| UNITED STATES |
| SECURITIES AND EXCHANGE COMMISSION |
| Washington, D.C. 20549 |
| |
FORM N-CSR |
| |
CERTIFIED SHAREHOLDER REPORT OF REGISTERED |
MANAGEMENT INVESTMENT COMPANIES |
| |
| |
| |
| Investment Company Act File Number: 811-5833 |
|
| |
| T. Rowe Price Institutional International Funds, Inc. |
|
| (Exact name of registrant as specified in charter) |
| |
| 100 East Pratt Street, Baltimore, MD 21202 |
|
| (Address of principal executive offices) |
| |
| David Oestreicher |
| 100 East Pratt Street, Baltimore, MD 21202 |
|
| (Name and address of agent for service) |
| |
| |
| Registrant’s telephone number, including area code: (410) 345-2000 |
| |
| |
| Date of fiscal year end: December 31 |
| |
| |
| Date of reporting period: June 30, 2008 |
Item 1: Report to Shareholders| Institutional International Bond Fund | June 30, 2008 |
The views and opinions in this report were current as of June 30, 2008. They are not guarantees of performance or investment results and should not be taken as investment advice. Investment decisions reflect a variety of factors, and the managers reserve the right to change their views about individual stocks, sectors, and the markets at any time. As a result, the views expressed should not be relied upon as a forecast of the fund’s future investment intent. The report is certified under the Sarbanes-Oxley Act, which requires mutual funds and other public companies to affirm that, to the best of their knowledge, the information in their financial reports is fairly and accurately stated in all material respects.
Manager’s Letter
T. Rowe Price Institutional Foreign Bond Funds
Dear Investor
The performance of international bonds was a study in contrasts during the first half of 2008. At the beginning of the reporting period, concerns about the global credit crisis and signs of economic weakening in the world’s developed markets triggered a pronounced demand for high-quality government bonds. Unsettled conditions within the credit markets made for volatile trading during the period. By the beginning of the second quarter, inflation replaced the earlier concerns and became the focus of the market’s apprehension. Central banks in developed countries outside the U.S. either raised rates or made hawkish comments about the need to raise rates, particularly in the second quarter. Overall, government bond markets declined in the second quarter and offset the first quarter’s stronger results, depressing overall returns for the first half of 2008. Emerging markets confronted a variety of challenges during the first half of the year. The most prominent were risk aversion and inflation. The dollar, burdened with large trade and budget deficits, fell against the euro and against the yen over the reporting period.
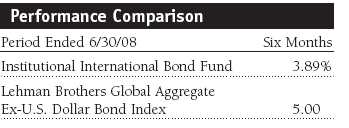
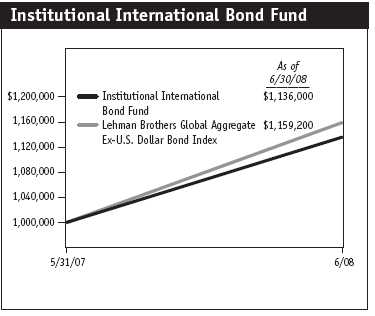
For the six-month period ended June 30, 2008, the Institutional International Bond Fund posted a 3.89% return compared with 5.00% for the Lehman Brothers Global Aggregate Ex-U.S. Dollar Bond Index.

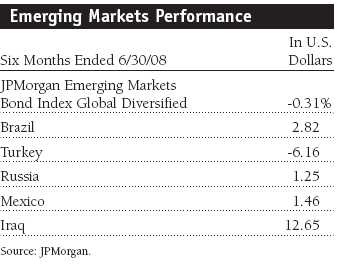
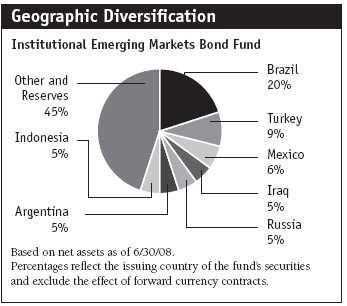
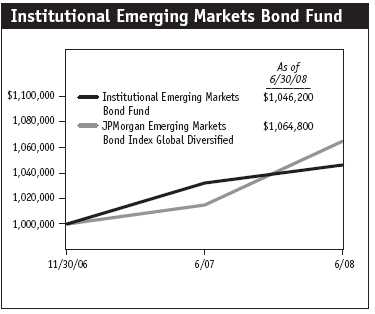
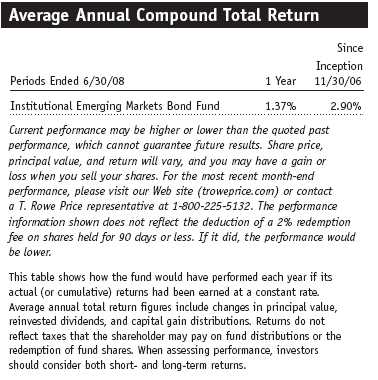
The Institutional Emerging Markets Bond Fund returned -1.94%, compared with -0.31% for the benchmark, the JPMorgan Emerging Markets Bond Index Global Diversified, for the six-month period ended June 30, 2008.
• Credit market turmoil, a weakening global economy, and inflationary pressures took their toll on developed and emerging bond markets. A weaker U.S. dollar bolstered international bond returns for U.S. international investors.
• The Institutional International Bond Fund posted a solid gain, but the Institutional Emerging Markets Bond Fund lost ground during the six-month period ended June 30, 2008.
• Performance in emerging markets varied. A number of our holdings, such as Iraq, performed well, but our exposure to Argentina and Turkey hurt overall results.
• Central banks remain concerned that rising commodity prices could fuel inflation and inflation expectations, and despite generally weaker economic conditions, a number of them are likely to raise rates in the second half of 2008 and early 2009.
Market Environment
During the six-month reporting period, global fixed-income market dynamics changed dramatically. At the beginning of the year, the market was preoccupied with continuing liquidity issues stemming from the collapse of the U.S. subprime mortgage market and subsequent liquidity issues. The failure of Wall Street dealer Bear Stearns in late March increased fears and generated more risk aversion. The takeover of Bear Stearns by JPMorgan started a short-lived period of increased risk taking. For a couple of weeks, equity markets performed strongly before another wave of risk aversion started. Bond market conditions deteriorated in the second quarter, primarily because the world’s central bankers focused on growing inflation risks and highlighted the need for rate hikes. Bond prices dropped worldwide in April and May and continued in June in Europe after it became clear that inflationary pressures were not abating and the likelihood of interest rate hikes was increasing.
The U.S. Federal Reserve aggressively cut its target rate four times to 2.0% from 4.25% to steady wobbly financial markets and to stimulate a weakening U.S. economy. Even as the Fed continued to lower rates, concerns about growing inflationary pressures came through the published statements. Torn between propping up a weakening U.S. economy and stifling energy- and food-generated inflation, the Fed kept rates steady after its April meeting. The market interpreted the Fed’s message to mean that its next rate move will be a rate hike and has priced in an increase by up to 75 basis points over the next 12 months.
Meanwhile, the European Central Bank (ECB) maintained its target rate, 4.0%, through the end of the reporting period. The ECB raised its refinancing rate to 4.25% in early July, after the end of this reporting period, to focus on its mission to fight inflation despite signs of economic weakening in the euro zone. Facing deteriorating economic conditions, the Bank of England cut its minimum lending rate twice from 5.50% to 5.00% to stimulate growth and support a weakening housing market. The Bank of Japan kept its rates on hold, and we are not expecting a rate hike until the first quarter of 2009.
The euro zone government bond market was down for the period, as government bond yields, especially at the shorter and intermediate part of the curve, rose sharply. At the beginning of June, ECB governor Jean-Claude Trichet’s comments that the bank would have “to move our rates by a small amount in our next meeting” to anchor inflation expectations sent two-year yields to a seven-year high and five-year yields to a five-year high. Other news on the region’s economies was downbeat, leading to concerns that higher interest rates would stifle growth.
Prices of Japanese government bonds were also down. The government revised its reading on first-quarter gross domestic product growth to 4% (annualized) from its original estimate of 3.3%. However, many economic indicators remained disappointing, suggesting the six-year expansion might have peaked. A sell-off in April and May, driven by higher inflation expectations, reversed slightly in June on the belief that soaring commodity prices would dampen economic activity and keep the Bank of Japan from raising interest rates this year.
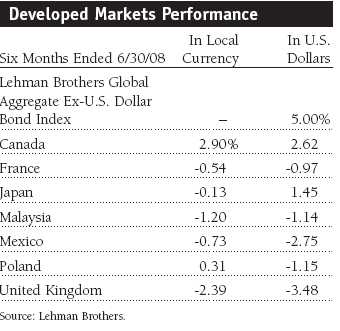
Although most of the world’s fixed-income markets posted losses in local currencies, the weaker dollar boosted returns for U.S. investors.
Emerging markets confronted a variety of challenges during the first half of the year. Despite this difficult environment, U.S. dollar-denominated emerging debt markets held up well relative to other risk-bearing fixed-income sectors. Good fundamentals in major emerging markets—decreasing fiscal deficits, growing cash reserves, and strong trade balances—supported the market. Higher commodities also bolstered a number of emerging economies but generated inflation concerns that hurt performance in several other markets. Central banks in Brazil, Turkey, Egypt, Mexico, South Africa, and Indonesia raised rates in an attempt to dampen inflationary pressures.
Midway through the period, sentiment improved. Investors believed the Federal Reserve’s aggressive intervention had relieved some of the financial market’s stress. As a result of the renewed appetite for risk, emerging markets debt experienced a powerful rally in April and positive returns in May. However, deepening concerns over inflation, the threat of slowing global growth, and worries about the ongoing financial crisis all led to declines in emerging markets debt in June—erasing all of the gains from the previous two months.
The rating upgrade of Brazil’s U.S. dollar-denominated government bonds to investment-grade was one of the highlights during the period. The higher rating means that Brazilian bonds will be included in Lehman Brother’s aggregate indexes, which should increase investor demand for the bonds and provide substantial support in the market. Brazil also stands out among emerging markets because the country’s central bank has high credibility among investors for its efforts to stay ahead of the curve in its fight against inflation.
Iraq was the top performer in the index, thanks to rising oil prices. Ecuador also benefited from higher oil prices. Argentina, Turkey, Vietnam, and Indonesia were four of the worst performers in the index during the period. These countries are facing tremendous inflation pressures, which led to credit downgrades during the period.
Institutional International Bond Fund
Despite some challenging conditions and a volatile market environment, the Institutional International Bond Fund posted a decent gain. Driven by fears of inflation, government bonds in major markets generally posted disappointing local returns over the reporting period.
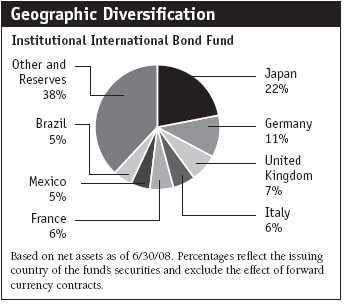
The fund is overweight in European government bonds. We believe European government bonds, driven by the ECB’s more aggressive monetary policy, are priced attractively in comparison to other major markets and offer long-term value. The fund initiated an overweight position in Hungarian government bonds at the beginning of the year and maintained its overweight to Mexico as the outlook for these markets looked promising. Over the reporting period, we had to acknowledge that these positions detracted from performance. Rising inflation prompted the central banks of Mexico and Hungary to hike their overnight rates, which resulted in a sell-off in these markets. However, attractive real (inflation-adjusted) yields relative to other markets make Mexican and Hungarian government bonds appealing over the long term. We are holding on to these positions, as countries dependent on the world’s major developed economies are likely to slow in the second half of 2008 and rate cuts are more likely. Due to higher inflation expectations, we increased our position in Japanese inflation-linked government bonds, a trade that performed especially well in the second quarter.
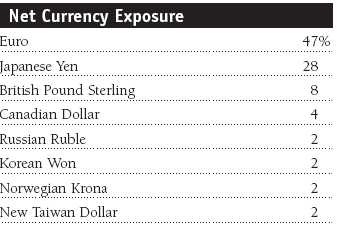
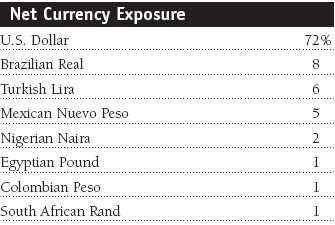
The weaker dollar helped to offset the negative effect of the weakness in global bond markets. We expect the dollar to recover over the medium term, but the fragile nature of the U.S. economy suggests that there may be some downside risk to the dollar in the coming months. In terms of the fund’s currency exposure, we are moving out of Asian currencies, but using the fund’s guideline ability to have a short position in the U.S. dollar by maintaining a structural allocation to Middle East currencies, such as the United Arab Emirates dirham and the Egyptian pound, which would benefit from a de-pegging against the U.S. dollar. On the back of the promising outlook of the U.S. dollar versus European currencies we are expecting an appreciation of the U.S. dollar relative to European currencies, namely the euro and U.K. sterling, where we initiated underweight positions over the last months. Our position in the Polish zloty versus the euro generated the largest currency contribution during the period. The fund’s overweight currency positions in peripheral markets, such as Mexico, and in emerging markets, such as Brazil and Egypt, contributed to relative returns. These gains slightly offset our overweight exposure to the yen versus the euro.
The fund’s allocation to local currency-denominated emerging markets bonds detracted from overall performance due to inflation concerns and general risk aversion. Our position in local Turkish and Brazilian government bonds was a major contributor to the fund’s underperformance. We retain a positive view on emerging markets and maintain exposure to local debt in such countries as Brazil and Turkey. With ongoing economic strength in the Brazilian economy and rate hikes by the Brazilian Central Bank already delivered and future ones priced in, the bond market offers long-term opportunities.
Overall we believe the valuation of high-quality, non-government bond markets is attractive, as widening spreads, driven by a lack of liquidity as much as by deteriorating fundamentals, offer opportunities in the European investment-grade corporate sector. The fund increased its tactical allocation to the corporate sector over the second quarter and is now overweight in this sector relative to the benchmark.
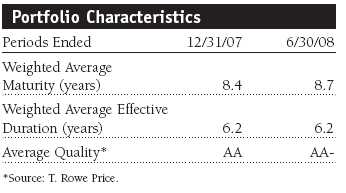
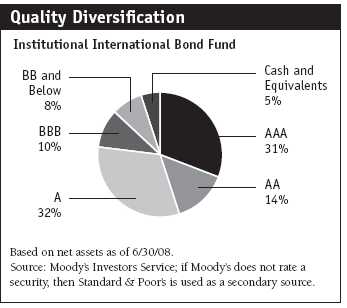
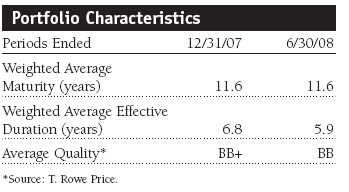
Although we trimmed our duration (a measure of the portfolio’s sensitivity to interest rate changes) over the reporting period, it remained longer than the benchmark. At the end of the period, the fund’s duration stood at 6.2 years—the same as the duration at the end of 2007. The fund’s credit quality remained high. Our average holding was rated AA-.
Institutional Emerging Markets Bond Fund
After several years of strong performance, emerging markets bonds struggled. Even though the fundamental environment—improved fiscal conditions and strong commodity markets—was unchanged in most emerging markets, their bond markets had to contend with a number of challenges and skittish investors. The market became much more volatile, creating a more difficult environment for the fund.
The Institutional Emerging Markets Bond Fund trailed the JPMorgan Emerging Markets Bond Index Global Diversified for the six-month period. Our larger-than-benchmark exposure to Argentina and Turkey hurt our relative performance. Our overweight exposure to Brazil and Iraq aided results.

Brazil is the highest-conviction position within our portfolio, and our allocation is split between U.S. dollar-denominated and local currency debt. While rate hikes weighed on our Brazilian local bonds during the quarter, we are encouraged by the central bank’s preemptive monetary policy actions. We trimmed some of our exposure to Brazil external debt in the second quarter as credit upgrades pushed valuations to rich levels. Real rates in Brazil are extremely attractive, and we added to our local exposure. Following a due-diligence visit, we increased our overweight position in Iraq during the period. Iraq remains one of our top-performing holdings, one not found in most of our peers’ portfolios.
We reduced our overweight position in Argentina. While high agriculture prices support Argentina’s growth prospects, we recently trimmed our position because we observed some deterioration in the country’s fundamentals. Our overweight position detracted from relative performance as the unresolved farmers’ strike continued to pressure debt prices. We have a significant underweight position in Venezuela where we are concerned with the country’s loose fiscal and monetary policies that are spawning inflation.
Regionally, the Middle East and Africa region remains our largest overweight. A significant portion of this overweight is attributable to our position in Iraq, but we also maintained positions in several frontier African markets, such as Ghana, Nigeria, Angola, and Gabon. We view our exposure to these and other frontier markets as an important element in our investment approach that takes advantage of all the reasonable opportunities in the market. We have maintained a significant underweight in Asia, mostly due to rich valuations. Inflation concerns have become a worry within this region, particularly since most of these countries are net oil importers. Government subsidies, which have been put in place to soften the blow of inflation, are also a source of concern.
We continue to purchase bonds denominated in local currencies, and we anticipate that local-currency bonds will become more prevalent in emerging markets as governments pay down debt, judiciously manage their economies, and build their reserves. As a result, they will be borrowing less in foreign currencies, and this trend should deepen emerging economies’ domestic currency markets.
Our strategy remains focused on fundamental credit analysis and establishing high-conviction positions where warranted. We remain less focused on near-term trading events and prefer to build a diverse portfolio of longer-term positions. This approach is more appropriate for our fundamental investment style and enables us to hold down turnover and trading costs.
Outlook
We expect U.S. growth to remain below its full potential for the remainder of the year, particularly if the dollar strengthens, which would reduce the exports that have helped sustain the economy. Although core inflation measures remain benign, food and energy prices continue to rise, creating a dilemma for policymakers who have to choose between stimulating a weakening economy and tamping down inflation. We believe the Fed is likely to increase rates before the year ends. In Europe, the ECB began its tightening cycle with its July rate hike. Over the next 12 months, we anticipate another hike of 25 basis points (0.25%). The near-term outlook for the Japanese economy is cloudy. Inflation has picked up, but the newly appointed head of the Bank of Japan has stressed that Japan will pursue a monetary policy that is appropriate to the weak environment. We believe the Bank of Japan will hold interest rates at 0.5% this year, but we anticipate a 25-basis-point hike in the first half of 2009.
In addition to the major developed markets, we are also looking at smaller and peripheral markets that are not as closely followed. We are focusing our research efforts on countries that are dependent on the world’s major economies and are likely to slow down this year, such as Hungary and Mexico. Weaker economies in these countries might lead to interest rate cuts and rising bond prices in the future.
We believe the long-term outlook for the U.S. dollar has improved. Positive trade and current account performance have stopped the dollar’s slippage and should support it in the future. As a result, we are expecting the dollar to appreciate relative to European currencies, particularly the euro and British pound. Given the stretched valuation of the euro, we see more potential in the currencies of peripheral European countries, such as Norway.
In emerging markets, inflation—mainly driven by recent spikes in commodity prices—has moved to the forefront on a global scale and now poses the most significant risk. While high commodity prices act as support for government balance sheets in several emerging economies, some governments have responded with subsidies and price controls to soften the blow of price increases on consumers. We plan to closely monitor and assess the impact on our holdings. High commodity and energy prices, growing domestic demand, improving trade balances and reserves, and solid policymaking should help emerging markets, and we believe they will remain a fertile ground for investors.
Respectfully submitted,

Ian Kelson
President of the International Fixed Income Division and chairman of the Institutional International Bond Fund’s Investment Advisory Committee

Michael Conelius
Chairman of the Investment Advisory Committee for the Institutional Emerging Markets Bond Fund.
July 28, 2008
The committee chairmen have day-to-day responsibility for the portfolios and work with committee members in developing and executing the funds’ investment programs.
| Risk of International Bond Investing |
Funds that invest overseas generally carry more risk than funds that invest strictly in U.S. assets, including unpredictable changes in currency values. Investments in emerging markets are subject to abrupt and severe price declines and should be regarded as speculative. The economic and political structures of developing nations, in most cases, do not compare favorably with the U.S. or other developed countries in terms of wealth and stability, and their financial markets often lack liquidity. Some countries also have legacies of hyperinflation, currency devaluations, and governmental interference in markets.
International investments are subject to currency risk, a decline in the value of a foreign currency versus the U.S. dollar, which reduces the dollar value of securities denominated in that currency. The overall impact on a fund’s holdings can be significant and long lasting, depending on the currencies represented in the portfolio, how each one appreciates or depreciates in relation to the U.S. dollar, and whether currency positions are hedged. Further, exchange rate movements are unpredictable, and it is not possible to effectively hedge the currency risks of many developing countries.
Bonds are also subject to interest rate risk, the decline in bond prices that usually accompanies a rise in interest rates, and credit risk, the chance that any fund holding could have its credit rating downgraded or that a bond issuer will default (fail to make timely payments of interest or principal), potentially reducing the fund’s income level and share price.
30-day SEC yield: The 30-day SEC yield represents net investment income earned by a fund over a 30-day period, expressed as an annual percentage rate based on the fund’s share price at the end of the 30-day period.
Average maturity: For a bond fund, this is the weighted average of the stated maturity dates of the portfolio’s securities. In general, the longer the average maturity, the greater the fund’s sensitivity to interest rate changes, which can mean greater price fluctuation. A shorter average maturity usually means less interest rate sensitivity and, consequently, a less volatile portfolio.
Basis point: One one-hundredth of one percentage point, or 0.01%.
Duration: A measure of a bond or bond fund’s sensitivity to changes in interest rates. For example, a fund with a duration of six years would fall about 6% in response to a one-percentage-point rise in rates, and vice versa.
Hedged: The buying and selling of forward exchange contracts to lock in a currency’s value. In an unhedged position, no steps are taken to protect against currency fluctuations.
JPMorgan Emerging Markets Bond Index Global Diversified: Tracks U.S. dollar government bonds of 31 foreign countries.
Lehman Brothers Global Aggregate Ex-U.S. Dollar Bond Index: Tracks an international basket of bonds that contains 65% government, 14% corporate, 13% agency, and 8% mortgage-related bonds.
Yield curve: A graphic depiction of the relationship between yields and maturity dates for a set of similar securities, such as Treasuries or municipal securities. Securities with longer maturities usually have a higher yield. If short-term securities offer a higher yield, then the curve is said to be “inverted.” If short- and long-term bonds are offering equivalent yields, then the curve is said to be “flat.”
Portfolio Highlights

Performance and Expenses
T. Rowe Price Institutional Foreign Bond Funds
This chart shows the value of a hypothetical $1 million investment in the fund over the past 10 fiscal year periods or since inception (for funds lacking 10-year records). The result is compared with benchmarks, which may include a broad-based market index and a peer group average or index. Market indexes do not include expenses, which are deducted from fund returns as well as mutual fund averages and indexes.
This chart shows the value of a hypothetical $1 million investment in the fund over the past 10 fiscal year periods or since inception (for funds lacking 10-year records). The result is compared with benchmarks, which may include a broad-based market index and a peer group average or index. Market indexes do not include expenses, which are deducted from fund returns as well as mutual fund averages and indexes.
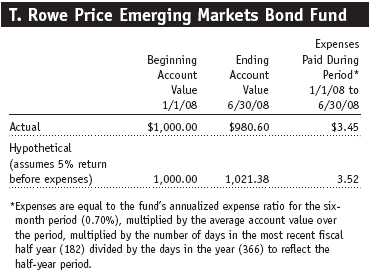
Fund Expense Example
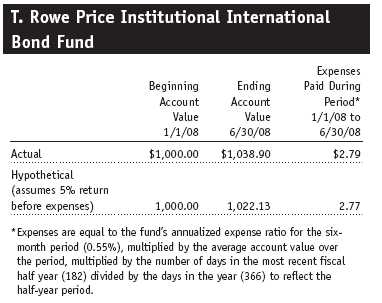
As a mutual fund shareholder, you may incur two types of costs: (1) transaction costs, such as redemption fees or sales loads, and (2) ongoing costs, including management fees, distribution and service (12b-1) fees, and other fund expenses. The following example is intended to help you understand your ongoing costs (in dollars) of investing in the fund and to compare these costs with the ongoing costs of investing in other mutual funds. The example is based on an investment of $1,000 invested at the beginning of the most recent six-month period and held for the entire period.
Actual Expenses
The first line of the following table (“Actual”) provides information about actual account values and actual expenses. You may use the information in this line, together with your account balance, to estimate the expenses that you paid over the period. Simply divide your account value by $1,000 (for example, an $8,600 account value divided by $1,000 = 8.6), then multiply the result by the number in the first line under the heading “Expenses Paid During Period” to estimate the expenses you paid on your account during this period.
Hypothetical Example for Comparison Purposes
The information on the second line of the table (“Hypothetical”) is based on hypothetical account values and expenses derived from the fund’s actual expense ratio and an assumed 5% per year rate of return before expenses (not the fund’s actual return). You may compare the ongoing costs of investing in the fund with other funds by contrasting this 5% hypothetical example and the 5% hypothetical examples that appear in the shareholder reports of the other funds. The hypothetical account values and expenses may not be used to estimate the actual ending account balance or expenses you paid for the period.
You should also be aware that the expenses shown in the table highlight only your ongoing costs and do not reflect any transaction costs, such as redemption fees or sales loads. Therefore, the second line of the table is useful in comparing ongoing costs only and will not help you determine the relative total costs of owning different funds. To the extent a fund charges transaction costs, however, the total cost of owning that fund is higher.
Financial Highlights
T. Rowe Price Institutional International Bond Fund
(Unaudited)
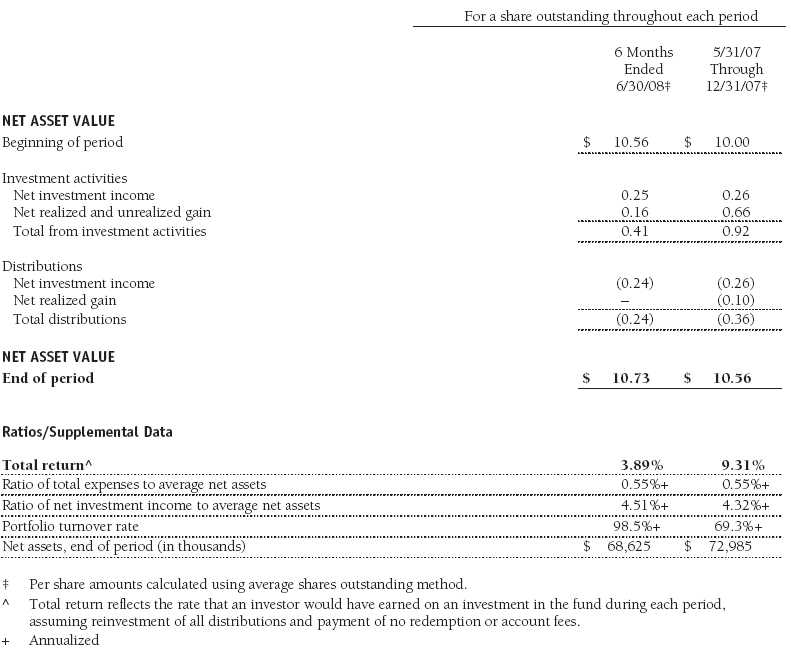
The accompanying notes are an integral part of these financial statements.
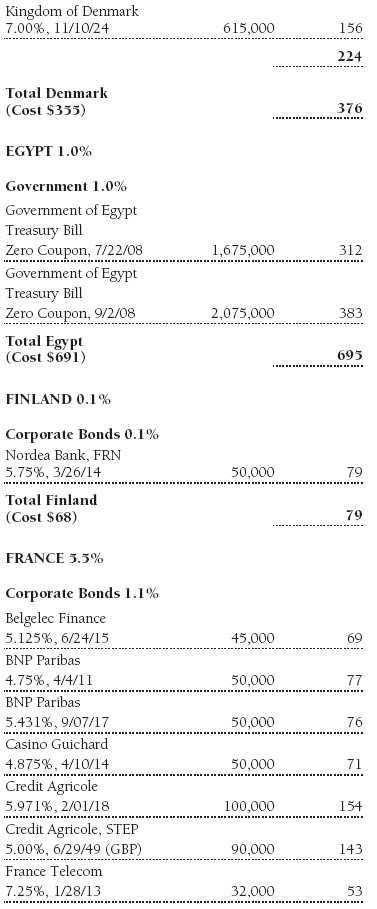
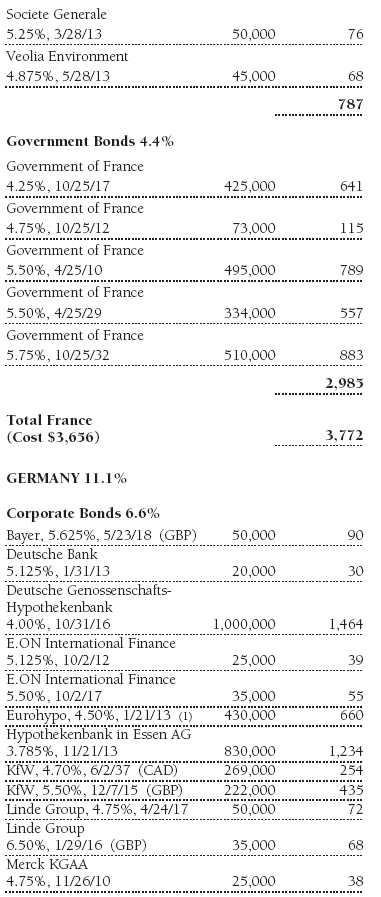
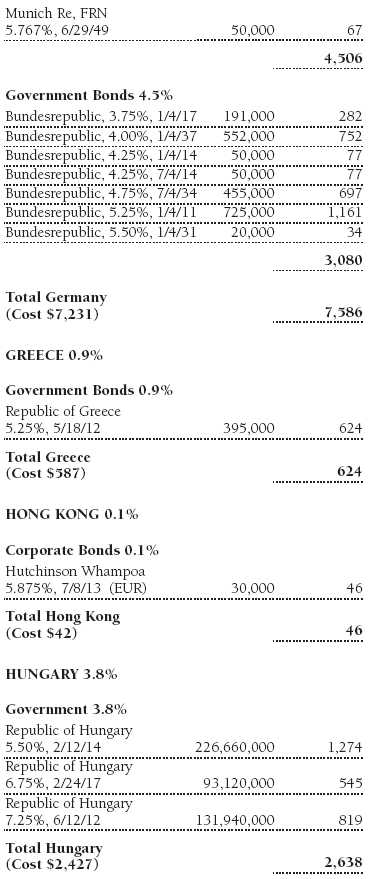
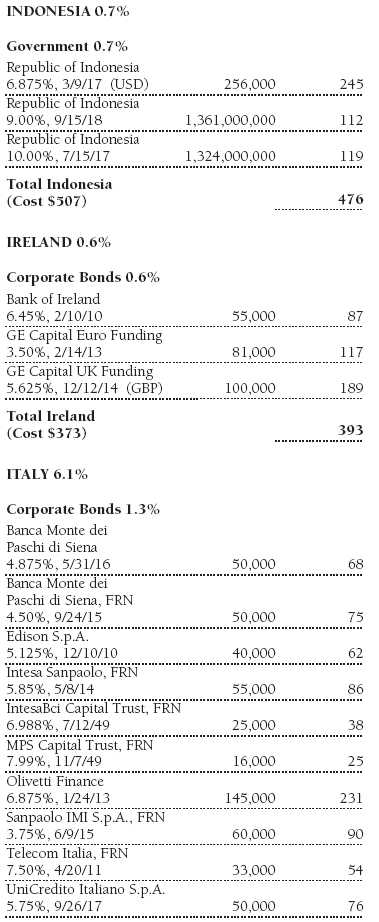
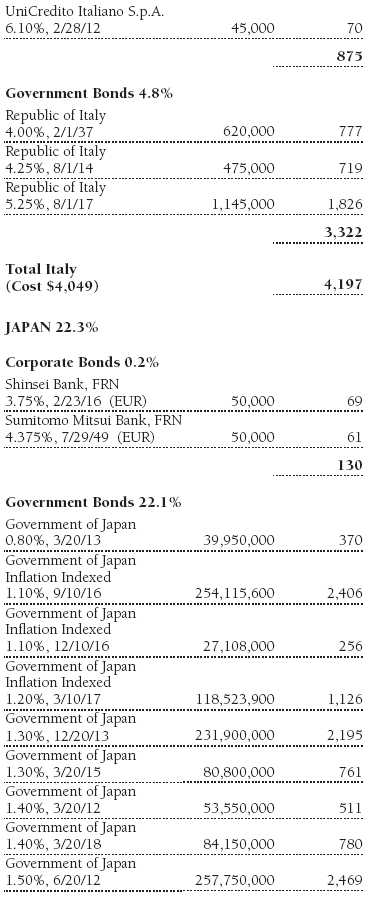
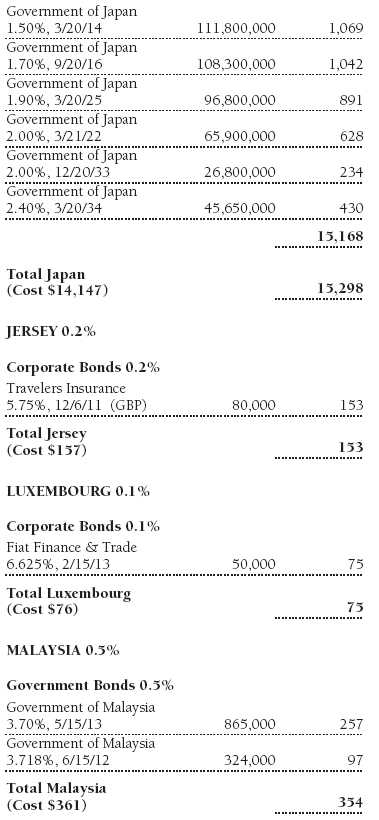
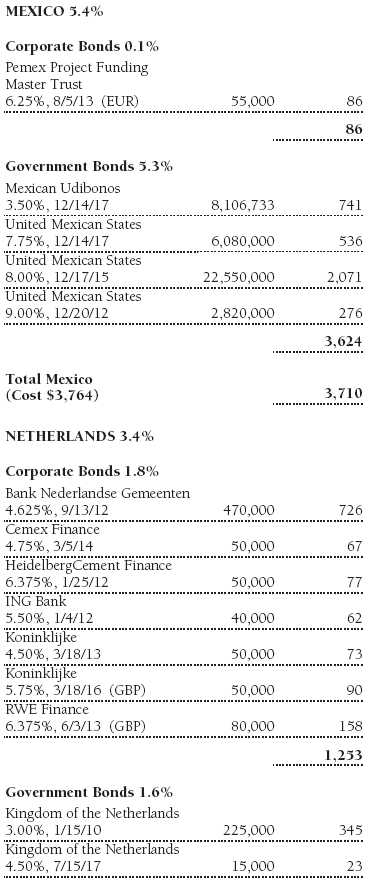
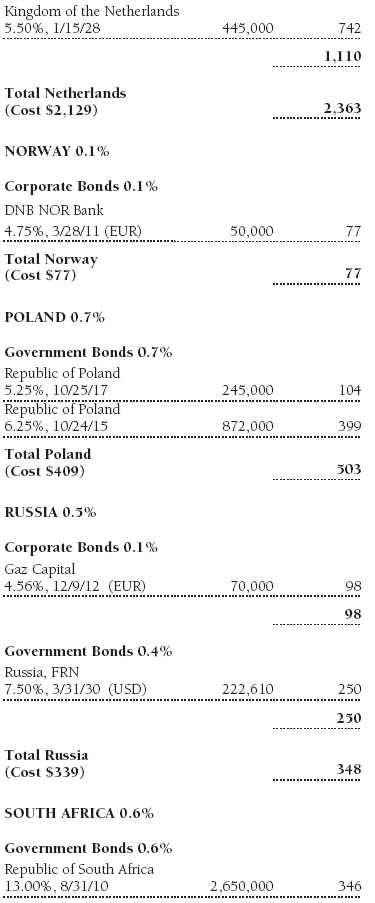
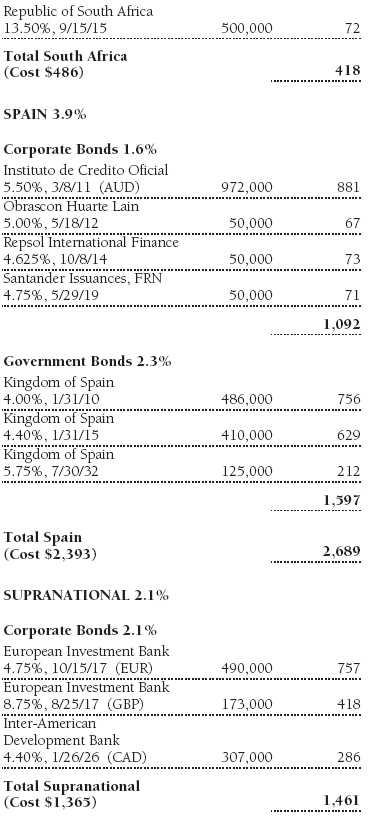
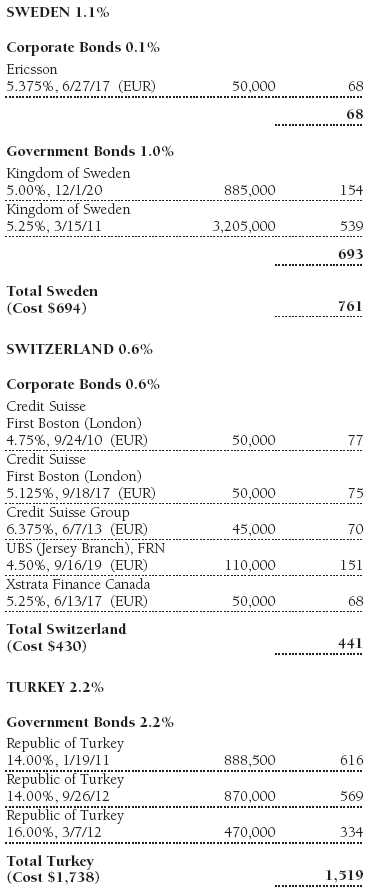
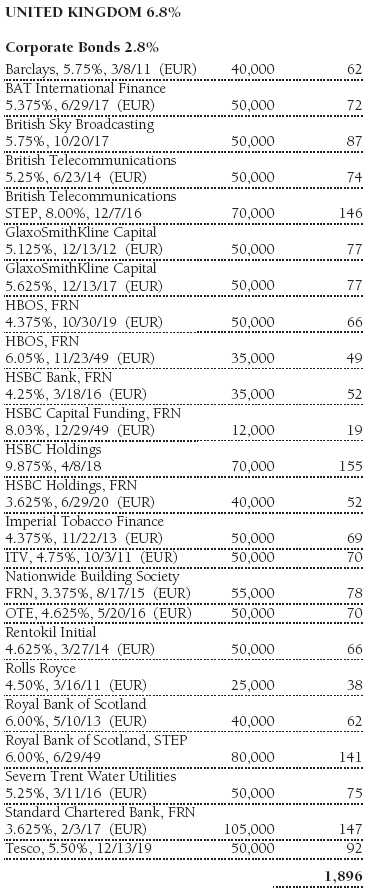
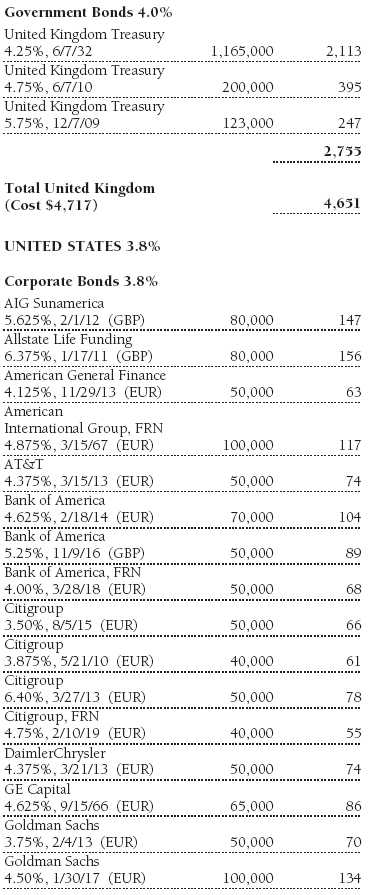
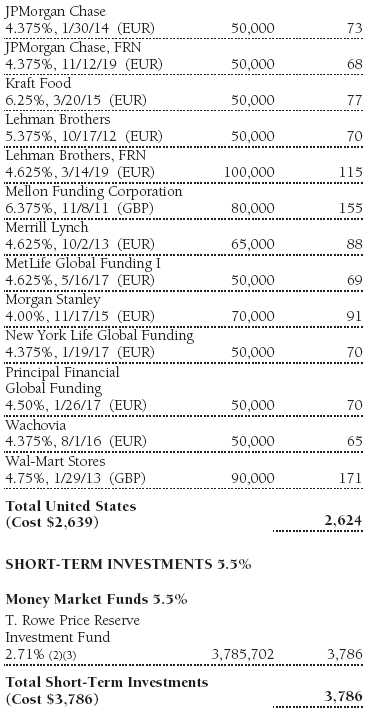
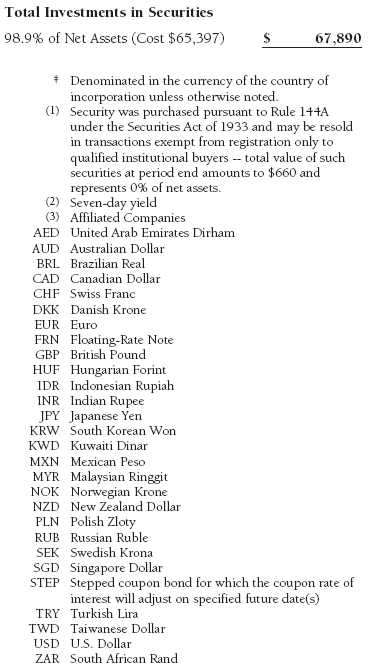
Portfolio of Investments ‡
T. Rowe Price Institutional International Bond Fund
June 30, 2008 (Unaudited)
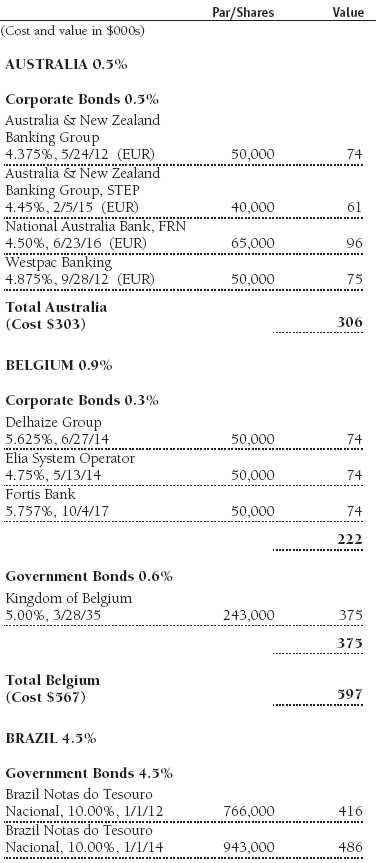
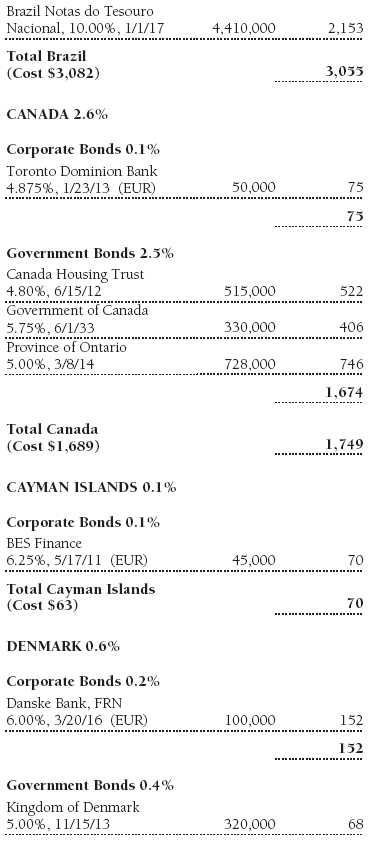

The accompanying notes are an integral part of these financial statements.
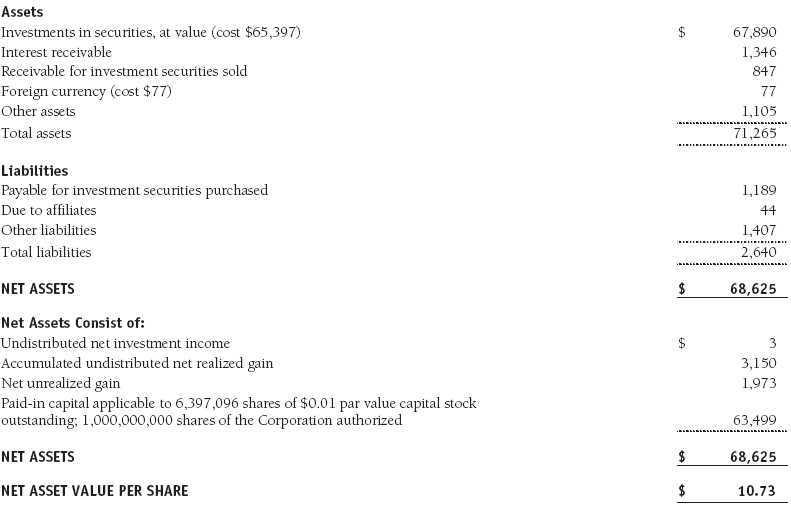
Statement of Assets and Liabilities
T. Rowe Price Institutional International Bond Fund
June 30, 2008 (Unaudited)
($000s, except shares and per share amounts)
The accompanying notes are an integral part of these financial statements.
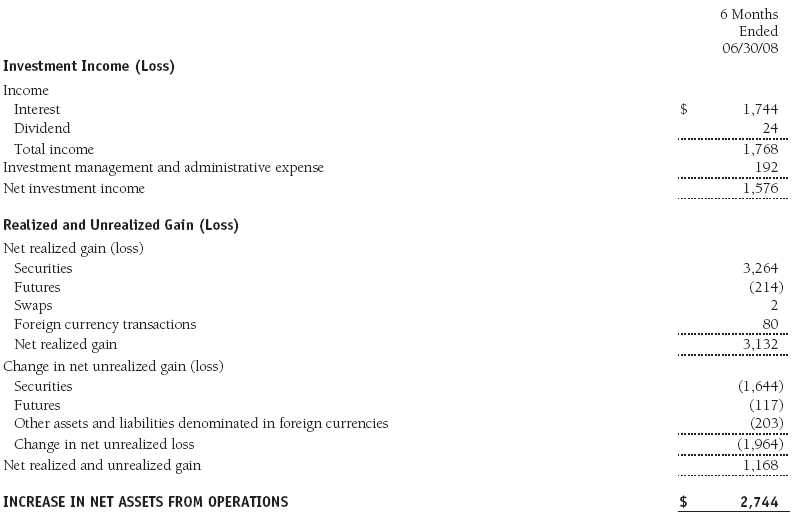
Statement of Operations
T. Rowe Price Institutional International Bond Fund
(Unaudited)
($000s)
The accompanying notes are an integral part of these financial statements.
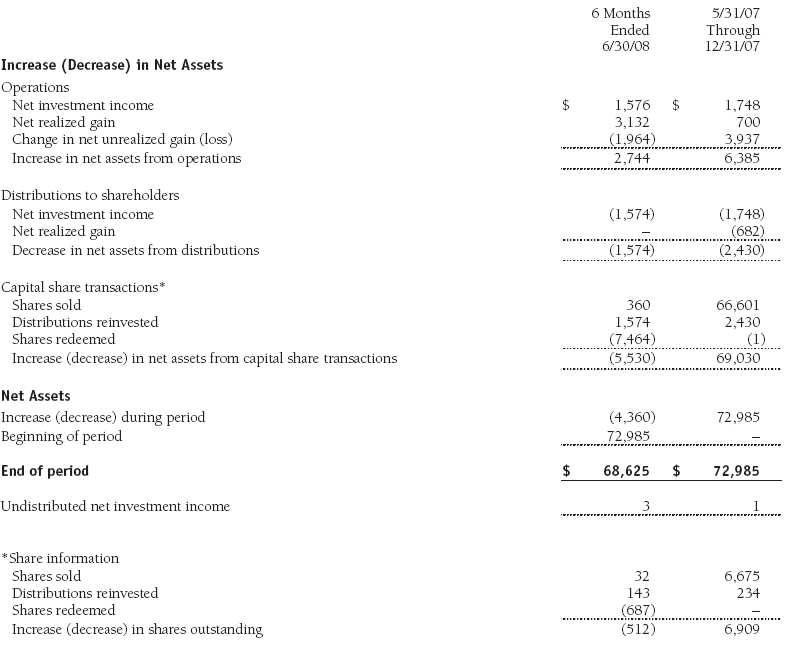
Statement of Changes in Net Assets
T. Rowe Price Institutional International Bond Fund
(Unaudited)
($000s)
The accompanying notes are an integral part of these financial statements.
Notes to Financial Statements
T. Rowe Price Institutional International Bond Fund
June 30, 2008 (Unaudited)
T. Rowe Price Institutional International Funds, Inc. (the corporation), is registered under the Investment Company Act of 1940 (the 1940 Act). The Institutional International Bond Fund (the fund), a nondiversified, open-end management investment company, is one portfolio established by the corporation. The fund commenced operations on May 31, 2007. The fund seeks to provide current income and capital appreciation.
NOTE 1 - SIGNIFICANT ACCOUNTING POLICIES
Basis of Preparation The accompanying financial statements were prepared in accordance with accounting principles generally accepted in the United States of America, which require the use of estimates made by fund management. Fund management believes that estimates and security valuations are appropriate; however, actual results may differ from those estimates, and the security valuations reflected in the financial statements may differ from the value the fund ultimately realizes upon sale of the securities.
Investment Transactions, Investment Income, and Distributions Income and expenses are recorded on the accrual basis. Premiums and discounts on debt securities are amortized for financial reporting purposes. Inflation adjustments to the principal amount of inflation-indexed bonds are reflected as interest income. Dividends received from mutual fund investments are reflected as dividend income; capital gain distributions are reflected as realized gain/loss. Dividend income and capital gain distributions are recorded on the ex-dividend date. Income tax-related interest and penalties, if incurred, would be recorded as income tax expense. Investment transactions are accounted for on the trade date. Realized gains and losses are reported on the identified cost basis. Payments (“variation margin”) made or received to settle the daily fluctuations in the value of futures contracts are recorded as unrealized gains or losses until the contracts are closed. Unsettled variation margin on futures contracts is reflected as other assets or liabilities, and unrealized gains and losses on futures contracts are reflected as the change in net unrealized gain or loss in the accompanying financial statements. Unrealized gains and losses on forward currency exchange contracts are reflected as the change in net unrealized gain or loss in the accompanying financial statements. Net periodic receipts or payments required by swaps are accrued daily and recorded as realized gain or loss in the accompanying financial statements. Fluctuations in the fair value of swaps are reflected in the change in net unrealized gain or loss and are reclassified to realized gain or loss upon termination prior to maturity. Distributions to shareholders are recorded on the ex-dividend date. Income distributions are declared on a daily basis and paid monthly. Capital gain distributions, if any, are declared and paid by the fund, typically on an annual basis.
Currency Translation Assets, including investments, and liabilities denominated in foreign currencies are translated into U.S. dollar values each day at the prevailing exchange rate, using the mean of the bid and asked prices of such currencies against U.S. dollars as quoted by a major bank. Purchases and sales of securities, income, and expenses are translated into U.S. dollars at the prevailing exchange rate on the date of the transaction. The effect of changes in foreign currency exchange rates on realized and unrealized security gains and losses is reflected as a component of security gains and losses.
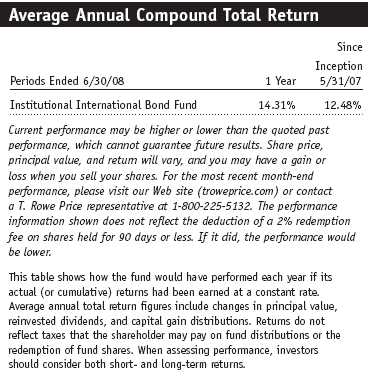
Redemption Fees A 2% fee is assessed on redemptions of fund shares held for 90 days or less to deter short-term trading and to protect the interests of long-term shareholders. Redemption fees are withheld from proceeds that shareholders receive from the sale or exchange of fund shares. The fees are paid to the fund, and are recorded as an increase to paid-in capital. The fees may cause the redemption price per share to differ from the net asset value per share.
New Accounting Pronouncements On January 1, 2008, the fund adopted Statement of Financial Accounting Standards No. 157 (FAS 157), Fair Value Measurements. FAS 157 defines fair value, establishes the framework for measuring fair value, and expands the disclosures of fair value measurements in the financial statements. Adoption of FAS 157 did not have a material impact on the fund’s net assets or results of operations.
In March 2008, the Financial Accounting Standards Board issued Statement of Financial Accounting Standards No. 161, Disclosures about Derivative Instruments and Hedging Activities (FAS 161), which is effective for fiscal years and interim periods beginning after November 15, 2008. FAS 161 requires enhanced disclosures about derivative and hedging activities, including how such activities are accounted for and their effect on financial position, performance and cash flows. Management is currently evaluating the impact the adoption of FAS 161 will have on the fund’s financial statements and related disclosures.
NOTE 2 - VALUATION
The fund’s investments are reported at fair value as defined under FAS 157. The fund values its investments and computes its net asset value per share at the close of the New York Stock Exchange (NYSE), normally 4 p.m. ET, each day that the NYSE is open for business.
Valuation Methods Debt securities are generally traded in the over-the-counter (OTC) market. Securities with remaining maturities of one year or more at the time of acquisition are valued at prices furnished by dealers who make markets in such securities or by an independent pricing service, which considers the yield or price of bonds of comparable quality, coupon, maturity, and type, as well as prices quoted by dealers who make markets in such securities. Securities with remaining maturities of less than one year at the time of acquisition generally use amortized cost in local currency to approximate fair value. However, if amortized cost is deemed not to reflect fair value or the fund holds a significant amount of such securities with remaining maturities of more than 60 days, the securities are valued at prices furnished by dealers who make markets in such securities or by an independent pricing service.
Investments in mutual funds are valued at the mutual fund’s closing net asset value per share on the day of valuation. Financial futures contracts are valued at closing settlement prices. Forward currency exchange contracts are valued using the prevailing forward exchange rate. Swaps are valued at net present value of the contract as furnished by counterparties or by an independent pricing service.
Other investments, including restricted securities, and those for which the above valuation procedures are inappropriate or are deemed not to reflect fair value are stated at fair value as determined in good faith by the T. Rowe Price Valuation Committee, established by the fund’s Board of Directors.
For valuation purposes, the last quoted prices of non-U.S. equity securities may be adjusted under the circumstances described below. If the fund determines that developments between the close of a foreign market and the close of the NYSE will, in its judgment, materially affect the value of some or all of its portfolio securities, the fund will adjust the previous closing prices to reflect what it believes to be the fair value of the securities as of the close of the NYSE. In deciding whether it is necessary to adjust closing prices to reflect fair value, the fund reviews a variety of factors, including developments in foreign markets, the performance of U.S. securities markets, and the performance of instruments trading in U.S. markets that represent foreign securities and baskets of foreign securities. A fund may also fair value securities in other situations, such as when a particular foreign market is closed but the fund is open. The fund uses outside pricing services to provide it with closing prices and information to evaluate and/or adjust those prices. The fund cannot predict how often it will use closing prices and how often it will determine it necessary to adjust those prices to reflect fair value. As a means of evaluating its security valuation process, the fund routinely compares closing prices, the next day’s opening prices in the same markets, and adjusted prices.
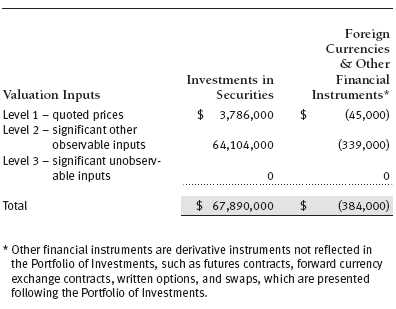
Valuation Inputs Various inputs are used to determine the value of the fund’s investments. These inputs are summarized in the three broad levels listed below:
Level 1 – quoted prices in active markets for identical securities
Level 2 – observable inputs other than Level 1 quoted prices (including, but not limited to, quoted prices for similar securities, interest rates, prepayment speeds, credit risk)
Level 3 – unobservable inputs
Observable inputs are those based on market data obtained from sources independent of the fund, and unobservable inputs reflect the fund’s own assumptions based on the best information available. The input levels are not necessarily an indication of the risk or liquidity associated with investments at that level. For example, non-U.S. equity securities actively traded in foreign markets generally are reflected in Level 2 despite the availability of closing prices, because the fund evaluates and determines whether those closing prices reflect fair value at the close of the NYSE or require adjustment, as described above. The following table summarizes the fund’s investments, based on the inputs used to determine their values on June 30, 2008:
NOTE 3 - INVESTMENT TRANSACTIONS
Consistent with its investment objective, the fund engages in the following practices to manage exposure to certain risks or to enhance performance. The investment objective, policies, program, and risk factors of the fund are described more fully in the fund’s prospectus and Statement of Additional Information.
Emerging Markets At June 30, 2008, approximately 20% of the fund’s net assets were invested, directly or through its investments in T. Rowe Price institutional funds, in securities of companies located in emerging markets or issued by governments of emerging market countries or denominated in or linked to the currencies of emerging market countries. Future economic or political developments could adversely affect the liquidity or value, or both, of such securities.
Restricted Securities The fund may invest in securities that are subject to legal or contractual restrictions on resale. Prompt sale of such securities at an acceptable price may be difficult and may involve substantial delays and additional costs.
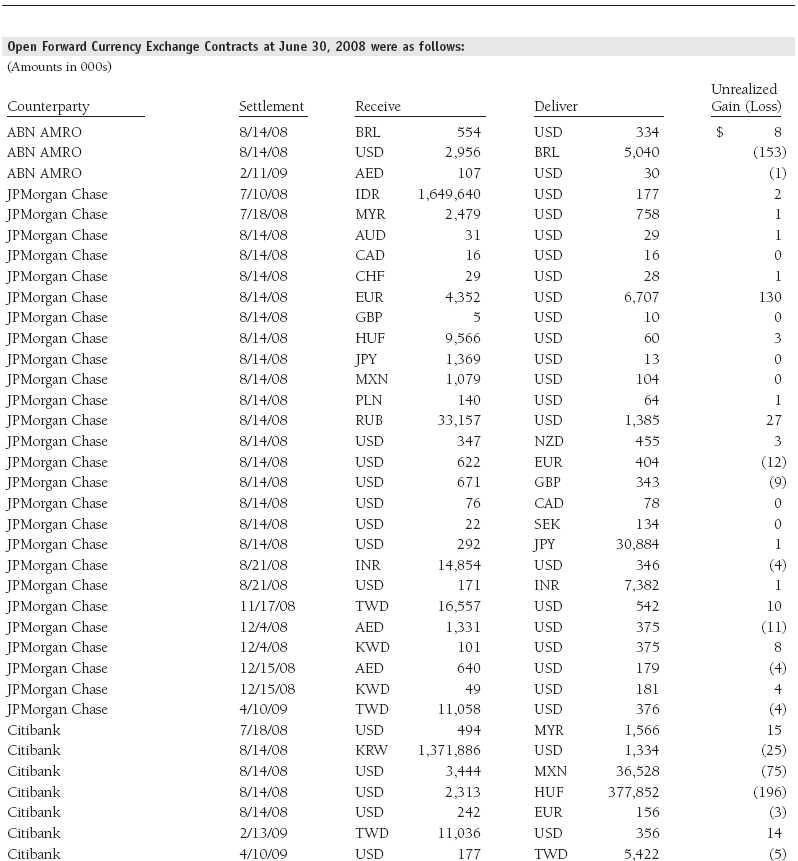
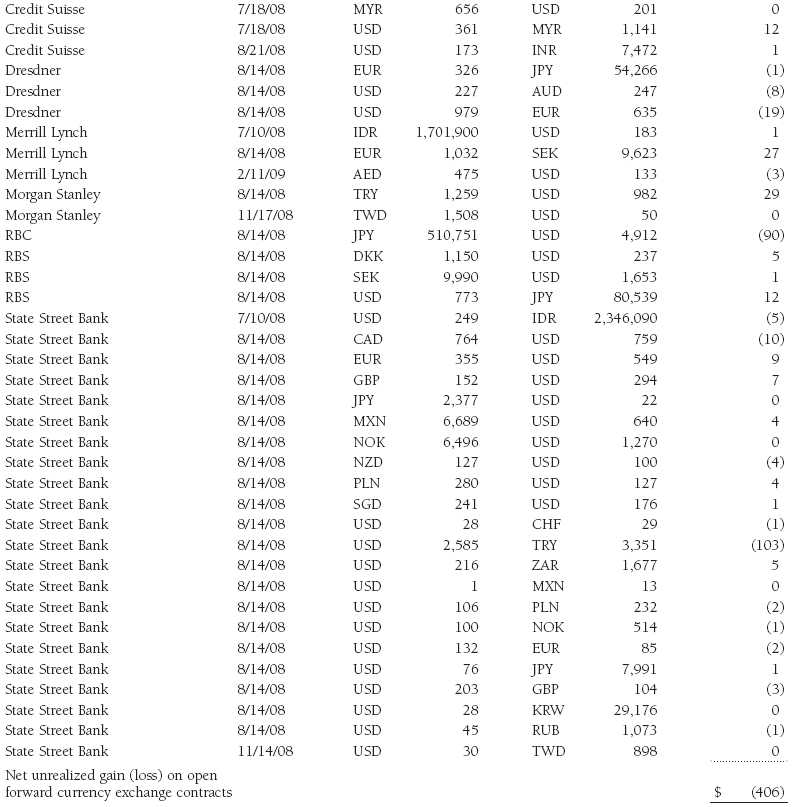
Forward Currency Exchange Contracts During the six months ended June 30, 2008, the fund was a party to forward currency exchange contracts under which it is obligated to exchange currencies at specified future dates and exchange rates. Risks arise from the possible inability of counterparties to meet the terms of their agreements and from movements in currency values.
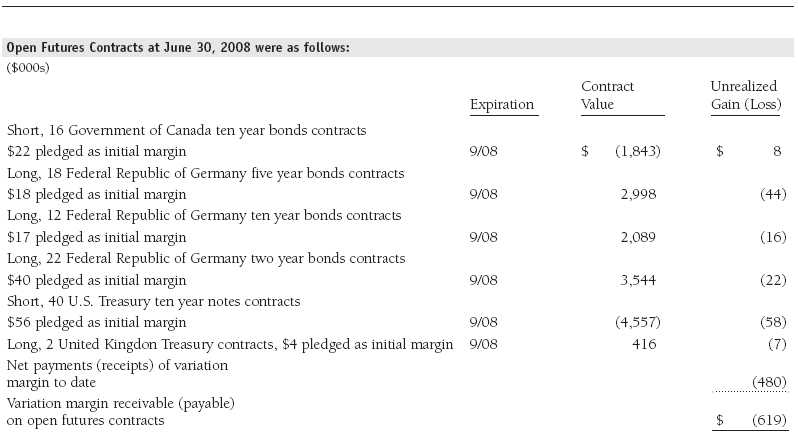
Futures Contracts During the six months ended June 30, 2008, the fund was a party to futures contracts, which provide for the future sale by one party and purchase by another of a specified amount of a specific financial instrument at an agreed upon price, date, time, and place. Risks arise from possible illiquidity of the futures market and from movements in security values and/or interest rates and/or currency values.
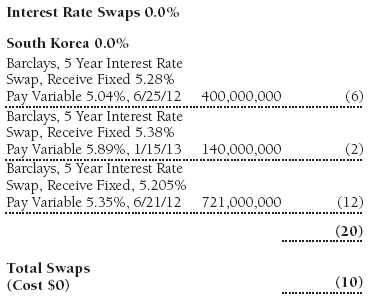
Swaps During the six months ended June 30, 2008, the fund was a party to interest rate swaps under which it is obligated to exchange cash flows based on the difference between specified interest rates applied to a notional principal amount for a specified period of time. Risks arise from the possible inability of counterparties to meet the terms of their agreements and from movements in interest rates. During the six months ended June 30, 2008, the fund was a party to credit default swaps under which it buys or sells credit protection against a defined-issuer credit event. Upon a defined-issuer credit event, the fund is required to either deliver the notional amount of the contract in cash and take delivery of the relevant credit or deliver cash approximately equal to the notional amount of the contract less market value of the relevant credit at the time of the credit event. Risks arise from the possible inability of counterparties to meet the terms of their agreements and from changes in creditworthiness of the relevant underlying issuer. In order to mitigate counterparty risk and subject to specific contractual arrangements, the fund may receive eligible security collateral from such counterparties upon unrealized gain amounts reaching certain thresholds. Eligible security collateral generally includes debt securities issued by the U.S. government or related agencies. At June 30, 2008, no such collateral was received.
Other Purchases and sales of portfolio securities, other than short-term securities, aggregated $33,227,000 and $42,434,000, respectively, for the six months ended June 30, 2008.
NOTE 4 - FEDERAL INCOME TAXES
No provision for federal income taxes is required since the fund intends to continue to qualify as a regulated investment company under Subchapter M of the Internal Revenue Code and distribute to shareholders all of its taxable income and gains. Distributions are determined in accordance with Federal income tax regulations, which differ from generally accepted accounting principles, and, therefore, may differ in amount or character from net investment income and realized gains for financial reporting purposes. Financial reporting records are adjusted for permanent book/tax differences to reflect tax character but are not adjusted for temporary differences. The amount and character of tax-basis distributions and composition of net assets are finalized at fiscal year-end; accordingly, tax-basis balances have not been determined as of June 30, 2008.
The fund intends to retain realized gains to the extent of available capital loss carryforwards. As of December 31, 2007, the fund had $211,000 of unused capital loss carryforwards, that expire in 2015.
At June 30, 2008, the cost of investments for federal income tax purposes was $65,397,000. Net unrealized gain aggregated $1,973,000 at period-end, of which $3,739,000 related to appreciated investments and $1,766,000 related to depreciated investments.
NOTE 5 - RELATED PARTY TRANSACTIONS
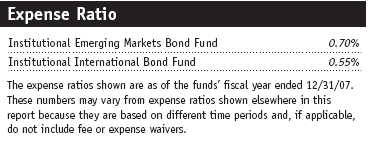
The fund is managed by T. Rowe Price International, Inc. (the manager), a wholly owned subsidiary of T. Rowe Price Associates, Inc. (Price Associates), which is wholly owned by T. Rowe Price Group, Inc. The investment management and administrative agreement between the fund and the manager provides for an all-inclusive annual fee equal to 0.55% of the fund’s average daily net assets. The fee is computed daily and paid monthly. The agreement provides that investment management, shareholder servicing, transfer agency, accounting, custody services, and directors’ fees and expenses are provided to the fund, and interest, taxes, brokerage commissions, and extraordinary expenses are paid directly by the fund.
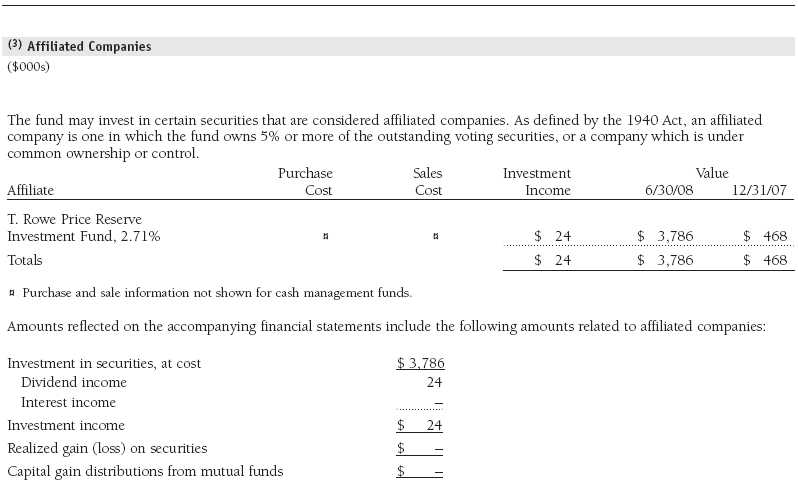
The fund may invest in the T. Rowe Price Reserve Investment Fund and the T. Rowe Price Government Reserve Investment Fund (collectively, the T. Rowe Price Reserve Investment Funds), open-end management investment companies managed by Price Associates and considered affiliates of the fund. The T. Rowe Price Reserve Investment Funds are offered as cash management options to mutual funds, trusts, and other accounts managed by Price Associates and/or its affiliates and are not available for direct purchase by members of the public. The T. Rowe Price Reserve Investment Funds pay no investment management fees.
Mutual funds and other accounts managed by T. Rowe Price and its affiliates (collectively, T. Rowe Price funds) may invest in the fund; however, no T. Rowe Price fund may invest for the purpose of exercising management or control over the fund. At June 30, 2008, approximately 99% of the fund’s outstanding shares were held by T. Rowe Price funds.
| Information on Proxy Voting Policies, Procedures, and Records |
A description of the policies and procedures used by T. Rowe Price funds and portfolios to determine how to vote proxies relating to portfolio securities is available in each fund’s Statement of Additional Information, which you may request by calling 1-800-225-5132 or by accessing the SEC’s Web site, www.sec.gov. The description of our proxy voting policies and procedures is also available on our Web site, www.troweprice.com. To access it, click on the words “Company Info” at the top of our homepage for individual investors. Then, in the window that appears, click on the “Proxy Voting Policy” navigation button in the top left corner.
Each fund’s most recent annual proxy voting record is available on our Web site and through the SEC’s Web site. To access it through our Web site, follow the directions above, then click on the words “Proxy Voting Record” at the bottom of the Proxy Voting Policy page.
| How to Obtain Quarterly Portfolio Holdings |
The fund files a complete schedule of portfolio holdings with the Securities and Exchange Commission for the first and third quarters of each fiscal year on Form N-Q. The fund’s Form N-Q is available electronically on the SEC’s Web site (www.sec.gov); hard copies may be reviewed and copied at the SEC’s Public Reference Room, 450 Fifth St. N.W., Washington, DC 20549. For more information on the Public Reference Room, call 1-800-SEC-0330.
| Approval of Investment Management Agreement |
On March 4, 2008, the fund’s Board of Directors (Board) unanimously approved the investment advisory contract (Contract) between the fund and its investment manager, T. Rowe Price International, Inc. (Manager). The Board considered a variety of factors in connection with its review of the Contract, also taking into account information provided by the Manager during the course of the year, as discussed below:
Services Provided by the Manager
The Board considered the nature, quality, and extent of the services provided to the fund by the Manager. These services included, but were not limited to, management of the fund’s portfolio and a variety of related activities, as well as financial and administrative services, reporting, and communications. The Board also reviewed the background and experience of the Manager’s senior management team and investment personnel involved in the management of the fund. The Board concluded that it was satisfied with the nature, quality, and extent of the services provided by the Manager.
Investment Performance of the Fund
The Board reviewed the fund’s total returns for the three-month and since-inception periods and compared them with previously agreed upon comparable performance measures and market data, including those supplied by Lipper and Morningstar, which are independent providers of mutual fund data. On the basis of this evaluation and the Board’s ongoing review of investment results, the Board concluded that the fund’s performance was satisfactory.
Fees and Expenses
The Board reviewed detailed information regarding the revenues received and benefits realized by the Manager (and its affiliates) from its relationship with other T. Rowe Price mutual funds, including research received under “soft dollar” agreements. The Board noted that soft dollars were not used to pay for third-party, non-broker research. The Board also received information on the estimated costs incurred and profits realized by the Manager and its affiliates from advising T. Rowe Price mutual funds and considered whether these funds benefit from any economies of scale realized by the Manager. The Board did not review information regarding profits and economies of scale with respect to the fund because its inception was May 31, 2007. The Board noted that, under the Contract, the fund pays the Manager a single fee based on the fund’s net assets and the Manager, in turn, pays all expenses of the fund, with certain exceptions. The Board reviewed the fund’s single-fee structure and the rate with fees and expenses of other comparable funds based on information and data supplied by Lipper. (For these purposes, the Board assumed the management fee was equal to the single fee less the fund’s operating expenses.) The information provided to the Board showed that the fund’s management fee and expense ratio were below the median for comparable funds. The Board also reviewed the fee schedules for comparable privately managed accounts of the Manager and its affiliates. Management informed the Board that the Manager’s responsibilities for privately managed accounts are more limited than its responsibilities for the fund and other T. Rowe Price mutual funds that it or its affiliates advise. On the basis of the information provided, the Board concluded that the fees paid by the fund under the Contract were reasonable.
Approval of the Contract
As noted, the Board approved the continuation of the Contract. No single factor was considered in isolation or to be determinative to the decision. Rather, the Board concluded, in light of the fund’s limited history and a weighting and balancing of all factors considered, that it was in the best interests of the fund to approve the continuation of the Contract, including the fees to be charged for services thereunder. Regarding the fund’s limited history, the data considered by the Board was as of December 31, 2007, at which time the fund had been in operation for six months.
Item 2. Code of Ethics.
A code of ethics, as defined in Item 2 of Form N-CSR, applicable to its principal executive officer, principal financial officer, principal accounting officer or controller, or persons performing similar functions is filed as an exhibit to the registrant’s annual Form N-CSR. No substantive amendments were approved or waivers were granted to this code of ethics during the registrant’s most recent fiscal half-year.
Item 3. Audit Committee Financial Expert.
Disclosure required in registrant’s annual Form N-CSR.
Item 4. Principal Accountant Fees and Services.
Disclosure required in registrant’s annual Form N-CSR.
Item 5. Audit Committee of Listed Registrants.
Not applicable.
Item 6. Investments.
(a) Not applicable. The complete schedule of investments is included in Item 1 of this Form N-CSR.
(b) Not applicable.
Item 7. Disclosure of Proxy Voting Policies and Procedures for Closed-End Management Investment Companies.
Not applicable.
Item 8. Portfolio Managers of Closed-End Management Investment Companies.
Not applicable.
Item 9. Purchases of Equity Securities by Closed-End Management Investment Company and Affiliated Purchasers.
Not applicable.
Item 10. Submission of Matters to a Vote of Security Holders.
Not applicable.
Item 11. Controls and Procedures.
(a) The registrant’s principal executive officer and principal financial officer have evaluated the registrant’s disclosure controls and procedures within 90 days of this filing and have concluded that the registrant’s disclosure controls and procedures were effective, as of that date, in ensuring that information required to be disclosed by the registrant in this Form N-CSR was recorded, processed, summarized, and reported timely.
(b) The registrant’s principal executive officer and principal financial officer are aware of no change in the registrant’s internal control over financial reporting that occurred during the registrant’s second fiscal quarter covered by this report that has materially affected, or is reasonably likely to materially affect, the registrant��s internal control over financial reporting.
Item 12. Exhibits.
(a)(1) The registrant’s code of ethics pursuant to Item 2 of Form N-CSR is filed with the registrant’s annual Form N-CSR.
(2) Separate certifications by the registrant's principal executive officer and principal financial officer, pursuant to Section 302 of the Sarbanes-Oxley Act of 2002 and required by Rule 30a-2(a) under the Investment Company Act of 1940, are attached.
(3) Written solicitation to repurchase securities issued by closed-end companies: not applicable.
(b) A certification by the registrant's principal executive officer and principal financial officer, pursuant to Section 906 of the Sarbanes-Oxley Act of 2002 and required by Rule 30a-2(b) under the Investment Company Act of 1940, is attached.
| | |
SIGNATURES |
| |
| | Pursuant to the requirements of the Securities Exchange Act of 1934 and the Investment |
| Company Act of 1940, the registrant has duly caused this report to be signed on its behalf by the |
| undersigned, thereunto duly authorized. |
| |
| T. Rowe Price Institutional International Funds, Inc. |
| |
| |
| |
| By | /s/ Edward C. Bernard |
| | Edward C. Bernard |
| | Principal Executive Officer |
| |
| Date | August 20, 2008 |
| |
| |
| |
| | Pursuant to the requirements of the Securities Exchange Act of 1934 and the Investment |
| Company Act of 1940, this report has been signed below by the following persons on behalf of |
| the registrant and in the capacities and on the dates indicated. |
| |
| |
| By | /s/ Edward C. Bernard |
| | Edward C. Bernard |
| | Principal Executive Officer |
| |
| Date | August 20, 2008 |
| |
| |
| |
| By | /s/ Gregory K. Hinkle |
| | Gregory K. Hinkle |
| | Principal Financial Officer |
| |
| Date | August 20, 2008 |