| UNITED STATES |
| SECURITIES AND EXCHANGE COMMISSION |
| Washington, D.C. 20549 |
| |
FORM N-CSR |
| |
CERTIFIED SHAREHOLDER REPORT OF REGISTERED |
MANAGEMENT INVESTMENT COMPANIES |
| |
| |
| |
| Investment Company Act File Number: 811-5833 |
|
| |
| T. Rowe Price Institutional International Funds, Inc. |
|
| (Exact name of registrant as specified in charter) |
| |
| 100 East Pratt Street, Baltimore, MD 21202 |
|
| (Address of principal executive offices) |
| |
| David Oestreicher |
| 100 East Pratt Street, Baltimore, MD 21202 |
|
| (Name and address of agent for service) |
| |
| |
| Registrant’s telephone number, including area code: (410) 345-2000 |
| |
| |
| Date of fiscal year end: October 31 |
| |
| |
| Date of reporting period: April 30, 2009 |
Item 1: Report to Shareholders| Institutional Global Equity Fund | April 30, 2009 |
• A sharp rally in global equities late in the period helped mitigate the devastating losses shareholders have endured during the past year.
• Your fund suffered a moderate loss during the six months ended April 30, 2009, against the backdrop of one of the most tumultuous periods for equity investors in history. It is still too early to know whether the past couple of months marked an end to the relentless selling that commenced early in 2008.
• We believe a broad-based approach to global stock investing makes sense—choosing less volatile, less economically sensitive stocks as an anchor as well as depressed stocks that we expect to outperform over the longer term.
• Although we think the global economy will get worse before it gets better, there should be some signs of economic stability in the latter half of this year or early 2010, with global equity markets reacting positively over a two- to three-year time frame.
The views and opinions in this report were current as of April 30, 2009. They are not guarantees of performance or investment results and should not be taken as investment advice. Investment decisions reflect a variety of factors, and the managers reserve the right to change their views about individual stocks, sectors, and the markets at any time. As a result, the views expressed should not be relied upon as a forecast of the fund’s future investment intent. The report is certified under the Sarbanes-Oxley Act, which requires mutual funds and other public companies to affirm that, to the best of their knowledge, the information in their financial reports is fairly and accurately stated in all material respects.
Manager’s Letter
T. Rowe Price Institutional Global Equity Fund
Dear Investor
A sharp rally in global equities late in the period helped mitigate the devastating losses shareholders have endured during the past year. Economic indicators—from the International Monetary Fund’s (IMF) forecast that Europe’s economy would contract 4% in 2009 to the all-time low hit by Japan’s business confidence survey—were more downbeat than those of previous months, but investors focused on signs that the worst of the world’s economic and financial crisis may be over. Many markets registered their largest gains since early last summer.
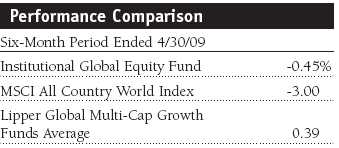
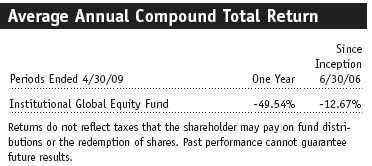
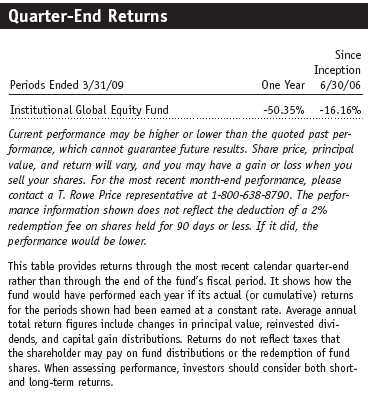
Your fund suffered a moderate loss during the six months ended April 30, 2009, against the backdrop of one of the most tumultuous periods for equity investors in history. Fund performance was slightly better than the returns for the MSCI All Country World Index but trailed that of the Lipper Global Multi-Cap Growth Funds Average. It is still too early to know whether the results of the past couple of months marked an end to the relentless selling that commenced early in 2008, but investors found some signs of hope that the worst may be over.
Market Review
Global equities fluctuated over a wide range during the period, falling to multiyear lows around the end of February before embarking on a sharp rally that erased most of the losses of the past six months. With nearly all of the world’s largest economies in recession, the economic data were bleak. The U.S. economy contracted sharply in the first quarter, and the data were similarly grim in the euro zone and Japan. Emerging market economies were not as weak but still experienced a sharp deceleration in growth. China’s economy expanded 6.1% in the first quarter, the slowest pace in almost a decade as poor demand from overseas consumers reduced exports. The IMF forecast in April that the world economy overall would shrink by 1.3% in 2009, and the World Bank and the Organization for Economic Cooperation and Development projected that global output could fall this year for the first time since World War II.
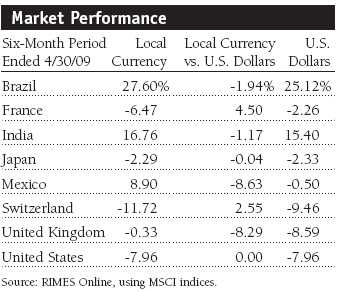
Concerns about the solvency of financial institutions—most prominently Citigroup, Bank of America, and AIG, all of which required further government funding—overshadowed the markets throughout late 2008 and early 2009. Funds were also made available to U.S. carmakers General Motors and Chrysler (Ford was notable for its statement that the company could survive without government help) as they tottered on the brink of bankruptcy because of a steep decline in sales. Fears surfaced that the global downturn would create instability among emerging countries, perhaps causing some to default on their loans, although the rapid provision of credit lines to several of them by the IMF helped alleviate the situation.
Authorities around the world continued to ease monetary policy aggressively and expand public spending in an attempt to stabilize global economies and financial markets. Toward the end of the period, these policy responses led to a rebound in investor confidence, particularly regarding financials amid signs that liquidity and solvency in the banking system might be improving. In addition, first-quarter earnings were generally less affected by the downturn than many had predicted. Stocks moved higher throughout March and April as fears of a full-blown depression diminished and markets began to sense a return to growth later this year or early in 2010.
Portfolio Performance and Strategy
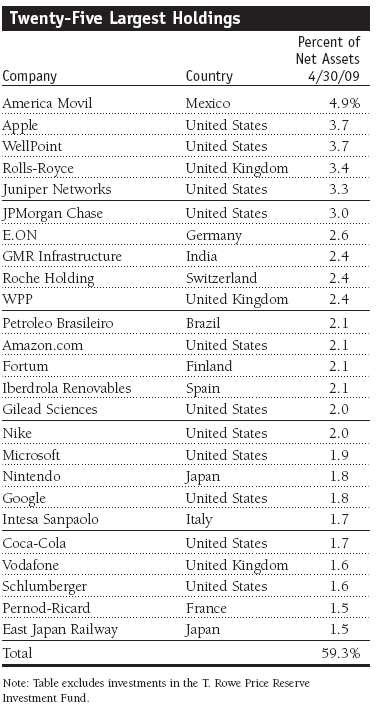
Our investments in financials helped fund performance during the past six months, notably our holdings in two of the largest U.S. banks, JPMorgan Chase and Wells Fargo. We judged these firms to be relatively strong compared with their peers and initiated positions as the negative sentiment surrounding the banking system peaked, resulting in attractive valuations. Both companies subsequently posted strong first-quarter earnings, and we took profits in Wells Fargo after its stock rose sharply. Despite a significant rally toward the end of the period, the financials sector still delivered the worst performance of any area, so our underweight allocation was somewhat beneficial. (Please refer to the portfolio of investments for a detailed list of holdings and the amount each represents in the portfolio.)
Our stock selection in the industrials and business services sector was also helpful, particularly investments in infrastructure companies located in emerging markets, which rebounded sharply. GMR Infrastructure, which owns a number of infrastructure assets in India including a part of Delhi International Airport, rose after the Indian government approved an airport tax on passengers, easing funding concerns. Zhejiang Expressway, a Chinese toll-road operator, aided results as investors were attracted to the company’s strong cash flows and dividend yield against the backdrop of various stimulus measures from the Chinese government.
Other significant contributors included the online retailer Amazon.com, which continued to gain market share after the failure of several competitors, and health insurer WellPoint, which advanced on news of the disposal of its pharmacy-benefits unit. Although we have booked some profits by trimming positions in these companies, we have retained core holdings due to our positive view of the prospects for both.
Our stock selection in other sectors such as energy, however, was less successful. Our holding in the world’s biggest natural gas producer, Russian energy company Gazprom, weighed on performance due to currency weakness combined with concerns about political risk. Our underweight exposure to the materials sector also detracted since this area delivered the strongest returns of any sector during the period as commodity prices rebounded.
In terms of strategy, we have positioned one portion of the portfolio more defensively, focusing on high-quality growth stocks that offer greater earnings stability and durability. With any future global recovery likely to be characterized by slower economic growth than in previous upturns, companies in this category should not only survive the downturn but also enter the next economic cycle in a stronger position. Their healthy balance sheets and access to capital should enable them to take market share from marginal players that may not survive. Examples of such stocks include Coca-Cola, Nike, and U.K. food retailer Tesco.
That said, given the current economic uncertainty and market volatility, we believe a broad-based approach to global stock investing makes sense—not only choosing less volatile, less economically sensitive stocks as an anchor but also selecting depressed stocks that we expect to outperform over the longer term. The other portion of the portfolio reflects this more opportunistic approach, including stocks that have strong growth prospects and may benefit from expanded price/earnings ratios when markets recover. These stocks are considered more market sensitive and offer compelling valuations. Apple, the advertising conglomerate WPP, and the Brazilian stock and derivatives exchange BM&F Bovespa all fall into this category.
At the sector level, we have maintained a significant weighting in information technology. Apple, one of our largest holdings, has seen its market share expand through strong sales of Macs, iPods, and iPhones. The company should continue to exceed expectations, in our view, being well positioned to benefit from the growth of smart phones and digital entertainment. Health care stocks are another focus, particularly companies with more stable earnings prospects, leading therapeutics, and limited regulatory risk. Our investments include Roche Holding, a Swiss pharmaceutical group, which is particularly strong in the oncology market, and Teva Pharmaceutical, the Israel-based global leader in generic drug production.
Our weighting in financials remains relatively low, particularly among commercial banks and insurance companies across the U.S., Europe, and Japan. While there was a dramatic rebound in the stock prices of most of these institutions in March and April, we believe there are residual credit quality and balance sheet issues, which could cause instability to return. Consequently, we prefer to emphasize other sectors.
Investment Outlook
When examining the prospects for global stock markets, we believe it is important to consider the following factors. First, economic conditions around the world are likely to deteriorate as the year progresses. The global economic recession has some way to run, with unemployment continuing to rise. Second, the financial system has yet to overcome many serious problems. While issues of creditworthiness at corporate and government levels remain, notably in Eastern Europe, we believe that the midpoint of the financial crisis has passed and that, by the end of the year, the system will be in moderately better shape. Third, by any historic measure, equities as an asset class are attractive. Following the significant sell-off and subsequent partial recovery, markets should continue to stabilize if there is more clarity on the size and duration of the decline in economic activity.
We believe that for a sustained recovery to occur, the following preconditions are necessary: Credit markets must continue to improve so that companies can finance their daily activities; the pace of deleveraging must slow, both on corporate balance sheets and in terms of the amount of money circulating in the financial system; government fiscal and monetary stimulus packages must gain further traction on liquidity and aggregate demand; and deflationary pressures must not become ingrained. With the exception of deflation, where a longer time horizon is required, there are some initial signs of improvement, and additional progress appears likely in the next 12 to 18 months.
Eventually, we foresee a new backdrop for global investing emerging from this slow transition, characterized by lower real global economic growth in the 1% to 3% range, with emerging markets the key drivers. Interest rates will likely rise, but slowly, while there will be moderate recoveries in consumer spending and fixed-asset investments such as property, plants, and equipment, along with gradual improvements in corporate pricing power and profit margins. After hitting rock bottom in the sell-off, equity valuations should continue to normalize. Although we expect the global economy to get worse before it gets better, there should be some signs of economic stability forming in the latter half of this year or early 2010, with global equity markets reacting positively over a two- to three-year time frame.
Respectfully submitted,

Robert N. Gensler
Chairman of the fund’s Investment Advisory Committee
May 15, 2009
The committee chairman has day-to-day responsibility for managing the portfolio and works with committee members in developing and executing the fund’s investment program.
| Risks of International Investing |
Funds that invest overseas generally carry more risk than funds that invest strictly in U.S. assets. Funds investing in a single country or in a limited geographic region tend to be riskier than more diversified funds. Risks can result from varying stages of economic and political development; differing regulatory environments, trading days, and accounting standards; and higher transaction costs of non-U.S. markets. Non-U.S. investments are also subject to currency risk, or a decline in the value of a foreign currency versus the U.S. dollar, which reduces the dollar value of securities denominated in that currency.
Lipper averages: The averages of available mutual fund performance returns for specified periods in defined categories as tracked by Lipper Inc.
MSCI All Country World Index: A capitalization-weighted index of stocks from developed and emerging markets worldwide.
Price/earnings (P/E) ratio: Calculated by dividing a stock’s market value per share by the company’s earnings per share for the past 12 months or by expected earnings for the coming year.
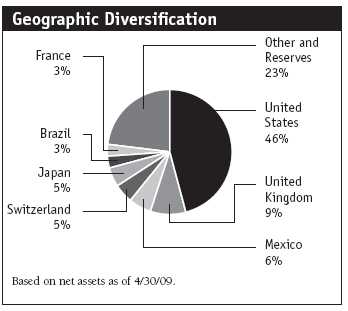
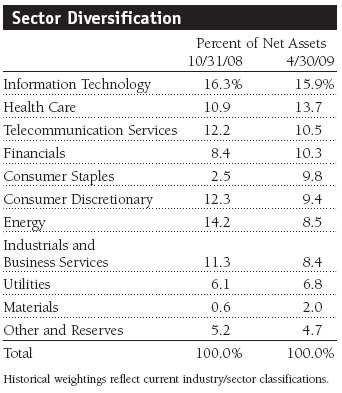
Portfolio Highlights
Performance and Expenses
T. Rowe Price Institutional Global Equity Fund
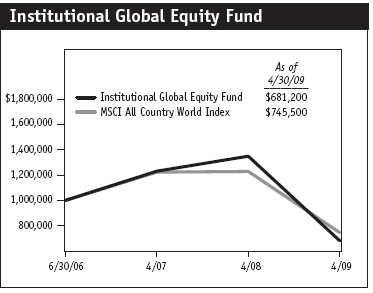
This chart shows the value of a hypothetical $1 million investment in the fund over the past 10 fiscal year periods or since inception (for funds lacking 10-year records). The result is compared with benchmarks, which may include a broad-based market index and a peer group average or index. Market indexes do not include expenses, which are deducted from fund returns as well as mutual fund averages and indexes.
This table shows how the portfolio would have performed each year if its actual (or cumulative) returns for periods shown had been earned at a constant rate.
Fund Expense Example
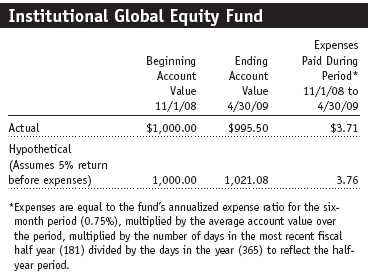
As a mutual fund shareholder, you may incur two types of costs: (1) transaction costs, such as redemption fees or sales loads, and (2) ongoing costs, including management fees, distribution and service (12b-1) fees, and other fund expenses. The following example is intended to help you understand your ongoing costs (in dollars) of investing in the fund and to compare these costs with the ongoing costs of investing in other mutual funds. The example is based on an investment of $1,000 invested at the beginning of the most recent six-month period and held for the entire period.
Actual Expenses
The first line of the following table (“Actual”) provides information about actual account values and actual expenses. You may use the information in this line, together with your account balance, to estimate the expenses that you paid over the period. Simply divide your account value by $1,000 (for example, an $8,600 account value divided by $1,000 = 8.6), then multiply the result by the number in the first line under the heading “Expenses Paid During Period” to estimate the expenses you paid on your account during this period.
Hypothetical Example for Comparison Purposes
The information on the second line of the table (“Hypothetical”) is based on hypothetical account values and expenses derived from the fund’s actual expense ratio and an assumed 5% per year rate of return before expenses (not the fund’s actual return). You may compare the ongoing costs of investing in the fund with other funds by contrasting this 5% hypothetical example and the 5% hypothetical examples that appear in the shareholder reports of the other funds. The hypothetical account values and expenses may not be used to estimate the actual ending account balance or expenses you paid for the period.
You should also be aware that the expenses shown in the table highlight only your ongoing costs and do not reflect any transaction costs, such as redemption fees or sales loads. Therefore, the second line of the table is useful in comparing ongoing costs only and will not help you determine the relative total costs of owning different funds. To the extent a fund charges transaction costs, however, the total cost of owning that fund is higher.
Financial Highlights
T. Rowe Price Institutional Global Equity Fund
(Unaudited)
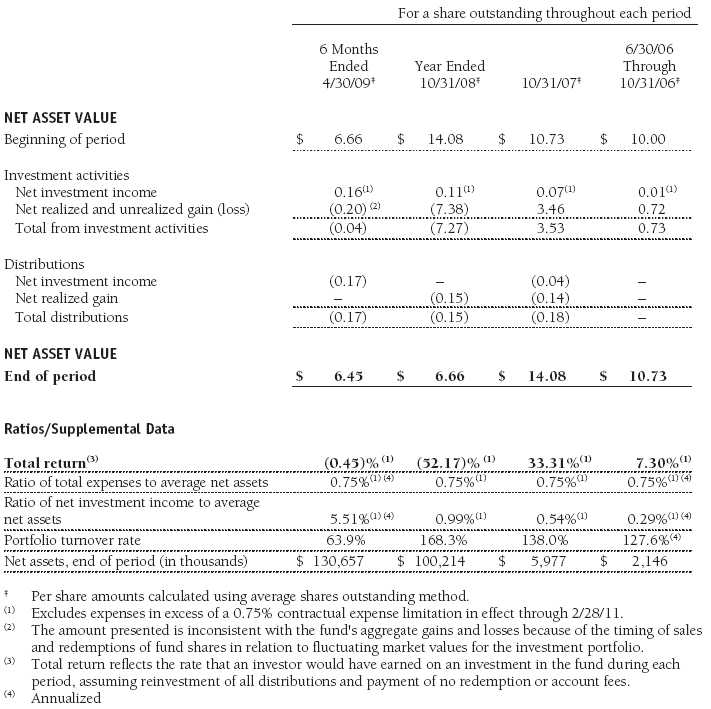
The accompanying notes are an integral part of these financial statements.
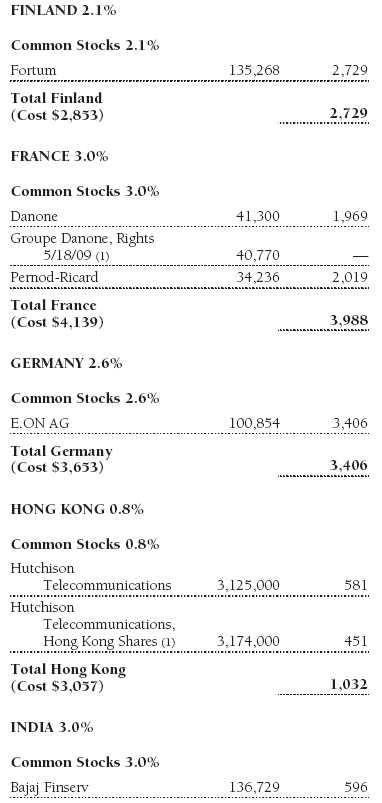
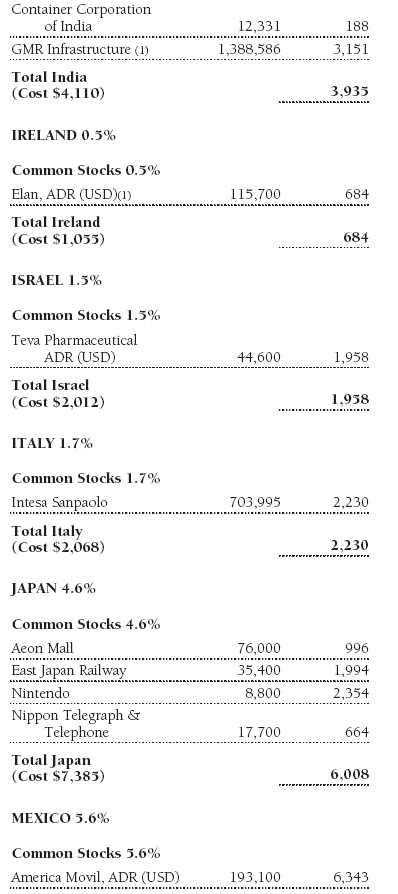
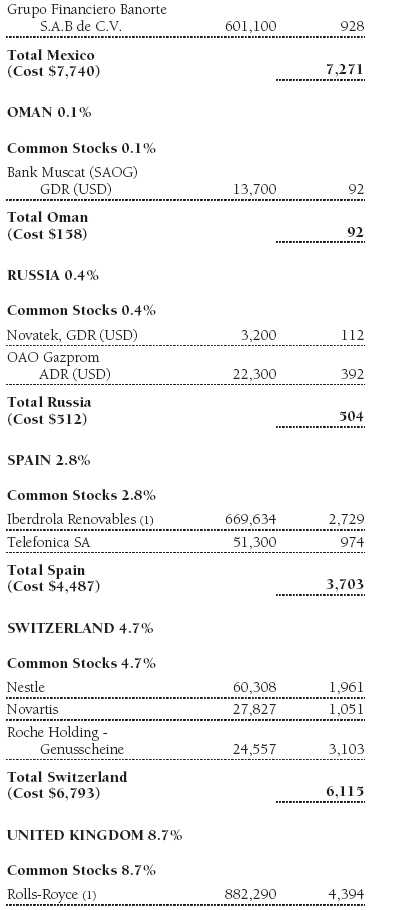
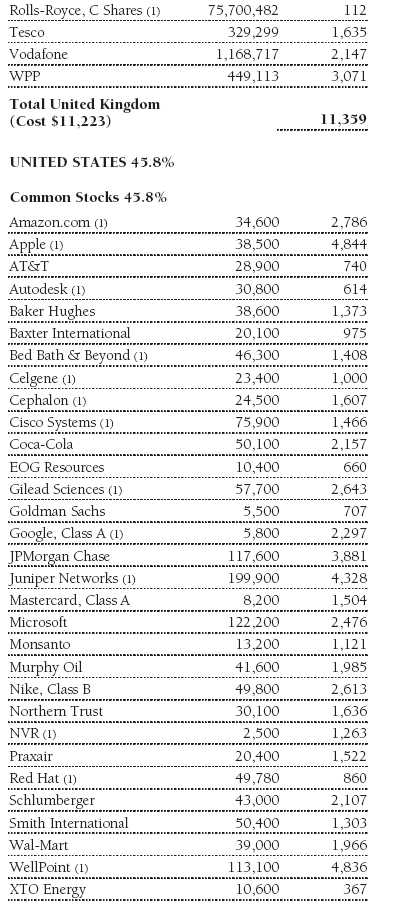
Portfolio of Investments ‡
T. Rowe Price Institutional Global Equity Fund
April 30, 2009 (Unaudited)
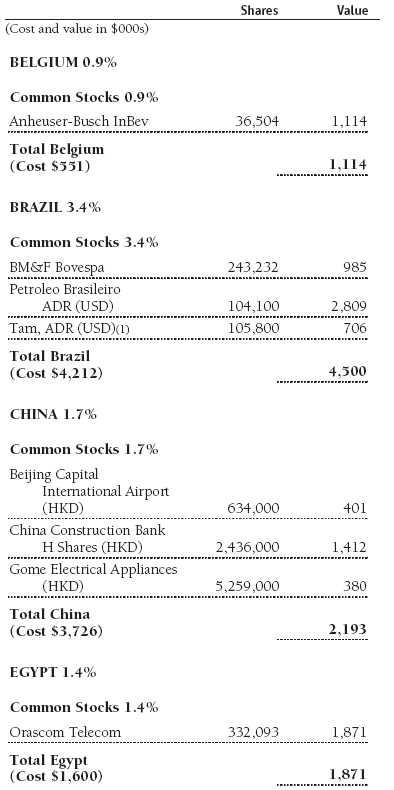
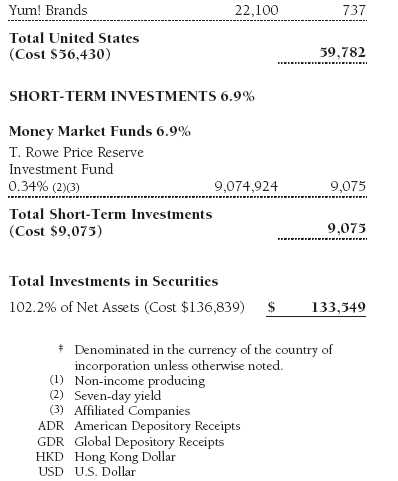

The accompanying notes are an integral part of these financial statements.
Statement of Assets and Liabilities
T. Rowe Price Institutional Global Equity Fund
April 30, 2009 (Unaudited)
($000s, except shares and per share amounts)
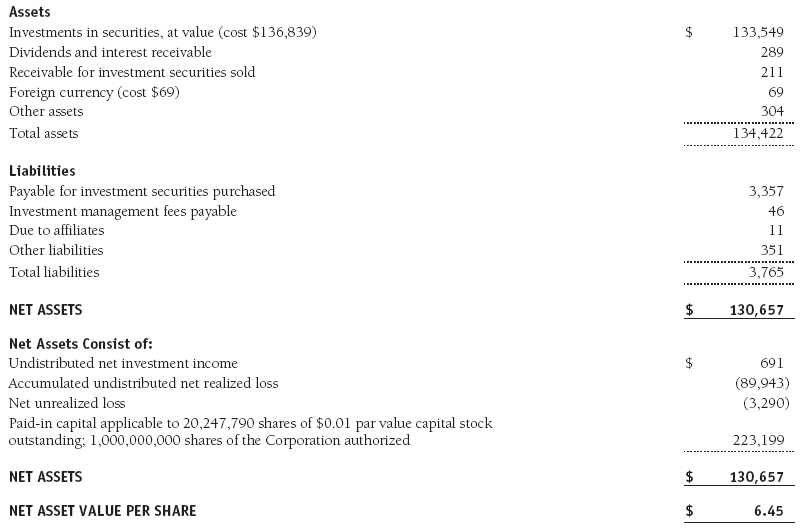
The accompanying notes are an integral part of these financial statements.
Statement of Operations
T. Rowe Price Institutional Global Equity Fund
(Unaudited)
($000s)
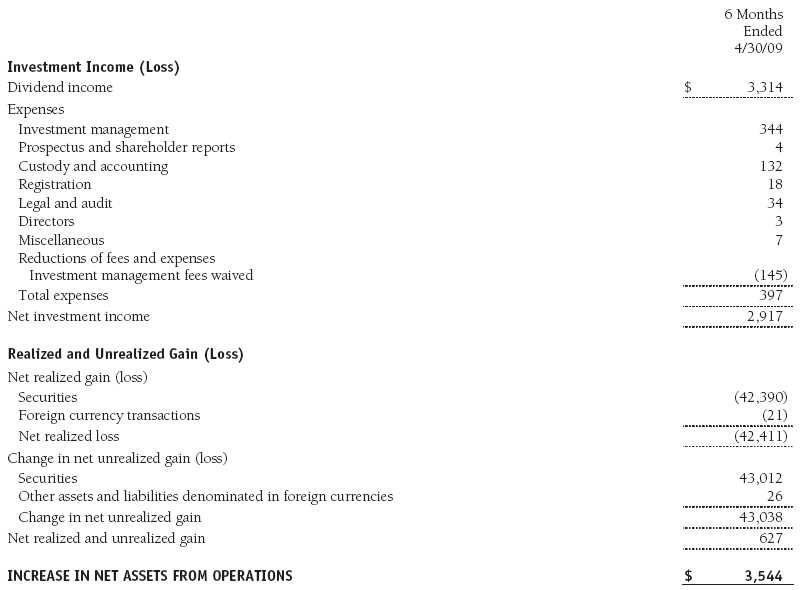
The accompanying notes are an integral part of these financial statements.
Statement of Changes in Net Assets
T. Rowe Price Institutional Global Equity Fund
(Unaudited)
($000s)
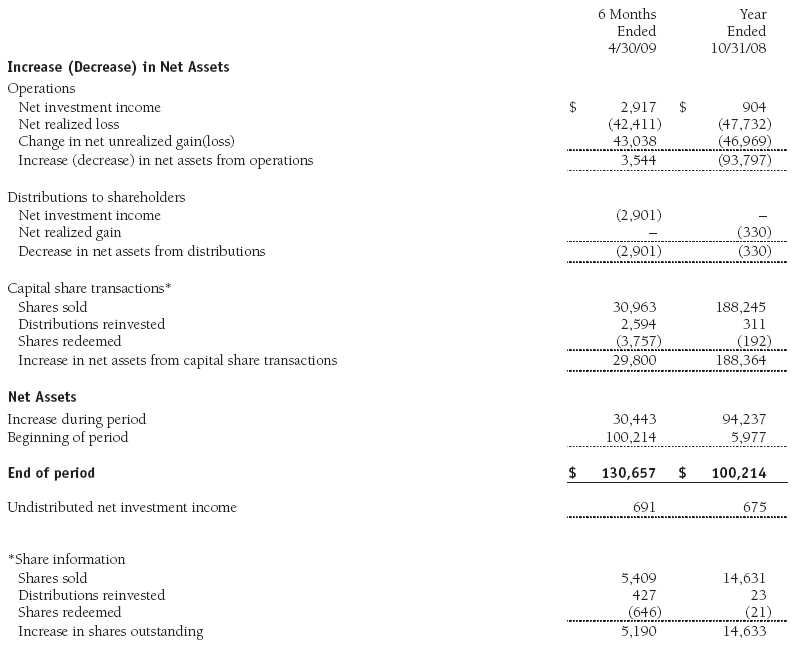
The accompanying notes are an integral part of these financial statements.
Notes to Financial Statements
T. Rowe Price Institutional Global Equity Fund
April 30, 2009 (Unaudited)
T. Rowe Price Institutional International Funds, Inc. (the corporation), is registered under the Investment Company Act of 1940 (the 1940 Act). The Institutional Global Equity Fund (the fund), a diversified, open-end management investment company, is one portfolio established by the corporation. The fund commenced operations on June 30, 2006. The fund seeks long-term growth of capital through investments primarily in the common stocks of established companies throughout the world, including the U.S.
NOTE 1 - SIGNIFICANT ACCOUNTING POLICIES
Basis of Preparation The accompanying financial statements were prepared in accordance with accounting principles generally accepted in the United States of America, which require the use of estimates made by fund management. Fund management believes that estimates and security valuations are appropriate; however, actual results may differ from those estimates, and the security valuations reflected in the financial statements may differ from the value the fund ultimately realizes upon sale of the securities.
Investment Transactions, Investment Income, and Distributions Income and expenses are recorded on the accrual basis. Dividends received from mutual fund investments are reflected as dividend income; capital gain distributions are reflected as realized gain/loss. Dividend income and capital gain distributions are recorded on the ex-dividend date. Income tax-related interest and penalties, if incurred, would be recorded as income tax expense. Investment transactions are accounted for on the trade date. Realized gains and losses are reported on the identified cost basis. Distributions to shareholders are recorded on the ex-dividend date. Income distributions are declared and paid on an annual basis. Capital gain distributions, if any, are declared and paid by the fund, typically on an annual basis.
Currency Translation Assets, including investments, and liabilities denominated in foreign currencies are translated into U.S. dollar values each day at the prevailing exchange rate, using the mean of the bid and asked prices of such currencies against U.S. dollars as quoted by a major bank. Purchases and sales of securities, income, and expenses are translated into U.S. dollars at the prevailing exchange rate on the date of the transaction. The effect of changes in foreign currency exchange rates on realized and unrealized security gains and losses is reflected as a component of security gains and losses.
Redemption Fees A 2% fee is assessed on redemptions of fund shares held for 90 days or less to deter short-term trading and to protect the interests of long-term shareholders. Redemption fees are withheld from proceeds that shareholders receive from the sale or exchange of fund shares. The fees are paid to the fund, and are recorded as an increase to paid-in capital. The fees may cause the redemption price per share to differ from the net asset value per share.
New Accounting Pronouncements On November 1, 2008, the fund adopted Statement of Financial Accounting Standards No. 157 (FAS 157), Fair Value Measurements. FAS 157 defines fair value, establishes the framework for measuring fair value, and expands the disclosures of fair value measurements in the financial statements. Adoption of FAS 157 did not have a material impact on the fund’s net assets or results of operations.
In March 2008, the Financial Accounting Standards Board issued Statement of Financial Accounting Standards No. 161 (FAS 161), Disclosures about Derivative Instruments and Hedging Activities, which is effective for fiscal years and interim periods beginning after November 15, 2008. FAS 161 requires enhanced disclosures about derivative and hedging activities, including how such activities are accounted for and their effect on financial position, performance and cash flows. Management is currently evaluating the impact the adoption of FAS 161 will have on the fund’s financial statements and related disclosures; however, it is expected to have no material impact on the fund’s net assets or results of operations.
NOTE 2 - VALUATION
The fund’s investments are reported at fair value as defined under FAS 157. The fund values its investments and computes its net asset value per share at the close of the New York Stock Exchange (NYSE), normally 4 p.m. ET, each day that the NYSE is open for business.
Valuation Methods Equity securities listed or regularly traded on a securities exchange or in the over-the-counter (OTC) market are valued at the last quoted sale price or, for certain markets, the official closing price at the time the valuations are made, except for OTC Bulletin Board securities, which are valued at the mean of the latest bid and asked prices. A security that is listed or traded on more than one exchange is valued at the quotation on the exchange determined to be the primary market for such security. Listed securities not traded on a particular day are valued at the mean of the latest bid and asked prices for domestic securities and the last quoted sale price for international securities.
Investments in mutual funds are valued at the mutual fund’s closing net asset value per share on the day of valuation.
Other investments, including restricted securities, and those for which the above valuation procedures are inappropriate or are deemed not to reflect fair value are stated at fair value as determined in good faith by the T. Rowe Price Valuation Committee, established by the fund’s Board of Directors.
For valuation purposes, the last quoted prices of non-U.S. equity securities may be adjusted under the circumstances described below. If the fund determines that developments between the close of a foreign market and the close of the NYSE will, in its judgment, materially affect the value of some or all of its portfolio securities, the fund will adjust the previous closing prices to reflect what it believes to be the fair value of the securities as of the close of the NYSE. In deciding whether it is necessary to adjust closing prices to reflect fair value, the fund reviews a variety of factors, including developments in foreign markets, the performance of U.S. securities markets, and the performance of instruments trading in U.S. markets that represent foreign securities and baskets of foreign securities. A fund may also fair value securities in other situations, such as when a particular foreign market is closed but the fund is open. The fund uses outside pricing services to provide it with closing prices and information to evaluate and/or adjust those prices. The fund cannot predict how often it will use closing prices and how often it will determine it necessary to adjust those prices to reflect fair value. As a means of evaluating its security valuation process, the fund routinely compares closing prices, the next day’s opening prices in the same markets, and adjusted prices.
Valuation Inputs Various inputs are used to determine the value of the fund’s investments. These inputs are summarized in the three broad levels listed below:
Level 1 – quoted prices in active markets for identical securities
Level 2 – observable inputs other than Level 1 quoted prices (including, but not limited to, quoted prices for similar securities, interest rates, prepayment speeds, credit risk)
Level 3 – unobservable inputs
Observable inputs are those based on market data obtained from sources independent of the fund, and unobservable inputs reflect the fund’s own assumptions based on the best information available. The input levels are not necessarily an indication of the risk or liquidity associated with investments at that level. For example, non-U.S. equity securities actively traded in foreign markets generally are reflected in Level 2 despite the availability of closing prices, because the fund evaluates and determines whether those closing prices reflect fair value at the close of the NYSE or require adjustment, as described above. The following table summarizes the fund’s investments, based on the inputs used to determine their values on April 30, 2009:

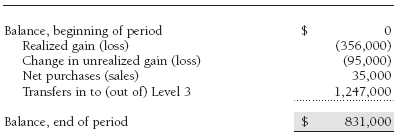
Following is a reconciliation of the fund’s Level 3 investments for the six months ended April 30, 2009:
NOTE 3 - INVESTMENT TRANSACTIONS
Consistent with its investment objective, the fund engages in the following practices to manage exposure to certain risks or to enhance performance. The investment objective, policies, program, and risk factors of the fund are described more fully in the fund’s prospectus and Statement of Additional Information.
Emerging Markets At April 30, 2009, approximately 17% of the fund’s net assets were invested, directly or indirectly, in securities of companies located in emerging markets or denominated in or linked to the currencies of emerging market countries. Future economic or political developments could adversely affect the liquidity or value, or both, of such securities.
Other Purchases and sales of portfolio securities, other than short-term securities, aggregated $93,283,000 and $64,899,000, respectively, for the six months ended April 30, 2009.
NOTE 4 - FEDERAL INCOME TAXES
No provision for federal income taxes is required since the fund intends to continue to qualify as a regulated investment company under Subchapter M of the Internal Revenue Code and distribute to shareholders all of its taxable income and gains. Distributions are determined in accordance with Federal income tax regulations, which differ from generally accepted accounting principles, and, therefore, may differ in amount or character from net investment income and realized gains for financial reporting purposes. Financial reporting records are adjusted for permanent book/tax differences to reflect tax character but are not adjusted for temporary differences. The amount and character of tax-basis distributions and composition of net assets are finalized at fiscal year-end; accordingly, tax-basis balances have not been determined as of April 30, 2009.
The fund intends to retain realized gains to the extent of available capital loss carryforwards. As of October 31, 2008, the fund had $35,674,000 of unused capital loss carryforwards, which expire in fiscal 2016.
At April 30, 2009, the cost of investments for federal income tax purposes was $136,839,000. Net unrealized loss aggregated $3,290,000 at period-end, of which $10,771,000 related to appreciated investments and $14,061,000 related to depreciated investments.
NOTE 5 - RELATED PARTY TRANSACTIONS
The fund is managed by T. Rowe Price International, Inc. (the manager), a wholly owned subsidiary of T. Rowe Price Associates, Inc. (Price Associates), which is wholly owned by T. Rowe Price Group, Inc. The investment management agreement between the fund and the manager provides for an annual investment management fee equal to 0.65% of the fund’s average daily net assets. The fee is computed daily and paid monthly.
The fund is also subject to a contractual expense limitation through February 28, 2011. During the limitation period, the manager is required to waive its management fee and reimburse the fund for any expenses, excluding interest, taxes, brokerage commissions, and extraordinary expenses, that would otherwise cause the fund’s ratio of annualized total expenses to average net assets (expense ratio) to exceed its expense limitation of 0.75%. For a period of three years after the date of any reimbursement or waiver, the fund is required to repay the manager for expenses previously reimbursed and management fees waived to the extent its net assets have grown or expenses have declined sufficiently to allow repayment without causing the fund’s expense ratio to exceed its expense limitation. Pursuant to this agreement, management fees in the amount of $145,000 were waived during the six months ended April 30, 2009. Including these amounts, management fees waived and expenses previously reimbursed by the manager in the amount of $654,000 remain subject to repayment at April 30, 2009.
In addition, the fund has entered into service agreements with Price Associates and a wholly owned subsidiary of Price Associates (collectively, Price). Price Associates computes the daily share price and provides certain other administrative services to the fund. T. Rowe Price Services, Inc., provides shareholder and administrative services in its capacity as the fund’s transfer and dividend disbursing agent. For the six months ended April 30, 2009, expenses incurred pursuant to these service agreements were $69,000 for Price Associates and less than $1,000 for T. Rowe Price Services, Inc. The total amount payable at period-end pursuant to these service agreements is reflected as Due to Affiliates in the accompanying financial statements.
The fund may invest in the T. Rowe Price Reserve Investment Fund and the T. Rowe Price Government Reserve Investment Fund (collectively, the T. Rowe Price Reserve Investment Funds), open-end management investment companies managed by Price Associates and considered affiliates of the fund. The T. Rowe Price Reserve Investment Funds are offered as cash management options to mutual funds, trusts, and other accounts managed by Price Associates and/or its affiliates and are not available for direct purchase by members of the public. The T. Rowe Price Reserve Investment Funds pay no investment management fees.
| Information on Proxy Voting Policies, Procedures, and Records |
A description of the policies and procedures used by T. Rowe Price funds and portfolios to determine how to vote proxies relating to portfolio securities is available in each fund’s Statement of Additional Information, which you may request by calling 1-800-225-5132 or by accessing the SEC’s Web site, www.sec.gov. The description of our proxy voting policies and procedures is also available on our Web site, www.troweprice.com. To access it, click on the words “Our Company” at the top of our corporate homepage. Then, when the next page appears, click on the words “Proxy Voting Policies” on the left side of the page.
Each fund’s most recent annual proxy voting record is available on our Web site and through the SEC’s Web site. To access it through our Web site, follow the directions above, then click on the words “Proxy Voting Records” on the right side of the Proxy Voting Policies page.
| How to Obtain Quarterly Portfolio Holdings |
The fund files a complete schedule of portfolio holdings with the Securities and Exchange Commission for the first and third quarters of each fiscal year on Form N-Q. The fund’s Form N-Q is available electronically on the SEC’s Web site (www.sec.gov); hard copies may be reviewed and copied at the SEC’s Public Reference Room, 450 Fifth St. N.W., Washington, DC 20549. For more information on the Public Reference Room, call 1-800-SEC-0330.
| Approval of Investment Management Agreement |
On March 10, 2009, the fund’s Board of Directors (Board) unanimously approved the investment advisory contract (Contract) between the fund and its investment manager, T. Rowe Price International, Inc. (Manager). The Board considered a variety of factors in connection with its review of the Contract, also taking into account information provided by the Manager during the course of the year, as discussed below:
Services Provided by the Manager
The Board considered the nature, quality, and extent of the services provided to the fund by the Manager. These services included, but were not limited to, management of the fund’s portfolio and a variety of activities related to portfolio management. The Board also reviewed the background and experience of the Manager’s senior management team and investment personnel involved in the management of the fund. The Board concluded that it was satisfied with the nature, quality, and extent of the services provided by the Manager.
Investment Performance of the Fund
The Board reviewed the fund’s total returns over the one-year and since-inception periods as well as the fund’s year-by-year returns and compared these returns with a wide variety of previously agreed upon comparable performance measures and market data, including those supplied by Lipper, an independent provider of mutual fund data. On the basis of this evaluation and the Board’s ongoing review of investment results, and factoring in the severity of market turmoil in 2008, the Board concluded that the fund’s performance was satisfactory.
Costs, Benefits, Profits and Economies of Scale
The Board reviewed detailed information regarding the revenues received by the Manager under the Contract and other benefits that the Manager (and its affiliates) may have realized from its relationship with the fund, including research received under “soft dollar” agreements. The Board noted that soft dollars were not used to pay for third-party, non-broker research during 2008. The Board also received information on the estimated costs incurred and profits realized by the Manager and its affiliates from advising T. Rowe Price mutual funds, as well as estimates of the gross profits realized from managing the fund in particular. The Board concluded that the Manager’s profits were reasonable in light of the services provided to the fund. In this regard, the Board noted that a portion of the advisory fees were being waived. The Board also considered the extent to which economies of scale were being realized by the Manager and whether the fund or other funds benefit from any such economies of scale under the fee levels set forth in the Contract. The Board concluded that the advisory fee structure for the fund continued to provide for a reasonable sharing of benefits from economies of scale with the fund’s investors.
Fees
The Board reviewed the fund’s management fee rate, operating expenses, and total expense ratio and compared them with fees and expenses of other comparable funds based on information and data supplied by Lipper. The information provided to the Board indicated that the fund’s management fee rate (after including any applicable fee waivers or expenses paid by the Manager or reimbursements by the fund) and expense ratio were generally below the median for comparable funds. The Board also reviewed the fee schedules for comparable privately managed accounts of the Manager and its affiliates. Management informed the Board that the Manager’s responsibilities for privately managed accounts are more limited than its responsibilities for the fund and other T. Rowe Price mutual funds that it or its affiliates advise. On the basis of the information provided, the Board concluded that the fees paid by the fund under the Contract were reasonable.
Approval of the Contract
As noted, the Board approved the continuation of the Contract. No single factor was considered in isolation or to be determinative to the decision. Rather, the Board concluded, in light of a weighting and balancing of all factors considered, that it was in the best interests of the fund to approve the continuation of the Contract, including the fees to be charged for services thereunder.
Item 2. Code of Ethics.
A code of ethics, as defined in Item 2 of Form N-CSR, applicable to its principal executive officer, principal financial officer, principal accounting officer or controller, or persons performing similar functions is filed as an exhibit to the registrant’s annual Form N-CSR. No substantive amendments were approved or waivers were granted to this code of ethics during the registrant’s most recent fiscal half-year.
Item 3. Audit Committee Financial Expert.
Disclosure required in registrant’s annual Form N-CSR.
Item 4. Principal Accountant Fees and Services.
Disclosure required in registrant’s annual Form N-CSR.
Item 5. Audit Committee of Listed Registrants.
Not applicable.
Item 6. Investments.
(a) Not applicable. The complete schedule of investments is included in Item 1 of this Form N-CSR.
(b) Not applicable.
Item 7. Disclosure of Proxy Voting Policies and Procedures for Closed-End Management Investment Companies.
Not applicable.
Item 8. Portfolio Managers of Closed-End Management Investment Companies.
Not applicable.
Item 9. Purchases of Equity Securities by Closed-End Management Investment Company and Affiliated Purchasers.
Not applicable.
Item 10. Submission of Matters to a Vote of Security Holders.
Not applicable.
Item 11. Controls and Procedures.
(a) The registrant’s principal executive officer and principal financial officer have evaluated the registrant’s disclosure controls and procedures within 90 days of this filing and have concluded that the registrant’s disclosure controls and procedures were effective, as of that date, in ensuring that information required to be disclosed by the registrant in this Form N-CSR was recorded, processed, summarized, and reported timely.
(b) The registrant’s principal executive officer and principal financial officer are aware of no change in the registrant’s internal control over financial reporting that occurred during the registrant’s second fiscal quarter covered by this report that has materially affected, or is reasonably likely to materially affect, the registrant’s internal control over financial reporting.
Item 12. Exhibits.
(a)(1) The registrant’s code of ethics pursuant to Item 2 of Form N-CSR is filed with the registrant’s annual Form N-CSR.
(2) Separate certifications by the registrant's principal executive officer and principal financial officer, pursuant to Section 302 of the Sarbanes-Oxley Act of 2002 and required by Rule 30a-2(a) under the Investment Company Act of 1940, are attached.
(3) Written solicitation to repurchase securities issued by closed-end companies: not applicable.
(b) A certification by the registrant's principal executive officer and principal financial officer, pursuant to Section 906 of the Sarbanes-Oxley Act of 2002 and required by Rule 30a-2(b) under the Investment Company Act of 1940, is attached.
| | |
SIGNATURES |
| |
| | Pursuant to the requirements of the Securities Exchange Act of 1934 and the Investment |
| Company Act of 1940, the registrant has duly caused this report to be signed on its behalf by the |
| undersigned, thereunto duly authorized. |
| |
| T. Rowe Price Institutional International Funds, Inc. |
| |
| By�� | /s/ Edward C. Bernard |
| | Edward C. Bernard |
| | Principal Executive Officer |
| | |
| Date | June 16, 2009 |
| |
| | Pursuant to the requirements of the Securities Exchange Act of 1934 and the Investment |
| Company Act of 1940, this report has been signed below by the following persons on behalf of |
| the registrant and in the capacities and on the dates indicated. |
| |
| By | /s/ Edward C. Bernard |
| | Edward C. Bernard |
| | Principal Executive Officer |
| | |
| Date | June 16, 2009 |
| |
| By | /s/ Gregory K. Hinkle |
| | Gregory K. Hinkle |
| | Principal Financial Officer |
| | |
| Date | June 16, 2009 |