UNITED STATES
SECURITIES AND EXCHANGE COMMISSION
Washington, D.C. 20549
FORM N-CSR
CERTIFIED SHAREHOLDER REPORT OF REGISTERED
MANAGEMENT INVESTMENT COMPANIES
Investment Company Act File Number: 811-05876
LORD ABBETT SERIES FUND, INC.
(Exact name of Registrant as specified in charter)
90 Hudson Street, Jersey City, NJ 07302
(Address of principal executive offices) (Zip code)
Brooke A. Fapohunda, Esq., Vice President & Assistant Secretary
90 Hudson Street, Jersey City, NJ 07302
(Name and address of agent for service)
Registrant’s telephone number, including area code: (800) 201-6984
Date of fiscal year end: 12/31
Date of reporting period: 12/31/2015
| Item 1: | Report(s) to Shareholders. |

2015 LORD ABBETT
ANNUAL REPORT
Lord Abbett
Series Fund—Bond Debenture Portfolio
For the fiscal year ended December 31, 2015
Table of Contents
Lord Abbett Series Fund – Bond Debenture Portfolio
Annual Report
For the fiscal year ended December 31, 2015

Daria L. Foster, Director, President and Chief Executive Officer of the Lord Abbett Funds, and E. Thayer Bigelow, Independent Chairman of the Lord Abbett Funds. | | Dear Shareholders: We are pleased to provide you with this overview of the performance of Lord Abbett Series Fund – Bond Debenture Portfolio for the fiscal year ended December 31, 2015. On this page, and the following pages, we discuss the major factors that influenced fiscal year performance. For additional information about the Fund, please visit our website at www.lordabbett.com, where you also can access the quarterly commentaries that provide updates on the Fund’s performance and other portfolio related updates. Thank you for investing in Lord Abbett mutual funds. We value the trust that you place in us and look forward to serving your investment needs in the years to come. Best regards, 
Daria L. Foster Director, President and Chief Executive Officer |
For the fiscal year ended December 31, 2015, the Fund returned -1.53%, reflecting performance at the net asset value (NAV) of Class VC shares, with all distributions reinvested, compared to its benchmark, the Barclays U.S. Aggregate Bond Index1, which returned 0.55% over the same period.
The high yield sector of the U.S. fixed income market experienced negative returns during the 12-month period, underperforming traditional government related and investment grade securities
within the fixed income market as well as the U.S. equity market. Leveraged loans also experienced negative returns, although not to the same extent as high yield bonds. High yield corporate spreads versus Treasuries widened during the period.
As in its previous fiscal year, the Fund maintained a significant allocation to high yield bonds, as the Fund’s portfolio management team remained positive on the high yield market from a fundamental perspective, excluding certain segments of
1
the energy sector. However, the Fund’s exposure to high yield bonds likely detracted from relative performance, as the high yield market underperformed government related and investment-grade securities, which make up a significant portion of the Fund’s benchmark.
The Fund maintained a sizable allocation to equities throughout the period, as the Fund’s portfolio management team maintained its belief that equities provided portfolio diversification, a high degree of liquidity, and a more diverse opportunity set to express certain investment themes than did certain fixed income securities. The Fund’s allocation to equities was divided in roughly equal amounts between securities of large cap companies and mid cap companies. The Fund’s allocation to mid cap equities likely detracted from relative
performance, as mid cap equities broadly underperformed the Fund’s benchmark. Its allocation to large cap equities, conversely, was likely a contributor to relative performance, as large cap equities modestly outperformed the Fund’s benchmark.
Within the Fund’s investment-grade bond allocation, the Fund maintained little to no exposure to U.S. Treasuries, which likely detracted from relative performance, as Treasuries outperformed corporates during the period and represent a sizable component of the Fund’s benchmark.
The Fund’s portfolio is actively managed and, therefore, its holdings and the weightings of a particular issuer or particular sector as a percentage of portfolio assets are subject to change. Sectors may include many industries.
2
1 The Barclays U.S. Aggregate Bond Index represents securities that are SEC-registered, taxable, and dollar-denominated. The index covers the U.S. investment-grade fixed-rate bond market, with index components for government and corporate securities, mortgage pass-through securities, and asset-backed securities. Total return comprises price appreciation/depreciation and income as a percentage of the original investment.
Unless otherwise specified, indexes reflect total return, with all dividends reinvested. Indexes are unmanaged, do not reflect the deduction of fees or expenses, and are not available for direct investment.
Important Performance and Other Information
Performance data quoted in the following pages reflect past performance and are no guarantee of future results. Current performance may be higher or lower than the performance quoted. The investment return and principal value of an investment in the Funds will fluctuate so that shares, on any given day or when redeemed, may be worth more or less than their original cost. You can obtain performance data current to the most recent month end by calling Lord Abbett at 888-522-2388 or referring to www.lordabbett.com.
During certain periods shown, expense waivers and reimbursements were in place. Without such waivers and expense reimbursements, the Fund’s returns would have been lower.
The annual commentary above discusses the views of the Fund’s management and various portfolio holdings of the Fund as of December 31, 2015. These views and portfolio holdings may have changed after this date. Information provided in the commentary is not a recommendation to buy or sell securities. Because the Fund’s portfolio is actively managed and may change significantly, the Fund may no longer own the securities described above or may have otherwise changed their positions in the securities. For more recent information about the Fund’s portfolio holdings, please visit www.lordabbett.com.
A Note about Risk: See Notes to Financial Statements for a discussion of investment risks. For a more detailed discussion of the risks associated with the Fund, please see the Fund’s prospectus.
Mutual funds are not insured by the FDIC, are not deposits or other obligations of, or guaranteed by, banks, and are subject to investment risks including possible loss of principal amount invested.
The Fund serves as an underlying investment vehicle for variable annuity contracts and variable life insurance policies.
3
Investment Comparison
Below is a comparison of a $10,000 investment in Class VC shares with the same investment in the Barclays U.S. Aggregate Bond Index and the BofA Merrill Lynch U.S. High Yield Constrained Index, assuming reinvestment of all dividends and distributions. The Fund’s shares are sold only to insurance company separate accounts that fund certain variable annuity and variable life contracts. This line graph comparison does not reflect the sales charges or other expenses of these contracts. If those sales charges and expenses were reflected, returns would be lower. The graph and performance table below do not reflect the deduction of taxes that a shareholder would pay on Fund distributions or the redemption of Fund shares. During certain periods, expenses of the Fund have been waived or reimbursed by Lord Abbett; without such waiver or reimbursement of expenses, the Fund’s returns would have been lower. Past performance is no guarantee of future results.

Average Annual Total Returns for the
Periods Ended December 31, 2015 |
| | | 1 Year | | 5 Years | | 10 Years | |
| Class VC | | -1.53% | | 5.48% | | 6.55% | |
1 Performance for each unmanaged index does not reflect any fees or expenses. The performance of each index is not necessarily representative of the Fund’s performance.
4
Expense Example
As a shareholder of the Fund, you incur ongoing costs, including management fees; expenses related to the Fund’s services arrangements with certain insurance companies; and other Fund expenses. This Example is intended to help you understand your ongoing costs (in dollars) of investing in the Fund and to compare these costs with the ongoing costs of investing in other mutual funds.
The Example is based on an investment of $1,000 invested at the beginning of the period and held for the entire period (July 1, 2015 through December 31, 2015).
The Example reflects only expenses that are deducted from the assets of the Fund. Fees and expenses, including sales charges applicable to the various insurance products that invest in the Fund, are not reflected in this Example. If such fees and expenses were reflected in the Example, the total expenses shown would be higher. Fees and expenses regarding such variable insurance products are separately described in the prospectus related to those products.
Actual Expenses
The first line of the table on the following page provides information about actual account values and actual expenses. You may use the information in this line, together with the amount you invested, to estimate the expenses that you paid over the period. Simply divide your account value by $1,000 (for example, an $8,600 account value divided by $1,000 = 8.6), then multiply the result by the number in the first line under the heading titled “Expenses Paid During Period 7/1/15 – 12/31/15” to estimate the expenses you paid on your account during this period.
Hypothetical Example for Comparison Purposes
The second line of the table on the following page provides information about hypothetical account values and hypothetical expenses based on the Fund’s actual expense ratio and an assumed rate of return of 5% per year before expenses, which is not the Fund’s actual return. The hypothetical account values and expenses may not be used to estimate the actual ending account balance or expenses you paid for the period. You may use this information to compare the ongoing costs of investing in the Fund and other funds. To do so, compare this 5% hypothetical example with the 5% hypothetical examples that appear in the shareholder reports of the other funds.
5
Please note that the expenses shown in the table are meant to highlight your ongoing costs only and do not reflect any transactional costs, such as sales charges. Therefore, the second line of the table is useful in comparing ongoing costs only, and will not help you determine the relative total costs of owning different funds. In addition, if these transactional costs were included, your costs would have been higher.
| | | Beginning
Account
Value | | Ending
Account
Value | | Expenses
Paid During
Period† | |
| | | 7/1/15 | | 12/31/15 | | 7/1/15 -
12/31/15 | |
| Class VC | | | | | | | |
| Actual | | $1,000.00 | | $ 955.80 | | $4.44 | |
| Hypothetical (5% Return Before Expenses) | | $1,000.00 | | $1,020.67 | | $4.58 | |
| † | Net expenses are equal to the Fund’s annualized expense ratio of 0.90%, multiplied by the average account value over the period, multiplied by 184/365 (to reflect one-half year period). |
Portfolio Holdings Presented by Sector
December 31, 2015
| Sector* | %** |
| Asset Backed | 0.54 | % |
| Automotive | 1.14 | % |
| Banking | 8.41 | % |
| Basic Industry | 6.78 | % |
| Capital Goods | 5.44 | % |
| Consumer Goods | 5.96 | % |
| Energy | 9.43 | % |
| Financial Services | 3.14 | % |
| Foreign Government | 2.11 | % |
| Healthcare | 8.91 | % |
| Insurance | 1.60 | % |
| Leisure | 5.52 | % |
| Media | 5.71 | % |
| Mortgage-Backed | 4.40 | % |
| Real Estate | 2.02 | % |
| Retail | 6.19 | % |
| Services | 2.12 | % |
| Technology & Electronics | 7.38 | % |
| Telecommunications | 5.89 | % |
| Transportation | 1.67 | % |
| Utility | 1.65 | % |
| Repurchase Agreement | 3.99 | % |
| Total | 100.00 | % |
| * | | A sector may comprise several industries. |
| ** | | Represents percent of total investments. |
6
Schedule of Investments
December 31, 2015
| Investments | | Interest
Rate | | Maturity
Date | | Principal
Amount
(000) | | | Fair
Value | |
| LONG-TERM INVESTMENTS 94.97% | | | | | | | | | | | | |
| | | | | | | | | | | | | |
| ASSET-BACKED SECURITIES 0.53% | | | | | | | | | | | | |
| | | | | | | | | | | | | |
| Other | | | | | | | | | | | | |
| Guggenheim 5180-2 CLO LP 2015-1A A2B† | | 2.914% | # | 11/25/2027 | | $ | 2,500 | | | $ | 2,467,690 | |
| JFIN CLO II Ltd. 2015-2A B1† | | 2.915% | # | 10/19/2026 | | | 1,500 | | | | 1,501,026 | |
| OZLM VIII Ltd. 2014-8A A2A† | | 2.439% | # | 10/17/2026 | | | 1,250 | | | | 1,232,891 | |
| Total Asset-Backed Securities (cost $5,167,369) | | | | | | | | | | | 5,201,607 | |
| | | | | | | | | | | | | |
| | | | | | | Shares | | | | | |
| | | | | | | (000) | | | | | |
| | | | | | | | | | | | | |
| COMMON STOCKS 13.21% | | | | | | | | | | | | |
| | | | | | | | | | | | | |
| Aerospace/Defense 0.29% | | | | | | | | | | | | |
| General Dynamics Corp. | | | | | | | 7 | | | | 964,404 | |
| Orbital ATK, Inc. | | | | | | | 11 | | | | 962,192 | |
| Raytheon Co. | | | | | | | 8 | | | | 953,900 | |
| Total | | | | | | | | | | | 2,880,496 | |
| | | | | | | | | | | | | |
| Air Transportation 0.20% | | | | | | | | | | | | |
| Alaska Air Group, Inc. | | | | | | | 13 | | | | 1,033,507 | |
| Southwest Airlines Co. | | | | | | | 23 | | | | 969,194 | |
| Total | | | | | | | | | | | 2,002,701 | |
| | | | | | | | | | | | | |
| Auto Parts & Equipment 0.27% | | | | | | | | | | | | |
| Chassix Holdings, Inc. | | | | | | | 59 | | | | 1,642,997 | |
| Drew Industries, Inc. | | | | | | | 16 | | | | 1,001,153 | |
| Total | | | | | | | | | | | 2,644,150 | |
| | | | | | | | | | | | | |
| Banking 0.61% | | | | | | | | | | | | |
| Bank of the Ozarks, Inc. | | | | | | | 19 | | | | 931,332 | |
| BankUnited, Inc. | | | | | | | 27 | | | | 966,841 | |
| First Republic Bank | | | | | | | 15 | | | | 985,417 | |
| Signature Bank* | | | | | | | 7 | | | | 1,119,141 | |
| Synovus Financial Corp. | | | | | | | 31 | | | | 1,012,231 | |
| Western Alliance Bancorp* | | | | | | | 26 | | | | 943,620 | |
| Total | | | | | | | | | | | 5,958,582 | |
| | | | | | | | | | | | | |
| Beverages 0.61% | | | | | | | | | | | | |
| Amplify Snack Brands, Inc.* | | | | | | | 42 | | | | 479,497 | |
| Brown-Forman Corp. Class B | | | | | | | 10 | | | | 995,679 | |
| | See Notes to Financial Statements. | 7 |
Schedule of Investments (continued)
December 31, 2015
| Investments | | | | | | Shares
(000) | | | Fair
Value | |
| Beverages (continued) | | | | | | | | | | | | |
| Constellation Brands, Inc. Class A | | | | | | | 10 | | | $ | 1,456,307 | |
| Dr. Pepper Snapple Group, Inc. | | | | | | | 11 | | | | 1,039,366 | |
| Fomento Economico Mexicano SAB de CV ADR | | | | | | | 10 | | | | 944,833 | |
| Monster Beverage Corp.* | | | | | | | 7 | | | | 1,063,574 | |
| Total | | | | | | | | | | | 5,979,256 | |
| | | | | | | | | | | | | |
| Brokerage 0.15% | | | | | | | | | | | | |
| CBOE Holdings, Inc. | | | | | | | 14 | | | | 940,206 | |
| E*TRADE Financial Corp.* | | | | | | | 17 | | | | 496,026 | |
| Total | | | | | | | | | | | 1,436,232 | |
| | | | | | | | | | | | | |
| Building & Construction 0.10% | | | | | | | | | | | | |
| Granite Construction, Inc. | | | | | | | 23 | | | | 991,693 | |
| | | | | | | | | | | | | |
| Building Materials 0.58% | | | | | | | | | | | | |
| Advanced Drainage Systems, Inc. | | | | | | | 10 | | | | 235,854 | |
| Beacon Roofing Supply, Inc.* | | | | | | | 27 | | | | 1,130,597 | |
| Fortune Brands Home & Security, Inc. | | | | | | | 18 | | | | 1,008,047 | |
| Martin Marietta Materials, Inc. | | | | | | | 7 | | | | 931,749 | |
| Masco Corp. | | | | | | | 17 | | | | 490,722 | |
| Summit Materials, Inc. Class A* | | | | | | | 48 | | | | 963,122 | |
| Vulcan Materials Co. | | | | | | | 10 | | | | 918,170 | |
| Total | | | | | | | | | | | 5,678,261 | |
| | | | | | | | | | | | | |
| Chemicals 0.49% | | | | | | | | | | | | |
| Chemtura Corp.* | | | | | | | 33 | | | | 890,720 | |
| Ecolab, Inc. | | | | | | | 8 | | | | 944,550 | |
| International Flavors & Fragrances, Inc. | | | | | | | 4 | | | | 491,720 | |
| Scotts Miracle-Gro Co. (The) Class A | | | | | | | 14 | | | | 925,332 | |
| Trinseo SA* | | | | | | | 53 | | | | 1,502,637 | |
| Total | | | | | | | | | | | 4,754,959 | |
| | | | | | | | | | | | | |
| Discount Stores 0.21% | | | | | | | | | | | | |
| Amazon.com, Inc.* | | | | | | | 3 | | | | 2,056,057 | |
| | | | | | | | | | | | | |
| Diversified Capital Goods 0.25% | | | | | | | | | | | | |
| A.O. Smith Corp. | | | | | | | 13 | | | | 975,628 | |
| Acuity Brands, Inc. | | | | | | | 4 | | | | 1,000,430 | |
| Danaher Corp. | | | | | | | 5 | | | | 480,004 | |
| Total | | | | | | | | | | | 2,456,062 | |
| 8 | See Notes to Financial Statements. |
Schedule of Investments (continued)
December 31, 2015
| Investments | | | | | | Shares
(000) | | | Fair
Value | |
| Electronics 0.10% | | | | | | | | | | |
| Fitbit, Inc. Class A* | | | | | | | 33 | | | $ | 976,707 | |
| | | | | | | | | | | | | |
| Energy: Exploration & Production 0.37% | | | | | | | | | | | | |
| Concho Resources, Inc.* | | | | | | | 9 | | | | 842,797 | |
| Diamondback Energy, Inc.* | | | | | | | 13 | | | | 868,764 | |
| Parsley Energy, Inc. Class A* | | | | | | | 57 | | | | 1,056,816 | |
| Seven Generations Energy Ltd. Class A*(a) | | | | | | CAD | 86 | | | | 838,250 | |
| Total | | | | | | | | | | | 3,606,627 | |
| | | | | | | | | | | | | |
| Food & Drug Retailers 0.37% | | | | | | | | | | | | |
| Alimentation Couche-Tard, Inc. Class B(a) | | | | | | CAD | 17 | | | | 747,850 | |
| Casey’s General Stores, Inc. | | | | | | | 10 | | | | 1,210,161 | |
| Kroger Co. (The) | | | | | | | 12 | | | | 495,602 | |
| Sprouts Farmers Market, Inc.* | | | | | | | 43 | | | | 1,141,642 | |
| Total | | | | | | | | | | | 3,595,255 | |
| | | | | | | | | | | | | |
| Food: Wholesale 0.41% | | | | | | | | | | | | |
| B&G Foods, Inc. | | | | | | | 28 | | | | 973,031 | |
| Blue Buffalo Pet Products, Inc.* | | | | | | | 54 | | | | 1,013,277 | |
| Core-Mark Holding Co., Inc. | | | | | | | 12 | | | | 1,022,447 | |
| Ingredion, Inc. | | | | | | | 10 | | | | 973,351 | |
| Total | | | | | | | | | | | 3,982,106 | |
| | | | | | | | | | | | | |
| Gaming 0.52% | | | | | | | | | | | | |
| Boyd Gaming Corp.* | | | | | | | 75 | | | | 1,491,979 | |
| Churchill Downs, Inc. | | | | | | | 3 | | | | 481,773 | |
| Isle of Capri Casinos, Inc.* | | | | | | | 39 | | | | 538,784 | |
| MGM Resorts International* | | | | | | | 43 | | | | 986,321 | |
| Wynn Resorts Ltd. | | | | | | | 22 | | | | 1,542,937 | |
| Total | | | | | | | | | | | 5,041,794 | |
| | | | | | | | | | | | | |
| Health Facilities 0.09% | | | | | | | | | | | | |
| Acadia Healthcare Co., Inc.* | | | | | | | 14 | | | | 863,010 | |
| | | | | | | | | | | | | |
| Insurance-Reinsurance 0.10% | | | | | | | | | | | | |
| Aspen Insurance Holdings Ltd. | | | | | | | 21 | | | | 993,483 | |
| | | | | | | | | | | | | |
| Investments & Miscellaneous Financial Services 0.16% | | | | | | | | | | | | |
| Intercontinental Exchange, Inc. | | | | | | | 4 | | | | 1,050,154 | |
| Public Storage | | | | | | | 2 | | | | 489,455 | |
| Total | | | | | | | | | | | 1,539,609 | |
| | | | | | | | | | | | | |
| | See Notes to Financial Statements. | 9 |
Schedule of Investments (continued)
December 31, 2015
| Investments | | | | | | Shares
(000) | | | Fair
Value | |
| Machinery 0.26% | | | | | | | | | | | | |
| Graco, Inc. | | | | | | | 7 | | | $ | 507,589 | |
| Roper Technologies, Inc. | | | | | | | 6 | | | | 1,081,803 | |
| Toro Co. (The) | | | | | | | 13 | | | | 974,535 | |
| Total | | | | | | | | | | | 2,563,927 | |
| | | | | | | | | | | | | |
| Media: Content 0.33% | | | | | | | | | | | | |
| Netflix, Inc.* | | | | | | | 20 | | | | 2,247,910 | |
| Starz Class A* | | | | | | | 29 | | | | 966,978 | |
| Total | | | | | | | | | | | 3,214,888 | |
| | | | | | | | | | | | | |
| Medical Products 0.34% | | | | | | | | | | | | |
| C.R. Bard, Inc. | | | | | | | 5 | | | | 1,029,038 | |
| Edwards Lifesciences Corp.* | | | | | | | 16 | | | | 1,259,652 | |
| STERIS plc (United Kingdom)(b) | | | | | | | 14 | | | | 1,033,439 | |
| Total | | | | | | | | | | | 3,322,129 | |
| | | | | | | | | | | | | |
| Metals/Mining (Excluding Steel) 0.00% | | | | | | | | | | | | |
| Mirabela Nickel Ltd.*(a) | | | | | | AUD | 2,560 | | | | 18,657 | |
| | | | | | | | | | | | | |
| Multi-Line Insurance 0.10% | | | | | | | | | | | | |
| Hanover Insurance Group, Inc. (The) | | | | | | | 12 | | | | 993,324 | |
| | | | | | | | | | | | | |
| Non-Electric Utilities 0.20% | | | | | | | | | | | | |
| American Water Works Co., Inc. | | | | | | | 16 | | | | 965,799 | |
| Aqua America, Inc. | | | | | | | 33 | | | | 990,761 | |
| Total | | | | | | | | | | | 1,956,560 | |
| | | | | | | | | | | | | |
| Packaging 0.15% | | | | | | | | | | | | |
| AptarGroup, Inc. | | | | | | | 7 | | | | 487,772 | |
| Berry Plastics Group, Inc.* | | | | | | | 27 | | | | 970,239 | |
| Total | | | | | | | | | | | 1,458,011 | |
| | | | | | | | | | | | | |
| Personal & Household Products 0.31% | | | | | | | | | | | | |
| Clorox Co. (The) | | | | | | | 8 | | | | 1,013,752 | |
| Estee Lauder Cos., Inc. (The) Class A | | | | | | | 6 | | | | 559,357 | |
| Pool Corp. | | | | | | | 12 | | | | 955,224 | |
| Shiseido Co., Ltd.(a) | | | | | | JPY | 23 | | | | 480,455 | |
| Total | | | | | | | | | | | 3,008,788 | |
| | | | | | | | | | | | | |
| Pharmaceuticals 0.51% | | | | | | | | | | | | |
| Alexion Pharmaceuticals, Inc.* | | | | | | | 5 | | | | 987,513 | |
| Eli Lilly & Co. | | | | | | | 13 | | | | 1,079,876 | |
| | |
| 10 | See Notes to Financial Statements. |
Schedule of Investments (continued)
December 31, 2015
| Investments | | | | | | Shares
(000) | | | Fair
Value | |
| Pharmaceuticals (continued) | | | | | | | | | | | | |
| Regeneron Pharmaceuticals, Inc.* | | | | | | | 3 | | | $ | 1,454,349 | |
| Vertex Pharmaceuticals, Inc.* | | | | | | | 8 | | | | 968,010 | |
| Zoetis, Inc. | | | | | | | 11 | | | | 508,910 | |
| Total | | | | | | | | | | | 4,998,658 | |
| | | | | | | | | | | | | |
| Property & Casualty 0.10% | | | | | | | | | | | | |
| Argo Group International Holdings Ltd. | | | | | | | 16 | | | | 983,171 | |
| | | | | | | | | | | | | |
| Real Estate Investment Trusts 0.47% | | | | | | | | | | | | |
| CubeSmart | | | | | | | 32 | | | | 987,862 | |
| Extra Space Storage, Inc. | | | | | | | 11 | | | | 970,398 | |
| InfraREIT, Inc. | | | | | | | 59 | | | | 1,097,032 | |
| National Storage Affiliates Trust | | | | | | | 33 | | | | 559,346 | |
| QTS Realty Trust, Inc. Class A | | | | | | | 22 | | | | 981,684 | |
| Total | | | | | | | | | | | 4,596,322 | |
| | | | | | | | | | | | | |
| Recreation & Travel 0.35% | | | | | | | | | | | | |
| Royal Caribbean Cruises Ltd. | | | | | | | 10 | | | | 1,058,960 | |
| Six Flags Entertainment Corp. | | | | | | | 26 | | | | 1,418,166 | |
| Vail Resorts, Inc. | | | | | | | 8 | | | | 989,363 | |
| Total | | | | | | | | | | | 3,466,489 | |
| | | | | | | | | | | | | |
| Restaurants 0.58% | | | | | | | | | | | | |
| McDonald’s Corp. | | | | | | | 9 | | | | 1,063,378 | |
| Restaurant Brands International, Inc. (Canada)(b) | | | | | | | 28 | | | | 1,031,510 | |
| Shake Shack, Inc. Class A* | | | | | | | 26 | | | | 1,029,758 | |
| Starbucks Corp. | | | | | | | 34 | | | | 2,014,187 | |
| Wendy’s Co. (The) | | | | | | | 48 | | | | 517,240 | |
| Total | | | | | | | | | | | 5,656,073 | |
| | | | | | | | | | | | | |
| Software/Services 1.50% | | | | | | | | | | | | |
| Accenture plc Class A (Ireland)(b) | | | | | | | 5 | | | | 505,466 | |
| Alibaba Group Holding Ltd. ADR* | | | | | | | 12 | | | | 948,421 | |
| Alphabet, Inc. Class C* | | | | | | | 2 | | | | 1,460,085 | |
| Arista Networks, Inc.* | | | | | | | 13 | | | | 1,013,710 | |
| Booz Allen Hamilton Holding Corp. | | | | | | | 18 | | | | 565,018 | |
| Facebook, Inc. Class A* | | | | | | | 19 | | | | 1,995,971 | |
| First Data Corp. Class A* | | | | | | | 112 | | | | 1,787,832 | |
| LinkedIn Corp. Class A* | | | | | | | 4 | | | | 959,966 | |
| MasterCard, Inc. Class A | | | | | | | 10 | | | | 1,001,737 | |
| | See Notes to Financial Statements. | 11 |
Schedule of Investments (continued)
December 31, 2015
| Investments | | | | | | Shares
(000) | | | Fair
Value | |
| Software/Services (continued) | | | | | | | | | | | | |
| PayPal Holdings, Inc.* | | | | | | | 27 | | | $ | 975,481 | |
| Proofpoint, Inc.* | | | | | | | 14 | | | | 915,341 | |
| ServiceNow, Inc.* | | | | | | | 12 | | | | 1,039,499 | |
| SS&C Technologies Holdings, Inc. | | | | | | | 14 | | | | 946,359 | |
| Tableau Software, Inc. Class A* | | | | | | | 6 | | | | 597,261 | |
| Total | | | | | | | | | | | 14,712,147 | |
| | | | | | | | | | | | | |
| Specialty Retail 0.70% | | | | | | | | | | | | |
| Home Depot, Inc. (The) | | | | | | | 11 | | | | 1,480,539 | |
| Moncler SpA(a) | | | | | | EUR | 65 | | | | 899,705 | |
| Murphy USA, Inc.* | | | | | | | 21 | | | | 1,294,612 | |
| NIKE, Inc. Class B | | | | | | | 26 | | | | 1,655,875 | |
| Tile Shop Holdings, Inc.* | | | | | | | 61 | | | | 1,005,189 | |
| Wayfair, Inc. Class A* | | | | | | | 10 | | | | 476,200 | |
| Total | | | | | | | | | | | 6,812,120 | |
| | | | | | | | | | | | | |
| Support: Services 0.53% | | | | | | | | | | | | |
| Bright Horizons Family Solutions, Inc.* | | | | | | | 15 | | | | 1,011,486 | |
| Cintas Corp. | | | | | | | 5 | | | | 497,406 | |
| Equifax, Inc. | | | | | | | 9 | | | | 1,008,455 | |
| Korn/Ferry International | | | | | | | 14 | | | | 450,651 | |
| Leidos Holdings, Inc. | | | | | | | 21 | | | | 1,174,821 | |
| TripAdvisor, Inc.* | | | | | | | 12 | | | | 1,020,784 | |
| Total | | | | | | | | | | | 5,163,603 | |
| | | | | | | | | | | | | |
| Technology Hardware & Equipment 0.25% | | | | | | | | | | | | |
| Cavium, Inc.* | | | | | | | 8 | | | | 518,189 | |
| Ingram Micro, Inc. Class A | | | | | | | 31 | | | | 949,983 | |
| NVIDIA Corp. | | | | | | | 30 | | | | 972,649 | |
| Total | | | | | | | | | | | 2,440,821 | |
| | | | | | | | | | | | | |
| Telecommunications: Wireless 0.10% | | | | | | | | | | | | |
| T-Mobile US, Inc.* | | | | | | | 25 | | | | 994,743 | |
| | | | | | | | | | | | | |
| Telecommunications: Wireline Integrated & Services 0.14% | | | | | | | | | | | | |
| Dycom Industries, Inc.* | | | | | | | 12 | | | | 843,928 | |
| Equinix, Inc. | | | | | | | 2 | | | | 521,035 | |
| Total | | | | | | | | | | | 1,364,963 | |
| | | | | | | | | | | | | |
| Theaters & Entertainment 0.10% | | | | | | | | | | | | |
| Activision Blizzard, Inc. | | | | | | | 25 | | | | 973,208 | |
| 12 | See Notes to Financial Statements. |
Schedule of Investments (continued)
December 31, 2015
| Investments | | | | | | Shares
(000) | | | Fair
Value | |
| Tobacco 0.21% | | | | | | | | | | | | |
| Altria Group, Inc. | | | | | | | 17 | | | $ | 1,005,287 | |
| Reynolds American, Inc. | | | | | | | 23 | | | | 1,045,897 | |
| Total | | | | | | | | | | | 2,051,184 | |
| | | | | | | | | | | | | |
| Trucking & Delivery 0.10% | | | | | | | | | | | | |
| AMERCO | | | | | | | 3 | | | | 984,266 | |
| Total Common Stocks (cost $126,200,806) | | | | | | | | | | | 129,171,092 | |
| | | | | | | | | | | | | |
| | | Interest
Rate | | Maturity
Date | | Principal
Amount
(000) | | | | | |
| | | | | | | | | | | | |
| CONVERTIBLE BONDS 0.71% | | | | | | | | | | | | |
| | | | | | | | | | | | | |
| Automakers 0.11% | | | | | | | | | | | | |
| Tesla Motors, Inc. | | 1.25% | | 3/1/2021 | | $ | 1,137 | | | | 1,047,461 | |
| | | | | | | | | | | | | |
| Electronics 0.10% | | | | | | | | | | | | |
| Novellus Systems, Inc. | | 2.625% | | 5/15/2041 | | | 423 | | | | 997,487 | |
| | | | | | | | | | | | | |
| Pharmaceuticals 0.10% | | | | | | | | | | | | |
| Incyte Corp. Ltd. | | 0.375% | | 11/15/2018 | | | 460 | | | | 992,738 | |
| | | | | | | | | | | | | |
| Software/Services 0.40% | | | | | | | | | | | | |
| Red Hat, Inc. | | 0.25% | | 10/1/2019 | | | 750 | | | | 980,156 | |
| salesforce.com, Inc. | | 0.25% | | 4/1/2018 | | | 775 | | | | 998,781 | |
| Twitter, Inc. | | 1.00% | | 9/15/2021 | | | 1,155 | | | | 970,922 | |
| Workday, Inc. | | 1.50% | | 7/15/2020 | | | 800 | | | | 953,000 | |
| Total | | | | | | | | | | | 3,902,859 | |
| Total Convertible Bonds (cost $7,062,422) | | | | | | | | | | | 6,940,545 | |
| | | | | | | | | | | | | |
| | | Dividend
Rate | | | | Shares
(000) | | | | | |
| | | | | | | | | | | | |
| CONVERTIBLE PREFERRED STOCKS 0.34% | | | | | | | | | | | | |
| | | | | | | | | | | | | |
| Building & Construction 0.09% | | | | | | | | | | | | |
| William Lyon Homes, Inc. Unit | | 6.50% | | | | | 10 | | | | 872,316 | |
| | | | | | | | | | | | | |
| Food: Wholesale 0.10% | | | | | | | | | | | | |
| Post Holdings, Inc. | | 5.25% | | | | | 8 | | | | 984,942 | |
| | See Notes to Financial Statements. | 13 |
Schedule of Investments (continued)
December 31, 2015
| Investments | | Dividend
Rate | | Maturity
Date | | Shares
(000) | | | Fair
Value | |
| Gas Distribution 0.15% | | | | | | | | | | |
| Kinder Morgan, Inc. | | 9.75% | | | | | 36 | | | $ | 1,432,665 | |
| Total Convertible Preferred Stocks (cost $3,232,015) | | | | | | | | | | | 3,289,923 | |
| | | | | | | | | | | | | |
| | | Interest
Rate | | | | Principal
Amount
(000) | | | | | |
| | | | | | | | | | | | | |
| FLOATING RATE LOANS(c) 2.18% | | | | | | | | | | | | |
| | | | | | | | | | | | | |
| Auto Parts & Equipment 0.08% | | | | | | | | | | | | |
| Chassix, Inc. Initial Term Loan | | 12.00% | | 7/29/2019 | | $ | 769 | | | | 769,220 | |
| | | | | | | | | | | | | |
| Consumer/Commercial/Lease Financing 0.09% | | | | | | | | | | | | |
| AWAS Finance Luxembourg 2012 SA Term Loan (Luxembourg)(b) | | 3.50% | | 7/16/2018 | | | 836 | | | | 835,146 | |
| | | | | | | | | | | | | |
| Electronics 0.27% | | | | | | | | | | | | |
| Avago Technologies Term Loan B | | – | (d) | 2/1/2023 | | | 1,968 | | | | 1,950,938 | |
| NXP B.V. Tranche D Term Loan (Netherlands)(b) | | 3.25% | | 1/11/2020 | | | 721 | | | | 714,002 | |
| Total | | | | | | | | | | | 2,664,940 | |
| | | | | | | | | | | | | |
| Energy: Exploration & Production 0.09% | | | | | | | | | | | | |
| Chief Exploration & Development LLC 2nd Lien Term Loan | | 7.50% | | 5/12/2021 | | | 1,025 | | | | 700,419 | |
| Templar Energy LLC 2nd Lien New Term Loan | | 8.50% | | 11/25/2020 | | | 1,905 | | | | 230,981 | |
| Total | | | | | | | | | | | 931,400 | |
| | | | | | | | | | | | | |
| Gaming 0.26% | | | | | | | | | | | | |
| Caesar’s Entertainment Resort Properties LLC Term Loan B | | 7.00% | | 10/11/2020 | | | 1,047 | | | | 956,347 | |
| Cowlitz Tribal Gaming Authority Term Loan B | | 11.50% | | 12/6/2021 | | | 1,725 | | | | 1,630,125 | |
| Total | | | | | | | | | | | 2,586,472 | |
| | | | | | | | | | | | | |
| Health Facilities 0.28% | | | | | | | | | | | | |
| CHG Healthcare Services, Inc. 1st Lien Term Loan | | 4.25% | | 11/19/2019 | | | 2,774 | | | | 2,732,149 | |
| | | | | | | | | | | | | |
| Metals/Mining (Excluding Steel) 0.19% | | | | | | | | | | | | |
| FMG Resources Pty Ltd. Term Loan (Australia)(b) | | 4.25% | | 6/30/2019 | | | 2,454 | | | | 1,831,803 | |
| | | | | | | | | | | | | |
| Packaging 0.12% | | | | | | | | | | | | |
| Crown Holdings, Inc. Delayed Draw Term Loan A | | 1.99% | | 12/19/2018 | | | 1,215 | | | | 1,213,982 | |
| 14 | See Notes to Financial Statements. |
Schedule of Investments (continued)
December 31, 2015
| Investments | | Interest
Rate | | Maturity
Date | | Principal
Amount
(000) | | | Fair
Value | |
| Personal & Household Products 0.11% | | | | | | | | | | |
| Britax US Holdings, Inc. Initial Dollar Term Loan | | 4.50% | | 10/15/2020 | | $ | 1,479 | | | $ | 1,051,641 | |
| | | | | | | | | | | | | |
| Pharmaceuticals 0.10% | | | | | | | | | | | | |
| RPI Finance Trust Term Loan B4 | | 3.50% | | 11/9/2020 | | | 973 | | | | 970,763 | |
| | | | | | | | | | | | | |
| Recreation & Travel 0.09% | | | | | | | | | | | | |
| Delta 2 (Lux) S.A.R.L. 2nd Lien Facility Term Loan (Luxembourg)(b) | | 7.75% | | 7/29/2022 | | | 970 | | | | 899,190 | |
| | | | | | | | | | | | | |
| Software/Services 0.10% | | | | | | | | | | | | |
| First Data Corp. New 2022 B Dollar Term Loan | | 4.168% | | 7/8/2022 | | | 950 | | | | 937,769 | |
| | | | | | | | | | | | | |
| Specialty Retail 0.13% | | | | | | | | | | | | |
| Bass Pro Group LLC 2015 New Term Loan | | 4.00% | | 6/5/2020 | | | 795 | | | | 767,828 | |
| Rue21, Inc. Term Loan B | | 5.625% | | 10/9/2020 | | | 623 | | | | 506,205 | |
| Total | | | | | | | | | | | 1,274,033 | |
| | | | | | | | | | | | | |
| Technology Hardware & Equipment 0.00% | | | | | | | | | | | | |
| TTM Technologies, Inc. Term Loan B | | 6.00% | | 5/31/2021 | | | 44 | | | | 39,717 | |
| | | | | | | | | | | | | |
| Telecommunications: Wireline Integrated & Services 0.10% | | | | | | | | | | |
| Fairpoint Communications, Inc. Term Loan | | 7.50% | | 2/14/2019 | | | 940 | | | | 936,804 | |
| | | | | | | | | | | | | |
| Theaters & Entertainment 0.17% | | | | | | | | | | | | |
| Kasima LLC Term Loan | | 3.25% | | 5/17/2021 | | | 722 | | | | 717,949 | |
| Six Flags Theme Parks, Inc. Tranche B Term Loan | | 3.50% | | 6/30/2022 | | | 965 | | | | 965,000 | |
| Total | | | | | | | | | | | 1,682,949 | |
| Total Floating Rate Loans (cost $23,632,488) | | | | | | | | | | | 21,357,978 | |
| | | | | | | | | | | | | |
| FOREIGN BONDS(a) 0.64% | | | | | | | | | | | | |
| | | | | | | | | | | | | |
| Luxembourg 0.05% | | | | | | | | | | | | |
| Altice Luxembourg SA† | | 6.25% | | 2/15/2025 | | EUR | 500 | | | | 460,510 | |
| | | | | | | | | | | | | |
| Mexico 0.06% | | | | | | | | | | | | |
| Red de Carreteras de Occidente S.A.P.I.B. de CV† | | 9.00% | | 6/10/2028 | | MXN | 10,000 | | | | 563,836 | |
| | | | | | | | | | | | | |
| Netherlands 0.11% | | | | | | | | | | | | |
| Hema Bondco I BV† | | 6.25% | | 6/15/2019 | | EUR | 1,300 | | | | 1,063,113 | |
| | | | | | | | | | | | | |
| Spain 0.20% | | | | | | | | | | | | |
| Banco Popular Espanol SA | | 11.50% | | – | (e) | EUR | 1,700 | | | | 2,013,747 | |
| | See Notes to Financial Statements. | 15 |
Schedule of Investments (continued)
December 31, 2015
| Investments | | Interest
Rate | | Maturity
Date | | Principal
Amount
(000) | | | Fair
Value | |
| United Kingdom 0.22% | | | | | | | | | | | | |
| New Look Secured Issuer plc† | | 6.50% | | 7/1/2022 | | GBP | 830 | | | $ | 1,217,652 | |
| Premier Foods Finance plc† | | 6.50% | | 3/15/2021 | | GBP | 675 | | | | 952,545 | |
| Total | | | | | | | | | | | 2,170,197 | |
| Total Foreign Bonds (cost $6,955,261) | | | | | | | | | | | 6,271,403 | |
| | | | | | | | | | | | | |
| FOREIGN GOVERNMENT OBLIGATIONS 2.09% | | | | | | | | | | | | |
| | | | | | | | | | | | | |
| Angola 0.09% | | | | | | | | | | | | |
| Republic of Angola†(b) | | 9.50% | | 11/12/2025 | | $ | 1,000 | | | | 932,500 | |
| | | | | | | | | | | | | |
| Argentina 0.37% | | | | | | | | | | | | |
| City of Buenos Aires†(b) | | 8.95% | | 2/19/2021 | | | 925 | | | | 980,500 | |
| Republic of Argentina(b) | | 8.75% | | 5/7/2024 | | | 2,500 | | | | 2,640,330 | |
| Total | | | | | | | | | | | 3,620,830 | |
| | | | | | | | | | | | | |
| Bahamas 0.10% | | | | | | | | | | | | |
| Commonwealth of Bahamas†(b) | | 5.75% | | 1/16/2024 | | | 900 | | | | 945,000 | |
| | | | | | | | | | | | | |
| Bermuda 0.24% | | | | | | | | | | | | |
| Government of Bermuda† | | 4.138% | | 1/3/2023 | | | 1,350 | | | | 1,352,194 | |
| Government of Bermuda† | | 4.854% | | 2/6/2024 | | | 975 | | | | 1,010,100 | |
| Total | | | | | | | | | | | 2,362,294 | |
| | | | | | | | | | | | | |
| Cayman Islands 0.06% | | | | | | | | | | | | |
| Cayman Islands Government† | | 5.95% | | 11/24/2019 | | | 525 | | | | 593,250 | |
| | | | | | | | | | | | | |
| Cyprus 0.20% | | | | | | | | | | | | |
| Republic of Cyprus(a) | | 4.75% | | 6/25/2019 | | EUR | 1,700 | | | | 1,992,501 | |
| | | | | | | | | | | | | |
| Dominican Republic 0.16% | | | | | | | | | | | | |
| Dominican Republic†(b) | | 6.85% | | 1/27/2045 | | $ | 1,665 | | | | 1,577,587 | |
| | | | | | | | | | | | | |
| Egypt 0.14% | | | | | | | | | | | | |
| Arab Republic of Egypt†(b) | | 5.875% | | 6/11/2025 | | | 1,530 | | | | 1,331,789 | |
| | | | | | | | | | | | | |
| Ethiopia 0.15% | | | | | | | | | | | | |
| Republic of Ethiopia†(b) | | 6.625% | | 12/11/2024 | | | 1,615 | | | | 1,437,996 | |
| | | | | | | | | | | | | |
| Greece 0.10% | | | | | | | | | | | | |
| Hellenic Republic†(a) | | 4.75% | | 4/17/2019 | | EUR | 1,000 | | | | 999,995 | |
| | | | | | | | | | | | | |
| Honduras 0.10% | | | | | | | | | | | | |
| Honduras Government†(b) | | 7.50% | | 3/15/2024 | | $ | 900 | | | | 951,750 | |
| 16 | See Notes to Financial Statements. |
Schedule of Investments (continued)
December 31, 2015
| Investments | | Interest
Rate | | Maturity
Date | | Principal
Amount
(000) | | | Fair
Value | |
| Jamaica 0.38% | | | | | | | | | | | | |
| Government of Jamaica(b) | | 6.75% | | 4/28/2028 | | $ | 1,500 | | | $ | 1,492,500 | |
| Government of Jamaica(b) | | 7.625% | | 7/9/2025 | | | 1,150 | | | | 1,226,187 | |
| Government of Jamaica(b) | | 8.00% | | 3/15/2039 | | | 910 | | | | 957,320 | |
| Total | | | | | | | | | | | 3,676,007 | |
| Total Foreign Government Obligations (cost $20,836,861) | | | | | | 20,421,499 | |
| | | | | | | | | | | | | |
| HIGH YIELD CORPORATE BONDS 70.92% | | | | | | | | | | | | |
| | | | | | | | | | | | | |
| Advertising 0.12% | | | | | | | | | | | | |
| Southern Graphics, Inc.† | | 8.375% | | 10/15/2020 | | | 1,200 | | | | 1,212,000 | |
| | | | | | | | | | | | | |
| Aerospace/Defense 1.46% | | | | | | | | | | | | |
| Aerojet Rocketdyne Holdings, Inc. | | 7.125% | | 3/15/2021 | | | 1,625 | | | | 1,698,125 | |
| BAE Systems Holdings, Inc.† | | 3.85% | | 12/15/2025 | | | 1,760 | | | | 1,745,917 | |
| CPI International, Inc. | | 8.75% | | 2/15/2018 | | | 1,233 | | | | 1,220,670 | |
| Harris Corp. | | 4.854% | | 4/27/2035 | | | 409 | | | | 403,685 | |
| Harris Corp. | | 5.054% | | 4/27/2045 | | | 1,962 | | | | 1,928,377 | |
| Hexcel Corp. | | 4.70% | | 8/15/2025 | | | 1,456 | | | | 1,444,586 | |
| Huntington Ingalls Industries, Inc.† | | 5.00% | | 12/15/2021 | | | 2,050 | | | | 2,096,125 | |
| Huntington Ingalls Industries, Inc.† | | 5.00% | | 11/15/2025 | | | 498 | | | | 506,715 | |
| Lockheed Martin Corp. | | 3.55% | | 1/15/2026 | | | 1,315 | | | | 1,322,338 | |
| Lockheed Martin Corp. | | 4.70% | | 5/15/2046 | | | 877 | | | | 902,008 | |
| TransDigm, Inc. | | 6.50% | | 7/15/2024 | | | 982 | | | | 981,509 | |
| Total | | | | | | | | | | | 14,250,055 | |
| | | | | | | | | | | | | |
| Air Transportation 0.44% | | | | | | | | | | | | |
| Air Canada (Canada)†(b) | | 7.75% | | 4/15/2021 | | | 1,410 | | | | 1,469,925 | |
| Air Canada 2015-2 Class A Pass-Through Trust (Canada)†(b) | | 4.125% | | 12/15/2027 | | | 882 | | | | 878,318 | |
| Air Canada 2015-2 Class B Pass-Through Trust (Canada)†(b) | | 5.00% | | 12/15/2023 | | | 1,950 | | | | 1,932,937 | |
| Total | | | | | | | | | | | 4,281,180 | |
| | | | | | | | | | | | | |
| Auto Parts & Equipment 0.67% | | | | | | | | | | | | |
| Gates Global LLC/Gates Global Co.† | | 6.00% | | 7/15/2022 | | | 1,317 | | | | 954,825 | |
| International Automotive Components Group SA (Luxembourg)†(b) | | 9.125% | | 6/1/2018 | | | 1,186 | | | | 1,019,960 | |
| Midas Intermediate Holdco II LLC/Midas Intermediate Holdco II Finance, Inc.† | | 7.875% | | 10/1/2022 | | | 1,100 | | | | 990,000 | |
| MPG Holdco I, Inc. | | 7.375% | | 10/15/2022 | | | 925 | | | | 938,875 | |
| Nemak SA de CV (Mexico)†(b) | | 5.50% | | 2/28/2023 | | | 478 | | | | 481,585 | |
| | See Notes to Financial Statements. | 17 |
Schedule of Investments (continued)
December 31, 2015
| Investments | | Interest
Rate | | Maturity
Date | | Principal
Amount
(000) | | | Fair
Value | |
| Auto Parts & Equipment (continued) | | | | | | | | | | | | |
| Omega US Sub LLC† | | 8.75% | | 7/15/2023 | | $ | 1,250 | | | $ | 1,159,375 | |
| ZF North America Capital, Inc.† | | 4.50% | | 4/29/2022 | | | 1,025 | | | | 1,005,781 | |
| Total | | | | | | | | | | | 6,550,401 | |
| | | | | | | | | | | | | |
| Banking 7.50% | | | | | | | | | | | | |
| ABN AMRO Bank NV (Netherlands)†(b) | | 4.75% | | 7/28/2025 | | | 2,300 | | | | 2,296,895 | |
| Ally Financial, Inc. | | 5.75% | | 11/20/2025 | | | 2,765 | | | | 2,806,475 | |
| ANZ New Zealand Int’l Ltd. (United Kingdom)†(b) | | 2.85% | | 8/6/2020 | | | 1,254 | | | | 1,265,884 | |
| Banco Bilbao Vizcaya Argentaria SA (Spain)(b) | | 9.00% | | – | (e) | | 800 | | | | 859,257 | |
| Bank of America Corp. | | 4.20% | | 8/26/2024 | | | 800 | | | | 795,168 | |
| Bank of America Corp. | | 4.25% | | 10/22/2026 | | | 1,800 | | | | 1,785,523 | |
| Bank of America Corp. | | 6.50% | | – | (e) | | 1,900 | | | | 2,004,500 | |
| Bank of China Ltd. (China)†(b) | | 5.00% | | 11/13/2024 | | | 1,525 | | | | 1,575,790 | |
| BankUnited, Inc. | | 4.875% | | 11/17/2025 | | | 2,525 | | | | 2,488,244 | |
| Barclays plc (United Kingdom)(b) | | 5.25% | | 8/17/2045 | | | 836 | | | | 853,615 | |
| BNP Paribas SA (France)†(b) | | 4.375% | | 9/28/2025 | | | 1,717 | | | | 1,684,789 | |
| BNP Paribas SA (France)†(b) | | 7.375% | | – | (e) | | 760 | | | | 780,900 | |
| CIT Group, Inc. | | 5.00% | | 8/15/2022 | | | 1,652 | | | | 1,700,536 | |
| Citigroup, Inc. | | 4.40% | | 6/10/2025 | | | 1,224 | | | | 1,238,622 | |
| Citigroup, Inc. | | 4.45% | | 9/29/2027 | | | 1,949 | | | | 1,940,483 | |
| Citigroup, Inc. | | 5.95% | | – | (e) | | 1,525 | | | | 1,494,119 | |
| Citizens Financial Group, Inc. | | 4.35% | | 8/1/2025 | | | 831 | | | | 829,245 | |
| Citizens Financial Group, Inc.† | | 5.50% | | – | (e) | | 1,495 | | | | 1,475,565 | |
| Commerzbank AG (Germany)†(b) | | 8.125% | | 9/19/2023 | | | 1,675 | | | | 1,928,695 | |
| Credit Suisse Group AG (Switzerland)†(b) | | 7.50% | | – | (e) | | 1,375 | | | | 1,449,685 | |
| Credit Suisse Group Funding Guernsey Ltd. (Guernsey)†(b) | | 3.80% | | 9/15/2022 | | | 1,826 | | | | 1,827,234 | |
| Fifth Third Bancorp | | 2.875% | | 7/27/2020 | | | 967 | | | | 966,953 | |
| Goldman Sachs Group, Inc. (The) | | 5.15% | | 5/22/2045 | | | 999 | | | | 974,027 | |
| HSBC Holdings plc (United Kingdom)(b) | | 4.25% | | 8/18/2025 | | | 6,671 | | | | 6,633,302 | |
| HSBC Holdings plc (United Kingdom)(b) | | 6.375% | | – | (e) | | 800 | | | | 801,000 | |
| Industrial & Commercial Bank of China Ltd. | | 3.231% | | 11/13/2019 | | | 1,550 | | | | 1,577,432 | |
| Intesa Sanpaolo SpA (Italy)†(b) | | 7.70% | | – | (e) | | 851 | | | | 868,428 | |
| JPMorgan Chase & Co. | | 3.875% | | 9/10/2024 | | | 1,900 | | | | 1,893,470 | |
| JPMorgan Chase & Co. | | 6.75% | | – | (e) | | 888 | | | | 969,030 | |
| LBG Capital No.1 plc (United Kingdom)†(b)(f) | | 8.00% | | – | (e) | | 400 | | | | 420,300 | |
| Lloyds Banking Group plc (United Kingdom)†(b) | | 4.582% | | 12/10/2025 | | | 2,300 | | | | 2,310,166 | |
| Lloyds Banking Group plc (United Kingdom)(b) | | 7.50% | | – | (e) | | 1,409 | | | | 1,504,107 | |
| 18 | See Notes to Financial Statements. | |
Schedule of Investments (continued)
December 31, 2015
| Investments | | Interest
Rate | | Maturity
Date | | Principal
Amount
(000) | | | Fair
Value | |
| Banking (continued) | | | | | | | | | | | | |
| Macquarie Bank Ltd. (Australia)†(b) | | 1.60% | | 10/27/2017 | | $ | 2,325 | | | $ | 2,309,064 | |
| Macquarie Group Ltd. (Australia)†(b) | | 6.00% | | 1/14/2020 | | | 725 | | | | 800,894 | |
| Morgan Stanley | | 4.00% | | 7/23/2025 | | | 937 | | | | 966,809 | |
| MUFG Americas Holdings Corp. | | 3.00% | | 2/10/2025 | | | 800 | | | | 767,407 | |
| National Savings Bank (Sri Lanka)†(b) | | 5.15% | | 9/10/2019 | | | 950 | | | | 888,250 | |
| Nationwide Building Society (United Kingdom)†(b) | | 3.90% | | 7/21/2025 | | | 1,782 | | | | 1,840,312 | |
| Nordea Bank AB (Sweden)†(b) | | 6.125% | | – | (e) | | 1,011 | | | | 990,982 | |
| Popular, Inc. | | 7.00% | | 7/1/2019 | | | 1,875 | | | | 1,760,156 | |
| Royal Bank of Scotland Group plc (United Kingdom)(b) | | 7.50% | | – | (e) | | 1,119 | | | | 1,167,956 | |
| Santander Holdings USA, Inc. | | 4.50% | | 7/17/2025 | | | 1,408 | | | | 1,435,973 | |
| Santander UK Group Holdings plc (United Kingdom)†(b) | | 4.75% | | 9/15/2025 | | | 508 | | | | 503,753 | |
| Santander UK plc (United Kingdom)(b) | | 7.95% | | 10/26/2029 | | | 210 | | | | 268,186 | |
| Societe Generale SA (France)†(b) | | 6.00% | | – | (e) | | 1,122 | | | | 1,063,768 | |
| Societe Generale SA (France)†(b) | | 8.00% | | – | (e) | | 878 | | | | 896,244 | |
| Standard Chartered plc (United Kingdom)†(b) | | 6.50% | | – | (e) | | 1,575 | | | | 1,527,377 | |
| Synovus Financial Corp. | | 7.875% | | 2/15/2019 | | | 700 | | | | 779,625 | |
| UBS Group Funding Jersey Ltd. (Jersey)†(b) | | 4.125% | | 9/24/2025 | | | 1,610 | | | | 1,611,526 | |
| Washington Mutual Bank(g) | | 6.875% | | 6/15/2011 | | | 1,250 | | | | 125 | |
| Wells Fargo & Co. | | 4.90% | | 11/17/2045 | | | 1,759 | | | | 1,778,864 | |
| Zions Bancorporation | | 5.80% | | – | (e) | | 30 | | | | 28,800 | |
| Total | | | | | | | | | | | 73,385,510 | |
| | | | | | | | | | | | | |
| Beverages 1.12% | | | | | | | | | | | | |
| Brown-Forman Corp. | | 4.50% | | 7/15/2045 | | | 1,572 | | | | 1,629,716 | |
| Coca-Cola Bottling Co. Consolidated | | 3.80% | | 11/25/2025 | | | 877 | | | | 879,217 | |
| Constellation Brands, Inc. | | 4.25% | | 5/1/2023 | | | 2,000 | | | | 2,005,000 | |
| Constellation Brands, Inc. | | 6.00% | | 5/1/2022 | | | 642 | | | | 707,805 | |
| Cott Beverages, Inc. | | 5.375% | | 7/1/2022 | | | 250 | | | | 245,625 | |
| Cott Beverages, Inc. | | 6.75% | | 1/1/2020 | | | 568 | | | | 587,880 | |
| Dr. Pepper Snapple Group, Inc. | | 3.40% | | 11/15/2025 | | | 1,758 | | | | 1,730,362 | |
| Dr. Pepper Snapple Group, Inc. | | 4.50% | | 11/15/2045 | | | 879 | | | | 862,923 | |
| Fomento Economico Mexicano SAB de CV (Mexico)(b) | | 4.375% | | 5/10/2043 | | | 1,058 | | | | 941,908 | |
| PepsiCo, Inc. | | 4.25% | | 10/22/2044 | | | 419 | | | | 416,762 | |
| PepsiCo, Inc. | | 4.45% | | 4/14/2046 | | | 927 | | | | 959,942 | |
| Total | | | | | | | | | | | 10,967,140 | |
| | See Notes to Financial Statements. | 19 |
Schedule of Investments (continued)
December 31, 2015
| Investments | | Interest
Rate | | Maturity
Date | | Principal
Amount
(000) | | | Fair
Value | |
| Brokerage 0.56% | | | | | | | | | | | | |
| Charles Schwab Corp. (The) | | 3.45% | | 2/13/2026 | | $ | 972 | | | $ | 989,673 | |
| E*TRADE Financial Corp. | | 4.625% | | 9/15/2023 | | | 953 | | | | 970,868 | |
| Lazard Group LLC | | 3.75% | | 2/13/2025 | | | 1,252 | | | | 1,157,340 | |
| TD Ameritrade Holding Corp. | | 2.95% | | 4/1/2022 | | | 800 | | | | 793,105 | |
| TD Ameritrade Holding Corp. | | 3.625% | | 4/1/2025 | | | 1,500 | | | | 1,519,686 | |
| Total | | | | | | | | | | | 5,430,672 | |
| | | | | | | | | | | | | |
| Building & Construction 1.22% | | | | | | | | | | | | |
| Ashton Woods USA LLC/Ashton Woods Finance Co.† | | 6.875% | | 2/15/2021 | | | 1,220 | | | | 1,043,100 | |
| Brookfield Residential Properties, Inc. (Canada)†(b) | | 6.50% | | 12/15/2020 | | | 1,300 | | | | 1,259,375 | |
| DR Horton, Inc. | | 4.75% | | 2/15/2023 | | | 359 | | | | 367,437 | |
| K. Hovnanian Enterprises, Inc.† | | 7.25% | | 10/15/2020 | | | 1,075 | | | | 929,875 | |
| Lennar Corp. | | 4.50% | | 11/15/2019 | | | 950 | | | | 970,781 | |
| PulteGroup, Inc. | | 6.375% | | 5/15/2033 | | | 2,250 | | | | 2,295,000 | |
| Toll Brothers Finance Corp. | | 5.625% | | 1/15/2024 | | | 1,000 | | | | 1,040,000 | |
| William Lyon Homes, Inc. | | 7.00% | | 8/15/2022 | | | 4,000 | | | | 4,030,000 | |
| Total | | | | | | | | | | | 11,935,568 | |
| | | | | | | | | | | | | |
| Building Materials 0.94% | | | | | | | | | | | | |
| Builders FirstSource, Inc.† | | 10.75% | | 8/15/2023 | | | 1,915 | | | | 1,910,213 | |
| Building Materials Corp. of America† | | 5.375% | | 11/15/2024 | | | 1,722 | | | | 1,726,305 | |
| Hillman Group, Inc. (The)† | | 6.375% | | 7/15/2022 | | | 1,372 | | | | 1,145,620 | |
| Lafarge SA (France)(b) | | 7.125% | | 7/15/2036 | | | 775 | | | | 891,424 | |
| Masonite International Corp.† | | 5.625% | | 3/15/2023 | | | 838 | | | | 869,425 | |
| Ply Gem Industries, Inc. | | 6.50% | | 2/1/2022 | | | 1,830 | | | | 1,667,219 | |
| Vulcan Materials Co. | | 4.50% | | 4/1/2025 | | | 1,005 | | | | 999,975 | |
| Total | | | | | | | | | | | 9,210,181 | |
| | | | | | | | | | | | | |
| Cable & Satellite Television 4.04% | | | | | | | | | | | | |
| Altice Financing SA (Luxembourg)†(b) | | 6.625% | | 2/15/2023 | | | 1,000 | | | | 990,000 | |
| Altice Finco SA (Luxembourg)†(b) | | 9.875% | | 12/15/2020 | | | 2,375 | | | | 2,535,312 | |
| Altice Luxembourg SA (Luxembourg)†(b) | | 7.75% | | 5/15/2022 | | | 2,000 | | | | 1,810,000 | |
| Cablevision Systems Corp. | | 5.875% | | 9/15/2022 | | | 3,000 | | | | 2,557,500 | |
| CCO Holdings LLC/CCO Holdings Capital Corp.† | | 5.125% | | 5/1/2023 | | | 1,050 | | | | 1,052,625 | |
| CCO Holdings LLC/CCO Holdings Capital Corp. | | 6.625% | | 1/31/2022 | | | 1,825 | | | | 1,927,656 | |
| CCO Safari II LLC† | | 4.908% | | 7/23/2025 | | | 1,650 | | | | 1,650,886 | |
| CCO Safari II LLC† | | 6.384% | | 10/23/2035 | | | 1,284 | | | | 1,300,137 | |
| DISH DBS Corp. | | 5.00% | | 3/15/2023 | | | 2,014 | | | | 1,752,180 | |
| DISH DBS Corp. | | 5.875% | | 7/15/2022 | | | 1,400 | | | | 1,309,000 | |
| 20 | See Notes to Financial Statements. | |
Schedule of Investments (continued)
December 31, 2015
| Investments | | Interest
Rate | | Maturity
Date | | Principal
Amount
(000) | | | Fair
Value | |
| Cable & Satellite Television (continued) | | | | | | | | | | | | |
| DISH DBS Corp. | | 6.75% | | 6/1/2021 | | $ | 697 | | | $ | 703,970 | |
| Mediacom Broadband LLC/Mediacom Broadband Corp. | | 6.375% | | 4/1/2023 | | | 2,269 | | | | 2,229,293 | |
| Mediacom LLC/Mediacom Capital Corp. | | 7.25% | | 2/15/2022 | | | 325 | | | | 329,469 | |
| Neptune Finco Corp.† | | 10.875% | | 10/15/2025 | | | 5,316 | | | | 5,581,800 | |
| Numericable-SFR SAS (France)†(b) | | 6.00% | | 5/15/2022 | | | 2,125 | | | | 2,066,563 | |
| RCN Telecom Services LLC/RCN Capital Corp.† | | 8.50% | | 8/15/2020 | | | 800 | | | | 811,000 | |
| Time Warner Cable, Inc. | | 5.875% | | 11/15/2040 | | | 1,537 | | | | 1,461,184 | |
| Unitymedia Hessen GmbH & Co. KG/Unitymedia NRW GmbH (Germany)†(b) | | 5.00% | | 1/15/2025 | | | 635 | | | | 608,806 | |
| Unitymedia Hessen GmbH & Co. KG/Unitymedia NRW GmbH (Germany)†(b) | | 5.50% | | 1/15/2023 | | | 2,068 | | | | 2,070,585 | |
| UPCB Finance IV Ltd.† | | 5.375% | | 1/15/2025 | | | 1,604 | | | | 1,519,790 | |
| Virgin Media Finance plc (United Kingdom)†(b) | | 6.00% | | 10/15/2024 | | | 575 | | | | 575,719 | |
| Virgin Media Secured Finance plc (United Kingdom)†(b) | | 5.375% | | 4/15/2021 | | | 2,745 | | | | 2,844,506 | |
| VTR Finance BV (Netherlands)†(b) | | 6.875% | | 1/15/2024 | | | 1,275 | | | | 1,176,188 | |
| Wave Holdco LLC/Wave Holdco Corp. PIK† | | 8.25% | | 7/15/2019 | | | 675 | | | | 654,750 | |
| Total | | | | | | | | | | | 39,518,919 | |
| | | | | | | | | | | | | |
| Chemicals 0.72% | | | | | | | | | | | | |
| Celanese US Holdings LLC | | 5.875% | | 6/15/2021 | | | 571 | | | | 605,260 | |
| Grupo Idesa SA de CV (Mexico)†(b) | | 7.875% | | 12/18/2020 | | | 1,350 | | | | 1,343,250 | |
| Huntsman International LLC† | | 5.125% | | 11/15/2022 | | | 1,073 | | | | 971,065 | |
| Israel Chemicals Ltd. (Israel)†(b) | | 4.50% | | 12/2/2024 | | | 2,075 | | | | 2,084,545 | |
| OCP SA (Morocco)†(b) | | 6.875% | | 4/25/2044 | | | 975 | | | | 960,697 | |
| Platform Specialty Products Corp.† | | 6.50% | | 2/1/2022 | | | 1,275 | | | | 1,109,250 | |
| Total | | | | | | | | | | | 7,074,067 | |
| | | | | | | | | | | | | |
| Consumer/Commercial/Lease Financing 1.65% | | | | | | | | | | | | |
| AerCap Ireland Capital Ltd./AerCap Global Aviation Trust (Ireland)(b) | | 3.75% | | 5/15/2019 | | | 925 | | | | 926,156 | |
| AerCap Ireland Capital Ltd./AerCap Global Aviation Trust (Ireland)(b) | | 5.00% | | 10/1/2021 | | | 1,150 | | | | 1,187,375 | |
| Air Lease Corp. | | 3.875% | | 4/1/2021 | | | 950 | | | | 957,125 | |
| Aircastle Ltd. | | 5.50% | | 2/15/2022 | | | 1,398 | | | | 1,436,445 | |
| Discover Bank | | 7.00% | | 4/15/2020 | | | 700 | | | | 797,754 | |
| Discover Financial Services | | 3.75% | | 3/4/2025 | | | 675 | | | | 649,447 | |
| International Lease Finance Corp. | | 6.25% | | 5/15/2019 | | | 2,900 | | | | 3,113,875 | |
| International Lease Finance Corp. | | 8.25% | | 12/15/2020 | | | 2,460 | | | | 2,915,100 | |
| | See Notes to Financial Statements. | 21 |
Schedule of Investments (continued)
December 31, 2015
| Investments | | Interest
Rate | | Maturity
Date | | Principal
Amount
(000) | | | Fair
Value | |
| Consumer/Commercial/Lease Financing (continued) | | | | | | | | |
| Ladder Capital Finance Holdings LLLP/Ladder Capital Finance Corp.† | | 5.875% | | 8/1/2021 | | $ | 1,435 | | | $ | 1,311,231 | |
| National Financial Partners Corp.† | | 9.00% | | 7/15/2021 | | | 953 | | | | 875,569 | |
| Navient Corp. | | 5.00% | | 10/26/2020 | | | 964 | | | | 848,320 | |
| OneMain Financial Holdings, Inc.† | | 6.75% | | 12/15/2019 | | | 900 | | | | 914,625 | |
| Springleaf Finance Corp. | | 5.25% | | 12/15/2019 | | | 242 | | | | 230,505 | |
| Total | | | | | | | | | | | 16,163,527 | |
| | | | | | | | | | | | | |
| Department Stores 0.20% | | | | | | | | | | | | |
| El Puerto de Liverpool SAB de CV (Mexico)†(b) | | 3.95% | | 10/2/2024 | | | 1,056 | | | | 1,028,280 | |
| SACI Falabella (Chile)†(b) | | 4.375% | | 1/27/2025 | | | 925 | | | | 919,207 | |
| Total | | | | | | | | | | | 1,947,487 | |
| | | | | | | | | | | | | |
| Discount Stores 0.88% | | | | | | | | | | | | |
| Amazon.com, Inc. | | 4.80% | | 12/5/2034 | | | 6,312 | | | | 6,666,267 | |
| Dollar Tree, Inc.† | | 5.75% | | 3/1/2023 | | | 1,848 | | | | 1,921,920 | |
| Total | | | | | | | | | | | 8,588,187 | |
| | | | | | | | | | | | | |
| Diversified Capital Goods 1.35% | | | | | | | | | | | | |
| Artesyn Embedded Technologies, Inc.† | | 9.75% | | 10/15/2020 | | | 1,550 | | | | 1,383,375 | |
| General Cable Corp. | | 5.75% | | 10/1/2022 | | | 1,152 | | | | 892,800 | |
| General Electric Co. | | 4.00% | | – | (e) | | 7,654 | | | | 7,663,467 | |
| Griffon Corp. | | 5.25% | | 3/1/2022 | | | 989 | | | | 946,968 | |
| Siemens Financieringsmaatschappij NV (Netherlands)†(b) | | 3.25% | | 5/27/2025 | | | 1,235 | | | | 1,235,957 | |
| Unifrax I LLC/Unifrax Holding Co.† | | 7.50% | | 2/15/2019 | | | 1,199 | | | | 1,073,105 | |
| Total | | | | | | | | | | | 13,195,672 | |
| | | | | | | | | | | | | |
| Electric: Distribution/Transportation 0.27% | | | | | | | | | | | | |
| Lamar Funding Ltd.† | | 3.958% | | 5/7/2025 | | | 1,500 | | | | 1,340,625 | |
| Oncor Electric Delivery Co. LLC | | 3.75% | | 4/1/2045 | | | 1,608 | | | | 1,341,968 | |
| Total | | | | | | | | | | | 2,682,593 | |
| | | | | | | | | | | | | |
| Electric: Generation 0.47% | | | | | | | | | | | | |
| AES Gener SA (Chile)†(b) | | 5.00% | | 7/14/2025 | | | 600 | | | | 575,375 | |
| Dynegy, Inc. | | 7.625% | | 11/1/2024 | | | 890 | | | | 765,222 | |
| Illinois Power Generating Co. | | 7.00% | | 4/15/2018 | | | 1,757 | | | | 1,185,975 | |
| NSG Holdings LLC/NSG Holdings, Inc.† | | 7.75% | | 12/15/2025 | | | 1,927 | | | | 2,090,724 | |
| Total | | | | | | | | | | | 4,617,296 | |
| 22 | See Notes to Financial Statements. | |
Schedule of Investments (continued)
December 31, 2015
| Investments | | Interest
Rate | | Maturity
Date | | Principal
Amount
(000) | | | Fair
Value | |
| Electric: Integrated 0.68% | | | | | | | | | | | | |
| AES El Salvador Trust II† | | 6.75% | | 3/28/2023 | | $ | 1,015 | | | $ | 910,963 | |
| AES Panama SRL (Panama)†(b) | | 6.00% | | 6/25/2022 | | | 977 | | | | 974,558 | |
| E.CL SA (Chile)†(b) | | 4.50% | | 1/29/2025 | | | 1,650 | | | | 1,629,809 | |
| El Paso Electric Co. | | 5.00% | | 12/1/2044 | | | 994 | | | | 976,952 | |
| Entergy Arkansas, Inc. | | 4.95% | | 12/15/2044 | | | 1,519 | | | | 1,500,884 | |
| IPALCO Enterprises, Inc. | | 3.45% | | 7/15/2020 | | | 86 | | | | 84,710 | |
| Louisville Gas & Electric Co. | | 4.375% | | 10/1/2045 | | | 598 | | | | 612,479 | |
| Total | | | | | | | | | | | 6,690,355 | |
| | | | | | | | | | | | | |
| Electronics 0.60% | | | | | | | | | | | | |
| Lam Research Corp. | | 3.80% | | 3/15/2025 | | | 856 | | | | 807,253 | |
| Qorvo, Inc.† | | 7.00% | | 12/1/2025 | | | 2,635 | | | | 2,720,637 | |
| Trimble Navigation Ltd. | | 4.75% | | 12/1/2024 | | | 2,378 | | | | 2,367,078 | |
| Total | | | | | | | | | | | 5,894,968 | |
| | | | | | | | | | | | | |
| Energy: Exploration & Production 5.26% | | | | | | | | | | | | |
| Antero Resources Corp. | | 5.375% | | 11/1/2021 | | | 1,722 | | | | 1,386,210 | |
| Bill Barrett Corp. | | 7.00% | | 10/15/2022 | | | 1,207 | | | | 814,725 | |
| Bonanza Creek Energy, Inc. | | 6.75% | | 4/15/2021 | | | 538 | | | | 328,180 | |
| Carrizo Oil & Gas, Inc. | | 6.25% | | 4/15/2023 | | | 1,297 | | | | 1,057,055 | |
| Carrizo Oil & Gas, Inc. | | 7.50% | | 9/15/2020 | | | 675 | | | | 593,156 | |
| Clayton Williams Energy, Inc. | | 7.75% | | 4/1/2019 | | | 1,035 | | | | 803,419 | |
| Concho Resources, Inc. | | 5.50% | | 4/1/2023 | | | 3,950 | | | | 3,673,500 | |
| Continental Resources, Inc. | | 5.00% | | 9/15/2022 | | | 2,827 | | | | 2,088,446 | |
| CrownRock LP/CrownRock Finance, Inc.† | | 7.125% | | 4/15/2021 | | | 2,840 | | | | 2,676,700 | |
| Denbury Resources, Inc. | | 5.50% | | 5/1/2022 | | | 1,440 | | | | 485,251 | |
| Devon Energy Corp. | | 5.85% | | 12/15/2025 | | | 1,507 | | | | 1,468,342 | |
| Diamondback Energy, Inc. | | 7.625% | | 10/1/2021 | | | 2,375 | | | | 2,410,625 | |
| Eclipse Resources Corp.† | | 8.875% | | 7/15/2023 | | | 1,436 | | | | 692,870 | |
| Encana Corp. (Canada)(b) | | 6.50% | | 8/15/2034 | | | 2,175 | | | | 1,763,460 | |
| EOG Resources, Inc. | | 3.15% | | 4/1/2025 | | | 1,003 | | | | 949,793 | |
| EP Energy LLC/Everest Acquisition Finance, Inc. | | 6.375% | | 6/15/2023 | | | 722 | | | | 364,610 | |
| EXCO Resources, Inc. | | 8.50% | | 4/15/2022 | | | 1,672 | | | | 309,320 | |
| Gulfport Energy Corp. | | 6.625% | | 5/1/2023 | | | 199 | | | | 167,160 | |
| Gulfport Energy Corp. | | 7.75% | | 11/1/2020 | | | 1,400 | | | | 1,260,000 | |
| Hilcorp Energy I LP/Hilcorp Finance Co.† | | 5.00% | | 12/1/2024 | | | 1,900 | | | | 1,586,500 | |
| Kosmos Energy Ltd. † | | 7.875% | | 8/1/2021 | | | 2,175 | | | | 1,761,750 | |
| Kunlun Energy Co., Ltd. (Hong Kong)†(b) | | 3.75% | | 5/13/2025 | | | 1,645 | | | | 1,605,619 | |
| MEG Energy Corp. (Canada)†(b) | | 6.375% | | 1/30/2023 | | | 1,200 | | | | 828,000 | |
| | See Notes to Financial Statements. | 23 |
Schedule of Investments (continued)
December 31, 2015
| Investments | | Interest
Rate | | Maturity
Date | | Principal
Amount
(000) | | | Fair
Value | |
| Energy: Exploration & Production (continued) | | | | | | | | | | | | |
| MEG Energy Corp. (Canada)†(b) | | 7.00% | | 3/31/2024 | | $ | 4,257 | | | $ | 3,043,755 | |
| Memorial Resource Development Corp. | | 5.875% | | 7/1/2022 | | | 2,090 | | | | 1,839,200 | |
| Newfield Exploration Co. | | 5.625% | | 7/1/2024 | | | 1,989 | | | | 1,705,567 | |
| Oasis Petroleum, Inc. | | 6.50% | | 11/1/2021 | | | 714 | | | | 476,595 | |
| Oasis Petroleum, Inc. | | 6.875% | | 3/15/2022 | | | 834 | | | | 537,930 | |
| Oasis Petroleum, Inc. | | 7.25% | | 2/1/2019 | | | 824 | | | | 595,340 | |
| Occidental Petroleum Corp. | | 3.50% | | 6/15/2025 | | | 1,474 | | | | 1,441,373 | |
| Paramount Resources Ltd. (Canada)†(b) | | 6.875% | | 6/30/2023 | | | 1,636 | | | | 1,300,620 | |
| Parsley Energy LLC/Parsley Finance Corp.† | | 7.50% | | 2/15/2022 | | | 900 | | | | 864,000 | |
| PDC Energy, Inc. | | 7.75% | | 10/15/2022 | | | 2,550 | | | | 2,460,750 | |
| Range Resources Corp.† | | 4.875% | | 5/15/2025 | | | 2,135 | | | | 1,630,606 | |
| Rice Energy, Inc. | | 6.25% | | 5/1/2022 | | | 1,258 | | | | 912,050 | |
| RSP Permian, Inc. | | 6.625% | | 10/1/2022 | | | 1,485 | | | | 1,373,625 | |
| Seven Generations Energy Ltd. (Canada)†(b) | | 6.75% | | 5/1/2023 | | | 495 | | | | 418,275 | |
| Seven Generations Energy Ltd. (Canada)†(b) | | 8.25% | | 5/15/2020 | | | 1,475 | | | | 1,334,875 | |
| SM Energy Co. | | 6.50% | | 11/15/2021 | | | 999 | | | | 749,250 | |
| Ultra Petroleum Corp.† | | 6.125% | | 10/1/2024 | | | 1,135 | | | | 263,888 | |
| YPF SA (Argentina)†(b) | | 8.50% | | 7/28/2025 | | | 1,510 | | | | 1,445,825 | |
| Total | | | | | | | | | | | 51,468,215 | |
| | | | | | | | | | | | | |
| Environmental 0.10% | | | | | | | | | | | | |
| ADS Waste Holdings, Inc. | | 8.25% | | 10/1/2020 | | | 968 | | | | 980,100 | |
| | | | | | | | | | | | | |
| Food & Drug Retailers 1.16% | | | | | | | | | | | | |
| BI-LO LLC/BI-LO Finance Corp.† | | 9.25% | | 2/15/2019 | | | 950 | | | | 961,875 | |
| Ingles Markets, Inc. | | 5.75% | | 6/15/2023 | | | 961 | | | | 963,403 | |
| New Albertson’s, Inc. | | 7.45% | | 8/1/2029 | | | 950 | | | | 845,500 | |
| New Albertson’s, Inc. | | 7.75% | | 6/15/2026 | | | 1,700 | | | | 1,572,500 | |
| Rite Aid Corp.† | | 6.125% | | 4/1/2023 | | | 1,250 | | | | 1,298,437 | |
| Rite Aid Corp. | | 7.70% | | 2/15/2027 | | | 3,175 | | | | 3,714,750 | |
| Tops Holding LLC/Top Markets II Corp.† | | 8.00% | | 6/15/2022 | | | 1,957 | | | | 1,937,430 | |
| Total | | | | | | | | | | | 11,293,895 | |
| | | | | | | | | | | | | |
| Food: Wholesale 1.46% | | | | | | | | | | | | |
| B&G Foods, Inc. | | 4.625% | | 6/1/2021 | | | 1,900 | | | | 1,888,125 | |
| Diamond Foods, Inc.† | | 7.00% | | 3/15/2019 | | | 1,500 | | | | 1,552,500 | |
| JBS USA LLC/JBS USA Finance, Inc.† | | 5.75% | | 6/15/2025 | | | 661 | | | | 578,375 | |
| JBS USA LLC/JBS USA Finance, Inc.† | | 5.875% | | 7/15/2024 | | | 825 | | | | 750,750 | |
| JBS USA LLC/JBS USA Finance, Inc.† | | 7.25% | | 6/1/2021 | | | 291 | | | | 290,273 | |
| 24 | See Notes to Financial Statements. | |
Schedule of Investments (continued)
December 31, 2015
| Investments | | Interest
Rate | | Maturity
Date | | Principal
Amount
(000) | | | Fair
Value | |
| Food: Wholesale (continued) | | | | | | | | | | | | |
| Land O’Lakes, Inc.† | | 6.00% | | 11/15/2022 | | $ | 1,274 | | | $ | 1,337,700 | |
| Mead Johnson Nutrition Co. | | 4.125% | | 11/15/2025 | | | 1,319 | | | | 1,331,538 | |
| Pinnacle Foods Finance LLC/Pinnacle Foods Finance Corp. | | 4.875% | | 5/1/2021 | | | 1,050 | | | | 1,010,625 | |
| Post Holdings, Inc.† | | 7.75% | | 3/15/2024 | | | 956 | | | | 1,003,800 | |
| Post Holdings, Inc.† | | 8.00% | | 7/15/2025 | | | 418 | | | | 444,125 | |
| WhiteWave Foods Co. (The) | | 5.375% | | 10/1/2022 | | | 3,870 | | | | 4,102,200 | |
| Total | | | | | | | | | | | 14,290,011 | |
| | | | | | | | | | | | | |
| Forestry/Paper 0.28% | | | | | | | | | | | | |
| Cascades, Inc. (Canada)†(b) | | 5.50% | | 7/15/2022 | | | 1,040 | | | | 1,012,700 | |
| Millar Western Forest Products Ltd. (Canada)(b) | | 8.50% | | 4/1/2021 | | | 1,450 | | | | 754,000 | |
| Norbord, Inc. (Canada)†(b) | | 6.25% | | 4/15/2023 | | | 975 | | | | 967,687 | |
| Total | | | | | | | | | | | 2,734,387 | |
| | | | | | | | | | | | | |
| Gaming 1.61% | | | | | | | | | | | | |
| Boyd Gaming Corp. | | 6.875% | | 5/15/2023 | | | 1,495 | | | | 1,543,588 | |
| Caesar’s Entertainment Resort Properties LLC/Caesar’s Entertainment Resort Properties Finance, Inc. | | 11.00% | | 10/1/2021 | | | 1,050 | | | | 955,500 | |
| Caesar’s Growth Properties Holdings LLC/Caesar’s Growth Properties Finance, Inc. | | 9.375% | | 5/1/2022 | | | 1,616 | | | | 1,333,200 | |
| CCM Merger, Inc.† | | 9.125% | | 5/1/2019 | | | 1,000 | | | | 1,048,750 | |
| MCE Finance Ltd. (Hong Kong)†(b) | | 5.00% | | 2/15/2021 | | | 1,750 | | | | 1,601,250 | |
| MGM Resorts International | | 6.00% | | 3/15/2023 | | | 2,156 | | | | 2,145,220 | |
| MGM Resorts International | | 7.75% | | 3/15/2022 | | | 762 | | | | 812,483 | |
| Mohegan Tribal Gaming Authority | | 9.75% | | 9/1/2021 | | | 1,512 | | | | 1,515,780 | |
| River Rock Entertainment Authority (The)(g) | | 9.00% | | 11/1/2018 | | | 431 | | | | 33,941 | |
| Rivers Pittsburgh Borrower LP/Rivers Pittsburgh Finance Corp.† | | 9.50% | | 6/15/2019 | | | 771 | | | | 801,840 | |
| Sugarhouse HSP Gaming Prop. Mezz. LP/Sugarhouse HSP Gaming Finance Corp.† | | 6.375% | | 6/1/2021 | | | 2,000 | | | | 1,870,000 | |
| Wynn Las Vegas LLC/Wynn Las Vegas Capital Corp. | | 5.375% | | 3/15/2022 | | | 1,001 | | | | 952,431 | |
| Wynn Macau Ltd. (Macau)†(b) | | 5.25% | | 10/15/2021 | | | 1,300 | | | | 1,150,500 | |
| Total | | | | | | | | | | | 15,764,483 | |
| | | | | | | | | | | | | |
| Gas Distribution 1.97% | | | | | | | | | | | | |
| Boardwalk Pipelines LP | | 4.95% | | 12/15/2024 | | | 766 | | | | 667,219 | |
| Dominion Gas Holdings LLC | | 3.60% | | 12/15/2024 | | | 1,175 | | | | 1,164,110 | |
| Energy Transfer Equity LP | | 5.50% | | 6/1/2027 | | | 1,097 | | | | 839,205 | |
| | See Notes to Financial Statements. | 25 |
Schedule of Investments (continued)
December 31, 2015
| Investments | | Interest
Rate | | Maturity
Date | | Principal
Amount
(000) | | | Fair
Value | |
| Gas Distribution (continued) | | | | | | | | | | | | |
| Energy Transfer Equity LP | | 5.875% | | 1/15/2024 | | $ | 1,179 | | | $ | 966,780 | |
| Florida Gas Transmission Co. LLC† | | 4.35% | | 7/15/2025 | | | 2,895 | | | | 2,659,466 | |
| Genesis Energy LP/Genesis Energy Finance Corp. | | 6.75% | | 8/1/2022 | | | 1,240 | | | | 1,060,200 | |
| IFM US Colonial Pipeline 2 LLC† | | 6.45% | | 5/1/2021 | | | 1,400 | | | | 1,494,279 | |
| LBC Tank Terminals Holding Netherlands BV (Belgium)†(b) | | 6.875% | | 5/15/2023 | | | 1,419 | | | | 1,411,905 | |
| Midcontinent Express Pipeline LLC† | | 6.70% | | 9/15/2019 | | | 114 | | | | 106,875 | |
| Rockies Express Pipeline LLC† | | 6.875% | | 4/15/2040 | | | 1,800 | | | | 1,557,000 | |
| Sabine Pass Liquefaction LLC | | 5.75% | | 5/15/2024 | | | 3,028 | | | | 2,649,500 | |
| SemGroup Corp. | | 7.50% | | 6/15/2021 | | | 353 | | | | 317,700 | |
| Southern Star Central Corp.† | | 5.125% | | 7/15/2022 | | | 910 | | | | 755,300 | |
| Tesoro Logistics LP/Tesoro Logistics Finance Corp.† | | 5.50% | | 10/15/2019 | | | 700 | | | | 682,500 | |
| Tesoro Logistics LP/Tesoro Logistics Finance Corp. | | 5.875% | | 10/1/2020 | | | 439 | | | | 421,440 | |
| Tesoro Logistics LP/Tesoro Logistics Finance Corp. | | 6.125% | | 10/15/2021 | | | 1,300 | | | | 1,241,500 | |
| Tesoro Logistics LP/Tesoro Logistics Finance Corp.† | | 6.25% | | 10/15/2022 | | | 1,350 | | | | 1,285,875 | |
| Total | | | | | | | | | | | 19,280,854 | |
| | | | | | | | | | | | | |
| Health Facilities 3.24% | | | | | | | | | | | | |
| Amsurg Corp. | | 5.625% | | 11/30/2020 | | | 2,450 | | | | 2,499,000 | |
| Amsurg Corp. | | 5.625% | | 7/15/2022 | | | 631 | | | | 627,056 | |
| CHS/Community Health Systems, Inc. | | 6.875% | | 2/1/2022 | | | 1,000 | | | | 953,750 | |
| CHS/Community Health Systems, Inc. | | 8.00% | | 11/15/2019 | | | 3,436 | | | | 3,478,950 | |
| DaVita HealthCare Partners, Inc. | | 5.75% | | 8/15/2022 | | | 2,750 | | | | 2,842,812 | |
| Dignity Health | | 3.812% | | 11/1/2024 | | | 1,175 | | | | 1,195,376 | |
| Dignity Health | | 4.50% | | 11/1/2042 | | | 246 | | | | 232,306 | |
| HCA, Inc. | | 4.25% | | 10/15/2019 | | | 775 | | | | 791,469 | |
| HCA, Inc. | | 5.375% | | 2/1/2025 | | | 1,050 | | | | 1,038,188 | |
| HCA, Inc. | | 5.875% | | 3/15/2022 | | | 915 | | | | 967,613 | |
| HCA, Inc. | | 7.05% | | 12/1/2027 | | | 210 | | | | 213,675 | |
| HCA, Inc. | | 7.50% | | 2/15/2022 | | | 3,040 | | | | 3,382,000 | |
| HCA, Inc. | | 7.58% | | 9/15/2025 | | | 344 | | | | 374,100 | |
| HCA, Inc. | | 7.69% | | 6/15/2025 | | | 1,165 | | | | 1,261,112 | |
| MEDNAX, Inc.† | | 5.25% | | 12/1/2023 | | | 659 | | | | 663,943 | |
| Memorial Sloan-Kettering Cancer Center | | 4.20% | | 7/1/2055 | | | 1,250 | | | | 1,206,771 | |
| MPT Operating Partnership LP/MPT Finance Corp. | | 5.50% | | 5/1/2024 | | | 858 | | | | 858,000 | |
| Tenet Healthcare Corp. | | 6.75% | | 6/15/2023 | | | 7,370 | | | | 6,849,494 | |
| Tenet Healthcare Corp. | | 8.125% | | 4/1/2022 | | | 2,250 | | | | 2,255,625 | |
| Total | | | | | | | | | | | 31,691,240 | |
| 26 | See Notes to Financial Statements. | |
Schedule of Investments (continued)
December 31, 2015
| | | | | | | Principal | | | | |
| | | Interest | | Maturity | | Amount | | | Fair | |
| Investments | | Rate | | Date | | (000) | | | Value | |
| Health Services 0.10% | | | | | | | | | | | | |
| ExamWorks Group, Inc. | | 5.625% | | 4/15/2023 | | $ | 974 | | | $ | 972,782 | |
| | | | | | | | | | | | | |
| Hotels 0.55% | | | | | | | | | | | | |
| Hilton Worldwide Finance LLC/Hilton Worldwide Finance Corp. | | 5.625% | | 10/15/2021 | | | 1,950 | | | | 2,030,437 | |
| Playa Resorts Holding BV (Netherlands)†(b) | | 8.00% | | 8/15/2020 | | | 1,400 | | | | 1,428,000 | |
| RHP Hotel Properties LP/RHP Finance Corp. | | 5.00% | | 4/15/2021 | | | 1,550 | | | | 1,584,875 | |
| RHP Hotel Properties LP/RHP Finance Corp. | | 5.00% | | 4/15/2023 | | | 328 | | | | 329,640 | |
| Total | | | | | | | | | | | 5,372,952 | |
| | | | | | | | | | | | | |
| Insurance-Reinsurance 0.35% | | | | | | | | | | | | |
| Allied World Assurance Co. Holdings Ltd. | | 4.35% | | 10/29/2025 | | | 3,453 | | | | 3,405,794 | |
| | | | | | | | | | | | | |
| Integrated Energy 0.56% | | | | | | | | | | | | |
| Alta Wind Holdings LLC† | | 7.00% | | 6/30/2035 | | | 495 | | | | 531,056 | |
| Rio Oil Finance Trust Series 2014-1 (Brazil)†(b) | | 9.25% | | 7/6/2024 | | | 2,960 | | | | 2,194,100 | |
| Shell International Finance BV (Netherlands)(b) | | 3.25% | | 5/11/2025 | | | 1,641 | | | | 1,604,771 | |
| Shell International Finance BV (Netherlands)(b) | | 4.375% | | 5/11/2045 | | | 789 | | | | 747,865 | |
| Shell International Finance BV (Netherlands)(b) | | 4.55% | | 8/12/2043 | | | 411 | | | | 401,050 | |
| Total | | | | | | | | | | | 5,478,842 | |
| | | | | | | | | | | | | |
| Investments & Miscellaneous Financial Services 0.51% | | | | | | | | | | | | |
| CME Group, Inc. | | 3.00% | | 3/15/2025 | | | 1,575 | | | | 1,547,006 | |
| FMR LLC† | | 5.35% | | 11/15/2021 | | | 800 | | | | 888,098 | |
| Intercontinental Exchange, Inc. | | 3.75% | | 12/1/2025 | | | 1,945 | | | | 1,952,704 | |
| Neuberger Berman Group LLC/Neuberger Berman Finance Corp.† | | 4.875% | | 4/15/2045 | | | 707 | | | | 598,260 | |
| Total | | | | | | | | | | | 4,986,068 | |
| | | | | | | | | | | | | |
| Life Insurance 0.74% | | | | | | | | | | | | |
| American Equity Investment Life Holding Co. | | 6.625% | | 7/15/2021 | | | 1,371 | | | | 1,432,695 | |
| CNO Financial Group, Inc. | | 5.25% | | 5/30/2025 | | | 1,893 | | | | 1,933,226 | |
| Prudential Financial, Inc. | | 5.375% | | 5/15/2045 | | | 974 | | | | 974,000 | |
| Teachers Insurance & Annuity Association of America† | | 4.90% | | 9/15/2044 | | | 1,424 | | | | 1,441,689 | |
| TIAA Asset Management Finance Co. LLC† | | 4.125% | | 11/1/2024 | | | 1,453 | | | | 1,460,612 | |
| Total | | | | | | | | | | | 7,242,222 | |
| | | | | | | | | | | | | |
| Machinery 0.05% | | | | | | | | | | | | |
| Milacron LLC/Mcron Finance Corp.† | | 7.75% | | 2/15/2021 | | | 500 | | | | 468,750 | |
| | See Notes to Financial Statements. | 27 |
Schedule of Investments (continued)
December 31, 2015
| | | | | | | Principal | | | | |
| | | Interest | | Maturity | | Amount | | | Fair | |
| Investments | | Rate | | Date | | (000) | | | Value | |
| Managed Care 0.26% | | | | | | | | | | | | |
| Centene Corp. | | 4.75% | | 5/15/2022 | | $ | 959 | | | $ | 932,627 | |
| MPH Acquisition Holdings LLC† | | 6.625% | | 4/1/2022 | | | 1,625 | | | | 1,633,125 | |
| Total | | | | | | | | | | | 2,565,752 | |
| | | | | | | | | | | | | |
| Media: Content 0.96% | | | | | | | | | | | | |
| AMC Networks, Inc. | | 4.75% | | 12/15/2022 | | | 1,900 | | | | 1,907,125 | |
| AMC Networks, Inc. | | 7.75% | | 7/15/2021 | | | 2,200 | | | | 2,321,000 | |
| Netflix, Inc. | | 5.375% | | 2/1/2021 | | | 2,800 | | | | 2,954,000 | |
| Sirius XM Radio, Inc.† | | 6.00% | | 7/15/2024 | | | 816 | | | | 854,760 | |
| Univision Communications, Inc.† | | 5.125% | | 2/15/2025 | | | 1,366 | | | | 1,301,115 | |
| Total | | | | | | | | | | | 9,338,000 | |
| | | | | | | | | | | | | |
| Media: Diversified 0.16% | | | | | | | | | | | | |
| Myriad International Holdings BV (Netherlands)†(b) | | 5.50% | | 7/21/2025 | | | 1,563 | | | | 1,510,171 | |
| | | | | | | | | | | | | |
| Medical Products 1.49% | | | | | | | | | | | | |
| Fresenius Medical Care US Finance II, Inc.† | | 4.75% | | 10/15/2024 | | | 475 | | | | 465,500 | |
| Fresenius Medical Care US Finance II, Inc.† | | 5.875% | | 1/31/2022 | | | 2,425 | | | | 2,606,875 | |
| Grifols Worldwide Operations Ltd. (Ireland)(b) | | 5.25% | | 4/1/2022 | | | 2,205 | | | | 2,221,537 | |
| Hologic, Inc.† | | 5.25% | | 7/15/2022 | | | 958 | | | | 980,753 | |
| Kinetic Concepts, Inc./KCI USA, Inc. | | 10.50% | | 11/1/2018 | | | 850 | | | | 830,875 | |
| Kinetic Concepts, Inc./KCI USA, Inc. | | 12.50% | | 11/1/2019 | | | 607 | | | | 553,888 | |
| Medtronic, Inc. | | 3.15% | | 3/15/2022 | | | 1,914 | | | | 1,936,520 | |
| Medtronic, Inc. | | 4.375% | | 3/15/2035 | | | 1,900 | | | | 1,924,333 | |
| St. Jude Medical, Inc. | | 3.875% | | 9/15/2025 | | | 848 | | | | 857,595 | |
| Sterigenics-Nordion Holdings LLC† | | 6.50% | | 5/15/2023 | | | 1,360 | | | | 1,302,200 | |
| Stryker Corp. | | 3.375% | | 11/1/2025 | | | 880 | | | | 869,656 | |
| Total | | | | | | | | | | | 14,549,732 | |
| | | | | | | | | | | | | |
| Metals/Mining (Excluding Steel) 1.78% | | | | | | | | | | | | |
| Aleris International, Inc. | | 7.875% | | 11/1/2020 | | | 793 | | | | 608,231 | |
| ALROSA Finance SA (Luxembourg)†(b) | | 7.75% | | 11/3/2020 | | | 1,375 | | | | 1,451,828 | |
| BHP Billiton Finance USA Ltd. (Australia)†(b) | | 6.25% | | 10/19/2075 | | | 2,206 | | | | 2,164,637 | |
| BHP Billiton Finance USA Ltd. (Australia)†(b) | | 6.75% | | 10/19/2075 | | | 1,976 | | | | 1,911,780 | |
| Coeur Mining, Inc. | | 7.875% | | 2/1/2021 | | | 1,108 | | | | 667,570 | |
| Freeport-McMoRan, Inc. | | 3.875% | | 3/15/2023 | | | 2,992 | | | | 1,720,400 | |
| HudBay Minerals, Inc. (Canada)(b) | | 9.50% | | 10/1/2020 | | | 1,220 | | | | 899,750 | |
| Imperial Metals Corp. (Canada)†(b) | | 7.00% | | 3/15/2019 | | | 1,050 | | | | 939,750 | |
| Kissner Milling Co. Ltd. (Canada)†(b) | | 7.25% | | 6/1/2019 | | | 766 | | | | 721,955 | |
| Lundin Mining Corp. (Canada)†(b) | | 7.875% | | 11/1/2022 | | | 1,150 | | | | 1,060,875 | |
| 28 | See Notes to Financial Statements. |
Schedule of Investments (continued)
December 31, 2015
| | | | | | | Principal | | | | |
| | | Interest | | Maturity | | Amount | | | Fair | |
| Investments | | Rate | | Date | | (000) | | | Value | |
| Metals/Mining (Excluding Steel) (continued) | | | | | | | | | | | | |
| Mirabela Nickel Ltd. (Australia)(b) | | 1.00% | | 9/16/2044 | | $ | 15 | | | $ | 1 | |
| MMC Norilsk Nickel OJSC via MMC Finance Ltd. (Ireland)†(b) | | 6.625% | | 10/14/2022 | | | 1,500 | | | | 1,530,960 | |
| New Gold, Inc. (Canada)†(b) | | 6.25% | | 11/15/2022 | | | 925 | | | | 740,000 | |
| New Gold, Inc. (Canada)†(b) | | 7.00% | | 4/15/2020 | | | 965 | | | | 872,119 | |
| Newmont Mining Corp. | | 4.875% | | 3/15/2042 | | | 1,058 | | | | 758,379 | |
| Newmont Mining Corp. | | 6.25% | | 10/1/2039 | | | 526 | | | | 421,354 | |
| Thompson Creek Metals Co., Inc. | | 7.375% | | 6/1/2018 | | | 755 | | | | 151,000 | |
| Thompson Creek Metals Co., Inc. | | 9.75% | | 12/1/2017 | | | 50 | | | | 43,250 | |
| Volcan Cia Minera SAA (Peru)†(b) | | 5.375% | | 2/2/2022 | | | 1,100 | | | | 704,000 | |
| Total | | | | | | | | | | | 17,367,839 | |
| | | | | | | | | | | | | |
| Oil Field Equipment & Services 0.45% | | | | | | | | | | | | |
| Gulfmark Offshore, Inc. | | 6.375% | | 3/15/2022 | | | 629 | | | | 341,233 | |
| Hornbeck Offshore Services, Inc. | | 5.875% | | 4/1/2020 | | | 1,725 | | | | 1,198,875 | |
| Oceaneering International, Inc. | | 4.65% | | 11/15/2024 | | | 1,615 | | | | 1,357,585 | |
| Weatherford International Ltd. | | 4.50% | | 4/15/2022 | | | 1,898 | | | | 1,368,932 | |
| Weatherford International Ltd. | | 5.125% | | 9/15/2020 | | | 186 | | | | 150,893 | |
| Total | | | | | | | | | | | 4,417,518 | |
| | | | | | | | | | | | | |
| Oil Refining & Marketing 0.47% | | | | | | | | | | | | |
| Citgo Holding, Inc.† | | 10.75% | | 2/15/2020 | | | 2,943 | | | | 2,858,389 | |
| Northern Tier Energy LLC/Northern Tier Finance Corp. | | 7.125% | | 11/15/2020 | | | 1,750 | | | | 1,776,250 | |
| Total | | | | | | | | | | | 4,634,639 | |
| | | | | | | | | | | | | |
| Packaging 1.45% | | | | | | | | | | | | |
| Ball Corp. | | 4.00% | | 11/15/2023 | | | 1,006 | | | | 964,503 | |
| Ball Corp. | | 4.375% | | 12/15/2020 | | | 1,099 | | | | 1,118,232 | |
| BWAY Holding Co.† | | 9.125% | | 8/15/2021 | | | 911 | | | | 856,340 | |
| Coveris Holdings SA (Luxembourg)†(b) | | 7.875% | | 11/1/2019 | | | 1,048 | | | | 919,620 | |
| Crown Cork & Seal Co., Inc. | | 7.375% | | 12/15/2026 | | | 1,295 | | | | 1,398,600 | |
| Graphic Packaging International, Inc. | | 4.75% | | 4/15/2021 | | | 900 | | | | 922,500 | |
| Graphic Packaging International, Inc. | | 4.875% | | 11/15/2022 | | | 969 | | | | 983,535 | |
| Pactiv LLC | | 7.95% | | 12/15/2025 | | | 825 | | | | 771,375 | |
| Reynolds Group Issuer, Inc./Reynolds Group Issuer LLC/Reynolds Group Issuer (Luxembourg) SA | | 5.75% | | 10/15/2020 | | | 1,000 | | | | 1,019,690 | |
| Reynolds Group Issuer, Inc./Reynolds Group Issuer LLC/Reynolds Group Issuer (Luxembourg) SA | | 8.25% | | 2/15/2021 | | | 1,875 | | | | 1,814,062 | |
| Sealed Air Corp.† | | 4.875% | | 12/1/2022 | | | 975 | | | | 981,094 | |
| | See Notes to Financial Statements. | 29 |
Schedule of Investments (continued)
December 31, 2015
| | | | | | | Principal | | | | |
| | | Interest | | Maturity | | Amount | | | Fair | |
| Investments | | Rate | | Date | | (000) | | | Value | |
| Packaging (continued) | | | | | | | | | | | | |
| Sealed Air Corp.† | | 5.125% | | 12/1/2024 | | $ | 484 | | | $ | 486,420 | |
| Sealed Air Corp.† | | 6.875% | | 7/15/2033 | | | 1,850 | | | | 1,900,875 | |
| Total | | | | | | | | | | | 14,136,846 | |
| | | | | | | | | | | | | |
| Personal & Household Products 1.09% | | | | | | | | | | | | |
| American Greetings Corp. | | 7.375% | | 12/1/2021 | | | 1,390 | | | | 1,457,762 | |
| Elizabeth Arden, Inc. | | 7.375% | | 3/15/2021 | | | 2,108 | | | | 1,359,660 | |
| Estee Lauder Cos., Inc. (The) | | 4.375% | | 6/15/2045 | | | 1,714 | | | | 1,733,785 | |
| FGI Operating Co. LLC/FGI Finance, Inc. | | 7.875% | | 5/1/2020 | | | 1,550 | | | | 1,123,750 | |
| Gibson Brands, Inc.† | | 8.875% | | 8/1/2018 | | | 2,225 | | | | 1,301,625 | |
| SC Johnson & Son, Inc.† | | 4.75% | | 10/15/2046 | | | 805 | | | | 840,537 | |
| Serta Simmons Bedding LLC† | | 8.125% | | 10/1/2020 | | | 935 | | | | 981,750 | |
| Spectrum Brands, Inc.† | | 5.75% | | 7/15/2025 | | | 817 | | | | 841,510 | |
| Springs Industries, Inc. | | 6.25% | | 6/1/2021 | | | 1,007 | | | | 1,001,965 | |
| Total | | | | | | | | | | | 10,642,344 | |
| | | | | | | | | | | | | |
| Pharmaceuticals 2.31% | | | | | | | | | | | | |
| AbbVie, Inc. | | 3.20% | | 11/6/2022 | | | 572 | | | | 563,895 | |
| AbbVie, Inc. | | 4.50% | | 5/14/2035 | | | 817 | | | | 802,887 | |
| AstraZeneca plc (United Kingdom)(b) | | 3.375% | | 11/16/2025 | | | 1,757 | | | | 1,747,908 | |
| Bayer US Finance LLC† | | 3.375% | | 10/8/2024 | | | 1,800 | | | | 1,814,863 | |
| Capsugel SA PIK (Luxembourg)†(b) | | 7.00% | | 5/15/2019 | | | 500 | | | | 488,437 | |
| Celgene Corp. | | 5.00% | | 8/15/2045 | | | 1,434 | | | | 1,445,091 | |
| DPx Holdings BV (Netherlands)†(b) | | 7.50% | | 2/1/2022 | | | 1,600 | | | | 1,566,000 | |
| Gilead Sciences, Inc. | | 2.55% | | 9/1/2020 | | | 1,266 | | | | 1,266,347 | |
| Gilead Sciences, Inc. | | 3.50% | | 2/1/2025 | | | 1,650 | | | | 1,665,644 | |
| Gilead Sciences, Inc. | | 4.75% | | 3/1/2046 | | | 1,266 | | | | 1,284,287 | |
| Jaguar Holding Co. II/Pharmaceutical Product Development LLC† | | 6.375% | | 8/1/2023 | | | 1,037 | | | | 1,013,667 | |
| Mallinckrodt International Finance SA/Mallinckrodt CB LLC (Luxembourg)†(b) | | 5.75% | | 8/1/2022 | | | 2,271 | | | | 2,191,515 | |
| Merck & Co., Inc. | | 3.70% | | 2/10/2045 | | | 1,554 | | | | 1,438,752 | |
| Pfizer, Inc. | | 5.60% | | 9/15/2040 | | | 1,072 | | | | 1,236,666 | |
| Quintiles Transnational Corp.† | | 4.875% | | 5/15/2023 | | | 970 | | | | 979,700 | |
| Roche Holdings, Inc.† | | 2.875% | | 9/29/2021 | | | 1,750 | | | | 1,774,503 | |
| Zoetis, Inc. | | 3.25% | | 2/1/2023 | | | 1,375 | | | | 1,314,961 | |
| Total | | | | | | | | | | | 22,595,123 | |
| 30 | See Notes to Financial Statements. |
Schedule of Investments (continued)
December 31, 2015
| | | | | | | Principal | | | | |
| | | Interest | | Maturity | | Amount | | | Fair | |
| Investments | | Rate | | Date | | (000) | | | Value | |
| Property & Casualty 0.19% | | | | | | | | | | | | |
| ACE INA Holdings, Inc. | | 4.35% | | 11/3/2045 | | $ | 876 | | | $ | 892,351 | |
| XLIT Ltd. (Ireland)(b) | | 4.45% | | 3/31/2025 | | | 975 | | | | 956,559 | |
| Total | | | | | | | | | | | 1,848,910 | |
| | | | | | | | | | | | | |
| Rail 0.61% | | | | | | | | | | | | |
| Central Japan Railway Co. (Japan)†(b) | | 4.25% | | 11/24/2045 | | | 1,324 | | | | 1,353,468 | |
| China Railway Resources Huitung Ltd. (Hong Kong)(b) | | 3.85% | | 2/5/2023 | | | 925 | | | | 918,966 | |
| Florida East Coast Holdings Corp.† | | 6.75% | | 5/1/2019 | | | 2,500 | | | | 2,293,750 | |
| Florida East Coast Holdings Corp.† | | 9.75% | | 5/1/2020 | | | 698 | | | | 478,130 | |
| Watco Cos. LLC/Watco Finance Corp.† | | 6.375% | | 4/1/2023 | | | 962 | | | | 952,380 | |
| Total | | | | | | | | | | | 5,996,694 | |
| | | | | | | | | | | | | |
| Real Estate Development & Management 0.39% | | | | | | | | | | | | |
| CBRE Services, Inc. | | 4.875% | | 3/1/2026 | | | 2,059 | | | | 2,055,084 | |
| CBRE Services, Inc. | | 5.00% | | 3/15/2023 | | | 900 | | | | 905,605 | |
| CBRE Services, Inc. | | 5.25% | | 3/15/2025 | | | 875 | | | | 887,883 | |
| Total | | | | | | | | | | | 3,848,572 | |
| | | | | | | | | | | | | |
| Real Estate Investment Trusts 1.14% | | | | | | | | | | | | |
| Alexandria Real Estate Equities, Inc. | | 4.30% | | 1/15/2026 | | | 881 | | | | 870,466 | |
| Brixmor Operating Partnership LP | | 3.85% | | 2/1/2025 | | | 1,990 | | | | 1,937,108 | |
| Brixmor Operating Partnership LP | | 3.875% | | 8/15/2022 | | | 1,931 | | | | 1,924,908 | |
| CubeSmart LP | | 4.00% | | 11/15/2025 | | | 878 | | | | 873,009 | |
| Digital Delta Holdings LLC† | | 4.75% | | 10/1/2025 | | | 1,289 | | | | 1,302,885 | |
| EPR Properties | | 4.50% | | 4/1/2025 | | | 1,518 | | | | 1,445,720 | |
| Goodman Funding Pty Ltd. (Australia)†(b) | | 6.00% | | 3/22/2022 | | | 775 | | | | 862,306 | |
| Jababeka International BV (Netherlands)†(b) | | 7.50% | | 9/24/2019 | | | 1,000 | | | | 949,706 | |
| Kilroy Realty LP | | 3.80% | | 1/15/2023 | | | 971 | | | | 963,567 | |
| Total | | | | | | | | | | | 11,129,675 | |
| | | | | | | | | | | | | |
| Recreation & Travel 0.59% | | | | | | | | | | | | |
| Cedar Fair LP/Canada’s Wonderland Co./Magnum Management Corp. | | 5.25% | | 3/15/2021 | | | 1,250 | | | | 1,293,750 | |
| NCL Corp. Ltd.† | | 5.25% | | 11/15/2019 | | | 650 | | | | 667,472 | |
| Royal Caribbean Cruises Ltd. | | 7.50% | | 10/15/2027 | | | 2,646 | | | | 3,023,055 | |
| Viking Cruises Ltd.† | | 8.50% | | 10/15/2022 | | | 825 | | | | 785,812 | |
| Total | | | | | | | | | | | 5,770,089 | |
| | See Notes to Financial Statements. | 31 |
Schedule of Investments (continued)
December 31, 2015
| | | | | | | Principal | | | | |
| | | Interest | | Maturity | | Amount | | | Fair | |
| Investments | | Rate | | Date | | (000) | | | Value | |
| Restaurants 0.80% | | | | | | | | | | | | |
| Arcos Dorados Holdings, Inc. (Argentina)†(b) | | 6.625% | | 9/27/2023 | | $ | 580 | | | $ | 537,950 | |
| McDonald’s Corp. | | 2.75% | | 12/9/2020 | | | 352 | | | | 352,160 | |
| McDonald’s Corp. | | 3.70% | | 1/30/2026 | | | 835 | | | | 836,056 | |
| McDonald’s Corp. | | 4.60% | | 5/26/2045 | | | 1,012 | | | | 977,544 | |
| McDonald’s Corp. | | 4.875% | | 12/9/2045 | | | 879 | | | | 887,809 | |
| New Red Finance, Inc. (Canada)†(b) | | 6.00% | | 4/1/2022 | | | 940 | | | | 970,550 | |
| PF Chang’s China Bistro, Inc.† | | 10.25% | | 6/30/2020 | | | 1,300 | | | | 1,072,500 | |
| Seminole Hard Rock Entertainment, Inc./Seminole Hard Rock International LLC† | | 5.875% | | 5/15/2021 | | | 975 | | | | 977,438 | |
| Yum! Brands, Inc. | | 3.75% | | 11/1/2021 | | | 606 | | | | 558,210 | |
| Yum! Brands, Inc. | | 3.875% | | 11/1/2023 | | | 760 | | | | 674,204 | |
| Total | | | | | | | | | | | 7,844,421 | |
| | | | | | | | | | | | | |
| Software/Services 3.39% | | | | | | | | | | | | |
| Adobe Systems, Inc. | | 3.25% | | 2/1/2025 | | | 1,400 | | | | 1,369,032 | |
| Alibaba Group Holding Ltd. (China)(b) | | 3.125% | | 11/28/2021 | | | 2,150 | | | | 2,089,101 | |
| Alibaba Group Holding Ltd. (China)(b) | | 3.60% | | 11/28/2024 | | | 1,825 | | | | 1,749,887 | |
| Alliance Data Systems Corp.† | | 6.375% | | 4/1/2020 | | | 4,775 | | | | 4,840,656 | |
| Blue Coat Holdings, Inc.† | | 8.375% | | 6/1/2023 | | | 1,120 | | | | 1,131,200 | |
| Fidelity National Information Services, Inc. | | 5.00% | | 10/15/2025 | | | 2,349 | | | | 2,418,133 | |
| First Data Corp.† | | 5.75% | | 1/15/2024 | | | 1,174 | | | | 1,159,325 | |
| First Data Corp.† | | 7.00% | | 12/1/2023 | | | 2,996 | | | | 3,003,490 | |
| Hewlett-Packard Enterprise Co.† | | 4.90% | | 10/15/2025 | | | 1,523 | | | | 1,496,341 | |
| Informatica LLC† | | 7.125% | | 7/15/2023 | | | 1,153 | | | | 1,049,230 | |
| MasterCard, Inc. | | 3.375% | | 4/1/2024 | | | 1,300 | | | | 1,329,952 | |
| Microsoft Corp. | | 2.375% | | 2/12/2022 | | | 1,900 | | | | 1,876,989 | |
| Microsoft Corp. | | 4.00% | | 2/12/2055 | | | 1,975 | | | | 1,779,058 | |
| MSCI, Inc.† | | 5.75% | | 8/15/2025 | | | 961 | | | | 987,428 | |
| Oracle Corp. | | 4.125% | | 5/15/2045 | | | 1,545 | | | | 1,468,594 | |
| Oracle Corp. | | 4.375% | | 5/15/2055 | | | 2,047 | | | | 1,877,678 | |
| Priceline Group, Inc. (The) | | 3.65% | | 3/15/2025 | | | 1,975 | | | | 1,925,906 | |
| VeriSign, Inc. | | 4.625% | | 5/1/2023 | | | 872 | | | | 848,674 | |
| VeriSign, Inc. | | 5.25% | | 4/1/2025 | | | 741 | | | | 746,558 | |
| Total | | | | | | | | | | | 33,147,232 | |
| 32 | See Notes to Financial Statements. |
Schedule of Investments (continued)
December 31, 2015
| | | | | | | Principal | | | | |
| | | Interest | | Maturity | | Amount | | | Fair | |
| Investments | | Rate | | Date | | (000) | | | Value | |
| Specialty Retail 0.87% | | | | | | | | | | | | |
| Argos Merger Sub, Inc.† | | 7.125% | | 3/15/2023 | | $ | 2,125 | | | $ | 2,112,250 | |
| AutoZone, Inc. | | 2.50% | | 4/15/2021 | | | 555 | | | | 542,214 | |
| Brookstone Holdings Corp. PIK | | 10.00% | | 7/7/2021 | | | 37 | | | | 25,161 | |
| CST Brands, Inc. | | 5.00% | | 5/1/2023 | | | 1,945 | | | | 1,935,275 | |
| Neiman Marcus Group Ltd. LLC† | | 8.00% | | 10/15/2021 | | | 2,474 | | | | 1,843,130 | |
| Sally Holdings LLC/Sally Capital, Inc. | | 5.50% | | 11/1/2023 | | | 525 | | | | 539,438 | |
| William Carter Co. (The) | | 5.25% | | 8/15/2021 | | | 1,500 | | | | 1,548,750 | |
| Total | | | | | | | | | | | 8,546,218 | |
| | | | | | | | | | | | | |
| Steel Producers/Products 0.32% | | | | | | | | | | | | |
| Allegheny Ludlum Corp. | | 6.95% | | 12/15/2025 | | | 1,497 | | | | 905,685 | |
| Allegheny Technologies, Inc. | | 9.375% | | 6/1/2019 | | | 292 | | | | 235,060 | |
| Steel Dynamics, Inc. | | 5.125% | | 10/1/2021 | | | 1,150 | | | | 1,069,500 | |
| Steel Dynamics, Inc. | | 5.50% | | 10/1/2024 | | | 975 | | | | 892,125 | |
| Total | | | | | | | | | | | 3,102,370 | |
| | | | | | | | | | | | | |
| Support: Services 1.47% | | | | | | | | | | | | |
| ADT Corp. (The) | | 3.50% | | 7/15/2022 | | | 1,050 | | | | 945,000 | |
| AECOM | | 5.875% | | 10/15/2024 | | | 999 | | | | 1,022,726 | |
| BlueLine Rental Finance Corp.† | | 7.00% | | 2/1/2019 | | | 925 | | | | 837,125 | |
| Cleveland Clinic Foundation (The) | | 4.858% | | 1/1/2114 | | | 1,100 | | | | 1,069,811 | |
| Compiler Finance Sub, Inc.† | | 7.00% | | 5/1/2021 | | | 651 | | | | 286,440 | |
| Expedia, Inc.† | | 5.00% | | 2/15/2026 | | | 3,000 | | | | 2,933,544 | |
| FTI Consulting, Inc. | | 6.00% | | 11/15/2022 | | | 1,325 | | | | 1,392,906 | |
| Iron Mountain, Inc.† | | 6.00% | | 10/1/2020 | | | 1,286 | | | | 1,359,945 | |
| Jurassic Holdings III, Inc.† | | 6.875% | | 2/15/2021 | | | 1,550 | | | | 937,750 | |
| Light Tower Rentals, Inc.† | | 8.125% | | 8/1/2019 | | | 695 | | | | 357,925 | |
| Metropolitan Museum of Art (The) | | 3.40% | | 7/1/2045 | | | 1,350 | | | | 1,230,837 | |
| NES Rentals Holdings, Inc.† | | 7.875% | | 5/1/2018 | | | 700 | | | | 640,500 | |
| Sotheby’s† | | 5.25% | | 10/1/2022 | | | 1,500 | | | | 1,372,500 | |
| Total | | | | | | | | | | | 14,387,009 | |
| | | | | | | | | | | | | |
| Technology Hardware & Equipment 0.58% | | | | | | | | | | | | |
| CDW LLC/CDW Finance Corp. | | 5.50% | | 12/1/2024 | | | 1,425 | | | | 1,496,250 | |
| CommScope Technologies Finance LLC† | | 6.00% | | 6/15/2025 | | | 1,022 | | | | 986,230 | |
| CommScope, Inc.† | | 5.50% | | 6/15/2024 | | | 1,500 | | | | 1,430,625 | |
| Dell, Inc. | | 7.10% | | 4/15/2028 | | | 875 | | | | 846,562 | |
| Denali Borrower LLC/Denali Finance Corp.† | | 5.625% | | 10/15/2020 | | | 875 | | | | 918,750 | |
| Total | | | | | | | | | | | 5,678,417 | |
| | See Notes to Financial Statements. | 33 |
Schedule of Investments (continued)
December 31, 2015
| | | | | | | Principal | | | | |
| | | Interest | | Maturity | | Amount | | | Fair | |
| Investments | | Rate | | Date | | (000) | | | Value | |
| Telecommunications: Satellite 0.72% | | | | | | | | | | | | |
| Hughes Satellite Systems Corp. | | 7.625% | | 6/15/2021 | | $ | 2,500 | | | $ | 2,659,375 | |
| Inmarsat Finance plc (United Kingdom)†(b) | | 4.875% | | 5/15/2022 | | | 1,775 | | | | 1,735,062 | |
| Intelsat Luxembourg SA (Luxembourg)(b) | | 6.75% | | 6/1/2018 | | | 2,300 | | | | 1,713,500 | |
| Intelsat Luxembourg SA (Luxembourg)(b) | | 7.75% | | 6/1/2021 | | | 2,028 | | | | 958,230 | |
| Total | | | | | | | | | | | 7,066,167 | |
| | | | | | | | | | | | | |
| Telecommunications: Wireless 2.76% | | | | | | | | | | | | |
| Comcel Trust via Comunicaciones Celulares SA† | | 6.875% | | 2/6/2024 | | | 1,925 | | | | 1,491,875 | |
| Crown Castle International Corp. | | 5.25% | | 1/15/2023 | | | 2,000 | | | | 2,110,000 | |
| Digicel Group Ltd. (Jamaica)†(b) | | 7.125% | | 4/1/2022 | | | 1,000 | | | | 755,000 | |
| Digicel Group Ltd. (Jamaica)†(b) | | 8.25% | | 9/30/2020 | | | 1,000 | | | | 830,000 | |
| Digicel Ltd. (Jamaica)†(b) | | 6.75% | | 3/1/2023 | | | 950 | | | | 798,000 | |
| Digicel Ltd. (Jamaica)†(b) | | 7.00% | | 2/15/2020 | | | 1,900 | | | | 1,738,500 | |
| SBA Communications Corp. | | 4.875% | | 7/15/2022 | | | 980 | | | | 968,975 | |
| Sprint Capital Corp. | | 6.90% | | 5/1/2019 | | | 948 | | | | 777,360 | |
| Sprint Communications, Inc. | | 7.00% | | 8/15/2020 | | | 382 | | | | 296,050 | |
| Sprint Corp. | | 7.875% | | 9/15/2023 | | | 453 | | | | 341,336 | |
| T-Mobile USA, Inc. | | 6.50% | | 1/15/2024 | | | 9,137 | | | | 9,342,582 | |
| T-Mobile USA, Inc. | | 6.50% | | 1/15/2026 | | | 1,028 | | | | 1,040,326 | |
| T-Mobile USA, Inc. | | 6.625% | | 11/15/2020 | | | 500 | | | | 520,995 | |
| T-Mobile USA, Inc. | | 6.633% | | 4/28/2021 | | | 2,750 | | | | 2,860,000 | |
| T-Mobile USA, Inc. | | 6.836% | | 4/28/2023 | | | 103 | | | | 106,863 | |
| Telefonica Celular del Paraguay SA (Paraguay)†(b) | | 6.75% | | 12/13/2022 | | | 635 | | | | 582,612 | |
| Wind Acquisition Finance SA (Italy)†(b) | | 7.375% | | 4/23/2021 | | | 2,550 | | | | 2,416,125 | |
| Total | | | | | | | | | | | 26,976,599 | |
| | | | | | | | | | | | | |
| Telecommunications: Wireline Integrated & Services 2.01% | | | | | | | | | | | | |
| Columbus International, Inc. (Barbados)†(b) | | 7.375% | | 3/30/2021 | | | 1,366 | | | | 1,357,462 | |
| Consolidated Communications, Inc. | | 6.50% | | 10/1/2022 | | | 845 | | | | 714,025 | |
| Equinix, Inc. | | 4.875% | | 4/1/2020 | | | 2,000 | | | | 2,089,000 | |
| Equinix, Inc. | | 5.375% | | 4/1/2023 | | | 785 | | | | 804,625 | |
| Equinix, Inc. | | 5.875% | | 1/15/2026 | | | 967 | | | | 998,428 | |
| Frontier Communications Corp. | | 6.875% | | 1/15/2025 | | | 1,259 | | | | 1,041,823 | |
| Frontier Communications Corp. | | 7.625% | | 4/15/2024 | | | 700 | | | | 591,500 | |
| Frontier Communications Corp. | | 9.25% | | 7/1/2021 | | | 1,925 | | | | 1,898,531 | |
| Frontier Communications Corp.† | | 10.50% | | 9/15/2022 | | | 1,922 | | | | 1,919,597 | |
| Frontier Communications Corp.† | | 11.00% | | 9/15/2025 | | | 3,698 | | | | 3,670,265 | |
| GCI, Inc. | | 6.875% | | 4/15/2025 | | | 1,125 | | | | 1,155,937 | |
| Sable International Finance Ltd.† | | 6.875% | | 8/1/2022 | | | 1,015 | | | | 984,550 | |
| 34 | See Notes to Financial Statements. |
Schedule of Investments (continued)
December 31, 2015
| | | | | | | Principal | | | | |
| | | Interest | | Maturity | | Amount | | | Fair | |
| Investments | | Rate | | Date | | (000) | | | Value | |
| Telecommunications: Wireline Integrated & Services (continued) | | | | | | | | |
| Telecom Italia SpA (Italy)†(b) | | 5.303% | | 5/30/2024 | | $ | 975 | | | $ | 966,469 | |
| Zayo Group LLC/Zayo Capital, Inc. | | 6.00% | | 4/1/2023 | | | 1,539 | | | | 1,462,050 | |
| Total | | | | | | | | | | | 19,654,262 | |
| | | | | | | | | | | | | |
| Theaters & Entertainment 1.21% | | | | | | | | | | | | |
| Activision Blizzard, Inc.† | | 5.625% | | 9/15/2021 | | | 1,848 | | | | 1,940,400 | |
| Activision Blizzard, Inc.† | | 6.125% | | 9/15/2023 | | | 9,300 | | | | 9,881,250 | |
| Total | | | | | | | | | | | 11,821,650 | |
| | | | | | | | | | | | | |
| Tobacco 0.38% | | | | | | | | | | | | |
| Altria Group, Inc. | | 5.375% | | 1/31/2044 | | | 845 | | | | 912,311 | |
| Reynolds American, Inc. | | 4.45% | | 6/12/2025 | | | 1,404 | | | | 1,471,115 | |
| Reynolds American, Inc. | | 5.85% | | 8/15/2045 | | | 1,210 | | | | 1,350,152 | |
| Total | | | | | | | | | | | 3,733,578 | |
| | | | | | | | | | | | | |
| Transportation: Infrastructure/Services 0.24% | | | | | | | | | | | | |
| Autoridad del Canal de Panama (Panama)†(b) | | 4.95% | | 7/29/2035 | | | 1,000 | | | | 1,035,000 | |
| XPO Logistics, Inc.† | | 6.50% | | 6/15/2022 | | | 527 | | | | 489,451 | |
| XPO Logistics, Inc.† | | 7.875% | | 9/1/2019 | | | 792 | | | | 808,252 | |
| Total | | | | | | | | | | | 2,332,703 | |
| Total High Yield Corporate Bonds (cost $724,659,346) | | | | | | | | | | | 693,668,903 | |
| | | | | | | | | | | | | |
| NON-AGENCY COMMERCIAL MORTGAGE-BACKED SECURITIES 4.35% | | | | | | | | | | | | |
| Banc of America Commercial Mortgage Trust 2015-UBS7 D | | 3.167% | | 9/15/2048 | | | 341 | | | | 251,530 | |
| BB-UBS Trust 2012-SHOW E† | | 4.16% | # | 11/5/2036 | | | 1,825 | | | | 1,758,356 | |
| BBCMS Trust 2015-VFM A2† | | 3.375% | | 3/12/2036 | | | 400 | | | | 401,510 | |
| BBCMS Trust 2015-VFM D† | | 3.483% | # | 3/12/2036 | | | 939 | | | | 897,801 | |
| Citigroup Commercial Mortgage Trust 2014-GC25 B | | 4.345% | | 10/10/2047 | | | 550 | | | | 559,743 | |
| Citigroup Commercial Mortgage Trust 2014-GC25 C | | 4.533% | # | 10/10/2047 | | | 1,200 | | | | 1,161,914 | |
| Citigroup Commercial Mortgage Trust 2015-101A D† | | 4.625% | # | 1/14/2043 | | | 775 | | | | 736,522 | |
| Commercial Mortgage Pass-Through Certificates 2013-WWP D† | | 3.898% | | 3/10/2031 | | | 1,175 | | | | 1,167,289 | |
| Commercial Mortgage Pass-Through Certificates 2014-CR20 C | | 4.507% | # | 11/10/2047 | | | 800 | | | | 783,127 | |
| Commercial Mortgage Pass-Through Certificates 2014-CR20 XB IO† | | 0.114% | # | 11/10/2047 | | | 10,550 | | | | 110,322 | |
| | See Notes to Financial Statements. | 35 |
Schedule of Investments (continued)
December 31, 2015
| | | | | | | Principal | | | | |
| | | Interest | | Maturity | | Amount | | | Fair | |
| Investments | | Rate | | Date | | (000) | | | Value | |
| NON-AGENCY COMMERCIAL MORTGAGE-BACKED SECURITIES (continued) | | | | | | | | |
| Commercial Mortgage Pass-Through Certificates 2014-CR20 XC IO† | | 1.285% | # | 11/10/2047 | | $ | 775 | | | $ | 77,448 | |
| Commercial Mortgage Pass-Through Certificates 2014-CR21 XB IO† | | 0.044% | # | 12/10/2047 | | | 6,550 | | | | 40,636 | |
| Commercial Mortgage Pass-Through Certificates 2014-CR21 XC IO† | | 0.50% | | 12/10/2047 | | | 3,150 | | | | 110,817 | |
| Commercial Mortgage Pass-Through Certificates 2014-UBS5 C | | 4.612% | # | 9/10/2047 | | | 610 | | | | 604,333 | |
| Commercial Mortgage Pass-Through Certificates 2014-UBS6 B | | 4.349% | | 12/10/2047 | | | 675 | | | | 685,920 | |
| Commercial Mortgage Pass-Through Certificates 2014-UBS6 C | | 4.466% | # | 12/10/2047 | | | 2,675 | | | | 2,543,426 | |
| Commercial Mortgage Pass-Through Certificates 2014-UBS6 XA IO | | 1.073% | # | 12/10/2047 | | | 12,823 | | | | 803,014 | |
| Commercial Mortgage Pass-Through Certificates 2015-PC1 D | | 4.443% | # | 7/10/2050 | | | 1,237 | | | | 972,484 | |
| Credit Suisse Mortgage Capital Certificates 2014-USA E† | | 4.373% | | 9/15/2037 | | | 3,200 | | | | 2,910,298 | |
| DBUBS Mortgage Trust 2011-LC2A D† | | 5.453% | # | 7/10/2044 | | | 1,125 | | | | 1,176,825 | |
| Federal Home Loan Mortgage Corp. 2015-K721 B† | | 3.681% | # | 11/25/2047 | | | 4,750 | | | | 4,206,168 | |
| Great Wolf Trust 2015-WFMZ M† | | 7.319% | # | 5/15/2032 | | | 1,350 | | | | 1,326,220 | |
| GS Mortgage Securities Trust 2014-GC26 D† | | 4.511% | # | 11/10/2047 | | | 1,275 | | | | 1,078,093 | |
| Impact Funding Affordable Multifamily Housing Mortgage Loan Trust 2010-1 B† | | 6.00% | | 1/25/2051 | | | 775 | | | | 852,760 | |
| Impact Funding Affordable Multifamily Housing Mortgage Loan Trust 2010-1 C† | | 6.378% | # | 1/25/2051 | | | 750 | | | | 783,758 | |
| Impact Funding Affordable Multifamily Housing Mortgage Loan Trust 2014-1A XB IO† | | 0.342% | # | 8/25/2047 | | | 2,000 | | | | 67,740 | |
| JPMorgan Chase Commercial Mortgage Securities Trust 2014-C24 XB1 IO | | 0.311% | # | 11/15/2047 | | | 5,950 | | | | 147,752 | |
| JPMorgan Chase Commercial Mortgage Securities Trust 2014-C26 D† | | 3.927% | # | 1/15/2048 | | | 1,175 | | | | 891,907 | |
| JPMorgan Chase Commercial Mortgage Securities Trust 2014-C26 XB IO | | 0.476% | # | 1/15/2048 | | | 5,275 | | | | 193,972 | |
| JPMorgan Chase Commercial Mortgage Securities Trust 2014-C26 XD IO† | | 0.50% | | 1/15/2048 | | | 4,200 | | | | 158,319 | |
| JPMorgan Chase Commercial Mortgage Securities Trust 2014-DSTY D† | | 3.805% | # | 6/10/2027 | | | 800 | | | | 781,895 | |
| JPMorgan Chase Commercial Mortgage Securities Trust 2015-C31 C | | 4.619% | # | 8/15/2048 | | | 1,474 | | | | 1,360,061 | |
| 36 | See Notes to Financial Statements. |
Schedule of Investments (continued)
December 31, 2015
| | | | | | | Principal | | | | |
| | | Interest | | Maturity | | Amount | | | Fair | |
| Investments | | Rate | | Date | | (000) | | | Value | |
| NON-AGENCY COMMERCIAL MORTGAGE-BACKED SECURITIES (continued) | | | | | | | | | |
| JPMorgan Chase Commercial Mortgage Securities Trust 2015-CSMO E† | | 4.281% | # | 1/15/2032 | | $ | 1,175 | | | $ | 1,160,394 | |
| Morgan Stanley Bank of America Merrill Lynch Trust 2013-C10 C | | 4.081% | # | 7/15/2046 | | | 475 | | | | 464,567 | |
| Morgan Stanley Bank of America Merrill Lynch Trust 2013-C9 C | | 4.073% | # | 5/15/2046 | | | 550 | | | | 542,567 | |
| Morgan Stanley Bank of America Merrill Lynch Trust 2014-C19 C | | 4.00% | | 12/15/2047 | | | 875 | | | | 831,603 | |
| Morgan Stanley Bank of America Merrill Lynch Trust 2014-C19 LNC1† | | 3.989% | | 12/15/2046 | | | 775 | | | | 760,625 | |
| Morgan Stanley Bank of America Merrill Lynch Trust 2014-C19 LNC2† | | 4.384% | | 12/15/2046 | | | 1,625 | | | | 1,612,935 | |
| Morgan Stanley Bank of America Merrill Lynch Trust 2014-C19 LNC4† | | 4.75% | | 12/15/2046 | | | 750 | | | | 699,071 | |
| Morgan Stanley Bank of America Merrill Lynch Trust 2014-C19 LNCX IO† | | 0.602% | | 12/15/2046 | | | 4,025 | | | | 167,312 | |
| Morgan Stanley Bank of America Merrill Lynch Trust 2014-C19 XC IO† | | 0.442% | # | 12/15/2047 | | | 8,525 | | | | 313,694 | |
| Motel 6 Trust 2015-MTL6 D† | | 4.532% | | 2/5/2030 | | | 500 | | | | 492,729 | |
| SFAVE Commercial Mortgage Securities Trust 2015-5AVE A1† | | 3.872% | # | 1/5/2035 | | | 431 | | | | 425,605 | |
| SFAVE Commercial Mortgage Securities Trust 2015-5AVE A2B† | | 4.144% | # | 1/5/2035 | | | 1,250 | | | | 1,196,682 | |
| SFAVE Commercial Mortgage Securities Trust 2015-5AVE XA IO† | | 0.599% | # | 1/5/2035 | | | 36,775 | | | | 2,383,572 | |
| Wells Fargo Commercial Mortgage Trust 2014-LC18 XB IO | | 0.396% | # | 12/15/2047 | | | 6,575 | | | | 211,588 | |
| Wells Fargo Commercial Mortgage Trust 2015-C27 C | | 3.894% | | 2/15/2048 | | | 900 | | | | 811,867 | |
| Wells Fargo Commercial Mortgage Trust 2015-LC20 D† | | 4.366% | # | 4/15/2050 | | | 350 | | | | 283,628 | |
| WFCG Commercial Mortgage Trust 2015-BXRP E† | | 3.471%# | | 11/15/2029 | | | 623 | | | | 616,482 | |
| Total Non-Agency Commercial Mortgage-Backed Securities (cost $43,607,436) | | | | | | 42,576,881 | |
| Total Long-Term Investments (cost $961,354,004) | | | | | | | | | | | 928,899,831 | |
| | See Notes to Financial Statements. | 37 |
Schedule of Investments (continued)
December 31, 2015
| | | Principal | | | | |
| | | Amount | | | Fair | |
| Investments | | (000) | | | | Value | |
| SHORT-TERM INVESTMENT 3.95% | | | | | | | | |
| | | | | | | | | |
| REPURCHASE AGREEMENT | | | | | | | | |
Repurchase Agreement dated 12/31/2015, 0.03% due 1/4/2016 with Fixed Income Clearing Corp. collateralized by $39,360,000 of U.S. Treasury Note at 1.625% due 7/31/2020; value: $39,409,200; proceeds: $38,631,712
(cost $38,631,584) | | $ | 38,632 | | | $ | 38,631,584 | |
| Total Investments in Securities 98.92% (cost $999,985,588) | | | | | | | 967,531,415 | |
| Cash and Other Assets in Excess of Liabilities(h) 1.08% | | | | | | | 10,597,418 | |
| Net Assets 100.00% | | | | | | $ | 978,128,833 | |
| AUD | | Australian dollar. |
| CAD | | Canadian dollar. |
| EUR | | euro. |
| GBP | | British pound. |
| JPY | | Japanese yen. |
| MXN | | Mexican peso. |
| ADR | | American Depositary Receipt. |
| IO | | Interest Only. |
| PIK | | Payment-in-kind. |
| † | | Security was purchased pursuant to Rule 144A under the Securities Act of 1933 and, unless registered under such Act or exempted from registration, may only be resold to qualified institutional buyers. |
| # | | Variable rate security. The interest rate represents the rate in effect at December 31, 2015. |
| * | | Non-income producing security. |
| (a) | | Investment in non-U.S. dollar denominated securities. |
| (b) | | Foreign security traded in U.S. dollars. |
| (c) | | Floating Rate Loans in which the Fund invests generally pay interest at rates which are periodically re-determined at a margin above the London Interbank Offered Rate (“LIBOR”) or the prime rate offered by major U.S. banks. The rate(s) shown is the rate(s) in effect at December 31, 2015. |
| (d) | | Interest rate to be determined. |
| (e) | | Security is perpetual in nature and has no stated maturity. |
| (f) | | Debenture pays interest at an annual fixed rate of 8.00% through June 15, 2020. Thereafter, interest will be paid at an annual floating rate of 3-month LIBOR plus 6.405% through December 29, 2049. This debenture is subject to full redemption at the option of the issuer any time prior to December 29, 2049. |
| (g) | | Defaulted security (non-income producing security). |
| (h) | | Cash and Other Assets in Excess of Liabilities include net unrealized appreciation/depreciation on open forward foreign currency exchange contracts, futures contracts and swaps, as follows: |
| 38 | See Notes to Financial Statements. |
Schedule of Investments (continued)
December 31, 2015
Open Forward Foreign Currency Exchange Contracts at December 31, 2015:
Forward
Foreign
Currency
Exchange
Contracts | | Transaction
Type | | Counterparty | | Expiration
Date | | Foreign
Currency | | | U.S. $
Cost on
Origination
Date | | | U.S. $
Current
Value | | Unrealized
Appreciation | |
| Australian dollar | | Buy | | State Street Bank and Trust | | 1/12/2016 | | | 150,000 | | | $ | 108,269 | | | $ | 109,269 | | | $ | 1,000 | |
| Canadian dollar | | Buy | | J.P. Morgan | | 2/19/2016 | | | 120,000 | | | | 86,619 | | | | 86,734 | | | | 115 | |
| Japanese yen | | Buy | | J.P. Morgan | | 3/4/2016 | | | 10,600,000 | | | | 87,843 | | | | 88,297 | | | | 454 | |
| British pound | | Sell | | Standard Chartered Bank | | 1/20/2016 | | | 1,430,000 | | | | 2,208,343 | | | | 2,108,197 | | | | 100,146 | |
| Canadian dollar | | Sell | | J.P. Morgan | | 2/19/2016 | | | 2,300,000 | | | | 1,724,578 | | | | 1,662,405 | | | | 62,173 | |
| euro | | Sell | | J.P. Morgan | | 3/11/2016 | | | 3,380,000 | | | | 3,711,992 | | | | 3,679,278 | | | | 32,714 | |
| Unrealized Appreciation on Forward Foreign Currency Exchange Contracts | | | | | | | | | $ | 196,602 | |
Forward
Foreign
Currency
Exchange
Contracts | | Transaction
Type | | Counterparty | | Expiration
Date | | Foreign
Currency | | | U.S. $
Cost on
Origination
Date | | | U.S. $
Current
Value | | Unrealized
Depreciation | |
| euro | | Buy | | Morgan Stanley | | 2/16/2016 | | | 150,000 | | | $ | 163,732 | | | $ | 163,181 | | | $ | (551 | ) |
| Australian dollar | | Sell | | J.P. Morgan | | 1/12/2016 | | | 150,000 | | | | 104,725 | | | | 109,269 | | | | (4,544 | ) |
| euro | | Sell | | J.P. Morgan | | 2/16/2016 | | | 2,750,000 | | | | 2,960,598 | | | | 2,991,664 | | | | (31,066 | ) |
| euro | | Sell | | Morgan Stanley | | 2/16/2016 | | | 966,000 | | | | 1,042,412 | | | | 1,050,890 | | | | (8,478 | ) |
| Japanese yen | | Sell | | J.P. Morgan | | 3/4/2016 | | | 69,000,000 | | | | 559,845 | | | | 574,761 | | | | (14,916 | ) |
| Unrealized Depreciation on Forward Foreign Currency Exchange Contracts | | | | | | | | | $ | (59,555 | ) |
| Open Futures Contracts at December 31, 2015: | | | | | | | | | |
| Type | | Expiration | | Contracts | | Position | | Fair Value | | | Unrealized
Appreciation | |
| U.S. 10-Year Treasury Note | | March 2016 | | 891 | | Short | | $ | (112,182,469 | ) | | | $ | 217,682 | |
| | | | | | | | | | | | | | | | |
| Type | | Expiration | | Contracts | | Position | | | Fair Value | | | Unrealized
Depreciation | |
| U.S. 5-Year Treasury Note | | March 2016 | | 783 | | Long | | $ | 92,644,805 | | | | $ | (221,597 | ) |
| U.S. Long Bond | | March 2016 | | 315 | | Short | | | (48,431,250 | ) | | | | (54,695 | ) |
| Totals | | | | | | | | $ | 44,213,555 | | | | $ | (276,292 | ) |
| | See Notes to Financial Statements. | 39 |
Schedule of Investments (continued)
December 31, 2015
Credit Default Swaps - Sell Protection at December 31, 2015(1):
Referenced
Issuer | | Fund
Receives | | Termination
Date | | Notional
Amount | | Fair
Value(2) | | Payments
Upfront(3) | | Unrealized
Depreciation | | Credit
Default
Swap
Agreements
Payable at
Fair Value(4) |
| JC Penney Co., Inc.(5) | | 5.00% | | 12/20/2020 | | $1,378,000 | | $1,145,990 | | $(78,520) | | $(153,490) | | $(232,010) |
| | |
| (1) | If the Fund is a seller of protection and a credit event occurs, as defined under the terms of that particular swap agreement, the Fund will either (i) pay to the buyer of protection an amount equal to the notional amount of the swap and take delivery of the referenced obligation or underlying securities comprising the referenced index or (ii) pay a net settlement amount in the form of cash or securities equal to the notional amount of the swap less the recovery value of the referenced obligation or underlying securities. |
| (2) | Fair value serves as the indicator of the current status of payment/performance risk. |
| (3) | Upfront payments received are presented net of amortization (See Note 2(l)). |
| (4) | Includes upfront payments received. |
| (5) | Swap Counterparty: Barclays Bank plc. Moody’s Credit Rating: Caa2 |
| 40 | See Notes to Financial Statements. |
Schedule of Investments (continued)
December 31, 2015
The following is a summary of the inputs used as of December 31, 2015 in valuing the Fund’s investments carried at fair value(1):
| Investment Type(2)(3) | | Level 1 | | | Level 2 | | | Level 3 | | | Total |
| Asset-Backed Securities | | $ | – | | | $ | 5,201,607 | | | $ | – | | | $ | 5,201,607 | |
| Common Stocks | | | | | | | | | | | | | | | | |
| Auto Parts & Equipment | | | 1,001,153 | | | | 1,642,997 | | | | – | | | | 2,644,150 | |
| Metals/Mining (Excluding Steel) | | | – | | | | – | | | | 18,657 | (4) | | | 18,657 | |
| Personal & Household Products | | | 2,528,333 | | | | 480,455 | | | | – | | | | 3,008,788 | |
| Specialty Retail | | | 5,912,415 | | | | 899,705 | | | | – | | | | 6,812,120 | |
| Remaining Industries | | | 116,687,377 | | | | – | | | | – | | | | 116,687,377 | |
| Convertible Bonds | | | – | | | | 6,940,545 | | | | – | | | | 6,940,545 | |
| Convertible Preferred Stocks | | | | | | | | | | | | | | | | |
| Building & Construction | | | – | | | | 872,316 | | | | – | | | | 872,316 | |
| Food: Wholesale | | | – | | | | 984,942 | | | | – | | | | 984,942 | |
| Gas Distribution | | | 1,432,665 | | | | – | | | | – | | | | 1,432,665 | |
| Floating Rate Loans(5) | | | | | | | | | | | | | | | | |
| Auto Parts & Equipment | | | – | | | | – | | | | 769,220 | | | | 769,220 | |
| Consumer/Commercial/Lease Financing | | | – | | | | 835,146 | | | | – | | | | 835,146 | |
| Electronics | | | – | | | | 2,664,940 | | | | – | | | | 2,664,940 | |
| Energy: Exploration & Production | | | – | | | | 931,400 | | | | – | | | | 931,400 | |
| Gaming | | | – | | | | 956,347 | | | | 1,630,125 | | | | 2,586,472 | |
| Health Facilities | | | – | | | | 2,732,149 | | | | – | | | | 2,732,149 | |
| Metals/Mining (Excluding Steel) | | | – | | | | 1,831,803 | | | | – | | | | 1,831,803 | |
| Packaging | | | – | | | | 1,213,982 | | | | – | | | | 1,213,982 | |
| Personal & Household Products | | | – | | | | 1,051,641 | | | | – | | | | 1,051,641 | |
| Pharmaceuticals | | | – | | | | 970,763 | | | | – | | | | 970,763 | |
| Recreation & Travel | | | – | | | | 899,190 | | | | – | | | | 899,190 | |
| Software/Services | | | – | | | | 937,769 | | | | – | | | | 937,769 | |
| Specialty Retail | | | – | | | | 1,274,033 | | | | – | | | | 1,274,033 | |
| Technology Hardware & Equipment | | | – | | | | 39,717 | | | | – | | | | 39,717 | |
| Telecommunications: Wireline Integrated & Services | | | – | | | | 936,804 | | | | – | | | | 936,804 | |
| Theaters & Entertainment | | | – | | | | 1,682,949 | | | | – | | | | 1,682,949 | |
| Foreign Bonds | | | – | | | | 6,271,403 | | | | – | | | | 6,271,403 | |
| Foreign Government Obligations | | | – | | | | 20,421,499 | | | | – | | | | 20,421,499 | |
| High Yield Corporate Bonds | | | | | | | | | | | | | | | | |
| Air Transportation | | | – | | | | 2,348,243 | | | | 1,932,937 | (4) | | | 4,281,180 | |
| Banking | | | – | | | | 73,385,385 | | | | 125 | (4) | | | 73,385,510 | |
| Metals/Mining (Excluding Steel) | | | – | | | | 17,367,838 | | | | 1 | (4) | | | 17,367,839 | |
| Specialty Retail | | | – | | | | 8,521,057 | | | | 25,161 | (6) | | | 8,546,218 | |
| Remaining Industries | | | – | | | | 590,088,156 | | | | – | | | | 590,088,156 | |
| Non–Agency Commercial Mortgage–Backed Securities | | | – | | | | 41,617,234 | | | | 959,647 | (6) | | | 42,576,881 | |
| Repurchase Agreement | | | – | | | | 38,631,584 | | | | – | | | | 38,631,584 | |
| Total | | $ | 127,561,943 | | | $ | 834,633,599 | | | $ | 5,335,873 | | | $ | 967,531,415 | |
| | See Notes to Financial Statements. | 41 |
Schedule of Investments (concluded)
December 31, 2015
| Investment Type(2)(3) | | Level 1 | | | Level 2 | | | Level 3 | | | Total |
| Other Financial Instruments | | | | | | | | | | | | | | | | |
| Credit Default Swap | | | | | | | | | | | | | | | | |
| Assets | | $ | – | | | $ | – | | | $ | – | | | $ | – | |
| Liabilities | | | – | | | | (232,010 | ) | | | – | | | | (232,010 | ) |
| Forward Foreign Currency Exchange Contracts | | | | | | | | | | | | | | | | |
| Assets | | | – | | | | 196,602 | | | | – | | | | 196,602 | |
| Liabilities | | | – | | | | (59,555 | ) | | | – | | | | (59,555 | ) |
| Futures Contracts | | | | | | | | | | | | | | | | |
| Assets | | | 217,682 | | | | – | | | | – | | | | 217,682 | |
| Liabilities | | | (276,292 | ) | | | – | | | | – | | | | (276,292 | ) |
| Total | | $ | (58,610 | ) | | $ | (94,963 | ) | | $ | – | | | $ | (153,573 | ) |
| | |
| (1) | Refer to Note 2(n) for a description of fair value measurements and the three–tier hierarchy of inputs. |
| (2) | See Schedule of Investments for fair values in each industry and identification of foreign issuers and/or geography. The table above is presented by Investment Type. Industries are presented within an Investment Type should such Investment Type include securities classified as two or more levels within the three–tier fair value hierarchy. |
| (3) | There were no Level 1/Level 2 transfers during the fiscal year ended December 31, 2015. |
| (4) | Level 3 securities fair valued by the Pricing Committee, as described in Note 2(a) in the Notes to Financials. |
| (5) | Floating Rate Loans categorized as Level 3 are valued based on a single quotation obtained from a dealer. Accounting principles generally accepted in the United States of America do not require the Fund to create quantitative unobservable inputs that were not developed by the Fund. Therefore, the Fund does not have access to unobservable inputs and cannot disclose such inputs in the valuation. |
| (6) | Includes securities (Brookstone Holdings Corp. PIK (High Yield Corporate Bonds), Impact Funding Affordable Multifamily Housing Mortgage Loan Trust 2014-1A XB IO (Non-Agency Commercial Mortgage-Backed Securities) and JPMorgan Chase Commercial Mortgage Securities Trust 2014-C26 D (Non-Agency Commercial Mortgage-Backed Securities)) valued utilizing third party pricing information without adjustment. Such valuations are based on unobservable inputs. A significant change in third party information could result in a significantly lower or higher value of such Level 3 investments. |
The following is a reconciliation of investments with unobservable inputs (Level 3) that were used in determining fair value:
| Investment Type | | Common
Stock | | | Floating
Rate Loans | | | High Yield
Corporate Bond | | | Non–Agency
Commercial
Mortgage–Backed
Securities | |
| Balance as of January 1, 2015 | | $ | 60,616 | | | $ | 5,424,314 | | | $ | 35,610 | | | | $ | – | |
| Accrued discounts/premiums | | | – | | | | 4,283 | | | | – | | | | | (379 | ) |
| Realized gain (loss) | | | – | | | | (16,038 | ) | | | 908 | | | | | 13,302 | |
| Change in unrealized appreciation/depreciation | | | (41,959 | ) | | | (31,647 | ) | | | (28,599 | ) | | | | (116,478 | ) |
| Purchases | | | – | | | | 2,436,352 | | | | 1,951,888 | | | | | – | |
| Sales | | | – | | | | (5,417,919 | ) | | | (1,583 | ) | | | | (287,942 | ) |
| Net transfers in or out of Level 3 | | | – | | | | – | | | | – | | | | | 1,351,144 | |
| Balance as of December 31, 2015 | | $ | 18,657 | | | $ | 2,399,345 | | | $ | 1,958,224 | | | | $ | 959,647 | |
| 42 | See Notes to Financial Statements. |
Statement of Assets and Liabilities
December 31, 2015
| ASSETS: | | | | |
| Investments in securities, at fair value (cost $999,985,588) | | $ | 967,531,415 | |
| Deposits with brokers for derivatives collateral | | | 1,973,663 | |
| Cash | | | 210,487 | |
| Receivables: | | | | |
| Interest and dividends | | | 11,722,163 | |
| Investment securities sold | | | 6,486,166 | |
| Capital shares sold | | | 151,889 | |
| From advisor (See Note 3) | | | 36,869 | |
| Unrealized appreciation on forward foreign currency exchange contracts | | | 196,602 | |
| Prepaid expenses and other assets | | | 5,975 | |
| Total assets | | | 988,315,229 | |
| LIABILITIES: | | | | |
| Payables: | | | | |
| Investment securities purchased | | | 7,954,448 | |
| Management fee | | | 416,190 | |
| Variation margin | | | 311,914 | |
| Capital shares reacquired | | | 237,196 | |
| Directors’ fees | | | 117,713 | |
| Fund administration | | | 33,296 | |
| Unrealized depreciation on forward foreign currency exchange contracts | | | 59,555 | |
| Credit default swap agreements payable, at fair value (including upfront payments received of $78,520) | | | 232,010 | |
| Accrued expenses | | | 824,074 | |
| Total liabilities | | | 10,186,396 | |
| NET ASSETS | | $ | 978,128,833 | |
| COMPOSITION OF NET ASSETS: | | | | |
| Paid-in capital | | $ | 1,029,732,655 | |
| Distributions in excess of net investment income | | | (5,523 | ) |
| Accumulated net realized loss on investments, futures contracts, swaps and foreign currency related transactions | | | (19,067,143 | ) |
| Net unrealized depreciation on investments, futures contracts, swaps and translation of assets and liabilities denominated in foreign currencies | | | (32,531,156 | ) |
| Net Assets | | $ | 978,128,833 | |
| Outstanding shares (200 million shares of common stock authorized, $.001 par value) | | | 87,838,303 | |
| Net asset value, offering and redemption price per share (Net assets divided by outstanding shares) | | | $11.14 | |
| | See Notes to Financial Statements. | 43 |
Statement of Operations
For the Year Ended December 31, 2015
| Investment income: | | | | |
| Dividends (net of foreign withholding taxes of $6,908) | | $ | 1,093,321 | |
| Interest and other | | | 45,945,038 | |
| Total investment income | | | 47,038,359 | |
| Expenses: | | | | |
| Management fee | | | 4,885,404 | |
| Non 12b-1 service fees | | | 2,443,996 | |
| Shareholder servicing | | | 1,049,153 | |
| Fund administration | | | 390,895 | |
| Reports to shareholders | | | 143,789 | |
| Professional | | | 65,779 | |
| Custody | | | 52,159 | |
| Directors’ fees | | | 34,978 | |
| Other | | | 131,800 | |
| Gross expenses | | | 9,197,953 | |
| Expense reductions (See Note 9) | | | (1,023 | ) |
| Fees waived and expenses reimbursed (See Note 3) | | | (401,790 | ) |
| Net expenses | | | 8,795,140 | |
| Net investment income | | | 38,243,219 | |
| Net realized and unrealized loss: | | | | |
| Net realized loss on investments | | | (13,912,386 | ) |
| Net realized loss on futures contracts, swaps and foreign currency related transactions | | | (515,782 | ) |
| Net change in unrealized appreciation/depreciation on investments | | | (40,563,342 | ) |
| Net change in unrealized appreciation/depreciation on futures contracts, swaps and translation of assets and liabilities denominated in foreign currencies | | | (284,139 | ) |
| Net realized and unrealized loss | | | (55,275,649 | ) |
| Net Decrease in Net Assets Resulting From Operations | | $ | (17,032,430 | ) |
| 44 | See Notes to Financial Statements. |
Statements of Changes in Net Assets
| | | For the Year Ended | | | For the Year Ended | |
| INCREASE IN NET ASSETS | | December 31, 2015 | | | December 31, 2014 | |
| Operations: | | | | | | | | |
| Net investment income | | $ | 38,243,219 | | | $ | 38,677,734 | |
| Net realized gain (loss) on investments, futures contracts, swaps and foreign currency related transactions | | | (14,428,168 | ) | | | 32,585,301 | |
| Net change in unrealized appreciation/depreciation on investments, futures contracts, swaps and translation of assets and liabilities denominated in foreign currencies | | | (40,847,481 | ) | | | (33,523,214 | ) |
| Net increase (decrease) in net assets resulting from operations | | | (17,032,430 | ) | | | 37,739,821 | |
| Distributions to shareholders from: | | | | | | | | |
| Net investment income | | | (41,094,016 | ) | | | (43,465,223 | ) |
| Net realized gain | | | (6,306,282 | ) | | | (24,258,874 | ) |
| Total distributions to shareholders | | | (47,400,298 | ) | | | (67,724,097 | ) |
| Capital share transactions (Net of share conversions) (See Note 13): | | | | | | | | |
| Proceeds from sales of shares | | | 322,164,243 | | | | 191,664,239 | |
| Reinvestment of distributions | | | 47,400,274 | | | | 67,724,096 | |
| Cost of shares reacquired | | | (240,111,353 | ) | | | (177,425,759 | ) |
| Net increase in net assets resulting from capital share transactions | | | 129,453,164 | | | | 81,962,576 | |
| Net increase in net assets | | | 65,020,436 | | | | 51,978,300 | |
| NET ASSETS: | | | | | | | | |
| Beginning of year | | $ | 913,108,397 | | | $ | 861,130,097 | |
| End of year | | $ | 978,128,833 | | | $ | 913,108,397 | |
| Undistributed (distributions in excess of) net investment income | | $ | (5,523 | ) | | $ | 213,777 | |
| | See Notes to Financial Statements. | 45 |
Financial Highlights
| | | | | | Per Share Operating Performance: | |
| | | | | | | Investment operations: | | Distributions to
shareholders from: | |
| | | | | | | | | | | | | | | | | | | | | | | | | | | | | | |
| | | Net asset
value,
beginning
of year | | Net
invest-
ment
income(a) | | Net
realized
and
unrealized
gain (loss) | | Total
from
invest-
ment
operations | | Net
invest-
ment
income | | Net
realized
gain | | Total
distributions | |
| 12/31/2015 | | | $11.89 | | | | 0.47 | | | | $(0.65 | ) | | | $(0.18 | ) | | | $(0.49 | ) | | | $(0.08 | ) | | | $(0.57 | ) | |
| 12/31/2014 | | | 12.31 | | | | 0.54 | | | | (0.01 | ) | | | 0.53 | | | | (0.61 | ) | | | (0.34 | ) | | | (0.95 | ) | |
| 12/31/2013 | | | 12.21 | | | | 0.62 | | | | 0.39 | | | | 1.01 | | | | (0.65 | ) | | | (0.26 | ) | | | (0.91 | ) | |
| 12/31/2012 | | | 11.64 | | | | 0.71 | | | | 0.74 | | | | 1.45 | | | | (0.72 | ) | | | (0.16 | ) | | | (0.88 | ) | |
| 12/31/2011 | | | 11.93 | | | | 0.73 | | | | (0.21 | ) | | | 0.52 | | | | (0.72 | ) | | | (0.09 | ) | | | (0.81 | ) | |
| (a) | Calculated using average shares outstanding during the year. |
| (b) | Total return does not consider the effects of sales charges or other expenses imposed by an insurance company and assumes the reinvestment of all distributions. |
| 46 | See Notes to Financial Statements. |
| | | | | | | Ratios to Average Net Assets: | | Supplemental Data: | |
| | | | | | | | | | | | | | | | | | | | | |
Net
asset
value,
end of
year | | Total
return
(%)(b) | | Total
expenses
after
waivers
and/or
reimburse-
ments
(%) | | Total
expenses
(%) | | Net
investment
income
(%) | | Net
assets,
end of
year
(000) | | Portfolio
turnover
rate
(%) | |
| | $11.14 | | | | (1.53 | ) | | | 0.90 | | | | 0.94 | | | | 3.91 | | | | $978,129 | | | | 116.08 | | |
| | 11.89 | | | | 4.35 | | | | 0.90 | | | | 0.93 | | | | 4.26 | | | | 913,108 | | | | 90.21 | | |
| | 12.31 | | | | 8.17 | | | | 0.90 | | | | 0.93 | | | | 4.89 | | | | 861,130 | | | | 49.59 | | |
| | 12.21 | | | | 12.53 | | | | 0.90 | | | | 0.93 | | | | 5.68 | | | | 773,725 | | | | 46.31 | | |
| | 11.64 | | | | 4.38 | | | | 0.90 | | | | 0.93 | | | | 5.92 | | | | 625,954 | | | | 33.43 | | |
| | See Notes to Financial Statements. | 47 |
Notes to Financial Statements
Lord Abbett Series Fund, Inc. (the “Company”) is registered under the Investment Company Act of 1940, as amended (the “Act”), as a diversified, open-end management investment company and was incorporated under Maryland law in 1989. The Company consists of thirteen separate portfolios. This report covers Bond-Debenture Portfolio (the “Fund”).
The Fund’s investment objective is to seek high current income and the opportunity for capital appreciation to produce a high total return. The Fund has Variable Contract class shares (“Class VC Shares”), which are currently issued and redeemed only in connection with investments in, and payments under, variable annuity contracts and variable life insurance policies issued by life insurance and insurance-related companies.
The preparation of the financial statements in conformity with accounting principles generally accepted in the United States of America (“U.S. GAAP”) requires management to make certain estimates and assumptions that affect the reported amounts of assets and liabilities and disclosure of contingent assets and liabilities at the date of the financial statements and the reported amounts of increases and decreases in net assets from operations during the reporting period. Actual results could differ from those estimates. The Fund is considered an investment company under U.S. GAAP and follows the accounting and reporting guidance applicable to investment companies.
| 2. | SIGNIFICANT ACCOUNTING POLICIES |
| (a) | Investment Valuation–Under procedures approved by the Fund’s Board of Directors (the “Board”), Lord, Abbett & Co. LLC (“Lord Abbett”), the Fund’s investment manager, has formed a Pricing Committee to administer the pricing and valuation of portfolio investments and to ensure that prices utilized reasonably reflect fair value. Among other things, these procedures allow the Fund to utilize independent pricing services, quotations from securities and financial instrument dealers and other market sources to determine fair value. |
| | |
| | Securities actively traded on any recognized U.S. or non-U.S. exchange or on The NASDAQ Stock Market LLC are valued at the last sale price or official closing price on the exchange or system on which they are principally traded. Events occurring after the close of trading on non-U.S. exchanges may result in adjustments to the valuation of foreign securities to reflect their fair value as of the close of regular trading on the New York Stock Exchange. The Fund may utilize an independent fair valuation service in adjusting the valuations of foreign securities. Unlisted equity securities are valued at the last quoted sale price or, if no sale price is available, at the mean between the most recently quoted bid and asked prices. Fixed income securities are valued based on evaluated prices supplied by independent pricing services, which reflect broker/dealer supplied valuations and the independent pricing services’ own electronic data processing techniques. Exchange traded options and futures contracts are valued at the last sale price in the market where they are principally traded. If no sale has occurred, the mean between the most recently quoted bid and asked prices is used. Floating rate loans are valued at the average of bid and ask quotations obtained from dealers in loans on the basis of prices supplied by independent pricing services. Forward foreign currency exchange contracts are valued using daily forward exchange rates. Swaps are valued daily using independent pricing services or quotations from broker/dealers to the extent available. |
48
Notes to Financial Statements (continued)
| | Securities for which prices are not readily available are valued at fair value as determined by the Pricing Committee. The Pricing Committee considers a number of factors, including observable and unobservable inputs, when arriving at fair value. The Pricing Committee may use related or comparable assets or liabilities, recent transactions, market multiples, book values, yield curves, broker quotes, observable trading activity, option adjusted spread models and other relevant information to determine the fair value of portfolio investments. The Board or a designated committee thereof regularly reviews fair value determinations made by the Pricing Committee and employs techniques such as reviewing related market activity, reviewing inputs and assumptions, and retrospectively comparing prices of subsequent purchases and sales transactions to fair value determinations made by the Pricing Committee. |
| | |
| | Short-term securities with 60 days or less remaining to maturity are valued using the amortized cost method, which approximates fair value. |
| | |
| (b) | Security Transactions–Security transactions are recorded as of the date that the securities are purchased or sold (trade date). Realized gains and losses on sales of portfolio securities are calculated using the identified-cost method. |
| | |
| (c) | Investment Income–Dividend income is recorded on the ex-dividend date. Interest income is recorded on the accrual basis as earned. Discounts are accreted and premiums are amortized using the effective interest method and are included in Interest and other income on the Statement of Operations. Withholding taxes on foreign dividends have been provided for in accordance with the applicable country’s tax rules and rates. |
| | |
| (d) | Income Taxes–It is the policy of the Fund to meet the requirements of Subchapter M of the Internal Revenue Code applicable to regulated investment companies and to distribute substantially all taxable income and capital gains to its shareholders. Therefore, no income tax provision is required. |
| | |
| | The Fund files U.S. federal and various state and local tax returns. No income tax returns are currently under examination. The statute of limitations on the Fund’s filed U.S. federal tax returns remains open for the fiscal years ended December 31, 2012 through December 31, 2015. The statutes of limitations on the Company’s state and local tax returns may remain open for an additional year depending upon the jurisdiction. |
| | |
| (e) | Expenses–Expenses incurred by the Company that do not specifically relate to an individual fund are generally allocated to the funds within the Company on a pro rata basis by relative net assets. |
| | |
| (f) | Foreign Transactions–The books and records of the Fund are maintained in U.S. dollars and transactions denominated in foreign currencies are recorded in the Fund’s records at the rate prevailing when earned or recorded. Asset and liability accounts that are denominated in foreign currencies are adjusted daily to reflect current exchange rates and any unrealized gain (loss) is included in Net change in unrealized appreciation/depreciation on futures contracts, swaps and translation of assets and liabilities denominated in foreign currencies on the Fund’s Statement of Operations. The resultant exchange gains and losses upon settlement of such transactions are included in Net realized loss on futures contracts, swaps and foreign currency related transactions on the Fund’s Statement of Operations. The Fund does not isolate that portion of the results of operations arising as a result of changes in the foreign exchange rates from the changes in market prices of the securities. |
49
Notes to Financial Statements (continued)
| | The Fund uses foreign currency exchange contracts to facilitate transactions in foreign-denominated securities. Losses from these transactions may arise from changes in the value of the foreign currency or if the counterparties do not perform under the contracts’ terms. |
| | |
| (g) | Forward Foreign Currency Exchange Contracts–The Fund may enter into forward foreign currency exchange contracts in order to reduce exposure to changes in foreign currency exchange rates on foreign portfolio holdings, or gain or reduce exposure to foreign currency solely for investment purposes. A forward foreign currency exchange contract is a commitment to purchase or sell a foreign currency at a future date at a negotiated rate. The contracts are valued daily at forward exchange rates and any unrealized gain (loss) is included in Net change in unrealized appreciation/depreciation on futures contracts, swaps and translation of assets and liabilities denominated in foreign currencies on the Fund’s Statement of Operations. The gain (loss) arising from the difference between the U.S. dollar cost of the original contract and the value of the foreign currency in U.S. dollars upon closing of such contracts is included in Net realized loss on futures contracts, swaps and foreign currency related transactions on the Fund’s Statement of Operations. |
| | |
| (h) | Futures Contracts–The Fund may purchase and sell futures contracts to enhance returns, to attempt to economically hedge some of its investment risk, or as a substitute position in lieu of holding the underlying asset on which the instrument is based. At the time of entering into a futures transaction, an investor is required to deposit and maintain a specified amount of cash or eligible securities called “initial margin.” Subsequent payments made or received by the Fund called “variation margin” are made on a daily basis as the market price of the futures contract fluctuates. The Fund will record an unrealized gain (loss) based on the amount of variation margin. When a contract is closed, a realized gain (loss) is recorded equal to the difference between the opening and closing value of the contract. |
| | |
| (i) | When-Issued, Forward Transactions or To-Be-Announced (“TBA”) Transactions–The Fund may purchase portfolio securities on a when-issued or forward basis. When-issued, forward transactions or TBA transactions involve a commitment by a fund to purchase securities, with payment and delivery (“settlement”) to take place in the future, in order to secure what is considered to be an advantageous price or yield at the time of entering into the transaction. During the period between purchase and settlement, the fair value of the securities will fluctuate and assets consisting of cash and/or marketable securities (normally short-term U.S. Government or U.S. Government sponsored enterprise securities) marked to market daily in an amount sufficient to make payment at settlement will be segregated at the Fund’s custodian in order to pay for the commitment. At the time the Fund makes the commitment to purchase a security on a when-issued basis, it will record the transaction and reflect the liability for the purchase and fair value of the security in determining its net asset value (“NAV”). The Fund, generally, has the ability to close out a purchase obligation on or before the settlement date rather than take delivery of the security. Under no circumstances will settlement for such securities take place more than 120 days after the purchase date. |
| | |
| (j) | Repurchase Agreements–The Fund may enter into repurchase agreements with respect to securities. A repurchase agreement is a transaction in which a fund acquires a security and simultaneously commits to resell that security to the seller (a bank or securities dealer) at an agreed-upon price on an agreed-upon date. The Fund requires at all times that the repurchase agreement be collateralized by cash, or by securities of the U.S. Government, its agencies, its instrumentalities, or U.S. Government sponsored enterprises having a value equal to, or in |
50
Notes to Financial Statements (continued)
| | excess of, the value of the repurchase agreement (including accrued interest). If the seller of the agreement defaults on its obligation to repurchase the underlying securities at a time when the fair value of these securities has declined, the Fund may incur a loss upon disposition of the securities. |
| | |
| (k) | Reverse Repurchase Agreements–The Fund may enter into reverse repurchase agreements. In a reverse repurchase agreement, the Fund sells a security to a securities dealer or bank for cash and also agrees to repurchase the same security later at a set price. Reverse repurchase agreements expose the Fund to credit risk (that is, the risk that the counterparty will fail to resell the security to the Fund). Engaging in reverse repurchase agreements also may involve the use of leverage, in that the Fund may reinvest the cash it receives in additional securities. Reverse repurchase agreements involve the risk that the market value of the securities to be repurchased by the Fund may decline below the repurchase price. |
| | |
| (l) | Credit Default Swaps–The Fund may enter into credit default swap contracts in order to hedge credit risk or for speculation purposes. As a seller of a credit default swap contract (“seller of protection”), the Fund is required to pay the notional amount or other agreed-upon value of a referenced debt obligation to the counterparty in the event of a default by or other credit event involving the referenced issuer, obligation or index. In return, the Fund receives from the counterparty a periodic stream of payments over the term of the contract. |
| | |
| | As a purchaser of a credit default swap contract (“buyer of protection”), the Fund would receive the notional amount or other agreed upon value of a referenced debt obligation from the counterparty in the event of default by or other credit event involving the referenced issuer, obligation or index. In return, the Fund would make periodic payments to the counterparty over the term of the contracts, provided no event of default has occurred. |
| | |
| | These credit default swaps may have as a reference obligation corporate or sovereign issuers or credit indices. These credit indices are comprised of a basket of securities representing a particular sector of the market. During the period, Emerging Markets Currency Fund entered into credit default swaps based on CMBX indices, which are comprised of commercial mortgage-backed securities. |
| | |
| | Credit default swaps are fair valued based upon quotations from counterparties, brokers or market-makers and the change in value, if any, is recorded as an unrealized appreciation or depreciation. For a credit default swap sold by the Fund, payment of the agreed-upon amount made by the Fund in the event of default of the referenced debt obligation is recorded as the cost of the referenced debt obligation purchased/received. For a credit default swap purchased by the Fund, the agreed-upon amount received by the Fund in the event of default of the referenced debt obligation is recorded as proceeds from sale/delivery of the referenced debt obligation and the resulting gain or loss realized on the referenced debt obligation is recorded as such by the Fund. |
| | |
| | Any upfront payments made or received upon entering a credit default swap contract would be amortized or accreted over the life of the swap and recorded as realized gains or losses. Collateral, in the form of cash or securities, may be required to be held in segregated accounts with the custodian bank or broker in accordance with the swap agreement. The value and credit rating of each credit default swap where the Fund is the seller of protection, are both measures of the current payment/performance risk of the swap. As the value of the swap changes as a positive or negative percentage of the total notional amount, the |
51
Notes to Financial Statements (continued)
| | payment/performance risk may decrease or increase, respectively. The maximum potential amount of future payments (undiscounted) that the Fund as a seller of protection could be required to make under a credit default swap agreement would be an amount equal to the notional amount of the agreement. These potential amounts would be partially offset by any recovery values of the respective referenced obligations, upfront payments received upon entering into the agreement, or net amounts received from the settlement of buy protection credit default swap agreements entered into by the Fund for the same referenced entity or entities. |
| | |
| | Entering into credit default swaps involves credit and market risk. Such risks involve the possibility that there will be no liquid market for these agreements, that the counterparty to the agreements may default on its obligation to perform or disagree as to the meaning of the contractual terms in the agreements, and that there may be unfavorable changes in interest rates, and that Lord Abbett does not correctly predict the creditworthiness of the issuers of the reference obligation on which the credit default swap is based. |
| | |
| (m) | Floating Rate Loans–The Fund may invest in floating rate loans, which usually take the form of loan participations and assignments. Loan participations and assignments are agreements to make money available to U.S. or foreign corporations, partnerships or other business entities (the “Borrower”) in a specified amount, at a specified rate and within a specified time. A loan is typically originated, negotiated and structured by a U.S. or foreign bank, insurance company or other financial institution (the “Agent”) for a group of loan investors (“Loan Investors”). The Agent typically administers and enforces the loan on behalf of the other Loan Investors in the syndicate and may hold any collateral on behalf of the Loan Investors. Such loan participations and assignments are typically senior, secured and collateralized in nature. The Fund records an investment when the Borrower withdraws money and records interest as earned. These loans pay interest at rates which are periodically reset by reference to a base lending rate plus a spread. These base lending rates are generally the prime rate offered by a designated U.S. bank or London InterBank Offered Rate (“LIBOR”). |
| | |
| | The loans in which the Fund invests may be subject to some restrictions on resale. For example, the Fund may be contractually obligated to receive approval from the Agent and/or Borrower prior to the sale of these investments. The Fund generally has no right to enforce compliance with the terms of the loan agreement with the Borrower. As a result, the Fund assumes the credit risk of the Borrower, the selling participant and any other persons interpositioned between the Fund and the Borrower (“Intermediate Participants”). In the event that the Borrower, selling participant or Intermediate Participants become insolvent or enter into bankruptcy, the Fund may incur certain costs and delays in realizing payment or may suffer a loss of principal and/or interest. |
| | |
| | Unfunded commitments represent the remaining obligation of the Fund to the Borrower. At any point in time, up to the maturity date of the issue, the Borrower may demand the unfunded portion. Until demanded by the Borrower, unfunded commitments are not recognized as an asset on the Statement of Assets and Liabilities. Unrealized appreciation/depreciation on unfunded commitments presented on the Statement of Assets and Liabilities represents mark to market of the unfunded portion of the Fund’s floating rate notes. As of December 31, 2015, the Fund had no unfunded loan commitment. |
| | |
| (n) | Fair Value Measurements–Fair value is defined as the price that the Fund would receive upon selling an investment or transferring a liability in an orderly transaction to an |
52
Notes to Financial Statements (continued)
| | independent buyer in the principal or most advantageous market of the investment. A three-tier hierarchy is used to maximize the use of observable market data and minimize the use of unobservable inputs and to establish classification of fair value measurements for disclosure purposes. Inputs refer broadly to the assumptions that market participants would use in pricing the asset or liability, including assumptions about risk - for example, the risk inherent in a particular valuation technique used to measure fair value (such as a pricing model) and/or the risk inherent in the inputs to the valuation technique. Inputs may be observable or unobservable. Observable inputs reflect the assumptions market participants would use in pricing the asset or liability. Observable inputs are based on market data obtained from sources independent of the reporting entity. Unobservable inputs reflect the reporting entity’s own assumptions about the assumptions market participants would use in pricing the asset or liability. Unobservable inputs are based on the best information available in the circumstances. The three-tier hierarchy of inputs is summarized in the three broad Levels listed below: |
| | |
| • | Level 1 – | unadjusted quoted prices in active markets for identical investments; |
| | | |
| • | Level 2 – | other significant observable inputs (including quoted prices for similar investments, interest rates, prepayment speeds, credit risk, etc.); and |
| | | |
| • | Level 3 – | significant unobservable inputs (including the Fund’s own assumptions in determining the fair value of investments). |
| | | |
| | A summary of inputs used in valuing the Fund’s investments and other financial instruments as of December 31, 2015 and, if applicable, Level 1/Level 2 transfers and Level 3 rollforwards for the fiscal year then ended is included in the Fund’s Schedule of Investments. |
| | |
| | Changes in valuation techniques may result in transfers into or out of an assigned level within the three-tier hierarchy. All transfers between different levels within the three-tier hierarchy are deemed to have occurred as of the beginning of the reporting period. The inputs or methodology used for valuing securities are not necessarily an indication of the risk associated with investing in those securities. |
| | |
| 3. | MANAGEMENT FEE AND OTHER TRANSACTIONS WITH AFFILIATES |
Management Fee
The Company has a management agreement with Lord Abbett, pursuant to which Lord Abbett supplies the Fund with investment management services and executive and other personnel, provides office space and pays for ordinary and necessary office and clerical expenses relating to research and statistical work and supervision of the Fund’s investment portfolio.
The management fee is based on the Fund’s average daily net assets at the following annual rate:
| First $1 billion | .50% |
| Over $1 billion | .45% |
For the fiscal year ended December 31, 2015, the effective management fee, net of waivers, was at an annualized rate of .46% of the Fund’s average daily net assets.
In addition, Lord Abbett provides certain administrative services to the Fund pursuant to an Administrative Services Agreement in return for a fee at an annual rate of .04% of the Fund’s average daily net assets.
During the fiscal year ended December 31, 2015 and continuing through April 30, 2016, Lord Abbett has contractually agreed to waive its fees and reimburse expenses to the extent necessary
53
Notes to Financial Statements (continued)
to limit total net annual operating expenses to an annual rate of .90%. This agreement may be terminated only upon the approval of the Board.
The Company, on behalf of the Fund, has entered into services arrangements with certain insurance companies. Under these arrangements, certain insurance companies will be compensated up to .25% of the average daily NAV of the Fund’s Class VC Shares held in the insurance company’s separate account to service and maintain the Variable Contract owners’ accounts. This amount is included in Non 12b-1 service fees on the Statement of Operations. The Fund may also compensate certain insurance companies, third-party administrators and other entities for providing recordkeeping, sub-transfer agency and other administrative services to the Fund. This amount is included in Shareholder servicing on the Statement of Operations.
A Director and certain of the Company’s officers have an interest in Lord Abbett.
| 4. | DISTRIBUTIONS AND CAPITAL LOSS CARRYFORWARDS |
Dividends from net investment income, if any, are declared and paid at least semi-annually. Taxable net realized gains from investment transactions, reduced by allowable capital loss carryforwards, if any, are declared and distributed to shareholders at least annually. The capital loss carryforward amount, if any, is available to offset future net capital gains. Dividends and distributions to shareholders are recorded on the ex-dividend date. The amounts of dividends and distributions from net investment income and net realized capital gains are determined in accordance with federal income tax regulations, which may differ from U.S. GAAP. These book/tax differences are either considered temporary or permanent in nature. To the extent these differences are permanent in nature, such amounts are reclassified within the components of net assets based on their federal tax basis treatment; temporary differences do not require reclassification. Dividends and distributions that exceed earnings and profits for tax purposes are reported as a tax return of capital.
The tax character of distributions paid during the fiscal years ended December 31, 2015 and 2014 was as follows:
| | | Year Ended | | | Year Ended |
| | | 12/31/2015 | | | 12/31/2014 |
| Distributions paid from: | | | | | | | |
| Ordinary income | | $ | 41,858,433 | | | $ | 45,882,170 |
| Net long-term capital gains | | | 5,541,865 | | | | 21,841,927 |
| Total distributions paid | | $ | 47,400,298 | | | $ | 67,724,097 |
As of December 31, 2015, the components of accumulated losses on a tax-basis were as follows:
| Undistributed ordinary income – net | | $ | 108,346 | |
| Total undistributed earnings | | | 108,346 | |
| Capital loss carryforwards* | | | (6,142,008 | ) |
| Temporary differences | | | (9,952,714 | ) |
| Unrealized losses – net | | | (35,617,446 | ) |
| Total accumulated losses – net | | $ | (51,603,822 | ) |
| * | The capital losses will carryforward indefinitely. |
At the Fund’s election, certain losses incurred within the taxable year (Qualified Late-Year Losses) are deemed to arise on the first business day of the Fund’s next taxable year. The Fund incurred and will elect to post-October capital losses of $9,835,002 during fiscal year 2015.
54
Notes to Financial Statements (continued)
As of December 31, 2015, the aggregate unrealized security gains and losses based on cost for U.S. federal income tax purposes were as follows:
| Tax cost | | $ | 1,002,993,441 | |
| Gross unrealized gain | | | 16,590,754 | |
| Gross unrealized loss | | | (52,052,780 | ) |
| Net unrealized security loss | | $ | (35,462,026 | ) |
The difference between book-basis and tax-basis unrealized gains (losses) is attributable to the tax treatment of certain securities, premium amortization and wash sales.
Permanent items identified during the fiscal year ended December 31, 2015 have been reclassified among the components of net assets based on their tax basis treatment as follows:
| Distributions in | | | |
| Excess of Net | | | |
| Investment | | Accumulated Net | |
| Income | | Realized Loss | |
| $2,631,497 | | $(2,631,497 | ) |
The permanent differences are attributable to the tax treatment of premium amortization, principal paydown gains and losses, certain securities, certain distributions and foreign currency transactions.
| 5. | PORTFOLIO SECURITIES TRANSACTIONS |
Purchases and sales of investment securities (excluding short-term investments) for the fiscal year ended December 31, 2015 were as follows:
| U.S. | Non-U.S. | U.S. | Non-U.S. |
| Government | Government | Government | Government |
| Purchases* | Purchases | Sales | Sales |
| $166,043,425 | $1,006,838,829 | $212,812,535 | $880,369,342 |
| | |
| * | Includes U.S. Government sponsored enterprises securities. |
The Fund is permitted to purchase and sell securities (“cross-trade”) from and to other Lord Abbett Funds or client accounts pursuant to procedures approved by the Board in compliance with Rule 17a-7 under the Act (the “Rule”). Each cross-trade is executed at a fair market price in compliance with provisions of the Rule. For the year ended December 31, 2015, the Fund engaged in cross-trade purchases of $582,826 and sales of $14,693,595, which resulted in net realized gains of $137,006.
| 6. | DISCLOSURES ABOUT DERIVATIVE INSTRUMENTS AND HEDGING ACTIVITIES |
The Fund entered into forward foreign currency exchange contracts for the fiscal year ended December 31, 2015 (as described in note 2(g)). A forward foreign currency exchange contract reduces the Fund’s exposure to changes in the value of the currency it will deliver (or settle in cash) and increases its exposure to changes in the value of the currency it will receive (or settle in cash) for the duration of the contract. The Fund’s use of forward foreign currency exchange contracts involves the risk that Lord Abbett will not accurately predict currency movements, and the Fund’s returns could be reduced as a result. Forward foreign currency exchange contracts are subject to the risk that those currencies will decline in value relative to the U.S. dollar, or, in the case of hedged positions, that the U.S. dollar will decline relative to the currency being hedged. Currency
55
Notes to Financial Statements (continued)
rates in foreign countries may fluctuate significantly over short periods of time. The Fund’s risk of loss from counterparty credit risk is the unrealized appreciation on forward foreign currency exchange contracts and deposits with brokers as collateral.
The Fund entered into U.S. Treasury futures contracts for the fiscal year ended December 31, 2015 (as described in note 2(h)) to economically hedge against changes in interest rates. The Fund bears the risk of interest rates moving unexpectedly, in which case the Fund may not achieve the anticipated benefits of the futures contracts and realize a loss. There is minimal counterparty credit risk to the Fund since futures are exchange traded and the exchange’s clearinghouse, as counterparty to all exchange traded futures, guarantees futures against default.
The Fund entered into credit default swaps for the fiscal year ended December 31, 2015 (as described in note 2(l)) to economically hedge credit risk. Credit default swaps involve the exchange of a fixed rate premium for protection against the loss in value of an underlying security within the index in the event of a defined credit event, such as payment default or bankruptcy. Under a credit default swap one party acts as a guarantor by receiving the fixed periodic payment in exchange for the commitment to purchase the underlying security at par if the defined credit event occurs. The Fund’s maximum risk of loss from counterparty risk, either as the protection seller or as the protection buyer, is the fair value of the contract.
As of December 31, 2015, the Fund had the following derivatives at fair value, grouped into appropriate risk categories that illustrate the Fund’s use of derivative instruments:
| | | | | | Foreign | | | |
| | | Interest Rate | | | Currency | | | Credit |
| Asset Derivatives | | Contracts | | | Contracts | | | Contracts |
| Forward Foreign Currency Exchange Contracts(1) | | | – | | | | $196,602 | | | | – |
| Futures Contracts(2) | | | $217,682 | | | | – | | | | – |
| | | | | | | | | | | | |
| Liability Derivatives | | | | | | | | | | | |
| Credit Default Swaps(3) | | | – | | | | – | | | | $232,010 |
| Forward Foreign Currency Exchange Contracts(4) | | | – | | | | $ 59,555 | | | | – |
| Futures Contracts(2) | | | $276,292 | | | | – | | | | – |
| | |
| (1) | Statements of Assets and Liabilities location: Unrealized appreciation on forward foreign currency exchange contracts. |
| (2) | Statements of Assets and Liabilities location: Includes cumulative unrealized appreciation/depreciation of futures contracts as reported in the Schedule of Investments. Only current day’s variation margin is reported within the Statements of Assets and Liabilities. |
| (3) | Statements of Assets and Liabilities location: Credit default swap agreement payable, at fair value. |
| (4) | Statements of Assets and Liabilities location: Unrealized depreciation on forward foreign currency exchange contracts. |
56
Notes to Financial Statements (continued)
Transactions in derivative instruments for the fiscal year ended December 31, 2015, were as follows:
| | | | | | Foreign | | | | |
| | | Interest Rate | | | Currency | | | Credit | |
| | | Contracts | | | Contracts | | | Contracts | |
| Net Realized Gain (Loss)(1) | | | | | | | | | | | | |
| Credit Default Swaps | | | – | | | | – | | | $ | (127,538 | ) |
| Forward Foreign Currency Exchange Contracts | | | – | | | $ | 592,080 | | | | – | |
| Futures Contracts | | $ | (1,079,730 | ) | | | – | | | | – | |
| Net Change in Unrealized Appreciation/Depreciation(2) | | | | | | | | | | | | |
| Credit Default Swaps | | | – | | | | – | | | $ | (153,490 | ) |
| Forward Foreign Currency Exchange Contracts | | | – | | | $ | (19,173 | ) | | | – | |
| Futures Contracts | | $ | (110,846 | ) | | | – | | | | – | |
| Average Number of Contracts/Notional Amounts* | | | | | | | | | | | | |
| Credit Default Swaps(3) | | | – | | | | – | | | $ | 3,616,308 | |
| Forward Foreign Currency Exchange Contracts(3) | | | – | | | $ | 13,020,723 | | | | – | |
| Futures Contracts(4) | | | 929 | | | | – | | | | – | |
| | | | | | | | | | | | | |
| * | Calculated based on the number of contracts or notional amounts for the fiscal year ended December 31, 2015. |
| (1) | Statements of Operations location: Net realized loss on futures contracts, swaps and foreign currency related transactions. |
| (2) | Statements of Operations location: Net change in unrealized appreciation/depreciation on futures contracts, swaps and translation of assets and liabilities denominated in foreign currencies. |
| (3) | Amount represents notional amounts in U.S. dollars. |
| (4) | Amount represents number of contracts. |
| | |
| 7. | DISCLOSURES ABOUT OFFSETTING ASSETS AND LIABILITIES |
The Financial Accounting Standards Board (“FASB”) requires disclosures intended to help better assess the effect or potential effect of offsetting arrangements on a fund’s financial position. The following tables illustrate gross and net information about recognized assets and liabilities eligible for offset in the statement of assets and liabilities; and disclose such amounts subject to an enforceable master netting agreement or similar agreement, by counterparty. A master netting agreement is an agreement between a fund and a counterparty which provides for the net settlement of amounts owed under all contracts traded under that agreement, as well as cash collateral, through a single payment by one party to the other in the event of default on or termination of any one contract. The Fund’s accounting policy with respect to balance sheet offsetting is that, absent an event of default by the counterparty or a termination of the agreement, the master netting agreement does not result in an offset of reported amounts of financial assets and liabilities in the statement of assets and liabilities across transactions between the Fund and the applicable counterparty:
| | | | | | Gross Amounts | | | Net Amounts of |
| | | | | | Offset in the | | | Assets Presented |
| | | Gross Amounts of | | | Statement of Assets | | | in the Statement of |
| Description | | Recognized Assets | | | and Liabilities | | | Assets and Liabilities |
| Forward Foreign Currency Exchange Contracts | | $ | 196,602 | | | $ | – | | | $ | 196,602 |
| Repurchase Agreement | | | 38,631,584 | | | | – | | | | 38,631,584 |
| Total | | $ | 38,828,186 | | | $ | – | | | $ | 38,828,186 |
57
Notes to Financial Statements (continued)
| | | Net Amounts | | | | | | | | | | | | |
| | | of Assets | | | Amounts Not Offset in the | | | |
| | | Presented in | | | Statement of Assets and Liabilities | | | |
| | | the Statement | | | | | | Cash | | | Securities | | | |
| | | of Assets | | | Financial | | | Collateral | | | Collateral | | | Net |
| Counterparty | | and Liabilities | | | Instruments | | | Received(a) | | | Received(a) | | | Amount(b) |
| Fixed Income Clearing Corp. | | $ | 38,631,584 | | | $ | – | | | $ | – | | | $ | (38,631,584 | ) | | $ | – |
| J.P. Morgan Chase | | | 95,456 | | | | (50,526 | ) | | | – | | | | – | | | | 44,930 |
| Standard Chartered Bank | | | 100,146 | | | | – | | | | – | | | | – | | | | 100,146 |
| State Street Bank and Trust | | | 1,000 | | | | – | | | | – | | | | – | | | | 1,000 |
| Total | | $ | 38,828,186 | | | $ | (50,526 | ) | | $ | – | | | $ | (38,631,584 | ) | | $ | 146,076 |
| | | | | | Gross Amounts | | | Net Amounts of |
| | | | | | Offset in the | | | Liabilities Presented |
| | | Gross Amounts of | | | Statement of Assets | | | in the Statement of |
| Description | | Recognized Liabilities | | | and Liabilities | | | Assets and Liabilities |
| Credit Default Swap Contracts | | $ | 232,010 | | | $ | – | | | $ | 232,010 |
| Forward Foreign Currency Exchange Contracts | | | 59,555 | | | | – | | | | 59,555 |
| Total | | $ | 291,565 | | | $ | – | | | $ | 291,565 |
| | | Net Amounts | | | | | | | | | | | | |
| | | of Liabilities | | | Amounts Not Offset in the | | | |
| | | Presented in | | | Statement of Assets and Liabilities | | | |
| | | the Statement | | | | | | Cash | | | Securities | | | |
| | | of Assets and | | | Financial | | | Collateral | | | Collateral | | | Net |
| Counterparty | | Liabilities | | | Instruments | | | Pledged(a) | | | Pledged(a) | | | Amount(c) |
| Barclays Bank plc | | $ | 232,010 | | | $ | – | | | $ | – | | | $ | – | | | $ | 232,010 |
| J.P. Morgan Chase | | | 50,526 | | | | (50,526 | ) | | | – | | | | – | | | | – |
| Morgan Stanley | | | 9,029 | | | | – | | | | – | | | | – | | | | 9,029 |
| Total | | $ | 291,565 | | | $ | (50,526 | ) | | $ | – | | | $ | – | | | $ | 241,039 |
| | |
| (a) | Collateral disclosed is limited to an amount not to exceed 100% of the net amount of assets (liabilities) presented in the Statement of Assets and Liabilities, for each respective counterparty. |
| (b) | Net amount represents the amount owed to the Fund by the counterparty as of December 31, 2015. |
| (c) | Net amount represents the amount owed by the Fund by the counterparty as of December 31, 2015. |
| | |
| 8. | DIRECTORS’ REMUNERATION |
The Company’s officers and a Director, who are associated with Lord Abbett, do not receive any compensation from the Company for serving in such capacities. Independent Directors’ fees are allocated among all Lord Abbett-sponsored funds based on the net assets of each fund. There is an equity-based plan available to all Independent Directors under which Independent Directors must defer receipt of a portion of, and may elect to defer receipt of an additional portion of Directors’ fees. The deferred amounts are treated as though equivalent dollar amounts had been invested in the funds. Such amounts and earnings accrued thereon are included in Directors’ fees on the Statement of Operations and in Directors’ fees payable on the Statement of Assets and Liabilities and are not deductible for U.S. federal income tax purposes until such amounts are paid.
The Company has entered into an arrangement with its transfer agent and custodian, whereby credits realized as a result of uninvested cash balances are used to reduce a portion of the Fund’s expenses.
58
Notes to Financial Statements (continued)
Effective August 31, 2015, the Fund and certain other funds managed by Lord Abbett (collectively, the “Participating Funds”) entered into a syndicated line of credit facility with various lenders for $550 million (the “Facility”), whereas State Street Bank and Trust Company (“SSB”) participates as a lender and as agent for the lenders. The Facility is to be used for temporary or emergency purposes as an additional source of: liquidity to satisfy redemptions. The Participating Funds are subject to graduated borrowing limits of one-third of Fund assets (if Fund assets are less than $750 million), $250 million, $300 million, or $350 million, based on past borrowings and likelihood of future borrowings. The Facility will continue through August 29, 2016.
Prior to August 31, 2015, the Fund and certain other funds managed by Lord Abbett participated in a $500 million unsecured revolving credit facility with SSB (the “SSB Facility”).
During the fiscal year ended December 31, 2015, the Fund did not utilize the Facility or the SSB Facility.
| 11. | CUSTODIAN AND ACCOUNTING AGENT |
SSB is the Company’s custodian and accounting agent. SSB performs custodial, accounting and recordkeeping functions relating to portfolio transactions and calculating the Fund’s NAV.
The Fund is subject to the general risks and considerations associated with investing in debt securities. The value of an investment will change as interest rates fluctuate and in response to market movements. When interest rates rise, the prices of debt securities are likely to decline; when rates fall, such prices tend to rise. Longer-term debt securities are usually more sensitive to interest rate changes. There is also the risk that an issuer of a debt security will fail to make timely payments of principal or interest to the Fund, a risk that is greater with high-yield securities (sometimes called “lower-rated bonds” or “junk bonds”) in which the Fund may substantially invest. Some issuers, particularly of high-yield securities, may default as to principal and/or interest payments after the Fund purchases its securities. A default, or concerns in the market about an increase in risk of default, may result in losses to the Fund. High-yield securities are subject to greater price fluctuations, as well as additional risks.
The mortgage-related securities in which the Fund may invest may be particularly sensitive to changes in prevailing interest rates and economic conditions, including delinquencies and/or defaults. These changes can affect the value, income and/or liquidity of such positions. When interest rates are declining, the value of these securities with prepayment features may not increase as much as other fixed income securities. Early principal repayment may deprive the Fund of income payments above current market rates. Alternatively, rising interest rates may cause prepayments to occur at a slower-than-expected rate, extending the duration of a security and typically reducing its value. The payment rate will thus affect the price and volatility of a mortgage-related security. In addition, while securities of government sponsored enterprises are guaranteed with respect to the timely payment of interest and principal by the particular enterprise involved, they are not guaranteed by the U.S. Government. In addition, the Fund may invest in non-agency asset backed and mortgage-related securities, which are issued by private institutions, not by government sponsored enterprises.
59
Notes to Financial Statements (concluded)
The Fund may invest up to 20% of its net assets in equity securities, the value of which fluctuates in response to movements in the equity securities market in general and to the changing prospects of individual companies in which the Fund invests.
The Fund may invest in convertible securities, which have both equity and fixed income risk characteristics. Generally, convertible securities offer lower interest or dividend yields than non-convertible securities of similar quality and less potential for gains or capital appreciation in a rising equity securities market than equity securities. They tend to be more volatile than other fixed income securities, and the market for convertible securities may be less liquid than the markets for stocks or bonds. A significant portion of convertible securities have below investment grade credit ratings and are subject to increased credit and liquidity risks.
Due to the Fund’s investment exposure to foreign companies and American Depositary Receipts, the Fund may experience increased market, liquidity, currency, political, information and other risks.
The Fund is subject to the risks associated with derivatives, which may be different from and greater than the risks associated with directly investing in securities. Derivatives may be subject to risks such as liquidity risk, leveraging risk, interest rate risk, market risk, and credit risk. Illiquid securities may lower the Fund’s returns since the Fund may be unable to sell these securities at their desired time or price. Derivatives also may involve the risk of mispricing or improper valuation and the risk that changes in the value of the derivative may not correlate perfectly with the value of the underlying asset, rate or index. Whether the Fund’s use of derivatives is successful will depend on, among other things, the Fund’s ability to correctly forecast market movements and other factors. If the Fund incorrectly forecasts these and other factors, the Fund’s performance could suffer. The Fund’s use of derivatives could result in a loss exceeding the amount of the Fund’s investment in these instruments.
The Fund may invest up to 15% of its net assets in floating rate or adjustable rate senior loans, including bridge loans, novations, assignments, and participations, which are subject to increased credit and liquidity risks. Senior loans are business loans made to borrowers that may be U.S. or foreign corporations, partnerships or other business entities.
These factors can affect the Fund’s performance.
| 13. | SUMMARY OF CAPITAL TRANSACTIONS |
Transactions in shares of capital stock were as follows:
| | | Year Ended | | | Year Ended | |
| | | December 31, 2015 | | | December 31, 2014 | |
| Shares sold | | | 26,681,576 | | | | 15,093,734 | |
| Reinvestment of distributions | | | 4,222,649 | | | | 5,690,428 | |
| Shares reacquired | | | (19,894,485 | ) | | | (13,921,574 | ) |
| Increase | | | 11,009,740 | | | | 6,862,588 | |
60
Report of Independent Registered Public Accounting Firm
To the Board of Directors of Lord Abbett Series Fund, Inc. and the Shareholders of Bond-Debenture Portfolio:
We have audited the accompanying statement of assets and liabilities, including the schedule of investments, of the Bond-Debenture Portfolio, one of the portfolios constituting the Lord Abbett Series Fund, Inc. (the “Fund”) as of December 31, 2015, and the related statement of operations for the year then ended, the statements of changes in net assets for each of the two years in the period then ended, and the financial highlights for each of the five years in the period then ended. These financial statements and financial highlights are the responsibility of the Fund’s management. Our responsibility is to express an opinion on these financial statements and financial highlights based on our audits.
We conducted our audits in accordance with the standards of the Public Company Accounting Oversight Board (United States). Those standards require that we plan and perform the audit to obtain reasonable assurance about whether the financial statements and financial highlights are free of material misstatement. The Fund is not required to have, nor were we engaged to perform, an audit of its internal control over financial reporting. Our audits included consideration of internal control over financial reporting as a basis for designing audit procedures that are appropriate in the circumstances, but not for the purpose of expressing an opinion on the effectiveness of the Fund’s internal control over financial reporting. Accordingly, we express no such opinion. An audit also includes examining, on a test basis, evidence supporting the amounts and disclosures in the financial statements, assessing the accounting principles used and significant estimates made by management, as well as evaluating the overall financial statement presentation. Our procedures included confirmation of securities owned as of December 31, 2015, by correspondence with the custodian, brokers, and agent banks; when replies were not received from brokers and agent banks, we performed other auditing procedures. We believe that our audits provide a reasonable basis for our opinion.
In our opinion, such financial statements and financial highlights referred to above present fairly, in all material respects, the financial position of Bond-Debenture Portfolio of the Lord Abbett Series Fund, Inc. as of December 31, 2015, the results of its operations for the year then ended, the changes in its net assets for each of the two years in the period then ended, and the financial highlights for each of the five years in the period then ended, in conformity with accounting principles generally accepted in the United States of America.
DELOITTE & TOUCHE LLP
New York, New York
February 16, 2016
61
Supplemental Proxy Information (unaudited)
A special meeting of shareholders of Bond Debenture Portfolio was held on November 5, 2015. The special meeting was held for shareholders of the Fund to vote on the following matters:
| | 1. | To amend the Fund’s fundamental restrictions related to borrowing and lending to enable the Fund to participate in an interfund lending program; and |
| | | |
| | 2. | To ratify the selection of Deloitte & Touche LLP as independent registered public accounting firm for the Fund’s current fiscal year. |
The results of the proxy solicitation on the preceding matter were as follows:
| 1. | To approve the amendment to the fundamental investment restrictions of the Fund as described in the proxy statement: |
| | (a) | Amend the fundamental investment restriction with respect to Borrowing |
| | | | | Broker |
| | Votes For | Votes Against | Abstain | Non-Votes |
| Bond Debenture Portfolio | 69,263,818 | 3,661,507 | 5,045,708 | 0 |
| 1. | To approve the amendment to the fundamental investment restrictions of the Fund as described in the proxy statement: |
| | (b) | Amend the fundamental investment restriction with respect to Lending |
| | | | | Broker |
| | Votes For | Votes Against | Abstain | Non-Votes |
| Bond Debenture Portfolio | 69,233,160 | 3,660,369 | 5,077,504 | 0 |
| 2. | To ratify the selection of Deloitte & Touche LLP as the Fund’s independent registered public accounting firm for the Fund’s current fiscal year |
| | | | | Broker |
| | Votes For | Votes Against | Abstain | Non-Votes |
| Bond Debenture Portfolio | 71,795,360 | 1,634,973 | 4,540,700 | – |
62
Basic Information About Management
The Board is responsible for the management of the business and affairs of the Company in accordance with the laws of the State of Maryland. The Board elects officers who are responsible for the day-to-day operations of the Fund and who execute policies authorized by the Board. The Board also approves an investment adviser to the Fund and continues to monitor the cost and quality of the services the investment adviser provides, and annually considers whether to renew the contract with the adviser. Generally, each Director holds office until his/her successor is elected and qualified or until his/her earlier resignation or removal, as provided in the Company’s organizational documents.
Lord Abbett, a Delaware limited liability company, is the Fund’s investment adviser. Designated Lord Abbett personnel are responsible for the day-to-day management of the Fund.
Interested Director
Ms. Foster is affiliated with Lord Abbett and is an “interested person” of the Company as defined in the Act. Ms. Foster is a director/trustee and officer of each of the 12 investment companies in the Lord Abbett Family of Funds, which consist of 58 portfolios or series.
| | | Current Position and | | |
| Name, Address and | | Length of Service | | Principal Occupation and Other Directorships |
| Year of Birth | | with the Fund | | During the Past Five Years |
| | | | | |
Daria L. Foster
Lord, Abbett & Co. LLC
90 Hudson Street
Jersey City, NJ 07302
(1954) | | Director and President since 2006; Chief Executive Officer since 2012 | | Principal Occupation: Managing Partner of Lord Abbett, joined Lord Abbett in 1990.
Other Directorships: None. |
Independent Directors
The following Independent Directors also are directors/trustees of each of the 12 investment companies in the Lord Abbett Family of Funds, which consist of 58 portfolios or series.
| | | Current Position and | | |
| Name, Address and | | Length of Service | | Principal Occupation and Other Directorships |
| Year of Birth | | with the Fund | | During the Past Five Years |
| | | | | |
E. Thayer Bigelow
Lord, Abbett & Co. LLC
c/o Legal Dept.
90 Hudson Street
Jersey City, NJ 07302
(1941) | | Director since 1994;
Chairman since 2013 | | Principal Occupation: Managing General Partner, Bigelow Media, LLC (since 2000); Senior Adviser, Time Warner Inc. (1998–2000).
Other Directorships: Currently serves as director of Crane Co. (since 1984) and Huttig Building Products Inc. (since 1998). Previously served as a director of R.H. Donnelley Inc. (2009–2010). |
| | | | | |
Robert B. Calhoun, Jr.
Lord, Abbett & Co. LLC
c/o Legal Dept.
90 Hudson Street
Jersey City, NJ 07302
(1942) | | Director since 1998 | | Principal Occupation: Senior Advisor of Monitor Clipper Partners, a private equity investment fund (since 1997); President of Clipper Asset Management Corp. (1991–2009).
Other Directorships: None. |
63
Basic Information About Management (continued)
| | | Current Position and | | |
| Name, Address and | | Length of Service | | Principal Occupation and Other Directorships |
| Year of Birth | | with the Fund | | During the Past Five Years |
| | | | | |
Eric C. Fast
Lord, Abbett & Co. LLC
c/o Legal Dept.
90 Hudson Street
Jersey City, NJ 07302
(1949) | | Director since 2014 | | Principal Occupation: Chief Executive Officer of Crane Co., an industrial products company (2001–2014).
Other Directorships: Currently serves as director of Automatic Data Processing, Inc. (since 2007) and Regions Financial Corporation (since 2010). Previously served as a director of Crane Co. (1999–2014). |
| | | | | |
Evelyn E. Guernsey
Lord, Abbett & Co. LLC
c/o Legal Dept.
90 Hudson Street
Jersey City, NJ 07302
(1955) | | Director since 2011 | | Principal Occupation: CEO, Americas of J.P. Morgan Asset Management (2004–2010).
Other Directorships: None. |
| | | | | |
Julie A. Hill
Lord, Abbett & Co. LLC
c/o Legal Dept.
90 Hudson Street
Jersey City, NJ 07302
(1946) | | Director since 2004 | | Principal Occupation: Owner and CEO of The Hill Company, a business consulting firm (since 1998).
Other Directorships: Currently serves as director of Anthem, Inc., a health benefits company (since 1994). |
| | | | | |
Franklin W. Hobbs
Lord, Abbett & Co. LLC
c/o Legal Dept.
90 Hudson Street
Jersey City, NJ 07302
(1947) | | Director since 2001 | | Principal Occupation: Advisor of One Equity Partners, a private equity firm (since 2004).
Other Directorships: Currently serves as director and Chairman of the Board of Ally Financial Inc., a financial services firm (since 2009), and as director of Molson Coors Brewing Company (since 2002). |
| | | | | |
James M. McTaggart
Lord, Abbett & Co. LLC
c/o Legal Dept.
90 Hudson Street
Jersey City, NJ 07302
(1947) | | Director since 2012 | | Principal Occupation: Independent management advisor and consultant (since 2012); Vice President, CRA International, Inc. (doing business as Charles River Associates), a global management consulting firm (2009–2012); Founder and Chairman of Marakon Associates, Inc., a strategy consulting firm (1978–2009); and Officer and Director of Trinsum Group, a holding company (2007–2009).
Other Directorships: Currently serves as director of Blyth, Inc., a home products company (since 2004). |
| | | | | |
James L.L. Tullis
Lord, Abbett & Co. LLC
c/o Legal Dept.
90 Hudson Street
Jersey City, NJ 07302
(1947) | | Director since 2006 | | Principal Occupation: CEO of Tullis-Dickerson and Co. Inc., a venture capital management firm (since 1990); CEO of Tullis Health Investors Inc. (since 2012).
Other Directorships: Currently serves as director of Crane Co. (since 1998). |
64
Basic Information About Management (continued)
Officers
None of the officers listed below have received compensation from the Company. All of the officers of the Company also may be officers of the other Lord Abbett Funds and maintain offices at 90 Hudson Street, Jersey City, NJ 07302. Unless otherwise indicated, the position(s) and title(s) listed under the “Principal Occupation During the Past Five Years” column indicate each officer’s position(s) and title(s) with Lord Abbett. Each officer serves for an indefinite term (i.e., until his or her death, resignation, retirement, or removal).
| | | | | Length of Service | | |
| Name and | | Current Position | | of Current | | Principal Occupation |
| Year of Birth | | with the Fund | | Position | | During the Past Five Years |
| | | | | | | |
Daria L. Foster
(1954) | | President and Chief Executive Officer | | Elected as President in 2006 and Chief Executive Officer in 2012 | | Managing Partner of Lord Abbett, joined Lord Abbett in 1990. |
| | | | | | | |
Sean J. Aurigemma
(1969) | | Executive Vice President | | Elected in 2010 | | Portfolio Manager, joined Lord Abbett in 2007. |
| | | | | | | |
Jeff D. Diamond
(1960) | | Executive Vice President | | Elected in 2008 | | Portfolio Manager, joined Lord Abbett in 2007. |
| | | | | | | |
Robert I. Gerber
(1954) | | Executive Vice President | | Elected in 2003 | | Partner and Chief Investment Officer, joined Lord Abbett in 1997. |
| | | | | | | |
Todd D. Jacobson
(1966) | | Executive Vice President | | Elected in 2005 | | Partner and Associate Director, joined Lord Abbett in 2003. |
| | | | | | | |
Robert A. Lee
(1969) | | Executive Vice President | | Elected in 2010 | | Partner and Deputy Chief Investment Officer, joined Lord Abbett in 1997. |
| | | | | | | |
Thomas B. Maher
(1967) | | Executive Vice President | | Elected in 2010 | | Partner and Portfolio Manager, joined Lord Abbett in 2003. |
| | | | | | | |
Justin C. Maurer
(1969) | | Executive Vice President | | Elected in 2010 | | Partner and Portfolio Manager, joined Lord Abbett in 2001. |
| | | | | | | |
Vincent J. McBride
(1964) | | Executive Vice President | | Elected in 2010 | | Partner and Director, joined Lord Abbett in 2003. |
| | | | | | | |
Andrew H. O’Brien
(1973) | | Executive Vice President | | Elected in 2010 | | Partner and Portfolio Manager, joined Lord Abbett in 1998. |
| | | | | | | |
F. Thomas O’Halloran, III
(1955) | | Executive Vice President | | Elected in 2010 | | Partner and Portfolio Manager, joined Lord Abbett in 2001. |
| | | | | | | |
Walter H. Prahl
(1958) | | Executive Vice President | | Elected in 2012 | | Partner and Director, joined Lord Abbett in 1997. |
| | | | | | | |
Steven F. Rocco
(1979) | | Executive Vice President | | Elected in 2014 | | Partner and Portfolio Manager, joined Lord Abbett in 2004. |
| | | | | | | |
Frederick J. Ruvkun
(1957) | | Executive Vice President | | Elected in 2012 | | Partner and Portfolio Manager, joined Lord Abbett in 2006. |
65
Basic Information About Management (continued)
| | | | | Length of Service | | |
| Name and | | Current Position | | of Current | | Principal Occupation |
| Year of Birth | | with the Fund | | Position | | During the Past Five Years |
| | | | | | | |
Paul J. Volovich
(1973) | | Executive Vice President | | Elected in 2005 | | Partner and Portfolio Manager, joined Lord Abbett in 1997. |
| | | | | | | |
A. Edward Allinson
(1961) | | Vice President | | Elected in 2011 | | Portfolio Manager, joined Lord Abbett in 2005. |
| | | | | | | |
John W. Ashbrook
(1964) | | Vice President and Assistant Secretary | | Elected in 2014 | | Assistant General Counsel, joined Lord Abbett in 2008. |
| | | | | | | |
Joan A. Binstock
(1954) | | Chief Financial Officer and Vice President | | Elected in 1999 | | Partner and Chief Financial and Operations Officer, joined Lord Abbett in 1999. |
| | | | | | | |
Brooke A. Fapohunda
(1975) | | Vice President and Assistant Secretary | | Elected in 2014 | | Deputy General Counsel, joined Lord Abbett in 2006. |
| | | | | | | |
John K. Forst
(1960) | | Vice President and Assistant Secretary | | Elected in 2005 | | Partner and Deputy General Counsel, joined Lord Abbett in 2004. |
| | | | | | | |
Anthony W. Hipple
(1964) | | Vice President | | Elected in 2014 | | Portfolio Manager, joined Lord Abbett in 2002. |
| | | | | | | |
Lawrence H. Kaplan
(1957) | | Vice President and Secretary | | Elected in 1997 | | Partner and General Counsel, joined Lord Abbett in 1997. |
| | | | | | | |
Jerald M. Lanzotti
(1967) | | Vice President | | Elected in 2012 | | Partner and Portfolio Manager, joined Lord Abbett in 1996. |
| | | | | | | |
David J. Linsen
(1974) | | Vice President | | Elected in 2008 | | Partner and Director, joined Lord Abbett in 2001. |
| | | | | | | |
Joseph M. McGill
(1962) | | Chief Compliance Officer | | Elected in 2014 | | Chief Compliance Officer, joined Lord Abbett in 2014 and was formerly Managing Director and the Chief Compliance Officer at UBS Global Asset Management (2003–2013). |
| | | | | | | |
A. Edward Oberhaus, III
(1959) | | Vice President | | Elected in 1998 | | Partner and Director, joined Lord Abbett in 1983. |
| | | | | | | |
Noah Petrucci
(1970) | | Vice President | | Elected in 2013 | | Portfolio Manager, joined Lord Abbett in 2012 and was formerly a Portfolio Manager at Columbia Management Investment Advisers, LLC and Columbia Management Advisors, LLC (2002–2012). |
| | | | | | | |
Lawrence B. Stoller
(1963) | | Vice President and Assistant Secretary | | Elected in 2007 | | Partner and Senior Deputy General Counsel, joined Lord Abbett in 2007. |
66
Basic Information About Management (concluded)
| | | | | Length of Service | | |
| Name and | | Current Position | | of Current | | Principal Occupation |
| Year of Birth | | with the Fund | | Position | | During the Past Five Years |
| | | | | | | |
Arthur K. Weise
(1970) | | Vice President | | Elected in 2010 | | Partner and Portfolio Manager, joined Lord Abbett in 2007. |
| | | | | | | |
Kewjin Yuoh
(1971) | | Vice President | | Elected in 2012 | | Partner and Portfolio Manager, joined Lord Abbett in 2010. |
| | | | | | | |
Scott S. Wallner
(1955) | | AML Compliance Officer | | Elected in 2011 | | Assistant General Counsel, joined Lord Abbett in 2004. |
| | | | | | | |
Bernard J. Grzelak
(1971) | | Treasurer | | Elected in 2003 | | Partner and Director of Fund Administration, joined Lord Abbett in 2003. |
Please call 888-522-2388 for a copy of the statement of additional information, which contains further information about the Company’s Directors. It is available free upon request.
67
Approval of Advisory Contract
The Board of Directors of the Fund, including all of the Directors who are not interested persons of the Fund or of Lord Abbett (the “Independent Board Members”), annually considers whether to approve the continuation of the existing management agreement between the Fund and Lord Abbett. In connection with its most recent approval, the Board reviewed materials relating specifically to the management agreement, as well as numerous materials received throughout the course of the year, including information about the Fund’s investment performance compared to the performance of its benchmark. Before making its decision as to the Fund, the Board had the opportunity to ask questions and request further information, taking into account its familiarity with Lord Abbett gained through its meetings and discussions. These meetings and discussions included the examination of the portfolio management team conducted by members of the Contract Committee, the deliberations of the Contract Committee, and discussions between the Contract Committee and Lord Abbett’s management. The Independent Board Members also discussed the materials described above with their independent legal counsel in a private session at which no representatives of management were present.
The materials received by the Board included, but were not limited to: (1) information provided by Morningstar Associates, LLC (“Morningstar”) regarding the investment performance of the Fund compared to the investment performance of a group of funds in the same Morningstar investment category (the “performance peer group”) and the investment performance of one or more appropriate benchmarks; (2) information provided by Morningstar regarding the expense ratios, contractual and effective management fee rates, and other expense components for the Fund and one or more groups of funds in the same Morningstar category, with the same share classes and operational characteristics, including asset size (the “expense peer group”); (3) information provided by Lord Abbett on the projected expense ratios, management fee rates, and other expense components for the Fund; (4) sales and redemption information for the Fund; (5) information regarding Lord Abbett’s financial condition; (6) an analysis of the relative profitability of the management agreement to Lord Abbett; (7) information provided by Lord Abbett regarding the investment management fees Lord Abbett receives from its other advisory clients maintaining accounts with a similar investment strategy as the Fund; (8) information regarding the distribution arrangements of the Fund; and (9) information regarding the personnel and other resources devoted by Lord Abbett to managing the Fund.
Investment Management Services Generally. The Board considered the investment management services provided by Lord Abbett to the Fund, including investment research, portfolio management, and trading, and Lord Abbett’s commitment to compliance with all applicable legal requirements. The Board also observed that Lord Abbett was solely engaged in the investment management business and accordingly did not experience the conflicts of interest that may result from being engaged in other lines of business. The Board considered the investment advisory services provided by Lord Abbett to other clients, the fees charged for the services, and the differences in the nature of the services provided to the Fund and other Lord Abbett Funds, on the one hand, and the services provided to other clients, on the other.
Investment Performance. The Board reviewed the Fund’s investment performance in relation to that of the performance peer group as of various periods ended August 31, 2015. The Board observed that the Fund’s investment performance was above the median of the performance peer group for the one-year, three-year, five-year, and ten-year periods.
68
Approval of Advisory Contract (continued)
Lord Abbett’s Personnel and Methods. The Board considered the qualifications of the personnel providing investment management services to the Fund, in light of its investment objective and discipline. Among other things, the Board considered the size, experience, and turnover of Lord Abbett’s investment management staff, Lord Abbett’s investment methodology and philosophy, and Lord Abbett’s approach to recruiting, training, and retaining investment management personnel.
Nature and Quality of Other Services. The Board considered the nature, quality, costs, and extent of compliance, administrative, and other services performed by Lord Abbett and Lord Abbett Distributor LLC (the “Distributor”) and the nature and extent of Lord Abbett’s supervision of third party service providers, including the Fund’s transfer agent and custodian.
Expenses. The Board considered the expense level of the Fund and the expense levels of the expense peer group. It also considered the projected expense levels and how those levels would relate to those of the expense peer group and the amount and nature of the fees paid by shareholders. The Board observed that the overall expense level of the Fund was below the median of the expense peer group.
Profitability. The Board considered the level of Lord Abbett’s profits in managing the Fund, including a review of Lord Abbett’s methodology for allocating its costs to its management of the Fund. The Board concluded that the allocation methodology had a reasonable basis and was appropriate. It considered any profits realized by Lord Abbett in connection with the operation of the Fund, including the fee that Lord Abbett receives from the Fund for providing administrative services to the Fund, and whether the amount of profit was fair for the management of the Fund. The Board also considered the profits realized from other business segments of Lord Abbett, which may benefit from or be related to the Fund’s business. The Board considered Lord Abbett’s profit margins in comparison with available industry data, both accounting for and ignoring marketing and distribution expenses, and how those profit margins could affect Lord Abbett’s ability to recruit and retain investment personnel. The Board recognized that Lord Abbett’s profitability was a factor in enabling it to attract and retain qualified investment management personnel to provide services to the Fund. The Board concluded that Lord Abbett’s profitability as to the Fund was not excessive.
Economies of Scale. The Board considered whether there had been any economies of scale in managing the Fund, whether the Fund had appropriately benefited from any such economies of scale, and whether there was potential for realization of any further economies of scale. The Board concluded that the existing management fee schedule, with its breakpoint or breakpoints in the level of the management fee, adequately addressed any economies of scale in managing the Fund.
Other Benefits to Lord Abbett. The Board considered the character and amount of fees paid by the Fund and the Fund’s shareholders to Lord Abbett and the Distributor for services other than investment advisory services. The Board also considered the revenues and profitability of Lord Abbett’s investment advisory business apart from its mutual fund business, and the intangible benefits enjoyed by Lord Abbett by virtue of its relationship with the Fund. The Board observed that the Distributor receives 12b-1 fees from certain of the Lord Abbett Funds as to shares held in accounts for which there is no other broker of record, may retain a portion of the 12b-1 fees it receives, and receives a portion of the sales charges on sales and redemptions of some classes of shares. In addition, the Board observed that Lord Abbett accrues certain benefits for its business of providing investment advice to clients other than the Lord Abbett Funds, but that business also benefits the Funds. The Board also noted that Lord Abbett, as disclosed in the prospectus of the
69
Approval of Advisory Contract (concluded)
Fund, has entered into revenue sharing arrangements with certain entities that distribute shares of the Fund.
Alternative Arrangements. The Board considered whether, instead of approving continuation of the management agreement, it might be in the best interests of the Fund to implement one or more alternative arrangements, such as continuing to employ Lord Abbett, but on different terms. After considering all of the relevant factors, the Board unanimously found that continuation of the existing management agreement was in the best interests of the Fund and its shareholders and voted unanimously to approve the continuation of the management agreement. In considering whether to approve the continuation of the management agreement, the Board did not identify any single factor as paramount or controlling. This summary does not discuss in detail all matters considered.
70
Householding
The Company has adopted a policy that allows it to send only one copy of the Fund’s prospectus, proxy material, annual report and semiannual report to certain shareholders residing at the same “household.” This reduces Fund expenses, which benefits you and other shareholders. If you need additional copies or do not want your mailings to be “householded,” please call Lord Abbett at 888-522-2388 or send a written request with your name, the name of your fund or funds and your account number or numbers to Lord Abbett Family of Funds, P.O. Box 219336, Kansas City, MO 64121.
Proxy Voting Policies, Procedures and Records
A description of the policies and procedures that Lord Abbett uses to vote proxies related to the Fund’s portfolio securities, and information on how Lord Abbett voted the Fund’s proxies during the 12-month period ended June 30 are available without charge, upon request, (i) by calling 888-522-2388; (ii) on Lord Abbett’s Website at www.lordabbett.com; and (iii) on the Securities and Exchange Commission’s (“SEC”) Website at www.sec.gov.
Shareholder Reports and Quarterly Portfolio Disclosure
The Fund is required to file its complete schedule of portfolio holdings with the SEC for its first and third fiscal quarters on Form N-Q. Copies of the filings are available without charge, upon request on the SEC’s Website at www.sec.gov and may be available by calling Lord Abbett at 888-522-2388. You can also obtain copies of Form N-Q by visiting the SEC’s Public Reference Room in Washington, DC (information on the operation of the Public Reference Room may be obtained by calling 800-SEC-0330).
Tax Information For corporate shareholders, 2% of the Fund’s ordinary income distributions qualified for the dividends received deduction. In addition, of the distributions paid to shareholders during the fiscal year ended December 31, 2015 $759,544 and $5,541,865, respectively, represent short-term capital gains and long-term capital gains. |
71

 | | |
| | | |
| | | |
| This report, when not used for the general information of shareholders of the Fund, is to be distributed only if preceded or accompanied by a current fund prospectus. | | |
| | Lord Abbett Series Fund, Inc. | |
| Lord Abbett mutual fund shares are distributed by | | LASFBD-2 |
| LORD ABBETT DISTRIBUTOR LLC. | Bond-Debenture Portfolio | (02/16) |

2015 LORD ABBETT
ANNUAL REPORT
Lord Abbett
Series Fund—Calibrated Dividend Growth Portfolio
For the fiscal year ended December 31, 2015
Table of Contents
Lord Abbett Series Fund — Calibrated Dividend Growth Portfolio
Annual Report
For the fiscal year ended December 31, 2015

Daria L. Foster, Director, President and Chief Executive Officer of the Lord Abbett Funds, and E. Thayer Bigelow, Independent Chairman of the Lord Abbett Funds. | | Dear Shareholders: We are pleased to provide you with this overview of the performance of Lord Abbett Series Fund — Calibrated Dividend Growth Portfolio for the fiscal year ended December 31, 2015. On this page and the following pages, we discuss the major factors that influenced fiscal year performance. For additional information about the Fund, please visit our website at www.lordabbett.com, where you also can access the quarterly commentaries that provide updates on the Fund’s performance and other portfolio related updates. Thank you for investing in Lord Abbett mutual funds. We value the trust that you place in us and look forward to serving your investment needs in the years to come. Best regards,  Daria L. Foster
Director, President and Chief Executive Officer |
For the fiscal year ended December 31, 2015, the Fund returned -2.13%, reflecting performance at the net asset value (NAV) of Class VC shares, with all distributions reinvested, compared to its benchmark, the S&P 500® Index1, which returned 1.38% over the same period.
Domestic equity markets advanced over the past year, with the S&P 500 rising 1.38% during the trailing 12-month period. Despite this general move upward, there were a few periods of short-term volatility, most notably in January 2015, when the
S&P 500 declined 3.0% in total return terms, and in August 2015, when the index dropped 6.0%, its greatest monthly loss in three years. One of the prevailing market themes during the trailing 12-month period was the continued weakness in energy prices. Finally, U.S. real gross domestic product (GDP), which was initially reported to have contracted by 0.2% in the first quarter of 2015, was later revised upwards to a modest 0.6% expansion. In the second quarter of 2015, real GDP advanced 3.9%, while the third estimate
1
from the Bureau of Economic Analysis indicated that real GDP increased 2.0% in the third quarter of 2015.
Among sectors, stock selection within the information technology sector was a detractor from the Fund’s performance, relative to its benchmark, during the period. Within information technology, the largest detractor was Qualcomm, Inc., a wireless technology company. Investors showed concern that margins could be volatile given ongoing concentration issues related to Samsung and Apple and a maturing smartphone market. Also detracting from performance was an underweight position in computing company Microsoft Corp. The company continued to execute on its transition from a PC-oriented company toward one that is cloud-based.
The Fund’s stock selection within the industrials sector also detracted from relative performance. Within industrials, one large detractor was Norfolk Southern Corp., a railroad and freight transportation company. A strengthening U.S. dollar continued to place pressure on coal exports, and domestic utilities faced competition from low natural gas prices, decreasing the demand for coal. Also detracting from performance was an overweight position in Caterpillar Inc., a manufacturer of construction and mining equipment, and other heavy machinery. Caterpillar faced a challenging macro environment, given a downturn in machinery demand across Latin America, Asia, Africa, and the Middle East.
Strong stock selection and an underweight within the financials sector were the primary contributors to relative performance over the trailing 12 months. Within the financials sector, an overweight position in Assurant, Inc., a specialty insurance provider, contributed to relative performance. During the period, the company explored strategies such as the sale of its Employee Benefits and Health businesses. The Health business has experienced difficulties due to the Affordable Care Act, while the Employee Benefits business could potentially attract multiple buyers. Going forward, the company has indicated that it will focus on its niche products in the housing and lifestyle protection markets. Also contributing to performance was an overweight position in ACE Ltd., a global insurance and reinsurance company. During the period, ACE announced the acquisition of Chubb Corp.; the merger should provide economies of scale, increased client reach, and geographic diversification.
The price of oil fell considerably during the period; as such, strong stock selection and an underweight in the energy sector also contributed to performance relative to the Fund’s benchmark.
The Fund’s portfolio is actively managed and, therefore, its holdings and the weightings of a particular issuer or particular sector as a percentage of portfolio assets are subject to change. Sectors may include many industries.
2
1 The S&P 500® Index is widely regarded as the standard for measuring large cap U.S. stock market performance and includes a representative sample of leading companies in leading industries.
Unless otherwise specified, indexes reflect total return, with all dividends reinvested. Indexes are unmanaged, do not reflect the deduction of fees or expenses, and are not available for direct investment.
Important Performance and Other Information
Performance data quoted in the following pages reflect past performance and are no guarantee of future results. Current performance may be higher or lower than the performance quoted. The investment return and principal value of an investment in the Funds will fluctuate so that shares, on any given day or when redeemed, may be worth more or less than their original cost. You can obtain performance data current to the most recent month end by calling Lord Abbett at 888-522-2388 or referring to www.lordabbett.com.
During certain periods shown, expense waivers and reimbursements were in place. Without such waivers and expense reimbursements, the Fund’s returns would have been lower.
The annual commentary above discusses the views of the Fund’s management and various portfolio holdings of the Fund as of December 31, 2015. These views and portfolio holdings may have changed after this date. Information provided in the commentary is not a recommendation to buy or sell securities. Because the Fund’s portfolio is actively managed and may change significantly, the Fund may no longer own the securities described above or may have otherwise changed their positions in the securities. For more recent information about the Fund’s portfolio holdings, please visit www.lordabbett.com.
A Note about Risk: See Notes to Financial Statements for a discussion of investment risks. For a more detailed discussion of the risks associated with the Fund, please see the Fund’s prospectus.
Mutual funds are not insured by the FDIC, are not deposits or other obligations of, or guaranteed by, banks, and are subject to investment risks including possible loss of principal amount invested.
The Fund serves as an underlying investment vehicle for variable annuity contracts and variable life insurance policies.
3
Investment Comparison
Below is a comparison of a $10,000 investment in Class VC shares with the same investment in the S&P 500® Index and the S&P 900® 10-Year Dividend Growth Index, assuming reinvestment of all dividends and distributions. The Fund’s shares are sold only to insurance company separate accounts that fund certain variable annuity and variable life contracts. The line graph comparison does not reflect the sales charges or other expenses of these contracts. If those sales charges and expenses were reflected, returns would be lower. The graph and performance table below do not reflect the deduction of taxes that a shareholder would pay on Fund distributions or the redemption of Fund shares. During certain periods, expenses of the Fund have been waived or reimbursed by Lord Abbett; without such waiver or reimbursement of expenses, the Fund’s returns would have been lower. Past performance is no guarantee of future results.

The S&P 900® 10-Year Dividend Growth Index is a custom index that, along with changes in the Fund’s investment strategy, the Fund began disclosing in its prospectus effective September 27, 2012.
Average Annual Total Returns for the
Periods Ended December 31, 2015
| | | | 1 Year | | | 5 Years | | | 10 Years |
| Class VC | | | –2.13 | % | | | 9.49 | % | | | 6.87 | % |
1 Performance for the unmanaged index does not reflect transaction costs, management fees or sales charges. The performance of the index is not necessarily representative of the Fund’s performance.
2 Performance for the unmanaged index does not reflect transaction costs, management fees or sales charges. The performance of the index is not necessarily representative of the Fund’s performance. Performance for the index began on September 27, 2012.
4
Expense Example
As a shareholder of the Fund, you incur ongoing costs, including management fees; expenses related to the Fund’s services arrangements with certain insurance companies; and other Fund expenses. This Example is intended to help you understand your ongoing costs (in dollars) of investing in the Fund and to compare these costs with the ongoing costs of investing in other mutual funds.
The Example is based on an investment of $1,000 invested at the beginning of the period and held for the entire period (July 1, 2015 through December 31, 2015).
The Example reflects only expenses that are deducted from the assets of the Fund. Fees and expenses, including sales charges applicable to the various insurance products that invest in the Fund, are not reflected in this Example. If such fees and expenses were reflected in the Example, the total expenses shown would be higher. Fees and expenses regarding such variable insurance products are separately described in the prospectus related to those products.
Actual Expenses
The first line of the table on the following page provides information about actual account values and actual expenses. You may use the information in this line, together with the amount you invested, to estimate the expenses that you paid over the period. Simply divide your account value by $1,000 (for example, an $8,600 account value divided by $1,000 = 8.6), then multiply the result by the number in the first line under the heading titled “Expenses Paid During Period 7/1/15 – 12/31/15” to estimate the expenses you paid on your account during this period.
Hypothetical Example for Comparison Purposes
The second line of the table on the following page provides information about hypothetical account values and hypothetical expenses based on the Fund’s actual expense ratio and an assumed rate of return of 5% per year before expenses, which is not the Fund’s actual return. The hypothetical account values and expenses may not be used to estimate the actual ending account balance or expenses you paid for the period. You may use this information to compare the ongoing costs of investing in the Fund and other funds. To do so, compare this 5% hypothetical example with the 5% hypothetical examples that appear in the shareholder reports of the other funds.
5
Please note that the expenses shown in the table are meant to highlight your ongoing costs only and do not reflect any transactional costs, such as sales charges. Therefore, the second line of the table is useful in comparing ongoing costs only, and will not help you determine the relative total costs of owning different funds. In addition, if these transactional costs were included, your costs would have been higher.
| | | Beginning | | Ending | | Expenses |
| | | Account | | Account | | Paid During |
| | | Value | | Value | | Period† |
| | | | | | | 7/1/15 - |
| | | 7/1/15 | | 12/31/15 | | 12/31/15 |
| Class VC | | | | | | |
| Actual | | $1,000.00 | | $ 999.90 | | $4.28 |
| Hypothetical (5% Return Before Expenses) | | $1,000.00 | | $1,020.92 | | $4.33 |
| † | Net expenses are equal to the Fund’s annualized expense ratio of 0.85%, multiplied by the average account value over the period, multiplied by 184/365 (to reflect one-half year period). |
Portfolio Holdings Presented by Sector
December 31, 2015
| Sector* | %** | |
| Consumer Discretionary | 12.73 | % |
| Consumer Staples | 20.52 | % |
| Energy | 6.12 | % |
| Financials | 5.66 | % |
| Health Care | 11.15 | % |
| Industrials | 18.49 | % |
| Information Technology | 7.99 | % |
| Materials | 5.59 | % |
| Telecommunication Services | 4.62 | % |
| Utilities | 6.53 | % |
| Repurchase Agreement | 0.60 | % |
| Total | 100.00 | % |
| * | | A sector may comprise several industries. |
| ** | | Represents percent of total investments. |
6
Schedule of Investments
December 31, 2015
| | | | | | Fair | |
| | | | | | Value | |
| Investments | | Shares | | | (000) | |
| COMMON STOCKS 98.96% | | | | | | | | |
| | | | | | | | | |
| Aerospace & Defense 6.33% | | | | | | | | |
| General Dynamics Corp. | | | 11,200 | | | $ | 1,538 | |
| Lockheed Martin Corp. | | | 9,292 | | | | 2,018 | |
| Northrop Grumman Corp. | | | 6,200 | | | | 1,171 | |
| Raytheon Co. | | | 3,700 | | | | 461 | |
| United Technologies Corp. | | | 15,200 | | | | 1,460 | |
| Total | | | | | | | 6,648 | |
| | | | | | | | | |
| Air Freight & Logistics 2.69% | | | | | | | | |
| Expeditors International of Washington, Inc. | | | 9,000 | | | | 406 | |
| FedEx Corp. | | | 16,265 | | | | 2,423 | |
| Total | | | | | | | 2,829 | |
| | | | | | | | | |
| Auto Components 0.63% | | | | | | | | |
| Johnson Controls, Inc. | | | 16,800 | | | | 663 | |
| | | | | | | | | |
| Banks 0.31% | | | | | | | | |
| People’s United Financial, Inc. | | | 20,400 | | | | 329 | |
| | | | | | | | | |
| Beverages 3.15% | | | | | | | | |
| Coca-Cola Co. (The) | | | 38,168 | | | | 1,640 | |
| PepsiCo, Inc. | | | 16,724 | | | | 1,671 | |
| Total | | | | | | | 3,311 | |
| | | | | | | | | |
| Biotechnology 2.10% | | | | | | | | |
| AbbVie, Inc. | | | 37,299 | | | | 2,210 | |
| | | | | | | | | |
| Building Products 0.50% | | | | | | | | |
| A.O. Smith Corp. | | | 6,900 | | | | 529 | |
| | | | | | | | | |
| Capital Markets 1.08% | | | | | | | | |
| SEI Investments Co. | | | 9,900 | | | | 519 | |
| T. Rowe Price Group, Inc. | | | 8,600 | | | | 615 | |
| Total | | | | | | | 1,134 | |
| | | | | | Fair | |
| | | | | | Value | |
| Investments | | Shares | | | (000) | |
| Chemicals 5.46% | | | | | | | | |
| Air Products & Chemicals, Inc. | | | 2,000 | | | $ | 260 | |
| Ecolab, Inc. | | | 2,400 | | | | 274 | |
| International Flavors & Fragrances, Inc. | | | 2,400 | | | | 287 | |
| Monsanto Co. | | | 20,195 | | | | 1,990 | |
| PPG Industries, Inc. | | | 6,506 | | | | 643 | |
| Sherwin-Williams Co. (The) | | | 5,750 | | | | 1,493 | |
| Valspar Corp. (The) | | | 9,514 | | | | 789 | |
| Total | | | | | | | 5,736 | |
| | | | | | | | | |
| Communications Equipment 2.11% | | | | | | | | |
| QUALCOMM, Inc. | | | 44,257 | | | | 2,212 | |
| | | | | | | | | |
| Containers & Packaging 0.10% | | | | | | | | |
| Bemis Co., Inc. | | | 2,300 | | | | 103 | |
| | | | | | | | | |
| Diversified Telecommunication Services 4.60% | | | | | | | | |
| AT&T, Inc. | | | 69,908 | | | | 2,406 | |
| Verizon Communications, Inc. | | | 52,400 | | | | 2,422 | |
| Total | | | | | | | 4,828 | |
| | | | | | | | | |
| Electric: Utilities 4.02% | | | | | | | | |
| Edison International | | | 19,200 | | | | 1,137 | |
| Eversource Energy | | | 3,700 | | | | 189 | |
| NextEra Energy, Inc. | | | 14,921 | | | | 1,550 | |
| Westar Energy, Inc. | | | 8,400 | | | | 356 | |
| Xcel Energy, Inc. | | | 27,400 | | | | 984 | |
| Total | | | | | | | 4,216 | |
| | | | | | | | | |
| Electrical Equipment 0.42% | | | | | | | | |
| Emerson Electric Co. | | | 9,211 | | | | 441 | |
| | | | | | | | | |
| Energy Equipment & Services 0.37% | | | | | | | | |
| Helmerich & Payne, Inc. | | | 7,212 | | | | 386 | |
| | | | | | | | | |
| Food & Staples Retailing 8.20% | | | | | | | | |
| Costco Wholesale Corp. | | | 8,100 | | | | 1,308 | |
| CVS Health Corp. | | | 26,200 | | | | 2,561 | |
| Wal-Mart Stores, Inc. | | | 16,380 | | | | 1,004 | |
| Walgreens Boots Alliance, Inc. | | | 43,821 | | | | 3,732 | |
| Total | | | | | | | 8,605 | |
| | | | | | | | | |
| | See Notes to Financial Statements. | 7 |
Schedule of Investments (continued)
December 31, 2015
| | | | | | Fair | |
| | | | | | Value | |
| Investments | | Shares | | | (000) | |
| Food Products 1.97% | | | | | | | | |
| Archer-Daniels-Midland Co. | | | 24,900 | | | $ | 913 | |
| General Mills, Inc. | | | 18,300 | | | | 1,055 | |
| McCormick & Co., Inc. | | | 1,200 | | | | 103 | |
| Total | | | | | | | 2,071 | |
| | | | | | | | | |
| Gas Utilities 0.48% | | | | | | | | |
| UGI Corp. | | | 14,900 | | | | 503 | |
| | | | | | | | | |
| Health Care Equipment & Supplies 3.80% | | | | | | | | |
| Becton, Dickinson & Co. | | | 7,100 | | | | 1,094 | |
| C.R. Bard, Inc. | | | 4,788 | | | | 907 | |
| Medtronic plc (Ireland)(a) | | | 25,891 | | | | 1,992 | |
| Total | | | | | | | 3,993 | |
| | | | | | | | | |
| Health Care Providers & Services 2.65% | | | | | | | | |
| AmerisourceBergen Corp. | | | 7,800 | | | | 809 | |
| Cardinal Health, Inc. | | | 22,148 | | | | 1,977 | |
| Total | | | | | | | 2,786 | |
| | | | | | | | | |
| Hotels, Restaurants & Leisure 4.23% | | | | | | | | |
| Darden Restaurants, Inc. | | | 12,900 | | | | 821 | |
| McDonald’s Corp. | | | 28,374 | | | | 3,352 | |
| Yum! Brands, Inc. | | | 3,700 | | | | 270 | |
| Total | | | | | | | 4,443 | |
| | | | | | | | | |
| Household Durables 0.12% | | | | | | | | |
| Leggett & Platt, Inc. | | | 3,000 | | | | 126 | |
| | | | | | | | | |
| Household Products 4.16% | | | | | | | | |
| Colgate-Palmolive Co. | | | 15,400 | | | | 1,026 | |
| Kimberly-Clark Corp. | | | 15,235 | | | | 1,939 | |
| Procter & Gamble Co. (The) | | | 17,700 | | | | 1,406 | |
| Total | | | | | | | 4,371 | |
| | | | | | | | | |
| Industrial Conglomerates 4.18% | | | | | | | | |
| 3M Co. | | | 23,717 | | | | 3,573 | |
| Roper Technologies, Inc. | | | 4,300 | | | | 816 | |
| Total | | | | | | | 4,389 | |
| | | | | | | | | |
| | | | | | Fair | |
| | | | | | Value | |
| Investments | | Shares | | | (000) | |
| Information Technology Services 3.69% | | | | | | | | |
| Accenture plc Class A (Ireland)(a) | | | 9,700 | | | $ | 1,014 | |
| Automatic Data | | | | | | | | |
| Processing, Inc. | | | 5,900 | | | | 500 | |
| International Business | | | | | | | | |
| Machines Corp. | | | 17,187 | | | | 2,365 | |
| Total | | | | | | | 3,879 | |
| | | | | | | | | |
| Insurance 4.25% | | | | | | | | |
| ACE Ltd. (Switzerland)(a) | | | 26,064 | | | | 3,045 | |
| Aflac, Inc. | | | 11,364 | | | | 681 | |
| Hanover Insurance Group, Inc. (The) | | | 4,100 | | | | 333 | |
| Old Republic International Corp. | | | 21,400 | | | | 399 | |
| Total | | | | | | | 4,458 | |
| | | | | | | | | |
| Leisure Products 1.62% | | | | | | | | |
| Hasbro, Inc. | | | 25,268 | | | | 1,702 | |
| | | | | | | | | |
| Machinery 3.05% | | | | | | | | |
| Cummins, Inc. | | | 5,700 | | | | 501 | |
| Graco, Inc. | | | 4,300 | | | | 310 | |
| Illinois Tool Works, Inc. | | | 8,200 | | | | 760 | |
| Nordson Corp. | | | 4,500 | | | | 289 | |
| Stanley Black & Decker, Inc. | | | 12,600 | | | | 1,345 | |
| Total | | | | | | | 3,205 | |
| | | | | | | | | |
| Multi-Line Retail 0.74% | | | | | | | | |
| Target Corp. | | | 10,700 | | | | 777 | |
| | | | | | | | | |
| Multi-Utilities 2.01% | | | | | | | | |
| Consolidated Edison, Inc. | | | 16,500 | | | | 1,061 | |
| SCANA Corp. | | | 17,298 | | | | 1,046 | |
| Total | | | | | | | 2,107 | |
| | | | | | | | | |
| Oil, Gas & Consumable Fuels 5.73% | | | | | | | | |
| Chevron Corp. | | | 40,349 | | | | 3,630 | |
| EOG Resources, Inc. | | | 7,250 | | | | 513 | |
| Occidental Petroleum Corp. | | | 20,273 | | | | 1,371 | |
| ONEOK, Inc. | | | 20,300 | | | | 500 | |
| Total | | | | | | | 6,014 | |
| 8 | See Notes to Financial Statements. |
Schedule of Investments (continued)
December 31, 2015
| | | | | | Fair | |
| | | | | | Value | |
| Investments | | Shares | | | (000) | |
| Pharmaceuticals 2.55% | | | | | | | | |
| Johnson & Johnson | | | 26,019 | | | $ | 2,673 | |
| | | | | | | | | |
| Professional Services 0.86% | | | | | | | | |
| Robert Half International, Inc. | | | 19,200 | | | | 905 | |
| | | | | | | | | |
| Road & Rail 0.36% | | | | | | | | |
| Ryder System, Inc. | | | 6,700 | | | | 381 | |
| | | | | | �� | | | |
| Semiconductors & Semiconductor Equipment 2.15% | | | | | |
| Analog Devices, Inc. | | | 10,600 | | | | 586 | |
| Microchip Technology, Inc. | | | 35,966 | | | | 1,674 | |
| Total | | | | | | | 2,260 | |
| | | | | | | | | |
| Specialty Retail 3.74% | | | | | | | | |
| Gap, Inc. (The) | | | 6,100 | | | | 151 | |
| Lowe’s Cos., Inc. | | | 44,425 | | | | 3,378 | |
| Ross Stores, Inc. | | | 7,300 | | | | 393 | |
| Total | | | | | | | 3,922 | |
| | | | | | | | | |
| Textiles, Apparel & Luxury Goods 1.60% | | | | | | | | |
| NIKE, Inc. Class B | | | 26,900 | | | | 1,681 | |
| | | | | | | | | |
| Tobacco 2.95% | | | | | | | | |
| Altria Group, Inc. | | | 9,027 | | | | 525 | |
| Reynolds American, Inc. | | | 55,700 | | | | 2,571 | |
| Total | | | | | | | 3,096 | |
Total Common Stocks
(cost $103,029,503) | | | | | | | 103,922 | |
| | | Principal | | | Fair | |
| | | Amount | | | Value | |
| Investments | | (000) | | | (000) | |
| SHORT-TERM INVESTMENT 0.59% | | | | | | | | |
| | | | | | | | | |
| Repurchase Agreement | | | | | | | | |
Repurchase Agreement dated 12/31/2015, 0.03% due 1/4/2016 with Fixed Income Clearing Corp. collateralized by $635,000 of U.S. Treasury Note at 1.625% due 7/31/2020; value: $635,794; proceeds: $623,273
(cost $623,271) | | $ | 623 | | | $ | 623 | |
Total Investments in Securities 99.55%
(cost $103,652,774) | | | | | | | 104,545 | |
| Other Assets in Excess of Liabilities(b) 0.45% | | | | | | | 471 | |
| Net Assets 100.00% | | | | | | $ | 105,016 | |
| (a) | | Foreign security traded in U.S. dollars. |
| (b) | | Other Assets in Excess of Liabilities include net unrealized depreciation on futures contracts as follows: |
Open Futures Contracts at December 31, 2015:
| | | | | | | | | | | Unrealized | |
| Type | | Expiration | | Contracts | | Position | | Fair Value | | Depreciation | |
| E-Mini S&P 500 Index | | March 2016 | | 7 | | Long | | $712,390 | | $(4,289 | ) |
| | See Notes to Financial Statements. | 9 |
Schedule of Investments (concluded)
December 31, 2015
The following is a summary of the inputs used as of December 31, 2015 in valuing the Fund’s investments carried at fair value(1):
| Investment Type(2)(3) | | Level 1
(000) | | | Level 2
(000) | | | Level 3
(000) | | | Total
(000) | |
| Common Stocks | | $ | 103,922 | | | $ | – | | | $ | – | | | $ | 103,922 | |
| Repurchase Agreement | | | – | | | | 623 | | | | – | | | | 623 | |
| Total | | $ | 103,922 | | | $ | 623 | | | $ | – | | | $ | 104,545 | |
| | | | | | | | | | | | | | | | | |
| Other Financial Instruments | | | | | | | | | | | | | | | | |
| Futures Contracts | | | | | | | | | | | | | | | | |
| Assets | | $ | – | | | $ | – | | | $ | – | | | $ | – | |
| Liabilities | | | (4 | ) | | | – | | | | – | | | | (4 | ) |
| Total | | $ | (4 | ) | | $ | – | | | $ | – | | | $ | (4 | ) |
| (1) | | Refer to Note 2(i) for a description of fair value measurements and the three-tier hierarchy of inputs. |
| (2) | | See Schedule of Investments for fair values in each industry and identification of foreign issuers and/or geography. |
| (3) | | There were no Level 1/Level 2 transfers during the fiscal year ended December 31, 2015. |
| 10 | See Notes to Financial Statements. |
Statement of Assets and Liabilities
December 31, 2015
| ASSETS: | | | | |
| Investments in securities, at fair value (cost $103,652,774) | | $ | 104,544,718 | |
| Deposits with brokers for futures collateral | | | 32,200 | |
| Receivables: | | | | |
| Investment securities sold | | | 798,812 | |
| Dividends | | | 176,757 | |
| From advisor (See Note 3) | | | 40,761 | |
| Capital shares sold | | | 40,305 | |
| Prepaid expenses | | | 650 | |
| Total assets | | | 105,634,203 | |
| LIABILITIES: | | | | |
| Payables: | | | | |
| Investment securities purchased | | | 395,057 | |
| Management fee | | | 66,763 | |
| Capital shares reacquired | | | 33,100 | |
| Directors’ fees | | | 18,254 | |
| Variation margin | | | 7,243 | |
| Fund administration | | | 3,561 | |
| Accrued expenses | | | 94,604 | |
| Total liabilities | | | 618,582 | |
| NET ASSETS | | $ | 105,015,621 | |
| COMPOSITION OF NET ASSETS: | | | | |
| Paid-in capital | | $ | 104,770,758 | |
| Distributions in excess of net investment income | | | (16,864 | ) |
| Accumulated net realized loss on investments, futures contracts and foreign currency related transactions | | | (625,928 | ) |
| Net unrealized appreciation on investments, futures contracts and translation of assets and liabilities denominated in foreign currencies | | | 887,655 | |
| Net Assets | | $ | 105,015,621 | |
| Outstanding shares (50 million shares of common stock authorized, $.001 par value) | | | 7,720,431 | |
| Net asset value, offering and redemption price per share (Net assets divided by outstanding shares) | | $ | 13.60 | |
| | See Notes to Financial Statements. | 11 |
Statement of Operations
For the Year Ended December 31, 2015
| Investment income: | | | | |
| Dividends | | $ | 2,882,343 | |
| Interest | | | 12 | |
| Total investment income | | | 2,882,355 | |
| Expenses: | | | | |
| Management fee | | | 828,318 | |
| Non 12b-1 service fees | | | 275,820 | |
| Shareholder servicing | | | 126,572 | |
| Professional | | | 51,902 | |
| Fund administration | | | 44,177 | |
| Reports to shareholders | | | 38,527 | |
| Custody | | | 24,588 | |
| Directors’ fees | | | 4,029 | |
| Other | | | 18,617 | |
| Gross expenses | | | 1,412,550 | |
| Expense reductions (See Note 9) | | | (114 | ) |
| Fees waived and expenses reimbursed (See Note 3) | | | (473,676 | ) |
| Net expenses | | | 938,760 | |
| Net investment income | | | 1,943,595 | |
| Net realized and unrealized gain (loss): | | | | |
| Net realized gain on investments | | | 6,347,441 | |
| Net realized gain on futures contracts and foreign currency related transactions | | | 24,673 | |
| Net change in unrealized appreciation/depreciation on investments | | | (10,953,398 | ) |
| Net change in unrealized appreciation/depreciation on futures contracts and translation of assets and liabilities denominated in foreign currencies | | | (28,286 | ) |
| Net realized and unrealized loss | | | (4,609,570 | ) |
| Net Decrease in Net Assets Resulting From Operations | | $ | (2,665,975 | ) |
| 12 | See Notes to Financial Statements. |
Statements of Changes in Net Assets
| | | For the Year Ended | | | For the Year Ended | |
| DECREASE IN NET ASSETS | | December 31, 2015 | | | December 31, 2014 | |
| Operations: | | | | | | | | |
| Net investment income | | $ | 1,943,595 | | | $ | 1,979,350 | |
| Net realized gain on investments, futures contracts and foreign currency related transactions | | | 6,372,114 | | | | 15,878,785 | |
| Net change in unrealized appreciation/depreciation on investments, futures contracts and translation of assets and liabilities denominated in foreign currencies | | | (10,981,684 | ) | | | (4,826,818 | ) |
| Net increase (decrease) in net assets resulting from operations | | | (2,665,975 | ) | | | 13,031,317 | |
| Distributions to shareholders from: | | | | | | | | |
| Net investment income | | | (1,956,907 | ) | | | (1,968,083 | ) |
| Net realized gain | | | (9,585,159 | ) | | | (15,462,826 | ) |
| Total distributions to shareholders | | | (11,542,066 | ) | | | (17,430,909 | ) |
| Capital share transactions (Net of share conversions) (See Note 13): | | | | |
| Proceeds from sales of shares | | | 31,364,855 | | | | 14,254,398 | |
| Reinvestment of distributions | | | 11,542,066 | | | | 17,430,909 | |
| Cost of shares reacquired | | | (41,983,707 | ) | | | (37,578,189 | ) |
| Net increase (decrease) in net assets resulting from capital share transactions | | | 923,214 | | | | (5,892,882 | ) |
| Net decrease in net assets | | | (13,284,827 | ) | | | (10,292,474 | ) |
| NET ASSETS: | | | | | | | | |
| Beginning of year | | $ | 118,300,448 | | | $ | 128,592,922 | |
| End of year | | $ | 105,015,621 | | | $ | 118,300,448 | |
| Distributions in excess of net investment income | | $ | (16,864 | ) | | $ | (3,086 | ) |
| | See Notes to Financial Statements. | 13 |
Financial Highlights
| | | | | | Per Share Operating Performance: |
| | | | | | | | | | | | | | | Distributions to |
| | | | | | Investment operations: | | shareholders from: |
| | | | | | | | | | | Total | | | | | | | |
| | | | | | | | Net | | from | | | | | | | |
| | | Net asset | | Net | | realized | | invest- | | | | | | | |
| | | value, | | invest- | | and | | ment | | Net | | Net | | Total |
| | | beginning | | ment | | unrealized | | opera- | | investment | | realized | | distri- |
| | | of year | | income(a) | | gain (loss) | | tions | | income | | gain | | butions |
| 12/31/2015 | | | $15.55 | | | | $0.27 | | | | $(0.60 | ) | | | $(0.33 | ) | | | $(0.27 | ) | | | $(1.35 | ) | | | $(1.62 | ) |
| 12/31/2014 | | | 16.27 | | | | 0.27 | | | | 1.60 | | | | 1.87 | | | | (0.29 | ) | | | (2.30 | ) | | | (2.59 | ) |
| 12/31/2013 | | | 14.22 | | | | 0.26 | | | | 3.68 | | | | 3.94 | | | | (0.28 | ) | | | (1.61 | ) | | | (1.89 | ) |
| 12/31/2012 | | | 13.03 | | | | 0.34 | | | | 1.29 | | | | 1.63 | | | | (0.44 | ) | | | – | | | | (0.44 | ) |
| 12/31/2011 | | | 13.39 | | | | 0.35 | | | | (0.33 | ) | | | 0.02 | | | | (0.38 | ) | | | – | | | | (0.38 | ) |
| (a) | | Calculated using average shares outstanding during the year. |
| (b) | | Total return does not consider the effects of sales charges or other expenses imposed by an insurance company and assumes the reinvestment of all distributions. |
| 14 | See Notes to Financial Statements. |
| | | | | | | Ratios to Average Net Assets: | | Supplemental Data: | |
| | | | | | | | | | |
| | | | | | | Total | | | | | | | | | | | | |
| | | | | | | expenses | | | | | | | | | | | | |
| Net | | | | | after | | | | | | | | Net | | | |
| asset | | | | waivers | | | | | Net | | assets, | | Portfolio | |
| value, | | Total | | and/or reim- | | Total | | investment | | end of | | turnover | |
| end of | | return(b) | | bursements | | expenses | | income | | year | | rate | |
| year | | (%) | | (%) | | (%) | | (%) | | (000) | | (%) | |
| $13.60 | | | | (2.13 | ) | | | 0.85 | | | | 1.28 | | | | 1.76 | | | | $105,016 | | | | 69.61 | | |
| | 15.55 | | | | 11.54 | | | | 0.85 | | | | 1.25 | | | | 1.63 | | | | 118,300 | | | | 79.31 | | |
| | 16.27 | | | | 27.93 | | | | 0.85 | | | | 1.27 | | | | 1.62 | | | | 128,593 | | | | 65.36 | | |
| | 14.22 | | | | 12.46 | | | | 1.07 | | | | 1.26 | | | | 2.42 | | | | 110,603 | | | | 116.38 | | |
| | 13.03 | | | | 0.19 | | | | 1.15 | | | | 1.23 | | | | 2.61 | | | | 114,854 | | | | 22.48 | | |
| | See Notes to Financial Statements. | 15 |
Notes to Financial Statements
Lord Abbett Series Fund, Inc. (the “Company”) is registered under the Investment Company Act of 1940, as amended (the “Act”), as a diversified, open-end management investment company and was incorporated under Maryland law in 1989. The Company consists of thirteen separate portfolios. This report covers Calibrated Dividend Growth Portfolio (the “Fund”).
The Fund’s investment objective is to seek current income and capital appreciation. The Fund has Variable Contract class shares (“Class VC Shares”), which are currently issued and redeemed only in connection with investments in, and payments under, variable annuity contracts and variable life insurance policies issued by life insurance and insurance-related companies.
The preparation of the financial statements in conformity with accounting principles generally accepted in the United States of America (“U.S. GAAP”) requires management to make certain estimates and assumptions that affect the reported amounts of assets and liabilities and disclosure of contingent assets and liabilities at the date of the financial statements and the reported amounts of increases and decreases in net assets from operations during the reporting period. Actual results could differ from those estimates. The Fund is considered an investment company under U.S. GAAP and follows the accounting and reporting guidance applicable to investment companies.
| 2. | SIGNIFICANT ACCOUNTING POLICIES |
| (a) | Investment Valuation–Under procedures approved by the Fund’s Board of Directors (the “Board”), Lord, Abbett & Co. LLC (“Lord Abbett”), the Fund’s investment manager, has formed a Pricing Committee to administer the pricing and valuation of portfolio investments and to ensure that prices utilized reasonably reflect fair value. Among other things, these procedures allow the Fund to utilize independent pricing services, quotations from securities and financial instrument dealers and other market sources to determine fair value. |
| | |
| | Securities actively traded on any recognized U.S. or non-U.S. exchange or on The NASDAQ Stock Market LLC are valued at the last sale price or official closing price on the exchange or system on which they are principally traded. Events occurring after the close of trading on non-U.S. exchanges may result in adjustments to the valuation of foreign securities to reflect their fair value as of the close of regular trading on the New York Stock Exchange. The Fund may utilize an independent fair valuation service in adjusting the valuations of foreign securities. Unlisted equity securities are valued at the last quoted sale price or, if no sale price is available, at the mean between the most recently quoted bid and asked prices. Exchange traded options and futures contracts are valued at the last sale price in the market where they are principally traded. If no sale has occurred, the mean between the most recently quoted bid and asked prices is used. |
| | |
| | Securities for which prices are not readily available are valued at fair value as determined by the Pricing Committee. The Pricing Committee considers a number of factors, including observable and unobservable inputs, when arriving at fair value. The Pricing Committee may use related or comparable assets or liabilities, recent transactions, market multiples, book values and other relevant information to determine the fair value of portfolio investments. The Board or a designated committee thereof regularly reviews fair value determinations made by the Pricing Committee and employs techniques such as reviewing related market activity, reviewing inputs and assumptions, and retrospectively comparing prices of subsequent purchases and sales transactions to fair value determinations made by the Pricing Committee. |
16
Notes to Financial Statements (continued)
| | Short-term securities with 60 days or less remaining to maturity are valued using the amortized cost method, which approximates fair value. |
| | |
| (b) | Security Transactions–Security transactions are recorded as of the date that the securities are purchased or sold (trade date). Realized gains and losses on sales of portfolio securities are calculated using the identified-cost method. |
| | |
| (c) | Investment Income–Dividend income is recorded on the ex-dividend date. Interest income is recorded on the accrual basis as earned. Discounts are accreted and premiums are amortized using the effective interest method and are included in Interest and other income on the Statement of Operations. Withholding taxes on foreign dividends have been provided for in accordance with the applicable country’s tax rules and rates. |
| | |
| (d) | Income Taxes–It is the policy of the Fund to meet the requirements of Subchapter M of the Internal Revenue Code applicable to regulated investment companies and to distribute substantially all taxable income and capital gains to its shareholders. Therefore, no income tax provision is required. |
| | |
| | The Fund files U.S. federal and various state and local tax returns. No income tax returns are currently under examination. The statute of limitations on the Fund’s filed U.S. federal tax returns remains open for the fiscal years ended December 31, 2012 through December 31, 2015. The statutes of limitations on the Company’s state and local tax returns may remain open for an additional year depending upon the jurisdiction. |
| | |
| (e) | Expenses–Expenses incurred by the Company that do not specifically relate to an individual fund are generally allocated to the funds within the Company on a pro rata basis by relative net assets. |
| | |
| (f) | Foreign Transactions–The books and records of the Fund are maintained in U.S. dollars and transactions denominated in foreign currencies are recorded in the Fund’s records at the rate prevailing when earned or recorded. Asset and liability accounts that are denominated in foreign currencies are adjusted daily to reflect current exchange rates and any unrealized gain (loss) is included in Net change in unrealized appreciation/depreciation on futures contracts and translation of assets and liabilities denominated in foreign currencies on the Fund’s Statement of Operations. The resultant exchange gains and losses upon settlement of such transactions are included in Net realized gain on futures contracts and foreign currency related transactions on the Fund’s Statement of Operations. The Fund does not isolate that portion of the results of operations arising as a result of changes in the foreign exchange rates from the changes in market prices of the securities. |
| | |
| (g) | Futures Contracts–The Fund may purchase and sell index futures contracts to manage cash, or as a substitute position in lieu of holding the underlying asset on which the instrument is based. At the time of entering into a futures transaction, an investor is required to deposit and maintain a specified amount of cash or eligible securities called “initial margin.” Subsequent payments made or received by the Fund called “variation margin” are made on a daily basis as the market price of the futures contract fluctuates. The Fund will record an unrealized gain (loss) based on the amount of variation margin. When a contract is closed, a realized gain (loss) is recorded equal to the difference between the opening and closing value of the contract. |
| | |
| (h) | Repurchase Agreements–The Fund may enter into repurchase agreements with respect to securities. A repurchase agreement is a transaction in which a fund acquires a security and simultaneously commits to resell that security to the seller (a bank or securities dealer) at an agreed- |
17
Notes to Financial Statements (continued)
| | upon price on an agreed-upon date. The Fund requires at all times that the repurchase agreement be collateralized by cash, or by securities of the U.S. Government, its agencies, its instrumentalities, or U.S. Government sponsored enterprises having a value equal to, or in excess of, the value of the repurchase agreement (including accrued interest). If the seller of the agreement defaults on its obligation to repurchase the underlying securities at a time when the fair value of these securities has declined, the Fund may incur a loss upon disposition of the securities. |
| | |
| (i) | Fair Value Measurements–Fair value is defined as the price that the Fund would receive upon selling an investment or transferring a liability in an orderly transaction to an independent buyer in the principal or most advantageous market of the investment. A three-tier hierarchy is used to maximize the use of observable market data and minimize the use of unobservable inputs and to establish classification of fair value measurements for disclosure purposes. Inputs refer broadly to the assumptions that market participants would use in pricing the asset or liability, including assumptions about risk—for example, the risk inherent in a particular valuation technique used to measure fair value (such as a pricing model) and/or the risk inherent in the inputs to the valuation technique. Inputs may be observable or unobservable. Observable inputs reflect the assumptions market participants would use in pricing the asset or liability. Observable inputs are based on market data obtained from sources independent of the reporting entity. Unobservable inputs reflect the reporting entity’s own assumptions about the assumptions market participants would use in pricing the asset or liability. Unobservable inputs are based on the best information available in the circumstances. The three-tier hierarchy of inputs is summarized in the three broad Levels listed below: |
| | • | Level 1 – | unadjusted quoted prices in active markets for identical investments; |
| | | | |
| | • | Level 2 – | other significant observable inputs (including quoted prices for similar investments, interest rates, prepayment speeds, credit risk, etc.); and |
| | | | |
| | • | Level 3 – | significant unobservable inputs (including the Fund’s own assumptions in determining the fair value of investments). |
| | A summary of inputs used in valuing the Fund’s investments and other financial instruments as of December 31, 2015 and, if applicable, Level 1/Level 2 transfers and Level 3 rollforwards for the fiscal year then ended is included in the Fund’s Schedule of Investments. |
| | |
| | Changes in valuation techniques may result in transfers into or out of an assigned level within the three-tier hierarchy. All transfers between different levels within the three-tier hierarchy are deemed to have occurred as of the beginning of the reporting period. The inputs or methodology used for valuing securities are not necessarily an indication of the risk associated with investing in those securities. |
| 3. | MANAGEMENT FEE AND OTHER TRANSACTIONS WITH AFFILIATES |
Management Fee
The Company has a management agreement with Lord Abbett, pursuant to which Lord Abbett supplies the Fund with investment management services and executive and other personnel, provides office space and pays for ordinary and necessary office and clerical expenses relating to research and statistical work and supervision of the Fund’s investment portfolio.
The management fee is based on the Fund’s average daily net assets at the following annual rate:
| First $1 billion | .75% |
| Next $1 billion | .70% |
| Over $2 billion | .65% |
18
Notes to Financial Statements (continued)
For the fiscal year ended December 31, 2015, the effective management fee, net of waivers, was at an annualized rate of .32% of the Fund’s average daily net assets.
In addition, Lord Abbett provides certain administrative services to the Fund pursuant to an Administrative Services Agreement in return for a fee at an annual rate of .04% of the Fund’s average daily net assets.
During the fiscal year ended December 31, 2015 and continuing through April 30, 2016, Lord Abbett has contractually agreed to waive its fees and reimburse expenses to the extent necessary to limit total net annual operating expenses to an annual rate of .85%. This agreement may be terminated only upon the approval of the Board.
The Company, on behalf of the Fund, has entered into services arrangements with certain insurance companies. Under these arrangements, certain insurance companies will be compensated up to .25% of the average daily net asset value (���NAV”) of the Fund’s Class VC Shares held in the insurance company’s separate account to service and maintain the Variable Contract owners’ accounts. This amount is included in Non 12b-1 service fees on the Statement of Operations. The Fund may also compensate certain insurance companies, third-party administrators and other entities for providing recordkeeping, sub-transfer agency and other administrative services to the Fund. This amount is included in Shareholder servicing on the Statement of Operations.
A Director and certain of the Company’s officers have an interest in Lord Abbett.
| 4. | DISTRIBUTIONS AND CAPITAL LOSS CARRYFORWARDS |
Dividends from net investment income, if any, are declared and paid at least semi-annually. Taxable net realized gains from investment transactions, reduced by allowable capital loss carryforwards, if any, are declared and distributed to shareholders at least annually. The capital loss carryforward amount, if any, is available to offset future net capital gains. Dividends and distributions to shareholders are recorded on the ex-dividend date. The amounts of dividends and distributions from net investment income and net realized capital gains are determined in accordance with federal income tax regulations, which may differ from U.S. GAAP. These book/tax differences are either considered temporary or permanent in nature. To the extent these differences are permanent in nature, such amounts are reclassified within the components of net assets based on their federal tax basis treatment; temporary differences do not require reclassification. Dividends and distributions that exceed earnings and profits for tax purposes are reported as a tax return of capital.
The tax character of distributions paid during the fiscal years ended December 31, 2015 and 2014 was as follows:
| | | Year Ended | | Year Ended |
| | | 12/31/2015 | | 12/31/2014 |
| Distributions paid from: | | | | |
| Ordinary income | | $5,299,556 | | $5,916,179 |
| Net long-term capital gains | | 6,242,510 | | 11,514,730 |
| Total distributions paid | | $11,542,066 | | $17,430,909 |
19
Notes to Financial Statements (continued)
As of December 31, 2015, the components of accumulated gains on a tax-basis were as follows:
| Undistributed ordinary income – net | | $ | 1,389 | |
| Undistributed long-term capital gains | | | 831,698 | |
| Total undistributed earnings | | | 833,087 | |
| Temporary differences | | | (275,274 | ) |
| Unrealized losses – net | | | (312,950 | ) |
| Total accumulated gains – net | | $ | 244,863 | |
At the Fund’s election, certain losses incurred within the taxable year (Qualified Late-Year Losses) are deemed to arise on the first business day of the Fund’s next taxable year. The Fund incurred and will elect to post-October capital losses of $257,021 during fiscal year 2015.
As of December 31, 2015, the aggregate unrealized security gains and losses based on cost for U.S. federal income tax purposes were as follows:
| Tax cost | | $ | 104,857,668 | |
| Gross unrealized gain | | | 5,930,395 | |
| Gross unrealized loss | | | (6,243,345 | ) |
| Net unrealized security loss | | $ | (312,950 | ) |
The difference between book-basis and tax-basis unrealized gains (losses) is attributable to wash sales.
Permanent items identified during the fiscal year ended December 31, 2015 have been reclassified among the components of net assets based on their tax basis treatment as follows:
| Distributions in | | Accumulated |
| Excess of Net | | Net Realized |
| Investment Income | | Loss |
| $(466) | | $466 |
The permanent differences are attributable to the tax treatment of foreign currency transactions.
| 5. | PORTFOLIO SECURITIES TRANSACTIONS |
Purchases and sales of investment securities (excluding short-term investments) for the fiscal year ended December 31, 2015 were as follows:
| Purchases | | Sales |
| $75,855,404 | | $84,026,455 |
There were no purchases or sales of U.S. Government securities for the fiscal year ended December 31, 2015.
The Fund is permitted to purchase and sell securities (“cross-trade”) from and to other Lord Abbett Funds or client accounts pursuant to procedures approved by the Board in compliance with Rule 17a-7 under the Act (the “Rule”). Each cross-trade is executed at a fair market price in compliance with provisions of the Rule. For the year ended December 31, 2015, the Fund engaged in cross-trade purchases of $1,243,078 and sales of $1,076,523, which resulted in net realized gains of ($81,354).
| 6. | DISCLOSURES ABOUT DERIVATIVE INSTRUMENTS AND HEDGING ACTIVITIES |
The Fund entered into E-Mini S&P 500 Index futures contracts for the fiscal year ended December 31, 2015 (as described in note 2(g)) to manage cash. The Fund bears the risk that the underlying index will move unexpectedly, in which case the Fund may realize a loss. There is minimal counterparty credit risk to the Fund since futures are exchange traded and the exchange’s clearinghouse, as counterparty to all exchange traded futures, guarantees futures against default.
20
Notes to Financial Statements (continued)
As of December 31, 2015, the Fund had futures contracts with unrealized depreciation of ($4,289), which is included in the Schedule of Investments. Only current day’s variation margin is reported within the Fund’s Statement of Assets and Liabilities. Amounts of $25,139 and ($29,112) are included in the Statement of Operations related to futures contracts under the captions Net realized gain on futures contracts and foreign currency related transactions and Net change in unrealized appreciation/depreciation on futures contracts and translation of assets and liabilities denominated in foreign currencies, respectively. The average number of futures contracts throughout the period was 8.
| 7. | DISCLOSURES ABOUT OFFSETTING ASSETS AND LIABILITIES |
The Financial Accounting Standards Board (“FASB”) requires disclosures intended to help better assess the effect or potential effect of offsetting arrangements on a fund’s financial position. The following tables illustrate gross and net information about recognized assets and liabilities eligible for offset in the statement of assets and liabilities; and disclose such amounts subject to an enforceable master netting agreement or similar agreement, by counterparty. A master netting agreement is an agreement between a fund and a counterparty which provides for the net settlement of amounts owed under all contracts traded under that agreement, as well as cash collateral, through a single payment by one party to the other in the event of default on or termination of any one contract. The Fund’s accounting policy with respect to balance sheet offsetting is that, absent an event of default by the counterparty or a termination of the agreement, the master netting agreement does not result in an offset of reported amounts of financial assets and liabilities in the statement of assets and liabilities across transactions between the Fund and the applicable counterparty:
| | | | | Gross Amounts | | Net Amounts of |
| | | | | Offset in the | | Assets Presented |
| | | Gross Amounts of | | Statement of Assets | | in the Statement of |
| Description | | Recognized Assets | | and Liabilities | | Assets and Liabilities |
| Repurchase Agreement | | $623,271 | | $ – | | $623,271 |
| Total | | $623,271 | | $ – | | $623,271 |
| | | Net Amounts | | | | | | |
| | | of Assets | | | | Amounts Not Offset in the | | |
| | | Presented in | | | | Statement of Assets and Liabilities | | |
| | | the Statement | | | | Cash | | Securities | | |
| | | of Assets and | | Financial | | Collateral | | Collateral | | Net |
| Counterparty | | Liabilities | | Instruments | | Received(a) | | Received(a) | | Amount(b) |
| Fixed Income Clearing Corp. | | $623,271 | | $ – | | $ – | | $(623,271) | | $ – |
| Total | | $623,271 | | $ – | | $ – | | $(623,271) | | $ – |
| (a) | Collateral disclosed is limited to an amount not to exceed 100% of the net amount of assets presented in the Statement of Assets and Liabilities, for each respective counterparty. |
| (b) | Net amount represents the amount owed to the Fund by the counterparty as of December 31, 2015. |
| 8. | DIRECTORS’ REMUNERATION |
The Company’s officers and a Director, who are associated with Lord Abbett, do not receive any compensation from the Company for serving in such capacities. Independent Directors’ fees are allocated among all Lord Abbett-sponsored funds based on the net assets of each fund. There is an equity-based plan available to all Independent Directors under which Independent Directors must defer receipt of a portion of, and may elect to defer receipt of an additional portion of Directors’ fees. The deferred amounts are treated as though equivalent dollar amounts had been invested in
21
Notes to Financial Statements (continued)
the funds. Such amounts and earnings accrued thereon are included in Directors’ fees on the Statement of Operations and in Directors’ fees payable on the Statement of Assets and Liabilities and are not deductible for U.S. federal income tax purposes until such amounts are paid.
The Company has entered into an arrangement with its transfer agent and custodian, whereby credits realized as a result of uninvested cash balances are used to reduce a portion of the Fund’s expenses.
Effective August 31, 2015, the Fund and certain other funds managed by Lord Abbett (collectively, the “Participating Funds”) entered into a syndicated line of credit facility with various lenders for $550 million (the “Facility”), whereas State Street Bank and Trust Company (“SSB”) participates as a lender and as agent for the lenders. The Facility is to be used for temporary or emergency purposes as an additional source of: liquidity to satisfy redemptions. The Participating Funds are subject to graduated borrowing limits of one-third of Fund assets (if Fund assets are less than $750 million), $250 million, $300 million, or $350 million, based on past borrowings and likelihood of future borrowings. The Facility will continue through August 29, 2016.
Prior to August 31, 2015, the Fund and certain other funds managed by Lord Abbett participated in a $500 million unsecured revolving credit facility with SSB (the “SSB Facility”).
During the fiscal year ended December 31, 2015, the Fund did not utilize the Facility or the SSB Facility.
| 11. | CUSTODIAN AND ACCOUNTING AGENT |
SSB is the Company’s custodian and accounting agent. SSB performs custodial, accounting and recordkeeping functions relating to portfolio transactions and calculating the Fund’s NAV.
The Fund is subject to the general risks and considerations associated with equity investing. The Fund invests primarily in equity securities of large and mid-sized company stocks that have a history of growing their dividends, but there is no guarantee that a company will pay a dividend. The value of the Fund’s investments in equity securities will fluctuate in response to general economic conditions and to the changes in the prospects of particular companies and/or sectors in the economy. If the Fund’s fundamental research and quantitative analysis fail to produce the intended result, the Fund may suffer losses or underperform its benchmark or other funds with the same investment objective or similar strategies, even in a rising market.
Large and mid-sized company stocks each may perform differently than the market as a whole and other types of stocks. This is because different types of stocks tend to shift in and out of favor depending on market and economic conditions. Mid-sized company stocks may be less able to weather economic shifts or other adverse developments than those of larger, more established companies.
The Fund’s exposure to foreign companies and markets presents increased market, liquidity, currency, political and other risks.
These factors can affect the Fund’s performance.
22
Notes to Financial Statements (concluded)
| 13. | SUMMARY OF CAPITAL TRANSACTIONS |
Transactions in shares of capital stock were as follows:
| | | Year Ended | | | Year Ended | |
| | | December 31, 2015 | | | December 31, 2014 | |
| Shares sold | | 2,104,100 | | | 847,562 | |
| Reinvestment of distributions | | 827,804 | | | 1,101,833 | |
| Shares reacquired | | (2,817,767 | ) | | (2,245,672 | ) |
| Increase (decrease) | | 114,137 | | | (296,277 | ) |
23
Report of Independent Registered Public Accounting Firm
To the Board of Directors of Lord Abbett Series Fund, Inc. and the Shareholders of Calibrated Dividend Growth Portfolio:
We have audited the accompanying statement of assets and liabilities, including the schedule of investments, of the Calibrated Dividend Growth Portfolio, one of the portfolios constituting the Lord Abbett Series Fund, Inc. (the “Fund”) as of December 31, 2015, and the related statement of operations for the year then ended, the statements of changes in net assets for each of the two years in the period then ended, and the financial highlights for each of the five years in the period then ended. These financial statements and financial highlights are the responsibility of the Fund’s management. Our responsibility is to express an opinion on these financial statements and financial highlights based on our audits.
We conducted our audits in accordance with the standards of the Public Company Accounting Oversight Board (United States). Those standards require that we plan and perform the audit to obtain reasonable assurance about whether the financial statements and financial highlights are free of material misstatement. The Fund is not required to have, nor were we engaged to perform, an audit of its internal control over financial reporting. Our audits included consideration of internal control over financial reporting as a basis for designing audit procedures that are appropriate in the circumstances, but not for the purpose of expressing an opinion on the effectiveness of the Fund’s internal control over financial reporting. Accordingly, we express no such opinion. An audit also includes examining, on a test basis, evidence supporting the amounts and disclosures in the financial statements, assessing the accounting principles used and significant estimates made by management, as well as evaluating the overall financial statement presentation. Our procedures included confirmation of securities owned as of December 31, 2015, by correspondence with the custodian and brokers; when replies were not received from brokers, we performed other auditing procedures. We believe that our audits provide a reasonable basis for our opinion.
In our opinion, such financial statements and financial highlights referred to above present fairly, in all material respects, the financial position of Calibrated Dividend Growth Portfolio of the Lord Abbett Series Fund, Inc. as of December 31, 2015, the results of its operations for the year then ended, the changes in its net assets for each of the two years in the period then ended, and the financial highlights for each of the five years in the period then ended, in conformity with accounting principles generally accepted in the United States of America.
DELOITTE & TOUCHE LLP
New York, New York
February 16, 2016
24
Supplemental Proxy Information (unaudited)
A special meeting of shareholders of Calibrated Dividend Growth Portfolio was held on November 5, 2015. The special meeting was held for shareholders of the Fund to vote on the following matters:
| | 1. | To amend the Fund’s fundamental restrictions related to borrowing and lending to enable the Fund to participate in an interfund lending program; and |
| | | |
| | 2. | To ratify the selection of Deloitte & Touche LLP as independent registered public accounting firm for the Fund’s current fiscal year. |
The results of the proxy solicitation on the preceding matter were as follows:
| 1. | To approve the amendment to the fundamental investment restrictions of the Fund as described in the proxy statement: |
| | |
| | (a) Amend the fundamental investment restriction with respect to Borrowing |
| | | | | | | | | Broker |
| | | Votes For | | Votes Against | | Abstain | | Non-Votes |
| Calibrated Dividend Growth Portfolio | | 5,514,542 | | 451,757 | | 400,937 | | 0 |
| 1. | To approve the amendment to the fundamental investment restrictions of the Fund as described in the proxy statement: |
| | |
| | (b) Amend the fundamental investment restriction with respect to Lending |
| | | | | | | | | Broker |
| | | Votes For | | Votes Against | | Abstain | | Non-Votes |
| Calibrated Dividend Growth Portfolio | | 5,530,129 | | 437,005 | | 400,102 | | 0 |
| 2. | To ratify the selection of Deloitte & Touche LLP as the Fund’s independent registered public accounting firm for the Fund’s current fiscal year |
| | | | | | | | | Broker |
| | | Votes For | | Votes Against | | Abstain | | Non-Votes |
| Calibrated Dividend Growth Portfolio | | 5,863,202 | | 255,155 | | 248,879 | | – |
25
Basic Information About Management
The Board is responsible for the management of the business and affairs of the Company in accordance with the laws of the State of Maryland. The Board elects officers who are responsible for the day-to-day operations of the Fund and who execute policies authorized by the Board. The Board also approves an investment adviser to the Fund and continues to monitor the cost and quality of the services the investment adviser provides, and annually considers whether to renew the contract with the adviser. Generally, each Director holds office until his/her successor is elected and qualified or until his/her earlier resignation or removal, as provided in the Company’s organizational documents.
Lord Abbett, a Delaware limited liability company, is the Fund’s investment adviser. Designated Lord Abbett personnel are responsible for the day-to-day management of the Fund.
Interested Director
Ms. Foster is affiliated with Lord Abbett and is an “interested person” of the Company as defined in the Act. Ms. Foster is a director/trustee and officer of each of the 12 investment companies in the Lord Abbett Family of Funds, which consist of 58 portfolios or series.
| | | Current Position and | | |
| Name, Address and | | Length of Service | | Principal Occupation and Other Directorships |
| Year of Birth | | with the Fund | | During the Past Five Years |
| | | | | |
Daria L. Foster Lord, Abbett & Co. LLC
90 Hudson Street
Jersey City, NJ 07302
(1954) | | Director and President since 2006; Chief Executive Officer since 2012 | | Principal Occupation: Managing Partner of Lord Abbett, joined Lord Abbett in 1990. Other Directorships: None. |
Independent Directors
The following Independent Directors also are directors/trustees of each of the 12 investment companies in the Lord Abbett Family of Funds, which consist of 58 portfolios or series.
| | | Current Position and | | |
| Name, Address and | | Length of Service | | Principal Occupation and Other Directorships |
| Year of Birth | | with the Fund | | During the Past Five Years |
| | | | | |
E. Thayer Bigelow
Lord, Abbett & Co. LLC
c/o Legal Dept.
90 Hudson Street
Jersey City, NJ 07302
(1941) | | Director since 1994; Chairman since 2013 | | Principal Occupation: Managing General Partner, Bigelow Media, LLC (since 2000); Senior Adviser, Time Warner Inc. (1998–2000). Other Directorships: Currently serves as director of Crane Co. (since 1984) and Huttig Building Products Inc. (since 1998). Previously served as a director of R.H. Donnelley Inc. (2009–2010). |
| | | | | |
Robert B. Calhoun, Jr.
Lord, Abbett & Co. LLC
c/o Legal Dept.
90 Hudson Street
Jersey City, NJ 07302
(1942) | | Director since 1998 | | Principal Occupation: Senior Advisor of Monitor Clipper Partners, a private equity investment fund (since 1997); President of Clipper Asset Management Corp. (1991–2009). Other Directorships: None. |
26
Basic Information About Management (continued)
| | | Current Position and | | |
| Name, Address and | | Length of Service | | Principal Occupation and Other Directorships |
| Year of Birth | | with the Fund | | During the Past Five Years |
| | | | | |
Eric C. Fast
Lord, Abbett & Co. LLC
c/o Legal Dept.
90 Hudson Street
Jersey City, NJ 07302
(1949) | | Director since 2014 | | Principal Occupation: Chief Executive Officer of Crane Co., an industrial products company (2001–2014). Other Directorships: Currently serves as director of Automatic Data Processing, Inc. (since 2007) and Regions Financial Corporation (since 2010). Previously served as a director of Crane Co. (1999–2014). |
| | | | | |
Evelyn E. Guernsey
Lord, Abbett & Co. LLC
c/o Legal Dept.
90 Hudson Street
Jersey City, NJ 07302
(1955) | | Director since 2011 | | Principal Occupation: CEO, Americas of J.P. Morgan Asset Management (2004–2010). Other Directorships: None. |
| | | | | |
Julie A. Hill
Lord, Abbett & Co. LLC
c/o Legal Dept.
90 Hudson Street
Jersey City, NJ 07302
(1946) | | Director since 2004 | | Principal Occupation: Owner and CEO of The Hill Company, a business consulting firm (since 1998). Other Directorships: Currently serves as director of Anthem, Inc., a health benefits company (since 1994). |
| | | | | |
Franklin W. Hobbs
Lord, Abbett & Co. LLC
c/o Legal Dept.
90 Hudson Street
Jersey City, NJ 07302
(1947) | | Director since 2001 | | Principal Occupation: Advisor of One Equity Partners, a private equity firm (since 2004). Other Directorships: Currently serves as director and Chairman of the Board of Ally Financial Inc., a financial services firm (since 2009), and as director of Molson Coors Brewing Company (since 2002). |
| | | | | |
James M. McTaggart
Lord, Abbett & Co. LLC
c/o Legal Dept.
90 Hudson Street
Jersey City, NJ 07302
(1947) | | Director since 2012 | | Principal Occupation: Independent management advisor and consultant (since 2012); Vice President, CRA International, Inc. (doing business as Charles River Associates), a global management consulting firm (2009–2012); Founder and Chairman of Marakon Associates, Inc., a strategy consulting firm (1978–2009); and Officer and Director of Trinsum Group, a holding company (2007–2009). Other Directorships: Currently serves as director of Blyth, Inc., a home products company (since 2004). |
| | | | | |
James L.L. Tullis
Lord, Abbett & Co. LLC
c/o Legal Dept.
90 Hudson Street
Jersey City, NJ 07302
(1947) | | Director since 2006 | | Principal Occupation: CEO of Tullis-Dickerson and Co. Inc., a venture capital management firm (since 1990); CEO of Tullis Health Investors Inc. (since 2012). Other Directorships: Currently serves as director of Crane Co. (since 1998). |
27
Basic Information About Management (continued)
Officers
None of the officers listed below have received compensation from the Company. All of the officers of the Company also may be officers of the other Lord Abbett Funds and maintain offices at 90 Hudson Street, Jersey City, NJ 07302. Unless otherwise indicated, the position(s) and title(s) listed under the “Principal Occupation During the Past Five Years” column indicate each officer’s position(s) and title(s) with Lord Abbett. Each officer serves for an indefinite term (i.e., until his or her death, resignation, retirement, or removal).
| | | | | Length of Service | | |
| Name and | | Current Position | | of Current | | Principal Occupation |
| Year of Birth | | with the Fund | | Position | | During the Past Five Years |
| | | | | | | |
Daria L. Foster
(1954) | | President and Chief Executive Officer | | Elected as President in 2006 and Chief Executive Officer in 2012 | | Managing Partner of Lord Abbett, joined Lord Abbett in 1990. |
| | | | | | | |
Sean J. Aurigemma
(1969) | | Executive Vice President | | Elected in 2010 | | Portfolio Manager, joined Lord Abbett in 2007. |
| | | | | | | |
Jeff D. Diamond
(1960) | | Executive Vice President | | Elected in 2008 | | Portfolio Manager, joined Lord Abbett in 2007. |
| | | | | | | |
Robert I. Gerber
(1954) | | Executive Vice President | | Elected in 2003 | | Partner and Chief Investment Officer, joined Lord Abbett in 1997. |
| | | | | | | |
Todd D. Jacobson
(1966) | | Executive Vice President | | Elected in 2005 | | Partner and Associate Director, joined Lord Abbett in 2003. |
| | | | | | | |
Robert A. Lee
(1969) | | Executive Vice President | | Elected in 2010 | | Partner and Deputy Chief Investment Officer, joined Lord Abbett in 1997. |
| | | | | | | |
Thomas B. Maher
(1967) | | Executive Vice President | | Elected in 2010 | | Partner and Portfolio Manager, joined Lord Abbett in 2003. |
| | | | | | | |
Justin C. Maurer
(1969) | | Executive Vice President | | Elected in 2010 | | Partner and Portfolio Manager, joined Lord Abbett in 2001. |
| | | | | | | |
Vincent J. McBride
(1964) | | Executive Vice President | | Elected in 2010 | | Partner and Director, joined Lord Abbett in 2003. |
| | | | | | | |
Andrew H. O’Brien
(1973) | | Executive Vice President | | Elected in 2010 | | Partner and Portfolio Manager, joined Lord Abbett in 1998. |
| | | | | | | |
F. Thomas O’Halloran, III
(1955) | | Executive Vice President | | Elected in 2010 | | Partner and Portfolio Manager, joined Lord Abbett in 2001. |
| | | | | | | |
Walter H. Prahl
(1958) | | Executive Vice President | | Elected in 2012 | | Partner and Director, joined Lord Abbett in 1997. |
| | | | | | | |
Steven F. Rocco
(1979) | | Executive Vice President | | Elected in 2014 | | Partner and Portfolio Manager, joined Lord Abbett in 2004. |
| | | | | | | |
Frederick J. Ruvkun
(1957) | | Executive Vice President | | Elected in 2012 | | Partner and Portfolio Manager, joined Lord Abbett in 2006. |
28
Basic Information About Management (continued)
| | | | | Length of Service | | |
| Name and | | Current Position | | of Current | | Principal Occupation |
| Year of Birth | | with the Fund | | Position | | During the Past Five Years |
| | | | | | | |
Paul J. Volovich
(1973) | | Executive Vice President | | Elected in 2005 | | Partner and Portfolio Manager, joined Lord Abbett in 1997. |
| | | | | | | |
A. Edward Allinson
(1961) | | Vice President | | Elected in 2011 | | Portfolio Manager, joined Lord Abbett in 2005. |
| | | | | | | |
John W. Ashbrook
(1964) | | Vice President and Assistant Secretary | | Elected in 2014 | | Assistant General Counsel, joined Lord Abbett in 2008. |
| | | | | | | |
Joan A. Binstock
(1954) | | Chief Financial Officer and Vice President | | Elected in 1999 | | Partner and Chief Financial and Operations Officer, joined Lord Abbett in 1999. |
| | | | | | | |
Brooke A. Fapohunda
(1975) | | Vice President and Assistant Secretary | | Elected in 2014 | | Deputy General Counsel, joined Lord Abbett in 2006. |
| | | | | | | |
John K. Forst
(1960) | | Vice President and Assistant Secretary | | Elected in 2005 | | Partner and Deputy General Counsel, joined Lord Abbett in 2004. |
| | | | | | | |
Anthony W. Hipple
(1964) | | Vice President | | Elected in 2014 | | Portfolio Manager, joined Lord Abbett in 2002. |
| | | | | | | |
Lawrence H. Kaplan
(1957) | | Vice President and Secretary | | Elected in 1997 | | Partner and General Counsel, joined Lord Abbett in 1997. |
| | | | | | | |
Jerald M. Lanzotti
(1967) | | Vice President | | Elected in 2012 | | Partner and Portfolio Manager, joined Lord Abbett in 1996. |
| | | | | | | |
David J. Linsen
(1974) | | Vice President | | Elected in 2008 | | Partner and Director, joined Lord Abbett in 2001. |
| | | | | | | |
Joseph M. McGill
(1962) | | Chief Compliance Officer | | Elected in 2014 | | Chief Compliance Officer, joined Lord Abbett in 2014 and was formerly Managing Director and the Chief Compliance Officer at UBS Global Asset Management (2003–2013). |
| | | | | | | |
A. Edward Oberhaus, III
(1959) | | Vice President | | Elected in 1998 | | Partner and Director, joined Lord Abbett in 1983. |
| | | | | | | |
Noah Petrucci
(1970) | | Vice President | | Elected in 2013 | | Portfolio Manager, joined Lord Abbett in 2012 and was formerly a Portfolio Manager at Columbia Management Investment Advisers, LLC and Columbia Management Advisors, LLC (2002–2012). |
| | | | | | | |
Lawrence B. Stoller
(1963) | | Vice President and Assistant Secretary | | Elected in 2007 | | Partner and Senior Deputy General Counsel, joined Lord Abbett in 2007. |
29
Basic Information About Management (concluded)
| | | | | Length of Service | | |
| Name and | | Current Position | | of Current | | Principal Occupation |
| Year of Birth | | with the Fund | | Position | | During the Past Five Years |
| | | | | | | |
Arthur K. Weise
(1970) | | Vice President | | Elected in 2010 | | Partner and Portfolio Manager, joined Lord Abbett in 2007. |
| | | | | | | |
Kewjin Yuoh
(1971) | | Vice President | | Elected in 2012 | | Partner and Portfolio Manager, joined Lord Abbett in 2010. |
| | | | | | | |
Scott S. Wallner
(1955) | | AML Compliance Officer | | Elected in 2011 | | Assistant General Counsel, joined Lord Abbett in 2004. |
| | | | | | | |
Bernard J. Grzelak
(1971) | | Treasurer | | Elected in 2003 | | Partner and Director of Fund Administration, joined Lord Abbett in 2003. |
Please call 888-522-2388 for a copy of the statement of additional information, which contains further information about the Company’s Directors. It is available free upon request.
30
Approval of Advisory Contract
The Board of Directors of the Fund, including all of the Directors who are not interested persons of the Fund or of Lord Abbett (the “Independent Board Members”), annually considers whether to approve the continuation of the existing management agreement between the Fund and Lord Abbett. In connection with its most recent approval, the Board reviewed materials relating specifically to the management agreement, as well as numerous materials received throughout the course of the year, including information about the Fund’s investment performance compared to the performance of its benchmark. Before making its decision as to the Fund, the Board had the opportunity to ask questions and request further information, taking into account its familiarity with Lord Abbett gained through its meetings and discussions. These meetings and discussions included the examination of the portfolio management team conducted by members of the Contract Committee, the deliberations of the Contract Committee, and discussions between the Contract Committee and Lord Abbett’s management. The Independent Board Members also discussed the materials described above with their independent legal counsel in a private session at which no representatives of management were present.
The materials received by the Board included, but were not limited to: (1) information provided by Morningstar Associates, LLC (“Morningstar”) regarding the investment performance of the Fund compared to the investment performance of a group of funds in the same Morningstar investment category (the “performance peer group”) and the investment performance of one or more appropriate benchmarks; (2) information provided by Morningstar regarding the expense ratios, contractual and effective management fee rates, and other expense components for the Fund and one or more groups of funds in the same Morningstar category, with the same share classes and operational characteristics, including asset size (the “expense peer group”); (3) information provided by Lord Abbett on the projected expense ratios, management fee rates, and other expense components for the Fund; (4) sales and redemption information for the Fund; (5) information regarding Lord Abbett’s financial condition; (6) an analysis of the relative profitability of the management agreement to Lord Abbett; (7) information provided by Lord Abbett regarding the investment management fees Lord Abbett receives from its other advisory clients maintaining accounts with a similar investment strategy as the Fund; (8) information regarding the distribution arrangements of the Fund; and (9) information regarding the personnel and other resources devoted by Lord Abbett to managing the Fund.
Investment Management Services Generally. The Board considered the investment management services provided by Lord Abbett to the Fund, including investment research, portfolio management, and trading, and Lord Abbett’s commitment to compliance with all applicable legal requirements. The Board also observed that Lord Abbett was solely engaged in the investment management business and accordingly did not experience the conflicts of interest that may result from being engaged in other lines of business. The Board considered the investment advisory services provided by Lord Abbett to other clients, the fees charged for the services, and the differences in the nature of the services provided to the Fund and other Lord Abbett Funds, on the one hand, and the services provided to other clients, on the other.
Investment Performance. The Board reviewed the Fund’s investment performance in relation to that of the performance peer group as of various periods ended August 31, 2015. The Board observed that the Fund’s investment performance was above the median of the performance peer group for the one-year and ten-year periods and below the median of the performance peer group for three-year and five-year periods.
31
Approval of Advisory Contract (continued)
Lord Abbett’s Personnel and Methods. The Board considered the qualifications of the personnel providing investment management services to the Fund, in light of its investment objective and discipline. Among other things, the Board considered the size, experience, and turnover of Lord Abbett’s investment management staff, Lord Abbett’s investment methodology and philosophy, and Lord Abbett’s approach to recruiting, training, and retaining investment management personnel.
Nature and Quality of Other Services. The Board considered the nature, quality, costs, and extent of compliance, administrative, and other services performed by Lord Abbett and Lord Abbett Distributor LLC (the “Distributor”) and the nature and extent of Lord Abbett’s supervision of third party service providers, including the Fund’s transfer agent and custodian.
Expenses. The Board considered the expense level of the Fund and the expense levels of the expense peer group. It also considered the projected expense levels and how those levels would relate to those of the expense peer group and the amount and nature of the fees paid by shareholders. The Board observed that the overall expense level of the Fund was below the median of the expense peer group.
Profitability. The Board considered the level of Lord Abbett’s profits in managing the Fund, including a review of Lord Abbett’s methodology for allocating its costs to its management of the Fund. The Board concluded that the allocation methodology had a reasonable basis and was appropriate. It considered any profits realized by Lord Abbett in connection with the operation of the Fund, including the fee that Lord Abbett receives from the Fund for providing administrative services to the Fund, and whether the amount of profit was fair for the management of the Fund. The Board also considered the profits realized from other business segments of Lord Abbett, which may benefit from or be related to the Fund’s business. The Board considered Lord Abbett’s profit margins in comparison with available industry data, both accounting for and ignoring marketing and distribution expenses, and how those profit margins could affect Lord Abbett’s ability to recruit and retain investment personnel. The Board recognized that Lord Abbett’s profitability was a factor in enabling it to attract and retain qualified investment management personnel to provide services to the Fund. The Board concluded that Lord Abbett’s profitability as to the Fund was not excessive.
Economies of Scale. The Board considered whether there had been any economies of scale in managing the Fund, whether the Fund had appropriately benefited from any such economies of scale, and whether there was potential for realization of any further economies of scale. The Board concluded that the existing management fee schedule, with its breakpoint or breakpoints in the level of the management fee, adequately addressed any economies of scale in managing the Fund.
Other Benefits to Lord Abbett. The Board considered the character and amount of fees paid by the Fund and the Fund’s shareholders to Lord Abbett and the Distributor for services other than investment advisory services. The Board also considered the revenues and profitability of Lord Abbett’s investment advisory business apart from its mutual fund business, and the intangible benefits enjoyed by Lord Abbett by virtue of its relationship with the Fund. The Board observed that the Distributor receives 12b-1 fees from certain of the Lord Abbett Funds as to shares held in accounts for which there is no other broker of record, may retain a portion of the 12b-1 fees it receives, and receives a portion of the sales charges on sales and redemptions of some classes of shares. In addition, the Board observed that Lord Abbett accrues certain benefits for its business of providing investment advice to clients other than the Lord Abbett Funds, but that business also benefits the Funds. The Board also noted that Lord Abbett, as disclosed in the prospectus of the Fund, has entered into revenue sharing arrangements with certain entities that distribute shares of
32
Approval of Advisory Contract (concluded)
the Fund. The Board also took into consideration the investment research that Lord Abbett receives as a result of Fund brokerage transactions.
Alternative Arrangements. The Board considered whether, instead of approving continuation of the management agreement, it might be in the best interests of the Fund to implement one or more alternative arrangements, such as continuing to employ Lord Abbett, but on different terms. After considering all of the relevant factors, the Board unanimously found that continuation of the existing management agreement was in the best interests of the Fund and its shareholders and voted unanimously to approve the continuation of the management agreement. In considering whether to approve the continuation of the management agreement, the Board did not identify any single factor as paramount or controlling. This summary does not discuss in detail all matters considered.
33
Householding
The Company has adopted a policy that allows it to send only one copy of the Fund’s prospectus, proxy material, annual report and semiannual report to certain shareholders residing at the same “household.” This reduces Fund expenses, which benefits you and other shareholders. If you need additional copies or do not want your mailings to be “householded,” please call Lord Abbett at 888-522-2388 or send a written request with your name, the name of your fund or funds and your account number or numbers to Lord Abbett Family of Funds, P.O. Box 219336, Kansas City, MO 64121.
Proxy Voting Policies, Procedures and Records
A description of the policies and procedures that Lord Abbett uses to vote proxies related to the Fund’s portfolio securities, and information on how Lord Abbett voted the Fund’s proxies during the 12-month period ended June 30 are available without charge, upon request, (i) by calling 888-522-2388; (ii) on Lord Abbett’s Website at www.lordabbett.com; and (iii) on the Securities and Exchange Commission’s (“SEC”) Website at www.sec.gov.
Shareholder Reports and Quarterly Portfolio Disclosure
The Fund is required to file its complete schedule of portfolio holdings with the SEC for its first and third fiscal quarters on Form N-Q. Copies of the filings are available without charge, upon request on the SEC’s Website at www.sec.gov and may be available by calling Lord Abbett at 888-522-2388. You can also obtain copies of Form N-Q by visiting the SEC’s Public Reference Room in Washington, DC (information on the operation of the Public Reference Room may be obtained by calling 800-SEC-0330).
Tax Information For corporate shareholders, 55% of the Fund’s ordinary income distributions qualified for the dividends received deduction. Additionally, of the distributions paid to the shareholders during the fiscal year ended December 31, 2015, $3,342,649 and $6,242,510, respectively, represent short-term capital gains and long-term capital gains. |
34


This report, when not used for the general information of
shareholders of the Fund, is to be distributed only if preceded or accompanied by a current fund prospectus. | | |
| | | |
Lord Abbett mutual fund shares are distributed by
LORD ABBETT DISTRIBUTOR LLC. | Lord Abbett Series Fund, Inc. | |
| | Calibrated Dividend Growth Portfolio | SFCS-PORT-3
(02/16) |

2015 LORD ABBETT
ANNUAL REPORT
Lord Abbett
Series Fund—Classic Stock Portfolio
For the fiscal year ended December 31, 2015
Table of Contents
Lord Abbett Series Fund – Classic Stock Portfolio
Annual Report
For the fiscal year ended December 31, 2015

Daria L. Foster, Director, President and Chief Executive Officer of the Lord Abbett Funds, and E. Thayer Bigelow, Independent Chairman of the Lord Abbett Funds.
Dear Shareholders: We are pleased to provide you with this overview of the performance of Lord Abbett Series Fund – Classic Stock Portfolio for the fiscal year ended December 31, 2015. On this page and the following pages, we discuss the major factors that influenced fiscal year performance. For additional information about the Fund, please visit our website at www.lordabbett.com, where you also can access the quarterly commentaries that provide updates on the Fund’s performance and other portfolio related updates.
Thank you for investing in Lord Abbett mutual funds. We value the trust that you place in us and look forward to serving your investment needs in the years to come.
Best regards,

Daria L. Foster
Director, President and Chief Executive Officer
For the fiscal year ended December 31, 2015, the Fund returned -0.90%, reflecting performance at the net asset value (NAV) of Class VC shares, with all distributions reinvested, compared to its benchmark, the Russell 1000® Index1, which returned 0.92% over the same period.
Domestic equity markets advanced over the past year, with the S&P 500® Index2 rising 1.38% during the trailing 12-month period. Despite this index general move upward, there were a few periods of short-term volatility, most notably in January
2015, when the S&P 500 declined 3.0% in total return terms, and in August 2015, when the index dropped 6.0%, its greatest monthly loss in three years. One of the prevailing market themes during the trailing 12-month period was the continued weakness in energy prices. Finally, U.S. real gross domestic product (GDP), which was initially reported to have contracted by 0.2% in the first quarter of 2015, was later revised upwards to a modest 0.6% expansion. In the second quarter of 2015, real GDP advanced 3.9%,
1
while the third estimate from the Bureau of Economic Analysis indicated that real GDP increased 2.0% in the third quarter of 2015.
The Fund underperformed its index for the period. Stock selection within the consumer discretionary and industrials sectors detracted from the Fund’s relative performance. Shares of Time Warner Inc., a media and entertainment company, fell as the market reacted poorly to media stocks due to concerns regarding the decline in pay-TV subscribers. Despite the sell-off, the Fund’s portfolio management team believes there are still growth opportunities in the firm’s HBO, Turner, and Warner Bros. segments. Shares of PVH Corp., an apparel company, detracted from performance, as sell-side analysts highlighted weakness in the U.S. retail market, particularly in apparel and accessories. Within the industrials sector, shares of Union Pacific Corporation, a railroad operating company, slid down along with the price of oil, which is a revenue driver. In addition, shares of United Technologies Corporation, a high technology products and services company, fell, as weaker growth in China led to weaker guidance.
Stock selection within the information technology and health care sectors
contributed to relative performance during the period. Shares of Vantiv, Inc., a technology holding company, steadily increased due to impressive revenue/ transaction growth. Strength from the Independent Software Vendors (ISV) and eCommerce segments also helped performance. In addition, shares of Alphabet, Inc., a collection of technology companies, increased as strong second-quarter earnings illustrated that the long-term growth story is intact. Within the health care sector, shares of Envision Healthcare Holdings, Inc., a provider of physician-led, outsourced medical services, performed well in the first half of the year due to strong trends in its EmCare and AMR segments. Shares of Allergan PLC. (formerly Actavis PLC), a specialty pharmaceutical company, benefited in the second half of 2015 after the company issued a strong third quarter earnings report and after an announced acquisition of the company by Pfizer in November.
The Fund’s portfolio is actively managed and, therefore, its holdings and the weightings of a particular issuer or particular sector as a percentage of portfolio assets are subject to change. Sectors may include many industries.
2
1 The Russell 1000 Index® measures the performance of the 1,000 largest companies in the Russell 3000 Index, which represents approximately 92% of the total market capitalization of the Russell 3000 Index.
2 The S&P 500® Index is widely regarded as the standard for measuring large cap U.S. stock market performance and includes a representative sample of leading companies in leading industries.
Unless otherwise specified, indexes reflect total return, with all dividends reinvested. Indexes are unmanaged, do not reflect the deduction of fees or expenses, and are not available for direct investment.
Important Performance and Other Information
Performance data quoted in the following pages reflect past performance and are no guarantee of future results. Current performance may be higher or lower than the performance quoted. The investment return and principal value of an investment in the Funds will fluctuate so that shares, on any given day or when redeemed, may be worth more or less than their original cost. You can obtain performance data current to the most recent month end by calling Lord Abbett at 888-522-2388 or referring to www.lordabbett.com.
During certain periods shown, expense waivers and reimbursements were in place. Without such waivers and expense reimbursements, the Fund’s returns would have been lower.
The annual commentary above discusses the views of the Fund’s management and various portfolio holdings of the Fund as of December 31, 2015. These views and portfolio holdings may have changed after this date. Information provided in the commentary is not a recommendation to buy or sell securities. Because the Fund’s portfolio is actively managed and may change significantly, the Fund may no longer own the securities described above or may have otherwise changed their positions in the securities. For more recent information about the Fund’s portfolio holdings, please visit www.lordabbett.com.
A Note about Risk: See Notes to Financial Statements for a discussion of investment risks. For a more detailed discussion of the risks associated with the Fund, please see the Fund’s prospectus.
Mutual funds are not insured by the FDIC, are not deposits or other obligations of, or guaranteed by, banks, and are subject to investment risks including possible loss of principal amount invested.
The Fund serves as an underlying investment vehicle for variable annuity contracts and variable life insurance policies.
3
Investment Comparison
Below is a comparison of a $10,000 investment in Class VC shares with the same investment in both the Russell 1000® Index and the S&P 500® Index, assuming reinvestment of all dividends and distributions. The Fund’s shares are sold only to insurance company separate accounts that fund certain variable annuity and variable life contracts. This line graph comparison does not reflect the sales charges or other expenses of these contracts. If those sales charges and expenses were reflected, returns would be lower. The graph and performance table below do not reflect the deduction of taxes that a shareholder would pay on Fund distributions or the redemption or Fund shares. During certain periods, expenses of the Fund have been waived or reimbursed by Lord Abbett; without such waiver or reimbursement of expenses, the Fund’s returns would have been lower. Past performance is no guarantee of future results.

Average Annual Total Returns for the
Periods Ended December 31, 2015
| | | 1 Year | | 5 Years | | 10 years |
| Class VC | | –0.90 | % | | 8.22 | % | | 6.21 | % |
1 Performance for each unmanaged index does not reflect any fees or expenses. The performance of each index is not necessarily representative of the Fund’s performance.
4
Expense Example
As a shareholder of the Fund, you incur ongoing costs, including management fees; expenses related to the Fund’s services arrangements with certain insurance companies; and other Fund expenses. This Example is intended to help you understand your ongoing costs (in dollars) of investing in the Fund and to compare these costs with the ongoing costs of investing in other mutual funds.
The Example is based on an investment of $1,000 invested at the beginning of the period and held for the entire period (July 1, 2015 through December 31, 2015).
The Example reflects only expenses that are deducted from the assets of the Fund. Fees and expenses, including sales charges applicable to the various insurance products that invest in the Fund, are not reflected in this Example. If such fees and expenses were reflected in the Example, the total expenses shown would be higher. Fees and expenses regarding such variable insurance products are separately described in the prospectus related to those products.
Actual Expenses
The first line of the table on the following page provides information about actual account values and actual expenses. You may use the information in this line, together with the amount you invested, to estimate the expenses that you paid over the period. Simply divide your account value by $1,000 (for example, an $8,600 account value divided by $1,000 = 8.6), then multiply the result by the number in the first line under the heading titled “Expenses Paid During Period 7/1/15 – 12/31/15” to estimate the expenses you paid on your account during this period.
Hypothetical Example for Comparison Purposes
The second line of the table on the following page provides information about hypothetical account values and hypothetical expenses based on the Fund’s actual expense ratio and an assumed rate of return of 5% per year before expenses, which is not the Fund’s actual return. The hypothetical account values and expenses may not be used to estimate the actual ending account balance or expenses you paid for the period. You may use this information to compare the ongoing costs of investing in the Fund and other funds. To do so, compare this 5% hypothetical example with the 5% hypothetical examples that appear in the shareholder reports of the other funds.
5
Please note that the expenses shown in the table are meant to highlight your ongoing costs only and do not reflect any transactional costs, such as sales charges. Therefore, the second line of the table is useful in comparing ongoing costs only, and will not help you determine the relative total costs of owning different funds. In addition, if these transactional costs were included, your costs would have been higher.
| | | Beginning
Account
Value | | Ending
Account
Value | | Expenses
Paid During
Period† | |
| | | 7/1/15 | | 12/31/15 | | 7/1/15 -
12/31/15 | |
| Class VC | | | | | | | |
| Actual | | $1,000.00 | | $ 984.00 | | $4.75 | |
| Hypothetical (5% Return Before Expenses) | | $1,000.00 | | $1,020.42 | | $4.84 | |
| † | Net expenses are equal to the Fund’s annualized expense ratio of 0.95%, multiplied by the average account value over the period, multiplied by 184/365 (to reflect one-half year period). |
Portfolio Holdings Presented by Sector
December 31, 2015
| Sector* | %** |
| Consumer Discretionary | 6.39 | % |
| Consumer Staples | 10.01 | % |
| Energy | 5.37 | % |
| Financials | 22.31 | % |
| Health Care | 12.66 | % |
| Industrials | 10.94 | % |
| Information Technology | 24.62 | % |
| Materials | 1.23 | % |
| Telecommunication Services | 1.38 | % |
| Utilities | 4.07 | % |
| Repurchase Agreement | 1.02 | % |
| Total | 100.00 | % |
| * | | A sector may comprise several industries. |
| ** | | Represents percent of total investments. |
6
Schedule of Investments
December 31, 2015
| Investments | | Shares | | | Fair
Value
(000) | |
| COMMON STOCKS 99.66% | | | | | | | | |
| |
| Aerospace & Defense 4.51% | | | | | | | | |
| Honeywell International, Inc. | | | 7,386 | | | $ | 765 | |
| TransDigm Group, Inc.* | | | 3,291 | | | | 752 | |
| Total | | | | | | | 1,517 | |
| |
| Banks 13.19% | | | | | | | | |
| Citizens Financial Group, Inc. | | | 31,979 | | | | 838 | |
| East West Bancorp, Inc. | | | 15,156 | | | | 630 | |
| First Republic Bank | | | 11,285 | | | | 745 | |
| JPMorgan Chase & Co. | | | 22,116 | | | | 1,460 | |
| Signature Bank* | | | 4,974 | | | | 763 | |
| Total | | | | | | | 4,436 | |
| |
| Beverages 2.93% | | | | | | | | |
| PepsiCo, Inc. | | | 9,870 | | | | 986 | |
| |
| Biotechnology 1.43% | | | | | | | | |
| Celgene Corp.* | | | 4,006 | | | | 480 | |
| |
| Capital Markets 3.53% | | | | | | | | |
| Affiliated Managers Group, Inc.* | | | 4,027 | | | | 643 | |
| Morgan Stanley | | | 17,127 | | | | 545 | |
| Total | | | | | | | 1,188 | |
| |
| Chemicals 1.24% | | | | | | | | |
| E.I. du Pont de Nemours & Co. | | | 6,259 | | | | 417 | |
| |
| Commercial Services & Supplies 1.44% | | | | | | | | |
| ADT Corp. (The) | | | 14,698 | | | | 485 | |
| |
| Communications Equipment 2.24% | | | | | | | | |
| Cisco Systems, Inc. | | | 27,696 | | | | 752 | |
| |
| Diversified Telecommunication Services 1.39% |
| Verizon Communications, Inc. | | | 10,094 | | | | 466 | |
| |
| Electric: Utilities 2.44% | | | | | | | | |
| NextEra Energy, Inc. | | | 7,894 | | | | 820 | |
| |
| Energy Equipment & Services 1.21% | | | | | | | | |
| Schlumberger Ltd. | | | 5,858 | | | | 409 | |
| Investments | | Shares | | | Fair
Value
(000) | |
| Food & Staples Retailing 2.95% | | | | | | | | |
| CVS Health Corp. | | | 10,142 | | | $ | 992 | |
| | | | | | | | | |
| Food Products 3.05% | | | | | | | | |
| Mondelez International, Inc. Class A | | | 22,876 | | | | 1,026 | |
| | | | | | | | | |
| Health Care Providers & Services 2.42% | | | | | | | | |
| UnitedHealth Group, Inc. | | | 6,909 | | | | 813 | |
| | | | | | | | | |
| Hotels, Restaurants & Leisure 2.92% | | | | | | | | |
| McDonald’s Corp. | | | 6,448 | | | | 762 | |
| Yum! Brands, Inc. | | | 3,038 | | | | 222 | |
| Total | | | | | | | 984 | |
| | | | | | | | | |
| Household Products 1.15% | | | | | | | | |
| Colgate-Palmolive Co. | | | 5,797 | | | | 386 | |
| | | | | | | | | |
| Industrial Conglomerates 3.32% | | | | | | | | |
| General Electric Co. | | | 35,913 | | | | 1,119 | |
| | | | | | | | | |
| Information Technology Services 1.44% | | | | | | | | |
| Vantiv, Inc. Class A* | | | 10,192 | | | | 483 | |
| | | | | | | | | |
| Insurance 4.67% | | | | | | | | |
| American International Group, Inc. | | | 12,307 | | | | 762 | |
| Hartford Financial Services Group, Inc. (The) | | | 18,610 | | | | 809 | |
| Total | | | | | | | 1,571 | |
| | | | | | | | | |
| Internet Software & Services 6.60% | | | | | | | | |
| Alphabet, Inc. Class A* | | | 1,725 | | | | 1,342 | |
| Alphabet, Inc. Class C* | | | 1,159 | | | | 880 | |
| Total | | | | | | | 2,222 | |
| | | | | | | | | |
| Machinery 1.74% | | | | | | | | |
| ITT Corp. | | | 16,101 | | | | 585 | |
| | | | | | | | | |
| Media 1.92% | | | | | | | | |
| Time Warner, Inc. | | | 9,981 | | | | 645 | |
| | | | | | | | | |
| Multi-Utilities 1.66% | | | | | | | | |
| PG&E Corp. | | | 10,526 | | | | 560 | |
| | See Notes to Financial Statements. | 7 |
Schedule of Investments (continued)
December 31, 2015
| Investments | | Shares | | | Fair
Value
(000) | |
| Oil, Gas & Consumable Fuels 4.19% | | | | | | | | |
| EOG Resources, Inc. | | | 7,368 | | | $ | 521 | |
| Exxon Mobil Corp. | | | 9,172 | | | | 715 | |
| Occidental Petroleum Corp. | | | 2,555 | | | | 173 | |
| Total | | | | | | | 1,409 | |
| |
| Pharmaceuticals 8.90% | | | | | | | | |
| Bristol-Myers Squibb Co. | | | 2,176 | | | | 150 | |
| Eli Lilly & Co. | | | 6,225 | | | | 524 | |
| Merck & Co., Inc. | | | 20,204 | | | | 1,067 | |
| Pfizer, Inc. | | | 38,804 | | | | 1,253 | |
| Total | | | | | | | 2,994 | |
| |
| Real Estate Investment Trusts 1.08% | | | | | | | | |
| Vornado Realty Trust | | | 3,636 | | | | 363 | |
| |
| Semiconductors & Semiconductor Equipment 5.56% | | | | | |
| Intel Corp. | | | 39,567 | | | | 1,363 | |
| Microchip Technology, Inc. | | | 10,888 | | | | 507 | |
| Total | | | | | | | 1,870 | |
| |
| Software 3.33% | | | | | | | | |
| Microsoft Corp. | | | 20,219 | | | | 1,122 | |
| |
| Specialty Retail 1.59% | | | | | | | | |
| AutoZone, Inc.* | | | 723 | | | | 536 | |
| |
| Technology Hardware, Storage & Peripherals 5.62% |
| Apple, Inc. | | | 17,980 | | | | 1,892 | |
Total Common Stocks
(cost $31,783,985) | | | | | | | 33,528 | |
| Investments | | Principal
Amount
(000) | | | Fair
Value
(000) | |
| SHORT-TERM INVESTMENT 1.02% | | | | | | | | |
| |
| Repurchase Agreement | | | | | | | | |
| Repurchase Agreement dated 12/31/2015, 0.03% due 1/4/2016 with Fixed Income Clearing Corp. collateralized by $355,000 of U.S. Treasury Note at 1.625% due 7/31/2020; value: $355,444; proceeds: $343,722 (cost $343,721) | | $ | 344 | | | $ | 344 | |
Total Investments in Securities 100.68%
(cost $32,127,706) | | | | | | | 33,872 | |
| Liabilities in Excess of Other Assets (0.68)% | | | | | | | (229 | ) |
| Net Assets 100.00% | | | | | | $ | 33,643 | |
| * | Non-income producing security. |
| 8 | See Notes to Financial Statements. | |
Schedule of Investments (concluded)
December 31, 2015
The following is a summary of the inputs used as of December 31, 2015 in valuing the Fund’s investments carried at fair value(1):
| | | Level 1 | | | Level 2 | | | Level 3 | | | Total | |
| Investment Type(2)(3) | | | (000) | | | | (000) | | | | (000) | | | | (000) | |
| Common Stocks | | | $33,528 | | | $ | – | | | $ | – | | | | $33,528 | |
| Repurchase Agreement | | | – | | | | 344 | | | | – | | | | 344 | |
| Total | | | $33,528 | | | $ | 344 | | | $ | – | | | | $33,872 | |
| (1) | Refer to Note 2(h) for a description of fair value measurements and the three-tier hierarchy of inputs. |
| (2) | See Schedule of Investments for fair values in each industry and identification of foreign issuers and/or geography. |
| (3) | There were no Level 1/Level 2 transfers during the fiscal year ended December 31, 2015. |
| | See Notes to Financial Statements. | 9 |
Statement of Assets and Liabilities
December 31, 2015
| ASSETS: | | | | |
| Investments in securities, at fair value (cost $32,127,706) | | $ | 33,872,105 | |
| Receivables: | | | | |
| Interest and dividends | | | 50,453 | |
| Investment securities sold | | | 40,870 | |
| From advisor (See Note 3) | | | 9,951 | |
| Capital shares sold | | | 3,291 | |
| Prepaid expenses | | | 282 | |
| Total assets | | | 33,976,952 | |
| LIABILITIES: | | | | |
| Payables: | | | | |
| Capital shares reacquired | | | 237,857 | |
| Management fee | | | 23,406 | |
| Directors’ fees | | | 5,480 | |
| Fund administration | | | 1,337 | |
| Accrued expenses | | | 66,206 | |
| Total liabilities | | | 334,286 | |
| NET ASSETS | | $ | 33,642,666 | |
| COMPOSITION OF NET ASSETS: | | | | |
| Paid-in capital | | $ | 31,445,534 | |
| Distributions in excess of net investment income | | | (5,249 | ) |
| Accumulated net realized gain on investments | | | 457,982 | |
| Net unrealized appreciation on investments | | | 1,744,399 | |
| Net Assets | | $ | 33,642,666 | |
| Outstanding shares (50 million shares of common stock authorized, $.001 par value) | | | 2,884,593 | |
Net asset value, offering and redemption price per share
(Net assets divided by outstanding shares) | | | $11.66 | |
| 10 | See Notes to Financial Statements. | |
Statement of Operations
For the Year Ended December 31, 2015
| Investment income: | | | | |
| Dividends | | $ | 696,017 | |
| Interest | | | 4 | |
| Total investment income | | | 696,021 | |
| Expenses: | | | | |
| Management fee | | | 282,530 | |
| Non 12b-1 service fees | | | 100,741 | |
| Shareholder servicing | | | 50,792 | |
| Professional | | | 44,515 | |
| Reports to shareholders | | | 20,409 | |
| Fund administration | | | 16,145 | |
| Custody | | | 5,176 | |
| Directors’ fees | | | 1,426 | |
| Other | | | 8,741 | |
| Gross expenses | | | 530,475 | |
| Expense reductions (See Note 8) | | | (42 | ) |
| Fees waived and expenses reimbursed (See Note 3) | | | (146,999 | ) |
| Net expenses | | | 383,434 | |
| Net investment income | | | 312,587 | |
| Net realized and unrealized gain (loss): | | | | |
| Net realized gain on investments | | | 5,555,517 | |
| Net change in unrealized appreciation/depreciation on investments | | | (6,847,347 | ) |
| Net realized and unrealized loss | | | (1,291,830 | ) |
| Net Decrease in Net Assets Resulting From Operations | | $ | (979,243 | ) |
| | See Notes to Financial Statements. | 11 |
Statements of Changes in Net Assets
| INCREASE (DECREASE) IN NET ASSETS | | For the Year Ended
December 31, 2015 | | | For the Year Ended
December 31, 2014 | |
| Operations: | | | | | | | | |
| Net investment income | | $ | 312,587 | | | $ | 295,368 | |
| Net realized gain on investments | | | 5,555,517 | | | | 5,576,625 | |
| Net change in unrealized appreciation/depreciation on investments | | | (6,847,347 | ) | | | (2,386,255 | ) |
| Net increase (decrease) in net assets resulting from operations | | | (979,243 | ) | | | 3,485,738 | |
| Distributions to shareholders from: | | | | | | | | |
| Net investment income | | | (305,595 | ) | | | (298,168 | ) |
| Net realized gain | | | (6,419,296 | ) | | | (5,179,421 | ) |
| Total distributions to shareholders | | | (6,724,891 | ) | | | (5,477,589 | ) |
| Capital share transactions (See Note 12): | | | | | | | | |
| Proceeds from sales of shares | | | 25,924,123 | | | | 9,366,146 | |
| Reinvestment of distributions | | | 6,724,890 | | | | 5,477,589 | |
| Cost of shares reacquired | | | (34,599,609 | ) | | | (15,012,380 | ) |
| Net decrease in net assets resulting from capital share transactions | | | (1,950,596 | ) | | | (168,645 | ) |
| Net decrease in net assets | | | (9,654,730 | ) | | | (2,160,496 | ) |
| NET ASSETS: | | | | | | | | |
| Beginning of year | | $ | 43,297,396 | | | $ | 45,457,892 | |
| End of year | | $ | 33,642,666 | | | $ | 43,297,396 | |
| Distributions in excess of net investment income | | $ | (5,249 | ) | | $ | (4,981 | ) |
| 12 | See Notes to Financial Statements. | |
This page is intentionally left blank.
Financial Highlights
| | | | | Per Share Operating Performance: |
| | | | | Investment operations: | | Distributions to
shareholders from: |
| | | Net asset
value,
beginning
of year | | Net
invest-
ment
income(a) | | Net
realized
and
unrealized
gain (loss) | | Total
from
invest-
ment
opera-
tions | | Net
investment
income | | Net
realized
gain | | Total
distri-
butions |
| 12/31/2015 | | $ | 14.15 | | | $ | 0.11 | | | $ | (0.23 | ) | | $ | (0.12 | ) | | $ | (0.11 | ) | | $ | (2.26 | ) | | $ | (2.37 | ) |
| 12/31/2014 | | | 14.77 | | | | 0.10 | | | | 1.25 | | | | 1.35 | | | | (0.11 | ) | | | (1.86 | ) | | | (1.97 | ) |
| 12/31/2013 | | | 12.77 | | | | 0.14 | | | | 3.64 | | | | 3.78 | | | | (0.15 | ) | | | (1.63 | ) | | | (1.78 | ) |
| 12/31/2012 | | | 11.21 | | | | 0.14 | | | | 1.55 | | | | 1.69 | | | | (0.13 | ) | | | – | | | | (0.13 | ) |
| 12/31/2011 | | | 12.30 | | | | 0.09 | | | | (1.09 | ) | | | (1.00 | ) | | | (0.09 | ) | | | – | | | | (0.09 | ) |
| (a) | Calculated using average shares outstanding during the year. |
| (b) | Total return does not consider the effects of sales charges or other expenses imposed by an insurance company and assumes the reinvestment of all distributions. |
| 14 | See Notes to Financial Statements. | |
| | | | | Ratios to Average Net Assets: | | Supplemental Data: |
| | | | | | | |
Net
asset
value,
end of
year | | Total
return(b)
(%) | | Total
expenses
after
waivers
and/or reim-
bursements
(%) | | Total
expenses
(%) | | Net
investment
income
(%) | | Net
assets,
end of
year
(000) | | Portfolio
turnover
rate
(%) |
| | $11.66 | | | | (0.90 | ) | | | 0.95 | | | | 1.32 | | | | 0.78 | | | $ | 33,643 | | | | 100.46 | |
| | 14.15 | | | | 9.14 | | | | 0.95 | | | | 1.30 | | | | 0.68 | | | | 43,297 | | | | 49.77 | |
| | 14.77 | | | | 29.85 | | | | 0.95 | | | | 1.31 | | | | 0.95 | | | | 45,458 | | | | 42.01 | |
| | 12.77 | | | | 15.09 | | | | 0.95 | | | | 1.32 | | | | 1.13 | | | | 39,909 | | | | 23.58 | |
| | 11.21 | | | | (8.15 | ) | | | 0.95 | | | | 1.30 | | | | 0.74 | | | | 32,856 | | | | 27.01 | |
| | See Notes to Financial Statements. | 15 |
Notes to Financial Statements
Lord Abbett Series Fund, Inc. (the “Company”) is registered under the Investment Company Act of 1940, as amended (the “Act”), as a diversified, open-end management investment company and was incorporated under Maryland law in 1989. The Company consists of thirteen separate portfolios. This report covers Classic Stock Portfolio (the “Fund”).
The Fund’s investment objective is growth of capital and growth of income consistent with reasonable risk. The Fund has Variable Contract class shares (“Class VC Shares”), which are currently issued and redeemed only in connection with investments in, and payments under, variable annuity contracts and variable life insurance policies issued by life insurance and insurance-related companies.
The preparation of the financial statements in conformity with accounting principles generally accepted in the United States of America (“U.S. GAAP”) requires management to make certain estimates and assumptions that affect the reported amounts of assets and liabilities and disclosure of contingent assets and liabilities at the date of the financial statements and the reported amounts of increases and decreases in net assets from operations during the reporting period. Actual results could differ from those estimates. The Fund is considered an investment company under U.S. GAAP and follows the accounting and reporting guidance applicable to investment companies.
| 2. | SIGNIFICANT ACCOUNTING POLICIES |
| (a) | Investment Valuation–Under procedures approved by the Fund’s Board of Directors (the “Board”), Lord, Abbett & Co. LLC (“Lord Abbett”), the Fund’s investment manager, has formed a Pricing Committee to administer the pricing and valuation of portfolio investments and to ensure that prices utilized reasonably reflect fair value. Among other things, these procedures allow the Fund to utilize independent pricing services, quotations from securities and financial instrument dealers and other market sources to determine fair value. |
| | |
| | Securities actively traded on any recognized U.S. or non-U.S. exchange or on The NASDAQ Stock Market LLC are valued at the last sale price or official closing price on the exchange or system on which they are principally traded. Events occurring after the close of trading on non-U.S. exchanges may result in adjustments to the valuation of foreign securities to reflect their fair value as of the close of regular trading on the New York Stock Exchange. The Fund may utilize an independent fair valuation service in adjusting the valuations of foreign securities. Unlisted equity securities are valued at the last quoted sale price or, if no sale price is available, at the mean between the most recently quoted bid and asked prices. |
| | |
| | Securities for which prices are not readily available are valued at fair value as determined by the Pricing Committee. The Pricing Committee considers a number of factors, including observable and unobservable inputs, when arriving at fair value. The Pricing Committee may use related or comparable assets or liabilities, recent transactions, market multiples, book values and other relevant information to determine the fair value of portfolio investments. The Board or a designated committee thereof regularly reviews fair value determinations made by the Pricing Committee and employs techniques such as reviewing related market activity, reviewing inputs and assumptions, and retrospectively comparing prices of subsequent purchases and sales transactions to fair value determinations made by the Pricing Committee. |
| | |
| | Short-term securities with 60 days or less remaining to maturity are valued using the amortized cost method, which approximates fair value. |
16
Notes to Financial Statements (continued)
| (b) | Security Transactions–Security transactions are recorded as of the date that the securities are purchased or sold (trade date). Realized gains and losses on sales of portfolio securities are calculated using the identified-cost method. |
| | |
| (c) | Investment Income–Dividend income is recorded on the ex-dividend date. Interest income is recorded on the accrual basis as earned. Discounts are accreted and premiums are amortized using the effective interest method and are included in Interest and other income on the Statement of Operations. Withholding taxes on foreign dividends have been provided for in accordance with the applicable country’s tax rules and rates. |
| | |
| (d) | Income Taxes–It is the policy of the Fund to meet the requirements of Subchapter M of the Internal Revenue Code applicable to regulated investment companies and to distribute substantially all taxable income and capital gains to its shareholders. Therefore, no income tax provision is required. |
| | |
| | The Fund files U.S. federal and various state and local tax returns. No income tax returns are currently under examination. The statute of limitations on the Fund’s filed U.S. federal tax returns remains open for the fiscal years ended December 31, 2012 through December 31, 2015. The statutes of limitations on the Company’s state and local tax returns may remain open for an additional year depending upon the jurisdiction. |
| | |
| (e) | Expenses–Expenses incurred by the Company that do not specifically relate to an individual fund are generally allocated to the funds within the Company on a pro rata basis by relative net assets. |
| | |
| (f) | Foreign Transactions–The books and records of the Fund are maintained in U.S. dollars and transactions denominated in foreign currencies are recorded in the Fund’s records at the rate prevailing when earned or recorded. Asset and liability accounts that are denominated in foreign currencies are adjusted daily to reflect current exchange rates and any unrealized gain (loss) is included in Net change in unrealized appreciation/depreciation on investments on the Fund’s Statement of Operations. The resultant exchange gains and losses upon settlement of such transactions are included in Net realized gain on investments on the Fund’s Statement of Operations. The Fund does not isolate that portion of the results of operations arising as a result of changes in the foreign exchange rates from the changes in market prices of the securities. |
| | |
| (g) | Repurchase Agreements–The Fund may enter into repurchase agreements with respect to securities. A repurchase agreement is a transaction in which a fund acquires a security and simultaneously commits to resell that security to the seller (a bank or securities dealer) at an agreed-upon price on an agreed-upon date. The Fund requires at all times that the repurchase agreement be collateralized by cash, or by securities of the U.S. Government, its agencies, its instrumentalities, or U.S. Government sponsored enterprises having a value equal to, or in excess of, the value of the repurchase agreement (including accrued interest). If the seller of the agreement defaults on its obligation to repurchase the underlying securities at a time when the fair value of these securities has declined, the Fund may incur a loss upon disposition of the securities. |
| | |
| (h) | Fair Value Measurements–Fair value is defined as the price that the Fund would receive upon selling an investment or transferring a liability in an orderly transaction to an independent buyer in the principal or most advantageous market of the investment. A three-tier hierarchy is used to maximize the use of observable market data and minimize the use of |
17
Notes to Financial Statements (continued)
| | unobservable inputs and to establish classification of fair value measurements for disclosure purposes. Inputs refer broadly to the assumptions that market participants would use in pricing the asset or liability, including assumptions about risk—for example, the risk inherent in a particular valuation technique used to measure fair value (such as a pricing model) and/or the risk inherent in the inputs to the valuation technique. Inputs may be observable or unobservable. Observable inputs reflect the assumptions market participants would use in pricing the asset or liability. Observable inputs are based on market data obtained from sources independent of the reporting entity. Unobservable inputs reflect the reporting entity’s own assumptions about the assumptions market participants would use in pricing the asset or liability. Unobservable inputs are based on the best information available in the circumstances. The three-tier hierarchy of inputs is summarized in the three broad Levels listed below: |
| | • | Level 1 – | unadjusted quoted prices in active markets for identical investments; |
| | | | |
| | • | Level 2 – | other significant observable inputs (including quoted prices for similar investments, interest rates, prepayment speeds, credit risk, etc.); and |
| | | | |
| | • | Level 3 – | significant unobservable inputs (including the Fund’s own assumptions in determining the fair value of investments). |
| | A summary of inputs used in valuing the Fund’s investments as of December 31, 2015 and, if applicable, Level 1/Level 2 transfers and Level 3 rollforwards for the fiscal year then ended is included in the Fund’s Schedule of Investments. |
| | |
| | Changes in valuation techniques may result in transfers into or out of an assigned level within the three-tier hierarchy. All transfers between different levels within the three-tier hierarchy are deemed to have occurred as of the beginning of the reporting period. The inputs or methodology used for valuing securities are not necessarily an indication of the risk associated with investing in those securities. |
| 3. | MANAGEMENT FEE AND OTHER TRANSACTIONS WITH AFFILIATES |
Management Fee
The Company has a management agreement with Lord Abbett, pursuant to which Lord Abbett supplies the Fund with investment management services and executive and other personnel, provides office space and pays for ordinary and necessary office and clerical expenses relating to research and statistical work and supervision of the Fund’s investment portfolio.
The management fee is based on the Fund’s average daily net assets at the following annual rate:
| First $1 billion | .70% |
| Next $1 billion | .65% |
| Over $2 billion | .60% |
For the fiscal year ended December 31, 2015, the effective management fee, net of waivers, was at an annualized rate of .34% of the Fund’s average daily net assets.
In addition, Lord Abbett provides certain administrative services to the Fund pursuant to an Administrative Services Agreement in return for a fee at an annual rate of .04% of the Fund’s average daily net assets.
During the fiscal year ended December 31, 2015 and continuing through April 30, 2016, Lord Abbett has contractually agreed to waive its fees and reimburse expenses to the extent necessary
18
Notes to Financial Statements (continued)
to limit total net annual operating expenses, to an annual rate of .95%. This agreement may be terminated only upon the approval of the Board.
The Company, on behalf of the Fund, has entered into services arrangements with certain insurance companies. Under these arrangements, certain insurance companies will be compensated up to .25% of the average daily net asset value (“NAV”) of the Fund’s Class VC Shares held in the insurance company’s separate account to service and maintain the Variable Contract owners’ accounts. This amount is included in Non 12b-1 service fees on the Statement of Operations. The Fund may also compensate certain insurance companies, third-party administrators and other entities for providing recordkeeping, sub-transfer agency and other administrative services to the Fund. This amount is included in Shareholder servicing on the Statement of Operations.
A Director and certain of the Company’s officers have an interest in Lord Abbett.
| 4. | DISTRIBUTIONS AND CAPITAL LOSS CARRYFORWARDS |
Dividends from net investment income, if any, are declared and paid at least semi-annually. Taxable net realized gains from investment transactions, reduced by allowable capital loss carryforwards, if any, are declared and distributed to shareholders at least annually. The capital loss carryforward amount, if any, is available to offset future net capital gains. Dividends and distributions to shareholders are recorded on the ex-dividend date. The amounts of dividends and distributions from net investment income and net realized capital gains are determined in accordance with federal income tax regulations, which may differ from U.S. GAAP. These book/tax differences are either considered temporary or permanent in nature. To the extent these differences are permanent in nature, such amounts are reclassified within the components of net assets based on their federal tax basis treatment; temporary differences do not require reclassification. Dividends and distributions that exceed earnings and profits for tax purposes are reported as a tax return of capital.
The tax character of distributions paid during the fiscal years ended December 31, 2015 and 2014 was as follows:
| | | Year Ended | | Year Ended |
| | | 12/31/2015 | | 12/31/2014 |
| Distributions paid from: | | | | | | |
| Ordinary income | | $ | 305,595 | | $ | 296,057 |
| Net long-term capital gains | | | 6,419,296 | | | 5,181,532 |
| Total distributions paid | | $ | 6,724,891 | | $ | 5,477,589 |
As of December 31, 2015, the components of accumulated gains on a tax-basis were as follows:
| Undistributed ordinary income – net | | $ | 231 | |
| Undistributed long-term capital gains | | | 658,878 | |
| Total undistributed earnings | | | 659,109 | |
| Temporary differences | | | (97,697 | ) |
| Unrealized gains – net | | | 1,635,720 | |
| Total accumulated gains – net | | $ | 2,197,132 | |
At the Fund’s election, certain losses incurred within the taxable year (Qualified Late-Year Losses) are deemed to arise on the first business day of the Fund’s next taxable year. The Fund incurred and will elect to post-October capital losses of $92,217 during fiscal year 2015.
19
Notes to Financial Statements (continued)
As of December 31, 2015, the aggregate unrealized security gains and losses based on cost for U.S. federal income tax purposes were as follows:
| Tax cost | | $ | 32,236,385 | |
| Gross unrealized gain | | | 2,750,651 | |
| Gross unrealized loss | | | (1,114,931 | ) |
| Net unrealized security gain | | $ | 1,635,720 | |
The difference between book-basis and tax-basis unrealized gains (losses) is attributable to wash sales.
Permanent items identified during the fiscal year ended December 31, 2015 have been reclassified among the components of net assets based on their tax basis treatment as follows:
| Distributions in | | Accumulated |
| Excess of Net | | Net Realized |
| Investment Income | | Gain |
| $(7,260) | | $7,260 |
The permanent differences are attributable to the tax treatment of certain distributions received.
| 5. | PORTFOLIO SECURITIES TRANSACTIONS |
Purchases and sales of investment securities (excluding short-term investments) for the fiscal year ended December 31, 2015 were as follows:
| Purchases | | Sales |
| $39,246,095 | | $46,565,645 |
There were no purchases or sales of U.S. Government securities for the fiscal year ended December 31, 2015.
| 6. | DISCLOSURES ABOUT OFFSETTING ASSETS AND LIABILITIES |
The Financial Accounting Standards Board (“FASB”) requires disclosures intended to help better assess the effect or potential effect of offsetting arrangements on a fund’s financial position. The following tables illustrate gross and net information about recognized assets and liabilities eligible for offset in the statement of assets and liabilities; and disclose such amounts subject to an enforceable master netting agreement or similar agreement, by counterparty. A master netting agreement is an agreement between a fund and a counterparty which provides for the net settlement of amounts owed under all contracts traded under that agreement, as well as cash collateral, through a single payment by one party to the other in the event of default on or termination of any one contract. The Fund’s accounting policy with respect to balance sheet offsetting is that, absent an event of default by the counterparty or a termination of the agreement, the master netting agreement does not result in an offset of reported amounts of financial assets and liabilities in the statement of assets and liabilities across transactions between the Fund and the applicable counterparty:
20
Notes to Financial Statements (continued)
| | | | | Gross Amounts | | Net Amounts of |
| | | | | Offset in the | | Assets Presented |
| | | Gross Amounts of | | Statement of Assets | | in the Statement of |
| Description | | Recognized Assets | | and Liabilities | | Assets and Liabilities |
| Repurchase Agreement | | $343,721 | | $ – | | $343,721 |
| Total | | $343,721 | | $ – | | $343,721 |
| | | Net Amounts | | | | | | | | |
| | | of Assets | | Amounts Not Offset in the | | |
| | | Presented in | | Statement of Assets and Liabilities | | |
| | | the Statement | | | | Cash | | Securities | | |
| | | of Assets and | | Financial | | Collateral | | Collateral | | Net |
| Counterparty | | Liabilities | | Instruments | | Received(a) | | Received(a) | | Amount(b) |
| Fixed Income Clearing Corp. | | $343,721 | | $ – | | $ – | | $(343,721) | | $ – |
| Total | | $343,721 | | $ – | | $ – | | $(343,721) | | $ – |
| (a) | Collateral disclosed is limited to an amount not to exceed 100% of the net amount of assets presented in the Statement of Assets and Liabilities, for each respective counterparty. |
| (b) | Net amount represents the amount owed to the Fund by the counterparty as of December 31, 2015. |
| 7. | DIRECTORS’ REMUNERATION |
The Company’s officers and a Director, who are associated with Lord Abbett, do not receive any compensation from the Company for serving in such capacities. Independent Directors’ fees are allocated among all Lord Abbett-sponsored funds based on the net assets of each fund. There is an equity-based plan available to all Independent Directors under which Independent Directors must defer receipt of a portion of, and may elect to defer receipt of an additional portion of Directors’ fees. The deferred amounts are treated as though equivalent dollar amounts had been invested in the funds. Such amounts and earnings accrued thereon are included in Directors’ fees on the Statement of Operations and in Directors’ fees payable on the Statement of Assets and Liabilities and are not deductible for U.S. federal income tax purposes until such amounts are paid.
The Company has entered into an arrangement with its transfer agent and custodian, whereby credits realized as a result of uninvested cash balances are used to reduce a portion of the Fund’s expenses.
Effective August 31, 2015, the Fund and certain other funds managed by Lord Abbett (collectively, the “Participating Funds”) entered into a syndicated line of credit facility with various lenders for $550 million (the “Facility”), whereas State Street Bank and Trust Company (“SSB”) participates as a lender and as agent for the lenders. The Facility is to be used for temporary or emergency purposes as an additional source of: liquidity to satisfy redemptions. The Participating Funds are subject to graduated borrowing limits of one-third of Fund assets (if Fund assets are less than $750 million), $250 million, $300 million, or $350 million, based on past borrowings and likelihood of future borrowings. The Facility will continue through August 29, 2016.
Prior to August 31, 2015, the Fund and certain other funds managed by Lord Abbett participated in a $500 million unsecured revolving credit facility with SSB (the “SSB Facility”).
During the fiscal year ended December 31, 2015, the Fund did not utilize the Facility or the SSB Facility.
21
Notes to Financial Statements (concluded)
| 10. | CUSTODIAN AND ACCOUNTING AGENT |
SSB is the Company’s custodian and accounting agent. SSB performs custodial, accounting and recordkeeping functions relating to portfolio transactions and calculating the Fund’s NAV.
The Fund is subject to the general risks and considerations associated with equity investing, as well as the particular risks associated with value and growth stocks. This means the value of your investment will fluctuate in response to movements in the equity securities market in general and to the changing prospects of individual companies in which the Fund invests. Large-cap value and growth stocks may perform differently than the market as a whole and differently than each other or other types of stocks, such as small company stocks. This is because different types of stocks tend to shift in and out of favor depending on market and economic conditions. The market may fail to recognize the intrinsic value of particular value stocks for a long time. Growth stocks may be more volatile than other stocks. In addition, if the Fund’s assessment of a company’s value or prospects for exceeding earnings expectations or market conditions is wrong, the Fund could suffer losses or produce poor performance relative to other funds, even in a rising market.
Due to its investment exposure to foreign companies and American Depositary Receipts, the Fund may experience increased market, liquidity, currency, political, information, and other risks.
These factors can affect the Fund’s performance.
| 12. | SUMMARY OF CAPITAL TRANSACTIONS |
Transactions in shares of capital stock were as follows:
| | | Year Ended | | | Year Ended | |
| | | December 31, 2015 | | | December 31, 2014 | |
| Shares sold | | 1,904,507 | | | 612,850 | |
| Reinvestment of distributions | | 558,469 | | | 379,433 | |
| Shares reacquired | | (2,638,654 | ) | | (1,010,256 | ) |
| Decrease | | (175,678 | ) | | (17,973 | ) |
22
Report of Independent Registered Public Accounting Firm
To the Board of Directors of Lord Abbett Series Fund, Inc. and the Shareholders of Classic Stock Portfolio:
We have audited the accompanying statement of assets and liabilities, including the schedule of investments, of the Classic Stock Portfolio, one of the portfolios constituting the Lord Abbett Series Fund, Inc. (the “Fund”) as of December 31, 2015, and the related statement of operations for the year then ended, the statements of changes in net assets for each of the two years in the period then ended, and the financial highlights for each of the five years in the period then ended. These financial statements and financial highlights are the responsibility of the Fund’s management. Our responsibility is to express an opinion on these financial statements and financial highlights based on our audits.
We conducted our audits in accordance with the standards of the Public Company Accounting Oversight Board (United States). Those standards require that we plan and perform the audit to obtain reasonable assurance about whether the financial statements and financial highlights are free of material misstatement. The Fund is not required to have, nor were we engaged to perform, an audit of its internal control over financial reporting. Our audits included consideration of internal control over financial reporting as a basis for designing audit procedures that are appropriate in the circumstances, but not for the purpose of expressing an opinion on the effectiveness of the Fund’s internal control over financial reporting. Accordingly, we express no such opinion. An audit also includes examining, on a test basis, evidence supporting the amounts and disclosures in the financial statements, assessing the accounting principles used and significant estimates made by management, as well as evaluating the overall financial statement presentation. Our procedures included confirmation of securities owned as of December 31, 2015, by correspondence with the custodian and brokers; when replies were not received from brokers, we performed other auditing procedures. We believe that our audits provide a reasonable basis for our opinion.
In our opinion, such financial statements and financial highlights referred to above present fairly, in all material respects, the financial position of Classic Stock Portfolio of the Lord Abbett Series Fund, Inc. as of December 31, 2015, the results of its operations for the year then ended, the changes in its net assets for each of the two years in the period then ended, and the financial highlights for each of the five years in the period then ended, in conformity with accounting principles generally accepted in the United States of America.
DELOITTE & TOUCHE LLP
New York, New York
February 16, 2016
23
Supplemental Proxy Information (unaudited)
A special meeting of shareholders of Classic Stock Portfolio was held on November 5, 2015. The special meeting was held for shareholders of the Fund to vote on the following matters:
| | 1. | To amend the Fund’s fundamental restrictions related to borrowing and lending to enable the Fund to participate in an interfund lending program; and |
| | | |
| | 2. | To ratify the selection of Deloitte & Touche LLP as independent registered public accounting firm for the Fund’s current fiscal year. |
The results of the proxy solicitation on the preceding matter were as follows:
| 1. | To approve the amendment to the fundamental investment restrictions of the Fund as described in the proxy statement: |
| | |
| | (a) Amend the fundamental investment restriction with respect to Borrowing |
| | | | | | | | | | | | Broker | |
| | | Votes For | | | Votes Against | | | Abstain | | | Non-Votes | |
| Classic Stock Portfolio | | | 2,665,699 | | | | 141,640 | | | | 229,573 | | | | 0 | |
| 1. | To approve the amendment to the fundamental investment restrictions of the Fund as described in the proxy statement: |
| | |
| | (b) Amend the fundamental investment restriction with respect to Lending |
| | | | | | | | | | | | Broker | |
| | | Votes For | | | Votes Against | | | Abstain | | | Non-Votes | |
| Classic Stock Portfolio | | | 2,663,602 | | | | 143,736 | | | | 229,574 | | | | 0 | |
| 2. | To ratify the selection of Deloitte & Touche LLP as the Fund’s independent registered public accounting firm for the Fund’s current fiscal year |
| | | | | | | | | | | | Broker | |
| | | Votes For | | | Votes Against | | | Abstain | | | Non-Votes | |
| Classic Stock Portfolio | | | 2,751,623 | | | | 85,755 | | | | 199,534 | | | | – | |
24
Basic Information About Management
The Board is responsible for the management of the business and affairs of the Company in accordance with the laws of the State of Maryland. The Board elects officers who are responsible for the day-to-day operations of the Fund and who execute policies authorized by the Board. The Board also approves an investment adviser to the Fund and continues to monitor the cost and quality of the services the investment adviser provides, and annually considers whether to renew the contract with the adviser. Generally, each Director holds office until his/her successor is elected and qualified or until his/her earlier resignation or removal, as provided in the Company’s organizational documents.
Lord Abbett, a Delaware limited liability company, is the Fund’s investment adviser. Designated Lord Abbett personnel are responsible for the day-to-day management of the Fund.
Interested Director
Ms. Foster is affiliated with Lord Abbett and is an “interested person” of the Company as defined in the Act. Ms. Foster is a director/trustee and officer of each of the 12 investment companies in the Lord Abbett Family of Funds, which consist of 58 portfolios or series.
Name, Address and
Year of Birth | | Current Position and
Length of Service
with the Fund | | Principal Occupation and Other Directorships
During the Past Five Years |
| | | | | |
Daria L. Foster
Lord, Abbett & Co. LLC
90 Hudson Street
Jersey City, NJ 07302
(1954) | | Director and President since 2006; Chief Executive Officer since 2012 | | Principal Occupation: Managing Partner of Lord Abbett, joined Lord Abbett in 1990. Other Directorships: None. |
Independent Directors
The following Independent Directors also are directors/trustees of each of the 12 investment companies in the Lord Abbett Family of Funds, which consist of 58 portfolios or series.
Name, Address and
Year of Birth | | Current Position and
Length of Service
with the Fund | | Principal Occupation and Other Directorships
During the Past Five Years |
| | | | | |
E. Thayer Bigelow
Lord, Abbett & Co. LLC
c/o Legal Dept.
90 Hudson Street
Jersey City, NJ 07302
(1941) | | Director since 1994; Chairman since 2013 | | Principal Occupation: Managing General Partner, Bigelow Media, LLC (since 2000); Senior Adviser, Time Warner Inc. (1998–2000). Other Directorships: Currently serves as director of Crane Co. (since 1984) and Huttig Building Products Inc. (since 1998). Previously served as a director of R.H. Donnelley Inc. (2009–2010). |
| | | | | |
Robert B. Calhoun, Jr.
Lord, Abbett & Co. LLC
c/o Legal Dept.
90 Hudson Street
Jersey City, NJ 07302
(1942) | | Director since 1998 | | Principal Occupation: Senior Advisor of Monitor Clipper Partners, a private equity investment fund (since 1997); President of Clipper Asset Management Corp. (1991–2009). Other Directorships: None. |
25
Basic Information About Management (continued)
Name, Address and
Year of Birth | | Current Position and
Length of Service
with the Fund | | Principal Occupation and Other Directorships
During the Past Five Years |
| | | | | |
Eric C. Fast
Lord, Abbett & Co. LLC
c/o Legal Dept.
90 Hudson Street
Jersey City, NJ 07302
(1949) | | Director since 2014 | | Principal Occupation: Chief Executive Officer of Crane Co., an industrial products company (2001–2014). Other Directorships: Currently serves as director of Automatic Data Processing, Inc. (since 2007) and Regions Financial Corporation (since 2010). Previously served as a director of Crane Co. (1999–2014). |
| | | | | |
Evelyn E. Guernsey
Lord, Abbett & Co. LLC
c/o Legal Dept.
90 Hudson Street
Jersey City, NJ 07302
(1955) | | Director since 2011 | | Principal Occupation: CEO, Americas of J.P. Morgan Asset Management (2004–2010). Other Directorships: None. |
| | | | | |
Julie A. Hill
Lord, Abbett & Co. LLC
c/o Legal Dept.
90 Hudson Street
Jersey City, NJ 07302
(1946) | | Director since 2004 | | Principal Occupation: Owner and CEO of The Hill Company, a business consulting firm (since 1998). Other Directorships: Currently serves as director of Anthem, Inc., a health benefits company (since 1994). |
| | | | | |
Franklin W. Hobbs
Lord, Abbett & Co. LLC
c/o Legal Dept.
90 Hudson Street
Jersey City, NJ 07302
(1947) | | Director since 2001 | | Principal Occupation: Advisor of One Equity Partners, a private equity firm (since 2004). Other Directorships: Currently serves as director and Chairman of the Board of Ally Financial Inc., a financial services firm (since 2009), and as director of Molson Coors Brewing Company (since 2002). |
| | | | | |
James M. McTaggart
Lord, Abbett & Co. LLC
c/o Legal Dept.
90 Hudson Street
Jersey City, NJ 07302
(1947) | | Director since 2012 | | Principal Occupation: Independent management advisor and consultant (since 2012); Vice President, CRA International, Inc. (doing business as Charles River Associates), a global management consulting firm (2009–2012); Founder and Chairman of Marakon Associates, Inc., a strategy consulting firm (1978–2009); and Officer and Director of Trinsum Group, a holding company (2007–2009). Other Directorships: Currently serves as director of Blyth, Inc., a home products company (since 2004). |
| | | | | |
James L.L. Tullis
Lord, Abbett & Co. LLC
c/o Legal Dept.
90 Hudson Street
Jersey City, NJ 07302
(1947) | | Director since 2006 | | Principal Occupation: CEO of Tullis-Dickerson and Co. Inc., a venture capital management firm (since 1990); CEO of Tullis Health Investors Inc. (since 2012). Other Directorships: Currently serves as director of Crane Co. (since 1998). |
26
Basic Information About Management (continued)
Officers
None of the officers listed below have received compensation from the Company. All of the officers of the Company also may be officers of the other Lord Abbett Funds and maintain offices at 90 Hudson Street, Jersey City, NJ 07302. Unless otherwise indicated, the position(s) and title(s) listed under the “Principal Occupation During the Past Five Years” column indicate each officer’s position(s) and title(s) with Lord Abbett. Each officer serves for an indefinite term (i.e., until his or her death, resignation, retirement, or removal).
Name and
Year of Birth | | Current Position
with the Fund | | Length of Service
of Current
Position | | Principal Occupation
During the Past Five Years |
| | | | | | | |
Daria L. Foster
(1954) | | President and Chief Executive Officer | | Elected as President in 2006 and Chief Executive Officer in 2012 | | Managing Partner of Lord Abbett, joined Lord Abbett in 1990. |
| | | | | | | |
Sean J. Aurigemma
(1969) | | Executive Vice President | | Elected in 2010 | | Portfolio Manager, joined Lord Abbett in 2007. |
| | | | | | | |
Jeff D. Diamond
(1960) | | Executive Vice President | | Elected in 2008 | | Portfolio Manager, joined Lord Abbett in 2007. |
| | | | | | | |
Robert I. Gerber
(1954) | | Executive Vice President | | Elected in 2003 | | Partner and Chief Investment Officer, joined Lord Abbett in 1997. |
| | | | | | | |
Todd D. Jacobson
(1966) | | Executive Vice President | | Elected in 2005 | | Partner and Associate Director, joined Lord Abbett in 2003. |
| | | | | | | |
Robert A. Lee
(1969) | | Executive Vice President | | Elected in 2010 | | Partner and Deputy Chief Investment Officer, joined Lord Abbett in 1997. |
| | | | | | | |
Thomas B. Maher
(1967) | | Executive Vice President | | Elected in 2010 | | Partner and Portfolio Manager, joined Lord Abbett in 2003. |
| | | | | | | |
Justin C. Maurer
(1969) | | Executive Vice President | | Elected in 2010 | | Partner and Portfolio Manager, joined Lord Abbett in 2001. |
| | | | | | | |
Vincent J. McBride
(1964) | | Executive Vice President | | Elected in 2010 | | Partner and Director, joined Lord Abbett in 2003. |
| | | | | | | |
Andrew H. O’Brien
(1973) | | Executive Vice President | | Elected in 2010 | | Partner and Portfolio Manager, joined Lord Abbett in 1998. |
| | | | | | | |
F. Thomas O’Halloran, III
(1955) | | Executive Vice President | | Elected in 2010 | | Partner and Portfolio Manager, joined Lord Abbett in 2001. |
| | | | | | | |
Walter H. Prahl
(1958) | | Executive Vice President | | Elected in 2012 | | Partner and Director, joined Lord Abbett in 1997. |
| | | | | | | |
Steven F. Rocco
(1979) | | Executive Vice President | | Elected in 2014 | | Partner and Portfolio Manager, joined Lord Abbett in 2004. |
| | | | | | | |
Frederick J. Ruvkun
(1957) | | Executive Vice President | | Elected in 2012 | | Partner and Portfolio Manager, joined Lord Abbett in 2006. |
27
Basic Information About Management (continued)
Name and
Year of Birth | | Current Position
with the Fund | | Length of Service
of Current
Position | | Principal Occupation
During the Past Five Years |
| | | | | | | |
Paul J. Volovich
(1973) | | Executive Vice President | | Elected in 2005 | | Partner and Portfolio Manager, joined Lord Abbett in 1997. |
| | | | | | | |
A. Edward Allinson
(1961) | | Vice President | | Elected in 2011 | | Portfolio Manager, joined Lord Abbett in 2005. |
| | | | | | | |
John W. Ashbrook
(1964) | | Vice President and Assistant Secretary | | Elected in 2014 | | Assistant General Counsel, joined Lord Abbett in 2008. |
| | | | | | | |
Joan A. Binstock
(1954) | | Chief Financial Officer and Vice President | | Elected in 1999 | | Partner and Chief Financial and Operations Officer, joined Lord Abbett in 1999. |
| | | | | | | |
Brooke A. Fapohunda
(1975) | | Vice President and Assistant Secretary | | Elected in 2014 | | Deputy General Counsel, joined Lord Abbett in 2006. |
| | | | | | | |
John K. Forst
(1960) | | Vice President and Assistant Secretary | | Elected in 2005 | | Partner and Deputy General Counsel, joined Lord Abbett in 2004. |
| | | | | | | |
Anthony W. Hipple
(1964) | | Vice President | | Elected in 2014 | | Portfolio Manager, joined Lord Abbett in 2002. |
| | | | | | | |
Lawrence H. Kaplan
(1957) | | Vice President and Secretary | | Elected in 1997 | | Partner and General Counsel, joined Lord Abbett in 1997. |
| | | | | | | |
Jerald M. Lanzotti
(1967) | | Vice President | | Elected in 2012 | | Partner and Portfolio Manager, joined Lord Abbett in 1996. |
| | | | | | | |
David J. Linsen
(1974) | | Vice President | | Elected in 2008 | | Partner and Director, joined Lord Abbett in 2001. |
| | | | | | | |
Joseph M. McGill
(1962) | | Chief Compliance Officer | | Elected in 2014 | | Chief Compliance Officer, joined Lord Abbett in 2014 and was formerly Managing Director and the Chief Compliance Officer at UBS Global Asset Management (2003–2013). |
| | | | | | | |
A. Edward Oberhaus, III
(1959) | | Vice President | | Elected in 1998 | | Partner and Director, joined Lord Abbett in 1983. |
| | | | | | | |
Noah Petrucci
(1970) | | Vice President | | Elected in 2013 | | Portfolio Manager, joined Lord Abbett in 2012 and was formerly a Portfolio Manager at Columbia Management Investment Advisers, LLC and Columbia Management Advisors, LLC (2002–2012). |
| | | | | | | |
Lawrence B. Stoller
(1963) | | Vice President and Assistant Secretary | | Elected in 2007 | | Partner and Senior Deputy General Counsel, joined Lord Abbett in 2007. |
28
Basic Information About Management (concluded)
Name and
Year of Birth | | Current Position
with the Fund | | Length of Service
of Current
Position | | Principal Occupation
During the Past Five Years |
| | | | | | | |
Arthur K. Weise
(1970) | | Vice President | | Elected in 2010 | | Partner and Portfolio Manager, joined Lord Abbett in 2007. |
| | | | | | | |
Kewjin Yuoh
(1971) | | Vice President | | Elected in 2012 | | Partner and Portfolio Manager, joined Lord Abbett in 2010. |
| | | | | | | |
Scott S. Wallner
(1955) | | AML Compliance Officer | | Elected in 2011 | | Assistant General Counsel, joined Lord Abbett in 2004. |
| | | | | | | |
Bernard J. Grzelak
(1971) | | Treasurer | | Elected in 2003 | | Partner and Director of Fund Administration, joined Lord Abbett in 2003. |
Please call 888-522-2388 for a copy of the statement of additional information, which contains further information about the Company’s Directors. It is available free upon request.
29
Approval of Advisory Contract
The Board of Directors of the Fund, including all of the Directors who are not interested persons of the Fund or of Lord Abbett (the “Independent Board Members”), annually considers whether to approve the continuation of the existing management agreement between the Fund and Lord Abbett. In connection with its most recent approval, the Board reviewed materials relating specifically to the management agreement, as well as numerous materials received throughout the course of the year, including information about the Fund’s investment performance compared to the performance of its benchmark. Before making its decision as to the Fund, the Board had the opportunity to ask questions and request further information, taking into account its familiarity with Lord Abbett gained through its meetings and discussions. These meetings and discussions included the examination of the portfolio management team conducted by members of the Contract Committee, the deliberations of the Contract Committee, and discussions between the Contract Committee and Lord Abbett’s management. The Independent Board Members also discussed the materials described above with their independent legal counsel in a private session at which no representatives of management were present.
The materials received by the Board included, but were not limited to: (1) information provided by Morningstar Associates, LLC (“Morningstar”) regarding the investment performance of the Fund compared to the investment performance of a group of funds in the same Morningstar investment category (the “performance peer group”) and the investment performance of one or more appropriate benchmarks; (2) information provided by Morningstar regarding the expense ratios, contractual and effective management fee rates, and other expense components for the Fund and one or more groups of funds in the same Morningstar category, with the same share classes and operational characteristics, including asset size (the “expense peer group”); (3) information provided by Lord Abbett on the projected expense ratios, management fee rates, and other expense components for the Fund; (4) sales and redemption information for the Fund; (5) information regarding Lord Abbett’s financial condition; (6) an analysis of the relative profitability of the management agreement to Lord Abbett; (7) information provided by Lord Abbett regarding the investment management fees Lord Abbett receives from its other advisory clients maintaining accounts with a similar investment strategy as the Fund; (8) information regarding the distribution arrangements of the Fund; and (9) information regarding the personnel and other resources devoted by Lord Abbett to managing the Fund.
Investment Management Services Generally. The Board considered the investment management services provided by Lord Abbett to the Fund, including investment research, portfolio management, and trading, and Lord Abbett’s commitment to compliance with all applicable legal requirements. The Board also observed that Lord Abbett was solely engaged in the investment management business and accordingly did not experience the conflicts of interest that may result from being engaged in other lines of business. The Board considered the investment advisory services provided by Lord Abbett to other clients, the fees charged for the services, and the differences in the nature of the services provided to the Fund and other Lord Abbett Funds, on the one hand, and the services provided to other clients, on the other.
Investment Performance. The Board reviewed the Fund’s investment performance in relation to that of the performance peer group as of various periods ended August 31, 2015. The Board observed that the Fund’s investment performance was above the median of the performance peer group for the one-year, three-year, and ten-year periods and below the median of the performance peer group for the five-year period.
30
Approval of Advisory Contract (continued)
Lord Abbett’s Personnel and Methods. The Board considered the qualifications of the personnel providing investment management services to the Fund, in light of its investment objective and discipline. Among other things, the Board considered the size, experience, and turnover of Lord Abbett’s investment management staff, Lord Abbett’s investment methodology and philosophy, and Lord Abbett’s approach to recruiting, training, and retaining investment management personnel.
Nature and Quality of Other Services. The Board considered the nature, quality, costs, and extent of compliance, administrative, and other services performed by Lord Abbett and Lord Abbett Distributor LLC (the “Distributor”) and the nature and extent of Lord Abbett’s supervision of third party service providers, including the Fund’s transfer agent and custodian.
Expenses. The Board considered the expense level of the Fund and the expense levels of the expense peer group. It also considered the projected expense levels and how those levels would relate to those of the expense peer group and the amount and nature of the fees paid by shareholders. The Board observed that the overall expense level of the Fund was below the median of the expense peer group.
Profitability. The Board considered the level of Lord Abbett’s profits in managing the Fund, including a review of Lord Abbett’s methodology for allocating its costs to its management of the Fund. The Board concluded that the allocation methodology had a reasonable basis and was appropriate. It considered any profits realized by Lord Abbett in connection with the operation of the Fund, including the fee that Lord Abbett receives from the Fund for providing administrative services to the Fund, and whether the amount of profit was fair for the management of the Fund. The Board also considered the profits realized from other business segments of Lord Abbett, which may benefit from or be related to the Fund’s business. The Board considered Lord Abbett’s profit margins in comparison with available industry data, both accounting for and ignoring marketing and distribution expenses, and how those profit margins could affect Lord Abbett’s ability to recruit and retain investment personnel. The Board recognized that Lord Abbett’s profitability was a factor in enabling it to attract and retain qualified investment management personnel to provide services to the Fund. The Board concluded that Lord Abbett’s profitability as to the Fund was not excessive.
Economies of Scale. The Board considered whether there had been any economies of scale in managing the Fund, whether the Fund had appropriately benefited from any such economies of scale, and whether there was potential for realization of any further economies of scale. The Board concluded that the existing management fee schedule, with its breakpoint or breakpoints in the level of the management fee, adequately addressed any economies of scale in managing the Fund.
Other Benefits to Lord Abbett. The Board considered the character and amount of fees paid by the Fund and the Fund’s shareholders to Lord Abbett and the Distributor for services other than investment advisory services. The Board also considered the revenues and profitability of Lord Abbett’s investment advisory business apart from its mutual fund business, and the intangible benefits enjoyed by Lord Abbett by virtue of its relationship with the Fund. The Board observed that the Distributor receives 12b-1 fees from certain of the Lord Abbett Funds as to shares held in accounts for which there is no other broker of record, may retain a portion of the 12b-1 fees it receives, and receives a portion of the sales charges on sales and redemptions of some classes of shares. In addition, the Board observed that Lord Abbett accrues certain benefits for its business of providing investment advice to clients other than the Lord Abbett Funds, but that business also benefits the Funds. The Board also noted that Lord Abbett, as disclosed in the prospectus of the Fund, has entered into revenue sharing arrangements with certain entities that distribute shares of the Fund. The Board also took into consideration the investment research that Lord Abbett receives as a result of Fund brokerage transactions.
31
Approval of Advisory Contract (concluded)
Alternative Arrangements. The Board considered whether, instead of approving continuation of the management agreement, it might be in the best interests of the Fund to implement one or more alternative arrangements, such as continuing to employ Lord Abbett, but on different terms. After considering all of the relevant factors, the Board unanimously found that continuation of the existing management agreement was in the best interests of the Fund and its shareholders and voted unanimously to approve the continuation of the management agreement. In considering whether to approve the continuation of the management agreement, the Board did not identify any single factor as paramount or controlling. This summary does not discuss in detail all matters considered.
32
Householding
The Company has adopted a policy that allows it to send only one copy of the Fund’s prospectus, proxy material, annual report and semiannual report to certain shareholders residing at the same “household.” This reduces Fund expenses, which benefits you and other shareholders. If you need additional copies or do not want your mailings to be “householded,” please call Lord Abbett at 888-522-2388 or send a written request with your name, the name of your fund or funds and your account number or numbers to Lord Abbett Family of Funds, P.O. Box 219336, Kansas City, MO 64121.
Proxy Voting Policies, Procedures and Records
A description of the policies and procedures that Lord Abbett uses to vote proxies related to the Fund’s portfolio securities, and information on how Lord Abbett voted the Fund’s proxies during the 12-month period ended June 30 are available without charge, upon request, (i) by calling 888-522-2388; (ii) on Lord Abbett’s Website at www.lordabbett.com; and (iii) on the Securities and Exchange Commission’s (“SEC”) Website at www.sec.gov.
Shareholder Reports and Quarterly Portfolio Disclosure
The Fund is required to file its complete schedule of portfolio holdings with the SEC for its first and third fiscal quarters on Form N-Q. Copies of the filings are available without charge, upon request on the SEC’s Website at www.sec.gov and may be available by calling Lord Abbett at 888-522-2388. You can also obtain copies of Form N-Q by visiting the SEC’s Public Reference Room in Washington, DC (information on the operation of the Public Reference Room may be obtained by calling 800-SEC-0330).
Tax Information For corporate shareholders, 100% of the Fund’s ordinary income distributions qualified for the dividends received deduction. Additionally, of the distributions paid to shareholders during the fiscal year ended December 31, 2015, $6,419,296 represents long-term capital gains. |
33


| This report, when not used for the general information of shareholders of the Fund, is to be distributed only if preceded or accompanied by a current fund prospectus. | | |
| | | |
Lord Abbett mutual fund shares are distributed by
LORD ABBETT DISTRIBUTOR LLC. | Lord Abbett Series Fund, Inc. Classic Stock Portfolio | SFCLASS-PORT-3
(02/16) |

2015 LORD ABBETT
ANNUAL REPORT
Lord Abbett
Series Fund — Developing Growth Portfolio
For the fiscal year ended December 31, 2015
Table of Contents
Lord Abbett Series Fund — Developing Growth Portfolio
Annual Report
For the fiscal year ended December 31, 2015

Daria L. Foster, Director, President and Chief Executive Officer of the Lord Abbett Funds, and E. Thayer Bigelow, Independent Chairman of the Lord Abbett Funds. | | Dear Shareholders: We are pleased to provide you with this overview of the performance of Lord Abbett Series Fund – Developing Growth Portfolio for the fiscal year ended December 31, 2015. On this page and the following pages, we discuss the major factors that influenced fiscal year performance. For additional information about the Fund, please visit our website at www.lordabbett.com, where you also can access the quarterly commentaries that provide updates on the Fund’s performance and other portfolio related updates. Thank you for investing in Lord Abbett mutual funds. We value the trust that you place in us and look forward to serving your investment needs in the years to come. Best regards, 
Daria L. Foster Director, President and Chief Executive Officer |
For the fiscal year ended December 31, 2015, the Fund returned -8.21%, reflecting performance at the net asset value (NAV) of Class VC Shares, with all distributions reinvested, compared to its benchmark, the Russell 2000® Growth Index1, which returned -1.38% over the same period.
Domestic equity markets modestly advanced over the past year, with the S&P 500® Index2 rising 1.38% during the trailing 12-month period. Despite this general move upwards, there were a few periods of short-term volatility, most
notably in January 2015, when the S&P 500® Index2 declined 3.0%, and in August 2015, when the index dropped 6.0%, its greatest monthly loss in three years.
One prevailing market theme for the year was the outperformance of large and mega-cap stocks relative to their smaller peers. During the period, large-cap stocks, as measured by the Russell 1000 Index3, returned 0.92%, while small-cap stocks, as measured by the Russell 2000 Index4, declined by 4.41%, and micro-cap stocks, as measured by the Russell Micro Cap Index5,
1
dropped by 5.16%. Another theme during the trailing 12-month period was the continued weakness in energy prices. Finally, U.S. real gross domestic product (GDP), which was initially reported to have contracted by 0.2% in the first quarter of 2015, was later revised upwards to a modest 0.6% expansion. In the second quarter of 2015, real GDP advanced 3.9%, while the third estimate from the Bureau of Economic Analysis indicated that real GDP increased 2.0% in the third quarter of 2015.
The leading detractor from the portfolio’s relative performance during the reporting period was security selection in the information technology sector. Within this sector, the portfolio’s holdings of Nimble Storage, Inc., a data storage platform provider, detracted most. Shares of Nimble Storage declined after the company reported third quarter earnings below previous guidance, and announced that it would not reach profitability in 2015 as it had previously expected. Another detractor within this sector over the past year was the portfolio’s position in Glu Mobile, Inc., a developer, publisher, and marketer of games for mobile devices. Shares of Glu Mobile fell after the company reduced its fiscal year 2015 guidance due the poor performance of some of its recently launched games.
Security selection in the health care sector also negatively impacted the portfolio’s relative performance during the reporting period. Within this sector, Amicus Therapeutics, Inc., a biopharmaceutical company, was the largest detractor. Shares of Amicus
Therapeutics fell after the company announced that the filing of one of their drugs with the FDA would be delayed. Another detractor within this sector was the portfolio’s position in Chimerix Inc., a biopharmaceutical company focused on oral antivirals. Shares of Chimerix declined late in the year after the company reported that a late stage clinical trial for one of its drugs failed to reach its primary endpoints.
Among the largest contributors to relative performance during the period were the portfolio’s underweight positions in the materials, industrials, and energy sectors. These were the three worst performing sectors in the Russell 2000 Growth Index in 2015, and the portfolio benefitted from maintaining an aggregate average exposure to these sectors that was roughly half that of the index during the period.
The largest individual stock contributor to relative performance was the portfolio’s position in Sketchers U.S.A, Inc., a designer and marketer of Sketchers branded footwear. Shares of Sketchers rose 35% in the month following its first quarter earnings report, in which the company beat consensus earnings estimates even despite some currency headwinds. Another large individual contributor was the portfolio’s position in Abiomed, Inc., a provider of temporary percutaneous mechanical circulatory support devices. Shares of Abiomed surged after the company reported second quarter 2015 earnings above consensus estimates, driven by strong year over year revenue growth in one of their medical devices.
2
1 The Russell 2000® Growth Index measures the performance of those Russell 2000 companies with higher price-to-book ratios and higher forecasted growth values.
2 The S&P 500® Index is widely regarded as the standard for measuring large cap U.S. stock market performance and includes a representative sample of leading companies in leading industries.
3 The Russell 1000® Index measures the performance of the 1,000 largest companies in the Russell 3000 Index, which represents approximately 92% of the total market capitalization of the Russell 3000 Index.
4 The Russell 2000® Index measures the performance of the 2,000 smallest companies in the Russell 3000 Index, which represents approximately 10% of the total market capitalization of the Russell 3000 Index.
5 The Russell Microcap® Index measures performance of the micro-cap segment, representing less than 3% of the U.S. equity market. The Russell Microcap Index includes the smallest 1,000 securities in the small cap Russell 2000 Index plus the next smaller 1,000 securities.
Unless otherwise specified, indexes reflect total return, with all dividends reinvested. Indexes are unmanaged, do not reflect the deduction of fees or expenses, and are not available for direct investment.
Important Performance and Other Information
Performance data quoted in the following pages reflect past performance and are no guarantee of future results. Current performance may be higher or lower than the performance quoted. The investment return and principal value of an
investment in the Funds will fluctuate so that shares, on any given day or when redeemed, may be worth more or less than their original cost. You can obtain performance data current to the most recent month end by calling Lord Abbett at 888-522-2388 or referring to www.lordabbett.com.
During certain periods shown, expense waivers and reimbursements were in place. Without such waivers and expense reimbursements, the Fund’s returns would have been lower.
The annual commentary above discusses the views of the Fund’s management and various portfolio holdings of the Fund as of December 31, 2015. These views and portfolio holdings may have changed after this date. Information provided in the commentary is not a recommendation to buy or sell securities. Because the Fund’s portfolio is actively managed and may change significantly, the Fund may no longer own the securities described above or may have otherwise changed their positions in the securities. For more recent information about the Fund’s portfolio holdings, please visit www.lordabbett.com.
A Note about Risk: See Notes to Financial Statements for a discussion of investment risks. For a more detailed discussion of the risks associated with the Fund, please see the Fund’s prospectus.
Mutual funds are not insured by the FDIC, are not deposits or other obligations of, or guaranteed by, banks, and are subject to investment risks including possible loss of principal amount invested.
The Fund serves as an underlying investment vehicle for variable annuity contracts and variable life insurance policies.
3
Investment Comparison
Below is a comparison of a $10,000 investment in Class VC shares with the same investment in the Russell 2000® Growth Index, assuming reinvestment of all dividends and distributions. The Fund’s shares are sold only to insurance company separate accounts that fund certain variable annuity and variable life contracts. The line graph comparison does not reflect the sales charges or other expenses of these contracts. If those sales charges and expenses were reflected, returns would be lower. The graph and performance table below do not reflect the deduction of taxes that a shareholder would pay on Fund distributions or the redemption of Fund shares. During the period, expenses of the Fund were waived or reimbursed by Lord Abbett; without such waiver or reimbursement of expenses, the Fund’s returns would have been lower. Past performance is no guarantee of future results.
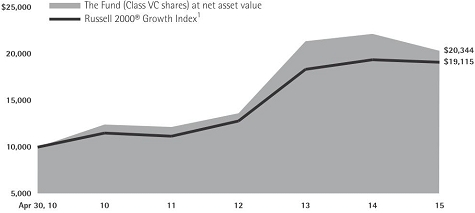
| | | Average Annual Total Returns for the
Periods Ended December 31, 2015 |
| | | 1 Year | | 5 Years | | Life of Class | |
| Class VC2 | | –8.21% | | 10.35% | | 13.34% | |
1 Performance for the unmanaged index does not reflect any fees or expenses. The performance of the index is not necessarily representative of the Fund’s performance. Performance for the index began on May 1, 2010.
2 The Class VC shares commenced operations on April 23, 2010. Performance for the Class began on May 1, 2010.
4
Expense Example
As a shareholder of the Fund, you incur ongoing costs, including management fees; expenses related to the Fund’s services arrangements with certain insurance companies; and other Fund expenses. This Example is intended to help you understand your ongoing costs (in dollars) of investing in the Fund and to compare these costs with the ongoing costs of investing in other mutual funds.
The Example is based on an investment of $1,000 invested at the beginning of the period and held for the entire period (July 1, 2015 through December 31, 2015).
The Example reflects only expenses that are deducted from the assets of the Fund. Fees and expenses, including sales charges applicable to the various insurance products that invest in the Fund, are not reflected in this Example. If such fees and expenses were reflected in the Example, the total expenses shown would be higher. Fees and expenses regarding such variable insurance products are separately described in the prospectus related to those products.
Actual Expenses
The first line of the table on the following page provides information about actual account values and actual expenses. You may use the information in this line, together with the amount you invested, to estimate the expenses that you paid over the period. Simply divide your account value by $1,000 (for example, an $8,600 account value divided by $1,000 = 8.6), then multiply the result by the number in the first line under the heading titled “Expenses Paid During Period 7/1/15 – 12/31/15” to estimate the expenses you paid on your account during this period.
Hypothetical Example for Comparison Purposes
The second line of the table on the following page provides information about hypothetical account values and hypothetical expenses based on the Fund’s actual expense ratio and an assumed rate of return of 5% per year before expenses, which is not the Fund’s actual return. The hypothetical account values and expenses may not be used to estimate the actual ending account balance or expenses you paid for the period. You may use this information to compare the ongoing costs of investing in the Fund and other funds. To do so, compare this 5% hypothetical example with the 5% hypothetical examples that appear in the shareholder reports of the other funds.
5
Please note that the expenses shown in the table are meant to highlight your ongoing costs only and do not reflect any transactional costs, such as sales charges. Therefore, the second line of the table is useful in comparing ongoing costs only, and will not help you determine the relative total costs of owning different funds. In addition, if these transactional costs were included, your costs would have been higher.
| | | Beginning
Account
Value | | Ending
Account
Value | | Expenses
Paid During
Period† | |
| | | 7/1/15 | | 12/31/15 | | 7/1/15 -
12/31/15 | |
| Class VC | | | | | | | |
| Actual | | $1,000.00 | | $ 832.50 | | $4.16 | |
| Hypothetical (5% Return Before Expenses) | | $1,000.00 | | $1,020.67 | | $4.58 | |
| † | Net expenses are equal to the Fund’s annualized expense ratio of 0.90%, multiplied by the average account value over the period, multiplied by 184/365 (to reflect one-half year period). |
Portfolio Holdings Presented by Sector
December 31, 2015
| Sector* | %** |
| Consumer Discretionary | 15.39 | % |
| Consumer Staples | 4.20 | % |
| Energy | 0.51 | % |
| Financials | 8.19 | % |
| Health Care | 24.86 | % |
| Industrials | 6.33 | % |
| Information Technology | 38.47 | % |
| Materials | 0.20 | % |
| Repurchase Agreement | 1.85 | % |
| Total | 100.00 | % |
| * | | A sector may comprise several industries. |
| ** | | Represents percent of total investments. |
6
Schedule of Investments
December 31, 2015
| | | | | | Fair | |
| | | | | | Value | |
| Investments | | | Shares | | | | (000) | |
| COMMON STOCKS 98.60% | | | | | | | | |
| | | | | | | | | |
| Aerospace & Defense 0.53% | | | | | | | | |
| Hexcel Corp. | | | 3,279 | | | $ | 152 | |
| | | | | | | | | |
| Banks 3.46% | | | | | | | | |
| Bank of the Ozarks, Inc. | | | 4,259 | | | | 211 | |
| PrivateBancorp, Inc. | | | 6,829 | | | | 280 | |
| SVB Financial Group* | | | 1,187 | | | | 141 | |
| Western Alliance Bancorp* | | | 10,197 | | | | 366 | |
| Total | | | | | | | 998 | |
| | | | | | | | | |
| Biotechnology 8.26% | | | | | | | | |
| ACADIA Pharmaceuticals, Inc.* | | | 4,098 | | | | 146 | |
| Agios Pharmaceuticals, Inc.* | | | 1,220 | | | | 79 | |
| Anacor Pharmaceuticals, Inc.* | | | 936 | | | | 106 | |
| Blueprint Medicines Corp.* | | | 3,561 | | | | 94 | |
| Celldex Therapeutics, Inc.* | | | 6,285 | | | | 99 | |
| Foundation Medicine, Inc.* | | | 2,555 | | | | 54 | |
| Juno Therapeutics, Inc.* | | | 2,783 | | | | 122 | |
| Kite Pharma, Inc.* | | | 1,028 | | | | 63 | |
| Neurocrine Biosciences, Inc.* | | | 4,136 | | | | 234 | |
| Ophthotech Corp.* | | | 2,578 | | | | 202 | |
| Portola Pharmaceuticals, Inc.* | | | 1,514 | | | | 78 | |
| Prothena Corp. plc (Ireland)*(a) | | | 1,079 | | | | 73 | |
| Sage Therapeutics, Inc.* | | | 5,599 | | | | 326 | |
| Sarepta Therapeutics, Inc.* | | | 4,074 | | | | 157 | |
| Spark Therapeutics, Inc.* | | | 3,829 | | | | 174 | |
| TESARO, Inc.* | | | 2,937 | | | | 154 | |
| Ultragenyx Pharmaceutical, Inc.* | | | 1,995 | | | | 224 | |
| Total | | | | | | | 2,385 | |
| | | | | | | | | |
| Building Products 1.02% | | | | | | | | |
| Builders FirstSource, Inc.* | | | 26,498 | | | | 294 | |
| | | | | | | | | |
| Capital Markets 1.93% | | | | | | | | |
| Evercore Partners, Inc. Class A | | | 6,314 | | | | 341 | |
| Financial Engines, Inc. | | | 4,388 | | | | 148 | |
| WisdomTree Investments, Inc. | | | 4,278 | | | | 67 | |
| Total | | | | | | | 556 | |
| | | | | | Fair | |
| | | | | | Value | |
| Investments | | Shares | | | (000) | |
| Chemicals 0.20% | | | | | | | | |
| Flotek Industries, Inc.* | | | 4,966 | | | $ | 57 | |
| | | | | | | | | |
| Commercial Services & Supplies 0.64% | | | | | |
| Healthcare Services Group, Inc. | | | 5,331 | | | | 186 | |
| | | | | | | | | |
| Communications Equipment 1.97% | | | | | |
| Arista Networks, Inc.* | | | 3,583 | | | | 279 | |
| Infinera Corp.* | | | 12,616 | | | | 228 | |
| Ruckus Wireless, Inc.* | | | 5,753 | | | | 62 | |
| Total | | | | | | | 569 | |
| | | | | | | | | |
| Distributors 1.02% | | | | | | | | |
| Pool Corp. | | | 3,648 | | | | 295 | |
| | | | | | | | | |
| Diversified Consumer Services 2.47% | | | | | |
| 2U, Inc.* | | | 14,741 | | | | 412 | |
| Bright Horizons Family Solutions, Inc.* | | | 3,454 | | | | 231 | |
| New Oriental Education & Technology Group, Inc. ADR | | | 2,250 | | | | 71 | |
| Total | | | | | | | 714 | |
| | | | | | | | | |
| Diversified Financial Services 2.61% | | | | | |
| CBOE Holdings, Inc. | | | 4,583 | | | | 298 | |
| MarketAxess Holdings, Inc. | | | 4,096 | | | | 457 | |
| Total | | | | | | | 755 | |
| | | | | | | | | |
| Electronic Equipment, Instruments & Components 1.81% | | | | | |
| IPG Photonics Corp.* | | | 2,436 | | | | 217 | |
| Universal Display Corp.* | | | 5,638 | | | | 307 | |
| Total | | | | | | | 524 | |
| | | | | | | | | |
| Energy Equipment & Services 0.12% | | | | | |
| U.S. Silica Holdings, Inc. | | | 1,883 | | | | 35 | |
| | | | | | | | | |
| Food & Staples Retailing 1.46% | | | | | | | | |
| Casey’s General Stores, Inc. | | | 2,306 | | | | 278 | |
| Performance Food Group Co.* | | | 6,271 | | | | 145 | |
| Total | | | | | | | 423 | |
| | See Notes to Financial Statements. | 7 |
Schedule of Investments (continued)
December 31, 2015
| | | | | | Fair | |
| | | | | | Value | |
| Investments | | Shares | | | (000) | |
| Food Products 2.76% | | | | | | | | |
| Blue Buffalo Pet Products, Inc.* | | | 15,828 | | | $ | 296 | |
| Calavo Growers, Inc. | | | 4,206 | | | | 206 | |
| Snyder’s-Lance, Inc. | | | 8,576 | | | | 294 | |
| Total | | | | | | | 796 | |
| | | | | | | | | |
| Health Care Equipment & Supplies 6.96% | | | | | |
| ABIOMED, Inc.* | | | 3,029 | | | | 273 | |
| Align Technology, Inc.* | | | 5,554 | | | | 366 | |
| Endologix, Inc.* | | | 12,165 | | | | 120 | |
| Glaukos Corp.* | | | 7,328 | | | | 181 | |
| LDR Holding Corp.* | | | 6,137 | | | | 154 | |
| Nevro Corp.* | | | 4,814 | | | | 325 | |
| Penumbra, Inc.* | | | 4,007 | | | | 216 | |
| ZELTIQ Aesthetics, Inc.* | | | 13,115 | | | | 374 | |
| Total | | | | | | | 2,009 | |
| | | | | | | | | |
| Health Care Providers & Services 1.08% | | | | | |
| Diplomat Pharmacy, Inc.* | | | 3,602 | | | | 123 | |
| HealthEquity, Inc.* | | | 7,518 | | | | 189 | |
| Total | | | | | | | 312 | |
| | | | | | | | | |
| Health Care Technology 5.13% | | | | | | | | |
| athenahealth, Inc.* | | | 2,431 | | | | 391 | |
| Evolent Health, Inc. Class A* | | | 9,005 | | | | 109 | |
| Medidata Solutions, Inc.* | | | 5,500 | | | | 271 | |
| Press Ganey Holdings, Inc.* | | | 9,846 | | | | 311 | |
| Veeva Systems, Inc. Class A* | | | 13,879 | | | | 401 | |
| Total | | | | | | | 1,483 | |
| | | | | | | | | |
| Hotels, Restaurants & Leisure 2.80% | | | | | |
| Buffalo Wild Wings, Inc.* | | | 664 | | | | 106 | |
| Habit Restaurants, Inc. (The) Class A* | | | 6,053 | | | | 140 | |
| Panera Bread Co. Class A* | | | 1,527 | | | | 297 | |
| Shake Shack, Inc. Class A* | | | 1,889 | | | | 75 | |
| Zoe’s Kitchen, Inc.* | | | 6,873 | | | | 192 | |
| Total | | | | | | | 810 | |
| | | | | | Fair | |
| | | | | | Value | |
| Investments | | Shares | | | (000) | |
| Household Durables 0.25% | | | | | | | | |
| iRobot Corp.* | | | 2,041 | | | $ | 72 | |
| | | | | | | | | |
| Information Technology Services 3.45% | | | | | |
| Blackhawk Network Holdings, Inc.* | | | 7,131 | | | | 315 | |
| EPAM Systems, Inc.* | | | 5,442 | | | | 428 | |
| Euronet Worldwide, Inc.* | | | 2,983 | | | | 216 | |
| Square, Inc. Class A* | | | 2,739 | | | | 36 | |
| Total | | | | | | | 995 | |
| | | | | | | | | |
| Internet & Catalog Retail 3.30% | | | | | |
| Etsy, Inc.* | | | 3,264 | | | | 27 | |
| Liberty TripAdvisor Holdings, Inc. Class A* | | | 13,354 | | | | 405 | |
| Wayfair, Inc. Class A* | | | 10,935 | | | | 521 | |
| Total | | | | | | | 953 | |
| | | | | | | | | |
| Internet Software & Services 10.46% | | | | | |
| Benefitfocus, Inc.* | | | 11,009 | | | | 401 | |
| Cimpress NV (Netherlands)*(a) | | | 2,628 | | | | 213 | |
| comScore, Inc.* | | | 5,011 | | | | 206 | |
| Criteo SA ADR* | | | 7,487 | | | | 297 | |
| Cvent, Inc.* | | | 3,864 | | | | 135 | |
| GoDaddy, Inc. Class A* | | | 12,417 | | | | 398 | |
| Gogo, Inc.* | | | 23,454 | | | | 418 | |
| LogMeIn, Inc.* | | | 2,077 | | | | 139 | |
| Match Group, Inc.* | | | 20,897 | | | | 283 | |
| New Relic, Inc.* | | | 4,117 | | | | 150 | |
| Shopify, Inc. Class A (Canada)*(a) | | | 5,468 | | | | 141 | |
| Textura Corp.* | | | 1,036 | | | | 22 | |
| WebMD Health Corp.* | | | 2,071 | | | | 100 | |
| Zillow Group, Inc. Class A* | | | 4,573 | | | | 119 | |
| Total | | | | | | | 3,022 | |
| | | | | | | | | |
| Leisure Products 0.86% | | | | | | | | |
| Brunswick Corp. | | | 4,918 | | | | 248 | |
| | | | | | | | | |
| Life Sciences Tools & Services 0.87% | | | | | |
| Pacific Biosciences of California, Inc.* | | | 19,037 | | | | 250 | |
| 8 | See Notes to Financial Statements. |
Schedule of Investments (continued)
December 31, 2015
| | | | | | Fair | |
| | | | | | Value | |
| Investments | | Shares | | | (000) | |
| Machinery 1.71% | | | | | | | | |
| Nordson Corp. | | | 1,142 | | | $ | 73 | |
| Proto Labs, Inc.* | | | 3,878 | | | | 247 | |
| RBC Bearings, Inc.* | | | 2,690 | | | | 174 | |
| Total | | | | | | | 494 | |
| | | | | | | | | |
| Media 3.30% | | | | | | | | |
| IMAX Corp. (Canada)*(a) | | | 13,105 | | | | 466 | |
| Rentrak Corp.* | | | 2,881 | | | | 137 | |
| Sinclair Broadcast Group, Inc. Class A | | | 10,793 | | | | 351 | |
| Total | | | | | | | 954 | |
| | | | | | | | | |
| Oil, Gas & Consumable Fuels 0.39% | | | | | |
| GasLog Ltd. (Monaco)(a) | | | 13,577 | | | | 113 | |
| | | | | | | | | |
| Pharmaceuticals 2.68% | | | | | | | | |
| Pacira Pharmaceuticals, Inc.* | | | 4,065 | | | | 312 | |
| Prestige Brands Holdings, Inc.* | | | 7,114 | | | | 366 | |
| Revance Therapeutics, Inc.* | | | 2,808 | | | | 96 | |
| Total | | | | | | | 774 | |
| | | | | | | | | |
| Professional Services 1.19% | | | | | | | | |
| On Assignment, Inc.* | | | 4,818 | | | | 216 | |
| TransUnion* | | | 4,597 | | | | 127 | |
| Total | | | | | | | 343 | |
| | | | | | | | | |
| Road & Rail 0.30% | | | | | | | | |
| Knight Transportation, Inc. | | | 3,646 | | | | 88 | |
| | | | | | | | | |
| Semiconductors & Semiconductor Equipment 5.50% | | | | | |
| Ambarella, Inc.* | | | 3,263 | | | | 182 | |
| Cavium, Inc.* | | | 5,328 | | | | 350 | |
| Cirrus Logic, Inc.* | | | 6,392 | | | | 189 | |
| Microsemi Corp.* | | | 4,069 | | | | 133 | |
| Monolithic Power Systems, Inc. | | | 2,316 | | | | 147 | |
| SunPower Corp.* | | | 15,023 | | | | 451 | |
| Synaptics, Inc.* | | | 1,691 | | | | 136 | |
| Total | | | | | | | 1,588 | |
| | | | | | Fair | |
| | | | | | Value | |
| Investments | | Shares | | | (000) | |
| Software 15.45% | | | | | | | | |
| Atlassian Corp. plc Class A (United Kingdom)*(a) | | | 5,584 | | | $ | 168 | |
| BroadSoft, Inc.* | | | 7,682 | | | | 272 | |
| Callidus Software, Inc.* | | | 13,794 | | | | 256 | |
| Fleetmatics Group plc (Ireland)*(a) | | | 5,639 | | | | 286 | |
| Guidewire Software, Inc.* | | | 4,963 | | | | 299 | |
| HubSpot, Inc.* | | | 2,631 | | | | 148 | |
| Manhattan Associates, Inc.* | | | 3,468 | | | | 229 | |
| Materialise NV ADR* | | | 7,458 | | | | 53 | |
| Paycom Software, Inc.* | | | 8,874 | | | | 334 | |
| Paylocity Holding Corp.* | | | 10,133 | | | | 411 | |
| Proofpoint, Inc.* | | | 2,134 | | | | 139 | |
| Rubicon Project, Inc. (The)* | | | 9,690 | | | | 159 | |
| Synchronoss Technologies, Inc.* | | | 245 | | | | 9 | |
| Tableau Software, Inc. Class A* | | | 3,192 | | | | 301 | |
| Tyler Technologies, Inc.* | | | 2,159 | | | | 376 | |
| Ultimate Software Group, Inc. (The)* | | | 3,259 | | | | 637 | |
| Zendesk, Inc.* | | | 14,597 | | | | 386 | |
| Total | | | | | | | 4,463 | |
| | | | | | | | | |
| Specialty Retail 1.45% | | | | | | | | |
| Monro Muffler Brake, Inc. | | | 2,181 | | | | 145 | |
| Restoration Hardware Holdings, Inc.* | | | 3,451 | | | | 274 | |
| Total | | | | | | | 419 | |
| | | | | | | | | |
| Thrifts & Mortgage Finance 0.24% | | | | | | | | |
| LendingTree, Inc.* | | | 765 | | | | 68 | |
| | | | | | | | | |
| Trading Companies & Distributors 0.97% | | | | | |
| Beacon Roofing Supply, Inc.* | | | 5,403 | | | | 223 | |
| United Rentals, Inc.* | | | 805 | | | | 58 | |
| Total | | | | | | | 281 | |
Total Common Stocks
(cost $28,674,186) | | | | | | | 28,478 | |
| | See Notes to Financial Statements. | 9 |
Schedule of Investments (concluded)
December 31, 2015
| | | Principal | | | Fair | |
| | | Amount | | | Value | |
| Investments | | (000) | | | (000) | |
| SHORT-TERM INVESTMENT 1.86% | | | | | | | | |
| | | | | | | | | |
| Repurchase Agreement | | | | | | | | |
| | | | | | | | | |
| Repurchase Agreement dated 12/31/2015, 0.03% due 1/4/2016 with Fixed Income Clearing Corp. collateralized by $550,000 of U.S. Treasury Note at 1.625% due 7/31/2020; value: $550,688; proceeds: $537,395 (cost $537,393) | | | $537 | | | $ | 537 | |
Total Investments in Securities 100.46%
(cost $29,211,579) | | | | | | | 29,015 | |
| Liabilities in Excess of Other Assets (0.46)% | | | | | | | (133 | ) |
| Net Assets 100.00% | | | | | | $ | 28,882 | |
| | |
| ADR | American Depositary Receipt. |
| * | Non-income producing security. |
| (a) | Foreign security traded in U.S. dollars. |
The following is a summary of the inputs used as of December 31, 2015 in valuing the Fund’s investments carried at fair value(1):
| | | Level 1 | | | Level 2 | | | Level 3 | | | Total | |
| Investment Type(2)(3) | | (000) | | | (000) | | | (000) | | | (000) | |
| Common Stocks | | $ | 28,478 | | | $ | – | | | $ | – | | | $ | 28,478 | |
| Repurchase Agreement | | | – | | | | 537 | | | | – | | | | 537 | |
| Total | | $ | 28,478 | | | $ | 537 | | | $ | – | | | $ | 29,015 | |
| | |
| (1) | Refer to Note 2(h) for a description of fair value measurements and the three-tier hierarchy of inputs. |
| (2) | See Schedule of Investments for fair values in each industry and identification of foreign issuers and/or geography. |
| (3) | There were no Level 1/Level 2 transfers during the fiscal year ended December 31, 2015. |
| | |
| 10 | See Notes to Financial Statements. |
Statement of Assets and Liabilities
December 31, 2015
| ASSETS: | | | | |
| Investments in securities, at fair value (cost $29,211,579) | | $ | 29,014,882 | |
| Receivables: | | | | |
| Investment securities sold | | | 181,495 | |
| Capital shares sold | | | 33,194 | |
| Dividends | | | 1,310 | |
| Prepaid expenses | | | 169 | |
| Total assets | | | 29,231,050 | |
| LIABILITIES: | | | | |
| Payables: | | | | |
| Investment securities purchased | | | 256,801 | |
| Capital shares reacquired | | | 24,037 | |
| Management fee | | | 2,244 | |
| Directors’ fees | | | 1,069 | |
| Fund administration | | | 1,001 | |
| Accrued expenses | | | 64,268 | |
| Total liabilities | | | 349,420 | |
| NET ASSETS | | $ | 28,881,630 | |
| COMPOSITION OF NET ASSETS: | | | | |
| Paid-in capital | | $ | 31,413,325 | |
| Accumulated net investment loss | | | (1,069 | ) |
| Accumulated net realized loss on investments | | | (2,333,929 | ) |
| Net unrealized depreciation on investments | | | (196,697 | ) |
| Net Assets | | $ | 28,881,630 | |
| Outstanding shares (50 million shares of common stock authorized, $.001 par value) | | | 1,296,554 | |
Net asset value, offering and redemption price per share
(Net assets divided by outstanding shares) | | $ | 22.28 | |
| | | |
| | See Notes to Financial Statements. | 11 |
Statement of Operations
For the Year Ended December 31, 2015
| Investment income: | | | | |
| Dividends | | $ | 93,973 | |
| Interest | | | 9 | |
| Total investment income | | | 93,982 | |
| Expenses: | | | | |
| Management fee | | | 205,367 | |
| Non 12b-1 service fees | | | 68,541 | |
| Custody | | | 44,917 | |
| Professional | | | 40,624 | |
| Shareholder servicing | | | 34,302 | |
| Reports to shareholders | | | 16,219 | |
| Fund administration | | | 10,953 | |
| Directors’ fees | | | 926 | |
| Other | | | 6,554 | |
| Gross expenses | | | 428,403 | |
| Expense reductions (See Note 8) | | | (29 | ) |
| Fees waived and expenses reimbursed (See Note 3) | | | (181,934 | ) |
| Net expenses | | | 246,440 | |
| Net investment loss | | | (152,458 | ) |
| Net realized and unrealized loss: | | | | |
| Net realized loss on investments | | | (1,527,619 | ) |
| Net change in unrealized appreciation/depreciation on investments | | | (1,631,984 | ) |
| Net realized and unrealized loss | | | (3,159,603 | ) |
| Net Decrease in Net Assets Resulting From Operations | | $ | (3,312,061 | ) |
| | |
| 12 | See Notes to Financial Statements. |
Statements of Changes in Net Assets
| INCREASE IN NET ASSETS | For the Year Ended
December 31, 2015 | | For the Year Ended
December 31, 2014 | |
| Operations: | | | | | | | | |
| Net investment loss | | $ | (152,458 | ) | | $ | (89,732 | ) |
| Net realized loss on investments | | | (1,527,619 | ) | | | (386,784 | ) |
| Net change in unrealized appreciation/depreciation on investments | | | (1,631,984 | ) | | | 1,024,768 | |
| Net increase (decrease) in net assets resulting from operations | | | (3,312,061 | ) | | | 548,252 | |
| Distributions to shareholders from: | | | | | | | | |
| Net realized gain | | | (235,366 | ) | | | (99,000 | ) |
| Capital share transactions (See Note 12): | | | | | | | | |
| Proceeds from sales of shares | | | 22,904,779 | | | | 19,404,903 | |
| Reinvestment of distributions | | | 235,366 | | | | 99,000 | |
| Cost of shares reacquired | | | (8,205,194 | ) | | | (6,753,055 | ) |
| Net increase in net assets resulting from capital share transactions | | | 14,934,951 | | | | 12,750,848 | |
| Net increase in net assets | | | 11,387,524 | | | | 13,200,100 | |
| NET ASSETS: | | | | | | | | |
| Beginning of year | | $ | 17,494,106 | | | $ | 4,294,006 | |
| End of year | | $ | 28,881,630 | | | $ | 17,494,106 | |
| Accumulated net investment loss | | $ | (1,069 | ) | | $ | (458 | ) |
| | See Notes to Financial Statements. | 13 |
Financial Highlights
| | | | | | Per Share Operating Performance: | | | | |
| | | | | | | | | | | | | | | Distributions | | | | |
| | | | | | | | | | | | | | | to | | | | |
| | | | | | | | | | | | | | | shareholders | | | | |
| | | | | | Investment operations: | | | from: | | | | |
| | | | | | | | | | | | | | | | | | | |
| | | Net asset | | | | | Net | | | | | | | | Net asset |
| | | value, | | Net | | realized and | | Total from | | Net | | value, |
| | | beginning of | | investment | | unrealized | | investment | | realized | | end of |
| | | year | | loss(a) | | gain (loss) | | operations | | gain | | year |
| 12/31/2015 | | | $24.46 | | | | $(0.14 | ) | | | $(1.86 | ) | | | $(2.00 | ) | | | $(0.18 | ) | | | $22.28 | |
| 12/31/2014 | | | 23.74 | | | | (0.16 | ) | | | 1.03 | | | | 0.87 | | | | (0.15 | ) | | | 24.46 | |
| 12/31/2013 | | | 16.43 | | | | (0.16 | ) | | | 9.44 | | | | 9.28 | | | | (1.97 | ) | | | 23.74 | |
| 12/31/2012 | | | 15.68 | | | | (0.08 | ) | | | 1.98 | | | | 1.90 | | | | (1.15 | ) | | | 16.43 | |
| 12/31/2011 | | | 18.04 | | | | (0.14 | ) | | | (0.25 | ) | | | (0.39 | ) | | | (1.97 | ) | | | 15.68 | |
| (a) | | Calculated using average shares outstanding during the year. |
| (b) | | Total return does not consider the effects of sales charges or other expenses imposed by an insurance company and assumes the reinvestment of all distributions. |
| 14 | See Notes to Financial Statements. | |
| | | | Ratios to Average Net Assets: | | | Supplemental Data: |
| | | | | | | | | | | | | | | | | |
| | | | Total | | | | | | | | | | | | |
| | | | expenses after | | | | | | | | | | | | |
| | | | waivers and/or | | | | | Net | | Net assets, | | Portfolio |
| Total | | reimburse- | | Total | | investment | | end of | | turnover |
| return(b) | | ments | | expenses | | loss | | year | | rate |
| (%) | | (%) | | (%) | | (%) | | (000) | | (%) |
| | (8.21 | ) | | | 0.90 | | | | 1.56 | | | | (0.56 | ) | | | $28,882 | | | | 196.74 | |
| | 3.71 | | | | 0.90 | | | | 2.02 | | | | (0.68 | ) | | | 17,494 | | | | 235.07 | |
| | 56.68 | | | | 0.90 | | | | 6.47 | | | | (0.72 | ) | | | 4,294 | | | | 245.36 | |
| | 12.11 | | | | 0.90 | | | | 26.16 | | | | (0.48 | ) | | | 327 | | | | 176.45 | |
| | (2.14 | ) | | | 0.90 | | | | 29.97 | | | | (0.76 | ) | | | 235 | | | | 173.40 | |
| | See Notes to Financial Statements. | 15 |
Notes to Financial Statements
Lord Abbett Series Fund, Inc. (the “Company”) is registered under the Investment Company Act of 1940, as amended (the “Act”), as a diversified, open-end management investment company and was incorporated under Maryland law in 1989. The Company consists of thirteen separate portfolios. This report covers Developing Growth Portfolio (the “Fund”).
The Fund’s investment objective is long-term growth of capital. The Fund has Variable Contract class shares (“Class VC Shares”), which are currently issued and redeemed only in connection with investments in, and payments under, variable annuity contracts and variable life insurance policies issued by life insurance and insurance-related companies.
The preparation of the financial statements in conformity with accounting principles generally accepted in the United States of America (“U.S. GAAP”) requires management to make certain estimates and assumptions that affect the reported amounts of assets and liabilities and disclosure of contingent assets and liabilities at the date of the financial statements and the reported amounts of increases and decreases in net assets from operations during the reporting period. Actual results could differ from those estimates. The Fund is considered an investment company under U.S. GAAP and follows the accounting and reporting guidance applicable to investment companies.
| 2. | SIGNIFICANT ACCOUNTING POLICIES |
| (a) | Investment Valuation–Under procedures approved by the Fund’s Board of Directors (the “Board”), Lord, Abbett & Co. LLC (“Lord Abbett”), the Fund’s investment manager, has formed a Pricing Committee to administer the pricing and valuation of portfolio investments and to ensure that prices utilized reasonably reflect fair value. Among other things, these procedures allow the Fund to utilize independent pricing services, quotations from securities and financial instrument dealers and other market sources to determine fair value. |
| | |
| | Securities actively traded on any recognized U.S. or non-U.S. exchange or on The NASDAQ Stock Market LLC are valued at the last sale price or official closing price on the exchange or system on which they are principally traded. Events occurring after the close of trading on non-U.S. exchanges may result in adjustments to the valuation of foreign securities to reflect their fair value as of the close of regular trading on the New York Stock Exchange. The Fund may utilize an independent fair valuation service in adjusting the valuations of foreign securities. Unlisted equity securities are valued at the last quoted sale price or, if no sale price is available, at the mean between the most recently quoted bid and asked prices. |
| | |
| | Securities for which prices are not readily available are valued at fair value as determined by the Pricing Committee. The Pricing Committee considers a number of factors, including observable and unobservable inputs, when arriving at fair value. The Pricing Committee may use related or comparable assets or liabilities, recent transactions, market multiples, book values and other relevant information to determine the fair value of portfolio investments. The Board or a designated committee thereof regularly reviews fair value determinations made by the Pricing Committee and employs techniques such as reviewing related market activity, reviewing inputs and assumptions, and retrospectively comparing prices of subsequent purchases and sales transactions to fair value determinations made by the Pricing Committee. |
| | |
| | Short-term securities with 60 days or less remaining to maturity are valued using the amortized cost method, which approximates fair value. |
16
Notes to Financial Statements (continued)
| (b) | Security Transactions–Security transactions are recorded as of the date that the securities are purchased or sold (trade date). Realized gains and losses on sales of portfolio securities are calculated using the identified-cost method. |
| | |
| (c) | Investment Income–Dividend income is recorded on the ex-dividend date. Interest income is recorded on the accrual basis as earned. Discounts are accreted and premiums are amortized using the effective interest method and are included in Interest and other income on the Statement of Operations. Withholding taxes on foreign dividends have been provided for in accordance with the applicable country’s tax rules and rates. |
| | |
| (d) | Income Taxes–It is the policy of the Fund to meet the requirements of Subchapter M of the Internal Revenue Code applicable to regulated investment companies and to distribute substantially all taxable income and capital gains to its shareholders. Therefore, no income tax provision is required. |
| | |
| | The Fund files U.S. federal and various state and local tax returns. No income tax returns are currently under examination. The statute of limitations on the Fund’s filed U.S. federal tax returns remains open for the fiscal years ended December 31, 2012 through December 31, 2015. The statutes of limitations on the Company’s state and local tax returns may remain open for an additional year depending upon the jurisdiction. |
| | |
| (e) | Expenses–Expenses incurred by the Company that do not specifically relate to an individual fund are generally allocated to the funds within the Company on a pro rata basis by relative net assets. |
| | |
| (f) | Foreign Transactions–The books and records of the Fund are maintained in U.S. dollars and transactions denominated in foreign currencies are recorded in the Fund’s records at the rate prevailing when earned or recorded. Asset and liability accounts that are denominated in foreign currencies are adjusted daily to reflect current exchange rates and any unrealized gain (loss) is included in Net change in unrealized appreciation/depreciation on investments on the Fund’s Statement of Operations. The resultant exchange gains and losses upon settlement of such transactions are included in Net realized loss on investments on the Fund’s Statement of Operations. The Fund does not isolate that portion of the results of operations arising as a result of changes in the foreign exchange rates from the changes in market prices of the securities. |
| | |
| (g) | Repurchase Agreements–The Fund may enter into repurchase agreements with respect to securities. A repurchase agreement is a transaction in which a fund acquires a security and simultaneously commits to resell that security to the seller (a bank or securities dealer) at an agreed-upon price on an agreed-upon date. The Fund requires at all times that the repurchase agreement be collateralized by cash, or by securities of the U.S. Government, its agencies, its instrumentalities, or U.S. Government sponsored enterprises having a value equal to, or in excess of, the value of the repurchase agreement (including accrued interest). If the seller of the agreement defaults on its obligation to repurchase the underlying securities at a time when the fair value of these securities has declined, the Fund may incur a loss upon disposition of the securities. |
| | |
| (h) | Fair Value Measurements–Fair value is defined as the price that the Fund would receive upon selling an investment or transferring a liability in an orderly transaction to an independent buyer in the principal or most advantageous market of the investment. A three-tier hierarchy is used to maximize the use of observable market data and minimize the use of |
17
Notes to Financial Statements (continued)
| | unobservable inputs and to establish classification of fair value measurements for disclosure purposes. Inputs refer broadly to the assumptions that market participants would use in pricing the asset or liability, including assumptions about risk—for example, the risk inherent in a particular valuation technique used to measure fair value (such as a pricing model) and/or the risk inherent in the inputs to the valuation technique. Inputs may be observable or unobservable. Observable inputs reflect the assumptions market participants would use in pricing the asset or liability. Observable inputs are based on market data obtained from sources independent of the reporting entity. Unobservable inputs reflect the reporting entity’s own assumptions about the assumptions market participants would use in pricing the asset or liability. Unobservable inputs are based on the best information available in the circumstances. The three-tier hierarchy of inputs is summarized in the three broad Levels listed below: |
| • | Level 1 – | unadjusted quoted prices in active markets for identical investments; |
| | |
| • | Level 2 – | other significant observable inputs (including quoted prices for similar investments, interest rates, prepayment speeds, credit risk, etc.); and |
| | |
| • | Level 3 – | significant unobservable inputs (including the Fund’s own assumptions in determining the fair value of investments). |
| | A summary of inputs used in valuing the Fund’s investments as of December 31, 2015 and, if applicable, Level 1/Level 2 transfers and Level 3 rollforwards for the fiscal year then ended is included in the Fund’s Schedule of Investments. |
| | |
| | Changes in valuation techniques may result in transfers into or out of an assigned level within the three-tier hierarchy. All transfers between different levels within the three-tier hierarchy are deemed to have occurred as of the beginning of the reporting period. The inputs or methodology used for valuing securities are not necessarily an indication of the risk associated with investing in those securities. |
| 3. | MANAGEMENT FEE AND OTHER TRANSACTIONS WITH AFFILIATES |
Management Fee
The Company has a management agreement with Lord Abbett, pursuant to which Lord Abbett supplies the Fund with investment management services and executive and other personnel, provides office space and pays for ordinary and necessary office and clerical expenses relating to research and statistical work and supervision of the Fund’s investment portfolio.
The management fee is based on the Fund’s average daily net assets at the following annual rate:
| First $100 million | .75% |
| Over $100 million | .50% |
For the fiscal year ended December 31, 2015, the effective management fee, net of waivers, was at an annualized rate of .09% of the Fund’s average daily net assets.
In addition, Lord Abbett provides certain administrative services to the Fund pursuant to an Administrative Services Agreement in return for a fee at an annual rate of .04% of the Fund’s average daily net assets.
During the fiscal year ended December 31, 2015 and continuing through April 30, 2016, Lord Abbett has contractually agreed to waive its fees and reimburse expenses to the extent necessary to limit total net annual operating expenses to an annual rate of 0.90%. This agreement may be terminated only upon the approval of the Board.
18
Notes to Financial Statements (continued)
The Company, on behalf of the Fund, has entered into services arrangements with certain insurance companies. Under these arrangements, certain insurance companies will be compensated up to .25% of the average daily net asset value (“NAV”) of the Fund’s Class VC Shares held in the insurance company’s separate account to service and maintain the Variable Contract owners’ accounts. This amount is included in Non 12b-1 service fees on the Statement of Operations. The Fund may also compensate certain insurance companies, third-party administrators and other entities for providing recordkeeping, sub-transfer agency and other administrative services to the Fund. This amount is included in Shareholder servicing on the Statement of Operations.
A Director and certain of the Company’s officers have an interest in Lord Abbett.
| 4. | DISTRIBUTIONS AND CAPITAL LOSS CARRYFORWARDS |
Dividends from net investment income, if any, are declared and paid at least semi-annually. Taxable net realized gains from investment transactions, reduced by allowable capital loss carryforwards, if any, are declared and distributed to shareholders at least annually. The capital loss carryforward amount, if any, is available to offset future net capital gains. Dividends and distributions to shareholders are recorded on the ex-dividend date. The amounts of dividends and distributions from net investment income and net realized capital gains are determined in accordance with federal income tax regulations, which may differ from U.S. GAAP. These book/tax differences are either considered temporary or permanent in nature. To the extent these differences are permanent in nature, such amounts are reclassified within the components of net assets based on their federal tax basis treatment; temporary differences do not require reclassification. Dividends and distributions that exceed earnings and profits for tax purposes are reported as a tax return of capital.
The tax character of distributions paid during the fiscal years ended December 31, 2015 and 2014 was as follows:
| | | Year Ended
12/31/2015 | | | Year Ended
12/31/2014 | |
| Distributions paid from: | | | | | | | | |
| Ordinary income | | | $187,754 | | | | $97,449 | |
| Net long-term capital gains | | | 47,612 | | | | 1,551 | |
| Total distributions paid | | | $235,366 | | | | $99,000 | |
As of December 31, 2015, the components of accumulated losses on a tax-basis were as follows:
| Temporary differences | | $ | (1,664,716 | ) |
| Unrealized losses – net | | | (866,979 | ) |
| Total accumulated losses – net | | $ | (2,531,695 | ) |
At the Fund’s election, certain losses incurred within the taxable year (Qualified Late-Year Losses) are deemed to arise on the first business day of the Fund’s next taxable year. The Fund incurred and will elect to defer post-October capital losses of $1,663,647 during fiscal year 2015.
As of December 31, 2015, the aggregate unrealized security gains and losses based on cost for U.S. federal income tax purposes were as follows:
| Tax cost | | $ | 29,881,861 | |
| Gross unrealized gain | | | 1,462,631 | |
| Gross unrealized loss | | | (2,329,610 | ) |
| Net unrealized security loss | | $ | (866,979 | ) |
The difference between book-basis and tax-basis unrealized gains (losses) is attributable to wash sales.
19
Notes to Financial Statements (continued)
Permanent items identified during the fiscal year ended December 31, 2015 have been reclassified among the components of net assets based on their tax basis treatment as follows:
| Accumulated | | Accumulated | | |
| Net Investment | | Net Realized | | Paid-in | |
| Loss | | Loss | | Capital | |
| $151,847 | | $(151,544 | ) | $(303 | ) |
The permanent differences are attributable to the tax treatment of net investment losses and certain distributions.
| 5. | PORTFOLIO SECURITIES TRANSACTIONS |
Purchases and sales of investment securities (excluding short-term investments) for the fiscal year ended December 31, 2015 were as follows:
| Purchases | | Sales |
| $65,878,289 | | $51,099,491 |
There were no purchases or sales of U.S. Government securities for the fiscal year ended December 31, 2015.
The Fund is permitted to purchase and sell securities (“cross-trade”) from and to other Lord Abbett Funds or client accounts pursuant to procedures approved by the Board in compliance with Rule 17a-7 under the Act (the “Rule”). Each cross-trade is executed at a fair market price in compliance with provisions of the Rule. For the year ended December 31, 2015, the Fund engaged in cross-trade purchases of $64,194 and sales of $33,771, which resulted in net realized losses of ($13,907).
| 6. | DISCLOSURES ABOUT OFFSETTING ASSETS AND LIABILITIES |
The Financial Accounting Standards Board (“FASB”) requires disclosures intended to help better assess the effect or potential effect of offsetting arrangements on a fund’s financial position. The following tables illustrate gross and net information about recognized assets and liabilities eligible for offset in the statement of assets and liabilities; and disclose such amounts subject to an enforceable master netting agreement or similar agreement, by counterparty. A master netting agreement is an agreement between a fund and a counterparty which provides for the net settlement of amounts owed under all contracts traded under that agreement, as well as cash collateral, through a single payment by one party to the other in the event of default on or termination of any one contract. The Fund’s accounting policy with respect to balance sheet offsetting is that, absent an event of default by the counterparty or a termination of the agreement, the master netting agreement does not result in an offset of reported amounts of financial assets and liabilities in the statement of assets and liabilities across transactions between the Fund and the applicable counterparty:
| Description | | Gross Amounts of
Recognized Assets | | | Gross Amounts
Offset in the
Statement of Assets
and Liabilities | | | Net Amounts of
Assets Presented
in the Statement of
Assets and Liabilities |
| Repurchase Agreement | | | $537,393 | | | $ | — | | | | $537,393 |
| Total | | | $537,393 | | | $ | — | | | | $537,393 |
20
Notes to Financial Statements (continued)
| | | Net Amounts | | | | | | | | | | | | | |
| | | of Assets | | | Amounts Not Offset in the | | | | |
| | | Presented in | | | Statement of Assets and Liabilities | | | | |
| | | the Statement | | | | | | Cash | | | Securities | | | | |
| | | of Assets and | | | Financial | | | Collateral | | | Collateral | | | Net | |
| Counterparty | | Liabilities | | | Instruments | | | Received(a) | | | Received(a) | | | Amount(b) | |
| Fixed Income Clearing Corp. | | | $537,393 | | | $ | — | | | $ | — | | | $ | (537,393 | ) | | $ | — | |
| Total | | | $537,393 | | | $ | — | | | $ | — | | | $ | (537,393 | ) | | $ | — | |
| (a) | Collateral disclosed is limited to an amount not to exceed 100% of the net amount of assets presented in the Statement of Assets and Liabilities, for each respective counterparty. |
| (b) | Net amount represents the amount owed to the Fund by the counterparty as of December 31, 2015. |
| 7. | DIRECTORS’ REMUNERATION |
The Company’s officers and a Director, who are associated with Lord Abbett, do not receive any compensation from the Company for serving in such capacities. Independent Directors’ fees are allocated among all Lord Abbett-sponsored funds based on the net assets of each fund. There is an equity-based plan available to all Independent Directors under which Independent Directors must defer receipt of a portion of, and may elect to defer receipt of an additional portion of Directors’ fees. The deferred amounts are treated as though equivalent dollar amounts had been invested in the funds. Such amounts and earnings accrued thereon are included in Directors’ fees on the Statement of Operations and in Directors’ fees payable on the Statement of Assets and Liabilities and are not deductible for U.S. federal income tax purposes until such amounts are paid.
The Company has entered into an arrangement with its transfer agent and custodian, whereby credits realized as a result of uninvested cash balances are used to reduce a portion of the Fund’s expenses.
Effective August 31, 2015, the Fund and certain other funds managed by Lord Abbett (collectively, the “Participating Funds”) entered into a syndicated line of credit facility with various lenders for $550 million (the “Facility”), whereas State Street Bank and Trust Company (“SSB”) participates as a lender and as agent for the lenders. The Facility is to be used for temporary or emergency purposes as an additional source of: liquidity to satisfy redemptions. The Participating Funds are subject to graduated borrowing limits of one-third of Fund assets (if Fund assets are less than $750 million), $250 million, $300 million, or $350 million, based on past borrowings and likelihood of future borrowings. The Facility will continue through August 29, 2016.
Prior to August 31, 2015, the Fund and certain other funds managed by Lord Abbett participated in a $500 million unsecured revolving credit facility with SSB (the “SSB Facility”).
During the fiscal year ended December 31, 2015, the Fund did not utilize the Facility or the SSB Facility.
| 10. | CUSTODIAN AND ACCOUNTING AGENT |
SSB is the Company’s custodian and accounting agent. SSB performs custodial, accounting and recordkeeping functions relating to portfolio transactions and calculating the Fund’s NAV.
21
Notes to Financial Statements (concluded)
The Fund is subject to the general risks and considerations associated with equity investing. The value of an investment will fluctuate in response to movements in the equity securities markets in general and to the changing prospects of individual companies in which the Fund invests.
The Fund has particular risks associated with growth stocks. Different types of stocks shift in and out of favor depending on market and economic conditions. Growth stocks tend to be more volatile than other stocks. In addition, if the Fund’s assessment of a company’s potential for growth or market conditions is wrong, it could suffer losses or produce poor performance relative to other funds, even in a rising market. The Fund invests primarily in small-cap growth company stocks, which tend to be more volatile and can be less liquid than other types of stocks. Small-cap companies may also have more limited product lines, markets or financial resources, and typically experience a higher risk of failure than large-cap companies. Because the Fund may invest a portion of its assets in foreign securities and American Depositary Receipts, it may experience increased market, liquidity, currency, political, information and other risks.
These factors can affect the Fund’s performance.
| 12. | SUMMARY OF CAPITAL TRANSACTIONS |
Transactions in shares of capital stock were as follows:
| | | | Year Ended
December 31, 2015 | | | | Year Ended
December 31, 2014 | |
| Shares sold | | | 905,924 | | | | 823,181 | |
| Reinvestment of distributions | | | 10,541 | | | | 4,414 | |
| Shares reacquired | | | (335,235 | ) | | | (293,182 | ) |
| Increase | | | 581,230 | | | | 534,413 | |
22
Report Of Independent Registered Public Accounting Firm
To the Board of Directors of Lord Abbett Series Fund, Inc. and the Shareholders of Developing Growth Portfolio:
We have audited the accompanying statement of assets and liabilities, including the schedule of investments, of the Developing Growth Portfolio, one of the portfolios constituting the Lord Abbett Series Fund, Inc. (the “Fund”) as of December 31, 2015, and the related statement of operations for the year then ended, the statements of changes in net assets for each of the two years in the period then ended, and the financial highlights for each of the five years in the period then ended. These financial statements and financial highlights are the responsibility of the Fund’s management. Our responsibility is to express an opinion on these financial statements and financial highlights based on our audits.
We conducted our audits in accordance with the standards of the Public Company Accounting Oversight Board (United States). Those standards require that we plan and perform the audit to obtain reasonable assurance about whether the financial statements and financial highlights are free of material misstatement. The Fund is not required to have, nor were we engaged to perform, an audit of its internal control over financial reporting. Our audits included consideration of internal control over financial reporting as a basis for designing audit procedures that are appropriate in the circumstances, but not for the purpose of expressing an opinion on the effectiveness of the Fund’s internal control over financial reporting. Accordingly, we express no such opinion. An audit also includes examining, on a test basis, evidence supporting the amounts and disclosures in the financial statements, assessing the accounting principles used and significant estimates made by management, as well as evaluating the overall financial statement presentation. Our procedures included confirmation of securities owned as of December 31, 2015, by correspondence with the custodian and brokers; when replies were not received from brokers, we performed other auditing procedures. We believe that our audits provide a reasonable basis for our opinion.
In our opinion, such financial statements and financial highlights referred to above present fairly, in all material respects, the financial position of Developing Growth Portfolio of the Lord Abbett Series Fund, Inc. as of December 31, 2015, the results of its operations for the year then ended, the changes in its net assets for each of the two years in the period then ended, and the financial highlights for each of the five years in the period then ended, in conformity with accounting principles generally accepted in the United States of America.
DELOITTE & TOUCHE LLP
New York, New York
February 16, 2016
23
Basic Information About Management
The Board is responsible for the management of the business and affairs of the Company in accordance with the laws of the State of Maryland. The Board elects officers who are responsible for the day-to-day operations of the Fund and who execute policies authorized by the Board. The Board also approves an investment adviser to the Fund and continues to monitor the cost and quality of the services the investment adviser provides, and annually considers whether to renew the contract with the adviser. Generally, each Director holds office until his/her successor is elected and qualified or until his/her earlier resignation or removal, as provided in the Company’s organizational documents.
Lord Abbett, a Delaware limited liability company, is the Fund’s investment adviser. Designated Lord Abbett personnel are responsible for the day-to-day management of the Fund.
Interested Director
Ms. Foster is affiliated with Lord Abbett and is an “interested person” of the Company as defined in the Act. Ms. Foster is a director/trustee and officer of each of the 12 investment companies in the Lord Abbett Family of Funds, which consist of 58 portfolios or series.
Name, Address and
Year of Birth | | Current Position and
Length of Service
with the Fund | | Principal Occupation and Other Directorships
During the Past Five Years |
Daria L. Foster
Lord, Abbett & Co. LLC
90 Hudson Street
Jersey City, NJ 07302
(1954) | | Director and President since 2006; Chief Executive Officer since 2012 | | Principal Occupation: Managing Partner of Lord Abbett, joined Lord Abbett in 1990.
Other Directorships: None. |
Independent Directors
The following Independent Directors also are directors/trustees of each of the 12 investment companies in the Lord Abbett Family of Funds, which consist of 58 portfolios or series.
Name, Address and
Year of Birth | | Current Position and
Length of Service
with the Fund | | Principal Occupation and Other Directorships
During the Past Five Years |
E. Thayer Bigelow
Lord, Abbett & Co. LLC
c/o Legal Dept.
90 Hudson Street
Jersey City, NJ 07302
(1941) | | Director since 1994;
Chairman since 2013 | | Principal Occupation: Managing General Partner, Bigelow Media, LLC (since 2000); Senior Adviser, Time Warner Inc. (1998–2000). Other Directorships: Currently serves as director of Crane Co. (since 1984) and Huttig Building Products Inc. (since 1998). Previously served as a director of R.H. Donnelley Inc. (2009–2010). |
| | | | | |
Robert B. Calhoun, Jr.
Lord, Abbett & Co. LLC
c/o Legal Dept.
90 Hudson Street
Jersey City, NJ 07302
(1942) | | Director since 1998 | | Principal Occupation: Senior Advisor of Monitor Clipper Partners, a private equity investment fund (since 1997); President of Clipper Asset Management Corp. (1991–2009). Other Directorships: None. |
24
Basic Information About Management (continued)
Name, Address and
Year of Birth | | Current Position and
Length of Service
with the Fund | | Principal Occupation and Other Directorships
During the Past Five Years |
Eric C. Fast
Lord, Abbett & Co. LLC
c/o Legal Dept.
90 Hudson Street
Jersey City, NJ 07302
(1949) | | Director since 2014 | | Principal Occupation: Chief Executive Officer of Crane Co., an industrial products company (2001–2014). Other Directorships: Currently serves as director of Automatic Data Processing, Inc. (since 2007) and Regions Financial Corporation (since 2010). Previously served as a director of Crane Co. (1999–2014). |
| | | | | |
Evelyn E. Guernsey
Lord, Abbett & Co. LLC
c/o Legal Dept.
90 Hudson Street
Jersey City, NJ 07302
(1955) | | Director since 2011 | | Principal Occupation: CEO, Americas of J.P. Morgan Asset Management (2004–2010). Other Directorships: None. |
| | | | | |
Julie A. Hill
Lord, Abbett & Co. LLC
c/o Legal Dept.
90 Hudson Street
Jersey City, NJ 07302
(1946) | | Director since 2004 | | Principal Occupation: Owner and CEO of The Hill Company, a business consulting firm (since 1998).
Other Directorships: Currently serves as director of Anthem, Inc., a health benefits company (since 1994). |
| | | | | |
Franklin W. Hobbs
Lord, Abbett & Co. LLC
c/o Legal Dept.
90 Hudson Street
Jersey City, NJ 07302
(1947) | | Director since 2001 | | Principal Occupation: Advisor of One Equity Partners, a private equity firm (since 2004). Other Directorships: Currently serves as director and Chairman of the Board of Ally Financial Inc., a financial services firm (since 2009), and as director of Molson Coors Brewing Company (since 2002). |
| | | | | |
James M. McTaggart
Lord, Abbett & Co. LLC
c/o Legal Dept.
90 Hudson Street
Jersey City, NJ 07302
(1947) | | Director since 2012 | | Principal Occupation: Independent management advisor and consultant (since 2012); Vice President, CRA International, Inc. (doing business as Charles River Associates), a global management consulting firm (2009–2012); Founder and Chairman of Marakon Associates, Inc., a strategy consulting firm (1978–2009); and Officer and Director of Trinsum Group, a holding company (2007–2009). Other Directorships: Currently serves as director of Blyth, Inc., a home products company (since 2004). |
| | | | | |
James L.L. Tullis
Lord, Abbett & Co. LLC
c/o Legal Dept.
90 Hudson Street
Jersey City, NJ 07302
(1947) | | Director since 2006 | | Principal Occupation: CEO of Tullis-Dickerson and Co. Inc., a venture capital management firm (since 1990); CEO of Tullis Health Investors Inc. (since 2012). Other Directorships: Currently serves as director of Crane Co. (since 1998). |
25
Basic Information About Management (continued)
Officers
None of the officers listed below have received compensation from the Company. All of the officers of the Company also may be officers of the other Lord Abbett Funds and maintain offices at 90 Hudson Street, Jersey City, NJ 07302. Unless otherwise indicated, the position(s) and title(s) listed under the “Principal Occupation During the Past Five Years” column indicate each officer’s position(s) and title(s) with Lord Abbett. Each officer serves for an indefinite term (i.e., until his or her death, resignation, retirement, or removal).
Name and
Year of Birth | | Current Position
with the Fund | | Length of Service
of Current
Position | | Principal Occupation
During the Past Five Years |
| | | | | | | |
Daria L. Foster
(1954) | | President and Chief Executive Officer | | Elected as President in 2006 and Chief Executive Officer in 2012 | | Managing Partner of Lord Abbett, joined Lord Abbett in 1990. |
| | | | | | | |
Sean J. Aurigemma
(1969) | | Executive Vice President | | Elected in 2010 | | Portfolio Manager, joined Lord Abbett in 2007. |
| | | | | | | |
Jeff D. Diamond
(1960) | | Executive Vice President | | Elected in 2008 | | Portfolio Manager, joined Lord Abbett in 2007. |
| | | | | | | |
Robert I. Gerber
(1954) | | Executive Vice President | | Elected in 2003 | | Partner and Chief Investment Officer, joined Lord Abbett in 1997. |
| | | | | | | |
Todd D. Jacobson
(1966) | | Executive Vice President | | Elected in 2005 | | Partner and Associate Director, joined Lord Abbett in 2003. |
| | | | | | | |
Robert A. Lee
(1969) | | Executive Vice President | | Elected in 2010 | | Partner and Deputy Chief Investment Officer, joined Lord Abbett in 1997. |
| | | | | | | |
Thomas B. Maher
(1967) | | Executive Vice President | | Elected in 2010 | | Partner and Portfolio Manager, joined Lord Abbett in 2003. |
| | | | | | | |
Justin C. Maurer
(1969) | | Executive Vice President | | Elected in 2010 | | Partner and Portfolio Manager, joined Lord Abbett in 2001. |
| | | | | | | |
Vincent J. McBride
(1964) | | Executive Vice President | | Elected in 2010 | | Partner and Director, joined Lord Abbett in 2003. |
| | | | | | | |
Andrew H. O’Brien
(1973) | | Executive Vice President | | Elected in 2010 | | Partner and Portfolio Manager, joined Lord Abbett in 1998. |
| | | | | | | |
F. Thomas O’Halloran, III
(1955) | | Executive Vice President | | Elected in 2010 | | Partner and Portfolio Manager, joined Lord Abbett in 2001. |
| | | | | | | |
Walter H. Prahl
(1958) | | Executive Vice President | | Elected in 2012 | | Partner and Director, joined Lord Abbett in 1997. |
| | | | | | | |
Steven F. Rocco
(1979) | | Executive Vice President | | Elected in 2014 | | Partner and Portfolio Manager, joined Lord Abbett in 2004. |
| | | | | | | |
Frederick J. Ruvkun
(1957) | | Executive Vice President | | Elected in 2012 | | Partner and Portfolio Manager, joined Lord Abbett in 2006. |
26
Basic Information About Management (continued)
Name and
Year of Birth | | Current Position
with the Fund | | Length of Service
of Current
Position | | Principal Occupation
During the Past Five Years |
| | | | | | | |
Paul J. Volovich
(1973) | | Executive Vice President | | Elected in 2005 | | Partner and Portfolio Manager, joined Lord Abbett in 1997. |
| | | | | | | |
A. Edward Allinson
(1961) | | Vice President | | Elected in 2011 | | Portfolio Manager, joined Lord Abbett in 2005. |
| | | | | | | |
John W. Ashbrook
(1964) | | Vice President and Assistant Secretary | | Elected in 2014 | | Assistant General Counsel, joined Lord Abbett in 2008. |
| | | | | | | |
Joan A. Binstock
(1954) | | Chief Financial Officer and Vice President | | Elected in 1999 | | Partner and Chief Financial and Operations Officer, joined Lord Abbett in 1999. |
| | | | | | | |
Brooke A. Fapohunda
(1975) | | Vice President and Assistant Secretary | | Elected in 2014 | | Deputy General Counsel, joined Lord Abbett in 2006. |
| | | | | | | |
John K. Forst
(1960) | | Vice President and Assistant Secretary | | Elected in 2005 | | Partner and Deputy General Counsel, joined Lord Abbett in 2004. |
| | | | | | | |
Anthony W. Hipple
(1964) | | Vice President | | Elected in 2014 | | Portfolio Manager, joined Lord Abbett in 2002. |
| | | | | | | |
Lawrence H. Kaplan
(1957) | | Vice President and Secretary | | Elected in 1997 | | Partner and General Counsel, joined Lord Abbett in 1997. |
| | | | | | | |
Jerald M. Lanzotti
(1967) | | Vice President | | Elected in 2012 | | Partner and Portfolio Manager, joined Lord Abbett in 1996. |
| | | | | | | |
David J. Linsen
(1974) | | Vice President | | Elected in 2008 | | Partner and Director, joined Lord Abbett in 2001. |
| | | | | | | |
Joseph M. McGill
(1962) | | Chief Compliance Officer | | Elected in 2014 | | Chief Compliance Officer, joined Lord Abbett in 2014 and was formerly Managing Director and the Chief Compliance Officer at UBS Global Asset Management (2003–2013). |
| | | | | | | |
A. Edward Oberhaus, III
(1959) | | Vice President | | Elected in 1998 | | Partner and Director, joined Lord Abbett in 1983. |
| | | | | | | |
Noah Petrucci
(1970) | | Vice President | | Elected in 2013 | | Portfolio Manager, joined Lord Abbett in 2012 and was formerly a Portfolio Manager at Columbia Management Investment Advisers, LLC and Columbia Management Advisors, LLC (2002–2012). |
| | | | | | | |
Lawrence B. Stoller
(1963) | | Vice President and Assistant Secretary | | Elected in 2007 | | Partner and Senior Deputy General Counsel, joined Lord Abbett in 2007. |
27
Basic Information About Management (concluded)
Name and
Year of Birth | | Current Position
with the Fund | | Length of Service
of Current
Position | | Principal Occupation
During the Past Five Years |
| | | | | | | |
Arthur K. Weise
(1970) | | Vice President | | Elected in 2010 | | Partner and Portfolio Manager, joined Lord Abbett in 2007. |
| | | | | | | |
Kewjin Yuoh
(1971) | | Vice President | | Elected in 2012 | | Partner and Portfolio Manager, joined Lord Abbett in 2010. |
| | | | | | | |
Scott S. Wallner
(1955) | | AML Compliance Officer | | Elected in 2011 | | Assistant General Counsel, joined Lord Abbett in 2004. |
| | | | | | | |
Bernard J. Grzelak
(1971) | | Treasurer | | Elected in 2003 | | Partner and Director of Fund Administration, joined Lord Abbett in 2003. |
Please call 888-522-2388 for a copy of the statement of additional information, which contains further information about the Company’s Directors. It is available free upon request.
28
Approval of Advisory Contract
The Board of Directors of the Fund, including all of the Directors who are not interested persons of the Fund or of Lord Abbett (the “Independent Board Members”), annually considers whether to approve the continuation of the existing management agreement between the Fund and Lord Abbett. In connection with its most recent approval, the Board reviewed materials relating specifically to the management agreement, as well as numerous materials received throughout the course of the year, including information about the Fund’s investment performance compared to the performance of its benchmark. Before making its decision as to the Fund, the Board had the opportunity to ask questions and request further information, taking into account its familiarity with Lord Abbett gained through its meetings and discussions. These meetings and discussions included the examination of the portfolio management team conducted by members of the Contract Committee, the deliberations of the Contract Committee, and discussions between the Contract Committee and Lord Abbett’s management. The Independent Board Members also discussed the materials described above with their independent legal counsel in a private session at which no representatives of management were present.
The materials received by the Board included, but were not limited to: (1) information provided by Morningstar Associates, LLC (“Morningstar”) regarding the investment performance of the Fund compared to the investment performance of a group of funds in the same Morningstar investment category (the “performance peer group”) and the investment performance of one or more appropriate benchmarks; (2) information provided by Morningstar regarding the expense ratios, contractual and effective management fee rates, and other expense components for the Fund and one or more groups of funds in the same Morningstar category, with the same share classes and operational characteristics, including asset size (the “expense peer group”); (3) information provided by Lord Abbett on the projected expense ratios, management fee rates, and other expense components for the Fund; (4) sales and redemption information for the Fund; (5) information regarding Lord Abbett’s financial condition; (6) an analysis of the relative profitability of the management agreement to Lord Abbett; (7) information provided by Lord Abbett regarding the investment management fees Lord Abbett receives from its other advisory clients maintaining accounts with a similar investment strategy as the Fund; (8) information regarding the distribution arrangements of the Fund; and (9) information regarding the personnel and other resources devoted by Lord Abbett to managing the Fund.
Investment Management Services Generally. The Board considered the investment management services provided by Lord Abbett to the Fund, including investment research, portfolio management, and trading, and Lord Abbett’s commitment to compliance with all applicable legal requirements. The Board also observed that Lord Abbett was solely engaged in the investment management business and accordingly did not experience the conflicts of interest that may result from being engaged in other lines of business. The Board considered the investment advisory services provided by Lord Abbett to other clients, the fees charged for the services, and the differences in the nature of the services provided to the Fund and other Lord Abbett Funds, on the one hand, and the services provided to other clients, on the other.
Investment Performance. The Board reviewed the Fund’s investment performance in relation to that of the performance peer group as of various periods ended August 31, 2015. The Board observed that the Fund’s investment performance was below the median of the performance peer group for the one-year period and above the median of the performance peer group for the three-year and five-year periods.
29
Approval of Advisory Contract (continued)
Lord Abbett’s Personnel and Methods. The Board considered the qualifications of the personnel providing investment management services to the Fund, in light of its investment objective and discipline. Among other things, the Board considered the size, experience, and turnover of Lord Abbett’s investment management staff, Lord Abbett’s investment methodology and philosophy, and Lord Abbett’s approach to recruiting, training, and retaining investment management personnel.
Nature and Quality of Other Services. The Board considered the nature, quality, costs, and extent of compliance, administrative, and other services performed by Lord Abbett and Lord Abbett Distributor LLC (the “Distributor”) and the nature and extent of Lord Abbett’s supervision of third party service providers, including the Fund’s transfer agent and custodian.
Expenses. The Board considered the expense level of the Fund and the expense levels of the expense peer group. It also considered the projected expense levels and how those levels would relate to those of the expense peer group and the amount and nature of the fees paid by shareholders. The Board observed that the overall expense level of the Fund was well below the median of the expense peer group.
Profitability. The Board considered the level of Lord Abbett’s profits in managing the Fund, including a review of Lord Abbett’s methodology for allocating its costs to its management of the Fund. The Board concluded that the allocation methodology had a reasonable basis and was appropriate. It considered any profits realized by Lord Abbett in connection with the operation of the Fund, including the fee that Lord Abbett receives from the Fund for providing administrative services to the Fund, and whether the amount of profit was fair for the management of the Fund. The Board also considered the profits realized from other business segments of Lord Abbett, which may benefit from or be related to the Fund’s business. The Board considered Lord Abbett’s profit margins in comparison with available industry data, both accounting for and ignoring marketing and distribution expenses, and how those profit margins could affect Lord Abbett’s ability to recruit and retain investment personnel. The Board recognized that Lord Abbett’s profitability was a factor in enabling it to attract and retain qualified investment management personnel to provide services to the Fund. The Board concluded that Lord Abbett’s profitability as to the Fund was not excessive.
Economies of Scale. The Board considered whether there had been any economies of scale in managing the Fund, whether the Fund had appropriately benefited from any such economies of scale, and whether there was potential for realization of any further economies of scale. The Board concluded that the existing management fee schedule, with its breakpoint or breakpoints in the level of the management fee, adequately addressed any economies of scale in managing the Fund.
Other Benefits to Lord Abbett. The Board considered the character and amount of fees paid by the Fund and the Fund’s shareholders to Lord Abbett and the Distributor for services other than investment advisory services. The Board also considered the revenues and profitability of Lord Abbett’s investment advisory business apart from its mutual fund business, and the intangible benefits enjoyed by Lord Abbett by virtue of its relationship with the Fund. The Board observed that the Distributor receives 12b-1 fees from certain of the Lord Abbett Funds as to shares held in accounts for which there is no other broker of record, may retain a portion of the 12b-1 fees it receives, and receives a portion of the sales charges on sales and redemptions of some classes of shares. In addition, the Board observed that Lord Abbett accrues certain benefits for its business of providing investment advice to clients other than the Lord Abbett Funds, but that business also benefits the Funds. The Board also noted that Lord Abbett, as disclosed in the prospectus of the
30
Approval of Advisory Contract (concluded)
Fund, has entered into revenue sharing arrangements with certain entities that distribute shares of the Fund. The Board also took into consideration the investment research that Lord Abbett receives as a result of Fund brokerage transactions.
Alternative Arrangements. The Board considered whether, instead of approving continuation of the management agreement, it might be in the best interests of the Fund to implement one or more alternative arrangements, such as continuing to employ Lord Abbett, but on different terms. After considering all of the relevant factors, the Board unanimously found that continuation of the existing management agreement was in the best interests of the Fund and its shareholders and voted unanimously to approve the continuation of the management agreement. In considering whether to approve the continuation of the management agreement, the Board did not identify any single factor as paramount or controlling. This summary does not discuss in detail all matters considered.
31
Householding
The Company has adopted a policy that allows it to send only one copy of the Fund’s prospectus, proxy material, annual report and semiannual report to certain shareholders residing at the same “household.” This reduces Fund expenses, which benefits you and other shareholders. If you need additional copies or do not want your mailings to be “householded,” please call Lord Abbett at 888-522-2388 or send a written request with your name, the name of your fund or funds and your account number or numbers to Lord Abbett Family of Funds, P.O. Box 219336, Kansas City, MO 64121.
Proxy Voting Policies, Procedures and Records
A description of the policies and procedures that Lord Abbett uses to vote proxies related to the Fund’s portfolio securities, and information on how Lord Abbett voted the Fund’s proxies during the 12-month period ended June 30 are available without charge, upon request, (i) by calling 888-522-2388; (ii) on Lord Abbett’s Website at www.lordabbett.com; and (iii) on the Securities and Exchange Commission’s (“SEC”) Website at www.sec.gov.
Shareholder Reports and Quarterly Portfolio Disclosure
The Fund is required to file its complete schedule of portfolio holdings with the SEC for its first and third fiscal quarters on Form N-Q. Copies of the filings are available without charge, upon request on the SEC’s Website at www.sec.gov and may be available by calling Lord Abbett at 888-522-2388. You can also obtain copies of Form N-Q by visiting the SEC’s Public Reference Room in Washington, DC (information on the operation of the Public Reference Room may be obtained by calling 800-SEC-0330).
Tax Information
For corporate shareholders, 46% of the Fund’s ordinary income distributions qualified for the dividends received deduction.
In addition, of the distributions paid to shareholders during the fiscal year ended December 31, 2015, $187,754 and $47,612, respectively, represent short-term and long-term capital gains.
32


| This report, when not used for the general information of shareholders of the Fund, is to be distributed only if preceded or accompanied by a current fund prospectus. | | |
| | Lord Abbett Series Fund, Inc. | |
| | |
Lord Abbett mutual fund shares are distributed by
LORD ABBETT DISTRIBUTOR LLC. | Developing Growth Portfolio | SFDG-PORT-3
(02/16) |

2015 LORD ABBETT
ANNUAL REPORT
Lord Abbett
Series Fund—Fundamental Equity Portfolio
For the fiscal year ended December 31, 2015
Table of Contents
Lord Abbett Series Fund – Fundamental Equity Portfolio
Annual Report
For the fiscal year ended December 31, 2015

Daria L. Foster, Director, President and Chief Executive Officer of the Lord Abbett Funds, and E. Thayer Bigelow, Independent Chairman of the Lord Abbett Funds.
Dear Shareholders: We are pleased to provide you with this overview of the performance of Lord Abbett Series Fund – Fundamental Equity Portfolio for the fiscal year ended December 31, 2015. On this page and the following pages, we discuss the major factors that influenced fiscal year performance. For additional information about the Fund, please visit our website at www.lordabbett.com, where you also can access the quarterly commentaries that provide updates on the Fund’s performance and other portfolio related updates.
Thank you for investing in Lord Abbett mutual funds. We value the trust that you place in us and look forward to serving your investment needs in the years to come.
Best regards,

Daria L. Foster
Director, President and Chief Executive Officer
For the fiscal year ended December 31, 2015, the Fund returned -3.44%, reflecting performance at the net asset value (NAV) of Class VC shares, with all distributions reinvested, compared to its benchmark, the Russell 1000® Value Index1, which returned -3.83% over the same period.
Domestic equity markets advanced over the past year, with the S&P 500® Index2 rising 1.38% during the trailing 12-month period. Despite this general move upward, there were a few periods of short-term volatility, most notably in January 2015,
when the S&P 500 declined 3.0% in total return terms, and in August 2015, when the index dropped 6.0%, its greatest monthly loss in three years. One of the prevailing market themes during the trailing 12-month period was the continued weakness in energy prices. Finally, U.S. real gross domestic product (GDP), which was initially reported to have contracted by 0.2% in the first quarter of 2015, was later revised upwards to a modest 0.6% expansion. In the second quarter of 2015, real GDP advanced 3.9%, while the third estimate
1
from the Bureau of Economic Analysis indicated that real GDP increased 2.0% in the third quarter of 2015.
The Fund outperformed its benchmark during the period. Stock selection within the information technology and consumer staples sectors contributed to relative performance during the period. Shares of Vantiv, Inc., a technology holding company, steadily increased due to impressive revenue/transaction growth, despite difficult comparisons. Performance from the ISV and eCommerce segments drove performance. Shares of Activision, Inc., a video game developer and publisher, climbed, likely due to increased user growth, revenue monetization, and a strong product offering, all of which aided margin expansion. Within the consumer staples sector, shares of Mondelez International, Inc., a snack food and beverage company, increased in value as shareholders seem to recognize the company’s efforts to reduce overhead, expand margin, and grow its near and long-term revenue opportunities in emerging markets. Shares of PepsiCo, a global food and beverage company, increased despite a challenging global macro environment. Stock performance was likely driven by strong operating profit and company guidance for growth.
Stock selection detracted from performance within the consumer discretionary and energy sectors. Shares of Time Warner Inc., a media and entertainment company, fell as the market reacted poorly to media stocks surrounding concerns about the decline in pay-TV subscribers. Despite the sell-off, growth opportunities remain in the HBO, Turner, and Warner Bros. segments. Shares of PVH Corp., an apparel company, detracted from performance, as sell-side analysts highlighted weakness in the U.S. retail market, particularly in apparel and accessories. Within the energy sector, shares of Marathon Oil Corp., an oil and natural gas exploration and production company, declined this year, as the market appeared to believe that the company’s cash flow outlook and return on equity likely would be negatively affected by the price of oil remaining low. In addition, shares of Devon Energy Corp., a natural gas and oil producer, also fell due to weak commodity prices, which resulted in declining earnings.
The Fund’s portfolio is actively managed and, therefore, its holdings and the weightings of a particular issuer or particular sector as a percentage of portfolio assets are subject to change. Sectors may include many industries.
2
1 The Russell 1000® Value Index measures the performance of those Russell 1000 companies with lower price-to-book ratios and lower forecasted growth values.
2 The S&P 500® Index is widely regarded as the standard for measuring large cap U.S. stock market performance and includes a representative sample of leading companies in leading industries.
Unless otherwise specified, indexes reflect total return, with all dividends reinvested. Indexes are unmanaged, do not reflect the deduction of fees or expenses, and are not available for direct investment.
Important Performance and Other Information
Performance data quoted in the following pages reflect past performance and are no guarantee of future results. Current performance may be higher or lower than the performance quoted. The investment return and principal value of an investment in the Funds will fluctuate so that shares, on any given day or when redeemed, may be worth more or less than their original cost. You can obtain performance data current to the most recent month end by calling Lord Abbett at 888-522-2388 or referring to www.lordabbett.com.
During certain periods shown, expense waivers and reimbursements were in place. Without such waivers and expense reimbursements, the Fund’s returns would have been lower.
The annual commentary above discusses the views of the Fund’s management and various portfolio holdings of the Fund as of December 31, 2015. These views and portfolio holdings may have changed after this date. Information provided in the commentary is not a recommendation to buy or sell securities. Because the Fund’s portfolio is actively managed and may change significantly, the Fund may no longer own the securities described above or may have otherwise changed their positions in the securities. For more recent information about the Fund’s portfolio holdings, please visit www.lordabbett.com.
A Note about Risk: See Notes to Financial Statements for a discussion of investment risks. For a more detailed discussion of the risks associated with the Fund, please see the Fund’s prospectus.
Mutual funds are not insured by the FDIC, are not deposits or other obligations of, or guaranteed by, banks, and are subject to investment risks including possible loss of principal amount invested.
The Fund serves as an underlying investment vehicle for variable annuity contracts and variable life insurance policies.
3
Investment Comparison
Below is a comparison of a $10,000 investment in Class VC shares with the same investment in the Russell 1000® Value Index, Russell 3000® Value Index, Russell 3000® Index, and S&P 500® Index, assuming reinvestment of all dividends and distributions. The Fund’s shares are sold only to insurance company separate accounts that fund certain variable annuity and variable life contracts. This line graph comparison does not reflect the sales charges or other expenses of these contracts. If those sales charges and expenses were reflected, returns would be lower. The graph and performance table below do not reflect the deduction of taxes that a shareholder would pay on Fund distributions or the redemption of Fund shares. During certain periods, expenses of the Fund have been waived or reimbursed by Lord Abbett; without such waiver or reimbursement of expenses, the Fund’s returns would have been lower. Past performance is no guarantee of future results.

Average Annual Total Returns for the
Periods Ended December 31, 2015
| | | 1 Year | | 5 Years | | 10 Years | |
| Class VC | | | –3.44 | % | | | 8.21 | % | | | 6.86 | % | |
1 Performance for each unmanaged index does not reflect any fees or expenses. The performance of each index is not necessarily representative of the Fund’s performance.
4
Expense Example
As a shareholder of the Fund, you incur ongoing costs, including management fees; expenses related to the Fund’s services arrangements with certain insurance companies; and other Fund expenses. This Example is intended to help you understand your ongoing costs (in dollars) of investing in the Fund and to compare these costs with the ongoing costs of investing in other mutual funds.
The Example is based on an investment of $1,000 invested at the beginning of the period and held for the entire period (July 1, 2015 through December 31, 2015).
The Example reflects only expenses that are deducted from the assets of the Fund. Fees and expenses, including sales charges applicable to the various insurance products that invest in the Fund, are not reflected in this Example. If such fees and expenses were reflected in the Example, the total expenses shown would be higher. Fees and expenses regarding such variable insurance products are separately described in the prospectus related to those products.
Actual Expenses
The first line of the table on the following page provides information about actual account values and actual expenses. You may use the information in this line, together with the amount you invested, to estimate the expenses that you paid over the period. Simply divide your account value by $1,000 (for example, an $8,600 account value divided by $1,000 = 8.6), then multiply the result by the number in the first line under the heading titled “Expenses Paid During Period 7/1/15 – 12/31/15” to estimate the expenses you paid on your account during this period.
Hypothetical Example for Comparison Purposes
The second line of the table on the following page provides information about hypothetical account values and hypothetical expenses based on the Fund’s actual expense ratio and an assumed rate of return of 5% per year before expenses, which is not the Fund’s actual return. The hypothetical account values and expenses may not be used to estimate the actual ending account balance or expenses you paid for the period. You may use this information to compare the ongoing costs of investing in the Fund and other funds. To do so, compare this 5% hypothetical example with the 5% hypothetical examples that appear in the shareholder reports of the other funds.
5
Please note that the expenses shown in the table are meant to highlight your ongoing costs only and do not reflect any transactional costs, such as sales charges. Therefore, the second line of the table is useful in comparing ongoing costs only, and will not help you determine the relative total costs of owning different funds. In addition, if these transactional costs were included, your costs would have been higher.
| | | Beginning | | Ending | | Expenses | |
| | | Account | | Account | | Paid During | |
| | | Value | | Value | | Period† | |
| | | | | | | 7/1/15 - | |
| | | 7/1/15 | | 12/31/15 | | 12/31/15 | |
| Class VC | | | | | | | |
| Actual | | $ | 1,000.00 | | | $ | 959.90 | | | | $5.68 | | |
| Hypothetical (5% Return Before Expenses) | | $ | 1,000.00 | | | $ | 1,019.41 | | | | $5.85 | | |
| † | Net expenses are equal to the Fund’s annualized expense ratio of 1.15%, multiplied by the average account value over the period, multiplied by 184/365 (to reflect one-half year period). |
Portfolio Holdings Presented by Sector
December 31, 2015
| Sector* | %** |
| Consumer Discretionary | 7.56 | % |
| Consumer Staples | 8.27 | % |
| Energy | 9.61 | % |
| Financials | 26.18 | % |
| Health Care | 11.00 | % |
| Industrials | 13.07 | % |
| Information Technology | 13.18 | % |
| Materials | 2.35 | % |
| Telecommunication Services | 2.03 | % |
| Utilities | 4.68 | % |
| Repurchase Agreement | 2.07 | % |
| Total | 100.00 | % |
| * | | A sector may comprise several industries. |
| ** | | Represents percent of total investments. |
6
Schedule of Investments
December 31, 2015
| Investments | | | Shares | | | | Fair
Value
(000) | |
| COMMON STOCKS 97.98% | | | | | | | | |
| | | | | | | | | |
| Aerospace & Defense 3.58% | | | | | | | | |
| General Dynamics Corp. | | | 40,900 | | | $ | 5,618 | |
| TransDigm Group, Inc.* | | | 16,300 | | | | 3,724 | |
| Total | | | | | | | 9,342 | |
| | | | | | | | | |
| Banks 13.21% | | | | | | | | |
| Citizens Financial Group, Inc. | | | 272,033 | | | | 7,124 | |
| East West Bancorp, Inc. | | | 145,851 | | | | 6,062 | |
| First Republic Bank | | | 64,054 | | | | 4,231 | |
| JPMorgan Chase & Co. | | | 189,721 | | | | 12,527 | |
| Signature Bank* | | | 29,528 | | | | 4,529 | |
| Total | | | | | | | 34,473 | |
| | | | | | | | | |
| Beverages 2.99% | | | | | | | | |
| PepsiCo, Inc. | | | 78,000 | | | | 7,794 | |
| | | | | | | | | |
| Building Products 1.03% | | | | | | | | |
| USG Corp.* | | | 111,000 | | | | 2,696 | |
| | | | | | | | | |
| Capital Markets 3.59% | | | | | | | | |
| Affiliated Managers Group, Inc.* | | | 29,200 | | | | 4,665 | |
| Greenhill & Co., Inc. | | | 51,036 | | | | 1,460 | |
| TD Ameritrade Holding Corp. | | | 93,193 | | | | 3,235 | |
| Total | | | | | | | 9,360 | |
| | | | | | | | | |
| Chemicals 2.35% | | | | | | | | |
| Dow Chemical Co. (The) | | | 15,650 | | | | 806 | |
| E.I. du Pont de Nemours & Co. | | | 80,155 | | | | 5,338 | |
| Total | | | | | | | 6,144 | |
| | | | | | | | | |
| Commercial Services & Supplies 1.55% | | | | | | | | |
| ADT Corp. (The) | | | 122,900 | | | | 4,053 | |
| | | | | | | | | |
| Communications Equipment 2.56% | | | | | | | | |
| Cisco Systems, Inc. | | | 246,100 | | | | 6,683 | |
| | | | | | | | | |
| Consumer Finance 0.72% | | | | | | | | |
| Capital One Financial Corp. | | | 26,147 | | | | 1,887 | |
| Investments | | | Shares | | | | Fair
Value
(000) | |
| Diversified Telecommunication Services 2.03% | | | | | | | | |
| AT&T, Inc. | | | 153,969 | | | $ | 5,298 | |
| | | | | | | | | |
| Electric: Utilities 3.78% | | | | | | | | |
| Duke Energy Corp. | | | 21,095 | | | | 1,506 | |
| NextEra Energy, Inc. | | | 80,402 | | | | 8,353 | |
| Total | | | | | | | 9,859 | |
| | | | | | | | | |
| Energy Equipment & Services 1.70% | | | | | | | | |
| Halliburton Co. | | | 92,308 | | | | 3,142 | |
| Schlumberger Ltd. | | | 18,600 | | | | 1,298 | |
| Total | | | | | | | 4,440 | |
| | | | | | | | | |
| Food & Staples Retailing 1.30% | | | | | | | | |
| Kroger Co. (The) | | | 81,042 | | | | 3,390 | |
| | | | | | | | | |
| Food Products 2.48% | | | | | | | | |
| Mondelez International, Inc. Class A | | | 144,213 | | | | 6,467 | |
| | | | | | | | | |
| Health Care Equipment & Supplies 1.28% | | | | | | | | |
| St. Jude Medical, Inc. | | | 54,100 | | | | 3,342 | |
| | | | | | | | | |
| Health Care Providers & Services 1.73% | | | | | | | | |
| UnitedHealth Group, Inc. | | | 38,307 | | | | 4,506 | |
| | | | | | | | | |
| Hotels, Restaurants & Leisure 3.85% | | | | | | | | |
| Carnival Corp. | | | 37,033 | | | | 2,018 | |
| McDonald’s Corp. | | | 49,900 | | | | 5,895 | |
| Yum! Brands, Inc. | | | 29,411 | | | | 2,148 | |
| Total | | | | | | | 10,061 | |
| | | | | | | | | |
| Household Products 1.52% | | | | | | | | |
| Colgate-Palmolive Co. | | | 59,400 | | | | 3,957 | |
| | | | | | | | | |
| Industrial Conglomerates 5.25% | | | | | | | | |
| General Electric Co. | | | 440,200 | | | | 13,712 | |
| | | | | | | | | |
| Information Technology Services 0.68% | | | | | | | | |
| Vantiv, Inc. Class A* | | | 37,181 | | | | 1,763 | |
| | See Notes to Financial Statements. | 7 |
Schedule of Investments (continued)
December 31, 2015
| Investments | | | Shares | | | | Fair
Value
(000) | |
| Insurance 5.91% | | | | | | | | |
| ACE Ltd. (Switzerland)(a) | | | 44,900 | | | $ | 5,247 | |
| American International Group, Inc. | | | 98,698 | | | | 6,116 | |
| Hartford Financial Services Group, Inc. (The) | | | 93,612 | | | | 4,068 | |
| Total | | | | | | | 15,431 | |
| | | | | | | | | |
| Internet Software & Services 1.01% | | | | | | | | |
| Alphabet, Inc. Class A* | | | 3,400 | | | | 2,645 | |
| | | | | | | | | |
| Machinery 1.65% | | | | | | | | |
| ITT Corp. | | | 118,954 | | | | 4,320 | |
| | | | | | | | | |
| Media 2.06% | | | | | | | | |
| Time Warner, Inc. | | | 83,159 | | | | 5,378 | |
| | | | | | | | | |
| Multi-Line Retail 1.65% | | | | | | | | |
| Target Corp. | | | 59,200 | | | | 4,299 | |
| | | | | | | | | |
| Multi-Utilities 0.90% | | | | | | | | |
| Sempra Energy | | | 25,046 | | | | 2,355 | |
| | | | | | | | | |
| Oil, Gas & Consumable Fuels 7.91% | | | | | | | | |
| Devon Energy Corp. | | | 53,300 | | | | 1,705 | |
| EOG Resources, Inc. | | | 58,597 | | | | 4,148 | |
| Exxon Mobil Corp. | | | 154,327 | | | | 12,030 | |
| Marathon Oil Corp. | | | 115,700 | | | | 1,457 | |
| Occidental Petroleum Corp. | | | 19,400 | | | | 1,312 | |
| Total | | | | | | | 20,652 | |
| | | | | | | | | |
| Pharmaceuticals 8.00% | | | | | | | | |
| Merck & Co., Inc. | | | 166,400 | | | | 8,789 | |
| Pfizer, Inc. | | | 374,300 | | | | 12,083 | |
| Total | | | | | | | 20,872 | |
| | | | | | | | | |
| Real Estate Investment Trusts 2.77% | | | | | | | | |
| Simon Property Group, Inc. | | | 13,900 | | | | 2,703 | |
| Vornado Realty Trust | | | 45,200 | | | | 4,518 | |
| Total | | | | | | | 7,221 | |
| Investments | | | Shares | | | | Fair
Value
(000) | |
| Semiconductors & Semiconductor Equipment 5.08% | | | | |
| Intel Corp. | | | 272,822 | | | $ | 9,399 | |
| Microchip Technology, Inc. | | | 83,200 | | | | 3,872 | |
| Total | | | | | | | 13,271 | |
| | | | | | | | | |
| Software 3.37% | | | | | | | | |
| Microsoft Corp. | | | 158,664 | | | | 8,803 | |
| | | | | | | | | |
| Technology Hardware, Storage & Peripherals 0.49% | | |
| Apple, Inc. | | | 12,058 | | | | 1,269 | |
Total Common Stocks
(cost $257,849,567) | | | | | | | 255,743 | |
| | | | | | | | | |
| | | | Principal
Amount
(000) | | | | | |
| SHORT-TERM INVESTMENT 2.07% | | | | | | | | |
| | | | | | | | | |
| Repurchase Agreement | | | | | | | | |
| Repurchase Agreement dated 12/31/2015, 0.03% due 1/4/2016 with Fixed Income Clearing Corp. collateralized by $5,505,000 of U.S. Treasury Note at 1.625% due 7/31/2020; value: $5,511,881; proceeds: $5,401,329 (cost $5,401,311) | | | $5,401 | | | | 5,401 | |
Total Investments in Securities 100.05%
(cost $263,250,878) | | | | | | | 261,144 | |
| Liabilities in Excess of Other Assets (0.05)% | | | | | | | (138 | ) |
| Net Assets 100.00% | | | | | | $ | 261,006 | |
| * | Non-income producing security. |
| (a) | Foreign security traded in U.S. dollars. |
| 8 | See Notes to Financial Statements. | |
Schedule of Investments (concluded)
December 31, 2015
The following is a summary of the inputs used as of December 31, 2015 in valuing the Fund’s investments carried at fair value(1):
| Investment Type(2)(3) | | | Level 1
(000) | | | Level 2
(000) | | | | Level 3
(000) | | | | Total
(000) | |
| Common Stocks | | | $255,743 | | | $ | – | | | | $ – | | | | $255,743 | |
| Repurchase Agreement | | | – | | | | 5,401 | | | | – | | | | 5,401 | |
| Total | | | $255,743 | | | $ | 5,401 | | | | $ – | | | | $261,144 | |
| | | | | | | | | | | | | | | | | |
| (1) | Refer to Note 2(h) for a description of fair value measurements and the three-tier hierarchy of inputs. |
| (2) | See Schedule of Investments for fair values in each industry and identification of foreign issuers and/or geography. |
| (3) | There were no Level 1/Level 2 transfers during the fiscal year ended December 31, 2015. |
| | |
| | See Notes to Financial Statements. | 9 |
Statement of Assets and Liabilities
December 31, 2015
| ASSETS: | | | | |
| Investments in securities, at fair value (cost $263,250,878) | | $ | 261,143,720 | |
| Receivables: | | | | |
| Interest and dividends | | | 403,433 | |
| Capital shares sold | | | 35,325 | |
| From advisor (See Note 3) | | | 14,059 | |
| Prepaid expenses | | | 2,258 | |
| Total assets | | | 261,598,795 | |
| LIABILITIES: | | | | |
| Payables: | | | | |
| Management fee | | | 170,300 | |
| Capital shares reacquired | | | 106,151 | |
| Directors’ fees | | | 44,359 | |
| Fund administration | | | 9,083 | |
| Accrued expenses | | | 262,530 | |
| Total liabilities | | | 592,423 | |
| NET ASSETS | | $ | 261,006,372 | |
| COMPOSITION OF NET ASSETS: | | | | |
| Paid-in capital | | $ | 265,261,487 | |
| Distributions in excess of net investment income | | | (44,359 | ) |
| Accumulated net realized loss on investments | | | (2,103,598 | ) |
| Net unrealized depreciation on investments | | | (2,107,158 | ) |
| Net Assets | | $ | 261,006,372 | |
| Outstanding shares (50 million shares of common stock authorized, $.001 par value) | | | 16,035,666 | |
| Net asset value, offering and redemption price per share (Net assets divided by outstanding shares) | | | $16.28 | |
| | | | | |
| 10 | See Notes to Financial Statements. | |
Statement of Operations
For the Year Ended December 31, 2015
| Investment income: | | | | |
| Dividends | | $ | 7,233,966 | |
| Interest and other | | | 66 | |
| Total investment income | | | 7,234,032 | |
| Expenses: | | | | |
| Management fee | | | 2,652,057 | |
| Non 12b-1 service fees | | | 881,951 | |
| Shareholder servicing | | | 392,548 | |
| Fund administration | | | 141,443 | |
| Reports to shareholders | | | 60,008 | |
| Professional | | | 46,450 | |
| Custody | | | 16,209 | |
| Directors’ fees | | | 13,133 | |
| Other | | | 59,108 | |
| Gross expenses | | | 4,262,907 | |
| Expense reductions (See Note 8) | | | (358 | ) |
| Fees waived and expenses reimbursed (See Note 3) | | | (196,062 | ) |
| Net expenses | | | 4,066,487 | |
| Net investment income | | | 3,167,545 | |
| Net realized and unrealized gain (loss): | | | | |
| Net realized gain on investments | | | 15,821,072 | |
| Net change in unrealized appreciation/depreciation on investments | | | (35,286,125 | ) |
| Net realized and unrealized loss | | | (19,465,053 | ) |
| Net Decrease in Net Assets Resulting From Operations | | $ | (16,297,508 | ) |
| | | | | |
| | See Notes to Financial Statements. | 11 |
Statements of Changes in Net Assets
| DECREASE IN NET ASSETS | For the Year Ended
December 31, 2015 | | For the Year Ended
December 31, 2014 | |
| Operations: | | | | | | | | |
| Net investment income | | $ | 3,167,545 | | | $ | 1,940,865 | |
| Net realized gain on investments | | | 15,821,072 | | | | 75,715,467 | |
| Net change in unrealized appreciation/depreciation on investments | | | (35,286,125 | ) | | | (49,950,574 | ) |
| Net increase (decrease) in net assets resulting from operations | | | (16,297,508 | ) | | | 27,705,758 | |
| Distributions to shareholders from: | | | | | | | | |
| Net investment income | | | (3,161,652 | ) | | | (1,966,094 | ) |
| Net realized gain | | | (24,501,799 | ) | | | (77,502,636 | ) |
| Total distributions to shareholders | | | (27,663,451 | ) | | | (79,468,730 | ) |
| Capital share transactions (See Note 12): | | | | | | | | |
| Proceeds from sales of shares | | | 193,716,593 | | | | 89,811,239 | |
| Reinvestment of distributions | | | 27,663,450 | | | | 79,468,730 | |
| Cost of shares reacquired | | | (359,272,647 | ) | | | (139,865,361 | ) |
| Net increase (decrease) in net assets resulting from capital share transactions | | | (137,892,604 | ) | | | 29,414,608 | |
| Net decrease in net assets | | | (181,853,563 | ) | | | (22,348,364 | ) |
| NET ASSETS: | | | | | | | | |
| Beginning of year | | $ | 442,859,935 | | | $ | 465,208,299 | |
| End of year | | $ | 261,006,372 | | | $ | 442,859,935 | |
| Distributions in excess of net investment income | | $ | (44,359 | ) | | $ | (38,941 | ) |
| | | | | | | | | |
| 12 | See Notes to Financial Statements. | |
This page is intentionally left blank.
Financial Highlights
| | | | | | | | Per Share Operating Performance: |
| | | | | | | | Investment operations: | | Distributions to
shareholders from: |
| | | Net asset
value,
beginning
of year | | Net
invest-
ment
income(a) | | Net
realized
and
unrealized
gain (loss) | | Total
from
invest-
ment
opera-
tions | | Net
investment
income | | Net
realized
gain | | Total
distri-
butions |
| 12/31/2015 | | | $18.61 | | | | $0.16 | | | | $(0.79 | ) | | | $(0.63 | ) | | | $(0.21 | ) | | | $(1.49 | ) | | | $(1.70 | ) |
| 12/31/2014 | | | 21.03 | | | | 0.09 | | | | 1.43 | | | | 1.52 | | | | (0.10 | ) | | | (3.84 | ) | | | (3.94 | ) |
| 12/31/2013 | | | 17.61 | | | | 0.05 | | | | 6.18 | | | | 6.23 | | | | (0.05 | ) | | | (2.76 | ) | | | (2.81 | ) |
| 12/31/2012 | | | 16.26 | | | | 0.10 | | | | 1.63 | | | | 1.73 | | | | (0.10 | ) | | | (0.28 | ) | | | (0.38 | ) |
| 12/31/2011 | | | 17.66 | | | | 0.04 | | | | (0.84 | ) | | | (0.80 | ) | | | (0.03 | ) | | | (0.57 | ) | | | (0.60 | ) |
| (a) | Calculated using average shares outstanding during the year. |
| (b) | Total return does not consider the effects of sales charges or other expenses imposed by an insurance company and assumes the reinvestment of all distributions. |
| 14 | See Notes to Financial Statements. | |
| | | | | | | Ratios to Average Net Assets: | | | Supplemental Data: |
| | | | | | | | | | |
Net
asset
value,
end of
year | | Total
return(b)
(%) | | Total
Expenses
after
waivers
and/or reim-
bursements
(%) | | Total
expenses
(%) | | Net
investment
income
(%) | | Net
assets,
end of
Year
(000) | | Portfolio
turnover
rate
(%) |
| $ | 16.28 | | | | (3.44 | ) | | | 1.15 | | | | 1.21 | | | | 0.90 | | | $ | 261,006 | | | | 135.25 | |
| | 18.61 | | | | 7.14 | | | | 1.15 | | | | 1.19 | | | | 0.43 | | | | 442,860 | | | | 131.55 | |
| | 21.03 | | | | 35.76 | | | | 1.15 | | | | 1.18 | | | | 0.26 | | | | 465,208 | | | | 86.75 | |
| | 17.61 | | | | 10.58 | | | | 1.15 | | | | 1.19 | | | | 0.60 | | | | 314,022 | | | | 78.16 | |
| | 16.26 | | | | (4.49 | ) | | | 1.15 | | | | 1.20 | | | | 0.25 | | | | 246,471 | | | | 55.92 | |
| | | | | | | | | | | | | | | | | | | | | | | | | | | |
| | See Notes to Financial Statements. | 15 |
Notes to Financial Statements
Lord Abbett Series Fund, Inc. (the “Company”) is registered under the Investment Company Act of 1940, as amended (the “Act”), as a diversified, open-end management investment company and was incorporated under Maryland law in 1989. The Company consists of thirteen separate portfolios. This report covers Fundamental Equity Portfolio (the “Fund”).
The Fund’s investment objective is long-term growth of capital and income without excessive fluctuations in market value. The Fund has Variable Contract class shares (“Class VC Shares”), which are currently issued and redeemed only in connection with investments in, and payments under, variable annuity contracts and variable life insurance policies issued by life insurance and insurance-related companies.
The preparation of the financial statements in conformity with accounting principles generally accepted in the United States of America (“U.S. GAAP”) requires management to make certain estimates and assumptions that affect the reported amounts of assets and liabilities and disclosure of contingent assets and liabilities at the date of the financial statements and the reported amounts of increases and decreases in net assets from operations during the reporting period. Actual results could differ from those estimates. The Fund is considered an investment company under U.S. GAAP and follows the accounting and reporting guidance applicable to investment companies.
| 2. | SIGNIFICANT ACCOUNTING POLICIES |
| (a) | Investment Valuation–Under procedures approved by the Fund’s Board of Directors (the “Board”), Lord, Abbett & Co. LLC (“Lord Abbett”), the Fund’s investment manager, has formed a Pricing Committee to administer the pricing and valuation of portfolio investments and to ensure that prices utilized reasonably reflect fair value. Among other things, these procedures allow the Fund to utilize independent pricing services, quotations from securities and financial instrument dealers and other market sources to determine fair value. |
| | |
| | Securities actively traded on any recognized U.S. or non-U.S. exchange or on The NASDAQ Stock Market LLC are valued at the last sale price or official closing price on the exchange or system on which they are principally traded. Events occurring after the close of trading on non-U.S. exchanges may result in adjustments to the valuation of foreign securities to reflect their fair value as of the close of regular trading on the New York Stock Exchange. The Fund may utilize an independent fair valuation service in adjusting the valuations of foreign securities. Unlisted equity securities are valued at the last quoted sale price or, if no sale price is available, at the mean between the most recently quoted bid and asked prices. |
| | |
| | Securities for which prices are not readily available are valued at fair value as determined by the Pricing Committee. The Pricing Committee considers a number of factors, including observable and unobservable inputs, when arriving at fair value. The Pricing Committee may use related or comparable assets or liabilities, recent transactions, market multiples, book values and other relevant information to determine the fair value of portfolio investments. The Board or a designated committee thereof regularly reviews fair value determinations made by the Pricing Committee and employs techniques such as reviewing related market activity, reviewing inputs and assumptions, and retrospectively comparing prices of subsequent purchases and sales transactions to fair value determinations made by the Pricing Committee. |
| | |
| | Short-term securities with 60 days or less remaining to maturity are valued using the amortized cost method, which approximates fair value. |
16
Notes to Financial Statements (continued)
| (b) | Security Transactions–Security transactions are recorded as of the date that the securities are purchased or sold (trade date). Realized gains and losses on sales of portfolio securities are calculated using the identified-cost method. |
| | |
| (c) | Investment Income–Dividend income is recorded on the ex-dividend date. Interest income is recorded on the accrual basis as earned. Discounts are accreted and premiums are amortized using the effective interest method and are included in Interest and other income on the Statement of Operations. Withholding taxes on foreign dividends have been provided for in accordance with the applicable country’s tax rules and rates. |
| | |
| (d) | Income Taxes–It is the policy of the Fund to meet the requirements of Subchapter M of the Internal Revenue Code applicable to regulated investment companies and to distribute substantially all taxable income and capital gains to its shareholders. Therefore, no income tax provision is required. |
| | |
| | The Fund files U.S. federal and various state and local tax returns. No income tax returns are currently under examination. The statute of limitations on the Fund’s filed U.S. federal tax returns remains open for the fiscal years ended December 31, 2012 through December 31, 2015. The statutes of limitations on the Company’s state and local tax returns may remain open for an additional year depending upon the jurisdiction. |
| | |
| (e) | Expenses–Expenses incurred by the Company that do not specifically relate to an individual fund are generally allocated to the funds within the Company on a pro rata basis by relative net assets. |
| | |
| (f) | Foreign Transactions–The books and records of the Fund are maintained in U.S. dollars and transactions denominated in foreign currencies are recorded in the Fund’s records at the rate prevailing when earned or recorded. Asset and liability accounts that are denominated in foreign currencies are adjusted daily to reflect current exchange rates and any unrealized gain (loss) is included in Net change in unrealized appreciation/depreciation on investments on the Fund’s Statement of Operations. The resultant exchange gains and losses upon settlement of such transactions are included in Net realized gain on investments on the Fund’s Statement of Operations. The Fund does not isolate that portion of the results of operations arising as a result of changes in the foreign exchange rates from the changes in market prices of the securities. |
| | |
| (g) | Repurchase Agreements–The Fund may enter into repurchase agreements with respect to securities. A repurchase agreement is a transaction in which a fund acquires a security and simultaneously commits to resell that security to the seller (a bank or securities dealer) at an agreed-upon price on an agreed-upon date. The Fund requires at all times that the repurchase agreement be collateralized by cash, or by securities of the U.S. Government, its agencies, its instrumentalities, or U.S. Government sponsored enterprises having a value equal to, or in excess of, the value of the repurchase agreement (including accrued interest). If the seller of the agreement defaults on its obligation to repurchase the underlying securities at a time when the fair value of these securities has declined, the Fund may incur a loss upon disposition of the securities. |
| | |
| (h) | Fair Value Measurements–Fair value is defined as the price that the Fund would receive upon selling an investment or transferring a liability in an orderly transaction to an independent buyer in the principal or most advantageous market of the investment. A three-tier hierarchy is used to maximize the use of observable market data and minimize the use of |
17
Notes to Financial Statements (continued)
| | unobservable inputs and to establish classification of fair value measurements for disclosure purposes. Inputs refer broadly to the assumptions that market participants would use in pricing the asset or liability, including assumptions about risk—for example, the risk inherent in a particular valuation technique used to measure fair value (such as a pricing model) and/or the risk inherent in the inputs to the valuation technique. Inputs may be observable or unobservable. Observable inputs reflect the assumptions market participants would use in pricing the asset or liability. Observable inputs are based on market data obtained from sources independent of the reporting entity. Unobservable inputs reflect the reporting entity’s own assumptions about the assumptions market participants would use in pricing the asset or liability. Unobservable inputs are based on the best information available in the circumstances. The three-tier hierarchy of inputs is summarized in the three broad Levels listed below: |
| • | Level 1 – | unadjusted quoted prices in active markets for identical investments; |
| | | |
| • | Level 2 – | other significant observable inputs (including quoted prices for similar investments, interest rates, prepayment speeds, credit risk, etc.); and |
| | | |
| • | Level 3 – | significant unobservable inputs (including the Fund’s own assumptions in determining the fair value of investments). |
| | A summary of inputs used in valuing the Fund’s investments as of December 31, 2015 and, if applicable, Level 1/Level 2 transfers and Level 3 rollforwards for the fiscal year then ended is included in the Fund’s Schedule of Investments. |
| | |
| | Changes in valuation techniques may result in transfers into or out of an assigned level within the three-tier hierarchy. All transfers between different levels within the three-tier hierarchy are deemed to have occurred as of the beginning of the reporting period. The inputs or methodology used for valuing securities are not necessarily an indication of the risk associated with investing in those securities. |
| 3. | MANAGEMENT FEE AND OTHER TRANSACTIONS WITH AFFILIATES |
Management Fee
The Company has a management agreement with Lord Abbett, pursuant to which Lord Abbett supplies the Fund with investment management services and executive and other personnel, provides office space and pays for ordinary and necessary office and clerical expenses relating to research and statistical work and supervision of the Fund’s investment portfolio.
The management fee is based on the Fund’s average daily net assets at the following annual rate:
| First $1 billion | | | .75 | % |
| Next $1 billion | | | .70 | % |
| Over $2 billion | | | .65 | % |
For the fiscal year ended December 31, 2015, the effective management fee, net of waivers, was at an annualized rate of .70% of the Fund’s average daily net assets.
In addition, Lord Abbett provides certain administrative services to the Fund pursuant to an Administrative Services Agreement in return for a fee at an annual rate of .04% of the Fund’s average daily net assets.
During the fiscal year ended December 31, 2015 and continuing through April 30, 2016, Lord Abbett has contractually agreed to waive its fees and reimburse expenses to the extent necessary to limit total net annual operating expenses to an annual rate of 1.15%. This agreement may be terminated only upon the approval of the Board.
18
Notes to Financial Statements (continued)
The Company, on behalf of the Fund, has entered into services arrangements with certain insurance companies. Under these arrangements, certain insurance companies will be compensated up to ..25% of the average daily net asset value (“NAV”) of the Fund’s Class VC Shares held in the insurance company’s separate account to service and maintain the Variable Contract owners’ accounts. This amount is included in Non 12b-1 service fees on the Statement of Operations. The Fund may also compensate certain insurance companies, third-party administrators and other entities for providing recordkeeping, sub-transfer agency and other administrative services to the Fund. This amount is included in Shareholder servicing on the Statement of Operations.
A Director and certain of the Company’s officers have an interest in Lord Abbett.
| 4. | DISTRIBUTIONS AND CAPITAL LOSS CARRYFORWARDS |
Dividends from net investment income, if any, are declared and paid at least semi-annually. Taxable net realized gains from investment transactions, reduced by allowable capital loss carryforwards, if any, are declared and distributed to shareholders at least annually. The capital loss carryforward amount, if any, is available to offset future net capital gains. Dividends and distributions to shareholders are recorded on the ex-dividend date. The amounts of dividends and distributions from net investment income and net realized capital gains are determined in accordance with federal income tax regulations, which may differ from U.S. GAAP. These book/tax differences are either considered temporary or permanent in nature. To the extent these differences are permanent in nature, such amounts are reclassified within the components of net assets based on their federal tax basis treatment; temporary differences do not require reclassification. Dividends and distributions that exceed earnings and profits for tax purposes are reported as a tax return of capital.
The tax character of distributions paid during the fiscal years ended December 31, 2015 and 2014 was as follows:
| | | Year Ended
12/31/2015 | | | Year Ended
12/31/2014 | |
| Distributions paid from: | | | | | | | | |
| Ordinary income | | $ | 5,438,690 | | | $ | 19,387,907 | |
| Net long-term capital gains | | | 22,224,761 | | | | 60,080,823 | |
| Total distributions paid | | $ | 27,663,451 | | | $ | 79,468,730 | |
As of December 31, 2015, the components of accumulated losses on a tax-basis were as follows:
| Undistributed long-term capital gains | | $ | 1,517,940 | |
| Total undistributed earnings | | | 1,517,940 | |
| Temporary differences | | | (122,148 | ) |
| Unrealized losses – net | | | (5,650,907 | ) |
| Total accumulated losses – net | | $ | (4,255,115 | ) |
At the Fund’s election, certain losses incurred within the taxable year (Qualified Late-Year Losses) are deemed to arise on the first business day of the Fund’s next taxable year. The Fund incurred and will elect to post-October capital losses of $77,789 during fiscal year 2015.
19
Notes to Financial Statements (continued)
As of December 31, 2015, the aggregate unrealized security gains and losses based on cost for U.S. federal income tax purposes were as follows:
| Tax cost | | $ | 266,794,627 | |
| Gross unrealized gain | | | 10,775,826 | |
| Gross unrealized loss | | | (16,426,733 | ) |
| Net unrealized security loss | | $ | (5,650,907 | ) |
The difference between book-basis and tax-basis unrealized gains (losses) is attributable to wash sales.
Permanent items identified during the fiscal year ended December 31, 2015 have been reclassified among the components of net assets based on their tax basis treatment as follows:
Distributions in
Excess of Net
Investment Income | | Accumulated
Net Realized
Loss |
| $(11,311) | | $11,311 |
The permanent differences are primarily attributable to the tax treatment of certain distributions.
| 5. | PORTFOLIO SECURITIES TRANSACTIONS |
Purchases and sales of investment securities (excluding short-term investments) for the fiscal year ended December 31, 2015 were as follows:
| Purchases | | Sales |
| $464,206,342 | | $626,832,180 |
There were no purchases or sales of U.S. Government securities for the fiscal year ended December 31, 2015.
The Fund is permitted to purchase and sell securities (“cross-trade”) from and to other Lord Abbett Funds or client accounts pursuant to procedures approved by the Board in compliance with Rule 17a-7 under the Act (the “Rule”). Each cross-trade is executed at a fair market price in compliance with provisions of the Rule. For the year ended December 31, 2015, the Fund engaged in cross-trade purchases of $868,802.
| 6. | DISCLOSURES ABOUT OFFSETTING ASSETS AND LIABILITIES |
The Financial Accounting Standards Board (“FASB”) requires disclosures intended to help better assess the effect or potential effect of offsetting arrangements on a fund’s financial position. The following tables illustrate gross and net information about recognized assets and liabilities eligible for offset in the statement of assets and liabilities; and disclose such amounts subject to an enforceable master netting agreement or similar agreement, by counterparty. A master netting agreement is an agreement between a fund and a counterparty which provides for the net settlement of amounts owed under all contracts traded under that agreement, as well as cash collateral, through a single payment by one party to the other in the event of default on or termination of any one contract. The Fund’s accounting policy with respect to balance sheet offsetting is that, absent an event of default by the counterparty or a termination of the agreement, the master netting agreement does not result in an offset of reported amounts of financial assets and liabilities in the statement of assets and liabilities across transactions between the Fund and the applicable counterparty:
20
Notes to Financial Statements (continued)
| Description | | | Gross Amounts of
Recognized Assets | | | | Gross Amounts
Offset in the
Statement of Assets
and Liabilities | | | | Net Amounts of
Assets Presented
in the Statement of
Assets and Liabilities |
| Repurchase Agreement | | | $5,401,311 | | | | $ – | | | | $5,401,311 |
| Total | | | $5,401,311 | | | | $ – | | | | $5,401,311 |
| | | Net Amounts
of Assets
Presented in | | | Amounts Not Offset in the
Statement of Assets and Liabilities | | | |
| Counterparty | | the Statement
of Assets and
Liabilities | | | Financial
Instruments | | | Cash
Collateral
Received(a) | | | Securities
Collateral
Received(a) | | | Net
Amount(b) |
| Fixed Income Clearing Corp. | | $ | 5,401,311 | | | $ | – | | | $ | – | | | $ | (5,401,311 | ) | | $ | – |
| Total | | $ | 5,401,311 | | | $ | – | | | $ | – | | | $ | (5,401,311 | ) | | $ | – |
| (a) | Collateral disclosed is limited to an amount not to exceed 100% of the net amount of assets presented in the Statement of Assets and Liabilities, for each respective counterparty. |
| (b) | Net amount represents the amount owed to the Fund by the counterparty as of December 31, 2015. |
| 7. | DIRECTORS’ REMUNERATION |
The Company’s officers and a Director, who are associated with Lord Abbett, do not receive any compensation from the Company for serving in such capacities. Independent Directors’ fees are allocated among all Lord Abbett-sponsored funds based on the net assets of each fund. There is an equity-based plan available to all Independent Directors under which Independent Directors must defer receipt of a portion of, and may elect to defer receipt of an additional portion of Directors’ fees. The deferred amounts are treated as though equivalent dollar amounts had been invested in the funds. Such amounts and earnings accrued thereon are included in Directors’ fees on the Statement of Operations and in Directors’ fees payable on the Statement of Assets and Liabilities and are not deductible for U.S. federal income tax purposes until such amounts are paid.
The Company has entered into an arrangement with its transfer agent and custodian, whereby credits realized as a result of uninvested cash balances are used to reduce a portion of the Fund’s expenses.
Effective August 31, 2015, the Fund and certain other funds managed by Lord Abbett (collectively, the “Participating Funds”) entered into a syndicated line of credit facility with various lenders for $550 million (the “Facility”), whereas State Street Bank and Trust Company (“SSB”) participates as a lender and as agent for the lenders. The Facility is to be used for temporary or emergency purposes as an additional source of: liquidity to satisfy redemptions. The Participating Funds are subject to graduated borrowing limits of one-third of Fund assets (if Fund assets are less than $750 million), $250 million, $300 million, or $350 million, based on past borrowings and likelihood of future borrowings. The Facility will continue through August 29, 2016.
Prior to August 31, 2015, the Fund and certain other funds managed by Lord Abbett participated in a $500 million unsecured revolving credit facility with SSB (the “SSB Facility”).
During the fiscal year ended December 31, 2015, the Fund did not utilize the Facility or the SSB Facility.
21
Notes to Financial Statements (concluded)
| 10. | CUSTODIAN AND ACCOUNTING AGENT |
SSB is the Company’s custodian and accounting agent. SSB performs custodial, accounting and recordkeeping functions relating to portfolio transactions and calculating the Fund’s NAV.
The Fund is subject to the general risks and considerations associated with investing in equity securities as well as the particular risks associated with value stocks. The value of an investment will fluctuate in response to movements in the equity securities market in general and to the changing prospects of individual companies in which the Fund invests. Large value stocks, in which the Fund invests a significant portion of its assets, may perform differently than the market as a whole and other types of stocks, such as mid-sized or small-company stocks and growth stocks. This is because different types of stocks tend to shift in and out of favor depending on market and economic conditions. Mid-cap and small-cap company stocks in which the Fund may invest may be more volatile and less liquid than large-cap stocks. The market may fail to recognize the intrinsic value of a particular value stock for a long time. In addition, if the Fund’s assessment of a company’s value or prospects for exceeding earnings expectations or market conditions is wrong, the Fund could suffer losses or produce poor performance relative to other funds, even in a rising market.
Due to the Fund’s investment exposure to foreign companies and American Depositary Receipts, the Fund may experience increased market, liquidity, currency, political, information, and other risks.
The Fund is subject to the risks associated with derivatives, which may be different and greater than the risks associated with investing directly in securities and other investments.
These factors can affect the Fund’s performance.
| 12. | SUMMARY OF CAPITAL TRANSACTIONS |
Transactions in shares of capital stock were as follows:
| | | Year Ended
December 31, 2015 | | Year Ended
December 31, 2014 | |
| Shares sold | | 10,986,185 | | 4,188,084 | |
| Reinvestment of distributions | | 1,644,621 | | 4,181,209 | |
| Shares reacquired | | (20,394,034 | ) | (6,694,490 | ) |
| Increase (decrease) | | (7,763,228 | ) | 1,674,803 | |
22
Report of Independent Registered Public Accounting Firm
To the Board of Directors of Lord Abbett Series Fund, Inc. and the Shareholders of Fundamental Equity Portfolio:
We have audited the accompanying statement of assets and liabilities, including the schedule of investments, of the Fundamental Equity Portfolio, one of the portfolios constituting the Lord Abbett Series Fund, Inc. (the “Fund”) as of December 31, 2015, and the related statement of operations for the year then ended, the statements of changes in net assets for each of the two years in the period then ended, and the financial highlights for each of the five years in the period then ended. These financial statements and financial highlights are the responsibility of the Fund’s management. Our responsibility is to express an opinion on these financial statements and financial highlights based on our audits.
We conducted our audits in accordance with the standards of the Public Company Accounting Oversight Board (United States). Those standards require that we plan and perform the audit to obtain reasonable assurance about whether the financial statements and financial highlights are free of material misstatement. The Fund is not required to have, nor were we engaged to perform, an audit of its internal control over financial reporting. Our audits included consideration of internal control over financial reporting as a basis for designing audit procedures that are appropriate in the circumstances, but not for the purpose of expressing an opinion on the effectiveness of the Fund’s internal control over financial reporting. Accordingly, we express no such opinion. An audit also includes examining, on a test basis, evidence supporting the amounts and disclosures in the financial statements, assessing the accounting principles used and significant estimates made by management, as well as evaluating the overall financial statement presentation. Our procedures included confirmation of securities owned as of December 31, 2015, by correspondence with the custodian. We believe that our audits provide a reasonable basis for our opinion.
In our opinion, such financial statements and financial highlights referred to above present fairly, in all material respects, the financial position of Fundamental Equity Portfolio of the Lord Abbett Series Fund, Inc. as of December 31, 2015 the results of its operations for the year then ended, the changes in its net assets for each of the two years in the period then ended, and the financial highlights for each of the five years in the period then ended, in conformity with accounting principles generally accepted in the United States of America.
DELOITTE & TOUCHE LLP
New York, New York
February 16, 2016
23
Supplemental Proxy Information (unaudited)
A special meeting of shareholders of Fundamental Equity Portfolio was held on November 5, 2015. The special meeting was held for shareholders of the Fund to vote on the following matters:
| | 1. | To amend the Fund’s fundamental restrictions related to borrowing and lending to enable the Fund to participate in an interfund lending program; and |
| | | |
| | 2. | To ratify the selection of Deloitte & Touche LLP as independent registered public accounting firm for the Fund’s current fiscal year. |
The results of the proxy solicitation on the preceding matter were as follows:
| 1. | To approve the amendment to the fundamental investment restrictions of the Fund as described in the proxy statement: |
| | (a) | Amend the fundamental investment restriction with respect to Borrowing |
| | | Votes For | | Votes Against | | Abstain | | Broker
Non-Votes |
| Fundamental Equity Portfolio | | 18,139,419 | | 858,577 | | 1,390,765 | | 0 |
| 1. | To approve the amendment to the fundamental investment restrictions of the Fund as described in the proxy statement: |
| | |
| | (b) | Amend the fundamental investment restriction with respect to Lending |
| | | Votes For | | Votes Against | | Abstain | | Broker
Non-Votes |
| Fundamental Equity Portfolio | | 18,128,312 | | 864,006 | | 1,396,443 | | 0 |
| 2. | To ratify the selection of Deloitte & Touche LLP as the Fund’s independent registered public accounting firm for the Fund’s current fiscal year |
| | | Votes For | | Votes Against | | Abstain | | Broker
Non-Votes |
| Fundamental Equity Portfolio | | 18,735,450 | | 389,533 | | 1,263,778 | | – |
24
Basic Information About Management
The Board is responsible for the management of the business and affairs of the Company in accordance with the laws of the State of Maryland. The Board elects officers who are responsible for the day-to-day operations of the Fund and who execute policies authorized by the Board. The Board also approves an investment adviser to the Fund and continues to monitor the cost and quality of the services the investment adviser provides, and annually considers whether to renew the contract with the adviser. Generally, each Director holds office until his/her successor is elected and qualified or until his/her earlier resignation or removal, as provided in the Company’s organizational documents.
Lord Abbett, a Delaware limited liability company, is the Fund’s investment adviser. Designated Lord Abbett personnel are responsible for the day-to-day management of the Fund.
Interested Director
Ms. Foster is affiliated with Lord Abbett and is an “interested person” of the Company as defined in the Act. Ms. Foster is a director/trustee and officer of each of the 12 investment companies in the Lord Abbett Family of Funds, which consist of 58 portfolios or series.
Name, Address and
Year of Birth | | Current Position and
Length of Service
with the Fund | | Principal Occupation and Other Directorships
During the Past Five Years |
| | | | | |
Daria L. Foster
Lord, Abbett & Co. LLC
90 Hudson Street
Jersey City, NJ 07302
(1954) | | Director and President since 2006; Chief Executive Officer since 2012 | | Principal Occupation: Managing Partner of Lord Abbett, joined Lord Abbett in 1990. Other Directorships: None. |
Independent Directors
The following Independent Directors also are directors/trustees of each of the 12 investment companies in the Lord Abbett Family of Funds, which consist of 58 portfolios or series.
Name, Address and
Year of Birth | | Current Position and
Length of Service
with the Fund | | Principal Occupation and Other Directorships
During the Past Five Years |
| | | | | |
E. Thayer Bigelow Lord, Abbett & Co. LLC
c/o Legal Dept.
90 Hudson Street
Jersey City, NJ 07302
(1941) | | Director since 1994;
Chairman since 2013 | | Principal Occupation: Managing General Partner, Bigelow Media, LLC (since 2000); Senior Adviser, Time Warner Inc. (1998–2000). Other Directorships: Currently serves as director of Crane Co. (since 1984) and Huttig Building Products Inc. (since 1998). Previously served as a director of R.H. Donnelley Inc. (2009–2010). |
Robert B. Calhoun, Jr. Lord, Abbett & Co. LLC
c/o Legal Dept.
90 Hudson Street
Jersey City, NJ 07302
(1942) | | Director since 1998 | | Principal Occupation: Senior Advisor of Monitor Clipper Partners, a private equity investment fund (since 1997); President of Clipper Asset Management Corp. (1991–2009). Other Directorships: None. |
25
Basic Information About Management (continued)
Name, Address and
Year of Birth | | Current Position and
Length of Service
with the Fund | | Principal Occupation and Other Directorships
During the Past Five Years |
| | | | | |
Eric C. Fast Lord, Abbett & Co. LLC
c/o Legal Dept.
90 Hudson Street
Jersey City, NJ 07302
(1949) | | Director since 2014 | | Principal Occupation: Chief Executive Officer of Crane Co., an industrial products company (2001–2014). Other Directorships: Currently serves as director of Automatic Data Processing, Inc. (since 2007) and Regions Financial Corporation (since 2010). Previously served as a director of Crane Co. (1999–2014). |
Evelyn E. Guernsey Lord, Abbett & Co. LLC
c/o Legal Dept.
90 Hudson Street
Jersey City, NJ 07302
(1955) | | Director since 2011 | | Principal Occupation: CEO, Americas of J.P. Morgan Asset Management (2004–2010). Other Directorships: None. |
Julie A. Hill Lord, Abbett & Co. LLC
c/o Legal Dept.
90 Hudson Street
Jersey City, NJ 07302
(1946) | | Director since 2004 | | Principal Occupation: Owner and CEO of The Hill Company, a business consulting firm (since 1998). Other Directorships: Currently serves as director of ]Anthem, Inc., a health benefits company (since 1994). |
Franklin W. Hobbs
Lord, Abbett & Co. LLC
c/o Legal Dept.
90 Hudson Street
Jersey City, NJ 07302
(1947) | | Director since 2001 | | Principal Occupation: Advisor of One Equity Partners, a private equity firm (since 2004). Other Directorships: Currently serves as director and Chairman of the Board of Ally Financial Inc., a financial services firm (since 2009), and as director of Molson Coors Brewing Company (since 2002). |
James M. McTaggart
Lord, Abbett & Co. LLC
c/o Legal Dept.
90 Hudson Street
Jersey City, NJ 07302
(1947) | | Director since 2012 | | Principal Occupation: Independent management advisor and consultant (since 2012); Vice President, CRA International, Inc. (doing business as Charles River Associates), a global management consulting firm (2009–2012); Founder and Chairman of Marakon Associates, Inc., a strategy consulting firm (1978–2009); and Officer and Director of Trinsum Group, a holding company (2007–2009). Other Directorships: Currently serves as director of Blyth, Inc., a home products company (since 2004). |
James L.L. Tullis
Lord, Abbett & Co. LLC
c/o Legal Dept.
90 Hudson Street
Jersey City, NJ 07302
(1947) | | Director since 2006 | | Principal Occupation: CEO of Tullis-Dickerson and Co. Inc., a venture capital management firm (since 1990); CEO of Tullis Health Investors Inc. (since 2012). Other Directorships: Currently serves as director of Crane Co. (since 1998). |
26
Basic Information About Management (continued)
Officers
None of the officers listed below have received compensation from the Company. All of the officers of the Company also may be officers of the other Lord Abbett Funds and maintain offices at 90 Hudson Street, Jersey City, NJ 07302. Unless otherwise indicated, the position(s) and title(s) listed under the “Principal Occupation During the Past Five Years” column indicate each officer’s position(s) and title(s) with Lord Abbett. Each officer serves for an indefinite term (i.e., until his or her death, resignation, retirement, or removal).
Name and
Year of Birth | | Current Position
with the Fund | | Length of Service
of Current
Position | | Principal Occupation
During the Past Five Years |
| | | | | | | |
Daria L. Foster (1954) | | President and Chief Executive Officer | | Elected as President in 2006 and Chief Executive Officer in 2012 | | Managing Partner of Lord Abbett, joined Lord Abbett in 1990. |
| | | | | | | |
Sean J. Aurigemma (1969) | | Executive Vice President | | Elected in 2010 | | Portfolio Manager, joined Lord Abbett in 2007. |
Jeff D. Diamond (1960) | | Executive Vice President | | Elected in 2008 | | Portfolio Manager, joined Lord Abbett in 2007. |
Robert I. Gerber (1954) | | Executive Vice President | | Elected in 2003 | | Partner and Chief Investment Officer, joined Lord Abbett in 1997. |
Todd D. Jacobson (1966) | | Executive Vice President | | Elected in 2005 | | Partner and Associate Director, joined Lord Abbett in 2003. |
Robert A. Lee (1969) | | Executive Vice President | | Elected in 2010 | | Partner and Deputy Chief Investment Officer, joined Lord Abbett in 1997. |
| | | | | | | |
Thomas B. Maher (1967) | | Executive Vice President | | Elected in 2010 | | Partner and Portfolio Manager, joined Lord Abbett in 2003. |
Justin C. Maurer (1969) | | Executive Vice President | | Elected in 2010 | | Partner and Portfolio Manager, joined Lord Abbett in 2001. |
Vincent J. McBride (1964) | | Executive Vice President | | Elected in 2010 | | Partner and Director, joined Lord Abbett in 2003. |
Andrew H. O’Brien (1973) | | Executive Vice President | | Elected in 2010 | | Partner and Portfolio Manager, joined Lord Abbett in 1998. |
F. Thomas O’Halloran, III (1955) | | Executive Vice President | | Elected in 2010 | | Partner and Portfolio Manager, joined Lord Abbett in 2001. |
Walter H. Prahl (1958) | | Executive Vice President | | Elected in 2012 | | Partner and Director, joined Lord Abbett in 1997. |
Steven F. Rocco (1979) | | Executive Vice President | | Elected in 2014 | | Partner and Portfolio Manager, joined Lord Abbett in 2004. |
Frederick J. Ruvkun (1957) | | Executive Vice President | | Elected in 2012 | | Partner and Portfolio Manager, joined Lord Abbett in 2006. |
27
Basic Information About Management (continued)
Name and
Year of Birth | | Current Position
with the Fund | | Length of Service
of Current
Position | | Principal Occupation
During the Past Five Years |
| | | | | | | |
Paul J. Volovich (1973) | | Executive Vice President | | Elected in 2005 | | Partner and Portfolio Manager, joined Lord Abbett in 1997. |
A. Edward Allinson (1961) | | Vice President | | Elected in 2011 | | Portfolio Manager, joined Lord Abbett in 2005. |
John W. Ashbrook (1964) | | Vice President and Assistant Secretary | | Elected in 2014 | | Assistant General Counsel, joined Lord Abbett in 2008. |
Joan A. Binstock (1954) | | Chief Financial Officer and Vice President | | Elected in 1999 | | Partner and Chief Financial and Operations Officer, joined Lord Abbett in 1999. |
| | | | | | | |
Brooke A. Fapohunda (1975) | | Vice President and Assistant Secretary | | Elected in 2014 | | Deputy General Counsel, joined Lord Abbett in 2006. |
John K. Forst (1960) | | Vice President and Assistant Secretary | | Elected in 2005 | | Partner and Deputy General Counsel, joined Lord Abbett in 2004. |
Anthony W. Hipple (1964) | | Vice President | | Elected in 2014 | | Portfolio Manager, joined Lord Abbett in 2002. |
Lawrence H. Kaplan (1957) | | Vice President and Secretary | | Elected in 1997 | | Partner and General Counsel, joined Lord Abbett in 1997. |
Jerald M. Lanzotti (1967) | | Vice President | | Elected in 2012 | | Partner and Portfolio Manager, joined Lord Abbett in 1996. |
David J. Linsen (1974) | | Vice President | | Elected in 2008 | | Partner and Director, joined Lord Abbett in 2001. |
Joseph M. McGill (1962) | | Chief Compliance Officer | | Elected in 2014 | | Chief Compliance Officer, joined Lord Abbett in 2014 and was formerly Managing Director and the Chief Compliance Officer at UBS Global Asset Management (2003–2013). |
| | | | | | | |
A. Edward Oberhaus, III (1959) | | Vice President | | Elected in 1998 | | Partner and Director, joined Lord Abbett in 1983. |
Noah Petrucci (1970) | | Vice President | | Elected in 2013 | | Portfolio Manager, joined Lord Abbett in 2012 and was formerly a Portfolio Manager at Columbia Management Investment Advisers, LLC and Columbia Management Advisors, LLC (2002–2012). |
| | | | | | | |
Lawrence B. Stoller (1963) | | Vice President and Assistant Secretary | | Elected in 2007 | | Partner and Senior Deputy General Counsel, joined Lord Abbett in 2007. |
28
Basic Information About Management (concluded)
Name and
Year of Birth | | Current Position
with the Fund | | Length of Service
of Current
Position | | Principal Occupation
During the Past Five Years |
| | | | | | | |
Arthur K. Weise (1970) | | Vice President | | Elected in 2010 | | Partner and Portfolio Manager, joined Lord Abbett in 2007. |
Kewjin Yuoh (1971) | | Vice President | | Elected in 2012 | | Partner and Portfolio Manager, joined Lord Abbett in 2010. |
Scott S. Wallner (1955) | | AML Compliance Officer | | Elected in 2011 | | Assistant General Counsel, joined Lord Abbett in 2004. |
Bernard J. Grzelak (1971) | | Treasurer | | Elected in 2003 | | Partner and Director of Fund Administration, joined Lord Abbett in 2003. |
Please call 888-522-2388 for a copy of the statement of additional information, which contains further information about the Company’s Directors. It is available free upon request.
29
Approval of Advisory Contract
The Board of Directors of the Fund, including all of the Directors who are not interested persons of the Fund or of Lord Abbett (the “Independent Board Members”), annually considers whether to approve the continuation of the existing management agreement between the Fund and Lord Abbett. In connection with its most recent approval, the Board reviewed materials relating specifically to the management agreement, as well as numerous materials received throughout the course of the year, including information about the Fund’s investment performance compared to the performance of its benchmark. Before making its decision as to the Fund, the Board had the opportunity to ask questions and request further information, taking into account its familiarity with Lord Abbett gained through its meetings and discussions. These meetings and discussions included the examination of the portfolio management team conducted by members of the Contract Committee, the deliberations of the Contract Committee, and discussions between the Contract Committee and Lord Abbett’s management. The Independent Board Members also discussed the materials described above with their independent legal counsel in a private session at which no representatives of management were present.
The materials received by the Board included, but were not limited to: (1) information provided by Morningstar Associates, LLC (“Morningstar”) regarding the investment performance of the Fund compared to the investment performance of a group of funds in the same Morningstar investment category (the “performance peer group”) and the investment performance of one or more appropriate benchmarks; (2) information provided by Morningstar regarding the expense ratios, contractual and effective management fee rates, and other expense components for the Fund and one or more groups of funds in the same Morningstar category, with the same share classes and operational characteristics, including asset size (the “expense peer group”); (3) information provided by Lord Abbett on the projected expense ratios, management fee rates, and other expense components for the Fund; (4) sales and redemption information for the Fund; (5) information regarding Lord Abbett’s financial condition; (6) an analysis of the relative profitability of the management agreement to Lord Abbett; (7) information provided by Lord Abbett regarding the investment management fees Lord Abbett receives from its other advisory clients maintaining accounts with a similar investment strategy as the Fund; (8) information regarding the distribution arrangements of the Fund; and (9) information regarding the personnel and other resources devoted by Lord Abbett to managing the Fund.
Investment Management Services Generally. The Board considered the investment management services provided by Lord Abbett to the Fund, including investment research, portfolio management, and trading, and Lord Abbett’s commitment to compliance with all applicable legal requirements. The Board also observed that Lord Abbett was solely engaged in the investment management business and accordingly did not experience the conflicts of interest that may result from being engaged in other lines of business. The Board considered the investment advisory services provided by Lord Abbett to other clients, the fees charged for the services, and the differences in the nature of the services provided to the Fund and other Lord Abbett Funds, on the one hand, and the services provided to other clients, on the other.
Investment Performance. The Board reviewed the Fund’s investment performance in relation to that of the performance peer group as of various periods ended August 31, 2015. The Board observed that the Fund’s investment performance was below the median of the performance peer group for the one-year and five-year periods and above the median of the performance peer group for the three-year and ten-year periods.
30
Approval of Advisory Contract (continued)
Lord Abbett’s Personnel and Methods. The Board considered the qualifications of the personnel providing investment management services to the Fund, in light of its investment objective and discipline. Among other things, the Board considered the size, experience, and turnover of Lord Abbett’s investment management staff, Lord Abbett’s investment methodology and philosophy, and Lord Abbett’s approach to recruiting, training, and retaining investment management personnel.
Nature and Quality of Other Services. The Board considered the nature, quality, costs, and extent of compliance, administrative, and other services performed by Lord Abbett and Lord Abbett Distributor LLC (the “Distributor”) and the nature and extent of Lord Abbett’s supervision of third party service providers, including the Fund’s transfer agent and custodian.
Expenses. The Board considered the expense level of the Fund and the expense levels of the expense peer group. It also considered the projected expense levels and how those levels would relate to those of the expense peer group and the amount and nature of the fees paid by shareholders. The Board observed that the overall expense level of the Fund was above the median of the expense peer group.
Profitability. The Board considered the level of Lord Abbett’s profits in managing the Fund, including a review of Lord Abbett’s methodology for allocating its costs to its management of the Fund. The Board concluded that the allocation methodology had a reasonable basis and was appropriate. It considered any profits realized by Lord Abbett in connection with the operation of the Fund, including the fee that Lord Abbett receives from the Fund for providing administrative services to the Fund, and whether the amount of profit was fair for the management of the Fund. The Board also considered the profits realized from other business segments of Lord Abbett, which may benefit from or be related to the Fund’s business. The Board considered Lord Abbett’s profit margins in comparison with available industry data, both accounting for and ignoring marketing and distribution expenses, and how those profit margins could affect Lord Abbett’s ability to recruit and retain investment personnel. The Board recognized that Lord Abbett’s profitability was a factor in enabling it to attract and retain qualified investment management personnel to provide services to the Fund. The Board concluded that Lord Abbett’s profitability as to the Fund was not excessive.
Economies of Scale. The Board considered whether there had been any economies of scale in managing the Fund, whether the Fund had appropriately benefited from any such economies of scale, and whether there was potential for realization of any further economies of scale. The Board concluded that the existing management fee schedule, with its breakpoint or breakpoints in the level of the management fee, adequately addressed any economies of scale in managing the Fund.
Other Benefits to Lord Abbett. The Board considered the character and amount of fees paid by the Fund and the Fund’s shareholders to Lord Abbett and the Distributor for services other than investment advisory services. The Board also considered the revenues and profitability of Lord Abbett’s investment advisory business apart from its mutual fund business, and the intangible benefits enjoyed by Lord Abbett by virtue of its relationship with the Fund. The Board observed that the Distributor receives 12b-1 fees from certain of the Lord Abbett Funds as to shares held in accounts for which there is no other broker of record, may retain a portion of the 12b-1 fees it receives, and receives a portion of the sales charges on sales and redemptions of some classes of shares. In addition, the Board observed that Lord Abbett accrues certain benefits for its business of providing investment advice to clients other than the Lord Abbett Funds, but that business also benefits the Funds. The Board also noted that Lord Abbett, as disclosed in the prospectus of the Fund, has entered into revenue sharing arrangements with certain entities that distribute shares of
31
Approval of Advisory Contract (concluded)
the Fund. The Board also took into consideration the investment research that Lord Abbett receives as a result of Fund brokerage transactions.
Alternative Arrangements. The Board considered whether, instead of approving continuation of the management agreement, it might be in the best interests of the Fund to implement one or more alternative arrangements, such as continuing to employ Lord Abbett, but on different terms. After considering all of the relevant factors, the Board unanimously found that continuation of the existing management agreement was in the best interests of the Fund and its shareholders and voted unanimously to approve the continuation of the management agreement. In considering whether to approve the continuation of the management agreement, the Board did not identify any single factor as paramount or controlling. This summary does not discuss in detail all matters considered.
32
Householding
The Company has adopted a policy that allows it to send only one copy of the Fund’s prospectus, proxy material, annual report and semiannual report to certain shareholders residing at the same “household.” This reduces Fund expenses, which benefits you and other shareholders. If you need additional copies or do not want your mailings to be “householded,” please call Lord Abbett at 888-522-2388 or send a written request with your name, the name of your fund or funds and your account number or numbers to Lord Abbett Family of Funds, P.O. Box 219336, Kansas City, MO 64121.
Proxy Voting Policies, Procedures and Records
A description of the policies and procedures that Lord Abbett uses to vote proxies related to the Fund’s portfolio securities, and information on how Lord Abbett voted the Fund’s proxies during the 12-month period ended June 30 are available without charge, upon request, (i) by calling 888-522-2388; (ii) on Lord Abbett’s Website at www.lordabbett.com; and (iii) on the Securities and Exchange Commission’s (“SEC”) Website at www.sec.gov.
Shareholder Reports and Quarterly Portfolio Disclosure
The Fund is required to file its complete schedule of portfolio holdings with the SEC for its first and third fiscal quarters on Form N-Q. Copies of the filings are available without charge, upon request on the SEC’s Website at www.sec.gov and may be available by calling Lord Abbett at 888-522-2388. You can also obtain copies of Form N-Q by visiting the SEC’s Public Reference Room in Washington, DC (information on the operation of the Public Reference Room may be obtained by calling 800-SEC-0330).
Tax Information For corporate shareholders, 70% of the Fund’s ordinary income distributions qualified for the dividends received deduction. Additionally, of the distribution paid to the shareholders during the fiscal year ended December 31, 2015, $2,282,764 and $22,224,761, respectively, represent short-term capital gains and long-term capital gains. |
33

 | | |
| | | |
| | |
| This report, when not used for the general information of shareholders of the Fund, is to be distributed only if preceded or accompanied by a current fund prospectus. | | |
| | Lord Abbett Series Fund, Inc. | |
| Lord Abbett mutual fund shares are distributed by | | SFFE-PORT-3 |
| LORD ABBETT DISTRIBUTOR LLC. | Fundamental Equity Portfolio | (02/16) |

2015 LORD ABBETT
ANNUAL REPORT
Lord Abbett
Series Fund—Growth and Income Portfolio
For the fiscal year ended December 31, 2015
Lord Abbett Series Fund — Growth and Income Portfolio
Annual Report
For the fiscal year ended December 31, 2015

Daria L. Foster, Director, President and Chief Executive Officer of the Lord Abbett Funds, and E. Thayer Bigelow, Independent Chairman of the Lord Abbett Funds. | | Dear Shareholders: We are pleased to provide you with this overview of the performance of Lord Abbett Series Fund – Growth and Income Portfolio for the fiscal year ended December 31, 2015. On this page and the following pages, we discuss the major factors that influenced fiscal year performance. For additional information about the Fund, please visit our website at www.lordabbett.com, where you also can access the quarterly commentaries that provide updates on the Fund’s performance and other portfolio related updates. Thank you for investing in Lord Abbett mutual funds. We value the trust that you place in us and look forward to serving your investment needs in the years to come. Best regards, 
Daria L. Foster Director, President and Chief Executive Officer |
For the fiscal year ended December 31, 2015, the Fund returned -2.86%, reflecting performance at the net asset value (NAV) of Class VC shares, with all distributions reinvested, compared to its benchmark, the Russell 1000® Value Index1, which returned -3.83% over the same period.
Domestic equity markets advanced over the past year, with the S&P 500® Index2 rising 1.38% during the trailing 12-month period. Despite this general move upward, there were a few periods of short-term volatility, most notably in
January 2015, when the S&P 500 declined 3.0% in total return terms, and in August 2015, when the index dropped 6.0%, its greatest monthly loss in three years. One of the prevailing market themes during the trailing 12-month period was the continued weakness in energy prices. Finally, U.S. real gross domestic product (GDP), which was initially reported to have contracted by 0.2% in the first quarter of 2015, was later revised upwards to a modest 0.6% expansion. In the second quarter of 2015, real GDP advanced 3.9%, while the third estimate from the Bureau of
Economic Analysis indicated that real GDP increased 2.0% in the third quarter of 2015.
The Fund outperformed its benchmark index for the period. Stock selection within the information technology and consumer staples sectors contributed to relative performance during the period. Shares of Vantiv, Inc., a technology holding company, increased steadily, likely due to impressive revenue/transaction growth, despite difficult comparisons. Performance from the ISV and eCommerce segments seems to have driven performance. Shares of Activision, Inc., a video-game developer and publisher, climbed, likely due to increased user growth, revenue monetization, and a strong product offering, all of which aided margin expansion. Within the consumer staples sector, shares of Mondelez International, Inc., a snack food and beverage company, increased in value as shareholders appeared to recognize the company’s efforts to expand margins and grow its near- and long-term revenue in emerging markets. Shares of PepsiCo, a global food and beverage company, increased despite a challenging global macro environment. Stock performance was likely driven by strong operating profit and company guidance for growth.
Stock selection detracted from performance within the consumer discretionary and energy sectors. Shares of Time Warner Inc., a media and entertainment company, fell as the market reacted poorly to media stocks surrounding concerns on the decline in pay-TV subscribers. Despite the sell-off, growth opportunities remain in the HBO, Turner, and Warner Bros. segments. Shares of PVH Corp., an apparel company, detracted from performance, as sell-side analysts highlighted weakness in the U.S. retail market, particularly in apparel and accessories. Within the energy sector, shares of Marathon Oil Corp., an oil and natural gas exploration and production company, declined this year, as the market appeared to believe that the company’s cash-flow outlook and return on equity would be negatively affected by oil prices remaining low. In addition, shares of Devon Energy Corp., a natural gas and oil producer, also fell due to weak commodity prices, which resulted in declining earnings.
The Fund’s portfolio is actively managed and, therefore, its holdings and the weightings of a particular issuer or particular sector as a percentage of portfolio assets are subject to change. Sectors may include many industries.
1 The Russell 1000® Value Index measures the performance of those Russell 1000 companies with lower price-to-book ratios and lower forecasted growth values.
2 The S&P 500® Index is widely regarded as the standard for measuring large cap U.S. stock market performance and includes a representative sample of leading companies in leading industries.
Unless otherwise specified, indexes reflect total return, with all dividends reinvested. Indexes are unmanaged, do not reflect the deduction of fees or expenses, and are not available for direct investment.
Important Performance and Other Information
Performance data quoted in the following pages reflect past performance and are no guarantee of future results. Current performance may be higher or lower than the performance quoted. The investment return and principal value of an investment in the Funds will fluctuate so that shares, on any given day or when redeemed, may be worth more or less than their original cost. You can obtain performance data current to the most recent month end by calling Lord Abbett at 888-522-2388 or referring to www.lordabbett.com.
The annual commentary above discusses the views of the Fund’s management and various portfolio holdings of the Fund as of December 31, 2015. These views and portfolio holdings may have changed after this date. Information provided in the commentary is not a recommendation to buy or sell securities. Because the Fund’s portfolio is actively managed and may change significantly, the Fund may no longer own the securities described above or may have otherwise changed their positions in the securities. For more recent information about the Fund’s portfolio holdings, please visit www.lordabbett.com.
A Note about Risk: See Notes to Financial Statements for a discussion of investment risks. For a more detailed discussion of the risks associated with the Fund, please see the Fund’s prospectus.
Mutual funds are not insured by the FDIC, are not deposits or other obligations of, or guaranteed by, banks, and are subject to investment risks including possible loss of principal amount invested.
The Fund serves as an underlying investment vehicle for variable annuity contracts and variable life insurance policies.
Investment Comparison
Below is a comparison of a $10,000 investment in Class VC shares with the same investment in the Russell 1000® Value Index, the S&P 500® Index and the S&P 500® Value Index, assuming reinvestment of all dividends and distributions. The Fund’s shares are sold only to insurance company separate accounts that fund certain variable annuity and variable life contracts. This line graph comparison does not reflect the sales charges or other expenses of these contracts. If those sales charges and expenses were reflected, returns would be lower. The graph and performance table below do not reflect the deduction of taxes that a shareholder would pay on Fund distributions or the redemption of Fund shares. Past performance is no guarantee of future results.
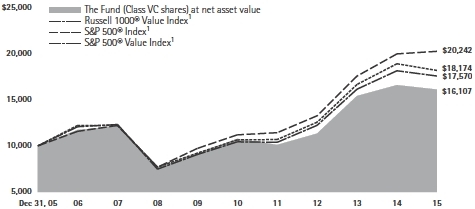
| | | Average Annual Total Returns for the
Periods Ended December 31, 2015 |
| | | 1 Year | | 5 Years | | 10 Years | |
| Class VC | | –2.86% | | 8.39% | | 4.88% | |
1 Performance for each unmanaged index does not reflect any fees or expenses. The performance of each index is not necessarily representative of the Fund’s performance.
Expense Example
As a shareholder of the Fund, you incur ongoing costs, including management fees; expenses related to the Fund’s services arrangements with certain insurance companies; and other Fund expenses. This Example is intended to help you understand your ongoing costs (in dollars) of investing in the Fund and to compare these costs with the ongoing costs of investing in other mutual funds.
The Example is based on an investment of $1,000 invested at the beginning of the period and held for the entire period (July 1, 2015 through December 31, 2015).
The Example reflects only expenses that are deducted from the assets of the Fund. Fees and expenses, including sales charges applicable to the various insurance products that invest in the Fund, are not reflected in this Example. If such fees and expenses were reflected in the Example, the total expenses shown would be higher. Fees and expenses regarding such variable insurance products are separately described in the prospectus related to those products.
Actual Expenses
The first line of the table on the following page provides information about actual account values and actual expenses. You may use the information in this line, together with the amount you invested, to estimate the expenses that you paid over the period. Simply divide your account value by $1,000 (for example, an $8,600 account value divided by $1,000 = 8.6), then multiply the result by the number in the first line under the heading titled “Expenses Paid During Period 7/1/15 – 12/31/15” to estimate the expenses you paid on your account during this period.
Hypothetical Example for Comparison Purposes
The second line of the table on the following page provides information about hypothetical account values and hypothetical expenses based on the Fund’s actual expense ratio and an assumed rate of return of 5% per year before expenses, which is not the Fund’s actual return. The hypothetical account values and expenses may not be used to estimate the actual ending account balance or expenses you paid for the period. You may use this information to compare the ongoing costs of investing in the Fund and other funds. To do so, compare this 5% hypothetical example with the 5% hypothetical examples that appear in the shareholder reports of the other funds.
Please note that the expenses shown in the table are meant to highlight your ongoing costs only and do not reflect any transactional costs, such as sales charges. Therefore, the second line of the table is useful in comparing ongoing costs only, and will not help you determine the relative total costs of owning different funds. In addition, if these transactional costs were included, your costs would have been higher.
| | | Beginning
Account
Value | | Ending
Account
Value | | Expenses
Paid During
Period† | |
| | | 7/1/15 | | 12/31/15 | | 7/1/15 -
12/31/15 | |
| Class VC | | | | | | | |
| Actual | | $1,000.00 | | $ 964.90 | | $4.75 | |
| Hypothetical (5% Return Before Expenses) | | $1,000.00 | | $1,020.37 | | $4.89 | |
| | |
| † | Net expenses are equal to the Fund’s annualized expense ratio of 0.96%, multiplied by the average account value over the period, multiplied by 184/365 (to reflect one-half year period). |
Portfolio Holdings Presented by Sector
December 31, 2015
| Sector* | %** |
| Consumer Discretionary | 6.50 | % |
| Consumer Staples | 6.46 | % |
| Energy | 10.43 | % |
| Financials | 27.76 | % |
| Health Care | 10.27 | % |
| Industrials | 12.59 | % |
| Information Technology | 13.13 | % |
| Materials | 3.56 | % |
| Telecommunication Services | 3.31 | % |
| Utilities | 5.13 | % |
| Repurchase Agreement | 0.86 | % |
| Total | 100.00 | % |
| * | | A sector may comprise several industries. |
| ** | | Represents percent of total investments. |
Schedule of Investments
December 31, 2015
| | | | | | Fair | |
| | | | | | Value | |
| Investments | | Shares | | | (000) | |
| COMMON STOCKS 99.62% | | | | | | | | |
| | | | | | | | | |
| Aerospace & Defense 3.33% | | | | | | | | |
| General Dynamics Corp. | | | 102,992 | | | $ | 14,147 | |
| TransDigm Group, Inc.* | | | 43,500 | | | | 9,938 | |
| Total | | | | | | | 24,085 | |
| | | | | | | | | |
| Banks 12.86% | | | | | | | | |
| Citizens Financial Group, Inc. | | | 731,992 | | | | 19,171 | |
| East West Bancorp, Inc. | | | 427,241 | | | | 17,756 | |
| First Republic Bank | | | 165,413 | | | | 10,927 | |
| JPMorgan Chase & Co. | | | 486,319 | | | | 32,112 | |
| Signature Bank* | | | 86,044 | | | | 13,196 | |
| Total | | | | | | | 93,162 | |
| | | | | | | | | |
| Beverages 3.11% | | | | | | | | |
| PepsiCo, Inc. | | | 225,600 | | | | 22,542 | |
| | | | | | | | | |
| Building Products 0.97% | | | | | | | | |
| USG Corp.* | | | 290,520 | | | | 7,057 | |
| | | | | | | | | |
| Capital Markets 3.87% | | | | | | | | |
| Affiliated Managers Group, Inc.* | | | 75,000 | | | | 11,982 | |
| Goldman Sachs Group, Inc. (The) | | | 30,631 | | | | 5,520 | |
| Greenhill & Co., Inc. | | | 164,970 | | | | 4,720 | |
| TD Ameritrade Holding Corp. | | | 168,016 | | | | 5,832 | |
| Total | | | | | | | 28,054 | |
| | | | | | | | | |
| Chemicals 3.58% | | | | | | | | |
| Dow Chemical Co. (The) | | | 215,431 | | | | 11,090 | |
| E.I. du Pont de Nemours & Co. | | | 222,337 | | | | 14,808 | |
| Total | | | | | | | 25,898 | |
| | | | | | | | | |
| Commercial Services & Supplies 1.75% | | | | | | | | |
| ADT Corp. (The) | | | 385,187 | | | | 12,703 | |
| | | | | | | | | |
| Communications Equipment 2.02% | | | | | | | | |
| Cisco Systems, Inc. | | | 538,220 | | | | 14,615 | |
| | | | | | Fair | |
| | | | | | Value | |
| Investments | | Shares | | | (000) | |
| Consumer Finance 0.97% | | | | | | | | |
| Capital One Financial Corp. | | | 97,124 | | | $ | 7,010 | |
| | | | | | | | | |
| Diversified Telecommunication Services 3.32% | | | | | |
| AT&T, Inc. | | | 585,648 | | | | 20,152 | |
| Verizon Communications, Inc. | | | 84,900 | | | | 3,924 | |
| Total | | | | | | | 24,076 | |
| | | | | | | | | |
| Electric: Utilities 3.67% | | | | | | | | |
| Duke Energy Corp. | | | 127,599 | | | | 9,109 | |
| NextEra Energy, Inc. | | | 168,071 | | | | 17,461 | |
| Total | | | | | | | 26,570 | |
| | | | | | | | | |
| Energy Equipment & Services 2.45% | | | | | | | | |
| Halliburton Co. | | | 280,755 | | | | 9,557 | |
| Schlumberger Ltd. | | | 117,000 | | | | 8,161 | |
| Total | | | | | | | 17,718 | |
| | | | | | | | | |
| Food Products 2.51% | | | | | | | | |
| Mondelez International, Inc. Class A | | | 405,841 | | | | 18,198 | |
| | | | | | | | | |
| Health Care Equipment & Supplies 1.46% | | | | | | | | |
| St. Jude Medical, Inc. | | | 170,969 | | | | 10,561 | |
| | | | | | | | | |
| Health Care Providers & Services 1.09% | | | | | | | | |
| UnitedHealth Group, Inc. | | | 67,359 | | | | 7,924 | |
| | | | | | | | | |
| Hotels, Restaurants & Leisure 3.29% | | | | | | | | |
| McDonald’s Corp. | | | 136,900 | | | | 16,173 | |
| Yum! Brands, Inc. | | | 104,633 | | | | 7,644 | |
| Total | | | | | | | 23,817 | |
| | | | | | | | | |
| Household Products 0.87% | | | | | | | | |
| Colgate-Palmolive Co. | | | 94,400 | | | | 6,289 | |
| | | | | | | | | |
| Industrial Conglomerates 5.02% | | | | | | | | |
| General Electric Co. | | | 1,166,233 | | | | 36,328 | |
| | | | | | | | | |
| Information Technology Services 0.78% | | | | | | | | |
| Vantiv, Inc. Class A* | | | 119,448 | | | | 5,664 | |
| | See Notes to Financial Statements. | 7 |
Schedule of Investments (continued)
December 31, 2015
| | | | | | Fair | |
| | | | | | Value | |
| Investments | | Shares | | | (000) | |
| Insurance 7.03% | | | | | | | | |
| ACE Ltd. (Switzerland)(a) | | | 98,856 | | | $ | 11,551 | |
| American International Group, Inc. | | | 374,051 | | | | 23,180 | |
| Hartford Financial Services Group, Inc. (The) | | | 372,797 | | | | 16,202 | |
| Total | | | | | | | 50,933 | |
| | | | | | | | | |
| Internet Software & Services 1.66% | | | | | | | | |
| Alphabet, Inc. Class A* | | | 15,500 | | | | 12,059 | |
| | | | | | | | | |
| Machinery 1.58% | | | | | | | | |
| ITT Corp. | | | 315,161 | | | | 11,447 | |
| | | | | | | | | |
| Media 1.75% | | | | | | | | |
| Time Warner, Inc. | | | 195,556 | | | | 12,647 | |
| | | | | | | | | |
| Multi-Line Retail 1.50% | | | | | | | | |
| Target Corp. | | | 149,699 | | | | 10,870 | |
| | | | | | | | | |
| Multi-Utilities 1.49% | | | | | | | | |
| Sempra Energy | | | 114,784 | | | | 10,791 | |
| | | | | | | | | |
| Oil, Gas & Consumable Fuels 8.04% | | | | | | | | |
| Chevron Corp. | | | 41,400 | | | | 3,724 | |
| Devon Energy Corp. | | | 152,300 | | | | 4,874 | |
| EOG Resources, Inc. | | | 170,068 | | | | 12,039 | |
| Exxon Mobil Corp. | | | 346,800 | | | | 27,033 | |
| Marathon Oil Corp. | | | 250,800 | | | | 3,158 | |
| Occidental Petroleum Corp. | | | 109,200 | | | | 7,383 | |
| Total | | | | | | | 58,211 | |
| | | | | | | | | |
| Pharmaceuticals 7.76% | | | | | | | | |
| Merck & Co., Inc. | | | 443,339 | | | | 23,417 | |
| Pfizer, Inc. | | | 1,016,200 | | | | 32,803 | |
| Total | | | | | | | 56,220 | |
| | | | | | | | | |
| Real Estate Investment Trusts 3.16% | | | | | | | | |
| Simon Property Group, Inc. | | | 60,000 | | | | 11,666 | |
| Vornado Realty Trust | | | 112,400 | | | | 11,236 | |
| Total | | | | | | | 22,902 | |
| | | | | | Fair | |
| | | | | | Value | |
| Investments | | Shares | | | (000) | |
| Semiconductors & Semiconductor Equipment 5.08% |
| Intel Corp. | | | 756,114 | | | $ | 26,048 | |
| Microchip Technology, Inc. | | | 230,873 | | | | 10,745 | |
| Total | | | | | | | 36,793 | |
| | | | | | | | | |
| Software 2.73% | | | | | | | | |
| Microsoft Corp. | | | 356,243 | | | | 19,764 | |
| | | | | | | | | |
| Technology Hardware, Storage & Peripherals 0.92% |
| Apple, Inc. | | | 63,217 | | | | 6,654 | |
Total Common Stocks
(cost $721,412,126) | | | | | | | 721,562 | |
| | | | | | | | | |
| | | Principal | | | | | |
| | | Amount | | | | | |
| | | (000) | | | | | |
| SHORT-TERM INVESTMENT 0.87% | | | | | | | | |
| | | | | | | | | |
| Repurchase Agreement | | | | | | | | |
| Repurchase Agreement dated 12/31/2015, 0.03% due 1/4/2016 with Fixed Income Clearing Corp. collateralized by $6,385,000 U.S. Treasury Note at 1.625% due 7/31/2020; value: $6,392,981; proceeds: $6,264,555 (cost $6,264,534) | | $ | 6,265 | | | | 6,265 | |
Total Investments in Securities 100.49%
(cost $727,676,660) | | | | | | | 727,827 | |
| Liabilities in Excess of Other Assets (0.49)% | | | | (3,529 | ) |
| Net Assets 100.00% | | | | | | $ | 724,298 | |
| | |
| * | Non-income producing security. |
| (a) | Foreign security traded in U.S. dollars. |
| 8 | See Notes to Financial Statements. |
Schedule of Investments (concluded)
December 31, 2015
The following is a summary of the inputs used as of December 31, 2015 in valuing the Fund’s investments carried at fair value(1):
| | | Level 1 | | | Level 2 | | | Level 3 | | | Total | |
| Investment Type(2)(3) | | (000) | | | (000) | | | (000) | | | (000) | |
| Common Stocks | | $ | 721,562 | | | $ | – | | | $ | – | | | $ | 721,562 | |
| Repurchase Agreement | | | – | | | | 6,265 | | | | – | | | | 6,265 | |
| Total | | $ | 721,562 | | | $ | 6,265 | | | $ | – | | | $ | 727,827 | |
| (1) | Refer to Note 2(h) for a description of fair value measurements and the three-tier hierarchy of inputs. |
| (2) | See Schedule of Investments for fair values in each industry and identification of foreign issuers and/or geography. |
| (3) | There were no Level 1/Level 2 transfers during the fiscal year ended December 31, 2015. |
| | See Notes to Financial Statements. | 9 |
Statement of Assets and Liabilities
December 31, 2015
| ASSETS: | | | | |
| Investments in securities, at fair value (cost $727,676,660) | | $ | 727,826,826 | |
| Receivables: | | | | |
| Interest and dividends | | | 1,213,601 | |
| Capital shares sold | | | 4,244 | |
| Prepaid expenses | | | 5,510 | |
| Total assets | | | 729,050,181 | |
| LIABILITIES: | | | | |
| Payables: | | | | |
| Capital shares reacquired | | | 3,445,172 | |
| Management fee | | | 313,086 | |
| Directors’ fees | | | 211,877 | |
| Fund administration | | | 25,047 | |
| Accrued expenses | | | 757,200 | |
| Total liabilities | | | 4,752,382 | |
| NET ASSETS | | $ | 724,297,799 | |
| COMPOSITION OF NET ASSETS: | | | | |
| Paid-in capital | | $ | 726,671,551 | |
| Distributions in excess of net investment income | | | (211,877 | ) |
| Accumulated net realized loss on investments | | | (2,312,041 | ) |
| Net unrealized appreciation on investments | | | 150,166 | |
| Net Assets | | $ | 724,297,799 | |
| Outstanding shares (200 million shares of common stock authorized, $.001 par value) | | | 22,485,836 | |
| Net asset value, offering and redemption price per share (Net assets divided by outstanding shares) | | $ | 32.21 | |
| 10 | See Notes to Financial Statements. |
Statement of Operations
For the Year Ended December 31, 2015
| Investment income: | | | | |
| Dividends | | $ | 16,832,971 | |
| Interest | | | 132 | |
| Total investment income | | | 16,833,103 | |
| Expenses: | | | | |
| Management fee | | | 4,029,915 | |
| Non 12b-1 service fees | | | 2,012,484 | |
| Shareholder servicing | | | 873,177 | |
| Fund administration | | | 322,393 | |
| Reports to shareholders | | | 132,553 | |
| Professional | | | 58,480 | |
| Directors’ fees | | | 29,745 | |
| Custody | | | 16,531 | |
| Other | | | 117,451 | |
| Gross expenses | | | 7,592,729 | |
| Expense reductions (See Note 8) | | | (831 | ) |
| Net expenses | | | 7,591,898 | |
| Net investment income | | | 9,241,205 | |
| Net realized and unrealized gain (loss): | | | | |
| Net realized gain on investments | | | 42,515,767 | |
| Net change in unrealized appreciation/depreciation on investments | | | (73,693,173 | ) |
| Net realized and unrealized loss | | | (31,177,406 | ) |
| Net Decrease in Net Assets Resulting From Operations | | $ | (21,936,201 | ) |
| | See Notes to Financial Statements. | 11 |
Statements of Changes in Net Assets
| | | For the Year Ended | | | For the Year Ended | |
| DECREASE IN NET ASSETS | | December 31, 2015 | | | December 31, 2014 | |
| Operations: | | | | | | | | | | |
| Net investment income | | | $ | 9,241,205 | | | | $ | 6,109,300 | |
| Net realized gain on investments | | | | 42,515,767 | | | | | 169,288,882 | |
| Net change in unrealized appreciation/depreciation on investments | | | | (73,693,173 | ) | | | | (108,306,791 | ) |
| Net increase (decrease) in net assets resulting from operations | | | | (21,936,201 | ) | | | | 67,091,391 | |
| Distributions to shareholders from: | | | | | | | | | | |
| Net investment income | | | | (9,227,497 | ) | | | | (6,132,100 | ) |
| Net realized gain | | | | (39,500,983 | ) | | | | – | |
| Total distributions to shareholders | | | | (48,728,480 | ) | | | | – | |
| Capital share transactions (See Note 12): | | | | | | | | | | |
| Proceeds from sales of shares | | | | 26,361,103 | | | | | 16,161,766 | |
| Reinvestment of distributions | | | | 48,728,480 | | | | | 6,132,100 | |
| Cost of shares reacquired | | | | (162,506,468 | ) | | | | (212,659,627 | ) |
| Net decrease in net assets resulting from capital share transactions | | | | (87,416,885 | ) | | | | (190,365,761 | ) |
| Net decrease in net assets | | | | (158,081,566 | ) | | | | (129,406,470 | ) |
| NET ASSETS: | | | | | | | | | | |
| Beginning of year | | | $ | 882,379,365 | | | | $ | 1,011,785,835 | |
| End of year | | | $ | 724,297,799 | | | | $ | 882,379,365 | |
| Distributions in excess of net investment income | | | $ | (211,877 | ) | | | $ | (211,308 | ) |
| 12 | See Notes to Financial Statements. |
This page is intentionally left blank.
| | See Notes to Financial Statements. | 13 |
Financial Highlights
| | | | | Per Share Operating Performance: |
| | | | | Investment operations: | | Distributions to
shareholders from: |
| | | Net asset
value,
beginning
of year | | Net
investment
income(a) | | Net
realized
and
unrealized
gain (loss) | | Total
from
investment
operations | | Net
investment
income | | Net
realized
gain | | Total
distributions |
| 12/31/2015 | | | $35.54 | | | | $0.40 | | | | $(1.43 | ) | | | $(1.03 | ) | | | $(0.44 | ) | | | $(1.86 | ) | | | $(2.30) | |
| 12/31/2014 | | | 33.24 | | | | 0.22 | | | | 2.33 | | | | 2.55 | | | | (0.25 | ) | | | – | | | | (0.25) | |
| 12/31/2013 | | | 24.59 | | | | 0.16 | | | | 8.66 | | | | 8.82 | | | | (0.17 | ) | | | – | | | | (0.17) | |
| 12/31/2012 | | | 22.15 | | | | 0.22 | | | | 2.46 | | | | 2.68 | | | | (0.24 | ) | | | – | | | | (0.24) | |
| 12/31/2011 | | | 23.77 | | | | 0.16 | | | | (1.61 | ) | | | (1.45 | ) | | | (0.17 | ) | | | – | | | | (0.17) | |
| (a) | Calculated using average shares outstanding during the year. |
| (b) | Total return does not consider the effects of sales charges or other expenses imposed by an insurance company and assumes the reinvestment of all distributions. |
| 14 | See Notes to Financial Statements. |
| | | | | | | Ratios to Average Net Assets: | | | Supplemental Data: |
| | Net
asset
value,
end of
year | | | Total
return(b)
(%) | | | Total
expenses
(%) | | | | Net
investment
income
(%) | | | Net
assets,
end of
year
(000) | | Portfolio
turnover
rate
(%) |
| | $32.21 | | | | (2.86 | ) | | | 0.94 | | | | 1.15 | | | | $ 724,298 | | | | 105.13 | |
| | 35.54 | | | | 7.65 | | | | 0.93 | | | | 0.65 | | | | 882,379 | | | | 121.75 | |
| | 33.24 | | | | 35.90 | | | | 0.92 | | | | 0.54 | | | | 1,011,786 | | | | 87.90 | |
| | 24.59 | | | | 12.09 | | | | 0.91 | | | | 0.94 | | | | 964,703 | | | | 72.59 | |
| | 22.15 | | | | (6.08 | ) | | | 0.92 | | | | 0.70 | | | | 993,595 | | | | 70.69 | |
| | See Notes to Financial Statements. | 15 |
Notes to Financial Statements
Lord Abbett Series Fund, Inc. (the “Company”) is registered under the Investment Company Act of 1940, as amended (the “Act”), as a diversified, open-end management investment company and was incorporated under Maryland law in 1989. The Company consists of thirteen separate portfolios. This report covers Growth and Income Portfolio (the “Fund”).
The Fund’s investment objective is long-term growth of capital and income without excessive fluctuations in market value. The Fund’s Variable Contract class shares (“Class VC Shares”), are currently issued and redeemed only in connection with investments in, and payments under, variable annuity contracts and variable life insurance policies issued by life insurance and insurance-related companies.
The preparation of the financial statements in conformity with accounting principles generally accepted in the United States of America (“U.S. GAAP”) requires management to make certain estimates and assumptions that affect the reported amounts of assets and liabilities and disclosure of contingent assets and liabilities at the date of the financial statements and the reported amounts of increases and decreases in net assets from operations during the reporting period. Actual results could differ from those estimates. The Fund is considered an investment company under U.S. GAAP and follows the accounting and reporting guidance applicable to investment companies.
| 2. | SIGNIFICANT ACCOUNTING POLICIES |
| (a) | Investment Valuation–Under procedures approved by the Fund’s Board of Directors (the “Board”), Lord, Abbett & Co. LLC (“Lord Abbett”), the Fund’s investment manager, has formed a Pricing Committee to administer the pricing and valuation of portfolio investments and to ensure that prices utilized reasonably reflect fair value. Among other things, these procedures allow the Fund to utilize independent pricing services, quotations from securities and financial instrument dealers and other market sources to determine fair value. |
| | |
| | Securities actively traded on any recognized U.S. or non-U.S. exchange or on The NASDAQ Stock Market LLC are valued at the last sale price or official closing price on the exchange or system on which they are principally traded. Events occurring after the close of trading on non-U.S. exchanges may result in adjustments to the valuation of foreign securities to reflect their fair value as of the close of regular trading on the New York Stock Exchange. The Fund may utilize an independent fair valuation service in adjusting the valuations of foreign securities. Unlisted equity securities are valued at the last quoted sale price or, if no sale price is available, at the mean between the most recently quoted bid and asked prices. |
| | |
| | Securities for which prices are not readily available are valued at fair value as determined by the Pricing Committee. The Pricing Committee considers a number of factors, including observable and unobservable inputs, when arriving at fair value. The Pricing Committee may use related or comparable assets or liabilities, recent transactions, market multiples, book values and other relevant information to determine the fair value of portfolio investments. The Board or a designated committee thereof regularly reviews fair value determinations made by the Pricing Committee and employs techniques such as reviewing related market activity, reviewing inputs and assumptions, and retrospectively comparing prices of subsequent purchases and sales transactions to fair value determinations made by the Pricing Committee. |
| | |
| | Short-term securities with 60 days or less remaining to maturity are valued using the amortized cost method, which approximates fair value. |
16
Notes to Financial Statements (continued)
| (b) | Security Transactions���Security transactions are recorded as of the date that the securities are purchased or sold (trade date). Realized gains and losses on sales of portfolio securities are calculated using the identified-cost method. |
| | |
| (c) | Investment Income–Dividend income is recorded on the ex-dividend date. Interest income is recorded on the accrual basis as earned. Discounts are accreted and premiums are amortized using the effective interest method and are included in Interest and other income on the Statement of Operations. Withholding taxes on foreign dividends have been provided for in accordance with the applicable country’s tax rules and rates. |
| | |
| (d) | Income Taxes–It is the policy of the Fund to meet the requirements of Subchapter M of the Internal Revenue Code applicable to regulated investment companies and to distribute substantially all taxable income and capital gains to its shareholders. Therefore, no income tax provision is required. |
| | |
| | The Fund files U.S. federal and various state and local tax returns. No income tax returns are currently under examination. The statute of limitations on the Fund’s filed U.S. federal tax returns remains open for the fiscal years ended December 31, 2012 through December 31, 2015. The statutes of limitations on the Company’s state and local tax returns may remain open for an additional year depending upon the jurisdiction. |
| | |
| (e) | Expenses–Expenses incurred by the Company that do not specifically relate to an individual fund are generally allocated to the funds within the Company on a pro rata basis by relative net assets. |
| | |
| (f) | Foreign Transactions–The books and records of the Fund are maintained in U.S. dollars and transactions denominated in foreign currencies are recorded in the Fund’s records at the rate prevailing when earned or recorded. Asset and liability accounts that are denominated in foreign currencies are adjusted daily to reflect current exchange rates and any unrealized gain (loss) is included in Net change in unrealized appreciation/depreciation on investments on the Fund’s Statement of Operations. The resultant exchange gains and losses upon settlement of such transactions are included in Net realized loss on investments on the Fund’s Statement of Operations. The Fund does not isolate that portion of the results of operations arising as a result of changes in the foreign exchange rates from the changes in market prices of the securities. |
| | |
| (g) | Repurchase Agreements–The Fund may enter into repurchase agreements with respect to securities. A repurchase agreement is a transaction in which a fund acquires a security and simultaneously commits to resell that security to the seller (a bank or securities dealer) at an agreed-upon price on an agreed-upon date. The Fund requires at all times that the repurchase agreement be collateralized by cash, or by securities of the U.S. Government, its agencies, its instrumentalities, or U.S. Government sponsored enterprises having a value equal to, or in excess of, the value of the repurchase agreement (including accrued interest). If the seller of the agreement defaults on its obligation to repurchase the underlying securities at a time when the fair value of these securities has declined, the Fund may incur a loss upon disposition of the securities. |
| | |
| (h) | Fair Value Measurements–Fair value is defined as the price that the Fund would receive upon selling an investment or transferring a liability in an orderly transaction to an independent buyer in the principal or most advantageous market of the investment. A three-tier hierarchy is used to maximize the use of observable market data and minimize the use of unobservable inputs and to establish classification of fair value measurements for disclosure |
17
Notes to Financial Statements (continued)
| | purposes. Inputs refer broadly to the assumptions that market participants would use in pricing the asset or liability, including assumptions about risk—for example, the risk inherent in a particular valuation technique used to measure fair value (such as a pricing model) and/or the risk inherent in the inputs to the valuation technique. Inputs may be observable or unobservable. Observable inputs reflect the assumptions market participants would use in pricing the asset or liability. Observable inputs are based on market data obtained from sources independent of the reporting entity. Unobservable inputs reflect the reporting entity’s own assumptions about the assumptions market participants would use in pricing the asset or liability. Unobservable inputs are based on the best information available in the circumstances. The three-tier hierarchy of inputs is summarized in the three broad Levels listed below: |
| • | Level 1 – | unadjusted quoted prices in active markets for identical investments; |
| | | |
| • | Level 2 – | other significant observable inputs (including quoted prices for similar investments, interest rates, prepayment speeds, credit risk, etc.); and |
| | | |
| • | Level 3 – | significant unobservable inputs (including the Fund’s own assumptions in determining the fair value of investments). |
| | A summary of inputs used in valuing the Fund’s investments as of December 31, 2015 and, if applicable, Level 1/Level 2 transfers and Level 3 rollforwards for the fiscal year then ended is included in the Fund’s Schedule of Investments. |
| | |
| | Changes in valuation techniques may result in transfers into or out of an assigned level within the three-tier hierarchy. All transfers between different levels within the three-tier hierarchy are deemed to have occurred as of the beginning of the reporting period. The inputs or methodology used for valuing securities are not necessarily an indication of the risk associated with investing in those securities. |
| 3. | MANAGEMENT FEE AND OTHER TRANSACTIONS WITH AFFILIATES |
Management Fee
The Company has a management agreement with Lord Abbett, pursuant to which Lord Abbett supplies the Fund with investment management services and executive and other personnel, provides office space and pays for ordinary and necessary office and clerical expenses relating to research and statistical work and supervision of the Fund’s investment portfolio.
The management fee is based on the Fund’s average daily net assets at the following annual rate:
| First $1 billion | .50% |
| Over $1 billion | .45% |
For the fiscal year ended December 31, 2015, the effective management fee paid to Lord Abbett was at an annualized rate of .50% of the Fund’s average daily net assets.
In addition, Lord Abbett provides certain administrative services to the Fund pursuant to an Administrative Services Agreement in return for a fee at an annual rate of .04% of the Fund’s average daily net assets.
The Company, on behalf of the Fund, has entered into services arrangements with certain insurance companies. Under these arrangements, certain insurance companies will be compensated up to .25% of the average daily net asset value (“NAV”) of the Fund’s Class VC Shares held in the insurance company’s separate account to service and maintain the Variable Contract owners’ accounts. This amount is included in Non 12b-1 service fees on the Statement of Operations. The
18
Notes to Financial Statements (continued)
Fund may also compensate certain insurance companies, third-party administrators and other entities for providing recordkeeping, sub-transfer agency and other administrative services to the Fund. This amount is included in Shareholder servicing on the Statement of Operations.
A Director and certain of the Company’s officers have an interest in Lord Abbett.
| 4. | DISTRIBUTIONS AND CAPITAL LOSS CARRYFORWARDS |
Dividends from net investment income, if any, are declared and paid at least semi-annually. Taxable net realized gains from investment transactions, reduced by allowable capital loss carryforwards, if any, are declared and distributed to shareholders at least annually. The capital loss carryforward amount, if any, is available to offset future net capital gains. Dividends and distributions to shareholders are recorded on the ex-dividend date. The amounts of dividends and distributions from net investment income and net realized capital gains are determined in accordance with federal income tax regulations, which may differ from U.S. GAAP. These book/tax differences are either considered temporary or permanent in nature. To the extent these differences are permanent in nature, such amounts are reclassified within the components of net assets based on their federal tax basis treatment; temporary differences do not require reclassification. Dividends and distributions that exceed earnings and profits for tax purposes are reported as a tax return of capital.
The tax character of distributions paid during the fiscal years ended December 31, 2015 and 2014 was as follows:
| | | Year Ended | | Year Ended |
| | | 12/31/2015 | | 12/31/2014 |
| Distributions paid from: | | | | | | |
| Ordinary income | | $ | 9,226,920 | | $ | 6,132,100 |
| Net long-term capital gains | | | 39,501,560 | | | – |
| Total distributions paid | | $ | 48,728,480 | | $ | 6,132,100 |
As of December 31, 2015, the components of accumulated losses on a tax-basis were as follows:
| Undistributed long-term capital gains | | $ | 2,143,944 | |
| Total undistributed earnings | | | 2,143,944 | |
| Temporary differences | | | (211,877 | ) |
| Unrealized losses – net | | | (4,305,819 | ) |
| Total accumulated losses – net | | $ | (2,373,752 | ) |
As of December 31, 2015, the aggregate unrealized security gains and losses based on cost for U.S. federal income tax purposes were as follows:
| Tax cost | | $ | 732,132,645 | |
| Gross unrealized gain | | | 38,928,935 | |
| Gross unrealized loss | | | (43,234,754 | ) |
| Net unrealized security loss | | $ | (4,305,819 | ) |
The difference between book-basis and tax-basis unrealized gains (losses) is attributable to wash sales.
19
Notes to Financial Statements (continued)
Permanent items identified during the fiscal year ended December 31, 2015 have been reclassified among the components of net assets based on their tax basis treatment as follows:
| Distributions in | | Accumulated |
| Excess of Net | | Net Realized |
| Investment Income | | Loss |
| $(14,277) | | $14,277 |
The permanent differences are attributable to the tax treatment of certain distributions.
| 5. | PORTFOLIO SECURITIES TRANSACTIONS |
Purchases and sales of investment securities (excluding short-term investments) for the fiscal year ended December 31, 2015 were as follows:
| Purchases | | Sales |
| $830,831,248 | | $958,954,077 |
There were no purchases or sales of U.S. Government securities for the fiscal year ended December 31, 2015.
The Fund is permitted to purchase and sell securities (“cross-trade”) from and to other Lord Abbett Funds or client accounts pursuant to procedures approved by the Board in compliance with Rule 17a-7 under the Act (the “Rule”). Each cross-trade is executed at a fair market price in compliance with provisions of the Rule. For the year ended December 31, 2015, the Fund engaged in cross-trade purchases of $2,881,670.
| 6. | DISCLOSURES ABOUT OFFSETTING ASSETS AND LIABILITIES |
The Financial Accounting Standards Board (“FASB”) requires disclosures intended to help better assess the effect or potential effect of offsetting arrangements on a fund’s financial position. The following tables illustrate gross and net information about recognized assets and liabilities eligible for offset in the statement of assets and liabilities; and disclose such amounts subject to an enforceable master netting agreement or similar agreement, by counterparty. A master netting agreement is an agreement between a fund and a counterparty which provides for the net settlement of amounts owed under all contracts traded under that agreement, as well as cash collateral, through a single payment by one party to the other in the event of default on or termination of any one contract. The Fund’s accounting policy with respect to balance sheet offsetting is that, absent an event of default by the counterparty or a termination of the agreement, the master netting agreement does not result in an offset of reported amounts of financial assets and liabilities in the statement of assets and liabilities across transactions between the Fund and the applicable counterparty:
| | | | | Gross Amounts | | Net Amounts of |
| | | | | Offset in the | | Assets Presented |
| | | Gross Amounts of | | Statement of Assets | | in the Statement of |
| Description | | Recognized Assets | | and Liabilities | | Assets and Liabilities |
| Repurchase Agreement | | $6,264,534 | | $ – | | $6,264,534 |
| Total | | $6,264,534 | | $ – | | $6,264,534 |
20
Notes to Financial Statements (continued)
| | | Net Amounts | | | | | | | | |
| | | of Assets | | Amounts Not Offset in the | | |
| | | Presented in | | Statement of Assets and Liabilities | | |
| | | the Statement | | | | Cash | | Securities | | |
| | | of Assets and | | Financial | | Collateral | | Collateral | | Net |
| Counterparty | | Liabilities | | Instruments | | Received(a) | | Received(a) | | Amount(b) |
| Fixed Income Clearing Corp. | | $6,264,534 | | $ – | | $ – | | $(6,264,534) | | $ – |
| Total | | $6,264,534 | | $ – | | $ – | | $(6,264,534) | | $ – |
| (a) | Collateral disclosed is limited to an amount not to exceed 100% of the net amount of assets presented in the Statement of Assets and Liabilities, for each respective counterparty. |
| (b) | Net amount represents the amount owed to the Fund by the counterparty as of December 31, 2015. |
| 7. | DIRECTORS’ REMUNERATION |
The Company’s officers and a Director, who are associated with Lord Abbett, do not receive any compensation from the Company for serving in such capacities. Independent Directors’ fees are allocated among all Lord Abbett-sponsored funds based on the net assets of each fund. There is an equity-based plan available to all Independent Directors under which Independent Directors must defer receipt of a portion of, and may elect to defer receipt of an additional portion of Directors’ fees. The deferred amounts are treated as though equivalent dollar amounts had been invested in the funds. Such amounts and earnings accrued thereon are included in Directors’ fees on the Statement of Operations and in Directors’ fees payable on the Statement of Assets and Liabilities and are not deductible for U.S. federal income tax purposes until such amounts are paid.
The Company has entered into an arrangement with its transfer agent and custodian, whereby credits realized as a result of uninvested cash balances are used to reduce a portion of the Fund’s expenses.
Effective August 31, 2015, the Fund and certain other funds managed by Lord Abbett (collectively, the “Participating Funds”) entered into a syndicated line of credit facility with various lenders for $550 million (the “Facility”), whereas State Street Bank and Trust Company (“SSB”) participates as a lender and as agent for the lenders. The Facility is to be used for temporary or emergency purposes as an additional source of: liquidity to satisfy redemptions. The Participating Funds are subject to graduated borrowing limits of one-third of Fund assets (if Fund assets are less than $750 million), $250 million, $300 million, or $350 million, based on past borrowings and likelihood of future borrowings. The Facility will continue through August 29, 2016.
Prior to August 31, 2015, the Fund and certain other funds managed by Lord Abbett participated in a $500 million unsecured revolving credit facility with SSB (the “SSB Facility”).
During the fiscal year ended December 31, 2015, the Fund did not utilize the Facility or the SSB Facility.
| 10. | CUSTODIAN AND ACCOUNTING AGENT |
SSB is the Company’s custodian and accounting agent. SSB performs custodial, accounting and recordkeeping functions relating to portfolio transactions and calculating the Fund’s NAV.
21
Notes to Financial Statements (concluded)
The Fund is subject to the general risks and considerations associated with equity investing, as well as the particular risks associated with value stocks. The value of an investment will fluctuate in response to movements in the equity securities market in general and to the changing prospects of individual companies in which the Fund invests. Large-cap value stocks may perform differently than the market as a whole and other types of stocks, such as small company stocks and growth stocks. This is because different types of stocks tend to shift in and out of favor depending on market and economic conditions. The market may fail to recognize the intrinsic value of particular value stocks for a long time. In addition, if the Fund’s assessment of a company’s value or prospects for exceeding earnings expectations or market conditions is wrong, the Fund could suffer losses or produce poor performance relative to other funds, even in a rising market.
Due to its investments in multinational companies, foreign companies and American Depositary Receipts, the Fund may experience increased market, liquidity, currency, political, information and other risks.
These factors can affect the Fund’s performance.
| 12. | SUMMARY OF CAPITAL TRANSACTIONS |
Transactions in shares of capital stock were as follows:
| | | Year Ended | | | Year Ended | |
| | | December 31, 2015 | | | December 31, 2014 | |
| Shares sold | | 762,180 | | | 474,291 | |
| Reinvestment of distributions | | 1,522,289 | | | 170,855 | |
| Shares reacquired | | (4,628,201 | ) | | (6,256,074 | ) |
| Decrease | | (2,343,732 | ) | | (5,610,928 | ) |
22
Report of Independent Registered Public Accounting Firm
To the Board of Directors of Lord Abbett Series Fund, Inc. and the Shareholders of Growth and Income Portfolio:
We have audited the accompanying statement of assets and liabilities, including the schedule of investments, of the Growth and Income Portfolio, one of the portfolios constituting the Lord Abbett Series Fund, Inc. (the “Fund”) as of December 31, 2015, and the related statement of operations for the year then ended, the statements of changes in net assets for each of the two years in the period then ended, and the financial highlights for each of the five years in the period then ended. These financial statements and financial highlights are the responsibility of the Fund’s management. Our responsibility is to express an opinion on these financial statements and financial highlights based on our audits.
We conducted our audits in accordance with the standards of the Public Company Accounting Oversight Board (United States). Those standards require that we plan and perform the audit to obtain reasonable assurance about whether the financial statements and financial highlights are free of material misstatement. The Fund is not required to have, nor were we engaged to perform, an audit of its internal control over financial reporting. Our audits included consideration of internal control over financial reporting as a basis for designing audit procedures that are appropriate in the circumstances, but not for the purpose of expressing an opinion on the effectiveness of the Fund’s internal control over financial reporting. Accordingly, we express no such opinion. An audit also includes examining, on a test basis, evidence supporting the amounts and disclosures in the financial statements, assessing the accounting principles used and significant estimates made by management, as well as evaluating the overall financial statement presentation. Our procedures included confirmation of securities owned as of December 31, 2015, by correspondence with the custodian. We believe that our audits provide a reasonable basis for our opinion.
In our opinion, such financial statements and financial highlights referred to above present fairly, in all material respects, the financial position of Growth and Income Portfolio of the Lord Abbett Series Fund, Inc. as of December 31, 2015, the results of its operations for the year then ended, the changes in its net assets for each of the two years in the period then ended, and the financial highlights for each of the five years in the period then ended, in conformity with accounting principles generally accepted in the United States of America.
DELOITTE & TOUCHE LLP
New York, New York
February 16, 2016
23
Supplemental Proxy Information (unaudited)
A special meeting of shareholders of Growth and Income Portfolio was held on November 5, 2015. The special meeting was held for shareholders of the Fund to vote on the following matters:
| | 1. | To amend the Fund’s fundamental restrictions related to borrowing and lending to enable the Fund to participate in an interfund lending program; and |
| | | |
| | 2. | To ratify the selection of Deloitte & Touche LLP as independent registered public accounting firm for the Fund’s current fiscal year. |
The results of the proxy solicitation on the preceding matter were as follows:
| 1. | To approve the amendment to the fundamental investment restrictions of the Fund as described in the proxy statement: |
| | |
| | (a) Amend the fundamental investment restriction with respect to Borrowing |
| | | | Votes For | | | | Votes Against | | | | Abstain | | | | Broker
Non-Votes |
| Growth and Income Portfolio | | | 17,144,295 | | | | 837,093 | | | | 1,444,128 | | | | 0 |
| 1. | To approve the amendment to the fundamental investment restrictions of the Fund as described in the proxy statement: |
| | |
| | (b) Amend the fundamental investment restriction with respect to Lending |
| | | | Votes For | | | | Votes Against | | | | Abstain | | | | Broker
Non-Votes |
| Growth and Income Portfolio | | | 17,094,998 | | | | 873,150 | | | | 1,457,368 | | | | 0 |
| 2. | To ratify the selection of Deloitte & Touche LLP as the Fund’s independent registered public accounting firm for the Fund’s current fiscal year |
| | | | Votes For | | | | Votes Against | | | | Abstain | | | | Broker
Non-Votes |
| Growth and Income Portfolio | | | 17,760,414 | | | | 322,738 | | | | 1,342,364 | | | | – |
24
Basic Information About Management
The Board is responsible for the management of the business and affairs of the Company in accordance with the laws of the State of Maryland. The Board elects officers who are responsible for the day-to-day operations of the Fund and who execute policies authorized by the Board. The Board also approves an investment adviser to the Fund and continues to monitor the cost and quality of the services the investment adviser provides, and annually considers whether to renew the contract with the adviser. Generally, each Director holds office until his/her successor is elected and qualified or until his/her earlier resignation or removal, as provided in the Company’s organizational documents.
Lord Abbett, a Delaware limited liability company, is the Fund’s investment adviser. Designated Lord Abbett personnel are responsible for the day-to-day management of the Fund.
Interested Director
Ms. Foster is affiliated with Lord Abbett and is an “interested person” of the Company as defined in the Act. Ms. Foster is a director/trustee and officer of each of the 12 investment companies in the Lord Abbett Family of Funds, which consist of 58 portfolios or series.
| | | Current Position and | | |
| Name, Address and | | Length of Service | | Principal Occupation and Other Directorships |
| Year of Birth | | with the Fund | | During the Past Five Years |
| | | | | |
Daria L. Foster
Lord, Abbett & Co. LLC
90 Hudson Street
Jersey City, NJ 07302
(1954) | | Director and President
since 2006; Chief
Executive Officer
since 2012 | | Principal Occupation: Managing Partner of Lord Abbett, joined Lord Abbett in 1990.
Other Directorships: None. |
Independent Directors
The following Independent Directors also are directors/trustees of each of the 12 investment companies in the Lord Abbett Family of Funds, which consist of 58 portfolios or series.
| | | Current Position and | | |
| Name, Address and | | Length of Service | | Principal Occupation and Other Directorships |
| Year of Birth | | with the Fund | | During the Past Five Years |
| | | | | |
E. Thayer Bigelow
Lord, Abbett & Co. LLC
c/o Legal Dept.
90 Hudson Street
Jersey City, NJ 07302
(1941) | | Director since 1994;
Chairman since 2013 | | Principal Occupation: Managing General Partner, Bigelow Media, LLC (since 2000); Senior Adviser, Time Warner Inc. (1998–2000).
Other Directorships: Currently serves as director of Crane Co. (since 1984) and Huttig Building Products Inc. (since 1998). Previously served as a director of R.H. Donnelley Inc. (2009–2010). |
| | | | | |
Robert B. Calhoun, Jr.
Lord, Abbett & Co. LLC
c/o Legal Dept.
90 Hudson Street
Jersey City, NJ 07302
(1942) | | Director since 1998 | | Principal Occupation: Senior Advisor of Monitor Clipper Partners, a private equity investment fund (since 1997); President of Clipper Asset Management Corp. (1991–2009).
Other Directorships: None. |
25
Basic Information About Management (continued)
| | | Current Position and | | |
| Name, Address and | | Length of Service | | Principal Occupation and Other Directorships |
| Year of Birth | | with the Fund | | During the Past Five Years |
| | | | | |
Eric C. Fast
Lord, Abbett & Co. LLC
c/o Legal Dept.
90 Hudson Street
Jersey City, NJ 07302
(1949) | | Director since 2014 | | Principal Occupation: Chief Executive Officer of Crane Co., an industrial products company (2001–2014).
Other Directorships: Currently serves as director of Automatic Data Processing, Inc. (since 2007) and Regions Financial Corporation (since 2010). Previously served as a director of Crane Co. (1999–2014). |
| | | | | |
Evelyn E. Guernsey
Lord, Abbett & Co. LLC
c/o Legal Dept.
90 Hudson Street
Jersey City, NJ 07302
(1955) | | Director since 2011 | | Principal Occupation: CEO, Americas of J.P. Morgan Asset Management (2004–2010).
Other Directorships: None. |
| | | | | |
Julie A. Hill
Lord, Abbett & Co. LLC
c/o Legal Dept.
90 Hudson Street
Jersey City, NJ 07302
(1946) | | Director since 2004 | | Principal Occupation: Owner and CEO of The Hill Company, a business consulting firm (since 1998).
Other Directorships: Currently serves as director of Anthem, Inc., a health benefits company (since 1994). |
| | | | | |
Franklin W. Hobbs
Lord, Abbett & Co. LLC
c/o Legal Dept.
90 Hudson Street
Jersey City, NJ 07302
(1947) | | Director since 2001 | | Principal Occupation: Advisor of One Equity Partners, a private equity firm (since 2004).
Other Directorships: Currently serves as director and Chairman of the Board of Ally Financial Inc., a financial services firm (since 2009), and as director of Molson Coors Brewing Company (since 2002). |
| | | | | |
James M. McTaggart
Lord, Abbett & Co. LLC
c/o Legal Dept.
90 Hudson Street
Jersey City, NJ 07302
(1947) | | Director since 2012 | | Principal Occupation: Independent management advisor and consultant (since 2012); Vice President, CRA International, Inc. (doing business as Charles River Associates), a global management consulting firm (2009–2012); Founder and Chairman of Marakon Associates, Inc., a strategy consulting firm (1978–2009); and Officer and Director of Trinsum Group, a holding company (2007–2009). |
| | | | | |
| | | | | Other Directorships: Currently serves as director of Blyth, Inc., a home products company (since 2004). |
| | | | | |
James L.L. Tullis
Lord, Abbett & Co. LLC
c/o Legal Dept.
90 Hudson Street
Jersey City, NJ 07302
(1947) | | Director since 2006 | | Principal Occupation: CEO of Tullis-Dickerson and Co. Inc., a venture capital management firm (since 1990); CEO of Tullis Health Investors Inc. (since 2012).
Other Directorships: Currently serves as director of Crane Co. (since 1998). |
26
Basic Information About Management (continued)
Officers
None of the officers listed below have received compensation from the Company. All of the officers of the Company also may be officers of the other Lord Abbett Funds and maintain offices at 90 Hudson Street, Jersey City, NJ 07302. Unless otherwise indicated, the position(s) and title(s) listed under the “Principal Occupation During the Past Five Years” column indicate each officer’s position(s) and title(s) with Lord Abbett. Each officer serves for an indefinite term (i.e., until his or her death, resignation, retirement, or removal).
| | | | | Length of Service | | |
| Name and | | Current Position | | of Current | | Principal Occupation |
| Year of Birth | | with the Fund | | Position | | During the Past Five Years |
| | | | | | | |
Daria L. Foster
(1954) | | President and Chief
Executive Officer | | Elected as President in 2006 and Chief Executive Officer in 2012 | | Managing Partner of Lord Abbett, joined Lord Abbett in 1990. |
| | | | | | | |
Sean J. Aurigemma
(1969) | | Executive Vice President | | Elected in 2010 | | Portfolio Manager, joined Lord Abbett in 2007. |
| | | | | | | |
Jeff D. Diamond
(1960) | | Executive Vice President | | Elected in 2008 | | Portfolio Manager, joined Lord Abbett in 2007. |
| | | | | | | |
Robert I. Gerber
(1954) | | Executive Vice President | | Elected in 2003 | | Partner and Chief Investment Officer, joined Lord Abbett in 1997. |
| | | | | | | |
Todd D. Jacobson
(1966) | | Executive Vice President | | Elected in 2005 | | Partner and Associate Director, joined Lord Abbett in 2003. |
| | | | | | | |
Robert A. Lee
(1969) | | Executive Vice President | | Elected in 2010 | | Partner and Deputy Chief Investment Officer, joined Lord Abbett in 1997. |
| | | | | | | |
Thomas B. Maher
(1967) | | Executive Vice President | | Elected in 2010 | | Partner and Portfolio Manager, joined Lord Abbett in 2003. |
| | | | | | | |
Justin C. Maurer
(1969) | | Executive Vice President | | Elected in 2010 | | Partner and Portfolio Manager, joined Lord Abbett in 2001. |
| | | | | | | |
Vincent J. McBride
(1964) | | Executive Vice President | | Elected in 2010 | | Partner and Director, joined Lord Abbett in 2003. |
| | | | | | | |
Andrew H. O’Brien
(1973) | | Executive Vice President | | Elected in 2010 | | Partner and Portfolio Manager, joined Lord Abbett in 1998. |
| | | | | | | |
F. Thomas O’Halloran, III
(1955) | | Executive Vice President | | Elected in 2010 | | Partner and Portfolio Manager, joined Lord Abbett in 2001. |
| | | | | | | |
Walter H. Prahl
(1958) | | Executive Vice President | | Elected in 2012 | | Partner and Director, joined Lord Abbett in 1997. |
| | | | | | | |
Steven F. Rocco
(1979) | | Executive Vice President | | Elected in 2014 | | Partner and Portfolio Manager, joined Lord Abbett in 2004. |
| | | | | | | |
Frederick J. Ruvkun
(1957) | | Executive Vice President | | Elected in 2012 | | Partner and Portfolio Manager, joined Lord Abbett in 2006. |
27
Basic Information About Management (continued)
| | | | | Length of Service | | |
| Name and | | Current Position | | of Current | | Principal Occupation |
| Year of Birth | | with the Fund | | Position | | During the Past Five Years |
| | | | | | | |
Paul J. Volovich
(1973) | | Executive Vice President | | Elected in 2005 | | Partner and Portfolio Manager, joined Lord Abbett in 1997. |
| | | | | | | |
A. Edward Allinson
(1961) | | Vice President | | Elected in 2011 | | Portfolio Manager, joined Lord Abbett in 2005. |
| | | | | | | |
John W. Ashbrook
(1964) | | Vice President and
Assistant Secretary | | Elected in 2014 | | Assistant General Counsel, joined Lord Abbett in 2008. |
| | | | | | | |
Joan A. Binstock
(1954) | | Chief Financial Officer
and Vice President | | Elected in 1999 | | Partner and Chief Financial and Operations Officer, joined Lord Abbett in 1999. |
| | | | | | | |
Brooke A. Fapohunda
(1975) | | Vice President and
Assistant Secretary | | Elected in 2014 | | Deputy General Counsel, joined Lord Abbett in 2006. |
| | | | | | | |
John K. Forst
(1960) | | Vice President and
Assistant Secretary | | Elected in 2005 | | Partner and Deputy General Counsel, joined Lord Abbett in 2004. |
| | | | | | | |
Anthony W. Hipple
(1964) | | Vice President | | Elected in 2014 | | Portfolio Manager, joined Lord Abbett in 2002. |
| | | | | | | |
Lawrence H. Kaplan
(1957) | | Vice President and
Secretary | | Elected in 1997 | | Partner and General Counsel, joined Lord Abbett in 1997. |
| | | | | | | |
Jerald M. Lanzotti
(1967) | | Vice President | | Elected in 2012 | | Partner and Portfolio Manager, joined Lord Abbett in 1996. |
| | | | | | | |
David J. Linsen
(1974) | | Vice President | | Elected in 2008 | | Partner and Director, joined Lord Abbett in 2001. |
| | | | | | | |
Joseph M. McGill
(1962) | | Chief Compliance Officer | | Elected in 2014 | | Chief Compliance Officer, joined Lord Abbett in 2014 and was formerly Managing Director and the Chief Compliance Officer at UBS Global Asset Management (2003–2013). |
| | | | | | | |
A. Edward Oberhaus, III
(1959) | | Vice President | | Elected in 1998 | | Partner and Director, joined Lord Abbett in 1983. |
| | | | | | | |
Noah Petrucci
(1970) | | Vice President | | Elected in 2013 | | Portfolio Manager, joined Lord Abbett in 2012 and was formerly a Portfolio Manager at Columbia Management Investment Advisers, LLC and Columbia Management Advisors, LLC (2002–2012). |
| | | | | | | |
Lawrence B. Stoller
(1963) | | Vice President and
Assistant Secretary | | Elected in 2007 | | Partner and Senior Deputy General Counsel, joined Lord Abbett in 2007. |
28
Basic Information About Management (concluded)
| | | | | Length of Service | | |
| Name and | | Current Position | | of Current | | Principal Occupation |
| Year of Birth | | with the Fund | | Position | | During the Past Five Years |
| | | | | | | |
Arthur K. Weise
(1970) | | Vice President | | Elected in 2010 | | Partner and Portfolio Manager, joined Lord Abbett in 2007. |
| | | | | | | |
Kewjin Yuoh
(1971) | | Vice President | | Elected in 2012 | | Partner and Portfolio Manager, joined Lord Abbett in 2010. |
| | | | | | | |
Scott S. Wallner
(1955) | | AML Compliance Officer | | Elected in 2011 | | Assistant General Counsel, joined Lord Abbett in 2004. |
| | | | | | | |
Bernard J. Grzelak
(1971) | | Treasurer | | Elected in 2003 | | Partner and Director of Fund Administration, joined Lord Abbett in 2003. |
Please call 888-522-2388 for a copy of the statement of additional information, which contains further information about the Company’s Directors. It is available free upon request.
29
Approval of Advisory Contract
The Board of Directors of the Fund, including all of the Directors who are not interested persons of the Fund or of Lord Abbett (the “Independent Board Members”), annually considers whether to approve the continuation of the existing management agreement between the Fund and Lord Abbett. In connection with its most recent approval, the Board reviewed materials relating specifically to the management agreement, as well as numerous materials received throughout the course of the year, including information about the Fund’s investment performance compared to the performance of its benchmark. Before making its decision as to the Fund, the Board had the opportunity to ask questions and request further information, taking into account its familiarity with Lord Abbett gained through its meetings and discussions. These meetings and discussions included the examination of the portfolio management team conducted by members of the Contract Committee, the deliberations of the Contract Committee, and discussions between the Contract Committee and Lord Abbett’s management. The Independent Board Members also discussed the materials described above with their independent legal counsel in a private session at which no representatives of management were present.
The materials received by the Board included, but were not limited to: (1) information provided by Morningstar Associates, LLC (“Morningstar”) regarding the investment performance of the Fund compared to the investment performance of a group of funds in the same Morningstar investment category (the “performance peer group”) and the investment performance of one or more appropriate benchmarks; (2) information provided by Morningstar regarding the expense ratios, contractual and effective management fee rates, and other expense components for the Fund and one or more groups of funds in the same Morningstar category, with the same share classes and operational characteristics, including asset size (the “expense peer group”); (3) information provided by Lord Abbett on the projected expense ratios, management fee rates, and other expense components for the Fund; (4) sales and redemption information for the Fund; (5) information regarding Lord Abbett’s financial condition; (6) an analysis of the relative profitability of the management agreement to Lord Abbett; (7) information provided by Lord Abbett regarding the investment management fees Lord Abbett receives from its other advisory clients maintaining accounts with a similar investment strategy as the Fund; (8) information regarding the distribution arrangements of the Fund; and (9) information regarding the personnel and other resources devoted by Lord Abbett to managing the Fund.
Investment Management Services Generally. The Board considered the investment management services provided by Lord Abbett to the Fund, including investment research, portfolio management, and trading, and Lord Abbett’s commitment to compliance with all applicable legal requirements. The Board also observed that Lord Abbett was solely engaged in the investment management business and accordingly did not experience the conflicts of interest that may result from being engaged in other lines of business. The Board considered the investment advisory services provided by Lord Abbett to other clients, the fees charged for the services, and the differences in the nature of the services provided to the Fund and other Lord Abbett Funds, on the one hand, and the services provided to other clients, on the other.
Investment Performance. The Board reviewed the Fund’s investment performance in relation to that of the performance peer group as of various periods ended August 31, 2015. The Board observed that the Fund’s investment performance was below the median of the performance peer group for the one-year, five-year, and ten-year periods and above the median of the performance peer group for the three-year period.
30
Approval of Advisory Contract (continued)
Lord Abbett’s Personnel and Methods. The Board considered the qualifications of the personnel providing investment management services to the Fund, in light of its investment objective and discipline. Among other things, the Board considered the size, experience, and turnover of Lord Abbett’s investment management staff, Lord Abbett’s investment methodology and philosophy, and Lord Abbett’s approach to recruiting, training, and retaining investment management personnel.
Nature and Quality of Other Services. The Board considered the nature, quality, costs, and extent of compliance, administrative, and other services performed by Lord Abbett and Lord Abbett Distributor LLC (the “Distributor”) and the nature and extent of Lord Abbett’s supervision of third party service providers, including the Fund’s transfer agent and custodian.
Expenses. The Board considered the expense level of the Fund and the expense levels of the expense peer group. It also considered the projected expense levels and how those levels would relate to those of the expense peer group and the amount and nature of the fees paid by shareholders. The Board observed that the overall expense level of the Fund was below the median of the expense peer group.
Profitability. The Board considered the level of Lord Abbett’s profits in managing the Fund, including a review of Lord Abbett’s methodology for allocating its costs to its management of the Fund. The Board concluded that the allocation methodology had a reasonable basis and was appropriate. It considered any profits realized by Lord Abbett in connection with the operation of the Fund, including the fee that Lord Abbett receives from the Fund for providing administrative services to the Fund, and whether the amount of profit was fair for the management of the Fund. The Board also considered the profits realized from other business segments of Lord Abbett, which may benefit from or be related to the Fund’s business. The Board considered Lord Abbett’s profit margins in comparison with available industry data, both accounting for and ignoring marketing and distribution expenses, and how those profit margins could affect Lord Abbett’s ability to recruit and retain investment personnel. The Board recognized that Lord Abbett’s profitability was a factor in enabling it to attract and retain qualified investment management personnel to provide services to the Fund. The Board concluded that Lord Abbett’s profitability as to the Fund was not excessive.
Economies of Scale. The Board considered whether there had been any economies of scale in managing the Fund, whether the Fund had appropriately benefited from any such economies of scale, and whether there was potential for realization of any further economies of scale. The Board concluded that the existing management fee schedule, with its breakpoint or breakpoints in the level of the management fee, adequately addressed any economies of scale in managing the Fund.
Other Benefits to Lord Abbett. The Board considered the character and amount of fees paid by the Fund and the Fund’s shareholders to Lord Abbett and the Distributor for services other than investment advisory services. The Board also considered the revenues and profitability of Lord Abbett’s investment advisory business apart from its mutual fund business, and the intangible benefits enjoyed by Lord Abbett by virtue of its relationship with the Fund. The Board observed that the Distributor receives 12b-1 fees from certain of the Lord Abbett Funds as to shares held in accounts for which there is no other broker of record, may retain a portion of the 12b-1 fees it receives, and receives a portion of the sales charges on sales and redemptions of some classes of shares. In addition, the Board observed that Lord Abbett accrues certain benefits for its business of providing investment advice to clients other than the Lord Abbett Funds, but that business also benefits the Funds. The Board also noted that Lord Abbett, as disclosed in the prospectus of the Fund, has entered into revenue sharing arrangements with certain entities that distribute shares of
31
Approval of Advisory Contract (concluded)
the Fund. The Board also took into consideration the investment research that Lord Abbett receives as a result of Fund brokerage transactions.
Alternative Arrangements. The Board considered whether, instead of approving continuation of the management agreement, it might be in the best interests of the Fund to implement one or more alternative arrangements, such as continuing to employ Lord Abbett, but on different terms. After considering all of the relevant factors, the Board unanimously found that continuation of the existing management agreement was in the best interests of the Fund and its shareholders and voted unanimously to approve the continuation of the management agreement. In considering whether to approve the continuation of the management agreement, the Board did not identify any single factor as paramount or controlling. This summary does not discuss in detail all matters considered.
32
Householding
The Company has adopted a policy that allows it to send only one copy of the Fund’s prospectus, proxy material, annual report and semiannual report to certain shareholders residing at the same “household.” This reduces Fund expenses, which benefits you and other shareholders. If you need additional copies or do not want your mailings to be “householded,” please call Lord Abbett at 888-522-2388 or send a written request with your name, the name of your fund or funds and your account number or numbers to Lord Abbett Family of Funds, P.O. Box 219336, Kansas City, MO 64121.
Proxy Voting Policies, Procedures and Records
A description of the policies and procedures that Lord Abbett uses to vote proxies related to the Fund’s portfolio securities, and information on how Lord Abbett voted the Fund’s proxies during the 12-month period ended June 30 are available without charge, upon request, (i) by calling 888-522-2388; (ii) on Lord Abbett’s Website at www.lordabbett.com; and (iii) on the Securities and Exchange Commission’s (“SEC”) Website at www.sec.gov.
Shareholder Reports and Quarterly Portfolio Disclosure
The Fund is required to file its complete schedule of portfolio holdings with the SEC for its first and third fiscal quarters on Form N-Q. Copies of the filings are available without charge, upon request on the SEC’s Website at www.sec.gov and may be available by calling Lord Abbett at 888-522-2388. You can also obtain copies of Form N-Q by visiting the SEC’s Public Reference Room in Washington, DC (information on the operation of the Public Reference Room may be obtained by calling 800-SEC-0330).
Tax Information
For corporate shareholders, 100% of the Fund’s ordinary income distributions qualified for the dividends received deduction.
Additionally, of the distribution paid to the shareholders during the fiscal year ended December 31, 2015, $39,501,560 represent long-term capital gains.
33


| This report, when not used for the general information of shareholders of the Fund, is to be distributed only if preceded or accompanied by a current fund prospectus. | | |
| | Lord Abbett Series Fund, Inc. | |
Lord Abbett mutual fund shares are distributed by
LORD ABBETT DISTRIBUTOR LLC. | Growth and Income Portfolio | LASFGI-3
(02/16) |

2015 LORD ABBETT
ANNUAL REPORT
Lord Abbett
Series Fund—Growth Opportunities Portfolio
For the fiscal year ended December 31, 2015
Table of Contents
Lord Abbett Series Fund – Growth Opportunities Portfolio
Annual Report
For the fiscal year ended December 31, 2015

Daria L. Foster, Director, President and Chief Executive Officer of the Lord Abbett Funds, and E. Thayer Bigelow, Independent Chairman of the Lord Abbett Funds.
Dear Shareholders: We are pleased to provide you with this overview of the performance of Lord Abbett Series Fund – Growth Opportunities Portfolio for the fiscal year ended December 31, 2015. On this page and the following pages, we discuss the major factors that influenced fiscal year performance. For additional information about the Fund, please visit our website at www.lordabbett.com, where you also can access the quarterly commentaries that provide updates on the Fund’s performance and other portfolio related updates.
Thank you for investing in Lord Abbett mutual funds. We value the trust that you place in us and look forward to serving your investment needs in the years to come.
Best regards,

Daria L. Foster
Director, President and Chief Executive Officer
For the fiscal year ended December 31, 2015, the Fund returned 2.72%, reflecting performance at the net asset value (NAV) of Class VC Shares, with all distributions reinvested, compared to its benchmark, the Russell Midcap® Growth Index1, which returned -0.20% over the same period.
Domestic equity markets modestly advanced over the past year, with the S&P 500® Index2 rising 1.38% during the trailing 12-month period. Despite this general move upwards there were a few periods of short-term volatility, most notably in in January 2015, when the S&P 500® declined
3.0%, and, in August 2015, when the index dropped 6.0%, its greatest monthly loss in three years. One of the prevailing market themes during the trailing 12-month period was the continued weakness in energy prices. Finally, U.S. real gross domestic product (GDP), which was initially reported to have contracted by 0.2% in the first quarter of 2015, was later revised upwards to a modest 0.6% expansion. In the second quarter of 2015, real GDP advanced 3.9%, while the third estimate from the Bureau of Economic Analysis
1
indicated that real GDP increased 2.0% in the third quarter of 2015.
Security selection in the consumer discretionary sector was the leading contributor to the Fund’s relative performance during the period. Within this sector, the Fund’s holdings of Expedia, Inc., an online travel company, contributed most. Expedia completed a number of notable acquisitions during the 12 month period, including several that offered immediate cost saving synergies. Another contributor within the consumer discretionary sector was the Fund’s position in Ulta Salon Cosmetics and Fragrance, Inc., a beauty retailer. Shares of Ulta rose throughout 2015, notably advancing in July after the company issued a revised earnings report and an independent company issued a report showing that traffic to Ulta’s website had grown by over 100% year-over-year. Share prices rose again in early December, after the company reported third quarter earnings above consensus estimates.
Security selection in the information technology sector was another contributor to the Fund’s relative performance during the period. Within this sector, the Fund’s holdings of Activision Blizzard, Inc., a developer and publisher of video games, contributed most. Activision made a surprise acquisition of mobile game developer King Digital that investors believed would position Activision as one of the top mobile game companies in the world and be immediately accretive.
Another contributor within the information technology sector was the Fund’s position in ServiceNow, Inc., a provider of cloud-based service management solutions. Shares of ServiceNow rose in early October as data points suggested that the company was beginning to generate momentum among public sector clients, and continued to advance later in the month after ServiceNow reported its strongest ever quarter of customer additions, driven in large part by growth in federal clients.
The largest detractor from Fund relative performance during the period was security selection in the consumer staples sector. Within this sector the Fund’s holdings of Whole Foods Market, Inc., a retailer of natural and organic foods and grocer, detracted most. Whole Foods struggled with competitive pressures throughout the 12 month period, leading to a notable deceleration in sales. Another detractor within the consumer staples sector was the Fund’s position in Rite Aid Corp., a retail drugstore chain. Shares of Rite Aid suffered as a slowdown in “front of the store” sales that began in the second quarter of 2015 persisted through September.
Security selection in the financials sector also detracted from Fund relative performance during the period. Within this sector, the Fund’s holdings of Realogy Holdings Corp., an integrated provider of residential real estate services in the United States, detracted most. Shares of Realogy declined after the company
2
reported underwhelming second quarter earnings that modestly missed consensus estimates and disappointed investors, although the company’s shares had performed well prior to the release of the earnings report. Another detractor within the sector was the Fund’s position in Affiliated Managers Group, Inc., a global
asset management company with equity investments in a diverse group of boutique investment management firms. Shares of Affiliated Managers Group (AMG) fell in December after Third Avenue Management, a majority owned affiliate of AMG, announced a liquidation plan for its Focused Credit Fund.
1 The Russell Midcap® Growth Index measures the performance of those Russell Midcap companies with higher price-to-book ratios and higher forecasted growth values.
2 The S&P 500® Index is widely regarded as the standard for measuring large cap U.S. stock market performance and includes a representative sample of leading companies in leading industries.
Unless otherwise specified, indexes reflect total return, with all dividends reinvested. Indexes are unmanaged, do not reflect the deduction of fees or expenses, and are not available for direct investment.
Important Performance and Other Information
Performance data quoted in the following pages reflect past performance and are no guarantee of future results. Current performance may be higher or lower than the performance quoted. The investment return and principal value of an investment in the Funds will fluctuate so that shares, on any given day or when redeemed, may be worth more or less than their original cost. You can obtain performance data current to the most recent month end by calling Lord Abbett at 888-522-2388 or referring to www.lordabbett.com.
During certain periods shown, expense waivers and reimbursements were in place. Without such waivers and expense reimbursements, the Fund’s returns would have been lower.
The annual commentary above discusses the views of the Fund’s management and various portfolio holdings of the Fund as of December 31, 2015. These views and portfolio holdings may have changed after this date. Information provided in the commentary is not a recommendation to buy or sell securities. Because the Fund’s portfolio is actively managed and may change significantly, the Fund may no longer own the securities described above or may have otherwise changed their positions in the securities. For more recent information about the Fund’s portfolio holdings, please visit www.lordabbett.com.
A Note about Risk: See Notes to Financial Statements for a discussion of investment risks. For a more detailed discussion of the risks associated with the Fund, please see the Fund’s prospectus.
Mutual funds are not insured by the FDIC, are not deposits or other obligations of, or guaranteed by, banks, and are subject to investment risks including possible loss of principal amount invested.
The Fund serves as an underlying investment vehicle for variable annuity contracts and variable life insurance policies.
3
Investment Comparison
Below is a comparison of a $10,000 investment in Class VC shares with the same investment in both the Russell Midcap® Growth Index and the Russell Midcap® Index, assuming reinvestment of all dividends and distributions. The Fund’s shares are sold only to insurance company separate accounts that fund certain variable annuity and variable life contracts. The line graph comparison does not reflect the sales charges or other expenses of these contracts. If those sales charges and expenses were reflected, returns would be lower. The graph and performance table below do not reflect the deduction of taxes that a shareholder would pay on Fund distributions or the redemption of Fund shares. During certain periods, expenses of the Fund have been waived or reimbursed by Lord Abbett; without such waiver or reimbursement of expenses, the Fund’s returns would have been lower. Past performance is no guarantee of future results.

Average Annual Total Returns for the
Periods Ended December 31, 2015
| | | 1 Year | | 5 Years | | 10 Years |
| Class VC | | 2.72 | % | | 8.92 | % | | 8.28 | % |
1 Performance for each unmanaged index does not reflect any fees or expenses. The performance of each index is not necessarily representative of the Fund’s performance.
2 The Fund (Class VC shares) at net asset value.
4
Expense Example
As a shareholder of the Fund, you incur ongoing costs, including management fees; expenses related to the Fund’s services arrangements with certain insurance companies; and other Fund expenses. This Example is intended to help you understand your ongoing costs (in dollars) of investing in the Fund and to compare these costs with the ongoing costs of investing in other mutual funds.
The Example is based on an investment of $1,000 invested at the beginning of the period and held for the entire period (July 1, 2015 through December 31, 2015).
The Example reflects only expenses that are deducted from the assets of the Fund. Fees and expenses, including sales charges applicable to the various insurance products that invest in the Fund, are not reflected in this Example. If such fees and expenses were reflected in the Example, the total expenses shown would be higher. Fees and expenses regarding such variable insurance products are separately described in the prospectus related to those products.
Actual Expenses
The first line of the table on the following page provides information about actual account values and actual expenses. You may use the information in this line, together with the amount you invested, to estimate the expenses that you paid over the period. Simply divide your account value by $1,000 (for example, an $8,600 account value divided by $1,000 = 8.6), then multiply the result by the number in the first line under the heading titled “Expenses Paid During Period 7/1/15 – 12/31/15” to estimate the expenses you paid on your account during this period.
Hypothetical Example for Comparison Purposes
The second line of the table on the following page provides information about hypothetical account values and hypothetical expenses based on the Fund’s actual expense ratio and an assumed rate of return of 5% per year before expenses, which is not the Fund’s actual return. The hypothetical account values and expenses may not be used to estimate the actual ending account balance or expenses you paid for the period. You may use this information to compare the ongoing costs of investing in the Fund and other funds. To do so, compare this 5% hypothetical example with the 5% hypothetical examples that appear in the shareholder reports of the other funds.
5
Please note that the expenses shown in the table are meant to highlight your ongoing costs only and do not reflect any transactional costs, such as sales charges. Therefore, the second line of the table is useful in comparing ongoing costs only, and will not help you determine the relative total costs of owning different funds. In addition, if these transactional costs were included, your costs would have been higher.
| | | Beginning
Account
Value | | Ending
Account
Value | | Expenses
Paid During
Period† | |
| | | 7/1/15 | | 12/31/15 | | 7/1/15 –
12/31/15 | |
| Class VC | | | | | | | |
| Actual | | $1,000.00 | | $ 947.90 | | $5.89 | |
| Hypothetical (5% Return Before Expenses) | | $1,000.00 | | $1,019.16 | | $6.11 | |
| † | Net expenses are equal to the Fund’s annualized expense ratio of 1.20%, multiplied by the average account value over the period, multiplied by 184/365 (to reflect one-half year period). |
Portfolio Holdings Presented by Sector
December 31, 2015
| Sector* | %** |
| Consumer Discretionary | 21.38 | % |
| Consumer Staples | 8.88 | % |
| Financials | 7.27 | % |
| Health Care | 18.20 | % |
| Industrials | 14.10 | % |
| Information Technology | 23.32 | % |
| Materials | 4.99 | % |
| Telecommunication Services | 1.02 | % |
| Repurchase Agreement | 0.84 | % |
| Total | 100.00 | % |
| * | | A sector may comprise several industries. |
| ** | | Represents percent of total investments. |
6
Schedule of Investments
December 31, 2015
| Investments | | Shares | | | Fair
Value
(000) | |
| COMMON STOCKS 99.36% | | | | | | | | |
| | | | | | | | | |
| Aerospace & Defense 0.64% | | | | | | | | |
| TransDigm Group, Inc.* | | | 2,561 | | | $ | 585 | |
| | | | | | | | | |
| Airlines 2.05% | | | | | | | | |
| Southwest Airlines Co. | | | 22,769 | | | | 980 | |
| United Continental Holdings, Inc.* | | | 15,855 | | | | 909 | |
| Total | | | | | | | 1,889 | |
| | | | | | | | | |
| Auto Components 1.65% | | | | | | | | |
| Delphi Automotive plc (United Kingdom)(a) | | | 17,661 | | | | 1,514 | |
| | | | | | | | | |
| Beverages 3.43% | | | | | | | | |
| Brown-Forman Corp. Class B | | | 11,446 | | | | 1,136 | |
| Dr. Pepper Snapple Group, Inc. | | | 12,934 | | | | 1,206 | |
| Monster Beverage Corp.* | | | 5,438 | | | | 810 | |
| Total | | | | | | | 3,152 | |
| | | | | | | | | |
| Biotechnology 2.47% | | | | | | | | |
| BioMarin Pharmaceutical, Inc.* | | | 9,842 | | | | 1,031 | |
| Incyte Corp., Ltd.* | | | 7,214 | | | | 782 | |
| Medivation, Inc.* | | | 9,524 | | | | 461 | |
| Total | | | | | | | 2,274 | |
| | | | | | | | | |
| Building Products 1.81% | | | | | | | | |
| Fortune Brands Home & Security, Inc. | | | 21,598 | | | | 1,199 | |
| Lennox International, Inc. | | | 3,727 | | | | 465 | |
| Total | | | | | | | 1,664 | |
| | | | | | | | | |
| Capital Markets 0.51% | | | | | | | | |
| Affiliated Managers Group, Inc.* | | | 2,960 | | | | 473 | |
| Investments | | Shares | | | Fair
Value
(000) | |
| Chemicals 3.92% | | | | | | | | |
| Axalta Coating Systems Ltd.* | | | 12,789 | | | $ | 341 | |
| International Flavors & Fragrances, Inc. | | | 8,170 | | | | 978 | |
| RPM International, Inc. | | | 25,357 | | | | 1,117 | |
| Sherwin-Williams Co. (The) | | | 4,497 | | | | 1,167 | |
| Total | | | | | | | 3,603 | |
| | | | | | | | | |
| Communications Equipment 0.79% | | | | | | | | |
| Harris Corp. | | | 8,351 | | | | 726 | |
| | | | | | | | | |
| Construction Materials 0.60% | | | | | | | | |
| Vulcan Materials Co. | | | 5,779 | | | | 549 | |
| | | | | | | | | |
| Containers & Packaging 0.49% | | | | | | | | |
| Owens-Illinois, Inc.* | | | 25,820 | | | | 450 | |
| | | | | | | | | |
| Distributors 0.63% | | | | | | | | |
| LKQ Corp.* | | | 19,622 | | | | 581 | |
| | | | | | | | | |
| Diversified Financial Services 3.31% | | | | | | | | |
| Intercontinental Exchange, Inc. | | | 7,185 | | | | 1,841 | |
| Moody’s Corp. | | | 11,947 | | | | 1,199 | |
| Total | | | | | | | 3,040 | |
| | | | | | | | | |
| Electrical Equipment 1.91% | | | | | | | | |
| AMETEK, Inc. | | | 20,700 | | | | 1,110 | |
| Rockwell Automation, Inc. | | | 6,278 | | | | 644 | |
| Total | | | | | | | 1,754 | |
| | | | | | | | | |
| Electronic Equipment, Instruments & Components 1.82% | | | | | | | | |
| Amphenol Corp. Class A | | | 22,346 | | | | 1,167 | |
| Fitbit, Inc. Class A* | | | 17,045 | | | | 504 | |
| Total | | | | | | | 1,671 | |
| | | | | | | | | |
| Food Products 4.13% | | | | | | | | |
| Hershey Co. (The) | | | 13,206 | | | | 1,179 | |
| Kellogg Co. | | | 13,395 | | | | 968 | |
| McCormick & Co., Inc. | | | 11,220 | | | | 960 | |
| Mead Johnson Nutrition Co. | | | 8,794 | | | | 694 | |
| Total | | | | | | | 3,801 | |
| | See Notes to Financial Statements. | 7 |
Schedule of Investments (continued)
December 31, 2015
| Investments | | Shares | | | Fair
Value
(000) | |
| Health Care Equipment & Supplies 5.47% | | | | | | | | |
| Align Technology, Inc.* | | | 17,179 | | | $ | 1,131 | |
| C.R. Bard, Inc. | | | 4,906 | | | | 929 | |
| Cooper Cos., Inc. (The) | | | 5,826 | | | | 782 | |
| IDEXX Laboratories, Inc.* | | | 15,790 | | | | 1,151 | |
| NuVasive, Inc.* | | | 5,909 | | | | 320 | |
| Sirona Dental Systems, Inc.* | | | 6,524 | | | | 715 | |
| Total | | | | | | | 5,028 | |
| | | | | | | | | |
| Health Care Providers & Services 5.21% | | | | | | | | |
| Acadia Healthcare Co., Inc.* | | | 11,112 | | | | 694 | |
| AmerisourceBergen Corp. | | | 7,968 | | | | 826 | |
| Centene Corp.* | | | 19,338 | | | | 1,273 | |
| Diplomat Pharmacy, Inc.* | | | 13,390 | | | | 458 | |
| Henry Schein, Inc.* | | | 6,433 | | | | 1,018 | |
| Universal Health Services, Inc. | | | | | | | | |
| Class B | | | 4,360 | | | | 521 | |
| Total | | | | | | | 4,790 | |
| | | | | | | | | |
| Health Care Technology 1.30% | | | | | | | | |
| Cerner Corp.* | | | 19,908 | | | | 1,198 | |
| | | | | | | | | |
| Hotels, Restaurants & Leisure 4.50% | | | | | | | | |
| Chipotle Mexican Grill, Inc.* | | | 1,166 | | | | 560 | |
| Hilton Worldwide Holdings, Inc. | | | 49,070 | | | | 1,050 | |
| Norwegian Cruise Line Holdings Ltd.* | | | 20,114 | | | | 1,179 | |
| Panera Bread Co. Class A* | | | 4,007 | | | | 780 | |
| Starwood Hotels & Resorts Worldwide, Inc. | | | 8,244 | | | | 571 | |
| Total | | | | | | | 4,140 | |
| | | | | | | | | |
| Household Durables 1.06% | | | | | | | | |
| Mohawk Industries, Inc.* | | | 5,165 | | | | 978 | |
| | | | | | | | | |
| Household Products 0.87% | | | | | | | | |
| Church & Dwight Co., Inc. | | | 9,409 | | | | 799 | |
| | | | | | | | | |
| Industrial Conglomerates 1.42% | | | | | | | | |
| Roper Technologies, Inc. | | | 6,871 | | | | 1,304 | |
| Investments | | Shares | | | Fair
Value
(000) | |
| Information Technology Services 5.88% | | | | | | | | |
| Alliance Data Systems Corp.* | | | 6,502 | | | $ | 1,798 | |
| Booz Allen Hamilton Holding Corp. | | | 26,489 | | | | 817 | |
| CSRA, Inc. | | | 16,401 | | | | 492 | |
| Fiserv, Inc.* | | | 13,668 | | | | 1,250 | |
| Vantiv, Inc. Class A* | | | 22,181 | | | | 1,052 | |
| Total | | | | | | | 5,409 | |
| | | | | | | | | |
| Internet & Catalog Retail 0.98% | | | | | | | | |
| Expedia, Inc. | | | 7,276 | | | | 904 | |
| | | | | | | | | |
| Internet Software & Services 3.87% | | | | | | | | |
| Akamai Technologies, Inc.* | | | 11,667 | | | | 614 | |
| CoStar Group, Inc.* | | | 5,905 | | | | 1,220 | |
| LinkedIn Corp. Class A* | | | 5,293 | | | | 1,191 | |
| Pandora Media, Inc.* | | | 40,084 | | | | 538 | |
| Total | | | | | | | 3,563 | |
| | | | | | | | | |
| Leisure Products 0.70% | | | | | | | | |
| Hasbro, Inc. | | | 9,494 | | | | 640 | |
| | | | | | | | | |
| Life Sciences Tools & Services 1.43% | | | | | | | | |
| Mettler-Toledo | | | | | | | | |
| International, Inc.* | | | 3,884 | | | | 1,317 | |
| | | | | | | | | |
| Machinery 3.14% | | | | | | | | |
| IDEX Corp. | | | 14,449 | | | | 1,107 | |
| Ingersoll-Rand plc | | | 9,881 | | | | 546 | |
| Middleby Corp. (The)* | | | 5,071 | | | | 547 | |
| Wabtec Corp. | | | 9,671 | | | | 688 | |
| Total | | | | | | | 2,888 | |
| | | | | | | | | |
| Multi-Line Retail 3.76% | | | | | | | | |
| Dollar General Corp. | | | 29,585 | | | | 2,126 | |
| Dollar Tree, Inc.* | | | 17,300 | | | | 1,336 | |
| Total | | | | | | | 3,462 | |
| | | | | | | | | |
| Personal Products 0.47% | | | | | | | | |
| Coty, Inc. Class A | | | 16,813 | | | | 431 | |
| 8 | See Notes to Financial Statements. | |
Schedule of Investments (continued)
December 31, 2015
| Investments | | Shares | | | Fair
Value
(000) | |
| Pharmaceuticals 2.35% | | | | | | | | |
| Perrigo Co. plc (Ireland)(a) | | | 4,908 | | | $ | 710 | |
| Zoetis, Inc. | | | 30,343 | | | | 1,454 | |
| Total | | | | | | | 2,164 | |
| | | | | | | | | |
| Professional Services 0.53% | | | | | | | | |
| Verisk Analytics, Inc.* | | | 6,328 | | | | 486 | |
| | | | | | | | | |
| Real Estate Investment Trusts 1.58% | | | | | | | | |
| Equinix, Inc. | | | 4,806 | | | | 1,453 | |
| | | | | | | | | |
| Real Estate Management & Development 1.89% | | | | | | | | |
| CBRE Group, Inc. Class A* | | | 28,248 | | | | 977 | |
| Realogy Holdings Corp.* | | | 20,641 | | | | 757 | |
| Total | | | | | | | 1,734 | |
| | | | | | | | | |
| Road & Rail 0.86% | | | | | | | | |
| J.B. Hunt Transport Services, Inc. | | | 10,808 | | | | 793 | |
| | | | | | | | | |
| Semiconductors & Semiconductor Equipment 2.87% |
| Cavium, Inc.* | | | 17,122 | | | | 1,125 | |
| Microchip Technology, Inc. | | | 20,583 | | | | 958 | |
| Microsemi Corp.* | | | 3,438 | | | | 112 | |
| NXP Semiconductors NV (Netherlands)*(a) | | | 5,312 | | | | 448 | |
| Total | | | | | | | 2,643 | |
| | | | | | | | | |
| Software 8.13% | | | | | | | | |
| Activision Blizzard, Inc. | | | 39,954 | | | | 1,547 | |
| FireEye, Inc.* | | | 16,221 | | | | 336 | |
| Red Hat, Inc.* | | | 23,184 | | | | 1,920 | |
| ServiceNow, Inc.* | | | 17,356 | | | | 1,502 | |
| Splunk, Inc.* | | | 10,635 | | | | 626 | |
| Tableau Software, Inc. Class A* | | | 7,253 | | | | 683 | |
| Workday, Inc. Class A* | | | 10,827 | | | | 863 | |
| Total | | | | | | | 7,477 | |
| Investments | | Shares | | | Fair
Value
(000) | |
| Specialty Retail 7.44% | | | | | | | | |
| Advance Auto Parts, Inc. | | | 4,436 | | | $ | 668 | |
| AutoZone, Inc.* | | | 2,549 | | | | 1,891 | |
| L Brands, Inc. | | | 16,708 | | | | 1,601 | |
| Tiffany & Co. | | | 8,157 | | | | 622 | |
| Tractor Supply Co. | | | 12,465 | | | | 1,066 | |
| Ulta Salon, Cosmetics & Fragrance, Inc.* | | | 5,402 | | | | 999 | |
| Total | | | | | | | 6,847 | |
| | | | | | | | | |
| Textiles, Apparel & Luxury Goods 0.70% | | | | | | | | |
| lululemon athletica, Inc. (Canada)*(a) | | | 12,246 | | | | 643 | |
| | | | | | | | | |
| Trading Companies & Distributors 1.77% | | | | | | | | |
| HD Supply Holdings, Inc.* | | | 33,939 | | | | 1,019 | |
| United Rentals, Inc.* | | | 8,424 | | | | 611 | |
| Total | | | | | | | 1,630 | |
| | | | | | | | | |
| Wireless Telecommunication Services 1.02% | | | | | | | | |
| T-Mobile US, Inc.* | | | 24,067 | | | | 942 | |
Total Common Stocks
(cost $89,814,988) | | | | | | | 91,389 | |
| | See Notes to Financial Statements. | 9 |
Schedule of Investments (concluded)
December 31, 2015
| | | Principal | | | Fair | |
| | | Amount | | | Value | |
| Investments | | (000) | | | (000) | |
| SHORT-TERM INVESTMENT 0.85% | | | | | | | | |
| | | | | | | | | |
| Repurchase Agreement | | | | | | | | |
| Repurchase Agreement dated 12/31/2015, 0.03% due 1/4/2016 with Fixed Income Clearing Corp. collateralized by $795,000 of U.S. Treasury Note at 1.625% due 7/31/2020; value: $795,994; proceeds: $776,591 (cost $776,588) | | | $777 | | | $ | 777 | |
Total Investments in Securities 100.21%
(cost $90,591,576) | | | | | | | 92,166 | |
| Liabilities in Excess of Cash and Other Assets (0.21)% | | | | | (189 | ) |
| Net Assets 100.00% | | | | | | $ | 91,977 | |
| * | Non-income producing security. |
| (a) | Foreign security traded in U.S. dollars. |
The following is a summary of the inputs used as of December 31, 2015 in valuing the Fund’s investments carried at fair value(1):
| | | Level 1 | | | Level 2 | | | Level 3 | | | Total | |
| Investment Type(2)(3) | | (000) | | | (000) | | | (000) | | | (000) | |
| Common Stocks | | $ | 91,389 | | | $ | – | | | $ | – | | | $ | 91,389 | |
| Repurchase Agreement | | | – | | | | 777 | | | | – | | | | 777 | |
| Total | | $ | 91,389 | | | $ | 777 | | | $ | – | | | $ | 92,166 | |
| (1) | Refer to Note 2(h) for a description of fair value measurements and the three-tier hierarchy of inputs. |
| (2) | See Schedule of Investments for fair values in each industry and identification of foreign issuers and/or geography. |
| (3) | There were no Level 1/Level 2 transfers during the fiscal year ended December 31, 2015. |
| 10 | See Notes to Financial Statements. | |
Statement of Assets and Liabilities
December 31, 2015
| ASSETS: | | | | |
| Investments in securities, at fair value (cost $90,591,576) | | $ | 92,165,785 | |
| Cash | | | 2,909 | |
| Receivables: | | | | |
| Dividends | | | 36,487 | |
| Capital shares sold | | | 13,454 | |
| From advisor (See Note 3) | | | 8,035 | |
| Prepaid expenses and other assets | | | 268 | |
| Total assets | | | 92,226,938 | |
| LIABILITIES: | | | | |
| Payables: | | | | |
| Management fee | | | 63,377 | |
| Capital shares reacquired | | | 24,052 | |
| Directors’ fees | | | 15,935 | |
| Fund administration | | | 3,169 | |
| Accrued expenses | | | 143,428 | |
| Total liabilities | | | 249,961 | |
| NET ASSETS | | $ | 91,976,977 | |
| COMPOSITION OF NET ASSETS: | | | | |
| Paid-in capital | | $ | 91,321,523 | |
| Accumulated net investment loss | | | (15,935 | ) |
| Accumulated net realized loss on investments | | | (902,820 | ) |
| Net unrealized appreciation on investments | | | 1,574,209 | |
| Net Assets | | $ | 91,976,977 | |
| Outstanding shares (50 million shares of common stock authorized, $.001 par value) | | | 7,740,860 | |
| Net asset value, offering and redemption price per share (Net assets divided by outstanding shares) | | $ | 11.88 | |
| | See Notes to Financial Statements. | 11 |
Statement of Operations
For the Year Ended December 31, 2015
| Investment income: | | | | |
| Dividends | | $ | 831,935 | |
| Interest | | | 15 | |
| Total investment income | | | 831,950 | |
| Expenses: | | | | |
| Management fee | | | 850,629 | |
| Non 12b-1 service fees | | | 265,843 | |
| Shareholder servicing | | | 127,341 | |
| Professional | | | 44,676 | |
| Fund administration | | | 42,531 | |
| Reports to shareholders | | | 28,830 | |
| Custody | | | 11,517 | |
| Directors’ fees | | | 3,740 | |
| Other | | | 18,236 | |
| Gross expenses | | | 1,393,343 | |
| Expense reductions (See Note 8) | | | (111 | ) |
| Fees waived and expenses reimbursed (See Note 3) | | | (117,288 | ) |
| Net expenses | | | 1,275,944 | |
| Net investment loss | | | (443,994 | ) |
| Net realized and unrealized gain (loss): | | | | |
| Net realized gain on investments | | | 9,932,960 | |
| Net change in unrealized appreciation/depreciation on investments | | | (7,390,033 | ) |
| Net realized and unrealized gain | | | 2,542,927 | |
| Net Increase in Net Assets Resulting From Operations | | $ | 2,098,933 | |
| 12 | See Notes to Financial Statements. | |
Statements of Changes in Net Assets
| | | For the Year Ended | | | For the Year Ended | |
| INCREASE (DECREASE) IN NET ASSETS | | December 31, 2015 | | | December 31, 2014 | |
| Operations: | | | | | | | | |
| Net investment loss | | $ | (443,994 | ) | | $ | (260,267 | ) |
| Net realized gain on investments | | | 9,932,960 | | | | 15,219,520 | |
| Net change in unrealized appreciation/depreciation on investments | | | (7,390,033 | ) | | | (9,708,968 | ) |
| Net increase in net assets resulting from operations | | | 2,098,933 | | | | 5,250,285 | |
| Distributions to shareholders from: | | | | | | | | |
| Net realized gain | | | (9,756,067 | ) | | | (18,410,009 | ) |
| Capital share transactions (See Note 12): | | | | | | | | |
| Proceeds from sales of shares | | | 101,073,915 | | | | 7,895,733 | |
| Reinvestment of distributions | | | 9,756,067 | | | | 18,410,009 | |
| Cost of shares reacquired | | | (98,429,963 | ) | | | (24,155,503 | ) |
| Net increase in net assets resulting from capital share transactions | | | 12,400,019 | | | | 2,150,239 | |
| Net increase (decrease) in net assets | | | 4,742,885 | | | | (11,009,485 | ) |
| NET ASSETS: | | | | | | | | |
| Beginning of year | | $ | 87,234,092 | | | $ | 98,243,577 | |
| End of year | | $ | 91,976,977 | | | $ | 87,234,092 | |
| Accumulated net investment loss | | $ | (15,935 | ) | | $ | (14,782 | ) |
| | See Notes to Financial Statements. | 13 |
Financial Highlights
| | | | | Per Share Operating Performance: | | |
| | | | | Investment operations: | | Distributions
to
shareholders
from: | | |
| | | Net asset | | | | Net | | | | | | Net asset |
| | | value, | | Net | | realized and | | Total from | | Net | | value, |
| | | beginning of | | investment | | unrealized | | investment | | realized | | end of |
| | | year | | loss(a) | | gain (loss) | | operations | | gain | | year |
| 12/31/2015 | | | $12.91 | | | | $(0.06 | ) | | | $0.41 | | | | $0.35 | | | | $(1.38 | ) | | | $11.88 | |
| 12/31/2014 | | | 15.25 | | | | (0.04 | ) | | | 0.95 | | | | 0.91 | | | | (3.25 | ) | | | 12.91 | |
| 12/31/2013 | | | 13.19 | | | | (0.08 | ) | | | 4.93 | | | | 4.85 | | | | (2.79 | ) | | | 15.25 | |
| 12/31/2012 | | | 12.23 | | | | (0.02 | ) | | | 1.75 | | | | 1.73 | | | | (0.77 | ) | | | 13.19 | |
| 12/31/2011 | | | 17.58 | | | | (0.07 | ) | | | (1.64 | ) | | | (1.71 | ) | | | (3.64 | ) | | | 12.23 | |
| (a) | Calculated using average shares outstanding during the year. |
| (b) | Total return does not consider the effects of sales charges or other expenses imposed by an insurance company and assumes the reinvestment of all distributions. |
| 14 | See Notes to Financial Statements. | |
| | | Ratios to Average Net Assets: | | Supplemental Data: | |
| | | | | | | | | | | | |
| | | Total | | | | | | | | | |
| | | expenses after | | | | | | | | | |
| | | waivers and/or | | | | Net | | Net assets, | | Portfolio | |
| Total | | reimburse- | | Total | | investment | | end of | | turnover | |
| return(b) | | ments | | expenses | | income | | year | | rate | |
| (%) | | (%) | | (%) | | (%) | | (000) | | (%) | |
| | 2.72 | | | | 1.20 | | | | 1.31 | | | | (0.42 | ) | | | $91,977 | | | | 125.17 | | |
| | 6.07 | | | | 1.20 | | | | 1.32 | | | | (0.28 | ) | | | 87,234 | | | | 197.85 | | |
| | 37.08 | | | | 1.20 | | | | 1.31 | | | | (0.49 | ) | | | 98,244 | | | | 120.75 | | |
| | 14.10 | | | | 1.20 | | | | 1.31 | | | | (0.12 | ) | | | 89,376 | | | | 138.33 | | |
| | (10.05 | ) | | | 1.20 | | | | 1.28 | | | | (0.43 | ) | | | 89,416 | | | | 116.06 | | |
| | See Notes to Financial Statements. | 15 |
Notes to Financial Statements
Lord Abbett Series Fund, Inc. (the “Company”) is registered under the Investment Company Act of 1940, as amended (“the Act”), as a diversified, open-end management investment company and was incorporated under Maryland law in 1989. The Company consists of thirteen separate portfolios. This report covers Growth Opportunities Portfolio (the “Fund”).
The Fund’s investment objective is capital appreciation. The Fund has Variable Contract class shares (“Class VC Shares”), which are currently issued and redeemed only in connection with investments in, and payments under, variable annuity contracts and variable life insurance policies issued by life insurance and insurance-related companies.
The preparation of the financial statements in conformity with accounting principles generally accepted in the United States of America (“U.S. GAAP”) requires management to make certain estimates and assumptions that affect the reported amounts of assets and liabilities and disclosure of contingent assets and liabilities at the date of the financial statements and the reported amounts of increases and decreases in net assets from operations during the reporting period. Actual results could differ from those estimates. The Fund is considered an investment company under U.S. GAAP and follows the accounting and reporting guidance applicable to investment companies.
| 2. | SIGNIFICANT ACCOUNTING POLICIES |
| (a) | Investment Valuation–Under procedures approved by the Fund’s Board of Directors (the “Board”), Lord, Abbett & Co. LLC (“Lord Abbett”), the Fund’s investment manager, has formed a Pricing Committee to administer the pricing and valuation of portfolio investments and to ensure that prices utilized reasonably reflect fair value. Among other things, these procedures allow the Fund to utilize independent pricing services, quotations from securities and financial instrument dealers and other market sources to determine fair value. |
| | |
| | Securities actively traded on any recognized U.S. or non-U.S. exchange or on The NASDAQ Stock Market LLC are valued at the last sale price or official closing price on the exchange or system on which they are principally traded. Events occurring after the close of trading on non-U.S. exchanges may result in adjustments to the valuation of foreign securities to reflect their fair value as of the close of regular trading on the New York Stock Exchange. The Fund may utilize an independent fair valuation service in adjusting the valuations of foreign securities. Unlisted equity securities are valued at the last quoted sale price or, if no sale price is available, at the mean between the most recently quoted bid and asked prices. |
| | |
| | Securities for which prices are not readily available are valued at fair value as determined by the Pricing Committee. The Pricing Committee considers a number of factors, including observable and unobservable inputs, when arriving at fair value. The Pricing Committee may use related or comparable assets or liabilities, recent transactions, market multiples, book values and other relevant information to determine the fair value of portfolio investments. The Board or a designated committee thereof regularly reviews fair value determinations made by the Pricing Committee and employs techniques such as reviewing related market activity, reviewing inputs and assumptions, and retrospectively comparing prices of subsequent purchases and sales transactions to fair value determinations made by the Pricing Committee. |
| | |
| | Short-term securities with 60 days or less remaining to maturity are valued using the amortized cost method, which approximates fair value. |
16
Notes to Financial Statements (continued)
| (b) | Security Transactions–Security transactions are recorded as of the date that the securities are purchased or sold (trade date). Realized gains and losses on sales of portfolio securities are calculated using the identified-cost method. |
| | |
| (c) | Investment Income–Dividend income is recorded on the ex-dividend date. Interest income is recorded on the accrual basis as earned. Discounts are accreted and premiums are amortized using the effective interest method and are included in Interest and other income on the Statement of Operations. Withholding taxes on foreign dividends have been provided for in accordance with the applicable country’s tax rules and rates. |
| | |
| (d) | Income Taxes–It is the policy of the Fund to meet the requirements of Subchapter M of the Internal Revenue Code applicable to regulated investment companies and to distribute substantially all taxable income and capital gains to its shareholders. Therefore, no income tax provision is required. |
| | |
| | The Fund files U.S. federal and various state and local tax returns. No income tax returns are currently under examination. The statute of limitations on the Fund’s filed U.S. federal tax returns remains open for the fiscal years ended December 31, 2012 through December 31, 2015. The statutes of limitations on the Company’s state and local tax returns may remain open for an additional year depending upon the jurisdiction. |
| | |
| (e) | Expenses–Expenses incurred by the Company that do not specifically relate to an individual fund are generally allocated to the funds within the Company on a pro rata basis by relative net assets. |
| | |
| (f) | Foreign Transactions–The books and records of the Fund are maintained in U.S. dollars and transactions denominated in foreign currencies are recorded in the Fund’s records at the rate prevailing when earned or recorded. Asset and liability accounts that are denominated in foreign currencies are adjusted daily to reflect current exchange rates and any unrealized gain (loss) is included in Net change in unrealized appreciation/depreciation on investments on the Fund’s Statement of Operations. The resultant exchange gains and losses upon settlement of such transactions are included in Net realized gain on investments on the Fund’s Statement of Operations. The Fund does not isolate that portion of the results of operations arising as a result of changes in the foreign exchange rates from the changes in market prices of the securities. |
| | |
| (g) | Repurchase Agreements–The Fund may enter into repurchase agreements with respect to securities. A repurchase agreement is a transaction in which a fund acquires a security and simultaneously commits to resell that security to the seller (a bank or securities dealer) at an agreed-upon price on an agreed-upon date. The Fund requires at all times that the repurchase agreement be collateralized by cash, or by securities of the U.S. Government, its agencies, its instrumentalities, or U.S. Government sponsored enterprises having a value equal to, or in excess of, the value of the repurchase agreement (including accrued interest). If the seller of the agreement defaults on its obligation to repurchase the underlying securities at a time when the fair value of these securities has declined, the Fund may incur a loss upon disposition of the securities. |
| | |
| (h) | Fair Value Measurements–Fair value is defined as the price that the Fund would receive upon selling an investment or transferring a liability in an orderly transaction to an independent buyer in the principal or most advantageous market of the investment. A three-tier hierarchy is used to maximize the use of observable market data and minimize the use of |
17
Notes to Financial Statements (continued)
| | unobservable inputs and to establish classification of fair value measurements for disclosure purposes. Inputs refer broadly to the assumptions that market participants would use in pricing the asset or liability, including assumptions about risk—for example, the risk inherent in a particular valuation technique used to measure fair value (such as a pricing model) and/or the risk inherent in the inputs to the valuation technique. Inputs may be observable or unobservable. Observable inputs reflect the assumptions market participants would use in pricing the asset or liability. Observable inputs are based on market data obtained from sources independent of the reporting entity. Unobservable inputs reflect the reporting entity’s own assumptions about the assumptions market participants would use in pricing the asset or liability. Unobservable inputs are based on the best information available in the circumstances. The three-tier hierarchy of inputs is summarized in the three broad Levels listed below: |
| | • | Level 1 – | unadjusted quoted prices in active markets for identical investments; |
| | | | |
| | • | Level 2 – | other significant observable inputs (including quoted prices for similar investments, interest rates, prepayment speeds, credit risk, etc.); and |
| | | | |
| | • | Level 3 – | significant unobservable inputs (including the Fund’s own assumptions in determining the fair value of investments). |
| | A summary of inputs used in valuing the Fund’s investments as of December 31, 2015 and, if applicable, Level 1/Level 2 transfers and Level 3 rollforwards for the fiscal year then ended is included in the Fund’s Schedule of Investments. |
| | |
| | Changes in valuation techniques may result in transfers into or out of an assigned level within the three-tier hierarchy. All transfers between different levels within the three-tier hierarchy are deemed to have occurred as of the beginning of the reporting period. The inputs or methodology used for valuing securities are not necessarily an indication of the risk associated with investing in those securities. |
| 3. | MANAGEMENT FEE AND OTHER TRANSACTIONS WITH AFFILIATES |
Management Fee
The Company has a management agreement with Lord Abbett, pursuant to which Lord Abbett supplies the Fund with investment management services and executive and other personnel, provides office space and pays for ordinary and necessary office and clerical expenses relating to research and statistical work and supervision of the Fund’s investment portfolio.
The management fee is based on the Fund’s average daily net assets at the following annual rate:
| First $1 billion | .80% |
| Next $1 billion | .75% |
| Next $1 billion | .70% |
| Over $3 billion | .65% |
For the fiscal year ended December 31, 2015, the effective management fee, net of waivers, was at an annualized rate of .69% of the Fund’s average daily net assets.
In addition, Lord Abbett provides certain administrative services to the Fund pursuant to an Administrative Services Agreement in return for a fee at an annual rate of .04% of the Fund’s average daily net assets.
During the fiscal year ended December 31, 2015 and continuing through April 30, 2016, Lord Abbett has contractually agreed to waive its fees and reimburse expenses to the extent necessary
18
Notes to Financial Statements (continued)
to limit total net annual operating expenses to an annual rate of 1.20%. This agreement may be terminated only upon the approval of the Board.
The Company, on behalf of the Fund, has entered into services arrangements with certain insurance companies. Under these arrangements, certain insurance companies will be compensated up to .25% of the average daily net asset value (“NAV”) of the Fund’s Class VC Shares held in the insurance company’s separate account to service and maintain the Variable Contract owners’ accounts. This amount is included in Non 12b-1 service fees on the Statement of Operations. The Fund may also compensate certain insurance companies, third-party administrators and other entities for providing recordkeeping, sub-transfer agency and other administrative services to the Fund. This amount is included in Shareholder servicing on the Statement of Operations.
A Director and certain of the Company’s officers have an interest in Lord Abbett.
| 4. | DISTRIBUTIONS AND CAPITAL LOSS CARRYFORWARDS |
Dividends from net investment income, if any, are declared and paid at least semi-annually. Taxable net realized gains from investment transactions, reduced by allowable capital loss carryforwards, if any, are declared and distributed to shareholders at least annually. The capital loss carryforward amount, if any, is available to offset future net capital gains. Dividends and distributions to shareholders are recorded on the ex-dividend date. The amounts of dividends and distributions from net investment income and net realized capital gains are determined in accordance with federal income tax regulations, which may differ from U.S. GAAP. These book/tax differences are either considered temporary or permanent in nature. To the extent these differences are permanent in nature, such amounts are reclassified within the components of net assets based on their federal tax basis treatment; temporary differences do not require reclassification. Dividends and distributions that exceed earnings and profits for tax purposes are reported as a tax return of capital.
The tax character of distributions paid during the fiscal years ended December 31, 2015 and 2014 was as follows:
| | | Year Ended | | | Year Ended | |
| | | 12/31/2015 | | | 12/31/2014 | |
| Distributions paid from: | | | | | | | | |
| Ordinary income | | $ | 2,224,813 | | | $ | 6,018,690 | |
| Net long-term capital gains | | | 7,531,254 | | | | 12,391,319 | |
| Total distributions paid | | $ | 9,756,067 | | | $ | 18,410,009 | |
As of December 31, 2015, the components of accumulated gains on a tax-basis were as follows:
| Undistributed long-term capital gains | | $ | 736,853 | |
| Total undistributed earnings | | | 736,853 | |
| Temporary differences | | | (982,079 | ) |
| Unrealized gains – net | | | 900,680 | |
| Total accumulated gains – net | | $ | 655,454 | |
At the Fund’s election, certain losses incurred within the taxable year (Qualified Late-Year Losses) are deemed to arise on the first business day of the Fund’s next taxable year. The Fund incurred and will elect to defer post-October capital losses of $966,144 during fiscal year 2015.
19
Notes to Financial Statements (continued)
As of December 31, 2015, the aggregate unrealized security gains and losses based on cost for U.S. federal income tax purposes were as follows:
| Tax cost | | $ | 91,265,105 | |
| Gross unrealized gain | | | 4,825,363 | |
| Gross unrealized loss | | | (3,924,683 | ) |
| Net unrealized security gain | | $ | 900,680 | |
The difference between book-basis and tax basis unrealized gains (losses) is attributable to the tax treatment of wash sales.
Permanent items identified during the fiscal year ended December 31, 2015 have been reclassified among the components of net assets based on their tax basis treatment as follows:
| | | Accumulated | |
| Accumulated Net | | Net Realized | |
| Investment Loss | | Loss | |
| $442,841 | | $(442,841 | ) |
The permanent differences are attributable to the tax treatment of certain distributions received and net investment losses.
| 5. | PORTFOLIO SECURITIES TRANSACTIONS |
Purchases and sales of investment securities (excluding short-term investments) for the fiscal year ended December 31, 2015 were as follows:
| Purchases | | Sales |
| $131,277,049 | | $129,351,208 |
There were no purchases or sales of U.S. Government securities for the fiscal year ended December 31, 2015.
The Fund is permitted to purchase and sell securities (“cross-trade”) from and to other Lord Abbett Funds or client accounts pursuant to procedures approved by the Board in compliance with Rule 17a-7 under the Act (the “Rule”). Each cross-trade is executed at a fair market price in compliance with provisions of the Rule. For the year ended December 31, 2015, the Fund engaged in cross-trade purchases of $119,715.
| 6. | DISCLOSURES ABOUT OFFSETTING ASSETS AND LIABILITIES |
The Financial Accounting Standards Board (“FASB”) requires disclosures intended to help better assess the effect or potential effect of offsetting arrangements on a fund’s financial position. The following tables illustrate gross and net information about recognized assets and liabilities eligible for offset in the statement of assets and liabilities; and disclose such amounts subject to an enforceable master netting agreement or similar agreement, by counterparty. A master netting agreement is an agreement between a fund and a counterparty which provides for the net settlement of amounts owed under all contracts traded under that agreement, as well as cash collateral, through a single payment by one party to the other in the event of default on or termination of any one contract. The Fund’s accounting policy with respect to balance sheet offsetting is that, absent an event of default by the counterparty or a termination of the agreement, the master netting agreement does not result in an offset of reported amounts of
20
Notes to Financial Statements (continued)
financial assets and liabilities in the statement of assets and liabilities across transactions between the Fund and the applicable counterparty:
| | | | | Gross Amounts | | Net Amounts of |
| | | | | Offset in the | | Assets Presented |
| | | Gross Amounts of | | Statement of Assets | | in the Statement of |
| Description | | Recognized Assets | | and Liabilities | | Assets and Liabilities |
| Repurchase Agreement | | $776,588 | | $ | – | | $776,588 |
| Total | | $776,588 | | $ | – | | $776,588 |
| | | Net Amounts | | | | | | | | | | | |
| | | of Assets | | Amounts Not Offset in the | | | |
| | | Presented in | | Statement of Assets and Liabilities | | | |
| | | the Statement | | | | | Cash | | | Securities | | | |
| | | of Assets and | | Financial | | | Collateral | | | Collateral | | | Net |
| Counterparty | | Liabilities | | Instruments | | | Received(a) | | | Received(a) | | | Amount(b) |
| Fixed Income Clearing Corp. | | | $776,588 | | $ | – | | | $ | – | | | | $(776,588 | ) | | $ | – |
| Total | | | $776,588 | | $ | – | | | $ | – | | | | $(776,588 | ) | | $ | – |
| (a) | Collateral disclosed is limited to an amount not to exceed 100% of the net amount of assets presented in the Statement of Assets and Liabilities, for each respective counterparty. |
| (b) | Net amount represents the amount owed to the Fund by the counterparty as of December 31, 2015. |
| 7. | DIRECTORS’ REMUNERATION | |
The Company’s officers and a Director, who are associated with Lord Abbett, do not receive any compensation from the Company for serving in such capacities. Independent Directors’ fees are allocated among all Lord Abbett-sponsored funds based on the net assets of each fund. There is an equity-based plan available to all Independent Directors under which Independent Directors must defer receipt of a portion of, and may elect to defer receipt of an additional portion of Directors’ fees. The deferred amounts are treated as though equivalent dollar amounts had been invested in the funds. Such amounts and earnings accrued thereon are included in Directors’ fees on the Statement of Operations and in Directors’ fees payable on the Statement of Assets and Liabilities and are not deductible for U.S. federal income tax purposes until such amounts are paid.
The Company has entered into an arrangement with its transfer agent and custodian, whereby credits realized as a result of uninvested cash balances are used to reduce a portion of the Fund’s expenses.
Effective August 31, 2015, the Fund and certain other funds managed by Lord Abbett (collectively, the “Participating Funds”) entered into a syndicated line of credit facility with various lenders for $550 million (the “Facility”), whereas State Street Bank and Trust Company (“SSB”) participates as a lender and as agent for the lenders. The Facility is to be used for temporary or emergency purposes as an additional source of: liquidity to satisfy redemptions. The Participating Funds are subject to graduated borrowing limits of one-third of Fund assets (if Fund assets are less than $750 million), $250 million, $300 million, or $350 million, based on past borrowings and likelihood of future borrowings. The Facility will continue through August 29, 2016.
21
Notes to Financial Statements (concluded)
Prior to August 31, 2015, the Fund and certain other funds managed by Lord Abbett participated in a $500 million unsecured revolving credit facility with SSB (the “SSB Facility”).
During the fiscal year ended December 31, 2015, the Fund did not utilize the Facility or the SSB Facility.
| 10. | CUSTODIAN AND ACCOUNTING AGENT | |
SSB is the Company’s custodian and accounting agent. SSB performs custodial, accounting and recordkeeping functions relating to portfolio transactions and calculating the Fund’s NAV.
The Fund is subject to the general risks and considerations associated with equity investing. The value of an investment will fluctuate in response to movements in the equity securities market in general, and to the changing prospects of individual companies in which the Fund invests. The Fund has particular risks associated with growth stocks. Growth companies may grow faster than other companies, which may result in more volatility in their stock prices. In addition, if the Fund’s assessment of a company’s potential for growth or market conditions is wrong, it could suffer losses or produce poor performance relative to other funds, even in a rising market. The Fund invests largely in mid-sized company stocks, which may be less able to weather economic shifts or other adverse developments than those of larger, more established companies.
Due to the Fund’s investment exposure to foreign companies and American Depositary Receipts, the Fund may experience increased market, liquidity, currency, political, information, and other risks.
These factors can affect the Fund’s performance.
| 12. | SUMMARY OF CAPITAL TRANSACTIONS | |
Transactions in shares of capital stock were as follows:
| | Year Ended | | Year Ended | |
| | December 31, 2015 | | December 31, 2014 | |
| Shares sold | 7,558,407 | | 518,033 | |
| Reinvestment of distributions | 815,710 | | 1,388,588 | |
| Shares reacquired | (7,389,904 | ) | (1,591,534 | ) |
| Increase | 984,213 | | 315,087 | |
22
Report of Independent Registered Public Accounting Firm
To the Board of Directors of Lord Abbett Series Fund, Inc. and the Shareholders of Growth Opportunities Portfolio:
We have audited the accompanying statement of assets and liabilities, including the schedule of investments, of the Growth Opportunities Portfolio, one of the portfolios constituting the Lord Abbett Series Fund, Inc. (the “Fund”) as of December 31, 2015, and the related statement of operations for the year then ended, the statements of changes in net assets for each of the two years in the period then ended, and the financial highlights for each of the five years in the period then ended. These financial statements and financial highlights are the responsibility of the Fund’s management. Our responsibility is to express an opinion on these financial statements and financial highlights based on our audits.
We conducted our audits in accordance with the standards of the Public Company Accounting Oversight Board (United States). Those standards require that we plan and perform the audit to obtain reasonable assurance about whether the financial statements and financial highlights are free of material misstatement. The Fund is not required to have, nor were we engaged to perform, an audit of its internal control over financial reporting. Our audits included consideration of internal control over financial reporting as a basis for designing audit procedures that are appropriate in the circumstances, but not for the purpose of expressing an opinion on the effectiveness of the Fund’s internal control over financial reporting. Accordingly, we express no such opinion. An audit also includes examining, on a test basis, evidence supporting the amounts and disclosures in the financial statements, assessing the accounting principles used and significant estimates made by management, as well as evaluating the overall financial statement presentation. Our procedures included confirmation of securities owned as of December 31, 2015, by correspondence with the custodian. We believe that our audits provide a reasonable basis for our opinion.
In our opinion, such financial statements and financial highlights referred to above present fairly, in all material respects, the financial position of Growth Opportunities Portfolio of the Lord Abbett Series Fund, Inc. as of December 31, 2015, the results of its operations for the year then ended, the changes in its net assets for each of the two years in the period then ended, and the financial highlights for each of the five years in the period then ended, in conformity with accounting principles generally accepted in the United States of America.
DELOITTE & TOUCHE LLP
New York, New York
February 16, 2016
23
Supplemental Proxy Information (unaudited)
A special meeting of shareholders of Growth Opportunities Portfolio was held on November 5, 2015. The special meeting was held for shareholders of the Fund to vote on the following matters:
| | 1. | To amend the Fund’s fundamental restrictions related to borrowing and lending to enable the Fund to participate in an interfund lending program; and |
| | | |
| | 2. | To ratify the selection of Deloitte & Touche LLP as independent registered public accounting firm for the Fund’s current fiscal year. |
The results of the proxy solicitation on the preceding matter were as follows:
| 1. | To approve the amendment to the fundamental investment restrictions of the Fund as described in the proxy statement: |
| | |
| | (a) Amend the fundamental investment restriction with respect to Borrowing |
| | | | | | | | | Broker |
| | | Votes For | | Votes Against | | Abstain | | Non-Votes |
| Growth Opportunities Portfolio | | 7,407,992 | | 390,440 | | 607,125 | | 0 |
| 1. | To approve the amendment to the fundamental investment restrictions of the Fund as described in the proxy statement: |
| | |
| | (b) Amend the fundamental investment restriction with respect to Lending |
| | | | | | | | | Broker |
| | | Votes For | | Votes Against | | Abstain | | Non-Votes |
| Growth Opportunities Portfolio | | 7,388,407 | | 410,955 | | 606,195 | | 0 |
| 2. | To ratify the selection of Deloitte & Touche LLP as the Fund’s independent registered public accounting firm for the Fund’s current fiscal year |
| | | | | | | | | Broker |
| | | Votes For | | Votes Against | | Abstain | | Non-Votes |
| Growth Opportunities Portfolio | | 7,697,793 | | 172,811 | | 534,953 | | – |
24
Basic Information About Management
The Board is responsible for the management of the business and affairs of the Company in accordance with the laws of the State of Maryland. The Board elects officers who are responsible for the day-to-day operations of the Fund and who execute policies authorized by the Board. The Board also approves an investment adviser to the Fund and continues to monitor the cost and quality of the services the investment adviser provides, and annually considers whether to renew the contract with the adviser. Generally, each Director holds office until his/her successor is elected and qualified or until his/her earlier resignation or removal, as provided in the Company’s organizational documents.
Lord Abbett, a Delaware limited liability company, is the Fund’s investment adviser. Designated Lord Abbett personnel are responsible for the day-to-day management of the Fund.
Interested Director
Ms. Foster is affiliated with Lord Abbett and is an “interested person” of the Company as defined in the Act. Ms. Foster is a director/trustee and officer of each of the 12 investment companies in the Lord Abbett Family of Funds, which consist of 58 portfolios or series.
Name, Address and
Year of Birth | | Current Position and
Length of Service
with the Fund | | Principal Occupation and Other Directorships
During the Past Five Years |
| | | | | |
Daria L. Foster
Lord, Abbett & Co. LLC
90 Hudson Street
Jersey City, NJ 07302
(1954) | | Director and President since 2006; Chief Executive Officer since 2012 | | Principal Occupation: Managing Partner of Lord Abbett, joined Lord Abbett in 1990. Other Directorships: None. |
Independent Directors
The following Independent Directors also are directors/trustees of each of the 12 investment companies in the Lord Abbett Family of Funds, which consist of 58 portfolios or series.
Name, Address and
Year of Birth | | Current Position and
Length of Service
with the Fund | | Principal Occupation and Other Directorships
During the Past Five Years |
| | | | | |
E. Thayer Bigelow
Lord, Abbett & Co. LLC
c/o Legal Dept.
90 Hudson Street
Jersey City, NJ 07302
(1941) | | Director since 1994;
Chairman since 2013 | | Principal Occupation: Managing General Partner, Bigelow Media, LLC (since 2000); Senior Adviser, Time Warner Inc. (1998–2000). Other Directorships: Currently serves as director of Crane Co. (since 1984) and Huttig Building Products Inc. (since 1998). Previously served as a director of R.H. Donnelley Inc. (2009–2010). |
| | | | | |
Robert B. Calhoun, Jr.
Lord, Abbett & Co. LLC
c/o Legal Dept.
90 Hudson Street
Jersey City, NJ 07302
(1942) | | Director since 1998 | | Principal Occupation: Senior Advisor of Monitor Clipper Partners, a private equity investment fund (since 1997); President of Clipper Asset Management Corp. (1991–2009). Other Directorships: None. |
25
Basic Information About Management (continued)
Name, Address and
Year of Birth | | Current Position and
Length of Service
with the Fund | | Principal Occupation and Other Directorships
During the Past Five Years |
| | | | | |
Eric C. Fast
Lord, Abbett & Co. LLC
c/o Legal Dept.
90 Hudson Street
Jersey City, NJ 07302
(1949) | | Director since 2014 | | Principal Occupation: Chief Executive Officer of Crane Co., an industrial products company (2001–2014). Other Directorships: Currently serves as director of Automatic Data Processing, Inc. (since 2007) and Regions Financial Corporation (since 2010). Previously served as a director of Crane Co. (1999–2014). |
| | | | | |
Evelyn E. Guernsey
Lord, Abbett & Co. LLC
c/o Legal Dept.
90 Hudson Street
Jersey City, NJ 07302
(1955) | | Director since 2011 | | Principal Occupation: CEO, Americas of J.P. Morgan Asset Management (2004–2010). Other Directorships: None. |
| | | | | |
Julie A. Hill
Lord, Abbett & Co. LLC
c/o Legal Dept.
90 Hudson Street
Jersey City, NJ 07302
(1946) | | Director since 2004 | | Principal Occupation: Owner and CEO of The Hill Company, a business consulting firm (since 1998). Other Directorships: Currently serves as director of Anthem, Inc., a health benefits company (since 1994). |
| | | | | |
Franklin W. Hobbs
Lord, Abbett & Co. LLC
c/o Legal Dept.
90 Hudson Street
Jersey City, NJ 07302
(1947) | | Director since 2001 | | Principal Occupation: Advisor of One Equity Partners, a private equity firm (since 2004). Other Directorships: Currently serves as director and Chairman of the Board of Ally Financial Inc., a financial services firm (since 2009), and as director of Molson Coors Brewing Company (since 2002). |
| | | | | |
James M. McTaggart
Lord, Abbett & Co. LLC
c/o Legal Dept.
90 Hudson Street
Jersey City, NJ 07302
(1947) | | Director since 2012 | | Principal Occupation: Independent management advisor and consultant (since 2012); Vice President, CRA International, Inc. (doing business as Charles River Associates), a global management consulting firm (2009–2012); Founder and Chairman of Marakon Associates, Inc., a strategy consulting firm (1978–2009); and Officer and Director of Trinsum Group, a holding company (2007–2009). Other Directorships: Currently serves as director of Blyth, Inc., a home products company (since 2004). |
| | | | | |
James L.L. Tullis
Lord, Abbett & Co. LLC
c/o Legal Dept.
90 Hudson Street
Jersey City, NJ 07302
(1947) | | Director since 2006 | | Principal Occupation: CEO of Tullis-Dickerson and Co. Inc., a venture capital management firm (since 1990); CEO of Tullis Health Investors Inc. (since 2012). Other Directorships: Currently serves as director of Crane Co. (since 1998). |
26
Basic Information About Management (continued)
Officers
None of the officers listed below have received compensation from the Company. All of the officers of the Company also may be officers of the other Lord Abbett Funds and maintain offices at 90 Hudson Street, Jersey City, NJ 07302. Unless otherwise indicated, the position(s) and title(s) listed under the “Principal Occupation During the Past Five Years” column indicate each officer’s position(s) and title(s) with Lord Abbett. Each officer serves for an indefinite term (i.e., until his or her death, resignation, retirement, or removal).
Name and
Year of Birth | | Current Position
with the Fund | | Length of Service
of Current
Position | | Principal Occupation
During the Past Five Years |
| | | | | | | |
Daria L. Foster
(1954) | | President and Chief Executive Officer | | Elected as President in 2006 and Chief Executive Officer in 2012 | | Managing Partner of Lord Abbett, joined Lord Abbett in 1990. |
| | | | | | | |
Sean J. Aurigemma
(1969) | | Executive Vice President | | Elected in 2010 | | Portfolio Manager, joined Lord Abbett in 2007. |
| | | | | | | |
Jeff D. Diamond
(1960) | | Executive Vice President | | Elected in 2008 | | Portfolio Manager, joined Lord Abbett in 2007. |
| | | | | | | |
Robert I. Gerber
(1954) | | Executive Vice President | | Elected in 2003 | | Partner and Chief Investment Officer, joined Lord Abbett in 1997. |
| | | | | | | |
Todd D. Jacobson
(1966) | | Executive Vice President | | Elected in 2005 | | Partner and Associate Director, joined Lord Abbett in 2003. |
| | | | | | | |
Robert A. Lee
(1969) | | Executive Vice President | | Elected in 2010 | | Partner and Deputy Chief Investment Officer, joined Lord Abbett in 1997. |
| | | | | | | |
Thomas B. Maher
(1967) | | Executive Vice President | | Elected in 2010 | | Partner and Portfolio Manager, joined Lord Abbett in 2003. |
| | | | | | | |
Justin C. Maurer
(1969) | | Executive Vice President | | Elected in 2010 | | Partner and Portfolio Manager, joined Lord Abbett in 2001. |
| | | | | | | |
Vincent J. McBride
(1964) | | Executive Vice President | | Elected in 2010 | | Partner and Director, joined Lord Abbett in 2003. |
| | | | | | | |
Andrew H. O’Brien
(1973) | | Executive Vice President | | Elected in 2010 | | Partner and Portfolio Manager, joined Lord Abbett in 1998. |
| | | | | | | |
F. Thomas O’Halloran, III
(1955) | | Executive Vice President | | Elected in 2010 | | Partner and Portfolio Manager, joined Lord Abbett in 2001. |
| | | | | | | |
Walter H. Prahl
(1958) | | Executive Vice President | | Elected in 2012 | | Partner and Director, joined Lord Abbett in 1997. |
| | | | | | | |
Steven F. Rocco
(1979) | | Executive Vice President | | Elected in 2014 | | Partner and Portfolio Manager, joined Lord Abbett in 2004. |
| | | | | | | |
Frederick J. Ruvkun
(1957) | | Executive Vice President | | Elected in 2012 | | Partner and Portfolio Manager, joined Lord Abbett in 2006. |
27
Basic Information About Management (continued)
Name and
Year of Birth | | Current Position
with the Fund | | Length of Service
of Current
Position | | Principal Occupation
During the Past Five Years |
| | | | | | | |
Paul J. Volovich
(1973) | | Executive Vice President | | Elected in 2005 | | Partner and Portfolio Manager, joined Lord Abbett in 1997. |
| | | | | | | |
A. Edward Allinson
(1961) | | Vice President | | Elected in 2011 | | Portfolio Manager, joined Lord Abbett in 2005. |
| | | | | | | |
John W. Ashbrook
(1964) | | Vice President and Assistant Secretary | | Elected in 2014 | | Assistant General Counsel, joined Lord Abbett in 2008. |
| | | | | | | |
Joan A. Binstock
(1954) | | Chief Financial Officer and Vice President | | Elected in 1999 | | Partner and Chief Financial and Operations Officer, joined Lord Abbett in 1999. |
| | | | | | | |
Brooke A. Fapohunda
(1975) | | Vice President and Assistant Secretary | | Elected in 2014 | | Deputy General Counsel, joined Lord Abbett in 2006. |
| | | | | | | |
John K. Forst
(1960) | | Vice President and Assistant Secretary | | Elected in 2005 | | Partner and Deputy General Counsel, joined Lord Abbett in 2004. |
| | | | | | | |
Anthony W. Hipple
(1964) | | Vice President | | Elected in 2014 | | Portfolio Manager, joined Lord Abbett in 2002. |
| | | | | | | |
Lawrence H. Kaplan
(1957) | | Vice President and Secretary | | Elected in 1997 | | Partner and General Counsel, joined Lord Abbett in 1997. |
| | | | | | | |
Jerald M. Lanzotti
(1967) | | Vice President | | Elected in 2012 | | Partner and Portfolio Manager, joined Lord Abbett in 1996. |
| | | | | | | |
David J. Linsen
(1974) | | Vice President | | Elected in 2008 | | Partner and Director, joined Lord Abbett in 2001. |
| | | | | | | |
Joseph M. McGill
(1962) | | Chief Compliance Officer | | Elected in 2014 | | Chief Compliance Officer, joined Lord Abbett in 2014 and was formerly Managing Director and the Chief Compliance Officer at UBS Global Asset Management (2003–2013). |
| | | | | | | |
A. Edward Oberhaus, III
(1959) | | Vice President | | Elected in 1998 | | Partner and Director, joined Lord Abbett in 1983. |
| | | | | | | |
Noah Petrucci
(1970) | | Vice President | | Elected in 2013 | | Portfolio Manager, joined Lord Abbett in 2012 and was formerly a Portfolio Manager at Columbia Management Investment Advisers, LLC and Columbia Management Advisors, LLC (2002–2012). |
| | | | | | | |
Lawrence B. Stoller
(1963) | | Vice President and Assistant Secretary | | Elected in 2007 | | Partner and Senior Deputy General Counsel, joined Lord Abbett in 2007. |
28
Basic Information About Management (concluded)
Name and
Year of Birth | | Current Position
with the Fund | | Length of Service
of Current
Position | | Principal Occupation
During the Past Five Years |
| | | | | | | |
Arthur K. Weise
(1970) | | Vice President | | Elected in 2010 | | Partner and Portfolio Manager, joined Lord Abbett in 2007. |
| | | | | | | |
Kewjin Yuoh
(1971) | | Vice President | | Elected in 2012 | | Partner and Portfolio Manager, joined Lord Abbett in 2010. |
| | | | | | | |
Scott S. Wallner
(1955) | | AML Compliance Officer | | Elected in 2011 | | Assistant General Counsel, joined Lord Abbett in 2004. |
| | | | | | | |
Bernard J. Grzelak
(1971) | | Treasurer | | Elected in 2003 | | Partner and Director of Fund Administration, joined Lord Abbett in 2003. |
Please call 888-522-2388 for a copy of the statement of additional information, which contains further information about the Company’s Directors. It is available free upon request.
29
Approval of Advisory Contract
The Board of Directors of the Fund, including all of the Directors who are not interested persons of the Fund or of Lord Abbett (the “Independent Board Members”), annually considers whether to approve the continuation of the existing management agreement between the Fund and Lord Abbett. In connection with its most recent approval, the Board reviewed materials relating specifically to the management agreement, as well as numerous materials received throughout the course of the year, including information about the Fund’s investment performance compared to the performance of its benchmark. Before making its decision as to the Fund, the Board had the opportunity to ask questions and request further information, taking into account its familiarity with Lord Abbett gained through its meetings and discussions. These meetings and discussions included the examination of the portfolio management team conducted by members of the Contract Committee, the deliberations of the Contract Committee, and discussions between the Contract Committee and Lord Abbett’s management. The Independent Board Members also discussed the materials described above with their independent legal counsel in a private session at which no representatives of management were present.
The materials received by the Board included, but were not limited to: (1) information provided by Morningstar Associates, LLC (“Morningstar”) regarding the investment performance of the Fund compared to the investment performance of a group of funds in the same Morningstar investment category (the “performance peer group”) and the investment performance of one or more appropriate benchmarks; (2) information provided by Morningstar regarding the expense ratios, contractual and effective management fee rates, and other expense components for the Fund and one or more groups of funds in the same Morningstar category, with the same share classes and operational characteristics, including asset size (the “expense peer group”); (3) information provided by Lord Abbett on the projected expense ratios, management fee rates, and other expense components for the Fund; (4) sales and redemption information for the Fund; (5) information regarding Lord Abbett’s financial condition; (6) an analysis of the relative profitability of the management agreement to Lord Abbett; (7) information provided by Lord Abbett regarding the investment management fees Lord Abbett receives from its other advisory clients maintaining accounts with a similar investment strategy as the Fund; (8) information regarding the distribution arrangements of the Fund; and (9) information regarding the personnel and other resources devoted by Lord Abbett to managing the Fund.
Investment Management Services Generally. The Board considered the investment management services provided by Lord Abbett to the Fund, including investment research, portfolio management, and trading, and Lord Abbett’s commitment to compliance with all applicable legal requirements. The Board also observed that Lord Abbett was solely engaged in the investment management business and accordingly did not experience the conflicts of interest that may result from being engaged in other lines of business. The Board considered the investment advisory services provided by Lord Abbett to other clients, the fees charged for the services, and the differences in the nature of the services provided to the Fund and other Lord Abbett Funds, on the one hand, and the services provided to other clients, on the other.
Investment Performance. The Board reviewed the Fund’s investment performance in relation to that of the performance peer group as of various periods ended August 31, 2015. The Board observed that the Fund’s investment performance was above the median of the performance peer group for the one-year, three-year, five-year, and ten-year periods.
Lord Abbett’s Personnel and Methods. The Board considered the qualifications of the personnel providing investment management services to the Fund, in light of its investment objective and
30
Approval of Advisory Contract (continued)
discipline. Among other things, the Board considered the size, experience, and turnover of Lord Abbett’s investment management staff, Lord Abbett’s investment methodology and philosophy, and Lord Abbett’s approach to recruiting, training, and retaining investment management personnel.
Nature and Quality of Other Services. The Board considered the nature, quality, costs, and extent of compliance, administrative, and other services performed by Lord Abbett and Lord Abbett Distributor LLC (the “Distributor”) and the nature and extent of Lord Abbett’s supervision of third party service providers, including the Fund’s transfer agent and custodian.
Expenses. The Board considered the expense level of the Fund and the expense levels of the expense peer group. It also considered the projected expense levels and how those levels would relate to those of the expense peer group and the amount and nature of the fees paid by shareholders. The Board observed that the overall expense level of the Fund was above the median of the expense peer group.
Profitability. The Board considered the level of Lord Abbett’s profits in managing the Fund, including a review of Lord Abbett’s methodology for allocating its costs to its management of the Fund. The Board concluded that the allocation methodology had a reasonable basis and was appropriate. It considered any profits realized by Lord Abbett in connection with the operation of the Fund, including the fee that Lord Abbett receives from the Fund for providing administrative services to the Fund, and whether the amount of profit was fair for the management of the Fund. The Board also considered the profits realized from other business segments of Lord Abbett, which may benefit from or be related to the Fund’s business. The Board considered Lord Abbett’s profit margins in comparison with available industry data, both accounting for and ignoring marketing and distribution expenses, and how those profit margins could affect Lord Abbett’s ability to recruit and retain investment personnel. The Board recognized that Lord Abbett’s profitability was a factor in enabling it to attract and retain qualified investment management personnel to provide services to the Fund. The Board concluded that Lord Abbett’s profitability as to the Fund was not excessive.
Economies of Scale. The Board considered whether there had been any economies of scale in managing the Fund, whether the Fund had appropriately benefited from any such economies of scale, and whether there was potential for realization of any further economies of scale. The Board concluded that the existing management fee schedule, with its breakpoint or breakpoints in the level of the management fee, adequately addressed any economies of scale in managing the Fund.
Other Benefits to Lord Abbett. The Board considered the character and amount of fees paid by the Fund and the Fund’s shareholders to Lord Abbett and the Distributor for services other than investment advisory services. The Board also considered the revenues and profitability of Lord Abbett’s investment advisory business apart from its mutual fund business, and the intangible benefits enjoyed by Lord Abbett by virtue of its relationship with the Fund. The Board observed that the Distributor receives 12b-1 fees from certain of the Lord Abbett Funds as to shares held in accounts for which there is no other broker of record, may retain a portion of the 12b-1 fees it receives, and receives a portion of the sales charges on sales and redemptions of some classes of shares. In addition, the Board observed that Lord Abbett accrues certain benefits for its business of providing investment advice to clients other than the Lord Abbett Funds, but that business also benefits the Funds. The Board also noted that Lord Abbett, as disclosed in the prospectus of the Fund, has entered into revenue sharing arrangements with certain entities that distribute shares of the Fund. The Board also took into consideration the investment research that Lord Abbett receives as a result of Fund brokerage transactions.
31
Approval of Advisory Contract (concluded)
Alternative Arrangements. The Board considered whether, instead of approving continuation of the management agreement, it might be in the best interests of the Fund to implement one or more alternative arrangements, such as continuing to employ Lord Abbett, but on different terms. After considering all of the relevant factors, the Board unanimously found that continuation of the existing management agreement was in the best interests of the Fund and its shareholders and voted unanimously to approve the continuation of the management agreement. In considering whether to approve the continuation of the management agreement, the Board did not identify any single factor as paramount or controlling. This summary does not discuss in detail all matters considered.
32
Householding
The Company has adopted a policy that allows it to send only one copy of the Fund’s prospectus, proxy material, annual report and semiannual report to certain shareholders residing at the same “household.” This reduces Fund expenses, which benefits you and other shareholders. If you need additional copies or do not want your mailings to be “householded,” please call Lord Abbett at 888-522-2388 or send a written request with your name, the name of your fund or funds and your account number or numbers to Lord Abbett Family of Funds, P.O. Box 219336, Kansas City, MO 64121.
Proxy Voting Policies, Procedures and Records
A description of the policies and procedures that Lord Abbett uses to vote proxies related to the Fund’s portfolio securities, and information on how Lord Abbett voted the Fund’s proxies during the 12-month period ended June 30 are available without charge, upon request, (i) by calling 888-522-2388; (ii) on Lord Abbett’s Website at www.lordabbett.com; and (iii) on the Securities and Exchange Commission’s (“SEC”) Website at www.sec.gov.
Shareholder Reports and Quarterly Portfolio Disclosure
The Fund is required to file its complete schedule of portfolio holdings with the SEC for its first and third fiscal quarters on Form N-Q. Copies of the filings are available without charge, upon request on the SEC’s Website at www.sec.gov and may be available by calling Lord Abbett at 888-522-2388. You can also obtain copies of Form N-Q by visiting the SEC’s Public Reference Room in Washington, DC (information on the operation of the Public Reference Room may be obtained by calling 800-SEC-0330).
Tax Information For corporate shareholders, 29% of the Fund’s ordinary income distributions qualified for the dividends received deduction. Additionally, of the distributions paid to the shareholders during the fiscal year ended December 31, 2015, $2,224,813 and $7,531,254, respectively, represent short-term capital gains and long-term capital gains. |
33


| This report, when not used for the general information of shareholders of the Fund, is to be distributed only if preceded or accompanied by a current fund prospectus. | | |
| | | |
Lord Abbett mutual fund shares are distributed by
LORD ABBETT DISTRIBUTOR LLC. | Lord Abbett Series Fund, Inc. Growth Opportunities Portfolio | LASFGO-3
(02/16) |

2015 LORD ABBETT
ANNUAL REPORT
Lord Abbett
Series Fund—International Core Equity Portfolio
For the fiscal year ended December 31, 2015
Table of Contents
Lord Abbett Series Fund — International Core Equity Portfolio
Annual Report
For the fiscal year ended December 31, 2015

Daria L. Foster, Director, President and Chief Executive Officer of the Lord Abbett Funds, and E. Thayer Bigelow, Independent Chairman of the Lord Abbett Funds.
Dear Shareholders: We are pleased to provide you with this overview of the performance of Lord Abbett Series Fund — International Core Equity Portfolio for the fiscal year ended December 31, 2015. On this page and the following pages, we discuss the major factors that influenced fiscal year performance. For additional information about the Fund, please visit our website at www.lordabbett.com, where you also can access the quarterly commentaries that provide updates on the Fund’s performance and other portfolio related updates.
Thank you for investing in Lord Abbett mutual funds. We value the trust that you place in us and look forward to serving your investment needs in the years to come.
Best regards,

Daria L. Foster
Director, President and Chief Executive Officer
For the fiscal year ended December 31, 2015, the Fund returned -1.78%, reflecting performance at the net asset value (NAV) of Class VC shares, with all distributions reinvested, compared to its benchmark, the MSCI EAFE Index with Gross Dividends1, which returned -0.39% over the same period.
Over the period, global equity markets experienced significant volatility, partly as a result of sharp moves in commodity prices, low interest rates, and uncertainty around Chinese economic growth. Overall,
Europe (as measured by the Euro Stoxx 502) fell by 0.47% (in U.S. dollars) for the period, while Japan’s Nikkei 2253 rose 8.43% (in U.S. dollars).
Crude oil prices struggled to rise above $60 per barrel in 2015, falling to less than $40 per barrel by the end of the year. In addition, the U.S. dollar strengthened at the start of 2015, as the market generally believed that the Federal Reserve (Fed) would begin to raise rates in the middle of the year, and the Fed did indeed raise interest rates, by 0.25%, in December 2015.
1
In contrast, the European Central Bank (ECB) announced an asset purchase program in January to support investment and consumption. European markets were adversely affected by concerns around Greece’s solvency, yet a deal was eventually struck with creditors. In Asia, the Bank of Japan continued its quantitative easing (QE) program, which appears to have acted as a tailwind for Japanese equities. The People’s Bank of China was also active during the year, cutting its interest rates five times in 2015 to support a slowing economy.
Market volatility sharply increased after the devaluation of the Chinese yuan, and in the weeks following the devaluation announcement, global equity markets fell more than 10%, in some of the largest intraday moves since the global financial crisis of 2008-09. Markets subsequently recovered toward the end of the trailing 12-month period, supported by central banks debating further stimulus and relatively robust results from large, bellwether companies.
During the period, the Fund’s underperformance, relative to the benchmark, was driven by stock selection, particularly within the telecommunications services and energy sectors. Within the telecommunications services sector, the Fund’s holdings of South Korean wireless telecommunications operator SK Telecom Co., Ltd. detracted from relative performance. Shares of the company declined after it announced disappointing
first quarter earnings in May, with revenue numbers missing analyst targets. In addition, shares of TeliaSonera AB, a Scandinavian telephone and mobile network company, performed poorly over the period, after reports revealed that the European Commission had launched an investigation into a joint venture between the firm and a competitor.
In the energy services sector, the Fund’s holdings of Canadian oil and natural gas producer Baytex Energy Corp. detracted from relative performance. Given the industry in which the firm operates, it is highly leveraged to the price of oil, which declined significantly over the course of the year, and the firm’s ability to pay a dividend came under close scrutiny.
Although the Fund underperformed its benchmark during the period, stock selection within the financials sector contributed to the Fund’s relative performance during the period. Within financials, shares of Indiabulls Housing Finance Ltd., an Indian home loan company, rallied last year, likely supported by resilient lending activity, declining funding costs, and expectations of a better credit rating. In addition, shares of Italian asset management firm Anima Holding SpA rallied after the company met expectations that it would benefit from the ECB’s QE program and growth in asset-managed products in Italy.
Stock selection within the utilities sector also bolstered the Fund’s relative performance. Within the sector, shares of
2
Italian natural gas infrastructure company Snam SpA performed well, possibly due to the company’s sustainable dividend profile and positive third quarter earnings results, which highlighted that a lower gas price had served to boost gas demand in Italy.
1 The MSCI EAFE Index (Europe, Australasia, Far East) is a free float-adjusted market capitalization index that is designed to measure the equity market performance of developed markets, excluding the US & Canada. The MSCI EAFE Index consists of the following 21 developed market country indices: Australia, Austria, Belgium, Denmark, Finland, France, Germany, Hong Kong, Ireland, Israel, Italy, Japan, the Netherlands, New Zealand, Norway, Portugal, Singapore, Spain, Sweden, Switzerland, and the United Kingdom.
The MSCI EAFE Index with Gross Dividends approximates the maximum possible dividend reinvestment. The amount reinvested is the entire dividend distributed to individuals resident in the country of the company, but does not include tax credits.
2 The EURO STOXX 50® Index represents the performance of the 50 largest companies among the 19 supersectors in terms of free-float market cap in 12 eurozone countries. These countries include Austria, Belgium, Finland, France, Germany, Greece, Ireland, Italy, Luxembourg, the Netherlands, Portugal and Spain. The index has a fixed number of components and is part of the STOXX blue-chip index family. The index captures about 60% of the free-float market cap of the EURO STOXX Total Market Index (TMI).
3 The Nikkei Stock Average, the Nikkei 225 is used around the globe as the premier index of Japanese stocks. Because of the prominent nature of the index, many financial products linked to the Nikkei 225 have been created are traded worldwide while the index has been sufficiently used as the indicator of the movement of Japanese stock markets. The Nikkei 225 is a price-weighted equity index, which consists of 225 stocks in the 1st section of the Tokyo Stock Exchange.
Unless otherwise specified, indexes reflect total return, with all dividends reinvested. Indexes are unmanaged, do not reflect the deduction of fees or expenses, and are not available for direct investment.
The Fund’s portfolio is actively managed and, therefore, its holdings and the weightings of a particular issuer or particular sector as a percentage of portfolio assets are subject to change. Sectors may include many industries.
Important Performance and Other Information Performance data quoted in the following pages reflect past performance and are no guarantee of future results. Current performance may be higher or lower than the performance quoted. The investment return and principal value of an investment in the Funds will fluctuate so that shares, on any given day or when redeemed, may be worth more or less than their original cost. You can obtain performance data current to the most recent month end by calling Lord Abbett at 888-522-2388 or referring to www.lordabbett.com.
During certain periods shown, expense waivers and reimbursements were in place. Without such waivers and expense reimbursements, the Fund’s returns would have been lower.
The annual commentary above discusses the views of the Fund’s management and various portfolio holdings of the Fund as of December 31, 2015. These views and portfolio holdings may have changed after this date. Information provided in the commentary is not a recommendation to buy or sell securities. Because the Fund’s portfolio is actively managed and may change significantly, the Fund may no longer own the securities described above or may have otherwise changed their positions in the securities. For more recent information about the Fund’s portfolio holdings, please visit www.lordabbett.com.
A Note about Risk: See Notes to Financial Statements for a discussion of investment risks. For a more detailed discussion of the risks associated with the Fund, please see the Fund’s prospectus.
Mutual funds are not insured by the FDIC, are not deposits or other obligations of, or guaranteed by, banks, and are subject to investment risks including possible loss of principal amount invested.
The Fund serves as an underlying investment vehicle for variable annuity contracts and variable life insurance policies.
3
Investment Comparison
Below is a comparison of a $10,000 investment in Class VC shares with the same investment in the MSCI EAFE® Index with Gross Dividends and the MSCI EAFE® Index with Net Dividends, assuming reinvestment of all dividends and distributions. The Fund’s shares are sold only to insurance company separate accounts that fund certain variable annuity and variable life contracts. This line graph comparison does not reflect the sales charges or other expenses of these contracts. If those sales charges and expenses were reflected, returns would be lower. The graph and performance table below do not reflect the deduction of taxes that a shareholder would pay on Fund distributions or the redemption of Fund shares. During the period, expenses of the Fund were waived or reimbursed by Lord Abbett; without such waiver or reimbursement of expenses, the Fund’s returns would have been lower. Past performance is no guarantee of future results.
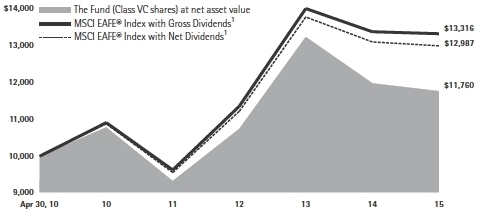
| | | Average Annual Total Returns for the
Period Ended December 31, 2015 |
| | | 1 Year | | 5 Years | | Life of Class | |
| Class VC2 | | –1.78% | | 1.76% | | 2.90% | |
1 Performance for each unmanaged index does not reflect any fees or expenses. The performance of each index is not necessarily representative of the Fund’s performance. Performance for each index began on May 1, 2010.
2 The Class VC shares commenced operations on April 16, 2010. Performance for the Class began on May 1, 2010.
4
Expense Example
As a shareholder of the Fund, you incur ongoing costs, including management fees; expenses related to the Fund’s services arrangements with certain insurance companies; and other Fund expenses. This Example is intended to help you understand your ongoing costs (in dollars) of investing in the Fund and to compare these costs with the ongoing costs of investing in other mutual funds.
The Example is based on an investment of $1,000 invested at the beginning of the period and held for the entire period (July 1, 2015 through December 31, 2015).
The Example reflects only expenses that are deducted from the assets of the Fund. Fees and expenses, including sales charges applicable to the various insurance products that invest in the Fund, are not reflected in this Example. If such fees and expenses were reflected in the Example, the total expenses shown would be higher. Fees and expenses regarding such variable insurance products are separately described in the prospectus related to those products.
Actual Expenses
The first line of the table on the following page provides information about actual account values and actual expenses. You may use the information in this line, together with the amount you invested, to estimate the expenses that you paid over the period. Simply divide your account value by $1,000 (for example, an $8,600 account value divided by $1,000 = 8.6), then multiply the result by the number in the first line under the heading titled “Expenses Paid During Period 7/1/15 – 12/31/15” to estimate the expenses you paid on your account during this period.
Hypothetical Example for Comparison Purposes
The second line of the table on the following page provides information about hypothetical account values and hypothetical expenses based on the Fund’s actual expense ratio and an assumed rate of return of 5% per year before expenses, which is not the Fund’s actual return. The hypothetical account values and expenses may not be used to estimate the actual ending account balance or expenses you paid for the period. You may use this information to compare the ongoing costs of investing in the Fund and other funds. To do so, compare this 5% hypothetical example with the 5% hypothetical examples that appear in the shareholder reports of the other funds.
5
Please note that the expenses shown in the table are meant to highlight your ongoing costs only and do not reflect any transactional costs, such as sales charges. Therefore, the second line of the table is useful in comparing ongoing costs only, and will not help you determine the relative total costs of owning different funds. In addition, if these transactional costs were included, your costs would have been higher.
| | | Beginning
Account
Value | | Ending
Account
Value | | Expenses
Paid During
Period† | |
| | | | | | | 7/1/15 - | |
| | | 7/1/15 | | 12/31/15 | | 12/31/15 | |
| Class VC | | | | | | | |
| Actual | | $1,000.00 | | $ 946.00 | | $4.27 | |
| Hypothetical (5% Return Before Expenses) | | $1,000.00 | | $1,020.82 | | $4.43 | |
| † | Net expenses are equal to the Fund’s annualized expense ratio of 0.87%, multiplied by the average account value over the period, multiplied by 184/365 (to reflect one-half year period). |
Portfolio Holdings Presented by Sector
December 31, 2015
| Sector* | | %** | |
| Consumer Discretionary | | | 11.48 | % |
| Consumer Staples | | | 12.64 | % |
| Energy | | | 3.80 | % |
| Financials | | | 23.52 | % |
| Health Care | | | 12.81 | % |
| Industrials | | | 11.14 | % |
| Information Technology | | | 9.24 | % |
| Materials | | | 1.86 | % |
| Telecommunication Services | | | 5.76 | % |
| Utilities | | | 4.22 | % |
| Repurchase Agreement | | | 3.53 | % |
| Total | | | 100.00 | % |
| * | | A sector may comprise several industries. |
| ** | | Represents percent of total investments. |
6
Schedule of Investments
December 31, 2015
| | | | | | U.S. $ | |
| | | | | | Fair Value | |
| Investments | | Shares | | | (000) | |
| LONG-TERM INVESTMENTS 96.52% | | | | | | | | |
| | | | | | | | | |
| COMMON STOCKS 96.52% | | | | | | | | |
| | | | | | | | | |
| Australia 2.17% | | | | | | | | |
| | | | | | | | | |
| Banks 1.03% | | | | | | | | |
| National Australia Bank Ltd. | | | 28,360 | | | $ | 619 | |
| | | | | | | | | |
| Real Estate Investment Trusts 1.14% | | | | | | | | |
| Mirvac Group | | | 480,330 | | | | 687 | |
| Total Australia | | | | | | | 1,306 | |
| | | | | | | | | |
| Austria 0.68% | | | | | | | | |
| | | | | | | | | |
| Diversified Telecommunication Services | | | | | | | | |
| Telekom Austria AG | | | 74,731 | | | | 409 | |
| | | | | | | | | |
| Belgium 1.26% | | | | | | | | |
| | | | | | | | | |
| Beverages | | | | | | | | |
| Anheuser-Busch InBev NV | | | 6,096 | | | | 759 | |
| | | | | | | | | |
| Canada 0.78% | | | | | | | | |
| | | | | | | | | |
| Oil, Gas & Consumable Fuels | | | | | | | | |
| Crescent Point Energy Corp. | | | 27,000 | | | | 314 | |
| Seven Generations Energy Ltd. Class A * | | | 16,200 | | | | 158 | |
| Total Canada | | | | | | | 472 | |
| | | | | | | | | |
| China 3.37% | | | | | | | | |
| | | | | | | | | |
| Automobiles 0.47% | | | | | | | | |
| Great Wall Motor Co., Ltd. Class H | | | 245,555 | | | | 284 | |
| | | | | | | | | |
| Internet Software & Services 1.16% | | | | | | | | |
| Baidu, Inc. ADR * | | | 3,674 | | | | 694 | |
| | | | | | | | | |
| Personal Products 0.31% | | | | | | | | |
| Hengan International Group Co., Ltd. | | | 20,000 | | | | 188 | |
| | | | | | | | | |
| Real Estate Management & Development 1.43% |
| China Overseas Land & Investment Ltd. | | | 247,169 | | | | 860 | |
| Total China | | | | | | | 2,026 | |
| | | | | | U.S. $ | |
| | | | | | Fair Value | |
| Investments | | Shares | | | (000) | |
| France 9.32% | | | | | | | | |
| | | | | | | | | |
| Aerospace & Defense 1.50% | | | | | | | | |
| Safran SA | | | 13,109 | | | $ | 901 | |
| | | | | | | | | |
| Banks 1.50% | | | | | | | | |
| BNP Paribas SA | | | 16,006 | | | | 906 | |
| | | | | | | | | |
| Food Products 2.21% | | | | | | | | |
| Danone SA | | | 19,730 | | | | 1,333 | |
| | | | | | | | | |
| Insurance 1.57% | | | | | | | | |
| AXA SA | | | 34,577 | | | | 945 | |
| | | | | | | | | |
| Life Sciences Tools & Services 0.49% | | | | | | | | |
| Genfit * | | | 8,417 | | | | 296 | |
| | | | | | | | | |
| Oil, Gas & Consumable Fuels 0.69% | | | | | | | | |
| Total SA | | | 9,299 | | | | 417 | |
| | | | | | | | | |
| Real Estate Investment Trusts 1.36% | | | | | | | | |
| Klepierre | | | 18,384 | | | | 817 | |
| Total France | | | | | | | 5,615 | |
| | | | | | | | | |
| Germany 7.48% | | | | | | | | |
| | | | | | | | | |
| Diversified Financial Services 0.89% | | | | | | | | |
| Deutsche Boerse AG | | | 6,076 | | | | 534 | |
| | | | | | | | | |
| Diversified Telecommunication Services 1.56% |
| Deutsche Telekom AG Registered Shares | | | 52,491 | | | | 943 | |
| | | | | | | | | |
| Health Care Providers & Services 2.64% | | | | | | | | |
| Fresenius Medical Care AG & Co. KGaA | | | 7,401 | | | | 622 | |
| Fresenius SE & Co. KGaA | | | 13,595 | | | | 968 | |
| | | | | | | | 1,590 | |
| | | | | | | | | |
| Life Sciences Tools & Services 0.67% | | | | | | | | |
| MorphoSys AG * | | | 6,508 | | | | 405 | |
| | | | | | | | | |
| Software 1.72% | | | | | | | | |
| SAP SE | | | 13,038 | | | | 1,035 | |
| Total Germany | | | | | | | 4,507 | |
| | See Notes to Financial Statements. | 7 |
Schedule of Investments (continued)
December 31, 2015
| | | | | | U.S. $ | |
| | | | | | Fair Value | |
| Investments | | Shares | | | (000) | |
| Hong Kong 3.13% | | | | | | | | |
| | | | | | | | | |
| Electric: Utilities 0.78% | | | | | | | | |
| Cheung Kong Infrastructure Holdings Ltd. | | | 50,741 | | | $ | 469 | |
| | | | | | | | | |
| Household Durables 0.80% | | | | | | | | |
| Techtronic Industries Co., Ltd. | | | 119,000 | | | | 482 | |
| | | | | | | | | |
| Industrial Conglomerates 1.55% | | | | | | | | |
| CK Hutchison Holdings Ltd. | | | 69,300 | | | | 931 | |
| Total Hong Kong | | | | | | | 1,882 | |
| | | | | | | | | |
| India 1.75% | | | | | | | | |
| | | | | | | | | |
| Oil, Gas & Consumable Fuels 0.81% | | | | | | | | |
| Reliance Industries Ltd. | | | 31,754 | | | | 486 | |
| | | | | | | | | |
| Thrifts & Mortgage Finance 0.94% | | | | | | | | |
| Indiabulls Housing Finance Ltd. | | | 51,250 | | | | 569 | |
| Total India | | | | | | | 1,055 | |
| | | | | | | | | |
| Indonesia 0.64% | | | | | | | | |
| | | | | | | | | |
| Food Products | | | | | | | | |
| PT Indofood Sukses Makmur Tbk | | | 1,031,900 | | | | 384 | |
| | | | | | | | | |
| Israel 1.89% | | | | | | | | |
| | | | | | | | | |
| Pharmaceuticals | | | | | | | | |
| Teva Pharmaceutical Industries Ltd. ADR | | | 17,367 | | | | 1,140 | |
| | | | | | | | | |
| Italy 3.34% | | | | | | | | |
| | | | | | | | | |
| Banks 0.74% | | | | | | | | |
| UniCredit SpA | | | 80,571 | | | | 446 | |
| | | | | | | | | |
| Capital Markets 0.78% | | | | | | | | |
| Anima Holding SpA† | | | 54,541 | | | | 471 | |
| | | | | | | | | |
| Gas Utilities 1.82% | | | | | | | | |
| Snam SpA | | | 209,248 | | | | 1,092 | |
| Total Italy | | | | | | | 2,009 | |
| | | | | | U.S. $ | |
| | | | | | Fair Value | |
| Investments | | Shares | | | (000) | |
| Japan 20.15% | | | | | | | | |
| | | | | | | | | |
| Airlines 1.41% | | | | | | | | |
| Japan Airlines Co., Ltd. | | | 23,700 | | | $ | 848 | |
| | | | | | | | | |
| Auto Components 1.30% | | | | | | | | |
| Stanley Electric Co., Ltd. | | | 35,800 | | | | 786 | |
| | | | | | | | | |
| Automobiles 3.30% | | | | | | | | |
| Honda Motor Co., Ltd. | | | 37,900 | | | | 1,211 | |
| Toyota Motor Corp. | | | 12,600 | | | | 776 | |
| | | | | | | | 1,987 | |
| Banks 1.70% | | | | | | | | |
| Sumitomo Mitsui Financial Group, Inc. | | | 27,100 | | | | 1,023 | |
| | | | | | | | | |
| Chemicals 0.69% | | | | | | | | |
| Asahi Kasei Corp. | | | 61,215 | | | | 414 | |
| | | | | | | | | |
| Diversified Financial Services 1.10% | | | | | | | | |
| ORIX Corp. | | | 47,100 | | | | 661 | |
| | | | | | | | | |
| Electrical Equipment 1.28% | | | | | | | | |
| Nidec Corp. | | | 10,600 | | | | 769 | |
| | | | | | | | | |
| Food & Staples Retailing 1.09% | | | | | | | | |
| Seven & i Holdings Co. Ltd. | | | 14,400 | | | | 659 | |
| | | | | | | | | |
| Information Technology Services 3.41% | | | | | | | | |
| Obic Co., Ltd. | | | 18,200 | | | | 963 | |
| SCSK Corp. | | | 27,100 | | | | 1,089 | |
| | | | | | | | 2,052 | |
| | | | | | | | | |
| Pharmaceuticals 1.44% | | | | | | | | |
| Astellas Pharma, Inc. | | | 60,900 | | | | 867 | |
| | | | | | | | | |
| Real Estate Management & Development 1.74% |
| Daiwa House Industry Co., Ltd. | | | 36,500 | | | | 1,049 | |
| | | | | | | | | |
| Trading Companies & Distributors 0.64% | | | | | | | | |
| Sumitomo Corp. | | | 37,700 | | | | 384 | |
| 8 | See Notes to Financial Statements. |
Schedule of Investments (continued)
December 31, 2015
| | | | | | U.S. $ | |
| | | | | | Fair Value | |
| Investments | | Shares | | | (000) | |
| Japan (continued) | | | | | | | | |
| | | | | | | | | |
| Wireless Telecommunication Services 1.05% | | | | | | | | |
| SoftBank Group Corp. | | | 12,600 | | | $ | 636 | |
| Total Japan | | | | | | | 12,135 | |
| | | | | | | | | |
| Netherlands 5.11% | | | | | | | | |
| | | | | | | | | |
| Beverages 2.36% | | | | | | | | |
| Heineken Holding NV | | | 18,440 | | | | 1,419 | |
| | | | | | | | | |
| Insurance 0.77% | | | | | | | | |
| Aegon NV | | | 82,363 | | | | 466 | |
| | | | | | | | | |
| Oil, Gas & Consumable Fuels 0.96% | | | | | | | | |
| Royal Dutch Shell plc Class A ADR | | | 12,619 | | | | 578 | |
| | | | | | | | | |
| Semiconductors & Semiconductor Equipment 1.02% |
| ASML Holding NV | | | 6,878 | | | | 611 | |
| Total Netherlands | | | | | | | 3,074 | |
| | | | | | | | | |
| South Korea 1.90% | | | | | | | | |
| | | | | | | | | |
| Technology Hardware, Storage & Peripherals 1.20% |
| Samsung Electronics Co., Ltd. | | | 677 | | | | 722 | |
| | | | | | | | | |
| Wireless Telecommunication Services 0.70% |
| SK Telecom Co., Ltd. | | | 2,304 | | | | 422 | |
| Total South Korea | | | | | | | 1,144 | |
| | | | | | | | | |
| Spain 0.81% | | | | | | | | |
| | | | | | | | | |
| Construction & Engineering | | | | | | | | |
| ACS Actividades de Construccion y Servicios SA | | | 16,671 | | | | 488 | |
| | | | | | | | | |
| Sweden 1.47% | | | | | | | | |
| | | | | | | | | |
| Diversified Telecommunication Services 0.78% |
| TeliaSonera AB | | | 94,746 | | | | 470 | |
| | | | | | | | | |
| Machinery 0.69% | | | | | | | | |
| Volvo AB B Shares | | | 44,859 | | | | 416 | |
| Total Sweden | | | | | | | 886 | |
| | | | | | U.S. $ | |
| | | | | | Fair Value | |
| Investments | | Shares | | | (000) | |
| Switzerland 3.85% | | | | | | | | |
| | | | | | | | | |
| Pharmaceuticals | | | | | | | | |
| Novartis AG Registered Shares | | | 13,324 | | | $ | 1,146 | |
| Roche Holding AG | | | 4,224 | | | | 1,171 | |
| Total Switzerland | | | | | | | 2,317 | |
| | | | | | | | | |
| Taiwan 0.75% | | | | | | | | |
| | | | | | | | | |
| Electronic Equipment, Instruments & Components |
| Delta Electronics, Inc. | | | 96,150 | | | | 452 | |
| | | | | | | | | |
| United Kingdom 26.18% | | | | | | | | |
| | | | | | | | | |
| Aerospace & Defense 1.27% | | | | | | | | |
| BAE Systems plc | | | 103,618 | | | | 763 | |
| | | | | | | | | |
| Airlines 1.26% | | | | | | | | |
| International Consolidated Airlines Group SA | | | 84,622 | | | | 761 | |
| | | | | | | | | |
| Banks 4.25% | | | | | | | | |
| Barclays plc | | | 200,999 | | | | 647 | |
| HSBC Holdings plc | | | 138,223 | | | | 1,091 | |
| Lloyds Banking Group plc | | | 760,810 | | | | 819 | |
| | | | | | | | 2,557 | |
| | | | | | | | | |
| Beverages 1.27% | | | | | | | | |
| SABMiller plc | | | 12,797 | | | | 765 | |
| | | | | | | | | |
| Capital Markets 0.95% | | | | | | | | |
| Jupiter Fund Management plc | | | 86,331 | | | | 574 | |
| | | | | | | | | |
| Diversified Telecommunication Services 0.98% |
| BT Group plc | | | 85,241 | | | | 592 | |
| | | | | | | | | |
| Household Durables 1.76% | | | | | | | | |
| Berkeley Group Holdings plc | | | 19,548 | | | | 1,063 | |
| | | | | | | | | |
| Insurance 1.64% | | | | | | | | |
| Prudential plc | | | 43,768 | | | | 986 | |
| | See Notes to Financial Statements. | 9 |
Schedule of Investments (continued)
December 31, 2015
| | | | | | U.S. $ | |
| | | | | | Fair Value | |
| Investments | | Shares | | | (000) | |
| United Kingdom (continued) | | | | | | | | |
| | | | | | | | | |
| Media 3.35% | | | | | | | | |
| ITV plc | | | 269,150 | | | $ | 1,096 | |
| Pearson plc | | | 13,513 | | | | 146 | |
| WPP plc | | | 33,702 | | | | 775 | |
| | | | | | | | 2,017 | |
| | | | | | | | | |
| Metals & Mining 1.17% | | | | | | | | |
| Rio Tinto plc ADR | | | 24,297 | | | | 707 | |
| | | | | | | | | |
| Multi-Line Retail 0.50% | | | | | | | | |
| Debenhams plc | | | 277,717 | | | | 299 | |
| | | | | | | | | |
| Multi-Utilities 1.63% | | | | | | | | |
| National Grid plc | | | 71,123 | | | | 981 | |
| | | | | | | | | |
| Oil, Gas & Consumable Fuels 0.56% | | | | | | | | |
| BG Group plc | | | 23,232 | | | | 337 | |
| | | | | | | | | |
| Personal Products 1.30% | | | | | | | | |
| Unilever plc | | | 18,273 | | | | 784 | |
| | | | | | | | | |
| Pharmaceuticals 1.34% | | | | | | | | |
| AstraZeneca plc | | | 12,001 | | | | 810 | |
| | | | | | | | | |
| Tobacco 2.20% | | | | | | | | |
| Imperial Tobacco Group plc | | | 25,064 | | | | 1,324 | |
| | | | | | | | | |
| Trading Companies & Distributors 0.75% | | | | | | | | |
| Ashtead Group plc | | | 27,275 | | | | 449 | |
| Total United Kingdom | | | | | | | 15,769 | |
| | | | | | | | | |
| United States 0.49% | | | | | | | | |
| | | | | | | | | |
| Health Care Equipment & Supplies | | | | | | | | |
| ResMed, Inc. | | | 5,523 | | | | 297 | |
Total Common Stocks
(cost $58,468,033) | | | | | | | 58,126 | |
| | | Principal | | | U.S. $ | |
| | | Amount | | | Fair Value | |
| Investments | | (000) | | | (000) | |
| SHORT-TERM INVESTMENT 3.53% | | | | | | | | |
| | | | | | | | | |
| Repurchase Agreement | | | | | | | | |
| Repurchase Agreement dated 12/31/2015, 0.03% due 1/4/2016 with Fixed Income Clearing Corp. collateralized by $2,170,000 of U.S. Treasury Note at 1.625% due 7/31/2020; value: $2,172,713; proceeds: $2,126,860 (cost $2,126,853) | | | $2,127 | | | $ | 2,127 | |
Total Investments in Securities 100.05%
(cost $60,594,886) | | | | | | | 60,253 | |
| Liabilities in Excess of Foreign Cash and Other Assets (0.05)% | | | | | | | (28 | ) |
| Net Assets 100.00% | | | | | | $ | 60,225 | |
| ADR | American Depositary Receipt. |
| * | Non-income producing security. |
| † | Security was purchased pursuant to Rule 144A under the Securities Act of 1933 and, unless registered under such Act or exempted from registration, may only be resold to qualified institutional buyers. |
| 10 | See Notes to Financial Statements. |
Schedule of Investments (concluded)
December 31, 2015
The following is a summary of the inputs used as of December 31, 2015 in valuing the Fund’s investments carried at fair value(1):
| | | Level 1 | | | Level 2 | | | Level 3 | | | Total | |
| Investment Type(2)(3) | | (000) | | | (000) | | | (000) | | | (000) | |
| Common Stocks | | | | | | | | | | | | | | | | |
| Australia | | $ | – | | | $ | 1,306 | | | $ | – | | | $ | 1,306 | |
| Austria | | | – | | | | 409 | | | | – | | | | 409 | |
| Belgium | | | – | | | | 759 | | | | – | | | | 759 | |
| Canada | | | 472 | | | | – | | | | – | | | | 472 | |
| China | | | 694 | | | | 1,332 | | | | – | | | | 2,026 | |
| France | | | – | | | | 5,615 | | | | – | | | | 5,615 | |
| Germany | | | – | | | | 4,507 | | | | – | | | | 4,507 | |
| Hong Kong | | | – | | | | 1,882 | | | | – | | | | 1,882 | |
| India | | | – | | | | 1,055 | | | | – | | | | 1,055 | |
| Indonesia | | | – | | | | 384 | | | | – | | | | 384 | |
| Israel | | | 1,140 | | | | – | | | | – | | | | 1,140 | |
| Italy | | | – | | | | 2,009 | | | | – | | | | 2,009 | |
| Japan | | | – | | | | 12,135 | | | | – | | | | 12,135 | |
| Netherlands | | | 578 | | | | 2,496 | | | | – | | | | 3,074 | |
| South Korea | | | – | | | | 1,144 | | | | – | | | | 1,144 | |
| Spain | | | – | | | | 488 | | | | – | | | | 488 | |
| Sweden | | | – | | | | 886 | | | | – | | | | 886 | |
| Switzerland | | | – | | | | 2,317 | | | | – | | | | 2,317 | |
| Taiwan | | | – | | | | 452 | | | | – | | | | 452 | |
| United Kingdom | | | 707 | | | | 15,062 | | | | – | | | | 15,769 | |
| United States | | | 297 | | | | – | | | | – | | | | 297 | |
| Repurchase Agreement | | | – | | | | 2,127 | | | | – | | | | 2,127 | |
| Total | | $ | 3,888 | | | $ | 56,365 | | | $ | – | | | $ | 60,253 | |
| (1) | Refer to Note 2(i) for a description of fair value measurements and the three-tier hierarchy of inputs. |
| (2) | See Schedule of Investments for fair values in each industry and identification of foreign issuers and/or geography. |
| (3) | There were no Level 1/Level 2 transfers during the fiscal year ended December 31, 2015. |
| | See Notes to Financial Statements. | 11 |
Statement of Assets and Liabilities
December 31, 2015
| ASSETS: | | | | |
| Investments in securities, at fair value (cost $60,594,886) | | $ | 60,252,612 | |
| Foreign cash, at value (cost $34,664) | | | 34,541 | |
| Receivables: | | | | |
| Interest and dividends | | | 113,933 | |
| From advisor (See Note 3) | | | 24,109 | |
| Prepaid expenses | | | 358 | |
| Total assets | | | 60,425,553 | |
| LIABILITIES: | | | | |
| Payables: | | | | |
| Capital shares reacquired | | | 57,020 | |
| Management fee | | | 38,583 | |
| Directors’ fees | | | 3,355 | |
| Fund administration | | | 2,058 | |
| Accrued expenses | | | 100,000 | |
| Total liabilities | | | 201,016 | |
| NET ASSETS | | $ | 60,224,537 | |
| COMPOSITION OF NET ASSETS: | | | | |
| Paid-in capital | | $ | 65,226,257 | |
| Distributions in excess of net investment income | | | (25,667 | ) |
| Accumulated net realized loss on investments and foreign currency related transactions | | | (4,630,590 | ) |
| Net unrealized depreciation on investments and translation of assets and liabilities denominated in foreign currencies | | | (345,463 | ) |
| Net Assets | | $ | 60,224,537 | |
| Outstanding shares (50 million shares of common stock authorized, $.001 par value) | | | 3,904,465 | |
| Net asset value, offering and redemption price per share (Net assets divided by outstanding shares) | | $ | 15.42 | |
| 12 | See Notes to Financial Statements. |
Statement of Operations
For the Year Ended December 31, 2015
| Investment income: | | | |
| Dividends (net of foreign withholding taxes of $142,442) | | $ | 1,636,170 | |
| Total investment income | | | 1,636,170 | |
| Expenses: | | | | |
| Management fee | | | 451,985 | |
| Non 12b-1 service fees | | | 150,683 | |
| Shareholder servicing | | | 65,663 | |
| Custody | | | 61,712 | |
| Professional | | | 53,745 | |
| Reports to shareholders | | | 24,616 | |
| Fund administration | | | 24,106 | |
| Directors’ fees | | | 2,133 | |
| Other | | | 26,333 | |
| Gross expenses | | | 860,976 | |
| Expense reductions (See Note 8) | | | (63 | ) |
| Fees waived and expenses reimbursed (See Note 3) | | | (336,611 | ) |
| Net expenses | | | 524,302 | |
| Net investment income | | | 1,111,868 | |
| Net realized and unrealized gain (loss): | | | | |
| Net realized loss on investments (net of foreign capital gains tax of $49,050) | | | (3,685,769 | ) |
| Net realized loss on foreign currency related transactions | | | (83,468 | ) |
| Net change in unrealized appreciation/depreciation on investments | | | 1,256,520 | |
| Net change in unrealized appreciation/depreciation on translation of assets and liabilities denominated in foreign currencies | | | 3,104 | |
| Net realized and unrealized loss | | | (2,509,613 | ) |
| Net Decrease in Net Assets Resulting From Operations | | $ | (1,397,745 | ) |
| | See Notes to Financial Statements. | 13 |
Statements of Changes in Net Assets
| INCREASE IN NET ASSETS | | For the Year Ended
December 31, 2015 | | | For the Year Ended
December 31, 2014 | |
| Operations: | | | | | | | | | | |
| Net investment income | | | $ | 1,111,868 | | | | $ | 633,977 | |
| Net realized gain (loss) on investments and foreign currency related transactions | | | | (3,769,237 | ) | | | | 238,081 | |
| Net change in unrealized appreciation/depreciation on investments and translation of assets and liabilities denominated in foreign currencies | | | | 1,259,624 | | | | | (5,471,641 | ) |
| Net decrease in net assets resulting from operations | | | | (1,397,745 | ) | | | | (4,599,583 | ) |
| Distributions to shareholders from: | | | | | | | | | | |
| Net investment income | | | | (911,239 | ) | | | | (559,031 | ) |
| Net realized gain | | | | – | | | | | (1,551,273 | ) |
| Return of capital | | | | (31,072 | ) | | | | – | |
| Total distributions to shareholders | | | | (942,311 | ) | | | | (2,110,304 | ) |
| Capital share transactions (See Note 12): | | | | | | | | | | |
| Proceeds from sales of shares | | | | 10,297,052 | | | | | 25,380,578 | |
| Reinvestment of distributions | | | | 942,311 | | | | | 2,110,304 | |
| Cost of shares reacquired | | | | (1,303,723 | ) | | | | (74,895 | ) |
| Net increase in net assets resulting from capital share transactions | | | | 9,935,640 | | | | | 27,415,987 | |
| Net increase in net assets | | | | 7,595,584 | | | | | 20,706,100 | |
| NET ASSETS: | | | | | | | | | | |
| Beginning of year | | | $ | 52,628,953 | | | | $ | 31,922,853 | |
| End of year | | | $ | 60,224,537 | | | | $ | 52,628,953 | |
| Distributions in excess of net investment income | | | $ | (25,667 | ) | | | $ | (77,797 | ) |
| 14 | See Notes to Financial Statements. |
This page is intentionally left blank.
Financial Highlights
| | | Per Share Operating Performance: |
| | | | | Investment operations: | | Distributions to
shareholders from: |
| | | Net asset
value,
beginning
of year | | Net
invest-
ment
income(a) | | | Net
realized
and
unrealized
gain (loss) | | Total
from
invest-
ment
opera-
tions | | Net
investment
income | | Net
realized
gain | | Return
of
capital |
| 12/31/2015 | | $15.95 | | $0.30 | | | | $(0.59 | ) | | | $(0.29 | ) | | $(0.23) | | | $ – | | | | $(0.01 | ) |
| 12/31/2014 | | 18.38 | | 0.26 | | | | (1.99 | ) | | | (1.73 | ) | | (0.18) | | | (0.52 | ) | | | – | |
| 12/31/2013 | | 15.31 | | 0.22 | | | | 3.32 | | | | 3.54 | | | (0.24) | | | (0.23 | ) | | | – | |
| 12/31/2012 | | 13.48 | | 0.29 | | | | 1.75 | | | | 2.04 | | | (0.21) | | | – | | | | – | |
| 12/31/2011 | | 15.72 | | 0.24 | | | | (2.36 | ) | | | (2.12 | ) | | (0.12) | | | – | | | | – | |
| (a) | Calculated using average shares outstanding during the year. |
| (b) | Total return does not consider the effects of sales charges or other expenses imposed by an insurance company and assumes the reinvestment of all distributions. |
| 16 | See Notes to Financial Statements. |
| | | | | | | | Ratios to Average Net Assets: | | Supplemental Data: | |
| | | | | | | | | | | |
| | | | | | | | Total | | | | | | | | | | |
Total
distri-
butions | | Net
asset
value,
end of
year | | Total
return(b)
(%) | | | expenses
after
waivers
and/or reim-
bursements
(%) | | | Total
expenses
(%) | | Net
investment
income
(%) | | Net
assets,
end of
year
(000) | | Portfolio
turnover
rate
(%) | |
| $(0.24) | | $15.42 | | (1.78 | ) | | | 0.87 | | | 1.43 | | | 1.84 | | $60,225 | | | 59.93 | |
| (0.70) | | 15.95 | | (9.47 | ) | | | 0.87 | | | 1.59 | | | 1.49 | | 52,629 | | | 57.80 | |
| (0.47) | | 18.38 | | 23.16 | | | | 0.87 | | | 2.02 | | | 1.31 | | 31,923 | | | 56.36 | |
| (0.21) | | 15.31 | | 15.13 | | | | 0.87 | | | 3.81 | | | 2.03 | | 9,945 | | | 78.47 | |
| (0.12) | | 13.48 | | (13.47 | ) | | | 0.87 | | | 10.75 | | | 1.65 | | 3,376 | | | 61.91 | |
| | See Notes to Financial Statements. | 17 |
Notes to Financial Statements
Lord Abbett Series Fund, Inc. (the “Company”) is registered under the Investment Company Act of 1940, as amended (“the Act”), as a diversified, open-end management investment company and was incorporated under Maryland law in 1989. The Company consists of thirteen separate portfolios. This report covers International Core Equity Portfolio (the “Fund”).
The Fund’s investment objective is to seek long-term capital appreciation. The Fund has Variable Contract class shares (“Class VC Shares”), which are currently issued and redeemed only in connection with investments in, and payments under, variable annuity contracts and variable life insurance policies issued by life insurance and insurance-related companies.
The preparation of the financial statements in conformity with accounting principles generally accepted in the United States of America (“U.S. GAAP”) requires management to make certain estimates and assumptions that affect the reported amounts of assets and liabilities and disclosure of contingent assets and liabilities at the date of the financial statements and the reported amounts of increases and decreases in net assets from operations during the reporting period. Actual results could differ from those estimates. The Fund is considered an investment company under U.S. GAAP and follows the accounting and reporting guidance applicable to investment companies.
| 2. | SIGNIFICANT ACCOUNTING POLICIES |
| | |
| (a) | Investment Valuation–Under procedures approved by the Fund’s Board of Directors (the “Board”), Lord, Abbett & Co. LLC (“Lord Abbett”), the Fund’s investment manager, has formed a Pricing Committee to administer the pricing and valuation of portfolio investments and to ensure that prices utilized reasonably reflect fair value. Among other things, these procedures allow the Fund to utilize independent pricing services, quotations from securities and financial instrument dealers and other market sources to determine fair value. |
| | |
| | Securities actively traded on any recognized U.S. or non-U.S. exchange or on The NASDAQ Stock Market LLC are valued at the last sale price or official closing price on the exchange or system on which they are principally traded. Events occurring after the close of trading on non-U.S. exchanges may result in adjustments to the valuation of foreign securities to reflect their fair value as of the close of regular trading on the New York Stock Exchange. The Fund may utilize an independent fair valuation service in adjusting the valuations of foreign securities. Unlisted equity securities are valued at the last quoted sale price or, if no sale price is available, at the mean between the most recently quoted bid and asked prices. |
| | |
| | Securities for which prices are not readily available are valued at fair value as determined by the Pricing Committee. The Pricing Committee considers a number of factors, including observable and unobservable inputs, when arriving at fair value. The Pricing Committee may use related or comparable assets or liabilities, recent transactions, market multiples, book values and other relevant information to determine the fair value of portfolio investments. The Board or a designated committee thereof regularly reviews fair value determinations made by the Pricing Committee and employs techniques such as reviewing related market activity, reviewing inputs and assumptions, and retrospectively comparing prices of subsequent purchases and sales transactions to fair value determinations made by the Pricing Committee. |
| | |
| | Short-term securities with 60 days or less remaining to maturity are valued using the amortized cost method, which approximates fair value. |
18
Notes to Financial Statements (continued)
| (b) | Security Transactions–Security transactions are recorded as of the date that the securities are purchased or sold (trade date). Realized gains and losses on sales of portfolio securities are calculated using the identified-cost method. |
| | |
| (c) | Investment Income–Dividend income is recorded on the ex-dividend date. Interest income is recorded on the accrual basis as earned. Discounts are accreted and premiums are amortized using the effective interest method and are included in Interest and other income on the Statement of Operations. Withholding taxes on foreign dividends have been provided for in accordance with the applicable country’s tax rules and rates. |
| | |
| (d) | Income Taxes–It is the policy of the Fund to meet the requirements of Subchapter M of the Internal Revenue Code applicable to regulated investment companies and to distribute substantially all taxable income and capital gains to its shareholders. Therefore, no income tax provision is required. |
| | |
| | The Fund files U.S. federal and various state and local tax returns. No income tax returns are currently under examination. The statute of limitations on the Fund’s filed U.S. federal tax returns remains open for the fiscal years ended December 31, 2012 through December 31, 2015. The statutes of limitations on the Company’s state and local tax returns may remain open for an additional year depending upon the jurisdiction. |
| | |
| (e) | Expenses–Expenses incurred by the Company that do not specifically relate to an individual fund are generally allocated to the funds within the Company on a pro rata basis by relative net assets. |
| | |
| (f) | Foreign Transactions–The books and records of the Fund are maintained in U.S. dollars and transactions denominated in foreign currencies are recorded in the Fund’s records at the rate prevailing when earned or recorded. Asset and liability accounts that are denominated in foreign currencies are adjusted daily to reflect current exchange rates and any unrealized gain (loss) is included in Net change in unrealized appreciation/depreciation on translation of assets and liabilities denominated in foreign currencies on the Fund’s Statement of Operations. The resultant exchange gains and losses upon settlement of such transactions are included in Net realized loss on foreign currency related transactions on the Fund’s Statement of Operations. The Fund does not isolate that portion of the results of operations arising as a result of changes in the foreign exchange rates from the changes in market prices of the securities. |
| | |
| | The Fund uses foreign currency exchange contracts to facilitate transactions in foreign-denominated securities. Losses from these transactions may arise from changes in the value of the foreign currency or if the counterparties do not perform under the contracts’ terms. |
| | |
| (g) | Forward Foreign Currency Exchange Contracts–The Fund may enter into forward foreign currency exchange contracts in order to reduce their exposure to changes in foreign currency exchange rates on their foreign portfolio holdings, or gain or reduce exposure to foreign currency solely for investment purposes. A forward foreign currency exchange contract is a commitment to purchase or sell a foreign currency at a future date at a negotiated rate. The contracts are valued daily at forward exchange rates and any unrealized gain (loss) is included in Net change in unrealized appreciation/depreciation on translation of assets and liabilities denominated in foreign currencies on the Fund’s Statement of Operations. The gain (loss) arising from the difference between the U.S. dollar cost of the original contract and the value of the foreign currency in U.S. dollars upon closing of such contracts is included in Net realized loss on foreign currency related transactions on the Fund’s Statement of Operations. |
19
Notes to Financial Statements (continued)
| (h) | Repurchase Agreements–The Fund may enter into repurchase agreements with respect to securities. A repurchase agreement is a transaction in which a fund acquires a security and simultaneously commits to resell that security to the seller (a bank or securities dealer) at an agreed-upon price on an agreed-upon date. The Fund requires at all times that the repurchase agreement be collateralized by cash, or by securities of the U.S. Government, its agencies, its instrumentalities, or U.S. Government sponsored enterprises having a value equal to, or in excess of, the value of the repurchase agreement (including accrued interest). If the seller of the agreement defaults on its obligation to repurchase the underlying securities at a time when the fair value of these securities has declined, the Fund may incur a loss upon disposition of the securities. |
| | |
| (i) | Fair Value Measurements–Fair value is defined as the price that the Fund would receive upon selling an investment or transferring a liability in an orderly transaction to an independent buyer in the principal or most advantageous market of the investment. A three-tier hierarchy is used to maximize the use of observable market data and minimize the use of unobservable inputs and to establish classification of fair value measurements for disclosure purposes. Inputs refer broadly to the assumptions that market participants would use in pricing the asset or liability, including assumptions about risk—for example, the risk inherent in a particular valuation technique used to measure fair value (such as a pricing model) and/or the risk inherent in the inputs to the valuation technique. Inputs may be observable or unobservable. Observable inputs reflect the assumptions market participants would use in pricing the asset or liability. Observable inputs are based on market data obtained from sources independent of the reporting entity. Unobservable inputs reflect the reporting entity’s own assumptions about the assumptions market participants would use in pricing the asset or liability. Unobservable inputs are based on the best information available in the circumstances. The three-tier hierarchy of inputs is summarized in the three broad Levels listed below: |
| | |
| | • | Level 1 – | unadjusted quoted prices in active markets for identical investments; |
| | | | |
| | • | Level 2 – | other significant observable inputs (including quoted prices for similar investments, interest rates, prepayment speeds, credit risk, etc.); and |
| | | | |
| | • | Level 3 – | significant unobservable inputs (including the Fund’s own assumptions in determining the fair value of investments). |
| | | | |
| | A summary of inputs used in valuing the Fund’s investments as of December 31, 2015 and, if applicable, Level 1/Level 2 transfers and Level 3 rollforwards for the fiscal year then ended is included in the Fund’s Schedule of Investments. |
| | |
| | Changes in valuation techniques may result in transfers into or out of an assigned level within the three-tier hierarchy. All transfers between different levels within the three-tier hierarchy are deemed to have occurred as of the beginning of the reporting period. The inputs or methodology used for valuing securities are not necessarily an indication of the risk associated with investing in those securities. |
| 3. | MANAGEMENT FEE AND OTHER TRANSACTIONS WITH AFFILIATES |
Management Fee
The Company has a management agreement with Lord Abbett, pursuant to which Lord Abbett supplies the Fund with investment management services and executive and other personnel, provides office space and pays for ordinary and necessary office and clerical expenses relating to research and statistical work and supervision of the Fund’s investment portfolio.
20
Notes to Financial Statements (continued)
The management fee is based on the Fund’s average daily net assets at the following annual rate:
| First $1 billion | .75% |
| Next $1 billion | .70% |
| Over $2 billion | .65% |
For the fiscal year ended December 31, 2015, the effective management fee, net of waivers, was at an annualized rate of .19% of the Fund’s average daily net assets.
In addition, Lord Abbett provides certain administrative services to the Fund pursuant to an Administrative Services Agreement in return for a fee at an annual rate of .04% of the Fund’s average daily net assets.
During the fiscal year ended December 31, 2015 and continuing through April 30, 2016, Lord Abbett has contractually agreed to waive its fees and reimburse expenses to the extent necessary to limit total net annual operating expenses, excluding any acquired fund fees and expenses, to an annual rate of .87%. This agreement may be terminated only upon the approval of the Board.
The Company, on behalf of the Fund, has entered into services arrangements with certain insurance companies. Under these arrangements, certain insurance companies will be compensated up to ..25% of the average daily net asset value (“NAV”) of the Fund’s Class VC Shares held in the insurance company’s separate account to service and maintain the Variable Contract owners’ accounts. This amount is included in Non 12b-1 service fees on the Statement of Operations. The Fund may also compensate certain insurance companies, third-party administrators and other entities for providing recordkeeping, sub-transfer agency and other administrative services to the Fund. This amount is included in Shareholder servicing on the Statement of Operations.
A Director and certain of the Company’s officers have an interest in Lord Abbett.
| 4. | DISTRIBUTIONS AND CAPITAL LOSS CARRYFORWARDS |
Dividends from net investment income, if any, are declared and paid at least semi-annually. Taxable net realized gains from investment transactions, reduced by allowable capital loss carryforwards, if any, are declared and distributed to shareholders at least annually. The capital loss carryforward amount, if any, is available to offset future net capital gains. Dividends and distributions to shareholders are recorded on the ex-dividend date. The amounts of dividends and distributions from net investment income and net realized capital gains are determined in accordance with federal income tax regulations, which may differ from U.S. GAAP. These book/tax differences are either considered temporary or permanent in nature. To the extent these differences are permanent in nature, such amounts are reclassified within the components of net assets based on their federal tax basis treatment; temporary differences do not require reclassification. Dividends and distributions that exceed earnings and profits for tax purposes are reported as a tax return of capital.
The tax character of distributions paid during the fiscal years ended December 31, 2015 and 2014 was as follows:
| | | Year Ended | | Year Ended |
| | | 12/31/2015 | | 12/31/2014 |
| Distributions paid from: | | | | | | |
| Ordinary income | | $ | 911,239 | | $ | 786,628 |
| Net long-term capital gains | | | – | | | 1,283,806 |
| Return of capital | | | 31,072 | | | 39,870 |
| Total distributions paid | | $ | 942,311 | | $ | 2,110,304 |
21
Notes to Financial Statements (continued)
As of December 31, 2015, the components of accumulated losses on a tax-basis were as follows:
| Capital loss carryforwards* | | $ | (2,235,469 | ) |
| Temporary differences | | | (1,657,595 | ) |
| Unrealized losses – net | | | (1,108,656 | ) |
| Total accumulated losses – net | | $ | (5,001,720 | ) |
| * | The capital losses will carryforward indefinitely. |
At the Fund’s election, certain losses incurred within the taxable year (Qualified Late-Year Losses) are deemed to arise on the first business day of the Fund’s next taxable year. The Fund incurred and will elect to defer post-October capital losses of $1,653,058 and late-year ordinary losses of $1,182 during fiscal year 2015.
As of December 31, 2015, the aggregate unrealized security gains and losses based on cost for U.S. federal income tax purposes were as follows:
| Tax cost | | $ | 61,358,079 | |
| Gross unrealized gain | | | 3,827,510 | |
| Gross unrealized loss | | | (4,932,977 | ) |
| Net unrealized security loss | | $ | (1,105,467 | ) |
The difference between book-basis and tax-basis unrealized gains (losses) is attributable to the tax treatment of certain foreign securities and wash sales.
Permanent items identified during the fiscal year ended December 31, 2015 have been reclassified among the components of net assets based on their tax basis treatment as follows:
| Distributions in | Accumulated | |
| Excess of Net | Net Realized | Paid-in |
| Investment Income | Loss | Capital |
| $(117,427) | $148,499 | $(31,072) |
The permanent differences are attributable to the tax treatment of foreign currency transactions, certain expenses, certain distributions, and certain foreign securities.
| 5. | PORTFOLIO SECURITIES TRANSACTIONS |
Purchases and sales of investment securities (excluding short-term investments) for the fiscal year ended December 31, 2015 were as follows:
| Purchases | Sales |
| $44,597,786 | $34,117,849 |
There were no purchases or sales of U.S. Government securities for the fiscal year ended December 31, 2015.
| 6. | DISCLOSURES ABOUT OFFSETTING ASSETS AND LIABILITIES |
The Financial Accounting Standards Board (“FASB”) requires disclosures intended to help better assess the effect or potential effect of offsetting arrangements on a fund’s financial position. The following tables illustrate gross and net information about recognized assets and liabilities eligible for offset in the statement of assets and liabilities; and disclose such amounts subject to an enforceable master netting agreement or similar agreement, by counterparty. A master netting agreement is an agreement between a fund and a counterparty which provides for the net settlement of amounts owed under all contracts traded under that agreement, as well as cash collateral, through a single payment by one party to the other in the event of default on or
22
Notes to Financial Statements (continued)
termination of any one contract. The Fund’s accounting policy with respect to balance sheet offsetting is that, absent an event of default by the counterparty or a termination of the agreement, the master netting agreement does not result in an offset of reported amounts of financial assets and liabilities in the statement of assets and liabilities across transactions between the Fund and the applicable counterparty:
| | | | | | Gross Amounts | | | Net Amounts of |
| | | | | | Offset in the | | | Assets Presented |
| | | Gross Amounts of | | | Statement of Assets | | | in the Statement of |
| Description | | Recognized Assets | | | and Liabilities | | | Assets and Liabilities |
| Repurchase Agreement | | | $2,126,853 | | | $ | – | | | $ | 2,126,853 |
| Total | | | $2,126,853 | | | $ | – | | | $ | 2,126,853 |
| | | | | | | | | | | | |
| | | Net Amounts | | | | | | | | | | | | |
| | | of Assets | | | Amounts Not Offset in the | | | |
| | | Presented in | | | Statement of Assets and Liabilities | | | |
| | | the Statement | | | | | | Cash | | | Securities | | | |
| | | of Assets and | | | Financial | | | Collateral | | | Collateral | | | Net |
| Counterparty | | Liabilities | | | Instruments | | | Received(a) | | | Received(a) | | | Amount(b) |
| Fixed Income Clearing Corp. | | $ | 2,126,853 | | | $ | – | | | $ | – | | | $ | (2,126,853 | ) | | $ | – |
| Total | | $ | 2,126,853 | | | $ | – | | | $ | – | | | $ | (2,126,853 | ) | | $ | – |
| | |
| (a) | Collateral disclosed is limited to an amount not to exceed 100% of the net amount of assets presented in the Statement of Assets and Liabilities, for each respective counterparty. |
| (b) | Net amount represents the amount owed to the Fund by the counterparty as of December 31, 2015. |
| 7. | DIRECTORS’ REMUNERATION |
The Company’s officers and a Director, who are associated with Lord Abbett, do not receive any compensation from the Company for serving in such capacities. Independent Directors’ fees are allocated among all Lord Abbett-sponsored funds based on the net assets of each fund. There is an equity-based plan available to all Independent Directors under which Independent Directors must defer receipt of a portion of, and may elect to defer receipt of an additional portion of Directors’ fees. The deferred amounts are treated as though equivalent dollar amounts had been invested in the funds. Such amounts and earnings accrued thereon are included in Directors’ fees on the Statement of Operations and in Directors’ fees payable on the Statement of Assets and Liabilities and are not deductible for U.S. federal income tax purposes until such amounts are paid.
The Company has entered into an arrangement with its transfer agent and custodian, whereby credits realized as a result of uninvested cash balances are used to reduce a portion of the Fund’s expenses.
Effective August 31, 2015, the Fund and certain other funds managed by Lord Abbett (collectively, the “Participating Funds”) entered into a syndicated line of credit facility with various lenders for $550 million (the “Facility”), whereas State Street Bank and Trust Company (“SSB”) participates as a lender and as agent for the lenders. The Facility is to be used for temporary or emergency purposes as an additional source of: liquidity to satisfy redemptions. The Participating Funds are subject to graduated borrowing limits of one-third of Fund assets (if Fund assets are less than $750 million), $250 million, $300 million, or $350 million, based on past borrowings and likelihood of future borrowings. The Facility will continue through August 29, 2016.
23
Notes to Financial Statements (continued)
Prior to August 31, 2015, the Fund and certain other funds managed by Lord Abbett participated in a $500 million unsecured revolving credit facility with SSB (the “SSB Facility”).
During the fiscal year ended December 31, 2015, the Fund did not utilize the Facility or the SSB Facility.
| 10. | CUSTODIAN AND ACCOUNTING AGENT |
SSB is the Company’s custodian and accounting agent. SSB performs custodial, accounting and recordkeeping functions relating to portfolio transactions and calculating the Fund’s NAV.
The Fund is subject to the general risks and considerations associated with equity investing. The value of an investment will fluctuate in response to movements in the equity securities markets in general and to the changing prospects of individual companies in which the Fund invests.
Large company value stocks, in which the Fund invests, may perform differently than the market as a whole and other types of stocks, such as small company stocks and growth stocks.
The Fund is subject to the risks of investing in foreign securities and derivatives. Foreign securities may pose greater risks than domestic securities, including greater price fluctuations and higher transaction costs. Foreign investments also may be affected by changes in currency rates or currency controls. These risks are generally greater for securities issued by companies in emerging market countries.
The Fund is also subject to the risks associated with derivatives, which may be different from and greater than the risks associated with investing directly in securities and other investments.
These factors can affect the Fund’s performance.
| 12. | SUMMARY OF CAPITAL TRANSACTIONS |
Transactions in shares of capital stock were as follows:
| | | Year Ended | | | Year Ended | |
| | | December 31, 2015 | | | December 31, 2014 | |
| Shares sold | | | 624,933 | | | | 1,437,492 | |
| Reinvestment of distributions | | | 61,468 | | | | 128,784 | |
| Shares reacquired | | | (81,333 | ) | | | (4,133 | ) |
| Increase | | | 605,068 | | | | 1,562,143 | |
24
Report of Independent Registered Public Accounting Firm
To the Board of Directors of Lord Abbett Series Fund, Inc. and the Shareholders of International Core Equity Portfolio:
We have audited the accompanying statement of assets and liabilities, including the schedule of investments, of the International Core Equity Portfolio, one of the portfolios constituting the Lord Abbett Series Fund, Inc. (the “Fund”) as of December 31, 2015, and the related statement of operations for the year then ended, the statements of changes in net assets for each of the two years in the period then ended, and the financial highlights for each of the five years in the period then ended. These financial statements and financial highlights are the responsibility of the Fund’s management. Our responsibility is to express an opinion on these financial statements and financial highlights based on our audits.
We conducted our audits in accordance with the standards of the Public Company Accounting Oversight Board (United States). Those standards require that we plan and perform the audit to obtain reasonable assurance about whether the financial statements and financial highlights are free of material misstatement. The Fund is not required to have, nor were we engaged to perform, an audit of its internal control over financial reporting. Our audits included consideration of internal control over financial reporting as a basis for designing audit procedures that are appropriate in the circumstances, but not for the purpose of expressing an opinion on the effectiveness of the Fund’s internal control over financial reporting. Accordingly, we express no such opinion. An audit also includes examining, on a test basis, evidence supporting the amounts and disclosures in the financial statements, assessing the accounting principles used and significant estimates made by management, as well as evaluating the overall financial statement presentation. Our procedures included confirmation of securities owned as of December 31, 2015, by correspondence with the custodian. We believe that our audits provide a reasonable basis for our opinion.
In our opinion, such financial statements and financial highlights referred to above present fairly, in all material respects, the financial position of International Core Equity Portfolio of the Lord Abbett Series Fund, Inc. as of December 31, 2015, the results of its operations for the year then ended, the changes in its net assets for each of the two years in the period then ended, and the financial highlights for each of the five years in the period then ended, in conformity with accounting principles generally accepted in the United States of America.
DELOITTE & TOUCHE LLP
New York, New York
February 16, 2016
25
Basic Information About Management
The Board is responsible for the management of the business and affairs of the Company in accordance with the laws of the State of Maryland. The Board elects officers who are responsible for the day-to-day operations of the Fund and who execute policies authorized by the Board. The Board also approves an investment adviser to the Fund and continues to monitor the cost and quality of the services the investment adviser provides, and annually considers whether to renew the contract with the adviser. Generally, each Director holds office until his/her successor is elected and qualified or until his/her earlier resignation or removal, as provided in the Company’s organizational documents.
Lord Abbett, a Delaware limited liability company, is the Fund’s investment adviser. Designated Lord Abbett personnel are responsible for the day-to-day management of the Fund.
Interested Director
Ms. Foster is affiliated with Lord Abbett and is an “interested person” of the Company as defined in the Act. Ms. Foster is a director/trustee and officer of each of the 12 investment companies in the Lord Abbett Family of Funds, which consist of 58 portfolios or series.
| | | Current Position and | | |
| Name, Address and | | Length of Service | | Principal Occupation and Other Directorships |
| Year of Birth | | with the Fund | | During the Past Five Years |
| | | | | |
Daria L. Foster
Lord, Abbett & Co. LLC
90 Hudson Street Jersey City, NJ 07302
(1954) | | Director and President since 2006; Chief Executive Officer since 2012 | | Principal Occupation: Managing Partner of Lord Abbett, joined Lord Abbett in 1990.
Other Directorships: None. |
Independent Directors
The following Independent Directors also are directors/trustees of each of the 12 investment companies in the Lord Abbett Family of Funds, which consist of 58 portfolios or series.
| | | Current Position and | | |
| Name, Address and | | Length of Service | | Principal Occupation and Other Directorships |
| Year of Birth | | with the Fund | | During the Past Five Years |
| | | | | |
E. Thayer Bigelow
Lord, Abbett & Co. LLC
c/o Legal Dept.
90 Hudson Street
Jersey City, NJ 07302
(1941) | | Director since 1994; Chairman since 2013 | | Principal Occupation: Managing General Partner, Bigelow Media, LLC (since 2000); Senior Adviser, Time Warner Inc. (1998–2000).
Other Directorships: Currently serves as director of Crane Co. (since 1984) and Huttig Building Products Inc. (since 1998). Previously served as a director of R.H. Donnelley Inc. (2009–2010). |
| | | | | |
Robert B. Calhoun, Jr.
Lord, Abbett & Co. LLC
c/o Legal Dept.
90 Hudson Street
Jersey City, NJ 07302
(1942) | | Director since 1998 | | Principal Occupation: Senior Advisor of Monitor Clipper Partners, a private equity investment fund (since 1997); President of Clipper Asset Management Corp. (1991–2009).
Other Directorships: None. |
26
Basic Information About Management (continued)
| | | Current Position and | | |
| Name, Address and | | Length of Service | | Principal Occupation and Other Directorships |
| Year of Birth | | with the Fund | | During the Past Five Years |
| | | | | |
Eric C. Fast
Lord, Abbett & Co. LLC
c/o Legal Dept.
90 Hudson Street
Jersey City, NJ 07302
(1949) | | Director since 2014 | | Principal Occupation: Chief Executive Officer of Crane Co., an industrial products company (2001–2014).
Other Directorships: Currently serves as director of Automatic Data Processing, Inc. (since 2007) and Regions Financial Corporation (since 2010). Previously served as a director of Crane Co. (1999–2014). |
| | | | | |
Evelyn E. Guernsey
Lord, Abbett & Co. LLC
c/o Legal Dept.
90 Hudson Street
Jersey City, NJ 07302
(1955) | | Director since 2011 | | Principal Occupation: CEO, Americas of J.P. Morgan Asset Management (2004–2010).
Other Directorships: None. |
| | | | | |
Julie A. Hill
Lord, Abbett & Co. LLC
c/o Legal Dept.
90 Hudson Street
Jersey City, NJ 07302
(1946) | | Director since 2004 | | Principal Occupation: Owner and CEO of The Hill Company, a business consulting firm (since 1998).
Other Directorships: Currently serves as director of Anthem, Inc., a health benefits company (since 1994). |
| | | | | |
Franklin W. Hobbs
Lord, Abbett & Co. LLC
c/o Legal Dept.
90 Hudson Street
Jersey City, NJ 07302
(1947) | | Director since 2001 | | Principal Occupation: Advisor of One Equity Partners, a private equity firm (since 2004).
Other Directorships: Currently serves as director and Chairman of the Board of Ally Financial Inc., a financial services firm (since 2009), and as director of Molson Coors Brewing Company (since 2002). |
| | | | | |
James M. McTaggart
Lord, Abbett & Co. LLC
c/o Legal Dept.
90 Hudson Street
Jersey City, NJ 07302
(1947) | | Director since 2012 | | Principal Occupation: Independent management advisor and consultant (since 2012); Vice President, CRA International, Inc. (doing business as Charles River Associates), a global management consulting firm (2009–2012); Founder and Chairman of Marakon Associates, Inc., a strategy consulting firm (1978–2009); and Officer and Director of Trinsum Group, a holding company (2007–2009).
Other Directorships: Currently serves as director of Blyth, Inc., a home products company (since 2004). |
| | | | | |
James L.L. Tullis
Lord, Abbett & Co. LLC
c/o Legal Dept.
90 Hudson Street
Jersey City, NJ 07302
(1947) | | Director since 2006 | | Principal Occupation: CEO of Tullis-Dickerson and Co. Inc., a venture capital management firm (since 1990); CEO of Tullis Health Investors Inc. (since 2012).
Other Directorships: Currently serves as director of Crane Co. (since 1998). |
27
Basic Information About Management (continued)
Officers
None of the officers listed below have received compensation from the Company. All of the officers of the Company also may be officers of the other Lord Abbett Funds and maintain offices at 90 Hudson Street, Jersey City, NJ 07302. Unless otherwise indicated, the position(s) and title(s) listed under the “Principal Occupation During the Past Five Years” column indicate each officer’s position(s) and title(s) with Lord Abbett. Each officer serves for an indefinite term (i.e., until his or her death, resignation, retirement, or removal).
| | | | | Length of Service | | |
| Name and | | Current Position | | of Current | | Principal Occupation |
| Year of Birth | | with the Fund | | Position | | During the Past Five Years |
| | | | | | | |
Daria L. Foster
(1954) | | President and Chief Executive Officer | | Elected as President in 2006 and Chief Executive Officer in 2012 | | Managing Partner of Lord Abbett, joined Lord Abbett in 1990. |
| | | | | | | |
Sean J. Aurigemma
(1969) | | Executive Vice President | | Elected in 2010 | | Portfolio Manager, joined Lord Abbett in 2007. |
| | | | | | | |
Jeff D. Diamond
(1960) | | Executive Vice President | | Elected in 2008 | | Portfolio Manager, joined Lord Abbett in 2007. |
| | | | | | | |
Robert I. Gerber
(1954) | | Executive Vice President | | Elected in 2003 | | Partner and Chief Investment Officer, joined Lord Abbett in 1997. |
| | | | | | | |
Todd D. Jacobson
(1966) | | Executive Vice President | | Elected in 2005 | | Partner and Associate Director, joined Lord Abbett in 2003. |
| | | | | | | |
Robert A. Lee
(1969) | | Executive Vice President | | Elected in 2010 | | Partner and Deputy Chief Investment Officer, joined Lord Abbett in 1997. |
| | | | | | | |
Thomas B. Maher
(1967) | | Executive Vice President | | Elected in 2010 | | Partner and Portfolio Manager, joined Lord Abbett in 2003. |
| | | | | | | |
Justin C. Maurer
(1969) | | Executive Vice President | | Elected in 2010 | | Partner and Portfolio Manager, joined Lord Abbett in 2001. |
| | | | | | | |
Vincent J. McBride
(1964) | | Executive Vice President | | Elected in 2010 | | Partner and Director, joined Lord Abbett in 2003. |
| | | | | | | |
Andrew H. O’Brien
(1973) | | Executive Vice President | | Elected in 2010 | | Partner and Portfolio Manager, joined Lord Abbett in 1998. |
| | | | | | | |
F. Thomas O’Halloran, III
(1955) | | Executive Vice President | | Elected in 2010 | | Partner and Portfolio Manager, joined Lord Abbett in 2001. |
| | | | | | | |
Walter H. Prahl
(1958) | | Executive Vice President | | Elected in 2012 | | Partner and Director, joined Lord Abbett in 1997. |
| | | | | | | |
Steven F. Rocco
(1979) | | Executive Vice President | | Elected in 2014 | | Partner and Portfolio Manager, joined Lord Abbett in 2004. |
| | | | | | | |
Frederick J. Ruvkun
(1957) | | Executive Vice President | | Elected in 2012 | | Partner and Portfolio Manager, joined Lord Abbett in 2006. |
28
Basic Information About Management (continued)
| | | | | Length of Service | | |
| Name and | | Current Position | | of Current | | Principal Occupation |
| Year of Birth | | with the Fund | | Position | | During the Past Five Years |
| | | | | | | |
Paul J. Volovich
(1973) | | Executive Vice President | | Elected in 2005 | | Partner and Portfolio Manager, joined Lord Abbett in 1997. |
| | | | | | | |
A. Edward Allinson
(1961) | | Vice President | | Elected in 2011 | | Portfolio Manager, joined Lord Abbett in 2005. |
| | | | | | | |
John W. Ashbrook
(1964) | | Vice President and Assistant Secretary | | Elected in 2014 | | Assistant General Counsel, joined Lord Abbett in 2008. |
| | | | | | | |
Joan A. Binstock
(1954) | | Chief Financial Officer and Vice President | | Elected in 1999 | | Partner and Chief Financial and Operations Officer, joined Lord Abbett in 1999. |
| | | | | | | |
Brooke A. Fapohunda
(1975) | | Vice President and Assistant Secretary | | Elected in 2014 | | Deputy General Counsel, joined Lord Abbett in 2006. |
| | | | | | | |
John K. Forst (1960) | | Vice President and Assistant Secretary | | Elected in 2005 | | Partner and Deputy General Counsel, joined Lord Abbett in 2004. |
| | | | | | | |
Anthony W. Hipple
(1964) | | Vice President | | Elected in 2014 | | Portfolio Manager, joined Lord Abbett in 2002. |
| | | | | | | |
Lawrence H. Kaplan
(1957) | | Vice President and Secretary | | Elected in 1997 | | Partner and General Counsel, joined Lord Abbett in 1997. |
| | | | | | | |
Jerald M. Lanzotti
(1967) | | Vice President | | Elected in 2012 | | Partner and Portfolio Manager, joined Lord Abbett in 1996. |
| | | | | | | |
David J. Linsen
(1974) | | Vice President | | Elected in 2008 | | Partner and Director, joined Lord Abbett in 2001. |
| | | | | | | |
Joseph M. McGill
(1962) | | Chief Compliance Officer | | Elected in 2014 | | Chief Compliance Officer, joined Lord Abbett in 2014 and was formerly Managing Director and the Chief Compliance Officer at UBS Global Asset Management (2003–2013). |
| | | | | | | |
A. Edward Oberhaus, III
(1959) | | Vice President | | Elected in 1998 | | Partner and Director, joined Lord Abbett in 1983. |
| | | | | | | |
Noah Petrucci (1970) | | Vice President | | Elected in 2013 | | Portfolio Manager, joined Lord Abbett in 2012 and was formerly a Portfolio Manager at Columbia Management Investment Advisers, LLC and Columbia Management Advisors, LLC (2002–2012). |
| | | | | | | |
Lawrence B. Stoller
(1963) | | Vice President and Assistant Secretary | | Elected in 2007 | | Partner and Senior Deputy General Counsel, joined Lord Abbett in 2007. |
29
Basic Information About Management (concluded)
| | | | | Length of Service | | |
| Name and | | Current Position | | of Current | | Principal Occupation |
| Year of Birth | | with the Fund | | Position | | During the Past Five Years |
| | | | | | | |
Arthur K. Weise
(1970) | | Vice President | | Elected in 2010 | | Partner and Portfolio Manager, joined Lord Abbett in 2007. |
| | | | | | | |
Kewjin Yuoh (1971) | | Vice President | | Elected in 2012 | | Partner and Portfolio Manager, joined Lord Abbett in 2010. |
| | | | | | | |
Scott S. Wallner
(1955) | | AML Compliance Officer | | Elected in 2011 | | Assistant General Counsel, joined Lord Abbett in 2004. |
| | | | | | | |
Bernard J. Grzelak
(1971) | | Treasurer | | Elected in 2003 | | Partner and Director of Fund Administration, joined Lord Abbett in 2003. |
Please call 888-522-2388 for a copy of the statement of additional information, which contains further information about the Company’s Directors. It is available free upon request.
30
Approval of Advisory Contract
The Board of Directors of the Fund, including all of the Directors who are not interested persons of the Fund or of Lord Abbett (the “Independent Board Members”), annually considers whether to approve the continuation of the existing management agreement between the Fund and Lord Abbett. In connection with its most recent approval, the Board reviewed materials relating specifically to the management agreement, as well as numerous materials received throughout the course of the year, including information about the Fund’s investment performance compared to the performance of its benchmark. Before making its decision as to the Fund, the Board had the opportunity to ask questions and request further information, taking into account its familiarity with Lord Abbett gained through its meetings and discussions. These meetings and discussions included the examination of the portfolio management team conducted by members of the Contract Committee, the deliberations of the Contract Committee, and discussions between the Contract Committee and Lord Abbett’s management. The Independent Board Members also discussed the materials described above with their independent legal counsel in a private session at which no representatives of management were present.
The materials received by the Board included, but were not limited to: (1) information provided by Morningstar Associates, LLC (“Morningstar”) regarding the investment performance of the Fund compared to the investment performance of a group of funds in the same Morningstar investment category (the “performance peer group”) and the investment performance of one or more appropriate benchmarks; (2) information provided by Morningstar regarding the expense ratios, contractual and effective management fee rates, and other expense components for the Fund and one or more groups of funds in the same Morningstar category, with the same share classes and operational characteristics, including asset size (the “expense peer group”); (3) information provided by Lord Abbett on the projected expense ratios, management fee rates, and other expense components for the Fund; (4) sales and redemption information for the Fund; (5) information regarding Lord Abbett’s financial condition; (6) an analysis of the relative profitability of the management agreement to Lord Abbett; (7) information provided by Lord Abbett regarding the investment management fees Lord Abbett receives from its other advisory clients maintaining accounts with a similar investment strategy as the Fund; (8) information regarding the distribution arrangements of the Fund; and (9) information regarding the personnel and other resources devoted by Lord Abbett to managing the Fund.
Investment Management Services Generally. The Board considered the investment management services provided by Lord Abbett to the Fund, including investment research, portfolio management, and trading, and Lord Abbett’s commitment to compliance with all applicable legal requirements. The Board also observed that Lord Abbett was solely engaged in the investment management business and accordingly did not experience the conflicts of interest that may result from being engaged in other lines of business. The Board considered the investment advisory services provided by Lord Abbett to other clients, the fees charged for the services, and the differences in the nature of the services provided to the Fund and other Lord Abbett Funds, on the one hand, and the services provided to other clients, on the other.
Investment Performance. The Board reviewed the Fund’s investment performance in relation to that of the performance peer group as of various periods ended August 31, 2015. The Board observed that the Fund’s investment performance was below the median of the performance peer group for the one-year, three-year, and five-year periods.
Lord Abbett’s Personnel and Methods. The Board considered the qualifications of the personnel providing investment management services to the Fund, in light of its investment objective and
31
Approval of Advisory Contract (continued)
discipline. Among other things, the Board considered the size, experience, and turnover of Lord Abbett’s investment management staff, Lord Abbett’s investment methodology and philosophy, and Lord Abbett’s approach to recruiting, training, and retaining investment management personnel. The Board also noted that Lord Abbett had recently hired a new global equity portfolio manager to lead Lord Abbett’s global equity efforts.
Nature and Quality of Other Services. The Board considered the nature, quality, costs, and extent of compliance, administrative, and other services performed by Lord Abbett and Lord Abbett Distributor LLC (the “Distributor”) and the nature and extent of Lord Abbett’s supervision of third party service providers, including the Fund’s transfer agent and custodian.
Expenses. The Board considered the expense level of the Fund and the expense levels of the expense peer group. It also considered the projected expense levels and how those levels would relate to those of the expense peer group and the amount and nature of the fees paid by shareholders. The Board observed that the overall expense level of the Fund was well below the median of the expense peer group.
Profitability. The Board considered the level of Lord Abbett’s profits in managing the Fund, including a review of Lord Abbett’s methodology for allocating its costs to its management of the Fund. The Board concluded that the allocation methodology had a reasonable basis and was appropriate. It considered any profits realized by Lord Abbett in connection with the operation of the Fund, including the fee that Lord Abbett receives from the Fund for providing administrative services to the Fund, and whether the amount of profit was fair for the management of the Fund. The Board also considered the profits realized from other business segments of Lord Abbett, which may benefit from or be related to the Fund’s business. The Board considered Lord Abbett’s profit margins in comparison with available industry data, both accounting for and ignoring marketing and distribution expenses, and how those profit margins could affect Lord Abbett’s ability to recruit and retain investment personnel. The Board recognized that Lord Abbett’s profitability was a factor in enabling it to attract and retain qualified investment management personnel to provide services to the Fund. The Board concluded that Lord Abbett’s profitability as to the Fund was not excessive.
Economies of Scale. The Board considered whether there had been any economies of scale in managing the Fund, whether the Fund had appropriately benefited from any such economies of scale, and whether there was potential for realization of any further economies of scale. The Board concluded that the existing management fee schedule, with its breakpoint or breakpoints in the level of the management fee, adequately addressed any economies of scale in managing the Fund.
Other Benefits to Lord Abbett. The Board considered the character and amount of fees paid by the Fund and the Fund’s shareholders to Lord Abbett and the Distributor for services other than investment advisory services. The Board also considered the revenues and profitability of Lord Abbett’s investment advisory business apart from its mutual fund business, and the intangible benefits enjoyed by Lord Abbett by virtue of its relationship with the Fund. The Board observed that the Distributor receives 12b-1 fees from certain of the Lord Abbett Funds as to shares held in accounts for which there is no other broker of record, may retain a portion of the 12b-1 fees it receives, and receives a portion of the sales charges on sales and redemptions of some classes of shares. In addition, the Board observed that Lord Abbett accrues certain benefits for its business of providing investment advice to clients other than the Lord Abbett Funds, but that business also benefits the Funds. The Board also noted that Lord Abbett, as disclosed in the prospectus of the Fund, has entered into revenue sharing arrangements with certain entities that distribute shares of
32
Approval of Advisory Contract (concluded)
the Fund. The Board also took into consideration the investment research that Lord Abbett receives as a result of Fund brokerage transactions.
Alternative Arrangements. The Board considered whether, instead of approving continuation of the management agreement, it might be in the best interests of the Fund to implement one or more alternative arrangements, such as continuing to employ Lord Abbett, but on different terms. After considering all of the relevant factors, the Board unanimously found that continuation of the existing management agreement was in the best interests of the Fund and its shareholders and voted unanimously to approve the continuation of the management agreement. In considering whether to approve the continuation of the management agreement, the Board did not identify any single factor as paramount or controlling. This summary does not discuss in detail all matters considered.
33
Householding
The Company has adopted a policy that allows it to send only one copy of the Fund’s prospectus, proxy material, annual report and semiannual report to certain shareholders residing at the same “household.” This reduces Fund expenses, which benefits you and other shareholders. If you need additional copies or do not want your mailings to be “householded,” please call Lord Abbett at 888-522-2388 or send a written request with your name, the name of your fund or funds and your account number or numbers to Lord Abbett Family of Funds, P.O. Box 219336, Kansas City, MO 64121.
Proxy Voting Policies, Procedures and Records
A description of the policies and procedures that Lord Abbett uses to vote proxies related to the Fund’s portfolio securities, and information on how Lord Abbett voted the Fund’s proxies during the 12-month period ended June 30 are available without charge, upon request, (i) by calling 888-522-2388; (ii) on Lord Abbett’s Website at www.lordabbett.com; and (iii) on the Securities and Exchange Commission’s (“SEC”) Website at www.sec.gov.
Shareholder Reports and Quarterly Portfolio Disclosure
The Fund is required to file its complete schedule of portfolio holdings with the SEC for its first and third fiscal quarters on Form N-Q. Copies of the filings are available without charge, upon request on the SEC’s Website at www.sec.gov and may be available by calling Lord Abbett at 888-522-2388. You can also obtain copies of Form N-Q by visiting the SEC’s Public Reference Room in Washington, DC (information on the operation of the Public Reference Room may be obtained by calling 800-SEC-0330).
Tax Information The Fund intends to pass through foreign source income of $1,765,253 and foreign taxes of $191,492. |
34

 | | |
| | | |
This report, when not used for the general information of shareholders of the Fund, is to be distributed only if preceded or accompanied by a current fund prospectus. | | |
| | | |
Lord Abbett mutual fund shares are distributed by
LORD ABBETT DISTRIBUTOR LLC. | Lord Abbett Series Fund, Inc. | |
| | | SFICE-3 |
| | International Core Equity Portfolio | (02/16) |

2015 LORD ABBETT
ANNUAL REPORT
Lord Abbett
Series Fund—International Opportunities Portfolio
For the fiscal year ended December 31, 2015
Table of Contents
Lord Abbett Series Fund – International Opportunities Portfolio
Annual Report
For the fiscal year ended December 31, 2015

Daria L. Foster, Director, President and Chief Executive Officer of the Lord Abbett Funds, and E. Thayer Bigelow, Independent Chairman of the Lord Abbett Funds.
Dear Shareholders: We are pleased to provide you with this overview of the performance of Lord Abbett Series Fund – International Opportunities Portfolio for the fiscal year ended December 31, 2015. On this page and the following pages, we discuss the major factors that influenced fiscal year performance. For additional information about the Fund, please visit our website at www.lordabbett.com, where you also can access the quarterly commentaries that provide updates on the Fund’s performance and other portfolio related updates.
Thank you for investing in Lord Abbett mutual funds. We value the trust that you place in us and look forward to serving your investment needs in the years to come.
Best regards,

Daria L. Foster
Director, President and Chief Executive Officer
For the fiscal year ended December 31, 2015, the Fund returned 11.10%, reflecting performance at the net asset value (NAV) of Class VC shares, with all distributions reinvested, compared to its benchmark, the S&P Developed Ex-U.S. SmallCap® Index1, which returned 5.92% over the same period.
Over the period, global equity markets experienced significant volatility, partly as a result of sharp moves in commodity prices, low interest rates, and uncertainty around Chinese economic growth. Overall,
Europe (as measured by the Euro Stoxx 502) fell by 0.47% (in U.S. dollars) for the period, while Japan’s Nikkei 2253 rose 8.43% (in U.S. dollars).
Crude oil prices struggled to rise above $60 per barrel in 2015, falling to less than $40 per barrel by the end of the year. In addition, the U.S. dollar strengthened at the start of 2015, as the market generally believed that the Federal Reserve (Fed) would begin to raise rates in the middle of the year, and the Fed did indeed raise interest rates, by 0.25%, in December 2015.
1
In contrast, the European Central Bank (ECB) announced an asset purchase program in January to support investment and consumption. European markets were adversely affected by concerns around Greece’s solvency, yet a deal was eventually struck with creditors. In Asia, the Bank of Japan continued its quantitative easing (QE) program, which appears to have acted as a tailwind for Japanese equities. The People’s Bank of China was also active during the year, cutting its interest rates five times in 2015 to support a slowing economy.
Market volatility sharply increased after the devaluation of the Chinese yuan, and in the weeks following the devaluation announcement, global equity markets fell more than 10%, in some of the largest intraday moves since the global financial crisis of 2008-09. Markets subsequently recovered toward the end of the trailing 12-month period, supported by central banks debating further stimulus and relatively robust results from large, bellwether companies.
Stock selection, most notably in the financials and industrials sectors, was the primary driver of relative outperformance during the period. Within financials, shares of Italian asset management firm Anima Holding SpA rose as the company was highlighted as one of the firms benefitting from the ECB’s QE program and growth in asset-managed products in Italy. In addition, shares of Indiabulls Housing Finance Ltd., an Indian home loan company
rallied during the period, supported by resilient lending activity, declining funding costs and expectations of a better credit rating.
Within the industrials sector, shares of Dutch recruitment company USG People N.V. were stronger over the period, as the firm’s sales growth was high relative to peers, and labor market trends have been supportive in the Netherlands.
Conversely, stock selection in the energy and information technology sectors detracted from relative performance. Within the energy sector, shares of Bankers Petroleum Ltd., a Canadian oil company operating in Albania, fell significantly over the period. The company was involved in a tax dispute with Albanian authorities, which led to the suspension of Bankers’ Albanian bank accounts, hurting the company’s share price. In addition, Genel Energy plc, an oil company headquartered in the United Kingdom, halted oil exploration in July as it awaited payments due from the Kurdistan Regional Government, after which Genel Energy shares fell in value. Genel Energy’s share price also appears to have been hurt by declines in the price of oil.
Within the information technology sector, shares of VTech Holdings Ltd., a Hong Kong-based cordless phone manufacturer, which had experienced a general decline through the year, fell sharply after the company announced that its database was hacked by an unauthorized party.
2
The Fund’s portfolio is actively managed and, therefore, its holdings and the weightings of a particular issuer or particular sector as a percentage of portfolio assets are subject to change. Sectors may include many industries.
1 The S&P Developed Ex-U.S. SmallCap® Index captures the bottom 15% of companies domiciled in the developed markets (excluding the United States) within the S&P Global BMI with a float-adjusted market capitalization of at least US$100 million and a value traded of at least US$50 million for the past 12 months at the time of the annual reconstitution. Stocks are excluded if their market capitalization falls below US$75 million, or if the value traded is less than US$35 million at the time of reconstitution.
2 The EURO STOXX 50® Index represents the performance of the 50 largest companies among the 19 supersectors in terms of free-float market cap in 12 eurozone countries. These countries include Austria, Belgium, Finland, France, Germany, Greece, Ireland, Italy, Luxembourg, the Netherlands, Portugal and Spain. The index has a fixed number of components and is part of the STOXX blue-chip index family. The index captures about 60% of the free-float market cap of the EURO STOXX Total Market Index (TMI).
3 The Nikkei Stock Average, the Nikkei 225 is used around the globe as the premier index of Japanese stocks. Because of the prominent nature of the index, many financial products linked to the Nikkei 225 have been created are traded worldwide while the index has been sufficiently used as the indicator of the movement of Japanese stock markets. The Nikkei 225 is a price-weighted equity index, which consists of 225 stocks in the 1st section of the Tokyo Stock Exchange.
Unless otherwise specified, indexes reflect total return, with all dividends reinvested. Indexes are unmanaged, do not reflect the deduction of fees or expenses, and are not available for direct investment.
Important Performance and Other Information
Performance data quoted in the following pages reflect past performance and are no guarantee of future results. Current performance may be higher or lower than the performance quoted. The investment return and principal value of an investment in the Funds will fluctuate so that shares, on any given day or when redeemed, may be worth more or less than their original cost. You can obtain performance data current to the most recent month end by calling Lord Abbett at 888-522-2388 or referring to www.lordabbett.com.
During certain periods shown, expense waivers and reimbursements were in place. Without such waivers and expense reimbursements, the Fund’s returns would have been lower.
The annual commentary above discusses the views of the Fund’s management and various portfolio holdings of the Fund as of December 31, 2015. These views and portfolio holdings may have changed after this date. Information provided in the commentary is not a recommendation to buy or sell securities. Because the Fund’s portfolio is actively managed and may change significantly, the Fund may no longer own the securities described above or may have otherwise changed their positions in the securities. For more recent information about the Fund’s portfolio holdings, please visit www.lordabbett.com.
A Note about Risk: See Notes to Financial Statements for a discussion of investment risks. For a more detailed discussion of the risks associated with the Fund, please see the Fund’s prospectus.
Mutual funds are not insured by the FDIC, are not deposits or other obligations of, or guaranteed by, banks, and are subject to investment risks including possible loss of principal amount invested.
The Fund serves as an underlying investment vehicle for variable annuity contracts and variable life insurance policies.
3
Investment Comparison
Below is a comparison of a $10,000 investment in Class VC shares with the same investment in the S&P Developed Ex-U.S. SmallCap Index, assuming reinvestment of all dividends and distributions. The Fund’s shares are sold only to insurance company separate accounts that fund certain variable annuity and variable life contracts. This line graph comparison does not reflect the sales charges or other expenses of these contracts. If those sales charges and expenses were reflected, returns would be lower. The graph and performance table below do not reflect the deduction of taxes that a shareholder would pay on Fund distributions or the redemption of Fund shares. During certain periods, expenses of the Fund have been waived or reimbursed by Lord Abbett; without such waiver or reimbursement of expenses, the Fund’s returns would have been lower. Past performance is no guarantee of future results.

| | | Average Annual Total Returns for the
Periods Ended December 31, 2015 |
| | | 1 Year | | 5 Years | | 10 Years | |
| Class VC | | 11.10% | | 6.95% | | 5.09% | |
1 Performance for the unmanaged index does not reflect any fees or expenses. The performance of the index is not necessarily representative of the Fund’s performance.
4
Expense Example
As a shareholder of the Fund, you incur ongoing costs, including management fees; expenses related to the Fund’s services arrangements with certain insurance companies; and other Fund expenses. This Example is intended to help you understand your ongoing costs (in dollars) of investing in the Fund and to compare these costs with the ongoing costs of investing in other mutual funds.
The Example is based on an investment of $1,000 invested at the beginning of the period and held for the entire period (July 1, 2015 through December 31, 2015).
The Example reflects only expenses that are deducted from the assets of the Fund. Fees and expenses, including sales charges applicable to the various insurance products that invest in the Fund, are not reflected in this Example. If such fees and expenses were reflected in the Example, the total expenses shown would be higher. Fees and expenses regarding such variable insurance products are separately described in the prospectus related to those products.
Actual Expenses
The first line of the table on the following page provides information about actual account values and actual expenses. You may use the information in this line, together with the amount you invested, to estimate the expenses that you paid over the period. Simply divide your account value by $1,000 (for example, an $8,600 account value divided by $1,000 = 8.6), then multiply the result by the number in the first line under the heading titled “Expenses Paid During Period 7/1/15 – 12/31/15” to estimate the expenses you paid on your account during this period.
Hypothetical Example for Comparison Purposes
The second line of the table on the following page provides information about hypothetical account values and hypothetical expenses based on the Fund’s actual expense ratio and an assumed rate of return of 5% per year before expenses, which is not the Fund’s actual return. The hypothetical account values and expenses may not be used to estimate the actual ending account balance or expenses you paid for the period. You may use this information to compare the ongoing costs of investing in the Fund and other funds. To do so, compare this 5% hypothetical example with the 5% hypothetical examples that appear in the shareholder reports of the other funds.
5
Please note that the expenses shown in the table are meant to highlight your ongoing costs only and do not reflect any transactional costs, such as sales charges. Therefore, the second line of the table is useful in comparing ongoing costs only, and will not help you determine the relative total costs of owning different funds. In addition, if these transactional costs were included, your costs would have been higher.
| | | Beginning
Account
Value | | Ending
Account
Value | | Expenses
Paid During
Period† | |
| | | 7/1/15 | | 12/31/15 | | 7/1/15 -
12/31/15 | |
| Class VC | | | | | | | |
| Actual | | $1,000.00 | | $ 980.90 | | $5.99 | |
| Hypothetical (5% Return Before Expenses) | | $1,000.00 | | $1,019.16 | | $6.11 | |
| | |
| † | Net expenses are equal to the Fund’s annualized expense ratio of 1.20%, multiplied by the average account value over the period, multiplied by 184/365 (to reflect one-half year period). |
Portfolio Holdings Presented by Sector
December 31, 2015
| Sector* | %** |
| Consumer Discretionary | 20.77 | % |
| Consumer Staples | 8.64 | % |
| Energy | 0.89 | % |
| Financials | 21.36 | % |
| Health Care | 3.93 | % |
| Industrials | 19.76 | % |
| Information Technology | 13.51 | % |
| Materials | 4.15 | % |
| Telecommunication Services | 1.55 | % |
| Utilities | 2.84 | % |
| Repurchase Agreement | 2.60 | % |
| Total | 100.00 | % |
| * | | A sector may comprise several industries. |
| ** | | Represents percent of total investments. |
6
Schedule of Investments
December 31, 2015
| | | | | | U.S. $ | |
| | | | | | Fair Value | |
| Investments | | Shares | | | (000) | |
| LONG-TERM INVESTMENTS 98.28% | | | | | | | | |
| | | | | | | | | |
| COMMON STOCKS 98.27% | | | | | | | | |
| | | | | | | | | |
| Australia 5.07% | | | | | | | | |
| | | | | | | | | |
| Beverages 1.38% | | | | | | | | |
| Treasury Wine Estates Ltd. | | | 123,197 | | | $ | 740 | |
| | | | | | | | | |
| Electric: Utilities 0.78% | | | | | | | | |
| AusNet Services | | | 390,694 | | | | 420 | |
| | | | | | | | | |
| Hotels, Restaurants & Leisure 1.72% | | | | | | | | |
| Mantra Group Ltd. | | | 252,687 | | | | 925 | |
| | | | | | | | | |
| Real Estate Investment Trusts 1.19% | | | | | | | | |
| Charter Hall Group | | | 195,447 | | | | 642 | |
| Total Australia | | | | | | | 2,727 | |
| | | | | | | | | |
| Austria 0.57% | | | | | | | | |
| | | | | | | | | |
| Semiconductors & Semiconductor Equipment | | | | | | | | |
| ams AG | | | 9,236 | | | | 309 | |
| | | | | | | | | |
| Canada 4.02% | | | | | | | | |
| | | | | | | | | |
| Auto Components 0.99% | | | | | | | | |
| Linamar Corp. | | | 9,868 | | | | 533 | |
| | | | | | | | | |
| Electric: Utilities 0.75% | | | | | | | | |
| Emera, Inc. | | | 13,000 | | | | 406 | |
| | | | | | | | | |
| Metals & Mining 0.51% | | | | | | | | |
| HudBay Minerals, Inc. | | | 71,302 | | | | 274 | |
| | | | | | | | | |
| Oil, Gas & Consumable Fuels 0.69% | | | | | | | | |
| Vermilion Energy, Inc. | | | 3,700 | | | | 101 | |
| Whitecap Resources, Inc. | | | 40,900 | | | | 268 | |
| | | | | | | | 369 | |
| | | | | | | | | |
| Paper & Forest Products 1.08% | | | | | | | | |
| Interfor Corp.* | | | 57,500 | | | | 583 | |
| Total Canada | | | | | | | 2,165 | |
| | | | | | U.S. $ | |
| | | | | | Fair Value | |
| Investments | | Shares | | | (000) | |
| China 1.02% | | | | | | | | |
| | | | | | | | | |
| Electronic Equipment, Instruments & Components 0.57% | | | | |
| Sunny Optical Technology Group Co., Ltd. | | | 135,000 | | | $ | 308 | |
| | | | | | | | | |
| Energy Equipment & Services 0.22% | | | | | | | | |
| Hilong Holding Ltd. | | | 679,600 | | | | 117 | |
| | | | | | | | | |
| Internet Software & Services 0.23% | | | | | | | | |
| Yirendai Ltd. ADR* | | | 13,050 | | | | 123 | |
| Total China | | | | | | | 548 | |
| | | | | | | | | |
| Finland 2.72% | | | | | | | | |
| | | | | | | | | |
| Leisure Product 1.58% | | | | | | | | |
| Amer Sports OYJ | | | 29,021 | | | | 847 | |
| | | | | | | | | |
| Trading Companies & Distributors 1.14% | | | | | | | | |
| Cramo OYJ | | | 29,834 | | | | 616 | |
| Total Finland | | | | | | | 1,463 | |
| | | | | | | | | |
| France 2.84% | | | | | | | | |
| | | | | | | | | |
| Commercial Services & Supplies 1.47% | | | | | | | | |
| Elior Participations SCA+ | | | 37,837 | | | | 793 | |
| | | | | | | | | |
| Information Technology Services 1.02% | | | | | | | | |
| Altran Technologies SA | | | 40,769 | | | | 546 | |
| | | | | | | | | |
| Life Sciences Tools & Services 0.35% | | | | | | | | |
| Genfit* | | | 5,356 | | | | 188 | |
| Total France | | | | | | | 1,527 | |
| | | | | | | | | |
| Germany 6.22% | | | | | | | | |
| | | | | | | | | |
| Internet Software & Services 0.62% | | | | | | | | |
| XING AG | | | 1,821 | | | | 336 | |
| | | | | | | | | |
| Life Sciences Tools & Services 1.54% | | | | | | | | |
| Gerresheimer AG | | | 6,896 | | | | 539 | |
| MorphoSys AG* | | | 4,629 | | | | 288 | |
| | | | | | | | 827 | |
| | | | | | | | | |
| Machinery 1.04% | | | | | | | | |
| Deutz AG | | | 141,093 | | | | 562 | |
| | See Notes to Financial Statements. | 7 |
Schedule of Investments (continued)
December 31, 2015
| | | | | | U.S. $ | |
| | | | | | Fair Value | |
| Investments | | Shares | | | (000) | |
| Germany (continued) | | | | | | | | |
| | | | | | | | | |
| Real Estate Management & Development 3.02% | | | | | | | | |
| Grand City Properties SA | | | 38,934 | | | $ | 900 | |
| Patrizia Immobilien AG* | | | 24,845 | | | | 726 | |
| | | | | | | | 1,626 | |
| Total Germany | | | | | | | 3,351 | |
| | | | | | | | | |
| Hong Kong 4.08% | | | | | | | | |
| | | | | | | | | |
| Communications Equipment 0.51% | | | | | | | | |
| VTech Holdings Ltd. | | | 26,300 | | | | 272 | |
| | | | | | | | | |
| Diversified Telecommunication Services 0.79% | | | | | | | | |
| HKBN Ltd. | | | 331,880 | | | | 427 | |
| | | | | | | | | |
| Electronic Equipment, Instruments & Components 0.90% | | | |
| Wasion Group Holdings Ltd. | | | 470,000 | | | | 487 | |
| | | | | | | | | |
| Household Durables 1.88% | | | | | | | | |
| Techtronic Industries Co., Ltd. | | | 249,500 | | | | 1,010 | |
| Total Hong Kong | | | | | | | 2,196 | |
| | | | | | | | | |
| India 3.64% | | | | | | | | |
| | | | | | | | | |
| Information Technology Services 0.78% | | | | | | | | |
| Vakrangee Ltd. | | | 160,655 | | | | 423 | |
| | | | | | | | | |
| Real Estate Management & Development 1.00% | | | | | | | | |
| Housing Development & Infrastructure Ltd.* | | | 459,149 | | | | 538 | |
| | | | | | | | | |
| Thrifts & Mortgage Finance 1.86% | | | | | | | | |
| Dewan Housing Finance Corp., Ltd. | | | 282,206 | | | | 1,000 | |
| Total India | | | | | | | 1,961 | |
| | | | | | | | | |
| Indonesia 1.12% | | | | | | | | |
| | | | | | | | | |
| Banks 0.82% | | | | | | | | |
| Bank Tabungan Negara Persero Tbk PT | | | 4,716,496 | | | | 440 | |
| | | | | | U.S. $ | |
| | | | | | Fair Value | |
| Investments | | Shares | | | (000) | |
| Consumer Finance 0.30% | | | | | | | | |
| PT Clipan Finance Indonesia Tbk* | | | 8,129,400 | | | $ | 162 | |
| Total Indonesia | | | | | | | 602 | |
| | | | | | | | | |
| Ireland 6.45% | | | | | | | | |
| | | | | | | | | |
| Beverages 1.04% | | | | | | | | |
| C&C Group plc | | | 139,040 | | | | 561 | |
| | | | | | | | | |
| Food Products 0.51% | | | | | | | | |
| Greencore Group plc | | | 52,492 | | | | 274 | |
| | | | | | | | | |
| Health Care Providers & Services 1.57% | | | | | | | | |
| UDG Healthcare plc | | | 95,830 | | | | 845 | |
| | | | | | | | | |
| Household Durables 1.59% | | | | | | | | |
| Cairn Homes plc* | | | 656,960 | | | | 853 | |
| | | | | | | | | |
| Real Estate Investment Trusts 0.73% | | | | | | | | |
| Hibernia REIT plc | | | 257,364 | | | | 394 | |
| | | | | | | | | |
| Trading Companies & Distributors 1.01% | | | | | | | | |
| Grafton Group plc Unit | | | 49,725 | | | | 543 | |
| Total Ireland | | | | | | | 3,470 | |
| | | | | | | | | |
| Israel 1.36% | | | | | | | | |
| | | | | | | | | |
| Chemicals | | | | | | | | |
| Frutarom Industries Ltd. | | | 13,646 | | | | 733 | |
| | | | | | | | | |
| Italy 5.77% | | | | | | | | |
| | | | | | | | | |
| Banks 1.30% | | | | | | | | |
| Banca Popolare di Milano Scarl | | | 707,765 | | | | 701 | |
| | | | | | | | | |
| Beverages 1.60% | | | | | | | | |
| Davide Campari-Milano SpA | | | 99,153 | | | | 857 | |
| | | | | | | | | |
| Capital Markets 0.71% | | | | | | | | |
| Anima Holding SpA+ | | | 44,398 | | | | 384 | |
| 8 | See Notes to Financial Statements. |
Schedule of Investments (continued)
December 31, 2015
| | | | | | U.S. $ | |
| | | | | | Fair Value | |
| Investments | | Shares | | | (000) | |
| Italy (continued) | | | | | | | | |
| | | | | | | | | |
| Construction & Engineering 0.64% | | | | | | | | |
| Maire Tecnimont SpA* | | | 126,943 | | | $ | 343 | |
| | | | | | | | | |
| Textiles, Apparel & Luxury Goods 1.52% | | | | | | | | |
| Brunello Cucinelli SpA | | | 30,221 | | | | 534 | |
| Moncler SpA | | | 20,468 | | | | 285 | |
| | | | | | | | 819 | |
| Total Italy | | | | | | | 3,104 | |
| | | | | | | | | |
| Japan 20.15% | | | | | | | | |
| | | | | | | | | |
| Construction & Engineering 0.92% | | | | | | | | |
| Maeda Road Construction Co., Ltd. | | | 14,000 | | | | 235 | |
| SHO-BOND Holdings Co., Ltd. | | | 7,100 | | | | 259 | |
| | | | | | | | 494 | |
| | | | | | | | | |
| Electronic Equipment, Instruments & Components 0.73% | | | | |
| Hitachi High-Technologies Corp. | | | 14,600 | | | | 395 | |
| | | | | | | | | |
| Food & Staples Retailing 1.55% | | | | | | | | |
| Sundrug Co., Ltd. | | | 13,000 | | | | 836 | |
| | | | | | | | | |
| Hotels, Restaurants & Leisure 2.16% | | | | | | | | |
| Resorttrust, Inc. | | | 24,700 | | | | 652 | |
| St. Marc Holdings Co., Ltd. | | | 18,400 | | | | 511 | |
| | | | | | | | 1,163 | |
| | | | | | | | | |
| Household Durables 1.53% | | | | | | | | |
| Iida Group Holdings Co., Ltd. | | | 44,300 | | | | 821 | |
| | | | | | | | | |
| Information Technology Services 4.56% | | | | | | | | |
| NS Solutions Corp. | | | 27,200 | | | | 620 | |
| Obic Co., Ltd. | | | 15,600 | | | | 826 | |
| SCSK Corp. | | | 25,100 | | | | 1,008 | |
| | | | | | | | 2,454 | |
| | | | | | | | | |
| Machinery 1.56% | | | | | | | | |
| CKD Corp. | | | 57,400 | | | | 571 | |
| Nabtesco Corp. | | | 13,300 | | | | 270 | |
| | | | | | | | 841 | |
| | | | | | U.S. $ | |
| | | | | | Fair Value | |
| Investments | | Shares | | | (000) | |
| Pharmaceuticals 0.51% | | | | | | | | |
| Sawai Pharmaceutical Co., Ltd. | | | 4,000 | | | $ | 274 | |
| | | | | | | | | |
| Professional Services 2.53% | | | | | | | | |
| en-japan, Inc. | | | 10,600 | | | | 390 | |
| Tanseisha Co., Ltd. | | | 78,700 | | | | 634 | |
| Temp Holdings Co., Ltd. | | | 21,900 | | | | 339 | |
| | | | | | | | 1,363 | |
| | | | | | | | | |
| Real Estate Management & Development 1.40% | | | | | | | | |
| Hulic Co., Ltd. | | | 17,200 | | | | 151 | |
| Takara Leben Co., Ltd. | | | 108,300 | | | | 601 | |
| | | | | | | | 752 | |
| | | | | | | | | |
| Software 1.93% | | | | | | | | |
| NSD Co., Ltd. | | | 31,800 | | | | 460 | |
| Trend Micro, Inc.* | | | 14,200 | | | | 576 | |
| | | | | | | | 1,036 | |
| | | | | | | | | |
| Wireless Telecommunication Services 0.77% | | | | | | | | |
| Okinawa Cellular Telephone Co. | | | 15,200 | | | | 414 | |
| Total Japan | | | | | | | 10,843 | |
| | | | | | | | | |
| Luxembourg 1.54% | | | | | | | | |
| | | | | | | | | |
| Machinery 0.81% | | | | | | | | |
| Stabilus SA* | | | 10,400 | | | | 434 | |
| | | | | | | | | |
| Multi-Line Retail 0.73% | | | | | | | | |
| B&M European Value Retail SA | | | 93,585 | | | | 393 | |
| Total Luxembourg | | | | | | | 827 | |
| | | | | | | | | |
| Netherlands 2.00% | | | | | | | | |
| | | | | | | | | |
| Machinery 0.76% | | | | | | | | |
| Aalberts Industries NV | | | 11,843 | | | | 408 | |
| | | | | | | | | |
| Professional Services 1.24% | | | | | | | | |
| USG People NV | | | 35,949 | | | | 669 | |
| Total Netherlands | | | | | | | 1,077 | |
| | See Notes to Financial Statements. | 9 |
Schedule of Investments (continued)
December 31, 2015
| | | | | | U.S. $ | |
| | | | | | Fair Value | |
| Investments | | Shares | | | (000) | |
| New Zealand 0.93% | | | | | | | | |
| | | | | | | | | |
| Airlines | | | | | | | | |
| Air New Zealand Ltd. | | | 247,422 | | | $ | 499 | |
| | | | | | | | | |
| Philippines 1.80% | | | | | | | | |
| | | | | | | | | |
| Banks 0.71% | | | | | | | | |
| Rizal Commercial Banking Corp. | | | 544,040 | | | | 380 | |
| | | | | | | | | |
| Real Estate Management & Development 1.09% | | | | | | | | |
| Filinvest Land, Inc. | | | 15,346,500 | | | | 590 | |
| Total Philippines | | | | | | | 970 | |
| | | | | | | | | |
| Portugal 1.33% | | | | | | | | |
| | | | | | | | | |
| Multi-Utilities | | | | | | | | |
| REN–Redes Energeticas Nacionais SGPS SA | | | 236,743 | | | | 715 | |
| | | | | | | | | |
| Spain 3.33% | | | | | | | | |
| | | | | | | | | |
| Food Products 1.37% | | | | | | | | |
| Ebro Foods SA | | | 37,332 | | | | 735 | |
| | | | | | | | | |
| Real Estate Investment Trusts 0.96% | | | | | | | | |
| Merlin Properties Socimi SA | | | 41,293 | | | | 517 | |
| | | | | | | | | |
| Real Estate Management & Development 1.00% | | | | | | | | |
| Hispania Activos Inmobiliarios SA* | | | 37,921 | | | | 539 | |
| Total Spain | | | | | | | 1,791 | |
| | | | | | | | | |
| Sweden 4.74% | | | | | | | | |
| | | | | | | | | |
| Auto Components 0.36% | | | | | | | | |
| Dometic Group AB*+ | | | 30,248 | | | | 194 | |
| | | | | | | | | |
| Commercial Services & Supplies 1.56% | | | | | | | | |
| Loomis AB Class B | | | 26,810 | | | | 836 | |
| | | | | | | | | |
| Consumer Finance 1.54% | | | | | | | | |
| Hoist Finance AB*+ | | | 79,756 | | | | 831 | |
| | | | | | U.S. $ | |
| | | | | | Fair Value | |
| Investments | | Shares | | | (000) | |
| Food & Staples Retailing 1.28% | | | | | | | | |
| Axfood AB | | | 39,824 | | | $ | 690 | |
| Total Sweden | | | | | | | 2,551 | |
| | | | | | | | | |
| Switzerland 3.68% | | | | | | | | |
| | | | | | | | | |
| Capital Markets 0.64% | | | | | | | | |
| EFG International AG* | | | 32,659 | | | | 344 | |
| | | | | | | | | |
| Commercial Services & Supplies 1.72% | | | | | | | | |
| Gategroup Holding AG* | | | 21,094 | | | | 926 | |
| | | | | | | | | |
| Household Durables 1.32% | | | | | | | | |
| Forbo Holding AG Registered Shares* | | | 605 | | | | 712 | |
| Total Switzerland | | | | | | | 1,982 | |
| | | | | | | | | |
| Taiwan 0.70% | | | | | | | | |
| | | | | | | | | |
| Technology Hardware, Storage & Peripherals | | | | | | | | |
| Adlink Technology, Inc. | | | 165,161 | | | | 380 | |
| | | | | | | | | |
| United Kingdom 13.19% | | | | | | | | |
| | | | | | | | | |
| Capital Markets 1.49% | | | | | | | | |
| Ashmore Group plc | | | 71,181 | | | | 268 | |
| Jupiter Fund Management plc | | | 80,136 | | | | 533 | |
| | | | | | | | 801 | |
| | | | | | | | | |
| Chemicals 1.23% | | | | | | | | |
| Essentra plc | | | 54,243 | | | | 661 | |
| | | | | | | | | |
| Communications Equipment 0.49% | | | | | | | | |
| Telit Communications plc* | | | 83,726 | | | | 264 | |
| | | | | | | | | |
| Consumer Finance 1.78% | | | | | | | | |
| Arrow Global Group plc | | | 246,467 | | | | 958 | |
| | | | | | | | | |
| Household Durables 3.12% | | | | | | | | |
| Bellway plc | | | 18,793 | | | | 786 | |
| Berkeley Group Holdings plc | | | 4,841 | | | | 263 | |
| DFS Furniture plc | | | 128,471 | | | | 629 | |
| | | | | | | | 1,678 | |
| 10 | See Notes to Financial Statements. |
Schedule of Investments (continued)
December 31, 2015
| | | | | | U.S. $ | |
| | | | | | Fair Value | |
| Investments | | Shares | | | (000) | |
| United Kingdom (continued) | | | | | | | | |
| | | | | | | | | |
| Multi-Line Retail 0.98% | | | | | | | | |
| Debenhams plc | | | 351,348 | | | $ | 379 | |
| Poundland Group plc | | | 49,767 | | | | 152 | |
| | | | | | | | 531 | |
| | | | | | | | | |
| Professional Services 2.61% | | | | | | | | |
| Exova Group plc | | | 164,187 | | | | 349 | |
| Hays plc | | | 198,621 | | | | 426 | |
| Michael Page International plc | | | 88,154 | | | | 630 | |
| | | | | | | | 1,405 | |
| | | | | | | | | |
| Specialty Retail 1.49% | | | | | | | | |
| Howden Joinery Group plc | | | 103,449 | | | | 802 | |
| Total United Kingdom | | | | | | | 7,100 | |
Total Common Stocks
(cost $48,580,576) | | | | | | | 52,891 | |
| | | | | | | | | |
| RIGHTS 0.01% | | | | | | | | |
| | | | | | | | | |
| Taiwan | | | | | | | | |
| | | | | | | | | |
| Technology Hardware, Storage & Peripherals | | | | | | | | |
Adlink Technology, Inc.*
(cost $0) | | | 9,209 | | | | 4 | |
| | | Principal | | | U.S. $ | |
| | | Amount | | | Fair Value | |
| Investments | | | (000) | | | | (000) | |
| SHORT-TERM INVESTMENT 2.62% | | | | |
| | | | | | | | | |
| Repurchase Agreement | | | | | | | | |
| Repurchase Agreement dated 12/31/2015, 0.03% due 1/4/2016 with Fixed Income Clearing Corp. collateralized by $1,440,000 of U.S. Treasury Note at 1.625% due 7/31/2020; value: $1,441,800; proceeds: $1,410,112 (cost $1,410,107) | | | $1,410 | | | $ | 1,410 | |
Total Investments in Securities 100.90%
(cost $49,990,683) | | | | | | | 54,305 | |
| Liabilities in Excess of Foreign Cash and Other Assets (0.90)% | | | | | | | (487 | ) |
| Net Assets 100.00% | | | | | | $ | 53,818 | |
| ADR | | American Depositary Receipt. |
| Unit | | More than one class of securities traded together. |
| * | | Non-income producing security. |
| + | | Security was purchased pursuant to Rule 144A under the Securities Act of 1933 and, unless registered under such Act or exempted from registration, may only be resold to qualified institutional buyers. |
| | See Notes to Financial Statements. | 11 |
Schedule of Investments (concluded)
December 31, 2015
The following is a summary of the inputs used as of December 31, 2015 in valuing the Fund’s investments carried at fair value(1):
| | Level 1 | | Level 2 | | Level 3 | | Total | |
| Investment Type(2) | (000) | | (000) | | (000) | | (000) | |
| Common Stocks | | | | | | | | | | | | | | | | |
| Australia | | $ | – | | | $ | 2,727 | | | $ | – | | | $ | 2,727 | |
| Austria | | | – | | | | 309 | | | | – | | | | 309 | |
| Canada | | | 2,165 | | | | – | | | | – | | | | 2,165 | |
| China | | | 123 | | | | 425 | | | | – | | | | 548 | |
| Finland | | | – | | | | 1,463 | | | | – | | | | 1,463 | |
| France | | | – | | | | 1,527 | | | | – | | | | 1,527 | |
| Germany(3) | | | – | | | | 3,351 | | | | – | | | | 3,351 | |
| Hong Kong(3) | | | – | | | | 2,196 | | | | – | | | | 2,196 | |
| India | | | – | | | | 1,961 | | | | – | | | | 1,961 | |
| Indonesia | | | 162 | | | | 440 | | | | – | | | | 602 | |
| Ireland(3) | | | 1,414 | | | | 2,056 | | | | – | | | | 3,470 | |
| Israel | | | – | | | | 733 | | | | – | | | | 733 | |
| Italy | | | – | | | | 3,104 | | | | – | | | | 3,104 | |
| Japan | | | – | | | | 10,843 | | | | – | | | | 10,843 | |
| Luxembourg | | | 393 | | | | 434 | | | | – | | | | 827 | |
| Netherlands | | | – | | | | 1,077 | | | | – | | | | 1,077 | |
| New Zealand | | | – | | | | 499 | | | | – | | | | 499 | |
| Philippines | | | – | | | | 970 | | | | – | | | | 970 | |
| Portugal | | | – | | | | 715 | | | | – | | | | 715 | |
| Spain | | | – | | | | 1,791 | | | | – | | | | 1,791 | |
| Sweden | | | 194 | | | | 2,357 | | | | – | | | | 2,551 | |
| Switzerland(3) | | | 344 | | | | 1,638 | | | | – | | | | 1,982 | |
| Taiwan | | | – | | | | 380 | | | | – | | | | 380 | |
| United Kingdom(3) | | | 2,003 | | | | 5,097 | | | | – | | | | 7,100 | |
| Right | | | – | | | | 4 | | | | – | | | | 4 | |
| Repurchase Agreement | | | – | | | | 1,410 | | | | – | | | | 1,410 | |
| Total | | $ | 6,798 | | | $ | 47,507 | | | $ | – | | | $ | 54,305 | |
| (1) | Refer to Note 2(i) for a description of fair value measurements and the three-tier hierarchy of inputs. |
| (2) | See Schedule of Investments for fair values in each industry and identification of foreign issuers and/or geography. |
| (3) | The following securities were transferred during the fiscal year ended December 31, 2015. |
| Security | | Country | | Level Transfer | | Transfer
Amount | | | Valuation Method
on 12/31/2015* |
| Grand City Properties SA | | Germany | | from Level 1 to Level 2 | | $ | 355,979 | | | Adjusted Valuation |
| VTech Holdings Ltd. | | Hong Kong | | from Level 1 to Level 2 | | $ | 619,479 | | | Adjusted Valuation |
| UDG Healthcare plc | | Ireland | | from Level 1 to Level 2 | | $ | 869,819 | | | Adjusted Valuation |
| Forbo Holding AG Registered Shares | | Switzerland | | from Level 1 to Level 2 | | $ | 937,283 | | | Adjusted Valuation |
| Arrow Global Group plc | | United Kingdom | | from Level 2 to Level 1 | | $ | 870,030 | | | Last sale price |
| Exova Group plc | | United Kingdom | | from Level 1 to Level 2 | | $ | 409,443 | | | Adjusted Valuation |
* See Note 2(a)
| 12 | See Notes to Financial Statements. | |
Statement of Assets and Liabilities
December 31, 2015
| ASSETS: | | | | |
| Investments in securities, at fair value (cost $49,990,683) | | $ | 54,304,776 | |
| Foreign cash, at value (cost $744) | | | 740 | |
| Receivables: | | | | |
| Investment securities sold | | | 151,358 | |
| Interest and dividends | | | 99,700 | |
| From advisor (See Note 3) | | | 17,339 | |
| Capital shares sold | | | 282 | |
| Prepaid expenses | | | 342 | |
| Total assets | | | 54,574,537 | |
| LIABILITIES: | | | | |
| Payables: | | | | |
| Capital shares reacquired | | | 450,292 | |
| Investment securities purchased | | | 139,449 | |
| Management fee | | | 34,388 | |
| Directors’ fees | | | 7,608 | |
| Fund administration | | | 1,834 | |
| Accrued expenses | | | 122,479 | |
| Total liabilities | | | 756,050 | |
| NET ASSETS | | $ | 53,818,487 | |
| COMPOSITION OF NET ASSETS: | | | | |
| Paid-in capital | | $ | 51,420,117 | |
| Distributions in excess of net investment income | | | (281,484 | ) |
| Accumulated net realized loss on investments and foreign currency related transactions | | | (1,631,835 | ) |
| Net unrealized appreciation on investments and translation of assets and liabilities denominated in foreign currencies | | | 4,311,689 | |
| Net Assets | | $ | 53,818,487 | |
| Outstanding shares (50 million shares of common stock authorized, $.001 par value) | | | 6,545,564 | |
| Net asset value, offering and redemption price per share (Net assets divided by outstanding shares) | | $ | 8.22 | |
| | See Notes to Financial Statements. | 13 |
Statement of Operations
For the Year Ended December 31, 2015
| Investment income: | | | | |
| Dividends (net of foreign withholding taxes of $95,458) | | $ | 1,044,588 | |
| Total investment income | | | 1,044,588 | |
| Expenses: | | | | |
| Management fee | | | 404,898 | |
| Non 12b-1 service fees | | | 134,982 | |
| Shareholder servicing | | | 81,255 | |
| Custody | | | 71,137 | |
| Professional | | | 60,728 | |
| Reports to shareholders | | | 25,003 | |
| Fund administration | | | 21,594 | |
| Directors’ fees | | | 1,928 | |
| Other | | | 19,107 | |
| Gross expenses | | | 820,632 | |
| Expense reductions (See Note 8) | | | (56 | ) |
| Fees waived and expenses reimbursed (See Note 3) | | | (172,740 | ) |
| Net expenses | | | 647,836 | |
| Net investment income | | | 396,752 | |
| Net realized and unrealized gain: | | | | |
| Net realized gain on investments (net of foreign capital gains tax of $83,280) | | | 2,226,187 | |
| Net realized loss on foreign currency related transactions | | | (45,662 | ) |
| Net change in unrealized appreciation/depreciation on investments | | | 2,673,241 | |
| Net change in unrealized appreciation/depreciation on translation of assets and liabilities denominated in foreign currencies | | | 3,320 | |
| Net realized and unrealized gain | | | 4,857,086 | |
| Net Increase in Net Assets Resulting From Operations | | $ | 5,253,838 | |
| 14 | See Notes to Financial Statements. | |
Statements of Changes in Net Assets
| | | For the Year Ended | | | For the Year Ended | |
| INCREASE (DECREASE) IN NET ASSETS | | December 31, 2015 | | | December 31, 2014 | |
| Operations: | | | | | | | | | | |
| Net investment income | | | $ | 396,752 | | | | $ | 481,134 | |
| Net realized gain on investments and foreign currency related transactions | | | | 2,180,525 | | | | | 6,008,672 | |
| Net change in unrealized appreciation/depreciation on investments and translation of assets and liabilities denominated in foreign currencies | | | | 2,676,561 | | | | | (9,445,428 | ) |
| Net increase (decrease) in net assets resulting from operations | | | | 5,253,838 | | | | | (2,955,622 | ) |
| Distributions to shareholders from: | | | | | | | | | | |
| Net investment income | | | | (441,845 | ) | | | | (682,549 | ) |
| Net realized gain | | | | (4,088,313 | ) | | | | (7,015,810 | ) |
| Total distributions to shareholders | | | | (4,530,158 | ) | | | | (7,698,359 | ) |
| Capital share transactions (See Note 12): | | | | | | | | | | |
| Proceeds from sales of shares | | | | 26,580,824 | | | | | 8,230,559 | |
| Reinvestment of distributions | | | | 4,530,158 | | | | | 7,698,359 | |
| Cost of shares reacquired | | | | (26,523,881 | ) | | | | (13,833,866 | ) |
| Net increase in net assets resulting from capital share transactions | | | | 4,587,101 | | | | | 2,095,052 | |
| Net increase (decrease) in net assets | | | | 5,310,781 | | | | | (8,558,929 | ) |
| NET ASSETS: | | | | | | | | |
| Beginning of year | | | $ | 48,507,706 | | | | $ | 57,066,635 | |
| End of year | | | $ | 53,818,487 | | | | $ | 48,507,706 | |
| Distributions in excess of net investment income | | | $ | (281,484 | ) | | | $ | (140,452 | ) |
| | See Notes to Financial Statements. | 15 |
Financial Highlights
| | | | | Per Share Operating Performance: |
| | | | | Investment operations: | | Distributions to
shareholders from: |
| | | Net asset
value,
beginning
of year | | Net
invest-
ment
income(a) | | Net
realized
and
unrealized
gain (loss) | | Total
from
invest-
ment
oper-
ations | | Net
investment
income | | Net
realized
gain | | Total
distri-
butions |
| Class VC | | | | | | | | | | | | | | | | | | | | | | | | | | | | |
| 12/31/2015 | | | $8.07 | | | | $0.06 | | | | $0.83 | | | | $0.89 | | | | $(0.07 | ) | | | $(0.67 | ) | | | $(0.74 | ) |
| 12/31/2014 | | | 10.08 | | | | 0.09 | | | | (0.64 | ) | | | (0.55 | ) | | | (0.13 | ) | | | (1.33 | ) | | | (1.46 | ) |
| 12/31/2013 | | | 8.48 | | | | 0.09 | | | | 2.56 | | | | 2.65 | | | | (0.19 | ) | | | (0.86 | ) | | | (1.05 | ) |
| 12/31/2012 | | | 7.30 | | | | 0.12 | | | | 1.37 | | | | 1.49 | | | | (0.17 | ) | | | (0.14 | ) | | | (0.31 | ) |
| 12/31/2011 | | | 8.76 | | | | 0.09 | | | | (1.47 | ) | | | (1.38 | ) | | | (0.08 | ) | | | – | | | | (0.08 | ) |
| (a) | Calculated using average shares outstanding during the year. |
| (b) | Total return does not consider the effects of sales charges or other expenses imposed by an insurance company and assumes the reinvestment of all distributions. |
| 16 | See Notes to Financial Statements. | |
| | | | | | | | | | | Ratios to Average Net Assets: | | Supplemental Data: |
| | | | | | | | | | | | | | |
| | | | | | | | | | | Total | | | | | | | | | | | | | | | | | |
| | | | | | | | | | | expenses | | | | | | | | | | | | | | | | | |
| Net | | | | | | | after | | | | | | | | | | | | | | | | | |
| asset | | | | | | | waivers | | | | | | Net | | Net | | Portfolio |
| value, | | Total | | and/or | | Total | | investment | | assets, end | | turnover |
| end of | | return | | reimbursements | | expenses | | income | | of year | | rate |
| year | | (%)(b) | | (%) | | (%) | | (%) | | (000) | | (%) |
| | $ | 8.22 | | | | 11.10 | | | | | 1.20 | | | | 1.52 | | | | 0.73 | | | | $ | 53,818 | | | | 87.07 | |
| | | 8.07 | | | | (5.76 | ) | | | | 1.20 | | | | 1.49 | | | | 0.90 | | | | | 48,508 | | | | 64.58 | |
| | | 10.08 | | | | 31.70 | | | | | 1.20 | | | | 1.44 | | | | 0.93 | | | | | 57,067 | | | | 89.28 | |
| | | 8.48 | | | | 20.38 | | | | | 1.20 | | | | 1.42 | | | | 1.44 | | | | | 49,131 | | | | 100.44 | |
| | | 7.30 | | | | (15.72 | ) | | | | 1.20 | | | | 1.51 | | | | 1.03 | | | | | 42,917 | | | | 99.73 | |
| | See Notes to Financial Statements. | 17 |
Notes to Financial Statements
Lord Abbett Series Fund, Inc. (the “Company”) is registered under the Investment Company Act of 1940, as amended (the “Act”), as a diversified, open-end management investment company and was incorporated under Maryland law in 1989. The Company consists of thirteen separate portfolios. This report covers International Opportunities Portfolio (the “Fund”).
The Fund’s investment objective is long-term capital appreciation. The Fund has Variable Contract class shares (“Class VC Shares”), which are currently issued and redeemed only in connection with investments in, and payments under, variable annuity contracts and variable life insurance policies issued by life insurance and insurance-related companies.
The preparation of the financial statements in conformity with accounting principles generally accepted in the United States of America (“U.S. GAAP”) requires management to make certain estimates and assumptions that affect the reported amounts of assets and liabilities and disclosure of contingent assets and liabilities at the date of the financial statements and the reported amounts of increases and decreases in net assets from operations during the reporting period. Actual results could differ from those estimates. The Fund is considered an investment company under U.S. GAAP and follows the accounting and reporting guidance applicable to investment companies.
| 2. | SIGNIFICANT ACCOUNTING POLICIES |
| (a) | Investment Valuation–Under procedures approved by the Fund’s Board of Directors (the “Board”), Lord, Abbett & Co. LLC (“Lord Abbett”), the Fund’s investment manager, has formed a Pricing Committee to administer the pricing and valuation of portfolio investments and to ensure that prices utilized reasonably reflect fair value. Among other things, these procedures allow the Fund to utilize independent pricing services, quotations from securities and financial instrument dealers and other market sources to determine fair value. |
| | |
| | Securities actively traded on any recognized U.S. or non-U.S. exchange or on The NASDAQ Stock Market LLC are valued at the last sale price or official closing price on the exchange or system on which they are principally traded. Events occurring after the close of trading on non-U.S. exchanges may result in adjustments to the valuation of foreign securities to reflect their fair value as of the close of regular trading on the New York Stock Exchange. The Fund may utilize an independent fair valuation service in adjusting the valuations of foreign securities. Unlisted equity securities are valued at the last quoted sale price or, if no sale price is available, at the mean between the most recently quoted bid and asked prices. |
| | |
| | Securities for which prices are not readily available are valued at fair value as determined by the Pricing Committee. The Pricing Committee considers a number of factors, including observable and unobservable inputs, when arriving at fair value. The Pricing Committee may use related or comparable assets or liabilities, recent transactions, market multiples, book values and other relevant information to determine the fair value of portfolio investments. The Board or a designated committee thereof regularly reviews fair value determinations made by the Pricing Committee and employs techniques such as reviewing related market activity, reviewing inputs and assumptions, and retrospectively comparing prices of subsequent purchases and sales transactions to fair value determinations made by the Pricing Committee. |
| | |
| | Short-term securities with 60 days or less remaining to maturity are valued using the amortized cost method, which approximates fair value. |
18
Notes to Financial Statements (continued)
| (b) | Security Transactions–Security transactions are recorded as of the date that the securities are purchased or sold (trade date). Realized gains and losses on sales of portfolio securities are calculated using the identified-cost method. |
| | |
| (c) | Investment Income–Dividend income is recorded on the ex-dividend date. Interest income is recorded on the accrual basis as earned. Discounts are accreted and premiums are amortized using the effective interest method and are included in Interest and other income on the Statement of Operations. Withholding taxes on foreign dividends have been provided for in accordance with the applicable country’s tax rules and rates. |
| | |
| (d) | Income Taxes–It is the policy of the Fund to meet the requirements of Subchapter M of the Internal Revenue Code applicable to regulated investment companies and to distribute substantially all taxable income and capital gains to its shareholders. Therefore, no income tax provision is required. |
| | |
| | The Fund files U.S. federal and various state and local tax returns. No income tax returns are currently under examination. The statute of limitations on the Fund’s filed U.S. federal tax returns remains open for the fiscal years ended December 31, 2012 through December 31, 2015. The statutes of limitations on the Company’s state and local tax returns may remain open for an additional year depending upon the jurisdiction. |
| | |
| (e) | Expenses–Expenses incurred by the Company that do not specifically relate to an individual fund are generally allocated to the funds within the Company on a pro rata basis by relative net assets. |
| | |
| (f) | Foreign Transactions–The books and records of the Fund are maintained in U.S. dollars and transactions denominated in foreign currencies are recorded in the Fund’s records at the rate prevailing when earned or recorded. Asset and liability accounts that are denominated in foreign currencies are adjusted daily to reflect current exchange rates and any unrealized gain (loss) is included in Net change in unrealized appreciation/depreciation on translation of assets and liabilities denominated in foreign currencies on the Fund’s Statement of Operations. The resultant exchange gains and losses upon settlement of such transactions are included in Net realized loss on foreign currency related transactions on the Fund’s Statement of Operations. The Fund does not isolate that portion of the results of operations arising as a result of changes in the foreign exchange rates from the changes in market prices of the securities. |
| | |
| | The Fund uses foreign currency exchange contracts to facilitate transactions in foreign-denominated securities. Losses from these transactions may arise from changes in the value of the foreign currency or if the counterparties do not perform under the contracts’ terms. |
| | |
| (g) | Forward Foreign Currency Exchange Contracts–The Fund may enter into forward foreign currency exchange contracts in order to reduce exposure to changes in foreign currency exchange rates on foreign portfolio holdings or gain or reduce exposure to foreign currency solely for investment purposes. A forward foreign currency exchange contract is a commitment to purchase or sell a foreign currency at a future date at a negotiated rate. The contracts are valued daily at forward exchange rates and any unrealized gain (loss) is included in Net change in unrealized appreciation/depreciation on translation of assets and liabilities denominated in foreign currencies on the Fund’s Statement of Operations. The gain (loss) arising from the difference between the U.S. dollar cost of the original contract and the value of the foreign currency in U.S. dollars upon closing of such contracts is included in Net realized loss on foreign currency related transactions on the Fund’s Statement of Operations. |
19
Notes to Financial Statements (continued)
| (h) | Repurchase Agreements–The Fund may enter into repurchase agreements with respect to securities. A repurchase agreement is a transaction in which a fund acquires a security and simultaneously commits to resell that security to the seller (a bank or securities dealer) at an agreed-upon price on an agreed-upon date. The Fund requires at all times that the repurchase agreement be collateralized by cash, or by securities of the U.S. Government, its agencies, its instrumentalities, or U.S. Government sponsored enterprises having a value equal to, or in excess of, the value of the repurchase agreement (including accrued interest). If the seller of the agreement defaults on its obligation to repurchase the underlying securities at a time when the fair value of these securities has declined, the Fund may incur a loss upon disposition of the securities. |
| | |
| (i) | Fair Value Measurements–Fair value is defined as the price that the Fund would receive upon selling an investment or transferring a liability in an orderly transaction to an independent buyer in the principal or most advantageous market of the investment. A three-tier hierarchy is used to maximize the use of observable market data and minimize the use of unobservable inputs and to establish classification of fair value measurements for disclosure purposes. Inputs refer broadly to the assumptions that market participants would use in pricing the asset or liability, including assumptions about risk – for example, the risk inherent in a particular valuation technique used to measure fair value (such as a pricing model) and/or the risk inherent in the inputs to the valuation technique. Inputs may be observable or unobservable. Observable inputs reflect the assumptions market participants would use in pricing the asset or liability. Observable inputs are based on market data obtained from sources independent of the reporting entity. Unobservable inputs reflect the reporting entity’s own assumptions about the assumptions market participants would use in pricing the asset or liability. Unobservable inputs are based on the best information available in the circumstances. |
| | |
| | The three-tier hierarchy of inputs is summarized in the three broad Levels listed below: |
| • | Level 1 – | unadjusted quoted prices in active markets for identical investments; |
| | | |
| • | Level 2 – | other significant observable inputs (including quoted prices for similar investments, interest rates, prepayment speeds, credit risk, etc.); and |
| | | |
| • | Level 3 – | significant unobservable inputs (including the Fund’s own assumptions in determining the fair value of investments). |
| | A summary of inputs used in valuing the Fund’s investments as of December 31, 2015 and, if applicable, Level 1/Level 2 transfers and Level 3 rollforwards for the fiscal year then ended is included in the Fund’s Schedule of Investments. |
| | |
| | Changes in valuation techniques may result in transfers into or out of an assigned level within the three-tier hierarchy. All transfers between different levels within the three-tier hierarchy are deemed to have occurred as of the beginning of the reporting period. The inputs or methodology used for valuing securities are not necessarily an indication of the risk associated with investing in those securities. |
20
Notes to Financial Statements (continued)
| 3. | MANAGEMENT FEE AND OTHER TRANSACTIONS WITH AFFILIATES |
Management Fee
The Company has a management agreement with Lord Abbett, pursuant to which Lord Abbett supplies the Fund with investment management services and executive and other personnel, provides office space and pays for ordinary and necessary office and clerical expenses relating to research and statistical work and supervision of the Fund’s investment portfolio.
The management fee is based on the Fund’s average daily net assets at the following annual rate:
| First $1 billion | .75% |
| Next $1 billion | .70% |
| Over $2 billion | .65% |
For the fiscal year ended December 31, 2015, the effective management fee, net of waivers, was at an annualized rate of .43% of the Fund’s average daily net assets.
In addition, Lord Abbett provides certain administrative services to the Fund pursuant to an Administrative Services Agreement in return for a fee at an annual rate of .04% of the Fund’s average daily net assets.
During the fiscal year ended December 31, 2015 and continuing through April 30, 2016, Lord Abbett has contractually agreed to waive its fees and reimburse expenses to the extent necessary to limit total net annual operating expenses to an annual rate of 1.20%. This agreement may be terminated only upon the approval of the Board.
The Company, on behalf of the Fund, has entered into services arrangements with certain insurance companies. Under these arrangements, certain insurance companies will be compensated up to .25% of the average daily net asset value (“NAV”) of the Fund’s Class VC Shares held in the insurance company’s separate account to service and maintain the Variable Contract owners’ accounts. This amount is included in Non 12b-1 service fees on the Statement of Operations. The Fund may also compensate certain insurance companies, third-party administrators and other entities for providing recordkeeping, sub-transfer agency and other administrative services to the Fund. This amount is included in Shareholder servicing on the Statement of Operations.
A Director and certain of the Company’s officers have an interest in Lord Abbett.
| 4. | DISTRIBUTIONS AND CAPITAL LOSS CARRYFORWARDS |
Dividends from net investment income, if any, are declared and paid at least semi-annually. Taxable net realized gains from investment transactions, reduced by allowable capital loss carryforwards, if any, are declared and distributed to shareholders at least annually. The capital loss carryforward amount, if any, is available to offset future net capital gains. Dividends and distributions to shareholders are recorded on the ex-dividend date. The amounts of dividends and distributions from net investment income and net realized capital gains are determined in accordance with federal income tax regulations, which may differ from U.S. GAAP. These book/tax differences are either considered temporary or permanent in nature. To the extent these differences are permanent in nature, such amounts are reclassified within the components of net assets based on their federal tax basis treatment; temporary differences do not require reclassification. Dividends and distributions that exceed earnings and profits for tax purposes are reported as a tax return of capital.
21
Notes to Financial Statements (continued)
The tax character of distributions paid during the fiscal years ended December 31, 2015 and 2014 was as follows:
| | | Year Ended
12/31/2015 | | | Year Ended
12/31/2014 | |
| Distributions paid from: | | | | | | | | |
| Ordinary income | | $ | 1,143,859 | | | $ | 3,300,644 | |
| Net long-term capital gains | | | 3,386,299 | | | | 4,397,715 | |
| Total distributions paid | | $ | 4,530,158 | | | $ | 7,698,359 | |
As of December 31, 2015, the components of accumulated gains on a tax-basis were as follows:
| Undistributed ordinary income – net | | $ | 90,787 | |
| Total undistributed earnings | | | 90,787 | |
| Temporary differences | | | (1,179,587 | ) |
| Unrealized gains – net | | | 3,487,170 | |
| Total accumulated gains – net | | $ | 2,398,370 | |
At the Fund’s election, certain losses incurred within the taxable year (Qualified Late-Year Losses) are deemed to arise on the first business day of the Fund’s next taxable year. The Fund incurred and will elect to defer post-October capital losses of $1,171,982 during fiscal year 2015.
As of December 31, 2015, the aggregate unrealized security gains and losses based on cost for U.S. federal income tax purposes were as follows:
| Tax cost | | $ | 50,815,206 | |
| Gross unrealized gain | | | 6,610,998 | |
| Gross unrealized loss | | | (3,121,428 | ) |
| Net unrealized security gain | | $ | 3,489,570 | |
The difference between book-basis and tax-basis unrealized gains (losses) is attributable to the tax treatment of certain foreign securities and wash sales.
Permanent items identified during the fiscal year ended December 31, 2015 have been reclassified among the components of net assets based on their tax basis treatment as follows:
| Distributions in | | Accumulated |
| Excess of Net | | Net Realized |
| Investment Income | | Loss |
| $(95,939) | | $95,939 |
The permanent differences are attributable to the tax treatment of certain foreign securities, certain expenses, certain distributions and foreign currency transactions.
| 5. | PORTFOLIO SECURITIES TRANSACTIONS |
Purchases and sales of investment securities (excluding short-term investments) for the fiscal year ended December 31, 2015 were as follows:
| Purchases | Sales |
| $46,776,397 | $45,718,930 |
There were no purchases or sales of U.S. Government securities for the fiscal year ended December 31, 2015.
22
Notes to Financial Statements (continued)
| 6. | DISCLOSURES ABOUT OFFSETTING ASSETS AND LIABILITIES |
The Financial Accounting Standards Board (“FASB”) requires disclosures intended to help better assess the effect or potential effect of offsetting arrangements on a fund’s financial position. The following tables illustrate gross and net information about recognized assets and liabilities eligible for offset in the statement of assets and liabilities; and disclose such amounts subject to an enforceable master netting agreement or similar agreement, by counterparty. A master netting agreement is an agreement between a fund and a counterparty which provides for the net settlement of amounts owed under all contracts traded under that agreement, as well as cash collateral, through a single payment by one party to the other in the event of default on or termination of any one contract. The Fund’s accounting policy with respect to balance sheet offsetting is that, absent an event of default by the counterparty or a termination of the agreement, the master netting agreement does not result in an offset of reported amounts of financial assets and liabilities in the statement of assets and liabilities across transactions between the Fund and the applicable counterparty:
| | | Gross Amounts | Net Amounts of |
| | | Offset in the | Assets Presented |
| | Gross Amounts of | Statement of Assets | in the Statement of |
| Description | Recognized Assets | and Liabilities | Assets and Liabilities |
| Repurchase Agreement | $1,410,107 | $ – | $1,410,107 |
| Total | $1,410,107 | $ – | $1,410,107 |
| | Net Amounts | | | | | | | | |
| | of Assets | | Amounts Not Offset in the | | | |
| | Presented in | | Statement of Assets and Liabilities | | | |
| | the Statement | | | Cash | | Securities | | | |
| | of Assets and | | Financial | Collateral | | Collateral | | Net | |
| Counterparty | Liabilities | | Instruments | Received(a | ) | Received(a | ) | Amount(b | ) |
| Fixed Income Clearing Corp. | $1,410,107 | | $ – | $ – | | $(1,410,107 | ) | $ – | |
| Total | $1,410,107 | | $ – | $ – | | $(1,410,107 | ) | $ – | |
| (a) | Collateral disclosed is limited to an amount not to exceed 100% of the net amount of assets presented in the Statement of Assets and Liabilities, for each respective counterparty. |
| (b) | Net amount represents the amount owed to the Fund by the counterparty as of December 31, 2015. |
| 7. | DIRECTORS’ REMUNERATION |
The Company’s officers and a Director, who are associated with Lord Abbett, do not receive any compensation from the Company for serving in such capacities. Independent Directors’ fees are allocated among all Lord Abbett-sponsored funds based on the net assets of each fund. There is an equity-based plan available to all Independent Directors under which Independent Directors must defer receipt of a portion of, and may elect to defer receipt of an additional portion of Directors’ fees. The deferred amounts are treated as though equivalent dollar amounts had been invested in the funds. Such amounts and earnings accrued thereon are included in Directors’ fees on the Statement of Operations and in Directors’ fees payable on the Statement of Assets and Liabilities and are not deductible for U.S. federal income tax purposes until such amounts are paid.
The Company has entered into an arrangement with its transfer agent and custodian, whereby credits realized as a result of uninvested cash balances are used to reduce a portion of the Fund’s expenses.
23
Notes to Financial Statements (concluded)
Effective August 31, 2015, the Fund and certain other funds managed by Lord Abbett (collectively, the “Participating Funds”) entered into a syndicated line of credit facility with various lenders for $550 million (the “Facility”), whereas State Street Bank and Trust Company (“SSB”) participates as a lender and as agent for the lenders. The Facility is to be used for temporary or emergency purposes as an additional source of: liquidity to satisfy redemptions. The Participating Funds are subject to graduated borrowing limits of one-third of Fund assets (if Fund assets are less than $750 million), $250 million, $300 million, or $350 million, based on past borrowings and likelihood of future borrowings. The Facility will continue through August 29, 2016.
Prior to August 31, 2015, the Fund and certain other funds managed by Lord Abbett participated in a $500 million unsecured revolving credit facility with SSB (the “SSB Facility”).
During the fiscal year ended December 31, 2015, the Fund did not utilize the Facility or the SSB Facility.
| 10. | CUSTODIAN AND ACCOUNTING AGENT |
SSB is the Company’s custodian and accounting agent. SSB performs custodial, accounting and recordkeeping functions relating to portfolio transactions and calculating the Fund’s NAV.
The Fund is subject to the general risks and considerations associated with equity investing. These include the risks of investing in equity markets in foreign countries, the risk of investing in derivatives, liquidity risk, and the risks from leverage. The value of an investment will fluctuate in response to movements in the stock market in general, and to the changing prospects of individual companies in which the Fund invests. The Fund is subject to the risks of investing in foreign securities and in the securities of small companies. Foreign securities may pose greater risks than domestic securities, including greater price fluctuations and higher transaction costs. Foreign investments also may be affected by changes in currency rates or currency controls. These risks are generally greater for securities issued by companies in emerging market countries. Investing in small companies generally involves greater risks than investing in the stocks of larger companies, including more volatility and less liquidity.
The Fund is also subject to the risks associated with derivatives, which may be different from and greater than the risks associated with investing directly in securities and other instruments.
These factors can affect the Fund’s performance.
| 12. | SUMMARY OF CAPITAL TRANSACTIONS |
Transactions in shares of capital stock were as follows:
| | | Year Ended | | | Year Ended | |
| | | December 31, 2015 | | | December 31, 2014 | |
| Shares sold | | | 3,003,758 | | | | 848,453 | |
| Reinvestment of distributions | | | 550,391 | | | | 912,041 | |
| Shares reacquired | | | (3,020,048 | ) | | | (1,411,340 | ) |
| Increase | | | 534,101 | | | | 349,154 | |
24
Report of Independent Registered Public Accounting Firm
To the Board of Directors of Lord Abbett Series Fund, Inc. and the Shareholders of International Opportunities Portfolio:
We have audited the accompanying statement of assets and liabilities, including the schedule of investments, of the International Opportunities Portfolio, one of the portfolios constituting the Lord Abbett Series Fund, Inc. (the “Fund”) as of December 31, 2015, and the related statement of operations for the year then ended, the statements of changes in net assets for each of the two years in the period then ended, and the financial highlights for each of the five years in the period then ended. These financial statements and financial highlights are the responsibility of the Fund’s management. Our responsibility is to express an opinion on these financial statements and financial highlights based on our audits.
We conducted our audits in accordance with the standards of the Public Company Accounting Oversight Board (United States). Those standards require that we plan and perform the audit to obtain reasonable assurance about whether the financial statements and financial highlights are free of material misstatement. The Fund is not required to have, nor were we engaged to perform, an audit of its internal control over financial reporting. Our audits included consideration of internal control over financial reporting as a basis for designing audit procedures that are appropriate in the circumstances, but not for the purpose of expressing an opinion on the effectiveness of the Fund’s internal control over financial reporting. Accordingly, we express no such opinion. An audit also includes examining, on a test basis, evidence supporting the amounts and disclosures in the financial statements, assessing the accounting principles used and significant estimates made by management, as well as evaluating the overall financial statement presentation. Our procedures included confirmation of securities owned as of December 31, 2015, by correspondence with the custodian and brokers; when replies were not received from brokers, we performed other auditing procedures. We believe that our audits provide a reasonable basis for our opinion.
In our opinion, such financial statements and financial highlights referred to above present fairly, in all material respects, the financial position of International Opportunities Portfolio of the Lord Abbett Series Fund, Inc. as of December 31, 2015, the results of its operations for the year then ended, the changes in its net assets for each of the two years in the period then ended, and the financial highlights for each of the five years in the period then ended, in conformity with accounting principles generally accepted in the United States of America.
DELOITTE & TOUCHE LLP
New York, New York
February 16, 2016
25
Supplemental Proxy Information (unaudited)
A special meeting of shareholders of International Opportunities Portfolio was held on November 5, 2015. The special meeting was held for shareholders of the Fund to vote on the following matters:
| | 1. | To amend the Fund’s fundamental restrictions related to borrowing and lending to enable the Fund to participate in an interfund lending program; and |
| | | |
| | 2. | To ratify the selection of Deloitte & Touche LLP as independent registered public accounting firm for the Fund’s current fiscal year. |
The results of the proxy solicitation on the preceding matter were as follows:
| 1. | To approve the amendment to the fundamental investment restrictions of the Fund as described in the proxy statement: |
| | (a) | Amend the fundamental investment restriction with respect to Borrowing |
| | | | | Broker |
| | Votes For | Votes Against | Abstain | Non-Votes |
| International Opportunities Portfolio | 5,459,721 | 278,888 | 424,655 | 0 |
| 1. | To approve the amendment to the fundamental investment restrictions of the Fund as described in the proxy statement: |
| | (b) | Amend the fundamental investment restriction with respect to Lending |
| | | | | Broker |
| | Votes For | Votes Against | Abstain | Non-Votes |
| International Opportunities Portfolio | 5,481,947 | 278,237 | 403,080 | 0 |
| 2. | To ratify the selection of Deloitte & Touche LLP as the Fund’s independent registered public accounting firm for the Fund’s current fiscal year |
| | | | | Broker |
| | Votes For | Votes Against | Abstain | Non-Votes |
| International Opportunities Portfolio | 5,685,807 | 122,383 | 355,074 | – |
26
Basic Information About Management
The Board is responsible for the management of the business and affairs of the Company in accordance with the laws of the State of Maryland. The Board elects officers who are responsible for the day-to-day operations of the Fund and who execute policies authorized by the Board. The Board also approves an investment adviser to the Fund and continues to monitor the cost and quality of the services the investment adviser provides, and annually considers whether to renew the contract with the adviser. Generally, each Director holds office until his/her successor is elected and qualified or until his/her earlier resignation or removal, as provided in the Company’s organizational documents.
Lord Abbett, a Delaware limited liability company, is the Fund’s investment adviser. Designated Lord Abbett personnel are responsible for the day-to-day management of the Fund.
Interested Director
Ms. Foster is affiliated with Lord Abbett and is an “interested person” of the Company as defined in the Act. Ms. Foster is a director/trustee and officer of each of the 12 investment companies in the Lord Abbett Family of Funds, which consist of 58 portfolios or series.
Name, Address and
Year of Birth | | Current Position and
Length of Service
with the Fund | | Principal Occupation and Other Directorships
During the Past Five Years |
| | | | | |
Daria L. Foster
Lord, Abbett & Co. LLC
90 Hudson Street
Jersey City, NJ 07302
(1954) | | Director and President since 2006; Chief Executive Officer since 2012 | | Principal Occupation: Managing Partner of Lord Abbett, joined Lord Abbett in 1990.
Other Directorships: None. |
Independent Directors
The following Independent Directors also are directors/trustees of each of the 12 investment companies in the Lord Abbett Family of Funds, which consist of 58 portfolios or series.
Name, Address and
Year of Birth | | Current Position and
Length of Service
with the Fund | | Principal Occupation and Other Directorships
During the Past Five Years |
| | | | | |
E. Thayer Bigelow
Lord, Abbett & Co. LLC
c/o Legal Dept.
90 Hudson Street
Jersey City, NJ 07302
(1941) | | Director since 1994;
Chairman since 2013 | | Principal Occupation: Managing General Partner, Bigelow Media, LLC (since 2000); Senior Adviser, Time Warner Inc. (1998–2000).
Other Directorships: Currently serves as director of Crane Co. (since 1984) and Huttig Building Products Inc. (since 1998). Previously served as a director of R.H. Donnelley Inc. (2009–2010). |
| | | | | |
Robert B. Calhoun, Jr.
Lord, Abbett & Co. LLC
c/o Legal Dept.
90 Hudson Street
Jersey City, NJ 07302
(1942) | | Director since 1998 | | Principal Occupation: Senior Advisor of Monitor Clipper Partners, a private equity investment fund (since 1997); President of Clipper Asset Management Corp. (1991–2009).
Other Directorships: None. |
27
Basic Information About Management (continued)
Name, Address and
Year of Birth | | Current Position and
Length of Service
with the Fund | | Principal Occupation and Other Directorships
During the Past Five Years |
| | | | | |
Eric C. Fast
Lord, Abbett & Co. LLC
c/o Legal Dept.
90 Hudson Street
Jersey City, NJ 07302
(1949) | | Director since 2014 | | Principal Occupation: Chief Executive Officer of Crane Co., an industrial products company (2001–2014).
Other Directorships: Currently serves as director of Automatic Data Processing, Inc. (since 2007) and Regions Financial Corporation (since 2010). Previously served as a director of Crane Co. (1999–2014). |
| | | | | |
Evelyn E. Guernsey
Lord, Abbett & Co. LLC
c/o Legal Dept.
90 Hudson Street
Jersey City, NJ 07302
(1955) | | Director since 2011 | | Principal Occupation: CEO, Americas of J.P. Morgan Asset Management (2004–2010).
Other Directorships: None. |
| | | | | |
Julie A. Hill
Lord, Abbett & Co. LLC
c/o Legal Dept.
90 Hudson Street
Jersey City, NJ 07302
(1946) | | Director since 2004 | | Principal Occupation: Owner and CEO of The Hill Company, a business consulting firm (since 1998).
Other Directorships: Currently serves as director of Anthem, Inc., a health benefits company (since 1994). |
| | | | | |
Franklin W. Hobbs
Lord, Abbett & Co. LLC
c/o Legal Dept.
90 Hudson Street
Jersey City, NJ 07302
(1947) | | Director since 2001 | | Principal Occupation: Advisor of One Equity Partners, a private equity firm (since 2004).
Other Directorships: Currently serves as director and Chairman of the Board of Ally Financial Inc., a financial services firm (since 2009), and as director of Molson Coors Brewing Company (since 2002). |
| | | | | |
James M. McTaggart
Lord, Abbett & Co. LLC
c/o Legal Dept.
90 Hudson Street
Jersey City, NJ 07302
(1947) | | Director since 2012 | | Principal Occupation: Independent management advisor and consultant (since 2012); Vice President, CRA International, Inc. (doing business as Charles River Associates), a global management consulting firm (2009–2012); Founder and Chairman of Marakon Associates, Inc., a strategy consulting firm (1978–2009); and Officer and Director of Trinsum Group, a holding company (2007–2009).
Other Directorships: Currently serves as director of Blyth, Inc., a home products company (since 2004). |
| | | | | |
James L.L. Tullis
Lord, Abbett & Co. LLC
c/o Legal Dept.
90 Hudson Street
Jersey City, NJ 07302
(1947) | | Director since 2006 | | Principal Occupation: CEO of Tullis-Dickerson and Co. Inc., a venture capital management firm (since 1990); CEO of Tullis Health Investors Inc. (since 2012).
Other Directorships: Currently serves as director of Crane Co. (since 1998). |
28
Basic Information About Management (continued)
Officers
None of the officers listed below have received compensation from the Company. All of the officers of the Company also may be officers of the other Lord Abbett Funds and maintain offices at 90 Hudson Street, Jersey City, NJ 07302. Unless otherwise indicated, the position(s) and title(s) listed under the “Principal Occupation During the Past Five Years” column indicate each officer’s position(s) and title(s) with Lord Abbett. Each officer serves for an indefinite term (i.e., until his or her death, resignation, retirement, or removal).
Name and
Year of Birth | | Current Position
with the Fund | | Length of Service
of Current
Position | | Principal Occupation
During the Past Five Years |
| | | | | | | |
Daria L. Foster
(1954) | | President and Chief Executive Officer | | Elected as President in 2006 and Chief Executive Officer in 2012 | | Managing Partner of Lord Abbett, joined Lord Abbett in 1990. |
| | | | | | | |
Sean J. Aurigemma
(1969) | | Executive Vice President | | Elected in 2010 | | Portfolio Manager, joined Lord Abbett in 2007. |
| | | | | | | |
Jeff D. Diamond
(1960) | | Executive Vice President | | Elected in 2008 | | Portfolio Manager, joined Lord Abbett in 2007. |
| | | | | | | |
Robert I. Gerber
(1954) | | Executive Vice President | | Elected in 2003 | | Partner and Chief Investment Officer, joined Lord Abbett in 1997. |
| | | | | | | |
Todd D. Jacobson
(1966) | | Executive Vice President | | Elected in 2005 | | Partner and Associate Director, joined Lord Abbett in 2003. |
| | | | | | | |
Robert A. Lee
(1969) | | Executive Vice President | | Elected in 2010 | | Partner and Deputy Chief Investment Officer, joined Lord Abbett in 1997. |
| | | | | | | |
Thomas B. Maher
(1967) | | Executive Vice President | | Elected in 2010 | | Partner and Portfolio Manager, joined Lord Abbett in 2003. |
| | | | | | | |
Justin C. Maurer
(1969) | | Executive Vice President | | Elected in 2010 | | Partner and Portfolio Manager, joined Lord Abbett in 2001. |
| | | | | | | |
Vincent J. McBride
(1964) | | Executive Vice President | | Elected in 2010 | | Partner and Director, joined Lord Abbett in 2003. |
| | | | | | | |
Andrew H. O’Brien
(1973) | | Executive Vice President | | Elected in 2010 | | Partner and Portfolio Manager, joined Lord Abbett in 1998. |
| | | | | | | |
F. Thomas O’Halloran, III
(1955) | | Executive Vice President | | Elected in 2010 | | Partner and Portfolio Manager, joined Lord Abbett in 2001. |
| | | | | | | |
Walter H. Prahl
(1958) | | Executive Vice President | | Elected in 2012 | | Partner and Director, joined Lord Abbett in 1997. |
| | | | | | | |
Steven F. Rocco
(1979) | | Executive Vice President | | Elected in 2014 | | Partner and Portfolio Manager, joined Lord Abbett in 2004. |
| | | | | | | |
Frederick J. Ruvkun
(1957) | | Executive Vice President | | Elected in 2012 | | Partner and Portfolio Manager, joined Lord Abbett in 2006. |
29
Basic Information About Management (continued)
Name and
Year of Birth | | Current Position
with the Fund | | Length of Service
of Current
Position | | Principal Occupation
During the Past Five Years |
| | | | | | | |
Paul J. Volovich
(1973) | | Executive Vice President | | Elected in 2005 | | Partner and Portfolio Manager, joined Lord Abbett in 1997. |
| | | | | | | |
A. Edward Allinson
(1961) | | Vice President | | Elected in 2011 | | Portfolio Manager, joined Lord Abbett in 2005. |
| | | | | | | |
John W. Ashbrook
(1964) | | Vice President and Assistant Secretary | | Elected in 2014 | | Assistant General Counsel, joined Lord Abbett in 2008. |
| | | | | | | |
Joan A. Binstock
(1954) | | Chief Financial Officer and Vice President | | Elected in 1999 | | Partner and Chief Financial and Operations Officer, joined Lord Abbett in 1999. |
| | | | | | | |
Brooke A. Fapohunda
(1975) | | Vice President and Assistant Secretary | | Elected in 2014 | | Deputy General Counsel, joined Lord Abbett in 2006. |
| | | | | | | |
John K. Forst
(1960) | | Vice President and Assistant Secretary | | Elected in 2005 | | Partner and Deputy General Counsel, joined Lord Abbett in 2004. |
| | | | | | | |
Anthony W. Hipple
(1964) | | Vice President | | Elected in 2014 | | Portfolio Manager, joined Lord Abbett in 2002. |
| | | | | | | |
Lawrence H. Kaplan
(1957) | | Vice President and Secretary | | Elected in 1997 | | Partner and General Counsel, joined Lord Abbett in 1997. |
| | | | | | | |
Jerald M. Lanzotti
(1967) | | Vice President | | Elected in 2012 | | Partner and Portfolio Manager, joined Lord Abbett in 1996. |
| | | | | | | |
David J. Linsen
(1974) | | Vice President | | Elected in 2008 | | Partner and Director, joined Lord Abbett in 2001. |
| | | | | | | |
Joseph M. McGill
(1962) | | Chief Compliance Officer | | Elected in 2014 | | Chief Compliance Officer, joined Lord Abbett in 2014 and was formerly Managing Director and the Chief Compliance Officer at UBS Global Asset Management (2003–2013). |
| | | | | | | |
A. Edward Oberhaus, III
(1959) | | Vice President | | Elected in 1998 | | Partner and Director, joined Lord Abbett in 1983. |
| | | | | | | |
Noah Petrucci
(1970) | | Vice President | | Elected in 2013 | | Portfolio Manager, joined Lord Abbett in 2012 and was formerly a Portfolio Manager at Columbia Management Investment Advisers, LLC and Columbia Management Advisors, LLC (2002–2012). |
| | | | | | | |
Lawrence B. Stoller
(1963) | | Vice President and Assistant Secretary | | Elected in 2007 | | Partner and Senior Deputy General Counsel, joined Lord Abbett in 2007. |
30
Basic Information About Management (concluded)
Name and
Year of Birth | | Current Position
with the Fund | | Length of Service
of Current
Position | | Principal Occupation
During the Past Five Years |
| | | | | | | |
Arthur K. Weise
(1970) | | Vice President | | Elected in 2010 | | Partner and Portfolio Manager, joined Lord Abbett in 2007. |
| | | | | | | |
Kewjin Yuoh
(1971) | | Vice President | | Elected in 2012 | | Partner and Portfolio Manager, joined Lord Abbett in 2010. |
| | | | | | | |
Scott S. Wallner
(1955) | | AML Compliance Officer | | Elected in 2011 | | Assistant General Counsel, joined Lord Abbett in 2004. |
| | | | | | | |
Bernard J. Grzelak
(1971) | | Treasurer | | Elected in 2003 | | Partner and Director of Fund Administration, joined Lord Abbett in 2003. |
Please call 888-522-2388 for a copy of the statement of additional information, which contains further information about the Company’s Directors. It is available free upon request.
31
Approval of Advisory Contract
The Board of Directors of the Fund, including all of the Directors who are not interested persons of the Fund or of Lord Abbett (the “Independent Board Members”), annually considers whether to approve the continuation of the existing management agreement between the Fund and Lord Abbett. In connection with its most recent approval, the Board reviewed materials relating specifically to the management agreement, as well as numerous materials received throughout the course of the year, including information about the Fund’s investment performance compared to the performance of its benchmark. Before making its decision as to the Fund, the Board had the opportunity to ask questions and request further information, taking into account its familiarity with Lord Abbett gained through its meetings and discussions. These meetings and discussions included the examination of the portfolio management team conducted by members of the Contract Committee, the deliberations of the Contract Committee, and discussions between the Contract Committee and Lord Abbett’s management. The Independent Board Members also discussed the materials described above with their independent legal counsel in a private session at which no representatives of management were present.
The materials received by the Board included, but were not limited to: (1) information provided by Morningstar Associates, LLC (“Morningstar”) regarding the investment performance of the Fund compared to the investment performance of a group of funds in the same Morningstar investment category (the “performance peer group”) and the investment performance of one or more appropriate benchmarks; (2) information provided by Morningstar regarding the expense ratios, contractual and effective management fee rates, and other expense components for the Fund and one or more groups of funds in the same Morningstar category, with the same share classes and operational characteristics, including asset size (the “expense peer group”); (3) information provided by Lord Abbett on the projected expense ratios, management fee rates, and other expense components for the Fund; (4) sales and redemption information for the Fund; (5) information regarding Lord Abbett’s financial condition; (6) an analysis of the relative profitability of the management agreement to Lord Abbett; (7) information provided by Lord Abbett regarding the investment management fees Lord Abbett receives from its other advisory clients maintaining accounts with a similar investment strategy as the Fund; (8) information regarding the distribution arrangements of the Fund; and (9) information regarding the personnel and other resources devoted by Lord Abbett to managing the Fund.
Investment Management Services Generally. The Board considered the investment management services provided by Lord Abbett to the Fund, including investment research, portfolio management, and trading, and Lord Abbett’s commitment to compliance with all applicable legal requirements. The Board also observed that Lord Abbett was solely engaged in the investment management business and accordingly did not experience the conflicts of interest that may result from being engaged in other lines of business. The Board considered the investment advisory services provided by Lord Abbett to other clients, the fees charged for the services, and the differences in the nature of the services provided to the Fund and other Lord Abbett Funds, on the one hand, and the services provided to other clients, on the other.
Investment Performance. The Board reviewed the Fund’s investment performance in relation to that of the performance peer group as of various periods ended August 31, 2015. The Board observed that the Fund’s investment performance was above the median of the performance peer group for the one-year, three-year, and five-year periods and below the median of the performance peer group for the ten-year period.
32
Approval of Advisory Contract (continued)
Lord Abbett’s Personnel and Methods. The Board considered the qualifications of the personnel providing investment management services to the Fund, in light of its investment objective and discipline. Among other things, the Board considered the size, experience, and turnover of Lord Abbett’s investment management staff, Lord Abbett’s investment methodology and philosophy, and Lord Abbett’s approach to recruiting, training, and retaining investment management personnel. The Board also noted that Lord Abbett had recently hired a new global portfolio manager to lead Lord Abbett’s global equity efforts.
Nature and Quality of Other Services. The Board considered the nature, quality, costs, and extent of compliance, administrative, and other services performed by Lord Abbett and Lord Abbett Distributor LLC (the “Distributor”) and the nature and extent of Lord Abbett’s supervision of third party service providers, including the Fund’s transfer agent and custodian.
Expenses. The Board considered the expense level of the Fund and the expense levels of the expense peer group. It also considered the projected expense levels and how those levels would relate to those of the expense peer group and the amount and nature of the fees paid by shareholders. The Board observed that the overall expense level of the Fund was well below the median of the expense peer group.
Profitability. The Board considered the level of Lord Abbett’s profits in managing the Fund, including a review of Lord Abbett’s methodology for allocating its costs to its management of the Fund. The Board concluded that the allocation methodology had a reasonable basis and was appropriate. It considered any profits realized by Lord Abbett in connection with the operation of the Fund, including the fee that Lord Abbett receives from the Fund for providing administrative services to the Fund, and whether the amount of profit was fair for the management of the Fund. The Board also considered the profits realized from other business segments of Lord Abbett, which may benefit from or be related to the Fund’s business. The Board considered Lord Abbett’s profit margins in comparison with available industry data, both accounting for and ignoring marketing and distribution expenses, and how those profit margins could affect Lord Abbett’s ability to recruit and retain investment personnel. The Board recognized that Lord Abbett’s profitability was a factor in enabling it to attract and retain qualified investment management personnel to provide services to the Fund. The Board concluded that Lord Abbett’s profitability as to the Fund was not excessive.
Economies of Scale. The Board considered whether there had been any economies of scale in managing the Fund, whether the Fund had appropriately benefited from any such economies of scale, and whether there was potential for realization of any further economies of scale. The Board concluded that the existing management fee schedule, with its breakpoint or breakpoints in the level of the management fee, adequately addressed any economies of scale in managing the Fund.
Other Benefits to Lord Abbett. The Board considered the character and amount of fees paid by the Fund and the Fund’s shareholders to Lord Abbett and the Distributor for services other than investment advisory services. The Board also considered the revenues and profitability of Lord Abbett’s investment advisory business apart from its mutual fund business, and the intangible benefits enjoyed by Lord Abbett by virtue of its relationship with the Fund. The Board observed that the Distributor receives 12b-1 fees from certain of the Lord Abbett Funds as to shares held in accounts for which there is no other broker of record, may retain a portion of the 12b-1 fees it receives, and receives a portion of the sales charges on sales and redemptions of some classes of shares. In addition, the Board observed that Lord Abbett accrues certain benefits for its business of providing investment advice to clients other than the Lord Abbett Funds, but that business also benefits the Funds. The Board also noted that Lord Abbett, as disclosed in the prospectus of the
33
Approval of Advisory Contract (concluded)
Fund, has entered into revenue sharing arrangements with certain entities that distribute shares of the Fund. The Board also took into consideration the investment research that Lord Abbett receives as a result of Fund brokerage transactions.
Alternative Arrangements. The Board considered whether, instead of approving continuation of the management agreement, it might be in the best interests of the Fund to implement one or more alternative arrangements, such as continuing to employ Lord Abbett, but on different terms. After considering all of the relevant factors, the Board unanimously found that continuation of the existing management agreement was in the best interests of the Fund and its shareholders and voted unanimously to approve the continuation of the management agreement. In considering whether to approve the continuation of the management agreement, the Board did not identify any single factor as paramount or controlling. This summary does not discuss in detail all matters considered.
34
Householding
The Company has adopted a policy that allows it to send only one copy of the Fund’s prospectus, proxy material, annual report and semiannual report to certain shareholders residing at the same “household.” This reduces Fund expenses, which benefits you and other shareholders. If you need additional copies or do not want your mailings to be “householded,” please call Lord Abbett at 888-522-2388 or send a written request with your name, the name of your fund or funds and your account number or numbers to Lord Abbett Family of Funds, P.O. Box 219336, Kansas City, MO 64121.
Proxy Voting Policies, Procedures and Records
A description of the policies and procedures that Lord Abbett uses to vote proxies related to the Fund’s portfolio securities, and information on how Lord Abbett voted the Fund’s proxies during the 12-month period ended June 30 are available without charge, upon request, (i) by calling 888-522-2388; (ii) on Lord Abbett’s Website at www.lordabbett.com; and (iii) on the Securities and Exchange Commission’s (“SEC”) Website at www.sec.gov.
Shareholder Reports and Quarterly Portfolio Disclosure
The Fund is required to file its complete schedule of portfolio holdings with the SEC for its first and third fiscal quarters on Form N-Q. Copies of the filings are available without charge, upon request on the SEC’s Website at www.sec.gov and may be available by calling Lord Abbett at 888-522-2388. You can also obtain copies of Form N-Q by visiting the SEC’s Public Reference Room in Washington, DC (information on the operation of the Public Reference Room may be obtained by calling 800-SEC-0330).
Tax Information
The Fund intends to pass through foreign source income of $1,140,052 and foreign taxes of $178,738.
In addition, of the distributions paid to shareholders during the fiscal year ended December 31, 2015, $701,601 and $3,386,299, respectively, represent short-term and long-term capital gains.
35


| This report, when not used for the general information of shareholders of the Fund, is to be distributed only if preceded or accompanied by a current fund prospectus. | | |
| | Lord Abbett Series Fund, Inc. | |
Lord Abbett mutual fund shares are distributed by
LORD ABBETT DISTRIBUTOR LLC. | International Opportunities Portfolio | SFIO-PORT-3
(02/16) |

2015 LORD ABBETT
ANNUAL REPORT
Lord Abbett
Series Fund—Mid Cap Stock Portfolio
For the fiscal year ended December 31, 2015
Table of Contents
Lord Abbett Series Fund – Mid Cap Stock Portfolio
Annual Report
For the fiscal year ended December 31, 2015

Daria L. Foster, Director, President and Chief Executive Officer of the Lord Abbett Funds, and E. Thayer Bigelow, Independent Chairman of the Lord Abbett Funds.
Dear Shareholders: We are pleased to provide you with this overview of the performance of Lord Abbett Series Fund – Mid Cap Stock Portfolio for the fiscal year ended December 31, 2015. On this page and the following pages, we discuss the major factors that influenced fiscal year performance. For additional information about the Fund, please visit our website at www.lordabbett.com, where you also can access the quarterly commentaries that provide updates on the Fund’s performance and other portfolio related updates.
Thank you for investing in Lord Abbett mutual funds. We value the trust that you place in us and look forward to serving your investment needs in the years to come.
Best regards,

Daria L. Foster
Director, President and Chief Executive Officer
For the fiscal year ended December 31, 2015, the Fund returned -3.79%, reflecting performance at the net asset value (NAV) of Class VC shares, with all distributions reinvested, compared to its benchmark, the Russell Midcap Value® Index1, which returned -4.78% over the same period.
Domestic equity markets advanced over the past year, with the S&P 500 rising 1.38% during the trailing 12-month period. Despite this general move upward, there were a few periods of short-term volatility, most notably in January 2015, when the S&P 500 declined 3.0% in total return
terms, and in August 2015, when the index dropped 6.0%, its greatest monthly loss in three years. One of the prevailing market themes during the trailing 12-month period was the continued weakness in energy prices. Finally, U.S. real gross domestic product (GDP), which was initially reported to have contracted by 0.2% in the first quarter of 2015, was later revised upwards to a modest 0.6% expansion. In the second quarter of 2015, real GDP advanced 3.9%, while the third estimate from the Bureau of Economic Analysis indicated that real GDP increased 2.0% in the third quarter of 2015.
1
Among sectors, stock selection within the energy sector contributed to the Fund’s performance, relative to its benchmark, over the trailing 12 months. The price of oil fell considerably during the period; as such, a focus on companies with responsible capital spending, shareholder-friendly payout polices, and low-cost assets likely contributed to performance relative to the Fund’s benchmark.
The Fund’s stock selection in the information technology sector also contributed to relative performance. Within information technology, an overweight position in NVIDIA Corp., a developer of visual computing processors, contributed to relative performance. NVIDIA continues to benefit from growing revenues in the automotive, data center, and video gaming markets. Similarly, an overweight allocation to Juniper Networks, Inc., a developer of high-performance networks, contributed to performance relative to the benchmark. Juniper’s share price benefited during the period from its expanded cost reduction initiative, generous capital return commitments, and new product cycle.
Stock selection within the materials sector was the primary detractor from relative performance over the trailing 12 months. Within the materials sector, an overweight position in Huntsman Corp., a chemicals manufacturer, detracted from
relative performance as the firm continued to face pressure from falling oil prices and slowing GDP in China. Also detracting from performance was an overweight position in WestRock Co., a paper and packaging solutions company. WestRock saw its share price negatively affected by concerns surrounding the outlook for containerboard demand.
The Fund’s stock selection in the industrials sector also detracted from performance relative to the Fund’s benchmark. Within industrials, aviation company Triumph Group, Inc., detracted from performance. During the period, Triumph’s management indicated that the company faces future uncertainty based on weak organic growth in its commercial and military aftermarket segments. An overweight position to Kennametal, Inc., a supplier of tooling, engineered components, and advanced materials, was another detractor from relative performance. Kennametal made further progress on its restructuring initiatives during the period, however, continued volume softness weighed on the company’s share price.
The Fund’s portfolio is actively managed and, therefore, its holdings and the weightings of a particular issuer or particular sector as a percentage of portfolio assets are subject to change. Sectors may include many industries.
2
1 The Russell Midcap® Value Index measures the performance of those Russell Midcap companies with lower price-to-book ratios and lower forecasted growth values. The stocks are also members of the Russell 1000® Value index.
2 The S&P 500® Index is widely regarded as the standard for measuring large cap U.S. stock market performance and includes a representative sample of leading companies in leading industries.
Unless otherwise specified, indexes reflect total return, with all dividends reinvested. Indexes are unmanaged, do not reflect the deduction of fees or expenses, and are not available for direct investment.
Important Performance and Other Information
Performance data quoted in the following pages reflect past performance and are no guarantee of future results. Current performance may be higher or lower than the performance quoted. The investment return and principal value of an investment in the Funds will fluctuate so that shares, on any given day or when redeemed, may be worth more or less than their original cost. You can obtain performance data current to the most recent month end by calling Lord Abbett at 888-522-2388 or referring to www.lordabbett.com.
The annual commentary above discusses the views of the Fund’s management and various portfolio holdings of the Fund as of December 31, 2015. These views and portfolio holdings may have changed after this date. Information provided in the commentary is not a recommendation to buy or sell securities. Because the Fund’s portfolio is actively managed and may change significantly, the Fund may no longer own the securities described above or may have otherwise changed their positions in the securities. For more recent information about the Fund’s portfolio holdings, please visit www.lordabbett.com.
A Note about Risk: See Notes to Financial Statements for a discussion of investment risks. For a more detailed discussion of the risks associated with the Fund, please see the Fund’s prospectus.
Mutual funds are not insured by the FDIC, are not deposits or other obligations of, or guaranteed by, banks, and are subject to investment risks including possible loss of principal amount invested.
The Fund serves as an underlying investment vehicle for variable annuity contracts and variable life insurance policies.
3
Investment Comparison
Below is a comparison of a $10,000 investment in Class VC shares with the same investment in both the Russell Midcap® Value Index and the S&P MidCap 400® Value Index assuming reinvestment of all dividends and distributions. the Fund’s shares are sold only to insurance company separate accounts that fund certain variable annuity and variable life contracts. This line graph comparison does not reflect the sales charges or other expenses of these contracts. If those sales charges and expenses were reflected, returns would be lower. The graph and performance table below do not reflect the deduction of taxes that a shareholder would pay on Fund distributions or the redemption of Fund shares. Past performance is no guarantee of future results.

Average Annual Total Returns for the
Periods Ended December 31, 2015
| | | 1 Year | | 5 Years | | 10 Years | |
| Class VC | | | –3.79 | % | | | 8.98 | % | | | 5.27 | % | |
1 Performance for each unmanaged index does not reflect any fees or expenses. The performance of each index is not necessarily representative of the Fund’s performance.
4
Expense Example
As a shareholder of the Fund, you incur ongoing costs, including management fees; expenses related to the Fund’s services arrangements with certain insurance companies; and other Fund expenses. This Example is intended to help you understand your ongoing costs (in dollars) of investing in the Fund and to compare these costs with the ongoing costs of investing in other mutual funds.
The Example is based on an investment of $1,000 invested at the beginning of the period and held for the entire period (July 1, 2015 through December 31, 2015).
The Example reflects only expenses that are deducted from the assets of the Fund. Fees and expenses, including sales charges applicable to the various insurance products that invest in the Fund, are not reflected in this Example. If such fees and expenses were reflected in the Example, the total expenses shown would be higher. Fees and expenses regarding such variable insurance products are separately described in the prospectus related to those products.
Actual Expenses
The first line of the table on the following page provides information about actual account values and actual expenses. You may use the information in this line, together with the amount you invested, to estimate the expenses that you paid over the period. Simply divide your account value by $1,000 (for example, an $8,600 account value divided by $1,000 = 8.6), then multiply the result by the number in the first line under the heading titled “Expenses Paid During Period 7/1/15 – 12/31/15” to estimate the expenses you paid on your account during this period.
Hypothetical Example for Comparison Purposes
The second line of the table on the following page provides information about hypothetical account values and hypothetical expenses based on the Fund’s actual expense ratio and an assumed rate of return of 5% per year before expenses, which is not the Fund’s actual return. The hypothetical account values and expenses may not be used to estimate the actual ending account balance or expenses you paid for the period. You may use this information to compare the ongoing costs of investing in the Fund and other funds. To do so, compare this 5% hypothetical example with the 5% hypothetical examples that appear in the shareholder reports of the other funds.
5
Please note that the expenses shown in the table are meant to highlight your ongoing costs only and do not reflect any transactional costs, such as sales charges. Therefore, the second line of the table is useful in comparing ongoing costs only, and will not help you determine the relative total costs of owning different funds. In addition, if these transactional costs were included, your costs would have been higher.
| | | Beginning | | Ending | | Expenses | |
| | | Account | | Account | | Paid During | |
| | | Value | | Value | | Period† | |
| | | | | | | 7/1/15 - | |
| | | 7/1/15 | | 12/31/15 | | 12/31/15 | |
| Class VC | | | | | | | |
| Actual | | $ | 1,000.00 | | | $ | 942.90 | | | $5.78 | |
| Hypothetical (5% Return Before Expenses) | | $ | 1,000.00 | | | $ | 1,019.26 | | | $6.01 | |
| | | | | | | | | | | | | | |
| † | Net expenses are equal to the Fund’s annualized expense ratio of 1.18%, multiplied by the average account value over the period, multiplied by 184/365 (to reflect one-half year period). |
Portfolio Holdings Presented by Sector
December 31, 2015
| Sector* | | | %** | |
| Consumer Discretionary | | | 10.08 | % | |
| Consumer Staples | | | 2.69 | % | |
| Energy | | | 8.44 | % | |
| Financials | | | 35.33 | % | |
| Health Care | | | 7.50 | % | |
| Industrials | | | 7.97 | % | |
| Information Technology | | | 12.44 | % | |
| Materials | | | 3.99 | % | |
| Utilities | | | 10.75 | % | |
| Repurchase Agreement | | | 0.81 | % | |
| Total | | | 100.00 | % | |
| * | | A sector may comprise several industries. |
| ** | | Represents percent of total investments. |
6
Schedule of Investments
December 31, 2015
| | | | | | Fair | |
| | | | | | Value | |
| Investments | | Shares | | | (000) | |
| COMMON STOCKS 99.31% | | | | | | | | |
| | | | | | | | | |
| Aerospace & Defense 2.30% | | | | | | | | |
| Orbital ATK, Inc. | | | 66,954 | | | $ | 5,982 | |
| Triumph Group, Inc. | | | 50,549 | | | | 2,009 | |
| Total | | | | | | | 7,991 | |
| | | | | | | | | |
| Banks 8.86% | | | | | | | | |
| CIT Group, Inc. | | | 106,599 | | | | 4,232 | |
| Citizens Financial Group, Inc. | | | 231,300 | | | | 6,058 | |
| East West Bancorp, Inc. | | | 83,500 | | | | 3,470 | |
| Fifth Third Bancorp | | | 272,600 | | | | 5,479 | |
| First Republic Bank | | | 56,500 | | | | 3,733 | |
| M&T Bank Corp. | | | 64,600 | | | | 7,828 | |
| Total | | | | | | | 30,800 | |
| | | | | | | | | |
| Beverages 1.21% | | | | | | | | |
| Molson Coors Brewing Co. | | | | | | | | |
| Class B | | | 44,756 | | | | 4,204 | |
| | | | | | | | | |
| Capital Markets 2.24% | | | | | | | | |
| Affiliated Managers | | | | | | | | |
| Group, Inc.* | | | 16,200 | | | | 2,588 | |
| Invesco Ltd. | | | 155,500 | | | | 5,206 | |
| Total | | | | | | | 7,794 | |
| | | | | | | | | |
| Chemicals 1.50% | | | | | | | | |
| Albemarle Corp. | | | 92,982 | | | | 5,208 | |
| | | | | | | | | |
| Communications Equipment 4.74% | | | | | | | | |
| Harris Corp. | | | 76,342 | | | | 6,634 | |
| Juniper Networks, Inc. | | | 192,600 | | | | 5,316 | |
| Motorola Solutions, Inc. | | | 66,100 | | | | 4,524 | |
| Total | | | | | | | 16,474 | |
| | | | | | | | | |
| Containers & Packaging 1.43% | | | | | | | | |
| WestRock Co. | | | 108,500 | | | | 4,950 | |
| | | | | | | | | |
| Electric: Utilities 9.24% | | | | | | | | |
| Edison International | | | 130,500 | | | | 7,727 | |
| Great Plains Energy, Inc. | | | 178,500 | | | | 4,875 | |
| ITC Holdings Corp. | | | 124,900 | | | | 4,902 | |
| Portland General Electric Co. | | | 174,800 | | | | 6,357 | |
| PPL Corp. | | | 242,100 | | | | 8,263 | |
| Total | | | | | | | 32,124 | |
| | | | | | Fair | |
| | | | | | Value | |
| Investments | | Shares | | | (000) | |
| Electrical Equipment 1.24% | | | | | | | | |
| Hubbell, Inc. | | | 42,739 | | | $ | 4,318 | |
| | | | | | | | | |
| Energy Equipment & Services 1.86% | | | | | | | | |
| Patterson-UTI Energy, Inc. | | | 238,812 | | | | 3,601 | |
| Superior Energy | | | | | | | | |
| Services, Inc. | | | 212,500 | | | | 2,863 | |
| Total | | | | | | | 6,464 | |
| | | | | | | | | |
| Food Products 1.48% | | | | | | | | |
| Pinnacle Foods, Inc. | | | 121,062 | | | | 5,140 | |
| | | | | | | | | |
| Health Care Equipment & Supplies 2.33% | | | | | | | | |
| Alere, Inc.* | | | 113,700 | | | | 4,445 | |
| St. Jude Medical, Inc. | | | 58,900 | | | | 3,638 | |
| Total | | | | | | | 8,083 | |
| | | | | | | | | |
| Health Care Providers & Services 2.03% | | | | | | | | |
| Cardinal Health, Inc. | | | 46,967 | | | | 4,193 | |
| HealthSouth Corp. | | | 82,074 | | | | 2,857 | |
| Total | | | | | | | 7,050 | |
| | | | | | | | | |
| Hotels, Restaurants & Leisure 4.42% | | | | | | | | |
| Aramark | | | 141,926 | | | | 4,577 | |
| MGM Resorts International* | | | 252,978 | | | | 5,748 | |
| Wyndham Worldwide Corp. | | | 69,300 | | | | 5,034 | |
| Total | | | | | | | 15,359 | |
| | | | | | | | | |
| Household Durables 4.75% | | | | | | | | |
| Jarden Corp.* | | | 101,100 | | | | 5,775 | |
| Lennar Corp. Class A | | | 76,100 | | | | 3,722 | |
| Newell Rubbermaid, Inc. | | | 22,802 | | | | 1,005 | |
| Whirlpool Corp. | | | 40,900 | | | | 6,007 | |
| Total | | | | | | | 16,509 | |
| | | | | | | | | |
| Information Technology Services 5.08% | | | | | | | | |
| CSRA, Inc. | | | 201,679 | | | | 6,050 | |
| Fidelity National Information | | | | | | | | |
| Services, Inc. | | | 106,500 | | | | 6,454 | |
| VeriFone Systems, Inc.* | | | 184,100 | | | | 5,159 | |
| Total | | | | | | | 17,663 | |
| | See Notes to Financial Statements. | 7 |
Schedule of Investments (continued)
December 31, 2015
| | | | | | Fair | |
| | | | | | Value | |
| Investments | | Shares | | | (000) | |
| Insurance 11.21% | | | | | | | | |
| Allstate Corp. (The) | | | 69,245 | | | $ | 4,299 | |
| Argo Group International Holdings Ltd. | | | 45,952 | | | | 2,750 | |
| Endurance Specialty Holdings Ltd. | | | 67,400 | | | | 4,313 | |
| Hanover Insurance Group, Inc. (The) | | | 73,238 | | | | 5,957 | |
| Hartford Financial Services Group, Inc. (The) | | | 174,286 | | | | 7,574 | |
| Lincoln National Corp. | | | 102,000 | | | | 5,127 | |
| XL Group plc (Ireland)(a) | | | 228,200 | | | | 8,941 | |
| Total | | | | | | | 38,961 | |
| | | | | | | | | |
| Life Sciences Tools & Services 2.21% | | | | | | | | |
| Agilent Technologies, Inc. | | | 101,600 | | | | 4,248 | |
| PerkinElmer, Inc. | | | 64,200 | | | | 3,439 | |
| Total | | | | | | | 7,687 | |
| | | | | | | | | |
| Machinery 3.94% | | | | | | | | |
| Ingersoll-Rand plc (Ireland)(a) | | | 76,300 | | | | 4,219 | |
| ITT Corp. | | | 81,827 | | | | 2,972 | |
| Kennametal, Inc. | | | 150,109 | | | | 2,882 | |
| Stanley Black & Decker, Inc. | | | 33,900 | | | | 3,618 | |
| Total | | | | | | | 13,691 | |
| | | | | | | | | |
| Metals & Mining 1.07% | | | | | | | | |
| Steel Dynamics, Inc. | | | 208,300 | | | | 3,722 | |
| | | | | | | | | |
| Multi-Utilities 1.52% | | | | | | | | |
| Sempra Energy | | | 56,300 | | | | 5,293 | |
| | | | | | | | | |
| Oil, Gas & Consumable Fuels 6.59% | | | | | | | | |
| Cimarex Energy Co. | | | 62,469 | | | | 5,583 | |
| EQT Corp. | | | 54,300 | | | | 2,831 | |
| Gulfport Energy Corp.* | | | 87,200 | | | | 2,143 | |
| Newfield Exploration Co.* | | | 96,000 | | | | 3,126 | |
| Noble Energy, Inc. | | | 148,144 | | | | 4,878 | |
| Pioneer Natural Resources Co. | | | 34,727 | | | | 4,354 | |
| Total | | | | | | | 22,915 | |
| | | | | | Fair | |
| | | | | | Value | |
| Investments | | Shares | | | (000) | |
| Pharmaceuticals 0.94% | | | | | | | | |
| Mallinckrodt plc* | | | 43,821 | | | $ | 3,270 | |
| | | | | | | | | |
| Real Estate Investment Trusts 10.76% | | | | | | | | |
| Alexandria Real Estate Equities, Inc. | | | 29,306 | | | | 2,648 | |
| Boston Properties, Inc. | | | 45,100 | | | | 5,752 | |
| Duke Realty Corp. | | | 257,100 | | | | 5,404 | |
| Healthcare Trust of America, Inc. Class A | | | 156,040 | | | | 4,209 | |
| Kimco Realty Corp. | | | 215,200 | | | | 5,694 | |
| Macerich Co. (The) | | | 42,710 | | | | 3,446 | |
| SL Green Realty Corp. | | | 30,800 | | | | 3,480 | |
| UDR, Inc. | | | 180,114 | | | | 6,767 | |
| Total | | | | | | | 37,400 | |
| | | | | | | | | |
| Real Estate Management & Development 2.30% | | | | | | | | |
| Jones Lang LaSalle, Inc. | | | 24,800 | | | | 3,965 | |
| Realogy Holdings Corp.* | | | 109,500 | | | | 4,015 | |
| Total | | | | | | | 7,980 | |
| | | | | | | | | |
| Semiconductors & Semiconductor Equipment 2.63% | | | | | | | | |
| NVIDIA Corp. | | | 182,900 | | | | 6,028 | |
| NXP Semiconductors NV (Netherlands)*(a) | | | 36,900 | | | | 3,109 | |
| Total | | | | | | | 9,137 | |
| | | | | | | | | |
| Textiles, Apparel & Luxury Goods 0.93% | | | | | | | | |
| PVH Corp. | | | 43,700 | | | | 3,219 | |
| | | | | | | | | |
| Trading Companies & Distributors 0.50% | | | | | | | | |
| Univar, Inc.* | | | 102,500 | | | | 1,744 | |
| Total Common Stocks | | | | | | | | |
| (cost $330,548,049) | | | | | | | 345,150 | |
| 8 | See Notes to Financial Statements. | |
Schedule of Investments (concluded)
December 31, 2015
| | | | | | | |
| | | Principal | | | Fair | |
| | | Amount | | | Value | |
| Investments | | | (000) | | | | (000) | |
| SHORT-TERM INVESTMENT 0.81% | | | | | | | | |
| | | | | | | | | |
| Repurchase Agreement | | | | | | | | |
| Repurchase Agreement dated 12/31/2015, 0.03% due 1/4/2016 with Fixed Income Clearing Corp. collateralized by $2,860,000 of U.S. Treasury Note at 1.625% due 7/31/2020; value: $2,863,575; proceeds: $2,805,413 (cost $2,805,404) | | | $2,805 | | | $ | 2,805 | |
Total Investments in Securities 100.12%
(cost $333,353,453) | | | | | | | 347,955 | |
| Liabilities in Excess of Cash and Other Assets (0.12)% | | | | | | | (429 | ) |
| Net Assets 100.00% | | | | | | $ | 347,526 | |
| * | | Non-income producing security. |
| (a) | | Foreign security traded in U.S. dollars. |
The following is a summary of the inputs used as of December 31, 2015 in valuing the Fund’s investments carried at fair value(1):
| | | Level 1 | | | Level 2 | | | Level 3 | | | Total | |
| Investment Type(2)(3) | | (000) | | | (000) | | | (000) | | | (000) | |
| Common Stocks | | $ | 345,150 | | | $ | – | | | $ | – | | | $ | 345,150 | |
| Repurchase Agreement | | | – | | | | 2,805 | | | | – | | | | 2,805 | |
| Total | | $ | 345,150 | | | $ | 2,805 | | | $ | – | | | $ | 347,955 | |
| (1) | Refer to Note 2(h) for a description of fair value measurements and the three-tier hierarchy of inputs. |
| (2) | See Schedule of Investments for fair values in each industry and identification of foreign issuers and/or geography. |
| (3) | There were no Level 1/Level 2 transfers during the fiscal year ended December 31, 2015. |
| | See Notes to Financial Statements. | 9 |
Statement of Assets and Liabilities
December 31, 2015
| ASSETS: | | | |
| Investments in securities, at fair value (cost $333,353,453) | | $347,954,924 | |
| Cash | | 67,767 | |
| Receivables: | | | |
| Interest and dividends | | 861,421 | |
| Capital shares sold | | 306,069 | |
| Prepaid expenses | | 2,666 | |
| Total assets | | 349,192,847 | |
| LIABILITIES: | | | |
| Payables: | | | |
| Capital shares reacquired | | 648,238 | |
| Management fee | | 223,029 | |
| Directors’ fees | | 107,362 | |
| Fund administration | | 11,895 | |
| Accrued expenses | | 676,276 | |
| Total liabilities | | 1,666,800 | |
| NET ASSETS | | $347,526,047 | |
| COMPOSITION OF NET ASSETS: | | | |
| Paid-in capital | | $332,568,615 | |
| Distributions in excess of net investment income | | (82,040 | ) |
| Accumulated net realized gain on investments | | 438,001 | |
| Net unrealized appreciation on investments | | 14,601,471 | |
| Net Assets | | $347,526,047 | |
| Outstanding shares (200 million shares of common stock authorized, $.001 par value) | | 14,925,997 | |
| Net asset value, offering and redemption price per share (Net assets divided by outstanding shares) | | $23.28 | |
| 10 | See Notes to Financial Statements. |
Statement of Operations
For the Year Ended December 31, 2015
| Investment income: | | | |
| Dividends | | $ 6,790,194 | |
| Interest | | 48 | |
| Total investment income | | 6,790,242 | |
| Expenses: | | | |
| Management fee | | 2,930,784 | |
| Non 12b-1 service fees | | 975,911 | |
| Shareholder servicing | | 348,163 | |
| Fund administration | | 156,308 | |
| Professional | | 55,919 | |
| Reports to shareholders | | 52,639 | |
| Directors’ fees | | 14,337 | |
| Custody | | 12,950 | |
| Other | | 59,490 | |
| Gross expenses | | 4,606,501 | |
| Expense reductions (See Note 8) | | (403 | ) |
| Net expenses | | 4,606,098 | |
| Net investment income | | 2,184,144 | |
| Net realized and unrealized gain (loss): | | | |
| Net realized gain on investments | | 46,095,610 | |
| Net change in unrealized appreciation/depreciation on investments | | (61,653,829 | ) |
| Net realized and unrealized loss | | (15,558,219 | ) |
| Net Decrease in Net Assets Resulting From Operations | | $(13,374,075 | ) |
| | See Notes to Financial Statements. | 11 |
Statements of Changes in Net Assets
| | For the Year Ended | | For the Year Ended | |
| DECREASE IN NET ASSETS | December 31, 2015 | | December 31, 2014 | |
| Operations: | | | | | | | | |
| Net investment income | | $ | 2,184,144 | | | $ | 1,690,977 | |
| Net realized gain on investments | | | 46,095,610 | | | | 64,900,547 | |
| Net change in unrealized appreciation/depreciation on investments | | | (61,653,829 | ) | | | (20,494,129 | ) |
| Net increase (decrease) in net assets resulting from operations | | | (13,374,075 | ) | | | 46,097,395 | |
| Distributions to shareholders from: | | | | | | | | |
| Net investment income | | | (2,135,083 | ) | | | (1,798,848 | ) |
| Net realized gain | | | (21,990,439 | ) | | | – | |
| Total distributions to shareholders | | | (24,125,522 | ) | | | (1,798,848 | ) |
| Capital share transactions (See Note 12): | | | | | | | | |
| Proceeds from sales of shares | | | 20,306,034 | | | | 18,657,754 | |
| Reinvestment of distributions | | | 24,125,522 | | | | 1,798,848 | |
| Cost of shares reacquired | | | (77,570,107 | ) | | | (83,745,873 | ) |
| Net decrease in net assets resulting from capital share transactions | | | (33,138,551 | ) | | | (63,289,271 | ) |
| Net decrease in net assets | | | (70,638,148 | ) | | | (18,990,724 | ) |
| NET ASSETS: | | | | | | | | |
| Beginning of year | | $ | 418,164,195 | | | $ | 437,154,919 | |
| End of year | | $ | 347,526,047 | | | $ | 418,164,195 | |
| Distributions in excess of net investment income | | $ | (82,040 | ) | | $ | (90,823 | ) |
| | |
| 12 | See Notes to Financial Statements. |
This page is intentionally left blank.
| | See Notes to Financial Statements. | 13 |
Financial Highlights
| | | | | Per Share Operating Performance: |
| | | | | | | | | | | Distributions to |
| | | | | Investment operations: | | shareholders from: |
| | | | | | | | | Total | | | | | | |
| | | | | | | Net | | from | | | | | | |
| | | Net asset | | Net | | realized | | invest- | | | | | | |
| | | value, | | invest- | | and | | ment | | Net | | Net | | Total |
| | | beginning | | ment | | unrealized | | opera- | | investment | | realized | | distri- |
| | | of year | | income(a) | | gain (loss) | | tions | | income | | gain | | butions |
| 12/31/2015 | | | $26.02 | | | | $0.15 | | | | $(1.16 | ) | | | $(1.01 | ) | | | $(0.15 | ) | | | $(1.58 | ) | | | $(1.73 | ) |
| 12/31/2014 | | | 23.43 | | | | 0.10 | | | | 2.60 | | | | 2.70 | | | | (0.11 | ) | | | – | | | | (0.11 | ) |
| 12/31/2013 | | | 18.05 | | | | 0.10 | | | | 5.37 | | | | 5.47 | | | | (0.09 | ) | | | – | | | | (0.09 | ) |
| 12/31/2012 | | | 15.86 | | | | 0.11 | | | | 2.20 | | | | 2.31 | | | | (0.12 | ) | | | – | | | | (0.12 | ) |
| 12/31/2011 | | | 16.56 | | | | 0.03 | | | | (0.69 | ) | | | (0.66 | ) | | | (0.04 | ) | | | – | | | | (0.04 | ) |
| (a) | Calculated using average shares outstanding during the year. |
| (b) | Total return does not consider the effects of sales charges or other expenses imposed by an insurance company and assumes the reinvestment of all distributions. |
| 14 | See Notes to Financial Statements. |
| | | | | Ratios to Average Net Assets: | | Supplemental Data: |
| |
Net
asset
value,
end of
year | | Total
return(b)
(%) | | Total
expenses
(%) | | | Net
investment
income
(%) | | Net
assets,
end of
year
(000) | | Portfolio
turnover
rate
(%) |
| $23.28 | | | | (3.79 | ) | | | 1.18 | | | | | 0.56 | | | | $347,526 | | | | 61.00 | |
| | 26.02 | | | | 11.53 | | | | 1.16 | | | | | 0.40 | | | | 418,164 | | | | 58.45 | |
| | 23.43 | | | | 30.32 | | | | 1.14 | | | | | 0.49 | | | | 437,155 | | | | 62.17 | |
| | 18.05 | | | | 14.55 | | | | 1.16 | | | | | 0.66 | | | | 399,199 | | | | 65.70 | |
| | 15.86 | | | | (4.01 | ) | | | 1.17 | | | | | 0.20 | | | | 414,004 | | | | 41.69 | |
| | See Notes to Financial Statements. | 15 |
Notes to Financial Statements
Lord Abbett Series Fund, Inc. (the “Company”) is registered under the Investment Company Act of 1940, as amended (“the Act”), as a diversified, open-end management investment company and was incorporated under Maryland law in 1989. The Company consists of thirteen separate portfolios. This report covers Mid Cap Stock Portfolio (the “Fund”).
The Fund’s investment objective is to seek capital appreciation through investments, primarily in equity securities, which are believed to be undervalued in the marketplace. The Fund has Variable Contract class shares (“Class VC Shares”), which are currently issued and redeemed only in connection with investments in, and payments under, variable annuity contracts and variable life insurance policies issued by life insurance and insurance-related companies.
The preparation of the financial statements in conformity with accounting principles generally accepted in the United States of America (“U.S. GAAP”) requires management to make certain estimates and assumptions that affect the reported amounts of assets and liabilities and disclosure of contingent assets and liabilities at the date of the financial statements and the reported amounts of increases and decreases in net assets from operations during the reporting period. Actual results could differ from those estimates. The Fund is considered an investment company under U.S. GAAP and follows the accounting and reporting guidance applicable to investment companies.
| 2. | SIGNIFICANT ACCOUNTING POLICIES |
| (a) | Investment Valuation–Under procedures approved by the Fund’s Board of Directors (the “Board”), Lord, Abbett & Co. LLC (“Lord Abbett”), the Fund’s investment manager, has formed a Pricing Committee to administer the pricing and valuation of portfolio investments and to ensure that prices utilized reasonably reflect fair value. Among other things, these procedures allow the Fund to utilize independent pricing services, quotations from securities and financial instrument dealers and other market sources to determine fair value. |
| | |
| | Securities actively traded on any recognized U.S. or non-U.S. exchange or on The NASDAQ Stock Market LLC are valued at the last sale price or official closing price on the exchange or system on which they are principally traded. Events occurring after the close of trading on non-U.S. exchanges may result in adjustments to the valuation of foreign securities to reflect their fair value as of the close of regular trading on the New York Stock Exchange. The Fund may utilize an independent fair valuation service in adjusting the valuations of foreign securities. Unlisted equity securities are valued at the last quoted sale price or, if no sale price is available, at the mean between the most recently quoted bid and asked prices. |
| | |
| | Securities for which prices are not readily available are valued at fair value as determined by the Pricing Committee. The Pricing Committee considers a number of factors, including observable and unobservable inputs, when arriving at fair value. The Pricing Committee may use related or comparable assets or liabilities, recent transactions, market multiples, book values and other relevant information to determine the fair value of portfolio investments. The Board or a designated committee thereof regularly reviews fair value determinations made by the Pricing Committee and employs techniques such as reviewing related market activity, reviewing inputs and assumptions, and retrospectively comparing prices of subsequent purchases and sales transactions to fair value determinations made by the Pricing Committee. |
16
Notes to Financial Statements (continued)
| | Short-term securities with 60 days or less remaining to maturity are valued using the amortized cost method, which approximates fair value. |
| | |
| (b) | Security Transactions–Security transactions are recorded as of the date that the securities are purchased or sold (trade date). Realized gains and losses on sales of portfolio securities are calculated using the identified-cost method. |
| | |
| (c) | Investment Income–Dividend income is recorded on the ex-dividend date. Interest income is recorded on the accrual basis as earned. Discounts are accreted and premiums are amortized using the effective interest method and are included in Interest and other income on the Statement of Operations. Withholding taxes on foreign dividends have been provided for in accordance with the applicable country’s tax rules and rates. |
| | |
| (d) | Income Taxes–It is the policy of the Fund to meet the requirements of Subchapter M of the Internal Revenue Code applicable to regulated investment companies and to distribute substantially all taxable income and capital gains to its shareholders. Therefore, no income tax provision is required. |
| | |
| | The Fund files U.S. federal and various state and local tax returns. No income tax returns are currently under examination. The statute of limitations on the Fund’s filed U.S. federal tax returns remains open for the fiscal years ended December 31, 2012 through December 31, 2015. The statutes of limitations on the Company’s state and local tax returns may remain open for an additional year depending upon the jurisdiction. |
| | |
| (e) | Expenses–Expenses incurred by the Company that do not specifically relate to an individual fund are generally allocated to the funds within the Company on a pro rata basis by relative net assets. |
| | |
| (f) | Foreign Transactions–The books and records of the Fund are maintained in U.S. dollars and transactions denominated in foreign currencies are recorded in the Fund’s records at the rate prevailing when earned or recorded. Asset and liability accounts that are denominated in foreign currencies are adjusted daily to reflect current exchange rates and any unrealized gain (loss) is included in Net change in unrealized appreciation/depreciation on investments on the Fund’s Statement of Operations. The resultant exchange gains and losses upon settlement of such transactions are included in Net realized gain on investments on the Fund’s Statement of Operations. The Fund does not isolate that portion of the results of operations arising as a result of changes in the foreign exchange rates from the changes in market prices of the securities. |
| | |
| (g) | Repurchase Agreements–The Fund may enter into repurchase agreements with respect to securities. A repurchase agreement is a transaction in which a fund acquires a security and simultaneously commits to resell that security to the seller (a bank or securities dealer) at an agreed-upon price on an agreed-upon date. The Fund requires at all times that the repurchase agreement be collateralized by cash, or by securities of the U.S. Government, its agencies, its instrumentalities, or U.S. Government sponsored enterprises having a value equal to, or in excess of, the value of the repurchase agreement (including accrued interest). If the seller of the agreement defaults on its obligation to repurchase the underlying securities at a time when the fair value of these securities has declined, the Fund may incur a loss upon disposition of the securities. |
| | |
| (h) | Fair Value Measurements–Fair value is defined as the price that the Fund would receive upon selling an investment or transferring a liability in an orderly transaction to an |
17
Notes to Financial Statements (continued)
| | independent buyer in the principal or most advantageous market of the investment. A three-tier hierarchy is used to maximize the use of observable market data and minimize the use of unobservable inputs and to establish classification of fair value measurements for disclosure purposes. Inputs refer broadly to the assumptions that market participants would use in pricing the asset or liability, including assumptions about risk—for example, the risk inherent in a particular valuation technique used to measure fair value (such as a pricing model) and/or the risk inherent in the inputs to the valuation technique. Inputs may be observable or unobservable. Observable inputs reflect the assumptions market participants would use in pricing the asset or liability. Observable inputs are based on market data obtained from sources independent of the reporting entity. Unobservable inputs reflect the reporting entity’s own assumptions about the assumptions market participants would use in pricing the asset or liability. Unobservable inputs are based on the best information available in the circumstances. The three-tier hierarchy of inputs is summarized in the three broad Levels listed below: |
| • | Level 1 – | unadjusted quoted prices in active markets for identical investments; |
| | | |
| • | Level 2 – | other significant observable inputs (including quoted prices for similar investments, interest rates, prepayment speeds, credit risk, etc.); and |
| | | |
| • | Level 3 – | significant unobservable inputs (including the Fund’s own assumptions in determining the fair value of investments). |
| | A summary of inputs used in valuing the Fund’s investments as of December 31, 2015 and, if applicable, Level 1/Level 2 transfers and Level 3 rollforwards for the fiscal year then ended is included in the Fund’s Schedule of Investments. |
| | |
| | Changes in valuation techniques may result in transfers into or out of an assigned level within the three-tier hierarchy. All transfers between different levels within the three-tier hierarchy are deemed to have occurred as of the beginning of the reporting period. The inputs or methodology used for valuing securities are not necessarily an indication of the risk associated with investing in those securities. |
| 3. | MANAGEMENT FEE AND OTHER TRANSACTIONS WITH AFFILIATES |
Management Fee
The Company has a management agreement with Lord Abbett, pursuant to which Lord Abbett supplies the Fund with investment management services and executive and other personnel, provides office space and pays for ordinary and necessary office and clerical expenses relating to research and statistical work and supervision of the Fund’s investment portfolio.
The management fee is based on the Fund’s average daily net assets at the following annual rate:
| First $1 billion | .75% |
| Next $1 billion | .70% |
| Over $2 billion | .65% |
For the fiscal year ended December 31, 2015, the effective management was at an annualized rate of .75% of the Fund’s average daily net assets.
In addition, Lord Abbett provides certain administrative services to the Fund pursuant to an Administrative Services Agreement in return for a fee at an annual rate of .04% of the Fund’s average daily net assets.
18
Notes to Financial Statements (continued)
The Company, on behalf of the Fund, has entered into services arrangements with certain insurance companies. Under these arrangements, certain insurance companies will be compensated up to .25% of the average daily net asset value (“NAV”) of the Fund’s Class VC Shares held in the insurance company’s separate account to service and maintain the Variable Contract owners’ accounts. This amount is included in Non 12b-1 service fees on the Statement of Operations. The Fund may also compensate certain insurance companies, third-party administrators and other entities for providing recordkeeping, sub-transfer agency and other administrative services to the Fund. This amount is included in Shareholder servicing on the Statement of Operations.
A Director and certain of the Company’s officers have an interest in Lord Abbett.
| 4. | DISTRIBUTIONS AND CAPITAL LOSS CARRYFORWARDS |
Dividends from net investment income, if any, are declared and paid at least semi-annually. Taxable net realized gains from investment transactions, reduced by allowable capital loss carryforwards, if any, are declared and distributed to shareholders at least annually. The capital loss carryforward amount, if any, is available to offset future net capital gains. Dividends and distributions to shareholders are recorded on the ex-dividend date. The amounts of dividends and distributions from net investment income and net realized capital gains are determined in accordance with federal income tax regulations, which may differ from U.S. GAAP. These book/tax differences are either considered temporary or permanent in nature. To the extent these differences are permanent in nature, such amounts are reclassified within the components of net assets based on their federal tax basis treatment; temporary differences do not require reclassification. Dividends and distributions that exceed earnings and profits for tax purposes are reported as a tax return of capital.
The tax character of distributions paid during the fiscal years ended December 31, 2015 and 2014 was as follows:
| | | Year Ended | | | Year Ended | |
| | | 12/31/2015 | | | 12/31/2014 | |
| Distributions paid from: | | | | | | | | |
| Ordinary income | | $ | 2,135,083 | | | $ | 1,798,848 | |
| Net long-term capital gains | | | 21,990,439 | | | | – | |
| Total distributions paid | | $ | 24,125,522 | | | $ | 1,798,848 | |
As of December 31, 2015, the components of accumulated gains on a tax-basis were as follows:
| Undistributed ordinary income – net | | $ | 25,322 | |
| Undistributed long-term capital gains | | | 2,542,247 | |
| Total undistributed earnings | | | 2,567,569 | |
| Temporary differences | | | (1,430,357 | ) |
| Unrealized gains – net | | | 13,820,220 | |
| Total accumulated gains – net | | $ | 14,957,432 | |
At the Fund’s election, certain losses incurred within the taxable year (Qualified Late-Year Losses) are deemed to arise on the first business day of the Fund’s next taxable year. The Fund incurred and will elect to post-October capital losses of $1,322,995 during fiscal year 2015.
19
Notes to Financial Statements (continued)
As of December 31, 2015, the aggregate unrealized security gains and losses based on cost for U.S. federal income tax purposes were as follows:
| Tax cost | | $ | 334,134,704 | |
| Gross unrealized gain | | | 38,016,043 | |
| Gross unrealized loss | | | (24,195,823 | ) |
| Net unrealized security gain | | $ | 13,820,220 | |
The difference between book-basis and tax-basis unrealized gains (losses) is attributable to wash sales.
Permanent items identified during the fiscal year ended December 31, 2015 have been reclassified among the components of net assets based on their tax basis treatment as follows:
| Distributions in | | Accumulated |
| Excess of Net | | Net Realized |
| Investment Income | | Gain |
| $(40,278) | | $40,278 |
The permanent differences are attributable to the tax treatment of certain distributions received.
| 5. | PORTFOLIO SECURITIES TRANSACTIONS |
Purchases and sales of investment securities (excluding short-term investments) for the fiscal year ended December 31, 2015 were as follows:
| Purchases | Sales | |
| $234,869,379 | $287,603,601 | |
There were no purchases or sales of U.S. Government securities for the fiscal year ended December 31, 2015.
The Fund is permitted to purchase and sell securities (“cross-trade”) from and to other Lord Abbett Funds or client accounts pursuant to procedures approved by the Board in compliance with Rule 17a-7 under the Act (the “Rule”). Each cross-trade is executed at a fair market price in compliance with provisions of the Rule. For the year ended December 31, 2015, the Fund engaged in cross-trade purchases of $14,388.
| 6. | DISCLOSURES ABOUT OFFSETTING ASSETS AND LIABILITIES |
The Financial Accounting Standards Board (“FASB”) requires disclosures intended to help better assess the effect or potential effect of offsetting arrangements on a fund’s financial position. The following tables illustrate gross and net information about recognized assets and liabilities eligible for offset in the statement of assets and liabilities; and disclose such amounts subject to an enforceable master netting agreement or similar agreement, by counterparty. A master netting agreement is an agreement between a fund and a counterparty which provides for the net settlement of amounts owed under all contracts traded under that agreement, as well as cash collateral, through a single payment by one party to the other in the event of default on or termination of any one contract. The Fund’s accounting policy with respect to balance sheet offsetting is that, absent an event of default by the counterparty or a termination of the agreement, the master netting agreement does not result in an offset of reported amounts of financial assets and liabilities in the statement of assets and liabilities across transactions between the Fund and the applicable counterparty:
20
Notes to Financial Statements (continued)
| | | Gross Amounts | Net Amounts of |
| | | Offset in the | Assets Presented |
| | Gross Amounts of | Statement of Assets | in the Statement of |
| Description | Recognized Assets | and Liabilities | Assets and Liabilities |
| Repurchase Agreement | $2,805,404 | $ – | $2,805,404 |
| Total | $2,805,404 | $ – | $2,805,404 |
| | | Net Amounts | | | | | | | | | | | | |
| | | of Assets | | Amounts Not Offset in the | | | | |
| | | Presented in | | Statement of Assets and Liabilities | | | | |
| | | the Statement | | | | | Cash | | | Securities | | | | |
| | | of Assets and | | Financial | | | Collateral | | | Collateral | | | Net | |
| Counterparty | | Liabilities | | Instruments | | | Received(a) | | | Received(a) | | | Amount(b) | |
| Fixed Income Clearing Corp. | | $2,805,404 | | $ | – | | | $ | – | | | | $2,805,404 | | | $ | – | |
| Total | | $2,805,404 | | $ | – | | | $ | – | | | | $2,805,404 | | | $ | – | |
| (a) | Collateral disclosed is limited to an amount not to exceed 100% of the net amount of assets presented in the Statement of Assets and Liabilities, for each respective counterparty. |
| (b) | Net amount represents the amount owed to the Fund by the counterparty as of December 31, 2015. |
| 7. | DIRECTORS’ REMUNERATION |
The Company’s officers and a Director, who are associated with Lord Abbett, do not receive any compensation from the Company for serving in such capacities. Independent Directors’ fees are allocated among all Lord Abbett-sponsored funds based on the net assets of each fund. There is an equity-based plan available to all Independent Directors under which Independent Directors must defer receipt of a portion of, and may elect to defer receipt of an additional portion of Directors’ fees. The deferred amounts are treated as though equivalent dollar amounts had been invested in the funds. Such amounts and earnings accrued thereon are included in Directors’ fees on the Statement of Operations and in Directors’ fees payable on the Statement of Assets and Liabilities and are not deductible for U.S. federal income tax purposes until such amounts are paid.
The Company has entered into an arrangement with its transfer agent and custodian, whereby credits realized as a result of uninvested cash balances are used to reduce a portion of the Fund’s expenses.
Effective August 31, 2015, the Fund and certain other funds managed by Lord Abbett (collectively, the “Participating Funds”) entered into a syndicated line of credit facility with various lenders for $550 million (the “Facility”), whereas State Street Bank and Trust Company (“SSB”) participates as a lender and as agent for the lenders. The Facility is to be used for temporary or emergency purposes as an additional source of: liquidity to satisfy redemptions. The Participating Funds are subject to graduated borrowing limits of one-third of Fund assets (if Fund assets are less than $750 million), $250 million, $300 million, or $350 million, based on past borrowings and likelihood of future borrowings. The Facility will continue through August 29, 2016.
Prior to August 31, 2015, the Fund and certain other funds managed by Lord Abbett participated in a $500 million unsecured revolving credit facility with SSB (the “SSB Facility”).
During the fiscal year ended December 31, 2015, the Fund did not utilize the Facility or the SSB Facility.
21
Notes to Financial Statements (concluded)
| 10. | CUSTODIAN AND ACCOUNTING AGENT |
SSB is the Company’s custodian and accounting agent. SSB performs custodial, accounting and recordkeeping functions relating to portfolio transactions and calculating the Fund’s NAV.
The Fund is subject to the general risks and considerations associated with equity investing, as well as the particular risks associated with value and mid-sized company stocks. The value of an investment will fluctuate in response to movements in the equity securities market in general and to the changing prospects of individual companies in which the Fund invests. The market may fail to recognize for a long time the intrinsic value of particular value stocks the Fund may hold. The mid-sized company stocks in which the Fund invests may be less able to weather economic shifts or other adverse developments than those of larger, more established companies. In addition, if the Fund’s assessment of a company’s value or prospects for exceeding earnings expectations or market conditions is wrong, the Fund could suffer losses or produce poor performance relative to other funds, even in a rising market.
Due to the Fund’s investment exposure to foreign companies and American Depositary Receipts, the Fund may experience increased market, liquidity, currency, political, information, and other risks.
These factors can affect the Fund’s performance.
| 12. | SUMMARY OF CAPITAL TRANSACTIONS |
Transactions in shares of capital stock were as follows:
| | | Year Ended | | | Year Ended | |
| | | December 31, 2015 | | | December 31, 2014 | |
| Shares sold | | | 783,314 | | | | 757,148 | |
| Reinvestment of distributions | | | 1,050,654 | | | | 68,554 | |
| Shares reacquired | | | (2,978,195 | ) | | | (3,411,614 | ) |
| Decrease | | | (1,144,227 | ) | | | (2,585,912 | ) |
22
Report of Independent Registered Public Accounting Firm
To the Board of Directors of Lord Abbett Series Fund, Inc. and the Shareholders of Mid Cap Stock Portfolio:
We have audited the accompanying statement of assets and liabilities, including the schedule of investments, of the Mid Cap Stock Portfolio, one of the portfolios constituting the Lord Abbett Series Fund, Inc. (the “Fund”) as of December 31, 2015, and the related statement of operations for the year then ended, the statements of changes in net assets for each of the two years in the period then ended, and the financial highlights for each of the five years in the period then ended. These financial statements and financial highlights are the responsibility of the Fund’s management. Our responsibility is to express an opinion on these financial statements and financial highlights based on our audits.
We conducted our audits in accordance with the standards of the Public Company Accounting Oversight Board (United States). Those standards require that we plan and perform the audit to obtain reasonable assurance about whether the financial statements and financial highlights are free of material misstatement. The Fund is not required to have, nor were we engaged to perform, an audit of its internal control over financial reporting. Our audits included consideration of internal control over financial reporting as a basis for designing audit procedures that are appropriate in the circumstances, but not for the purpose of expressing an opinion on the effectiveness of the Fund’s internal control over financial reporting. Accordingly, we express no such opinion. An audit also includes examining, on a test basis, evidence supporting the amounts and disclosures in the financial statements, assessing the accounting principles used and significant estimates made by management, as well as evaluating the overall financial statement presentation. Our procedures included confirmation of securities owned as of December 31, 2015, by correspondence with the custodian. We believe that our audits provide a reasonable basis for our opinion.
In our opinion, such financial statements and financial highlights referred to above present fairly, in all material respects, the financial position of Mid Cap Stock Portfolio of the Lord Abbett Series Fund, Inc. as of December 31, 2015, the results of its operations for the year then ended, the changes in its net assets for each of the two years in the period then ended, and the financial highlights for each of the five years in the period then ended, in conformity with accounting principles generally accepted in the United States of America.
DELOITTE & TOUCHE LLP
New York, New York
February 16, 2016
23
Supplemental Proxy Information (unaudited)
A special meeting of shareholders of Mid Cap Stock Portfolio was held on November 5, 2015. The special meeting was held for shareholders of the Fund to vote on the following matters:
| | 1. | To amend the Fund’s fundamental restrictions related to borrowing and lending to enable the Fund to participate in an interfund lending program; and |
| | | |
| | 2. | To ratify the selection of Deloitte & Touche LLP as independent registered public accounting firm for the Fund’s current fiscal year. |
The results of the proxy solicitation on the preceding matter were as follows:
| 1. | To approve the amendment to the fundamental investment restrictions of the Fund as described in the proxy statement: |
| | |
| | (a) Amend the fundamental investment restriction with respect to Borrowing |
| | | | | Broker |
| | Votes For | Votes Against | Abstain | Non-Votes |
| Mid Cap Stock Portfolio | 11,573,667 | 678,581 | 779,428 | 0 |
| 1. | To approve the amendment to the fundamental investment restrictions of the Fund as described in the proxy statement: |
| | |
| | (b) Amend the fundamental investment restriction with respect to Lending |
| | | | | Broker |
| | Votes For | Votes Against | Abstain | Non-Votes |
| Mid Cap Stock Portfolio | 11,570,290 | 690,681 | 770,705 | 0 |
| 2. | To ratify the selection of Deloitte & Touche LLP as the Fund’s independent registered public accounting firm for the Fund’s current fiscal year |
| | | | | Broker |
| | Votes For | Votes Against | Abstain | Non-Votes |
| Mid Cap Stock Portfolio | 12,108,343 | 256,154 | 667,179 | – |
24
Basic Information About Management
The Board is responsible for the management of the business and affairs of the Company in accordance with the laws of the State of Maryland. The Board elects officers who are responsible for the day-to-day operations of the Fund and who execute policies authorized by the Board. The Board also approves an investment adviser to the Fund and continues to monitor the cost and quality of the services the investment adviser provides, and annually considers whether to renew the contract with the adviser. Generally, each Director holds office until his/her successor is elected and qualified or until his/her earlier resignation or removal, as provided in the Company’s organizational documents.
Lord Abbett, a Delaware limited liability company, is the Fund’s investment adviser. Designated Lord Abbett personnel are responsible for the day-to-day management of the Fund.
Interested Director
Ms. Foster is affiliated with Lord Abbett and is an “interested person” of the Company as defined in the Act. Ms. Foster is a director/trustee and officer of each of the 12 investment companies in the Lord Abbett Family of Funds, which consist of 58 portfolios or series.
Name, Address and
Year of Birth | | Current Position and
Length of Service
with the Fund | | Principal Occupation and Other Directorships
During the Past Five Years |
| | | | | |
Daria L. Foster
Lord, Abbett & Co. LLC
90 Hudson Street
Jersey City, NJ 07302
(1954) | | Director and President since 2006; Chief Executive Officer since 2012 | | Principal Occupation: Managing Partner of Lord Abbett, joined Lord Abbett in 1990. Other Directorships: None. |
Independent Directors
The following Independent Directors also are directors/trustees of each of the 12 investment companies in the Lord Abbett Family of Funds, which consist of 58 portfolios or series.
Name, Address and
Year of Birth | | Current Position and
Length of Service
with the Fund | | Principal Occupation and Other Directorships
During the Past Five Years |
| | | | | |
E. Thayer Bigelow
Lord, Abbett & Co. LLC
c/o Legal Dept.
90 Hudson Street
Jersey City, NJ 07302
(1941) | | Director since 1994;
Chairman since 2013 | | Principal Occupation: Managing General Partner, Bigelow Media, LLC (since 2000); Senior Adviser, Time Warner Inc. (1998–2000). Other Directorships: Currently serves as director of Crane Co. (since 1984) and Huttig Building Products Inc. (since 1998). Previously served as a director of R.H. Donnelley Inc. (2009–2010). |
Robert B. Calhoun, Jr.
Lord, Abbett & Co. LLC
c/o Legal Dept.
90 Hudson Street
Jersey City, NJ 07302
(1942) | | Director since 1998 | | Principal Occupation: Senior Advisor of Monitor Clipper Partners, a private equity investment fund (since 1997); President of Clipper Asset Management Corp. (1991–2009). Other Directorships: None. |
25
Basic Information About Management (continued)
Name, Address and
Year of Birth | | Current Position and
Length of Service
with the Fund | | Principal Occupation and Other Directorships
During the Past Five Years |
| | | | | |
Eric C. Fast
Lord, Abbett & Co. LLC
c/o Legal Dept.
90 Hudson Street
Jersey City, NJ 07302
(1949) | | Director since 2014 | | Principal Occupation: Chief Executive Officer of Crane Co., an industrial products company (2001–2014). Other Directorships: Currently serves as director of Automatic Data Processing, Inc. (since 2007) and Regions Financial Corporation (since 2010). Previously served as a director of Crane Co. (1999–2014). |
| | | | | |
Evelyn E. Guernsey
Lord, Abbett & Co. LLC
c/o Legal Dept.
90 Hudson Street
Jersey City, NJ 07302
(1955) | | Director since 2011 | | Principal Occupation: CEO, Americas of J.P. Morgan Asset Management (2004–2010). Other Directorships: None. |
| | | | | |
Julie A. Hill
Lord, Abbett & Co. LLC
c/o Legal Dept.
90 Hudson Street
Jersey City, NJ 07302
(1946) | | Director since 2004 | | Principal Occupation: Owner and CEO of The Hill Company, a business consulting firm (since 1998). Other Directorships: Currently serves as director of Anthem, Inc., a health benefits company (since 1994). |
| | | | | |
Franklin W. Hobbs
Lord, Abbett & Co. LLC
c/o Legal Dept.
90 Hudson Street
Jersey City, NJ 07302
(1947) | | Director since 2001 | | Principal Occupation: Advisor of One Equity Partners, a private equity firm (since 2004). Other Directorships: Currently serves as director and Chairman of the Board of Ally Financial Inc., a financial services firm (since 2009), and as director of Molson Coors Brewing Company (since 2002). |
| | | | | |
James M. McTaggart
Lord, Abbett & Co. LLC
c/o Legal Dept.
90 Hudson Street
Jersey City, NJ 07302
(1947) | | Director since 2012 | | Principal Occupation: Independent management advisor and consultant (since 2012); Vice President, CRA International, Inc. (doing business as Charles River Associates), a global management consulting firm (2009–2012); Founder and Chairman of Marakon Associates, Inc., a strategy consulting firm (1978–2009); and Officer and Director of Trinsum Group, a holding company (2007–2009). |
| | | | | |
| | | | | Other Directorships: Currently serves as director of Blyth, Inc., a home products company (since 2004). |
| | | | | |
James L.L. Tullis
Lord, Abbett & Co. LLC
c/o Legal Dept.
90 Hudson Street
Jersey City, NJ 07302
(1947) | | Director since 2006 | | Principal Occupation: CEO of Tullis-Dickerson and Co. Inc., a venture capital management firm (since 1990); CEO of Tullis Health Investors Inc. (since 2012). Other Directorships: Currently serves as director of Crane Co. (since 1998). |
26
Basic Information About Management (continued)
Officers
None of the officers listed below have received compensation from the Company. All of the officers of the Company also may be officers of the other Lord Abbett Funds and maintain offices at 90 Hudson Street, Jersey City, NJ 07302. Unless otherwise indicated, the position(s) and title(s) listed under the “Principal Occupation During the Past Five Years” column indicate each officer’s position(s) and title(s) with Lord Abbett. Each officer serves for an indefinite term (i.e., until his or her death, resignation, retirement, or removal).
Name and
Year of Birth | | Current Position
with the Fund | | Length of Service
of Current
Position | | Principal Occupation
During the Past Five Years |
| | | | | | | |
Daria L. Foster
(1954) | | President and Chief Executive Officer | | Elected as President in 2006 and Chief Executive Officer in 2012 | | Managing Partner of Lord Abbett, joined Lord Abbett in 1990. |
| | | | | | | |
Sean J. Aurigemma
(1969) | | Executive Vice President | | Elected in 2010 | | Portfolio Manager, joined Lord Abbett in 2007. |
| | | | | | | |
Jeff D. Diamond
(1960) | | Executive Vice President | | Elected in 2008 | | Portfolio Manager, joined Lord Abbett in 2007. |
| | | | | | | |
Robert I. Gerber
(1954) | | Executive Vice President | | Elected in 2003 | | Partner and Chief Investment Officer, joined Lord Abbett in 1997. |
| | | | | | | |
Todd D. Jacobson
(1966) | | Executive Vice President | | Elected in 2005 | | Partner and Associate Director, joined Lord Abbett in 2003. |
| | | | | | | |
Robert A. Lee
(1969) | | Executive Vice President | | Elected in 2010 | | Partner and Deputy Chief Investment Officer, joined Lord Abbett in 1997. |
| | | | | | | |
Thomas B. Maher
(1967) | | Executive Vice President | | Elected in 2010 | | Partner and Portfolio Manager, joined Lord Abbett in 2003. |
| | | | | | | |
Justin C. Maurer
(1969) | | Executive Vice President | | Elected in 2010 | | Partner and Portfolio Manager, joined Lord Abbett in 2001. |
| | | | | | | |
Vincent J. McBride
(1964) | | Executive Vice President | | Elected in 2010 | | Partner and Director, joined Lord Abbett in 2003. |
| | | | | | | |
Andrew H. O’Brien
(1973) | | Executive Vice President | | Elected in 2010 | | Partner and Portfolio Manager, joined Lord Abbett in 1998. |
| | | | | | | |
F. Thomas O’Halloran, III
(1955) | | Executive Vice President | | Elected in 2010 | | Partner and Portfolio Manager, joined Lord Abbett in 2001. |
| | | | | | | |
Walter H. Prahl
(1958) | | Executive Vice President | | Elected in 2012 | | Partner and Director, joined Lord Abbett in 1997. |
| | | | | | | |
Steven F. Rocco
(1979) | | Executive Vice President | | Elected in 2014 | | Partner and Portfolio Manager, joined Lord Abbett in 2004. |
| | | | | | | |
Frederick J. Ruvkun
(1957) | | Executive Vice President | | Elected in 2012 | | Partner and Portfolio Manager, joined Lord Abbett in 2006. |
27
Basic Information About Management (continued)
Name and
Year of Birth | | Current Position
with the Fund | | Length of Service
of Current
Position | | Principal Occupation
During the Past Five Years |
| | | | | | | |
Paul J. Volovich
(1973) | | Executive Vice President | | Elected in 2005 | | Partner and Portfolio Manager, joined Lord Abbett in 1997. |
| | | | | | | |
A. Edward Allinson
(1961) | | Vice President | | Elected in 2011 | | Portfolio Manager, joined Lord Abbett in 2005. |
| | | | | | | |
John W. Ashbrook
(1964) | | Vice President and Assistant Secretary | | Elected in 2014 | | Assistant General Counsel, joined Lord Abbett in 2008. |
| | | | | | | |
Joan A. Binstock
(1954) | | Chief Financial Officer and Vice President | | Elected in 1999 | | Partner and Chief Financial and Operations Officer, joined Lord Abbett in 1999. |
| | | | | | | |
Brooke A. Fapohunda
(1975) | | Vice President and Assistant Secretary | | Elected in 2014 | | Deputy General Counsel, joined Lord Abbett in 2006. |
| | | | | | | |
John K. Forst
(1960) | | Vice President and Assistant Secretary | | Elected in 2005 | | Partner and Deputy General Counsel, joined Lord Abbett in 2004. |
| | | | | | | |
Anthony W. Hipple
(1964) | | Vice President | | Elected in 2014 | | Portfolio Manager, joined Lord Abbett in 2002. |
| | | | | | | |
Lawrence H. Kaplan
(1957) | | Vice President and Secretary | | Elected in 1997 | | Partner and General Counsel, joined Lord Abbett in 1997. |
| | | | | | | |
Jerald M. Lanzotti
(1967) | | Vice President | | Elected in 2012 | | Partner and Portfolio Manager, joined Lord Abbett in 1996. |
| | | | | | | |
David J. Linsen
(1974) | | Vice President | | Elected in 2008 | | Partner and Director, joined Lord Abbett in 2001. |
| | | | | | | |
Joseph M. McGill
(1962) | | Chief Compliance Officer | | Elected in 2014 | | Chief Compliance Officer, joined Lord Abbett in 2014 and was formerly Managing Director and the Chief Compliance Officer at UBS Global Asset Management (2003–2013). |
| | | | | | | |
A. Edward Oberhaus, III
(1959) | | Vice President | | Elected in 1998 | | Partner and Director, joined Lord Abbett in 1983. |
| | | | | | | |
Noah Petrucci
(1970) | | Vice President | | Elected in 2013 | | Portfolio Manager, joined Lord Abbett in 2012 and was formerly a Portfolio Manager at Columbia Management Investment Advisers, LLC and Columbia Management Advisors, LLC (2002–2012). |
| | | | | | | |
Lawrence B. Stoller
(1963) | | Vice President and Assistant Secretary | | Elected in 2007 | | Partner and Senior Deputy General Counsel, joined Lord Abbett in 2007. |
28
Basic Information About Management (concluded)
Name and
Year of Birth | | Current Position
with the Fund | | Length of Service
of Current
Position | | Principal Occupation
During the Past Five Years |
| | | | | | | |
Arthur K. Weise
(1970) | | Vice President | | Elected in 2010 | | Partner and Portfolio Manager, joined Lord Abbett in 2007. |
| | | | | | | |
Kewjin Yuoh
(1971) | | Vice President | | Elected in 2012 | | Partner and Portfolio Manager, joined Lord Abbett in 2010. |
| | | | | | | |
Scott S. Wallner
(1955) | | AML Compliance Officer | | Elected in 2011 | | Assistant General Counsel, joined Lord Abbett in 2004. |
| | | | | | | |
Bernard J. Grzelak
(1971) | | Treasurer | | Elected in 2003 | | Partner and Director of Fund Administration, joined Lord Abbett in 2003. |
Please call 888-522-2388 for a copy of the statement of additional information, which contains further information about the Company’s Directors. It is available free upon request.
29
Approval of Advisory Contract
The Board of Directors of the Fund, including all of the Directors who are not interested persons of the Fund or of Lord Abbett (the “Independent Board Members”), annually considers whether to approve the continuation of the existing management agreement between the Fund and Lord Abbett. In connection with its most recent approval, the Board reviewed materials relating specifically to the management agreement, as well as numerous materials received throughout the course of the year, including information about the Fund’s investment performance compared to the performance of its benchmark. Before making its decision as to the Fund, the Board had the opportunity to ask questions and request further information, taking into account its familiarity with Lord Abbett gained through its meetings and discussions. These meetings and discussions included the examination of the portfolio management team conducted by members of the Contract Committee, the deliberations of the Contract Committee, and discussions between the Contract Committee and Lord Abbett’s management. The Independent Board Members also discussed the materials described above with their independent legal counsel in a private session at which no representatives of management were present.
The materials received by the Board included, but were not limited to: (1) information provided by Morningstar Associates, LLC (“Morningstar”) regarding the investment performance of the Fund compared to the investment performance of a group of funds in the same Morningstar investment category (the “performance peer group”) and the investment performance of one or more appropriate benchmarks; (2) information provided by Morningstar regarding the expense ratios, contractual and effective management fee rates, and other expense components for the Fund and one or more groups of funds in the same Morningstar category, with the same share classes and operational characteristics, including asset size (the “expense peer group”); (3) information provided by Lord Abbett on the projected expense ratios, management fee rates, and other expense components for the Fund; (4) sales and redemption information for the Fund; (5) information regarding Lord Abbett’s financial condition; (6) an analysis of the relative profitability of the management agreement to Lord Abbett; (7) information provided by Lord Abbett regarding the investment management fees Lord Abbett receives from its other advisory clients maintaining accounts with a similar investment strategy as the Fund; (8) information regarding the distribution arrangements of the Fund; and (9) information regarding the personnel and other resources devoted by Lord Abbett to managing the Fund.
Investment Management Services Generally. The Board considered the investment management services provided by Lord Abbett to the Fund, including investment research, portfolio management, and trading, and Lord Abbett’s commitment to compliance with all applicable legal requirements. The Board also observed that Lord Abbett was solely engaged in the investment management business and accordingly did not experience the conflicts of interest that may result from being engaged in other lines of business. The Board considered the investment advisory services provided by Lord Abbett to other clients, the fees charged for the services, and the differences in the nature of the services provided to the Fund and other Lord Abbett Funds, on the one hand, and the services provided to other clients, on the other.
Investment Performance. The Board reviewed the Fund’s investment performance in relation to that of the performance peer group as of various periods ended August 31, 2015. The Board observed that the Fund’s investment performance was above the median of the performance peer group for the one-year, three-year, and five-year periods and below the median of the performance peer group for the ten-year period.
30
Approval of Advisory Contract (continued)
Lord Abbett’s Personnel and Methods. The Board considered the qualifications of the personnel providing investment management services to the Fund, in light of its investment objective and discipline. Among other things, the Board considered the size, experience, and turnover of Lord Abbett’s investment management staff, Lord Abbett’s investment methodology and philosophy, and Lord Abbett’s approach to recruiting, training, and retaining investment management personnel.
Nature and Quality of Other Services. The Board considered the nature, quality, costs, and extent of compliance, administrative, and other services performed by Lord Abbett and Lord Abbett Distributor LLC (the “Distributor”) and the nature and extent of Lord Abbett’s supervision of third party service providers, including the Fund’s transfer agent and custodian.
Expenses. The Board considered the expense level of the Fund and the expense levels of the expense peer group. It also considered the projected expense levels and how those levels would relate to those of the expense peer group and the amount and nature of the fees paid by shareholders. The Board observed that the overall expense level of the Fund was slightly above the median of the expense peer group.
Profitability. The Board considered the level of Lord Abbett’s profits in managing the Fund, including a review of Lord Abbett’s methodology for allocating its costs to its management of the Fund. The Board concluded that the allocation methodology had a reasonable basis and was appropriate. It considered any profits realized by Lord Abbett in connection with the operation of the Fund, including the fee that Lord Abbett receives from the Fund for providing administrative services to the Fund, and whether the amount of profit was fair for the management of the Fund. The Board also considered the profits realized from other business segments of Lord Abbett, which may benefit from or be related to the Fund’s business. The Board considered Lord Abbett’s profit margins in comparison with available industry data, both accounting for and ignoring marketing and distribution expenses, and how those profit margins could affect Lord Abbett’s ability to recruit and retain investment personnel. The Board recognized that Lord Abbett’s profitability was a factor in enabling it to attract and retain qualified investment management personnel to provide services to the Fund. The Board concluded that Lord Abbett’s profitability as to the Fund was not excessive.
Economies of Scale. The Board considered whether there had been any economies of scale in managing the Fund, whether the Fund had appropriately benefited from any such economies of scale, and whether there was potential for realization of any further economies of scale. The Board concluded that the existing management fee schedule, with its breakpoint or breakpoints in the level of the management fee, adequately addressed any economies of scale in managing the Fund.
Other Benefits to Lord Abbett. The Board considered the character and amount of fees paid by the Fund and the Fund’s shareholders to Lord Abbett and the Distributor for services other than investment advisory services. The Board also considered the revenues and profitability of Lord Abbett’s investment advisory business apart from its mutual fund business, and the intangible benefits enjoyed by Lord Abbett by virtue of its relationship with the Fund. The Board observed that the Distributor receives 12b-1 fees from certain of the Lord Abbett Funds as to shares held in accounts for which there is no other broker of record, may retain a portion of the 12b-1 fees it receives, and receives a portion of the sales charges on sales and redemptions of some classes of shares. In addition, the Board observed that Lord Abbett accrues certain benefits for its business of providing investment advice to clients other than the Lord Abbett Funds, but that business also benefits the Funds. The Board also noted that Lord Abbett, as disclosed in the prospectus of the Fund, has entered into revenue sharing arrangements with certain entities that distribute shares of
31
Approval of Advisory Contract (concluded)
the Fund. The Board also took into consideration the investment research that Lord Abbett receives as a result of Fund brokerage transactions.
Alternative Arrangements. The Board considered whether, instead of approving continuation of the management agreement, it might be in the best interests of the Fund to implement one or more alternative arrangements, such as continuing to employ Lord Abbett, but on different terms. After considering all of the relevant factors, the Board unanimously found that continuation of the existing management agreement was in the best interests of the Fund and its shareholders and voted unanimously to approve the continuation of the management agreement. In considering whether to approve the continuation of the management agreement, the Board did not identify any single factor as paramount or controlling. This summary does not discuss in detail all matters considered.
32
Householding
The Company has adopted a policy that allows it to send only one copy of the Fund’s prospectus, proxy material, annual report and semiannual report to certain shareholders residing at the same “household.” This reduces Fund expenses, which benefits you and other shareholders. If you need additional copies or do not want your mailings to be “householded,” please call Lord Abbett at 888-522-2388 or send a written request with your name, the name of your fund or funds and your account number or numbers to Lord Abbett Family of Funds, P.O. Box 219336, Kansas City, MO 64121.
Proxy Voting Policies, Procedures and Records
A description of the policies and procedures that Lord Abbett uses to vote proxies related to the Fund’s portfolio securities, and information on how Lord Abbett voted the Fund’s proxies during the 12-month period ended June 30 are available without charge, upon request, (i) by calling 888-522-2388; (ii) on Lord Abbett’s Website at www.lordabbett.com; and (iii) on the Securities and Exchange Commission’s (“SEC”) Website at www.sec.gov.
Shareholder Reports and Quarterly Portfolio Disclosure
The Fund is required to file its complete schedule of portfolio holdings with the SEC for its first and third fiscal quarters on Form N-Q. Copies of the filings are available without charge, upon request on the SEC’s Website at www.sec.gov and may be available by calling Lord Abbett at 888-522-2388. You can also obtain copies of Form N-Q by visiting the SEC’s Public Reference Room in Washington, DC (information on the operation of the Public Reference Room may be obtained by calling 800-SEC-0330).
Tax Information For corporate shareholders, 100% of the Fund’s ordinary income distributions qualified for the dividends received deduction. Additionally, of the distributions paid to shareholders during the fiscal year ended December 31, 2015, $21,990,439 represents long-term capital gains. |
33


| This report, when not used for the general information of shareholders of the Fund, is to be distributed only if preceded or accompanied by a current fund prospectus. | | | |
| | | Lord Abbett Series Fund, Inc. | |
| Lord Abbett mutual fund shares are distributed by | | | LASFMCV-3 |
| LORD ABBETT DISTRIBUTOR LLC. | | Mid Cap Stock Portfolio | (02/16) |

2015 LORD ABBETT
ANNUAL REPORT
Lord Abbett
Series Fund—Short Duration Income Portfolio
For the fiscal year ended December 31, 2015
Table of Contents
Lord Abbett Series Fund – Short Duration Income Portfolio
Annual Report
For the fiscal year ended December 31, 2015

Daria L. Foster, Director, President and Chief Executive Officer of the Lord Abbett Funds, and E. Thayer Bigelow, Independent Chairman of the Lord Abbett Funds.
Dear Shareholders: We are pleased to provide you with this overview of the performance of Lord Abbett Series Fund – Short Duration Income Portfolio for the fiscal year ended December 31, 2015. On this page and the following pages, we discuss the major factors that influenced fiscal year performance. For additional information about the Fund, please visit our website at www.lordabbett.com, where you also can access the quarterly commentaries that provide updates on the Fund’s performance and other portfolio related updates.
Thank you for investing in Lord Abbett mutual funds. We value the trust that you place in us and look forward to serving your investment needs in the years to come.
Best regards,

Daria L. Foster
Director, President and Chief Executive Officer
For the fiscal year ended December 31, 2015 the Fund returned 0.58%, reflecting performance at the net asset value (NAV) of Class VC shares, with all distributions reinvested, compared to its benchmark, the BofA Merrill Lynch 1-3 Year U.S. Corporate Index1, which returned 1.01% over the same period.
Yields on longer-dated Treasury bonds were relatively flat, rising only slightly over the 12-month period ended December 31, 2015, while the yield on the shorter-dated two-year Treasury notes increased 39 bps
over the same period, leading to a flattening of the Treasury yield curve. Corporate credit spreads widened over the 12-month period, particularly within lower-rated, investment-grade debt. U.S inflation rates ticked up modestly, with the Consumer Price Index (CPI) rising 0.5% over the 12-month period ended December 31, 2015. Meanwhile, the employment picture continued to improve as the unemployment rate held steady at 5.0%, with 211,000 and 292,000 jobs added in November and December 2015,
1
respectively. This compares with an unemployment rate of 5.6% a year earlier and a recent high of 10.0% in October 2009. In December, the U.S. Federal Reserve (Fed) announced its first interest rate hike since 2006, which increased the range for the Fed funds rate from 0-0.25% to 0.25%-0.50%.
Consistent with the Fund’s strategic design, the Fund maintained exposures to a variety of bond market sectors, in addition to the investment-grade corporate bonds represented in the benchmark. This design allows for the flexibility to take advantage of relative value opportunities across sectors, and these weightings were important factors affecting performance.
The primary factors likely affecting the Fund’s performance over the prior 12 months were underexposure to ‘A’ and ‘AA’ rated securities and out-of-benchmark allocations to high yield and securitized debt, including commercial mortgage-backed securities (CMBS) and asset-backed securities (ABS).
Within the Fund’s corporate bond exposure, it maintained its strategic overweight versus the benchmark to higher yielding securities. Throughout the
period, high-yield bonds underperformed, and spreads widened, likely detracting from the relative performance of the Fund. In addition, the Fund was overweight ‘BBB’ rated securities compared to the benchmark, and this likely detracted from performance as ‘A’ and ‘AA’ rated securities outperformed those rated ‘BBB’.
The Fund maintained out-of-benchmark exposure to securitized sectors, including CMBS, which likely aided absolute performance, as this sector outperformed investment-grade corporate bonds during the 12-month period. Similarly, the Fund’s out-of-benchmark exposure to ABS was maintained throughout the period due to the attractive risk-adjusted return characteristics of the asset class. The Fund’s allocation to this sector most likely aided performance, as asset-backed securities also outperformed investment-grade corporate bonds during the period.
The Fund’s portfolio is actively managed and, therefore, its holdings and the weightings of a particular issuer or particular sector as a percentage of portfolio assets are subject to change. Sectors may include many industries.
2
1 The BofA Merrill Lynch 1-3 Year U.S. Corporate Credit Index is an unmanaged index comprised of U.S. dollar denominated investment grade corporate debt securities publicly issued in the U.S. domestic market with between one and three year remaining to final maturity
Unless otherwise specified, indexes reflect total return, with all dividends reinvested. Indexes are unmanaged, do not reflect the deduction of fees or expenses, and are not available for direct investment.
Important Performance and Other Information
Performance data quoted in the following pages reflect past performance and are no guarantee of future results. Current performance may be higher or lower than the performance quoted. The investment return and principal value of an investment in the Funds will fluctuate so that shares, on any given day or when redeemed, may be worth more or less than their original cost. You can obtain performance data current to the most recent month end by calling Lord Abbett at 888-522-2388 or referring to www.lordabbett.com.
During certain periods shown, expense waivers and reimbursements were in place. Without such waivers and expense reimbursements, the Fund’s returns would have been lower.
The annual commentary above discusses the views of the Fund’s management and various portfolio holdings of the Fund as of December 31, 2015. These views and portfolio holdings may have changed after this date. Information provided in the commentary is not a recommendation to buy or sell securities. Because the Fund’s portfolio is actively managed and may change significantly, the Fund may no longer own the securities described above or may have otherwise changed their positions in the securities. For more recent information about the Fund’s portfolio holdings, please visit www.lordabbett.com.
A Note about Risk: See Notes to Financial Statements for a discussion of investment risks. For a more detailed discussion of the risks associated with the Fund, please see the Fund’s prospectus.
Mutual funds are not insured by the FDIC, are not deposits or other obligations of, or guaranteed by, banks, and are subject to investment risks including possible loss of principal amount invested.
The Fund serves as an underlying investment vehicle for variable annuity contracts and variable life insurance policies.
3
Investment Comparison
Below is a comparison of a $10,000 investment in Class VC shares with the same investment in the BofA Merrill Lynch 1-3 Year U.S. Corporate Index, assuming reinvestment of all dividends and distributions. The Fund’s shares are sold only to insurance company separate accounts that fund certain variable annuity and variable life contracts. This line graph comparison does not reflect the sales charges or other expenses of these contracts. If those sales charges and expenses were reflected, returns would be lower. The graph and performance table below do not reflect the deduction of taxes that a shareholder would pay on Fund distributions or the redemption of Fund shares. During the period, expenses of the Fund were waived or reimbursed by Lord Abbett; without such waiver or reimbursement of expenses, the Fund’s returns would have been lower. Past performance is no guarantee of future results.
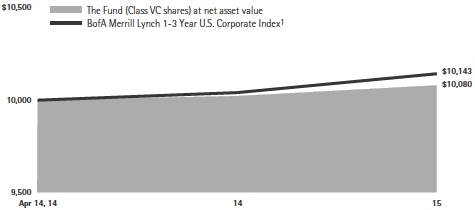
Average Annual Total Returns for the
Periods Ended December 31, 2015 |
| | | 1 Year | | Life of Class | |
| Class VC2 | | 0.58% | | 0.47% | |
1 Performance for the unmanaged index does not reflect any fees or expenses. The performance of the index is not necessarily representative of the Fund’s performance. Performance for the index began on April 14, 2014.
2 The Class VC shares commenced operations on April 4, 2014. Performance for the Class began on April 14, 2014.
4
Expense Example
As a shareholder of the Fund, you incur ongoing costs, including management fees; expenses related to the Fund’s services arrangements with certain insurance companies; and other Fund expenses. This Example is intended to help you understand your ongoing costs (in dollars) of investing in the Fund and to compare these costs with the ongoing costs of investing in other mutual funds.
The Example is based on an investment of $1,000 invested at the beginning of the period and held for the entire period (July 1, 2015 through December 31, 2015).
The Example reflects only expenses that are deducted from the assets of the Fund. Fees and expenses, including sales charges applicable to the various insurance products that invest in the Fund, are not reflected in this Example. If such fees and expenses were reflected in the Example, the total expenses shown would be higher. Fees and expenses regarding such variable insurance products are separately described in the prospectus related to those products.
Actual Expenses
The first line of the table on the following page provides information about actual account values and actual expenses. You may use the information in this line, together with the amount you invested, to estimate the expenses that you paid over the period. Simply divide your account value by $1,000 (for example, an $8,600 account value divided by $1,000 = 8.6), then multiply the result by the number in the first line under the heading titled “Expenses Paid During Period 7/1/15 – 12/31/15” to estimate the expenses you paid on your account during this period.
Hypothetical Example for Comparison Purposes
The second line of the table on the following page provides information about hypothetical account values and hypothetical expenses based on the Fund’s actual expense ratio and an assumed rate of return of 5% per year before expenses, which is not the Fund’s actual return. The hypothetical account values and expenses may not be used to estimate the actual ending account balance or expenses you paid for the period. You may use this information to compare the ongoing costs of investing in the Fund and other funds. To do so, compare this 5% hypothetical example with the 5% hypothetical examples that appear in the shareholder reports of the other funds.
5
Please note that the expenses shown in the table are meant to highlight your ongoing costs only and do not reflect any transactional costs, such as sales charges. Therefore, the second line of the table is useful in comparing ongoing costs only, and will not help you determine the relative total costs of owning different funds. In addition, if these transactional costs were included, your costs would have been higher.
| | | Beginning
Account
Value | | Ending
Account
Value | | Expenses
Paid During
Period† | |
| | | 7/1/15 | | 12/31/15 | | 7/1/15 -
12/31/15 | |
| Class VC | | | | | | | |
| Actual | | $1,000.00 | | $ 993.00 | | $4.02 | |
| Hypothetical (5% Return Before Expenses) | | $1,000.00 | | $1,021.17 | | $4.08 | |
| | |
| † | Net expenses are equal to the Fund’s annualized expense ratio of 0.80%, multiplied by the average account value over the period, multiplied by 184/365 (to reflect one-half year period). |
Portfolio Holdings Presented by Sector
December 31, 2015
| Sector* | %** |
| Auto | 2.23 | % |
| Basic Industry | 0.50 | % |
| Capital Goods | 0.81 | % |
| Consumer Cyclical | 1.46 | % |
| Consumer Discretionary | 0.99 | % |
| Consumer Services | 2.18 | % |
| Consumer Staples | 0.81 | % |
| Energy | 8.75 | % |
| Financial Services | 53.98 | % |
| Foreign Government | 0.39 | % |
| Government | 7.15 | % |
| Health Care | 4.86 | % |
| Integrated Oils | 0.84 | % |
| Materials & Processing | 1.57 | % |
| Municipal | 0.12 | % |
| Producer Durables | 1.37 | % |
| Technology | 2.56 | % |
| Telecommunications | 1.75 | % |
| Transportation | 0.99 | % |
| Utilities | 1.72 | % |
| Repurchase Agreement | 4.97 | % |
| Total | 100.00 | % |
| | | |
| * | | A sector may comprise several industries. |
| ** | | Represents percent of total investments. |
6
Schedule of Investments
December 31, 2015
| Investments | | Interest
Rate | | Maturity
Date | | Principal
Amount
(000) | | | Fair
Value | |
| LONG-TERM INVESTMENTS 92.44% | | | | | | | | | | | | |
| | | | | | | | | | | | | |
| ASSET-BACKED SECURITIES 15.05% | | | | | | | | | | | | |
| | | | | | | | | | | | | |
| Automobiles 7.59% | | | | | | | | | | | | |
| Ally Auto Receivables Trust 2014-2 A3 | | 1.25% | | 4/15/2019 | | $ | 21 | | | $ | 20,962 | |
| Ally Auto Receivables Trust 2015-2 A3 | | 1.49% | | 11/15/2019 | | | 8 | | | | 7,971 | |
| AmeriCredit Automobile Receivables Trust 2013-5 A3 | | 0.90% | | 9/10/2018 | | | 15 | | | | 15,306 | |
| Avis Budget Rental Car Funding AESOP LLC 2013-2A A† | | 2.97% | | 2/20/2020 | | | 100 | | | | 101,850 | |
| Avis Budget Rental Car Funding AESOP LLC 2014-1A A† | | 2.46% | | 7/20/2020 | | | 100 | | | | 100,403 | |
| Avis Budget Rental Car Funding AESOP LLC 2014-2A A† | | 2.50% | | 2/20/2021 | | | 100 | | | | 99,886 | |
| BMW Vehicle Lease Trust 2015-1 A3 | | 1.24% | | 12/20/2017 | | | 35 | | | | 34,956 | |
| BMW Vehicle Owner Trust 2014-A A3 | | 0.97% | | 11/26/2018 | | | 14 | | | | 13,967 | |
| California Republic Auto Receivables Trust 2013-1 A2† | | 1.41% | | 9/17/2018 | | | 62 | | | | 61,575 | |
| California Republic Auto Receivables Trust 2014-3 A3 | | 1.09% | | 11/15/2018 | | | 5 | | | | 4,987 | |
| California Republic Auto Receivables Trust 2014-4 A3 | | 1.27% | | 1/15/2019 | | | 10 | | | | 9,967 | |
| California Republic Auto Receivables Trust 2015-1 A2 | | 0.88% | | 12/15/2017 | | | 3 | | | | 3,085 | |
| California Republic Auto Receivables Trust 2015-1 A3 | | 1.33% | | 4/15/2019 | | | 6 | | | | 5,970 | |
| California Republic Auto Receivables Trust 2015-2 A4 | | 1.75% | | 1/15/2021 | | | 67 | | | | 65,659 | |
| California Republic Auto Receivables Trust 2015-2 B | | 2.53% | | 6/15/2021 | | | 32 | | | | 30,943 | |
| California Republic Auto Receivables Trust 2015-3 A4 | | 2.13% | | 5/17/2021 | | | 15 | | | | 14,816 | |
| California Republic Auto Receivables Trust 2015-4 A2† | | 1.60% | | 9/17/2018 | | | 29 | | | | 28,988 | |
| California Republic Auto Receivables Trust 2015-4 A3† | | 2.04% | | 1/15/2020 | | | 23 | | | | 22,959 | |
| California Republic Auto Receivables Trust 2015-4 B† | | 3.73% | | 11/15/2021 | | | 12 | | | | 11,961 | |
| Capital Auto Receivables Asset Trust 2014-3 C† | | 2.71% | | 11/20/2019 | | | 8 | | | | 7,987 | |
| Capital Auto Receivables Asset Trust 2015-2 A1A | | 0.99% | | 10/20/2017 | | | 33 | | | | 32,902 | |
| Capital Auto Receivables Asset Trust 2015-2 A2 | | 1.39% | | 9/20/2018 | | | 14 | | | | 13,944 | |
| Capital Auto Receivables Asset Trust 2015-3 B | | 2.43% | | 9/21/2020 | | | 11 | | | | 10,907 | |
| | See Notes to Financial Statements. | 7 |
Schedule of Investments (continued)
December 31, 2015
| Investments | | Interest
Rate | | Maturity
Date | | Principal
Amount
(000) | | | Fair
Value | |
| Automobiles (continued) | | | | | | | | | | | | |
| Capital Auto Receivables Asset Trust 2015-3 C | | 2.90% | | 12/21/2020 | | $ | 10 | | | $ | 9,955 | |
| Capital Auto Receivables Asset Trust 2015-3 D | | 3.34% | | 3/22/2021 | | | 9 | | | | 8,847 | |
| CarMax Auto Owner Trust 2013-1 C | | 1.54% | | 12/15/2018 | | | 5 | | | | 4,989 | |
| CarMax Auto Owner Trust 2013-2 A3 | | 0.64% | | 1/16/2018 | | | 10 | | | | 9,999 | |
| CarMax Auto Owner Trust 2013-3 A3 | | 0.97% | | 4/16/2018 | | | 8 | | | | 8,198 | |
| CarMax Auto Owner Trust 2014-2 A3 | | 0.98% | | 1/15/2019 | | | 40 | | | | 39,873 | |
| CarMax Auto Owner Trust 2015-2 A2A | | 0.82% | | 6/15/2018 | | | 8 | | | | 8,362 | |
| CarMax Auto Owner Trust 2015-3 A2A | | 1.10% | | 11/15/2018 | | | 116 | | | | 115,741 | |
| Chrysler Capital Auto Receivables Trust 2013-AA A3† | | 0.91% | | 4/16/2018 | | | 9 | | | | 9,275 | |
| Chrysler Capital Auto Receivables Trust 2014-BA A2† | | 0.69% | | 9/15/2017 | | | 5 | | | | 5,020 | |
| Chrysler Capital Auto Receivables Trust 2014-BA A3† | | 1.27% | | 5/15/2019 | | | 136 | | | | 135,626 | |
| Chrysler Capital Auto Receivables Trust 2015-BA B† | | 2.70% | | 12/15/2020 | | | 3 | | | | 2,992 | |
| Drive Auto Receivables Trust 2015-AA C† | | 3.06% | | 5/17/2021 | | | 50 | | | | 50,083 | |
| Drive Auto Receivables Trust 2015-BA B† | | 2.12% | | 6/17/2019 | | | 11 | | | | 10,979 | |
| Drive Auto Receivables Trust 2015-BA C† | | 2.76% | | 7/15/2021 | | | 3 | | | | 2,981 | |
| Drive Auto Receivables Trust 2015-DA C† | | 3.38% | | 11/15/2021 | | | 25 | | | | 24,897 | |
| Drive Auto Receivables Trust 2015-DA D† | | 4.59% | | 1/17/2023 | | | 22 | | | | 21,944 | |
| Fifth Third Auto Trust 2014-3 A3 | | 0.96% | | 3/15/2019 | | | 30 | | | | 29,907 | |
| Flagship Credit Auto Trust 2015-2 A† | | 1.98% | | 10/15/2020 | | | 18 | | | | 17,455 | |
| Flagship Credit Auto Trust 2015-3 A† | | 2.38% | | 10/15/2020 | | | 10 | | | | 9,722 | |
| Ford Credit Auto Owner Trust 2012-D A3 | | 0.51% | | 4/15/2017 | | | – | (a) | | | 379 | |
| Ford Credit Auto Owner Trust 2013-D A3 | | 0.67% | | 4/15/2018 | | | 25 | | | | 25,291 | |
| Honda Auto Receivables Owner Trust 2013-4 A3 | | 0.69% | | 9/18/2017 | | | 28 | | | | 28,251 | |
| Hyundai Auto Receivables Trust 2015-A A2 | | 0.68% | | 10/16/2017 | | | 18 | | | | 17,586 | |
| Nissan Auto Receivables Owner Trust 2014-B A3 | | 1.11% | | 5/15/2019 | | | 50 | | | | 49,862 | |
| Santander Drive Auto Receivables Trust 2013-3 B | | 1.19% | | 5/15/2018 | | | 15 | | | | 14,776 | |
| Santander Drive Auto Receivables Trust 2014-4 C | | 2.60% | | 11/16/2020 | | | 23 | | | | 23,050 | |
| Santander Drive Auto Receivables Trust 2015-1 C | | 2.57% | | 4/15/2021 | | | 36 | | | | 35,809 | |
| Santander Drive Auto Receivables Trust 2015-3 B | | 2.07% | | 4/15/2020 | | | 11 | | | | 10,976 | |
| Santander Drive Auto Receivables Trust 2015-3 C | | 2.74% | | 1/15/2021 | | | 13 | | | | 12,945 | |
| Santander Drive Auto Receivables Trust 2015-4 C | | 2.97% | | 3/15/2021 | | | 17 | | | | 16,986 | |
| Santander Drive Auto Receivables Trust 2015-5 D | | 3.65% | | 12/15/2021 | | | 27 | | | | 26,662 | |
| TCF Auto Receivables Owner Trust 2015-1A A4† | | 1.96% | | 11/16/2020 | | | 34 | | | | 33,625 | |
| TCF Auto Receivables Owner Trust 2015-1A B† | | 2.49% | | 4/15/2021 | | | 29 | | | | 28,686 | |
| TCF Auto Receivables Owner Trust 2015-2A A2† | | 1.64% | | 1/15/2019 | | | 11 | | | | 10,987 | |
| 8 | See Notes to Financial Statements. |
Schedule of Investments (continued)
December 31, 2015
| Investments | | Interest
Rate | | Maturity
Date | | Principal
Amount
(000) | | | Fair
Value | |
| Automobiles (continued) | | | | | | | | | | | | |
| TCF Auto Receivables Owner Trust 2015-2A A3† | | 2.06% | | 4/15/2020 | | $ | 16 | | | $ | 15,968 | |
| TCF Auto Receivables Owner Trust 2015-2A B† | | 3.00% | | 9/15/2021 | | | 6 | | | | 5,979 | |
| TCF Auto Receivables Owner Trust 2015-2A C† | | 3.75% | | 12/15/2021 | | | 4 | | | | 3,986 | |
| Volkswagen Auto Loan Enhanced Trust 2013-2 A3 | | 0.70% | | 4/20/2018 | | | 45 | | | | 44,574 | |
| Total | | | | | | | | | | | 1,655,174 | |
| | | | | | | | | | | | | |
| Credit Cards 1.27% | | | | | | | | | | | | |
| Bank of America Credit Card Trust 2014-A3 A | | 0.621% | # | 1/15/2020 | | | 5 | | | | 4,997 | |
| Capital One Multi-Asset Execution Trust 2014-A2 | | 1.26% | | 1/15/2020 | | | 14 | | | | 14,000 | |
| Capital One Multi-Asset Execution Trust 2015-A3 | | 0.731% | # | 3/15/2023 | | | 56 | | | | 55,581 | |
| First National Master Note Trust 2015-1 A | | 1.101% | # | 9/15/2020 | | | 3 | | | | 3,007 | |
| Synchrony Credit Card Master Note Trust 2011-2 A | | 0.811% | # | 5/15/2019 | | | 100 | | | | 100,009 | |
| Synchrony Credit Card Master Note Trust 2012-6 A | | 1.36% | | 8/17/2020 | | | 100 | | | | 99,545 | |
| Total | | | | | | | | | | | 277,139 | |
| | | | | | | | | | | | | |
| Other 6.19% | | | | | | | | | | | | |
| Ally Master Owner Trust 2015-3 A | | 1.63% | | 5/15/2020 | | | 100 | | | | 99,107 | |
| CNH Equipment Trust 2015-B A4 | | 1.89% | | 4/15/2022 | | | 11 | | | | 10,956 | |
| Diamond Resorts Owner Trust 2015-2 A† | | 2.99% | | 5/22/2028 | | | 96 | | | | 95,852 | |
| Engs Commercial Finance Trust 2015-1A A2† | | 2.31% | | 10/22/2021 | | | 116 | | | | 115,826 | |
| GMF Floorplan Owner Revolving Trust 2015-1 A1† | | 1.65% | | 5/15/2020 | | | 100 | | | | 98,998 | |
| Nomura CRE CDO Ltd. 2007-2A A2† | | 0.658% | # | 5/21/2042 | | | 103 | | | | 102,842 | |
| Oaktree EIF II Ltd. 2015-A1 A†(b) | | 2.265% | # | 10/18/2027 | | | 250 | | | | 247,375 | |
| Octagon Investment Partners XIX Ltd. 2014-1A A† | | 1.809% | # | 4/15/2026 | | | 250 | | | | 248,860 | |
| SLM Private Education Loan Trust 2011-B A1† | | 1.181% | # | 12/16/2024 | | | 13 | | | | 13,296 | |
| SLM Private Education Loan Trust 2012-A A1† | | 1.731% | # | 8/15/2025 | | | 24 | | | | 24,005 | |
| SLM Private Education Loan Trust 2013-B A1† | | 0.981% | # | 7/15/2022 | | | 44 | | | | 44,346 | |
| Tryon Park CLO Ltd. 2013-1A A1† | | 1.409% | # | 7/15/2025 | | | 250 | | | | 246,786 | |
| Total | | | | | | | | | | | 1,348,249 | |
| Total Asset-Backed Securities (cost $3,291,458) | | | | | | | | | | | 3,280,562 | |
| | | | | | | | | | | | | |
| CORPORATE BONDS 43.57% | | | | | | | | | | | | |
| | | | | | | | | | | | | |
| Aerospace/Defense 0.66% | | | | | | | | | | | | |
| BAE Systems plc (United Kingdom)†(c) | | 3.50% | | 10/11/2016 | | | 5 | | | | 5,073 | |
| Exelis, Inc. | | 4.25% | | 10/1/2016 | | | 65 | | | | 66,179 | |
| Harris Corp. | | 2.70% | | 4/27/2020 | | | 18 | | | | 17,677 | |
| Litton Industries, Inc. | | 6.75% | | 4/15/2018 | | | 10 | | | | 10,974 | |
| Lockheed Martin Corp. | | 2.50% | | 11/23/2020 | | | 15 | | | | 14,928 | |
| Spirit AeroSystems, Inc. | | 6.75% | | 12/15/2020 | | | 29 | | | | 30,033 | |
| Total | | | | | | | | | | | 144,864 | |
| | See Notes to Financial Statements. | 9 |
Schedule of Investments (continued)
December 31, 2015
| Investments | | Interest
Rate | | Maturity
Date | | Principal
Amount
(000) | | | Fair
Value | |
| Auto Parts: Original Equipment 0.31% | | | | | | | | | | | | |
| BorgWarner, Inc. | | 5.75% | | 11/1/2016 | | $ | 8 | | | $ | 8,254 | |
| International Automotive Components Group SA (Luxembourg)†(c) | | 9.125% | | 6/1/2018 | | | 15 | | | | 12,900 | |
| Tenneco, Inc. | | 6.875% | | 12/15/2020 | | | 45 | | | | 46,800 | |
| Total | | | | | | | | | | | 67,954 | |
| | | | | | | | | | | | | |
| Automotive 1.96% | | | | | | | | | | | | |
| Ford Motor Credit Co. LLC | | 6.625% | | 8/15/2017 | | | 200 | | | | 213,257 | |
| General Motors Co. | | 3.50% | | 10/2/2018 | | | 32 | | | | 32,401 | |
| General Motors Financial Co., Inc. | | 2.40% | | 4/10/2018 | | | 17 | | | | 16,926 | |
| General Motors Financial Co., Inc. | | 3.00% | | 9/25/2017 | | | 4 | | | | 4,017 | |
| General Motors Financial Co., Inc. | | 3.10% | | 1/15/2019 | | | 20 | | | | 19,985 | |
| General Motors Financial Co., Inc. | | 3.20% | | 7/13/2020 | | | 70 | | | | 68,994 | |
| General Motors Financial Co., Inc. | | 3.25% | | 5/15/2018 | | | 5 | | | | 5,028 | |
| General Motors Financial Co., Inc. | | 4.75% | | 8/15/2017 | | | 50 | | | | 51,842 | |
| Hyundai Capital America† | | 2.40% | | 10/30/2018 | | | 15 | | | | 14,960 | |
| Total | | | | | | | | | | | 427,410 | |
| | | | | | | | | | | | | |
| Banks: Regional 4.54% | | | | | | | | | | | | |
| Associated Banc-Corp. | | 5.125% | | 3/28/2016 | | | 19 | | | | 19,104 | |
| Bank of America Corp. | | 2.625% | | 10/19/2020 | | | 34 | | | | 33,610 | |
| Bank of America Corp. | | 7.80% | | 9/15/2016 | | | 125 | | | | 130,189 | |
| Capital One Financial Corp. | | 5.25% | | 2/21/2017 | | | 5 | | | | 5,171 | |
| Capital One Financial Corp. | | 6.15% | | 9/1/2016 | | | 10 | | | | 10,306 | |
| CIT Group, Inc. | | 3.875% | | 2/19/2019 | | | 4 | | | | 3,990 | |
| CIT Group, Inc. | | 4.25% | | 8/15/2017 | | | 26 | | | | 26,650 | |
| CIT Group, Inc. | | 5.00% | | 5/15/2017 | | | 2 | | | | 2,065 | |
| CIT Group, Inc.† | | 5.50% | | 2/15/2019 | | | 36 | | | | 37,710 | |
| Citigroup, Inc. | | 2.65% | | 10/26/2020 | | | 32 | | | | 31,777 | |
| Fifth Third Bancorp | | 2.875% | | 7/27/2020 | | | 36 | | | | 35,998 | |
| Fifth Third Bancorp | | 5.45% | | 1/15/2017 | | | 5 | | | | 5,185 | |
| Goldman Sachs Group, Inc. (The) | | 5.625% | | 1/15/2017 | | | 48 | | | | 49,869 | |
| Goldman Sachs Group, Inc. (The) | | 5.95% | | 1/18/2018 | | | 8 | | | | 8,620 | |
| HBOS plc (United Kingdom)†(c) | | 6.75% | | 5/21/2018 | | | 100 | | | | 109,315 | |
| Huntington Bancshares, Inc. | | 2.60% | | 8/2/2018 | | | 41 | | | | 41,072 | |
| Huntington Bancshares, Inc. | | 7.00% | | 12/15/2020 | | | 13 | | | | 15,154 | |
| JPMorgan Chase & Co. | | 2.25% | | 1/23/2020 | | | 18 | | | | 17,718 | |
| Lloyds Bank plc (United Kingdom)(c) | | 9.875% | | 12/16/2021 | | | 125 | | | | 133,848 | |
| National City Corp. | | 6.875% | | 5/15/2019 | | | 47 | | | | 53,137 | |
| PNC Funding Corp. | | 5.625% | | 2/1/2017 | | | 5 | | | | 5,199 | |
| 10 | See Notes to Financial Statements. |
Schedule of Investments (continued)
December 31, 2015
| Investments | | Interest
Rate | | Maturity
Date | | Principal
Amount
(000) | | | Fair
Value | |
| Popular, Inc. | | 7.00% | | 7/1/2019 | | $ | 12 | | | $ | 11,265 | |
| Regions Financial Corp. | | 2.00% | | 5/15/2018 | | | 27 | | | | 26,825 | |
| Royal Bank of Scotland NV (Netherlands)(c) | | 4.65% | | 6/4/2018 | | | 2 | | | | 2,066 | |
| Royal Bank of Scotland plc (The) (United Kingdom)(c) | | 9.50% | | 3/16/2022 | | | 77 | | | | 83,530 | |
| Santander Holdings USA, Inc. | | 4.625% | | 4/19/2016 | | | 8 | | | | 8,071 | |
| Santander UK Group Holdings plc (United Kingdom)(c) | | 2.875% | | 10/16/2020 | | | 44 | | | | 43,789 | |
| Synovus Financial Corp. | | 7.875% | | 2/15/2019 | | | 35 | | | | 38,981 | |
| Total | | | | | | | | | | | 990,214 | |
| | | | | | | | | | | | | |
| Biotechnology Research & Production 0.05% | | | | | | | | | | | | |
| Biogen, Inc. | | 2.90% | | 9/15/2020 | | | 12 | | | | 11,981 | |
| | | | | | | | | | | | | |
| Building Materials 0.24% | | | | | | | | | | | | |
| Fortune Brands Home & Security, Inc. | | 3.00% | | 6/15/2020 | | | 5 | | | | 4,978 | |
| Martin Marietta Materials, Inc. | | 1.703% | # | 6/30/2017 | | | 32 | | | | 31,789 | |
| Martin Marietta Materials, Inc. | | 6.60% | | 4/15/2018 | | | 12 | | | | 12,936 | |
| Owens Corning | | 9.00% | | 6/15/2019 | | | 3 | | | | 3,479 | |
| Total | | | | | | | | | | | 53,182 | |
| | | | | | | | | | | | | |
| Business Services 0.83% | | | | | | | | | | | | |
| Hertz Corp. (The) | | 7.50% | | 10/15/2018 | | | 46 | | | | 47,035 | |
| Igloo Holdings Corp. PIK† | | 8.25% | | 12/15/2017 | | | 20 | | | | 20,025 | |
| Interactive Data Corp.† | | 5.875% | | 4/15/2019 | | | 25 | | | | 25,625 | |
| NES Rentals Holdings, Inc.† | | 7.875% | | 5/1/2018 | | | 16 | | | | 14,640 | |
| Verisk Analytics, Inc. | | 4.875% | | 1/15/2019 | | | 17 | | | | 17,794 | |
| Western Union Co. (The) | | 2.875% | | 12/10/2017 | | | 25 | | | | 25,309 | |
| Western Union Co. (The) | | 3.35% | | 5/22/2019 | | | 20 | | | | 20,269 | |
| Western Union Co. (The) | | 5.93% | | 10/1/2016 | | | 10 | | | | 10,320 | |
| Total | | | | | | | | | | | 181,017 | |
| | | | | | | | | | | | | |
| Chemicals 0.14% | | | | | | | | | | | | |
| Nufarm Australia Ltd. (Australia)†(c) | | 6.375% | | 10/15/2019 | | | 10 | | | | 9,937 | |
| PetroLogistics LP/PetroLogistics Finance Corp. | | 6.25% | | 4/1/2020 | | | 20 | | | | 21,000 | |
| Total | | | | | | | | | | | 30,937 | |
| | | | | | | | | | | | | |
| Computer Hardware 0.52% | | | | | | | | | | | | |
| Computer Sciences Corp. | | 6.50% | | 3/15/2018 | | | 25 | | | | 26,988 | |
| Hewlett-Packard Enterprise Co.† | | 2.85% | | 10/5/2018 | | | 55 | | | | 55,005 | |
| Hewlett-Packard Enterprise Co.† | | 3.60% | | 10/15/2020 | | | 31 | | | | 31,105 | |
| Total | | | | | | | | | | | 113,098 | |
| | See Notes to Financial Statements. | 11 |
Schedule of Investments (continued)
December 31, 2015
| Investments | | Interest
Rate | | Maturity
Date | | Principal
Amount
(000) | | | Fair
Value | |
| Computer Software 0.36% | | | | | | | | | | | | |
| Aspect Software, Inc. | | 10.625% | | 5/15/2017 | | $ | 7 | | | $ | 3,850 | |
| Audatex North America, Inc.† | | 6.00% | | 6/15/2021 | | | 2 | | | | 2,022 | |
| Audatex North America, Inc.† | | 6.125% | | 11/1/2023 | | | 13 | | | | 13,130 | |
| Dun & Bradstreet Corp. (The) | | 3.25% | | 12/1/2017 | | | 5 | | | | 5,041 | |
| Emdeon, Inc. | | 11.00% | | 12/31/2019 | | | 31 | | | | 32,434 | |
| Fidelity National Information Services, Inc. | | 2.85% | | 10/15/2018 | | | 21 | | | | 21,088 | |
| Fidelity National Information Services, Inc. | | 5.00% | | 3/15/2022 | | | 2 | | | | 2,080 | |
| Total | | | | | | | | | | | 79,645 | |
| | | | | | | | | | | | | |
| Containers 0.33% | | | | | | | | | | | | |
| Coveris Holding Corp.† | | 10.00% | | 6/1/2018 | | | 28 | | | | 26,740 | |
| Novelis, Inc. | | 8.75% | | 12/15/2020 | | | 27 | | | | 24,907 | |
| Reynolds Group Issuer, Inc./Reynolds Group Issuer LLC/Reynolds Group Issuer (Luxembourg) SA | | 8.50% | | 5/15/2018 | | | 20 | | | | 19,800 | |
| Total | | | | | | | | | | | 71,447 | |
| | | | | | | | | | | | | |
| Diversified 0.17% | | | | | | | | | | | | |
| Alphabet Holding Co., Inc. PIK | | 7.75% | | 11/1/2017 | | | 38 | | | | 37,145 | |
| | | | | | | | | | | | | |
| Drugs 2.69% | | | | | | | | | | | | |
| Actavis Funding SCS (Luxembourg)(c) | | 2.35% | | 3/12/2018 | | | 10 | | | | 10,016 | |
| Baxalta, Inc.† | | 2.875% | | 6/23/2020 | | | 30 | | | | 29,659 | |
| Capsugel SA PIK (Luxembourg)†(c) | | 7.00% | | 5/15/2019 | | | 38 | | | | 37,121 | |
| Express Scripts Holding Co. | | 2.65% | | 2/15/2017 | | | 59 | | | | 59,596 | |
| Express Scripts Holding Co. | | 7.25% | | 6/15/2019 | | | 3 | | | | 3,454 | |
| Forest Laboratories, Inc.† | | 4.375% | | 2/1/2019 | | | 156 | | | | 163,539 | |
| McKesson Corp. | | 7.50% | | 2/15/2019 | | | 5 | | | | 5,725 | |
| Medco Health Solutions, Inc. | | 7.125% | | 3/15/2018 | | | 13 | | | | 14,378 | |
| Mylan NV† | | 3.00% | | 12/15/2018 | | | 10 | | | | 9,985 | |
| Mylan NV† | | 3.75% | | 12/15/2020 | | | 25 | | | | 25,054 | |
| Mylan, Inc. | | 1.35% | | 11/29/2016 | | | 23 | | | | 22,812 | |
| Mylan, Inc. | | 1.80% | | 6/24/2016 | | | 30 | | | | 29,984 | |
| Mylan, Inc. | | 2.55% | | 3/28/2019 | | | 11 | | | | 10,864 | |
| Mylan, Inc. | | 2.60% | | 6/24/2018 | | | 72 | | | | 71,489 | |
| Valeant Pharmaceuticals International, Inc.† | | 6.75% | | 8/15/2018 | | | 7 | | | | 6,972 | |
| Valeant Pharmaceuticals International, Inc.† | | 7.00% | | 10/1/2020 | | | 15 | | | | 15,038 | |
| Zoetis, Inc. | | 1.15% | | 2/1/2016 | | | 5 | | | | 4,999 | |
| Zoetis, Inc. | | 1.875% | | 2/1/2018 | | | 66 | | | | 65,151 | |
| Total | | | | | | | | | | | 585,836 | |
| 12 | See Notes to Financial Statements. |
Schedule of Investments (continued)
December 31, 2015
| Investments | | Interest
Rate | | Maturity
Date | | Principal
Amount
(000) | | | Fair
Value | |
| Electric: Power 1.56% | | | | | | | | | | | | |
| Dominion Resources, Inc. | | 1.25% | | 3/15/2017 | | $ | 10 | | | $ | 9,941 | |
| Duquesne Light Holdings, Inc.† | | 6.40% | | 9/15/2020 | | | 10 | | | | 11,331 | |
| Entergy Corp. | | 4.70% | | 1/15/2017 | | | 30 | | | | 30,770 | |
| Entergy Corp. | | 5.125% | | 9/15/2020 | | | 1 | | | | 1,076 | |
| Exelon Generation Co. LLC | | 2.95% | | 1/15/2020 | | | 35 | | | | 34,907 | |
| Exelon Generation Co. LLC | | 4.00% | | 10/1/2020 | | | 32 | | | | 33,013 | |
| Exelon Generation Co. LLC | | 5.20% | | 10/1/2019 | | | 1 | | | | 1,078 | |
| Jersey Central Power & Light Co. | | 7.35% | | 2/1/2019 | | | 10 | | | | 11,263 | |
| Metropolitan Edison Co. | | 7.70% | | 1/15/2019 | | | 11 | | | | 12,534 | |
| NextEra Energy Capital Holdings, Inc. | | 2.056% | | 9/1/2017 | | | 50 | | | | 50,067 | |
| NiSource Finance Corp. | | 6.80% | | 1/15/2019 | | | 50 | | | | 56,131 | |
| NRG Energy, Inc. | | 8.25% | | 9/1/2020 | | | 30 | | | | 29,250 | |
| Pennsylvania Electric Co. | | 6.05% | | 9/1/2017 | | | 4 | | | | 4,259 | |
| PG&E Corp. | | 2.40% | | 3/1/2019 | | | 5 | | | | 4,993 | |
| PPL WEM Ltd./Western Power Distribution Ltd. (United Kingdom)†(c) | | 3.90% | | 5/1/2016 | | | 41 | | | | 41,167 | |
| Progress Energy, Inc. | | 7.05% | | 3/15/2019 | | | 4 | | | | 4,541 | |
| TECO Finance, Inc. | | 6.572% | | 11/1/2017 | | | 3 | | | | 3,234 | |
| Total | | | | | | | | | | | 339,555 | |
| | | | | | | | | | | | | |
| Electrical Equipment 0.29% | | | | | | | | | | | | |
| KLA-Tencor Corp. | | 2.375% | | 11/1/2017 | | | 16 | | | | 16,016 | |
| KLA-Tencor Corp. | | 3.375% | | 11/1/2019 | | | 46 | | | | 46,513 | |
| Total | | | | | | | | | | | 62,529 | |
| | | | | | | | | | | | | |
| Electronics 0.55% | | | | | | | | | | | | |
| FLIR Systems, Inc. | | 3.75% | | 9/1/2016 | | | 13 | | | | 13,190 | |
| Jabil Circuit, Inc. | | 7.75% | | 7/15/2016 | | | 72 | | | | 73,980 | |
| Jabil Circuit, Inc. | | 8.25% | | 3/15/2018 | | | 22 | | | | 24,310 | |
| Kemet Corp. | | 10.50% | | 5/1/2018 | | | 10 | | | | 8,550 | |
| Total | | | | | | | | | | | 120,030 | |
| | | | | | | | | | | | | |
| Engineering & Contracting Services 0.05% | | | | | | | | | | | | |
| New Enterprise Stone & Lime Co., Inc. | | 11.00% | | 9/1/2018 | | | 13 | | | | 10,400 | |
| | | | | | | | | | | | | |
| Entertainment 0.68% | | | | | | | | | | | | |
| CCM Merger, Inc.† | | 9.125% | | 5/1/2019 | | | 14 | | | | 14,683 | |
| Mohegan Tribal Gaming Authority† | | 11.00% | | 9/15/2018 | | | 24 | | | | 23,940 | |
| Palace Entertainment Holdings LLC/Palace Entertainment Holdings Corp.† | | 8.875% | | 4/15/2017 | | | 33 | | | | 32,402 | |
| Peninsula Gaming LLC/Peninsula Gaming Corp.† | | 8.375% | | 2/15/2018 | | | 10 | | | | 10,200 | |
| | See Notes to Financial Statements. | 13 |
Schedule of Investments (continued)
December 31, 2015
| Investments | | Interest
Rate | | Maturity
Date | | Principal
Amount
(000) | | | Fair
Value | |
| Entertainment (continued) | | | | | | | | | | | | |
| Pinnacle Entertainment, Inc. | | 7.50% | | 4/15/2021 | | $ | 29 | | | $ | 30,377 | |
| Pinnacle Entertainment, Inc. | | 8.75% | | 5/15/2020 | | | 8 | | | | 8,350 | |
| Rivers Pittsburgh Borrower LP/Rivers Pittsburgh Finance Corp.† | | 9.50% | | 6/15/2019 | | | 23 | | | | 23,920 | |
| Shingle Springs Tribal Gaming Authority† | | 9.75% | | 9/1/2021 | | | 4 | | | | 4,100 | |
| Total | | | | | | | | | | | 147,972 | |
| | | | | | | | | | | | | |
| Financial Services 4.53% | | | | | | | | | | | | |
| Air Lease Corp. | | 4.50% | | 1/15/2016 | | | 18 | | | | 18,012 | |
| Air Lease Corp. | | 5.625% | | 4/1/2017 | | | 161 | | | | 167,440 | |
| Alliance Data Systems Corp.† | | 6.375% | | 4/1/2020 | | | 24 | | | | 24,330 | |
| Bear Stearns Cos. LLC (The) | | 5.55% | | 1/22/2017 | | | 32 | | | | 33,263 | |
| Countrywide Financial Corp. | | 6.25% | | 5/15/2016 | | | 65 | | | | 66,102 | |
| Denali Borrower LLC/Denali Finance Corp.† | | 5.625% | | 10/15/2020 | | | 122 | | | | 128,100 | |
| Discover Financial Services | | 6.45% | | 6/12/2017 | | | 66 | | | | 69,779 | |
| International Lease Finance Corp. | | 5.875% | | 4/1/2019 | | | 2 | | | | 2,125 | |
| International Lease Finance Corp. | | 6.25% | | 5/15/2019 | | | 75 | | | | 80,531 | |
| International Lease Finance Corp.† | | 7.125% | | 9/1/2018 | | | 27 | | | | 29,666 | |
| Jefferies Group LLC | | 5.125% | | 4/13/2018 | | | 18 | | | | 18,741 | |
| Jefferies Group LLC | | 6.875% | | 4/15/2021 | | | 22 | | | | 24,666 | |
| Jefferies Group LLC | | 8.50% | | 7/15/2019 | | | 56 | | | | 65,322 | |
| Lazard Group LLC | | 4.25% | | 11/14/2020 | | | 7 | | | | 7,258 | |
| Lazard Group LLC | | 6.85% | | 6/15/2017 | | | 6 | | | | 6,390 | |
| Macquarie Group Ltd. (Australia)†(c) | | 6.00% | | 1/14/2020 | | | 75 | | | | 82,851 | |
| Nationstar Mortgage LLC/Nationstar Capital Corp. | | 9.625% | | 5/1/2019 | | | 33 | | | | 34,155 | |
| Navient Corp. | | 4.875% | | 6/17/2019 | | | 16 | | | | 14,760 | |
| Navient Corp. | | 5.50% | | 1/15/2019 | | | 36 | | | | 33,750 | |
| Neuberger Berman Group LLC/Neuberger Berman Finance Corp.† | | 5.875% | | 3/15/2022 | | | 54 | | | | 56,228 | |
| ROC Finance LLC/ROC Finance 1 Corp.† | | 12.125% | | 9/1/2018 | | | 22 | | | | 23,100 | |
| Utility Contract Funding LLC† | | 7.944% | | 10/1/2016 | | | – | (a) | | | 308 | |
| Total | | | | | | | | | | | 986,877 | |
| | | | | | | | | | | | | |
| Food 0.64% | | | | | | | | | | | | |
| Bumble Bee Holdco SCA PIK (Luxembourg)†(c) | | 9.625% | | 3/15/2018 | | | 20 | | | | 20,050 | |
| JBS USA LLC/JBS USA Finance, Inc. † | | 7.25% | | 6/1/2021 | | | 47 | | | | 46,883 | |
| Kraft Heinz Foods Co.† | | 1.60% | | 6/30/2017 | | | 21 | | | | 20,947 | |
| Kraft Heinz Foods Co.† | | 2.00% | | 7/2/2018 | | | 5 | | | | 4,979 | |
| Mondelez International, Inc. | | 0.849% | # | 2/1/2019 | | | 2 | | | | 1,966 | |
| 14 | See Notes to Financial Statements. |
Schedule of Investments (continued)
December 31, 2015
| Investments | | Interest
Rate | | Maturity
Date | | Principal
Amount
(000) | | | Fair
Value | |
| Food (continued) | | | | | | | | | | | | |
| Tesco plc (United Kingdom)†(c) | | 5.50% | | 11/15/2017 | | $ | 2 | | | $ | 2,088 | |
| US Foods, Inc. | | 8.50% | | 6/30/2019 | | | 41 | | | | 42,333 | |
| Total | | | | | | | | | | | 139,246 | |
| | | | | | | | | | | | | |
| Health Care Products 1.09% | | | | | | | | | | | | |
| Becton, Dickinson & Co. | | 6.375% | | 8/1/2019 | | | 42 | | | | 47,450 | |
| Boston Scientific Corp. | | 2.65% | | 10/1/2018 | | | 2 | | | | 2,012 | |
| Boston Scientific Corp. | | 2.85% | | 5/15/2020 | | | 61 | | | | 60,744 | |
| Boston Scientific Corp. | | 6.00% | | 1/15/2020 | | | 25 | | | | 27,785 | |
| Immucor, Inc. | | 11.125% | | 8/15/2019 | | | 22 | | | | 20,130 | |
| Kinetic Concepts, Inc./KCI USA, Inc. | | 12.50% | | 11/1/2019 | | | 23 | | | | 20,987 | |
| Life Technologies Corp. | | 6.00% | | 3/1/2020 | | | 22 | | | | 24,411 | |
| Zimmer Biomet Holdings, Inc. | | 2.00% | | 4/1/2018 | | | 10 | | | | 9,944 | |
| Zimmer Biomet Holdings, Inc. | | 2.70% | | 4/1/2020 | | | 25 | | | | 24,710 | |
| Total | | | | | | | | | | | 238,173 | |
| | | | | | | | | | | | | |
| Health Care Services 0.61% | | | | | | | | | | | | |
| CHS/Community Health Systems, Inc. | | 8.00% | | 11/15/2019 | | | 47 | | | | 47,587 | |
| HealthSouth Corp. | | 7.75% | | 9/15/2022 | | | 19 | | | | 19,855 | |
| IASIS Healthcare LLC/IASIS Capital Corp. | | 8.375% | | 5/15/2019 | | | 29 | | | | 26,825 | |
| Tenet Healthcare Corp. | | 8.00% | | 8/1/2020 | | | 39 | | | | 39,293 | |
| Total | | | | | | | | | | | 133,560 | |
| | | | | | | | | | | | | |
| Household Equipment/Products 0.04% | | | | | | | | | | | | |
| Jarden Corp. | | 6.125% | | 11/15/2022 | | | 8 | | | | 8,265 | |
| | | | | | | | | | | | | |
| Insurance 0.82% | | | | | | | | | | | | |
| American Equity Investment Life Holding Co. | | 6.625% | | 7/15/2021 | | | 22 | | | | 22,990 | |
| CNO Financial Group, Inc. | | 4.50% | | 5/30/2020 | | | 27 | | | | 27,607 | |
| Fidelity National Financial, Inc. | | 6.60% | | 5/15/2017 | | | 11 | | | | 11,610 | |
| Kemper Corp. | | 6.00% | | 5/15/2017 | | | 6 | | | | 6,235 | |
| Liberty Mutual Group, Inc.† | | 6.70% | | 8/15/2016 | | | 2 | | | | 2,066 | |
| Lincoln National Corp. | | 8.75% | | 7/1/2019 | | | 7 | | | | 8,414 | |
| TIAA Asset Management Finance Co. LLC† | | 2.95% | | 11/1/2019 | | | 47 | | | | 47,136 | |
| Torchmark Corp. | �� | 6.375% | | 6/15/2016 | | | 10 | | | | 10,209 | |
| Willis Group Holdings plc (United Kingdom)(c) | | 4.125% | | 3/15/2016 | | | 25 | | | | 25,137 | |
| Willis North America, Inc. | | 6.20% | | 3/28/2017 | | | 16 | | | | 16,832 | |
| Total | | | | | | | | | | | 178,236 | |
| | See Notes to Financial Statements. | 15 |
Schedule of Investments (continued)
December 31, 2015
| Investments | | Interest
Rate | | Maturity
Date | | Principal
Amount
(000) | | | Fair
Value | |
| Leasing 0.93% | | | | | | | | | | | | |
| Aviation Capital Group Corp.† | | 2.875% | | 9/17/2018 | | $ | 20 | | | $ | 19,910 | |
| Aviation Capital Group Corp.† | | 3.875% | | 9/27/2016 | | | 4 | | | | 4,035 | |
| Aviation Capital Group Corp.† | | 4.625% | | 1/31/2018 | | | 17 | | | | 17,361 | |
| Aviation Capital Group Corp.† | | 7.125% | | 10/15/2020 | | | 77 | | | | 88,261 | |
| Penske Truck Leasing Co. LP/PTL Finance Corp.† | | 2.50% | | 6/15/2019 | | | 2 | | | | 1,969 | |
| Penske Truck Leasing Co. LP/PTL Finance Corp.† | | 2.875% | | 7/17/2018 | | | 2 | | | | 2,014 | |
| Penske Truck Leasing Co. LP/PTL Finance Corp.† | | 3.20% | | 7/15/2020 | | | 63 | | | | 62,433 | |
| Penske Truck Leasing Co. LP/PTL Finance Corp.† | | 3.375% | | 3/15/2018 | | | 4 | | | | 4,066 | |
| Penske Truck Leasing Co. LP/PTL Finance Corp.† | | 3.75% | | 5/11/2017 | | | 2 | | | | 2,041 | |
| Total | | | | | | | | | | | 202,090 | |
| | | | | | | | | | | | | |
| Leisure 0.07% | | | | | | | | | | | | |
| Carnival Corp. | | 3.95% | | 10/15/2020 | | | 15 | | | | 15,685 | |
| | | | | | | | | | | | | |
| Lodging 0.29% | | | | | | | | | | | | |
| Hyatt Hotels Corp.† | | 6.875% | | 8/15/2019 | | | 50 | | | | 56,729 | |
| Starwood Hotels & Resorts Worldwide, Inc. | | 6.75% | | 5/15/2018 | | | 5 | | | | 5,473 | |
| Total | | | | | | | | | | | 62,202 | |
| | | | | | | | | | | | | |
| Machinery: Agricultural 0.60% | | | | | | | | | | | | |
| Reynolds American, Inc. | | 3.50% | | 8/4/2016 | | | 2 | | | | 2,022 | |
| Reynolds American, Inc. | | 6.75% | | 6/15/2017 | | | 1 | | | | 1,068 | |
| Reynolds American, Inc. | | 6.875% | | 5/1/2020 | | | 78 | | | | 90,067 | |
| Reynolds American, Inc. | | 7.75% | | 6/1/2018 | | | 32 | | | | 36,103 | |
| Southern States Cooperative, Inc.† | | 10.00% | | 8/15/2021 | | | 2 | | | | 1,740 | |
| Total | | | | | | | | | | | 131,000 | |
| | | | | | | | | | | | | |
| Machinery: Industrial/Specialty 0.35% | | | | | | | | | | | | |
| CNH Industrial Capital LLC | | 6.25% | | 11/1/2016 | | | 50 | | | | 51,188 | |
| Stanley Black & Decker, Inc. | | 2.451% | | 11/17/2018 | | | 10 | | | | 10,046 | |
| Xylem, Inc. | | 3.55% | | 9/20/2016 | | | 15 | | | | 15,207 | |
| Total | | | | | | | | | | | 76,441 | |
| | | | | | | | | | | | | |
| Manufacturing 0.03% | | | | | | | | | | | | |
| Ingersoll-Rand Global Holding Co., Ltd. | | 2.875% | | 1/15/2019 | | | 2 | | | | 2,022 | |
| Smith & Wesson Holding Corp.† | | 5.00% | | 7/15/2018 | | | 5 | | | | 5,087 | |
| Total | | | | | | | | | | | 7,109 | |
| 16 | See Notes to Financial Statements. |
Schedule of Investments (continued)
December 31, 2015
| Investments | | Interest
Rate | | Maturity
Date | | Principal
Amount
(000) | | | Fair
Value | |
| Media 1.72% | | | | | | | | | | | | |
| Block Communications, Inc.† | | 7.25% | | 2/1/2020 | | $ | 12 | | | $ | 12,000 | |
| CCO Holdings LLC/CCO Holdings Capital Corp. | | 6.50% | | 4/30/2021 | | | 66 | | | | 68,764 | |
| CCO Holdings LLC/CCO Holdings Capital Corp. | | 7.00% | | 1/15/2019 | | | 2 | | | | 2,045 | |
| Cox Communications, Inc.† | | 5.875% | | 12/1/2016 | | | 33 | | | | 34,125 | |
| Cox Communications, Inc.† | | 6.25% | | 6/1/2018 | | | 5 | | | | 5,376 | |
| Cox Communications, Inc.† | | 9.375% | | 1/15/2019 | | | 45 | | | | 52,173 | |
| Discovery Communications LLC | | 5.625% | | 8/15/2019 | | | 63 | | | | 68,613 | |
| Harron Communications LP/Harron Finance Corp.† | | 9.125% | | 4/1/2020 | | | 10 | | | | 10,613 | |
| Sirius XM Radio, Inc.† | | 5.25% | | 8/15/2022 | | | 5 | | | | 5,294 | |
| Time Warner Cable, Inc. | | 8.25% | | 4/1/2019 | | | 10 | | | | 11,491 | |
| Time Warner Cable, Inc. | | 8.75% | | 2/14/2019 | | | 6 | | | | 6,965 | |
| Univision Communications, Inc.† | | 8.50% | | 5/15/2021 | | | 34 | | | | 34,893 | |
| Viacom, Inc. | | 2.20% | | 4/1/2019 | | | 30 | | | | 29,491 | |
| Viacom, Inc. | | 2.75% | | 12/15/2019 | | | 5 | | | | 4,937 | |
| Viacom, Inc. | | 3.50% | | 4/1/2017 | | | 5 | | | | 5,090 | |
| Viacom, Inc. | | 6.125% | | 10/5/2017 | | | 4 | | | | 4,260 | |
| WideOpenWest Finance LLC/WideOpenWest Capital Corp. | | 10.25% | | 7/15/2019 | | | 20 | | | | 18,935 | |
| Total | | | | | | | | | | | 375,065 | |
| | | | | | | | | | | | | |
| Metals & Minerals: Miscellaneous 0.68% | | | | | | | | | | | | |
| Glencore Finance Canada Ltd. (Canada)†(c) | | 2.70% | | 10/25/2017 | | | 5 | | | | 4,577 | |
| Glencore Finance Canada Ltd. (Canada)†(c) | | 3.60% | | 1/15/2017 | | | 23 | | | | 22,224 | |
| Glencore Finance Canada Ltd. (Canada)†(c) | | 5.80% | | 11/15/2016 | | | 7 | | | | 6,975 | |
| Glencore Funding LLC† | | 2.125% | | 4/16/2018 | | | 50 | | | | 44,456 | |
| Kinross Gold Corp. (Canada)(c) | | 3.625% | | 9/1/2016 | | | 37 | | | | 36,087 | |
| New Gold, Inc. (Canada)†(c) | | 7.00% | | 4/15/2020 | | | 37 | | | | 33,439 | |
| Total | | | | | | | | | | | 147,758 | |
| | | | | | | | | | | | | |
| Natural Gas 0.27% | | | | | | | | | | | | |
| CenterPoint Energy, Inc. | | 5.95% | | 2/1/2017 | | | 30 | | | | 31,307 | |
| Laclede Group, Inc. (The) | | 1.112% | # | 8/15/2017 | | | 5 | | | | 4,977 | |
| Sempra Energy | | 9.80% | | 2/15/2019 | | | 18 | | | | 21,797 | |
| Total | | | | | | | | | | | 58,081 | |
| |
| Oil 4.13% | | | | | | | | | | | | |
| Anadarko Petroleum Corp. | | 5.95% | | 9/15/2016 | | | 41 | | | | 42,137 | |
| Anadarko Petroleum Corp. | | 6.375% | | 9/15/2017 | | | 6 | | | | 6,294 | |
| Anadarko Petroleum Corp. | | 8.70% | | 3/15/2019 | | | 3 | | | | 3,411 | |
| | See Notes to Financial Statements. | 17 |
Schedule of Investments (continued)
December 31, 2015
| Investments | | Interest
Rate | | Maturity
Date | | Principal
Amount
(000) | | | Fair
Value | |
| Oil (continued) | | | | | | | | | | | | |
| Antero Resources Corp. | | 6.00% | | 12/1/2020 | | $ | 23 | | | $ | 19,320 | |
| Bill Barrett Corp. | | 7.625% | | 10/1/2019 | | | 6 | | | | 4,230 | |
| Canadian Natural Resources Ltd. (Canada)(c) | | 5.70% | | 5/15/2017 | | | 15 | | | | 15,325 | |
| Canadian Oil Sands Ltd. (Canada)†(c) | | 7.75% | | 5/15/2019 | | | 5 | | | | 5,360 | |
| Carrizo Oil & Gas, Inc. | | 7.50% | | 9/15/2020 | | | 27 | | | | 23,726 | |
| Chaparral Energy, Inc. | | 8.25% | | 9/1/2021 | | | 7 | | | | 1,715 | |
| Chaparral Energy, Inc. | | 9.875% | | 10/1/2020 | | | 14 | | | | 3,570 | |
| Cimarex Energy Co. | | 5.875% | | 5/1/2022 | | | 4 | | | | 3,835 | |
| Clayton Williams Energy, Inc. | | 7.75% | | 4/1/2019 | | | 3 | | | | 2,329 | |
| CNOOC Finance 2013 Ltd. (Hong Kong)(c) | | 1.75% | | 5/9/2018 | | | 200 | | | | 197,015 | |
| Concho Resources, Inc. | | 6.50% | | 1/15/2022 | | | 18 | | | | 17,370 | |
| Concho Resources, Inc. | | 7.00% | | 1/15/2021 | | | 2 | | | | 1,980 | |
| ConocoPhillips | | 5.75% | | 2/1/2019 | | | 50 | | | | 54,141 | |
| Continental Resources, Inc. | | 7.125% | | 4/1/2021 | | | 56 | | | | 52,004 | |
| Continental Resources, Inc. | | 7.375% | | 10/1/2020 | | | 25 | | | | 23,047 | |
| Delek & Avner Tamar Bond Ltd. (Israel)†(c) | | 2.803% | | 12/30/2016 | | | 100 | | | | 99,966 | |
| Denbury Resources, Inc. | | 5.50% | | 5/1/2022 | | | 12 | | | | 4,044 | |
| Devon Energy Corp. | | 1.052% | # | 12/15/2016 | | | 34 | | | | 33,660 | |
| Devon Energy Corp. | | 6.30% | | 1/15/2019 | | | 15 | | | | 15,465 | |
| Ecopetrol SA (Colombia)(c) | | 4.25% | | 9/18/2018 | | | 12 | | | | 11,970 | |
| Hess Corp. | | 1.30% | | 6/15/2017 | | | 25 | | | | 24,471 | |
| Hilcorp Energy I LP/Hilcorp Finance Co.† | | 7.625% | | 4/15/2021 | | | 23 | | | | 22,195 | |
| Legacy Reserves LP/Legacy Reserves Finance Corp. | | 8.00% | | 12/1/2020 | | | 6 | | | | 1,290 | |
| Marathon Petroleum Corp. | | 2.70% | | 12/14/2018 | | | 25 | | | | 24,738 | |
| MEG Energy Corp. (Canada)†(c) | | 6.50% | | 3/15/2021 | | | 19 | | | | 13,395 | |
| Noble Energy, Inc. | | 5.625% | | 5/1/2021 | | | 24 | | | | 23,503 | |
| Noble Energy, Inc. | | 5.875% | | 6/1/2022 | | | 53 | | | | 50,485 | |
| Petrobras Global Finance BV (Netherlands)(c) | | 2.886% | # | 3/17/2017 | | | 8 | | | | 7,350 | |
| Petroleos Mexicanos (Mexico)(c) | | 2.335% | # | 7/18/2018 | | | 25 | | | | 24,781 | |
| Pioneer Natural Resources Co. | | 6.65% | | 3/15/2017 | | | 3 | | | | 3,098 | |
| Pioneer Natural Resources Co. | | 6.875% | | 5/1/2018 | | | 1 | | | | 1,063 | |
| Range Resources Corp. | | 5.00% | | 8/15/2022 | | | 10 | | | | 7,525 | |
| Range Resources Corp. | | 5.75% | | 6/1/2021 | | | 9 | | | | 7,155 | |
| Rowan Cos., Inc. | | 7.875% | | 8/1/2019 | | | 7 | | | | 6,887 | |
| Seven Generations Energy Ltd. (Canada)†(c) | | 8.25% | | 5/15/2020 | | | 10 | | | | 9,050 | |
| SM Energy Co. | | 6.50% | | 11/15/2021 | | | 8 | | | | 6,000 | |
| Southwestern Energy Co. | | 3.30% | | 1/23/2018 | | | 3 | | | | 2,464 | |
| Sunoco, Inc. | | 5.75% | | 1/15/2017 | | | 2 | | | | 2,011 | |
| 18 | See Notes to Financial Statements. | |
Schedule of Investments (continued)
December 31, 2015
| Investments | | Interest
Rate | | Maturity
Date | | Principal
Amount
(000) | | | Fair
Value | |
| Oil (continued) | | | | | | | | | | | | |
| Valero Energy Corp. | | 9.375% | | 3/15/2019 | | $ | 17 | | | $ | 20,099 | |
| W&T Offshore, Inc. | | 8.50% | | 6/15/2019 | | | 6 | | | | 2,130 | |
| Total | | | | | | | | | | | 901,604 | |
| |
| Oil: Crude Producers 3.58% | | | | | | | | | | | | |
| Columbia Pipeline Group, Inc.† | | 3.30% | | 6/1/2020 | | | 46 | | | | 44,836 | |
| Copano Energy LLC/Copano Energy Finance Corp. | | 7.125% | | 4/1/2021 | | | 15 | | | | 14,986 | |
| DCP Midstream LLC† | | 9.75% | | 3/15/2019 | | | 20 | | | | 20,465 | |
| Enbridge Energy Partners LP | | 6.50% | | 4/15/2018 | | | 15 | | | | 15,724 | |
| Enbridge Energy Partners LP | | 9.875% | | 3/1/2019 | | | 16 | | | | 18,232 | |
| Energy Transfer Partners LP | | 2.50% | | 6/15/2018 | | | 6 | | | | 5,750 | |
| Energy Transfer Partners LP | | 9.00% | | 4/15/2019 | | | 64 | | | | 70,466 | |
| Energy Transfer Partners LP | | 9.70% | | 3/15/2019 | | | 42 | | | | 46,288 | |
| EnLink Midstream Partners LP/EnLink Midstream Finance Corp. | | 7.125% | | 6/1/2022 | | | 13 | | | | 13,828 | |
| Enterprise Products Operating LLC | | 6.30% | | 9/15/2017 | | | 2 | | | | 2,105 | |
| Florida Gas Transmission Co. LLC† | | 7.90% | | 5/15/2019 | | | 25 | | | | 28,190 | |
| Gulf South Pipeline Co. LP† | | 6.30% | | 8/15/2017 | | | 15 | | | | 15,626 | |
| Gulfstream Natural Gas System LLC† | | 6.95% | | 6/1/2016 | | | 25 | | | | 25,471 | |
| Hiland Partners LP/Hiland Partners Finance Corp.† | | 5.50% | | 5/15/2022 | | | 12 | | | | 11,542 | |
| Hiland Partners LP/Hiland Partners Finance Corp.† | | 7.25% | | 10/1/2020 | | | 114 | | | | 115,282 | |
| Kinder Morgan Finance Co. LLC | | 5.70% | | 1/5/2016 | | | 2 | | | | 2,000 | |
| Kinder Morgan, Inc. | | 7.25% | | 6/1/2018 | | | 23 | | | | 23,896 | |
| Magellan Midstream Partners LP | | 5.65% | | 10/15/2016 | | | 42 | | | | 43,151 | |
| Magellan Midstream Partners LP | | 6.55% | | 7/15/2019 | | | 10 | | | | 10,926 | |
| Midcontinent Express Pipeline LLC† | | 6.70% | | 9/15/2019 | | | 9 | | | | 8,437 | |
| Northwest Pipeline LLC | | 7.00% | | 6/15/2016 | | | 25 | | | | 25,664 | |
| Plains All American Pipeline LP/PAA Finance Corp. | | 8.75% | | 5/1/2019 | | | 2 | | | | 2,196 | |
| Regency Energy Partners LP/Regency Energy Finance Corp. | | 6.50% | | 7/15/2021 | | | 49 | | | | 49,490 | |
| Sabine Pass LNG LP | | 6.50% | | 11/1/2020 | | | 29 | | | | 28,275 | |
| Spectra Energy Partners LP | | 2.95% | | 6/15/2016 | | | 8 | | | | 8,030 | |
| Sunoco Logistics Partners Operations LP | | 6.125% | | 5/15/2016 | | | 5 | | | | 5,072 | |
| TransCanada PipeLines Ltd. (Canada)(c) | | 7.125% | | 1/15/2019 | | | 25 | | | | 27,868 | |
| Transcontinental Gas Pipe Line Co. LLC | | 6.40% | | 4/15/2016 | | | 10 | | | | 10,123 | |
| Williams Partners LP/ACMP Finance Corp. | | 4.875% | | 5/15/2023 | | | 11 | | | | 8,930 | |
| Williams Partners LP/ACMP Finance Corp. | | 6.125% | | 7/15/2022 | | | 83 | | | | 78,619 | |
| Total | | | | | | | | | | | 781,468 | |
| | See Notes to Financial Statements. | 19 |
Schedule of Investments (continued)
December 31, 2015
| Investments | | Interest
Rate | | Maturity
Date | | Principal
Amount
(000) | | | Fair
Value | |
| Oil: Integrated Domestic 0.74% | | | | | | | | | | | | |
| Cameron International Corp. | | 1.15% | | 12/15/2016 | | $ | 2 | | | $ | 1,981 | |
| Cameron International Corp. | | 1.40% | | 6/15/2017 | | | 4 | | | | 3,945 | |
| Cameron International Corp. | | 6.375% | | 7/15/2018 | | | 25 | | | | 27,129 | |
| Schlumberger Holdings Corp.† | | 2.35% | | 12/21/2018 | | | 40 | | | | 39,768 | |
| Schlumberger Holdings Corp.† | | 3.00% | | 12/21/2020 | | | 25 | | | | 24,705 | |
| Weatherford International Ltd. | | 9.625% | | 3/1/2019 | | | 66 | | | | 64,350 | |
| Total | | | | | | | | | | | 161,878 | |
| | | | | | | | | | | | | |
| Paper & Forest Products 0.09% | | | | | | | | | | | | |
| Georgia-Pacific LLC† | | 5.40% | | 11/1/2020 | | | 2 | | | | 2,208 | |
| Mercer International, Inc. (Canada)(c) | | 7.00% | | 12/1/2019 | | | 18 | | | | 18,135 | |
| Total | | | | | | | | | | | 20,343 | |
| | | | | | | | | | | | | |
| Real Estate Investment Trusts 3.53% | | | | | | | | | | | | |
| American Tower Corp. | | 2.80% | | 6/1/2020 | | | 50 | | | | 49,475 | |
| American Tower Corp. | | 7.25% | | 5/15/2019 | | | 32 | | | | 36,227 | |
| Boston Properties LP | | 5.625% | | 11/15/2020 | | | 25 | | | | 27,854 | |
| DDR Corp. | | 7.50% | | 4/1/2017 | | | 30 | | | | 31,970 | |
| DDR Corp. | | 7.50% | | 7/15/2018 | | | 5 | | | | 5,614 | |
| DDR Corp. | | 9.625% | | 3/15/2016 | | | 15 | | | | 15,235 | |
| Digital Delta Holdings LLC† | | 3.40% | | 10/1/2020 | | | 20 | | | | 20,043 | |
| Digital Realty Trust LP | | 5.875% | | 2/1/2020 | | | 27 | | | | 29,794 | |
| EPR Properties | | 7.75% | | 7/15/2020 | | | 89 | | | | 103,912 | |
| HCP, Inc. | | 3.75% | | 2/1/2019 | | | 2 | | | | 2,065 | |
| HCP, Inc. | | 5.625% | | 5/1/2017 | | | 75 | | | | 78,475 | |
| HCP, Inc. | | 6.00% | | 1/30/2017 | | | 25 | | | | 26,049 | |
| HCP, Inc. | | 6.30% | | 9/15/2016 | | | 5 | | | | 5,170 | |
| Healthcare Realty Trust, Inc. | | 5.75% | | 1/15/2021 | | | 2 | | | | 2,208 | |
| Hospitality Properties Trust | | 6.30% | | 6/15/2016 | | | 29 | | | | 29,100 | |
| Hospitality Properties Trust | | 6.70% | | 1/15/2018 | | | 5 | | | | 5,291 | |
| Kilroy Realty LP | | 4.80% | | 7/15/2018 | | | 25 | | | | 26,254 | |
| Kilroy Realty LP | | 6.625% | | 6/1/2020 | | | 50 | | | | 56,686 | |
| Mid-America Apartments LP | | 6.05% | | 9/1/2016 | | | 5 | | | | 5,130 | |
| Reckson Operating Partnership LP | | 6.00% | | 3/31/2016 | | | 25 | | | | 25,235 | |
| Regency Centers LP | | 5.875% | | 6/15/2017 | | | 2 | | | | 2,110 | |
| Senior Housing Properties Trust | | 3.25% | | 5/1/2019 | | | 2 | | | | 1,994 | |
| Senior Housing Properties Trust | | 6.75% | | 4/15/2020 | | | 14 | | | | 15,508 | |
| SL Green Realty Corp. | | 5.00% | | 8/15/2018 | | | 8 | | | | 8,399 | |
| SL Green Realty Corp. | | 7.75% | | 3/15/2020 | | | 16 | | | | 18,692 | |
| 20 | See Notes to Financial Statements. | |
Schedule of Investments (continued)
December 31, 2015
| Investments | | Interest
Rate | | Maturity
Date | | Principal
Amount
(000) | | | Fair
Value | |
| Real Estate Investment Trusts (continued) | | | | | | | | | | | | |
| Ventas Realty LP | | 1.55% | | 9/26/2016 | | $ | 2 | | | $ | 2,002 | |
| Vereit Operating Partnership LP | | 2.00% | | 2/6/2017 | | | 22 | | | | 21,835 | |
| Vereit Operating Partnership LP | | 3.00% | | 2/6/2019 | | | 93 | | | | 89,698 | |
| Vornado Realty LP | | 2.50% | | 6/30/2019 | | | 25 | | | | 24,641 | |
| Weyerhaeuser Co. | | 7.375% | | 10/1/2019 | | | 2 | | | | 2,299 | |
| Total | | | | | | | | | | | 768,965 | |
| | | | | | | | | | | | | |
| Retail 0.64% | | | | | | | | | | | | |
| Checkers Drive-In Restaurants, Inc.† | | 11.00% | | 12/1/2017 | | | 2 | | | | 2,110 | |
| Chinos Intermediate Holdings A, Inc. PIK† | | 7.75% | | 5/1/2019 | | | 33 | | | | 8,295 | |
| Dollar General Corp. | | 4.125% | | 7/15/2017 | | | 19 | | | | 19,518 | |
| Neiman Marcus Group Ltd. LLC PIK† | | 8.75% | | 10/15/2021 | | | 14 | | | | 8,750 | |
| Petco Animal Supplies, Inc.† | | 9.25% | | 12/1/2018 | | | 2 | | | | 2,055 | |
| PETCO Holdings, Inc. PIK† | | 8.50% | | 10/15/2017 | | | 30 | | | | 30,563 | |
| QVC, Inc. | | 3.125% | | 4/1/2019 | | | 17 | | | | 16,791 | |
| Rite Aid Corp. | | 9.25% | | 3/15/2020 | | | 2 | | | | 2,118 | |
| Serta Simmons Bedding LLC† | | 8.125% | | 10/1/2020 | | | 30 | | | | 31,500 | |
| Walgreen Co. | | 5.25% | | 1/15/2019 | | | 2 | | | | 2,139 | |
| Yum! Brands, Inc. | | 6.25% | | 4/15/2016 | | | 15 | | | | 15,198 | |
| Total | | | | | | | | | | | 139,037 | |
| |
| Retail: Specialty 0.08% | | | | | | | | | | | | |
| Avon Products, Inc. | | 6.35% | | 3/15/2020 | | | 22 | | | | 17,050 | |
| | | | | | | | | | | | | |
|
| Steel 0.25% | | | | | | | | | | | | |
| | | | | | | | | | | | | |
| Allegheny Technologies, Inc. | | 9.375% | | 6/1/2019 | | | 30 | | | | 24,150 | |
| Vale Overseas Ltd. (Brazil)(c) | | 6.25% | | 1/23/2017 | | | 30 | | | | 29,973 | |
| Total | | | | | | | | | | | 54,123 | |
| |
| Technology 0.30% | | | | | | | | | | | | |
| Expedia, Inc. | | 7.456% | | 8/15/2018 | | | 58 | | | | 64,673 | |
| |
| Telecommunications 1.60% | | | | | | | | | | | | |
| America Movil SAB de CV (Mexico)(c) | | 5.625% | | 11/15/2017 | | | 20 | | | | 21,379 | |
| AT&T, Inc. | | 2.45% | | 6/30/2020 | | | 59 | | | | 58,166 | |
| AT&T, Inc. | | 5.50% | | 2/1/2018 | | | 30 | | | | 32,085 | |
| AT&T, Inc. | | 5.80% | | 2/15/2019 | | | 10 | | | | 11,040 | |
| Frontier Communications Corp. | | 8.50% | | 4/15/2020 | | | 35 | | | | 35,175 | |
| Frontier Communications Corp.† | | 8.875% | | 9/15/2020 | | | 45 | | | | 45,675 | |
| GTE Corp. | | 6.84% | | 4/15/2018 | | | 40 | | | | 43,970 | |
| Intelsat Jackson Holdings SA (Luxembourg)(c) | | 7.25% | | 4/1/2019 | | | 36 | | | | 33,210 | |
| | See Notes to Financial Statements. | 21 |
Schedule of Investments (continued)
December 31, 2015
| Investments | | Interest
Rate | | Maturity
Date | | Principal
Amount
(000) | | | Fair
Value | |
| Telecommunications (continued) | | | | | | | | | | | | |
| T-Mobile USA, Inc. | | 6.464% | | 4/28/2019 | | $ | 46 | | | $ | 47,487 | |
| T-Mobile USA, Inc. | | 6.625% | | 11/15/2020 | | | 19 | | | | 19,798 | |
| Total | | | | | | | | | | | 347,985 | |
| | | | | | | | | | | | | |
| Transportation: Miscellaneous 0.03% | | | | | | | | | | | | |
| Ryder System, Inc. | | 5.85% | | 11/1/2016 | | | 3 | | | | 3,111 | |
| Southern Railway Co. | | 9.75% | | 6/15/2020 | | | 3 | | | | 3,831 | |
| Total | | | | | | | | | | | 6,942 | |
| Total Corporate Bonds (cost $9,731,762) | | | | | | | | | | | 9,499,072 | |
| | | | | | | | | | | | | |
| FLOATING RATE LOANS(d) 3.12% | | | | | | | | | | | | |
| | | | | | | | | | | | | |
| Biotechnology Research & Production 0.05% | | | | | | | | | | | | |
| Amgen, Inc. Term Loan | | 1.607% | | 10/1/2018 | | | 11 | | | | 10,821 | |
| | | | | | | | | | | | | |
| Business Services 0.04% | | | | | | | | | | | | |
| Hertz Corp. (The) Letter of Credit Term Loan | | 1.00% | | 3/11/2018 | | | 5 | | | | 4,950 | |
| Neff Rental LLC 2nd Lien Closing Date Term Loan | | 7.25% | | 6/9/2021 | | | 5 | | | | 4,426 | |
| Total | | | | | | | | | | | 9,376 | |
| | | | | | | | | | | | | |
| Computer Software 0.22% | | | | | | | | | | | | |
| Activision Blizzard, Inc. Term Loan | | 3.25% | | 10/13/2020 | | | 21 | | | | 21,166 | |
| First Data Corp. 2018 New Dollar Term Loan | | 3.918% | | 3/23/2018 | | | 26 | | | | 25,706 | |
| Total | | | | | | | | | | | 46,872 | |
| | | | | | | | | | | | | |
| Containers 0.07% | | | | | | | | | | | | |
| Owens Illinois, Inc. Term Loan B | | 3.50% | | 9/1/2022 | | | 15 | | | | 14,941 | |
| | | | | | | | | | | | | |
| Electric: Power 0.04% | | | | | | | | | | | | |
| Moxie Liberty LLC Advance Construction Term Loan B1 | | 7.50% | | 8/21/2020 | | | 5 | | | | 4,650 | |
| Panda Sherman Power LLC Advance Construction Term Loan | | 9.00% | | 9/14/2018 | | | – | (a) | | | 896 | |
| Texas Competitive Electric Holdings Co. LLC DIP 2014 Delayed Draw Term Loan | | 3.75% | | 11/7/2016 | | | 4 | | | | 3,972 | |
| Total | | | | | | | | | | | 9,518 | |
| | | | | | | | | | | | | |
| Electrical Equipment 0.54% | | | | | | | | | | | | |
| Avago Technologies Cayman Ltd. Term Loan | | 3.75% | | 5/6/2021 | | | 8 | | | | 8,153 | |
| Avago Technologies Term Loan B | | –(e) | | 2/1/2023 | | | 90 | | | | 89,220 | |
| Sensata Technologies B.V. 6th Amendment Term Loan (Netherlands)(c) | | 3.00% | | 10/14/2021 | | | 20 | | | | 19,606 | |
| Total | | | | | | | | | | | 116,979 | |
| 22 | See Notes to Financial Statements. | |
Schedule of Investments (continued)
December 31, 2015
| Investments | | Interest
Rate | | Maturity
Date | | Principal
Amount
(000) | | | Fair
Value | |
| Entertainment 0.12% | | | | | | | | | | | | |
| Kasima LLC Term Loan | | 3.25% | | 5/17/2021 | | $ | 27 | | | $ | 26,562 | |
| | | | | | | | | | | | | |
| Financial Services 0.25% | | | | | | | | | | | | |
| Delos Finance S.A.R.L. Term Loan (Luxembourg)(c) | | 3.50% | | 3/6/2021 | | | 22 | | | | 21,959 | |
| Synchrony Financial Term Loan | | 2.169% | | 8/5/2019 | | | 34 | | | | 33,436 | |
| Total | | | | | | | | | | | 55,395 | |
| | | | | | | | | | | | | |
| Food/Beverage 0.10% | | | | | | | | | | | | |
| Aramark Corp. Term Loan E | | 3.25% | | 9/7/2019 | | | 21 | | | | 21,027 | |
| | | | | | | | | | | | | |
| Gaming 0.09% | | | | | | | | | | | | |
| Seminole Tribe of Florida Initial Term Loan | | 3.00% | | 4/29/2020 | | | 19 | | | | 19,225 | |
| | | | | | | | | | | | | |
| Health Care Products 0.44% | | | | | | | | | | | | |
| Fresenius US Finance I, Inc. Tranche B Term Loan (Germany)(c) | | 2.422% | | 8/7/2019 | | | 32 | | | | 32,393 | |
| Mallinckrodt International Finance SA Initial Term Loan B (Luxembourg)(c) | | 3.25% | | 3/19/2021 | | | 45 | | | | 43,441 | |
| Zimmer Holdings, Inc. Term Loan A | | 1.618%–1.803% | | 5/29/2019 | | | 20 | | | | 19,950 | |
| Total | | | | | | | | | | | 95,784 | |
| | | | | | | | | | | | | |
| Health Care Services 0.02% | | | | | | | | | | | | |
| Fresenius Medical Care AG & Co. KGaA Tranche A Term Loan | | 1.697% | | 10/30/2019 | | | 4 | | | | 4,275 | |
| | | | | | | | | | | | | |
| Household Equipment/Products 0.06% | | | | | | | | | | | | |
| Dell International LLC Term Loan B2 | | 4.00% | | 4/29/2020 | | | 14 | | | | 13,845 | |
| | | | | | | | | | | | | |
| Lodging 0.33% | | | | | | | | | | | | |
| Las Vegas Sands LLC Term Loan B | | 3.25% | | 12/19/2020 | | | 72 | | | | 71,706 | |
| | | | | | | | | | | | | |
| Media 0.46% | | | | | | | | | | | | |
| AMC Networks, Inc. Term Loan A | | 1.776% | | 12/16/2019 | | | 58 | | | | 56,732 | |
| Charter Communications Operating LLC Term Loan E | | 3.00% | | 7/1/2020 | | | 24 | | | | 23,371 | |
| CSC Holdings LLC Term Loan B | | 2.924% | | 4/17/2020 | | | 21 | | | | 20,971 | |
| Total | | | | | | | | | | | 101,074 | |
| | | | | | | | | | | | | |
| Miscellaneous 0.11% | | | | | | | | | | | | |
| Harris Corp. 3 Year Tranche Term Loan | | 1.74% | | 5/29/2018 | | | 5 | | | | 4,865 | |
| Harris Corp. 5 Year Tranche Term Loan | | 1.93% | | 5/29/2020 | | | 19 | | | | 18,500 | |
| Total | | | | | | | | | | | 23,365 | |
| | See Notes to Financial Statements. | 23 |
Schedule of Investments (continued)
December 31, 2015
| Investments | | Interest
Rate | | Maturity
Date | | Principal
Amount
(000) | | | Fair
Value | |
| Oil 0.00% | | | | | | | | | | | | |
| Templar Energy LLC 2nd Lien New Term Loan | | 8.50% | | 11/25/2020 | | | 3 | | | | 364 | |
| | | | | | | | | | | | | |
| Retail 0.09% | | | | | | | | | | | | |
| Rite Aid Corp. 2nd Lien Tranche 2 Term Loan | | 4.875% | | 6/21/2021 | | | 8 | | | | 7,995 | |
| Staples, Inc. Initial Term Loan | | –(e) | | 4/23/2021 | | | 12 | | | | 11,890 | |
| Total | | | | | | | | | | | 19,885 | |
| | | | | | | | | | | | | |
| Telecommunications 0.09% | | | | | | | | | | | | |
| AT&T, Inc. Tranche A Term Loan | | 1.416% | | 3/2/2018 | | | 10 | | | | 9,987 | |
| DigitalGlobe, Inc. Term Loan | | 4.75% | | 1/31/2020 | | | 10 | | | | 9,724 | |
| Total | | | | | | | | | | | 19,711 | |
| Total Floating Rate Loans (cost $686,429) | | | | | | | | | | | 680,725 | |
| | | | | | | | | | | | | |
| FOREIGN GOVERNMENT OBLIGATIONS(c) 0.40% | | | | | | | | | | | | |
| | | | | | | | | | | | | |
| Dominican Republic 0.03% | | | | | | | | | | | | |
| Dominican Republic† | | 9.04% | | 1/23/2018 | | | 5 | | | | 5,793 | |
| | | | | | | | | | | | | |
| Mexico 0.10% | | | | | | | | | | | | |
| United Mexican States | | 5.95% | | 3/19/2019 | | | 20 | | | | 22,225 | |
| | | | | | | | | | | | | |
| Peru 0.08% | | | | | | | | | | | | |
| Republic of Peru | | 7.125% | | 3/30/2019 | | | 15 | | | | 17,115 | |
| | | | | | | | | | | | | |
| Philippines 0.09% | | | | | | | | | | | | |
| Republic of Philippines | | 9.875% | | 1/15/2019 | | | 15 | | | | 18,594 | |
| | | | | | | | | | | | | |
| Poland 0.10% | | | | | | | | | | | | |
| Republic of Poland | | 6.375% | | 7/15/2019 | | | 20 | | | | 22,875 | |
| Total Foreign Government Obligations (cost $86,349) | | | | | | | | | | | 86,602 | |
| | | | | | | | | | | | | |
| GOVERNMENT SPONSORED ENTERPRISES COLLATERALIZED MORTGAGE OBLIGATIONS 2.52% | |
| Federal Home Loan Mortgage Corp. 2011-K704 B† | | 4.535% | # | 10/25/2030 | | | 20 | | | | 20,843 | |
| Federal Home Loan Mortgage Corp. 2012-K707 B† | | 3.883% | # | 1/25/2047 | | | 42 | | | | 42,898 | |
| Federal Home Loan Mortgage Corp. 2012-K709 B† | | 3.741% | # | 4/25/2045 | | | 75 | | | | 76,508 | |
| Federal Home Loan Mortgage Corp. 2012-K710 B† | | 3.819% | # | 6/25/2047 | | | 85 | | | | 86,911 | |
| Federal Home Loan Mortgage Corp. 2012-K711 B† | | 3.562% | # | 8/25/2045 | | | 30 | | | | 30,404 | |
| Federal Home Loan Mortgage Corp. 2013-K713 B† | | 3.165% | # | 4/25/2046 | | | 30 | | | | 29,906 | |
| Federal Home Loan Mortgage Corp. 2014-K503 B† | | 3.009% | # | 10/25/2047 | | | 10 | | | | 9,941 | |
| Government National Mortgage Assoc. 2014-109 A | | 2.325% | | 1/16/2046 | | | 18 | | | | 18,216 | |
| Government National Mortgage Assoc. 2014-112 A | | 3.00% | | 1/16/2048 | | | 9 | | | | 9,578 | |
| 24 | See Notes to Financial Statements. | |
Schedule of Investments (continued)
December 31, 2015
| Investments | | Interest
Rate | | Maturity
Date | | Principal
Amount
(000) | | | Fair
Value | |
| GOVERNMENT SPONSORED ENTERPRISES COLLATERALIZED MORTGAGE OBLIGATIONS (continued) | |
| Government National Mortgage Assoc. 2014-135 AS | | 2.30% | | 2/16/2047 | | $ | 22 | | | $ | 22,299 | |
| Government National Mortgage Assoc. 2014-64 A | | 2.20% | | 2/16/2045 | | | 48 | | | | 48,427 | |
| Government National Mortgage Assoc. 2014-64 IO | | 1.307% | # | 12/16/2054 | | | 485 | | | | 41,170 | |
| Government National Mortgage Assoc. 2014-78 A | | 2.20% | | 4/16/2047 | | | 1 | | | | 1,500 | |
| Government National Mortgage Assoc. 2014-78 IO | | 0.801% | # | 3/16/2056 | | | 83 | | | | 5,291 | |
| Government National Mortgage Assoc. 2015-47 AE | | 2.90% | # | 11/16/2055 | | | 15 | | | | 14,994 | |
| Government National Mortgage Assoc. 2015-48 AS | | 2.90% | # | 2/16/2049 | | | 35 | | | | 34,978 | |
| Government National Mortgage Assoc. 2015-73 AC | | 2.90% | # | 2/16/2053 | | | 54 | | | | 55,224 | |
Total Government Sponsored Enterprises Collateralized Mortgage Obligations
(cost $553,026) | | | | | | | | | 549,088 | |
| | | | | | | | | | | | | |
| GOVERNMENT SPONSORED ENTERPRISES PASS-THROUGHS 2.96% | | | | | |
| Federal Home Loan Mortgage Corp. | | 2.526% | # | 6/1/2041 | | | 22 | | | | 23,868 | |
| Federal Home Loan Mortgage Corp. | | 3.076% | # | 10/1/2044 | | | 96 | | | | 98,357 | |
| Federal Home Loan Mortgage Corp. | | 3.087% | # | 10/1/2043 | | | 27 | | | | 27,293 | |
| Federal Home Loan Mortgage Corp. | | 3.212% | # | 12/1/2040 | | | 54 | | | | 56,387 | |
| Federal Home Loan Mortgage Corp. | | 3.411% | # | 6/1/2042 | | | 19 | | | | 19,590 | |
| Federal National Mortgage Assoc. | | 2.491% | # | 10/1/2036 | | | 72 | | | | 76,165 | |
| Federal National Mortgage Assoc. | | 2.721% | # | 12/1/2045 | | | 12 | | | | 12,223 | |
| Federal National Mortgage Assoc. | | 2.735% | # | 12/1/2045 | | | 50 | | | | 50,953 | |
| Federal National Mortgage Assoc. | | 2.81% | # | 11/1/2044 | | | 28 | | | | 28,833 | |
| Federal National Mortgage Assoc. | | 2.844% | # | 10/1/2045 | | | 13 | | | | 13,294 | |
| Federal National Mortgage Assoc. | | 2.894% | # | 6/1/2042 | | | 34 | | | | 35,300 | |
| Federal National Mortgage Assoc. | | 3.149% | # | 3/1/2042 | | | 34 | | | | 35,632 | |
| Federal National Mortgage Assoc. | | 3.369% | # | 12/1/2040 | | | 4 | | | | 4,475 | |
| Federal National Mortgage Assoc. | | 3.419% | # | 12/1/2040 | | | 8 | | | | 8,374 | |
| Federal National Mortgage Assoc. | | 3.457% | # | 10/1/2040 | | | 3 | | | | 2,841 | |
| Federal National Mortgage Assoc. | | 3.695% | # | 1/1/2042 | | | 71 | | | | 74,272 | |
| Federal National Mortgage Assoc. | | 3.969% | # | 4/1/2040 | | | 74 | | | | 78,095 | |
| Total Government Sponsored Enterprises Pass-Throughs (cost $651,419) | | | | | | 645,952 | |
| | See Notes to Financial Statements. | 25 |
Schedule of Investments (continued)
December 31, 2015
| Investments | | Interest
Rate | | Maturity
Date | | Principal
Amount
(000) | | | Fair
Value | |
| MUNICIPAL BONDS 0.12% | | | | | | | | | | | | |
| | | | | | | | | | | | | |
| Miscellaneous | | | | | | | | | | | | |
| Illinois | | 5.163% | | 2/1/2018 | | $ | 15 | | | $ | 15,671 | |
| New Jersey Transp Tr Fnd Auth | | 1.087% | | 12/15/2016 | | | 10 | | | | 9,984 | |
| Total Municipal Bonds (cost $25,576) | | | | | | | | | | | 25,655 | |
| | | | | | | | | | | | | |
| NON-AGENCY COMMERCIAL MORTGAGE-BACKED SECURITIES 22.88% | | | | | |
| A10 Bridge Asset Financing LLC 2015-AA A† | | 2.381% | # | 5/15/2030 | | | 75 | | | | 75,000 | |
| Americold LLC Trust 2010-ARTA A1† | | 3.847% | | 1/14/2029 | | | 57 | | | | 58,922 | |
| Aventura Mall Trust 2013-AVM A† | | 3.867% | # | 12/5/2032 | | | 100 | | | | 104,602 | |
| BAMLL-DB Trust 2012-OSI A1† | | 2.343% | | 4/13/2029 | | | 69 | | | | 69,274 | |
| Banc of America Commercial Mortgage Trust 2006-6 AM | | 5.39% | | 10/10/2045 | | | 35 | | | | 35,908 | |
| Banc of America Commercial Mortgage, Inc. 2006-5 A4 | | 5.414% | | 9/10/2047 | | | 5 | | | | 5,251 | |
| Banc of America Re-REMIC Trust 2010-RC30 A5B† | | 5.334% | | 12/16/2043 | | | 100 | | | | 102,253 | |
| BB-UBS Trust 2012-TFT A† | | 2.892% | | 6/5/2030 | | | 100 | | | | 99,136 | |
| BB-UBS Trust 2012-TFT B† | | 3.584% | # | 6/5/2030 | | | 100 | | | | 97,812 | |
| Bear Stearns Commercial Mortgage Securities Trust 2004-PWR6 E† | | 5.406% | | 11/11/2041 | | | 15 | | | | 16,121 | |
| Bear Stearns Commercial Mortgage Securities Trust 2004-PWR6 F† | | 5.667% | # | 11/11/2041 | | | 25 | | | | 26,906 | |
| Bear Stearns Commercial Mortgage Securities Trust 2005-T20 AJ | | 5.177% | # | 10/12/2042 | | | – | (a) | | | 808 | |
| Citigroup Commercial Mortgage Trust 2007-C6 A4 | | 5.71% | # | 12/10/2049 | | | 1 | | | | 1,034 | |
| Citigroup Commercial Mortgage Trust 2007-C6 AM | | 5.71% | # | 12/10/2049 | | | 35 | | | | 35,810 | |
| Citigroup Commercial Mortgage Trust 2013-GC15 A2 | | 3.161% | | 9/10/2046 | | | 100 | | | | 102,784 | |
| Citigroup Commercial Mortgage Trust 2013-SMP D† | | 2.911% | # | 1/12/2030 | | | 100 | | | | 99,898 | |
| Citigroup Commercial Mortgage Trust 2014-GC19 A1 | | 1.199% | | 3/10/2047 | | | 27 | | | | 26,482 | |
| Citigroup Commercial Mortgage Trust 2015-GC31 XA IO | | 0.479% | # | 6/10/2048 | | | 997 | | | | 32,056 | |
| Citigroup Commercial Mortgage Trust 2015-SHP2 XCP IO† | | 0.114% | # | 7/15/2027 | | | 46,545 | | | | 81,198 | |
| COBALT CMBS Commercial Mortgage Trust 2007-C3 AM | | 5.766% | # | 5/15/2046 | | | 100 | | | | 105,060 | |
| Commercial Mortgage Loan Trust 2008-LS1 ASM | | 6.044% | # | 12/10/2049 | | | 50 | | | | 52,507 | |
| 26 | See Notes to Financial Statements. | |
Schedule of Investments (continued)
December 31, 2015
| Investments | | Interest
Rate | | Maturity
Date | | Principal
Amount
Value | | | Fair
(000) | |
| NON-AGENCY COMMERCIAL MORTGAGE-BACKED SECURITIES (continued) | | |
| Commercial Mortgage Pass-Through Certificates 2004-LB2A G† | | 5.54% | | 3/10/2039 | | $ | 35 | | | $ | 38,163 | |
| Commercial Mortgage Pass-Through Certificates 2013-CR11 A2 | | 3.047% | | 10/10/2046 | | | 10 | | | | 10,207 | |
| Commercial Mortgage Pass-Through Certificates 2013-CR6 A2 | | 2.122% | | 3/10/2046 | | | 10 | | | | 10,005 | |
| Commercial Mortgage Pass-Through Certificates 2013-LC6 A2 | | 1.906% | | 1/10/2046 | | | 32 | | | | 31,961 | |
| Commercial Mortgage Pass-Through Certificates 2013-SFS A1† | | 1.873% | | 4/12/2035 | | | 152 | | | | 149,049 | |
| Commercial Mortgage Pass-Through Certificates 2014-KYO A† | | 1.201% | # | 6/11/2027 | | | 100 | | | | 98,883 | |
| Commercial Mortgage Pass-Through Certificates 2014-SAVA A† | | 1.481% | # | 6/15/2034 | | | 54 | | | | 54,291 | |
| Commercial Mortgage Pass-Through Certificates 2014-UBS5 XB1 IO† | | 0.098% | # | 9/10/2047 | | | 2,000 | | | | 24,651 | |
| Commercial Mortgage Pass-Through Certificates 2015-PC1 XA IO† | | 0.797% | # | 7/10/2050 | | | 100 | | | | 4,767 | |
| Core Industrial Trust 2015-CALW XA IO† | | 0.81% | # | 2/10/2034 | | | 1,006 | | | | 44,510 | |
| Credit Suisse First Boston Mortgage Securities Corp. 2006-OMA B1† | | 5.466% | | 5/15/2023 | | | 50 | | | | 54,663 | |
| Credit Suisse First Boston Mortgage Securities Corp. 2006-OMA B2† | | 5.538% | | 5/15/2023 | | | 100 | | | | 111,869 | |
| Credit Suisse Mortgage Capital Certificates 2007-C2 A2 | | 5.448% | | 1/15/2049 | | | – | (a) | | | 534 | |
| Credit Suisse Mortgage Capital Certificates 2014-TIKI C† | | 2.131% | # | 9/15/2038 | | | 100 | | | | 98,951 | |
| CSAIL Commercial Mortgage Trust 2015-C4 A2 | | 3.157% | | 11/15/2048 | | | 10 | | | | 10,239 | |
| DBRR Trust 2013-EZ3 A† | | 1.636% | | 12/18/2049 | | | 99 | | | | 98,653 | |
| DBUBS Mortgage Trust 2011-LC2A D† | | 5.453% | # | 7/10/2044 | | | 100 | | | | 104,607 | |
| DBWF Mortgage Trust 2015-LCM A1† | | 2.998% | | 6/10/2034 | | | 24 | | | | 24,403 | |
| Extended Stay America Trust 2013-ESH7 C7† | | 3.902% | | 12/5/2031 | | | 200 | | | | 200,707 | |
| GAHR Commericial Mortgage Trust 2015-NRF EFX† | | 3.382% | # | 12/15/2019 | | | 20 | | | | 18,661 | |
| GS Mortgage Securities Corp. II 2013-GC10 A3 | | 2.613% | | 2/10/2046 | | | 100 | | | | 100,828 | |
| GS Mortgage Securities Trust 2006-GG8 AM | | 5.591% | | 11/10/2039 | | | 100 | | | | 102,046 | |
| GS Mortgage Securities Trust 2012-GC6 XA IO† | | 2.06% | # | 1/10/2045 | | | 341 | | | | 29,930 | |
| GS Mortgage Securities Trust 2013-GC14 A1 | | 1.217% | | 8/10/2046 | | | 48 | | | | 47,371 | |
| GS Mortgage Securities Trust 2015-GS1 XB IO | | 0.185% | # | 11/10/2048 | | | 1,082 | | | | 21,440 | |
| H/2 Asset Funding 2015-1A-AFL | | 1.837% | | 6/24/2049 | | | 25 | | | | 24,516 | |
| H/2 Asset Funding 2015-1A-AFX | | 3.353% | | 6/24/2049 | | | 25 | | | | 24,694 | |
| | See Notes to Financial Statements. | 27 |
Schedule of Investments (continued)
December 31, 2015
| | | | | | | Principal | | | | |
| | | Interest | | Maturity | | Amount | | | Fair | |
| Investments | | Rate | | Date | | (000) | | | Value | |
| NON-AGENCY COMMERCIAL MORTGAGE-BACKED SECURITIES (continued) |
| H/2 Asset Funding 2015-1A-BFX | | 3.993% | | 6/24/2049 | | $ | 25 | | | $ | 24,712 | |
| Hudsons Bay Simon JV Trust 2015-HB7 XA7 IO† | | 1.417% | # | 8/5/2034 | | | 1,000 | | | | 74,485 | |
| Irvine Core Office Trust 2013-IRV A1† | | 2.068% | | 5/15/2048 | | | 38 | | | | 38,022 | |
| JPMorgan Chase Commercial Mortgage Securities Trust 2004-LN2 A2 | | 5.115% | | 7/15/2041 | | | 4 | | | | 4,128 | |
| JPMorgan Chase Commercial Mortgage Securities Trust 2007-CB19 AM | | 5.695% | # | 2/12/2049 | | | 85 | | | | 87,680 | |
| JPMorgan Chase Commercial Mortgage Securities Trust 2009-IWST C† | | 7.693% | # | 12/5/2027 | | | 25 | | | | 28,853 | |
| JPMorgan Chase Commercial Mortgage Securities Trust 2014-C19 A2 | | 3.046% | | 4/15/2047 | | | 10 | | | | 10,220 | |
| JPMorgan Chase Commercial Mortgage Securities Trust 2014-C24 A1 | | 1.539% | | 11/15/2047 | | | 9 | | | | 8,455 | |
| JPMorgan Chase Commercial Mortgage Securities Trust 2014-C26 XA IO | | 1.182% | # | 1/15/2048 | | | 995 | | | | 64,847 | |
| JPMorgan Chase Commercial Mortgage Securities Trust 2015-C30 XA IO | | 0.724% | # | 7/15/2048 | | | 998 | | | | 41,990 | |
| LB-UBS Commercial Mortgage Trust 2006-C4 AM | | 5.84% | # | 6/15/2038 | | | 30 | | | | 30,530 | |
| LB-UBS Commercial Mortgage Trust 2006-C7 AM | | 5.378% | | 11/15/2038 | | | 50 | | | | 51,144 | |
| LB-UBS Commercial Mortgage Trust 2007-C1 AM | | 5.455% | | 2/15/2040 | | | 25 | | | | 25,780 | |
| LMREC, Inc. 2015-CRE1 A† | | 2.168% | # | 2/22/2032 | | | 100 | | | | 98,833 | |
| Morgan Stanley Bank of America Merrill Lynch Trust 2013-C12 A2 | | 3.001% | | 10/15/2046 | | | 10 | | | | 10,221 | |
| Morgan Stanley Bank of America Merrill Lynch Trust 2013-C8 A1 | | 0.777% | | 12/15/2048 | | | 49 | | | | 48,716 | |
| Morgan Stanley Bank of America Merrill Lynch Trust 2015-C23 XA IO | | 0.767% | # | 7/15/2050 | | | 498 | | | | 22,503 | |
| Morgan Stanley Capital I Trust 2007-HQ12 AM | | 5.723% | # | 4/12/2049 | | | 175 | | | | 181,487 | |
| Morgan Stanley Capital I Trust 2011-C2 A4† | | 4.661% | | 6/15/2044 | | | 10 | | | | 10,896 | |
| Morgan Stanley Capital I Trust 2011-C3 A4 | | 4.118% | | 7/15/2049 | | | 36 | | | | 38,403 | |
| Morgan Stanley Re-REMIC Trust 2009-GG10 A4B† | | 5.794% | # | 8/12/2045 | | | 100 | | | | 103,442 | |
| Morgan Stanley Re-REMIC Trust 2010-GG10 A4B† | | 5.794% | # | 8/15/2045 | | | 175 | | | | 181,745 | |
| Prima Capital CRE Securization 2006-1 | | 2.55% | | 8/26/2049 | | | 100 | | | | 97,920 | |
| ReadyCap Commercial Mortgage Trust 2015-2 A† | | 3.804% | | 6/25/2055 | | | 50 | | | | 49,479 | |
| TimberStar Trust I 2006-1A A† | | 5.668% | | 10/15/2036 | | | 190 | | | | 194,956 | |
| UBS-Barclays Commercial Mortgage Trust 2012-C4 AAB | | 2.459% | | 12/10/2045 | | | 25 | | | | 24,714 | |
| UBS-Barclays Commercial Mortgage Trust 2013-C5 XA IO† | | 1.086% | # | 3/10/2046 | | | 962 | | | | 54,187 | |
| 28 | See Notes to Financial Statements. | |
Schedule of Investments (continued)
December 31, 2015
| | | | | | | Principal | | | | | |
| | | Interest | | Maturity | | Amount | | | Fair | |
| Investments | | Rate | | Date | | (000) | | | Value | |
| NON-AGENCY COMMERCIAL MORTGAGE-BACKED SECURITIES (continued) |
| UBS-Citigroup Commercial Mortgage Trust 2011-C1 A3 | | 3.595% | | 1/10/2045 | | $ | 20 | | | $ | 20,876 | |
| Wachovia Bank Commercial Mortgage Trust 2004-C11 A5 | | 5.169% | # | 1/15/2041 | | | 1 | | | | 1,465 | |
| Wachovia Bank Commercial Mortgage Trust 2006-C25 A5 | | 5.767% | # | 5/15/2043 | | | 25 | | | | 25,135 | |
| Wachovia Bank Commercial Mortgage Trust 2006-C27 AM | | 5.795% | | 7/15/2045 | | | 10 | | | | 10,168 | |
| Wachovia Bank Commercial Mortgage Trust 2006-C29 AM | | 5.339% | | 11/15/2048 | | | 25 | | | | 25,533 | |
| Wachovia Bank Commercial Mortgage Trust 2007-C30 AM | | 5.383% | | 12/15/2043 | | | 150 | | | | 155,093 | |
| Wachovia Bank Commercial Mortgage Trust 2007-C31 AM | | 5.591% | | 4/15/2047 | | | 50 | | | | 51,869 | |
| Wells Fargo Commercial Mortgage Trust 2010-C1 C† | | 5.612% | # | 11/15/2043 | | | 5 | | | | 5,374 | |
| Wells Fargo Commercial Mortgage Trust 2015-C29 XB IO | | 0.018% | # | 6/15/2048 | | | 2,000 | | | | 7,870 | |
| Wells Fargo Commercial Mortgage Trust 2015-NXS4 A2A | | 3.075% | | 12/15/2048 | | | 10 | | | | 10,241 | |
| Wells Fargo Commercial Mortgage Trust 2015-NXS4 A2B | | 4.757% | # | 12/15/2048 | | | 36 | | | | 39,461 | |
| Wells Fargo Commercial Mortgage Trust 2015-SG1 XA IO | | 0.833% | # | 12/15/2047 | | | 997 | | | | 54,412 | |
| Wells Fargo Resecuritization Trust 2012-IO A† | | 1.75% | | 8/20/2021 | | | 25 | | | | 25,345 | |
| WF-RBS Commercial Mortgage Trust 2011-C3 A2† | | 3.24% | | 3/15/2044 | | | 33 | | | | 32,654 | |
| WF-RBS Commercial Mortgage Trust 2011-C4 A3† | | 4.394% | | 6/15/2044 | | | 100 | | | | 105,172 | |
| WF-RBS Commercial Mortgage Trust 2012-C8 XA IO† | | 2.164% | # | 8/15/2045 | | | 475 | | | | 39,780 | |
Total Non-Agency Commercial Mortgage-Backed Securities
(cost $5,044,281) | | | | | | | | | | | 4,988,217 | |
| | | | | | | | | | | | | |
| U.S. TREASURY OBLIGATION 1.82% | | | | | | | | | | | | |
U.S. Treasury Note
(cost $398,872) | | 0.875% | | 10/15/2017 | | | 398 | | | | 396,857 | |
| Total Long-Term Investments (cost $20,469,172) | | | | | | | | | | | 20,152,730 | |
| | See Notes to Financial Statements. | 29 |
Schedule of Investments (continued)
December 31, 2015
| | | Interest | | Maturity | | Principal
Amount | | | | Fair | |
| Investments | | Rate | | Date | | (000) | | | | Value | |
| SHORT-TERM INVESTMENTS 9.49% | | | | | | | | | | | | |
| | | | | | | | | | | | | |
| CONVERTIBLE BOND 0.03% | | | | | | | | | | | | |
| | | | | | | | | | | | | |
| Investment Management Companies | | | | | | | | | | | | |
Ares Capital Corp.
(cost $6,018) | | 5.75% | | 2/1/2016 | | $ | 6 | | | $ | 6,011 | |
| | | | | | | | | | | | | |
| CORPORATE BONDS 3.02% | | | | | | | | | | | | |
| | | | | | | | | | | | | |
| Banks: Regional 0.37% | | | | | | | | | | | | |
| Bank of America Corp. | | 5.75% | | 8/15/2016 | | | 55 | | | | 56,357 | |
| Fifth Third Bancorp | | 3.625% | | 1/25/2016 | | | 25 | | | | 25,044 | |
| Total | | | | | | | | | | | 81,401 | |
| | | | | | | | | | | | | |
| Beverages 0.02% | | | | | | | | | | | | |
| Beam Suntory, Inc. | | 5.375% | | 1/15/2016 | | | 5 | | | | 5,005 | |
| | | | | | | | | | | | | |
| Building Materials 0.23% | | | | | | | | | | | | |
| CRH America, Inc. | | 4.125% | | 1/15/2016 | | | 25 | | | | 25,019 | |
| Lafarge SA (France)(c) | | 6.50% | | 7/15/2016 | | | 25 | | | | 25,634 | |
| Total | | | | | | | | | | | 50,653 | |
| | | | | | | | | | | | | |
| Electric: Power 0.15% | | | | | | | | | | | | |
| Jersey Central Power & Light Co. | | 5.625% | | 5/1/2016 | | | 25 | | | | 25,319 | |
| Ohio Power Co. | | 6.00% | | 6/1/2016 | | | 5 | | | | 5,093 | |
| TECO Finance, Inc. | | 4.00% | | 3/15/2016 | | | 2 | | | | 2,010 | |
| Total | | | | | | | | | | | 32,422 | |
| | | | | | | | | | | | | |
| Financial Services 0.16% | | | | | | | | | | | | |
| International Lease Finance Corp.† | | 6.75% | | 9/1/2016 | | | 4 | | | | 4,115 | |
| Jefferies Group LLC | | 5.50% | | 3/15/2016 | | | 10 | | | | 10,082 | |
| Navient Corp. | | 6.25% | | 1/25/2016 | | | 17 | | | | 17,041 | |
| Raymond James Financial, Inc. | | 4.25% | | 4/15/2016 | | | 4 | | | | 4,030 | |
| Total | | | | | | | | | | | 35,268 | |
| | | | | | | | | | | | | |
| Food 0.07% | | | | | | | | | | | | |
| ConAgra Foods, Inc. | | 1.30% | | 1/25/2016 | | | 15 | | | | 15,003 | |
| | | | | | | | | | | | | |
| Insurance 0.09% | | | | | | | | | | | | |
| Symetra Financial Corp.† | | 6.125% | | 4/1/2016 | | | 3 | | | | 3,031 | |
| Unum Group | | 7.125% | | 9/30/2016 | | | 15 | | | | 15,596 | |
| Total | | | | | | | | | | | 18,627 | |
| 30 | See Notes to Financial Statements. | |
Schedule of Investments (continued)
December 31, 2015
| | | | | | | Principal | | | | | |
| | | Interest | | Maturity | | Amount | | | | Fair | |
| Investments | | Rate | | Date | | (000) | | | | Value | |
| Leasing 0.02% | | | | | | | | | | | | |
| Penske Truck Leasing Co. LP/PTL Finance Corp.† | | 2.50% | | 3/15/2016 | | $ | 4 | | | $ | 4,007 | |
| | | | | | | | | | | | | |
| Machinery: Agricultural 0.19% | | | | | | | | | | | | |
| Bunge Ltd. Finance Corp. | | 4.10% | | 3/15/2016 | | | 42 | | | | 42,218 | |
| | | | | | | | | | | | | |
| Media 0.04% | | | | | | | | | | | | |
| Viacom, Inc. | | 2.50% | | 12/15/2016 | | | 7 | | | | 7,016 | |
| Viacom, Inc. | | 6.25% | | 4/30/2016 | | | 2 | | | | 2,031 | |
| Total | | | | | | | | | | | 9,047 | |
| | | | | | | | | | | | | |
| Metals & Minerals: Miscellaneous 0.01% | | | | | | | | | | | | |
| Glencore Funding LLC† | | 1.567% | # | 5/27/2016 | | | 2 | | | | 1,968 | |
| | | | | | | | | | | | | |
| Natural Gas 0.01% | | | | | | | | | | | | |
| Sempra Energy | | 6.50% | | 6/1/2016 | | | 2 | | | | 2,037 | |
| | | | | | | | | | | | | |
| Office Furniture & Business Equipment 0.22% | | | | | | | | | | | | |
| Pitney Bowes, Inc. | | 4.75% | | 1/15/2016 | | | 15 | | | | 15,014 | |
| Xerox Corp. | | 6.40% | | 3/15/2016 | | | 22 | | | | 22,204 | |
| Xerox Corp. | | 7.20% | | 4/1/2016 | | | 10 | | | | 10,130 | |
| Total | | | | | | | | | | | 47,348 | |
| | | | | | | | | | | | | |
| Oil 0.35% | | | | | | | | | | | | |
| Canadian Natural Resources Ltd. (Canada)(c) | | 0.978% | # | 3/30/2016 | | | 5 | | | | 4,989 | |
| Canadian Natural Resources Ltd. (Canada)(c) | | 6.00% | | 8/15/2016 | | | 2 | | | | 2,053 | |
| Marathon Petroleum Corp. | | 3.50% | | 3/1/2016 | | | 50 | | | | 50,143 | |
| Noble Holding International Ltd. | | 3.05% | | 3/1/2016 | | | 10 | | | | 10,001 | |
| Pioneer Natural Resources Co. | | 5.875% | | 7/15/2016 | | | 8 | | | | 8,126 | |
| Total | | | | | | | | | | | 75,312 | |
| | | | | | | | | | | | | |
| Oil: Crude Producers 0.58% | | | | | | | | | | | | |
| Enbridge, Inc. (Canada)(c) | | 0.976% | # | 10/1/2016 | | | 25 | | | | 24,817 | |
| Enterprise Products Operating LLC | | 3.20% | | 2/1/2016 | | | 6 | | | | 6,002 | |
| ONEOK Partners LP | | 3.25% | | 2/1/2016 | | | 27 | | | | 27,047 | |
| Plains All American Pipeline LP/PAA Finance Corp. | | 5.875% | | 8/15/2016 | | | 50 | | | | 50,939 | |
| Tennessee Gas Pipeline Co. LLC | | 8.00% | | 2/1/2016 | | | 15 | | | | 15,055 | |
| TransCanada PipeLines Ltd. (Canada)(c) | | 7.69% | | 6/30/2016 | | | 2 | | | | 2,058 | |
| Total | | | | | | | | | | | 125,918 | |
| | | | | | | | | | | | | |
| Oil: Integrated Domestic 0.11% | | | | | | | | | | | | |
| Weatherford International Ltd. | | 5.50% | | 2/15/2016 | | | 25 | | | | 24,906 | |
| | See Notes to Financial Statements. | 31 |
Schedule of Investments (continued)
December 31, 2015
| | | | | | | Principal | | | | | |
| | | Interest | | Maturity | | Amount | | | | Fair | |
| Investments | | Rate | | Date | | (000) | | | | Value | |
| Paper & Forest Products 0.02% | | | | | | | | | | | | |
| International Paper Co. | | 5.25% | | 4/1/2016 | | $ | 4 | | | $ | 4,037 | |
| | | | | | | | | | | | | |
| Real Estate Investment Trusts 0.29% | | | | | | | | | | | | |
| BioMed Realty LP | | 3.85% | | 4/15/2016 | | | 10 | | | | 10,031 | |
| Brandywine Operating Partnership LP | | 6.00% | | 4/1/2016 | | | 25 | | | | 25,255 | |
| First Industrial LP | | 5.75% | | 1/15/2016 | | | 15 | | | | 15,014 | |
| Liberty Property LP | | 5.50% | | 12/15/2016 | | | 10 | | | | 10,331 | |
| Welltower, Inc. | | 6.20% | | 6/1/2016 | | | 3 | | | | 3,059 | |
| Total | | | | | | | | | | | 63,690 | |
| | | | | | | | | | | | | |
| Telecommunications 0.09% | | | | | | | | | | | | |
| Embarq Corp. | | 7.082% | | 6/1/2016 | | | 5 | | | | 5,090 | |
| Qwest Corp. | | 8.375% | | 5/1/2016 | | | 15 | | | | 15,244 | |
| Total | | | | | | | | | | | 20,334 | |
| Total Corporate Bonds (cost $659,629) | | | | | | | | | | | 659,201 | |
| | | | | | | | | | | | | |
| FLOATING RATE LOAN(d) 0.03% | | | | | | | | | | | | |
| | | | | | | | | | | | | |
| Air Transportation | | | | | | | | | | | | |
Delta Air Lines, Inc. 2014 Term Loan B2
(cost $6,947) | | 2.67% | | 4/18/2016 | | | 7 | | | | 6,936 | |
| | | | | | | | | | | | | |
| REPURCHASE AGREEMENT 5.06% | | | | | | | | | | | | |
Repurchase Agreement dated 12/31/2015, 0.03% due 1/4/2016 with Fixed Income Clearing Corp. collateralized by $1,125,000 of U.S. Treasury Note at 1.625% due 7/31/2020; value: $1,126,406; proceeds: $1,104,243
(cost $1,104,239) | | | | | | | 1,104 | | | | 1,104,239 | |
| | | | | | | | | | | | | |
| U.S. TREASURY OBLIGATIONS 1.35% | | | | | | | | | | | | |
| U.S. Treasury Note | | 0.875% | | 9/15/2016 | | | 147 | | | | 147,204 | |
| U.S. Treasury Note | | 1.00% | | 9/30/2016 | | | 147 | | | | 147,310 | |
| Total U.S. Treasury Obligations (cost $294,800) | | | | | | | | | | | 294,514 | |
| Total Short-Term Investments (cost $2,071,633) | | | | | | | | | | | 2,070,901 | |
| Total Investments in Securities 101.93% (cost $22,540,805) | | | | | | | | | | | 22,223,631 | |
| Liabilities in Excess of Cash, Foreign Cash and Other Assets(f) (1.93%) | | | | | | | | | (420,477 | ) |
| Net Assets 100.00% | | | | | | | | | | $ | 21,803,154 | |
| 32 | See Notes to Financial Statements. | |
Schedule of Investments (continued)
December 31, 2015
| IO | | Interest Only. |
| PIK | | Payment-in-kind. |
| † | | Security was purchased pursuant to Rule 144A under the Securities Act of 1933 and, unless registered under such Act or exempted from registration, may only be resold to qualified institutional buyers. |
| # | | Variable rate security. The interest rate represents the rate in effect at December 31, 2015. |
| (a) | | Amount is less than $1,000. |
| (b) | | Securities purchased on a when-issued basis (See Note 2(i)). |
| (c) | | Foreign security traded in U.S. dollars. |
| (d) | | Floating Rate Loans in which the Fund invests generally pay interest at rates which are periodically re-determined at a margin above the London Interbank Offered Rate (“LIBOR”) or the prime rate offered by major U.S. banks. The rate(s) shown is the rate(s) in effect at December 31, 2015. |
| (e) | | Interest rate to be determined. |
| (f) | | Liabilities in Excess of Cash, Foreign Cash and Other Assets include net unrealized appreciation/depreciation on futures contracts as follows: |
Open Futures Contracts at December 31, 2015:
| | | | | | | | | | | | | | Unrealized | |
| Type | | Expiration | | Contracts | | Position | | | Fair Value | | | | Appreciation | |
| U.S. 5-Year Treasury Note | | March 2016 | | 23 | | Short | | | $(2,721,367 | ) | | | $4,819 | |
| | | | | | | | | | | | | | | |
| | | | | | | | | | | | | | Unrealized | |
| Type | | Expiration | | Contracts | | Position | | | Fair Value | | | | Depreciation | |
| U.S. 2-Year Treasury Note | | March 2016 | | 29 | | Long | | | $6,299,797 | | | | $(8,300) | |
| | See Notes to Financial Statements. | 33 |
Schedule of Investments (continued)
December 31, 2015
The following is a summary of the inputs used as of December 31, 2015 in valuing the Fund’s investments carried at fair value(1):
| Investment Type(2)(3) | | | Level 1 | | | | Level 2 | | | | Level 3 | | | | Total | |
| Asset-Backed Securities | | | | | | | | | | | | | | | | |
| Automobiles | | $ | – | | | $ | 1,618,254 | | | $ | 36,920 | (4) | | $ | 1,655,174 | |
| Credit Cards | | | – | | | | 277,139 | | | | – | | | | 277,139 | |
| Other | | | – | | | | 1,005,022 | | | | 343,227 | (4) | | | 1,348,249 | |
| Corporate Bonds | | | | | | | | | | | | | | | | |
| Computer Software | | | – | | | | 75,795 | | | | 3,850 | (5) | | | 79,645 | |
| Remaining Industries | | | – | | | | 10,078,628 | | | | – | | | | 10,078,628 | |
| Floating Rate Loans(6) | | | | | | | | | | | | | | | | |
| Air Transportation | | | – | | | | 6,936 | | | | – | | | | 6,936 | |
| Biotechnology Research & Production | | | – | | | | 10,821 | | | | – | | | | 10,821 | |
| Business Services | | | – | | | | – | | | | 9,376 | | | | 9,376 | |
| Computer Software | | | – | | | | 46,872 | | | | – | | | | 46,872 | |
| Containers | | | – | | | | 14,941 | | | | – | | | | 14,941 | |
| Electric: Power | | | – | | | | 3,972 | | | | 5,546 | | | | 9,518 | |
| Electrical Equipment | | | – | | | | 116,979 | | | | – | | | | 116,979 | |
| Entertainment | | | – | | | | 26,562 | | | | – | | | | 26,562 | |
| Financial Services | | | – | | | | 55,395 | | | | – | | | | 55,395 | |
| Food/Beverage | | | – | | | | 21,027 | | | | – | | | | 21,027 | |
| Gaming | | | – | | | | 19,225 | | | | – | | | | 19,225 | |
| Health Care Products | | | – | | | | 75,834 | | | | 19,950 | | | | 95,784 | |
| Health Care Services | | | – | | | | 4,275 | | | | – | | | | 4,275 | |
| Household Equipment/Products | | | – | | | | 13,845 | | | | – | | | | 13,845 | |
| Lodging | | | – | | | | 71,706 | | | | – | | | | 71,706 | |
| Media | | | – | | | | 101,074 | | | | – | | | | 101,074 | |
| Miscellaneous | | | – | | | | – | | | | 23,365 | | | | 23,365 | |
| Oil | | | – | | | | 364 | | | | – | | | | 364 | |
| Retail | | | – | | | | 19,885 | | | | – | | | | 19,885 | |
| Telecommunications | | | – | | | | 9,724 | | | | 9,987 | | | | 19,711 | |
| Foreign Government Obligations | | | – | | | | 86,602 | | | | – | | | | 86,602 | |
| Government Sponsored Enterprises Collateralized Mortgage Obligations | | | – | | | | 549,088 | | | | – | | | | 549,088 | |
| Government Sponsored Enterprises Pass-Throughs | | | – | | | | 645,952 | | | | – | | | | 645,952 | |
| Municipal Bonds | | | – | | | | 25,655 | | | | – | | | | 25,655 | |
| Non-Agency Commercial Mortgage-Backed Securities | | | – | | | | 4,567,898 | | | | 420,319 | (4) | | | 4,988,217 | |
| U.S. Treasury Obligations | | | – | | | | 691,371 | | | | – | | | | 691,371 | |
| Convertible Bond | | | – | | | | 6,011 | | | | – | | | | 6,011 | |
| Repurchase Agreement | | | – | | | | 1,104,239 | | | | – | | | | 1,104,239 | |
| Total | | $ | – | | | $ | 21,351,091 | | | $ | 872,540 | | | $ | 22,223,631 | |
| 34 | See Notes to Financial Statements. | |
Schedule of Investments (concluded)
December 31, 2015
| Investment Type(2)(3) | | Level 1 | | | Level 2 | | | Level 3 | | | Total | |
| Other Financial Instruments | | | | | | | | | | | | | | | | |
| Futures Contracts | | | | | | | | | | | | | | | | |
| Assets | | $ | 4,819 | | | $ | – | | | $ | – | | | $ | 4,819 | |
| Liabilities | | | (8,300 | ) | | | – | | | | – | | | | (8,300 | ) |
| Total | | $ | (3,481 | ) | | $ | – | | | $ | – | | | $ | (3,481 | ) |
| (1) | Refer to Note 2(l) for a description of fair value measurements and the three-tier hierarchy of inputs. |
| (2) | See Schedule of Investments for fair values in each industry and identification of foreign issuers and/or geography. The table above is presented by Investment Type. Industries are presented within an Investment Type should such Investment Type include securities classified as two or more levels within the three-tier fair value hierarchy. |
| (3) | There were no Level 1/Level 2 transfers during the fiscal year ended December 31, 2015. |
| (4) | Includes securities valued utilizing third party pricing information without adjustment. Such valuations are based on unobservable inputs. A significant change in third party information could result in a significantly lower or higher value of such Level 3 investments. |
| (5) | Level 3 securities fair valued by the Pricing Committee, as described in Note 2(a) in the Notes to Financials. |
| (6) | Floating Rate Loans categorized as Level 3 are valued based on a single quotation obtained from a dealer. Accounting principles generally accepted in the United States of America do not require the Fund to create quantitative unobservable inputs that were not developed by the Fund. Therefore, the Fund does not have access to unobservable inputs and cannot disclose such inputs in the valuation. |
The following is a reconciliation of investments with unobservable inputs (Level 3) that were used in determining fair value:
| | | | | | | | | | | | Non-Agency | |
| | | | | | | | | | | | Commercial | |
| | | Asset-Backed | | | Corporate | | | Floating | | | Mortgage-Backed | |
| Investment Type | | Securities | | | Bonds | | | Rate Loans | | | Securities | |
| Balance as of January 1, 2015 | | $ | – | | | $ | – | | | $ | 27,861 | | | $ | – | |
| Accrued discounts/premiums | | | – | | | | (229 | ) | | | (26 | ) | | | 2 | |
| Realized gain (loss) | | | 1 | | | | (429 | ) | | | (518 | ) | | | 3 | |
| Change in unrealized appreciation/depreciation | | | (77 | ) | | | (2,267 | ) | | | (959 | ) | | | (2,620 | ) |
| Purchases | | | 384,343 | | | | – | | | | 71,093 | | | | 454,800 | |
| Sales | | | (4,120 | ) | | | (3,675 | ) | | | (29,227 | ) | | | (31,866 | ) |
| Net transfers in or out of Level 3 | | | – | | | | 10,450 | | | | – | | | | – | |
| Balance as of December 31, 2015 | | $ | 380,147 | | | $ | 3,850 | | | $ | 68,224 | | | $ | 420,319 | |
| | See Notes to Financial Statements. | 35 |
Statement of Assets and Liabilities
December 31, 2015
| ASSETS: | | | | |
| Investments in securities, at fair value (cost $22,540,805) | | $ | 22,223,631 | |
| Deposits with brokers for futures collateral | | | 7,960 | |
| Cash | | | 114,908 | |
| Foreign cash, at value (cost $2) | | | 2 | |
| Receivables: | | | | |
| Interest | | | 173,436 | |
| Capital shares sold | | | 11,050 | |
| Investment securities sold | | | 6,732 | |
| From advisor (See Note 3) | | | 5,488 | |
| Prepaid expenses | | | 80 | |
| Total assets | | | 22,543,287 | |
| LIABILITIES: | | | | |
| Payables: | | | | |
| Investment securities purchased | | | 660,577 | |
| Capital shares reacquired | | | 5,194 | |
| Variation margin | | | 1,979 | |
| Offering costs | | | 1,399 | |
| Fund administration | | | 703 | |
| Directors’ fees | | | 419 | |
| Accrued expenses | | | 69,862 | |
| Total liabilities | | | 740,133 | |
| NET ASSETS | | $ | 21,803,154 | |
| COMPOSITION OF NET ASSETS: | | | | |
| Paid-in capital | | $ | 22,496,757 | |
| Distributions in excess of net investment income | | | (483 | ) |
| Accumulated net realized loss on investments, futures contracts and foreign currency related transactions | | | (372,465 | ) |
| Net unrealized depreciation on investments, futures contracts and translation of assets and liabilities denominated in foreign currencies | | | (320,655 | ) |
| Net Assets | | $ | 21,803,154 | |
| Outstanding shares (200 million shares of common stock authorized, $.001 par value) | | | 1,510,672 | |
| Net asset value, offering and redemption price per share (Net assets divided by outstanding shares) | | | $14.43 | |
| 36 | See Notes to Financial Statements. | |
Statement of Operations
For the Year Ended December 31, 2015
| Investment income: | | | |
| Interest and other | | $ | 358,760 | |
| Total investment income | | | 358,760 | |
| Expenses: | | | | |
| Professional | | | 52,198 | |
| Management fee | | | 48,287 | |
| Non 12b-1 service fees | | | 34,617 | |
| Reports to shareholders | | | 22,560 | |
| Shareholder servicing | | | 12,937 | |
| Custody | | | 12,808 | |
| Offering costs | | | 9,623 | |
| Fund administration | | | 5,519 | |
| Directors’ fees | | | 443 | |
| Other | | | 1,594 | |
| Gross expenses | | | 200,586 | |
| Expense reductions (See Note 9) | | | (15 | ) |
| Fees waived and expenses reimbursed (See Note 3) | | | (90,199 | ) |
| Net expenses | | | 110,372 | |
| Net investment income | | | 248,388 | |
| Net realized and unrealized loss: | | | | |
| Net realized loss on investments | | | (56,862 | ) |
| Net realized gain on futures contracts and foreign currency related transactions | | | 14,648 | |
| Net change in unrealized appreciation/depreciation on investments | | | (251,607 | ) |
| Net change in unrealized appreciation/depreciation on futures contracts and translation of assets and liabilities denominated in foreign currencies | | | (1,597 | ) |
| Net realized and unrealized loss | | | (295,418 | ) |
| Net Decrease in Net Assets Resulting From Operations | | $ | (47,030 | ) |
| | See Notes to Financial Statements. | 37 |
Statements of Changes in Net Assets
| | | For the Year Ended | | | For the Year Ended | |
| INCREASE IN NET ASSETS | | December 31, 2015 | | | December 31, 2014 | * |
| Operations: | | | | | | | | |
| Net investment income | | $ | 248,388 | | | $ | 70,202 | |
| Net realized gain (loss) on investments, futures contracts and foreign currency related transactions | | | (42,214 | ) | | | 375 | |
| Net change in unrealized appreciation/depreciation on investments, futures contracts and translation of assets and liabilities denominated in foreign currencies | | | (253,204 | ) | | | (67,451 | ) |
| Net increase (decrease) in net assets resulting from operations | | | (47,030 | ) | | | 3,126 | |
| Distributions to shareholders from: | | | | | | | | |
| Net investment income | | | (510,223 | ) | | | (154,801 | ) |
| Return of capital | | | (9,512 | ) | | | – | |
| Total distributions to shareholders | | | (519,735 | ) | | | (154,801 | ) |
| Capital share transactions (Net of share conversions) (See Note 13): | | | | | | | | |
| Proceeds from sales of shares | | | 15,992,964 | | | | 7,977,919 | |
| Reinvestment of distributions | | | 519,735 | | | | 154,801 | |
| Cost of shares reacquired | | | (1,822,380 | ) | | | (301,445 | ) |
| Net increase in net assets resulting from capital share transactions | | | 14,690,319 | | | | 7,831,275 | |
| Net increase in net assets | | | 14,123,554 | | | | 7,679,600 | |
| NET ASSETS: | | | | | | | | |
| Beginning of period | | $ | 7,679,600 | | | $ | – | |
| End of period | | $ | 21,803,154 | | | $ | 7,679,600 | |
| Undistributed (distributions in excess of) net investment income | | $ | (483 | ) | | $ | 1,878 | |
| * | For the period April 4, 2014 (commencement of operations) to December 31, 2014. |
| 38 | See Notes to Financial Statements. |
This page is intentionally left blank.
Financial Highlights
| | | | | | Per Share Operating Performance: |
| | | | | | | | | | | | | | | Distributions to |
| | | | | | Investment operations: | | shareholders from: |
| | | Net asset
value,
beginning
of period | | Net
investment
income(a) | | Net
realized
and
unrealized
gain (loss) | | Total
from
investment
operations | | Net
investment
income | | Return
of
capital |
| 12/31/2015 | | $ | 14.72 | | | $ | 0.27 | | | $ | (0.21 | ) | | $ | 0.06 | | | $ | (0.34 | ) | | $ | (0.01 | ) |
| 4/4/2014 – 12/31/2014(c)(d) | | | 15.00 | | | | 0.18 | | | | (0.15 | ) | | | 0.03 | | | | (0.31 | ) | | | – | |
| (a) | Calculated using average shares outstanding during the year. |
| (b) | Total return does not consider the effects of sales charges or other expenses imposed by an insurance company and assumes the reinvestment of all distributions. |
| (c) | Commencement of operations was 4/4/2014 and SEC effective date was 4/14/2014. |
| (d) | Net investment income, net realized and unrealized gain (loss) amounted to less than $.01 for the period 4/4/2014 through 4/14/2014. |
| (e) | Not annualized. |
| (f) | Total return for the period 4/14/2014 through 12/31/2014 was also 0.22%. |
| (g) | Annualized. |
| 40 | See Notes to Financial Statements. |
| | | | | Ratios to Average Net Assets: | | Supplemental Data: |
Total
distri-
butions | | Net
asset
value,
end of
period | | Total
return(b)
(%) | | Total expenses
after waivers
and/or
reimbursements
(%) | | Total
expenses
(%) | | Net
investment
income
(%) | | Net
assets,
end of
period
(000) | | Portfolio
turnover
rate
(%) |
| $ | (0.35 | ) | | $ | 14.43 | | | | 0.58 | | | | 0.80 | | | | 1.45 | | | | 1.79 | | | $ | 21,803 | | | | 61.27 | |
| | – | | | | 14.72 | | | | 0.22 | (e)(f) | | | 0.80 | (g) | | | 2.02 | (g) | | | 1.61 | (g) | | | 7,680 | | | | 102.97 | (e) |
| | See Notes to Financial Statements. | 41 |
Notes to Financial Statements
Lord Abbett Series Fund, Inc. (the “Company”) is registered under the Investment Company Act of 1940, as amended (the “Act”), as a diversified, open-end management investment company and was incorporated under Maryland law in 1989. The Company consists of thirteen separate portfolios. This report covers Short Duration Income Portfolio (the “Fund”). The Fund commenced operations on April 4, 2014, and its shares became available to the public on May 1, 2014.
The Fund’s investment objective is to seek a high level of income consistent with preservation of capital. The Fund has Variable Contract class shares (“Class VC Shares”), which are currently issued and redeemed only in connection with investments in, and payments under, variable annuity contracts and variable life insurance policies issued by life insurance and insurance-related companies.
The preparation of the financial statements in conformity with accounting principles generally accepted in the United States of America (“U.S. GAAP”) requires management to make certain estimates and assumptions that affect the reported amounts of assets and liabilities and disclosure of contingent assets and liabilities at the date of the financial statements and the reported amounts of increases and decreases in net assets from operations during the reporting period. Actual results could differ from those estimates. The Fund is considered an investment company under U.S. GAAP and follows the accounting and reporting guidance applicable to investment companies.
| 2. | SIGNIFICANT ACCOUNTING POLICIES |
| (a) | Investment Valuation–Under procedures approved by the Fund’s Board of Directors (the “Board”), Lord, Abbett & Co. LLC (“Lord Abbett”), the Fund’s investment manager, has formed a Pricing Committee to administer the pricing and valuation of portfolio investments and to ensure that prices utilized reasonably reflect fair value. Among other things, these procedures allow the Fund to utilize independent pricing services, quotations from securities and financial instrument dealers and other market sources to determine fair value. |
| | Securities actively traded on any recognized U.S. or non-U.S. exchange or on The NASDAQ Stock Market LLC are valued at the last sale price or official closing price on the exchange or system on which they are principally traded. Events occurring after the close of trading on non-U.S. exchanges may result in adjustments to the valuation of foreign securities to reflect their fair value as of the close of regular trading on the New York Stock Exchange. The Fund may utilize an independent fair valuation service in adjusting the valuations of foreign securities. Unlisted equity securities are valued at the last quoted sale price or, if no sale price is available, at the mean between the most recently quoted bid and asked prices. Fixed income securities are valued based on evaluated prices supplied by independent pricing services, which reflect broker/dealer supplied valuations and the independent pricing services’ own electronic data processing techniques. Exchange traded options and futures contracts are valued at the last sale price in the market where they are principally traded. If no sale has occurred, the mean between the most recently quoted bid and asked prices is used. Floating rate loans are valued at the average of bid and ask quotations obtained from dealers in loans on the basis of prices supplied by independent pricing services. Forward foreign currency exchange contracts are valued using daily forward exchange rates. |
| | |
| | Securities for which prices are not readily available are valued at fair value as determined by the Pricing Committee. The Pricing Committee considers a number of factors, including observable and unobservable inputs, when arriving at fair value. The Pricing Committee may |
42
Notes to Financial Statements (continued)
| | use related or comparable assets or liabilities, recent transactions, market multiples, book values, yield curves, broker quotes, observable trading activity, option adjusted spread models and other relevant information to determine the fair value of portfolio investments. The Board or a designated committee thereof regularly reviews fair value determinations made by the Pricing Committee and employs techniques such as reviewing related market activity, reviewing inputs and assumptions, and retrospectively comparing prices of subsequent purchases and sales transactions to fair value determinations made by the Pricing Committee. |
| | |
| | Short-term securities with 60 days or less remaining to maturity are valued using the amortized cost method, which approximates fair value. |
| | |
| (b) | Security Transactions–Security transactions are recorded as of the date that the securities are purchased or sold (trade date). Realized gains and losses on sales of portfolio securities are calculated using the identified-cost method. |
| | |
| (c) | Investment Income–Dividend income is recorded on the ex-dividend date. Interest income is recorded on the accrual basis as earned. Discounts are accreted and premiums are amortized using the effective interest method and are included in Interest and other income on the Statement of Operations. Withholding taxes on foreign dividends have been provided for in accordance with the applicable country’s tax rules and rates. |
| | |
| (d) | Income Taxes–It is the policy of the Fund to meet the requirements of Subchapter M of the Internal Revenue Code applicable to regulated investment companies and to distribute substantially all taxable income and capital gains to its shareholders. Therefore, no income tax provision is required. |
| | |
| | The Fund files U.S. federal and various state and local tax returns. No income tax returns are currently under examination. The statute of limitations on the Fund’s filed U.S. federal tax returns remains open for the fiscal years ended December 31, 2014 through December 31, 2015. The statutes of limitations on the Company’s state and local tax returns may remain open for an additional year depending upon jurisdiction. |
| | |
| (e) | Expenses–Expenses incurred by the Company that do not specifically relate to an individual fund are generally allocated to the funds within the Company on a pro rata basis by relative net assets. Offering costs incurred by the Fund are amortized over a twelve month period beginning at the commencement of operations and are included in the Fund’s Statement of Operations. |
| | |
| (f) | Foreign Transactions–The books and records of the Fund are maintained in U.S. dollars and transactions denominated in foreign currencies are recorded in the Fund’s records at the rate prevailing when earned or recorded. Asset and liability accounts that are denominated in foreign currencies are adjusted daily to reflect current exchange rates and any unrealized gain (loss) is included in Net change in unrealized appreciation/depreciation on futures contracts and translation of assets and liabilities denominated in foreign currencies on the Fund’s Statement of Operations. The resultant exchange gains and losses upon settlement of such transactions are included in Net realized gain on futures contracts and foreign currency related transactions on the Fund’s Statement of Operations. The Fund does not isolate that portion of the results of operations arising as a result of changes in the foreign exchange rates from the changes in market prices of the securities. |
| | |
| (g) | Forward Foreign Currency Exchange Contracts–The Fund may enter into forward foreign currency exchange contracts in order to reduce exposure to changes in foreign currency |
43
Notes to Financial Statements (continued)
| | exchange rates on foreign portfolio holdings, or gain or reduce exposure to foreign currency solely for investment purposes. A forward foreign currency exchange contract is a commitment to purchase or sell a foreign currency at a future date at a negotiated rate. The contracts are valued daily at forward exchange rates and any unrealized gain (loss) is included in Net change in unrealized appreciation/depreciation on futures contracts and translation of assets and liabilities denominated in foreign currencies on the Fund’s Statement of Operations. The gain (loss) arising from the difference between the U.S. dollar cost of the original contract and the value of the foreign currency in U.S. dollars upon closing of such contracts is included in Net realized gain on futures contracts and foreign currency related transactions on the Fund’s Statement of Operations. |
| | |
| (h) | Futures Contracts–The Fund may purchase and sell futures contracts to enhance returns, to attempt to economically hedge some of its investment risk, or as a substitute position in lieu of holding the underlying asset on which the instrument is based. At the time of entering into a futures transaction, an investor is required to deposit and maintain a specified amount of cash or eligible securities called “initial margin.” Subsequent payments made or received by the Fund called “variation margin” are made on a daily basis as the market price of the futures contract fluctuates. The Fund will record an unrealized gain (loss) based on the amount of variation margin. When a contract is closed, a realized gain (loss) is recorded equal to the difference between the opening and closing value of the contract. |
| | |
| (i) | When-Issued, Forward Transactions or To-Be-Announced (“TBA”) Transactions–The Fund may purchase portfolio securities on a when-issued or forward basis. When-issued, forward transactions or TBA transactions involve a commitment by a fund to purchase securities, with payment and delivery (“settlement”) to take place in the future, in order to secure what is considered to be an advantageous price or yield at the time of entering into the transaction. During the period between purchase and settlement, the fair value of the securities will fluctuate and assets consisting of cash and/or marketable securities (normally short-term U.S. Government or U.S. Government sponsored enterprise securities) marked to market daily in an amount sufficient to make payment at settlement will be segregated at the Fund’s custodian in order to pay for the commitment. At the time the Fund makes the commitment to purchase a security on a when-issued basis, it will record the transaction and reflect the liability for the purchase and fair value of the security in determining its net asset value (“NAV”). The Fund, generally, has the ability to close out a purchase obligation on or before the settlement date rather than take delivery of the security. Under no circumstances will settlement for such securities take place more than 120 days after the purchase date. |
| | |
| (j) | Repurchase Agreements–The Fund may enter into repurchase agreements with respect to securities. A repurchase agreement is a transaction in which a fund acquires a security and simultaneously commits to resell that security to the seller (a bank or securities dealer) at an agreed-upon price on an agreed-upon date. The Fund requires at all times that the repurchase agreement be collateralized by cash, or by securities of the U.S. Government, its agencies, its instrumentalities, or U.S. Government sponsored enterprises having a value equal to, or in excess of, the value of the repurchase agreement (including accrued interest). If the seller of the agreement defaults on its obligation to repurchase the underlying securities at a time when the fair value of these securities has declined, the Fund may incur a loss upon disposition of the securities. |
44
Notes to Financial Statements (continued)
| (k) | Floating Rate Loans–The Fund may invest in floating rate loans, which usually take the form of loan participations and assignments. Loan participations and assignments are agreements to make money available to U.S. or foreign corporations, partnerships or other business entities (the “Borrower”) in a specified amount, at a specified rate and within a specified time. A loan is typically originated, negotiated and structured by a U.S. or foreign bank, insurance company or other financial institution (the “Agent”) for a group of loan investors (“Loan Investors”). The Agent typically administers and enforces the loan on behalf of the other Loan Investors in the syndicate and may hold any collateral on behalf of the Loan Investors. Such loan participations and assignments are typically senior, secured and collateralized in nature. The Fund records an investment when the Borrower withdraws money and records interest as earned. These loans pay interest at rates which are periodically reset by reference to a base lending rate plus a spread. These base lending rates are generally the prime rate offered by a designated U.S. bank or London InterBank Offered Rate (“LIBOR”). |
| | |
| | The loans in which the Fund invests may be subject to some restrictions on resale. For example, the Fund may be contractually obligated to receive approval from the Agent and/or Borrower prior to the sale of these investments. The Fund generally has no right to enforce compliance with the terms of the loan agreement with the Borrower. As a result, the Fund assumes the credit risk of the Borrower, the selling participant and any other persons interpositioned between the Fund and the Borrower (“Intermediate Participants”). In the event that the Borrower, selling participant or Intermediate Participants become insolvent or enter into bankruptcy, the Fund may incur certain costs and delays in realizing payment or may suffer a loss of principal and/or interest. |
| | |
| | Unfunded commitments represent the remaining obligation of the Fund to the Borrower. At any point in time, up to the maturity date of the issue, the Borrower may demand the unfunded portion. Until demanded by the Borrower, unfunded commitments are not recognized as an asset on the Statement of Assets and Liabilities. Unrealized appreciation/depreciation on unfunded commitments presented on the Statement of Assets and Liabilities represents mark to market of the unfunded portion of the Fund’s floating rate notes. As of December 31, 2015, the Fund did not have unfunded loan commitments. |
| | |
| (l) | Fair Value Measurements–Fair value is defined as the price that the Fund would receive upon selling an investment or transferring a liability in an orderly transaction to an independent buyer in the principal or most advantageous market of the investment. A three-tier hierarchy is used to maximize the use of observable market data and minimize the use of unobservable inputs and to establish classification of fair value measurements for disclosure purposes. Inputs refer broadly to the assumptions that market participants would use in pricing the asset or liability, including assumptions about risk—for example, the risk inherent in a particular valuation technique used to measure fair value (such as a pricing model) and/or the risk inherent in the inputs to the valuation technique. Inputs may be observable or unobservable. Observable inputs reflect the assumptions market participants would use in pricing the asset or liability. Observable inputs are based on market data obtained from sources independent of the reporting entity. Unobservable inputs reflect the reporting entity’s own assumptions about the assumptions market participants would use in pricing the asset or liability. Unobservable inputs are based on the best information available in the circumstances. The three-tier hierarchy of inputs is summarized in the three broad Levels listed below: |
45
Notes to Financial Statements (continued)
| • | Level 1 – | unadjusted quoted prices in active markets for identical investments; |
| | | |
| • | Level 2 – | other significant observable inputs (including quoted prices for similar investments, interest rates, prepayment speeds, credit risk, etc.); and |
| | | |
| • | Level 3 – | significant unobservable inputs (including the Fund’s own assumptions in determining the fair value of investments). |
| | | |
| | A summary of inputs used in valuing the Fund’s investments and other financial instruments as of December 31, 2015 and, if applicable, Level 1/Level 2 transfers and Level 3 rollforwards for the fiscal year then ended is included in the Fund’s Schedule of Investments. |
| | |
| | Changes in valuation techniques may result in transfers into or out of an assigned level within the three-tier hierarchy. All transfers between different levels within the three-tier hierarchy are deemed to have occurred as of the beginning of the reporting period. The inputs or methodology used for valuing securities are not necessarily an indication of the risk associated with investing in those securities. |
| 3. | MANAGEMENT FEE AND OTHER TRANSACTIONS WITH AFFILIATES |
Management Fee
The Company has a management agreement with Lord Abbett, pursuant to which Lord Abbett supplies the Fund with investment management services and executive and other personnel, provides office space and pays for ordinary and necessary office and clerical expenses relating to research and statistical work and supervision of the Fund’s investment portfolio.
The management fee is based on the Fund’s average daily net assets at the following annual rate:
| First $1 billion | | | .35 | % |
| Next $1 billion | | | .30 | % |
| Over $2 billion | | | .25 | % |
For the fiscal year ended December 31, 2015, the effective management fee, net of waivers, was at an annualized rate of 0.00% of the Fund’s average daily net assets.
In addition, Lord Abbett provides certain administrative services to the Fund pursuant to an Administrative Services Agreement in return for a fee at an annual rate of .04% of the Fund’s average daily net assets.
During the fiscal year ended December 31, 2015 and continuing through April 30, 2016, Lord Abbett has contractually agreed to waive its fees and reimburse expenses to the extent necessary to limit total net operating expenses to an annual rate of .80%. This agreement may be terminated only upon the approval of the Board.
The Company, on behalf of the Fund, has entered into services arrangements with certain insurance companies. Under these arrangements, certain insurance companies will be compensated up to .25% of the average daily net asset value (“NAV”) of the Fund’s Class VC Shares held in the insurance company’s separate account to service and maintain the Variable Contract owners’ accounts. This amount is included in Non 12b-1 service fees on the Statement of Operations. The Fund may also compensate certain insurance companies, third-party administrators and other entities for providing recordkeeping, sub-transfer agency and other administrative services to the Fund. This amount is included in Shareholder servicing on the Statement of Operations.
A Director and certain of the Company’s officers have an interest in Lord Abbett.
46
Notes to Financial Statements (continued)
| 4. | DISTRIBUTIONS AND CAPITAL LOSS CARRYFORWARDS | |
Dividends from net investment income, if any, are declared and paid at least semi-annually. Taxable net realized gains from investment transactions, reduced by allowable capital loss carryforwards, if any, are declared and distributed to shareholders at least annually. The capital loss carryforward amount, if any, is available to offset future net capital gains. Dividends and distributions to shareholders are recorded on the ex-dividend date. The amounts of dividends and distributions from net investment income and net realized capital gains are determined in accordance with federal income tax regulations, which may differ from U.S. GAAP. These book/tax differences are either considered temporary or permanent in nature. To the extent these differences are permanent in nature, such amounts are reclassified within the components of net assets based on their federal tax basis treatment; temporary differences do not require reclassification. Dividends and distributions that exceed earnings and profits for tax purposes are reported as a tax return of capital.
The tax character of distributions paid during the fiscal year ended December 31, 2015 and the period ended December 31, 2014 was as follows:
| | Year Ended | Period Ended |
| | 12/31/2015 | 12/31/2014* |
| Distributions paid from: | | |
| Ordinary income | $510,223 | $154,801 |
| Return of capital | 9,512 | – |
| Total distributions paid | $519,735 | $154,801 |
* For the period April 4, 2014 (commencement of operations) to December 31, 2014.
As of December 31, 2015, the components of accumulated losses on a tax-basis were as follows:
| Capital loss carryforwards* | | $ | (114,697 | ) |
| Temporary differences | | | (36,230 | ) |
| Unrealized losses – net | | | (542,676 | ) |
| Total accumulated losses – net | | $ | (693,603 | ) |
* The capital losses will carryforward indefinitely.
At the Fund’s election, certain losses incurred within the taxable year (Qualified Late-Year Losses) are deemed to arise on the first business day of the Fund’s next taxable year. The Fund incurred and will elect to defer post-October capital losses of $35,747 and late-year ordinary losses of $64 during fiscal year 2015.
As of December 31, 2015, the aggregate unrealized security gains and losses based on cost for U.S. federal income tax purposes were as follows:
| Tax cost | | $ | 22,766,307 | |
| Gross unrealized gain | | | 22,085 | |
| Gross unrealized loss | | | (564,761 | ) |
| Net unrealized security loss | | $ | (542,676 | ) |
The difference between book-basis and tax-basis unrealized gains (losses) is due to tax treatment of premium amortization and wash sales.
47
Notes to Financial Statements (continued)
Permanent items identified during the fiscal year ended December 31, 2015 have been reclassified among the components of net assets based on their tax basis treatment as follows:
| Distributions in | | | | | | | |
| Excess of Net | | | Accumulated | | | | |
| Investment | | | Net Realized | | | Paid-in | |
| Income | | | Loss | | | Capital | |
| | $268,986 | | | | $(252,507 | ) | | | $(16,479 | ) |
The permanent differences are attributable to the tax treatment of foreign currency transactions, premium amortization, certain distributions, certain securities, principal paydown gains and losses and certain expenses.
| 5. | PORTFOLIO SECURITIES TRANSACTIONS |
Purchases and sales of investment securities (excluding short-term investments) for the fiscal year ended December 31, 2015 were as follows:
| U.S. | Non-U.S. | U.S. | Non-U.S. |
| Government | Government | Government | Government |
| Purchases* | Purchases | Sales* | Sales |
| $2,431,672 | $20,591,036 | $1,711,532 | $6,106,664 |
* Includes U.S. Government sponsored enterprises securities.
The Fund is permitted to purchase and sell securities (“cross-trade”) from and to other Lord Abbett Funds or client accounts pursuant to procedures approved by the Board in compliance with Rule 17a-7 under the Act (the “Rule”). Each cross-trade is executed at a fair market price in compliance with provisions of the Rule. For the year ended December 31, 2015, the Fund engaged in cross-trade purchases of $418,219 and sales of $302,984, which resulted in net realized losses of ($893).
| 6. | DISCLOSURES ABOUT DERIVATIVE INSTRUMENTS AND HEDGING ACTIVITIES |
The Fund entered into forward foreign currency exchange contracts for the fiscal year ended December 31, 2015 (as described in note 2(g)). A forward foreign currency exchange contract reduces the Fund’s exposure to changes in the value of the currency it will deliver (or settle in cash) and increases its exposure to changes in the value of the currency it will receive (or settle in cash) for the duration of the contract. The Fund’s use of forward foreign currency exchange contracts involves the risk that Lord Abbett will not accurately predict currency movements, and the Fund’s returns could be reduced as a result. Forward foreign currency exchange contracts are subject to the risk that those currencies will decline in value relative to the U.S. dollar, or, in the case of hedged positions, that the U.S. dollar will decline relative to the currency being hedged. Currency rates in foreign countries may fluctuate significantly over short periods of time. The Fund’s risk of loss from counterparty credit risk is the unrealized appreciation on forward foreign currency exchange contracts and deposits with brokers as collateral.
The Fund entered into U.S. Treasury futures contracts for the fiscal year ended December 31, 2015 (as described in note 2(h)) to hedge against changes in interest rates. The Fund bears the risk of interest rates moving unexpectedly, in which case the Fund may not achieve the anticipated benefits of the futures contracts and realize a loss. There is minimal counterparty credit risk to the Fund since futures are exchange traded and the exchange’s clearinghouse, as counterparty to all exchange traded futures, guarantees futures against default.
48
Notes to Financial Statements (continued)
As of December 31, 2015, the Fund had the following derivatives at fair value, grouped into appropriate risk categories that illustrate the Funds use of derivative instruments:
| | Interest Rate |
| Asset Derivatives | Contracts |
| Futures Contracts(1) | $4,819 |
| |
| Liability Derivatives | |
| Futures Contracts(1) | $8,300 |
| (1) | Statement of Assets and Liabilities location: Includes cumulative unrealized appreciation/depreciation of futures contracts as reported in the Schedule of Investments. Only current day’s variation margin is reported within the Statement of Assets and Liabilities. |
Transactions in derivative instruments for the fiscal year ended December 31, 2015, were as follows:
| | | | | Foreign | |
| | | Interest Rate | | Currency | |
| | | Contracts | | Contracts | |
| Net Realized Gain(1) | | | | | | | | |
| Forward Foreign Currency Exchange Contracts | | $ | – | | | $ | 306 | |
| Futures Contracts | | | 13,992 | | | | – | |
| Net Change in Unrealized Appreciation/Depreciation(2) | | | | | | | | |
| Forward Foreign Currency Exchange Contracts | | $ | – | | | $ | (102 | ) |
| Futures Contracts | | | (1,495 | ) | | | – | |
| Average Number of Contracts/Notional Amounts* | | | | | | | | |
| Forward Foreign Currency Exchange Contracts(3) | | $ | – | | | $ | 2,627 | |
| Futures Contracts(4) | | | 23 | | | | – | |
| * | Calculated based on the number of contracts or notional amounts for the period ended December 31, 2015. |
| (1) | Statements of Operations location: Net realized gain on futures contracts and foreign currency related transactions. |
| (2) | Statements of Operations location: Net change in unrealized appreciation/depreciation on futures contracts and translation of assets and liabilities denominated in foreign currencies. |
| (3) | Amount represents notional amounts in U.S. dollars. |
| (4) | Amount represents number of contracts. |
| 7. | DISCLOSURES ABOUT OFFSETTING ASSETS AND LIABILITIES |
The Financial Accounting Standards Board (“FASB”) requires disclosures intended to help better assess the effect or potential effect of offsetting arrangements on a fund’s financial position. The following tables illustrate gross and net information about recognized assets and liabilities eligible for offset in the statement of assets and liabilities; and disclose such amounts subject to an enforceable master netting agreement or similar agreement, by counterparty. A master netting agreement is an agreement between a fund and a counterparty which provides for the net settlement of amounts owed under all contracts traded under that agreement, as well as cash collateral, through a single payment by one party to the other in the event of default on or termination of any one contract. The Fund’s accounting policy with respect to balance sheet offsetting is that, absent an event of default by the counterparty or a termination of the agreement, the master netting agreement does not result in an offset of reported amounts of financial assets and liabilities in the statement of assets and liabilities across transactions between the Fund and the applicable counterparty:
49
Notes to Financial Statements (continued)
| | | | | Gross Amounts | | | Net Amounts of |
| | | | | Offset in the | | | Assets Presented |
| | | Gross Amounts of | | Statement of Assets | | | in the Statement of |
| Description | | Recognized Assets | | and Liabilities | | | Assets and Liabilities |
| Repurchase Agreements | | $1,104,239 | | $ | – | | | $1,104,239 |
| Total | | $1,104,239 | | $ | – | | | $1,104,239 |
| | | Net Amounts | | | | | | |
| | | of Assets | | Amounts Not Offset in the | | | | |
| | | Presented in | | Statement of Assets and Liabilities | | | | |
| | | the Statement | | | | | Cash | | | Securities | | | | |
| | | of Assets and | | Financial | | | Collateral | | | Collateral | | | Net | |
| Counterparty | | Liabilities | | Instruments | | | Received(a) | | | Received(a) | | | Amount(b) | |
| Fixed Income Clearing Corp. | | $1,104,239 | | $ | – | | | $ | – | | | $ | (1,104,239 | ) | | $ | – | |
| Total | | $1,104,239 | | $ | – | | | $ | – | | | $ | (1,104,239 | ) | | $ | – | |
| (a) | Collateral disclosed is limited to an amount not to exceed 100% of the net amount of assets presented in the Statement of Assets and Liabilities, for each respective counterparty. |
| (b) | Net amount represents the amount owed to the Fund by the counterparty as of December 31, 2015. |
| 8. | DIRECTORS’ REMUNERATION |
The Company’s officers and a Director, who are associated with Lord Abbett, do not receive any compensation from the Company for serving in such capacities. Independent Directors’ fees are allocated among all Lord Abbett-sponsored funds based on the net assets of each fund. There is an equity-based plan available to all Independent Directors under which Independent Directors must defer receipt of a portion of, and may elect to defer receipt of an additional portion of Directors’ fees. The deferred amounts are treated as though equivalent dollar amounts had been invested in the funds. Such amounts and earnings accrued thereon are included in Directors’ fees on the Statement of Operations and in Directors’ fees payable on the Statement of Assets and Liabilities and are not deductible for U.S. federal income tax purposes until such amounts are paid.
The Company has entered into an arrangement with its transfer agent and custodian, whereby credits realized as a result of uninvested cash balances are used to reduce a portion of the Fund’s expenses.
Effective August 31, 2015, the Fund and certain other funds managed by Lord Abbett (collectively, the “Participating Funds”) entered into a syndicated line of credit facility with various lenders for $550 million (the “Facility”), whereas State Street Bank and Trust Company (“SSB”) participates as a lender and as agent for the lenders. The Facility is to be used for temporary or emergency purposes as an additional source of: liquidity to satisfy redemptions. The Participating Funds are subject to graduated borrowing limits of one-third of Fund assets (if Fund assets are less than $750 million), $250 million, $300 million, or $350 million, based on past borrowings and likelihood of future borrowings. The Facility will continue through August 29, 2016.
Prior to August 31, 2015, the Fund and certain other funds managed by Lord Abbett participated in a $500 million unsecured revolving credit facility with SSB (the “SSB Facility”).
During the fiscal year ended December 31, 2015, the Fund did not utilize the Facility or the SSB Facility.
50
Notes to Financial Statements (continued)
| 11. | CUSTODIAN AND ACCOUNTING AGENT |
SSB is the Company’s custodian and accounting agent. SSB performs custodial, accounting and recordkeeping functions relating to portfolio transactions and calculating the Fund’s NAV.
The Fund is subject to the general risks and considerations associated with investing in fixed income securities. The value of an investment will change as interest rates fluctuate and in response to market movements. When interest rates rise, the prices of fixed income securities are likely to decline; when interest rates fall, such prices tend to rise. Longer-term securities are usually more sensitive to interest rate changes. There is also the risk that an issuer of a fixed income security will fail to make timely payments of principal and/or interest to the Fund, a risk that is greater with high-yield bonds (sometimes called “junk bonds”) in which the Fund may substantially invest. Some issuers, particularly of high-yield bonds, may default as to principal and/or interest payments after the Fund purchases its securities. A default, or concerns in the market about an increase in risk of default, may result in losses to the Fund. High-yield bonds are subject to greater price fluctuations, as well as additional risks.
The Fund is subject to the general risks and considerations associated with investing in convertible securities, which have both equity and fixed income risk characteristics. Generally, convertible securities offer lower interest or dividend yields than non-convertible securities of similar quality and less potential for gains or capital appreciation in a rising equity securities market than equity securities. They tend to be more volatile than other fixed income securities, and the markets for convertible securities may be less liquid than markets for stocks or bonds. A significant portion of convertible securities have below investment grade credit ratings and are subject to increased credit and liquidity risks.
The Fund’s investment exposure to foreign (which may include emerging market) companies presents increased market, liquidity, currency, political, information and other risks. The cost of the Fund’s potential use of forward foreign currency exchange contracts varies with factors such as the currencies involved, the length of the contract period and the market conditions prevailing.
The Fund is subject to the risks associated with derivatives, which may be different from and greater than the risks associated with directly investing in securities. Derivatives may be subject to risks such as liquidity risk, leveraging risk, interest rate risk, market risk, and credit risk. Illiquid securities may lower the Fund’s returns since the Fund may be unable to sell these securities at their desired time or price. Derivatives also may involve the risk of mispricing or improper valuation and the risk that changes in the value of the derivative may not correlate perfectly with the value of the underlying asset, rate or index. Whether the Fund’s use of derivatives is successful will depend on, among other things, the Fund’s ability to correctly forecast market movements, changes in foreign exchange and interest rates, and other factors. If the Fund incorrectly forecasts these and other factors, its performance could suffer. The Fund’s use of derivatives could result in a loss exceeding the amount of the Fund’s investment in these instruments.
The Fund may invest in swap contracts. Swap contracts are bi-lateral agreements between a fund and its counterparty. Each party is exposed to the risk of default by the other. In addition, they may involve a small investment of cash compared to the risk assumed with the result that small changes may produce disproportionate and substantial gains or losses to the Fund.
51
Notes to Financial Statements (concluded)
The Fund may invest in credit default swap contracts. The risks associated with the Fund’s investment in credit default swaps are greater than if the Fund invested directly in the reference obligation because they are subject to illiquidity risk, counterparty risk, and credit risk at both the counterparty and underlying issuer levels.
The Fund may invest in floating rate or adjustable rate senior loans, which are subject to increased credit and liquidity risks. Senior loans are business loans made to borrowers that may be U.S. or foreign corporations, partnerships or other business entities. The senior loans in which the Fund may invest may consist primarily of senior loans that are rated below investment grade or, if unrated, deemed by Lord Abbett to be equivalent to below investment grade securities. Below investment grade senior loans, as in the case of high-yield debt securities, or junk bonds, are usually more credit sensitive than interest rate sensitive, although the value of these instruments may be impacted by broader interest rate swings in the overall fixed income market.
The Fund may invest in mortgage-related securities, including those of such Government sponsored enterprises as Federal Home Loan Mortgage Corporation and Federal National Mortgage Association. In addition, the Fund may invest in non-agency backed and mortgage related securities, which are issued by the private institutions, not by the government-sponsored enterprises. Such securities may be particularly sensitive to changes in economic conditions, including delinquencies and/or defaults, and changes in prevailing interest rates. These changes can affect the value, income and/or liquidity of such positions. When interest rates are declining, the value of these securities with prepayment features may not increase as much as other fixed income securities. Early principal repayment may deprive the Fund of income payments above current markets rates. The prepayment rate also will affect the price and volatility of a mortgage-related security. In addition, securities of government sponsored enterprises are guaranteed with respect to the timely payment of interest and principal by the particular enterprise involved, not by the U.S. Government.
These factors can affect the Fund’s performance.
| 13. | SUMMARY OF CAPITAL TRANSACTIONS | |
Transactions in shares of capital stock were as follows:
| | | Year Ended | | | Period Ended | |
| | | December 31, 2015 | | | December 31, 2014† | |
| Shares sold | | | 1,075,441 | | | | 531,133 | |
| Reinvestment of distributions | | | 36,013 | | | | 10,531 | |
| Shares reacquired | | | (122,435 | ) | | | (20,011 | ) |
| Increase | | | 989,019 | | | | 521,653 | |
| † | For the period April 4, 2014 (commencement of operations) to December 31, 2014. |
52
Report of Independent Registered Public Accounting Firm
To the Board of Directors of Lord Abbett Series Fund, Inc. and the Shareholders of Short Duration Income Portfolio:
We have audited the accompanying statement of assets and liabilities, including the schedule of investments, of the Short Duration Income Portfolio, one of the portfolios constituting the Lord Abbett Series Fund, Inc. (the “Fund”) as of December 31, 2015, and the related statement of operations, the statements of changes in net assets, and the financial highlights for the year then ended. These financial statements and financial highlights are the responsibility of the Fund’s management. Our responsibility is to express an opinion on these financial statements and financial highlights based on our audits.
We conducted our audits in accordance with the standards of the Public Company Accounting Oversight Board (United States). Those standards require that we plan and perform the audit to obtain reasonable assurance about whether the financial statements and financial highlights are free of material misstatement. The Fund is not required to have, nor were we engaged to perform, an audit of its internal control over financial reporting. Our audits included consideration of internal control over financial reporting as a basis for designing audit procedures that are appropriate in the circumstances, but not for the purpose of expressing an opinion on the effectiveness of the Fund’s internal control over financial reporting. Accordingly, we express no such opinion. An audit also includes examining, on a test basis, evidence supporting the amounts and disclosures in the financial statements, assessing the accounting principles used and significant estimates made by management, as well as evaluating the overall financial statement presentation. Our procedures included confirmation of securities owned as of December 31, 2015, by correspondence with the custodian, brokers, and agent banks; when replies were not received from brokers and agent banks, we performed other auditing procedures. We believe that our audits provide a reasonable basis for our opinion.
In our opinion, such financial statements and financial highlights referred to above present fairly, in all material respects, the financial position of Short Duration Income Portfolio of the Lord Abbett Series Fund, Inc. as of December 31, 2015, the results of its operations, the changes in its net assets, and the financial highlights for the year then ended, in conformity with accounting principles generally accepted in the United States of America.
DELOITTE & TOUCHE LLP
New York, New York
February 16, 2016
53
Basic Information About Management
The Board is responsible for the management of the business and affairs of the Company in accordance with the laws of the State of Maryland. The Board elects officers who are responsible for the day-to-day operations of the Fund and who execute policies authorized by the Board. The Board also approves an investment adviser to the Fund and continues to monitor the cost and quality of the services the investment adviser provides, and annually considers whether to renew the contract with the adviser. Generally, each Director holds office until his/her successor is elected and qualified or until his/her earlier resignation or removal, as provided in the Company’s organizational documents.
Lord Abbett, a Delaware limited liability company, is the Fund’s investment adviser. Designated Lord Abbett personnel are responsible for the day-to-day management of the Fund.
Interested Director
Ms. Foster is affiliated with Lord Abbett and is an “interested person” of the Company as defined in the Act. Ms. Foster is a director/trustee and officer of each of the 12 investment companies in the Lord Abbett Family of Funds, which consist of 58 portfolios or series.
Name, Address and
Year of Birth | | Current Position and
Length of Service
with the Fund | | Principal Occupation and Other Directorships
During the Past Five Years |
Daria L. Foster
Lord, Abbett & Co. LLC
90 Hudson Street
Jersey City, NJ 07302
(1954) | | Director and President since 2006; Chief Executive Officer since 2012 | | Principal Occupation: Managing Partner of Lord Abbett, joined Lord Abbett in 1990.
Other Directorships: None. |
Independent Directors
The following Independent Directors also are directors/trustees of each of the 12 investment companies in the Lord Abbett Family of Funds, which consist of 58 portfolios or series.
Name, Address and
Year of Birth | | Current Position and
Length of Service
with the Fund | | Principal Occupation and Other Directorships
During the Past Five Years |
E. Thayer Bigelow
Lord, Abbett & Co. LLC
c/o Legal Dept.
90 Hudson Street
Jersey City, NJ 07302
(1941) | | Director since 1994; Chairman since 2013 | | Principal Occupation: Managing General Partner, Bigelow Media, LLC (since 2000); Senior Adviser, Time Warner Inc. (1998–2000).
Other Directorships: Currently serves as director of Crane Co. (since 1984) and Huttig Building Products Inc. (since 1998). Previously served as a director of R.H. Donnelley Inc. (2009–2010). |
| | | | | |
Robert B. Calhoun, Jr.
Lord, Abbett & Co. LLC
c/o Legal Dept.
90 Hudson Street
Jersey City, NJ 07302
(1942) | | Director since 1998 | | Principal Occupation: Senior Advisor of Monitor Clipper Partners, a private equity investment fund (since 1997); President of Clipper Asset Management Corp. (1991–2009).
Other Directorships: None. |
54
Basic Information About Management (continued)
Name, Address and
Year of Birth | | Current Position and
Length of Service
with the Fund | | Principal Occupation and Other Directorships
During the Past Five Years |
| | | | | |
Eric C. Fast
Lord, Abbett & Co. LLC
c/o Legal Dept.
90 Hudson Street
Jersey City, NJ 07302
(1949) | | Director since 2014 | | Principal Occupation: Chief Executive Officer of Crane Co., an industrial products company (2001–2014). Other Directorships: Currently serves as director of Automatic Data Processing, Inc. (since 2007) and Regions Financial Corporation (since 2010). Previously served as a director of Crane Co. (1999–2014). |
| | | | | |
Evelyn E. Guernsey
Lord, Abbett & Co. LLC
c/o Legal Dept.
90 Hudson Street
Jersey City, NJ 07302
(1955) | | Director since 2011 | | Principal Occupation: CEO, Americas of J.P. Morgan Asset Management (2004–2010). Other Directorships: None. |
| | | | | |
Julie A. Hill
Lord, Abbett & Co. LLC
c/o Legal Dept.
90 Hudson Street
Jersey City, NJ 07302
(1946) | | Director since 2004 | | Principal Occupation: Owner and CEO of The Hill Company, a business consulting firm (since 1998). Other Directorships: Currently serves as director of Anthem, Inc., a health benefits company (since 1994). |
| | | | | |
Franklin W. Hobbs
Lord, Abbett & Co. LLC
c/o Legal Dept.
90 Hudson Street
Jersey City, NJ 07302
(1947) | | Director since 2001 | | Principal Occupation: Advisor of One Equity Partners, a private equity firm (since 2004). Other Directorships: Currently serves as director and Chairman of the Board of Ally Financial Inc., a financial services firm (since 2009), and as director of Molson Coors Brewing Company (since 2002). |
| | | | | |
James M. McTaggart
Lord, Abbett & Co. LLC
c/o Legal Dept.
90 Hudson Street
Jersey City, NJ 07302
(1947) | | Director since 2012 | | Principal Occupation: Independent management advisor and consultant (since 2012); Vice President, CRA International, Inc. (doing business as Charles River Associates), a global management consulting firm (2009–2012); Founder and Chairman of Marakon Associates, Inc., a strategy consulting firm (1978–2009); and Officer and Director of Trinsum Group, a holding company (2007–2009). Other Directorships: Currently serves as director of Blyth, Inc., a home products company (since 2004). |
| | | | | |
James L.L. Tullis
Lord, Abbett & Co. LLC
c/o Legal Dept.
90 Hudson Street
Jersey City, NJ 07302
(1947) | | Director since 2006 | | Principal Occupation: CEO of Tullis-Dickerson and Co. Inc., a venture capital management firm (since 1990); CEO of Tullis Health Investors Inc. (since 2012). Other Directorships: Currently serves as director of Crane Co. (since 1998). |
55
Basic Information About Management (continued)
Officers
None of the officers listed below have received compensation from the Company. All of the officers of the Company also may be officers of the other Lord Abbett Funds and maintain offices at 90 Hudson Street, Jersey City, NJ 07302. Unless otherwise indicated, the position(s) and title(s) listed under the “Principal Occupation During the Past Five Years” column indicate each officer’s position(s) and title(s) with Lord Abbett. Each officer serves for an indefinite term (i.e., until his or her death, resignation, retirement, or removal).
Name and
Year of Birth | | Current Position
with the Fund | | Length of Service
of Current
Position | | Principal Occupation
During the Past Five Years |
| | | | | | | |
Daria L. Foster
(1954) | | President and Chief Executive Officer | | Elected as President in 2006 and Chief Executive Officer in 2012 | | Managing Partner of Lord Abbett, joined Lord Abbett in 1990. |
| | | | | | | |
Sean J. Aurigemma
(1969) | | Executive Vice President | | Elected in 2010 | | Portfolio Manager, joined Lord Abbett in 2007. |
| | | | | | | |
Jeff D. Diamond
(1960) | | Executive Vice President | | Elected in 2008 | | Portfolio Manager, joined Lord Abbett in 2007. |
| | | | | | | |
Robert I. Gerber
(1954) | | Executive Vice President | | Elected in 2003 | | Partner and Chief Investment Officer, joined Lord Abbett in 1997. |
| | | | | | | |
Todd D. Jacobson
(1966) | | Executive Vice President | | Elected in 2005 | | Partner and Associate Director, joined Lord Abbett in 2003. |
| | | | | | | |
Robert A. Lee
(1969) | | Executive Vice President | | Elected in 2010 | | Partner and Deputy Chief Investment Officer, joined Lord Abbett in 1997. |
| | | | | | | |
Thomas B. Maher
(1967) | | Executive Vice President | | Elected in 2010 | | Partner and Portfolio Manager, joined Lord Abbett in 2003. |
| | | | | | | |
Justin C. Maurer
(1969) | | Executive Vice President | | Elected in 2010 | | Partner and Portfolio Manager, joined Lord Abbett in 2001. |
| | | | | | | |
Vincent J. McBride
(1964) | | Executive Vice President | | Elected in 2010 | | Partner and Director, joined Lord Abbett in 2003. |
| | | | | | | |
Andrew H. O’Brien
(1973) | | Executive Vice President | | Elected in 2010 | | Partner and Portfolio Manager, joined Lord Abbett in 1998. |
| | | | | | | |
F. Thomas O’Halloran, III
(1955) | | Executive Vice President | | Elected in 2010 | | Partner and Portfolio Manager, joined Lord Abbett in 2001. |
| | | | | | | |
Walter H. Prahl
(1958) | | Executive Vice President | | Elected in 2012 | | Partner and Director, joined Lord Abbett in 1997. |
| | | | | | | |
Steven F. Rocco
(1979) | | Executive Vice President | | Elected in 2014 | | Partner and Portfolio Manager, joined Lord Abbett in 2004. |
| | | | | | | |
Frederick J. Ruvkun
(1957) | | Executive Vice President | | Elected in 2012 | | Partner and Portfolio Manager, joined Lord Abbett in 2006. |
56
Basic Information About Management (continued)
Name and
Year of Birth | | Current Position
with the Fund | | Length of Service
of Current
Position | | Principal Occupation
During the Past Five Years |
| | | | | | | |
Paul J. Volovich
(1973) | | Executive Vice President | | Elected in 2005 | | Partner and Portfolio Manager, joined Lord Abbett in 1997. |
| | | | | | | |
A. Edward Allinson
(1961) | | Vice President | | Elected in 2011 | | Portfolio Manager, joined Lord Abbett in 2005. |
| | | | | | | |
John W. Ashbrook
(1964) | | Vice President and Assistant Secretary | | Elected in 2014 | | Assistant General Counsel, joined Lord Abbett in 2008. |
| | | | | | | |
Joan A. Binstock
(1954) | | Chief Financial Officer and Vice President | | Elected in 1999 | | Partner and Chief Financial and Operations Officer, joined Lord Abbett in 1999. |
| | | | | | | |
Brooke A. Fapohunda
(1975) | | Vice President and Assistant Secretary | | Elected in 2014 | | Deputy General Counsel, joined Lord Abbett in 2006. |
| | | | | | | |
John K. Forst
(1960) | | Vice President and Assistant Secretary | | Elected in 2005 | | Partner and Deputy General Counsel, joined Lord Abbett in 2004. |
| | | | | | | |
Anthony W. Hipple
(1964) | | Vice President | | Elected in 2014 | | Portfolio Manager, joined Lord Abbett in 2002. |
| | | | | | | |
Lawrence H. Kaplan
(1957) | | Vice President and Secretary | | Elected in 1997 | | Partner and General Counsel, joined Lord Abbett in 1997. |
| | | | | | | |
Jerald M. Lanzotti
(1967) | | Vice President | | Elected in 2012 | | Partner and Portfolio Manager, joined Lord Abbett in 1996. |
| | | | | | | |
David J. Linsen
(1974) | | Vice President | | Elected in 2008 | | Partner and Director, joined Lord Abbett in 2001. |
| | | | | | | |
Joseph M. McGill
(1962) | | Chief Compliance Officer | | Elected in 2014 | | Chief Compliance Officer, joined Lord Abbett in 2014 and was formerly Managing Director and the Chief Compliance Officer at UBS Global Asset Management (2003–2013). |
| | | | | | | |
A. Edward Oberhaus, III
(1959) | | Vice President | | Elected in 1998 | | Partner and Director, joined Lord Abbett in 1983. |
| | | | | | | |
Noah Petrucci
(1970) | | Vice President | | Elected in 2013 | | Portfolio Manager, joined Lord Abbett in 2012 and was formerly a Portfolio Manager at Columbia Management Investment Advisers, LLC and Columbia Management Advisors, LLC (2002–2012). |
| | | | | | | |
Lawrence B. Stoller
(1963) | | Vice President and Assistant Secretary | | Elected in 2007 | | Partner and Senior Deputy General Counsel, joined Lord Abbett in 2007. |
57
Basic Information About Management (concluded)
Name and
Year of Birth | | Current Position
with the Fund | | Length of Service
of Current
Position | | Principal Occupation
During the Past Five Years |
| | | | | | | |
Arthur K. Weise
(1970) | | Vice President | | Elected in 2010 | | Partner and Portfolio Manager, joined Lord Abbett in 2007. |
| | | | | | | |
Kewjin Yuoh
(1971) | | Vice President | | Elected in 2012 | | Partner and Portfolio Manager, joined Lord Abbett in 2010. |
| | | | | | | |
Scott S. Wallner
(1955) | | AML Compliance Officer | | Elected in 2011 | | Assistant General Counsel, joined Lord Abbett in 2004. |
| | | | | | | |
Bernard J. Grzelak
(1971) | | Treasurer | | Elected in 2003 | | Partner and Director of Fund Administration, joined Lord Abbett in 2003. |
Please call 888-522-2388 for a copy of the statement of additional information, which contains further information about the Company’s Directors. It is available free upon request.
58
Approval of Advisory Contract
The Board of Directors of the Fund, including all of the Directors who are not interested persons of the Fund or of Lord Abbett (the “Independent Board Members”), annually considers whether to approve the continuation of the existing management agreement between the Fund and Lord Abbett. In connection with its most recent approval, the Board reviewed materials relating specifically to the management agreement, as well as numerous materials received throughout the course of the year, including information about the Fund’s investment performance compared to the performance of its benchmark. Before making its decision as to the Fund, the Board had the opportunity to ask questions and request further information, taking into account its familiarity with Lord Abbett gained through its meetings and discussions. These meetings and discussions included the examination of the portfolio management team conducted by members of the Contract Committee, the deliberations of the Contract Committee, and discussions between the Contract Committee and Lord Abbett’s management. The Independent Board Members also discussed the materials described above with their independent legal counsel in a private session at which no representatives of management were present.
The materials received by the Board included, but were not limited to: (1) information provided by Morningstar Associates, LLC (“Morningstar”) regarding the investment performance of the Fund compared to the investment performance of a group of funds in the same Morningstar investment category (the “performance peer group”) and the investment performance of one or more appropriate benchmarks; (2) information provided by Morningstar regarding the expense ratios, contractual and effective management fee rates, and other expense components for the Fund and one or more groups of funds in the same Morningstar category, with the same share classes and operational characteristics, including asset size (the “expense peer group”); (3) information provided by Lord Abbett on the projected expense ratios, management fee rates, and other expense components for the Fund; (4) sales and redemption information for the Fund; (5) information regarding Lord Abbett’s financial condition; (6) an analysis of the relative profitability of the management agreement to Lord Abbett; (7) information provided by Lord Abbett regarding the investment management fees Lord Abbett receives from its other advisory clients maintaining accounts with a similar investment strategy as the Fund; (8) information regarding the distribution arrangements of the Fund; and (9) information regarding the personnel and other resources devoted by Lord Abbett to managing the Fund.
Investment Management Services Generally. The Board considered the investment management services provided by Lord Abbett to the Fund, including investment research, portfolio management, and trading, and Lord Abbett’s commitment to compliance with all applicable legal requirements. The Board also observed that Lord Abbett was solely engaged in the investment management business and accordingly did not experience the conflicts of interest that may result from being engaged in other lines of business. The Board considered the investment advisory services provided by Lord Abbett to other clients, the fees charged for the services, and the differences in the nature of the services provided to the Fund and other Lord Abbett Funds, on the one hand, and the services provided to other clients, on the other.
Investment Performance. The Board reviewed the Fund’s investment performance in relation to that of the performance peer group as of various periods ended August 31, 2015. The Board observed that the Fund’s investment performance was slightly below the median of the performance peer group for the one-year period.
Lord Abbett’s Personnel and Methods. The Board considered the qualifications of the personnel providing investment management services to the Fund, in light of its investment objective and
59
Approval of Advisory Contract (continued)
discipline. Among other things, the Board considered the size, experience, and turnover of Lord Abbett’s investment management staff, Lord Abbett’s investment methodology and philosophy, and Lord Abbett’s approach to recruiting, training, and retaining investment management personnel.
Nature and Quality of Other Services. The Board considered the nature, quality, costs, and extent of compliance, administrative, and other services performed by Lord Abbett and Lord Abbett Distributor LLC (the “Distributor”) and the nature and extent of Lord Abbett’s supervision of third party service providers, including the Fund’s transfer agent and custodian.
Expenses. The Board considered the expense level of the Fund and the expense levels of the expense peer group. It also considered the projected expense levels and how those levels would relate to those of the expense peer group and the amount and nature of the fees paid by shareholders. The Board observed that the overall expense level of the Fund was well above the median of the expense peer group.
Profitability. The Board considered the level of Lord Abbett’s profits in managing the Fund, including a review of Lord Abbett’s methodology for allocating its costs to its management of the Fund. The Board concluded that the allocation methodology had a reasonable basis and was appropriate. It considered any profits realized by Lord Abbett in connection with the operation of the Fund, including the fee that Lord Abbett receives from the Fund for providing administrative services to the Fund, and whether the amount of profit was fair for the management of the Fund. The Board also considered the profits realized from other business segments of Lord Abbett, which may benefit from or be related to the Fund’s business. The Board considered Lord Abbett’s profit margins in comparison with available industry data, both accounting for and ignoring marketing and distribution expenses, and how those profit margins could affect Lord Abbett’s ability to recruit and retain investment personnel. The Board recognized that Lord Abbett’s profitability was a factor in enabling it to attract and retain qualified investment management personnel to provide services to the Fund. The Board concluded that Lord Abbett’s profitability as to the Fund was not excessive.
Economies of Scale. The Board considered whether there had been any economies of scale in managing the Fund, whether the Fund had appropriately benefited from any such economies of scale, and whether there was potential for realization of any further economies of scale. The Board concluded that the existing management fee schedule, with its breakpoint or breakpoints in the level of the management fee, adequately addressed any economies of scale in managing the Fund.
Other Benefits to Lord Abbett. The Board considered the character and amount of fees paid by the Fund and the Fund’s shareholders to Lord Abbett and the Distributor for services other than investment advisory services. The Board also considered the revenues and profitability of Lord Abbett’s investment advisory business apart from its mutual fund business, and the intangible benefits enjoyed by Lord Abbett by virtue of its relationship with the Fund. The Board observed that the Distributor receives 12b-1 fees from certain of the Lord Abbett Funds as to shares held in accounts for which there is no other broker of record, may retain a portion of the 12b-1 fees it receives, and receives a portion of the sales charges on sales and redemptions of some classes of shares. In addition, the Board observed that Lord Abbett accrues certain benefits for its business of providing investment advice to clients other than the Lord Abbett Funds, but that business also benefits the Funds. The Board also noted that Lord Abbett, as disclosed in the prospectus of the Fund, has entered into revenue sharing arrangements with certain entities that distribute shares of the Fund.
60
Approval of Advisory Contract (concluded)
Alternative Arrangements. The Board considered whether, instead of approving continuation of the management agreement, it might be in the best interests of the Fund to implement one or more alternative arrangements, such as continuing to employ Lord Abbett, but on different terms. After considering all of the relevant factors, the Board unanimously found that continuation of the existing management agreement was in the best interests of the Fund and its shareholders and voted unanimously to approve the continuation of the management agreement. In considering whether to approve the continuation of the management agreement, the Board did not identify any single factor as paramount or controlling. This summary does not discuss in detail all matters considered.
61
Householding
The Company has adopted a policy that allows it to send only one copy of the Fund’s prospectus, proxy material, annual report and semiannual report to certain shareholders residing at the same “household.” This reduces Fund expenses, which benefits you and other shareholders. If you need additional copies or do not want your mailings to be “householded,” please call Lord Abbett at 888–522–2388 or send a written request with your name, the name of your fund or funds and your account number or numbers to Lord Abbett Family of Funds, P.O. Box 219336, Kansas City, MO 64121.
Proxy Voting Policies, Procedures and Records
A description of the policies and procedures that Lord Abbett uses to vote proxies related to the Fund’s portfolio securities, and information on how Lord Abbett voted the Fund’s proxies during the 12-month period ended June 30 are available without charge, upon request, (i) by calling 888-522-2388; (ii) on Lord Abbett’s Website at www.lordabbett.com; and (iii) on the Securities and Exchange Commission’s (“SEC”) Website at www.sec.gov.
Shareholder Reports and Quarterly Portfolio Disclosure
The Fund is required to file its complete schedule of portfolio holdings with the SEC for its first and third fiscal quarters on Form N-Q. Copies of the filings are available without charge, upon request on the SEC’s Website at www.sec.gov and may be available by calling Lord Abbett at 888-522-2388. You can also obtain copies of Form N-Q by visiting the SEC’s Public Reference Room in Washington, DC (information on the operation of the Public Reference Room may be obtained by calling 800-SEC-0330).
62

 | | |
| | | |
| | | |
This report, when not used for the general information of
shareholders of the Fund, is to be distributed only if preceded
or accompanied by a current fund prospectus. | | |
| | Lord Abbett Series Fund, Inc. | |
| Lord Abbett mutual fund shares are distributed by | | SFSDI-PORT-3 |
| LORD ABBETT DISTRIBUTOR LLC. | Short Duration Income Portfolio | (02/16) |

2015 LORD ABBETT
ANNUAL REPORT
Lord Abbett
Series Fund—Total Return Portfolio
For the fiscal year ended December 31, 2015
Table of Contents
Lord Abbett Series Fund – Total Return Portfolio
Annual Report
For the fiscal year ended December 31, 2015

Daria L. Foster, Director, President and Chief Executive Officer of the Lord Abbett Funds, and E. Thayer Bigelow, Independent Chairman of the Lord Abbett Funds.
Dear Shareholders: We are pleased to provide you with this overview of the performance of Lord Abbett Series Fund – Total Return Portfolio for the fiscal year ended December 31, 2015. On this page and the following pages, we discuss the major factors that influenced fiscal year performance. For additional information about the Fund, please visit our website at www.lordabbett.com, where you also can access the quarterly commentaries that provide updates on the Fund’s performance and other portfolio related updates.
Thank you for investing in Lord Abbett mutual funds. We value the trust that you place in us and look forward to serving your investment needs in the years to come.
Best regards,

Daria L. Foster
Director, President and Chief Executive Officer
For the fiscal year ended December 31, 2015, the Fund returned -0.66%, reflecting performance at the net asset value (NAV) of Class VC shares, with all distributions reinvested, compared to its benchmark, the Barclays U.S. Universal Index1, which returned 0.43% over the same period.
Yields on longer-dated Treasury bonds were relatively flat, rising slightly over the 12 month period ending December 31, 2015, while the yield on the shorter-dated Treasury notes increased substantially over the same period, leading to a flattening of
the Treasury yield curve. Credit-sensitive sectors of the fixed-income market witnessed negative returns as spreads widened in the period. U.S inflation rates remained subdued, with the Consumer Price Index (CPI) rising 0.7% over the 12-month period ended December 31, 2015. Meanwhile, the employment picture continued to improve as the unemployment rate fell from 5.6% to 5.0% in 2015, with a total of 2.7 million jobs added for the period. In December, the U.S. Federal Reserve has initiated its first interest rate hike since
1
2006, this increased the range for the Fed funds rate from 0–0.25% to 0.25%–0.50%.
During the 12-month period, corporate sectors underperformed Treasuries, which the Fund’s portfolio management team believes is likely due in part to elevated uncertainty in the second half of the period. In addition to concerns surrounding slower growth in China, investors’ fears seem to have broadened to include persistent softness in commodity markets, recent weakness in emerging markets, rising default risk within the high-yield corporate credit sector, and lower prospects for global growth. These concerns appear to have resulted in widening spreads across credit sensitive sectors of fixed income in recent months.
As such, the Fund’s allocations to investment grade corporate credits, particularly ‘BBB’-rated corporates, were likely a drag on relative performance as higher grade credits outperformed ‘BBB’-rated corporates. Although ‘BBB’-rated corporate credits underperformed during the period, the Fund’s portfolio management team maintains its preference for issuers of ‘BBB’-rated corporates as we believe these firms are
less likely to prioritize equity holders over debt holders. Further, we believe firms in this segment of the corporate market will provide better long-term returns for investors, despite heightened volatility.
Within the securitized sector, the Fund’s overweight allocation to asset-backed securities (ABS) contributed positively to performance during the period. The Fund’s portfolio management team continues to believe that exposure to ABS can provide a liquid source of attractive risk-adjusted yield. Also within the securitized sector, the Fund’s overweight to commercial mortgage backed securities (CMBS) contributed positively to relative performance during the period. The Fund’s portfolio management team increased the Fund’s allocation to CMBS in the second half of 2015, as we believe tactical opportunities may be found within this sector.
The Fund’s portfolio is actively managed and, therefore, its holdings and the weightings of a particular issuer or portfolio sector as a percentage of portfolio assets are subject to change. Sectors may include many industries.
2
1 The Barclays U.S. Universal Index represents the union of the U.S. Aggregate Index, the U.S High-Yield Corporate Index, the 144A Index, the Eurodollar Index, the Emerging Markets Index, and the non-ERISA portion of the CMBS Index. Municipal debt, private placements, and non-dollar-denominated issues are excluded from the Universal Index. The only constituent of the index that includes floating-rate debt is the Emerging Markets Index.
Unless otherwise specified, indexes reflect total return, with all dividends reinvested. Indexes are unmanaged, do not reflect the deduction of fees or expenses, and are not available for direct investment.
Important Performance and Other Information
Performance data quoted in the following pages reflect past performance and are no guarantee of future results. Current performance may be higher or lower than the performance quoted. The investment return and principal value of an investment in the Funds will fluctuate so that shares, on any given day or when redeemed, may be worth more or less than their original cost. You can obtain performance data current to the most recent month end by calling Lord Abbett at 888-522-2388 or referring to www.lordabbett.com.
During certain periods shown, expense waivers and reimbursements were in place. Without such waivers and expense reimbursements, the Fund’s returns would have been lower.
The annual commentary above discusses the views of the Fund’s management and various portfolio holdings of the Fund as of December 31, 2015. These views and portfolio holdings may have changed after this date. Information provided in the commentary is not a recommendation to buy or sell securities. Because the Fund’s portfolio is actively managed and may change significantly, the Fund may no longer own the securities described above or may have otherwise changed their positions in the securities. For more recent information about the Fund’s portfolio holdings, please visit www.lordabbett.com.
A Note about Risk: See Notes to Financial Statements for a discussion of investment risks. For a more detailed discussion of the risks associated with the Fund, please see the Fund’s prospectus.
Mutual funds are not insured by the FDIC, are not deposits or other obligations of, or guaranteed by, banks, and are subject to investment risks including possible loss of principal amount invested.
The Fund serves as an underlying investment vehicle for variable annuity contracts and variable life insurance policies.
3
Investment Comparison
Below is a comparison of a $10,000 investment in Class VC shares with the same investment in both the Barclays U.S. Universal Index and the Barclays U.S. Aggregate Bond Index, assuming reinvestment of all dividends and distributions. The Fund’s shares are sold only to insurance company separate accounts that fund certain variable annuity and variable life contracts. The line graph comparison does not reflect the sales charges or other expenses of these contracts. If those sales charges and expenses were reflected, returns would be lower. The graph and performance table below do not reflect the deduction of taxes that a shareholder would pay on Fund distributions or the redemption of Fund shares. During the period, expenses of the Fund were waived or reimbursed by Lord Abbett; without such waiver or reimbursement of expenses, the Fund’s returns would have been lower. Past performance is no guarantee of future results.

Average Annual Total Returns for the
Periods Ended December 31, 2015
| | | | 1 Year | | | 5 Years | | Life of Class | |
| Class VC2 | | | –0.66 | % | | | 3.90 | % | | | 4.31 | % | |
1 Performance for each unmanaged index does not reflect any fees or expenses. The performance of each index is not necessarily representative of the Fund’s performance. Performance for each index began on May 1, 2010.
2 The Class VC shares commenced operations on April 16, 2010. Performance for the Class began on May 1, 2010.
4
Expense Example
As a shareholder of the Fund, you incur ongoing costs, including management fees; expenses related to the Fund’s services arrangements with certain insurance companies; and other Fund expenses. This Example is intended to help you understand your ongoing costs (in dollars) of investing in the Fund and to compare these costs with the ongoing costs of investing in other mutual funds.
The Example is based on an investment of $1,000 invested at the beginning of the period and held for the entire period (July 1, 2015 through December 31, 2015).
The Example reflects only expenses that are deducted from the assets of the Fund. Fees and expenses, including sales charges applicable to the various insurance products that invest in the Fund, are not reflected in this Example. If such fees and expenses were reflected in the Example, the total expenses shown would be higher. Fees and expenses regarding such variable insurance products are separately described in the prospectus related to those products.
Actual Expenses
The first line of the table on the following page provides information about actual account values and actual expenses. You may use the information in this line, together with the amount you invested, to estimate the expenses that you paid over the period. Simply divide your account value by $1,000 (for example, an $8,600 account value divided by $1,000 = 8.6), then multiply the result by the number in the first line under the heading titled “Expenses Paid During Period 7/1/15 – 12/31/15” to estimate the expenses you paid on your account during this period.
Hypothetical Example for Comparison Purposes
The second line of the table on the following page provides information about hypothetical account values and hypothetical expenses based on the Fund’s actual expense ratio and an assumed rate of return of 5% per year before expenses, which is not the Fund’s actual return. The hypothetical account values and expenses may not be used to estimate the actual ending account balance or expenses you paid for the period. You may use this information to compare the ongoing costs of investing in the Fund and other funds. To do so, compare this 5% hypothetical example with the 5% hypothetical examples that appear in the shareholder reports of the other funds.
5
Please note that the expenses shown in the table are meant to highlight your ongoing costs only and do not reflect any transactional costs, such as sales charges. Therefore, the second line of the table is useful in comparing ongoing costs only, and will not help you determine the relative total costs of owning different funds. In addition, if these transactional costs were included, your costs would have been higher.
| | | Beginning | | Ending | | Expenses | |
| | | Account | | Account | | Paid During | |
| | | Value | | Value | | Period† | |
| | | | | | | 7/1/15 – | |
| | | 7/1/15 | | 12/31/15 | | 12/31/15 | |
| Class VC | | | | | | | |
| Actual | | $ | 1,000.00 | | | $ | 992.90 | | | | $3.21 | | |
| Hypothetical (5% Return Before Expenses) | | $ | 1,000.00 | | | $ | 1,021.98 | | | | $3.26 | | |
| † | Net expenses are equal to the Fund’s annualized expense ratio of 0.64%, multiplied by the average account value over the period, multiplied by 184/365 (to reflect one-half year period). |
Portfolio Holdings Presented by Sector
December 31, 2015
| Sector* | | %** |
| Auto | | | 0.50 | % | |
| Basic Industry | | | 0.56 | % | |
| Capital Goods | | | 0.14 | % | |
| Consumer Cyclical | | | 1.59 | % | |
| Consumer Discretionary | | | 0.26 | % | |
| Consumer Services | | | 2.34 | % | |
| Consumer Staples | | | 0.63 | % | |
| Energy | | | 4.18 | % | |
| Financial Services | | | 26.62 | % | |
| Foreign Government | | | 3.03 | % | |
| Government | | | 42.81 | % | |
| Health Care | | | 1.63 | % | |
| Integrated Oils | | | 0.50 | % | |
| Materials & Processing | | | 0.96 | % | |
| Municipal | | | 0.34 | % | |
| Producer Durables | | | 0.41 | % | |
| Technology | | | 1.47 | % | |
| Telecommunications | | | 2.14 | % | |
| Transportation | | | 0.48 | % | |
| Utilities | | | 1.31 | % | |
| Repurchase Agreement | | | 8.10 | % | |
| Total | | | 100.00 | % | |
| * | | A sector may comprise several industries. |
| ** | | Represents percent of total investments. |
6
Schedule of Investments
December 31, 2015
| Investments | | Interest
Rate | | Maturity
Date | | Principal
Amount
(000) | | | Fair
Value | |
| LONG-TERM INVESTMENTS 103.46% | | | | | | | | | | | | |
| | | | | | | | | | | | | |
| ASSET-BACKED SECURITIES 18.59% | | | | | | | | | | | | |
| | | | | | | | | | | | | |
| Automobiles 11.24% | | | | | | | | | | | | |
| Ally Auto Receivables Trust 2013-1 A3 | | 0.63% | | 5/15/2017 | | $ | 46 | | | $ | 45,510 | |
| Ally Auto Receivables Trust 2014-1 A2 | | 0.48% | | 2/15/2017 | | | 44 | | | | 43,816 | |
| American Credit Acceptance Receivables Trust 2015-1 C† | | 4.29% | | 4/12/2021 | | | 717 | | | | 709,072 | |
| AmeriCredit Automobile Receivables Trust 2013-2 A3 | | 0.65% | | 12/8/2017 | | | 70 | | | | 69,915 | |
| AmeriCredit Automobile Receivables Trust 2013-5 A3 | | 0.90% | | 9/10/2018 | | | 443 | | | | 442,644 | |
| AmeriCredit Automobile Receivables Trust 2014-1 A3 | | 0.90% | | 2/8/2019 | | | 505 | | | | 503,655 | |
| AmeriCredit Automobile Receivables Trust 2014-1 C | | 2.15% | | 3/9/2020 | | | 402 | | | | 400,663 | |
| AmeriCredit Automobile Receivables Trust 2014-4 D | | 3.07% | | 11/9/2020 | | | 829 | | | | 825,710 | |
| Avis Budget Rental Car Funding AESOP LLC 2010-5A A† | | 3.15% | | 3/20/2017 | | | 1,578 | | | | 1,581,527 | |
| Avis Budget Rental Car Funding AESOP LLC 2011-3A A† | | 3.41% | | 11/20/2017 | | | 548 | | | | 554,161 | |
| Avis Budget Rental Car Funding AESOP LLC 2011-5A A† | | 3.27% | | 2/20/2018 | | | 402 | | | | 407,985 | |
| Avis Budget Rental Car Funding AESOP LLC 2012-2A A† | | 2.802% | | 5/20/2018 | | | 908 | | | | 918,714 | |
| Avis Budget Rental Car Funding AESOP LLC 2012-3A A† | | 2.10% | | 3/20/2019 | | | 525 | | | | 524,664 | |
| Avis Budget Rental Car Funding AESOP LLC 2014-1A A† | | 2.46% | | 7/20/2020 | | | 592 | | | | 594,386 | |
| Avis Budget Rental Car Funding AESOP LLC 2014-2A A† | | 2.50% | | 2/20/2021 | | | 216 | | | | 215,754 | |
| Avis Budget Rental Car Funding AESOP LLC 2015-1A A† | | 2.50% | | 7/20/2021 | | | 970 | | | | 958,962 | |
| Avis Budget Rental Car Funding AESOP LLC 2015-2A A† | | 2.63% | | 12/20/2021 | | | 596 | | | | 589,231 | |
| BMW Vehicle Lease Trust 2015-1 A3 | | 1.24% | | 12/20/2017 | | | 1,005 | | | | 1,003,725 | |
| California Republic Auto Receivables Trust 2014-4 A2 | | 0.77% | | 9/15/2017 | | | 288 | | | | 287,871 | |
| California Republic Auto Receivables Trust 2015-1 A2 | | 0.88% | | 12/15/2017 | | | 534 | | | | 533,729 | |
| | See Notes to Financial Statements. | 7 |
Schedule of Investments (continued)
December 31, 2015
| Investments | | Interest
Rate | | Maturity
Date | | Principal
Amount
(000) | | | Fair
Value | |
| Automobiles (continued) | | | | | | | | | | | | |
| California Republic Auto Receivables Trust 2015-2 A4 | | 1.75% | | 1/15/2021 | | $ | 1,316 | | | $ | 1,289,662 | |
| California Republic Auto Receivables Trust 2015-2 B | | 2.53% | | 6/15/2021 | | | 908 | | | | 877,995 | |
| California Republic Auto Receivables Trust 2015-3 A4 | | 2.13% | | 5/17/2021 | | | 1,283 | | | | 1,267,288 | |
| California Republic Auto Receivables Trust 2015-3 B | | 2.70% | | 9/15/2021 | | | 115 | | | | 110,683 | |
| Capital Auto Receivables Asset Trust 2013-4 A3 | | 1.09% | | 3/20/2018 | | | 939 | | | | 937,677 | |
| Capital Auto Receivables Asset Trust 2014-3 B† | | 2.35% | | 7/22/2019 | | | 938 | | | | 938,611 | |
| Capital Auto Receivables Asset Trust 2014-3 C† | | 2.71% | | 11/20/2019 | | | 1,202 | | | | 1,200,070 | |
| Capital Auto Receivables Asset Trust 2015-1 A3 | | 1.61% | | 6/20/2019 | | | 680 | | | | 676,900 | |
| Capital Auto Receivables Asset Trust 2015-2 A1A | | 0.99% | | 10/20/2017 | | | 1,156 | | | | 1,152,565 | |
| Capital Auto Receivables Asset Trust 2015-2 A2 | | 1.39% | | 9/20/2018 | | | 485 | | | | 483,061 | |
| CarFinance Capital Auto Trust 2014-1A A† | | 1.46% | | 12/17/2018 | | | 35 | | | | 35,249 | |
| CarMax Auto Owner Trust 2013-3 A3 | | 0.97% | | 4/16/2018 | | | 1,082 | | | | 1,079,954 | |
| CarMax Auto Owner Trust 2015-2 A2A | | 0.82% | | 6/15/2018 | | | 298 | | | | 297,308 | |
| CarMax Auto Owner Trust 2015-2 A4 | | 1.80% | | 3/15/2021 | | | 620 | | | | 615,445 | |
| Chrysler Capital Auto Receivables Trust 2013-BA A3† | | 0.85% | | 5/15/2018 | | | 468 | | | | 467,867 | |
| Chrysler Capital Auto Receivables Trust 2014-AA A3† | | 0.83% | | 9/17/2018 | | | 1,377 | | | | 1,374,054 | |
| Chrysler Capital Auto Receivables Trust 2014-BA A2† | | 0.69% | | 9/15/2017 | | | 166 | | | | 166,376 | |
| Chrysler Capital Auto Receivables Trust 2014-BA A3† | | 1.27% | | 5/15/2019 | | | 860 | | | | 857,635 | |
| Drive Auto Receivables Trust 2015-BA B† | | 2.12% | | 6/17/2019 | | | 377 | | | | 376,264 | |
| Drive Auto Receivables Trust 2015-DA C† | | 3.38% | | 11/15/2021 | | | 585 | | | | 582,595 | |
| Drive Auto Receivables Trust 2015-DA D† | | 4.59% | | 1/17/2023 | | | 455 | | | | 453,835 | |
| First Investors Auto Owner Trust 2013-2A D† | | 3.58% | | 6/15/2020 | | | 261 | | | | 259,244 | |
| First Investors Auto Owner Trust 2015-2A A1† | | 1.59% | | 12/16/2019 | | | 1,044 | | | | 1,042,311 | |
| Ford Credit Auto Owner Trust 2012-D A3 | | 0.51% | | 4/15/2017 | | | – | (a) | | | 683 | |
| Ford Credit Auto Owner Trust 2013-D A3 | | 0.67% | | 4/15/2018 | | | 526 | | | | 525,487 | |
| GM Financial Automobile Leasing Trust 2014-2A A3† | | 1.22% | | 1/22/2018 | | | 360 | | | | 359,462 | |
| Harley-Davidson Motorcycle Trust 2015-2 A4 | | 1.66% | | 12/15/2022 | | | 299 | | | | 295,848 | |
| Honda Auto Receivables Owner Trust 2013-1 A3 | | 0.48% | | 11/21/2016 | | | 34 | | | | 33,528 | |
| Honda Auto Receivables Owner Trust 2013-2 A3 | | 0.53% | | 2/16/2017 | | | 74 | | | | 74,218 | |
| Honda Auto Receivables Owner Trust 2013-3 A3 | | 0.77% | | 5/15/2017 | | | 485 | | | | 484,358 | |
| Honda Auto Receivables Owner Trust 2013-4 A3 | | 0.69% | | 9/18/2017 | | | 333 | | | | 332,229 | |
| 8 | See Notes to Financial Statements. | |
Schedule of Investments (continued)
December 31, 2015
| Investments | | Interest
Rate | | Maturity
Date | | Principal
Amount
(000) | | | Fair
Value | |
| Automobiles (continued) | | | | | | | | | | | | |
| Hyundai Auto Lease Securitization Trust 2014-B A2† | | 0.61% | | 2/15/2017 | | $ | 237 | | | $ | 236,786 | |
| Hyundai Auto Receivables Trust 2013-A A3 | | 0.56% | | 7/17/2017 | | | 184 | | | | 184,258 | |
| Hyundai Auto Receivables Trust 2015-A A2 | | 0.68% | | 10/16/2017 | | | 475 | | | | 474,830 | |
| M&T Bank Auto Receivables Trust 2013-1A A3† | | 1.06% | | 11/15/2017 | | | 530 | | | | 530,239 | |
| Nissan Auto Receivables Owner Trust 2013-A A3 | | 0.50% | | 5/15/2017 | | | 53 | | | | 52,622 | |
| Porsche Innovative Lease Owner Trust 2014-1 A3† | | 1.03% | | 11/20/2017 | | | 1,658 | | | | 1,654,496 | |
| Santander Drive Auto Receivables Trust 2014-2 C | | 2.33% | | 11/15/2019 | | | 375 | | | | 375,722 | |
| Santander Drive Auto Receivables Trust 2014-3 C | | 2.13% | | 8/17/2020 | | | 433 | | | | 433,475 | |
| Santander Drive Auto Receivables Trust 2014-4 C | | 2.60% | | 11/16/2020 | | | 638 | | | | 639,389 | |
| Santander Drive Auto Receivables Trust 2015-1 C | | 2.57% | | 4/15/2021 | | | 1,924 | | | | 1,913,779 | |
| Santander Drive Auto Receivables Trust 2015-5 D | | 3.65% | | 12/15/2021 | | | 580 | | | | 572,731 | |
| SunTrust Auto Receivables Trust 2015-1A A2† | | 0.99% | | 6/15/2018 | | | 1,806 | | | | 1,805,198 | |
| SunTrust Auto Receivables Trust 2015-1A D† | | 3.24% | | 1/16/2023 | | | 727 | | | | 732,233 | |
| TCF Auto Receivables Owner Trust 2015-1A A3† | | 1.49% | | 12/16/2019 | | | 1,273 | | | | 1,262,723 | |
| TCF Auto Receivables Owner Trust 2015-1A A4† | | 1.96% | | 11/16/2020 | | | 1,872 | | | | 1,851,352 | |
| TCF Auto Receivables Owner Trust 2015-1A B† | | 2.49% | | 4/15/2021 | | | 791 | | | | 782,436 | |
| World Omni Automobile Lease Securitization Trust 2013-A A3 | | 1.10% | | 12/15/2016 | | | 444 | | | | 443,880 | |
| World Omni Automobile Lease Securitization Trust 2014-A A3 | | 1.16% | | 9/15/2017 | | | 58 | | | | 57,834 | |
| Total | | | | | | | | | | | 43,864,139 | |
| |
| Credit Cards 1.60% | | | | | | | | | | | | |
| Chase Issuance Trust 2014-A6 | | 1.26% | | 7/15/2019 | | | 800 | | | | 798,599 | |
| Citibank Credit Card Issuance Trust 2006-A3 | | 5.30% | | 3/15/2018 | | | 685 | | | | 691,159 | |
| Citibank Credit Card Issuance Trust 2013-A6 | | 1.32% | | 9/7/2018 | | | 1,210 | | | | 1,212,537 | |
| Discover Card Execution Note Trust 2013-A5 | | 1.04% | | 4/15/2019 | | | 474 | | | | 473,844 | |
| Synchrony Credit Card Master Note Trust 2011-2 A | | 0.811% | # | 5/15/2019 | | | 1,505 | | | | 1,505,139 | |
| Synchrony Credit Card Master Note Trust 2012-6 A | | 1.36% | | 8/17/2020 | | | 445 | | | | 442,977 | |
| Synchrony Credit Card Master Note Trust 2015-3 A | | 1.74% | | 9/15/2021 | | | 470 | | | | 466,580 | |
| World Financial Network Credit Card Master Trust 2013-B A | | 0.91% | | 3/16/2020 | | | 216 | | | | 215,846 | |
| World Financial Network Credit Card Master Trust 2014-A | | 0.711% | # | 12/15/2019 | | | 450 | | | | 450,030 | |
| Total | | | | | | | | | | | 6,256,711 | |
| |
| Home Equity 0.13% | | | | | | | | | | | | |
| Asset Backed Securities Corp. Home Equity Loan Trust Series NC 2006-HE4 A5 | | | | | | | | | | | | |
| Trust Series NC 2006-HE4 A5 | | 0.381% | # | 5/25/2036 | | | 39 | | | | 36,812 | |
| | See Notes to Financial Statements. | 9 |
Schedule of Investments (continued)
December 31, 2015
| Investments | | Interest
Rate | | Maturity
Date | | Principal
Amount
(000) | | | Fair
Value | |
| Home Equity (continued) | | | | | | | | | | | | |
| Home Equity Asset Trust 2006-7 2A2 | | 0.331% | # | 1/25/2037 | | $ | 17 | | | $ | 17,364 | |
| Meritage Mortgage Loan Trust 2004-2 M3 | | 1.196% | # | 1/25/2035 | | | 399 | | | | 379,267 | |
| New Century Home Equity Loan Trust 2005-A A6 | | 4.954% | | 8/25/2035 | | | 78 | | | | 76,763 | |
| Total | | | | | | | | | | | 510,206 | |
| |
| Other 5.62% | | | | | | | | | | | | |
| Apollo Credit Funding IV Ltd. 4A A1† | | 1.725% | # | 4/15/2027 | | | 1,000 | | | | 993,512 | |
| Carlyle Global Market Strategies 2015-2A A1† | | 1.864% | # | 4/27/2027 | | | 850 | | | | 842,029 | |
| Carlyle Global Market Strategies CLO Ltd. 2013-2A A1† | | 1.437% | # | 4/18/2025 | | | 400 | | | | 394,185 | |
| Cent CLO Ltd. 2013-19A A1A† | | 1.624% | # | 10/29/2025 | | | 850 | | | | 833,317 | |
| CIFC Funding II Ltd. 2014-2A A1L† | | 1.809% | # | 5/24/2026 | | | 250 | | | | 247,644 | |
| CNH Equipment Trust 2015-B A4 | | 1.89% | | 4/15/2022 | | | 373 | | | | 371,510 | |
| Dell Equipment Finance Trust 2015-2 A3† | | 1.72% | | 9/22/2020 | | | 259 | | | | 257,465 | |
| Diamond Resorts Owner Trust 2015-2 A† | | 2.99% | | 5/22/2028 | | | 360 | | | | 359,445 | |
| Engs Commercial Finance Trust 2015-1A A2† | | 2.31% | | 10/22/2021 | | | 927 | | | | 925,612 | |
| Fortress Credit BSL II Ltd. 2013-2A A1F† | | 1.787% | # | 10/19/2025 | | | 200 | | | | 197,404 | |
| Fortress Credit BSL Ltd. 2013-1A A† | | 1.467% | # | 1/19/2025 | | | 900 | | | | 883,581 | |
| Gleneagles CLO Ltd. 2005-1A B† | | 0.879% | # | 11/1/2017 | | | 342 | | | | 342,179 | |
| GMF Floorplan Owner Revolving Trust 2015-1 B† | | 1.97% | | 5/15/2020 | | | 394 | | | | 392,617 | |
| Jackson Mill CLO Ltd. 2015-1A A† | | 1.804% | # | 4/15/2027 | | | 1,100 | | | | 1,089,851 | |
| Jasper CLO Ltd. 2005-1A A† | | 0.599% | # | 8/1/2017 | | | 34 | | | | 34,098 | |
| JFIN Revolver CLO Ltd. 2015-4A A† | | 1.436% | # | 4/22/2020 | | | 1,199 | | | | 1,190,722 | |
| John Deere Owner Trust 2014-A A3 | | 0.92% | | 4/16/2018 | | | 430 | | | | 429,466 | |
| Leaf Receivables Funding 10 LLC 2015-1 A4† | | 2.03% | | 8/17/2020 | | | 535 | | | | 527,528 | |
| Marathon CLO IV Ltd. 2012-4A A1† | | 1.723% | # | 5/20/2023 | | | 784 | | | | 782,766 | |
| NextGear Floorplan Master Owner Trust 2015-1A A† | | 1.80% | | 7/15/2019 | | | 797 | | | | 793,237 | |
| Oaktree CLO Ltd. 2014-2A A1A† | | 1.817% | # | 10/20/2026 | | | 1,000 | | | | 992,014 | |
| Oaktree EIF II Ltd. 2015-A1 B†(b) | | 3.245% | # | 10/18/2027 | | | 900 | | | | 892,890 | |
| Octagon Investment Partners XIX Ltd. 2014-1A A† | | 1.809% | # | 4/15/2026 | | | 500 | | | | 497,719 | |
| OZLM Funding Ltd. 2012-1A A2R† | | 2.645% | # | 7/22/2027 | | | 1,000 | | | | 999,311 | |
| OZLM VII Ltd. 2014-7A A1B† | | 1.779% | # | 7/17/2026 | | | 1,000 | | | | 993,051 | |
| OZLM VIII Ltd. 2014-8A A1A† | | 1.729% | # | 10/17/2026 | | | 410 | | | | 405,964 | |
| Recette CLO LLC 2015-1A B1† | | 2.515% | # | 10/20/2027 | | | 250 | | | | 247,189 | |
| Sheridan Square CLO Ltd. 2013-1A A1† | | 1.339% | # | 4/15/2025 | | | 500 | | | | 489,933 | |
| SLM Private Education Loan Trust 2010-A 2A† | | 3.581% | # | 5/16/2044 | | | 48 | | | | 49,104 | |
| SLM Private Education Loan Trust 2011-B A1† | | 1.181% | # | 12/16/2024 | | | 310 | | | | 309,803 | |
| SLM Private Education Loan Trust 2012-A A1† | | 1.731% | # | 8/15/2025 | | | 71 | | | | 70,815 | |
| SLM Private Education Loan Trust 2012-C A1† | | 1.431% | # | 8/15/2023 | | | 393 | | | | 393,538 | |
| 10 | See Notes to Financial Statements. | |
Schedule of Investments (continued)
December 31, 2015
| Investments | | Interest
Rate | | Maturity
Date | | Principal
Amount
(000) | | | Fair
Value | |
| Other (continued) | | | | | | | | | | | | |
| SLM Private Education Loan Trust 2012-E A1† | | 1.081% | # | 10/16/2023 | | $ | 477 | | | $ | 475,993 | |
| SLM Student Loan Trust 2011-1 A1 | | 0.942% | # | 3/25/2026 | | | 40 | | | | 39,021 | |
| Tryon Park CLO Ltd. 2013-1A A1† | | 1.409% | # | 7/15/2025 | | | 800 | | | | 789,715 | |
| Venture XVI CLO Ltd. 2014-16A A1L† | | 1.789% | # | 4/15/2026 | | | 988 | | | | 979,407 | |
| Venture XVII CLO Ltd. 2014-17A A† | | 1.769% | # | 7/15/2026 | | | 650 | | | | 644,570 | |
| Venture XVIII CLO Ltd. 2014-18A A† | | 1.739% | # | 10/15/2026 | | | 500 | | | | 495,197 | |
| Westchester CLO Ltd. 2007-1A A1A† | | 0.525% | # | 8/1/2022 | | | 252 | | | | 249,752 | |
| Total | | | | | | | | | | | 21,903,154 | |
| Total Asset-Backed Securities (cost $72,898,422) | | | | | | | | | | | 72,534,210 | |
| | | | | | | | | | | | | |
| CORPORATE BONDS 29.84% | | | | | | | | | | | | |
| |
| Aerospace/Defense 0.03% | | | | | | | | | | | | |
| Embraer SA (Brazil)(c) | | 5.15% | | 6/15/2022 | | | 10 | | | | 9,725 | |
| Harris Corp. | | 4.854% | | 4/27/2035 | | | 119 | | | | 117,454 | |
| Total | | | | | | | | | | | 127,179 | |
| |
| Air Transportation 0.07% | | | | | | | | | | | | |
| Air Canada (Canada)†(c) | | 7.75% | | 4/15/2021 | | | 70 | | | | 72,975 | |
| American Airlines 2013-2 Class B Pass-Through Trust† | | 5.60% | | 1/15/2022 | | | 208 | | | | 212,241 | |
| Total | | | | | | | | | | | 285,216 | |
| |
| Auto Parts: Original Equipment 0.06% | | | | | | | | | | | | |
| International Automotive Components Group SA (Luxembourg)†(c) | | 9.125% | | 6/1/2018 | | | 280 | | | | 240,800 | |
| |
| Automotive 0.51% | | | | | | | | | | | | |
| Ford Motor Co. | | 6.375% | | 2/1/2029 | | | 40 | | | | 45,159 | |
| Ford Motor Co. | | 6.625% | | 10/1/2028 | | | 736 | | | | 851,681 | |
| General Motors Co. | | 5.00% | | 4/1/2035 | | | 1,166 | | | | 1,091,404 | |
| Total | | | | | | | | | | | 1,988,244 | |
| |
| Banks: Regional 3.48% | | | | | | | | | | | | |
| Agricola Senior Trust† | | 6.75% | | 6/18/2020 | | | 180 | | | | 179,813 | |
| Bank of America Corp. | | 3.95% | | 4/21/2025 | | | 400 | | | | 390,256 | |
| Bank of America Corp. | | 4.20% | | 8/26/2024 | | | 938 | | | | 932,334 | |
| Bank of America Corp. | | 4.25% | | 10/22/2026 | | | 566 | | | | 561,448 | |
| Barclays plc (United Kingdom)(c) | | 3.65% | | 3/16/2025 | | | 813 | | | | 782,816 | |
| BBVA Banco Continental SA (Peru)†(c) | | 5.25% | | 9/22/2029 | | | 200 | | | | 195,000 | |
| Citigroup, Inc. | | 5.50% | | 9/13/2025 | | | 1,672 | | | | 1,818,384 | |
| Goldman Sachs Group, Inc. (The) | | 6.25% | | 2/1/2041 | | | 338 | | | | 404,546 | |
| | See Notes to Financial Statements. | 11 |
Schedule of Investments (continued)
December 31, 2015
| Investments | | Interest
Rate | | Maturity
Date | | Principal
Amount
(000) | | | Fair
Value | |
| Banks: Regional (continued) | | | | | | | | | | | | |
| Goldman Sachs Group, Inc. (The) | | 6.75% | | 10/1/2037 | | $ | 573 | | | $ | 671,836 | |
| JPMorgan Chase & Co. | | 3.875% | | 9/10/2024 | | | 1,952 | | | | 1,945,291 | |
| JPMorgan Chase & Co. | | 4.25% | | 10/1/2027 | | | 627 | | | | 626,936 | |
| Lloyds Banking Group plc (United Kingdom)†(c) | | 4.582% | | 12/10/2025 | | | 743 | | | | 746,284 | |
| Macquarie Bank Ltd. (Australia)†(c) | | 4.875% | | 6/10/2025 | | | 700 | | | | 692,160 | |
| Macquarie Bank Ltd. (Australia)†(c) | | 6.625% | | 4/7/2021 | | | 271 | | | | 303,936 | |
| Morgan Stanley | | 4.35% | | 9/8/2026 | | | 26 | | | | 26,140 | |
| Morgan Stanley | | 5.00% | | 11/24/2025 | | | 389 | | | | 413,750 | |
| Morgan Stanley | | 7.25% | | 4/1/2032 | | | 84 | | | | 110,374 | |
| Santander UK Group Holdings plc (United Kingdom)†(c) | | 4.75% | | 9/15/2025 | | | 770 | | | | 763,562 | |
| Santander UK plc (United Kingdom)(c) | | 7.95% | | 10/26/2029 | | | 835 | | | | 1,066,358 | |
| Wells Fargo & Co. | | 4.10% | | 6/3/2026 | | | 673 | | | | 680,181 | |
| Wells Fargo Bank NA | | 5.85% | | 2/1/2037 | | | 234 | | | | 280,101 | |
| Total | | | | | | | | | | | 13,591,506 | |
| |
| Beverages 0.27% | | | | | | | | | | | | |
| Anadolu Efes Biracilik Ve Malt Sanayii AS (Turkey)†(c) | | 3.375% | | 11/1/2022 | | | 240 | | | | 202,297 | |
| Central American Bottling Corp. (Guatemala)†(c) | | 6.75% | | 2/9/2022 | | | 205 | | | | 208,588 | |
| Corporacion Lindley SA (Peru)†(c) | | 4.625% | | 4/12/2023 | | | 27 | | | | 26,730 | |
| Fomento Economico Mexicano SAB de CV (Mexico)(c) | | 4.375% | | 5/10/2043 | | | 300 | | | | 267,082 | |
| JB y Cia SA de CV (Mexico)†(c) | | 3.75% | | 5/13/2025 | | | 350 | | | | 335,142 | |
| Total | | | | | | | | | | | 1,039,839 | |
| |
| Biotechnology Research & Production 0.56% | | | | | | | | | | | | |
| Amgen, Inc. | | 4.95% | | 10/1/2041 | | | 158 | | | | 157,099 | |
| Amgen, Inc. | | 6.40% | | 2/1/2039 | | | 1,387 | | | | 1,650,572 | |
| Gilead Sciences, Inc. | | 4.60% | | 9/1/2035 | | | 361 | | | | 367,777 | |
| Total | | | | | | | | | | | 2,175,448 | |
| |
| Business Services 0.32% | | | | | | | | | | | | |
| Hertz Corp. (The) | | 6.25% | | 10/15/2022 | | | 396 | | | | 411,840 | |
| Hertz Corp. (The) | | 7.375% | | 1/15/2021 | | | 38 | | | | 39,615 | |
| Mersin Uluslararasi Liman Isletmeciligi AS (Turkey)†(c) | | 5.875% | | 8/12/2020 | | | 200 | | | | 205,616 | |
| United Rentals North America, Inc. | | 5.75% | | 11/15/2024 | | | 385 | | | | 383,075 | |
| Western Union Co. (The) | | 3.35% | | 5/22/2019 | | | 202 | | | | 204,719 | |
| Total | | | | | | | | | | | 1,244,865 | |
| 12 | See Notes to Financial Statements. | |
Schedule of Investments (continued)
December 31, 2015
| Investments | | Interest
Rate | | Maturity
Date | | Principal
Amount
(000) | | | Fair
Value | |
| Chemicals 0.34% | | | �� | | | | | | | | | |
| Mexichem SAB de CV (Mexico)†(c) | | 4.875% | | 9/19/2022 | | $ | 205 | | | $ | 204,487 | |
| Montell Finance Co. BV (Netherlands)†(c) | | 8.10% | | 3/15/2027 | | | 624 | | | | 779,534 | |
| NewMarket Corp. | | 4.10% | | 12/15/2022 | | | 135 | | | | 134,541 | |
| OCP SA (Morocco)†(c) | | 6.875% | | 4/25/2044 | | | 200 | | | | 197,066 | |
| Total | | | | | | | | | | | 1,315,628 | |
| |
| Computer Hardware 0.37% | | | | | | | | | | | | |
| Dell, Inc. | | 7.10% | | 4/15/2028 | | | 401 | | | | 387,967 | |
| Hewlett-Packard Enterprise Co.† | | 4.90% | | 10/15/2025 | | | 1,056 | | | | 1,037,516 | |
| Total | | | | | | | | | | | 1,425,483 | |
| | | | | | | | | | | | | |
| Computer Software 0.30% | | | | | | | | | | | | |
| Audatex North America, Inc.† | | 6.00% | | 6/15/2021 | | | 69 | | | | 69,776 | |
| Audatex North America, Inc.† | | 6.125% | | 11/1/2023 | | | 296 | | | | 298,960 | |
| Fidelity National Information Services, Inc. | | 5.00% | | 10/15/2025 | | | 497 | | | | 511,627 | |
| First Data Corp.† | | 5.75% | | 1/15/2024 | | | 285 | | | | 281,438 | |
| Total | | | | | | | | | | | 1,161,801 | |
| |
| Containers 0.20% | | | | | | | | | | | | |
| Coveris Holdings SA (Luxembourg)†(c) | | 7.875% | | 11/1/2019 | | | 200 | | | | 175,500 | |
| Crown Cork & Seal Co., Inc. | | 7.375% | | 12/15/2026 | | | 112 | | | | 120,960 | |
| Reynolds Group Issuer, Inc./Reynolds Group | | | | | | | | | | | | |
| Issuer LLC/Reynolds Group Issuer (Luxembourg) SA | | 8.50% | | 5/15/2018 | | | 500 | | | | 495,000 | |
| Total | | | | | | | | | | | 791,460 | |
| |
| Diversified 0.25% | | | | | | | | | | | | |
| Alphabet Holding Co., Inc. PIK | | 7.75% | | 11/1/2017 | | | 657 | | | | 642,217 | |
| Argos Merger Sub, Inc.† | | 7.125% | | 3/15/2023 | | | 328 | | | | 326,032 | |
| Total | | | | | | | | | | | 968,249 | |
| |
| Drugs 0.73% | | | | | | | | | | | | |
| Actavis Funding SCS (Luxembourg)(c) | | 4.55% | | 3/15/2035 | | | 304 | | | | 296,377 | |
| Express Scripts Holding Co. | | 6.125% | | 11/15/2041 | | | 828 | | | | 944,178 | |
| Forest Laboratories LLC† | | 5.00% | | 12/15/2021 | | | 1,093 | | | | 1,189,137 | |
| Valeant Pharmaceuticals International, Inc.† | | 6.75% | | 8/15/2018 | | | 58 | | | | 57,768 | |
| Valeant Pharmaceuticals International, Inc.† | | 7.00% | | 10/1/2020 | | | 118 | | | | 118,295 | |
| Zoetis, Inc. | | 4.70% | | 2/1/2043 | | | 297 | | | | 260,212 | |
| Total | | | | | | | | | | | 2,865,967 | |
| | See Notes to Financial Statements. | 13 |
Schedule of Investments (continued)
December 31, 2015
| Investments | | Interest
Rate | | Maturity
Date | | Principal
Amount
(000) | | | Fair
Value | |
| Electric: Power 1.31% | | | | | | | | | | | | |
| AES El Salvador Trust II† | | 6.75% | | 3/28/2023 | | $ | 260 | | | $ | 233,350 | |
| AES Gener SA (Chile)†(c) | | 5.00% | | 7/14/2025 | | | 200 | | | | 191,792 | |
| Appalachian Power Co. | | 7.00% | | 4/1/2038 | | | 529 | | | | 661,445 | |
| Berkshire Hathaway Energy Co. | | 6.50% | | 9/15/2037 | | | 73 | | | | 89,122 | |
| Calpine Corp. | | 5.75% | | 1/15/2025 | | | 374 | | | | 331,457 | |
| Dominion Resources, Inc. | | 7.00% | | 6/15/2038 | | | 266 | | | | 320,768 | |
| Empresa Electrica Guacolda SA (Chile)†(c) | | 4.56% | | 4/30/2025 | | | 200 | | | | 184,695 | |
| Entergy Corp. | | 5.125% | | 9/15/2020 | | | 672 | | | | 722,824 | |
| Exelon Generation Co. LLC | | 5.60% | | 6/15/2042 | | | 390 | | | | 364,362 | |
| Exelon Generation Co. LLC | | 6.25% | | 10/1/2039 | | | 692 | | | | 702,189 | |
| NRG Energy, Inc. | | 8.25% | | 9/1/2020 | | | 235 | | | | 229,125 | |
| Oncor Electric Delivery Co. LLC | | 7.50% | | 9/1/2038 | | | 132 | | | | 175,064 | |
| Origin Energy Finance Ltd. (Australia)†(c) | | 3.50% | | 10/9/2018 | | | 375 | | | | 365,914 | |
| Public Service Co. of New Mexico | | 7.95% | | 5/15/2018 | | | 179 | | | | 200,420 | |
| Red Oak Power LLC | | 8.54% | | 11/30/2019 | | | 70 | | | | 73,235 | |
| Texas-New Mexico Power Co.† | | 9.50% | | 4/1/2019 | | | 212 | | | | 254,070 | |
| Total | | | | | | | | | | | 5,099,832 | |
| |
| Electrical Equipment 0.15% | | | | | | | | | | | | |
| KLA-Tencor Corp. | | 4.65% | | 11/1/2024 | | | 600 | | | | 604,752 | |
| |
| Engineering & Contracting Services 0.03% | | | | | | | | | | | | |
| Odebrecht Finance Ltd.† | | 5.25% | | 6/27/2029 | | | 200 | | | | 98,500 | |
| |
| Entertainment 0.39% | | | | | | | | | | | | |
| CCM Merger, Inc.† | | 9.125% | | 5/1/2019 | | | 221 | | | | 231,774 | |
| Mohegan Tribal Gaming Authority† | | 11.00% | | 9/15/2018 | | | 163 | | | | 162,592 | |
| Palace Entertainment Holdings LLC/Palace Entertainment Holdings Corp.† | | 8.875% | | 4/15/2017 | | | 150 | | | | 147,281 | |
| Pinnacle Entertainment, Inc. | | 8.75% | | 5/15/2020 | | | 300 | | | | 313,125 | |
| Rivers Pittsburgh Borrower LP/Rivers Pittsburgh Finance Corp.† | | 9.50% | | 6/15/2019 | | | 183 | | | | 190,320 | |
| Seminole Tribe of Florida, Inc.† | | 6.535% | | 10/1/2020 | | | 475 | | | | 496,375 | |
| Total | | | | | | | | | | | 1,541,467 | |
| |
| Financial Services 1.38% | | | | | | | | | | | | |
| Air Lease Corp. | | 4.25% | | 9/15/2024 | | | 283 | | | | 278,048 | |
| Denali Borrower LLC/Denali Finance Corp.† | | 5.625% | | 10/15/2020 | | | 527 | | | | 553,350 | |
| General Electric Capital Corp. | | 6.75% | | 3/15/2032 | | | 515 | | | | 673,982 | |
| Jefferies Group LLC | | 6.875% | | 4/15/2021 | | | 543 | | | | 608,802 | |
| Lazard Group LLC | | 6.85% | | 6/15/2017 | | | 132 | | | | 140,591 | |
| 14 | See Notes to Financial Statements. | |
Schedule of Investments (continued)
December 31, 2015
| Investments | | Interest
Rate | | Maturity
Date | | Principal
Amount
(000) | | | Fair
Value | |
| Financial Services (continued) | | | | | | | | | | | | |
| Nationstar Mortgage LLC/Nationstar Capital Corp. | | 7.875% | | 10/1/2020 | | $ | 350 | | | $ | 335,825 | |
| Navient Corp. | | 5.50% | | 1/15/2019 | | | 657 | | | | 615,937 | |
| Navient Corp. | | 8.45% | | 6/15/2018 | | | 442 | | | | 466,310 | |
| Neuberger Berman Group LLC/Neuberger Berman Finance Corp.† | | 5.875% | | 3/15/2022 | | | 749 | | | | 779,896 | |
| Scottrade Financial Services, Inc.† | | 6.125% | | 7/11/2021 | | | 868 | | | | 914,415 | |
| Total | | | | | | | | | | | 5,367,156 | |
| |
| Food 0.45% | | | | | | | | | | | | |
| Gruma SAB de CV (Mexico)†(c) | | 4.875% | | 12/1/2024 | | | 200 | | | | 205,000 | |
| Kraft Foods Group, Inc. | | 6.875% | | 1/26/2039 | | | 700 | | | | 832,225 | |
| Kraft Heinz Foods Co. | | 6.75% | | 3/15/2032 | | | 155 | | | | 179,841 | |
| US Foods, Inc. | | 8.50% | | 6/30/2019 | | | 532 | | | | 549,290 | |
| Total | | | | | | | | | | | 1,766,356 | |
| |
| Health Care Products 0.06% | | | | | | | | | | | | |
| Medtronic, Inc. | | 4.625% | | 3/15/2044 | | | 214 | | | | 218,296 | |
| |
| Health Care Services 0.50% | | | | | | | | | | | | |
| Acadia Healthcare Co., Inc. | | 5.625% | | 2/15/2023 | | | 274 | | | | 260,300 | |
| CHS/Community Health Systems, Inc. | | 6.875% | | 2/1/2022 | | | 556 | | | | 530,285 | |
| IASIS Healthcare LLC/IASIS Capital Corp. | | 8.375% | | 5/15/2019 | | | 392 | | | | 362,600 | |
| Tenet Healthcare Corp. | | 6.75% | | 6/15/2023 | | | 318 | | | | 295,541 | |
| Tenet Healthcare Corp. | | 8.00% | | 8/1/2020 | | | 507 | | | | 510,803 | |
| Total | | | | | | | | | | | 1,959,529 | |
| |
| Household Equipment/Products 0.03% | | | | | | | | | | | | |
| Kimberly-Clark de Mexico SAB de CV (Mexico)†(c) | | 3.80% | | 4/8/2024 | | | 100 | | | | 100,475 | |
| |
| Insurance 0.51% | | | | | | | | | | | | |
| CNO Financial Group, Inc. | | 5.25% | | 5/30/2025 | | | 519 | | | | 530,029 | |
| Symetra Financial Corp.† | | 6.125% | | 4/1/2016 | | | 250 | | | | 252,592 | |
| Teachers Insurance & Annuity Association of America† | | 4.90% | | 9/15/2044 | | | 906 | | | | 917,254 | |
| Willis North America, Inc. | | 7.00% | | 9/29/2019 | | | 274 | | | | 307,336 | |
| Total | | | | | | | | | | | 2,007,211 | |
| |
| Leasing 0.37% | | | | | | | | | | | | |
| Aviation Capital Group Corp.† | | 6.75% | | 4/6/2021 | | | 1,273 | | | | 1,427,351 | |
| | See Notes to Financial Statements. | 15 |
Schedule of Investments (continued)
December 31, 2015
| Investments | | Interest
Rate | | Maturity
Date | | Principal
Amount
(000) | | | Fair
Value | |
| Leisure 0.32% | | | | | | | | | | | | |
| Carnival plc (United Kingdom) | | 7.875% | | 6/1/2027 | | $ | 277 | | | $ | 345,641 | |
| Royal Caribbean Cruises Ltd. | | 7.50% | | 10/15/2027 | | | 798 | | | | 911,715 | |
| Total | | | | | | | | | | | 1,257,356 | |
| |
| Lodging 0.82% | | | | | | | | | | | | |
| Caesar’s Entertainment Resort Properties LLC/Caesar’s Entertainment Resort Properties Finance, Inc. | | 11.00% | | 10/1/2021 | | | 105 | | | | 95,550 | |
| Hyatt Hotels Corp.† | | 6.875% | | 8/15/2019 | | | 632 | | | | 717,055 | |
| Starwood Hotels & Resorts Worldwide, Inc. | | 4.50% | | 10/1/2034 | | | 525 | | | | 474,712 | |
| Sugarhouse HSP Gaming Prop. Mezz. LP/Sugarhouse HSP Gaming Finance Corp.† | | 6.375% | | 6/1/2021 | | | 269 | | | | 251,515 | |
| Wynn Las Vegas LLC/Wynn Las Vegas Capital Corp. | | 5.375% | | 3/15/2022 | | | 1,739 | | | | 1,654,624 | |
| Total | | | | | | | | | | | 3,193,456 | |
| |
| Machinery: Agricultural 0.35% | | | | | | | | | | | | |
| Altria Group, Inc. | | 9.95% | | 11/10/2038 | | | 522 | | | | 839,135 | |
| Reynolds American, Inc. | | 5.70% | | 8/15/2035 | | | 383 | | | | 420,953 | |
| Reynolds American, Inc. | | 8.125% | | 5/1/2040 | | | 78 | | | | 95,960 | |
| Total | | | | | | | | | | | 1,356,048 | |
| |
| Manufacturing 0.12% | | | | | | | | | | | | |
| Trinity Industries, Inc. | | 4.55% | | 10/1/2024 | | | 513 | | | | 470,732 | |
| |
| Media 2.65% | | | | | | | | | | | | |
| 21st Century Fox America, Inc. | | 6.20% | | 12/15/2034 | | | 106 | | | | 120,707 | |
| 21st Century Fox America, Inc. | | 6.90% | | 8/15/2039 | | | 753 | | | | 893,282 | |
| Block Communications, Inc.† | | 7.25% | | 2/1/2020 | | | 195 | | | | 195,000 | |
| CCO Holdings LLC/CCO Holdings Capital Corp. | | 6.50% | | 4/30/2021 | | | 155 | | | | 161,491 | |
| CCO Holdings LLC/CCO Holdings Capital Corp. | | 7.00% | | 1/15/2019 | | | 106 | | | | 108,385 | |
| CCO Safari II LLC† | | 6.384% | | 10/23/2035 | | | 1,124 | | | | 1,138,126 | |
| CCOH Safari LLC† | | 5.75% | | 2/15/2026 | | | 278 | | | | 279,390 | |
| Cox Communications, Inc.† | | 8.375% | | 3/1/2039 | | | 667 | | | | 736,980 | |
| Discovery Communications LLC | | 6.35% | | 6/1/2040 | | | 592 | | | | 590,782 | |
| Globo Comunicacao e Participacoes SA (Brazil)†(c) | | 4.875% | | 4/11/2022 | | | 600 | | | | 583,500 | |
| Myriad International Holdings BV (Netherlands)†(c) | | 5.50% | | 7/21/2025 | | | 350 | | | | 338,170 | |
| Neptune Finco Corp.† | | 10.875% | | 10/15/2025 | | | 406 | | | | 426,300 | |
| Numericable-SFR SAS (France)†(c) | | 6.00% | | 5/15/2022 | | | 500 | | | | 486,250 | |
| Time Warner Cable, Inc. | | 7.30% | | 7/1/2038 | | | 1,403 | | | | 1,525,424 | |
| Time Warner, Inc. | | 7.625% | | 4/15/2031 | | | 949 | | | | 1,177,087 | |
| Univision Communications, Inc.† | | 8.50% | | 5/15/2021 | | | 602 | | | | 617,803 | |
| 16 | See Notes to Financial Statements. | |
Schedule of Investments (continued)
December 31, 2015
| Investments | | Interest
Rate | | Maturity
Date | | Principal
Amount
(000) | | | Fair
Value | |
| Media (continued) | | | | | | | | | | | | |
| Viacom, Inc. | | 6.875% | | 4/30/2036 | | $ | 515 | | | $ | 511,542 | |
| VTR Finance BV (Netherlands)†(c) | | 6.875% | | 1/15/2024 | | | 507 | | | | 467,708 | |
| Total | | | | | | | | | | | 10,357,927 | |
| |
| Metals & Minerals: Miscellaneous 0.45% | | | | | | | | | | | | |
| Barrick Gold Corp. (Canada)(c) | | 4.10% | | 5/1/2023 | | | 91 | | | | 78,185 | |
| Barrick International Barbados Corp. (Barbados)†(c) | | 6.35% | | 10/15/2036 | | | 158 | | | | 117,646 | |
| Glencore Finance Canada Ltd. (Canada)†(c) | | 6.00% | | 11/15/2041 | | | 631 | | | | 458,727 | |
| Glencore Funding LLC† | | 4.625% | | 4/29/2024 | | | 88 | | | | 64,344 | |
| Goldcorp, Inc. (Canada)(c) | | 5.45% | | 6/9/2044 | | | 286 | | | | 230,663 | |
| MMC Norilsk Nickel OJSC via MMC Finance Ltd. (Ireland)†(c) | | 6.625% | | 10/14/2022 | | | 200 | | | | 204,128 | |
| New Gold, Inc. (Canada)†(c) | | 6.25% | | 11/15/2022 | | | 671 | | | | 536,800 | |
| New Gold, Inc. (Canada)†(c) | | 7.00% | | 4/15/2020 | | | 69 | | | | 62,359 | |
| Total | | | | | | | | | | | 1,752,852 | |
| |
| Natural Gas 0.33% | | | | | | | | | | | | |
| Dominion Gas Holdings LLC | | 4.60% | | 12/15/2044 | | | 527 | | | | 491,666 | |
| Fermaca Enterprises S de RL de CV (Mexico)†(c) | | 6.375% | | 3/30/2038 | | | 441 | | | | 414,203 | |
| GNL Quintero SA (Chile)†(c) | | 4.634% | | 7/31/2029 | | | 200 | | | | 189,950 | |
| Southern Star Central Gas Pipeline, Inc.† | | 6.00% | | 6/1/2016 | | | 2 | | | | 2,020 | |
| Transportadora de Gas del Peru SA (Peru)†(c) | | 4.25% | | 4/30/2028 | | | 200 | | | | 188,000 | |
| Total | | | | | | | | | | | 1,285,839 | |
| |
| Oil 2.22% | | | | | | | | | | | | |
| Afren plc (United Kingdom)†(c)(d) | | 6.625% | | 12/9/2020 | | | 244 | | | | 4,928 | |
| Antero Resources Corp.† | | 5.625% | | 6/1/2023 | | | 263 | | | | 206,455 | |
| Apache Corp. | | 6.00% | | 1/15/2037 | | | 570 | | | | 552,138 | |
| Bill Barrett Corp. | | 7.625% | | 10/1/2019 | | | 668 | | | | 470,940 | |
| Canadian Oil Sands Ltd. (Canada)†(c) | | 7.75% | | 5/15/2019 | | | 190 | | | | 203,690 | |
| Canadian Oil Sands Ltd. (Canada)†(c) | | 7.90% | | 9/1/2021 | | | 128 | | | | 138,660 | |
| Carrizo Oil & Gas, Inc. | | 7.50% | | 9/15/2020 | | | 88 | | | | 77,330 | |
| Chaparral Energy, Inc. | | 8.25% | | 9/1/2021 | | | 201 | | | | 49,245 | |
| Delek & Avner Tamar Bond Ltd. (Israel)†(c) | | 5.412% | | 12/30/2025 | | | 137 | | | | 138,199 | |
| Ecopetrol SA (Colombia)(c) | | 5.875% | | 9/18/2023 | | | 250 | | | | 230,625 | |
| Ecopetrol SA (Colombia)(c) | | 5.875% | | 5/28/2045 | | | 100 | | | | 71,500 | |
| Eni SpA (Italy)†(c) | | 5.70% | | 10/1/2040 | | | 1,650 | | | | 1,485,457 | |
| GeoPark Latin America Ltd. Agencia en Chile (Chile)†(c) | | 7.50% | | 2/11/2020 | | | 400 | | | | 281,000 | |
| Helmerich & Payne International Drilling Co. | | 4.65% | | 3/15/2025 | | | 40 | | | | 40,092 | |
| | See Notes to Financial Statements. | 17 |
Schedule of Investments (continued)
December 31, 2015
| Investments | | Interest
Rate | | Maturity
Date | | Principal
Amount
(000) | | | Fair
Value | |
| Oil (continued) | | | | | | | | | | | | |
| Hilcorp Energy I LP/Hilcorp Finance Co.† | | 7.625% | | 4/15/2021 | | $ | 442 | | | $ | 426,530 | |
| Kerr-McGee Corp. | | 7.125% | | 10/15/2027 | | | 142 | | | | 149,736 | |
| Kerr-McGee Corp. | | 7.875% | | 9/15/2031 | | | 422 | | | | 456,333 | |
| Kunlun Energy Co., Ltd. (Hong Kong)†(c) | | 3.75% | | 5/13/2025 | | | 200 | | | | 195,212 | |
| LUKOIL International Finance BV (Netherlands)†(c) | | 6.656% | | 6/7/2022 | | | 100 | | | | 102,984 | |
| Marathon Oil Corp. | | 5.20% | | 6/1/2045 | | | 322 | | | | 229,902 | |
| Marathon Oil Corp. | | 6.60% | | 10/1/2037 | | | 163 | | | | 140,220 | |
| MEG Energy Corp. (Canada)†(c) | | 6.375% | | 1/30/2023 | | | 86 | | | | 59,340 | |
| MEG Energy Corp. (Canada)†(c) | | 7.00% | | 3/31/2024 | | | 881 | | | | 629,915 | |
| PDC Energy, Inc. | | 7.75% | | 10/15/2022 | | | 446 | | | | 430,390 | |
| Petrobras Global Finance BV (Netherlands)(c) | | 4.375% | | 5/20/2023 | | | 310 | | | | 205,375 | |
| Rowan Cos., Inc. | | 7.875% | | 8/1/2019 | | | 593 | | | | 583,404 | |
| Shell International Finance BV (Netherlands)(c) | | 6.375% | | 12/15/2038 | | | 226 | | | | 268,040 | |
| Valero Energy Corp. | | 10.50% | | 3/15/2039 | | | 286 | | | | 381,475 | |
| YPF SA (Argentina)†(c) | | 8.50% | | 7/28/2025 | | | 481 | | | | 460,557 | |
| Total | | | | | | | | | | | 8,669,672 | |
| |
| Oil: Crude Producers 2.20% | | | | | | | | | | | | |
| Columbia Pipeline Group, Inc.† | | 3.30% | | 6/1/2020 | | | 530 | | | | 516,588 | |
| El Paso Pipeline Partners Operating Co. LLC | | 7.50% | | 11/15/2040 | | | 325 | | | | 297,251 | |
| Enbridge Energy Partners LP | | 9.875% | | 3/1/2019 | | | 707 | | | | 805,632 | |
| Energy Transfer Partners LP | | 6.125% | | 12/15/2045 | | | 117 | | | | 95,479 | |
| Energy Transfer Partners LP | | 6.625% | | 10/15/2036 | | | 271 | | | | 235,295 | |
| Energy Transfer Partners LP | | 7.50% | | 7/1/2038 | | | 747 | | | | 691,736 | |
| Enterprise Products Operating LLC | | 7.55% | | 4/15/2038 | | | 561 | | | | 601,620 | |
| Gulfstream Natural Gas System LLC† | | 4.60% | | 9/15/2025 | | | 295 | | | | 280,548 | |
| IFM US Colonial Pipeline 2 LLC† | | 6.45% | | 5/1/2021 | | | 370 | | | | 394,917 | |
| Kinder Morgan Energy Partners LP | | 7.30% | | 8/15/2033 | | | 201 | | | | 184,587 | |
| Kinder Morgan Energy Partners LP | | 7.40% | | 3/15/2031 | | | 176 | | | | 162,598 | |
| Kinder Morgan, Inc. | | 7.75% | | 1/15/2032 | | | 965 | | | | 919,784 | |
| Kinder Morgan, Inc. | | 7.80% | | 8/1/2031 | | | 157 | | | | 147,630 | |
| Plains All American Pipeline LP/PAA Finance Corp. | | 6.65% | | 1/15/2037 | | | 400 | | | | 354,284 | |
| Regency Energy Partners LP/Regency Energy Finance Corp. | | 5.875% | | 3/1/2022 | | | 160 | | | | 151,000 | |
| Ruby Pipeline LLC† | | 6.00% | | 4/1/2022 | | | 534 | | | | 556,848 | |
| Sabine Pass Liquefaction LLC | | 6.25% | | 3/15/2022 | | | 650 | | | | 604,500 | |
| Sabine Pass LNG LP | | 6.50% | | 11/1/2020 | | | 334 | | | | 325,650 | |
| Southeast Supply Header LLC† | | 4.25% | | 6/15/2024 | | | 416 | | | | 399,656 | |
| Tennessee Gas Pipeline Co. LLC | | 8.375% | | 6/15/2032 | | | 67 | | | | 65,196 | |
| 18 | See Notes to Financial Statements. | |
Schedule of Investments (continued)
December 31, 2015
| Investments | | Interest
Rate | | Maturity
Date | | Principal
Amount
(000) | | | Fair
Value | |
| Oil: Crude Producers (continued) | | | | | | | | | | | | |
| Transportadora de Gas Internacional SA ESP (Colombia)†(c) | | 5.70% | | 3/20/2022 | | $ | 200 | | | $ | 201,500 | |
| Williams Cos., Inc. (The) | | 8.75% | | 3/15/2032 | | | 794 | | | | 599,523 | |
| Total | | | | | | | | | | | 8,591,822 | |
| | | | | | | | | | | | | |
| Oil: Integrated Domestic 0.57% | | | | | | | | | | | | |
| Cameron International Corp. | | 7.00% | | 7/15/2038 | | | 170 | | | | 203,248 | |
| Halliburton Co. | | 6.70% | | 9/15/2038 | | | 114 | | | | 133,954 | |
| Halliburton Co. | | 7.45% | | 9/15/2039 | | | 353 | | | | 452,265 | |
| Schlumberger Holdings Corp.† | | 4.00% | | 12/21/2025 | | | 840 | | | | 830,581 | |
| Weatherford International Ltd. | | 9.875% | | 3/1/2039 | | | 702 | | | | 608,107 | |
| Total | | | | | | | | | | | 2,228,155 | |
| | | | | | | | | | | | | |
| Paper & Forest Products 0.44% | | | | | | | | | | | | |
| Georgia-Pacific LLC | | 8.875% | | 5/15/2031 | | | 1,210 | | | | 1,698,714 | |
| | | | | | | | | | | | | |
| Real Estate Investment Trusts 1.86% | | | | | | | | | | | | |
| American Tower Corp. | | 4.00% | | 6/1/2025 | | | 676 | | | | 665,762 | |
| CBRE Services, Inc. | | 4.875% | | 3/1/2026 | | | 892 | | | | 890,303 | |
| CBRE Services, Inc. | | 5.25% | | 3/15/2025 | | | 258 | | | | 261,799 | |
| EPR Properties | | 5.25% | | 7/15/2023 | | | 1,033 | | | | 1,053,555 | |
| Hospitality Properties Trust | | 4.65% | | 3/15/2024 | | | 375 | | | | 369,715 | |
| Host Hotels & Resorts LP | | 5.25% | | 3/15/2022 | | | 372 | | | | 399,829 | |
| Iron Mountain, Inc. | | 6.00% | | 8/15/2023 | | | 182 | | | | 189,052 | |
| Kilroy Realty LP | | 6.625% | | 6/1/2020 | | | 364 | | | | 412,673 | |
| Omega Healthcare Investors, Inc. | | 4.95% | | 4/1/2024 | | | 87 | | | | 88,008 | |
| Omega Healthcare Investors, Inc. | | 5.875% | | 3/15/2024 | | | 639 | | | | 662,962 | |
| PLA Administradora Industrial S de RL de CV (Mexico)†(c) | | 5.25% | | 11/10/2022 | | | 200 | | | | 194,750 | |
| Senior Housing Properties Trust | | 6.75% | | 12/15/2021 | | | 340 | | | | 383,139 | |
| Trust F/1401 (Mexico)†(c) | | 5.25% | | 1/30/2026 | | | 200 | | | | 195,500 | |
| Vereit Operating Partnership LP | | 3.00% | | 2/6/2019 | | | 1,544 | | | | 1,489,188 | |
| Total | | | | | | | | | | | 7,256,235 | |
| | | | | | | | | | | | | |
| Retail 0.67% | | | | | | | | | | | | |
| Chinos Intermediate Holdings A, Inc. PIK† | | 7.75% | | 5/1/2019 | | | 680 | | | | 170,937 | |
| McDonald’s Corp. | | 4.70% | | 12/9/2035 | | | 254 | | | | 253,873 | |
| New Albertson’s, Inc. | | 7.45% | | 8/1/2029 | | | 198 | | | | 176,220 | |
| PVH Corp. | | 7.75% | | 11/15/2023 | | | 561 | | | | 636,735 | |
| QVC, Inc. | | 5.125% | | 7/2/2022 | | | 250 | | | | 249,544 | |
| Tops Holding LLC/Top Markets II Corp.† | | 8.00% | | 6/15/2022 | | | 470 | | | | 465,300 | |
| | See Notes to Financial Statements. | 19 |
Schedule of Investments (continued)
December 31, 2015
| Investments | | Interest
Rate | | Maturity
Date | | Principal
Amount
(000) | | | Fair
Value | |
| Retail (continued) | | | | | | | | | | | | |
| Walgreens Boots Alliance, Inc. | | 4.50% | | 11/18/2034 | | $ | 477 | | | $ | 436,936 | |
| Walgreens Boots Alliance, Inc. | | 4.80% | | 11/18/2044 | | | 245 | | | | 222,448 | |
| Total | | | | | | | | | | | 2,611,993 | |
| | | | | | | | | | | | | |
| Savings & Loan 0.10% | | | | | | | | | | | | |
| First Niagara Financial Group, Inc. | | 7.25% | | 12/15/2021 | | | 323 | | | | 378,051 | |
| | | | | | | | | | | | | |
| Steel 0.18% | | | | | | | | | | | | |
| Allegheny Technologies, Inc. | | 7.625% | | 8/15/2023 | | | 740 | | | | 440,300 | |
| Allegheny Technologies, Inc. | | 9.375% | | 6/1/2019 | | | 340 | | | | 273,700 | |
| Total | | | | | | | | | | | 714,000 | |
| | | | | | | | | | | | | |
| Technology 0.98% | | | | | | | | | | | | |
| Alibaba Group Holding Ltd. (China)(c) | | 3.60% | | 11/28/2024 | | | 680 | | | | 652,013 | |
| Amazon.com, Inc. | | 4.80% | | 12/5/2034 | | | 2,058 | | | | 2,173,507 | |
| Expedia, Inc. | | 4.50% | | 8/15/2024 | | | 478 | | | | 462,153 | |
| Tencent Holdings Ltd. (China)†(c) | | 3.375% | | 5/2/2019 | | | 510 | | | | 518,998 | |
| Total | | | | | | | | | | | 3,806,671 | |
| | | | | | | | | | | | | |
| Telecommunications 2.43% | | | | | | | | | | | | |
| AT&T, Inc. | | 4.50% | | 5/15/2035 | | | 153 | | | | 141,948 | |
| AT&T, Inc. | | 6.30% | | 1/15/2038 | | | 868 | | | | 952,792 | |
| AT&T, Inc. | | 6.50% | | 9/1/2037 | | | 899 | | | | 1,007,698 | |
| CenturyLink, Inc. | | 6.75% | | 12/1/2023 | | | 757 | | | | 712,526 | |
| CenturyLink, Inc. | | 6.875% | | 1/15/2028 | | | 183 | | | | 137,250 | |
| Digicel Group Ltd. (Jamaica)†(c) | | 7.125% | | 4/1/2022 | | | 200 | | | | 151,000 | |
| Frontier Communications Corp. | | 7.625% | | 4/15/2024 | | | 225 | | | | 190,125 | |
| Frontier Communications Corp. | | 9.25% | | 7/1/2021 | | | 910 | | | | 897,487 | |
| Frontier Communications Corp.† | | 10.50% | | 9/15/2022 | | | 214 | | | | 213,733 | |
| Frontier Communications Corp.† | | 11.00% | | 9/15/2025 | | | 375 | | | | 372,187 | |
| GTE Corp. | | 6.94% | | 4/15/2028 | | | 1,606 | | | | 1,904,523 | |
| Millicom International Cellular SA (Luxembourg)†(c) | | 4.75% | | 5/22/2020 | | | 200 | | | | 180,000 | |
| Motorola Solutions, Inc. | | 3.75% | | 5/15/2022 | | | 525 | | | | 481,657 | |
| MTN Mauritius Investments Ltd. (Mauritius)†(c) | | 4.755% | | 11/11/2024 | | | 200 | | | | 175,500 | |
| T-Mobile USA, Inc. | | 6.00% | | 3/1/2023 | | | 588 | | | | 596,820 | |
| T-Mobile USA, Inc. | | 6.464% | | 4/28/2019 | | | 202 | | | | 208,529 | |
| T-Mobile USA, Inc. | | 6.542% | | 4/28/2020 | | | 440 | | | | 459,800 | |
| Verizon Communications, Inc. | | 4.272% | | 1/15/2036 | | | 323 | | | | 292,550 | |
| Verizon Communications, Inc. | | 5.85% | | 9/15/2035 | | | 372 | | | | 399,013 | |
| Total | | | | | | | | | | | 9,475,138 | |
| 20 | See Notes to Financial Statements. | |
Schedule of Investments (continued)
December 31, 2015
| Investments | | Interest
Rate | | Maturity
Date | | Principal
Amount
(000) | | | Fair
Value | |
| Textiles Products 0.10% | | | | | | | | | | | | |
| Mohawk Industries, Inc. | | 6.125% | | 1/15/2016 | | $ | 385 | | | $ | 385,410 | |
| | | | | | | | | | | | | |
| Transportation: Miscellaneous 0.10% | | | | | | | | | | | | |
| Autoridad del Canal de Panama (Panama)†(c) | | 4.95% | | 7/29/2035 | | | 200 | | | | 207,000 | |
| Florida East Coast Holdings Corp.† | | 6.75% | | 5/1/2019 | | | 205 | | | | 188,088 | |
| Total | | | | | | | | | | | 395,088 | |
| | | | | | | | | | | | | |
| Utilities 0.18% | | | | | | | | | | | | |
| Aquarion Co.† | | 4.00% | | 8/15/2024 | | | 742 | | | | 720,719 | |
| | | | | | | | | | | | | |
| Utilities: Electrical 0.10% | | | | | | | | | | | | |
| Tennessee Valley Authority | | 3.50% | | 12/15/2042 | | | 440 | | | | 407,358 | |
| Total Corporate Bonds (cost $124,508,460) | | | | | | | | | | | 116,425,846 | |
| | | | | | | | | | | | | |
| FOREIGN GOVERNMENT OBLIGATIONS 3.45% | | | | | | | | | | | | |
| | | | | | | | | | | | | |
| Argentina 0.07% | | | | | | | | | | | | |
| Provincia de Buenos Aires†(c) | | 9.95% | | 6/9/2021 | | | 250 | | | | 258,125 | |
| | | | | | | | | | | | | |
| Bermuda 0.25% | | | | | | | | | | | | |
| Government of Bermuda† | | 5.603% | | 7/20/2020 | | | 900 | | | | 993,375 | |
| | | | | | | | | | | | | |
| Brazil 0.12% | | | | | | | | | | | | |
| Federal Republic of Brazil(c) | | 4.25% | | 1/7/2025 | | | 400 | | | | 322,500 | |
| Federal Republic of Brazil(c) | | 5.00% | | 1/27/2045 | | | 200 | | | | 134,500 | |
| Total | | | | | | | | | | | 457,000 | |
| | | | | | | | | | | | | |
| Chile 0.09% | | | | | | | | | | | | |
| Republic of Chile(c) | | 3.125% | | 3/27/2025 | | | 356 | | | | 357,424 | |
| | | | | | | | | | | | | |
| Dominican Republic 0.19% | | | | | | | | | | | | |
| Dominican Republic†(c) | | 5.50% | | 1/27/2025 | | | 290 | | | | 280,575 | |
| Dominican Republic†(c) | | 6.60% | | 1/28/2024 | | | 200 | | | | 209,000 | |
| Dominican Republic†(c) | | 6.85% | | 1/27/2045 | | | 250 | | | | 236,875 | |
| Total | | | | | | | | | | | 726,450 | |
| | | | | | | | | | | | | |
| El Salvador 0.05% | | | | | | | | | | | | |
| Republic of EI Salvador†(c) | | 6.375% | | 1/18/2027 | | | 206 | | | | 175,100 | |
| | | | | | | | | | | | | |
| Ethiopia 0.05% | | | | | | | | | | | | |
| Republic of Ethiopia†(c) | | 6.625% | | 12/11/2024 | | | 200 | | | | 178,080 | |
| | | | | | | | | | | | | |
| Gabon 0.04% | | | | | | | | | | | | |
| Republic of Gabon†(c) | | 6.375% | | 12/12/2024 | | | 200 | | | | 159,608 | |
| | See Notes to Financial Statements. | 21 |
Schedule of Investments (continued)
December 31, 2015
| Investments | | Interest
Rate | | Maturity
Date | | Principal
Amount
(000) | | | Fair
Value | |
| Ghana 0.08% | | | | | | | | | | | | |
| Republic of Ghana†(c) | | 7.875% | | 8/7/2023 | | $ | 400 | | | $ | 317,404 | |
| | | | | | | | | | | | | |
| Honduras 0.22% | | | | | | | | | | | | |
| Honduras Government†(c) | | 7.50% | | 3/15/2024 | | | 800 | | | | 846,000 | |
| | | | | | | | | | | | | |
| Hungary 0.12% | | | | | | | | | | | | |
| Republic of Hungary(c) | | 5.375% | | 3/25/2024 | | | 418 | | | | 458,755 | |
| Republic of Hungary(c) | | 5.75% | | 11/22/2023 | | | 2 | | | | 2,243 | |
| Total | | | | | | | | | | | 460,998 | |
| | | | | | | | | | | | | |
| Indonesia 0.24% | | | | | | | | | | | | |
| Perusahaan Penerbit SBSN†(c) | | 3.30% | | 11/21/2022 | | | 200 | | | | 186,946 | |
| Perusahaan Penerbit SBSN†(c) | | 4.00% | | 11/21/2018 | | | 200 | | | | 208,500 | |
| Perusahaan Penerbit SBSN†(c) | | 4.325% | | 5/28/2025 | | | 275 | | | | 262,983 | |
| Republic of Indonesia†(c) | | 5.875% | | 1/15/2024 | | | 250 | | | | 268,453 | |
| Total | | | | | | | | | | | 926,882 | |
| | | | | | | | | | | | | |
| Ivory Coast 0.09% | | | | | | | | | | | | |
| Ivory Coast Bond†(c) | | 6.375% | | 3/3/2028 | | | 400 | | | | 365,984 | |
| | | | | | | | | | | | | |
| Kazakhstan 0.04% | | | | | | | | | | | | |
| Republic of Kazakhstan†(c) | | 4.875% | | 10/14/2044 | | | 200 | | | | 167,693 | |
| | | | | | | | | | | | | |
| Latvia 0.08% | | | | | | | | | | | | |
| Republic of Latvia†(c) | | 5.25% | | 6/16/2021 | | | 258 | | | | 293,274 | |
| | | | | | | | | | | | | |
| Lithuania 0.18% | | | | | | | | | | | | |
| Republic of Lithuania†(c) | | 7.375% | | 2/11/2020 | | | 592 | | | | 701,520 | |
| | | | | | | | | | | | | |
| Mexico 0.24% | | | | | | | | | | | | |
| United Mexican States(c) | | 4.00% | | 10/2/2023 | | | 664 | | | | 674,292 | |
| United Mexican States(c) | | 5.55% | | 1/21/2045 | | | 243 | | | | 249,986 | |
| Total | | | | | | | | | | | 924,278 | |
| | | | | | | | | | | | | |
| Panama 0.11% | | | | | | | | | | | | |
| Republic of Panama(c) | | 4.00% | | 9/22/2024 | | | 200 | | | | 201,000 | |
| Republic of Panama(c) | | 6.70% | | 1/26/2036 | | | 64 | | | | 76,320 | |
| Republic of Panama(c) | | 8.875% | | 9/30/2027 | | | 100 | | | | 138,750 | |
| Total | | | | | | | | | | | 416,070 | |
| | | | | | | | | | | | | |
| Paraguay 0.26% | | | | | | | | | | | | |
| Republic of Paraguay†(c) | | 4.625% | | 1/25/2023 | | | 1,050 | | | | 1,023,750 | |
| | | | | | | | | | | | | |
| Peru 0.04% | | | | | | | | | | | | |
| Republic of Peru(c) | | 4.125% | | 8/25/2027 | | | 152 | | | | 149,720 | |
| 22 | See Notes to Financial Statements. | |
Schedule of Investments (continued)
December 31, 2015
| Investments | | Interest
Rate | | Maturity
Date | | Principal
Amount
(000) | | | Fair
Value | |
| Philippines 0.15% | | | | | | | | | | | | |
| Republic of Philippines(c) | | 3.95% | | 1/20/2040 | | $ | 200 | | | $ | 202,827 | |
| Republic of Philippines(c) | | 7.50% | | 9/25/2024 | | | 200 | | | | 260,798 | |
| Republic of Philippines(c) | | 9.50% | | 10/21/2024 | | | 92 | | | | 136,596 | |
| Total | | | | | | | | | | | 600,221 | |
| | | | | | | | | | | | | |
| Poland 0.08% | | | | | | | | | | | | |
| Republic of Poland(c) | | 4.00% | | 1/22/2024 | | | 291 | | | | 306,566 | |
| | | | | | | | | | | | | |
| Romania 0.01% | | | | | | | | | | | | |
| Republic of Romania†(c) | | 6.125% | | 1/22/2044 | | | 49 | | | | 57,452 | |
| | | | | | | | | | | | | |
| Russia 0.10% | | | | | | | | | | | | |
| Russia Eurobonds†(c) | | 4.875% | | 9/16/2023 | | | 400 | | | | 407,250 | |
| | | | | | | | | | | | | |
| Slovenia 0.11% | | | | | | | | | | | | |
| Republic of Slovenia†(c) | | 5.25% | | 2/18/2024 | | | 400 | | | | 442,250 | |
| | | | | | | | | | | | | |
| South Africa 0.08% | | | | | | | | | | | | |
| Republic of South Africa(c) | | 4.665% | | 1/17/2024 | | | 122 | | | | 116,358 | |
| Republic of South Africa(c) | | 5.875% | | 9/16/2025 | | | 200 | | | | 205,330 | |
| Total | | | | | | | | | | | 321,688 | |
| | | | | | | | | | | | | |
| Trinidad And Tobago 0.05% | | | | | | | | | | | | |
| Republic of Trinidad & Tobago†(c) | | 4.375% | | 1/16/2024 | | | 200 | | | | 212,000 | |
| | | | | | | | | | | | | |
| Turkey 0.31% | | | | | | | | | | | | |
| Republic of Turkey(c) | | 4.25% | | 4/14/2026 | | | 200 | | | | 188,130 | |
| Republic of Turkey(c) | | 5.625% | | 3/30/2021 | | | 440 | | | | 466,400 | |
| Republic of Turkey(c) | | 5.75% | | 3/22/2024 | | | 510 | | | | 540,228 | |
| Total | | | | | | | | | | | 1,194,758 | |
| Total Foreign Government Obligations (cost $13,917,089) | | | | | | | | | | | 13,440,920 | |
| | | | | | | | | | | | | |
| GOVERNMENT SPONSORED ENTERPRISES COLLATERALIZED MORTGAGE OBLIGATIONS 1.00% | |
| Federal Home Loan Mortgage Corp. Q001 XA IO | | 2.364% | # | 2/25/2032 | | | 2,953 | | | | 539,804 | |
| Government National Mortgage Assoc. 2014-78 A | | 2.20% | | 4/16/2047 | | | 65 | | | | 65,247 | |
| Government National Mortgage Assoc. 2015-47 AE | | 2.90% | # | 11/16/2055 | | | 1,818 | | | | 1,832,225 | |
| Government National Mortgage Assoc. 2015-48 AS | | 2.90% | # | 2/16/2049 | | | 1,037 | | | | 1,049,349 | |
| Government National Mortgage Assoc. 2015-73 AC | | 2.90% | # | 2/16/2053 | | | 396 | | | | 401,631 | |
Total Government Sponsored Enterprises Collateralized Mortgage Obligations
(cost $3,921,249) | | | | | | | | | 3,888,256 | |
| | See Notes to Financial Statements. | 23 |
Schedule of Investments (continued)
December 31, 2015
| Investments | | Interest
Rate | | Maturity
Date | | Principal
Amount
(000) | | | Fair
Value | |
| GOVERNMENT SPONSORED ENTERPRISES PASS-THROUGHS 19.99% | | | | | | | | |
| Federal Home Loan Mortgage Corp. | | 2.156% | # | 6/1/2043 | | $ | 1,177 | | | $ | 1,192,173 | |
| Federal Home Loan Mortgage Corp. | | 3.076% | # | 10/1/2044 | | | 1,488 | | | | 1,529,451 | |
| Federal Home Loan Mortgage Corp. | | 3.161% | # | 7/1/2044 | | | 538 | | | | 553,925 | |
| Federal Home Loan Mortgage Corp. | | 3.216% | # | 6/1/2044 | | | 745 | | | | 768,101 | |
| Federal Home Loan Mortgage Corp.(e) | | 3.50% | | TBA | | | 8,240 | | | | 8,482,774 | |
| Federal Home Loan Mortgage Corp. | | 4.00% | | 12/1/2044 | | | 1,391 | | | | 1,487,614 | |
| Federal Home Loan Mortgage Corp. | | 5.00% | | 9/1/2019 -
6/1/2026 | | | 450 | | | | 471,089 | |
| Federal National Mortgage Assoc. | | 2.81% | # | 11/1/2044 | | | 426 | | | | 436,866 | |
| Federal National Mortgage Assoc. (e) | | 3.00% | | TBA | | | 16,174 | | | | 16,293,235 | |
| Federal National Mortgage Assoc. | | 3.149% | # | 3/1/2042 | | | 1,528 | | | | 1,603,448 | |
| Federal National Mortgage Assoc.(e) | | 3.50% | | TBA | | | 7,620 | | | | 7,862,326 | |
| Federal National Mortgage Assoc. | | 3.50% | | 4/1/2043 -
11/1/2045 | | | 11,527 | | | | 11,926,606 | |
| Federal National Mortgage Assoc. | | 4.00% | | 10/1/2040 -
11/1/2044 | | | 5,265 | | | | 5,597,419 | |
| Federal National Mortgage Assoc.(e) | | 4.50% | | TBA | | | 16,495 | | | | 17,815,116 | |
| Federal National Mortgage Assoc. | | 5.50% | | 11/1/2034 -
9/1/2036 | | | 1,761 | | | | 1,977,662 | |
| Total Government Sponsored Enterprises Pass-Throughs (cost $78,496,539) | | | | | | | 77,997,805 | |
| | | | | | | | | | | | | |
| MUNICIPAL BONDS 0.26% | | | | | | | | | | | | |
| | | | | | | | | | | | | |
| Miscellaneous | | | | | | | | | | | | |
| Municipal Elec Auth of Georgia | | 7.055% | | 4/1/2057 | | | 557 | | | | 623,701 | |
| North Texas Tollway Auth | | 8.91% | | 2/1/2030 | | | 320 | | | | 380,755 | |
| Total Municipal Bonds (cost $985,835) | | | | | | | | | | | 1,004,456 | |
| | | | | | | | | | | | | |
| NON-AGENCY COMMERCIAL MORTGAGE-BACKED SECURITIES 3.76% | | | | | | | | |
| Banc of America Commercial Mortgage Trust 2015-UBS7 B | | 4.367% | # | 9/15/2048 | | | 188 | | | | 193,634 | |
| Banc of America Commercial Mortgage Trust 2015-UBS7 C | | 4.367% | # | 9/15/2048 | | | 94 | | | | 91,379 | |
| Bear Stearns ALT-A Trust 2004-8 1A | | 0.921% | # | 9/25/2034 | | | 93 | | | | 90,720 | |
| CGBAM Commercial Mortgage Trust 2015-SMRT B† | | 3.213% | | 4/10/2028 | | | 212 | | | | 213,716 | |
| CGBAM Commercial Mortgage Trust 2015-SMRT C† | | 3.516% | | 4/10/2028 | | | 159 | | | | 160,362 | |
| Citigroup Commercial Mortgage Trust 2014-GC25 C | | 4.533% | # | 10/10/2047 | | | 300 | | | | 290,478 | |
| 24 | See Notes to Financial Statements. | |
Schedule of Investments (continued)
December 31, 2015
| Investments | | Interest
Rate | | Maturity
Date | | Principal
Amount
(000) | | | Fair
Value | |
| NON-AGENCY COMMERCIAL MORTGAGE-BACKED SECURITIES (continued) | | | | | | | | |
| Citigroup Commercial Mortgage Trust 2015-GC33 AS | | 4.114% | | 9/10/2058 | | $ | 381 | | | $ | 391,505 | |
| Citigroup Commercial Mortgage Trust 2015-GC33 B | | 4.571% | | 9/10/2058 | | | 415 | | | | 430,469 | |
| COBALT CMBS Commercial Mortgage Trust 2007-C2 AMFX | | 5.526% | | 4/15/2047 | | | 165 | | | | 171,892 | |
| Commercial Mortgage Pass-Through Certificates 2013-WWP D† | | 3.898% | | 3/10/2031 | | | 593 | | | | 589,109 | |
| Commercial Mortgage Pass-Through Certificates 2014-CR19 XA IO | | 1.295% | # | 8/10/2047 | | | 756 | | | | 52,624 | |
| Commercial Mortgage Pass-Through Certificates 2015-LC23 C | | 4.646% | # | 10/10/2053 | | | 350 | | | | 341,705 | |
| Commercial Mortgage Pass-Through Certificates 2015-LC23 D† | | 3.646% | # | 10/10/2053 | | | 606 | | | | 493,715 | |
| Commercial Mortgage Pass-Through Certificates 2015-PC1 B | | 4.443% | # | 7/10/2050 | | | 178 | | | | 178,418 | |
| CSAIL Commercial Mortgage Trust 2015-C2 C | | 4.213% | # | 6/15/2057 | | | 700 | | | | 635,002 | |
| DBWF Mortgage Trust 2015-LCM A2† | | 3.421% | # | 6/10/2034 | | | 245 | | | | 241,372 | |
| DBWF Mortgage Trust 2015-LCM D† | | 3.421% | # | 6/10/2034 | | | 257 | | | | 235,775 | |
| GAHR Commercial Mortgage Trust 2015-NRF DFX† | | 3.382% | # | 12/15/2019 | | | 278 | | | | 268,277 | |
| GS Mortgage Securities Corp. II 2012-TMSQ A† | | 3.007% | | 12/10/2030 | | | 900 | | | | 889,789 | |
| GS Mortgage Securities Trust 2015-GC32 C | | 4.412% | # | 7/10/2048 | | | 195 | | | | 189,171 | |
| Houston Galleria Mall Trust 2015-HGLR A1A2† | | 3.087% | | 3/5/2037 | | | 134 | | | | 131,042 | |
| Hudsons Bay Simon JV Trust 2015-HB7 B7† | | 4.666% | | 8/5/2034 | | | 668 | | | | 685,937 | |
| Hudsons Bay Simon JV Trust 2015-HB7 D7† | | 5.159% | # | 8/5/2034 | | | 629 | | | | 615,623 | |
| JPMorgan Chase Commercial Mortgage Securities Trust 2014-C19 AS | | 4.243% | | 4/15/2047 | | | 400 | | | | 419,442 | |
| JPMorgan Chase Commercial Mortgage Securities Trust 2014-C25 AS | | 4.065% | | 11/15/2047 | | | 707 | | | | 730,495 | |
| JPMorgan Chase Commercial Mortgage Securities Trust 2015-C30 C | | 4.313% | # | 7/15/2048 | | | 157 | | | | 141,155 | |
| LB-UBS Commercial Mortgage Trust 2006-C4 AM | | 5.84% | # | 6/15/2038 | | | 240 | | | | 244,237 | |
| MASTR Asset Securitization Trust 2006-3 1A3 | | 6.00% | | 10/25/2036 | | | 10 | | | | 9,903 | |
| MASTR Asset Securitization Trust 2006-3 1A8 | | 6.00% | | 10/25/2036 | | | 23 | | | | 22,262 | |
| Merrill Lynch Mortgage Investors Trust 2006-AF2 AF1 | | 6.25% | | 10/25/2036 | | | 27 | | | | 23,704 | |
| Morgan Stanley Bank of America Merrill Lynch Trust 2015-C23 XA IO | | 0.767% | # | 7/15/2050 | | | 19,923 | | | | 900,138 | |
| Motel 6 Trust 2015-MTL6 D† | | 4.532% | | 2/5/2030 | | | 1,012 | | | | 997,283 | |
| | See Notes to Financial Statements. | 25 |
Schedule of Investments (continued)
December 31, 2015
| Investments | | Interest
Rate | | Maturity
Date | | Principal
Amount
(000) | | | Fair
Value | |
| NON-AGENCY COMMERCIAL MORTGAGE-BACKED SECURITIES (continued) | | | | | | | | |
| SFAVE Commercial Mortgage Securities Trust 2015-5AVE A1† | | 3.872% | # | 1/5/2035 | | $ | 401 | | | $ | 395,981 | |
| SFAVE Commercial Mortgage Securities Trust 2015-5AVE A2B† | | 4.144% | # | 1/5/2035 | | | 250 | | | | 239,336 | |
| Structured Asset Securities Corp. 2006-3H 1A2 | | 5.75% | | 12/25/2035 | | | 15 | | | | 14,626 | |
| UBS-BAMLL Trust 2012-WRM E† | | 4.238% | # | 6/10/2030 | | | 595 | | | | 571,708 | |
| UBS-Barclays Commercial Mortgage Trust 2012-C3 B† | | 4.365% | | 8/10/2049 | | | 200 | | | | 209,165 | |
| Wells Fargo Commercial Mortgage Trust 2013-120B D† | | 2.71% | # | 3/18/2028 | | | 44 | | | | 42,137 | |
| Wells Fargo Commercial Mortgage Trust 2013-LC12 D† | | 4.299% | # | 7/15/2046 | | | 364 | | | | 333,209 | |
| Wells Fargo Commercial Mortgage Trust 2015-C28 D | | 4.139% | # | 5/15/2048 | | | 1,489 | | | | 1,175,257 | |
| Wells Fargo Commercial Mortgage Trust 2015-LC20 B | | 3.719% | | 4/15/2050 | | | 402 | | | | 383,893 | |
| WF-RBS Commercial Mortgage Trust 2014-C25 B | | 4.236% | | 11/15/2047 | | | 215 | | | | 216,083 | |
| Total Non-Agency Commercial Mortgage-Backed Securities (cost $14,783,479) | | | | | | | 14,651,728 | |
| | | | | | | | | | | | | |
| U.S. TREASURY OBLIGATIONS 26.57% | | | | | | | | | | | | |
| U.S. Treasury Bond | | 2.875% | | 8/15/2045 | | | 5,358 | | | | 5,205,002 | |
| U.S. Treasury Bond | | 3.00% | | 5/15/2045 | | | 7,482 | | | | 7,449,708 | |
| U.S. Treasury Note | | 0.875% | | 10/15/2017 | | | 30,919 | | | | 30,830,232 | |
| U.S. Treasury Note | | 1.25% | | 11/30/2018 | | | 21,292 | | | | 21,259,572 | |
| U.S. Treasury Note | | 1.375% | | 10/31/2020 | | | 7,559 | | | | 7,426,271 | |
| U.S. Treasury Note | | 1.625% | | 11/30/2020 | | | 23,991 | | | | 23,850,893 | |
| U.S. Treasury Note | | 1.75% | | 12/31/2020 | | | 3,245 | | | | 3,242,086 | |
| U.S. Treasury Note | | 2.625% | | 11/15/2020 | | | 4,247 | | | | 4,413,397 | |
| Total U.S. Treasury Obligations (cost $104,088,759) | | | | | | | | | | | 103,677,161 | |
| Total Long-Term Investments (cost $413,599,832) | | | | | | | | | | | 403,620,382 | |
| | | | | | | | | | | | | |
| SHORT-TERM INVESTMENTS 10.18% | | | | | | | | | | | | |
| | | | | | | | | | | | | |
| U.S. TREASURY OBLIGATION 0.98% | | | | | | | | | | | | |
U.S. Treasury Note
(cost $3,841,536) | | 1.50% | | 7/31/2016 | | | 3,815 | | | | 3,834,670 | |
| 26 | See Notes to Financial Statements. | |
Schedule of Investments (continued)
December 31, 2015
| Investments | | | Principal
Amount
(000) | | | | Fair
Value | |
| REPURCHASE AGREEMENT 9.20% | | | | | | | | |
Repurchase Agreement dated 12/31/2015, 0.03% due 1/4/2016 with Fixed Income Clearing Corp. collateralized by $36,580,000 of U.S. Treasury Note at 1.625% due 7/31/2020; value: $36,625,725; proceeds: $35,906,099
(cost $35,905,980) | | $ | 35,906 | | | $ | 35,905,980 | |
| Total Short-Term Investments (cost $39,747,516) | | | | | | | 39,740,650 | |
| Total Investments in Securities 113.64% (cost $453,347,348) | | | | | | | 443,361,032 | |
| Liabilities in Excess of Cash and Other Assets(f) (13.64%) | | | | | | | (53,206,290 | ) |
| Net Assets 100.00% | | | | | | $ | 390,154,742 | |
| IO | | Interest Only. |
| PIK | | Payment-in-kind. |
| † | | Security was purchased pursuant to Rule 144A under the Securities Act of 1933 and, unless registered under such Act or exempted from registration, may only be resold to qualified institutional buyers. |
| # | | Variable rate security. The interest rate represents the rate in effect at December 31, 2015. |
| (a) | | Amount is less than $1,000. |
| (b) | | Securities purchased on a when-issued basis (See Note 2(i)). |
| (c) | | Foreign security traded in U.S. dollars. |
| (d) | | Defaulted Security |
| (e) | | To-be-announced (“TBA”). Security purchased on a forward commitment basis with an approximate principal and maturity date. Actual principal and maturity will be determined upon settlement when the specific mortgage pools are assigned. |
| (f) | | Liabilities in Excess of Cash and Other Assets include net unrealized appreciation/depreciation on futures contracts as follows: |
Open Futures Contracts at December 31, 2015:
| Type | | Expiration | | Contracts | | Position | | Fair Value | | | Unrealized
Appreciation |
| U.S. 10-Year Treasury Note | | March 2016 | | 77 | | Short | | $(9,694,781 | ) | | $34,154 |
| | | | | | | | | | | | |
| Type | | Expiration | | Contracts | | Position | | Fair Value | | | Unrealized
Depreciation |
| U.S. 5-Year Treasury Note | | March 2016 | | 170 | | Long | | $20,114,453 | | | $(47,331) |
| | See Notes to Financial Statements. | 27 |
Schedule of Investments (concluded)
December 31, 2015
The following is a summary of the inputs used as of December 31, 2015 in valuing the Fund’s investments carried at fair value(1):
| Investment Type(2)(3) | | Level 1 | | | Level 2 | | | Level 3 | | | Total | |
| Asset-Backed Securities | | | | | | | | | | | | | | | | |
| Other | | $ | – | | | $ | 20,650,819 | | | $ | 1,252,335 | (4) | | $ | 21,903,154 | |
| Remaining Industries | | | – | | | | 50,631,056 | | | | – | | | | 50,631,056 | |
| Corporate Bonds | | | – | | | | 116,425,846 | | | | – | | | | 116,425,846 | |
| Foreign Government Obligations | | | – | | | | 13,440,920 | | | | – | | | | 13,440,920 | |
| Government Sponsored Enterprises Collateralized Mortgage Obligations | | | – | | | | 3,348,452 | | | | 539,804 | (4) | | | 3,888,256 | |
| Government Sponsored Enterprises Pass-Throughs | | | – | | | | 77,997,805 | | | | – | | | | 77,997,805 | |
| Municipal Bonds | | | – | | | | 1,004,456 | | | | – | | | | 1,004,456 | |
| Non-Agency Commercial Mortgage-Backed Securities | | | – | | | | 14,651,728 | | | | – | | | | 14,651,728 | |
| U.S. Treasury Obligations | | | – | | | | 107,511,831 | | | | – | | | | 107,511,831 | |
| Repurchase Agreement | | | – | | | | 35,905,980 | | | | – | | | | 35,905,980 | |
| Total | | $ | – | | | $ | 441,568,893 | | | $ | 1,792,139 | | | $ | 443,361,032 | |
| | | | | | | | | | | | | | | | | |
| Other Financial Instruments | | | | | | | | | | | | | | | | |
| Futures Contracts | | | | | | | | | | | | | | | | |
| Assets | | $ | 34,154 | | | $ | – | | | $ | – | | | $ | 34,154 | |
| Liabilities | | | (47,331 | ) | | | – | | | | – | | | | (47,331 | ) |
| Total | | $ | (13,177 | ) | | $ | – | | | $ | – | | | $ | (13,177 | ) |
| (1) | | Refer to Note 2(k) for a description of fair value measurements and the three-tier hierarchy of inputs. |
| (2) | | See Schedule of Investments for fair values in each industry and identification of foreign issuers and/or geography. |
| (3) | | There were no Level 1/Level 2 transfers during the fiscal year ended December 31, 2015. |
| (4) | | Includes securities valued utilizing third party pricing information without adjustment. Such valuations are based on unobservable inputs. A significant change in third party information could result in a significantly lower or higher value of such Level 3 investments. |
The following is a reconciliation of investments with unobservable inputs (Level 3) that were used in determining fair value:
| Investment Type | | Asset-Backed
Securities | | | Government
Sponsored Enerprises
Collateralized
Mortgage Obligations | |
| Balance as of January 1, 2015 | | $ | – | | | $ | – | |
| Accrued discounts/premiums | | | – | | | | (38,384 | ) |
| Realized gain (loss) | | | 5 | | | | – | |
| Change in unrealized appreciation/depreciation | | | – | | | | (23,933 | ) |
| Purchases | | | 1,267,782 | | | | – | |
| Sales | | | (15,452 | ) | | | – | |
| Net transfers in or out of Level 3 | | | – | | | | 602,121 | |
| Balance as of December 31, 2015 | | $ | 1,252,335 | | | $ | 539,804 | |
| 28 | See Notes to Financial Statements. | |
Statement of Assets and Liabilities
December 31, 2015
| ASSETS: | | | |
| Investments in securities, at fair value (cost $453,347,348) | | $ | 443,361,032 | |
| Deposits with brokers for futures collateral | | | 81,390 | |
| Cash | | | 26,271 | |
| Receivables: | | | | |
| Interest | | | 2,779,183 | |
| Capital shares sold | | | 225,056 | |
| From advisor (See Note 3) | | | 86,542 | |
| Variation margin | | | 1,032 | |
| Prepaid expenses | | | 2,152 | |
| Total assets | | | 446,562,658 | |
| LIABILITIES: | | | | |
| Payables: | | | | |
| Investment securities purchased | | | 55,951,003 | |
| Management fee | | | 145,620 | |
| Directors’ fees | | | 17,943 | |
| Fund administration | | | 12,944 | |
| Capital shares reacquired | | | 6,850 | |
| Accrued expenses | | | 273,556 | |
| Total liabilities | | | 56,407,916 | |
| NET ASSETS | | $ | 390,154,742 | |
| COMPOSITION OF NET ASSETS: | | | | |
| Paid-in capital | | $ | 402,750,855 | |
| Undistributed net investment income | | | 40,752 | |
| Accumulated net realized loss on investments and futures contracts | | | (2,637,372 | ) |
| Net unrealized depreciation on investments and futures contracts | | | (9,999,493 | ) |
| Net Assets | | $ | 390,154,742 | |
| Outstanding shares (50 million shares of common stock authorized, $.001 par value) | | | 24,015,159 | |
| Net asset value, offering and redemption price per share (Net assets divided by outstanding shares) | | | $16.25 | |
| | See Notes to Financial Statements. | 29 |
Statement of Operations
For the Year Ended December 31, 2015
| Investment income: | | | |
| Interest and other | | $ | 10,155,834 | |
| Total investment income | | | 10,155,834 | |
| Expenses: | | | | |
| Management fee | | | 1,663,291 | |
| Non 12b-1 service fees | | | 924,689 | |
| Shareholder servicing | | | 393,113 | |
| Fund administration | | | 147,848 | |
| Professional | | | 50,331 | |
| Reports to shareholders | | | 40,230 | |
| Custody | | | 21,384 | |
| Directors’ fees | | | 12,751 | |
| Other | | | 50,659 | |
| Gross expenses | | | 3,304,296 | |
| Expense reductions (See Note 9) | | | (389 | ) |
| Fees waived and expenses reimbursed (See Note 3) | | | (938,337 | ) |
| Net expenses | | | 2,365,570 | |
| Net investment income | | | 7,790,264 | |
| Net realized and unrealized gain (loss): | | | | |
| Net realized gain on investments | | | 855,550 | |
| Net realized gain on futures contracts | | | 240,749 | |
| Net change in unrealized appreciation/depreciation on investments | | | (11,930,045 | ) |
| Net change in unrealized appreciation/depreciation on futures contracts | | | (41,092 | ) |
| Net realized and unrealized loss | | | (10,874,838 | ) |
| Net Decrease in Net Assets Resulting From Operations | | $ | (3,084,574 | ) |
| 30 | See Notes to Financial Statements. | |
Statements of Changes in Net Assets
| INCREASE IN NET ASSETS | | For the Year Ended
December 31, 2015 | | | For the Year Ended
December 31, 2014 | |
| Operations: | | | | | | | | |
| Net investment income | | $ | 7,790,264 | | | $ | 3,928,179 | |
| Net realized gain on investments and futures contracts | | | 1,096,299 | | | | 4,100,562 | |
| Net change in unrealized appreciation/depreciation on | | | | | | | | |
| investments and futures contracts | | | (11,971,137 | ) | | | 3,096,560 | |
| Net increase (decrease) in net assets resulting from operations | | | (3,084,574 | ) | | | 11,125,301 | |
| Distributions to shareholders from: | | | | | | | | |
| Net investment income | | | (10,557,123 | ) | | | (5,950,169 | ) |
| Net realized gain | | | (517,492 | ) | | | (540,936 | ) |
| Total distributions to shareholders | | | (11,074,615 | ) | | | (6,491,105 | ) |
| Capital share transactions (Net of share conversions) (See Note 13): |
| Proceeds from sales of shares | | | 112,443,645 | | | | 163,654,366 | |
| Reinvestment of distributions | | | 11,074,615 | | | | 6,491,105 | |
| Cost of shares reacquired | | | (36,936,737 | ) | | | (4,717,518 | ) |
| Net increase in net assets resulting from capital share transactions | | | 86,581,523 | | | | 165,427,953 | |
| Net increase in net assets | | | 72,422,334 | | | | 170,062,149 | |
| NET ASSETS: | | | | | | | | |
| Beginning of year | | $ | 317,732,408 | | | $ | 147,670,259 | |
| End of year | | $ | 390,154,742 | | | $ | 317,732,408 | |
| Undistributed net investment income | | $ | 40,752 | | | $ | 25,148 | |
| | See Notes to Financial Statements. | 31 |
Financial Highlights
| | | | | | Per Share Operating Performance: |
| | | | | | Investment operations: | | Distributions to
shareholders from: |
| | | Net asset
value,
beginning
of year | | Net
invest-
ment
income(a) | | Net
realized
and
unrealized
gain (loss) | | Total
from
invest-
ment
opera-
tions | | Net
investment
income | | Net
realized
gain | | Total
distri-
butions |
| 12/31/2015 | | | $16.85 | | | | $0.36 | | | | $(0.47 | ) | | | $(0.11 | ) | | | $(0.47 | ) | | | $(0.02 | ) | | | $(0.49 | ) |
| 12/31/2014 | | | 16.22 | | | | 0.32 | | | | 0.66 | | | | 0.98 | | | | (0.32 | ) | | | (0.03 | ) | | | (0.35 | ) |
| 12/31/2013 | | | 16.73 | | | | 0.29 | | | | (0.47 | ) | | | (0.18 | ) | | | (0.32 | ) | | | (0.01 | ) | | | (0.33 | ) |
| 12/31/2012 | | | 16.06 | | | | 0.31 | | | | 0.78 | | | | 1.09 | | | | (0.30 | ) | | | (0.12 | ) | | | (0.42 | ) |
| 12/31/2011 | | | 15.28 | | | | 0.40 | | | | 0.95 | | | | 1.35 | | | | (0.34 | ) | | | (0.23 | ) | | | (0.57 | ) |
| (a) | Calculated using average shares outstanding during the year. |
| (b) | Total return does not consider the effects of sales charges or other expenses imposed by an insurance company and assumes the reinvestment of all distributions. |
| 32 | See Notes to Financial Statements. | |
| | | | | Ratios to Average Net Assets: | | Supplemental Data: |
Net
asset
value,
end of
year | | Total
return(b)
(%) | | Total
expenses
after
waivers
and/or reim-
bursements
(%) | | Total
expenses
(%) | | Net
investment
income
(%) | | Net
assets,
end of
year
(000) | | Portfolio
turnover
rate
(%) |
| $ | 16.25 | | | | (0.66 | ) | | | 0.64 | | | | 0.89 | | | | 2.11 | | | | $390,155 | | | | 431.81 | |
| | 16.85 | | | | 6.08 | | | | 0.64 | | | | 0.90 | | | | 1.87 | | | | 317,732 | | | | 466.40 | |
| | 16.22 | | | | (1.10 | ) | | | 0.64 | | | | 0.95 | | | | 1.74 | | | | 147,670 | | | | 625.23 | |
| | 16.73 | | | | 6.82 | | | | 0.64 | | | | 1.16 | | | | 1.85 | | | | 50,239 | | | | 588.93 | |
| | 16.06 | | | | 8.77 | | | | 0.64 | | | | 1.95 | | | | 2.48 | | | | 12,878 | | | | 645.34 | |
| | See Notes to Financial Statements. | 33 |
Notes to Financial Statements
Lord Abbett Series Fund, Inc. (the “Company”) is registered under the Investment Company Act of 1940, as amended (“the Act”), as a diversified, open-end management investment company and was incorporated under Maryland law in 1989. The Company consists of thirteen separate portfolios. This report covers Total Return Portfolio (the “Fund”).
The Fund’s investment objective is to seek income and capital appreciation to produce a high total return. The Fund has Variable Contract class shares (“Class VC Shares”), which are currently issued and redeemed only in connection with investments in, and payments under, variable annuity contracts and variable life insurance policies issued by life insurance and insurance-related companies.
The preparation of the financial statements in conformity with accounting principles generally accepted in the United States of America (“U.S. GAAP”) requires management to make certain estimates and assumptions that affect the reported amounts of assets and liabilities and disclosure of contingent assets and liabilities at the date of the financial statements and the reported amounts of increases and decreases in net assets from operations during the reporting period. Actual results could differ from those estimates. The Fund is considered an investment company under U.S. GAAP and follows the accounting and reporting guidance applicable to investment companies.
| 2. | SIGNIFICANT ACCOUNTING POLICIES |
| (a) | Investment Valuation–Under procedures approved by the Fund’s Board of Directors (the “Board”), Lord, Abbett & Co. LLC (“Lord Abbett”), the Fund’s investment manager, has formed a Pricing Committee to administer the pricing and valuation of portfolio investments and to ensure that prices utilized reasonably reflect fair value. Among other things, these procedures allow the Fund to utilize independent pricing services, quotations from securities and financial instrument dealers and other market sources to determine fair value. |
| | |
| | Securities actively traded on any recognized U.S. or non-U.S. exchange or on The NASDAQ Stock Market LLC are valued at the last sale price or official closing price on the exchange or system on which they are principally traded. Events occurring after the close of trading on non-U.S. exchanges may result in adjustments to the valuation of foreign securities to reflect their fair value as of the close of regular trading on the New York Stock Exchange. The Fund may utilize an independent fair valuation service in adjusting the valuations of foreign securities. Unlisted equity securities are valued at the last quoted sale price or, if no sale price is available, at the mean between the most recently quoted bid and asked prices. Fixed income securities are valued based on evaluated prices supplied by independent pricing services, which reflect broker/dealer supplied valuations and the independent pricing services’ own electronic data processing techniques. Exchange traded options and futures contracts are valued at the last sale price in the market where they are principally traded. If no sale has occurred, the mean between the most recently quoted bid and asked prices is used. |
| | |
| | Securities for which prices are not readily available are valued at fair value as determined by the Pricing Committee. The Pricing Committee considers a number of factors, including observable and unobservable inputs, when arriving at fair value. The Pricing Committee may use related or comparable assets or liabilities, recent transactions, market multiples, book values, yield curves, broker quotes, observable trading activity, option adjusted spread models and other relevant information to determine the fair value of portfolio investments. The Board or a designated committee thereof regularly reviews fair value determinations made by the |
34
Notes to Financial Statements (continued)
| | Pricing Committee and employs techniques such as reviewing related market activity, reviewing inputs and assumptions, and retrospectively comparing prices of subsequent purchases and sales transactions to fair value determinations made by the Pricing Committee. |
| | |
| | Short-term securities with 60 days or less remaining to maturity are valued using the amortized cost method, which approximates fair value. |
| | |
| (b) | Security Transactions–Security transactions are recorded as of the date that the securities are purchased or sold (trade date). Realized gains and losses on sales of portfolio securities are calculated using the identified-cost method. |
| | |
| (c) | Investment Income–Dividend income is recorded on the ex-dividend date. Interest income is recorded on the accrual basis as earned. Discounts are accreted and premiums are amortized using the effective interest method and are included in Interest and other on the Statement of Operations. Withholding taxes on foreign dividends have been provided for in accordance with the applicable country’s tax rules and rates. |
| | |
| (d) | Income Taxes–It is the policy of the Fund to meet the requirements of Subchapter M of the Internal Revenue Code applicable to regulated investment companies and to distribute substantially all taxable income and capital gains to its shareholders. Therefore, no income tax provision is required. |
| | |
| | The Fund files U.S. federal and various state and local tax returns. No income tax returns are currently under examination. The statute of limitations on the Fund’s filed U.S. federal tax returns remains open for the fiscal years ended December 31, 2012 through December 31, 2015. The statutes of limitations on the Company’s state and local tax returns may remain open for an additional year depending upon the jurisdiction. |
| | |
| (e) | Expenses–Expenses incurred by the Company that do not specifically relate to an individual fund are generally allocated to the funds within the Company on a pro rata basis by relative net assets. |
| | |
| (f) | Foreign Transactions–The books and records of the Fund are maintained in U.S. dollars and transactions denominated in foreign currencies are recorded in the Fund’s records at the rate prevailing when earned or recorded. Asset and liability accounts that are denominated in foreign currencies are adjusted daily to reflect current exchange rates and any unrealized gain (loss) is included in Net change in unrealized appreciation/depreciation on futures contracts on the Fund’s Statement of Operations. The resultant exchange gains and losses upon settlement of such transactions are included in Net realized gain on futures contracts on the Fund’s Statement of Operations. The Fund does not isolate that portion of the results of operations arising as a result of changes in the foreign exchange rates from the changes in market prices of the securities. |
| | |
| (g) | Futures Contracts–The Fund may purchase and sell futures contracts to enhance returns, to attempt to economically hedge some of its investment risk, or as a substitute position in lieu of holding the underlying asset on which the instrument is based. At the time of entering into a futures transaction, an investor is required to deposit and maintain a specified amount of cash or eligible securities called “initial margin.” Subsequent payments made or received by the Fund called “variation margin” are made on a daily basis as the market price of the futures contract fluctuates. The Fund will record an unrealized gain (loss) based on the amount of variation margin. When a contract is closed, a realized gain (loss) is recorded equal to the difference between the opening and closing value of the contract. |
35
Notes to Financial Statements (continued)
| (h) | Repurchase Agreements–The Fund may enter into repurchase agreements with respect to securities. A repurchase agreement is a transaction in which a fund acquires a security and simultaneously commits to resell that security to the seller (a bank or securities dealer) at an agreed-upon price on an agreed-upon date. The Fund requires at all times that the repurchase agreement be collateralized by cash, or by securities of the U.S. Government, its agencies, its instrumentalities, or U.S. Government sponsored enterprises having a value equal to, or in excess of, the value of the repurchase agreement (including accrued interest). If the seller of the agreement defaults on its obligation to repurchase the underlying securities at a time when the fair value of these securities has declined, the Fund may incur a loss upon disposition of the securities. |
| | |
| (i) | When-Issued, Forward Transactions or To-Be-Announced (“TBA”) Transactions–The Fund may purchase portfolio securities on a when-issued or forward basis. When-issued, forward transactions or TBA transactions involve a commitment by a fund to purchase securities, with payment and delivery (“settlement”) to take place in the future, in order to secure what is considered to be an advantageous price or yield at the time of entering into the transaction. During the period between purchase and settlement, the fair value of the securities will fluctuate and assets consisting of cash and/or marketable securities (normally short-term U.S. Government or U.S. Government sponsored enterprise securities) marked to market daily in an amount sufficient to make payment at settlement will be segregated at the Fund’s custodian in order to pay for the commitment. At the time the Fund makes the commitment to purchase a security on a when-issued basis, it will record the transaction and reflect the liability for the purchase and fair value of the security in determining its net asset value (“NAV”). The Fund, generally, has the ability to close out a purchase obligation on or before the settlement date rather than take delivery of the security. Under no circumstances will settlement for such securities take place more than 120 days after the purchase date. |
| | |
| (j) | Mortgage Dollar Rolls–The Fund may enter into mortgage dollar rolls in which a fund sells mortgage-backed securities for delivery in the current month and simultaneously contracts with the same counterparty to repurchase similar (same type, coupon and maturity) but not identical securities on a specified future date. During the roll period, the Fund loses the right to receive principal (including prepayments of principal) and interest paid on the securities sold. |
| | |
| (k) | Fair Value Measurements–Fair value is defined as the price that the Fund would receive upon selling an investment or transferring a liability in an orderly transaction to an independent buyer in the principal or most advantageous market of the investment. A three-tier hierarchy is used to maximize the use of observable market data and minimize the use of unobservable inputs and to establish classification of fair value measurements for disclosure purposes. Inputs refer broadly to the assumptions that market participants would use in pricing the asset or liability, including assumptions about risk—for example, the risk inherent in a particular valuation technique used to measure fair value (such as a pricing model) and/or the risk inherent in the inputs to the valuation technique. Inputs may be observable or unobservable. Observable inputs reflect the assumptions market participants would use in pricing the asset or liability. Observable inputs are based on market data obtained from sources independent of the reporting entity. Unobservable inputs reflect the reporting entity’s own assumptions about the assumptions market participants would use in pricing the asset or liability. Unobservable inputs are based on the best information available in the circumstances. |
36
Notes to Financial Statements (continued)
| | The three-tier hierarchy of inputs is summarized in the three broad Levels listed below: |
| | |
| | • | Level 1 – | unadjusted quoted prices in active markets for identical investments; |
| | | | |
| | • | Level 2 – | other significant observable inputs (including quoted prices for similar investments, interest rates, prepayment speeds, credit risk, etc.); and |
| | | | |
| | • | Level 3 – | significant unobservable inputs (including the Fund’s own assumptions in determining the fair value of investments). |
A summary of inputs used in valuing the Fund’s investments as of December 31, 2015 and, if applicable, Level 1/Level 2 transfers and Level 3 rollforwards for the fiscal year then ended is included in the Fund’s Schedule of Investments.
Changes in valuation techniques may result in transfers into or out of an assigned level within the three-tier hierarchy. All transfers between different levels within the three-tier hierarchy are deemed to have occurred as of the beginning of the reporting period. The inputs or methodology used for valuing securities are not necessarily an indication of the risk associated with investing in those securities.
| 3. | MANAGEMENT FEE AND OTHER TRANSACTIONS WITH AFFILIATES |
Management Fee
The Company has a management agreement with Lord Abbett, pursuant to which Lord Abbett supplies the Fund with investment management services and executive and other personnel, provides office space and pays for ordinary and necessary office and clerical expenses relating to research and statistical work and supervision of the Fund’s investment portfolio.
The management fee is based on the Fund’s average daily net assets at the following annual rate:
| First $1 billion | | | .45 | % |
| Next $1 billion | | | .40 | % |
| Over $2 billion | | | .35 | % |
For the fiscal year ended December 31, 2015, the effective management fee, net of waivers, was at an annualized rate of .20% of the Fund’s average daily net assets.
In addition, Lord Abbett provides certain administrative services to the Fund pursuant to an Administrative Services Agreement in return for a fee at an annual rate of .04% of the Fund’s average daily net assets.
During the fiscal year ended December 31, 2015 and continuing through April 30, 2016, Lord Abbett has contractually agreed to waive its fees and reimburse expenses to the extent necessary to limit total net annual operating expenses to an annual rate of .64%. This agreement may be terminated only by the approval of the Board.
The Company, on behalf of the Fund, has entered into services arrangements with certain insurance companies. Under these arrangements, certain insurance companies will be compensated up to .25% of the average daily net asset value (“NAV”) of the Fund’s Class VC Shares held in the insurance company’s separate account to service and maintain the Variable Contract owners’ accounts. This amount is included in Non 12b-1 service fees on the Statement of Operations. The Fund may also compensate certain insurance companies, third-party administrators and other entities for providing recordkeeping, sub-transfer agency and other administrative services to the Fund. This amount is included in Shareholder servicing on the Statement of Operations.
37
Notes to Financial Statements (continued)
A Director and certain of the Company’s officers have an interest in Lord Abbett.
| 4. | DISTRIBUTIONS AND CAPITAL LOSS CARRYFORWARDS |
Dividends from net investment income, if any, are declared and paid at least semi-annually. Taxable net realized gains from investment transactions, reduced by allowable capital loss carryforwards, if any, are declared and distributed to shareholders at least annually. The capital loss carryforward amount, if any, is available to offset future net capital gains. Dividends and distributions to shareholders are recorded on the ex-dividend date. The amounts of dividends and distributions from net investment income and net realized capital gains are determined in accordance with federal income tax regulations, which may differ from U.S. GAAP. These book/tax differences are either considered temporary or permanent in nature. To the extent these differences are permanent in nature, such amounts are reclassified within the components of net assets based on their federal tax basis treatment; temporary differences do not require reclassification. Dividends and distributions that exceed earnings and profits for tax purposes are reported as a tax return of capital.
The tax character of distributions paid during the fiscal years ended December 31, 2015 and 2014 was as follows:
| | | Year Ended
12/31/2015 | | | Year Ended
12/31/2014 | |
| Distributions paid from: | | | | | | |
| Ordinary income | | $ | 11,074,615 | | | $ | 6,491,105 | |
| Total distributions paid | | $ | 11,074,615 | | | $ | 6,491,105 | |
As of December 31, 2015, the components of accumulated losses on a tax-basis were as follows:
| Undistributed ordinary income – net | | $ | 58,695 | |
| Total undistributed earnings | | | 58,695 | |
| Capital loss carryforwards* | | | (81,006 | ) |
| Temporary differences | | | (848,649 | ) |
| Unrealized losses – net | | | (11,725,153 | ) |
| Total accumulated losses – net | | $ | (12,596,113 | ) |
* The capital losses will carryforward indefintely.
At the Fund’s election, certain losses incurred within the taxable year (Qualified Late-Year Losses) are deemed to arise on the first business day of the Fund’s next taxable year. The Fund incurred and will elect to defer post-October capital losses of $830,706 during fiscal year 2015.
As of December 31, 2015, the aggregate unrealized security gains and losses based on cost for U.S. federal income tax purposes were as follows:
| Tax cost | | $ | 455,033,431 | |
| Gross unrealized gain | | | 653,190 | |
| Gross unrealized loss | | | (12,325,589 | ) |
| Net unrealized security loss | | $ | (11,672,399 | ) |
The difference between book-basis and tax-basis unrealized gains (losses) is attributable to the tax treatment of premium amortization and wash sales.
38
Notes to Financial Statements (continued)
Permanent items identified during the fiscal year ended December 31, 2015 have been reclassified among the components of net assets based on their tax basis treatment as follows:
Undistributed
Net Investment
Income | | | Accumulated
Net Realized
Loss | | | Paid-in
Capital | |
| $ 2,782,463 | | | | $ (2,804,451 | ) | | | $ 21,988 | |
The permanent differences are attributable to the tax treatment of premium amortization, principal paydown gains and losses, certain securities and certain distributions.
| 5. | PORTFOLIO SECURITIES TRANSACTIONS |
Purchases and sales of investment securities (excluding short-term investments) for the fiscal year ended December 31, 2015 were as follows:
U.S.
Government
Purchases* | | | Non-U.S.
Government
Purchases | | | U.S.
Government
Sales* | | | Non-U.S.
Government
Sales | |
| $ 1,578,608,932 | | | | $ 211,978,795 | | | | $ 1,548,851,061 | | | | $ 142,986,401 | |
* Includes U.S. Government sponsored enterprises securities.
The Fund is permitted to purchase and sell securities (“cross-trade”) from and to other Lord Abbett Funds or client accounts pursuant to procedures approved by the Board in compliance with Rule 17a-7 under the Act (the “Rule”). Each cross-trade is executed at a fair market price in compliance with provisions of the Rule. For the year ended December 31, 2015, the Fund engaged in cross-trade purchases of $23,835 and sales of $228,900, which resulted in net realized gains of $6,808.
| 6. | DISCLOSURES ABOUT DERIVATIVE INSTRUMENTS AND HEDGING ACTIVITIES |
The Fund entered into U.S. Treasury futures contracts for the fiscal year ended December 31, 2015 (as described in note 2(g)) to economically hedge against changes in interest rates. The Fund bears the risk of interest rates moving unexpectedly, in which case the Fund may not achieve the anticipated benefits of the futures contracts and realize a loss. There is minimal counterparty credit risk to the Fund since futures are exchange traded and the exchange’s clearinghouse, as counterparty to all exchange traded futures, guarantees futures against default.
As of December 31, 2015, the Fund had futures contracts with unrealized depreciation of $13,177, which is included in the Schedule of Investments. Only current day’s variation margin is reported within the Fund’s Statement of Assets and Liabilities. Net realized gain of $240,749 and net change in unrealized depreciation of $(41,092) are included on the Statement of Operations related to futures contracts under the captions Net realized gain on futures contracts and Net change in unrealized appreciation/depreciation on futures contracts, respectively. The average number of futures contracts throughout the period was 402.
| 7. | DISCLOSURES ABOUT OFFSETTING ASSETS AND LIABILITIES |
The Financial Accounting Standards Board (“FASB”) requires disclosures intended to help better assess the effect or potential effect of offsetting arrangements on a fund’s financial position. The following tables illustrate gross and net information about recognized assets and liabilities eligible for offset in the statement of assets and liabilities; and disclose such amounts subject to an enforceable master netting agreement or similar agreement, by counterparty. A master netting agreement is an agreement between a fund and a counterparty which provides for the net
39
Notes to Financial Statements (continued)
settlement of amounts owed under all contracts traded under that agreement, as well as cash collateral, through a single payment by one party to the other in the event of default on or termination of any one contract. The Fund’s accounting policy with respect to balance sheet offsetting is that, absent an event of default by the counterparty or a termination of the agreement, the master netting agreement does not result in an offset of reported amounts of financial assets and liabilities in the statement of assets and liabilities across transactions between the Fund and the applicable counterparty:
| Description | | Gross Amounts of
Recognized Assets | | | Gross Amounts
Offset in the
Statement of Assets
and Liabilities | | Net Amounts of
Assets Presented
in the Statement of
Assets and Liabilities |
| Repurchase Agreement | | $ | 35,905,980 | | | $ | – | | $ | 35,905,980 |
| Total | | $ | 35,905,980 | | | $ | – | | $ | 35,905,980 |
| | | Net Amounts | | | | | | | | | | | | |
| | | of Assets | | | Amounts Not Offset in the | | | |
| | | Presented in | | | Statement of Assets and Liabilities | | | |
| | | the Statement | | | | | | Cash | | | Securities | | | |
| | | of Assets and | | | Financial | | | Collateral | | | Collateral | | | Net |
| Counterparty | | Liabilities | | | Instruments | | | Received(a) | | | Received(a) | | | Amount(b) |
| Fixed Income Clearing Corp. | | | $35,905,980 | | | $ | – | | | $ | – | | | | $(35,905,980 | ) | | $ | – |
| Total | | | $35,905,980 | | | $ | – | | | $ | – | | | | $(35,905,980 | ) | | $ | – |
| (a) | Collateral disclosed is limited to an amount not to exceed 100% of the net amount of assets presented in the Statement of Assets and Liabilities, for each respective counterparty. |
| (b) | Net amount represents the amount owed to the Fund by the counterparty as of December 31, 2015. |
| 8. | DIRECTORS’ REMUNERATION |
The Company’s officers and a Director, who are associated with Lord Abbett, do not receive any compensation from the Company for serving in such capacities. Independent Directors’ fees are allocated among all Lord Abbett-sponsored funds based on the net assets of each fund. There is an equity-based plan available to all Independent Directors under which Independent Directors must defer receipt of a portion of, and may elect to defer receipt of an additional portion of Directors’ fees. The deferred amounts are treated as though equivalent dollar amounts had been invested in the funds. Such amounts and earnings accrued thereon are included in Directors’ fees on the Statement of Operations and in Directors’ fees payable on the Statement of Assets and Liabilities and are not deductible for U.S. federal income tax purposes until such amounts are paid.
The Company has entered into an arrangement with its transfer agent and custodian, whereby credits realized as a result of uninvested cash balances are used to reduce a portion of the Fund’s expenses.
Effective August 31, 2015, the Fund and certain other funds managed by Lord Abbett (collectively, the “Participating Funds”) entered into a syndicated line of credit facility with various lenders for $550 million (the “Facility”), whereas State Street Bank and Trust Company (“SSB”) participates as a lender and as agent for the lenders. The Facility is to be used for temporary or emergency purposes as an additional source of: liquidity to satisfy redemptions. The Participating Funds are subject to graduated borrowing limits of one-third of Fund assets (if Fund assets are less than $750
40
Notes to Financial Statements (continued)
million), $250 million, $300 million, or $350 million, based on past borrowings and likelihood of future borrowings. The Facility will continue through August 29, 2016.
Prior to August 31, 2015, the Fund and certain other funds managed by Lord Abbett participated in a $500 million unsecured revolving credit facility with SSB (the “SSB Facility”).
During the fiscal year ended December 31, 2015, the Fund did not utilize the Facility or the SSB Facility.
| 11. | CUSTODIAN AND ACCOUNTING AGENT |
SSB is the Company’s custodian and accounting agent. SSB performs custodial, accounting and recordkeeping functions relating to portfolio transactions and calculating the Fund’s NAV.
The Fund is subject to the general risks and considerations associated with investing in fixed income securities. The value of an investment will change as interest rates fluctuate in response to market movements. When interest rates rise, the prices of fixed income securities are likely to decline; when interest rates fall, such prices tend to rise.
The Fund may invest a significant portion of its assets in asset backed securities and mortgage related securities, including those of such government sponsored enterprises as Federal Home Loan Mortgage Corporation and Federal National Mortgage Association. In addition, the Fund may invest in non-agency asset backed and mortgage related securities, which are issued by private institutions, not by government-sponsored enterprises. Such securities may be particularly sensitive to changes in economic conditions, including delinquencies and/or defaults, and changes in prevailing interest rates. These changes can affect the value, income and/or liquidity of such positions. When interest rates are declining, the value of these securities with prepayment features may not increase as much as other fixed income securities. Early principal repayment may deprive the Fund of income payments above current market rates. The prepayment rate also will affect the price and volatility of these securities. In addition, securities of government sponsored enterprises are guaranteed with respect to the timely payment of interest and principal by the particular enterprises involved, not by the U.S. Government.
The lower-rated or high-yield bonds (also known as “junk” bonds) in which the Fund may invest are subject to greater price fluctuations, as well as additional risks.
The Fund is subject to the risks associated with derivatives, which may be different from and greater than the risks associated with directly investing in securities. Derivatives may be subject to risks such as liquidity risk, leveraging risk, interest rate risk, market risk, and credit risk. Illiquid securities may lower the Fund’s returns since the Fund may be unable to sell these securities at their desired time or price. Derivatives also may involve the risk of mispricing or improper valuation and the risk that changes in the value of the derivative may not correlate perfectly with the value of the underlying asset, rate or index. Whether the Fund’s use of derivatives is successful will depend on, among other things, the Fund’s ability to correctly forecast market movements, changes in foreign exchange and interest rates, and other factors. If the Fund incorrectly forecasts these and other factors, its performance could suffer.
The Fund’s investment exposure to foreign (which may include emerging market) companies presents increased market, liquidity, currency, political, information and other risks. The cost of the Fund’s use of forward foreign currency exchange contracts varies with factors such as the
41
Notes to Financial Statements (concluded)
currencies involved, the length of the contract period and the market conditions prevailing. The Fund’s exposure to inflation-linked investments, such as Treasury Inflation Protected Securities, may be vulnerable to changes in expectations of inflation or interest rates.
The Fund may invest in floating rate or adjustable rate senior loans, which are subject to increased credit and liquidity risks. Senior loans are business loans made to borrowers that may be U.S. or foreign corporations, partnerships or other business entities. The senior loans in which the Fund invests may consist primarily of senior loans that are rated below investment grade or, if unrated, deemed by Lord Abbett to be equivalent to below investment grade securities. Below investment grade senior loans, as in the case of high-yield debt securities, or junk bonds, are usually more credit sensitive than interest rate sensitive, although the value of these instruments may be impacted by broader interest rate swings in the overall fixed income market.
These factors can affect the Fund’s performance.
| 13. | SUMMARY OF CAPITAL TRANSACTIONS |
Transactions in shares of capital stock were as follows:
| | | Year Ended
December 31, 2015 | | | Year Ended
December 31, 2014 | |
| Shares sold | | | 6,664,833 | | | | 9,645,453 | |
| Reinvestment of distributions | | | 680,589 | | | | 386,825 | |
| Shares reacquired | | | (2,188,823 | ) | | | (277,907 | ) |
| Increase | | | 5,156,599 | | | | 9,754,371 | |
42
Report of Independent Registered Public Accounting Firm
To the Board of Directors of Lord Abbett Series Fund, Inc. and the Shareholders of Total Return Portfolio:
We have audited the accompanying statement of assets and liabilities, including the schedule of investments, of the Total Return Portfolio, one of the portfolios constituting the Lord Abbett Series Fund, Inc. (the “Fund”) as of December 31, 2015, and the related statement of operations for the year then ended, the statements of changes in net assets for each of the two years in the period then ended, and the financial highlights for each of the five years in the period then ended. These financial statements and financial highlights are the responsibility of the Fund’s management. Our responsibility is to express an opinion on these financial statements and financial highlights based on our audits.
We conducted our audits in accordance with the standards of the Public Company Accounting Oversight Board (United States). Those standards require that we plan and perform the audit to obtain reasonable assurance about whether the financial statements and financial highlights are free of material misstatement. The Fund is not required to have, nor were we engaged to perform, an audit of its internal control over financial reporting. Our audits included consideration of internal control over financial reporting as a basis for designing audit procedures that are appropriate in the circumstances, but not for the purpose of expressing an opinion on the effectiveness of the Fund’s internal control over financial reporting. Accordingly, we express no such opinion. An audit also includes examining, on a test basis, evidence supporting the amounts and disclosures in the financial statements, assessing the accounting principles used and significant estimates made by management, as well as evaluating the overall financial statement presentation. Our procedures included confirmation of securities owned as of December 31, 2015, by correspondence with the custodian and brokers; when replies were not received from brokers, we performed other auditing procedures. We believe that our audits provide a reasonable basis for our opinion.
In our opinion, such financial statements and financial highlights referred to above present fairly, in all material respects, the financial position of Total Return Portfolio of the Lord Abbett Series Fund, Inc. as of December 31, 2015, the results of its operations for the year then ended, the changes in its net assets for each of the two years in the period then ended, and the financial highlights for each of the five years in the period then ended, in conformity with accounting principles generally accepted in the United States of America.
DELOITTE & TOUCHE LLP
New York, New York
February 16, 2016
43
Basic Information About Management
The Board is responsible for the management of the business and affairs of the Company in accordance with the laws of the State of Maryland. The Board elects officers who are responsible for the day-to-day operations of the Fund and who execute policies authorized by the Board. The Board also approves an investment adviser to the Fund and continues to monitor the cost and quality of the services the investment adviser provides, and annually considers whether to renew the contract with the adviser. Generally, each Director holds office until his/her successor is elected and qualified or until his/her earlier resignation or removal, as provided in the Company’s organizational documents.
Lord Abbett, a Delaware limited liability company, is the Fund’s investment adviser. Designated Lord Abbett personnel are responsible for the day-to-day management of the Fund.
Interested Director
Ms. Foster is affiliated with Lord Abbett and is an “interested person” of the Company as defined in the Act. Ms. Foster is a director/trustee and officer of each of the 12 investment companies in the Lord Abbett Family of Funds, which consist of 58 portfolios or series.
Name, Address and
Year of Birth | | Current Position and
Length of Service
with the Fund | | Principal Occupation and Other Directorships
During the Past Five Years |
Daria L. Foster
Lord, Abbett & Co. LLC
90 Hudson Street
Jersey City, NJ 07302
(1954) | | Director and President
since 2006; Chief
Executive Officer
since 2012 | | Principal Occupation: Managing Partner of Lord Abbett, joined Lord Abbett in 1990. Other Directorships: None. |
Independent Directors
The following Independent Directors also are directors/trustees of each of the 12 investment companies in the Lord Abbett Family of Funds, which consist of 58 portfolios or series.
Name, Address and
Year of Birth | | Current Position and
Length of Service
with the Fund | | Principal Occupation and Other Directorships
During the Past Five Years |
E. Thayer Bigelow
Lord, Abbett & Co. LLC
c/o Legal Dept.
90 Hudson Street
Jersey City, NJ 07302
(1941) | | Director since 1994;
Chairman since 2013 | | Principal Occupation: Managing General Partner, Bigelow Media, LLC (since 2000); Senior Adviser, Time Warner Inc. (1998–2000). Other Directorships: Currently serves as director of Crane Co. (since 1984) and Huttig Building Products Inc. (since 1998). Previously served as a director of R.H. Donnelley Inc. (2009–2010). |
Robert B. Calhoun, Jr.
Lord, Abbett & Co. LLC
c/o Legal Dept.
90 Hudson Street
Jersey City, NJ 07302
(1942) | | Director since 1998 | | Principal Occupation: Senior Advisor of Monitor Clipper Partners, a private equity investment fund (since 1997); President of Clipper Asset Management Corp. (1991–2009). Other Directorships: None. |
44
Basic Information About Management (continued)
Name, Address and
Year of Birth | | Current Position and
Length of Service
with the Fund | | Principal Occupation and Other Directorships
During the Past Five Years |
Eric C. Fast
Lord, Abbett & Co. LLC
c/o Legal Dept.
90 Hudson Street
Jersey City, NJ 07302
(1949) | | Director since 2014 | | Principal Occupation: Chief Executive Officer of Crane Co., an industrial products company (2001–2014). Other Directorships: Currently serves as director of Automatic Data Processing, Inc. (since 2007) and Regions Financial Corporation (since 2010). Previously served as a director of Crane Co. (1999–2014). |
| | | | | |
Evelyn E. Guernsey
Lord, Abbett & Co. LLC
c/o Legal Dept.
90 Hudson Street
Jersey City, NJ 07302
(1955) | | Director since 2011 | | Principal Occupation: CEO, Americas of J.P. Morgan Asset Management (2004–2010). Other Directorships: None. |
| | | | | |
Julie A. Hill
Lord, Abbett & Co. LLC
c/o Legal Dept.
90 Hudson Street
Jersey City, NJ 07302
(1946) | | Director since 2004 | | Principal Occupation: Owner and CEO of The Hill Company, a business consulting firm (since 1998). Other Directorships: Currently serves as director of Anthem, Inc., a health benefits company (since 1994). |
| | | | | |
Franklin W. Hobbs
Lord, Abbett & Co. LLC
c/o Legal Dept.
90 Hudson Street
Jersey City, NJ 07302
(1947) | | Director since 2001 | | Principal Occupation: Advisor of One Equity Partners, a private equity firm (since 2004). Other Directorships: Currently serves as director and Chairman of the Board of Ally Financial Inc., a financial services firm (since 2009), and as director of Molson Coors Brewing Company (since 2002). |
| | | | | |
James M. McTaggart
Lord, Abbett & Co. LLC
c/o Legal Dept.
90 Hudson Street
Jersey City, NJ 07302
(1947) | | Director since 2012 | | Principal Occupation: Independent management advisor and consultant (since 2012); Vice President, CRA International, Inc. (doing business as Charles River Associates), a global management consulting firm (2009–2012); Founder and Chairman of Marakon Associates, Inc., a strategy consulting firm (1978–2009); and Officer and Director of Trinsum Group, a holding company (2007–2009). Other Directorships: Currently serves as director of Blyth, Inc., a home products company (since 2004). |
| | | | | |
James L.L. Tullis
Lord, Abbett & Co. LLC
c/o Legal Dept.
90 Hudson Street
Jersey City, NJ 07302
(1947) | | Director since 2006 | | Principal Occupation: CEO of Tullis-Dickerson and Co. Inc., a venture capital management firm (since 1990); CEO of Tullis Health Investors Inc. (since 2012). Other Directorships: Currently serves as director of Crane Co. (since 1998). |
45
Basic Information About Management (continued)
Officers
None of the officers listed below have received compensation from the Company. All of the officers of the Company also may be officers of the other Lord Abbett Funds and maintain offices at 90 Hudson Street, Jersey City, NJ 07302. Unless otherwise indicated, the position(s) and title(s) listed under the “Principal Occupation During the Past Five Years” column indicate each officer’s position(s) and title(s) with Lord Abbett. Each officer serves for an indefinite term (i.e., until his or her death, resignation, retirement, or removal).
Name and
Year of Birth | | Current Position
with the Fund | | Length of Service
of Current
Position | | Principal Occupation
During the Past Five Years |
Daria L. Foster
(1954) | | President and Chief
Executive Officer | | Elected as President in 2006 and Chief Executive Officer in 2012 | | Managing Partner of Lord Abbett, joined Lord Abbett in 1990. |
Sean J. Aurigemma
(1969) | | Executive Vice President | | Elected in 2010 | | Portfolio Manager, joined Lord Abbett in 2007. |
Jeff D. Diamond
(1960) | | Executive Vice President | | Elected in 2008 | | Portfolio Manager, joined Lord Abbett in 2007. |
Robert I. Gerber
(1954) | | Executive Vice President | | Elected in 2003 | | Partner and Chief Investment Officer, joined Lord Abbett in 1997. |
Todd D. Jacobson
(1966) | | Executive Vice President | | Elected in 2005 | | Partner and Associate Director, joined Lord Abbett in 2003. |
Robert A. Lee
(1969) | | Executive Vice President | | Elected in 2010 | | Partner and Deputy Chief Investment Officer, joined Lord Abbett in 1997. |
Thomas B. Maher
(1967) | | Executive Vice President | | Elected in 2010 | | Partner and Portfolio Manager, joined Lord Abbett in 2003. |
Justin C. Maurer
(1969) | | Executive Vice President | | Elected in 2010 | | Partner and Portfolio Manager, joined Lord Abbett in 2001. |
Vincent J. McBride
(1964) | | Executive Vice President | | Elected in 2010 | | Partner and Director, joined Lord Abbett in 2003. |
Andrew H. O’Brien
(1973) | | Executive Vice President | | Elected in 2010 | | Partner and Portfolio Manager, joined Lord Abbett in 1998. |
F. Thomas O’Halloran, III
(1955) | | Executive Vice President | | Elected in 2010 | | Partner and Portfolio Manager, joined Lord Abbett in 2001. |
Walter H. Prahl
(1958) | | Executive Vice President | | Elected in 2012 | | Partner and Director, joined Lord Abbett in 1997. |
Steven F. Rocco
(1979) | | Executive Vice President | | Elected in 2014 | | Partner and Portfolio Manager, joined Lord Abbett in 2004. |
Frederick J. Ruvkun
(1957) | | Executive Vice President | | Elected in 2012 | | Partner and Portfolio Manager, joined Lord Abbett in 2006. |
46
Basic Information About Management (continued)
Name and
Year of Birth | | Current Position
with the Fund | | Length of Service
of Current
Position | | Principal Occupation
During the Past Five Years |
Paul J. Volovich
(1973) | | Executive Vice President | | Elected in 2005 | | Partner and Portfolio Manager, joined Lord Abbett in 1997. |
A. Edward Allinson
(1961) | | Vice President | | Elected in 2011 | | Portfolio Manager, joined Lord Abbett in 2005. |
John W. Ashbrook
(1964) | | Vice President and
Assistant Secretary | | Elected in 2014 | | Assistant General Counsel, joined Lord Abbett in 2008. |
Joan A. Binstock
(1954) | | Chief Financial Officer
and Vice President | | Elected in 1999 | | Partner and Chief Financial and Operations Officer, joined Lord Abbett in 1999. |
Brooke A. Fapohunda
(1975) | | Vice President and
Assistant Secretary | | Elected in 2014 | | Deputy General Counsel, joined Lord Abbett in 2006. |
John K. Forst
(1960) | | Vice President and
Assistant Secretary | | Elected in 2005 | | Partner and Deputy General Counsel, joined Lord Abbett in 2004. |
Anthony W. Hipple
(1964) | | Vice President | | Elected in 2014 | | Portfolio Manager, joined Lord Abbett in 2002. |
Lawrence H. Kaplan
(1957) | | Vice President and
Secretary | | Elected in 1997 | | Partner and General Counsel, joined Lord Abbett in 1997. |
Jerald M. Lanzotti
(1967) | | Vice President | | Elected in 2012 | | Partner and Portfolio Manager, joined Lord Abbett in 1996. |
David J. Linsen
(1974) | | Vice President | | Elected in 2008 | | Partner and Director, joined Lord Abbett in 2001. |
Joseph M. McGill
(1962) | | Chief Compliance Officer | | Elected in 2014 | | Chief Compliance Officer, joined Lord Abbett in 2014 and was formerly Managing Director and the Chief Compliance Officer at UBS Global Asset Management (2003–2013). |
A. Edward Oberhaus, III
(1959) | | Vice President | | Elected in 1998 | | Partner and Director, joined Lord Abbett in 1983. |
Noah Petrucci
(1970) | | Vice President | | Elected in 2013 | | Portfolio Manager, joined Lord Abbett in 2012 and was formerly a Portfolio Manager at Columbia Management Investment Advisers, LLC and Columbia Management Advisors, LLC (2002–2012). |
Lawrence B. Stoller
(1963) | | Vice President and
Assistant Secretary | | Elected in 2007 | | Partner and Senior Deputy General Counsel, joined Lord Abbett in 2007. |
47
Basic Information About Management (concluded)
Name and
Year of Birth | | Current Position
with the Fund | | Length of Service
of Current
Position | | Principal Occupation
During the Past Five Years |
Arthur K. Weise
(1970) | | Vice President | | Elected in 2010 | | Partner and Portfolio Manager, joined Lord Abbett in 2007. |
Kewjin Yuoh
(1971) | | Vice President | | Elected in 2012 | | Partner and Portfolio Manager, joined Lord Abbett in 2010. |
Scott S. Wallner
(1955) | | AML Compliance Officer | | Elected in 2011 | | Assistant General Counsel, joined Lord Abbett in 2004. |
Bernard J. Grzelak
(1971) | | Treasurer | | Elected in 2003 | | Partner and Director of Fund Administration, joined Lord Abbett in 2003. |
Please call 888-522-2388 for a copy of the statement of additional information, which contains further information about the Company’s Directors. It is available free upon request.
48
Approval of Advisory Contract
The Board of Directors of the Fund, including all of the Directors who are not interested persons of the Fund or of Lord Abbett (the “Independent Board Members”), annually considers whether to approve the continuation of the existing management agreement between the Fund and Lord Abbett. In connection with its most recent approval, the Board reviewed materials relating specifically to the management agreement, as well as numerous materials received throughout the course of the year, including information about the Fund’s investment performance compared to the performance of its benchmark. Before making its decision as to the Fund, the Board had the opportunity to ask questions and request further information, taking into account its familiarity with Lord Abbett gained through its meetings and discussions. These meetings and discussions included the examination of the portfolio management team conducted by members of the Contract Committee, the deliberations of the Contract Committee, and discussions between the Contract Committee and Lord Abbett’s management. The Independent Board Members also discussed the materials described above with their independent legal counsel in a private session at which no representatives of management were present.
The materials received by the Board included, but were not limited to: (1) information provided by Morningstar Associates, LLC (“Morningstar”) regarding the investment performance of the Fund compared to the investment performance of a group of funds in the same Morningstar investment category (the “performance peer group”) and the investment performance of one or more appropriate benchmarks; (2) information provided by Morningstar regarding the expense ratios, contractual and effective management fee rates, and other expense components for the Fund and one or more groups of funds in the same Morningstar category, with the same share classes and operational characteristics, including asset size (the “expense peer group”); (3) information provided by Lord Abbett on the projected expense ratios, management fee rates, and other expense components for the Fund; (4) sales and redemption information for the Fund; (5) information regarding Lord Abbett’s financial condition; (6) an analysis of the relative profitability of the management agreement to Lord Abbett; (7) information provided by Lord Abbett regarding the investment management fees Lord Abbett receives from its other advisory clients maintaining accounts with a similar investment strategy as the Fund; (8) information regarding the distribution arrangements of the Fund; and (9) information regarding the personnel and other resources devoted by Lord Abbett to managing the Fund.
Investment Management Services Generally. The Board considered the investment management services provided by Lord Abbett to the Fund, including investment research, portfolio management, and trading, and Lord Abbett’s commitment to compliance with all applicable legal requirements. The Board also observed that Lord Abbett was solely engaged in the investment management business and accordingly did not experience the conflicts of interest that may result from being engaged in other lines of business. The Board considered the investment advisory services provided by Lord Abbett to other clients, the fees charged for the services, and the differences in the nature of the services provided to the Fund and other Lord Abbett Funds, on the one hand, and the services provided to other clients, on the other.
Investment Performance. The Board reviewed the Fund’s investment performance in relation to that of the performance peer group as of various periods ended August 31, 2015. The Board observed that the Fund’s investment performance was below the median of the performance peer group for the one-year and three-year periods and approximately the same as the median of the performance peer group for the five-year period.
49
Approval of Advisory Contract (continued)
Lord Abbett’s Personnel and Methods. The Board considered the qualifications of the personnel providing investment management services to the Fund, in light of its investment objective and discipline. Among other things, the Board considered the size, experience, and turnover of Lord Abbett’s investment management staff, Lord Abbett’s investment methodology and philosophy, and Lord Abbett’s approach to recruiting, training, and retaining investment management personnel.
Nature and Quality of Other Services. The Board considered the nature, quality, costs, and extent of compliance, administrative, and other services performed by Lord Abbett and Lord Abbett Distributor LLC (the “Distributor”) and the nature and extent of Lord Abbett’s supervision of third party service providers, including the Fund’s transfer agent and custodian.
Expenses. The Board considered the expense level of the Fund and the expense levels of the expense peer group. It also considered the projected expense levels and how those levels would relate to those of the expense peer group and the amount and nature of the fees paid by shareholders. The Board observed that the overall expense level of the Fund was well below the median of the expense peer group.
Profitability. The Board considered the level of Lord Abbett’s profits in managing the Fund, including a review of Lord Abbett’s methodology for allocating its costs to its management of the Fund. The Board concluded that the allocation methodology had a reasonable basis and was appropriate. It considered any profits realized by Lord Abbett in connection with the operation of the Fund, including the fee that Lord Abbett receives from the Fund for providing administrative services to the Fund, and whether the amount of profit was fair for the management of the Fund. The Board also considered the profits realized from other business segments of Lord Abbett, which may benefit from or be related to the Fund’s business. The Board considered Lord Abbett’s profit margins in comparison with available industry data, both accounting for and ignoring marketing and distribution expenses, and how those profit margins could affect Lord Abbett’s ability to recruit and retain investment personnel. The Board recognized that Lord Abbett’s profitability was a factor in enabling it to attract and retain qualified investment management personnel to provide services to the Fund. The Board concluded that Lord Abbett’s profitability as to the Fund was not excessive.
Economies of Scale. The Board considered whether there had been any economies of scale in managing the Fund, whether the Fund had appropriately benefited from any such economies of scale, and whether there was potential for realization of any further economies of scale. The Board concluded that the existing management fee schedule, with its breakpoint or breakpoints in the level of the management fee, adequately addressed any economies of scale in managing the Fund.
Other Benefits to Lord Abbett. The Board considered the character and amount of fees paid by the Fund and the Fund’s shareholders to Lord Abbett and the Distributor for services other than investment advisory services. The Board also considered the revenues and profitability of Lord Abbett’s investment advisory business apart from its mutual fund business, and the intangible benefits enjoyed by Lord Abbett by virtue of its relationship with the Fund. The Board observed that the Distributor receives 12b-1 fees from certain of the Lord Abbett Funds as to shares held in accounts for which there is no other broker of record, may retain a portion of the 12b-1 fees it receives, and receives a portion of the sales charges on sales and redemptions of some classes of shares. In addition, the Board observed that Lord Abbett accrues certain benefits for its business of providing investment advice to clients other than the Lord Abbett Funds, but that business also benefits the Funds. The Board also noted that Lord Abbett, as disclosed in the prospectus of the Fund, has entered into revenue sharing arrangements with certain entities that distribute shares of the Fund.
50
Approval of Advisory Contract (concluded)
Alternative Arrangements. The Board considered whether, instead of approving continuation of the management agreement, it might be in the best interests of the Fund to implement one or more alternative arrangements, such as continuing to employ Lord Abbett, but on different terms. After considering all of the relevant factors, the Board unanimously found that continuation of the existing management agreement was in the best interests of the Fund and its shareholders and voted unanimously to approve the continuation of the management agreement. In considering whether to approve the continuation of the management agreement, the Board did not identify any single factor as paramount or controlling. This summary does not discuss in detail all matters considered.
51
Householding
The Company has adopted a policy that allows it to send only one copy of the Fund’s prospectus, proxy material, annual report and semiannual report to certain shareholders residing at the same “household.” This reduces Fund expenses, which benefits you and other shareholders. If you need additional copies or do not want your mailings to be “householded,” please call Lord Abbett at 888-522-2388 or send a written request with your name, the name of your fund or funds and your account number or numbers to Lord Abbett Family of Funds, P.O. Box 219336, Kansas City, MO 64121.
Proxy Voting Policies, Procedures and Records
A description of the policies and procedures that Lord Abbett uses to vote proxies related to the Fund’s portfolio securities, and information on how Lord Abbett voted the Fund’s proxies during the 12-month period ended June 30 are available without charge, upon request, (i) by calling 888-522-2388; (ii) on Lord Abbett’s Website at www.lordabbett.com; and (iii) on the Securities and Exchange Commission’s (“SEC”) Website at www.sec.gov.
Shareholder Reports and Quarterly Portfolio Disclosure
The Fund is required to file its complete schedule of portfolio holdings with the SEC for its first and third fiscal quarters on Form N-Q. Copies of the filings are available without charge, upon request on the SEC’s Website at www.sec.gov and may be available by calling Lord Abbett at 888-522-2388. You can also obtain copies of Form N-Q by visiting the SEC’s Public Reference Room in Washington, DC (information on the operation of the Public Reference Room may be obtained by calling 800-SEC-0330).
Tax Information
Of the distributions paid to shareholders during the fiscal year ended December 31, 2015, $517,492 represents short-term capital gains.
52


| This report, when not used for the general information of shareholders of the Fund, is to be distributed only if preceded or accompanied by a current fund prospectus. | | |
| | Lord Abbett Series Fund, Inc. | |
Lord Abbett mutual fund shares are distributed by
LORD ABBETT DISTRIBUTOR LLC. | Total Return Portfolio | SFTR-PORT-3
(02/16) |

2015 LORD ABBETT
ANNUAL REPORT
Lord Abbett
Series Fund—Value Opportunities Portfolio
For the fiscal year ended December 31, 2015
Table of Contents
Lord Abbett Series Fund – Value Opportunities Portfolio
Annual Report
For the fiscal year ended December 31, 2015

Daria L. Foster, Director, President and Chief Executive Officer of the Lord Abbett Funds, and E. Thayer Bigelow, Independent Chairman of the Lord Abbett Funds.
Dear Shareholders: We are pleased to provide you with this overview of the performance of Lord Abbett Series Fund – Value Opportunities Portfolio for the fiscal year ended December 31, 2015. On this page and the following pages, we discuss the major factors that influenced fiscal year performance. For additional information about the Fund, please visit our website at www.lordabbett.com, where you also can access the quarterly commentaries that provide updates on the Fund’s performance and other portfolio related updates.
Thank you for investing in Lord Abbett mutual funds. We value the trust that you place in us and look forward to serving your investment needs in the years to come.
Best regards,

Daria L. Foster
Director, President and Chief Executive Officer
For the fiscal year ended December 31, 2015, the Fund returned -2.53%, reflecting performance at the net asset value (NAV) of Class A shares, with all distributions reinvested, compared to its benchmark, the Russell 2500TM Index1, which returned -2.90% over the same period.
Domestic equity markets advanced over the past year, with the S&P 500® Index2 rising 1.38% during the trailing 12-month period. Despite this general move upward, there were a few periods of short-term volatility, most notably in January 2015,
when the S&P 500 declined 3.0% in total return terms, and in August 2015, when the index dropped 6.0%, its greatest monthly loss in three years. One of the prevailing market themes during the trailing 12-month period was the continued weakness in energy prices. Finally, U.S. real gross domestic product (GDP), which was initially reported to have contracted by 0.2% in the first quarter of 2015, was later revised upwards to a modest 0.6% expansion. In the second quarter of 2015, real GDP advanced 3.9%, while the third estimate
1
from the Bureau of Economic Analysis indicated that real GDP increased 2.0% in the third quarter of 2015.
During the period, stock selection in the financials and utility sectors contributed to the Fund’s relative outperformance. Within the financials sector, shares of HCC Insurance Holdings, Inc., a specialty insurer, immediately increased following an announcement that the company would be acquired at a premium by Tokio Marine Holdings, Inc. Western Alliance Bancorporation, a bank holding company, experienced strong annualized loan growth and tax rates below expectations. Within the utilities sector, shares of American Water Works Company, Inc., a water and wastewater utility holding company, continued to rise as third quarter earnings supported the rally in the stock. Shares of CMS Energy Corporation, an energy company, benefited in the second half of the year as
earnings increased year over year as a result of its growth strategy.
Conversely, stock selection in the industrials and energy sectors was a main detractor from the Fund’s performance over the period. Within the industrials sector, shares of Genesee & Wyoming, Inc., an owner and operator of regional railroads, stumbled due to weaker-than-expected volumes and management’s reduced guidance for second quarter earnings. Shares of United Rentals, Inc., an equipment rental holding company, fell, in part due to the company’s exposure to oil markets and foreign currency headwinds. Within the energy sector, shares of Rice Energy Inc., an independent natural gas and oil company, and Helix Energy Solutions Group, Inc., an international offshore energy services company, detracted from relative performance. Both companies’ shares slid in the second half of 2015 as oil prices fell.
1 The Russell 2500TM Index is a market cap weighted index that includes the smallest 2,500 companies covered in the Russell 3000 universe of United States-based listed equities.
2 The S&P 500® Index is widely regarded as the standard for measuring large cap U.S. stock market performance and includes a representative sample of leading companies in leading industries.
Unless otherwise specified, indexes reflect total return, with all dividends reinvested. Indexes are unmanaged, do not reflect the deduction of fees or expenses, and are not available for direct investment.
Important Performance and Other Information
Performance data quoted in the following pages reflect past performance and are no guarantee of future results. Current performance may be higher or lower than the performance quoted.
The investment return and principal value of an investment in the Funds will fluctuate so that shares, on any given day or when redeemed, may be worth more or less than their original cost. You can obtain performance data current to the most recent month end by calling Lord Abbett at 888-522-2388 or referring to www.lordabbett.com.
During certain periods shown, expense waivers and reimbursements were in place. Without such waivers and expense reimbursements, the Fund’s returns would have been lower.
The annual commentary above discusses the views of the Fund’s management and various portfolio holdings of the Fund as of December 31, 2015. These views and portfolio holdings may have changed after this date. Information provided in the commentary is not a recommendation to buy or sell securities. Because the Fund’s portfolio is actively managed and
2
may change significantly, the Fund may no longer own the securities described above or may have otherwise changed their positions in the securities. For more recent information about the Fund’s portfolio holdings, please visit www.lordabbett.com.
A Note about Risk: See Notes to Financial Statements for a discussion of investment risks. For a more detailed discussion of the risks associated with the Fund, please see the Fund’s prospectus.
Mutual funds are not insured by the FDIC, are not deposits or other obligations of, or guaranteed by, banks, and are subject to investment risks including possible loss of principal amount invested.
The Fund serves as an underlying investment vehicle for variable annuity contracts and variable life insurance policies.
3
Investment Comparison
Below is a comparison of a $10,000 investment in Class VC shares with the same investment in the Russell 2500™ Index and the Russell 2500™ Value Index, assuming reinvestment of all dividends and distributions. The Fund’s shares are sold only to insurance company separate accounts that fund certain variable annuity and variable life contracts. The line graph comparison does not reflect the sales charges or other expenses of these contracts. If those sales charges and expenses were reflected, returns would be lower. The graph and performance table below do not reflect the deduction of taxes that a shareholder would pay on Fund distributions or the redemption of Fund shares. During the period, expenses of the Fund were waived or reimbursed by Lord Abbett; without such waiver or reimbursement of expenses, the Fund’s returns would have been lower. Past performance is no guarantee of future results.

| | | Average Annual Total Returns for the |
| | | Periods Ended December 31, 2015 |
| | | 1 Year | | | 5 Years | | | Life of Class | |
| Class VC2 | | | –2.53% | | | | 9.32% | | | | 10.13% | |
1 Performance for each unmanaged index does not reflect any fees or expenses. The performance of each index is not necessarily representative of the Fund’s performance. Performance for each index began on May 1, 2010.
2 The Class VC shares commenced operations on April 23, 2010. Performance for the Class began on May 1, 2010.
4
Expense Example
As a shareholder of the Fund, you incur ongoing costs, including management fees; expenses related to the Fund’s services arrangements with certain insurance companies; and other Fund expenses. This Example is intended to help you understand your ongoing costs (in dollars) of investing in the Fund and to compare these costs with the ongoing costs of investing in other mutual funds.
The Example is based on an investment of $1,000 invested at the beginning of the period and held for the entire period (July 1, 2015 through December 31, 2015).
The Example reflects only expenses that are deducted from the assets of the Fund. Fees and expenses, including sales charges applicable to the various insurance products that invest in the Fund, are not reflected in this Example. If such fees and expenses were reflected in the Example, the total expenses shown would be higher. Fees and expenses regarding such variable insurance products are separately described in the prospectus related to those products.
Actual Expenses
The first line of the table on the following page provides information about actual account values and actual expenses. You may use the information in this line, together with the amount you invested, to estimate the expenses that you paid over the period. Simply divide your account value by $1,000 (for example, an $8,600 account value divided by $1,000 = 8.6), then multiply the result by the number in the first line under the heading titled “Expenses Paid During Period 7/1/15 – 12/31/15” to estimate the expenses you paid on your account during this period.
Hypothetical Example for Comparison Purposes
The second line of the table on the following page provides information about hypothetical account values and hypothetical expenses based on the Fund’s actual expense ratio and an assumed rate of return of 5% per year before expenses, which is not the Fund’s actual return. The hypothetical account values and expenses may not be used to estimate the actual ending account balance or expenses you paid for the period. You may use this information to compare the ongoing costs of investing in the Fund and other funds. To do so, compare this 5% hypothetical example with the 5% hypothetical examples that appear in the shareholder reports of the other funds.
5
Please note that the expenses shown in the table are meant to highlight your ongoing costs only and do not reflect any transactional costs, such as sales charges. Therefore, the second line of the table is useful in comparing ongoing costs only, and will not help you determine the relative total costs of owning different funds. In addition, if these transactional costs were included, your costs would have been higher.
| | | | Beginning | | Ending | | Expenses | |
| | | | Account | | Account | | Paid During | |
| | | | Value | | Value | | Period† | |
| | | | | | | | 7/1/15 - | |
| | | | 7/1/15 | | 12/31/15 | | 12/31/15 | |
| Class VC | | | | | | | | |
| Actual | | | $1,000.00 | | $ 938.80 | | $5.38 | |
| Hypothetical (5% Return Before Expenses) | | | $1,000.00 | | $1,019.66 | | $5.60 | |
| † | Net expenses are equal to the Fund’s annualized expense ratio of 1.10%, multiplied by the average account value over the period, multiplied by 184/365 (to reflect one-half year period). |
Portfolio Holdings Presented by Sector
December 31, 2015
| Sector* | | %** |
| Consumer Discretionary | | | 13.00 | % |
| Consumer Staples | | | 2.59 | % |
| Energy | | | 3.40 | % |
| Financials | | | 25.73 | % |
| Health Care | | | 9.70 | % |
| Industrials | | | 11.82 | % |
| Information Technology | | | 18.42 | % |
| Materials | | | 6.02 | % |
| Telecommunication Services | | | 1.82 | % |
| Utilities | | | 7.50 | % |
| Total | | | 100.00 | % |
| * | | A sector may comprise several industries. |
| ** | | Represents percent of total investments. |
6
Schedule of Investments
December 31, 2015
| Investments | | Shares | | | Fair
Value | |
| COMMON STOCKS 105.00% | | | | | | | | |
| | | | | | | | | |
| Banks 8.35% | | | | | | | | |
| Bank of Hawaii Corp. | | | 84 | | | $ | 5,284 | |
| Citizens Financial Group, Inc. | | | 202 | | | | 5,290 | |
| East West Bancorp, Inc. | | | 93 | | | | 3,865 | |
| First Republic Bank | | | 57 | | | | 3,766 | |
| Signature Bank* | | | 36 | | | | 5,521 | |
| Western Alliance Bancorp* | | | 170 | | | | 6,096 | |
| Total | | | | | | | 29,822 | |
| | | | | | | | | |
| Capital Markets 2.17% | | | | | | | | |
| Moelis & Co. Class A | | | 110 | | | | 3,210 | |
| Raymond James Financial, Inc. | | | 78 | | | | 4,521 | |
| Total | | | | | | | 7,731 | |
| | | | | | | | | |
| Chemicals 1.10% | | | | | | | | |
| RPM International, Inc. | | | 89 | | | | 3,921 | |
| | | | | | | | | |
| Commercial Services & Supplies 3.12% | | | | | | | | |
| Herman Miller, Inc. | | | 173 | | | | 4,965 | |
| KAR Auction Services, Inc. | | | 167 | | | | 6,184 | |
| Total | | | | | | | 11,149 | |
| | | | | | | | | |
| Communications Equipment 1.84% | | | | | | | | |
| ARRIS Group, Inc.* | | | 215 | | | | 6,573 | |
| | | | | | | | | |
| Construction & Engineering 3.98% | | | | | | | | |
| AECOM* | | | 304 | | | | 9,129 | |
| Jacobs Engineering Group, Inc.* | | | 121 | | | | 5,076 | |
| Total | | | | | | | 14,205 | |
| | | | | | | | | |
| Containers & Packaging 3.89% | | | | | | | | |
| Berry Plastics Group, Inc.* | | | 151 | | | | 5,463 | |
| Sealed Air Corp. | | | 101 | | | | 4,505 | |
| WestRock Co. | | | 86 | | | | 3,923 | |
| Total | | | | | | | 13,891 | |
| | | | | | | | | |
| Diversified Telecommunication Services 1.91% | | | | | | | | |
| Zayo Group Holdings, Inc.* | | | 256 | | | | 6,807 | |
| Investments | | Shares | | | Fair
Value | |
| Electric: Utilities 3.51% | | | | | | | | |
| ITC Holdings Corp. | | | 138 | | | $ | 5,416 | |
| Portland General Electric Co. | | | 196 | | | | 7,129 | |
| Total | | | | | | | 12,545 | |
| | | | | | | | | |
| Electronic Equipment, Instruments & Components 1.11% |
| Amphenol Corp. Class A | | | 76 | | | | 3,970 | |
| | | | | | | | | |
| Energy Equipment & Services 0.51% | | | | | | | | |
| Helmerich & Payne, Inc. | | | 34 | | | | 1,821 | |
| | | | | | | | | |
| Food Products 1.97% | | | | | | | | |
| Pinnacle Foods, Inc. | | | 166 | | | | 7,048 | |
| | | | | | | | | |
| Health Care Equipment & Supplies 2.24% | | | | | | | | |
| STERIS plc (United Kingdom)(a) | | | 106 | | | | 7,986 | |
| | | | | | | | | |
| Health Care Providers & Services 4.46% | | | | | | | | |
| ExamWorks Group, Inc.* | | | 223 | | | | 5,932 | |
| HealthSouth Corp. | | | 184 | | | | 6,405 | |
| MEDNAX, Inc.* | | | 50 | | | | 3,583 | |
| Total | | | | | | | 15,920 | |
| | | | | | | | | |
| Hotels, Restaurants & Leisure 4.29% | | | | | | | | |
| Aramark | | | 176 | | | | 5,676 | |
| Red Robin Gourmet Burgers, Inc.* | | | 64 | | | | 3,951 | |
| SeaWorld Entertainment, Inc. | | | 289 | | | | 5,691 | |
| Total | | | | | | | 15,318 | |
| | | | | | | | | |
| Household Durables 3.56% | | | | | | | | |
| Jarden Corp.* | | | 143 | | | | 8,168 | |
| Lennar Corp. Class A | | | 93 | | | | 4,549 | |
| Total | | | | | | | 12,717 | |
| | | | | | | | | |
| Information Technology Services 10.78% | | | | | | | | |
| Acxiom Corp.* | | | 209 | | | | 4,372 | |
| Amdocs Ltd. | | | 107 | | | | 5,839 | |
| Booz Allen Hamilton | | | | | | | | |
| Holding Corp. | | | 312 | | | | 9,625 | |
| Cardtronics, Inc.* | | | 105 | | | | 3,533 | |
| | See Notes to Financial Statements. | 7 |
Schedule of Investments (continued)
December 31, 2015
| Investments | | Shares | | | Fair
Value | |
| Information Technology Services (continued) | | | | | | | | |
| Fidelity National Information | | | | | | | | |
| Services, Inc. | | | 109 | | | $ | 6,606 | |
| MAXIMUS, Inc. | | | 71 | | | | 3,994 | |
| Vantiv, Inc. Class A* | | | 95 | | | | 4,505 | |
| Total | | | | | | | 38,474 | |
| | | | | | | | | |
| Insurance 7.11% | | | | | | | | |
| Arch Capital Group Ltd.* | | | 83 | | | | 5,789 | |
| Hartford Financial Services | | | | | | | | |
| Group, Inc. (The) | | | 134 | | | | 5,824 | |
| Markel Corp.* | | | 6 | | | | 5,300 | |
| RenaissanceRe Holdings Ltd. | | | 75 | | | | 8,489 | |
| Total | | | | | | | 25,402 | |
| | | | | | | | | |
| Internet Software & Services 1.30% | | | | | | | | |
| Akamai Technologies, Inc.* | | | 88 | | | | 4,631 | |
| | | | | | | | | |
| Leisure Products 0.99% | | | | | | | | |
| Brunswick Corp. | | | 70 | | | | 3,536 | |
| | | | | | | | | |
| Life Sciences Tools & Services 2.49% | | | | | | | | |
| PerkinElmer, Inc. | | | 111 | | | | 5,946 | |
| Quintiles Transnational | | | | | | | | |
| Holdings, Inc.* | | | 43 | | | | 2,953 | |
| Total | | | | | | | 8,899 | |
| | | | | | | | | |
| Machinery 2.21% | | | | | | | | |
| Snap-on, Inc. | | | 34 | | | | 5,829 | |
| WABCO Holdings, Inc.* | | | 20 | | | | 2,045 | |
| Total | | | | | | | 7,874 | |
| | | | | | | | | |
| Marine 0.50% | | | | | | | | |
| Kirby Corp.* | | | 34 | | | | 1,789 | |
| | | | | | | | | |
| Media 2.45% | | | | | | | | |
| AMC Networks, Inc. Class A* | | | 58 | | | | 4,331 | |
| New York Times Co. (The) | | | | | | | | |
| Class A | | | 328 | | | | 4,402 | |
| Total | | | | | | | 8,733 | |
| | | | | | | | | |
| Metals & Mining 1.33% | | | | | | | | |
| Reliance Steel & Aluminum Co. | | | 82 | | | | 4,749 | |
| Investments | | Shares | | | Fair
Value | |
| Multi-Utilities 1.90% | | | | | | | | |
| CMS Energy Corp. | | | 188 | | | $ | 6,783 | |
| | | | | | | | | |
| Oil, Gas & Consumable Fuels 3.06% | | | | | | | | |
| Carrizo Oil & Gas, Inc.* | | | 124 | | | | 3,668 | |
| Cimarex Energy Co. | | | 14 | | | | 1,251 | |
| EQT Corp. | | | 58 | | | | 3,024 | |
| Rice Energy, Inc.* | | | 275 | | | | 2,997 | |
| Total | | | | | | | 10,940 | |
| | | | | | | | | |
| Personal Products 0.75% | | | | | | | | |
| Coty, Inc. Class A | | | 104 | | | | 2,666 | |
| | | | | | | | | |
| Pharmaceuticals 0.99% | | | | | | | | |
| Prestige Brands Holdings, Inc.* | | | 69 | | | | 3,552 | |
| | | | | | | | | |
| Real Estate Investment Trusts 7.57% | | | | | | | | |
| Federal Realty Investment Trust | | | 71 | | | | 10,373 | |
| Highwoods Properties, Inc. | | | 137 | | | | 5,973 | |
| Physicians Realty Trust | | | 331 | | | | 5,581 | |
| Retail Opportunity | | | | | | | | |
| Investments Corp. | | | 286 | | | | 5,119 | |
| Total | | | | | | | 27,046 | |
| | | | | | | | | |
| Real Estate Management & Development 0.72% |
| Realogy Holdings Corp.* | | | 70 | | | | 2,567 | |
| | | | | | | | | |
| Road & Rail 1.52% | | | | | | | | |
| Genesee & Wyoming, Inc. Class A* | | | 44 | | | | 2,362 | |
| Old Dominion Freight Line, Inc.* | | | 52 | | | | 3,072 | |
| Total | | | | | | | 5,434 | |
| | | | | | | | | |
| Semiconductors & Semiconductor Equipment 4.32% |
| Cypress Semiconductor Corp.* | | | 432 | | | | 4,238 | |
| Lam Research Corp. | | | 74 | | | | 5,877 | |
| Synaptics, Inc.* | | | 66 | | | | 5,302 | |
| Total | | | | | | | 15,417 | |
| 8 | See Notes to Financial Statements. |
Schedule of Investments (concluded)
December 31, 2015
| Investments | | Shares | | | Fair
Value | |
| Specialty Retail 0.76% | | | | | | | | |
| American Eagle Outfitters, Inc. | | | 64 | | | $ | 992 | |
| Penske Automotive Group, Inc. | | | 41 | | | | 1,736 | |
| Total | | | | | | | 2,728 | |
| | | | | | | | | |
| Textiles, Apparel & Luxury Goods 1.60% | | | | | | | | |
| Steven Madden Ltd.* | | | 189 | | | | 5,712 | |
| | | | | | | | | |
| Thrifts & Mortgage Finance 1.10% | | | | | | | | |
| Essent Group Ltd.* | | | 179 | | | | 3,918 | |
| | | | | | | | | |
| Trading Companies & Distributors 1.08% | | | | | | | | |
| Watsco, Inc. | | | 33 | | | | 3,865 | |
| Investments | | Shares | | | Fair
Value | |
| Water Utilities 2.46% | | | | | | |
| American Water Works Co., Inc. | | | 147 | | | $ | 8,783 | |
Total Investments in Common Stock 105.00%
(cost $345,693) | | | | 374,922 | |
| Liabilities in Excess of Cash and Other Assets (5.00)% | | | | (17,869 | ) |
| Net Assets 100% | | | | | | $ | 357,053 | |
| * | | Non-income producing security. |
| (a) | | Foreign security traded in U.S. dollars. |
The following is a summary of the inputs used as of December 31, 2015 in valuing the Fund’s investments carried at fair value(1):
| Investment Type(2)(3) | | Level 1 | | | Level 2 | | | Level 3 | | | Total | |
| Common Stocks | | $ | 374,922 | | | $ | – | | | $ | – | | | $ | 374,922 | |
| Total | | $ | 374,922 | | | $ | – | | | $ | – | | | $ | 374,922 | |
| (1) | Refer to Note 2(g) for a description of fair value measurements and the three-tier hierarchy of inputs. |
| (2) | See Schedule of Investments for fair values in each industry and identification of foreign issuers and/or geography. |
| (3) | There were no Level 1/Level 2 transfers during the fiscal year ended December 31, 2015. |
| | See Notes to Financial Statements. | 9 |
Statement of Assets and Liabilities
December 31, 2015
| ASSETS: | | | |
| Investments in securities, at fair value (cost $345,693) | | $ | 374,922 | |
| Cash | | | 9,375 | |
| Receivables: | | | | |
| From advisor (See Note 3) | | | 4,740 | |
| Dividends | | | 379 | |
| Investment securities sold | | | 279 | |
| Prepaid expenses | | | 1 | |
| Total assets | | | 389,696 | |
| LIABILITIES: | | | | |
| Payables: | | | | |
| Investment securities purchased | | | 276 | |
| Directors’ fees | | | 35 | |
| Accrued expenses | | | 32,332 | |
| Total liabilities | | | 32,643 | |
| NET ASSETS | | $ | 357,053 | |
| COMPOSITION OF NET ASSETS: | | | | |
| Paid-in capital | | $ | 323,191 | |
| Distributions in excess of net investment income | | | (35 | ) |
| Accumulated net realized gain on investments | | | 4,668 | |
| Net unrealized appreciation on investments | | | 29,229 | |
| Net Assets | | $ | 357,053 | |
| Outstanding shares (50 million shares of common stock authorized, $.001 par value) | | | 19,303 | |
| Net asset value, offering and redemption price per share (Net assets divided by outstanding shares) | | $ | 18.50 | |
| 10 | See Notes to Financial Statements. |
Statement of Operations
For the Year Ended December 31, 2015
| Investment income: | | | |
| Dividends | | $ | 4,295 | |
| Total investment income | | | 4,295 | |
| Expenses: | | | | |
| Professional | | | 33,512 | |
| Reports to shareholders | | | 12,654 | |
| Custody | | | 6,243 | |
| Management fee | | | 2,892 | |
| Shareholder servicing | | | 238 | |
| Non 12b-1 service fees | | | 203 | |
| Fund administration | | | 154 | |
| Directors’ fees | | | 13 | |
| Other | | | 2,718 | |
| Gross expenses | | | 58,627 | |
| Fees waived and expenses reimbursed (See Note 3) | | | (54,386 | ) |
| Net expenses | | | 4,241 | |
| Net investment income | | | 54 | |
| Net realized and unrealized gain (loss): | | | | |
| Net realized gain on investments | | | 16,033 | |
| Net change in unrealized appreciation/depreciation on investments | | | (25,869 | ) |
| Net realized and unrealized loss | | | (9,836 | ) |
| Net Decrease in Net Assets Resulting From Operations | | $ | (9,782 | ) |
| | See Notes to Financial Statements. | 11 |
Statements of Changes in Net Assets
| | | For the Year Ended | | | For the Year Ended | |
| INCREASE (DECREASE) IN NET ASSETS | | December 31, 2015 | | | December 31, 2014 | |
| Operations: | | | | | | | | |
| Net investment income | | $ | 54 | | | $ | 367 | |
| Net realized gain on investments | | | 16,033 | | | | 52,014 | |
| Net change in unrealized appreciation/depreciation on investments | | | (25,869 | ) | | | (23,991 | ) |
| Net increase (decrease) in net assets resulting from operations | | | (9,782 | ) | | | 28,390 | |
| Distributions to shareholders from: | | | | | | | | |
| Net investment income | | | (146 | ) | | | (370 | ) |
| Net realized gain | | | (12,894 | ) | | | (54,446 | ) |
| Total distributions to shareholders | | | (13,040 | ) | | | (54,816 | ) |
| Capital share transactions (See Note 11): | | | | | | | | |
| Proceeds from sales of shares | | | 3,575 | | | | 91,454 | |
| Reinvestment of distributions | | | 13,040 | | | | 54,816 | |
| Cost of shares reacquired | | | (15,898 | ) | | | (58,730 | ) |
| Net increase in net assets resulting from capital share transactions | | | 717 | | | | 87,540 | |
| Net increase (decrease) in net assets | | | (22,105 | ) | | | 61,114 | |
| NET ASSETS: | | | | | | | | |
| Beginning of year | | $ | 379,158 | | | $ | 318,044 | |
| End of year | | $ | 357,053 | | | $ | 379,158 | |
| Undistributed (distributions in excess of) net investment income | | $ | (35 | ) | | $ | 19 | |
| 12 | See Notes to Financial Statements. |
This page is intentionally left blank.
Financial Highlights
| | | | | | Per Share Operating Performance: |
| | | | | | | | | | | | | | | Distributions to |
| | | | | | Investment operations: | | shareholders from: |
| | | Net asset
value,
beginning
of year | | Net
invest-
ment
income(a) | | Net
realized
and
unrealized
gain (loss) | | Total
from
invest-
ment
oper-
ations | | Net
investment
income | | Net
realized
gain | | Total
distri-
butions |
| 12/31/2015 | | $ | 19.66 | | | $ | – | (c) | | $ | (0.49 | ) | | $ | (0.49 | ) | | $ | (0.01 | ) | | $ | (0.66 | ) | | $ | (0.67 | ) |
| 12/31/2014 | | | 21.09 | | | | 0.02 | | | | 1.83 | | | | 1.85 | | | | (0.02 | ) | | | (3.26 | ) | | | (3.28 | ) |
| 12/31/2013 | | | 17.02 | | | | 0.03 | | | | 6.56 | | | | 6.59 | | | | (0.09 | ) | | | (2.43 | ) | | | (2.52 | ) |
| 12/31/2012 | | | 15.38 | | | | 0.04 | | | | 1.64 | | | | 1.68 | | | | (0.04 | ) | | | – | | | | (0.04 | ) |
| 12/31/2011 | | | 16.11 | | | | – | (c) | | | (0.73 | ) | | | (0.73 | ) | | | – | | | | – | | | | – | |
| (a) | Calculated using average shares outstanding during the year. |
| (b) | Total return does not consider the effects of sales charges or other expenses imposed by an insurance company and assumes the reinvestment of all distributions. |
| (c) | Amount is less than $.01. |
| 14 | See Notes to Financial Statements. |
| | | | | | | Ratios to Average Net Assets: | | Supplemental Data: |
Net
asset
value,
end of
year | | Total
return(b)
(%) | | Total
expenses
after
waivers
and/or
reimbursements
(%) | | Total
expenses
(%) | | Net
investment
income
(%) | | Net
assets, end
of year
(000) | | Portfolio
turnover
rate
(%) |
| | $18.50 | | | | (2.53 | ) | | | 1.10 | | | | 15.21 | | | | 0.01 | | | | $357 | | | | 55.58 | |
| | 19.66 | | | | 8.92 | | | | 1.10 | | | | 14.53 | | | | 0.10 | | | | 379 | | | | 72.37 | |
| | 21.09 | | | | 38.82 | | | | 1.10 | | | | 23.61 | | | | 0.14 | | | | 318 | | | | 65.96 | |
| | 17.02 | | | | 10.92 | | | | 1.10 | | | | 28.69 | | | | 0.28 | | | | 229 | | | | 62.36 | |
| | 15.38 | | | | (4.47 | ) | | | 1.10 | | | | 30.03 | | | | 0.03 | | | | 206 | | | | 66.18 | |
| | See Notes to Financial Statements. | 15 |
Notes to Financial Statements
Lord Abbett Series Fund, Inc. (the “Company”) is registered under the Investment Company Act of 1940, as amended (the “Act”), as a diversified, open-end management investment company and was incorporated under Maryland law in 1989. The Company consists of thirteen separate portfolios. This report covers Value Opportunities Portfolio (the “Fund”).
The Fund’s investment objective is long-term capital appreciation. The Fund offers Variable Contract class shares (“Class VC Shares”), which are currently issued and redeemed only in connection with investments in, and payments under, variable annuity contracts and variable life insurance policies issued by life insurance and insurance-related companies.
The preparation of the financial statements in conformity with accounting principles generally accepted in the United States of America (“U.S. GAAP”) requires management to make certain estimates and assumptions that affect the reported amounts of assets and liabilities and disclosure of contingent assets and liabilities at the date of the financial statements and the reported amounts of increases and decreases in net assets from operations during the reporting period. Actual results could differ from those estimates. The Fund is considered an investment company under U.S. GAAP and follows the accounting and reporting guidance applicable to investment companies.
| 2. | SIGNIFICANT ACCOUNTING POLICIES |
| | |
| (a) | Investment Valuation–Under procedures approved by the Fund’s Board of Directors (the “Board”), Lord, Abbett & Co. LLC (“Lord Abbett”), the Fund’s investment manager, has formed a Pricing Committee to administer the pricing and valuation of portfolio investments and to ensure that prices utilized reasonably reflect fair value. Among other things, these procedures allow the Fund to utilize independent pricing services, quotations from securities and financial instrument dealers and other market sources to determine fair value. |
| | |
| | Securities actively traded on any recognized U.S. or non-U.S. exchange or on The NASDAQ Stock Market LLC are valued at the last sale price or official closing price on the exchange or system on which they are principally traded. Events occurring after the close of trading on non-U.S. exchanges may result in adjustments to the valuation of foreign securities to reflect their fair value as of the close of regular trading on the New York Stock Exchange. The Fund may utilize an independent fair valuation service in adjusting the valuations of foreign securities. Unlisted equity securities are valued at the last quoted sale price or, if no sale price is available, at the mean between the most recently quoted bid and asked prices. |
| | |
| | Securities for which prices are not readily available are valued at fair value as determined by the Pricing Committee. The Pricing Committee considers a number of factors, including observable and unobservable inputs, when arriving at fair value. The Pricing Committee may use related or comparable assets or liabilities, recent transactions, market multiples, book values and other relevant information to determine the fair value of portfolio investments. The Board or a designated committee thereof regularly reviews fair value determinations made by the Pricing Committee and employs techniques such as reviewing related market activity, reviewing inputs and assumptions, and retrospectively comparing prices of subsequent purchases and sales transactions to fair value determinations made by the Pricing Committee. |
| | |
| | Short-term securities with 60 days or less remaining to maturity are valued using the amortized cost method, which approximates fair value. |
16
Notes to Financial Statements (continued)
| (b) | Security Transactions–Security transactions are recorded as of the date that the securities are purchased or sold (trade date). Realized gains and losses on sales of portfolio securities are calculated using the identified-cost method. |
| | |
| (c) | Investment Income–Dividend income is recorded on the ex-dividend date. Interest income is recorded on the accrual basis as earned. Discounts are accreted and premiums are amortized using the effective interest method and are included in Interest and other income on the Statement of Operations. Withholding taxes on foreign dividends have been provided for in accordance with the applicable country’s tax rules and rates. |
| | |
| (d) | Income Taxes–It is the policy of the Fund to meet the requirements of Subchapter M of the Internal Revenue Code applicable to regulated investment companies and to distribute substantially all taxable income and capital gains to its shareholders. Therefore, no income tax provision is required. |
| | |
| | The Fund files U.S. federal and various state and local tax returns. No income tax returns are currently under examination. The statute of limitations on the Fund’s filed U.S. federal tax returns remains open for the fiscal years ended December 31, 2012 through December 31, 2015. The statutes of limitations on the Company’s state and local tax returns may remain open for an additional year depending upon the jurisdiction. |
| | |
| (e) | Expenses–Expenses incurred by the Company that do not specifically relate to an individual fund are generally allocated to the funds within the Company on a pro rata basis by relative net assets. |
| | |
| (f) | Repurchase Agreements–The Fund may enter into repurchase agreements with respect to securities. A repurchase agreement is a transaction in which a fund acquires a security and simultaneously commits to resell that security to the seller (a bank or securities dealer) at an agreed-upon price on an agreed-upon date. The Fund requires at all times that the repurchase agreement be collateralized by cash, or by securities of the U.S. Government, its agencies, its instrumentalities, or U.S. Government sponsored enterprises having a value equal to, or in excess of, the value of the repurchase agreement (including accrued interest). If the seller of the agreement defaults on its obligation to repurchase the underlying securities at a time when the fair value of these securities has declined, the Fund may incur a loss upon disposition of the securities. |
| | |
| (g) | Fair Value Measurements–Fair value is defined as the price that the Fund would receive upon selling an investment or transferring a liability in an orderly transaction to an independent buyer in the principal or most advantageous market of the investment. A three-tier hierarchy is used to maximize the use of observable market data and minimize the use of unobservable inputs and to establish classification of fair value measurements for disclosure purposes. Inputs refer broadly to the assumptions that market participants would use in pricing the asset or liability, including assumptions about risk – for example, the risk inherent in a particular valuation technique used to measure fair value (such as a pricing model) and/or the risk inherent in the inputs to the valuation technique. Inputs may be observable or unobservable. Observable inputs reflect the assumptions market participants would use in pricing the asset or liability. Observable inputs are based on market data obtained from sources independent of the reporting entity. Unobservable inputs reflect the reporting entity’s own assumptions about the assumptions market participants would use in pricing the asset or liability. Unobservable inputs are based on the best information available in the circumstances. |
17
Notes to Financial Statements (continued)
The three-tier hierarchy of inputs is summarized in the three broad Levels listed below:
| | • | Level 1 – | unadjusted quoted prices in active markets for identical investments; |
| | | | |
| | • | Level 2 – | other significant observable inputs (including quoted prices for similar investments, interest rates, prepayment speeds, credit risk, etc.); and |
| | | | |
| | • | Level 3 – | significant unobservable inputs (including the Fund’s own assumptions in determining the fair value of investments). |
| | A summary of inputs used in valuing the Fund’s investments as of December 31, 2015 and, if applicable, Level 1/Level 2 transfers and Level 3 rollforwards for the fiscal year then ended is included in the Fund’s Schedule of Investments. |
| | Changes in valuation techniques may result in transfers into or out of an assigned level within the three-tier hierarchy. All transfers between different levels within the three-tier hierarchy are deemed to have occurred as of the beginning of the reporting period. The inputs or methodology used for valuing securities are not necessarily an indication of the risk associated with investing in those securities. |
| 3. | MANAGEMENT FEE AND OTHER TRANSACTIONS WITH AFFILIATES |
Management Fee
The Company has a management agreement with Lord Abbett, pursuant to which Lord Abbett supplies the Fund with investment management services and executive and other personnel, provides office space and pays for ordinary and necessary office and clerical expenses relating to research and statistical work and supervision of the Fund’s investment portfolio.
The management fee is based on the Fund’s average daily net assets at the following annual rate:
| First $1 billion | .75% |
| Next $1 billion | .70% |
| Over $2 billion | .65% |
For the fiscal year ended December 31, 2015, the effective management fee, net of waivers, was at an annualized rate of .00% of the Fund’s average daily net assets.
In addition, Lord Abbett provides certain administrative services to the Fund pursuant to an Administrative Services Agreement in return for a fee at an annual rate of ..04% of the Fund’s average daily net assets.
During the fiscal year ended December 31, 2015 and continuing through April 30, 2016, Lord Abbett has contractually agreed to waive its fees and reimburse expenses to the extent necessary to limit total net annual operating expenses to an annual rate of 1.10%. This agreement may be terminated only upon the approval of the Board.
The Company, on behalf of the Fund, has entered into services arrangements with certain insurance companies. Under these arrangements, certain insurance companies will be compensated up to .25% of the average daily net asset value (“NAV”) of the Fund’s Class VC Shares held in the insurance company’s separate account to service and maintain the Variable Contract owners’ accounts. This amount is included in Non 12b-1 service fees on the Statement of Operations. The Fund may also compensate certain insurance companies, third-party administrators and other entities for providing recordkeeping, sub-transfer agency and other administrative services to the Fund. This amount is included in Shareholder servicing on the Statement of Operations.
A Director and certain of the Company’s officers have an interest in Lord Abbett.
18
Notes to Financial Statements (continued)
| 4. | DISTRIBUTIONS AND CAPITAL LOSS CARRYFORWARDS |
Dividends from net investment income, if any, are declared and paid at least semi-annually. Taxable net realized gains from investment transactions, reduced by allowable capital loss carryforwards, if any, are declared and distributed to shareholders at least annually. The capital loss carryforward amount, if any, is available to offset future net capital gains. Dividends and distributions to shareholders are recorded on the ex-dividend date. The amounts of dividends and distributions from net investment income and net realized capital gains are determined in accordance with federal income tax regulations, which may differ from U.S. GAAP. These book/tax differences are either considered temporary or permanent in nature. To the extent these differences are permanent in nature, such amounts are reclassified within the components of net assets based on their federal tax basis treatment; temporary differences do not require reclassification. Dividends and distributions that exceed earnings and profits for tax purposes are reported as a tax return of capital.
The tax character of distributions paid during the fiscal years ended December 31, 2015 and 2014 was as follows:
| | | Year Ended | | | Year Ended |
| | | 12/31/2015 | | | 12/31/2014 |
| Distributions paid from: | | | | | | | |
| Ordinary income | | $ | 100 | | | $ | 6,530 |
| Net long-term capital gains | | | 12,940 | | | | 48,286 |
| Total distributions paid | | $ | 13,040 | | | $ | 54,816 |
As of December 31, 2015, the components of accumulated gains on a tax-basis were as follows:
| Undistributed long-term capital gains | | $ | 4,931 | |
| Total undistributed earnings | | | 4,931 | |
| Temporary differences | | $ | (35 | ) |
| Unrealized gains – net | | | 28,966 | |
| Total accumulated gains – net | | $ | 33,862 | |
As of December 31, 2015, the aggregate unrealized security gains and losses based on cost for U.S. federal income tax purposes were as follows:
| Tax cost | | $ | 345,956 | |
| Gross unrealized gain | | | 47,997 | |
| Gross unrealized loss | | | (19,031 | ) |
| Net unrealized security gain | | $ | 28,966 | |
The difference between book-basis and tax-basis unrealized gains (losses) is attributable to wash sales.
Permanent items identified during the fiscal year ended December 31, 2015 have been reclassified among the components of net assets based on their tax basis treatment as follows:
| Distributions in | | |
| Excess of Net | | |
| Investment | Accumulated Net | |
| Income | Realized Gain | |
| $38 | $(38 | ) |
The permanent differences are primarily attributable to the tax treatment of certain distributions.
19
Notes to Financial Statements (continued)
| 5. | PORTFOLIO SECURITIES TRANSACTIONS |
Purchases and sales of investment securities (excluding short-term investments) for the fiscal year ended December 31, 2015 were as follows:
| Purchases | Sales |
| $217,198 | $220,346 |
There were no purchases or sales of U.S. Government securities for the fiscal year ended December 31, 2015.
The Fund is permitted to purchase and sell securities (“cross-trade”) from and to other Lord Abbett Funds or client accounts pursuant to procedures approved by the Board in compliance with Rule 17a-7 under the Act (the “Rule”). Each cross-trade is executed at a fair market price in compliance with provisions of the Rule. For the year ended December 31, 2015, the Fund engaged in cross-trade purchases of $483.
| 6. | DISCLOSURES ABOUT OFFSETTING ASSETS AND LIABILITIES |
The Financial Accounting Standards Board (“FASB”) requires disclosures intended to help better assess the effect or potential effect of offsetting arrangements on a fund’s financial position. The following tables illustrate gross and net information about recognized assets and liabilities eligible for offset in the statement of assets and liabilities; and disclose such amounts subject to an enforceable master netting agreement or similar agreement, by counterparty. A master netting agreement is an agreement between a fund and a counterparty which provides for the net settlement of amounts owed under all contracts traded under that agreement, as well as cash collateral, through a single payment by one party to the other in the event of default on or termination of any one contract. The Fund’s accounting policy with respect to balance sheet offsetting is that, absent an event of default by the counterparty or a termination of the agreement, the master netting agreement does not result in an offset of reported amounts of financial assets and liabilities in the statement of assets and liabilities across transactions between the Fund and the applicable counterparty. As of December 31, 2015, the Fund did not have assets or liabilities subject to the FASB disclosure requirements.
| 7. | DIRECTORS’ REMUNERATION |
The Company’s officers and a Director, who are associated with Lord Abbett, do not receive any compensation from the Company for serving in such capacities. Independent Directors’ fees are allocated among all Lord Abbett-sponsored funds based on the net assets of each fund. There is an equity-based plan available to all Independent Directors under which Independent Directors must defer receipt of a portion of, and may elect to defer receipt of an additional portion of Directors’ fees. The deferred amounts are treated as though equivalent dollar amounts had been invested in the funds. Such amounts and earnings accrued thereon are included in Directors’ fees on the Statement of Operations and in Directors’ fees payable on the Statement of Assets and Liabilities and are not deductible for U.S. federal income tax purposes until such amounts are paid.
The Company has entered into an arrangement with its transfer agent and custodian, whereby credits realized as a result of uninvested cash balances are used to reduce a portion of the Fund’s expenses.
20
Notes to Financial Statements (concluded)
| 9. | CUSTODIAN AND ACCOUNTING AGENT |
State Street Bank and Trust Company (“SSB”) is the Company’s custodian and accounting agent. SSB performs custodial, accounting and recordkeeping functions relating to portfolio transactions and calculating the Fund’s NAV.
The Fund is subject to the general risks and considerations associated with equity investing, as well as the particular risks associated with value stocks. The value of an investment will fluctuate in response to movements in the equity securities market in general and to the changing prospects of individual companies in which the Fund invests. Small and mid-sized company stocks, in which the Fund invests, may perform differently than the market as a whole and other types of stocks, such as large-company and growth stocks. This is because different types of stocks tend to shift in and out of favor depending on market and economic conditions. The market may fail to recognize the intrinsic value of particular value stocks for a long time. In addition, if the Fund’s assessment of a company’s value or prospects for exceeding earnings expectations or market conditions is wrong, the Fund could suffer losses or produce poor performance relative to other funds, even in a rising market.
Due to the Fund’s investment exposure to foreign companies and American Depositary Receipts, the Fund may experience increased market, liquidity, currency, political, information and other risks.
These factors can affect the Fund’s performance.
| 11. | SUMMARY OF CAPITAL TRANSACTIONS |
Transactions in shares of capital stock were as follows:
| | | Year Ended | | | Year Ended | |
| | | December 31, 2015 | | | December 31, 2014 | |
| Shares sold | | | 185 | | | | 4,153 | |
| Reinvestment of distributions | | | 695 | | | | 2,757 | |
| Shares reacquired | | | (863 | ) | | | (2,706 | ) |
| Increase | | | 17 | | | | 4,204 | |
21
Report of Independent Registered Public Accounting Firm
To the Board of Directors of Lord Abbett Series Fund, Inc. and the Shareholders of Value Opportunities Portfolio:
We have audited the accompanying statement of assets and liabilities, including the schedule of investments, of the Value Opportunities Portfolio, one of the portfolios constituting the Lord Abbett Series Fund, Inc. (the “Fund”) as of December 31, 2015, and the related statement of operations for the year then ended, the statements of changes in net assets for each of the two years in the period then ended, and the financial highlights for each of the five years in the period then ended. These financial statements and financial highlights are the responsibility of the Fund’s management. Our responsibility is to express an opinion on these financial statements and financial highlights based on our audits.
We conducted our audits in accordance with the standards of the Public Company Accounting Oversight Board (United States). Those standards require that we plan and perform the audit to obtain reasonable assurance about whether the financial statements and financial highlights are free of material misstatement. The Fund is not required to have, nor were we engaged to perform, an audit of its internal control over financial reporting. Our audits included consideration of internal control over financial reporting as a basis for designing audit procedures that are appropriate in the circumstances, but not for the purpose of expressing an opinion on the effectiveness of the Fund’s internal control over financial reporting. Accordingly, we express no such opinion. An audit also includes examining, on a test basis, evidence supporting the amounts and disclosures in the financial statements, assessing the accounting principles used and significant estimates made by management, as well as evaluating the overall financial statement presentation. Our procedures included confirmation of securities owned as of December 31, 2015, by correspondence with the custodian and brokers; when replies were not received from brokers, we performed other auditing procedures. We believe that our audits provide a reasonable basis for our opinion.
In our opinion, such financial statements and financial highlights referred to above present fairly, in all material respects, the financial position of Value Opportunities Portfolio of the Lord Abbett Series Fund, Inc. as of December 31, 2015, the results of its operations for the year then ended, the changes in its net assets for each of the two years in the period then ended, and the financial highlights for each of the five years in the period then ended, in conformity with accounting principles generally accepted in the United States of America.
DELOITTE & TOUCHE LLP
New York, New York
February 16, 2016
22
Basic Information About Management
The Board is responsible for the management of the business and affairs of the Company in accordance with the laws of the State of Maryland. The Board elects officers who are responsible for the day-to-day operations of the Fund and who execute policies authorized by the Board. The Board also approves an investment adviser to the Fund and continues to monitor the cost and quality of the services the investment adviser provides, and annually considers whether to renew the contract with the adviser. Generally, each Director holds office until his/her successor is elected and qualified or until his/her earlier resignation or removal, as provided in the Company’s organizational documents.
Lord Abbett, a Delaware limited liability company, is the Fund’s investment adviser. Designated Lord Abbett personnel are responsible for the day-to-day management of the Fund.
Interested Director
Ms. Foster is affiliated with Lord Abbett and is an “interested person” of the Company as defined in the Act. Ms. Foster is a director/trustee and officer of each of the 12 investment companies in the Lord Abbett Family of Funds, which consist of 58 portfolios or series.
| | | Current Position and | | |
| Name, Address and | | Length of Service | | Principal Occupation and Other Directorships |
| Year of Birth | | with the Fund | | During the Past Five Years |
| | | | | |
Daria L. Foster
Lord, Abbett & Co. LLC
90 Hudson Street
Jersey City, NJ 07302
(1954) | | Director and President since 2006; Chief Executive Officer since 2012 | | Principal Occupation: Managing Partner of Lord Abbett, joined Lord Abbett in 1990.
Other Directorships: None. |
Independent Directors
The following Independent Directors also are directors/trustees of each of the 12 investment companies in the Lord Abbett Family of Funds, which consist of 58 portfolios or series.
| | | Current Position and | | |
| Name, Address and | | Length of Service | | Principal Occupation and Other Directorships |
| Year of Birth | | with the Fund | | During the Past Five Years |
| | | | | |
E. Thayer Bigelow
Lord, Abbett & Co. LLC
c/o Legal Dept.
90 Hudson Street
Jersey City, NJ 07302
(1941) | | Director since 1994; Chairman since 2013 | | Principal Occupation: Managing General Partner, Bigelow Media, LLC (since 2000); Senior Adviser, Time Warner Inc. (1998–2000).
Other Directorships: Currently serves as director of Crane Co. (since 1984) and Huttig Building Products Inc. (since 1998). Previously served as a director of R.H. Donnelley Inc. (2009–2010). |
| | | | | |
Robert B. Calhoun, Jr.
Lord, Abbett & Co. LLC
c/o Legal Dept.
90 Hudson Street
Jersey City, NJ 07302
(1942) | | Director since 1998 | | Principal Occupation: Senior Advisor of Monitor Clipper Partners, a private equity investment fund (since 1997); President of Clipper Asset Management Corp. (1991–2009).
Other Directorships: None. |
23
Basic Information About Management (continued)
| | | Current Position and | | |
| Name, Address and | | Length of Service | | Principal Occupation and Other Directorships |
| Year of Birth | | with the Fund | | During the Past Five Years |
Eric C. Fast
Lord, Abbett & Co. LLC
c/o Legal Dept.
90 Hudson Street
Jersey City, NJ 07302
(1949) | | Director since 2014 | | Principal Occupation: Chief Executive Officer of Crane Co., an industrial products company (2001–2014).
Other Directorships: Currently serves as director of Automatic Data Processing, Inc. (since 2007) and Regions Financial Corporation (since 2010). Previously served as a director of Crane Co. (1999–2014). |
| | | | | |
Evelyn E. Guernsey
Lord, Abbett & Co. LLC
c/o Legal Dept.
90 Hudson Street
Jersey City, NJ 07302
(1955) | | Director since 2011 | | Principal Occupation: CEO, Americas of J.P. Morgan Asset Management (2004–2010).
Other Directorships: None. |
| | | | | |
Julie A. Hill
Lord, Abbett & Co. LLC
c/o Legal Dept.
90 Hudson Street
Jersey City, NJ 07302
(1946) | | Director since 2004 | | Principal Occupation: Owner and CEO of The Hill Company, a business consulting firm (since 1998).
Other Directorships: Currently serves as director of Anthem, Inc., a health benefits company (since 1994). |
| | | | | |
Franklin W. Hobbs
Lord, Abbett & Co. LLC
c/o Legal Dept.
90 Hudson Street
Jersey City, NJ 07302
(1947) | | Director since 2001 | | Principal Occupation: Advisor of One Equity Partners, a private equity firm (since 2004).
Other Directorships: Currently serves as director and Chairman of the Board of Ally Financial Inc., a financial services firm (since 2009), and as director of Molson Coors Brewing Company (since 2002). |
| | | | | |
James M. McTaggart
Lord, Abbett & Co. LLC
c/o Legal Dept.
90 Hudson Street
Jersey City, NJ 07302
(1947) | | Director since 2012 | | Principal Occupation: Independent management advisor and consultant (since 2012); Vice President, CRA International, Inc. (doing business as Charles River Associates), a global management consulting firm (2009–2012); Founder and Chairman of Marakon Associates, Inc., a strategy consulting firm (1978–2009); and Officer and Director of Trinsum Group, a holding company (2007–2009).
Other Directorships: Currently serves as director of Blyth, Inc., a home products company (since 2004). |
| | | | | |
James L.L. Tullis
Lord, Abbett & Co. LLC
c/o Legal Dept.
90 Hudson Street
Jersey City, NJ 07302
(1947) | | Director since 2006 | | Principal Occupation: CEO of Tullis-Dickerson and Co. Inc., a venture capital management firm (since 1990); CEO of Tullis Health Investors Inc. (since 2012).
Other Directorships: Currently serves as director of Crane Co. (since 1998). |
24
Basic Information About Management (continued)
Officers
None of the officers listed below have received compensation from the Company. All of the officers of the Company also may be officers of the other Lord Abbett Funds and maintain offices at 90 Hudson Street, Jersey City, NJ 07302. Unless otherwise indicated, the position(s) and title(s) listed under the “Principal Occupation During the Past Five Years” column indicate each officer’s position(s) and title(s) with Lord Abbett. Each officer serves for an indefinite term (i.e., until his or her death, resignation, retirement, or removal).
| | | | | Length of Service | | |
| Name and | | Current Position | | of Current | | Principal Occupation |
| Year of Birth | | with the Fund | | Position | | During the Past Five Years |
| | | | | | | |
Daria L. Foster
(1954) | | President and Chief Executive Officer | | Elected as President in 2006 and Chief Executive Officer in 2012 | | Managing Partner of Lord Abbett, joined Lord Abbett in 1990. |
| | | | | | | |
Sean J. Aurigemma
(1969) | | Executive Vice President | | Elected in 2010 | | Portfolio Manager, joined Lord Abbett in 2007. |
| | | | | | | |
Jeff D. Diamond
(1960) | | Executive Vice President | | Elected in 2008 | | Portfolio Manager, joined Lord Abbett in 2007. |
| | | | | | | |
Robert I. Gerber
(1954) | | Executive Vice President | | Elected in 2003 | | Partner and Chief Investment Officer, joined Lord Abbett in 1997. |
| | | | | | | |
Todd D. Jacobson
(1966) | | Executive Vice President | | Elected in 2005 | | Partner and Associate Director, joined Lord Abbett in 2003. |
| | | | | | | |
Robert A. Lee
(1969) | | Executive Vice President | | Elected in 2010 | | Partner and Deputy Chief Investment Officer, joined Lord Abbett in 1997. |
| | | | | | | |
Thomas B. Maher
(1967) | | Executive Vice President | | Elected in 2010 | | Partner and Portfolio Manager, joined Lord Abbett in 2003. |
| | | | | | | |
Justin C. Maurer
(1969) | | Executive Vice President | | Elected in 2010 | | Partner and Portfolio Manager, joined Lord Abbett in 2001. |
| | | | | | | |
Vincent J. McBride
(1964) | | Executive Vice President | | Elected in 2010 | | Partner and Director, joined Lord Abbett in 2003. |
| | | | | | | |
Andrew H. O’Brien
(1973) | | Executive Vice President | | Elected in 2010 | | Partner and Portfolio Manager, joined Lord Abbett in 1998. |
| | | | | | | |
F. Thomas O’Halloran, III
(1955) | | Executive Vice President | | Elected in 2010 | | Partner and Portfolio Manager, joined Lord Abbett in 2001. |
| | | | | | | |
Walter H. Prahl
(1958) | | Executive Vice President | | Elected in 2012 | | Partner and Director, joined Lord Abbett in 1997. |
| | | | | | | |
Steven F. Rocco
(1979) | | Executive Vice President | | Elected in 2014 | | Partner and Portfolio Manager, joined Lord Abbett in 2004. |
25
Basic Information About Management (continued)
| | | | | Length of Service | | |
| Name and | | Current Position | | of Current | | Principal Occupation |
| Year of Birth | | with the Fund | | Position | | During the Past Five Years |
| | | | | | | |
Frederick J. Ruvkun
(1957) | | Executive Vice President | | Elected in 2012 | | Partner and Portfolio Manager, joined Lord Abbett in 2006. |
| | | | | | | |
Paul J. Volovich
(1973) | | Executive Vice President | | Elected in 2005 | | Partner and Portfolio Manager, joined Lord Abbett in 1997. |
| | | | | | | |
A. Edward Allinson
(1961) | | Vice President | | Elected in 2011 | | Portfolio Manager, joined Lord Abbett in 2005. |
| | | | | | | |
John W. Ashbrook
(1964) | | Vice President and Assistant Secretary | | Elected in 2014 | | Assistant General Counsel, joined Lord Abbett in 2008. |
| | | | | | | |
Joan A. Binstock
(1954) | | Chief Financial Officer and Vice President | | Elected in 1999 | | Partner and Chief Financial and Operations Officer, joined Lord Abbett in 1999. |
| | | | | | | |
Brooke A. Fapohunda
(1975) | | Vice President and Assistant Secretary | | Elected in 2014 | | Deputy General Counsel, joined Lord Abbett in 2006. |
| | | | | | | |
John K. Forst
(1960) | | Vice President and Assistant Secretary | | Elected in 2005 | | Partner and Deputy General Counsel, joined Lord Abbett in 2004. |
| | | | | | | |
Anthony W. Hipple
(1964) | | Vice President | | Elected in 2014 | | Portfolio Manager, joined Lord Abbett in 2002. |
| | | | | | | |
Lawrence H. Kaplan
(1957) | | Vice President and Secretary | | Elected in 1997 | | Partner and General Counsel, joined Lord Abbett in 1997. |
| | | | | | | |
Jerald M. Lanzotti
(1967) | | Vice President | | Elected in 2012 | | Partner and Portfolio Manager, joined Lord Abbett in 1996. |
| | | | | | | |
David J. Linsen
(1974) | | Vice President | | Elected in 2008 | | Partner and Director, joined Lord Abbett in 2001. |
| | | | | | | |
Joseph M. McGill
(1962) | | Chief Compliance Officer | | Elected in 2014 | | Chief Compliance Officer, joined Lord Abbett in 2014 and was formerly Managing Director and the Chief Compliance Officer at UBS Global Asset Management (2003–2013). |
| | | | | | | |
A. Edward Oberhaus, III
(1959) | | Vice President | | Elected in 1998 | | Partner and Director, joined Lord Abbett in 1983. |
| | | | | | | |
Noah Petrucci
(1970) | | Vice President | | Elected in 2013 | | Portfolio Manager, joined Lord Abbett in 2012 and was formerly a Portfolio Manager at Columbia Management Investment Advisers, LLC and Columbia Management Advisors, LLC (2002–2012). |
26
Basic Information About Management (concluded)
| | | | | Length of Service | | |
| Name and | | Current Position | | of Current | | Principal Occupation |
| Year of Birth | | with the Fund | | Position | | During the Past Five Years |
| | | | | | | |
Lawrence B. Stoller
(1963) | | Vice President and Assistant Secretary | | Elected in 2007 | | Partner and Senior Deputy General Counsel, joined Lord Abbett in 2007. |
| | | | | | | |
Arthur K. Weise
(1970) | | Vice President | | Elected in 2010 | | Partner and Portfolio Manager, joined Lord Abbett in 2007. |
| | | | | | | |
Kewjin Yuoh
(1971) | | Vice President | | Elected in 2012 | | Partner and Portfolio Manager, joined Lord Abbett in 2010. |
| | | | | | | |
Scott S. Wallner
(1955) | | AML Compliance Officer | | Elected in 2011 | | Assistant General Counsel, joined Lord Abbett in 2004. |
| | | | | | | |
Bernard J. Grzelak
(1971) | | Treasurer | | Elected in 2003 | | Partner and Director of Fund Administration, joined Lord Abbett in 2003. |
Please call 888-522-2388 for a copy of the statement of additional information, which contains further information about the Company’s Directors. It is available free upon request.
27
Approval of Advisory Contract
The Board of Directors of the Fund, including all of the Directors who are not interested persons of the Fund or of Lord Abbett (the “Independent Board Members”), annually considers whether to approve the continuation of the existing management agreement between the Fund and Lord Abbett. In connection with its most recent approval, the Board reviewed materials relating specifically to the management agreement, as well as numerous materials received throughout the course of the year, including information about the Fund’s investment performance compared to the performance of its benchmark. Before making its decision as to the Fund, the Board had the opportunity to ask questions and request further information, taking into account its familiarity with Lord Abbett gained through its meetings and discussions. These meetings and discussions included the examination of the portfolio management team conducted by members of the Contract Committee, the deliberations of the Contract Committee, and discussions between the Contract Committee and Lord Abbett’s management. The Independent Board Members also discussed the materials described above with their independent legal counsel in a private session at which no representatives of management were present.
The materials received by the Board included, but were not limited to: (1) information provided by Morningstar Associates, LLC (“Morningstar”) regarding the investment performance of the Fund compared to the investment performance of a group of funds in the same Morningstar investment category (the “performance peer group”) and the investment performance of one or more appropriate benchmarks; (2) information provided by Morningstar regarding the expense ratios, contractual and effective management fee rates, and other expense components for the Fund and one or more groups of funds in the same Morningstar category, with the same share classes and operational characteristics, including asset size (the “expense peer group”); (3) information provided by Lord Abbett on the projected expense ratios, management fee rates, and other expense components for the Fund; (4) sales and redemption information for the Fund; (5) information regarding Lord Abbett’s financial condition; (6) an analysis of the relative profitability of the management agreement to Lord Abbett; (7) information provided by Lord Abbett regarding the investment management fees Lord Abbett receives from its other advisory clients maintaining accounts with a similar investment strategy as the Fund; (8) information regarding the distribution arrangements of the Fund; and (9) information regarding the personnel and other resources devoted by Lord Abbett to managing the Fund.
Investment Management Services Generally. The Board considered the investment management services provided by Lord Abbett to the Fund, including investment research, portfolio management, and trading, and Lord Abbett’s commitment to compliance with all applicable legal requirements. The Board also observed that Lord Abbett was solely engaged in the investment management business and accordingly did not experience the conflicts of interest that may result from being engaged in other lines of business. The Board considered the investment advisory services provided by Lord Abbett to other clients, the fees charged for the services, and the differences in the nature of the services provided to the Fund and other Lord Abbett Funds, on the one hand, and the services provided to other clients, on the other.
Investment Performance. The Board reviewed the Fund’s investment performance in relation to that of the performance peer group as of various periods ended August 31, 2015. The Board observed that the Fund’s investment performance was above the median of the performance peer group for the one-year, three-year, and five-year periods.
28
Approval of Advisory Contract (continued)
Lord Abbett’s Personnel and Methods. The Board considered the qualifications of the personnel providing investment management services to the Fund, in light of its investment objective and discipline. Among other things, the Board considered the size, experience, and turnover of Lord Abbett’s investment management staff, Lord Abbett’s investment methodology and philosophy, and Lord Abbett’s approach to recruiting, training, and retaining investment management personnel.
Nature and Quality of Other Services. The Board considered the nature, quality, costs, and extent of compliance, administrative, and other services performed by Lord Abbett and Lord Abbett Distributor LLC (the “Distributor”) and the nature and extent of Lord Abbett’s supervision of third party service providers, including the Fund’s transfer agent and custodian.
Expenses. The Board considered the expense level of the Fund and the expense levels of the expense peer group. It also considered the projected expense levels and how those levels would relate to those of the expense peer group and the amount and nature of the fees paid by shareholders. The Board observed that the overall expense level of the Fund was above the median of the expense peer group.
Profitability. The Board considered the level of Lord Abbett’s profits in managing the Fund, including a review of Lord Abbett’s methodology for allocating its costs to its management of the Fund. The Board concluded that the allocation methodology had a reasonable basis and was appropriate. It considered any profits realized by Lord Abbett in connection with the operation of the Fund, including the fee that Lord Abbett receives from the Fund for providing administrative services to the Fund, and whether the amount of profit was fair for the management of the Fund. The Board also considered the profits realized from other business segments of Lord Abbett, which may benefit from or be related to the Fund’s business. The Board considered Lord Abbett’s profit margins in comparison with available industry data, both accounting for and ignoring marketing and distribution expenses, and how those profit margins could affect Lord Abbett’s ability to recruit and retain investment personnel. The Board recognized that Lord Abbett’s profitability was a factor in enabling it to attract and retain qualified investment management personnel to provide services to the Fund. The Board concluded that Lord Abbett’s profitability as to the Fund was not excessive.
Economies of Scale. The Board considered whether there had been any economies of scale in managing the Fund, whether the Fund had appropriately benefited from any such economies of scale, and whether there was potential for realization of any further economies of scale. The Board concluded that the existing management fee schedule, with its breakpoint or breakpoints in the level of the management fee, adequately addressed any economies of scale in managing the Fund.
Other Benefits to Lord Abbett. The Board considered the character and amount of fees paid by the Fund and the Fund’s shareholders to Lord Abbett and the Distributor for services other than investment advisory services. The Board also considered the revenues and profitability of Lord Abbett’s investment advisory business apart from its mutual fund business, and the intangible benefits enjoyed by Lord Abbett by virtue of its relationship with the Fund. The Board observed that the Distributor receives 12b-1 fees from certain of the Lord Abbett Funds as to shares held in accounts for which there is no other broker of record, may retain a portion of the 12b-1 fees it receives, and receives a portion of the sales charges on sales and redemptions of some classes of shares. In addition, the Board observed that Lord Abbett accrues certain benefits for its business of providing investment advice to clients other than the Lord Abbett Funds, but that business also benefits the Funds. The Board also noted that Lord Abbett, as disclosed in the prospectus of the Fund, has entered into revenue sharing arrangements with certain entities that distribute shares of
29
Approval of Advisory Contract (concluded)
the Fund. The Board also took into consideration the investment research that Lord Abbett receives as a result of Fund brokerage transactions.
Alternative Arrangements. The Board considered whether, instead of approving continuation of the management agreement, it might be in the best interests of the Fund to implement one or more alternative arrangements, such as continuing to employ Lord Abbett, but on different terms. After considering all of the relevant factors, the Board unanimously found that continuation of the existing management agreement was in the best interests of the Fund and its shareholders and voted unanimously to approve the continuation of the management agreement. In considering whether to approve the continuation of the management agreement, the Board did not identify any single factor as paramount or controlling. This summary does not discuss in detail all matters considered.
30
Householding
The Company has adopted a policy that allows it to send only one copy of the Fund’s prospectus, proxy material, annual report and semiannual report to certain shareholders residing at the same “household.” This reduces Fund expenses, which benefits you and other shareholders. If you need additional copies or do not want your mailings to be “householded,” please call Lord Abbett at 888-522-2388 or send a written request with your name, the name of your fund or funds and your account number or numbers to Lord Abbett Family of Funds, P.O. Box 219336, Kansas City, MO 64121.
Proxy Voting Policies, Procedures and Records
A description of the policies and procedures that Lord Abbett uses to vote proxies related to the Fund’s portfolio securities, and information on how Lord Abbett voted the Fund’s proxies during the 12-month period ended June 30 are available without charge, upon request, (i) by calling 888-522-2388; (ii) on Lord Abbett’s Website at www.lordabbett.com; and (iii) on the Securities and Exchange Commission’s (“SEC”) Website at www.sec.gov.
Shareholder Reports and Quarterly Portfolio Disclosure
The Fund is required to file its complete schedule of portfolio holdings with the SEC for its first and third fiscal quarters on Form N-Q. Copies of the filings are available without charge, upon request on the SEC’s Website at www.sec.gov and may be available by calling Lord Abbett at 888-522-2388. You can also obtain copies of Form N-Q by visiting the SEC’s Public Reference Room in Washington, DC (information on the operation of the Public Reference Room may be obtained by calling 800-SEC-0330).
Tax Information
100% of the ordinary income distributions paid by the Fund during the year is qualified dividend income.
For corporate shareholders, 100% of the Fund’s ordinary income distributions qualified for the dividends received deduction.
Additionally, of the distributions paid to shareholders during the fiscal year ended December 31, 2015, $12,940, represents long-term capital gains.
31


| This report, when not used for the general information of shareholders of the Fund, is to be distributed only if preceded or accompanied by a current fund prospectus. | | |
| | Lord Abbett Series Fund, Inc. | |
| | | |
Lord Abbett mutual fund shares are distributed by
LORD ABBETT DISTRIBUTOR LLC. | Value Opportunities Portfolio | SFVALOPP-PORT-3
(02/16) |
| (a) | In accordance with applicable requirements, the Registrant adopted a Sarbanes-Oxley Code of Ethics on June 19, 2003 that applies to the principal executive officer and senior financial officers of the Registrant (“Code of Ethics”). The Code of Ethics was in effect during the fiscal year ended December 31, 2015 (the “Period”). |
| (c) | The Registrant has not amended the Code of Ethics as described in Form N-CSR during the Period. |
| (d) | The Registrant has not granted any waiver, including an implicit waiver, from a provision of the Code of Ethics as described in Form N-CSR during the Period. |
| (f) | See Item 12(a)(1) concerning the filing of the Code of Ethics. |
| Item 3: | Audit Committee Financial Expert. |
The Registrant’s board of directors has determined that each of the following independent directors who are members of the audit committee is an audit committee financial expert: E. Thayer Bigelow and Robert B. Calhoun, Jr. Each of these persons is independent within the meaning of the Form N-CSR.
| Item 4: | Principal Accountant Fees and Services. |
In response to sections (a), (b), (c) and (d) of Item 4, the aggregate fees billed to the Registrant for the fiscal years ended December 31, 2015 and 2014 by the Registrant’s principal accounting firm, Deloitte & Touche LLP, the member firms of Deloitte Touche Tohmatsu and their respective affiliates (collectively, “Deloitte”) were as follows:
| | | Fiscal year ended: | |
| | | 2015 | | | 2014 | |
| Audit Fees {a} | | | $502,000 | | | | $475,900 | |
| Audit-Related Fees | | | - 0 - | | | | - 0 - | |
| Total audit and audit-related fees | | | 502,000 | | | | 475,900 | |
| | | | | | | | | |
| Tax Fees {b} | | | 122,522 | | | | 117,787 | |
| All Other Fees | | | - 0 - | | | | - 0 - | |
| | | | | | | | | |
| Total Fees | | | $624,522 | | | | $593,687 | |
{a} Consists of fees for audits of the Registrant’s annual financial statements.
{b} Fees for the fiscal year ended December 31, 2015 and 2014 consist of fees for preparing the U.S. Income Tax Return for Regulated Investment Companies, New Jersey Corporation Business Tax Return, New Jersey Annual Report Form, U.S. Return of Excise Tax on Undistributed Income of Investment Companies, IRS Forms 1099-MISC and 1096 Annual Summary and Transmittal of U.S. Information Returns.
(e) (1) Pursuant to Rule 2-01(c) (7) of Regulation S-X, the Registrant’s Audit Committee has adopted pre-approval policies and procedures. Such policies and procedures generally provide that the Audit Committee must pre-approve:
| · | any audit, audit-related, tax, and other services to be provided to the Lord Abbett Funds, including the Registrant, and |
| · | any audit-related, tax, and other services to be provided to the Registrant’s investment adviser and any entity controlling, controlled by or under common control with the investment adviser that provides ongoing services to one or more Funds comprising the Registrant if the engagement relates directly to operations and financial reporting of a Fund, by the independent auditor to assure that the provision of such services does not impair the auditor’s independence. |
The Audit Committee has delegated pre-approval authority to its Chairman, subject to a fee limit of $10,000 per event, and not to exceed $25,000 annually. The Chairman will report any pre-approval decisions to the Audit Committee at its next scheduled meeting. Unless a type of service to be provided by the independent auditor has received general pre-approval, it must be pre-approved by the Audit Committee. Any proposed services exceeding pre-approved cost levels will require specific pre-approval by the Audit Committee.
(e) (2) The Registrant’s Audit Committee has approved 100% of the services described in this Item 4 (b) through (d).
(f) Not applicable.
(g) The aggregate non-audit fees billed by Deloitte for services rendered to the Registrant are shown above in the response to Item 4 (a), (b), (c) and (d) as “All Other Fees”.
The aggregate non-audit fees billed by Deloitte for services rendered to the Registrant’s investment adviser, Lord, Abbett & Co. LLC (“Lord Abbett”), for the fiscal years ended December 31, 2015 and 2014 were:
| | | Fiscal year ended: | |
| | | 2015 | | | 2014 | |
| All Other Fees {a} | | | $215,031 | | | | $185,734 | |
{a} Consist of fees for Independent Services Auditors’ Report on Controls Placed in Operation and Tests of Operating Effectiveness related to Lord Abbett’s Asset Management Services (“SOC-1 Report”).
The aggregate non-audit fees billed by Deloitte for services rendered to entities under the common control of Lord Abbett for the fiscal years ended December 31, 2015 and 2014 were:
| | | Fiscal year ended: | |
| | | 2015 | | | 2014 | |
| All Other Fees | | | $ - 0 - | | | | $ - 0 - | |
(h) The Registrant’s Audit Committee has considered the provision of non-audit services that were rendered to the Registrant’s investment adviser, and any entity controlling, controlled by or under common control with the investment adviser that provides ongoing services to the Registrant, that were not pre-approved pursuant to Rule 2-01 (c)(7)(ii) of Regulation S-X and has determined that the provision of such services is compatible with maintaining Deloitte’s independence.
| Item 5: | Audit Committee of Listed Registrants. |
| | |
| | Not applicable. |
| Item 6: | Investments. |
| | |
| | Not applicable. |
| Item 7: | Disclosure of Proxy Voting Policies and Procedures for Closed-End Management Investment Companies. |
| | |
| | Not applicable. |
| | |
| Item 8: | Portfolio Managers of Closed-End Management Investment Companies. |
| | |
| | Not applicable. |
| Item 9: | Purchases of Equity Securities by Closed-End Management Investment Company and Affiliated Purchasers. |
| | |
| | Not applicable. |
| | |
| Item 10: | Submission of Matters to a Vote of Security Holders. |
| | |
| Not applicable. |
| | |
| Item 11: | Controls and Procedures. |
| (a) | Based on their evaluation of the Registrant’s disclosure controls and procedures (as defined in Rule 30a-3(c) under the Investment Company Act of 1940) as of a date within 90 days prior to the filing date of this report, the Chief Executive Officer and Chief Financial Officer of the Registrant have concluded that such disclosure controls and procedures are reasonably designed and effective to ensure that material information relating to the Registrant, including its consolidated subsidiaries, is made known to them by others within those entities. |
| (b) | There were no changes in the Registrant’s internal control over financial reporting (as defined in Rule 30a-3(d) under the Investment Company Act of 1940) that occurred during the second fiscal quarter of the period covered by this report that have materially affected, or are reasonably likely to materially affect, the Registrant’s internal control over financial reporting. |
| (a)(1) | The Lord Abbett Family of Funds Sarbanes Oxley Code of Ethics for the Principal Executive Officer and Senior Financial Officers is attached hereto as part of Ex-99.CODEETH. |
| | | |
| | (a)(2) | Certification of each Principal Executive Officer and Principal Financial Officer of the Registrant as required by Rule 30a-2 under the Investment Company Act of 1940 is attached hereto as a part of EX-99.CERT. |
| (b) | Certification of each Principal Executive Officer and Principal Financial Officer of the Registrant as required by Section 906 of the Sarbanes-Oxley Act of 2002 is provided as a part of EX-99.906CERT. |
SIGNATURES
Pursuant to the requirements of the Securities Exchange Act of 1934 and the Investment Company Act of 1940, the Registrant has duly caused this report to be signed on its behalf by the undersigned, thereunto duly authorized.
| | | LORD ABBETT SERIES FUND, INC. |
| | | |
| | By: | /s/ Daria L. Foster | |
| | | Daria L. Foster | |
| | | President and Chief Executive Officer | |
Date: February 16, 2016
| | By: | /s/ Joan A. Binstock | |
| | | Joan A. Binstock | |
| | | Chief Financial Officer and Vice President |
Date: February 16, 2016
Pursuant to the requirements of the Securities Exchange Act of 1934 and the Investment Company Act of 1940, this report has been signed below by the following persons on behalf of the Registrant and in the capacities and on the dates indicated.
| | By: | /s/ Daria L. Foster | |
| | | Daria L. Foster | |
| | | President and Chief Executive Officer | |
Date: February 16, 2016
| | By: | /s/ Joan A. Binstock | |
| | | Joan A. Binstock | |
| | | Chief Financial Officer and Vice President |
Date: February 16, 2016