UNITED STATES
SECURITIES AND EXCHANGE COMMISSION
Washington, D.C. 20549
FORM N-CSR
CERTIFIED SHAREHOLDER REPORT OF REGISTERED
MANAGEMENT INVESTMENT COMPANIES
Investment Company Act File Number: 811-05876
LORD ABBETT SERIES FUND, INC.
(Exact name of Registrant as specified in charter)
90 Hudson Street, Jersey City, NJ 07302
(Address of principal executive offices) (Zip code)
Brooke A. Fapohunda, Esq., Vice President & Assistant Secretary
90 Hudson Street, Jersey City, NJ 07302
(Name and address of agent for service)
Registrant’s telephone number, including area code: (800) 201-6984
Date of fiscal year end: 12/31
Date of reporting period: 12/31/2017
| Item 1: | Report(s) to Shareholders. |
![]()
LORD ABBETT
ANNUAL REPORT
Lord Abbett
Series Fund—Bond Debenture Portfolio
For the fiscal year ended December 31, 2017
Table of Contents
Lord Abbett Series Fund – Bond Debenture Portfolio
Annual Report
For the fiscal year ended December 31, 2017
From left to right: James L.L. Tullis, Independent Chairman of the Lord Abbett Funds and Daria L. Foster, Director, President, and Chief Executive Officer of the Lord Abbett Funds.
| Dear Shareholders: We are pleased to provide you with this overview of the performance of Lord Abbett Series Fund – Bond Debenture Portfolio for the fiscal year ended December 31, 2017. On this page, and the following pages, we discuss the major factors that influenced fiscal year performance. For additional information about the Fund, please visit our website at www.lordabbett.com, where you also can access the quarterly commentaries that provide updates on the Fund’s performance and other portfolio related updates. Thank you for investing in Lord Abbett mutual funds. We value the trust that you place in us and look forward to serving your investment needs in the years to come.
Best regards,
Daria L. Foster Director, President and Chief Executive Officer |


For the fiscal year ended December 31, 2017, the Fund returned 9.21%, reflecting performance at the net asset value (NAV) of Class VC shares, with all distributions reinvested, compared to its benchmark, the Bloomberg Barclays U.S. Aggregate Bond Index1 which returned 3.54% over the same period.
During the 12-month period the leveraged credit sectors of the U.S. fixed income market, including high yield bonds and loans, experienced positive returns, outperforming traditional government
related and investment grade securities. Despite some episodes of heightened volatility, high yield corporate spreads continued to compress during the period and returns within the high yield market were driven primarily by the lower quality segment, as CCC rated bonds meaningfully outperformed the broader market for the 12- month period.
As it has in the past, the Fund maintained a significant allocation to high yield bonds, as we remained positive on the high yield market from a fundamental
1
perspective. The Fund’s exposure to high yield bonds contributed to relative performance, as the high yield market significantly outperformed investment grade bonds, as represented by the Fund’s benchmark the Bloomberg Barclays U.S. Aggregate Bond Index.
The Fund maintained an allocation to equities throughout the period, which also contributed to relative performance, as the asset class outperformed fixed income segments of the market, including the Bloomberg Barclays U.S. Aggregate Bond Index.
The Fund’s modest allocation to government-related and securitized products detracted from performance, as these securities lagged risk assets during the period.
The Fund’s portfolio is actively managed and, therefore, its holdings and the weightings of a particular issuer or particular sector as a percentage of portfolio assets are subject to change. Sectors may include many industries.
1 The Bloomberg Barclays U.S. Aggregate Bond Index is an index of U.S dollar-denominated, investment-grade U.S. government and corporate securities, and mortgage pass-through securities, and asset-backed securities. Indexes are unmanaged, do not reflect the deduction of fees or expenses, and an investor cannot invest directly in an index.
Unless otherwise specified, indexes reflect total return, with all dividends reinvested. Indexes are unmanaged, do not reflect the deduction of fees or expenses, and are not available for direct investment.
Important Performance and Other Information
Performance data quoted in the following pages reflect past performance and are no guarantee of future results. Current performance may be higher or lower than the performance quoted. The investment return and principal value of an investment in the Fund will fluctuate so that shares, on any given day or when redeemed, may be worth more or less than their original cost. You can obtain performance data current to the most recent month end by calling Lord Abbett at 888-522-2388 or referring to www.lordabbett.com.
During certain periods shown, expense waivers and reimbursements were in place. Without such expense waivers and reimbursements, the Fund’s returns would have been lower.
The annual commentary above discusses the views of the Fund’s management and various portfolio holdings of the Fund as of December 31, 2017. These views and portfolio holdings may have changed after this date. Information provided in the commentary is not a recommendation to buy or sell securities. Because the Fund’s portfolio is actively managed and may change significantly, the Fund may no longer own the securities described above or may have otherwise changed its position in the securities. For more recent information about the Fund’s portfolio holdings, please visit www.lordabbett.com.
A Note about Risk: See Notes to Financial Statements for a discussion of investment risks. For a more detailed discussion of the risks associated with the Fund, please see the Fund’s prospectus.
Mutual funds are not insured by the FDIC, are not deposits or other obligations of, or guaranteed by, banks, and are subject to investment risks including possible loss of principal amount invested.
The Fund serves as an underlying investment vehicle for variable annuity contracts and variable life insurance policies.
2
Below is a comparison of a $10,000 investment in Class VC shares with the same investment in the Bloomberg Barclays U.S. Aggregate Bond Index and the ICE BofA Merrill Lynch U.S. High Yield Constrained Index, assuming reinvestment of all dividends and distributions. The Fund’s shares are sold only to insurance company separate accounts that fund certain variable annuity and variable life contracts. This line graph comparison does not reflect the sales charges or other expenses of these contracts. If those sales charges and expenses were reflected, returns would be lower. The graph and performance table below do not reflect the deduction of taxes that a shareholder would pay on Fund distributions or the redemption of Fund shares. During certain periods, expenses of the Fund have been waived or reimbursed by Lord Abbett; without such waiver or reimbursement of expenses, the Fund’s returns would have been lower. Past performance is no guarantee of future results.
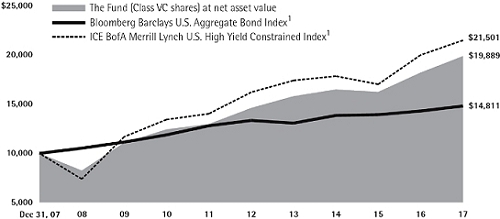
Average Annual Total Returns for the
Periods Ended December 31, 2017
| 1 Year | 5 Years | 10 Years | ||||
| Class VC | 9.21% | 6.36% | 7.12% |
1 Performance for each unmanaged index does not reflect any fees or expenses. The performance of each index is not necessarily representative of the Fund’s performance.
3
As a shareholder of the Fund, you incur ongoing costs, including management fees; expenses related to the Fund’s services arrangements with certain insurance companies; and other Fund expenses. This Example is intended to help you understand your ongoing costs (in dollars) of investing in the Fund and to compare these costs with the ongoing costs of investing in other mutual funds.
The Example is based on an investment of $1,000 invested at the beginning of the period and held for the entire period (July 1, 2017 through December 31, 2017).
The Example reflects only expenses that are deducted from the assets of the Fund. Fees and expenses, including sales charges applicable to the various insurance products that invest in the Fund, are not reflected in this Example. If such fees and expenses were reflected in the Example, the total expenses shown would be higher. Fees and expenses regarding such variable insurance products are separately described in the prospectus related to those products.
Actual Expenses
The first line of the table on the following page provides information about actual account values and actual expenses. You may use the information in this line, together with the amount you invested, to estimate the expenses that you paid over the period. Simply divide your account value by $1,000 (for example, an $8,600 account value divided by $1,000 = 8.6), then multiply the result by the number in the first line under the heading titled “Expenses Paid During Period 7/1/17 – 12/31/17” to estimate the expenses you paid on your account during this period.
Hypothetical Example for Comparison Purposes
The second line of the table on the following page provides information about hypothetical account values and hypothetical expenses based on the Fund’s actual expense ratio and an assumed rate of return of 5% per year before expenses, which is not the Fund’s actual return. The hypothetical account values and expenses may not be used to estimate the actual ending account balance or expenses you paid for the period. You may use this information to compare the ongoing costs of investing in the Fund and other funds. To do so, compare this 5% hypothetical example with the 5% hypothetical examples that appear in the shareholder reports of the other funds.
4
Please note that the expenses shown in the table are meant to highlight your ongoing costs only and do not reflect any transactional costs, such as sales charges. Therefore, the second line of the table is useful in comparing ongoing costs only, and will not help you determine the relative total costs of owning different funds. In addition, if these transactional costs were included, your costs would have been higher.
| Beginning Account Value | Ending Account Value | Expenses Paid During Period† | |||||
| 7/1/17 | 12/31/17 | 7/1/17 – 12/31/17 | | ||||
| Class VC | |||||||
| Actual | $1,000.00 | $1,042.40 | $4.63 | ||||
| Hypothetical (5% Return Before Expenses) | $1,000.00 | $1,020.67 | $4.58 |
| † | Net expenses are equal to the Fund’s annualized expense ratio of 0.90%, multiplied by the average account value over the period, multiplied by 184/365 (to reflect one-half year period). |
Portfolio Holdings Presented by Sector
December 31, 2017
| Sector* | %** | |
| Asset Backed | 1.86 | % |
| Automotive | 1.84 | % |
| Banking | 8.74 | % |
| Basic Industry | 9.97 | % |
| Capital Goods | 3.53 | % |
| Consumer Goods | 3.45 | % |
| Energy | 12.10 | % |
| Financial Services | 4.09 | % |
| Foreign Government | 3.81 | % |
| Healthcare | 6.59 | % |
| Insurance | 2.38 | % |
| Leisure | 4.21 | % |
| Media | 3.36 | % |
| Municipal | 3.97 | % |
| Real Estate | 1.47 | % |
| Retail | 5.48 | % |
| Services | 3.22 | % |
| Technology | 6.90 | % |
| Telecommunications | 2.90 | % |
| Transportation | 3.14 | % |
| U.S. Government | 1.44 | % |
| Utility | 4.33 | % |
| Repurchase Agreement | 1.22 | % |
| Total | 100.00 | % |
| * | A sector may comprise several industries. | |
| ** | Represents percent of total investments. |
5
December 31, 2017
| Investments | Interest Rate | Maturity Date | Principal Amount (000) | Fair Value | ||||||||
| LONG-TERM INVESTMENTS 99.38% | ||||||||||||
| ASSET-BACKED SECURITIES 1.92% | ||||||||||||
| Automobiles 0.11% | ||||||||||||
| TCF Auto Receivables Owner Trust 2016-1A B† | 2.32% | 6/15/2022 | $ | 979 | $ | 964,024 | ||||||
| Westlake Automobile Receivables Trust 2016-3A B† | 2.07% | 12/15/2021 | 277 | 276,180 | ||||||||
| Total | 1,240,204 | |||||||||||
| Other 1.81% | ||||||||||||
| ALM XIX Ltd. 2016-19A C† | 5.709% (3 Mo. LIBOR + 4.35% | )# | 7/15/2028 | 462 | 475,152 | |||||||
| ALM XVIII Ltd. 2016-18A C† | 5.709% (3 Mo. LIBOR + 4.35% | )# | 7/15/2027 | 500 | 515,353 | |||||||
| AMMC CLO XII Ltd. 2013-12A DR† | 4.11% (3 Mo. LIBOR + 2.47% | )#(a) | 11/10/2030 | 391 | 393,625 | |||||||
| Anchorage Capital CLO 8 Ltd. 2016-8A D† | 5.578% (3 Mo. LIBOR + 4.20% | )# | 7/28/2028 | 250 | 253,845 | |||||||
| Anchorage Capital CLO 9 Ltd. 2016-9A D† | 5.359% (3 Mo. LIBOR + 4.00% | )# | 1/15/2029 | 1,150 | 1,177,136 | |||||||
| Apex Credit CLO Ltd. 2015-2A B1† | 3.753% (3 Mo. LIBOR + 2.40% | )# | 10/19/2026 | 1,500 | 1,501,565 | |||||||
| Ascentium Equipment Receivables Trust 2016-2A B† | 2.50% | 9/12/2022 | 417 | 415,210 | ||||||||
| BlueMountain CLO Ltd. 2016-1A D† | 6.163% (3 Mo. LIBOR + 4.80% | )# | 4/20/2027 | 500 | 508,882 | |||||||
| Conn Funding II LP 2017-B C† | 5.95% | 11/15/2022 | 2,250 | 2,273,600 | (b) | |||||||
| Engs Commercial Finance Trust 2016-1A A2† | 2.63% | 2/22/2022 | 832 | 828,109 | ||||||||
| Guggenheim 5180-2 CLO LP 2015-1A A2B† | 4.012% (3 Mo. LIBOR + 2.55% | )# | 11/25/2027 | 2,500 | 2,507,979 | |||||||
| Jamestown CLO VII Ltd. 2015-7A BR† | 3.017% (3 Mo. LIBOR + 1.65% | )#(a) | 7/25/2027 | 1,202 | 1,203,006 | |||||||
| KKR Financial CLO Ltd. 2013-2A C† | 5.113% (3 Mo. LIBOR + 3.75% | )# | 1/23/2026 | 500 | 501,285 | |||||||
| Marble Point CLO XI Ltd. 2017-2A A† | 2.793% (3 Mo. LIBOR + 1.18% | )#(a) | 12/18/2030 | 1,800 | 1,802,610 | |||||||
| Regatta III Funding Ltd. 2014-1A CR† | 4.659% (3 Mo. LIBOR + 3.30% | )# | 4/15/2026 | 400 | 402,931 | |||||||
| Regatta IV Funding Ltd. 2014-1A DR† | 4.667% (3 Mo. LIBOR + 3.30% | )# | 7/25/2026 | 1,300 | 1,300,761 | |||||||
| Sound Point CLO XI Ltd. 2016-1A D† | 6.013% (3 Mo. LIBOR + 4.65% | )# | 7/20/2028 | 2,000 | 2,045,240 | |||||||
| Voya CLO Ltd. 2016-2A C† | 5.607% (3 Mo. LIBOR + 4.25% | )# | 7/19/2028 | 750 | 760,662 | |||||||
| Voya CLO Ltd. 2017-4A A1† | 2.514% (3 Mo. LIBOR + 1.13% | )#(a) | 10/15/2030 | 1,059 | 1,062,121 | |||||||
| West CLO Ltd. 2014-2A BR† | 3.111% (3 Mo. LIBOR + 1.75% | )#(a) | 1/16/2027 | 459 | 459,542 | |||||||
| 6 | See Notes to Financial Statements. |
Schedule of Investments (continued)
December 31, 2017
| Investments | Interest Rate | Maturity Date | Principal Amount (000) | Fair Value | ||||||||
| Other (continued) | ||||||||||||
| Westcott Park CLO Ltd. 2016-1A D† | 5.713% (3 Mo. LIBOR + 4.35% | )# | 7/20/2028 | $ | 850 | $ | 861,103 | |||||
| Total | 21,249,717 | |||||||||||
| Total Asset-Backed Securities (cost $22,092,665) | 22,489,921 | |||||||||||
| Shares (000) | ||||||||||||
| Common Stocks 14.62% | ||||||||||||
| Aerospace/Defense 0.30% | ||||||||||||
| Huntington Ingalls Industries, Inc. | 7 | 1,744,887 | ||||||||||
| Mercury Systems, Inc.* | 35 | 1,805,825 | ||||||||||
| Total | 3,550,712 | |||||||||||
| Air Transportation 0.20% | ||||||||||||
| Allegiant Travel Co. | 7 | 1,121,937 | ||||||||||
| Wizz Air Holdings plc†*(c) | GBP | 26 | 1,263,568 | |||||||||
| Total | 2,385,505 | |||||||||||
| Auto Loans 0.15% | ||||||||||||
| Credit Acceptance Corp.* | 5 | 1,734,823 | ||||||||||
| Auto Parts & Equipment 0.09% | ||||||||||||
| Chassix Holdings, Inc. | 59 | 1,085,419 | ||||||||||
| Automakers 0.10% | ||||||||||||
| Oshkosh Corp. | 13 | 1,199,566 | ||||||||||
| Banking 0.72% | ||||||||||||
| BOK Financial Corp. | 7 | 634,146 | ||||||||||
| Cullen/Frost Bankers, Inc. | 12 | 1,119,426 | ||||||||||
| LegacyTexas Financial Group, Inc. | 28 | 1,201,128 | ||||||||||
| Northern Trust Corp. | 12 | 1,177,303 | ||||||||||
| Sberbank of Russia PJSC ADR | 120 | 2,026,877 | ||||||||||
| SVB Financial Group* | 10 | 2,290,712 | ||||||||||
| Total | 8,449,592 | |||||||||||
| Beverages 0.79% | ||||||||||||
| Brown-Forman Corp. Class B | 36 | 2,447,673 | ||||||||||
| Constellation Brands, Inc. Class A | 5 | 1,223,307 | ||||||||||
| Monster Beverage Corp.* | 19 | 1,178,396 | ||||||||||
| Remy Cointreau SA(c) | EUR | 20 | 2,710,690 | |||||||||
| Treasury Wine Estates Ltd.(c) | AUD | 142 | 1,767,632 | |||||||||
| Total | 9,327,698 | |||||||||||
| See Notes to Financial Statements. | 7 |
Schedule of Investments (continued)
December 31, 2017
| Investments | Shares (000) | Fair Value | ||||||||||
| Brokerage 0.10% | ||||||||||||
| Cboe Global Markets, Inc. | 10 | $ | 1,200,798 | |||||||||
| Building Materials 0.21% | ||||||||||||
| Owens Corning | 27 | 2,465,923 | ||||||||||
| Chemicals 0.55% | ||||||||||||
| Potash Corp. of Saskatchewan, Inc. (Canada)(d) | 117 | 2,413,345 | ||||||||||
| Venator Materials plc (United Kingdom)*(d) | 51 | 1,128,695 | ||||||||||
| Versum Materials, Inc. | 30 | 1,149,883 | ||||||||||
| Westlake Chemical Corp. | 17 | 1,761,900 | ||||||||||
| Total | 6,453,823 | |||||||||||
| Discount Stores 0.40% | ||||||||||||
| Amazon.com, Inc.* | 1 | 1,160,114 | ||||||||||
| Dollar Tree, Inc.* | 11 | 1,178,371 | ||||||||||
| Wal-Mart Stores, Inc. | 24 | 2,370,593 | ||||||||||
| Total | 4,709,078 | |||||||||||
| Diversified Capital Goods 0.10% | ||||||||||||
| Rockwell Automation, Inc. | 6 | 1,169,461 | ||||||||||
| Electric: Integrated 0.67% | ||||||||||||
| El Paso Electric Co. | 29 | 1,596,405 | ||||||||||
| IDACORP, Inc. | 18 | 1,657,727 | ||||||||||
| NextEra Energy, Inc. | 11 | 1,734,021 | ||||||||||
| Pampa Energia SA ADR* | 25 | 1,678,636 | ||||||||||
| Public Service Enterprise Group, Inc. | 23 | 1,189,650 | ||||||||||
| Total | 7,856,439 | |||||||||||
| Electronics 0.49% | ||||||||||||
| Keyence Corp.(c) | JPY | 2 | 1,106,090 | |||||||||
| Littelfuse, Inc. | 6 | 1,117,287 | ||||||||||
| Nintendo Co., Ltd.(c) | JPY | 3 | 1,213,525 | |||||||||
| Rogers Corp.* | 7 | 1,194,322 | ||||||||||
| Trimble, Inc.* | 29 | 1,161,857 | ||||||||||
| Total | 5,793,081 | |||||||||||
| Energy: Exploration & Production 1.06% | ||||||||||||
| Carrizo Oil & Gas, Inc.* | 57 | 1,206,108 | ||||||||||
| Chaparral Energy, Inc.* | 12 | 291,648 | ||||||||||
| Chaparral Energy, Inc. Class A* | 59 | 1,386,955 | ||||||||||
| Concho Resources, Inc.* | 8 | 1,196,202 | ||||||||||
| 8 | See Notes to Financial Statements. |
Schedule of Investments (continued)
December 31, 2017
| Investments | Shares (000) | Fair Value | ||||||
| Energy: Exploration & Production (continued) | ||||||||
| Continental Resources, Inc.* | 74 | $ | 3,917,979 | |||||
| Extraction Oil & Gas, Inc.* | 58 | 831,654 | ||||||
| Jagged Peak Energy, Inc.* | 65 | 1,018,788 | ||||||
| Peabody Energy Corp. | – | (e) | 10,613 | |||||
| SM Energy Co. | 58 | 1,274,016 | ||||||
| Templar Energy LLC Class A Units | 46 | 101,682 | ||||||
| WildHorse Resource Development Corp.* | 67 | 1,232,734 | ||||||
| Total | 12,468,379 | |||||||
| Food: Wholesale 0.31% | ||||||||
| Costco Wholesale Corp. | 6 | 1,191,168 | ||||||
| Hormel Foods Corp. | 32 | 1,169,938 | ||||||
| TreeHouse Foods, Inc.* | 25 | 1,231,752 | ||||||
| Total | 3,592,858 | |||||||
| Forestry/Paper 0.10% | ||||||||
| Potlatch Corp. | 23 | 1,138,419 | ||||||
| Gaming 0.87% | ||||||||
| Aristocrat Leisure Ltd.(c) | AUD | 71 | 1,300,097 | |||||
| Caesars Entertainment Corp.* | 88 | 1,114,389 | ||||||
| Penn National Gaming, Inc.* | 80 | 2,498,599 | ||||||
| Scientific Games Corp. Class A* | 44 | 2,257,149 | ||||||
| VICI Properties, Inc.* | 29 | 597,759 | ||||||
| Wynn Resorts Ltd. | 14 | 2,423,144 | ||||||
| Total | 10,191,137 | |||||||
| Hotels 0.10% | ||||||||
| Hilton Grand Vacations, Inc.* | 29 | 1,195,575 | ||||||
| Investments & Miscellaneous Financial Services 0.71% | ||||||||
| Ameriprise Financial, Inc. | 14 | 2,344,956 | ||||||
| BlackRock, Inc. | 2 | 1,182,560 | ||||||
| Federated Investors, Inc. Class B | 34 | 1,215,680 | ||||||
| SEI Investments Co. | 16 | 1,178,576 | ||||||
| T. Rowe Price Group, Inc. | 23 | 2,379,183 | ||||||
| Total | 8,300,955 | |||||||
| Machinery 0.63% | ||||||||
| Deere & Co. | 16 | 2,459,085 | ||||||
| DMG Mori Co., Ltd.(c) | JPY | 55 | 1,130,253 | |||||
| See Notes to Financial Statements. | 9 |
Schedule of Investments (continued)
December 31, 2017
| Investments | Shares (000) | Fair Value | ||||||
| Machinery (continued) | ||||||||
| Gardner Denver Holdings, Inc.* | 37 | $ | 1,249,302 | |||||
| Komatsu Ltd.(c) | JPY | 35 | 1,270,311 | |||||
| Terex Corp. | 26 | 1,245,330 | ||||||
| Total | 7,354,281 | |||||||
| Media: Content 0.10% | ||||||||
| Netflix, Inc.* | 6 | 1,189,192 | ||||||
| Medical Products 0.05% | ||||||||
| Align Technology, Inc.* | 3 | 572,806 | ||||||
| Metals/Mining (Excluding Steel) 0.22% | ||||||||
| Sumitomo Metal Mining Co. Ltd.(c) | JPY | 57 | 2,603,785 | |||||
| Monoline Insurance 0.19% | ||||||||
| FNF Group | 29 | 1,144,984 | ||||||
| MGIC Investment Corp.* | 76 | 1,065,968 | ||||||
| Total | 2,210,952 | |||||||
| Non-Electric Utilities 0.16% | ||||||||
| Aqua America, Inc. | 48 | 1,873,860 | ||||||
| Oil Field Equipment & Services 0.15% | ||||||||
| RPC, Inc. | 70 | 1,776,097 | ||||||
| Oil Refining & Marketing 0.16% | ||||||||
| HollyFrontier Corp. | 37 | 1,896,677 | ||||||
| Pharmaceuticals 0.78% | ||||||||
| Bio-Rad Laboratories, Inc. Class A* | 5 | 1,145,616 | ||||||
| Bluebird Bio, Inc.* | 15 | 2,628,222 | ||||||
| Blueprint Medicines Corp.* | 39 | 2,933,675 | ||||||
| Juno Therapeutics, Inc.* | 27 | 1,221,828 | ||||||
| Loxo Oncology, Inc.* | 14 | 1,187,191 | ||||||
| Total | 9,116,532 | |||||||
| Printing & Publishing 0.10% | ||||||||
| S&P Global, Inc. | 7 | 1,144,975 | ||||||
| Real Estate Development & Management 0.15% | ||||||||
| CoStar Group, Inc.* | 6 | 1,779,027 | ||||||
| Real Estate Investment Trusts 0.15% | ||||||||
| Goodman Group(c) | AUD | 260 | 1,705,272 | |||||
| 10 | See Notes to Financial Statements. |
Schedule of Investments (continued)
December 31, 2017
| Investments | Shares (000) | Fair Value | ||||||
| Restaurants 0.30% | ||||||||
| Dunkin’ Brands Group, Inc. | 19 | $ | 1,237,824 | |||||
| McDonald’s Corp. | 7 | 1,159,400 | ||||||
| Shake Shack, Inc. Class A* | 26 | 1,122,207 | ||||||
| Total | 3,519,431 | |||||||
| Software/Services 1.05% | ||||||||
| 2U, Inc.* | 18 | 1,165,051 | ||||||
| Black Knight, Inc.* | 13 | 556,952 | ||||||
| Blackbaud, Inc. | 17 | 1,620,503 | ||||||
| FleetCor Technologies, Inc.* | 9 | 1,751,690 | ||||||
| InterXion Holding NV (Netherlands)*(d) | 10 | 603,090 | ||||||
| MSCI, Inc. | 9 | 1,157,208 | ||||||
| Rheinmetall AG(c) | EUR | 5 | 619,671 | |||||
| Snap, Inc. Class A* | 36 | 531,190 | ||||||
| Tableau Software, Inc. Class A* | 16 | 1,105,539 | ||||||
| Twitter, Inc.* | 81 | 1,940,560 | ||||||
| VMware, Inc. Class A* | 10 | 1,263,978 | ||||||
| Total | 12,315,432 | |||||||
| Specialty Retail 1.21% | ||||||||
| Canada Goose Holdings, Inc. (Canada)*(d) | 43 | 1,349,190 | ||||||
| Children’s Place, Inc. (The) | 9 | 1,293,615 | ||||||
| Columbia Sportswear Co. | 17 | 1,250,712 | ||||||
| Five Below, Inc.* | 18 | 1,200,127 | ||||||
| Kering(c) | EUR | 4 | 1,796,765 | |||||
| Maisons du Monde SA†(c) | EUR | 16 | 709,264 | |||||
| Moncler SpA(c) | EUR | 56 | 1,752,640 | |||||
| Ollie’s Bargain Outlet Holdings, Inc.* | 25 | 1,307,287 | ||||||
| Polaris Industries, Inc. | 9 | 1,140,708 | ||||||
| Skechers U.S.A., Inc. Class A* | 33 | 1,244,936 | ||||||
| VF Corp. | 16 | 1,176,674 | ||||||
| Total | 14,221,918 | |||||||
| Support: Services 0.53% | ||||||||
| Ashtead Group plc(c) | GBP | 46 | 1,233,788 | |||||
| Bright Horizons Family Solutions, Inc.* | 13 | 1,200,192 | ||||||
| ManpowerGroup, Inc. | 9 | 1,172,823 | ||||||
| TopBuild Corp.* | 17 | 1,316,361 | ||||||
| Total System Services, Inc. | 16 | 1,242,425 | ||||||
| Total | 6,165,589 | |||||||
| See Notes to Financial Statements. | 11 |
Schedule of Investments (continued)
December 31, 2017
| Investments | Shares (000) | Fair Value | ||||||||||
| Technology Hardware & Equipment 0.21% | ||||||||||||
| Marvell Technology Group Ltd. | 50 | $ | 1,074,874 | |||||||||
| Tokyo Electron Ltd.(c) | JPY | 8 | 1,352,921 | |||||||||
| Total | 2,427,795 | |||||||||||
| Transportation: Infrastructure/Services 0.10% | ||||||||||||
| Landstar System, Inc. | 11 | 1,170,813 | ||||||||||
| Trucking & Delivery 0.36% | ||||||||||||
| Knight-Swift Transportation Holdings, Inc. | 27 | 1,184,812 | ||||||||||
| Old Dominion Freight Line, Inc. | 23 | 3,001,182 | ||||||||||
| Total | 4,185,994 | |||||||||||
| Total Common Stocks (cost $151,846,041) | 171,499,669 | |||||||||||
| Interest Rate | Maturity Date | Principal Amount (000) | ||||||||||
| CONVERTIBLE BONDS 0.30% | ||||||||||||
| Automakers 0.10% | ||||||||||||
| Tesla, Inc. | 1.25% | 3/1/2021 | $ | 1,035 | 1,121,681 | |||||||
| Investments & Miscellaneous Financial Services 0.10% | ||||||||||||
| Square, Inc.† | 0.375% | 3/1/2022 | 709 | 1,159,658 | ||||||||
| Software/Services 0.10% | ||||||||||||
| RealPage, Inc.† | 1.50% | 11/15/2022 | 976 | 1,212,680 | ||||||||
| Total Convertible Bonds (cost $3,582,358) | 3,494,019 | |||||||||||
| Dividend Rate | Shares (000) | |||||||||||
| CONVERTIBLE PREFERRED STOCKS 0.25% | ||||||||||||
| Personal & Household Products 0.20% | ||||||||||||
| Stanley Black & Decker, Inc. | 5.375% | 19 | 2,381,350 | |||||||||
| Software/Services 0.05% | ||||||||||||
| Mandatory Exchangeable Trust† | 5.75% | 3 | 565,167 | |||||||||
| Total Convertible Preferred Stocks (cost $2,388,060) | 2,946,517 | |||||||||||
| 12 | See Notes to Financial Statements. |
Schedule of Investments (continued)
December 31, 2017
| Investments | Interest Rate | Maturity Date | Principal Amount (000) | Fair Value | ||||||||
| FLOATING RATE LOANS(f) 3.20% | ||||||||||||
| Advertising 0.15% | ||||||||||||
| Southern Graphics, Inc. 1st Lien Initial Term Loan | – | (g) | 12/8/2022 | $ | 1,507 | $ | 1,516,992 | |||||
| Southern Graphics, Inc. Delayed Draw Term Loan | – | (g) | 12/31/2022 | 243 | 244,926 | |||||||
| Total | 1,761,918 | |||||||||||
| Building Materials 0.13% | ||||||||||||
| Zodiac Pool Solutions LLC 1st Lien Tranche B1 Term Loan | 5.693% (3 Mo. LIBOR + 4.00% | ) | 12/20/2023 | 1,514 | 1,524,153 | |||||||
| Department Stores 0.10% | ||||||||||||
| Neiman Marcus Group, Inc. Other Term Loan | 4.642% (3 Mo. LIBOR + 3.25% | ) | 10/25/2020 | 1,456 | 1,193,017 | |||||||
| Electric: Generation 0.48% | ||||||||||||
| EFS Cogen Holdings I LLC Advanced Term Loan B | 4.95% (3 Mo. LIBOR + 3.25% | ) | 6/28/2023 | 503 | 508,048 | |||||||
| Lightstone Holdco LLC Refinanced Term Loan B | 6.069% (3 Mo. LIBOR + 4.50% | ) | 1/30/2024 | 2,521 | 2,536,457 | |||||||
| Lightstone Holdco LLC Refinanced Term Loan C | 6.069% (3 Mo. LIBOR + 4.50% | ) | 1/30/2024 | 161 | 161,964 | |||||||
| Sandy Creek Energy Associates, L.P. Term Loan | 5.693% (3 Mo. LIBOR + 4.00% | ) | 11/9/2020 | 1,547 | 1,300,697 | |||||||
| Viva Alamo LLC Term Loan B | 5.819% (3 Mo. LIBOR + 4.25% | ) | 2/20/2021 | 1,182 | 1,170,487 | |||||||
| Total | 5,677,653 | |||||||||||
| Electronics 0.10% | ||||||||||||
| EXC III Holding Corp. 1st Lien Initial Term Loan | 5.161% (3 Mo. LIBOR + 7.50% | ) | 12/1/2025 | 1,141 | 1,151,874 | |||||||
| Energy: Exploration & Production 0.15% | ||||||||||||
| California Resources Corp. Initial Term Loan | – | (g) | 12/31/2022 | 589 | 587,896 | |||||||
| Chief Exploration & Development LLC 2nd Lien Term Loan | 7.959% (3 Mo. LIBOR + 6.50% | ) | 5/16/2021 | 1,179 | 1,162,299 | |||||||
| Total | 1,750,195 | |||||||||||
| Gaming 0.30% | ||||||||||||
| Cowlitz Tribal Gaming Authority Term Loan B | 12.069% (1 Mo. LIBOR + 10.50% | ) | 12/6/2021 | 2,182 | 2,449,716 | (h) | ||||||
| Stars Group, Inc. (The) 1st Lien Initial Term Loan B3 (Netherlands)(d) | 5.193% (3 Mo. LIBOR + 3.50% | ) | 8/1/2021 | 1,106 | 1,113,688 | |||||||
| Total | 3,563,404 | |||||||||||
| See Notes to Financial Statements. | 13 |
Schedule of Investments (continued)
December 31, 2017
| Investments | Interest Rate | Maturity Date | Principal Amount (000) | Fair Value | ||||||||
| Health Services 0.10% | ||||||||||||
| Genoa, a QoL Healthcare Company, LLC 1st Lien Amendment No. 1 Term Loan | 4.819% (1 Mo. LIBOR + 3.25% | ) | 10/28/2023 | $ | 1,095 | $ | 1,103,628 | |||||
| Investments & Miscellaneous Financial Services 0.07% | ||||||||||||
| VFH Parent LLC Initial Term Loan | 5.135% (3 Mo. LIBOR + 3.75% | ) | 12/30/2021 | 861 | 869,478 | |||||||
| Media: Diversified 0.11% | ||||||||||||
| UFC Holdings, LLC 2nd Lien Term Loan | 9.052% (1 Mo. LIBOR + 7.50% | ) | 8/18/2024 | 1,231 | 1,255,109 | |||||||
| Metals/Mining (Excluding Steel) 0.06% | ||||||||||||
| Oxbow Carbon LLC 2nd Lien Initial Term Loan | 10.50% (3 Mo. LIBOR + 7.50% | ) | 1/4/2024 | 650 | 652,438 | |||||||
| Personal & Household Products 0.14% | ||||||||||||
| Britax US Holdings, Inc. Initial Dollar Term Loan | 5.193% (3 Mo. LIBOR + 3.50% | ) | 10/15/2020 | 1,896 | 1,614,488 | |||||||
| Real Estate Development & Management 0.09% | ||||||||||||
| Capital Automotive L.P. 2nd Lien Initial Tranche B Term Loan | 7.57% (1 Mo. LIBOR + 6.00% | ) | 3/24/2025 | 1,051 | 1,082,920 | |||||||
| Recreation & Travel 0.24% | ||||||||||||
| Intrawest Resorts Holdings, Inc. Term Loan B1 | 4.819% (3 Mo. LIBOR + 3.25% | ) | 7/31/2024 | 2,088 | 2,106,928 | |||||||
| Kingpin Intermediate Holdings LLC 1st Lien Term Loan | 5.73% (3 Mo. LIBOR + 4.25% | ) | 6/29/2024 | 679 | 687,360 | (h) | ||||||
| Total | 2,794,288 | |||||||||||
| Software/Services 0.08% | ||||||||||||
| Misys Ltd 2nd Lien Dollar Term Loan | 8.729% (3 Mo. LIBOR + 7.25% | ) | 6/13/2025 | 965 | 970,307 | |||||||
| Specialty Retail 0.56% | ||||||||||||
| Bass Pro Group, LLC Term Loan B | – | (g) | 9/25/2024 | 1,731 | 1,728,499 | |||||||
| Container Store, Inc. Term Loan B | 8.693% (3 Mo. LIBOR + 7.00% | ) | 8/18/2021 | 899 | 873,345 | |||||||
| Forterra Finance, LLC Term Loan | – | (g) | 10/25/2023 | 1,267 | 1,188,708 | |||||||
| J.C. Penney Corp., Inc. 2016 Term Loan B | 5.729% (3 Mo. LIBOR + 0.425% | ) | 6/23/2023 | 1,295 | 1,214,005 | |||||||
| 14 | See Notes to Financial Statements. |
Schedule of Investments (continued)
December 31, 2017
| Investments | Interest Rate | Maturity Date | Principal Amount (000) | Fair Value | ||||||||
| Specialty Retail (continued) | ||||||||||||
| PetSmart, Inc. Tranche B2 Term Loan | 4.57% (1 Mo. LIBOR + 3.00% | ) | 3/11/2022 | $ | 1,965 | $ | 1,578,615 | |||||
| Total | 6,583,172 | |||||||||||
| Support: Services 0.03% | ||||||||||||
| Pike Corp. 2017 Initial Term Loan | 5.07% (3 Mo. LIBOR + 3.50% | ) | 9/20/2024 | 328 | 333,550 | |||||||
| Telecommunications: Satellite 0.05% | ||||||||||||
| Intelsat Jackson Holdings S.A. Tranche Term Loan B5 (Luxembourg)(d) | – | (g) | 1/2/2024 | 602 | 609,402 | |||||||
| Transportation: Infrastructure/Services 0.26% | ||||||||||||
| Uber Technologies, Inc. Term Loan B | 5.552% (3 Mo. LIBOR + 4.00% | ) | 7/13/2023 | 2,984 | 3,006,644 | |||||||
| Total Floating Rate Loans (cost $36,927,667) | 37,497,638 | |||||||||||
| FOREIGN BONDS(c) 0.45% | ||||||||||||
| France 0.21% | ||||||||||||
| CMA CGM SA† | 5.25% | 1/15/2025 | EUR | 657 | 787,844 | |||||||
| CMA CGM SA† | 6.50% | 7/15/2022 | EUR | 1,377 | 1,737,916 | |||||||
| Total | 2,525,760 | |||||||||||
| Netherlands 0.24% | ||||||||||||
| Hema Bondco I BV† | 6.25% (3 Mo. Euribor + 6.25% | )# | 7/15/2022 | EUR | 2,291 | 2,812,733 | ||||||
| Total Foreign Bonds (cost $4,971,412) | 5,338,493 | |||||||||||
| FOREIGN GOVERNMENT OBLIGATIONS 3.47% | ||||||||||||
| Argentina 0.89% | ||||||||||||
| City of Buenos Aires†(d) | 7.50% | 6/1/2027 | 1,275 | 1,422,262 | ||||||||
| City of Buenos Aires†(d) | 8.95% | 2/19/2021 | 1,125 | 1,251,563 | ||||||||
| Province of Santa Fe†(d) | 6.90% | 11/1/2027 | 1,521 | 1,614,009 | ||||||||
| Provincia de Mendoza†(d) | 8.375% | 5/19/2024 | 2,025 | 2,263,059 | ||||||||
| Provincia of Neuquen†(d) | 7.50% | 4/27/2025 | 540 | 579,150 | ||||||||
| Provincia of Neuquen†(d) | 8.625% | 5/12/2028 | 719 | 808,566 | ||||||||
| Republic of Argentina(d) | 7.50% | 4/22/2026 | 2,208 | 2,503,099 | ||||||||
| Total | 10,441,708 | |||||||||||
| Australia 0.33% | ||||||||||||
| Australian Government(c) | 4.25% | 4/21/2026 | AUD | 2,084 | 1,828,570 | |||||||
| Queensland Treasury Corp.†(c) | 4.00% | 6/21/2019 | AUD | 2,500 | 2,007,947 | |||||||
| Total | 3,836,517 | |||||||||||
| See Notes to Financial Statements. | 15 |
Schedule of Investments (continued)
December 31, 2017
| Investments | Interest Rate | Maturity Date | Principal Amount (000) | Fair Value | ||||||||
| Bahamas 0.29% | ||||||||||||
| Commonwealth of Bahamas†(d) | 5.75% | 1/16/2024 | $ | 1,100 | $ | 1,150,930 | ||||||
| Commonwealth of Bahamas†(d) | 6.00% | 11/21/2028 | 2,200 | 2,299,000 | ||||||||
| Total | 3,449,930 | |||||||||||
| Bermuda 0.23% | ||||||||||||
| Government of Bermuda† | 4.138% | 1/3/2023 | 1,350 | 1,422,387 | ||||||||
| Government of Bermuda† | 4.854% | 2/6/2024 | 1,175 | 1,277,965 | ||||||||
| Total | 2,700,352 | |||||||||||
| Canada 0.21% | ||||||||||||
| Province of British Columbia Canada(c) | 2.85% | 6/18/2025 | CAD | 3,000 | 2,453,007 | |||||||
| Cayman Islands 0.04% | ||||||||||||
| Cayman Islands Government† | 5.95% | 11/24/2019 | $ | 425 | 459,045 | |||||||
| Ghana 0.14% | ||||||||||||
| Republic of Ghana†(d) | 7.875% | 8/7/2023 | 1,541 | 1,697,396 | ||||||||
| Greece 0.16% | ||||||||||||
| Hellenic Republic†(c) | 4.375% | 8/1/2022 | EUR | 1,500 | 1,869,605 | |||||||
| Honduras 0.21% | ||||||||||||
| Honduras Government†(d) | 6.25% | 1/19/2027 | $ | 2,300 | 2,465,830 | |||||||
| Jamaica 0.35% | ||||||||||||
| Government of Jamaica(d) | 6.75% | 4/28/2028 | 2,373 | 2,696,321 | ||||||||
| Government of Jamaica(d) | 8.00% | 3/15/2039 | 1,110 | 1,364,701 | ||||||||
| Total | 4,061,022 | |||||||||||
| Nigeria 0.08% | ||||||||||||
| Republic of Nigeria†(d) | 6.50% | 11/28/2027 | 857 | 895,807 | ||||||||
| Senegal 0.15% | ||||||||||||
| Republic of Senegal†(d) | 6.25% | 5/23/2033 | 1,661 | 1,758,095 | ||||||||
| Sri Lanka 0.20% | ||||||||||||
| Republic of Sri Lanka†(d) | 6.20% | 5/11/2027 | 2,209 | 2,336,501 | ||||||||
| United Arab Emirates 0.10% | ||||||||||||
| Abu Dhabi Government International†(d) | 3.125% | 5/3/2026 | 1,255 | 1,241,282 | ||||||||
| Uruguay 0.09% | ||||||||||||
| Republic of Uruguay†(c) | 8.50% | 3/15/2028 | UYU | 30,282 | 1,057,655 | |||||||
| Total Foreign Government Obligations (cost $38,491,810) | 40,723,752 | |||||||||||
| 16 | See Notes to Financial Statements. |
Schedule of Investments (continued)
December 31, 2017
| Investments | Interest Rate | Maturity Date | Principal Amount (000) | Fair Value | ||||||||
| GOVERNMENT SPONSORED ENTERPRISES PASS-THROUGH 1.45% | ||||||||||||
| Federal National Mortgage Assoc.(i) (cost $17,124,134) | 3.50% | TBA | $ | 16,600 | $ | 17,054,477 | ||||||
| HIGH YIELD CORPORATE BONDS 69.02% | ||||||||||||
| Advertising 0.19% | ||||||||||||
| Clear Channel Worldwide Holdings, Inc. | 6.50% | 11/15/2022 | 1,579 | 1,612,554 | ||||||||
| Lamar Media Corp. | 5.75% | 2/1/2026 | 566 | 606,327 | ||||||||
| Total | 2,218,881 | |||||||||||
| Aerospace/Defense 0.78% | ||||||||||||
| Bombardier, Inc. (Canada)†(d) | 7.50% | 12/1/2024 | 1,068 | 1,086,690 | ||||||||
| Bombardier, Inc. (Canada)†(d) | 8.75% | 12/1/2021 | 1,010 | 1,116,050 | ||||||||
| Bombardier, Inc.(Canada)†(d) | 7.50% | 3/15/2025 | 4,079 | 4,129,988 | ||||||||
| Huntington Ingalls Industries, Inc.† | 3.483% | 12/1/2027 | 1,711 | 1,708,861 | ||||||||
| Huntington Ingalls Industries, Inc.† | 5.00% | 11/15/2025 | 1,048 | 1,123,980 | ||||||||
| Total | 9,165,569 | |||||||||||
| Air Transportation 0.56% | ||||||||||||
| Air Canada (Canada)†(d) | 7.75% | 4/15/2021 | 1,140 | 1,305,300 | ||||||||
| Air Canada 2015-2 Class A Pass-Through Trust (Canada)†(d) | 4.125% | 6/15/2029 | 818 | 859,111 | ||||||||
| American Airlines 2013-2 Class B Pass-Through Trust† | 5.60% | 1/15/2022 | 647 | 670,626 | ||||||||
| Azul Investments LLP† | 5.875% | 10/26/2024 | 3,049 | 3,037,566 | ||||||||
| Latam Finance Ltd.† | 6.875% | 4/11/2024 | 656 | 685,520 | ||||||||
| Total | 6,558,123 | |||||||||||
| Auto Parts & Equipment 0.72% | ||||||||||||
| Allison Transmission, Inc.† | 5.00% | 10/1/2024 | 1,250 | 1,292,188 | ||||||||
| American Axle & Manufacturing, Inc.† | 6.25% | 4/1/2025 | 2,056 | 2,169,080 | ||||||||
| American Axle & Manufacturing, Inc.† | 6.50% | 4/1/2027 | 2,296 | 2,436,630 | ||||||||
| Gates Global LLC/Gates Global Co.† | 6.00% | 7/15/2022 | 1,617 | 1,661,467 | ||||||||
| International Automotive Components Group SA (Luxembourg)†(d) | 9.125% | 6/1/2018 | 257 | 254,591 | ||||||||
| TI Group Automotive Systems LLC (United Kingdom)†(d) | 8.75% | 7/15/2023 | 584 | 629,260 | ||||||||
| Total | 8,443,216 | |||||||||||
| Automakers 0.70% | ||||||||||||
| BMW US Capital LLC† | 2.80% | 4/11/2026 | 1,199 | 1,173,195 | ||||||||
| Tesla, Inc.† | 5.30% | 8/15/2025 | 7,365 | 7,061,194 | ||||||||
| Total | 8,234,389 | |||||||||||
| See Notes to Financial Statements. | 17 |
Schedule of Investments (continued)
December 31, 2017
| Investments | Interest Rate | Maturity Date | Principal Amount (000) | Fair Value | ||||||||
| Banking 8.13% | ||||||||||||
| ABN AMRO Bank NV (Netherlands)†(d) | 4.75% | 7/28/2025 | $ | 3,251 | $ | 3,457,438 | ||||||
| Ally Financial, Inc. | 8.00% | 11/1/2031 | 901 | 1,175,805 | ||||||||
| American Express Credit Corp. | 3.30% | 5/3/2027 | 1,891 | 1,920,659 | ||||||||
| ANZ New Zealand Int’l Ltd. (United Kingdom)†(d) | 2.125% | 7/28/2021 | 1,510 | 1,480,189 | ||||||||
| Associated Banc-Corp. | 4.25% | 1/15/2025 | 1,000 | 1,030,940 | ||||||||
| Astoria Financial Corp. | 3.50% | 6/8/2020 | 1,393 | 1,399,122 | ||||||||
| Australia & New Zealand Banking Group Ltd. (United Kingdom)†(d) | 6.75% (USD Swap + 5.17% | )# | – | (j) | 1,415 | 1,613,100 | ||||||
| Banco de Bogota SA (Colombia)†(d) | 4.375% | 8/3/2027 | 900 | 900,000 | ||||||||
| Banco de Bogota SA (Colombia)†(d) | 6.25% | 5/12/2026 | 1,000 | 1,080,800 | ||||||||
| Banco de Galicia y Buenos Aires SA (Argentina)†(d) | 8.25% (5 Yr Treasury Note CMT + 7.16% | )# | 7/19/2026 | 1,000 | 1,116,200 | |||||||
| Banco do Brasil SA† | 6.25% (10 Yr Treasury Note CMT + 4.40% | )# | – | (j) | 1,983 | 1,829,318 | ||||||
| Banco General SA (Panama)†(d) | 4.125% | 8/7/2027 | 2,275 | 2,277,685 | ||||||||
| Banco Mercantil del Norte SA (Mexico)†(d) | 7.625% (10 Yr Treasury Note CMT + 5.35% | )# | – | (j) | 1,077 | 1,183,354 | ||||||
| Banistmo SA (Panama)†(d) | 3.65% | 9/19/2022 | 1,390 | 1,376,100 | ||||||||
| Bank of America Corp. | 4.45% | 3/3/2026 | 2,201 | 2,352,798 | ||||||||
| Bank of Montreal (Canada)(d) | 3.803% (USSW5 + 1.43% | )#(k) | 12/15/2032 | 2,220 | 2,197,534 | |||||||
| BankUnited, Inc. | 4.875% | 11/17/2025 | 2,525 | 2,688,121 | ||||||||
| BNP Paribas SA (France)†(d) | 6.75% (5 Yr Swap rate + 4.92% | )# | – | (j) | 1,817 | 1,971,445 | ||||||
| Citigroup, Inc. | 4.45% | 9/29/2027 | 1,473 | 1,560,868 | ||||||||
| Citizens Financial Group, Inc. | 4.35% | 8/1/2025 | 831 | 865,539 | ||||||||
| Comerica, Inc. | 3.80% | 7/22/2026 | 1,258 | 1,278,219 | ||||||||
| Commonwealth Bank of Australia (Australia)†(d) | 4.50% | 12/9/2025 | 973 | 1,020,003 | ||||||||
| Compass Bank | 3.875% | 4/10/2025 | 2,100 | 2,109,490 | ||||||||
| Credit Suisse Group AG (Switzerland)†(d) | 7.50% (5 Yr Swap rate + 4.60% | )# | – | (j) | 1,075 | 1,230,821 | ||||||
| Fifth Third Bancorp | 8.25% | 3/1/2038 | 1,708 | 2,614,111 | ||||||||
| First Republic Bank | 4.625% | 2/13/2047 | 1,161 | 1,245,575 | ||||||||
| Goldman Sachs Group, Inc. (The) | 3.50% | 11/16/2026 | 1,520 | 1,530,081 | ||||||||
| Goldman Sachs Group, Inc. (The) | 6.75% | 10/1/2037 | 2,100 | 2,814,370 | ||||||||
| Home BancShares, Inc. | 5.625% (3 Mo. LIBOR + 3.58% | )# | 4/15/2027 | 2,396 | 2,513,404 | |||||||
| HSBC Holdings plc (United Kingdom)(d) | 4.25% | 8/18/2025 | 3,671 | 3,812,202 | ||||||||
| Intesa Sanpaolo SpA (Italy)†(d) | 5.71% | 1/15/2026 | 3,212 | 3,388,439 | ||||||||
| Intesa Sanpaolo SpA (Italy)†(d) | 7.70% (5 Yr Swap rate + 5.46% | )# | – | (j) | 2,717 | 2,954,737 | ||||||
| Itau Unibanco Holding SA† | 6.125% (BADLAR + 3.98% | )# | – | (j) | 1,186 | 1,186,709 | ||||||
| 18 | See Notes to Financial Statements. |
Schedule of Investments (continued)
December 31, 2017
| Investments | Interest Rate | Maturity Date | Principal Amount (000) | Fair Value | ||||||||
| Banking (continued) | ||||||||||||
| JPMorgan Chase & Co. | 3.54% (3 Mo. LIBOR + 1.38% | )# | 5/1/2028 | $ | 1,306 | $ | 1,329,845 | |||||
| JPMorgan Chase & Co. | 3.90% | 7/15/2025 | 1,150 | 1,206,460 | ||||||||
| JPMorgan Chase & Co. | 6.75% (3 Mo. LIBOR + 3.78% | )# | – | (j) | 1,688 | 1,913,770 | ||||||
| Lloyds Banking Group plc (United Kingdom)(d) | 7.50% (5 Yr Swap rate + 4.76% | )# | – | (j) | 1,519 | 1,725,964 | ||||||
| Macquarie Bank Ltd. (United Kingdom)†(d) | 6.125% (5 Yr Swap rate + 3.70% | )# | – | (j) | 1,794 | 1,868,003 | ||||||
| Macquarie Group Ltd. (Australia)†(d) | 6.00% | 1/14/2020 | 725 | 772,729 | ||||||||
| Manufacturers & Traders Trust Co. | 3.40% | 8/17/2027 | 526 | 532,622 | ||||||||
| Morgan Stanley | 3.125% | 7/27/2026 | 2,144 | 2,116,476 | ||||||||
| Morgan Stanley | 3.625% | 1/20/2027 | 2,026 | 2,075,324 | ||||||||
| Morgan Stanley | 4.00% | 7/23/2025 | 937 | 981,810 | ||||||||
| National Savings Bank (Sri Lanka)†(d) | 5.15% | 9/10/2019 | 950 | 964,155 | ||||||||
| People’s United Bank NA | 4.00% | 7/15/2024 | 1,100 | 1,112,281 | ||||||||
| Popular, Inc. | 7.00% | 7/1/2019 | 1,625 | 1,698,125 | ||||||||
| Royal Bank of Scotland Group plc (United Kingdom)(d) | 5.125% | 5/28/2024 | 584 | 620,152 | ||||||||
| Royal Bank of Scotland Group plc (United Kingdom)(d) | 6.10% | 6/10/2023 | 1,517 | 1,672,171 | ||||||||
| Royal Bank of Scotland Group plc (United Kingdom)(d) | 6.125% | 12/15/2022 | 506 | 555,140 | ||||||||
| Royal Bank of Scotland Group plc (United Kingdom)(d) | 7.50% (5 Yr Swap rate + 5.80% | )# | – | (j) | 2,235 | 2,369,100 | ||||||
| Royal Bank of Scotland Group plc (United Kingdom)(d) | 8.625% (5 Yr Swap rate + 7.60% | )# | – | (j) | 1,571 | 1,773,266 | ||||||
| SVB Financial Group | 3.50% | 1/29/2025 | 999 | 1,002,718 | ||||||||
| Toronto-Dominion Bank (The) (Canada)(d) | 3.625% (5 Yr Swap rate + 2.21% | )# | 9/15/2031 | 750 | 748,974 | |||||||
| Turkiye Garanti Bankasi AS (Turkey)†(d) | 5.25% | 9/13/2022 | 1,150 | 1,175,588 | ||||||||
| UBS AG | 7.625% | 8/17/2022 | 606 | 709,444 | ||||||||
| UBS Group AG (Switzerland)(d) | 7.00% (5 Yr Swap rate + 4.87% | )# | – | (j) | 1,000 | 1,135,000 | ||||||
| UniCredit SpA (Italy)(d) | 6.375% (5 Yr Swap rate + 5.51% | )# | 5/2/2023 | 1,149 | 1,163,752 | |||||||
| Washington Mutual Bank(l) | 6.875% | 6/15/2011 | 1,250 | 125 | (m) | |||||||
| Wells Fargo & Co. | 4.90% | 11/17/2045 | 1,759 | 1,993,800 | ||||||||
| Zenith Bank plc (Nigeria)†(d) | 7.375% | 5/30/2022 | 900 | 938,880 | ||||||||
| Total | 95,330,850 | |||||||||||
| See Notes to Financial Statements. | 19 |
Schedule of Investments (continued)
December 31, 2017
| Investments | Interest Rate | Maturity Date | Principal Amount (000) | Fair Value | ||||||||
| Beverages 0.43% | ||||||||||||
| Bacardi Ltd.† | 2.75% | 7/15/2026 | $ | 1,149 | $ | 1,105,843 | ||||||
| Brown-Forman Corp. | 4.50% | 7/15/2045 | 1,572 | 1,782,240 | ||||||||
| PepsiCo, Inc. | 3.60% | 3/1/2024 | 1,653 | 1,734,482 | ||||||||
| PepsiCo, Inc. | 4.25% | 10/22/2044 | 419 | 463,118 | ||||||||
| Total | 5,085,683 | |||||||||||
| Brokerage 0.21% | ||||||||||||
| E*TRADE Financial Corp. | 3.80% | 8/24/2027 | 1,167 | 1,165,188 | ||||||||
| Freedom Mortgage Corp.† | 8.125% | 11/15/2024 | 1,255 | 1,281,669 | ||||||||
| Total | 2,446,857 | |||||||||||
| Building & Construction 1.24% | ||||||||||||
| Ashton Woods USA LLC/Ashton Woods Finance Co.† | 6.75% | 8/1/2025 | 1,087 | 1,091,076 | ||||||||
| Ashton Woods USA LLC/Ashton Woods Finance Co.† | 6.875% | 2/15/2021 | 1,023 | 1,047,296 | ||||||||
| Beazer Homes USA, Inc. | 6.75% | 3/15/2025 | 705 | 746,419 | ||||||||
| Boral Finance Pty Ltd. (Australia)†(d) | 3.75% | 5/1/2028 | 1,306 | 1,318,021 | ||||||||
| ITR Concession Co. LLC† | 5.183% | 7/15/2035 | 785 | 831,940 | ||||||||
| Lennar Corp. | 4.75% | 11/15/2022 | 1,304 | 1,374,090 | ||||||||
| Lennar Corp. | 4.75% | 5/30/2025 | 830 | 865,275 | ||||||||
| PulteGroup, Inc. | 5.00% | 1/15/2027 | 1,959 | 2,054,501 | ||||||||
| PulteGroup, Inc. | 6.375% | 5/15/2033 | 2,250 | 2,531,250 | ||||||||
| Toll Brothers Finance Corp. | 5.625% | 1/15/2024 | 1,000 | 1,101,250 | ||||||||
| William Lyon Homes, Inc. | 5.875% | 1/31/2025 | 1,500 | 1,535,625 | ||||||||
| Total | 14,496,743 | |||||||||||
| Building Materials 1.05% | ||||||||||||
| Builders FirstSource, Inc.† | 5.625% | 9/1/2024 | 752 | 785,426 | ||||||||
| FBM Finance, Inc.† | 8.25% | 8/15/2021 | 1,003 | 1,070,703 | ||||||||
| Hillman Group, Inc. (The)† | 6.375% | 7/15/2022 | 1,311 | 1,314,278 | ||||||||
| James Hardie International Finance DAC (Ireland)†(d) | 4.75% | 1/15/2025 | 485 | 491,063 | ||||||||
| Lennox International, Inc. | 3.00% | 11/15/2023 | 1,081 | 1,068,668 | ||||||||
| Martin Marietta Materials, Inc. | 4.25% | 7/2/2024 | 1,146 | 1,206,851 | ||||||||
| Owens Corning | 4.30% | 7/15/2047 | 1,763 | 1,741,517 | ||||||||
| Standard Industries, Inc.† | 5.00% | 2/15/2027 | 1,121 | 1,149,025 | ||||||||
| Standard Industries, Inc.† | 5.375% | 11/15/2024 | 934 | 980,980 | ||||||||
| Standard Industries, Inc.† | 6.00% | 10/15/2025 | 1,786 | 1,915,485 | ||||||||
| U.S. Concrete, Inc. | 6.375% | 6/1/2024 | 552 | 594,780 | ||||||||
| Total | 12,318,776 | |||||||||||
| 20 | See Notes to Financial Statements. |
Schedule of Investments (continued)
December 31, 2017
| Investments | Interest Rate | Maturity Date | Principal Amount (000) | Fair Value | ||||||||
| Cable & Satellite Television 1.34% | ||||||||||||
| CCO Holdings LLC/CCO Holdings Capital Corp.† | 5.125% | 5/1/2027 | $ | 2,134 | $ | 2,107,325 | ||||||
| CCO Holdings LLC/CCO Holdings Capital Corp.† | 5.75% | 2/15/2026 | 1,575 | 1,639,969 | ||||||||
| CCO Holdings LLC/CCO Holdings Capital Corp.† | 5.875% | 4/1/2024 | 1,785 | 1,865,325 | ||||||||
| CSC Holdings LLC† | 10.875% | 10/15/2025 | 2,647 | 3,149,930 | ||||||||
| DISH DBS Corp. | 7.75% | 7/1/2026 | 3,658 | 3,859,190 | ||||||||
| UPCB Finance IV Ltd.† | 5.375% | 1/15/2025 | 1,929 | 1,951,955 | ||||||||
| Ziggo Secured Finance BV (Netherlands)†(d) | 5.50% | 1/15/2027 | 1,122 | 1,123,402 | ||||||||
| Total | 15,697,096 | |||||||||||
| Chemicals 1.32% | ||||||||||||
| Albemarle Corp. | 5.45% | 12/1/2044 | 1,524 | 1,803,523 | ||||||||
| CF Industries, Inc.† | 4.50% | 12/1/2026 | 1,640 | 1,712,231 | ||||||||
| Chemours Co. (The) | 5.375% | 5/15/2027 | 647 | 671,262 | ||||||||
| Chemours Co. (The) | 7.00% | 5/15/2025 | 1,380 | 1,504,200 | ||||||||
| GCP Applied Technologies, Inc.† | 9.50% | 2/1/2023 | 459 | 510,638 | ||||||||
| Halcyon Agri Corp. Ltd. (Singapore)(d) | 4.50% (H15T2Y + 8.31% | )# | – | (j) | 758 | 754,033 | ||||||
| Kraton Polymers LLC/Kraton Polymers Capital Corp.† | 10.50% | 4/15/2023 | 1,025 | 1,163,375 | ||||||||
| Olin Corp. | 5.125% | 9/15/2027 | 1,992 | 2,101,560 | ||||||||
| Sociedad Quimica y Minera de Chile SA (Chile)†(d) | 4.375% | 1/28/2025 | 1,092 | 1,138,410 | ||||||||
| TPC Group, Inc.† | 8.75% | 12/15/2020 | 1,133 | 1,138,665 | ||||||||
| Tronox Finance LLC† | 7.50% | 3/15/2022 | 1,772 | 1,856,170 | ||||||||
| Westlake Chemical Corp. | 3.60% | 8/15/2026 | 1,108 | 1,116,105 | ||||||||
| Total | 15,470,172 | |||||||||||
| Consumer/Commercial/Lease Financing 1.00% | ||||||||||||
| Nationstar Mortgage LLC/Nationstar Capital Corp. | 6.50% | 7/1/2021 | 892 | 907,053 | ||||||||
| Navient Corp. | 5.00% | 10/26/2020 | 964 | 979,665 | ||||||||
| Navient Corp. | 6.125% | 3/25/2024 | 3,319 | 3,377,082 | ||||||||
| Navient Corp. | 6.75% | 6/25/2025 | 2,669 | 2,749,070 | ||||||||
| Quicken Loans, Inc.† | 5.25% | 1/15/2028 | 3,532 | 3,495,620 | ||||||||
| TMX Finance LLC/TitleMax Finance Corp.† | 8.50% | 9/15/2018 | 189 | 173,880 | ||||||||
| Total | 11,682,370 | |||||||||||
| Department Stores 0.35% | ||||||||||||
| Kohl’s Corp. | 5.55% | 7/17/2045 | 2,288 | 2,241,109 | ||||||||
| Macy’s Retail Holdings, Inc. | 4.375% | 9/1/2023 | 1,868 | 1,886,287 | ||||||||
| Total | 4,127,396 | |||||||||||
| See Notes to Financial Statements. | 21 |
Schedule of Investments (continued)
December 31, 2017
| Investments | Interest Rate | Maturity Date | Principal Amount (000) | Fair Value | ||||||||
| Discount Stores 0.79% | ||||||||||||
| Amazon.com, Inc.† | 4.25% | 8/22/2057 | $ | 2,075 | $ | 2,272,354 | ||||||
| Amazon.com, Inc. | 4.80% | 12/5/2034 | 4,062 | 4,778,610 | ||||||||
| Amazon.com, Inc. | 5.20% | 12/3/2025 | 1,950 | 2,241,559 | ||||||||
| Total | 9,292,523 | |||||||||||
| Diversified Capital Goods 0.80% | ||||||||||||
| BCD Acquisition, Inc.† | 9.625% | 9/15/2023 | 1,561 | 1,721,002 | ||||||||
| Griffon Corp. | 5.25% | 3/1/2022 | 1,163 | 1,180,445 | ||||||||
| Siemens Financieringsmaatschappij NV (Netherlands)†(d) | 3.25% | 5/27/2025 | 1,235 | 1,256,461 | ||||||||
| SPX FLOW, Inc.† | 5.625% | 8/15/2024 | 873 | 923,198 | ||||||||
| SPX FLOW, Inc.† | 5.875% | 8/15/2026 | 1,465 | 1,560,225 | ||||||||
| Valmont Industries, Inc. | 5.25% | 10/1/2054 | 2,656 | 2,756,919 | ||||||||
| Total | 9,398,250 | |||||||||||
| Electric: Distribution/Transportation 0.20% | ||||||||||||
| Oklahoma Gas & Electric Co. | 4.15% | 4/1/2047 | 960 | 1,046,191 | ||||||||
| Pennsylvania Electric Co.† | 3.25% | 3/15/2028 | 1,334 | 1,315,008 | ||||||||
| Total | 2,361,199 | |||||||||||
| Electric: Generation 1.06% | ||||||||||||
| Acwa Power Management & Investments One Ltd. (United Arab Emirates)†(d) | 5.95% | 12/15/2039 | 1,386 | 1,424,725 | ||||||||
| Calpine Corp. | 5.75% | 1/15/2025 | 1,886 | 1,798,772 | ||||||||
| Dynegy, Inc.† | 8.125% | 1/30/2026 | 1,517 | 1,663,011 | ||||||||
| Infraestructura Energetica Nova SAB de CV (Mexico)†(d) | 4.875% | 1/14/2048 | 766 | 738,233 | ||||||||
| Minejesa Capital BV (Netherlands)†(d) | 4.625% | 8/10/2030 | 2,170 | 2,223,284 | ||||||||
| NSG Holdings LLC/NSG Holdings, Inc.† | 7.75% | 12/15/2025 | 1,763 | 1,943,755 | ||||||||
| Talen Energy Supply LLC | 4.60% | 12/15/2021 | 1,287 | 1,184,040 | ||||||||
| TerraForm Power Operating LLC† | 5.00% | 1/31/2028 | 1,486 | 1,472,998 | ||||||||
| Total | 12,448,818 | |||||||||||
| Electric: Integrated 1.68% | ||||||||||||
| Aegea Finance Sarl (Brazil)†(d) | 5.75% | 10/10/2024 | 1,132 | 1,154,640 | ||||||||
| Arizona Public Service Co. | 2.95% | 9/15/2027 | 1,333 | 1,314,123 | ||||||||
| El Paso Electric Co. | 5.00% | 12/1/2044 | 1,953 | 2,161,595 | ||||||||
| Emera, Inc. (Canada)(d) | 6.75% (3 Mo. LIBOR + 5.44% | )# | 6/15/2076 | 916 | 1,035,080 | |||||||
| Enel Finance International NV (Netherlands)†(d) | 3.625% | 5/25/2027 | 2,137 | 2,126,802 | ||||||||
| Entergy Arkansas, Inc. | 4.95% | 12/15/2044 | 1,909 | 2,000,350 | ||||||||
| Entergy Mississippi, Inc. | 2.85% | 6/1/2028 | 625 | 605,752 | ||||||||
| 22 | See Notes to Financial Statements. |
Schedule of Investments (continued)
December 31, 2017
| Investments | Interest Rate | Maturity Date | Principal Amount (000) | Fair Value | ||||||||
| Electric: Integrated (continued) | ||||||||||||
| Indianapolis Power & Light Co.† | 4.05% | 5/1/2046 | $ | 2,203 | $ | 2,298,890 | ||||||
| Louisville Gas & Electric Co. | 4.375% | 10/1/2045 | 1,017 | 1,133,347 | ||||||||
| Monongahela Power Co.† | 3.55% | 5/15/2027 | 942 | 961,992 | ||||||||
| NRG Energy, Inc.† | 5.75% | 1/15/2028 | 1,059 | 1,072,237 | ||||||||
| Puget Sound Energy, Inc. | 7.02% | 12/1/2027 | 314 | 405,637 | ||||||||
| Rochester Gas & Electric Corp.† | 3.10% | 6/1/2027 | 1,113 | 1,102,749 | ||||||||
| Southern California Edison Co. | 3.90% | 3/15/2043 | 1,000 | 1,053,636 | ||||||||
| Southern California Edison Co. | 4.00% | 4/1/2047 | 1,237 | 1,330,812 | ||||||||
| Total | 19,757,642 | |||||||||||
| Electronics 1.41% | ||||||||||||
| Applied Materials, Inc. | 4.35% | 4/1/2047 | 2,370 | 2,662,923 | ||||||||
| Corning, Inc. | 4.375% | 11/15/2057 | 2,595 | 2,585,459 | ||||||||
| Nokia OYJ (Finland)(d) | 4.375% | 6/12/2027 | 928 | 919,648 | ||||||||
| NVIDIA Corp. | 3.20% | 9/16/2026 | 2,872 | 2,885,187 | ||||||||
| Qorvo, Inc. | 7.00% | 12/1/2025 | 2,479 | 2,779,579 | ||||||||
| Trimble, Inc. | 4.75% | 12/1/2024 | 3,132 | 3,384,274 | ||||||||
| Xilinx, Inc. | 2.95% | 6/1/2024 | 1,345 | 1,337,468 | ||||||||
| Total | 16,554,538 | |||||||||||
| Energy: Exploration & Production 5.44% | ||||||||||||
| Alta Mesa Holdings LP/Alta Mesa Finance Services Corp. | 7.875% | 12/15/2024 | 1,563 | 1,721,254 | ||||||||
| Anadarko Petroleum Corp. | 6.60% | 3/15/2046 | 1,740 | 2,244,384 | ||||||||
| Bill Barrett Corp. | 7.00% | 10/15/2022 | 1,042 | 1,066,748 | ||||||||
| Bill Barrett Corp. | 8.75% | 6/15/2025 | 548 | 608,280 | ||||||||
| California Resources Corp.† | 8.00% | 12/15/2022 | 1,484 | 1,229,865 | ||||||||
| Carrizo Oil & Gas, Inc. | 6.25% | 4/15/2023 | 1,916 | 1,997,430 | ||||||||
| Centennial Resource Production LLC† | 5.375% | 1/15/2026 | 1,155 | 1,179,544 | ||||||||
| CNX Resources Corp. | 8.00% | 4/1/2023 | 1,091 | 1,172,280 | ||||||||
| CNX Resources Corp. | 5.875% | 4/15/2022 | 740 | 759,425 | ||||||||
| Concho Resources, Inc. | 4.875% | 10/1/2047 | 2,658 | 2,915,919 | ||||||||
| Continental Resources, Inc. | 3.80% | 6/1/2024 | 3,564 | 3,537,270 | ||||||||
| Continental Resources, Inc. | 4.50% | 4/15/2023 | 4,919 | 5,029,677 | ||||||||
| Eclipse Resources Corp. | 8.875% | 7/15/2023 | 1,322 | 1,363,312 | ||||||||
| Endeavor Energy Resources LP/EER Finance, Inc.† | 5.50% | 1/30/2026 | 849 | 865,980 | ||||||||
| EP Energy LLC/Everest Acquisition Finance, Inc.† | 8.00% | 11/29/2024 | 1,138 | 1,180,675 | ||||||||
| EP Energy LLC/Everest Acquisition Finance, Inc.† | 8.00% | 2/15/2025 | 437 | 321,195 | ||||||||
| Gulfport Energy Corp. | 6.00% | 10/15/2024 | 259 | 260,295 | ||||||||
| Gulfport Energy Corp. | 6.375% | 5/15/2025 | 327 | 329,861 | ||||||||
| See Notes to Financial Statements. | 23 |
Schedule of Investments (continued)
December 31, 2017
| Investments | Interest Rate | Maturity Date | Principal Amount (000) | Fair Value | ||||||||
| Energy: Exploration & Production (continued) | ||||||||||||
| Gulfport Energy Corp.† | 6.375% | 1/15/2026 | $ | 658 | $ | 664,580 | ||||||
| Halcon Resources Corp.† | 6.75% | 2/15/2025 | 1,097 | 1,146,365 | ||||||||
| Hilcorp Energy I LP/Hilcorp Finance Co.† | 5.00% | 12/1/2024 | 2,553 | 2,540,235 | ||||||||
| Jonah Energy LLC/Jonah Energy Finance Corp.† | 7.25% | 10/15/2025 | 1,853 | 1,869,214 | ||||||||
| Kosmos Energy Ltd.† | 7.875% | 8/1/2021 | 1,175 | 1,207,313 | ||||||||
| MEG Energy Corp. (Canada)†(d) | 6.375% | 1/30/2023 | 1,661 | 1,420,155 | ||||||||
| MEG Energy Corp. (Canada)†(d) | 6.50% | 1/15/2025 | 1,354 | 1,342,153 | ||||||||
| MEG Energy Corp. (Canada)†(d) | 7.00% | 3/31/2024 | 3,196 | 2,712,605 | ||||||||
| Murphy Oil Corp. | 6.875% | 8/15/2024 | 517 | 553,190 | ||||||||
| Newfield Exploration Co. | 5.625% | 7/1/2024 | 3,041 | 3,284,280 | ||||||||
| Oasis Petroleum, Inc. | 6.875% | 3/15/2022 | 1,100 | 1,131,625 | ||||||||
| PT Saka Energi Indonesia (Indonesia)†(d) | 4.45% | 5/5/2024 | 948 | 964,259 | ||||||||
| Range Resources Corp. | 4.875% | 5/15/2025 | 2,379 | 2,307,630 | ||||||||
| Range Resources Corp. | 5.875% | 7/1/2022 | 726 | 744,150 | ||||||||
| Sanchez Energy Corp. | 6.125% | 1/15/2023 | 2,564 | 2,185,810 | ||||||||
| SM Energy Co. | 6.50% | 1/1/2023 | 1,867 | 1,913,675 | ||||||||
| Southwestern Energy Co. | 7.75% | 10/1/2027 | 1,714 | 1,831,837 | ||||||||
| SRC Energy, Inc.† | 6.25% | 12/1/2025 | 1,455 | 1,495,012 | ||||||||
| Texaco Capital, Inc. | 8.625% | 11/15/2031 | 1,223 | 1,881,577 | ||||||||
| Ultra Resources, Inc.† | 7.125% | 4/15/2025 | 918 | 919,148 | ||||||||
| WPX Energy, Inc. | 6.00% | 1/15/2022 | 1,242 | 1,304,100 | ||||||||
| YPF SA (Argentina)†(d) | 6.95% | 7/21/2027 | 1,361 | 1,448,104 | ||||||||
| YPF SA (Argentina)†(d) | 7.00% | 12/15/2047 | 1,180 | 1,172,330 | ||||||||
| Total | 63,822,741 | |||||||||||
| Food & Drug Retailers 0.10% | ||||||||||||
| Ingles Markets, Inc. | 5.75% | 6/15/2023 | 1,158 | 1,178,265 | ||||||||
| Food: Wholesale 1.08% | ||||||||||||
| Arcor SAIC (Argentina)†(d) | 6.00% | 7/6/2023 | 890 | 946,738 | ||||||||
| Chobani LLC/Chobani Finance Corp., Inc.† | 7.50% | 4/15/2025 | 1,312 | 1,395,640 | ||||||||
| Cosan Luxembourg SA (Luxembourg)†(d) | 7.00% | 1/20/2027 | 1,664 | 1,797,120 | ||||||||
| Kernel Holding SA (Ukraine)†(d) | 8.75% | 1/31/2022 | 1,185 | 1,308,117 | ||||||||
| Lamb Weston Holdings, Inc.† | 4.625% | 11/1/2024 | 1,299 | 1,344,465 | ||||||||
| McCormick & Co., Inc. | 4.20% | 8/15/2047 | 613 | 647,979 | ||||||||
| MHP SE (Ukraine)†(d) | 7.75% | 5/10/2024 | 1,597 | 1,734,981 | ||||||||
| Pilgrim’s Pride Corp.† | 5.875% | 9/30/2027 | 1,148 | 1,185,310 | ||||||||
| Post Holdings, Inc.† | 5.75% | 3/1/2027 | 1,235 | 1,259,700 | ||||||||
| Simmons Foods, Inc.† | 5.75% | 11/1/2024 | 1,095 | 1,086,787 | ||||||||
| Total | 12,706,837 | |||||||||||
| 24 | See Notes to Financial Statements. |
Schedule of Investments (continued)
December 31, 2017
| Investments | Interest Rate | Maturity Date | Principal Amount (000) | Fair Value | ||||||||
| Foreign Sovereign 0.14% | ||||||||||||
| Instituto Costarricense de Electricidad (Costa Rica)†(d) | 6.375% | 5/15/2043 | $ | 1,801 | $ | 1,669,563 | ||||||
| Forestry/Paper 0.55% | ||||||||||||
| Klabin Finance SA (Luxembourg)†(d) | 4.875% | 9/19/2027 | 1,313 | 1,299,214 | ||||||||
| Norbord, Inc. (Canada)†(d) | 6.25% | 4/15/2023 | 1,991 | 2,182,634 | ||||||||
| Rayonier AM Products, Inc.† | 5.50% | 6/1/2024 | 1,145 | 1,146,431 | ||||||||
| Rayonier, Inc. | 3.75% | 4/1/2022 | 1,262 | 1,278,682 | ||||||||
| West Fraser Timber Co. Ltd. (Canada)†(d) | 4.35% | 10/15/2024 | 600 | 590,622 | ||||||||
| Total | 6,497,583 | |||||||||||
| Gaming 1.62% | ||||||||||||
| CRC Escrow Issuer LLC/CRC Finco, Inc.† | 5.25% | 10/15/2025 | 2,286 | 2,315,261 | ||||||||
| Eldorado Resorts, Inc. | 6.00% | 4/1/2025 | 552 | 579,600 | ||||||||
| Everi Payments, Inc.† | 7.50% | 12/15/2025 | 1,494 | 1,484,662 | ||||||||
| GLP Capital LP/GLP Financing II, Inc. | 5.375% | 4/15/2026 | 704 | 756,800 | ||||||||
| International Game Technology plc† | 6.50% | 2/15/2025 | 593 | 665,643 | ||||||||
| Jacobs Entertainment, Inc.† | 7.875% | 2/1/2024 | 1,033 | 1,107,892 | ||||||||
| MGM Growth Properties Operating Partnership LP/MGP Finance Co-Issuer, Inc. | 5.625% | 5/1/2024 | 544 | 582,080 | ||||||||
| MGM Resorts International | 6.00% | 3/15/2023 | 3,631 | 3,930,557 | ||||||||
| MGM Resorts International | 7.75% | 3/15/2022 | 416 | 475,280 | ||||||||
| Mohegan Gaming & Entertainment† | 7.875% | 10/15/2024 | 2,065 | 2,124,369 | ||||||||
| Penn National Gaming, Inc.† | 5.625% | 1/15/2027 | 1,226 | 1,275,040 | ||||||||
| River Rock Entertainment Authority(l) | 9.00% | 11/1/2018 | 431 | 104,518 | ||||||||
| Scientific Games International, Inc. | 10.00% | 12/1/2022 | 1,460 | 1,607,825 | ||||||||
| Station Casinos LLC† | 5.00% | 10/1/2025 | 1,110 | 1,118,325 | ||||||||
| Wynn Macau Ltd. (Macau)†(d) | 5.50% | 10/1/2027 | 823 | 834,316 | ||||||||
| Total | 18,962,168 | |||||||||||
| Gas Distribution 1.74% | ||||||||||||
| Andeavor Logistics LP/Tesoro Logistics Finance Corp. | 6.25% | 10/15/2022 | 398 | 422,764 | ||||||||
| Blue Racer Midstream LLC/Blue Racer Finance Corp.† | 6.125% | 11/15/2022 | 1,057 | 1,104,565 | ||||||||
| Cheniere Corpus Christi Holdings LLC | 5.125% | 6/30/2027 | 1,162 | 1,204,878 | ||||||||
| Cheniere Corpus Christi Holdings LLC | 5.875% | 3/31/2025 | 1,059 | 1,149,677 | ||||||||
| Cheniere Corpus Christi Holdings LLC | 7.00% | 6/30/2024 | 1,017 | 1,159,380 | ||||||||
| Dominion Energy Gas Holdings LLC | 3.60% | 12/15/2024 | 1,175 | 1,202,093 | ||||||||
| Energy Transfer Equity LP | 5.875% | 1/15/2024 | 347 | 366,085 | ||||||||
| Florida Gas Transmission Co. LLC† | 4.35% | 7/15/2025 | 1,895 | 2,026,737 | ||||||||
| See Notes to Financial Statements. | 25 |
Schedule of Investments (continued)
December 31, 2017
| Investments | Interest Rate | Maturity Date | Principal Amount (000) | Fair Value | ||||||||
| Gas Distribution (continued) | ||||||||||||
| IFM US Colonial Pipeline 2 LLC† | 6.45% | 5/1/2021 | $ | 1,400 | $ | 1,537,124 | ||||||
| LBC Tank Terminals Holding Netherlands BV (Belgium)†(d) | 6.875% | 5/15/2023 | 1,419 | 1,484,629 | ||||||||
| National Fuel Gas Co. | 3.95% | 9/15/2027 | 1,975 | 1,970,497 | ||||||||
| NGPL PipeCo LLC† | 4.875% | 8/15/2027 | 1,339 | 1,394,234 | ||||||||
| Rockies Express Pipeline LLC† | 5.625% | 4/15/2020 | 1,600 | 1,684,000 | ||||||||
| Rockies Express Pipeline LLC† | 6.875% | 4/15/2040 | 1,360 | 1,536,800 | ||||||||
| Southern Star Central Corp.† | 5.125% | 7/15/2022 | 1,145 | 1,190,800 | ||||||||
| Williams Cos., Inc. (The) | 3.70% | 1/15/2023 | 543 | 543,000 | ||||||||
| Williams Cos., Inc. (The) | 4.55% | 6/24/2024 | 457 | 476,422 | ||||||||
| Total | 20,453,685 | |||||||||||
| Health Facilities 1.97% | ||||||||||||
| Ascension Health | 3.945% | 11/15/2046 | 1,017 | 1,077,133 | ||||||||
| CHS/Community Health Systems, Inc. | 8.00% | 11/15/2019 | 1,203 | 1,025,557 | ||||||||
| Dignity Health | 3.812% | 11/1/2024 | 675 | 697,389 | ||||||||
| HCA, Inc. | 5.25% | 4/15/2025 | 1,612 | 1,708,720 | ||||||||
| HCA, Inc. | 5.25% | 6/15/2026 | 763 | 810,687 | ||||||||
| HCA, Inc. | 5.50% | 6/15/2047 | 1,683 | 1,683,000 | ||||||||
| HCA, Inc. | 5.875% | 3/15/2022 | 1,715 | 1,839,337 | ||||||||
| HCA, Inc. | 7.05% | 12/1/2027 | 390 | 430,950 | ||||||||
| HCA, Inc. | 7.50% | 2/15/2022 | 2,467 | 2,781,542 | ||||||||
| HCA, Inc. | 7.58% | 9/15/2025 | 552 | 634,800 | ||||||||
| HCA, Inc. | 7.69% | 6/15/2025 | 1,240 | 1,410,500 | ||||||||
| HCA, Inc. | 8.36% | 4/15/2024 | 261 | 309,938 | ||||||||
| Kindred Healthcare, Inc. | 8.75% | 1/15/2023 | 1,190 | 1,267,350 | ||||||||
| Memorial Sloan-Kettering Cancer Center | 4.20% | 7/1/2055 | 2,978 | 3,225,668 | ||||||||
| New York & Presbyterian Hospital (The) | 4.063% | 8/1/2056 | 1,770 | 1,862,635 | ||||||||
| NYU Hospitals Center | 4.368% | 7/1/2047 | 1,191 | 1,285,286 | ||||||||
| RegionalCare Hospital Partners Holdings, Inc.† | 8.25% | 5/1/2023 | 1,034 | 1,096,040 | ||||||||
| Total | 23,146,532 | |||||||||||
| Health Services 0.81% | ||||||||||||
| ASP AMC Merger Sub, Inc.† | 8.00% | 5/15/2025 | 1,405 | 1,355,825 | ||||||||
| inVentiv Group Holdings, Inc./inVentiv Health, Inc./inVentiv Health Clinical, Inc.† | 7.50% | 10/1/2024 | 596 | 646,660 | ||||||||
| Jaguar Holding Co. II/Pharmaceutical Product Development LLC† | 6.375% | 8/1/2023 | 1,109 | 1,122,863 | ||||||||
| MPH Acquisition Holdings LLC† | 7.125% | 6/1/2024 | 1,034 | 1,103,795 | ||||||||
| Polaris Intermediate Corp. PIK 8.5%† | 8.50% | 12/1/2022 | 1,603 | 1,667,120 | ||||||||
| 26 | See Notes to Financial Statements. |
Schedule of Investments (continued)
December 31, 2017
| Investments | Interest Rate | Maturity Date | Principal Amount (000) | Fair Value | ||||||||
| Health Services (continued) | ||||||||||||
| Sterigenics-Nordion Holdings LLC† | 6.50% | 5/15/2023 | $ | 1,483 | $ | 1,549,735 | ||||||
| West Street Merger Sub, Inc.† | 6.375% | 9/1/2025 | 2,006 | 2,021,045 | ||||||||
| Total | 9,467,043 | |||||||||||
| Hotels 0.30% | ||||||||||||
| ESH Hospitality, Inc.† | 5.25% | 5/1/2025 | 1,095 | 1,108,688 | ||||||||
| Hilton Domestic Operating Co., Inc. | 4.25% | 9/1/2024 | 1,254 | 1,269,675 | ||||||||
| Hilton Grand Vacations Borrower LLC/Hilton | ||||||||||||
| Grand Vacations Borrower, Inc.† | 6.125% | 12/1/2024 | 1,070 | 1,172,987 | ||||||||
| Total | 3,551,350 | |||||||||||
| Insurance Brokerage 0.30% | ||||||||||||
| Alliant Holdings Intermediate LLC/Alliant | ||||||||||||
| Holdings Co-Issuer† | 8.25% | 8/1/2023 | 1,639 | 1,725,048 | ||||||||
| Farmers Insurance Exchange† | 4.747% (3 Mo. LIBOR + 3.23% | )#(k) | 11/1/2057 | 1,750 | 1,759,275 | |||||||
| Total | 3,484,323 | |||||||||||
| Insurance-Reinsurance 0.36% | ||||||||||||
| Berkshire Hathaway, Inc. | 2.75% | 3/15/2023 | 907 | 913,436 | ||||||||
| Berkshire Hathaway, Inc. | 3.125% | 3/15/2026 | 907 | 917,988 | ||||||||
| Validus Holdings Ltd. | 8.875% | 1/26/2040 | 1,581 | 2,342,725 | ||||||||
| Total | 4,174,149 | |||||||||||
| Integrated Energy 1.26% | ||||||||||||
| Cenovus Energy, Inc. (Canada)(d) | 6.75% | 11/15/2039 | 2,678 | 3,244,944 | ||||||||
| Exxon Mobil Corp. | 3.043% | 3/1/2026 | 2,101 | 2,135,138 | ||||||||
| Hess Corp. | 4.30% | 4/1/2027 | 552 | 554,225 | ||||||||
| Hess Corp. | 5.80% | 4/1/2047 | 602 | 671,814 | ||||||||
| Petrobras Global Finance BV (Netherlands)(d) | 5.625% | 5/20/2043 | 2,500 | 2,243,475 | ||||||||
| Petrobras Global Finance BV (Netherlands)(d) | 7.375% | 1/17/2027 | 1,200 | 1,323,600 | ||||||||
| Petroleos Mexicanos (Mexico)(d) | 5.50% | 6/27/2044 | 1,275 | 1,176,137 | ||||||||
| Shell International Finance BV (Netherlands)(d) | 6.375% | 12/15/2038 | 2,473 | 3,451,922 | ||||||||
| Total | 14,801,255 | |||||||||||
| Investments & Miscellaneous Financial Services 1.54% | ||||||||||||
| Cboe Global Markets, Inc. | 3.65% | 1/12/2027 | 874 | 901,635 | ||||||||
| FMR LLC† | 5.35% | 11/15/2021 | 800 | 873,182 | ||||||||
| GrupoSura Finance SA† | 5.50% | 4/29/2026 | 1,015 | 1,102,544 | ||||||||
| Moody’s Corp.† | 3.25% | 1/15/2028 | 2,326 | 2,303,658 | ||||||||
| MSCI, Inc.† | 5.75% | 8/15/2025 | 1,338 | 1,443,368 | ||||||||
| See Notes to Financial Statements. | 27 |
Schedule of Investments (continued)
December 31, 2017
| Investments | Interest Rate | Maturity Date | Principal Amount (000) | Fair Value | ||||||||
| Investments & Miscellaneous Financial Services (continued) | ||||||||||||
| Neuberger Berman Group LLC/Neuberger Berman Finance Corp.† | 4.50% | 3/15/2027 | $ | 1,938 | $ | 2,041,595 | ||||||
| Neuberger Berman Group LLC/Neuberger Berman Finance Corp.† | 4.875% | 4/15/2045 | 4,097 | 4,189,989 | ||||||||
| OM Asset Management plc (United Kingdom)(d) | 4.80% | 7/27/2026 | 1,571 | 1,629,031 | ||||||||
| S&P Global, Inc. | 6.55% | 11/15/2037 | 1,391 | 1,868,328 | ||||||||
| Unifin Financiera SAB de CV SOFOM ENR (Mexico)†(d) | 7.25% | 9/27/2023 | 1,100 | 1,156,155 | ||||||||
| VFH Parent LLC/Orchestra Co-Issuer, Inc.† | 6.75% | 6/15/2022 | 550 | 580,250 | ||||||||
| Total | 18,089,735 | |||||||||||
| Life Insurance 0.73% | ||||||||||||
| Lincoln National Corp. | 3.625% | 12/12/2026 | 1,176 | 1,201,957 | ||||||||
| Northwestern Mutual Life Insurance Co. (The)† | 3.85% | 9/30/2047 | 2,206 | 2,240,051 | ||||||||
| Nuveen Finance LLC† | 4.125% | 11/1/2024 | 1,453 | 1,535,382 | ||||||||
| Teachers Insurance & Annuity Association of America† | 4.27% | 5/15/2047 | 1,889 | 2,000,878 | ||||||||
| Teachers Insurance & Annuity Association of America† | 4.90% | 9/15/2044 | 1,424 | 1,631,283 | ||||||||
| Total | 8,609,551 | |||||||||||
| Machinery 0.09% | ||||||||||||
| Xylem, Inc. | 3.25% | 11/1/2026 | 1,004 | 1,000,345 | ||||||||
| Managed Care 0.91% | ||||||||||||
| Anthem, Inc. | 3.65% | 12/1/2027 | 1,434 | 1,464,245 | ||||||||
| Centene Corp. | 4.75% | 1/15/2025 | 1,797 | 1,832,940 | ||||||||
| Centene Corp. | 6.125% | 2/15/2024 | 2,044 | 2,166,640 | ||||||||
| Kaiser Foundation Hospitals | 4.15% | 5/1/2047 | 2,048 | 2,216,549 | ||||||||
| WellCare Health Plans, Inc. | 5.25% | 4/1/2025 | 2,829 | 2,991,667 | ||||||||
| Total | 10,672,041 | |||||||||||
| Media: Content 1.17% | ||||||||||||
| Activision Blizzard, Inc. | 3.40% | 9/15/2026 | 1,101 | 1,116,001 | ||||||||
| AMC Networks, Inc. | 4.75% | 8/1/2025 | 1,741 | 1,730,119 | ||||||||
| Gray Television, Inc.† | 5.125% | 10/15/2024 | 151 | 151,000 | ||||||||
| Gray Television, Inc.† | 5.875% | 7/15/2026 | 481 | 494,227 | ||||||||
| iHeartCommunications, Inc. | 9.00% | 3/1/2021 | 3,492 | 2,514,240 | ||||||||
| Netflix, Inc. | 4.375% | 11/15/2026 | 1,705 | 1,675,162 | ||||||||
| Netflix, Inc.† | 4.875% | 4/15/2028 | 1,307 | 1,282,494 | ||||||||
| Netflix, Inc. | 5.875% | 2/15/2025 | 1,661 | 1,768,965 | ||||||||
| 28 | See Notes to Financial Statements. |
Schedule of Investments (continued)
December 31, 2017
| Investments | Interest Rate | Maturity Date | Principal Amount (000) | Fair Value | ||||||||
| Media: Content (continued) | ||||||||||||
| Sirius XM Radio, Inc.† | 5.00% | 8/1/2027 | $ | 1,792 | $ | 1,805,440 | ||||||
| Sirius XM Radio, Inc.† | 6.00% | 7/15/2024 | 1,075 | 1,139,500 | ||||||||
| Total | 13,677,148 | |||||||||||
| Media: Diversified 0.25% | ||||||||||||
| 21st Century Fox America, Inc. | 4.75% | 11/15/2046 | 2,576 | 2,991,453 | ||||||||
| Medical Products 0.66% | ||||||||||||
| Boston Scientific Corp. | 7.00% | 11/15/2035 | 1,785 | 2,312,104 | ||||||||
| Fresenius Medical Care US Finance II, Inc.† | 4.75% | 10/15/2024 | 1,613 | 1,722,790 | ||||||||
| Ortho-Clinical Diagnostics, Inc./Ortho-Clinical Diagnostics SA† | 6.625% | 5/15/2022 | 2,325 | 2,348,250 | ||||||||
| Stryker Corp. | 4.625% | 3/15/2046 | 644 | 733,662 | ||||||||
| Teleflex, Inc. | 4.625% | 11/15/2027 | 641 | 648,885 | ||||||||
| Total | 7,765,691 | |||||||||||
| Metals/Mining (Excluding Steel) 4.16% | ||||||||||||
| Alcoa Nederland Holding BV (Netherlands)†(d) | 6.75% | 9/30/2024 | 2,477 | 2,712,315 | ||||||||
| Aleris International, Inc.† | 9.50% | 4/1/2021 | 1,184 | 1,255,040 | ||||||||
| Alliance Resource Operating Partners LP/Alliance Resource Finance Corp.† | 7.50% | 5/1/2025 | 1,363 | 1,453,299 | ||||||||
| Anglo American Capital plc (United Kingdom)†(d) | 4.00% | 9/11/2027 | 1,321 | 1,313,881 | ||||||||
| Anglo American Capital plc (United Kingdom)†(d) | 4.75% | 4/10/2027 | 2,386 | 2,500,297 | ||||||||
| Cleveland-Cliffs, Inc.† | 5.75% | 3/1/2025 | 2,458 | 2,353,535 | ||||||||
| Corp. Nacional del Cobre de Chile (Chile)†(d) | 4.50% | 8/1/2047 | 910 | 981,581 | ||||||||
| First Quantum Minerals Ltd. (Canada)†(d) | 7.25% | 4/1/2023 | 1,150 | 1,242,000 | ||||||||
| Freeport-McMoRan, Inc. | 3.55% | 3/1/2022 | 4,670 | 4,629,137 | ||||||||
| Freeport-McMoRan, Inc. | 3.875% | 3/15/2023 | 4,941 | 4,941,000 | ||||||||
| Glencore Funding LLC† | 4.00% | 3/27/2027 | 1,958 | 1,969,009 | ||||||||
| Grinding Media, Inc./Moly-Cop AltaSteel Ltd.† | 7.375% | 12/15/2023 | 686 | 738,273 | ||||||||
| Hudbay Minerals, Inc. (Canada)†(d) | 7.25% | 1/15/2023 | 1,039 | 1,106,535 | ||||||||
| Imperial Metals Corp. (Canada)†(d) | 7.00% | 3/15/2019 | 1,037 | 979,965 | ||||||||
| Indika Energy Capital III Pte Ltd. (Singapore)†(d) | 5.875% | 11/9/2024 | 1,182 | 1,186,401 | ||||||||
| Indo Energy Finance II BV (Netherlands)†(d) | 6.375% | 1/24/2023 | 1,408 | 1,450,467 | ||||||||
| Kinross Gold Corp. (Canada)(d) | 5.125% | 9/1/2021 | 1,175 | 1,230,812 | ||||||||
| Kinross Gold Corp. (Canada)(d) | 5.95% | 3/15/2024 | 1,322 | 1,455,852 | ||||||||
| Lundin Mining Corp. (Canada)†(d) | 7.875% | 11/1/2022 | 964 | 1,036,300 | ||||||||
| Mirabela Nickel Ltd. (Australia)(d)(l) | 1.00% | 9/10/2044 | 15 | 2 | (m) | |||||||
| New Gold, Inc. (Canada)†(d) | 6.375% | 5/15/2025 | 481 | 511,063 | ||||||||
| Novelis Corp.† | 5.875% | 9/30/2026 | 1,000 | 1,022,500 | ||||||||
| See Notes to Financial Statements. | 29 |
Schedule of Investments (continued)
December 31, 2017
| Investments | Interest Rate | Maturity Date | Principal Amount (000) | Fair Value | ||||||||
| Metals/Mining (Excluding Steel) (continued) | ||||||||||||
| Novelis Corp.† | 6.25% | 8/15/2024 | $ | 974 | $ | 1,022,700 | ||||||
| Peabody Energy Corp.† | 6.00% | 3/31/2022 | 1,099 | 1,144,334 | ||||||||
| Peabody Energy Corp.† | 6.375% | 3/31/2025 | 2,810 | 2,932,937 | ||||||||
| Peabody Energy Corp.(l) | 10.00% | 3/15/2022 | 1,310 | 131 | (m) | |||||||
| Rain CII Carbon LLC/CII Carbon Corp.† | 7.25% | 4/1/2025 | 2,127 | 2,321,089 | ||||||||
| Rain CII Carbon LLC/CII Carbon Corp.†(c) | 8.50% | 1/15/2021 | EUR | 475 | 586,855 | |||||||
| Samarco Mineracao SA (Brazil)†(d)(l) | 4.125% | 11/1/2022 | $ | 1,620 | 1,109,700 | |||||||
| Teck Resources Ltd. (Canada)†(d) | 8.50% | 6/1/2024 | 1,169 | 1,323,892 | ||||||||
| Vedanta Resources plc (India)†(d) | 6.125% | 8/9/2024 | 2,272 | 2,323,938 | ||||||||
| Total | 48,834,840 | |||||||||||
| Monoline Insurance 0.35% | ||||||||||||
| Acrisure LLC/Acrisure Finance, Inc.† | 7.00% | 11/15/2025 | 2,449 | 2,366,371 | ||||||||
| Fidelity National Financial, Inc. | 5.50% | 9/1/2022 | 406 | 448,313 | ||||||||
| MGIC Investment Corp. | 5.75% | 8/15/2023 | 1,204 | 1,319,885 | ||||||||
| Total | 4,134,569 | |||||||||||
| Multi-Line Insurance 0.15% | ||||||||||||
| American International Group, Inc. | 4.70% | 7/10/2035 | 1,576 | 1,747,084 | ||||||||
| Non-Electric Utilities 0.12% | ||||||||||||
| Brooklyn Union Gas Co. (The)† | 3.407% | 3/10/2026 | 1,368 | 1,397,343 | ||||||||
| Oil Field Equipment & Services 1.60% | ||||||||||||
| Abu Dhabi Crude Oil Pipeline LLC (United Arab Emirates)†(d) | 4.60% | 11/2/2047 | 2,329 | 2,401,828 | ||||||||
| Ensco plc (United kingdom)(d) | 4.50% | 10/1/2024 | 1,035 | 874,575 | ||||||||
| Ensco plc (United kingdom)(d) | 5.20% | 3/15/2025 | 1,368 | 1,169,640 | ||||||||
| Eterna Capital Pte Ltd. PIK 6.00% (Singapore)(d) | 6.00% | 12/11/2022 | 70 | 73,541 | (b) | |||||||
| Eterna Capital Pte Ltd. PIK 8.00% (Singapore)(d) | 8.00% | 12/11/2022 | 252 | 243,549 | (b) | |||||||
| Forum Energy Technologies, Inc. | 6.25% | 10/1/2021 | 1,300 | 1,309,750 | ||||||||
| National Oilwell Varco, Inc. | 3.95% | 12/1/2042 | 2,614 | 2,321,090 | ||||||||
| Precision Drilling Corp. (Canada)(d) | 5.25% | 11/15/2024 | 1,804 | 1,709,290 | ||||||||
| Precision Drilling Corp. (Canada)(d) | 6.50% | 12/15/2021 | 182 | 186,322 | ||||||||
| Precision Drilling Corp. (Canada)(d) | 7.75% | 12/15/2023 | 553 | 583,415 | ||||||||
| Rowan Cos., Inc. | 4.75% | 1/15/2024 | 1,114 | 985,890 | ||||||||
| Rowan Cos., Inc. | 7.375% | 6/15/2025 | 553 | 567,516 | ||||||||
| Transocean Phoenix 2 Ltd.† | 7.75% | 10/15/2024 | 921 | 1,011,619 | ||||||||
| Transocean Proteus Ltd.† | 6.25% | 12/1/2024 | 899 | 946,303 | ||||||||
| 30 | See Notes to Financial Statements. |
Schedule of Investments (continued)
December 31, 2017
| Investments | Interest Rate | Maturity Date | Principal Amount (000) | Fair Value | ||||||||
| Oil Field Equipment & Services (continued) | ||||||||||||
| Transocean, Inc.† | 7.50% | 1/15/2026 | $ | 1,992 | $ | 2,044,888 | ||||||
| Unit Corp. | 6.625% | 5/15/2021 | 1,136 | 1,150,200 | ||||||||
| Weatherford International Ltd. | 9.875% | 2/15/2024 | 1,071 | 1,143,292 | ||||||||
| Total | 18,722,708 | |||||||||||
| Oil Refining & Marketing 0.65% | ||||||||||||
| Andeavor | 4.50% | 4/1/2048 | 1,092 | 1,107,899 | ||||||||
| Citgo Holding, Inc.† | 10.75% | 2/15/2020 | 1,985 | 2,138,838 | ||||||||
| HollyFrontier Corp. | 5.875% | 4/1/2026 | 876 | 976,012 | ||||||||
| Marathon Petroleum Corp. | 4.75% | 9/15/2044 | 1,042 | 1,091,926 | ||||||||
| Raizen Fuels Finance SA (Luxembourg)†(d) | 5.30% | 1/20/2027 | 1,051 | 1,102,289 | ||||||||
| Tupras Turkiye Petrol Rafinerileri AS (Turkey)†(d) | 4.50% | 10/18/2024 | 1,168 | 1,156,537 | ||||||||
| Total | 7,573,501 | |||||||||||
| Packaging 0.87% | ||||||||||||
| BWAY Holding Co.† | 7.25% | 4/15/2025 | 3,369 | 3,486,915 | ||||||||
| Crown Cork & Seal Co., Inc. | 7.375% | 12/15/2026 | 1,295 | 1,515,150 | ||||||||
| Pactiv LLC | 7.95% | 12/15/2025 | 1,152 | 1,310,400 | ||||||||
| Plastipak Holdings, Inc.† | 6.25% | 10/15/2025 | 1,732 | 1,788,290 | ||||||||
| Sealed Air Corp.† | 6.875% | 7/15/2033 | 1,850 | 2,159,875 | ||||||||
| Total | 10,260,630 | |||||||||||
| Personal & Household Products 0.53% | ||||||||||||
| FGI Operating Co. LLC/FGI Finance, Inc. | 7.875% | 5/1/2020 | 1,582 | 359,905 | ||||||||
| Gibson Brands, Inc.† | 8.875% | 8/1/2018 | 1,725 | 1,457,625 | ||||||||
| Mattel, Inc. | 2.35% | 8/15/2021 | 2,885 | 2,584,787 | ||||||||
| Mattel, Inc.† | 6.75% | 12/31/2025 | 839 | 852,382 | ||||||||
| SC Johnson & Son, Inc.† | 4.75% | 10/15/2046 | 805 | 942,520 | ||||||||
| Total | 6,197,219 | |||||||||||
| Pharmaceuticals 1.11% | ||||||||||||
| Johnson & Johnson | 2.90% | 1/15/2028 | 4,318 | 4,328,561 | ||||||||
| Pfizer, Inc. | 5.60% | 9/15/2040 | 1,578 | 2,058,076 | ||||||||
| Valeant Pharmaceuticals International, Inc.† | 5.625% | 12/1/2021 | 2,885 | 2,830,906 | ||||||||
| Valeant Pharmaceuticals International, Inc.† | 7.00% | 3/15/2024 | 1,332 | 1,428,570 | ||||||||
| Valeant Pharmaceuticals International, Inc.† | 7.50% | 7/15/2021 | 1,451 | 1,481,834 | ||||||||
| Zoetis, Inc. | 3.95% | 9/12/2047 | 889 | 909,619 | ||||||||
| Total | 13,037,566 | |||||||||||
| See Notes to Financial Statements. | 31 |
Schedule of Investments (continued)
December 31, 2017
| Investments | Interest Rate | Maturity Date | Principal Amount (000) | Fair Value | ||||||||
| Property & Casualty 0.33% | ||||||||||||
| Allstate Corp. (The) | 4.20% | 12/15/2046 | $ | 1,244 | $ | 1,361,815 | ||||||
| Arch Capital Finance LLC | 4.011% | 12/15/2026 | 1,507 | 1,571,430 | ||||||||
| Chubb INA Holdings, Inc. | 3.35% | 5/3/2026 | 876 | 894,722 | ||||||||
| Total | 3,827,967 | |||||||||||
| Rail 0.39% | ||||||||||||
| Central Japan Railway Co. (Japan)†(d) | 4.25% | 11/24/2045 | 1,524 | 1,691,519 | ||||||||
| Rumo Luxembourg Sarl (Luxembourg)†(d) | 7.375% | 2/9/2024 | 1,659 | 1,789,397 | ||||||||
| Watco Cos. LLC/Watco Finance Corp.† | 6.375% | 4/1/2023 | 1,072 | 1,114,880 | ||||||||
| Total | 4,595,796 | |||||||||||
| Real Estate Development & Management 0.23% | ||||||||||||
| Country Garden Holdings Co. Ltd. (China)(d) | 4.75% | 9/28/2023 | 1,076 | 1,071,535 | ||||||||
| Kaisa Group Holdings Ltd. (China)(d) | 9.375% | 6/30/2024 | 1,663 | 1,624,837 | ||||||||
| Total | 2,696,372 | |||||||||||
| Real Estate Investment Trusts 0.64% | ||||||||||||
| Alexandria Real Estate Equities, Inc. | 3.95% | 1/15/2028 | 1,627 | 1,664,200 | ||||||||
| Digital Realty Trust LP | 3.70% | 8/15/2027 | 1,132 | 1,142,195 | ||||||||
| Digital Realty Trust LP | 4.75% | 10/1/2025 | 989 | 1,076,669 | ||||||||
| Goodman US Finance Four LLC† | 4.50% | 10/15/2037 | 1,137 | 1,178,002 | ||||||||
| Goodman US Finance Three LLC† | 3.70% | 3/15/2028 | 769 | 764,454 | ||||||||
| VEREIT Operating Partnership LP | 3.95% | 8/15/2027 | 1,748 | 1,730,946 | ||||||||
| Total | 7,556,466 | |||||||||||
| Real Estate Management & Development 0.22% | ||||||||||||
| Ontario Teachers’ Cadillac Fairview Properties Trust (Canada)†(d) | 3.875% | 3/20/2027 | 2,539 | 2,597,938 | ||||||||
| Recreation & Travel 0.83% | ||||||||||||
| Cedar Fair LP/Canada’s Wonderland Co./Magnum Management Corp./Millennium Op† | 5.375% | 4/15/2027 | 1,144 | 1,204,060 | ||||||||
| LTF Merger Sub, Inc.† | 8.50% | 6/15/2023 | 591 | 628,676 | ||||||||
| Royal Caribbean Cruises Ltd. | 3.70% | 3/15/2028 | 1,186 | 1,177,346 | ||||||||
| Royal Caribbean Cruises Ltd. | 7.50% | 10/15/2027 | 2,950 | 3,812,314 | ||||||||
| Silversea Cruise Finance Ltd.† | 7.25% | 2/1/2025 | 1,587 | 1,717,928 | ||||||||
| Viking Cruises Ltd.† | 5.875% | 9/15/2027 | 1,144 | 1,166,880 | ||||||||
| Total | 9,707,204 | |||||||||||
| Restaurants 0.73% | ||||||||||||
| Arcos Dorados Holdings, Inc. (Uruguay)†(d) | 5.875% | 4/4/2027 | 1,199 | 1,270,532 | ||||||||
| Arcos Dorados Holdings, Inc. (Uruguay)†(d) | 6.625% | 9/27/2023 | 880 | 986,269 | ||||||||
| 32 | See Notes to Financial Statements. |
Schedule of Investments (continued)
December 31, 2017
| Investments | Interest Rate | Maturity Date | Principal Amount (000) | Fair Value | ||||||||
| Restaurants (continued) | ||||||||||||
| KFC Holding Co./Pizza Hut Holdings LLC/Taco Bell of America LLC† | 4.75% | 6/1/2027 | $ | 762 | $ | 781,050 | ||||||
| KFC Holding Co./Pizza Hut Holdings LLC/Taco Bell of America LLC† | 5.00% | 6/1/2024 | 1,610 | 1,664,338 | ||||||||
| McDonald’s Corp. | 3.70% | 1/30/2026 | 2,699 | 2,817,474 | ||||||||
| Seminole Hard Rock Entertainment, Inc./Seminole Hard Rock International LLC† | 5.875% | 5/15/2021 | 975 | 994,500 | ||||||||
| Total | 8,514,163 | |||||||||||
| Software/Services 2.58% | ||||||||||||
| Alibaba Group Holding Ltd. (China)(d) | 3.125% | 11/28/2021 | 2,150 | 2,178,966 | ||||||||
| Alibaba Group Holding Ltd. (China)(d) | 4.20% | 12/6/2047 | 426 | 444,260 | ||||||||
| Alibaba Group Holding Ltd. (China)(d) | 4.40% | 12/6/2057 | 747 | 779,591 | ||||||||
| Autodesk, Inc. | 3.50% | 6/15/2027 | 2,322 | 2,281,581 | ||||||||
| Citrix Systems, Inc. | 4.50% | 12/1/2027 | 1,722 | 1,750,561 | ||||||||
| First Data Corp.† | 5.75% | 1/15/2024 | 2,996 | 3,122,581 | ||||||||
| j2 Cloud Services LLC/j2 Global Co-Obligor, Inc.† | 6.00% | 7/15/2025 | 1,095 | 1,157,962 | ||||||||
| Match Group, Inc.† | 5.00% | 12/15/2027 | 1,154 | 1,174,195 | ||||||||
| Microsoft Corp. | 3.30% | 2/6/2027 | 2,122 | 2,190,742 | ||||||||
| Microsoft Corp. | 4.00% | 2/12/2055 | 3,817 | 4,091,147 | ||||||||
| Oracle Corp. | 4.375% | 5/15/2055 | 2,565 | 2,872,160 | ||||||||
| Rackspace Hosting, Inc.† | 8.625% | 11/15/2024 | 1,065 | 1,139,550 | ||||||||
| Solera LLC/Solera Finance, Inc.† | 10.50% | 3/1/2024 | 1,010 | 1,141,280 | ||||||||
| Sophia LP/Sophia Finance, Inc.† | 9.00% | 9/30/2023 | 700 | 743,750 | ||||||||
| VeriSign, Inc. | 4.625% | 5/1/2023 | 872 | 899,250 | ||||||||
| VeriSign, Inc. | 5.25% | 4/1/2025 | 1,593 | 1,742,344 | ||||||||
| Visa, Inc. | 3.15% | 12/14/2025 | 477 | 488,012 | ||||||||
| VMware, Inc. | 3.90% | 8/21/2027 | 2,091 | 2,114,345 | ||||||||
| Total | 30,312,277 | |||||||||||
| Specialty Retail 0.76% | ||||||||||||
| Alimentation Couche-Tard, Inc. (Canada)†(d) | 4.50% | 7/26/2047 | 1,095 | 1,143,310 | ||||||||
| Brookstone Holdings Corp. PIK 10.00% | 10.00% | 7/7/2021 | 44 | 2,409 | (b) | |||||||
| Claire’s Stores, Inc.† | 9.00% | 3/15/2019 | 1,464 | 962,580 | ||||||||
| Hot Topic, Inc.† | 9.25% | 6/15/2021 | 1,564 | 1,493,620 | ||||||||
| Midas Intermediate Holdco II LLC/Midas Intermediate Holdco II Finance, Inc.† | 7.875% | 10/1/2022 | 1,475 | 1,493,438 | ||||||||
| Rent-A-Center, Inc. | 4.75% | 5/1/2021 | 960 | 912,000 | ||||||||
| Tapestry, Inc. | 4.125% | 7/15/2027 | 1,682 | 1,697,562 | ||||||||
| Tiffany & Co. | 4.90% | 10/1/2044 | 1,133 | 1,146,934 | ||||||||
| See Notes to Financial Statements. | 33 |
Schedule of Investments (continued)
December 31, 2017
| Investments | Interest Rate | Maturity Date | Principal Amount (000) | Fair Value | ||||||||
| Specialty Retail (continued) | ||||||||||||
| VF Corp. | 6.00% | 10/15/2033 | $ | 8 | $ | 10,037 | ||||||
| Total | 8,861,890 | |||||||||||
| Steel Producers/Products 0.51% | ||||||||||||
| Allegheny Technologies, Inc. | 5.95% | 1/15/2021 | 235 | 240,875 | ||||||||
| Allegheny Technologies, Inc. | 7.875% | 8/15/2023 | 849 | 918,508 | ||||||||
| ArcelorMittal (Luxembourg)(d) | 6.125% | 6/1/2025 | 2,346 | 2,712,562 | ||||||||
| Joseph T Ryerson & Son, Inc.† | 11.00% | 5/15/2022 | 815 | 913,819 | ||||||||
| Steel Dynamics, Inc.† | 4.125% | 9/15/2025 | 604 | 610,040 | ||||||||
| Steel Dynamics, Inc. | 5.00% | 12/15/2026 | 502 | 532,120 | ||||||||
| Total | 5,927,924 | |||||||||||
| Support: Services 2.70% | ||||||||||||
| AECOM | 5.125% | 3/15/2027 | 1,418 | 1,447,991 | ||||||||
| AECOM | 5.875% | 10/15/2024 | 999 | 1,087,112 | ||||||||
| Ahern Rentals, Inc.† | 7.375% | 5/15/2023 | 1,190 | 1,124,550 | ||||||||
| Ashtead Capital, Inc.† | 4.375% | 8/15/2027 | 1,393 | 1,417,378 | ||||||||
| BakerCorp International, Inc. | 8.25% | 6/1/2019 | 507 | 468,975 | ||||||||
| BlueLine Rental Finance Corp./BlueLine Rental LLC† | 9.25% | 3/15/2024 | 1,040 | 1,112,800 | ||||||||
| Brand Industrial Services, Inc.† | 8.50% | 7/15/2025 | 1,787 | 1,880,817 | ||||||||
| Brink’s Co. (The)† | 4.625% | 10/15/2027 | 1,509 | 1,482,592 | ||||||||
| Cleveland Clinic Foundation (The) | 4.858% | 1/1/2114 | 1,100 | 1,239,624 | ||||||||
| Cloud Crane LLC† | 10.125% | 8/1/2024 | 990 | 1,118,700 | ||||||||
| GW Honos Security Corp. (Canada)†(d) | 8.75% | 5/15/2025 | 1,182 | 1,273,605 | ||||||||
| H&E Equipment Services, Inc.† | 5.625% | 9/1/2025 | 1,122 | 1,175,295 | ||||||||
| IHS Markit Ltd. (United kingdom)†(d) | 4.00% | 3/1/2026 | 1,698 | 1,704,367 | ||||||||
| Jurassic Holdings III, Inc.† | 6.875% | 2/15/2021 | 1,467 | 1,254,285 | ||||||||
| Marble II Pte Ltd. (Singapore)†(d) | 5.30% | 6/20/2022 | 2,199 | 2,235,816 | ||||||||
| Metropolitan Museum of Art (The) | 3.40% | 7/1/2045 | 1,350 | 1,304,740 | ||||||||
| Monitronics International, Inc. | 9.125% | 4/1/2020 | 1,185 | 989,475 | ||||||||
| Prime Security Services Borrower LLC/Prime Finance, Inc.† | 9.25% | 5/15/2023 | 1,601 | 1,781,112 | ||||||||
| Ritchie Bros Auctioneers, Inc. (Canada)†(d) | 5.375% | 1/15/2025 | 1,130 | 1,169,550 | ||||||||
| Sotheby’s† | 5.25% | 10/1/2022 | 837 | 863,366 | ||||||||
| United Rentals North America, Inc. | 4.625% | 10/15/2025 | 1,138 | 1,149,380 | ||||||||
| United Rentals North America, Inc. | 4.875% | 1/15/2028 | 1,328 | 1,337,960 | ||||||||
| United Rentals North America, Inc. | 5.875% | 9/15/2026 | 755 | 810,681 | ||||||||
| Weight Watchers International, Inc.† | 8.625% | 12/1/2025 | 2,134 | 2,235,365 | ||||||||
| Total | 31,665,536 | |||||||||||
| 34 | See Notes to Financial Statements. |
Schedule of Investments (continued)
December 31, 2017
| Investments | Interest Rate | Maturity Date | Principal Amount (000) | Fair Value | ||||||||
| Technology Hardware & Equipment 0.81% | ||||||||||||
| CDW LLC/CDW Finance Corp. | 5.50% | 12/1/2024 | $ | 1,425 | $ | 1,556,813 | ||||||
| Dell International LLC/EMC Corp.† | 6.02% | 6/15/2026 | 2,552 | 2,817,805 | ||||||||
| Dell International LLC/EMC Corp.† | 7.125% | 6/15/2024 | 3,055 | 3,345,964 | ||||||||
| Western Digital Corp. | 10.50% | 4/1/2024 | 1,489 | 1,729,101 | ||||||||
| Total | 9,449,683 | |||||||||||
| Telecommunications: Satellite 0.40% | ||||||||||||
| Intelsat Connect Finance SA (Luxembourg)†(d) | 12.50% | 4/1/2022 | 1,225 | 1,078,000 | ||||||||
| Intelsat Jackson Holdings SA (Luxembourg)(d) | 7.25% | 10/15/2020 | 1,719 | 1,624,455 | ||||||||
| Intelsat Jackson Holdings SA (Luxembourg)(d) | 7.50% | 4/1/2021 | 2,183 | 1,997,445 | ||||||||
| Total | 4,699,900 | |||||||||||
| Telecommunications: Wireless 1.31% | ||||||||||||
| GTH Finance BV (Netherlands)†(d) | 7.25% | 4/26/2023 | 1,939 | 2,184,051 | ||||||||
| SBA Communications Corp. | 4.875% | 9/1/2024 | 663 | 682,890 | ||||||||
| Sprint Corp. | 7.625% | 2/15/2025 | 3,410 | 3,580,500 | ||||||||
| Sprint Corp. | 7.875% | 9/15/2023 | 1,686 | 1,799,805 | ||||||||
| T-Mobile USA, Inc. | 6.375% | 3/1/2025 | 2,386 | 2,558,985 | ||||||||
| T-Mobile USA, Inc. | 6.50% | 1/15/2026 | 4,228 | 4,624,375 | ||||||||
| Total | 15,430,606 | |||||||||||
| Telecommunications: Wireline Integrated & Services 1.17% | ||||||||||||
| Equinix, Inc. | 5.875% | 1/15/2026 | 4,621 | 4,973,351 | ||||||||
| GCI, Inc. | 6.875% | 4/15/2025 | 1,480 | 1,583,600 | ||||||||
| IHS Netherlands Holdco BV (Netherlands)†(d) | 9.50% | 10/27/2021 | 1,050 | 1,133,333 | ||||||||
| Uniti Group LP/Uniti Group Finance, Inc./CSL Capital LLC | 8.25% | 10/15/2023 | 1,578 | 1,526,715 | ||||||||
| West Corp.† | 8.50% | 10/15/2025 | 1,201 | 1,191,993 | ||||||||
| Wind Tre SpA (Italy)†(d) | 5.00% | 1/20/2026 | 2,186 | 2,089,816 | ||||||||
| WTT Investment Ltd. (Hong Kong)†(d) | 5.50% | 11/21/2022 | 1,168 | 1,191,088 | ||||||||
| Total | 13,689,896 | |||||||||||
| Transportation: Infrastructure/Services 0.79% | ||||||||||||
| Adani Ports & Special Economic Zone Ltd. (India)†(d) | 4.00% | 7/30/2027 | 1,579 | 1,569,425 | ||||||||
| Aeropuertos Dominicanos Siglo XXI SA (Dominican Republic)†(d) | 6.75% | 3/30/2029 | 1,200 | 1,318,500 | ||||||||
| Autopistas del Sol SA (Costa Rica)†(d) | 7.375% | 12/30/2030 | 1,418 | 1,516,917 | ||||||||
| Autoridad del Canal de Panama (Panama)†(d) | 4.95% | 7/29/2035 | 1,000 | 1,118,750 | ||||||||
| Delhi International Airport Ltd. (India)†(d) | 6.125% | 10/31/2026 | 1,706 | 1,816,890 | ||||||||
| DP World Ltd. (United Arab Emirates)†(d) | 6.85% | 7/2/2037 | 1,030 | 1,270,539 | ||||||||
| Stena AB (Sweden)†(d) | 7.00% | 2/1/2024 | 677 | 639,342 | ||||||||
| Total | 9,250,363 | |||||||||||
| See Notes to Financial Statements. | 35 |
Schedule of Investments (continued)
December 31, 2017
| Investments | Interest Rate | Maturity Date | Principal Amount (000) | Fair Value | ||||||||
| Trucking & Delivery 0.10% | ||||||||||||
| XPO CNW, Inc. | 6.70% | 5/1/2034 | $ | 1,155 | $ | 1,206,975 | ||||||
| Total High Yield Corporate Bonds (cost $781,005,212) | 809,706,965 | |||||||||||
| MUNICIPAL BONDS 4.29% | ||||||||||||
| Air Transportation 0.09% | ||||||||||||
| Miami Dade Cnty, FL | 3.982% | 10/1/2041 | 970 | 993,930 | ||||||||
| Education 1.12% | ||||||||||||
| California St Univ | 3.899% | 11/1/2047 | 2,675 | 2,822,526 | ||||||||
| Ohio Univ | 5.59% | 12/1/2114 | 1,000 | 1,201,300 | ||||||||
| Permanent University Fund - Texas A&M University System | 3.66% | 7/1/2047 | 7,640 | 7,651,002 | ||||||||
| Univ of California Bd of Regents | 6.548% | 5/15/2048 | 1,000 | 1,421,690 | ||||||||
| Total | 13,096,518 | |||||||||||
| General Obligation 1.37% | ||||||||||||
| California | 7.55% | 4/1/2039 | 1,000 | 1,577,630 | ||||||||
| Chicago Transit Auth, IL | 6.899% | 12/1/2040 | 1,000 | 1,358,760 | ||||||||
| Chicago, IL | 5.432% | 1/1/2042 | 2,292 | 2,212,926 | ||||||||
| Chicago, IL | 6.314% | 1/1/2044 | 2,167 | 2,315,244 | ||||||||
| District of Columbia | 5.591% | 12/1/2034 | 1,445 | 1,789,286 | ||||||||
| Honolulu City & Cnty, HI | 5.418% | 12/1/2027 | 740 | 876,944 | ||||||||
| Los Angeles Unif Sch Dist, CA | 5.75% | 7/1/2034 | 1,000 | 1,277,910 | ||||||||
| New York City | 5.985% | 12/1/2036 | 1,134 | 1,467,192 | ||||||||
| Ohio St Univ | 4.048% | 12/1/2056 | 676 | 728,120 | ||||||||
| Pennsylvania | 5.45% | 2/15/2030 | 1,336 | 1,583,494 | ||||||||
| The Bd of Governors of the Univ of North Carolina | 3.847% | 12/1/2034 | 855 | 926,623 | ||||||||
| Total | 16,114,129 | |||||||||||
| Government Guaranteed 0.05% | ||||||||||||
| City & County of San Francisco CA | 5.45% | 6/15/2025 | 460 | 535,284 | ||||||||
| Lease Obligation 0.06% | ||||||||||||
| Wisconsin | 3.294% | 5/1/2037 | 790 | 756,212 | ||||||||
| Miscellaneous 0.59% | ||||||||||||
| Dallas Convention Center Hotel Dev Corp., TX | 1,960 | 2,668,834 | ||||||||||
| Pasadena Public Fing Auth | 2,945 | 4,304,883 | ||||||||||
| Total | 6,973,717 | |||||||||||
| 36 | See Notes to Financial Statements. |
Schedule of Investments (continued)
December 31, 2017
| Investments | Interest Rate | Maturity Date | Principal Amount (000) | Fair Value | ||||||||
| Tax Revenue 0.65% | ||||||||||||
| Massachusetts Sch Bldg Auth | 5.715% | 8/15/2039 | $ | 2,220 | $ | 2,833,697 | ||||||
| Memphis-Shelby County Industrial Development Board, TN | 7.00% | 7/1/2045 | 1,225 | 1,303,633 | ||||||||
| New York City Indl Dev Agy† | 11.00% | 3/1/2029 | 2,585 | 3,523,225 | ||||||||
| Total | 7,660,555 | |||||||||||
| Transportation: Infrastructure/Services 0.19% | ||||||||||||
| Chicago Transit Auth, IL | 6.20% | 12/1/2040 | 330 | 430,591 | ||||||||
| Port of Seattle, WA | 3.571% | 5/1/2032 | 650 | 658,827 | ||||||||
| Port of Seattle, WA | 3.755% | 5/1/2036 | 1,105 | 1,130,967 | ||||||||
| Total | 2,220,385 | |||||||||||
| Utilities 0.17% | ||||||||||||
| San Antonio, TX | 5.718% | 2/1/2041 | 1,480 | 1,991,384 | ||||||||
| Total Municipal Bonds (cost $48,577,067) | 50,342,114 | |||||||||||
| NON-AGENCY COMMERCIAL MORTGAGE-BACKED SECURITY 0.38% | ||||||||||||
| Caesars Palace Las Vegas Trust 2017-VICI D† (cost $4,421,759) | 4.354% | #(a) | 10/15/2034 | 4,354 | 4,448,033 | |||||||
| Dividend Rate | Shares (000) | |||||||||||
| PREFERRED STOCK 0.03% | ||||||||||||
| Energy: Exploration & Production | ||||||||||||
| Templar Energy LLC Units (cost $387,546) | Zero Coupon | 39 | 368,169 | |||||||||
| Total Long-Term Investments (cost $1,111,815,731) | $ | 1,165,909,767 | ||||||||||
| See Notes to Financial Statements. | 37 |
Schedule of Investments (continued)
December 31, 2017
| Investments | Interest Rate | Maturity Date | Principal Amount (000) | Fair Value | ||||||||
| SHORT-TERM INVESTMENTS 1.40% | ||||||||||||
| FOREIGN GOVERNMENT OBLIGATION 0.17% | ||||||||||||
| Uruguay | ||||||||||||
| Uruguay Treasury Bill(c) (cost $2,023,057) | Zero Coupon | 5/4/2018 | UYU | 58,901 | $ | 1,981,978 | ||||||
| REPURCHASE AGREEMENT 1.23% | ||||||||||||
| Repurchase Agreement dated 12/29/2017, 0.54% due 1/2/2018 with Fixed Income Clearing Corp. collateralized by $12,225,000 of U.S. Treasury Bond at 7.875% due 2/15/2021; value: $14,756,895; proceeds: $14,466,016 (cost $14,465,148) | $ | 14,465 | 14,465,148 | |||||||||
| Total Short-Term Investments (cost $16,488,205) | 16,447,126 | |||||||||||
| Total Investments in Securities 100.78% (cost $1,128,303,936) | 1,182,356,893 | |||||||||||
| Liabilities in Excess of Other Assets(n) (0.78%) | (9,135,662 | ) | ||||||||||
| Net Assets 100.00% | $ | 1,173,221,231 | ||||||||||
| AUD | Australian dollar. | |
| CAD | Canadian dollar. | |
| EUR | euro. | |
| GBP | British pound. | |
| JPY | Japanese yen. | |
| UYU | Uruguayan Peso. | |
| ADR | American Depositary Receipt. | |
| BADLAR | Banco de la Republica Argentina. | |
| LIBOR | London Interbank Offered Rate. | |
| PIK | Payment-in-kind. | |
| Units | More than one class of securities traded together. | |
| † | Security was purchased pursuant to Rule 144A under the Securities Act of 1933 and, unless registered under such Act or exempted from registration, may only be resold to qualified institutional buyers. | |
| # | Variable rate security. The interest rate represents the rate in effect at December 31, 2017. | |
| * | Non-income producing security. | |
| (a) | Interest rate is based on the weighted average interest rates of the underlying mortgages within the mortgage pool. | |
| (b) | Level 3 Investment as described in Note 2(o) in the Notes to Financials. Security valued utilizing third party pricing information without adjustment. Such valuations are based on unobservable inputs. A significant change in third party information could result in a significantly lower or higher value of such Level 3 investments. | |
| (c) | Investment in non-U.S. dollar denominated securities. | |
| (d) | Foreign security traded in U.S. dollars. | |
| (e) | Amount is less than $1,000. | |
| (f) | Floating Rate Loans in which the Fund invests generally pay interest at rates which are periodically re-determined at a margin above the London Interbank Offered Rate (“LIBOR”) or the prime rate offered by major U.S. banks. The rate(s) shown is the rate(s) in effect at December 31, 2017. | |
| (g) | Interest rate to be determined. | |
| (h) | Floating Rate Loans categorized as Level 3 are valued based on a single quotation obtained from a dealer. Accounting principles generally accepted in the United States of America do not require the Fund to create quantitative unobservable inputs that were not developed by the Fund. Therefore, the Fund does not have access to unobservable inputs and cannot disclose such inputs in the valuation. |
| 38 | See Notes to Financial Statements. |
Schedule of Investments (continued)
December 31, 2017
| (i) | To-be-announced (“TBA”). Security purchased on a forward commitment basis with an approximate principal and maturity date. Actual principal and maturity will be determined upon settlement when the specific mortgage pools are assigned. | |
| (j) | Security is perpetual in nature and has no stated maturity. | |
| (k) | Variable Rate is Fixed to Float: Rate remains fixed until designated future date. | |
| (l) | Defaulted (non-income producing security). | |
| (m) | Level 3 Investment as described in Note 2(o) in the Notes to Financials. Security fair valued by the Pricing Committee. | |
| (n) | Liabilities in Excess of Other Assets include net unrealized appreciation/depreciation on open forward foreign currency exchange contracts, futures contracts and swaps as follows: |
Centrally Cleared Credit Default Swaps on Indexes - Buy Protection at December 31, 2017(1):
| Referenced Index | Central Clearing party | Fund Pays | Termination Date | Notional Amount | Notional Value | Payments Upfront(2) | Unrealized Depreciation(3) | |||||||||||||||||
| Markit CDX. NA.IG.29(4)(5) | Credit Suisse | 1.00% | 12/20/2022 | $ | 12,998,000 | $ | 13,307,723 | $ | (265,992 | ) | $ | (43,731 | ) | |||||||||||
| Markit CDX. NA.IG.28(4)(5) | Credit Suisse | 1.00% | 6/20/2022 | 81,136,000 | 82,943,995 | (1,298,219 | ) | (509,776 | ) | |||||||||||||||
| Markit CDX. NA.EM.28(6)(7) | Credit Suisse | 1.00% | 12/20/2022 | 39,101,670 | 38,750,011 | 1,497,815 | (1,146,156 | ) | ||||||||||||||||
| $ | 133,235,670 | $ | 135,001,729 | $ | (66,396 | ) | $ | (1,699,663 | ) | |||||||||||||||
| (1) | If the Fund is a buyer of protection and a credit event occurs, as defined under the terms of that particular swap agreement, the Fund will either (i) receive from the seller of protection an amount equal to the notional amount of the swap and make delivery of the referenced obligation or underlying securities comprising the referenced index or (ii) pay a net settlement amount in the form of cash or securities equal to the notional amount of the swap less the recovery value of the referenced obligation or underlying securities. | |
| (2) | Upfront payments received by Central Clearinghouse are presented net of amortization (See Note 2(m)). | |
| (3) | Total unrealized appreciation on Credit Default Swaps on Indexes amounted to $0. Total unrealized depreciation on Credit Default Swaps on Indexes amounted to $1,699,663. | |
| (4) | Central Clearinghouse: Chicago Mercantile Exchange (CME). | |
| (5) | The Referenced Index is for Centrally Cleared Credit Default Swaps on Indexes, which is comprised of a basket of investment grade issuers. | |
| (6) | Central Clearinghouse: Intercontinental Exchange (ICE). | |
| (7) | The Referenced Index is for Credit Default Swaps on Indexes, which is comprised of a basket of emerging markets soverign Issuers. (See Note 2(m)). |
| See Notes to Financial Statements. | 39 |
Schedule of Investments (continued)
December 31, 2017
Open Forward Foreign Currency Exchange Contracts at December 31, 2017:
| Forward Foreign Currency Exchange Contracts | Transaction Type | Counterparty | Expiration Date | Foreign Currency | U.S. $ Cost on Origination Date | U.S. $ Current Value | Unrealized Appreciation | |||||||||||||||
| Danish krone | Buy | Barclays Bank plc | 1/10/2018 | 2,166,000 | $ | 344,034 | $ | 349,244 | $ | 5,210 | ||||||||||||
| Danish krone | Buy | J.P. Morgan | 1/10/2018 | 2,189,000 | 348,532 | 352,953 | 4,421 | |||||||||||||||
| Danish krone | Buy | J.P. Morgan | 1/10/2018 | 3,645,000 | 581,129 | 587,717 | 6,588 | |||||||||||||||
| euro | Buy | Barclays Bank plc | 2/16/2018 | 263,000 | 311,440 | 316,360 | 4,920 | |||||||||||||||
| euro | Buy | Deutsche Bank AG | 2/16/2018 | 782,000 | 927,940 | 940,661 | 12,721 | |||||||||||||||
| euro | Buy | Standard Chartered Bank | 2/16/2018 | 295,000 | 349,698 | 354,853 | 5,155 | |||||||||||||||
| euro | Buy | State Street Bank and Trust | 2/16/2018 | 780,000 | 925,771 | 938,255 | 12,484 | |||||||||||||||
| euro | Buy | UBS AG | 2/16/2018 | 361,000 | 430,334 | 434,244 | 3,910 | |||||||||||||||
| Swiss franc | Buy | J.P. Morgan | 1/5/2018 | 572,000 | 582,758 | 587,038 | 4,280 | |||||||||||||||
| Swiss franc | Buy | J.P. Morgan | 1/5/2018 | 201,000 | 205,040 | 206,284 | 1,244 | |||||||||||||||
| Swiss franc | Buy | State Street Bank and Trust | 1/5/2018 | 457,000 | 466,569 | 469,015 | 2,446 | |||||||||||||||
| British pound | Sell | State Street Bank and Trust | 1/19/2018 | 258,941 | 350,135 | 349,787 | 348 | |||||||||||||||
| Swiss franc | Sell | Barclays Bank plc | 1/5/2018 | 1,230,000 | 1,270,370 | 1,262,337 | 8,033 | |||||||||||||||
| Unrealized Appreciation on Forward Foreign Currency Exchange Contracts | $ | 71,760 | ||||||||||||||||||||
| 40 | See Notes to Financial Statements. |
Schedule of Investments (continued)
December 31, 2017
| Forward Foreign Currency Exchange Contracts | Transaction Type | Counterparty | Expiration Date | Foreign Currency | U.S. $ Cost on Origination Date | U.S. $ Current Value | Unrealized Depreciation | |||||||||||||||
| British pound | Sell | J.P. Morgan | 1/19/2018 | 616,000 | $ | 812,222 | $ | 832,117 | $ | (19,895 | ) | |||||||||||
| British pound | Sell | State Street Bank and Trust | 1/19/2018 | 265,000 | 348,594 | 357,972 | (9,378 | ) | ||||||||||||||
| British pound | Sell | State Street Bank and Trust | 1/19/2018 | 432,000 | 583,130 | 583,562 | (432 | ) | ||||||||||||||
| British pound | Sell | State Street Bank and Trust | 1/19/2018 | 73,500 | 98,924 | 99,287 | (363 | ) | ||||||||||||||
| British pound | Sell | State Street Bank and Trust | 1/19/2018 | 140,000 | 188,566 | 189,117 | (551 | ) | ||||||||||||||
| Danish krone | Sell | Barclays Bank plc | 1/10/2018 | 8,000,000 | 1,268,174 | 1,289,915 | (21,741 | ) | ||||||||||||||
| euro | Sell | Barclays Bank plc | 2/16/2018 | 391,000 | 468,618 | 470,330 | (1,712 | ) | ||||||||||||||
| euro | Sell | State Street Bank and Trust | 2/16/2018 | 500,000 | 583,971 | 601,445 | (17,474 | ) | ||||||||||||||
| euro | Sell | State Street Bank and Trust | 2/16/2018 | 13,900,000 | 16,455,822 | 16,720,181 | (264,359 | ) | ||||||||||||||
| euro | Sell | State Street Bank and Trust | 2/16/2018 | 586,000 | 698,481 | 704,894 | (6,413 | ) | ||||||||||||||
| Japanese yen | Sell | Barclays Bank plc | 1/26/2018 | 633,000,000 | 5,580,953 | 5,623,724 | (42,771 | ) | ||||||||||||||
| Japanese yen | Sell | J.P. Morgan | 1/26/2018 | 26,272,000 | 232,749 | 233,407 | (658 | ) | ||||||||||||||
| Japanese yen | Sell | J.P. Morgan | 1/26/2018 | 145,284,000 | 1,286,340 | 1,290,738 | (4,398 | ) | ||||||||||||||
| Japanese yen | Sell | State Street Bank and Trust | 1/26/2018 | 39,648,000 | 350,291 | 352,242 | (1,951 | ) | ||||||||||||||
| Japanese yen | Sell | State Street Bank and Trust | 1/26/2018 | 119,226,000 | 1,053,340 | 1,059,232 | (5,892 | ) | ||||||||||||||
| Unrealized Depreciation on Forward Foreign Currency Exchange Contracts | $ | (397,988 | ) | |||||||||||||||||||
Open Futures Contracts at December 31, 2017:
| Notional | Notional | Unrealized | ||||||||||||||||||||||
| Type | Expiration | Contracts | Position | Amount | Value | Appreciation | ||||||||||||||||||
| U.S. 10-Year Treasury Note | March 2018 | 1,061 | Short | $ | (131,988,847 | ) | $ | (131,613,734 | ) | $ | 375,113 | |||||||||||||
| U.S. Ultra Treasury Bond | March 2018 | 95 | Short | (12,743,071 | ) | (12,688,437 | ) | 54,634 | ||||||||||||||||
| U.S. Long Bond | March 2018 | 986 | Short | (151,232,890 | ) | (150,858,000 | ) | 374,890 | ||||||||||||||||
| Totals | $ | (295,964,808 | ) | $ | (295,160,171 | ) | $ | 804,637 | ||||||||||||||||
| Notional | Notional | Unrealized | ||||||||||||||||||||||
| Type | Expiration | Contracts | Position | Amount | Value | Depreciation | ||||||||||||||||||
| U.S. 2-Year Treasury Note | March 2018 | 207 | Long | $ | 44,385,667 | $ | 44,320,641 | $ | (65,026 | ) | ||||||||||||||
| U.S. 5-Year Treasury Note | March 2018 | 1,875 | Long | 218,922,537 | 217,807,618 | (1,114,919 | ) | |||||||||||||||||
| Ultra Long U.S. Treasury Bond | March 2018 | 11 | Short | (1,838,441 | ) | (1,844,219 | ) | (5,778 | ) | |||||||||||||||
| Totals | $ | 261,469,763 | $ | 260,284,040 | $ | (1,185,723 | ) | |||||||||||||||||
| See Notes to Financial Statements. | 41 |
Schedule of Investments (continued)
December 31, 2017
The following is a summary of the inputs used as of December 31, 2017 in valuing the Fund’s investments carried at fair value(1):
| Investment Type(2) | Level 1 | Level 2 | Level 3 | Total | ||||||||||||
| Asset-Backed Securities | ||||||||||||||||
| Other | $ | – | $ | 18,976,117 | $ | 2,273,600 | $ | 21,249,717 | ||||||||
| Remaining Industries | – | 1,240,204 | – | 1,240,204 | ||||||||||||
| Common Stocks(3) | ||||||||||||||||
| Air Transportation | 1,121,937 | 1,263,568 | – | 2,385,505 | ||||||||||||
| Auto Parts & Equipment | – | 1,085,419 | – | 1,085,419 | ||||||||||||
| Banking | 6,422,715 | 2,026,877 | – | 8,449,592 | ||||||||||||
| Beverages | 4,849,376 | 4,478,322 | – | 9,327,698 | ||||||||||||
| Electronics | 3,473,466 | 2,319,615 | – | 5,793,081 | ||||||||||||
| Energy: Exploration & Production | 12,064,436 | 403,943 | – | 12,468,379 | ||||||||||||
| Gaming | 8,891,040 | 1,300,097 | – | 10,191,137 | ||||||||||||
| Machinery | 4,953,717 | 2,400,564 | – | 7,354,281 | ||||||||||||
| Metals/Mining (Excluding Steel) | – | 2,603,785 | – | 2,603,785 | ||||||||||||
| Real Estate Investment Trusts | – | 1,705,272 | – | 1,705,272 | ||||||||||||
| Software/Services | 11,695,761 | 619,671 | – | 12,315,432 | ||||||||||||
| Specialty Retail | 10,672,513 | 3,549,405 | – | 14,221,918 | ||||||||||||
| Support: Services | 4,931,801 | 1,233,788 | – | 6,165,589 | ||||||||||||
| Technology Hardware & Equipment | 1,074,874 | 1,352,921 | – | 2,427,795 | ||||||||||||
| Remaining Industries | 75,004,786 | – | – | 75,004,786 | ||||||||||||
| Convertible Bonds | – | 3,494,019 | – | 3,494,019 | ||||||||||||
| Convertible Preferred Stocks | ||||||||||||||||
| Personal & Household Products | 2,381,350 | – | – | 2,381,350 | ||||||||||||
| Software/Services | – | 565,167 | – | 565,167 | ||||||||||||
| Floating Rate Loans | ||||||||||||||||
| Advertising | – | 1,761,918 | – | 1,761,918 | ||||||||||||
| Building Materials | – | 1,524,153 | – | 1,524,153 | ||||||||||||
| Department Stores | – | 1,193,017 | – | 1,193,017 | ||||||||||||
| Electric: Generation | – | 5,677,653 | – | 5,677,653 | ||||||||||||
| Electronics | – | 1,151,874 | – | 1,151,874 | ||||||||||||
| Energy: Exploration & Production | – | 1,750,195 | – | 1,750,195 | ||||||||||||
| Gaming | – | 1,113,688 | 2,449,716 | 3,563,404 | ||||||||||||
| Health Services | – | 1,103,628 | – | 1,103,628 | ||||||||||||
| Investments & Miscellaneous Financial Services | – | 869,478 | – | 869,478 | ||||||||||||
| Media: Diversified | – | 1,255,109 | – | 1,255,109 | ||||||||||||
| Metals/Mining (Excluding Steel) | – | 652,438 | – | 652,438 | ||||||||||||
| Personal & Household Products | – | 1,614,488 | – | 1,614,488 | ||||||||||||
| Real Estate Development & Management | – | 1,082,920 | – | 1,082,920 | ||||||||||||
| Recreation & Travel | – | 2,106,928 | 687,360 | 2,794,288 | ||||||||||||
| Software/Services | – | 970,307 | – | 970,307 | ||||||||||||
| Specialty Retail | – | 6,583,172 | – | 6,583,172 | ||||||||||||
| Support: Services | – | 333,550 | – | 333,550 | ||||||||||||
| Telecommunications: Satellite | – | 609,402 | – | 609,402 | ||||||||||||
| Transportation: Infrastructure/Services | – | 3,006,644 | – | 3,006,644 | ||||||||||||
| 42 | See Notes to Financial Statements. | |
Schedule of Investments (continued)
December 31, 2017
| Investment Type(2) | Level 1 | Level 2 | Level 3 | Total | ||||||||||||
| Foreign Bonds | $ | – | $ | 5,338,493 | $ | – | $ | 5,338,493 | ||||||||
| Foreign Government Obligations | – | 42,705,730 | – | 42,705,730 | ||||||||||||
| Government Sponsored Enterprises Pass-Through | – | 17,054,477 | – | 17,054,477 | ||||||||||||
| High Yield Corporate Bonds | ||||||||||||||||
| Banking | – | 95,330,725 | 125 | 95,330,850 | ||||||||||||
| Metals/Mining (Excluding Steel) | – | 48,834,707 | 133 | 48,834,840 | ||||||||||||
| Oil Field Equipment & Services | – | 18,405,618 | 317,090 | 18,722,708 | ||||||||||||
| Specialty Retail | – | 8,859,481 | 2,409 | 8,861,890 | ||||||||||||
| Remaining Industries | – | 637,956,677 | – | 637,956,677 | ||||||||||||
| Municipal Bonds | – | 50,342,114 | – | 50,342,114 | ||||||||||||
| Non-Agency Commercial Mortgage-Backed Security | – | 4,448,033 | – | 4,448,033 | ||||||||||||
| Preferred Stock | – | 368,169 | – | 368,169 | ||||||||||||
| Repurchase Agreement | – | 14,465,148 | – | 14,465,148 | ||||||||||||
| Total | $ | 147,537,772 | $ | 1,029,088,688 | $ | 5,730,433 | $ | 1,182,356,893 | ||||||||
| Other Financial Instruments | ||||||||||||||||
| Centrally Cleared Credit Default Swap | ||||||||||||||||
| Assets | $ | – | $ | – | $ | – | $ | – | ||||||||
| Liabilities | – | (1,699,663 | ) | – | (1,699,663 | ) | ||||||||||
| Forward Foreign Currency Exchange Contracts | ||||||||||||||||
| Assets | – | 71,760 | – | 71,760 | ||||||||||||
| Liabilities | – | (397,988 | ) | – | (397,988 | ) | ||||||||||
| Futures Contracts | ||||||||||||||||
| Assets | 804,637 | – | – | 804,637 | ||||||||||||
| Liabilities | (1,185,723 | ) | – | – | (1,185,723 | ) | ||||||||||
| Total | $ | (381,086 | ) | $ | (2,025,891 | ) | $ | – | $ | (2,406,977 | ) | |||||
| (1) | Refer to Note 2(o) for a description of fair value measurements and the three-tier hierarchy of inputs. | |
| (2) | See Schedule of Investments for fair values in each industry and identification of foreign issuers and/or geography. The table above is presented by Investment Type. Industries are presented within an Investment Type should such Investment Type include securities classified as two or more levels within the three-tier fair value hierarchy. Each level 3 security is identified on the Schedule of Investment along with the valuation technique utilized. | |
| (3) | Securities in the amount of $4,540,867 were transferred from Level 1 to Level 2 during the fiscal year ended December 31, 2017, due to a change in valuation technique. As of December 31, 2017, the Fund utilized adjusted valuations (as described in Note 2(a)), which resulted in Level 2 inputs. As of December 31, 2016, the Fund utilized the last sale or official closing price on the exchange or system on which the securities are principally traded, which resulted in Level 1 inputs. |
| See Notes to Financial Statements. | 43 |
Schedule of Investments (concluded)
December 31, 2017
The following is a reconciliation of investments with unobservable inputs (Level 3) that were used in determining fair value:
| Asset-Backed Securities | Common Stocks | Floating Rate Loans | High Yield Corporate Bonds | Non-Agency Commercial Mortgage-Backed Securities | ||||||||||||||||
| Balance as of January 1, 2017 | $ | 1,057,410 | $ | 18,476 | $ | 765,335 | $ | 6,521 | $ | 63,006 | ||||||||||
| Accrued Discounts (Premiums) | 2 | — | 22,471 | 9 | (616 | ) | ||||||||||||||
| Realized Gain (Loss) | — | (184,855 | ) | (4,676 | ) | — | (10,306 | ) | ||||||||||||
| Change in Unrealized Appreciation (Depreciation) | 23,898 | 166,379 | 63,748 | (8,982 | ) | 3,697 | ||||||||||||||
| Purchases | 2,249,700 | — | 688,733 | 322,209 | — | |||||||||||||||
| Sales | — | — | (790,860 | ) | — | (55,781 | ) | |||||||||||||
| Transfers into Level 3 | — | — | 2,392,325 | — | — | |||||||||||||||
| Transfers out of Level 3 | (1,057,410 | ) | — | — | — | — | ||||||||||||||
| Balance as of December 31, 2017 | $ | 2,273,600 | $ | — | $ | 3,137,076 | $ | 319,757 | $ | — | ||||||||||
| Change in unrealized appreciation/depreciation for the year ended December 31, 2017 related to Level 3 investments held at December 31, 2017 | $ | 23,898 | $ | — | $ | 59,602 | $ | (8,982 | ) | $ | — | |||||||||
| 44 | See Notes to Financial Statements. |
Statement of Assets and Liabilities
December 31, 2017
| ASSETS: | ||||
| Investments in securities, at fair value (cost $1,128,303,936) | $ | 1,182,356,893 | ||
| Deposits with brokers for derivatives collateral | 5,401,326 | |||
| Receivables: | ||||
| Interest and dividends | 13,175,966 | |||
| Investment securities sold | 2,433,271 | |||
| Capital shares sold | 2,304,378 | |||
| From advisor (See Note 3) | 19,493 | |||
| Unrealized appreciation on forward foreign currency exchange contracts | 71,760 | |||
| Prepaid expenses and other assets | 5,975 | |||
| Total assets | 1,205,769,062 | |||
| LIABILITIES: | ||||
| Payables: | ||||
| Investment securities purchased | 27,245,511 | |||
| Management fee | 487,650 | |||
| Capital shares reacquired | 404,440 | |||
| Variation margin on futures contracts | 332,810 | |||
| Directors’ fees | 142,474 | |||
| Fund administration | 39,572 | |||
| Variation margin for centrally cleared credit default swap agreements | 1,309,673 | |||
| To Bank | 1,262,062 | |||
| Unrealized depreciation on forward foreign currency exchange contracts | 397,988 | |||
| Accrued expenses | 925,651 | |||
| Total liabilities | 32,547,831 | |||
| NET ASSETS | $ | 1,173,221,231 | ||
| COMPOSITION OF NET ASSETS: | ||||
| Paid-in capital | $ | 1,114,654,666 | ||
| Undistributed net investment income | 110,404 | |||
| Accumulated net realized gain on investments, futures contracts, swaps and foreign currency related transactions | 6,806,619 | |||
| Net unrealized appreciation on investments, futures contracts, swaps and translation of assets and liabilities denominated in foreign currencies | 51,649,542 | |||
| Net Assets | $ | 1,173,221,231 | ||
| Outstanding shares (200 million shares of common stock authorized, $.001 par value) | 94,751,471 | |||
| Net asset value, offering and redemption price per share (Net assets divided by outstanding shares) | $12.38 | |||
| See Notes to Financial Statements. | 45 |
For the Year Ended December 31, 2017
| Investment income: | ||||
| Dividends (net of foreign withholding taxes of $49,117) | $ | 1,903,871 | ||
| Interest and other (net of foreign withholding taxes of $4,910) | 54,655,194 | |||
| Interest earned from Interfund Lending (See Note 11) | 261 | |||
| Total investment income | 56,559,326 | |||
| Expenses: | ||||
| Management fee | 5,561,682 | |||
| Non 12b-1 service fees | 2,813,390 | |||
| Shareholder servicing | 1,206,394 | |||
| Fund administration | 449,927 | |||
| Reports to shareholders | 103,143 | |||
| Professional | 96,885 | |||
| Custody | 72,550 | |||
| Directors’ fees | 31,419 | |||
| Other | 60,532 | |||
| Gross expenses | 10,395,922 | |||
| Expense reductions (See Note 9) | (10,277 | ) | ||
| Fees waived and expenses reimbursed (See Note 3) | (262,281 | ) | ||
| Net expenses | 10,123,364 | |||
| Net investment income | 46,435,962 | |||
| Net realized and unrealized gain (loss): | ||||
| Net realized gain on investments | 54,252,097 | |||
| Net realized loss on futures contracts | (5,804,820 | ) | ||
| Net realized loss on foreign currency exchange contracts | (1,524,163 | ) | ||
| Net realized loss on swap contracts | (1,511,322 | ) | ||
| Net realized gain on foreign currency related translations | 36,421 | |||
| Net change in unrealized appreciation/depreciation on investments | 10,225,785 | |||
| Net change in unrealized appreciation/depreciation on futures contracts | (1,516,229 | ) | ||
| Net change in unrealized appreciation/depreciation on foreign currency exchange contracts | (443,457 | ) | ||
| Net change in unrealized appreciation/depreciation on swap contracts | (1,283,037 | ) | ||
| Net change in unrealized appreciation/depreciation on translation of assets and liabilities denominated in foreign currencies | 7,177 | |||
| Net realized and unrealized gain | 52,438,452 | |||
| Net Increase in Net Assets Resulting From Operations | $ | 98,874,414 | ||
| 46 | See Notes to Financial Statements. |
Statements of Changes in Net Assets
| For the Year Ended | For the Year Ended | |||||||
| INCREASE IN NET ASSETS | December 31, 2017 | December 31, 2016 | ||||||
| Operations: | ||||||||
| Net investment income | $ | 46,435,962 | $ | 44,967,399 | ||||
| Net realized gain (loss) on investments, futures contracts, swaps and foreign currency related transactions | 45,448,213 | (4,832,421 | ) | |||||
| Net change in unrealized appreciation/depreciation on investments, futures contracts, swaps and translation of assets and liabilities denominated in foreign currencies | 6,990,239 | 77,190,459 | ||||||
| Net increase in net assets resulting from operations | 98,874,414 | 117,325,437 | ||||||
| Distributions to shareholders from: | ||||||||
| Net investment income | (47,823,337 | ) | (47,075,516 | ) | ||||
| Net realized gain | (11,266,291 | ) | — | |||||
| Total distributions to shareholders | (59,089,628 | ) | (47,075,516 | ) | ||||
| Capital share transactions (See Note 14): | ||||||||
| Proceeds from sales of shares | 146,613,258 | 148,838,089 | ||||||
| Reinvestment of distributions | 59,089,628 | 47,075,515 | ||||||
| Cost of shares reacquired | (138,899,244 | ) | (177,659,555 | ) | ||||
| Net increase in net assets resulting from capital share transactions | 66,803,642 | 18,254,049 | ||||||
| Net increase in net assets | 106,588,428 | 88,503,970 | ||||||
| NET ASSETS: | ||||||||
| Beginning of year | $ | 1,066,632,803 | $ | 978,128,833 | ||||
| End of year | $ | 1,173,221,231 | $ | 1,066,632,803 | ||||
| Undistributed (distributions in excess of) net investment income | $ | 110,404 | $ | (133,148 | ) | |||
| See Notes to Financial Statements. | 47 |
| Per Share Operating Performance: | ||||||||||||||||||||||||||||
| Investment operations: | Distributions to shareholders from: | |||||||||||||||||||||||||||
| Net asset value, beginning of period | Net invest- ment income(a) | Net realized and unrealized gain (loss) | Total from invest- ment operations | Net invest- | Net realized gain | Total distributions | ||||||||||||||||||||||
| 12/31/2017 | $ | 11.94 | $ | 0.52 | $ | 0.58 | $ | 1.10 | $ | (0.53 | ) | $ | (0.13 | ) | $ | (0.66 | ) | |||||||||||
| 12/31/2016 | 11.14 | 0.52 | 0.83 | 1.35 | (0.55 | ) | — | (0.55 | ) | |||||||||||||||||||
| 12/31/2015 | 11.89 | 0.47 | (0.65 | ) | (0.18 | ) | (0.49 | ) | (0.08 | ) | (0.57 | ) | ||||||||||||||||
| 12/31/2014 | 12.31 | 0.54 | (0.01 | ) | 0.53 | (0.61 | ) | (0.34 | ) | (0.95 | ) | |||||||||||||||||
| 12/31/2013 | 12.21 | 0.62 | 0.39 | 1.01 | (0.65 | ) | (0.26 | ) | (0.91 | ) | ||||||||||||||||||
| (a) | Calculated using average shares outstanding during the period. |
| (b) | Total return does not consider the effects of sales charges or other expenses imposed by an insurance company and assumes the reinvestment of all distributions. |
| 48 | See Notes to Financial Statements. |
| Ratios to Average Net Assets: | Supplemental Data: | |||||||||||||||||||||||
| Net asset value, end of period | Total return (%)(b) | Total expenses after waivers and/or reimburse- ments (%) | Total expenses (%) | Net investment income (%) | Net end of | Portfolio turnover rate (%) | ||||||||||||||||||
| $12.38 | 9.21 | 0.90 | 0.92 | 4.13 | $ | 1,173,221 | 121 | |||||||||||||||||
| 11.94 | 12.13 | 0.90 | 0.93 | 4.41 | 1,066,633 | 120 | ||||||||||||||||||
| 11.14 | (1.53 | ) | 0.90 | 0.94 | 3.91 | 978,129 | 116 | |||||||||||||||||
| 11.89 | 4.35 | 0.90 | 0.93 | 4.26 | 913,108 | 90 | ||||||||||||||||||
| 12.31 | 8.17 | 0.90 | 0.93 | 4.89 | 861,130 | 50 | ||||||||||||||||||
| See Notes to Financial Statements. | 49 |
| 1. | ORGANIZATION |
Lord Abbett Series Fund, Inc. (the “Company”) is registered under the Investment Company Act of 1940, as amended (the “Act”), as a diversified, open-end management investment company and was incorporated under Maryland law in 1989. The Company consists of twelve separate portfolios. This report covers Bond-Debenture Portfolio (the “Fund”).
The Fund’s investment objective is to seek high current income and the opportunity for capital appreciation to produce a high total return. The Fund has Variable Contract class shares (“Class VC Shares”), which are currently issued and redeemed only in connection with investments in, and payments under, variable annuity contracts and variable life insurance policies issued by life insurance and insurance-related companies.
The preparation of the financial statements in conformity with accounting principles generally accepted in the United States of America (“U.S. GAAP”) requires management to make certain estimates and assumptions that affect the reported amounts of assets and liabilities and disclosure of contingent assets and liabilities at the date of the financial statements and the reported amounts of increases and decreases in net assets from operations during the reporting period. Actual results could differ from those estimates. The Fund is considered an investment company under U.S. GAAP and follows the accounting and reporting guidance applicable to investment companies.
| 2. | SIGNIFICANT ACCOUNTING POLICIES |
| (a) | Investment Valuation–Under procedures approved by the Fund’s Board of Directors (the “Board”), Lord, Abbett & Co. LLC (“Lord Abbett”), the Fund’s investment manager, has formed a Pricing Committee to administer the pricing and valuation of portfolio investments and to ensure that prices utilized reasonably reflect fair value. Among other things, these procedures allow the Fund to utilize independent pricing services, quotations from securities and financial instrument dealers and other market sources to determine fair value. |
| Securities actively traded on any recognized U.S. or non-U.S. exchange or on The NASDAQ Stock Market LLC are valued at the last sale price or official closing price on the exchange or system on which they are principally traded. Events occurring after the close of trading on non-U.S. exchanges may result in adjustments to the valuation of foreign securities to reflect their fair value as of the close of regular trading on the New York Stock Exchange. The Fund may utilize an independent fair valuation service in adjusting the valuations of foreign securities. Unlisted equity securities are valued at the last quoted sale price or, if no sale price is available, at the mean between the most recently quoted bid and asked prices. Exchange traded options and futures contracts are valued at the last sale price in the market where they are principally traded. If no sale has occurred, the mean between the most recently quoted bid and asked prices is used. | |
| Fixed income securities are valued based on evaluated prices supplied by independent pricing services, which reflect broker/dealer supplied valuations and the independent pricing services’ own electronic data processing techniques. Exchange traded options and futures contracts are valued at the last sale price in the market where they are principally traded. If no sale has occurred, the mean between the most recently quoted bid and asked prices is used. Floating rate loans are valued at the average of bid and ask quotations obtained from dealers in loans on the basis of prices supplied by independent pricing services. Forward foreign currency exchange contracts are valued using daily forward exchange rates. Swaps are valued daily using independent pricing services or quotations from broker/dealers to the extent available. |
50
Notes to Financial Statements (continued)
| Securities for which prices are not readily available are valued at fair value as determined by the Pricing Committee. The Pricing Committee considers a number of factors, including observable and unobservable inputs, when arriving at fair value. The Pricing Committee may use related or comparable assets or liabilities, recent transactions, market multiples, book values, yield curves, broker quotes, observable trading activity, option adjusted spread models and other relevant information to determine the fair value of portfolio investments. The Board or a designated committee thereof regularly reviews fair value determinations made by the Pricing Committee and may employ techniques such as reviewing related market activity, reviewing inputs and assumptions, and retrospectively comparing prices of subsequent purchases and sales transactions to fair value determinations made by the Pricing Committee. | |
| Short-term securities with 60 days or less remaining to maturity are valued using the amortized cost method, which approximates fair value. | |
| (b) | Security Transactions–Security transactions are recorded as of the date that the securities are purchased or sold (trade date). Realized gains and losses on sales of portfolio securities are calculated using the identified-cost method. |
| (c) | Investment Income–Dividend income is recorded on the ex-dividend date. Interest income is recorded on the accrual basis as earned. Discounts are accreted and premiums are amortized using the effective interest method and are included in Interest and other income on the Statement of Operations. Withholding taxes on foreign dividends have been provided for in accordance with the applicable country’s tax rules and rates. |
| (d) | Income Taxes–It is the policy of the Fund to meet the requirements of Subchapter M of the Internal Revenue Code applicable to regulated investment companies and to distribute substantially all taxable income and capital gains to its shareholders. Therefore, no income tax provision is required. |
| The Fund files U.S. federal and various state and local tax returns. No income tax returns are currently under examination. The statute of limitations on the Fund’s filed U.S. federal tax returns remains open for the fiscal years ended December 31, 2014 through December 31, 2017. The statutes of limitations on the Company’s state and local tax returns may remain open for an additional year depending upon the jurisdiction. | |
| (e) | Expenses–Expenses incurred by the Company that do not specifically relate to an individual fund are generally allocated to the funds within the Company on a pro rata basis by relative net assets. |
| (f) | Foreign Transactions–The books and records of the Fund are maintained in U.S. dollars and transactions denominated in foreign currencies are recorded in the Fund’s records at the rate prevailing when earned or recorded. Asset and liability accounts that are denominated in foreign currencies are adjusted daily to reflect current exchange rates and any unrealized gain (loss) is included in Net change in unrealized appreciation/depreciation on futures contracts, swaps and translation of assets and liabilities denominated in foreign currencies on the Fund’s Statement of Operations. The resultant exchange gains and losses upon settlement of such transactions are included in Net realized loss on futures contracts, swaps and foreign currency related transactions on the Fund’s Statement of Operations. The Fund does not isolate that portion of the results of operations arising as a result of changes in the foreign exchange rates from the changes in market prices of the securities. |
51
Notes to Financial Statements (continued)
| The Fund uses foreign currency exchange contracts to facilitate transactions in foreign-denominated securities. Losses from these transactions may arise from changes in the value of the foreign currency or if the counterparties do not perform under the contracts’ terms. | |
| (g) | Forward Foreign Currency Exchange Contracts–The Fund may enter into forward foreign currency exchange contracts in order to reduce exposure to changes in foreign currency exchange rates on foreign portfolio holdings, or gain or reduce exposure to foreign currency solely for investment purposes. A forward foreign currency exchange contract is a commitment to purchase or sell a foreign currency at a future date at a negotiated rate. The contracts are valued daily at forward exchange rates and any unrealized gain (loss) is included in Net change in unrealized appreciation/depreciation on futures contracts, swaps and translation of assets and liabilities denominated in foreign currencies on the Fund’s Statement of Operations. The gain (loss) arising from the difference between the U.S. dollar cost of the original contract and the value of the foreign currency in U.S. dollars upon closing of such contracts is included in Net realized loss on futures contracts, swaps and foreign currency related transactions on the Fund’s Statement of Operations. |
| (h) | Futures Contracts–The Fund may purchase and sell futures contracts to enhance returns, to attempt to economically hedge some of its investment risk, or as a substitute position in lieu of holding the underlying asset on which the instrument is based. At the time of entering into a futures transaction, an investor is required to deposit and maintain a specified amount of cash or eligible securities called “initial margin.” Subsequent payments made or received by the Fund called “variation margin” are made on a daily basis as the market price of the futures contract fluctuates. The Fund will record an unrealized gain (loss) based on the amount of variation margin. When a contract is closed, a realized gain (loss) is recorded equal to the difference between the opening and closing value of the contract. |
| (i) | When-Issued, Forward Transactions or To-Be-Announced (“TBA”) Transactions–The Fund may purchase portfolio securities on a when-issued or forward basis. When-issued, forward transactions or TBA transactions involve a commitment by a fund to purchase securities, with payment and delivery (“settlement”) to take place in the future, in order to secure what is considered to be an advantageous price or yield at the time of entering into the transaction. During the period between purchase and settlement, the fair value of the securities will fluctuate and assets consisting of cash and/or marketable securities (normally short-term U.S. Government or U.S. Government sponsored enterprise securities) marked to market daily in an amount sufficient to make payment at settlement will be segregated at the Fund’s custodian in order to pay for the commitment. At the time the Fund makes the commitment to purchase a security on a when-issued basis, it will record the transaction and reflect the liability for the purchase and fair value of the security in determining its net asset value (“NAV”). The Fund, generally, has the ability to close out a purchase obligation on or before the settlement date rather than take delivery of the security. Under no circumstances will settlement for such securities take place more than 120 days after the purchase date. |
| (j) | TBA Sale Commitments–The Fund may enter into TBA sale commitments to hedge its positions or to sell mortgage-backed securities it owns under delayed delivery arrangements. Proceeds of TBA sale commitments are not received until the contractual settlement date. During the time a TBA sale commitment is outstanding, equivalent deliverable securities, or an offsetting TBA purchase commitment deliverable on or before the sale commitment date, are held as “cover” for the transaction. Unsettled TBA sale commitments are valued at the current |
52
Notes to Financial Statements (continued)
| market value of the underlying securities, according to the procedures described under “Investment Valuation” above. The contract is adjusted to market value daily and the change in market value is recorded by the Fund as unrealized appreciation (depreciation). If the TBA sale (purchase) commitment is closed through the acquisition of an offsetting purchase (sale) commitment, the Fund realizes a gain or loss from the sale of the securities based upon the unit price established at the date the commitment was entered into. | |
| (k) | Mortgage Dollar Rolls–The Fund may enter into mortgage dollar rolls in which the Fund sells mortgage-backed securities for delivery in the current month and simultaneously contracts with the same counterparty to repurchase similar (same type, coupon and maturity) but not identical securities on a specified future date. During the roll period, the Fund loses the right to receive principal (including prepayments of principal) and interest paid on the securities sold. |
| (l) | Repurchase Agreements–The Fund may enter into repurchase agreements with respect to securities. A repurchase agreement is a transaction in which a fund acquires a security and simultaneously commits to resell that security to the seller (a bank or securities dealer) at an agreed-upon price on an agreed-upon date. The Fund requires at all times that the repurchase agreement be collateralized by cash, or by securities of the U.S. Government, its agencies, its instrumentalities, or U.S. Government sponsored enterprises having a value equal to, or in excess of, the value of the repurchase agreement (including accrued interest). If the seller of the agreement defaults on its obligation to repurchase the underlying securities at a time when the fair value of these securities has declined, the Fund may incur a loss upon disposition of the securities. |
| (m) | Credit Default Swaps–The Fund may enter into credit default swap contracts in order to hedge credit risk or for speculation purposes. As a seller of a credit default swap contract (“seller of protection”), the Fund is required to pay the notional amount or other agreed-upon value of a referenced debt obligation to the counterparty in the event of a default by or other credit event involving the referenced issuer, obligation or index. In return, the Fund receives from the counterparty a periodic stream of payments over the term of the contract. |
| As a purchaser of a credit default swap contract (“buyer of protection”), the Fund would receive the notional amount or other agreed upon value of a referenced debt obligation from the counterparty in the event of default by or other credit event involving the referenced issuer, obligation or index. In return, the Fund would make periodic payments to the counterparty over the term of the contracts, provided no event of default has occurred. | |
| These credit default swaps may have as a reference obligation corporate or sovereign issuers or credit indices. These credit indices are comprised of a basket of securities representing a particular sector of the market. During the fiscal year, the Fund entered into credit default swaps based on CMBX indexes, CDX indices and single issuers, which are comprised of a basket of commercial mortgage-backed securities, a basket of investment grade securities, a basket of emerging markets sovereign issuers and a corporate issuer, respectively. | |
| Credit default swaps are fair valued based upon quotations from counterparties, brokers or market-makers and the change in value, if any, is recorded as an unrealized appreciation or depreciation. For a credit default swap sold by the Fund, payment of the agreed-upon amount made by the Fund in the event of default of the referenced debt obligation is recorded as the cost of the referenced debt obligation purchased/received. For a credit default swap purchased by the Fund, the agreed-upon amount received by the Fund in the event of default of the referenced debt obligation is recorded as proceeds from sale/delivery of the referenced debt |
53
Notes to Financial Statements (continued)
| obligation and the resulting gain or loss realized on the referenced debt obligation is recorded as such by the Fund. | |
| Any upfront payments made or received upon entering a credit default swap contract would be amortized or accreted over the life of the swap and recorded as realized gains or losses. Collateral, in the form of cash or securities, may be required to be held in segregated accounts with the custodian bank or broker in accordance with the swap agreement. The value and credit rating of each credit default swap where the Fund is the seller of protection, are both measures of the current payment/performance risk of the swap. As the value of the swap changes as a positive or negative percentage of the total notional amount, the payment/performance risk may decrease or increase, respectively. The maximum potential amount of future payments (undiscounted) that the Fund as a seller of protection could be required to make under a credit default swap agreement would be an amount equal to the notional amount of the agreement. These potential amounts would be partially offset by any recovery values of the respective referenced obligations, upfront payments received upon entering into the agreement, or net amounts received from the settlement of buy protection credit default swap agreements entered into by the Fund for the same referenced entity or entities. | |
| Entering into credit default swaps involves credit and market risk. Such risks involve the possibility that there will be no liquid market for these agreements, that the counterparty to the agreements may default on its obligation to perform or disagree as to the meaning of the contractual terms in the agreements, and that there may be unfavorable changes in interest rates, and that Lord Abbett does not correctly predict the creditworthiness of the issuers of the reference obligation on which the credit default swap is based. For the centrally cleared credit default swaps, there was minimal counterparty risk to the Fund, since such credit default swaps entered into were traded through a central clearinghouse, which guarantees against default. | |
| (n) | Floating Rate Loans–The Fund may invest in floating rate loans, which usually take the form of loan participations and assignments. Loan participations and assignments are agreements to make money available to U.S. or foreign corporations, partnerships or other business entities (the “Borrower”) in a specified amount, at a specified rate and within a specified time. A loan is typically originated, negotiated and structured by a U.S. or foreign bank, insurance company or other financial institution (the “Agent”) for a group of loan investors (“Loan Investors”). The Agent typically administers and enforces the loan on behalf of the other Loan Investors in the syndicate and may hold any collateral on behalf of the Loan Investors. Such loan participations and assignments are typically senior, secured and collateralized in nature. The Fund records an investment when the Borrower withdraws money and records interest as earned. These loans pay interest at rates which are periodically reset by reference to a base lending rate plus a spread. These base lending rates are generally the prime rate offered by a designated U.S. bank or London InterBank Offered Rate (“LIBOR”). |
| The loans in which the Fund invests may be subject to some restrictions on resale. For example, the Fund may be contractually obligated to receive approval from the Agent and/or Borrower prior to the sale of these investments. The Fund generally has no right to enforce compliance with the terms of the loan agreement with the Borrower. As a result, the Fund assumes the credit risk of the Borrower, the selling participant and any other persons interpositioned between the Fund and the Borrower (“Intermediate Participants”). In the event that the Borrower, selling participant or Intermediate Participants become insolvent or enter into bankruptcy, the Fund may incur certain costs and delays in realizing payment or may suffer a loss of principal and/or interest. |
54
Notes to Financial Statements (continued)
| Unfunded commitments represent the remaining obligation of the Fund to the Borrower. At any point in time, up to the maturity date of the issue, the Borrower may demand the unfunded portion. Until demanded by the Borrower, unfunded commitments are not recognized as an asset on the Statement of Assets and Liabilities. Unrealized appreciation/depreciation on unfunded commitments presented on the Statement of Assets and Liabilities represents mark to market of the unfunded portion of the Fund’s floating rate notes. As of December 31, 2017, the Fund had unfunded loan commitments: | |
| Itron Inc., 2017 Bridge Loan | $ | 1,158,000 | ||||
| Centene Corp. Bridge Loan | 3,340,000 | |||||
| Total | $ | 4,498,000 |
| (o) | Fair Value Measurements–Fair value is defined as the price that the Fund would receive upon selling an investment or transferring a liability in an orderly transaction to an independent buyer in the principal or most advantageous market of the investment. A three-tier hierarchy is used to maximize the use of observable market data and minimize the use of unobservable inputs and to establish classification of fair value measurements for disclosure purposes. Inputs refer broadly to the assumptions that market participants would use in pricing the asset or liability, including assumptions about risk—for example, the risk inherent in a particular valuation technique used to measure fair value (such as a pricing model) and/or the risk inherent in the inputs to the valuation technique. Inputs may be observable or unobservable. Observable inputs reflect the assumptions market participants would use in pricing the asset or liability. Observable inputs are based on market data obtained from sources independent of the reporting entity. Unobservable inputs reflect the reporting entity’s own assumptions about the assumptions market participants would use in pricing the asset or liability. Unobservable inputs are based on the best information available in the circumstances. The three-tier hierarchy classification is determined based on the lowest level of inputs that is significant to the fair value measurement, and is summarized in the three broad Levels listed below: |
| • | Level 1 – unadjusted quoted prices in active markets for identical investments; | ||
| • | Level 2 – other significant observable inputs (including quoted prices for similar investments, interest rates, prepayment speeds, credit risk, etc.); and | ||
| • | Level 3 – significant unobservable inputs (including the Fund’s own assumptions in determining the fair value of investments). | ||
| A summary of inputs used in valuing the Fund’s investments and other financial instruments as of December 31, 2017 and, if applicable, Level 1/Level 2 transfers and Level 3 rollforwards for the fiscal year then ended is included in the Fund’s Schedule of Investments. | |
| Changes in valuation techniques may result in transfers into or out of an assigned level within the three-tier hierarchy. All transfers between different levels within the three-tier hierarchy are deemed to have occurred as of the beginning of the reporting period. The inputs or methodology used for valuing securities are not necessarily an indication of the risk associated with investing in those securities. |
| 3. | MANAGEMENT FEE AND OTHER TRANSACTIONS WITH AFFILIATES |
Management Fee
The Company has a management agreement with Lord Abbett, pursuant to which Lord Abbett supplies the Fund with investment management services and executive and other personnel,
55
Notes to Financial Statements (continued)
provides office space and pays for ordinary and necessary office and clerical expenses relating to research and statistical work and supervision of the Fund’s investment portfolio.
The management fee is based on the Fund’s average daily net assets at the following annual rate:
| First $1 billion | .50% |
| Over $1 billion | .45% |
For the fiscal year ended December 31, 2017, the effective management fee, net of waivers, was at an annualized rate of .47% of the Fund’s average daily net assets.
In addition, Lord Abbett provides certain administrative services to the Fund pursuant to an Administrative Services Agreement in return for a fee at an annual rate of .04% of the Fund’s average daily net assets.
During the fiscal year ended December 31, 2017 and continuing through April 30, 2018, Lord Abbett has contractually agreed to waive its fees and reimburse expenses to the extent necessary to limit total net annual operating expenses to an annual rate of .90%. This agreement may be terminated only upon the approval of the Board.
The Company, on behalf of the Fund, has entered into services arrangements with certain insurance companies. Under these arrangements, certain insurance companies will be compensated up to ..25% of the average daily NAV of the Fund’s Class VC Shares held in the insurance company’s separate account to service and maintain the Variable Contract owners’ accounts. This amount is included in Non 12b-1 service fees on the Statement of Operations. The Fund may also compensate certain insurance companies, third-party administrators and other entities for providing recordkeeping, sub-transfer agency and other administrative services to the Fund. This amount is included in Shareholder servicing on the Statement of Operations.
Two Directors and certain of the Company’s officers have an interest in Lord Abbett.
| 4. | DISTRIBUTIONS AND CAPITAL LOSS CARRYFORWARDS |
Dividends from net investment income, if any, are declared and paid at least semi-annually. Taxable net realized gains from investment transactions, reduced by allowable capital loss carryforwards, if any, are declared and distributed to shareholders at least annually. The capital loss carryforward amount, if any, is available to offset future net capital gains. Dividends and distributions to shareholders are recorded on the ex-dividend date. The amounts of dividends and distributions from net investment income and net realized capital gains are determined in accordance with federal income tax regulations, which may differ from U.S. GAAP. These book/tax differences are either considered temporary or permanent in nature. To the extent these differences are permanent in nature, such amounts are reclassified within the components of net assets based on their federal tax basis treatment; temporary differences do not require reclassification. Dividends and distributions that exceed earnings and profits for tax purposes are reported as a tax return of capital.
The tax character of distributions paid during the fiscal years ended December 31, 2017 and 2016 was as follows:
| Year Ended 12/31/2017 | Year Ended 12/31/2016 | |||||||||
| Distributions paid from: | ||||||||||
| Ordinary income | $ | 55,855,286 | $ | 47,075,516 | ||||||
| Net long-term capital gains | 3,234,342 | – | ||||||||
| Total distributions paid | $ | 59,089,628 | $ | 47,075,516 | ||||||
56
Notes to Financial Statements (continued)
As of December 31, 2017, the components of accumulated gains on a tax-basis were as follows:
| Undistributed ordinary income – net | $ | 7,105,534 | ||
| Undistributed long-term capital gains | 1,672,887 | |||
| Total undistributed earnings | 8,778,421 | |||
| Temporary differences | (142,473 | ) | ||
| Unrealized gains – net | 49,930,617 | |||
| Total accumulated gains – net | $ | 58,566,565 |
As of December 31, 2017, the aggregate unrealized security gains and losses on investments and other financial instruments based on cost for U.S. federal income tax purposes were as follows:
| Tax cost | $ | 1,130,022,861 | ||
| Gross unrealized gain | 61,039,858 | |||
| Gross unrealized loss | (11,112,803 | ) | ||
| Net unrealized security gain | $ | 49,927,055 |
The difference between book-basis and tax-basis unrealized gains (losses) is attributable to the tax treatment of certain securities, forward currency contracts, futures, swaps, amortization of premium and wash sales.
Permanent items identified during the fiscal year ended December 31, 2017 have been reclassified among the components of net assets based on their tax basis treatment as follows:
| Undistributed Net Investment Income | Accumulated Net Realized Gain | ||||
| $1,630,927 | $(1,630,927) | ||||
The permanent differences are primarily attributable to the tax treatment of foreign currency transactions, certain securities, premium amortization, certain distributions, and principal paydown gains and losses.
| 5. | PORTFOLIO SECURITIES TRANSACTIONS |
Purchases and sales of investment securities (excluding short-term investments) for the fiscal year ended December 31, 2017 were as follows:
| U.S. Government Purchases | | | Non-U.S. Government Purchases | | | U.S. Government Sales | | | Non-U.S. Government Sales | | ||||
| $220,070,606 | $1,188,332,857 | $203,165,074 | $1,140,619,750 | |||||||||||
The Fund is permitted to purchase and sell securities (“cross-trade”) from and to other Lord Abbett funds or client accounts pursuant to procedures approved by the Board in compliance with Rule 17a-7 under the Act (the “Rule”). Each cross-trade is executed at a fair market price in compliance with provisions of the Rule. For the fiscal year ended December 31, 2017, the Fund engaged in cross-trades purchases of $2,219,524 and sales of $19,814,409, which resulted in net realized gains of $959,076.
57
Notes to Financial Statements (continued)
| 6. | DISCLOSURES ABOUT DERIVATIVE INSTRUMENTS AND HEDGING ACTIVITIES |
The Fund entered into forward foreign currency exchange contracts for the fiscal year ended December 31, 2017 (as described in note 2(g)). A forward foreign currency exchange contract reduces the Fund’s exposure to changes in the value of the currency it will deliver (or settle in cash) and increases its exposure to changes in the value of the currency it will receive (or settle in cash) for the duration of the contract. The Fund’s use of forward foreign currency exchange contracts involves the risk that Lord Abbett will not accurately predict currency movements, and the Fund’s returns could be reduced as a result. Forward foreign currency exchange contracts are subject to the risk that those currencies will decline in value relative to the U.S. dollar, or, in the case of hedged positions, that the U.S. dollar will decline relative to the currency being hedged. Currency rates in foreign countries may fluctuate significantly over short periods of time. The Fund’s risk of loss from counterparty credit risk is the unrealized appreciation on forward foreign currency exchange contracts and deposits with brokers as collateral.
The Fund entered into U.S. Treasury futures contracts for the fiscal year ended December 31, 2017 (as described in note 2(h)) to economically hedge against changes in interest rates. The Fund bears the risk of interest rates moving unexpectedly, in which case the Fund may not achieve the anticipated benefits of the futures contracts and realize a loss. There is minimal counterparty credit risk to the Fund since futures are exchange traded and the exchange’s clearinghouse, as counterparty to all exchange traded futures, guarantees futures against default.
The Fund entered into credit default swaps for the fiscal year ended December 31, 2017 (as described in note 2(m)) to economically hedge credit risk. Credit default swaps involve the exchange of a fixed rate premium for protection against the loss in value of an underlying security within the index in the event of a defined credit event, such as payment default or bankruptcy. Under a credit default swap one party acts as a guarantor by receiving the fixed periodic payment in exchange for the commitment to purchase the underlying security at par if the defined credit event occurs. The Fund’s maximum risk of loss from counterparty risk, either as the protection seller or as the protection buyer, is the fair value of the contract.
As of December 31, 2017, the Fund had the following derivatives at fair value, grouped into appropriate risk categories that illustrate the Fund’s use of derivative instruments:
| Asset Derivatives | Interest Rate Contracts | Foreign Currency Contracts | Credit Contracts | ||||||||
| Forward Foreign Currency Exchange Contracts(1) | – | $ | 71,760 | – | |||||||
| Futures Contract(2) | $ | 804,637 | – | – | |||||||
| Liability Derivatives | |||||||||||
| Forward Foreign Currency Exchange Contracts(3) | – | $ | 397,988 | – | |||||||
| Futures Contracts(2) | $ | 1,185,723 | – | – | |||||||
| Centrally Cleared Credit Default Swap Contracts(4) | – | – | $ | 1,699,663 | |||||||
| (1) | Statements of Assets and Liabilities location: Unrealized appreciation on forward foreign currency exchange contracts. |
| (2) | Statements of Assets and Liabilities location: Includes cumulative unrealized appreciation/depreciation of futures contracts as reported in the Schedule of Investments. Only current day’s variation margin is reported within the Statements of Assets and Liabilities. |
| (3) | Statements of Assets and Liabilities location: Unrealized depreciation on forward foreign currency exchange contracts. |
| (4) | Statements of Assets and Liabilities location: Includes cumulative unrealized appreciation/depreciation of centrally cleared swap contracts as reported in the Schedule of Investments. Only current day’s variation margin is reported within the Statement of Assets and Liabilities. |
58
Notes to Financial Statements (continued)
Transactions in derivative instruments for the year ended December 31, 2017, were as follows:
| Interest Rate Contracts | Forward Currency Contracts | Credit Contracts | ||||||||||
| Net Realized Gain (Loss) | ||||||||||||
| Credit Default Swaps Contracts(1) | – | – | $ | (1,511,322 | ) | |||||||
| Forward Foreign Currency Exchange Contracts(2) | – | $ | (1,524,163 | ) | – | |||||||
| Futures Contracts(3) | $ | (5,804,820 | ) | – | – | |||||||
| Net Change in Unrealized Appreciation/Depreciation | ||||||||||||
| Credit Default Swaps Contracts(4) | – | – | $ | (1,283,037 | ) | |||||||
| Forward Foreign Currency Exchange Contracts(5) | – | $ | (443,457 | ) | – | |||||||
| Futures Contracts(6) | $ | (1,516,229 | ) | – | – | |||||||
| Average Number of Contracts/Notional Amounts* | ||||||||||||
| Credit Default Swaps Contracts(7) | – | – | $ | 80,603,205 | ||||||||
| Forward Foreign Currency Exchange Contracts(7) | – | $ | 27,615,707 | – | ||||||||
| Futures Contracts(8) | 2,572 | — | – | |||||||||
| * | Calculated based on the number of contracts or notional amounts for the fiscal year ended December 31, 2017. |
| (1) | Statements of Operations location: Net realized gain (loss) on swap contracts. |
| (2) | Statements of Operations location: Net realized gain (loss) on foreign currency exchange contracts. |
| (3) | Statements of Operations location: Net realized gain (loss) on future contracts. |
| (4) | Statements of Operations location: Net Change in unrealized appreciation/depreciation on swap contracts. |
| (5) | Statements of Operations location: Net change in unrealized appreciation/depreciation on foreign currency exchange contracts. |
| (6) | Statements of Operations location: Net change in unrealized appreciation/depreciation on future contracts. |
| (7) | Amount represents notional amounts in U.S. dollars. |
| (8) | Amount represents number of contracts. |
| 7. | DISCLOSURES ABOUT OFFSETTING ASSETS AND LIABILITIES |
The Financial Accounting Standards Board (“FASB”) requires disclosures intended to help better assess the effect or potential effect of offsetting arrangements on a fund’s financial position. The following tables illustrate gross and net information about recognized assets and liabilities eligible for offset in the statement of assets and liabilities; and disclose such amounts subject to an enforceable master netting agreement or similar agreement, by counterparty. A master netting agreement is an agreement between a fund and a counterparty which provides for the net settlement of amounts owed under all contracts traded under that agreement, as well as cash collateral, through a single payment by one party to the other in the event of default on or termination of any one contract. The Fund’s accounting policy with respect to balance sheet offsetting is that, absent an event of default by the counterparty or a termination of the agreement, the master netting agreement does not result in an offset of reported amounts of financial assets and liabilities in the statement of assets and liabilities across transactions between the Fund and the applicable counterparty:
| Description | Gross Amounts of Recognized Assets | Gross Amounts Offset in the Statement of Assets and Liabilities | Net Amounts of Assets Presented in the Statement of Assets and Liabilities | ||||||||
| Forward Foreign Currency Exchange Contracts | $ | 71,760 | $ | – | $ | 71,760 | |||||
| Repurchase Agreements | 14,465,148 | – | 14,465,148 | ||||||||
| Total | $ | 14,536,908 | $ | – | $ | 14,536,908 | |||||
59
Notes to Financial Statements (continued)
| Net Amounts | |||||||||||||||||||
| of Assets | Amounts Not Offset in the | ||||||||||||||||||
| Presented in | Statement of Assets and Liabilities | ||||||||||||||||||
| Counterparty | the Statement of Assets and Liabilities | Financial Instruments | Cash Collateral Received(a) | Securities Collateral Received(a) | Net Amount(b) | ||||||||||||||
| Barclays Bank plc | $ | 18,163 | $ | (18,163 | ) | $ | – | $ | – | $ | – | ||||||||
| Deutsche Bank AG | 12,721 | – | – | – | 12,721 | ||||||||||||||
| Fixed Income Clearing Corp. | 14,465,148 | – | – | (14,465,148 | ) | – | |||||||||||||
| J.P. Morgan Chase | 16,533 | (16,533 | ) | – | – | – | |||||||||||||
| Standard Chartered Bank | 5,155 | – | – | – | 5,155 | ||||||||||||||
| State Street Bank and Trust | 15,278 | (15,278 | ) | – | – | – | |||||||||||||
| UBS AG | 3,910 | – | – | – | 3,910 | ||||||||||||||
| Total | $ | 14,536,908 | $ | (49,974 | ) | $ | – | $ | (14,465,148 | ) | $ | 21,786 | |||||||
| Description | Gross Amounts of Recognized Liabilities | Gross Amounts Offset in the Statement of Assets and Liabilities | Net Amounts of Liabilities Presented in the Statement of Assets and Liabilities | ||||||||
| Forward Foreign Currency Exchange Contracts | $ | 397,988 | $ | – | $ | 397,988 | |||||
| Total | $ | 397,988 | $ | – | $ | 397,988 | |||||
| Net Amounts | |||||||||||||||||||
| of Liabilities | Amounts Not Offset in the | ||||||||||||||||||
| Presented in | Statement of Assets and Liabilities | ||||||||||||||||||
| Counterparty | the Statement of Assets and Liabilities | Financial Instruments | Cash Collateral Pledged(a) | Securities Collateral Pledged(a) | Net Amount(b) | ||||||||||||||
| Barclays Bank plc | $ | 66,224 | $ | (18,163 | ) | $ | – | $ | – | $ | 48,061 | ||||||||
| J.P. Morgan Chase | 24,951 | (16,533 | ) | – | – | 8,418 | |||||||||||||
| State Street Bank and Trust | 306,813 | (15,278 | ) | – | – | 291,535 | |||||||||||||
| Total | $ | 397,988 | $ | (49,974 | ) | $ | – | $ | – | $ | 348,014 | ||||||||
| (a) | Collateral disclosed is limited to an amount not to exceed 100% of the net amount of assets (liabilities) presented in the Statement of Assets and Liabilities, for each respective counterparty. |
| (b) | Net amount represents the amount owed to the Fund by the counterparty as of December 31, 2017. |
| 8. | DIRECTORS’ REMUNERATION |
The Company’s officers and two Directors, who are associated with Lord Abbett, do not receive any compensation from the Company for serving in such capacities. Independent Directors’ fees are allocated among all Lord Abbett-sponsored funds based on the net assets of each fund. There is an equity-based plan available to all Independent Directors under which Independent Directors must defer receipt of a portion of, and may elect to defer receipt of an additional portion of Directors’ fees. The deferred amounts are treated as though equivalent dollar amounts had been invested in the funds. Such amounts and earnings accrued thereon are included in Directors’ fees on the Statement of Operations and in Directors’ fees payable on the Statement of Assets and Liabilities and are not deductible for U.S. federal income tax purposes until such amounts are paid.
60
Notes to Financial Statements (continued)
| 9. | EXPENSE REDUCTIONS |
The Company has entered into an arrangement with its transfer agent and custodian, whereby credits realized as a result of uninvested cash balances are used to reduce a portion of the Fund’s expenses.
| 10. | LINE OF CREDIT |
Effective August 28, 2017, the Fund and certain other funds managed by Lord Abbett (collectively, the “Participating Funds”) entered into an amended syndicated line of credit facility with various lenders for $600 million (the “Facility”), whereas State Street Bank and Trust Company (“SSB”) participates as a lender and as agent for the lenders. The Facility is to be used for temporary or emergency purposes as an additional source of liquidity to satisfy redemptions. The Participating Funds are subject to graduated borrowing limits of one-third of Fund assets (if Fund assets are less than $750 million), $250 million, $300 million, or $350 million, based on past borrowings and likelihood of future borrowings.
Prior to August 28, 2017, the Funds and certain other funds managed by Lord Abbett participated in a $550 million syndicated line of credit facility, based on the same terms as described above.
During the fiscal year ended December 31, 2017, the Fund did not utilize the Facility.
| 11. | INTERFUND LENDING PROGRAM |
Pursuant to an exemptive order issued by the U.S. Securities and Exchange Commission (“SEC exemptive order”), certain registered open-end management investment companies managed by Lord Abbett, including the Fund, participate in a joint lending and borrowing program (the “Interfund Lending Program”). The SEC exemptive order allows the Funds to borrow money from and lend money to each other for temporary or emergency purposes subject to the limitations and conditions.
During the fiscal year ended December 31, 2017, the Fund participated as a lender in the Interfund Lending Program. The average amount loaned and interest rate were $4,958,199 and 1.01%, respectively. The Fund earned interest of $261, which is included in the Statement of Operations. There were no interfund loans outstanding as of December 31, 2017.
| 12. | CUSTODIAN AND ACCOUNTING AGENT |
SSB is the Company’s custodian and accounting agent. SSB performs custodial, accounting and recordkeeping functions relating to portfolio transactions and calculating the Fund’s NAV.
| 13. | INVESTMENT RISKS |
The Fund is subject to the general risks and considerations associated with investing in debt securities and to the changing prospects of individual companies and/or sectors in which the Fund invests. The value of an investment will change as interest rates fluctuate and in response to market movements. When interest rates rise, the prices of debt securities are likely to decline; when rates fall, such prices tend to rise. Longer-term debt securities are usually more sensitive to interest rate changes. There is also the risk that an issuer of a debt security will fail to make timely payments of principal or interest to the Fund, a risk that is greater with high-yield securities (sometimes called “lower-rated bonds” or “junk bonds”) in which the Fund may substantially invest. Some issuers, particularly of high-yield securities, may default as to principal and/or interest payments after the Fund purchases its securities. A default, or concerns in the market about an increase in risk of default, may result in losses to the Fund. High-yield securities are subject to
61
Notes to Financial Statements (continued)
greater price fluctuations, as well as additional risks. The market for below investment grade securities may be less liquid, which may make such securities more difficult to sell at an acceptable price, especially during periods of financial distress, increased market volatility, or significant market decline.
The Fund is subject to the risk of investing in securities issued or guaranteed by the U.S. Government or its agencies and instrumentalities (such as the Government National Mortgage Association (“Ginnie Mae”), the Federal National Mortgage Association (“Fannie Mae”), or the Federal Home Loan Mortgage Corporation (“Freddie Mac”)). Unlike Ginnie Mae securities, securities issued or guaranteed by U.S. Government-related organizations such as Fannie Mae and Freddie Mac are not backed by the full faith and credit of the U.S. Government and no assurance can be given that the U.S. Government would provide financial support to its agencies and instrumentalities if not required to do so by law. Consequently, the Fund may be required to look principally to the agency issuing or guaranteeing the obligation.
The asset backed securities and mortgage-related securities in which the Fund may invest may be particularly sensitive to changes in prevailing interest rates and economic conditions, including delinquencies and/or defaults. These changes can affect the value, income and/or liquidity of such positions. When interest rates are declining, the value of these securities with prepayment features may not increase as much as other fixed income securities. Early principal repayment may deprive the Fund of income payments above current market rates. Alternatively, rising interest rates may cause prepayments to occur at a slower-than-expected rate, extending the duration of a security and typically reducing its value. The payment rate will thus affect the price and volatility of a mortgage-related security. In addition, the Fund may invest in non-agency asset backed and mortgage-related securities, which are issued by private institutions, not by government sponsored enterprises.
The Fund may invest up to 20% of its net assets in equity securities, the value of which fluctuates in response to movements in the equity securities market in general, changing prospects of individual companies in which the Fund invests, or an individual company’s financial condition.
The Fund may invest in convertible securities, which have both equity and fixed income risk characteristics, including market, credit, liquidity, and interest rate risks. Generally, convertible securities offer lower interest or dividend yields than non-convertible securities of similar quality and less potential for gains or capital appreciation in a rising equity securities market than equity securities. They tend to be more volatile than other fixed income securities, and the market for convertible securities may be less liquid than the markets for stocks or bonds. A significant portion of convertible securities have below investment grade credit ratings and are subject to increased credit and liquidity risks.
Due to the Fund’s investment exposure to foreign companies and American Depositary Receipts, the Fund may experience increased market, industry and sector, liquidity, currency, political, information and other risks. The securities of foreign companies also may be subject to inadequate exchange control regulations, the imposition of economic sanctions or other government restrictions, higher transaction and other costs, and delays in settlement to the extent they are traded on non-U.S. exchanges or markets.
The Fund is subject to the risks associated with derivatives, which may be different from and greater than the risks associated with directly investing in securities. Derivatives may be subject to risks such as liquidity risk, leveraging risk, interest rate risk, market risk, and credit risk. Illiquid securities may
62
Notes to Financial Statements (concluded)
lower the Fund’s returns since the Fund may be unable to sell these securities at their desired time or price. Derivatives also may involve the risk of mispricing or improper valuation and the risk that changes in the value of the derivative may not correlate perfectly with the value of the underlying asset, rate or index. Whether the Fund’s use of derivatives is successful will depend on, among other things, the Fund’s ability to correctly forecast market movements and other factors. If the Fund incorrectly forecasts these and other factors, the Fund’s performance could suffer. The Fund’s use of derivatives could result in a loss exceeding the amount of the Fund’s investment in these instruments.
The Fund may invest up to 15% of its net assets in floating rate or adjustable rate senior loans, including bridge loans, novations, assignments, and participations, which are subject to increased credit and liquidity risks. Senior loans are business loans made to borrowers that may be U.S. or foreign corporations, partnerships or other business entities. The senior loans in which the Fund invests may consist primarily of senior loans that are rated below investment grade or, if unrated, deemed by Lord Abbett to be equivalent to below investment grade securities. Below investment grade senior loans, as in the case of high-yield debt securities, or junk bonds, are usually more credit sensitive than interest rate sensitive, although the value of these instruments may be impacted by broader interest rate swings in the overall fixed income market. Below investment grade senior loans may be affected by interest rate swings in the overall fixed income market. In addition, senior loans may be subject to structural subordination.
These factors can affect the Fund’s performance.
| 14. | SUMMARY OF CAPITAL TRANSACTIONS |
Transactions in shares of capital stock were as follows:
| Year Ended December 31, 2017 | Year Ended December 31, 2016 | |||||||
| Shares sold | 11,707,991 | 12,721,182 | ||||||
| Reinvestment of distributions | 4,788,463 | 3,949,141 | ||||||
| Shares reacquired | (11,090,027 | ) | (15,163,582 | ) | ||||
| Increase | 5,406,427 | 1,506,741 | ||||||
63
Report of Independent Registered Public Accounting Firm
To the Board of Directors of Lord Abbett Series Fund, Inc. and the shareholders of Bond-Debenture Portfolio:
Opinion on the Financial Statements and Financial Highlights
We have audited the accompanying statement of assets and liabilities, including the schedule of investments, of the Bond-Debenture Portfolio, one of the portfolios constituting the Lord Abbett Series Fund, Inc. (the “Fund”), as of December 31, 2017, the related statement of operations for the year then ended, the statements of changes in net assets for each of the two years in the period then ended, the financial highlights for each of the five years in the period then ended, and the related notes. In our opinion, the financial statements and financial highlights present fairly, in all material respects, the financial position of the Bond-Debenture Portfolio of the Fund as of December 31, 2017, the results of its operations for the year then ended, the changes in its net assets for each of the two years in the period then ended, and the financial highlights for each of the five years in the period then ended, in conformity with accounting principles generally accepted in the United States of America.
Basis for Opinion
These financial statements and financial highlights are the responsibility of the Fund’s management. Our responsibility is to express an opinion on the Fund’s financial statements and financial highlights based on our audits. We are a public accounting firm registered with the Public Company Accounting Oversight Board (United States) (PCAOB) and are required to be independent with respect to the Fund in accordance with the U.S. federal securities laws and the applicable rules and regulations of the Securities and Exchange Commission and the PCAOB.
We conducted our audits in accordance with the standards of the PCAOB. Those standards require that we plan and perform the audit to obtain reasonable assurance about whether the financial statements and financial highlights are free of material misstatement, whether due to error or fraud. The Fund is not required to have, nor were we engaged to perform, an audit of its internal control over financial reporting. As part of our audits we are required to obtain an understanding of internal control over financial reporting but not for the purpose of expressing an opinion on the effectiveness of the Fund’s internal control over financial reporting. Accordingly, we express no such opinion.
Our audits included performing procedures to assess the risks of material misstatement of the financial statements and financial highlights, whether due to error or fraud, and performing procedures that respond to those risks. Such procedures included examining, on a test basis, evidence regarding the amounts and disclosures in the financial statements and financial highlights. Our audits also included evaluating the accounting principles used and significant estimates made by management, as well as evaluating the overall financial statement presentation and financial highlights. Our procedures included confirmation of securities owned as of December 31, 2017, by correspondence with the custodian, brokers and agent banks; when replies were not received from brokers, we performed other auditing procedures. We believe that our audits provide a reasonable basis for our opinion.
DELOITTE & TOUCHE LLP
New York, New York
February 15, 2018
We have served as the auditor of one or more Lord Abbett Family of Funds’ investment companies since 1932.
64
Basic Information About Management
The Board is responsible for the management of the business and affairs of the Company in accordance with the laws of the State of Maryland. The Board elects officers who are responsible for the day-to-day operations of the Fund and who execute policies authorized by the Board. The Board also approves an investment adviser to the Fund and continues to monitor the cost and quality of the services the investment adviser provides, and annually considers whether to renew the contract with the adviser. Generally, each Director holds office until his/her successor is elected and qualified or until his/her earlier resignation or removal, as provided in the Company’s organizational documents.
Lord Abbett, a Delaware limited liability company, is the Fund’s investment adviser. Designated Lord Abbett personnel are responsible for the day-to-day management of the Fund.
Interested Directors
Ms. Foster and Mr. Sieg are affiliated with Lord Abbett and are “interested persons” of the Fund as defined in the Act. Ms. Foster and Mr. Sieg are directors/trustees of each of the 12 investment companies in the Lord Abbett Family of Funds, which consist of 61 portfolios or series. Ms. Foster is an officer of the Lord Abbett Family of Funds.
| Name, Address and Year of Birth | Current Position and Length of Service with the Company | Principal Occupation and Other Directorships During the Past Five Years | ||
| Daria L. Foster(1) Lord, Abbett & Co. LLC 90 Hudson Street Jersey City, NJ 07302 (1954) | Director and President since 2006; Chief Executive Officer since 2012 | Principal Occupation: Managing Partner of Lord Abbett, joined Lord Abbett in 1990. Other Directorships: None. | ||
| Douglas B. Sieg(1) Lord, Abbett & Co. LLC 90 Hudson Street Jersey City, NJ 07302 (1969) | Director since 2016 | Principal Occupation: Partner (since 2001) and Head of Client Services (since 2013), formerly Director of Marketing and Relationship Management, joined Lord Abbett in 1994. Other Directorships: None. |
Independent Directors
The following Independent Directors also are directors/trustees of each of the 12 investment companies in the Lord Abbett Family of Funds, which consist of 61 portfolios or series.
| Name, Address and Year of Birth | Current Position and Length of Service with the Company | Principal Occupation and Other Directorships During the Past Five Years | ||
| Eric C. Fast Lord, Abbett & Co. LLC c/o Legal Dept. 90 Hudson Street Jersey City, NJ 07302 (1949) | Director since 2014 | Principal Occupation: Chief Executive Officer of Crane Co., an industrial products company (2001–2014). Other Directorships: Currently serves as director of Automatic Data Processing, Inc. (since 2007) and Regions Financial Corporation (since 2010). Previously served as a director of Crane Co. (1999–2014). |
| (1) | Daria L. Foster, Managing Partner of Lord Abbett, a member of the Board, and the Chief Executive Officer and President of the Lord Abbett Family of Funds, will retire from her positions with Lord Abbett and the Lord Abbett Family of Funds effective March 31, 2018. Douglas B. Sieg, Partner and head of Client Services at Lord Abbett, and a member of the Board, will succeed Ms. Foster effective April 1, 2018. |
65
Basic Information About Management (continued)
| Name, Address and Year of Birth | Current Position and Length of Service with the Company | Principal Occupation and Other Directorships During the Past Five Years | ||
| Evelyn E. Guernsey Lord, Abbett & Co. LLC c/o Legal Dept. 90 Hudson Street Jersey City, NJ 07302 (1955) | Director since 2011 | Principal Occupation: CEO, Americas of J.P. Morgan Asset Management (2004–2010). Other Directorships: None. | ||
| Julie A. Hill Lord, Abbett & Co. LLC c/o Legal Dept. 90 Hudson Street Jersey City, NJ 07302 (1946) | Director since 2004 | Principal Occupation: Owner and CEO of The Hill Company, a business consulting firm (since 1998). Other Directorships: Currently serves as director of Anthem, Inc., a health benefits company (since 1994). | ||
| Franklin W. Hobbs Lord, Abbett & Co. LLC c/o Legal Dept. 90 Hudson Street Jersey City, NJ 07302 (1947) | Director since 2001 | Principal Occupation: President and CEO of Ribbon Communications (since 2017) and Advisor of One Equity Partners, a private equity firm (since 2004). Other Directorships: Currently serves as director of Ribbon Communications (since 2017), director and Chairman of the Board of Ally Financial Inc., a financial services firm (since 2009), and as director of Molson Coors Brewing Company (since 2002). | ||
| Kathleen M. Lutito Lord, Abbett & Co. LLC c/o Legal Dept. 90 Hudson Street Jersey City, NJ 07302 (1963) | Director since 2017 | Principal Occupation: President and Chief Investment Officer of CenturyLink Investment Management Company (since 2006). Other Directorships: None | ||
| James M. McTaggart Lord, Abbett & Co. LLC c/o Legal Dept. 90 Hudson Street Jersey City, NJ 07302 (1947) | Director since 2012 | Principal Occupation: Independent management advisor and consultant (since 2012); Vice President, CRA International, Inc. (doing business as Charles River Associates), a global management consulting firm (2009–2012); Founder and Chairman of Marakon Associates, Inc., a strategy consulting firm (1978–2009); and Officer and Director of Trinsum Group, a holding company (2007–2009). Other Directorships: Blyth, Inc., a home products company (2004–2015). | ||
| Karla M. Rabusch Lord, Abbett & Co. LLC c/o Legal Dept. 90 Hudson Street Jersey City, NJ 07302 (1959) | Director since 2017 | Principal Occupation: President and Director of Wells Fargo Funds Management, LLC (2003–2017); President of Wells Fargo Funds (2003–2016). Other Directorships: None. | ||
| Mark A. Schmid Lord, Abbett & Co. LLC c/o Legal Dept. 90 Hudson Street Jersey City, NJ 07302 (1959) | Director since 2016 | Principal Occupation: Vice President and Chief Investment Officer of the University of Chicago (since 2009). Other Directorships: None. |
66
Basic Information About Management (continued)
| Name, Address and Year of Birth | Current Position and Length of Service with the Company | Principal Occupation and Other Directorships During the Past Five Years | ||
| James L.L. Tullis Lord, Abbett & Co. LLC c/o Legal Dept. 90 Hudson Street Jersey City, NJ 07302 (1947) | Director since 2006; Chairman since 2017 | Principal Occupation: CEO of Tullis-Dickerson and Co. Inc., a venture capital management firm (since 1990); CEO of Tullis Health Investors Inc. (since 2012). Other Directorships: Currently serves as director of Crane Co. (since 1998). |
Officers
None of the officers listed below have received compensation from the Company. All of the officers of the Company also may be officers of the other Lord Abbett Funds and maintain offices at 90 Hudson Street, Jersey City, NJ 07302. Unless otherwise indicated, the position(s) and title(s) listed under the “Principal Occupation During the Past Five Years” column indicate each officer’s position(s) and title(s) with Lord Abbett. Each officer serves for an indefinite term (i.e., until his or her death, resignation, retirement, or removal).
| Name and Year of Birth | Current Position with the Company | Length of Service of Current Position | Principal Occupation During the Past Five Years | |||
| Daria L. Foster (1954) | President and Chief Executive Officer | Elected as President in 2006 and Chief Executive Officer in 2012 | Managing Partner of Lord Abbett, joined Lord Abbett in 1990. | |||
| Sean J. Aurigemma (1969) | Executive Vice President | Elected in 2010 | Portfolio Manager, joined Lord Abbett in 2007. | |||
| Jeff D. Diamond (1960) | Executive Vice President | Elected in 2008 | Portfolio Manager, joined Lord Abbett in 2007. | |||
| Todd D. Jacobson (1966) | Executive Vice President | Elected in 2005 | Partner and Associate Director, joined Lord Abbett in 2003. | |||
| Robert A. Lee (1969) | Executive Vice President | Elected in 2010 | Partner and Chief Investment Officer, and was formerly Deputy Chief Investment Officer and Director of Taxable Fixed Income, joined Lord Abbett in 1997. | |||
| David J. Linsen (1974) | Executive Vice President | Elected in 2008 | Partner and Director, joined Lord Abbett in 2001. | |||
| Thomas B. Maher (1967) | Executive Vice President | Elected in 2010 | Partner and Portfolio Manager, joined Lord Abbett in 2003. | |||
| Justin C. Maurer (1969) | Executive Vice President | Elected in 2010 | Partner and Portfolio Manager, joined Lord Abbett in 2001. |
67
Basic Information About Management (continued)
| Name and Year of Birth | Current Position with the Company | Length of Service of Current Position | Principal Occupation During the Past Five Years | |||
| Vincent J. McBride (1964) | Executive Vice President | Elected in 2010 | Partner and Director, joined Lord Abbett in 2003. | |||
| Andrew H. O’Brien (1973) | Executive Vice President | Elected in 2010 | Partner and Portfolio Manager, joined Lord Abbett in 1998. | |||
| F. Thomas O’Halloran, III (1955) | Executive Vice President | Elected in 2010 | Partner and Portfolio Manager, joined Lord Abbett in 2001. | |||
| Marc Pavese (1972) | Executive Vice President | Elected in 2016 | Partner and Portfolio Manager, joined Lord Abbett in 2008. | |||
| Walter H. Prahl (1958) | Executive Vice President | Elected in 2012 | Partner and Director, joined Lord Abbett in 1997. | |||
| Jeffrey Rabinowitz (1972) | Executive Vice President | Elected in 2017 | Portfolio Manager, joined Lord Abbett in 2017 and was formerly a Managing Director and Portfolio Manager/Technology Analyst at Jennison Associates LLC (2014–2017) and Managing Director and Portfolio Manager/Technology Analyst at Goldman Sachs Asset Management (1999–2014). | |||
| Steven F. Rocco (1979) | Executive Vice President | Elected in 2014 | Partner and Portfolio Manager, joined Lord Abbett in 2004. | |||
| A. Edward Allinson (1961) | Vice President | Elected in 2011 | Portfolio Manager, joined Lord Abbett in 2005. | |||
| Matthew R. DeCicco (1977) | Vice President | Elected in 2003 | Portfolio Manager, joined Lord Abbett in 1999. | |||
| Brooke A. Fapohunda (1975) | Vice President and Assistant Secretary | Elected in 2014 | Partner and Deputy General Counsel, joined Lord Abbett in 2006. | |||
| John K. Forst (1960) | Vice President and Assistant Secretary | Elected in 2005 | Partner and Deputy General Counsel, joined Lord Abbett in 2004. | |||
| Bernard J. Grzelak (1971) | Chief Financial Officer and Vice President | Elected in 2017 | Partner and Chief Operations Officer, and was formerly Director of Fund Administration, joined Lord Abbett in 2003. | |||
| Lawrence H. Kaplan (1957) | Vice President and Secretary | Elected in 1997 | Partner and General Counsel, joined Lord Abbett in 1997. |
68
Basic Information About Management (concluded)
| Name and Year of Birth | Current Position with the Company | Length of Service of Current Position | Principal Occupation During the Past Five Years | |||
| Linda Y. Kim (1980) | Vice President and Assistant Secretary | Elected in 2016 | Counsel, joined Lord Abbett in 2015 and was formerly an Associate at Stroock & Stroock & Lavan LLP (2007–2015). | |||
| Joseph M. McGill (1962) | Chief Compliance Officer | Elected in 2014 | Partner and Chief Compliance Officer, joined Lord Abbett in 2014 and was formerly Managing Director and the Chief Compliance Officer at UBS Global Asset Management (2003–2013). | |||
| A. Edward Oberhaus, III (1959) | Vice President | Elected in 1998 | Partner and Director, joined Lord Abbett in 1983. | |||
| Noah Petrucci (1970) | Vice President | Elected in 2013 | Portfolio Manager, joined Lord Abbett in 2012. | |||
| Lawrence B. Stoller (1963) | Vice President and Assistant Secretary | Elected in 2007 | Partner and Senior Deputy General Counsel, joined Lord Abbett in 2007. | |||
| Leah G. Traub (1979) | Vice President | Elected in 2016 | Partner and Portfolio Manager, joined Lord Abbett in 2007. | |||
| Arthur K. Weise (1970) | Vice President | Elected in 2010 | Partner and Portfolio Manager, joined Lord Abbett in 2007. | |||
| Kewjin Yuoh (1971) | Vice President | Elected in 2012 | Partner and Portfolio Manager, joined Lord Abbett in 2010. | |||
| Scott S. Wallner (1955) | AML Compliance Officer | Elected in 2011 | Assistant General Counsel, joined Lord Abbett in 2004. | |||
| Christian J. Kelly (1975) | Treasurer | Elected in 2017 | Director of Fund Administration, joined Lord Abbett in 2009. |
Please call 888-522-2388 for a copy of the statement of additional information, which contains further information about the Company’s Directors. It is available free upon request.
69
Approval of Advisory Contract
The Board, including all of the Directors who are not “interested persons” of the Company or of Lord Abbett, as defined in the Investment Company Act of 1940, as amended (the “Independent Directors”), annually considers whether to approve the continuation of the existing management agreement between the Fund and Lord Abbett (the “Agreement”). In connection with its most recent approval, the Board reviewed materials relating specifically to the Agreement, as well as numerous materials received throughout the course of the year, including information about the Fund’s investment performance compared to the performance of appropriate benchmarks. Before making its decision as to the Fund, the Board had the opportunity to ask questions and request further information, taking into account its familiarity with Lord Abbett gained through its meetings and discussions. These meetings and discussions included reviews of Fund performance conducted by members of the Contract Committee, the deliberations of the Contract Committee, and discussions between the Contract Committee and Lord Abbett’s management. The Independent Directors also met with their independent legal counsel in various private sessions at which no representatives of management were present.
The materials received by the Board included, but were not limited to: (1) information provided by Morningstar, Inc. (“Morningstar”) regarding the investment performance of the Fund compared to the investment performance of certain funds with similar investment styles as determined by Morningstar, based, in part, on the Fund’s Morningstar category (the “performance peer group”), and the investment performance of two appropriate benchmarks; (2) information provided by Morningstar regarding the expense ratios, contractual and actual management fee rates, and other expense components for the Fund and certain funds in the same Morningstar category, with generally the same or similar share classes and operational characteristics, including asset size (the “expense peer group”); (3) certain supplemental investment performance information provided by Lord Abbett; (4) information provided by Lord Abbett on the expense ratios, management fee rates, and other expense components for the Fund; (5) sales and redemption information for the Fund; (6) information regarding Lord Abbett’s financial condition; (7) an analysis of the relative profitability of the Agreement to Lord Abbett; (8) information provided by Lord Abbett regarding the investment management fee schedules for Lord Abbett’s other advisory clients maintaining accounts with a similar investment strategy as the Fund; and (9) information regarding the personnel and other resources devoted by Lord Abbett to managing the Fund.
Investment Management Services Generally. The Board considered the investment management services provided by Lord Abbett to the Fund, including investment research, portfolio management, and trading, and Lord Abbett’s commitment to compliance with all applicable legal requirements. The Board also observed that Lord Abbett was solely engaged in the investment management business and accordingly did not experience the conflicts of interest that may result from being engaged in other lines of business. The Board considered the investment advisory services provided by Lord Abbett to other clients, the fees charged for the services, and the differences in the nature of the services provided to the Fund and other Lord Abbett Funds, on the one hand, and the services provided to other clients, on the other. After reviewing these and related factors, the Board concluded that the Fund was likely to continue to benefit from the nature, extent and quality of the investment services provided by Lord Abbett under the Agreement.
Investment Performance. The Board reviewed the Fund’s investment performance in relation to that of the performance peer group and two appropriate benchmarks as of various periods ended August 31, 2017. The Board observed that the Fund’s investment performance was above the median of the performance peer group for the one-, three-, five-, and ten-year periods. The Board
70
Approval of Advisory Contract (continued)
further considered Lord Abbett’s performance and reputation generally, the performance of other Lord Abbett-managed funds overseen by the Board, and the willingness of Lord Abbett to take steps intended to improve performance when necessary. After reviewing these and related factors, the Board concluded that the Fund’s investment performance was reasonable and supported the continuation of the Agreement.
Lord Abbett’s Personnel and Methods. The Board considered the qualifications of the personnel providing investment management services to the Fund, in light of its investment objective and discipline. Among other things, the Board considered the size, experience, and turnover of Lord Abbett’s investment management staff, Lord Abbett’s investment methodology and philosophy, and Lord Abbett’s approach to recruiting, training, and retaining investment management personnel.
Nature and Quality of Other Services. The Board considered the nature, quality, costs, and extent of compliance, administrative, and other services performed by Lord Abbett and the nature and extent of Lord Abbett’s supervision of third party service providers, including the Fund’s transfer agent and custodian.
Expenses. The Board considered the expense level of the Fund and the expense levels of the expense peer group. It also considered how the expense level of the Fund related to those of the expense peer group and the amount and nature of the fees paid by shareholders. The Board observed that the net total expense ratio of the Fund was below the median of the expense peer group. After reviewing these and related factors, the Board concluded, within the context of its overall approval of the Agreement, that the expense level of the Fund was reasonable and supported the continuation of the Agreement.
Profitability. The Board considered the level of Lord Abbett’s operating margin in managing the Fund, including a review of Lord Abbett’s methodology for allocating its costs to its management of the Fund. It considered whether the Fund was profitable to Lord Abbett in connection with the Fund’s operation, including the fee that Lord Abbett receives from the Fund for providing administrative services to the Fund. The Board also considered the profits realized from other business segments of Lord Abbett, which may benefit from or be related to the Fund’s business. The Board considered Lord Abbett’s profit margins excluding Lord Abbett’s marketing and distribution expenses. The Board also considered Lord Abbett’s profit margins, without those exclusions, in comparison with available industry data and how those profit margins could affect Lord Abbett’s ability to recruit and retain investment personnel. The Board recognized that Lord Abbett’s overall profitability was a factor in enabling it to attract and retain qualified investment management personnel to provide services to the Fund. After reviewing these and related factors, the Board concluded, within the context of its overall approval of the Agreement, that Lord Abbett’s profitability with respect to the Fund was not excessive.
Economies of Scale. The Board considered the extent to which there had been economies of scale in managing the Fund, whether the Fund’s shareholders had appropriately benefited from such economies of scale, and whether there was potential for realization of any further economies of scale. The Board concluded that the existing management fee schedule, with its breakpoint in the level of the management fee, adequately addressed any economies of scale in managing the Fund.
Other Benefits to Lord Abbett. The Board considered the amount and nature of the fees paid by the Fund and the Fund’s shareholders to Lord Abbett for services other than investment advisory services. The Board also considered the revenues and profitability of Lord Abbett’s investment
71
Approval of Advisory Contract (concluded)
advisory business apart from its mutual fund business, and the intangible benefits enjoyed by Lord Abbett by virtue of its relationship with the Fund. The Board observed that the Distributor receives 12b-1 fees from certain of the Lord Abbett Funds as to shares held in accounts for which there is no other broker of record, may retain a portion of the 12b-1 fees it receives, and receives a portion of the sales charges on sales and redemptions of some classes of shares of the Lord Abbett Funds. In addition, the Board observed that Lord Abbett accrues certain benefits for its business of providing investment advice to clients other than the Lord Abbett Funds, but that business also benefits the Funds. The Board also noted that Lord Abbett, as disclosed in the prospectus of the Fund, has entered into revenue sharing arrangements with certain entities that distribute shares of the Fund. The Board also took into consideration the investment research that Lord Abbett receives as a result of Fund brokerage transactions.
Alternative Arrangements. The Board considered whether, instead of approving continuation of the Agreement, it might be in the best interests of the Fund to implement one or more alternative arrangements, such as continuing to employ Lord Abbett, but on different terms. After considering all of the relevant factors, the Board unanimously found that continuation of the Agreement was in the best interests of the Fund and its shareholders and voted unanimously to approve the continuation of the Agreement. In considering whether to approve the continuation of the Agreement, the Board did not identify any single factor as paramount or controlling. Individual Directors may have evaluated the information presented differently from one another, giving different weights to various factors. This summary does not discuss in detail all matters considered.
72
Householding
The Company has adopted a policy that allows it to send only one copy of the Fund’s prospectus, proxy material, annual report and semiannual report to certain shareholders residing at the same “household.” This reduces Fund expenses, which benefits you and other shareholders. If you need additional copies or do not want your mailings to be “householded,” please call Lord Abbett at 888-522-2388 or send a written request with your name, the name of your fund or funds and your account number or numbers to Lord Abbett Family of Funds, P.O. Box 219336, Kansas City, MO 64121.
Proxy Voting Policies, Procedures and Records
A description of the policies and procedures that Lord Abbett uses to vote proxies related to the Fund’s portfolio securities, and information on how Lord Abbett voted the Fund’s proxies during the 12-month period ended June 30 are available without charge, upon request, (i) by calling 888-522-2388; (ii) on Lord Abbett’s Website at www.lordabbett.com; and (iii) on the Securities and Exchange Commission’s (“SEC”) Website at www.sec.gov.
Shareholder Reports and Quarterly Portfolio Disclosure
The Fund is required to file its complete schedule of portfolio holdings with the SEC for its first and third fiscal quarters on Form N-Q. Copies of the filings are available without charge, upon request on the SEC’s Website at www.sec.gov and may be available by calling Lord Abbett at 888-522-2388. You can also obtain copies of Form N-Q by visiting the SEC’s Public Reference Room in Washington, DC (information on the operation of the Public Reference Room may be obtained by calling 800-SEC-0330).
Tax Information
For corporate shareholders, 2% of the Fund’s ordinary income distributions qualified for the dividends received deduction.
Additionally, of the distribution paid to the shareholders during the year ended December 31, 2017, $8,031,949 and $3,234,342, respectively, represent short-term capital gains and long-term capital gains.
73


| This report, when not used for the general information of shareholders of the Fund, is to be distributed only if preceded or accompanied by a current fund prospectus. | |||
| Lord Abbett Series Fund, Inc. | |||
| Lord Abbett mutual fund shares are distributed by | LASFBD-2 | ||
| LORD ABBETT DISTRIBUTOR LLC. | Bond-Debenture Portfolio | (02/18) |
![]()
LORD ABBETT
ANNUAL REPORT
Lord Abbett
Series Fund—Calibrated Dividend Growth Portfolio
For the fiscal year ended December 31, 2017
Table of Contents
Lord Abbett Series Fund — Calibrated Dividend Growth Portfolio
Annual Report
For the fiscal year ended December 31, 2017

From left to right: James L.L. Tullis, Independent Chairman of the Lord Abbett Funds and Daria L. Foster, Director, President, and Chief Executive Officer of the Lord Abbett Funds.
Dear Shareholders: We are pleased to provide you with this overview of the performance of Lord Abbett Series Fund — Calibrated Dividend Growth Portfolio for the fiscal year ended December 31, 2017. On this page and the following pages, we discuss the major factors that influenced fiscal year performance. For additional information about the Fund, please visit our website at www.lordabbett.com, where you also can access the quarterly commentaries that provide updates on the Fund’s performance and other portfolio related updates.
Thank you for investing in Lord Abbett mutual funds. We value the trust that you place in us and look forward to serving your investment needs in the years to come.
Best regards,

Daria L. Foster
Director, President and Chief Executive Officer
For the fiscal year ended December 31, 2017, the Fund returned 19.12%, reflecting performance at the net asset value (NAV) of Class VC shares with all distributions reinvested, compared to its benchmark, the S&P 500® Index1, which returned 21.83% over the same period.
Domestic equity markets (as represented by the S&P 500® Index1) returned 21.83%, ending the year with their strongest quarterly performance in two years and marking their first calendar year with 12 consecutive months of positive performance. Much of the market
momentum was driven by the anticipation of supportive U.S. fiscal policies, as the passage of the Tax Cut and Jobs Act and the prospect of significant infrastructure spending drove the forecast of U.S. gross domestic product (GDP) growth incrementally higher. These forces persisted despite a myriad of geopolitical and environmental headwinds, as threats from North Korea, U.S. political tensions, and Hurricanes Harvey, Irma, and Maria all had the potential to derail the market’s forward progress.
1
During the year, the National Federation of Independent Business Index of Small Business Optimism reached a 34 year high, marking its second-highest level in the history of the index. The University of Michigan’s average consumer confidence measure for the year was the highest since 2000, while consumer spending reached an all-time high in the third quarter. A reoccurring theme persisted throughout the year with large caps outperforming small caps and value stocks significantly outpacing their growth-oriented peers.
The U.S. economy continued to expand during the trailing 12-month period. U.S. GDP grew at a 3.2% pace during the third quarter, an increase over the second quarter. The U.S. Bureau of Economic Analysis stated that during the third quarter personal consumption and federal government spending increased, quarter-over-quarter. The Federal Reserve raised target rates three times during the year, changing the target range in December 2017 from 1.00–1.25% to 1.25–1.50%. In addition to GDP growth, the U.S. unemployment rate remained relatively steady throughout the period, and was reported at 4.1% in December, a decline of 0.6% year-over-year.
The Fund underperformed its index for the period. The Fund’s stock selection in the information technology sector detracted from relative performance. Within information technology, an underweight position in Apple, Inc. detracted. The
consumer electronics company’s stock rose throughout the year as Apple was viewed as a potential beneficiary of tax reform and reported strong initial sales of its much-anticipated updated iPhone X model. Similarly, the Fund’s underweight position in Facebook Inc., detracted from the Fund’s relative performance as the stock rose. The social networking company benefited from strong advertising revenue growth, increasing operating margins, and a growing user base.
Stock selection in the consumer staples sector also detracted from the Fund’s performance relative to its benchmark. Within consumer staples, an overweight position in Walgreens Boots Alliance, Inc., a provider of drug store services, detracted. The company’s stock declined after the company reported a decline in same-store-sales amid an increase in cheaper generic drugs. The company also continued to struggle after it failed to get approval from the Federal Trade Commission to purchase as many Rite Aid stores as it had initially planned.
Stock selection in the industrials sector was a positive contributor to the Fund’s performance, relative to its benchmark, during the period. Within industrials, one of the largest contributors was 3M Co., a manufacturer of industrial, safety, and consumer products. 3M benefited from strong organic growth and an undervalued balance sheet, as well as above-average returns and margins. An underweight position in General Electric Co., also
2
contributed to relative performance as the technology and financial services company’s stock price declined throughout the year. The company’s stock was hurt after its CEO resigned and the new CEO cut earnings guidance, labeled 2018 a “reset year”, and committed to a rethinking of the company’s entire business model.
Stock selection in the health care sector also contributed positively to the Fund’s performance relative to its benchmark. Within health care, an
overweight position in AbbVie Inc., helped relative performance. The biopharmaceutical company advanced as the company’s Humira drug forecasts improved following an intellectual property case resolution.
The Fund’s portfolio is actively managed and, therefore, its holdings and the weightings of a particular issuer or particular sector as a percentage of portfolio assets are subject to change. Sectors may include many industries.
3
1 The S&P 500® Index is widely regarded as the standard for measuring large cap U.S. stock market performance and includes a representative sample of leading companies in leading industries.
Unless otherwise specified, indexes reflect total return, with all dividends reinvested. Indexes are unmanaged, do not reflect the deduction of fees or expenses, and are not available for direct investment.
Important Performance and Other Information
Performance data quoted in the following pages reflect past performance and are no guarantee of future results. Current performance may be higher or lower than the performance quoted. The investment return and principal value of an investment in the Fund will fluctuate so that shares, on any given day or when redeemed, may be worth more or less than their original cost. You can obtain performance data current to the most recent month end by calling Lord Abbett at 888-522-2388 or referring to www.lordabbett.com.
During certain periods shown, expense waivers and reimbursements were in place. Without such expense waivers and reimbursements, the Fund’s returns would have been lower.
The annual commentary above discusses the views of the Fund’s management and various portfolio holdings of the Fund as of December 31, 2017. These views and portfolio holdings may have changed after this date. Information provided in the commentary is not a recommendation to buy or sell securities. Because the Fund’s portfolio is actively managed and may change significantly, the Fund may no longer own the securities described above or may have otherwise changed its position in the securities. For more recent information about the Fund’s portfolio holdings, please visit www.lordabbett.com.
A Note about Risk: See Notes to Financial Statements for a discussion of investment risks. For a more detailed discussion of the risks associated with the Fund, please see the Fund’s prospectus.
Mutual funds are not insured by the FDIC, are not deposits or other obligations of, or guaranteed by, banks, and are subject to investment risks including possible loss of principal amount invested.
The Fund serves as an underlying investment vehicle for variable annuity contracts and variable life insurance policies.
4
Below is a comparison of a $10,000 investment in Class VC shares with the same investment in the S&P 500® Index and the S&P 900® 10-Year Dividend Growth Index, assuming reinvestment of all dividends and distributions. The Fund’s shares are sold only to insurance company separate accounts that fund certain variable annuity and variable life contracts. The line graph comparison does not reflect the sales charges or other expenses of these contracts. If those sales charges and expenses were reflected, returns would be lower. The graph and performance table below do not reflect the deduction of taxes that a shareholder would pay on Fund distributions or the redemption of Fund shares. During certain periods, expenses of the Fund have been waived or reimbursed by Lord Abbett; without such waiver or reimbursement of expenses, the Fund’s returns would have been lower. Past performance is no guarantee of future results.

The S&P 900® 10-Year Dividend Growth Index is a custom index that, along with changes in the Fund’s investment strategy, the Fund began disclosing in its prospectus effective September 27, 2012.
Average Annual Total Returns for the
Periods Ended December 31, 2017
| 1 Year | 5 Years | 10 Years | ||||
| Class VC | 19.12% | 13.87% | 8.47% |
1 Performance for the unmanaged index does not reflect transaction costs, management fees or sales charges. The performance of the index is not necessarily representative of the Fund’s performance.
2 Performance for the unmanaged index does not reflect transaction costs, management fees or sales charges. The performance of the index is not necessarily representative of the Fund’s performance. Performance for the index began on September 27, 2012.
5
As a shareholder of the Fund, you incur ongoing costs, including management fees; expenses related to the Fund’s services arrangements with certain insurance companies; and other Fund expenses. This Example is intended to help you understand your ongoing costs (in dollars) of investing in the Fund and to compare these costs with the ongoing costs of investing in other mutual funds.
The Example is based on an investment of $1,000 invested at the beginning of the period and held for the entire period (July 1, 2017 through December 31, 2017).
The Example reflects only expenses that are deducted from the assets of the Fund. Fees and expenses, including sales charges applicable to the various insurance products that invest in the Fund, are not reflected in this Example. If such fees and expenses were reflected in the Example, the total expenses shown would be higher. Fees and expenses regarding such variable insurance products are separately described in the prospectus related to those products.
Actual Expenses
The first line of the table on the following page provides information about actual account values and actual expenses. You may use the information in this line, together with the amount you invested, to estimate the expenses that you paid over the period. Simply divide your account value by $1,000 (for example, an $8,600 account value divided by $1,000 = 8.6), then multiply the result by the number in the first line under the heading titled “Expenses Paid During Period 7/1/17 – 12/31/17” to estimate the expenses you paid on your account during this period.
Hypothetical Example for Comparison Purposes
The second line of the table on the following page provides information about hypothetical account values and hypothetical expenses based on the Fund’s actual expense ratio and an assumed rate of return of 5% per year before expenses, which is not the Fund’s actual return. The hypothetical account values and expenses may not be used to estimate the actual ending account balance or expenses you paid for the period. You may use this information to compare the ongoing costs of investing in the Fund and other funds. To do so, compare this 5% hypothetical example with the 5% hypothetical examples that appear in the shareholder reports of the other funds.
6
Please note that the expenses shown in the table are meant to highlight your ongoing costs only and do not reflect any transactional costs, such as sales charges. Therefore, the second line of the table is useful in comparing ongoing costs only, and will not help you determine the relative total costs of owning different funds. In addition, if these transactional costs were included, your costs would have been higher.
| Beginning Account Value | Ending Account Value | Expenses Paid During Period† | |||||
| 7/1/17 | 12/31/17 | 7/1/17 - 12/31/17 | |||||
| Class VC | |||||||
| Actual | $1,000.00 | $1,113.50 | $4.53 | ||||
| Hypothetical (5% Return Before Expenses) | $1,000.00 | $1,020.92 | $4.33 |
| † | Net expenses are equal to the Fund’s annualized expense ratio of 0.85%, multiplied by the average account value over the period, multiplied by 184/365 (to reflect one-half year period). |
Portfolio Holdings Presented by Sector
December 31, 2017
| Sector* | %** | |
| Consumer Discretionary | 9.90 | % |
| Consumer Staples | 17.36 | % |
| Energy | 4.96 | % |
| Financials | 7.00 | % |
| Health Care | 11.10 | % |
| Industrials | 21.48 | % |
| Information Technology | 12.24 | % |
| Materials | 5.30 | % |
| Telecommunication Services | 3.39 | % |
| Utilities | 6.41 | % |
| Repurchase Agreement | 0.86 | % |
| Total | 100.00 | % |
| * | A sector may comprise several industries. | |
| ** | Represents percent of total investments. |
7
December 31, 2017
| Investments | Shares | Fair Value (000) | ||||||
| COMMON STOCKS 99.03% | ||||||||
| Aerospace & Defense 5.36% | ||||||||
| General Dynamics Corp. | 11,700 | $ | 2,380 | |||||
| Lockheed Martin Corp. | 10,192 | 3,272 | ||||||
| Northrop Grumman Corp. | 7,500 | 2,302 | ||||||
| Raytheon Co. | 12,500 | 2,348 | ||||||
| Total | 10,302 | |||||||
| Air Freight & Logistics 2.17% | ||||||||
| FedEx Corp. | 16,700 | 4,167 | ||||||
| Banks 0.40% | ||||||||
| People’s United Financial, Inc. | 40,900 | 765 | ||||||
| Beverages 4.14% | ||||||||
| Brown-Forman Corp. Class B | 7,500 | 515 | ||||||
| Coca-Cola Co. (The) | 89,668 | 4,114 | ||||||
| PepsiCo, Inc. | 27,824 | 3,337 | ||||||
| Total | 7,966 | |||||||
| Biotechnology 2.91% | ||||||||
| AbbVie, Inc. | 57,899 | 5,599 | ||||||
| Building Products 0.94% | ||||||||
| A.O. Smith Corp. | 29,500 | 1,808 | ||||||
| Capital Markets 2.86% | ||||||||
| Ameriprise Financial, Inc. | 13,900 | 2,356 | ||||||
| Eaton Vance Corp. | 20,400 | 1,151 | ||||||
| S&P Global, Inc. | 9,500 | 1,609 | ||||||
| T. Rowe Price Group, Inc. | 3,700 | 388 | ||||||
| Total | 5,504 | |||||||
| Chemicals 5.03% | ||||||||
| Air Products & Chemicals, Inc. | 4,600 | 755 | ||||||
| Ecolab, Inc. | 11,200 | 1,503 | ||||||
| International Flavors & Fragrances, Inc. | 8,700 | 1,328 | ||||||
| Monsanto Co. | 18,395 | 2,148 | ||||||
| PPG Industries, Inc. | 16,506 | 1,928 | ||||||
| RPM International, Inc. | 24,300 | 1,274 | ||||||
| Sherwin-Williams Co. (The) | 1,800 | 738 | ||||||
| Total | 9,674 | |||||||
| Investments | Shares | Fair Value (000) | ||||||
| Commercial Services & Supplies 0.76% | ||||||||
| Waste Management, Inc. | 16,800 | $ | 1,450 | |||||
| Containers & Packaging 0.26% | ||||||||
| Sonoco Products Co. | 9,400 | 499 | ||||||
| Diversified Telecommunication Services 3.39% | ||||||||
| AT&T, Inc. | 66,608 | 2,590 | ||||||
| Verizon Communications, Inc. | 74,000 | 3,917 | ||||||
| Total | 6,507 | |||||||
| Electric: Utilities 3.66% | ||||||||
| Edison International | 15,500 | 980 | ||||||
| Eversource Energy | 18,100 | 1,143 | ||||||
| NextEra Energy, Inc. | 14,821 | 2,315 | ||||||
| Southern Co. (The) | 27,300 | 1,313 | ||||||
| Xcel Energy, Inc. | 26,600 | 1,280 | ||||||
| Total | 7,031 | |||||||
| Food & Staples Retailing 7.91% | ||||||||
| Costco Wholesale Corp. | 12,500 | 2,326 | ||||||
| CVS Health Corp. | 31,400 | 2,277 | ||||||
| Kroger Co. (The) | 27,900 | 766 | ||||||
| Sysco Corp. | 41,600 | 2,526 | ||||||
| Wal-Mart Stores, Inc. | 44,180 | 4,363 | ||||||
| Walgreens Boots Alliance, Inc. | 40,421 | 2,935 | ||||||
| Total | 15,193 | |||||||
| Food Products 1.55% | ||||||||
| Archer-Daniels-Midland Co. | 9,400 | 377 | ||||||
| Flowers Foods, Inc. | 19,300 | 373 | ||||||
| General Mills, Inc. | 21,000 | 1,245 | ||||||
| J.M. Smucker Co. (The) | 7,900 | 981 | ||||||
| Total | 2,976 | |||||||
| Health Care Equipment & Supplies 5.37% | ||||||||
| Abbott Laboratories | 78,600 | 4,486 | ||||||
| Becton, Dickinson & Co. | 10,000 | 2,140 | ||||||
| Medtronic plc (Ireland)(a) | 38,091 | 3,076 | ||||||
| West Pharmaceutical Services, Inc. | 6,200 | 612 | ||||||
| Total | 10,314 | |||||||
8
Schedule of Investments (continued)
December 31, 2017
| Investments | Shares | Fair Value (000) | ||||||
| Health Care Providers & Services 0.96% | ||||||||
| AmerisourceBergen Corp. | 5,500 | $ | 505 | |||||
| Cardinal Health, Inc. | 21,948 | 1,345 | ||||||
| Total | 1,850 | |||||||
| Hotels, Restaurants & Leisure 2.53% | ||||||||
| McDonald’s Corp. | 28,274 | 4,866 | ||||||
| Household Products 3.74% | ||||||||
| Clorox Co. (The) | 4,400 | 655 | ||||||
| Kimberly-Clark Corp. | 30,135 | 3,636 | ||||||
| Procter & Gamble Co. (The) | 31,600 | 2,903 | ||||||
| Total | 7,194 | |||||||
| Industrial Conglomerates 3.16% | ||||||||
| 3M Co. | 20,417 | 4,806 | ||||||
| Roper Technologies, Inc. | 4,900 | 1,269 | ||||||
| Total | 6,075 | |||||||
| Information Technology Services 4.60% | ||||||||
| Accenture plc Class A (Ireland)(a) | 22,200 | 3,398 | ||||||
| Automatic Data Processing, Inc. | 11,300 | 1,324 | ||||||
| International Business Machines Corp. | 26,787 | 4,110 | ||||||
| Total | 8,832 | |||||||
| Insurance 3.73% | ||||||||
| Aflac, Inc. | 5,000 | 439 | ||||||
| Brown & Brown, Inc. | 11,500 | 592 | ||||||
| Chubb Ltd. (Switzerland)(a) | 25,564 | 3,736 | ||||||
| Hanover Insurance Group, Inc. (The) | 7,500 | 810 | ||||||
| RenaissanceRe Holdings Ltd. | 12,700 | 1,595 | ||||||
| Total | 7,172 | |||||||
| Leisure Products 0.80% | ||||||||
| Hasbro, Inc. | 16,900 | 1,536 | ||||||
| Investments | Shares | Fair Value (000) | ||||||
| Machinery 5.01% | ||||||||
| Caterpillar, Inc. | 4,800 | $ | 756 | |||||
| Cummins, Inc. | 13,800 | 2,438 | ||||||
| Graco, Inc. | 19,500 | 882 | ||||||
| Illinois Tool Works, Inc. | 15,800 | 2,636 | ||||||
| Pentair plc (United Kingdom)(a) | 24,100 | 1,702 | ||||||
| Stanley Black & Decker, Inc. | 7,200 | 1,222 | ||||||
| Total | 9,636 | |||||||
| Multi-Utilities 2.75% | ||||||||
| Consolidated Edison, Inc. | 11,500 | 977 | ||||||
| Dominion Energy, Inc. | 42,600 | 3,453 | ||||||
| SCANA Corp. | 21,298 | 847 | ||||||
| Total | 5,277 | |||||||
| Oil, Gas & Consumable Fuels 4.96% | ||||||||
| Chevron Corp. | 52,849 | 6,616 | ||||||
| Occidental Petroleum Corp. | 39,573 | 2,915 | ||||||
| Total | 9,531 | |||||||
| Pharmaceuticals 1.85% | ||||||||
| Johnson & Johnson | 25,419 | 3,552 | ||||||
| Professional Services 0.97% | ||||||||
| Robert Half International, Inc. | 33,700 | 1,872 | ||||||
| Road & Rail 2.69% | ||||||||
| J.B. Hunt Transport Services, Inc. | 5,700 | 655 | ||||||
| Ryder System, Inc. | 6,100 | 513 | ||||||
| Union Pacific Corp. | 29,900 | 4,010 | ||||||
| Total | 5,178 | |||||||
| Semiconductors & Semiconductor Equipment 5.30% | ||||||||
| Analog Devices, Inc. | 24,900 | 2,217 | ||||||
| Microchip Technology, Inc. | 21,866 | 1,922 | ||||||
| QUALCOMM, Inc. | 46,757 | 2,993 | ||||||
| Texas Instruments, Inc. | 29,300 | 3,060 | ||||||
| Total | 10,192 | |||||||
| See Notes to Financial Statements. | 9 |
Schedule of Investments (continued)
December 31, 2017
| Investments | Shares | Fair Value (000) | ||||||
| Software 2.33% | ||||||||
| Microsoft Corp. | 52,300 | $ | 4,474 | |||||
| Specialty Retail 4.55% | ||||||||
| Lowe’s Cos., Inc. | 51,125 | 4,752 | ||||||
| Ross Stores, Inc. | 35,200 | 2,825 | ||||||
| TJX Cos., Inc. (The) | 15,400 | 1,177 | ||||||
| Total | 8,754 | |||||||
| Textiles, Apparel & Luxury Goods 2.00% | ||||||||
| NIKE, Inc. Class B | 39,500 | 2,471 | ||||||
| VF Corp. | 18,600 | 1,376 | ||||||
| Total | 3,847 | |||||||
| Trading Companies & Distributors 0.39% | ||||||||
| W.W. Grainger, Inc. | 3,200 | 756 | ||||||
| Total Common Stocks (cost $165,520,463) | 190,349 | |||||||
| Investments | Principal Amount (000) | Fair Value (000) | ||||||
| SHORT-TERM INVESTMENT 0.86% | ||||||||
| Repurchase Agreement | ||||||||
| Repurchase Agreement dated 12/29/2017, 0.54% due 1/2/2018 with Fixed Income Clearing Corp. collateralized by $1,400,000 of U.S. Treasury Bond at 7.875% due 2/15/2021; value: $1,689,951; proceeds: $1,654,266 (cost $1,654,166) | $ | 1,654 | $ | 1,654 | ||||
| Total Investments in Securities 99.89% (cost $167,174,629) | 192,003 | |||||||
| Other Assets in Excess of Liabilities(b) 0.11% | 219 | |||||||
| Net Assets 100.00% | $ | 192,222 | ||||||
| (a) | Foreign security traded in U.S. dollars. | |
| (b) | Other Assets in Excess of Liabilities include net unrealized Appreciation on futures contracts as follows: |
Open Futures Contracts at December 31, 2017:
| Type | Expiration | Contracts | Position | Notional Amount | Notional Value | Unrealized Appreciation | |||||||
| E-Mini S&P 500 Index | March 2018 | 10 | Long | $1,333,306 | $1,338,000 | $4,694 |
| 10 | See Notes to Financial Statements. |
Schedule of Investments (concluded)
December 31, 2017
The following is a summary of the inputs used as of December 31, 2017 in valuing the Fund’s investments carried at fair value(1):
| Investment Type(2)(3) | Level 1 (000) | Level 2 (000) | Level 3 (000) | Total (000) | ||||||||||||
| Common Stocks | $ | 190,349 | $ | – | $ | – | $ | 190,349 | ||||||||
| Repurchase Agreement | – | 1,654 | – | 1,654 | ||||||||||||
| Total | $ | 190,349 | $ | 1,654 | $ | – | $ | 192,003 | ||||||||
| Other Financial Instruments | ||||||||||||||||
| Futures Contracts | ||||||||||||||||
| Assets | $ | 5 | $ | – | $ | – | $ | 5 | ||||||||
| Liabilities | – | – | – | – | ||||||||||||
| Total | $ | 5 | $ | – | $ | – | $ | 5 | ||||||||
| (1) | Refer to Note 2(i) for a description of fair value measurements and the three-tier hierarchy of inputs. | |
| (2) | See Schedule of Investments for fair values in each industry and identification of foreign issuers and/or geography. | |
| (3) | There were no Level 1/Level 2 transfers during the fiscal year ended December 31, 2017. |
| See Notes to Financial Statements. | 11 |
Statement of Assets and Liabilities
December 31, 2017
| ASSETS: | ||||
| Investments in securities, at fair value (cost $167,174,629) | $ | 192,002,960 | ||
| Deposits with brokers for futures collateral | 45,000 | |||
| Receivables: | ||||
| Interest and dividends | 237,547 | |||
| Investment securities sold | 211,784 | |||
| From advisor (See Note 3) | 59,888 | |||
| Capital shares sold | 19,178 | |||
| Prepaid expenses | 913 | |||
| Total assets | 192,577,270 | |||
| LIABILITIES: | ||||
| Payables: | ||||
| Management fee | 122,118 | |||
| Capital shares reacquired | 43,662 | |||
| Directors’ fees | 21,798 | |||
| Fund administration | 6,513 | |||
| Variation margin for futures contracts | 4,865 | |||
| Accrued expenses | 156,608 | |||
| Total liabilities | 355,564 | |||
| NET ASSETS | $ | 192,221,706 | ||
| COMPOSITION OF NET ASSETS: | ||||
| Paid-in capital | $ | 167,422,362 | ||
| Distributions in excess of net investment income | (21,797 | ) | ||
| Accumulated net realized loss on investments, futures contracts and foreign currency related transactions | (11,884 | ) | ||
| Net unrealized appreciation on investments and futures contracts | 24,833,025 | |||
| Net Assets | $ | 192,221,706 | ||
| Outstanding shares (50 million shares of common stock authorized, $.001 par value) | 12,001,154 | |||
| Net asset value, offering and redemption price per share (Net assets divided by outstanding shares) | $16.02 | |||
| 12 | See Notes to Financial Statements. |
For the Year Ended December 31, 2017
| Investment income: | ||||
| Dividends | $ | 4,595,595 | ||
| Interest | 2,031 | |||
| Total investment income | 4,597,626 | |||
| Expenses: | ||||
| Management fee | 1,348,403 | |||
| Non 12b-1 service fees | 449,717 | |||
| Shareholder servicing | 191,755 | |||
| Fund administration | 71,915 | |||
| Professional | 56,451 | |||
| Reports to shareholders | 24,041 | |||
| Custody | 20,832 | |||
| Directors’ fees | 4,998 | |||
| Other | 14,252 | |||
| Gross expenses | 2,182,364 | |||
| Expense reductions (See Note 9) | (1,640 | ) | ||
| Fees waived and expenses reimbursed (See Note 3) | (652,535 | ) | ||
| Net expenses | 1,528,189 | |||
| Net investment income | 3,069,437 | |||
| Net realized and unrealized gain (loss): | ||||
| Net realized gain on investments | 9,936,031 | |||
| Net realized gain on futures contracts | 227,659 | |||
| Net realized loss on foreign currency related transactions | (352 | ) | ||
| Net change in unrealized appreciation/depreciation on investments | 18,391,849 | |||
| Net change in unrealized appreciation/depreciation on futures contracts | 8,819 | |||
| Net realized and unrealized gain | 28,564,006 | |||
| Net Increase in Net Assets Resulting From Operations | $ | 31,633,443 | ||
| See Notes to Financial Statements. | 13 |
Statements of Changes in Net Assets
| INCREASE IN NET ASSETS | For the Year Ended December 31, 2017 | For the Year Ended December 31, 2016 | ||||||
| Operations: | ||||||||
| Net investment income | $ | 3,069,437 | $ | 2,757,601 | ||||
| Net realized gain on investments, futures contracts and foreign currency related transactions | 10,163,338 | 11,315,945 | ||||||
| Net change in unrealized appreciation/depreciation on investments and futures contracts | 18,400,668 | 5,544,702 | ||||||
| Net increase in net assets resulting from operations | 31,633,443 | 19,618,248 | ||||||
| Distributions to shareholders from: | ||||||||
| Net investment income | (3,082,034 | ) | (2,760,683 | ) | ||||
| Net realized gain | (10,510,653 | ) | (10,343,840 | ) | ||||
| Total distributions to shareholders | (13,592,687 | ) | (13,104,523 | ) | ||||
| Capital share transactions (See Note 14): | ||||||||
| Proceeds from sales of shares | 21,128,282 | 87,781,663 | ||||||
| Reinvestment of distributions | 13,592,687 | 13,104,523 | ||||||
| Cost of shares reacquired | (31,869,957 | ) | (41,085,594 | ) | ||||
| Net increase in net assets resulting from capital share transactions | 2,851,012 | 59,800,592 | ||||||
| Net increase in net assets | 20,891,768 | 66,314,317 | ||||||
| NET ASSETS: | ||||||||
| Beginning of year | $ | 171,329,938 | $ | 105,015,621 | ||||
| End of year | $ | 192,221,706 | $ | 171,329,938 | ||||
| Distributions in excess of net investment income | $ | (21,797 | ) | $ | (19,946 | ) | ||
| 14 | See Notes to Financial Statements. |
This page is intentionally left blank.
| Per Share Operating Performance: | ||||||||||||||||||||||||||||
| Investment operations: | Distributions to shareholders from: | |||||||||||||||||||||||||||
| Net asset value, beginning of period | Net invest- ment income(a) | Net realized and unrealized gain (loss) | Total from invest- ment opera- tions | Net investment income | Net realized gain | Total distri- butions | ||||||||||||||||||||||
| 12/31/2017 | $14.47 | $0.26 | $2.49 | $2.75 | $(0.27 | ) | $(0.93 | ) | $(1.20 | ) | ||||||||||||||||||
| 12/31/2016 | 13.60 | 0.28 | 1.78 | 2.06 | (0.25 | ) | (0.94 | ) | (1.19 | ) | ||||||||||||||||||
| 12/31/2015 | 15.55 | 0.27 | (0.60 | ) | (0.33 | ) | (0.27 | ) | (1.35 | ) | (1.62 | ) | ||||||||||||||||
| 12/31/2014 | 16.27 | 0.27 | 1.60 | 1.87 | (0.29 | ) | (2.30 | ) | (2.59 | ) | ||||||||||||||||||
| 12/31/2013 | 14.22 | 0.26 | 3.68 | 3.94 | (0.28 | ) | (1.61 | ) | (1.89 | ) | ||||||||||||||||||
| (a) | Calculated using average shares outstanding during the period. |
| (b) | Total return does not consider the effects of sales loads and assumes the reinvestment of all distributions. |
| 16 | See Notes to Financial Statements. |
| Ratios to Average Net Assets: | Supplemental Data: | |||||||||||||||||||||||||
| Net asset value, end of period | Total return(b) (%) | Total expenses after waivers and/or reim- bursements (%) | Total expenses (%) | Net investment income (%) | Net assets, end of period (000) | Portfolio turnover rate (%) | ||||||||||||||||||||
| $16.02 | 19.12 | 0.85 | 1.21 | 1.71 | $192,222 | 58 | ||||||||||||||||||||
| 14.47 | 15.10 | 0.85 | 1.25 | 1.89 | 171,330 | 75 | ||||||||||||||||||||
| 13.60 | (2.13 | ) | 0.85 | 1.28 | 1.76 | 105,016 | 70 | |||||||||||||||||||
| 15.55 | 11.54 | 0.85 | 1.25 | 1.63 | 118,300 | 79 | ||||||||||||||||||||
| 16.27 | 27.93 | 0.85 | 1.27 | 1.62 | 128,593 | 65 | ||||||||||||||||||||
| See Notes to Financial Statements. | 17 |
| 1. | ORGANIZATION |
Lord Abbett Series Fund, Inc. (the “Company”) is registered under the Investment Company Act of 1940, as amended (the “Act”), as a diversified, open-end management investment company and was incorporated under Maryland law in 1989. The Company consists of twelve separate portfolios. This report covers Calibrated Dividend Growth Portfolio (the “Fund”).
The Fund’s investment objective is to seek current income and capital appreciation. The Fund has Variable Contract class shares (“Class VC Shares”), which are currently issued and redeemed only in connection with investments in, and payments under, variable annuity contracts and variable life insurance policies issued by life insurance and insurance-related companies.
The preparation of the financial statements in conformity with accounting principles generally accepted in the United States of America (“U.S. GAAP”) requires management to make certain estimates and assumptions that affect the reported amounts of assets and liabilities and disclosure of contingent assets and liabilities at the date of the financial statements and the reported amounts of increases and decreases in net assets from operations during the reporting period. Actual results could differ from those estimates. The Fund is considered an investment company under U.S. GAAP and follows the accounting and reporting guidance applicable to investment companies.
| 2. | SIGNIFICANT ACCOUNTING POLICIES |
| (a) | Investment Valuation–Under procedures approved by the Fund’s Board of Directors (the “Board”), Lord, Abbett & Co. LLC (“Lord Abbett”), the Fund’s investment manager, has formed a Pricing Committee to administer the pricing and valuation of portfolio investments and to ensure that prices utilized reasonably reflect fair value. Among other things, these procedures allow the Fund to utilize independent pricing services, quotations from securities and financial instrument dealers and other market sources to determine fair value. |
| Securities actively traded on any recognized U.S. or non-U.S. exchange or on The NASDAQ Stock Market LLC are valued at the last sale price or official closing price on the exchange or system on which they are principally traded. Events occurring after the close of trading on non-U.S. exchanges may result in adjustments to the valuation of foreign securities to reflect their fair value as of the close of regular trading on the New York Stock Exchange. The Fund may utilize an independent fair valuation service in adjusting the valuations of foreign securities. Unlisted equity securities are valued at the last quoted sale price or, if no sale price is available, at the mean between the most recently quoted bid and asked prices. Exchange traded options and futures contracts are valued at the last sale price in the market where they are principally traded. If no sale has occurred, the mean between the most recently quoted bid and asked prices is used. | |
| Securities for which prices are not readily available are valued at fair value as determined by the Pricing Committee. The Pricing Committee considers a number of factors, including observable and unobservable inputs, when arriving at fair value. The Pricing Committee may use related or comparable assets or liabilities, recent transactions, market multiples, book values and other relevant information to determine the fair value of portfolio investments. The Board or a designated committee thereof regularly reviews fair value determinations made by the Pricing Committee and may employ techniques such as reviewing related market activity, reviewing inputs and assumptions, and retrospectively comparing prices of subsequent purchases and sales transactions to fair value determinations made by the Pricing Committee. |
18
Notes to Financial Statements (continued)
Short-term securities with 60 days or less remaining to maturity are valued using the amortized cost method, which approximates fair value.
| (b) | Security Transactions–Security transactions are recorded as of the date that the securities are purchased or sold (trade date). Realized gains and losses on sales of portfolio securities are calculated using the identified-cost method. |
| (c) | Investment Income–Dividend income is recorded on the ex-dividend date. Interest income is recorded on the accrual basis as earned. Discounts are accreted and premiums are amortized using the effective interest method and are included in Interest and other income on the Statement of Operations. Withholding taxes on foreign dividends have been provided for in accordance with the applicable country’s tax rules and rates. |
| (d) | Income Taxes–It is the policy of the Fund to meet the requirements of Subchapter M of the Internal Revenue Code applicable to regulated investment companies and to distribute substantially all taxable income and capital gains to its shareholders. Therefore, no income tax provision is required. |
| The Fund files U.S. federal and various state and local tax returns. No income tax returns are currently under examination. The statute of limitations on the Fund’s filed U.S. federal tax returns remains open for the fiscal years ended December 31, 2014 through December 31, 2017. The statutes of limitations on the Company’s state and local tax returns may remain open for an additional year depending upon the jurisdiction. | |
| (e) | Expenses–Expenses incurred by the Company that do not specifically relate to an individual fund are generally allocated to the funds within the Company on a pro rata basis by relative net assets. |
| (f) | Foreign Transactions–The books and records of the Fund are maintained in U.S. dollars and transactions denominated in foreign currencies are recorded in the Fund’s records at the rate prevailing when earned or recorded. Asset and liability accounts that are denominated in foreign currencies are adjusted daily to reflect current exchange rates and any unrealized gain (loss) is included in Net change in unrealized appreciation/depreciation on futures contracts and translation of assets and liabilities denominated in foreign currencies in the Fund’s Statement of Operations. The resultant exchange gains and losses upon settlement of such transactions are included in Net realized gain on futures contracts and foreign currency related transactions in the Fund’s Statement of Operations. The Fund does not isolate that portion of the results of operations arising as a result of changes in the foreign exchange rates from the changes in market prices of the securities. |
| (g) | Futures Contracts–The Fund may purchase and sell index futures contracts to manage cash, or as a substitute position in lieu of holding the underlying asset on which the instrument is based. At the time of entering into a futures transaction, an investor is required to deposit and maintain a specified amount of cash or eligible securities called “initial margin.” Subsequent payments made or received by the Fund called “variation margin” are made on a daily basis as the market price of the futures contract fluctuates. The Fund will record an unrealized gain (loss) based on the amount of variation margin. When a contract is closed, a realized gain (loss) is recorded equal to the difference between the opening and closing value of the contract. |
| (h) | Repurchase Agreements–The Fund may enter into repurchase agreements with respect to securities. A repurchase agreement is a transaction in which a fund acquires a security and simultaneously commits to resell that security to the seller (a bank or securities dealer) at an |
19
Notes to Financial Statements (continued)
agreed-upon price on an agreed-upon date. The Fund requires at all times that the repurchase agreement be collateralized by cash, or by securities of the U.S. Government, its agencies, its instrumentalities, or U.S. Government sponsored enterprises having a value equal to, or in excess of, the value of the repurchase agreement (including accrued interest). If the seller of the agreement defaults on its obligation to repurchase the underlying securities at a time when the fair value of these securities has declined, the Fund may incur a loss upon disposition of the securities.
| (i) | Fair Value Measurements–Fair value is defined as the price that the Fund would receive upon selling an investment or transferring a liability in an orderly transaction to an independent buyer in the principal or most advantageous market of the investment. A three-tier hierarchy is used to maximize the use of observable market data and minimize the use of unobservable inputs and to establish classification of fair value measurements for disclosure purposes. Inputs refer broadly to the assumptions that market participants would use in pricing the asset or liability, including assumptions about risk—for example, the risk inherent in a particular valuation technique used to measure fair value (such as a pricing model) and/or the risk inherent in the inputs to the valuation technique. Inputs may be observable or unobservable. Observable inputs reflect the assumptions market participants would use in pricing the asset or liability. Observable inputs are based on market data obtained from sources independent of the reporting entity. Unobservable inputs reflect the reporting entity’s own assumptions about the assumptions market participants would use in pricing the asset or liability. Unobservable inputs are based on the best information available in the circumstances. The three-tier hierarchy classification is determined based on the lowest level of inputs that is significant to the fair value measurement, and is summarized in the three broad Levels listed below: |
| • | Level 1 | – | unadjusted quoted prices in active markets for identical investments; | |
| • | Level 2 | – | other significant observable inputs (including quoted prices for similar investments, interest rates, prepayment speeds, credit risk, etc.); and | |
| • | Level 3 | – | significant unobservable inputs (including the Fund’s own assumptions in determining the fair value of investments). |
A summary of inputs used in valuing the Fund’s investments and other financial instruments as of December 31, 2017 and, if applicable, Level 1/Level 2 transfers and Level 3 rollforwards for the fiscal year then ended is included in the Fund’s Schedule of Investments.
Changes in valuation techniques may result in transfers into or out of an assigned level within the three-tier hierarchy. All transfers between different levels within the three-tier hierarchy are deemed to have occurred as of the beginning of the reporting period. The inputs or methodology used for valuing securities are not necessarily an indication of the risk associated with investing in those securities.
| 3. | MANAGEMENT FEE AND OTHER TRANSACTIONS WITH AFFILIATES |
Management Fee
The Company has a management agreement with Lord Abbett, pursuant to which Lord Abbett supplies the Fund with investment management services and executive and other personnel, provides office space and pays for ordinary and necessary office and clerical expenses relating to research and statistical work and supervision of the Fund’s investment portfolio.
20
Notes to Financial Statements (continued)
The management fee is based on the Fund’s average daily net assets at the following annual rate:
| First $1 billion | .75% |
| Next $1 billion | .70% |
| Over $2 billion | .65% |
For the fiscal year ended December 31, 2017, the effective management fee, net of waivers, was at an annualized rate of .39% of the Fund’s average daily net assets.
In addition, Lord Abbett provides certain administrative services to the Fund pursuant to an Administrative Services Agreement in return for a fee at an annual rate of .04% of the Fund’s average daily net assets.
During the fiscal year ended December 31, 2017 and continuing through April 30, 2018, Lord Abbett has contractually agreed to waive its fees and reimburse expenses to the extent necessary to limit total net annual operating expenses to an annual rate of .85%. This agreement may be terminated only upon the approval of the Board.
The Company, on behalf of the Fund, has entered into services arrangements with certain insurance companies. Under these arrangements, certain insurance companies will be compensated up to ..25% of the average daily net asset value (“NAV”) of the Fund’s Class VC Shares held in the insurance company’s separate account to service and maintain the Variable Contract owners’ accounts. This amount is included in Non 12b-1 service fees on the Statement of Operations. The Fund may also compensate certain insurance companies, third-party administrators and other entities for providing recordkeeping, sub-transfer agency and other administrative services to the Fund. This amount is included in Shareholder servicing on the Statement of Operations.
Two Directors and certain of the Company’s officers have an interest in Lord Abbett.
| 4. | DISTRIBUTIONS AND CAPITAL LOSS CARRYFORWARDS |
Dividends from net investment income, if any, are declared and paid at least semi-annually. Taxable net realized gains from investment transactions, reduced by allowable capital loss carryforwards, if any, are declared and distributed to shareholders at least annually. The capital loss carryforward amount, if any, is available to offset future net capital gains. Dividends and distributions to shareholders are recorded on the ex-dividend date. The amounts of dividends and distributions from net investment income and net realized capital gains are determined in accordance with federal income tax regulations, which may differ from U.S. GAAP. These book/tax differences are either considered temporary or permanent in nature. To the extent these differences are permanent in nature, such amounts are reclassified within the components of net assets based on their federal tax basis treatment; temporary differences do not require reclassification. Dividends and distributions that exceed earnings and profits for tax purposes are reported as a tax return of capital.
The tax character of distributions paid during the fiscal years ended December 31, 2017 and 2016 was as follows:
| Year Ended 12/31/2017 | Year Ended 12/31/2016 | |||||||||
| Distributions paid from: | ||||||||||
| Ordinary income | $ | 9,776,911 | $ | 4,821,625 | ||||||
| Net long-term capital gains | 3,815,776 | 8,282,898 | ||||||||
| Total distributions paid | $ | 13,592,687 | $ | 13,104,523 | ||||||
21
Notes to Financial Statements (continued)
As of December 31, 2017, the components of accumulated gains on a tax-basis were as follows:
| Undistributed ordinary income – net | $ | 784,137 | ||
| Undistributed long-term capital gains | 999,614 | |||
| Total undistributed earnings | 1,783,751 | |||
| Temporary differences | (21,797 | ) | ||
| Unrealized gains – net | 23,037,390 | |||
| Total accumulated gains – net | $ | 24,799,344 |
As of December 31, 2017, the aggregate unrealized security gains and losses on investments and other financial instruments based on cost for U.S. federal income tax purposes were as follows:
| Tax cost | $ | 168,970,264 | ||
| Gross unrealized gain | 25,957,970 | |||
| Gross unrealized loss | (2,920,580 | ) | ||
| Net unrealized security gain | $ | 23,037,390 |
The difference between book-basis and tax-basis unrealized gains (losses) is attributable to the tax treatment of futures and wash sales.
Permanent items identified during the fiscal year ended December 31, 2017 have been reclassified among the components of net assets based on their tax basis treatment as follows:
| Distributions in Excess of Net Investment Income | Accumulated Net Realized Loss | ||||
| $10,746 | $(10,746 | ) | |||
The permanent differences are attributable to the tax treatment of foreign currency transactions, and certain distributions.
| 5. | PORTFOLIO SECURITIES TRANSACTIONS |
Purchases and sales of investment securities (excluding short-term investments) for the fiscal year ended December 31, 2017 were as follows:
| Purchases | Sales | |
| $103,771,724 | $111,246,519 |
There were no purchases or sales of U.S. Government securities for the fiscal year ended December 31, 2017.
The Fund is permitted to purchase and sell securities (“cross-trade”) from and to other Lord Abbett funds or client accounts pursuant to procedures approved by the Board in compliance with Rule 17a-7 under the Act (the “Rule”). Each cross-trade is executed at a fair market price in compliance with provisions of the Rule. For the fiscal year ended December 31, 2017, the Fund engaged in cross-trades purchases of $835,131 and sales of $613,929, which resulted in net realized gains of $28,248.
22
Notes to Financial Statements (continued)
| 6. | DISCLOSURES ABOUT DERIVATIVE INSTRUMENTS AND HEDGING ACTIVITIES |
The Fund entered into E-Mini S&P 500® Index futures contracts for the fiscal year ended December 31, 2017 (as described in note 2(g)) to manage cash. The Fund bears the risk that the underlying index will move unexpectedly, in which case the Fund may realize a loss. There is minimal counterparty credit risk to the Fund since futures are exchange traded and the exchange’s clearinghouse, as counterparty to all exchange traded futures, guarantees futures against default.
As of December 31, 2017, the Fund had futures contracts with unrealized appreciation of $4,694, which is included in the Schedule of Investments. Only the current day’s variation margin is reported within the Fund’s Statement of Assets and Liabilities. Amounts of $227,659 and $8,819 are included in the Statement of Operations related to futures contracts under the captions Net realized gain on futures contracts and Net change in unrealized appreciation/depreciation on futures contracts, respectively. The average number of futures contracts throughout the period was 10.
| 7. | DISCLOSURES ABOUT OFFSETTING ASSETS AND LIABILITIES |
The Financial Accounting Standards Board (“FASB”) requires disclosures intended to help better assess the effect or potential effect of offsetting arrangements on a fund’s financial position. The following tables illustrate gross and net information about recognized assets and liabilities eligible for offset in the statement of assets and liabilities; and disclose such amounts subject to an enforceable master netting agreement or similar agreement, by counterparty. A master netting agreement is an agreement between a fund and a counterparty which provides for the net settlement of amounts owed under all contracts traded under that agreement, as well as cash collateral, through a single payment by one party to the other in the event of default on or termination of any one contract. The Fund’s accounting policy with respect to balance sheet offsetting is that, absent an event of default by the counterparty or a termination of the agreement, the master netting agreement does not result in an offset of reported amounts of financial assets and liabilities in the statement of assets and liabilities across transactions between the Fund and the applicable counterparty:
| Description | Gross Amounts of Recognized Assets | Gross Amounts Offset in the Statement of Assets and Liabilities | Net Amounts of Assets Presented in the Statement of Assets and Liabilities | |||||||||
| Repurchase Agreement | $1,654,166 | $ | – | $ | 1,654,166 | |||||||
| Total | $1,654,166 | $ | – | $ | 1,654,166 | |||||||
| Net Amounts | ||||||||||||||||||||
| of Assets | Amounts Not Offset in the | |||||||||||||||||||
| Presented in | Statement of Assets and Liabilities | |||||||||||||||||||
| Counterparty | the Statement of Assets and Liabilities | Financial Instruments | Cash Collateral Received(a) | Securities Collateral Received(a) | Net Amount(b) | |||||||||||||||
| Fixed Income Clearing Corp. | $1,654,166 | $ | – | $ | – | $ | (1,654,166 | ) | $ | – | ||||||||||
| Total | $1,654,166 | $ | – | $ | – | $ | (1,654,166 | ) | $ | – | ||||||||||
| (a) | Collateral disclosed is limited to an amount not to exceed 100% of the net amount of assets presented in the Statement of Assets and Liabilities, for each respective counterparty. |
| (b) | Net amount represents the amount owed to the Fund by the counterparty as of December 31, 2017. |
23
Notes to Financial Statements (continued)
| 8. | DIRECTORS’ REMUNERATION |
The Company’s officers and two Directors, who are associated with Lord Abbett, do not receive any compensation from the Company for serving in such capacities. Independent Directors’ fees are allocated among all Lord Abbett-sponsored funds based on the net assets of each fund. There is an equity-based plan available to all Independent Directors under which Independent Directors must defer receipt of a portion of, and may elect to defer receipt of an additional portion of Directors’ fees. The deferred amounts are treated as though equivalent dollar amounts had been invested in the funds. Such amounts and earnings accrued thereon are included in Directors’ fees on the Statement of Operations and in Directors’ fees payable on the Statement of Assets and Liabilities and are not deductible for U.S. federal income tax purposes until such amounts are paid.
| 9. | EXPENSE REDUCTIONS |
The Company has entered into an arrangement with its transfer agent and custodian, whereby credits realized as a result of uninvested cash balances are used to reduce a portion of the Fund’s expenses.
| 10. | LINE OF CREDIT |
Effective August 28, 2017, the Fund and certain other funds managed by Lord Abbett (collectively, the “Participating Funds”) entered into an amended syndicated line of credit facility with various lenders for $600 million (the “Facility”), whereas State Street Bank and Trust Company (“SSB”) participates as a lender and as agent for the lenders. The Facility is to be used for temporary or emergency purposes as an additional source of liquidity to satisfy redemptions. The Participating Funds are subject to graduated borrowing limits of one-third of Fund assets (if Fund assets are less than $750 million), $250 million, $300 million, or $350 million, based on past borrowings and likelihood of future borrowings.
Prior to August 28, 2017, the Funds and certain other funds managed by Lord Abbett participated in a $550 million syndicated line of credit facility, based on the same terms as described above.
During the fiscal year ended December 31, 2017, the Fund did not utilize the Facility.
| 11. | INTERFUND LENDING PROGRAM |
Pursuant to an exemptive order issued by the U.S. Securities and Exchange Commission (“SEC exemptive order”), certain registered open-end management investment companies managed by Lord Abbett, including the Fund, participate in a joint lending and borrowing program (the “Interfund Lending Program”). The SEC exemptive order allows the Funds to borrow money from and lend money to each other for temporary or emergency purposes subject to the limitations and conditions.
During the fiscal year ended December 31, 2017, the Fund did not participate as a borrower or lender in the Interfund Lending Program.
| 12. | CUSTODIAN AND ACCOUNTING AGENT |
SSB is the Company’s custodian and accounting agent. SSB performs custodial, accounting and recordkeeping functions relating to portfolio transactions and calculating the Fund’s NAV.
24
Notes to Financial Statements (concluded)
| 13. | INVESTMENT RISKS |
The Fund is subject to the general risks and considerations associated with equity investing. The Fund invests primarily in equity securities of large and mid-sized company stocks that have a history of growing their dividends, but there is no guarantee that a company will pay a dividend. At times, the performance of dividend paying companies may lag the performance of other companies or the broader market as a whole. The value of the Fund’s investments in equity securities will fluctuate in response to general economic conditions and to the changes in the prospects of particular companies and/or sectors in the economy. If the Fund’s fundamental research and quantitative analysis fail to produce the intended result, the Fund may suffer losses or underperform its benchmark or other funds with the same investment objective or similar strategies, even in a favorable market.
Large and mid-sized company stocks each may perform differently than the market as a whole and other types of stocks. This is because different types of stocks tend to shift in and out of favor over time depending on market and economic conditions. Mid-sized company stocks may be less able to weather economic shifts or other adverse developments than those of larger, more established companies. Although investing in mid-sized companies offers the potential for above average returns, these companies may not succeed and the value of their stock could decline significantly. Mid-sized companies also may fall out of favor relative to larger companies in certain market cycles, causing the Fund to incur losses or under perform.
The Fund’s exposure to foreign companies and markets presents increased market, industry and sector, liquidity, currency, political and other risks. The securities of foreign companies also may be subject to inadequate exchange control regulations, the imposition of economic sanctions or other government restrictions, higher transaction and other costs, and delays in settlement to the extent they are traded on non-U.S. exchanges or markets.
These factors can affect the Fund’s performance.
| 14. | SUMMARY OF CAPITAL TRANSACTIONS |
Transactions in shares of capital stock were as follows:
| Year Ended December 31, 2017 | Year Ended December 31, 2016 | |||||||
| Shares sold | 1,365,645 | 6,045,995 | ||||||
| Reinvestment of distributions | 854,365 | 893,876 | ||||||
| Shares reacquired | (2,057,388 | ) | (2,821,771 | ) | ||||
| Increase | 162,622 | 4,118,100 | ||||||
25
Report of Independent Registered Public Accounting Firm
To the Board of Directors of Lord Abbett Series Fund, Inc. and the shareholders of Calibrated Dividend Growth Portfolio:
Opinion on the Financial Statements and Financial Highlights
We have audited the accompanying statement of assets and liabilities, including the schedule of investments, of the Calibrated Dividend Growth Portfolio, one of the portfolios constituting the Lord Abbett Series Fund, Inc. (the “Fund”), as of December 31, 2017, the related statement of operations for the year then ended, the statements of changes in net assets for each of the two years in the period then ended, the financial highlights for each of the five years in the period then ended, and the related notes. In our opinion, the financial statements and financial highlights present fairly, in all material respects, the financial position of the Calibrated Dividend Growth Portfolio of the Fund as of December 31, 2017, the results of its operations for the year then ended, the changes in its net assets for each of the two years in the period then ended, and the financial highlights for each of the five years in the period then ended, in conformity with accounting principles generally accepted in the United States of America.
Basis for Opinion
These financial statements and financial highlights are the responsibility of the Fund’s management. Our responsibility is to express an opinion on the Fund’s financial statements and financial highlights based on our audits. We are a public accounting firm registered with the Public Company Accounting Oversight Board (United States) (PCAOB) and are required to be independent with respect to the Fund in accordance with the U.S. federal securities laws and the applicable rules and regulations of the Securities and Exchange Commission and the PCAOB.
We conducted our audits in accordance with the standards of the PCAOB. Those standards require that we plan and perform the audit to obtain reasonable assurance about whether the financial statements and financial highlights are free of material misstatement, whether due to error or fraud. The Fund is not required to have, nor were we engaged to perform, an audit of its internal control over financial reporting. As part of our audits we are required to obtain an understanding of internal control over financial reporting but not for the purpose of expressing an opinion on the effectiveness of the Fund’s internal control over financial reporting. Accordingly, we express no such opinion.
Our audits included performing procedures to assess the risks of material misstatement of the financial statements and financial highlights, whether due to error or fraud, and performing procedures that respond to those risks. Such procedures included examining, on a test basis, evidence regarding the amounts and disclosures in the financial statements and financial highlights. Our audits also included evaluating the accounting principles used and significant estimates made by management, as well as evaluating the overall financial statement presentation and financial highlights. Our procedures included confirmation of securities owned as of December 31, 2017, by correspondence with the custodian and brokers. We believe that our audits provide a reasonable basis for our opinion.
DELOITTE & TOUCHE LLP
New York, New York
February 15, 2018
We have served as the auditor of one or more Lord Abbett Family of Funds’ investment companies since 1932.
26
Basic Information About Management
The Board is responsible for the management of the business and affairs of the Company in accordance with the laws of the State of Maryland. The Board elects officers who are responsible for the day-to-day operations of the Fund and who execute policies authorized by the Board. The Board also approves an investment adviser to the Fund and continues to monitor the cost and quality of the services the investment adviser provides, and annually considers whether to renew the contract with the adviser. Generally, each Director holds office until his/her successor is elected and qualified or until his/her earlier resignation or removal, as provided in the Company’s organizational documents.
Lord Abbett, a Delaware limited liability company, is the Fund’s investment adviser. Designated Lord Abbett personnel are responsible for the day-to-day management of the Fund.
Interested Directors
Ms. Foster and Mr. Sieg are affiliated with Lord Abbett and are “interested persons” of the Fund as defined in the Act. Ms. Foster and Mr. Sieg are directors/trustees of each of the 12 investment companies in the Lord Abbett Family of Funds, which consist of 61 portfolios or series. Ms. Foster is an officer of the Lord Abbett Family of Funds.
| Name, Address and Year of Birth | Current Position and Length of Service with the Company | Principal Occupation and Other Directorships During the Past Five Years | ||
| Daria L. Foster(1) Lord, Abbett & Co. LLC 90 Hudson Street Jersey City, NJ 07302 (1954) | Director and President since 2006; Chief Executive Officer since 2012 | Principal Occupation: Managing Partner of Lord Abbett, joined Lord Abbett in 1990.
Other Directorships: None.
| ||
| Douglas B. Sieg(1) Lord, Abbett & Co. LLC 90 Hudson Street Jersey City, NJ 07302 (1969) | Director since 2016 | Principal Occupation: Partner (since 2001) and Head of Client Services (since 2013), formerly Director of Marketing and Relationship Management, joined Lord Abbett in 1994.
Other Directorships: None. |
Independent Directors
The following Independent Directors also are directors/trustees of each of the 12 investment companies in the Lord Abbett Family of Funds, which consist of 61 portfolios or series.
| Name, Address and Year of Birth | Current Position and Length of Service with the Company | Principal Occupation and Other Directorships During the Past Five Years | ||
| Eric C. Fast Lord, Abbett & Co. LLC c/o Legal Dept. 90 Hudson Street Jersey City, NJ 07302 (1949) | Director since 2014 | Principal Occupation: Chief Executive Officer of Crane Co., an industrial products company (2001–2014).
Other Directorships: Currently serves as director of Automatic Data Processing, Inc. (since 2007) and Regions Financial Corporation (since 2010). Previously served as a director of Crane Co. (1999–2014). |
| (1) | Daria L. Foster, Managing Partner of Lord Abbett, a member of the Board, and the Chief Executive Officer and President of the Lord Abbett Family of Funds, will retire from her positions with Lord Abbett and the Lord Abbett Family of Funds effective March 31, 2018. Douglas B. Sieg, Partner and head of Client Services at Lord Abbett, and a member of the Board, will succeed Ms. Foster effective April 1, 2018. |
27
Basic Information About Management (continued)
| Name, Address and Year of Birth | Current Position and Length of Service with the Company | Principal Occupation and Other Directorships During the Past Five Years | ||
| Evelyn E. Guernsey Lord, Abbett & Co. LLC c/o Legal Dept. 90 Hudson Street Jersey City, NJ 07302 (1955) | Director since 2011 | Principal Occupation: CEO, Americas of J.P. Morgan Asset Management (2004–2010).
Other Directorships: None. | ||
| Julie A. Hill Lord, Abbett & Co. LLC c/o Legal Dept. 90 Hudson Street Jersey City, NJ 07302 (1946) | Director since 2004 | Principal Occupation: Owner and CEO of The Hill Company, a business consulting firm (since 1998).
Other Directorships: Currently serves as director of Anthem, Inc., a health benefits company (since 1994). | ||
| Franklin W. Hobbs Lord, Abbett & Co. LLC c/o Legal Dept. 90 Hudson Street Jersey City, NJ 07302 (1947) | Director since 2001 | Principal Occupation: President and CEO of Ribbon Communications (since 2017) and Advisor of One Equity Partners, a private equity firm (since 2004).
Other Directorships: Currently serves as director of Ribbon Communications (since 2017), director and Chairman of the Board of Ally Financial Inc., a financial services firm (since 2009), and as director of Molson Coors Brewing Company (since 2002). | ||
| Kathleen M. Lutito Lord, Abbett & Co. LLC c/o Legal Dept. 90 Hudson Street Jersey City, NJ 07302 (1963) | Director since 2017 | Principal Occupation: President and Chief Investment Officer of CenturyLink Investment Management Company (since 2006).
Other Directorships: None | ||
| James M. McTaggart Lord, Abbett & Co. LLC c/o Legal Dept. 90 Hudson Street Jersey City, NJ 07302 (1947) | Director since 2012 | Principal Occupation: Independent management advisor and consultant (since 2012); Vice President, CRA International, Inc. (doing business as Charles River Associates), a global management consulting firm (2009–2012); Founder and Chairman of Marakon Associates, Inc., a strategy consulting firm (1978–2009); and Officer and Director of Trinsum Group, a holding company (2007–2009). | ||
| Other Directorships: Blyth, Inc., a home products company (2004–2015). | ||||
| Karla M. Rabusch Lord, Abbett & Co. LLC c/o Legal Dept. 90 Hudson Street Jersey City, NJ 07302 (1959) | Director since 2017 | Principal Occupation: President and Director of Wells Fargo Funds Management, LLC (2003–2017); President of Wells Fargo Funds (2003–2016).
Other Directorships: None. | ||
| Mark A. Schmid Lord, Abbett & Co. LLC c/o Legal Dept. 90 Hudson Street Jersey City, NJ 07302 (1959) | Director since 2016 | Principal Occupation: Vice President and Chief Investment Officer of the University of Chicago (since 2009).
Other Directorships: None. |
28
Basic Information About Management (continued)
| Name, Address and Year of Birth | Current Position and Length of Service with the Company | Principal Occupation and Other Directorships During the Past Five Years | ||
| James L.L. Tullis Lord, Abbett & Co. LLC c/o Legal Dept. 90 Hudson Street Jersey City, NJ 07302 (1947) | Director since 2006; Chairman since 2017 | Principal Occupation: CEO of Tullis-Dickerson and Co. Inc., a venture capital management firm (since 1990); CEO of Tullis Health Investors Inc. (since 2012).
Other Directorships: Currently serves as director of Crane Co. (since 1998). |
Officers
None of the officers listed below have received compensation from the Company. All of the officers of the Company also may be officers of the other Lord Abbett Funds and maintain offices at 90 Hudson Street, Jersey City, NJ 07302. Unless otherwise indicated, the position(s) and title(s) listed under the “Principal Occupation During the Past Five Years” column indicate each officer’s position(s) and title(s) with Lord Abbett. Each officer serves for an indefinite term (i.e., until his or her death, resignation, retirement, or removal).
| Name and Year of Birth | Current Position with the Company | Length of Service of Current Position | Principal Occupation During the Past Five Years | |||
| Daria L. Foster (1954) | President and Chief Executive Officer | Elected as President in 2006 and Chief Executive Officer in 2012 | Managing Partner of Lord Abbett, joined Lord Abbett in 1990. | |||
| Sean J. Aurigemma (1969) | Executive Vice President | Elected in 2010 | Portfolio Manager, joined Lord Abbett in 2007. | |||
| Jeff D. Diamond (1960) | Executive Vice President | Elected in 2008 | Portfolio Manager, joined Lord Abbett in 2007. | |||
| Todd D. Jacobson (1966) | Executive Vice President | Elected in 2005 | Partner and Associate Director, joined Lord Abbett in 2003. | |||
| Robert A. Lee (1969) | Executive Vice President | Elected in 2010 | Partner and Chief Investment Officer, and was formerly Deputy Chief Investment Officer and Director of Taxable Fixed Income, joined Lord Abbett in 1997. | |||
| David J. Linsen (1974) | Executive Vice President | Elected in 2008 | Partner and Director, joined Lord Abbett in 2001. | |||
| Thomas B. Maher (1967) | Executive Vice President | Elected in 2010 | Partner and Portfolio Manager, joined Lord Abbett in 2003. | |||
| Justin C. Maurer (1969) | Executive Vice President | Elected in 2010 | Partner and Portfolio Manager, joined Lord Abbett in 2001. |
29
Basic Information About Management (continued)
| Name and Year of Birth | Current Position with the Company | Length of Service of Current Position | Principal Occupation During the Past Five Years | |||
| Vincent J. McBride (1964) | Executive Vice President | Elected in 2010 | Partner and Director, joined Lord Abbett in 2003. | |||
| Andrew H. O’Brien (1973) | Executive Vice President | Elected in 2010 | Partner and Portfolio Manager, joined Lord Abbett in 1998. | |||
| F. Thomas O’Halloran, III (1955) | Executive Vice President | Elected in 2010 | Partner and Portfolio Manager, joined Lord Abbett in 2001. | |||
| Marc Pavese (1972) | Executive Vice President | Elected in 2016 | Partner and Portfolio Manager, joined Lord Abbett in 2008. | |||
| Walter H. Prahl (1958) | Executive Vice President | Elected in 2012 | Partner and Director, joined Lord Abbett in 1997. | |||
| Jeffrey Rabinowitz (1972) | Executive Vice President | Elected in 2017 | Portfolio Manager, joined Lord Abbett in 2017 and was formerly a Managing Director and Portfolio Manager/Technology Analyst at Jennison Associates LLC (2014–2017) and Managing Director and Portfolio Manager/ Technology Analyst at Goldman Sachs Asset Management (1999–2014). | |||
| Steven F. Rocco (1979) | Executive Vice President | Elected in 2014 | Partner and Portfolio Manager, joined Lord Abbett in 2004. | |||
| A. Edward Allinson (1961) | Vice President | Elected in 2011 | Portfolio Manager, joined Lord Abbett in 2005. | |||
| Matthew R. DeCicco (1977) | Vice President | Elected in 2003 | Portfolio Manager, joined Lord Abbett in 1999. | |||
| Brooke A. Fapohunda (1975) | Vice President and Assistant Secretary | Elected in 2014 | Partner and Deputy General Counsel, joined Lord Abbett in 2006. | |||
| John K. Forst (1960) | Vice President and Assistant Secretary | Elected in 2005 | Partner and Deputy General Counsel, joined Lord Abbett in 2004. | |||
| Bernard J. Grzelak (1971) | Chief Financial Officer and Vice President | Elected in 2017 | Partner and Chief Operations Officer, and was formerly Director of Fund Administration, joined Lord Abbett in 2003. | |||
| Lawrence H. Kaplan (1957) | Vice President and Secretary | Elected in 1997 | Partner and General Counsel, joined Lord Abbett in 1997. |
30
Basic Information About Management (concluded)
| Name and Year of Birth | Current Position with the Company | Length of Service of Current Position | Principal Occupation During the Past Five Years | |||
| Linda Y. Kim (1980) | Vice President and Assistant Secretary | Elected in 2016 | Counsel, joined Lord Abbett in 2015 and was formerly an Associate at Stroock & Stroock & Lavan LLP (2007–2015). | |||
| Joseph M. McGill (1962) | Chief Compliance Officer | Elected in 2014 | Partner and Chief Compliance Officer, joined Lord Abbett in 2014 and was formerly Managing Director and the Chief Compliance Officer at UBS Global Asset Management (2003–2013). | |||
| A. Edward Oberhaus, III (1959) | Vice President | Elected in 1998 | Partner and Director, joined Lord Abbett in 1983. | |||
| Noah Petrucci (1970) | Vice President | Elected in 2013 | Portfolio Manager, joined Lord Abbett in 2012. | |||
| Lawrence B. Stoller (1963) | Vice President and Assistant Secretary | Elected in 2007 | Partner and Senior Deputy General Counsel, joined Lord Abbett in 2007. | |||
| Leah G. Traub (1979) | Vice President | Elected in 2016 | Partner and Portfolio Manager, joined Lord Abbett in 2007. | |||
| Arthur K. Weise (1970) | Vice President | Elected in 2010 | Partner and Portfolio Manager, joined Lord Abbett in 2007. | |||
| Kewjin Yuoh (1971) | Vice President | Elected in 2012 | Partner and Portfolio Manager, joined Lord Abbett in 2010. | |||
| Scott S. Wallner (1955) | AML Compliance Officer | Elected in 2011 | Assistant General Counsel, joined Lord Abbett in 2004. | |||
| Christian J. Kelly (1975) | Treasurer | Elected in 2017 | Director of Fund Administration, joined Lord Abbett in 2009. |
Please call 888-522-2388 for a copy of the statement of additional information, which contains further information about the Company’s Directors. It is available free upon request.
31
Approval of Advisory Contract
The Board, including all of the Directors who are not “interested persons” of the Company or of Lord Abbett, as defined in the Investment Company Act of 1940, as amended (the “Independent Directors”), annually considers whether to approve the continuation of the existing management agreement between the Fund and Lord Abbett (the “Agreement”). In connection with its most recent approval, the Board reviewed materials relating specifically to the Agreement, as well as numerous materials received throughout the course of the year, including information about the Fund’s investment performance compared to the performance of appropriate benchmarks. Before making its decision as to the Fund, the Board had the opportunity to ask questions and request further information, taking into account its familiarity with Lord Abbett gained through its meetings and discussions. These meetings and discussions included reviews of Fund performance conducted by members of the Contract Committee, the deliberations of the Contract Committee, and discussions between the Contract Committee and Lord Abbett’s management. The Independent Directors also met with their independent legal counsel in various private sessions at which no representatives of management were present.
The materials received by the Board included, but were not limited to: (1) information provided by Morningstar, Inc. (“Morningstar”) regarding the investment performance of the Fund compared to the investment performance of certain funds with similar investment styles as determined by Morningstar, based, in part, on the Fund’s Morningstar category (the “performance peer group”), and the investment performance of two appropriate benchmarks; (2) information provided by Morningstar regarding the expense ratios, contractual and actual management fee rates, and other expense components for the Fund and certain funds in the same Morningstar category, with generally the same or similar share classes and operational characteristics, including asset size (the “expense peer group”); (3) certain supplemental investment performance information provided by Lord Abbett; (4) information provided by Lord Abbett on the expense ratios, management fee rates, and other expense components for the Fund; (5) sales and redemption information for the Fund; (6) information regarding Lord Abbett’s financial condition; (7) an analysis of the relative profitability of the Agreement to Lord Abbett; (8) information provided by Lord Abbett regarding the investment management fee schedules for Lord Abbett’s other advisory clients maintaining accounts with a similar investment strategy as the Fund; and (9) information regarding the personnel and other resources devoted by Lord Abbett to managing the Fund.
Investment Management Services Generally. The Board considered the investment management services provided by Lord Abbett to the Fund, including investment research, portfolio management, and trading, and Lord Abbett’s commitment to compliance with all applicable legal requirements. The Board also observed that Lord Abbett was solely engaged in the investment management business and accordingly did not experience the conflicts of interest that may result from being engaged in other lines of business. The Board considered the investment advisory services provided by Lord Abbett to other clients, the fees charged for the services, and the differences in the nature of the services provided to the Fund and other Lord Abbett Funds, on the one hand, and the services provided to other clients, on the other. After reviewing these and related factors, the Board concluded that the Fund was likely to continue to benefit from the nature, extent and quality of the investment services provided by Lord Abbett under the Agreement.
Investment Performance. The Board reviewed the Fund’s investment performance in relation to that of the performance peer group and two appropriate benchmarks as of various periods ended August 31, 2017. The Board observed that the Fund’s investment performance was above the median of the performance peer group for the three- and ten-year periods and below the median
32
Approval of Advisory Contract (continued)
for the one- and five-year periods. The Board considered that Lord Abbett was implementing a plan intended to improve the performance of its equity Funds. The Board further considered Lord Abbett’s performance and reputation generally, the performance of other Lord Abbett-managed funds overseen by the Board, and the willingness of Lord Abbett to take steps intended to improve performance when necessary. After reviewing these and related factors, the Board concluded that the Fund’s Agreement should be continued.
Lord Abbett’s Personnel and Methods. The Board considered the qualifications of the personnel providing investment management services to the Fund, in light of its investment objective and discipline. Among other things, the Board considered the size, experience, and turnover of Lord Abbett’s investment management staff, Lord Abbett’s investment methodology and philosophy, and Lord Abbett’s approach to recruiting, training, and retaining investment management personnel.
Nature and Quality of Other Services. The Board considered the nature, quality, costs, and extent of compliance, administrative, and other services performed by Lord Abbett and the nature and extent of Lord Abbett’s supervision of third party service providers, including the Fund’s transfer agent and custodian.
Expenses. The Board considered the expense level of the Fund and the expense levels of the expense peer group. It also considered how the expense level of the Fund related to those of the expense peer group and the amount and nature of the fees paid by shareholders. The Board observed that the net total expense ratio of the Fund was below the median of the expense peer group. After reviewing these and related factors, the Board concluded, within the context of its overall approval of the Agreement, that the expense level of the Fund was reasonable and supported the continuation of the Agreement.
Profitability. The Board considered the level of Lord Abbett’s operating margin in managing the Fund, including a review of Lord Abbett’s methodology for allocating its costs to its management of the Fund. It considered whether the Fund was profitable to Lord Abbett in connection with the Fund’s operation, including the fee that Lord Abbett receives from the Fund for providing administrative services to the Fund. The Board also considered the profits realized from other business segments of Lord Abbett, which may benefit from or be related to the Fund’s business. The Board considered Lord Abbett’s profit margins excluding Lord Abbett’s marketing and distribution expenses. The Board also considered Lord Abbett’s profit margins, without those exclusions, in comparison with available industry data and how those profit margins could affect Lord Abbett’s ability to recruit and retain investment personnel. The Board recognized that Lord Abbett’s overall profitability was a factor in enabling it to attract and retain qualified investment management personnel to provide services to the Fund. After reviewing these and related factors, the Board concluded, within the context of its overall approval of the Agreement, that Lord Abbett’s profitability with respect to the Fund was not excessive.
Economies of Scale. The Board considered the extent to which there had been economies of scale in managing the Fund, whether the Fund’s shareholders had appropriately benefited from such economies of scale, and whether there was potential for realization of any further economies of scale. The Board concluded that the existing management fee schedule, with its breakpoints in the level of the management fee, in conjunction with the Fund’s proposed expense limitation agreement, adequately addressed any economies of scale in managing the Fund.
Other Benefits to Lord Abbett. The Board considered the amount and nature of the fees paid by the Fund and the Fund’s shareholders to Lord Abbett for services other than investment advisory
33
Approval of Advisory Contract (concluded)
services. The Board also considered the revenues and profitability of Lord Abbett’s investment advisory business apart from its mutual fund business, and the intangible benefits enjoyed by Lord Abbett by virtue of its relationship with the Fund. The Board observed that the Distributor receives 12b-1 fees from certain of the Lord Abbett Funds as to shares held in accounts for which there is no other broker of record, may retain a portion of the 12b-1 fees it receives, and receives a portion of the sales charges on sales and redemptions of some classes of shares of the Lord Abbett Funds. In addition, the Board observed that Lord Abbett accrues certain benefits for its business of providing investment advice to clients other than the Lord Abbett Funds, but that business also benefits the Funds. The Board also noted that Lord Abbett, as disclosed in the prospectus of the Fund, has entered into revenue sharing arrangements with certain entities that distribute shares of the Fund. The Board also took into consideration the investment research that Lord Abbett receives as a result of Fund brokerage transactions.
Alternative Arrangements. The Board considered whether, instead of approving continuation of the Agreement, it might be in the best interests of the Fund to implement one or more alternative arrangements, such as continuing to employ Lord Abbett, but on different terms. After considering all of the relevant factors, the Board unanimously found that continuation of the Agreement was in the best interests of the Fund and its shareholders and voted unanimously to approve the continuation of the Agreement. In considering whether to approve the continuation of the Agreement, the Board did not identify any single factor as paramount or controlling. Individual Directors may have evaluated the information presented differently from one another, giving different weights to various factors. This summary does not discuss in detail all matters considered.
34
Householding
The Company has adopted a policy that allows it to send only one copy of the Fund’s prospectus, proxy material, annual report and semiannual report to certain shareholders residing at the same “household.” This reduces Fund expenses, which benefits you and other shareholders. If you need additional copies or do not want your mailings to be “householded,” please call Lord Abbett at 888-522-2388 or send a written request with your name, the name of your fund or funds and your account number or numbers to Lord Abbett Family of Funds, P.O. Box 219336, Kansas City, MO 64121.
Proxy Voting Policies, Procedures and Records
A description of the policies and procedures that Lord Abbett uses to vote proxies related to the Fund’s portfolio securities, and information on how Lord Abbett voted the Fund’s proxies during the 12-month period ended June 30 are available without charge, upon request, (i) by calling 888-522-2388; (ii) on Lord Abbett’s Website at www.lordabbett.com; and (iii) on the Securities and Exchange Commission’s (“SEC”) Website at www.sec.gov.
Shareholder Reports and Quarterly Portfolio Disclosure
The Fund is required to file its complete schedule of portfolio holdings with the SEC for its first and third fiscal quarters on Form N-Q. Copies of the filings are available without charge, upon request on the SEC’s Website at www.sec.gov and may be available by calling Lord Abbett at 888-522-2388. You can also obtain copies of Form N-Q by visiting the SEC’s Public Reference Room in Washington, DC (information on the operation of the Public Reference Room may be obtained by calling 800-SEC-0330).
Tax Information
For corporate shareholders, 46% of the Fund’s ordinary income distributions qualified for the dividends received deduction.
Additionally, of the distribution paid to the shareholders during the year ended December 31, 2017, $6,705,975 and $3,815,776, respectively, represent short-term capital gains and long-term capital gains. |
35


| This report, when not used for the general information of shareholders of the Fund, is to be distributed only if preceded or accompanied by a current fund prospectus. | |||
| Lord Abbett mutual fund shares are distributed by LORD ABBETT DISTRIBUTOR LLC. | Lord Abbett Series Fund, Inc.
Calibrated Dividend Growth Portfolio | SFCS-PORT-3 (02/18) |
![]()
LORD ABBETT
ANNUAL REPORT
Lord Abbett
Series Fund—Classic Stock Portfolio
For the fiscal year ended December 31, 2017
Table of Contents
Lord Abbett Series Fund – Classic Stock Portfolio
Annual Report
For the fiscal year ended December 31, 2017

From left to right: James L.L. Tullis, Independent Chairman of the Lord Abbett Funds and Daria L. Foster, Director, President, and Chief Executive Officer of the Lord Abbett Funds.
Dear Shareholders: We are pleased to provide you with this overview of the performance of Lord Abbett Series Fund - Classic Stock Portfolio for the fiscal year ended December 31, 2017. On this page and the following pages, we discuss the major factors that influenced fiscal year performance. For additional information about the Fund, please visit our website at www.lordabbett.com, where you also can access the quarterly commentaries that provide updates on the Fund’s performance and other portfolio related updates.
Thank you for investing in Lord Abbett mutual funds. We value the trust that you place in us and look forward to serving your investment needs in the years to come.
Best regards,

Daria L. Foster
Director, President and Chief Executive Officer
For the fiscal year ended December 31, 2017, the Fund returned 16.84%, reflecting performance at the net asset value (NAV) of Class VC shares, with all distributions reinvested, compared to its benchmark, the Russell 1000® Index,1 which returned 21.69% over the same period.
The domestic equity market (as represented by the S&P 500® Index2) returned 21.83%, ending the year with its strongest quarterly performance in two years and marking its first calendar year with 12 consecutive months of positive performance. Much of the market
momentum was driven by the anticipation of supportive U.S. fiscal policies, as the passage of the Tax Cut and Jobs Act and the prospect of significant infrastructure spending drove the forecast of U.S. gross domestic product (GDP) growth incrementally higher. These forces persisted despite a myriad of geopolitical and environmental headwinds, as North Korea, U.S. political tensions, and Hurricanes Harvey, Irma, and Maria all had the potential to derail the market’s forward progress.
During the year the National Federation of Independent Business Small Business
1
Confidence Index reached a 34 year high, marking its second-highest level in the history of the index. The University of Michigan’s average consumer confidence for the year was the highest since 2000, while consumer spending reached an all-time high in the third quarter. A reoccurring theme persisted throughout the year with large caps outperforming small caps and value stocks significantly outpacing their growth oriented peers.
The U.S. economy continued to expand during the trailing 12-month period. U.S. gross domestic product (GDP) grew at a 3.2% pace during the third quarter, an increase over the second quarter. The U.S. Bureau of Economic Analysis stated that during the third quarter personal consumption and federal government spending increased, quarter-over-quarter. The Federal Reserve (Fed) gradually raised the Fed Funds rate over the trailing 12-month period by raising interest rates by 25bps three times, ultimately reaching a target range of 1.25-1.50%. In addition to GDP growth, the U.S. unemployment rate remained relatively steady throughout the period, and was reported at 4.1% in December, a decline of 0.6% year-over-year.
The Fund underperformed its index for the period. The largest detractors to relative performance during the trailing 12-month period were the information technology and energy sectors. Within the information technology sector, shares of Qualcomm, Inc., a manufacturer of digital wireless communication equipment, dropped early
in the year following Apple’s lawsuit, which accused Qualcomm’s patent of violating competition laws. Trading volatility in shares of Oracle Corp., a supplier of software and information management, detracted from relative performance. Additionally, shares of Oracle fell following disappointing sales forecasts for the company’s cloud-based software and services. Within the energy sector, shares of Range Resources Corp., an independent natural gas, natural gas liquids, and oil company, were hurt by the weakness in gas prices driven by above average winter temperatures. Shares further declined after the company posted disappointing third-quarter production guidance. Shares of Anadarko Petroleum Corp., an oil and gas company, dropped after the company came under pressure after a fire broke out from one of Anadarko’s oil tanks, resulting in the death of two individuals.
Among the largest contributors to relative performance during the trailing 12-month period were the health care and industrials sectors. Within the health care sector, shares of Abbott Laboratories, a diversified global medical products company, advanced in the beginning of 2017 after Abbott completed its acquisition of St. Jude Medical, Inc. and gained approval by the FDA for the Assurance MRI pacemaker and Tendril MRI pacing lead. Shares continued to rise after the company expanded its implantable cardioverter defibrillator market share with the MRI compatibility of its Ellipse ICD, and
2
when the FDA approved the FreeStyle Libre Flash Glocose Monitoring system. Shares of UnitedHealth Group, Inc., a diversified health company, rose from strong financial performance and solid growth across all business lines. Within the industrials sector, the Fund’s holding of CSX Corp., a rail-based freight transportation company, contributed to performance as shares of the company jumped in the beginning of the year due to speculation that Canadian Pacific’s former CEO, Hunter Harrison, would be installed as CEO of CSX via activism. Despite his sudden death at the end of 2017, investors appeared to be confident that Harrison, who became CEO of CSX in March 2017, implemented
necessary structural changes throughout the year in order to drive future performance. Shares of Honeywell International Inc., a diversified technology and manufacturing company, rose after the company reported strong earnings throughout the year. Shares continued to increase over positive sentiment after Honeywell announced its intention to spin off into two separate companies.
The Fund’s portfolio is actively managed and, therefore, its holdings and the weightings of a particular issuer or particular sector as a percentage of portfolio assets are subject to change. Sectors may include many industries.
1 The Russell 1000 Index® measures the performance of the 1,000 largest companies in the Russell 3000 Index, which represent approximately 92% of the total market capitalization of the Russell 3000 Index.
2 The S&P 500® Index is widely regarded as the standard for measuring large cap U.S. stock market performance and includes a representative sample of leading companies in leading industries.
Unless otherwise specified, indexes reflect total return, with all dividends reinvested. Indexes are unmanaged, do not reflect the deduction of fees or expenses, and are not available for direct investment.
Important Performance and Other Information
Performance data quoted in the following pages reflect past performance and are no guarantee of future results. Current performance may be higher or lower than the performance quoted. The investment return and principal value of an investment in the Fund will fluctuate so that shares, on any given day or when redeemed, may be worth more or less than their original cost. You can obtain performance data current to the most recent month end by calling Lord Abbett at 888-522-2388 or referring to www.lordabbett.com.
During certain periods shown, expense waivers and reimbursements were in place. Without such expense waivers and reimbursements, the Fund’s returns would have been lower.
The annual commentary above discusses the views of the Fund’s management and various portfolio holdings of the Fund as of December 31, 2017. These views and portfolio holdings may have changed after this date. Information provided in the commentary is not a recommendation to buy or sell securities. Because the Fund’s portfolio is actively managed and may change significantly, the Fund may no longer own the securities described above or may have otherwise changed its position in the securities. For more recent information about the Fund’s portfolio holdings, please visit www.lordabbett.com.
A Note about Risk: See Notes to Financial Statements for a discussion of investment risks. For a more detailed discussion of the risks associated with the Fund, please see the Fund’s prospectus.
Mutual funds are not insured by the FDIC, are not deposits or other obligations of, or guaranteed by, banks, and are subject to investment risks including possible loss of principal amount invested.
The Fund serves as an underlying investment vehicle for variable annuity contracts and variable life insurance policies.
3
Below is a comparison of a $10,000 investment in Class VC shares with the same investment in both the Russell 1000® Index and the S&P 500® Index, assuming reinvestment of all dividends and distributions. The Fund’s shares are sold only to insurance company separate accounts that fund certain variable annuity and variable life contracts. This line graph comparison does not reflect the sales charges or other expenses of these contracts. If those sales charges and expenses were reflected, returns would be lower. The graph and performance table below do not reflect the deduction of taxes that a shareholder would pay on Fund distributions or the redemption of Fund shares. During certain periods, expenses of the Fund have been waived or reimbursed by Lord Abbett; without such waiver or reimbursement of expenses, the Fund’s returns would have been lower. Past performance is no guarantee of future results.

| Average Annual Total Returns for the Periods Ended December 31, 2017 | |||||||
| 1 Year | 5 Years | 10 years | |||||
| Class VC | 16.84% | 13.03% | 6.74% | ||||
1 Performance for each unmanaged index does not reflect any fees or expenses. The performance of each index is not necessarily representative of the Fund’s performance.
4
As a shareholder of the Fund, you incur ongoing costs, including management fees; expenses related to the Fund’s services arrangements with certain insurance companies; and other Fund expenses. This Example is intended to help you understand your ongoing costs (in dollars) of investing in the Fund and to compare these costs with the ongoing costs of investing in other mutual funds.
The Example is based on an investment of $1,000 invested at the beginning of the period and held for the entire period (July 1, 2017 through December 31, 2017).
The Example reflects only expenses that are deducted from the assets of the Fund. Fees and expenses, including sales charges applicable to the various insurance products that invest in the Fund, are not reflected in this Example. If such fees and expenses were reflected in the Example, the total expenses shown would be higher. Fees and expenses regarding such variable insurance products are separately described in the prospectus related to those products.
Actual Expenses
The first line of the table on the following page provides information about actual account values and actual expenses. You may use the information in this line, together with the amount you invested, to estimate the expenses that you paid over the period. Simply divide your account value by $1,000 (for example, an $8,600 account value divided by $1,000 = 8.6), then multiply the result by the number in the first line under the heading titled “Expenses Paid During Period 7/1/17 – 12/31/17” to estimate the expenses you paid on your account during this period.
Hypothetical Example for Comparison Purposes
The second line of the table on the following page provides information about hypothetical account values and hypothetical expenses based on the Fund’s actual expense ratio and an assumed rate of return of 5% per year before expenses, which is not the Fund’s actual return. The hypothetical account values and expenses may not be used to estimate the actual ending account balance or expenses you paid for the period. You may use this information to compare the ongoing costs of investing in the Fund and other funds. To do so, compare this 5% hypothetical example with the 5% hypothetical examples that appear in the shareholder reports of the other funds.
5
Please note that the expenses shown in the table are meant to highlight your ongoing costs only and do not reflect any transactional costs, such as sales charges. Therefore, the second line of the table is useful in comparing ongoing costs only, and will not help you determine the relative total costs of owning different funds. In addition, if these transactional costs were included, your costs would have been higher.
| Beginning Account Value | Ending Account Value | Expenses Paid During Period† | ||||||
| 7/1/17 | 12/31/17 | 7/1/17 - 12/31/17 | ||||||
| Class VC | ||||||||
| Actual | $1,000.00 | $1,099.00 | $5.03 | |||||
| Hypothetical (5% Return Before Expenses) | $1,000.00 | $1,020.42 | $4.84 |
| † | Net expenses are equal to the Fund’s annualized expense ratio of 0.95%, multiplied by the average account value over the period, multiplied by 184/365 (to reflect one-half year period). |
Portfolio Holdings Presented by Sector
December 31, 2017
| Sector* | %** | |
| Consumer Discretionary | 15.53 | % |
| Consumer Staples | 6.18 | % |
| Energy | 3.57 | % |
| Financials | 16.67 | % |
| Health Care | 13.29 | % |
| Industrials | 7.32 | % |
| Information Technology | 23.25 | % |
| Materials | 3.76 | % |
| Real Estate | 2.68 | % |
| Telecommunication Services | 1.25 | % |
| Utilities | 1.99 | % |
| Repurchase Agreement | 4.51 | % |
| Total | 100.00 | % |
| * | A sector may comprise several industries. | |
| ** | Represents percent of total investments. |
6
December 31, 2017
| Investments | Shares | Fair Value (000) | ||||||
| COMMON STOCKS 98.04% | ||||||||
| Banks 4.87% | ||||||||
| Citizens Financial Group, Inc. | 36,044 | $ | 1,513 | |||||
| East West Bancorp, Inc. | 11,320 | 689 | ||||||
| Total | 2,202 | |||||||
| Beverages 1.81% | ||||||||
| Coca-Cola Co. (The) | 12,542 | 575 | ||||||
| PepsiCo, Inc. | 2,023 | 243 | ||||||
| Total | 818 | |||||||
| Biotechnology 1.92% | ||||||||
| Vertex Pharmaceuticals, Inc.* | 5,788 | 867 | ||||||
| Capital Markets 3.63% | ||||||||
| Charles Schwab Corp. (The) | 8,966 | 461 | ||||||
| Morgan Stanley | 22,462 | 1,178 | ||||||
| Total | 1,639 | |||||||
| Chemicals 3.86% | ||||||||
| DowDuPont, Inc. | 12,286 | 875 | ||||||
| PPG Industries, Inc. | 7,454 | 871 | ||||||
| Total | 1,746 | |||||||
| Consumer Finance 1.76% | ||||||||
| Discover Financial Services | 10,335 | 795 | ||||||
| Diversified Telecommunication Services 1.28% | ||||||||
| AT&T, Inc. | 14,910 | 580 | ||||||
| Electric: Utilities 2.05% | ||||||||
| NextEra Energy, Inc. | 5,923 | 925 | ||||||
| Electrical Equipment 1.35% | ||||||||
| AMETEK, Inc. | 8,421 | 610 | ||||||
| Electronic Equipment, Instruments & Components 1.61% | ||||||||
| Corning, Inc. | 22,807 | 730 | ||||||
| Energy Equipment & Services 0.58% | ||||||||
| Halliburton Co. | 5,395 | 264 | ||||||
| Investments | Shares | Fair Value (000) | ||||||
| Equity Real Estate Investment Trusts 2.76% | ||||||||
| Boston Properties, Inc. | 5,027 | $ | 654 | |||||
| Prologis, Inc. | 9,177 | 592 | ||||||
| Total | 1,246 | |||||||
| Food & Staples Retailing 2.11% | ||||||||
| Wal-Mart Stores, Inc. | 9,639 | 952 | ||||||
| Food Products 0.52% | ||||||||
| Mondelez International, Inc. Class A | 5,550 | 238 | ||||||
| Health Care Equipment & Supplies 3.09% | ||||||||
| Abbott Laboratories | 8,230 | 470 | ||||||
| Baxter International, Inc. | 14,372 | 929 | ||||||
| Total | 1,399 | |||||||
| Health Care Providers & Services 3.83% | ||||||||
| UnitedHealth Group, Inc. | 7,847 | 1,730 | ||||||
| Hotels, Restaurants & Leisure 2.74% | ||||||||
| McDonald’s Corp. | 3,576 | 616 | ||||||
| Yum! Brands, Inc. | 7,613 | 621 | ||||||
| Total | 1,237 | |||||||
| Household Durables 0.56% | ||||||||
| Lennar Corp. Class A | 4,021 | 254 | ||||||
| Household Products 1.34% | ||||||||
| Clorox Co. (The) | 3,276 | 487 | ||||||
| Colgate-Palmolive Co. | 1,584 | 120 | ||||||
| Total | 607 | |||||||
| Industrial Conglomerates 2.56% | ||||||||
| Honeywell International, Inc. | 7,554 | 1,158 | ||||||
| Information Technology Services 0.76% | ||||||||
| Vantiv, Inc. Class A* | 4,658 | 343 | ||||||
| Insurance 6.85% | ||||||||
| Allstate Corp. (The) | 13,716 | 1,436 | ||||||
| Chubb Ltd. (Switzerland)(a) | 7,239 | 1,058 | ||||||
| Hartford Financial Services Group, Inc. (The) | 10,744 | 605 | ||||||
| Total | 3,099 |
| See Notes to Financial Statements. | 7 |
Schedule of Investments (continued)
December 31, 2017
| Investments | Shares | Fair Value (000) | ||||||
| Internet & Direct Marketing Retail 5.23% | ||||||||
| Amazon.com, Inc.* | 1,161 | $ | 1,358 | |||||
| Netflix, Inc.* | 5,254 | 1,008 | ||||||
| Total | 2,366 | |||||||
| Internet Software & Services 7.58% | ||||||||
| Alibaba Group Holding Ltd. ADR* | 5,036 | 868 | ||||||
| Alphabet, Inc. Class A* | 1,202 | 1,266 | ||||||
| Facebook, Inc. Class A* | 7,325 | 1,293 | ||||||
| Total | 3,427 | |||||||
| Machinery 2.49% | ||||||||
| Caterpillar, Inc. | 1,244 | 196 | ||||||
| ITT, Inc. | 9,160 | 489 | ||||||
| Parker-Hannifin Corp. | 2,217 | 442 | ||||||
| Total | 1,127 | |||||||
| Media 4.04% | ||||||||
| Charter Communications, Inc. Class A* | 658 | 221 | ||||||
| Comcast Corp. Class A | 11,844 | 474 | ||||||
| Walt Disney Co. (The) | 10,509 | 1,130 | ||||||
| Total | 1,825 | |||||||
| Oil, Gas & Consumable Fuels 3.09% | ||||||||
| Devon Energy Corp. | 21,238 | 879 | ||||||
| EOG Resources, Inc. | 4,783 | 516 | ||||||
| Total | 1,395 | |||||||
| Pharmaceuticals 4.80% | ||||||||
| Bristol-Myers Squibb Co. | 5,368 | 329 | ||||||
| Johnson & Johnson | 8,282 | 1,157 | ||||||
| Novartis AG ADR | 8,158 | 685 | ||||||
| Total | 2,171 | |||||||
| Professional Services 0.35% | ||||||||
| Nielsen Holdings plc | 4,359 | 159 |
| Investments | Shares | Fair Value (000) | ||||||
| Road & Rail 0.76% | ||||||||
| CSX Corp. | 6,236 | $ | 343 | |||||
| Semiconductors & Semiconductor Equipment 1.65% | ||||||||
| Tower Semiconductor Ltd. (Israel) *(a) | 21,885 | 746 | ||||||
| Software 7.87% | ||||||||
| Microsoft Corp. | 21,311 | 1,823 | ||||||
| Nintendo Co. Ltd. ADR | 14,230 | 642 | ||||||
| Oracle Corp. | 23,122 | 1,093 | ||||||
| Total | 3,558 | |||||||
| Specialty Retail 2.34% | ||||||||
| Burlington Stores, Inc.* | 3,713 | 457 | ||||||
| Home Depot, Inc. (The) | 3,164 | 599 | ||||||
| Total | 1,056 | |||||||
| Technology Hardware, Storage & Peripherals 4.40% | ||||||||
| Apple, Inc. | 11,756 | 1,989 | ||||||
| Textiles, Apparel & Luxury Goods 1.04% | ||||||||
| Kering ADR | 9,971 | 469 | ||||||
| Tobacco 0.56% | ||||||||
| Altria Group, Inc. | 3,539 | 253 | ||||||
| Total Common Stocks (cost $37,353,648) | 44,323 | |||||||
| 8 | See Notes to Financial Statements. |
Schedule of Investments (concluded)
December 31, 2017
| Investments | Principal Amount (000) | Fair Value (000) | ||||||
| SHORT-TERM INVESTMENT 4.63% | ||||||||
| Repurchase Agreement | ||||||||
| Repurchase Agreement dated 12/29/2017, 0.54% due 1/2/2018 with Fixed Income Clearing Corp. collateralized by $2,190,000 of U.S. Treasury Note at 1.125% due 2/28/2021; value: $2,136,082; proceeds: $2,092,499 (cost $2,092,373) | $2,092 | $ | 2,092 | |||||
| Total Investments in Securities 102.67% (cost $39,446,021) | 46,415 | |||||||
| Liabilities in Excess of Cash and Other Assets (2.67)% | (1,208 | ) | ||||||
| Net Assets 100.00% | $ | 45,207 | ||||||
| ADR | American Depositary Receipt. | |
| * | Non-income producing security. | |
| (a) | Foreign security traded in U.S. dollars. |
The following is a summary of the inputs used as of December 31, 2017 in valuing the Fund’s investments carried at fair value(1):
| Investment Type(2)(3) | Level 1 (000) | Level 2 (000) | Level 3 (000) | Total (000) | ||||||||||||
| Common Stocks | $ | 44,323 | $ | – | $ | – | $ | 44,323 | ||||||||
| Repurchase Agreement | – | 2,092 | – | 2,092 | ||||||||||||
| Total | $ | 44,323 | $ | 2,092 | $ | – | $ | 46,415 | ||||||||
| (1) | Refer to Note 2(h) for a description of fair value measurements and the three-tier hierarchy of inputs. | |
| (2) | See Schedule of Investments for fair values in each industry and identification of foreign issuers and/or geography. | |
| (3) | There were no Level 1/Level 2 transfers during the fiscal year ended December 31, 2017. |
| See Notes to Financial Statements. | 9 |
Statement of Assets and Liabilities
December 31, 2017
| ASSETS: | ||||
| Investments in securities, at fair value (cost $39,446,021) | $46,414,653 | |||
| Cash | 238 | |||
| Receivables: | ||||
| Interest and dividends | 36,412 | |||
| From advisor (See Note 3) | 8,726 | |||
| Capital shares sold | 284 | |||
| Prepaid expenses | 255 | |||
| Total assets | 46,460,568 | |||
| LIABILITIES: | ||||
| Payables: | ||||
| Investment securities purchased | 1,139,812 | |||
| Management fee | 26,889 | |||
| Directors’ fees | 6,310 | |||
| Capital shares reacquired | 4,535 | |||
| Fund administration | 1,537 | |||
| Accrued expenses | 74,074 | |||
| Total liabilities | 1,253,157 | |||
| NET ASSETS | $45,207,411 | |||
| COMPOSITION OF NET ASSETS: | ||||
| Paid-in capital | $37,485,393 | |||
| Distributions in excess of net investment income | (6,310 | ) | ||
| Accumulated net realized gain on investments | 759,696 | |||
| Net unrealized appreciation on investments | 6,968,632 | |||
| Net Assets | $45,207,411 | |||
| Outstanding shares (50 million shares of common stock authorized, $.001 par value) | 3,391,864 | |||
| Net asset value, offering and redemption price per share (Net assets divided by outstanding shares) | $13.33 | |||
| 10 | See Notes to Financial Statements. |
For the Year Ended December 31, 2017
| Investment income: | ||||
| Dividends | $ | 752,888 | ||
| Interest | 1,394 | |||
| Total investment income | 754,282 | |||
| Expenses: | ||||
| Management fee | 310,111 | |||
| Non 12b-1 service fees | 110,764 | |||
| Shareholder servicing | 46,603 | |||
| Professional | 42,786 | |||
| Reports to shareholders | 20,107 | |||
| Fund administration | 17,721 | |||
| Custody | 4,230 | |||
| Directors’ fees | 1,251 | |||
| Other | 5,509 | |||
| Gross expenses | 559,082 | |||
| Expense reductions (See Note 8) | (402 | ) | ||
| Fees waived and expenses reimbursed (See Note 3) | (137,815 | ) | ||
| Net expenses | 420,865 | |||
| Net investment income | 333,417 | |||
| Net realized and unrealized gain: | ||||
| Net realized gain on investments | 3,973,533 | |||
| Net change in unrealized appreciation/depreciation on investments | 2,600,901 | |||
| Net realized and unrealized gain | 6,574,434 | |||
| Net Increase in Net Assets Resulting From Operations | $ | 6,907,851 | ||
| See Notes to Financial Statements. | 11 |
Statements of Changes in Net Assets
| INCREASE IN NET ASSETS | For the Year Ended December 31, 2017 | For the Year Ended December 31, 2016 | ||||||
| Operations: | ||||||||
| Net investment income | $ | 333,417 | $ | 483,688 | ||||
| Net realized gain on investments | 3,973,533 | 1,660,746 | ||||||
| Net change in unrealized appreciation/depreciation on investments | 2,600,901 | 2,623,332 | ||||||
| Net increase in net assets resulting from operations | 6,907,851 | 4,767,766 | ||||||
| Distributions to shareholders from: | ||||||||
| Net investment income | (358,909 | ) | (442,540 | ) | ||||
| Net realized gain | (3,672,218 | ) | (1,677,064 | ) | ||||
| Total distributions to shareholders | (4,031,127 | ) | (2,119,604 | ) | ||||
| Capital share transactions (See Note 13): | ||||||||
| Proceeds from sales of shares | 1,448,843 | 29,910,562 | ||||||
| Reinvestment of distributions | 4,031,127 | 2,119,575 | ||||||
| Cost of shares reacquired | (8,346,425 | ) | (23,123,823 | ) | ||||
| Net increase (decrease) in net assets resulting from capital share transactions | (2,866,455 | ) | 8,906,314 | |||||
| Net increase in net assets | 10,269 | 11,554,476 | ||||||
| NET ASSETS: | ||||||||
| Beginning of year | $ | 45,197,142 | $ | 33,642,666 | ||||
| End of year | $ | 45,207,411 | $ | 45,197,142 | ||||
| Distributions in excess of net investment income | $ | (6,310 | ) | $ | (221 | ) | ||
| 12 | See Notes to Financial Statements. |
This page is intentionally left blank.
13
| Per Share Operating Performance: | ||||||||||||||||||||||||||||
| Investment operations: | Distributions to shareholders from: | |||||||||||||||||||||||||||
| Net asset value, beginning of period | Net invest- ment income(a) | Net realized and unrealized gain (loss) | Total from invest- ment opera- tions | Net investment income | Net realized gain | Total distri- butions | ||||||||||||||||||||||
| 12/31/2017 | $12.51 | $0.10 | $ 1.99 | $ 2.09 | $(0.11 | ) | $(1.16 | ) | $(1.27 | ) | ||||||||||||||||||
| 12/31/2016 | 11.66 | 0.14 | 1.31 | 1.45 | (0.13 | ) | (0.47 | ) | (0.60 | ) | ||||||||||||||||||
| 12/31/2015 | 14.15 | 0.11 | (0.23 | ) | (0.12 | ) | (0.11 | ) | (2.26 | ) | (2.37 | ) | ||||||||||||||||
| 12/31/2014 | 14.77 | 0.10 | 1.25 | 1.35 | (0.11 | ) | 1.86 | (1.97 | ) | |||||||||||||||||||
| 12/31/2013 | 12.77 | 0.14 | 3.64 | 3.78 | (0.15 | ) | (1.63 | ) | (1.78 | ) | ||||||||||||||||||
| (a) | Calculated using average shares outstanding during the period. |
| (b) | Total return does not consider the effects of sales charges or other expenses imposed by an insurance company and assumes the reinvestment of all distributions. |
| 14 | See Notes to Financial Statements. |
| Ratios to Average Net Assets: | Supplemental Data: | |||||||||||||||||||||||||
| Net asset value, end of period | Total return(b) (%) | Total expenses after waivers and/or reim- bursements (%) | Total expenses (%) | Net investment income (%) | Net assets, end of period (000) | Portfolio turnover rate (%) | ||||||||||||||||||||
| $13.33 | 16.84 | 0.95 | 1.26 | 0.75 | $45,207 | 71 | ||||||||||||||||||||
| 12.51 | 12.44 | 0.95 | 1.33 | 1.20 | 45,197 | 100 | ||||||||||||||||||||
| 11.66 | (0.90 | ) | 0.95 | 1.32 | 0.78 | 33,643 | 100 | |||||||||||||||||||
| 14.15 | 9.14 | 0.95 | 1.30 | 0.68 | 43,297 | 50 | ||||||||||||||||||||
| 14.77 | 29.85 | 0.95 | 1.31 | 0.95 | 45,458 | 42 | ||||||||||||||||||||
| See Notes to Financial Statements. | 15 |
| 1. | ORGANIZATION |
Lord Abbett Series Fund, Inc. (the “Company”) is registered under the Investment Company Act of 1940, as amended (the “Act”), as a diversified, open-end management investment company and was incorporated under Maryland law in 1989. The Company consists of twelve separate portfolios. This report covers Classic Stock Portfolio (the “Fund”).
The Fund’s investment objective is growth of capital and growth of income consistent with reasonable risk. The Fund has Variable Contract class shares (“Class VC Shares”), which are currently issued and redeemed only in connection with investments in, and payments under, variable annuity contracts and variable life insurance policies issued by life insurance and insurance-related companies.
The preparation of the financial statements in conformity with accounting principles generally accepted in the United States of America (“U.S. GAAP”) requires management to make certain estimates and assumptions that affect the reported amounts of assets and liabilities and disclosure of contingent assets and liabilities at the date of the financial statements and the reported amounts of increases and decreases in net assets from operations during the reporting period. Actual results could differ from those estimates. The Fund is considered an investment company under U.S. GAAP and follows the accounting and reporting guidance applicable to investment companies.
| 2. | SIGNIFICANT ACCOUNTING POLICIES |
| (a) | Investment Valuation–Under procedures approved by the Fund’s Board of Directors (the “Board”), Lord, Abbett & Co. LLC (“Lord Abbett”), the Fund’s investment manager, has formed a Pricing Committee to administer the pricing and valuation of portfolio investments and to ensure that prices utilized reasonably reflect fair value. Among other things, these procedures allow the Fund to utilize independent pricing services, quotations from securities and financial instrument dealers and other market sources to determine fair value. |
| Securities actively traded on any recognized U.S. or non-U.S. exchange or on The NASDAQ Stock Market LLC are valued at the last sale price or official closing price on the exchange or system on which they are principally traded. Events occurring after the close of trading on non-U.S. exchanges may result in adjustments to the valuation of foreign securities to reflect their fair value as of the close of regular trading on the New York Stock Exchange. The Fund may utilize an independent fair valuation service in adjusting the valuations of foreign securities. Unlisted equity securities are valued at the last quoted sale price or, if no sale price is available, at the mean between the most recently quoted bid and asked prices. Exchange traded options and futures contracts are valued at the last sale price in the market where they are principally traded. If no sale has occurred, the mean between the most recently quoted bid and asked prices is used. | |
| Securities for which prices are not readily available are valued at fair value as determined by the Pricing Committee. The Pricing Committee considers a number of factors, including observable and unobservable inputs, when arriving at fair value. The Pricing Committee may use related or comparable assets or liabilities, recent transactions, market multiples, book values and other relevant information to determine the fair value of portfolio investments. The Board or a designated committee thereof regularly reviews fair value determinations made by the Pricing Committee and may employ techniques such as reviewing related market activity, reviewing inputs and assumptions, and retrospectively comparing prices of subsequent purchases and sales transactions to fair value determinations made by the Pricing Committee. | |
| Short-term securities with 60 days or less remaining to maturity are valued using the amortized cost method, which approximates fair value. |
16
Notes to Financial Statements (continued)
| (b) | Security Transactions–Security transactions are recorded as of the date that the securities are purchased or sold (trade date). Realized gains and losses on sales of portfolio securities are calculated using the identified-cost method. |
| (c) | Investment Income–Dividend income is recorded on the ex-dividend date. Interest income is recorded on the accrual basis as earned. Discounts are accreted and premiums are amortized using the effective interest method and are included in Interest and other income on the Statement of Operations. Withholding taxes on foreign dividends have been provided for in accordance with the applicable country’s tax rules and rates. |
| (d) | Income Taxes–It is the policy of the Fund to meet the requirements of Subchapter M of the Internal Revenue Code applicable to regulated investment companies and to distribute substantially all taxable income and capital gains to its shareholders. Therefore, no income tax provision is required. |
| The Fund files U.S. federal and various state and local tax returns. No income tax returns are currently under examination. The statute of limitations on the Fund’s filed U.S. federal tax returns remains open for the fiscal years ended December 31, 2014 through December 31, 2017. The statutes of limitations on the Company’s state and local tax returns may remain open for an additional year depending upon the jurisdiction. | |
| (e) | Expenses–Expenses incurred by the Company that do not specifically relate to an individual fund are generally allocated to the funds within the Company on a pro rata basis by relative net assets. |
| (f) | Foreign Transactions–The books and records of the Fund are maintained in U.S. dollars and transactions denominated in foreign currencies are recorded in the Fund’s records at the rate prevailing when earned or recorded. Asset and liability accounts that are denominated in foreign currencies are adjusted daily to reflect current exchange rates and any unrealized gain (loss) is included in Net change in unrealized appreciation/depreciation on investments in the Fund’s Statement of Operations. The resultant exchange gains and losses upon settlement of such transactions are included in Net realized gain on investments in the Fund’s Statement of Operations. The Fund does not isolate that portion of the results of operations arising as a result of changes in the foreign exchange rates from the changes in market prices of the securities. |
| (g) | Repurchase Agreements–The Fund may enter into repurchase agreements with respect to securities. A repurchase agreement is a transaction in which a fund acquires a security and simultaneously commits to resell that security to the seller (a bank or securities dealer) at an agreed-upon price on an agreed-upon date. The Fund requires at all times that the repurchase agreement be collateralized by cash, or by securities of the U.S. Government, its agencies, its instrumentalities, or U.S. Government sponsored enterprises having a value equal to, or in excess of, the value of the repurchase agreement (including accrued interest). If the seller of the agreement defaults on its obligation to repurchase the underlying securities at a time when the fair value of these securities has declined, the Fund may incur a loss upon disposition of the securities. |
| (h) | Fair Value Measurements–Fair value is defined as the price that the Fund would receive upon selling an investment or transferring a liability in an orderly transaction to an independent buyer in the principal or most advantageous market of the investment. A three-tier hierarchy is used to maximize the use of observable market data and minimize the use of unobservable inputs and to establish classification of fair value measurements for disclosure purposes. Inputs |
17
Notes to Financial Statements (continued)
| refer broadly to the assumptions that market participants would use in pricing the asset or liability, including assumptions about risk — for example, the risk inherent in a particular valuation technique used to measure fair value (such as a pricing model) and/or the risk inherent in the inputs to the valuation technique. Inputs may be observable or unobservable. Observable inputs reflect the assumptions market participants would use in pricing the asset or liability. Observable inputs are based on market data obtained from sources independent of the reporting entity. Unobservable inputs reflect the reporting entity’s own assumptions about the assumptions market participants would use in pricing the asset or liability. Unobservable inputs are based on the best information available in the circumstances. The three-tier hierarchy classification is determined based on the lowest level of inputs that is significant to the fair value measurement, and is summarized in the three broad Levels listed below: | |||
| • | Level 1 – | unadjusted quoted prices in active markets for identical investments; | |
| • | Level 2 – | other significant observable inputs (including quoted prices for similar investments, interest rates, prepayment speeds, credit risk, etc.); and | |
| • | Level 3 – | significant unobservable inputs (including the Fund’s own assumptions in determining the fair value of investments). | |
| A summary of inputs used in valuing the Fund’s investments as of December 31, 2017 and, if applicable, Level 1/Level 2 transfers and Level 3 rollforwards for the fiscal year then ended is included in the Fund’s Schedule of Investments. | |
| Changes in valuation techniques may result in transfers into or out of an assigned level within the three-tier hierarchy. All transfers between different levels within the three-tier hierarchy are deemed to have occurred as of the beginning of the reporting period. The inputs or methodology used for valuing securities are not necessarily an indication of the risk associated with investing in those securities. |
| 3. | MANAGEMENT FEE AND OTHER TRANSACTIONS WITH AFFILIATES |
Management Fee
The Company has a management agreement with Lord Abbett, pursuant to which Lord Abbett supplies the Fund with investment management services and executive and other personnel, provides office space and pays for ordinary and necessary office and clerical expenses relating to research and statistical work and supervision of the Fund’s investment portfolio.
The management fee is based on the Fund’s average daily net assets at the following annual rate:
| First $1 billion | .70% |
| Next $1 billion | .65% |
| Over $2 billion | .60% |
For the fiscal year ended December 31, 2017, the effective management fee, net of waivers, was at an annualized rate of .39% of the Fund’s average daily net assets.
In addition, Lord Abbett provides certain administrative services to the Fund pursuant to an Administrative Services Agreement in return for a fee at an annual rate of .04% of the Fund’s average daily net assets.
During the fiscal year ended December 31, 2017 and continuing through April 30, 2018, Lord Abbett has contractually agreed to waive its fees and reimburse expenses to the extent necessary
18
Notes to Financial Statements (continued)
to limit total net annual operating expenses, to an annual rate of .95%. This agreement may be terminated only upon the approval of the Board.
The Company, on behalf of the Fund, has entered into services arrangements with certain insurance companies. Under these arrangements, certain insurance companies will be compensated up to .25% of the average daily net asset value (“NAV”) of the Fund’s Class VC Shares held in the insurance company’s separate account to service and maintain the Variable Contract owners’ accounts. This amount is included in Non 12b-1 service fees on the Statement of Operations. The Fund may also compensate certain insurance companies, third-party administrators and other entities for providing recordkeeping, sub-transfer agency and other administrative services to the Fund. This amount is included in Shareholder servicing on the Statement of Operations.
Two Directors and certain of the Company’s officers have an interest in Lord Abbett.
| 4. | DISTRIBUTIONS AND CAPITAL LOSS CARRYFORWARDS |
Dividends from net investment income, if any, are declared and paid at least semi-annually. Taxable net realized gains from investment transactions, reduced by allowable capital loss carryforwards, if any, are declared and distributed to shareholders at least annually. The capital loss carryforward amount, if any, is available to offset future net capital gains. Dividends and distributions to shareholders are recorded on the ex-dividend date. The amounts of dividends and distributions from net investment income and net realized capital gains are determined in accordance with federal income tax regulations, which may differ from U.S. GAAP. These book/tax differences are either considered temporary or permanent in nature. To the extent these differences are permanent in nature, such amounts are reclassified within the components of net assets based on their federal tax basis treatment; temporary differences do not require reclassification. Dividends and distributions that exceed earnings and profits for tax purposes are reported as a tax return of capital.
The tax character of distributions paid during the fiscal years ended December 31, 2017 and 2016 was as follows:
| Year Ended 12/31/2017 | Year Ended 12/31/2016 | |||||||||
| Distributions paid from: | ||||||||||
| Ordinary income | $ | 1,067,214 | $ | 442,540 | ||||||
| Net long-term capital gains | 2,963,913 | 1,677,064 | ||||||||
| Total distributions paid | $ | 4,031,127 | $ | 2,119,604 | ||||||
As of December 31, 2017, the components of accumulated gains on a tax-basis were as follows:
| Undistributed ordinary income – net | $ | 136,196 | ||
| Undistributed long-term capital gains | 684,291 | |||
| Total undistributed earnings | 820,487 | |||
| Temporary differences | (6,310 | ) | ||
| Unrealized gains – net | 6,907,841 | |||
| Total accumulated gains – net | $ | 7,722,018 |
19
Notes to Financial Statements (continued)
As of December 31, 2017, the aggregate unrealized security gains and losses on investments and other financial instruments based on cost for U.S. federal income tax purposes were as follows:
| Tax cost | $ | 39,506,812 | ||
| Gross unrealized gain | 7,138,946 | |||
| Gross unrealized loss | (231,105 | ) | ||
| Net unrealized security gain | $ | 6,907,841 |
The difference between book-basis and tax-basis unrealized gains (losses) is attributable to the tax treatment of wash sales.
Permanent items identified during the fiscal year ended December 31, 2017 have been reclassified among the components of net assets based on their tax basis treatment as follows:
| Distributions in Excess of Net Investment Income | Accumulated Net Realized Gain | |||||
| $19,403 | $(19,403 | ) | ||||
The permanent differences are attributable to the tax treatment of certain distributions.
| 5. | PORTFOLIO SECURITIES TRANSACTIONS |
Purchases and sales of investment securities (excluding short-term investments) for the fiscal year ended December 31, 2017 were as follows:
| Purchases | Sales | |
| $30,915,016 | $37,451,996 |
There were no purchases or sales of U.S. Government securities for the fiscal year ended December 31, 2017.
| 6. | DISCLOSURES ABOUT OFFSETTING ASSETS AND LIABILITIES |
The Financial Accounting Standards Board (“FASB”) requires disclosures intended to help better assess the effect or potential effect of offsetting arrangements on a fund’s financial position. The following tables illustrate gross and net information about recognized assets and liabilities eligible for offset in the statement of assets and liabilities; and disclose such amounts subject to an enforceable master netting agreement or similar agreement, by counterparty. A master netting agreement is an agreement between a fund and a counterparty which provides for the net settlement of amounts owed under all contracts traded under that agreement, as well as cash collateral, through a single payment by one party to the other in the event of default on or termination of any one contract. The Fund’s accounting policy with respect to balance sheet offsetting is that, absent an event of default by the counterparty or a termination of the agreement, the master netting agreement does not result in an offset of reported amounts of financial assets and liabilities in the statement of assets and liabilities across transactions between the Fund and the applicable counterparty:
20
Notes to Financial Statements (continued)
| Description | Gross Amounts of Recognized Assets | Gross Amounts Offset in the Statement of Assets and Liabilities | Net Amounts of Assets Presented in the Statement of Assets and Liabilities | |||||||||
| Repurchase Agreement | $ | 2,092,373 | $ | – | $ | 2,092,373 | ||||||
| Total | $ | 2,092,373 | $ | – | $ | 2,092,373 | ||||||
| Net Amounts | ||||||||||||||||||||
| of Assets | Amounts Not Offset in the | |||||||||||||||||||
| Presented in | Statement of Assets and Liabilities | |||||||||||||||||||
| Counterparty | the Statement of Assets and Liabilities | Financial Instruments | Cash Collateral Received(a) | Securities Collateral Received(a) | Net Amount(b) | |||||||||||||||
| Fixed Income Clearing Corp. | $ | 2,092,373 | $ | – | $ | – | $ | (2,092,373 | ) | $ | – | |||||||||
| Total | $ | 2,092,373 | $ | – | $ | – | $ | (2,092,373 | ) | $ | – | |||||||||
| (a) | Collateral disclosed is limited to an amount not to exceed 100% of the net amount of assets presented in the Statement of Assets and Liabilities, for each respective counterparty. |
| (b) | Net amount represents the amount owed to the Fund by the counterparty as of December 31, 2017. |
| 7. | DIRECTORS’ REMUNERATION |
The Company’s officers and two Directors, who are associated with Lord Abbett, do not receive any compensation from the Company for serving in such capacities. Independent Directors’ fees are allocated among all Lord Abbett-sponsored funds based on the net assets of each fund. There is an equity-based plan available to all Independent Directors under which Independent Directors must defer receipt of a portion of, and may elect to defer receipt of an additional portion of Directors’ fees. The deferred amounts are treated as though equivalent dollar amounts had been invested in the funds. Such amounts and earnings accrued thereon are included in Directors’ fees on the Statement of Operations and in Directors’ fees payable on the Statement of Assets and Liabilities and are not deductible for U.S. federal income tax purposes until such amounts are paid.
| 8. | EXPENSE REDUCTIONS |
The Company has entered into an arrangement with its transfer agent and custodian, whereby credits realized as a result of uninvested cash balances are used to reduce a portion of the Fund’s expenses.
| 9. | LINE OF CREDIT |
Effective August 28, 2017, the Funds and certain other funds managed by Lord Abbett (collectively, the “Participating Funds”) entered into an amended syndicated line of credit facility with various lenders for $600 million (the “Facility”), whereas State Street Bank and Trust Company (“SSB”) participates as a lender and as agent for the lenders. The Facility is to be used for temporary or emergency purposes as an additional source of liquidity to satisfy redemptions. The Participating Funds are subject to graduated borrowing limits of one-third of Fund assets (if Fund assets are less than $750 million), $250 million, $300 million, or $350 million, based on past borrowings and likelihood of future borrowings.
Prior to August 28, 2017, the Funds and certain other funds managed by Lord Abbett participated in a $550 million syndicated line of credit facility, based on the same terms as described above.
During the fiscal year ended December 31, 2017, the Fund did not utilize the Facility.
21
Notes to Financial Statements (concluded)
| 10. | INTERFUND LENDING PROGRAM |
Pursuant to an exemptive order issued by the U.S. Securities and Exchange Commission (“SEC exemptive order”), certain registered open-end management investment companies managed by Lord Abbett, including the Fund, participate in a joint lending and borrowing program (the “Interfund Lending Program”). The SEC exemptive order allows the Funds to borrow money from and lend money to each other for temporary or emergency purposes subject to the limitations and conditions. During the fiscal year ended December 31, 2017, the Fund did not participate as a borrower or lender in the Interfund Lending Program.
| 11. | CUSTODIAN AND ACCOUNTING AGENT |
SSB is the Company’s custodian and accounting agent. SSB performs custodial, accounting and recordkeeping functions relating to portfolio transactions and calculating the Fund’s NAV.
| 12. | INVESTMENT RISKS |
The Fund is subject to the general risks and considerations associated with equity investing, as well as the particular risks associated with value and growth stocks. This means the value of your investment will fluctuate in response to movements in the equity securities market in general and to the changing prospects of individual companies in which the Fund invests. Large-cap value and growth stocks may perform differently than the market as a whole and differently than each other or other types of stocks, such as small company stocks. This is because different types of stocks tend to shift in and out of favor over time depending on market and economic conditions. The market may fail to recognize the intrinsic value of particular value stocks for a long time. Growth stocks may be more volatile than other stocks. Growth stocks are often more sensitive to market fluctuations than other securities because their market prices are highly sensitive to future earnings expectations. In addition, if the Fund’s assessment of a company’s value or prospects for exceeding earnings expectations or market conditions is wrong, the Fund could suffer losses or produce poor performance relative to other funds, even in a favorable market.
Due to its investment exposure to foreign companies and American Depositary Receipts, the Fund may experience increased market, industry and sector liquidity, currency, political, information, and other risks. The securities of foreign companies also may be subject to inadequate exchange control regulations, the imposition of economic sanctions or other government restrictions, higher transaction and other costs, and delays in settlement to the extent they are traded on non-U.S. exchanges or markets.
These factors can affect the Fund’s performance.
| 13. | SUMMARY OF CAPITAL TRANSACTIONS |
Transactions in shares of capital stock were as follows:
| Year Ended December 31, 2017 | Year Ended December 31, 2016 | |||||||
| Shares sold | 108,740 | 2,570,120 | ||||||
| Reinvestment of distributions | 302,332 | 169,122 | ||||||
| Shares reacquired | (631,764 | ) | (2,011,279 | ) | ||||
| Increase (decrease) | (220,692 | ) | 727,963 | |||||
22
Report of Independent Registered Public Accounting Firm
To the Board of Directors of Lord Abbett Series Fund, Inc. and the shareholders of Classic Stock Portfolio:
Opinion on the Financial Statements and Financial Highlights
We have audited the accompanying statement of assets and liabilities, including the schedule of investments, of the Classic Stock Portfolio, one of the portfolios constituting the Lord Abbett Series Fund, Inc. (the “Fund”), as of December 31, 2017, the related statement of operations for the year then ended, the statements of changes in net assets for each of the two years in the period then ended, the financial highlights for each of the five years in the period then ended, and the related notes. In our opinion, the financial statements and financial highlights present fairly, in all material respects, the financial position of the Classic Stock Portfolio of the Fund as of December 31, 2017, the results of its operations for the year then ended, the changes in its net assets for each of the two years in the period then ended, and the financial highlights for each of the five years in the period then ended, in conformity with accounting principles generally accepted in the United States of America.
Basis for Opinion
These financial statements and financial highlights are the responsibility of the Fund’s management. Our responsibility is to express an opinion on the Fund’s financial statements and financial highlights based on our audits. We are a public accounting firm registered with the Public Company Accounting Oversight Board (United States) (PCAOB) and are required to be independent with respect to the Fund in accordance with the U.S. federal securities laws and the applicable rules and regulations of the Securities and Exchange Commission and the PCAOB.
We conducted our audits in accordance with the standards of the PCAOB. Those standards require that we plan and perform the audit to obtain reasonable assurance about whether the financial statements and financial highlights are free of material misstatement, whether due to error or fraud. The Fund is not required to have, nor were we engaged to perform, an audit of its internal control over financial reporting. As part of our audits we are required to obtain an understanding of internal control over financial reporting but not for the purpose of expressing an opinion on the effectiveness of the Fund’s internal control over financial reporting. Accordingly, we express no such opinion.
Our audits included performing procedures to assess the risks of material misstatement of the financial statements and financial highlights, whether due to error or fraud, and performing procedures that respond to those risks. Such procedures included examining, on a test basis, evidence regarding the amounts and disclosures in the financial statements and financial highlights. Our audits also included evaluating the accounting principles used and significant estimates made by management, as well as evaluating the overall financial statement presentation and financial highlights. Our procedures included confirmation of securities owned as of December 31, 2017, by correspondence with the custodian and brokers; when replies were not received from brokers, we performed other auditing procedures. We believe that our audits provide a reasonable basis for our opinion.
DELOITTE & TOUCHE LLP
New York, New York
February 15, 2018
We have served as the auditor of one or more Lord Abbett Family of Funds’ investment companies since 1932.
23
Basic Information About Management
The Board is responsible for the management of the business and affairs of the Company in accordance with the laws of the State of Maryland. The Board elects officers who are responsible for the day-to-day operations of the Fund and who execute policies authorized by the Board. The Board also approves an investment adviser to the Fund and continues to monitor the cost and quality of the services the investment adviser provides, and annually considers whether to renew the contract with the adviser. Generally, each Director holds office until his/her successor is elected and qualified or until his/her earlier resignation or removal, as provided in the Company’s organizational documents.
Lord Abbett, a Delaware limited liability company, is the Fund’s investment adviser. Designated Lord Abbett personnel are responsible for the day-to-day management of the Fund.
Interested Directors
Ms. Foster and Mr. Sieg are affiliated with Lord Abbett and are “interested persons” of the Fund as defined in the Act. Ms. Foster and Mr. Sieg are directors/trustees of each of the 12 investment companies in the Lord Abbett Family of Funds, which consist of 61 portfolios or series. Ms. Foster is an officer of the Lord Abbett Family of Funds.
| Name, Address and Year of Birth | Current Position and Length of Service with the Company | Principal Occupation and Other Directorships During the Past Five Years | ||
| Daria L. Foster(1) Lord, Abbett & Co. LLC 90 Hudson Street Jersey City, NJ 07302 (1954) | Director and President since 2006; Chief Executive Officer since 2012 | Principal Occupation: Managing Partner of Lord Abbett, joined Lord Abbett in 1990.
Other Directorships: None.
| ||
| Douglas B. Sieg(1) Lord, Abbett & Co. LLC 90 Hudson Street Jersey City, NJ 07302 (1969) | Director since 2016 | Principal Occupation: Partner (since 2001) and Head of Client Services (since 2013), formerly Director of Marketing and Relationship Management, joined Lord Abbett in 1994.
Other Directorships: None. |
Independent Directors
The following Independent Directors also are directors/trustees of each of the 12 investment companies in the Lord Abbett Family of Funds, which consist of 61 portfolios or series.
| Name, Address and Year of Birth | Current Position and Length of Service with the Company | Principal Occupation and Other Directorships During the Past Five Years | ||
| Eric C. Fast Lord, Abbett & Co. LLC c/o Legal Dept. 90 Hudson Street Jersey City, NJ 07302 (1949) | Director since 2014 | Principal Occupation: Chief Executive Officer of Crane Co., an industrial products company (2001–2014).
Other Directorships: Currently serves as director of Automatic Data Processing, Inc. (since 2007) and Regions Financial Corporation (since 2010). Previously served as a director of Crane Co. (1999–2014). |
| (1) | Daria L. Foster, Managing Partner of Lord Abbett, a member of the Board, and the Chief Executive Officer and President of the Lord Abbett Family of Funds, will retire from her positions with Lord Abbett and the Lord Abbett Family of Funds effective March 31, 2018. Douglas B. Sieg, Partner and head of Client Services at Lord Abbett, and a member of the Board, will succeed Ms. Foster effective April 1, 2018. |
24
Basic Information About Management (continued)
| Name, Address and Year of Birth | Current Position and Length of Service with the Company | Principal Occupation and Other Directorships During the Past Five Years | ||
| Evelyn E. Guernsey Lord, Abbett & Co. LLC c/o Legal Dept. 90 Hudson Street Jersey City, NJ 07302 (1955) | Director since 2011 | Principal Occupation: CEO, Americas of J.P. Morgan Asset Management (2004–2010).
Other Directorships: None. | ||
| Julie A. Hill Lord, Abbett & Co. LLC c/o Legal Dept. 90 Hudson Street Jersey City, NJ 07302 (1946) | Director since 2004 | Principal Occupation: Owner and CEO of The Hill Company, a business consulting firm (since 1998). Other Directorships: Currently serves as director of Anthem, Inc., a health benefits company (since 1994). | ||
| Franklin W. Hobbs Lord, Abbett & Co. LLC c/o Legal Dept. 90 Hudson Street Jersey City, NJ 07302 (1947) | Director since 2001 | Principal Occupation: President and CEO of Ribbon Communications (since 2017) and Advisor of One Equity Partners, a private equity firm (since 2004). Other Directorships: Currently serves as director of Ribbon Communications (since 2017), director and Chairman of the Board of Ally Financial Inc., a financial services firm (since 2009), and as director of Molson Coors Brewing Company (since 2002). | ||
| Kathleen M. Lutito Lord, Abbett & Co. LLC c/o Legal Dept. 90 Hudson Street Jersey City, NJ 07302 (1963) | Director since 2017 | Principal Occupation: President and Chief Investment Officer of CenturyLink Investment Management Company (since 2006). Other Directorships: None | ||
| James M. McTaggart Lord, Abbett & Co. LLC c/o Legal Dept. 90 Hudson Street Jersey City, NJ 07302 (1947) | Director since 2012 | Principal Occupation: Independent management advisor and consultant (since 2012); Vice President, CRA International, Inc. (doing business as Charles River Associates), a global management consulting firm (2009–2012); Founder and Chairman of Marakon Associates, Inc., a strategy consulting firm (1978–2009); and Officer and Director of Trinsum Group, a holding company (2007–2009). Other Directorships: Blyth, Inc., a home products company (2004–2015). | ||
| Karla M. Rabusch Lord, Abbett & Co. LLC c/o Legal Dept. 90 Hudson Street Jersey City, NJ 07302 (1959) | Director since 2017 | Principal Occupation: President and Director of Wells Fargo Funds Management, LLC (2003–2017); President of Wells Fargo Funds (2003–2016). Other Directorships: None. | ||
| Mark A. Schmid Lord, Abbett & Co. LLC c/o Legal Dept. 90 Hudson Street Jersey City, NJ 07302 (1959) | Director since 2016 | Principal Occupation: Vice President and Chief Investment Officer of the University of Chicago (since 2009). Other Directorships: None. |
25
Basic Information About Management (continued)
| Name, Address and Year of Birth | Current Position and Length of Service with the Company | Principal Occupation and Other Directorships During the Past Five Years | ||
| James L.L. Tullis Lord, Abbett & Co. LLC c/o Legal Dept. 90 Hudson Street Jersey City, NJ 07302 (1947) | Director since 2006; Chairman since 2017 | Principal Occupation: CEO of Tullis-Dickerson and Co. Inc., a venture capital management firm (since 1990); CEO of Tullis Health Investors Inc. (since 2012).
Other Directorships: Currently serves as director of Crane Co. (since 1998). |
Officers
None of the officers listed below have received compensation from the Company. All of the officers of the Company also may be officers of the other Lord Abbett Funds and maintain offices at 90 Hudson Street, Jersey City, NJ 07302. Unless otherwise indicated, the position(s) and title(s) listed under the “Principal Occupation During the Past Five Years” column indicate each officer’s position(s) and title(s) with Lord Abbett. Each officer serves for an indefinite term (i.e., until his or her death, resignation, retirement, or removal).
| Name and Year of Birth | Current Position with the Company | Length of Service of Current Position | Principal Occupation During the Past Five Years | |||
| Daria L. Foster (1954) | President and Chief Executive Officer | Elected as President in 2006 and Chief Executive Officer in 2012 | Managing Partner of Lord Abbett, joined Lord Abbett in 1990. | |||
| Sean J. Aurigemma (1969) | Executive Vice President | Elected in 2010 | Portfolio Manager, joined Lord Abbett in 2007. | |||
| Jeff D. Diamond (1960) | Executive Vice President | Elected in 2008 | Portfolio Manager, joined Lord Abbett in 2007. | |||
| Todd D. Jacobson (1966) | Executive Vice President | Elected in 2005 | Partner and Associate Director, joined Lord Abbett in 2003. | |||
| Robert A. Lee (1969) | Executive Vice President | Elected in 2010 | Partner and Chief Investment Officer, and was formerly Deputy Chief Investment Officer and Director of Taxable Fixed Income, joined Lord Abbett in 1997. | |||
| David J. Linsen (1974) | Executive Vice President | Elected in 2008 | Partner and Director, joined Lord Abbett in 2001. | |||
| Thomas B. Maher (1967) | Executive Vice President | Elected in 2010 | Partner and Portfolio Manager, joined Lord Abbett in 2003. | |||
| Justin C. Maurer (1969) | Executive Vice President | Elected in 2010 | Partner and Portfolio Manager, joined Lord Abbett in 2001. |
26
Basic Information About Management (continued)
| Name and Year of Birth | Current Position with the Company | Length of Service of Current Position | Principal Occupation During the Past Five Years | |||
| Vincent J. McBride (1964) | Executive Vice President | Elected in 2010 | Partner and Director, joined Lord Abbett in 2003. | |||
| Andrew H. O’Brien (1973) | Executive Vice President | Elected in 2010 | Partner and Portfolio Manager, joined Lord Abbett in 1998. | |||
| F. Thomas O’Halloran, III (1955) | Executive Vice President | Elected in 2010 | Partner and Portfolio Manager, joined Lord Abbett in 2001. | |||
| Marc Pavese (1972) | Executive Vice President | Elected in 2016 | Partner and Portfolio Manager, joined Lord Abbett in 2008. | |||
| Walter H. Prahl (1958) | Executive Vice President | Elected in 2012 | Partner and Director, joined Lord Abbett in 1997. | |||
| Jeffrey Rabinowitz (1972) | Executive Vice President | Elected in 2017 | Portfolio Manager, joined Lord Abbett in 2017 and was formerly a Managing Director and Portfolio Manager/Technology Analyst at Jennison Associates LLC (2014–2017) and Managing Director and Portfolio Manager/ Technology Analyst at Goldman Sachs Asset Management (1999–2014). | |||
| Steven F. Rocco (1979) | Executive Vice President | Elected in 2014 | Partner and Portfolio Manager, joined Lord Abbett in 2004. | |||
| A. Edward Allinson (1961) | Vice President | Elected in 2011 | Portfolio Manager, joined Lord Abbett in 2005. | |||
| Matthew R. DeCicco (1977) | Vice President | Elected in 2003 | Portfolio Manager, joined Lord Abbett in 1999. | |||
| Brooke A. Fapohunda (1975) | Vice President and Assistant Secretary | Elected in 2014 | Partner and Deputy General Counsel, joined Lord Abbett in 2006. | |||
| John K. Forst (1960) | Vice President and Assistant Secretary | Elected in 2005 | Partner and Deputy General Counsel, joined Lord Abbett in 2004. | |||
| Bernard J. Grzelak (1971) | Chief Financial Officer and Vice President | Elected in 2017 | Partner and Chief Operations Officer, and was formerly Director of Fund Administration, joined Lord Abbett in 2003. | |||
| Lawrence H. Kaplan (1957) | Vice President and Secretary | Elected in 1997 | Partner and General Counsel, joined Lord Abbett in 1997. |
27
Basic Information About Management (concluded)
| Name and Year of Birth | Current Position with the Company | Length of Service of Current Position | Principal Occupation During the Past Five Years | |||
| Linda Y. Kim (1980) | Vice President and Assistant Secretary | Elected in 2016 | Counsel, joined Lord Abbett in 2015 and was formerly an Associate at Stroock & Stroock & Lavan LLP (2007–2015). | |||
| Joseph M. McGill (1962) | Chief Compliance Officer | Elected in 2014 | Partner and Chief Compliance Officer, joined Lord Abbett in 2014 and was formerly Managing Director and the Chief Compliance Officer at UBS Global Asset Management (2003–2013). | |||
| A. Edward Oberhaus, III (1959) | Vice President | Elected in 1998 | Partner and Director, joined Lord Abbett in 1983. | |||
| Noah Petrucci (1970) | Vice President | Elected in 2013 | Portfolio Manager, joined Lord Abbett in 2012. | |||
| Lawrence B. Stoller (1963) | Vice President and Assistant Secretary | Elected in 2007 | Partner and Senior Deputy General Counsel, joined Lord Abbett in 2007. | |||
| Leah G. Traub (1979) | Vice President | Elected in 2016 | Partner and Portfolio Manager, joined Lord Abbett in 2007. | |||
| Arthur K. Weise (1970) | Vice President | Elected in 2010 | Partner and Portfolio Manager, joined Lord Abbett in 2007. | |||
| Kewjin Yuoh (1971) | Vice President | Elected in 2012 | Partner and Portfolio Manager, joined Lord Abbett in 2010. | |||
| Scott S. Wallner (1955) | AML Compliance Officer | Elected in 2011 | Assistant General Counsel, joined Lord Abbett in 2004. | |||
| Christian J. Kelly (1975) | Treasurer | Elected in 2017 | Director of Fund Administration, joined Lord Abbett in 2009. |
Please call 888-522-2388 for a copy of the statement of additional information, which contains further information about the Company’s Directors. It is available free upon request.
28
Approval of Advisory Contract
The Board, including all of the Directors who are not “interested persons” of the Company or of Lord Abbett, as defined in the Investment Company Act of 1940, as amended (the “Independent Directors”), annually considers whether to approve the continuation of the existing management agreement between the Fund and Lord Abbett (the “Agreement”). In connection with its most recent approval, the Board reviewed materials relating specifically to the Agreement, as well as numerous materials received throughout the course of the year, including information about the Fund’s investment performance compared to the performance of its benchmark. Before making its decision as to the Fund, the Board had the opportunity to ask questions and request further information, taking into account its familiarity with Lord Abbett gained through its meetings and discussions. These meetings and discussions included reviews of Fund performance conducted by members of the Contract Committee, the deliberations of the Contract Committee, and discussions between the Contract Committee and Lord Abbett’s management. The Independent Directors also met with their independent legal counsel in various private sessions at which no representatives of management were present.
The materials received by the Board included, but were not limited to: (1) information provided by Morningstar, Inc. (“Morningstar”) regarding the investment performance of the Fund compared to the investment performance of certain funds with similar investment styles as determined by Morningstar, based, in part, on the Fund’s Morningstar category (the “performance peer group”), and the investment performance of two appropriate benchmarks; (2) information provided by Morningstar regarding the expense ratios, contractual and actual management fee rates, and other expense components for the Fund and certain funds in the same Morningstar category, with generally the same or similar share classes and operational characteristics, including asset size (the “expense peer group”); (3) certain supplemental investment performance information provided by Lord Abbett; (4) information provided by Lord Abbett on the expense ratios, management fee rates, and other expense components for the Fund; (5) sales and redemption information for the Fund; (6) information regarding Lord Abbett’s financial condition; (7) an analysis of the relative profitability of the Agreement to Lord Abbett; (8) information provided by Lord Abbett regarding the investment management fee schedules for Lord Abbett’s other advisory clients maintaining accounts with a similar investment strategy as the Fund; and (9) information regarding the personnel and other resources devoted by Lord Abbett to managing the Fund.
Investment Management Services Generally. The Board considered the investment management services provided by Lord Abbett to the Fund, including investment research, portfolio management, and trading, and Lord Abbett’s commitment to compliance with all applicable legal requirements. The Board also observed that Lord Abbett was solely engaged in the investment management business and accordingly did not experience the conflicts of interest that may result from being engaged in other lines of business. The Board considered the investment advisory services provided by Lord Abbett to other clients, the fees charged for the services, and the differences in the nature of the services provided to the Fund and other Lord Abbett Funds, on the one hand, and the services provided to other clients, on the other. After reviewing these and related factors, the Board concluded that the Fund was likely to continue to benefit from the nature, extent and quality of the investment services provided by Lord Abbett under the Agreement.
Investment Performance. The Board reviewed the Fund’s investment performance in relation to that of the performance peer group and two appropriate benchmarks as of various periods ended August 31, 2017. The Board observed that the Fund’s investment performance was above the median of the performance peer group for the one-, three-, five-, and ten-year periods. The Board
29
Approval of Advisory Contract (continued)
considered that Lord Abbett was implementing a plan intended to improve the performance of its equity Funds. The Board further considered Lord Abbett’s performance and reputation generally, the performance of other Lord Abbett-managed funds overseen by the Board, and the willingness of Lord Abbett to take steps intended to improve performance when necessary. After reviewing these and related factors, the Board concluded that the Fund’s Agreement should be continued.
Lord Abbett’s Personnel and Methods. The Board considered the qualifications of the personnel providing investment management services to the Fund, in light of its investment objective and discipline. Among other things, the Board considered the size, experience, and turnover of Lord Abbett’s investment management staff, Lord Abbett’s investment methodology and philosophy, and Lord Abbett’s approach to recruiting, training, and retaining investment management personnel.
Nature and Quality of Other Services. The Board considered the nature, quality, costs, and extent of compliance, administrative, and other services performed by Lord Abbett and the nature and extent of Lord Abbett’s supervision of third party service providers, including the Fund’s transfer agent and custodian.
Expenses. The Board considered the expense level of the Fund and the expense levels of the expense peer group. It also considered how the expense level of the Fund related to those of the expense peer group and the amount and nature of the fees paid by shareholders. The Board observed that the net total expense ratio of the Fund was equal to the median of the expense peer group. After reviewing these and related factors, the Board concluded, within the context of its overall approval of the Agreement, that the expense level of the Fund was reasonable and supported the continuation of the Agreement.
Profitability. The Board considered the level of Lord Abbett’s operating margin in managing the Fund, including a review of Lord Abbett’s methodology for allocating its costs to its management of the Fund. It considered whether the Fund was profitable to Lord Abbett in connection with the Fund’s operation, including the fee that Lord Abbett receives from the Fund for providing administrative services to the Fund. The Board also considered the profits realized from other business segments of Lord Abbett, which may benefit from or be related to the Fund’s business. The Board considered Lord Abbett’s profit margins excluding Lord Abbett’s marketing and distribution expenses. The Board also considered Lord Abbett’s profit margins, without those exclusions, in comparison with available industry data and how those profit margins could affect Lord Abbett’s ability to recruit and retain investment personnel. The Board recognized that Lord Abbett’s overall profitability was a factor in enabling it to attract and retain qualified investment management personnel to provide services to the Fund. After reviewing these and related factors, the Board concluded, within the context of its overall approval of the Agreement, that Lord Abbett’s profitability with respect to the Fund was not excessive.
Economies of Scale. The Board considered the extent to which there had been economies of scale in managing the Fund, whether the Fund’s shareholders had appropriately benefited from such economies of scale, and whether there was potential for realization of any further economies of scale. The Board concluded that the existing management fee schedule, with its breakpoints in the level of the management fee, in conjunction with the Fund’s proposed expense limitation agreement, adequately addressed any economies of scale in managing the Fund.
Other Benefits to Lord Abbett. The Board considered the amount and nature of the fees paid by the Fund and the Fund’s shareholders to Lord Abbett for services other than investment advisory services. The Board also considered the revenues and profitability of Lord Abbett’s investment advisory business apart from its mutual fund business, and the intangible benefits enjoyed by Lord
30
Approval of Advisory Contract (concluded)
Abbett by virtue of its relationship with the Fund. The Board observed that the Distributor receives 12b-1 fees from certain of the Lord Abbett Funds as to shares held in accounts for which there is no other broker of record, may retain a portion of the 12b-1 fees it receives, and receives a portion of the sales charges on sales and redemptions of some classes of shares of the Lord Abbett Funds. In addition, the Board observed that Lord Abbett accrues certain benefits for its business of providing investment advice to clients other than the Lord Abbett Funds, but that business also benefits the Funds. The Board also noted that Lord Abbett, as disclosed in the prospectus of the Fund, has entered into revenue sharing arrangements with certain entities that distribute shares of the Fund. The Board also took into consideration the investment research that Lord Abbett receives as a result of Fund brokerage transactions.
Alternative Arrangements. The Board considered whether, instead of approving continuation of the Agreement, it might be in the best interests of the Fund to implement one or more alternative arrangements, such as continuing to employ Lord Abbett, but on different terms. After considering all of the relevant factors, the Board unanimously found that continuation of the Agreement was in the best interests of the Fund and its shareholders and voted unanimously to approve the continuation of the Agreement. In considering whether to approve the continuation of the Agreement, the Board did not identify any single factor as paramount or controlling. Individual Directors may have evaluated the information presented differently from one another, giving different weights to various factors. This summary does not discuss in detail all matters considered.
31
Householding
The Company has adopted a policy that allows it to send only one copy of the Fund’s prospectus, proxy material, annual report and semiannual report to certain shareholders residing at the same “household.” This reduces Fund expenses, which benefits you and other shareholders. If you need additional copies or do not want your mailings to be “householded,” please call Lord Abbett at 888-522-2388 or send a written request with your name, the name of your fund or funds and your account number or numbers to Lord Abbett Family of Funds, P.O. Box 219336, Kansas City, MO 64121.
Proxy Voting Policies, Procedures and Records
A description of the policies and procedures that Lord Abbett uses to vote proxies related to the Fund’s portfolio securities, and information on how Lord Abbett voted the Fund’s proxies during the 12-month period ended June 30 are available without charge, upon request, (i) by calling 888-522-2388; (ii) on Lord Abbett’s Website at www.lordabbett.com; and (iii) on the Securities and Exchange Commission’s (“SEC”) Website at www.sec.gov.
Shareholder Reports and Quarterly Portfolio Disclosure
The Fund is required to file its complete schedule of portfolio holdings with the SEC for its first and third fiscal quarters on Form N-Q. Copies of the filings are available without charge, upon request on the SEC’s Website at www.sec.gov and may be available by calling Lord Abbett at 888-522-2388. You can also obtain copies of Form N-Q by visiting the SEC’s Public Reference Room in Washington, DC (information on the operation of the Public Reference Room may be obtained by calling 800-SEC-0330).
Tax Information
For corporate shareholders, 58% of the Fund’s ordinary income distributions qualified for the dividends received deduction.
Additionally, of the distribution paid to the shareholders during the year ended December 31, 2017, $709,765 and $2,963,913, respectively, represent short-term capital gains and long-term capital gains. |
32


| This report, when not used for the general information of shareholders of the Fund, is to be distributed only if preceded or accompanied by a current fund prospectus. Lord Abbett mutual fund shares are distributed by LORD ABBETT DISTRIBUTOR LLC. | Lord Abbett Series Fund, Inc. Classic Stock Portfolio | SFCLASS-PORT-3 (02/18) |
![]()
LORD ABBETT
ANNUAL REPORT
Lord Abbett
Series Fund—Developing Growth Portfolio
For the fiscal year ended December 31, 2017
Table of Contents
Lord Abbett Series Fund — Developing Growth Portfolio
Annual Report
For the fiscal year ended December 31, 2017

From left to right: James L.L. Tullis, Independent Chairman of the Lord Abbett Funds and Daria L. Foster, Director, President, and Chief Executive Officer of the Lord Abbett Funds.
Dear Shareholders: We are pleased to provide you with this overview of the performance of Lord Abbett Series Fund — Developing Growth Portfolio for the fiscal year ended December 31, 2017. On this page and the following pages, we discuss the major factors that influenced fiscal year performance. For additional information about the Fund, please visit our website at www.lordabbett.com, where you also can access the quarterly commentaries that provide updates on the Fund’s performance and other portfolio related updates.
Thank you for investing in Lord Abbett mutual funds. We value the trust that you place in us and look forward to serving your investment needs in the years to come.
Best regards,

Daria L. Foster
Director, President and Chief Executive Officer
For the fiscal year ended December 31, 2017, the Fund returned 29.92%, reflecting performance at the net asset value (NAV) of Class VC shares, with all distributions reinvested, compared to its benchmark, the Russell 2000® Growth Index,1 which returned 22.17% over the same period.
The domestic equity market (as represented by the S&P 500® Index2) returned 21.83%, ending the year with its strongest quarterly performance in two years and marking its first calendar year with 12 consecutive months of positive performance. Much of the market
momentum was driven by the anticipation of supportive U.S. fiscal policies, as the passage of the Tax Cut and Jobs Act and the prospect of significant infrastructure spending drove the forecast for U.S. gross domestic product (GDP) growth incrementally higher. These forces persisted despite a myriad of geopolitical and environmental headwinds, as threats from North Korea, U.S. political tensions, and Hurricanes Harvey, Irma, and Maria all had the potential to derail the market’s forward progress.
1
During the year, the National Federation of Independent Business Small Business Confidence Index reached a 34 year high, marking its second-highest level in the history of the index. The University of Michigan’s average consumer confidence measure for the year was the highest since 2000, while consumer spending reached an all-time high in the third quarter. A reoccurring theme persisted throughout the year with large caps outperforming small caps and value stocks significantly outpacing their growth-oriented peers.
The U.S. economy continued to expand during the trailing 12-month period. U.S. GDP grew at a 3.2% pace during the third quarter, an increase over the second quarter. The U.S. Bureau of Economic Analysis stated that during the third quarter personal consumption and federal government spending increased, quarter-over-quarter. The Federal Reserve raised target rates three times during the year, changing the target range in December from 1.00–1.25% to 1.25–1.50%. In addition to GDP growth, the U.S. unemployment rate remained relatively steady throughout the period, and was reported at 4.1% in December, a decline of 0.6% year-over-year.
The leading contributor to the Fund’s relative performance during the period was security selection in the information technology sector. Within this sector, the Fund’s holdings of Shopify, Inc., an operator of a multi-faceted cloud-based commerce
platform utilized by businesses, contributed most. Shares of Shopify rose as continued platform enhancements and better than expected new merchant growth fueled accelerated revenue growth and market share gains. Another contributor within this sector over the past year was the Fund’s position in Universal Display Corp., a developer of organic light emitting technologies. Shares of Universal Display appreciated as it reported faster than expected revenue growth, which was driven by iPhone and OLED TV market penetration.
Security selection within the health care sector also positively impacted the Fund’s relative performance during the period. Within this sector, the Fund’s holdings of Exact Sciences, Inc., a molecular diagnostics company, contributed most. Exact Sciences released results that displayed faster than expected adoption of non-invasive colorectal cancer screening.
The leading detractor from the Fund’s performance, relative to the benchmark, during the period was stock selection within the materials sector. Within this sector, the Fund’s position in AK Steel Holding Corp., an operator of steel making and metallurgical coal plants, detracted. Shares of AK Steel were adversely affected by increased raw material costs, which put near-term pressure on the company’s pricing and margins. Additionally, the lack of progress on an infrastructure spending bill and the current administration’s delay in prioritizing section 232, an investigation
2
into steel imports’ relation to national security, were also headwinds. Another detractor within the sector was the Fund’s position in Cleveland-Cliffs, Inc., a mining and natural resources company. Shares of Cleveland-Cliffs declined as iron ore prices fell during the period.
Stock selection and an overweight in the financials sector were detractors from the Fund’s performance, relative to the benchmark, during the period. Within this sector, the Fund’s holdings of WisdomTree Investments, Inc., an asset manager
focused on exchange traded products, detracted. Shares of WisdomTree fell precipitously as higher than expected compensation expenses, pessimism around the company’s international business, and increasing industry pressure on fees, weighed on the stock.
The Fund’s portfolio is actively managed and, therefore, its holdings and the weightings of a particular issuer or particular sector as a percentage of portfolio assets are subject to change. Sectors may include many industries.
1 The Russell 2000® Growth Index measures the performance of those Russell 2000 companies with higher price-to-book ratios and higher forecasted growth values.
2 The S&P 500® Index is widely regarded as the standard for measuring large cap U.S. stock market performance and includes a representative sample of leading companies in leading industries.
Unless otherwise specified, indexes reflect total return, with all dividends reinvested. Indexes are unmanaged, do not reflect the deduction of fees or expenses, and are not available for direct investment.
Important Performance and Other Information
Performance data quoted in the following pages reflect past performance and are no guarantee of future results. Current performance may be higher or lower than the performance quoted. The investment return and principal value of an investment in the Fund will fluctuate so that shares, on any given day or when redeemed, may be worth more or less than their original cost. You can obtain performance data current to the most recent month end by calling Lord Abbett at 888-522-2388 or referring to www.lordabbett.com.
The annual commentary above discusses the views of the Fund’s management and various portfolio holdings of the Fund as of December 31, 2017. These views and portfolio holdings may have changed after this date. Information provided in the commentary is not a recommendation to buy or sell securities. Because the Fund’s portfolio is actively managed and may change significantly, the Fund may no longer own the securities described above or may have otherwise changed its position in the securities. For more recent information about the Fund’s portfolio holdings, please visit www.lordabbett.com.
A Note about Risk: See Notes to Financial Statements for a discussion of investment risks. For a more detailed discussion of the risks associated with the Fund, please see the Fund’s prospectus.
Mutual funds are not insured by the FDIC, are not deposits or other obligations of, or guaranteed by, banks, and are subject to investment risks including possible loss of principal amount invested.
The Fund serves as an underlying investment vehicle for variable annuity contracts and variable life insurance policies.
3
Below is a comparison of a $10,000 investment in Class VC shares with the same investment in the Russell 2000® Growth Index, assuming reinvestment of all dividends and distributions. The Fund’s shares are sold only to insurance company separate accounts that fund certain variable annuity and variable life contracts. The line graph comparison does not reflect the sales charges or other expenses of these contracts. If those sales charges and expenses were reflected, returns would be lower. The graph and performance table below do not reflect the deduction of taxes that a shareholder would pay on Fund distributions or the redemption of Fund shares. During the period, expenses of the Fund have been waived or reimbursed by Lord Abbett; without such waiver or reimbursement of expenses, the Fund’s returns would have been lower. Past performance is no guarantee of future results.

Average Annual Total Returns for the
Periods Ended December 31, 2017
| 1 Year | 5 Years | Life of Class | ||||||||||
| Class VC2 | 29.92 | % | 13.55 | % | 13.12 | % | ||||||
1 Performance for the unmanaged index does not reflect any fees or expenses. The performance of the index is not necessarily representative of the Fund’s performance. Performance for the index began on May 1, 2010.
2 The Class VC shares commenced operations on April 23, 2010. Performance for the Class began on May 1, 2010.
4
As a shareholder of the Fund, you incur ongoing costs, including management fees; expenses related to the Fund’s services arrangements with certain insurance companies; and other Fund expenses. This Example is intended to help you understand your ongoing costs (in dollars) of investing in the Fund and to compare these costs with the ongoing costs of investing in other mutual funds.
The Example is based on an investment of $1,000 invested at the beginning of the period and held for the entire period (July 1, 2017 through December 31, 2017).
The Example reflects only expenses that are deducted from the assets of the Fund. Fees and expenses, including sales charges applicable to the various insurance products that invest in the Fund, are not reflected in this Example. If such fees and expenses were reflected in the Example, the total expenses shown would be higher. Fees and expenses regarding such variable insurance products are separately described in the prospectus related to those products.
Actual Expenses
The first line of the table on the following page provides information about actual account values and actual expenses. You may use the information in this line, together with the amount you invested, to estimate the expenses that you paid over the period. Simply divide your account value by $1,000 (for example, an $8,600 account value divided by $1,000 = 8.6), then multiply the result by the number in the first line under the heading titled “Expenses Paid During Period 7/1/17 – 12/31/17” to estimate the expenses you paid on your account during this period.
Hypothetical Example for Comparison Purposes
The second line of the table on the following page provides information about hypothetical account values and hypothetical expenses based on the Fund’s actual expense ratio and an assumed rate of return of 5% per year before expenses, which is not the Fund’s actual return. The hypothetical account values and expenses may not be used to estimate the actual ending account balance or expenses you paid for the period. You may use this information to compare the ongoing costs of investing in the Fund and other funds. To do so, compare this 5% hypothetical example with the 5% hypothetical examples that appear in the shareholder reports of the other funds.
5
Please note that the expenses shown in the table are meant to highlight your ongoing costs only and do not reflect any transactional costs, such as sales charges. Therefore, the second line of the table is useful in comparing ongoing costs only, and will not help you determine the relative total costs of owning different funds. In addition, if these transactional costs were included, your costs would have been higher.
| Beginning Account Value | Ending Account Value | Expenses Paid During Period† | |||||
| 7/1/17 | 12/31/17 | 7/1/17 - 12/31/17 | |||||
| Class VC | |||||||
| Actual | $1,000.00 | $1,151.10 | $4.88 | ||||
| Hypothetical (5% Return Before Expenses) | $1,000.00 | $1,020.67 | $4.58 |
| † | Net expenses are equal to the Fund’s annualized expense ratio of 0.90%, multiplied by the average account value over the period, multiplied by 184/365 (to reflect one-half year period). |
Portfolio Holdings Presented by Sector
December 31, 2017
| Sector* | %** | |||
| Consumer Discretionary | 17.76 | % | ||
| Energy | 1.66 | % | ||
| Financials | 10.19 | % | ||
| Health Care | 21.42 | % | ||
| Industrials | 19.22 | % | ||
| Information Technology | 26.29 | % | ||
| Materials | 1.99 | % | ||
| Real Estate | 0.51 | % | ||
| Repurchase Agreement | 0.96 | % | ||
| Total | 100.00 | % | ||
| * | A sector may comprise several industries. | |
| ** | Represents percent of total investments. |
| 6 | See Notes to Financial Statements. |
December 31, 2017
| Investments | Shares | Fair Value (000) | ||||||
| COMMON STOCKS 99.25% | ||||||||
| Aerospace & Defense 3.58% | ||||||||
| Aerojet Rocketdyne Holdings, Inc.* | 8,591 | $ | 268 | |||||
| Aerovironment, Inc.* | 6,320 | 355 | ||||||
| BWX Technologies, Inc. | 6,328 | 383 | ||||||
| Curtiss-Wright Corp. | 3,400 | 414 | ||||||
| Total | 1,420 | |||||||
| Air Freight & Logistics 2.92% | ||||||||
| Atlas Air Worldwide Holdings, Inc.* | 8,586 | 504 | ||||||
| XPO Logistics, Inc.* | 7,165 | 656 | ||||||
| Total | 1,160 | |||||||
| Banks 7.79% | ||||||||
| Cadence BanCorp* | 11,406 | 309 | ||||||
| CenterState Bank Corp. | 17,572 | 452 | ||||||
| Pinnacle Financial Partners, Inc. | 6,038 | 400 | ||||||
| Sterling Bancorp | 11,697 | 288 | ||||||
| Texas Capital Bancshares, Inc.* | 4,365 | 388 | ||||||
| Webster Financial Corp. | 5,738 | 322 | ||||||
| Western Alliance Bancorp* | 10,550 | 597 | ||||||
| Wintrust Financial Corp. | 4,023 | 332 | ||||||
| Total | 3,088 | |||||||
| Biotechnology 15.24% | ||||||||
| Agios Pharmaceuticals, Inc.* | 5,737 | 328 | ||||||
| Avexis, Inc.* | 4,793 | 530 | ||||||
| Bluebird Bio, Inc.* | 2,857 | 509 | ||||||
| Blueprint Medicines Corp.* | 9,308 | 702 | ||||||
| Clovis Oncology, Inc.* | 2,978 | 203 | ||||||
| Exact Sciences Corp.* | 9,250 | 486 | ||||||
| FibroGen, Inc.* | 6,877 | 326 | ||||||
| Foundation Medicine, Inc.* | 6,686 | 456 | ||||||
| Insmed, Inc.* | 7,484 | 233 | ||||||
| Loxo Oncology, Inc.* | 5,204 | 438 | ||||||
| Repligen Corp.* | 5,799 | 210 | ||||||
| Sage Therapeutics, Inc.* | 5,212 | 859 | ||||||
| Sarepta Therapeutics, Inc.* | 8,042 | 447 | ||||||
| Investments | Shares | Fair Value (000) | ||||||
| Biotechnology (continued) | ||||||||
| Spark Therapeutics, Inc.* | 3,984 | $ | 205 | |||||
| TESARO, Inc.* | 1,345 | 112 | ||||||
| Total | 6,044 | |||||||
| Building Products 2.34% | ||||||||
| Builders FirstSource, Inc.* | 24,342 | 530 | ||||||
| Trex Co., Inc.* | 3,670 | 398 | ||||||
| Total | 928 | |||||||
| Capital Markets 2.20% | ||||||||
| Evercore, Inc. Class A | 4,902 | 441 | ||||||
| Hamilton Lane, Inc. Class A | 1,000 | 35 | ||||||
| Moelis & Co. Class A | 8,200 | 398 | ||||||
| Total | 874 | |||||||
| Chemicals 0.79% | ||||||||
| Minerals Technologies, Inc. | 368 | 25 | ||||||
| PolyOne Corp. | 6,609 | 288 | ||||||
| Total | 313 | |||||||
| Commercial Services & Supplies 0.64% | ||||||||
| Brink’s Co. (The) | 3,242 | 255 | ||||||
| Communications Equipment 0.46% | ||||||||
| Lumentum Holdings, Inc.* | 3,735 | 183 | ||||||
| Construction & Engineering 2.50% | ||||||||
| MasTec, Inc.* | 10,238 | 501 | ||||||
| Quanta Services, Inc.* | 12,506 | 489 | ||||||
| Total | 990 | |||||||
| Construction Materials 1.21% | ||||||||
| Eagle Materials, Inc. | 4,225 | 479 | ||||||
| Diversified Consumer Services 3.00% | ||||||||
| Chegg, Inc.* | 37,267 | 608 | ||||||
| Grand Canyon Education, Inc.* | 6,488 | 581 | ||||||
| Total | 1,189 | |||||||
| Electronic Equipment, Instruments & Components 1.39% | ||||||||
| Universal Display Corp. | 3,183 | 550 | ||||||
| See Notes to Financial Statements. | 7 |
Schedule of Investments (continued)
December 31, 2017
| Investments | Shares | Fair Value (000) | ||||||
| Health Care Equipment & Supplies 4.99% | ||||||||
| ABIOMED, Inc.* | 710 | $ | 133 | |||||
| Insulet Corp.* | 12,572 | 868 | ||||||
| Nevro Corp.* | 4,653 | 321 | ||||||
| Penumbra, Inc.* | 6,993 | 658 | ||||||
| Total | 1,980 | |||||||
| Health Care Providers & Services 1.23% | ||||||||
| HealthEquity, Inc.* | 6,208 | 290 | ||||||
| Tivity Health, Inc.* | 5,443 | 199 | ||||||
| Total | 489 | |||||||
| Hotels, Restaurants & Leisure 4.49% | ||||||||
| Dave & Buster’s Entertainment, Inc.* | 5,635 | 311 | ||||||
| Marriott Vacations Worldwide Corp. | 3,101 | 419 | ||||||
| Planet Fitness, Inc. Class A* | 30,320 | 1,050 | ||||||
| Total | 1,780 | |||||||
| Household Durables 2.94% | ||||||||
| Roku, Inc.* | 10,772 | 558 | ||||||
| SodaStream International Ltd. (Israel)*(a) | 8,668 | 609 | ||||||
| Total | 1,167 | |||||||
| Information Technology Services 1.00% | ||||||||
| EPAM Systems, Inc.* | 3,674 | 395 | ||||||
| Internet & Direct Marketing Retail 0.46% | ||||||||
| Overstock.com, Inc.* | 2,842 | 182 | ||||||
| Internet Software & Services 10.55% | ||||||||
| 2U, Inc.* | 13,286 | 857 | ||||||
| Alarm.com Holdings, Inc.* | 5,045 | 190 | ||||||
| Cargurus, Inc.* | 9,415 | 282 | ||||||
| Coupa Software, Inc.* | 5,324 | 166 | ||||||
| Etsy, Inc.* | 15,338 | 314 | ||||||
| Five9, Inc.* | 21,897 | 545 | ||||||
| GrubHub, Inc.* | 10,735 | 771 | ||||||
| Mimecast Ltd.* | 6,730 | 193 | ||||||
| MuleSoft, Inc. Class A* | 3,904 | 91 | ||||||
| Okta, Inc.* | 4,718 | 121 | ||||||
| Investments | Shares | Fair Value (000) | ||||||
| Internet Software & Services (continued) | ||||||||
| Stamps.com, Inc.* | 2,057 | $ | 387 | |||||
| Trade Desk, Inc. (The) Class A* | 5,863 | 268 | ||||||
| Total | 4,185 | |||||||
| Machinery 3.72% | ||||||||
| Allison Transmission Holdings, Inc. | 9,148 | 394 | ||||||
| Chart Industries, Inc.* | 8,472 | 397 | ||||||
| Proto Labs, Inc.* | 3,806 | 392 | ||||||
| RBC Bearings, Inc.* | 2,314 | 292 | ||||||
| Total | 1,475 | |||||||
| Media 1.68% | ||||||||
| Live Nation Entertainment, Inc.* | 15,672 | 667 | ||||||
| Multi-Line Retail 0.46% | ||||||||
| Ollie’s Bargain Outlet Holdings, Inc.* | 3,405 | 181 | ||||||
| Oil, Gas & Consumable Fuels 1.66% | ||||||||
| GasLog Ltd. (Monaco)(a) | 29,664 | 660 | ||||||
| Professional Services 0.49% | ||||||||
| WageWorks, Inc.* | 3,139 | 195 | ||||||
| Real Estate Management & Development 0.52% | ||||||||
| Redfin Corp.* | 6,518 | 204 | ||||||
| Semiconductors & Semiconductor Equipment 4.14% | ||||||||
| Cavium, Inc.* | 3,335 | 280 | ||||||
| CEVA, Inc.* | 8,614 | 398 | ||||||
| Cirrus Logic, Inc.* | 4,001 | 207 | ||||||
| Inphi Corp.* | 4,764 | 174 | ||||||
| Monolithic Power Systems, Inc. | 5,179 | 582 | ||||||
| Total | 1,641 | |||||||
| Software 8.81% | ||||||||
| Appian Corp.* | 5,454 | 172 | ||||||
| Blackline, Inc.* | 6,076 | 199 | ||||||
| Everbridge, Inc.* | 8,939 | 266 | ||||||
| HubSpot, Inc.* | 8,432 | 745 | ||||||
| 8 | See Notes to Financial Statements. |
Schedule of Investments (concluded)
December 31, 2017
| Investments | Shares | Fair Value (000) | ||||||
| Software (continued) | ||||||||
| Materialise NV ADR* | 5,840 | $ | 74 | |||||
| Paycom Software, Inc.* | 7,051 | 566 | ||||||
| Paylocity Holding Corp.* | 5,442 | 257 | ||||||
| Proofpoint, Inc.* | 5,415 | 481 | ||||||
| RingCentral, Inc. Class A* | 11,267 | 545 | ||||||
| Verint Systems, Inc.* | 4,513 | 189 | ||||||
| Total | 3,494 | |||||||
| Specialty Retail 3.28% | ||||||||
| At Home Group, Inc.* | 9,483 | 288 | ||||||
| Camping World Holdings, Inc. Class A | 8,745 | 391 | ||||||
| Floor & Decor Holdings, Inc. Class A* | 11,573 | 563 | ||||||
| National Vision Holdings, Inc.* | 1,466 | 60 | ||||||
| Total | 1,302 | |||||||
| Textiles, Apparel & Luxury Goods 1.49% | ||||||||
| Canada Goose Holdings, Inc. (Canada)*(a) | 18,754 | 592 | ||||||
| Thrifts & Mortgage Finance 0.22% | ||||||||
| WSFS Financial Corp. | 1,795 | 86 | ||||||
| Trading Companies & Distributors 3.06% | ||||||||
| Air Lease Corp. | 12,829 | 617 | ||||||
| Beacon Roofing Supply, Inc.* | 9,365 | 597 | ||||||
| Total | 1,214 | |||||||
| Total Common Stocks (cost $31,760,173) | 39,362 | |||||||
| Investments | Principal Amount (000) | Fair Value (000) | ||||||
| SHORT-TERM INVESTMENT 0.96% | ||||||||
| Repurchase Agreement | ||||||||
| Repurchase Agreement dated 12/29/2017, 0.54% due 1/2/2018 with Fixed Income Clearing Corp. collateralized by $325,000 of U.S. Treasury Bond at 7.875% due 2/15/2021; value: $392,310; proceeds: $379,738 (cost $379,716) | $ | 380 | $ | 380 | ||||
| Total Investments in Securities 100.21% (cost $32,139,889) | 39,742 | |||||||
| Liabilities in Excess of Other Assets (0.21)% | (84 | ) | ||||||
| Net Assets 100.00% | $ | 39,658 | ||||||
| ADR | American Depositary Receipt. | |
| * | Non-income producing security. | |
| (a) | Foreign security traded in U.S. dollars. |
The following is a summary of the inputs used as of December 31, 2017 in valuing the Fund’s investments carried at fair value(1):
| Level 1 | Level 2 | Level 3 | Total | |||||||||||||
| Investment Type(2)(3) | (000) | (000) | (000) | (000) | ||||||||||||
| Common Stocks | $ | 39,362 | $ | – | $ | – | $ | 39,362 | ||||||||
| Repurchase Agreement | – | 380 | – | 380 | ||||||||||||
| Total | $ | 39,362 | $ | 380 | $ | – | $ | 39,742 | ||||||||
| (1) | Refer to Note 2(h) for a description of fair value measurements and the three-tier hierarchy of inputs. | |
| (2) | See Schedule of Investments for fair values in each industry and identification of foreign issuers and/or geography. | |
| (3) | There were no Level 1/Level 2 transfers during the fiscal year ended December 31, 2017. |
| See Notes to Financial Statements. | 9 |
Statement of Assets and Liabilities
December 31, 2017
| ASSETS: | ||||
| Investments in securities, at fair value (cost $32,139,889) | $ | 39,741,593 | ||
| Receivables: | ||||
| Investment securities sold | 117,511 | |||
| Capital shares sold | 23,412 | |||
| From advisor (See Note 3) | 10,480 | |||
| Interest and dividends | 5,530 | |||
| Prepaid expenses | 173 | |||
| Total assets | 39,898,699 | |||
| LIABILITIES: | ||||
| Payables: | ||||
| Investment securities purchased | 113,249 | |||
| Capital shares reacquired | 30,293 | |||
| Management fee | 25,370 | |||
| Directors’ fees | 2,269 | |||
| Fund administration | 1,353 | |||
| Accrued expenses | 67,849 | |||
| Total liabilities | 240,383 | |||
| NET ASSETS | $ | 39,658,316 | ||
| COMPOSITION OF NET ASSETS: | ||||
| Paid-in capital | $ | 33,135,442 | ||
| Accumulated net investment loss | (2,269 | ) | ||
| Accumulated net realized loss on investments | (1,076,561 | ) | ||
| Net unrealized appreciation on investments | 7,601,704 | |||
| Net Assets | $ | 39,658,316 | ||
| Outstanding shares (50 million shares of common stock authorized, $.001 par value) | 1,407,406 | |||
| Net asset value, offering and redemption price per share (Net assets divided by outstanding shares) | $28.18 |
| 10 | See Notes to Financial Statements. |
For the Year Ended December 31, 2017
| Investment income: | ||||
| Dividends | $ | 129,679 | ||
| Interest | 1,109 | |||
| Total investment income | 130,788 | |||
| Expenses: | ||||
| Management fee | 258,012 | |||
| Non 12b-1 service fees | 86,130 | |||
| Professional | 40,892 | |||
| Shareholder servicing | 36,896 | |||
| Custody | 18,360 | |||
| Reports to shareholders | 15,734 | |||
| Fund administration | 13,761 | |||
| Directors’ fees | 945 | |||
| Other | 4,837 | |||
| Gross expenses | 475,567 | |||
| Expense reductions (See Note 8) | (317 | ) | ||
| Fees waived and expenses reimbursed (See Note 3) | (165,636 | ) | ||
| Net expenses | 309,614 | |||
| Net investment loss | (178,826 | ) | ||
| Net realized and unrealized gain: | ||||
| Net realized gain on investments | 3,225,081 | |||
| Net change in unrealized appreciation/depreciation on investments | 5,999,258 | |||
| Net realized and unrealized gain | 9,224,339 | |||
| Net Increase in Net Assets Resulting From Operations | $ | 9,045,513 |
| See Notes to Financial Statements. | 11 |
Statements of Changes in Net Assets
| INCREASE (DECREASE) IN NET ASSETS | For the Year Ended December 31, 2017 | For the Year Ended December 31, 2016 | ||||||
| Operations: | ||||||||
| Net investment loss | $ | (178,826 | ) | $ | (104,073 | ) | ||
| Net realized gain (loss) on investments | 3,225,081 | (1,968,606 | ) | |||||
| Net change in unrealized appreciation/depreciation on investments | 5,999,258 | 1,799,143 | ||||||
| Net increase (decrease) in net assets resulting from operations | 9,045,513 | (273,536 | ) | |||||
| Capital share transactions (See Note 13): | ||||||||
| Proceeds from sales of shares | 9,093,518 | 15,087,712 | ||||||
| Cost of shares reacquired | (7,085,462 | ) | (15,091,059 | ) | ||||
| Net increase (decrease) in net assets resulting from capital share transactions | 2,008,056 | (3,347 | ) | |||||
| Net increase (decrease) in net assets | 11,053,569 | (276,883 | ) | |||||
| NET ASSETS: | ||||||||
| Beginning of year | $ | 28,604,747 | $ | 28,881,630 | ||||
| End of year | $ | 39,658,316 | $ | 28,604,747 | ||||
| Accumulated net investment loss | $ | (2,269 | ) | $ | (1,760 | ) | ||
| 12 | See Notes to Financial Statements. |
This page is intentionally left blank.
| Per Share Operating Performance: | ||||||||||||||||||||||||
| Investment operations: | Distributions to shareholders from: | |||||||||||||||||||||||
| Net asset value, beginning of period | Net investment income (loss)(a) | Net realized and unrealized gain (loss) | Total from investment operations | Net realized gain | Net asset value, end of period | |||||||||||||||||||
| 12/31/2017 | $21.69 | $(0.13 | ) | $ 6.62 | $ 6.49 | $ – | $28.18 | |||||||||||||||||
| 12/31/2016 | 22.28 | (0.07 | ) | (0.52 | ) | (0.59 | ) | – | 21.69 | |||||||||||||||
| 12/31/2015 | 24.46 | (0.14 | ) | (1.86 | ) | (2.00 | ) | (0.18 | ) | 22.28 | ||||||||||||||
| 12/31/2014 | 23.74 | (0.16 | ) | 1.03 | 0.87 | (0.15 | ) | 24.46 | ||||||||||||||||
| 12/31/2013 | 16.43 | (0.16 | ) | 9.44 | 9.28 | (1.97 | ) | 23.74 | ||||||||||||||||
| (a) | Calculated using average shares outstanding during the period. | |
| (b) | Total return does not consider the effects of sales charges or other expenses imposed by an insurance company and assumes the reinvestment of all distributions. |
| 14 | See Notes to Financial Statements. |
| Ratios to Average Net Assets: | Supplemental Data: | |||||||||||||||||||||
| Total return(b) (%) | Total expenses after waivers and/or reimburse- ments (%) | Total expenses (%) | Net investment income (loss) (%) | Net assets, end of period (000) | Portfolio turnover rate (%) | |||||||||||||||||
| 29.92 | 0.90 | 1.38 | (0.52 | ) | $39,658 | 103 | ||||||||||||||||
| (2.60 | ) | 0.90 | 1.51 | (0.34 | ) | 28,605 | 222 | |||||||||||||||
| (8.21 | ) | 0.90 | 1.56 | (0.56 | ) | 28,882 | 197 | |||||||||||||||
| 3.71 | 0.90 | 2.02 | (0.68 | ) | 17,494 | 235 | ||||||||||||||||
| 56.68 | 0.90 | 6.47 | (0.72 | ) | 4,294 | 245 | ||||||||||||||||
| See Notes to Financial Statements. | 15 |
| 1. | ORGANIZATION |
Lord Abbett Series Fund, Inc. (the “Company”) is registered under the Investment Company Act of 1940, as amended (the “Act”), as a diversified, open-end management investment company and was incorporated under Maryland law in 1989. The Company consists of twelve separate portfolios. This report covers Developing Growth Portfolio (the “Fund”).
The Fund’s investment objective is long-term growth of capital. The Fund has Variable Contract class shares (“Class VC Shares”), which are currently issued and redeemed only in connection with investments in, and payments under, variable annuity contracts and variable life insurance policies issued by life insurance and insurance-related companies.
The preparation of the financial statements in conformity with accounting principles generally accepted in the United States of America (“U.S. GAAP”) requires management to make certain estimates and assumptions that affect the reported amounts of assets and liabilities and disclosure of contingent assets and liabilities at the date of the financial statements and the reported amounts of increases and decreases in net assets from operations during the reporting period. Actual results could differ from those estimates. The Fund is considered an investment company under U.S. GAAP and follows the accounting and reporting guidance applicable to investment companies.
| 2. | SIGNIFICANT ACCOUNTING POLICIES |
| (a) | Investment Valuation–Under procedures approved by the Fund’s Board of Directors (the “Board”), Lord, Abbett & Co. LLC (“Lord Abbett”), the Fund’s investment manager, has formed a Pricing Committee to administer the pricing and valuation of portfolio investments and to ensure that prices utilized reasonably reflect fair value. Among other things, these procedures allow the Fund to utilize independent pricing services, quotations from securities and financial instrument dealers and other market sources to determine fair value. |
| Securities actively traded on any recognized U.S. or non-U.S. exchange or on The NASDAQ Stock Market LLC are valued at the last sale price or official closing price on the exchange or system on which they are principally traded. Events occurring after the close of trading on non-U.S. exchanges may result in adjustments to the valuation of foreign securities to reflect their fair value as of the close of regular trading on the New York Stock Exchange. The Fund may utilize an independent fair valuation service in adjusting the valuations of foreign securities. Unlisted equity securities are valued at the last quoted sale price or, if no sale price is available, at the mean between the most recently quoted bid and asked prices. Exchange traded options and futures contracts are valued at the last sale price in the market where they are principally traded. If no sale has occurred, the mean between the most recently quoted bid and asked prices is used. | |
| Securities for which prices are not readily available are valued at fair value as determined by the Pricing Committee. The Pricing Committee considers a number of factors, including observable and unobservable inputs, when arriving at fair value. The Pricing Committee may use related or comparable assets or liabilities, recent transactions, market multiples, book values and other relevant information to determine the fair value of portfolio investments. The Board or a designated committee thereof regularly reviews fair value determinations made by the Pricing Committee and may employ techniques such as reviewing related market activity, reviewing inputs and assumptions, and retrospectively comparing prices of subsequent purchases and sales transactions to fair value determinations made by the Pricing Committee. |
16
Notes to Financial Statements (continued)
| Short-term securities with 60 days or less remaining to maturity are valued using the amortized cost method, which approximates fair value. | |
| (b) | Security Transactions–Security transactions are recorded as of the date that the securities are purchased or sold (trade date). Realized gains and losses on sales of portfolio securities are calculated using the identified-cost method. |
| (c) | Investment Income–Dividend income is recorded on the ex-dividend date. Interest income is recorded on the accrual basis as earned. Discounts are accreted and premiums are amortized using the effective interest method and are included in Interest and other income on the Statement of Operations. Withholding taxes on foreign dividends have been provided for in accordance with the applicable country’s tax rules and rates. |
| (d) | Income Taxes–It is the policy of the Fund to meet the requirements of Subchapter M of the Internal Revenue Code applicable to regulated investment companies and to distribute substantially all taxable income and capital gains to its shareholders. Therefore, no income tax provision is required. |
| The Fund files U.S. federal and various state and local tax returns. No income tax returns are currently under examination. The statute of limitations on the Fund’s filed U.S. federal tax returns remains open for the fiscal years ended December 31, 2014 through December 31, 2017. The statutes of limitations on the Company’s state and local tax returns may remain open for an additional year depending upon the jurisdiction. | |
| (e) | Expenses–Expenses incurred by the Company that do not specifically relate to an individual fund are generally allocated to the funds within the Company on a pro rata basis by relative net assets. |
| (f) | Foreign Transactions–The books and records of the Fund are maintained in U.S. dollars and transactions denominated in foreign currencies are recorded in the Fund’s records at the rate prevailing when earned or recorded. Asset and liability accounts that are denominated in foreign currencies are adjusted daily to reflect current exchange rates and any unrealized gain (loss) is included in Net change in unrealized appreciation/depreciation on investments in the Fund’s Statement of Operations. The resultant exchange gains and losses upon settlement of such transactions are included in Net realized loss on investments in the Fund’s Statement of Operations. The Fund does not isolate that portion of the results of operations arising as a result of changes in the foreign exchange rates from the changes in market prices of the securities. |
| (g) | Repurchase Agreements–The Fund may enter into repurchase agreements with respect to securities. A repurchase agreement is a transaction in which a fund acquires a security and simultaneously commits to resell that security to the seller (a bank or securities dealer) at an agreed-upon price on an agreed-upon date. The Fund requires at all times that the repurchase agreement be collateralized by cash, or by securities of the U.S. Government, its agencies, its instrumentalities, or U.S. Government sponsored enterprises having a value equal to, or in excess of, the value of the repurchase agreement (including accrued interest). If the seller of the agreement defaults on its obligation to repurchase the underlying securities at a time when the fair value of these securities has declined, the Fund may incur a loss upon disposition of the securities. |
| (h) | Fair Value Measurements–Fair value is defined as the price that the Fund would receive upon selling an investment or transferring a liability in an orderly transaction to an independent buyer in the principal or most advantageous market of the investment. A three-tier hierarchy |
17
Notes to Financial Statements (continued)
| is used to maximize the use of observable market data and minimize the use of unobservable inputs and to establish classification of fair value measurements for disclosure purposes. Inputs refer broadly to the assumptions that market participants would use in pricing the asset or liability, including assumptions about risk — for example, the risk inherent in a particular valuation technique used to measure fair value (such as a pricing model) and/or the risk inherent in the inputs to the valuation technique. Inputs may be observable or unobservable. Observable inputs reflect the assumptions market participants would use in pricing the asset or liability. Observable inputs are based on market data obtained from sources independent of the reporting entity. Unobservable inputs reflect the reporting entity’s own assumptions about the assumptions market participants would use in pricing the asset or liability. Unobservable inputs are based on the best information available in the circumstances. The three-tier hierarchy classification is determined based on the lowest level of inputs that is significant to the fair value measurement, and is summarized in the three broad Levels listed below: | |
| • | Level 1 – | unadjusted quoted prices in active markets for identical investments; | |
| • | Level 2 – | other significant observable inputs (including quoted prices for similar investments, interest rates, prepayment speeds, credit risk, etc.); and | |
| • | Level 3 – | significant unobservable inputs (including the Fund’s own assumptions in determining the fair value of investments). | |
| A summary of inputs used in valuing the Fund’s investments as of December 31, 2017 and, if applicable, Level 1/Level 2 transfers and Level 3 rollforwards for the fiscal year then ended is included in the Fund’s Schedule of Investments. | |
| Changes in valuation techniques may result in transfers into or out of an assigned level within the three-tier hierarchy. All transfers between different levels within the three-tier hierarchy are deemed to have occurred as of the beginning of the reporting period. The inputs or methodology used for valuing securities are not necessarily an indication of the risk associated with investing in those securities. | |
| 3. | MANAGEMENT FEE AND OTHER TRANSACTIONS WITH AFFILIATES |
Management Fee
The Company has a management agreement with Lord Abbett, pursuant to which Lord Abbett supplies the Fund with investment management services and executive and other personnel, provides office space and pays for ordinary and necessary office and clerical expenses relating to research and statistical work and supervision of the Fund’s investment portfolio.
The management fee is based on the Fund’s average daily net assets at the following annual rate:
| First $100 million | .75% |
| Over $100 million | .50% |
For the fiscal year ended December 31, 2017, the effective management fee, net of waivers, was at an annualized rate of 0.27% of the Fund’s average daily net assets.
In addition, Lord Abbett provides certain administrative services to the Fund pursuant to an Administrative Services Agreement in return for a fee at an annual rate of ..04% of the Fund’s average daily net assets.
During the fiscal year ended December 31, 2017 and continuing through April 30, 2018, Lord Abbett has contractually agreed to waive its fees and reimburse expenses to the extent necessary
18
Notes to Financial Statements (continued)
to limit total net annual operating expenses to an annual rate of 0.90%. This agreement may be terminated prior to April 30, 2018 only upon the approval of the Board.
The Company, on behalf of the Fund, has entered into services arrangements with certain insurance companies. Under these arrangements, certain insurance companies will be compensated up to .25% of the average daily net asset value (“NAV”) of the Fund’s Class VC Shares held in the insurance company’s separate account to service and maintain the Variable Contract owners’ accounts. This amount is included in Non 12b-1 service fees on the Statement of Operations. The Fund may also compensate certain insurance companies, third-party administrators and other entities for providing recordkeeping, sub-transfer agency and other administrative services to the Fund. This amount is included in Shareholder servicing on the Statement of Operations.
Two Directors and certain of the Company’s officers have an interest in Lord Abbett.
| 4. | DISTRIBUTIONS AND CAPITAL LOSS CARRYFORWARDS |
Dividends from net investment income, if any, are declared and paid at least semi-annually. Taxable net realized gains from investment transactions, reduced by allowable capital loss carryforwards, if any, are declared and distributed to shareholders at least annually. The capital loss carryforward amount, if any, is available to offset future net capital gains. Dividends and distributions to shareholders are recorded on the ex-dividend date. The amounts of dividends and distributions from net investment income and net realized capital gains are determined in accordance with federal income tax regulations, which may differ from U.S. GAAP. These book/tax differences are either considered temporary or permanent in nature. To the extent these differences are permanent in nature, such amounts are reclassified within the components of net assets based on their federal tax basis treatment; temporary differences do not require reclassification. Dividends and distributions that exceed earnings and profits for tax purposes are reported as a tax return of capital.
As of December 31, 2017, the components of accumulated gains on a tax-basis were as follows:
| Capital loss carryforwards* | $ | (920,342 | ) | |
| Temporary differences | (2,269 | ) | ||
| Unrealized gains – net | 7,445,485 | |||
| Total accumulated gains – net | $ | 6,522,874 |
| * | The capital losses will carry forward indefinitely. |
As of December 31, 2017, the aggregate unrealized security gains and losses on investments and other financial instruments based on cost for U.S. federal income tax purposes were as follows:
| Tax cost | $ | 32,296,108 | ||
| Gross unrealized gain | 8,236,112 | |||
| Gross unrealized loss | (790,627 | ) | ||
| Net unrealized security gain | $ | 7,445,485 |
The difference between book-basis and tax-basis unrealized gains (losses) is attributable to the tax treatment of wash sales.
19
Notes to Financial Statements (continued)
Permanent items identified during the fiscal year ended December 31, 2017 have been reclassified among the components of net assets based on their tax basis treatment as follows:
| Accumulated Net Investment Loss | Paid-in Capital | ||
| $178,317 | $(178,317 | ) |
The permanent differences are attributable to the tax treatment of net investment losses.
| 5. | PORTFOLIO SECURITIES TRANSACTIONS |
Purchases and sales of investment securities (excluding short-term investments) for the fiscal year ended December 31, 2017 were as follows:
| Purchases | Sales | ||
| $36,536,142 | $34,720,298 |
There were no purchases or sales of U.S. Government securities for the fiscal year ended December 31, 2017.
The Fund is permitted to purchase and sell securities (“cross-trade”) from and to other Lord Abbett funds or client accounts pursuant to procedures approved by the Board in compliance with Rule 17a-7 under the Act (the “Rule”). Each cross-trade is executed at a fair market price in compliance with provisions of the Rule. For the year ended December 31, 2017, the Fund engaged in cross-trades purchases of $81,330 and sales of $159,651, which resulted in net realized gains of $27,972.
| 6. | DISCLOSURES ABOUT OFFSETTING ASSETS AND LIABILITIES |
The Financial Accounting Standards Board (“FASB”) requires disclosures intended to help better assess the effect or potential effect of offsetting arrangements on a fund’s financial position. The following tables illustrate gross and net information about recognized assets and liabilities eligible for offset in the statement of assets and liabilities; and disclose such amounts subject to an enforceable master netting agreement or similar agreement, by counterparty. A master netting agreement is an agreement between a fund and a counterparty which provides for the net settlement of amounts owed under all contracts traded under that agreement, as well as cash collateral, through a single payment by one party to the other in the event of default on or termination of any one contract. The Fund’s accounting policy with respect to balance sheet offsetting is that, absent an event of default by the counterparty or a termination of the agreement, the master netting agreement does not result in an offset of reported amounts of financial assets and liabilities in the statement of assets and liabilities across transactions between the Fund and the applicable counterparty:
| Description | Gross Amounts of Recognized Assets | Gross Amounts Offset in the Statement of Assets and Liabilities | Net Amounts of Assets Presented in the Statement of Assets and Liabilities | |||||||||
| Repurchase Agreement | $379,716 | $ | – | $379,716 | ||||||||
| Total | $379,716 | $ | – | $379,716 | ||||||||
20
Notes to Financial Statements (continued)
| Net Amounts of Assets Presented in the Statement of Assets and Liabilities | Amounts Not Offset in the Statement of Assets and Liabilities | |||||||||||||||||||
| Counterparty | Financial Instruments | Cash Collateral Received(a) | Securities Collateral Received(a) | Net Amount(b) | ||||||||||||||||
| Fixed Income Clearing Corp. | $379,716 | $ | – | $ | – | $(379,716 | ) | $ | – | |||||||||||
| Total | $379,716 | $ | – | $ | – | $(379,716 | ) | $ | – | |||||||||||
| (a) | Collateral disclosed is limited to an amount not to exceed 100% of the net amount of assets presented in the Statement of Assets and Liabilities, for each respective counterparty. |
| (b) | Net amount represents the amount owed to the Fund by the counterparty as of December 31, 2017. |
| 7. | DIRECTORS’ REMUNERATION |
The Company’s officers and two Directors, who are associated with Lord Abbett, do not receive any compensation from the Company for serving in such capacities. Independent Directors’ fees are allocated among all Lord Abbett-sponsored funds based on the net assets of each fund. There is an equity-based plan available to all Independent Directors under which Independent Directors must defer receipt of a portion of, and may elect to defer receipt of an additional portion of Directors’ fees. The deferred amounts are treated as though equivalent dollar amounts had been invested in the funds. Such amounts and earnings accrued thereon are included in Directors’ fees on the Statement of Operations and in Directors’ fees payable on the Statement of Assets and Liabilities and are not deductible for U.S. federal income tax purposes until such amounts are paid.
| 8. | EXPENSE REDUCTIONS |
The Company has entered into an arrangement with its transfer agent and custodian, whereby credits realized as a result of uninvested cash balances are used to reduce a portion of the Fund’s expenses.
| 9. | LINE OF CREDIT |
Effective August 28, 2017, the Fund and certain other funds managed by Lord Abbett (collectively, the “Participating Funds”) entered into an amended syndicated line of credit facility with various lenders for $600 million (the “Facility”), whereas State Street Bank and Trust Company (“SSB”) participates as a lender and as agent for the lenders. The Facility is to be used for temporary or emergency purposes as an additional source of liquidity to satisfy redemptions. The Participating Funds are subject to graduated borrowing limits of one-third of Fund assets (if Fund assets are less than $750 million), $250 million, $300 million, or $350 million, based on past borrowings and likelihood of future borrowings.
Prior to August 28, 2017, the Funds and certain other funds managed by Lord Abbett participated in a $550 million syndicated line of credit facility, based on the same terms as described above.
During the fiscal year ended December 31, 2017, the Fund did not utilize the Facility.
| 10. | INTERFUND LENDING PROGRAM |
Pursuant to an exemptive order issued by the U.S. Securities and Exchange Commission (“SEC exemptive order”), certain registered open-end management investment companies managed by Lord Abbett, including the Fund, participate in a joint lending and borrowing program (the “Interfund Lending Program”). The SEC exemptive order allows the Funds to borrow money from and lend money to each other for temporary or emergency purposes subject to the limitations and conditions.
21
Notes to Financial Statements (concluded)
During the fiscal year ended December 31, 2017, the Fund did not participate as a borrower or lender in the Interfund Lending Program.
| 11. | CUSTODIAN AND ACCOUNTING AGENT |
SSB is the Company’s custodian and accounting agent. SSB performs custodial, accounting and recordkeeping functions relating to portfolio transactions and calculating the Fund’s NAV.
| 12. | INVESTMENT RISKS |
The Fund is subject to the general risks and considerations associated with equity investing. The value of an investment will fluctuate in response to movements in the equity securities markets in general and to the changing prospects of individual companies in which the Fund invests.
The Fund has particular risks associated with growth stocks. Different types of stocks shift in and out of favor over time depending on market and economic conditions. Growth stocks tend to be more volatile than other stocks. Growth stocks are often more sensitive to marker fluctuations than other securities because their market prices are highly sensitive to future earnings expectations. In addition, if the Fund’s assessment of a company’s potential for growth or market conditions is wrong, it could suffer losses or produce poor performance relative to other funds, even in a favorable market. The Fund invests primarily in small-cap growth company stocks, which tend to be more volatile and can be less liquid than other types of stocks. The shares of small and mid-sized companies tend to trade less frequently than those of larger, more established companies, which can adversely affect the pricing of these securities and the ability to sell these securities in the future. Small-cap companies may also have more limited product lines, markets or financial resources, and typically experience a higher risk of failure than large-cap companies. Because the Fund may invest a portion of its assets in foreign securities and American Depositary Receipts, it may experience increased market, industry and sector, liquidity, currency, political, information and other risks. The securities of foreign companies also may be subject to inadequate exchange control regulations, the imposition of economic sanctions or other government restrictions, higher transaction and other costs, and delays in settlement to the extent they are traded on non-U.S. exchanges or markets.
These factors can affect the Fund’s performance.
| 13. | SUMMARY OF CAPITAL TRANSACTIONS |
Transactions in shares of capital stock were as follows:
| Year Ended December 31, 2017 | Year Ended December 31, 2016 | |||||||
| Shares sold | 371,336 | 738,518 | ||||||
| Reinvestment of distributions | – | – | ||||||
| Shares reacquired | (282,612 | ) | (716,390 | ) | ||||
| Increase | 88,724 | 22,128 | ||||||
22
Report of Independent Registered Public Accounting Firm
To the Board of Directors of Lord Abbett Series Fund, Inc. and the shareholders of Developing Growth Portfolio:
Opinion on the Financial Statements and Financial Highlights
We have audited the accompanying statement of assets and liabilities, including the schedule of investments, of the Developing Growth Portfolio, one of the portfolios constituting the Lord Abbett Series Fund, Inc. (the “Fund”), as of December 31, 2017, the related statement of operations for the year then ended, the statements of changes in net assets for each of the two years in the period then ended, the financial highlights for each of the five years in the period then ended, and the related notes. In our opinion, the financial statements and financial highlights present fairly, in all material respects, the financial position of the Developing Growth Portfolio of the Fund as of December 31, 2017, the results of its operations for the year then ended, the changes in its net assets for each of the two years in the period then ended, and the financial highlights for each of the five years in the period then ended, in conformity with accounting principles generally accepted in the United States of America.
Basis for Opinion
These financial statements and financial highlights are the responsibility of the Fund’s management. Our responsibility is to express an opinion on the Fund’s financial statements and financial highlights based on our audits. We are a public accounting firm registered with the Public Company Accounting Oversight Board (United States) (PCAOB) and are required to be independent with respect to the Fund in accordance with the U.S. federal securities laws and the applicable rules and regulations of the Securities and Exchange Commission and the PCAOB.
We conducted our audits in accordance with the standards of the PCAOB. Those standards require that we plan and perform the audit to obtain reasonable assurance about whether the financial statements and financial highlights are free of material misstatement, whether due to error or fraud. The Fund is not required to have, nor were we engaged to perform, an audit of its internal control over financial reporting. As part of our audits we are required to obtain an understanding of internal control over financial reporting but not for the purpose of expressing an opinion on the effectiveness of the Fund’s internal control over financial reporting. Accordingly, we express no such opinion.
Our audits included performing procedures to assess the risks of material misstatement of the financial statements and financial highlights, whether due to error or fraud, and performing procedures that respond to those risks. Such procedures included examining, on a test basis, evidence regarding the amounts and disclosures in the financial statements and financial highlights. Our audits also included evaluating the accounting principles used and significant estimates made by management, as well as evaluating the overall financial statement presentation and financial highlights. Our procedures included confirmation of securities owned as of December 31, 2017, by correspondence with the custodian and brokers; when replies were not received from brokers, we performed other auditing procedures. We believe that our audits provide a reasonable basis for our opinion.
DELOITTE & TOUCHE LLP
New York, New York
February 15, 2018
We have served as the auditor of one or more Lord Abbett Family of Funds’ investment companies since 1932.
23
Basic Information About Management
The Board is responsible for the management of the business and affairs of the Company in accordance with the laws of the State of Maryland. The Board elects officers who are responsible for the day-to-day operations of the Fund and who execute policies authorized by the Board. The Board also approves an investment adviser to the Fund and continues to monitor the cost and quality of the services the investment adviser provides, and annually considers whether to renew the contract with the adviser. Generally, each Director holds office until his/her successor is elected and qualified or until his/her earlier resignation or removal, as provided in the Company’s organizational documents.
Lord Abbett, a Delaware limited liability company, is the Fund’s investment adviser. Designated Lord Abbett personnel are responsible for the day-to-day management of the Fund.
Interested Directors
Ms. Foster and Mr. Sieg are affiliated with Lord Abbett and are “interested persons” of the Fund as defined in the Act. Ms. Foster and Mr. Sieg are directors/trustees of each of the 12 investment companies in the Lord Abbett Family of Funds, which consist of 61 portfolios or series. Ms. Foster is an officer of the Lord Abbett Family of Funds.
| Name, Address and Year of Birth | Current Position and Length of Service with the Company | Principal Occupation and Other Directorships During the Past Five Years | ||
| Daria L. Foster(1) Lord, Abbett & Co. LLC 90 Hudson Street Jersey City, NJ 07302 (1954) | Director and President since 2006; Chief Executive Officer since 2012 | Principal Occupation: Managing Partner of Lord Abbett, joined Lord Abbett in 1990.
Other Directorships: None. | ||
| Douglas B. Sieg(1) Lord, Abbett & Co. LLC 90 Hudson Street Jersey City, NJ 07302 (1969) | Director since 2016 | Principal Occupation: Partner (since 2001) and Head of Client Services (since 2013), formerly Director of Marketing and Relationship Management, joined Lord Abbett in 1994.
Other Directorships: None. |
Independent Directors
The following Independent Directors also are directors/trustees of each of the 12 investment companies in the Lord Abbett Family of Funds, which consist of 61 portfolios or series.
| Name, Address and Year of Birth | Current Position and Length of Service with the Company | Principal Occupation and Other Directorships During the Past Five Years | ||
| Eric C. Fast Lord, Abbett & Co. LLC c/o Legal Dept. 90 Hudson Street Jersey City, NJ 07302 (1949) | Director since 2014 | Principal Occupation: Chief Executive Officer of Crane Co., an industrial products company (2001–2014).
Other Directorships: Currently serves as director of Automatic Data Processing, Inc. (since 2007) and Regions Financial Corporation (since 2010). Previously served as a director of Crane Co. (1999–2014). |
| (1) | Daria L. Foster, Managing Partner of Lord Abbett, a member of the Board, and the Chief Executive Officer and President of the Lord Abbett Family of Funds, will retire from her positions with Lord Abbett and the Lord Abbett Family of Funds effective March 31, 2018. Douglas B. Sieg, Partner and head of Client Services at Lord Abbett, and a member of the Board, will succeed Ms. Foster effective April 1, 2018. |
24
Basic Information About Management (continued)
| Name, Address and Year of Birth | Current Position and Length of Service with the Company | Principal Occupation and Other Directorships During the Past Five Years | ||
| Evelyn E. Guernsey Lord, Abbett & Co. LLC c/o Legal Dept. 90 Hudson Street Jersey City, NJ 07302 (1955) | Director since 2011 | Principal Occupation: CEO, Americas of J.P. Morgan Asset Management (2004–2010).
Other Directorships: None. | ||
| Julie A. Hill Lord, Abbett & Co. LLC c/o Legal Dept. 90 Hudson Street Jersey City, NJ 07302 (1946) | Director since 2004 | Principal Occupation: Owner and CEO of The Hill Company, a business consulting firm (since 1998).
Other Directorships: Currently serves as director of Anthem, Inc., a health benefits company (since 1994). | ||
| Franklin W. Hobbs Lord, Abbett & Co. LLC c/o Legal Dept. 90 Hudson Street Jersey City, NJ 07302 (1947) | Director since 2001 | Principal Occupation: President and CEO of Ribbon Communications (since 2017) and Advisor of One Equity Partners, a private equity firm (since 2004).
Other Directorships: Currently serves as director of Ribbon Communications (since 2017), director and Chairman of the Board of Ally Financial Inc., a financial services firm (since 2009), and as director of Molson Coors Brewing Company (since 2002). | ||
| Kathleen M. Lutito Lord, Abbett & Co. LLC c/o Legal Dept. 90 Hudson Street Jersey City, NJ 07302 (1963) | Director since 2017 | Principal Occupation: President and Chief Investment Officer of CenturyLink Investment Management Company (since 2006).
Other Directorships: None | ||
| James M. McTaggart Lord, Abbett & Co. LLC c/o Legal Dept. 90 Hudson Street Jersey City, NJ 07302 (1947) | Director since 2012 | Principal Occupation: Independent management advisor and consultant (since 2012); Vice President, CRA International, Inc. (doing business as Charles River Associates), a global management consulting firm (2009–2012); Founder and Chairman of Marakon Associates, Inc., a strategy consulting firm (1978–2009); and Officer and Director of Trinsum Group, a holding company (2007–2009).
Other Directorships: Blyth, Inc., a home products company (2004–2015). | ||
| Karla M. Rabusch Lord, Abbett & Co. LLC c/o Legal Dept. 90 Hudson Street Jersey City, NJ 07302 (1959) | Director since 2017 | Principal Occupation: President and Director of Wells Fargo Funds Management, LLC (2003–2017); President of Wells Fargo Funds (2003–2016).
Other Directorships: None. | ||
| Mark A. Schmid Lord, Abbett & Co. LLC c/o Legal Dept. 90 Hudson Street Jersey City, NJ 07302 (1959) | Director since 2016 | Principal Occupation: Vice President and Chief Investment Officer of the University of Chicago (since 2009).
Other Directorships: None. |
25
Basic Information About Management (continued)
| Name, Address and Year of Birth | Current Position and Length of Service with the Company | Principal Occupation and Other Directorships During the Past Five Years | ||
| James L.L. Tullis Lord, Abbett & Co. LLC c/o Legal Dept. 90 Hudson Street Jersey City, NJ 07302 (1947) | Director since 2006; Chairman since 2017 | Principal Occupation: CEO of Tullis-Dickerson and Co. Inc., a venture capital management firm (since 1990); CEO of Tullis Health Investors Inc. (since 2012).
Other Directorships: Currently serves as director of Crane Co. (since 1998). |
Officers
None of the officers listed below have received compensation from the Company. All of the officers of the Company also may be officers of the other Lord Abbett Funds and maintain offices at 90 Hudson Street, Jersey City, NJ 07302. Unless otherwise indicated, the position(s) and title(s) listed under the “Principal Occupation During the Past Five Years” column indicate each officer’s position(s) and title(s) with Lord Abbett. Each officer serves for an indefinite term (i.e., until his or her death, resignation, retirement, or removal).
| Name and Year of Birth | Current Position with the Company | Length of Service of Current Position | Principal Occupation During the Past Five Years | |||
| Daria L. Foster (1954) | President and Chief Executive Officer | Elected as President in 2006 and Chief Executive Officer in 2012 | Managing Partner of Lord Abbett, joined Lord Abbett in 1990. | |||
| Sean J. Aurigemma (1969) | Executive Vice President | Elected in 2010 | Portfolio Manager, joined Lord Abbett in 2007. | |||
| Jeff D. Diamond (1960) | Executive Vice President | Elected in 2008 | Portfolio Manager, joined Lord Abbett in 2007. | |||
| Todd D. Jacobson (1966) | Executive Vice President | Elected in 2005 | Partner and Associate Director, joined Lord Abbett in 2003. | |||
| Robert A. Lee (1969) | Executive Vice President | Elected in 2010 | Partner and Chief Investment Officer, and was formerly Deputy Chief Investment Officer and Director of Taxable Fixed Income, joined Lord Abbett in 1997. | |||
| David J. Linsen (1974) | Executive Vice President | Elected in 2008 | Partner and Director, joined Lord Abbett in 2001. | |||
| Thomas B. Maher (1967) | Executive Vice President | Elected in 2010 | Partner and Portfolio Manager, joined Lord Abbett in 2003. | |||
| Justin C. Maurer (1969) | Executive Vice President | Elected in 2010 | Partner and Portfolio Manager, joined Lord Abbett in 2001. |
26
Basic Information About Management (continued)
| Name and Year of Birth | Current Position with the Company | Length of Service of Current Position | Principal Occupation During the Past Five Years | |||
| Vincent J. McBride (1964) | Executive Vice President | Elected in 2010 | Partner and Director, joined Lord Abbett in 2003. | |||
| Andrew H. O’Brien (1973) | Executive Vice President | Elected in 2010 | Partner and Portfolio Manager, joined Lord Abbett in 1998. | |||
| F. Thomas O’Halloran, III (1955) | Executive Vice President | Elected in 2010 | Partner and Portfolio Manager, joined Lord Abbett in 2001. | |||
| Marc Pavese (1972) | Executive Vice President | Elected in 2016 | Partner and Portfolio Manager, joined Lord Abbett in 2008. | |||
| Walter H. Prahl (1958) | Executive Vice President | Elected in 2012 | Partner and Director, joined Lord Abbett in 1997. | |||
| Jeffrey Rabinowitz (1972) | Executive Vice President | Elected in 2017 | Portfolio Manager, joined Lord Abbett in 2017 and was formerly a Managing Director and Portfolio Manager/Technology Analyst at Jennison Associates LLC (2014–2017) and Managing Director and Portfolio Manager/ Technology Analyst at Goldman Sachs Asset Management (1999–2014). | |||
| Steven F. Rocco (1979) | Executive Vice President | Elected in 2014 | Partner and Portfolio Manager, joined Lord Abbett in 2004. | |||
| A. Edward Allinson (1961) | Vice President | Elected in 2011 | Portfolio Manager, joined Lord Abbett in 2005. | |||
| Matthew R. DeCicco (1977) | Vice President | Elected in 2003 | Portfolio Manager, joined Lord Abbett in 1999. | |||
| Brooke A. Fapohunda (1975) | Vice President and Assistant Secretary | Elected in 2014 | Partner and Deputy General Counsel, joined Lord Abbett in 2006. | |||
| John K. Forst (1960) | Vice President and Assistant Secretary | Elected in 2005 | Partner and Deputy General Counsel, joined Lord Abbett in 2004. | |||
| Bernard J. Grzelak (1971) | Chief Financial Officer and Vice President | Elected in 2017 | Partner and Chief Operations Officer, and was formerly Director of Fund Administration, joined Lord Abbett in 2003. | |||
| Lawrence H. Kaplan (1957) | Vice President and Secretary | Elected in 1997 | Partner and General Counsel, joined Lord Abbett in 1997. |
27
Basic Information About Management (concluded)
| Name and Year of Birth | Current Position with the Company | Length of Service of Current Position | Principal Occupation During the Past Five Years | |||
| Linda Y. Kim (1980) | Vice President and Assistant Secretary | Elected in 2016 | Counsel, joined Lord Abbett in 2015 and was formerly an Associate at Stroock & Stroock & Lavan LLP (2007–2015). | |||
| Joseph M. McGill (1962) | Chief Compliance Officer | Elected in 2014 | Partner and Chief Compliance Officer, joined Lord Abbett in 2014 and was formerly Managing Director and the Chief Compliance Officer at UBS Global Asset Management (2003–2013). | |||
| A. Edward Oberhaus, III (1959) | Vice President | Elected in 1998 | Partner and Director, joined Lord Abbett in 1983. | |||
| Noah Petrucci (1970) | Vice President | Elected in 2013 | Portfolio Manager, joined Lord Abbett in 2012. | |||
| Lawrence B. Stoller (1963) | Vice President and Assistant Secretary | Elected in 2007 | Partner and Senior Deputy General Counsel, joined Lord Abbett in 2007. | |||
| Leah G. Traub (1979) | Vice President | Elected in 2016 | Partner and Portfolio Manager, joined Lord Abbett in 2007. | |||
| Arthur K. Weise (1970) | Vice President | Elected in 2010 | Partner and Portfolio Manager, joined Lord Abbett in 2007. | |||
| Kewjin Yuoh (1971) | Vice President | Elected in 2012 | Partner and Portfolio Manager, joined Lord Abbett in 2010. | |||
| Scott S. Wallner (1955) | AML Compliance Officer | Elected in 2011 | Assistant General Counsel, joined Lord Abbett in 2004. | |||
| Christian J. Kelly (1975) | Treasurer | Elected in 2017 | Director of Fund Administration, joined Lord Abbett in 2009. |
Please call 888-522-2388 for a copy of the statement of additional information, which contains further information about the Company’s Directors. It is available free upon request.
28
Approval of Advisory Contract
The Board, including all of the Directors who are not “interested persons” of the Company or of Lord Abbett, as defined in the Investment Company Act of 1940, as amended (the “Independent Directors”), annually considers whether to approve the continuation of the existing management agreement between the Fund and Lord Abbett (the “Agreement”). In connection with its most recent approval, the Board reviewed materials relating specifically to the Agreement, as well as numerous materials received throughout the course of the year, including information about the Fund’s investment performance compared to the performance of its benchmark. Before making its decision as to the Fund, the Board had the opportunity to ask questions and request further information, taking into account its familiarity with Lord Abbett gained through its meetings and discussions. These meetings and discussions included reviews of Fund performance conducted by members of the Contract Committee, the deliberations of the Contract Committee, and discussions between the Contract Committee and Lord Abbett’s management. The Independent Directors also met with their independent legal counsel in various private sessions at which no representatives of management were present.
The materials received by the Board included, but were not limited to: (1) information provided by Morningstar, Inc. (“Morningstar”) regarding the investment performance of the Fund compared to the investment performance of certain funds with similar investment styles as determined by Morningstar, based, in part, on the Fund’s Morningstar category (the “performance peer group”), and the investment performance of the Fund’s benchmark; (2) information provided by Morningstar regarding the expense ratios, contractual and actual management fee rates, and other expense components for the Fund and certain funds in the same Morningstar category, with generally the same or similar share classes and operational characteristics, including asset size (the “expense peer group”); (3) certain supplemental investment performance information provided by Lord Abbett; (4) information provided by Lord Abbett on the expense ratios, management fee rates, and other expense components for the Fund; (5) sales and redemption information for the Fund; (6) information regarding Lord Abbett’s financial condition; (7) an analysis of the relative profitability of the Agreement to Lord Abbett; (8) information provided by Lord Abbett regarding the investment management fee schedules for Lord Abbett’s other advisory clients maintaining accounts with a similar investment strategy as the Fund; and (9) information regarding the personnel and other resources devoted by Lord Abbett to managing the Fund.
Investment Management Services Generally. The Board considered the investment management services provided by Lord Abbett to the Fund, including investment research, portfolio management, and trading, and Lord Abbett’s commitment to compliance with all applicable legal requirements. The Board also observed that Lord Abbett was solely engaged in the investment management business and accordingly did not experience the conflicts of interest that may result from being engaged in other lines of business. The Board considered the investment advisory services provided by Lord Abbett to other clients, the fees charged for the services, and the differences in the nature of the services provided to the Fund and other Lord Abbett Funds, on the one hand, and the services provided to other clients, on the other. After reviewing these and related factors, the Board concluded that the Fund was likely to continue to benefit from the nature, extent and quality of the investment services provided by Lord Abbett under the Agreement.
Investment Performance. The Board reviewed the Fund’s investment performance in relation to that of the performance peer group and the Fund’s benchmark as of various periods ended August 31, 2017. The Board observed that the Fund’s investment performance was below the median of the performance peer group for the one-, three-, and five-year periods. The Board considered that
29
Approval of Advisory Contract (continued)
Lord Abbett was implementing a plan intended to improve the performance of its equity Funds. The Board further considered Lord Abbett’s performance and reputation generally, the performance of other Lord Abbett-managed funds overseen by the Board, and the willingness of Lord Abbett to take steps intended to improve performance when necessary. After reviewing these and related factors, the Board concluded that the Fund’s Agreement should be continued.
Lord Abbett’s Personnel and Methods. The Board considered the qualifications of the personnel providing investment management services to the Fund, in light of its investment objective and discipline. Among other things, the Board considered the size, experience, and turnover of Lord Abbett’s investment management staff, Lord Abbett’s investment methodology and philosophy, and Lord Abbett’s approach to recruiting, training, and retaining investment management personnel.
Nature and Quality of Other Services. The Board considered the nature, quality, costs, and extent of compliance, administrative, and other services performed by Lord Abbett and the nature and extent of Lord Abbett’s supervision of third party service providers, including the Fund’s transfer agent and custodian.
Expenses. The Board considered the expense level of the Fund and the expense levels of the expense peer group. It also considered how the expense level of the Fund related to those of the expense peer group and the amount and nature of the fees paid by shareholders. The Board observed that the net total expense ratio of the Fund was below the median of the expense peer group. After reviewing these and related factors, the Board concluded, within the context of its overall approval of the Agreement, that the expense level of the Fund was reasonable and supported the continuation of the Agreement.
Profitability. The Board considered the level of Lord Abbett’s operating margin in managing the Fund, including a review of Lord Abbett’s methodology for allocating its costs to its management of the Fund. It considered whether the Fund was profitable to Lord Abbett in connection with the Fund’s operation, including the fee that Lord Abbett receives from the Fund for providing administrative services to the Fund. The Board also considered the profits realized from other business segments of Lord Abbett, which may benefit from or be related to the Fund’s business. The Board considered Lord Abbett’s profit margins excluding Lord Abbett’s marketing and distribution expenses. The Board also considered Lord Abbett’s profit margins, without those exclusions, in comparison with available industry data and how those profit margins could affect Lord Abbett’s ability to recruit and retain investment personnel. The Board recognized that Lord Abbett’s overall profitability was a factor in enabling it to attract and retain qualified investment management personnel to provide services to the Fund. After reviewing these and related factors, the Board concluded, within the context of its overall approval of the Agreement, that Lord Abbett’s profitability with respect to the Fund was not excessive.
Economies of Scale. The Board considered the extent to which there had been economies of scale in managing the Fund, whether the Fund’s shareholders had appropriately benefited from such economies of scale, and whether there was potential for realization of any further economies of scale. The Board concluded that the existing management fee schedule, with its breakpoint in the level of the management fee, in conjunction with the Fund’s proposed expense limitation agreement, adequately addressed any economies of scale in managing the Fund.
Other Benefits to Lord Abbett. The Board considered the amount and nature of the fees paid by the Fund and the Fund’s shareholders to Lord Abbett for services other than investment advisory
30
Approval of Advisory Contract (concluded)
services. The Board also considered the revenues and profitability of Lord Abbett’s investment advisory business apart from its mutual fund business, and the intangible benefits enjoyed by Lord Abbett by virtue of its relationship with the Fund. The Board observed that the Distributor receives 12b-1 fees from certain of the Lord Abbett Funds as to shares held in accounts for which there is no other broker of record, may retain a portion of the 12b-1 fees it receives, and receives a portion of the sales charges on sales and redemptions of some classes of shares of the Lord Abbett Funds. In addition, the Board observed that Lord Abbett accrues certain benefits for its business of providing investment advice to clients other than the Lord Abbett Funds, but that business also benefits the Funds. The Board also noted that Lord Abbett, as disclosed in the prospectus of the Fund, has entered into revenue sharing arrangements with certain entities that distribute shares of the Fund. The Board also took into consideration the investment research that Lord Abbett receives as a result of Fund brokerage transactions.
Alternative Arrangements. The Board considered whether, instead of approving continuation of the Agreement, it might be in the best interests of the Fund to implement one or more alternative arrangements, such as continuing to employ Lord Abbett, but on different terms. After considering all of the relevant factors, the Board unanimously found that continuation of the Agreement was in the best interests of the Fund and its shareholders and voted unanimously to approve the continuation of the Agreement. In considering whether to approve the continuation of the Agreement, the Board did not identify any single factor as paramount or controlling. Individual Directors may have evaluated the information presented differently from one another, giving different weights to various factors. This summary does not discuss in detail all matters considered.
31
Householding
The Company has adopted a policy that allows it to send only one copy of the Fund’s prospectus, proxy material, annual report and semiannual report to certain shareholders residing at the same “household.” This reduces Fund expenses, which benefits you and other shareholders. If you need additional copies or do not want your mailings to be “householded,” please call Lord Abbett at 888-522-2388 or send a written request with your name, the name of your fund or funds and your account number or numbers to Lord Abbett Family of Funds, P.O. Box 219336, Kansas City, MO 64121.
Proxy Voting Policies, Procedures and Records
A description of the policies and procedures that Lord Abbett uses to vote proxies related to the Fund’s portfolio securities, and information on how Lord Abbett voted the Fund’s proxies during the 12-month period ended June 30 are available without charge, upon request, (i) by calling 888-522-2388; (ii) on Lord Abbett’s Website at www.lordabbett.com; and (iii) on the Securities and Exchange Commission’s (“SEC”) Website at www.sec.gov.
Shareholder Reports and Quarterly Portfolio Disclosure
The Fund is required to file its complete schedule of portfolio holdings with the SEC for its first and third fiscal quarters on Form N-Q. Copies of the filings are available without charge, upon request on the SEC’s Website at www.sec.gov and may be available by calling Lord Abbett at 888-522-2388. You can also obtain copies of Form N-Q by visiting the SEC’s Public Reference Room in Washington, DC (information on the operation of the Public Reference Room may be obtained by calling 800-SEC-0330).
32


This report, when not used for the general information of shareholders of the Fund, is to be distributed only if preceded or accompanied by a current fund prospectus.
Lord Abbett mutual fund shares are distributed by | Lord Abbett Series Fund, Inc.
Developing Growth Portfolio | SFDG-PORT-3 (02/18) |
![]()
LORD ABBETT
ANNUAL REPORT
Lord Abbett
Series Fund—Fundamental Equity Portfolio
For the fiscal year ended December 31, 2017
Table of Contents
Lord Abbett Series Fund – Fundamental Equity Portfolio
Annual Report
For the fiscal year ended December 31, 2017

From left to right: James L.L. Tullis, Independent Chairman of the Lord Abbett Funds and Daria L. Foster, Director, President, and Chief Executive Officer of the Lord Abbett Funds.
Dear Shareholders: We are pleased to provide you with this overview of the performance of Lord Abbett Series Fund – Fundamental Equity Portfolio for the fiscal year ended December 31, 2017. On this page and the following pages, we discuss the major factors that influenced fiscal year performance. For additional information about the Fund, please visit our website at www.lordabbett.com, where you also can access the quarterly commentaries that provide updates on the Fund’s performance and other portfolio related updates.
Thank you for investing in Lord Abbett mutual funds. We value the trust that you place in us and look forward to serving your investment needs in the years to come.
Best regards,

Daria L. Foster
Director, President and Chief Executive Officer
For the fiscal year ended December 31, 2017, the Fund returned 12.57%, reflecting performance at the net asset value (NAV) of Class VC shares, with all distributions reinvested, compared to its benchmark, the Russell 1000® Value Index,1 which returned 13.66% over the same period.
The domestic equity market (as represented by the S&P 500® Index2) returned 21.83%, ending the year with its strongest quarterly performance in two years and marking its first calendar year with 12 consecutive months of positive performance. Much of the market momentum was driven by the anticipation
of supportive U.S. fiscal policies, as the passage of the Tax Cut and Jobs Act and the prospect of significant infrastructure spending drove the forecast of U.S. gross domestic product (GDP) growth incrementally higher. These forces persisted despite a myriad of geopolitical and environmental headwinds, as North Korea, U.S. political tenions, and Hurricanes Harvey, Irma, and Maria all had the potential to derail the market’s forward progress.
During the year the National Federation of Independent Business Index of Small Business Confidence reached a 34
1
year high, marking its second-highest level in the history of the index. The University of Michigan’s average consumer confidence for the year was the highest since 2000, while consumer spending reached an all-time high in the third quarter. A reoccurring theme persisted throughout the year with large caps outperforming small caps and value stocks significantly outpacing their growth oriented peers.
The U.S. economy continued to expand during the trailing 12-month period. U.S. gross domestic product (GDP) grew at a 3.2% pace during the third quarter, an increase over the second quarter. The U.S. Bureau of Economic Analysis stated that during the third quarter personal consumption and federal government spending increased, quarter-over-quarter. The Federal Reserve (Fed) gradually raised the Fed Funds rate over the trailing 12-month period by raising interest rates by 25bps three times, ultimately reaching a target range of 1.25-1.50%. In addition to GDP growth, the U.S. unemployment rate remained relatively steady throughout the period, and was reported at 4.1% in December, a decline of 0.6% year-over-year.
The Fund underperformed its index for the period. During the trailing 12-month period, the largest detractors from relative performance were the financials and consumer staples sectors. Within the financials sector, shares of Signature Bank, a full-service commercial bank, fell after the bank had to write down its taxi
medallion portfolio due to increased pressure from the ride-share industry, which resulted in loan losses. TD Ameritrade Holding Corp., a brokerage, mutual fund, and banking company, found itself involved in a price war in the beginning of the year as competing firms lowered commissions on online retail trading, which led shares of the company to decline. Within the consumer staples sector, shares of CVS Health Corp., a pharmacy and health care provider, dropped after sales in the retail segment fell due to the impact of the three large hurricanes during the year. Shares further declined after analysts suggested that Amazon would be in the business of selling prescription drugs in the next few years. Shares of Mondelez International Inc., a manufacturer of snack food and beverage products, dropped due to disappointing organic sales after a cyberattack crippled the company’s corporate computer systems and disrupted the company’s ability to ship and invoice.
Among the largest contributors to relative performance during the trailing 12-month period were the industrials and the consumer discretionary sectors. Within the industrials sector, the portfolio’s holding of CSX Corp., a rail-based freight transportation company, contributed to performance as shares of the company jumped in the beginning of the year due to speculation that Canadian Pacific’s former CEO, Hunter Harrison, would be installed as CEO of CSX via activism. Despite his sudden
2
death at the end of 2017, investors appeared to be confident that Harrison, who became CEO of CSX in March 2017, implemented necessary structural changes throughout the year in order to drive future performance. Shares of Ametek, Inc., a global manufacturer of electric instruments and electromechanical devices, rose throughout the year after producing strong organic growth through its digital marketing investments and initiatives around sales force training and development coupled with the company’s successful “growth by M&A” strategy. Within the consumer discretionary sector,
shares of Lennar Corp., a homebuilding company, rose due to the company’s improving fundamentals and focus on technology to optimize returns. Shares of Burlington Stores, Inc., an owner and operator of clothing retail stores, also rose due to improving sales, efficient inventory management, and the growth of its online presence.
The Fund’s portfolio is actively managed and, therefore, its holdings and the weightings of a particular issuer or particular sector as a percentage of portfolio assets are subject to change. Sectors may include many industries.
1 The Russell 1000® Value Index measures the performance of those Russell 1000 companies with lower price-to-book ratios and lower forecasted growth values.
2 The S&P 500® Index is widely regarded as the standard for measuring large cap U.S. stock market performance and includes a representative sample of leading companies in leading industries.
Unless otherwise specified, indexes reflect total return, with all dividends reinvested. Indexes are unmanaged, do not reflect the deduction of fees or expenses, and are not available for direct investment.
Important Performance and Other Information
Performance data quoted in the following pages reflect past performance and are no guarantee of future results. Current performance may be higher or lower than the performance quoted. The investment return and principal value of an investment in the Fund will fluctuate so that shares, on any given day or when redeemed, may be worth more or less than their original cost. You can obtain performance data current to the most recent month end by calling Lord Abbett at 888-522-2388 or referring to www.lordabbett.com.
During certain periods shown, expense waivers and reimbursements were in place. Without such expense waivers and reimbursements, the Fund’s returns would have been lower.
The annual commentary above discusses the views of the Fund’s management and various portfolio holdings of the Fund as of December 31, 2017. These views and portfolio holdings may have changed after this date. Information provided in the commentary is not a recommendation to buy or sell securities. Because the Fund’s portfolio is actively managed and may change significantly, the Fund may no longer own the securities described above or may have otherwise changed its position in the securities. For more recent information about the Fund’s portfolio holdings, please visit www.lordabbett.com.
A Note about Risk: See Notes to Financial Statements for a discussion of investment risks. For a more detailed discussion of the risks associated with the Fund, please see the Fund’s prospectus.
Mutual funds are not insured by the FDIC, are not deposits or other obligations of, or guaranteed by, banks, and are subject to investment risks including possible loss of principal amount invested.
The Fund serves as an underlying investment vehicle for variable annuity contracts and variable life insurance policies.
3
Below is a comparison of a $10,000 investment in Class VC shares with the same investment in the Russell 1000® Value Index, Russell 3000® Index, Russell 3000® Value Index, and S&P 500® Index, assuming reinvestment of all dividends and distributions. The Fund’s shares are sold only to insurance company separate accounts that fund certain variable annuity and variable life contracts. This line graph comparison does not reflect the sales charges or other expenses of these contracts. If those sales charges and expenses were reflected, returns would be lower. The graph and performance table below do not reflect the deduction of taxes that a shareholder would pay on Fund distributions or the redemption of Fund shares. During certain periods, expenses of the Fund have been waived or reimbursed by Lord Abbett; without such waiver or reimbursement of expenses, the Fund’s returns would have been lower. Past performance is no guarantee of future results.

| Average Annual Total Returns for the | |||||||
| Periods Ended December 31, 2017 | |||||||
| 1 Year | 5 Years | 10 Years | |||||
| Class VC | 12.57% | 12.85% | 7.53% | ||||
1 Performance for each unmanaged index does not reflect any fees or expenses. The performance of each index is not necessarily representative of the Fund’s performance.
4
As a shareholder of the Fund, you incur ongoing costs, including management fees; expenses related to the Fund’s services arrangements with certain insurance companies; and other Fund expenses. This Example is intended to help you understand your ongoing costs (in dollars) of investing in the Fund and to compare these costs with the ongoing costs of investing in other mutual funds.
The Example is based on an investment of $1,000 invested at the beginning of the period and held for the entire period (July 1, 2017 through December 31, 2017).
The Example reflects only expenses that are deducted from the assets of the Fund. Fees and expenses, including sales charges applicable to the various insurance products that invest in the Fund, are not reflected in this Example. If such fees and expenses were reflected in the Example, the total expenses shown would be higher. Fees and expenses regarding such variable insurance products are separately described in the prospectus related to those products.
Actual Expenses
The first line of the table on the following page provides information about actual account values and actual expenses. You may use the information in this line, together with the amount you invested, to estimate the expenses that you paid over the period. Simply divide your account value by $1,000 (for example, an $8,600 account value divided by $1,000 = 8.6), then multiply the result by the number in the first line under the heading titled “Expenses Paid During Period 7/1/17 – 12/31/17” to estimate the expenses you paid on your account during this period.
Hypothetical Example for Comparison Purposes
The second line of the table on the following page provides information about hypothetical account values and hypothetical expenses based on the Fund’s actual expense ratio and an assumed rate of return of 5% per year before expenses, which is not the Fund’s actual return. The hypothetical account values and expenses may not be used to estimate the actual ending account balance or expenses you paid for the period. You may use this information to compare the ongoing costs of investing in the Fund and other funds. To do so, compare this 5% hypothetical example with the 5% hypothetical examples that appear in the shareholder reports of the other funds.
5
Please note that the expenses shown in the table are meant to highlight your ongoing costs only and do not reflect any transactional costs, such as sales charges. Therefore, the second line of the table is useful in comparing ongoing costs only, and will not help you determine the relative total costs of owning different funds. In addition, if these transactional costs were included, your costs would have been higher.
| Beginning Account Value | Ending Account Value | Expenses Paid During Period† | |||||||||||
| 7/1/17 | 12/31/17 | 7/1/17 - 12/31/17† | |||||||||||
| Class VC | |||||||||||||
| Actual | $1,000.00 | $1,085.40 | $6.04 | ||||||||||
| Hypothetical (5% Return Before Expenses) | $1,000.00 | $1,019.41 | $5.85 | ||||||||||
| † | Net expenses are equal to the Fund’s annualized expense ratio of 1.15%, multiplied by the average account value over the period, multiplied by 184/365 (to reflect one-half year period). |
Portfolio Holdings Presented by Sector
December 31, 2017
| Sector* | %** | |||
| Consumer Discretionary | 5.55 | % | ||
| Consumer Staples | 7.85 | % | ||
| Energy | 11.90 | % | ||
| Financials | 27.81 | % | ||
| Health Care | 12.79 | % | ||
| Industrials | 9.99 | % | ||
| Information Technology | 11.64 | % | ||
| Materials | 3.26 | % | ||
| Real Estate | 1.61 | % | ||
| Telecommunication Services | 2.58 | % | ||
| Utilities | 3.15 | % | ||
| Repurchase Agreement | 1.87 | % | ||
| Total | 100.00 | % | ||
| * | A sector may comprise several industries. | |
| ** | Represents percent of total investments. |
6
December 31, 2017
| Investments | Shares | Fair Value (000) | ||||||
| COMMON STOCKS 98.24% | ||||||||
| Aerospace & Defense 1.27% | ||||||||
| General Dynamics Corp. | 24,349 | $ | 4,954 | |||||
| Airlines 1.20% | ||||||||
| Delta Air Lines, Inc. | 83,296 | 4,665 | ||||||
| Banks 16.72% | ||||||||
| Bank of America Corp. | 287,277 | 8,480 | ||||||
| Citigroup, Inc. | 115,079 | 8,563 | ||||||
| Citizens Financial Group, Inc. | 177,041 | 7,432 | ||||||
| Comerica, Inc. | 48,574 | 4,217 | ||||||
| East West Bancorp, Inc. | 95,245 | 5,794 | ||||||
| JPMorgan Chase & Co. | 174,621 | 18,674 | ||||||
| Signature Bank* | 34,789 | 4,775 | ||||||
| Webster Financial Corp. | 72,259 | 4,058 | ||||||
| Wells Fargo & Co. | 49,395 | 2,997 | ||||||
| Total | 64,990 | |||||||
| Beverages 1.58% | ||||||||
| Coca-Cola Co. (The) | 62,221 | 2,854 | ||||||
| PepsiCo, Inc. | 27,500 | 3,298 | ||||||
| Total | 6,152 | |||||||
| Building Products 1.05% | ||||||||
| Owens Corning | 44,554 | 4,096 | ||||||
| Capital Markets 3.29% | ||||||||
| Charles Schwab Corp. (The) | 43,682 | 2,244 | ||||||
| Goldman Sachs Group, | ||||||||
| Inc. (The) | 22,077 | 5,624 | ||||||
| Invesco Ltd. | 134,511 | 4,915 | ||||||
| Total | 12,783 | |||||||
| Chemicals 2.39% | ||||||||
| DowDuPont, Inc. | 130,250 | 9,276 | ||||||
| Communications Equipment 3.04% | ||||||||
| Cisco Systems, Inc. | 308,700 | 11,823 | ||||||
| Consumer Finance 1.67% | ||||||||
| Discover Financial Services | 84,440 | 6,495 | ||||||
| Investments | Shares | Fair Value (000) | ||||||
| Diversified Telecommunication Services 2.58% | ||||||||
| AT&T, Inc. | 258,469 | $ | 10,049 | |||||
| Electric: Utilities 3.15% | ||||||||
| Duke Energy Corp. | 76,195 | 6,409 | ||||||
| NextEra Energy, Inc. | 37,402 | 5,842 | ||||||
| Total | 12,251 | |||||||
| Electrical Equipment 1.61% | ||||||||
| AMETEK, Inc. | 86,404 | 6,262 | ||||||
| Electronic Equipment, Instruments & Components 1.36% | ||||||||
| Corning, Inc. | 165,568 | 5,297 | ||||||
| Energy Equipment & Services 1.30% | ||||||||
| Halliburton Co. | 103,208 | 5,044 | ||||||
| Equity Real Estate Investment Trusts 1.62% | ||||||||
| Boston Properties, Inc. | 15,180 | 1,974 | ||||||
| Prologis, Inc. | 66,843 | 4,312 | ||||||
| Total | 6,286 | |||||||
| Food & Staples Retailing 3.00% | ||||||||
| CVS Health Corp. | 47,802 | 3,466 | ||||||
| Wal-Mart Stores, Inc. | 82,839 | 8,180 | ||||||
| Total | 11,646 | |||||||
| Food Products 0.81% | ||||||||
| Mondelez International, Inc. | ||||||||
| Class A | 73,213 | 3,134 | ||||||
| Health Care Equipment & Supplies 4.08% | ||||||||
| Abbott Laboratories | 174,600 | 9,964 | ||||||
| Baxter International, Inc. | 77,208 | 4,991 | ||||||
| Boston Scientific Corp.* | 37,363 | 926 | ||||||
| Total | 15,881 | |||||||
| Health Care Providers & Services 2.22% | ||||||||
| Aetna, Inc. | 16,104 | 2,905 | ||||||
| HCA Healthcare, Inc.* | 26,949 | 2,367 | ||||||
| UnitedHealth Group, Inc. | 15,207 | 3,353 | ||||||
| Total | 8,625 | |||||||
| See Notes to Financial Statements. | 7 |
Schedule of Investments (continued)
December 31, 2017
| Investments | Shares | Fair Value (000) | ||||||
| Hotels, Restaurants & Leisure 1.42% | ||||||||
| Carnival Corp. | 37,015 | $ | 2,457 | |||||
| Yum! Brands, Inc. | 37,411 | 3,053 | ||||||
| Total | 5,510 | |||||||
| Household Durables 0.35% | ||||||||
| Lennar Corp. Class A | 21,721 | 1,374 | ||||||
| Household Products 1.38% | ||||||||
| Clorox Co. (The) | 21,930 | 3,262 | ||||||
| Colgate-Palmolive Co. | 28,000 | 2,112 | ||||||
| Total | 5,374 | |||||||
| Industrial Conglomerates 1.99% | ||||||||
| General Electric Co. | 53,400 | 932 | ||||||
| Honeywell International, Inc. | 44,385 | 6,807 | ||||||
| Total | 7,739 | |||||||
| Insurance 6.17% | ||||||||
| Allstate Corp. (The) | 73,700 | 7,717 | ||||||
| Chubb Ltd. (Switzerland)(a) | 45,800 | 6,693 | ||||||
| Hartford Financial Services Group, Inc. (The) | 87,663 | 4,934 | ||||||
| MetLife, Inc. | 91,659 | 4,634 | ||||||
| Total | 23,978 | |||||||
| Internet Software & Services 0.72% | ||||||||
| Alphabet, Inc. Class A* | 2,652 | 2,794 | ||||||
| Life Sciences Tools & Services 0.49% | ||||||||
| Thermo Fisher Scientific, Inc. | 10,030 | 1,904 | ||||||
| Machinery 2.30% | ||||||||
| Dover Corp. | 51,175 | 5,168 | ||||||
| ITT, Inc. | 70,715 | 3,774 | ||||||
| Total | 8,942 | |||||||
| Media 1.31% | ||||||||
| Comcast Corp. Class A | 54,906 | 2,199 | ||||||
| Walt Disney Co. (The) | 27,041 | 2,907 | ||||||
| Total | 5,106 | |||||||
| Investments | Shares | Fair Value (000) | ||||||
| Metals & Mining 0.87% | ||||||||
| Reliance Steel & | ||||||||
| Aluminum Co. | 39,572 | $ | 3,395 | |||||
| Oil, Gas & Consumable Fuels 10.62% | ||||||||
| Chevron Corp. | 107,018 | 13,398 | ||||||
| ConocoPhillips | 139,300 | 7,646 | ||||||
| Devon Energy Corp. | 130,900 | 5,419 | ||||||
| EOG Resources, Inc. | 61,892 | 6,679 | ||||||
| Exxon Mobil Corp. | 23,727 | 1,984 | ||||||
| Royal Dutch Shell plc Class A ADR | 92,319 | 6,159 | ||||||
| Total | 41,285 | |||||||
| Pharmaceuticals 6.02% | ||||||||
| Allergan plc | 14,991 | 2,452 | ||||||
| Johnson & Johnson | 97,900 | 13,679 | ||||||
| Merck & Co., Inc. | 34,505 | 1,942 | ||||||
| Novartis AG ADR | 63,275 | 5,312 | ||||||
| Total | 23,385 | |||||||
| Road & Rail 0.57% | ||||||||
| CSX Corp. | 40,452 | 2,225 | ||||||
| Semiconductors & Semiconductor Equipment 3.35% | ||||||||
| Broadcom Ltd. | 6,322 | 1,624 | ||||||
| Intel Corp. | 165,222 | 7,627 | ||||||
| Marvell Technology Group Ltd. | 123,826 | 2,659 | ||||||
| QUALCOMM, Inc. | 17,624 | 1,128 | ||||||
| Total | 13,038 | |||||||
| Software 2.69% | ||||||||
| Microsoft Corp. | 62,564 | 5,352 | ||||||
| Oracle Corp. | 108,332 | 5,122 | ||||||
| Total | 10,474 | |||||||
| Specialty Retail 2.47% | ||||||||
| Burlington Stores, Inc.* | 26,318 | 3,238 | ||||||
| Home Depot, Inc. (The) | 10,603 | 2,010 | ||||||
| Lowe’s Cos., Inc. | 46,806 | 4,350 | ||||||
| Total | 9,598 | |||||||
| 8 | See Notes to Financial Statements. |
Schedule of Investments (concluded)
December 31, 2017
| Investments | Shares | Fair Value (000) | ||||||
| Technology Hardware, Storage & Peripherals 0.49% | ||||||||
| Apple, Inc. | 11,159 | $ | 1,888 | |||||
| Tobacco 1.09% | ||||||||
| Altria Group, Inc. | 27,640 | 1,974 | ||||||
| Philip Morris | ||||||||
| International, Inc. | 21,520 | 2,273 | ||||||
| Total | 4,247 | |||||||
| Total Common Stocks (cost $334,086,363) | 381,965 | |||||||
| Investments | Principal Amount (000) | Fair Value (000) | ||||||
| SHORT-TERM INVESTMENT 1.88% | ||||||||
| Repurchase Agreement | ||||||||
| Repurchase Agreement dated 12/29/2017, 0.54% due 1/2/2018 with Fixed Income Clearing Corp. collateralized by $6,165,000 of U.S. Treasury Bond at 7.875% due 2/15/2021; value: $7,441,821; proceeds: $7,294,890 (cost $7,294,452) | $ | 7,294 | $ | 7,294 | ||||
| Total Investments in Securities 100.12% (cost $341,380,815) | 389,259 | |||||||
| Liabilities in Excess of Other Assets (0.12)% | (460 | ) | ||||||
| Net Assets 100.00% | $ | 388,799 | ||||||
| ADR | American Depositary Receipt. | |
| * | Non-income producing security. | |
| (a) | Foreign security traded in U.S. dollars. |
The following is a summary of the inputs used as of December 31, 2017 in valuing the Fund’s investments carried at fair value(1):
| Level 1 | Level 2 | Level 3 | Total | |||||||||||||
| Investment Type(2)(3) | (000) | (000) | (000) | (000) | ||||||||||||
| Common Stocks | $ | 381,965 | $ | — | $ | — | $ | 381,965 | ||||||||
| Repurchase Agreement | — | 7,294 | — | 7,294 | ||||||||||||
| Total | $ | 381,965 | $ | 7,294 | $ | — | $ | 389,259 | ||||||||
| (1) | Refer to Note 2(h) for a description of fair value measurements and the three-tier hierarchy of inputs. | |
| (2) | See Schedule of Investments for fair values in each industry and identification of foreign issuers and/or geography. | |
| (3) | There were no Level 1/Level 2 transfers during the fiscal year ended December 31, 2017. |
| See Notes to Financial Statements. | 9 |
Statement of Assets and Liabilities
December 31, 2017
| ASSETS: | ||||
| Investments in securities, at fair value (cost $341,380,815) | $ | 389,258,795 | ||
| Receivables: | ||||
| Interest and dividends | 300,285 | |||
| Capital shares sold | 14,536 | |||
| From advisor (See Note 3) | 13,935 | |||
| Prepaid expenses | 1,922 | |||
| Total assets | 389,589,473 | |||
| LIABILITIES: | ||||
| Payables: | ||||
| Management fee | 247,735 | |||
| Capital shares reacquired | 127,919 | |||
| Directors’ fees | 51,644 | |||
| Fund administration | 13,213 | |||
| Accrued expenses | 350,361 | |||
| Total liabilities | 790,872 | |||
| NET ASSETS | $ | 388,798,601 | ||
| COMPOSITION OF NET ASSETS: | ||||
| Paid-in capital | $ | 340,527,645 | ||
| Distributions in excess of net investment income | (51,644 | ) | ||
| Accumulated net realized gain on investments | 444,620 | |||
| Net unrealized appreciation on investments | 47,877,980 | |||
| Net Assets | $ | 388,798,601 | ||
| Outstanding shares (50 million shares of common stock authorized, $.001 par value) | 20,613,386 | |||
| Net asset value, offering and redemption price per share (Net assets divided by outstanding shares) | $18.86 | |||
| 10 | See Notes to Financial Statements. |
For the Year Ended December 31, 2017
| Investment income: | ||||
| Dividends (net of foreign withholding taxes of $10,944) | $8,256,136 | |||
| Interest | 10,620 | |||
| Total investment income | 8,266,756 | |||
| Expenses: | ||||
| Management fee | 2,876,869 | |||
| Non 12b-1 service fees | 959,041 | |||
| Shareholder servicing | 409,660 | |||
| Fund administration | 153,433 | |||
| Professional | 57,005 | |||
| Reports to shareholders | 41,534 | |||
| Custody | 21,226 | |||
| Directors’ fees | 10,852 | |||
| Other | 28,979 | |||
| Gross expenses | 4,558,599 | |||
| Expense reductions (See Note 8) | (3,487 | ) | ||
| Fees waived and expenses reimbursed (See Note 3) | (143,913 | ) | ||
| Net expenses | 4,411,199 | |||
| Net investment income | 3,855,557 | |||
| Net realized and unrealized gain: | ||||
| Net realized gain on investments | 31,007,779 | |||
| Net change in unrealized appreciation/depreciation on investments | 10,765,589 | |||
| Net realized and unrealized gain | 41,773,368 | |||
| Net Increase in Net Assets Resulting From Operations | $ | 45,628,925 | ||
| See Notes to Financial Statements. | 11 |
Statements of Changes in Net Assets
| INCREASE IN NET ASSETS | For the Year Ended December 31, 2017 | For the Year Ended December 31, 2016 | ||||||||
| Operations: | ||||||||||
| Net investment income | $ | 3,855,557 | $ | 4,564,594 | ||||||
| Net realized gain on investments | 31,007,779 | 7,678,555 | ||||||||
| Net change in unrealized appreciation/depreciation on investments | 10,765,589 | 39,219,549 | ||||||||
| Net increase in net assets resulting from operations | 45,628,925 | 51,462,698 | ||||||||
| Distributions to shareholders from: | ||||||||||
| Net investment income | (3,948,579 | ) | (4,325,749 | ) | ||||||
| Net realized gain | (29,231,636 | ) | (7,059,588 | ) | ||||||
| Total distributions to shareholders | (33,180,215 | ) | (11,385,337 | ) | ||||||
| Capital share transactions (See Note 13): | ||||||||||
| Proceeds from sales of shares | 13,642,490 | 248,253,422 | ||||||||
| Reinvestment of distributions | 33,180,215 | 11,385,337 | ||||||||
| Cost of shares reacquired | (57,991,110 | ) | (173,204,196 | ) | ||||||
| Net increase (decrease) in net assets resulting from capital share transactions | (11,168,405 | ) | 86,434,563 | |||||||
| Net increase in net assets | 1,280,305 | 126,511,924 | ||||||||
| NET ASSETS: | ||||||||||
| Beginning of year | $ | 387,518,296 | $ | 261,006,372 | ||||||
| End of year | $ | 388,798,601 | $ | 387,518,296 | ||||||
| Distributions in excess of net investment income | $ | (51,644 | ) | $ | (48,682 | ) | ||||
| 12 | See Notes to Financial Statements. |
This page is intentionally left blank.
13
| Per Share Operating Performance: | ||||||||||||||||||||||||||||
| Investment operations: | Distributions to shareholders from: | |||||||||||||||||||||||||||
| Net asset value, beginning of period | Net invest- ment income(a) | Net realized and unrealized gain (loss) | Total from invest- ment opera- tions | Net investment income | Net realized gain | Total distri- butions | ||||||||||||||||||||||
| 12/31/2017 | $18.30 | $0.19 | $ 2.10 | $ 2.29 | $(0.21 | ) | $(1.52 | ) | $(1.73 | ) | ||||||||||||||||||
| 12/31/2016 | 16.28 | 0.23 | 2.34 | 2.57 | (0.21 | ) | (0.34 | ) | (0.55 | ) | ||||||||||||||||||
| 12/31/2015 | 18.61 | 0.16 | (0.79 | ) | (0.63 | ) | (0.21 | ) | (1.49 | ) | (1.70 | ) | ||||||||||||||||
| 12/31/2014 | 21.03 | 0.09 | 1.43 | 1.52 | (0.10 | ) | (3.84 | ) | (3.94 | ) | ||||||||||||||||||
| 12/31/2013 | 17.61 | 0.05 | 6.18 | 6.23 | (0.05 | ) | (2.76 | ) | (2.81 | ) | ||||||||||||||||||
| (a) | Calculated using average shares outstanding during the period. |
| (b) | Total return does not consider the effects of sales charges or other expenses imposed by an insurance company and assumes the reinvestment of all distributions. |
| 14 | See Notes to Financial Statements. |
| Ratios to Average Net Assets: | Supplemental Data: | |||||||||||||||||||||||||
| Net asset value, end of period | Total return(b) (%) | Total expenses after waivers and/or reim- bursements (%) | Total expenses (%) | Net investment income (%) | Net assets, end of period (000) | Portfolio turnover rate (%) | ||||||||||||||||||||
| $18.86 | 12.57 | 1.15 | 1.19 | 1.01 | $ | 388,799 | 106 | |||||||||||||||||||
| 18.30 | 15.74 | 1.15 | 1.20 | 1.36 | 387,518 | 132 | ||||||||||||||||||||
| 16.28 | (3.44 | ) | 1.15 | 1.21 | 0.90 | 261,006 | 135 | |||||||||||||||||||
| 18.61 | 7.14 | 1.15 | 1.19 | 0.43 | 442,860 | 132 | ||||||||||||||||||||
| 21.03 | 35.76 | 1.15 | 1.18 | 0.26 | 465,208 | 87 | ||||||||||||||||||||
| See Notes to Financial Statements. | 15 |
| 1. | ORGANIZATION |
Lord Abbett Series Fund, Inc. (the “Company”) is registered under the Investment Company Act of 1940, as amended (the “Act”), as a diversified, open-end management investment company and was incorporated under Maryland law in 1989. The Company consists of twelve separate portfolios. This report covers Fundamental Equity Portfolio (the “Fund”).
The Fund’s investment objective is long-term growth of capital and income without excessive fluctuations in market value. The Fund has Variable Contract class shares (“Class VC Shares”), which are currently issued and redeemed only in connection with investments in, and payments under, variable annuity contracts and variable life insurance policies issued by life insurance and insurance-related companies.
The preparation of the financial statements in conformity with accounting principles generally accepted in the United States of America (“U.S. GAAP”) requires management to make certain estimates and assumptions that affect the reported amounts of assets and liabilities and disclosure of contingent assets and liabilities at the date of the financial statements and the reported amounts of increases and decreases in net assets from operations during the reporting period. Actual results could differ from those estimates. The Fund is considered an investment company under U.S. GAAP and follows the accounting and reporting guidance applicable to investment companies.
| 2. | SIGNIFICANT ACCOUNTING POLICIES |
| (a) | Investment Valuation–Under procedures approved by the Fund’s Board of Directors (the “Board”), Lord, Abbett & Co. LLC (“Lord Abbett”), the Fund’s investment manager, has formed a Pricing Committee to administer the pricing and valuation of portfolio investments and to ensure that prices utilized reasonably reflect fair value. Among other things, these procedures allow the Fund to utilize independent pricing services, quotations from securities and financial instrument dealers and other market sources to determine fair value. |
| Securities actively traded on any recognized U.S. or non-U.S. exchange or on The NASDAQ Stock Market LLC are valued at the last sale price or official closing price on the exchange or system on which they are principally traded. Events occurring after the close of trading on non-U.S. exchanges may result in adjustments to the valuation of foreign securities to reflect their fair value as of the close of regular trading on the New York Stock Exchange. The Fund may utilize an independent fair valuation service in adjusting the valuations of foreign securities. Unlisted equity securities are valued at the last quoted sale price or, if no sale price is available, at the mean between the most recently quoted bid and asked prices. Exchange traded options and futures contracts are valued at the last sale price in the market where they are principally traded. If no sale has occurred, the mean between the most recently quoted bid and asked prices is used. | |
| Securities for which prices are not readily available are valued at fair value as determined by the Pricing Committee. The Pricing Committee considers a number of factors, including observable and unobservable inputs, when arriving at fair value. The Pricing Committee may use related or comparable assets or liabilities, recent transactions, market multiples, book values and other relevant information to determine the fair value of portfolio investments. The Board or a designated committee thereof regularly reviews fair value determinations made by the Pricing Committee and may employ techniques such as reviewing related market activity, reviewing inputs and assumptions, and retrospectively comparing prices of subsequent purchases and sales transactions to fair value determinations made by the Pricing Committee. |
16
Notes to Financial Statements (continued)
| Short-term securities with 60 days or less remaining to maturity are valued using the amortized cost method, which approximates fair value. | |
| (b) | Security Transactions–Security transactions are recorded as of the date that the securities are purchased or sold (trade date). Realized gains and losses on sales of portfolio securities are calculated using the identified-cost method. |
| (c) | Investment Income–Dividend income is recorded on the ex-dividend date. Interest income is recorded on the accrual basis as earned. Discounts are accreted and premiums are amortized using the effective interest method and are included in Interest and other income on the Statement of Operations. Withholding taxes on foreign dividends have been provided for in accordance with the applicable country’s tax rules and rates. |
| (d) | Income Taxes–It is the policy of the Fund to meet the requirements of Subchapter M of the Internal Revenue Code applicable to regulated investment companies and to distribute substantially all taxable income and capital gains to its shareholders. Therefore, no income tax provision is required. |
| The Fund files U.S. federal and various state and local tax returns. No income tax returns are currently under examination. The statute of limitations on the Fund’s filed U.S. federal tax returns remains open for the fiscal years ended December 31, 2014 through December 31, 2017. The statutes of limitations on the Company’s state and local tax returns may remain open for an additional year depending upon the jurisdiction. | |
| (e) | Expenses–Expenses incurred by the Company that do not specifically relate to an individual fund are generally allocated to the funds within the Company on a pro rata basis by relative net assets. |
| (f) | Foreign Transactions–The books and records of the Fund are maintained in U.S. dollars and transactions denominated in foreign currencies are recorded in the Fund’s records at the rate prevailing when earned or recorded. Asset and liability accounts that are denominated in foreign currencies are adjusted daily to reflect current exchange rates and any unrealized gain (loss) is included in Net change in unrealized appreciation/depreciation on investments in the Fund’s Statement of Operations. The resultant exchange gains and losses upon settlement of such transactions are included in Net realized gain on investments in the Fund’s Statement of Operations. The Fund does not isolate that portion of the results of operations arising as a result of changes in the foreign exchange rates from the changes in market prices of the securities. |
| (g) | Repurchase Agreements–The Fund may enter into repurchase agreements with respect to securities. A repurchase agreement is a transaction in which a fund acquires a security and simultaneously commits to resell that security to the seller (a bank or securities dealer) at an agreed-upon price on an agreed-upon date. The Fund requires at all times that the repurchase agreement be collateralized by cash, or by securities of the U.S. Government, its agencies, its instrumentalities, or U.S. Government sponsored enterprises having a value equal to, or in excess of, the value of the repurchase agreement (including accrued interest). If the seller of the agreement defaults on its obligation to repurchase the underlying securities at a time when the fair value of these securities has declined, the Fund may incur a loss upon disposition of the securities. |
| (h) | Fair Value Measurements–Fair value is defined as the price that the Fund would receive upon selling an investment or transferring a liability in an orderly transaction to an independent |
17
Notes to Financial Statements (continued)
| buyer in the principal or most advantageous market of the investment. A three-tier hierarchy is used to maximize the use of observable market data and minimize the use of unobservable inputs and to establish classification of fair value measurements for disclosure purposes. Inputs refer broadly to the assumptions that market participants would use in pricing the asset or liability, including assumptions about risk—for example, the risk inherent in a particular valuation technique used to measure fair value (such as a pricing model) and/or the risk inherent in the inputs to the valuation technique. Inputs may be observable or unobservable. Observable inputs reflect the assumptions market participants would use in pricing the asset or liability. Observable inputs are based on market data obtained from sources independent of the reporting entity. Unobservable inputs reflect the reporting entity’s own assumptions about the assumptions market participants would use in pricing the asset or liability. Unobservable inputs are based on the best information available in the circumstances. The three-tier hierarchy classification is determined based on the lowest level of inputs that is significant to the fair value measurement, and is summarized in the three broad Levels listed below: | |
| • | Level 1 – | unadjusted quoted prices in active markets for identical investments; |
| • | Level 2 – | other significant observable inputs (including quoted prices for similar investments, interest rates, prepayment speeds, credit risk, etc.); and |
| • | Level 3 – | significant unobservable inputs (including the Fund’s own assumptions in determining the fair value of investments). |
| A summary of inputs used in valuing the Fund’s investments as of December 31, 2017 and, if applicable, Level 1/Level 2 transfers and Level 3 rollforwards for the fiscal year then ended is included in the Fund’s Schedule of Investments. | |
| Changes in valuation techniques may result in transfers into or out of an assigned level within the three-tier hierarchy. All transfers between different levels within the three-tier hierarchy are deemed to have occurred as of the beginning of the reporting period. The inputs or methodology used for valuing securities are not necessarily an indication of the risk associated with investing in those securities. | |
| 3. | MANAGEMENT FEE AND OTHER TRANSACTIONS WITH AFFILIATES |
Management Fee
The Company has a management agreement with Lord Abbett, pursuant to which Lord Abbett supplies the Fund with investment management services and executive and other personnel, provides office space and pays for ordinary and necessary office and clerical expenses relating to research and statistical work and supervision of the Fund’s investment portfolio.
The management fee is based on the Fund’s average daily net assets at the following annual rate:
| First $1 billion | .75 | % | ||
| Next $1 billion | .70 | % | ||
| Over $2 billion | .65 | % |
For the fiscal year ended December 31, 2017, the effective management fee, net of waivers, was at an annualized rate of .71% of the Fund’s average daily net assets.
In addition, Lord Abbett provides certain administrative services to the Fund pursuant to an Administrative Services Agreement in return for a fee at an annual rate of .04% of the Fund’s average daily net assets.
18
Notes to Financial Statements (continued)
During the fiscal year ended December 31, 2017 and continuing through April 30, 2018, Lord Abbett has contractually agreed to waive its fees and reimburse expenses to the extent necessary to limit total net annual operating expenses to an annual rate of 1.15%. This agreement may be terminated only upon the approval of the Board.
The Company, on behalf of the Fund, has entered into services arrangements with certain insurance companies. Under these arrangements, certain insurance companies will be compensated up to ..25% of the average daily net asset value (“NAV”) of the Fund’s Class VC Shares held in the insurance company’s separate account to service and maintain the Variable Contract owners’ accounts. This amount is included in Non 12b-1 service fees on the Statement of Operations. The Fund may also compensate certain insurance companies, third-party administrators and other entities for providing recordkeeping, sub-transfer agency and other administrative services to the Fund. This amount is included in Shareholder servicing on the Statement of Operations.
Two Directors and certain of the Company’s officers have an interest in Lord Abbett.
| 4. | DISTRIBUTIONS AND CAPITAL LOSS CARRYFORWARDS |
Dividends from net investment income, if any, are declared and paid at least semi-annually. Taxable net realized gains from investment transactions, reduced by allowable capital loss carryforwards, if any, are declared and distributed to shareholders at least annually. The capital loss carryforward amount, if any, is available to offset future net capital gains. Dividends and distributions to shareholders are recorded on the ex-dividend date. The amounts of dividends and distributions from net investment income and net realized capital gains are determined in accordance with federal income tax regulations, which may differ from U.S. GAAP. These book/tax differences are either considered temporary or permanent in nature. To the extent these differences are permanent in nature, such amounts are reclassified within the components of net assets based on their federal tax basis treatment; temporary differences do not require reclassification. Dividends and distributions that exceed earnings and profits for tax purposes are reported as a tax return of capital.
The tax character of distributions paid during the fiscal years ended December 31, 2017 and 2016 was as follows:
| Year Ended 12/31/2017 | Year Ended 12/31/2016 | |||||||
| Distributions paid from: | ||||||||
| Ordinary income | $ | 24,955,446 | $ | 9,867,397 | ||||
| Net long-term capital gains | 8,224,769 | 1,517,940 | ||||||
| Total distributions paid | $ | 33,180,215 | $ | 11,385,337 | ||||
As of December 31, 2017, the components of accumulated gains on a tax-basis were as follows:
| Undistributed ordinary income – net | $ | 1,857,839 | ||
| Undistributed long-term capital gains | 1,013,879 | |||
| Total undistributed earnings | 2,871,718 | |||
| Temporary differences | (51,644 | ) | ||
| Unrealized gains – net | 45,450,882 | |||
| Total accumulated gains – net | $ | 48,270,956 |
19
Notes to Financial Statements (continued)
As of December 31, 2017, the aggregate unrealized security gains and losses on investments and other financial instruments based on cost for U.S. federal income tax purposes were as follows:
| Tax cost | $ | 343,807,913 | ||
| Gross unrealized gain | 48,428,975 | |||
| Gross unrealized loss | (2,978,093 | ) | ||
| Net unrealized security gain | $ | 45,450,882 |
The difference between book-basis and tax-basis unrealized gains (losses) is attributable to the tax treatment of wash sales.
Permanent items identified during the fiscal year ended December 31, 2017 have been reclassified among the components of net assets based on their tax basis treatment as follows:
| Distributions in Excess of Net Investment Income | Accumulated Net Realized Gain | |||||
| $90,060 | $(90,060 | ) |
The permanent differences are attributable to the tax treatment of certain distributions.
| 5. | PORTFOLIO SECURITIES TRANSACTIONS |
Purchases and sales of investment securities (excluding short-term investments) for the fiscal year ended December 31, 2017 were as follows:
| Purchases | Sales | |||||
| $398,304,735 | $439,027,765 | |||||
There were no purchases or sales of U.S. Government securities for the fiscal year ended December 31, 2017.
The Fund is permitted to purchase and sell securities (“cross-trade”) from and to other Lord Abbett funds or client accounts pursuant to procedures approved by the Board in compliance with Rule 17a-7 under the Act (the “Rule”). Each cross-trade is executed at a fair market price in compliance with provisions of the Rule. For the fiscal year ended December 31, 2017, the Fund engaged in cross-trades sales of $1,253,915 and sales of $1,319,228, which resulted in net realized gains of $145,896.
| 6. | DISCLOSURES ABOUT OFFSETTING ASSETS AND LIABILITIES |
The Financial Accounting Standards Board (“FASB”) requires disclosures intended to help better assess the effect or potential effect of offsetting arrangements on a fund’s financial position. The following tables illustrate gross and net information about recognized assets and liabilities eligible for offset in the statement of assets and liabilities; and disclose such amounts subject to an enforceable master netting agreement or similar agreement, by counterparty. A master netting agreement is an agreement between a fund and a counterparty which provides for the net settlement of amounts owed under all contracts traded under that agreement, as well as cash collateral, through a single payment by one party to the other in the event of default on or termination of any one contract. The Fund’s accounting policy with respect to balance sheet offsetting is that, absent an event of default by the counterparty or a termination of the agreement, the master netting agreement does not result in an offset of reported amounts of
20
Notes to Financial Statements (continued)
financial assets and liabilities in the statement of assets and liabilities across transactions between the Fund and the applicable counterparty:
| Description | Gross Amounts of Gross Amounts | Recognized Assets Offset in the Statement of Assets and Liabilities | Net Amounts of Assets Presented in the Statement of Assets and Liabilities | |||||||||
| Repurchase Agreement | $ | 7,294,452 | $ | – | $ | 7,294,452 | ||||||
| Total | $ | 7,294,452 | $ | – | $ | 7,294,452 | ||||||
| Net Amounts of Assets Presented in the Statement of Assets and Liabilities | Amounts Not Offset in the Statement of Assets and Liabilities | |||||||||||||||||||
| Counterparty | Financial Instruments | Cash Collateral Received(a) | Securities Collateral Received(a) | Net Amount(b) | ||||||||||||||||
| Fixed Income Clearing Corp. | $ | 7,294,452 | $ | – | $ | – | $ | (7,294,452 | ) | $ | – | |||||||||
| Total | $ | 7,294,452 | $ | – | $ | – | $ | (7,294,452 | ) | $ | – | |||||||||
| (a) | Collateral disclosed is limited to an amount not to exceed 100% of the net amount of assets presented in the Statement of Assets and Liabilities, for each respective counterparty. |
| (b) | Net amount represents the amount owed to the Fund by the counterparty as of December 31, 2017. |
| 7. | DIRECTORS’ REMUNERATION |
The Company’s officers and two Directors, who are associated with Lord Abbett, do not receive any compensation from the Company for serving in such capacities. Independent Directors’ fees are allocated among all Lord Abbett-sponsored funds based on the net assets of each fund. There is an equity-based plan available to all Independent Directors under which Independent Directors must defer receipt of a portion of, and may elect to defer receipt of an additional portion of Directors’ fees. The deferred amounts are treated as though equivalent dollar amounts had been invested in the funds. Such amounts and earnings accrued thereon are included in Directors’ fees on the Statement of Operations and in Directors’ fees payable on the Statement of Assets and Liabilities and are not deductible for U.S. federal income tax purposes until such amounts are paid.
| 8. | EXPENSE REDUCTIONS |
The Company has entered into an arrangement with its transfer agent and custodian, whereby credits realized as a result of uninvested cash balances are used to reduce a portion of the Fund’s expenses.
| 9. | LINE OF CREDIT |
Effective August 28, 2017, the Fund and certain other funds managed by Lord Abbett (collectively, the “Participating Funds”) entered into an amended syndicated line of credit facility with various lenders for $600 million (the “Facility”), whereas State Street Bank and Trust Company (“SSB”) participates as a lender and as agent for the lenders. The Facility is to be used for temporary or emergency purposes as an additional source of liquidity to satisfy redemptions. The Participating Funds are subject to graduated borrowing limits of one-third of Fund assets (if Fund assets are less than $750 million), $250 million, $300 million, or $350 million, based on past borrowings and likelihood of future borrowings.
21
Notes to Financial Statements (continued)
Prior to August 28, 2017, the Funds and certain other funds managed by Lord Abbett participated in a $550 million syndicated line of credit facility, based on the same terms as described above.
During the fiscal year ended December 31, 2017, the Fund did not utilize the Facility.
| 10. | INTERFUND LENDING PROGRAM |
Pursuant to an exemptive order issued by the U.S. Securities and Exchange Commission (“SEC exemptive order”), certain registered open-end management investment companies managed by Lord Abbett, including the Fund, participate in a joint lending and borrowing program (the “Interfund Lending Program”). The SEC exemptive order allows the Funds to borrow money from and lend money to each other for temporary or emergency purposes subject to the limitations and conditions.
During the fiscal year ended December 31, 2017, the Fund did not participate as a borrower or lender in the Interfund Lending Program.
| 11. | CUSTODIAN AND ACCOUNTING AGENT |
SSB is the Company’s custodian and accounting agent. SSB performs custodial, accounting and recordkeeping functions relating to portfolio transactions and calculating the Fund’s NAV.
| 12. | INVESTMENT RISKS |
The Fund is subject to the general risks and considerations associated with investing in equity securities as well as the particular risks associated with value stocks. The value of an investment will fluctuate in response to movements in the equity securities market in general and to the changing prospects of individual companies in which the Fund invests. Value investing also is subject to the risk that a company judged to be undervalued may actually be appropriately priced or even overpriced. Large value stocks, in which the Fund invests a significant portion of its assets, may perform differently than the market as a whole and other types of stocks, such as mid-sized or small-company stocks and growth stocks. This is because different types of stocks tend to shift in and out of favor over time depending on market and economic conditions as well as investor sentiment. In addition, large companies may have smaller rates of growth as compared to successful but well established smaller companies. Mid-cap and small-cap company stocks in which the Fund may invest may be more volatile and less liquid than large-cap stocks, especially over the short term. The market may fail to recognize the intrinsic value of a particular value stock for a long time. In addition, if the Fund’s assessment of a company’s value or prospects for exceeding earnings expectations or market conditions is wrong, the Fund could suffer losses or produce poor performance relative to other funds, even in a favorable market.
Due to the Fund’s investment exposure to foreign companies and American Depositary Receipts, the Fund may experience increased market, industry and sector, liquidity, currency, political, information, and other risks. The securities of foreign companies also may be subject to inadequate exchange control regulations, the imposition of economic sanctions or other government restrictions, higher transaction and other costs, and delays in settlement to the extent they are traded on non-U.S. exchanges or markets.
The Fund is subject to the risks associated with derivatives, which may be different and greater than the risks associated with investing directly in securities and other investments. Derivatives may be subject to risks such as liquidity risk, leveraging risk, interest rate risk, market risk, and credit risk. Illiquid securities may lower the Fund’s returns since the Fund may be unable to sell
22
Notes to Financial Statements (concluded)
these securities at their desired time or price. Derivatives also may involve the risk of mispricing or improper valuation and the risk that changes in the value of the derivative may not correlate perfectly with the value of the underlying asset, rate or index. Whether the Fund’s use of derivatives is successful will depend on, among other things, the Fund’s ability to correctly forecast market movements, changes in foreign exchange and interest rates, and other factors. If the Fund incorrectly forecasts these and other factors, its performance could suffer. The Fund’s use of derivatives could result in a loss exceeding the amount of the Fund’s investment in these instruments.
These factors can affect the Fund’s performance.
| 13. | SUMMARY OF CAPITAL TRANSACTIONS |
Transactions in shares of capital stock were as follows:
| Year Ended December 31, 2017 | Year Ended December 31, 2016 | |||||||
| Shares sold | 723,908 | 15,238,804 | ||||||
| Reinvestment of distributions | 1,762,529 | 620,615 | ||||||
| Shares reacquired | (3,047,575 | ) | (10,720,561 | ) | ||||
| Increase (decrease) | (561,138 | ) | 5,138,858 | |||||
23
Report of Independent Registered Public Accounting Firm
To the Board of Directors of Lord Abbett Series Fund, Inc. and the shareholders of Fundamental Equity Portfolio:
Opinion on the Financial Statements and Financial Highlights
We have audited the accompanying statement of assets and liabilities, including the schedule of investments, of the Fundamental Equity Portfolio, one of the portfolios constituting the Lord Abbett Series Fund, Inc. (the “Fund”), as of December 31, 2017, the related statement of operations for the year then ended, the statements of changes in net assets for each of the two years in the period then ended, the financial highlights for each of the five years in the period then ended, and the related notes. In our opinion, the financial statements and financial highlights present fairly, in all material respects, the financial position of the Fundamental Equity Portfolio of the Fund as of December 31, 2017, the results of its operations for the year then ended, the changes in its net assets for each of the two years in the period then ended, and the financial highlights for each of the five years in the period then ended, in conformity with accounting principles generally accepted in the United States of America.
Basis for Opinion
These financial statements and financial highlights are the responsibility of the Fund’s management. Our responsibility is to express an opinion on the Fund’s financial statements and financial highlights based on our audits. We are a public accounting firm registered with the Public Company Accounting Oversight Board (United States) (PCAOB) and are required to be independent with respect to the Fund in accordance with the U.S. federal securities laws and the applicable rules and regulations of the Securities and Exchange Commission and the PCAOB.
We conducted our audits in accordance with the standards of the PCAOB. Those standards require that we plan and perform the audit to obtain reasonable assurance about whether the financial statements and financial highlights are free of material misstatement, whether due to error or fraud. The Fund is not required to have, nor were we engaged to perform, an audit of its internal control over financial reporting. As part of our audits we are required to obtain an understanding of internal control over financial reporting but not for the purpose of expressing an opinion on the effectiveness of the Fund’s internal control over financial reporting. Accordingly, we express no such opinion.
Our audits included performing procedures to assess the risks of material misstatement of the financial statements and financial highlights, whether due to error or fraud, and performing procedures that respond to those risks. Such procedures included examining, on a test basis, evidence regarding the amounts and disclosures in the financial statements and financial highlights. Our audits also included evaluating the accounting principles used and significant estimates made by management, as well as evaluating the overall financial statement presentation and financial highlights. Our procedures included confirmation of securities owned as of December 31, 2017, by correspondence with the custodian and brokers. We believe that our audits provide a reasonable basis for our opinion.
DELOITTE & TOUCHE LLP
New York, New York
February 15, 2018
We have served as the auditor of one or more Lord Abbett Family of Funds’ investment companies since 1932.
24
Basic Information About Management
The Board is responsible for the management of the business and affairs of the Company in accordance with the laws of the State of Maryland. The Board elects officers who are responsible for the day-to-day operations of the Fund and who execute policies authorized by the Board. The Board also approves an investment adviser to the Fund and continues to monitor the cost and quality of the services the investment adviser provides, and annually considers whether to renew the contract with the adviser. Generally, each Director holds office until his/her successor is elected and qualified or until his/her earlier resignation or removal, as provided in the Company’s organizational documents.
Lord Abbett, a Delaware limited liability company, is the Fund’s investment adviser. Designated Lord Abbett personnel are responsible for the day-to-day management of the Fund.
Interested Directors
Ms. Foster and Mr. Sieg are affiliated with Lord Abbett and are “interested persons” of the Fund as defined in the Act. Ms. Foster and Mr. Sieg are directors/trustees of each of the 12 investment companies in the Lord Abbett Family of Funds, which consist of 61 portfolios or series. Ms. Foster is an officer of the Lord Abbett Family of Funds.
| Name, Address and Year of Birth | Current Position and Length of Service with the Company | Principal Occupation and Other Directorships During the Past Five Years | ||
| Daria L. Foster(1) Lord, Abbett & Co. LLC 90 Hudson Street Jersey City, NJ 07302 (1954) | Director and President since 2006; Chief Executive Officer since 2012 | Principal Occupation: Managing Partner of Lord Abbett, joined Lord Abbett in 1990. Other Directorships: None. | ||
| Douglas B. Sieg(1) Lord, Abbett & Co. LLC 90 Hudson Street Jersey City, NJ 07302 (1969) | Director since 2016 | Principal Occupation: Partner (since 2001) and Head of Client Services (since 2013), formerly Director of Marketing and Relationship Management, joined Lord Abbett in 1994. Other Directorships: None. |
Independent Directors
The following Independent Directors also are directors/trustees of each of the 12 investment companies in the Lord Abbett Family of Funds, which consist of 61 portfolios or series.
| Name, Address and Year of Birth | Current Position and Length of Service with the Company | Principal Occupation and Other Directorships During the Past Five Years | ||
| Eric C. Fast Lord, Abbett & Co. LLC c/o Legal Dept. 90 Hudson Street Jersey City, NJ 07302 (1949) | Director since 2014 | Principal Occupation: Chief Executive Officer of Crane Co., an industrial products company (2001–2014). Other Directorships: Currently serves as director of Automatic Data Processing, Inc. (since 2007) and Regions Financial Corporation (since 2010). Previously served as a director of Crane Co. (1999–2014). | ||
| (1) | Daria L. Foster, Managing Partner of Lord Abbett, a member of the Board, and the Chief Executive Officer and President of the Lord Abbett Family of Funds, will retire from her positions with Lord Abbett and the Lord Abbett Family of Funds effective March 31, 2018. Douglas B. Sieg, Partner and head of Client Services at Lord Abbett, and a member of the Board, will succeed Ms. Foster effective April 1, 2018. |
25
Basic Information About Management (continued)
| Name, Address and Year of Birth | Current Position and Length of Service with the Company | Principal Occupation and Other Directorships During the Past Five Years | ||
| Evelyn E. Guernsey Lord, Abbett & Co. LLC c/o Legal Dept. 90 Hudson Street Jersey City, NJ 07302 (1955) | Director since 2011 | Principal Occupation: CEO, Americas of J.P. Morgan Asset Management (2004–2010). Other Directorships: None. | ||
| Julie A. Hill Lord, Abbett & Co. LLC c/o Legal Dept. 90 Hudson Street Jersey City, NJ 07302 (1946) | Director since 2004 | Principal Occupation: Owner and CEO of The Hill Company, a business consulting firm (since 1998). Other Directorships: Currently serves as director of Anthem, Inc., a health benefits company (since 1994). | ||
| Franklin W. Hobbs Lord, Abbett & Co. LLC c/o Legal Dept. 90 Hudson Street Jersey City, NJ 07302 (1947) | Director since 2001 | Principal Occupation: President and CEO of Ribbon Communications (since 2017) and Advisor of One Equity Partners, a private equity firm (since 2004). Other Directorships: Currently serves as director of Ribbon Communications (since 2017), director and Chairman of the Board of Ally Financial Inc., a financial services firm (since 2009), and as director of Molson Coors Brewing Company (since 2002). | ||
| Kathleen M. Lutito Lord, Abbett & Co. LLC c/o Legal Dept. 90 Hudson Street Jersey City, NJ 07302 (1963) | Director since 2017 | Principal Occupation: President and Chief Investment Officer of CenturyLink Investment Management Company (since 2006). Other Directorships: None | ||
| James M. McTaggart Lord, Abbett & Co. LLC c/o Legal Dept. 90 Hudson Street Jersey City, NJ 07302 (1947) | Director since 2012 | Principal Occupation: Independent management advisor and consultant (since 2012); Vice President, CRA International, Inc. (doing business as Charles River Associates), a global management consulting firm (2009–2012); Founder and Chairman of Marakon Associates, Inc., a strategy consulting firm (1978–2009); and Officer and Director of Trinsum Group, a holding company (2007–2009). Other Directorships: Blyth, Inc., a home products company (2004–2015). | ||
| Karla M. Rabusch Lord, Abbett & Co. LLC c/o Legal Dept. 90 Hudson Street Jersey City, NJ 07302 (1959) | Director since 2017 | Principal Occupation: President and Director of Wells Fargo Funds Management, LLC (2003–2017); President of Wells Fargo Funds (2003–2016). Other Directorships: None. | ||
| Mark A. Schmid Lord, Abbett & Co. LLC c/o Legal Dept. 90 Hudson Street Jersey City, NJ 07302 (1959) | Director since 2016 | Principal Occupation: Vice President and Chief Investment Officer of the University of Chicago (since 2009). Other Directorships: None. |
26
Basic Information About Management (continued)
| Name, Address and Year of Birth | Current Position and Length of Service with the Company | Principal Occupation and Other Directorships During the Past Five Years | ||
| James L.L. Tullis Lord, Abbett & Co. LLC c/o Legal Dept. 90 Hudson Street Jersey City, NJ 07302 (1947) | Director since 2006; Chairman since 2017 | Principal Occupation: CEO of Tullis-Dickerson and Co. Inc., a venture capital management firm (since 1990); CEO of Tullis Health Investors Inc. (since 2012). Other Directorships: Currently serves as director of Crane Co. (since 1998). |
Officers
None of the officers listed below have received compensation from the Company. All of the officers of the Company also may be officers of the other Lord Abbett Funds and maintain offices at 90 Hudson Street, Jersey City, NJ 07302. Unless otherwise indicated, the position(s) and title(s) listed under the “Principal Occupation During the Past Five Years” column indicate each officer’s position(s) and title(s) with Lord Abbett. Each officer serves for an indefinite term (i.e., until his or her death, resignation, retirement, or removal).
| Name and Year of Birth | Current Position with the Company | Length of Service of Current Position | Principal Occupation During the Past Five Years | |||
| Daria L. Foster (1954) | President and Chief Executive Officer | Elected as President in 2006 and Chief Executive Officer in 2012 | Managing Partner of Lord Abbett, joined Lord Abbett in 1990. | |||
| Sean J. Aurigemma (1969) | Executive Vice President | Elected in 2010 | Portfolio Manager, joined Lord Abbett in 2007. | |||
| Jeff D. Diamond (1960) | Executive Vice President | Elected in 2008 | Portfolio Manager, joined Lord Abbett in 2007. | |||
| Todd D. Jacobson (1966) | Executive Vice President | Elected in 2005 | Partner and Associate Director, joined Lord Abbett in 2003. | |||
| Robert A. Lee (1969) | Executive Vice President | Elected in 2010 | Partner and Chief Investment Officer, and was formerly Deputy Chief Investment Officer and Director of Taxable Fixed Income, joined Lord Abbett in 1997. | |||
| David J. Linsen (1974) | Executive Vice President | Elected in 2008 | Partner and Director, joined Lord Abbett in 2001. | |||
| Thomas B. Maher (1967) | Executive Vice President | Elected in 2010 | Partner and Portfolio Manager, joined Lord Abbett in 2003. | |||
| Justin C. Maurer (1969) | Executive Vice President | Elected in 2010 | Partner and Portfolio Manager, joined Lord Abbett in 2001. |
27
Basic Information About Management (continued)
| Name and Year of Birth | Current Position with the Company | Length of Service of Current Position | Principal Occupation During the Past Five Years | |||
| Vincent J. McBride (1964) | Executive Vice President | Elected in 2010 | Partner and Director, joined Lord Abbett in 2003. | |||
| Andrew H. O’Brien (1973) | Executive Vice President | Elected in 2010 | Partner and Portfolio Manager, joined Lord Abbett in 1998. | |||
| F. Thomas O’Halloran, III (1955) | Executive Vice President | Elected in 2010 | Partner and Portfolio Manager, joined Lord Abbett in 2001. | |||
| Marc Pavese (1972) | Executive Vice President | Elected in 2016 | Partner and Portfolio Manager, joined Lord Abbett in 2008. | |||
| Walter H. Prahl (1958) | Executive Vice President | Elected in 2012 | Partner and Director, joined Lord Abbett in 1997. | |||
| Jeffrey Rabinowitz (1972) | Executive Vice President | Elected in 2017 | Portfolio Manager, joined Lord Abbett in 2017 and was formerly a Managing Director and Portfolio Manager/Technology Analyst at Jennison Associates LLC (2014–2017) and Managing Director and Portfolio Manager/ Technology Analyst at Goldman Sachs Asset Management (1999–2014). | |||
| Steven F. Rocco (1979) | Executive Vice President | Elected in 2014 | Partner and Portfolio Manager, joined Lord Abbett in 2004. | |||
| A. Edward Allinson (1961) | Vice President | Elected in 2011 | Portfolio Manager, joined Lord Abbett in 2005. | |||
| Matthew R. DeCicco (1977) | Vice President | Elected in 2003 | Portfolio Manager, joined Lord Abbett in 1999. | |||
| Brooke A. Fapohunda (1975) | Vice President and Assistant Secretary | Elected in 2014 | Partner and Deputy General Counsel, joined Lord Abbett in 2006. | |||
| John K. Forst (1960) | Vice President and Assistant Secretary | Elected in 2005 | Partner and Deputy General Counsel, joined Lord Abbett in 2004. | |||
| Bernard J. Grzelak (1971) | Chief Financial Officer and Vice President | Elected in 2017 | Partner and Chief Operations Officer, and was formerly Director of Fund Administration, joined Lord Abbett in 2003. | |||
| Lawrence H. Kaplan (1957) | Vice President and Secretary | Elected in 1997 | Partner and General Counsel, joined Lord Abbett in 1997. |
28
Basic Information About Management (concluded)
| Name and Year of Birth | Current Position with the Company | Length of Service of Current Position | Principal Occupation During the Past Five Years | |||
| Linda Y. Kim (1980) | Vice President and Assistant Secretary | Elected in 2016 | Counsel, joined Lord Abbett in 2015 and was formerly an Associate at Stroock & Stroock & Lavan LLP (2007–2015). | |||
| Joseph M. McGill (1962) | Chief Compliance Officer | Elected in 2014 | Partner and Chief Compliance Officer, joined Lord Abbett in 2014 and was formerly Managing Director and the Chief Compliance Officer at UBS Global Asset Management (2003–2013). | |||
| A. Edward Oberhaus, III (1959) | Vice President | Elected in 1998 | Partner and Director, joined Lord Abbett in 1983. | |||
| Noah Petrucci (1970) | Vice President | Elected in 2013 | Portfolio Manager, joined Lord Abbett in 2012. | |||
| Lawrence B. Stoller (1963) | Vice President and Assistant Secretary | Elected in 2007 | Partner and Senior Deputy General Counsel, joined Lord Abbett in 2007. | |||
| Leah G. Traub (1979) | Vice President | Elected in 2016 | Partner and Portfolio Manager, joined Lord Abbett in 2007. | |||
| Arthur K. Weise (1970) | Vice President | Elected in 2010 | Partner and Portfolio Manager, joined Lord Abbett in 2007. | |||
| Kewjin Yuoh (1971) | Vice President | Elected in 2012 | Partner and Portfolio Manager, joined Lord Abbett in 2010. | |||
| Scott S. Wallner (1955) | AML Compliance Officer | Elected in 2011 | Assistant General Counsel, joined Lord Abbett in 2004. | |||
| Christian J. Kelly (1975) | Treasurer | Elected in 2017 | Director of Fund Administration, joined Lord Abbett in 2009. |
Please call 888-522-2388 for a copy of the statement of additional information, which contains further information about the Company’s Directors. It is available free upon request.
29
Approval of Advisory Contract
The Board, including all of the Directors who are not “interested persons” of the Company or of Lord Abbett, as defined in the Investment Company Act of 1940, as amended (the “Independent Directors”), annually considers whether to approve the continuation of the existing management agreement between the Fund and Lord Abbett (the “Agreement”). In connection with its most recent approval, the Board reviewed materials relating specifically to the Agreement, as well as numerous materials received throughout the course of the year, including information about the Fund’s investment performance compared to the performance of appropriate benchmarks. Before making its decision as to the Fund, the Board had the opportunity to ask questions and request further information, taking into account its familiarity with Lord Abbett gained through its meetings and discussions. These meetings and discussions included reviews of Fund performance conducted by members of the Contract Committee, the deliberations of the Contract Committee, and discussions between the Contract Committee and Lord Abbett’s management. The Independent Directors also met with their independent legal counsel in various private sessions at which no representatives of management were present.
The materials received by the Board included, but were not limited to: (1) information provided by Morningstar, Inc. (“Morningstar”) regarding the investment performance of the Fund compared to the investment performance of certain funds with similar investment styles as determined by Morningstar, based, in part, on the Fund’s Morningstar category (the “performance peer group”), and the investment performance of two appropriate benchmarks; (2) information provided by Morningstar regarding the expense ratios, contractual and actual management fee rates, and other expense components for the Fund and certain funds in the same Morningstar category, with generally the same or similar share classes and operational characteristics, including asset size (the “expense peer group”); (3) certain supplemental investment performance information provided by Lord Abbett; (4) information provided by Lord Abbett on the expense ratios, management fee rates, and other expense components for the Fund; (5) sales and redemption information for the Fund; (6) information regarding Lord Abbett’s financial condition; (7) an analysis of the relative profitability of the Agreement to Lord Abbett; (8) information provided by Lord Abbett regarding the investment management fee schedules for Lord Abbett’s other advisory clients maintaining accounts with a similar investment strategy as the Fund; and (9) information regarding the personnel and other resources devoted by Lord Abbett to managing the Fund.
Investment Management Services Generally. The Board considered the investment management services provided by Lord Abbett to the Fund, including investment research, portfolio management, and trading, and Lord Abbett’s commitment to compliance with all applicable legal requirements. The Board also observed that Lord Abbett was solely engaged in the investment management business and accordingly did not experience the conflicts of interest that may result from being engaged in other lines of business. The Board considered the investment advisory services provided by Lord Abbett to other clients, the fees charged for the services, and the differences in the nature of the services provided to the Fund and other Lord Abbett Funds, on the one hand, and the services provided to other clients, on the other. After reviewing these and related factors, the Board concluded that the Fund was likely to continue to benefit from the nature, extent and quality of the investment services provided by Lord Abbett under the Agreement.
Investment Performance. The Board reviewed the Fund’s investment performance in relation to that of the performance peer group and two appropriate benchmarks as of various periods ended August 31, 2017. The Board observed that the Fund’s investment performance was above the median of the performance peer group for the three-, five-, and ten-year periods and below the
30
Approval of Advisory Contract (continued)
median for the one-year period. The Board considered that Lord Abbett was implementing a plan intended to improve the performance of its equity Funds. The Board further considered Lord Abbett’s performance and reputation generally, the performance of other Lord Abbett-managed funds overseen by the Board, and the willingness of Lord Abbett to take steps intended to improve performance when necessary. After reviewing these and related factors, the Board concluded that the Fund’s Agreement should be continued.
Lord Abbett’s Personnel and Methods. The Board considered the qualifications of the personnel providing investment management services to the Fund, in light of its investment objective and discipline. Among other things, the Board considered the size, experience, and turnover of Lord Abbett’s investment management staff, Lord Abbett’s investment methodology and philosophy, and Lord Abbett’s approach to recruiting, training, and retaining investment management personnel.
Nature and Quality of Other Services. The Board considered the nature, quality, costs, and extent of compliance, administrative, and other services performed by Lord Abbett and the nature and extent of Lord Abbett’s supervision of third party service providers, including the Fund’s transfer agent and custodian.
Expenses. The Board considered the expense level of the Fund and the expense levels of the expense peer group. It also considered how the expense level of the Fund related to those of the expense peer group and the amount and nature of the fees paid by shareholders. The Board observed that the net total expense ratio of the Fund was above the median of the expense peer group. After reviewing these and related factors, the Board concluded, within the context of its overall approval of the Agreement, that the expense level of the Fund was reasonable.
Profitability. The Board considered the level of Lord Abbett’s operating margin in managing the Fund, including a review of Lord Abbett’s methodology for allocating its costs to its management of the Fund. It considered whether the Fund was profitable to Lord Abbett in connection with the Fund’s operation, including the fee that Lord Abbett receives from the Fund for providing administrative services to the Fund. The Board also considered the profits realized from other business segments of Lord Abbett, which may benefit from or be related to the Fund’s business. The Board considered Lord Abbett’s profit margins excluding Lord Abbett’s marketing and distribution expenses. The Board also considered Lord Abbett’s profit margins, without those exclusions, in comparison with available industry data and how those profit margins could affect Lord Abbett’s ability to recruit and retain investment personnel. The Board recognized that Lord Abbett’s overall profitability was a factor in enabling it to attract and retain qualified investment management personnel to provide services to the Fund. After reviewing these and related factors, the Board concluded, within the context of its overall approval of the Agreement, that Lord Abbett’s profitability with respect to the Fund was not excessive.
Economies of Scale. The Board considered the extent to which there had been economies of scale in managing the Fund, whether the Fund’s shareholders had appropriately benefited from such economies of scale, and whether there was potential for realization of any further economies of scale. The Board concluded that the existing management fee schedule, with its breakpoints in the level of the management fee, adequately addressed any economies of scale in managing the Fund.
Other Benefits to Lord Abbett. The Board considered the amount and nature of the fees paid by the Fund and the Fund’s shareholders to Lord Abbett for services other than investment advisory services. The Board also considered the revenues and profitability of Lord Abbett’s investment advisory business apart from its mutual fund business, and the intangible benefits enjoyed by Lord
31
Approval of Advisory Contract (concluded)
Abbett by virtue of its relationship with the Fund. The Board observed that the Distributor receives 12b-1 fees from certain of the Lord Abbett Funds as to shares held in accounts for which there is no other broker of record, may retain a portion of the 12b-1 fees it receives, and receives a portion of the sales charges on sales and redemptions of some classes of shares of the Lord Abbett Funds. In addition, the Board observed that Lord Abbett accrues certain benefits for its business of providing investment advice to clients other than the Lord Abbett Funds, but that business also benefits the Funds. The Board also noted that Lord Abbett, as disclosed in the prospectus of the Fund, has entered into revenue sharing arrangements with certain entities that distribute shares of the Fund. The Board also took into consideration the investment research that Lord Abbett receives as a result of Fund brokerage transactions.
Alternative Arrangements. The Board considered whether, instead of approving continuation of the Agreement, it might be in the best interests of the Fund to implement one or more alternative arrangements, such as continuing to employ Lord Abbett, but on different terms. After considering all of the relevant factors, the Board unanimously found that continuation of the Agreement was in the best interests of the Fund and its shareholders and voted unanimously to approve the continuation of the Agreement. In considering whether to approve the continuation of the Agreement, the Board did not identify any single factor as paramount or controlling. Individual Directors may have evaluated the information presented differently from one another, giving different weights to various factors. This summary does not discuss in detail all matters considered.
32
Householding
The Company has adopted a policy that allows it to send only one copy of the Fund’s prospectus, proxy material, annual report and semiannual report to certain shareholders residing at the same “household.” This reduces Fund expenses, which benefits you and other shareholders. If you need additional copies or do not want your mailings to be “householded,” please call Lord Abbett at 888-522-2388 or send a written request with your name, the name of your fund or funds and your account number or numbers to Lord Abbett Family of Funds, P.O. Box 219336, Kansas City, MO 64121.
Proxy Voting Policies, Procedures and Records
A description of the policies and procedures that Lord Abbett uses to vote proxies related to the Fund’s portfolio securities, and information on how Lord Abbett voted the Fund’s proxies during the 12-month period ended June 30 are available without charge, upon request, (i) by calling 888-522-2388; (ii) on Lord Abbett’s Website at www.lordabbett.com; and (iii) on the Securities and Exchange Commission’s (“SEC”) Website at www.sec.gov.
Shareholder Reports and Quarterly Portfolio Disclosure
The Fund is required to file its complete schedule of portfolio holdings with the SEC for its first and third fiscal quarters on Form N-Q. Copies of the filings are available without charge, upon request on the SEC’s Website at www.sec.gov and may be available by calling Lord Abbett at 888-522-2388. You can also obtain copies of Form N-Q by visiting the SEC’s Public Reference Room in Washington, DC (information on the operation of the Public Reference Room may be obtained by calling 800-SEC-0330).
Tax Information
For corporate shareholders, 33% of the Fund’s ordinary income distributions qualified for the dividends received deduction.
Additionally, of the distribution paid to the shareholders during the year ended December 31, 2017, $21,026,825 and $8,224,769, respectively, represent short-term capital gains and long-term capital gains.
|
33


| This report, when not used for the general information of shareholders of the Fund, is to be distributed only if preceded or accompanied by a current fund prospectus. Lord Abbett mutual fund shares are distributed by LORD ABBETT DISTRIBUTOR LLC. | Lord Abbett Series Fund, Inc. Fundamental Equity Portfolio | SFFE-PORT-3 (02/18) |
![]()
LORD ABBETT
ANNUAL REPORT
Lord Abbett
Series Fund—Growth and Income Portfolio
For the fiscal year ended December 31, 2017
Table of Contents
Lord Abbett Series Fund — Growth and Income Portfolio
Annual Report
For the fiscal year ended December 31, 2017

From left to right: James L.L. Tullis, Independent Chairman of the Lord Abbett Funds and Daria L. Foster, Director, President, and Chief Executive Officer of the Lord Abbett Funds.
Dear Shareholders: We are pleased to provide you with this overview of the performance of Lord Abbett Series Fund - Growth and Income Portfolio for the fiscal year ended December 31, 2017. On this page and the following pages, we discuss the major factors that influenced fiscal year performance. For additional information about the Fund, please visit our website at www.lordabbett.com, where you also can access the quarterly commentaries that provide updates on the Fund’s performance and other portfolio related updates.
Thank you for investing in Lord Abbett mutual funds. We value the trust that you place in us and look forward to serving your investment needs in the years to come.
Best regards,

Daria L. Foster
Director, President and Chief Executive Officer
For the fiscal year ended December 31, 2017, the Fund returned 13.38%, reflecting performance at the net asset value (NAV) of Class VC shares, with all distributions reinvested, compared to its benchmark, the Russell 1000® Value Index,1 which returned 13.66% over the same period.
The domestic equity market (as represented by the S&P 500® Index2) returned 21.83%, ending the year with its strongest quarterly performance in two years and marking its first calendar year with 12 consecutive months of positive performance. Much of the market
momentum was driven by the anticipation of supportive U.S. fiscal policies, as the passage of the Tax Cut and Jobs Act and the prospect of significant infrastructure spending drove the forecast of U.S. gross domestic product (GDP) growth incrementally higher. These forces persisted despite a myriad of geopolitical and environmental headwinds, as North Korea, U.S. political tensions, and Hurricanes Harvey, Irma and Maria all had the potential to derail the market’s forward progress.
During the year the National Federation of Independent Business Small Business
1
Confidence Index reached a 34 year high, marking its second-highest level in the history of the index. The University of Michigan’s average consumer confidence for the year was the highest since 2000, while consumer spending reached an all-time high in the third quarter. A reoccurring theme persisted throughout the year with large caps outperforming small caps and value stocks significantly outpacing their growth oriented peers.
The U.S. economy continued to expand during the trailing 12-month period. U.S. gross domestic product (GDP) grew at a 3.2% pace during the third quarter, an increase over the second quarter. The U.S. Bureau of Economic Analysis stated that during the third quarter personal consumption and federal government spending increased, quarter-over-quarter. The Federal Reserve (Fed) gradually raised the Fed Funds rate over the trailing 12-month period by raising interest rates by 25bps three times, ultimately reaching a target range of 1.25-1.50%. In addition to GDP growth, the U.S. unemployment rate remained relatively steady throughout the period, and was reported at 4.1% in December, a decline of 0.6% year-over-year.
The Fund underperformed its index for the period. During the trailing 12-month period, the largest detractors from relative performance were the financials and consumer staples sectors. Within the financials sector, shares of Signature Bank, a full-service commercial bank, fell after the bank had to write down its taxi medallion portfolio due to increased
pressure from the ride-share industry, which resulted in loan losses. TD Ameritrade Holding Corp., a brokerage, mutual fund, and banking company, found itself involved in a price war in the beginning of the year as competing firms lowered commissions on online retail trading, which led shares of the company to decline. Within the consumer staples sector, shares of Mondelez International Inc., a manufacturer of snack food and beverage products, dropped due to disappointing organic sales after a cyberattack crippled the company’s corporate computer systems and disrupted the company’s ability to ship and invoice. Shares of CVS Health Corp., a pharmacy and health care provider, dropped after sales in the retail segment fell due to the impact of the three large hurricanes during the year. Shares further declined after analysts suggested that Amazon would be in the business of selling prescription drugs during the next few years.
Among the largest contributors to relative performance during the trailing 12-month period were the industrials and the consumer discretionary sectors. Within the industrials sector, the portfolio’s holding of CSX Corp., a rail-based freight transportation company, contributed to performance as shares of the company jumped in the beginning of the year due to speculation that Canadian Pacific’s former CEO, Hunter Harrison, would be installed as CEO of CSX via activism. Despite his sudden death at the end of 2017, investors appeared to be confident that Harrison,
2
who became CEO of CSX in March 2017, implemented necessary structural changes throughout the year in order to drive future performance. Shares of Ametek, Inc., a global manufacturer of electric instruments and electromechanical devices, rose throughout the year after producing strong organic growth through its digital marketing investments and initiatives around sales force training and development coupled with the company’s successful “growth by M&A” strategy. Within the consumer discretionary sector, shares of Lennar Corp., a homebuilding
company, rose due to the company’s improving fundamentals and focus on technology to optimize returns. Shares of Burlington Stores, Inc., an owner and operator of clothing retail stores, also rose due to improving sales, efficient inventory management, and the growth of its online presence.
The Fund’s portfolio is actively managed and, therefore, its holdings and the weightings of a particular issuer or particular sector as a percentage of portfolio assets are subject to change. Sectors may include many industries.
1 The Russell 1000® Value Index measures the performance of those Russell 1000 companies with lower price-to-book ratios and lower forecasted growth values.
2 The S&P 500® Index is widely regarded as the standard for measuring large cap U.S. stock market performance and includes a representative sample of leading companies in leading industries.
Unless otherwise specified, indexes reflect total return, with all dividends reinvested. Indexes are unmanaged, do not reflect the deduction of fees or expenses, and are not available for direct investment.
Important Performance and Other Information
Performance data quoted in the following pages reflect past performance and are no guarantee of future results. Current performance may be higher or lower than the performance quoted. The investment return and principal value of an investment in the Fund will fluctuate so that shares, on any given day or when redeemed, may be worth more or less than their original cost. You can obtain performance data current to the most recent month end by calling Lord Abbett at 888-522-2388 or referring to www.lordabbett.com.
The annual commentary above discusses the views of the Fund’s management and various portfolio holdings of the Fund as of December 31, 2017. These views and portfolio holdings may have changed after this date. Information provided in the commentary is not a recommendation to buy or sell securities. Because the Fund’s portfolio is actively managed and may change significantly, the Fund may no longer own the securities described above or may have otherwise changed its position in the securities. For more recent information about the Fund’s portfolio holdings, please visit www.lordabbett.com.
A Note about Risk: See Notes to Financial Statements for a discussion of investment risks. For a more detailed discussion of the risks associated with the Fund, please see the Fund’s prospectus.
Mutual funds are not insured by the FDIC, are not deposits or other obligations of, or guaranteed by, banks, and are subject to investment risks including possible loss of principal amount invested.
The Fund serves as an underlying investment vehicle for variable annuity contracts and variable life insurance policies.
3
Below is a comparison of a $10,000 investment in Class VC shares with the same investment in the Russell 1000® Value Index, the S&P 500® Index and the S&P 500® Value Index, assuming reinvestment of all dividends and distributions. The Fund’s shares are sold only to insurance company separate accounts that fund certain variable annuity and variable life contracts. This line graph comparison does not reflect the sales charges or other expenses of these contracts. If those sales charges and expenses were reflected, returns would be lower. The graph and performance table below do not reflect the deduction of taxes that a shareholder would pay on Fund distributions or the redemption of Fund shares. Past performance is no guarantee of future results.

| Average Annual Total Returns for the Periods Ended December 31, 2017 | |||||||
| 1 Year | 5 Years | 10 Years | |||||
| Class VC | 13.38% | 13.54% | 5.83% | ||||
1 Performance for each unmanaged index does not reflect any fees or expenses. The performance of each index is not necessarily representative of the Fund’s performance.
4
As a shareholder of the Fund, you incur ongoing costs, including management fees; expenses related to the Fund’s services arrangements with certain insurance companies; and other Fund expenses. This Example is intended to help you understand your ongoing costs (in dollars) of investing in the Fund and to compare these costs with the ongoing costs of investing in other mutual funds.
The Example is based on an investment of $1,000 invested at the beginning of the period and held for the entire period (July 1, 2017 through December 31, 2017).
The Example reflects only expenses that are deducted from the assets of the Fund. Fees and expenses, including sales charges applicable to the various insurance products that invest in the Fund, are not reflected in this Example. If such fees and expenses were reflected in the Example, the total expenses shown would be higher. Fees and expenses regarding such variable insurance products are separately described in the prospectus related to those products.
Actual Expenses
The first line of the table on the following page provides information about actual account values and actual expenses. You may use the information in this line, together with the amount you invested, to estimate the expenses that you paid over the period. Simply divide your account value by $1,000 (for example, an $8,600 account value divided by $1,000 = 8.6), then multiply the result by the number in the first line under the heading titled “Expenses Paid During Period 7/1/17 – 12/31/17” to estimate the expenses you paid on your account during this period.
Hypothetical Example for Comparison Purposes
The second line of the table on the following page provides information about hypothetical account values and hypothetical expenses based on the Fund’s actual expense ratio and an assumed rate of return of 5% per year before expenses, which is not the Fund’s actual return. The hypothetical account values and expenses may not be used to estimate the actual ending account balance or expenses you paid for the period. You may use this information to compare the ongoing costs of investing in the Fund and other funds. To do so, compare this 5% hypothetical example with the 5% hypothetical examples that appear in the shareholder reports of the other funds.
5
Please note that the expenses shown in the table are meant to highlight your ongoing costs only and do not reflect any transactional costs, such as sales charges. Therefore, the second line of the table is useful in comparing ongoing costs only, and will not help you determine the relative total costs of owning different funds. In addition, if these transactional costs were included, your costs would have been higher.
| Beginning Account Value | Ending Account Value | Expenses Paid During Period† | |||||
| 7/1/17 | 12/31/17 | 7/1/17 - 12/31/17 | |||||
| Class VC | |||||||
| Actual | $1,000.00 | $1,091.00 | $4.85 | ||||
| Hypothetical (5% Return Before Expenses) | $1,000.00 | $1,020.57 | $4.69 |
| † | Net expenses are equal to the Fund’s annualized expense ratio of 0.92%, multiplied by the average account value over the period, multiplied by 184/365 (to reflect one-half year period). |
Portfolio Holdings Presented by Sector
December 31, 2017
| Sector* | %** | |
| Consumer Discretionary | 5.52 | % |
| Consumer Staples | 7.81 | % |
| Energy | 11.83 | % |
| Financials | 28.40 | % |
| Health Care | 12.69 | % |
| Industrials | 9.91 | % |
| Information Technology | 11.54 | % |
| Materials | 3.14 | % |
| Real Estate | 1.60 | % |
| Telecommunication Services | 2.57 | % |
| Utilities | 3.13 | % |
| Repurchase Agreement | 1.86 | % |
| Total | 100.00 | % |
| * | A sector may comprise several industries. | |
| ** | Represents percent of total investments. |
6
December 31, 2017
| Investments | Shares | Fair Value (000) | ||||||
| COMMON STOCKS 98.57% | ||||||||
| Aerospace & Defense 1.27% | ||||||||
| General Dynamics Corp. | 43,577 | $ | 8,866 | |||||
| Airlines 1.20% | ||||||||
| Delta Air Lines, Inc. | 148,966 | 8,342 | ||||||
| Banks 17.45% | ||||||||
| Bank of America Corp. | 513,820 | 15,168 | ||||||
| Citigroup, Inc. | 205,816 | 15,315 | ||||||
| Citizens Financial Group, Inc. | 316,440 | 13,284 | ||||||
| Comerica, Inc. | 99,819 | 8,665 | ||||||
| East West Bancorp, Inc. | 197,391 | 12,008 | ||||||
| JPMorgan Chase & Co. | 311,865 | 33,351 | ||||||
| Signature Bank* | 61,715 | 8,471 | ||||||
| Webster Financial Corp. | 177,172 | 9,950 | ||||||
| Wells Fargo & Co. | 88,367 | 5,361 | ||||||
| Total | 121,573 | |||||||
| Beverages 1.58% | ||||||||
| Coca-Cola Co. (The) | 111,216 | 5,103 | ||||||
| PepsiCo, Inc. | 49,100 | 5,888 | ||||||
| Total | 10,991 | |||||||
| Building Products 1.05% | ||||||||
| Owens Corning | 79,578 | 7,316 | ||||||
| Capital Markets 3.26% | ||||||||
| Charles Schwab Corp. (The) | 78,159 | 4,015 | ||||||
| Goldman Sachs Group, Inc. (The) | 39,250 | 9,999 | ||||||
| Invesco Ltd. | 238,082 | 8,700 | ||||||
| Total | 22,714 | |||||||
| Chemicals 2.29% | ||||||||
| DowDuPont, Inc. | 223,531 | 15,920 | ||||||
| Communications Equipment 3.04% | ||||||||
| Cisco Systems, Inc. | 552,120 | 21,146 | ||||||
| Consumer Finance 1.67% | ||||||||
| Discover Financial Services | 150,973 | 11,613 | ||||||
| Investments | Shares | Fair Value (000) | ||||||
| Diversified Telecommunication Services 2.58% | ||||||||
| AT&T, Inc. | 462,148 | $ | 17,968 | |||||
| Electric: Utilities 3.14% | ||||||||
| Duke Energy Corp. | 136,099 | 11,447 | ||||||
| NextEra Energy, Inc. | 66,871 | 10,445 | ||||||
| Total | 21,892 | |||||||
| Electrical Equipment 1.60% | ||||||||
| AMETEK, Inc. | 153,420 | 11,118 | ||||||
| Electronic Equipment, Instruments & Components 1.36% | ||||||||
| Corning, Inc. | 295,522 | 9,454 | ||||||
| Energy Equipment & Services 1.30% | ||||||||
| Halliburton Co. | 184,655 | 9,024 | ||||||
| Equity Real Estate Investment Trusts 1.60% | ||||||||
| Boston Properties, Inc. | 27,096 | 3,523 | ||||||
| Prologis, Inc. | 118,535 | 7,647 | ||||||
| Total | 11,170 | |||||||
| Food & Staples Retailing 2.99% | ||||||||
| CVS Health Corp. | 85,447 | 6,195 | ||||||
| Wal-Mart Stores, Inc. | 148,193 | 14,634 | ||||||
| Total | 20,829 | |||||||
| Food Products 0.80% | ||||||||
| Mondelez International, Inc. | ||||||||
| Class A | 130,941 | 5,604 | ||||||
| Health Care Equipment & Supplies 4.07% | ||||||||
| Abbott Laboratories | 311,829 | 17,796 | ||||||
| Baxter International, Inc. | 138,057 | 8,924 | ||||||
| Boston Scientific Corp.* | 66,683 | 1,653 | ||||||
| Total | 28,373 | |||||||
| Health Care Providers & Services 2.21% | ||||||||
| Aetna, Inc. | 28,784 | 5,192 | ||||||
| HCA Healthcare, Inc.* | 48,074 | 4,223 | ||||||
| UnitedHealth Group, Inc. | 27,259 | 6,010 | ||||||
| Total | 15,425 | |||||||
| See Notes to Financial Statements. | 7 |
Schedule of Investments (continued)
December 31, 2017
| Investments | Shares | Fair Value (000) | ||||||
| Hotels, Restaurants & Leisure 1.41% | ||||||||
| Carnival Corp. | 65,749 | $ | 4,364 | |||||
| Yum! Brands, Inc. | 66,933 | 5,462 | ||||||
| Total | 9,826 | |||||||
| Household Durables 0.35% | ||||||||
| Lennar Corp. Class A | 38,860 | 2,458 | ||||||
| Household Products 1.38% | ||||||||
| Clorox Co. (The) | 39,283 | 5,843 | ||||||
| Colgate-Palmolive Co. | 50,100 | 3,780 | ||||||
| Total | 9,623 | |||||||
| Industrial Conglomerates 1.97% | ||||||||
| General Electric Co. | 95,533 | 1,667 | ||||||
| Honeywell International, Inc. | 78,647 | 12,061 | ||||||
| Total | 13,728 | |||||||
| Insurance 6.14% | ||||||||
| Allstate Corp. (The) | 131,900 | 13,811 | ||||||
| Chubb Ltd. (Switzerland)(a) | 81,856 | 11,962 | ||||||
| Hartford Financial Services Group, Inc. (The) | 155,197 | 8,734 | ||||||
| MetLife, Inc. | 163,945 | 8,289 | ||||||
| Total | 42,796 | |||||||
| Internet Software & Services 0.66% | ||||||||
| Alphabet, Inc. Class A* | 4,371 | 4,604 | ||||||
| Life Sciences Tools & Services 0.49% | ||||||||
| Thermo Fisher Scientific, Inc. | 18,007 | 3,419 | ||||||
| Machinery 2.29% | ||||||||
| Dover Corp. | 91,465 | 9,237 | ||||||
| ITT, Inc. | 126,365 | 6,744 | ||||||
| Total | 15,981 | |||||||
| Media 1.31% | ||||||||
| Comcast Corp. Class A | 98,040 | 3,926 | ||||||
| Walt Disney Co. (The) | 48,429 | 5,207 | ||||||
| Total | 9,133 | |||||||
| Investments | Shares | Fair Value (000) | ||||||
| Metals & Mining 0.87% | ||||||||
| Reliance Steel & Aluminum Co. | 70,851 | $ | 6,078 | |||||
| Oil, Gas & Consumable Fuels 10.59% | ||||||||
| Chevron Corp. | 191,401 | 23,962 | ||||||
| ConocoPhillips | 248,900 | 13,662 | ||||||
| Devon Energy Corp. | 234,100 | 9,692 | ||||||
| EOG Resources, Inc. | 109,968 | 11,867 | ||||||
| Exxon Mobil Corp. | 42,400 | 3,546 | ||||||
| Royal Dutch Shell plc Class A ADR | 165,077 | 11,012 | ||||||
| Total | 73,741 | |||||||
| Pharmaceuticals 5.97% | ||||||||
| Allergan plc | 26,757 | 4,377 | ||||||
| Johnson & Johnson | 173,573 | 24,252 | ||||||
| Merck & Co., Inc. | 61,674 | 3,470 | ||||||
| Novartis AG ADR | 113,076 | 9,494 | ||||||
| Total | 41,593 | |||||||
| Road & Rail 0.57% | ||||||||
| CSX Corp. | 72,345 | 3,980 | ||||||
| Semiconductors & Semiconductor Equipment 3.35% | ||||||||
| Broadcom Ltd. | 11,292 | 2,901 | ||||||
| Intel Corp. | 295,314 | 13,632 | ||||||
| Marvell Technology Group Ltd. | 221,368 | 4,753 | ||||||
| QUALCOMM, Inc. | 31,538 | 2,019 | ||||||
| Total | 23,305 | |||||||
| Software 2.71% | ||||||||
| Microsoft Corp. | 113,143 | 9,678 | ||||||
| Oracle Corp. | 193,875 | 9,167 | ||||||
| Total | 18,845 | |||||||
| Specialty Retail 2.47% | ||||||||
| Burlington Stores, Inc.* | 47,139 | 5,799 | ||||||
| Home Depot, Inc. (The) | 18,956 | 3,593 | ||||||
| Lowe’s Cos., Inc. | 83,732 | 7,782 | ||||||
| Total | 17,174 | |||||||
| 8 | See Notes to Financial Statements. |
Schedule of Investments (concluded)
December 31, 2017
| Investments | Shares | Fair Value (000) | ||||||
| Technology Hardware, Storage & Peripherals 0.49% | ||||||||
| Apple, Inc. | 19,960 | $ | 3,378 | |||||
| Tobacco 1.09% | ||||||||
| Altria Group, Inc. | 49,358 | 3,525 | ||||||
| Philip Morris International, Inc. | 38,479 | 4,065 | ||||||
| Total | 7,590 | |||||||
| Total Common Stocks (cost $586,587,981) | 686,590 | |||||||
| Investments | Principal Amount (000) | Fair Value (000) | ||||||
| SHORT-TERM INVESTMENT 1.87% | ||||||||
| Repurchase Agreement | ||||||||
| Repurchase Agreement dated 12/29/2017, 0.54% due 1/2/2018 with Fixed Income Clearing Corp. collateralized by $13,650,000 of U.S. Treasury Note at 1.125% due 2/28/2021; value: $13,313,937; proceeds: $13,052,236 (cost $13,051,453) | $13,051 | $ | 13,051 | |||||
| Total Investments in Securities 100.44% (cost $599,639,434) | 699,641 | |||||||
| Other Assets in Excess of Liabilities (0.44)% | (3,077 | ) | ||||||
| Net Assets 100.00% | $ | 696,564 | ||||||
| ADR | American Depositary Receipt. | |
| * | Non-income producing security. | |
| (a) | Foreign security traded in U.S. dollars. |
The following is a summary of the inputs used as of December 31, 2017 in valuing the Fund’s investments carried at fair value(1):
| Investment Type(2)(3) | Level 1 (000) | Level 2 (000) | Level 3 (000) | Total (000) | ||||||||||||
| Common Stocks | $ | 686,590 | $ | – | $ | – | $ | 686,590 | ||||||||
| Repurchase Agreement | – | 13,051 | – | 13,051 | ||||||||||||
| Total | $ | 686,590 | $ | 13,051 | $ | – | $ | 699,641 | ||||||||
| (1) | Refer to Note 2(h) for a description of fair value measurements and the three-tier hierarchy of inputs. | |
| (2) | See Schedule of Investments for fair values in each industry and identification of foreign issuers and/or geography. | |
| (3) | There were no Level 1/Level 2 transfers during the fiscal year ended December 31, 2017. |
| See Notes to Financial Statements. | 9 |
Statement of Assets and Liabilities
December 31, 2017
| ASSETS: | ||||
| Investments in securities, at fair value (cost $599,639,434) | $ | 699,640,974 | ||
| Receivables: | ||||
| Interest and dividends | 526,669 | |||
| Capital shares sold | 8,672 | |||
| Prepaid expenses | 4,292 | |||
| Total assets | 700,180,607 | |||
| LIABILITIES: | ||||
| Payables: | ||||
| Capital shares reacquired | 2,366,435 | |||
| Management fee | 295,361 | |||
| Directors’ fees | 205,674 | |||
| Fund administration | 23,629 | |||
| Accrued expenses | 725,549 | |||
| Total liabilities | 3,616,648 | |||
| NET ASSETS | $ | 696,563,959 | ||
| COMPOSITION OF NET ASSETS: | ||||
| Paid-in capital | $ | 596,084,715 | ||
| Distributions in excess of net investment income | (205,674 | ) | ||
| Accumulated net realized gain on investments | 683,378 | |||
| Net unrealized appreciation on investments | 100,001,540 | |||
| Net Assets | $ | 696,563,959 | ||
| Outstanding shares (200 million shares of common stock authorized, $.001 par value) | 18,749,752 | |||
| Net asset value, offering and redemption price per share (Net assets divided by outstanding shares) | $37.15 | |||
| 10 | See Notes to Financial Statements. |
For the Year Ended December 31, 2017
| Investment income: | ||||
| Dividends (net of foreign withholding taxes of $19,582) | $ | 15,244,949 | ||
| Interest and other | 15,964 | |||
| Total investment income | 15,260,913 | |||
| Expenses: | ||||
| Management fee | 3,496,532 | |||
| Non 12b-1 service fees | 1,748,050 | |||
| Shareholder servicing | 749,663 | |||
| Fund administration | 279,723 | |||
| Professional | 77,426 | |||
| Reports to shareholders | 43,687 | |||
| Custody | 21,241 | |||
| Directors’ fees | 19,875 | |||
| Other | 55,112 | |||
| Gross expenses | 6,491,309 | |||
| Expense reductions (See Note 8) | (6,341 | ) | ||
| Net expenses | 6,484,968 | |||
| Net investment income | 8,775,945 | |||
| Net realized and unrealized gain: | ||||
| Net realized gain on investments | 70,166,662 | |||
| Net change in unrealized appreciation/depreciation on investments | 8,637,716 | |||
| Net realized and unrealized gain | 78,804,378 | |||
| Net Increase in Net Assets Resulting From Operations | $ | 87,580,323 | ||
| See Notes to Financial Statements. | 11 |
Statements of Changes in Net Assets
| DECREASE IN NET ASSETS | For the Year Ended December 31, 2017 | For the Year Ended December 31, 2016 | ||||||
| Operations: | ||||||||
| Net investment income | $ | 8,775,945 | $ | 10,810,723 | ||||
| Net realized gain on investments | 70,166,662 | 8,690,520 | ||||||
| Net change in unrealized appreciation/depreciation on investments | 8,637,716 | 91,213,658 | ||||||
| Net increase in net assets resulting from operations | 87,580,323 | 110,714,901 | ||||||
| Distributions to shareholders from: | ||||||||
| Net investment income | (9,018,929 | ) | (10,267,052 | ) | ||||
| Net realized gain | (66,734,396 | ) | (9,421,851 | ) | ||||
| Total distributions to shareholders | (75,753,325 | ) | (19,688,903 | ) | ||||
| Capital share transactions (See Note 13): | ||||||||
| Proceeds from sales of shares | 17,368,355 | 19,444,471 | ||||||
| Reinvestment of distributions | 75,753,394 | 19,688,903 | ||||||
| Cost of shares reacquired | (126,934,815 | ) | (135,907,144 | ) | ||||
| Net decrease in net assets resulting from capital share transactions | (33,813,066 | ) | (96,773,770 | ) | ||||
| Net decrease in net assets | (21,986,068 | ) | (5,747,772 | ) | ||||
| NET ASSETS: | ||||||||
| Beginning of year | $ | 718,550,027 | $ | 724,297,799 | ||||
| End of year | $ | 696,563,959 | $ | 718,550,027 | ||||
| Distributions in excess of net investment income | $ | (205,674 | ) | $ | (212,408 | ) | ||
| 12 | See Notes to Financial Statements. |
This page is intentionally left blank.
| Per Share Operating Performance: | ||||||||||||||||||||||||||||
| Investment operations: | Distributions to shareholders from: | |||||||||||||||||||||||||||
| Net asset value, beginning of period | Net invest- ment income(a) | Net realized and unrealized gain (loss) | Total from invest- ment opera- tions | Net investment income | Net realized gain | Total distri- butions | ||||||||||||||||||||||
| 12/31/2017 | $36.72 | $0.48 | $ 4.39 | $ 4.87 | $(0.53 | ) | $(3.91 | ) | $(4.44 | ) | ||||||||||||||||||
| 12/31/2016 | 32.21 | 0.52 | 4.99 | 5.51 | (0.52 | ) | (0.48 | ) | (1.00 | ) | ||||||||||||||||||
| 12/31/2015 | 35.54 | 0.40 | (1.43 | ) | (1.03 | ) | (0.44 | ) | (1.86 | ) | (2.30 | ) | ||||||||||||||||
| 12/31/2014 | 33.24 | 0.22 | 2.33 | 2.55 | (0.25 | ) | – | (0.25 | ) | |||||||||||||||||||
| 12/31/2013 | 24.59 | 0.16 | 8.66 | 8.82 | (0.17 | ) | – | (0.17 | ) | |||||||||||||||||||
| (a) | Calculated using average shares outstanding during the period. | |
| (b) | Total return does not consider the effects of sales loads and assumes the reinvestment of all distributions. |
| 14 | See Notes to Financial Statements. |
| Ratios to Average Net Assets: | Supplemental Data: | |||||||||||||||||||||
| Net asset value, end of period | Total return(b) (%) | Total expenses (%) | Net investment income (%) | Net assets, end of period (000) | Portfolio turnover rate (%) | |||||||||||||||||
| $37.15 | 13.38 | 0.93 | 1.26 | $ 696,564 | 97 | |||||||||||||||||
| 36.72 | 17.11 | 0.94 | 1.54 | 718,550 | 98 | |||||||||||||||||
| 32.21 | (2.86 | ) | 0.94 | 1.15 | 724,298 | 105 | ||||||||||||||||
| 35.54 | 7.65 | 0.93 | 0.65 | 882,379 | 122 | |||||||||||||||||
| 33.24 | 35.90 | 0.92 | 0.54 | 1,011,786 | 88 | |||||||||||||||||
| See Notes to Financial Statements. | 15 |
| 1. | ORGANIZATION |
Lord Abbett Series Fund, Inc. (the “Company”) is registered under the Investment Company Act of 1940, as amended (the “Act”), as a diversified, open-end management investment company and was incorporated under Maryland law in 1989. The Company consists of twelve separate portfolios. This report covers Growth and Income Portfolio (the “Fund”).
The Fund’s investment objective is long-term growth of capital and income without excessive fluctuations in market value. The Fund’s Variable Contract class shares (“Class VC Shares”), are currently issued and redeemed only in connection with investments in, and payments under, variable annuity contracts and variable life insurance policies issued by life insurance and insurance-related companies.
The preparation of the financial statements in conformity with accounting principles generally accepted in the United States of America (“U.S. GAAP”) requires management to make certain estimates and assumptions that affect the reported amounts of assets and liabilities and disclosure of contingent assets and liabilities at the date of the financial statements and the reported amounts of increases and decreases in net assets from operations during the reporting period. Actual results could differ from those estimates. The Fund is considered an investment company under U.S. GAAP and follows the accounting and reporting guidance applicable to investment companies.
| 2. | SIGNIFICANT ACCOUNTING POLICIES |
| (a) | Investment Valuation–Under procedures approved by the Fund’s Board of Directors (the “Board”), Lord, Abbett & Co. LLC (“Lord Abbett”), the Fund’s investment manager, has formed a Pricing Committee to administer the pricing and valuation of portfolio investments and to ensure that prices utilized reasonably reflect fair value. Among other things, these procedures allow the Fund to utilize independent pricing services, quotations from securities and financial instrument dealers and other market sources to determine fair value. |
| Securities actively traded on any recognized U.S. or non-U.S. exchange or on The NASDAQ Stock Market LLC are valued at the last sale price or official closing price on the exchange or system on which they are principally traded. Events occurring after the close of trading on non-U.S. exchanges may result in adjustments to the valuation of foreign securities to reflect their fair value as of the close of regular trading on the New York Stock Exchange. The Fund may utilize an independent fair valuation service in adjusting the valuations of foreign securities. Unlisted equity securities are valued at the last quoted sale price or, if no sale price is available, at the mean between the most recently quoted bid and asked prices. Exchange traded options and futures contracts are valued at the last sale price in the market where they are principally traded. If no sale has occurred, the mean between the most recently quoted bid and asked prices is used. | |
| Securities for which prices are not readily available are valued at fair value as determined by the Pricing Committee. The Pricing Committee considers a number of factors, including observable and unobservable inputs, when arriving at fair value. The Pricing Committee may use related or comparable assets or liabilities, recent transactions, market multiples, book values and other relevant information to determine the fair value of portfolio investments. The Board or a designated committee thereof regularly reviews fair value determinations made by the Pricing Committee and may employ techniques such as reviewing related market activity, |
16
Notes to Financial Statements (continued)
| reviewing inputs and assumptions, and retrospectively comparing prices of subsequent purchases and sales transactions to fair value determinations made by the Pricing Committee. | |
| Short-term securities with 60 days or less remaining to maturity are valued using the amortized cost method, which approximates fair value. | |
| (b) | Security Transactions–Security transactions are recorded as of the date that the securities are purchased or sold (trade date). Realized gains and losses on sales of portfolio securities are calculated using the identified-cost method. |
| (c) | Investment Income–Dividend income is recorded on the ex-dividend date. Interest income is recorded on the accrual basis as earned. Discounts are accreted and premiums are amortized using the effective interest method and are included in Interest and other income on the Statement of Operations. Withholding taxes on foreign dividends have been provided for in accordance with the applicable country’s tax rules and rates. |
| (d) | Income Taxes–It is the policy of the Fund to meet the requirements of Subchapter M of the Internal Revenue Code applicable to regulated investment companies and to distribute substantially all taxable income and capital gains to its shareholders. Therefore, no income tax provision is required. |
| The Fund files U.S. federal and various state and local tax returns. No income tax returns are currently under examination. The statute of limitations on the Fund’s filed U.S. federal tax returns remains open for the fiscal years ended December 31, 2014 through December 31, 2017. The statutes of limitations on the Company’s state and local tax returns may remain open for an additional year depending upon the jurisdiction. | |
| (e) | Expenses–Expenses incurred by the Company that do not specifically relate to an individual fund are generally allocated to the funds within the Company on a pro rata basis by relative net assets. |
| (f) | Foreign Transactions–The books and records of the Fund are maintained in U.S. dollars and transactions denominated in foreign currencies are recorded in the Fund’s records at the rate prevailing when earned or recorded. Asset and liability accounts that are denominated in foreign currencies are adjusted daily to reflect current exchange rates and any unrealized gain (loss) is included in Net change in unrealized appreciation/depreciation on investments in the Fund’s Statement of Operations. The resultant exchange gains and losses upon settlement of such transactions are included in Net realized loss on investments in the Fund’s Statement of Operations. The Fund does not isolate that portion of the results of operations arising as a result of changes in the foreign exchange rates from the changes in market prices of the securities. |
| (g) | Repurchase Agreements–The Fund may enter into repurchase agreements with respect to securities. A repurchase agreement is a transaction in which a fund acquires a security and simultaneously commits to resell that security to the seller (a bank or securities dealer) at an agreed-upon price on an agreed-upon date. The Fund requires at all times that the repurchase agreement be collateralized by cash, or by securities of the U.S. Government, its agencies, its instrumentalities, or U.S. Government sponsored enterprises having a value equal to, or in excess of, the value of the repurchase agreement (including accrued interest). If the seller of the agreement defaults on its obligation to repurchase the underlying securities at a time when the fair value of these securities has declined, the Fund may incur a loss upon disposition of the securities. |
17
Notes to Financial Statements (continued)
| (h) | Fair Value Measurements–Fair value is defined as the price that the Fund would receive upon selling an investment or transferring a liability in an orderly transaction to an independent buyer in the principal or most advantageous market of the investment. A three-tier hierarchy is used to maximize the use of observable market data and minimize the use of unobservable inputs and to establish classification of fair value measurements for disclosure purposes. Inputs refer broadly to the assumptions that market participants would use in pricing the asset or liability, including assumptions about risk—for example, the risk inherent in a particular valuation technique used to measure fair value (such as a pricing model) and/or the risk inherent in the inputs to the valuation technique. Inputs may be observable or unobservable. Observable inputs reflect the assumptions market participants would use in pricing the asset or liability. Observable inputs are based on market data obtained from sources independent of the reporting entity. Unobservable inputs reflect the reporting entity’s own assumptions about the assumptions market participants would use in pricing the asset or liability. Unobservable inputs are based on the best information available in the circumstances. The three-tier hierarchy classification is determined based on the lowest level of inputs that is significant to the fair value measurement, and is summarized in the three broad Levels listed below: |
| • | Level 1 – unadjusted quoted prices in active markets for identical investments; | ||
| • | Level 2 – other significant observable inputs (including quoted prices for similar investments, interest rates, prepayment speeds, credit risk, etc.); and | ||
| • | Level 3 – significant unobservable inputs (including the Fund’s own assumptions in determining the fair value of investments). | ||
| A summary of inputs used in valuing the Fund’s investments as of December 31, 2017 and, if applicable, Level 1/Level 2 transfers and Level 3 rollforwards for the fiscal year then ended is included in the Fund’s Schedule of Investments. | |
| Changes in valuation techniques may result in transfers into or out of an assigned level within the three-tier hierarchy. All transfers between different levels within the three-tier hierarchy are deemed to have occurred as of the beginning of the reporting period. The inputs or methodology used for valuing securities are not necessarily an indication of the risk associated with investing in those securities. |
| 3. | MANAGEMENT FEE AND OTHER TRANSACTIONS WITH AFFILIATES |
Management Fee
The Company has a management agreement with Lord Abbett, pursuant to which Lord Abbett supplies the Fund with investment management services and executive and other personnel, provides office space and pays for ordinary and necessary office and clerical expenses relating to research and statistical work and supervision of the Fund’s investment portfolio.
The management fee is based on the Fund’s average daily net assets at the following annual rate:
| First $1 billion | .50% |
| Over $1 billion | .45% |
For the fiscal year ended December 31, 2017, the effective management fee paid to Lord Abbett was at an annualized rate of .50% of the Fund’s average daily net assets.
18
Notes to Financial Statements (continued)
In addition, Lord Abbett provides certain administrative services to the Fund pursuant to an Administrative Services Agreement in return for a fee at an annual rate of .04% of the Fund’s average daily net assets.
The Company, on behalf of the Fund, has entered into services arrangements with certain insurance companies. Under these arrangements, certain insurance companies will be compensated up to ..25% of the average daily net asset value (“NAV”) of the Fund’s Class VC Shares held in the insurance company’s separate account to service and maintain the Variable Contract owners’ accounts. This amount is included in Non 12b-1 service fees on the Statement of Operations. The Fund may also compensate certain insurance companies, third-party administrators and other entities for providing recordkeeping, sub-transfer agency and other administrative services to the Fund. This amount is included in Shareholder servicing on the Statement of Operations.
Two Directors and certain of the Company’s officers have an interest in Lord Abbett.
| 4. | DISTRIBUTIONS AND CAPITAL LOSS CARRYFORWARDS |
Dividends from net investment income, if any, are declared and paid at least semi-annually. Taxable net realized gains from investment transactions, reduced by allowable capital loss carryforwards, if any, are declared and distributed to shareholders at least annually. The capital loss carryforward amount, if any, is available to offset future net capital gains. Dividends and distributions to shareholders are recorded on the ex-dividend date. The amounts of dividends and distributions from net investment income and net realized capital gains are determined in accordance with federal income tax regulations, which may differ from U.S. GAAP. These book/tax differences are either considered temporary or permanent in nature. To the extent these differences are permanent in nature, such amounts are reclassified within the components of net assets based on their federal tax basis treatment; temporary differences do not require reclassification. Dividends and distributions that exceed earnings and profits for tax purposes are reported as a tax return of capital.
The tax character of distributions paid during the fiscal years ended December 31, 2017 and 2016 were as follows:
| Year Ended 12/31/2017 | Year Ended 12/31/2016 | |||||||||
| Distributions paid from: | ||||||||||
| Ordinary income | $ | 33,415,693 | $ | 17,544,959 | ||||||
| Net long-term capital gains | 42,337,632 | 2,143,944 | ||||||||
| Total distributions paid | $ | 75,753,325 | $ | 19,688,903 | ||||||
As of December 31, 2017, the components of accumulated gains on a tax-basis were as follows:
| Undistributed ordinary income – net | $ | 5,596,688 | ||
| Undistributed long-term capital gains | 2,969,138 | |||
| Total undistributed earnings | 8,565,826 | |||
| Temporary differences | (205,674 | ) | ||
| Unrealized gains – net | 92,119,092 | |||
| Total accumulated gains – net | $ | 100,479,244 |
19
Notes to Financial Statements (continued)
As of December 31, 2017, the aggregate unrealized security gains and losses on investments and other financial instruments based on cost for U.S. federal income tax purposes were as follows:
| Tax cost | $ | 607,521,882 | ||
| Gross unrealized gain | 96,656,493 | |||
| Gross unrealized loss | (4,537,401 | ) | ||
| Net unrealized security gain | $ | 92,119,092 |
The difference between book-basis and tax-basis unrealized gains (losses) is attributable to the tax treatment of wash sales.
Permanent items identified during the fiscal year ended December 31, 2017 have been reclassified among the components of net assets based on their tax basis treatment as follows:
| Distributions in | |||||||
| Excess of Net | Accumulated Net | ||||||
| Investment Income | Realized Gain | ||||||
| $249,718 | $(249,718 | ) | |||||
The permanent differences are attributable to the tax treatment of certain distributions.
| 5. | PORTFOLIO SECURITIES TRANSACTIONS |
Purchases and sales of investment securities (excluding short-term investments) for the fiscal year ended December 31, 2017 were as follows:
| Purchases | Sales | |
| $666,615,019 | $771,979,978 |
There were no purchases or sales of U.S. Government securities for the fiscal year ended December 31, 2017.
The Fund is permitted to purchase and sell securities (“cross-trade”) from and to other Lord Abbett funds or client accounts pursuant to procedures approved by the Board in compliance with Rule 17a-7 under the Act (the “Rule”). Each cross-trade is executed at a fair market price in compliance with provisions of the Rule. For the fiscal year ended December 31, 2017, the Fund engaged in cross-trades purchase of $2,240,745, and sales of $2,412,342, which resulted in net realized gains of $262,604.
| 6. | DISCLOSURES ABOUT OFFSETTING ASSETS AND LIABILITIES |
The Financial Accounting Standards Board (“FASB”) requires disclosures intended to help better assess the effect or potential effect of offsetting arrangements on a fund’s financial position. The following tables illustrate gross and net information about recognized assets and liabilities eligible for offset in the statement of assets and liabilities; and disclose such amounts subject to an enforceable master netting agreement or similar agreement, by counterparty. A master netting agreement is an agreement between a fund and a counterparty which provides for the net settlement of amounts owed under all contracts traded under that agreement, as well as cash collateral, through a single payment by one party to the other in the event of default on or termination of any one contract. The Fund’s accounting policy with respect to balance sheet offsetting is that, absent an event of default by the counterparty or a termination of the agreement, the master netting agreement does not result in an offset of reported amounts of financial assets and liabilities in the statement of assets and liabilities across transactions between the Fund and the applicable counterparty:
20
Notes to Financial Statements (continued)
| Description | Gross Amounts of Recognized Assets | Gross Amounts Offset in the Statement of Assets and Liabilities | Net Amounts of Assets Presented in the Statement of Assets and Liabilities | |||||||||
| Repurchase Agreement | $ | 13,051,453 | $ | – | $ | 13,051,453 | ||||||
| Total | $ | 13,051,453 | $ | – | $ | 13,051,453 | ||||||
| Net Amounts | ||||||||||||||||||||
| of Assets | Amounts Not Offset in the | |||||||||||||||||||
| Presented in | Statement of Assets and Liabilities | |||||||||||||||||||
| Counterparty | the Statement of Assets and Liabilities | Financial Instruments | Cash Collateral Received(a) | Securities Collateral Received(a) | Net Amount(b) | |||||||||||||||
| Fixed Income Clearing Corp. | $ | 13,051,453 | $ | – | $ | – | $ | (13,051,453 | ) | $ | – | |||||||||
| Total | $ | 13,051,453 | $ | – | $ | – | $ | (13,051,453 | ) | $ | – | |||||||||
| (a) | Collateral disclosed is limited to an amount not to exceed 100% of the net amount of assets presented in the Statement of Assets and Liabilities, for each respective counterparty. |
| (b) | Net amount represents the amount owed to the Fund by the counterparty as of December 31, 2017. |
| 7. | DIRECTORS’ REMUNERATION |
The Company’s officers and two Directors, who are associated with Lord Abbett, do not receive any compensation from the Company for serving in such capacities. Independent Directors’ fees are allocated among all Lord Abbett-sponsored funds based on the net assets of each fund. There is an equity-based plan available to all Independent Directors under which Independent Directors must defer receipt of a portion of, and may elect to defer receipt of an additional portion of Directors’ fees. The deferred amounts are treated as though equivalent dollar amounts had been invested in the funds. Such amounts and earnings accrued thereon are included in Directors’ fees on the Statement of Operations and in Directors’ fees payable on the Statement of Assets and Liabilities and are not deductible for U.S. federal income tax purposes until such amounts are paid.
| 8. | EXPENSE REDUCTIONS |
The Company has entered into an arrangement with its transfer agent and custodian, whereby credits realized as a result of uninvested cash balances are used to reduce a portion of the Fund’s expenses.
| 9. | LINE OF CREDIT |
Effective August 28, 2017, the Fund and certain other funds managed by Lord Abbett (collectively, the “Participating Funds”) entered into an amended syndicated line of credit facility with various lenders for $600 million (the “Facility”), whereas State Street Bank and Trust Company (“SSB”) participates as a lender and as agent for the lenders. The Facility is to be used for temporary or emergency purposes as an additional source of liquidity to satisfy redemptions. The Participating Funds are subject to graduated borrowing limits of one-third of Fund assets (if Fund assets are less than $750 million), $250 million, $300 million, or $350 million, based on past borrowings and likelihood of future borrowings.
Prior to August 28, 2017, the Funds and certain other funds managed by Lord Abbett participated in a $550 million syndicated line of credit facility, based on the same terms as described above.
During the fiscal year ended December 31, 2017, the Fund did not utilize the Facility.
21
Notes to Financial Statements (concluded)
| 10. | INTERFUND LENDING PROGRAM |
Pursuant to an exemptive order issued by the U.S. Securities and Exchange Commission (“SEC exemptive order”) certain registered open-ended management investment companies managed by Lord Abbett, including the Fund, participate in a joint lending and borrowing program (the Interfund Lending Program”). The SEC exemptive order allows the Funds to borrow money from and lend money to each other for temporary emergency purposes subject to the limitations and conditions.
During the fiscal year ended December 31, 2017, the Fund did not participate as a borrower or lender in the Interfund Lending Program.
| 11. | CUSTODIAN AND ACCOUNTING AGENT |
SSB is the Company’s custodian and accounting agent. SSB performs custodial, accounting and recordkeeping functions relating to portfolio transactions and calculating the Fund’s NAV.
| 12. | INVESTMENT RISKS |
The Fund is subject to the general risks and considerations associated with equity investing, as well as the particular risks associated with value stocks. The value of an investment will fluctuate in response to movements in the equity securities market in general and to the changing prospects of individual companies in which the Fund invests. Value investing also is subject to the risk that the company judged to be undervalued may actually be appropriately priced or even overpriced. Large-cap value stocks may perform differently than the market as a whole and other types of stocks, such as small company stocks and growth stocks. This is because different types of stocks tend to shift in and out of favor over time depending on market and economic conditions as well as investor sentiment. In addition, large companies may have smaller rates of growth as compared to successful but well established smaller companies.. The market may fail to recognize the intrinsic value of particular value stocks for a long time. In addition, if the Fund’s assessment of a company’s value or prospects for exceeding earnings expectations or market conditions is wrong, the Fund could suffer losses or produce poor performance relative to other funds, even in a favorable market.
Due to its investments in multinational companies, foreign companies and American Depositary Receipts, the Fund may experience increased market, industry and sector, liquidity, currency, political, information and other risks. The securities of foreign companies also may be subject to inadequate exchange control regulations, the imposition of economic sanctions or other government restrictions, higher transaction and other costs, and delays in settlement to the extent they are traded on non-U.S. exchanges or markets.
These factors can affect the Fund’s performance.
| 13. | SUMMARY OF CAPITAL TRANSACTIONS |
Transactions in shares of capital stock were as follows:
| Year Ended December 31, 2017 | Year Ended December 31, 2016 | |||||||
| Shares sold | 459,722 | 565,181 | ||||||
| Reinvestment of distributions | 2,044,858 | 534,694 | ||||||
| Shares reacquired | (3,324,857 | ) | (4,015,682 | ) | ||||
| Decrease | (820,277 | ) | (2,915,807 | ) | ||||
22
Report of Independent Registered Public Accounting Firm
To the Board of Directors of Lord Abbett Series Fund, Inc. and the shareholders of Growth and Income Portfolio:
Opinion on the Financial Statements and Financial Highlights
We have audited the accompanying statement of assets and liabilities, including the schedule of investments, of the Growth and Income Portfolio, one of the portfolios constituting the Lord Abbett Series Fund, Inc. (the “Fund”), as of December 31, 2017, the related statement of operations for the year then ended, the statements of changes in net assets for each of the two years in the period then ended, the financial highlights for each of the five years in the period then ended, and the related notes. In our opinion, the financial statements and financial highlights present fairly, in all material respects, the financial position of the Growth and Income Portfolio of the Fund as of December 31, 2017, the results of its operations for the year then ended, the changes in its net assets for each of the two years in the period then ended, and the financial highlights for each of the five years in the period then ended, in conformity with accounting principles generally accepted in the United States of America.
Basis for Opinion
These financial statements and financial highlights are the responsibility of the Fund’s management. Our responsibility is to express an opinion on the Fund’s financial statements and financial highlights based on our audits. We are a public accounting firm registered with the Public Company Accounting Oversight Board (United States) (PCAOB) and are required to be independent with respect to the Fund in accordance with the U.S. federal securities laws and the applicable rules and regulations of the Securities and Exchange Commission and the PCAOB.
We conducted our audits in accordance with the standards of the PCAOB. Those standards require that we plan and perform the audit to obtain reasonable assurance about whether the financial statements and financial highlights are free of material misstatement, whether due to error or fraud. The Fund is not required to have, nor were we engaged to perform, an audit of its internal control over financial reporting. As part of our audits we are required to obtain an understanding of internal control over financial reporting but not for the purpose of expressing an opinion on the effectiveness of the Fund’s internal control over financial reporting. Accordingly, we express no such opinion.
Our audits included performing procedures to assess the risks of material misstatement of the financial statements and financial highlights, whether due to error or fraud, and performing procedures that respond to those risks. Such procedures included examining, on a test basis, evidence regarding the amounts and disclosures in the financial statements and financial highlights. Our audits also included evaluating the accounting principles used and significant estimates made by management, as well as evaluating the overall financial statement presentation and financial highlights. Our procedures included confirmation of securities owned as of December 31, 2017, by correspondence with the custodian and brokers. We believe that our audits provide a reasonable basis for our opinion.
DELOITTE & TOUCHE LLP
New York, New York
February 15, 2018
We have served as the auditor of one or more Lord Abbett Family of Funds’ investment companies since 1932.
23
Basic Information About Management
The Board is responsible for the management of the business and affairs of the Company in accordance with the laws of the State of Maryland. The Board elects officers who are responsible for the day-to-day operations of the Fund and who execute policies authorized by the Board. The Board also approves an investment adviser to the Fund and continues to monitor the cost and quality of the services the investment adviser provides, and annually considers whether to renew the contract with the adviser. Generally, each Director holds office until his/her successor is elected and qualified or until his/her earlier resignation or removal, as provided in the Company’s organizational documents.
Lord Abbett, a Delaware limited liability company, is the Fund’s investment adviser. Designated Lord Abbett personnel are responsible for the day-to-day management of the Fund.
Interested Directors
Ms. Foster and Mr. Sieg are affiliated with Lord Abbett and are “interested persons” of the Fund as defined in the Act. Ms. Foster and Mr. Sieg are directors/trustees of each of the 12 investment companies in the Lord Abbett Family of Funds, which consist of 61 portfolios or series. Ms. Foster is an officer of the Lord Abbett Family of Funds.
| Name, Address and Year of Birth | Current Position and Length of Service with the Company | Principal Occupation and Other Directorships During the Past Five Years | ||
| Daria L. Foster(1) Lord, Abbett & Co. LLC 90 Hudson Street Jersey City, NJ 07302 (1954) | Director and President since 2006; Chief Executive Officer since 2012 | Principal Occupation: Managing Partner of Lord Abbett, joined Lord Abbett in 1990.
Other Directorships: None. | ||
| Douglas B. Sieg(1) Lord, Abbett & Co. LLC 90 Hudson Street Jersey City, NJ 07302 (1969) | Director since 2016 | Principal Occupation: Partner (since 2001) and Head of Client Services (since 2013), formerly Director of Marketing and Relationship Management, joined Lord Abbett in 1994.
Other Directorships: None. |
Independent Directors
The following Independent Directors also are directors/trustees of each of the 12 investment companies in the Lord Abbett Family of Funds, which consist of 61 portfolios or series.
| Name, Address and Year of Birth | Current Position and Length of Service with the Company | Principal Occupation and Other Directorships During the Past Five Years | ||
| Eric C. Fast Lord, Abbett & Co. LLC c/o Legal Dept. 90 Hudson Street Jersey City, NJ 07302 (1949) | Director since 2014 | Principal Occupation: Chief Executive Officer of Crane Co., an industrial products company (2001–2014).
Other Directorships: Currently serves as director of Automatic Data Processing, Inc. (since 2007) and Regions Financial Corporation (since 2010). Previously served as a director of Crane Co. (1999–2014). |
| (1) | Daria L. Foster, Managing Partner of Lord Abbett, a member of the Board, and the Chief Executive Officer and President of the Lord Abbett Family of Funds, will retire from her positions with Lord Abbett and the Lord Abbett Family of Funds effective March 31, 2018. Douglas B. Sieg, Partner and head of Client Services at Lord Abbett, and a member of the Board, will succeed Ms. Foster effective April 1, 2018. |
24
Basic Information About Management (continued)
| Name, Address and Year of Birth | Current Position and Length of Service with the Company | Principal Occupation and Other Directorships During the Past Five Years | ||
| Evelyn E. Guernsey Lord, Abbett & Co. LLC c/o Legal Dept. 90 Hudson Street Jersey City, NJ 07302 (1955) | Director since 2011 | Principal Occupation: CEO, Americas of J.P. Morgan Asset Management (2004–2010).
Other Directorships: None. | ||
| Julie A. Hill Lord, Abbett & Co. LLC c/o Legal Dept. 90 Hudson Street Jersey City, NJ 07302 (1946) | Director since 2004 | Principal Occupation: Owner and CEO of The Hill Company, a business consulting firm (since 1998).
Other Directorships: Currently serves as director of Anthem, Inc., a health benefits company (since 1994). | ||
| Franklin W. Hobbs Lord, Abbett & Co. LLC c/o Legal Dept. 90 Hudson Street Jersey City, NJ 07302 (1947) | Director since 2001 | Principal Occupation: President and CEO of Ribbon Communications (since 2017) and Advisor of One Equity Partners, a private equity firm (since 2004).
Other Directorships: Currently serves as director of Ribbon Communications (since 2017), director and Chairman of the Board of Ally Financial Inc., a financial services firm (since 2009), and as director of Molson Coors Brewing Company (since 2002). | ||
| Kathleen M. Lutito Lord, Abbett & Co. LLC c/o Legal Dept. 90 Hudson Street Jersey City, NJ 07302 (1963) | Director since 2017 | Principal Occupation: President and Chief Investment Officer of CenturyLink Investment Management Company (since 2006).
Other Directorships: None | ||
| James M. McTaggart Lord, Abbett & Co. LLC c/o Legal Dept. 90 Hudson Street Jersey City, NJ 07302 (1947) | Director since 2012 | Principal Occupation: Independent management advisor and consultant (since 2012); Vice President, CRA International, Inc. (doing business as Charles River Associates), a global management consulting firm (2009–2012); Founder and Chairman of Marakon Associates, Inc., a strategy consulting firm (1978–2009); and Officer and Director of Trinsum Group, a holding company (2007–2009).
Other Directorships: Blyth, Inc., a home products company (2004–2015). | ||
| Karla M. Rabusch Lord, Abbett & Co. LLC c/o Legal Dept. 90 Hudson Street Jersey City, NJ 07302 (1959) | Director since 2017 | Principal Occupation: President and Director of Wells Fargo Funds Management, LLC (2003–2017); President of Wells Fargo Funds (2003–2016).
Other Directorships: None. | ||
| Mark A. Schmid Lord, Abbett & Co. LLC c/o Legal Dept. 90 Hudson Street Jersey City, NJ 07302 (1959) | Director since 2016 | Principal Occupation: Vice President and Chief Investment Officer of the University of Chicago (since 2009).
Other Directorships: None. |
25
Basic Information About Management (continued)
| Name, Address and Year of Birth | Current Position and Length of Service with the Company | Principal Occupation and Other Directorships During the Past Five Years | ||
| James L.L. Tullis Lord, Abbett & Co. LLC c/o Legal Dept. 90 Hudson Street Jersey City, NJ 07302 (1947) | Director since 2006; Chairman since 2017 | Principal Occupation: CEO of Tullis-Dickerson and Co. Inc., a venture capital management firm (since 1990); CEO of Tullis Health Investors Inc. (since 2012).
Other Directorships: Currently serves as director of Crane Co. (since 1998). |
Officers
None of the officers listed below have received compensation from the Company. All of the officers of the Company also may be officers of the other Lord Abbett Funds and maintain offices at 90 Hudson Street, Jersey City, NJ 07302. Unless otherwise indicated, the position(s) and title(s) listed under the “Principal Occupation During the Past Five Years” column indicate each officer’s position(s) and title(s) with Lord Abbett. Each officer serves for an indefinite term (i.e., until his or her death, resignation, retirement, or removal).
| Name and Year of Birth | Current Position with the Company | Length of Service of Current Position | Principal Occupation During the Past Five Years | |||
| Daria L. Foster (1954) | President and Chief Executive Officer | Elected as President in 2006 and Chief Executive Officer in 2012 | Managing Partner of Lord Abbett, joined Lord Abbett in 1990. | |||
| Sean J. Aurigemma (1969) | Executive Vice President | Elected in 2010 | Portfolio Manager, joined Lord Abbett in 2007. | |||
| Jeff D. Diamond (1960) | Executive Vice President | Elected in 2008 | Portfolio Manager, joined Lord Abbett in 2007. | |||
| Todd D. Jacobson (1966) | Executive Vice President | Elected in 2005 | Partner and Associate Director, joined Lord Abbett in 2003. | |||
| Robert A. Lee (1969) | Executive Vice President | Elected in 2010 | Partner and Chief Investment Officer, and was formerly Deputy Chief Investment Officer and Director of Taxable Fixed Income, joined Lord Abbett in 1997. | |||
| David J. Linsen (1974) | Executive Vice President | Elected in 2008 | Partner and Director, joined Lord Abbett in 2001. | |||
| Thomas B. Maher (1967) | Executive Vice President | Elected in 2010 | Partner and Portfolio Manager, joined Lord Abbett in 2003. | |||
| Justin C. Maurer (1969) | Executive Vice President | Elected in 2010 | Partner and Portfolio Manager, joined Lord Abbett in 2001. |
26
Basic Information About Management (continued)
| Name and Year of Birth | Current Position with the Company | Length of Service of Current Position | Principal Occupation During the Past Five Years | |||
| Vincent J. McBride (1964) | Executive Vice President | Elected in 2010 | Partner and Director, joined Lord Abbett in 2003. | |||
| Andrew H. O’Brien (1973) | Executive Vice President | Elected in 2010 | Partner and Portfolio Manager, joined Lord Abbett in 1998. | |||
| F. Thomas O’Halloran, III (1955) | Executive Vice President | Elected in 2010 | Partner and Portfolio Manager, joined Lord Abbett in 2001. | |||
| Marc Pavese (1972) | Executive Vice President | Elected in 2016 | Partner and Portfolio Manager, joined Lord Abbett in 2008. | |||
| Walter H. Prahl (1958) | Executive Vice President | Elected in 2012 | Partner and Director, joined Lord Abbett in 1997. | |||
| Jeffrey Rabinowitz (1972) | Executive Vice President | Elected in 2017 | Portfolio Manager, joined Lord Abbett in 2017 and was formerly a Managing Director and Portfolio Manager/Technology Analyst at Jennison Associates LLC (2014–2017) and Managing Director and Portfolio Manager/Technology Analyst at Goldman Sachs Asset Management (1999–2014). | |||
| Steven F. Rocco (1979) | Executive Vice President | Elected in 2014 | Partner and Portfolio Manager, joined Lord Abbett in 2004. | |||
| A. Edward Allinson (1961) | Vice President | Elected in 2011 | Portfolio Manager, joined Lord Abbett in 2005. | |||
| Matthew R. DeCicco (1977) | Vice President | Elected in 2003 | Portfolio Manager, joined Lord Abbett in 1999. | |||
| Brooke A. Fapohunda (1975) | Vice President and Assistant Secretary | Elected in 2014 | Partner and Deputy General Counsel, joined Lord Abbett in 2006. | |||
| John K. Forst (1960) | Vice President and Assistant Secretary | Elected in 2005 | Partner and Deputy General Counsel, joined Lord Abbett in 2004. | |||
| Bernard J. Grzelak (1971) | Chief Financial Officer and Vice President | Elected in 2017 | Partner and Chief Operations Officer, and was formerly Director of Fund Administration, joined Lord Abbett in 2003. | |||
| Lawrence H. Kaplan (1957) | Vice President and Secretary | Elected in 1997 | Partner and General Counsel, joined Lord Abbett in 1997. |
27
Basic Information About Management (concluded)
| Name and Year of Birth | Current Position with the Company | Length of Service of Current Position | Principal Occupation During the Past Five Years | |||
| Linda Y. Kim (1980) | Vice President and Assistant Secretary | Elected in 2016 | Counsel, joined Lord Abbett in 2015 and was formerly an Associate at Stroock & Stroock & Lavan LLP (2007–2015). | |||
| Joseph M. McGill (1962) | Chief Compliance Officer | Elected in 2014 | Partner and Chief Compliance Officer, joined Lord Abbett in 2014 and was formerly Managing Director and the Chief Compliance Officer at UBS Global Asset Management (2003–2013). | |||
| A. Edward Oberhaus, III (1959) | Vice President | Elected in 1998 | Partner and Director, joined Lord Abbett in 1983. | |||
| Noah Petrucci (1970) | Vice President | Elected in 2013 | Portfolio Manager, joined Lord Abbett in 2012. | |||
| Lawrence B. Stoller (1963) | Vice President and Assistant Secretary | Elected in 2007 | Partner and Senior Deputy General Counsel, joined Lord Abbett in 2007. | |||
| Leah G. Traub (1979) | Vice President | Elected in 2016 | Partner and Portfolio Manager, joined Lord Abbett in 2007. | |||
| Arthur K. Weise (1970) | Vice President | Elected in 2010 | Partner and Portfolio Manager, joined Lord Abbett in 2007. | |||
| Kewjin Yuoh (1971) | Vice President | Elected in 2012 | Partner and Portfolio Manager, joined Lord Abbett in 2010. | |||
| Scott S. Wallner (1955) | AML Compliance Officer | Elected in 2011 | Assistant General Counsel, joined Lord Abbett in 2004. | |||
| Christian J. Kelly (1975) | Treasurer | Elected in 2017 | Director of Fund Administration, joined Lord Abbett in 2009. |
Please call 888-522-2388 for a copy of the statement of additional information, which contains further information about the Company’s Directors. It is available free upon request.
28
Approval of Advisory Contract
The Board, including all of the Directors who are not “interested persons” of the Company or of Lord Abbett, as defined in the Investment Company Act of 1940, as amended (the “Independent Directors”), annually considers whether to approve the continuation of the existing management agreement between the Fund and Lord Abbett (the “Agreement”). In connection with its most recent approval, the Board reviewed materials relating specifically to the Agreement, as well as numerous materials received throughout the course of the year, including information about the Fund’s investment performance compared to the performance of its benchmark. Before making its decision as to the Fund, the Board had the opportunity to ask questions and request further information, taking into account its familiarity with Lord Abbett gained through its meetings and discussions. These meetings and discussions included reviews of Fund performance conducted by members of the Contract Committee, the deliberations of the Contract Committee, and discussions between the Contract Committee and Lord Abbett’s management. The Independent Directors also met with their independent legal counsel in various private sessions at which no representatives of management were present.
The materials received by the Board included, but were not limited to: (1) information provided by Morningstar, Inc. (“Morningstar”) regarding the investment performance of the Fund compared to the investment performance of certain funds with similar investment styles as determined by Morningstar, based, in part, on the Fund’s Morningstar category (the “performance peer group”), and the investment performance of two appropriate benchmarks; (2) information provided by Morningstar regarding the expense ratios, contractual and actual management fee rates, and other expense components for the Fund and certain funds in the same Morningstar category, with generally the same or similar share classes and operational characteristics, including asset size (the “expense peer group”); (3) certain supplemental investment performance information provided by Lord Abbett; (4) information provided by Lord Abbett on the expense ratios, management fee rates, and other expense components for the Fund; (5) sales and redemption information for the Fund; (6) information regarding Lord Abbett’s financial condition; (7) an analysis of the relative profitability of the Agreement to Lord Abbett; and (8) information regarding the personnel and other resources devoted by Lord Abbett to managing the Fund.
Investment Management Services Generally. The Board considered the investment management services provided by Lord Abbett to the Fund, including investment research, portfolio management, and trading, and Lord Abbett’s commitment to compliance with all applicable legal requirements. The Board also observed that Lord Abbett was solely engaged in the investment management business and accordingly did not experience the conflicts of interest that may result from being engaged in other lines of business. The Board considered the investment advisory services provided by Lord Abbett to other clients, the fees charged for the services, and the differences in the nature of the services provided to the Fund and other Lord Abbett Funds, on the one hand, and the services provided to other clients, on the other. After reviewing these and related factors, the Board concluded that the Fund was likely to continue to benefit from the nature, extent and quality of the investment services provided by Lord Abbett under the Agreement.
Investment Performance. The Board reviewed the Fund’s investment performance in relation to that of the performance peer group and two appropriate benchmarks as of various periods ended August 31, 2017. The Board observed that the Fund’s investment performance was above the median of the performance peer group for the three- and five-year periods, equal to the median for the ten-year period, and below the median for the one-year period. The Board considered that Lord Abbett was implementing a plan intended to improve the performance of its equity Funds.
29
Approval of Advisory Contract (continued)
The Board further considered Lord Abbett’s performance and reputation generally, the performance of other Lord Abbett-managed funds overseen by the Board, and the willingness of Lord Abbett to take steps intended to improve performance when necessary. After reviewing these and related factors, the Board concluded that the Fund’s Agreement should be continued.
Lord Abbett’s Personnel and Methods. The Board considered the qualifications of the personnel providing investment management services to the Fund, in light of its investment objective and discipline. Among other things, the Board considered the size, experience, and turnover of Lord Abbett’s investment management staff, Lord Abbett’s investment methodology and philosophy, and Lord Abbett’s approach to recruiting, training, and retaining investment management personnel.
Nature and Quality of Other Services. The Board considered the nature, quality, costs, and extent of compliance, administrative, and other services performed by Lord Abbett and the nature and extent of Lord Abbett’s supervision of third party service providers, including the Fund’s transfer agent and custodian.
Expenses. The Board considered the expense level of the Fund and the expense levels of the expense peer group. It also considered how the expense level of the Fund related to those of the expense peer group and the amount and nature of the fees paid by shareholders. The Board observed that the net total expense ratio of the Fund was below the median of the expense peer group. After reviewing these and related factors, the Board concluded, within the context of its overall approval of the Agreement, that the expense level of the Fund was reasonable and supported the continuation of the Agreement.
Profitability. The Board considered the level of Lord Abbett’s operating margin in managing the Fund, including a review of Lord Abbett’s methodology for allocating its costs to its management of the Fund. It considered whether the Fund was profitable to Lord Abbett in connection with the Fund’s operation, including the fee that Lord Abbett receives from the Fund for providing administrative services to the Fund. The Board also considered the profits realized from other business segments of Lord Abbett, which may benefit from or be related to the Fund’s business. The Board considered Lord Abbett’s profit margins excluding Lord Abbett’s marketing and distribution expenses. The Board also considered Lord Abbett’s profit margins, without those exclusions, in comparison with available industry data and how those profit margins could affect Lord Abbett’s ability to recruit and retain investment personnel. The Board recognized that Lord Abbett’s overall profitability was a factor in enabling it to attract and retain qualified investment management personnel to provide services to the Fund. After reviewing these and related factors, the Board concluded, within the context of its overall approval of the Agreement, that Lord Abbett’s profitability with respect to the Fund was not excessive.
Economies of Scale. The Board considered the extent to which there had been economies of scale in managing the Fund, whether the Fund’s shareholders had appropriately benefited from such economies of scale, and whether there was potential for realization of any further economies of scale. The Board concluded that the existing management fee schedule, with its breakpoint in the level of the management fee, adequately addressed any economies of scale in managing the Fund.
Other Benefits to Lord Abbett. The Board considered the amount and nature of the fees paid by the Fund and the Fund’s shareholders to Lord Abbett for services other than investment advisory services. The Board also considered the revenues and profitability of Lord Abbett’s investment advisory business apart from its mutual fund business, and the intangible benefits enjoyed by Lord
30
Approval of Advisory Contract (concluded)
Abbett by virtue of its relationship with the Fund. The Board observed that the Distributor receives 12b-1 fees from certain of the Lord Abbett Funds as to shares held in accounts for which there is no other broker of record, may retain a portion of the 12b-1 fees it receives, and receives a portion of the sales charges on sales and redemptions of some classes of shares of the Lord Abbett Funds. In addition, the Board observed that Lord Abbett accrues certain benefits for its business of providing investment advice to clients other than the Lord Abbett Funds, but that business also benefits the Funds. The Board also noted that Lord Abbett, as disclosed in the prospectus of the Fund, has entered into revenue sharing arrangements with certain entities that distribute shares of the Fund. The Board also took into consideration the investment research that Lord Abbett receives as a result of Fund brokerage transactions.
Alternative Arrangements. The Board considered whether, instead of approving continuation of the Agreement, it might be in the best interests of the Fund to implement one or more alternative arrangements, such as continuing to employ Lord Abbett, but on different terms. After considering all of the relevant factors, the Board unanimously found that continuation of the Agreement was in the best interests of the Fund and its shareholders and voted unanimously to approve the continuation of the Agreement. In considering whether to approve the continuation of the Agreement, the Board did not identify any single factor as paramount or controlling. Individual Directors may have evaluated the information presented differently from one another, giving different weights to various factors. This summary does not discuss in detail all matters considered.
31
Householding
The Company has adopted a policy that allows it to send only one copy of the Fund’s prospectus, proxy material, annual report and semiannual report to certain shareholders residing at the same “household.” This reduces Fund expenses, which benefits you and other shareholders. If you need additional copies or do not want your mailings to be “householded,” please call Lord Abbett at 888-522-2388 or send a written request with your name, the name of your fund or funds and your account number or numbers to Lord Abbett Family of Funds, P.O. Box 219336, Kansas City, MO 64121.
Proxy Voting Policies, Procedures and Records
A description of the policies and procedures that Lord Abbett uses to vote proxies related to the Fund’s portfolio securities, and information on how Lord Abbett voted the Fund’s proxies during the 12-month period ended June 30 are available without charge, upon request, (i) by calling 888-522-2388; (ii) on Lord Abbett’s Website at www.lordabbett.com; and (iii) on the Securities and Exchange Commission’s (“SEC”) Website at www.sec.gov.
Shareholder Reports and Quarterly Portfolio Disclosure
The Fund is required to file its complete schedule of portfolio holdings with the SEC for its first and third fiscal quarters on Form N-Q. Copies of the filings are available without charge, upon request on the SEC’s Website at www.sec.gov and may be available by calling Lord Abbett at 888-522-2388. You can also obtain copies of Form N-Q by visiting the SEC’s Public Reference Room in Washington, DC (information on the operation of the Public Reference Room may be obtained by calling 800-SEC-0330).
Tax Information
For corporate shareholders, 44% of the Fund’s ordinary income distributions qualified for the dividends received deduction.
Additionally, of the distribution paid to the shareholders during the year ended December 31, 2017, $24,437,917 and $42,337,632, respectively, represent short-term capital gains and long-term capital gains. |
32


| This report, when not used for the general information of shareholders of the Fund, is to be distributed only if preceded or accompanied by a current fund prospectus. | |||
| Lord Abbett mutual fund shares are distributed by LORD ABBETT DISTRIBUTOR LLC. | Lord Abbett Series Fund, Inc.
Growth and Income Portfolio | LASFGI-3 (02/18) |
![]()
LORD ABBETT
ANNUAL REPORT
Lord Abbett
Series Fund—Growth Opportunities Portfolio
For the fiscal year ended December 31, 2017
Table of Contents
Lord Abbett Series Fund – Growth Opportunities Portfolio
Annual Report
For the fiscal year ended December 31, 2017

From left to right: James L.L. Tullis, Independent Chairman of the Lord Abbett Funds and Daria L. Foster, Director, President, and Chief Executive Officer of the Lord Abbett Funds.
Dear Shareholders: We are pleased to provide you with this overview of the performance of Lord Abbett Series Fund - Growth Opportunities Portfolio for the fiscal year ended December 31, 2017. On this page and the following pages, we discuss the major factors that influenced fiscal year performance. For additional information about the Fund, please visit our website at www.lordabbett.com, where you also can access the quarterly commentaries that provide updates on the Fund’s performance and other portfolio related updates.
Thank you for investing in Lord Abbett mutual funds. We value the trust that you place in us and look forward to serving your investment needs in the years to come.
Best regards,

Daria L. Foster
Director, President and Chief Executive Officer
For the fiscal year ended December 31, 2017, the Fund returned 22.91%, reflecting performance at the net asset value (NAV) of Class VC shares, with all distributions reinvested, compared to its benchmark, the Russell Midcap® Growth Index,1 which returned 25.27% over the same period.
The domestic equity market (as represented by the S&P 500® Index2) returned 21.83%, ending the year with its strongest quarterly performance in two years and marking its first calendar year with 12 consecutive months of positive performance. Much of the market momentum was driven by the anticipation
of supportive U.S. fiscal policies, as the passage of the Tax Cut and Jobs Act and the prospect of significant infrastructure spending drove the forecast for U.S. gross domestic product (GDP) growth incrementally higher. These forces persisted despite a myriad of geopolitical and environmental headwinds, as threats from North Korea, U.S. political tensions, and Hurricanes Harvey, Irma, and Maria all had the potential to derail the market’s forward progress.
During the year, the National Federation of Independent Business Small Business Confidence Index reached a 34
1
year high, marking its second-highest level in the history of the index. The University of Michigan’s average consumer confidence measure for the year was the highest since 2000, while consumer spending reached an all-time high in the third quarter. A reoccurring theme persisted throughout the year with large caps outperforming small caps and value stocks significantly outpacing their growth-oriented peers.
The U.S. economy continued to expand during the trailing 12-month period. U.S. GDP grew at a 3.2% pace during the third quarter, an increase over the second quarter. The U.S. Bureau of Economic Analysis stated that during the third-quarter personal consumption and federal government spending increased, quarter-over-quarter. The Federal Reserve raised target rates three times during the year, changing the target range in December from 1.00–1.25% to 1.25–1.50%. In addition to GDP growth, the U.S. unemployment rate remained relatively steady throughout the period, and was reported at 4.1% in December, a decline of 0.6% year-over-year.
Security selection in the health care sector was the largest detractor from the Fund’s relative performance during the period. Within the health care sector, the Fund’s holdings of Dexcom, Inc., a manufacturer of medical devices, detracted most. Shares of Dexcom fell as Abbott Laboratories’ flash glucose monitor, Libre, received a “concomitant nonadjunctive to
fingerstick label”, meaning the utilization of fingersticks alongside its monitoring systems is not required. This development eliminated a key competitive advantage of Dexcom’s G5 product, undercutting its addressable market. The Fund’s position in TESARO, Inc., a biopharmaceutical company focused on oncology, also detracted from performance. New competition from Astra Zeneca’s Lynparza, a PARP inhibitor, pressured future revenue estimates for TESARO’s Zejula drug.
Security selection and a modest overweight to the information technology sector also detracted from the Fund’s relative performance. The Fund’s holdings of Akamai Technologies, Inc., a cloud service provider, detracted. Shares of Akamai Technologies fell as the company faced multiple headwinds over the past year. Akamai’s slowing media segment, an increasingly competitive industry environment, and the risk of clients insourcing business capabilities, resulted in continued pressure on the company’s earnings and stock price.
During the period, security selection in the consumer discretionary sector was the largest contributor to the Fund’s relative performance. Within the consumer discretionary sector, the Fund’s holdings of Wynn Resorts, Ltd., a developer of casino resorts, contributed to performance. Shares of Wynn rose as strong growth within the Macau gaming market, specifically the VIP segment, drove revenues higher. The Fund’s
2
position in Marriott International, Inc., a global lodging and hotel company, contributed. Shares of Marriott rose throughout the period driven by substantial cost and revenue synergies associated with its merger with Starwood, and its large share repurchase program.
Security selection and an underweight to the consumer staples sector also contributed to the Fund’s relative performance. The Fund’s position in Brown-Forman Corp., a distributor of
alcoholic beverages, contributed. Shares of Brown-Forman rose as the company experienced significant sales growth, specifically in the United States and emerging markets.
The Fund’s portfolio is actively managed and, therefore, its holdings and the weightings of a particular issuer or particular sector as a percentage of portfolio assets are subject to change. Sectors may include many industries.
1 The Russell Midcap® Growth Index measures the performance of those Russell Midcap companies with higher price-to-book ratios and higher forecasted growth values.
2 The S&P 500® Index is widely regarded as the standard for measuring large cap U.S. stock market performance and includes a representative sample of leading companies in leading industries.
Unless otherwise specified, indexes reflect total return, with all dividends reinvested. Indexes are unmanaged, do not reflect the deduction of fees or expenses, and are not available for direct investment.
Important Performance and Other Information
Performance data quoted in the following pages reflect past performance and are no guarantee of future results. Current performance may be higher or lower than the performance quoted. The investment return and principal value of an investment in the Fund will fluctuate so that shares, on any given day or when redeemed, may be worth more or less than their original cost. You can obtain performance data current to the most recent month end by calling Lord Abbett at 888-522-2388 or referring to www.lordabbett.com.
During certain periods shown, expense waivers and reimbursements were in place. Without such expense
waivers and reimbursements, the Fund’s returns would have been lower.
The annual commentary above discusses the views of the Fund’s management and various portfolio holdings of the Fund as of December 31, 2017. These views and portfolio holdings may have changed after this date. Information provided in the commentary is not a recommendation to buy or sell securities. Because the Fund’s portfolio is actively managed and may change significantly, the Fund may no longer own the securities described above or may have otherwise changed its position in the securities. For more recent information about the Fund’s portfolio holdings, please visit www.lordabbett.com.
A Note about Risk: See Notes to Financial Statements for a discussion of investment risks. For a more detailed discussion of the risks associated with the Fund, please see the Fund’s prospectus.
Mutual funds are not insured by the FDIC, are not deposits or other obligations of, or guaranteed by, banks, and are subject to investment risks including possible loss of principal amount invested.
The Fund serves as an underlying investment vehicle for variable annuity contracts and variable life insurance policies.
3
Below is a comparison of a $10,000 investment in Class VC shares with the same investment in both the Russell Midcap® Growth Index and the Russell Midcap® Index, assuming reinvestment of all dividends and distributions. The Fund’s shares are sold only to insurance company separate accounts that fund certain variable annuity and variable life contracts. The line graph comparison does not reflect the sales charges or other expenses of these contracts. If those sales charges and expenses were reflected, returns would be lower. The graph and performance table below do not reflect the deduction of taxes that a shareholder would pay on Fund distributions or the redemption of Fund shares. During certain periods, expenses of the Fund have been waived or reimbursed by Lord Abbett; without such waiver or reimbursement of expenses, the Fund’s returns would have been lower. Past performance is no guarantee of future results.

Average Annual Total Returns for the
Periods Ended December 31, 2017
| 1 Year | 5 Years | 10 Years | ||||
| Class VC | 22.91% | 13.19% | 7.74% |
1 Performance for each unmanaged index does not reflect any fees or expenses. The performance of each index is not necessarily representative of the Fund’s performance.
2 The Fund (Class VC shares) at net asset value.
4
As a shareholder of the Fund, you incur ongoing costs, including management fees; expenses related to the Fund’s services arrangements with certain insurance companies; and other Fund expenses. This Example is intended to help you understand your ongoing costs (in dollars) of investing in the Fund and to compare these costs with the ongoing costs of investing in other mutual funds.
The Example is based on an investment of $1,000 invested at the beginning of the period and held for the entire period (July 1, 2017 through December 31, 2017).
The Example reflects only expenses that are deducted from the assets of the Fund. Fees and expenses, including sales charges applicable to the various insurance products that invest in the Fund, are not reflected in this Example. If such fees and expenses were reflected in the Example, the total expenses shown would be higher. Fees and expenses regarding such variable insurance products are separately described in the prospectus related to those products.
Actual Expenses
The first line of the table on the following page provides information about actual account values and actual expenses. You may use the information in this line, together with the amount you invested, to estimate the expenses that you paid over the period. Simply divide your account value by $1,000 (for example, an $8,600 account value divided by $1,000 = 8.6), then multiply the result by the number in the first line under the heading titled “Expenses Paid During Period 7/1/17 – 12/31/17” to estimate the expenses you paid on your account during this period.
Hypothetical Example for Comparison Purposes
The second line of the table on the following page provides information about hypothetical account values and hypothetical expenses based on the Fund’s actual expense ratio and an assumed rate of return of 5% per year before expenses, which is not the Fund’s actual return. The hypothetical account values and expenses may not be used to estimate the actual ending account balance or expenses you paid for the period. You may use this information to compare the ongoing costs of investing in the Fund and other funds. To do so, compare this 5% hypothetical example with the 5% hypothetical examples that appear in the shareholder reports of the other funds.
5
Please note that the expenses shown in the table are meant to highlight your ongoing costs only and do not reflect any transactional costs, such as sales charges. Therefore, the second line of the table is useful in comparing ongoing costs only, and will not help you determine the relative total costs of owning different funds. In addition, if these transactional costs were included, your costs would have been higher.
| Beginning Account Value | Ending Account Value | Expenses Paid During Period† | |||||
| 7/1/17 | 12/31/17 | 7/1/17 – 12/31/17 | |||||
| Class VC | |||||||
| Actual | $1,000.00 | $1,093.70 | $5.80 | ||||
| Hypothetical (5% Return Before Expenses) | $1,000.00 | $1,019.66 | $5.60 |
| † | Net expenses are equal to the Fund’s annualized expense ratio of 1.10%, multiplied by the average account value over the period, multiplied by 184/365 (to reflect one-half year period). |
Portfolio Holdings Presented by Sector
December 31, 2017
| Sector* | %** | |
| Consumer Discretionary | 19.16 | % |
| Consumer Staples | 3.23 | % |
| Energy | 1.27 | % |
| Financials | 11.52 | % |
| Health Care | 15.22 | % |
| Industrials | 15.11 | % |
| Information Technology | 27.52 | % |
| Materials | 6.10 | % |
| Real Estate | 0.59 | % |
| Repurchase Agreement | 0.28 | % |
| Total | 100.00 | % |
| * | A sector may comprise several industries. | |
| ** | Represents percent of total investments. |
| 6 | See Notes to Financial Statements. |
December 31, 2017
| Investments | Shares | Fair Value (000) | ||||||
| COMMON STOCKS 99.97% | ||||||||
| Air Freight & Logistics 0.87% | ||||||||
| Expeditors International of Washington, Inc. | 18,032 | $ | 1,166 | |||||
| Banks 2.25% | ||||||||
| First Republic Bank | 15,450 | 1,339 | ||||||
| Western Alliance Bancorp* | 29,604 | 1,676 | ||||||
| Total | 3,015 | |||||||
| Beverages 1.33% | ||||||||
| Brown-Forman Corp. Class B | 25,916 | 1,780 | ||||||
| Biotechnology 3.50% | ||||||||
| Alexion Pharmaceuticals, Inc.* | 8,834 | 1,056 | ||||||
| Incyte Corp., Ltd.* | 9,921 | 940 | ||||||
| Insmed, Inc.* | 23,532 | 734 | ||||||
| Repligen Corp.* | 15,877 | 576 | ||||||
| TESARO, Inc.* | 5,174 | 429 | ||||||
| Vertex Pharmaceuticals, Inc.* | 6,407 | 960 | ||||||
| Total | 4,695 | |||||||
| Building Products 1.40% | ||||||||
| A.O. Smith Corp. | 13,581 | 832 | ||||||
| Allegion plc (Ireland)(a) | 13,068 | 1,040 | ||||||
| Total | 1,872 | |||||||
| Capital Markets 5.35% | ||||||||
| Cboe Global Markets, Inc. | 10,950 | 1,364 | ||||||
| E*TRADE Financial Corp.* | 29,857 | 1,480 | ||||||
| MarketAxess Holdings, Inc. | 5,155 | 1,040 | ||||||
| Moody’s Corp. | 16,614 | 2,452 | ||||||
| MSCI, Inc. | 6,635 | 840 | ||||||
| Total | 7,176 | |||||||
| Chemicals 2.78% | ||||||||
| Axalta Coating Systems Ltd.* | 45,364 | 1,468 | ||||||
| FMC Corp. | 23,924 | 2,265 | ||||||
| Total | 3,733 | |||||||
| Commercial Services & Supplies 1.18% | ||||||||
| Cintas Corp. | 10,160 | 1,583 | ||||||
| Investments | Shares | Fair Value (000) | ||||||
| Construction Materials 1.37% | ||||||||
| Vulcan Materials Co. | 14,357 | $ | 1,843 | |||||
| Consumer Finance 0.78% | ||||||||
| SLM Corp.* | 93,044 | 1,051 | ||||||
| Containers & Packaging 1.96% | ||||||||
| Ball Corp. | 32,586 | 1,234 | ||||||
| Owens-Illinois, Inc.* | 63,293 | 1,403 | ||||||
| Total | 2,637 | |||||||
| Diversified Consumer Services 0.87% | ||||||||
| Service Corp. International | 31,337 | 1,170 | ||||||
| Electrical Equipment 3.18% | ||||||||
| AMETEK, Inc. | 19,979 | 1,448 | ||||||
| Hubbell, Inc. | 10,825 | 1,465 | ||||||
| Rockwell Automation, Inc. | 6,893 | 1,353 | ||||||
| Total | 4,266 | |||||||
| Electronic Equipment, Instruments & Components 2.43% | ||||||||
| Keysight Technologies, Inc.* | 21,351 | 888 | ||||||
| Trimble, Inc.* | 35,799 | 1,455 | ||||||
| Universal Display Corp. | 5,281 | 912 | ||||||
| Total | 3,255 | |||||||
| Equity Real Estate Investment Trusts 0.59% | ||||||||
| SBA Communications Corp.* | 4,826 | 788 | ||||||
| Food Products 1.00% | ||||||||
| Hershey Co. (The) | 11,844 | 1,344 | ||||||
| Health Care Equipment & Supplies 3.71% | ||||||||
| DENTSPLY SIRONA, Inc. | 11,913 | 784 | ||||||
| Edwards Lifesciences Corp.* | 16,897 | 1,905 | ||||||
| Intuitive Surgical, Inc.* | 1,861 | 679 | ||||||
| West Pharmaceutical Services, Inc. | 16,337 | 1,612 | ||||||
| Total | 4,980 | |||||||
| Health Care Providers & Services 0.69% | ||||||||
| Centene Corp.* | 9,157 | 924 | ||||||
| See Notes to Financial Statements. | 7 |
Schedule of Investments (continued)
December 31, 2017
| Investments | Shares | Fair Value (000) | ||||||
| Hotels, Restaurants & Leisure 4.96% | ||||||||
| Aramark | 33,103 | $ | 1,415 | |||||
| Marriott International, Inc. Class A | 8,290 | 1,125 | ||||||
| Norwegian Cruise Line Holdings Ltd.* | 19,263 | 1,026 | ||||||
| Vail Resorts, Inc. | 6,923 | 1,471 | ||||||
| Wynn Resorts Ltd. | 9,594 | 1,617 | ||||||
| Total | 6,654 | |||||||
| Household Durables 1.34% | ||||||||
| Mohawk Industries, Inc.* | 6,521 | 1,799 | ||||||
| Household Products 0.91% | ||||||||
| Church & Dwight Co., Inc. | 24,308 | 1,220 | ||||||
| Industrial Conglomerates 1.73% | ||||||||
| Roper Technologies, Inc. | 8,982 | 2,326 | ||||||
| Information Technology Services 7.67% | ||||||||
| DXC Technology Co. | 21,941 | 2,082 | ||||||
| Euronet Worldwide, Inc.* | 15,136 | 1,276 | ||||||
| Fidelity National Information Services, Inc. | 23,511 | 2,212 | ||||||
| Global Payments, Inc. | 21,320 | 2,137 | ||||||
| Total System Services, Inc. | 15,393 | 1,217 | ||||||
| Vantiv, Inc. Class A* | 18,571 | 1,366 | ||||||
| Total | 10,290 | |||||||
| Insurance 3.17% | ||||||||
| Progressive Corp. (The) | 51,670 | 2,910 | ||||||
| RenaissanceRe Holdings Ltd. | 10,694 | 1,343 | ||||||
| Total | 4,253 | |||||||
| Internet & Direct Marketing Retail 0.76% | ||||||||
| Expedia, Inc. | 8,526 | 1,021 | ||||||
| Internet Software & Services 2.44% | ||||||||
| CoStar Group, Inc.* | 6,016 | 1,786 | ||||||
| IAC/InterActiveCorp.* | 12,215 | 1,494 | ||||||
| Total | 3,280 | |||||||
| Leisure Products 0.84% | ||||||||
| Hasbro, Inc. | 12,428 | 1,130 | ||||||
| Investments | Shares | Fair Value (000) | ||||||
| Life Sciences Tools & Services 4.89% | ||||||||
| Agilent Technologies, Inc. | 25,556 | $ | 1,711 | |||||
| Charles River Laboratories International, Inc.* | 11,161 | 1,222 | ||||||
| Illumina, Inc.* | 8,222 | 1,796 | ||||||
| Mettler-Toledo International, Inc.* | 2,965 | 1,837 | ||||||
| Total | 6,566 | |||||||
| Machinery 4.85% | ||||||||
| Fortive Corp. | 26,385 | 1,909 | ||||||
| IDEX Corp. | 13,940 | 1,840 | ||||||
| Stanley Black & Decker, Inc. | 7,630 | 1,295 | ||||||
| Wabtec Corp. | 18,055 | 1,470 | ||||||
| Total | 6,514 | |||||||
| Multi-Line Retail 3.22% | ||||||||
| Dollar General Corp. | 23,526 | 2,188 | ||||||
| Dollar Tree, Inc.* | 19,900 | 2,136 | ||||||
| Total | 4,324 | |||||||
| Oil, Gas & Consumable Fuels 1.27% | ||||||||
| Cimarex Energy Co. | 11,744 | 1,433 | ||||||
| Parsley Energy, Inc. Class A* | 9,251 | 272 | ||||||
| Total | 1,705 | |||||||
| Pharmaceuticals 2.47% | ||||||||
| Zoetis, Inc. | 46,073 | 3,319 | ||||||
| Road & Rail 1.94% | ||||||||
| Genesee & Wyoming, Inc. Class A* | 16,547 | 1,303 | ||||||
| J.B. Hunt Transport Services, Inc. | 11,298 | 1,299 | ||||||
| Total | 2,602 | |||||||
| Semiconductors & Semiconductor Equipment 7.13% | ||||||||
| Advanced Micro Devices, Inc.* | 37,876 | 389 | ||||||
| Analog Devices, Inc. | 28,314 | 2,521 | ||||||
| Lam Research Corp. | 11,825 | 2,177 | ||||||
| MACOM Technology Solutions Holdings, Inc.* | 21,346 | 695 | ||||||
| 8 | See Notes to Financial Statements. |
Schedule of Investments (continued)
December 31, 2017
| Investments | Shares | Fair Value (000) | ||||||
| Semiconductors & Semiconductor Equipment (continued) | ||||||||
| Marvell Technology Group Ltd. | 28,996 | $ | 623 | |||||
| Microchip Technology, Inc. | 19,780 | 1,738 | ||||||
| Skyworks Solutions, Inc. | 15,002 | 1,424 | ||||||
| Total | 9,567 | |||||||
| Software 7.13% | ||||||||
| PTC, Inc.* | 22,397 | 1,361 | ||||||
| Red Hat, Inc.* | 23,520 | 2,825 | ||||||
| ServiceNow, Inc.* | 17,204 | 2,243 | ||||||
| Splunk, Inc.* | 15,053 | 1,247 | ||||||
| Ultimate Software Group, Inc. (The)* | 8,661 | 1,890 | ||||||
| Total | 9,566 | |||||||
| Specialty Retail 6.22% | ||||||||
| AutoZone, Inc.* | 1,844 | 1,312 | ||||||
| Burlington Stores, Inc.* | 16,261 | 2,000 | ||||||
| O’Reilly Automotive, Inc.* | 6,905 | 1,661 | ||||||
| Tractor Supply Co. | 21,722 | 1,624 | ||||||
| Ulta Salon, Cosmetics & Fragrance, Inc.* | 7,839 | 1,753 | ||||||
| Total | 8,350 | |||||||
| Technology Hardware, Storage & Peripherals 0.80% | ||||||||
| NetApp, Inc. | 19,385 | 1,072 | ||||||
| Textiles, Apparel & Luxury Goods 0.99% | ||||||||
| Carter’s, Inc. | 11,274 | 1,325 | ||||||
| Total Common Stocks (cost $112,782,970) | | | | | 134,161 | | ||
| Investments | Principal Amount (000) | Fair Value (000) | ||||||
| SHORT-TERM INVESTMENT 0.28% | ||||||||
| Repurchase Agreement | ||||||||
| Repurchase Agreement dated 12/29/2017, 0.54% due 1/2/2018 with Fixed Income Clearing Corp. collateralized by $325,000 of U.S. Treasury Bond at 7.875% due 2/15/2021; value: $392,310; proceeds: $379,194 (cost $379,172) | $379 | $ | 379 | |||||
| Total Investments in Securities 100.25% (cost $113,162,142) | 134,540 | |||||||
| Liabilities in Excess of Other Assets (0.25)% | (339 | ) | ||||||
| Net Assets 100.00% | $ | 134,201 | ||||||
| * | Non-income producing security. | |
| (a) | Foreign security traded in U.S. dollars. |
| See Notes to Financial Statements. | 9 |
Schedule of Investments (concluded)
December 31, 2017
The following is a summary of the inputs used as of December 31, 2017 in valuing the Fund’s investments carried at fair value(1):
| Investment Type(2)(3) | Level 1 (000) | Level 2 (000) | Level 3 (000) | Total (000) | ||||||||||||
| Common Stocks | $ | 134,161 | $ | – | $ | – | $ | 134,161 | ||||||||
| Repurchase Agreement | – | 379 | – | 379 | ||||||||||||
| Total | $ | 134,161 | $ | 379 | $ | – | $ | 134,540 | ||||||||
| (1) | Refer to Note 2(h) for a description of fair value measurements and the three-tier hierarchy of inputs. | |
| (2) | See Schedule of Investments for fair values in each industry and identification of foreign issuers and/or geography. | |
| (3) | There were no Level 1/Level 2 transfers during the fiscal year ended December 31, 2017. |
| 10 | See Notes to Financial Statements. |
Statement of Assets and Liabilities
December 31, 2017
| ASSETS: | ||||
| Investments in securities, at fair value (cost $113,162,142) | $ | 134,540,072 | ||
| Receivables: | ||||
| Interest and dividends | 32,922 | |||
| Capital shares sold | 27,652 | |||
| From advisor (See Note 3) | 19,309 | |||
| Prepaid expenses and other assets | 284 | |||
| Total assets | 134,620,239 | |||
| LIABILITIES: | ||||
| Payables: | ||||
| Capital shares reacquired | 130,152 | |||
| Management fee | 91,505 | |||
| Directors’ fees | 18,184 | |||
| Fund administration | 4,575 | |||
| Accrued expenses | 174,765 | |||
| Total liabilities | 419,181 | |||
| NET ASSETS | $ | 134,201,058 | ||
| COMPOSITION OF NET ASSETS: | ||||
| Paid-in capital | $ | 112,019,881 | ||
| Accumulated net investment loss | (18,184 | ) | ||
| Accumulated net realized gain on investments | 821,431 | |||
| Net unrealized appreciation on investments | 21,377,930 | |||
| Net Assets | $ | 134,201,058 | ||
| Outstanding shares (50 million shares of common stock authorized, $.001 par value) | 9,451,927 | |||
| Net asset value, offering and redemption price per share (Net assets divided by outstanding shares) | $14.20 |
| See Notes to Financial Statements. | 11 |
For the Year Ended December 31, 2017
| Investment income: | ||||
| Dividends | $1,067,479 | |||
| Interest | 851 | |||
| Total investment income | 1,068,330 | |||
| Expenses: | ||||
| Management fee | 1,056,165 | |||
| Non 12b-1 service fees | 330,258 | |||
| Shareholder servicing | 139,243 | |||
| Fund administration | 52,808 | |||
| Professional | 47,217 | |||
| Reports to shareholders | 31,741 | |||
| Custody | 9,515 | |||
| Directors’ fees | 3,659 | |||
| Other | 11,615 | |||
| Gross expenses | 1,682,221 | |||
| Expense reductions (See Note 8) | (1,207 | ) | ||
| Fees waived and expenses reimbursed (See Note 3) | (228,788 | ) | ||
| Net expenses | 1,452,226 | |||
| Net investment loss | (383,896 | ) | ||
| Net realized and unrealized gain: | ||||
| Net realized gain on investments | 6,248,087 | |||
| Net change in unrealized appreciation/depreciation on investments | 21,239,301 | |||
| Net realized and unrealized gain | 27,487,388 | |||
| Net Increase in Net Assets Resulting From Operations | $27,103,492 |
| 12 | See Notes to Financial Statements. |
Statements of Changes in Net Assets
| INCREASE IN NET ASSETS | For the Year Ended December 31, 2017 | For the Year Ended December 31, 2016 | ||||||
| Operations: | ||||||||
| Net investment loss | $ | (383,896 | ) | $ | (266,854 | ) | ||
| Net realized gain on investments | 6,248,087 | 1,180,737 | ||||||
| Net change in unrealized appreciation/depreciation on investments | 21,239,301 | (1,435,580 | ) | |||||
| Net increase (decrease) in net assets resulting from operations | 27,103,492 | (521,697 | ) | |||||
| Distributions to shareholders from: | ||||||||
| Net realized gain | (4,600,431 | ) | (736,893 | ) | ||||
| Capital share transactions (See Note 13): | ||||||||
| Proceeds from sales of shares | 5,748,922 | 141,471,322 | ||||||
| Reinvestment of distributions | 4,600,431 | 736,893 | ||||||
| Cost of shares reacquired | (22,386,775 | ) | (109,191,183 | ) | ||||
| Net increase (decrease) in net assets resulting from capital share transactions | (12,037,422 | ) | 33,017,032 | |||||
| Net increase in net assets | 10,465,639 | 31,758,442 | ||||||
| NET ASSETS: | ||||||||
| Beginning of year | $ | 123,735,419 | $ | 91,976,977 | ||||
| End of year | $ | 134,201,058 | $ | 123,735,419 | ||||
| Accumulated net investment loss | $ | (18,184 | ) | $ | (17,279 | ) | ||
| See Notes to Financial Statements. | 13 |
| Per Share Operating Performance: | ||||||||||||||||||||||||
| Investment Operations: | Distributions to shareholders from: | |||||||||||||||||||||||
| Net asset value, beginning of period | Net investment income (loss)(a) | Net realized and unrealized gain | Total from investment operations | Net realized gain | Net asset value, end of period | |||||||||||||||||||
| 12/31/2017 | $11.96 | $(0.04 | ) | $2.77 | $2.73 | $(0.49 | ) | $14.20 | ||||||||||||||||
| 12/31/2016 | 11.88 | (0.03 | ) | 0.18 | 0.15 | (0.07 | ) | 11.96 | ||||||||||||||||
| 12/31/2015 | 12.91 | (0.06 | ) | 0.41 | 0.35 | (1.38 | ) | 11.88 | ||||||||||||||||
| 12/31/2014 | 15.25 | (0.04 | ) | 0.95 | 0.91 | (3.25 | ) | 12.91 | ||||||||||||||||
| 12/31/2013 | 13.19 | (0.08 | ) | 4.93 | 4.85 | (2.79 | ) | 15.25 | ||||||||||||||||
| (a) | Calculated using average shares outstanding during the period. | |
| (b) | Total return does not consider the effects of sales charges or other expenses imposed by an insurance company and assumes the reinvestment of all distributions. |
| 14 | See Notes to Financial Statements. |
| Ratios to Average Net Assets: | Supplemental Data: | |||||||||||||||||||||
| Total return(b) (%) | Total expenses after waivers and/or reimburse- ments (%) | Total expenses (%) | Net investment income (loss) (%) | Net assets, end of period (000) | Portfolio turnover rate (%) | |||||||||||||||||
| 22.91 | 1.10 | 1.27 | (0.29 | ) | $134,201 | 69 | ||||||||||||||||
| 1.23 | 1.13 | 1.33 | (0.25 | ) | 123,735 | 155 | ||||||||||||||||
| 2.72 | 1.20 | 1.31 | (0.42 | ) | 91,977 | 125 | ||||||||||||||||
| 6.07 | 1.20 | 1.32 | (0.28 | ) | 87,234 | 198 | ||||||||||||||||
| 37.08 | 1.20 | 1.31 | (0.49 | ) | 98,244 | 121 | ||||||||||||||||
| See Notes to Financial Statements. | 15 |
| 1. | ORGANIZATION |
Lord Abbett Series Fund, Inc. (the “Company”) is registered under the Investment Company Act of 1940, as amended (“the Act”), as a diversified, open-end management investment company and was incorporated under Maryland law in 1989. The Company consists of twelve separate portfolios. This report covers Growth Opportunities Portfolio (the “Fund”).
The Fund’s investment objective is capital appreciation. The Fund has Variable Contract class shares (“Class VC Shares”), which are currently issued and redeemed only in connection with investments in, and payments under, variable annuity contracts and variable life insurance policies issued by life insurance and insurance-related companies.
The preparation of the financial statements in conformity with accounting principles generally accepted in the United States of America (“U.S. GAAP”) requires management to make certain estimates and assumptions that affect the reported amounts of assets and liabilities and disclosure of contingent assets and liabilities at the date of the financial statements and the reported amounts of increases and decreases in net assets from operations during the reporting period. Actual results could differ from those estimates. The Fund is considered an investment company under U.S. GAAP and follows the accounting and reporting guidance applicable to investment companies.
| 2. | SIGNIFICANT ACCOUNTING POLICIES |
| (a) | Investment Valuation–Under procedures approved by the Fund’s Board of Directors (the “Board”), Lord, Abbett & Co. LLC (“Lord Abbett”), the Fund’s investment manager, has formed a Pricing Committee to administer the pricing and valuation of portfolio investments and to ensure that prices utilized reasonably reflect fair value. Among other things, these procedures allow the Fund to utilize independent pricing services, quotations from securities and financial instrument dealers and other market sources to determine fair value. |
| Securities actively traded on any recognized U.S. or non-U.S. exchange or on The NASDAQ Stock Market LLC are valued at the last sale price or official closing price on the exchange or system on which they are principally traded. Events occurring after the close of trading on non-U.S. exchanges may result in adjustments to the valuation of foreign securities to reflect their fair value as of the close of regular trading on the New York Stock Exchange. The Fund may utilize an independent fair valuation service in adjusting the valuations of foreign securities. Unlisted equity securities are valued at the last quoted sale price or, if no sale price is available, at the mean between the most recently quoted bid and asked prices. Exchange traded options and futures contracts are valued at the last sale price in the market where they are principally traded. If no sale has occurred, the mean between the most recently quoted bid and asked prices is used. |
| Securities for which prices are not readily available are valued at fair value as determined by the Pricing Committee. The Pricing Committee considers a number of factors, including observable and unobservable inputs, when arriving at fair value. The Pricing Committee may use related or comparable assets or liabilities, recent transactions, market multiples, book values and other relevant information to determine the fair value of portfolio investments. The Board or a designated committee thereof regularly reviews fair value determinations made by the Pricing Committee and may employ techniques such as reviewing related market activity, |
16
Notes to Financial Statements (continued)
| reviewing inputs and assumptions, and retrospectively comparing prices of subsequent purchases and sales transactions to fair value determinations made by the Pricing Committee. |
| Short-term securities with 60 days or less remaining to maturity are valued using the amortized cost method, which approximates fair value. |
| (b) | Security Transactions–Security transactions are recorded as of the date that the securities are purchased or sold (trade date). Realized gains and losses on sales of portfolio securities are calculated using the identified-cost method. |
| (c) | Investment Income–Dividend income is recorded on the ex-dividend date. Interest income is recorded on the accrual basis as earned. Discounts are accreted and premiums are amortized using the effective interest method and are included in Interest and other income on the Statement of Operations. Withholding taxes on foreign dividends have been provided for in accordance with the applicable country’s tax rules and rates. |
| (d) | Income Taxes–It is the policy of the Fund to meet the requirements of Subchapter M of the Internal Revenue Code applicable to regulated investment companies and to distribute substantially all taxable income and capital gains to its shareholders. Therefore, no income tax provision is required. |
| The Fund files U.S. federal and various state and local tax returns. No income tax returns are currently under examination. The statute of limitations on the Fund’s filed U.S. federal tax returns remains open for the fiscal years ended December 31, 2014 through December 31, 2017. The statutes of limitations on the Company’s state and local tax returns may remain open for an additional year depending upon the jurisdiction. |
| (e) | Expenses-Expenses incurred by the Company that do not specifically relate to an individual fund are generally allocated to the funds within the Company on a pro rata basis by relative net assets. |
| (f) | Foreign Transactions–The books and records of the Fund are maintained in U.S. dollars and transactions denominated in foreign currencies are recorded in the Fund’s records at the rate prevailing when earned or recorded. Asset and liability accounts that are denominated in foreign currencies are adjusted daily to reflect current exchange rates and any unrealized gain (loss) is included in Net change in unrealized appreciation/depreciation on investments in the Fund’s Statement of Operations. The resultant exchange gains and losses upon settlement of such transactions are included in Net realized gain on investments in the Fund’s Statement of Operations. The Fund does not isolate that portion of the results of operations arising as a result of changes in the foreign exchange rates from the changes in market prices of the securities. |
| (g) | Repurchase Agreements–The Fund may enter into repurchase agreements with respect to securities. A repurchase agreement is a transaction in which a fund acquires a security and simultaneously commits to resell that security to the seller (a bank or securities dealer) at an agreed-upon price on an agreed-upon date. The Fund requires at all times that the repurchase agreement be collateralized by cash, or by securities of the U.S. Government, its agencies, its instrumentalities, or U.S. Government sponsored enterprises having a value equal to, or in excess of, the value of the repurchase agreement (including accrued interest). If the seller of the agreement defaults on its obligation to repurchase the underlying securities at a time when the fair value of these securities has declined, the Fund may incur a loss upon disposition of the securities. |
17
Notes to Financial Statements (continued)
| (h) | Fair Value Measurements–Fair value is defined as the price that the Fund would receive upon selling an investment or transferring a liability in an orderly transaction to an independent buyer in the principal or most advantageous market of the investment. A three-tier hierarchy is used to maximize the use of observable market data and minimize the use of unobservable inputs and to establish classification of fair value measurements for disclosure purposes. Inputs refer broadly to the assumptions that market participants would use in pricing the asset or liability, including assumptions about risk—for example, the risk inherent in a particular valuation technique used to measure fair value (such as a pricing model) and/or the risk inherent in the inputs to the valuation technique. Inputs may be observable or unobservable. Observable inputs reflect the assumptions market participants would use in pricing the asset or liability. Observable inputs are based on market data obtained from sources independent of the reporting entity. Unobservable inputs reflect the reporting entity’s own assumptions about the assumptions market participants would use in pricing the asset or liability. Unobservable inputs are based on the best information available in the circumstances. The three-tier hierarchy classification is determined based on the lowest level of inputs that is significant to the fair value measurement, and is summarized in the three broad Levels listed below: |
| • | Level 1 | – | unadjusted quoted prices in active markets for identical investments; | |
| • | Level 2 | – | other significant observable inputs (including quoted prices for similar investments, interest rates, prepayment speeds, credit risk, etc.); and | |
| • | Level 3 | – | significant unobservable inputs (including the Fund’s own assumptions in determining the fair value of investments). |
A summary of inputs used in valuing the Fund’s investments as of December 31, 2017 and, if applicable, Level 1/Level 2 transfers and Level 3 rollforwards for the fiscal year then ended is included in the Fund’s Schedule of Investments.
Changes in valuation techniques may result in transfers into or out of an assigned level within the three-tier hierarchy. All transfers between different levels within the three-tier hierarchy are deemed to have occurred as of the beginning of the reporting period. The inputs or methodology used for valuing securities are not necessarily an indication of the risk associated with investing in those securities.
| 3. | MANAGEMENT FEE AND OTHER TRANSACTIONS WITH AFFILIATES |
Management Fee
The Company has a management agreement with Lord Abbett, pursuant to which Lord Abbett supplies the Fund with investment management services and executive and other personnel, provides office space and pays for ordinary and necessary office and clerical expenses relating to research and statistical work and supervision of the Fund’s investment portfolio.
The management fee is based on the Fund’s average daily net assets at the following annual rate:
| First $1 billion | .80% |
| Next $1 billion | .75% |
| Next $1 billion | .70% |
| Over $3 billion | .65% |
For the fiscal year ended December 31, 2017, the effective management fee, net of waivers, was at an annualized rate of .63% of the Fund’s average daily net assets.
18
Notes to Financial Statements (continued)
In addition, Lord Abbett provides certain administrative services to the Fund pursuant to an Administrative Services Agreement in return for a fee at an annual rate of .04% of the Fund’s average daily net assets.
During the fiscal year ended December 31, 2017 and continuing through April 30, 2018, Lord Abbett has contractually agreed to waive its fees and reimburse expenses to the extent necessary to limit total net annual operating expenses, excluding acquired fund fees and expenses, to an annual rate of 1.10%. This agreement may be terminated only upon the approval of the Board.
The Company, on behalf of the Fund, has entered into services arrangements with certain insurance companies. Under these arrangements, certain insurance companies will be compensated up to .25% of the average daily net asset value (“NAV”) of the Fund’s Class VC Shares held in the insurance company’s separate account to service and maintain the Variable Contract owners’ accounts. This amount is included in Non 12b-1 service fees on the Statement of Operations. The Fund may also compensate certain insurance companies, third-party administrators and other entities for providing recordkeeping, sub-transfer agency and other administrative services to the Fund. This amount is included in Shareholder servicing on the Statement of Operations.
Two Directors and certain of the Company’s officers have an interest in Lord Abbett.
| 4. | DISTRIBUTIONS AND CAPITAL LOSS CARRYFORWARDS |
Dividends from net investment income, if any, are declared and paid at least semi-annually. Taxable net realized gains from investment transactions, reduced by allowable capital loss carryforwards, if any, are declared and distributed to shareholders at least annually. The capital loss carryforward amount, if any, is available to offset future net capital gains. Dividends and distributions to shareholders are recorded on the ex-dividend date. The amounts of dividends and distributions from net investment income and net realized capital gains are determined in accordance with federal income tax regulations, which may differ from U.S. GAAP. These book/tax differences are either considered temporary or permanent in nature. To the extent these differences are permanent in nature, such amounts are reclassified within the components of net assets based on their federal tax basis treatment; temporary differences do not require reclassification. Dividends and distributions that exceed earnings and profits for tax purposes are reported as a tax return of capital.
The tax character of distributions paid during the fiscal years ended December 31, 2017 and 2016 was as follows:
| Year Ended 12/31/2017 | Year Ended 12/31/2016 | |||||
| Distributions paid from: | ||||||
| Ordinary income | $1,521,325 | $ | – | |||
| Net long-term capital gains | 3,079,106 | 736,893 | ||||
| Total distributions paid | $4,600,431 | $ | 736,893 | |||
19
Notes to Financial Statements (continued)
As of December 31, 2017, the components of accumulated gains on a tax-basis were as follows:
| Undistributed ordinary income – net | $ | 514,368 | ||
| Undistributed long-term capital gains | 986,590 | |||
| Total undistributed earnings | 1,500,958 | |||
| Temporary differences | (18,184 | ) | ||
| Unrealized gains – net | 20,698,403 | |||
| Total accumulated gains – net | $ | 22,181,177 |
As of December 31, 2017, the aggregate unrealized security gains and losses on investments and other financial instruments based on cost for U.S. federal income tax purposes were as follows:
| Tax cost | $ | 113,841,669 | ||
| Gross unrealized gain | $ | 22,601,359 | ||
| Gross unrealized loss | (1,902,956 | ) | ||
| Net unrealized security gain | $ | 20,698,403 |
The difference between book-basis and tax basis unrealized gains (losses) is attributable to the tax treatment of wash sales.
Permanent items identified during the fiscal year ended December 31, 2017 have been reclassified among the components of net assets based on their tax basis treatment as follows:
| Accumulated Net Investment Loss | Accumulated Net Realized Gain | ||
| $382,991 | $(382,991 | ) |
The permanent differences are attributable to the tax treatment of certain distributions and net investment losses.
| 5. | PORTFOLIO SECURITIES TRANSACTIONS |
Purchases and sales of investment securities (excluding short-term investments) for the fiscal year ended December 31, 2017 were as follows:
| Purchases | Sales |
| $89,966,006 | $105,452,142 |
There were no purchases or sales of U.S. Government securities for the fiscal year ended December 31, 2017.
The Fund is permitted to purchase and sell securities (“cross-trade”) from and to other Lord Abbett funds or client accounts pursuant to procedures approved by the Board in compliance with Rule 17a-7 under the Act (the “Rule”). Each cross-trade is executed at a fair market price in compliance with provisions of the Rule. For the fiscal year ended December 31, 2017, the Fund engaged in cross-trades purchases of $256,839 and sales of $430,392, which resulted in net realized gains of $43,574.
| 6. | DISCLOSURES ABOUT OFFSETTING ASSETS AND LIABILITIES |
The Financial Accounting Standards Board (“FASB”) requires disclosures intended to help better assess the effect or potential effect of offsetting arrangements on a fund’s financial position. The following tables illustrate gross and net information about recognized assets and liabilities eligible for offset in the statement of assets and liabilities; and disclose such amounts subject to an enforceable master netting agreement or similar agreement, by counterparty. A master netting
20
Notes to Financial Statements (continued)
agreement is an agreement between a fund and a counterparty which provides for the net settlement of amounts owed under all contracts traded under that agreement, as well as cash collateral, through a single payment by one party to the other in the event of default on or termination of any one contract. The Fund’s accounting policy with respect to balance sheet offsetting is that, absent an event of default by the counterparty or a termination of the agreement, the master netting agreement does not result in an offset of reported amounts of financial assets and liabilities in the statement of assets and liabilities across transactions between the Fund and the applicable counterparty:
| Gross Amounts | Net Amounts of | ||||||
| Offset in the | Assets Presented | ||||||
| Gross Amounts of | Statement of Assets | in the Statement of | |||||
| Description | Recognized Assets | and Liabilities | Assets and Liabilities | ||||
| Repurchase Agreement | $379,172 | $ – | $379,172 | ||||
| Total | $379,172 | $ – | $379,172 |
| Net Amounts | ||||||||||
| of Assets | Amounts Not Offset in the | |||||||||
| Presented in | Statement of Assets and Liabilities | |||||||||
| the Statement | Cash | Securities | ||||||||
| of Assets and | Financial | Collateral | Collateral | Net | ||||||
| Counterparty | Liabilities | Instruments | Received(a) | Received(a) | Amount(b) | |||||
| Fixed Income Clearing Corp. | $379,172 | $ – | $ – | $(379,172 | ) | $ – | ||||
| Total | $379,172 | $ – | $ – | $(379,172 | ) | $ – | ||||
| (a) | Collateral disclosed is limited to an amount not to exceed 100% of the net amount of assets presented in the Statement of Assets and Liabilities, for each respective counterparty. |
| (b) | Net amount represents the amount owed to the Fund by the counterparty as of December 31, 2017. |
| 7. | DIRECTORS’ REMUNERATION |
The Company’s officers and two Directors, who are associated with Lord Abbett, do not receive any compensation from the Company for serving in such capacities. Independent Directors’ fees are allocated among all Lord Abbett-sponsored funds based on the net assets of each fund. There is an equity-based plan available to all Independent Directors under which Independent Directors must defer receipt of a portion of, and may elect to defer receipt of an additional portion of Directors’ fees. The deferred amounts are treated as though equivalent dollar amounts had been invested in the funds. Such amounts and earnings accrued thereon are included in Directors’ fees on the Statement of Operations and in Directors’ fees payable on the Statement of Assets and Liabilities and are not deductible for U.S. federal income tax purposes until such amounts are paid.
| 8. | EXPENSE REDUCTIONS |
The Company has entered into an arrangement with its transfer agent and custodian, whereby credits realized as a result of uninvested cash balances are used to reduce a portion of the Fund’s expenses.
| 9. | LINE OF CREDIT |
Effective August 28, 2017, the Fund and certain other funds managed by Lord Abbett (collectively, the “Participating Funds”) entered into an amended syndicated line of credit facility with various lenders for $600 million (the “Facility”), whereas State Street Bank and Trust Company (“SSB”) participates as a lender and as agent for the lenders. The Facility is to be used for temporary or
21
Notes to Financial Statements (continued)
emergency purposes as an additional source of liquidity to satisfy redemptions. The Participating Funds are subject to graduated borrowing limits of one-third of Fund assets (if Fund assets are less than $750 million), $250 million, $300 million, or $350 million, based on past borrowings and likelihood of future borrowings.
Prior to August 28, 2017, the Funds and certain other funds managed by Lord Abbett participated in a $550 million syndicated line of credit facility, based on the same terms as described above.
During the fiscal year ended December 31, 2017, the Fund did not utilize the Facility.
| 10. | INTERFUND LENDING PROGRAM |
Pursuant to an exemptive order issued by the U.S. Securities and Exchange Commission (“SEC exemptive order”), certain registered open-end management investment companies managed by Lord Abbett, including the Fund, participate in a joint lending and borrowing program (the “Interfund Lending Program”). The SEC exemptive order allows the Funds to borrow money from and lend money to each other for temporary or emergency purposes subject to the limitations and conditions.
During the fiscal year ended December 31, 2017, the Fund did not participate as a borrower or lender in the Interfund Lending Program.
| 11. | CUSTODIAN AND ACCOUNTING AGENT |
SSB is the Company’s custodian and accounting agent. SSB performs custodial, accounting and recordkeeping functions relating to portfolio transactions and calculating the Fund’s NAV.
| 12. | INVESTMENT RISKS |
The Fund is subject to the general risks and considerations associated with equity investing. The value of an investment will fluctuate in response to movements in the equity securities markets in general, the changing prospects of individual companies in which the Fund invests, or an individual company’s financial condition. The Fund has particular risks associated with growth stocks. Growth companies may grow faster than other companies, which may result in more volatility in their stock prices. Growth stocks are often more sensitive to market fluctuations than other securities because their market prices are highly sensitive to future earnings expectations. In addition, if the Fund’s assessment of a company’s potential for growth or market conditions is wrong, it could suffer losses or produce poor performance relative to other funds, even in a favorable market. The Fund invests largely in mid-sized company stocks, which may be less able to weather economic shifts or other adverse developments than those of larger, more established companies. Although investing in mid-sized companies offers the potential for above average returns, these companies may not succeed and the value of their stock could decline significantly. Mid-sized companies also may fall out of favor relative to larger companies in certain market cycles, causing the Fund to incur losses or under perform.
Due to the Fund’s investment exposure to foreign companies and American Depositary Receipts, the Fund may experience increased market, industry and sector, liquidity, currency, political, information, and other risks. The securities of foreign companies also may be subject to inadequate exchange control regulations, the imposition of economic sanctions or other government restrictions, higher transaction and other costs, and delays in settlement to the extent they are traded on non-U.S. exchanges or markets.
These factors can affect the Fund’s performance.
22
Notes to Financial Statements (concluded)
| 13. | SUMMARY OF CAPITAL TRANSACTIONS |
Transactions in shares of capital stock were as follows:
| Year Ended | Year Ended | |||||||||
| December 31, 2017 | December 31, 2016 | |||||||||
| Shares sold | 442,997 | 12,040,758 | ||||||||
| Reinvestment of distributions | 326,154 | 59,571 | ||||||||
| Shares reacquired | (1,664,435 | ) | (9,493,978 | ) | ||||||
| Increase (decrease) | (895,284 | ) | 2,606,351 | |||||||
23
Report of Independent Registered Public Accounting Firm
To the Board of Directors of Lord Abbett Series Fund, Inc. and the shareholders of Growth Opportunities Portfolio:
Opinion on the Financial Statements and Financial Highlights
We have audited the accompanying statement of assets and liabilities, including the schedule of investments, of the Growth Opportunities Portfolio, one of the portfolios constituting the Lord Abbett Series Fund, Inc. (the “Fund”), as of December 31, 2017, the related statement of operations for the year then ended, the statements of changes in net assets for each of the two years in the period then ended, the financial highlights for each of the five years in the period then ended, and the related notes. In our opinion, the financial statements and financial highlights present fairly, in all material respects, the financial position of the Growth Opportunities Portfolio of the Fund as of December 31, 2017, the results of its operations for the year then ended, the changes in its net assets for each of the two years in the period then ended, and the financial highlights for each of the five years in the period then ended, in conformity with accounting principles generally accepted in the United States of America.
Basis for Opinion
These financial statements and financial highlights are the responsibility of the Fund’s management. Our responsibility is to express an opinion on the Fund’s financial statements and financial highlights based on our audits. We are a public accounting firm registered with the Public Company Accounting Oversight Board (United States) (PCAOB) and are required to be independent with respect to the Fund in accordance with the U.S. federal securities laws and the applicable rules and regulations of the Securities and Exchange Commission and the PCAOB.
We conducted our audits in accordance with the standards of the PCAOB. Those standards require that we plan and perform the audit to obtain reasonable assurance about whether the financial statements and financial highlights are free of material misstatement, whether due to error or fraud. The Fund is not required to have, nor were we engaged to perform, an audit of its internal control over financial reporting. As part of our audits we are required to obtain an understanding of internal control over financial reporting but not for the purpose of expressing an opinion on the effectiveness of the Fund’s internal control over financial reporting. Accordingly, we express no such opinion.
Our audits included performing procedures to assess the risks of material misstatement of the financial statements and financial highlights, whether due to error or fraud, and performing procedures that respond to those risks. Such procedures included examining, on a test basis, evidence regarding the amounts and disclosures in the financial statements and financial highlights. Our audits also included evaluating the accounting principles used and significant estimates made by management, as well as evaluating the overall financial statement presentation and financial highlights. Our procedures included confirmation of securities owned as of December 31, 2017, by correspondence with the custodian and brokers. We believe that our audits provide a reasonable basis for our opinion.
DELOITTE & TOUCHE LLP
New York, New York
February 15, 2018
We have served as the auditor of one or more Lord Abbett Family of Funds’ investment companies since 1932.
24
Basic Information About Management
The Board is responsible for the management of the business and affairs of the Company in accordance with the laws of the State of Maryland. The Board elects officers who are responsible for the day-to-day operations of the Fund and who execute policies authorized by the Board. The Board also approves an investment adviser to the Fund and continues to monitor the cost and quality of the services the investment adviser provides, and annually considers whether to renew the contract with the adviser. Generally, each Director holds office until his/her successor is elected and qualified or until his/her earlier resignation or removal, as provided in the Company’s organizational documents.
Lord Abbett, a Delaware limited liability company, is the Fund’s investment adviser. Designated Lord Abbett personnel are responsible for the day-to-day management of the Fund.
Interested Directors
Ms. Foster and Mr. Sieg are affiliated with Lord Abbett and are “interested persons” of the Fund as defined in the Act. Ms. Foster and Mr. Sieg are directors/trustees of each of the 12 investment companies in the Lord Abbett Family of Funds, which consist of 61 portfolios or series. Ms. Foster is an officer of the Lord Abbett Family of Funds.
| Name, Address and Year of Birth | Current Position and Length of Service with the Company | Principal Occupation and Other Directorships During the Past Five Years | ||
| Daria L. Foster(1) Lord, Abbett & Co. LLC 90 Hudson Street Jersey City, NJ 07302 (1954) | Director and President since 2006; Chief Executive Officer since 2012 | Principal Occupation: Managing Partner of Lord Abbett, joined Lord Abbett in 1990. Other Directorships: None. | ||
| Douglas B. Sieg(1) Lord, Abbett & Co. LLC 90 Hudson Street Jersey City, NJ 07302 (1969) | Director since 2016 | Principal Occupation: Partner (since 2001) and Head of Client Services (since 2013), formerly Director of Marketing and Relationship Management, joined Lord Abbett in 1994. Other Directorships: None. |
Independent Directors
The following Independent Directors also are directors/trustees of each of the 12 investment companies in the Lord Abbett Family of Funds, which consist of 61 portfolios or series.
| Name, Address and Year of Birth | Current Position and Length of Service with the Company | Principal Occupation and Other Directorships During the Past Five Years | ||
| Eric C. Fast Lord, Abbett & Co. LLC c/o Legal Dept. 90 Hudson Street Jersey City, NJ 07302 (1949) | Director since 2014 | Principal Occupation: Chief Executive Officer of Crane Co., an industrial products company (2001–2014). Other Directorships: Currently serves as director of Automatic Data Processing, Inc. (since 2007) and Regions Financial Corporation (since 2010). Previously served as a director of Crane Co. (1999–2014). |
| (1) | Daria L. Foster, Managing Partner of Lord Abbett, a member of the Board, and the Chief Executive Officer and President of the Lord Abbett Family of Funds, will retire from her positions with Lord Abbett and the Lord Abbett Family of Funds effective March 31, 2018. Douglas B. Sieg, Partner and head of Client Services at Lord Abbett, and a member of the Board, will succeed Ms. Foster effective April 1, 2018. |
25
Basic Information About Management (continued)
| Name, Address and Year of Birth | Current Position and Length of Service with the Company | Principal Occupation and Other Directorships During the Past Five Years | ||
| Evelyn E. Guernsey Lord, Abbett & Co. LLC c/o Legal Dept. 90 Hudson Street Jersey City, NJ 07302 (1955) | Director since 2011 | Principal Occupation: CEO, Americas of J.P. Morgan Asset Management (2004–2010).
Other Directorships: None. | ||
| Julie A. Hill Lord, Abbett & Co. LLC c/o Legal Dept. 90 Hudson Street Jersey City, NJ 07302 (1946) | Director since 2004 | Principal Occupation: Owner and CEO of The Hill Company, a business consulting firm (since 1998).
Other Directorships: Currently serves as director of Anthem, Inc., a health benefits company (since 1994). | ||
| Franklin W. Hobbs Lord, Abbett & Co. LLC c/o Legal Dept. 90 Hudson Street Jersey City, NJ 07302 (1947) | Director since 2001 | Principal Occupation: President and CEO of Ribbon Communications (since 2017) and Advisor of One Equity Partners, a private equity firm (since 2004).
Other Directorships: Currently serves as director of Ribbon Communications (since 2017), director and Chairman of the Board of Ally Financial Inc., a financial services firm (since 2009), and as director of Molson Coors Brewing Company (since 2002). | ||
| Kathleen M. Lutito Lord, Abbett & Co. LLC c/o Legal Dept. 90 Hudson Street Jersey City, NJ 07302 (1963) | Director since 2017 | Principal Occupation: President and Chief Investment Officer of CenturyLink Investment Management Company (since 2006).
Other Directorships: None | ||
| James M. McTaggart Lord, Abbett & Co. LLC c/o Legal Dept. 90 Hudson Street Jersey City, NJ 07302 (1947) | Director since 2012 | Principal Occupation: Independent management advisor and consultant (since 2012); Vice President, CRA International, Inc. (doing business as Charles River Associates), a global management consulting firm (2009–2012); Founder and Chairman of Marakon Associates, Inc., a strategy consulting firm (1978–2009); and Officer and Director of Trinsum Group, a holding company (2007–2009).
Other Directorships: Blyth, Inc., a home products company (2004–2015). | ||
| Karla M. Rabusch Lord, Abbett & Co. LLC c/o Legal Dept. 90 Hudson Street Jersey City, NJ 07302 (1959) | Director since 2017 | Principal Occupation: President and Director of Wells Fargo Funds Management, LLC (2003–2017); President of Wells Fargo Funds (2003–2016).
Other Directorships: None. | ||
| Mark A. Schmid Lord, Abbett & Co. LLC c/o Legal Dept. 90 Hudson Street Jersey City, NJ 07302 (1959) | Director since 2016 | Principal Occupation: Vice President and Chief Investment Officer of the University of Chicago (since 2009).
Other Directorships: None. |
26
Basic Information About Management (continued)
| Name, Address and Year of Birth | Current Position and Length of Service with the Company | Principal Occupation and Other Directorships During the Past Five Years | ||
| James L.L. Tullis Lord, Abbett & Co. LLC c/o Legal Dept. 90 Hudson Street Jersey City, NJ 07302 (1947) | Director since 2006; Chairman since 2017 | Principal Occupation: CEO of Tullis-Dickerson and Co. Inc., a venture capital management firm (since 1990); CEO of Tullis Health Investors Inc. (since 2012).
Other Directorships: Currently serves as director of Crane Co. (since 1998). |
Officers
None of the officers listed below have received compensation from the Company. All of the officers of the Company also may be officers of the other Lord Abbett Funds and maintain offices at 90 Hudson Street, Jersey City, NJ 07302. Unless otherwise indicated, the position(s) and title(s) listed under the “Principal Occupation During the Past Five Years” column indicate each officer’s position(s) and title(s) with Lord Abbett. Each officer serves for an indefinite term (i.e., until his or her death, resignation, retirement, or removal).
| Name and Year of Birth | Current Position with the Company | Length of Service of Current Position | Principal Occupation During the Past Five Years | |||
| Daria L. Foster (1954) | President and Chief Executive Officer | Elected as President in 2006 and Chief Executive Officer in 2012 | Managing Partner of Lord Abbett, joined Lord Abbett in 1990. | |||
| Sean J. Aurigemma (1969) | Executive Vice President | Elected in 2010 | Portfolio Manager, joined Lord Abbett in 2007. | |||
| Jeff D. Diamond (1960) | Executive Vice President | Elected in 2008 | Portfolio Manager, joined Lord Abbett in 2007. | |||
| Todd D. Jacobson (1966) | Executive Vice President | Elected in 2005 | Partner and Associate Director, joined Lord Abbett in 2003. | |||
| Robert A. Lee (1969) | Executive Vice President | Elected in 2010 | Partner and Chief Investment Officer, and was formerly Deputy Chief Investment Officer and Director of Taxable Fixed Income, joined Lord Abbett in 1997. | |||
| David J. Linsen (1974) | Executive Vice President | Elected in 2008 | Partner and Director, joined Lord Abbett in 2001. | |||
| Thomas B. Maher (1967) | Executive Vice President | Elected in 2010 | Partner and Portfolio Manager, joined Lord Abbett in 2003. | |||
| Justin C. Maurer (1969) | Executive Vice President | Elected in 2010 | Partner and Portfolio Manager, joined Lord Abbett in 2001. |
27
Basic Information About Management (continued)
| Name and Year of Birth | Current Position with the Company | Length of Service of Current Position | Principal Occupation During the Past Five Years | |||
| Vincent J. McBride (1964) | Executive Vice President | Elected in 2010 | Partner and Director, joined Lord Abbett in 2003. | |||
| Andrew H. O’Brien (1973) | Executive Vice President | Elected in 2010 | Partner and Portfolio Manager, joined Lord Abbett in 1998. | |||
| F. Thomas O’Halloran, III (1955) | Executive Vice President | Elected in 2010 | Partner and Portfolio Manager, joined Lord Abbett in 2001. | |||
| Marc Pavese (1972) | Executive Vice President | Elected in 2016 | Partner and Portfolio Manager, joined Lord Abbett in 2008. | |||
| Walter H. Prahl (1958) | Executive Vice President | Elected in 2012 | Partner and Director, joined Lord Abbett in 1997. | |||
| Jeffrey Rabinowitz (1972) | Executive Vice President | Elected in 2017 | Portfolio Manager, joined Lord Abbett in 2017 and was formerly a Managing Director and Portfolio Manager/Technology Analyst at Jennison Associates LLC (2014–2017) and Managing Director and Portfolio Manager/Technology Analyst at Goldman Sachs Asset Management (1999–2014). | |||
| Steven F. Rocco (1979) | Executive Vice President | Elected in 2014 | Partner and Portfolio Manager, joined Lord Abbett in 2004. | |||
| A. Edward Allinson (1961) | Vice President | Elected in 2011 | Portfolio Manager, joined Lord Abbett in 2005. | |||
| Matthew R. DeCicco (1977) | Vice President | Elected in 2003 | Portfolio Manager, joined Lord Abbett in 1999. | |||
| Brooke A. Fapohunda (1975) | Vice President and Assistant Secretary | Elected in 2014 | Partner and Deputy General Counsel, joined Lord Abbett in 2006. | |||
| John K. Forst (1960) | Vice President and Assistant Secretary | Elected in 2005 | Partner and Deputy General Counsel, joined Lord Abbett in 2004. | |||
| Bernard J. Grzelak (1971) | Chief Financial Officer and Vice President | Elected in 2017 | Partner and Chief Operations Officer, and was formerly Director of Fund Administration, joined Lord Abbett in 2003. | |||
| Lawrence H. Kaplan (1957) | Vice President and Secretary | Elected in 1997 | Partner and General Counsel, joined Lord Abbett in 1997. |
28
Basic Information About Management (concluded)
| Name and Year of Birth | Current Position with the Company | Length of Service of Current Position | Principal Occupation During the Past Five Years | |||
| Linda Y. Kim (1980) | Vice President and Assistant Secretary | Elected in 2016 | Counsel, joined Lord Abbett in 2015 and was formerly an Associate at Stroock & Stroock & Lavan LLP (2007–2015). | |||
| Joseph M. McGill (1962) | Chief Compliance Officer | Elected in 2014 | Partner and Chief Compliance Officer, joined Lord Abbett in 2014 and was formerly Managing Director and the Chief Compliance Officer at UBS Global Asset Management (2003–2013). | |||
| A. Edward Oberhaus, III (1959) | Vice President | Elected in 1998 | Partner and Director, joined Lord Abbett in 1983. | |||
| Noah Petrucci (1970) | Vice President | Elected in 2013 | Portfolio Manager, joined Lord Abbett in 2012. | |||
| Lawrence B. Stoller (1963) | Vice President and Assistant Secretary | Elected in 2007 | Partner and Senior Deputy General Counsel, joined Lord Abbett in 2007. | |||
| Leah G. Traub (1979) | Vice President | Elected in 2016 | Partner and Portfolio Manager, joined Lord Abbett in 2007. | |||
| Arthur K. Weise (1970) | Vice President | Elected in 2010 | Partner and Portfolio Manager, joined Lord Abbett in 2007. | |||
| Kewjin Yuoh (1971) | Vice President | Elected in 2012 | Partner and Portfolio Manager, joined Lord Abbett in 2010. | |||
| Scott S. Wallner (1955) | AML Compliance Officer | Elected in 2011 | Assistant General Counsel, joined Lord Abbett in 2004. | |||
| Christian J. Kelly (1975) | Treasurer | Elected in 2017 | Director of Fund Administration, joined Lord Abbett in 2009. |
Please call 888-522-2388 for a copy of the statement of additional information, which contains further information about the Company’s Directors. It is available free upon request.
29
Approval of Advisory Contract
The Board, including all of the Directors who are not “interested persons” of the Company or of Lord Abbett, as defined in the Investment Company Act of 1940, as amended (the “Independent Directors”), annually considers whether to approve the continuation of the existing management agreement between the Fund and Lord Abbett (the “Agreement”). In connection with its most recent approval, the Board reviewed materials relating specifically to the Agreement, as well as numerous materials received throughout the course of the year, including information about the Fund’s investment performance compared to the performance of its benchmark. Before making its decision as to the Fund, the Board had the opportunity to ask questions and request further information, taking into account its familiarity with Lord Abbett gained through its meetings and discussions. These meetings and discussions included reviews of Fund performance conducted by members of the Contract Committee, the deliberations of the Contract Committee, and discussions between the Contract Committee and Lord Abbett’s management. The Independent Directors also met with their independent legal counsel in various private sessions at which no representatives of management were present.
The materials received by the Board included, but were not limited to: (1) information provided by Morningstar, Inc. (“Morningstar”) regarding the investment performance of the Fund compared to the investment performance of certain funds with similar investment styles as determined by Morningstar, based, in part, on the Fund’s Morningstar category (the “performance peer group”), and the investment performance of two appropriate benchmarks; (2) information provided by Morningstar regarding the expense ratios, contractual and actual management fee rates, and other expense components for the Fund and certain funds in the same Morningstar category, with generally the same or similar share classes and operational characteristics, including asset size (the “expense peer group”); (3) certain supplemental investment performance information provided by Lord Abbett; (4) information provided by Lord Abbett on the expense ratios, management fee rates, and other expense components for the Fund; (5) sales and redemption information for the Fund; (6) information regarding Lord Abbett’s financial condition; (7) an analysis of the relative profitability of the Agreement to Lord Abbett; (8) information provided by Lord Abbett regarding the investment management fee schedules for Lord Abbett’s other advisory clients maintaining accounts with a similar investment strategy as the Fund; and (9) information regarding the personnel and other resources devoted by Lord Abbett to managing the Fund.
Investment Management Services Generally. The Board considered the investment management services provided by Lord Abbett to the Fund, including investment research, portfolio management, and trading, and Lord Abbett’s commitment to compliance with all applicable legal requirements. The Board also observed that Lord Abbett was solely engaged in the investment management business and accordingly did not experience the conflicts of interest that may result from being engaged in other lines of business. The Board considered the investment advisory services provided by Lord Abbett to other clients, the fees charged for the services, and the differences in the nature of the services provided to the Fund and other Lord Abbett Funds, on the one hand, and the services provided to other clients, on the other. After reviewing these and related factors, the Board concluded that the Fund was likely to continue to benefit from the nature, extent and quality of the investment services provided by Lord Abbett under the Agreement.
Investment Performance. The Board reviewed the Fund’s investment performance in relation to that of the performance peer group and two appropriate benchmarks as of various periods ended August 31, 2017. The Board observed that the Fund’s investment performance was below the median of the performance peer group for the one-, three-, five-, and ten-year periods. The Board
30
Approval of Advisory Contract (continued)
considered that Lord Abbett was implementing a plan intended to improve the performance of its equity Funds. The Board further considered Lord Abbett’s performance and reputation generally, the performance of other Lord Abbett-managed funds overseen by the Board, and the willingness of Lord Abbett to take steps intended to improve performance when necessary. After reviewing these and related factors, the Board concluded that the Fund’s Agreement should be continued.
Lord Abbett’s Personnel and Methods. The Board considered the qualifications of the personnel providing investment management services to the Fund, in light of its investment objective and discipline. Among other things, the Board considered the size, experience, and turnover of Lord Abbett’s investment management staff, Lord Abbett’s investment methodology and philosophy, and Lord Abbett’s approach to recruiting, training, and retaining investment management personnel.
Nature and Quality of Other Services. The Board considered the nature, quality, costs, and extent of compliance, administrative, and other services performed by Lord Abbett and the nature and extent of Lord Abbett’s supervision of third party service providers, including the Fund’s transfer agent and custodian.
Expenses. The Board considered the expense level of the Fund and the expense levels of the expense peer group. It also considered how the expense level of the Fund related to those of the expense peer group and the amount and nature of the fees paid by shareholders. The Board observed that the net total expense ratio of the Fund was below the median of the expense peer group. After reviewing these and related factors, the Board concluded, within the context of its overall approval of the Agreement, that the expense level of the Fund was reasonable and supported the continuation of the Agreement.
Profitability. The Board considered the level of Lord Abbett’s operating margin in managing the Fund, including a review of Lord Abbett’s methodology for allocating its costs to its management of the Fund. It considered whether the Fund was profitable to Lord Abbett in connection with the Fund’s operation, including the fee that Lord Abbett receives from the Fund for providing administrative services to the Fund. The Board also considered the profits realized from other business segments of Lord Abbett, which may benefit from or be related to the Fund’s business. The Board considered Lord Abbett’s profit margins excluding Lord Abbett’s marketing and distribution expenses. The Board also considered Lord Abbett’s profit margins, without those exclusions, in comparison with available industry data and how those profit margins could affect Lord Abbett’s ability to recruit and retain investment personnel. The Board recognized that Lord Abbett’s overall profitability was a factor in enabling it to attract and retain qualified investment management personnel to provide services to the Fund. After reviewing these and related factors, the Board concluded, within the context of its overall approval of the Agreement, that Lord Abbett’s profitability with respect to the Fund was not excessive.
Economies of Scale. The Board considered the extent to which there had been economies of scale in managing the Fund, whether the Fund’s shareholders had appropriately benefited from such economies of scale, and whether there was potential for realization of any further economies of scale. The Board concluded that the existing management fee schedule, with its breakpoints in the level of the management fee, in conjunction with the Fund’s proposed expense limitation agreement, adequately addressed any economies of scale in managing the Fund.
Other Benefits to Lord Abbett. The Board considered the amount and nature of the fees paid by the Fund and the Fund’s shareholders to Lord Abbett for services other than investment advisory services. The Board also considered the revenues and profitability of Lord Abbett’s investment
31
Approval of Advisory Contract (concluded)
advisory business apart from its mutual fund business, and the intangible benefits enjoyed by Lord Abbett by virtue of its relationship with the Fund. The Board observed that the Distributor receives 12b-1 fees from certain of the Lord Abbett Funds as to shares held in accounts for which there is no other broker of record, may retain a portion of the 12b-1 fees it receives, and receives a portion of the sales charges on sales and redemptions of some classes of shares of the Lord Abbett Funds. In addition, the Board observed that Lord Abbett accrues certain benefits for its business of providing investment advice to clients other than the Lord Abbett Funds, but that business also benefits the Funds. The Board also noted that Lord Abbett, as disclosed in the prospectus of the Fund, has entered into revenue sharing arrangements with certain entities that distribute shares of the Fund. The Board also took into consideration the investment research that Lord Abbett receives as a result of Fund brokerage transactions.
Alternative Arrangements. The Board considered whether, instead of approving continuation of the Agreement, it might be in the best interests of the Fund to implement one or more alternative arrangements, such as continuing to employ Lord Abbett, but on different terms. After considering all of the relevant factors, the Board unanimously found that continuation of the Agreement was in the best interests of the Fund and its shareholders and voted unanimously to approve the continuation of the Agreement. In considering whether to approve the continuation of the Agreement, the Board did not identify any single factor as paramount or controlling. Individual Directors may have evaluated the information presented differently from one another, giving different weights to various factors. This summary does not discuss in detail all matters considered.
32
Householding
The Company has adopted a policy that allows it to send only one copy of the Fund’s prospectus, proxy material, annual report and semiannual report to certain shareholders residing at the same “household.” This reduces Fund expenses, which benefits you and other shareholders. If you need additional copies or do not want your mailings to be “householded,” please call Lord Abbett at 888-522-2388 or send a written request with your name, the name of your fund or funds and your account number or numbers to Lord Abbett Family of Funds, P.O. Box 219336, Kansas City, MO 64121.
Proxy Voting Policies, Procedures and Records
A description of the policies and procedures that Lord Abbett uses to vote proxies related to the Fund’s portfolio securities, and information on how Lord Abbett voted the Fund’s proxies during the 12-month period ended June 30 are available without charge, upon request, (i) by calling 888-522-2388; (ii) on Lord Abbett’s Website at www.lordabbett.com; and (iii) on the Securities and Exchange Commission’s (“SEC”) Website at www.sec.gov.
Shareholder Reports and Quarterly Portfolio Disclosure
The Fund is required to file its complete schedule of portfolio holdings with the SEC for its first and third fiscal quarters on Form N-Q. Copies of the filings are available without charge, upon request on the SEC’s Website at www.sec.gov and may be available by calling Lord Abbett at 888-522-2388. You can also obtain copies of Form N-Q by visiting the SEC’s Public Reference Room in Washington, DC (information on the operation of the Public Reference Room may be obtained by calling 800-SEC-0330).
Tax Information
For corporate shareholders, 49% of the Fund’s ordinary income distributions qualified for the dividends received deduction.
Additionally, of the distribution paid to the shareholders during the year ended December 31, 2017, $1,521,325 and $3,079,106, respectively, represent short-term capital gains and long-term capital gains. |
33


| This report, when not used for the general information of shareholders of the Fund, is to be distributed only if preceded or accompanied by a current fund prospectus. | |||
| Lord Abbett mutual fund shares are distributed by LORD ABBETT DISTRIBUTOR LLC. | Lord Abbett Series Fund, Inc. | ||
| Growth Opportunities Portfolio | LASFGO-3 (02/18) |
![]()
LORD ABBETT
ANNUAL REPORT
Lord Abbett
Series Fund—International Equity Portfolio*
For the fiscal year ended December 31, 2017
*Formerly International Core Equity Portfolio
Table of Contents
Lord Abbett Series Fund — International Equity Portfolio
Annual Report
For the fiscal year ended December 31, 2017

From left to right: James L.L. Tullis, Independent Chairman of the Lord Abbett Funds and Daria L. Foster, Director, President, and Chief Executive Officer of the Lord Abbett Funds.
Dear Shareholders: We are pleased to provide you with this overview of the performance of Lord Abbett Series Fund — International Equity Portfolio for the fiscal year ended December 31, 2017. On this page and the following pages, we discuss the major factors that influenced fiscal year performance. For additional information about the Fund, please visit our website at www.lordabbett.com, where you also can access the quarterly commentaries that provide updates on the Fund’s performance and other portfolio related updates.
Thank you for investing in Lord Abbett mutual funds. We value the trust that you place in us and look forward to serving your investment needs in the years to come.
Best regards,

Daria L. Foster
Director, President and Chief Executive Officer
For the fiscal year ended December 31, 2017, the Fund returned 25.67%, reflecting performance at the net asset value (NAV) of Class VC Shares, with all distributions reinvested, compared to its benchmark, the MSCI ACWI ex-USA® Index — Net Dividends1, which returned 27.19% over the same period.
Over the period, global equity markets experienced significant positive performance, as most central banks remained accommodative, interest rates remained low, unemployment steadily declined, corporate earnings grew, and
global economic growth accelerated. Overall, European markets (as measured by the EURO STOXX 50® Index2) rose roughly 25.3% in U.S. dollars for the period, while Japan’s Nikkei 2253 rose 21.33% in U.S. dollars.
At its March 2017 meeting, the Federal Reserve (Fed) raised interest rates for the third time since the financial crisis to a range of 0.75% – 1.00%, after indicating that the “stance of monetary policy remains accommodative, thereby supporting some further strengthening in labor market conditions and sustained return to 2 percent inflation”. The Fed
1
continued with 0.25% rate hikes at its June and December meetings, bringing the fed funds rate to a range between 1.25% -1.50% and forecasted three additional rate increases in both 2018 and 2019. Additionally, the Fed indicated that in October of 2017 it would begin its much anticipated balance sheet normalization process by selling assets it had purchased as part of its quantitative easing program. Meanwhile, other central banks have continued their accommodative policies. The European Central Bank (ECB) kept its benchmark rate unchanged at 0%, since March 2016, and at its October 2017 meeting, the ECB extended its asset purchase program at a monthly pace of €30 billion until the end of September 2018 “or beyond, if necessary”, from a previous rate of €60 billion a month. The Bank of Japan (BoJ) also maintained its stimulative monetary policy at its December 2017 meeting as short term interest rates remained unchanged, at -0.1%, and the bank kept its 10-year government bond yield target at around 0%, amid a more upbeat view on private consumption and capital expenditure.
The election of Donald Trump as U.S. President in November 2016 coincided with the start of rising equity markets, as Trump’s “America First” policy focused on lower taxes, lower regulation, “smart trade” policy, and less government spending, fueling global growth optimism. Unemployment steadily declined in most developed countries, falling to a nine year
low of 8.7% in the Euro area, 4.1% in the United States, 2.7% in Japan, and 3.95% in China, all multiyear lows. GDP growth has remained positive in most developed countries, while inflation remained subdued, allowing central banks to continue their stimulative monetary policies with global stock markets as the beneficiaries. At the end of the year, the United States passed its much anticipated tax reform, lowering the corporate tax rate to 21%, reducing the tax on accumulated overseas earnings, and altering the individual tax brackets, among other changes. This reform is broadly expected to benefit corporations going forward.
Although volatility, as measured by the VIX index, has remained near all-time low levels for most of the year, sources of tension throughout the year have come from nuclear threats from North Korea, continued turmoil in the middle east, populist and independence forces in Europe, and remaining uncertainty regarding “Brexit”.
During the period, the Fund’s underperformance relative to the benchmark was driven by stock selection, and sector weights, particularly within the consumer staples and information technology sectors. Within the consumer staples sector, an underweight position in Diageo Plc detracted from relative performance. Shares of the British alcoholic beverage producer and distributor rose as the company reported accelerating organic growth during the
2
year and strong sales in most regions. Additionally, shares of Jbs Sa also detracted from relative performance. The Brazilian meat processor company’s shares declined after the company was involved in a Brazilian political bribery scandal.
An underweight to the information technology sector also detracted from relative performance. The sector had the strongest performance in the index over the year as technology stocks led markets higher with generally strong balance sheets, large free cash flows, and the belief that they would benefit from expected tax changes on overseas earnings.
Conversely, stock selection within the utilities and industrials sectors contributed to relative performance over the period. Within the utilities sector, shares of Enel S.p.A. contributed to relative performance. Shares of the multinational power company rose as it signaled that it was adding new renewal power generation
capacity at a higher rate, which would lead to higher earnings growth in the future. RWE AG, a German electricity generator, distributor, and trader, also contributed to relative performance. The company benefited as it reported earnings that suggested that full year adjusted net income would be at the top end of the previous guidance range and that net debt was lower than market expectations.
Within the industrials sector, shares of Vinci S.a. a French construction and engineering firm, contributed to performance. The company has continued to benefit from its strong position in the European road and airport segments and good visibility on future growth drivers.
The Fund’s portfolio is actively managed and, therefore, its holdings and the weightings of a particular issuer or particular sector as a percentage of portfolio assets are subject to change. Sectors may include many industries.
1 The Morgan Stanley Capital International (MSCI) All Country World Index (ACWI) ex-USA® Index is a subset of the MSCI ACWI ex-USA® Index. The MSCI ACWI ex-USA® Index is a free float adjusted market capitalization weighted index that is designed to measure the equity market performance of developed and emerging markets. The MSCI ACWI ex-USA® Index with Gross Dividends approximates the maximum possible dividend reinvestment. The amount reinvested is the entire dividend distributed to individuals resident in the country of the company, but does not include tax credits. The MSCI ACWI ex-USA® Index with Net Dividends approximates the minimum possible dividend reinvestment. The dividend is reinvested after deduction of withholding tax, applying the rate to non-resident individuals who do not benefit from double taxation treaties. MSCI ACWI ex-USA® uses withholding tax rates applicable to Luxembourg holding companies, as Luxembourg applies the highest rates.
2 The EURO STOXX 50® Index represents the performance of the 50 largest companies among the 19 supersectors in terms of free-float market cap in 12 eurozone countries. These countries include Austria, Belgium, Finland, France, Germany, Greece, Ireland, Italy, Luxembourg, the Netherlands, Portugal and Spain. The index has a fixed number of components and is part of the STOXX blue-chip index family. The index captures about 60% of the free-float market cap of the EURO STOXX Total Market Index (TMI).
3 The Nikkei Stock Average, the Nikkei 225 is used around the globe as the premier index of Japanese stocks. Because of the prominent nature of the index, many financial products linked to the Nikkei 225 have been created are traded worldwide while the index has been sufficiently used as the indicator of the movement of Japanese stock markets. The Nikkei 225
3
is a price-weighted equity index, which consists of 225 stocks in the 1st section of the Tokyo Stock Exchange.
Unless otherwise specified, indexes reflect total return, with all dividends reinvested. Indexes are unmanaged, do not reflect the deduction of fees or expenses, and are not available for direct investment.
Important Performance and Other Information
Performance data quoted in the following pages reflect past performance and are no guarantee of future results. Current performance may be higher or lower than the performance quoted. The investment return and principal value of an investment in the Fund will fluctuate so that shares, on any given day or when redeemed, may be worth more or less than their original cost. You can obtain performance data current to the most recent month end by calling Lord Abbett at 888-522-2388 or referring to www.lordabbett.com.
During certain periods shown, expense waivers and reimbursements were in place. Without such expense waivers and reimbursements, the Fund’s returns would have been lower.
The annual commentary above discusses the views of the Fund’s management and various portfolio holdings of the Fund as of December 31, 2017. These views and portfolio holdings may have changed after this date. Information provided in the commentary is not a recommendation to buy or sell securities. Because the Fund’s portfolio is actively managed and may change significantly, the Fund may no longer own the securities described above or may have otherwise changed its position in the securities. For more recent information about the Fund’s portfolio holdings, please visit www.lordabbett.com.
A Note about Risk: See Notes to Financial Statements for a discussion of investment risks. For a more detailed discussion of the risks associated with the Fund, please see the Fund’s prospectus.
Mutual funds are not insured by the FDIC, are not deposits or other obligations of, or guaranteed by, banks, and are subject to investment risks including possible loss of principal amount invested.
The Fund serves as an underlying investment vehicle for variable annuity contracts and variable life insurance policies.
4
Below is a comparison of a $10,000 investment in Class VC shares with the same investment in the Morgan Stanley Capital International (MSCI) All Country World Index (ACWI) ex-USA® Index with Gross Dividends, the MSCI ACWI ex-USA® Index with Net Dividends, the MSCI Europe, Australasia, Far East® Index (MSCI EAFE® Index) with Gross Dividends and the MSCI EAFE® Index with Net Dividends, assuming reinvestment of all dividends and distributions. The Fund has adopted the MSCI ACWI ex-USA® Index as its primary benchmark index and therefore will remove the MSCI EAFE® Index from its next annual report. The Fund believes that the MSCI ACWI ex-USA® Index more closely reflects the Fund’s investment strategies than the MSCI EAFE® Index. The Fund’s shares are sold only to insurance company separate accounts that fund certain variable annuity and variable life contracts. This line graph comparison does not reflect the sales charges or other expenses of these contracts. If those sales charges and expenses were reflected, returns would be lower. The graph and performance table below do not reflect the deduction of taxes that a shareholder would pay on Fund distributions or the redemption of Fund shares. During the period, expenses of the Fund were waived or reimbursed by Lord Abbett; without such waiver or reimbursement of expenses, the Fund’s returns would have been lower. Past performance is no guarantee of future results.

Average Annual Total Returns for the
Period Ended December 31, 2017
| 1 Year | 5 Years | Life of Class | ||||
| Class VC2 | 25.67% | 6.22% | 4.98% |
1 Performance for each unmanaged index does not reflect any fees or expenses. The performance of each index is not necessarily representative of the Fund’s performance. Performance for each index began on May 1, 2010.
2 The Class VC shares commenced operations on April 16, 2010. Performance for the Class began on May 1, 2010.
5
As a shareholder of the Fund, you incur ongoing costs, including management fees; expenses related to the Fund’s services arrangements with certain insurance companies; and other Fund expenses. This Example is intended to help you understand your ongoing costs (in dollars) of investing in the Fund and to compare these costs with the ongoing costs of investing in other mutual funds.
The Example is based on an investment of $1,000 invested at the beginning of the period and held for the entire period (July 1, 2017 through December 31, 2017).
The Example reflects only expenses that are deducted from the assets of the Fund. Fees and expenses, including sales charges applicable to the various insurance products that invest in the Fund, are not reflected in this Example. If such fees and expenses were reflected in the Example, the total expenses shown would be higher. Fees and expenses regarding such variable insurance products are separately described in the prospectus related to those products.
Actual Expenses
The first line of the table on the following page provides information about actual account values and actual expenses. You may use the information in this line, together with the amount you invested, to estimate the expenses that you paid over the period. Simply divide your account value by $1,000 (for example, an $8,600 account value divided by $1,000 = 8.6), then multiply the result by the number in the first line under the heading titled “Expenses Paid During Period 7/1/17 – 12/31/17” to estimate the expenses you paid on your account during this period.
Hypothetical Example for Comparison Purposes
The second line of the table on the following page provides information about hypothetical account values and hypothetical expenses based on the Fund’s actual expense ratio and an assumed rate of return of 5% per year before expenses, which is not the Fund’s actual return. The hypothetical account values and expenses may not be used to estimate the actual ending account balance or expenses you paid for the period. You may use this information to compare the ongoing costs of investing in the Fund and other funds. To do so, compare this 5% hypothetical example with the 5% hypothetical examples that appear in the shareholder reports of the other funds.
6
Please note that the expenses shown in the table are meant to highlight your ongoing costs only and do not reflect any transactional costs, such as sales charges. Therefore, the second line of the table is useful in comparing ongoing costs only, and will not help you determine the relative total costs of owning different funds. In addition, if these transactional costs were included, your costs would have been higher.
| Beginning Account Value | Ending Account Value | Expenses Paid During Period† | |||||
| 7/1/17 | 12/31/17 | 7/1/17 - 12/31/17 | |||||
| Class VC | |||||||
| Actual | $1,000.00 | $1,128.20 | $4.67 | ||||
| Hypothetical (5% Return Before Expenses) | $1,000.00 | $1,020.82 | $4.43 |
| † | Net expenses are equal to the Fund’s annualized expense ratio of 0.87%, multiplied by the average account value over the period, multiplied by 184/365 (to reflect one-half year period). |
Portfolio Holdings Presented by Sector
December 31, 2017
| Sector* | %** | |
| Consumer Discretionary | 13.47 | % |
| Consumer Staples | 8.35 | % |
| Energy | 4.31 | % |
| Financials | 24.88 | % |
| Health Care | 5.67 | % |
| Industrials | 16.32 | % |
| Information Technology | 12.54 | % |
| Materials | 7.15 | % |
| Real Estate | 2.50 | % |
| Telecommunication Services | 2.70 | % |
| Utilities | 1.56 | % |
| Repurchase Agreement | 0.55 | % |
| Total | 100.00 | % |
| * | A sector may comprise several industries. | |
| ** | Represents percent of total investments. |
7
December 31, 2017
| U.S. $ | ||||||||
| Fair Value | ||||||||
| Investments | Shares | (000) | ||||||
| COMMON STOCKS 97.36% | ||||||||
| Australia 1.42% | ||||||||
| Beverages 0.61% | ||||||||
| Treasury Wine Estates Ltd. | 32,817 | $ | 407 | |||||
| Metals & Mining 0.81% | ||||||||
| BHP Billiton Ltd. | 23,689 | 544 | ||||||
| Total Australia | 951 | |||||||
| Austria 1.03% | ||||||||
| Banks | ||||||||
| Erste Group Bank AG* | 15,930 | 690 | ||||||
| Belgium 0.90% | ||||||||
| Beverages | ||||||||
| Anheuser-Busch InBev SA | 5,402 | 603 | ||||||
| Canada 0.72% | ||||||||
| Oil, Gas & Consumable Fuels | ||||||||
| Seven Generations Energy Ltd. Class A* | 11,600 | 164 | ||||||
| Whitecap Resources, Inc. | 44,300 | 315 | ||||||
| Total Canada | 479 | |||||||
| China 2.86% | ||||||||
| Insurance 0.49% | ||||||||
| Ping An Insurance Group Co. of China Ltd. Class H | 32,000 | 332 | ||||||
| Internet Software & Services 2.37% | ||||||||
| Alibaba Group Holding Ltd. ADR* | 3,800 | 655 | ||||||
| China Literature Ltd.*† | 9 | – | (a) | |||||
| Tencent Holdings Ltd. | 17,900 | 927 | ||||||
| 1,582 | ||||||||
| Total China | 1,914 | |||||||
| Denmark 2.80% | ||||||||
| Banks 1.25% | ||||||||
| Danske Bank A/S | 21,485 | 836 | ||||||
| U.S. $ | ||||||||
| Fair Value | ||||||||
| Investments | Shares | (000) | ||||||
| Diversified Telecommunication Services 1.01% | ||||||||
| TDC A/S | 110,397 | $ | 678 | |||||
| Pharmaceuticals 0.54% | ||||||||
| Novo Nordisk A/S Class B | 6,654 | 358 | ||||||
| Total Denmark | 1,872 | |||||||
| Finland 0.95% | ||||||||
| Insurance | ||||||||
| Sampo OYJ A Shares | 11,594 | 636 | ||||||
| France 8.42% | ||||||||
| Auto Components 1.28% | ||||||||
| Valeo SA | 11,472 | 855 | ||||||
| Beverages 1.38% | ||||||||
| Remy Cointreau SA | 6,656 | 922 | ||||||
| Construction & Engineering 1.63% | ||||||||
| Vinci SA | 10,701 | 1,092 | ||||||
| Information Technology Services 0.69% | ||||||||
| Atos SE | 3,166 | 460 | ||||||
| Machinery 1.04% | ||||||||
| Alstom SA | 16,683 | 692 | ||||||
| Oil, Gas & Consumable Fuels 0.97% | ||||||||
| Total SA | 11,763 | 649 | ||||||
| Pharmaceuticals 0.43% | ||||||||
| Sanofi | 3,310 | 285 | ||||||
| Textiles, Apparel & Luxury Goods 1.00% | ||||||||
| LVMH Moet Hennessy Louis Vuitton SE | 2,275 | 668 | ||||||
| Total France | 5,623 | |||||||
| Germany 9.64% | ||||||||
| Hotels, Restaurants & Leisure 1.19% | ||||||||
| TUI AG | 38,373 | 795 | ||||||
| Industrial Conglomerates 0.70% | ||||||||
| Rheinmetall AG | 3,668 | 464 | ||||||
| 8 | See Notes to Financial Statements. |
Schedule of Investments (continued)
December 31, 2017
| U.S. $ | ||||||||
| Fair Value | ||||||||
| Investments | Shares | (000) | ||||||
| Germany (continued) | ||||||||
| Insurance 1.52% | ||||||||
| Allianz SE Registered Shares | 4,423 | $ | 1,012 | |||||
| Life Sciences Tools & Services 0.68% | ||||||||
| MorphoSys AG* | 4,992 | 456 | ||||||
| Pharmaceuticals 0.95% | ||||||||
| Bayer AG Registered Shares | 5,097 | 633 | ||||||
| Real Estate Management & Development 2.44% | ||||||||
| Aroundtown SA | 115,486 | 889 | ||||||
| PATRIZIA Immobilien AG* | 32,149 | 744 | ||||||
| 1,633 | ||||||||
| Semiconductors & Semiconductor Equipment 1.18% | ||||||||
| Infineon Technologies AG | 28,933 | 788 | ||||||
| Software 0.98% | ||||||||
| SAP SE | 5,873 | 657 | ||||||
| Total Germany | 6,438 | |||||||
| Hong Kong 3.49% | ||||||||
| Hotels, Restaurants & Leisure 0.53% | ||||||||
| Melco Resorts & Entertainment Ltd. ADR | 12,121 | 352 | ||||||
| Household Durables 1.10% | ||||||||
| Techtronic Industries Co., Ltd. | 113,000 | 735 | ||||||
| Insurance 1.10% | ||||||||
| AIA Group Ltd. | 86,600 | 737 | ||||||
| Paper & Forest Products 0.76% | ||||||||
| Nine Dragons Paper Holdings Ltd. | 316,000 | 505 | ||||||
| Total Hong Kong | 2,329 | |||||||
| India 1.92% | ||||||||
| Banks 1.32% | ||||||||
| ICICI Bank Ltd. ADR | 90,805 | 883 | ||||||
| U.S. $ | ||||||||
| Fair Value | ||||||||
| Investments | Shares | (000) | ||||||
| Information Technology Services 0.60% | ||||||||
| Vakrangee Ltd. | 30,486 | $ | 201 | |||||
| Vakrangee Ltd. | 30,486 | 200 | ||||||
| 401 | ||||||||
| Total India | 1,284 | |||||||
| Indonesia 1.69% | ||||||||
| Banks | ||||||||
| Bank Rakyat Indonesia Persero Tbk PT | 2,720,500 | 730 | ||||||
| Bank Tabungan Negara Persero Tbk PT | 1,511,700 | 398 | ||||||
| Total Indonesia | 1,128 | |||||||
| Ireland 1.10% | ||||||||
| Banks | ||||||||
| AIB Group plc | 56,241 | 371 | ||||||
| Bank of Ireland Group plc* | 42,480 | 362 | ||||||
| Total Ireland | 733 | |||||||
| Israel 0.81% | ||||||||
| Semiconductors & Semiconductor Equipment | ||||||||
| Tower Semiconductor Ltd.* | 15,861 | 540 | ||||||
| Italy 5.41% | ||||||||
| Banks 0.90% | ||||||||
| UniCredit SpA* | 32,064 | 598 | ||||||
| Capital Markets 0.53% | ||||||||
| Anima Holding SpA† | 49,798 | 356 | ||||||
| Consumer Finance 0.72% | ||||||||
| doBank SpA*† | 29,670 | 483 | ||||||
| Electric: Utilities 1.53% | ||||||||
| Enel SpA | 166,397 | 1,023 | ||||||
| Electrical Equipment 1.23% | ||||||||
| Prysmian SpA | 25,143 | 819 | ||||||
| Internet & Direct Marketing Retail 0.50% | ||||||||
| Yoox Net-A-Porter Group SpA* | 9,664 | 337 | ||||||
| Total Italy | 3,616 | |||||||
| See Notes to Financial Statements. | 9 |
Schedule of Investments (continued)
December 31, 2017
| U.S. $ | ||||||||
| Fair Value | ||||||||
| Investments | Shares | (000) | ||||||
| Japan 17.80% | ||||||||
| Automobiles 1.86% | ||||||||
| Honda Motor Co., Ltd. | 36,400 | $ | 1,242 | |||||
| Building Products 1.27% | ||||||||
| Daikin Industries Ltd. | 7,200 | 851 | ||||||
| Chemicals 3.27% | ||||||||
| Asahi Kasei Corp. | 49,735 | 640 | ||||||
| Mitsubishi Chemical Holdings Corp. | 62,100 | 679 | ||||||
| Mitsubishi Gas Chemical Co., Inc. | 30,200 | 865 | ||||||
| 2,184 | ||||||||
| Construction & Engineering 0.45% | ||||||||
| Taisei Corp. | 6,100 | 303 | ||||||
| Distributors 0.82% | ||||||||
| PALTAC Corp. | 12,100 | 551 | ||||||
| Diversified Financial Services 1.20% | ||||||||
| ORIX Corp. | 47,600 | 803 | ||||||
| Household Durables 1.57% | ||||||||
| Sony Corp. | 23,300 | 1,046 | ||||||
| Machinery 3.45% | ||||||||
| DMG Mori Co., Ltd. | 33,700 | 694 | ||||||
| Komatsu Ltd. | 13,000 | 470 | ||||||
| Makino Milling Machine Co., Ltd. | 48,000 | 484 | ||||||
| SMC Corp. | 1,600 | 656 | ||||||
| 2,304 | ||||||||
| Professional Services 0.77% | ||||||||
| Recruit Holdings Co., Ltd. | 20,600 | 512 | ||||||
| Software 0.93% | ||||||||
| Nintendo Co., Ltd. | 1,727 | 622 | ||||||
| Specialty Retail 1.02% | ||||||||
| Bic Camera, Inc. | 47,400 | 683 | ||||||
| U.S. $ | ||||||||
| Fair Value | ||||||||
| Investments | Shares | (000) | ||||||
| Trading Companies & Distributors 1.19% | ||||||||
| Mitsubishi Corp. | 28,730 | $ | 792 | |||||
| Total Japan | 11,893 | |||||||
| Luxembourg 0.57% | ||||||||
| Multi-Line Retail | ||||||||
| B&M European Value Retail SA | 67,322 | 384 | ||||||
| Macau 1.01% | ||||||||
| Hotels, Restaurants & Leisure | ||||||||
| Wynn Macau Ltd. | 213,200 | 674 | ||||||
| Mexico 0.72% | ||||||||
| Banks | ||||||||
| Grupo Financiero Banorte SAB de CV | 87,600 | 480 | ||||||
| Netherlands 4.99% | ||||||||
| Banks 0.97% | ||||||||
| ING Groep NV | 35,285 | 648 | ||||||
| Health Care Equipment & Supplies 1.07% | ||||||||
| Koninklijke Philips NV | 19,008 | 718 | ||||||
| Insurance 1.03% | ||||||||
| ASR Nederland NV | 16,649 | 686 | ||||||
| Oil, Gas & Consumable Fuels 1.43% | ||||||||
| Royal Dutch Shell plc B Shares | 28,430 | 957 | ||||||
| Semiconductors & Semiconductor Equipment 0.49% | ||||||||
| ASML Holding NV | 1,883 | 327 | ||||||
| Total Netherlands | 3,336 | |||||||
| Norway 0.29% | ||||||||
| Banks | ||||||||
| Sparebank 1 Oestlandet* | 17,663 | 195 | ||||||
| 10 | See Notes to Financial Statements. |
Schedule of Investments (continued)
December 31, 2017
| U.S. $ | ||||||||
| Fair Value | ||||||||
| Investments | Shares | (000) | ||||||
| Philippines 1.34% | ||||||||
| Banks | ||||||||
| Metropolitan Bank & Trust Co. | 440,740 | $ | 894 | |||||
| Poland 0.76% | ||||||||
| Banks | ||||||||
| Powszechna Kasa Oszczednosci Bank Polski SA* | 40,077 | 509 | ||||||
| South Africa 1.12% | ||||||||
| Paper & Forest Products | ||||||||
| Mondi plc | 28,785 | 748 | ||||||
| South Korea 3.50% | ||||||||
| Auto Components 0.74% | ||||||||
| Mando Corp. | 1,707 | 492 | ||||||
| Insurance 1.05% | ||||||||
| ING Life Insurance Korea Ltd.† | 14,152 | 706 | ||||||
| Technology Hardware, Storage & Peripherals 1.71% | ||||||||
| Samsung Electronics Co., Ltd. | 481 | 1,143 | ||||||
| Total South Korea | 2,341 | |||||||
| Spain 2.05% | ||||||||
| Banks 0.97% | ||||||||
| Banco Bilbao Vizcaya Argentaria SA | 76,457 | 650 | ||||||
| Oil, Gas & Consumable Fuels 1.08% | ||||||||
| Repsol SA | 40,744 | 719 | ||||||
| Total Spain | 1,369 | |||||||
| Sweden 2.22% | ||||||||
| Commercial Services & Supplies 1.29% | ||||||||
| Loomis AB Class B | 20,550 | 863 | ||||||
| Machinery 0.93% | ||||||||
| Volvo AB B Shares | 33,418 | 623 | ||||||
| Total Sweden | 1,486 | |||||||
| U.S. $ | ||||||||
| Fair Value | ||||||||
| Investments | Shares | (000) | ||||||
| Switzerland 5.00% | ||||||||
| Food Products 1.77% | ||||||||
| Nestle SA Registered Shares | 13,778 | $ | 1,185 | |||||
| Insurance 1.35% | ||||||||
| Swiss Life Holding AG Registered Shares* | 2,550 | 901 | ||||||
| Pharmaceuticals 1.88% | ||||||||
| Novartis AG Registered Shares | 8,042 | 677 | ||||||
| Roche Holding AG | 2,295 | 580 | ||||||
| 1,257 | ||||||||
| Total Switzerland | 3,343 | |||||||
| Taiwan 1.89% | ||||||||
| Semiconductors & Semiconductor Equipment 1.48% | ||||||||
| Advanced Semiconductor Engineering, Inc. | 383,682 | 491 | ||||||
| Taiwan Semiconductor Manufacturing Co., Ltd. ADR | 12,585 | 499 | ||||||
| 990 | ||||||||
| Technology Hardware, Storage & Peripherals 0.41% | ||||||||
| Primax Electronics Ltd. | 103,470 | 274 | ||||||
| Total Taiwan | 1,264 | |||||||
| United Kingdom 9.89% | ||||||||
| Beverages 0.94% | ||||||||
| Coca-Cola European Partners plc | 15,704 | 626 | ||||||
| Insurance 1.03% | ||||||||
| Direct Line Insurance Group plc | 133,128 | 685 | ||||||
| Machinery 1.03% | ||||||||
| Weir Group plc (The) | 23,986 | 688 | ||||||
| Metals & Mining 1.04% | ||||||||
| Rio Tinto plc | 13,308 | 698 | ||||||
| Personal Products 0.99% | ||||||||
| Unilever NV CVA | 11,749 | 661 | ||||||
| See Notes to Financial Statements. | 11 |
Schedule of Investments (continued)
December 31, 2017
| U.S. $ | ||||||||
| Fair Value | ||||||||
| Investments | Shares | (000) | ||||||
| United Kingdom (continued) | ||||||||
| Professional Services 1.01% | ||||||||
| RELX NV | 29,400 | $ | 676 | |||||
| Semiconductors & Semiconductor Equipment 0.63% | ||||||||
| IQE plc* | 228,643 | 423 | ||||||
| Tobacco 1.59% | ||||||||
| British American Tobacco plc | 15,726 | 1,063 | ||||||
| Wireless Telecommunication Services 1.63% | ||||||||
| Vodafone Group plc | 343,768 | 1,087 | ||||||
| Total United Kingdom | 6,607 | |||||||
| United States 1.05% | ||||||||
| Insurance | ||||||||
| Hiscox Ltd. | 35,419 | 700 | ||||||
| Total Common Stocks (cost $56,359,460) | 65,059 | |||||||
| RIGHTS 0.03% | ||||||||
| Spain | ||||||||
| Oil, Gas & Consumable Fuels | ||||||||
| Repsol SA* (cost $18,582) | 40,744 | 19 | ||||||
| Principal | U.S. $ | |||||||
| Amount | Fair Value | |||||||
| Investments | (000) | (000) | ||||||
| SHORT-TERM INVESTMENT 0.54% | ||||||||
| Repurchase Agreement | ||||||||
| Repurchase Agreement dated 12/29/2017, 0.54% due 1/2/2018 with Fixed Income Clearing Corp. collateralized by $355,000 of U.S. Treasury Note at 3.625% due 2/15/2020; value: $372,412; proceeds: $361,218 (cost $361,197) | $ | 361 | $ | 361 | ||||
| Total Investments in Securities 97.93% (cost $56,739,239) | 65,439 | |||||||
| Foreign Cash and Other Assets in Excess of Liabilities 2.07% | 1,383 | |||||||
| Net Assets 100.00% | $ | 66,822 | ||||||
| ADR | American Depositary Receipt. | |
| CVA | Company Voluntary Arrangement. | |
| * | Non-income producing security. | |
| † | Security was purchased pursuant to Rule 144A under the Securities Act of 1933 and, unless registered under such Act or exempted from registration, may only be resold to qualified institutional buyers. | |
| (a) | Amount is less than $1,000. |
| 12 | See Notes to Financial Statements. |
Schedule of Investments (concluded)
December 31, 2017
The following is a summary of the inputs used as of December 31, 2017 in valuing the Fund’s investments carried at fair value(1):
| Level 1 | Level 2 | Level 3 | Total | ||||||||||||
| Investment Type(2) | (000) | (000) | (000) | (000) | |||||||||||
| Common Stocks | |||||||||||||||
| Australia | $ | – | $ | 951 | $ | – | $ | 951 | |||||||
| Austria(3) | – | 690 | – | 690 | |||||||||||
| Belgium(3) | – | 603 | – | 603 | |||||||||||
| Canada | 479 | – | – | 479 | |||||||||||
| China | 655 | 1,259 | – | 1,914 | |||||||||||
| Denmark(3) | 678 | 1,194 | – | 1,872 | |||||||||||
| Finland | – | 636 | – | 636 | |||||||||||
| France(3) | – | 5,623 | – | 5,623 | |||||||||||
| Germany(3) | 889 | 5,549 | – | 6,438 | |||||||||||
| Hong Kong | 352 | 1,977 | – | 2,329 | |||||||||||
| India | 1,084 | 200 | – | 1,284 | |||||||||||
| Indonesia | 1,128 | – | – | 1,128 | |||||||||||
| Ireland | 733 | – | – | 733 | |||||||||||
| Israel | 540 | – | – | 540 | |||||||||||
| Italy(3) | 483 | 3,133 | – | 3,616 | |||||||||||
| Japan(3) | – | 11,893 | – | 11,893 | |||||||||||
| Luxembourg | – | 384 | – | 384 | |||||||||||
| Macau | – | 674 | – | 674 | |||||||||||
| Mexico | 480 | – | – | 480 | |||||||||||
| Netherlands(3) | – | 3,336 | – | 3,336 | |||||||||||
| Norway | 195 | – | – | 195 | |||||||||||
| Philippines | – | 894 | – | 894 | |||||||||||
| Poland | – | 509 | – | 509 | |||||||||||
| South Africa | – | 748 | – | 748 | |||||||||||
| South Korea(3) | 706 | 1,635 | – | 2,341 | |||||||||||
| Spain(3) | – | 1,369 | – | 1,369 | |||||||||||
| Sweden(3) | 863 | 623 | – | 1,486 | |||||||||||
| Switzerland(3) | – | 3,343 | – | 3,343 | |||||||||||
| Taiwan | 499 | 765 | – | 1,264 | |||||||||||
| United Kingdom(3) | 1,111 | 5,496 | – | 6,607 | |||||||||||
| United States | 700 | – | – | 700 | |||||||||||
| Right | 19 | – | – | 19 | |||||||||||
| Repurchase Agreement | – | 361 | – | 361 | |||||||||||
| Total | $ | 11,594 | $ | 53,845 | $ | – | $ | 65,439 | |||||||
| (1) | Refer to Note 2(i) for a description of fair value measurements and the three-tier hierarchy of inputs. | |
| (2) | See Schedule of Investments for fair values in each industry and identification of foreign issuers and/or geography. The table above is presented by Investment Type. Industries are presented within an Investment Type should such Investment Type include securities classified as two or more levels within the three-tier fair value hierarchy. | |
| (3) | Securities in the amount of $24,910,118 were transferred from Level 1 to Level 2 during the fiscal year ended December 31, 2017, due to a change in valuation technique. As of December 31, 2017, the Fund utilized adjusted valuations (as described in Note 2(a)), which resulted in Level 2 inputs. As of December 31, 2016, the Fund utilized the last sale or official closing price on the exchange or system on which the securities are principally traded, which resulted in Level 1 inputs. |
| See Notes to Financial Statements. | 13 |
Statement of Assets and Liabilities
December 31, 2017
| ASSETS: | ||||
| Investments in securities, at fair value (cost $56,739,239) | $ | 65,438,537 | ||
| Foreign cash, at value (cost $1,652,484) | 1,678,880 | |||
| Receivables: | ||||
| Interest and dividends | 152,395 | |||
| From advisor (See Note 3) | 37,246 | |||
| Prepaid expenses | 318 | |||
| Total assets | 67,307,376 | |||
| LIABILITIES: | ||||
| Payables: | ||||
| Investment securities purchased | 304,239 | |||
| Management fee | 42,112 | |||
| Directors’ fees | 5,360 | |||
| Fund administration | 2,246 | |||
| Accrued expenses | 131,444 | |||
| Total liabilities | 485,401 | |||
| NET ASSETS | $ | 66,821,975 | ||
| COMPOSITION OF NET ASSETS: | ||||
| Paid-in capital | $ | 61,101,956 | ||
| Distributions in excess of net investment income | (113,574 | ) | ||
| Accumulated net realized loss on investments and foreign currency related transactions | (2,895,580 | ) | ||
| Net unrealized appreciation on investments and translation of assets and liabilities denominated in foreign currencies | 8,729,173 | |||
| Net Assets | $ | 66,821,975 | ||
| Outstanding shares (50 million shares of common stock authorized, $.001 par value) | 3,672,449 | |||
| Net asset value, offering and redemption price per share (Net assets divided by outstanding shares) | $18.20 |
| 14 | See Notes to Financial Statements. |
For the Year Ended December 31, 2017
| Investment income: | ||||
| Dividends (net of foreign withholding taxes of $171,042) | $ | 1,579,430 | ||
| Interest | 240 | |||
| Total investment income | 1,579,670 | |||
| Expenses: | ||||
| Management fee | 475,997 | |||
| Non 12b-1 service fees | 158,758 | |||
| Custody | 68,844 | |||
| Shareholder servicing | 68,117 | |||
| Professional | 58,474 | |||
| Fund administration | 25,387 | |||
| Reports to shareholders | 24,878 | |||
| Directors’ fees | 1,762 | |||
| Other | 11,666 | |||
| Gross expenses | 893,883 | |||
| Expense reductions (See Note 8) | (579 | ) | ||
| Fees waived and expenses reimbursed (See Note 3) | (341,148 | ) | ||
| Net expenses | 552,156 | |||
| Net investment income | 1,027,514 | |||
| Net realized and unrealized gain (loss): | ||||
| Net realized gain on investments (net of foreign capital gains tax of $16,514) | 6,199,403 | |||
| Net realized loss on foreign currency related transactions | (20,318 | ) | ||
| Net change in unrealized appreciation/depreciation on investments | 7,188,771 | |||
| Net change in unrealized appreciation/depreciation on translation of assets and liabilities denominated in foreign currencies | 34,602 | |||
| Net realized and unrealized gain | 13,402,458 | |||
| Net Increase in Net Assets Resulting From Operations | $ | 14,429,972 |
| See Notes to Financial Statements. | 15 |
Statements of Changes in Net Assets
| For the Year Ended | For the Year Ended | |||||||
| INCREASE (DECREASE) IN NET ASSETS | December 31, 2017 | December 31, 2016 | ||||||
| Operations: | ||||||||
| Net investment income | $ | 1,027,514 | $ | 1,416,990 | ||||
| Net realized gain (loss) on investments and foreign currency related transactions | 6,179,085 | (4,234,373 | ) | |||||
| Net change in unrealized appreciation/depreciation on investments and translation of assets and liabilities denominated in foreign currencies | 7,223,373 | 1,851,263 | ||||||
| Net increase (decrease) in net assets resulting from operations | 14,429,972 | (966,120 | ) | |||||
| Distributions to shareholders from: | ||||||||
| Net investment income | (1,203,254 | ) | (1,555,460 | ) | ||||
| Capital share transactions (See Note 13): | ||||||||
| Proceeds from sales of shares | 1,733,223 | 3,545,976 | ||||||
| Reinvestment of distributions | 1,203,254 | 1,555,460 | ||||||
| Cost of shares reacquired | (8,370,323 | ) | (3,775,290 | ) | ||||
| Net increase (decrease) in net assets resulting from capital share transactions | (5,433,846 | ) | 1,326,146 | |||||
| Net increase (decrease) in net assets | 7,792,872 | (1,195,434 | ) | |||||
| NET ASSETS: | ||||||||
| Beginning of year | $ | 59,029,103 | $ | 60,224,537 | ||||
| End of year | $ | 66,821,975 | $ | 59,029,103 | ||||
| Distributions in excess of net investment income | $ | (113,574 | ) | $ | (52,131 | ) | ||
| 16 | See Notes to Financial Statements. |
This page is intentionally left blank.
17
| Per Share Operating Performance: | ||||||||||||||||||||||||||||
| Distributions to | ||||||||||||||||||||||||||||
| Investment operations: | shareholders from: | |||||||||||||||||||||||||||
| Total | ||||||||||||||||||||||||||||
| Net | from | |||||||||||||||||||||||||||
| Net asset | Net | realized | invest- | |||||||||||||||||||||||||
| value, | invest- | and | ment | Net | Net | Return | ||||||||||||||||||||||
| beginning | ment | unrealized | opera- | investment | realized | of | ||||||||||||||||||||||
| of period | income(a) | gain (loss) | tions | income | gain | capital | ||||||||||||||||||||||
| 12/31/2017 | $14.75 | $0.27 | $ 3.51 | $ 3.78 | $(0.33 | ) | $ – | $ – | ||||||||||||||||||||
| 12/31/2016 | 15.42 | 0.36 | (0.63 | ) | (0.27 | ) | (0.40 | ) | – | – | ||||||||||||||||||
| 12/31/2015 | 15.95 | 0.30 | (0.59 | ) | (0.29 | ) | (0.23 | ) | – | (0.01 | ) | |||||||||||||||||
| 12/31/2014 | 18.38 | 0.26 | (1.99 | ) | (1.73 | ) | (0.18 | ) | (0.52 | ) | – | |||||||||||||||||
| 12/31/2013 | 15.31 | 0.22 | 3.32 | 3.54 | (0.24 | ) | (0.23 | ) | – | |||||||||||||||||||
| (a) | Calculated using average shares outstanding during the period. |
| (b) | Total return does not consider the effects of sales charges or other expenses imposed by an insurance company and assumes the reinvestment of all distributions. |
| 18 | See Notes to Financial Statements. |
| Ratios to Average Net Assets: | Supplemental Data: | |||||||||||||||||||||||||||||
| Total expenses | ||||||||||||||||||||||||||||||
| Net | after | Net | ||||||||||||||||||||||||||||
| asset | waivers | Net | assets, | Portfolio | ||||||||||||||||||||||||||
| Total | value, | Total | and/or reim- | Total | investment | end of | turnover | |||||||||||||||||||||||
| distri- | end of | return(b) | bursements | expenses | income | period | rate | |||||||||||||||||||||||
| butions | period | (%) | (%) | (%) | (%) | (000) | (%) | |||||||||||||||||||||||
| $(0.33 | ) | $18.20 | 25.67 | 0.87 | 1.41 | 1.62 | $66,822 | 137 | ||||||||||||||||||||||
| (0.40 | ) | 14.75 | (1.74 | ) | 0.87 | 1.39 | 2.43 | 59,029 | 190 | |||||||||||||||||||||
| (0.24 | ) | 15.42 | (1.78 | ) | 0.87 | 1.43 | 1.84 | 60,225 | 60 | |||||||||||||||||||||
| (0.70 | ) | 15.95 | (9.47 | ) | 0.87 | 1.59 | 1.49 | 52,629 | 58 | |||||||||||||||||||||
| (0.47 | ) | 18.38 | 23.16 | 0.87 | 2.02 | 1.31 | 31,923 | 56 | ||||||||||||||||||||||
| See Notes to Financial Statements. | 19 |
| 1. | ORGANIZATION |
Lord Abbett Series Fund, Inc. (the “Company”) is registered under the Investment Company Act of 1940, as amended (“the Act”), as a diversified, open-end management investment company and was incorporated under Maryland law in 1989. The Company consists of twelve separate portfolios. This report covers International Equity Portfolio (the “Fund”). Effective October 31, 2017, International Core Equity Portfolio changed its name to International Equity Portfolio.
The Fund’s investment objective is to seek long-term capital appreciation. The Fund has Variable Contract class shares (“Class VC Shares”), which are currently issued and redeemed only in connection with investments in, and payments under, variable annuity contracts and variable life insurance policies issued by life insurance and insurance-related companies.
The preparation of the financial statements in conformity with accounting principles generally accepted in the United States of America (“U.S. GAAP”) requires management to make certain estimates and assumptions that affect the reported amounts of assets and liabilities and disclosure of contingent assets and liabilities at the date of the financial statements and the reported amounts of increases and decreases in net assets from operations during the reporting period. Actual results could differ from those estimates. The Fund is considered an investment company under U.S. GAAP and follows the accounting and reporting guidance applicable to investment companies.
| 2. | SIGNIFICANT ACCOUNTING POLICIES |
| (a) | Investment Valuation–Under procedures approved by the Fund’s Board of Directors (the “Board”), Lord, Abbett & Co. LLC (“Lord Abbett”), the Fund’s investment manager, has formed a Pricing Committee to administer the pricing and valuation of portfolio investments and to ensure that prices utilized reasonably reflect fair value. Among other things, these procedures allow the Fund to utilize independent pricing services, quotations from securities and financial instrument dealers and other market sources to determine fair value. |
| Securities actively traded on any recognized U.S. or non-U.S. exchange or on The NASDAQ Stock Market LLC are valued at the last sale price or official closing price on the exchange or system on which they are principally traded. Events occurring after the close of trading on non-U.S. exchanges may result in adjustments to the valuation of foreign securities to reflect their fair value as of the close of regular trading on the New York Stock Exchange. The Fund may utilize an independent fair valuation service in adjusting the valuations of foreign securities. Unlisted equity securities are valued at the last quoted sale price or, if no sale price is available, at the mean between the most recently quoted bid and asked prices. Exchange traded options and futures contracts are valued at the last sale price in the market where they are principally traded. If no sale has occurred, the mean between the most recently quoted bid and asked prices is used. | |
| Securities for which prices are not readily available are valued at fair value as determined by the Pricing Committee. The Pricing Committee considers a number of factors, including observable and unobservable inputs, when arriving at fair value. The Pricing Committee may use related or comparable assets or liabilities, recent transactions, market multiples, book values and other relevant information to determine the fair value of portfolio investments. The Board or a designated committee thereof regularly reviews fair value determinations made by the Pricing Committee and may employ techniques such as reviewing related market activity, |
20
Notes to Financial Statements (continued)
| reviewing inputs and assumptions, and retrospectively comparing prices of subsequent purchases and sales transactions to fair value determinations made by the Pricing Committee. | |
| Short-term securities with 60 days or less remaining to maturity are valued using the amortized cost method, which approximates fair value. | |
| (b) | Security Transactions–Security transactions are recorded as of the date that the securities are purchased or sold (trade date). Realized gains and losses on sales of portfolio securities are calculated using the identified-cost method. |
| (c) | Investment Income–Dividend income is recorded on the ex-dividend date. Interest income is recorded on the accrual basis as earned. Discounts are accreted and premiums are amortized using the effective interest method and are included in Interest and other income on the Statement of Operations. Withholding taxes on foreign dividends have been provided for in accordance with the applicable country’s tax rules and rates. |
| (d) | Income Taxes–It is the policy of the Fund to meet the requirements of Subchapter M of the Internal Revenue Code applicable to regulated investment companies and to distribute substantially all taxable income and capital gains to its shareholders. Therefore, no income tax provision is required. |
| The Fund files U.S. federal and various state and local tax returns. No income tax returns are currently under examination. The statute of limitations on the Fund’s filed U.S. federal tax returns remains open for the fiscal years ended December 31, 2014 through December 31, 2017. The statutes of limitations on the Company’s state and local tax returns may remain open for an additional year depending upon the jurisdiction. | |
| (e) | Expenses–Expenses incurred by the Company that do not specifically relate to an individual fund are generally allocated to the funds within the Company on a pro rata basis by relative net assets. |
| (f) | Foreign Transactions–The books and records of the Fund are maintained in U.S. dollars and transactions denominated in foreign currencies are recorded in the Fund’s records at the rate prevailing when earned or recorded. Asset and liability accounts that are denominated in foreign currencies are adjusted daily to reflect current exchange rates and any unrealized gain (loss) is included in Net change in unrealized appreciation/depreciation on translation of assets and liabilities denominated in foreign currencies in the Fund’s Statement of Operations. The resultant exchange gains and losses upon settlement of such transactions are included in Net realized loss on foreign currency related transactions in the Fund’s Statement of Operations. The Fund does not isolate that portion of the results of operations arising as a result of changes in the foreign exchange rates from the changes in market prices of the securities. |
| The Fund uses foreign currency exchange contracts to facilitate transactions in foreign-denominated securities. Losses from these transactions may arise from changes in the value of the foreign currency or if the counterparties do not perform under the contracts’ terms. | |
| (g) | Forward Foreign Currency Exchange Contracts–The Fund may enter into forward foreign currency exchange contracts in order to reduce their exposure to changes in foreign currency exchange rates on their foreign portfolio holdings, or gain or reduce exposure to foreign currency solely for investment purposes. A forward foreign currency exchange contract is a commitment to purchase or sell a foreign currency at a future date at a negotiated rate. The contracts are valued daily at forward exchange rates and any unrealized gain (loss) is included |
21
Notes to Financial Statements (continued)
| in Net change in unrealized appreciation/depreciation on translation of assets and liabilities denominated in foreign currencies in the Fund’s Statement of Operations. The gain (loss) arising from the difference between the U.S. dollar cost of the original contract and the value of the foreign currency in U.S. dollars upon closing of such contracts is included in Net realized loss on foreign currency related transactions in the Fund’s Statement of Operations. | |
| (h) | Repurchase Agreements–The Fund may enter into repurchase agreements with respect to securities. A repurchase agreement is a transaction in which a fund acquires a security and simultaneously commits to resell that security to the seller (a bank or securities dealer) at an agreed-upon price on an agreed-upon date. The Fund requires at all times that the repurchase agreement be collateralized by cash, or by securities of the U.S. Government, its agencies, its instrumentalities, or U.S. Government sponsored enterprises having a value equal to, or in excess of, the value of the repurchase agreement (including accrued interest). If the seller of the agreement defaults on its obligation to repurchase the underlying securities at a time when the fair value of these securities has declined, the Fund may incur a loss upon disposition of the securities. |
| (i) | Fair Value Measurements–Fair value is defined as the price that the Fund would receive upon selling an investment or transferring a liability in an orderly transaction to an independent buyer in the principal or most advantageous market of the investment. A three-tier hierarchy is used to maximize the use of observable market data and minimize the use of unobservable inputs and to establish classification of fair value measurements for disclosure purposes. Inputs refer broadly to the assumptions that market participants would use in pricing the asset or liability, including assumptions about risk—for example, the risk inherent in a particular valuation technique used to measure fair value (such as a pricing model) and/or the risk inherent in the inputs to the valuation technique. Inputs may be observable or unobservable. Observable inputs reflect the assumptions market participants would use in pricing the asset or liability. Observable inputs are based on market data obtained from sources independent of the reporting entity. Unobservable inputs reflect the reporting entity’s own assumptions about the assumptions market participants would use in pricing the asset or liability. Unobservable inputs are based on the best information available in the circumstances. The three-tier hierarchy classification is determined based on the lowest level of inputs that is significant to the fair value measurement, and is summarized in the three broad Levels listed below: |
| • | Level 1 – unadjusted quoted prices in active markets for identical investments; | ||
| • | Level 2 – other significant observable inputs (including quoted prices for similar investments, interest rates, prepayment speeds, credit risk, etc.); and | ||
| • | Level 3 – significant unobservable inputs (including the Fund’s own assumptions in determining the fair value of investments). | ||
A summary of inputs used in valuing the Fund’s investments as of December 31, 2017 and, if applicable, Level 1/Level 2 transfers and Level 3 rollforwards for the fiscal year then ended is included in the Fund’s Schedule of Investments.
Changes in valuation techniques may result in transfers into or out of an assigned level within the three-tier hierarchy. All transfers between different levels within the three-tier hierarchy are deemed to have occurred as of the beginning of the reporting period. The inputs or methodology used for valuing securities are not necessarily an indication of the risk associated with investing in those securities.
22
Notes to Financial Statements (continued)
| 3. | MANAGEMENT FEE AND OTHER TRANSACTIONS WITH AFFILIATES |
Management Fee
The Company has a management agreement with Lord Abbett, pursuant to which Lord Abbett supplies the Fund with investment management services and executive and other personnel, provides office space and pays for ordinary and necessary office and clerical expenses relating to research and statistical work and supervision of the Fund’s investment portfolio.
The management fee is based on the Fund’s average daily net assets at the following annual rate:
| First $1 billion | .75% |
| Next $1 billion | .70% |
| Over $2 billion | .65% |
For the fiscal year ended December 31, 2017, the effective management fee, net of waivers, was at an annualized rate of 0.21% of the Fund’s average daily net assets.
In addition, Lord Abbett provides certain administrative services to the Fund pursuant to an Administrative Services Agreement in return for a fee at an annual rate of .04% of the Fund’s average daily net assets.
During the fiscal year ended December 31, 2017 and continuing through April 30, 2018, Lord Abbett has contractually agreed to waive its fees and reimburse expenses to the extent necessary to limit total net annual operating expenses, excluding any acquired fund fees and expenses, to an annual rate of .87%. This agreement may be terminated only upon the approval of the Board.
The Company, on behalf of the Fund, has entered into services arrangements with certain insurance companies. Under these arrangements, certain insurance companies will be compensated up to .25% of the average daily net asset value (“NAV”) of the Fund’s Class VC Shares held in the insurance company’s separate account to service and maintain the Variable Contract owners’ accounts. This amount is included in Non 12b-1 service fees on the Statement of Operations. The Fund may also compensate certain insurance companies, third-party administrators and other entities for providing recordkeeping, sub-transfer agency and other administrative services to the Fund. This amount is included in Shareholder servicing on the Statement of Operations.
Two Directors and certain of the Company’s officers have an interest in Lord Abbett.
| 4. | DISTRIBUTIONS AND CAPITAL LOSS CARRYFORWARDS |
Dividends from net investment income, if any, are declared and paid at least semi-annually. Taxable net realized gains from investment transactions, reduced by allowable capital loss carryforwards, if any, are declared and distributed to shareholders at least annually. The capital loss carryforward amount, if any, is available to offset future net capital gains. Dividends and distributions to shareholders are recorded on the ex-dividend date. The amounts of dividends and distributions from net investment income and net realized capital gains are determined in accordance with federal income tax regulations, which may differ from U.S. GAAP. These book/tax differences are either considered temporary or permanent in nature. To the extent these differences are permanent in nature, such amounts are reclassified within the components of net assets based on their federal tax basis treatment; temporary differences do not require reclassification. Dividends and distributions that exceed earnings and profits for tax purposes are reported as a tax return of capital.
23
Notes to Financial Statements (continued)
The tax character of distributions paid during the fiscal year ended December 31, 2017 and fiscal year ended December 31, 2016, was as follows:
| Year Ended | Year Ended | |||||||||
| 12/31/2017 | 12/31/2016 | |||||||||
| Distributions paid from: | ||||||||||
| Ordinary income | $ | 1,203,254 | $ | 1,555,460 | ||||||
| Total distributions paid | $ | 1,203,254 | $ | 1,555,460 | ||||||
As of December 31, 2017, the components of accumulated gains on a tax-basis were as follows:
| Undistributed ordinary income – net | $ | 55,010 | ||
| Total undistributed earnings | 55,010 | |||
| Capital loss carryforwards* | (2,840,212 | ) | ||
| Temporary differences | (5,360 | ) | ||
| Unrealized gains – net | 8,510,581 | |||
| Total accumulated gains – net | $ | 5,720,019 |
| * | The capital losses will carry forward indefinitely. |
As of December 31, 2017, the aggregate unrealized security gains and losses on investments and other financial instruments based on cost for U.S. federal income tax purposes were as follows:
| Tax cost | $ | 56,957,831 | ||
| Gross unrealized gain | 8,785,249 | |||
| Gross unrealized loss | (304,543 | ) | ||
| Net unrealized security gain | $ | 8,480,706 |
The difference between book-basis and tax-basis unrealized gains (losses) is attributable to the tax treatment of certain securities, forward currency contracts and wash sales.
Permanent items identified during the fiscal year ended December 31, 2017 have been reclassified among the components of net assets based on their tax basis treatment as follows:
| Distributions in | |||
| Excess of Net | Accumulated Net | ||
| Investment Income | Realized Loss | ||
| $114,297 | $(114,297 | ) |
The permanent differences are attributable to the tax treatment of certain securities, certain expenses, and foreign currency transactions.
| 5. | PORTFOLIO SECURITIES TRANSACTIONS |
Purchases and sales of investment securities (excluding short-term investments) for the fiscal year ended December 31, 2017 were as follows:
| Purchases | Sales | |
| $84,584,187 | $90,571,962 |
There were no purchases or sales of U.S. Government securities for the fiscal year ended December 31, 2017.
The Fund is permitted to purchase and sell securities (“cross-trade”) from and to other Lord Abbett funds or client accounts pursuant to procedures approved by the Board in compliance with Rule 17a-7 under the Act (the “Rule”). Each cross-trade is executed at a fair market price in compliance
24
Notes to Financial Statements (continued)
with provisions of the Rule. For the fiscal year ended December 31, 2017, the Fund engaged in cross-trades purchases of $213,268 and sales of $131,156, which resulted in net realized gains (losses) of $16,407.
| 6. | DISCLOSURES ABOUT OFFSETTING ASSETS AND LIABILITIES |
The Financial Accounting Standards Board (“FASB”) requires disclosures intended to help better assess the effect or potential effect of offsetting arrangements on a fund’s financial position. The following tables illustrate gross and net information about recognized assets and liabilities eligible for offset in the statement of assets and liabilities; and disclose such amounts subject to an enforceable master netting agreement or similar agreement, by counterparty. A master netting agreement is an agreement between a fund and a counterparty which provides for the net settlement of amounts owed under all contracts traded under that agreement, as well as cash collateral, through a single payment by one party to the other in the event of default on or termination of any one contract. The Fund’s accounting policy with respect to balance sheet offsetting is that, absent an event of default by the counterparty or a termination of the agreement, the master netting agreement does not result in an offset of reported amounts of financial assets and liabilities in the statement of assets and liabilities across transactions between the Fund and the applicable counterparty:
| Gross Amounts | Net Amounts of | |||||||||||
| Offset in the | Assets Presented | |||||||||||
| Gross Amounts of | Statement of Assets | in the Statement of | ||||||||||
| Description | Recognized Assets | and Liabilities | Assets and Liabilities | |||||||||
| Repurchase Agreement | $361,197 | $ | – | $361,197 | ||||||||
| Total | $361,197 | $ | – | $361,197 | ||||||||
| Net Amounts | ||||||||||||||||||||
| of Assets | Amounts Not Offset in the | |||||||||||||||||||
| Presented in | Statement of Assets and Liabilities | |||||||||||||||||||
| the Statement | Cash | Securities | ||||||||||||||||||
| of Assets and | Financial | Collateral | Collateral | Net | ||||||||||||||||
| Counterparty | Liabilities | Instruments | Received(a) | Received(a) | Amount(b) | |||||||||||||||
| Fixed Income Clearing Corp. | $361,197 | $ | – | $ | – | $(361,197 | ) | $ | – | |||||||||||
| Total | $361,197 | $ | – | $ | – | $(361,197 | ) | $ | – | |||||||||||
| (a) | Collateral disclosed is limited to an amount not to exceed 100% of the net amount of assets presented in the Statement of Assets and Liabilities, for each respective counterparty. |
| (b) | Net amount represents the amount owed to the Fund by the counterparty as of December 31, 2017. |
| 7. | DIRECTORS’ REMUNERATION |
The Company’s officers and two Directors, who are associated with Lord Abbett, do not receive any compensation from the Company for serving in such capacities. Independent Directors’ fees are allocated among all Lord Abbett-sponsored funds based on the net assets of each fund. There is an equity-based plan available to all Independent Directors under which Independent Directors must defer receipt of a portion of, and may elect to defer receipt of an additional portion of Directors’ fees. The deferred amounts are treated as though equivalent dollar amounts had been invested in the funds. Such amounts and earnings accrued thereon are included in Directors’ fees on the Statement of Operations and in Directors’ fees payable on the Statement of Assets and Liabilities and are not deductible for U.S. federal income tax purposes until such amounts are paid.
25
Notes to Financial Statements (continued)
| 8. | EXPENSE REDUCTIONS |
The Company has entered into an arrangement with its transfer agent and custodian, whereby credits realized as a result of uninvested cash balances are used to reduce a portion of the Fund’s expenses.
| 9. | LINE OF CREDIT |
Effective August 28, 2017, the Fund and certain other funds managed by Lord Abbett (collectively, the “Participating Funds”) entered into an amended syndicated line of credit facility with various lenders for $600 million (the “Facility”), whereas State Street Bank and Trust Company (“SSB”) participates as a lender and as agent for the lenders. The Facility is to be used for temporary or emergency purposes as an additional source of liquidity to satisfy redemptions. The Participating Funds are subject to graduated borrowing limits of one-third of Fund assets (if Fund assets are less than $750 million), $250 million, $300 million, or $350 million, based on past borrowings and likelihood of future borrowings.
Prior to August 28, 2017, the Funds and certain other funds managed by Lord Abbett participated in a $550 million syndicated line of credit facility, based on the same terms as described above.
During the fiscal year ended December 31, 2017, the Fund did not utilize the Facility.
| 10. | INTERFUND LENDING PROGRAM |
Pursuant to an exemptive order issued by the U.S. Securities and Exchange Commission (“SEC exemptive order”), certain registered open-end management investment companies managed by Lord Abbett, including the Fund, participate in a joint lending and borrowing program (the “Interfund Lending Program”). The SEC exemptive order allows the Funds to borrow money from and lend money to each other for temporary or emergency purposes subject to the limitations and conditions.
During the fiscal year ended December 31, 2017, the Fund did not participate as a borrower or lender in the Interfund Lending Program.
| 11. | CUSTODIAN AND ACCOUNTING AGENT |
SSB is the Company’s custodian and accounting agent. SSB performs custodial, accounting and recordkeeping functions relating to portfolio transactions and calculating the Fund’s NAV.
| 12. | INVESTMENT RISKS |
The Fund is subject to the general risks and considerations associated with equity investing. The value of an investment will fluctuate in response to movements in the equity securities markets in general and to the changing prospects of individual companies in which the Fund invests.
Large company value stocks, in which the Fund invests, may perform differently than the market as a whole and other types of stocks, such as small company stocks and growth stocks. This is because different types of stocks tend to shift in and out of favor over time depending on market and economic conditions as well as investor sentiment. In addition, large companies may have smaller rates of growth as compared to successful but well established smaller companies.
The Fund is subject to the risks of investing in foreign securities and derivatives. Foreign securities may pose greater risks than domestic securities, including greater price fluctuations and higher transaction costs. Foreign investments also may be affected by changes in currency rates or
26
Notes to Financial Statements (concluded)
currency controls. These risks are generally greater for securities issued by companies in emerging market countries. As compared with companies organized and operated in the U.S., these companies may be more vulnerable to economic, political and social instability and subject to less government supervision, lack of transparency, inadequate regulatory and accounting standards, and foreign taxes. The securities of foreign companies also may be subject to inadequate exchange control regulations, the imposition of economic sanctions or other government restrictions, higher transaction and other costs, and delays in settlement to the extent they are traded on non-U.S. exchanges or markets.
The Fund is also subject to the risks associated with derivatives, which may be different from and greater than the risks associated with investing directly in securities and other investments. Derivatives may be subject to risks such as liquidity risk, leveraging risk, interest rate risk, market risk, and credit risk. Illiquid securities may lower the Fund’s returns since the Fund may be unable to sell these securities at their desired time or price. Derivatives also may involve the risk of mispricing or improper valuation and the risk that changes in the value of the derivative may not correlate perfectly with the value of the underlying asset, rate or index. Whether the Fund’s use of derivatives is successful will depend on, among other things, the Fund’s ability to correctly forecast market movements, changes in foreign exchange and interest rates, and other factors. If the Fund incorrectly forecasts these and other factors, its performance could suffer. The Fund’s use of derivatives could result in a loss exceeding the amount of the Fund’s investment in these instruments.
These factors can affect the Fund’s performance.
| 13. | SUMMARY OF CAPITAL TRANSACTIONS |
Transactions in shares of capital stock were as follows:
| Year Ended | Year Ended | |||||||
| December 31, 2017 | December 31, 2016 | |||||||
| Shares sold | 106,804 | 241,082 | ||||||
| Reinvestment of distributions | 66,810 | 105,670 | ||||||
| Shares reacquired | (501,938 | ) | (250,444 | ) | ||||
| Increase (decrease) | (328,324 | ) | 96,308 | |||||
27
Report of Independent Registered Public Accounting Firm
To the Board of Directors of Lord Abbett Series Fund, Inc. and the shareholders of International Equity Portfolio:
Opinion on the Financial Statements and Financial Highlights
We have audited the accompanying statement of assets and liabilities, including the schedules of investments, of the International Equity Portfolio, one of the portfolios constituting the Lord Abbett Series Fund, Inc. (the “Fund”), as of December 31, 2017, the related statement of operations for the year then ended, the statements of changes in net assets for each of the two years in the period then ended, the financial highlights for each of the five years in the period then ended, and the related notes. In our opinion, the financial statements and financial highlights present fairly, in all material respects, the financial position of the International Equity Portfolio of the Fund as of December 31, 2017, the results of its operations for the year then ended, the changes in its net assets for each of the two years in the period then ended, and the financial highlights for each of the five years in the period then ended, in conformity with accounting principles generally accepted in the United States of America.
Basis for Opinion
These financial statements and financial highlights are the responsibility of the Fund’s management. Our responsibility is to express an opinion on the Fund’s financial statements and financial highlights based on our audits. We are a public accounting firm registered with the Public Company Accounting Oversight Board (United States) (PCAOB) and are required to be independent with respect to the Fund in accordance with the U.S. federal securities laws and the applicable rules and regulations of the Securities and Exchange Commission and the PCAOB.
We conducted our audits in accordance with the standards of the PCAOB. Those standards require that we plan and perform the audit to obtain reasonable assurance about whether the financial statements and financial highlights are free of material misstatement, whether due to error or fraud. The Fund is not required to have, nor were we engaged to perform, an audit of its internal control over financial reporting. As part of our audits we are required to obtain an understanding of internal control over financial reporting but not for the purpose of expressing an opinion on the effectiveness of the Fund’s internal control over financial reporting. Accordingly, we express no such opinion.
Our audits included performing procedures to assess the risks of material misstatement of the financial statements and financial highlights, whether due to error or fraud, and performing procedures that respond to those risks. Such procedures included examining, on a test basis, evidence regarding the amounts and disclosures in the financial statements and financial highlights. Our audits also included evaluating the accounting principles used and significant estimates made by management, as well as evaluating the overall financial statement presentation and financial highlights. Our procedures included confirmation of securities owned as of December 31, 2017, by correspondence with the custodian and brokers; when replies were not received from brokers, we performed other auditing procedures. We believe that our audits provide a reasonable basis for our opinion.
DELOITTE & TOUCHE LLP
New York, New York
February 15, 2018
We have served as the auditor of one or more Lord Abbett Family of Funds’ investment companies since 1932.
28
Basic Information About Management
The Board is responsible for the management of the business and affairs of the Company in accordance with the laws of the State of Maryland. The Board elects officers who are responsible for the day-to-day operations of the Fund and who execute policies authorized by the Board. The Board also approves an investment adviser to the Fund and continues to monitor the cost and quality of the services the investment adviser provides, and annually considers whether to renew the contract with the adviser. Generally, each Director holds office until his/her successor is elected and qualified or until his/her earlier resignation or removal, as provided in the Company’s organizational documents.
Lord Abbett, a Delaware limited liability company, is the Fund’s investment adviser. Designated Lord Abbett personnel are responsible for the day-to-day management of the Fund.
Interested Directors
Ms. Foster and Mr. Sieg are affiliated with Lord Abbett and are “interested persons” of the Fund as defined in the Act. Ms. Foster and Mr. Sieg are directors/trustees of each of the 12 investment companies in the Lord Abbett Family of Funds, which consist of 61 portfolios or series. Ms. Foster is an officer of the Lord Abbett Family of Funds.
| Name, Address and Year of Birth | Current Position and Length of Service with the Company | Principal Occupation and Other Directorships During the Past Five Years | ||
| Daria L. Foster(1) Lord, Abbett & Co. LLC 90 Hudson Street Jersey City, NJ 07302 (1954) | Director and President since 2006; Chief Executive Officer since 2012 | Principal Occupation: Managing Partner of Lord Abbett, joined Lord Abbett in 1990.
Other Directorships: None. | ||
| Douglas B. Sieg(1) Lord, Abbett & Co. LLC 90 Hudson Street Jersey City, NJ 07302 (1969) | Director since 2016 | Principal Occupation: Partner (since 2001) and Head of Client Services (since 2013), formerly Director of Marketing and Relationship Management, joined Lord Abbett in 1994.
Other Directorships: None. |
Independent Directors
The following Independent Directors also are directors/trustees of each of the 12 investment companies in the Lord Abbett Family of Funds, which consist of 61 portfolios or series.
| Name, Address and Year of Birth | Current Position and Length of Service with the Company | Principal Occupation and Other Directorships During the Past Five Years | ||
| Eric C. Fast Lord, Abbett & Co. LLC c/o Legal Dept. 90 Hudson Street Jersey City, NJ 07302 (1949) | Director since 2014 | Principal Occupation: Chief Executive Officer of Crane Co., an industrial products company (2001–2014).
Other Directorships: Currently serves as director of Automatic Data Processing, Inc. (since 2007) and Regions Financial Corporation (since 2010). Previously served as a director of Crane Co. (1999–2014). |
| (1) | Daria L. Foster, Managing Partner of Lord Abbett, a member of the Board and the Chief Executive Officer and President of the Lord Abbett Family of Funds, will retire from her positions with Lord Abbett and the Lord Abbett Family of Funds effective March 31, 2018. Douglas B. Sieg, Partner and head of Client Services at Lord Abbett, and a member of the Board, will succeed Ms. Foster effective April 1, 2018. |
29
Basic Information About Management (continued)
| Name, Address and Year of Birth | Current Position and Length of Service with the Company | Principal Occupation and Other Directorships During the Past Five Years | ||
| Evelyn E. Guernsey Lord, Abbett & Co. LLC c/o Legal Dept. 90 Hudson Street Jersey City, NJ 07302 (1955) | Director since 2011 | Principal Occupation: CEO, Americas of J.P. Morgan Asset Management (2004–2010).
Other Directorships: None. | ||
| Julie A. Hill Lord, Abbett & Co. LLC c/o Legal Dept. 90 Hudson Street Jersey City, NJ 07302 (1946) | Director since 2004 | Principal Occupation: Owner and CEO of The Hill Company, a business consulting firm (since 1998).
Other Directorships: Currently serves as director of Anthem, Inc., a health benefits company (since 1994). | ||
| Franklin W. Hobbs Lord, Abbett & Co. LLC c/o Legal Dept. 90 Hudson Street Jersey City, NJ 07302 (1947) | Director since 2001 | Principal Occupation: President and CEO of Ribbon Communications (since 2017) and Advisor of One Equity Partners, a private equity firm (since 2004).
Other Directorships: Currently serves as director of Ribbon Communications (since 2017), director and Chairman of the Board of Ally Financial Inc., a financial services firm (since 2009), and as director of Molson Coors Brewing Company (since 2002). | ||
| Kathleen M. Lutito Lord, Abbett & Co. LLC c/o Legal Dept. 90 Hudson Street Jersey City, NJ 07302 (1963) | Director since 2017 | Principal Occupation: President and Chief Investment Officer of CenturyLink Investment Management Company (since 2006).
Other Directorships: None | ||
| James M. McTaggart Lord, Abbett & Co. LLC c/o Legal Dept. 90 Hudson Street Jersey City, NJ 07302 (1947) | Director since 2012 | Principal Occupation: Independent management advisor and consultant (since 2012); Vice President, CRA International, Inc. (doing business as Charles River Associates), a global management consulting firm (2009–2012); Founder and Chairman of Marakon Associates, Inc., a strategy consulting firm (1978–2009); and Officer and Director of Trinsum Group, a holding company (2007–2009).
Other Directorships: Blyth, Inc., a home products company (2004–2015). | ||
| Karla M. Rabusch Lord, Abbett & Co. LLC c/o Legal Dept. 90 Hudson Street Jersey City, NJ 07302 (1959) | Director since 2017 | Principal Occupation: President and Director of Wells Fargo Funds Management, LLC (2003–2017); President of Wells Fargo Funds (2003–2016).
Other Directorships: None. | ||
| Mark A. Schmid Lord, Abbett & Co. LLC c/o Legal Dept. 90 Hudson Street Jersey City, NJ 07302 (1959) | Director since 2016 | Principal Occupation: Vice President and Chief Investment Officer of the University of Chicago (since 2009).
Other Directorships: None. |
30
Basic Information About Management (continued)
| Name, Address and Year of Birth | Current Position and Length of Service with the Company | Principal Occupation and Other Directorships During the Past Five Years | ||
| James L.L. Tullis Lord, Abbett & Co. LLC c/o Legal Dept. 90 Hudson Street Jersey City, NJ 07302 (1947) | Director since 2006; Chairman since 2017 | Principal Occupation: CEO of Tullis-Dickerson and Co. Inc., a venture capital management firm (since 1990); CEO of Tullis Health Investors Inc. (since 2012).
Other Directorships: Currently serves as director of Crane Co. (since 1998). |
Officers
None of the officers listed below have received compensation from the Company. All of the officers of the Company also may be officers of the other Lord Abbett Funds and maintain offices at 90 Hudson Street, Jersey City, NJ 07302. Unless otherwise indicated, the position(s) and title(s) listed under the “Principal Occupation During the Past Five Years” column indicate each officer’s position(s) and title(s) with Lord Abbett. Each officer serves for an indefinite term (i.e., until his or her death, resignation, retirement, or removal).
| Name and Year of Birth | Current Position with the Company | Length of Service of Current Position | Principal Occupation During the Past Five Years | |||
| Daria L. Foster (1954) | President and Chief Executive Officer | Elected as President in 2006 and Chief Executive Officer in 2012 | Managing Partner of Lord Abbett, joined Lord Abbett in 1990. | |||
| Sean J. Aurigemma (1969) | Executive Vice President | Elected in 2010 | Portfolio Manager, joined Lord Abbett in 2007. | |||
| Jeff D. Diamond (1960) | Executive Vice President | Elected in 2008 | Portfolio Manager, joined Lord Abbett in 2007. | |||
| Todd D. Jacobson (1966) | Executive Vice President | Elected in 2005 | Partner and Associate Director, joined Lord Abbett in 2003. | |||
| Robert A. Lee (1969) | Executive Vice President | Elected in 2010 | Partner and Chief Investment Officer, and was formerly Deputy Chief Investment Officer and Director of Taxable Fixed Income, joined Lord Abbett in 1997. | |||
| David J. Linsen (1974) | Executive Vice President | Elected in 2008 | Partner and Director, joined Lord Abbett in 2001. | |||
| Thomas B. Maher (1967) | Executive Vice President | Elected in 2010 | Partner and Portfolio Manager, joined Lord Abbett in 2003. | |||
| Justin C. Maurer (1969) | Executive Vice President | Elected in 2010 | Partner and Portfolio Manager, joined Lord Abbett in 2001. |
31
Basic Information About Management (continued)
| Name and Year of Birth | Current Position with the Company | Length of Service of Current Position | Principal Occupation During the Past Five Years | |||
| Vincent J. McBride (1964) | Executive Vice President | Elected in 2010 | Partner and Director, joined Lord Abbett in 2003. | |||
| Andrew H. O’Brien (1973) | Executive Vice President | Elected in 2010 | Partner and Portfolio Manager, joined Lord Abbett in 1998. | |||
| F. Thomas O’Halloran, III (1955) | Executive Vice President | Elected in 2010 | Partner and Portfolio Manager, joined Lord Abbett in 2001. | |||
| Marc Pavese (1972) | Executive Vice President | Elected in 2016 | Partner and Portfolio Manager, joined Lord Abbett in 2008. | |||
| Walter H. Prahl (1958) | Executive Vice President | Elected in 2012 | Partner and Director, joined Lord Abbett in 1997. | |||
| Jeffrey Rabinowitz (1972) | Executive Vice President | Elected in 2017 | Portfolio Manager, joined Lord Abbett in 2017 and was formerly a Managing Director and Portfolio Manager/Technology Analyst at Jennison Associates LLC (2014–2017) and Managing Director and Portfolio Manager/ Technology Analyst at Goldman Sachs Asset Management (1999–2014). | |||
| Steven F. Rocco (1979) | Executive Vice President | Elected in 2014 | Partner and Portfolio Manager, joined Lord Abbett in 2004. | |||
| A. Edward Allinson (1961) | Vice President | Elected in 2011 | Portfolio Manager, joined Lord Abbett in 2005. | |||
| Matthew R. DeCicco (1977) | Vice President | Elected in 2003 | Portfolio Manager, joined Lord Abbett in 1999. | |||
| Brooke A. Fapohunda (1975) | Vice President and Assistant Secretary | Elected in 2014 | Partner and Deputy General Counsel, joined Lord Abbett in 2006. | |||
| John K. Forst (1960) | Vice President and Assistant Secretary | Elected in 2005 | Partner and Deputy General Counsel, joined Lord Abbett in 2004. | |||
| Bernard J. Grzelak (1971) | Chief Financial Officer and Vice President | Elected in 2017 | Partner and Chief Operations Officer, and was formerly Director of Fund Administration, joined Lord Abbett in 2003. | |||
| Lawrence H. Kaplan (1957) | Vice President and Secretary | Elected in 1997 | Partner and General Counsel, joined Lord Abbett in 1997. |
32
Basic Information About Management (concluded)
| Name and Year of Birth | Current Positio with the Company | Length of Service of Current Position | Principal Occupation During the Past Five Years | |||
| Linda Y. Kim (1980) | Vice President and Assistant Secretary | Elected in 2016 | Counsel, joined Lord Abbett in 2015 and was formerly an Associate at Stroock & Stroock & Lavan LLP (2007–2015). | |||
| Joseph M. McGill (1962) | Chief Compliance Officer | Elected in 2014 | Partner and Chief Compliance Officer, joined Lord Abbett in 2014 and was formerly Managing Director and the Chief Compliance Officer at UBS Global Asset Management (2003–2013). | |||
| A. Edward Oberhaus, III (1959) | Vice President | Elected in 1998 | Partner and Director, joined Lord Abbett in 1983. | |||
| Noah Petrucci (1970) | Vice President | Elected in 2013 | Portfolio Manager, joined Lord Abbett in 2012. | |||
| Lawrence B. Stoller (1963) | Vice President and Assistant Secretary | Elected in 2007 | Partner and Senior Deputy General Counsel, joined Lord Abbett in 2007. | |||
| Leah G. Traub (1979) | Vice President | Elected in 2016 | Partner and Portfolio Manager, joined Lord Abbett in 2007. | |||
| Arthur K. Weise (1970) | Vice President | Elected in 2010 | Partner and Portfolio Manager, joined Lord Abbett in 2007. | |||
| Kewjin Yuoh (1971) | Vice President | Elected in 2012 | Partner and Portfolio Manager, joined Lord Abbett in 2010. | |||
| Scott S. Wallner (1955) | AML Compliance Officer | Elected in 2011 | Assistant General Counsel, joined Lord Abbett in 2004. | |||
| Christian J. Kelly (1975) | Treasurer | Elected in 2017 | Director of Fund Administration, joined Lord Abbett in 2009. |
Please call 888-522-2388 for a copy of the statement of additional information, which contains further information about the Company’s Directors. It is available free upon request.
33
Approval of Advisory Contract
The Board, including all of the Directors who are not “interested persons” of the Company or of Lord Abbett, as defined in the Investment Company Act of 1940, as amended (the “Independent Directors”), annually considers whether to approve the continuation of the existing management agreement between the Fund and Lord Abbett (the “Agreement”). In connection with its most recent approval, the Board reviewed materials relating specifically to the Agreement, as well as numerous materials received throughout the course of the year, including information about the Fund’s investment performance compared to the performance of its benchmark. Before making its decision as to the Fund, the Board had the opportunity to ask questions and request further information, taking into account its familiarity with Lord Abbett gained through its meetings and discussions. These meetings and discussions included reviews of Fund performance conducted by members of the Contract Committee, the deliberations of the Contract Committee, and discussions between the Contract Committee and Lord Abbett’s management. The Independent Directors also met with their independent legal counsel in various private sessions at which no representatives of management were present.
The materials received by the Board included, but were not limited to: (1) information provided by Morningstar, Inc. (“Morningstar”) regarding the investment performance of the Fund compared to the investment performance of certain funds with similar investment styles as determined by Morningstar, based, in part, on the Fund’s Morningstar category (the “performance peer group”), and the investment performance of the Fund’s benchmark; (2) information provided by Morningstar regarding the expense ratios, contractual and actual management fee rates, and other expense components for the Fund and certain funds in the same Morningstar category, with generally the same or similar share classes and operational characteristics, including asset size (the “expense peer group”); (3) certain supplemental investment performance information provided by Lord Abbett; (4) information provided by Lord Abbett on the expense ratios, management fee rates, and other expense components for the Fund; (5) sales and redemption information for the Fund; (6) information regarding Lord Abbett’s financial condition; (7) an analysis of the relative profitability of the Agreement to Lord Abbett; (8) information provided by Lord Abbett regarding the investment management fee schedules for Lord Abbett’s other advisory clients maintaining accounts with a similar investment strategy as the Fund; and (9) information regarding the personnel and other resources devoted by Lord Abbett to managing the Fund.
Investment Management Services Generally. The Board considered the investment management services provided by Lord Abbett to the Fund, including investment research, portfolio management, and trading, and Lord Abbett’s commitment to compliance with all applicable legal requirements. The Board also observed that Lord Abbett was solely engaged in the investment management business and accordingly did not experience the conflicts of interest that may result from being engaged in other lines of business. The Board considered the investment advisory services provided by Lord Abbett to other clients, the fees charged for the services, and the differences in the nature of the services provided to the Fund and other Lord Abbett Funds, on the one hand, and the services provided to other clients, on the other. After reviewing these and related factors, the Board concluded that the Fund was likely to continue to benefit from the nature, extent and quality of the investment services provided by Lord Abbett under the Agreement.
Investment Performance. The Board reviewed the Fund’s investment performance in relation to that of the performance peer group and the Fund’s benchmark as of various periods ended August 31, 2017. The Board observed that the Fund’s investment performance was below the median of the performance peer group for the one-, three-, and five-year periods. The Board considered that Lord
34
Approval of Advisory Contract (continued)
Abbett was implementing a plan intended to improve the performance of its equity Funds. The Board further considered Lord Abbett’s performance and reputation generally, the performance of other Lord Abbett-managed funds overseen by the Board, and the willingness of Lord Abbett to take steps intended to improve performance when necessary. After reviewing these and related factors, the Board concluded that the Fund’s Agreement should be continued.
Lord Abbett’s Personnel and Methods. The Board considered the qualifications of the personnel providing investment management services to the Fund, in light of its investment objective and discipline. Among other things, the Board considered the size, experience, and turnover of Lord Abbett’s investment management staff, Lord Abbett’s investment methodology and philosophy, and Lord Abbett’s approach to recruiting, training, and retaining investment management personnel.
Nature and Quality of Other Services. The Board considered the nature, quality, costs, and extent of compliance, administrative, and other services performed by Lord Abbett and the nature and extent of Lord Abbett’s supervision of third party service providers, including the Fund’s transfer agent and custodian.
Expenses. The Board considered the expense level of the Fund and the expense levels of the expense peer group. It also considered how the expense level of the Fund related to those of the expense peer group and the amount and nature of the fees paid by shareholders. The Board observed that the net total expense ratio of the Fund was below the median of the expense peer group. After reviewing these and related factors, the Board concluded, within the context of its overall approval of the Agreement, that the expense level of the Fund was reasonable and supported the continuation of the Agreement.
Profitability. The Board considered the level of Lord Abbett’s operating margin in managing the Fund, including a review of Lord Abbett’s methodology for allocating its costs to its management of the Fund. It considered whether the Fund was profitable to Lord Abbett in connection with the Fund’s operation, including the fee that Lord Abbett receives from the Fund for providing administrative services to the Fund. The Board also considered the profits realized from other business segments of Lord Abbett, which may benefit from or be related to the Fund’s business. The Board considered Lord Abbett’s profit margins excluding Lord Abbett’s marketing and distribution expenses. The Board also considered Lord Abbett’s profit margins, without those exclusions, in comparison with available industry data and how those profit margins could affect Lord Abbett’s ability to recruit and retain investment personnel. The Board recognized that Lord Abbett’s overall profitability was a factor in enabling it to attract and retain qualified investment management personnel to provide services to the Fund. After reviewing these and related factors, the Board concluded, within the context of its overall approval of the Agreement, that Lord Abbett’s profitability with respect to the Fund was not excessive.
Economies of Scale. The Board considered the extent to which there had been economies of scale in managing the Fund, whether the Fund’s shareholders had appropriately benefited from such economies of scale, and whether there was potential for realization of any further economies of scale. The Board concluded that the existing management fee schedule, with its breakpoints in the level of the management fee, in conjunction with the Fund’s proposed expense limitation agreement, adequately addressed any economies of scale in managing the Fund.
Other Benefits to Lord Abbett. The Board considered the amount and nature of the fees paid by the Fund and the Fund’s shareholders to Lord Abbett for services other than investment advisory services. The Board also considered the revenues and profitability of Lord Abbett’s investment
35
Approval of Advisory Contract (concluded)
advisory business apart from its mutual fund business, and the intangible benefits enjoyed by Lord Abbett by virtue of its relationship with the Fund. The Board observed that the Distributor receives 12b-1 fees from certain of the Lord Abbett Funds as to shares held in accounts for which there is no other broker of record, may retain a portion of the 12b-1 fees it receives, and receives a portion of the sales charges on sales and redemptions of some classes of shares of the Lord Abbett Funds. In addition, the Board observed that Lord Abbett accrues certain benefits for its business of providing investment advice to clients other than the Lord Abbett Funds, but that business also benefits the Funds. The Board also noted that Lord Abbett, as disclosed in the prospectus of the Fund, has entered into revenue sharing arrangements with certain entities that distribute shares of the Fund. The Board also took into consideration the investment research that Lord Abbett receives as a result of Fund brokerage transactions.
Alternative Arrangements. The Board considered whether, instead of approving continuation of the Agreement, it might be in the best interests of the Fund to implement one or more alternative arrangements, such as continuing to employ Lord Abbett, but on different terms. After considering all of the relevant factors, the Board unanimously found that continuation of the Agreement was in the best interests of the Fund and its shareholders and voted unanimously to approve the continuation of the Agreement. In considering whether to approve the continuation of the Agreement, the Board did not identify any single factor as paramount or controlling. Individual Directors may have evaluated the information presented differently from one another, giving different weights to various factors. This summary does not discuss in detail all matters considered.
36
Householding
The Company has adopted a policy that allows it to send only one copy of the Fund’s prospectus, proxy material, annual report and semiannual report to certain shareholders residing at the same “household.” This reduces Fund expenses, which benefits you and other shareholders. If you need additional copies or do not want your mailings to be “householded,” please call Lord Abbett at 888-522-2388 or send a written request with your name, the name of your fund or funds and your account number or numbers to Lord Abbett Family of Funds, P.O. Box 219336, Kansas City, MO 64121.
Proxy Voting Policies, Procedures and Records
A description of the policies and procedures that Lord Abbett uses to vote proxies related to the Fund’s portfolio securities, and information on how Lord Abbett voted the Fund’s proxies during the 12-month period ended June 30 are available without charge, upon request, (i) by calling 888-522-2388; (ii) on Lord Abbett’s Website at www.lordabbett.com; and (iii) on the Securities and Exchange Commission’s (“SEC”) Website at www.sec.gov.
Shareholder Reports and Quarterly Portfolio Disclosure
The Fund is required to file its complete schedule of portfolio holdings with the SEC for its first and third fiscal quarters on Form N-Q. Copies of the filings are available without charge, upon request on the SEC’s Website at www.sec.gov and may be available by calling Lord Abbett at 888-522-2388. You can also obtain copies of Form N-Q by visiting the SEC’s Public Reference Room in Washington, DC (information on the operation of the Public Reference Room may be obtained by calling 800-SEC-0330).
Tax Information
The Fund intends to pass through foreign source income of $1,749,958 and foreign taxes of $186,030. |
37


| This report, when not used for the general information of shareholders of the Fund, is to be distributed only if preceded or accompanied by a current fund prospectus. | |||
| Lord Abbett mutual fund shares are distributed by LORD ABBETT DISTRIBUTOR LLC. | Lord Abbett Series Fund, Inc.
International Equity Portfolio | SFICE-3 (02/18) |
![]()
LORD ABBETT
ANNUAL REPORT
Lord Abbett
Series Fund—International Opportunities Portfolio
For the fiscal year ended December 31, 2017
Table of Contents
Lord Abbett Series Fund — International Opportunities Portfolio
Annual Report
For the fiscal year ended December 31, 2017

From left to right: James L.L. Tullis, Independent Chairman of the Lord Abbett Funds and Daria L. Foster, Director, President, and Chief Executive Officer of the Lord Abbett Funds.
Dear Shareholders: We are pleased to provide you with this overview of the performance of Lord Abbett Series Fund — International Opportunities Portfolio for the fiscal year ended December 31, 2017. On this page and the following pages, we discuss the major factors that influenced fiscal year performance. For additional information about the Fund, please visit our website at www.lordabbett.com, where you also can access the quarterly commentaries that provide updates on the Fund’s performance and other portfolio related updates.
Thank you for investing in Lord Abbett mutual funds. We value the trust that you place in us and look forward to serving your investment needs in the years to come.
Best regards,

Daria L. Foster
Director, President and Chief Executive Officer
For the fiscal year ended December 31, 2017, the Fund returned 39.21%, reflecting performance at the net asset value (NAV) of Class VC Shares, with all distributions reinvested, compared to its benchmark, the S&P Developed Ex-US Small Cap® Index1, which returned 32.39% over the same period.
Over the period, global equity markets experienced significant positive performance, as most central banks remained accommodative, interest rates remained low, unemployment steadily declined, corporate earnings grew, and
global economic growth accelerated. Overall, European markets (as measured by the EURO STOXX 50® Index2) rose roughly 25.3% in U.S. dollars for the period, while Japan’s Nikkei 2253 rose 21.33% in U.S. dollars.
At its March 2017 meeting, the Federal Reserve (Fed) raised interest rates for the third time since the financial crisis to a range of 0.75% - 1.00%, after indicating that the “stance of monetary policy remains accommodative, thereby supporting some further strengthening in labor market conditions and sustained
1
return to 2 percent inflation”. The Fed continued with 0.25% rate hikes at its June and December meetings, bringing the fed funds rate to a range between 1.25% - 1.50% and forecasted three additional rate increases in both 2018 and 2019. Additionally, the Fed indicated that in October of 2017 it would begin its much anticipated balance sheet normalization process by selling assets it had purchased as part of its quantitative easing program. Meanwhile, other central banks have continued their accommodative policies. The European Central Bank (ECB) kept its benchmark rate unchanged at 0%, since March 2016, and at its October 2017 meeting, the ECB extended its asset purchase program at a monthly pace of €30 billion until the end of September 2018 “or beyond, if necessary”, from a previous rate of €60 billion a month. The Bank of Japan (BoJ) also maintained its stimulative monetary policy at its December 2017 meeting as short term interest rates remained unchanged, at -0.1%, and the bank kept its 10-year government bond yield target at around 0%, amid a more upbeat view on private consumption and capital expenditure.
The election of Donald Trump as U.S. President in November 2016 coincided with the start of rising equity markets, as Trump’s “America First” policy focused on lower taxes, lower regulation, “smart trade” policy, and less government spending, fueling global growth optimism. Unemployment steadily declined in most
developed countries, falling to a nine year low of 8.7% in the Euro area, 4.1% in the United States, 2.7% in Japan, and 3.95% in China, all multiyear lows. GDP growth has remained positive in most developed countries, while inflation remained subdued, allowing central banks to continue their stimulative monetary policies with global stock markets as the beneficiaries. At the end of the year, the United States passed its much anticipated tax reform, lowering the corporate tax rate to 21%, reducing the tax on accumulated overseas earnings, and altering the individual tax brackets, among other changes. This reform is broadly expected to benefit corporations going forward.
Although volatility, as measured by the VIX index, has remained near all-time low levels for most of the year, sources of tension throughout the year have come from nuclear threats from North Korea, continued turmoil in the middle east, populist and independence forces in Europe, and remaining uncertainty regarding “Brexit”.
Stock selection, most notably in the financials and consumer discretionary sectors, was the primary driver of relative outperformance during the period. Within the financials sector, shares of Dewan Housing Finance contributed to performance. Shares of the Indian housing finance provider rose as its loan portfolio experienced strong growth during the period and the company benefited from government efforts to encourage home ownership. In addition, shares of Man
2
Group plc contributed to performance. Shares of the global provider of alternative investment products and solutions advanced throughout the year as the company had strong net inflows into its products and announced a new share buyback program.
Within the consumer discretionary sector, shares of Cairn Homes PLC contributed to performance. Shares of the Irish homebuilder advanced, as the company was able to build more completed housing units that sold for higher prices and market conditions remained positive.
Conversely, stock selection in the energy and health care sectors detracted from relative performance. Within the energy sector, shares of Africa Oil Corp detracted from relative performance. Shares of the oil and gas exploration and production company declined as the company was
impacted by political uncertainty in Africa, which affected its performance. The Fund’s position in Whitecap Resources Inc. also detracted from relative performance during the period. Shares of the Canadian exploration and production company declined as oil prices were under pressure for much of the year.
Within the health care sector, an underweight position to Lonza Group AG detracted from relative performance, as shares of the company rose during the year. The Swiss life science equipment company benefited from strong demand for its clinical stage services.
The Fund’s portfolio is actively managed and, therefore, its holdings and the weightings of a particular issuer or particular sector as a percentage of portfolio assets are subject to change. Sectors may include many industries.
3
1 The S&P Developed Ex-U.S. Small Cap® Index captures the bottom 15% of companies domiciled in the developed markets (excluding the United States) within the S&P Global BMI with a float-adjusted market capitalization of at least US$100 million and a value traded of at least US$50 million for the past 12 months at the time of the annual reconstitution. Stocks are excluded if their market capitalization falls below US$75 million, or if the value traded is less than US$35 million at the time of reconstitution.
2 The EURO STOXX 50® Index represents the performance of the 50 largest companies among the 19 supersectors in terms of free-float market cap in 12 eurozone countries. These countries include Austria, Belgium, Finland, France, Germany, Greece, Ireland, Italy, Luxembourg, the Netherlands, Portugal and Spain. The index has a fixed number of components and is part of the STOXX blue-chip index family. The index captures about 60% of the free-float market cap of the EURO STOXX Total Market Index (TMI).
3 The Nikkei Stock Average, the Nikkei 225 is used around the globe as the premier index of Japanese stocks. Because of the prominent nature of the index, many financial products linked to the Nikkei 225 have been created are traded worldwide while the index has been sufficiently used as the indicator of the movement of Japanese stock markets. The Nikkei 225 is a price-weighted equity index, which consists of 225 stocks in the 1st section of the Tokyo Stock Exchange.
Unless otherwise specified, indexes reflect total return, with all dividends reinvested. Indexes are unmanaged, do not reflect the deduction of fees or expenses, and are not available for direct investment.
Important Performance and Other Information
Performance data quoted in the following pages reflect past performance and are no guarantee of
future results. Current performance may be higher or lower than the performance quoted. The investment return and principal value of an investment in the Fund will fluctuate so that shares, on any given day or when redeemed, may be worth more or less than their original cost. You can obtain performance data current to the most recent month end by calling Lord Abbett at 888-522-2388 or referring to www.lordabbett.com.
During certain periods shown, expense waivers and reimbursements were in place. Without such expense waivers and reimbursements, the Fund’s returns would have been lower.
The annual commentary above discusses the views of the Fund’s management and various portfolio holdings of the Fund as of December 31, 2017. These views and portfolio holdings may have changed after this date. Information provided in the commentary is not a recommendation to buy or sell securities. Because the Fund’s portfolio is actively managed and may change significantly, the Fund may no longer own the securities described above or may have otherwise changed its position in the securities. For more recent information about the Fund’s portfolio holdings, please visit www.lordabbett.com.
A Note about Risk: See Notes to Financial Statements for a discussion of investment risks. For a more detailed discussion of the risks associated with the Fund, please see the Fund’s prospectus.
Mutual funds are not insured by the FDIC, are not deposits or other obligations of, or guaranteed by, banks, and are subject to investment risks including possible loss of principal amount invested.
The Fund serves as an underlying investment vehicle for variable annuity contracts and variable life insurance policies.
4
Below is a comparison of a $10,000 investment in Class VC shares with the same investment in the S&P Developed Ex-U.S. SmallCap® Index, assuming reinvestment of all dividends and distributions. The Fund’s shares are sold only to insurance company separate accounts that fund certain variable annuity and variable life contracts. This line graph comparison does not reflect the sales charges or other expenses of these contracts. If those sales charges and expenses were reflected, returns would be lower. The graph and performance table below do not reflect the deduction of taxes that a shareholder would pay on Fund distributions or the redemption of Fund shares. During certain periods, expenses of the Fund have been waived or reimbursed by Lord Abbett; without such waiver or reimbursement of expenses, the Fund’s returns would have been lower. Past performance is no guarantee of future results.
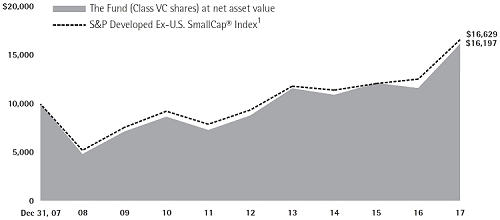
| Average Annual Total Returns for the Periods Ended December 31, 2017 | ||||||||||||
| 1 Year | 5 Years | 10 Years | ||||||||||
| Class VC | 39.21% | 12.94% | 4.94% | |||||||||
1 Performance for the unmanaged index does not reflect any fees or expenses. The performance of the index is not necessarily representative of the Fund’s performance.
5
Expense Example
As a shareholder of the Fund, you incur ongoing costs, including management fees; expenses related to the Fund’s services arrangements with certain insurance companies; and other Fund expenses. This Example is intended to help you understand your ongoing costs (in dollars) of investing in the Fund and to compare these costs with the ongoing costs of investing in other mutual funds.
The Example is based on an investment of $1,000 invested at the beginning of the period and held for the entire period (July 1, 2017 through December 31, 2017).
The Example reflects only expenses that are deducted from the assets of the Fund. Fees and expenses, including sales charges applicable to the various insurance products that invest in the Fund, are not reflected in this Example. If such fees and expenses were reflected in the Example, the total expenses shown would be higher. Fees and expenses regarding such variable insurance products are separately described in the prospectus related to those products.
Actual Expenses
The first line of the table on the following page provides information about actual account values and actual expenses. You may use the information in this line, together with the amount you invested, to estimate the expenses that you paid over the period. Simply divide your account value by $1,000 (for example, an $8,600 account value divided by $1,000 = 8.6), then multiply the result by the number in the first line under the heading titled “Expenses Paid During Period 7/1/17 – 12/31/17” to estimate the expenses you paid on your account during this period.
Hypothetical Example for Comparison Purposes
The second line of the table on the following page provides information about hypothetical account values and hypothetical expenses based on the Fund’s actual expense ratio and an assumed rate of return of 5% per year before expenses, which is not the Fund’s actual return. The hypothetical account values and expenses may not be used to estimate the actual ending account balance or expenses you paid for the period. You may use this information to compare the ongoing costs of investing in the Fund and other funds. To do so, compare this 5% hypothetical example with the 5% hypothetical examples that appear in the shareholder reports of the other funds.
6
Please note that the expenses shown in the table are meant to highlight your ongoing costs only and do not reflect any transactional costs, such as sales charges. Therefore, the second line of the table is useful in comparing ongoing costs only, and will not help you determine the relative total costs of owning different funds. In addition, if these transactional costs were included, your costs would have been higher.
| Beginning Account Value | Ending Account Value | Expenses Paid During Period† | |||||
| 7/1/17 | 12/31/17 | 7/1/17 - 12/31/17 | |||||
| Class VC | |||||||
| Actual | $1,000.00 | $1,158.60 | $6.53 | ||||
| Hypothetical (5% Return Before Expenses) | $1,000.00 | $1,019.16 | $6.11 |
| † | Net expenses are equal to the Fund’s annualized expense ratio of 1.20%, multiplied by the average account value over the period, multiplied by 184/365 (to reflect one-half year period). |
Portfolio Holdings Presented by Sector
December 31, 2017
| Sector* | %** | |||
| Consumer Discretionary | 16.41 | % | ||
| Consumer Staples | 6.00 | % | ||
| Energy | 3.67 | % | ||
| Financials | 18.31 | % | ||
| Health Care | 4.53 | % | ||
| Industrials | 18.91 | % | ||
| Information Technology | 12.02 | % | ||
| Materials | 8.58 | % | ||
| Real Estate | 7.22 | % | ||
| Telecommunication Services | 0.91 | % | ||
| Utilities | 2.24 | % | ||
| Repurchase Agreement | 1.20 | % | ||
| Total | 100.00 | % | ||
| * | A sector may comprise several industries. | |
| ** | Represents percent of total investments. |
7
December 31, 2017
| Investments | Shares | U.S. $ Fair Value (000) | |||||||
| COMMON STOCKS 96.94% | |||||||||
| Australia 1.61% | |||||||||
| Auto Components 0.58% | |||||||||
| GUD Holdings Ltd. | 34,449 | $ | 327 | ||||||
| Electric: Utilities 1.03% | |||||||||
| AusNet Services | 414,581 | 582 | |||||||
| Total Australia | 909 | ||||||||
| Canada 4.61% | |||||||||
| Metals & Mining 0.85% | |||||||||
| Hudbay Minerals, Inc. | 54,302 | 481 | |||||||
| Oil, Gas & Consumable Fuels 2.73% | |||||||||
| Africa Oil Corp.* | 197,904 | 222 | |||||||
| Canacol Energy Ltd.* | 163,000 | 582 | |||||||
| Vermilion Energy, Inc. | 10,800 | 393 | |||||||
| Whitecap Resources, Inc. | 49,600 | 353 | |||||||
| 1,550 | |||||||||
| Paper & Forest Products 1.03% | |||||||||
| Interfor Corp.* | 34,700 | 583 | |||||||
| Total Canada | 2,614 | ||||||||
| China 0.78% | |||||||||
| Consumer Finance 0.19% | |||||||||
| China Rapid Finance Ltd. ADR* | 19,000 | 109 | |||||||
| Energy Equipment & Services 0.16% | |||||||||
| Hilong Holding Ltd. | 649,000 | 93 | |||||||
| Internet & Direct Marketing Retail 0.43% | |||||||||
| Secoo Holding Ltd. ADR* | 25,064 | 242 | |||||||
| Total China | 444 | ||||||||
| Finland 3.70% | |||||||||
| Health Care Providers & Services 0.69% | |||||||||
| Terveystalo OYJ*† | 36,596 | 391 | |||||||
| Investments | Shares | U.S. $ Fair Value (000) | |||||||
| Machinery 2.34% | |||||||||
| Konecranes OYJ | 15,490 | $ | 709 | ||||||
| Outotec OYJ* | 72,025 | 613 | |||||||
| 1,322 | |||||||||
| Trading Companies & Distributors 0.67% | |||||||||
| Cramo OYJ | 16,077 | 381 | |||||||
| Total Finland | 2,094 | ||||||||
| France 4.27% | |||||||||
| Construction Materials 0.72% | |||||||||
| Vicat SA | 5,196 | 410 | |||||||
| Health Care Providers & Services 0.97% | |||||||||
| Korian SA | 15,577 | 550 | |||||||
| Information Technology Services 0.47% | |||||||||
| Altran Technologies SA | 15,887 | 264 | |||||||
| Life Sciences Tools & Services 0.25% | |||||||||
| Genfit* | 4,893 | 141 | |||||||
| Real Estate Management & Development 1.07% | |||||||||
| Nexity SA* | 10,163 | 605 | |||||||
| Specialty Retail 0.79% | |||||||||
| Maisons du Monde SA† | 9,955 | 451 | |||||||
| Total France | 2,421 | ||||||||
| Germany 5.93% | |||||||||
| Industrial Conglomerates 0.95% | |||||||||
| Rheinmetall AG | 4,274 | 541 | |||||||
| Internet Software & Services 0.77% | |||||||||
| XING SE | 1,356 | 436 | |||||||
| Life Sciences Tools & Services 1.57% | |||||||||
| Gerresheimer AG | 6,723 | 556 | |||||||
| MorphoSys AG* | 3,646 | 333 | |||||||
| 889 | |||||||||
| Machinery 1.27% | |||||||||
| Deutz AG | 79,432 | 718 | |||||||
| 8 | See Notes to Financial Statements. |
Schedule of Investments (continued)
December 31, 2017
| Investments | Shares | U.S. $ Fair Value (000) | |||||||
| Germany (continued) | |||||||||
| Real Estate Management & Development 1.37% | |||||||||
| PATRIZIA Immobilien AG* | 33,533 | $ | 776 | ||||||
| Total Germany | 3,360 | ||||||||
| Hong Kong 1.79% | |||||||||
| Communications Equipment 0.91% | |||||||||
| VTech Holdings Ltd. | 39,400 | 515 | |||||||
| Paper & Forest Products 0.88% | |||||||||
| Lee & Man Paper Manufacturing Ltd. | 423,000 | 498 | |||||||
| Total Hong Kong | 1,013 | ||||||||
| India 1.66% | |||||||||
| Consumer Finance 0.54% | |||||||||
| Satin Creditcare Network Ltd.* | 43,167 | 308 | |||||||
| Information Technology Services 0.59% | |||||||||
| Vakrangee Ltd. | 25,638 | 168 | |||||||
| Vakrangee Ltd. | 25,638 | 168 | |||||||
| 336 | |||||||||
| Thrifts & Mortgage Finance 0.53% | |||||||||
| Dewan Housing Finance Corp., Ltd. | 32,590 | 297 | |||||||
| Total India | 941 | ||||||||
| Indonesia 1.24% | |||||||||
| Banks 0.97% | |||||||||
| Bank Tabungan Negara Persero Tbk PT | 2,093,196 | 551 | |||||||
| Consumer Finance 0.27% | |||||||||
| PT Clipan Finance Indonesia Tbk* | 7,426,600 | 153 | |||||||
| Total Indonesia | 704 | ||||||||
| Investments | Shares | U.S. $ Fair Value (000) | |||||||
| Ireland 4.04% | |||||||||
| Equity Real Estate Investment Trusts 1.14% | |||||||||
| Hibernia REIT plc | 354,361 | $ | 648 | ||||||
| Food Products 0.57% | |||||||||
| Origin Enterprises plc | 42,554 | 324 | |||||||
| Health Care Providers & Services 0.48% | |||||||||
| UDG Healthcare plc | 23,702 | 270 | |||||||
| Household Durables 1.85% | |||||||||
| Cairn Homes plc* | 291,478 | 684 | |||||||
| Glenveagh Properties plc*† | 257,967 | 365 | |||||||
| 1,049 | |||||||||
| Total Ireland | 2,291 | ||||||||
| Israel 2.63% | |||||||||
| Chemicals 0.60% | |||||||||
| Frutarom Industries Ltd. | 3,592 | 337 | |||||||
| Electronic Equipment, Instruments & Components 1.23% | |||||||||
| Orbotech Ltd.* | 13,895 | 698 | |||||||
| Semiconductors & Semiconductor Equipment 0.80% | |||||||||
| Tower Semiconductor Ltd.* | 13,324 | 454 | |||||||
| Total Israel | 1,489 | ||||||||
| Italy 7.78% | |||||||||
| Beverages 0.39% | |||||||||
| Davide Campari-Milano SpA | 28,956 | 223 | |||||||
| Capital Markets 1.05% | |||||||||
| Anima Holding SpA† | 83,187 | 594 | |||||||
| Construction Materials 1.23% | |||||||||
| Buzzi Unicem SpA | 25,903 | 699 | |||||||
| Consumer Finance 1.20% | |||||||||
| doBank SpA*† | 41,844 | 680 | |||||||
| Electrical Equipment 0.98% | |||||||||
| Prysmian SpA | 16,971 | 553 | |||||||
| See Notes to Financial Statements. | 9 |
Schedule of Investments (continued)
December 31, 2017
| Investments | Shares | U.S. $ Fair Value (000) | |||||||
| Italy (continued) | |||||||||
| Internet & Direct Marketing Retail 0.94% | |||||||||
| Yoox Net-A-Porter Group SpA* | 15,332 | $ | 535 | ||||||
| Textiles, Apparel & Luxury Goods 1.99% | |||||||||
| Brunello Cucinelli SpA | 16,985 | 550 | |||||||
| Moncler SpA | 18,441 | 576 | |||||||
| 1,126 | |||||||||
| Total Italy | 4,410 | ||||||||
| Japan 21.65% | |||||||||
| Banks 0.78% | |||||||||
| Shinsei Bank Ltd. | 25,600 | 441 | |||||||
| Beverages 1.52% | |||||||||
| Coca-Cola Bottlers Japan, Inc. | 23,600 | 861 | |||||||
| Chemicals 1.39% | |||||||||
| KH Neochem Co., Ltd. | 30,700 | 785 | |||||||
| Construction & Engineering 0.49% | |||||||||
| SHO-BOND Holdings Co., Ltd. | 3,900 | 278 | |||||||
| Containers & Packaging 0.80% | |||||||||
| Fuji Seal International, Inc. | 13,900 | 454 | |||||||
| Equity Real Estate Investment Trusts 0.94% | |||||||||
| GLP J-Reit | 493 | 533 | |||||||
| Food & Staples Retailing 1.59% | |||||||||
| Sundrug Co., Ltd. | 19,400 | 900 | |||||||
| Food Products 0.77% | |||||||||
| Nichirei Corp. | 15,800 | 437 | |||||||
| Health Care Providers & Services 0.49% | |||||||||
| Japan Lifeline Co., Ltd. | 13,400 | 278 | |||||||
| Hotels, Restaurants & Leisure 1.18% | |||||||||
| HIS Co., Ltd. | 7,500 | 272 | |||||||
| St. Marc Holdings Co., Ltd. | 14,500 | 399 | |||||||
| 671 | |||||||||
| Investments | Shares | U.S. $ Fair Value (000) | |||||||
| Information Technology Services 1.07% | |||||||||
| NS Solutions Corp. | 22,100 | $ | 604 | ||||||
| Machinery 2.52% | |||||||||
| DMG Mori Co., Ltd. | 30,000 | 618 | |||||||
| Takeuchi Manufacturing Co., Ltd. | 34,300 | 810 | |||||||
| 1,428 | |||||||||
| Professional Services 1.73% | |||||||||
| en-japan, Inc. | 20,800 | 979 | |||||||
| Real Estate Management & Development 1.10% | |||||||||
| Kenedix, Inc. | 102,400 | 625 | |||||||
| Semiconductors & Semiconductor Equipment 0.65% | |||||||||
| Megachips Corp. | 12,400 | 370 | |||||||
| Software 1.54% | |||||||||
| Capcom Co., Ltd. | 17,600 | 556 | |||||||
| Trend Micro, Inc.* | 5,600 | 317 | |||||||
| 873 | |||||||||
| Specialty Retail 2.20% | |||||||||
| Bic Camera, Inc. | 35,200 | 507 | |||||||
| United Arrows Ltd. | 18,200 | 739 | |||||||
| 1,246 | |||||||||
| Wireless Telecommunication Services 0.89% | |||||||||
| Okinawa Cellular Telephone Co. | 13,900 | 506 | |||||||
| Total Japan | 12,269 | ||||||||
| Luxembourg 1.63% | |||||||||
| Machinery 0.25% | |||||||||
| Stabilus SA | 1,588 | 143 | |||||||
| Multi-Line Retail 1.38% | |||||||||
| B&M European Value Retail SA | 136,937 | 781 | |||||||
| Total Luxembourg | 924 | ||||||||
| 10 | See Notes to Financial Statements. |
Schedule of Investments (continued)
December 31, 2017
| Investments | Shares | U.S. $ Fair Value (000) | |||||||
| Mexico 0.73% | |||||||||
| Banks | |||||||||
| Banco del Bajio SA*† | 225,500 | $ | 413 | ||||||
| Netherlands 4.85% | |||||||||
| Air Freight & Logistics 1.31% | |||||||||
| PostNL NV | 152,524 | 745 | |||||||
| Hotels, Restaurants & Leisure 1.01% | |||||||||
| Basic-Fit NV*† | 23,695 | 572 | |||||||
| Insurance 1.15% | |||||||||
| ASR Nederland NV | 15,801 | 650 | |||||||
| Machinery 1.38% | |||||||||
| Aalberts Industries NV | 15,334 | 779 | |||||||
| Total Netherlands | 2,746 | ||||||||
| Philippines 1.73% | |||||||||
| Banks 1.05% | |||||||||
| Security Bank Corp. | 117,880 | 594 | |||||||
| Real Estate Management & Development 0.68% | |||||||||
| Filinvest Land, Inc. | 10,256,500 | 386 | |||||||
| Total Philippines | 980 | ||||||||
| Portugal 1.17% | |||||||||
| Multi-Utilities | |||||||||
| REN—Redes Energeticas Nacionais SGPS SA | 223,554 | 665 | |||||||
| South Korea 2.41% | |||||||||
| Auto Components 1.36% | |||||||||
| Mando Corp. | 2,668 | 769 | |||||||
| Insurance 1.05% | |||||||||
| ING Life Insurance Korea Ltd.† | 11,916 | 594 | |||||||
| Total South Korea | 1,363 | ||||||||
| Investments | Shares | U.S. $ Fair Value (000) | |||||||
| Spain 1.84% | |||||||||
| Household Durables 1.06% | |||||||||
| Neinor Homes SA*† | 27,477 | $ | 603 | ||||||
| Real Estate Management & Development 0.78% | |||||||||
| Aedas Homes SAU*† | 12,021 | 442 | |||||||
| Total Spain | 1,045 | ||||||||
| Sweden 5.34% | |||||||||
| Commercial Services & Supplies 2.92% | |||||||||
| Bravida Holding AB† | 45,627 | 305 | |||||||
| Intrum Justitia AB | 14,225 | 526 | |||||||
| Loomis AB Class B | 19,611 | 824 | |||||||
| 1,655 | |||||||||
| Consumer Finance 1.37% | |||||||||
| Hoist Finance AB† | 69,071 | 777 | |||||||
| Food & Staples Retailing 1.05% | |||||||||
| Axfood AB | 30,762 | 592 | |||||||
| Total Sweden | 3,024 | ||||||||
| Taiwan 1.61% | |||||||||
| Semiconductors & Semiconductor Equipment 1.06% | |||||||||
| Realtek Semiconductor Corp. | 96,000 | 350 | |||||||
| Visual Photonics Epitaxy Co., Ltd. | 80,000 | 250 | |||||||
| 600 | |||||||||
| Technology Hardware, Storage & Peripherals 0.55% | |||||||||
| Primax Electronics Ltd. | 119,000 | 315 | |||||||
| United Kingdom 11.28% | |||||||||
| Capital Markets 2.63% | |||||||||
| Man Group plc | 264,412 | 736 | |||||||
| TP ICAP plc | 105,330 | 755 | |||||||
| 1,491 | |||||||||
| Consumer Finance 0.97% | |||||||||
| Arrow Global Group plc | 102,945 | 551 | |||||||
| See Notes to Financial Statements. | 11 |
Schedule of Investments (continued)
December 31, 2017
| Investments | Shares | U.S. $ Fair Value (000) | |||||||
| United Kingdom (continued) | |||||||||
| Electronic Equipment, Instruments & Components 0.81% | |||||||||
| accesso Technology Group plc* | 17,280 | $ | 458 | ||||||
| Insurance 1.32% | |||||||||
| Lancashire Holdings Ltd. | 81,408 | 749 | |||||||
| Internet & Direct Marketing Retail 1.03% | |||||||||
| ASOS plc* | 6,444 | 581 | |||||||
| Machinery 1.75% | |||||||||
| Bodycote plc | 52,116 | 641 | |||||||
| Concentric AB | 18,918 | 348 | |||||||
| 989 | |||||||||
| Media 0.30% | |||||||||
| Huntsworth plc | 152,837 | 168 | |||||||
| Metals & Mining 0.92% | |||||||||
| Hill & Smith Holdings plc | 28,793 | 521 | |||||||
| Oil, Gas & Consumable Fuels 0.70% | |||||||||
| Tullow Oil plc* | 143,282 | 399 | |||||||
| Semiconductors & Semiconductor Equipment 0.75% | |||||||||
| IQE plc* | 230,193 | 426 | |||||||
| Software 0.10% | |||||||||
| Alfa Financial Software Holdings plc*† | 8,039 | 58 | |||||||
| Total United Kingdom | 6,391 | ||||||||
| United States 1.29% | |||||||||
| Exchange-Traded Funds 0.81% | |||||||||
| VanEck Vectors Junior Gold Miners | 13,347 | 455 | |||||||
| Semiconductors & Semiconductor Equipment 0.48% | |||||||||
| CEVA, Inc.* | 5,907 | 273 | |||||||
| Total United States | 728 | ||||||||
| Investments | Shares | U.S. $ Fair Value (000) | |||||||
| Vietnam 1.37% | |||||||||
| Closed-Ended Fund | |||||||||
| VinaCapital Vietnam Opportunity Fund Ltd. | 173,283 | $ | 774 | ||||||
| Total Common Stocks (cost $44,816,847) | 54,927 | ||||||||
| Principal Amount (000) | |||||||||
| SHORT-TERM INVESTMENT 1.18% | |||||||||
| Repurchase Agreement | |||||||||
| Repurchase Agreement dated 12/29/2017, 0.54% due 1/2/2018 with Fixed Income Clearing Corp. collateralized by $700,000 of U.S. Treasury Note at 1.125% due 2/28/2021; value: $682,766; proceeds: $667,434 (cost $667,394) | $667 | 667 | |||||||
| Total Investments in Securities 98.12% (cost $45,484,241) | 55,594 | ||||||||
| Foreign Cash and Other Assets in Excess of Liabilities 1.88% | 1,068 | ||||||||
| Net Assets 100.00% | $ | 56,662 | |||||||
| ADR | American Depositary Receipt. | |
| * | Non-income producing security. | |
| † | Security was purchased pursuant to Rule 144A under the Securities Act of 1933 and, unless registered under such Act or exempted from registration, may only be resold to qualified institutional buyers. |
| 12 | See Notes to Financial Statements. |
Schedule of Investments (concluded)
December 31, 2017
The following is a summary of the inputs used as of December 31, 2017 in valuing the Fund’s investments carried at fair value(1):
| Investment Type(2) | Level 1 (000) | Level 2 (000) | Level 3 (000) | Total (000) | ||||||||||||
| Common Stocks | ||||||||||||||||
| Australia(3) | $ | – | $ | 909 | $ | – | $ | 909 | ||||||||
| Canada | 2,614 | – | – | 2,614 | ||||||||||||
| China(3) | 351 | 93 | – | 444 | ||||||||||||
| Finland(3) | 772 | 1,322 | – | 2,094 | ||||||||||||
| France(3) | 1,552 | 869 | – | 2,421 | ||||||||||||
| Germany(3) | – | 3,360 | – | 3,360 | ||||||||||||
| Hong Kong(3) | – | 1,013 | – | 1,013 | ||||||||||||
| India(3) | 168 | 773 | – | 941 | ||||||||||||
| Indonesia | 704 | – | – | 704 | ||||||||||||
| Ireland(3) | 1,337 | 954 | – | 2,291 | ||||||||||||
| Israel(3) | 1,152 | 337 | – | 1,489 | ||||||||||||
| Italy(3) | 680 | 3,730 | – | 4,410 | ||||||||||||
| Japan(3) | 739 | 11,530 | – | 12,269 | ||||||||||||
| Luxembourg(3) | 143 | 781 | – | 924 | ||||||||||||
| Mexico | 413 | – | – | 413 | ||||||||||||
| Netherlands(3) | 572 | 2,174 | – | 2,746 | ||||||||||||
| Philippines | 980 | – | – | 980 | ||||||||||||
| Portugal | 665 | – | – | 665 | ||||||||||||
| South Korea | 594 | 769 | – | 1,363 | ||||||||||||
| Spain | 1,045 | – | – | 1,045 | ||||||||||||
| Sweden(3) | 2,432 | 592 | – | 3,024 | ||||||||||||
| Taiwan(3) | 250 | 665 | – | 915 | ||||||||||||
| United Kingdom(3) | 2,530 | 3,861 | – | 6,391 | ||||||||||||
| United States | 728 | – | – | 728 | ||||||||||||
| Vietnam(3) | – | 774 | – | 774 | ||||||||||||
| Repurchase Agreement | – | 667 | – | 667 | ||||||||||||
| Total | $ | 20,421 | $ | 35,173 | $ | – | $ | 55,594 | ||||||||
| (1) | Refer to Note 2(i) for a description of fair value measurements and the three-tier hierarchy of inputs. | |
| (2) | See Schedule of Investments for fair values in each industry and identification of foreign issuers and/or geography. The table above is presented by Investment Type. Industries are presented within an Investment Type should such Investment Type include securities classified as two or more levels within the three-tier fair value hierarchy. | |
| (3) | Securities in the amount of $19,006,256 were transferred from Level 1 to Level 2 during the fiscal year ended December 31, 2017, due to a change in valuation technique. As of December 31, 2017, the Fund utilized adjusted valuations (as described in Note 2(a)), which resulted in Level 2 inputs. As of December 31, 2016, the Fund utilized the last sale or official closing price on the exchange or system on which the securities are principally traded, which resulted in Level 1 inputs. |
| See Notes to Financial Statements. | 13 |
Statement of Assets and Liabilities
December 31, 2017
| ASSETS: | ||||
| Investments in securities, at fair value (cost $45,484,241) | $ | 55,594,386 | ||
| Foreign cash, at value (cost $982,249) | 995,941 | |||
| Receivables: | ||||
| Investment securities sold | 224,470 | |||
| Interest and dividends | 59,015 | |||
| Capital shares sold | 23,129 | |||
| From advisor (See Note 3) | 8,818 | |||
| Prepaid expenses | 280 | |||
| Total assets | 56,906,039 | |||
| LIABILITIES: | ||||
| Payables: | ||||
| Management fee | 35,525 | |||
| Investment securities purchased | 29,189 | |||
| Capital shares reacquired | 28,258 | |||
| Directors’ fees | 8,359 | |||
| Fund administration | 1,895 | |||
| Accrued expenses | 141,140 | |||
| Total liabilities | 244,366 | |||
| NET ASSETS | $ | 56,661,673 | ||
| COMPOSITION OF NET ASSETS: | ||||
| Paid-in capital | $ | 45,384,969 | ||
| Distributions in excess of net investment income | (299,300 | ) | ||
| Accumulated net realized gain on investments and foreign currency related transactions | 1,450,402 | |||
| Net unrealized appreciation on investments and translation of assets and liabilities denominated in foreign currencies | 10,125,602 | |||
| Net Assets | $ | 56,661,673 | ||
| Outstanding shares (50 million shares of common stock authorized, $.001 par value) | 5,748,702 | |||
| Net asset value, offering and redemption price per share (Net assets divided by outstanding shares) | $ | 9.86 |
| 14 | See Notes to Financial Statements. |
For the Year Ended December 31, 2017
| Investment income: | ||||
| Dividends (net of foreign withholding taxes of $97,554) | $ | 875,922 | ||
| Interest | 780 | |||
| Total investment income | 876,702 | |||
| Expenses: | ||||
| Management fee | 390,868 | |||
| Non 12b-1 service fees | 130,428 | |||
| Professional | 65,164 | |||
| Shareholder servicing | 64,273 | |||
| Custody | 51,202 | |||
| Fund administration | 20,846 | |||
| Reports to shareholders | 20,774 | |||
| Directors’ fees | 1,428 | |||
| Other | 8,686 | |||
| Gross expenses | 753,669 | |||
| Expense reductions (See Note 8) | (481 | ) | ||
| Fees waived and expenses reimbursed (See Note 3) | (127,799 | ) | ||
| Net expenses | 625,389 | |||
| Net investment income | 251,313 | |||
| Net realized and unrealized gain (loss): | ||||
| Net realized gain on investments (net of foreign capital gains tax of $50,967) | 8,184,086 | |||
| Net realized loss on foreign currency related transactions | (14,196 | ) | ||
| Net change in unrealized appreciation/depreciation on investments | 8,452,742 | |||
| Net change in unrealized appreciation/depreciation on translation of assets and liabilities denominated in foreign currencies | 17,851 | |||
| Net realized and unrealized gain | 16,640,483 | |||
| Net Increase in Net Assets Resulting From Operations | $ | 16,891,796 |
| See Notes to Financial Statements. | 15 |
Statements of Changes in Net Assets
| INCREASE (DECREASE) IN NET ASSETS | For the Year Ended December 31, 2017 | For the Year Ended December 31, 2016 | ||||||
| Operations: | ||||||||
| Net investment income | $ | 251,313 | $ | 457,593 | ||||
| Net realized gain (loss) on investments and foreign currency related transactions | 8,169,890 | (310,960 | ) | |||||
| Net change in unrealized appreciation/depreciation on investments and translation of assets and liabilities denominated in foreign currencies | 8,470,593 | (2,656,680 | ) | |||||
| Net increase (decrease) in net assets resulting from operations | 16,891,796 | (2,510,047 | ) | |||||
| Distributions to shareholders from: | ||||||||
| Net investment income | (580,813 | ) | (435,134 | ) | ||||
| Net realized gain | (4,487,468 | ) | – | |||||
| Total distributions to shareholders | (5,068,281 | ) | (435,134 | ) | ||||
| Capital share transactions (See Note 13): | ||||||||
| Proceeds from sales of shares | 24,321,830 | 11,437,768 | ||||||
| Reinvestment of distributions | 5,068,281 | 435,134 | ||||||
| Cost of shares reacquired | (27,556,502 | ) | (19,741,659 | ) | ||||
| Net increase (decrease) in net assets resulting from capital share transactions | 1,833,609 | (7,868,757 | ) | |||||
| Net increase (decrease) in net assets | 13,657,124 | (10,813,938 | ) | |||||
| NET ASSETS: | ||||||||
| Beginning of year | $ | 43,004,549 | $ | 53,818,487 | ||||
| End of year | $ | 56,661,673 | $ | 43,004,549 | ||||
| Distributions in excess of net investment income | $ | (299,300 | ) | $ | (151,918 | ) | ||
| 16 | See Notes to Financial Statements. |
This page is intentionally left blank.
17
| Per Share Operating Performance: | ||||||||||||||||||||||||||||
| Investment operations: | Distributions to shareholders from: | |||||||||||||||||||||||||||
| Net asset value, beginning of period | Net invest- ment income(a) | Net realized and unrealized gain (loss) | Total from invest- ment oper- ations | Net investment income | Net realized gain | Total distri- butions | ||||||||||||||||||||||
| 12/31/2017 | $ | 7.79 | $ | 0.05 | $ | 2.99 | $ | 3.04 | $(0.11 | ) | $(0.86 | ) | $ | (0.97 | ) | |||||||||||||
| 12/31/2016 | 8.22 | 0.08 | (0.43 | ) | (0.35 | ) | (0.08 | ) | – | (0.08 | ) | |||||||||||||||||
| 12/31/2015 | 8.07 | 0.06 | 0.83 | 0.89 | (0.07 | ) | (0.67 | ) | (0.74 | ) | ||||||||||||||||||
| 12/31/2014 | 10.08 | 0.09 | (0.64 | ) | (0.55 | ) | (0.13 | ) | (1.33 | ) | (1.46 | ) | ||||||||||||||||
| 12/31/2013 | 8.48 | 0.09 | 2.56 | 2.65 | (0.19 | ) | (0.86 | ) | (1.05 | ) | ||||||||||||||||||
| (a) | Calculated using average shares outstanding during the period. |
| (b) | Total return does not consider the effects of sales charges or other expenses imposed by an insurance company and assumes the reinvestment of all distributions. |
| 18 | See Notes to Financial Statements. |
| Ratios to Average Net Assets: | Supplemental Data: | |||||||||||||||||||||||||
| Net asset value, end of period | Total return(b) (%) | Total expenses after waivers and/or reimbursements (%) | Total expenses (%) | Net investment income (%) | Net assets, end of period (000) | Portfolio turnover rate (%) | ||||||||||||||||||||
| $ | 9.86 | 39.21 | 1.20 | 1.44 | 0.48 | $ | 56,662 | 75 | ||||||||||||||||||
| 7.79 | (4.28 | ) | 1.20 | 1.57 | 0.97 | 43,005 | 84 | |||||||||||||||||||
| 8.22 | 11.10 | 1.20 | 1.52 | 0.73 | 53,818 | 87 | ||||||||||||||||||||
| 8.07 | (5.76 | ) | 1.20 | 1.49 | 0.90 | 48,508 | 65 | |||||||||||||||||||
| 10.08 | 31.70 | 1.20 | 1.44 | 0.93 | 57,067 | 89 | ||||||||||||||||||||
| See Notes to Financial Statements. | 19 |
| 1. | ORGANIZATION |
Lord Abbett Series Fund, Inc. (the “Company”) is registered under the Investment Company Act of 1940, as amended (the “Act”), as a diversified, open-end management investment company and was incorporated under Maryland law in 1989. The Company consists of twelve separate portfolios. This report covers International Opportunities Portfolio (the “Fund”).
The Fund’s investment objective is long-term capital appreciation. The Fund has Variable Contract class shares (“Class VC Shares”), which are currently issued and redeemed only in connection with investments in, and payments under, variable annuity contracts and variable life insurance policies issued by life insurance and insurance-related companies.
The preparation of the financial statements in conformity with accounting principles generally accepted in the United States of America (“U.S. GAAP”) requires management to make certain estimates and assumptions that affect the reported amounts of assets and liabilities and disclosure of contingent assets and liabilities at the date of the financial statements and the reported amounts of increases and decreases in net assets from operations during the reporting period. Actual results could differ from those estimates. The Fund is considered an investment company under U.S. GAAP and follows the accounting and reporting guidance applicable to investment companies.
| 2. | SIGNIFICANT ACCOUNTING POLICIES |
| (a) | Investment Valuation–Under procedures approved by the Fund’s Board of Directors (the “Board”), Lord, Abbett & Co. LLC (“Lord Abbett”), the Fund’s investment manager, has formed a Pricing Committee to administer the pricing and valuation of portfolio investments and to ensure that prices utilized reasonably reflect fair value. Among other things, these procedures allow the Fund to utilize independent pricing services, quotations from securities and financial instrument dealers and other market sources to determine fair value. |
| Securities actively traded on any recognized U.S. or non-U.S. exchange or on The NASDAQ Stock Market LLC are valued at the last sale price or official closing price on the exchange or system on which they are principally traded. Events occurring after the close of trading on non-U.S. exchanges may result in adjustments to the valuation of foreign securities to reflect their fair value as of the close of regular trading on the New York Stock Exchange. The Fund may utilize an independent fair valuation service in adjusting the valuations of foreign securities. Unlisted equity securities are valued at the last quoted sale price or, if no sale price is available, at the mean between the most recently quoted bid and asked prices. Exchange traded options and futures contracts are valued at the last sale price in the market where they are principally traded. If no sale has occurred, the mean between the most recently quoted bid and asked prices is used. | |
| Securities for which prices are not readily available are valued at fair value as determined by the Pricing Committee. The Pricing Committee considers a number of factors, including observable and unobservable inputs, when arriving at fair value. The Pricing Committee may use related or comparable assets or liabilities, recent transactions, market multiples, book values and other relevant information to determine the fair value of portfolio investments. The Board or a designated committee thereof regularly reviews fair value determinations made by the Pricing Committee and may employ techniques such as reviewing related market activity, reviewing inputs and assumptions, and retrospectively comparing prices of subsequent purchases and sales transactions to fair value determinations made by the Pricing Committee. |
20
Notes to Financial Statements (continued)
| Short-term securities with 60 days or less remaining to maturity are valued using the amortized cost method, which approximates fair value. | |
| (b) | Security Transactions–Security transactions are recorded as of the date that the securities are purchased or sold (trade date). Realized gains and losses on sales of portfolio securities are calculated using the identified-cost method. |
| (c) | Investment Income–Dividend income is recorded on the ex-dividend date. Interest income is recorded on the accrual basis as earned. Discounts are accreted and premiums are amortized using the effective interest method and are included in Interest and other income on the Statement of Operations. Withholding taxes on foreign dividends have been provided for in accordance with the applicable country’s tax rules and rates. |
| (d) | Income Taxes–It is the policy of the Fund to meet the requirements of Subchapter M of the Internal Revenue Code applicable to regulated investment companies and to distribute substantially all taxable income and capital gains to its shareholders. Therefore, no income tax provision is required. |
| The Fund files U.S. federal and various state and local tax returns. No income tax returns are currently under examination. The statute of limitations on the Fund’s filed U.S. federal tax returns remains open for the fiscal years ended December 31, 2014 through December 31, 2017. The statutes of limitations on the Company’s state and local tax returns may remain open for an additional year depending upon the jurisdiction. | |
| (e) | Expenses–Expenses incurred by the Company that do not specifically relate to an individual fund are generally allocated to the funds within the Company on a pro rata basis by relative net assets. |
| (f) | Foreign Transactions–The books and records of the Fund are maintained in U.S. dollars and transactions denominated in foreign currencies are recorded in the Fund’s records at the rate prevailing when earned or recorded. Asset and liability accounts that are denominated in foreign currencies are adjusted daily to reflect current exchange rates and any unrealized gain (loss) is included in Net change in unrealized appreciation/depreciation on translation of assets and liabilities denominated in foreign currencies in the Fund’s Statement of Operations. The resultant exchange gains and losses upon settlement of such transactions are included in Net realized loss on foreign currency related transactions in the Fund’s Statement of Operations. The Fund does not isolate that portion of the results of operations arising as a result of changes in the foreign exchange rates from the changes in market prices of the securities. |
| The Fund uses foreign currency exchange contracts to facilitate transactions in foreign-denominated securities. Losses from these transactions may arise from changes in the value of the foreign currency or if the counterparties do not perform under the contracts’ terms. | |
| (g) | Forward Foreign Currency Exchange Contracts–The Fund may enter into forward foreign currency exchange contracts in order to reduce exposure to changes in foreign currency exchange rates on foreign portfolio holdings or gain or reduce exposure to foreign currency solely for investment purposes. A forward foreign currency exchange contract is a commitment to purchase or sell a foreign currency at a future date at a negotiated rate. The contracts are valued daily at forward exchange rates and any unrealized gain (loss) is included in Net change in unrealized appreciation/depreciation on translation of assets and liabilities denominated in foreign currencies in the Fund’s Statement of Operations. The gain (loss) arising from the difference between the U.S. dollar cost of the original contract and the value of the foreign currency in U.S. dollars upon closing of such contracts is included in Net realized loss on foreign currency related transactions in the Fund’s Statement of Operations. |
21
Notes to Financial Statements (continued)
| (h) | Repurchase Agreements–The Fund may enter into repurchase agreements with respect to securities. A repurchase agreement is a transaction in which a fund acquires a security and simultaneously commits to resell that security to the seller (a bank or securities dealer) at an agreed-upon price on an agreed-upon date. The Fund requires at all times that the repurchase agreement be collateralized by cash, or by securities of the U.S. Government, its agencies, its instrumentalities, or U.S. Government sponsored enterprises having a value equal to, or in excess of, the value of the repurchase agreement (including accrued interest). If the seller of the agreement defaults on its obligation to repurchase the underlying securities at a time when the fair value of these securities has declined, the Fund may incur a loss upon disposition of the securities. |
| (i) | Fair Value Measurements–Fair value is defined as the price that the Fund would receive upon selling an investment or transferring a liability in an orderly transaction to an independent buyer in the principal or most advantageous market of the investment. A three-tier hierarchy is used to maximize the use of observable market data and minimize the use of unobservable inputs and to establish classification of fair value measurements for disclosure purposes. Inputs refer broadly to the assumptions that market participants would use in pricing the asset or liability, including assumptions about risk—for example, the risk inherent in a particular valuation technique used to measure fair value (such as a pricing model) and/or the risk inherent in the inputs to the valuation technique. Inputs may be observable or unobservable. Observable inputs reflect the assumptions market participants would use in pricing the asset or liability. Observable inputs are based on market data obtained from sources independent of the reporting entity. Unobservable inputs reflect the reporting entity’s own assumptions about the assumptions market participants would use in pricing the asset or liability. Unobservable inputs are based on the best information available in the circumstances. The three-tier hierarchy classification is determined based on the lowest level of inputs that is significant to the fair value measurement, and is summarized in the three broad Levels listed below: |
| ● | Level 1 – | unadjusted quoted prices in active markets for identical investments; | |
| ● | Level 2 – | other significant observable inputs (including quoted prices for similar investments, interest rates, prepayment speeds, credit risk, etc.); and | |
| ● | Level 3 – | significant unobservable inputs (including the Fund’s own assumptions in determining the fair value of investments). |
| A summary of inputs used in valuing the Fund’s investments as of December 31, 2017 and, if applicable, Level 1/Level 2 transfers and Level 3 rollforwards for the fiscal year then ended is included in the Fund’s Schedule of Investments. | |
| Changes in valuation techniques may result in transfers into or out of an assigned level within the three-tier hierarchy. All transfers between different levels within the three-tier hierarchy are deemed to have occurred as of the beginning of the reporting period. The inputs or methodology used for valuing securities are not necessarily an indication of the risk associated with investing in those securities. | |
| 3. | MANAGEMENT FEE AND OTHER TRANSACTIONS WITH AFFILIATES |
Management Fee
The Company has a management agreement with Lord Abbett, pursuant to which Lord Abbett supplies the Fund with investment management services and executive and other personnel, provides office space and pays for ordinary and necessary office and clerical expenses relating to research and statistical work and supervision of the Fund’s investment portfolio.
22
Notes to Financial Statements (continued)
The management fee is based on the Fund’s average daily net assets at the following annual rate:
| First $1 billion | .75% |
| Next $1 billion | .70% |
| Over $2 billion | .65% |
For the fiscal year ended December 31, 2017, the effective management fee, net of waivers, was at an annualized rate of .50% of the Fund’s average daily net assets.
In addition, Lord Abbett provides certain administrative services to the Fund pursuant to an Administrative Services Agreement in return for a fee at an annual rate of ..04% of the Fund’s average daily net assets.
During the fiscal year ended December 31, 2017 and continuing through April 30, 2018, Lord Abbett has contractually agreed to waive its fees and reimburse expenses to the extent necessary to limit total net annual operating expenses to an annual rate of 1.20%. This agreement may be terminated only upon the approval of the Board.
The Company, on behalf of the Fund, has entered into services arrangements with certain insurance companies. Under these arrangements, certain insurance companies will be compensated up to .25% of the average daily net asset value (“NAV”) of the Fund’s Class VC Shares held in the insurance company’s separate account to service and maintain the Variable Contract owners’ accounts. This amount is included in Non 12b-1 service fees on the Statement of Operations. The Fund may also compensate certain insurance companies, third-party administrators and other entities for providing recordkeeping, sub-transfer agency and other administrative services to the Fund. This amount is included in Shareholder servicing on the Statement of Operations.
Two Directors and certain of the Company’s officers have an interest in Lord Abbett.
| 4. | DISTRIBUTIONS AND CAPITAL LOSS CARRYFORWARDS |
Dividends from net investment income, if any, are declared and paid at least semi-annually. Taxable net realized gains from investment transactions, reduced by allowable capital loss carryforwards, if any, are declared and distributed to shareholders at least annually. The capital loss carryforward amount, if any, is available to offset future net capital gains. Dividends and distributions to shareholders are recorded on the ex-dividend date. The amounts of dividends and distributions from net investment income and net realized capital gains are determined in accordance with federal income tax regulations, which may differ from U.S. GAAP. These book/tax differences are either considered temporary or permanent in nature. To the extent these differences are permanent in nature, such amounts are reclassified within the components of net assets based on their federal tax basis treatment; temporary differences do not require reclassification. Dividends and distributions that exceed earnings and profits for tax purposes are reported as a tax return of capital.
The tax character of distributions paid during the fiscal years ended December 31, 2017 and 2016 was as follows:
| Year Ended 12/31/2017 | Year Ended 12/31/2016 | |||||||
| Distributions paid from: | ||||||||
| Ordinary income | $ | 669,964 | $ | 435,134 | ||||
| Net long-term capital gains | 4,398,317 | – | ||||||
| Total distributions paid | $ | 5,068,281 | $ | 435,134 | ||||
23
Notes to Financial Statements (continued)
As of December 31, 2017, the components of accumulated gains on a tax-basis were as follows:
| Undistributed ordinary income – net | $ | 409,768 | ||
| Undistributed long-term capital gains | 1,261,369 | |||
| Total undistributed earnings | 1,671,137 | |||
| Temporary differences | (8,356 | ) | ||
| Unrealized gains – net | 9,613,923 | |||
| Total accumulated gains – net | $ | 11,276,704 |
As of December 31, 2017, the aggregate unrealized security gains and losses on investments and other financial instruments based on cost for U.S. federal income tax purposes were as follows:
| Tax cost | $ | 45,995,920 | ||
| Gross unrealized gain | 10,496,338 | |||
| Gross unrealized loss | (897,872 | ) | ||
| Net unrealized security gain | $ | 9,598,466 |
The difference between book-basis and tax-basis unrealized gains (losses) is attributable to the tax treatment of certain securities, forward currency contracts, and wash sales.
Permanent items identified during the fiscal year ended December 31, 2017 have been reclassified among the components of net assets based on their tax basis treatment as follows:
| Distributions in Excess of Net Investment Income | Accumulated Net Realized Gain | ||
| $182,118 | $(182,118 | ) |
The permanent differences are attributable to the tax treatment of certain securities, certain expenses, and foreign currency transactions.
| 5. | PORTFOLIO SECURITIES TRANSACTIONS |
Purchases and sales of investment securities (excluding short-term investments) for the fiscal year ended December 31, 2017 were as follows:
| Purchases | Sales | ||
| $38,206,305 | $42,219,284 |
There were no purchases or sales of U.S. Government securities for the fiscal year ended December 31, 2017.
| 6. | DISCLOSURES ABOUT OFFSETTING ASSETS AND LIABILITIES |
The Financial Accounting Standards Board (“FASB”) requires disclosures intended to help better assess the effect or potential effect of offsetting arrangements on a fund’s financial position. The following tables illustrate gross and net information about recognized assets and liabilities eligible for offset in the statement of assets and liabilities; and disclose such amounts subject to an enforceable master netting agreement or similar agreement, by counterparty. A master netting agreement is an agreement between a fund and a counterparty which provides for the net settlement of amounts owed under all contracts traded under that agreement, as well as cash collateral, through a single payment by one party to the other in the event of default on or termination of any one contract. The Fund’s accounting policy with respect to balance sheet offsetting is that, absent an event of default by the counterparty or a termination of the agreement, the master netting agreement does not result in an offset of reported amounts of
24
Notes to Financial Statements (continued)
financial assets and liabilities in the statement of assets and liabilities across transactions between the Fund and the applicable counterparty:
| Description | Gross Amounts of Recognized Assets | Gross Amounts Offset in the Statement of Assets and Liabilities | Net Amounts of Assets Presented in the Statement of Assets and Liabilities | |||||||||
| Repurchase Agreement | $667,394 | $ | – | $667,394 | ||||||||
| Total | $667,394 | $ | – | $667,394 | ||||||||
| Net Amounts of Assets Presented in | Amounts Not Offset in the Statement of Assets and Liabilities | |||||||||||||||||||
| Counterparty | the Statement of Assets and Liabilities | Financial Instruments | Cash Collateral Received(a) | Securities Collateral Received(a) | Net Amount(b) | |||||||||||||||
| Fixed Income Clearing Corp. | $667,394 | $ | – | $ | – | $(667,394 | ) | $ | – | |||||||||||
| Total | $667,394 | $ | – | $ | – | $(667,394 | ) | $ | – | |||||||||||
| (a) | Collateral disclosed is limited to an amount not to exceed 100% of the net amount of assets presented in the Statement of Assets and Liabilities, for each respective counterparty. |
| (b) | Net amount represents the amount owed to the Fund by the counterparty as of December 31, 2017. |
| 7. | DIRECTORS’ REMUNERATION |
The Company’s officers and two Directors, who are associated with Lord Abbett, do not receive any compensation from the Company for serving in such capacities. Independent Directors’ fees are allocated among all Lord Abbett-sponsored funds based on the net assets of each fund. There is an equity-based plan available to all Independent Directors under which Independent Directors must defer receipt of a portion of, and may elect to defer receipt of an additional portion of Directors’ fees. The deferred amounts are treated as though equivalent dollar amounts had been invested in the funds. Such amounts and earnings accrued thereon are included in Directors’ fees on the Statement of Operations and in Directors’ fees payable on the Statement of Assets and Liabilities and are not deductible for U.S. federal income tax purposes until such amounts are paid.
| 8. | EXPENSE REDUCTIONS |
The Company has entered into an arrangement with its transfer agent and custodian, whereby credits realized as a result of uninvested cash balances are used to reduce a portion of the Fund’s expenses.
| 9. | LINE OF CREDIT |
Effective August 28, 2017, the Fund and certain other funds managed by Lord Abbett (collectively, the “Participating Funds”) entered into an amended syndicated line of credit facility with various lenders for $600 million (the “Facility”), whereas State Street Bank and Trust Company (“SSB”) participates as a lender and as agent for the lenders. The Facility is to be used for temporary or emergency purposes as an additional source of liquidity to satisfy redemptions. The Participating Funds are subject to graduated borrowing limits of one-third of Fund assets (if Fund assets are less than $750 million), $250 million, $300 million, or $350 million, based on past borrowings and likelihood of future borrowings.
Prior to August 28, 2017, the Funds and certain other funds managed by Lord Abbett participated in a $550 million syndicated line of credit facility, based on the same terms as described above.
25
Notes to Financial Statements (continued)
During the fiscal year ended December 31, 2017, the Fund did not utilize the Facility.
| 10. | INTERFUND LENDING PROGRAM |
Pursuant to an exemptive order issued by the U.S. Securities and Exchange Commission (“SEC exemptive order”), certain registered open-end management investment companies managed by Lord Abbett, including the Fund, participate in a joint lending and borrowing program (the “Interfund Lending Program”). The SEC exemptive order allows the Funds to borrow money from and lend money to each other for temporary or emergency purposes subject to the limitations and conditions.
During the fiscal year ended December 31, 2017, the Fund did not participate as a borrower or lender in the Interfund Lending Program.
| 11. | CUSTODIAN AND ACCOUNTING AGENT |
SSB is the Company’s custodian and accounting agent. SSB performs custodial, accounting and recordkeeping functions relating to portfolio transactions and calculating the Fund’s NAV.
| 12. | INVESTMENT RISKS |
The Fund is subject to the general risks and considerations associated with equity investing. These include the risks of investing in equity markets in foreign countries, the risk of investing in derivatives, liquidity risk, and the risks from leverage. The value of an investment will fluctuate in response to movements in the stock market in general, and to the changing prospects of individual companies in which the Fund invests. The Fund is subject to the risks of investing in foreign securities and in the securities of small companies. Foreign securities may pose greater risks than domestic securities, including greater price fluctuations and higher transaction costs. The securities of foreign companies also may be subject to inadequate exchange control regulations, the imposition of economic sanctions or other government restrictions, higher transaction and other costs, and delays in settlement to the extent they are traded on non-U.S. exchanges or markets. Foreign investments also may be affected by changes in currency rates or currency controls. These risks are generally greater for securities issued by companies in emerging market countries. Investing in small companies generally involves greater risks than investing in the stocks of larger companies, including more volatility and less liquidity.
The Fund is also subject to the risks associated with derivatives, which may be different from and greater than the risks associated with investing directly in securities and other instruments. Derivatives may be subject to risks such as liquidity risk, leveraging risk, interest rate risk, market risk, and credit risk. Illiquid securities may lower the Fund’s returns since the Fund may be unable to sell these securities at their desired time or price. Derivatives also may involve the risk of mispricing or improper valuation and the risk that changes in the value of the derivative may not correlate perfectly with the value of the underlying asset, rate or index. Whether the Fund’s use of derivatives is successful will depend on, among other things, the Fund’s ability to correctly forecast market movements, changes in foreign exchange and interest rates, and other factors. If the Fund incorrectly forecasts these and other factors, its performance could suffer. The Fund’s use of derivatives could result in a loss exceeding the amount of the Fund’s investment in these instruments.
These factors can affect the Fund’s performance.
26
Notes to Financial Statements (concluded)
| 13. | SUMMARY OF CAPITAL TRANSACTIONS |
Transactions in shares of capital stock were as follows:
| Year Ended December 31, 2017 | Year Ended December 31, 2016 | |||||||
| Shares sold | 2,634,183 | 1,441,534 | ||||||
| Reinvestment of distributions | 523,558 | 56,070 | ||||||
| Shares reacquired | (2,932,383 | ) | (2,519,824 | ) | ||||
| Increase (decrease) | 225,358 | (1,022,220 | ) | |||||
27
Report of Independent Registered Public Accounting Firm
To the Board of Directors of Lord Abbett Series Fund, Inc. and the shareholders of International Opportunities Portfolio:
Opinion on the Financial Statements and Financial Highlights
We have audited the accompanying statement of assets and liabilities, including the schedule of investments, of the International Opportunities Portfolio, one of the portfolios constituting the Lord Abbett Series Fund, Inc. (the “Fund”), as of December 31, 2017, the related statement of operations for the year then ended, the statements of changes in net assets for each of the two years in the period then ended, the financial highlights for each of the five years in the period then ended, and the related notes. In our opinion, the financial statements and financial highlights present fairly, in all material respects, the financial position of the International Opportunities Portfolio of the Fund as of December 31, 2017, the results of its operations for the year then ended, the changes in its net assets for each of the two years in the period then ended, and the financial highlights for each of the five years in the period then ended, in conformity with accounting principles generally accepted in the United States of America.
Basis for Opinion
These financial statements and financial highlights are the responsibility of the Fund’s management. Our responsibility is to express an opinion on the Fund’s financial statements and financial highlights based on our audits. We are a public accounting firm registered with the Public Company Accounting Oversight Board (United States) (PCAOB) and are required to be independent with respect to the Fund in accordance with the U.S. federal securities laws and the applicable rules and regulations of the Securities and Exchange Commission and the PCAOB.
We conducted our audits in accordance with the standards of the PCAOB. Those standards require that we plan and perform the audit to obtain reasonable assurance about whether the financial statements and financial highlights are free of material misstatement, whether due to error or fraud. The Fund is not required to have, nor were we engaged to perform, an audit of its internal control over financial reporting. As part of our audits we are required to obtain an understanding of internal control over financial reporting but not for the purpose of expressing an opinion on the effectiveness of the Fund’s internal control over financial reporting. Accordingly, we express no such opinion.
Our audits included performing procedures to assess the risks of material misstatement of the financial statements and financial highlights, whether due to error or fraud, and performing procedures that respond to those risks. Such procedures included examining, on a test basis, evidence regarding the amounts and disclosures in the financial statements and financial highlights. Our audits also included evaluating the accounting principles used and significant estimates made by management, as well as evaluating the overall financial statement presentation and financial highlights. Our procedures included confirmation of securities owned as of December 31, 2017, by correspondence with the custodian and brokers; when replies were not received from brokers, we performed other auditing procedures. We believe that our audits provide a reasonable basis for our opinion.
DELOITTE & TOUCHE LLP
New York, New York
February 15, 2018
We have served as the auditor of one or more Lord Abbett Family of Funds’ investment companies since 1932.
28
Basic Information About Management
The Board is responsible for the management of the business and affairs of the Company in accordance with the laws of the State of Maryland. The Board elects officers who are responsible for the day-to-day operations of the Fund and who execute policies authorized by the Board. The Board also approves an investment adviser to the Fund and continues to monitor the cost and quality of the services the investment adviser provides, and annually considers whether to renew the contract with the adviser. Generally, each Director holds office until his/her successor is elected and qualified or until his/her earlier resignation or removal, as provided in the Company’s organizational documents.
Lord Abbett, a Delaware limited liability company, is the Fund’s investment adviser. Designated Lord Abbett personnel are responsible for the day-to-day management of the Fund.
Interested Directors
Ms. Foster and Mr. Sieg are affiliated with Lord Abbett and are “interested persons” of the Fund as defined in the Act. Ms. Foster and Mr. Sieg are directors/trustees of each of the 12 investment companies in the Lord Abbett Family of Funds, which consist of 61 portfolios or series. Ms. Foster is an officer of the Lord Abbett Family of Funds.
| Name, Address and Year of Birth | Current Position and Length of Service with the Company | Principal Occupation and Other Directorships During the Past Five Years | ||
| Daria L. Foster(1) Lord, Abbett & Co. LLC 90 Hudson Street Jersey City, NJ 07302 (1954) | Director and President since 2006; Chief Executive Officer since 2012 | Principal Occupation: Managing Partner of Lord Abbett, joined Lord Abbett in 1990.
Other Directorships: None.
| ||
| Douglas B. Sieg(1) Lord, Abbett & Co. LLC 90 Hudson Street Jersey City, NJ 07302 (1969) | Director since 2016 | Principal Occupation: Partner (since 2001) and Head of Client Services (since 2013), formerly Director of Marketing and Relationship Management, joined Lord Abbett in 1994.
Other Directorships: None. |
Independent Directors
The following Independent Directors also are directors/trustees of each of the 12 investment companies in the Lord Abbett Family of Funds, which consist of 61 portfolios or series.
| Name, Address and Year of Birth | Current Position and Length of Service with the Company | Principal Occupation and Other Directorships During the Past Five Years | ||
| Eric C. Fast Lord, Abbett & Co. LLC c/o Legal Dept. 90 Hudson Street Jersey City, NJ 07302 (1949) | Director since 2014 | Principal Occupation: Chief Executive Officer of Crane Co., an industrial products company (2001–2014).
Other Directorships: Currently serves as director of Automatic Data Processing, Inc. (since 2007) and Regions Financial Corporation (since 2010). Previously served as a director of Crane Co. (1999–2014). |
| (1) | Daria L. Foster, Managing Partner of Lord Abbett, a member of the Board, and the Chief Executive Officer and President of the Lord Abbett Family of Funds, will retire from her positions with Lord Abbett and the Lord Abbett Family of Funds effective March 31, 2018. Douglas B. Sieg, Partner and head of Client Services at Lord Abbett, and a member of the Board, will succeed Ms. Foster effective April 1, 2018. |
29
Basic Information About Management (continued)
| Name, Address and Year of Birth | Current Position and Length of Service with the Company | Principal Occupation and Other Directorships During the Past Five Years | ||
| Evelyn E. Guernsey Lord, Abbett & Co. LLC c/o Legal Dept. 90 Hudson Street Jersey City, NJ 07302 (1955) | Director since 2011 | Principal Occupation: CEO, Americas of J.P. Morgan Asset Management (2004–2010).
Other Directorships: None. | ||
| Julie A. Hill Lord, Abbett & Co. LLC c/o Legal Dept. 90 Hudson Street Jersey City, NJ 07302 (1946) | Director since 2004 | Principal Occupation: Owner and CEO of The Hill Company, a business consulting firm (since 1998).
Other Directorships: Currently serves as director of Anthem, Inc., a health benefits company (since 1994). | ||
| Franklin W. Hobbs Lord, Abbett & Co. LLC c/o Legal Dept. 90 Hudson Street Jersey City, NJ 07302 (1947) | Director since 2001 | Principal Occupation: President and CEO of Ribbon Communications (since 2017) and Advisor of One Equity Partners, a private equity firm (since 2004).
Other Directorships: Currently serves as director of Ribbon Communications (since 2017), director and Chairman of the Board of Ally Financial Inc., a financial services firm (since 2009), and as director of Molson Coors Brewing Company (since 2002). | ||
| Kathleen M. Lutito Lord, Abbett & Co. LLC c/o Legal Dept. 90 Hudson Street Jersey City, NJ 07302 (1963) | Director since 2017 | Principal Occupation: President and Chief Investment Officer of CenturyLink Investment Management Company (since 2006).
Other Directorships: None | ||
| James M. McTaggart Lord, Abbett & Co. LLC c/o Legal Dept. 90 Hudson Street Jersey City, NJ 07302 (1947) | Director since 2012 | Principal Occupation: Independent management advisor and consultant (since 2012); Vice President, CRA International, Inc. (doing business as Charles River Associates), a global management consulting firm (2009–2012); Founder and Chairman of Marakon Associates, Inc., a strategy consulting firm (1978–2009); and Officer and Director of Trinsum Group, a holding company (2007–2009).
Other Directorships: Blyth, Inc., a home products company (2004–2015). | ||
| Karla M. Rabusch Lord, Abbett & Co. LLC c/o Legal Dept. 90 Hudson Street Jersey City, NJ 07302 (1959) | Director since 2017 | Principal Occupation: President and Director of Wells Fargo Funds Management, LLC (2003–2017); President of Wells Fargo Funds (2003–2016).
Other Directorships: None. | ||
| Mark A. Schmid Lord, Abbett & Co. LLC c/o Legal Dept. 90 Hudson Street Jersey City, NJ 07302 (1959) | Director since 2016 | Principal Occupation: Vice President and Chief Investment Officer of the University of Chicago (since 2009).
Other Directorships: None. |
30
Basic Information About Management (continued)
| Name, Address and Year of Birth | Current Position and Length of Service with the Company | Principal Occupation and Other Directorships During the Past Five Years | ||
| James L.L. Tullis Lord, Abbett & Co. LLC c/o Legal Dept. 90 Hudson Street Jersey City, NJ 07302 (1947) | Director since 2006; Chairman since 2017 | Principal Occupation: CEO of Tullis-Dickerson and Co. Inc., a venture capital management firm (since 1990); CEO of Tullis Health Investors Inc. (since 2012).
Other Directorships: Currently serves as director of Crane Co. (since 1998).
|
Officers
None of the officers listed below have received compensation from the Company. All of the officers of the Company also may be officers of the other Lord Abbett Funds and maintain offices at 90 Hudson Street, Jersey City, NJ 07302. Unless otherwise indicated, the position(s) and title(s) listed under the “Principal Occupation During the Past Five Years” column indicate each officer’s position(s) and title(s) with Lord Abbett. Each officer serves for an indefinite term (i.e., until his or her death, resignation, retirement, or removal).
| Name and Year of Birth | Current Position with the Company | Length of Service of Current Position | Principal Occupation During the Past Five Years | |||
| Daria L. Foster (1954) | President and Chief Executive Officer | Elected as President in 2006 and Chief Executive Officer in 2012 | Managing Partner of Lord Abbett, joined Lord Abbett in 1990. | |||
| Sean J. Aurigemma (1969) | Executive Vice President | Elected in 2010 | Portfolio Manager, joined Lord Abbett in 2007. | |||
| Jeff D. Diamond (1960) | Executive Vice President | Elected in 2008 | Portfolio Manager, joined Lord Abbett in 2007. | |||
| Todd D. Jacobson (1966) | Executive Vice President | Elected in 2005 | Partner and Associate Director, joined Lord Abbett in 2003. | |||
| Robert A. Lee (1969) | Executive Vice President | Elected in 2010 | Partner and Chief Investment Officer, and was formerly Deputy Chief Investment Officer and Director of Taxable Fixed Income, joined Lord Abbett in 1997. | |||
| David J. Linsen (1974) | Executive Vice President | Elected in 2008 | Partner and Director, joined Lord Abbett in 2001. | |||
| Thomas B. Maher (1967) | Executive Vice President | Elected in 2010 | Partner and Portfolio Manager, joined Lord Abbett in 2003. | |||
| Justin C. Maurer (1969) | Executive Vice President | Elected in 2010 | Partner and Portfolio Manager, joined Lord Abbett in 2001. |
31
Basic Information About Management (continued)
| Name and Year of Birth | Current Position with the Company | Length of Service of Current Position | Principal Occupation During the Past Five Years | |||
| Vincent J. McBride (1964) | Executive Vice President | Elected in 2010 | Partner and Director, joined Lord Abbett in 2003. | |||
| Andrew H. O’Brien (1973) | Executive Vice President | Elected in 2010 | Partner and Portfolio Manager, joined Lord Abbett in 1998. | |||
| F. Thomas O’Halloran, III (1955) | Executive Vice President | Elected in 2010 | Partner and Portfolio Manager, joined Lord Abbett in 2001. | |||
| Marc Pavese (1972) | Executive Vice President | Elected in 2016 | Partner and Portfolio Manager, joined Lord Abbett in 2008. | |||
| Walter H. Prahl (1958) | Executive Vice President | Elected in 2012 | Partner and Director, joined Lord Abbett in 1997. | |||
| Jeffrey Rabinowitz (1972) | Executive Vice President | Elected in 2017 | Portfolio Manager, joined Lord Abbett in 2017 and was formerly a Managing Director and Portfolio Manager/Technology Analyst at Jennison Associates LLC (2014–2017) and Managing Director and Portfolio Manager/ Technology Analyst at Goldman Sachs Asset Management (1999–2014). | |||
| Steven F. Rocco (1979) | Executive Vice President | Elected in 2014 | Partner and Portfolio Manager, joined Lord Abbett in 2004. | |||
| A. Edward Allinson (1961) | Vice President | Elected in 2011 | Portfolio Manager, joined Lord Abbett in 2005. | |||
| Matthew R. DeCicco (1977) | Vice President | Elected in 2003 | Portfolio Manager, joined Lord Abbett in 1999. | |||
| Brooke A. Fapohunda (1975) | Vice President and Assistant Secretary | Elected in 2014 | Partner and Deputy General Counsel, joined Lord Abbett in 2006. | |||
| John K. Forst (1960) | Vice President and Assistant Secretary | Elected in 2005 | Partner and Deputy General Counsel, joined Lord Abbett in 2004. | |||
| Bernard J. Grzelak (1971) | Chief Financial Officer and Vice President | Elected in 2017 | Partner and Chief Operations Officer, and was formerly Director of Fund Administration, joined Lord Abbett in 2003. | |||
| Lawrence H. Kaplan (1957) | Vice President and Secretary | Elected in 1997 | Partner and General Counsel, joined Lord Abbett in 1997. |
32
Basic Information About Management (concluded)
| Name and Year of Birth | Current Position with the Company | Length of Service of Current Position | Principal Occupation During the Past Five Years | |||
| Linda Y. Kim (1980) | Vice President and Assistant Secretary | Elected in 2016 | Counsel, joined Lord Abbett in 2015 and was formerly an Associate at Stroock & Stroock & Lavan LLP (2007–2015). | |||
| Joseph M. McGill (1962) | Chief Compliance Officer | Elected in 2014 | Partner and Chief Compliance Officer, joined Lord Abbett in 2014 and was formerly Managing Director and the Chief Compliance Officer at UBS Global Asset Management (2003–2013). | |||
| A. Edward Oberhaus, III (1959) | Vice President | Elected in 1998 | Partner and Director, joined Lord Abbett in 1983. | |||
| Noah Petrucci (1970) | Vice President | Elected in 2013 | Portfolio Manager, joined Lord Abbett in 2012. | |||
| Lawrence B. Stoller (1963) | Vice President and Assistant Secretary | Elected in 2007 | Partner and Senior Deputy General Counsel, joined Lord Abbett in 2007. | |||
| Leah G. Traub (1979) | Vice President | Elected in 2016 | Partner and Portfolio Manager, joined Lord Abbett in 2007. | |||
| Arthur K. Weise (1970) | Vice President | Elected in 2010 | Partner and Portfolio Manager, joined Lord Abbett in 2007. | |||
| Kewjin Yuoh (1971) | Vice President | Elected in 2012 | Partner and Portfolio Manager, joined Lord Abbett in 2010. | |||
| Scott S. Wallner (1955) | AML Compliance Officer | Elected in 2011 | Assistant General Counsel, joined Lord Abbett in 2004. | |||
| Christian J. Kelly (1975) | Treasurer | Elected in 2017 | Director of Fund Administration, joined Lord Abbett in 2009. |
Please call 888-522-2388 for a copy of the statement of additional information, which contains further information about the Company’s Directors. It is available free upon request.
33
Approval of Advisory Contract
The Board, including all of the Directors who are not “interested persons” of the Company or of Lord Abbett, as defined in the Investment Company Act of 1940, as amended (the “Independent Directors”), annually considers whether to approve the continuation of the existing management agreement between the Fund and Lord Abbett (the “Agreement”). In connection with its most recent approval, the Board reviewed materials relating specifically to the Agreement, as well as numerous materials received throughout the course of the year, including information about the Fund’s investment performance compared to the performance of its benchmark. Before making its decision as to the Fund, the Board had the opportunity to ask questions and request further information, taking into account its familiarity with Lord Abbett gained through its meetings and discussions. These meetings and discussions included reviews of Fund performance conducted by members of the Contract Committee, the deliberations of the Contract Committee, and discussions between the Contract Committee and Lord Abbett’s management. The Independent Directors also met with their independent legal counsel in various private sessions at which no representatives of management were present.
The materials received by the Board included, but were not limited to: (1) information provided by Morningstar, Inc. (“Morningstar”) regarding the investment performance of the Fund compared to the investment performance of certain funds with similar investment styles as determined by Morningstar, based, in part, on the Fund’s Morningstar category (the “performance peer group”), and the investment performance of the Fund’s benchmark; (2) information provided by Morningstar regarding the expense ratios, contractual and actual management fee rates, and other expense components for the Fund and certain funds in the same Morningstar category, with generally the same or similar share classes and operational characteristics, including asset size (the “expense peer group”); (3) certain supplemental investment performance information provided by Lord Abbett; (4) information provided by Lord Abbett on the expense ratios, management fee rates, and other expense components for the Fund; (5) sales and redemption information for the Fund; (6) information regarding Lord Abbett’s financial condition; (7) an analysis of the relative profitability of the Agreement to Lord Abbett; (8) information provided by Lord Abbett regarding the investment management fee schedules for Lord Abbett’s other advisory clients maintaining accounts with a similar investment strategy as the Fund; and (9) information regarding the personnel and other resources devoted by Lord Abbett to managing the Fund.
Investment Management Services Generally. The Board considered the investment management services provided by Lord Abbett to the Fund, including investment research, portfolio management, and trading, and Lord Abbett’s commitment to compliance with all applicable legal requirements. The Board also observed that Lord Abbett was solely engaged in the investment management business and accordingly did not experience the conflicts of interest that may result from being engaged in other lines of business. The Board considered the investment advisory services provided by Lord Abbett to other clients, the fees charged for the services, and the differences in the nature of the services provided to the Fund and other Lord Abbett Funds, on the one hand, and the services provided to other clients, on the other. After reviewing these and related factors, the Board concluded that the Fund was likely to continue to benefit from the nature, extent and quality of the investment services provided by Lord Abbett under the Agreement.
Investment Performance. The Board reviewed the Fund’s investment performance in relation to that of the performance peer group and the Fund’s benchmark as of various periods ended August 31, 2017. The Board observed that the Fund’s investment performance was above the median of the performance peer group for the one-, three-, and five-year periods and below the median for the
34
Approval of Advisory Contract (continued)
ten-year period. The Board considered that Lord Abbett was implementing a plan intended to improve the performance of its equity Funds. The Board further considered Lord Abbett’s performance and reputation generally, the performance of other Lord Abbett-managed funds overseen by the Board, and the willingness of Lord Abbett to take steps intended to improve performance when necessary. After reviewing these and related factors, the Board concluded that the Fund’s Agreement should be continued.
Lord Abbett’s Personnel and Methods. The Board considered the qualifications of the personnel providing investment management services to the Fund, in light of its investment objective and discipline. Among other things, the Board considered the size, experience, and turnover of Lord Abbett’s investment management staff, Lord Abbett’s investment methodology and philosophy, and Lord Abbett’s approach to recruiting, training, and retaining investment management personnel.
Nature and Quality of Other Services. The Board considered the nature, quality, costs, and extent of compliance, administrative, and other services performed by Lord Abbett and the nature and extent of Lord Abbett’s supervision of third party service providers, including the Fund’s transfer agent and custodian.
Expenses. The Board considered the expense level of the Fund and the expense levels of the expense peer group. It also considered how the expense level of the Fund related to those of the expense peer group and the amount and nature of the fees paid by shareholders. The Board observed that the net total expense ratio of the Fund was below the median of the expense peer group. After reviewing these and related factors, the Board concluded, within the context of its overall approval of the Agreement, that the expense level of the Fund was reasonable and supported the continuation of the Agreement.
Profitability. The Board considered the level of Lord Abbett’s operating margin in managing the Fund, including a review of Lord Abbett’s methodology for allocating its costs to its management of the Fund. It considered whether the Fund was profitable to Lord Abbett in connection with the Fund’s operation, including the fee that Lord Abbett receives from the Fund for providing administrative services to the Fund. The Board also considered the profits realized from other business segments of Lord Abbett, which may benefit from or be related to the Fund’s business. The Board considered Lord Abbett’s profit margins excluding Lord Abbett’s marketing and distribution expenses. The Board also considered Lord Abbett’s profit margins, without those exclusions, in comparison with available industry data and how those profit margins could affect Lord Abbett’s ability to recruit and retain investment personnel. The Board recognized that Lord Abbett’s overall profitability was a factor in enabling it to attract and retain qualified investment management personnel to provide services to the Fund. After reviewing these and related factors, the Board concluded, within the context of its overall approval of the Agreement, that Lord Abbett’s profitability with respect to the Fund was not excessive.
Economies of Scale. The Board considered the extent to which there had been economies of scale in managing the Fund, whether the Fund’s shareholders had appropriately benefited from such economies of scale, and whether there was potential for realization of any further economies of scale. The Board concluded that the existing management fee schedule, with its breakpoints in the level of the management fee, in conjunction with the Fund’s proposed expense limitation agreement, adequately addressed any economies of scale in managing the Fund.
35
Approval of Advisory Contract (concluded)
Other Benefits to Lord Abbett. The Board considered the amount and nature of the fees paid by the Fund and the Fund’s shareholders to Lord Abbett for services other than investment advisory services. The Board also considered the revenues and profitability of Lord Abbett’s investment advisory business apart from its mutual fund business, and the intangible benefits enjoyed by Lord Abbett by virtue of its relationship with the Fund. The Board observed that the Distributor receives 12b-1 fees from certain of the Lord Abbett Funds as to shares held in accounts for which there is no other broker of record, may retain a portion of the 12b-1 fees it receives, and receives a portion of the sales charges on sales and redemptions of some classes of shares of the Lord Abbett Funds. In addition, the Board observed that Lord Abbett accrues certain benefits for its business of providing investment advice to clients other than the Lord Abbett Funds, but that business also benefits the Funds. The Board also noted that Lord Abbett, as disclosed in the prospectus of the Fund, has entered into revenue sharing arrangements with certain entities that distribute shares of the Fund. The Board also took into consideration the investment research that Lord Abbett receives as a result of Fund brokerage transactions.
Alternative Arrangements. The Board considered whether, instead of approving continuation of the Agreement, it might be in the best interests of the Fund to implement one or more alternative arrangements, such as continuing to employ Lord Abbett, but on different terms. After considering all of the relevant factors, the Board unanimously found that continuation of the Agreement was in the best interests of the Fund and its shareholders and voted unanimously to approve the continuation of the Agreement. In considering whether to approve the continuation of the Agreement, the Board did not identify any single factor as paramount or controlling. Individual Directors may have evaluated the information presented differently from one another, giving different weights to various factors. This summary does not discuss in detail all matters considered.
36
Householding
The Company has adopted a policy that allows it to send only one copy of the Fund’s prospectus, proxy material, annual report and semiannual report to certain shareholders residing at the same “household.” This reduces Fund expenses, which benefits you and other shareholders. If you need additional copies or do not want your mailings to be “householded,” please call Lord Abbett at 888-522-2388 or send a written request with your name, the name of your fund or funds and your account number or numbers to Lord Abbett Family of Funds, P.O. Box 219336, Kansas City, MO 64121.
Proxy Voting Policies, Procedures and Records
A description of the policies and procedures that Lord Abbett uses to vote proxies related to the Fund’s portfolio securities, and information on how Lord Abbett voted the Fund’s proxies during the 12-month period ended June 30 are available without charge, upon request, (i) by calling 888-522-2388; (ii) on Lord Abbett’s Website at www.lordabbett.com; and (iii) on the Securities and Exchange Commission’s (“SEC”) Website at www.sec.gov.
Shareholder Reports and Quarterly Portfolio Disclosure
The Fund is required to file its complete schedule of portfolio holdings with the SEC for its first and third fiscal quarters on Form N-Q. Copies of the filings are available without charge, upon request on the SEC’s Website at www.sec.gov and may be available by calling Lord Abbett at 888-522-2388. You can also obtain copies of Form N-Q by visiting the SEC’s Public Reference Room in Washington, DC (information on the operation of the Public Reference Room may be obtained by calling 800-SEC-0330).
Tax Information
Of the distribution paid to the shareholders during the year ended December 31, 2017, $89,151 and $4,398,317, respectively, represent short-term capital gains and long-term capital gains.
The Fund intends to pass through foreign source income of $973,274 and foreign taxes of $148,492.
37


This report, when not used for the general information of shareholders of the Fund, is to be distributed only if preceded or accompanied by a current fund prospectus.
Lord Abbett mutual fund shares are distributed by | Lord Abbett Series Fund, Inc.
International Opportunities Portfolio | SFIO-PORT-3 (02/18) |
![]()
LORD ABBETT
ANNUAL REPORT
Lord Abbett
Series Fund—Mid Cap Stock Portfolio
For the fiscal year ended December 31, 2017
Table of Contents
Lord Abbett Series Fund — Mid Cap Stock Portfolio
Annual Report
For the fiscal year ended December 31, 2017

From left to right: James L.L. Tullis, Independent Chairman of the Lord Abbett Funds and Daria L. Foster, Director, President, and Chief Executive Officer of the Lord Abbett Funds.
Dear Shareholders: We are pleased to provide you with this overview of the performance of Lord Abbett Series Fund — Mid Cap Stock Portfolio for the fiscal year ended December 31, 2017. On this page and the following pages, we discuss the major factors that influenced fiscal year performance. For additional information about the Fund, please visit our website at www.lordabbett.com, where you also can access the quarterly commentaries that provide updates on the Fund’s performance and other portfolio related updates.
Thank you for investing in Lord Abbett mutual funds. We value the trust that you place in us and look forward to serving your investment needs in the years to come.
Best regards,

Daria L. Foster
Director, President and Chief Executive Officer
For the fiscal year ended December 31, 2017, the Fund returned 6.83%, reflecting performance at the net asset value (NAV) of Class VC shares, with all distributions reinvested, compared to its benchmark, the Russell Midcap® Value Index,1 which returned 13.34% over the same period.
The domestic equity market (as represented by the S&P 500® Index2) returned 21.83%, ending the year with its strongest quarterly performance in two years and marking its first calendar year with 12 consecutive months of positive performance. Much of the market
momentum was driven by the anticipation of supportive U.S. fiscal policies, as the passage of the Tax Cut and Jobs Act and the prospect of significant infrastructure spending drove the forecast for U.S. gross domestic product (GDP) growth incrementally higher. These forces persisted despite a myriad of geopolitical and environmental headwinds, as threats from North Korea, U.S. political tensions, and Hurricanes Harvey, Irma, and Maria all had the potential to derail the market’s forward progress.
1
During the year, the National Federation of Independent Business Small Business Confidence Index reached a 34 year high, marking its second-highest level in the history of the index. The University of Michigan’s average consumer confidence measure for the year was the highest since 2000, while consumer spending reached an all-time high in the third quarter. A reoccurring theme persisted throughout the year with large caps outperforming small caps and value stocks significantly outpacing their growth-oriented peers.
The U.S. economy continued to expand during the trailing 12-month period. U.S. GDP grew at a 3.2% pace during the third quarter, an increase over the second quarter. The U.S. Bureau of Economic Analysis stated that during the third quarter personal consumption and federal government spending increased, quarter-over-quarter. The Federal Reserve raised target rates three times during the year, changing the target range in December from 1.00–1.25% to 1.25–1.50%. In addition to GDP growth, the U.S. unemployment rate remained relatively steady throughout the period, and was reported at 4.1% in December, a decline of 0.6% year-over-year.
Security selection in the consumer discretionary sector was the largest detractor from the Fund’s relative performance during the period. Within this sector, the Fund’s holdings of Newell Rubbermaid, Inc., a manufacturer and
marketer of consumer and commercial products, detracted. Shares of Newell fell precipitously as a myriad of headwinds continued to adversely affect the company. The bankruptcy of Toys “R” Us and an overall industry slowdown were contributing factors to Newell reporting third quarter results that missed on all fronts. Additionally, Hurricane Harvey disrupted resin supply lines, causing shortages. The Fund’s position in L Brands, Inc., a retail business, also detracted from performance. Shares of L Brands fell as comparable store sales growth from Victoria’s Secret slowed, despite already lowering expectations to account for its exit from the swimwear and apparel categories last year.
Security selection and a modest overweight to the energy sector also detracted from the Fund’s performance. The Fund’s holdings of Marathon Oil Corp., a producer of natural gas and liquid hydrocarbons, detracted. Shares of Marathon fell as oil prices experienced significant volatility during the first half of the year.
During the period, security selection and an overweight in the materials sector were the largest contributors to the Fund’s relative performance. Within the materials sector, the Fund’s holdings of FMC Corp., a developer of products and solutions for various industries, contributed to performance. The required divestiture and subsequent acquisition by FMC of DuPont’s chewing pest insecticide and cereal
2
herbicide business was thought to have high expected synergies and transform FMC into a major player in the crop protection chemical industry. The Fund’s position in Freeport-McMoRan, Inc., a mining company, contributed. Investors expected the negotiations between Freeport-McMoRan and the state-owned PT Indonesia Asahan Aluminium to end favorably, as the Indonesian Government would acquire a majority ownership in the Grasberg mine.
The Fund’s underweight to the telecommunication services sector
contributed as it was the worst performing sector relative to the benchmark during the period. The relatively small sector housed the worst performing stock in the index, Frontier Communications Corporation, which adversely affected the sector’s overall performance.
The Fund’s portfolio is actively managed and, therefore, its holdings and the weightings of a particular issuer or particular sector as a percentage of portfolio assets are subject to change. Sectors may include many industries.
1 The Russell Midcap® Value Index measures the performance of those Russell Midcap companies with lower price-to-book ratios and lower forecasted growth values. The stocks are also members of the Russell 1000® Value index.
2 The S&P 500® Index is widely regarded as the standard for measuring large cap U.S. stock market performance and includes a representative sample of leading companies in leading industries.
Unless otherwise specified, indexes reflect total return, with all dividends reinvested. Indexes are unmanaged, do not reflect the deduction of fees or expenses, and are not available for direct investment.
Important Performance and Other Information
Performance data quoted in the following pages reflect past performance and are no guarantee of future results. Current performance may be higher or lower than the performance quoted. The investment return and principal value of an investment in the Fund will fluctuate so that shares, on any given day or when redeemed, may be worth more or less than their original cost. You can obtain performance data current to the most recent month end by calling Lord Abbett at 888-522-2388 or referring to www.lordabbett.com.
The annual commentary above discusses the views of the Fund’s management and various portfolio holdings of the Fund as of December 31, 2017. These views and portfolio holdings may have changed after this date. Information provided in the commentary is not a recommendation to buy or sell securities. Because the Fund’s portfolio is actively managed and may change significantly, the Fund may no longer own the securities described above or may have otherwise changed its position in the securities. For more recent information about the Fund’s portfolio holdings, please visit www.lordabbett.com.
A Note about Risk: See Notes to Financial Statements for a discussion of investment risks. For a more detailed discussion of the risks associated with the Fund, please see the Fund’s prospectus.
Mutual funds are not insured by the FDIC, are not deposits or other obligations of, or guaranteed by, banks, and are subject to investment risks including possible loss of principal amount invested.
The Fund serves as an underlying investment vehicle for variable annuity contracts and variable life insurance policies.
3
Below is a comparison of a $10,000 investment in Class VC shares with the same investment in both the Russell Midcap® Value Index and the S&P MidCap 400® Value Index assuming reinvestment of all dividends and distributions. The Fund’s shares are sold only to insurance company separate accounts that fund certain variable annuity and variable life contracts. This line graph comparison does not reflect the sales charges or other expenses of these contracts. If those sales charges and expenses were reflected, returns would be lower. The graph and performance table below do not reflect the deduction of taxes that a shareholder would pay on Fund distributions or the redemption of Fund shares. Past performance is no guarantee of future results.
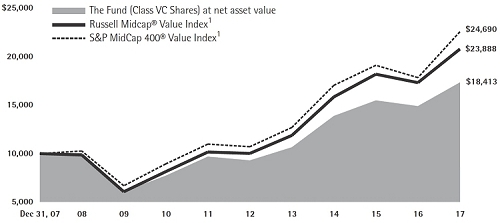
Average Annual Total Returns for the
Periods Ended December 31, 2017
| 1 Year | 5 Years | 10 Years | ||||
| Class VC | 6.83% | 11.70% | 6.29% |
1 Performance for each unmanaged index does not reflect any fees or expenses. The performance of each index is not necessarily representative of the Fund’s performance.
4
As a shareholder of the Fund, you incur ongoing costs, including management fees; expenses related to the Fund’s services arrangements with certain insurance companies; and other Fund expenses. This Example is intended to help you understand your ongoing costs (in dollars) of investing in the Fund and to compare these costs with the ongoing costs of investing in other mutual funds.
The Example is based on an investment of $1,000 invested at the beginning of the period and held for the entire period (July 1, 2017 through December 31, 2017).
The Example reflects only expenses that are deducted from the assets of the Fund. Fees and expenses, including sales charges applicable to the various insurance products that invest in the Fund, are not reflected in this Example. If such fees and expenses were reflected in the Example, the total expenses shown would be higher. Fees and expenses regarding such variable insurance products are separately described in the prospectus related to those products.
Actual Expenses
The first line of the table on the following page provides information about actual account values and actual expenses. You may use the information in this line, together with the amount you invested, to estimate the expenses that you paid over the period. Simply divide your account value by $1,000 (for example, an $8,600 account value divided by $1,000 = 8.6), then multiply the result by the number in the first line under the heading titled “Expenses Paid During Period 7/1/17 – 12/31/17” to estimate the expenses you paid on your account during this period.
Hypothetical Example for Comparison Purposes
The second line of the table on the following page provides information about hypothetical account values and hypothetical expenses based on the Fund’s actual expense ratio and an assumed rate of return of 5% per year before expenses, which is not the Fund’s actual return. The hypothetical account values and expenses may not be used to estimate the actual ending account balance or expenses you paid for the period. You may use this information to compare the ongoing costs of investing in the Fund and other funds. To do so, compare this 5% hypothetical example with the 5% hypothetical examples that appear in the shareholder reports of the other funds.
5
Please note that the expenses shown in the table are meant to highlight your ongoing costs only and do not reflect any transactional costs, such as sales charges. Therefore, the second line of the table is useful in comparing ongoing costs only, and will not help you determine the relative total costs of owning different funds. In addition, if these transactional costs were included, your costs would have been higher.
| Beginning Account Value | Ending Account Value | Expenses Paid During Period† | |||||
| 7/1/17 - | |||||||
| 7/1/17 | 12/31/17 | 12/31/17 | |||||
| Class VC | |||||||
| Actual | $1,000.00 | $1,026.90 | $5.93 | ||||
| Hypothetical (5% Return Before Expenses) | $1,000.00 | $1,019.36 | $5.90 |
| † | Net expenses are equal to the Fund’s annualized expense ratio of 1.16%, multiplied by the average account value over the period, multiplied by 184/365 (to reflect one-half year period). |
Portfolio Holdings Presented by Sector
December 31, 2017
| Sector* | %** | |||
| Consumer Discretionary | 8.01 | % | ||
| Consumer Staples | 4.08 | % | ||
| Energy | 8.98 | % | ||
| Financials | 20.94 | % | ||
| Health Care | 5.45 | % | ||
| Industrials | 13.84 | % | ||
| Information Technology | 7.75 | % | ||
| Materials | 8.91 | % | ||
| Real Estate | 11.06 | % | ||
| Utilities | 7.22 | % | ||
| Repurchase Agreement | 3.76 | % | ||
| Total | 100.00 | % | ||
| * | A sector may comprise several industries. | |
| ** | Represents percent of total investments. |
6
December 31, 2017
| Investments | Shares | Fair Value (000) | ||||||
| COMMON STOCKS 96.19% | ||||||||
| Aerospace & Defense 1.99% | ||||||||
| Textron, Inc. | 116,468 | $ | 6,591 | |||||
| Airlines 1.55% | ||||||||
| Alaska Air Group, Inc. | 69,815 | 5,132 | ||||||
| Banks 9.51% | ||||||||
| CIT Group, Inc. | 90,954 | 4,478 | ||||||
| Citizens Financial Group, Inc. | 156,600 | 6,574 | ||||||
| East West Bancorp, Inc. | 67,700 | 4,118 | ||||||
| First Horizon National Corp. | 203,200 | 4,062 | ||||||
| KeyCorp | 381,800 | 7,701 | ||||||
| Sterling Bancorp | 186,162 | 4,579 | ||||||
| Total | 31,512 | |||||||
| Beverages 2.31% | ||||||||
| Coca-Cola European Partners plc (United Kingdom)(a) | 65,959 | 2,628 | ||||||
| Molson Coors Brewing Co. Class B | 61,356 | 5,036 | ||||||
| Total | 7,664 | |||||||
| Capital Markets 2.97% | ||||||||
| E*TRADE Financial Corp.* | 121,600 | 6,028 | ||||||
| OM Asset Management plc (United Kingdom)(a) | 228,384 | 3,825 | ||||||
| Total | 9,853 | |||||||
| Chemicals 4.63% | ||||||||
| Ashland Global Holdings, Inc. | 64,000 | 4,557 | ||||||
| Axalta Coating Systems Ltd.* | 92,431 | 2,991 | ||||||
| Eastman Chemical Co. | 50,617 | 4,689 | ||||||
| FMC Corp. | 32,611 | 3,087 | ||||||
| Total | 15,324 | |||||||
| Containers & Packaging 1.86% | ||||||||
| Graphic Packaging Holding Co. | 275,936 | 4,263 | ||||||
| Packaging Corp. of America | 15,702 | 1,893 | ||||||
| Total | 6,156 | |||||||
| Investments | Shares | Fair Value (000) | ||||||
| Electric: Utilities 5.04% | ||||||||
| Edison International | 66,700 | $ | 4,218 | |||||
| FirstEnergy Corp. | 209,695 | 6,421 | ||||||
| Great Plains Energy, Inc. | 188,000 | 6,061 | ||||||
| Total | 16,700 | |||||||
| Electrical Equipment 2.91% | ||||||||
| AMETEK, Inc. | 42,501 | 3,080 | ||||||
| Hubbell, Inc. | 48,539 | 6,569 | ||||||
| Total | 9,649 | |||||||
| Electronic Equipment, Instruments & Components 1.10% | ||||||||
| Flex Ltd.* | 202,700 | 3,647 | ||||||
| Energy Equipment & Services 1.18% | ||||||||
| Patterson-UTI Energy, Inc. | 169,812 | 3,907 | ||||||
| Equity Real Estate Investment Trusts 11.06% | ||||||||
| Alexandria Real Estate Equities, Inc. | 40,206 | 5,250 | ||||||
| Apartment Investment & Management Co. Class A | 71,300 | 3,117 | ||||||
| Boston Properties, Inc. | 37,300 | 4,850 | ||||||
| Brixmor Property Group, Inc. | 124,360 | 2,321 | ||||||
| Duke Realty Corp. | 151,101 | 4,111 | ||||||
| Healthcare Trust of America, Inc. Class A | 128,740 | 3,867 | ||||||
| Highwoods Properties, Inc. | 83,600 | 4,256 | ||||||
| Invitation Homes, Inc. | 134,700 | 3,175 | ||||||
| UDR, Inc. | 147,914 | 5,698 | ||||||
| Total | 36,645 | |||||||
| Food Products 1.77% | ||||||||
| B&G Foods, Inc. | 91,120 | 3,203 | ||||||
| Bunge Ltd. | 39,617 | 2,657 | ||||||
| Total | 5,860 | |||||||
| Health Care Equipment & Supplies 2.79% | ||||||||
| DENTSPLY SIRONA, Inc. | 67,211 | 4,424 | ||||||
| Zimmer Biomet Holdings, Inc. | 40,000 | 4,827 | ||||||
| Total | 9,251 | |||||||
| See Notes to Financial Statements. | 7 |
Schedule of Investments (continued)
December 31, 2017
| Investments | Shares | Fair Value (000) | ||||||
| Health Care Providers & Services 1.03% | ||||||||
| Encompass Health Corp. | 69,274 | $ | 3,423 | |||||
| Hotels, Restaurants & Leisure 2.37% | ||||||||
| Aramark | 92,500 | 3,953 | ||||||
| MGM Resorts International | 116,678 | 3,896 | ||||||
| Total | 7,849 | |||||||
| Household Durables 2.65% | ||||||||
| Lennar Corp. Class A | 68,700 | 4,345 | ||||||
| Newell Brands, Inc. | 143,719 | 4,441 | ||||||
| Total | 8,786 | |||||||
| Information Technology Services 2.07% | ||||||||
| Conduent, Inc.* | 225,535 | 3,644 | ||||||
| CSRA, Inc. | 107,779 | 3,225 | ||||||
| Total | 6,869 | |||||||
| Insurance 8.44% | ||||||||
| Allstate Corp. (The) | 20,245 | 2,120 | ||||||
| Brown & Brown, Inc. | 44,867 | 2,309 | ||||||
| Hanover Insurance Group, Inc. (The) | 42,648 | 4,610 | ||||||
| Hartford Financial Services Group, Inc. (The) | 80,086 | 4,507 | ||||||
| Lincoln National Corp. | 45,300 | 3,482 | ||||||
| RenaissanceRe Holdings Ltd. | 25,297 | 3,177 | ||||||
| Validus Holdings Ltd. | 66,600 | 3,125 | ||||||
| XL Group Ltd. | 132,200 | 4,648 | ||||||
| Total | 27,978 | |||||||
| Leisure Products 1.07% | ||||||||
| Hasbro, Inc. | 39,028 | 3,547 | ||||||
| Life Sciences Tools & Services 1.63% | ||||||||
| Agilent Technologies, Inc. | 21,100 | 1,413 | ||||||
| PerkinElmer, Inc. | 54,400 | 3,978 | ||||||
| Total | 5,391 | |||||||
| Investments | Shares | Fair Value (000) | ||||||
| Machinery 6.39% | ||||||||
| ITT, Inc. | 88,227 | $ | 4,709 | |||||
| Kennametal, Inc. | 85,309 | 4,130 | ||||||
| Parker-Hannifin Corp. | 27,369 | 5,462 | ||||||
| Pentair plc (United Kingdom)(a) | 97,399 | 6,878 | ||||||
| Total | 21,179 | |||||||
| Metals & Mining 2.42% | ||||||||
| Freeport-McMoRan, Inc.* | 210,851 | 3,998 | ||||||
| Steel Dynamics, Inc. | 93,300 | 4,024 | ||||||
| Total | 8,022 | |||||||
| Multi-Line Retail 1.05% | ||||||||
| Dollar Tree, Inc.* | 32,253 | 3,461 | ||||||
| Multi-Utilities 2.18% | ||||||||
| CMS Energy Corp. | 123,825 | 5,857 | ||||||
| SCANA Corp. | 34,316 | 1,365 | ||||||
| Total | 7,222 | |||||||
| Oil, Gas & Consumable Fuels 7.79% | ||||||||
| Cabot Oil & Gas Corp. | 118,300 | 3,383 | ||||||
| Cimarex Energy Co. | 54,569 | 6,658 | ||||||
| Concho Resources, Inc.* | 40,200 | 6,039 | ||||||
| Hess Corp. | 60,100 | 2,853 | ||||||
| Noble Energy, Inc. | 107,444 | 3,131 | ||||||
| Williams Cos., Inc. (The) | 123,400 | 3,763 | ||||||
| Total | 25,827 | |||||||
| Road & Rail 0.99% | ||||||||
| Kansas City Southern | 31,267 | 3,290 | ||||||
| Semiconductors & Semiconductor Equipment 2.84% | ||||||||
| Marvell Technology Group Ltd. | 142,300 | 3,055 | ||||||
| Qorvo, Inc.* | 43,978 | 2,929 | ||||||
| Teradyne, Inc. | 21,609 | 905 | ||||||
| Tower Semiconductor Ltd. (Israel)*(a) | 73,700 | 2,512 | ||||||
| Total | 9,401 | |||||||
| 8 | See Notes to Financial Statements. |
Schedule of Investments (concluded)
December 31, 2017
| Investments | Shares | Fair Value (000) | ||||||
| Specialty Retail 0.87% | ||||||||
| Advance Auto Parts, Inc. | 29,000 | $ | 2,891 | |||||
| Technology Hardware, Storage & Peripherals 1.73% | ||||||||
| NetApp, Inc. | 70,362 | 3,893 | ||||||
| Western Digital Corp. | 23,200 | 1,845 | ||||||
| Total | 5,738 | |||||||
| Total Common Stocks (cost $281,767,692) | 318,765 | |||||||
| Investments | Principal Amount (000) | Fair Value (000) | ||||||
| SHORT-TERM INVESTMENT 3.76% | ||||||||
| Repurchase Agreement | ||||||||
| Repurchase Agreement dated 12/29/2017, 0.54% due 1/2/2018 with Fixed Income Clearing Corp. collateralized by $13,040,000 of U.S. Treasury Note at 1.125% due 2/28/2021; value: $12,718,955; proceeds: $12,469,184 (cost $12,468,435) | $ | 12,468 | $ | 12,468 | ||||
| Total Investments in Securities 99.95% (cost $294,236,127) | 331,233 | |||||||
| Other Assets in Excess of Liabilities 0.05% | 155 | |||||||
| Net Assets 100.00% | $ | 331,388 | ||||||
| * | Non-income producing security. | |
| (a) | Foreign security traded in U.S. dollars. |
The following is a summary of the inputs used as of December 31, 2017 in valuing the Fund’s investments carried at fair value(1):
| Investment Type(2)(3) | Level 1 (000) | Level 2 (000) | Level 3 (000) | Total (000) | ||||||||||||
| Common Stocks | $ | 318,765 | $ | – | $ | – | $ | 318,765 | ||||||||
| Repurchase Agreement | – | 12,468 | – | 12,468 | ||||||||||||
| Total | $ | 318,765 | $ | 12,468 | $ | – | $ | 331,233 | ||||||||
| (1) | Refer to Note 2(h) for a description of fair value measurements and the three-tier hierarchy of inputs. | |
| (2) | See Schedule of Investments for fair values in each industry and identification of foreign issuers and/or geography. | |
| (3) | There were no Level 1/Level 2 transfers during the fiscal year ended December 31, 2017. |
| See Notes to Financial Statements. | 9 |
Statement of Assets and Liabilities
December 31, 2017
| ASSETS: | ||||
| Investments in securities, at fair value (cost $294,236,127) | $ | 331,233,384 | ||
| Receivables: | ||||
| Capital shares sold | 660,296 | |||
| Interest and dividends | 477,025 | |||
| Prepaid expenses | 2,074 | |||
| Total assets | 332,372,779 | |||
| LIABILITIES: | ||||
| Payables: | ||||
| Management fee | 208,790 | |||
| Directors’ fees | 103,835 | |||
| Fund administration | 11,135 | |||
| Capital shares reacquired | 7,470 | |||
| Accrued expenses | 653,721 | |||
| Total liabilities | 984,951 | |||
| NET ASSETS | $ | 331,387,828 | ||
| COMPOSITION OF NET ASSETS: | ||||
| Paid-in capital | $ | 296,749,868 | ||
| Distributions in excess of net investment income | (103,835 | ) | ||
| Accumulated net realized loss on investments | (2,255,462 | ) | ||
| Net unrealized appreciation on investments | 36,997,257 | |||
| Net Assets | $ | 331,387,828 | ||
| Outstanding shares (200 million shares of common stock authorized, $.001 par value) | 13,522,417 | |||
| Net asset value, offering and redemption price per share (Net assets divided by outstanding shares) | $24.51 | |||
| 10 | See Notes to Financial Statements. |
For the Year Ended December 31, 2017
| Investment income: | ||||
| Dividends | $ | 5,834,252 | ||
| Interest | 9,295 | |||
| Total investment income | 5,843,547 | |||
| Expenses: | ||||
| Management fee | 2,560,256 | |||
| Non 12b-1 service fees | 853,288 | |||
| Shareholder servicing | 260,431 | |||
| Fund administration | 136,547 | |||
| Professional | 64,414 | |||
| Reports to shareholders | 42,702 | |||
| Custody | 12,045 | |||
| Directors’ fees | 9,764 | |||
| Other | 26,598 | |||
| Gross expenses | 3,966,045 | |||
| Expense reductions (See Note 8) | (3,099 | ) | ||
| Net expenses | 3,962,946 | |||
| Net investment income | 1,880,601 | |||
| Net realized and unrealized gain (loss): | ||||
| Net realized gain on investments | 24,410,967 | |||
| Net change in unrealized appreciation/depreciation on investments | (3,751,279 | ) | ||
| Net realized and unrealized gain | 20,659,688 | |||
| Net Increase in Net Assets Resulting From Operations | $ | 22,540,289 | ||
| See Notes to Financial Statements. | 11 |
Statements of Changes in Net Assets
| INCREASE (DECREASE) IN NET ASSETS | For the Year Ended December 31, 2017 | For the Year Ended December 31, 2016 | ||||||
| Operations: | ||||||||
| Net investment income | $ | 1,880,601 | $ | 1,791,492 | ||||
| Net realized gain on investments | 24,410,967 | 24,359,673 | ||||||
| Net change in unrealized appreciation/depreciation on investments | (3,751,279 | ) | 26,147,065 | |||||
| Net increase in net assets resulting from operations | 22,540,289 | 52,298,230 | ||||||
| Distributions to shareholders from: | ||||||||
| Net investment income | (1,987,686 | ) | (1,708,602 | ) | ||||
| Net realized gain | (32,008,018 | ) | (19,456,583 | ) | ||||
| Total distributions to shareholders | (33,995,704 | ) | (21,165,185 | ) | ||||
| Capital share transactions (See Note 13): | ||||||||
| Proceeds from sales of shares | 23,848,124 | 23,269,382 | ||||||
| Reinvestment of distributions | 33,995,704 | 21,165,186 | ||||||
| Cost of shares reacquired | (71,563,154 | ) | (66,531,091 | ) | ||||
| Net decrease in net assets resulting from capital share transactions | (13,719,326 | ) | (22,096,523 | ) | ||||
| Net increase (decrease) in net assets | (25,174,741 | ) | 9,036,522 | |||||
| NET ASSETS: | ||||||||
| Beginning of year | $ | 356,562,569 | $ | 347,526,047 | ||||
| End of year | $ | 331,387,828 | $ | 356,562,569 | ||||
| Undistributed (distributions in excess of) net investment income | $ | (103,835 | ) | $ | 850 | |||
| 12 | See Notes to Financial Statements. |
This page is intentionally left blank.
13
| Per Share Operating Performance: | ||||||||||||||||||||||||||||
| Investment operations: | Distributions to shareholders from: | |||||||||||||||||||||||||||
| Net asset value, beginning of period | Net invest- ment income(a) | Net realized and unrealized gain (loss) | Total from invest- ment opera- tions | Net investment income | Net realized gain | Total distri- butions | ||||||||||||||||||||||
| 12/31/2017 | $25.52 | $0.14 | $ 1.58 | $ 1.72 | $(0.16 | ) | $(2.57 | ) | $(2.73 | ) | ||||||||||||||||||
| 12/31/2016 | 23.28 | 0.13 | 3.69 | 3.82 | (0.13 | ) | (1.45 | ) | (1.58 | ) | ||||||||||||||||||
| 12/31/2015 | 26.02 | 0.15 | (1.16 | ) | (1.01 | ) | (0.15 | ) | (1.58 | ) | (1.73 | ) | ||||||||||||||||
| 12/31/2014 | 23.43 | 0.10 | 2.60 | 2.70 | (0.11 | ) | – | (0.11 | ) | |||||||||||||||||||
| 12/31/2013 | 18.05 | 0.10 | 5.37 | 5.47 | (0.09 | ) | – | (0.09 | ) | |||||||||||||||||||
| (a) | Calculated using average shares outstanding during the period. | |
| (b) | Total return does not consider the effects of sales charges or other expenses imposed by an insurance company and assumes the reinvestment of all distributions. |
| 14 | See Notes to Financial Statements. |
| Ratios to Average Net Assets: | Supplemental Data: | ||||||||||||||||||||||
| Net asset value, end of period | Total return(b) (%) | Total expenses (%) | Net investment income (%) | Net assets, end of period (000) | Portfolio turnover rate (%) | ||||||||||||||||||
| $ | 24.51 | 6.83 | 1.16 | 0.55 | $ | 331,388 | 70 | ||||||||||||||||
| 25.52 | 16.39 | 1.17 | 0.52 | 356,563 | 67 | ||||||||||||||||||
| 23.28 | (3.79 | ) | 1.18 | 0.56 | 347,526 | 61 | |||||||||||||||||
| 26.02 | 11.53 | 1.16 | 0.40 | 418,164 | 58 | ||||||||||||||||||
| 23.43 | 30.32 | 1.14 | 0.49 | 437,155 | 62 | ||||||||||||||||||
| See Notes to Financial Statements. | 15 |
| 1. | ORGANIZATION |
Lord Abbett Series Fund, Inc. (the “Company”) is registered under the Investment Company Act of 1940, as amended (“the Act”), as a diversified, open-end management investment company and was incorporated under Maryland law in 1989. The Company consists of twelve separate portfolios. This report covers Mid Cap Stock Portfolio (the “Fund”).
The Fund’s investment objective is to seek capital appreciation through investments, primarily in equity securities, which are believed to be undervalued in the marketplace. The Fund has Variable Contract class shares (“Class VC Shares”), which are currently issued and redeemed only in connection with investments in, and payments under, variable annuity contracts and variable life insurance policies issued by life insurance and insurance-related companies.
The preparation of the financial statements in conformity with accounting principles generally accepted in the United States of America (“U.S. GAAP”) requires management to make certain estimates and assumptions that affect the reported amounts of assets and liabilities and disclosure of contingent assets and liabilities at the date of the financial statements and the reported amounts of increases and decreases in net assets from operations during the reporting period. Actual results could differ from those estimates. The Fund is considered an investment company under U.S. GAAP and follows the accounting and reporting guidance applicable to investment companies.
| 2. | SIGNIFICANT ACCOUNTING POLICIES |
| (a) | Investment Valuation–Under procedures approved by the Fund’s Board of Directors (the “Board”), Lord, Abbett & Co. LLC (“Lord Abbett”), the Fund’s investment manager, has formed a Pricing Committee to administer the pricing and valuation of portfolio investments and to ensure that prices utilized reasonably reflect fair value. Among other things, these procedures allow the Fund to utilize independent pricing services, quotations from securities and financial instrument dealers and other market sources to determine fair value. |
| Securities actively traded on any recognized U.S. or non-U.S. exchange or on The NASDAQ Stock Market LLC are valued at the last sale price or official closing price on the exchange or system on which they are principally traded. Events occurring after the close of trading on non-U.S. exchanges may result in adjustments to the valuation of foreign securities to reflect their fair value as of the close of regular trading on the New York Stock Exchange. The Fund may utilize an independent fair valuation service in adjusting the valuations of foreign securities. Unlisted equity securities are valued at the last quoted sale price or, if no sale price is available, at the mean between the most recently quoted bid and asked prices. Exchange traded options and futures contracts are valued at the last sale price in the market where they are principally traded. If no sale has occurred, the mean between the most recently quoted bid and asked prices is used. | |
| Securities for which prices are not readily available are valued at fair value as determined by the Pricing Committee. The Pricing Committee considers a number of factors, including observable and unobservable inputs, when arriving at fair value. The Pricing Committee may use related or comparable assets or liabilities, recent transactions, market multiples, book values and other relevant information to determine the fair value of portfolio investments. The Board or a designated committee thereof regularly reviews fair value determinations made by the Pricing Committee and may employ techniques such as reviewing related market activity, reviewing inputs and assumptions, and retrospectively comparing prices of subsequent purchases and sales transactions to fair value determinations made by the Pricing Committee. |
16
Notes to Financial Statements (continued)
Short-term securities with 60 days or less remaining to maturity are valued using the amortized cost method, which approximates fair value.
| (b) | Security Transactions–Security transactions are recorded as of the date that the securities are purchased or sold (trade date). Realized gains and losses on sales of portfolio securities are calculated using the identified-cost method. |
| (c) | Investment Income–Dividend income is recorded on the ex-dividend date. Interest income is recorded on the accrual basis as earned. Discounts are accreted and premiums are amortized using the effective interest method and are included in Interest and other income on the Statement of Operations. Withholding taxes on foreign dividends have been provided for in accordance with the applicable country’s tax rules and rates. |
| (d) | Income Taxes–It is the policy of the Fund to meet the requirements of Subchapter M of the Internal Revenue Code applicable to regulated investment companies and to distribute substantially all taxable income and capital gains to its shareholders. Therefore, no income tax provision is required. |
| The Fund files U.S. federal and various state and local tax returns. No income tax returns are currently under examination. The statute of limitations on the Fund’s filed U.S. federal tax returns remains open for the fiscal years ended December 31, 2014 through December 31, 2017. The statutes of limitations on the Company’s state and local tax returns may remain open for an additional year depending upon the jurisdiction. | |
| (e) | Expenses–Expenses incurred by the Company that do not specifically relate to an individual fund are generally allocated to the funds within the Company on a pro rata basis by relative net assets. |
| (f) | Foreign Transactions–The books and records of the Fund are maintained in U.S. dollars and transactions denominated in foreign currencies are recorded in the Fund’s records at the rate prevailing when earned or recorded. Asset and liability accounts that are denominated in foreign currencies are adjusted daily to reflect current exchange rates and any unrealized gain (loss) is included in Net change in unrealized appreciation/depreciation on investments in the Fund’s Statement of Operations. The resultant exchange gains and losses upon settlement of such transactions are included in Net realized gain on investments in the Fund’s Statement of Operations. The Fund does not isolate that portion of the results of operations arising as a result of changes in the foreign exchange rates from the changes in market prices of the securities. |
| (g) | Repurchase Agreements–The Fund may enter into repurchase agreements with respect to securities. A repurchase agreement is a transaction in which a fund acquires a security and simultaneously commits to resell that security to the seller (a bank or securities dealer) at an agreed-upon price on an agreed-upon date. The Fund requires at all times that the repurchase agreement be collateralized by cash, or by securities of the U.S. Government, its agencies, its instrumentalities, or U.S. Government sponsored enterprises having a value equal to, or in excess of, the value of the repurchase agreement (including accrued interest). If the seller of the agreement defaults on its obligation to repurchase the underlying securities at a time when the fair value of these securities has declined, the Fund may incur a loss upon disposition of the securities. |
| (h) | Fair Value Measurements–Fair value is defined as the price that the Fund would receive upon selling an investment or transferring a liability in an orderly transaction to an independent buyer in the principal or most advantageous market of the investment. A three-tier hierarchy |
17
Notes to Financial Statements (continued)
| is used to maximize the use of observable market data and minimize the use of unobservable inputs and to establish classification of fair value measurements for disclosure purposes. Inputs refer broadly to the assumptions that market participants would use in pricing the asset or liability, including assumptions about risk — for example, the risk inherent in a particular valuation technique used to measure fair value (such as a pricing model) and/or the risk inherent in the inputs to the valuation technique. Inputs may be observable or unobservable. Observable inputs reflect the assumptions market participants would use in pricing the asset or liability. Observable inputs are based on market data obtained from sources independent of the reporting entity. Unobservable inputs reflect the reporting entity’s own assumptions about the assumptions market participants would use in pricing the asset or liability. Unobservable inputs are based on the best information available in the circumstances. The three-tier hierarchy classification is determined based on the lowest level of inputs that is significant to the fair value measurement, and is summarized in the three broad Levels listed below: | |
| • | Level 1 – unadjusted quoted prices in active markets for identical investments; | |
| • | Level 2 – other significant observable inputs (including quoted prices for similar investments, interest rates, prepayment speeds, credit risk, etc.); and | |
| • | Level 3 – significant unobservable inputs (including the Fund’s own assumptions in determining the fair value of investments). |
A summary of inputs used in valuing the Fund’s investments as of December 31, 2017 and, if applicable, Level 1/Level 2 transfers and Level 3 rollforwards for the fiscal year then ended is included in the Fund’s Schedule of Investments.
Changes in valuation techniques may result in transfers into or out of an assigned level within the three-tier hierarchy. All transfers between different levels within the three-tier hierarchy are deemed to have occurred as of the beginning of the reporting period. The inputs or methodology used for valuing securities are not necessarily an indication of the risk associated with investing in those securities.
| 3. | MANAGEMENT FEE AND OTHER TRANSACTIONS WITH AFFILIATES |
Management Fee
The Company has a management agreement with Lord Abbett, pursuant to which Lord Abbett supplies the Fund with investment management services and executive and other personnel, provides office space and pays for ordinary and necessary office and clerical expenses relating to research and statistical work and supervision of the Fund’s investment portfolio.
The management fee is based on the Fund’s average daily net assets at the following annual rate:
| First $1 billion | .75% |
| Next $1 billion | .70% |
| Over $2 billion | .65% |
For the fiscal year ended December 31, 2017, the effective management was at an annualized rate of .75% of the Fund’s average daily net assets.
In addition, Lord Abbett provides certain administrative services to the Fund pursuant to an Administrative Services Agreement in return for a fee at an annual rate of .04% of the Fund’s average daily net assets.
18
Notes to Financial Statements (continued)
The Company, on behalf of the Fund, has entered into services arrangements with certain insurance companies. Under these arrangements, certain insurance companies will be compensated up to ..25% of the average daily net asset value (“NAV”) of the Fund’s Class VC Shares held in the insurance company’s separate account to service and maintain the Variable Contract owners’ accounts. This amount is included in Non 12b-1 service fees on the Statement of Operations. The Fund may also compensate certain insurance companies, third-party administrators and other entities for providing recordkeeping, sub-transfer agency and other administrative services to the Fund. This amount is included in Shareholder servicing on the Statement of Operations.
Two Directors and certain of the Company’s officers have an interest in Lord Abbett.
| 4. | DISTRIBUTIONS AND CAPITAL LOSS CARRYFORWARDS |
Dividends from net investment income, if any, are declared and paid at least semi-annually. Taxable net realized gains from investment transactions, reduced by allowable capital loss carryforwards, if any, are declared and distributed to shareholders at least annually. The capital loss carryforward amount, if any, is available to offset future net capital gains. Dividends and distributions to shareholders are recorded on the ex-dividend date. The amounts of dividends and distributions from net investment income and net realized capital gains are determined in accordance with federal income tax regulations, which may differ from U.S. GAAP. These book/tax differences are either considered temporary or permanent in nature. To the extent these differences are permanent in nature, such amounts are reclassified within the components of net assets based on their federal tax basis treatment; temporary differences do not require reclassification. Dividends and distributions that exceed earnings and profits for tax purposes are reported as a tax return of capital.
The tax character of distributions paid during the fiscal years ended December 31, 2017 and 2016 was as follows:
| Year Ended 12/31/2017 | Year Ended 12/31/2016 | |||||||
| Distributions paid from: | ||||||||
| Ordinary income | $ | 5,200,449 | $ | 1,708,602 | ||||
| Net long-term capital gains | 28,795,255 | 19,456,583 | ||||||
| Total distributions paid | $ | 33,995,704 | $ | 21,165,185 | ||||
As of December 31, 2017, the components of accumulated gains on a tax-basis were as follows:
| Temporary differences | $ | (596,952 | ) | |
| Unrealized gains – net | 35,234,912 | |||
| Total accumulated gains – net | $ | 34,637,960 |
At the Fund’s election, certain losses incurred within the taxable year (Qualified Late-Year Losses) are deemed to arise on the first business day of the Fund’s next taxable year. The Fund incurred and will elect to defer post-October capital losses of $493,117 during fiscal 2017.
As of December 31, 2017, the aggregate unrealized security gains and losses on investments and other financial instruments based on cost for U.S. federal income tax purposes were as follows:
| Tax cost | $ | 295,998,472 | ||
| Gross unrealized gain | 42,208,010 | |||
| Gross unrealized loss | (6,973,098 | ) | ||
| Net unrealized security gain | $ | 35,234,912 |
19
Notes to Financial Statements (continued)
The difference between book-basis and tax-basis unrealized gains (losses) is attributable to the tax treatment of wash sales.
Permanent items identified during the fiscal year ended December 31, 2017 have been reclassified among the components of net assets based on their tax basis treatment as follows:
| Distributions in | |||||||||
| Excess of Net | |||||||||
| Investment | Accumulated Net | ||||||||
| Income | Realized Loss | Paid-in Capital | |||||||
| $2,400 | $498 | $(2,898 | ) | ||||||
The permanent differences are attributable to certain distributions.
| 5. | PORTFOLIO SECURITIES TRANSACTIONS |
Purchases and sales of investment securities (excluding short-term investments) for the fiscal year ended December 31, 2017 were as follows:
| Purchases | Sales | |
| $233,647,611 | $288,908,032 |
There were no purchases or sales of U.S. Government securities for the fiscal year ended December 31, 2017.
The Fund is permitted to purchase and sell securities (“cross-trade”) from and to other Lord Abbett funds or client accounts pursuant to procedures approved by the Board in compliance with Rule 17a-7 under the Act (the “Rule”). Each cross-trade is executed at a fair market price in compliance with provisions of the Rule. For the fiscal year ended December 31, 2017, the Fund engaged in cross-trades purchases of $716,395 and sales of $2,982,894, which resulted in net realized gains of $34,946.
| 6. | DISCLOSURES ABOUT OFFSETTING ASSETS AND LIABILITIES |
The Financial Accounting Standards Board (“FASB”) requires disclosures intended to help better assess the effect or potential effect of offsetting arrangements on a fund’s financial position. The following tables illustrate gross and net information about recognized assets and liabilities eligible for offset in the statement of assets and liabilities; and disclose such amounts subject to an enforceable master netting agreement or similar agreement, by counterparty. A master netting agreement is an agreement between a fund and a counterparty which provides for the net settlement of amounts owed under all contracts traded under that agreement, as well as cash collateral, through a single payment by one party to the other in the event of default on or termination of any one contract. The Fund’s accounting policy with respect to balance sheet offsetting is that, absent an event of default by the counterparty or a termination of the agreement, the master netting agreement does not result in an offset of reported amounts of financial assets and liabilities in the statement of assets and liabilities across transactions between the Fund and the applicable counterparty:
20
Notes to Financial Statements (continued)
| Description | Gross Amounts of Recognized Assets | Gross Amounts Offset in the Statement of Assets and Liabilities | Net Amounts of Assets Presented in the Statement of Assets and Liabilities | |||||||||
| Repurchase Agreement | $ | 12,468,435 | $ | – | $ | 12,468,435 | ||||||
| Total | $ | 12,468,435 | $ | – | $ | 12,468,435 | ||||||
| Net Amounts | ||||||||||||||||
| of Assets | Amounts Not Offset in the | |||||||||||||||
| Presented in | Statement of Assets and Liabilities | |||||||||||||||
| Counterparty | the Statement of Assets and Liabilities | Financial Instruments | Cash Collateral Received(a) | Securities Collateral Received(a) | Net Amount(b) | |||||||||||
| Fixed Income Clearing Corp. | $12,468,435 | $ – | $ | – | $ | (12,468,435 | ) | $ | – | |||||||
| Total | $12,468,435 | $ – | $ | – | $ | (12,468,435 | ) | $ | – | |||||||
| (a) | Collateral disclosed is limited to an amount not to exceed 100% of the net amount of assets presented in the Statement of Assets and Liabilities, for each respective counterparty. | |
| (b) | Net amount represents the amount owed to the Fund by the counterparty as of December 31, 2017. |
| 7. | DIRECTORS’ REMUNERATION |
The Company’s officers and two Directors, who are associated with Lord Abbett, do not receive any compensation from the Company for serving in such capacities. Independent Directors’ fees are allocated among all Lord Abbett-sponsored funds based on the net assets of each fund. There is an equity-based plan available to all Independent Directors under which Independent Directors must defer receipt of a portion of, and may elect to defer receipt of an additional portion of Directors’ fees. The deferred amounts are treated as though equivalent dollar amounts had been invested in the funds. Such amounts and earnings accrued thereon are included in Directors’ fees on the Statement of Operations and in Directors’ fees payable on the Statement of Assets and Liabilities and are not deductible for U.S. federal income tax purposes until such amounts are paid.
| 8. | EXPENSE REDUCTIONS |
The Company has entered into an arrangement with its transfer agent and custodian, whereby credits realized as a result of uninvested cash balances are used to reduce a portion of the Fund’s expenses.
| 9. | LINE OF CREDIT |
Effective August 28, 2017, the Fund and certain other funds managed by Lord Abbett (collectively, the “Participating Funds”) entered into an amended syndicated line of credit facility with various lenders for $600 million (the “Facility”), whereas State Street Bank and Trust Company (“SSB”) participates as a lender and as agent for the lenders. The Facility is to be used for temporary or emergency purposes as an additional source of liquidity to satisfy redemptions. The Participating Funds are subject to graduated borrowing limits of one-third of Fund assets (if Fund assets are less than $750 million), $250 million, $300 million, or $350 million, based on past borrowings and likelihood of future borrowings.
Prior to August 28, 2017, the Funds and certain other funds managed by Lord Abbett participated in a $550 million syndicated line of credit facility, based on the same terms as described above.
During the fiscal year ended December 31, 2017, the Fund did not utilize the Facility.
21
Notes to Financial Statements (concluded)
| 10. | INTERFUND LENDING PROGRAM |
Pursuant to an exemptive order issued by the U.S. Securities and Exchange Commission issued an exemptive order (“SEC exemptive order”) which permits certain registered open-end management investment companies managed by Lord Abbett, including the Fund, to participate in a joint lending and borrowing program (the “Interfund Lending Program”). The SEC exemptive order allows the Funds to borrow money from and lend money to each other for temporary or emergency purposes subject to the limitations and conditions. During the fiscal year ended December 31, 2017, the Fund did not participate as a borrower or lender in the Interfund Lending Program.
| 11. | CUSTODIAN AND ACCOUNTING AGENT |
SSB is the Company’s custodian and accounting agent. SSB performs custodial, accounting and recordkeeping functions relating to portfolio transactions and calculating the Fund’s NAV.
| 12. | INVESTMENT RISKS |
The Fund is subject to the general risks and considerations associated with equity investing, as well as the particular risks associated with value and mid-sized company stocks. The value of an investment will fluctuate in response to movements in the equity securities market in general and to the changing prospects of individual companies in which the Fund invests. The market may fail to recognize for a long time the intrinsic value of particular value stocks the Fund may hold. Value investing also is subject to the risk that the company judged to be undervalued may actually be appropriately priced or even overpriced. The mid-sized company stocks in which the Fund invests may be less able to weather economic shifts or other adverse developments than those of larger, more established companies. Although investing in mid-sized companies offers the potential for above average returns, these companies may not succeed and the value of their stock could decline significantly. Mid-sized companies also may fall out of favor relative to larger companies in certain market cycles, causing the Fund to incur losses or under perform. In addition, if the Fund’s assessment of a company’s value or prospects for exceeding earnings expectations or market conditions is wrong, the Fund could suffer losses or produce poor performance relative to other funds, even in a rising market.
Due to the Fund’s investment exposure to foreign companies and American Depositary Receipts, the Fund may experience increased market, industry and sector liquidity, currency, political, information, and other risks. The securities of foreign companies also may be subject to inadequate exchange control regulations, the imposition of economic sanctions or other government restrictions, higher transaction and other costs, and delays in settlement to the extent they are traded on non-U.S. exchanges or markets.
These factors can affect the Fund’s performance.
| 13. | SUMMARY OF CAPITAL TRANSACTIONS |
Transactions in shares of capital stock were as follows:
| Year Ended December 31, 2017 | Year Ended December 31, 2016 | |||||||
| Shares sold | 917,562 | 972,000 | ||||||
| Reinvestment of distributions | 1,373,182 | 822,686 | ||||||
| Shares reacquired | (2,739,249 | ) | (2,749,761 | ) | ||||
| Decrease | (448,505 | ) | (955,075 | ) |
22
Report of Independent Registered Public Accounting Firm
To the Board of Directors of Lord Abbett Series Fund, Inc. and the shareholders of Mid Cap Stock Portfolio:
Opinion on the Financial Statements and Financial Highlights
We have audited the accompanying statement of assets and liabilities, including the schedule of investments, of the Mid Cap Stock Portfolio, one of the portfolios constituting the Lord Abbett Series Fund, Inc. (the “Fund”), as of December 31, 2017, the related statement of operations for the year then ended, the statements of changes in net assets for each of the two years in the period then ended, the financial highlights for each of the five years in the period then ended, and the related notes. In our opinion, the financial statements and financial highlights present fairly, in all material respects, the financial position of the Mid Cap Stock Portfolio of the Fund as of December 31, 2017, the results of its operations for the year then ended, the changes in its net assets for each of the two years in the period then ended, and the financial highlights for each of the five years in the period then ended, in conformity with accounting principles generally accepted in the United States of America.
Basis for Opinion
These financial statements and financial highlights are the responsibility of the Fund’s management. Our responsibility is to express an opinion on the Fund’s financial statements and financial highlights based on our audits. We are a public accounting firm registered with the Public Company Accounting Oversight Board (United States) (PCAOB) and are required to be independent with respect to the Fund in accordance with the U.S. federal securities laws and the applicable rules and regulations of the Securities and Exchange Commission and the PCAOB.
We conducted our audits in accordance with the standards of the PCAOB. Those standards require that we plan and perform the audit to obtain reasonable assurance about whether the financial statements and financial highlights are free of material misstatement, whether due to error or fraud. The Fund is not required to have, nor were we engaged to perform, an audit of its internal control over financial reporting. As part of our audits we are required to obtain an understanding of internal control over financial reporting but not for the purpose of expressing an opinion on the effectiveness of the Fund’s internal control over financial reporting. Accordingly, we express no such opinion.
Our audits included performing procedures to assess the risks of material misstatement of the financial statements and financial highlights, whether due to error or fraud, and performing procedures that respond to those risks. Such procedures included examining, on a test basis, evidence regarding the amounts and disclosures in the financial statements and financial highlights. Our audits also included evaluating the accounting principles used and significant estimates made by management, as well as evaluating the overall financial statement presentation and financial highlights. Our procedures included confirmation of securities owned as of December 31, 2017, by correspondence with the custodian and brokers. We believe that our audits provide a reasonable basis for our opinion.
DELOITTE & TOUCHE LLP
New York, New York
February 15, 2018
We have served as the auditor of one or more Lord Abbett Family of Funds’ investment companies since 1932.
23
Basic Information About Management
The Board is responsible for the management of the business and affairs of the Company in accordance with the laws of the State of Maryland. The Board elects officers who are responsible for the day-to-day operations of the Fund and who execute policies authorized by the Board. The Board also approves an investment adviser to the Fund and continues to monitor the cost and quality of the services the investment adviser provides, and annually considers whether to renew the contract with the adviser. Generally, each Director holds office until his/her successor is elected and qualified or until his/her earlier resignation or removal, as provided in the Company’s organizational documents.
Lord Abbett, a Delaware limited liability company, is the Fund’s investment adviser. Designated Lord Abbett personnel are responsible for the day-to-day management of the Fund.
Interested Directors
Ms. Foster and Mr. Sieg are affiliated with Lord Abbett and are “interested persons” of the Fund as defined in the Act. Ms. Foster and Mr. Sieg are directors/trustees of each of the 12 investment companies in the Lord Abbett Family of Funds, which consist of 61 portfolios or series. Ms. Foster is an officer of the Lord Abbett Family of Funds.
| Name, Address and Year of Birth | Current Position and Length of Service with the Company | Principal Occupation and Other Directorships During the Past Five Years | ||
| Daria L. Foster(1) Lord, Abbett & Co. LLC 90 Hudson Street Jersey City, NJ 07302 (1954) | Director and President since 2006; Chief Executive Officer since 2012 | Principal Occupation: Managing Partner of Lord Abbett, joined Lord Abbett in 1990.
Other Directorships: None.
| ||
| Douglas B. Sieg(1) Lord, Abbett & Co. LLC 90 Hudson Street Jersey City, NJ 07302 (1969) | Director since 2016 | Principal Occupation: Partner (since 2001) and Head of Client Services (since 2013), formerly Director of Marketing and Relationship Management, joined Lord Abbett in 1994.
Other Directorships: None.
|
Independent Directors
The following Independent Directors also are directors/trustees of each of the 12 investment companies in the Lord Abbett Family of Funds, which consist of 61 portfolios or series.
| Name, Address and Year of Birth | Current Position and Length of Service with the Company | Principal Occupation and Other Directorships During the Past Five Years | ||
| Eric C. Fast Lord, Abbett & Co. LLC c/o Legal Dept. 90 Hudson Street Jersey City, NJ 07302 (1949) | Director since 2014 | Principal Occupation: Chief Executive Officer of Crane Co., an industrial products company (2001–2014).
Other Directorships: Currently serves as director of Automatic Data Processing, Inc. (since 2007) and Regions Financial Corporation (since 2010). Previously served as a director of Crane Co. (1999–2014). |
| (1) | Daria L. Foster, Managing Partner of Lord Abbett, a member of the Board, and the Chief Executive Officer and President of the Lord Abbett Family of Funds, will retire from her positions with Lord Abbett and the Lord Abbett Family of Funds effective March 31, 2018. Douglas B. Sieg, Partner and head of Client Services at Lord Abbett, and a member of the Board, will succeed Ms. Foster effective April 1, 2018. |
24
Basic Information About Management (continued)
| Name, Address and Year of Birth | Current Position and Length of Service with the Company | Principal Occupation and Other Directorships During the Past Five Years | ||
| Evelyn E. Guernsey Lord, Abbett & Co. LLC c/o Legal Dept. 90 Hudson Street Jersey City, NJ 07302 (1955) | Director since 2011 | Principal Occupation: CEO, Americas of J.P. Morgan Asset Management (2004–2010).
Other Directorships: None.
| ||
| Julie A. Hill Lord, Abbett & Co. LLC c/o Legal Dept. 90 Hudson Street Jersey City, NJ 07302 (1946) | Director since 2004 | Principal Occupation: Owner and CEO of The Hill Company, a business consulting firm (since 1998).
Other Directorships: Currently serves as director of Anthem, Inc., a health benefits company (since 1994).
| ||
| Franklin W. Hobbs Lord, Abbett & Co. LLC c/o Legal Dept. 90 Hudson Street Jersey City, NJ 07302 (1947) | Director since 2001 | Principal Occupation: President and CEO of Ribbon Communications (since 2017) and Advisor of One Equity Partners, a private equity firm (since 2004).
Other Directorships: Currently serves as director of Ribbon Communications (since 2017), director and Chairman of the Board of Ally Financial Inc., a financial services firm (since 2009), and as director of Molson Coors Brewing Company (since 2002). | ||
| Kathleen M. Lutito Lord, Abbett & Co. LLC c/o Legal Dept. 90 Hudson Street Jersey City, NJ 07302 (1963) | Director since 2017 | Principal Occupation: President and Chief Investment Officer of CenturyLink Investment Management Company (since 2006).
Other Directorships: None
| ||
| James M. McTaggart Lord, Abbett & Co. LLC c/o Legal Dept. 90 Hudson Street Jersey City, NJ 07302 (1947) | Director since 2012 | Principal Occupation: Independent management advisor and consultant (since 2012); Vice President, CRA International, Inc. (doing business as Charles River Associates), a global management consulting firm (2009–2012); Founder and Chairman of Marakon Associates, Inc., a strategy consulting firm (1978–2009); and Officer and Director of Trinsum Group, a holding company (2007–2009).
Other Directorships: Blyth, Inc., a home products company (2004–2015).
| ||
| Karla M. Rabusch Lord, Abbett & Co. LLC c/o Legal Dept 90 Hudson Street Jersey City, NJ 07302 (1959) | Director since 2017 | Principal Occupation: President and Director of Wells Fargo Funds Management, LLC (2003–2017); President of Wells Fargo Funds (2003–2016).
Other Directorships: None.
| ||
| Mark A. Schmid Lord, Abbett & Co. LLC c/o Legal Dept. 90 Hudson Street Jersey City, NJ 07302 (1959) | Director since 2016 | Principal Occupation: Vice President and Chief Investment Officer of the University of Chicago (since 2009).
Other Directorships: None.
| ||
25
Basic Information About Management (continued)
| Name, Address and Year of Birth | Current Position and Length of Service with the Company | Principal Occupation and Other Directorships During the Past Five Years | ||
| James L.L. Tullis Lord, Abbett & Co. LLC c/o Legal Dept. 90 Hudson Street Jersey City, NJ 07302 (1947) | Director since 2006; Chairman since 2017 | Principal Occupation: CEO of Tullis-Dickerson and Co. Inc., a venture capital management firm (since 1990); CEO of Tullis Health Investors Inc. (since 2012).
Other Directorships: Currently serves as director of Crane Co. (since 1998).
|
Officers
None of the officers listed below have received compensation from the Company. All of the officers of the Company also may be officers of the other Lord Abbett Funds and maintain offices at 90 Hudson Street, Jersey City, NJ 07302. Unless otherwise indicated, the position(s) and title(s) listed under the “Principal Occupation During the Past Five Years” column indicate each officer’s position(s) and title(s) with Lord Abbett. Each officer serves for an indefinite term (i.e., until his or her death, resignation, retirement, or removal).
| Name and Year of Birth | Current Position with the Company | Length of Service of Current Position | Principal Occupation During the Past Five Years | |||
| Daria L. Foster (1954) | President and Chief Executive Officer | Elected as President in 2006 and Chief Executive Officer in 2012 | Managing Partner of Lord Abbett, joined Lord Abbett in 1990. | |||
| Sean J. Aurigemma (1969) | Executive Vice President | Elected in 2010 | Portfolio Manager, joined Lord Abbett in 2007. | |||
| Jeff D. Diamond (1960) | Executive Vice President | Elected in 2008 | Portfolio Manager, joined Lord Abbett in 2007. | |||
| Todd D. Jacobson (1966) | Executive Vice President | Elected in 2005 | Partner and Associate Director, joined Lord Abbett in 2003. | |||
| Robert A. Lee (1969) | Executive Vice President | Elected in 2010 | Partner and Chief Investment Officer, and was formerly Deputy Chief Investment Officer and Director of Taxable Fixed Income, joined Lord Abbett in 1997. | |||
| David J. Linsen (1974) | Executive Vice President | Elected in 2008 | Partner and Director, joined Lord Abbett in 2001. | |||
| Thomas B. Maher (1967) | Executive Vice President | Elected in 2010 | Partner and Portfolio Manager, joined Lord Abbett in 2003. | |||
| Justin C. Maurer (1969) | Executive Vice President | Elected in 2010 | Partner and Portfolio Manager, joined Lord Abbett in 2001. | |||
26
Basic Information About Management (continued)
| Name and Year of Birth | Current Position with the Company | Length of Service of Current Position | Principal Occupation During the Past Five Years | |||
| Vincent J. McBride (1964) | Executive Vice President | Elected in 2010 | Partner and Director, joined Lord Abbett in 2003. | |||
| Andrew H. O’Brien (1973) | Executive Vice President | Elected in 2010 | Partner and Portfolio Manager, joined Lord Abbett in 1998. | |||
| F. Thomas O’Halloran, III (1955) | Executive Vice President | Elected in 2010 | Partner and Portfolio Manager, joined Lord Abbett in 2001. | |||
| Marc Pavese (1972) | Executive Vice President | Elected in 2016 | Partner and Portfolio Manager, joined Lord Abbett in 2008. | |||
| Walter H. Prahl (1958) | Executive Vice President | Elected in 2012 | Partner and Director, joined Lord Abbett in 1997. | |||
| Jeffrey Rabinowitz (1972) | Executive Vice President | Elected in 2017 | Portfolio Manager, joined Lord Abbett in 2017 and was formerly a Managing Director and Portfolio Manager/Technology Analyst at Jennison Associates LLC (2014–2017) and Managing Director and Portfolio Manager/Technology Analyst at Goldman Sachs Asset Management (1999–2014). | |||
| Steven F. Rocco (1979) | Executive Vice President | Elected in 2014 | Partner and Portfolio Manager, joined Lord Abbett in 2004. | |||
| A. Edward Allinson (1961) | Vice President | Elected in 2011 | Portfolio Manager, joined Lord Abbett in 2005. | |||
| Matthew R. DeCicco (1977) | Vice President | Elected in 2003 | Portfolio Manager, joined Lord Abbett in 1999. | |||
| Brooke A. Fapohunda (1975) | Vice President and Assistant Secretary | Elected in 2014 | Partner and Deputy General Counsel, joined Lord Abbett in 2006. | |||
| John K. Forst (1960) | Vice President and Assistant Secretary | Elected in 2005 | Partner and Deputy General Counsel, joined Lord Abbett in 2004. | |||
| Bernard J. Grzelak (1971) | Chief Financial Officer and Vice President | Elected in 2017 | Partner and Chief Operations Officer, and was formerly Director of Fund Administration, joined Lord Abbett in 2003. | |||
| Lawrence H. Kaplan (1957) | Vice President and Secretary | Elected in 1997 | Partner and General Counsel, joined Lord Abbett in 1997. |
27
Basic Information About Management (concluded)
| Name and Year of Birth | Current Position with the Company | Length of Service of Current Position | Principal Occupation During the Past Five Years | |||
| Linda Y. Kim (1980) | Vice President and Assistant Secretary | Elected in 2016 | Counsel, joined Lord Abbett in 2015 and was formerly an Associate at Stroock & Stroock & Lavan LLP (2007–2015). | |||
| Joseph M. McGill (1962) | Chief Compliance Officer | Elected in 2014 | Partner and Chief Compliance Officer, joined Lord Abbett in 2014 and was formerly Managing Director and the Chief Compliance Officer at UBS Global Asset Management (2003–2013). | |||
| A. Edward Oberhaus, III (1959) | Vice President | Elected in 1998 | Partner and Director, joined Lord Abbett in 1983. | |||
| Noah Petrucci (1970) | Vice President | Elected in 2013 | Portfolio Manager, joined Lord Abbett in 2012. | |||
| Lawrence B. Stoller (1963) | Vice President and Assistant Secretary | Elected in 2007 | Partner and Senior Deputy General Counsel, joined Lord Abbett in 2007. | |||
| Leah G. Traub (1979) | Vice President | Elected in 2016 | Partner and Portfolio Manager, joined Lord Abbett in 2007. | |||
| Arthur K. Weise (1970) | Vice President | Elected in 2010 | Partner and Portfolio Manager, joined Lord Abbett in 2007. | |||
| Kewjin Yuoh (1971) | Vice President | Elected in 2012 | Partner and Portfolio Manager, joined Lord Abbett in 2010. | |||
| Scott S. Wallner (1955) | AML Compliance Officer | Elected in 2011 | Assistant General Counsel, joined Lord Abbett in 2004. | |||
| Christian J. Kelly (1975) | Treasurer | Elected in 2017 | Director of Fund Administration, joined Lord Abbett in 2009. |
Please call 888-522-2388 for a copy of the statement of additional information, which contains further information about the Company’s Directors. It is available free upon request.
28
Approval of Advisory Contract
The Board, including all of the Directors who are not “interested persons” of the Company or of Lord Abbett, as defined in the Investment Company Act of 1940, as amended (the “Independent Directors”), annually considers whether to approve the continuation of the existing management agreement between the Fund and Lord Abbett (the “Agreement”). In connection with its most recent approval, the Board reviewed materials relating specifically to the Agreement, as well as numerous materials received throughout the course of the year, including information about the Fund’s investment performance compared to the performance of its benchmark. Before making its decision as to the Fund, the Board had the opportunity to ask questions and request further information, taking into account its familiarity with Lord Abbett gained through its meetings and discussions. These meetings and discussions included reviews of Fund performance conducted by members of the Contract Committee, the deliberations of the Contract Committee, and discussions between the Contract Committee and Lord Abbett’s management. The Independent Directors also met with their independent legal counsel in various private sessions at which no representatives of management were present.
The materials received by the Board included, but were not limited to: (1) information provided by Morningstar, Inc. (“Morningstar”) regarding the investment performance of the Fund compared to the investment performance of certain funds with similar investment styles as determined by Morningstar, based, in part, on the Fund’s Morningstar category (the “performance peer group”), and the investment performance of two appropriate benchmarks; (2) information provided by Morningstar regarding the expense ratios, contractual and actual management fee rates, and other expense components for the Fund and certain funds in the same Morningstar category, with generally the same or similar share classes and operational characteristics, including asset size (the “expense peer group”); (3) certain supplemental investment performance information provided by Lord Abbett; (4) information provided by Lord Abbett on the expense ratios, management fee rates, and other expense components for the Fund; (5) sales and redemption information for the Fund; (6) information regarding Lord Abbett’s financial condition; (7) an analysis of the relative profitability of the Agreement to Lord Abbett; (8) information provided by Lord Abbett regarding the investment management fee schedules for Lord Abbett’s other advisory clients maintaining accounts with a similar investment strategy as the Fund; and (9) information regarding the personnel and other resources devoted by Lord Abbett to managing the Fund.
Investment Management Services Generally. The Board considered the investment management services provided by Lord Abbett to the Fund, including investment research, portfolio management, and trading, and Lord Abbett’s commitment to compliance with all applicable legal requirements. The Board also observed that Lord Abbett was solely engaged in the investment management business and accordingly did not experience the conflicts of interest that may result from being engaged in other lines of business. The Board considered the investment advisory services provided by Lord Abbett to other clients, the fees charged for the services, and the differences in the nature of the services provided to the Fund and other Lord Abbett Funds, on the one hand, and the services provided to other clients, on the other. After reviewing these and related factors, the Board concluded that the Fund was likely to continue to benefit from the nature, extent and quality of the investment services provided by Lord Abbett under the Agreement.
Investment Performance. The Board reviewed the Fund’s investment performance in relation to that of the performance peer group and two appropriate benchmarks as of various periods ended August 31, 2017. The Board observed that the Fund’s investment performance was below the median of the performance peer group for the one-, three-, five-, and ten-year periods. The Board
29
Approval of Advisory Contract (continued)
considered that Lord Abbett was implementing a plan intended to improve the performance of its equity Funds. The Board further considered Lord Abbett’s performance and reputation generally, the performance of other Lord Abbett-managed funds overseen by the Board, and the willingness of Lord Abbett to take steps intended to improve performance when necessary. After reviewing these and related factors, the Board concluded that the Fund’s Agreement should be continued.
Lord Abbett’s Personnel and Methods. The Board considered the qualifications of the personnel providing investment management services to the Fund, in light of its investment objective and discipline. Among other things, the Board considered the size, experience, and turnover of Lord Abbett’s investment management staff Lord Abbett’s investment methodology and philosophy, and Lord Abbett’s approach to recruiting, training, and retaining investment management personnel.
Nature and Quality of Other Services. The Board considered the nature, quality, costs, and extent of compliance, administrative, and other services performed by Lord Abbett and the nature and extent of Lord Abbett’s supervision of third party service providers, including the Fund’s transfer agent and custodian.
Expenses. The Board considered the expense level of the Fund and the expense levels of the expense peer group. It also considered how the expense level of the Fund related to those of the expense peer group and the amount and nature of the fees paid by shareholders. The Board observed that although the Fund’s net total expense ratio was above the median of the expense peer group, the Fund’s advisory fee rate equaled the median of the expense peer group. After reviewing these and related factors, the Board concluded, within the context of its overall approval of the Agreement, that the expense level of the Fund was reasonable and supported the continuation of the Agreement.
Profitability. The Board considered the level of Lord Abbett’s operating margin in managing the Fund, including a review of Lord Abbett’s methodology for allocating its costs to its management of the Fund. It considered whether the Fund was profitable to Lord Abbett in connection with the Fund’s operation, including the fee that Lord Abbett receives from the Fund for providing administrative services to the Fund. The Board also considered the profits realized from other business segments of Lord Abbett, which may benefit from or be related to the Fund’s business. The Board considered Lord Abbett’s profit margins excluding Lord Abbett’s marketing and distribution expenses. The Board also considered Lord Abbett’s profit margins, without those exclusions, in comparison with available industry data and how those profit margins could affect Lord Abbett’s ability to recruit and retain investment personnel. The Board recognized that Lord Abbett’s overall profitability was a factor in enabling it to attract and retain qualified investment management personnel to provide services to the Fund. After reviewing these and related factors, the Board concluded, within the context of its overall approval of the Agreement, that Lord Abbett’s profitability with respect to the Fund was not excessive.
Economies of Scale. The Board considered the extent to which there had been economies of scale in managing the Fund, whether the Fund’s shareholders had appropriately benefited from such economies of scale, and whether there was potential for realization of any further economies of scale. The Board concluded that the existing management fee schedule, with its breakpoints in the level of the management fee, adequately addressed any economies of scale in managing the Fund.
Other Benefits to Lord Abbett. The Board considered the amount and nature of the fees paid by the Fund and the Fund’s shareholders to Lord Abbett for services other than investment advisory services. The Board also considered the revenues and profitability of Lord Abbett’s investment
30
Approval of Advisory Contract (concluded)
advisory business apart from its mutual fund business, and the intangible benefits enjoyed by Lord Abbett by virtue of its relationship with the Fund. The Board observed that the Distributor receives 12b-1 fees from certain of the Lord Abbett Funds as to shares held in accounts for which there is no other broker of record, may retain a portion of the 12b-1 fees it receives, and receives a portion of the sales charges on sales and redemptions of some classes of shares of the Lord Abbett Funds. In addition, the Board observed that Lord Abbett accrues certain benefits for its business of providing investment advice to clients other than the Lord Abbett Funds, but that business also benefits the Funds. The Board also noted that Lord Abbett, as disclosed in the prospectus of the Fund, has entered into revenue sharing arrangements with certain entities that distribute shares of the Fund. The Board also took into consideration the investment research that Lord Abbett receives as a result of Fund brokerage transactions.
Alternative Arrangements. The Board considered whether, instead of approving continuation of the Agreement, it might be in the best interests of the Fund to implement one or more alternative arrangements, such as continuing to employ Lord Abbett, but on different terms. After considering all of the relevant factors, the Board unanimously found that continuation of the Agreement was in the best interests of the Fund and its shareholders and voted unanimously to approve the continuation of the Agreement. In considering whether to approve the continuation of the Agreement, the Board did not identify any single factor as paramount or controlling. Individual Directors may have evaluated the information presented differently from one another, giving different weights to various factors. This summary does not discuss in detail all matters considered.
31
Householding
The Company has adopted a policy that allows it to send only one copy of the Fund’s prospectus, proxy material, annual report and semiannual report to certain shareholders residing at the same “household.” This reduces Fund expenses, which benefits you and other shareholders. If you need additional copies or do not want your mailings to be “householded,” please call Lord Abbett at 888-522-2388 or send a written request with your name, the name of your fund or funds and your account number or numbers to Lord Abbett Family of Funds, P.O. Box 219336, Kansas City, MO 64121.
Proxy Voting Policies, Procedures and Records
A description of the policies and procedures that Lord Abbett uses to vote proxies related to the Fund’s portfolio securities, and information on how Lord Abbett voted the Fund’s proxies during the 12-month period ended June 30 are available without charge, upon request, (i) by calling 888-522-2388; (ii) on Lord Abbett’s Website at www.lordabbett.com; and (iii) on the Securities and Exchange Commission’s (“SEC”) Website at www.sec.gov.
Shareholder Reports and Quarterly Portfolio Disclosure
The Fund is required to file its complete schedule of portfolio holdings with the SEC for its first and third fiscal quarters on Form N-Q. Copies of the filings are available without charge, upon request on the SEC’s Website at www.sec.gov and may be available by calling Lord Abbett at 888-522-2388. You can also obtain copies of Form N-Q by visiting the SEC’s Public Reference Room in Washington, DC (information on the operation of the Public Reference Room may be obtained by calling 800-SEC-0330).
Tax Information
For corporate shareholders, 84% of the Fund’s ordinary income distributions qualified for the dividends received deduction.
Additionally, of the distribution paid to the shareholders during the year ended December 31, 2017, $3,212,763 and $28,795,255, respectively, represent short-term capital gains and long-term capital gains.
|
32


| This report, when not used for the general information of shareholders of the Fund, is to be distributed only if preceded or accompanied by a current fund prospectus. | |||
Lord Abbett Series Fund, Inc. | |||
| Lord Abbett mutual fund shares are distributed by LORD ABBETT DISTRIBUTOR LLC. |
Mid Cap Stock Portfolio | LASFMCV-3 (02/18) |
![]()
LORD ABBETT
ANNUAL REPORT
Lord Abbett
Series Fund — Short Duration Income Portfolio
For the fiscal year ended December 31, 2017
Table of Contents
Lord Abbett Series Fund — Short Duration Income
Portfolio Annual Report
For the fiscal year ended December 31, 2017

From left to right: James L.L. Tullis, Independent Chairman of the Lord Abbett Funds and Daria L. Foster, Director, President, and Chief Executive Officer of the Lord Abbett Funds.
Dear Shareholders: We are pleased to provide you with this overview of the performance of Lord Abbett Series Fund — Short Duration Income Portfolio for the fiscal year ended December 31, 2017. On this page and the following pages, we discuss the major factors that influenced fiscal year performance. For additional information about the Fund, please visit our website at www.lordabbett.com, where you also can access the quarterly commentaries that provide updates on the Fund’s performance and other portfolio related updates.
Thank you for investing in Lord Abbett mutual funds. We value the trust that you place in us and look forward to serving your investment needs in the years to come.
Best regards,

Daria L. Foster
Director, President and Chief Executive Officer
For the fiscal year ended December 31, 2017, the Fund returned 2.19%, reflecting performance at the net asset value (NAV) of Class VC shares, with all distributions reinvested, compared to its benchmark, the ICE BofA Merrill Lynch 1-3 year U.S. Corporate Credit Index,1 which returned 1.91% over the same period.
The Federal Reserve (Fed) gradually raised the Fed Funds rate over the 12-month period ended December 31, 2017, by raising interest rates by 25bps three times, ultimately reaching a target range of
1.25-1.50%. Inflation rose at a moderate pace during the year. The Consumer Price Index (CPI) gained 2.1% over the 12-month period ended December 31, 2017. Meanwhile, the employment picture continued to improve with the unemployment rate falling to 4.1% by year end, compared to 4.7% a year earlier and a high of 10.0% in October 2009. The U.S. Treasury yield curve flattened during the period, with the yield on two-year Treasury notes increasing by 69bps. Yields on longer-dated Treasury bonds were lower
1
over the period, with the yield on 10-year Treasury bonds slightly lower and the yield on 30-year Treasury bonds falling 32bps.
Consistent with the Fund’s strategic design, the Fund maintained exposures to a variety of bond market sectors, in addition to the investment grade corporate bonds represented in the benchmark. This design provides portfolio diversification and allows for the flexibility to take advantage of relative value opportunities across sectors. These sector weightings were important factors affecting performance.
For the trailing 12-month period, the primary factor contributing to the Fund’s relative performance was allocation to out-of-benchmark sectors, including commercial mortgage-backed securities and high yield corporate bonds. High yield corporate bonds outperformed higher-
rated securities as spreads tightened. Improving fundamentals and low defaults also created a positive environment for high yield corporate bonds during the period. Additionally, security selection within investment grade corporate bonds contributed to performance.
The Fund’s modest allocation to U.S. Government-related securities detracted from performance. While these securities offer diversification and liquidity with limited volatility, they did not perform as well as corporate bonds during the period.
The Fund’s portfolio is actively managed and, therefore, its holdings and the weightings of a particular issuer or particular sector as a percentage of portfolio assets are subject to change. Sectors may include many industries.
1 The ICE BofA Merrill Lynch 1-3 Year U.S. Corporate Credit Index is an unmanaged index comprised of U.S. dollar-denominated investment grade corporate debt securities publicly issued in the U.S. domestic market with between one and three years remaining to final maturity.
Unless otherwise specified, indexes reflect total return, with all dividends reinvested. Indexes are unmanaged, do not reflect the deduction of fees or expenses, and are not available for direct investment.
Important Performance and Other Information Performance data quoted in the following pages reflect past performance and are no guarantee of future results. Current performance may be higher or lower than the performance quoted. The investment return and principal value of an investment in the Fund will fluctuate so that shares, on any given day or when redeemed, may be worth more or less than their original cost.
You can obtain performance data current to the most recent month end by calling Lord Abbett at 888-522-2388 or referring to www.lordabbett.com.
The annual commentary above discusses the views of the Fund’s management and various portfolio holdings of the Fund as of December 31, 2017. These views and portfolio holdings may have changed after this date. Information provided in the commentary is not a recommendation to buy or sell securities. Because the Fund’s portfolio is actively managed and may change significantly, the Fund may no longer own the securities described above or may have otherwise changed its position in the securities. For more recent information about the Fund’s portfolio holdings, please visit www.lordabbett.com.
A Note about Risk: See Notes to Financial Statements for a discussion of investment risks. For a more detailed discussion of the risks associated with the Fund, please see the Fund’s prospectus.
2
Mutual funds are not insured by the FDIC, are not deposits or other obligations of, or guaranteed by, banks, and are subject to investment risks including possible loss of principal amount invested.
The Fund serves as an underlying investment vehicle for variable annuity contracts and variable life insurance policies.
3
Below is a comparison of a $10,000 investment in Class VC shares with the same investment in the ICE BofA Merrill Lynch 1-3 Year U.S. Corporate® Index, assuming reinvestment of all dividends and distributions. The Fund’s shares are sold only to insurance company separate accounts that fund certain variable annuity and variable life contracts. This line graph comparison does not reflect the sales charges or other expenses of these contracts. If those sales charges and expenses were reflected, returns would be lower. The graph and performance table below do not reflect the deduction of taxes that a shareholder would pay on Fund distributions or the redemption of Fund shares. During the period, expenses of the Fund were waived or reimbursed by Lord Abbett; without such waiver or reimbursement of expenses, the Fund’s returns would have been lower. Past performance is no guarantee of future results.

Average Annual Total Returns for the
Periods Ended December 31, 2017
| 1 Year | Life of Class | |||
| Class VC2 | 2.19% | 1.73% |
1 Performance for the unmanaged index does not reflect any fees or expenses. The performance of the index is not necessarily representative of the Fund’s performance. Performance for the index began on April 14, 2014.
2 The Class VC shares commenced operations on April 4, 2014. Performance for the Class began on April 14, 2014.
4
As a shareholder of the Fund, you incur ongoing costs, including management fees; expenses related to the Fund’s services arrangements with certain insurance companies; and other Fund expenses. This Example is intended to help you understand your ongoing costs (in dollars) of investing in the Fund and to compare these costs with the ongoing costs of investing in other mutual funds.
The Example is based on an investment of $1,000 invested at the beginning of the period and held for the entire period (July 1, 2017 through December 31, 2017).
The Example reflects only expenses that are deducted from the assets of the Fund. Fees and expenses, including sales charges applicable to the various insurance products that invest in the Fund, are not reflected in this Example. If such fees and expenses were reflected in the Example, the total expenses shown would be higher. Fees and expenses regarding such variable insurance products are separately described in the prospectus related to those products.
Actual Expenses
The first line of the table on the following page provides information about actual account values and actual expenses. You may use the information in this line, together with the amount you invested, to estimate the expenses that you paid over the period. Simply divide your account value by $1,000 (for example, an $8,600 account value divided by $1,000 = 8.6), then multiply the result by the number in the first line under the heading titled “Expenses Paid During Period 7/1/17 – 12/31/17” to estimate the expenses you paid on your account during this period.
Hypothetical Example for Comparison Purposes
The second line of the table on the following page provides information about hypothetical account values and hypothetical expenses based on the Fund’s actual expense ratio and an assumed rate of return of 5% per year before expenses, which is not the Fund’s actual return. The hypothetical account values and expenses may not be used to estimate the actual ending account balance or expenses you paid for the period. You may use this information to compare the ongoing costs of investing in the Fund and other funds. To do so, compare this 5% hypothetical example with the 5% hypothetical examples that appear in the shareholder reports of the other funds.
5
Please note that the expenses shown in the table are meant to highlight your ongoing costs only and do not reflect any transactional costs, such as sales charges. Therefore, the second line of the table is useful in comparing ongoing costs only, and will not help you determine the relative total costs of owning different funds. In addition, if these transactional costs were included, your costs would have been higher.
| Beginning Account Value | Ending Account Value | Expenses Paid During Period† | ||||
| 7/1/17 | 12/31/17 | 7/1/17 - 12/31/17 | ||||
| Class VC | ||||||
| Actual | $1,000.00 | $1,007.40 | $4.05 | |||
| Hypothetical (5% Return Before Expenses) | $1,000.00 | $1,021.17 | $4.08 |
| † | Net expenses are equal to the Fund’s annualized expense ratio of 0.80%, multiplied by the average account value over the period, multiplied by 184/365 (to reflect one-half year period). |
Portfolio Holdings Presented by Sector
December 31, 2017
| Sector* | %** | |||
| Auto | 2.13 | % | ||
| Basic Industry | 0.55 | % | ||
| Capital Goods | 0.69 | % | ||
| Consumer Cyclical | 0.97 | % | ||
| Consumer Discretionary | 0.46 | % | ||
| Consumer Services | 0.80 | % | ||
| Consumer Staples | 0.54 | % | ||
| Energy | 9.15 | % | ||
| Financial Services | 64.22 | % | ||
| Foreign Government | 0.22 | % | ||
| Health Care | 1.61 | % | ||
| Integrated Oils | 0.34 | % | ||
| Materials & Processing | 3.45 | % | ||
| Municipal | 0.20 | % | ||
| Other | 0.11 | % | ||
| Producer Durables | 0.67 | % | ||
| Technology | 2.85 | % | ||
| Telecommunications | 0.25 | % | ||
| Transportation | 0.17 | % | ||
| U.S. Government | 5.59 | % | ||
| Utilities | 2.69 | % | ||
| Repurchase Agreement | 2.34 | % | ||
| Total | 100.00 | % | ||
| * | A sector may comprise several industries. |
| ** | Represents percent of total investments. |
| 6 | See Notes to Financial Statements. |
December 31, 2017
| Investments | Interest Rate | Maturity Date | Principal Amount (000) | Fair Value | ||||||||
| LONG-TERM INVESTMENTS 96.63% | ||||||||||||
| ASSET-BACKED SECURITIES 29.14% | ||||||||||||
| Automobiles 12.52% | ||||||||||||
| Ally Auto Receivables Trust 2014-2 A3 | 1.25% | 4/15/2019 | $ | – | (a) | $ | 388 | |||||
| Ally Auto Receivables Trust 2015-2 A3 | 1.49% | 11/15/2019 | 3 | 3,116 | ||||||||
| American Credit Acceptance Receivables Trust 2015-3 C† | 4.84% | 10/12/2021 | 100 | 101,974 | ||||||||
| AmeriCredit Automobile Receivables Trust 2013-3 E† | 3.74% | 12/8/2020 | 100 | 100,185 | ||||||||
| AmeriCredit Automobile Receivables Trust 2014-3 B | 1.92% | 11/8/2019 | 93 | 92,637 | ||||||||
| AmeriCredit Automobile Receivables Trust 2016-3 A3 | 1.46% | 5/10/2021 | 49 | 48,782 | ||||||||
| AmeriCredit Automobile Receivables Trust 2016-3 B | 1.80% | 10/8/2021 | 31 | 30,803 | ||||||||
| AmeriCredit Automobile Receivables Trust 2016-4 A2A | 1.34% | 4/8/2020 | 15 | 14,740 | ||||||||
| AmeriCredit Automobile Receivables Trust 2016-4 D | 2.74% | 12/8/2022 | 166 | 164,650 | ||||||||
| AmeriCredit Automobile Receivables Trust 2017-1 A2A | 1.51% | 5/18/2020 | 26 | 25,658 | ||||||||
| AmeriCredit Automobile Receivables Trust 2017-1 D | 3.13% | 1/18/2023 | 16 | 16,040 | ||||||||
| AmeriCredit Automobile Receivables Trust 2017-2 B | 2.40% | 5/18/2022 | 43 | 42,963 | ||||||||
| AmeriCredit Automobile Receivables Trust 2017-2 C | 2.97% | 3/20/2023 | 64 | 64,375 | ||||||||
| AmeriCredit Automobile Receivables Trust 2017-3 A2A | 1.69% | 12/18/2020 | 54 | 53,930 | ||||||||
| AmeriCredit Automobile Receivables Trust 2017-3 B | 2.24% | 6/19/2023 | 29 | 28,765 | ||||||||
| AmeriCredit Automobile Receivables Trust 2017-4 A3 | 2.04% | 7/18/2022 | 97 | 96,610 | ||||||||
| AmeriCredit Automobile Receivables Trust 2017-4 B | 2.36% | 12/19/2022 | 42 | 41,780 | ||||||||
| Avis Budget Rental Car Funding AESOP LLC 2012-3A A† | 2.10% | 3/20/2019 | 97 | 96,503 | ||||||||
| Bank of The West Auto Trust 2017-1 A3† | 2.11% | 1/15/2023 | 100 | 99,504 | ||||||||
| Bank of The West Auto Trust 2017-1 A4† | 2.33% | 9/15/2023 | 100 | 99,473 | ||||||||
| California Republic Auto Receivables Trust 2015-3 A4 | 2.13% | 5/17/2021 | 15 | 15,009 | ||||||||
| See Notes to Financial Statements. | 7 |
Schedule of Investments (continued)
December 31, 2017
| Investments | Interest Rate | Maturity Date | Principal Amount (000) | Fair Value | ||||||||
| Automobiles (continued) | ||||||||||||
| California Republic Auto Receivables Trust 2015-4 A3† | 2.04% | 1/15/2020 | $ | 4 | $ | 4,075 | ||||||
| California Republic Auto Receivables Trust 2015-4 A4† | 2.58% | 6/15/2021 | 228 | 229,025 | ||||||||
| California Republic Auto Receivables Trust 2015-4 B† | 3.73% | 11/15/2021 | 12 | 12,194 | ||||||||
| California Republic Auto Receivables Trust 2016-1 A3 | 1.89% | 5/15/2020 | 19 | 18,762 | ||||||||
| California Republic Auto Receivables Trust 2016-1 A4 | 2.24% | 10/15/2021 | 58 | 58,041 | ||||||||
| California Republic Auto Receivables Trust 2016-2 A3 | 1.56% | 7/15/2020 | 10 | 9,762 | ||||||||
| California Republic Auto Receivables Trust 2016-2 A4 | 1.83% | 12/15/2021 | 15 | 14,896 | ||||||||
| Capital Auto Receivables Asset Trust 2014-3 C† | 2.71% | 11/20/2019 | 21 | 21,057 | ||||||||
| Capital Auto Receivables Asset Trust 2015-2 C | 2.67% | 8/20/2020 | 132 | 132,685 | ||||||||
| Capital Auto Receivables Asset Trust 2015-3 B | 2.43% | 9/21/2020 | 11 | 11,033 | ||||||||
| Capital Auto Receivables Asset Trust 2015-3 C | 2.90% | 12/21/2020 | 10 | 10,071 | ||||||||
| Capital Auto Receivables Asset Trust 2015-3 D | 3.34% | 3/22/2021 | 9 | 9,114 | ||||||||
| Capital Auto Receivables Asset Trust 2016-1 A4 | 1.98% | 10/20/2020 | 16 | 15,981 | ||||||||
| Capital Auto Receivables Asset Trust 2016-1 B | 2.67% | 12/21/2020 | 12 | 12,063 | ||||||||
| Capital Auto Receivables Asset Trust 2016-2 A3 | 1.46% | 6/22/2020 | 19 | 19,359 | ||||||||
| Capital Auto Receivables Asset Trust 2016-2 A4 | 1.63% | 1/20/2021 | 24 | 23,873 | ||||||||
| Capital Auto Receivables Asset Trust 2016-2 B | 2.11% | 3/22/2021 | 4 | 3,990 | ||||||||
| Capital Auto Receivables Asset Trust 2017-1 A2† | 1.76% | 6/22/2020 | 64 | 63,905 | ||||||||
| Capital Auto Receivables Asset Trust 2017-1 A3† | 2.02% | 8/20/2021 | 28 | 27,934 | ||||||||
| Capital Auto Receivables Asset Trust 2017-1 A4† | 2.22% | 3/21/2022 | 17 | 16,919 | ||||||||
| CarMax Auto Owner Trust 2016-3 A3 | 1.39% | 5/17/2021 | 32 | 31,767 | ||||||||
| CarMax Auto Owner Trust 2016-3 A4 | 1.60% | 1/18/2022 | 32 | 31,491 | ||||||||
| CarMax Auto Owner Trust 2016-4 A2 | 1.21% | 11/15/2019 | 17 | 17,063 | ||||||||
| CarMax Auto Owner Trust 2016-4 A3 | 1.40% | 8/15/2021 | 28 | 27,725 | ||||||||
| CarMax Auto Owner Trust 2016-4 A4 | 1.60% | 6/15/2022 | 21 | 20,614 | ||||||||
| CarMax Auto Owner Trust 2017-3 A2A | 1.64% | 9/15/2020 | 113 | 112,776 | ||||||||
| CarMax Auto Owner Trust 2017-3 A3 | 1.97% | 4/15/2022 | 165 | 164,148 | ||||||||
| CarMax Auto Owner Trust 2017-3 A4 | 2.22% | 11/15/2022 | 49 | 48,755 | ||||||||
| CarMax Auto Owner Trust 2017-4 A3 | 2.11% | 10/17/2022 | 125 | 124,434 | ||||||||
| Chesapeake Funding II LLC 2016-2A A1† | 1.88% | 6/15/2028 | 148 | 147,865 | ||||||||
| Chesapeake Funding II LLC 2017-4A A1† | 2.12% | 11/15/2029 | 130 | 129,688 | ||||||||
| Chrysler Capital Auto Receivables Trust 2015-AA A4† | 1.55% | 2/18/2020 | 32 | 32,042 | ||||||||
| 8 | See Notes to Financial Statements. |
Schedule of Investments (continued)
December 31, 2017
| Investments | Interest Rate | Maturity Date | Principal Amount (000) | Fair Value | ||||||||
| Automobiles (continued) | ||||||||||||
| Chrysler Capital Auto Receivables Trust 2015-BA B† | 2.70% | 12/15/2020 | $ | 3 | $ | 3,019 | ||||||
| Chrysler Capital Auto Receivables Trust 2016-AA A3† | 1.77% | 10/15/2020 | 33 | 32,637 | ||||||||
| Chrysler Capital Auto Receivables Trust 2016-AA B† | 2.88% | 2/15/2022 | 11 | 11,100 | ||||||||
| CPS Auto Receivables Trust 2016-B A† | 2.07% | 11/15/2019 | 19 | 19,289 | ||||||||
| CPS Auto Receivables Trust 2017-C A† | 1.78% | 9/15/2020 | 74 | 73,738 | ||||||||
| CPS Auto Receivables Trust 2017-C B† | 2.30% | 7/15/2021 | 100 | 99,619 | ||||||||
| CPS Auto Trust 2017-D C† | 3.01% | 10/17/2022 | 100 | 99,395 | ||||||||
| Drive Auto Receivables Trust 2015-AA C† | 3.06% | 5/17/2021 | 32 | 32,120 | ||||||||
| Drive Auto Receivables Trust 2015-BA C† | 2.76% | 7/15/2021 | 1 | 1,182 | ||||||||
| Drive Auto Receivables Trust 2015-BA D† | 3.84% | 7/15/2021 | 5 | 5,081 | ||||||||
| Drive Auto Receivables Trust 2015-DA C† | 3.38% | 11/15/2021 | 18 | 18,272 | ||||||||
| Drive Auto Receivables Trust 2015-DA D† | 4.59% | 1/17/2023 | 22 | 22,521 | ||||||||
| Drive Auto Receivables Trust 2016-AA B† | 3.17% | 5/15/2020 | 4 | 4,155 | ||||||||
| Drive Auto Receivables Trust 2016-BA B† | 2.56% | 6/15/2020 | 9 | 9,143 | ||||||||
| Drive Auto Receivables Trust 2016-BA C† | 3.19% | 7/15/2022 | 20 | 20,155 | ||||||||
| Drive Auto Receivables Trust 2016-BA D† | 4.53% | 8/15/2023 | 41 | 42,166 | ||||||||
| Drive Auto Receivables Trust 2016-CA B† | 2.37% | 11/16/2020 | 30 | 30,043 | ||||||||
| Drive Auto Receivables Trust 2016-CA C† | 3.02% | 11/15/2021 | 78 | 78,608 | ||||||||
| Drive Auto Receivables Trust 2016-CA D† | 4.18% | 3/15/2024 | 27 | 27,739 | ||||||||
| Drive Auto Receivables Trust 2017-2 B | 2.25% | 6/15/2021 | 37 | 37,023 | ||||||||
| Drive Auto Receivables Trust 2017-2 C | 2.75% | 9/15/2023 | 42 | 42,077 | ||||||||
| Drive Auto Receivables Trust 2017-2 D | 3.49% | 9/15/2023 | 180 | 179,975 | ||||||||
| Drive Auto Receivables Trust 2017-BA B† | 2.20% | 5/15/2020 | 41 | 41,077 | ||||||||
| Drive Auto Receivables Trust 2017-BA C† | 2.61% | 8/16/2021 | 52 | 52,128 | ||||||||
| Drive Auto Receivables Trust 2017-BA D† | 3.72% | 10/17/2022 | 34 | 34,468 | ||||||||
| Exeter Automobile Receivables Trust 2017-3A A† | 2.05% | 12/15/2021 | 56 | 55,795 | ||||||||
| Exeter Automobile Receivables Trust 2017-3A B† | 2.81% | 9/15/2022 | 50 | 49,680 | ||||||||
| Fifth Third Auto Trust 2017-1 A4 | 2.03% | 7/15/2024 | 39 | 38,628 | ||||||||
| First Investors Auto Owner Trust 2016-2A A1† | 1.53% | 11/16/2020 | 17 | 16,807 | ||||||||
| First Investors Auto Owner Trust 2017-1A A1† | 1.69% | 4/15/2021 | 28 | 27,488 | ||||||||
| First Investors Auto Owner Trust 2017-3A A1† | 2.00% | 3/15/2022 | 53 | 53,420 | ||||||||
| Flagship Credit Auto Trust 2015-2 A† | 1.98% | 10/15/2020 | 74 | 73,816 | ||||||||
| Flagship Credit Auto Trust 2015-3 A† | 2.38% | 10/15/2020 | 3 | 2,580 | ||||||||
| Flagship Credit Auto Trust 2016-2 A2† | 3.05% | 8/16/2021 | 60 | 60,388 | ||||||||
| Flagship Credit Auto Trust 2016-4 A2† | 1.96% | 2/16/2021 | 10 | 9,980 | ||||||||
| Flagship Credit Auto Trust 2017-3 A† | 1.88% | 10/15/2021 | 55 | 55,311 | ||||||||
| See Notes to Financial Statements. | 9 |
Schedule of Investments (continued)
December 31, 2017
| Investments | Interest Rate | Maturity Date | Principal Amount (000) | Fair Value | ||||||||
| Automobiles (continued) | ||||||||||||
| Flagship Credit Auto Trust 2017-3 B† | 2.59% | 7/15/2022 | $ | 30 | $ | 29,889 | ||||||
| Flagship Credit Auto Trust 2017-4 A† | 2.07% | 4/15/2022 | 83 | 82,899 | ||||||||
| Ford Credit Auto Lease Trust 2016-A A3 | 1.71% | 4/15/2019 | 23 | 23,005 | ||||||||
| Ford Credit Auto Owner Trust 2016-C A2A | 1.04% | 9/15/2019 | 35 | 34,607 | ||||||||
| Honda Auto Receivables Owner Trust 2016-4 A2 | 1.04% | 4/18/2019 | 32 | 31,555 | ||||||||
| Huntington Auto Trust 2016-1 A3 | 1.59% | 11/16/2020 | 92 | 91,638 | ||||||||
| Hyundai Auto Receivables Trust 2016-B C | 2.19% | 11/15/2022 | 72 | 71,270 | ||||||||
| Mercedes-Benz Auto Lease Trust 2016-A A3 | 1.52% | 3/15/2019 | 35 | 34,756 | ||||||||
| Mercedes-Benz Auto Receivables Trust 2016-1 A2A | 1.11% | 3/15/2019 | 22 | 21,676 | ||||||||
| Nissan Auto Receivables Owner Trust 2014-B A3 | 1.11% | 5/15/2019 | 7 | 7,271 | ||||||||
| Nissan Auto Receivables Owner Trust 2016-A A3 | 1.34% | 10/15/2020 | 590 | 587,371 | ||||||||
| Nissan Auto Receivables Owner Trust 2016-B A3 | 1.32% | 1/15/2021 | 26 | 25,825 | ||||||||
| Santander Drive Auto Receivables Trust 2014-3 D | 2.65% | 8/17/2020 | 14 | 14,045 | ||||||||
| Santander Drive Auto Receivables Trust 2014-4 C | 2.60% | 11/16/2020 | 11 | 10,737 | ||||||||
| Santander Drive Auto Receivables Trust 2015-3 B | 2.07% | 4/15/2020 | 3 | 2,709 | ||||||||
| Santander Drive Auto Receivables Trust 2015-3 C | 2.74% | 1/15/2021 | 13 | 13,063 | ||||||||
| Santander Drive Auto Receivables Trust 2015-4 C | 2.97% | 3/15/2021 | 77 | 77,545 | ||||||||
| Santander Drive Auto Receivables Trust 2015-5 D | 3.65% | 12/15/2021 | 22 | 22,342 | ||||||||
| Santander Drive Auto Receivables Trust 2016-1 D | 4.02% | 4/15/2022 | 264 | 270,784 | ||||||||
| Santander Drive Auto Receivables Trust 2016-2 B | 2.08% | 2/16/2021 | 10 | 10,004 | ||||||||
| Santander Drive Auto Receivables Trust 2016-3 A2 | 1.34% | 11/15/2019 | 6 | 6,275 | ||||||||
| Santander Drive Auto Receivables Trust 2016-3 A3 | 1.50% | 8/17/2020 | 34 | 33,947 | ||||||||
| Santander Drive Auto Receivables Trust 2016-3 B | 1.89% | 6/15/2021 | 250 | 249,518 | ||||||||
| Santander Drive Auto Receivables Trust 2017-1 D | 3.17% | 4/17/2023 | 14 | 14,080 | ||||||||
| Santander Drive Auto Receivables Trust 2017-2 D | 3.49% | 7/17/2023 | 89 | 89,954 | ||||||||
| Santander Drive Auto Receivables Trust 2017-3 C | 2.76% | 12/15/2022 | 20 | 20,022 | ||||||||
| TCF Auto Receivables Owner Trust 2015-1A A4† | 1.96% | 11/16/2020 | 621 | 620,761 | ||||||||
| TCF Auto Receivables Owner Trust 2015-1A B† | 2.49% | 4/15/2021 | 29 | 29,003 | ||||||||
| TCF Auto Receivables Owner Trust 2015-1A D† | 3.53% | 3/15/2022 | 10 | 9,974 | ||||||||
| TCF Auto Receivables Owner Trust 2015-2A A3† | 2.06% | 4/15/2020 | 8 | 8,489 | ||||||||
| TCF Auto Receivables Owner Trust 2015-2A B† | 3.00% | 9/15/2021 | 6 | 6,034 | ||||||||
| TCF Auto Receivables Owner Trust 2015-2A C† | 3.75% | 12/15/2021 | 4 | 4,044 | ||||||||
| TCF Auto Receivables Owner Trust 2016-1A A2† | 1.39% | 11/15/2019 | 15 | 14,860 | ||||||||
| TCF Auto Receivables Owner Trust 2016-1A A4† | 2.03% | 2/15/2022 | 50 | 49,644 | ||||||||
| TCF Auto Receivables Owner Trust 2016-1A B† | 2.32% | 6/15/2022 | 33 | 32,495 | ||||||||
| TCF Auto Receivables Owner Trust 2016-PT1A A† | 1.93% | 6/15/2022 | 65 | 64,900 | ||||||||
| Toyota Auto Receivables Owner Trust 2016-A A3 | 1.25% | 3/16/2020 | 41 | 40,907 | ||||||||
| Toyota Auto Receivables Owner Trust 2016-D A3 | 1.23% | 10/15/2020 | 40 | 39,659 | ||||||||
| 10 | See Notes to Financial Statements. |
Schedule of Investments (continued)
December 31, 2017
| Investments | Interest Rate | Maturity Date | Principal Amount (000) | Fair Value | ||||||||
| Automobiles (continued) | ||||||||||||
| Westlake Automobile Receivables Trust 2016-2A C† | 2.83% | 5/17/2021 | $ | 10 | $ | 10,032 | ||||||
| Westlake Automobile Receivables Trust 2016-3A B† | 2.07% | 12/15/2021 | 11 | 10,967 | ||||||||
| Westlake Automobile Receivables Trust 2017-1A B† | 2.30% | 10/17/2022 | 100 | 99,927 | ||||||||
| Westlake Automobile Receivables Trust 2017-2A A2A† | 1.80% | 7/15/2020 | 82 | 81,880 | ||||||||
| Westlake Automobile Receivables Trust 2017-2A B† | 2.25% | 12/15/2020 | 67 | 66,691 | ||||||||
| Westlake Automobile Receivables Trust 2017-2A D† | 3.28% | 12/15/2022 | 130 | 128,962 | ||||||||
| Total | 7,497,631 | |||||||||||
| Credit Cards 7.32% | ||||||||||||
| American Express Credit Account Master Trust 2017-6 A | 2.04% | 5/15/2023 | 167 | 166,251 | ||||||||
| American Express Credit Account Master Trust 2017-7 A | 2.35% | 5/15/2025 | 129 | 128,701 | ||||||||
| BA Credit Card Trust 2016-A1 A | 1.867% (1 Mo. LIBOR + .39% | )# | 10/15/2021 | 48 | 48,182 | |||||||
| BA Credit Card Trust 2017-A2 | 1.84% | 1/17/2023 | 241 | 238,724 | ||||||||
| Barclays Dryrock Issuance Trust 2016-1 A | 1.52% | 5/16/2022 | 100 | 99,113 | ||||||||
| Barclays Dryrock Issuance Trust 2017-1 A | 1.807% (1 Mo. LIBOR + .33% | )# | 3/15/2023 | 220 | 220,723 | |||||||
| Barclays Dryrock Issuance Trust 2017-2 A | 1.777% (1 Mo. LIBOR + .30% | )# | 5/15/2023 | 221 | 221,323 | |||||||
| Capital One Multi-Asset Execution Trust 2015-A3 | 1.877% (1 Mo. LIBOR + .40% | )# | 3/15/2023 | 50 | 50,285 | |||||||
| Capital One Multi-Asset Execution Trust 2015-A5 | 1.60% | 5/17/2021 | 28 | 27,974 | ||||||||
| Capital One Multi-Asset Execution Trust 2016-A1 | 1.927% (1 Mo. LIBOR + .45% | )# | 2/15/2022 | 74 | 74,364 | |||||||
| Capital One Multi-Asset Execution Trust 2016-A4 | 1.33% | 6/15/2022 | 28 | 27,660 | ||||||||
| Capital One Multi-Asset Execution Trust 2017-A4 | 1.99% | 7/17/2023 | 247 | 245,527 | ||||||||
| Capital One Multi-Asset Execution Trust 2017-A6 | 2.29% | 7/15/2025 | 133 | 132,190 | ||||||||
| Chase Issuance Trust 2012-A4 | 1.58% | 8/16/2021 | 150 | 148,799 | ||||||||
| Chase Issuance Trust 2016-A2 A | 1.37% | 6/15/2021 | 22 | 21,793 | ||||||||
| Citibank Credit Card Issuance Trust 2014-A1 | 2.88% | 1/23/2023 | 35 | 35,645 | ||||||||
| Citibank Credit Card Issuance Trust 2017-A8 | 1.86% | 8/8/2022 | 178 | 176,390 | ||||||||
| Discover Card Execution Note Trust 2015-A2 A | 1.90% | 10/17/2022 | 145 | 144,166 | ||||||||
| Discover Card Execution Note Trust 2015-A4 | 2.19% | 4/17/2023 | 100 | 100,039 | ||||||||
| Discover Card Execution Note Trust 2016-A2 | 2.017% (1 Mo. LIBOR + .54% | )# | 9/15/2021 | 100 | 100,547 | |||||||
| Discover Card Execution Note Trust 2016-A4 | 1.39% | 3/15/2022 | 100 | 98,801 | ||||||||
| Discover Card Execution Note Trust 2017-A6 | 1.88% | 2/15/2023 | 161 | 159,771 | ||||||||
| See Notes to Financial Statements. | 11 |
Schedule of Investments (continued)
December 31, 2017
| Investments | Interest Rate | Maturity Date | Principal Amount (000) | Fair Value | ||||||||
| Credit Cards (continued) | ||||||||||||
| First National Master Note Trust 2017-2 A | 1.917% (1 Mo. LIBOR + 0.44% | )# | 10/16/2023 | $ | 172 | $ | 172,443 | |||||
| Synchrony Credit Card Master Note Trust 2015-1 A | 2.37% | 3/15/2023 | 24 | 24,080 | ||||||||
| Synchrony Credit Card Master Note Trust 2015-2 A | 1.60% | 4/15/2021 | 56 | 55,967 | ||||||||
| Synchrony Credit Card Master Note Trust 2016-1 A | 2.04% | 3/15/2022 | 300 | 299,962 | ||||||||
| Synchrony Credit Card Master Note Trust 2016-2 A | 2.21% | 5/15/2024 | 179 | 178,053 | ||||||||
| Synchrony Credit Card Master Note Trust 2016-2 B | 2.55% | 5/15/2024 | 100 | 99,111 | ||||||||
| Synchrony Credit Card Master Note Trust 2017-1 A | 1.93% | 6/15/2023 | 142 | 140,739 | ||||||||
| Synchrony Credit Card Master Note Trust 2017-1 B | 2.19% | 6/15/2023 | 44 | 43,503 | ||||||||
| Synchrony Credit Card Master Note Trust 2017-2 A | 2.62% | 10/15/2025 | 122 | 122,081 | ||||||||
| Synchrony Credit Card Master Note Trust 2017-2 B | 2.82% | 10/15/2025 | 100 | 99,645 | ||||||||
| World Financial Network Credit Card Master Trust 2012-A | 3.14% | 1/17/2023 | 17 | 17,212 | ||||||||
| World Financial Network Credit Card Master Trust 2015-B A | 2.55% | 6/17/2024 | 49 | 49,206 | ||||||||
| World Financial Network Credit Card Master Trust 2016-A | 2.03% | 4/15/2025 | 134 | 131,678 | ||||||||
| World Financial Network Credit Card Master Trust 2017-A | 2.12% | 3/15/2024 | 150 | 149,452 | ||||||||
| World Financial Network Credit Card Master Trust 2017-B A | 1.98% | 6/15/2023 | 131 | 130,650 | ||||||||
| Total | 4,380,750 | |||||||||||
| Other 9.30% | ||||||||||||
| Access Point Funding I LLC 2017-A† | 3.06% | 4/15/2029 | 242 | 241,483 | ||||||||
| Ammc CLO 19 Ltd. 2016-19A A† | 2.859% (3 Mo. LIBOR + 1.50% | )# | 10/15/2028 | 250 | 252,495 | |||||||
| Apidos CLO X 2012-10A A† | 2.798% (3 Mo. LIBOR + 1.42% | )# | 10/30/2022 | 109 | 109,651 | |||||||
| Arbor Realty Collateralized Loan Obligation Ltd. 2017-FL3 A† | 2.233% (1 Mo. LIBOR + 0.99% | )# | 12/15/2027 | 100 | 100,196 | |||||||
| Ascentium Equipment Receivables Trust 2016-1A A2† | 1.75% | 11/13/2018 | 7 | 6,921 | ||||||||
| Ascentium Equipment Receivables Trust 2016-2A A2† | 1.46% | 4/10/2019 | 13 | 13,363 | ||||||||
| Ascentium Equipment Receivables Trust 2016-2A A3† | 1.65% | 5/10/2022 | 28 | 27,784 | ||||||||
| Ascentium Equipment Receivables Trust 2017-1A A3† | 2.29% | 6/10/2021 | 20 | 19,943 | ||||||||
| Ascentium Equipment Receivables Trust 2017-2A A2† | 2.00% | 5/11/2020 | 22 | 21,947 | ||||||||
| 12 | See Notes to Financial Statements. |
Schedule of Investments (continued)
December 31, 2017
| Investments | Interest Rate | Maturity Date | Principal Amount (000) | Fair Value | ||||||||
| Other (continued) | ||||||||||||
| Avery Point V CLO Ltd. 2014-5A AR† | 2.333% (3 Mo. LIBOR + .98% | )# | 7/17/2026 | $ | 250 | $ | 250,820 | |||||
| CNH Equipment Trust 2015-B A4 | 1.89% | 4/15/2022 | 11 | 10,978 | ||||||||
| CNH Equipment Trust 2015-C A3 | 1.66% | 11/16/2020 | 43 | 43,186 | ||||||||
| CNH Equipment Trust 2016-B A4 | 1.97% | 11/15/2021 | 6 | 5,953 | ||||||||
| Conn Funding II LP 2017-A† | 2.73% | 7/15/2019 | 26 | 26,514 | ||||||||
| Dell Equipment Finance Trust 2016-1 A3† | 1.65% | 7/22/2021 | 100 | 99,871 | ||||||||
| Dell Equipment Finance Trust 2016-1 B† | 2.03% | 7/22/2021 | 100 | 99,818 | ||||||||
| Dell Equipment Finance Trust 2017-1 A2† | 1.86% | 6/24/2019 | 100 | 99,973 | ||||||||
| Dell Equipment Finance Trust 2017-1 A3† | 2.14% | 4/22/2022 | 100 | 99,918 | ||||||||
| Diamond Resorts Owner Trust 2015-2 A† | 2.99% | 5/22/2028 | 28 | 28,103 | ||||||||
| Diamond Resorts Owner Trust 2016-1 A† | 3.08% | 11/20/2028 | 46 | 46,519 | ||||||||
| DLL Securitization Trust 2017-A A2† | 1.89% | 7/15/2020 | 100 | 99,839 | ||||||||
| DLL Securitization Trust 2017-A A3† | 2.14% | 12/15/2021 | 100 | 99,537 | ||||||||
| Dryden 30 Senior Loan Fund 2013-30A AR† | 2.236% (3 Mo. LIBOR + .82% | )# | 11/15/2028 | 250 | 250,310 | |||||||
| Engs Commercial Finance Trust 2015-1A A2† | 2.31% | 10/22/2021 | 30 | 29,579 | ||||||||
| Engs Commercial Finance Trust 2016-1A A2† | 2.63% | 2/22/2022 | 78 | 77,903 | (b) | |||||||
| Ford Credit Floorplan Master Owner Trust 2015-4 A1 | 1.77% | 8/15/2020 | 62 | 61,969 | ||||||||
| Ford Credit Floorplan Master Owner Trust 2017-2 A1 | 2.16% | 9/15/2022 | 100 | 99,658 | ||||||||
| Ford Credit Floorplan Master Owner Trust A 2015-1 A1 | 1.42% | 1/15/2020 | 50 | 49,991 | ||||||||
| GoldenTree Loan Opportunities IX Ltd. 2014-9A AR† | 2.748% (3 Mo. LIBOR + 1.37% | )# | 10/29/2026 | 500 | 504,010 | |||||||
| Greystone Commercial Real Estate Notes Ltd. 2017-FL1A A† | 3.027% (1 Mo. LIBOR + 1.55% | )# | 3/15/2027 | 100 | 100,873 | |||||||
| Greystone Commercial Real Estate Notes Ltd. 2017-FL1A B† | 4.227% (1 Mo. LIBOR + 2.75% | )# | 3/15/2027 | 100 | 100,151 | |||||||
| Leaf Receivables Funding 12 LLC 2017-1 A3† | 2.07% | 8/15/2020 | 100 | 99,666 | ||||||||
| MMAF Equipment Finance LLC 2016-AA A2† | 1.39% | 12/17/2018 | 32 | 31,868 | ||||||||
| Mountain Hawk II CLO Ltd. 2013-2A A1† | 2.523% (3 Mo. LIBOR + 1.16% | )# | 7/22/2024 | 249 | 249,478 | |||||||
| Mountain Hawk III CLO Ltd. 2014-3A AR† | 2.554% (3 Mo. LIBOR + 1.20% | )# | 4/18/2025 | 250 | 250,793 | |||||||
| MVW Owner Trust 2017-1A A† | 2.42% | 12/20/2034 | 96 | 95,329 | ||||||||
| NextGear Floorplan Master Owner Trust 2017-1A A2† | 2.54% | 4/18/2022 | 100 | 99,796 | ||||||||
| Nissan Master Owner Trust Receivables 2016-A A2 | 1.54% | 6/15/2021 | 35 | 34,714 | ||||||||
| See Notes to Financial Statements. | 13 |
Schedule of Investments (continued)
December 31, 2017
| Investments | Interest Rate | Maturity Date | Principal Amount (000) | Fair Value | ||||||||
| Other (continued) | ||||||||||||
| Oaktree EIF I Ltd. 2015-A1 A† | 2.974% (3 Mo. LIBOR + 1.62% | )# | 10/18/2027 | $ | 250 | $ | 251,367 | |||||
| Octagon Investment Partners XXI Ltd. 2014-1A A1AR† | 2.763% (3 Mo. LIBOR + 1.35% | )# | 11/14/2026 | 250 | 251,588 | |||||||
| OneMain Financial Issuance Trust 2015-1A A† | 3.19% | 3/18/2026 | 100 | 100,636 | ||||||||
| OneMain Financial Issuance Trust 2015-2A A† | 2.57% | 7/18/2025 | 48 | 47,692 | ||||||||
| SCF Equipment Leasing LLC 2017-2A A† | 3.41% | 12/20/2023 | 97 | 96,762 | ||||||||
| SoFi Professional Loan Program 2017-D A1FX† | 1.72% | 9/25/2040 | 85 | 84,500 | ||||||||
| SoFi Professional Loan Program LLC 2017-C A2A† | 1.75% | 7/25/2040 | 77 | 77,196 | ||||||||
| SoFi Professional Loan Program LLC 2017-E A2A† | 1.86% | 11/26/2040 | 128 | 127,116 | ||||||||
| SoFi Professional Loan Program LLC 2017-F A1FX† | 2.05% | 1/25/2041 | 100 | 99,767 | ||||||||
| Taco Bell Funding LLC 2016-1A A2I† | 3.832% | 5/25/2046 | 25 | 25,074 | ||||||||
| Tryon Park CLO Ltd. 2013-1A A1† | 2.479% (3 Mo. LIBOR + 1.12% | )# | 7/15/2025 | 213 | 213,468 | |||||||
| Wells Fargo Dealer Floorplan Master Note Trust 2015-2 A | 2.151% (1 Mo. LIBOR + .65% | )# | 1/20/2022 | 5 | 5,036 | |||||||
| West CLO Ltd. 2014-2A A1AR† | 2.231% (3 Mo. LIBOR + 0.87% | )# | 1/16/2027 | 250 | 250,116 | |||||||
| Total | 5,571,218 | |||||||||||
| Total Asset-Backed Securities (cost $17,478,747) | 17,449,599 | |||||||||||
| Shares (000) | ||||||||||||
| COMMON STOCK 0.00% | ||||||||||||
| Oil | ||||||||||||
| Templar Energy LLC Class A Units (cost $728) | — | (a) | 160 | |||||||||
| Principal Amount (000) | ||||||||||||
| CONVERTIBLE BOND 0.14% | ||||||||||||
| Real Estate Investment Trusts | ||||||||||||
| VEREIT, Inc. (cost $84,336) | 3.00% | 8/1/2018 | $ | 84 | 84,105 | |||||||
| 14 | See Notes to Financial Statements. |
Schedule of Investments (continued)
December 31, 2017
| Investments | Interest Rate | Maturity Date | Principal Amount (000) | Fair Value | ||||||||
| CORPORATE BONDS 36.49% | ||||||||||||
| Aerospace/Defense 0.38% | ||||||||||||
| Embraer Overseas Ltd.† | 5.696% | 9/16/2023 | $ | 33 | $ | 36,217 | ||||||
| Embraer SA (Brazil)(c) | 5.15% | 6/15/2022 | 2 | 2,145 | ||||||||
| Harris Corp. | 1.999% | 4/27/2018 | 60 | 59,942 | ||||||||
| Orbital ATK, Inc. | 5.50% | 10/1/2023 | 122 | 129,320 | ||||||||
| Total | 227,624 | |||||||||||
| Air Transportation 0.05% | ||||||||||||
| American Airlines 2014-1 Class B Pass-Through Trust | 4.375% | 4/1/2024 | 13 | 13,587 | ||||||||
| Continental Airlines 2012-1 Class B Pass-Through Trust | 6.25% | 10/11/2021 | 3 | 2,853 | ||||||||
| US Airways 2012-2 Class B Pass-Through Trust | 6.75% | 12/3/2022 | 11 | 11,763 | ||||||||
| Total | 28,203 | |||||||||||
| Auto Parts: Original Equipment 0.55% | ||||||||||||
| American Axle & Manufacturing, Inc. | 6.625% | 10/15/2022 | 79 | 82,061 | ||||||||
| International Automotive Components Group SA (Luxembourg)†(c) | 9.125% | 6/1/2018 | 17 | 16,841 | ||||||||
| Nexteer Automotive Group Ltd.† | 5.875% | 11/15/2021 | 200 | 209,500 | ||||||||
| TI Group Automotive Systems LLC (United Kingdom)†(c) | 8.75% | 7/15/2023 | 8 | 8,620 | ||||||||
| Titan International, Inc.† | 6.50% | 11/30/2023 | 14 | 14,280 | ||||||||
| Total | 331,302 | |||||||||||
| Automotive 1.40% | ||||||||||||
| Deck Chassis Acquisition, Inc.† | 10.00% | 6/15/2023 | 19 | 21,233 | ||||||||
| Ford Motor Credit Co. LLC | 8.125% | 1/15/2020 | 200 | 221,637 | ||||||||
| General Motors Financial Co., Inc. | 2.40% | 5/9/2019 | 55 | 55,027 | ||||||||
| General Motors Financial Co., Inc. | 3.15% | 6/30/2022 | 103 | 103,014 | ||||||||
| General Motors Financial Co., Inc. | 3.20% | 7/6/2021 | 46 | 46,482 | ||||||||
| General Motors Financial Co., Inc. | 4.20% | 3/1/2021 | 85 | 88,452 | ||||||||
| General Motors Financial Co., Inc. | 4.375% | 9/25/2021 | 82 | 86,320 | ||||||||
| Hyundai Capital America† | 1.75% | 9/27/2019 | 36 | 35,328 | ||||||||
| Hyundai Capital America† | 2.00% | 7/1/2019 | 5 | 4,941 | ||||||||
| Hyundai Capital America† | 2.40% | 10/30/2018 | 29 | 28,978 | ||||||||
| Hyundai Capital America† | 2.50% | 3/18/2019 | 117 | 116,741 | ||||||||
| Hyundai Capital America† | 3.25% | 9/20/2022 | 31 | 30,993 | ||||||||
| Total | 839,146 | |||||||||||
| See Notes to Financial Statements. | 15 |
Schedule of Investments (continued)
December 31, 2017
| Principal | ||||||||||||
| Interest | Maturity | Amount | Fair | |||||||||
| Investments | Rate | Date | (000) | Value | ||||||||
| Banks: Regional 8.18% | ||||||||||||
| ABN AMRO Bank NV (Netherlands)(c) | 6.25% | 4/27/2022 | $ | 400 | $ | 447,516 | ||||||
| Associated Banc-Corp. | 2.75% | 11/15/2019 | 29 | 29,108 | ||||||||
| Banco de Credito del Peru (Panama)†(c) | 2.25% | 10/25/2019 | 200 | 200,250 | ||||||||
| Bank of America Corp. | 2.151% | 11/9/2020 | 20 | 19,921 | ||||||||
| Bank of America Corp. | 2.328% | #(d) | 10/1/2021 | 59 | 58,853 | |||||||
| Bank of America Corp. | 2.369% (3 Mo. LIBOR + .66% | )# | 7/21/2021 | 37 | 36,946 | |||||||
| Bank of America Corp. | 2.65% | 4/1/2019 | 9 | 9,052 | ||||||||
| Bank of America Corp.† | 3.004% | #(d) | 12/20/2023 | 225 | 225,701 | |||||||
| Bank of America Corp. | 5.49% | 3/15/2019 | 300 | 310,661 | ||||||||
| Bank of America Corp. | 5.65% | 5/1/2018 | 50 | 50,599 | ||||||||
| Bank of America Corp. | 6.875% | 4/25/2018 | 83 | 84,272 | ||||||||
| Bank of America Corp. | 6.875% | 11/15/2018 | 14 | 14,581 | ||||||||
| Barclays Bank plc (United Kingdom)†(c) | 10.179% | 6/12/2021 | 80 | 97,563 | ||||||||
| Citigroup, Inc. | 1.80% | 2/5/2018 | 20 | 19,998 | ||||||||
| Citigroup, Inc. | 2.327% (3 Mo. LIBOR + .96% | )# | 4/25/2022 | 90 | 90,988 | |||||||
| Citigroup, Inc. | 2.45% | 1/10/2020 | 61 | 61,054 | ||||||||
| Citigroup, Inc. | 2.876% (3 Mo. LIBOR + .95% | )# | 7/24/2023 | 61 | 60,751 | |||||||
| Citigroup, Inc. | 2.90% | 12/8/2021 | 70 | 70,517 | ||||||||
| Citigroup, Inc. | 4.05% | 7/30/2022 | 42 | 43,754 | ||||||||
| Citigroup, Inc. | 8.50% | 5/22/2019 | 45 | 48,761 | ||||||||
| Compass Bank | 5.50% | 4/1/2020 | 68 | 71,578 | ||||||||
| Discover Bank | 8.70% | 11/18/2019 | 250 | 274,983 | ||||||||
| European Investment Bank (Luxembourg)(c) | 1.00% | 3/15/2018 | 157 | 156,810 | ||||||||
| European Investment Bank (Luxembourg)(c) | 1.25% | 5/15/2018 | 66 | 65,907 | ||||||||
| Goldman Sachs Group, Inc. (The) | 2.481% (3 Mo. LIBOR + 1.11% | )# | 4/26/2022 | 64 | 64,775 | |||||||
| Goldman Sachs Group, Inc. (The) | 2.60% | 12/27/2020 | 69 | 69,036 | ||||||||
| Goldman Sachs Group, Inc. (The) | 2.876% | #(d) | 10/31/2022 | 96 | 95,766 | |||||||
| Goldman Sachs Group, Inc. (The) | 2.908% (3 Mo. LIBOR + 1.05% | )# | 6/5/2023 | 67 | 66,615 | |||||||
| Goldman Sachs Group, Inc. (The) | 5.25% | 7/27/2021 | 103 | 111,674 | ||||||||
| Goldman Sachs Group, Inc. (The) | 5.375% | 3/15/2020 | 119 | 126,212 | ||||||||
| Goldman Sachs Group, Inc. (The) | 5.75% | 1/24/2022 | 24 | 26,623 | ||||||||
| Goldman Sachs Group, Inc. (The) | 5.95% | 1/18/2018 | 8 | 8,013 | ||||||||
| Goldman Sachs Group, Inc. (The) | 6.00% | 6/15/2020 | 19 | 20,554 | ||||||||
| Goldman Sachs Group, Inc. (The) | 7.50% | 2/15/2019 | 55 | 58,138 | ||||||||
| HBOS plc (United Kingdom)†(c) | 6.75% | 5/21/2018 | 400 | 406,819 | ||||||||
| Intesa Sanpaolo SpA (Italy)(c) | 3.875% | 1/15/2019 | 200 | 202,706 | ||||||||
| Macquarie Bank Ltd. (Australia)†(c) | 2.539% (3 Mo. LIBOR + 1.18% | )# | 1/15/2019 | 136 | 137,230 | |||||||
| 16 | See Notes to Financial Statements. |
Schedule of Investments (continued)
December 31, 2017
| Principal | ||||||||||||
| Interest | Maturity | Amount | Fair | |||||||||
| Investments | Rate | Date | (000) | Value | ||||||||
| Banks: Regional (continued) | ||||||||||||
| Macquarie Group Ltd. (Australia)†(c) | 6.00% | 1/14/2020 | $ | 75 | $ | 79,937 | ||||||
| Macquarie Group Ltd. (Australia)†(c) | 7.625% | 8/13/2019 | 9 | 9,708 | ||||||||
| Morgan Stanley | 2.213% (3 Mo. LIBOR + .80% | )# | 2/14/2020 | 56 | 56,232 | |||||||
| Morgan Stanley | 2.543% (3 Mo. LIBOR + 1.18% | )# | 1/20/2022 | 59 | 60,002 | |||||||
| Morgan Stanley | 2.80% | 6/16/2020 | 11 | 11,105 | ||||||||
| Morgan Stanley | 4.875% | 11/1/2022 | 39 | 42,036 | ||||||||
| Morgan Stanley | 7.30% | 5/13/2019 | 200 | 213,274 | ||||||||
| Popular, Inc. | 7.00% | 7/1/2019 | 57 | 59,565 | ||||||||
| Santander UK Group Holdings plc (United Kingdom)(c) | 2.875% | 10/16/2020 | 55 | 55,232 | ||||||||
| Santander UK Group Holdings plc (United Kingdom)(c) | 3.125% | 1/8/2021 | 173 | 174,816 | ||||||||
| Santander UK plc (United Kingdom)(c) | 2.00% | 8/24/2018 | 10 | 10,003 | ||||||||
| Santander UK plc (United Kingdom)(c) | 2.50% | 3/14/2019 | 38 | 38,121 | ||||||||
| Santander UK plc (United Kingdom)(c) | 3.05% | 8/23/2018 | 15 | 15,104 | ||||||||
| SVB Financial Group | 5.375% | 9/15/2020 | 5 | 5,347 | ||||||||
| Wells Fargo & Co. | 2.55% | 12/7/2020 | 6 | 6,026 | ||||||||
| Wells Fargo & Co. | 3.069% | 1/24/2023 | 117 | 117,931 | ||||||||
| Total | 4,898,724 | |||||||||||
| Beverages 0.03% | ||||||||||||
| Beam Suntory, Inc. | 1.75% | 6/15/2018 | 2 | 1,997 | ||||||||
| Cott Beverages, Inc. | 5.375% | 7/1/2022 | 16 | 16,643 | ||||||||
| Total | 18,640 | |||||||||||
| Biotechnology Research & Production 0.02% | ||||||||||||
| Sterigenics-Nordion Topco LLC PIK 8.875%† | 8.125% | 11/1/2021 | 11 | 11,138 | ||||||||
| Building Materials 0.36% | ||||||||||||
| Atrium Windows & Doors, Inc.† | 7.75% | 5/1/2019 | 12 | 12,225 | ||||||||
| Boral Finance Pty Ltd. (Australia)†(c) | 3.00% | 11/1/2022 | 19 | 18,852 | ||||||||
| CPG Merger Sub LLC† | 8.00% | 10/1/2021 | 37 | 38,388 | ||||||||
| Griffon Corp.† | 5.25% | 3/1/2022 | 48 | 48,720 | ||||||||
| Holcim US Finance Sarl & Cie SCS (Luxembourg)†(c) | 6.00% | 12/30/2019 | 34 | 36,083 | ||||||||
| Martin Marietta Materials, Inc. | 2.096% (3 Mo. LIBOR + .65% | )# | 5/22/2020 | 10 | 10,057 | |||||||
| Martin Marietta Materials, Inc. | 6.60% | 4/15/2018 | 14 | 14,182 | ||||||||
| NCI Building Systems, Inc.† | 8.25% | 1/15/2023 | 13 | 13,796 | ||||||||
| Ply Gem Industries, Inc. | 6.50% | 2/1/2022 | 24 | 24,900 | ||||||||
| Total | 217,203 | |||||||||||
| See Notes to Financial Statements. | 17 |
Schedule of Investments (continued)
December 31, 2017
| Principal | ||||||||||||
| Interest | Maturity | Amount | Fair | |||||||||
| Investments | Rate | Date | (000) | Value | ||||||||
| Business Services 0.37% | ||||||||||||
| APX Group, Inc. | 8.75% | 12/1/2020 | $ | 113 | $ | 115,684 | ||||||
| Chicago Parking Meters LLC† | 5.489% | 12/30/2020 | 30 | 30,747 | ||||||||
| ERAC USA Finance LLC† | 5.25% | 10/1/2020 | 25 | 26,697 | ||||||||
| Prime Security Services Borrower LLC/Prime Finance, Inc.† | 9.25% | 5/15/2023 | 19 | 21,137 | ||||||||
| Sotheby’s† | 5.25% | 10/1/2022 | 11 | 11,346 | ||||||||
| Verisk Analytics, Inc. | 4.875% | 1/15/2019 | 17 | 17,411 | ||||||||
| Total | 223,022 | |||||||||||
| Chemicals 0.57% | ||||||||||||
| Blue Cube Spinco, Inc. | 9.75% | 10/15/2023 | 62 | 73,470 | ||||||||
| Celanese US Holdings LLC | 5.875% | 6/15/2021 | 55 | 60,250 | ||||||||
| GCP Applied Technologies, Inc.† | 9.50% | 2/1/2023 | 9 | 10,013 | ||||||||
| Westlake Chemical Corp. | 4.625% | 2/15/2021 | 60 | 61,800 | ||||||||
| Westlake Chemical Corp. | 4.875% | 5/15/2023 | 81 | 83,835 | ||||||||
| Yara International ASA (Norway)†(c) | 7.875% | 6/11/2019 | 47 | 50,451 | ||||||||
| Total | 339,819 | |||||||||||
| Coal 0.03% | ||||||||||||
| Eterna Capital Pte Ltd. PIK 6% (Singapore)(c) | 6.00% | 12/11/2022 | 10 | 10,506 | (b) | |||||||
| Peabody Energy Corp.† | 6.00% | 3/31/2022 | 8 | 8,330 | ||||||||
| Total | 18,836 | |||||||||||
| Computer Hardware 0.51% | ||||||||||||
| Dell International LLC/EMC Corp.† | 3.48% | 6/1/2019 | 32 | 32,409 | ||||||||
| Dell International LLC/EMC Corp.† | 5.45% | 6/15/2023 | 49 | 53,005 | ||||||||
| Dell International LLC/EMC Corp.† | 4.42% | 6/15/2021 | 93 | 96,974 | ||||||||
| Dell International LLC/EMC Corp.† | 5.875% | 6/15/2021 | 30 | 31,200 | ||||||||
| Everi Payments, Inc. | 10.00% | 1/15/2022 | 88 | 94,875 | ||||||||
| Total | 308,463 | |||||||||||
| Computer Software 0.66% | ||||||||||||
| Activision Blizzard, Inc.† | 6.125% | 9/15/2023 | 98 | 103,909 | ||||||||
| Dun & Bradstreet Corp. (The) | 4.25% | 6/15/2020 | 3 | 3,078 | ||||||||
| First Data Corp.† | 5.75% | 1/15/2024 | 31 | 32,310 | ||||||||
| First Data Corp.† | 7.00% | 12/1/2023 | 77 | 81,620 | ||||||||
| Infor Software Parent LLC/Infor Software Parent, Inc. PIK 7.875%† | 7.125% | 5/1/2021 | 41 | 42,127 | ||||||||
| Solera LLC/Solera Finance, Inc.† | 10.50% | 3/1/2024 | 63 | 71,189 | ||||||||
| VMware, Inc. | 2.95% | 8/21/2022 | 60 | 59,889 | ||||||||
| Total | 394,122 | |||||||||||
| 18 | See Notes to Financial Statements. |
Schedule of Investments (continued)
December 31, 2017
| Principal | ||||||||||||
| Interest | Maturity | Amount | Fair | |||||||||
| Investments | Rate | Date | (000) | Value | ||||||||
| Construction/Homebuilding 0.44% | ||||||||||||
| Brookfield Residential Properties, Inc. (Canada)†(c) | 6.50% | 12/15/2020 | $ | 98 | $ | 100,205 | ||||||
| Century Communities, Inc. | 6.875% | 5/15/2022 | 30 | 31,650 | ||||||||
| D.R. Horton, Inc. | 3.75% | 3/1/2019 | 60 | 60,816 | ||||||||
| M/I Homes, Inc. | 6.75% | 1/15/2021 | 3 | 3,120 | ||||||||
| William Lyon Homes, Inc. | 5.75% | 4/15/2019 | 30 | 30,300 | ||||||||
| William Lyon Homes, Inc. | 7.00% | 8/15/2022 | 35 | 36,138 | ||||||||
| Total | 262,229 | |||||||||||
| Containers 0.34% | ||||||||||||
| OI European Group BV (Netherlands)†(c) | 4.00% | 3/15/2023 | 15 | 15,058 | ||||||||
| Packaging Corp. of America | 6.50% | 3/15/2018 | 85 | 85,705 | ||||||||
| Reynolds Group Issuer, Inc./Reynolds Group Issuer LLC/Reynolds Group Issuer (Luxembourg) SA | 5.75% | 10/15/2020 | 102 | 103,410 | ||||||||
| Total | 204,173 | |||||||||||
| Drugs 0.42% | ||||||||||||
| inVentiv Group Holdings, Inc./inVentiv Health, Inc./inVentiv Health Clinical, Inc.† | 7.50% | 10/1/2024 | 14 | 15,190 | ||||||||
| Mylan, Inc. | 2.55% | 3/28/2019 | 122 | 122,030 | ||||||||
| Teva Pharmaceutical Finance Co. BV (Curacao)(c) | 3.65% | 11/10/2021 | 9 | 8,569 | ||||||||
| Teva Pharmaceutical Finance Netherlands III BV (Netherlands)(c) | 1.40% | 7/20/2018 | 36 | 35,765 | ||||||||
| Teva Pharmaceutical Finance Netherlands III BV (Netherlands)(c) | 1.70% | 7/19/2019 | 30 | 29,156 | ||||||||
| Teva Pharmaceutical Finance Netherlands III BV (Netherlands)(c) | 2.20% | 7/21/2021 | 44 | 40,222 | ||||||||
| Total | 250,932 | |||||||||||
| Electric: Power 2.27% | ||||||||||||
| AES Corp. (The) | 4.875% | 5/15/2023 | 31 | 31,736 | ||||||||
| Dominion Energy, Inc. | 2.962% | 7/1/2019 | 37 | 37,297 | ||||||||
| Dominion Energy, Inc.† | 1.50% | 9/30/2018 | 30 | 29,898 | ||||||||
| Dominion Energy, Inc. | 4.104% | 4/1/2021 | 77 | 80,183 | ||||||||
| Duquesne Light Holdings, Inc.† | 5.90% | 12/1/2021 | 15 | 16,598 | ||||||||
| Duquesne Light Holdings, Inc.† | 6.40% | 9/15/2020 | 22 | 24,071 | ||||||||
| Emera US Finance LP | 2.70% | 6/15/2021 | 10 | 9,983 | ||||||||
| Enel Finance International NV (Netherlands)†(c) | 2.875% | 5/25/2022 | 200 | 199,636 | ||||||||
| Eversource Energy | 2.50% | 3/15/2021 | 200 | 198,866 | ||||||||
| Exelon Generation Co. LLC | 3.40% | 3/15/2022 | 7 | 7,124 | ||||||||
| Exelon Generation Co. LLC | 4.25% | 6/15/2022 | 2 | 2,100 | ||||||||
| Jersey Central Power & Light Co. | 7.35% | 2/1/2019 | 45 | 47,262 | ||||||||
| See Notes to Financial Statements. | 19 |
Schedule of Investments (continued)
December 31, 2017
| Principal | ||||||||||||
| Interest | Maturity | Amount | Fair | |||||||||
| Investments | Rate | Date | (000) | Value | ||||||||
| Electric: Power (continued) | ||||||||||||
| Metropolitan Edison Co. | 7.70% | 1/15/2019 | $ | 11 | $ | 11,595 | ||||||
| Oklahoma Gas & Electric Co. | 8.25% | 1/15/2019 | 100 | 105,971 | ||||||||
| Origin Energy Finance Ltd. (Australia)†(c) | 3.50% | 10/9/2018 | 200 | 201,228 | ||||||||
| Origin Energy Finance Ltd. (Australia)†(c) | 5.45% | 10/14/2021 | 102 | 110,097 | ||||||||
| Pennsylvania Electric Co. | 5.20% | 4/1/2020 | 11 | 11,616 | ||||||||
| PPL WEM Ltd./Western Power Distribution Ltd. (United Kingdom)†(c) | 5.375% | 5/1/2021 | 10 | 10,724 | ||||||||
| PSEG Power LLC | 5.125% | 4/15/2020 | 3 | 3,173 | ||||||||
| Public Service Co. of New Mexico | 7.95% | 5/15/2018 | 19 | 19,397 | ||||||||
| Puget Energy, Inc. | 6.00% | 9/1/2021 | 35 | 38,750 | ||||||||
| San Diego Gas & Electric Co. | 1.914% | 2/1/2022 | 19 | 18,835 | ||||||||
| SCANA Corp. | 4.125% | 2/1/2022 | 53 | 54,169 | ||||||||
| SCANA Corp. | 4.75% | 5/15/2021 | 40 | 41,503 | ||||||||
| SCANA Corp. | 6.25% | 4/1/2020 | 39 | 41,420 | ||||||||
| TECO Finance, Inc. | 5.15% | 3/15/2020 | 7 | 7,371 | ||||||||
| Total | 1,360,603 | |||||||||||
| Electrical Equipment 0.55% | ||||||||||||
| Broadcom Corp./Broadcom Cayman Finance Ltd.† | 2.375% | 1/15/2020 | 13 | 12,918 | ||||||||
| Broadcom Corp./Broadcom Cayman Finance Ltd.† | 2.65% | 1/15/2023 | 71 | 68,514 | ||||||||
| Broadcom Corp./Broadcom Cayman Finance Ltd.† | 3.00% | 1/15/2022 | 43 | 42,671 | ||||||||
| NXP BV/NXP Funding LLC (Netherlands)†(c) | 5.75% | 3/15/2023 | 200 | 207,000 | ||||||||
| Total | 331,103 | |||||||||||
| Electrical: Household 0.13% | ||||||||||||
| General Cable Corp. | 5.75% | 10/1/2022 | 74 | 77,052 | ||||||||
| Electronics 0.15% | ||||||||||||
| Jabil, Inc. | 8.25% | 3/15/2018 | 22 | 22,378 | ||||||||
| PerkinElmer, Inc. | 5.00% | 11/15/2021 | 10 | 10,789 | ||||||||
| Tech Data Corp. | 3.70% | 2/15/2022 | 55 | 55,216 | ||||||||
| Total | 88,383 | |||||||||||
| Entertainment 0.33% | ||||||||||||
| Eldorado Resorts, Inc. | 7.00% | 8/1/2023 | 11 | 11,797 | ||||||||
| Rivers Pittsburgh Borrower LP/Rivers Pittsburgh Finance Corp.† | 6.125% | 8/15/2021 | 5 | 4,975 | ||||||||
| Scientific Games International, Inc. | 6.25% | 9/1/2020 | 31 | 31,504 | ||||||||
| Scientific Games International, Inc. | 6.625% | 5/15/2021 | 36 | 37,350 | ||||||||
| Scientific Games International, Inc. | 10.00% | 12/1/2022 | 91 | 100,214 | ||||||||
| Seminole Tribe of Florida, Inc.† | 7.804% | 10/1/2020 | 3 | 3,045 | ||||||||
| 20 | See Notes to Financial Statements. |
Schedule of Investments (continued)
December 31, 2017
| Principal | ||||||||||||
| Interest | Maturity | Amount | Fair | |||||||||
| Investments | Rate | Date | (000) | Value | ||||||||
| Entertainment (continued) | ||||||||||||
| WMG Acquisition Corp.† | 5.625% | 4/15/2022 | $ | 2 | $ | 2,068 | ||||||
| WMG Acquisition Corp.† | 6.75% | 4/15/2022 | 9 | 9,427 | ||||||||
| Total | 200,380 | |||||||||||
| Financial Services 2.07% | ||||||||||||
| Discover Financial Services | 5.20% | 4/27/2022 | 31 | 33,396 | ||||||||
| E*TRADE Financial Corp. | 2.95% | 8/24/2022 | 18 | 17,865 | ||||||||
| International Lease Finance Corp. | 5.875% | 4/1/2019 | 34 | 35,395 | ||||||||
| International Lease Finance Corp. | 6.25% | 5/15/2019 | 104 | 109,009 | ||||||||
| International Lease Finance Corp.† | 7.125% | 9/1/2018 | 61 | 62,954 | ||||||||
| International Lease Finance Corp. | 8.25% | 12/15/2020 | 183 | 210,646 | ||||||||
| International Lease Finance Corp. | 8.625% | 1/15/2022 | 2 | 2,411 | ||||||||
| Jefferies Group LLC | 8.50% | 7/15/2019 | 196 | 212,947 | ||||||||
| Lazard Group LLC | 4.25% | 11/14/2020 | 75 | 78,165 | ||||||||
| Nationstar Mortgage LLC/Nationstar Capital Corp. | 7.875% | 10/1/2020 | 59 | 60,291 | ||||||||
| Nationstar Mortgage LLC/Nationstar Capital Corp. | 9.625% | 5/1/2019 | 27 | 27,783 | ||||||||
| Navient Corp. | 4.875% | 6/17/2019 | 21 | 21,407 | ||||||||
| Navient Corp. | 5.00% | 10/26/2020 | 120 | 121,950 | ||||||||
| Navient Corp. | 5.50% | 1/15/2019 | 42 | 42,840 | ||||||||
| Navient Corp. | 5.875% | 3/25/2021 | 14 | 14,507 | ||||||||
| Navient Corp. | 6.625% | 7/26/2021 | 58 | 61,335 | ||||||||
| Navient Corp. | 8.00% | 3/25/2020 | 12 | 13,005 | ||||||||
| OneMain Financial Holdings LLC† | 6.75% | 12/15/2019 | 52 | 53,732 | ||||||||
| OneMain Financial Holdings LLC† | 7.25% | 12/15/2021 | 49 | 50,951 | ||||||||
| VFH Parent LLC/Orchestra Co-Issuer, Inc.† | 6.75% | 6/15/2022 | 7 | 7,385 | ||||||||
| Total | 1,237,974 | |||||||||||
| Food 0.47% | ||||||||||||
| Dean Foods Co.† | 6.50% | 3/15/2023 | 37 | 36,908 | ||||||||
| JBS USA LUX SA/JBS USA Finance, Inc. † | 7.25% | 6/1/2021 | 138 | 140,932 | ||||||||
| JBS USA LUX SA/JBS USA Finance, Inc.† | 8.25% | 2/1/2020 | 76 | 76,418 | ||||||||
| Smithfield Foods, Inc.† | 2.70% | 1/31/2020 | 17 | 16,905 | ||||||||
| Smithfield Foods, Inc.† | 3.35% | 2/1/2022 | 10 | 10,028 | ||||||||
| Total | 281,191 | |||||||||||
| Health Care Products 0.26% | ||||||||||||
| Life Technologies Corp. | 5.00% | 1/15/2021 | 49 | 51,871 | ||||||||
| Life Technologies Corp. | 6.00% | 3/1/2020 | 96 | 102,794 | ||||||||
| Total | 154,665 | |||||||||||
| See Notes to Financial Statements. | 21 |
Schedule of Investments (continued)
December 31, 2017
| Principal | ||||||||||||
| Interest | Maturity | Amount | Fair | |||||||||
| Investments | Rate | Date | (000) | Value | ||||||||
| Health Care Services 0.44% | ||||||||||||
| Acadia Healthcare Co., Inc. | 6.125% | 3/15/2021 | $ | 18 | $ | 18,338 | ||||||
| Eagle Holding Co. II LLC PIK 8.375%† | 7.625% | 5/15/2022 | 24 | 24,480 | ||||||||
| Fresenius Medical Care US Finance II, Inc.† | 4.125% | 10/15/2020 | 7 | 7,214 | ||||||||
| Fresenius Medical Care US Finance II, Inc.† | 5.875% | 1/31/2022 | 95 | 104,675 | ||||||||
| Fresenius Medical Care US Finance, Inc.† | 5.75% | 2/15/2021 | 6 | 6,496 | ||||||||
| Kindred Healthcare, Inc. | 8.00% | 1/15/2020 | 24 | 26,123 | ||||||||
| Kindred Healthcare, Inc. | 8.75% | 1/15/2023 | 38 | 40,470 | ||||||||
| Universal Health Services, Inc.† | 3.75% | 8/1/2019 | 11 | 11,220 | ||||||||
| Universal Health Services, Inc.† | 4.75% | 8/1/2022 | 25 | 25,531 | ||||||||
| Total | 264,547 | |||||||||||
| Insurance 0.19% | ||||||||||||
| CNA Financial Corp. | 5.875% | 8/15/2020 | 11 | 11,905 | ||||||||
| HUB International Ltd.† | 7.875% | 10/1/2021 | 6 | 6,255 | ||||||||
| Liberty Mutual Group, Inc.† | 5.00% | 6/1/2021 | 17 | 18,194 | ||||||||
| Lincoln National Corp. | 7.00% | 3/15/2018 | 5 | 5,049 | ||||||||
| Lincoln National Corp. | 8.75% | 7/1/2019 | 10 | 10,921 | ||||||||
| Protective Life Corp. | 7.375% | 10/15/2019 | 15 | 16,263 | ||||||||
| Willis North America, Inc. | 7.00% | 9/29/2019 | 44 | 47,203 | ||||||||
| Total | 115,790 | |||||||||||
| Leasing 0.03% | ||||||||||||
| DAE Funding LLC (United Arab Emirates)†(c) | 4.00% | 8/1/2020 | 18 | 18,225 | ||||||||
| Leisure 0.27% | ||||||||||||
| LTF Merger Sub, Inc.† | 8.50% | 6/15/2023 | 40 | 42,550 | ||||||||
| NCL Corp. Ltd.† | 4.75% | 12/15/2021 | 14 | 14,525 | ||||||||
| Royal Caribbean Cruises Ltd. | 5.25% | 11/15/2022 | 95 | 104,424 | ||||||||
| Total | 161,499 | |||||||||||
| Lodging 0.09% | ||||||||||||
| Hyatt Hotels Corp.† | 6.875% | 8/15/2019 | 50 | 53,318 | ||||||||
| Machinery: Agricultural 0.23% | ||||||||||||
| BAT Capital Corp.† | 2.764% | 8/15/2022 | 36 | 35,838 | ||||||||
| Bunge Ltd. Finance Corp. | 8.50% | 6/15/2019 | 1 | 1,083 | ||||||||
| Viterra, Inc. (Canada)†(c) | 5.95% | 8/1/2020 | 94 | 101,567 | ||||||||
| Total | 138,488 | |||||||||||
| Machinery: Industrial/Specialty 0.02% | ||||||||||||
| Kennametal, Inc. | 2.65% | 11/1/2019 | 10 | 10,011 | ||||||||
| 22 | See Notes to Financial Statements. |
Schedule of Investments (continued)
December 31, 2017
| Principal | ||||||||||||
| Interest | Maturity | Amount | Fair | |||||||||
| Investments | Rate | Date | (000) | Value | ||||||||
| Manufacturing 0.29% | ||||||||||||
| American Outdoor Brands Corp.† | 5.00% | 7/15/2018 | $ | 5 | $ | 4,975 | ||||||
| Bombardier, Inc. (Canada)†(c) | 6.125% | 1/15/2023 | 42 | 41,370 | ||||||||
| Bombardier, Inc. (Canada)†(c) | 8.75% | 12/1/2021 | 56 | 61,880 | ||||||||
| Gates Global LLC/Gates Global Co.† | 6.00% | 7/15/2022 | 45 | 46,237 | ||||||||
| Pentair Finance Sarl (Luxembourg)(c) | 2.90% | 9/15/2018 | 17 | 17,070 | ||||||||
| Total | 171,532 | |||||||||||
| Media 0.73% | ||||||||||||
| Clear Channel Worldwide Holdings, Inc. | 7.625% | 3/15/2020 | 92 | 90,505 | ||||||||
| Cox Communications, Inc.† | 3.25% | 12/15/2022 | 49 | 49,145 | ||||||||
| DISH DBS Corp. | 6.75% | 6/1/2021 | 33 | 34,774 | ||||||||
| NBCUniversal Enterprise, Inc.† | 5.25% | – | (e) | 100 | 106,500 | |||||||
| Sky plc (United Kingdom)†(c) | 9.50% | 11/15/2018 | 50 | 53,110 | ||||||||
| Time Warner Cable LLC | 8.25% | 4/1/2019 | 22 | 23,519 | ||||||||
| Time Warner Cable LLC | 8.75% | 2/14/2019 | 6 | 6,399 | ||||||||
| Viacom, Inc. | 2.75% | 12/15/2019 | 24 | 23,972 | ||||||||
| WaveDivision Escrow LLC/WaveDivision Escrow Corp.† | 8.125% | 9/1/2020 | 50 | 51,063 | ||||||||
| Total | 438,987 | |||||||||||
| Metal Fabricating 0.05% | ||||||||||||
| Zekelman Industries, Inc.† | 9.875% | 6/15/2023 | 26 | 29,315 | ||||||||
| Metals & Minerals: Miscellaneous 1.30% | ||||||||||||
| Century Aluminum Co.† | 7.50% | 6/1/2021 | 80 | 82,400 | ||||||||
| Eldorado Gold Corp. (Canada)†(c) | 6.125% | 12/15/2020 | 31 | 30,767 | ||||||||
| FMG Resources (August 2006) Pty Ltd. (Australia)†(c) | 9.75% | 3/1/2022 | 271 | 300,539 | ||||||||
| Glencore Finance Canada Ltd. (Canada)†(c) | 4.25% | 10/25/2022 | 70 | 73,426 | ||||||||
| Glencore Finance Canada Ltd. (Canada)†(c) | 4.95% | 11/15/2021 | 54 | 57,670 | ||||||||
| Glencore Funding LLC† | 3.00% | 10/27/2022 | 11 | 10,913 | ||||||||
| Glencore Funding LLC† | 4.125% | 5/30/2023 | 12 | 12,429 | ||||||||
| Goldcorp, Inc. (Canada)(c) | 2.125% | 3/15/2018 | 14 | 14,008 | ||||||||
| Goldcorp, Inc. (Canada)(c) | 3.625% | 6/9/2021 | 80 | 81,813 | ||||||||
| Hecla Mining Co. | 6.875% | 5/1/2021 | 23 | 23,661 | ||||||||
| Hudbay Minerals, Inc. (Canada)†(c) | 7.25% | 1/15/2023 | 35 | 37,275 | ||||||||
| Joseph T Ryerson & Son, Inc.† | 11.00% | 5/15/2022 | 19 | 21,304 | ||||||||
| New Gold, Inc. (Canada)†(c) | 6.25% | 11/15/2022 | 30 | 31,050 | ||||||||
| Total | 777,255 | |||||||||||
| See Notes to Financial Statements. | 23 |
Schedule of Investments (continued)
December 31, 2017
| Principal | ||||||||||||
| Interest | Maturity | Amount | Fair | |||||||||
| Investments | Rate | Date | (000) | Value | ||||||||
| Natural Gas 0.13% | ||||||||||||
| CenterPoint Energy Resources Corp. | 4.50% | 1/15/2021 | $ | 10 | $ | 10,465 | ||||||
| National Fuel Gas Co. | 3.75% | 3/1/2023 | 8 | 8,113 | ||||||||
| National Fuel Gas Co. | 4.90% | 12/1/2021 | 2 | 2,108 | ||||||||
| Questar Gas Co. | 5.31% | 3/15/2018 | 10 | 10,059 | ||||||||
| Sempra Energy | 6.15% | 6/15/2018 | 30 | 30,560 | ||||||||
| Sempra Energy | 9.80% | 2/15/2019 | 18 | 19,499 | ||||||||
| Total | 80,804 | |||||||||||
| Oil 4.10% | ||||||||||||
| Anadarko Holding Co. | 7.05% | 5/15/2018 | 4 | 4,065 | ||||||||
| Anadarko Petroleum Corp. | 4.85% | 3/15/2021 | 36 | 38,041 | ||||||||
| Anadarko Petroleum Corp. | 6.95% | 6/15/2019 | 7 | 7,434 | ||||||||
| Bill Barrett Corp. | 7.00% | 10/15/2022 | 12 | 12,285 | ||||||||
| Canadian Oil Sands Ltd. (Canada)†(c) | 7.75% | 5/15/2019 | 13 | 13,880 | ||||||||
| Canadian Oil Sands Ltd. (Canada)†(c) | 9.40% | 9/1/2021 | 63 | 75,376 | ||||||||
| Carrizo Oil & Gas, Inc. | 6.25% | 4/15/2023 | 21 | 21,892 | ||||||||
| Carrizo Oil & Gas, Inc. | 7.50% | 9/15/2020 | 114 | 116,280 | ||||||||
| Cenovus Energy, Inc. (Canada)(c) | 5.70% | 10/15/2019 | 35 | 36,829 | ||||||||
| CNOOC Finance 2013 Ltd. (Hong Kong)(c) | 1.75% | 5/9/2018 | 400 | 399,408 | ||||||||
| CNOOC Finance 2015 Australia Pty Ltd. (Australia)(c) | 2.625% | 5/5/2020 | 200 | 199,585 | ||||||||
| CNX Resources Corp. | 8.00% | 4/1/2023 | 22 | 23,639 | ||||||||
| Continental Resources, Inc. | 5.00% | 9/15/2022 | 177 | 180,319 | ||||||||
| Devon Energy Corp. | 2.25% | 12/15/2018 | 15 | 14,912 | ||||||||
| Devon Energy Corp. | 4.00% | 7/15/2021 | 11 | 11,463 | ||||||||
| Devon Energy Corp. | 6.30% | 1/15/2019 | 6 | 6,224 | ||||||||
| Eclipse Resources Corp. | 8.875% | 7/15/2023 | 35 | 36,094 | ||||||||
| Encana Corp. (Canada)(c) | 3.90% | 11/15/2021 | 27 | 27,770 | ||||||||
| Encana Corp. (Canada)(c) | 6.50% | 5/15/2019 | 112 | 117,712 | ||||||||
| Eni SpA (Italy)†(c) | 4.15% | 10/1/2020 | 100 | 103,583 | ||||||||
| Gulfport Energy Corp. | 6.625% | 5/1/2023 | 33 | 33,825 | ||||||||
| KazMunayGas National Co. JSC (Kazakhstan)†(c) | 9.125% | 7/2/2018 | 100 | 103,189 | ||||||||
| Matador Resources Co. | 6.875% | 4/15/2023 | 59 | 62,245 | ||||||||
| Motiva Enterprises LLC† | 5.75% | 1/15/2020 | 8 | 8,452 | ||||||||
| Newfield Exploration Co. | 5.75% | 1/30/2022 | 51 | 54,697 | ||||||||
| Noble Energy, Inc. | 5.625% | 5/1/2021 | 56 | 57,566 | ||||||||
| Oasis Petroleum, Inc. | 6.875% | 3/15/2022 | 38 | 39,092 | ||||||||
| Petrobras Global Finance BV (Netherlands)(c) | 6.125% | 1/17/2022 | 25 | 26,594 | ||||||||
| Petroleos Mexicanos (Mexico)(c) | 3.125% | 1/23/2019 | 20 | 20,150 | ||||||||
| 24 | See Notes to Financial Statements. |
Schedule of Investments (continued)
December 31, 2017
| Principal | ||||||||||||
| Interest | Maturity | Amount | Fair | |||||||||
| Investments | Rate | Date | (000) | Value | ||||||||
| Oil (continued) | ||||||||||||
| Petroleos Mexicanos (Mexico)(c) | 5.50% | 2/4/2019 | $ | 105 | $ | 108,775 | ||||||
| Petroleos Mexicanos (Mexico)(c) | 8.00% | 5/3/2019 | 30 | 32,115 | ||||||||
| Phillips 66† | 2.009% (3 Mo. LIBOR + .65% | )# | 4/15/2019 | 16 | 16,010 | |||||||
| Pioneer Natural Resources Co. | 3.45% | 1/15/2021 | 25 | 25,519 | ||||||||
| Pioneer Natural Resources Co. | 3.95% | 7/15/2022 | 14 | 14,605 | ||||||||
| Pioneer Natural Resources Co. | 6.875% | 5/1/2018 | 21 | 21,325 | ||||||||
| Pioneer Natural Resources Co. | 7.50% | 1/15/2020 | 13 | 14,265 | ||||||||
| Range Resources Corp. | 5.75% | 6/1/2021 | 55 | 57,337 | ||||||||
| Resolute Energy Corp. | 8.50% | 5/1/2020 | 59 | 60,327 | ||||||||
| RSP Permian, Inc. | 6.625% | 10/1/2022 | 4 | 4,205 | ||||||||
| Sable Permian Resources Land LLC† | 13.00% | 11/30/2020 | 27 | 31,185 | ||||||||
| Sanchez Energy Corp. | 6.125% | 1/15/2023 | 23 | 19,607 | ||||||||
| Seven Generations Energy Ltd. (Canada)†(c) | 6.75% | 5/1/2023 | 2 | 2,135 | ||||||||
| Seven Generations Energy Ltd. (Canada)†(c) | 6.875% | 6/30/2023 | 51 | 54,442 | ||||||||
| SM Energy Co. | 6.50% | 11/15/2021 | 68 | 69,190 | ||||||||
| SM Energy Co. | 6.50% | 1/1/2023 | 8 | 8,200 | ||||||||
| Sunoco LP/Sunoco Finance Corp. | 5.50% | 8/1/2020 | 39 | 40,146 | ||||||||
| Whiting Petroleum Corp. | 5.00% | 3/15/2019 | 21 | 21,562 | ||||||||
| Total | 2,453,551 | |||||||||||
| Oil: Crude Producers 4.61% | ||||||||||||
| Andeavor Logistics LP/Tesoro Logistics Finance Corp. | 6.25% | 10/15/2022 | 22 | 23,369 | ||||||||
| Andeavor Logistics LP/Tesoro Logistics Finance Corp. | 6.375% | 5/1/2024 | 92 | 99,935 | ||||||||
| Boardwalk Pipelines LP | 5.20% | 6/1/2018 | 55 | 55,559 | ||||||||
| Boardwalk Pipelines LP | 5.75% | 9/15/2019 | 7 | 7,340 | ||||||||
| Buckeye Partners LP | 2.65% | 11/15/2018 | 111 | 111,342 | ||||||||
| Buckeye Partners LP | 5.50% | 8/15/2019 | 50 | 51,936 | ||||||||
| Buckeye Partners LP | 6.05% | 1/15/2018 | 41 | 41,051 | ||||||||
| Columbia Pipeline Group, Inc. | 2.45% | 6/1/2018 | 115 | 115,079 | ||||||||
| Columbia Pipeline Group, Inc. | 3.30% | 6/1/2020 | 77 | 78,139 | ||||||||
| DCP Midstream Operating LP† | 9.75% | 3/15/2019 | 71 | 77,124 | ||||||||
| Enbridge Energy Partners LP | 6.50% | 4/15/2018 | 70 | 70,933 | ||||||||
| Enbridge Energy Partners LP | 9.875% | 3/1/2019 | 110 | 119,067 | ||||||||
| Energy Transfer LP | 9.00% | 4/15/2019 | 59 | 63,676 | ||||||||
| Energy Transfer LP | 9.70% | 3/15/2019 | 42 | 45,466 | ||||||||
| Energy Transfer LP | 4.65% | 6/1/2021 | 40 | 42,015 | ||||||||
| Florida Gas Transmission Co. LLC† | 5.45% | 7/15/2020 | 228 | 243,305 | ||||||||
| See Notes to Financial Statements. | 25 |
Schedule of Investments (continued)
December 31, 2017
| Principal | ||||||||||||
| Interest | Maturity | Amount | Fair | |||||||||
| Investments | Rate | Date | (000) | Value | ||||||||
| Oil: Crude Producers (continued) | ||||||||||||
| Florida Gas Transmission Co. LLC† | 7.90% | 5/15/2019 | $ | 44 | $ | 47,126 | ||||||
| Gulf South Pipeline Co. LP | 4.00% | 6/15/2022 | 30 | 30,836 | ||||||||
| Kinder Morgan Energy Partners LP | 5.30% | 9/15/2020 | 15 | 15,996 | ||||||||
| Kinder Morgan Energy Partners LP | 5.80% | 3/1/2021 | 62 | 67,304 | ||||||||
| Kinder Morgan Energy Partners LP | 5.95% | 2/15/2018 | 66 | 66,309 | ||||||||
| Kinder Morgan Energy Partners LP | 6.50% | 4/1/2020 | 125 | 134,904 | ||||||||
| Kinder Morgan Energy Partners LP | 6.85% | 2/15/2020 | 30 | 32,510 | ||||||||
| Kinder Morgan Energy Partners LP | 9.00% | 2/1/2019 | 25 | 26,695 | ||||||||
| Kinder Morgan, Inc.† | 5.00% | 2/15/2021 | 16 | 16,987 | ||||||||
| Kinder Morgan, Inc.† | 5.625% | 11/15/2023 | 66 | 72,948 | ||||||||
| Kinder Morgan, Inc. | 7.25% | 6/1/2018 | 79 | 80,672 | ||||||||
| Midcontinent Express Pipeline LLC† | 6.70% | 9/15/2019 | 33 | 34,510 | ||||||||
| MPLX LP | 5.50% | 2/15/2023 | 133 | 137,034 | ||||||||
| NGPL PipeCo LLC† | 4.375% | 8/15/2022 | 9 | 9,186 | ||||||||
| ONEOK Partners LP | 3.20% | 9/15/2018 | 22 | 22,131 | ||||||||
| Panhandle Eastern Pipe Line Co. LP | 7.00% | 6/15/2018 | 65 | 66,446 | ||||||||
| Rockies Express Pipeline LLC† | 6.00% | 1/15/2019 | 37 | 38,202 | ||||||||
| Rockies Express Pipeline LLC† | 6.85% | 7/15/2018 | 7 | 7,157 | ||||||||
| Sabine Pass Liquefaction LLC | 5.625% | 2/1/2021 | 240 | 257,442 | ||||||||
| Sabine Pass Liquefaction LLC | 5.625% | 4/15/2023 | 200 | 219,780 | ||||||||
| Spectra Energy Partners LP | 4.60% | 6/15/2021 | 5 | 5,290 | ||||||||
| Sunoco Logistics Partners Operations LP | 3.45% | 1/15/2023 | 25 | 24,880 | ||||||||
| Texas Eastern Transmission LP† | 2.80% | 10/15/2022 | 5 | 4,973 | ||||||||
| Texas Eastern Transmission LP† | 4.125% | 12/1/2020 | 5 | 5,198 | ||||||||
| Texas Gas Transmission LLC† | 4.50% | 2/1/2021 | 25 | 26,053 | ||||||||
| TransCanada PipeLines Ltd. (Canada)(c) | 6.50% | 8/15/2018 | 1 | 1,027 | ||||||||
| TransCanada PipeLines Ltd. (Canada)(c) | 7.125% | 1/15/2019 | 25 | 26,223 | ||||||||
| Western Gas Partners LP | 2.60% | 8/15/2018 | 5 | 5,009 | ||||||||
| Williams Partners LP/ACMP Finance Corp. | 4.875% | 3/15/2024 | 32 | 33,520 | ||||||||
| Total | 2,761,684 | |||||||||||
| Oil: Integrated Domestic 0.34% | ||||||||||||
| FTS International, Inc.† | 9.089% (3 Mo. LIBOR + 7.50% | )# | 6/15/2020 | 3 | 3,060 | |||||||
| National Oilwell Varco, Inc. | 2.60% | 12/1/2022 | 83 | 81,135 | ||||||||
| SESI LLC | 7.125% | 12/15/2021 | 38 | 38,997 | ||||||||
| TechnipFMC plc (United Kingdom)†(c) | 3.45% | 10/1/2022 | 4 | 3,999 | ||||||||
| Weatherford International Ltd. | 9.625% | 3/1/2019 | 69 | 73,747 | ||||||||
| Total | 200,938 | |||||||||||
| 26 | See Notes to Financial Statements. |
Schedule of Investments (continued)
December 31, 2017
| Principal | ||||||||||||
| Interest | Maturity | Amount | Fair | |||||||||
| Investments | Rate | Date | (000) | Value | ||||||||
| Real Estate Investment Trusts 1.46% | ||||||||||||
| Brixmor Operating Partnership LP | 3.875% | 8/15/2022 | $ | 29 | $ | 29,740 | ||||||
| CBRE Services, Inc. | 5.00% | 3/15/2023 | 55 | 56,560 | ||||||||
| DDR Corp. | 3.50% | 1/15/2021 | 23 | 23,362 | ||||||||
| DDR Corp. | 4.625% | 7/15/2022 | 34 | 35,878 | ||||||||
| DDR Corp. | 7.50% | 7/15/2018 | 22 | 22,603 | ||||||||
| EPR Properties | 7.75% | 7/15/2020 | 131 | 145,378 | ||||||||
| HCP, Inc. | 3.75% | 2/1/2019 | 50 | 50,609 | ||||||||
| Healthcare Trust of America Holdings LP | 2.95% | 7/1/2022 | 10 | 9,983 | ||||||||
| Healthcare Trust of America Holdings LP | 3.375% | 7/15/2021 | 29 | 29,556 | ||||||||
| Kilroy Realty LP | 6.625% | 6/1/2020 | 92 | 100,193 | ||||||||
| SL Green Operating Partnership LP | 3.25% | 10/15/2022 | 3 | 2,991 | ||||||||
| SL Green Realty Corp. | 4.50% | 12/1/2022 | 12 | 12,579 | ||||||||
| SL Green Realty Corp. | 5.00% | 8/15/2018 | 8 | 8,099 | ||||||||
| SL Green Realty Corp. | 7.75% | 3/15/2020 | 75 | 82,560 | ||||||||
| VEREIT Operating Partnership LP | 3.00% | 2/6/2019 | 118 | 118,591 | ||||||||
| VEREIT Operating Partnership LP | 4.125% | 6/1/2021 | 41 | 42,590 | ||||||||
| Welltower, Inc. | 2.25% | 3/15/2018 | 75 | 75,033 | ||||||||
| Weyerhaeuser Co. | 4.70% | 3/15/2021 | 25 | 26,566 | ||||||||
| Weyerhaeuser Co. | 7.375% | 10/1/2019 | 2 | 2,168 | ||||||||
| Total | 875,039 | |||||||||||
| Retail 0.22% | ||||||||||||
| Best Buy Co., Inc. | 5.00% | 8/1/2018 | 5 | 5,083 | ||||||||
| PVH Corp. | 4.50% | 12/15/2022 | 30 | 30,672 | ||||||||
| Rite Aid Corp. | 6.75% | �� | 6/15/2021 | 72 | 72,000 | |||||||
| Tapestry, Inc. | 3.00% | 7/15/2022 | 23 | 22,940 | ||||||||
| Total | 130,695 | |||||||||||
| Savings & Loan 0.19% | ||||||||||||
| People’s United Financial, Inc. | 3.65% | 12/6/2022 | 109 | 111,714 | ||||||||
| Steel 0.27% | ||||||||||||
| BlueScope Steel Finance Ltd/BlueScope Steel | ||||||||||||
| Finance USA LLC (Australia)†(c) | 6.50% | 5/15/2021 | 45 | 47,025 | ||||||||
| Signode Industrial Group Lux SA/Signode Industrial Group US, Inc.† | 6.375% | 5/1/2022 | 52 | 54,535 | ||||||||
| U.S. Steel Corp.† | 8.375% | 7/1/2021 | 56 | 60,788 | ||||||||
| Total | 162,348 | |||||||||||
| See Notes to Financial Statements. | 27 |
Schedule of Investments (continued)
December 31, 2017
| Principal | ||||||||||||
| Interest | Maturity | Amount | Fair | |||||||||
| Investments | Rate | Date | (000) | Value | ||||||||
| Technology 0.67% | ||||||||||||
| Baidu, Inc. (China)(c) | 3.25% | 8/6/2018 | $ | 200 | $ | 200,983 | ||||||
| eBay, Inc. | 1.857% (3 Mo. LIBOR + .48% | )# | 8/1/2019 | 75 | 75,218 | |||||||
| Expedia, Inc. | 7.456% | 8/15/2018 | 58 | 59,826 | ||||||||
| TIBCO Software, Inc.† | 11.375% | 12/1/2021 | 55 | 60,053 | ||||||||
| VeriSign, Inc. | 4.625% | 5/1/2023 | 8 | 8,250 | ||||||||
| Total | 404,330 | |||||||||||
| Telecommunications 0.17% | ||||||||||||
| GCI, Inc. | 6.75% | 6/1/2021 | 14 | 14,263 | ||||||||
| Intelsat Jackson Holdings SA (Luxembourg)(c) | 7.25% | 10/15/2020 | 54 | 51,030 | ||||||||
| Level 3 Parent LLC | 5.75% | 12/1/2022 | 31 | 31,203 | ||||||||
| T-Mobile USA, Inc. | 6.125% | 1/15/2022 | 4 | 4,136 | ||||||||
| Total | 100,632 | |||||||||||
| Textiles Products 0.04% | ||||||||||||
| Springs Industries, Inc. | 6.25% | 6/1/2021 | 22 | 22,495 | ||||||||
| Transportation: Miscellaneous 0.09% | ||||||||||||
| Asciano Finance Ltd. (Australia)†(c) | 5.00% | 4/7/2018 | 25 | 25,161 | ||||||||
| Watco Cos. LLC/Watco Finance Corp.† | 6.375% | 4/1/2023 | 25 | 26,000 | ||||||||
| XPO Logistics, Inc.† | 6.50% | 6/15/2022 | 3 | 3,142 | ||||||||
| Total | 54,303 | |||||||||||
| Utilities 0.02% | ||||||||||||
| United Utilities plc (United Kingdom)(c) | 5.375% | 2/1/2019 | 10 | 10,307 | ||||||||
| Total Corporate Bonds (cost $21,805,877) | 21,852,734 | |||||||||||
| FLOATING RATE LOANS(f) 3.19% | ||||||||||||
| Aerospace/Defense 0.01% | ||||||||||||
| Gol LuxCo S.A. Term Loan (Luxembourg)(c) | 6.50% | 8/31/2020 | 6 | 6,165 | ||||||||
| Biotechnology Research & Production 0.22% | ||||||||||||
| Gilead Sciences, Inc. Term Loan | 2.218% (3 Mo. LIBOR + 0.875% | ) | 9/7/2018 | 62 | 62,039 | (g) | ||||||
| Gilead Sciences, Inc. Three Year Term Loan | 2.495% (3 Mo. LIBOR + 1.00% | ) | 9/8/2020 | 70 | 70,087 | (g) | ||||||
| Total | 132,126 | |||||||||||
| Chemicals 0.44% | ||||||||||||
| Celanese U.S. Holdings LLC Term Loan | 2.861% (1 Mo. LIBOR + 1.50% | ) | 7/15/2021 | 53 | 53,425 | |||||||
| 28 | See Notes to Financial Statements. |
Schedule of Investments (continued)
December 31, 2017
| Investments | Interest Rate | Maturity Date | Principal Amount (000) | Fair Value | ||||||||
| Chemicals (continued) | ||||||||||||
| E.I. du Pont de Nemours and Company Delayed Draw Term Loan A | 2.35% (3 Mo. LIBOR + 1.00% | ) | 3/22/2019 | $ | 110 | $ | 109,931 | (g) | ||||
| FMC Corporation Term Loan A | 2.819% (1 Mo. LIBOR + 1.25% | ) | 4/21/2020 | 15 | 15,028 | (g) | ||||||
| Mosaic Company (The) Term Loan | 3.052% (1 Mo. LIBOR + 1.50% | ) | 11/18/2021 | 80 | 79,601 | (g) | ||||||
| Sherwin-Williams Company (The) Term Loan A | 2.622% (1 Mo. LIBOR + 1.25% | ) | 4/13/2021 | 5 | 5,100 | |||||||
| Total | 263,085 | |||||||||||
| Computer Hardware 0.39% | ||||||||||||
| Dell International L.L.C. Replacement Term Loan A2 | 3.32% (1 Mo. LIBOR + 1.75% | ) | 9/7/2021 | 122 | 122,348 | |||||||
| Dell International L.L.C. Replacement Term Loan A3 | 3.07% (1 Mo. LIBOR + 1.50% | ) | 12/31/2018 | 109 | 109,529 | |||||||
| Total | 231,877 | |||||||||||
| Containers 0.19% | ||||||||||||
| Ball Corp. USD Term Loan A | 3.319% (3 Mo. LIBOR + 1.75% | ) | 7/1/2021 | 70 | 70,488 | |||||||
| WestRock Co. Closing Date Term Loan | 2.475% (1 Mo. LIBOR + 1.13% | ) | 7/1/2020 | 41 | 41,019 | (g) | ||||||
| Total | 111,507 | |||||||||||
| Drugs 0.11% | ||||||||||||
| Teva Pharmaceutical Industries Ltd Delayed Draw Term Loan B (Israel)(c) | 3.052% (3 Mo. LIBOR + 1.50% | ) | 11/16/2020 | 65 | 63,243 | (g) | ||||||
| Electric: Power 0.38% | ||||||||||||
| Energy Future Intermediate Holding Co. LLC DIP Term Loan | 4.283% (1 Mo. LIBOR + 3.00%)-4.349% | 6/30/2018 | 51 | 51,173 | ||||||||
| FirstEnergy Corp. Term Loan | 3.227% (1 Mo. LIBOR + 1.75% | ) | 12/6/2021 | 174 | 173,347 | (g) | ||||||
| Total | 224,520 | |||||||||||
| Electrical Equipment 0.13% | ||||||||||||
| Analog Devices, Term Loan A | 2.565% (3 Mo. LIBOR + 1.13% | ) | 3/10/2020 | 79 | 78,638 | (g) | ||||||
| Electronics 0.05% | ||||||||||||
| Keysight Technologies, Inc. Delayed Draw Term Loan | 2.938% (3 Mo. LIBOR + 1.50% | ) | 2/15/2020 | 27 | 27,300 | (g) | ||||||
| See Notes to Financial Statements. | 29 |
Schedule of Investments (continued)
December 31, 2017
| Investments | Interest Rate | Maturity Date | Principal Amount (000) | Fair Value | ||||||||
| Food 0.04% | ||||||||||||
| Amplify Snack Brands, Inc. Term Loan | 6.88% (1 Mo. LIBOR + 5.50% | ) | 9/2/2023 | $ | 26 | $ | 25,813 | |||||
| Health Care Products 0.14% | ||||||||||||
| Zimmer Biomet Holdings, Inc. Term Loan | 2.819% (1 Mo. LIBOR + 1.25% | ) | 9/30/2019 | 64 | 63,980 | (g) | ||||||
| Zimmer Holdings, Inc. Term Loan | 2.944% (1 Mo. LIBOR + 1.38% | ) | 5/29/2019 | 19 | 18,936 | (g) | ||||||
| Total | 82,916 | |||||||||||
| Health Care Services 0.00% | ||||||||||||
| Laboratory Corp. of America Holdings Term Loan | 2.819% (3 Mo. LIBOR + 1.25% | ) | 2/19/2020 | 2 | 1,916 | (g) | ||||||
| Investment Management Companies 0.05% | ||||||||||||
| RPI Finance Trust Term Loan A3 | 3.443% (3 Mo. LIBOR + 1.75% | ) | 10/14/2021 | 32 | 31,577 | |||||||
| Lodging 0.09% | ||||||||||||
| VML US Finance, LLC USD Term Loan | – | (h) | 5/31/2022 | 55 | 54,587 | (g) | ||||||
| Machinery: Industrial/Specialty 0.06% | ||||||||||||
| Flowserve Corp. 2012 Term Loan | 2.943% (3 Mo. LIBOR + 1.25% | ) | 10/14/2020 | 34 | 34,482 | (g) | ||||||
| Manufacturing 0.08% | ||||||||||||
| Tyco International Holding S.a.r.I. Term Loan | ||||||||||||
| (Luxembourg)(c) | 2.843% (3 Mo. LIBOR + 1.50% | ) | 3/6/2020 | 51 | 50,754 | |||||||
| Media 0.04% | ||||||||||||
| Charter Communications Operating, LLC Term Loan B | – | (h) | 4/30/2025 | 26 | 26,046 | |||||||
| Miscellaneous 0.11% | ||||||||||||
| Harris Corp. 3 Year Tranche Term Loan | 3.07% (3 Mo. LIBOR + 1.50% | ) | 5/29/2018 | 3 | 2,843 | (g) | ||||||
| Rockwell Collins, Inc. Term Loan | 2.71% (1 Mo. LIBOR + 1.25% | ) | 12/16/2019 | 56 | 56,627 | (g) | ||||||
| UTEX Industries Inc. Initial Term Loan B | – | (h) | 5/22/2021 | 7 | 6,863 | |||||||
| Total | 66,333 | |||||||||||
| Oil 0.03% | ||||||||||||
| Petroleos Mexicanos Delayed Draw Term Loan (Mexico)(c) | – | (h) | 2/17/2020 | 20 | 19,938 | (g) | ||||||
| 30 | See Notes to Financial Statements. |
Schedule of Investments (continued)
December 31, 2017
| Investments | Interest Rate | Maturity Date | Principal Amount (000) | Fair Value | ||||||||
| Oil: Crude Producers 0.06% | ||||||||||||
| Buckeye Partners L.P. Delayed Draw Term Loan | 2.92% (1 Mo. LIBOR + 1.35% | ) | 9/30/2019 | $ | 17 | $ | 16,958 | (g) | ||||
| ONEOK Partners, L.P. Delayed Draw Term Loan | 2.869% (3 Mo. LIBOR + 1.30% | ) | 1/8/2019 | 19 | 18,523 | (g) | ||||||
| Total | 35,481 | |||||||||||
| Real Estate Investment Trusts 0.18% | ||||||||||||
| American Tower Corporation Term Loan | 2.82% (3 Mo. LIBOR + 1.25% | ) | 1/31/2023 | 107 | 105,834 | (g) | ||||||
| Retail 0.30% | ||||||||||||
| Burlington Coat Factory Warehouse Corporation Term Loan B5 | 4.00% (1 Mo. LIBOR + 2.50% | ) | 11/7/2024 | 72 | 72,030 | |||||||
| PVH Corp. Tranche A Term Loan | 2.991% (1 Mo. LIBOR + 1.50% | ) | 5/19/2021 | 88 | 87,690 | |||||||
| Rite Aid Corp. 2nd Lien Tranche 2 Term Loan | 5.365% (3 Mo. LIBOR + 3.88% | ) | 6/21/2021 | 18 | 18,067 | |||||||
| Total | 177,787 | |||||||||||
| Technology 0.02% | ||||||||||||
| Symantec Corp. Term Loan A1 | 3.00% (3 Mo. LIBOR + 1.50% | ) | 5/10/2019 | 2 | 1,500 | |||||||
| Symantec Corp. Term Loan A2 | 2.938% (3 Mo. LIBOR + 1.50% | ) | 8/1/2019 | 2 | 1,999 | |||||||
| Zayo Group, LLC 2017 Incremental Refinancing Term Loan B1 | 3.552% (3 Mo. LIBOR + 2.00% | ) | 1/19/2021 | 9 | 8,967 | |||||||
| Total | 12,466 | |||||||||||
| Telecommunications 0.07% | ||||||||||||
| Intelsat Jackson Holdings SA Tranche B2 Term Loan (Luxembourg)(c) | – | (h) | 6/30/2019 | 44 | 43,952 | |||||||
| Total Floating Rate Loans (cost $1,904,981) | 1,908,343 | |||||||||||
| FOREIGN GOVERNMENT OBLIGATIONS 0.22% | ||||||||||||
| Argentina 0.04% | ||||||||||||
| Republic of Argentina | 5.625% | 1/26/2022 | 25 | 26,438 | ||||||||
| Dominican Republic 0.00% | ||||||||||||
| Dominican Republic† | 9.04% | 1/23/2018 | 1 | 1,104 | ||||||||
| Qatar 0.18% | ||||||||||||
| State of Qatar† | 5.25% | 1/20/2020 | 100 | 105,176 | ||||||||
| Total Foreign Government Obligations (cost $131,962) | 132,718 | |||||||||||
| See Notes to Financial Statements. | 31 |
Schedule of Investments (continued)
December 31, 2017
| Investments | Interest Rate | Maturity Date | Principal Amount (000) | Fair Value | ||||||||
| GOVERNMENT SPONSORED ENTERPRISES COLLATERALIZED MORTGAGE OBLIGATIONS 3.43% | ||||||||||||
| Federal Home Loan Mortgage Corp. 2011-K704 B† | 4.536% | #(i) | 10/25/2030 | $ | 20 | $ | 20,205 | |||||
| Federal Home Loan Mortgage Corp. 2012-K707 B† | 3.883% | #(i) | 1/25/2047 | 143 | 144,535 | |||||||
| Federal Home Loan Mortgage Corp. 2012-K709 B† | 3.741% | #(i) | 4/25/2045 | 75 | 76,120 | |||||||
| Federal Home Loan Mortgage Corp. 2012-K710 B† | 3.812% | #(i) | 6/25/2047 | 104 | 105,702 | |||||||
| Federal Home Loan Mortgage Corp. 2012-K711 B† | 3.562% | #(i) | 8/25/2045 | 30 | 30,377 | |||||||
| Federal Home Loan Mortgage Corp. 2013-K713 B† | 3.165% | #(i) | 4/25/2046 | 30 | 30,176 | |||||||
| Federal Home Loan Mortgage Corp. 2014-K503 B† | 3.002% | #(i) | 10/25/2047 | 39 | 39,131 | |||||||
| Government National Mortgage Assoc. 2014-109 A | 2.325% | 1/16/2046 | 13 | 13,263 | ||||||||
| Government National Mortgage Assoc. 2014-112 A | 3.00% | #(i) | 1/16/2048 | 7 | 7,150 | |||||||
| Government National Mortgage Assoc. 2014-135 AS | 2.30% | 2/16/2047 | 17 | 17,175 | ||||||||
| Government National Mortgage Assoc. 2014-64 A | 2.20% | 2/16/2045 | 27 | 26,976 | ||||||||
| Government National Mortgage Assoc. 2014-64 IO | 1.175% | #(i) | 12/16/2054 | 311 | 20,975 | |||||||
| Government National Mortgage Assoc. 2014-78 A | 2.20% | 4/16/2047 | 1 | 678 | ||||||||
| Government National Mortgage Assoc. 2014-78 IO | 0.607% | #(i) | 3/16/2056 | 56 | 2,564 | |||||||
| Government National Mortgage Assoc. 2015-47 AE | 2.90% | #(i) | 11/16/2055 | 11 | 10,930 | |||||||
| Government National Mortgage Assoc. 2015-48 AS | 2.90% | #(i) | 2/16/2049 | 26 | 26,462 | |||||||
| Government National Mortgage Assoc. 2015-73 AC | 2.90% | #(i) | 2/16/2053 | 43 | 42,881 | |||||||
| Government National Mortgage Assoc. 2017 20 AS | 2.50% | 2/16/2057 | 56 | 54,758 | ||||||||
| Government National Mortgage Assoc. 2017 23 AB | 2.60% | 12/16/2057 | 40 | 38,913 | ||||||||
| Government National Mortgage Assoc. 2017-100 AS | 2.75% | 2/16/2058 | 49 | 47,917 | ||||||||
| Government National Mortgage Assoc. 2017-168 AS | 2.70% | 8/16/2058 | 172 | 169,988 | ||||||||
| Government National Mortgage Assoc. 2017-22 GA | 2.60% | #(i) | 8/16/2051 | 29 | 28,063 | |||||||
| Government National Mortgage Assoc. 2017-28 AB | 2.50% | 10/16/2051 | 67 | 65,149 | ||||||||
| Government National Mortgage Assoc. 2017-41 AS | 2.60% | 6/16/2057 | 194 | 190,504 | ||||||||
| Government National Mortgage Assoc. 2017-44 AD | 2.65% | 11/17/2048 | 58 | 57,285 | ||||||||
| Government National Mortgage Assoc. 2017-51 AS | 2.75% | 4/16/2058 | 90 | 88,762 | ||||||||
| Government National Mortgage Assoc. 2017-53 B | 2.75% | 3/16/2050 | 88 | 86,683 | ||||||||
| Government National Mortgage Assoc. 2017-54 AD | 2.75% | 1/16/2057 | 88 | 86,741 | ||||||||
| Government National Mortgage Assoc. 2017-61 A | 2.60% | 8/16/2058 | 60 | 58,256 | ||||||||
| Government National Mortgage Assoc. 2017-69 AS | 2.75% | 2/16/2058 | 74 | 73,133 | ||||||||
| Government National Mortgage Assoc. 2017-71 AS | 2.70% | 4/16/2057 | 50 | 48,619 | ||||||||
| Government National Mortgage Assoc. 2017-72 AM | 2.60% | 9/16/2051 | 30 | 28,992 | ||||||||
| Government National Mortgage Assoc. 2017-74 AS | 2.60% | 10/16/2057 | 30 | 29,037 | ||||||||
| Government National Mortgage Assoc. 2017-76 AS | 2.65% | 11/16/2050 | 60 | 59,038 | ||||||||
| Government National Mortgage Assoc. 2017-86 AS | 2.75% | 2/16/2058 | 58 | 57,066 | ||||||||
| Government National Mortgage Assoc. 2017-89 AB | 2.60% | 7/16/2058 | 48 | 46,941 | ||||||||
| Government National Mortgage Assoc. 2017-90 AS | 2.70% | 7/16/2057 | 66 | 65,250 | ||||||||
| Government National Mortgage Assoc. 2017-92 AS | 2.75% | 6/16/2058 | 60 | 58,979 | ||||||||
| Total Government Sponsored Enterprises Collateralized Mortgage Obligations (cost $2,088,289) | 2,055,374 | |||||||||||
| 32 | See Notes to Financial Statements. |
Schedule of Investments (continued)
December 31, 2017
| Investments | Interest Rate | Maturity Date | Principal Amount (000) | Fair Value | ||||||||
| GOVERNMENT SPONSORED ENTERPRISES PASS-THROUGHS 0.47% | ||||||||||||
| Federal Home Loan Mortgage Corp. | 3.124% (12 Mo. LIBOR + 1.64% | )# | 10/1/2043 | $ | 13 | $ | 12,814 | |||||
| Federal Home Loan Mortgage Corp. | 3.389% (12 Mo. LIBOR + 1.83% | )# | 6/1/2042 | 9 | 9,594 | |||||||
| Federal Home Loan Mortgage Corp. | 3.563% (12 Mo. LIBOR + 1.82% | )# | 6/1/2041 | 13 | 13,621 | |||||||
| Federal Home Loan Mortgage Corp. | 3.603% (12 Mo. LIBOR + 1.90% | )# | 12/1/2040 | 20 | 21,281 | |||||||
| Federal National Mortgage Assoc. | 2.697% (12 Mo. LIBOR + 1.60% | )# | 12/1/2045 | 9 | 9,303 | |||||||
| Federal National Mortgage Assoc. | 2.719% (12 Mo. LIBOR + 1.60% | )# | 12/1/2045 | 37 | 37,373 | |||||||
| Federal National Mortgage Assoc. | 2.835% (12 Mo. LIBOR + 1.60% | )# | 10/1/2045 | 10 | 9,781 | |||||||
| Federal National Mortgage Assoc. | 2.908% (12 Mo. LIBOR + 1.72% | )# | 6/1/2042 | 22 | 22,130 | |||||||
| Federal National Mortgage Assoc. | 3.137% (12 Mo. LIBOR + 1.79% | )# | 3/1/2042 | 19 | 19,974 | |||||||
| Federal National Mortgage Assoc. | 3.51% (12 Mo. LIBOR + 1.78% | )# | 10/1/2036 | 42 | 44,761 | |||||||
| Federal National Mortgage Assoc. | 3.517% (12 Mo. LIBOR + 1.82% | )# | 4/1/2040 | 34 | 35,219 | |||||||
| Federal National Mortgage Assoc. | 3.532% (12 Mo. LIBOR + 1.82% | )# | 12/1/2040 | 3 | 3,249 | |||||||
| Federal National Mortgage Assoc. | 3.544% (12 Mo. LIBOR + 1.80% | )# | 10/1/2040 | 1 | 1,206 | |||||||
| Federal National Mortgage Assoc. | 3.558% (12 Mo. LIBOR + 1.81% | )# | 12/1/2040 | 2 | 1,907 | |||||||
| Federal National Mortgage Assoc. | 3.687% (12 Mo. LIBOR + 1.81% | )# | 1/1/2042 | 40 | 41,768 | |||||||
| Total Government Sponsored Enterprises Pass-Throughs (cost $287,315) | 283,981 | |||||||||||
| MUNICIPAL BONDS 0.20% | ||||||||||||
| Miscellaneous | ||||||||||||
| Illinois | 3.90% | 1/1/2018 | 5 | 5,000 | ||||||||
| Illinois | 4.95% | 6/1/2023 | 7 | 7,310 | ||||||||
| Illinois | 5.163% | 2/1/2018 | 50 | 50,111 | ||||||||
| Illinois | 5.665% | 3/1/2018 | 25 | 25,137 | ||||||||
| Illinois | 5.877% | 3/1/2019 | 15 | 15,471 | ||||||||
| New Jersey Transp Tr Fnd Auth | 1.758% | 12/15/2018 | 15 | 14,912 | ||||||||
| Total Municipal Bonds (cost $117,691) | 117,941 | |||||||||||
| See Notes to Financial Statements. | 33 |
Schedule of Investments (continued)
December 31, 2017
| Investments | Interest Rate | Maturity Date | Principal Amount (000) | Fair Value | ||||||||
| NON-AGENCY COMMERCIAL MORTGAGE-BACKED SECURITIES 21.93% | ||||||||||||
| A10 Bridge Asset Financing LLC 2015-AA A1† | 3.30% | 5/15/2036 | $ | 116 | $ | 115,356 | (b) | |||||
| Americold LLC 2010-ARTA A1† | 3.847% | 1/14/2029 | 36 | 37,021 | ||||||||
| AOA Mortgage Trust 2015-1177 A† | 2.957% | 12/13/2029 | 100 | 100,696 | ||||||||
| Assurant Commercial Mortgage Trust 2016-1A A1† | 1.362% | 5/15/2049 | 12 | 12,324 | ||||||||
| Aventura Mall Trust 2013-AVM C† | 3.743% | #(i) | 12/5/2032 | 100 | 101,893 | |||||||
| Bancorp Commercial Mortgage Trust 2016-CRE1 A† | 2.907% (1 Mo. LIBOR + 1.43% | )# | 11/15/2033 | 88 | 88,534 | |||||||
| BB-UBS Trust 2012-TFT A† | 2.892% | 6/5/2030 | 200 | 196,787 | ||||||||
| BB-UBS Trust 2012-TFT B† | 3.468% | #(i) | 6/5/2030 | 100 | 97,801 | |||||||
| BB-UBS Trust 2012-TFT C† | 3.468% | #(i) | 6/5/2030 | 100 | 97,112 | |||||||
| BBCMS Mortgage Trust 2017-GLKS B† | 2.451% (1 Mo. LIBOR + 1.20% | )# | 11/15/2034 | 39 | 39,025 | |||||||
| BBCMS Mortgage Trust 2017-GLKS C† | 2.651% (1 Mo. LIBOR + 1.40% | )# | 11/15/2034 | 10 | 10,006 | |||||||
| Bear Stearns Commercial Mortgage Securities Trust 2004-PWR6 E† | 5.406% | #(i) | 11/11/2041 | 15 | 15,546 | |||||||
| Bear Stearns Commercial Mortgage Securities Trust 2004-PWR6 F† | 5.673% | #(i) | 11/11/2041 | 25 | 26,010 | |||||||
| BX Trust 2017-SLCT A† | 2.397% (1 Mo. LIBOR + .92% | )# | 7/15/2034 | 55 | 55,172 | |||||||
| BX Trust 2017-SLCT B† | 2.677% (1 Mo. LIBOR + 1.20% | )# | 7/15/2034 | 47 | 47,037 | |||||||
| BX Trust 2017-SLCT D† | 3.527% (1 Mo. LIBOR + 2.05% | )# | 7/15/2034 | 73 | 73,114 | |||||||
| BX Trust 2017-SLCT E† | 4.627% (1 Mo. LIBOR + 3.15% | )# | 7/15/2034 | 60 | 60,300 | |||||||
| BX Trust 2017-SLCT F† | 5.727% (1 Mo. LIBOR + 4.25% | )# | 7/15/2034 | 42 | 42,302 | |||||||
| BXP Trust 2017-CQHP A† | 2.327% (1 Mo. LIBOR + .85% | )# | 11/15/2034 | 43 | 43,053 | |||||||
| Caesars Palace Las Vegas Trust 2017-VICI A† | 3.531% | 10/15/2034 | 212 | 217,020 | ||||||||
| Caesars Palace Las Vegas Trust 2017-VICI B† | 3.835% | 10/15/2034 | 99 | 101,569 | ||||||||
| Caesars Palace Las Vegas Trust 2017-VICI C† | 4.138% | 10/15/2034 | 149 | 153,206 | ||||||||
| Caesars Palace Las Vegas Trust 2017-VICI D† | 4.354% | #(i) | 10/15/2034 | 40 | 40,864 | |||||||
| Caesars Palace Las Vegas Trust 2017-VICI E† | 4.354% | #(i) | 10/15/2034 | 140 | 136,270 | |||||||
| Caesars Palace Las Vegas Trust 2017-VICI XA IO† | 0.823% | #(i) | 10/15/2034 | 1,000 | 36,691 | |||||||
| Caesars Palace Las Vegas Trust 2017-VICI XB IO† | 0.393% | #(i) | 10/15/2034 | 1,000 | 18,651 | |||||||
| CCRESG Commercial Mortgage Trust 2016-HEAT B† | 4.114% | 4/10/2029 | 29 | 29,221 | ||||||||
| CCRESG Commercial Mortgage Trust 2016-HEAT C† | 4.919% | 4/10/2029 | 29 | 29,396 | ||||||||
| CFCRE Commercial Mortgage Trust 2016-C6 XA IO | 1.207% | #(i) | 11/10/2049 | 194 | 15,327 | |||||||
| CFCRE Commercial Mortgage Trust 2016-C7 XA IO | 0.789% | #(i) | 12/10/2054 | 192 | 10,486 | |||||||
| CGGS Commercial Mortgage Trust 2016-RNDA DFX† | 4.387% | 2/10/2033 | 87 | 86,834 | ||||||||
| Chicago Skyscraper Trust 2017-SKY A† | 2.277% (1 Mo. LIBOR + .80% | )# | 2/15/2030 | 137 | 137,353 | |||||||
| 34 | See Notes to Financial Statements. |
Schedule of Investments (continued)
December 31, 2017
| Investments | Interest Rate | Maturity Date | Principal Amount (000) | Fair Value | ||||||||
| NON-AGENCY COMMERCIAL MORTGAGE-BACKED SECURITIES (continued) | ||||||||||||
| Chicago Skyscraper Trust 2017-SKY C† | 2.727% (1 Mo. LIBOR + 1.25% | )# | 2/15/2030 | $ | 100 | $ | 100,351 | |||||
| Chicago Skyscraper Trust 2017-SKY XCP IO | 2.624% | #(i) | 2/15/2030 | 2,938 | 11,091 | |||||||
| CHT Mortgage Trust 2017-CSMO A† | 2.31% | # | 11/15/2036 | 100 | 100,202 | |||||||
| CHT Mortgage Trust 2017-CSMO B† | 2.78% | # | 11/15/2036 | 100 | 100,204 | |||||||
| CHT Mortgage Trust 2017-CSMO D† | 3.63% | # | 11/15/2036 | 100 | 100,249 | |||||||
| Citigroup Commercial Mortgage Trust 2014-GC19 A1 | 1.199% | 3/10/2047 | 1 | 614 | ||||||||
| Citigroup Commercial Mortgage Trust 2015-GC27 AAB | 2.944% | 2/10/2048 | 10 | 10,113 | ||||||||
| Citigroup Commercial Mortgage Trust 2015-GC31 XA IO | 0.446% | #(i) | 6/10/2048 | 981 | 25,073 | |||||||
| Citigroup Commercial Mortgage Trust 2015-SHP2 XCP IO† | Zero Coupon | #(i) | 7/15/2027 | 46,545 | 382 | |||||||
| Citigroup Commercial Mortgage Trust 2015-SSHP C† | 3.577% (1 Mo. LIBOR + 2.10% | )# | 9/15/2027 | 100 | 99,626 | |||||||
| Citigroup Commercial Mortgage Trust 2016-SMPL A† | 2.228% | 9/10/2031 | 100 | 98,173 | ||||||||
| Commercial Mortgage Loan Trust 2008-LS1 ASM | 6.077% | #(i) | 12/10/2049 | 25 | 24,525 | |||||||
| Commercial Mortgage Pass-Through Certificates 2004-LB2A G† | 5.54% | #(i) | 3/10/2039 | 35 | 35,958 | |||||||
| Commercial Mortgage Pass-Through Certificates 2012-CR3 B† | 3.922% | 10/15/2045 | 200 | 202,253 | ||||||||
| Commercial Mortgage Pass-Through Certificates 2013-CR11 A2 | 3.047% | 8/10/2050 | 10 | 10,095 | ||||||||
| Commercial Mortgage Pass-Through Certificates 2013-CR6 A2 | 2.122% | 3/10/2046 | 1 | 1,175 | ||||||||
| Commercial Mortgage Pass-Through Certificates 2013-LC6 A2 | 1.906% | 1/10/2046 | 3 | 2,765 | ||||||||
| Commercial Mortgage Pass-Through Certificates 2013-SFS A1† | 1.873% | 4/12/2035 | 114 | 111,574 | ||||||||
| Commercial Mortgage Pass-Through Certificates 2014-FL4 C† | 3.41% (1 Mo. LIBOR + 1.95% | )# | 7/13/2031 | 62 | 63,033 | |||||||
| Commercial Mortgage Pass-Through Certificates 2014-UBS5 XB1 IO† | 0.098% | #(i) | 9/10/2047 | 2,000 | 19,348 | |||||||
| Commercial Mortgage Pass-Through Certificates 2015-PC1 XA IO† | 0.751% | #(i) | 7/10/2050 | 97 | 3,488 | |||||||
| Commercial Mortgage Pass-Through Certificates 2016-GCT D† | 3.461% | #(i) | 8/10/2029 | 100 | 100,299 | |||||||
| Commercial Mortgage Pass-Through Certificates 2016-GCT XA IO† | 0.784% | 8/10/2029 | 4,000 | 91,340 | ||||||||
| See Notes to Financial Statements. | 35 |
Schedule of Investments (continued)
December 31, 2017
| Investments | Interest Rate | Maturity Date | Principal Amount (000) | Fair Value | ||||||||
| NON-AGENCY COMMERCIAL MORTGAGE-BACKED SECURITIES (continued) | ||||||||||||
| Commercial Mortgage Pass-Through Certificates 2016-SAVA A† | 3.152% (1 Mo. LIBOR + 1.72% | )# | 10/15/2034 | $ | 105 | $ | 104,950 | |||||
| Commercial Mortgage Pass-Through Certificates 2016-SAVA B† | 3.732% (1 Mo. LIBOR + 2.30% | )# | 10/15/2034 | 100 | 100,378 | |||||||
| Commercial Mortgage Pass-Through Certificates 2016-SAVA XCP IO† | 2.173% | #(i) | 10/15/2034 | 578 | 9,962 | (b) | ||||||
| Commercial Mortgage Trust 2016-CD1 XA IO | 1.437% | #(i) | 8/10/2049 | 56 | 5,174 | |||||||
| Core Industrial Trust 2015-CALW XA IO† | 0.81% | #(i) | 2/10/2034 | 1,006 | 29,385 | |||||||
| Credit Suisse First Boston Mortgage Securities Corp. 2006-OMA B1† | 5.466% | 5/15/2023 | 50 | 51,442 | ||||||||
| Credit Suisse First Boston Mortgage Securities Corp. 2006-OMA B2† | 5.538% | 5/15/2023 | 200 | 209,610 | ||||||||
| Credit Suisse Mortgage Capital Certificates 2014-USA X1 IO† | 0.552% | #(i) | 9/15/2037 | 1,000 | 34,995 | |||||||
| Credit Suisse Mortgage Capital Certificates 2015-DEAL A† | 2.797% (1 Mo. LIBOR + 1.32% | )# | 4/15/2029 | 72 | 72,048 | |||||||
| Credit Suisse Mortgage Capital Certificates 2016-MFF B† | 3.977% (1 Mo. LIBOR + 2.50% | )# | 11/15/2033 | 50 | 50,319 | |||||||
| Credit Suisse Mortgage Capital Certificates 2016-MFF C† | 4.977% (1 Mo. LIBOR + 3.50% | )# | 11/15/2033 | 50 | 50,478 | |||||||
| Credit Suisse Mortgage Capital Certificates 2017-HD A† | 2.427% (1 Mo. LIBOR + .95% | )# | 2/15/2031 | 50 | 50,100 | |||||||
| Credit Suisse Mortgage Capital Certificates 2017-HD D† | 3.977% (1 Mo. LIBOR + 2.50% | )# | 2/15/2031 | 50 | 50,127 | |||||||
| Credit Suisse Mortgage Capital Certificates 2017-LSTK A† | 2.761% | 4/5/2033 | 84 | 84,259 | ||||||||
| Credit Suisse Mortgage Capital Certificates 2017-LSTK B† | 3.03% | 4/5/2033 | 50 | 50,171 | ||||||||
| Credit Suisse Mortgage Capital Certificates 2017-LSTK C† | 3.229% | 4/5/2033 | 50 | 50,249 | ||||||||
| Credit Suisse Mortgage Capital Certificates 2017-LSTK D† | 3.331% | #(i) | 4/5/2033 | 50 | 49,825 | |||||||
| Credit Suisse Mortgage Capital Certificates 2017-MOON A† | 3.197% | 7/10/2034 | 60 | 61,489 | (b) | |||||||
| Credit Suisse Mortgage Capital Certificates 2017-MOON B† | 3.197% | #(i) | 7/10/2034 | 50 | 50,911 | (b) | ||||||
| Credit Suisse Mortgage Capital Certificates 2017-MOON C† | 3.197% | #(i) | 7/10/2034 | 109 | 109,884 | (b) | ||||||
| Credit Suisse Mortgage Capital Certificates 2017-MOON D† | 3.197% | #(i) | 7/10/2034 | 50 | 49,048 | (b) | ||||||
| Credit Suisse Mortgage Capital Certificates 2017-MOON X IO† | Zero Coupon | #(i) | 7/10/2034 | 28,675 | 44,590 | (b) | ||||||
| 36 | See Notes to Financial Statements. |
Schedule of Investments (continued)
December 31, 2017
| Investments | Interest Rate | Maturity Date | Principal Amount (000) | Fair Value | ||||||||
| NON-AGENCY COMMERCIAL MORTGAGE-BACKED SECURITIES (continued) | ||||||||||||
| Credit Suisse Mortgage Capital Certificates Trust 2017-HD XCP IO† | 1.935% | #(i) | 2/15/2031 | $ | 1,376 | $ | 25,357 | (b) | ||||
| Credit Suisse Mortgage Capital Certificates Trust 2017-PFHP A† | 2.245% | # | 12/15/2020 | 50 | 50,024 | |||||||
| CSAIL Commercial Mortgage Trust 2015-C4 A2 | 3.157% | 11/15/2048 | 10 | 10,145 | ||||||||
| CSAIL Commercial Mortgage Trust 2016-C6 XA IO | 1.809% | #(i) | 1/15/2049 | 994 | 103,902 | |||||||
| DBJPM Mortgage Trust 2016-C3 XA IO | 1.512% | #(i) | 9/10/2049 | 198 | 20,000 | |||||||
| DBUBS Mortgage Trust 2011-LC2A D† | 5.542% | #(i) | 7/10/2044 | 100 | 104,346 | |||||||
| DBWF Mortgage Trust 2015-LCM A1† | 2.998% | 6/10/2034 | 20 | 20,051 | ||||||||
| DBWF Mortgage Trust 2016-85T XA IO† | 0.014% | #(i) | 12/10/2036 | 3,140 | 13,094 | |||||||
| GAHR Commercial Mortgage Trust 2015-NRF BFX† | 3.382% | #(i) | 12/15/2034 | 100 | 101,189 | |||||||
| GAHR Commercial Mortgage Trust 2015-NRF CFX† | 3.382% | #(i) | 12/15/2034 | 323 | 325,311 | |||||||
| GS Mortgage Securities Corp. II 2013-GC10 A3 | 2.613% | 2/10/2046 | 74 | 74,079 | ||||||||
| GS Mortgage Securities Corp. Trust 2016-RENT C† | 4.067% | #(i) | 2/10/2029 | 100 | 101,987 | |||||||
| GS Mortgage Securities Corp. Trust 2017-485L XB IO† | 0.111% | #(i) | 2/10/2037 | 1,590 | 20,726 | (b) | ||||||
| GS Mortgage Securities Corp. Trust 2017-GPTX C† | 3.302% | 5/10/2034 | 100 | 99,961 | ||||||||
| GS Mortgage Securities Corp. Trust 2017-STAY A† | 2.327% (1 Mo. LIBOR + .85% | )# | 7/15/2032 | 100 | 99,562 | |||||||
| GS Mortgage Securities Trust 2011-GC5 B† | 5.398% | #(i) | 8/10/2044 | 107 | 114,250 | |||||||
| GS Mortgage Securities Trust 2012-GC6 XA IO† | 1.956% | #(i) | 1/10/2045 | 300 | 19,116 | |||||||
| GS Mortgage Securities Trust 2012-GCJ7 B | 4.74% | 5/10/2045 | 20 | 21,062 | ||||||||
| GS Mortgage Securities Trust 2013-G1 A2† | 3.557% | #(i) | 4/10/2031 | 100 | 98,758 | |||||||
| GS Mortgage Securities Trust 2015-GS1 XB IO | 0.184% | #(i) | 11/10/2048 | 1,082 | 17,761 | |||||||
| GS Mortgage Securities Trust 2016-GS4 225A† | 2.636% | 11/10/2029 | 15 | 14,820 | (b) | |||||||
| GS Mortgage Securities Trust 2016-GS4 225C† | 3.778% | 11/10/2029 | 26 | 25,867 | (b) | |||||||
| GS Mortgage Securities Trust 2016-GS4 225D† | 4.766% | 11/10/2029 | 35 | 34,924 | (b) | |||||||
| H/2 Asset Funding 2015-1A-AFL | 2.633% | 6/24/2049 | 13 | 12,954 | (b) | |||||||
| H/2 Asset Funding 2015-1A-AFX | 3.353% | 6/24/2049 | 13 | 12,742 | (b) | |||||||
| H/2 Asset Funding 2015-1A-BFX | 3.993% | 6/24/2049 | 25 | 24,087 | (b) | |||||||
| HMH Trust 2017-NSS A† | 3.062% | 7/5/2031 | 100 | 99,602 | ||||||||
| HMH Trust 2017-NSS B† | 3.343% | 7/5/2031 | 100 | 100,264 | ||||||||
| HMH Trust 2017-NSS C† | 3.787% | 7/5/2031 | 100 | 99,245 | ||||||||
| HMH Trust 2017-NSS D† | 4.723% | 7/5/2031 | 100 | 99,297 | ||||||||
| Hospitality Mortgage Trust 2017-HIT D† | 3.394% (1 Mo. LIBOR + 2.15% | )# | 5/8/2030 | 100 | 100,326 | |||||||
| Hospitality Mortgage Trust 2017-HIT E† | 4.794% (1 Mo. LIBOR + 3.55% | )# | 5/8/2030 | 100 | 100,673 | |||||||
| Hudsons Bay Simon JV Trust 2015-HB7 A7† | 3.914% | 8/5/2034 | 100 | 101,608 | ||||||||
| See Notes to Financial Statements. | 37 |
Schedule of Investments (continued)
December 31, 2017
| Investments | Interest Rate | Maturity Date | Principal Amount (000) | Fair Value | ||||||||
| NON-AGENCY COMMERCIAL MORTGAGE-BACKED SECURITIES (continued) | ||||||||||||
| Hudsons Bay Simon JV Trust 2015-HB7 B7† | 4.666% | 8/5/2034 | $ | 179 | $ | 178,071 | ||||||
| Hudsons Bay Simon JV Trust 2015-HB7 XA7 IO† | 1.245% | #(i) | 8/5/2034 | 1,000 | 53,465 | |||||||
| Irvine Core Office Trust 2013-IRV A1† | 2.068% | 5/15/2048 | 29 | 28,470 | ||||||||
| Irvine Core Office Trust 2013-IRV A2† | 3.173% | #(i) | 5/15/2048 | 10 | 10,169 | |||||||
| JPMorgan Chase Commercial Mortgage Securities Trust 2009-IWST C† | 7.445% | #(i) | 12/5/2027 | 25 | 27,251 | |||||||
| JPMorgan Chase Commercial Mortgage Securities Trust 2012-C6 B | 4.819% | #(i) | 5/15/2045 | 11 | 11,657 | |||||||
| JPMorgan Chase Commercial Mortgage Securities Trust 2012-WLDN A† | 3.905% | 5/5/2030 | 95 | 97,811 | ||||||||
| JPMorgan Chase Commercial Mortgage Securities Trust 2014-C19 A2 | 3.046% | 4/15/2047 | 25 | 25,156 | ||||||||
| JPMorgan Chase Commercial Mortgage Securities Trust 2014-C24 A1 | 1.539% | 11/15/2047 | 4 | 4,011 | ||||||||
| JPMorgan Chase Commercial Mortgage Securities Trust 2014-C26 XA IO | 1.132% | #(i) | 1/15/2048 | 967 | 46,493 | |||||||
| JPMorgan Chase Commercial Mortgage Securities Trust 2014-DSTY A† | 3.429% | 6/10/2027 | 200 | 201,520 | ||||||||
| JPMorgan Chase Commercial Mortgage Securities Trust 2015-C30 XA IO | 0.685% | #(i) | 7/15/2048 | 978 | 31,015 | |||||||
| JPMorgan Chase Commercial Mortgage Securities Trust 2015-C32 ASB | 3.358% | 11/15/2048 | 20 | 20,536 | ||||||||
| JPMorgan Chase Commercial Mortgage Securities Trust 2016-JP4 XA IO | 0.815% | #(i) | 12/15/2049 | 993 | 44,101 | |||||||
| JPMorgan Chase Commercial Mortgage Securities Trust 2016-WIKI A† | 2.798% | 10/5/2031 | 30 | 30,057 | ||||||||
| JPMorgan Chase Commercial Mortgage Securities Trust 2016-WIKI B† | 3.201% | 10/5/2031 | 25 | 25,115 | ||||||||
| JPMorgan Chase Commercial Mortgage Securities Trust 2016-WIKI C† | 3.554% | 10/5/2031 | 20 | 20,131 | ||||||||
| JPMorgan Chase Commercial Mortgage Securities Trust 2016-WIKI D† | 4.009% | #(i) | 10/5/2031 | 35 | 35,195 | |||||||
| JPMorgan Chase Commercial Mortgage Securities Trust 2016-WIKI E† | 4.009% | #(i) | 10/5/2031 | 12 | 11,846 | |||||||
| JPMorgan Chase Commercial Mortgage Securities Trust 2016-WIKI XB IO† | 0.657% | #(i) | 10/5/2031 | 1,000 | 21,944 | (b) | ||||||
| JPMorgan Chase Commercial Mortgage Securities Trust 2016-WPT A† | 2.927% (1 Mo. LIBOR + 1.45% | )# | 10/15/2033 | 68 | 68,237 | |||||||
| JPMorgan Chase Commercial Mortgage Securities Trust 2016-WPT C† | 4.327% (1 Mo. LIBOR + 2.85% | )# | 10/15/2033 | 10 | 10,069 | |||||||
| JPMorgan Chase Commercial Mortgage Securities Trust 2016-WPT D† | 5.227% (1 Mo. LIBOR + 3.75% | )# | 10/15/2033 | 27 | 27,278 | |||||||
| 38 | See Notes to Financial Statements. |
Schedule of Investments (continued)
December 31, 2017
| Investments | Interest Rate | Maturity Date | Principal Amount (000) | Fair Value | ||||||||
| NON-AGENCY COMMERCIAL MORTGAGE-BACKED SECURITIES (continued) | ||||||||||||
| JPMorgan Chase Commercial Mortgage Securities Trust 2016-WPT XCP IO† | 1.198% | #(i) | 10/15/2018 | $ | 4,967 | $ | 49,447 | |||||
| JPMorgan Chase Commercial Mortgage Securities Trust 2017-JP7 XA IO | 1.093% | #(i) | 9/15/2050 | 999 | 75,144 | |||||||
| JPMorgan Chase Commercial Mortgage Securities Trust 2017-MARK A† | 3.392% | 6/5/2032 | 67 | 68,208 | ||||||||
| JPMorgan Chase Commercial Mortgage Securities Trust 2017-MARK B† | 3.795% | 6/5/2032 | 27 | 27,546 | ||||||||
| JPMorgan Chase Commercial Mortgage Securities Trust 2017-MARK C† | 4.036% | #(i) | 6/5/2032 | 20 | 20,414 | |||||||
| JPMorgan Chase Commercial Mortgage Securities Trust 2017-MAUI C† | 2.727% (1 Mo. LIBOR + 1.25% | )# | 7/15/2034 | 20 | 20,038 | |||||||
| JPMorgan Chase Commercial Mortgage Securities Trust 2017-MAUI D† | 3.427% (1 Mo. LIBOR + 1.95% | )# | 7/15/2034 | 31 | 31,071 | |||||||
| LMREC, Inc. 2015-CRE1 A† | 3.285% (1 Mo. LIBOR + 1.75% | )# | 2/22/2032 | 100 | 100,958 | |||||||
| LSTAR Commercial Mortgage Trust 2015-3 A2† | 2.729% | #(i) | 4/20/2048 | 8 | 7,664 | |||||||
| LSTAR Commercial Mortgage Trust 2015-3 A3† | 3.113% | #(i) | 4/20/2048 | 56 | 56,144 | |||||||
| LSTAR Commercial Mortgage Trust 2016-4 XA IO† | 1.952% | #(i) | 3/10/2049 | 993 | 74,770 | |||||||
| LSTAR Commercial Mortgage Trust 2017-5 A1† | 2.417% | 3/10/2050 | 99 | 98,326 | ||||||||
| LSTAR Commercial Mortgage Trust 2017-5 A2† | 2.776% | 3/10/2050 | 100 | 99,641 | ||||||||
| LSTAR Commercial Mortgage Trust 2017-5 A3† | 4.50% | 3/10/2050 | 100 | 107,043 | ||||||||
| Morgan Stanley Bank of America Merrill Lynch Trust 2012-CKSV A1† | 2.117% | 10/15/2030 | 53 | 51,529 | ||||||||
| Morgan Stanley Bank of America Merrill Lynch Trust 2013-C12 A2 | 3.001% | 10/15/2046 | 10 | 10,049 | ||||||||
| Morgan Stanley Bank of America Merrill Lynch Trust 2015-C23 XA IO | 0.732% | #(i) | 7/15/2050 | 488 | 16,390 | |||||||
| Morgan Stanley Bank of America Merrill Lynch Trust 2015-C24 ASB | 3.479% | 5/15/2048 | 21 | 21,683 | ||||||||
| Morgan Stanley Bank of America Merrill Lynch Trust 2016-C31 XA IO | 1.456% | #(i) | 11/15/2049 | 989 | 88,958 | |||||||
| Morgan Stanley Capital Barclays Bank Trust 2016-MART B† | 2.48% | 9/13/2031 | 50 | 49,151 | ||||||||
| Morgan Stanley Capital Barclays Bank Trust 2016-MART C† | 2.817% | 9/13/2031 | 100 | 98,614 | ||||||||
| Morgan Stanley Capital Barclays Bank Trust 2016-MART XCP IO† | 0.316% | #(i) | 9/13/2031 | 9,863 | 29,342 | (b) | ||||||
| Morgan Stanley Capital I Trust 2012-C4 B† | 5.213% | #(i) | 3/15/2045 | 100 | 107,403 | |||||||
| Morgan Stanley Capital I Trust 2014-MP A† | 3.469% | 8/11/2033 | 100 | 102,451 | ||||||||
| Morgan Stanley Capital I Trust 2015-UBS8 ASB | 3.626% | 12/15/2048 | 12 | 12,451 | ||||||||
| Morgan Stanley Capital I Trust 2016-UB11 XB IO | 0.995% | #(i) | 8/15/2049 | 1,000 | 71,216 | |||||||
| See Notes to Financial Statements. | 39 |
Schedule of Investments (continued)
December 31, 2017
| Investments | Interest Rate | Maturity Date | Principal Amount (000) | Fair Value | ||||||||
| NON-AGENCY COMMERCIAL MORTGAGE-BACKED SECURITIES (continued) | ||||||||||||
| Morgan Stanley Capital I Trust 2017-PRME D† | 4.877% (1 Mo. LIBOR + 3.40% | )# | 2/15/2034 | $ | 90 | $ | 90,398 | |||||
| MSCG Trust 2015-ALDR A1† | 2.612% | 6/7/2035 | 20 | 19,178 | ||||||||
| MSCG Trust 2016-SNR A† | 3.348% | #(i) | 11/15/2034 | 69 | 68,657 | |||||||
| MSCG Trust 2016-SNR B† | 4.181% | 11/15/2034 | 33 | 33,097 | ||||||||
| MSCG Trust 2016-SNR C† | 5.205% | 11/15/2034 | 25 | 25,425 | ||||||||
| Nationslink Funding Corp. 1999-LTL1 D† | 6.45% | 1/22/2026 | 21 | 21,820 | ||||||||
| Palisades Center Trust 2016-PLSD A† | 2.713% | 4/13/2033 | 10 | 9,944 | ||||||||
| Palisades Center Trust 2016-PLSD D† | 4.737% | 4/13/2033 | 77 | 77,186 | ||||||||
| Palisades Center Trust 2016-PLSD XCP IO† | 0.965% | #(i) | 5/13/2018 | 1,000 | 4,085 | |||||||
| PFP Ltd. 2017-3 A† | 2.482% (1 Mo. LIBOR + 1.05% | )# | 1/14/2035 | 94 | 94,177 | |||||||
| PFP Ltd. 2017-3 B† | 3.182% (1 Mo. LIBOR + 1.75% | )# | 1/14/2035 | 100 | 100,398 | |||||||
| PFP Ltd. 2017-3 D† | 4.932% (1 Mo. LIBOR + 3.50% | )# | 1/14/2035 | 100 | 100,833 | |||||||
| Prima Capital CRE Securitization Ltd. 2016-6A A† | 2.85% | 8/25/2040 | 131 | 131,590 | (b) | |||||||
| Prima Capital CRE Securitization 2006-1 | 2.55% | 8/26/2049 | 80 | 79,997 | ||||||||
| RAIT Trust 2017-FL8 A† | 2.10% (1 Mo. LIBOR + .85% | )# | 12/15/2037 | 49 | 49,389 | |||||||
| RBS Commercial Funding, Inc. Trust 2013-SMV A† | 3.26% | 3/11/2031 | 100 | 100,162 | ||||||||
| ReadyCap Commercial Mortgage Trust 2015-2 A† | 3.804% | 6/25/2055 | 38 | 38,653 | ||||||||
| ReadyCap Mortgage Trust 2016-3 A† | 2.94% | 11/20/2038 | 162 | 161,995 | ||||||||
| Shops at Crystals Trust 2016-CSTL XB IO† | 0.203% | #(i) | 7/5/2036 | 1,000 | 18,155 | |||||||
| Stonemont Portfolio Trust 2017-MONT D† | 3.551% (1 Mo. LIBOR + 2.05% | )# | 8/20/2030 | 100 | 100,188 | |||||||
| Stonemont Portfolio Trust 2017-MONT E† | 4.251% (1 Mo. LIBOR + 2.75% | )# | 8/20/2030 | 149 | 149,279 | |||||||
| Stonemont Portfolio Trust 2017-MONT F† | 5.101% (1 Mo. LIBOR + 3.60% | )# | 8/20/2030 | 17 | 17,032 | |||||||
| Stonemont Portfolio Trust 2017-MONT XCP IO† | 0.638% | #(i) | 8/20/2030 | 14,750 | 90,418 | |||||||
| UBS-BAMLL Trust 2012-WRM D† | 4.238% | #(i) | 6/10/2030 | 100 | 98,292 | |||||||
| UBS-Barclays Commercial Mortgage Trust 2012-C2 A4 | 3.525% | 5/10/2063 | 34 | 35,147 | ||||||||
| UBS-Barclays Commercial Mortgage Trust 2012-C4 A5 | 2.85% | 12/10/2045 | 75 | 75,338 | ||||||||
| UBS-Barclays Commercial Mortgage Trust 2013-C5 A4 | 3.185% | 3/10/2046 | 52 | 52,992 | ||||||||
| UBS-Barclays Commercial Mortgage Trust 2013-C5 XA IO† | 0.993% | #(i) | 3/10/2046 | 911 | 37,524 | |||||||
| UBS-Citigroup Commercial Mortgage Trust 2011-C1 A3 | 3.595% | 1/10/2045 | 82 | 83,729 | ||||||||
| VNDO Mortgage Trust 2012-6AVE A† | 2.996% | 11/15/2030 | 300 | 303,062 | ||||||||
| Wachovia Bank Commercial Mortgage Trust 2005-C21 D | 5.291% | #(i) | 10/15/2044 | 10 | 9,968 | |||||||
| 40 | See Notes to Financial Statements. |
Schedule of Investments (continued)
December 31, 2017
| Investments | Interest Rate | Maturity Date | Principal Amount (000) | Fair Value | ||||||||
| NON-AGENCY COMMERCIAL MORTGAGE-BACKED SECURITIES (continued) | ||||||||||||
| Waldorf Astoria Boca Raton Trust 2016-BOCA C† | 3.977% (1 Mo. LIBOR + 2.50% | )# | 6/15/2029 | $ | 100 | $ | 100,170 | |||||
| Waldorf Astoria Boca Raton Trust 2016-BOCA E† | 5.827% (1 Mo. LIBOR + 4.35% | )# | 6/15/2029 | 27 | 27,085 | |||||||
| Wells Fargo Commercial Mortgage Trust 2010-C1 C† | 5.598% | #(i) | 11/15/2043 | 100 | 104,961 | |||||||
| Wells Fargo Commercial Mortgage Trust 2015-C26 ASB | 2.991% | 2/15/2048 | 21 | 21,240 | ||||||||
| Wells Fargo Commercial Mortgage Trust 2015-C29 ASB | 3.40% | 6/15/2048 | 10 | 10,288 | ||||||||
| Wells Fargo Commercial Mortgage Trust 2015-C29 XB IO | 0.018% | #(i) | 6/15/2048 | 2,000 | 6,506 | |||||||
| Wells Fargo Commercial Mortgage Trust 2015-NXS4 A2A | 3.075% | 12/15/2048 | 10 | 10,124 | ||||||||
| Wells Fargo Commercial Mortgage Trust 2015-NXS4 A2B | 4.60% | #(i) | 12/15/2048 | 36 | 38,035 | |||||||
| Wells Fargo Commercial Mortgage Trust 2015-SG1 XA IO | 0.784% | #(i) | 9/15/2048 | 974 | 41,882 | |||||||
| Wells Fargo Commercial Mortgage Trust 2016-BNK1 XA IO | 1.796% | #(i) | 8/15/2049 | 988 | 114,424 | |||||||
| West Town Mall Trust 2017-KNOX A† | 3.823% | 7/5/2030 | 74 | 75,338 | ||||||||
| West Town Mall Trust 2017-KNOX B† | 4.322% | 7/5/2030 | 31 | 31,572 | ||||||||
| West Town Mall Trust 2017-KNOX C† | 4.346% | #(i) | 7/5/2030 | 25 | 24,671 | |||||||
| West Town Mall Trust 2017-KNOX D† | 4.346% | #(i) | 7/5/2030 | 25 | 23,827 | |||||||
| West Town Mall Trust 2017-KNOX E† | 4.346% | #(i) | 7/5/2030 | 16 | 14,613 | |||||||
| West Town Mall Trust 2017-KNOX X IO† | 0.376% | #(i) | 7/5/2030 | 1,604 | 26,003 | |||||||
| WF-RBS Commercial Mortgage Trust 2011-C2 A4† | 4.869% | #(i) | 2/15/2044 | 25 | 26,240 | |||||||
| WF-RBS Commercial Mortgage Trust 2011-C4 A3† | 4.394% | 6/15/2044 | 59 | 60,210 | ||||||||
| WF-RBS Commercial Mortgage Trust 2012-C7 B | 4.761% | #(i) | 6/15/2045 | 25 | 25,810 | |||||||
| WF-RBS Commercial Mortgage Trust 2012-C8 A2 | 1.881% | 8/15/2045 | – | (a) | 3 | |||||||
| WF-RBS Commercial Mortgage Trust 2012-C8 XA IO† | 1.851% | #(i) | 8/15/2045 | 357 | 24,053 | |||||||
| WF-RBS Commercial Mortgage Trust 2012-C9 A3 | 2.87% | 11/15/2045 | 274 | 276,088 | ||||||||
| WFCG Commercial Mortgage Trust 2015-BXRP A† | 2.599% (1 Mo. LIBOR + 1.12% | )# | 11/15/2029 | 25 | 24,758 | |||||||
| Total Non-Agency Commercial Mortgage-Backed Securities (cost $13,221,500) | 13,131,650 | |||||||||||
| Shares (000) | ||||||||||||
| PREFERRED STOCK 0.02% | ||||||||||||
| Oil | ||||||||||||
| Templar Energy LLC Units (cost $10,685) | 1 | 10,151 | ||||||||||
| See Notes to Financial Statements. | 41 |
Schedule of Investments (continued)
December 31, 2017
| Investments | Interest Rate | Maturity Date | Principal Amount (000) | Fair Value | ||||||||
| U.S. TREASURY OBLIGATIONS 1.40% | ||||||||||||
| U.S. Treasury Note | 1.50% | 10/31/2019 | $ | 227 | $ | 225,439 | ||||||
| U.S. Treasury Note | 1.625% | 12/31/2019 | 151 | 150,211 | ||||||||
| U.S. Treasury Note | 1.75% | 11/30/2019 | 462 | 460,834 | ||||||||
| Total U.S. Treasury Obligations (cost $839,671) | 836,484 | |||||||||||
| Total Long-Term Investments (cost $57,971,782) | 57,863,240 | |||||||||||
| SHORT-TERM INVESTMENTS 3.00% | ||||||||||||
| COMMERCIAL PAPER 0.16% | ||||||||||||
| Automotive | ||||||||||||
| Ford Motor Credit Co. (cost $98,916) | 2.058% | 7/16/2018 | 100 | 98,912 | ||||||||
| CORPORATE BONDS 0.52% | ||||||||||||
| Banks: Regional 0.33% | ||||||||||||
| Intesa Sanpaolo SpA (Italy)(c) | 3.875% | 1/16/2018 | 200 | 200,135 | ||||||||
| Electric: Power 0.02% | ||||||||||||
| TransAlta Corp. (Canada)(c) | 6.90% | 5/15/2018 | 11 | 11,184 | ||||||||
| Media 0.02% | ||||||||||||
| Sky plc (United Kingdom)†(c) | 6.10% | 2/15/2018 | 10 | 10,047 | ||||||||
| Oil: Crude Producers 0.14% | ||||||||||||
| Kinder Morgan Finance Co. LLC† | 6.00% | 1/15/2018 | 87 | 87,154 | ||||||||
| Telecommunications 0.01% | ||||||||||||
| Nortel Networks Ltd. (Canada)(c)(j) | 10.75% | 7/15/2016 | 76 | 4,275 | ||||||||
| Total Corporate Bonds (cost $312,467) | 312,795 | |||||||||||
| REPURCHASE AGREEMENT 2.32% | ||||||||||||
| Repurchase Agreement dated 12/29/2017, 0.54% due 1/2/2018 with Fixed Income Clearing Corp. collateralized by $1,460,000 of U.S. Treasury Note at 1.125% due 2/28/2021; value: $1,424,055; proceeds: $1,392,629 (cost $1,392,545) | 1,393 | 1,392,545 | ||||||||||
| Total Short-Term Investments (cost $1,803,928) | 1,804,252 | |||||||||||
| Total Investments in Securities 99.63% (cost $59,775,710) | 59,667,492 | |||||||||||
| Cash, Foreign Cash and Other Assets in Excess of Liabilities(k) 0.37% | 220,412 | |||||||||||
| Net Assets 100.00% | $ | 59,887,904 | ||||||||||
| 42 | See Notes to Financial Statements. |
Schedule of Investments (continued)
December 31, 2017
| IO | Interest Only. | |
| LIBOR | London Interbank Offered Rate. | |
| PIK | Payment-in-kind. | |
| Units | More than one class of securities traded together. | |
| † | Security was purchased pursuant to Rule 144A under the Securities Act of 1933 and, unless registered under such Act or exempted from registration, may only be resold to qualified institutional buyers. | |
| # | Variable rate security. The interest rate represents the rate in effect at December 31, 2017. | |
| (a) | Amount is less than $1,000. | |
| (b) | Level 3 Investment as described in Note 2(l) in the Notes to Financials. Security valued utilizing third party pricing information without adjustment. Such valuations are based on unobservable inputs. A significant change in third party information could result in a significantly lower or higher value of such Level 3 investments. | |
| (c) | Foreign security traded in U.S. dollars. | |
| (d) | Variable Rate is Fixed to Float: Rate remains fixed until designated future date. | |
| (e) | Security is perpetual in nature and has no stated maturity. | |
| (f) | Floating Rate Loans in which the Fund invests generally pay interest at rates which are periodically re-determined at a margin above the London Interbank Offered Rate (“LIBOR”) or the prime rate offered by major U.S. banks. The rate(s) shown is the rate(s) in effect at December 31, 2017. | |
| (g) | Floating Rate Loans categorized as Level 3 are valued based on a single quotation obtained from a dealer. Accounting principles generally accepted in the United States of America do not require the Fund to create quantitative unobservable inputs that were not developed by the Fund. Therefore, the Fund does not have access to unobservable inputs and cannot disclose such inputs in the valuation. | |
| (h) | Interest rate to be determined. | |
| (i) | Interest rate is based on the weighted average interest rates of the underlying mortgages within the mortgage pool. | |
| (j) | Defaulted (non-income producing security). | |
| (k) | Cash, Foreign Cash and Other Assets in Excess of Liabilities include net unrealized appreciation (depreciation) on open forward foreign currency exchange contracts and futures contracts as follows: |
| See Notes to Financial Statements. | 43 |
Schedule of Investments (continued)
December 31, 2017
Open Forward Foreign Currency Exchange Contracts at December 31, 2017:
| Forward Foreign Currency Exchange Contracts | Transaction Type | Counterparty | Expiration Date | Foreign Currency | U.S. $ Cost on Origination Date | U.S. $ Current Value | Unrealized Appreciation | ||||||||
| euro | Buy | Morgan Stanley | 2/16/2018 | 5,585 | $6,656 | $6,718 | $62 | ||||||||
| Forward Foreign Currency Exchange Contracts | Transaction Type | Counterparty | Expiration Date | Foreign Currency | U.S. $ Cost on Origination Date | U.S. $ Current Value | Unrealized Depreciation | ||||||||
| euro | Sell | State Street Bank and Trust | 2/16/2018 | 13,000 | $15,375 | $15,637 | $(262) |
Open Futures Contracts at December 31, 2017:
| Type | Expiration | Contracts | Position | Notional Amount | Notional Value | Unrealized Appreciation | ||||||||||
| U.S. 10-Year Treasury Note | March 2018 | 1 | Short | $ (124,430) | $ (124,047) | $ 383 | ||||||||||
| U.S. 5-Year Treasury Note | March 2018 | 8 | Short | (932,079) | (929,312) | 2,767 | ||||||||||
| Totals | $(1,056,509) | $(1,053,359) | $3,150 | |||||||||||||
| Type | Expiration | Contracts | Position | Notional Amount | Notional Value | Unrealized Depreciation | ||||||||||
| U.S. 2-Year Treasury Note | March 2018 | 44 | Long | $9,434,625 | $9,420,813 | $(13,812 | ) |
| 44 | See Notes to Financial Statements. |
Schedule of Investments (continued)
December 31, 2017
The following is a summary of the inputs used as of December 31, 2017 in valuing the Fund’s investments carried at fair value(1):
| Investment Type(2)(3) | Level 1 | Level 2 | Level 3 | Total | ||||||||||||
| Asset-Backed Securities | $ | – | $ | 17,449,599 | $ | – | $ | 17,449,599 | ||||||||
| Common Stock | – | 160 | – | 160 | ||||||||||||
| Convertible Bond | – | 84,105 | – | 84,105 | ||||||||||||
| Corporate Bonds | ||||||||||||||||
| Coal | – | 8,330 | 10,506 | 18,836 | ||||||||||||
| Remaining Industries | – | 22,146,693 | – | 22,146,693 | ||||||||||||
| Floating Rate Loans | ||||||||||||||||
| Aerospace/Defense | – | 6,165 | – | 6,165 | ||||||||||||
| Biotechnology Research & Production | – | – | 132,126 | 132,126 | ||||||||||||
| Chemicals | – | 58,525 | 204,560 | 263,085 | ||||||||||||
| Computer Hardware | – | 231,877 | – | 231,877 | ||||||||||||
| Containers | – | 70,488 | 41,019 | 111,507 | ||||||||||||
| Drugs | – | – | 63,243 | 63,243 | ||||||||||||
| Electric: Power | – | 51,173 | 173,347 | 224,520 | ||||||||||||
| Electrical Equipment | – | – | 78,638 | 78,638 | ||||||||||||
| Electronics | – | – | 27,300 | 27,300 | ||||||||||||
| Food | – | 25,813 | – | 25,813 | ||||||||||||
| Health Care Products | – | – | 82,916 | 82,916 | ||||||||||||
| Health Care Services | – | – | 1,916 | 1,916 | ||||||||||||
| Investment Management Companies | – | 31,577 | – | 31,577 | ||||||||||||
| Lodging | – | – | 54,587 | 54,587 | ||||||||||||
| Machinery: Industrial/Specialty | – | – | 34,482 | 34,482 | ||||||||||||
| Manufacturing | – | 50,754 | – | 50,754 | ||||||||||||
| Media | – | 26,046 | – | 26,046 | ||||||||||||
| Miscellaneous | – | 6,863 | 59,470 | 66,333 | ||||||||||||
| Oil | – | – | 19,938 | 19,938 | ||||||||||||
| Oil: Crude Producers | – | – | 35,481 | 35,481 | ||||||||||||
| Real Estate Investment Trusts | – | – | 105,834 | 105,834 | ||||||||||||
| Retail | – | 177,787 | – | 177,787 | ||||||||||||
| Technology | – | 12,466 | – | 12,466 | ||||||||||||
| Telecommunications | – | 43,952 | – | 43,952 | ||||||||||||
| Foreign Government Obligations | – | 132,718 | – | 132,718 | ||||||||||||
| Government Sponsored Enterprises Collateralized Mortgage Obligations | – | 2,055,374 | – | 2,055,374 | ||||||||||||
| Government Sponsored Enterprises Pass-Throughs | – | 283,981 | – | 283,981 | ||||||||||||
| Municipal Bonds | – | 117,941 | – | 117,941 | ||||||||||||
| Non-Agency Commercial Mortgage-Backed Securities | – | 12,812,911 | 318,739 | 13,131,650 | ||||||||||||
| Preferred Stock | – | 10,151 | – | 10,151 | ||||||||||||
| U.S. Treasury Obligations | – | 836,484 | – | 836,484 | ||||||||||||
| Commercial Paper | – | 98,912 | – | 98,912 | ||||||||||||
| Repurchase Agreement | – | 1,392,545 | – | 1,392,545 | ||||||||||||
| Total | $ | – | $ | 58,223,390 | $ | 1,444,102 | $ | 59,667,492 | ||||||||
| See Notes to Financial Statements. | 45 |
Schedule of Investments (concluded)
December 31, 2017
| Other Financial Instruments | Level 1 | Level 2 | Level 3 | Total | ||||||||||||
| Forward Foreign Currency Exchange Contracts | ||||||||||||||||
| Assets | $ | – | $ | 62 | $ | – | $ | 62 | ||||||||
| Liabilities | – | (262 | ) | – | (262 | ) | ||||||||||
| Futures Contracts | ||||||||||||||||
| Assets | 3,150 | – | – | 3,150 | ||||||||||||
| Liabilities | (13,812 | ) | – | – | (13,812 | ) | ||||||||||
| Total | $ | (10,662 | ) | $ | (200 | ) | $ | – | $ | (10,862 | ) | |||||
| (1) | Refer to Note 2(l) for a description of fair value measurements and the three-tier hierarchy of inputs. | |
| (2) | See Schedule of Investments for fair values in each industry and identification of foreign issuers and/or geography. The table above is presented by Investment Type. Industries are presented within an Investment Type should such Investment Type include securities classified as two or more levels within the three-tier fair value hierarchy. Each Level 3 security is identified on the Schedule of Investment along with the valuation technique utilized. | |
| (3) | There were no Level 1/Level 2 transfers during the fiscal year ended December 31, 2017. |
The following is a reconciliation of investments with unobservable inputs (Level 3) that were used in determining fair value:
| Investment Type | Asset-Backed Securities | Corporate Bonds | Floating Rate Loans | Non-Agency Commercial Mortgage-Backed Securities | ||||||||||||
| Balance as of January 1, 2017 | $ | 99,474 | $ | – | $ | 923,403 | $ | 707,721 | ||||||||
| Accrued Discounts (Premiums) | – | (1 | ) | 670 | (38,539 | ) | ||||||||||
| Realized Gain (Loss) | – | – | 2,946 | – | ||||||||||||
| Change in Unrealized Appreciation (Depreciation) | – | (43 | ) | 528 | 465 | |||||||||||
| Purchases | – | 10,550 | 1,192,474 | 182,042 | ||||||||||||
| Sales | – | – | (818,467 | ) | (182,250 | ) | ||||||||||
| Transfers into Level 3 | – | – | 16,936 | – | ||||||||||||
| Transfers out of Level 3 | $ | (99,474 | ) | – | (203,633 | ) | (350,700 | ) | ||||||||
| Balance as of December 31, 2017 | – | $ | 10,506 | $ | 1,114,857 | $ | 318,739 | |||||||||
| Net change in unrealized appreciation/depreciation for year ended December 31, 2017 related to Level 3 investments held at December 31, 2017 | $ | – | $ | (43 | ) | $ | 1,257 | $ | 465 | |||||||
| 46 | See Notes to Financial Statements. |
Statement of Assets and Liabilities
December 31, 2017
| ASSETS: | |||
| Investments in securities, at fair value (cost $59,775,710) | $59,667,492 | ||
| Cash | 23,876 | ||
| Deposits with brokers for futures collateral | 16,859 | ||
| Foreign cash, at value (cost $8,914) | 8,897 | ||
| Receivables: | |||
| Interest | 416,606 | ||
| Investment securities sold | 84,886 | ||
| Capital shares sold | 47,590 | ||
| From advisor (See Note 3) | 5,728 | ||
| Variation margin for futures contracts | 1,261 | ||
| Unrealized appreciation on forward foreign currency exchange contracts | 62 | ||
| Prepaid expenses | 276 | ||
| Total assets | 60,273,533 | ||
| LIABILITIES: | |||
| Payables: | |||
| Investment securities purchased | 253,349 | ||
| Management fee | 17,838 | ||
| Fund administration | 2,039 | ||
| Directors’ fees | 1,966 | ||
| Capital shares reacquired | 348 | ||
| Unrealized depreciation on forward foreign currency exchange contracts | 262 | ||
| Accrued expenses | 109,827 | ||
| Total liabilities | 385,629 | ||
| NET ASSETS | $59,887,904 | ||
| COMPOSITION OF NET ASSETS: | |||
| Paid-in capital | $61,906,180 | ||
| Undistributed net investment income | 11,873 | ||
| Accumulated net realized loss on investments, futures contracts and foreign currency related transactions | (1,911,053 | ) | |
| Net unrealized depreciation on investments, futures contracts and translation of assets and liabilities denominated in foreign currencies | (119,096 | ) | |
| Net Assets | $59,887,904 | ||
| Outstanding shares (200 million shares of common stock authorized, $.001 par value) | 4,165,927 | ||
| Net asset value, offering and redemption price per share (Net assets divided by outstanding shares) | $14.38 |
| See Notes to Financial Statements. | 47 |
For the Year Ended December 31, 2017
| Investment income: | ||||
| Dividends | $ | 235 | ||
| Interest and other (net of foreign withholding taxes of $172) | 1,518,688 | |||
| Total investment income | 1,518,923 | |||
| Expenses: | ||||
| Management fee | 186,203 | |||
| Non 12b-1 service fees | 133,150 | |||
| Shareholder servicing | 56,259 | |||
| Professional | 53,730 | |||
| Reports to shareholders | 22,287 | |||
| Fund administration | 21,280 | |||
| Custody | 18,652 | |||
| Directors’ fees | 1,451 | |||
| Other | 4,948 | |||
| Gross expenses | 497,960 | |||
| Expense reductions (See Note 9) | (486 | ) | ||
| Fees waived and expenses reimbursed (See Note 3) | (71,867 | ) | ||
| Net expenses | 425,607 | |||
| Net investment income | 1,093,316 | |||
| Net realized and unrealized gain (loss): | ||||
| Net realized gain on investments | 58,443 | |||
| Net realized loss on futures contracts | (24,117 | ) | ||
| Net realized loss on foreign currency exchange contracts | (1,364 | ) | ||
| Net realized gain on foreign currency related translations | 396 | |||
| Net change in unrealized appreciation/depreciation on investments | (35,235 | ) | ||
| Net change in unrealized appreciation/depreciation on futures contracts | (9,118 | ) | ||
| Net change in unrealized appreciation/depreciation on foreign currency exchange contracts | (1,164 | ) | ||
| Net change in unrealized appreciation/depreciation on translation of assets and liabilities denominated in foreign currencies | (11 | ) | ||
| Net realized and unrealized loss | (12,170 | ) | ||
| Net Increase in Net Assets Resulting From Operations | $ | 1,081,146 |
| 48 | See Notes to Financial Statements. |
Statements of Changes in Net Assets
| INCREASE IN NET ASSETS | For the Year Ended December 31, 2017 | For the Year Ended December 31, 2016 | ||||||
| Operations: | ||||||||
| Net investment income | $ | 1,093,316 | $ | 664,907 | ||||
| Net realized gain (loss) on investments, futures contracts and foreign currency related transactions | 33,358 | (78,539 | ) | |||||
| Net change in unrealized appreciation/depreciation on investments, futures contracts and translation of assets and liabilities denominated in foreign currencies | (45,528 | ) | 247,087 | |||||
| Net increase in net assets resulting from operations | 1,081,146 | 833,455 | ||||||
| Distributions to shareholders from: | ||||||||
| Net investment income | (2,047,290 | ) | (1,192,100 | ) | ||||
| Capital share transactions (See Note 14): | ||||||||
| Proceeds from sales of shares | 33,186,207 | 32,551,047 | ||||||
| Reinvestment of distributions | 2,047,290 | 1,192,100 | ||||||
| Cost of shares reacquired | (21,598,047 | ) | (7,969,058 | ) | ||||
| Net increase in net assets resulting from capital share transactions | 13,635,450 | 25,774,089 | ||||||
| Net increase in net assets | 12,669,306 | 25,415,444 | ||||||
| NET ASSETS: | ||||||||
| Beginning of year | $ | 47,218,598 | $ | 21,803,154 | ||||
| End of year | $ | 59,887,904 | $ | 47,218,598 | ||||
| Undistributed net investment income | $ | 11,873 | $ | 1,788 | ||||
| See Notes to Financial Statements. | 49 |
| Per Share Operating Performance: | ||||||||||||||||||||||||
| Investment operations: | Distributions to shareholders from: | |||||||||||||||||||||||
| Net asset value, beginning of period | Net investment income(a) | Net realized and unrealized gain (loss) | Total from investment operations | Net investment income | Return of capital | |||||||||||||||||||
| 12/31/2017 | $14.57 | $0.30 | $0.02 | $0.32 | $(0.51 | ) | $ | – | ||||||||||||||||
| 12/31/2016 | 14.43 | 0.33 | 0.19 | 0.52 | (0.38 | ) | – | |||||||||||||||||
| 12/31/2015 | 14.72 | 0.27 | (0.21 | ) | 0.06 | (0.34 | ) | (0.01 | ) | |||||||||||||||
| 12/31/2014(c)(d) | 15.00 | 0.18 | (0.15 | ) | 0.03 | (0.31 | ) | – | ||||||||||||||||
| (a) | Calculated using average shares outstanding during the period. | |
| (b) | Total return does not consider the effects of sales charges or other expenses imposed by an insurance company and assumes the reinvestment of all distributions. | |
| (c) | Commencement of operations was 4/4/2014, SEC effective date was 4/14/2014 and date shares first became available to the public was 5/1/2014. | |
| (d) | Net investment income, net realized and unrealized gain (loss) amounted to less than $.01 for the period 4/4/2014 through 4/14/2014. | |
| (e) | Not annualized. | |
| (f) | Total return for the period 4/14/2014 through 12/31/2014 was also 0.22%. | |
| (g) | Annualized. |
| 50 | See Notes to Financial Statements. |
| Ratios to Average Net Assets: | Supplemental Data: | |||||||||||||||||||||||||||||
| Total distri- butions | Net asset value, end of period | Total return(b) (%) | Total expenses after waivers and/or reimbursements (%) | Total expenses (%) | Net investment income (%) | Net assets, end of period (000) | Portfolio turnover rate (%) | |||||||||||||||||||||||
| $(0.51 | ) | $ | 14.38 | 2.19 | 0.80 | 0.94 | 2.05 | $59,888 | 75 | |||||||||||||||||||||
| (0.38 | ) | 14.57 | 3.47 | 0.80 | 1.04 | 2.21 | 47,219 | 69 | ||||||||||||||||||||||
| (0.35 | ) | 14.43 | 0.58 | 0.80 | 1.45 | 1.79 | 21,803 | 61 | ||||||||||||||||||||||
| (0.31 | ) | 14.72 | 0.22 | (e)(f) | 0.80 | (g) | 2.02 | (g) | 1.61 | (g) | 7,680 | 103 | (e) | |||||||||||||||||
| See Notes to Financial Statements. | 51 |
| 1. | ORGANIZATION |
Lord Abbett Series Fund, Inc. (the “Company”) is registered under the Investment Company Act of 1940, as amended (the “Act”), as a diversified, open-end management investment company and was incorporated under Maryland law in 1989. The Company consists of twelve separate portfolios. This report covers Short Duration Income Portfolio (the “Fund”).
The Fund’s investment objective is to seek a high level of income consistent with preservation of capital. The Fund has Variable Contract class shares (“Class VC Shares”), which are currently issued and redeemed only in connection with investments in, and payments under, variable annuity contracts and variable life insurance policies issued by life insurance and insurance-related companies.
The preparation of the financial statements in conformity with accounting principles generally accepted in the United States of America (“U.S. GAAP”) requires management to make certain estimates and assumptions that affect the reported amounts of assets and liabilities and disclosure of contingent assets and liabilities at the date of the financial statements and the reported amounts of increases and decreases in net assets from operations during the reporting period. Actual results could differ from those estimates. The Fund is considered an investment company under U.S. GAAP and follows the accounting and reporting guidance applicable to investment companies.
| 2. | SIGNIFICANT ACCOUNTING POLICIES |
| (a) | Investment Valuation–Under procedures approved by the Fund’s Board of Directors (the “Board”), Lord, Abbett & Co. LLC (“Lord Abbett”), the Fund’s investment manager, has formed a Pricing Committee to administer the pricing and valuation of portfolio investments and to ensure that prices utilized reasonably reflect fair value. Among other things, these procedures allow the Fund to utilize independent pricing services, quotations from securities and financial instrument dealers and other market sources to determine fair value. |
| Securities actively traded on any recognized U.S. or non-U.S. exchange or on The NASDAQ Stock Market LLC are valued at the last sale price or official closing price on the exchange or system on which they are principally traded. Events occurring after the close of trading on non-U.S. exchanges may result in adjustments to the valuation of foreign securities to reflect their fair value as of the close of regular trading on the New York Stock Exchange. The Fund may utilize an independent fair valuation service in adjusting the valuations of foreign securities. Unlisted equity securities are valued at the last quoted sale price or, if no sale price is available, at the mean between the most recently quoted bid and asked prices. Exchange traded options and futures contracts are valued at the last sale price in the market where they are principally traded. If no sale has occurred, the mean between the most recently quoted bid and asked prices is used. Fixed income securities are valued based on evaluated prices supplied by independent pricing services, which reflect broker/dealer supplied valuations and the independent pricing services’ own electronic data processing techniques. Exchange traded options and futures contracts are valued at the last sale price in the market where they are principally traded. If no sale has occurred, the mean between the most recently quoted bid and asked prices is used. Floating rate loans are valued at the average of bid and ask quotations obtained from dealers in loans on the basis of prices supplied by independent pricing services. Forward foreign currency exchange contracts are valued using daily forward exchange rates. |
52
Notes to Financial Statements (continued)
| Securities for which prices are not readily available are valued at fair value as determined by the Pricing Committee. The Pricing Committee considers a number of factors, including observable and unobservable inputs, when arriving at fair value. The Pricing Committee may use related or comparable assets or liabilities, recent transactions, market multiples, book values, yield curves, broker quotes, observable trading activity, option adjusted spread models and other relevant information to determine the fair value of portfolio investments. The Board or a designated committee thereof regularly reviews fair value determinations made by the Pricing Committee and may employ techniques such as reviewing related market activity, reviewing inputs and assumptions, and retrospectively comparing prices of subsequent purchases and sales transactions to fair value determinations made by the Pricing Committee. | |
| Short-term securities with 60 days or less remaining to maturity are valued using the amortized cost method, which approximates fair value. | |
| (b) | Security Transactions–Security transactions are recorded as of the date that the securities are purchased or sold (trade date). Realized gains and losses on sales of portfolio securities are calculated using the identified-cost method. |
| (c) | Investment Income–Dividend income is recorded on the ex-dividend date. Interest income is recorded on the accrual basis as earned. Discounts are accreted and premiums are amortized using the effective interest method and are included in Interest and other income on the Statement of Operations. Withholding taxes on foreign dividends have been provided for in accordance with the applicable country’s tax rules and rates. |
| (d) | Income Taxes–It is the policy of the Fund to meet the requirements of Subchapter M of the Internal Revenue Code applicable to regulated investment companies and to distribute substantially all taxable income and capital gains to its shareholders. Therefore, no income tax provision is required. |
| The Fund files U.S. federal and various state and local tax returns. No income tax returns are currently under examination. The statute of limitations on the Fund’s filed U.S. federal tax returns remain open for the fiscal years ended December 31, 2014 through December 31, 2017. The statutes of limitations on the Company’s state and local tax returns may remain open for an additional year depending on jurisdiction | |
| (e) | Expenses–Expenses incurred by the Company that do not specifically relate to an individual fund are generally allocated to the funds within the Company on a pro rata basis by relative net assets. |
| (f) | Foreign Transactions–The books and records of the Fund are maintained in U.S. dollars and transactions denominated in foreign currencies are recorded in the Fund’s records at the rate prevailing when earned or recorded. Asset and liability accounts that are denominated in foreign currencies are adjusted daily to reflect current exchange rates and any unrealized gain (loss) is included in Net change in unrealized appreciation/depreciation on futures contracts and translation of assets and liabilities denominated in foreign currencies on the Fund’s Statement of Operations. The resultant exchange gains and losses upon settlement of such transactions, if any, are included in Net realized loss on futures contracts and foreign currency related transactions on the Fund’s Statement of Operations. The Fund does not isolate that portion of the results of operations arising as a result of changes in the foreign exchange rates from the changes in market prices of the securities. |
53
Notes to Financial Statements (continued)
| (g) | Forward Foreign Currency Exchange Contracts–The Fund may enter into forward foreign currency exchange contracts in order to reduce exposure to changes in foreign currency exchange rates on foreign portfolio holdings, or gain or reduce exposure to foreign currency solely for investment purposes. A forward foreign currency exchange contract is a commitment to purchase or sell a foreign currency at a future date at a negotiated rate. The contracts are valued daily at forward exchange rates and any unrealized gain (loss) is included in Net change in unrealized appreciation/depreciation on futures contracts and translation of assets and liabilities denominated in foreign currencies in the Fund’s Statement of Operations. The gain (loss) arising from the difference between the U.S. dollar cost of the original contract and the value of the foreign currency in U.S. dollars upon closing of such contracts is included in Net realized gain on futures contracts and foreign currency related transactions in the Fund’s Statement of Operations. |
| (h) | Futures Contracts–The Fund may purchase and sell futures contracts to enhance returns, to attempt to economically hedge some of its investment risk, or as a substitute position in lieu of holding the underlying asset on which the instrument is based. At the time of entering into a futures transaction, an investor is required to deposit and maintain a specified amount of cash or eligible securities called “initial margin.” Subsequent payments made or received by the Fund called “variation margin” are made on a daily basis as the market price of the futures contract fluctuates. The Fund will record an unrealized gain (loss) based on the amount of variation margin. When a contract is closed, a realized gain (loss) is recorded equal to the difference between the opening and closing value of the contract. |
| (i) | When-Issued, Forward Transactions or To-Be-Announced (“TBA”) Transactions–The Fund may purchase portfolio securities on a when-issued or forward basis. When-issued, forward transactions or TBA transactions involve a commitment by a fund to purchase securities, with payment and delivery (“settlement”) to take place in the future, in order to secure what is considered to be an advantageous price or yield at the time of entering into the transaction. During the period between purchase and settlement, the fair value of the securities will fluctuate and assets consisting of cash and/or marketable securities (normally short-term U.S. Government or U.S. Government sponsored enterprise securities) marked to market daily in an amount sufficient to make payment at settlement will be segregated at the Fund’s custodian in order to pay for the commitment. At the time the Fund makes the commitment to purchase a security on a when-issued basis, it will record the transaction and reflect the liability for the purchase and fair value of the security in determining its net asset value (“NAV”). The Fund, generally, has the ability to close out a purchase obligation on or before the settlement date rather than take delivery of the security. Under no circumstances will settlement for such securities take place more than 120 days after the purchase date. |
| (j) | Repurchase Agreements–The Fund may enter into repurchase agreements with respect to securities. A repurchase agreement is a transaction in which a fund acquires a security and simultaneously commits to resell that security to the seller (a bank or securities dealer) at an agreed-upon price on an agreed-upon date. The Fund requires at all times that the repurchase agreement be collateralized by cash, or by securities of the U.S. Government, its agencies, its instrumentalities, or U.S. Government sponsored enterprises having a value equal to, or in excess of, the value of the repurchase agreement (including accrued interest). If the seller of the agreement defaults on its obligation to repurchase the underlying securities at a time |
54
Notes to Financial Statements (continued)
| when the fair value of these securities has declined, the Fund may incur a loss upon disposition of the securities. | |
| (k) | Floating Rate Loans–The Fund may invest in floating rate loans, which usually take the form of loan participations and assignments. Loan participations and assignments are agreements to make money available to U.S. or foreign corporations, partnerships or other business entities (the “Borrower”) in a specified amount, at a specified rate and within a specified time. A loan is typically originated, negotiated and structured by a U.S. or foreign bank, insurance company or other financial institution (the “Agent”) for a group of loan investors (“Loan Investors”). The Agent typically administers and enforces the loan on behalf of the other Loan Investors in the syndicate and may hold any collateral on behalf of the Loan Investors. Such loan participations and assignments are typically senior, secured and collateralized in nature. The Fund records an investment when the Borrower withdraws money and records interest as earned. These loans pay interest at rates which are periodically reset by reference to a base lending rate plus a spread. These base lending rates are generally the prime rate offered by a designated U.S. bank or London InterBank Offered Rate (“LIBOR”). |
| The loans in which the Fund invests may be subject to some restrictions on resale. For example, the Fund may be contractually obligated to receive approval from the Agent and/or Borrower prior to the sale of these investments. The Fund generally has no right to enforce compliance with the terms of the loan agreement with the Borrower. As a result, the Fund assumes the credit risk of the Borrower, the selling participant and any other persons interpositioned between the Fund and the Borrower (“Intermediate Participants”). In the event that the Borrower, selling participant or Intermediate Participants become insolvent or enter into bankruptcy, the Fund may incur certain costs and delays in realizing payment or may suffer a loss of principal and/or interest. | |
| Unfunded commitments represent the remaining obligation of the Fund to the Borrower. At any point in time, up to the maturity date of the issue, the Borrower may demand the unfunded portion. Until demanded by the Borrower, unfunded commitments are not recognized as an asset on the Statement of Assets and Liabilities. Unrealized appreciation/depreciation on unfunded commitments presented on the Statement of Assets and Liabilities represents mark to market of the unfunded portion of the Fund’s floating rate notes. As of December 31, 2017, the Fund did not have unfunded loan commitments. | |
| (l) | Fair Value Measurements–Fair value is defined as the price that the Fund would receive upon selling an investment or transferring a liability in an orderly transaction to an independent buyer in the principal or most advantageous market of the investment. A three-tier hierarchy is used to maximize the use of observable market data and minimize the use of unobservable inputs and to establish classification of fair value measurements for disclosure purposes. Inputs refer broadly to the assumptions that market participants would use in pricing the asset or liability, including assumptions about risk — for example, the risk inherent in a particular valuation technique used to measure fair value (such as a pricing model) and/or the risk inherent in the inputs to the valuation technique. Inputs may be observable or unobservable. Observable inputs reflect the assumptions market participants would use in pricing the asset or liability. Observable inputs are based on market data obtained from sources independent of the reporting entity. Unobservable inputs reflect the reporting entity’s own assumptions about the assumptions market participants would use in pricing the asset or liability. Unobservable inputs are based on the best information available in the circumstances. The three-tier hierarchy |
55
Notes to Financial Statements (continued)
| classification is determined based on the lowest level of inputs that is significant to the fair value measurement, and is summarized in the three broad Levels listed below: |
| • | Level 1 | – | unadjusted quoted prices in active markets for identical investments; | |
| • | Level 2 | – | other significant observable inputs (including quoted prices for similar investments, interest rates, prepayment speeds, credit risk, etc.); and | |
| • | Level 3 | – | significant unobservable inputs (including the Fund’s own assumptions in determining the fair value of investments). |
| A summary of inputs used in valuing the Fund’s investments and other financial instruments as of December 31, 2017 and, if applicable, Level 1/Level 2 transfers and Level 3 rollforwards for the fiscal year then ended is included in the Fund’s Schedule of Investments. | |
| Changes in valuation techniques may result in transfers into or out of an assigned level within the three-tier hierarchy. All transfers between different levels within the three-tier hierarchy are deemed to have occurred as of the beginning of the reporting period. The inputs or methodology used for valuing securities are not necessarily an indication of the risk associated with investing in those securities. |
| 3. | MANAGEMENT FEE AND OTHER TRANSACTIONS WITH AFFILIATES |
Management Fee
The Company has a management agreement with Lord Abbett, pursuant to which Lord Abbett supplies the Fund with investment management services and executive and other personnel, provides office space and pays for ordinary and necessary office and clerical expenses relating to research and statistical work and supervision of the Fund’s investment portfolio.
The management fee is based on the Fund’s average daily net assets at the following annual rate:
| First $1 billion | .35% |
| Next $1 billion | .30% |
| Over $2 billion | .25% |
For the fiscal year ended December 31, 2017, the effective management fee, net of waivers, was at an annualized rate of 0.21% of the Fund’s average daily net assets.
In addition, Lord Abbett provides certain administrative services to the Fund pursuant to an Administrative Services Agreement in return for a fee at an annual rate of .04% of the Fund’s average daily net assets.
During the fiscal year ended December 31, 2017 and continuing through April 30, 2018, Lord Abbett has contractually agreed to waive its fees and reimburse expenses to the extent necessary to limit total net operating expenses to an annual rate of .80%. This agreement may be terminated only upon the approval of the Board.
The Company, on behalf of the Fund, has entered into services arrangements with certain insurance companies. Under these arrangements, certain insurance companies will be compensated up to ..25% of the average daily net asset value (“NAV”) of the Fund’s Class VC Shares held in the insurance company’s separate account to service and maintain the Variable Contract owners’ accounts. This amount is included in Non 12b-1 service fees on the Statement of Operations. The Fund may also compensate certain insurance companies, third-party administrators and other entities for providing recordkeeping, sub-transfer agency and other
56
Notes to Financial Statements (continued)
administrative services to the Fund. This amount is included in Shareholder servicing on the Statement of Operations.
Two Directors and certain of the Company’s officers have an interest in Lord Abbett.
| 4. | DISTRIBUTIONS AND CAPITAL LOSS CARRYFORWARDS |
Dividends from net investment income, if any, are declared and paid at least semi-annually. Taxable net realized gains from investment transactions, reduced by allowable capital loss carryforwards, if any, are declared and distributed to shareholders at least annually. The capital loss carryforward amount, if any, is available to offset future net capital gains. Dividends and distributions to shareholders are recorded on the ex-dividend date. The amounts of dividends and distributions from net investment income and net realized capital gains are determined in accordance with federal income tax regulations, which may differ from U.S. GAAP. These book/tax differences are either considered temporary or permanent in nature. To the extent these differences are permanent in nature, such amounts are reclassified within the components of net assets based on their federal tax basis treatment; temporary differences do not require reclassification. Dividends and distributions that exceed earnings and profits for tax purposes are reported as a tax return of capital.
The tax character of distributions paid during the fiscal years ended December 31, 2017 and 2016 was as follows:
| Year Ended 12/31/2017 | Year Ended 12/31/2016 | ||||||
| Distributions paid from: | |||||||
| Ordinary income | $2,047,290 | $1,192,100 | |||||
| Total distributions paid | $2,047,290 | $1,192,100 | |||||
As of December 31, 2017, the components of accumulated losses on a tax-basis were as follows:
| Undistributed ordinary income - net | $ | 13,839 | ||
| Total undistributed earnings | 13,839 | |||
| Capital loss carryforwards* | (806,015 | ) | ||
| Temporary differences | (1,966 | ) | ||
| Unrealized losses | (1,224,134 | ) | ||
| Total accumulated losses | (2,018,276 | ) |
| * | The capital losses will carry forward indefinitely. |
As of December 31, 2017, the aggregate unrealized security gains and losses on investments and other financial instruments based on cost for U.S. federal income tax purposes were as follows:
| Tax cost | $ | 60,880,748 | ||
| Gross unrealized gain | 185,336 | |||
| Gross unrealized loss | (1,409,454 | ) | ||
| Net unrealized security loss | $ | (1,224,118 | ) |
The difference between book-basis unrealized gains (losses) is primarily attributable to the tax treatment of forward currency contracts, futures, amortization of premium and wash sales.
Permanent items identified during the fiscal year ended December 31, 2017 have been reclassified among the components of net assets based on their tax basis treatment as follows:
57
Notes to Financial Statements (continued)
| Undistributed Net Investment Income | Accumulated Net Realized Loss | ||
| $ 964,059 | $(964,059 | ) |
The permanent differences are primarily attributable to the tax treatment of foreign currency transactions, certain securities, premium amortization, and principal paydown gains and losses.
| 5. | PORTFOLIO SECURITIES TRANSACTIONS |
Purchases and sales of investment securities (excluding short-term investments) for the fiscal year ended December 31, 2017 were as follows:
| U.S. Government Purchases | Non-U.S. Government Purchases | U.S. Government Sales | Non-U.S. Government Sales | |||
| $7,195,203 | $44,967,116 | $7,276,860 | $30,273,342 |
The Fund is permitted to purchase and sell securities (“cross-trade”) from and to other Lord Abbett funds or client accounts pursuant to procedures approved by the Board in compliance with Rule 17a-7 under the Act (the “Rule”). Each cross-trade is executed at a fair market price in compliance with provisions of the Rule. For the fiscal year ended December 31, 2017, the Fund engaged in cross-trades purchases of $754,503.
| 6. | DISCLOSURES ABOUT DERIVATIVE INSTRUMENTS AND HEDGING ACTIVITIES |
The Fund entered into forward foreign currency exchange contracts for the fiscal year ended December 31, 2017 (as described in note 2(g)). A forward foreign currency exchange contract reduces the Fund’s exposure to changes in the value of the currency it will deliver (or settle in cash) and increases its exposure to changes in the value of the currency it will receive (or settle in cash) for the duration of the contract. The Fund’s use of forward foreign currency exchange contracts involves the risk that Lord Abbett will not accurately predict currency movements, and the Fund’s returns could be reduced as a result. Forward foreign currency exchange contracts are subject to the risk that those currencies will decline in value relative to the U.S. dollar, or, in the case of hedged positions, that the U.S. dollar will decline relative to the currency being hedged. Currency rates in foreign countries may fluctuate significantly over short periods of time. The Fund’s risk of loss from counterparty credit risk is the unrealized appreciation on forward foreign currency exchange contracts and deposits with brokers as collateral.
The Fund entered into U.S. Treasury futures contracts for the fiscal year ended December 31, 2017 (as described in note 2(h)) to hedge against changes in interest rates. The Fund bears the risk of interest rates moving unexpectedly, in which case the Fund may not achieve the anticipated benefits of the futures contracts and realize a loss. There is minimal counterparty credit risk to the Fund since futures are exchange traded and the exchange’s clearinghouse, as counterparty to all exchange traded futures, guarantees futures against default.
58
Notes to Financial Statements (continued)
As of December 31, 2017, the Fund had the following derivatives at fair value, grouped into appropriate risk categories that illustrate the Funds use of derivative instruments:
| Short Duration Income Portfolio | ||||||
| Asset Derivatives | Interest Rate Contracts | Foreign Currency Contracts | ||||
| Forward Foreign Currency Exchange Contracts(1) | – | $ | 62 | |||
| Futures Contracts(3) | $3,150 | – | ||||
| Liability Derivatives | ||||||
| Forward Foreign Currency Exchange Contracts(2) | – | $ | 262 | |||
| Futures Contracts(3) | $13,812 | – | ||||
| (1) | Statements of Assets and Liabilities location: Unrealized appreciation on forward foreign currency exchange contracts. |
| (2) | Statements of Assets and Liabilities location: Unrealized depreciation on forward foreign currency exchange contracts. |
| (3) | Statements of Assets and Liabilities location: Includes cumulative unrealized appreciation/depreciation of futures contracts as reported in the Schedule of Investments. Only the current day’s variation margin is reported within the Statement of Assets and Liabilities. |
Transactions in derivative instruments for the fiscal year ended December 31, 2017, were as follows:
| Short Duration Income Portfolio | ||||||||
| Interest Rate Contracts | Forward Currency Contracts | |||||||
| Net Realized Gain (Loss) | ||||||||
| Forward Foreign Currency Exchange Contracts(1) | – | $ | (1,364 | ) | ||||
| Futures Contracts(2) | $ | (24,117 | ) | – | ||||
| Net Change in Unrealized Appreciation/Depreciation | ||||||||
| Forward Foreign Currency Exchange Contracts(3) | – | $ | (1,164 | ) | ||||
| Futures Contracts(4) | $ | (9,118 | ) | $ | – | |||
| Average Number of Contracts/Notional Amounts* | ||||||||
| Forward Foreign Currency Exchange Contracts(5) | $ | – | $ | 23,033 | ||||
| Futures Contracts(6) | 62 | – | ||||||
| * | Calculated based on the number of contracts or notional amounts for the fiscal year ended December 31, 2017. |
| (1) | Statements of Operations location: Net realized loss on forward foreign currency related transactions. |
| (2) | Statements of Operations location: Net realized loss on futures contracts. |
| (3) | Statements of Operations location: Net change in unrealized appreciation/depreciation on forward foreign currency related transactions. |
| (4) | Statements of Operations location: Net change in unrealized appreciation/depreciation on futures contracts. |
| (5) | Amount represents notional amounts in U.S. dollars. |
| (6) | Amount represents number of contracts. |
| 7. | DISCLOSURES ABOUT OFFSETTING ASSETS AND LIABILITIES |
The Financial Accounting Standards Board (“FASB”) requires disclosures intended to help better assess the effect or potential effect of offsetting arrangements on a fund’s financial position. The following tables illustrate gross and net information about recognized assets and liabilities eligible for offset in the statement of assets and liabilities; and disclose such amounts subject to an enforceable master netting agreement or similar agreement, by counterparty. A master netting agreement is an agreement between a fund and a counterparty which provides for the net
59
Notes to Financial Statements (continued)
settlement of amounts owed under all contracts traded under that agreement, as well as cash collateral, through a single payment by one party to the other in the event of default on or termination of any one contract. The Fund’s accounting policy with respect to balance sheet offsetting is that, absent an event of default by the counterparty or a termination of the agreement, the master netting agreement does not result in an offset of reported amounts of financial assets and liabilities in the statement of assets and liabilities across transactions between the Fund and the applicable counterparty:
| Description | Gross Amounts of Recognized Assets | Gross Amounts Offset in the Statement of Assets and Liabilities | Net Amounts of Assets Presented in the Statement of Assets and Liabilities | |||||||
| Forward Foreign Currency Exchange Contracts | $ | 62 | $ | – | $ | 62 | ||||
| Repurchase Agreements | 1,392,545 | – | 1,392,545 | |||||||
| Total | $ | 1,392,607 | $ | – | $ | 1,392,607 | ||||
| Net Amounts of Assets Presented in | Amounts Not Offset in the Statement of Assets and Liabilities | |||||||||||||||||||
| Counterparty | the Statement of Assets and Liabilities | Financial Instruments | Cash Collateral Received(a) | Securities Collateral Received(a) | Net Amount(b) | |||||||||||||||
| Fixed Income Clearing Corp. | $1,392,545 | $ | – | $ | – | $(1,392,545 | ) | $ – | ||||||||||||
| Morgan Stanley | 62 | – | – | – | 62 | |||||||||||||||
| Total | $1,392,607 | $ | – | $ | – | $(1,392,545 | ) | $62 | ||||||||||||
| Description | Gross Amounts of Recognized Liabilities | Gross Amounts Offset in the Statement of Assets and Liabilities | Net Amounts of Liabilities Presented in the Statement of Assets and Liabilities | |||||||
| Forward Foreign Currency Exchange Contracts | $262 | $ | – | $262 | ||||||
| Total | $262 | $ | – | $262 | ||||||
| Net Amounts of Liabilities Presented in | Amounts Not Offset in the Statement of Assets and Liabilities | |||||||||||||||||||
| Counterparty | the Statement of Assets and Liabilities | Financial Instruments | Cash Collateral Pledged(a) | Securities Collateral Pledged(a) | Net Amount(c) | |||||||||||||||
| State Street Bank and Trust | $262 | $ | – | $ | – | $ | – | $262 | ||||||||||||
| Total | $262 | $ | – | $ | – | $ | – | $262 | ||||||||||||
| (a) | Collateral disclosed is limited to an amount not to exceed 100% of the net amount of assets (liabilities) presented in the Statement of Assets and Liabilities, for each respective counterparty. |
| (b) | Net amount represents the amount owed to the Fund by the counterparty as of December 31, 2017. |
| (c) | Net amount represents the amount owed by the Fund to the counterparty as of December 31, 2017. |
| 8. | DIRECTORS’ REMUNERATION |
The Company’s officers and two Directors, who are associated with Lord Abbett, do not receive any compensation from the Company for serving in such capacities. Independent Directors’ fees are allocated among all Lord Abbett-sponsored funds based on the net assets of each fund. There is an
60
Notes to Financial Statements (continued)
equity-based plan available to all Independent Directors under which Independent Directors must defer receipt of a portion of, and may elect to defer receipt of an additional portion of Directors’ fees. The deferred amounts are treated as though equivalent dollar amounts had been invested in the funds. Such amounts and earnings accrued thereon are included in Directors’ fees on the Statement of Operations and in Directors’ fees payable on the Statement of Assets and Liabilities and are not deductible for U.S. federal income tax purposes until such amounts are paid.
| 9. | EXPENSE REDUCTIONS |
The Company has entered into an arrangement with its transfer agent and custodian, whereby credits realized as a result of uninvested cash balances are used to reduce a portion of the Fund’s expenses.
| 10. | LINE OF CREDIT |
Effective August 28, 2017, the Fund and certain other funds managed by Lord Abbett (collectively, the “Participating Funds”) entered into an amended syndicated line of credit facility with various lenders for $600 million (the “Facility”), whereas State Street Bank and Trust Company (“SSB”) participates as a lender and as agent for the lenders. The Facility is to be used for temporary or emergency purposes as an additional source of liquidity to satisfy redemptions. The Participating Funds are subject to graduated borrowing limits of one-third of Fund assets (if Fund assets are less than $750 million), $250 million, $300 million, or $350 million, based on past borrowings and likelihood of future borrowings.
Prior to August 28, 2017, the Funds and certain other funds managed by Lord Abbett participated in a $550 million syndicated line of credit facility, based on the same terms as described above.
During the fiscal year ended December 31, 2017, the Fund did not utilize the Facility.
| 11. | INTERFUND LENDING PROGRAM |
Pursuant to an exemptive order issued by the U.S. Securities and Exchange Commission (“SEC exemptive order”), certain registered open-end management investment companies managed by Lord Abbett, including the Fund, participate in a joint lending and borrowing program (the “Interfund Lending Program”). The SEC exemptive order allows the Funds to borrow money from and lend money to each other for temporary or emergency purposes subject to the limitations and conditions. During the fiscal year ended December 31, 2017, the Fund did not participate as a borrower or lender in the Interfund Lending Program.
| 12. | CUSTODIAN AND ACCOUNTING AGENT |
SSB is the Company’s custodian and accounting agent. SSB performs custodial, accounting and recordkeeping functions relating to portfolio transactions and calculating the Fund’s NAV.
| 13. | INVESTMENT RISKS |
The Fund is subject to the general risks and considerations associated with investing in fixed income securities, including the risk that issuers will fail to make timely payments of principal or interest or default altogether. The value of an investment will change as interest rates fluctuate and in response to market movements. When interest rates rise, the prices of fixed income securities are likely to decline; when interest rates fall, such prices tend to rise. Longer-term securities are usually more sensitive to interest rate changes. There is also the risk that an issuer of a fixed income security will fail to make timely payments of principal and/or interest to the Fund, a risk that is greater with high-yield bonds (sometimes called “junk bonds”) in which the Fund may
61
Notes to Financial Statements (continued)
substantially invest. Some issuers, particularly of high-yield bonds, may default as to principal and/or interest payments after the Fund purchases its securities. A default, or concerns in the market about an increase in risk of default, may result in losses to the Fund. High-yield bonds are subject to greater price fluctuations, as well as additional risks. The market for below investment grade securities may be less liquid, which may make such securities more difficult to sell at an acceptable price, especially during periods of financial distress, increased market volatility, or significant market decline.
The Fund is subject to the general risks and considerations associated with investing in convertible securities, which have both equity and fixed income risk characteristics, including market, credit, liquidity, and interest rate risks. Generally, convertible securities offer lower interest or dividend yields than non-convertible securities of similar quality and less potential for gains or capital appreciation in a rising equity securities market than equity securities. They tend to be more volatile than other fixed income securities, and the markets for convertible securities may be less liquid than markets for stocks or bonds. A significant portion of convertible securities have below investment grade credit ratings and are subject to increased credit and liquidity risks.
The Fund’s investment exposure to foreign (which may include emerging market) companies presents increased market, liquidity, currency, political, information and other risks. As compared with companies organized and operated in the U.S., these companies may be more vulnerable to economic, political and social instability and subject to less government supervision, lack of transparency, inadequate regulatory and accounting standards, and foreign taxes. The securities of foreign companies also may be subject to inadequate exchange control regulations, the imposition of economic sanctions or other government restrictions, higher transaction and other costs, and delays in settlement to the extent they are traded on non-U.S. exchanges or markets. The cost of the Fund’s potential use of forward foreign currency exchange contracts varies with factors such as the currencies involved, the length of the contract period and the market conditions prevailing.
The Fund is subject to the risks associated with derivatives, which may be different from and greater than the risks associated with directly investing in securities. Derivatives may be subject to risks such as liquidity risk, leveraging risk, interest rate risk, market risk, and credit risk. Illiquid securities may lower the Fund’s returns since the Fund may be unable to sell these securities at their desired time or price. Derivatives also may involve the risk of mispricing or improper valuation and the risk that changes in the value of the derivative may not correlate perfectly with the value of the underlying asset, rate or index. Whether the Fund’s use of derivatives is successful will depend on, among other things, the Fund’s ability to correctly forecast market movements, changes in foreign exchange and interest rates, and other factors. If the Fund incorrectly forecasts these and other factors, its performance could suffer. The Fund’s use of derivatives could result in a loss exceeding the amount of the Fund’s investment in these instruments.
The Fund may invest in swap contracts. Swap contracts are bi-lateral agreements between a fund and its counterparty. Each party is exposed to the risk of default by the other. In addition, they may involve a small investment of cash compared to the risk assumed with the result that small changes may produce disproportionate and substantial gains or losses to the Fund.
The Fund may invest in credit default swap contracts. The risks associated with the Fund’s investment in credit default swaps are greater than if the Fund invested directly in the reference obligation because they are subject to illiquidity risk, counterparty risk, and credit risk at both the counterparty and underlying issuer levels.
62
Notes to Financial Statements (concluded)
The Fund may invest in floating rate or adjustable rate senior loans, which are subject to increased credit and liquidity risks. Senior loans are business loans made to borrowers that may be U.S. or foreign corporations, partnerships, or other business entities. The senior loans in which the Fund may invest may consist primarily of senior loans that are rated below investment grade or, if unrated, deemed by Lord Abbett to be equivalent to below investment grade securities. Below investment grade senior loans, as in the case of high-yield debt securities, or junk bonds, are usually more credit sensitive than interest rate sensitive, although the value of these instruments may be impacted by broader interest rate swings in the overall fixed income market. In addition, senior loans may be subject to structural subordination.
The Fund is subject to the risk of investing a significant portion of its assets in securities issued or guaranteed by the U.S. Government or its agencies and instrumentalities (such as the Government National Mortgage Association (“Ginnie Mae”), the Federal National Mortgage Association (“Fannie Mae”), or the Federal Home Loan Mortgage Corporation (“Freddie Mac”)). Unlike Ginnie Mae securities, securities issued or guaranteed by U.S. Government-related organizations such as Fannie Mae and Freddie Mac are not backed by the full faith and credit of the U.S. Government and no assurance can be given that the U.S. Government would provide financial support to its agencies and instrumentalities if not required to do so by law. Consequently, the Fund may be required to look principally to the agency issuing or guaranteeing the obligation. In addition, the Fund may invest in non-agency backed and mortgage related securities, which are issued by the private institutions, not by the government-sponsored enterprises. Such securities may be particularly sensitive to changes in economic conditions, including delinquencies and/or defaults, and changes in prevailing interest rates. These changes can affect the value, income and/or liquidity of such positions. When interest rates are declining, the value of these securities with prepayment features may not increase as much as other fixed income securities. Early principal repayment may deprive the Fund of income payments above current markets rates. The prepayment rate also will affect the price and volatility of a mortgage-related security. In addition, securities of government sponsored enterprises are guaranteed with respect to the timely payment of interest and principal by the particular enterprise involved, not by the U.S. Government.
These factors can affect the Fund’s performance.
| 14. | SUMMARY OF CAPITAL TRANSACTIONS |
Transactions in shares of capital stock were as follows:
| Year Ended December 31, 2017 | Year Ended December 31, 2016 | ||||||
| Shares sold | 2,247,989 | 2,190,614 | |||||
| Reinvestment of distributions | 142,561 | 81,988 | |||||
| Shares reacquired | (1,465,617 | ) | (542,280 | ) | |||
| Increase | 924,933 | 1,730,322 |
63
Report of Independent Registered Public Accounting Firm
To the Board of Directors of Lord Abbett Series Fund, Inc. and the shareholders of Short Duration Income Portfolio:
Opinion on the Financial Statements and Financial Highlights
We have audited the accompanying statement of assets and liabilities, including the schedule of investments, of the Short Duration Income Portfolio, one of the portfolios constituting the Lord Abbett Series Fund, Inc. (the “Fund”), as of December 31, 2017, the related statement of operations for the year then ended, the statements of changes in net assets for each of the two years in the period then ended, the financial highlights for each of the periods presented, and the related notes. In our opinion, the financial statements and financial highlights present fairly, in all material respects, the financial position of the Short Duration Income Portfolio of the Fund as of December 31, 2017, the results of its operations for the year then ended, the changes in its net assets, and the financial highlights for each of the periods presented, in conformity with accounting principles generally accepted in the United States of America.
Basis for Opinion
These financial statements and financial highlights are the responsibility of the Fund’s management. Our responsibility is to express an opinion on the Fund’s financial statements and financial highlights based on our audits. We are a public accounting firm registered with the Public Company Accounting Oversight Board (United States) (PCAOB) and are required to be independent with respect to the Fund in accordance with the U.S. federal securities laws and the applicable rules and regulations of the Securities and Exchange Commission and the PCAOB.
We conducted our audits in accordance with the standards of the PCAOB. Those standards require that we plan and perform the audit to obtain reasonable assurance about whether the financial statements and financial highlights are free of material misstatement, whether due to error or fraud. The Fund is not required to have, nor were we engaged to perform, an audit of its internal control over financial reporting. As part of our audits we are required to obtain an understanding of internal control over financial reporting but not for the purpose of expressing an opinion on the effectiveness of the Fund’s internal control over financial reporting. Accordingly, we express no such opinion.
Our audits included performing procedures to assess the risks of material misstatement of the financial statements and financial highlights, whether due to error or fraud, and performing procedures that respond to those risks. Such procedures included examining, on a test basis, evidence regarding the amounts and disclosures in the financial statements and financial highlights. Our audits also included evaluating the accounting principles used and significant estimates made by management, as well as evaluating the overall financial statement presentation and financial highlights. Our procedures included confirmation of securities owned as of December 31, 2017, by correspondence with the custodian, brokers and agent banks; when replies were not received from brokers, we performed other auditing procedures. We believe that our audits provide a reasonable basis for our opinion.
DELOITTE & TOUCHE LLP
New York, New York
February 15, 2018
We have served as the auditor of one or more Lord Abbett Family of Funds’ investment companies since 1932.
64
Basic Information About Management
The Board is responsible for the management of the business and affairs of the Company in accordance with the laws of the State of Maryland. The Board elects officers who are responsible for the day-to-day operations of the Fund and who execute policies authorized by the Board. The Board also approves an investment adviser to the Fund and continues to monitor the cost and quality of the services the investment adviser provides, and annually considers whether to renew the contract with the adviser. Generally, each Director holds office until his/her successor is elected and qualified or until his/her earlier resignation or removal, as provided in the Company’s organizational documents.
Lord Abbett, a Delaware limited liability company, is the Fund’s investment adviser. Designated Lord Abbett personnel are responsible for the day-to-day management of the Fund.
Interested Directors
Ms. Foster and Mr. Sieg are affiliated with Lord Abbett and are “interested persons” of the Fund as defined in the Act. Ms. Foster and Mr. Sieg are directors/trustees of each of the 12 investment companies in the Lord Abbett Family of Funds, which consist of 61 portfolios or series. Ms. Foster is an officer of the Lord Abbett Family of Funds.
| Name, Address and Year of Birth | Current Position and Length of Service with the Company | Principal Occupation and Other Directorships During the Past Five Years | ||
Daria L. Foster(1) (1954)
| Director and President since 2006; Chief Executive Officer since 2012 | Principal Occupation: Managing Partner of Lord Abbett, joined Lord Abbett in 1990. Other Directorships: None. | ||
| Douglas B. Sieg(1) Lord, Abbett & Co. LLC 90 Hudson Street Jersey City, NJ 07302 (1969) | Director since 2016 | Principal Occupation: Partner (since 2001) and Head of Client Services (since 2013), formerly Director of Marketing and Relationship Management, joined Lord Abbett in 1994. Other Directorships: None. |
Independent Directors
The following Independent Directors also are directors/trustees of each of the 12 investment companies in the Lord Abbett Family of Funds, which consist of 61 portfolios or series.
| Name, Address and Year of Birth | Current Position and Length of Service with the Company | Principal Occupation and Other Directorships During the Past Five Years | ||
| Eric C. Fast Lord, Abbett & Co. LLC c/o Legal Dept. 90 Hudson Street Jersey City, NJ 07302 (1949) | Director since 2014 | Principal Occupation: Chief Executive Officer of Crane Co., an industrial products company (2001–2014). Other Directorships: Currently serves as director of Automatic Data Processing, Inc. (since 2007) and Regions Financial Corporation (since 2010). Previously served as a director of Crane Co. (1999–2014). |
| (1) | Daria L. Foster, Managing Partner of Lord Abbett, a member of the Board, and the Chief Executive Officer and President of the Lord Abbett Family of Funds, will retire from her positions with Lord Abbett and the Lord Abbett Family of Funds effective March 31, 2018. Douglas B. Sieg, Partner and head of Client Services at Lord Abbett, and a member of the Board, will succeed Ms. Foster effective April 1, 2018. |
65
Basic Information About Management (continued)
| Name, Address and Year of Birth | Current Position and Length of Service with the Company | Principal Occupation and Other Directorships During the Past Five Years | ||
| Evelyn E. Guernsey Lord, Abbett & Co. LLC c/o Legal Dept. 90 Hudson Street Jersey City, NJ 07302 (1955) | Director since 2011 | Principal Occupation: CEO, Americas of J.P. Morgan Asset Management (2004–2010). Other Directorships: None. | ||
| Julie A. Hill Lord, Abbett & Co. LLC c/o Legal Dept. 90 Hudson Street Jersey City, NJ 07302 (1946) | Director since 2004 | Principal Occupation: Owner and CEO of The Hill Company, a business consulting firm (since 1998). Other Directorships: Currently serves as director of Anthem, Inc., a health benefits company (since 1994). | ||
| Franklin W. Hobbs Lord, Abbett & Co. LLC c/o Legal Dept. 90 Hudson Street Jersey City, NJ 07302 (1947) | Director since 2001 | Principal Occupation: President and CEO of Ribbon Communications (since 2017) and Advisor of One Equity Partners, a private equity firm (since 2004). Other Directorships: Currently serves as director of Ribbon Communications (since 2017), director and Chairman of the Board of Ally Financial Inc., a financial services firm (since 2009), and as director of Molson Coors Brewing Company (since 2002). | ||
| Kathleen M. Lutito Lord, Abbett & Co. LLC c/o Legal Dept. 90 Hudson Street Jersey City, NJ 07302 (1963) | Director since 2017 | Principal Occupation: President and Chief Investment Officer of CenturyLink Investment Management Company (since 2006). Other Directorships: None | ||
| James M. McTaggart Lord, Abbett & Co. LLC c/o Legal Dept. 90 Hudson Street Jersey City, NJ 07302 (1947) | Director since 2012 | Principal Occupation: Independent management advisor and consultant (since 2012); Vice President, CRA International, Inc. (doing business as Charles River Associates), a global management consulting firm (2009–2012); Founder and Chairman of Marakon Associates, Inc., a strategy consulting firm (1978–2009); and Officer and Director of Trinsum Group, a holding company (2007–2009). Other Directorships: Blyth, Inc., a home products company (2004–2015). | ||
| Karla M. Rabusch Lord, Abbett & Co. LLC c/o Legal Dept. 90 Hudson Street Jersey City, NJ 07302 (1959) | Director since 2017 | Principal Occupation: President and Director of Wells Fargo Funds Management, LLC (2003–2017); President of Wells Fargo Funds (2003–2016). Other Directorships: None. | ||
| Mark A. Schmid Lord, Abbett & Co. LLC c/o Legal Dept. 90 Hudson Street Jersey City, NJ 07302 (1959) | Director since 2016 | Principal Occupation: Vice President and Chief Investment Officer of the University of Chicago (since 2009). Other Directorships: None. |
66
Basic Information About Management (continued)
| Name, Address and Year of Birth | Current Position and Length of Service with the Company | Principal Occupation and Other Directorships During the Past Five Years | ||
| James L.L. Tullis Lord, Abbett & Co. LLC c/o Legal Dept. 90 Hudson Street Jersey City, NJ 07302 (1947) | Director since 2006; Chairman since 2017 | Principal Occupation: CEO of Tullis-Dickerson and Co. Inc., a venture capital management firm (since 1990); CEO of Tullis Health Investors Inc. (since 2012). Other Directorships: Currently serves as director of Crane Co. (since 1998). |
Officers
None of the officers listed below have received compensation from the Company. All of the officers of the Company also may be officers of the other Lord Abbett Funds and maintain offices at 90 Hudson Street, Jersey City, NJ 07302. Unless otherwise indicated, the position(s) and title(s) listed under the “Principal Occupation During the Past Five Years” column indicate each officer’s position(s) and title(s) with Lord Abbett. Each officer serves for an indefinite term (i.e., until his or her death, resignation, retirement, or removal).
| Name and Year of Birth | Current Position with the Company | Length of Service of Current Position | Principal Occupation During the Past Five Years | |||
| Daria L. Foster (1954) | President and Chief Executive Officer | Elected as President in 2006 and Chief Executive Officer in 2012 | Managing Partner of Lord Abbett, joined Lord Abbett in 1990. | |||
| Sean J. Aurigemma (1969) | Executive Vice President | Elected in 2010 | Portfolio Manager, joined Lord Abbett in 2007. | |||
| Jeff D. Diamond (1960) | Executive Vice President | Elected in 2008 | Portfolio Manager, joined Lord Abbett in 2007. | |||
| Todd D. Jacobson (1966) | Executive Vice President | Elected in 2005 | Partner and Associate Director, joined Lord Abbett in 2003. | |||
| Robert A. Lee (1969) | Executive Vice President | Elected in 2010 | Partner and Chief Investment Officer, and was formerly Deputy Chief Investment Officer and Director of Taxable Fixed Income, joined Lord Abbett in 1997. | |||
| David J. Linsen (1974) | Executive Vice President | Elected in 2008 | Partner and Director, joined Lord Abbett in 2001. | |||
| Thomas B. Maher (1967) | Executive Vice President | Elected in 2010 | Partner and Portfolio Manager, joined Lord Abbett in 2003. | |||
| Justin C. Maurer (1969) | Executive Vice President | Elected in 2010 | Partner and Portfolio Manager, joined Lord Abbett in 2001. |
67
Basic Information About Management (continued)
| Name and Year of Birth | Current Position with the Company | Length of Service of Current Position | Principal Occupation During the Past Five Years | |||
| Vincent J. McBride (1964) | Executive Vice President | Elected in 2010 | Partner and Director, joined Lord Abbett in 2003. | |||
| Andrew H. O’Brien (1973) | Executive Vice President | Elected in 2010 | Partner and Portfolio Manager, joined Lord Abbett in 1998. | |||
| F. Thomas O’Halloran, III (1955) | Executive Vice President | Elected in 2010 | Partner and Portfolio Manager, joined Lord Abbett in 2001. | |||
| Marc Pavese (1972) | Executive Vice President | Elected in 2016 | Partner and Portfolio Manager, joined Lord Abbett in 2008. | |||
| Walter H. Prahl (1958) | Executive Vice President | Elected in 2012 | Partner and Director, joined Lord Abbett in 1997. | |||
| Jeffrey Rabinowitz (1972) | Executive Vice President | Elected in 2017 | Portfolio Manager, joined Lord Abbett in 2017 and was formerly a Managing Director and Portfolio Manager/Technology Analyst at Jennison Associates LLC (2014–2017) and Managing Director and Portfolio Manager/Technology Analyst at Goldman Sachs Asset Management (1999–2014). | |||
| Steven F. Rocco (1979) | Executive Vice President | Elected in 2014 | Partner and Portfolio Manager, joined Lord Abbett in 2004. | |||
| A. Edward Allinson (1961) | Vice President | Elected in 2011 | Portfolio Manager, joined Lord Abbett in 2005. | |||
| Matthew R. DeCicco (1977) | Vice President | Elected in 2003 | Portfolio Manager, joined Lord Abbett in 1999. | |||
| Brooke A. Fapohunda (1975) | Vice President and Assistant Secretary | Elected in 2014 | Partner and Deputy General Counsel, joined Lord Abbett in 2006. | |||
| John K. Forst (1960) | Vice President and Assistant Secretary | Elected in 2005 | Partner and Deputy General Counsel, joined Lord Abbett in 2004. | |||
| Bernard J. Grzelak (1971) | Chief Financial Officer and Vice President | Elected in 2017 | Partner and Chief Operations Officer, and was formerly Director of Fund Administration, joined Lord Abbett in 2003. | |||
| Lawrence H. Kaplan (1957) | Vice President and Secretary | Elected in 1997 | Partner and General Counsel, joined Lord Abbett in 1997. |
68
Basic Information About Management (concluded)
| Name and Year of Birth | Current Position with the Company | Length of Service of Current Position | Principal Occupation During the Past Five Years | |||
| Linda Y. Kim (1980) | Vice President and Assistant Secretary | Elected in 2016 | Counsel, joined Lord Abbett in 2015 and was formerly an Associate at Stroock & Stroock & Lavan LLP (2007–2015). | |||
| Joseph M. McGill (1962) | Chief Compliance Officer | Elected in 2014 | Partner and Chief Compliance Officer, joined Lord Abbett in 2014 and was formerly Managing Director and the Chief Compliance Officer at UBS Global Asset Management (2003–2013). | |||
| A. Edward Oberhaus, III (1959) | Vice President | Elected in 1998 | Partner and Director, joined Lord Abbett in 1983. | |||
| Noah Petrucci (1970) | Vice President | Elected in 2013 | Portfolio Manager, joined Lord Abbett in 2012. | |||
| Lawrence B. Stoller (1963) | Vice President and Assistant Secretary | Elected in 2007 | Partner and Senior Deputy General Counsel, joined Lord Abbett in 2007. | |||
| Leah G. Traub (1979) | Vice President | Elected in 2016 | Partner and Portfolio Manager, joined Lord Abbett in 2007. | |||
| Arthur K. Weise (1970) | Vice President | Elected in 2010 | Partner and Portfolio Manager, joined Lord Abbett in 2007. | |||
| Kewjin Yuoh (1971) | Vice President | Elected in 2012 | Partner and Portfolio Manager, joined Lord Abbett in 2010. | |||
| Scott S. Wallner (1955) | AML Compliance Officer | Elected in 2011 | Assistant General Counsel, joined Lord Abbett in 2004. | |||
| Christian J. Kelly (1975) | Treasurer | Elected in 2017 | Director of Fund Administration, joined Lord Abbett in 2009. |
Please call 888-522-2388 for a copy of the statement of additional information, which contains further information about the Company’s Directors. It is available free upon request.
69
Approval of Advisory Contract
The Board, including all of the Directors who are not “interested persons” of the Company or of Lord Abbett, as defined in the Investment Company Act of 1940, as amended (the “Independent Directors”), annually considers whether to approve the continuation of the existing management agreement between the Fund and Lord Abbett (the “Agreement”). In connection with its most recent approval, the Board reviewed materials relating specifically to the Agreement, as well as numerous materials received throughout the course of the year, including information about the Fund’s investment performance compared to the performance of its benchmark. Before making its decision as to the Fund, the Board had the opportunity to ask questions and request further information, taking into account its familiarity with Lord Abbett gained through its meetings and discussions. These meetings and discussions included reviews of Fund performance conducted by members of the Contract Committee, the deliberations of the Contract Committee, and discussions between the Contract Committee and Lord Abbett’s management. The Independent Directors also met with their independent legal counsel in various private sessions at which no representatives of management were present.
The materials received by the Board included, but were not limited to: (1) information provided by Morningstar, Inc. (“Morningstar”) regarding the investment performance of the Fund compared to the investment performance of certain funds with similar investment styles as determined by Morningstar, based, in part, on the Fund’s Morningstar category (the “performance peer group”), and the investment performance of the Fund’s benchmark; (2) information provided by Morningstar regarding the expense ratios, contractual and actual management fee rates, and other expense components for the Fund and certain funds in the same Morningstar category, with generally the same or similar share classes and operational characteristics, including asset size (the “expense peer group”); (3) certain supplemental investment performance information provided by Lord Abbett; (4) information provided by Lord Abbett on the expense ratios, management fee rates, and other expense components for the Fund; (5) sales and redemption information for the Fund; (6) information regarding Lord Abbett’s financial condition; (7) an analysis of the relative profitability of the Agreement to Lord Abbett; (8) information provided by Lord Abbett regarding the investment management fee schedules for Lord Abbett’s other advisory clients maintaining accounts with a similar investment strategy as the Fund; and (9) information regarding the personnel and other resources devoted by Lord Abbett to managing the Fund.
Investment Management Services Generally. The Board considered the investment management services provided by Lord Abbett to the Fund, including investment research, portfolio management, and trading, and Lord Abbett’s commitment to compliance with all applicable legal requirements. The Board also observed that Lord Abbett was solely engaged in the investment management business and accordingly did not experience the conflicts of interest that may result from being engaged in other lines of business. The Board considered the investment advisory services provided by Lord Abbett to other clients, the fees charged for the services, and the differences in the nature of the services provided to the Fund and other Lord Abbett Funds, on the one hand, and the services provided to other clients, on the other. After reviewing these and related factors, the Board concluded that the Fund was likely to continue to benefit from the nature, extent and quality of the investment services provided by Lord Abbett under the Agreement.
Investment Performance. The Board reviewed the Fund’s investment performance in relation to that of the performance peer group and the Fund’s benchmark as of various periods ended August 31, 2017. The Board observed that the Fund’s investment performance was above the median of the
70
Approval of Advisory Contract (continued)
performance peer group for the one- and three-year periods. The Board further considered Lord Abbett’s performance and reputation generally, the performance of other Lord Abbett-managed funds overseen by the Board, and the willingness of Lord Abbett to take steps intended to improve performance when necessary. After reviewing these and related factors, the Board concluded that the Fund’s investment performance was reasonable and supported the continuation of the Agreement.
Lord Abbett’s Personnel and Methods. The Board considered the qualifications of the personnel providing investment management services to the Fund, in light of its investment objective and discipline. Among other things, the Board considered the size, experience, and turnover of Lord Abbett’s investment management staff, Lord Abbett’s investment methodology and philosophy, and Lord Abbett’s approach to recruiting, training, and retaining investment management personnel.
Nature and Quality of Other Services. The Board considered the nature, quality, costs, and extent of compliance, administrative, and other services performed by Lord Abbett and the nature and extent of Lord Abbett’s supervision of third party service providers, including the Fund’s transfer agent and custodian.
Expenses. The Board considered the expense level of the Fund and the expense levels of the expense peer group. It also considered how the expense level of the Fund related to those of the expense peer group and the amount and nature of the fees paid by shareholders. The Board observed that the net total expense ratio of the Fund was equal to the median of the expense peer group. After reviewing these and related factors, the Board concluded, within the context of its overall approval of the Agreement, that the expense level of the Fund was reasonable and supported the continuation of the Agreement.
Profitability. The Board considered the level of Lord Abbett’s operating margin in managing the Fund, including a review of Lord Abbett’s methodology for allocating its costs to its management of the Fund. It considered whether the Fund was profitable to Lord Abbett in connection with the Fund’s operation, including the fee that Lord Abbett receives from the Fund for providing administrative services to the Fund. The Board also considered the profits realized from other business segments of Lord Abbett, which may benefit from or be related to the Fund’s business. The Board considered Lord Abbett’s profit margins excluding Lord Abbett’s marketing and distribution expenses. The Board also considered Lord Abbett’s profit margins, without those exclusions, in comparison with available industry data and how those profit margins could affect Lord Abbett’s ability to recruit and retain investment personnel. The Board recognized that Lord Abbett’s overall profitability was a factor in enabling it to attract and retain qualified investment management personnel to provide services to the Fund. After reviewing these and related factors, the Board concluded, within the context of its overall approval of the Agreement, that Lord Abbett’s profitability with respect to the Fund was not excessive.
Economies of Scale. The Board considered the extent to which there had been economies of scale in managing the Fund, whether the Fund’s shareholders had appropriately benefited from such economies of scale, and whether there was potential for realization of any further economies of scale. The Board concluded that the existing management fee schedule, with its breakpoints in the level of the management fee, in conjunction with the Fund’s proposed expense limitation agreement, adequately addressed any economies of scale in managing the Fund.
Other Benefits to Lord Abbett. The Board considered the amount and nature of the fees paid by the Fund and the Fund’s shareholders to Lord Abbett for services other than investment advisory services. The Board also considered the revenues and profitability of Lord Abbett’s investment
71
Approval of Advisory Contract (concluded)
advisory business apart from its mutual fund business, and the intangible benefits enjoyed by Lord Abbett by virtue of its relationship with the Fund. The Board observed that the Distributor receives 12b-1 fees from certain of the Lord Abbett Funds as to shares held in accounts for which there is no other broker of record, may retain a portion of the 12b-1 fees it receives, and receives a portion of the sales charges on sales and redemptions of some classes of shares of the Lord Abbett Funds. In addition, the Board observed that Lord Abbett accrues certain benefits for its business of providing investment advice to clients other than the Lord Abbett Funds, but that business also benefits the Funds. The Board also noted that Lord Abbett, as disclosed in the prospectus of the Fund, has entered into revenue sharing arrangements with certain entities that distribute shares of the Fund. The Board also took into consideration the investment research that Lord Abbett receives as a result of Fund brokerage transactions.
Alternative Arrangements. The Board considered whether, instead of approving continuation of the Agreement, it might be in the best interests of the Fund to implement one or more alternative arrangements, such as continuing to employ Lord Abbett, but on different terms. After considering all of the relevant factors, the Board unanimously found that continuation of the Agreement was in the best interests of the Fund and its shareholders and voted unanimously to approve the continuation of the Agreement. In considering whether to approve the continuation of the Agreement, the Board did not identify any single factor as paramount or controlling. Individual Directors may have evaluated the information presented differently from one another, giving different weights to various factors. This summary does not discuss in detail all matters considered.
72
Householding
The Company has adopted a policy that allows it to send only one copy of the Fund’s prospectus, proxy material, annual report and semiannual report to certain shareholders residing at the same “household.” This reduces Fund expenses, which benefits you and other shareholders. If you need additional copies or do not want your mailings to be “householded,” please call Lord Abbett at 888-522-2388 or send a written request with your name, the name of your fund or funds and your account number or numbers to Lord Abbett Family of Funds, P.O. Box 219336, Kansas City, MO 64121.
Proxy Voting Policies, Procedures and Records
A description of the policies and procedures that Lord Abbett uses to vote proxies related to the Fund’s portfolio securities, and information on how Lord Abbett voted the Fund’s proxies during the 12-month period ended June 30 are available without charge, upon request, (i) by calling 888-522-2388; (ii) on Lord Abbett’s Website at www.lordabbett.com; and (iii) on the Securities and Exchange Commission’s (“SEC”) Website at www.sec.gov.
Shareholder Reports and Quarterly Portfolio Disclosure
The Fund is required to file its complete schedule of portfolio holdings with the SEC for its first and third fiscal quarters on Form N-Q. Copies of the filings are available without charge, upon request on the SEC’s Website at www.sec.gov and may be available by calling Lord Abbett at 888-522-2388. You can also obtain copies of Form N-Q by visiting the SEC’s Public Reference Room in Washington, DC (information on the operation of the Public Reference Room may be obtained by calling 800-SEC-0330).
73


| This report, when not used for the general information of shareholders of the Fund, is to be distributed only if preceded or accompanied by a current fund prospectus. | |||
| Lord Abbett Series Fund, Inc. | |||
| Lord Abbett mutual fund shares are distributed by LORD ABBETT DISTRIBUTOR LLC. | Short Duration Income Portfolio | SFSDI-PORT-3 (02/18) |
![]()
LORD ABBETT
ANNUAL REPORT
Lord Abbett
Series Fund—Total Return Portfolio
For the fiscal year ended December 31, 2017
Table of Contents
Lord Abbett Series Fund — Total Return Portfolio
Annual Report
For the fiscal year ended December 31, 2017

From left to right: James L.L. Tullis, Independent Chairman of the Lord Abbett Funds and Daria L. Foster, Director, President, and Chief Executive Officer of the Lord Abbett Funds.
Dear Shareholders: We are pleased to provide you with this overview of the performance of Lord Abbett Series Fund – Total Return Portfolio for the fiscal year ended December 31, 2017. On this page and the following pages, we discuss the major factors that influenced fiscal year performance. For additional information about the Fund, please visit our website at www.lordabbett.com, where you also can access the quarterly commentaries that provide updates on the Fund’s performance and other portfolio related updates.
Thank you for investing in Lord Abbett mutual funds. We value the trust that you place in us and look forward to serving your investment needs in the years to come.
Best regards,

Daria L. Foster
Director, President and Chief Executive Officer
For the fiscal year ended December 31, 2017, the Fund returned 3.86%, reflecting performance at the net asset value (NAV) of Class VC shares, with all distributions reinvested, compared to its benchmark, the Bloomberg Barclays U.S. Universal® Index,1 which returned 4.09% over the same period.
The Federal Reserve (Fed) gradually raised the Fed Funds rate over the 12-month period ended December 31, 2017, by raising interest rates by 25bps three times, ultimately reaching a target range of
1.25 - 1.50%. Inflation rose at a moderate pace during the year. The Consumer Price Index (CPI) gained 2.1% over the 12-month period ended December 31, 2017. Meanwhile, the employment picture continued to improve with the unemployment rate falling to 4.1% by year end, compared to 4.7% a year earlier and a high of 10.0% in October 2009. The U.S. Treasury yield curve flattened during the period, with the yield on two-year Treasury notes increasing by 69bps. Yields on longer-dated Treasury bonds were lower
1
over the period, with the yield on 10-year Treasury bonds slightly lower and the yield on 30-year Treasury bonds falling 32bps.
The overall global economic picture and accommodative Fed policy have created a positive environment for corporate credit. Although there was some volatility in spreads during the period, corporate credit spreads tightened across the ratings spectrum during the 12-month period, which generated strong returns, particularly within lower-rated corporate debt. This was beneficial for both high yield and investment grade corporate bonds.
For the 12-month period ended December 2017, the Fund’s overweight positions in Treasuries and asset-backed securities detracted from performance, as these securities lagged riskier assets. Security selection within mortgage-backed securities also detracted from performance. More specifically, an up-in-
coupon bias was a detractor, as higher coupons underperformed.
The Fund’s positioning within investment grade corporate bonds was the largest contributor to relative performance. Specifically, the Fund’s overweight position and security selection in ‘BBB’ rated bonds contributed to performance. Additionally, the Fund’s overweight position and security selection in high yield corporate bonds contributed to relative performance, as improving credit fundamentals and a continuation of low defaults have created a positive environment for high yield bonds.
The Fund’s portfolio is actively managed and, therefore, its holdings and the weightings of a particular issuer or particular sector as a percentage of portfolio assets are subject to change. Sectors may include many industries.
1 The Bloomberg Barclays U.S. Universal® Index represents the union of the U.S. Aggregate Index, the U.S High Yield Corporate Index, the 144A Index, the Eurodollar Index, the Emerging Markets Index, and the non-ERISA portion of the CMBS Index. Municipal debt, private placements, and non-dollar-denominated issues are excluded from the Universal Index. The only constituent of the index that includes floating-rate debt is the Emerging Markets Index.
Unless otherwise specified, indexes reflect total return, with all dividends reinvested. Indexes are unmanaged, do not reflect the deduction of fees or expenses, and are not available for direct investment.
Important Performance and Other Information
Performance data quoted in the following pages reflect past performance and are no guarantee of future results. Current performance may be higher or lower than the performance quoted. The investment return and principal value of an
investment in the Fund will fluctuate so that shares, on any given day or when redeemed, may be worth more or less than their original cost. You can obtain performance data current to the most recent month end by calling Lord Abbett at 888-522-2388 or referring to www.lordabbett.com.
During certain periods shown, expense waivers and reimbursements were in place. Without such expense waivers and reimbursements, the Fund’s returns would have been lower.
The annual commentary above discusses the views of the Fund’s management and various portfolio holdings of the Fund as of December 31, 2017. These views and portfolio holdings may have changed after this date. Information provided in the commentary is not a recommendation to buy or sell securities. Because the Fund’s portfolio is actively managed and may change significantly, the Fund may no longer own the securities
2
described above or may have otherwise changed its position in the securities. For more recent information about the Fund’s portfolio holdings, please visit www.lordabbett.com.
A Note about Risk: See Notes to Financial Statements for a discussion of investment risks. For a more detailed discussion of the risks associated with the Fund, please see the Fund’s prospectus.
Mutual funds are not insured by the FDIC, are not deposits or other obligations of, or guaranteed by, banks, and are subject to investment risks including possible loss of principal amount invested.
The Fund serves as an underlying investment vehicle for variable annuity contracts and variable life insurance policies.
3
Below is a comparison of a $10,000 investment in Class VC shares with the same investment in both the Bloomberg Barclays U.S. Universal® Index and the Bloomberg Barclays U.S. Aggregate Bond® Index, assuming reinvestment of all dividends and distributions. The Fund’s shares are sold only to insurance company separate accounts that fund certain variable annuity and variable life contracts. The line graph comparison does not reflect the sales charges or other expenses of these contracts. If those sales charges and expenses were reflected, returns would be lower. The graph and performance table below do not reflect the deduction of taxes that a shareholder would pay on Fund distributions or the redemption of Fund shares. During the period, expenses of the Fund were waived or reimbursed by Lord Abbett; without such waiver or reimbursement of expenses, the Fund’s returns would have been lower. Past performance is no guarantee of future results.

| Average Annual Total Returns for the Periods Ended December 31, 2017 | ||||||||||||
| 1 Year | 5 Years | Life of Class | ||||||||||
| Class VC2 | 3.86% | 2.45% | 4.24% | |||||||||
1 Performance for each unmanaged index does not reflect any fees or expenses. The performance of each index is not necessarily representative of the Fund’s performance. Performance for each index began on May 1, 2010.
2 The Class VC shares commenced operations on April 16, 2010. Performance for the Class began on May 1, 2010.
4
As a shareholder of the Fund, you incur ongoing costs, including management fees; expenses related to the Fund’s services arrangements with certain insurance companies; and other Fund expenses. This Example is intended to help you understand your ongoing costs (in dollars) of investing in the Fund and to compare these costs with the ongoing costs of investing in other mutual funds.
The Example is based on an investment of $1,000 invested at the beginning of the period and held for the entire period (July 1, 2017 through December 31, 2017).
The Example reflects only expenses that are deducted from the assets of the Fund. Fees and expenses, including sales charges applicable to the various insurance products that invest in the Fund, are not reflected in this Example. If such fees and expenses were reflected in the Example, the total expenses shown would be higher. Fees and expenses regarding such variable insurance products are separately described in the prospectus related to those products.
Actual Expenses
The first line of the table on the following page provides information about actual account values and actual expenses. You may use the information in this line, together with the amount you invested, to estimate the expenses that you paid over the period. Simply divide your account value by $1,000 (for example, an $8,600 account value divided by $1,000 = 8.6), then multiply the result by the number in the first line under the heading titled “Expenses Paid During Period 7/1/17 – 12/31/17” to estimate the expenses you paid on your account during this period.
Hypothetical Example for Comparison Purposes
The second line of the table on the following page provides information about hypothetical account values and hypothetical expenses based on the Fund’s actual expense ratio and an assumed rate of return of 5% per year before expenses, which is not the Fund’s actual return. The hypothetical account values and expenses may not be used to estimate the actual ending account balance or expenses you paid for the period. You may use this information to compare the ongoing costs of investing in the Fund and other funds. To do so, compare this 5% hypothetical example with the 5% hypothetical examples that appear in the shareholder reports of the other funds.
5
Please note that the expenses shown in the table are meant to highlight your ongoing costs only and do not reflect any transactional costs, such as sales charges. Therefore, the second line of the table is useful in comparing ongoing costs only, and will not help you determine the relative total costs of owning different funds. In addition, if these transactional costs were included, your costs would have been higher.
| Beginning Account Value | Ending Account Value | Expenses Paid During Period† | |||||
| 7/1/17 | 12/31/17 | 7/1/17 - 12/31/17 | |||||
| Class VC | |||||||
| Actual | $1,000.00 | $1,012.70 | $3.25 | ||||
| Hypothetical (5% Return Before Expenses) | $1,000.00 | $1,021.98 | $3.26 |
| † | Net expenses are equal to the Fund’s annualized expense ratio of 0.64%, multiplied by the average account value over the period, multiplied by 184/365 (to reflect one-half year period). |
Portfolio Holdings Presented by Sector
December 31, 2017
| Sector* | %** | |||
| Auto | 0.99 | % | ||
| Basic Industry | 0.12 | % | ||
| Consumer Cyclical | 0.90 | % | ||
| Consumer Discretionary | 0.55 | % | ||
| Consumer Services | 1.45 | % | ||
| Consumer Staples | 0.54 | % | ||
| Energy | 2.89 | % | ||
| Financial Services | 32.20 | % | ||
| Foreign Government | 5.01 | % | ||
| Health Care | 0.71 | % | ||
| Integrated Oils | 0.53 | % | ||
| Materials & Processing | 2.64 | % | ||
| Municipal | 0.38 | % | ||
| Producer Durables | 0.57 | % | ||
| Technology | 1.57 | % | ||
| Telecommunications | 0.79 | % | ||
| Transportation | 0.27 | % | ||
| U.S. Government | 44.97 | % | ||
| Utilities | 1.39 | % | ||
| Repurchase Agreement | 1.53 | % | ||
| Total | 100.00 | % | ||
| * | A sector may comprise several industries. | |
| ** | Represents percent of total investments. |
| 6 | See Notes to Financial Statements. |
December 31, 2017
| Investments | Interest Rate | Maturity Date | Principal Amount (000) | Fair Value | ||||||||
| LONG-TERM INVESTMENTS 106.51% | ||||||||||||
| ASSET-BACKED SECURITIES 20.27% | ||||||||||||
| Automobiles 10.21% | ||||||||||||
| Ally Auto Receivables Trust 2014-A† | 0.63% | 4/15/2019 | $ | 222 | $ | 221,897 | ||||||
| American Credit Acceptance Receivables Trust 2015-1 C† | 4.29% | 4/12/2021 | 717 | 724,164 | ||||||||
| American Credit Acceptance Receivables Trust 2016-2 C† | 6.09% | 5/12/2022 | 272 | 284,252 | ||||||||
| AmeriCredit Automobile Receivables Trust 2013-5 D | 2.86% | 12/9/2019 | 656 | 658,642 | ||||||||
| AmeriCredit Automobile Receivables Trust 2014-1 C | 2.15% | 3/9/2020 | 301 | 301,210 | ||||||||
| AmeriCredit Automobile Receivables Trust 2015-2 C | 2.40% | 1/8/2021 | 1,977 | 1,982,795 | ||||||||
| AmeriCredit Automobile Receivables Trust 2015-3 A3 | 1.54% | 3/9/2020 | 191 | 191,226 | ||||||||
| AmeriCredit Automobile Receivables Trust 2015-3 B | 2.08% | 9/8/2020 | 502 | 502,292 | ||||||||
| AmeriCredit Automobile Receivables Trust 2016-2 A2A | 1.42% | 10/8/2019 | 30 | 29,673 | ||||||||
| AmeriCredit Automobile Receivables Trust 2016-2 C | 2.87% | 11/8/2021 | 2,600 | 2,616,439 | ||||||||
| AmeriCredit Automobile Receivables Trust 2016-4 A2A | 1.34% | 4/8/2020 | 185 | 184,464 | ||||||||
| AmeriCredit Automobile Receivables Trust 2017-2 A2A | 1.65% | 9/18/2020 | 1,726 | 1,723,265 | ||||||||
| AmeriCredit Automobile Receivables Trust 2017-2 C | 2.97% | 3/20/2023 | 669 | 672,917 | ||||||||
| AmeriCredit Automobile Receivables Trust 2017-3 A2A | 1.69% | 12/18/2020 | 506 | 505,345 | ||||||||
| AmeriCredit Automobile Receivables Trust 2017-3 B | 2.24% | 6/19/2023 | 275 | 272,775 | ||||||||
| AmeriCredit Automobile Receivables Trust 2017-4 C | 2.60% | 9/18/2023 | 1,331 | 1,327,742 | ||||||||
| AmeriCredit Automobile Receivables Trust 2017-4 D | 3.08% | 12/18/2023 | 1,967 | 1,961,089 | ||||||||
| Avis Budget Rental Car Funding AESOP LLC 2012-3A A† | 2.10% | 3/20/2019 | 263 | 262,510 | ||||||||
| Avis Budget Rental Car Funding AESOP LLC 2013-1A A† | 1.92% | 9/20/2019 | 1,070 | 1,068,493 | ||||||||
| Avis Budget Rental Car Funding AESOP LLC 2013-2A† | 2.97% | 2/20/2020 | 535 | 538,669 | ||||||||
| See Notes to Financial Statements. | 7 |
Schedule of Investments (continued)
December 31, 2017
| Investments | Interest Rate | Maturity Date | Principal Amount (000) | Fair Value | ||||||||
| Automobiles (continued) | ||||||||||||
| Avis Budget Rental Car Funding AESOP LLC 2014-1A† | 2.46% | 7/20/2020 | $ | 592 | $ | 593,018 | ||||||
| California Republic Auto Receivables Trust 2014-3 B | 2.66% | 8/17/2020 | 376 | 377,014 | ||||||||
| California Republic Auto Receivables Trust 2015-1 A4 | 1.82% | 9/15/2020 | 595 | 594,667 | ||||||||
| California Republic Auto Receivables Trust 2015-2 B | 2.53% | 6/15/2021 | 908 | 907,966 | ||||||||
| California Republic Auto Receivables Trust 2015-3 B | 2.70% | 9/15/2021 | 120 | 120,091 | ||||||||
| California Republic Auto Receivables Trust 2016-2 A3 | 1.56% | 7/15/2020 | 163 | 162,412 | ||||||||
| California Republic Auto Receivables Trust 2016-2 B | 2.52% | 5/16/2022 | 328 | 325,062 | ||||||||
| Capital Auto Receivables Asset Trust 2014-3 B† | 2.35% | 7/22/2019 | 712 | 712,043 | ||||||||
| Capital Auto Receivables Asset Trust 2015-1 A3 | 1.61% | 6/20/2019 | 113 | 113,337 | ||||||||
| Capital Auto Receivables Asset Trust 2016-2 A3 | 1.46% | 6/22/2020 | 340 | 339,243 | ||||||||
| Capital Auto Receivables Asset Trust 2017-1 B† | 2.43% | 5/20/2022 | 462 | 459,586 | ||||||||
| Capital Auto Receivables Asset Trust 2017-1 C† | 2.70% | 9/20/2022 | 656 | 655,083 | ||||||||
| Capital Auto Receivables Asset Trust 2017-1 D† | 3.15% | 2/20/2025 | 427 | 424,971 | ||||||||
| CarMax Auto Owner Trust 2014-1 A4 | 1.32% | 7/15/2019 | 150 | 149,535 | ||||||||
| CarMax Auto Owner Trust 2015-2 A3 | 1.37% | 3/16/2020 | 91 | 90,930 | ||||||||
| CarMax Auto Owner Trust 2016-3 A2 | 1.17% | 8/15/2019 | 205 | 205,174 | ||||||||
| CarMax Auto Owner Trust 2016-3 A3 | 1.39% | 5/17/2021 | 553 | 548,974 | ||||||||
| CarMax Auto Owner Trust 2016-4 A2 | 1.21% | 11/15/2019 | 178 | 177,261 | ||||||||
| Chesapeake Funding II LLC 2016-2A A1† | 1.88% | 6/15/2028 | 601 | 599,594 | ||||||||
| Chrysler Capital Auto Receivables Trust 2014-BA D† | 3.44% | 8/16/2021 | 367 | 369,563 | ||||||||
| Chrysler Capital Auto Receivables Trust 2016-AA B† | 2.88% | 2/15/2022 | 195 | 196,778 | ||||||||
| Chrysler Capital Auto Receivables Trust 2016-AA C† | 3.25% | 6/15/2022 | 134 | 135,325 | ||||||||
| CPS Auto Receivables Trust 2016-B D† | 6.58% | 3/15/2022 | 150 | 159,253 | ||||||||
| CPS Auto Trust 2017-D A† | 1.87% | 3/15/2021 | 1,144 | 1,142,109 | ||||||||
| Drive Auto Receivables Trust 2015-AA C† | 3.06% | 5/17/2021 | 123 | 123,381 | ||||||||
| Drive Auto Receivables Trust 2015-BA D† | 3.84% | 7/15/2021 | 2,374 | 2,412,330 | ||||||||
| Drive Auto Receivables Trust 2015-DA C† | 3.38% | 11/15/2021 | 425 | 427,572 | ||||||||
| Drive Auto Receivables Trust 2015-DA D† | 4.59% | 1/17/2023 | 607 | 621,361 | ||||||||
| Drive Auto Receivables Trust 2016-BA D† | 4.53% | 8/15/2023 | 979 | 1,006,845 | ||||||||
| Drive Auto Receivables Trust 2016-CA B† | 2.37% | 11/16/2020 | 284 | 284,406 | ||||||||
| Drive Auto Receivables Trust 2016-CA C† | 3.02% | 11/15/2021 | 1,581 | 1,593,316 | ||||||||
| Drive Auto Receivables Trust 2016-CA D† | 4.18% | 3/15/2024 | 254 | 260,948 | ||||||||
| Drive Auto Receivables Trust 2017-2 A2A | 1.63% | 8/15/2019 | 630 | 629,754 | ||||||||
| 8 | See Notes to Financial Statements. |
Schedule of Investments (continued)
December 31, 2017
| Investments | Interest Rate | Maturity Date | Principal Amount (000) | Fair Value | ||||||||
| Automobiles (continued) | ||||||||||||
| Drive Auto Receivables Trust 2017-2 A3 | 1.82% | 6/15/2020 | $ | 943 | $ | 942,353 | ||||||
| Drive Auto Receivables Trust 2017-3 C | 2.80% | 7/15/2022 | 1,459 | 1,460,293 | ||||||||
| Drive Auto Receivables Trust 2017-AA B† | 2.51% | 1/15/2021 | 535 | 536,556 | ||||||||
| Drive Auto Receivables Trust 2017-AA D† | 4.16% | 5/15/2024 | 447 | 458,472 | ||||||||
| Enterprise Fleet Financing LLC 2017-1 A2† | 2.13% | 7/20/2022 | 538 | 538,280 | ||||||||
| First Investors Auto Owner Trust 2016-2A A1† | 1.53% | 11/16/2020 | 209 | 208,841 | ||||||||
| First Investors Auto Owner Trust 2017-3A A2† | 2.41% | 12/15/2022 | 571 | 568,968 | ||||||||
| First Investors Auto Owner Trust 2017-3A B† | 2.72% | 4/17/2023 | 218 | 217,121 | (a) | |||||||
| Flagship Credit Auto Trust 2017-3 A† | 1.88% | 10/15/2021 | 520 | 519,073 | ||||||||
| Flagship Credit Auto Trust 2017-3 B† | 2.59% | 7/15/2022 | 300 | 298,887 | ||||||||
| Ford Credit Auto Owner Trust 2014-C A3 | 1.06% | 5/15/2019 | 78 | 77,622 | ||||||||
| Ford Credit Auto Owner Trust 2016-B A2A | 1.08% | 3/15/2019 | 84 | 83,804 | ||||||||
| Ford Credit Auto Owner Trust 2016-C A2A | 1.04% | 9/15/2019 | 362 | 361,449 | ||||||||
| Ford Credit Auto Owner Trust 2017-2 B† | 2.60% | 3/15/2029 | 108 | 106,126 | ||||||||
| Ford Credit Auto Owner Trust/Ford Credit 2014-1 A† | 2.26% | 11/15/2025 | 2,624 | 2,629,985 | ||||||||
| Foursight Capital Automobile Receivables Trust 2016-1 A2† | 2.87% | 10/15/2021 | 435 | 435,235 | ||||||||
| GM Financial Consumer Automobile 2017-1A B† | 2.30% | 6/16/2023 | 144 | 143,012 | ||||||||
| Harley-Davidson Motorcycle Trust 2015-2 A4 | 1.66% | 12/15/2022 | 299 | 298,251 | ||||||||
| Honda Auto Receivables Owner Trust 2014-4 A3 | 0.99% | 9/17/2018 | 6 | 5,933 | ||||||||
| Honda Auto Receivables Owner Trust 2015-1 A3 | 1.05% | 10/15/2018 | 43 | 43,414 | ||||||||
| Honda Auto Receivables Owner Trust 2016-4 A2 | 1.04% | 4/18/2019 | 329 | 328,623 | ||||||||
| Huntington Auto Trust 2016-1 A3 | 1.59% | 11/16/2020 | 2,646 | 2,635,582 | ||||||||
| Mercedes-Benz Auto Receivables Trust 2016-1 A2A | 1.11% | 3/15/2019 | 271 | 270,948 | ||||||||
| Santander Drive Auto Receivables Trust 2014-2 C | 2.33% | 11/15/2019 | 117 | 116,724 | ||||||||
| Santander Drive Auto Receivables Trust 2014-3 C | 2.13% | 8/17/2020 | 484 | 483,916 | ||||||||
| Santander Drive Auto Receivables Trust 2014-4 C | 2.60% | 11/16/2020 | 630 | 631,608 | ||||||||
| Santander Drive Auto Receivables Trust 2015-1 C | 2.57% | 4/15/2021 | 1,613 | 1,617,650 | ||||||||
| Santander Drive Auto Receivables Trust 2016-2 B | 2.08% | 2/16/2021 | 190 | 190,068 | ||||||||
| Santander Drive Auto Receivables Trust 2016-3 A2 | 1.34% | 11/15/2019 | 80 | 79,759 | ||||||||
| Santander Drive Auto Receivables Trust 2016-3 B | 1.89% | 6/15/2021 | 264 | 263,491 | ||||||||
| Santander Drive Auto Receivables Trust 2017-2 A2 | 1.60% | 3/16/2020 | 1,545 | 1,544,092 | ||||||||
| Santander Drive Auto Receivables Trust 2017-2 B | 2.21% | 10/15/2021 | 1,359 | 1,358,660 | ||||||||
| Santander Drive Auto Receivables Trust 2017-2 D | 3.49% | 7/17/2023 | 808 | 816,665 | ||||||||
| Santander Drive Auto Receivables Trust 2017-3 C | 2.76% | 12/15/2022 | 192 | 192,208 | ||||||||
| SunTrust Auto Receivables Trust 2015-1A A3† | 1.42% | 9/16/2019 | 278 | 278,192 | ||||||||
| SunTrust Auto Receivables Trust 2015-1A D† | 3.24% | 1/16/2023 | 754 | 738,677 | ||||||||
| TCF Auto Receivables Owner Trust 2014-1A A4† | 1.56% | 1/15/2020 | 346 | 346,035 | ||||||||
| See Notes to Financial Statements. | 9 |
Schedule of Investments (continued)
December 31, 2017
| Investments | Interest Rate | Maturity Date | Principal Amount (000) | Fair Value | ||||||||
| Automobiles (continued) | ||||||||||||
| TCF Auto Receivables Owner Trust 2015-1A A3† | 1.49% | 12/16/2019 | $ | 40 | $ | 39,690 | ||||||
| TCF Auto Receivables Owner Trust 2015-1A B† | 2.49% | 4/15/2021 | 791 | 791,078 | ||||||||
| TCF Auto Receivables Owner Trust 2016-PT1A B† | 2.92% | 10/17/2022 | 443 | 439,052 | ||||||||
| Wheels SPV 2 LLC 2016-1A A2† | 1.59% | 5/20/2025 | 589 | 587,459 | ||||||||
| Total | 56,632,613 | |||||||||||
| Credit Cards 3.20% | ||||||||||||
| BA Credit Card Trust 2015-A1 A | 1.807% (1 Mo. LIBOR + .33% | )# | 6/15/2020 | 3,682 | 3,682,580 | |||||||
| Capital One Multi-Asset Execution Trust 2015-A1 | 1.39% | 1/15/2021 | 370 | 369,793 | ||||||||
| Capital One Multi-Asset Execution Trust 2017-A5 | 2.057% (1 Mo. LIBOR + .58% | )# | 7/15/2027 | 513 | 517,873 | |||||||
| Capital One Multi-Asset Execution Trust 2017-A6 | 2.29% | 7/15/2025 | 1,243 | 1,235,433 | ||||||||
| Citibank Credit Card Issuance Trust 2017-A5 | 2.155% (1 Mo. LIBOR + 0.62% | )# | 4/22/2026 | 698 | 706,870 | |||||||
| Discover Card Execution Note Trust 2013-A1 | 1.777% (1 Mo. LIBOR + 0.30% | )# | 8/17/2020 | 3,126 | 3,127,094 | |||||||
| Discover Card Execution Note Trust 2017-A4 | 2.53% | 10/15/2026 | 165 | 164,645 | ||||||||
| Synchrony Credit Card Master Note Trust 2017-2 A | 2.62% | 10/15/2025 | 1,152 | 1,152,762 | ||||||||
| World Financial Network Credit Card Master Trust 2013-A | 1.61% | 12/15/2021 | 601 | 600,887 | ||||||||
| World Financial Network Credit Card Master Trust 2015-A | 1.957% (1 Mo. LIBOR + .48% | )# | 2/15/2022 | 1,863 | 1,864,598 | |||||||
| World Financial Network Credit Card Master Trust 2017-B A | 1.98% | 6/15/2023 | 1,217 | 1,213,746 | ||||||||
| World Financial Network Credit Card Master Trust 2017-C A | 2.31% | 8/15/2024 | 2,151 | 2,143,051 | ||||||||
| World Financial Network Credit Card Master Trust 2017-C M | 2.66% | 8/15/2024 | 946 | 943,196 | ||||||||
| Total | 17,722,528 | |||||||||||
| Home Equity 0.05% | ||||||||||||
| Asset Backed Securities Corp. Home Equity Loan | ||||||||||||
| Trust Series NC 2006-HE4 A5 | 1.712% (1 Mo. LIBOR + .16% | )# | 5/25/2036 | 28 | 27,782 | |||||||
| Meritage Mortgage Loan Trust 2004-2 M3 | 2.527% (1 Mo. LIBOR + .98% | )# | 1/25/2035 | 204 | 201,489 | |||||||
| New Century Home Equity Loan Trust 2005-A A6 | 4.507% | #(b) | 8/25/2035 | 31 | 31,721 | |||||||
| Total | 260,992 | |||||||||||
| 10 | See Notes to Financial Statements. |
Schedule of Investments (continued)
December 31, 2017
| Investments | Interest Rate | Maturity Date | Principal Amount (000) | Fair Value | ||||||||
| Other 6.81% | ||||||||||||
| Access Point Funding I LLC 2017-A† | 3.06% | 4/15/2029 | $ | 498 | $ | 497,455 | ||||||
| Anchorage Capital CLO Ltd. 2012-1A A2R† | 3.459% (3 Mo. LIBOR + 2.10% | )# | 1/13/2027 | 1,500 | 1,511,078 | |||||||
| Anchorage Capital CLO Ltd. 2014-4A A1AR† | 2.518% (3 Mo. LIBOR + 1.14% | )# | 7/28/2026 | 1,500 | 1,506,117 | |||||||
| Apidos CLO XVI 2013-16A CR† | 4.357% (3 Mo. LIBOR + 3.00% | )# | 1/19/2025 | 250 | 251,512 | |||||||
| Apollo Credit Funding IV Ltd. 4A A1† | 2.829% (3 Mo. LIBOR + 1.47% | )# | 4/15/2027 | 1,000 | 1,007,420 | |||||||
| Ascentium Equipment Receivables Trust 2016-2A A2† | 1.46% | 4/10/2019 | 137 | 136,595 | ||||||||
| Ascentium Equipment Receivables Trust 2016-2A A3† | 1.65% | 5/10/2022 | 283 | 280,821 | ||||||||
| Ascentium Equipment Receivables Trust 2016-2A B† | 2.50% | 9/12/2022 | 182 | 181,219 | ||||||||
| Ascentium Equipment Receivables Trust 2017-1A A2† | 1.87% | 7/10/2019 | 608 | 607,194 | ||||||||
| Ascentium Equipment Receivables Trust 2017-1A A3† | 2.29% | 6/10/2021 | 183 | 182,479 | ||||||||
| Atrium XIII 13A A1† | 2.621% (3 Mo. LIBOR + 1.18% | )# | 11/21/2030 | 500 | 503,174 | |||||||
| Avery Point V CLO Ltd. 2014-5A BR† | 2.853% (3 Mo. LIBOR + 1.50% | )# | 7/17/2026 | 372 | 373,820 | |||||||
| Birchwood Park CLO Ltd. 2014-1A AR† | 2.539% (3 Mo. LIBOR + 1.18% | )# | 7/15/2026 | 1,000 | 1,001,612 | |||||||
| BlueMountain CLO Ltd. 2013-2A A1R† | 2.539% (3 Mo. LIBOR + 1.18% | )# | 10/22/2030 | 753 | 758,418 | |||||||
| Carlyle Global Market Strategies CLO Ltd. 2015-2A A1† | 2.845% (3 Mo. LIBOR + 1.47% | )# | 4/27/2027 | 850 | 849,620 | |||||||
| Cavalry CLO IV Ltd. 2014-4A B1R† | 2.709% (3 Mo. LIBOR + 1.35% | )# | 10/15/2026 | 250 | 250,474 | |||||||
| Cent CLO Ltd. 2013-19A A1A† | 2.708% (3 Mo. LIBOR + 1.33% | )# | 10/29/2025 | 850 | 851,380 | |||||||
| CIFC Funding Ltd. 2017-5A A1† | 2.543% (3 Mo. LIBOR + 1.18% | )# | 11/16/2030 | 1,732 | 1,731,955 | (a) | ||||||
| CNH Equipment Trust 2014-C A3 | 1.05% | 11/15/2019 | 45 | 45,088 | ||||||||
| CNH Equipment Trust 2016-A A2B | 1.997% (1 Mo. LIBOR + .52% | )# | 7/15/2019 | 37 | 36,648 | |||||||
| Conn Funding II LP 2017-B A† | 2.73% | 7/15/2020 | 1,666 | 1,682,115 | (a) | |||||||
| Conn Funding II LP 2017-B C† | 5.95% | 11/15/2022 | 1,063 | 1,074,150 | (a) | |||||||
| Dell Equipment Finance Trust 2015-2 A3† | 1.72% | 9/22/2020 | 30 | 29,690 | ||||||||
| See Notes to Financial Statements. | 11 |
Schedule of Investments (continued)
December 31, 2017
| Investments | Interest Rate | Maturity Date | Principal Amount (000) | Fair Value | ||||||||
| Other (continued) | ||||||||||||
| Dell Equipment Finance Trust 2016-1 A3† | 1.65% | 7/22/2021 | $ | 100 | $ | 99,872 | ||||||
| Dell Equipment Finance Trust 2017-1 A1† | 1.35% | 5/22/2018 | 420 | 420,220 | ||||||||
| Dell Equipment Finance Trust 2017-1 A2† | 1.86% | 6/24/2019 | 186 | 185,950 | ||||||||
| Diamond Resorts Owner Trust 2013-1 A† | 1.95% | 1/20/2025 | 125 | 124,196 | ||||||||
| Diamond Resorts Owner Trust 2015-2 A† | 2.99% | 5/22/2028 | 149 | 148,666 | ||||||||
| Diamond Resorts Owner Trust 2016-1 A† | 3.08% | 11/20/2028 | 105 | 105,598 | ||||||||
| Diamond Resorts Owner Trust 2017-1A B† | 4.11% | 10/22/2029 | 784 | 778,802 | ||||||||
| DLL Securitization Trust 2017-A A4† | 2.43% | 11/17/2025 | 1,224 | 1,216,611 | ||||||||
| DRB Prime Student Loan Trust 2015-D A2† | 3.20% | 1/25/2040 | 647 | 652,857 | ||||||||
| Engs Commercial Finance Trust 2015-1A A2† | 2.31% | 10/22/2021 | 355 | 353,927 | ||||||||
| Ford Credit Floorplan Master Owner Trust 2017-2 A1 | 2.16% | 9/15/2022 | 942 | 938,782 | ||||||||
| GMF Floorplan Owner Revolving Trust 2015-1 B† | 1.97% | 5/15/2020 | 394 | 393,795 | ||||||||
| Jackson Mill CLO Ltd. 2015-1A A† | 2.899% (3 Mo. LIBOR + 1.54% | )# | 4/15/2027 | 350 | 353,303 | |||||||
| Jamestown CLO VII Ltd. 2015-7A CR† | 3.967% (3 Mo. LIBOR + 2.60% | )# | 7/25/2027 | 611 | 612,035 | |||||||
| KKR CLO Ltd-11 AR† | 2.539%# | 1/15/2031 | 2,057 | 2,059,673 | ||||||||
| Laurel Road Prime Student Loan Trust 2017-B A1FX† | 1.63% | 8/25/2042 | 85 | 84,733 | ||||||||
| Marble Point CLO XI Ltd. 2017-2A A† | 2.793% (3 Mo. LIBOR + 1.18% | )# | 12/18/2030 | 1,809 | 1,811,623 | |||||||
| Mountain Hawk III CLO Ltd. 2014-3A AR† | 2.554% (3 Mo. LIBOR + 1.20% | )# | 4/18/2025 | 2,350 | 2,357,451 | |||||||
| Oaktree EIF I Series Ltd. 2015-A1 B† | 3.954% (3 Mo. LIBOR + 2.60% | )# | 10/18/2027 | 900 | 904,481 | |||||||
| Oaktree EIF II Series Ltd. 2014-A2 AR† | 2.566% (3 Mo. LIBOR + 1.15% | )# | 11/15/2025 | 500 | 501,445 | |||||||
| Oaktree EIF II Series Ltd. 2014-A2 BR† | 3.116% (3 Mo. LIBOR + 1.70% | )# | 11/15/2025 | 900 | 903,319 | |||||||
| OneMain Financial Issuance Trust 2015-1A A† | 3.19% | 3/18/2026 | 484 | 487,077 | ||||||||
| OneMain Financial Issuance Trust 2016-1A A† | 3.66% | 2/20/2029 | 315 | 320,190 | ||||||||
| OneMain Financial Issuance Trust 2016-2A B† | 5.94% | 3/20/2028 | 100 | 102,555 | ||||||||
| Pennsylvania Higher Education Assistance Agency 2006-1 B | 1.637% (3 Mo. LIBOR + .27% | )# | 4/25/2038 | 350 | 338,575 | |||||||
| Regatta IV Funding Ltd. 2014-1A DR† | 4.667% (3 Mo. LIBOR + 3.30% | )# | 7/25/2026 | 600 | 600,351 | |||||||
| SCF Equipment Leasing LLC 2017-2A A† | 3.41% | 12/20/2023 | 451 | 448,976 | ||||||||
| Shackleton CLO 2014-6A A2R† | 2.513% (3 Mo. LIBOR + 1.16% | )# | 7/17/2026 | 438 | 439,319 | |||||||
| SLM Private Education Loan Trust 2010-A 2A† | 4.727% (1 Mo. LIBOR + 3.25% | )# | 5/16/2044 | 24 | 24,915 | |||||||
| 12 | See Notes to Financial Statements. |
Schedule of Investments (continued)
December 31, 2017
| Investments | Interest Rate | Maturity Date | Principal Amount (000) | Fair Value | ||||||||
| Other (continued) | ||||||||||||
| SLM Student Loan Trust 2011-1 A1 | 1.848% (1 Mo. LIBOR + .52% | )# | 3/25/2026 | $ | 18 | $ | 18,043 | |||||
| SoFi Professional Loan Program LLC 2017-E A1† | 2.052% (1 Mo. LIBOR + .5% | )# | 11/26/2040 | 1,028 | 1,030,288 | |||||||
| SoFi Professional Loan Program LLC 2017-E A2B† | 2.72% | 11/26/2040 | 802 | 798,903 | ||||||||
| Sound Point CLO IX Ltd. 2015-2A AR† | 2.243% (3 Mo. LIBOR + .88% | )# | 7/20/2027 | 250 | 250,077 | |||||||
| Tryon Park CLO Ltd. 2013-1A A1† | 2.479% (3 Mo. LIBOR + 1.12% | )# | 7/15/2025 | 681 | 683,097 | |||||||
| WhiteHorse VIII Ltd. 2014-1A AR† | 2.277% (3 Mo. LIBOR + .9% | )# | 5/1/2026 | 1,833 | 1,834,277 | |||||||
| Total | 37,734,016 | |||||||||||
| Total Asset-Backed Securities (cost $112,410,252) | 112,350,149 | |||||||||||
| CORPORATE BONDS 26.94% | ||||||||||||
| Aerospace/Defense 0.00% | ||||||||||||
| Embraer SA (Brazil)(c) | 5.15% | 6/15/2022 | 10 | 10,725 | ||||||||
| Air Transportation 0.05% | ||||||||||||
| Air Canada (Canada)†(c) | 7.75% | 4/15/2021 | 70 | 80,150 | ||||||||
| American Airlines 2013-2 Class B Pass-Through Trust† | 5.60% | 1/15/2022 | 168 | 174,627 | ||||||||
| Total | 254,777 | |||||||||||
| Auto Parts: Original Equipment 0.27% | ||||||||||||
| American Axle & Manufacturing, Inc.† | 6.25% | 4/1/2025 | 1,309 | 1,380,995 | ||||||||
| International Automotive Components Group SA (Luxembourg)†(c) | 9.125% | 6/1/2018 | 107 | 105,997 | ||||||||
| Total | 1,486,992 | |||||||||||
| Automotive 0.80% | ||||||||||||
| Aston Martin Capital Holdings Ltd. (Jersey)†(c) | 6.50% | 4/15/2022 | 200 | 210,750 | ||||||||
| Ford Motor Co. | 7.45% | 7/16/2031 | 1,297 | 1,698,784 | ||||||||
| General Motors Co. | 6.60% | 4/1/2036 | 1,489 | 1,818,115 | ||||||||
| Tesla, Inc.† | 5.30% | 8/15/2025 | 751 | 720,021 | ||||||||
| Total | 4,447,670 | |||||||||||
| See Notes to Financial Statements. | 13 |
Schedule of Investments (continued)
December 31, 2017
| Investments | Interest Rate | Maturity Date | Principal Amount (000) | Fair Value | ||||||||
| Banks: Regional 6.20% | ||||||||||||
| Akbank Turk AS (Turkey)†(c) | 7.20% (5 Yr Swap rate + 5.03% | )# | 3/16/2027 | $ | 200 | $ | 210,500 | |||||
| Banco de Credito e Inversiones (Chile)†(c) | 3.50% | 10/12/2027 | 535 | 522,628 | ||||||||
| Bank of America Corp. | 3.593% (3 Mo. LIBOR + 1.37% | )# | 7/21/2028 | 1,565 | 1,592,200 | |||||||
| Bank of America Corp. | 3.824% (3 Mo. LIBOR + 1.58% | )# | 1/20/2028 | 1,597 | 1,653,318 | |||||||
| Bank of America Corp. | 3.95% | 4/21/2025 | 250 | 258,715 | ||||||||
| Bank of America Corp. | 4.00% | 1/22/2025 | 728 | 757,909 | ||||||||
| Bank of America Corp. | 4.45% | 3/3/2026 | 315 | 336,725 | ||||||||
| Bank of Montreal (Canada)†(c) | 2.50% | 1/11/2022 | 2,747 | 2,744,435 | ||||||||
| Citigroup, Inc. | 3.668% (3 Mo. LIBOR + 1.39% | )# | 7/24/2028 | 1,692 | 1,718,177 | |||||||
| Citigroup, Inc. | 3.887% (3 Mo. LIBOR + 1.56% | )# | 1/10/2028 | 396 | 410,245 | |||||||
| Citigroup, Inc. | 4.45% | 9/29/2027 | 552 | 584,928 | ||||||||
| Commonwealth Bank of Australia (Australia)†(c) | 4.50% | 12/9/2025 | 734 | 769,458 | ||||||||
| First Republic Bank | 4.625% | 2/13/2047 | 418 | 448,450 | ||||||||
| Goldman Sachs Group, Inc. (The) | 2.908% (3 Mo. LIBOR + 1.05% | )# | 6/5/2023 | 1,067 | 1,060,863 | |||||||
| Goldman Sachs Group, Inc. (The) | 6.25% | 2/1/2041 | 588 | 793,415 | ||||||||
| Goldman Sachs Group, Inc. (The) | 6.75% | 10/1/2037 | 479 | 641,944 | ||||||||
| Intesa Sanpaolo SpA (Italy)†(c) | 5.71% | 1/15/2026 | 523 | 551,729 | ||||||||
| JPMorgan Chase & Co. | 3.54% (3 Mo. LIBOR + 1.38% | )# | 5/1/2028 | 553 | 563,097 | |||||||
| JPMorgan Chase & Co. | 3.782% (3 Mo. LIBOR + 1.34% | )# | 2/1/2028 | 2,762 | 2,864,610 | |||||||
| Manufacturers & Traders Trust Co. | 3.40% | 8/17/2027 | 264 | 267,324 | ||||||||
| Morgan Stanley | 3.625% | 1/20/2027 | 408 | 417,933 | ||||||||
| Morgan Stanley | 3.875% | 1/27/2026 | 873 | 910,699 | ||||||||
| Morgan Stanley | 4.00% | 7/23/2025 | 770 | 806,824 | ||||||||
| Morgan Stanley | 7.25% | 4/1/2032 | 84 | 116,552 | ||||||||
| Santander UK Group Holdings plc (United Kingdom)(c) | 3.823% | # | 11/3/2028 | 632 | 634,566 | |||||||
| Santander UK Group Holdings plc (United Kingdom)†(c) | 4.75% | 9/15/2025 | 545 | 572,710 | ||||||||
| Santander UK plc (United Kingdom)†(c) | 5.00% | 11/7/2023 | 223 | 238,834 | ||||||||
| Santander UK plc (United Kingdom)(c) | 7.95% | 10/26/2029 | 902 | 1,175,986 | ||||||||
| Toronto-Dominion Bank (The) (Canada)†(c) | 2.50% | 1/18/2022 | 3,297 | 3,290,257 | ||||||||
| Toronto-Dominion Bank (The) (Canada)(c) | 3.625% (5 Yr Swap rate + 2.21% | )# | 9/15/2031 | 1,324 | 1,322,189 | |||||||
| Turkiye Garanti Bankasi AS (Turkey)†(c) | 6.125% (5 Yr Swap rate + 4.22% | )# | 5/24/2027 | 475 | 475,271 | |||||||
| Turkiye Garanti Bankasi AS (Turkey)†(c) | 6.25% | 4/20/2021 | 200 | 211,825 | ||||||||
| Wachovia Corp. | 7.574% | 8/1/2026 | 596 | 762,487 | ||||||||
| Wells Fargo & Co. | 3.00% | 10/23/2026 | 483 | 473,827 | ||||||||
| 14 | See Notes to Financial Statements. |
Schedule of Investments (continued)
December 31, 2017
| Investments | Interest Rate | Maturity Date | Principal Amount (000) | Fair Value | ||||||||
| Banks: Regional (continued) | ||||||||||||
| Wells Fargo Bank NA | 5.85% | 2/1/2037 | $ | 1,880 | $ | 2,413,720 | ||||||
| Wells Fargo Bank NA | 6.60% | 1/15/2038 | 687 | 959,344 | ||||||||
| Westpac Banking Corp. (Australia)(c) | 4.322% (USISDA05 + 2.24% | )# | 11/23/2031 | 812 | 837,927 | |||||||
| Total | 34,371,621 | |||||||||||
| Beverages 0.42% | ||||||||||||
| Anheuser-Busch InBev Finance, Inc. | 4.70% | 2/1/2036 | 1,481 | 1,665,976 | ||||||||
| Becle SAB de CV (Mexico)†(c) | 3.75% | 5/13/2025 | 350 | 351,815 | ||||||||
| Fomento Economico Mexicano SAB de CV (Mexico)(c) | 4.375% | 5/10/2043 | 300 | 317,386 | ||||||||
| Total | 2,335,177 | |||||||||||
| Building Materials 0.41% | ||||||||||||
| James Hardie International Finance DAC (Ireland)†(c) | 4.75% | 1/15/2025 | 794 | 803,925 | ||||||||
| Standard Industries, Inc.† | 5.50% | 2/15/2023 | 272 | 284,240 | ||||||||
| Standard Industries, Inc.† | 6.00% | 10/15/2025 | 1,086 | 1,164,735 | ||||||||
| Total | 2,252,900 | |||||||||||
| Business Services 0.45% | ||||||||||||
| Adani Ports & Special Economic Zone Ltd. (India)†(c) | 4.00% | 7/30/2027 | 275 | 273,332 | ||||||||
| Ashtead Capital, Inc.† | 4.375% | 8/15/2027 | 277 | 281,848 | ||||||||
| Brink’s Co. (The)† | 4.625% | 10/15/2027 | 676 | 664,170 | ||||||||
| Rent-A-Center, Inc. | 4.75% | 5/1/2021 | 528 | 501,600 | ||||||||
| United Rentals North America, Inc. | 4.875% | 1/15/2028 | 783 | 788,872 | ||||||||
| Total | 2,509,822 | |||||||||||
| Chemicals 0.69% | ||||||||||||
| Blue Cube Spinco, Inc. | 10.00% | 10/15/2025 | 1,043 | 1,256,815 | ||||||||
| Chemours Co. (The) | 7.00% | 5/15/2025 | 469 | 511,210 | ||||||||
| Equate Petrochemical BV (Netherlands)†(c) | 4.25% | 11/3/2026 | 700 | 714,350 | ||||||||
| GCP Applied Technologies, Inc.† | 9.50% | 2/1/2023 | 94 | 104,575 | ||||||||
| Mexichem SAB de CV (Mexico)†(c) | 4.875% | 9/19/2022 | 205 | 218,325 | ||||||||
| Rain CII Carbon LLC/CII Carbon Corp.† | 7.25% | 4/1/2025 | 403 | 439,774 | ||||||||
| Tronox Finance LLC† | 7.50% | 3/15/2022 | 417 | 436,807 | ||||||||
| Valvoline, Inc. | 5.50% | 7/15/2024 | 116 | 123,540 | ||||||||
| Total | 3,805,396 | |||||||||||
| Coal 0.13% | ||||||||||||
| Peabody Energy Corp.† | 6.00% | 3/31/2022 | 79 | 82,259 | ||||||||
| Peabody Energy Corp.† | 6.375% | 3/31/2025 | 624 | 651,300 | ||||||||
| Total | 733,559 | |||||||||||
| See Notes to Financial Statements. | 15 |
Schedule of Investments (continued)
December 31, 2017
| Investments | Interest Rate | Maturity Date | Principal Amount (000) | Fair Value | ||||||||
| Computer Hardware 0.34% | ||||||||||||
| Dell International LLC/EMC Corp.† | 3.48% | 6/1/2019 | $ | 278 | $ | 281,554 | ||||||
| Dell International LLC/EMC Corp.† | 5.45% | 6/15/2023 | 251 | 271,514 | ||||||||
| Dell International LLC/EMC Corp.† | 6.02% | 6/15/2026 | 563 | 621,640 | ||||||||
| Dell International LLC/EMC Corp.† | 7.125% | 6/15/2024 | 294 | 322,001 | ||||||||
| Dell International LLC/EMC Corp.† | 8.35% | 7/15/2046 | 283 | 365,550 | ||||||||
| Total | 1,862,259 | |||||||||||
| Computer Software 0.26% | ||||||||||||
| First Data Corp.† | 5.75% | 1/15/2024 | 500 | 521,125 | ||||||||
| Oracle Corp. | 6.125% | 7/8/2039 | 675 | 928,167 | ||||||||
| Total | 1,449,292 | |||||||||||
| Construction/Homebuilding 0.38% | ||||||||||||
| AV Homes, Inc. | 6.625% | 5/15/2022 | 505 | 531,512 | ||||||||
| Century Communities, Inc. | 5.875% | 7/15/2025 | 365 | 367,738 | ||||||||
| PulteGroup, Inc. | 7.875% | 6/15/2032 | 442 | 556,920 | ||||||||
| TRI Pointe Group, Inc. | 5.25% | 6/1/2027 | 310 | 318,355 | ||||||||
| William Lyon Homes, Inc. | 5.875% | 1/31/2025 | 307 | 314,291 | ||||||||
| Total | 2,088,816 | |||||||||||
| Containers 0.13% | ||||||||||||
| BWAY Holding Co.† | 7.25% | 4/15/2025 | 479 | 495,765 | ||||||||
| SAN Miguel Industrias Pet SA (Peru)†(c) | 4.50% | 9/18/2022 | 200 | 203,700 | ||||||||
| Total | 699,465 | |||||||||||
| Drugs 0.11% | ||||||||||||
| Teva Pharmaceutical Finance Netherlands III BV (Netherlands)(c) | 2.20% | 7/21/2021 | 356 | 325,434 | ||||||||
| Valeant Pharmaceuticals International, Inc.† | 5.625% | 12/1/2021 | 226 | 221,763 | ||||||||
| Valeant Pharmaceuticals International, Inc.† | 7.50% | 7/15/2021 | 68 | 69,445 | ||||||||
| Total | 616,642 | |||||||||||
| Electric: Power 1.36% | ||||||||||||
| Appalachian Power Co. | 7.00% | 4/1/2038 | 529 | 754,916 | ||||||||
| Dominion Energy, Inc. | 7.00% | 6/15/2038 | 266 | 368,242 | ||||||||
| Dynegy, Inc. | 7.625% | 11/1/2024 | 755 | 813,512 | ||||||||
| Emirates Semb Corp., Water & Power Co. PJSC (United Arab Emirates)†(c) | 4.45% | 8/1/2035 | 275 | 281,378 | ||||||||
| Enel Finance International NV (Netherlands)†(c) | 2.75% | 4/6/2023 | 882 | 870,010 | ||||||||
| Exelon Generation Co. LLC | 5.60% | 6/15/2042 | 390 | 428,757 | ||||||||
| Exelon Generation Co. LLC | 6.25% | 10/1/2039 | 592 | 694,227 | ||||||||
| 16 | See Notes to Financial Statements. |
Schedule of Investments (continued)
December 31, 2017
| Investments | Interest Rate | Maturity Date | Principal Amount (000) | Fair Value | ||||||||
| Electric: Power (continued) | ||||||||||||
| Massachusetts Electric Co.† | 4.004% | 8/15/2046 | $ | 501 | $ | 532,861 | ||||||
| Minejesa Capital BV (Netherlands)†(c) | 4.625% | 8/10/2030 | 250 | 256,139 | ||||||||
| Orazul Energy Egenor S en C por A (Peru)†(c) | 5.625% | 4/28/2027 | 574 | 566,251 | ||||||||
| Origin Energy Finance Ltd. (Australia)†(c) | 3.50% | 10/9/2018 | 375 | 377,302 | ||||||||
| Pacific Gas & Electric Co.† | 3.30% | 12/1/2027 | 1,099 | 1,090,696 | ||||||||
| South Carolina Electric & Gas Co. | 6.05% | 1/15/2038 | 177 | 221,768 | ||||||||
| South Carolina Electric & Gas Co. | 6.625% | 2/1/2032 | 246 | 312,233 | ||||||||
| Total | 7,568,292 | |||||||||||
| Engineering & Contracting Services 0.35% | ||||||||||||
| Aeropuertos Dominicanos Siglo XXI SA (Dominican Republic)†(c) | 6.75% | 3/30/2029 | 295 | 324,131 | ||||||||
| Brand Industrial Services, Inc.† | 8.50% | 7/15/2025 | 651 | 685,178 | ||||||||
| China Railway Resources Huitung Ltd. (Hong Kong)(c) | 3.85% | 2/5/2023 | 900 | 928,796 | ||||||||
| Total | 1,938,105 | |||||||||||
| Entertainment 0.48% | ||||||||||||
| Cedar Fair LP/Canada’s Wonderland Co./Magnum Management Corp./Millennium Op† | 5.375% | 4/15/2027 | 862 | 907,255 | ||||||||
| Eldorado Resorts, Inc. | 6.00% | 4/1/2025 | 505 | 530,250 | ||||||||
| Jacobs Entertainment, Inc.† | 7.875% | 2/1/2024 | 445 | 477,263 | ||||||||
| Mohegan Gaming & Entertainment† | 7.875% | 10/15/2024 | 723 | 743,786 | ||||||||
| Total | 2,658,554 | |||||||||||
| Financial Services 1.32% | ||||||||||||
| Affiliated Managers Group, Inc. | 3.50% | 8/1/2025 | 125 | 126,495 | ||||||||
| Affiliated Managers Group, Inc. | 4.25% | 2/15/2024 | 248 | 261,650 | ||||||||
| Discover Financial Services | 4.10% | 2/9/2027 | 992 | 1,017,739 | ||||||||
| Intelsat Connect Finance SA (Luxembourg)†(c) | 12.50% | 4/1/2022 | 539 | 474,320 | ||||||||
| International Lease Finance Corp. | 5.875% | 4/1/2019 | 1,433 | 1,491,799 | ||||||||
| Nationstar Mortgage LLC/Nationstar Capital Corp. | 7.875% | 10/1/2020 | 367 | 375,028 | ||||||||
| Navient Corp. | 6.625% | 7/26/2021 | 1,015 | 1,073,362 | ||||||||
| Neuberger Berman Group LLC/Neuberger Berman Finance Corp.† | 4.50% | 3/15/2027 | 343 | 361,335 | ||||||||
| Neuberger Berman Group LLC/Neuberger Berman Finance Corp.† | 4.875% | 4/15/2045 | 347 | 354,876 | ||||||||
| OM Asset Management plc (United Kingdom)(c) | 4.80% | 7/27/2026 | 489 | 507,063 | ||||||||
| Quicken Loans, Inc.† | 5.25% | 1/15/2028 | 978 | 967,927 | ||||||||
| SURA Asset Management SA (Colombia)†(c) | 4.375% | 4/11/2027 | 280 | 283,500 | ||||||||
| Total | 7,295,094 | |||||||||||
| See Notes to Financial Statements. | 17 |
Schedule of Investments (continued)
December 31, 2017
| Investments | Interest Rate | Maturity Date | Principal Amount (000) | Fair Value | ||||||||
| Food 0.17% | ||||||||||||
| Arcor SAIC (Argentina)†(c) | 6.00% | 7/6/2023 | $ | 297 | $ | 315,934 | ||||||
| Chobani LLC/Chobani Finance Corp., Inc.† | 7.50% | 4/15/2025 | 370 | 393,587 | ||||||||
| Gruma SAB de CV (Mexico)†(c) | 4.875% | 12/1/2024 | 200 | 214,500 | ||||||||
| Total | 924,021 | |||||||||||
| Health Care Services 0.65% | ||||||||||||
| Ascension Health | 3.945% | 11/15/2046 | 265 | 280,669 | ||||||||
| HCA, Inc. | 5.50% | 6/15/2047 | 390 | 390,000 | ||||||||
| HCA, Inc. | 7.50% | 11/6/2033 | 125 | 140,625 | ||||||||
| Kaiser Foundation Hospitals | 4.15% | 5/1/2047 | 366 | 396,121 | ||||||||
| MPH Acquisition Holdings LLC† | 7.125% | 6/1/2024 | 97 | 103,548 | ||||||||
| New York & Presbyterian Hospital (The) | 4.063% | 8/1/2056 | 496 | 521,959 | ||||||||
| NYU Hospitals Center | 4.368% | 7/1/2047 | 85 | 91,729 | ||||||||
| Polaris Intermediate Corp. PIK 8.5%† | 8.50% | 12/1/2022 | 746 | 775,840 | ||||||||
| WellCare Health Plans, Inc. | 5.25% | 4/1/2025 | 866 | 915,795 | ||||||||
| Total | 3,616,286 | |||||||||||
| Household Equipment/Products 0.12% | ||||||||||||
| Central Garden & Pet Co. | 6.125% | 11/15/2023 | 513 | 545,062 | ||||||||
| Kimberly-Clark de Mexico SAB de CV (Mexico)†(c) | 3.80% | 4/8/2024 | 100 | 101,794 | ||||||||
| Total | 646,856 | |||||||||||
| Insurance 0.61% | ||||||||||||
| American International Group, Inc. | 4.70% | 7/10/2035 | 680 | 753,818 | ||||||||
| Lincoln National Corp. | 6.30% | 10/9/2037 | 202 | 260,996 | ||||||||
| Teachers Insurance & Annuity Association of America† | 4.90% | 9/15/2044 | 1,230 | 1,409,044 | ||||||||
| Unum Group | 5.75% | 8/15/2042 | 330 | 404,921 | ||||||||
| Willis North America, Inc. | 7.00% | 9/29/2019 | 524 | 562,142 | ||||||||
| Total | 3,390,921 | |||||||||||
| Leisure 0.50% | ||||||||||||
| Carlson Travel, Inc.† | 6.75% | 12/15/2023 | 236 | 214,170 | ||||||||
| Carnival plc | 7.875% | 6/1/2027 | 277 | 365,598 | ||||||||
| Royal Caribbean Cruises Ltd. | 7.50% | 10/15/2027 | 1,030 | 1,331,079 | ||||||||
| Silversea Cruise Finance Ltd.† | 7.25% | 2/1/2025 | 495 | 535,838 | ||||||||
| Viking Cruises Ltd.† | 5.875% | 9/15/2027 | 343 | 349,860 | ||||||||
| Total | 2,796,545 | |||||||||||
| Machinery: Industrial/Specialty 0.14% | ||||||||||||
| SPX FLOW, Inc.† | 5.625% | 8/15/2024 | 720 | 761,400 | ||||||||
| 18 | See Notes to Financial Statements. |
Schedule of Investments (continued)
December 31, 2017
| Investments | Interest Rate | Maturity Date | Principal Amount (000) | Fair Value | ||||||||
| Machinery: Oil Well Equipment & Services 0.10% | ||||||||||||
| BlueLine Rental Finance Corp./BlueLine Rental LLC† | 9.25% | 3/15/2024 | $ | 497 | $ | 531,790 | ||||||
| Manufacturing 0.47% | ||||||||||||
| Bombardier, Inc.(Canada)†(c) | 7.50% | 3/15/2025 | 533 | 539,662 | ||||||||
| Gates Global LLC/Gates Global Co.† | 6.00% | 7/15/2022 | 658 | 676,095 | ||||||||
| Koppers, Inc.† | 6.00% | 2/15/2025 | 495 | 525,938 | ||||||||
| Siemens Financieringsmaatschappij NV (Netherlands)†(c) | 3.40% | 3/16/2027 | 876 | 893,429 | ||||||||
| Total | 2,635,124 | |||||||||||
| Media 1.57% | ||||||||||||
| 21st Century Fox America, Inc. | 7.75% | 12/1/2045 | 451 | 717,496 | ||||||||
| Block Communications, Inc.† | 6.875% | 2/15/2025 | 253 | 266,283 | ||||||||
| Cablevision Systems Corp. | 5.875% | 9/15/2022 | 453 | 447,337 | ||||||||
| CCO Holdings LLC/CCO Holdings Capital Corp.† | 5.75% | 2/15/2026 | 178 | 185,343 | ||||||||
| Comcast Corp. | 3.15% | 3/1/2026 | 1,505 | 1,517,370 | ||||||||
| Comcast Corp. | 3.969% | 11/1/2047 | 722 | 747,124 | ||||||||
| Cox Communications, Inc.† | 8.375% | 3/1/2039 | 782 | 1,102,811 | ||||||||
| CSC Holdings LLC† | 10.875% | 10/15/2025 | 200 | 238,000 | ||||||||
| DISH DBS Corp. | 7.75% | 7/1/2026 | 397 | 418,835 | ||||||||
| Myriad International Holdings BV (Netherlands)†(c) | 5.50% | 7/21/2025 | 350 | 381,895 | ||||||||
| SFR Group SA (France)†(c) | 6.00% | 5/15/2022 | 500 | 506,875 | ||||||||
| Time Warner Cable LLC | 7.30% | 7/1/2038 | 1,032 | 1,296,507 | ||||||||
| Time Warner Entertainment Co. LP | 8.375% | 7/15/2033 | 245 | 337,733 | ||||||||
| VTR Finance BV (Netherlands)†(c) | 6.875% | 1/15/2024 | 507 | 536,152 | ||||||||
| Total | 8,699,761 | |||||||||||
| Metal Fabricating 0.02% | ||||||||||||
| Grinding Media, Inc./Moly-Cop AltaSteel Ltd.† | 7.375% | 12/15/2023 | 130 | 139,906 | ||||||||
| Metals & Minerals: Miscellaneous 0.87% | ||||||||||||
| Aleris International, Inc.† | 9.50% | 4/1/2021 | 160 | 169,600 | ||||||||
| Barrick International Barbados Corp. (Barbados)†(c) | 6.35% | 10/15/2036 | 158 | 204,868 | ||||||||
| Barrick North America Finance LLC | 7.50% | 9/15/2038 | 200 | 277,001 | ||||||||
| Corp. Nacional del Cobre de Chile (Chile)†(c) | 4.50% | 9/16/2025 | 700 | 753,312 | ||||||||
| Freeport-McMoRan, Inc. | 3.875% | 3/15/2023 | 775 | 775,000 | ||||||||
| Glencore Finance Canada Ltd. (Canada)†(c) | 5.55% | 10/25/2042 | 640 | 709,640 | ||||||||
| Hudbay Minerals, Inc. (Canada)†(c) | 7.25% | 1/15/2023 | 72 | 76,680 | ||||||||
| Hudbay Minerals, Inc. (Canada)†(c) | 7.625% | 1/15/2025 | 107 | 117,700 | ||||||||
| Kinross Gold Corp. (Canada)(c) | 5.95% | 3/15/2024 | 281 | 309,451 | ||||||||
| See Notes to Financial Statements. | 19 |
Schedule of Investments (continued)
December 31, 2017
| Investments | Interest Rate | Maturity Date | Principal Amount (000) | Fair Value | ||||||||
| Metals & Minerals: Miscellaneous (continued) | ||||||||||||
| MMC Norilsk Nickel OJSC via MMC Finance DAC (Ireland)†(c) | 4.10% | 4/11/2023 | $ | 430 | $ | 433,622 | ||||||
| Teck Resources Ltd. (Canada)(c) | 4.75% | 1/15/2022 | 948 | 994,262 | ||||||||
| Total | 4,821,136 | |||||||||||
| Natural Gas 0.20% | ||||||||||||
| Dominion Energy Gas Holdings LLC | 4.60% | 12/15/2044 | 1,026 | 1,132,255 | ||||||||
| Oil 1.93% | ||||||||||||
| Afren plc (United Kingdom)†(c)(d) | 6.625% | 12/9/2020 | 244 | 1,003 | ||||||||
| Cenovus Energy, Inc. (Canada)(c) | 5.40% | 6/15/2047 | 248 | 261,737 | ||||||||
| Continental Resources, Inc. | 3.80% | 6/1/2024 | 832 | 825,760 | ||||||||
| Eni SpA (Italy)†(c) | 5.70% | 10/1/2040 | 1,800 | 1,963,245 | ||||||||
| EP Energy LLC/Everest Acquisition Finance, Inc.† | 8.00% | 11/29/2024 | 498 | 516,675 | ||||||||
| Gazprom OAO via Gaz Capital SA (Luxembourg)†(c) | 4.95% | 2/6/2028 | 200 | 208,677 | ||||||||
| Halcon Resources Corp.† | 6.75% | 2/15/2025 | 476 | 497,420 | ||||||||
| Kerr-McGee Corp. | 7.875% | 9/15/2031 | 479 | 637,667 | ||||||||
| MEG Energy Corp. (Canada)†(c) | 7.00% | 3/31/2024 | 450 | 381,937 | ||||||||
| Pertamina Persero PT (Indonesia)†(c) | 5.625% | 5/20/2043 | 200 | 217,981 | ||||||||
| Petrobras Global Finance BV (Netherlands)(c) | 4.375% | 5/20/2023 | 358 | 354,946 | ||||||||
| Petrobras Global Finance BV (Netherlands)(c) | 7.25% | 3/17/2044 | 376 | 391,980 | ||||||||
| Petroleos Mexicanos (Mexico)(c) | 4.50% | 1/23/2026 | 489 | 489,342 | ||||||||
| Precision Drilling Corp. (Canada)(c) | 7.75% | 12/15/2023 | 147 | 155,085 | ||||||||
| Raizen Fuels Finance SA (Luxembourg)†(c) | 5.30% | 1/20/2027 | 200 | 209,760 | ||||||||
| Sanchez Energy Corp. | 6.125% | 1/15/2023 | 682 | 581,405 | ||||||||
| Sinopec Group Overseas Development Ltd.† | 4.375% | 10/17/2023 | 364 | 386,761 | ||||||||
| SM Energy Co. | 5.625% | 6/1/2025 | 26 | 25,350 | ||||||||
| SM Energy Co. | 6.50% | 1/1/2023 | 1,055 | 1,081,375 | ||||||||
| Valero Energy Corp. | 10.50% | 3/15/2039 | 421 | 721,950 | ||||||||
| WPX Energy, Inc. | 5.25% | 9/15/2024 | 374 | 374,580 | ||||||||
| WPX Energy, Inc. | 6.00% | 1/15/2022 | 104 | 109,200 | ||||||||
| YPF SA (Argentina)†(c) | 8.50% | 7/28/2025 | 281 | 326,662 | ||||||||
| Total | 10,720,498 | |||||||||||
| Oil: Crude Producers 0.77% | ||||||||||||
| Abu Dhabi Crude Oil Pipeline LLC (United Arab Emirates)†(c) | 4.60% | 11/2/2047 | 320 | 330,006 | ||||||||
| Cheniere Corpus Christi Holdings LLC | 5.125% | 6/30/2027 | 501 | 519,487 | ||||||||
| Energy Transfer LP | 7.50% | 7/1/2038 | 679 | 843,784 | ||||||||
| Energy Transfer LP/Regency Energy Finance Corp. | 5.00% | 10/1/2022 | 23 | 24,539 | ||||||||
| 20 | See Notes to Financial Statements. |
Schedule of Investments (continued)
December 31, 2017
| Investments | Interest Rate | Maturity Date | Principal Amount (000) | Fair Value | ||||||||
| Oil: Crude Producers (continued) | ||||||||||||
| GNL Quintero SA (Chile)†(c) | 4.634% | 7/31/2029 | $ | 200 | $ | 209,000 | ||||||
| IFM US Colonial Pipeline 2 LLC† | 6.45% | 5/1/2021 | 370 | 406,240 | ||||||||
| Kinder Morgan, Inc. | 7.75% | 1/15/2032 | 1,413 | 1,828,282 | ||||||||
| Tennessee Gas Pipeline Co. LLC | 8.375% | 6/15/2032 | 67 | 87,455 | ||||||||
| Total | 4,248,793 | |||||||||||
| Oil: Integrated Domestic 0.57% | ||||||||||||
| Baker Hughes a GE Co. LLC/Baker Hughes Co-Obligor, Inc.† | 3.337% | 12/15/2027 | 1,092 | 1,091,205 | ||||||||
| Halliburton Co. | 6.70% | 9/15/2038 | 209 | 278,514 | ||||||||
| Halliburton Co. | 7.45% | 9/15/2039 | 227 | 325,398 | ||||||||
| National Oilwell Varco, Inc. | 3.95% | 12/1/2042 | 431 | 382,705 | ||||||||
| Transocean Proteus Ltd.† | 6.25% | 12/1/2024 | 343 | 360,902 | ||||||||
| Trinidad Drilling Ltd. (Canada)†(c) | 6.625% | 2/15/2025 | 204 | 194,820 | ||||||||
| Weatherford International Ltd. | 8.25% | 6/15/2023 | 522 | 528,525 | ||||||||
| Total | 3,162,069 | |||||||||||
| Real Estate Investment Trusts 1.15% | ||||||||||||
| Boston Properties LP | 3.20% | 1/15/2025 | 235 | 234,562 | ||||||||
| EPR Properties | 4.75% | 12/15/2026 | 501 | 515,033 | ||||||||
| EPR Properties | 5.25% | 7/15/2023 | 1,150 | 1,224,965 | ||||||||
| Equinix, Inc. | 5.875% | 1/15/2026 | 784 | 843,780 | ||||||||
| Goodman US Finance Four LLC† | 4.50% | 10/15/2037 | 316 | 327,395 | ||||||||
| Goodman US Finance Three LLC† | 3.70% | 3/15/2028 | 272 | 270,392 | ||||||||
| MGM Growth Properties Operating Partnership LP/MGP Finance Co-Issuer, Inc. | 5.625% | 5/1/2024 | 195 | 208,650 | ||||||||
| Ontario Teachers’ Cadillac Fairview Properties Trust (Canada)†(c) | 3.875% | 3/20/2027 | 875 | 895,312 | ||||||||
| Physicians Realty LP | 4.30% | 3/15/2027 | 193 | 196,681 | ||||||||
| VEREIT Operating Partnership LP | 3.00% | 2/6/2019 | 1,669 | 1,677,354 | ||||||||
| Total | 6,394,124 | |||||||||||
| Retail 0.47% | ||||||||||||
| FirstCash, Inc.† | 5.375% | 6/1/2024 | 259 | 271,303 | ||||||||
| JC Penney Corp., Inc.† | 5.875% | 7/1/2023 | 859 | 813,902 | ||||||||
| Men’s Wearhouse, Inc. (The) | 7.00% | 7/1/2022 | 827 | 834,278 | ||||||||
| PVH Corp. | 7.75% | 11/15/2023 | 561 | 676,005 | ||||||||
| Total | 2,595,488 | |||||||||||
| See Notes to Financial Statements. | 21 |
Schedule of Investments (continued)
December 31, 2017
| Investments | Interest Rate | Maturity Date | Principal Amount (000) | Fair Value | ||||||||
| Steel 0.14% | ||||||||||||
| Cleveland-Cliffs, Inc.† | 5.75% | 3/1/2025 | $ | 578 | $ | 553,435 | ||||||
| Vale Overseas Ltd. (Brazil)(c) | 6.875% | 11/10/2039 | 188 | 231,475 | ||||||||
| Total | 784,910 | |||||||||||
| Technology 1.10% | ||||||||||||
| Alibaba Group Holding Ltd. (China)(c) | 3.60% | 11/28/2024 | 965 | 1,001,724 | ||||||||
| Alibaba Group Holding Ltd. (China)(c) | 4.40% | 12/6/2057 | 200 | 208,726 | ||||||||
| Amazon.com, Inc.† | 3.15% | 8/22/2027 | 840 | 842,715 | ||||||||
| Amazon.com, Inc. | 4.80% | 12/5/2034 | 1,301 | 1,530,520 | ||||||||
| Baidu, Inc. (China)(c) | 3.50% | 11/28/2022 | 433 | 439,672 | ||||||||
| Expedia, Inc. | 3.80% | 2/15/2028 | 635 | 614,690 | ||||||||
| Netflix, Inc. | 4.375% | 11/15/2026 | 944 | 927,480 | ||||||||
| Tencent Holdings Ltd. (China)†(c) | 3.375% | 5/2/2019 | 510 | 516,189 | ||||||||
| Total | 6,081,716 | |||||||||||
| Telecommunications 0.86% | ||||||||||||
| AT&T, Inc. | 5.15% | 2/14/2050 | 112 | 112,998 | ||||||||
| AT&T, Inc.† | 5.15% | 11/15/2046 | 672 | 688,809 | ||||||||
| AT&T, Inc. | 6.00% | 8/15/2040 | 1,281 | 1,453,331 | ||||||||
| MTN Mauritius Investment Ltd. (Mauritius)†(c) | 4.755% | 11/11/2024 | 200 | 199,200 | ||||||||
| Ooredoo International Finance Ltd.† | 3.75% | 6/22/2026 | 300 | 298,706 | ||||||||
| Sprint Corp. | 7.125% | 6/15/2024 | 745 | 759,900 | ||||||||
| Verizon Communications, Inc. | 4.862% | 8/21/2046 | 526 | 549,564 | ||||||||
| Wind Tre SpA (Italy)†(c) | 5.00% | 1/20/2026 | 734 | 701,704 | ||||||||
| Total | 4,764,212 | |||||||||||
| Transportation: Miscellaneous 0.24% | ||||||||||||
| Autoridad del Canal de Panama (Panama)†(c) | 4.95% | 7/29/2035 | 200 | 223,750 | ||||||||
| Rumo Luxembourg Sarl (Luxembourg)†(c) | 7.375% | 2/9/2024 | 458 | 493,999 | ||||||||
| XPO Logistics, Inc.† | 6.125% | 9/1/2023 | 596 | 632,505 | ||||||||
| Total | 1,350,254 | |||||||||||
| Utilities 0.14% | ||||||||||||
| Aquarion Co.† | 4.00% | 8/15/2024 | 724 | 755,906 | ||||||||
| Total Corporate Bonds (cost $145,067,733) | 149,339,129 | |||||||||||
| FOREIGN GOVERNMENT OBLIGATIONS 5.52% | ||||||||||||
| Argentina 0.43% | ||||||||||||
| City of Buenos Aires(e) | 26.661% (BADLAR + 3.25% | )# | 3/29/2024 | ARS | 1,800 | 94,481 | ||||||
| Provincia de Buenos Aires†(c) | 6.50% | 2/15/2023 | $ | 226 | 243,357 | |||||||
| 22 | See Notes to Financial Statements. |
Schedule of Investments (continued)
December 31, 2017
| Principal | ||||||||||||
| Interest | Maturity | Amount | Fair | |||||||||
| Investments | Rate | Date | (000) | Value | ||||||||
| Argentina (continued) | ||||||||||||
| Provincia de Mendoza†(c) | 8.375% | 5/19/2024 | $ | 400 | $ | 447,024 | ||||||
| Republic of Argentina(c) | 6.875% | 1/26/2027 | 682 | 746,108 | ||||||||
| Republic of Argentina(c) | 8.28% | 12/31/2033 | 714 | 844,947 | ||||||||
| Total | 2,375,917 | |||||||||||
| Bahamas 0.13% | ||||||||||||
| Commonwealth of Bahamas†(c) | 6.00% | 11/21/2028 | 370 | 386,650 | ||||||||
| Commonwealth of Bahamas†(c) | 6.95% | 11/20/2029 | 300 | 330,241 | ||||||||
| Total | 716,891 | |||||||||||
| Bermuda 0.08% | ||||||||||||
| Government of Bermuda† | 3.717% | 1/25/2027 | 430 | 436,988 | ||||||||
| Brazil 0.14% | ||||||||||||
| Federal Republic of Brazil(c) | 4.25% | 1/7/2025 | 600 | 610,950 | ||||||||
| Federal Republic of Brazil(c) | 5.00% | 1/27/2045 | 200 | 186,900 | ||||||||
| Total | 797,850 | |||||||||||
| Canada 0.57% | ||||||||||||
| Province of Quebec Canada(c) | 2.75% | 4/12/2027 | 3,186 | 3,162,541 | ||||||||
| Egypt 0.04% | ||||||||||||
| Arab Republic of Egypt†(c) | 6.125% | 1/31/2022 | 220 | 230,599 | ||||||||
| Ghana 0.04% | ||||||||||||
| Republic of Ghana†(c) | 7.875% | 8/7/2023 | 225 | 247,835 | ||||||||
| Indonesia 0.21% | ||||||||||||
| Perusahaan Penerbit SBSN†(c) | 4.00% | 11/21/2018 | 200 | 203,460 | ||||||||
| Republic of Indonesia†(c) | 4.35% | 1/8/2027 | 645 | 683,460 | ||||||||
| Republic of Indonesia†(c) | 5.875% | 1/15/2024 | 250 | 285,240 | ||||||||
| Total | 1,172,160 | |||||||||||
| Japan 3.13% | ||||||||||||
| Japan Bank for International Corp.(c) | 2.125% | 7/21/2020 | 1,248 | 1,238,842 | ||||||||
| Japan Bank for International Corp.(c) | 2.125% | 11/16/2020 | 16,216 | 16,083,628 | ||||||||
| Total | 17,322,470 | |||||||||||
| Latvia 0.05% | ||||||||||||
| Republic of Latvia†(c) | 5.25% | 6/16/2021 | 258 | 283,392 | ||||||||
| Lithuania 0.12% | ||||||||||||
| Republic of Lithuania†(c) | 7.375% | 2/11/2020 | 592 | 654,627 | ||||||||
| See Notes to Financial Statements. | 23 |
Schedule of Investments (continued)
December 31, 2017
| Principal | ||||||||||||
| Interest | Maturity | Amount | Fair | |||||||||
| Investments | Rate | Date | (000) | Value | ||||||||
| Mexico 0.16% | ||||||||||||
| United Mexican States(c) | 4.00% | 10/2/2023 | $ | 834 | $ | 874,866 | ||||||
| Qatar 0.06% | ||||||||||||
| State of Qatar†(c) | 3.25% | 6/2/2026 | 345 | 336,682 | ||||||||
| Romania 0.01% | ||||||||||||
| Republic of Romania†(c) | 6.125% | 1/22/2044 | 49 | 63,415 | ||||||||
| Sri Lanka 0.08% | ||||||||||||
| Republic of Sri Lanka†(c) | 6.25% | 7/27/2021 | 200 | 212,955 | ||||||||
| Republic of Sri Lanka†(c) | 6.85% | 11/3/2025 | 200 | 221,148 | ||||||||
| Total | 434,103 | |||||||||||
| Turkey 0.25% | ||||||||||||
| Republic of Turkey(c) | 3.25% | 3/23/2023 | 220 | 208,911 | ||||||||
| Republic of Turkey(c) | 5.625% | 3/30/2021 | 616 | 649,411 | ||||||||
| Republic of Turkey(c) | 5.75% | 3/22/2024 | 510 | 540,913 | ||||||||
| Total | 1,399,235 | |||||||||||
| Uruguay 0.02% | ||||||||||||
| Republic of Uruguay(c) | 7.875% | 1/15/2033 | 61 | 87,535 | ||||||||
| Total Foreign Government Obligations (cost $30,417,918) | 30,597,106 | |||||||||||
| GOVERNMENT SPONSORED ENTERPRISES COLLATERALIZED MORTGAGE OBLIGATIONS 1.52% | ||||||||||||
| Federal Home Loan Mortgage Corp. Q001 XA IO | 2.303% | #(b) | 2/25/2032 | 2,857 | 453,060 | |||||||
| Government National Mortgage Assoc. 2014-78 A | 2.20% | 4/16/2047 | 30 | 29,498 | ||||||||
| Government National Mortgage Assoc. 2015-47 AE | 2.90% | #(b) | 11/16/2055 | 1,333 | 1,335,669 | |||||||
| Government National Mortgage Assoc. 2015-48 AS | 2.90% | #(b) | 2/16/2049 | 793 | 793,847 | |||||||
| Government National Mortgage Assoc. 2015-73 AC | 2.90% | #(b) | 2/16/2053 | 314 | 311,861 | |||||||
| Government National Mortgage Assoc. 2017-168 AS | 2.70% | 8/16/2058 | 1,619 | 1,602,039 | ||||||||
| Government National Mortgage Assoc. 2017-41 AS | 2.60% | 6/16/2057 | 1,311 | 1,286,877 | ||||||||
| Government National Mortgage Assoc. 2017-69 AS | 2.75% | 2/16/2058 | 675 | 664,043 | ||||||||
| Government National Mortgage Assoc. 2017-71 AS | 2.70% | 4/16/2057 | 450 | 441,465 | ||||||||
| Government National Mortgage Assoc. 2017-86 AS | 2.75% | 2/16/2058 | 514 | 509,661 | ||||||||
| Government National Mortgage Assoc. 2017-89 AB | 2.60% | 7/16/2058 | 432 | 425,399 | ||||||||
| Government National Mortgage Assoc. 2017-90 AS | 2.70% | 7/16/2057 | 602 | 593,597 | ||||||||
| Total Government Sponsored Enterprises Collateralized Mortgage Obligations (cost $8,535,373) | 8,447,016 | |||||||||||
| GOVERNMENT SPONSORED ENTERPRISES PASS-THROUGHS 16.93% | ||||||||||||
| Federal Home Loan Mortgage Corp. | 0.75% | 4/9/2018 | 11,929 | 11,907,349 | ||||||||
| Federal Home Loan Mortgage Corp. | 4.00% | 12/1/2044 - 8/1/2047 | 6,357 | 6,674,030 | ||||||||
| 24 | See Notes to Financial Statements. |
Schedule of Investments (continued)
December 31, 2017
| Principal | ||||||||||||
| Interest | Maturity | Amount | Fair | |||||||||
| Investments | Rate | Date | (000) | Value | ||||||||
| GOVERNMENT SPONSORED ENTERPRISES PASS-THROUGHS (continued) | ||||||||||||
| Federal Home Loan Mortgage Corp. | 5.00% | 9/1/2019 - 6/1/2026 | $ | 117 | $ | 120,762 | ||||||
| Federal National Mortgage Assoc. | 3.137% (12 Mo. LIBOR + 1.79% | )# | 3/1/2042 | 859 | 898,840 | |||||||
| Federal National Mortgage Assoc. | 3.50% | 4/1/2043 - 7/1/2043 | 2,387 | 2,476,400 | ||||||||
| Federal National Mortgage Assoc.(f) | 3.50% | TBA | 25,750 | 26,454,987 | ||||||||
| Federal National Mortgage Assoc. | 4.00% | 10/1/2040 - 9/1/2047 | 17,238 | 18,084,026 | ||||||||
| Federal National Mortgage Assoc.(f) | 4.50% | TBA | 9,800 | 10,427,751 | ||||||||
| Federal National Mortgage Assoc. | 4.50% | 9/1/2047 | 5,721 | 6,096,741 | ||||||||
| Federal National Mortgage Assoc. | 5.50% | 11/1/2034 - 9/1/2036 | 1,032 | 1,145,104 | ||||||||
| Government National Mortgage Assoc.(f) | 3.00% | TBA | 9,500 | 9,584,342 | ||||||||
| Total Government Sponsored Enterprises Pass-Throughs (cost $94,150,484) | 93,870,332 | |||||||||||
| MUNICIPAL BONDS 0.31% | ||||||||||||
| Miscellaneous | ||||||||||||
| District of Columbia | 5.591% | 12/1/2034 | 695 | 860,590 | ||||||||
| North Texas Tollway Auth | 8.91% | 2/1/2030 | 538 | 604,115 | ||||||||
| Pennsylvania | 5.35% | 5/1/2030 | 235 | 249,911 | ||||||||
| Total | 1,714,616 | |||||||||||
| Total Municipal Bonds (cost $1,699,494) | 1,714,616 | |||||||||||
| NON-AGENCY COMMERCIAL MORTGAGE-BACKED SECURITIES 3.31% | ||||||||||||
| BWAY Mortgage Trust 2015-1740 A† | 2.917% | 1/10/2035 | 880 | 865,791 | ||||||||
| Caesars Palace Las Vegas Trust 2017-VICI A† | 3.531% | 10/15/2034 | 1,474 | 1,508,904 | ||||||||
| Caesars Palace Las Vegas Trust 2017-VICI B† | 3.835% | 10/15/2034 | 901 | 924,378 | ||||||||
| CCUBS Commercial Mortgage Trust 2017-C1 B | 4.159% | #(b) | 11/15/2050 | 739 | 760,764 | |||||||
| CFCRE Commercial Mortgage Trust 2017-C8 B | 4.199% | #(b) | 6/15/2050 | 282 | 287,995 | |||||||
| CGBAM Commercial Mortgage Trust 2015-SMRT B† | 3.213% | 4/10/2028 | 212 | 212,608 | ||||||||
| CGBAM Commercial Mortgage Trust 2015-SMRT C† | 3.516% | 4/10/2028 | 159 | 159,952 | ||||||||
| Citigroup Commercial Mortgage Trust 2016-GC36 D† | 2.85% | 2/10/2049 | 1,250 | 953,394 | ||||||||
| Commercial Mortgage Pass-Through Certificates 2014-CR19 XA IO | 1.224% | #(b) | 8/10/2047 | 731 | 36,709 | |||||||
| Commercial Mortgage Pass-Through Certificates 2015-PC1 B | 4.441% | #(b) | 7/10/2050 | 178 | 182,192 | |||||||
| Commercial Mortgage Pass-Through Certificates 2015-PC1 C | 4.441% | #(b) | 7/10/2050 | 410 | 391,968 | |||||||
| Commercial Mortgage Pass-Through Certificates 2015-PC1 D | 4.441% | #(b) | 7/10/2050 | 574 | 465,439 | |||||||
| See Notes to Financial Statements. | 25 |
Schedule of Investments (continued)
December 31, 2017
| Principal | ||||||||||||
| Interest | Maturity | Amount | Fair | |||||||||
| Investments | Rate | Date | (000) | Value | ||||||||
| NON-AGENCY COMMERCIAL MORTGAGE-BACKED SECURITIES (continued) | ||||||||||||
| Commercial Mortgage Pass-Through Certificates 2016-SAVA A† | 3.152% (1 Mo. LIBOR + 1.72% | )# | 10/15/2034 | $ | 1,060 | $ | 1,062,376 | |||||
| CSAIL Commercial Mortgage Trust 2015-C2 C | 4.21% | #(b) | 6/15/2057 | 700 | 647,182 | |||||||
| DBWF Mortgage Trust 2015-LCM D† | 3.421% | #(b) | 6/10/2034 | 257 | 225,920 | |||||||
| GAHR Commercial Mortgage Trust 2015-NRF DFX† | 3.382% | #(b) | 12/15/2034 | 278 | 279,102 | |||||||
| GS Mortgage Securities Corp. II 2017-GS8 B | 3.953% | #(b) | 11/10/2050 | 227 | 233,726 | |||||||
| GS Mortgage Securities Trust 2015-GC32 C | 4.412% | #(b) | 7/10/2048 | 195 | 194,607 | |||||||
| Hudsons Bay Simon JV Trust 2015-HB7 B7† | 4.666% | 8/5/2034 | 668 | 664,531 | ||||||||
| Hudsons Bay Simon JV Trust 2015-HB7 D7† | 5.159% | #(b) | 8/5/2034 | 629 | 597,703 | |||||||
| JPMorgan Chase Commercial Mortgage Securities Trust 2014-C19 AS | 4.243% | #(b) | 4/15/2047 | 300 | 316,428 | |||||||
| JPMorgan Chase Commercial Mortgage Securities Trust 2015-C30 C | 4.309% | #(b) | 7/15/2048 | 374 | 365,274 | |||||||
| JPMorgan Chase Commercial Mortgage Securities Trust 2017-JP7 B | 4.05% | 9/15/2050 | 274 | 280,960 | ||||||||
| MASTR Asset Securitization Trust 2006-3 1A3 | 6.00% | 10/25/2036 | 6 | 5,930 | ||||||||
| MASTR Asset Securitization Trust 2006-3 1A8 | 6.00% | 10/25/2036 | 13 | 13,330 | ||||||||
| Merrill Lynch Mortgage Investors Trust 2006-AF2 AF1 | 6.25% | 10/25/2036 | 18 | 14,791 | ||||||||
| Morgan Stanley Bank of America Merrill Lynch Trust 2015-C23 XA IO | 0.732% | #(b) | 7/15/2050 | 19,534 | 655,584 | |||||||
| Morgan Stanley Capital I, Inc. 2017-HR2 B | 4.061% | 12/15/2050 | 792 | 818,845 | ||||||||
| SFAVE Commercial Mortgage Securities Trust 2015-5AVE A2B† | 4.144% | #(b) | 1/5/2043 | 250 | 257,124 | |||||||
| Structured Asset Securities Corp. 2006-3H 1A2 | 5.75% | 12/25/2035 | 9 | 9,202 | ||||||||
| UBS Commercial Mortgage Trust 2017-C5 B | 4.10% | #(b) | 11/15/2050 | 886 | 915,113 | |||||||
| UBS Commercial Mortgage Trust 2017-C6 B | 4.154% | #(b) | 12/15/2050 | 507 | 523,824 | |||||||
| UBS-BAMLL Trust 2012-WRM E† | 4.238% | #(b) | 6/10/2030 | 595 | 569,812 | |||||||
| UBS-Barclays Commercial Mortgage Trust 2012-C3 B† | 4.365% | #(b) | 8/10/2049 | 200 | 208,234 | |||||||
| Wells Fargo Commercial Mortgage Trust 2013-LC12 D† | 4.291% | #(b) | 7/15/2046 | 364 | 307,058 | |||||||
| Wells Fargo Commercial Mortgage Trust 2015-C28 D | 4.133% | #(b) | 5/15/2048 | 1,489 | 1,181,702 | |||||||
| Wells Fargo Commercial Mortgage Trust 2016-NXS5 E† | 4.88% | #(b) | 1/15/2059 | 434 | 359,418 | |||||||
| Wells Fargo Commercial Mortgage Trust 2017-C41 B | 4.188% | #(b) | 11/15/2050 | 855 | 878,687 | |||||||
| Total Non-Agency Commercial Mortgage-Backed Securities (cost $18,150,323) | 18,336,557 | |||||||||||
| 26 | See Notes to Financial Statements. |
Schedule of Investments (continued)
December 31, 2017
| Principal | ||||||||||||
| Interest | Maturity | Amount | Fair | |||||||||
| Investments | Rate | Date | (000) | Value | ||||||||
| U.S. TREASURY OBLIGATIONS 31.71% | ||||||||||||
| U.S. Treasury Bond | 2.75% | 8/15/2047 | $ | 6,348 | $ | 6,350,162 | ||||||
| U.S. Treasury Bond | 2.75% | 11/15/2047 | 1,466 | 1,466,984 | ||||||||
| U.S. Treasury Bond | 3.00% | 5/15/2047 | 16,319 | 17,141,857 | ||||||||
| U.S. Treasury Bond | 3.75% | 11/15/2043 | 5,621 | 6,692,033 | ||||||||
| U.S. Treasury Inflation Indexed Bond(g) | 0.125% | 4/15/2022 | 11,117 | 11,044,070 | ||||||||
| U.S. Treasury Inflation Indexed Bond(g) | 0.625% | 1/15/2026 | 4,746 | 4,827,159 | ||||||||
| U.S. Treasury Note | 1.125% | 8/31/2021 | 3,591 | 3,469,289 | ||||||||
| U.S. Treasury Note | 1.25% | 3/31/2021 | 5,378 | 5,245,688 | ||||||||
| U.S. Treasury Note | 1.375% | 6/30/2018 | 10,368 | 10,362,027 | ||||||||
| U.S. Treasury Note | 1.375% | 5/31/2021 | 2,934 | 2,868,240 | ||||||||
| U.S. Treasury Note | 1.50% | 10/31/2019 | 4,772 | 4,739,179 | ||||||||
| U.S. Treasury Note | 1.625% | 12/31/2019 | 1,620 | 1,611,533 | ||||||||
| U.S. Treasury Note | 1.75% | 11/30/2019 | 4,659 | 4,647,249 | ||||||||
| U.S. Treasury Note | 1.75% | 5/31/2022 | 2,028 | 1,992,721 | ||||||||
| U.S. Treasury Note | 1.875% | 4/30/2022 | 1,406 | 1,389,267 | ||||||||
| U.S. Treasury Note | 1.875% | 9/30/2022 | 62,105 | 61,205,981 | ||||||||
| U.S. Treasury Note | 2.25% | 11/15/2027 | 10,547 | 10,396,558 | ||||||||
| U.S. Treasury Note | 2.625% | 11/15/2020 | 4,247 | 4,323,779 | ||||||||
| U.S. Treasury Notes | 1.875% | 12/15/2020 | 16,051 | 16,004,930 | ||||||||
| Total U.S. Treasury Obligations (cost $176,320,400) | 175,778,706 | |||||||||||
| Total Long-Term Investments (cost $586,751,977) | $ | 590,433,611 | ||||||||||
| SHORT-TERM INVESTMENT 1.65% | ||||||||||||
| REPURCHASE AGREEMENT | ||||||||||||
| Repurchase Agreement dated 12/29/2017, 0.54% due 1/2/2018 with Fixed Income Clearing Corp. collateralized by $8,910,000 of U.S. Treasury Note at 3.625% due 2/15/2020; value: $9,347,009; proceeds: $9,164,006 (cost $9,163,456) | 9,163 | 9,163,456 | ||||||||||
| Total Investments in Securities 108.16% (cost $595,915,433) | 599,597,067 | |||||||||||
| Liabilities in Excess of Other Assets(h) (8.16%) | (45,219,136 | ) | ||||||||||
| Net Assets 100.00% | $ | 554,377,931 | ||||||||||
| See Notes to Financial Statements. | 27 |
Schedule of Investments (continued)
December 31, 2017
| ARS | Argentine Peso. | |
| BADLAR | Banco de la Republica Argentina. | |
| IO | Interest Only. | |
| LIBOR | London Interbank Offered Rate. | |
| PIK | Payment-in-kind. | |
| † | Security was purchased pursuant to Rule 144A under the Securities Act of 1933 and, unless registered under such Act or exempted from registration, may only be resold to qualified institutional buyers. | |
| # | Variable rate security. The interest rate represents the rate in effect at December 31, 2017. | |
| (a) | Level 3 Investment as described in Note 2(k) in the Notes to Financials. Security valued utilizing third party pricing information without adjustment. Such valuations are based on unobservable inputs. A significant change in third party information could result in a significantly lower or higher value of such Level 3 investments. | |
| (b) | Interest rate is based on the weighted average interest rates of the underlying mortgages within the mortgage pool. | |
| (c) | Foreign security traded in U.S. dollars. | |
| (d) | Defaulted (non-income producing security). | |
| (e) | Investment in non-U.S. dollar denominated securities. | |
| (f) | To-be-announced (“TBA”). Security purchased on a forward commitment basis with an approximate principal and maturity date. Actual principal and maturity will be determined upon settlement when the specific mortgage pools are assigned. | |
| (g) | Treasury Inflation Protected Security. A U.S. Treasury Note or Bond that offers protection from inflation by paying a fixed rate of interest on principal amount that is adjusted for inflation based on the Consumer Price Index. | |
| (h) | Liabilities in Excess of Other Assets include net unrealized appreciation/depreciation on futures contracts as follows: |
Open Futures Contracts at December 31, 2017:
| Notional | Notional | Unrealized | ||||||||||||||||
| Type | Expiration | Contracts | Position | Amount | Value | Appreciation | ||||||||||||
| U.S. 10-Year Treasury Note | March 2018 | 80 | Short | $ | (9,954,376) | $ | (9,923,750) | $ | 30,626 | |||||||||
| Ultra Long U.S. Treasury Bond | March 2018 | 6 | Long | 1,002,057 | 1,005,937 | 3,880 | ||||||||||||
| Totals | $ | (8,952,319) | $ | (8,917,813) | $ | 34,506 | ||||||||||||
| Notional | Notional | Unrealized | ||||||||||||||||
| Type | Expiration | Contracts | Position | Amount | Value | Depreciation | ||||||||||||
| U.S. 2-Year Treasury Note | March 2018 | 146 | Long | $ | 31,305,840 | $ | 31,259,969 | $ | (45,871) | |||||||||
| U.S. 5-Year Treasury Note | March 2018 | 175 | Long | 20,442,495 | 20,328,711 | (113,784) | ||||||||||||
| Totals | $ | 51,748,335 | $ | 51,588,680 | $ | (159,655) | ||||||||||||
| 28 | See Notes to Financial Statements. |
Schedule of Investments (concluded)
December 31, 2017
The following is a summary of the inputs used as of December 31, 2017 in valuing the Fund’s investments carried at fair value(1):
| Investment Type(2)(3) | Level 1 | Level 2 | Level 3 | Total | ||||||||||||
| Asset-Backed Securities | $ | – | $ | 107,861,929 | $ | 4,488,220 | $ | 112,350,149 | ||||||||
| Corporate Bonds | – | 149,339,129 | – | 149,339,129 | ||||||||||||
| Foreign Government Obligations | – | 30,597,106 | – | 30,597,106 | ||||||||||||
| Government Sponsored Enterprises Collateralized Mortgage Obligations | – | 8,447,016 | – | 8,447,016 | ||||||||||||
| Government Sponsored Enterprises Pass-Throughs | – | 93,870,332 | – | 93,870,332 | ||||||||||||
| Municipal Bonds | – | 1,714,616 | – | 1,714,616 | ||||||||||||
| Non-Agency Commercial Mortgage-Backed Securities | – | 18,336,557 | – | 18,336,557 | ||||||||||||
| U.S. Treasury Obligations | – | 175,778,706 | – | 175,778,706 | ||||||||||||
| Repurchase Agreement | – | 9,163,456 | – | 9,163,456 | ||||||||||||
| Total | $ | – | $ | 595,108,847 | $ | 4,488,220 | $ | 599,597,067 | ||||||||
| Other Financial Instruments | ||||||||||||||||
| Futures Contracts | ||||||||||||||||
| Assets | $ | 34,506 | $ | – | $ | – | $ | 34,506 | ||||||||
| Liabilities | (159,655 | ) | – | – | (159,655 | ) | ||||||||||
| Total | $ | (125,149 | ) | $ | – | $ | – | $ | (125,149 | ) | ||||||
| (1) | Refer to Note 2(k) for a description of fair value measurements and the three-tier hierarchy of inputs. |
| (2) | See Schedule of Investments for fair values in each industry and identification of foreign issuers and/or geography. The table above is presented by Investment Type. Industries are presented within an Investment Type should such Investment Type include securities classified as two or more levels within the three-tier fair value hierarchy. Each Level 3 security is identified on the Schedule of Investments along with the valuation technique utilized. |
| (3) | There were no Level 1/Level 2 transfers during the fiscal year ended December 31, 2017. |
The following is a reconciliation of investments with unobservable inputs (Level 3) that were used in determining fair value:
| Investment Type | Asset-Backed Securities | |||
| Balance as of January 1, 2017 | $ | – | ||
| Accrued Discounts (Premiums) | 2 | |||
| Realized Gain (Loss) | – | |||
| Change in Unrealized Appreciation (Depreciation) | 27,431 | |||
| Purchases | 4,460,787 | |||
| Sales | – | |||
| Transfers into Level 3 | – | |||
| Transfers out of Level 3 | – | |||
| Balance as of December 31, 2017 | $ | 4,488,220 | ||
| Change in unrealized appreciation/depreciation for the year ended December 31, 2017 related to Level 3 investments held at December 31, 2017 | $ | 27,431 | ||
| See Notes to Financial Statements. | 29 |
Statement of Assets and Liabilities
December 31, 2017
| ASSETS: | ||||
| Investments in securities, at fair value (cost $595,915,433) | $ | 599,597,067 | ||
| Deposits with brokers for futures collateral | 131,355 | |||
| Receivables: | ||||
| Interest and dividends | 3,556,778 | |||
| Capital shares sold | 260,371 | |||
| From advisor (See Note 3) | 108,904 | |||
| Variation margin for futures contracts | 11,998 | |||
| Prepaid expenses | 2,422 | |||
| Total assets | 603,668,895 | |||
| LIABILITIES: | ||||
| Payables: | ||||
| Investment securities purchased | 48,296,494 | |||
| Capital shares reacquired | 336,334 | |||
| Management fee | 210,367 | |||
| Directors’ fees | 33,848 | |||
| Fund administration | 18,699 | |||
| Accrued expenses | 395,222 | |||
| Total liabilities | 49,290,964 | |||
| NET ASSETS | $ | 554,377,931 | ||
| COMPOSITION OF NET ASSETS: | ||||
| Paid-in capital | $ | 559,109,240 | ||
| Distributions in excess of net investment income | (33,848 | ) | ||
| Accumulated net realized loss on investments, futures contracts and foreign currency related transactions | (8,253,568 | ) | ||
| Net unrealized appreciation on investments, futures contracts and translation of assets and liabilities denominated in foreign currencies | 3,556,107 | |||
| Net Assets | $ | 554,377,931 | ||
| Outstanding shares (50 million shares of common stock authorized, $.001 par value) | 33,287,411 | |||
| Net asset value, offering and redemption price per share (Net assets divided by outstanding shares) | $16.65 |
| 30 | See Notes to Financial Statements. |
For the Year Ended December 31, 2017
| Investment income: | ||||
| Interest and other (net of foreign withholding taxes of $1,232) | $ | 13,901,801 | ||
| Total investment income | 13,901,801 | |||
| Expenses: | ||||
| Management fee | 2,233,409 | |||
| Non 12b-1 service fees | 1,241,731 | |||
| Shareholder servicing | 532,704 | |||
| Fund administration | 198,525 | |||
| Professional | 64,527 | |||
| Reports to shareholders | 39,606 | |||
| Custody | 19,419 | |||
| Directors’ fees | 13,631 | |||
| Other | 34,475 | |||
| Gross expenses | 4,378,027 | |||
| Expense reductions (See Note 9) | (4,550 | ) | ||
| Fees waived and expenses reimbursed (See Note 3) | (1,197,074 | ) | ||
| Net expenses | 3,176,403 | |||
| Net investment income | 10,725,398 | |||
| Net realized and unrealized gain (loss): | ||||
| Net realized gain on investments | 796,529 | |||
| Net realized loss on futures contracts | (186,030 | ) | ||
| Net realized loss on foreign currency related transactions | (699 | ) | ||
| Net change in unrealized appreciation/depreciation on investments | 7,005,125 | |||
| Net change in unrealized appreciation/depreciation on futures contracts | (135,338 | ) | ||
| Net change in unrealized appreciation/depreciation on translation of assets and liabilities denominated in foreign currencies | (378 | ) | ||
| Net realized and unrealized gain | 7,479,209 | |||
| Net Increase in Net Assets Resulting From Operations | $ | 18,204,607 | ||
| See Notes to Financial Statements. | 31 |
Statements of Changes in Net Assets
| For the Year Ended | For the Year Ended | |||||||
| INCREASE IN NET ASSETS | December 31, 2017 | December 31, 2016 | ||||||
| Operations: | ||||||||
| Net investment income | $ | 10,725,398 | $ | 9,082,563 | ||||
| Net realized gain on investments, futures contracts and foreign currency related transactions | 609,800 | 303,334 | ||||||
| Net change in unrealized appreciation/depreciation on investments, futures contracts and translation of assets and liabilities denominated in foreign currencies | 6,869,409 | 6,686,191 | ||||||
| Net increase in net assets resulting from operations | 18,204,607 | 16,072,088 | ||||||
| Distributions to shareholders from: | ||||||||
| Net investment income | (13,065,635 | ) | (11,678,719 | ) | ||||
| Net realized gain | – | (1,693,962 | ) | |||||
| Total distributions to shareholders | (13,065,635 | ) | (13,372,681 | ) | ||||
| Capital share transactions (See Note 14): | ||||||||
| Proceeds from sales of shares | 141,989,369 | 98,161,165 | ||||||
| Reinvestment of distributions | 13,065,635 | 13,372,681 | ||||||
| Cost of shares reacquired | (52,931,398 | ) | (57,272,642 | ) | ||||
| Net increase in net assets resulting from capital share transactions | 102,123,606 | 54,261,204 | ||||||
| Net increase in net assets | 107,262,578 | 56,960,611 | ||||||
| NET ASSETS: | ||||||||
| Beginning of year | $ | 447,115,353 | $ | 390,154,742 | ||||
| End of year | $ | 554,377,931 | $ | 447,115,353 | ||||
| Distributions in excess of net investment income | $ | (33,848 | ) | $ | (16,313 | ) | ||
| 32 | See Notes to Financial Statements. |
This page is intentionally left blank.
33
| Per Share Operating Performance: | ||||||||||||||||||||||||||||
| Distributions to | ||||||||||||||||||||||||||||
| Investment Operations: | shareholders from: | |||||||||||||||||||||||||||
| Net asset value, beginning of period | Net invest- ment income(a) | Net realized and unrealized gain (loss) | Total from invest- ment opera- tions | Net Investment income | Net realized gain | Total distri- butions | ||||||||||||||||||||||
| 12/31/2017 | $16.42 | $0.36 | $ | 0.27 | $ | 0.63 | $(0.40 | ) | $ | – | $(0.40 | ) | ||||||||||||||||
| 12/31/2016 | 16.25 | 0.36 | 0.31 | 0.67 | (0.44 | ) | (0.06 | ) | (0.50 | ) | ||||||||||||||||||
| 12/31/2015 | 16.85 | 0.36 | (0.47 | ) | (0.11 | ) | (0.47 | ) | (0.02 | ) | (0.49 | ) | ||||||||||||||||
| 12/31/2014 | 16.22 | 0.32 | 0.66 | 0.98 | (0.32 | ) | (0.03 | ) | (0.35 | ) | ||||||||||||||||||
| 12/31/2013 | 16.73 | 0.29 | (0.47 | ) | (0.18 | ) | (0.32 | ) | (0.01 | ) | (0.33 | ) | ||||||||||||||||
| (a) | Calculated using average shares outstanding during the period. |
| (b) | Total return does not consider the effects of sales charges or other expenses imposed by an insurance company and assumes the reinvestment of all distributions. |
| 34 | See Notes to Financial Statements. |
| Ratios to Average Net Assets: | Supplemental Data: | |||||||||||||||||||||||||
| Total | ||||||||||||||||||||||||||
| expenses | ||||||||||||||||||||||||||
| Net | after | Net | ||||||||||||||||||||||||
| asset | waivers | Net | assets, | Portfolio | ||||||||||||||||||||||
| value, | Total | and/or reim- | Total | investment | end of | turnover | ||||||||||||||||||||
| end of | return(b) | bursements | expenses | income | period | rate | ||||||||||||||||||||
| period | (%) | (%) | (%) | (%) | (000) | (%) | ||||||||||||||||||||
| $ | 16.65 | 3.86 | 0.64 | 0.88 | 2.16 | $ | 554,378 | 452 | ||||||||||||||||||
| 16.42 | 4.26 | 0.64 | 0.89 | 2.16 | 447,115 | 443 | ||||||||||||||||||||
| 16.25 | (0.66 | ) | 0.64 | 0.89 | 2.11 | 390,155 | 432 | |||||||||||||||||||
| 16.85 | 6.08 | 0.64 | 0.90 | 1.87 | 317,732 | 466 | ||||||||||||||||||||
| 16.22 | (1.10 | ) | 0.64 | 0.95 | 1.74 | 147,670 | 625 | |||||||||||||||||||
| See Notes to Financial Statements. | 35 |
| 1. | ORGANIZATION |
Lord Abbett Series Fund, Inc. (the “Company”) is registered under the Investment Company Act of 1940, as amended (“the Act”), as a diversified, open-end management investment company and was incorporated under Maryland law in 1989. The Company consists of twelve separate portfolios. This report covers Total Return Portfolio (the “Fund”).
The Fund’s investment objective is to seek income and capital appreciation to produce a high total return. The Fund has Variable Contract class shares (“Class VC Shares”), which are currently issued and redeemed only in connection with investments in, and payments under, variable annuity contracts and variable life insurance policies issued by life insurance and insurance-related companies.
The preparation of the financial statements in conformity with accounting principles generally accepted in the United States of America (“U.S. GAAP”) requires management to make certain estimates and assumptions that affect the reported amounts of assets and liabilities and disclosure of contingent assets and liabilities at the date of the financial statements and the reported amounts of increases and decreases in net assets from operations during the reporting period. Actual results could differ from those estimates. The Fund is considered an investment company under U.S. GAAP and follows the accounting and reporting guidance applicable to investment companies.
| 2. | SIGNIFICANT ACCOUNTING POLICIES |
| (a) | Investment Valuation–Under procedures approved by the Fund’s Board of Directors (the “Board”), Lord, Abbett & Co. LLC (“Lord Abbett”), the Fund’s investment manager, has formed a Pricing Committee to administer the pricing and valuation of portfolio investments and to ensure that prices utilized reasonably reflect fair value. Among other things, these procedures allow the Fund to utilize independent pricing services, quotations from securities and financial instrument dealers and other market sources to determine fair value. |
| Securities actively traded on any recognized U.S. or non-U.S. exchange or on The NASDAQ Stock Market LLC are valued at the last sale price or official closing price on the exchange or system on which they are principally traded. Events occurring after the close of trading on non-U.S. exchanges may result in adjustments to the valuation of foreign securities to reflect their fair value as of the close of regular trading on the New York Stock Exchange. The Fund may utilize an independent fair valuation service in adjusting the valuations of foreign securities. Unlisted equity securities are valued at the last quoted sale price or, if no sale price is available, at the mean between the most recently quoted bid and asked prices. Exchange traded options and futures contracts are valued at the last sale price in the market where they are principally traded. If no sale has occurred, the mean between the most recently quoted bid and asked prices is used. | |
| Fixed income securities are valued based on evaluated prices supplied by independent pricing services, which reflect broker/dealer supplied valuations and the independent pricing services’ own electronic data processing techniques. Exchange traded options and futures contracts are valued at the last sale price in the market where they are principally traded. If no sale has occurred, the mean between the most recently quoted bid and asked prices is used. | |
| Securities for which prices are not readily available are valued at fair value as determined by the Pricing Committee. The Pricing Committee considers a number of factors, including observable and unobservable inputs, when arriving at fair value. The Pricing Committee may |
36
Notes to Financial Statements (continued)
| use related or comparable assets or liabilities, recent transactions, market multiples, book values, yield curves, broker quotes, observable trading activity, option adjusted spread models and other relevant information to determine the fair value of portfolio investments. The Board or a designated committee thereof regularly reviews fair value determinations made by the Pricing Committee and may employ techniques such as reviewing related market activity, reviewing inputs and assumptions, and retrospectively comparing prices of subsequent purchases and sales transactions to fair value determinations made by the Pricing Committee. | |
| Short-term securities with 60 days or less remaining to maturity are valued using the amortized cost method, which approximates fair value. | |
| (b) | Security Transactions–Security transactions are recorded as of the date that the securities are purchased or sold (trade date). Realized gains and losses on sales of portfolio securities are calculated using the identified-cost method. |
| (c) | Investment Income–Dividend income is recorded on the ex-dividend date. Interest income is recorded on the accrual basis as earned. Discounts are accreted and premiums are amortized using the effective interest method and are included in Interest and other income on the Statement of Operations. Withholding taxes on foreign dividends have been provided for in accordance with the applicable country’s tax rules and rates. |
| (d) | Income Taxes–It is the policy of the Fund to meet the requirements of Subchapter M of the Internal Revenue Code applicable to regulated investment companies and to distribute substantially all taxable income and capital gains to its shareholders. Therefore, no income tax provision is required. |
| The Fund files U.S. federal and various state and local tax returns. No income tax returns are currently under examination. The statute of limitations on the Fund’s filed U.S. federal tax returns remains open for the fiscal years ended December 31, 2014 through December 31, 2017. The statutes of limitations on the Company’s state and local tax returns may remain open for an additional year depending upon the jurisdiction. | |
| (e) | Expenses–Expenses incurred by the Company that do not specifically relate to an individual fund are generally allocated to the funds within the Company on a pro rata basis by relative net assets. |
| (f) | Foreign Transactions–The books and records of the Fund are maintained in U.S. dollars and transactions denominated in foreign currencies are recorded in the Fund’s records at the rate prevailing when earned or recorded. Asset and liability accounts that are denominated in foreign currencies are adjusted daily to reflect current exchange rates and any unrealized gain (loss) is included in Net change in unrealized appreciation/depreciation on futures contracts in the Fund’s Statement of Operations. The resultant exchange gains and losses upon settlement of such transactions are included in Net realized gain on futures contracts in the Fund’s Statement of Operations. The Fund does not isolate that portion of the results of operations arising as a result of changes in the foreign exchange rates from the changes in market prices of the securities. |
| (g) | Futures Contracts–The Fund may purchase and sell futures contracts to enhance returns, to attempt to economically hedge some of its investment risk, or as a substitute position in lieu of holding the underlying asset on which the instrument is based. At the time of entering into a futures transaction, an investor is required to deposit and maintain a specified amount of |
37
Notes to Financial Statements (continued)
| cash or eligible securities called “initial margin.” Subsequent payments made or received by the Fund called “variation margin” are made on a daily basis as the market price of the futures contract fluctuates. The Fund will record an unrealized gain (loss) based on the amount of variation margin. When a contract is closed, a realized gain (loss) is recorded equal to the difference between the opening and closing value of the contract. | |
| (h) | Repurchase Agreements–The Fund may enter into repurchase agreements with respect to securities. A repurchase agreement is a transaction in which a fund acquires a security and simultaneously commits to resell that security to the seller (a bank or securities dealer) at an agreed-upon price on an agreed-upon date. The Fund requires at all times that the repurchase agreement be collateralized by cash, or by securities of the U.S. Government, its agencies, its instrumentalities, or U.S. Government sponsored enterprises having a value equal to, or in excess of, the value of the repurchase agreement (including accrued interest). If the seller of the agreement defaults on its obligation to repurchase the underlying securities at a time when the fair value of these securities has declined, the Fund may incur a loss upon disposition of the securities. |
| (i) | When-Issued, Forward Transactions or To-Be-Announced (“TBA”) Transactions–The Fund may purchase portfolio securities on a when-issued or forward basis. When-issued, forward transactions or TBA transactions involve a commitment by a fund to purchase securities, with payment and delivery (“settlement”) to take place in the future, in order to secure what is considered to be an advantageous price or yield at the time of entering into the transaction. During the period between purchase and settlement, the fair value of the securities will fluctuate and assets consisting of cash and/or marketable securities (normally short-term U.S. Government or U.S. Government sponsored enterprise securities) marked to market daily in an amount sufficient to make payment at settlement will be segregated at the Fund’s custodian in order to pay for the commitment. At the time the Fund makes the commitment to purchase a security on a when-issued basis, it will record the transaction and reflect the liability for the purchase and fair value of the security in determining its net asset value (“NAV”). The Fund, generally, has the ability to close out a purchase obligation on or before the settlement date rather than take delivery of the security. Under no circumstances will settlement for such securities take place more than 120 days after the purchase date. |
| (j) | Mortgage Dollar Rolls–The Fund may enter into mortgage dollar rolls in which the Fund sells mortgage-backed securities for delivery in the current month and simultaneously contracts with the same counterparty to repurchase similar (same type, coupon and maturity) but not identical securities on a specified future date. During the roll period, the Fund loses the right to receive principal (including prepayments of principal) and interest paid on the securities sold. |
| (k) | Fair Value Measurements–Fair value is defined as the price that the Fund would receive upon selling an investment or transferring a liability in an orderly transaction to an independent buyer in the principal or most advantageous market of the investment. A three-tier hierarchy is used to maximize the use of observable market data and minimize the use of unobservable inputs and to establish classification of fair value measurements for disclosure purposes. Inputs refer broadly to the assumptions that market participants would use in pricing the asset or liability, including assumptions about risk—for example, the risk inherent in a particular valuation technique used to measure fair value (such as a pricing model) and/or the risk inherent in the inputs to the valuation technique. Inputs may be observable or unobservable.Observable inputs reflect the assumptions market participants would use in pricing the asset or |
38
Notes to Financial Statements (continued)
| liability. Observable inputs are based on market data obtained from sources independent of the reporting entity. Unobservable inputs reflect the reporting entity’s own assumptions about the assumptions market participants would use in pricing the asset or liability. Unobservable inputs are based on the best information available in the circumstances. The three-tier hierarchy classification is determined based on the lowest level of inputs that is significant to the fair value measurement, and is summarized in the three broad Levels listed below: | |
| • | Level 1 – | unadjusted quoted prices in active markets for identical investments; | |
| • | Level 2 – | other significant observable inputs (including quoted prices for similar investments, interest rates, prepayment speeds, credit risk, etc.); and | |
| • | Level 3 – | significant unobservable inputs (including the Fund’s own assumptions in determining the fair value of investments). | |
| A summary of inputs used in valuing the Fund’s investments as of December 31, 2017 and, if applicable, Level 1/Level 2 transfers and Level 3 rollforwards for the fiscal year then ended is included in the Fund’s Schedule of Investments. | |
| Changes in valuation techniques may result in transfers into or out of an assigned level within the three-tier hierarchy. All transfers between different levels within the three-tier hierarchy are deemed to have occurred as of the beginning of the reporting period. The inputs or methodology used for valuing securities are not necessarily an indication of the risk associated with investing in those securities. |
| 3. | MANAGEMENT FEE AND OTHER TRANSACTIONS WITH AFFILIATES |
Management Fee
The Company has a management agreement with Lord Abbett, pursuant to which Lord Abbett supplies the Fund with investment management services and executive and other personnel, provides office space and pays for ordinary and necessary office and clerical expenses relating to research and statistical work and supervision of the Fund’s investment portfolio.
The management fee is based on the Fund’s average daily net assets at the following annual rate:
| First $1 billion | .45% |
| Next $1 billion | .40% |
| Over $2 billion | .35% |
For the fiscal year ended December 31, 2017, the effective management fee, net of waivers, was at an annualized rate of .21% of the Fund’s average daily net assets.
In addition, Lord Abbett provides certain administrative services to the Fund pursuant to an Administrative Services Agreement in return for a fee at an annual rate of .04% of the Fund’s average daily net assets.
During the fiscal year ended December 31, 2017 and continuing through April 30, 2018, Lord Abbett has contractually agreed to waive its fees and reimburse expenses to the extent necessary to limit total net annual operating expenses to an annual rate of .64%. This agreement may be terminated only by the approval of the Board.
The Company, on behalf of the Fund, has entered into services arrangements with certain insurance companies. Under these arrangements, certain insurance companies will be compensated up to ..25% of the average daily net asset value (“NAV”) of the Fund’s Class VC Shares
39
Notes to Financial Statements (continued)
held in the insurance company’s separate account to service and maintain the Variable Contract owners’ accounts. This amount is included in Non 12b-1 service fees on the Statement of Operations. The Fund may also compensate certain insurance companies, third-party administrators and other entities for providing recordkeeping, sub-transfer agency and other administrative services to the Fund. This amount is included in Shareholder servicing on the Statement of Operations.
Two Directors and certain of the Company’s officers have an interest in Lord Abbett.
| 4. | DISTRIBUTIONS AND CAPITAL LOSS CARRYFORWARDS |
Dividends from net investment income, if any, are declared and paid at least semi-annually. Taxable net realized gains from investment transactions, reduced by allowable capital loss carryforwards, if any, are declared and distributed to shareholders at least annually. The capital loss carryforward amount, if any, is available to offset future net capital gains. Dividends and distributions to shareholders are recorded on the ex-dividend date. The amounts of dividends and distributions from net investment income and net realized capital gains are determined in accordance with federal income tax regulations, which may differ from U.S. GAAP. These book/tax differences are either considered temporary or permanent in nature. To the extent these differences are permanent in nature, such amounts are reclassified within the components of net assets based on their federal tax basis treatment; temporary differences do not require reclassification. Dividends and distributions that exceed earnings and profits for tax purposes are reported as a tax return of capital.
The tax character of distributions paid during the fiscal years ended December 31, 2017 and 2016, was as follows:
| Year Ended | Year Ended | |||||||
| 12/31/2017 | 12/31/2016 | |||||||
| Distributions paid from: | ||||||||
| Ordinary income | $ | 13,065,635 | $ | 13,372,681 | ||||
| Total distributions paid | $ | 13,065,635 | $ | 13,372,681 | ||||
As of December 31, 2017, the components of accumulated losses on a tax-basis were as follows:
| Capital loss carryforwards* | $ | (6,159,666 | ) | |
| Temporary differences | (33,848 | ) | ||
| Unrealized gains – net | 1,462,205 | |||
| Total accumulated losses — net | $ | (4,731,309 | ) |
| * | The capital losses will carry forward indefinitely. |
As of December 31, 2017, the aggregate unrealized security gains and losses on investments and other financial instruments based on cost for U.S. federal income tax purposes were as follows:
| Tax cost | $ | 598,009,335 | ||
| Gross unrealized gain | 4,352,165 | |||
| Gross unrealized loss | (2,889,582 | ) | ||
| Net unrealized security gain | $ | 1,462,583 |
The difference between book-basis and tax-basis unrealized gains (losses) is attributable to the tax treatment of futures, premium amortization and wash sales.
Permanent items identified during the year ended December 31, 2017 have been reclassified among the components of net assets based on their tax basis treatment as follows:
40
Notes to Financial Statements (continued)
| Distributions in Excess of Net Investment Income | Accumulated Net Realized Loss | Paid-in Capital | ||||||||
| $2,322,702 | $(2,296,277 | ) | $(26,425 | ) | ||||||
The permanent differences are attributable to the tax treatment of foreign currency transactions, premium amortization, principal paydown gains and losses, certain securities and certain distributions.
| 5. | PORTFOLIO SECURITIES TRANSACTIONS |
Purchases and sales of investment securities (excluding short-term investments) for the fiscal year ended December 31, 2017 were as follows:
| U.S. Government Purchases | * | Non-U.S. Government Purchases | U.S. Government Sales | * | Non-U.S. Government Sales | |||||||||
| $2,233,084,849 | $275,168,863 | $2,219,111,147 | $205,390,372 | |||||||||||
| * | Includes U.S. Government sponsored enterprises securities. |
The Fund is permitted to purchase and sell securities (“cross-trade”) from and to other Lord Abbett funds or client accounts pursuant to procedures approved by the Board in compliance with Rule 17a-7 under the Act (the “Rule”). Each cross-trade is executed at a fair market price in compliance with provisions of the Rule. For the fiscal year ended December 31, 2017, the Fund engaged in cross-trades sales of $1,917,985, which resulted in net realized gains of $88,651.
| 6. | DISCLOSURES ABOUT DERIVATIVE INSTRUMENTS AND HEDGING ACTIVITIES |
The Fund entered into U.S. Treasury futures contracts for the fiscal year ended December 31, 2017 (as described in note 2(g)) to hedge against changes in interest rates. The Fund bears the risk of interest rates moving unexpectedly, in which case the Fund may not achieve the anticipated benefits of the futures contracts and realize a loss. There is minimal counterparty credit risk to the Fund since futures are exchange traded and the exchange’s clearinghouse, as counterparty to all exchange traded futures, guarantees futures against default.
As of December 31, 2017, the Fund had futures contracts with unrealized appreciation of $34,506 and depreciation of $159,655 which is included in the Schedule of Investments. Only current day’s variation margin is reported within the Fund’s Statement of Assets and Liabilities. Net realized loss of $186,030 and net change in unrealized depreciation of $135,338 are included on the Statement of Operations related to futures contracts under the captions Net realized gain on futures contracts and Net change in unrealized appreciation/depreciation on futures contracts, respectively. The average number of futures contracts throughout the fiscal year was 429.
| 7. | DISCLOSURES ABOUT OFFSETTING ASSETS AND LIABILITIES |
The Financial Accounting Standards Board (“FASB”) requires disclosures intended to help better assess the effect or potential effect of offsetting arrangements on a fund’s financial position. The following tables illustrate gross and net information about recognized assets and liabilities eligible for offset in the statement of assets and liabilities; and disclose such amounts subject to an enforceable master netting agreement or similar agreement, by counterparty. A master netting agreement is an agreement between a fund and a counterparty which provides for the net settlement of amounts owed under all contracts traded under that agreement, as well as cash collateral, through a single payment by one party to the other in the event of default on or
41
Notes to Financial Statements (continued)
termination of any one contract. The Fund’s accounting policy with respect to balance sheet offsetting is that, absent an event of default by the counterparty or a termination of the agreement, the master netting agreement does not result in an offset of reported amounts of financial assets and liabilities in the statement of assets and liabilities across transactions between the Fund and the applicable counterparty:
| Offset in the | Assets Presented | |||||||||||
| Gross Amounts of | Statement of Assets | in the Statement of | ||||||||||
| Description | Recognized Assets | and Liabilities | Assets and Liabilities | |||||||||
| Repurchase Agreement | $9,163,456 | $ | – | $9,163,456 | ||||||||
| Total | $9,163,456 | $ | – | $9,163,456 | ||||||||
| Net Amounts | |||||||||||||||||
| of Assets | Amounts Not Offset in the | ||||||||||||||||
| Presented in | Statement of Assets and Liabilities | ||||||||||||||||
| Counterparty | the Statement of Assets and Liabilities | Financial Instruments | Cash Collateral Received(a) | Securities Collateral Received(a) | Net Amount(b) | ||||||||||||
| Fixed Income Clearing Corp. | $9,163,456 | $ | – | $ | – | $ | (9,163,456 | ) | $ | – | |||||||
| Total | $9,163,456 | $ | – | $ | – | $ | (9,163,456 | ) | $ | – | |||||||
| (a) | Collateral disclosed is limited to an amount not to exceed 100% of the net amount of assets presented in the Statement of Assets and Liabilities, for each respective counterparty. |
| (b) | Net amount represents the amount owed to the Fund by the counterparty as of December 31, 2017. |
| 8. | DIRECTORS’ REMUNERATION |
The Company’s officers and two Directors, who are associated with Lord Abbett, do not receive any compensation from the Company for serving in such capacities. Independent Directors’ fees are allocated among all Lord Abbett-sponsored funds based on the net assets of each fund. There is an equity-based plan available to all Independent Directors under which Independent Directors must defer receipt of a portion of, and may elect to defer receipt of an additional portion of Directors’ fees. The deferred amounts are treated as though equivalent dollar amounts had been invested in the funds. Such amounts and earnings accrued thereon are included in Directors’ fees on the Statement of Operations and in Directors’ fees payable on the Statement of Assets and Liabilities and are not deductible for U.S. federal income tax purposes until such amounts are paid.
| 9. | EXPENSE REDUCTIONS |
The Company has entered into an arrangement with its transfer agent and custodian, whereby credits realized as a result of uninvested cash balances are used to reduce a portion of the Fund’s expenses.
| 10. | LINE OF CREDIT |
Effective August 28, 2017, the Fund and certain other funds managed by Lord Abbett (collectively, the “Participating Funds”) entered into an amended syndicated line of credit facility with various lenders for $600 million (the “Facility”), whereas State Street Bank and Trust Company (“SSB”) participates as a lender and as agent for the lenders. The Facility is to be used for temporary or emergency purposes as an additional source of liquidity to satisfy redemptions. The Participating Funds are subject to graduated borrowing limits of one-third of Fund assets (if Fund assets are less than $750 million), $250 million, $300 million, or $350 million, based on past borrowings and likelihood of future borrowings.
42
Notes to Financial Statements (continued)
Prior to August 28, 2017, the Funds and certain other funds managed by Lord Abbett participated in a $550 million syndicated line of credit facility, based on the same terms as described above.
During the fiscal year ended December 31, 2017, the Fund did not utilize the Facility.
| 11. | INTERFUND LENDING PROGRAM |
Pursuant to an exemptive order issued by the U.S. Securities and Exchange Commission (“SEC exemptive order”), certain registered open-end management investment companies managed by Lord Abbett, including the Fund, participate in a joint lending and borrowing program (the “Interfund Lending Program”). The SEC exemptive order allows the Funds to borrow money from and lend money to each other for temporary or emergency purposes subject to the limitations and conditions. During the fiscal year ended December 31, 2017, the Fund did not participate as a borrower or lender in the Interfund Lending Program.
| 12. | CUSTODIAN AND ACCOUNTING AGENT |
SSB is the Company’s custodian and accounting agent. SSB performs custodial, accounting and recordkeeping functions relating to portfolio transactions and calculating the Fund’s NAV.
| 13. | INVESTMENT RISKS |
The Fund is subject to the general risks and considerations associated with investing in fixed income securities, including the risk that issuers will fail to make timely payments of principal or interest or default altogether. The value of an investment will change as interest rates fluctuate in response to market movements. When interest rates rise, the prices of fixed income securities are likely to decline; when interest rates fall, such prices tend to rise.
The Fund is subject to the risk of investing a significant portion of its assets in securities issued or guaranteed by the U.S. Government or its agencies and instrumentalities (such as the Government National Mortgage Association (“Ginnie Mae”), the Federal National Mortgage Association (“Fannie Mae”), or the Federal Home Loan Mortgage Corporation (“Freddie Mac”)). Unlike Ginnie Mae securities, securities issued or guaranteed by U.S. Government-related organizations such as Fannie Mae and Freddie Mac are not backed by the full faith and credit of the U.S. Government and no assurance can be given that the U.S. Government would provide financial support to its agencies and instrumentalities if not required to do so by law. Consequently, the Fund may be required to look principally to the agency issuing or guaranteeing the obligation. In addition, the Fund may invest in non-agency asset backed and mortgage related securities, which are issued by private institutions, not by government-sponsored enterprises. Such securities may be particularly sensitive to changes in economic conditions, including delinquencies and/or defaults, and changes in prevailing interest rates. These changes can affect the value, income and/or liquidity of such positions. When interest rates are declining, the value of these securities with prepayment features may not increase as much as other fixed income securities. Early principal repayment may deprive the Fund of income payments above current market rates. The prepayment rate also will affect the price and volatility of these securities. In addition, securities of government sponsored enterprises are guaranteed with respect to the timely payment of interest and principal by the particular enterprises involved, not by the U.S. Government.
The lower-rated or high-yield bonds (also known as “junk” bonds) in which the Fund may invest are subject to greater price fluctuations, as well as additional risks. The market for below investment grade securities may be less liquid, which may make such securities more difficult to
43
Notes to Financial Statements (concluded)
sell at an acceptable price, especially during periods of financial distress, increased market volatility, or significant market decline.
The Fund is subject to the risks associated with derivatives, which may be different from and greater than the risks associated with directly investing in securities. Derivatives may be subject to risks such as liquidity risk, leveraging risk, interest rate risk, market risk, and credit risk. Illiquid securities may lower the Fund’s returns since the Fund may be unable to sell these securities at their desired time or price. Derivatives also may involve the risk of mispricing or improper valuation and the risk that changes in the value of the derivative may not correlate perfectly with the value of the underlying asset, rate or index. Whether the Fund’s use of derivatives is successful will depend on, among other things, the Fund’s ability to correctly forecast market movements, changes in foreign exchange and interest rates, and other factors. Losses may also arise from the failure of a derivative counterparty to meet its contractual obligations. If the Fund incorrectly forecasts these and other factors, its performance could suffer.
The Fund’s investment exposure to foreign (which may include emerging market) companies presents increased market, industry and sector, liquidity, currency, political, information and other risks. As compared with companies organized and operated in the U.S., these companies may be more vulnerable to economic, political and social instability and subject to less govenment supervision, lack of transparency, inadequate regulatory and accounting standards, and foreign taxes. The securities of foreign companies also may be subject to inadequate exchange control regulations, the imposition of economic sanctions or other government restrictions, higher transaction and other costs, and delays in settlement to the extent they are traded on non-U.S. exchanges or markets. The cost of the Fund’s use of forward foreign currency exchange contracts varies with factors such as the currencies involved, the length of the contract period and the market conditions prevailing. The Fund’s exposure to inflation-linked investments, such as Treasury Inflation Protected Securities, may be vulnerable to changes in expectations of inflation or interest rates.
The Fund may invest in floating rate or adjustable rate senior loans, which are subject to increased credit and liquidity risks. Senior loans are business loans made to borrowers that may be U.S. or foreign corporations, partnerships or other business entities. The senior loans in which the Fund invests may consist primarily of senior loans that are rated below investment grade or, if unrated, deemed by Lord Abbett to be equivalent to below investment grade securities. Below investment grade senior loans, as in the case of high-yield debt securities, or junk bonds, are usually more credit sensitive than interest rate sensitive, although the value of these instruments may be impacted by broader interest rate swings in the overall fixed income market. In addition, senior loans may be subject to structural subordination.
These factors can affect the Fund’s performance.
| 14. | SUMMARY OF CAPITAL TRANSACTIONS |
Transactions in shares of capital stock were as follows:
| Year Ended | Year Ended | |||||||
| December 31, 2017 | December 31, 2016 | |||||||
| Shares sold | 8,429,040 | 5,779,565 | ||||||
| Reinvestment of distributions | 788,496 | 819,226 | ||||||
| Shares reacquired | (3,155,253 | ) | (3,388,823 | ) | ||||
| Increase | 6,062,283 | 3,209,968 | ||||||
44
Report of Independent Registered Public Accounting Firm
To the Board of Directors of Lord Abbett Series Fund, Inc. and the shareholders of Total Return Portfolio:
Opinion on the Financial Statements and Financial Highlights
We have audited the accompanying statement of assets and liabilities, including the schedule of investments, of the Total Return Portfolio, one of the portfolios constituting the Lord Abbett Series Fund, Inc. (the “Fund”), as of December 31, 2017, the related statement of operations for the year then ended, the statements of changes in net assets for each of the two years in the period then ended, the financial highlights for each of the five years in the period then ended, and the related notes. In our opinion, the financial statements and financial highlights present fairly, in all material respects, the financial position of the Total Return Portfolio of the Fund as of December 31, 2017, the results of its operations for the year then ended, the changes in its net assets for each of the two years in the period then ended, and the financial highlights for each of the five years in the period then ended, in conformity with accounting principles generally accepted in the United States of America.
Basis for Opinion
These financial statements and financial highlights are the responsibility of the Fund’s management. Our responsibility is to express an opinion on the Fund’s financial statements and financial highlights based on our audits. We are a public accounting firm registered with the Public Company Accounting Oversight Board (United States) (PCAOB) and are required to be independent with respect to the Fund in accordance with the U.S. federal securities laws and the applicable rules and regulations of the Securities and Exchange Commission and the PCAOB.
We conducted our audits in accordance with the standards of the PCAOB. Those standards require that we plan and perform the audit to obtain reasonable assurance about whether the financial statements and financial highlights are free of material misstatement, whether due to error or fraud. The Fund is not required to have, nor were we engaged to perform, an audit of its internal control over financial reporting. As part of our audits we are required to obtain an understanding of internal control over financial reporting but not for the purpose of expressing an opinion on the effectiveness of the Fund’s internal control over financial reporting. Accordingly, we express no such opinion.
Our audits included performing procedures to assess the risks of material misstatement of the financial statements and financial highlights, whether due to error or fraud, and performing procedures that respond to those risks. Such procedures included examining, on a test basis, evidence regarding the amounts and disclosures in the financial statements and financial highlights. Our audits also included evaluating the accounting principles used and significant estimates made by management, as well as evaluating the overall financial statement presentation and financial highlights. Our procedures included confirmation of securities owned as of December 31, 2017, by correspondence with the custodian and brokers; when replies were not received from brokers, we performed other auditing procedures. We believe that our audits provide a reasonable basis for our opinion.
DELOITTE & TOUCHE LLP
New York, New York
February 15, 2018
We have served as the auditor of one or more Lord Abbett Family of Funds’ investment companies since 1932.
45
Basic Information About Management
The Board is responsible for the management of the business and affairs of the Company in accordance with the laws of the State of Maryland. The Board elects officers who are responsible for the day-to-day operations of the Fund and who execute policies authorized by the Board. The Board also approves an investment adviser to the Fund and continues to monitor the cost and quality of the services the investment adviser provides, and annually considers whether to renew the contract with the adviser. Generally, each Director holds office until his/her successor is elected and qualified or until his/her earlier resignation or removal, as provided in the Company’s organizational documents.
Lord Abbett, a Delaware limited liability company, is the Fund’s investment adviser. Designated Lord Abbett personnel are responsible for the day-to-day management of the Fund.
Interested Directors
Ms. Foster and Mr. Sieg are affiliated with Lord Abbett and are “interested persons” of the Fund as defined in the Act. Ms. Foster and Mr. Sieg are directors/trustees of each of the 12 investment companies in the Lord Abbett Family of Funds, which consist of 61 portfolios or series. Ms. Foster is an officer of the Lord Abbett Family of Funds.
| Name, Address and Year of Birth | Current Position and Length of Service with the Company | Principal Occupation and Other Directorships During the Past Five Years | ||
| Daria L. Foster(1) Lord, Abbett & Co. LLC 90 Hudson Street Jersey City, NJ 07302 (1954) | Director and President since 2006; Chief Executive Officer since 2012 | Principal Occupation: Managing Partner of Lord Abbett, joined Lord Abbett in 1990.
Other Directorships: None.
| ||
| Douglas B. Sieg(1) Lord, Abbett & Co. LLC 90 Hudson Street Jersey City, NJ 07302 (1969) | Director since 2016 | Principal Occupation: Partner (since 2001) and Head of Client Services (since 2013), formerly Director of Marketing and Relationship Management, joined Lord Abbett in 1994.
Other Directorships: None. |
Independent Directors
The following Independent Directors also are directors/trustees of each of the 12 investment companies in the Lord Abbett Family of Funds, which consist of 61 portfolios or series.
| Name, Address and Year of Birth | Current Position and Length of Service with the Company | Principal Occupation and Other Directorships During the Past Five Years | ||
| Eric C. Fast Lord, Abbett & Co. LLC c/o Legal Dept. 90 Hudson Street Jersey City, NJ 07302 (1949) | Director since 2014 | Principal Occupation: Chief Executive Officer of Crane Co., an industrial products company (2001–2014).
Other Directorships: Currently serves as director of Automatic Data Processing, Inc. (since 2007) and Regions Financial Corporation (since 2010). Previously served as a director of Crane Co. (1999–2014).
|
| (1) | Daria L. Foster, Managing Partner of Lord Abbett, a member of the Board, and the Chief Executive Officer and President of the Lord Abbett Family of Funds, will retire from her positions with Lord Abbett and the Lord Abbett Family of Funds effective March 31, 2018. Douglas B. Sieg, Partner and head of Client Services at Lord Abbett, and a member of the Board, will succeed Ms. Foster effective April 1, 2018. |
46
Basic Information About Management (continued)
| Name, Address and Year of Birth | Current Position and Length of Service with the Company | Principal Occupation and Other Directorships During the Past Five Years | ||
| Evelyn E. Guernsey Lord, Abbett & Co. LLC c/o Legal Dept. 90 Hudson Street Jersey City, NJ 07302 (1955) | Director since 2011 | Principal Occupation: CEO, Americas of J.P. Morgan Asset Management (2004–2010).
Other Directorships: None.
| ||
| Julie A. Hill Lord, Abbett & Co. LLC c/o Legal Dept. 90 Hudson Street Jersey City, NJ 07302 (1946) | Director since 2004 | Principal Occupation: Owner and CEO of The Hill Company, a business consulting firm (since 1998).
Other Directorships: Currently serves as director of Anthem, Inc., a health benefits company (since 1994).
| ||
| Franklin W. Hobbs Lord, Abbett & Co. LLC c/o Legal Dept. 90 Hudson Street Jersey City, NJ 07302 (1947) | Director since 2001 | Principal Occupation: President and CEO of Ribbon Communications (since 2017) and Advisor of One Equity Partners, a private equity firm (since 2004).
Other Directorships: Currently serves as director of Ribbon Communications (since 2017), director and Chairman of the Board of Ally Financial Inc., a financial services firm (since 2009), and as director of Molson Coors Brewing Company (since 2002).
| ||
| Kathleen M. Lutito Lord, Abbett & Co. LLC c/o Legal Dept. 90 Hudson Street Jersey City, NJ 07302 (1963) | Director since 2017 | Principal Occupation: President and Chief Investment Officer of CenturyLink Investment Management Company (since 2006).
Other Directorships: None
| ||
| James M. McTaggart Lord, Abbett & Co. LLC c/o Legal Dept. 90 Hudson Street Jersey City, NJ 07302 (1947) | Director since 2012 | Principal Occupation: Independent management advisor and consultant (since 2012); Vice President, CRA International, Inc. (doing business as Charles River Associates), a global management consulting firm (2009–2012); Founder and Chairman of Marakon Associates, Inc., a strategy consulting firm (1978–2009); and Officer and Director of Trinsum Group, a holding company (2007–2009).
Other Directorships: Blyth, Inc., a home products company (2004–2015).
| ||
| Karla M. Rabusch Lord, Abbett & Co. LLC c/o Legal Dept. 90 Hudson Street Jersey City, NJ 07302 (1959) | Director since 2017 | Principal Occupation: President and Director of Wells Fargo Funds Management, LLC (2003–2017); President of Wells Fargo Funds (2003–2016). Other Directorships: None. | ||
Mark A. Schmid 90 Hudson Street | Director since 2016 | Principal Occupation: Vice President and Chief Investment Officer of the University of Chicago (since 2009).
Other Directorships: None.
| ||
47
Basic Information About Management (continued)
| Name, Address and Year of Birth | Current Position and Length of Service with the Company | Principal Occupation and Other Directorships During the Past Five Years | ||
| James L.L. Tullis Lord, Abbett & Co. LLC c/o Legal Dept. 90 Hudson Street Jersey City, NJ 07302 (1947) | Director since 2006; Chairman since 2017 | Principal Occupation: CEO of Tullis-Dickerson and Co. Inc., a venture capital management firm (since 1990); CEO of Tullis Health Investors Inc. (since 2012).
Other Directorships: Currently serves as director of Crane Co. (since 1998). |
Officers
None of the officers listed below have received compensation from the Company. All of the officers of the Company also may be officers of the other Lord Abbett Funds and maintain offices at 90 Hudson Street, Jersey City, NJ 07302. Unless otherwise indicated, the position(s) and title(s) listed under the “Principal Occupation During the Past Five Years” column indicate each officer’s position(s) and title(s) with Lord Abbett. Each officer serves for an indefinite term (i.e., until his or her death, resignation, retirement, or removal).
| Name and Year of Birth | Current Position with the Company | Length of Service of Current Position | Principal Occupation During the Past Five Years | |||
| Daria L. Foster (1954) | President and Chief Executive Officer | Elected as President in 2006 and Chief Executive Officer in 2012 | Managing Partner of Lord Abbett, joined Lord Abbett in 1990. | |||
| Sean J. Aurigemma (1969) | Executive Vice President | Elected in 2010 | Portfolio Manager, joined Lord Abbett in 2007. | |||
| Jeff D. Diamond (1960) | Executive Vice President | Elected in 2008 | Portfolio Manager, joined Lord Abbett in 2007. | |||
| Todd D. Jacobson (1966) | Executive Vice President | Elected in 2005 | Partner and Associate Director, joined Lord Abbett in 2003. | |||
| Robert A. Lee (1969) | Executive Vice President | Elected in 2010 | Partner and Chief Investment Officer, and was formerly Deputy Chief Investment Officer and Director of Taxable Fixed Income, joined Lord Abbett in 1997. | |||
| David J. Linsen (1974) | Executive Vice President | Elected in 2008 | Partner and Director, joined Lord Abbett in 2001. | |||
| Thomas B. Maher (1967) | Executive Vice President | Elected in 2010 | Partner and Portfolio Manager, joined Lord Abbett in 2003. | |||
| Justin C. Maurer (1969) | Executive Vice President | Elected in 2010 | Partner and Portfolio Manager, joined Lord Abbett in 2001. |
48
Basic Information About Management (continued)
| Name and Year of Birth | Current Position with the Company | Length of Service of Current Position | Principal Occupation During the Past Five Years | |||
| Vincent J. McBride (1964) | Executive Vice President | Elected in 2010 | Partner and Director, joined Lord Abbett in 2003. | |||
| Andrew H. O’Brien (1973) | Executive Vice President | Elected in 2010 | Partner and Portfolio Manager, joined Lord Abbett in 1998. | |||
| F. Thomas O’Halloran, III (1955) | Executive Vice President | Elected in 2010 | Partner and Portfolio Manager, joined Lord Abbett in 2001. | |||
| Marc Pavese (1972) | Executive Vice President | Elected in 2016 | Partner and Portfolio Manager, joined Lord Abbett in 2008. | |||
| Walter H. Prahl (1958) | Executive Vice President | Elected in 2012 | Partner and Director, joined Lord Abbett in 1997. | |||
| Jeffrey Rabinowitz (1972) | Executive Vice President | Elected in 2017 | Portfolio Manager, joined Lord Abbett in 2017 and was formerly a Managing Director and Portfolio Manager/Technology Analyst at Jennison Associates LLC (2014–2017) and Managing Director and Portfolio Manager/ Technology Analyst at Goldman Sachs Asset Management (1999–2014). | |||
| Steven F. Rocco (1979) | Executive Vice President | Elected in 2014 | Partner and Portfolio Manager, joined Lord Abbett in 2004. | |||
| A. Edward Allinson (1961) | Vice President | Elected in 2011 | Portfolio Manager, joined Lord Abbett in 2005. | |||
| Matthew R. DeCicco (1977) | Vice President | Elected in 2003 | Portfolio Manager, joined Lord Abbett in 1999. | |||
| Brooke A. Fapohunda (1975) | Vice President and Assistant Secretary | Elected in 2014 | Partner and Deputy General Counsel, joined Lord Abbett in 2006. | |||
| John K. Forst (1960) | Vice President and Assistant Secretary | Elected in 2005 | Partner and Deputy General Counsel, joined Lord Abbett in 2004. | |||
| Bernard J. Grzelak (1971) | Chief Financial Officer and Vice President | Elected in 2017 | Partner and Chief Operations Officer, and was formerly Director of Fund Administration, joined Lord Abbett in 2003. | |||
| Lawrence H. Kaplan (1957) | Vice President and Secretary | Elected in 1997 | Partner and General Counsel, joined Lord Abbett in 1997. |
49
Basic Information About Management (concluded)
| Name and Year of Birth | Current Position with the Company | Length of Service of Current Position | Principal Occupation During the Past Five Years | |||
| Linda Y. Kim (1980) | Vice President and Assistant Secretary | Elected in 2016 | Counsel, joined Lord Abbett in 2015 and was formerly an Associate at Stroock & Stroock & Lavan LLP (2007–2015). | |||
| Joseph M. McGill (1962) | Chief Compliance Officer | Elected in 2014 | Partner and Chief Compliance Officer, joined Lord Abbett in 2014 and was formerly Managing Director and the Chief Compliance Officer at UBS Global Asset Management (2003–2013). | |||
| A. Edward Oberhaus, III (1959) | Vice President | Elected in 1998 | Partner and Director, joined Lord Abbett in 1983. | |||
| Noah Petrucci (1970) | Vice President | Elected in 2013 | Portfolio Manager, joined Lord Abbett in 2012. | |||
| Lawrence B. Stoller (1963) | Vice President and Assistant Secretary | Elected in 2007 | Partner and Senior Deputy General Counsel, joined Lord Abbett in 2007. | |||
| Leah G. Traub (1979) | Vice President | Elected in 2016 | Partner and Portfolio Manager, joined Lord Abbett in 2007. | |||
| Arthur K. Weise (1970) | Vice President | Elected in 2010 | Partner and Portfolio Manager, joined Lord Abbett in 2007. | |||
| Kewjin Yuoh (1971) | Vice President | Elected in 2012 | Partner and Portfolio Manager, joined Lord Abbett in 2010. | |||
| Scott S. Wallner (1955) | AML Compliance Officer | Elected in 2011 | Assistant General Counsel, joined Lord Abbett in 2004. | |||
| Christian J. Kelly (1975) | Treasurer | Elected in 2017 | Director of Fund Administration, joined Lord Abbett in 2009. |
Please call 888-522-2388 for a copy of the statement of additional information, which contains further information about the Company’s Directors. It is available free upon request.
50
Approval of Advisory Contract
The Board, including all of the Directors who are not “interested persons” of the Company or of Lord Abbett, as defined in the Investment Company Act of 1940, as amended (the “Independent Directors”), annually considers whether to approve the continuation of the existing management agreement between the Fund and Lord Abbett (the “Agreement”). In connection with its most recent approval, the Board reviewed materials relating specifically to the Agreement, as well as numerous materials received throughout the course of the year, including information about the Fund’s investment performance compared to the performance of its benchmark. Before making its decision as to the Fund, the Board had the opportunity to ask questions and request further information, taking into account its familiarity with Lord Abbett gained through its meetings and discussions. These meetings and discussions included reviews of Fund performance conducted by members of the Contract Committee, the deliberations of the Contract Committee, and discussions between the Contract Committee and Lord Abbett’s management. The Independent Directors also met with their independent legal counsel in various private sessions at which no representatives of management were present.
The materials received by the Board included, but were not limited to: (1) information provided by Morningstar, Inc. (“Morningstar”) regarding the investment performance of the Fund compared to the investment performance of certain funds with similar investment styles as determined by Morningstar, based, in part, on the Fund’s Morningstar category (the “performance peer group”), and the investment performance of two appropriate benchmarks; (2) information provided by Morningstar regarding the expense ratios, contractual and actual management fee rates, and other expense components for the Fund and certain funds in the same Morningstar category, with generally the same or similar share classes and operational characteristics, including asset size (the “expense peer group”); (3) certain supplemental investment performance information provided by Lord Abbett; (4) information provided by Lord Abbett on the expense ratios, management fee rates, and other expense components for the Fund; (5) sales and redemption information for the Fund; (6) information regarding Lord Abbett’s financial condition; (7) an analysis of the relative profitability of the Agreement to Lord Abbett; (8) information provided by Lord Abbett regarding the investment management fee schedules for Lord Abbett’s other advisory clients maintaining accounts with a similar investment strategy as the Fund; and (9) information regarding the personnel and other resources devoted by Lord Abbett to managing the Fund.
Investment Management Services Generally. The Board considered the investment management services provided by Lord Abbett to the Fund, including investment research, portfolio management, and trading, and Lord Abbett’s commitment to compliance with all applicable legal requirements. The Board also observed that Lord Abbett was solely engaged in the investment management business and accordingly did not experience the conflicts of interest that may result from being engaged in other lines of business. The Board considered the investment advisory services provided by Lord Abbett to other clients, the fees charged for the services, and the differences in the nature of the services provided to the Fund and other Lord Abbett Funds, on the one hand, and the services provided to other clients, on the other. After reviewing these and related factors, the Board concluded that the Fund was likely to continue to benefit from the nature, extent and quality of the investment services provided by Lord Abbett under the Agreement.
Investment Performance. The Board reviewed the Fund’s investment performance in relation to that of the performance peer group and two appropriate benchmarks as of various periods ended August 31, 2017. The Board observed that although the Fund’s investment performance was below the median of the performance peer group for the one-, three-, and five-year periods, the Fund
51
Approval of Advisory Contract (continued)
outperformed both benchmarks for the one-, three-, and five-year periods. The Board further considered Lord Abbett’s performance and reputation generally, the performance of other Lord Abbett-managed funds overseen by the Board, and the willingness of Lord Abbett to take steps intended to improve performance when necessary. After reviewing these and related factors, the Board concluded that the Fund’s Agreement should be continued.
Lord Abbett’s Personnel and Methods. The Board considered the qualifications of the personnel providing investment management services to the Fund, in light of its investment objective and discipline. Among other things, the Board considered the size, experience, and turnover of Lord Abbett’s investment management staff, Lord Abbett’s investment methodology and philosophy, and Lord Abbett’s approach to recruiting, training, and retaining investment management personnel.
Nature and Quality of Other Services. The Board considered the nature, quality, costs, and extent of compliance, administrative, and other services performed by Lord Abbett and the nature and extent of Lord Abbett’s supervision of third party service providers, including the Fund’s transfer agent and custodian.
Expenses. The Board considered the expense level of the Fund and the expense levels of the expense peer group. It also considered how the expense level of the Fund related to those of the expense peer group and the amount and nature of the fees paid by shareholders. The Board observed that the net total expense ratio of the Fund was below the median of the expense peer group. After reviewing these and related factors, the Board concluded, within the context of its overall approval of the Agreement, that the expense level of the Fund was reasonable and supported the continuation of the Agreement.
Profitability. The Board considered the level of Lord Abbett’s operating margin in managing the Fund, including a review of Lord Abbett’s methodology for allocating its costs to its management of the Fund. It considered whether the Fund was profitable to Lord Abbett in connection with the Fund’s operation, including the fee that Lord Abbett receives from the Fund for providing administrative services to the Fund. The Board also considered the profits realized from other business segments of Lord Abbett, which may benefit from or be related to the Fund’s business. The Board considered Lord Abbett’s profit margins excluding Lord Abbett’s marketing and distribution expenses. The Board also considered Lord Abbett’s profit margins, without those exclusions, in comparison with available industry data and how those profit margins could affect Lord Abbett’s ability to recruit and retain investment personnel. The Board recognized that Lord Abbett’s overall profitability was a factor in enabling it to attract and retain qualified investment management personnel to provide services to the Fund. After reviewing these and related factors, the Board concluded, within the context of its overall approval of the Agreement, that Lord Abbett’s profitability with respect to the Fund was not excessive.
Economies of Scale. The Board considered the extent to which there had been economies of scale in managing the Fund, whether the Fund’s shareholders had appropriately benefited from such economies of scale, and whether there was potential for realization of any further economies of scale. The Board concluded that the existing management fee schedule, with its breakpoints in the level of the management fee, in conjunction with the Fund’s proposed expense limitation agreement, adequately addressed any economies of scale in managing the Fund.
Other Benefits to Lord Abbett. The Board considered the amount and nature of the fees paid by the Fund and the Fund’s shareholders to Lord Abbett for services other than investment advisory services. The Board also considered the revenues and profitability of Lord Abbett’s investment
52
Approval of Advisory Contract (concluded)
advisory business apart from its mutual fund business, and the intangible benefits enjoyed by Lord Abbett by virtue of its relationship with the Fund. The Board observed that the Distributor receives 12b-1 fees from certain of the Lord Abbett Funds as to shares held in accounts for which there is no other broker of record, may retain a portion of the 12b-1 fees it receives, and receives a portion of the sales charges on sales and redemptions of some classes of shares of the Lord Abbett Funds. In addition, the Board observed that Lord Abbett accrues certain benefits for its business of providing investment advice to clients other than the Lord Abbett Funds, but that business also benefits the Funds. The Board also noted that Lord Abbett, as disclosed in the prospectus of the Fund, has entered into revenue sharing arrangements with certain entities that distribute shares of the Fund. The Board also took into consideration the investment research that Lord Abbett receives as a result of Fund brokerage transactions.
Alternative Arrangements. The Board considered whether, instead of approving continuation of the Agreement, it might be in the best interests of the Fund to implement one or more alternative arrangements, such as continuing to employ Lord Abbett, but on different terms. After considering all of the relevant factors, the Board unanimously found that continuation of the Agreement was in the best interests of the Fund and its shareholders and voted unanimously to approve the continuation of the Agreement. In considering whether to approve the continuation of the Agreement, the Board did not identify any single factor as paramount or controlling. Individual Directors may have evaluated the information presented differently from one another, giving different weights to various factors. This summary does not discuss in detail all matters considered.
53
Householding
The Company has adopted a policy that allows it to send only one copy of the Fund’s prospectus, proxy material, annual report and semiannual report to certain shareholders residing at the same “household.” This reduces Fund expenses, which benefits you and other shareholders. If you need additional copies or do not want your mailings to be “householded,” please call Lord Abbett at 888-522-2388 or send a written request with your name, the name of your fund or funds and your account number or numbers to Lord Abbett Family of Funds, P.O. Box 219336, Kansas City, MO 64121.
Proxy Voting Policies, Procedures and Records
A description of the policies and procedures that Lord Abbett uses to vote proxies related to the Fund’s portfolio securities, and information on how Lord Abbett voted the Fund’s proxies during the 12-month period ended June 30 are available without charge, upon request, (i) by calling 888-522-2388; (ii) on Lord Abbett’s Website at www.lordabbett.com; and (iii) on the Securities and Exchange Commission’s (“SEC”) Website at www.sec.gov.
Shareholder Reports and Quarterly Portfolio Disclosure
The Fund is required to file its complete schedule of portfolio holdings with the SEC for its first and third fiscal quarters on Form N-Q. Copies of the filings are available without charge, upon request on the SEC’s Website at www.sec.gov and may be available by calling Lord Abbett at 888-522-2388. You can also obtain copies of Form N-Q by visiting the SEC’s Public Reference Room in Washington, DC (information on the operation of the Public Reference Room may be obtained by calling 800-SEC-0330).
54


| This report, when not used for the general information of shareholders of the Fund, is to be distributed only if preceded or accompanied by a current fund prospectus. | |||
| Lord Abbett Series Fund, Inc. | |||
| Lord Abbett mutual fund shares are distributed by LORD ABBETT DISTRIBUTOR LLC. | Total Return Portfolio | SFTR-PORT-3 (02/18) |
| Item 2: | Code of Ethics. |
| (a) | In accordance with applicable requirements, the Registrant adopted a Sarbanes-Oxley Code of Ethics on June 19, 2003 that applies to the principal executive officer and senior financial officers of the Registrant (“Code of Ethics”). The Code of Ethics was in effect during the fiscal year ended December 31, 2017 (the “Period”). |
| (b) | Not applicable. |
| (c) | The Registrant has not amended the Code of Ethics as described in Form N-CSR during the Period. |
| (d) | The Registrant has not granted any waiver, including an implicit waiver, from a provision of the Code of Ethics as described in Form N-CSR during the Period. |
| (e) | Not applicable. |
| (f) | See Item 12(a)(1) concerning the filing of the Code of Ethics. |
| Item 3: | Audit Committee Financial Expert. |
The Registrant’s board of directors has determined that each of the following independent directors who are members of the audit committee is an audit committee financial expert: Evelyn E. Guernsey and Mark A. Schmid. Each of these persons is independent within the meaning of the Form N-CSR.
| Item 4: | Principal Accountant Fees and Services. |
In response to sections (a), (b), (c) and (d) of Item 4, the aggregate fees billed to the Registrant for the fiscal years ended December 31, 2017 and 2016 by the Registrant’s principal accounting firm, Deloitte & Touche LLP, the member firms of Deloitte Touche Tohmatsu and their respective affiliates (collectively, “Deloitte”) were as follows:
| Fiscal year ended: | ||||
| 2017 | 2016 | |||
| Audit Fees {a} | $464,200 | $507,800 | ||
| Audit-Related Fees | - 0 - | - 0 - | ||
| Total audit and audit-related fees | 464,200 | 507,800 | ||
| Tax Fees {b} | 123,098 | 122,938 | ||
| All Other Fees | - 0 - | - 0 - | ||
| Total Fees | $587,298 | $630,738 | ||
{a} Consists of fees for audits of the Registrant’s annual financial statements.
{b} Fees for the fiscal year ended December 31, 2017 and 2016 consist of fees for preparing the U.S. Income Tax Return for Regulated Investment Companies, New Jersey Corporation Business Tax Return, New Jersey Annual Report Form, U.S. Return of Excise Tax on Undistributed Income of Investment Companies, IRS Forms 1099-MISC and 1096 Annual Summary and Transmittal of U.S. Information Returns.
(e) (1) Pursuant to Rule 2-01(c) (7) of Regulation S-X, the Registrant’s Audit Committee has adopted pre-approval policies and procedures. Such policies and procedures generally provide that the Audit Committee must pre-approve:
| · | any audit, audit-related, tax, and other services to be provided to the Lord Abbett Funds, including the Registrant, and |
| · | any audit-related, tax, and other services to be provided to the Registrant’s investment adviser and any entity controlling, controlled by or under common control with the investment adviser that provides ongoing services to one or more Funds comprising the Registrant if the engagement relates directly to operations and financial reporting of a Fund, by the independent auditor to assure that the provision of such services does not impair the auditor’s independence. |
The Audit Committee has delegated pre-approval authority to its Chairman, subject to a fee limit of $10,000 per event, and not to exceed $25,000 annually. The Chairman will report any pre-approval decisions to the Audit Committee at its next scheduled meeting. Unless a type of service to be provided by the independent auditor has received general pre-approval, it must be pre-approved by the Audit Committee. Any proposed services exceeding pre-approved cost levels will require specific pre-approval by the Audit Committee.
(e) (2) The Registrant’s Audit Committee has approved 100% of the services described in this Item 4 (b) through (d).
(f) Not applicable.
(g) The aggregate non-audit fees billed by Deloitte for services rendered to the Registrant are shown above in the response to Item 4 (a), (b), (c) and (d) as “All Other Fees”.
The aggregate non-audit fees billed by Deloitte for services rendered to the Registrant’s investment adviser, Lord, Abbett & Co. LLC (“Lord Abbett”), for the fiscal years ended December 31, 2017 and 2016 were:
| Fiscal year ended: | ||||
| 2017 | 2016 | |||
| All Other Fees {a} | $201,416 | $95,230 | ||
{a} Consist of fees for Independent Services Auditors’ Report on Controls Placed in Operation and Tests of Operating Effectiveness related to Lord Abbett’s Asset Management Services (“SOC-1 Report”).
The aggregate non-audit fees billed by Deloitte for services rendered to entities under the common control of Lord Abbett for the fiscal years ended December 31, 2017 and 2016 were:
| Fiscal year ended: | ||||
| 2017 | 2016 | |||
| All Other Fees | $ - 0 - | $ - 0- | ||
(h) The Registrant’s Audit Committee has considered the provision of non-audit services that were rendered to the Registrant’s investment adviser, and any entity controlling, controlled by or under common control with the investment adviser that provides ongoing services to the Registrant, that were not pre-approved pursuant to Rule 2-01 (c)(7)(ii) of Regulation S-X and has determined that the provision of such services is compatible with maintaining Deloitte’s independence.
| Item 5: | Audit Committee of Listed Registrants. |
Not applicable.
| Item 6: | Investments. |
Not applicable.
| Item 7: | Disclosure of Proxy Voting Policies and Procedures for Closed-End Management Investment Companies. |
Not applicable.
| Item 8: | Portfolio Managers of Closed-End Management Investment Companies. |
Not applicable.
| Item 9: | Purchases of Equity Securities by Closed-End Management Investment Company and Affiliated Purchasers. |
Not applicable.
| Item 10: | Submission of Matters to a Vote of Security Holders. |
Not applicable.
| Item 11: | Controls and Procedures. |
| (a) | Based on their evaluation of the Registrant’s disclosure controls and procedures (as defined in Rule 30a-3(c) under the Investment Company Act of 1940) as of a date within 90 days prior to the filing date of this report, the Chief Executive Officer and Chief Financial Officer of the Registrant have concluded that such disclosure controls and procedures are reasonably designed and effective to ensure that material information relating to the Registrant, including its consolidated subsidiaries, is made known to them by others within those entities. |
| (b) | There were no changes in the Registrant’s internal control over financial reporting (as defined in Rule 30a-3(d) under the Investment Company Act of 1940) that occurred during the second fiscal quarter of the period covered by this report that have materially affected, or are reasonably likely to materially affect, the Registrant’s internal control over financial reporting. |
| Item 12: | Exhibits. |
| (a)(1) | The Lord Abbett Family of Funds Sarbanes Oxley Code of Ethics for the Principal Executive Officer and Senior Financial Officers is attached hereto as part of Ex-99. CODEETH. |
| (a)(2) | Certification of each Principal Executive Officer and Principal Financial Officer of the Registrant as required by Rule 30a-2 under the Investment Company Act of 1940 is attached hereto as a part of EX-99.CERT. |
| (b) | Certification of each Principal Executive Officer and Principal Financial Officer of the Registrant as required by Section 906 of the Sarbanes-Oxley Act of 2002 is provided as a part of EX-99.906CERT. |
SIGNATURES
Pursuant to the requirements of the Securities Exchange Act of 1934 and the Investment Company Act of 1940, the Registrant has duly caused this report to be signed on its behalf by the undersigned, thereunto duly authorized.
| LORD ABBETT SERIES FUND, INC. | |||
| By: | /s/ Daria L. Foster | ||
| Daria L. Foster | |||
| President and Chief Executive Officer | |||
| Date: February 15, 2018 | |||
| By: | /s/ Bernard J. Grzelak | ||
| Bernard J. Grzelak | |||
| Chief Financial Officer and Vice President | |||
| Date: February 15, 2018 | |||
Pursuant to the requirements of the Securities Exchange Act of 1934 and the Investment Company Act of 1940, this report has been signed below by the following persons on behalf of the Registrant and in the capacities and on the dates indicated.
| By: | /s/ Daria L. Foster | ||
| Daria L. Foster | |||
| President and Chief Executive Officer | |||
| Date: February 15, 2018 | |||
| By: | /s/ Bernard J. Grzelak | ||
| Bernard J. Grzelak | |||
| Chief Financial Officer and Vice President | |||
| Date: February 15, 2018 | |||