UNITED STATES
SECURITIES AND EXCHANGE COMMISSION
Washington, D.C. 20549
FORM N-CSR
CERTIFIED SHAREHOLDER REPORT OF REGISTERED
MANAGEMENT INVESTMENT COMPANIES
Investment Company Act File Number: 811-05876
LORD ABBETT SERIES FUND, INC.
(Exact name of Registrant as specified in charter)
90 Hudson Street, Jersey City, NJ 07302
(Address of principal executive offices) (Zip code)
Brooke A. Fapohunda, Esq., Vice President & Assistant Secretary
90 Hudson Street, Jersey City, NJ 07302
(Name and address of agent for service)
Registrant’s telephone number, including area code: (800) 201-6984
Date of fiscal year end: 12/31
Date of reporting period: 12/31/2016
| Item 1: | Report(s) to Shareholders. |

2016 LORD ABBETT
ANNUAL REPORT
Lord Abbett
Series Fund—Bond Debenture Portfolio
For the fiscal year ended December 31, 2016
Table of Contents
Lord Abbett Series Fund — Bond Debenture Portfolio
Annual Report
For the fiscal year ended December 31, 2016

From left to right: James L.L. Tullis, Chairman of the Lord Abbett Funds and Daria L. Foster Director, President, and Chief Executive Officer of the Lord Abbett Funds. | | Dear Shareholders: We are pleased to provide you with this overview of the performance of Lord Abbett Series Fund — Bond Debenture Portfolio for the fiscal year ended December 31, 2016. On this page, and the following pages, we discuss the major factors that influenced fiscal year performance. For additional information about the Fund, please visit our website at www.lordabbett.com, where you also can access the quarterly commentaries that provide updates on the Fund’s performance and other portfolio related updates. Thank you for investing in Lord Abbett mutual funds. We value the trust that you place in us and look forward to serving your investment needs in the years to come. Best regards, 
Daria L. Foster Director, President and Chief Executive Officer |
For the fiscal year ended December 31, 2016, the Fund returned 12.13%, reflecting performance at the net asset value (NAV) of Class VC shares, with all distributions reinvested, compared to its benchmark, the Bloomberg Barclays U.S. Aggregate Bond Index1 which returned 2.65% over the same period.
The high yield sector of the U.S. fixed income market experienced strong returns during the 12-month period, outperforming traditional government-related and investment grade securities
within the fixed income market as well as the U.S. equity market. Leveraged loans also experienced strong returns, although not to the same extent as high yield bonds.
As it has in the past, the Fund maintained a significant allocation to high yield bonds, as we remained positive on the high yield market from a fundamental perspective. The Fund’s exposure to high yield bonds likely contributed to relative performance, as the high yield market significantly outperformed the Fund’s benchmark.
1
The Fund maintained a sizable allocation to equities throughout the period, as equities provided portfolio diversification, a high degree of liquidity, and a more diverse opportunity set to express certain investment themes than did certain fixed income securities. The Fund’s allocation to equities likely contributed to relative performance, as the asset class outperformed the Bloomberg Barclays U.S. Aggregate Bond Index.
Within the Fund’s investment grade bond allocation, the Fund’s exposure to ‘AAA’ rated bonds likely detracted from performance, as ‘AAA’ rated bonds underperformed the benchmark during the period.
The Fund’s portfolio is actively managed and, therefore, its holdings and the weightings of a particular issuer or particular sector as a percentage of portfolio assets are subject to change. Sectors may include many industries.
1 The Bloomberg Barclays U.S. Aggregate Bond Index represents securities that are SEC-registered, taxable, and dollar-denominated. The index covers the U.S. investment-grade fixed-rate bond market, with index components for government and corporate securities, mortgage pass-through securities, and asset-backed securities. Total return comprises price appreciation/depreciation and income as a percentage of the original investment.
Unless otherwise specified, indexes reflect total return, with all dividends reinvested. Indexes are unmanaged, do not reflect the deduction of fees or expenses, and are not available for direct investment.
Important Performance and Other Information
Performance data quoted in the following pages reflect past performance and are no guarantee of future results. Current performance may be higher or lower than the performance quoted. The investment return and principal value of an investment in the Funds will fluctuate so that shares, on any given day or when redeemed, may be worth more or less than their original cost. You can obtain performance data current to the most recent month end by calling Lord Abbett at 888-522-2388 or referring to www.lordabbett.com.
During certain periods shown, expense waivers and reimbursements were in place. Without such expense
waivers and reimbursements, the Funds’ returns would have been lower.
The annual commentary above discusses the views of the Fund’s management and various portfolio holdings of the Funds as of December 31, 2016. These views and portfolio holdings may have changed after this date. Information provided in the commentary is not a recommendation to buy or sell securities. Because the Fund’s portfolio is actively managed and may change significantly, the Fund may no longer own the securities described above or may have otherwise changed their positions in the securities. For more recent information about the Fund’s portfolio holdings, please visit www.lordabbett.com.
A Note about Risk: See Notes to Financial Statements for a discussion of investment risks. For a more detailed discussion of the risks associated with each Fund, please see the Fund’s prospectus.
Mutual funds are not insured by the FDIC, are not deposits or other obligations of, or guaranteed by, banks, and are subject to investment risks including possible loss of principal amount invested.
The Fund serves as an underlying investment vehicle for variable annuity contracts and variable life insurance policies.
2
Investment Comparison
Below is a comparison of a $10,000 investment in Class VC shares with the same investment in the Bloomberg Barclays U.S. Aggregate Bond Index and the BofA Merrill Lynch U.S. High Yield Constrained Index, assuming reinvestment of all dividends and distributions. The Fund’s shares are sold only to insurance company separate accounts that fund certain variable annuity and variable life contracts. This line graph comparison does not reflect the sales charges or other expenses of these contracts. If those sales charges and expenses were reflected, returns would be lower. The graph and performance table below do not reflect the deduction of taxes that a shareholder would pay on Fund distributions or the redemption of Fund shares. During certain periods, expenses of the Fund have been waived or reimbursed by Lord Abbett; without such waiver or reimbursement of expenses, the Fund’s returns would have been lower. Past performance is no guarantee of future results.
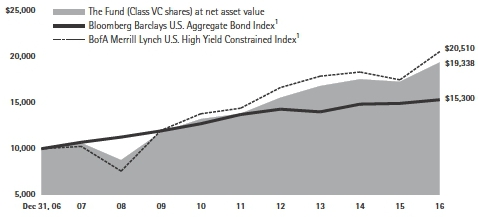
| | | Average Annual Total Returns for the
Periods Ended December 31, 2016 |
| | | | 1 Year | | | 5 Years | | | 10 Years |
| Class VC | | | 12.13 | % | | | 7.00 | % | | | 6.82 | % |
1 Performance for each unmanaged index does not reflect any fees or expenses. The performance of each index is not necessarily representative of the Fund’s performance.
3
Expense Example
As a shareholder of the Fund, you incur ongoing costs, including management fees; expenses related to the Fund’s services arrangements with certain insurance companies; and other Fund expenses. This Example is intended to help you understand your ongoing costs (in dollars) of investing in the Fund and to compare these costs with the ongoing costs of investing in other mutual funds.
The Example is based on an investment of $1,000 invested at the beginning of the period and held for the entire period (July 1, 2016 through December 31, 2016).
The Example reflects only expenses that are deducted from the assets of the Fund. Fees and expenses, including sales charges applicable to the various insurance products that invest in the Fund, are not reflected in this Example. If such fees and expenses were reflected in the Example, the total expenses shown would be higher. Fees and expenses regarding such variable insurance products are separately described in the prospectus related to those products.
Actual Expenses
The first line of the table on the following page provides information about actual account values and actual expenses. You may use the information in this line, together with the amount you invested, to estimate the expenses that you paid over the period. Simply divide your account value by $1,000 (for example, an $8,600 account value divided by $1,000 = 8.6), then multiply the result by the number in the first line under the heading titled “Expenses Paid During Period 7/1/16 – 12/31/16” to estimate the expenses you paid on your account during this period.
Hypothetical Example for Comparison Purposes
The second line of the table on the following page provides information about hypothetical account values and hypothetical expenses based on the Fund’s actual expense ratio and an assumed rate of return of 5% per year before expenses, which is not the Fund’s actual return. The hypothetical account values and expenses may not be used to estimate the actual ending account balance or expenses you paid for the period. You may use this information to compare the ongoing costs of investing in the Fund and other funds. To do so, compare this 5% hypothetical example with the 5% hypothetical examples that appear in the shareholder reports of the other funds.
4
Please note that the expenses shown in the table are meant to highlight your ongoing costs only and do not reflect any transactional costs, such as sales charges. Therefore, the second line of the table is useful in comparing ongoing costs only, and will not help you determine the relative total costs of owning different funds. In addition, if these transactional costs were included, your costs would have been higher.
| | | Beginning | | Ending | | Expenses |
| | | Account | | Account | | Paid During |
| | | Value | | Value | | Period† |
| | | | | | | 7/1/16 - |
| | | 7/1/16 | | 12/31/16 | | 12/31/16 |
| Class VC | | | | | | |
| Actual | | $1,000.00 | | $1,058.60 | | $4.66 |
| Hypothetical (5% Return Before Expenses) | | $1,000.00 | | $1,020.61 | | $4.57 |
| † | Net expenses are equal to the Fund’s annualized expense ratio of 0.90%, multiplied by the average account value over the period, multiplied by 184/366 (to reflect one-half year period). |
Portfolio Holdings Presented by Sector
December 31, 2016
| Sector* | %** | |
| Asset Backed | 2.48 | % |
| Automotive | 1.54 | % |
| Banking | 8.15 | % |
| Basic Industry | 13.53 | % |
| Capital Goods | 4.50 | % |
| Consumer Goods | 4.82 | % |
| Energy | 15.57 | % |
| Financial Services | 2.04 | % |
| Foreign Government | 4.23 | % |
| Healthcare | 5.07 | % |
| Insurance | 1.49 | % |
| Leisure | 4.32 | % |
| Media | 6.31 | % |
| Municipal | 0.33 | % |
| Real Estate | 1.28 | % |
| Retail | 4.42 | % |
| Services | 2.52 | % |
| Technology & Electronics | 5.41 | % |
| Telecommunications | 5.14 | % |
| Transportation | 2.81 | % |
| Utility | 2.85 | % |
| Repurchase Agreement | 1.19 | % |
| Total | 100.00 | % |
| * | A sector may comprise several industries. |
| ** | Represents percent of total investments. |
5
Schedule of Investments
December 31, 2016
| Investments | | Interest
Rate | | Maturity
Date | | Principal
Amount
(000) | | | Fair
Value | |
| LONG-TERM INVESTMENTS 97.53% | | | | | | | | | | | | |
| | | | | | | | | | | | | |
| ASSET-BACKED SECURITIES 2.04% | | | | | | | | | | | | |
| | | | | | | | ’ | | | | | |
| Automobiles 0.37% | | | | | | | | | | | | |
| Drive Auto Receivables Trust 2016-BA D† | | 4.53% | | 8/15/2023 | | $ | 1,028 | | | $ | 1,034,569 | |
| Ford Credit Auto Owner Trust 2016-C C | | 1.93% | | 4/15/2023 | | | 532 | | | | 523,311 | |
| Hyundai Auto Receivables Trust 2016-B C | | 2.19% | | 11/15/2022 | | | 1,175 | | | | 1,157,601 | |
| TCF Auto Receivables Owner Trust 2016-1A B† | | 2.32% | | 6/15/2022 | | | 979 | | | | 966,737 | |
| Westlake Automobile Receivables Trust 2016-3A B† | | 2.07% | | 12/15/2021 | | | 277 | | | | 275,914 | |
| Total | | | | | | | | | | | 3,958,132 | |
| | | | | | | | | | | | | |
| Other 1.67% | | | | | | | | | | | | |
| ALM XIX Ltd. 2016-19A C† | | 4.984% | # | 7/15/2028 | | | 462 | | | | 468,856 | |
| ALM XVIII Ltd. 2016-18A C† | | 5.007% | # | 7/15/2027 | | | 500 | | | | 504,587 | |
| Anchorage Capital CLO 7 Ltd. 2015-7A D† | | 4.53% | # | 10/15/2027 | | | 400 | | | | 391,335 | |
| Anchorage Capital CLO 8 Ltd. 2016-8A D† | | 4.921% | # | 7/28/2028 | | | 250 | | | | 253,066 | |
| Anchorage Capital CLO 9 Ltd. 2016-9A D† | | 4.951% | # | 1/15/2029 | | | 900 | | | | 894,126 | |
| Anchorage Capital CLO Ltd. 2013-1A C† | | 4.378% | # | 7/13/2025 | | | 250 | | | | 247,463 | |
| Ascentium Equipment Receivables Trust 2016-2A B† | | 2.50% | | 9/12/2022 | | | 417 | | | | 410,958 | |
| BlueMountain CLO Ltd. 2016-1A D† | | 5.681% | # | 4/20/2027 | | | 500 | | | | 506,060 | |
| Engs Commercial Finance Trust 2016-1A A2† | | 2.63% | | 2/22/2022 | | | 1,063 | | | | 1,057,410 | |
| Guggenheim 5180-2 CLO LP 2015-1A A2B† | | 3.48% | # | 11/25/2027 | | | 2,500 | | | | 2,522,893 | |
| JFIN CLO II Ltd. 2015-2A B1† | | 3.28% | # | 10/19/2026 | | | 1,500 | | | | 1,505,893 | |
| KKR Financial CLO Ltd. 2013-2A C† | | 4.632% | # | 1/23/2026 | | | 500 | | | | 486,630 | |
| Leaf Receivables Funding 11 LLC 2016-1 A3† | | 2.05% | | 6/15/2019 | | | 492 | | | | 491,105 | |
| Leaf Receivables Funding 11 LLC 2016-1 A4† | | 2.49% | | 4/15/2022 | | | 634 | | | | 630,604 | |
| OHA Loan Funding Ltd. 2013-1A D† | | 4.482% | # | 7/23/2025 | | | 450 | | | | 446,691 | |
| OZLM VIII Ltd. 2014-8A A2A† | | 3.03% | # | 10/17/2026 | | | 1,250 | | | | 1,252,151 | |
| PFS Financing Corp. 2016-BA A† | | 1.87% | | 10/15/2021 | | | 562 | | | | 557,082 | |
| Sonic Capital LLC 2016-1A A2† | | 4.472% | | 5/20/2046 | | | 537 | | | | 531,458 | |
| Sound Point CLO XI Ltd. 2016-1A D† | | 5.531% | # | 7/20/2028 | | | 2,000 | | | | 2,009,060 | |
| Taco Bell Funding LLC 2016-1A A23† | | 4.97% | | 5/25/2046 | | | 1,025 | | | | 1,020,387 | |
| Voya CLO Ltd. 2016-2A C† | | 4.932% | # | 7/19/2028 | | | 750 | | | | 737,942 | |
| Westcott Park CLO Ltd. 2016-1A D† | | 5.231% | # | 7/20/2028 | | | 850 | | | | 849,986 | |
| Total | | | | | | | | | | | 17,775,743 | |
| Total Asset-Backed Securities (cost $21,441,083) | | | | | | | | | | | 21,733,875 | |
| 6 | See Notes to Financial Statements. | |
Schedule of Investments (continued)
December 31, 2016
| Investments | | Shares
(000) | | Fair
Value | |
| COMMON STOCKS 13.29% | | | | | | |
| | | | | | | |
| Aerospace/Defense 0.21% | | | | | | |
| Huntington Ingalls Industries, Inc. | | 6 | | $ | 1,101,088 | |
| Northrop Grumman Corp. | | 5 | | | 1,170,342 | |
| Total | | | | | 2,271,430 | |
| | | | | | | |
| Air Transportation 0.24% | | | | | | |
| Hawaiian Holdings, Inc.* | | 26 | | | 1,457,832 | |
| Spirit Airlines, Inc.* | | 18 | | | 1,051,027 | |
| Total | | | | | 2,508,859 | |
| | | | | | | |
| Auto Parts & Equipment 0.36% | | | | | | |
| BorgWarner, Inc. | | 26 | | | 1,039,126 | |
| Chassix Holdings, Inc. | | 59 | | | 1,754,512 | |
| LCI Industries | | 10 | | | 1,060,152 | |
| Total | | | | | 3,853,790 | |
| | | | | | | |
| Automakers 0.24% | | | | | | |
| Oshkosh Corp. | | 16 | | | 1,017,284 | |
| Thor Industries, Inc. | | 15 | | | 1,509,755 | |
| Total | | | | | 2,527,039 | |
| | | | | | | |
| Banking 1.40% | | | | | | |
| Comerica, Inc. | | 27 | | | 1,809,274 | |
| Cullen/Frost Bankers, Inc. | | 15 | | | 1,311,892 | |
| Great Western Bancorp, Inc. | | 30 | | | 1,287,736 | |
| Hilltop Holdings, Inc. | | 37 | | | 1,096,849 | |
| LegacyTexas Financial Group, Inc. | | 29 | | | 1,239,697 | |
| PacWest Bancorp | | 20 | | | 1,088,800 | |
| Regions Financial Corp. | | 75 | | | 1,077,000 | |
| Sberbank of Russia PJSC ADR | | 96 | | | 1,111,200 | |
| SVB Financial Group* | | 12 | | | 2,111,761 | |
| Texas Capital Bancshares, Inc.* | | 19 | | | 1,520,960 | |
| Zions Bancorporation | | 31 | | | 1,313,150 | |
| Total | | | | | 14,968,319 | |
| | | | | | | |
| Beverages 0.10% | | | | | | |
| Boston Beer Co., Inc. (The) Class A* | | 6 | | | 1,082,794 | |
| | | | | | | |
| Brokerage 0.12% | | | | | | |
| E*TRADE Financial Corp.* | | 37 | | | 1,267,462 | |
| | See Notes to Financial Statements. | 7 |
Schedule of Investments (continued)
December 31, 2016
| Investments | | Shares
(000) | | Fair
Value | |
| Building & Construction 0.27% | | | | | | |
| Granite Construction, Inc. | | 34 | | $ | 1,849,595 | |
| LGI Homes, Inc.* | | 34 | | | 969,379 | |
| Total | | | | | 2,818,974 | |
| | | | | | | |
| Building Materials 0.51% | | | | | | |
| Beacon Roofing Supply, Inc.* | | 23 | | | 1,052,331 | |
| Gibraltar Industries, Inc.* | | 23 | | | 974,610 | |
| Martin Marietta Materials, Inc. | | 6 | | | 1,332,503 | |
| Simpson Manufacturing Co., Inc. | | 23 | | | 1,015,000 | |
| Vulcan Materials Co. | | 8 | | | 1,040,747 | |
| Total | | | | | 5,415,191 | |
| | | | | | | |
| Chemicals 0.54% | | | | | | |
| Celanese Corp. Series A | | 13 | | | 1,012,754 | |
| CF Industries Holdings, Inc. | | 36 | | | 1,142,724 | |
| Scotts Miracle-Gro Co. (The) Class A | | 12 | | | 1,147,078 | |
| Trinseo SA | | 20 | | | 1,206,280 | |
| Versum Materials, Inc.* | | 45 | | | 1,249,115 | |
| Total | | | | | 5,757,951 | |
| | | | | | | |
| Diversified Capital Goods 0.50% | | | | | | |
| A.O. Smith Corp. | | 23 | | | 1,072,383 | |
| AMETEK, Inc. | | 22 | | | 1,058,751 | |
| Belden, Inc. | | 14 | | | 1,070,332 | |
| MSC Industrial Direct Co., Inc. Class A | | 12 | | | 1,112,653 | |
| Rockwell Automation, Inc. | | 8 | | | 1,050,202 | |
| Total | | | | | 5,364,321 | |
| | | | | | | |
| Electric: Integrated 0.21% | | | | | | |
| IDACORP, Inc. | | 13 | | | 1,071,315 | |
| Portland General Electric Co. | | 26 | | | 1,108,555 | |
| Total | | | | | 2,179,870 | |
| | | | | | | |
| Electronics 0.42% | | | | | | |
| Cognex Corp. | | 17 | | | 1,059,337 | |
| Littelfuse, Inc. | | 8 | | | 1,177,280 | |
| MKS Instruments, Inc. | | 18 | | | 1,086,782 | |
| Trimble, Inc.* | | 37 | | | 1,114,465 | |
| Total | | | | | 4,437,864 | |
| 8 | See Notes to Financial Statements. | |
Schedule of Investments (continued)
December 31, 2016
| Investments | | Shares
(000) | | Fair
Value | |
| Energy: Exploration & Production 0.53% | | | | | | |
| Callon Petroleum Co.* | | 78 | | $ | 1,202,826 | |
| Concho Resources, Inc.* | | 8 | | | 996,091 | |
| Diamondback Energy, Inc.* | | 10 | | | 1,024,951 | |
| Parsley Energy, Inc. Class A* | | 29 | | | 1,036,267 | |
| Sanchez Energy Corp.* | | 2 | | | 16,380 | |
| Templar Energy LLC Class A | | 46 | | | 346,644 | |
| WPX Energy, Inc.* | | 72 | | | 1,049,521 | |
| Total | | | | | 5,672,680 | |
| | | | | | | |
| Environmental 0.10% | | | | | | |
| Tetra Tech, Inc. | | 25 | | | 1,063,648 | |
| | | | | | | |
| Food: Wholesale 0.19% | | | | | | |
| Hershey Co. (The) | | 10 | | | 1,069,570 | |
| Mead Johnson Nutrition Co. | | 14 | | | 997,716 | |
| Total | | | | | 2,067,286 | |
| | | | | | | |
| Forestry/Paper 0.31% | | | | | | |
| KapStone Paper and Packaging Corp. | | 50 | | | 1,100,295 | |
| Louisiana-Pacific Corp.* | | 60 | | | 1,128,342 | |
| Potlatch Corp. | | 27 | | | 1,116,803 | |
| Total | | | | | 3,345,440 | |
| | | | | | | |
| Gaming 0.10% | | | | | | |
| Wynn Resorts Ltd. | | 12 | | | 1,045,992 | |
| | | | | | | |
| Hotels 0.16% | | | | | | |
| La Quinta Holdings, Inc.* | | 39 | | | 559,874 | |
| Marriott International, Inc. Class A | | 13 | | | 1,107,912 | |
| Total | | | | | 1,667,786 | |
| | | | | | | |
| Integrated Energy 0.09% | | | | | | |
| NOW, Inc.* | | 48 | | | 986,408 | |
| | | | | | | |
| Machinery 0.44% | | | | | | |
| Middleby Corp. (The)* | | 13 | | | 1,669,893 | |
| Nordson Corp. | | 16 | | | 1,786,974 | |
| Toro Co. (The) | | 23 | | | 1,263,015 | |
| Total | | | | | 4,719,882 | |
| | | | | | | |
| Managed Care 0.10% | | | | | | |
| WellCare Health Plans, Inc.* | | 8 | | | 1,076,352 | |
| | See Notes to Financial Statements. | 9 |
Schedule of Investments (continued)
December 31, 2016
| Investments | | Shares
(000) | | Fair
Value | |
| Media: Content 0.41% | | | | | | | |
| AMC Networks, Inc. Class* | | | 20 | | $ | 1,041,357 | |
| Netflix, Inc.* | | | 18 | | | 2,203,269 | |
| Scripps Networks Interactive, Inc. Class A | | | 16 | | | 1,148,343 | |
| Total | | | | | | 4,392,969 | |
| | | | | | | | |
| Medical Products 0.15% | | | | | | | |
| ABIOMED, Inc.* | | | 5 | | | 531,286 | |
| ICU Medical, Inc.* | | | 8 | | | 1,105,125 | |
| Total | | | | | | 1,636,411 | |
| | | | | | | | |
| Metals/Mining (Excluding Steel) 0.63% | | | | | | | |
| Anglo American plc*(a) | | GBP | 112 | | | 1,597,517 | |
| First Majestic Silver Corp. (Canada)*(b) | | | 110 | | | 837,507 | |
| Fresnillo plc(a) | | GBP | 71 | | | 1,075,106 | |
| Mirabela Nickel Ltd.*(a) | | AUD | 2,560 | | | 18,476 | |
| MMC Norilsk Nickel PJSC ADR | | | 70 | | | 1,177,130 | |
| Silver Wheaton Corp. (Canada)(b) | | | 53 | | | 1,023,999 | |
| Vale SA ADR | | | 130 | | | 994,044 | |
| Total | | | | | | 6,723,779 | |
| | | | | | | | |
| Non-Electric Utilities 0.20% | | | | | | | |
| American Water Works Co., Inc. | | | 14 | | | 1,039,668 | |
| Aqua America, Inc. | | | 35 | | | 1,059,271 | |
| Total | | | | | | 2,098,939 | |
| | | | | | | | |
| Oil Field Equipment & Services 0.61% | | | | | | | |
| Halliburton Co. | | | 24 | | | 1,284,638 | |
| MRC Global, Inc.* | | | 70 | | | 1,427,580 | |
| National Oilwell Varco, Inc. | | | 29 | | | 1,093,885 | |
| Patterson-UTI Energy, Inc. | | | 53 | | | 1,431,740 | |
| U.S. Silica Holdings, Inc. | | | 23 | | | 1,295,081 | |
| Total | | | | | | 6,532,924 | |
| | | | | | | | |
| Packaging 0.10% | | | | | | | |
| Packaging Corp. of America | | | 12 | | | 1,048,375 | |
| | | | | | | | |
| Personal & Household Products 0.41% | | | | | | | |
| Brunswick Corp. | | | 20 | | | 1,068,984 | |
| Central Garden & Pet Co.* | | | 22 | | | 737,907 | |
| Hasbro, Inc. | | | 13 | | | 1,018,427 | |
| 10 | See Notes to Financial Statements. | |
Schedule of Investments (continued)
December 31, 2016
| Investments | | Shares
(000) | | Fair
Value | |
| Personal & Household Products (continued) | | | | | | | |
| LVMH Moet Hennessy Louis Vuitton SE(a) | | EUR | 3 | | $ | 534,662 | |
| Pool Corp. | | | 10 | | | 1,044,443 | |
| Total | | | | | | 4,404,423 | |
| | | | | | | | |
| Pharmaceuticals 0.54% | | | | | | | |
| Blueprint Medicines Corp.* | | | 21 | | | 589,050 | |
| Cantel Medical Corp. | | | 14 | | | 1,102,500 | |
| Exelixis, Inc.* | | | 73 | | | 1,083,331 | |
| Patheon NV (Netherlands)*(b) | | | 39 | | | 1,116,819 | |
| Seattle Genetics, Inc.* | | | 16 | | | 827,803 | |
| TESARO, Inc.* | | | 8 | | | 1,075,436 | |
| Total | | | | | | 5,794,939 | |
| | | | | | | | |
| Rail 0.10% | | | | | | | |
| CSX Corp. | | | 29 | | | 1,040,174 | |
| | | | | | | | |
| Real Estate Investment Trusts 0.20% | | | | | | | |
| DCT Industrial Trust, Inc. | | | 23 | | | 1,089,605 | |
| EastGroup Properties, Inc. | | | 7 | | | 535,340 | |
| Pebblebrook Hotel Trust | | | 17 | | | 514,675 | |
| Total | | | | | | 2,139,620 | |
| | | | | | | | |
| Recreation & Travel 0.31% | | | | | | | |
| Camping World Holdings, Inc. Class A | | | 35 | | | 1,142,638 | |
| Royal Caribbean Cruises Ltd. | | | 13 | | | 1,058,316 | |
| Vail Resorts, Inc. | | | 7 | | | 1,069,485 | |
| Total | | | | | | 3,270,439 | |
| | | | | | | | |
| Restaurants 0.31% | | | | | | | |
| Cheesecake Factory, Inc. (The) | | | 17 | | | 1,031,433 | |
| Shake Shack, Inc. Class A* | | | 33 | | | 1,186,975 | |
| Texas Roadhouse, Inc. | | | 23 | | | 1,107,205 | |
| Total | | | | | | 3,325,613 | |
| | | | | | | | |
| Software/Services 0.31% | | | | | | | |
| Arista Networks, Inc.* | | | 11 | | | 1,074,341 | |
| Proofpoint, Inc.* | | | 14 | | | 1,024,213 | |
| Veeva Systems, Inc. Class A* | | | 29 | | | 1,198,615 | |
| Total | | | | | | 3,297,169 | |
| | See Notes to Financial Statements. | 11 |
Schedule of Investments (continued)
December 31, 2016
| Investments | | Shares
(000) | | Fair
Value | |
| Specialty Retail 0.55% | | | | | | | |
| Kering(a) | | EUR | 5 | | $ | 1,134,103 | |
| Lithia Motors, Inc. Class A | | | 11 | | | 1,040,922 | |
| Moncler SpA(a) | | EUR | 66 | | | 1,152,562 | |
| Ritchie Bros Auctioneers, Inc. (Canada)(b) | | | 27 | | | 928,200 | |
| Tiffany & Co. | | | 6 | | | 495,552 | |
| Ulta Salon, Cosmetics & Fragrance, Inc.* | | | 4 | | | 1,049,333 | |
| Total | | | | | | 5,800,672 | |
| | | | | | | | |
| Steel Producers/Products 0.12% | | | | | | | |
| Worthington Industries, Inc. | | | 27 | | | 1,261,572 | |
| | | | | | | | |
| Support: Services 0.35% | | | | | | | |
| Ashtead Group plc(a) | | GBP | 59 | | | 1,143,002 | |
| Neff Corp. Class A* | | | 36 | | | 500,550 | |
| Science Applications International Corp. | | | 13 | | | 1,111,643 | |
| Total System Services, Inc. | | | 21 | | | 1,015,558 | |
| Total | | | | | | 3,770,753 | |
| | | | | | | | |
| Technology Hardware & Equipment 0.16% | | | | | | | |
| NVIDIA Corp. | | | 16 | | | 1,731,216 | |
| | | | | | | | |
| Telecommunications: Wireless 0.12% | | | | | | | |
| T-Mobile US, Inc.* | | | 23 | | | 1,308,237 | |
| | | | | | | | |
| Telecommunications: Wireline Integrated & Services 0.10% | | | | | | | |
| Zayo Group Holdings, Inc.* | | | 33 | | | 1,067,950 | |
| | | | | | | | |
| Theaters & Entertainment 0.10% | | | | | | | |
| Live Nation Entertainment, Inc.* | | | 39 | | | 1,043,252 | |
| | | | | | | | |
| Transportation: Infrastructure/Services 0.10% | | | | | | | |
| Landstar System, Inc. | | | 13 | | | 1,076,913 | |
| | | | | | | | |
| Trucking & Delivery 0.27% | | | | | | | |
| Old Dominion Freight Line, Inc.* | | | 20 | | | 1,743,682 | |
| Ryder System, Inc. | | | 15 | | | 1,104,615 | |
| Total | | | | | | 2,848,297 | |
| Total Common Stocks (cost $125,817,510) | | | | | | 141,713,974 | |
| 12 | See Notes to Financial Statements. | |
Schedule of Investments (continued)
December 31, 2016
| Investments | | Interest
Rate | | | Maturity
Date | | Principal
Amount
(000) | | | Fair
Value | |
| CONVERTIBLE BONDS 0.30% | | | | | | | | | | | |
| | | | | | | | | | | | |
| Oil Field Equipment & Services 0.20% | | | | | | | | | | | | | | |
| Ensco Jersey Finance Ltd. (Jersey)†(b) | | | 3.00% | | | 1/31/2024 | | $ | 2,037 | | | $ | 2,082,833 | |
| | | | | | | | | | | | | | | |
| Support: Services 0.10% | | | | | | | | | | | | | | |
| Priceline Group, Inc. (The) | | | 1.00% | | | 3/15/2018 | | | 675 | | | | 1,066,078 | |
| Total Convertible Bonds (cost $3,153,171) | | | | | | | | | | | | | 3,148,911 | |
| | | | | | | | | | | | | | | |
| | | Dividend
Rate | | | | | Shares
(000) | | | | | |
| CONVERTIBLE PREFERRED STOCKS 0.13% | | | | | | | | | | | | | | |
| | | | | | | | | | | | | | | |
| Building & Construction 0.08% | | | | | | | | | | | | | | |
| William Lyon Homes Unit | | | Zero Coupon | | | | | | 9 | | | | 828,414 | |
| | | | | | | | | | | | | | | |
| Energy: Exploration & Production 0.05% | | | | | | | | | | | | | | |
| Sanchez Energy Corp. | | | 4.875% | | | | | | 10 | | | | 267,691 | |
| Sanchez Energy Corp. | | | 6.50% | | | | | | 11 | | | | 342,435 | |
| Total | | | | | | | | | | | | | 610,126 | |
| Total Convertible Preferred Stocks (cost $1,365,338) | | | | | | | | | | | | | 1,438,540 | |
| | | | | | | | | | | | | | | |
| | | | | | | | | Principal | | | | | |
| | | Interest | | | | | Amount | | | | | |
| | | Rate | | | | | (000) | | | | | |
| FLOATING RATE LOANS(c) 4.29% | | | | | | | | | | | | | | |
| | | | | | | | | | | | | | | |
| Auto Parts & Equipment 0.07% | | | | | | | | | | | | | | |
| Chassix, Inc. Initial Term Loan | | | 12.00% | | | 7/29/2019 | | $ | 762 | | | | 765,335 | |
| | | | | | | | | | | | | | | |
| Department Stores 0.10% | | | | | | | | | | | | | | |
| Belk, Inc. 1st Lien Closing Date Term Loan | | | 5.75% | | | 12/12/2022 | | | 1,230 | | | | 1,064,977 | |
| | | | | | | | | | | | | | | |
| Diversified Capital Goods 0.10% | | | | | | | | | | | | | | |
| Harsco Corp. Initial Term Loan | | | 6.00% | | | 11/2/2023 | | | 1,067 | | | | 1,091,674 | |
| | | | | | | | | | | | | | | |
| Electric: Generation 0.39% | | | | | | | | | | | | | | |
| Dayton Power & Light Co. (The) Term Loan | | | 4.01% | | | 8/24/2022 | | | 1,060 | | | | 1,076,568 | |
| Lightstone Generation LLC Term Loan B | | | 6.54% | | | 1/30/2024 | | | 1,512 | | | | 1,533,417 | |
| Lightstone Generation LLC Term Loan C | | | 6.54% | | | 1/30/2024 | | | 144 | | | | 146,040 | |
| Longview Power LLC Advance Term Loan B | | | 7.00% | | | 4/13/2021 | | | 1,026 | | | | 909,642 | |
| Moxie Liberty LLC Advance Construction Term Loan B1 | | | 7.50% | | | 8/21/2020 | | | 525 | | | | 518,682 | |
| Total | | | | | | | | | | | | | 4,184,349 | |
| | See Notes to Financial Statements. | 13 |
Schedule of Investments (continued)
December 31, 2016
| | | Interest | | | Maturity | | Principal
Amount | | | Fair | |
| Investments | | Rate | | | Date | | (000) | | | Value | |
| Energy: Exploration & Production 0.58% | | | | | | | | | | | | | | |
| California Resources Corp. Term Loan | | | –(d) | | | 9/24/2019 | | $ | 1,079 | | | $ | 1,050,555 | |
| California Resources Corp. Term Loan | | | 11.375% | | | 12/31/2021 | | | 1,480 | | | | 1,647,114 | |
| Chesapeake Energy Corp. Class A Term Loan | | | 8.50% | | | 8/23/2021 | | | 741 | | | | 808,616 | |
| Chief Exploration & Development LLC 2nd Lien Term Loan | | | 7.753% | | | 5/16/2021 | | | 1,600 | | | | 1,572,000 | |
| Jonah Energy LLC 2nd Lien Initial Term Loan | | | 7.50% | | | 5/12/2021 | | | 1,190 | | | | 1,130,500 | |
| Total | | | | | | | | | | | | | 6,208,785 | |
| | | | |
| Food: Wholesale 0.24% | | | | | | | | | | | | | | |
| Amplify Snack Brands, Inc. Term Loan | | | 6.50% | | | 8/24/2023 | | | 2,673 | | | | 2,607,577 | |
| | | | | | | | | | | | | | | |
| Gaming 0.44% | | | | | | | | | | | | | | |
| Amaya Holdings B.V. 1st Lien Initial Term Loan B (Netherlands)(b) | | | 5.00% | | | 8/1/2021 | | | 1,042 | | | | 1,048,073 | |
| Caesar’s Entertainment Resort Properties LLC Term Loan B | | | 7.00% | | | 10/11/2020 | | | 1,235 | | | | 1,248,619 | |
| Cowlitz Tribal Gaming Authority Term Loan B | | | 11.50% | | | 12/6/2021 | | | 2,210 | | | | 2,392,325 | |
| Total | | | | | | | | | | | | | 4,689,017 | |
| | | | |
| Health Services 0.10% | | | | | | | | | | | | | | |
| Genoa, a QoL Healthcare Co., LLC 1st Lien initial Term Loan | | | 4.75% | | | 10/30/2023 | | | 1,059 | | | | 1,072,587 | |
| | | | |
| Media: Diversified 0.11% | | | | | | | | | | | | | | |
| UFC Holdings, LLC 2nd Lien Term Loan | | | 8.50% | | | 8/18/2024 | | | 1,107 | | | | 1,140,902 | |
| | | | |
| Metals/Mining (Excluding Steel) 0.30% | | | | | | | | | | | | | | |
| Murray Energy Corp. Term Loan B2 | | | 8.25% | | | 4/16/2020 | | | 1,415 | | | | 1,358,219 | |
| Oxbow Carbon LLC 2nd Lien Initial Term Loan | | | 8.00% | | | 1/17/2020 | | | 650 | | | | 638,625 | |
| Peabody Energy Corp. Term Loan | | | –(d) | | | 9/24/2020 | | | 1,200 | | | | 1,174,800 | |
| Total | | | | | | | | | | | | | 3,171,644 | |
| | | | |
| Oil Field Equipment & Services 0.24% | | | | | | | | | | | | | | |
| Fairmount Santrol, Inc. Tranche B2 Term Loan | | | 4.50% | | | 9/5/2019 | | | 1,705 | | | | 1,661,965 | |
| FTS International, Inc. Initial Term Loan | | | 5.75% | | | 4/16/2021 | | | 1,030 | | | | 848,030 | |
| Total | | | | | | | | | | | | | 2,509,995 | |
| | | | |
| Personal & Household Products 0.25% | | | | | | | | | | | | | | |
| Britax US Holdings, Inc. Initial Dollar Term Loan | | | 4.50% | | | 10/15/2020 | | | 2,421 | | | | 2,072,165 | |
| FGI Operating Co. LLC Term Loan B | | | 5.50% | | | 4/19/2019 | | | 586 | | | | 559,089 | |
| Total | | | | | | | | | | | | | 2,631,254 | |
| 14 | See Notes to Financial Statements. | |
Schedule of Investments (continued)
December 31, 2016
| | | | | | | | Principal | | | | |
| | | Interest | | | Maturity | | Amount | | | Fair | |
| Investments | | Rate | | | Date | | (000) | | | Value | |
| Recreation & Travel 0.10% | | | | | | | | | | | | | | |
| Delta 2 (Lux) S.A.R.L. 2nd Lien Facility Term Loan (Luxembourg)(b) | | | 8.068% | | | 7/29/2022 | | $ | 1,045 | | | $ | 1,055,450 | |
| | | | | | | | | | | | | | | |
| Specialty Retail 0.37% | | | | | | | | | | | | | | |
| Bass Pro Group, LLC Term Loan B | | | 5.97% | | | 12/15/2023 | | | 2,134 | | | | 2,116,853 | |
| Container Store, Inc. (The) Facility Term Loan | | | 4.25% | | | 4/6/2019 | | | 1,193 | | | | 1,095,755 | |
| Gymboree Corp. (The) Term Loan | | | 5.00% | | | 2/23/2018 | | | 1,342 | | | | 717,299 | |
| Total | | | | | | | | | | | | | 3,929,907 | |
| | | | | | | | | | | | | | | |
| Support: Services 0.71% | | | | | | | | | | |
| BakerCorp International, Inc. Refinanced Term Loan | | | 4.25% | | | 2/7/2020 | | | 780 | | | | 748,008 | |
| Monitronics International Inc. Term Loan B2 | | | 6.50% | | | 9/30/2022 | | | 1,211 | | | | 1,224,970 | |
| Safway Group Holding LLC Initial Term Loan | | | 5.75% | | | 8/21/2023 | | | 1,858 | | | | 1,888,150 | |
| University Support Services LLC Term Loan | | | 6.25% | | | 7/6/2022 | | | 2,163 | | | | 2,195,962 | |
| Zodiac Pool Solutions LLC 1st Lien Term Loan (France)(b) | | | 5.50% | | | 12/20/2023 | | | 1,529 | | | | 1,543,342 | |
| Total | | | | | | | | | | | | | 7,600,432 | |
| | | | | | | | | | | | | | | |
| Telecommunications: Wireline Integrated & Services 0.09% | | | | | | | | | | | |
| Fairpoint Communications, Inc. Term Loan | | | 7.50% | | | 2/14/2019 | | | 931 | | | | 942,444 | |
| | | | | | | | | | | | | | | |
| Trucking & Delivery 0.10% | | | | | | | | | | | | | | |
| YRC Worldwide, Inc. Initial Term Loan | | | 8.00% | | | 2/13/2019 | | | 1,058 | | | | 1,051,134 | |
| Total Floating Rate Loans (cost $43,766,162) | | | | | | | | | | | | | 45,717,463 | |
| | | | | | | | | | | | | | | |
| FOREIGN BONDS(a) 0.45% | | | | | | | | | | | | | | |
| | | | | | | | | | | | | | | |
| Mexico 0.09% | | | | | | | | | | | | | | |
| Red de Carreteras de Occidente S.A.P.I.B. de CV† | | | 9.00% | | | 6/10/2028 | | MXN | 22,100 | | | | 987,408 | |
| | | | | | | | | | | | | | | |
| Netherlands 0.12% | | | | | | | | | | | | | | |
| Hema Bondco I BV† | | | 6.25% | | | 6/15/2019 | | EUR | 1,300 | | | | 1,272,826 | |
| | | | | | | | | | | | | | | |
| Spain 0.14% | | | | | | | | | | | | | | |
| Banco Popular Espanol SA | | | 11.50% | # | | 1/1/2099 | | EUR | 1,400 | | | | 1,489,980 | |
| | | | | | | | | | | | | | | |
| United Kingdom 0.10% | | | | | | | | | | | | | | |
| Premier Foods Finance plc† | | | 6.50% | | | 3/15/2021 | | GBP | 816 | | | | 1,038,824 | |
| Total Foreign Bonds (cost $5,495,390) | | | | | | | | | | | | | 4,789,038 | |
| | | | | | | | | | | | | | | |
| FOREIGN GOVERNMENT OBLIGATIONS 4.31% | | | | | | | | | | | | | | |
| | | | | | | | | | | | | | | |
| Angola 0.11% | | | | | | | | | | | | | | |
| Republic of Angola†(b) | | | 9.50% | | | 11/12/2025 | | $ | 1,200 | | | | 1,165,170 | |
| | See Notes to Financial Statements. | 15 |
Schedule of Investments (continued)
December 31, 2016
| | | | | | | | Principal | | | | |
| | | Interest | | | Maturity | | Amount | | | Fair | |
| Investments | | Rate | | | Date | | (000) | | | Value | |
| Argentina 0.85% | | | | | | | | | | | |
| City of Buenos Aires†(b) | | | 7.50% | | | 6/1/2027 | | $ | 725 | | | $ | 743,125 | |
| City of Buenos Aires†(b) | | | 8.95% | | | 2/19/2021 | | | 925 | | | | 1,036,000 | |
| Province of Santa Fe†(b) | | | 6.90% | | | 11/1/2027 | | | 1,094 | | | | 1,031,095 | |
| Provincia de Mendoza†(b) | | | 8.375% | | | 5/19/2024 | | | 1,346 | | | | 1,389,745 | |
| Provincia of Neuquen†(b) | | | 8.625% | | | 5/12/2028 | | | 992 | | | | 1,029,200 | |
| Republic of Argentina†(b) | | | 7.50% | | | 4/22/2026 | | | 1,618 | | | | 1,702,945 | |
| Republic of Argentina(b) | | | 8.75% | | | 5/7/2024 | | | 1,800 | | | | 2,139,975 | |
| Total | | | | | | | | | | | | | 9,072,085 | |
| | | | | | | | | | | | | | | |
| Australia 0.41% | | | | | | | | | | | | | | |
| Australian Government(a) | | | 4.25% | | | 4/21/2026 | | AUD | 3,084 | | | | 2,506,623 | |
| Queensland Treasury Corp.†(a) | | | 4.00% | | | 6/21/2019 | | AUD | 2,500 | | | | 1,885,087 | |
| Total | | | | | | | | | | | | | 4,391,710 | |
| | | | | | | | | | | | | | | |
| Bahamas 0.09% | | | | | | | | | | | | | | |
| Commonwealth of Bahamas†(b) | | | 5.75% | | | 1/16/2024 | | $ | 900 | | | | 918,477 | |
| | | | | | | | | | | | | | | |
| Bermuda 0.23% | | | | | | | | | | | | | | |
| Government of Bermuda† | | | 4.138% | | | 1/3/2023 | | | 1,350 | | | | 1,391,040 | |
| Government of Bermuda† | | | 4.854% | | | 2/6/2024 | | | 975 | | | | 1,018,066 | |
| Total | | | | | | | | | | | | | 2,409,106 | |
| | | | | | | | | | | | | | | |
| Brazil 0.14% | | | | | | | | | | | | | | |
| Federal Republic of Brazil†(b) | | | 5.333% | | | 2/15/2028 | | | 1,550 | | | | 1,453,125 | |
| | | | | | | | | | | | | | | |
| Canada 0.37% | | | | | | | | | | | | | | |
| Province of British Columbia Canada(a) | | | 2.85% | | | 6/18/2025 | | CAD | 5,000 | | | | 3,895,654 | |
| | | | | | | | | | | | | | | |
| Cayman Islands 0.04% | | | | | | | | | | | | | | |
| Cayman Islands Government† | | | 5.95% | | | 11/24/2019 | | $ | 425 | | | | 469,094 | |
| | | | | | | | | | | | | | | |
| Dominican Republic 0.28% | | | | | | | | | | | | | | |
| Dominican Republic†(b) | | | 6.85% | | | 1/27/2045 | | | 3,173 | | | | 3,013,462 | |
| | | | | | | | | | | | | | | |
| Ethiopia 0.10% | | | | | | | | | | | | | | |
| Republic of Ethiopia†(b) | | | 6.625% | | | 12/11/2024 | | | 1,115 | | | | 1,031,330 | |
| | | | | | | | | | | | | | | |
| Gabon 0.11% | | | | | | | | | | | | | | |
| Republic of Gabon†(b) | | | 6.375% | | | 12/12/2024 | | | 1,300 | | | | 1,216,735 | |
| | | | | | | | | | | | | | | |
| Ghana 0.12% | | | | | | | | | | | | | | |
| Republic of Ghana†(b) | | | 9.25% | | | 9/15/2022 | | | 1,200 | | | | 1,287,018 | |
| 16 | See Notes to Financial Statements. |
Schedule of Investments (continued)
December 31, 2016
| | | | | | | Principal | | | |
| | | Interest | | | Maturity | | Amount | | | Fair | |
| Investments | | Rate | | | Date | | (000) | | | Value | |
| Greece 0.09% | | | | | | | | | | | | | | |
| Hellenic Republic†(a) | | | 4.75% | | | 4/17/2019 | | EUR | 1,000 | | | $ | 996,197 | |
| | | | | | | | | | | | | | | |
| Honduras 0.15% | | | | | | | | | | | | | | |
| Honduras Government†(b) | | | 7.50% | | | 3/15/2024 | | $ | 1,500 | | | | 1,610,100 | |
| | | | | | | | | | | | | | | |
| Jamaica 0.50% | | | | | | | | | | | | | | |
| Government of Jamaica(b) | | | 6.75% | | | 4/28/2028 | | | 1,500 | | | | 1,646,250 | |
| Government of Jamaica(b) | | | 7.625% | | | 7/9/2025 | | | 1,150 | | | | 1,317,566 | |
| Government of Jamaica(b) | | | 8.00% | | | 3/15/2039 | | | 2,110 | | | | 2,353,431 | |
| Total | | | | | | | | | | | | | 5,317,247 | |
| | | | | | | | | | | | | | | |
| Jordan 0.10% | | | | | | | | | | | | | | |
| Kingdom of Jordan†(b) | | | 5.75% | | | 1/31/2027 | | | 1,135 | | | | 1,078,012 | |
| | | | | | | | | | | | | | | |
| Qatar 0.14% | | | | | | | | | | | | | | |
| State of Qatar†(b) | | | 4.625% | | | 6/2/2046 | | | 1,500 | | | | 1,503,891 | |
| | | | | | | | | | | | | | | |
| Russia 0.21% | | | | | | | | | | | | | | |
| Russian Federal Bond—OFZ(a) | | | 7.60% | | | 4/14/2021 | | RUB | 141,915 | | | | 2,272,167 | |
| | | | | | | | | | | | | | | |
| United Arab Emirates 0.12% | | | | | | | | | | | | | | |
| Abu Dhabi Government International†(b) | | | 3.125% | | | 5/3/2026 | | $ | 1,255 | | | | 1,233,937 | |
| | | | | | | | | | | | | | | |
| Zambia 0.15% | | | | | | | | | | | | | | |
| Republic of Zambia†(b) | | | 8.97% | | | 7/30/2027 | | | 1,666 | | | | 1,649,340 | |
| Total Foreign Government Obligations (cost $44,951,255) | | | | | | | | | | | | | 45,983,857 | |
| | | | | | | | | | | | | | | |
| HIGH YIELD CORPORATE BONDS 71.93% | | | | | | | | | | | | | | |
| | | | | | | | | | | | | | | |
| Advertising 0.32% | | | | | | | | | | | | | | |
| Clear Channel Worldwide Holdings, Inc. | | | 6.50% | | | 11/15/2022 | | | 1,579 | | | | 1,622,422 | |
| Lamar Media Corp. | | | 5.75% | | | 2/1/2026 | | | 566 | | | | 597,838 | |
| Southern Graphics, Inc.† | | | 8.375% | | | 10/15/2020 | | | 1,200 | | | | 1,224,000 | |
| Total | | | | | | | | | | | | | 3,444,260 | |
| | | | | | | | | | | | | | | |
| Aerospace/Defense 0.51% | | | | | | | | | | | | | | |
| Huntington Ingalls Industries, Inc.† | | | 5.00% | | | 12/15/2021 | | | 2,050 | | | | 2,139,687 | |
| Huntington Ingalls Industries, Inc.† | | | 5.00% | | | 11/15/2025 | | | 498 | | | | 518,542 | |
| L-3 Communications Corp. | | | 3.85% | | | 12/15/2026 | | | 703 | | | | 700,224 | |
| Lockheed Martin Corp. | | | 4.70% | | | 5/15/2046 | | | 877 | | | | 957,830 | |
| TransDigm, Inc. | | | 6.50% | | | 7/15/2024 | | | 1,111 | | | | 1,167,939 | |
| Total | | | | | | | | | | | | | 5,484,222 | |
| | See Notes to Financial Statements. | 17 |
Schedule of Investments (continued)
December 31, 2016
| | | | | | | | Principal | | | | |
| | | Interest | | | Maturity | | Amount | | | Fair | |
| Investments | | Rate | | | Date | | (000) | | | Value | |
| Air Transportation 0.48% | | | | | | | | | | | | | | |
| Air Canada (Canada)†(b) | | | 7.75% | | | 4/15/2021 | | $ | 1,140 | | | $ | 1,279,650 | |
| Air Canada 2015-2 Class A Pass-Through Trust (Canada)†(b) | | | 4.125% | | | 6/15/2029 | | | 861 | | | | 883,326 | |
| Air Canada 2015-2 Class B Pass-Through Trust (Canada)†(b) | | | 5.00% | | | 6/15/2025 | | | 1,859 | | | | 1,861,319 | |
| Avianca Holdings SA/Avianca Leasing LLC/Grupo Taca Holdings Ltd. (Panama)†(b) | | | 8.375% | | | 5/10/2020 | | | 1,090 | | | | 1,111,800 | |
| Total | | | | | | | | | | | | | 5,136,095 | |
| | | | | | | | | | | | | | | |
| Auto Parts & Equipment 0.68% | | | | | | | | | | | | | | |
| Allison Transmission, Inc.† | | | 5.00% | | | 10/1/2024 | | | 1,250 | | | | 1,265,625 | |
| Gates Global LLC/Gates Global Co.† | | | 6.00% | | | 7/15/2022 | | | 1,617 | | | | 1,589,511 | |
| International Automotive Components Group SA (Luxembourg)†(b) | | | 9.125% | | | 6/1/2018 | | | 1,186 | | | | 1,162,280 | |
| MPG Holdco I, Inc. | | | 7.375% | | | 10/15/2022 | | | 1,036 | | | | 1,087,800 | |
| Nemak SA de CV (Mexico)†(b) | | | 5.50% | | | 2/28/2023 | | | 826 | | | | 823,935 | |
| TI Group Automotive Systems LLC† | | | 8.75% | | | 7/15/2023 | | | 1,250 | | | | 1,312,500 | |
| Total | | | | | | | | | | | | | 7,241,651 | |
| | | | | | | | | | | | | | | |
| Automakers 0.27% | | | | | | | | | | | | | | |
| BMW US Capital LLC† | | | 2.80% | | | 4/11/2026 | | | 1,024 | | | | 987,311 | |
| General Motors Co. | | | 6.25% | | | 10/2/2043 | | | 1,714 | | | | 1,901,239 | |
| Total | | | | | | | | | | | | | 2,888,550 | |
| | | | | | | | | | | | | | | |
| Banking 6.51% | | | | | | | | | | | | | | |
| ABN AMRO Bank NV (Netherlands)†(b) | | | 4.75% | | | 7/28/2025 | | | 1,976 | | | | 2,006,745 | |
| ANZ New Zealand Int’l Ltd. (United Kingdom)†(b) | | | 2.125% | | | 7/28/2021 | | | 1,510 | | | | 1,470,092 | |
| Associated Banc-Corp. | | | 4.25% | | | 1/15/2025 | | | 1,000 | | | | 992,684 | |
| Australia & New Zealand Banking Group Ltd. (United Kingdom)†(b) | | | 6.75% | # | | – | (e) | | 1,415 | | | | 1,497,745 | |
| Banco Bilbao Vizcaya Argentaria SA (Spain)(b) | | | 9.00% | # | | – | (e) | | 800 | | | | 836,198 | |
| Banco de Bogota SA (Colombia)†(b) | | | 6.25% | | | 5/12/2026 | | | 700 | | | | 715,750 | |
| Banco de Galicia y Buenos Aires SA (Argentina)†(b) | | | 8.25% | # | | 7/19/2026 | | | 1,000 | | | | 1,047,500 | |
| Bank of America Corp. | | | 4.25% | | | 10/22/2026 | | | 1,468 | | | | 1,488,734 | |
| Bank of America Corp. | | | 4.45% | | | 3/3/2026 | | | 2,501 | | | | 2,582,213 | |
| BankUnited, Inc. | | | 4.875% | | | 11/17/2025 | | | 2,525 | | | | 2,504,709 | |
| BNP Paribas SA (France)†(b) | | | 6.75% | # | | – | (e) | | 1,617 | | | | 1,598,809 | |
| Citigroup, Inc. | | | 4.45% | | | 9/29/2027 | | | 1,473 | | | | 1,499,520 | |
| Citizens Financial Group, Inc. | | | 4.35% | | | 8/1/2025 | | | 831 | | | | 836,348 | |
| Citizens Financial Group, Inc. | | | 5.50% | # | | – | (e) | | 1,495 | | | | 1,487,525 | |
| Comerica, Inc. | | | 3.80% | | | 7/22/2026 | | | 1,258 | | | | 1,241,121 | |
| 18 | See Notes to Financial Statements. | |
Schedule of Investments (continued)
December 31, 2016
| | | | | | | | Principal | | | | |
| | | Interest | | | Maturity | | Amount | | | Fair | |
| Investments | | Rate | | | Date | | (000) | | | Value | |
| Banking (continued) | | | | | | | | | | | | | | |
| Commonwealth Bank of Australia (Australia)†(b) | | | 4.50% | | | 12/9/2025 | | $ | 973 | | | $ | 998,075 | |
| Compass Bank | | | 3.875% | | | 4/10/2025 | | | 1,100 | | | | 1,048,628 | |
| Credit Suisse Group AG (Switzerland)†(b) | | | 7.50% | # | | – | (e) | | 1,075 | | | | 1,128,669 | |
| Fifth Third Bancorp | | | 8.25% | | | 3/1/2038 | | | 1,708 | | | | 2,388,044 | |
| First Republic Bank | | | 4.375% | | | 8/1/2046 | | | 80 | | | | 72,993 | |
| Global Bank Corp. (Panama)†(b) | | | 4.50% | | | 10/20/2021 | | | 1,500 | | | | 1,464,300 | |
| Goldman Sachs Group, Inc. (The) | | | 3.50% | | | 1/23/2025 | | | 1,545 | | | | 1,527,101 | |
| Goldman Sachs Group, Inc. (The) | | | 5.15% | | | 5/22/2045 | | | 1,911 | | | | 2,017,370 | |
| HSBC Holdings plc (United Kingdom)(b) | | | 4.25% | | | 8/18/2025 | | | 4,671 | | | | 4,722,185 | |
| Industrial & Commercial Bank of China Ltd. | | | 3.231% | | | 11/13/2019 | | | 1,550 | | | | 1,590,057 | |
| Intesa Sanpaolo SpA (Italy)†(b) | | | 5.71% | | | 1/15/2026 | | | 1,269 | | | | 1,213,074 | |
| Intesa Sanpaolo SpA (Italy)†(b) | | | 7.70% | # | | – | (e) | | 1,851 | | | | 1,746,881 | |
| JPMorgan Chase & Co. | | | 3.90% | | | 7/15/2025 | | | 1,900 | | | | 1,955,797 | |
| JPMorgan Chase & Co. | | | 6.75% | # | | – | (e) | | 888 | | | | 957,930 | |
| KeyBank NA | | | 2.50% | | | 11/22/2021 | | | 1,508 | | | | 1,499,403 | |
| Lloyds Banking Group plc (United Kingdom)(b) | | | 4.582% | | | 12/10/2025 | | | 975 | | | | 981,495 | |
| Lloyds Banking Group plc (United Kingdom)(b) | | | 7.50% | # | | – | (e) | | 1,019 | | | | 1,052,118 | |
| M&T Bank Corp. | | | 5.125% | # | | – | (e) | | 1,147 | | | | 1,111,156 | |
| Macquarie Group Ltd. (Australia)†(b) | | | 6.00% | | | 1/14/2020 | | | 725 | | | | 786,022 | |
| Morgan Stanley | | | 3.125% | | | 7/27/2026 | | | 2,144 | | | | 2,052,507 | |
| Morgan Stanley | | | 4.00% | | | 7/23/2025 | | | 937 | | | | 962,174 | |
| National Savings Bank (Sri Lanka)†(b) | | | 5.15% | | | 9/10/2019 | | | 950 | | | | 937,859 | |
| People’s United Bank NA | | | 4.00% | | | 7/15/2024 | | | 1,100 | | | | 1,085,301 | |
| Popular, Inc. | | | 7.00% | | | 7/1/2019 | | | 2,125 | | | | 2,202,031 | |
| Royal Bank of Scotland Group plc (United Kingdom)(b) | | | 5.125% | | | 5/28/2024 | | | 584 | | | | 583,183 | |
| Royal Bank of Scotland Group plc (United Kingdom)(b) | | | 6.10% | | | 6/10/2023 | | | 506 | | | | 530,338 | |
| Royal Bank of Scotland Group plc (United Kingdom)(b) | | | 6.125% | | | 12/15/2022 | | | 506 | | | | 538,717 | |
| Royal Bank of Scotland Group plc (United Kingdom)(b) | | | 7.50% | # | | – | (e) | | 2,235 | | | | 2,123,250 | |
| Royal Bank of Scotland Group plc (United Kingdom)(b) | | | 8.625% | # | | – | (e) | | 870 | | | | 889,575 | |
| Sberbank of Russia Via SB Capital SA (Luxembourg)†(b) | | | 5.50% | # | | 2/26/2024 | | | 1,095 | | | | 1,115,531 | |
| Standard Chartered plc (United Kingdom)†(b) | | | 7.50% | # | | – | (e) | | 1,025 | | | | 1,025,000 | |
| SVB Financial Group | | | 3.50% | | | 1/29/2025 | | | 999 | | | | 964,241 | |
| Toronto-Dominion Bank (The) (Canada)(b) | | | 3.625% | # | | 9/15/2031 | | | 750 | | | | 733,862 | |
| | See Notes to Financial Statements. | 19 |
Schedule of Investments (continued)
December 31, 2016
| | | | | | | | Principal | | | | |
| | | Interest | | | Maturity | | Amount | | | Fair | |
| Investments | | Rate | | | Date | | (000) | | | Value | |
| Banking (continued) | | | | | | | | | | | | | | |
| UBS AG/Stamford CT | | | 7.625% | | | 8/17/2022 | | $ | 606 | | | $ | 688,568 | |
| UBS Group AG (Switzerland)(b) | | | 7.00% | # | | – | (e) | | 1,000 | | | | 1,051,750 | |
| Washington Mutual Bank(f) | | | 6.875% | | | 6/15/2011 | | | 1,250 | | | | 125 | |
| Wells Fargo & Co. | | | 4.90% | | | 11/17/2045 | | | 1,759 | | | | 1,810,927 | |
| Wells Fargo Capital X | | | 5.95% | | | 12/1/2086 | | | 101 | | | | 105,545 | |
| Total | | | | | | | | | | | | | 69,467,475 | |
| | | | | | | | | | | | | | | |
| Beverages 1.37% | | | | | | | | | | | | | | |
| Anheuser-Busch InBev Finance, Inc. | | | 3.65% | | | 2/1/2026 | | | 4,153 | | | | 4,224,000 | |
| Bacardi Ltd.† | | | 2.75% | | | 7/15/2026 | | | 999 | | | | 934,187 | |
| Brown-Forman Corp. | | | 4.50% | | | 7/15/2045 | | | 1,572 | | | | 1,647,288 | |
| Coca-Cola Bottling Co. Consolidated | | | 3.80% | | | 11/25/2025 | | | 877 | | | | 882,298 | |
| Constellation Brands, Inc. | | | 4.25% | | | 5/1/2023 | | | 1,300 | | | | 1,354,457 | |
| Constellation Brands, Inc. | | | 6.00% | | | 5/1/2022 | | | 1,343 | | | | 1,521,404 | |
| Dr. Pepper Snapple Group, Inc. | | | 4.50% | | | 11/15/2045 | | | 879 | | | | 895,373 | |
| PepsiCo, Inc. | | | 3.60% | | | 3/1/2024 | | | 1,653 | | | | 1,725,621 | |
| PepsiCo, Inc. | | | 4.25% | | | 10/22/2044 | | | 419 | | | | 433,772 | |
| PepsiCo, Inc. | | | 4.45% | | | 4/14/2046 | | | 927 | | | | 989,784 | |
| Total | | | | | | | | | | | | | 14,608,184 | |
| | | | | | | | | | | | | | | |
| Brokerage 0.08% | | | | | | | | | | | | | | |
| TD Ameritrade Holding Corp. | | | 2.95% | | | 4/1/2022 | | | 800 | | | | 810,529 | |
| | | | | | | | | | | | | | | |
| Building & Construction 1.41% | | | | | | | | | | | | | | |
| Ashton Woods USA LLC/Ashton Woods Finance Co.† | | | 6.875% | | | 2/15/2021 | | | 1,220 | | | | 1,180,350 | |
| Brookfield Residential Properties, Inc. (Canada)†(b) | | | 6.50% | | | 12/15/2020 | | | 632 | | | | 649,380 | |
| Brookfield Residential Properties, Inc./Brookfield Residential U.S. Corp. (Canada)†(b) | | | 6.125% | | | 7/1/2022 | | | 947 | | | | 956,470 | |
| DR Horton, Inc. | | | 4.75% | | | 2/15/2023 | | | 580 | | | | 595,950 | |
| K. Hovnanian Enterprises, Inc.† | | | 7.25% | | | 10/15/2020 | | | 1,564 | | | | 1,482,359 | |
| Lennar Corp. | | | 4.75% | | | 11/15/2022 | | | 1,754 | | | | 1,806,620 | |
| Lennar Corp. | | | 4.75% | | | 5/30/2025 | | | 830 | | | | 813,400 | |
| PulteGroup, Inc. | | | 5.00% | | | 1/15/2027 | | | 1,759 | | | | 1,677,646 | |
| PulteGroup, Inc. | | | 6.375% | | | 5/15/2033 | | | 2,250 | | | | 2,255,625 | |
| Toll Brothers Finance Corp. | | | 5.625% | | | 1/15/2024 | | | 1,000 | | | | 1,042,500 | |
| William Lyon Homes, Inc. | | | 7.00% | | | 8/15/2022 | | | 2,514 | | | | 2,614,560 | |
| Total | | | | | | | | | | | | | 15,074,860 | |
| 20 | See Notes to Financial Statements. | |
Schedule of Investments (continued)
December 31, 2016
| | | | | | | | Principal | | | | |
| | | Interest | | Maturity | | Amount | | | Fair | |
| Investments | | Rate | | Date | | (000) | | | Value | |
| Building Materials 1.78% | | | | | | | | | | | | | | |
| Allegion plc (Ireland)(b) | | | 5.875 | % | | 9/15/2023 | | $ | 409 | | | $ | 435,585 | |
| Builders FirstSource, Inc.† | | | 5.625 | % | | 9/1/2024 | | | 752 | | | | 758,580 | |
| Builders FirstSource, Inc.† | | | 10.75 | % | | 8/15/2023 | | | 1,075 | | | | 1,238,938 | |
| Cemex SAB de CV (Mexico)†(b) | | | 7.75 | % | | 4/16/2026 | | | 1,996 | | | | 2,215,560 | |
| Eagle Materials, Inc. | | | 4.50 | % | | 8/1/2026 | | | 768 | | | | 769,920 | |
| FBM Finance, Inc.† | | | 8.25 | % | | 8/15/2021 | | | 1,003 | | | | 1,063,180 | |
| HD Supply, Inc.† | | | 5.75 | % | | 4/15/2024 | | | 458 | | | | 484,656 | |
| Hillman Group, Inc. (The)† | | | 6.375 | % | | 7/15/2022 | | | 1,311 | | | | 1,238,895 | |
| Lennox International, Inc. | | | 3.00 | % | | 11/15/2023 | | | 1,001 | | | | 973,360 | |
| Martin Marietta Materials, Inc. | | | 4.25 | % | | 7/2/2024 | | | 1,146 | | | | 1,166,152 | |
| Masco Corp. | | | 4.375 | % | | 4/1/2026 | | | 635 | | | | 644,525 | |
| Masonite International Corp.† | | | 5.625 | % | | 3/15/2023 | | | 838 | | | | 869,425 | |
| Ply Gem Industries, Inc. | | | 6.50 | % | | 2/1/2022 | | | 1,025 | | | | 1,057,031 | |
| Standard Industries, Inc.† | | | 5.375 | % | | 11/15/2024 | | | 1,949 | | | | 2,012,343 | |
| Standard Industries, Inc.† | | | 5.50 | % | | 2/15/2023 | | | 950 | | | | 988,095 | |
| Voto-Votorantim Overseas Trading Operations IV Ltd.† | | | 7.75 | % | | 6/24/2020 | | | 1,900 | | | | 2,061,500 | |
| Vulcan Materials Co. | | | 4.50 | % | | 4/1/2025 | | | 1,005 | | | | 1,055,250 | |
| Total | | | | | | | | | | | | | 19,032,995 | |
| | | | | | | | | | | | | | | |
| Cable & Satellite Television 4.09% | | | | | | | | | | | | | | |
| Altice Financing SA (Luxembourg)†(b) | | | 6.625 | % | | 2/15/2023 | | | 1,600 | | | | 1,648,000 | |
| Altice Financing SA (Luxembourg)†(b) | | | 7.50 | % | | 5/15/2026 | | | 515 | | | | 536,888 | |
| Cablevision SA (Argentina)†(b) | | | 6.50 | % | | 6/15/2021 | | | 1,020 | | | | 1,039,125 | |
| Cablevision Systems Corp. | | | 5.875 | % | | 9/15/2022 | | | 3,000 | | | | 2,932,500 | |
| CCO Holdings LLC/CCO Holdings Capital Corp.† | | | 5.125 | % | | 5/1/2023 | | | 702 | | | | 724,815 | |
| CCO Holdings LLC/CCO Holdings Capital Corp.† | | | 5.875 | % | | 4/1/2024 | | | 1,785 | | | | 1,909,950 | |
| Charter Communications Operating LLC/Charter Communications Operating Capital | | | 6.384 | % | | 10/23/2035 | | | 2,701 | | | | 3,092,777 | |
| Charter Communications Operating LLC/Charter Communications Operating Capital | | | 6.484 | % | | 10/23/2045 | | | 772 | | | | 895,606 | |
| CSC Holdings LLC† | | | 10.125 | % | | 1/15/2023 | | | 925 | | | | 1,070,688 | |
| CSC Holdings LLC† | | | 10.875 | % | | 10/15/2025 | | | 5,316 | | | | 6,339,330 | |
| DISH DBS Corp. | | | 7.75 | % | | 7/1/2026 | | | 5,313 | | | | 6,003,690 | |
| Mediacom Broadband LLC/Mediacom Broadband Corp. | | | 6.375 | % | | 4/1/2023 | | | 2,269 | | | | 2,393,795 | |
| Mediacom LLC/Mediacom Capital Corp. | | | 7.25 | % | | 2/15/2022 | | | 325 | | | | 335,969 | |
| SFR Group SA (France)†(b) | | | 6.00 | % | | 5/15/2022 | | | 4,132 | | | | 4,255,960 | |
| Time Warner Cable, Inc. | | | 5.875 | % | | 11/15/2040 | | | 1,537 | | | | 1,644,456 | |
| Unitymedia GmbH (Germany)†(b) | | | 6.125 | % | | 1/15/2025 | | | 449 | | | | 463,593 | |
| | See Notes to Financial Statements. | 21 |
Schedule of Investments (continued)
December 31, 2016
| | | | | | | | Principal | | | | |
| | | Interest | | Maturity | | Amount | | | Fair | |
| Investments | | Rate | | Date | | (000) | | | Value | |
| Cable & Satellite Television (continued) | | | | | | | | | | | | | | |
| Unitymedia Hessen GmbH & Co. KG/Unitymedia NRW GmbH (Germany)†(b) | | | 5.00 | % | | 1/15/2025 | | $ | 1,111 | | | $ | 1,111,000 | |
| Unitymedia Hessen GmbH & Co. KG/Unitymedia NRW GmbH (Germany)†(b) | | | 5.50 | % | | 1/15/2023 | | | 2,068 | | | | 2,161,060 | |
| UPCB Finance IV Ltd.† | | | 5.375 | % | | 1/15/2025 | | | 1,929 | | | | 1,953,112 | |
| Virgin Media Finance plc (United Kingdom)†(b) | | | 6.00 | % | | 10/15/2024 | | | 997 | | | | 1,030,649 | |
| VTR Finance BV (Netherlands)†(b) | | | 6.875 | % | | 1/15/2024 | | | 1,275 | | | | 1,319,625 | |
| Wave Holdco LLC/Wave Holdco Corp. PIK† | | | 8.25 | % | | 7/15/2019 | | | 737 | | | | 723,817 | |
| Total | | | | | | | | | | | | | 43,586,405 | |
| | | | | | | | | | | | | | | |
| Chemicals 1.65% | | | | | | | | | | | | | | |
| Albemarle Corp. | | | 5.45 | % | | 12/1/2044 | | | 1,524 | | | | 1,642,995 | |
| Braskem Finance Ltd. | | | 6.45 | % | | 2/3/2024 | | | 1,002 | | | | 1,059,615 | |
| Celanese US Holdings LLC | | | 5.875 | % | | 6/15/2021 | | | 571 | | | | 634,727 | |
| CF Industries, Inc.† | | | 4.50 | % | | 12/1/2026 | | | 1,090 | | | | 1,073,471 | |
| Chemours Co. (The) | | | 7.00 | % | | 5/15/2025 | | | 1,640 | | | | 1,623,600 | |
| Equate Petrochemical BV (Netherlands)†(b) | | | 4.25 | % | | 11/3/2026 | | | 1,350 | | | | 1,292,679 | |
| GCP Applied Technologies, Inc.† | | | 9.50 | % | | 2/1/2023 | | | 459 | | | | 527,850 | |
| Grupo Idesa SA de CV (Mexico)†(b) | | | 7.875 | % | | 12/18/2020 | | | 1,450 | | | | 1,319,500 | |
| Hexion, Inc. | | | 6.625 | % | | 4/15/2020 | | | 1,191 | | | | 1,059,990 | |
| Kraton Polymers LLC/Kraton Polymers Capital Corp.† | | | 10.50 | % | | 4/15/2023 | | | 1,025 | | | | 1,160,812 | |
| Momentive Performance Materials, Inc. | | | 3.88 | % | | 10/24/2021 | | | 1,278 | | | | 1,207,710 | |
| NOVA Chemicals Corp. (Canada)†(b) | | | 5.25 | % | | 8/1/2023 | | | 1,129 | | | | 1,144,524 | |
| TPC Group, Inc.† | | | 8.75 | % | | 12/15/2020 | | | 410 | | | | 348,500 | |
| Trinseo Materials Operating SCA/Trinseo Materials Finance, Inc. (Luxembourg)†(b) | | | 6.75 | % | | 5/1/2022 | | | 505 | | | | 531,513 | |
| Tronox Finance LLC | | | 6.375 | % | | 8/15/2020 | | | 206 | | | | 193,640 | |
| Tronox Finance LLC† | | | 7.50 | % | | 3/15/2022 | | | 1,838 | | | | 1,723,125 | |
| Westlake Chemical Corp.† | | | 5.00 | % | | 8/15/2046 | | | 1,108 | | | | 1,098,623 | |
| Total | | | | | | | | | | | | | 17,642,874 | |
| | | | | | | | | | | | | | | |
| Consumer/Commercial/Lease Financing 0.99% | | | | | | | | | | | | | | |
| Discover Bank/Greenwood DE | | | 3.45 | % | | 7/27/2026 | | | 1,823 | | | | 1,763,851 | |
| Nationstar Mortgage LLC/Nationstar Capital Corp. | | | 6.50 | % | | 7/1/2021 | | | 1,788 | | | | 1,819,290 | |
| Navient Corp. | | | 5.00 | % | | 10/26/2020 | | | 964 | | | | 985,690 | |
| Navient Corp. | | | 5.875 | % | | 10/25/2024 | | | 419 | | | | 400,145 | |
| Navient Corp. | | | 6.125 | % | | 3/25/2024 | | | 771 | | | | 752,689 | |
| Navient Corp. | | | 6.625 | % | | 7/26/2021 | | | 3,011 | | | | 3,191,660 | |
| NFP Corp.† | | | 9.00 | % | | 7/15/2021 | | | 1,553 | | | | 1,644,238 | |
| Total | | | | | | | | | | | | | 10,557,563 | |
| 22 | See Notes to Financial Statements. | |
Schedule of Investments (continued)
December 31, 2016
| | | | | | | | Principal | | | | |
| | | Interest | | | Maturity | | Amount | | | Fair | |
| Investments | | Rate | | | Date | | (000) | | | Value | |
| Discount Stores 0.65% | | | | | | | | | | | | | | |
| Amazon.com, Inc. | | | 4.80% | | | 12/5/2034 | | $ | 6,312 | | | $ | 6,968,315 | |
| | | | | | | | | | | | | | | |
| Diversified Capital Goods 1.59% | | | | | | | | | | | | | | |
| Accudyne Industries Borrower/Accudyne Industries LLC (Luxembourg)†(b) | | | 7.75% | | | 12/15/2020 | | | 1,225 | | | | 1,025,937 | |
| Apex Tool Group LLC† | | | 7.00% | | | 2/1/2021 | | | 614 | | | | 552,600 | |
| BCD Acquisition, Inc.† | | | 9.625% | | | 9/15/2023 | | | 1,020 | | | | 1,096,500 | |
| Fortive Corp.† | | | 3.15% | | | 6/15/2026 | | | 1,019 | | | | 1,006,223 | |
| Fortive Corp.† | | | 4.30% | | | 6/15/2046 | | | 509 | | | | 506,076 | |
| General Cable Corp. | | | 5.75% | | | 10/1/2022 | | | 1,152 | | | | 1,123,200 | |
| General Electric Co. | | | 5.00% | # | | – | (e) | | 2,356 | | | | 2,447,766 | |
| Griffon Corp. | | | 5.25% | | | 3/1/2022 | | | 1,163 | | | | 1,182,771 | |
| Siemens Financieringsmaatschappij NV (Netherlands)†(b) | | | 3.25% | | | 5/27/2025 | | | 1,235 | | | | 1,239,650 | |
| SPX FLOW, Inc.† | | | 5.625% | | | 8/15/2024 | | | 523 | | | | 528,230 | |
| SPX FLOW, Inc.† | | | 5.875% | | | 8/15/2026 | | | 753 | | | | 754,882 | |
| Unifrax I LLC/Unifrax Holding Co.† | | | 7.50% | | | 2/15/2019 | | | 1,199 | | | | 1,199,000 | |
| Valmont Industries, Inc. | | | 5.25% | | | 10/1/2054 | | | 2,656 | | | | 2,335,442 | |
| Wabtec Corp.† | | | 3.45% | | | 11/15/2026 | | | 1,998 | | | | 1,924,566 | |
| Total | | | | | | | | | | | | | 16,922,843 | |
| | | | | | | | | | | | | | | |
| Electric: Generation 0.51% | | | | | | | | | | | | | | |
| Energy Future Intermediate Holding Co. LLC/EFIH Finance, Inc.†(f) | | | 10.00% | | | 12/1/2020 | | | 2,300 | | | | 523,250 | |
| Illinois Power Generating Co.(f) | | | 7.00% | | | 4/15/2018 | | | 1,757 | | | | 632,520 | |
| Listrindo Capital BV (Netherlands)†(b) | | | 4.95% | | | 9/14/2026 | | | 1,243 | | | | 1,214,318 | |
| NSG Holdings LLC/NSG Holdings, Inc.† | | | 7.75% | | | 12/15/2025 | | | 1,845 | | | | 2,000,043 | |
| Talen Energy Supply LLC | | | 6.50% | | | 6/1/2025 | | | 1,371 | | | | 1,065,952 | |
| Total | | | | | | | | | | | | | 5,436,083 | |
| | | | | | | | | | | | | | | |
| Electric: Integrated 1.38% | | | | | | | | | | | | | | |
| AES Panama SRL (Panama)†(b) | | | 6.00% | | | 6/25/2022 | | | 577 | | | | 600,080 | |
| Black Hills Corp. | | | 4.20% | | | 9/15/2046 | | | 803 | | | | 768,667 | |
| Cleco Corporate Holdings LLC† | | | 4.973% | | | 5/1/2046 | | | 1,221 | | | | 1,240,793 | |
| El Paso Electric Co. | | | 5.00% | | | 12/1/2044 | | | 1,953 | | | | 2,044,135 | |
| Emera, Inc. (Canada)(b) | | | 6.75% | # | | 6/15/2076 | | | 1,916 | | | | 2,059,700 | |
| Entergy Arkansas, Inc. | | | 4.95% | | | 12/15/2044 | | | 1,909 | | | | 1,952,172 | |
| Entergy Mississippi, Inc. | | | 2.85% | | | 6/1/2028 | | | 1,525 | | | | 1,450,168 | |
| Indianapolis Power & Light Co.† | | | 4.05% | | | 5/1/2046 | | | 2,043 | | | | 1,936,272 | |
| IPALCO Enterprises, Inc. | | | 3.45% | | | 7/15/2020 | | | 168 | | | | 171,780 | |
| | See Notes to Financial Statements. | 23 |
Schedule of Investments (continued)
December 31, 2016
| | | | | | | | Principal | | | | |
| | | Interest | | Maturity | | Amount | | | Fair | |
| Investments | | Rate | | Date | | (000) | | | Value | |
| Electric: Integrated (continued) | | | | | | | | | | | | | | |
| Louisville Gas & Electric Co. | | | 4.375 | % | | 10/1/2045 | | $ | 598 | | | $ | 630,010 | |
| Puget Energy, Inc. | | | 3.65 | % | | 5/15/2025 | | | 909 | | | | 897,434 | |
| Southern California Edison Co. | | | 3.90 | % | | 3/15/2043 | | | 1,000 | | | | 985,837 | |
| Total | | | | | | | | | | | | | 14,737,048 | |
| | | | | | | | | | | | | | | |
| Electronics 1.61% | | | | | | | | | | | | | | |
| Micron Technology, Inc.† | | | 7.50 | % | | 9/15/2023 | | | 1,435 | | | | 1,592,850 | |
| NVIDIA Corp. | | | 3.20 | % | | 9/16/2026 | | | 3,622 | | | | 3,489,576 | |
| NXP BV/NXP Funding LLC (Netherlands)†(b) | | | 3.875 | % | | 9/1/2022 | | | 3,511 | | | | 3,563,665 | |
| NXP BV/NXP Funding LLC (Netherlands)†(b) | | | 4.625 | % | | 6/1/2023 | | | 984 | | | | 1,035,660 | |
| Qorvo, Inc. | | | 7.00 | % | | 12/1/2025 | | | 2,879 | | | | 3,202,887 | |
| QUALCOMM, Inc. | | | 4.65 | % | | 5/20/2035 | | | 500 | | | | 529,533 | |
| QUALCOMM, Inc. | | | 4.80 | % | | 5/20/2045 | | | 500 | | | | 535,577 | |
| Trimble, Inc. | | | 4.75 | % | | 12/1/2024 | | | 3,132 | | | | 3,176,753 | |
| Total | | | | | | | | | | | | | 17,126,501 | |
| | | | | | | | | | | | | | | |
| Energy: Exploration & Production 6.11% | | | | | | | | | | | | | | |
| Bill Barrett Corp. | | | 7.00 | % | | 10/15/2022 | | | 1,261 | | | | 1,210,560 | |
| Bonanza Creek Energy, Inc. | | | 6.75 | % | | 4/15/2021 | | | 1,270 | | | | 952,500 | |
| Carrizo Oil & Gas, Inc. | | | 6.25 | % | | 4/15/2023 | | | 1,916 | | | | 1,973,480 | |
| Chaparral Energy, Inc.(f) | | | 7.625 | % | | 11/15/2022 | | | 859 | | | | 773,100 | |
| Chaparral Energy, Inc.(f) | | | 8.25 | % | | 9/1/2021 | | | 1,036 | | | | 934,990 | |
| Chesapeake Energy Corp. | | | 4.875 | % | | 4/15/2022 | | | 636 | | | | 583,530 | |
| Chesapeake Energy Corp. | | | 6.625 | % | | 8/15/2020 | | | 2,669 | | | | 2,709,035 | |
| Clayton Williams Energy, Inc. | | | 7.75 | % | | 4/1/2019 | | | 1,035 | | | | 1,045,350 | |
| Concho Resources, Inc. | | | 5.50 | % | | 4/1/2023 | | | 3,820 | | | | 3,977,766 | |
| CONSOL Energy, Inc. | | | 5.875 | % | | 4/15/2022 | | | 1,065 | | | | 1,049,025 | |
| CONSOL Energy, Inc. | | | 8.00 | % | | 4/1/2023 | | | 1,091 | | | | 1,125,094 | |
| Continental Resources, Inc. | | | 4.50 | % | | 4/15/2023 | | | 1,099 | | | | 1,082,515 | |
| Continental Resources,Inc. | | | 3.80 | % | | 6/1/2024 | | | 3,075 | | | | 2,852,062 | |
| CrownRock LP/CrownRock Finance, Inc.† | | | 7.125 | % | | 4/15/2021 | | | 2,840 | | | | 2,967,800 | |
| Denbury Resources, Inc. | | | 4.625 | % | | 7/15/2023 | | | 617 | | | | 498,228 | |
| Denbury Resources, Inc. | | | 5.50 | % | | 5/1/2022 | | | 2,783 | | | | 2,442,082 | |
| Eclipse Resources Corp. | | | 8.875 | % | | 7/15/2023 | | | 1,229 | | | | 1,288,914 | |
| EP Energy LLC/Everest Acquisition Finance, Inc. | | | 9.375 | % | | 5/1/2020 | | | 1,082 | | | | 1,002,873 | |
| Gulfport Energy Corp. | | | 6.625 | % | | 5/1/2023 | | | 197 | | | | 206,850 | |
| Hilcorp Energy I LP/Hilcorp Finance Co.† | | | 5.00 | % | | 12/1/2024 | | | 2,703 | | | | 2,696,242 | |
| Kosmos Energy Ltd. † | | | 7.875 | % | | 8/1/2021 | | | 2,175 | | | | 2,175,000 | |
| Marathon Oil Corp. | | | 3.85 | % | | 6/1/2025 | | | 562 | | | | 545,955 | |
| 24 | See Notes to Financial Statements. | |
Schedule of Investments (continued)
December 31, 2016
| | | | | | | | Principal | | | | |
| | | Interest | | Maturity | | Amount | | | Fair | |
| Investments | | Rate | | Date | | (000) | | | Value | |
| Energy: Exploration & Production (continued) | | | | | | | | | | | | | | |
| MEG Energy Corp. (Canada)†(b) | | | 6.375 | % | | 1/30/2023 | | $ | 1,661 | | | $ | 1,486,595 | |
| MEG Energy Corp. (Canada)†(b) | | | 7.00 | % | | 3/31/2024 | | | 4,023 | | | | 3,660,930 | |
| Murphy Oil Corp. | | | 6.875 | % | | 8/15/2024 | | | 517 | | | | 551,898 | |
| Newfield Exploration Co. | | | 5.625 | % | | 7/1/2024 | | | 2,399 | | | | 2,512,952 | |
| Oasis Petroleum, Inc. | | | 6.875 | % | | 3/15/2022 | | | 1,168 | | | | 1,203,040 | |
| Occidental Petroleum Corp. | | | 4.40 | % | | 4/15/2046 | | | 805 | | | | 821,209 | |
| PDC Energy, Inc.† | | | 6.125 | % | | 9/15/2024 | | | 449 | | | | 461,348 | |
| PDC Energy, Inc. | | | 7.75 | % | | 10/15/2022 | | | 2,550 | | | | 2,728,500 | |
| Petrobras Argentina SA (Argentina)†(b) | | | 7.375 | % | | 7/21/2023 | | | 1,019 | | | | 996,073 | |
| Range Resources Corp. | | | 4.875 | % | | 5/15/2025 | | | 2,435 | | | | 2,371,081 | |
| Range Resources Corp.† | | | 5.875 | % | | 7/1/2022 | | | 2,071 | | | | 2,164,195 | |
| Rice Energy, Inc. | | | 6.25 | % | | 5/1/2022 | | | 1,587 | | | | 1,638,578 | |
| RSP Permian, Inc. | | | 6.625 | % | | 10/1/2022 | | | 1,517 | | | | 1,611,813 | |
| Sanchez Energy Corp. | | | 6.125 | % | | 1/15/2023 | | | 1,379 | | | | 1,316,945 | |
| Sanchez Energy Corp. | | | 7.75 | % | | 6/15/2021 | | | 906 | | | | 926,385 | |
| Seven Generations Energy Ltd. (Canada)†(b) | | | 6.875 | % | | 6/30/2023 | | | 1,779 | | | | 1,894,635 | |
| SM Energy Co. | | | 5.625 | % | | 6/1/2025 | | | 655 | | | | 635,350 | |
| SM Energy Co. | | | 6.75 | % | | 9/15/2026 | | | 887 | | | | 918,045 | |
| Southwestern Energy Co. | | | 6.70 | % | | 1/23/2025 | | | 1,100 | | | | 1,130,250 | |
| Tullow Oil plc (United Kingdom)†(b) | | | 6.25 | % | | 4/15/2022 | | | 1,106 | | | | 1,034,110 | |
| WPX Energy, Inc. | | | 6.00 | % | | 1/15/2022 | | | 1,000 | | | | 1,030,000 | |
| Total | | | | | | | | | | | | | 65,186,883 | |
| | | | | | | | | | | | | | | |
| Food & Drug Retailers 0.87% | | | | | | | | | | | | | | |
| BI-LO LLC/BI-LO Finance Corp.† | | | 9.25 | % | | 2/15/2019 | | | 804 | | | | 685,410 | |
| Ingles Markets, Inc. | | | 5.75 | % | | 6/15/2023 | | | 961 | | | | 992,233 | |
| New Albertson’s, Inc. | | | 7.45 | % | | 8/1/2029 | | | 950 | | | | 902,500 | |
| New Albertson’s, Inc. | | | 7.75 | % | | 6/15/2026 | | | 1,700 | | | | 1,691,500 | |
| Rite Aid Corp. | | | 7.70 | % | | 2/15/2027 | | | 2,175 | | | | 2,729,625 | |
| SMU SA (Chile)†(b) | | | 7.75 | % | | 2/8/2020 | | | 900 | | | | 877,500 | |
| Tops Holding LLC/Top Markets II Corp.† | | | 8.00 | % | | 6/15/2022 | | | 1,662 | | | | 1,437,630 | |
| Total | | | | | | | | | | | | | 9,316,398 | |
| | | | | | | | | | | | | | | |
| Food: Wholesale 1.18% | | | | | | | | | | | | | | |
| Arcor SAIC (Argentina)†(b) | | | 6.00 | % | | 7/6/2023 | | | 1,018 | | | | 1,063,810 | |
| Bunge Ltd. Finance Corp. | | | 3.25 | % | | 8/15/2026 | | | 1,204 | | | | 1,158,530 | |
| Cosan Luxembourg SA (Luxembourg)†(b) | | | 7.00 | % | | 1/20/2027 | | | 1,200 | | | | 1,203,000 | |
| Kellogg Co. | | | 4.50 | % | | 4/1/2046 | | | 2,033 | | | | 1,994,674 | |
| Lamb Weston Holdings, Inc.† | | | 4.625 | % | | 11/1/2024 | | | 1,248 | | | | 1,254,240 | |
| | See Notes to Financial Statements. | 25 |
Schedule of Investments (continued)
December 31, 2016
| | | | | | | | Principal | | | | |
| | | Interest | | Maturity | | Amount | | | Fair | |
| Investments | | Rate | | Date | | (000) | | | Value | |
| Food: Wholesale (continued) | | | | | | | | | | | | | | |
| Land O’Lakes, Inc.† | | | 6.00 | % | | 11/15/2022 | | $ | 1,274 | | | $ | 1,395,030 | |
| Mead Johnson Nutrition Co. | | | 4.125 | % | | 11/15/2025 | | | 1,319 | | | | 1,350,967 | |
| Pinnacle Foods Finance LLC/Pinnacle Foods Finance Corp. | | | 4.875 | % | | 5/1/2021 | | | 1,050 | | | | 1,086,750 | |
| Post Holdings, Inc.† | | | 7.75 | % | | 3/15/2024 | | | 1,397 | | | | 1,557,655 | |
| Post Holdings, Inc.† | | | 8.00 | % | | 7/15/2025 | | | 418 | | | | 470,250 | |
| Total | | | | | | | | | | | | | 12,534,906 | |
| | | | | | | | | | | | | | | |
| Forestry/Paper 0.41% | | | | | | | | | | | | | | |
| International Paper Co. | | | 4.40 | % | | 8/15/2047 | | | 1,211 | | | | 1,149,094 | |
| Millar Western Forest Products Ltd. (Canada)(b) | | | 8.50 | % | | 4/1/2021 | | | 1,010 | | | | 560,550 | |
| Norbord, Inc. (Canada)†(b) | | | 6.25 | % | | 4/15/2023 | | | 1,475 | | | | 1,534,000 | |
| Rayonier AM Products, Inc.† | | | 5.50 | % | | 6/1/2024 | | | 1,145 | | | | 1,076,300 | |
| Total | | | | | | | | | | | | | 4,319,944 | |
| | | | | | | | | | | | | | | |
| Gaming 2.22% | | | | | | | | | | | | | | |
| Boyd Gaming Corp. | | | 6.875 | % | | 5/15/2023 | | | 1,495 | | | | 1,612,731 | |
| Caesar’s Entertainment Resort Properties LLC/Caesar’s Entertainment Resort Properties Finance, Inc. | | | 11.00 | % | | 10/1/2021 | | | 1,050 | | | | 1,152,375 | |
| Caesar’s Growth Properties Holdings LLC/Caesar’s Growth Properties Finance, Inc. | | | 9.375 | % | | 5/1/2022 | | | 1,496 | | | | 1,620,318 | |
| Carlson Travel, Inc.† | | | 6.75 | % | | 12/15/2023 | | | 942 | | | | 982,035 | |
| GLP Capital LP/GLP Financing II, Inc. | | | 5.375 | % | | 4/15/2026 | | | 704 | | | | 735,962 | |
| International Game Technology plc† | | | 6.50 | % | | 2/15/2025 | | | 1,343 | | | | 1,447,082 | |
| MCE Finance Ltd. (Hong Kong)†(b) | | | 5.00 | % | | 2/15/2021 | | | 1,750 | | | | 1,747,601 | |
| MGM Growth Properties Operating Partnership LP/MGP Finance Co-Issuer, Inc.† | | | 5.625 | % | | 5/1/2024 | | | 544 | | | | 571,200 | |
| MGM Resorts International | | | 6.00 | % | | 3/15/2023 | | | 3,985 | | | | 4,313,762 | |
| MGM Resorts International | | | 7.75 | % | | 3/15/2022 | | | 762 | | | | 878,205 | |
| Mohegan Tribal Gaming Authority† | | | 7.875 | % | | 10/15/2024 | | | 2,065 | | | | 2,114,044 | |
| River Rock Entertainment Authority(f) | | | 9.00 | % | | 11/1/2018 | | | 431 | | | | 89,432 | |
| Scientific Games International, Inc. | | | 10.00 | % | | 12/1/2022 | | | 1,120 | | | | 1,120,000 | |
| Sugarhouse HSP Gaming Prop. Mezz. LP/Sugarhouse HSP Gaming Finance Corp.† | | | 6.375 | % | | 6/1/2021 | | | 2,490 | | | | 2,496,225 | |
| Wynn Macau Ltd. (Macau)†(b) | | | 5.25 | % | | 10/15/2021 | | | 2,780 | | | | 2,814,750 | |
| Total | | | | | | | | | | | | | 23,695,722 | |
| | | | | | | | | | | | | | | |
| Gas Distribution 3.73% | | | | | | | | | | | | | | |
| American Midstream Partners LP/American Midstream Finance Corp.† | | | 8.50 | % | | 12/15/2021 | | | 672 | | | | 668,640 | |
| 26 | See Notes to Financial Statements. |
Schedule of Investments (continued)
December 31, 2016
| | | | | | | | Principal | | | | |
| | | Interest | | | Maturity | | Amount | | | Fair | |
| Investments | | Rate | | | Date | | (000) | | | Value | |
| Gas Distribution (continued) | | | | | | | | | | | | | | |
| Boardwalk Pipelines LP | | | 5.95% | | | 6/1/2026 | | $ | 1,570 | | | $ | 1,708,425 | |
| Cheniere Corpus Christi Holdings LLC† | | | 5.875% | | | 3/31/2025 | | | 1,059 | | | | 1,084,480 | |
| Cheniere Corpus Christi Holdings LLC† | | | 7.00% | | | 6/30/2024 | | | 1,017 | | | | 1,105,988 | |
| Columbia Pipeline Group, Inc. | | | 4.50% | | | 6/1/2025 | | | 1,024 | | | | 1,077,620 | |
| Dominion Gas Holdings LLC | | | 3.60% | | | 12/15/2024 | | | 1,175 | | | | 1,193,411 | |
| Enbridge, Inc. (Canada)(b) | | | 6.00% | # | | 1/15/2077 | | | 1,146 | | | | 1,146,000 | |
| Energy Transfer Equity LP | | | 5.50% | | | 6/1/2027 | | | 1,097 | | | | 1,075,060 | |
| Energy Transfer Equity LP | | | 5.875% | | | 1/15/2024 | | | 1,263 | | | | 1,310,362 | |
| Florida Gas Transmission Co. LLC† | | | 4.35% | | | 7/15/2025 | | | 2,895 | | | | 2,922,885 | |
| Genesis Energy LP/Genesis Energy Finance Corp. | | | 6.75% | | | 8/1/2022 | | | 1,240 | | | | 1,294,560 | |
| IFM US Colonial Pipeline 2 LLC† | | | 6.45% | | | 5/1/2021 | | | 1,400 | | | | 1,525,752 | |
| LBC Tank Terminals Holding Netherlands BV (Belgium)†(b) | | | 6.875% | | | 5/15/2023 | | | 1,419 | | | | 1,458,022 | |
| Magellan Midstream Partners LP | | | 5.00% | | | 3/1/2026 | | | 1,369 | | | | 1,503,923 | |
| MPLX LP | | | 5.50% | | | 2/15/2023 | | | 1,355 | | | | 1,409,896 | |
| ONEOK, Inc. | | | 4.25% | | | 2/1/2022 | | | 794 | | | | 801,940 | |
| Rockies Express Pipeline LLC† | | | 5.625% | | | 4/15/2020 | | | 1,160 | | | | 1,226,700 | |
| Rockies Express Pipeline LLC† | | | 6.875% | | | 4/15/2040 | | | 1,800 | | | | 1,800,000 | |
| Sabine Pass Liquefaction LLC | | | 5.75% | | | 5/15/2024 | | | 5,553 | | | | 5,983,357 | |
| Southern Star Central Corp.† | | | 5.125% | | | 7/15/2022 | | | 1,145 | | | | 1,165,038 | |
| Tesoro Logistics LP/Tesoro Logistics Finance Corp. | | | 5.25% | | | 1/15/2025 | | | 1,103 | | | | 1,130,575 | |
| Tesoro Logistics LP/Tesoro Logistics Finance Corp. | | | 5.875% | | | 10/1/2020 | | | 439 | | | | 453,268 | |
| Tesoro Logistics LP/Tesoro Logistics Finance Corp. | | | 6.25% | | | 10/15/2022 | | | 1,350 | | | | 1,437,750 | |
| Transcanada Trust (Canada)(b) | | | 5.875% | # | | 8/15/2076 | | | 2,489 | | | | 2,594,782 | |
| Williams Cos., Inc. (The) | | | 4.55% | | | 6/24/2024 | | | 1,000 | | | | 997,500 | |
| Williams Cos., Inc. (The) | | | 5.75% | | | 6/24/2044 | | | 518 | | | | 505,050 | |
| Williams Partners LP/ACMP Finance Corp. | | | 4.875% | | | 5/15/2023 | | | 1,158 | | | | 1,180,668 | |
| Total | | | | | | | | | | | | | 39,761,652 | |
| | | | | | | | | | | | | | | |
| Health Facilities 1.81% | | | | | | | | | | | | | | |
| Acadia Healthcare Co., Inc. | | | 6.50% | | | 3/1/2024 | | | 620 | | | | 635,500 | |
| Ascension Health | | | 3.945% | | | 11/15/2046 | | | 1,017 | | | | 973,551 | |
| Dignity Health | | | 3.812% | | | 11/1/2024 | | | 1,175 | | | | 1,170,548 | |
| Dignity Health | | | 4.50% | | | 11/1/2042 | | | 246 | | | | 228,153 | |
| Envision Healthcare Corp.† | | | 5.125% | | | 7/1/2022 | | | 632 | | | | 632,790 | |
| Envision Healthcare Corp. | | | 5.625% | | | 7/15/2022 | | | 879 | | | | 909,545 | |
| HCA, Inc. | | | 5.25% | | | 4/15/2025 | | | 1,375 | | | | 1,438,594 | |
| HCA, Inc. | | | 5.875% | | | 3/15/2022 | | | 915 | | | | 988,200 | |
| HCA, Inc. | | | 7.05% | | | 12/1/2027 | | | 390 | | | | 401,700 | |
| | See Notes to Financial Statements. | 27 |
Schedule of Investments (continued)
December 31, 2016
| | | | | | | | Principal | | | | |
| | | Interest | | Maturity | | Amount | | | Fair | |
| Investments | | Rate | | Date | | (000) | | | Value | |
| Health Facilities (continued) | | | | | | | | | | | | | | |
| HCA, Inc. | | | 7.50 | % | | 2/15/2022 | | $ | 4,467 | | | $ | 5,081,212 | |
| HCA, Inc. | | | 7.58 | % | | 9/15/2025 | | | 552 | | | | 597,540 | |
| HCA, Inc. | | | 7.69 | % | | 6/15/2025 | | | 1,240 | | | | 1,354,700 | |
| HCA, Inc. | | | 8.36 | % | | 4/15/2024 | | | 261 | | | | 297,540 | |
| Memorial Sloan-Kettering Cancer Center | | | 4.20 | % | | 7/1/2055 | | | 1,250 | | | | 1,216,238 | |
| MPT Operating Partnership LP/MPT Finance Corp. | | | 5.25 | % | | 8/1/2026 | | | 604 | | | | 593,430 | |
| Northwell Healthcare, Inc. | | | 3.979 | % | | 11/1/2046 | | | 3,001 | | | | 2,769,704 | |
| Total | | | | | | | | | | | | | 19,288,945 | |
| | | | | | | | | | | | | | | |
| Health Services 0.30% | | | | | | | | | | | | | | |
| inVentiv Group Holdings, Inc./inVentiv Health Inc/inVentiv Health Clinical, Inc.† | | | 7.50 | % | | 10/1/2024 | | | 693 | | | | 729,313 | |
| Sterigenics-Nordion Holdings LLC† | | | 6.50 | % | | 5/15/2023 | | | 1,483 | | | | 1,512,660 | |
| Sterigenics-Nordion Topco LLC PIK† | | | 8.125 | % | | 11/1/2021 | | | 1,005 | | | | 1,002,488 | |
| Total | | | | | | | | | | | | | 3,244,461 | |
| | | | | | | | | | | | | | | |
| Hotels 0.36% | | | | | | | | | | | | | | |
| ESH Hospitality, Inc.† | | | 5.25 | % | | 5/1/2025 | | | 734 | | | | 732,165 | |
| Hilton Domestic Operating Co., Inc.† | | | 4.25 | % | | 9/1/2024 | | | 1,254 | | | | 1,222,650 | |
| Playa Resorts Holding BV (Netherlands)†(b) | | | 8.00 | % | | 8/15/2020 | | | 983 | | | | 1,029,693 | |
| Starwood Property Trust, Inc.† | | | 5.00 | % | | 12/15/2021 | | | 840 | | | | 853,356 | |
| Total | | | | | | | | | | | | | 3,837,864 | |
| | | | | | | | | | | | | | | |
| Insurance Brokerage 0.15% | | | | | | | | | | | | | | |
| Alliant Holdings Intermediate LLC† | | | 8.25 | % | | 8/1/2023 | | | 1,550 | | | | 1,604,250 | |
| | | | | | | | | | | | | | | |
| Insurance-Reinsurance 0.17% | | | | | | | | | | | | | | |
| Berkshire Hathaway, Inc. | | | 2.75 | % | | 3/15/2023 | | | 907 | | | | 904,362 | |
| Berkshire Hathaway, Inc. | | | 3.125 | % | | 3/15/2026 | | | 907 | | | | 902,182 | |
| Total | | | | | | | | | | | | | 1,806,544 | |
| | | | | | | | | | | | | | | |
| Integrated Energy 0.53% | | | | | | | | | | | | | | |
| Exxon Mobil Corp. | | | 4.114 | % | | 3/1/2046 | | | 1,348 | | | | 1,384,227 | |
| Petrobras Global Finance BV (Netherlands)(b) | | | 4.375 | % | | 5/20/2023 | | | 1,228 | | | | 1,075,974 | |
| Shell International Finance BV (Netherlands)(b) | | | 6.375 | % | | 12/15/2038 | | | 2,473 | | | | 3,195,378 | |
| Total | | | | | | | | | | | | | 5,655,579 | |
| | | | | | | | | | | | | | | |
| Investments & Miscellaneous Financial Services 0.83% | | | | | | | | | | | | | | |
| CME Group, Inc. | | | 3.00 | % | | 3/15/2025 | | | 1,575 | | | | 1,575,906 | |
| FMR LLC† | | | 5.35 | % | | 11/15/2021 | | | 800 | | | | 884,423 | |
| GrupoSura Finance SA† | | | 5.50 | % | | 4/29/2026 | | | 1,015 | | | | 1,040,629 | |
| Intercontinental Exchange, Inc. | | | 3.75 | % | | 12/1/2025 | | | 1,945 | | | | 1,995,167 | |
| 28 | See Notes to Financial Statements. |
Schedule of Investments (continued)
December 31, 2016
| | | | | | | | Principal | | | | |
| | | Interest | | Maturity | | Amount | | | Fair | |
| Investments | | Rate | | Date | | (000) | | | Value | |
| Investments & Miscellaneous Financial Services (continued) | | | | | | | | | | | | | | |
| Neuberger Berman Group LLC/Neuberger Berman Finance Corp.† | | | 4.875 | % | | 4/15/2045 | | $ | 547 | | | $ | 435,723 | |
| OM Asset Management plc (United Kingdom)(b) | | | 4.80 | % | | 7/27/2026 | | | 1,571 | | | | 1,491,273 | |
| Unifin Financiera SAB de CV SOFOM ENR (Mexico)†(b) | | | 7.25 | % | | 9/27/2023 | | | 1,500 | | | | 1,468,500 | |
| Total | | | | | | | | | | | | | 8,891,621 | |
| | | | | | | | | | | | | | | |
| Life Insurance 0.56% | | | | | | | | | | | | | | |
| CNO Financial Group, Inc. | | | 5.25 | % | | 5/30/2025 | | | 1,480 | | | | 1,485,550 | |
| Lincoln National Corp. | | | 3.625 | % | | 12/12/2026 | | | 1,176 | | | | 1,175,693 | |
| Lincoln National Corp. | | | 6.30 | % | | 10/9/2037 | | | 265 | | | | 314,042 | |
| Teachers Insurance & Annuity Association of America† | | | 4.90 | % | | 9/15/2044 | | | 1,424 | | | | 1,544,027 | |
| TIAA Asset Management Finance Co. LLC† | | | 4.125 | % | | 11/1/2024 | | | 1,453 | | | | 1,470,019 | |
| Total | | | | | | | | | | | | | 5,989,331 | |
| | | | | | | | | | | | | | | |
| Machinery 0.20% | | | | | | | | | | | | | | |
| Milacron LLC/Mcron Finance Corp.† | | | 7.75 | % | | 2/15/2021 | | | 1,125 | | | | 1,161,562 | |
| Xylem, Inc. | | | 4.375 | % | | 11/1/2046 | | | 1,004 | | | | 993,100 | |
| Total | | | | | | | | | | | | | 2,154,662 | |
| | | | | | | | | | | | | | | |
| Managed Care 0.30% | | | | | | | | | | | | | | |
| Centene Corp. | | | 6.125 | % | | 2/15/2024 | | | 1,948 | | | | 2,057,575 | |
| MPH Acquisition Holdings LLC† | | | 7.125 | % | | 6/1/2024 | | | 1,034 | | | | 1,090,973 | |
| Total | | | | | | | | | | | | | 3,148,548 | |
| | | | | | | | | | | | | | | |
| Media: Content 1.31% | | | | | | | | | | | | | | |
| Activision Blizzard, Inc.† | | | 3.40 | % | | 9/15/2026 | | | 1,501 | | | | 1,427,538 | |
| AMC Networks, Inc. | | | 4.75 | % | | 12/15/2022 | | | 2,385 | | | | 2,408,850 | |
| Discovery Communications LLC | | | 4.875 | % | | 4/1/2043 | | | 1,051 | | | | 974,686 | |
| Discovery Communications LLC | | | 4.95 | % | | 5/15/2042 | | | 1,093 | | | | 1,011,606 | |
| iHeartCommunications, Inc. | | | 9.00 | % | | 3/1/2021 | | | 2,025 | | | | 1,506,094 | |
| Netflix, Inc.† | | | 4.375 | % | | 11/15/2026 | | | 1,100 | | | | 1,068,375 | |
| Netflix, Inc. | | | 5.50 | % | | 2/15/2022 | | | 1,266 | | | | 1,370,445 | |
| Netflix, Inc. | | | 5.875 | % | | 2/15/2025 | | | 1,661 | | | | 1,795,956 | |
| Sirius XM Radio, Inc.† | | | 6.00 | % | | 7/15/2024 | | | 1,075 | | | | 1,126,063 | |
| Univision Communications, Inc.† | | | 5.125 | % | | 2/15/2025 | | | 1,366 | | | | 1,311,360 | |
| Total | | | | | | | | | | | | | 14,000,973 | |
| | | | | | | | | | | | | | | |
| Medical Products 1.40% | | | | | | | | | | | | | | |
| Boston Scientific Corp. | | | 7.00 | % | | 11/15/2035 | | | 2,396 | | | | 2,936,789 | |
| Edwards Lifesciences Corp. | | | 2.875 | % | | 10/15/2018 | | | 552 | | | | 560,533 | |
| | See Notes to Financial Statements. | 29 |
Schedule of Investments (continued)
December 31, 2016
| | | | | | | | Principal | | | | |
| | | Interest | | Maturity | | Amount | | | Fair | |
| Investments | | | Rate | | Date | | | (000) | | | | Value | |
| Medical Products (continued) | | | | | | | | | | | | | | |
| Fresenius Medical Care US Finance II, Inc.† | | | 4.75 | % | | 10/15/2024 | | $ | 475 | | | $ | 482,125 | |
| Fresenius Medical Care US Finance II, Inc.† | | | 5.875 | % | | 1/31/2022 | | | 2,425 | | | | 2,667,500 | |
| Grifols Worldwide Operations Ltd. (Ireland)(b) | | | 5.25 | % | | 4/1/2022 | | | 2,463 | | | | 2,561,520 | |
| Hologic, Inc.† | | | 5.25 | % | | 7/15/2022 | | | 1,030 | | | | 1,087,938 | |
| Medtronic, Inc. | | | 4.375 | % | | 3/15/2035 | | | 1,779 | | | | 1,885,630 | |
| Ortho-Clinical Diagnostics, Inc./Ortho-Clinical Diagnostics SA† | | | 6.625 | % | | 5/15/2022 | | | 1,225 | | | | 1,090,250 | |
| Stryker Corp. | | | 3.50 | % | | 3/15/2026 | | | 635 | | | | 642,219 | |
| Stryker Corp. | | | 4.625 | % | | 3/15/2046 | | | 972 | | | | 995,086 | |
| Total | | | | | | | | | | | | | 14,909,590 | |
| | | | | | | | | | | | | | | |
| Metals/Mining (Excluding Steel) 4.42% | | | | | | | | | | | | | | |
| Alcoa Nederland Holding BV (Netherlands)†(b) | | | 6.75 | % | | 9/30/2024 | | | 1,417 | | | | 1,540,988 | |
| Aleris International, Inc. | | | 7.875 | % | | 11/1/2020 | | | 1,193 | | | | 1,201,948 | |
| Aleris International, Inc.† | | | 9.50 | % | | 4/1/2021 | | | 1,411 | | | | 1,520,353 | |
| ALROSA Finance SA (Luxembourg)†(b) | | | 7.75 | % | | 11/3/2020 | | | 900 | | | | 1,018,539 | |
| Anglo American Capital plc (United Kingdom)†(b) | | | 4.125 | % | | 4/15/2021 | | | 717 | | | | 733,133 | |
| Anglo American Capital plc (United Kingdom)†(b) | | | 4.875 | % | | 5/14/2025 | | | 660 | | | | 672,375 | |
| AngloGold Ashanti Holdings plc (Isle of Man)(b) | | | 6.50 | % | | 4/15/2040 | | | 728 | | | | 658,840 | |
| Coeur Mining, Inc. | | | 7.875 | % | | 2/1/2021 | | | 852 | | | | 888,210 | |
| First Quantum Minerals Ltd. (Canada)†(b) | | | 6.75 | % | | 2/15/2020 | | | 880 | | | | 882,200 | |
| First Quantum Minerals Ltd. (Canada)†(b) | | | 7.25 | % | | 10/15/2019 | | | 220 | | | | 223,300 | |
| FMG Resources (August 2006) Pty Ltd. (Australia)†(b) | | | 9.75 | % | | 3/1/2022 | | | 1,775 | | | | 2,067,999 | |
| Freeport-McMoRan, Inc. | | | 3.55 | % | | 3/1/2022 | | | 2,520 | | | | 2,356,200 | |
| Freeport-McMoRan, Inc. | | | 3.875 | % | | 3/15/2023 | | | 4,459 | | | | 4,113,427 | |
| Glencore Funding LLC† | | | 4.125 | % | | 5/30/2023 | | | 1,141 | | | | 1,149,838 | |
| Grinding Media, Inc./MC Grinding Media Canada, Inc.† | | | 7.375 | % | | 12/15/2023 | | | 686 | | | | 722,427 | |
| HudBay Minerals, Inc. (Canada)†(b) | | | 7.25 | % | | 1/15/2023 | | | 298 | | | | 309,175 | |
| HudBay Minerals, Inc. (Canada)†(b) | | | 7.625 | % | | 1/15/2025 | | | 665 | | | | 692,850 | |
| Imperial Metals Corp. (Canada)†(b) | | | 7.00 | % | | 3/15/2019 | | | 1,050 | | | | 1,008,000 | |
| Indo Energy Finance BV (Netherlands)†(b) | | | 7.00 | % | | 5/7/2018 | | | 500 | | | | 470,000 | |
| Indo Energy Finance II BV (Netherlands)†(b) | | | 6.375 | % | | 1/24/2023 | | | 908 | | | | 662,677 | |
| Kinross Gold Corp. (Canada)(b) | | | 5.125 | % | | 9/1/2021 | | | 1,825 | | | | 1,862,631 | |
| Kinross Gold Corp. (Canada)(b) | | | 5.95 | % | | 3/15/2024 | | | 2,299 | | | | 2,339,232 | |
| Lundin Mining Corp. (Canada)†(b) | | | 7.875 | % | | 11/1/2022 | | | 1,150 | | | | 1,256,375 | |
| Mirabela Nickel Ltd. (Australia)(b) | | | 1.00 | % | | 9/10/2044 | | | 15 | | | | 2 | |
| MMC Norilsk Nickel OJSC via MMC Finance DAC (Ireland)†(b) | | | 6.625 | % | | 10/14/2022 | | | 1,500 | | | | 1,675,500 | |
| 30 | See Notes to Financial Statements. |
Schedule of Investments (continued)
December 31, 2016
| | | | | | | | Principal | | | | |
| | | Interest | | | Maturity | | Amount | | | Fair | |
| Investments | | Rate | | | Date | | (000) | | | Value | |
| Metals/Mining (Excluding Steel) (continued) | | | | | | | | | | | | | | |
| New Gold, Inc. (Canada)†(b) | | | 6.25% | | | 11/15/2022 | | $ | 2,498 | | | $ | 2,572,940 | |
| New Gold, Inc. (Canada)†(b) | | | 7.00% | | | 4/15/2020 | | | 771 | | | | 794,130 | |
| Newmont Mining Corp. | | | 6.25% | | | 10/1/2039 | | | 2,384 | | | | 2,631,035 | |
| Novelis Corp.† | | | 5.875% | | | 9/30/2026 | | | 1,000 | | | | 1,012,500 | |
| Novelis Corp.† | | | 6.25% | | | 8/15/2024 | | | 974 | | | | 1,034,875 | |
| Peabody Energy Corp.†(f) | | | 10.00% | | | 3/15/2022 | | | 1,310 | | | | 1,169,175 | |
| Rain CII Carbon LLC/CII Carbon Corp.† | | | 8.00% | | | 12/1/2018 | | | 655 | | | | 655,000 | |
| Rain CII Carbon LLC/CII Carbon Corp.†(a) | | | 8.50% | | | 1/15/2021 | | EUR | 475 | | | | 498,759 | |
| Teck Resources Ltd. (Canada)(b) | | | 4.75% | | | 1/15/2022 | | $ | 2,605 | | | | 2,624,537 | |
| Teck Resources Ltd. (Canada)†(b) | | | 8.50% | | | 6/1/2024 | | | 1,169 | | | | 1,350,195 | |
| Vale Overseas Ltd. (Brazil)(b) | | | 6.25% | | | 8/10/2026 | | | 1,443 | | | | 1,504,328 | |
| Volcan Cia Minera SAA (Peru)†(b) | | | 5.375% | | | 2/2/2022 | | | 1,293 | | | | 1,285,242 | |
| Total | | | | | | | | | | | | | 47,158,935 | |
| | | | | | | | | | | | | | | |
| Monoline Insurance 0.12% | | | | | | | | | | | | | | |
| MGIC Investment Corp. | | | 5.75% | | | 8/15/2023 | | | 1,204 | | | | 1,258,180 | |
| | | | | | | | | | | | | | | |
| Non-Electric Utilities 0.13% | | | | | | | | | | | | | | |
| Brooklyn Union Gas Co. (The)† | | | 3.407% | | | 3/10/2026 | | | 1,368 | | | | 1,377,368 | |
| | | | | | | | | | | | | | | |
| Oil Field Equipment & Services 2.34% | | | | | | | | | | | | | | |
| Diamond Offshore Drilling, Inc. | | | 5.70% | | | 10/15/2039 | | | 417 | | | | 329,430 | |
| Ensco plc (United kingdom)(b) | | | 4.50% | | | 10/1/2024 | | | 184 | | | | 158,240 | |
| Ensco plc (United kingdom)(b) | | | 5.20% | | | 3/15/2025 | | | 1,770 | | | | 1,537,546 | |
| Forum Energy Technologies, Inc. | | | 6.25% | | | 10/1/2021 | | | 1,300 | | | | 1,306,500 | |
| FTS International, Inc. | | | 6.25% | | | 5/1/2022 | | | 303 | | | | 253,005 | |
| FTS International, Inc.† | | | 8.463% | # | | 6/15/2020 | | | 1,177 | | | | 1,178,471 | |
| Halliburton Co. | | | 3.80% | | | 11/15/2025 | | | 971 | | | | 988,240 | |
| Halliburton Co. | | | 5.00% | | | 11/15/2045 | | | 506 | | | | 547,825 | |
| Hornbeck Offshore Services, Inc. | | | 5.00% | | | 3/1/2021 | | | 937 | | | | 632,475 | |
| Nabors Industries, Inc. | | | 4.625% | | | 9/15/2021 | | | 197 | | | | 201,239 | |
| Nabors Industries, Inc.† | | | 5.50% | | | 1/15/2023 | | | 2,575 | | | | 2,687,656 | |
| Noble Holding International Ltd. | | | 4.625% | | | 3/1/2021 | | | 503 | | | | 484,138 | |
| Noble Holding International Ltd. | | | 7.20% | | | 4/1/2025 | | | 543 | | | | 511,778 | |
| Noble Holding International Ltd. | | | 7.75% | | | 1/15/2024 | | | 1,680 | | | | 1,584,408 | |
| Oceaneering International, Inc. | | | 4.65% | | | 11/15/2024 | | | 1,570 | | | | 1,551,100 | |
| Precision Drilling Corp. (Canada)(b) | | | 5.25% | | | 11/15/2024 | | | 1,861 | | | | 1,749,340 | |
| Precision Drilling Corp. (Canada)(b) | | | 6.50% | | | 12/15/2021 | | | 377 | | | | 384,540 | |
| Precision Drilling Corp. (Canada)†(b) | | | 7.75% | | | 12/15/2023 | | | 553 | | | | 586,180 | |
| SESI LLC | | | 6.375% | | | 5/1/2019 | | | 535 | | | | 537,675 | |
| | See Notes to Financial Statements. | 31 |
Schedule of Investments (continued)
December 31, 2016
| | | | | | | | Principal | | | | |
| | | Interest | | | Maturity | | Amount | | | Fair | |
| Investments | | Rate | | | Date | | (000) | | | Value | |
| Oil Field Equipment & Services (continued) | | | | | | | | | | | | | | |
| SESI LLC | | | 7.125% | | | 12/15/2021 | | $ | 615 | | | $ | 628,838 | |
| Transocean Phoenix 2 Ltd.† | | | 7.75% | | | 10/15/2024 | | | 1,023 | | | | 1,084,380 | |
| Transocean Proteus Ltd.† | | | 6.25% | | | 12/1/2024 | | | 1,499 | | | | 1,520,556 | |
| Unit Corp. | | | 6.625% | | | 5/15/2021 | | | 1,299 | | | | 1,266,525 | |
| Weatherford International Ltd. | | | 7.75% | | | 6/15/2021 | | | 2,126 | | | | 2,155,232 | |
| Weatherford International Ltd.† | | | 9.875% | | | 2/15/2024 | | | 1,000 | | | | 1,068,120 | |
| Total | | | | | | | | | | | | | 24,933,437 | |
| | | | | | | | | | | | | | | |
| Oil Refining & Marketing 0.32% | | | | | | | | | | | | | | |
| Citgo Holding, Inc.† | | | 10.75% | | | 2/15/2020 | | | 1,987 | | | | 2,140,993 | |
| Valero Energy Partners LP | | | 4.375% | | | 12/15/2026 | | | 1,205 | | | | 1,218,186 | |
| Total | | | | | | | | | | | | | 3,359,179 | |
| | | | | | | | | | | | | | | |
| Packaging 0.78% | | | | | | | | | | | | | | |
| BWAY Holding Co.† | | | 9.125% | | | 8/15/2021 | | | 1,052 | | | | 1,115,120 | |
| Coveris Holdings SA (Luxembourg)†(b) | | | 7.875% | | | 11/1/2019 | | | 1,024 | | | | 1,021,440 | |
| Crown Cork & Seal Co., Inc. | | | 7.375% | | | 12/15/2026 | | | 1,295 | | | | 1,456,875 | |
| Graphic Packaging International, Inc. | | | 4.875% | | | 11/15/2022 | | | 969 | | | | 995,647 | |
| Pactiv LLC | | | 7.95% | | | 12/15/2025 | | | 825 | | | | 878,625 | |
| Sealed Air Corp.† | | | 4.875% | | | 12/1/2022 | | | 975 | | | | 1,005,469 | |
| Sealed Air Corp.† | | | 6.875% | | | 7/15/2033 | | | 1,850 | | | | 1,891,625 | |
| Total | | | | | | | | | | | | | 8,364,801 | |
| | | | | | | | | | | | | | | |
| Personal & Household Products 0.82% | | | | | | | | | | | | | | |
| Brunswick Corp.† | | | 4.625% | | | 5/15/2021 | | | 445 | | | | 452,231 | |
| FGI Operating Co. LLC/FGI Finance, Inc. | | | 7.875% | | | 5/1/2020 | | | 1,582 | | | | 1,352,610 | |
| Gibson Brands, Inc.† | | | 8.875% | | | 8/1/2018 | | | 2,225 | | | | 2,069,250 | |
| Newell Brands, Inc. | | | 5.50% | | | 4/1/2046 | | | 1,815 | | | | 2,088,464 | |
| SC Johnson & Son, Inc.† | | | 4.75% | | | 10/15/2046 | | | 805 | | | | 868,140 | |
| Spectrum Brands, Inc. | | | 5.75% | | | 7/15/2025 | | | 817 | | | | 851,723 | |
| Springs Industries, Inc. | | | 6.25% | | | 6/1/2021 | | | 1,007 | | | | 1,047,280 | |
| Total | | | | | | | | | | | | | 8,729,698 | |
| | | | | | | | | | | | | | | |
| Pharmaceuticals 0.30% | | | | | | | | | | | | | | |
| Jaguar Holding Co. II/Pharmaceutical Product | | | | | | | | | | | | | | |
| Development LLC† | | | 6.375% | | | 8/1/2023 | | | 1,225 | | | | 1,313,812 | |
| Pfizer, Inc. | | | 5.60% | | | 9/15/2040 | | | 1,578 | | | | 1,908,279 | |
| Total | | | | | | | | | | | | | 3,222,091 | |
| | | | | | | | | | | | | | | |
| Property & Casualty 0.47% | | | | | | | | | | | | | | |
| Allstate Corp. (The) | | | 5.75% | # | | 8/15/2053 | | | 974 | | | | 1,008,845 | |
| 32 | See Notes to Financial Statements. |
Schedule of Investments (continued)
December 31, 2016
| | | | | | | | Principal | | | | |
| | | Interest | | Maturity | | Amount | | | Fair | |
| Investments | | Rate | | Date | | (000) | | | Value | |
| Property & Casualty (continued) | | | | | | | | | | | | | | |
| Arch Capital Finance LLC | | | 5.031 | % | | 12/15/2046 | | $ | 1,507 | | | $ | 1,583,623 | |
| Chubb INA Holdings, Inc. | | | 4.35 | % | | 11/3/2045 | | | 876 | | | | 927,623 | |
| Hanover Insurance Group, Inc. (The) | | | 4.50 | % | | 4/15/2026 | | | 1,526 | | | | 1,536,244 | |
| Total | | | | | | | | | | | | | 5,056,335 | |
| | | | | | | | | | | | | | | |
| Rail 0.75% | | | | | | | | | | | | | | |
| Central Japan Railway Co. (Japan)†(b) | | | 4.25 | % | | 11/24/2045 | | | 1,524 | | | | 1,556,524 | |
| CSX Corp. | | | 4.25 | % | | 11/1/2066 | | | 1,502 | | | | 1,377,400 | |
| Florida East Coast Holdings Corp.† | | | 6.75 | % | | 5/1/2019 | | | 1,830 | | | | 1,898,625 | |
| Florida East Coast Holdings Corp.† | | | 9.75 | % | | 5/1/2020 | | | 1,608 | | | | 1,660,260 | |
| Kansas City Southern | | | 3.125 | % | | 6/1/2026 | | | 509 | | | | 485,750 | |
| Watco Cos. LLC/Watco Finance Corp.† | | | 6.375 | % | | 4/1/2023 | | | 962 | | | | 1,000,480 | |
| Total | | | | | | | | | | | | | 7,979,039 | |
| | | | | | | | | | | | | | | |
| Real Estate Investment Trusts 1.06% | | | | | | | | | | | | | | |
| Brixmor Operating Partnership LP | | | 3.25 | % | | 9/15/2023 | | | 1,504 | | | | 1,460,277 | |
| Brixmor Operating Partnership LP | | | 3.85 | % | | 2/1/2025 | | | 1,520 | | | | 1,499,333 | |
| Brixmor Operating Partnership LP | | | 3.875 | % | | 8/15/2022 | | | 1,531 | | | | 1,562,676 | |
| CubeSmart LP | | | 4.00 | % | | 11/15/2025 | | | 878 | | | | 892,807 | |
| Digital Realty Trust LP | | | 4.75 | % | | 10/1/2025 | | | 989 | | | | 1,028,290 | |
| Healthcare Trust of America Holdings LP | | | 3.50 | % | | 8/1/2026 | | | 1,010 | | | | 967,123 | |
| Jababeka International BV (Netherlands)†(b) | | | 6.50 | % | | 10/5/2023 | | | 1,000 | | | | 981,977 | |
| Tanger Properties LP | | | 3.125 | % | | 9/1/2026 | | | 1,206 | | | | 1,135,174 | |
| VEREIT Operating Partnership LP | | | 4.60 | % | | 2/6/2024 | | | 730 | | | | 737,300 | |
| VEREIT Operating Partnership LP | | | 4.875 | % | | 6/1/2026 | | | 1,025 | | | | 1,042,015 | |
| Total | | | | | | | | | | | | | 11,306,972 | |
| | | | | | | | | | | | | | | |
| Recreation & Travel 0.33% | | | | | | | | | | | | | | |
| Royal Caribbean Cruises Ltd. | | | 7.50 | % | | 10/15/2027 | | | 2,950 | | | | 3,495,750 | |
| | | | | | | | | | | | | | | |
| Restaurants 0.71% | | | | | | | | | | | | | | |
| Arcos Dorados Holdings, Inc. (Uruguay)†(b) | | | 6.625 | % | | 9/27/2023 | | | 1,080 | | | | 1,112,400 | |
| KFC Holding Co./Pizza Hut Holdings LLC/Taco Bell of America LLC† | | | 5.00 | % | | 6/1/2024 | | | 1,515 | | | | 1,550,981 | |
| McDonald’s Corp. | | | 3.70 | % | | 1/30/2026 | | | 835 | | | | 851,704 | |
| McDonald’s Corp. | | | 4.60 | % | | 5/26/2045 | | | 1,012 | | | | 1,049,098 | |
| McDonald’s Corp. | | | 4.875 | % | | 12/9/2045 | | | 879 | | | | 945,194 | |
| PF Chang’s China Bistro, Inc.† | | | 10.25 | % | | 6/30/2020 | | | 1,093 | | | | 1,073,873 | |
| Seminole Hard Rock Entertainment, Inc./Seminole Hard Rock International LLC† | | | 5.875 | % | | 5/15/2021 | | | 975 | | | | 970,125 | |
| Total | | | | | | | | | | | | | 7,553,375 | |
| | See Notes to Financial Statements. | 33 |
Schedule of Investments (continued)
December 31, 2016
| Investments | | | Interest
Rate | | | Maturity
Date | | Principal
Amount
(000) | | | Fair
Value | |
| Software/Services 1.76% | | | | | | | | | | | | | | |
| Alibaba Group Holding Ltd. (China)(b) | | | 3.125% | | | 11/28/2021 | | $ | 2,150 | | | $ | 2,152,356 | |
| Camelot Finance SA (Luxembourg)†(b) | | | 7.875% | | | 10/15/2024 | | | 923 | | | | 957,613 | |
| First Data Corp.† | | | 7.00% | | | 12/1/2023 | | | 2,996 | | | | 3,198,230 | |
| Hewlett Packard Enterprise Co. | | | 6.35% | | | 10/15/2045 | | | 1,518 | | | | 1,538,382 | |
| Microsoft Corp. | | | 3.70% | | | 8/8/2046 | | | 522 | | | | 492,737 | |
| Microsoft Corp. | | | 4.00% | | | 2/12/2055 | | | 3,175 | | | | 3,011,411 | |
| MSCI, Inc.† | | | 5.75% | | | 8/15/2025 | | | 961 | | | | 1,025,868 | |
| Oracle Corp. | | | 4.375% | | | 5/15/2055 | | | 2,047 | | | | 2,041,637 | |
| Priceline Group, Inc. (The) | | | 3.60% | | | 6/1/2026 | | | 1,015 | | | | 1,005,826 | |
| Solera LLC/Solera Finance, Inc.† | | | 10.50% | | | 3/1/2024 | | | 1,010 | | | | 1,141,300 | |
| VeriSign, Inc. | | | 4.625% | | | 5/1/2023 | | | 872 | | | | 885,080 | |
| VeriSign, Inc. | | | 5.25% | | | 4/1/2025 | | | 741 | | | | 763,230 | |
| Visa, Inc. | | | 4.30% | | | 12/14/2045 | | | 477 | | | | 504,741 | |
| Total | | | | | | | | | | | | | 18,718,411 | |
| | | | | | | | | | | | | | | |
| Specialty Retail 0.69% | | | | | | | | | | | | | | |
| Brookstone Holdings Corp. PIK | | | 10.00% | | | 7/7/2021 | | | 40 | | | | 6,394 | |
| Hot Topic, Inc.† | | | 9.25% | | | 6/15/2021 | | | 1,017 | | | | 1,075,478 | |
| Midas Intermediate Holdco II LLC/Midas Intermediate Holdco II Finance, Inc.† | | | 7.875% | | | 10/1/2022 | | | 1,475 | | | | 1,530,312 | |
| Neiman Marcus Group Ltd. LLC† | | | 8.00% | | | 10/15/2021 | | | 1,432 | | | | 1,070,420 | |
| PetSmart, Inc.† | | | 7.125% | | | 3/15/2023 | | | 2,950 | | | | 3,016,375 | |
| Ritchie Bros Auctioneers, Inc. (Canada)†(b) | | | 5.375% | | | 1/15/2025 | | | 630 | | | | 644,175 | |
| Total | | | | | | | | | | | | | 7,343,154 | |
| | | | | | | | | | | | | | | |
| Steel Producers/Products 0.81% | | | | | | | | | | | | | | |
| ArcelorMittal (Luxembourg)(b) | | | 6.125% | | | 6/1/2025 | | | 1,508 | | | | 1,658,800 | |
| Gerdau Trade, Inc.† | | | 4.75% | | | 4/15/2023 | | | 350 | | | | 336,000 | |
| GTL Trade Finance, Inc.† | | | 5.893% | | | 4/29/2024 | | | 1,850 | | | | 1,850,000 | |
| Joseph T Ryerson & Son, Inc.† | | | 11.00% | | | 5/15/2022 | | | 1,082 | | | | 1,192,905 | |
| Steel Dynamics, Inc.† | | | 5.00% | | | 12/15/2026 | | | 502 | | | | 501,372 | |
| Steel Dynamics, Inc. | | | 5.50% | | | 10/1/2024 | | | 732 | | | | 777,750 | |
| U.S. Steel Corp. | | | 6.875% | | | 4/1/2021 | | | 135 | | | | 137,025 | |
| U.S. Steel Corp. | | | 7.50% | | | 3/15/2022 | | | 289 | | | | 299,838 | |
| U.S. Steel Corp.† | | | 8.375% | | | 7/1/2021 | | | 1,009 | | | | 1,118,002 | |
| Zekelman Industries, Inc.† | | | 9.875% | | | 6/15/2023 | | | 632 | | | | 709,420 | |
| Total | | | | | | | | | | | | | 8,581,112 | |
| 34 | See Notes to Financial Statements. | |
Schedule of Investments (continued)
December 31, 2016
| Investments | | | Interest
Rate | | | Maturity
Date | | Principal
Amount
(000) | | | Fair
Value | |
| Support: Services 1.22% | | | | | | | | | | | | | | |
| AECOM | | | 5.875% | | | 10/15/2024 | | $ | 999 | | | $ | 1,071,537 | |
| BakerCorp International, Inc. | | | 8.25% | | | 6/1/2019 | | | 507 | | | | 430,950 | |
| BlueLine Rental Finance Corp.† | | | 7.00% | | | 2/1/2019 | | | 1,097 | | | | 1,075,060 | |
| Cleveland Clinic Foundation (The) | | | 4.858% | | | 1/1/2114 | | | 1,100 | | | | 1,046,488 | |
| Jurassic Holdings III, Inc.† | | | 6.875% | | | 2/15/2021 | | | 1,550 | | | | 1,278,750 | |
| Leidos Holdings, Inc. | | | 4.45% | | | 12/1/2020 | | | 450 | | | | 465,795 | |
| Metropolitan Museum of Art (The) | | | 3.40% | | | 7/1/2045 | | | 1,350 | | | | 1,234,522 | |
| Monitronics International, Inc. | | | 9.125% | | | 4/1/2020 | | | 1,185 | | | | 1,122,788 | |
| NES Rentals Holdings, Inc.† | | | 7.875% | | | 5/1/2018 | | | 700 | | | | 700,000 | |
| Sotheby’s† | | | 5.25% | | | 10/1/2022 | | | 837 | | | | 826,538 | |
| Total System Services, Inc. | | | 4.80% | | | 4/1/2026 | | | 1,311 | | | | 1,415,226 | |
| United Rentals North America, Inc. | | | 5.875% | | | 9/15/2026 | | | 755 | | | | 780,481 | |
| United Rentals North America, Inc. | | | 6.125% | | | 6/15/2023 | | | 1,477 | | | | 1,573,005 | |
| Total | | | | | | | | | | | | | 13,021,140 | |
| | | | | | | | | | | | | | | |
| Technology Hardware & Equipment 1.10% | | | | | | | | | | | | | | |
| CDW LLC/CDW Finance Corp. | | | 5.50% | | | 12/1/2024 | | | 1,425 | | | | 1,464,187 | |
| CommScope Technologies Finance LLC† | | | 6.00% | | | 6/15/2025 | | | 2,852 | | | | 3,037,380 | |
| Diamond 1 Finance Corp./Diamond 2 Finance Corp.† | | | 4.42% | | | 6/15/2021 | | | 1,015 | | | | 1,051,305 | |
| Diamond 1 Finance Corp./Diamond 2 Finance Corp.† | | | 5.875% | | | 6/15/2021 | | | 2,614 | | | | 2,782,070 | |
| Diamond 1 Finance Corp./Diamond 2 Finance Corp.† | | | 7.125% | | | 6/15/2024 | | | 3,080 | | | | 3,421,270 | |
| Total | | | | | | | | | | | | | 11,756,212 | |
| | | | | | | | | | | | | | | |
| Telecommunications: Satellite 0.05% | | | | | | | | | | | | | | |
| Intelsat Connect Finance SA (Luxembourg)†(b) | | | 12.50% | | | 4/1/2022 | | | 688 | | | | 426,622 | |
| Intelsat Jackson Holdings SA (Luxembourg)(b) | | | 7.25% | | | 4/1/2019 | | | 136 | | | | 114,920 | |
| Total | | | | | | | | | | | | | 541,542 | |
| | | | | | | | | | | | | | | |
| Telecommunications: Wireless 2.70% | | | | | | | | | | | | | | |
| Comcel Trust via Comunicaciones Celulares SA† | | | 6.875% | | | 2/6/2024 | | | 2,125 | | | | 2,151,562 | |
| GTH Finance BV (Netherlands)†(b) | | | 7.25% | | | 4/26/2023 | | | 1,939 | | | | 2,085,839 | |
| SBA Communications Corp. | | | 4.875% | | | 7/15/2022 | | | 900 | | | | 915,750 | |
| Sprint Corp. | | | 7.125% | | | 6/15/2024 | | | 1,215 | | | | 1,254,488 | |
| Sprint Corp. | | | 7.625% | | | 2/15/2025 | | | 3,361 | | | | 3,541,654 | |
| Sprint Corp. | | | 7.875% | | | 9/15/2023 | | | 534 | | | | 571,380 | |
| T-Mobile USA, Inc. | | | 6.50% | | | 1/15/2024 | | | 9,137 | | | | 9,822,275 | |
| T-Mobile USA, Inc. | | | 6.50% | | | 1/15/2026 | | | 1,978 | | | | 2,143,657 | |
| T-Mobile USA, Inc. | | | 6.625% | | | 4/1/2023 | | | 2,750 | | | | 2,921,875 | |
| T-Mobile USA, Inc. | | | 6.836% | | | 4/28/2023 | | | 103 | | | | 110,596 | |
| Telefonica Celular del Paraguay SA (Paraguay)†(b) | | | 6.75% | | | 12/13/2022 | | | 635 | | | | 649,288 | |
| | See Notes to Financial Statements. | 35 |
Schedule of Investments (continued)
December 31, 2016
| Investments | | | Interest
Rate | | | Maturity
Date | | Principal
Amount
(000) | | | Fair
Value | |
| Telecommunications: Wireless (continued) | | | | | | | | | | | | |
| Wind Acquisition Finance SA (Italy)†(b) | | | 7.375% | | | 4/23/2021 | | $ | 2,550 | | | $ | 2,658,375 | |
| Total | | | | | | | | | | | | | 28,826,739 | |
| | | | | | | | | | | | | | | |
| Telecommunications: Wireline Integrated & Services 2.01% | | | | | | | | | | | | | | |
| Columbus Cable Barbados Ltd. (Barbados)†(b) | | | 7.375% | | | 3/30/2021 | | | 1,366 | | | | 1,458,738 | |
| Communications Sales & Leasing, Inc./ CSL Capital LLC | | | 8.25% | | | 10/15/2023 | | | 959 | | | | 1,021,335 | |
| Consolidated Communications, Inc. | | | 6.50% | | | 10/1/2022 | | | 845 | | | | 842,887 | |
| Equinix, Inc. | | | 5.375% | | | 4/1/2023 | | | 785 | | | | 818,363 | |
| Equinix, Inc. | | | 5.875% | | | 1/15/2026 | | | 5,121 | | | | 5,402,655 | |
| Frontier Communications Corp. | | | 9.25% | | | 7/1/2021 | | | 1,925 | | | | 2,028,469 | |
| Frontier Communications Corp. | | | 11.00% | | | 9/15/2025 | | | 1,917 | | | | 1,986,491 | |
| GCI, Inc. | | | 6.875% | | | 4/15/2025 | | | 1,480 | | | | 1,509,600 | |
| IHS Netherlands Holdco BV (Netherlands)†(b) | | | 9.50% | | | 10/27/2021 | | | 2,400 | | | | 2,462,693 | |
| Sable International Finance Ltd.† | | | 6.875% | | | 8/1/2022 | | | 1,465 | | | | 1,530,925 | |
| Windstream Services LLC | | | 7.75% | | | 10/1/2021 | | | 550 | | | | 568,150 | |
| Zayo Group LLC/Zayo Capital, Inc. | | | 6.00% | | | 4/1/2023 | | | 1,729 | | | | 1,806,805 | |
| Total | | | | | | | | | | | | | 21,437,111 | |
| | | | | | | | | | | | | | | |
| Theaters & Entertainment 0.07% | | | | | | | | | | | | | | |
| AMC Entertainment Holdings, Inc.† | | | 5.875% | | | 11/15/2026 | | | 750 | | | | 768,750 | |
| | | | | | | | | | | | | | | |
| Transportation: Infrastructure/Services 0.52% | | | | | | | | | | | | | | |
| Autoridad del Canal de Panama (Panama)†(b) | | | 4.95% | | | 7/29/2035 | | | 1,000 | | | | 1,060,000 | |
| Delhi International Airport Pvt Ltd. (India)†(b) | | | 6.125% | | | 10/31/2026 | | | 1,506 | | | | 1,560,272 | |
| DP World Ltd. (United Arab Emirates)†(b) | | | 6.85% | | | 7/2/2037 | | | 1,030 | | | | 1,103,105 | |
| Mexico City Airport Trust (Mexico)†(b) | | | 5.50% | | | 10/31/2046 | | | 1,200 | | | | 1,083,000 | |
| Stena AB (Sweden)†(b) | | | 7.00% | | | 2/1/2024 | | | 877 | | | | 781,100 | |
| Total | | | | | | | | | | | | | 5,587,477 | |
| | | | | | | | | | | | | | | |
| Trucking & Delivery 0.13% | | | | | | | | | | | | | | |
| FedEx Corp. | | | 4.55% | | | 4/1/2046 | | | 1,361 | | | | 1,376,994 | |
| Total High Yield Corporate Bonds (cost $741,432,174) | | | | | | | | | | | | | 767,268,128 | |
| | | | | | | | | | | | | | | |
| MUNICIPAL BOND 0.32% | | | | | | | | | | | | | | |
| | | | | | | | | | | | | | | |
| Other | | | | | | | | | | | | | | |
New York City Indus Dev Agy†
(cost $3,606,198) | | | | | | | | | 2,500 | | | | 3,434,750 | |
| 36 | See Notes to Financial Statements. | |
Schedule of Investments (continued)
December 31, 2016
| Investments | | | Interest
Rate | | | Maturity
Date | | Principal
Amount
(000) | | | Fair
Value | |
| NON-AGENCY COMMERCIAL MORTGAGE-BACKED SECURITIES 0.42% | | | | | | | | | | | |
| Citigroup Commercial Mortgage Trust 2015-101A D† | | | 4.625% | # | | 1/14/2043 | | $ | 775 | | | $ | 687,537 | |
| Commercial Mortgage Pass-Through Certificates 2014-UBS5 C | | | 4.613% | # | | 9/10/2047 | | | 610 | | | | 608,559 | |
| Commercial Mortgage Pass-Through Certificates 2015-PC1 D | | | 4.443% | # | | 7/10/2050 | | | 1,237 | | | | 903,828 | |
| Impact Funding Affordable Multifamily Housing Mortgage Loan Trust 2010-1 B† | | | 6.00% | # | | 1/25/2051 | | | 775 | | | | 784,552 | |
| Impact Funding Affordable Multifamily Housing Mortgage Loan Trust 2010-1 C† | | | 6.374% | # | | 1/25/2051 | | | 750 | | | | 718,976 | |
| Impact Funding Affordable Multifamily Housing Mortgage Loan Trust 2014-1A XB IO† | | | 0.342% | # | | 8/25/2047 | | | 2,000 | | | | 63,006 | |
| Morgan Stanley Bank of America Merrill Lynch Trust 2014-C19 LNC4† | | | 4.75% | | | 12/15/2046 | | | 750 | | | | 671,970 | |
Total Non-Agency Commercial Mortgage-Backed Securities
(cost $4,980,509) | | | | | | | | | | | | | 4,438,428 | |
| | | | | | | | | | | | | | | |
| | | | Dividend | | | | | | Shares | | | | | |
| | | | Rate | | | | | | (000) | | | | | |
| | | | | | | | | | | | | | | |
| PREFERRED STOCK 0.05% | | | | | | | | | | | | | | |
| | | | | | | | | | | | | | | |
| Energy: Exploration & Production | | | | | | | | | | | | | | |
Templar Energy LLC
(cost $379,030) | | | Zero Coupon | | | | | | 38 | | | | 568,545 | |
| Total Long-Term Investments (cost $996,387,820) | | | | | | | | | | | | | 1,040,235,509 | |
| | See Notes to Financial Statements. | 37 |
Schedule of Investments (continued)
December 31, 2016
| Investments | | | Interest
Rate | | | Maturity
Date | | Principal
Amount
(000) | | Fair
Value | |
| SHORT-TERM INVESTMENTS 1.26% | | | | | | | | | | | | | |
| | | | | | | | | | | | | | |
| HIGH YIELD CORPORATE BOND 0.09% | | | | | | | | | | | | | |
| | | | | | | | | | | | | | |
| Gaming | | | | | | | | | | | | | |
Caesars Entertainment Operating Co., Inc.(f)
(cost $989,364) | | | 11.25% | | | 6/1/2017 | | $ | 948 | | | $ | 968,847 | |
| | | | | | | | | | | | | | |
| REPURCHASE AGREEMENT 1.17% | | | | | | | | | | | | | |
Repurchase Agreement dated 12/30/2016, 0.03% due 1/3/2017 with Fixed Income Clearing Corp. collateralized by $11,990,000 of U.S. Treasury Inflation Indexed Note at 0.125% due 4/15/2017; value: $ 12,787,059; proceeds: $ 12,535,625
(cost $12,535,583) | | | | | | | | | 12,536 | | | | 12,535,583 | |
| Total Short-Term Investments (cost $13,524,947) | | | | | | | | | | | | | 13,504,430 | |
| Total Investments in Securities 98.79% (cost $1,009,912,767) | | | | | | | | | | | | | 1,053,739,939 | |
| Cash and Other Assets in Excess of Liabilities(g) 1.21% | | | | | | | | | | | | | 12,892,864 | |
| Net Assets 100.00% | | | | | | | | | | | | $ | 1,066,632,803 | |
| AUD | | Australian dollar. |
| CAD | | Canadian dollar. |
| EUR | | euro. |
| GBP | | British pound. |
| MXN | | Mexican peso. |
| RUB | | Russian ruble. |
| ADR | | American Depositary Receipt. |
| IO | | Interest Only. |
| PIK | | Payment-in-kind. |
| † | | Security was purchased pursuant to Rule 144A under the Securities Act of 1933 and, unless registered under such Act or exempted from registration, may only be resold to qualified institutional buyers. |
| # | | Variable rate security. The interest rate represents the rate in effect at December 31, 2016. |
| * | | Non-income producing security. |
| (a) | | Investment in non-U.S. dollar denominated securities. |
| (b) | | Foreign security traded in U.S. dollars. |
| (c) | | Floating Rate Loans in which the Fund invests generally pay interest at rates which are periodically re-determined at a margin above the London Interbank Offered Rate (“LIBOR”) or the prime rate offered by major U.S. banks. The rate(s) shown is the rate(s) in effect at December 31, 2016. |
| (d) | | Interest rate to be determined. |
| (e) | | Security is perpetual in nature and has no stated maturity. |
| (f) | | Defaulted (non-income producing security). |
| (g) | | Cash and Other Assets in Excess of Liabilities include net unrealized appreciation/depreciation on open forward foreign currency exchange contracts, futures contracts and swaps as follows: |
| 38 | See Notes to Financial Statements. | |
Schedule of Investments (continued)
December 31, 2016
Centrally Cleared Credit Default Swaps on Indexes - Buy Protection at December 31, 2016(1):
| Referenced | | Fund | | Termination | | Notional | | Fair | | Payments | | Unrealized |
| Index* | | Pays | | Date | | Amount | | Value(2) | | Upfront(3) | | Depreciation(4) |
| Markit CDX. | | | | | | | | | | | | |
| NA.EM.26(5) | | 1.00% | | 12/20/2021 | | $29,269,000 | | $31,106,409 | | $2,254,034 | | $(416,625) |
| * | | The Referenced Index is for the Credit Default Swaps on Indexes, which is comprised of a basket of emerging markets sovereign issuers. (See Note 2(l)). |
| (1) | | If the Fund is a buyer of protection and a credit event occurs, as defined under the terms of that particular swap agreement, the Fund will either (i) receive from the seller of protection an amount equal to the notional amount of the swap and make delivery of the referenced obligation or underlying securities comprising the referenced index or (ii) pay a net settlement amount in the form of cash or securities equal to the notional amount of the swap less the recovery value of the referenced obligation or underlying securities. |
| (2) | | Fair value serves as the indicator of the current status of payment/performance risk. |
| (3) | | Upfront payments received by Central Clearinghouse are presented net of amortization (See Note 2(l)). |
| (4) | | Total unrealized appreciation on Credit Default Swaps on Indexes amounted to $0. Total unrealized depreciation on Credit Default Swaps on Indexes amounted to $416,625. |
| (5) | | Central Clearinghouse: Credit Suisse. |
| Forward | | | | | | | | | | | | | | | | | | |
| Foreign | | | | | | | | | | | U.S. $ | | | | | | | |
| Currency | | | | | | | | | | | Cost on | | | U.S. $ | | | | |
| Exchange | | Transaction | | | | Expiration | | Foreign | | | Origination | | | Current | | | Unrealized | |
| Contracts | | Type | | Counterparty | | Date | | Currency | | | Date | | | Value | | | Appreciation | |
| British pound | | Buy | | State Street Bank and Trust | | 1/19/2017 | | | 220,000 | | | $ | 270,374 | | | $ | 271,251 | | | | $ | 877 | |
| British pound | | Sell | | J.P. Morgan | | 1/19/2017 | | | 570,000 | | | | 716,156 | | | | 702,787 | | | | 13,369 | |
| British pound | | Sell | | J.P. Morgan | | 1/19/2017 | | | 100,000 | | | | 124,486 | | | | 123,296 | | | | 1,190 | |
| British pound | | Sell | | State Street Bank and Trust | | 1/19/2017 | | | 361,000 | | | | 451,958 | | | | 445,099 | | | | 6,859 | |
| British pound | | Sell | | State Street Bank and Trust | | 1/19/2017 | | | 40,000 | | | | 49,843 | | | | 49,318 | | | | 525 | |
| euro | | Sell | | J.P. Morgan | | 2/16/2017 | | | 775,000 | | | | 820,051 | | | | 817,526 | | | | 2,525 | |
| euro | | Sell | | Morgan Stanley | | 2/16/2017 | | | 1,030,000 | | | | 1,100,848 | | | | 1,086,518 | | | | 14,330 | |
| euro | | Sell | | Standard Chartered Bank | | 2/16/2017 | | | 6,780,000 | | | | 7,300,575 | | | | 7,152,033 | | | | 148,542 | |
| euro | | Sell | | State Street Bank and Trust | | 2/16/2017 | | | 89,000 | | | | 94,683 | | | | 93,884 | | | | | 799 | |
| Unrealized Appreciation on Forward Foreign Currency Exchange Contracts | | | | | | | | | | | $ | 189,016 | |
| Forward | | | | | | | | | | | | | | | | | | |
| Foreign | | | | | | | | | | | U.S. $ | | | | | | | |
| Currency | | | | | | | | | | | Cost on | | | U.S. $ | | | | |
| Exchange | | Transaction | | | | Expiration | | Foreign | | | Origination | | | Current | | | Unrealized | |
| Contracts | | Type | | Counterparty | | Date | | Currency | | | Date | | | Value | | | Depreciation | |
| euro | | Buy | | Standard Chartered Bank | | 2/16/2017 | | | 935,000 | | | $ | 1,000,258 | | | $ | 986,305 | | | | $ | (13,953 | ) |
| euro | | Buy | | Standard Chartered Bank | | 2/16/2017 | | | 650,000 | | | | 693,945 | | | | 685,667 | | | | (8,278 | ) |
| euro | | Buy | | State Street Bank and Trust | | 2/16/2017 | | | 320,000 | | | | 343,098 | | | | 337,559 | | | | (5,539 | ) |
| British pound | | Sell | | J.P. Morgan | | 1/19/2017 | | | 3,045,000 | | | | 3,710,347 | | | | 3,754,365 | | | | | (44,018 | ) |
| Unrealized Depreciation on Forward Foreign Currency Exchange Contracts | | | | | | | | | | | | $ | (71,788 | ) |
| | See Notes to Financial Statements. | 39 |
Schedule of Investments (continued)
December 31, 2016
| Open Futures Contracts at December 31, 2016: | | | | | | | | | | |
| | | | | | | | | Notional | | | Unrealized | |
| Type | | Expiration | | Contracts | | Position | | Value | | | Appreciation | |
| Long U.S. Treasury Bond | | March 2017 | | 512 | | Short | | | $ | (77,136,000 | ) | | | $ | 835,383 | |
| U.S. 10-Year Treasury Note | | March 2017 | | 682 | | Short | | | | (84,759,813 | ) | | | | 452,144 | |
| Totals | | | | | | | | | $ | (161,895,813 | ) | | | $ | 1,287,527 | |
| | | | | | | | | | Notional | | | | Unrealized | |
| Type | | Expiration | | Contracts | | Position | | | Value | | | | Depreciation | |
| U.S. 5-Year Treasury Note | | March 2017 | | 805 | | Long | | | | $94,719,571 | | | | | $(152,384 | ) |
| 40 | See Notes to Financial Statements. | |
Schedule of Investments (continued)
December 31, 2016
The following is a summary of the inputs used as of December 31, 2016 in valuing the Fund’s investments carried at fair value(1):
| Investment Type(2) | | Level 1 | | | Level 2 | | | Level 3 | | | Total |
| Asset-Backed Securities | | | | | | | | | | | | | | | | |
| Other | | $ | – | | | $ | 16,718,333 | | | | $1,057,410 | (3) | | $ | 17,775,743 | |
| Remaining Industries | | | – | | | | 3,958,132 | | | | – | | | | 3,958,132 | |
| Common Stocks | | | | | | | | | | | | | | | | |
| Auto Parts & Equipment | | | 2,099,278 | | | | 1,754,512 | | | | – | | | | 3,853,790 | |
| Energy: Exploration & Production | | | 5,326,036 | | | | 346,644 | | | | – | | | | 5,672,680 | |
| Metals/Mining (Excluding Steel) | | | 6,705,303 | | | | – | | | | 18,476 | (4) | | | 6,723,779 | |
| Remaining Industries(5) | | | 125,463,725 | | | | – | | | | – | | | | 125,463,725 | |
| Convertible Bonds | | | – | | | | 3,148,911 | | | | – | | | | 3,148,911 | |
| Convertible Preferred Stocks | | | – | | | | 1,438,540 | | | | – | | | | 1,438,540 | |
| Floating Rate Loans(6) | | | | | | | | | | | | | | | | |
| Auto Parts & Equipment | | | – | | | | – | | | | 765,335 | | | | 765,335 | |
| Department Stores | | | – | | | | 1,064,977 | | | | – | | | | 1,064,977 | |
| Diversified Capital Goods | | | – | | | | 1,091,674 | | | | – | | | | 1,091,674 | |
| Electric: Generation | | | – | | | | 4,184,349 | | | | – | | | | 4,184,349 | |
| Energy: Exploration & Production | | | – | | | | 6,208,785 | | | | – | | | | 6,208,785 | |
| Food: Wholesale | | | – | | | | 2,607,577 | | | | – | | | | 2,607,577 | |
| Gaming | | | – | | | | 4,689,017 | | | | – | | | | 4,689,017 | |
| Health Services | | | – | | | | 1,072,587 | | | | – | | | | 1,072,587 | |
| Media: Diversified | | | – | | | | 1,140,902 | | | | – | | | | 1,140,902 | |
| Metals/Mining (Excluding Steel) | | | – | | | | 3,171,644 | | | | – | | | | 3,171,644 | |
| Oil Field Equipment & Services | | | – | | | | 2,509,995 | | | | – | | | | 2,509,995 | |
| Personal & Household Products | | | – | | | | 2,631,254 | | | | – | | | | 2,631,254 | |
| Recreation & Travel | | | – | | | | 1,055,450 | | | | – | | | | 1,055,450 | |
| Specialty Retail | | | – | | | | 3,929,907 | | | | – | | | | 3,929,907 | |
| Support: Services | | | – | | | | 7,600,432 | | | | – | | | | 7,600,432 | |
| Telecommunications: Wireline Integrated & Services | | | – | | | | 942,444 | | | | – | | | | 942,444 | |
| Trucking & Delivery | | | – | | | | 1,051,134 | | | | – | | | | 1,051,134 | |
| Foreign Bonds | | | – | | | | 4,789,038 | | | | – | | | | 4,789,038 | |
| Foreign Government Obligations | | | – | | | | 45,983,857 | | | | – | | | | 45,983,857 | |
| High Yield Corporate Bonds | | | | | | | | | | | | | | | | |
| Banking | | | – | | | | 69,467,350 | | | | 125 | (4) | | | 69,467,475 | |
| Metals/Mining (Excluding Steel) | | | – | | | | 47,158,933 | | | | 2 | (4) | | | 47,158,935 | |
| Specialty Retail | | | – | | | | 7,336,760 | | | | 6,394 | (3) | | | 7,343,154 | |
| Remaining Industries | | | – | | | | 644,267,411 | | | | – | | | | 644,267,411 | |
| Municipal Bond | | | – | | | | 3,434,750 | | | | – | | | | 3,434,750 | |
| Non-Agency Commercial Mortgage-Backed Securities | | | – | | | | 4,375,422 | | | | 63,006 | (3) | | | 4,438,428 | |
| Preferred Stock | | | – | | | | 568,545 | | | | – | | | | 568,545 | |
| Repurchase Agreement | | | – | | | | 12,535,583 | | | | – | | | | 12,535,583 | |
| Total | | $ | 139,594,342 | | | $ | 912,234,849 | | | | $1,910,748 | | | $ | 1,053,739,939 | |
| | See Notes to Financial Statements. | 41 |
Schedule of Investments (concluded)
December 31, 2016
| Investment Type(2) | | Level 1 | | | Level 2 | | | Level 3 | | | Total |
| Other Financial Instruments | | | | | | | | | | | | | | | | |
| Credit Default Swap | | | | | | | | | | | | | | | | |
| Assets | | $ | – | | | $ | 1,837,409 | | | $ | – | | | $ | 1,837,409 | |
| Liabilities | | | – | | | | – | | | | – | | | | – | |
| Forward Foreign Currency Exchange Contracts | | | | | | | | | | | | | | | | |
| Assets | | | – | | | | 189,016 | | | | – | | | | 189,016 | |
| Liabilities | | | – | | | | (71,788 | ) | | | – | | | | (71,788 | ) |
| Futures Contracts | | | | | | | | | | | | | | | | |
| Assets | | | 1,287,527 | | | | – | | | | – | | | | 1,287,527 | |
| Liabilities | | | (152,384 | ) | | | – | | | | – | | | | (152,384 | ) |
| Total | | $ | 1,135,143 | | | $ | 1,954,637 | | | $ | – | | | $ | 3,089,780 | |
| | (1) | Refer to Note 2(n) for a description of fair value measurements and the three-tier hierarchy of inputs. |
| | (2) | See Schedule of Investments for fair values in each industry and identification of foreign issuers and/or geography. The table above is presented by Investment Type. Industries are presented within an Investment Type should such Investment Type include securities classified as two or more levels within the three-tier fair value hierarchy. |
| | (3) | Includes securities valued using third party pricing information without adjustment. Such valuations are based on unobservable inputs. A significant change in third party information could result in a significantly lower or higher value of such Level 3 investments. |
| | (4) | Level 3 securities fair valued by the Pricing Committee, as described in Note 2(a) in the Notes to Financials. |
| | (5) | As of December 31, 2016, Moncler SpA. was categorized as level 1 due to an active market quoted price. For the period ended December 31, 2016, the total amount transferred from Level 2 to Level 1 was $899,705. |
| | (6) | Floating Rate Loans categorized as Level 3 are valued based on a single quotation obtained from a dealer. Accounting principles generally accepted in the United States of America do not require the Fund to create quantitative unobservable inputs that were not developed by the Fund. Therefore, the Fund does not have access to unobservable inputs and cannot disclose such inputs in the valuation. |
The following is a reconciliation of investments with unobservable inputs (Level 3) that were used in determining fair value:
| | | | | | | | | | | | | | | Non-Agency | |
| | | | | | | | | | | | High Yield | | | Commercial | |
| | | Asset-Backed | | | Common | | | Floating | | | Corporate | | | Mortgage-Backed | |
| Investment Type | | Securities | | | Stock | | | Rate Loans | | | Bond | | | Securities | |
| Balance as of January 1, 2016 | | $ | – | | | $ | 18,657 | | | $ | 2,399,345 | | | $ | 1,958,224 | | | $ | 959,647 | |
| Accrued discounts/premiums | | | 4 | | | | – | | | | (3,094 | ) | | | | | | | (1,928 | ) |
| Realized gain (loss) | | | – | | | | – | | | | (92 | ) | | | – | | | | (110,537 | ) |
| Change in unrealized appreciation/depreciation | | | (5,441 | ) | | | (181 | ) | | | 6,994 | | | | (22,660 | ) | | | 100,746 | |
| Purchases | | | 1,062,847 | | | | – | | | | – | | | | 3,894 | | | | – | |
| Sales | | | – | | | | – | | | | (7,693 | ) | | | – | | | | (884,922 | ) |
| Net transfers in or out of Level 3 | | | – | | | | – | | | | (1,630,125 | ) | | | (1,932,937 | ) | | | – | |
| Balance as of December 31, 2016 | | $ | 1,057,410 | | | $ | 18,476 | | | $ | 765,335 | | | $ | 6,521 | | | $ | 63,006 | |
| 42 | See Notes to Financial Statements. | |
Statement of Assets and Liabilities
December 31, 2016
| ASSETS: | | | | |
| Investments in securities, at fair value (cost $1,009,912,767) | | $ | 1,053,739,939 | |
| Cash | | | 392,586 | |
| Deposits with brokers for derivatives collateral | | | 1,853,864 | |
| Receivables: | | | | |
| Interest and dividends | | | 12,844,511 | |
| Investment securities sold | | | 3,537,102 | |
| Capital shares sold | | | 180,445 | |
| From advisor (See Note 3) | | | 29,610 | |
| Unrealized appreciation on forward foreign currency exchange contracts | | | 189,016 | |
| Credit default swap agreements receivable, at fair value (including upfront payments of $2,254,034) | | | 1,837,409 | |
| Prepaid expenses and other assets | | | 6,388 | |
| Total assets | | | 1,074,610,870 | |
| LIABILITIES: | | | | |
| Payables: | | | | |
| Investment securities purchased | | | 4,856,767 | |
| Capital shares reacquired | | | 1,138,015 | |
| Variation margin | | | 484,916 | |
| Management fee | | | 447,037 | |
| Directors’ fees | | | 133,148 | |
| Fund administration | | | 35,972 | |
| Unrealized depreciation on forward foreign currency exchange contracts | | | 71,788 | |
| Accrued expenses and other liabilities | | | 810,424 | |
| Total liabilities | | | 7,978,067 | |
| NET ASSETS | | $ | 1,066,632,803 | |
| COMPOSITION OF NET ASSETS: | | | | |
| Paid-in capital | | $ | 1,047,851,024 | |
| Distributions in excess of net investment income | | | (133,148 | ) |
| Accumulated net realized loss on investments, futures contracts, swaps and foreign currency related transactions | | | (25,744,376 | ) |
| Net unrealized appreciation on investments, futures contracts, swaps and translation of assets and liabilities denominated in foreign currencies | | | 44,659,303 | |
| Net Assets | | $ | 1,066,632,803 | |
| Outstanding shares (200 million shares of common stock authorized, $.001 par value) | | | 89,345,044 | |
| Net asset value, offering and redemption price per share (Net assets divided by outstanding shares) | | | $11.94 | |
| | | |
| | See Notes to Financial Statements. | 43 |
Statement of Operations
For the Year Ended December 31, 2016
| Investment income: | | | | |
| Dividends (net of foreign withholding taxes of $15,421) | | $ | 1,747,222 | |
| Interest and other (net of foreign withholding taxes of $580) | | | 52,385,357 | |
| Interest earned from Interfund Lending (See Note 11) | | | 253 | |
| Total investment income | | | 54,132,832 | |
| Expenses: | | | | |
| Management fee | | | 5,077,272 | |
| Non 12b-1 service fees | | | 2,546,891 | |
| Shareholder servicing | | | 1,098,832 | |
| Fund administration | | | 407,353 | |
| Reports to shareholders | | | 127,298 | |
| Directors’ fees | | | 35,243 | |
| Professional | | | 71,522 | |
| Custody | | | 53,251 | |
| Other | | | 75,105 | |
| Gross expenses | | | 9,492,767 | |
| Expense reductions (See Note 9) | | | (3,930 | ) |
| Fees waived and expenses reimbursed (See Note 3) | | | (323,404 | ) |
| Net expenses | | | 9,165,433 | |
| Net investment income | | | 44,967,399 | |
| Net realized and unrealized gain (loss): | | | | |
| Net realized loss on investments | | | (1,888,360 | ) |
| Net realized loss on futures contracts, swaps and foreign currency related transactions | | | (2,944,061 | ) |
| Net change in unrealized appreciation/depreciation on investments | | | 76,281,345 | |
| Net change in unrealized appreciation/depreciation on futures contracts, swaps and translation of assets and liabilities denominated in foreign currencies | | | 909,114 | |
| Net realized and unrealized gain | | | 72,358,038 | |
| Net Increase in Net Assets Resulting From Operations | | $ | 117,325,437 | |
| | |
| 44 | See Notes to Financial Statements. |
Statements of Changes in Net Assets
| | | For the Year Ended | | | For the Year Ended | |
| INCREASE IN NET ASSETS | | December 31, 2016 | | | December 31, 2015 | |
| Operations: | | | | | | | | | | |
| Net investment income | | | $ | 44,967,399 | | | | $ | 38,243,219 | |
| Net realized loss on investments, futures contracts, swaps and foreign currency related transactions | | | | (4,832,421 | ) | | | | (14,428,168 | ) |
| Net change in unrealized appreciation/depreciation on investments, futures contracts, swaps and translation of assets and liabilities denominated in foreign currencies | | | | 77,190,459 | | | | | (40,847,481 | ) |
| Net increase (decrease) in net assets resulting from operations | | | | 117,325,437 | | | | | (17,032,430 | ) |
| Distributions to shareholders from: | | | | | | | | | | |
| Net investment income | | | | (47,075,516 | ) | | | | (41,094,016 | ) |
| Net realized gain | | | | – | | | | | (6,306,282 | ) |
| Total distributions to shareholders | | | | (47,075,516 | ) | | | | (47,400,298 | ) |
| Capital share transactions (See Note 14): | | | | | | | | | | |
| Proceeds from sales of shares | | | | 148,838,089 | | | | | 322,164,243 | |
| Reinvestment of distributions | | | | 47,075,515 | | | | | 47,400,274 | |
| Cost of shares reacquired | | | | (177,659,555 | ) | | | | (240,111,353 | ) |
| Net increase in net assets resulting from capital share transactions | | | | 18,254,049 | | | | | 129,453,164 | |
| Net increase in net assets | | | | 88,503,970 | | | | | 65,020,436 | |
| NET ASSETS: | | | | | | | | | | |
| Beginning of year | | | $ | 978,128,833 | | | | $ | 913,108,397 | |
| End of year | | | $ | 1,066,632,803 | | | | $ | 978,128,833 | |
| Distributions in excess of net investment income | | | $ | (133,148 | ) | | | $ | (5,523 | ) |
| | | |
| | See Notes to Financial Statements. | 45 |
Financial Highlights
| | | | | Per Share Operating Performance: |
| | | | | | | | | | | | Distributions to |
| | | | | Investment operations: | | shareholders from: |
| | | | | | | |
| | | | | | | | Net | | Total | | | | | | |
| | | Net asset | | Net | | | realized | | from | | Net | | | | |
| | | value, | | invest- | | | and | | invest- | | invest- | | Net | | |
| | | beginning | | ment | | | unrealized | | ment | | ment | | realized | | Total |
| | | of period | | income(a) | | | gain (loss) | | operations | | income | | gain | | distributions |
| 12/31/2016 | | $11.14 | | $0.52 | | | | $ 0.83 | | | | $ 1.35 | | | $(0.55) | | | $ – | | | | $(0.55 | ) |
| 12/31/2015 | | 11.89 | | 0.47 | | | | (0.65 | ) | | | (0.18 | ) | | (0.49) | | | (0.08 | ) | | | (0.57 | ) |
| 12/31/2014 | | 12.31 | | 0.54 | | | | (0.01 | ) | | | 0.53 | | | (0.61) | | | (0.34 | ) | | | (0.95 | ) |
| 12/31/2013 | | 12.21 | | 0.62 | | | | 0.39 | | | | 1.01 | | | (0.65) | | | (0.26 | ) | | | (0.91 | ) |
| 12/31/2012 | | 11.64 | | 0.71 | | | | 0.74 | | | | 1.45 | | | (0.72) | | | (0.16 | ) | | | (0.88 | ) |
| | |
| (a) | Calculated using average shares outstanding during the period. |
| (b) | Total return does not consider the effects of sales charges or other expenses imposed by an insurance company and assumes the reinvestment of all distributions. |
| | |
| 46 | See Notes to Financial Statements. |
| | | | | Ratios to Average Net Assets: | | Supplemental Data: |
| | | | | | | | | | | | | |
| | | | | Total | | | | | | | | |
| | | | | expenses | | | | | | | | |
| | | | | after | | | | | | | | |
| Net | | | | waivers | | | | | | Net | | |
| asset | | | | and/or | | | | Net | | assets, | | Portfolio |
| value, | | Total | | reimburse- | | Total | | investment | | end of | | turnover |
| end of | | return | | ments | | expenses | | income | | period | | rate |
| period | | (%)(b) | | (%) | | (%) | | (%) | | (000) | | (%) |
| $11.94 | | | 12.13 | | | 0.90 | | 0.93 | | 4.41 | | | $1,066,633 | | | | 120.09 | |
| 11.14 | | | (1.53 | ) | | 0.90 | | 0.94 | | 3.91 | | | 978,129 | | | | 116.08 | |
| 11.89 | | | 4.35 | | | 0.90 | | 0.93 | | 4.26 | | | 913,108 | | | | 90.21 | |
| 12.31 | | | 8.17 | | | 0.90 | | 0.93 | | 4.89 | | | 861,130 | | | | 49.59 | |
| 12.21 | | | 12.53 | | | 0.90 | | 0.93 | | 5.68 | | | 773,725 | | | | 46.31 | |
| | | |
| | See Notes to Financial Statements. | 47 |
Notes to Financial Statements
Lord Abbett Series Fund, Inc. (the “Company”) is registered under the Investment Company Act of 1940, as amended (the “Act”), as a diversified, open-end management investment company and was incorporated under Maryland law in 1989. The Company consists of thirteen separate portfolios. This report covers Bond-Debenture Portfolio (the “Fund”).
The Fund’s investment objective is to seek high current income and the opportunity for capital appreciation to produce a high total return. The Fund has Variable Contract class shares (“Class VC Shares”), which are currently issued and redeemed only in connection with investments in, and payments under, variable annuity contracts and variable life insurance policies issued by life insurance and insurance-related companies.
The preparation of the financial statements in conformity with accounting principles generally accepted in the United States of America (“U.S. GAAP”) requires management to make certain estimates and assumptions that affect the reported amounts of assets and liabilities and disclosure of contingent assets and liabilities at the date of the financial statements and the reported amounts of increases and decreases in net assets from operations during the reporting period. Actual results could differ from those estimates. The Fund is considered an investment company under U.S. GAAP and follows the accounting and reporting guidance applicable to investment companies.
| 2. | SIGNIFICANT ACCOUNTING POLICIES |
| (a) | Investment Valuation–Under procedures approved by the Fund’s Board of Directors (the “Board”), Lord, Abbett & Co. LLC (“Lord Abbett”), the Fund’s investment manager, has formed a Pricing Committee to administer the pricing and valuation of portfolio investments and to ensure that prices utilized reasonably reflect fair value. Among other things, these procedures allow the Fund to utilize independent pricing services, quotations from securities and financial instrument dealers and other market sources to determine fair value. |
| | |
| | Securities actively traded on any recognized U.S. or non-U.S. exchange or on The NASDAQ Stock Market LLC are valued at the last sale price or official closing price on the exchange or system on which they are principally traded. Events occurring after the close of trading on non-U.S. exchanges may result in adjustments to the valuation of foreign securities to reflect their fair value as of the close of regular trading on the New York Stock Exchange. The Fund may utilize an independent fair valuation service in adjusting the valuations of foreign securities. Unlisted equity securities are valued at the last quoted sale price or, if no sale price is available, at the mean between the most recently quoted bid and asked prices. Fixed income securities are valued based on evaluated prices supplied by independent pricing services, which reflect broker/dealer supplied valuations and the independent pricing services’ own electronic data processing techniques. Exchange traded options and futures contracts are valued at the last sale price in the market where they are principally traded. If no sale has occurred, the mean between the most recently quoted bid and asked prices is used. Floating rate loans are valued at the average of bid and ask quotations obtained from dealers in loans on the basis of prices supplied by independent pricing services. Forward foreign currency exchange contracts are valued using daily forward exchange rates. Swaps are valued daily using independent pricing services or quotations from broker/dealers to the extent available. |
| | |
| | Securities for which prices are not readily available are valued at fair value as determined by the Pricing Committee. The Pricing Committee considers a number of factors, including |
48
Notes to Financial Statements (continued)
| | observable and unobservable inputs, when arriving at fair value. The Pricing Committee may use related or comparable assets or liabilities, recent transactions, market multiples, book values, yield curves, broker quotes, observable trading activity, option adjusted spread models and other relevant information to determine the fair value of portfolio investments. The Board or a designated committee thereof regularly reviews fair value determinations made by the Pricing Committee and employs techniques such as reviewing related market activity, reviewing inputs and assumptions, and retrospectively comparing prices of subsequent purchases and sales transactions to fair value determinations made by the Pricing Committee. |
| | |
| | Short-term securities with 60 days or less remaining to maturity are valued using the amortized cost method, which approximates fair value. |
| | |
| (b) | Security Transactions–Security transactions are recorded as of the date that the securities are purchased or sold (trade date). Realized gains and losses on sales of portfolio securities are calculated using the identified-cost method. |
| | |
| (c) | Investment Income–Dividend income is recorded on the ex-dividend date. Interest income is recorded on the accrual basis as earned. Discounts are accreted and premiums are amortized using the effective interest method and are included in Interest and other income on the Statement of Operations. Withholding taxes on foreign dividends have been provided for in accordance with the applicable country’s tax rules and rates. |
| | |
| (d) | Income Taxes–It is the policy of the Fund to meet the requirements of Subchapter M of the Internal Revenue Code applicable to regulated investment companies and to distribute substantially all taxable income and capital gains to its shareholders. Therefore, no income tax provision is required. |
| | |
| | The Fund files U.S. federal and various state and local tax returns. No income tax returns are currently under examination. The statute of limitations on the Fund’s filed U.S. federal tax returns remains open for the fiscal years ended December 31, 2013 through December 31, 2016. The statutes of limitations on the Company’s state and local tax returns may remain open for an additional year depending upon the jurisdiction. |
| | |
| (e) | Expenses–Expenses incurred by the Company that do not specifically relate to an individual fund are generally allocated to the funds within the Company on a pro rata basis by relative net assets. |
| | |
| (f) | Foreign Transactions–The books and records of the Fund are maintained in U.S. dollars and transactions denominated in foreign currencies are recorded in the Fund’s records at the rate prevailing when earned or recorded. Asset and liability accounts that are denominated in foreign currencies are adjusted daily to reflect current exchange rates and any unrealized gain (loss) is included in Net change in unrealized appreciation/depreciation on futures contracts, swaps and translation of assets and liabilities denominated in foreign currencies on the Fund’s Statement of Operations. The resultant exchange gains and losses upon settlement of such transactions are included in Net realized loss on futures contracts, swaps and foreign currency related transactions on the Fund’s Statement of Operations. The Fund does not isolate that portion of the results of operations arising as a result of changes in the foreign exchange rates from the changes in market prices of the securities. |
| | |
| | The Fund uses foreign currency exchange contracts to facilitate transactions in foreign-denominated securities. Losses from these transactions may arise from changes in the value of the foreign currency or if the counterparties do not perform under the contracts’ terms. |
49
Notes to Financial Statements (continued)
| (g) | Forward Foreign Currency Exchange Contracts–The Fund may enter into forward foreign currency exchange contracts in order to reduce exposure to changes in foreign currency exchange rates on foreign portfolio holdings, or gain or reduce exposure to foreign currency solely for investment purposes. A forward foreign currency exchange contract is a commitment to purchase or sell a foreign currency at a future date at a negotiated rate. The contracts are valued daily at forward exchange rates and any unrealized gain (loss) is included in Net change in unrealized appreciation/depreciation on futures contracts, swaps and translation of assets and liabilities denominated in foreign currencies on the Fund’s Statement of Operations. The gain (loss) arising from the difference between the U.S. dollar cost of the original contract and the value of the foreign currency in U.S. dollars upon closing of such contracts is included in Net realized loss on futures contracts, swaps and foreign currency related transactions on the Fund’s Statement of Operations. |
| | |
| (h) | Futures Contracts–The Fund may purchase and sell futures contracts to enhance returns, to attempt to economically hedge some of its investment risk, or as a substitute position in lieu of holding the underlying asset on which the instrument is based. At the time of entering into a futures transaction, an investor is required to deposit and maintain a specified amount of cash or eligible securities called “initial margin.” Subsequent payments made or received by the Fund called “variation margin” are made on a daily basis as the market price of the futures contract fluctuates. The Fund will record an unrealized gain (loss) based on the amount of variation margin. When a contract is closed, a realized gain (loss) is recorded equal to the difference between the opening and closing value of the contract. |
| | |
| (i) | When-Issued, Forward Transactions or To-Be-Announced (“TBA”) Transactions–The Fund may purchase portfolio securities on a when-issued or forward basis. When-issued, forward transactions or TBA transactions involve a commitment by a fund to purchase securities, with payment and delivery (“settlement”) to take place in the future, in order to secure what is considered to be an advantageous price or yield at the time of entering into the transaction. During the period between purchase and settlement, the fair value of the securities will fluctuate and assets consisting of cash and/or marketable securities (normally short-term U.S. Government or U.S. Government sponsored enterprise securities) marked to market daily in an amount sufficient to make payment at settlement will be segregated at the Fund’s custodian in order to pay for the commitment. At the time the Fund makes the commitment to purchase a security on a when-issued basis, it will record the transaction and reflect the liability for the purchase and fair value of the security in determining its net asset value (“NAV”). The Fund, generally, has the ability to close out a purchase obligation on or before the settlement date rather than take delivery of the security. Under no circumstances will settlement for such securities take place more than 120 days after the purchase date. |
| | |
| (j) | Repurchase Agreements–The Fund may enter into repurchase agreements with respect to securities. A repurchase agreement is a transaction in which a fund acquires a security and simultaneously commits to resell that security to the seller (a bank or securities dealer) at an agreed-upon price on an agreed-upon date. The Fund requires at all times that the repurchase agreement be collateralized by cash, or by securities of the U.S. Government, its agencies, its instrumentalities, or U.S. Government sponsored enterprises having a value equal to, or in excess of, the value of the repurchase agreement (including accrued interest). If the seller of the agreement defaults on its obligation to repurchase the underlying securities at a time when the fair value of these securities has declined, the Fund may incur a loss upon disposition of the securities. |
50
Notes to Financial Statements (continued)
| (k) | Reverse Repurchase Agreements–Each Fund may enter into reverse repurchase agreements. In a reverse repurchase agreement, a Fund sells a security to a securities dealer or bank for cash and also agrees to repurchase the same security later at a set price. Reverse repurchase agreements expose the Fund to credit risk (that is, the risk that the counterparty will fail to resell the security to the Fund). Engaging in reverse repurchase agreements also may involve the use of leverage, in that the Fund may reinvest the cash it receives in additional securities. Reverse repurchase agreements involve the risk that the market value of the securities to be repurchased by the Fund may decline below the repurchase price. |
| | |
| (l) | Credit Default Swaps–The Fund may enter into credit default swap contracts in order to hedge credit risk or for speculation purposes. As a seller of a credit default swap contract (“seller of protection”), the Fund is required to pay the notional amount or other agreed-upon value of a referenced debt obligation to the counterparty in the event of a default by or other credit event involving the referenced issuer, obligation or index. In return, the Fund receives from the counterparty a periodic stream of payments over the term of the contract. |
| | |
| | As a purchaser of a credit default swap contract (“buyer of protection”), the Fund would receive the notional amount or other agreed upon value of a referenced debt obligation from the counterparty in the event of default by or other credit event involving the referenced issuer, obligation or index. In return, the Fund would make periodic payments to the counterparty over the term of the contracts, provided no event of default has occurred. |
| | |
| | These credit default swaps may have as a reference obligation corporate or sovereign issuers or credit indices. These credit indices are comprised of a basket of securities representing a particular sector of the market. |
| | |
| | Credit default swaps are fair valued based upon quotations from counterparties, brokers or market-makers and the change in value, if any, is recorded as an unrealized appreciation or depreciation. For a credit default swap sold by the Fund, payment of the agreed-upon amount made by the Fund in the event of default of the referenced debt obligation is recorded as the cost of the referenced debt obligation purchased/received. For a credit default swap purchased by the Fund, the agreed-upon amount received by the Fund in the event of default of the referenced debt obligation is recorded as proceeds from sale/delivery of the referenced debt obligation and the resulting gain or loss realized on the referenced debt obligation is recorded as such by the Fund. |
| | |
| | Any upfront payments made or received upon entering a credit default swap contract would be amortized or accreted over the life of the swap and recorded as realized gains or losses. Collateral, in the form of cash or securities, may be required to be held in segregated accounts with the custodian bank or broker in accordance with the swap agreement. The value and credit rating of each credit default swap where the Fund is the seller of protection, are both measures of the current payment/performance risk of the swap. As the value of the swap changes as a positive or negative percentage of the total notional amount, the payment/performance risk may decrease or increase, respectively. The maximum potential amount of future payments (undiscounted) that the Fund as a seller of protection could be required to make under a credit default swap agreement would be an amount equal to the notional amount of the agreement. These potential amounts would be partially offset by any recovery values of the respective referenced obligations, upfront payments received upon entering into the agreement, or net amounts received from the settlement of buy protection credit default swap agreements entered into by the Fund for the same referenced entity or entities. |
51
Notes to Financial Statements (continued)
| | Entering into credit default swaps involves credit and market risk. Such risks involve the possibility that there will be no liquid market for these agreements, that the counterparty to the agreements may default on its obligation to perform or disagree as to the meaning of the contractual terms in the agreements, and that there may be unfavorable changes in interest rates, and that Lord Abbett does not correctly predict the creditworthiness of the issuers of the reference obligation on which the credit default swap is based. |
| | |
| (m) | Floating Rate Loans–The Fund may invest in floating rate loans, which usually take the form of loan participations and assignments. Loan participations and assignments are agreements to make money available to U.S. or foreign corporations, partnerships or other business entities (the “Borrower”) in a specified amount, at a specified rate and within a specified time. A loan is typically originated, negotiated and structured by a U.S. or foreign bank, insurance company or other financial institution (the “Agent”) for a group of loan investors (“Loan Investors”). The Agent typically administers and enforces the loan on behalf of the other Loan Investors in the syndicate and may hold any collateral on behalf of the Loan Investors. Such loan participations and assignments are typically senior, secured and collateralized in nature. The Fund records an investment when the Borrower withdraws money and records interest as earned. These loans pay interest at rates which are periodically reset by reference to a base lending rate plus a spread. These base lending rates are generally the prime rate offered by a designated U.S. bank or London InterBank Offered Rate (“LIBOR”). |
| | |
| | The loans in which the Fund invests may be subject to some restrictions on resale. For example, the Fund may be contractually obligated to receive approval from the Agent and/or Borrower prior to the sale of these investments. The Fund generally has no right to enforce compliance with the terms of the loan agreement with the Borrower. As a result, the Fund assumes the credit risk of the Borrower, the selling participant and any other persons interpositioned between the Fund and the Borrower (“Intermediate Participants”). In the event that the Borrower, selling participant or Intermediate Participants become insolvent or enter into bankruptcy, the Fund may incur certain costs and delays in realizing payment or may suffer a loss of principal and/or interest. |
| | |
| | Unfunded commitments represent the remaining obligation of the Fund to the Borrower. At any point in time, up to the maturity date of the issue, the Borrower may demand the unfunded portion. Until demanded by the Borrower, unfunded commitments are not recognized as an asset on the Statement of Assets and Liabilities. Unrealized appreciation/depreciation on unfunded commitments presented on the Statement of Assets and Liabilities represents mark to market of the unfunded portion of the Fund’s floating rate notes. As of December 31, 2016, the Fund had no unfunded loan commitment. |
| | |
| (n) | Fair Value Measurements–Fair value is defined as the price that the Fund would receive upon selling an investment or transferring a liability in an orderly transaction to an independent buyer in the principal or most advantageous market of the investment. A three-tier hierarchy is used to maximize the use of observable market data and minimize the use of unobservable inputs and to establish classification of fair value measurements for disclosure purposes. Inputs refer broadly to the assumptions that market participants would use in pricing the asset or liability, including assumptions about risk – for example, the risk inherent in a particular valuation technique used to measure fair value (such as a pricing model) and/or the risk inherent in the inputs to the valuation technique. Inputs may be observable or unobservable. Observable inputs reflect the assumptions market participants would use in pricing the asset or |
52
Notes to Financial Statements (continued)
| | liability. Observable inputs are based on market data obtained from sources independent of the reporting entity. Unobservable inputs reflect the reporting entity’s own assumptions about the assumptions market participants would use in pricing the asset or liability. Unobservable inputs are based on the best information available in the circumstances. The three-tier hierarchy classification is determined based on the lowest level of inputs that is significant to the fair value measurement, and is summarized in the three broad Levels listed below: |
| | |
| | • | Level 1 – | unadjusted quoted prices in active markets for identical investments; |
| | | |
| | • | Level 2 – | other significant observable inputs (including quoted prices for similar investments, interest rates, prepayment speeds, credit risk, etc.); and |
| | | |
| | • | Level 3 – | significant unobservable inputs (including the Fund’s own assumptions in determining the fair value of investments). |
| | | |
| | A summary of inputs used in valuing the Fund’s investments and other financial instruments as of December 31, 2016 and, if applicable, Level 1/Level 2 transfers and Level 3 rollforwards for the fiscal year then ended is included in the Fund’s Schedule of Investments. |
| | |
| | Changes in valuation techniques may result in transfers into or out of an assigned level within the three-tier hierarchy. All transfers between different levels within the three-tier hierarchy are deemed to have occurred as of the beginning of the reporting period. The inputs or methodology used for valuing securities are not necessarily an indication of the risk associated with investing in those securities. |
| | |
| 3. | MANAGEMENT FEE AND OTHER TRANSACTIONS WITH AFFILIATES |
Management Fee
The Company has a management agreement with Lord Abbett, pursuant to which Lord Abbett supplies the Fund with investment management services and executive and other personnel, provides office space and pays for ordinary and necessary office and clerical expenses relating to research and statistical work and supervision of the Fund’s investment portfolio.
The management fee is based on the Fund’s average daily net assets at the following annual rate:
| First $1 billion | .50% |
| Over $1 billion | .45% |
For the fiscal year ended December 31, 2016, the effective management fee, net of waivers, was at an annualized rate of .47% of the Fund’s average daily net assets.
In addition, Lord Abbett provides certain administrative services to the Fund pursuant to an Administrative Services Agreement in return for a fee at an annual rate of .04% of the Fund’s average daily net assets.
During the fiscal year ended December 31, 2016 and continuing through April 30, 2017, Lord Abbett has contractually agreed to waive its fees and reimburse expenses to the extent necessary to limit total net annual operating expenses to an annual rate of .90%. This agreement may be terminated only upon the approval of the Board.
The Company, on behalf of the Fund, has entered into services arrangements with certain insurance companies. Under these arrangements, certain insurance companies will be compensated up to .25% of the average daily NAV of the Fund’s Class VC Shares held in the insurance company’s separate account to service and maintain the Variable Contract owners’ accounts. This amount is included in Non 12b-1 service fees on the Statement of Operations. The
53
Notes to Financial Statements (continued)
Fund may also compensate certain insurance companies, third-party administrators and other entities for providing recordkeeping, sub-transfer agency and other administrative services to the Fund. This amount is included in Shareholder servicing on the Statement of Operations.
Two Directors and certain of the Company’s officers have an interest in Lord Abbett.
| 4. | DISTRIBUTIONS AND CAPITAL LOSS CARRYFORWARDS |
Dividends from net investment income, if any, are declared and paid at least semi-annually. Taxable net realized gains from investment transactions, reduced by allowable capital loss carryforwards, if any, are declared and distributed to shareholders at least annually. The capital loss carryforward amount, if any, is available to offset future net capital gains. Dividends and distributions to shareholders are recorded on the ex-dividend date. The amounts of dividends and distributions from net investment income and net realized capital gains are determined in accordance with federal income tax regulations, which may differ from U.S. GAAP. These book/tax differences are either considered temporary or permanent in nature. To the extent these differences are permanent in nature, such amounts are reclassified within the components of net assets based on their federal tax basis treatment; temporary differences do not require reclassification. Dividends and distributions that exceed earnings and profits for tax purposes are reported as a tax return of capital.
The tax character of distributions paid during the fiscal years ended December 31, 2016 and 2015 was as follows:
| | | Year Ended | | Year Ended |
| | | 12/31/2016 | | 12/31/2015 |
| Distributions paid from: | | | | | | |
| Ordinary income | | $ | 47,075,516 | | $ | 41,858,433 |
| Net long-term capital gains | | | – | | | 5,541,865 |
| Total distributions paid | | $ | 47,075,516 | | $ | 47,400,298 |
As of December 31, 2016, the components of accumulated gains on a tax-basis were as follows:
| Capital loss carryforwards* | | $ | (22,106,945 | ) |
| Temporary differences | | | (133,147 | ) |
| Unrealized gains – net | | | 41,021,871 | |
| Total accumulated gains – net | | $ | 18,781,779 | |
| * | The capital losses will carryforward indefinitely |
As of December 31, 2016, the aggregate unrealized security gains and losses based on cost for U.S. federal income tax purposes were as follows:
| Tax cost | | $ | 1,012,297,828 | |
| Gross unrealized gain | | | 54,164,307 | |
| Gross unrealized loss | | | (12,722,196 | ) |
| Net unrealized security gain | | $ | 41,442,111 | |
54
Notes to Financial Statements (continued)
The difference between book-basis and tax-basis unrealized gains (losses) is attributable to the tax treatment of certain distributions received, premium amortization and wash sales.
Permanent items identified during the fiscal year ended December 31, 2016 have been reclassified among the components of net assets based on their tax basis treatment as follows:
| Distributions in | | |
| Excess of Net | | |
| Investment | Accumulated Net | |
| Income | Realized Loss | Paid-in Capital |
| $1,980,492 | $(1,844,812) | $(135,680) |
The permanent differences are attributable to the tax treatment of premium amortization, certain securities, certain distributions and foreign currency transactions.
| 5. | PORTFOLIO SECURITIES TRANSACTIONS |
Purchases and sales of investment securities (excluding short-term investments) for the fiscal year ended December 31, 2016 were as follows:
| U.S. | Non-U.S. | U.S. | Non-U.S. |
| Government | Government | Government | Government |
| Purchases* | Purchases | Sales* | Sales |
| $197,236,658 | $1,036,374,302 | $212,132,059 | $984,859,960 |
| * | Includes U.S. Government sponsored enterprise securities. |
The Fund is permitted to purchase and sell securities (“cross-trade”) from and to other Lord Abbett funds or client accounts pursuant to procedures approved by the Board in compliance with Rule 17a-7 under the Act (the “Rule”). Each cross-trade is executed at a fair market price in compliance with provisions of the Rule. For the period ended December 31, 2016, the Fund engaged in crosstrades purchases of $551,529 and sales of $8,951,649, which resulted in net realized loss of $(166,490).
| 6. | DISCLOSURES ABOUT DERIVATIVE INSTRUMENTS AND HEDGING ACTIVITIES |
The Fund entered into forward foreign currency exchange contracts for the fiscal year ended December 31, 2016 (as described in note 2(g)). A forward foreign currency exchange contract reduces the Fund’s exposure to changes in the value of the currency it will deliver (or settle in cash) and increases its exposure to changes in the value of the currency it will receive (or settle in cash) for the duration of the contract. The Fund’s use of forward foreign currency exchange contracts involves the risk that Lord Abbett will not accurately predict currency movements, and the Fund’s returns could be reduced as a result. Forward foreign currency exchange contracts are subject to the risk that those currencies will decline in value relative to the U.S. dollar, or, in the case of hedged positions, that the U.S. dollar will decline relative to the currency being hedged. Currency rates in foreign countries may fluctuate significantly over short periods of time. The Fund’s risk of loss from counterparty credit risk is the unrealized appreciation on forward foreign currency exchange contracts and deposits with brokers as collateral.
The Fund entered into U.S. Treasury futures contracts for the fiscal year ended December 31, 2016 (as described in note 2(h)) to economically hedge against changes in interest rates. The Fund bears the risk of interest rates moving unexpectedly, in which case the Fund may not achieve the anticipated benefits of the futures contracts and realize a loss. There is minimal counterparty credit risk to the Fund since futures are exchange traded and the exchange’s clearinghouse, as counterparty to all exchange traded futures, guarantees futures against default.
55
Notes to Financial Statements (continued)
The Fund entered into centrally cleared credit default swaps on indexes during the fiscal year ended December 31, 2016 (as described in note 2(l)) to economically hedge credit risk. Centrally cleared credit default swaps on indexes involve the exchange of a fixed rate premium for protection against the loss in value of underlying securities within an index in the event of a defined credit event, such as payment default or bankruptcy. Under a credit default swap one party acts as a guarantor by receiving the fixed periodic payment in exchange for the commitment to purchase the underlying security at par if the defined credit event occurs. Upon the occurrence of a defined credit event, the difference between the value of the reference obligation and the swap’s notional amount is recorded as realized gain or loss on swap transactions in the Statements of Operations. There is minimal counterparty credit risk to the Funds since these credit default swaps are traded through a central clearinghouse. As a counterparty to all centrally cleared credit default swaps, the clearinghouse guarantees credit default swaps against default.
As of December 31, 2016, the Fund had the following derivatives at fair value, grouped into appropriate risk categories that illustrate the Fund’s use of derivative instruments:
| | | Foreign | |
| | Interest Rate | Currency | Credit |
| Asset Derivatives | Contracts | Contracts | Contracts |
| Forward Foreign Currency Exchange Contracts(2) | – | $189,016 | – |
| Futures Contracts(3) | $1,287,527 | – | – |
| | | | |
| Liability Derivatives | | | |
| Centrally Cleared Credit Default Swaps(1) | – | – | $416,625 |
| Futures Contracts(3) | $ 152,384 | – | – |
| Forward Foreign Currency Exchange Contracts(4) | – | $ 71,788 | – |
| (1) | Statements of Assets and Liabilities location: Includes cumulative unrealized of centrally cleared credit default swap contracts as reported in the Schedule of Investments. Only current day’s variation margin is reported within the Statements of Assets and Liabilities. |
| (2) | Statements of Assets and Liabilities location: Unrealized appreciation on forward foreign currency exchange contracts. |
| (3) | Statements of Assets and Liabilities location: Includes cumulative unrealized appreciation/depreciation of futures contracts as reported in the Schedule of Investments. Only current day’s variation margin is reported within the Statements of Assets and Liabilities. |
| (4) | Statements of Assets and Liabilities location: Unrealized depreciation on forward foreign currency exchange contracts. |
56
Notes to Financial Statements (continued)
Transactions in derivative instruments for the year ended December 31, 2016, were as follows:
| | | | | | Forward | | | | | | | |
| | | Interest Rate | | | Currency | | | Credit | | | Equity | |
| | | Contracts | | | Contracts | | | Contracts | | | Contracts | |
| Net Realized Gain (Loss)(1) | | | | | | | | | | | | | | | | |
| Credit Default Swaps Contracts | | | – | | | | – | | | $ | (1,019,488 | ) | | | – | |
| Forward Foreign Currency Exchange Contracts | | | – | | | $ | 907,718 | | | | – | | | | – | |
| Futures Contracts | | $ | (1,909,521 | ) | | | – | | | | – | | | $ | (949,298 | ) |
| Net Change in Unrealized Appreciation/Depreciation(2) | | | | | | | | | | | | | | | | |
| Credit Default Swaps Contracts | | | – | | | | – | | | $ | (263,136 | ) | | | – | |
| Forward Foreign Currency Exchange Contracts | | | – | | | $ | (19,818 | ) | | | – | | | | – | |
| Futures Contracts | | $ | 1,193,753 | | | | – | | | | – | | | | – | |
| Average Number of Contracts/Notional Amounts* | | | | | | | | | | | | | | | | |
| Credit Default Swaps Contracts(3) | | | – | | | | – | | | $ | 11,254,308 | | | | – | |
| Forward Foreign Currency Exchange Contracts(3) | | | | | | $ | 12,314,438 | | | | | | | | | |
| Futures Contracts(4) | | | 1,699 | | | | – | | | | – | | | | 17 | |
| * | Calculated based on the number of contracts or notional amounts for the fiscal year ended December 31, 2016. |
| (1) | Statements of Operations location: Net realized gain (loss) on futures contracts, swaps and foreign currency related transactions. |
| (2) | Statements of Operations location: Net change in unrealized appreciation/depreciation on futures contracts, swaps and translation of assets and liabilities denominated in foreign currencies. |
| (3) | Amount represents notional amounts in U.S. dollars. |
| (4) | Amount represents number of contracts. |
| 7. | DISCLOSURES ABOUT OFFSETTING ASSETS AND LIABILITIES |
The Financial Accounting Standards Board (“FASB”) requires disclosures intended to help better assess the effect or potential effect of offsetting arrangements on a fund’s financial position. The following tables illustrate gross and net information about recognized assets and liabilities eligible for offset in the statement of assets and liabilities; and disclose such amounts subject to an enforceable master netting agreement or similar agreement, by counterparty. A master netting agreement is an agreement between a fund and a counterparty which provides for the net settlement of amounts owed under all contracts traded under that agreement, as well as cash collateral, through a single payment by one party to the other in the event of default on or termination of any one contract. The Fund’s accounting policy with respect to balance sheet offsetting is that, absent an event of default by the counterparty or a termination of the agreement, the master netting agreement does not result in an offset of reported amounts of financial assets and liabilities in the statement of assets and liabilities across transactions between the Fund and the applicable counterparty:
| | | | | | Gross Amounts | | | Net Amounts of | |
| | | | | | Offset in the | | | Assets Presented | |
| | | Gross Amounts of | | | Statement of Assets | | | in the Statement of | |
| Description | | Recognized Assets | | | and Liabilities | | | Assets and Liabilities | |
| Forward Foreign Currency Exchange Contracts | | $ | 189,016 | | | $ | – | | | $ | 189,016 | |
| Repurchase Agreements | | | 12,535,583 | | | | – | | | | 12,535,583 | |
| Total | | $ | 12,724,599 | | | $ | – | | | $ | 12,724,599 | |
57
Notes to Financial Statements (continued)
| | | Net Amounts | | | | | | | | |
| | | of Assets | | Amounts Not Offset in the | | |
| | | Presented in | | Statement of Assets and Liabilities | | |
| | | the Statement | | | | Cash | | Securities | | |
| | | of Assets | | Financial | | Collateral | | Collateral | | Net |
| Counterparty | | and Liabilities | | Instruments | | Received(a) | | Received(a) | | Amount(b) |
| Fixed Income Clearing Corp. | | $12,535,583 | | $ – | | $ – | | $(12,535,583) | | $ – |
| J.P. Morgan Chase | | 17,084 | | (17,084) | | – | | – | | – |
| Morgan Stanley | | 14,330 | | – | | – | | – | | 14,330 |
| Standard Chartered Bank | | 148,542 | | (22,231) | | – | | – | | 126,311 |
| State Street Bank and Trust | | 9,060 | | (5,539) | | – | | – | | 3,521 |
| Total | | $12,724,599 | | $(44,854) | | $ – | | $(12,535,583 | ) | $144,162 |
| | | | | Gross Amounts | | Net Amounts of |
| | | | | Offset in the | | Liabilities Presented |
| | | Gross Amounts of | | Statement of Assets | | in the Statement of |
| Description | | Recognized Liabilities | | and Liabilities | | Assets and Liabilities |
| Forward Foreign Currency Exchange Contracts | | $71,788 | | $ – | | $71,788 |
| Total | | $71,788 | | $ – | | $71,788 |
| | | Net Amounts | | | | | | | | |
| | | of Liabilities | | Amounts Not Offset in the | | |
| | | Presented in | | Statement of Assets and Liabilities | | |
| | | the Statement | | | | Cash | | Securities | | |
| | | of Assets and | | Financial | | Collateral | | Collateral | | Net |
| Counterparty | | Liabilities | | Instruments | | Pledged(a) | | Pledged(a) | | Amount(c) |
| J.P. Morgan Chase | | $44,018 | | $(17,084) | | $ – | | $ – | | $26,934 |
| Standard Chartered Bank | | 22,231 | | (22,231) | | – | | – | | – |
| State Street Bank and Trust | | 5,539 | | (5,539) | | – | | – | | – |
| Total | | $71,788 | | $(44,854) | | $ – | | $ – | | $26,934 |
| (a) | Collateral disclosed is limited to an amount not to exceed 100% of the net amount of assets (liabilities) presented in the Statement of Assets and Liabilities, for each respective counterparty. |
| (b) | Net amount represents the amount owed to the Fund by the counterparty as of December 31, 2016. |
| (c) | Net amount represents the amount owed by the Fund by the counterparty as of December 31, 2016. |
| 8. | DIRECTORS’ REMUNERATION |
The Company’s officers and two Directors, who are associated with Lord Abbett, do not receive any compensation from the Company for serving in such capacities. Independent Directors’ fees are allocated among all Lord Abbett-sponsored funds based on the net assets of each fund. There is an equity-based plan available to all Independent Directors under which Independent Directors must defer receipt of a portion of, and may elect to defer receipt of an additional portion of Directors’ fees. The deferred amounts are treated as though equivalent dollar amounts had been invested in the funds. Such amounts and earnings accrued thereon are included in Directors’ fees on the Statement of Operations and in Directors’ fees payable on the Statement of Assets and Liabilities and are not deductible for U.S. federal income tax purposes until such amounts are paid.
The Company has entered into an arrangement with its transfer agent and custodian, whereby credits realized as a result of uninvested cash balances are used to reduce a portion of the Fund’s expenses.
58
Notes to Financial Statements (continued)
The Fund and certain other funds managed by Lord Abbett (collectively, the “Participating Funds”) entered into a syndicated line of credit facility with various lenders for $550 million (the “Facility”), whereas State Street Bank and Trust Company (“SSB”) participates as a lender and as agent for the lenders. The Facility is to be used for temporary or emergency purposes as an additional source of liquidity to satisfy redemptions. The Participating Funds are subject to graduated borrowing limits of one-third of Fund assets (if Fund assets are less than $750 million), $250 million, $300 million, or $350 million, based on past borrowings and likelihood of future borrowings. The Facility will continue through August 28, 2017.
During the fiscal year ended December 31, 2016, the Fund did not utilize the Facility.
| 11. | INTERFUND LENDING PROGRAM |
On July 26, 2016, the U.S. Securities and Exchange Commission issued an exemptive order (“SEC exemptive order”) which permits certain registered open-end management investment companies managed by Lord Abbett, including the Fund, to participate in a joint lending and borrowing program (the “Interfund Lending Program”). The SEC exemptive order allows the Funds to borrow money from and lend money to each other for temporary or emergency purposes subject to the limitations and conditions.
During the fiscal year ended December 31, 2016, the Fund participated as a lender in the Interfund Lending Program. The average amount loaned and interest rate were $12,712,216 and 0.725%, respectively. The Fund earned interest of $253, which is included in the Statement of Operations. There were no interfund loans outstanding as of December 31, 2016.
| 12. | CUSTODIAN AND ACCOUNTING AGENT |
SSB is the Company’s custodian and accounting agent. SSB performs custodial, accounting and recordkeeping functions relating to portfolio transactions and calculating the Fund’s NAV.
The Fund is subject to the general risks and considerations associated with investing in debt securities. The value of an investment will change as interest rates fluctuate and in response to market movements. When interest rates rise, the prices of debt securities are likely to decline; when rates fall, such prices tend to rise. Longer-term debt securities are usually more sensitive to interest rate changes. There is also the risk that an issuer of a debt security will fail to make timely payments of principal or interest to the Fund, a risk that is greater with high-yield securities (sometimes called “lower-rated bonds” or “junk bonds”) in which the Fund may substantially invest. Some issuers, particularly of high-yield securities, may default as to principal and/or interest payments after the Fund purchases its securities. A default, or concerns in the market about an increase in risk of default, may result in losses to the Fund. High-yield securities are subject to greater price fluctuations, as well as additional risks.
The mortgage-related securities in which the Fund may invest may be particularly sensitive to changes in prevailing interest rates and economic conditions, including delinquencies and/or defaults. These changes can affect the value, income and/or liquidity of such positions. When interest rates are declining, the value of these securities with prepayment features may not increase as much as other fixed income securities. Early principal repayment may deprive the Fund of income payments above current market rates. Alternatively, rising interest rates may cause
59
Notes to Financial Statements (concluded)
prepayments to occur at a slower-than-expected rate, extending the duration of a security and typically reducing its value. The payment rate will thus affect the price and volatility of a mortgage-related security. In addition, while securities of government sponsored enterprises are guaranteed with respect to the timely payment of interest and principal by the particular enterprise involved, they are not guaranteed by the U.S. Government. In addition, the Fund may invest in non-agency asset backed and mortgage-related securities, which are issued by private institutions, not by government sponsored enterprises.
The Fund may invest a portion of its net assets in equity securities, the value of which fluctuates in response to movements in the equity securities market in general and to the changing prospects of individual companies in which the Fund invests.
The Fund may invest in convertible securities, which have both equity and fixed income risk characteristics. Generally, convertible securities offer lower interest or dividend yields than non-convertible securities of similar quality and less potential for gains or capital appreciation in a rising equity securities market than equity securities. They tend to be more volatile than other fixed income securities, and the market for convertible securities may be less liquid than the markets for stocks or bonds. A significant portion of convertible securities have below investment grade credit ratings and are subject to increased credit and liquidity risks.
Due to the Fund’s investment exposure to foreign companies and American Depositary Receipts, the Fund may experience increased market, liquidity, currency, political, information and other risks.
The Fund is subject to the risks associated with derivatives, which may be different from and greater than the risks associated with directly investing in securities. Derivatives may be subject to risks such as liquidity risk, leveraging risk, interest rate risk, market risk, and credit risk. Illiquid securities may lower the Fund’s returns since the Fund may be unable to sell these securities at their desired time or price. Derivatives also may involve the risk of mispricing or improper valuation and the risk that changes in the value of the derivative may not correlate perfectly with the value of the underlying asset, rate or index. Whether the Fund’s use of derivatives is successful will depend on, among other things, the Fund’s ability to correctly forecast market movements and other factors. If the Fund incorrectly forecasts these and other factors, the Fund’s performance could suffer. The Fund’s use of derivatives could result in a loss exceeding the amount of the Fund’s investment in these instruments.
The Fund may invest a portion of its net assets in floating rate or adjustable rate senior loans, including bridge loans, novations, assignments, and participations, which are subject to increased credit and liquidity risks. Senior loans are business loans made to borrowers that may be U.S. or foreign corporations, partnerships or other business entities.
These factors can affect the Fund’s performance.
| 14. | SUMMARY OF CAPITAL TRANSACTIONS |
Transactions in shares of capital stock were as follows:
| | | Year Ended | | | Year Ended | |
| | | December 31, 2016 | | | December 31, 2015 | |
| Shares sold | | | 12,721,182 | | | | 26,681,576 | |
| Reinvestment of distributions | | | 3,949,141 | | | | 4,222,649 | |
| Shares reacquired | | | (15,163,582 | ) | | | (19,894,485 | ) |
| Increase | | | 1,506,741 | | | | 11,009,740 | |
60
Report of Independent Registered Public Accounting Firm
To the Board of Directors of Lord Abbett Series Fund, Inc. and the Shareholders of Bond-Debenture Portfolio:
We have audited the accompanying statement of assets and liabilities, including the schedule of investments, of the Bond-Debenture Portfolio, one of the portfolios constituting the Lord Abbett Series Fund, Inc. (the “Fund”) as of December 31, 2016, and the related statement of operations for the year then ended, the statements of changes in net assets for each of the two years in the period then ended, and the financial highlights for each of the five years in the period then ended. These financial statements and financial highlights are the responsibility of the Fund’s management. Our responsibility is to express an opinion on these financial statements and financial highlights based on our audits.
We conducted our audits in accordance with the standards of the Public Company Accounting Oversight Board (United States). Those standards require that we plan and perform the audit to obtain reasonable assurance about whether the financial statements and financial highlights are free of material misstatement. The Fund is not required to have, nor were we engaged to perform, an audit of its internal control over financial reporting. Our audits included consideration of internal control over financial reporting as a basis for designing audit procedures that are appropriate in the circumstances, but not for the purpose of expressing an opinion on the effectiveness of the Fund’s internal control over financial reporting. Accordingly, we express no such opinion. An audit also includes examining, on a test basis, evidence supporting the amounts and disclosures in the financial statements, assessing the accounting principles used and significant estimates made by management, as well as evaluating the overall financial statement presentation. Our procedures included confirmation of securities owned as of December 31, 2016, by correspondence with the custodian, brokers, and agent banks; when replies were not received from brokers and agent banks, we performed other auditing procedures. We believe that our audits provide a reasonable basis for our opinion.
In our opinion, such financial statements and financial highlights referred to above present fairly, in all material respects, the financial position of Bond-Debenture Portfolio of the Lord Abbett Series Fund, Inc. as of December 31, 2016, the results of its operations for the year then ended, the changes in its net assets for each of the two years in the period then ended, and the financial highlights for each of the five years in the period then ended, in conformity with accounting principles generally accepted in the United States of America.
DELOITTE & TOUCHE LLP
New York, New York
February 15, 2017
61
Basic Information About Management
The Board is responsible for the management of the business and affairs of the Company in accordance with the laws of the State of Maryland. The Board elects officers who are responsible for the day-to-day operations of each Fund and who execute policies authorized by the Board. The Board also approves an investment adviser to each Fund and continues to monitor the cost and quality of the services the investment adviser provides, and annually considers whether to renew the contract with the adviser. Generally, each Director holds office until his/her successor is elected and qualified or until his/her earlier resignation or removal, as provided in the Company’s organizational documents.
Lord Abbett, a Delaware limited liability company, is the Fund’s investment adviser. Designated Lord Abbett personnel are responsible for the day-to-day management of the Funds.
Interested Directors
Ms. Foster and Mr. Sieg are affiliated with Lord Abbett and are “interested persons” of the Company as defined in the Act. Ms. Foster and Mr. Sieg are directors/trustees of each of the 12 investment companies in the Lord Abbett Family of Funds, which consist of 60 portfolios or series. Ms. Foster is an officer of the Lord Abbett Family of Funds.
Name, Address and
Year of Birth | | Current Position and
Length of Service
with the Company | | Principal Occupation and Other Directorships
During the Past Five Years |
Daria L. Foster
Lord, Abbett & Co. LLC
90 Hudson Street
Jersey City, NJ 07302
(1954) | | Director and President since 2006; Chief Executive Officer since 2012 | | Principal Occupation: Managing Partner of Lord Abbett, joined Lord Abbett in 1990.
Other Directorships: None. |
| | | | | |
Douglas B. Sieg
Lord, Abbett & Co. LLC
90 Hudson Street
Jersey City, NJ 07302
(1969) | | Director since 2016 | | Principal Occupation: Partner (since 2001) and Head of Client Services (since 2013), formerly Director of Marketing and Relationship Management, joined Lord Abbett in 1994.
Other Directorships: None. |
Independent Directors
The following Independent Directors also are directors/trustees of each of the 12 investment companies in the Lord Abbett Family of Funds, which consist of 60 portfolios or series.
Name, Address and
Year of Birth | | Current Position and
Length of Service
with the Company | | Principal Occupation and Other Directorships
During the Past Five Years |
Robert B. Calhoun, Jr.
Lord, Abbett & Co. LLC
c/o Legal Dept.
90 Hudson Street
Jersey City, NJ 07302
(1942) | | Director since 1998 | | Principal Occupation: Senior Advisor of Monitor Clipper Partners, a private equity investment fund (since 1997); President of Clipper Asset Management Corp. (1991–2009).
Other Directorships: None. |
62
Basic Information About Management (continued)
Name, Address and
Year of Birth | | Current Position and
Length of Service
with the Company | | Principal Occupation and Other Directorships
During the Past Five Years |
Eric C. Fast
Lord, Abbett & Co. LLC
c/o Legal Dept.
90 Hudson Street
Jersey City, NJ 07302
(1949) | | Director since 2014 | | Principal Occupation: Chief Executive Officer of Crane Co., an industrial products company (2001–2014).
Other Directorships: Currently serves as director of Automatic Data Processing, Inc. (since 2007) and Regions Financial Corporation (since 2010). Previously served as a director of Crane Co. (1999–2014). |
| | | | | |
Evelyn E. Guernsey
Lord, Abbett & Co. LLC
c/o Legal Dept.
90 Hudson Street
Jersey City, NJ 07302 (1955) | | Director since 2011 | | Principal Occupation: CEO, Americas of J.P. Morgan Asset Management (2004–2010).
Other Directorships: None. |
| | | | | |
Julie A. Hill
Lord, Abbett & Co. LLC
c/o Legal Dept.
90 Hudson Street
Jersey City, NJ 07302
(1946) | | Director since 2004 | | Principal Occupation: Owner and CEO of The Hill Company, a business consulting firm (since 1998).
Other Directorships: Currently serves as director of Anthem, Inc., a health benefits company (since 1994). |
| | | | | |
Franklin W. Hobbs
Lord, Abbett & Co. LLC
c/o Legal Dept.
90 Hudson Street
Jersey City, NJ 07302
(1947) | | Director since 2001 | | Principal Occupation: Advisor of One Equity Partners, a private equity firm (since 2004).
Other Directorships: Currently serves as director and Chairman of the Board of Ally Financial Inc., a financial services firm (since 2009), and as director of Molson Coors Brewing Company (since 2002). |
| | | | | |
James M. McTaggart
Lord, Abbett & Co. LLC
c/o Legal Dept.
90 Hudson Street
Jersey City, NJ 07302
(1947) | | Director since 2012 | | Principal Occupation: Independent management advisor and consultant (since 2012); Vice President, CRA International, Inc. (doing business as Charles River Associates), a global management consulting firm (2009–2012); Founder and Chairman of Marakon Associates, Inc., a strategy consulting firm (1978–2009); and Officer and Director of Trinsum Group, a holding company (2007–2009).
Other Directorships: Currently serves as director of Blyth, Inc., a home products company (since 2004). |
| | | | | |
Mark A. Schmid
Lord, Abbett & Co. LLC
c/o Legal Dept.
90 Hudson Street
Jersey City, NJ 07302
(1959) | | Director since 2016 | | Principal Occupation: Vice President and Chief Investment Officer of the University of Chicago (since 2009).
Other Directorships: None. |
63
Basic Information About Management (continued)
Name, Address and
Year of Birth | | Current Position and
Length of Service
with the Company | | Principal Occupation and Other Directorships
During the Past Five Years |
James L.L. Tullis
Lord, Abbett & Co. LLC
c/o Legal Dept.
90 Hudson Street
Jersey City, NJ 07302
(1947) | | Director since 2006; Chairman since 2017 | | Principal Occupation: CEO of Tullis-Dickerson and Co. Inc., a venture capital management firm (since 1990); CEO of Tullis Health Investors Inc. (since 2012).
Other Directorships: Currently serves as director of Crane Co. (since 1998). |
Officers
None of the officers listed below have received compensation from the Company. All of the officers of the Company also may be officers of the other Lord Abbett Funds and maintain offices at 90 Hudson Street, Jersey City, NJ 07302. Unless otherwise indicated, the position(s) and title(s) listed under the “Principal Occupation During the Past Five Years” column indicate each officer’s position(s) and title(s) with Lord Abbett. Each officer serves for an indefinite term (i.e., until his or her death, resignation, retirement, or removal).
Name and
Year of Birth | | Current Position
with the Company | | Length of Service
of Current
Position | | Principal Occupation
During the Past Five Years |
Daria L. Foster
(1954) | | President and Chief Executive Officer | | Elected as President in 2006 and Chief Executive Officer in 2012 | | Managing Partner of Lord Abbett, joined Lord Abbett in 1990. |
| | | | | | | |
Sean J. Aurigemma
(1969) | | Executive Vice President | | Elected in 2010 | | Portfolio Manager, joined Lord Abbett in 2007. |
| | | | | | | |
Jeff D. Diamond
(1960) | | Executive Vice President | | Elected in 2008 | | Portfolio Manager, joined Lord Abbett in 2007. |
| | | | | | | |
Todd D. Jacobson
(1966) | | Executive Vice President | | Elected in 2005 | | Partner and Associate Director, joined Lord Abbett in 2003. |
| | | | | | | |
Robert A. Lee
(1969) | | Executive Vice President | | Elected in 2010 | | Partner and Chief Investment Officer, and was formerly Deputy Chief Investment Officer and Director of Taxable Fixed Income, joined Lord Abbett in 1997. |
| | | | | | | |
Thomas B. Maher
(1967) | | Executive Vice President | | Elected in 2010 | | Partner and Portfolio Manager, joined Lord Abbett in 2003. |
| | | | | | | |
Justin C. Maurer
(1969) | | Executive Vice President | | Elected in 2010 | | Partner and Portfolio Manager, joined Lord Abbett in 2001. |
| | | | | | | |
Vincent J. McBride
(1964) | | Executive Vice President | | Elected in 2010 | | Partner and Director, joined Lord Abbett in 2003. |
| | | | | | | |
Andrew H. O’Brien
(1973) | | Executive Vice President | | Elected in 2010 | | Partner and Portfolio Manager, joined Lord Abbett in 1998. |
64
Basic Information About Management (continued)
Name and
Year of Birth | | Current Position
with the Company | | Length of Service
of Current
Position | | Principal Occupation
During the Past Five Years |
F. Thomas O’Halloran, III
(1955) | | Executive Vice President | | Elected in 2010 | | Partner and Portfolio Manager, joined Lord Abbett in 2001. |
| | | | | | | |
Marc Pavese
(1972) | | Executive Vice President | | Elected in 2016 | | Partner and Portfolio Manager, joined Lord Abbett in 2008. |
| | | | | | | |
Walter H. Prahl
(1958) | | Executive Vice President | | Elected in 2012 | | Partner and Director, joined Lord Abbett in 1997. |
| | | | | | | |
Steven F. Rocco
(1979) | | Executive Vice President | | Elected in 2014 | | Partner and Portfolio Manager, joined Lord Abbett in 2004. |
| | | | | | | |
Didier O. Rosenfeld
(1976) | | Executive Vice President | | Elected in 2016 | | Director of Global Equity, joined Lord Abbett in 2015 and was formerly a Portfolio Manager and Senior Analyst at Cornerstone Capital Management (2014–2015) and Managing Director at State Street Global Advisors (2000–2013). |
| | | | | | | |
Frederick J. Ruvkun
(1957) | | Executive Vice President | | Elected in 2012 | | Partner and Portfolio Manager, joined Lord Abbett in 2006. |
| | | | | | | |
Paul J. Volovich
(1973) | | Executive Vice President | | Elected in 2005 | | Partner and Portfolio Manager, joined Lord Abbett in 1997. |
| | | | | | | |
A. Edward Allinson
(1961) | | Vice President | | Elected in 2011 | | Portfolio Manager, joined Lord Abbett in 2005. |
| | | | | | | |
John W. Ashbrook
(1964) | | Vice President and Assistant Secretary | | Elected in 2014 | | Assistant General Counsel, joined Lord Abbett in 2008. |
| | | | | | | |
Joan A. Binstock
(1954) | | Chief Financial Officer and Vice President | | Elected in 1999 | | Partner and Chief Financial Officer, and was formerly Chief Operations Officer, joined Lord Abbett in 1999. |
| | | | | | | |
Brooke A. Fapohunda
(1975) | | Vice President and Assistant Secretary | | Elected in 2014 | | Deputy General Counsel, joined Lord Abbett in 2006. |
| | | | | | | |
John K. Forst
(1960) | | Vice President and Assistant Secretary | | Elected in 2005 | | Partner and Deputy General Counsel, joined Lord Abbett in 2004. |
| | | | | | | |
Anthony W. Hipple
(1964) | | Vice President | | Elected in 2014 | | Portfolio Manager, joined Lord Abbett in 2002. |
| | | | | | | |
Lawrence H. Kaplan
(1957) | | Vice President and Secretary | | Elected in 1997 | | Partner and General Counsel, joined Lord Abbett in 1997. |
65
Basic Information About Management (concluded)
Name and
Year of Birth | | Current Position
with the Company | | Length of Service
of Current
Position | | Principal Occupation
During the Past Five Years |
Linda Y. Kim
(1980) | | Vice President and Assistant Secretary | | Elected in 2016 | | Counsel, joined Lord Abbett in 2015 and was formerly an Associate at Stroock & Stroock & Lavan LLP (2007–2015). |
| | | | | | | |
David J. Linsen
(1974) | | Vice President | | Elected in 2008 | | Partner and Director, joined Lord Abbett in 2001. |
| | | | | | | |
Joseph M. McGill
(1962) | | Chief Compliance Officer | | Elected in 2014 | | Partner and Chief Compliance Officer, joined Lord Abbett in 2014 and was formerly Managing Director and the Chief Compliance Officer at UBS Global Asset Management (2003–2013). |
| | | | | | | |
A. Edward Oberhaus, III
(1959) | | Vice President | | Elected in 1998 | | Partner and Director, joined Lord Abbett in 1983. |
| | | | | | | |
Noah Petrucci
(1970) | | Vice President | | Elected in 2013 | | Portfolio Manager, joined Lord Abbett in 2012 and was formerly a Portfolio Manager at Columbia Management Investment Advisers, LLC and Columbia Management Advisors, LLC (2002–2012). |
| | | | | | | |
Lawrence B. Stoller
(1963) | | Vice President and Assistant Secretary | | Elected in 2007 | | Partner and Senior Deputy General Counsel, joined Lord Abbett in 2007. |
| | | | | | | |
Leah G. Traub
(1979) | | Vice President | | Elected in 2016 | | Partner and Portfolio Manager, joined Lord Abbett in 2007. |
| | | | | | | |
Arthur K. Weise
(1970) | | Vice President | | Elected in 2010 | | Partner and Portfolio Manager, joined Lord Abbett in 2007. |
| | | | | | | |
Kewjin Yuoh
(1971) | | Vice President | | Elected in 2012 | | Partner and Portfolio Manager, joined Lord Abbett in 2010. |
| | | | | | | |
Scott S. Wallner
(1955) | | AML Compliance Officer | | Elected in 2011 | | Assistant General Counsel, joined Lord Abbett in 2004. |
| | | | | | | |
Bernard J. Grzelak
(1971) | | Treasurer | | Elected in 2003 | | Partner and Chief Operations Officer, and was formerly Director of Fund Administration, joined Lord Abbett in 2003. |
Please call 888-522-2388 for a copy of the statement of additional information, which contains further information about the Company’s Directors. It is available free upon request.
66
Approval of Advisory Contract
The Board, including all of the Directors who are not interested persons of the Fund or of Lord Abbett (the “Independent Board Members”), annually considers whether to approve the continuation of the existing management agreement between the Fund and Lord Abbett (the “Agreement”). In connection with its most recent approval, the Board reviewed materials relating specifically to the Agreement, as well as numerous materials received throughout the course of the year, including information about the Fund’s investment performance compared to the performance of its benchmark. Before making its decision as to the Fund, the Board had the opportunity to ask questions and request further information, taking into account its familiarity with Lord Abbett gained through its meetings and discussions. These meetings and discussions included the review of the portfolio management team conducted by members of the Contract Committee, the deliberations of the Contract Committee, and discussions between the Contract Committee and Lord Abbett’s management. The Independent Board Members also met with their independent legal counsel in a private session at which no representatives of management were present.
The materials received by the Board included, but were not limited to: (1) information provided by Morningstar Associates, LLC (“Morningstar”) regarding the investment performance of the Fund compared to the investment performance of certain funds with similar investment styles as determined by Morningstar, based, in part, on the Fund’s Morningstar category (the “performance peer group”), and the investment performance of two appropriate benchmarks; (2) information provided by Morningstar regarding the expense ratios, contractual and effective management fee rates, and other expense components for the Fund and certain funds in the same Morningstar category, with generally the same or similar share classes and operational characteristics, including asset size (the “expense peer group”); (3) certain supplemental investment performance information provided by Lord Abbett; (4) information provided by Lord Abbett on the expense ratios, management fee rates, and other expense components for the Fund; (5) sales and redemption information for the Fund; (6) information regarding Lord Abbett’s financial condition; (7) an analysis of the relative profitability of the Agreement to Lord Abbett; (8) information provided by Lord Abbett regarding the investment management fee schedules for Lord Abbett’s other advisory clients maintaining accounts with a similar investment strategy as the Fund; and (9) information regarding the personnel and other resources devoted by Lord Abbett to managing the Fund.
Investment Management Services Generally. The Board considered the investment management services provided by Lord Abbett to the Fund, including investment research, portfolio management, and trading, and Lord Abbett’s commitment to compliance with all applicable legal requirements. The Board also observed that Lord Abbett was solely engaged in the investment management business and accordingly did not experience the conflicts of interest that may result from being engaged in other lines of business. The Board considered the investment advisory services provided by Lord Abbett to other clients, the fees charged for the services, and the differences in the nature of the services provided to the Fund and other Lord Abbett Funds, on the one hand, and the services provided to other clients, on the other. After reviewing these and related factors, the Board concluded that the Fund was likely to continue to benefit from the nature, extent and quality of the investment services provided by Lord Abbett under the Agreement.
Investment Performance. The Board reviewed the Fund’s investment performance in relation to that of the performance peer group and two appropriate benchmarks as of various periods ended August 31, 2016. The Board observed that the Fund’s investment performance was above the median of the performance peer group for the one-year, three-year, five-year and ten-year periods. The Board also considered Lord Abbett’s performance and reputation generally, the
67
Approval of Advisory Contract (continued)
performance of other Lord Abbett-managed funds overseen by the Board and the willingness of Lord Abbett to take steps intended to improve performance when necessary. After reviewing these and related factors, the Board concluded that the Fund’s investment performance was reasonable and supported the continuation of the Agreement.
Lord Abbett’s Personnel and Methods. The Board considered the qualifications of the personnel providing investment management services to the Fund, in light of its investment objective and discipline. Among other things, the Board considered the size, experience, and turnover of Lord Abbett’s investment management staff, Lord Abbett’s investment methodology and philosophy, and Lord Abbett’s approach to recruiting, training, and retaining investment management personnel.
Nature and Quality of Other Services. The Board considered the nature, quality, costs, and extent of compliance, administrative, and other services performed by Lord Abbett and the nature and extent of Lord Abbett’s supervision of third party service providers, including the Fund’s transfer agent and custodian.
Expenses. The Board considered the expense level of the Fund and the expense levels of the expense peer group. It also considered how the expense levels of the Fund related to those of the expense peer group and the amount and nature of the fees paid by shareholders. The Board observed that the overall expense level of the Fund was below the median of the expense peer group. After reviewing these and related factors, the Board concluded, within the context of its overall approval of the Agreement, that the expense level of the Fund was reasonable and supported the continuation of the Agreement.
Profitability. The Board considered the level of Lord Abbett’s operating margin in managing the Fund, including a review of Lord Abbett’s methodology for allocating its costs to its management of the Fund. It considered whether the Fund was profitable to Lord Abbett in connection with the operation of the Fund, including the fee that Lord Abbett receives from the Fund for providing administrative services to the Fund. The Board also considered the profits realized from other business segments of Lord Abbett, which may benefit from or be related to the Fund’s business. The Board considered Lord Abbett’s profit margins in comparison with available industry data, both accounting for and excluding marketing and distribution expenses, and how those profit margins could affect Lord Abbett’s ability to recruit and retain investment personnel. The Board recognized that Lord Abbett’s overall profitability was a factor in enabling it to attract and retain qualified investment management personnel to provide services to the Fund. After reviewing these and related factors, the Board concluded, within the context of its overall approval of the Agreement, that Lord Abbett’s profitability with respect to the Fund was not excessive.
Economies of Scale. The Board considered the extent to which there had been economies of scale in managing the Fund, whether the Fund’s shareholders had appropriately benefited from such economies of scale, and whether there was potential for realization of any further economies of scale. The Board concluded that the existing management fee schedule, with its breakpoint in the level of the management fee, in conjunction with a proposed expense limitation agreement adequately addressed any economies of scale in managing the Fund.
Other Benefits to Lord Abbett. The Board considered the character and amount of fees paid by the Fund and the Fund’s shareholders to Lord Abbett and the Distributor for services other than investment advisory services. The Board also considered the revenues and profitability of Lord Abbett’s investment advisory business apart from its mutual fund business, and the intangible
68
Approval of Advisory Contract (concluded)
benefits enjoyed by Lord Abbett by virtue of its relationship with the Fund. The Board observed that the Distributor receives 12b-1 fees from certain of the Lord Abbett Funds as to shares held in accounts for which there is no other broker of record, may retain a portion of the 12b-1 fees it receives, and receives a portion of the sales charges on sales and redemptions of some classes of shares. In addition, the Board observed that Lord Abbett accrues certain benefits for its business of providing investment advice to clients other than the Lord Abbett Funds, but that business also benefits the Funds. The Board also noted that Lord Abbett, as disclosed in the prospectus of the Fund, has entered into revenue sharing arrangements with certain entities that distribute shares of the Fund. The Board also took into consideration the investment research that Lord Abbett receives as a result of Fund brokerage transactions.
Alternative Arrangements. The Board considered whether, instead of approving continuation of the Agreement, it might be in the best interests of the Fund to implement one or more alternative arrangements, such as continuing to employ Lord Abbett, but on different terms. After considering all of the relevant factors, the Board unanimously found that continuation of the Agreement was in the best interests of the Fund and its shareholders and voted unanimously to approve the continuation of the Agreement. In considering whether to approve the continuation of the Agreement, the Board did not identify any single factor as paramount or controlling. Individual Directors may have evaluated the information presented differently from one another, giving different weights to various factors. This summary does not discuss in detail all matters considered.
69
Householding
The Company has adopted a policy that allows it to send only one copy of the Fund’s prospectus, proxy material, annual report and semiannual report to certain shareholders residing at the same “household.” This reduces Fund expenses, which benefits you and other shareholders. If you need additional copies or do not want your mailings to be “householded,” please call Lord Abbett at 888-522-2388 or send a written request with your name, the name of your fund or funds and your account number or numbers to Lord Abbett Family of Funds, P.O. Box 219336, Kansas City, MO 64121.
Proxy Voting Policies, Procedures and Records
A description of the policies and procedures that Lord Abbett uses to vote proxies related to the Fund’s portfolio securities, and information on how Lord Abbett voted the Fund’s proxies during the 12-month period ended June 30 are available without charge, upon request, (i) by calling 888-522-2388; (ii) on Lord Abbett’s Website at www.lordabbett.com; and (iii) on the Securities and Exchange Commission’s (“SEC”) Website at www.sec.gov.
Shareholder Reports and Quarterly Portfolio Disclosure
The Fund is required to file its complete schedule of portfolio holdings with the SEC for its first and third fiscal quarters on Form N-Q. Copies of the filings are available without charge, upon request on the SEC’s Website at www.sec.gov and may be available by calling Lord Abbett at 888-522-2388. You can also obtain copies of Form N-Q by visiting the SEC’s Public Reference Room in Washington, DC (information on the operation of the Public Reference Room may be obtained by calling 800-SEC-0330).
Tax Information For corporate shareholders, 3% of the Fund’s ordinary income distributions qualified for the dividend received deduction. |
70


| This report, when not used for the general information of shareholders of the Fund, is to be distributed only if preceded or accompanied by a current fund prospectus. | | | |
| | | Lord Abbett Series Fund, Inc. | |
| | | | |
Lord Abbett mutual fund shares are distributed by
LORD ABBETT DISTRIBUTOR LLC. | | Bond-Debenture Portfolio | LASFBD-2
(02/17) |

2016 LORD ABBETT
ANNUAL REPORT
Lord Abbett
Series Fund—Calibrated Dividend Growth Portfolio
For the fiscal year ended December 31, 2016
Table of Contents
Lord Abbett Series Fund — Calibrated Dividend Growth Portfolio
Annual Report
For the fiscal year ended December 31, 2016

From left to right: James L.L. Tullis, Chairman of the Lord Abbett Funds and Daria L. Foster Director, President, and Chief Executive Officer of the Lord Abbett Funds.
Dear Shareholders: We are pleased to provide you with this overview of the performance of Lord Abbett Series Fund — Calibrated Dividend Growth Portfolio for the fiscal year ended December 31, 2016. On this page and the following pages, we discuss the major factors that influenced fiscal year performance. For additional information about the Fund, please visit our website at www.lordabbett.com, where you also can access the quarterly commentaries that provide updates on the Fund’s performance and other portfolio related updates.
Thank you for investing in Lord Abbett mutual funds. We value the trust that you place in us and look forward to serving your investment needs in the years to come.
Best regards,

Daria L. Foster
Director, President and Chief Executive Officer
For the fiscal year ended December 31, 2016, the Fund returned 15.10%, reflecting performance at the net asset value (NAV) of Class VC shares, with all distributions reinvested, compared to its benchmark, the S&P 500® Index1, which returned 11.96% over the same period.
Domestic equity markets (as represented by the S&P 500® Index1) returned 11.96% over the past year. Despite this general move higher, there were significant bouts of volatility within U.S. stock markets, including their worst start to a calendar year on record.
Crude oil prices played a significant role in the increased market volatility, as Brent oil prices fluctuated sharply throughout the fiscal year. In December, the Organization of Petroleum Exporting Countries agreed to reduce oil production effective 2017. Furthermore, global markets were affected by the devaluation of China’s currency and weak economic data out of the region. The Chinese economy advanced at an annual rate of 6.7% in the third quarter of 2016, a slower pace than in recent years.
1
Geopolitical events also contributed to volatility in global markets. The United Kingdom’s referendum in June to leave the European Union (“Brexit”) was a surprise that caused a sell-off in global markets.
In contrast to the equity market volatility, the U.S. economy continued to expand during the trailing 12-month period. The Federal Reserve (Fed) raised target rates for the second time in 12 months in December, from 0.25%–0.50% to 0.50%–0.75%. U.S. gross domestic product (GDP) grew at a 3.2% pace during the third quarter, a significant increase over the second quarter. The U.S. Bureau of Economic Analysis stated that during the third-quarter personal consumption and federal government spending increased. In addition to GDP growth, the U.S. unemployment rate remained relatively steady throughout the period, finishing at 4.6% in November.
The U.S. presidential election took an unexpected turn as Donald J. Trump was elected president, in contrast to indications from poll numbers before the election. Markets rallied on improved clarity in the U.S. political agenda, with the House and Senate also under Republican control.
The Fund focuses on U.S. large cap companies that consistently have grown their dividends over time, which represents a relatively narrow market segment, compared to its benchmark, the S&P 500. Relative to the S&P 500 benchmark, stock selection and sector weightings drove the Fund’s relative performance during the year.
Stock selection in the industrials sector was a positive contributor to the Fund’s performance, relative to its benchmark, during the period. Within industrials, one of the largest contributors was 3M Co., a diversified industrial manufacturer. 3M Co. reported stable, positive growth throughout the year with additional growth being forecasted in the future. Also contributing to relative performance was FedEx Corp., a provider of transportation, e-commerce, and business services. FedEx reported a strong fiscal first quarter of 2017, which beat consensus estimates, with earnings per share growing 20% year over year. In addition, the company was able to raise ground daily package volumes by 10%, while increasing margins in the segment by 0.20%.
The Fund’s sector underweight and positive stock selection in the health care sector also contributed to the Fund’s performance, relative to its benchmark. Within the health care sector, an overweight position in C.R. Bard, Inc., a medical equipment manufacturer, helped relative performance. The company benefited from a strong second quarter earnings report, which beat consensus estimates and raised future revenue growth estimates. The company’s international segments also contributed to earnings as investments overseas continued to pay off. Similarly, the Fund’s holdings of Abbvie Inc., a pharmaceuticals developer and manufacturer, contributed to performance. The company’s stock
2
advanced as challenges to its important Humira patent were rejected and Trump’s presidential victory was viewed positively for pharmaceuticals, with Hillary Clinton’s proposed reforms now less likely to succeed.
Conversely, the Fund’s stock selection in the consumer staples sector detracted from relative performance. Within consumer staples, shares of CVS Health Corp., an integrated pharmacy health care services company, detracted from performance. The company’s shares declined, reflecting a lower profit outlook following the projected loss of significant retail prescriptions due to new retail pharmacy networks that are excluding CVS pharmacy drug stores. Also detracting from relative performance were shares of Kimberly-Clark Corp., a global health and hygiene company, which declined during the period. The company reported third
quarter 2016 earnings that missed expectations with lower organic sales growth than estimated. Foreign exchange changes also adversely impacted the company as management cited a more challenging economic and competitive environment.
The Fund’s underweight to the financials sector also detracted from relative performance during the year. After a challenging start to the year, the sector performed strongly following Trump’s presidential victory and market expectations for stronger growth, higher inflation, and reduced regulations.
The Fund’s portfolio is actively managed and, therefore, its holdings and the weightings of a particular issuer or particular sector as a percentage of portfolio assets are subject to change. Sectors may include many industries.
3
1 The S&P 500® Index is widely regarded as the standard for measuring large cap U.S. stock market performance and includes a representative sample of leading companies in leading industries.
Unless otherwise specified, indexes reflect total return, with all dividends reinvested. Indexes are unmanaged, do not reflect the deduction of fees or expenses, and are not available for direct investment.
Important Performance and Other Information
Performance data quoted in the following pages reflect past performance and are no guarantee of future results. Current performance may be higher or lower than the performance quoted. The investment return and principal value of an investment in the Funds will fluctuate so that shares, on any given day or when redeemed, may be worth more or less than their original cost. You can obtain performance data current to the most recent month end by calling Lord Abbett at 888-522-2388 or referring to www.lordabbett.com.
During certain periods shown, expense waivers and reimbursements were in place. Without such expense waivers and reimbursements, the Funds’ returns would have been lower.
The annual commentary above discusses the views of the Fund’s management and various portfolio holdings of the Funds as of December 31, 2016. These views and portfolio holdings may have changed after this date. Information provided in the commentary is not a recommendation to buy or sell securities. Because the Fund’s portfolio is actively managed and may change significantly, the Fund may no longer own the securities described above or may have otherwise changed their positions in the securities. For more recent information about the Fund’s portfolio holdings, please visit www.lordabbett.com.
A Note about Risk: See Notes to Financial Statements for a discussion of investment risks. For a more detailed discussion of the risks associated with each Fund, please see the Fund’s prospectus.
Mutual funds are not insured by the FDIC, are not deposits or other obligations of, or guaranteed by, banks, and are subject to investment risks including possible loss of principal amount invested.
The Fund serves as an underlying investment vehicle for variable annuity contracts and variable life insurance policies.
4
Investment Comparison
Below is a comparison of a $10,000 investment in Class VC shares with the same investment in the S&P 500® Index and the S&P 900® 10-Year Dividend Growth Index, assuming reinvestment of all dividends and distributions. The Fund’s shares are sold only to insurance company separate accounts that fund certain variable annuity and variable life contracts. The line graph comparison does not reflect the sales charges or other expenses of these contracts. If those sales charges and expenses were reflected, returns would be lower. The graph and performance table below do not reflect the deduction of taxes that a shareholder would pay on Fund distributions or the redemption of Fund shares. During certain periods, expenses of the Fund have been waived or reimbursed by Lord Abbett; without such waiver or reimbursement of expenses, the Fund’s returns would have been lower. Past performance is no guarantee of future results.
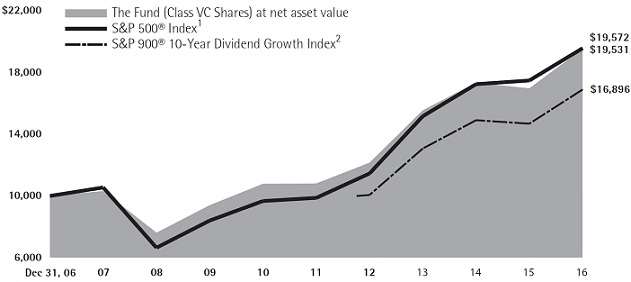
The S&P 900® 10-Year Dividend Growth Index is a custom index that, along with changes in the Fund’s investment strategy, the Fund began disclosing in its prospectus effective September 27, 2012.
Average Annual Total Returns for the
Periods Ended December 31, 2016 |
| | | 1 Year | | 5 Years | | 10 Years | |
| Class VC | | 15.10% | | 12.57% | | 6.92% | |
1 Performance for the unmanaged index does not reflect transaction costs, management fees or sales charges. The performance of the index is not necessarily representative of the Fund’s performance.
2 Performance for the unmanaged index does not reflect transaction costs, management fees or sales charges. The performance of the index is not necessarily representative of the Fund’s performance. Performance for the index began on September 27, 2012.
5
Expense Example
As a shareholder of the Fund, you incur ongoing costs, including management fees; expenses related to the Fund’s services arrangements with certain insurance companies; and other Fund expenses. This Example is intended to help you understand your ongoing costs (in dollars) of investing in the Fund and to compare these costs with the ongoing costs of investing in other mutual funds.
The Example is based on an investment of $1,000 invested at the beginning of the period and held for the entire period (July 1, 2016 through December 31, 2016).
The Example reflects only expenses that are deducted from the assets of the Fund. Fees and expenses, including sales charges applicable to the various insurance products that invest in the Fund, are not reflected in this Example. If such fees and expenses were reflected in the Example, the total expenses shown would be higher. Fees and expenses regarding such variable insurance products are separately described in the prospectus related to those products.
Actual Expenses
The first line of the table on the following page provides information about actual account values and actual expenses. You may use the information in this line, together with the amount you invested, to estimate the expenses that you paid over the period. Simply divide your account value by $1,000 (for example, an $8,600 account value divided by $1,000 = 8.6), then multiply the result by the number in the first line under the heading titled “Expenses Paid During Period 7/1/16 – 12/31/16” to estimate the expenses you paid on your account during this period.
Hypothetical Example for Comparison Purposes
The second line of the table on the following page provides information about hypothetical account values and hypothetical expenses based on the Fund’s actual expense ratio and an assumed rate of return of 5% per year before expenses, which is not the Fund’s actual return. The hypothetical account values and expenses may not be used to estimate the actual ending account balance or expenses you paid for the period. You may use this information to compare the ongoing costs of investing in the Fund and other funds. To do so, compare this 5% hypothetical example with the 5% hypothetical examples that appear in the shareholder reports of the other funds.
6
Please note that the expenses shown in the table are meant to highlight your ongoing costs only and do not reflect any transactional costs, such as sales charges. Therefore, the second line of the table is useful in comparing ongoing costs only, and will not help you determine the relative total costs of owning different funds. In addition, if these transactional costs were included, your costs would have been higher.
| | | Beginning
Account
Value | | Ending
Account
Value | | Expenses
Paid During
Period† | |
| | | | | | | 7/1/16 - | |
| | | 7/1/16 | | 12/31/16 | | 12/31/16 | |
| Class VC | | | | | | | |
| Actual | | $1,000.00 | | $1,034.60 | | $4.35 | |
| Hypothetical (5% Return Before Expenses) | | $1,000.00 | | $1,020.86 | | $4.32 | |
| | |
| † | Net expenses are equal to the Fund’s annualized expense ratio of 0.85%, multiplied by the average account value over the period, multiplied by 184/366 (to reflect one-half year period). |
Portfolio Holdings Presented by Sector
December 31, 2016
| Sector* | %** |
| Consumer Discretionary | 9.03 | % |
| Consumer Staples | 18.04 | % |
| Energy | 7.85 | % |
| Financials | 6.78 | % |
| Health Care | 9.42 | % |
| Industrials | 19.72 | % |
| Information Technology | 12.36 | % |
| Materials | 5.10 | % |
| Telecommunication Services | 4.15 | % |
| Utilities | 6.57 | % |
| Repurchase Agreement | 0.98 | % |
| Total | 100.00 | % |
| | | |
| * | | A sector may comprise several industries. |
| ** | | Represents percent of total investments. |
7
Schedule of Investments
December 31, 2016
| Investments | | Shares | | | Fair
Value
(000) | |
| COMMON STOCKS 98.93% | | | | | | | | |
| | | | | | | | | |
| Aerospace & Defense 6.96% | | | | | | | | |
| General Dynamics Corp. | | | 11,800 | | | $ | 2,038 | |
| Lockheed Martin Corp. | | | 10,692 | | | | 2,672 | |
| Northrop Grumman Corp. | | | 8,100 | | | | 1,884 | |
| Raytheon Co. | | | 13,500 | | | | 1,917 | |
| United Technologies Corp. | | | 31,100 | | | | 3,409 | |
| Total | | | | | | | 11,920 | |
| | | | | | | | | |
| Air Freight & Logistics 0.66% | | | | | | | | |
| FedEx Corp. | | | 6,065 | | | | 1,129 | |
| | | | | | | | | |
| Banks 0.66% | | | | | | | | |
| Cullen/Frost Bankers, Inc. | | | 12,800 | | | | 1,129 | |
| | | | | | | | | |
| Beverages 3.77% | | | | | | | | |
| Coca-Cola Co. (The) | | | 69,668 | | | | 2,889 | |
| PepsiCo, Inc. | | | 34,124 | | | | 3,570 | |
| Total | | | | | | | 6,459 | |
| | | | | | | | | |
| Biotechnology 1.63% | | | | | | | | |
| AbbVie, Inc. | | | 44,599 | | | | 2,793 | |
| | | | | | | | | |
| Capital Markets 2.94% | | | | | | | | |
| Eaton Vance Corp. | | | 21,900 | | | | 917 | |
| S&P Global, Inc. | | | 14,200 | | | | 1,527 | |
| SEI Investments Co. | | | 20,800 | | | | 1,027 | |
| T. Rowe Price Group, Inc. | | | 20,800 | | | | 1,565 | |
| Total | | | | | | | 5,036 | |
| | | | | | | | | |
| Chemicals 4.50% | | | | | | | | |
| Air Products & Chemicals, Inc. | | | 4,800 | | | | 690 | |
| International Flavors & Fragrances, Inc. | | | 11,500 | | | | 1,355 | |
| Monsanto Co. | | | 24,095 | | | | 2,535 | |
| PPG Industries, Inc. | | | 17,306 | | | | 1,640 | |
| Praxair, Inc. | | | 5,500 | | | | 645 | |
| RPM International, Inc. | | | 15,800 | | | | 851 | |
| Total | | | | | | | 7,716 | |
| | | | | | | | | |
| Commercial Services & Supplies 0.52% | | | | | | | | |
| Republic Services, Inc. | | | 15,500 | | | | 884 | |
| Investments | | Shares | | | Fair
Value
(000) | |
| Containers & Packaging 0.23% | | | | | | | | |
| Bemis Co., Inc. | | | 8,100 | | | $ | 387 | |
| | | | | | | | | |
| Distributors 0.52% | | | | | | | | |
| Genuine Parts Co. | | | 9,400 | | | | 898 | |
| | | | | | | | | |
| Diversified Telecommunication Services 4.15% | | | | | | | | |
| AT&T, Inc. | | | 74,408 | | | | 3,165 | |
| Verizon Communications, Inc. | | | 73,800 | | | | 3,939 | |
| Total | | | | | | | 7,104 | |
| | | | | | | | | |
| Electric: Utilities 3.33% | | | | | | | | |
| Edison International | | | 27,400 | | | | 1,973 | |
| Eversource Energy | | | 45,600 | | | | 2,518 | |
| NextEra Energy, Inc. | | | 5,121 | | | | 612 | |
| Southern Co. (The) | | | 12,300 | | | | 605 | |
| Total | | | | | | | 5,708 | |
| | | | | | | | | |
| Energy Equipment & Services 0.47% | | | | | | | | |
| Helmerich & Payne, Inc. | | | 10,412 | | | | 806 | |
| | | | | | | | | |
| Food & Staples Retailing 7.25% | | | | | | | | |
| Costco Wholesale Corp. | | | 15,300 | | | | 2,450 | |
| CVS Health Corp. | | | 29,700 | | | | 2,344 | |
| Sysco Corp. | | | 10,400 | | | | 576 | |
| Wal-Mart Stores, Inc. | | | 39,580 | | | | 2,736 | |
| Walgreens Boots Alliance, Inc. | | | 52,121 | | | | 4,313 | |
| Total | | | | | | | 12,419 | |
| | | | | | | | | |
| Food Products 2.60% | | | | | | | | |
| Archer-Daniels-Midland Co. | | | 38,000 | | | | 1,735 | |
| General Mills, Inc. | | | 28,100 | | | | 1,736 | |
| Hormel Foods Corp. | | | 19,800 | | | | 689 | |
| Kellogg Co. | | | 3,900 | | | | 287 | |
| Total | | | | | | | 4,447 | |
| | | | | | | | | |
| Gas Utilities 0.18% | | | | | | | | |
| UGI Corp. | | | 6,800 | | | | 313 | |
8
Schedule of Investments (continued)
December 31, 2016
| Investments | | Shares | | | Fair
Value
(000) | |
| Health Care Equipment & Supplies 4.01% | | | | | | | | |
| Becton, Dickinson & Co. | | | 5,000 | | | $ | 828 | |
| C.R. Bard, Inc. | | | 10,088 | | | | 2,266 | |
| Medtronic plc (Ireland)(a) | | | 32,591 | | | | 2,322 | |
| STERIS plc (United Kingdom)(a) | | | 4,300 | | | | 290 | |
| West Pharmaceutical Services, Inc. | | | 13,700 | | | | 1,162 | |
| Total | | | | | | | 6,868 | |
| | | | | | | | | |
| Health Care Providers & Services 1.56% | | | | | | | | |
| AmerisourceBergen Corp. | | | 11,200 | | | | 876 | |
| Cardinal Health, Inc. | | | 25,048 | | | | 1,803 | |
| Total | | | | | | | 2,679 | |
| | | | | | | | | |
| Hotels, Restaurants & Leisure 2.99% | | | | | | | | |
| McDonald’s Corp. | | | 36,674 | | | | 4,464 | |
| Cracker Barrel Old Country Store, Inc. | | | 4,000 | | | | 668 | |
| Total | | | | | | | 5,132 | |
| | | | | | | | | |
| Household Products 3.70% | | | | | | | | |
| Kimberly-Clark Corp. | | | 31,635 | | | | 3,610 | |
| Procter & Gamble Co. (The) | | | 32,400 | | | | 2,724 | |
| Total | | | | | | | 6,334 | |
| | | | | | | | | |
| Industrial Conglomerates 2.78% | | | | | | | | |
| 3M Co. | | | 23,017 | | | | 4,110 | |
| Roper Technologies, Inc. | | | 3,600 | | | | 659 | |
| Total | | | | | | | 4,769 | |
| | | | | | | | | |
| Information Technology Services 4.59% | | | | | | | | |
| Accenture plc Class A (Ireland)(a) | | | 18,000 | | | | 2,108 | |
| Automatic Data Processing, Inc. | | | 11,800 | | | | 1,213 | |
| International Business Machines Corp. | | | 27,387 | | | | 4,546 | |
| Total | | | | | | | 7,867 | |
| Investments | | Shares | | | Fair
Value
(000) | |
| Insurance 3.17% | | | | | | | | |
| Chubb Ltd. (Switzerland)(a) | | | 30,764 | | | $ | 4,065 | |
| Hanover Insurance Group, Inc. (The) | | | 7,200 | | | | 655 | |
| Old Republic International Corp. | | | 37,800 | | | | 718 | |
| Total | | | | | | | 5,438 | |
| | | | | | | | | |
| Machinery 4.76% | | | | | | | | |
| Caterpillar, Inc. | | | 16,900 | | | | 1,567 | |
| Cummins, Inc. | | | 18,100 | | | | 2,474 | |
| Graco, Inc. | | | 12,100 | | | | 1,006 | |
| Illinois Tool Works, Inc. | | | 6,200 | | | | 759 | |
| Nordson Corp. | | | 3,500 | | | | 392 | |
| Parker-Hannifin Corp. | | | 4,700 | | | | 658 | |
| Pentair plc (United Kingdom)(a) | | | 23,100 | | | | 1,295 | |
| Total | | | | | | | 8,151 | |
| | | | | | | | | |
| Metals & Mining 0.36% | | | | | | | | |
| Nucor Corp. | | | 10,500 | | | | 625 | |
| | | | | | | | | |
| Multi-Utilities 3.05% | | | | | | | | |
| Dominion Resources, Inc. | | | 47,200 | | | | 3,615 | |
| SCANA Corp. | | | 21,898 | | | | 1,605 | |
| Total | | | | | | | 5,220 | |
| | | | | | | | | |
| Oil, Gas & Consumable Fuels 7.37% | | | | | | | | |
| Chevron Corp. | | | 57,649 | | | | 6,785 | |
| EOG Resources, Inc. | | | 21,150 | | | | 2,138 | |
| Exxon Mobil Corp. | | | 7,200 | | | | 650 | |
| Occidental Petroleum Corp. | | | 29,073 | | | | 2,071 | |
| Williams Cos., Inc. (The) | | | 31,600 | | | | 984 | |
| Total | | | | | | | 12,628 | |
| | | | | | | | | |
| Pharmaceuticals 2.21% | | | | | | | | |
| Johnson & Johnson | | | 32,919 | | | | 3,793 | |
| | | | | | | | | |
| Professional Services 0.78% | | | | | | | | |
| Robert Half International, Inc. | | | 27,500 | | | | 1,342 | |
| | See Notes to Financial Statements. | 9 |
Schedule of Investments (continued)
December 31, 2016
| Investments | | Shares | | | Fair
Value
(000) | |
| Road & Rail 1.69% | | | | | | | | |
| CSX Corp. | | | 80,500 | | | $ | 2,892 | |
| | | | | | | | | |
| Semiconductors & Semiconductor Equipment 5.82% |
| Microchip Technology, Inc. | | | 34,366 | | | | 2,205 | |
| QUALCOMM, Inc. | | | 79,057 | | | | 5,154 | |
| Texas Instruments, Inc. | | | 35,700 | | | | 2,605 | |
| Total | | | | | | | 9,964 | |
| | | | | | | | | |
| Software 1.95% | | | | | | | | |
| Microsoft Corp. | | | 53,700 | | | | 3,337 | |
| | | | | | | | | |
| Specialty Retail 3.84% | | | | | | | | |
| Best Buy Co., Inc. | | | 20,900 | | | | 892 | |
| Lowe’s Cos., Inc. | | | 36,525 | | | | 2,598 | |
| Ross Stores, Inc. | | | 27,000 | | | | 1,771 | |
| Tiffany & Co. | | | 9,100 | | | | 704 | |
| TJX Cos., Inc. (The) | | | 8,200 | | | | 616 | |
| Total | | | | | | | 6,581 | |
| | | | | | | | | |
| Textiles, Apparel & Luxury Goods 1.66% | | | | | | | | |
| NIKE, Inc. Class B | | | 39,600 | | | | 2,013 | |
| VF Corp. | | | 15,600 | | | | 832 | |
| Total | | | | | | | 2,845 | |
| | | | | | | | | |
| Tobacco 0.71% | | | | | | | | |
| Reynolds American, Inc. | | | 21,700 | | | | 1,216 | |
| | | | | | | | | |
| Trading Companies & Distributors 1.56% | | | | | | | | |
| MSC Industrial Direct Co., Inc. Class A | | | 15,600 | | | | 1,441 | |
| W.W. Grainger, Inc. | | | 5,300 | | | | 1,231 | |
| Total | | | | | | | 2,672 | |
Total Common Stocks
(cost $163,064,541) | | | | | | | 169,501 | |
| Investments | | Principal
Amount
(000) | | | Fair
Value
(000) | |
| SHORT-TERM INVESTMENT 0.99% | | | | | | | | |
| | | | | | | | | |
| Repurchase Agreement | | | | | | | | |
Repurchase Agreement dated 12/30/2016, 0.03% due 1/3/2017 with Fixed Income Clearing Corp. collateralized by $1,615,000 of U.S. Treasury Inflation Indexed Note at 0.125% due 4/15/2017; value: $1,722,360; proceeds: $1,684,993
(cost $1,684,987) | | $ | 1,685 | | | $ | 1,685 | |
Total Investments in Securities 99.92%
(cost $164,749,528) | | | | | | | 171,186 | |
| Other Assets in Excess of Liabilities(b) 0.08% | | | | | | | 144 | |
| Net Assets 100.00% | | | | | | $ | 171,330 | |
| (a) | | Foreign security traded in U.S. dollars. |
| (b) | | Other Assets in Excess of Liabilities include net unrealized depreciation on futures contracts as follows: |
| Open Futures Contracts at December 31, 2016: | | | | | | |
| Type | | Expiration | | Contracts | | Position | | Notional Value | | Unrealized
Depreciation |
| E-Mini S&P 500 Index | | March 2017 | | 11 | | Long | | $1,229,910 | | $(4,125) |
| 10 | See Notes to Financial Statements. |
Schedule of Investments (concluded)
December 31, 2016
The following is a summary of the inputs used as of December 31, 2016 in valuing the Fund’s investments carried at fair value(1):
| | | Level 1 | | Level 2 | | Level 3 | | | Total | |
| Investment Type(2)(3) | | (000) | | | (000) | | | (000) | | | (000) | |
| Common Stocks | | $ | 169,501 | | | $ | – | | | $ | – | | | $ | 169,501 | |
| Repurchase Agreement | | | – | | | | 1,685 | | | | – | | | | 1,685 | |
| Total | | $ | 169,501 | | | $ | 1,685 | | | $ | – | | | $ | 171,186 | |
| | | | | | | | | | | | | | | | | |
| Other Financial Instruments | | | | | | | | | | | | | | | | |
| Futures Contracts | | | | | | | | | | | | | | | | |
| Assets | | $ | – | | | $ | – | | | $ | – | | | $ | – | |
| Liabilities | | | (4 | ) | | | – | | | | – | | | | (4 | ) |
| Total | | $ | (4 | ) | | $ | – | | | $ | – | | | $ | (4 | ) |
| (1) | | Refer to Note 2(i) for a description of fair value measurements and the three-tier hierarchy of inputs. |
| (2) | | See Schedule of Investments for fair values in each industry and identification of foreign issuers and/or geography. |
| (3) | | There were no Level 1/Level 2 transfers during the fiscal year ended December 31, 2016. |
| | See Notes to Financial Statements. | 11 |
Statement of Assets and Liabilities
December 31, 2016
| ASSETS: | | | | |
| Investments in securities, at fair value (cost $164,749,528) | | $ | 171,186,010 | |
| Deposits with brokers for futures collateral | | | 47,500 | |
| Receivables: | | | | |
| Investment securities sold | | | 1,084,137 | |
| Interest and dividends | | | 255,013 | |
| Capital shares sold | | | 121,898 | |
| From advisor (See Note 3) | | | 55,180 | |
| Prepaid expenses | | | 935 | |
| Total assets | | | 172,750,673 | |
| LIABILITIES: | | | | |
| Payables: | | | | |
| Investment securities purchased | | | 1,085,411 | |
| Management fee | | | 108,947 | |
| Capital shares reacquired | | | 78,510 | |
| Directors’ fees | | | 20,204 | |
| Variation margin | | | 4,507 | |
| Fund administration | | | 5,810 | |
| Accrued expenses | | | 117,346 | |
| Total liabilities | | | 1,420,735 | |
| NET ASSETS | | $ | 171,329,938 | |
| COMPOSITION OF NET ASSETS: | | | | |
| Paid-in capital | | $ | 164,571,350 | |
| Distributions in excess of net investment income | | | (19,946 | ) |
| Accumulated net realized gain on investments and futures contracts | | | 346,177 | |
| Net unrealized appreciation on investments and futures contracts | | | 6,432,357 | |
| Net Assets | | $ | 171,329,938 | |
| Outstanding shares (50 million shares of common stock authorized, $.001 par value) | | | 11,838,532 | |
Net asset value, offering and redemption price per share
(Net assets divided by outstanding shares) | | $ | 14.47 | |
| 12 | See Notes to Financial Statements. |
Statement of Operations
For the Year Ended December 31, 2016
| Investment income: | | | | |
| Dividends | | $ | 3,997,074 | |
| Interest | | | 644 | |
| Total investment income | | | 3,997,718 | |
| Expenses: | | | | |
| Management fee | | | 1,094,221 | |
| Non 12b-1 service fees | | | 365,308 | |
| Shareholder servicing | | | 164,080 | |
| Fund administration | | | 58,358 | |
| Reports to shareholders | | | 33,119 | |
| Directors’ fees | | | 4,872 | |
| Professional | | | 52,738 | |
| Custody | | | 36,445 | |
| Other | | | 12,894 | |
| Gross expenses | | | 1,822,035 | |
| Expense reductions (See Note 9) | | | (573 | ) |
| Fees waived and expenses reimbursed (See Note 3) | | | (581,345 | ) |
| Net expenses | | | 1,240,117 | |
| Net investment income | | | 2,757,601 | |
| Net realized and unrealized gain: | | | | |
| Net realized gain on investments | | | 11,169,750 | |
| Net realized gain on futures contracts | | | 146,195 | |
| Net change in unrealized appreciation/depreciation on investments | | | 5,544,538 | |
| Net change in unrealized appreciation/depreciation on futures contracts | | | 164 | |
| Net realized and unrealized gain | | | 16,860,647 | |
| Net Increase in Net Assets Resulting From Operations | | $ | 19,618,248 | |
| | See Notes to Financial Statements. | 13 |
Statements of Changes in Net Assets
| INCREASE (DECREASE) IN NET ASSETS | | For the Year Ended
December 31, 2016 | | | For the Year Ended
December 31, 2015 | |
| Operations: | | | | | | | | | | |
| Net investment income | | | $ | 2,757,601 | | | | $ | 1,943,595 | |
| Net realized gain on investments and futures contracts | | | | 11,315,945 | | | | | 6,372,114 | |
| Net change in unrealized appreciation/depreciation on investments and futures contracts | | | | 5,544,702 | | | | | (10,981,684 | ) |
| Net increase (decrease) in net assets resulting from operations | | | | 19,618,248 | | | | | (2,665,975 | ) |
| Distributions to shareholders from: | | | | | | | | | | |
| Net investment income | | | | (2,760,683 | ) | | | | (1,956,907 | ) |
| Net realized gain | | | | (10,343,840 | ) | | | | (9,585,159 | ) |
| Total distributions to shareholders | | | | (13,104,523 | ) | | | | (11,542,066 | ) |
| Capital share transactions (See Note 14): | | | | | | | | | | |
| Proceeds from sales of shares | | | | 87,781,663 | | | | | 31,364,855 | |
| Reinvestment of distributions | | | | 13,104,523 | | | | | 11,542,066 | |
| Cost of shares reacquired | | | | (41,085,594 | ) | | | | (41,983,707 | ) |
| Net increase in net assets resulting from capital share transactions | | | | 59,800,592 | | | | | 923,214 | |
| Net increase (decrease) in net assets | | | | 66,314,317 | | | | | (13,284,827 | ) |
| NET ASSETS: | | | | | | | | | | |
| Beginning of year | | | $ | 105,015,621 | | | | $ | 118,300,448 | |
| End of year | | | $ | 171,329,938 | | | | $ | 105,015,621 | |
| Distributions in excess of net investment income | | | $ | (19,946 | ) | | | $ | (16,864 | ) |
| 14 | See Notes to Financial Statements. |
This page is intentionally left blank.
Financial Highlights
| | | | | Per Share Operating Performance: |
| | | | | Investment operations: | | Distributions to
shareholders from: |
| | | | | | | |
| | | Net asset
value,
beginning
of period | | Net
invest-
ment
income(a) | | Net
realized
and
unrealized
gain (loss) | | Total
from
invest-
ment
opera-
tions | | Net
investment
income | | Net
realized
gain | | Total
distri-
butions |
| 12/31/2016 | | | $13.60 | | | | $0.28 | | | | $ 1.78 | | | | $ 2.06 | | | | $(0.25 | ) | | | $(0.94 | ) | | | $(1.19 | ) |
| 12/31/2015 | | | 15.55 | | | | 0.27 | | | | (0.60 | ) | | | (0.33 | ) | | | (0.27 | ) | | | (1.35 | ) | | | (1.62 | ) |
| 12/31/2014 | | | 16.27 | | | | 0.27 | | | | 1.60 | | | | 1.87 | | | | (0.29 | ) | | | (2.30 | ) | | | (2.59 | ) |
| 12/31/2013 | | | 14.22 | | | | 0.26 | | | | 3.68 | | | | 3.94 | | | | (0.28 | ) | | | (1.61 | ) | | | (1.89 | ) |
| 12/31/2012 | | | 13.03 | | | | 0.34 | | | | 1.29 | | | | 1.63 | | | | (0.44 | ) | | | – | | | | (0.44 | ) |
| (a) | Calculated using average shares outstanding during the period. |
| (b) | Total return does not consider the effects of sales loads and assumes the reinvestment of all distributions. |
| 16 | See Notes to Financial Statements. |
| | | | | Ratios to Average Net Assets: | | Supplemental Data: |
| | | | | | | | | | | | | |
Net
asset
value,
end of
period | | Total
return(b)
(%) | | Total
expenses
after
waivers
and/or reim-
bursements
(%) | | Total
expenses
(%) | | Net
investment
income
(%) | | Net
assets,
end of
period
(000) | | Portfolio
turnover
rate
(%) |
| | $14.47 | | | | 15.10 | | | | 0.85 | | | | 1.25 | | | | 1.89 | | | | $171,330 | | | | 75.49 | |
| | 13.60 | | | | (2.13 | ) | | | 0.85 | | | | 1.28 | | | | 1.76 | | | | 105,016 | | | | 69.61 | |
| | 15.55 | | | | 11.54 | | | | 0.85 | | | | 1.25 | | | | 1.63 | | | | 118,300 | | | | 79.31 | |
| | 16.27 | | | | 27.93 | | | | 0.85 | | | | 1.27 | | | | 1.62 | | | | 128,593 | | | | 65.36 | |
| | 14.22 | | | | 12.46 | | | | 1.07 | | | | 1.26 | | | | 2.42 | | | | 110,603 | | | | 116.38 | |
| | See Notes to Financial Statements. | 17 |
Notes to Financial Statements
Lord Abbett Series Fund, Inc. (the “Company”) is registered under the Investment Company Act of 1940, as amended (the “Act”), as a diversified, open-end management investment company and was incorporated under Maryland law in 1989. The Company consists of thirteen separate portfolios. This report covers Calibrated Dividend Growth Portfolio (the “Fund”).
The Fund’s investment objective is to seek current income and capital appreciation. The Fund has Variable Contract class shares (“Class VC Shares”), which are currently issued and redeemed only in connection with investments in, and payments under, variable annuity contracts and variable life insurance policies issued by life insurance and insurance-related companies.
The preparation of the financial statements in conformity with accounting principles generally accepted in the United States of America (“U.S. GAAP”) requires management to make certain estimates and assumptions that affect the reported amounts of assets and liabilities and disclosure of contingent assets and liabilities at the date of the financial statements and the reported amounts of increases and decreases in net assets from operations during the reporting period. Actual results could differ from those estimates. The Fund is considered an investment company under U.S. GAAP and follows the accounting and reporting guidance applicable to investment companies.
| 2. | SIGNIFICANT ACCOUNTING POLICIES |
| (a) | Investment Valuation–Under procedures approved by the Fund’s Board of Directors (the “Board”), Lord, Abbett & Co. LLC (“Lord Abbett”), the Fund’s investment manager, has formed a Pricing Committee to administer the pricing and valuation of portfolio investments and to ensure that prices utilized reasonably reflect fair value. Among other things, these procedures allow the Fund to utilize independent pricing services, quotations from securities and financial instrument dealers and other market sources to determine fair value. |
| | |
| | Securities actively traded on any recognized U.S. or non-U.S. exchange or on The NASDAQ Stock Market LLC are valued at the last sale price or official closing price on the exchange or system on which they are principally traded. Events occurring after the close of trading on non-U.S. exchanges may result in adjustments to the valuation of foreign securities to reflect their fair value as of the close of regular trading on the New York Stock Exchange. The Fund may utilize an independent fair valuation service in adjusting the valuations of foreign securities. Unlisted equity securities are valued at the last quoted sale price or, if no sale price is available, at the mean between the most recently quoted bid and asked prices. Exchange traded options and futures contracts are valued at the last sale price in the market where they are principally traded. If no sale has occurred, the mean between the most recently quoted bid and asked prices is used. |
| | |
| | Securities for which prices are not readily available are valued at fair value as determined by the Pricing Committee. The Pricing Committee considers a number of factors, including observable and unobservable inputs, when arriving at fair value. The Pricing Committee may use related or comparable assets or liabilities, recent transactions, market multiples, book values and other relevant information to determine the fair value of portfolio investments. The Board or a designated committee thereof regularly reviews fair value determinations made by the Pricing Committee and employs techniques such as reviewing related market activity, reviewing inputs and assumptions, and retrospectively comparing prices of subsequent purchases and sales transactions to fair value determinations made by the Pricing Committee. |
18
Notes to Financial Statements (continued)
| | Short-term securities with 60 days or less remaining to maturity are valued using the amortized cost method, which approximates fair value. |
| | |
| (b) | Security Transactions–Security transactions are recorded as of the date that the securities are purchased or sold (trade date). Realized gains and losses on sales of portfolio securities are calculated using the identified-cost method. |
| | |
| (c) | Investment Income–Dividend income is recorded on the ex-dividend date. Interest income is recorded on the accrual basis as earned. Discounts are accreted and premiums are amortized using the effective interest method and are included in Interest and other income on the Statement of Operations. Withholding taxes on foreign dividends have been provided for in accordance with the applicable country’s tax rules and rates. |
| | |
| (d) | Income Taxes–It is the policy of the Fund to meet the requirements of Subchapter M of the Internal Revenue Code applicable to regulated investment companies and to distribute substantially all taxable income and capital gains to its shareholders. Therefore, no income tax provision is required. |
| | |
| | The Fund files U.S. federal and various state and local tax returns. No income tax returns are currently under examination. The statute of limitations on the Fund’s filed U.S. federal tax returns remains open for the fiscal years ended December 31, 2013 through December 31, 2016. The statutes of limitations on the Company’s state and local tax returns may remain open for an additional year depending upon the jurisdiction. |
| | |
| (e) | Expenses–Expenses incurred by the Company that do not specifically relate to an individual fund are generally allocated to the funds within the Company on a pro rata basis by relative net assets. |
| | |
| (f) | Foreign Transactions–The books and records of the Fund are maintained in U.S. dollars and transactions denominated in foreign currencies are recorded in the Fund’s records at the rate prevailing when earned or recorded. Asset and liability accounts that are denominated in foreign currencies are adjusted daily to reflect current exchange rates and any unrealized gain (loss) is included in Net change in unrealized appreciation/depreciation on futures contracts and translation of assets and liabilities denominated in foreign currencies in the Fund’s Statement of Operations. The resultant exchange gains and losses upon settlement of such transactions are included in Net realized gain on futures contracts and foreign currency related transactions in the Fund’s Statement of Operations. The Fund does not isolate that portion of the results of operations arising as a result of changes in the foreign exchange rates from the changes in market prices of the securities. |
| | |
| (g) | Futures Contracts–The Fund may purchase and sell index futures contracts to manage cash, or as a substitute position in lieu of holding the underlying asset on which the instrument is based. At the time of entering into a futures transaction, an investor is required to deposit and maintain a specified amount of cash or eligible securities called “initial margin.” Subsequent payments made or received by the Fund called “variation margin” are made on a daily basis as the market price of the futures contract fluctuates. The Fund will record an unrealized gain (loss) based on the amount of variation margin. When a contract is closed, a realized gain (loss) is recorded equal to the difference between the opening and closing value of the contract. |
| | |
| (h) | Repurchase Agreements–The Fund may enter into repurchase agreements with respect to securities. A repurchase agreement is a transaction in which a fund acquires a security and simultaneously commits to resell that security to the seller (a bank or securities dealer) at an |
19
Notes to Financial Statements (continued)
| | agreed-upon price on an agreed-upon date. The Fund requires at all times that the repurchase agreement be collateralized by cash, or by securities of the U.S. Government, its agencies, its instrumentalities, or U.S. Government sponsored enterprises having a value equal to, or in excess of, the value of the repurchase agreement (including accrued interest). If the seller of the agreement defaults on its obligation to repurchase the underlying securities at a time when the fair value of these securities has declined, the Fund may incur a loss upon disposition of the securities. |
| | |
| (i) | Fair Value Measurements–Fair value is defined as the price that the Fund would receive upon selling an investment or transferring a liability in an orderly transaction to an independent buyer in the principal or most advantageous market of the investment. A three-tier hierarchy is used to maximize the use of observable market data and minimize the use of unobservable inputs and to establish classification of fair value measurements for disclosure purposes. Inputs refer broadly to the assumptions that market participants would use in pricing the asset or liability, including assumptions about risk – for example, the risk inherent in a particular valuation technique used to measure fair value (such as a pricing model) and/or the risk inherent in the inputs to the valuation technique. Inputs may be observable or unobservable. Observable inputs reflect the assumptions market participants would use in pricing the asset or liability. Observable inputs are based on market data obtained from sources independent of the reporting entity. Unobservable inputs reflect the reporting entity’s own assumptions about the assumptions market participants would use in pricing the asset or liability. Unobservable inputs are based on the best information available in the circumstances. The three-tier hierarchy classification is determined based on the lowest level of inputs that is significant to the fair value measurement, and is summarized in the three broad Levels listed below: |
| | • | Level 1 – unadjusted quoted prices in active markets for identical investments; |
| | | | |
| | • | Level 2 – other significant observable inputs (including quoted prices for similar investments, interest rates, prepayment speeds, credit risk, etc.); and |
| | | | |
| | • | Level 3 – significant unobservable inputs (including the Fund’s own assumptions in determining the fair value of investments). |
| | A summary of inputs used in valuing the Fund’s investments and other financial instruments as of December 31, 2016 and, if applicable, Level 1/Level 2 transfers and Level 3 rollforwards for the fiscal year then ended is included in the Fund’s Schedule of Investments. |
| | |
| | Changes in valuation techniques may result in transfers into or out of an assigned level within the three-tier hierarchy. All transfers between different levels within the three-tier hierarchy are deemed to have occurred as of the beginning of the reporting period. The inputs or methodology used for valuing securities are not necessarily an indication of the risk associated with investing in those securities. |
| 3. | MANAGEMENT FEE AND OTHER TRANSACTIONS WITH AFFILIATES |
Management Fee
The Company has a management agreement with Lord Abbett, pursuant to which Lord Abbett supplies the Fund with investment management services and executive and other personnel, provides office space and pays for ordinary and necessary office and clerical expenses relating to research and statistical work and supervision of the Fund’s investment portfolio.
20
Notes to Financial Statements (continued)
The management fee is based on the Fund’s average daily net assets at the following annual rate:
| First $1 billion | .75% |
| Next $1 billion | .70% |
| Over $2 billion | .65% |
For the fiscal year ended December 31, 2016, the effective management fee, net of waivers, was at an annualized rate of .35% of the Fund’s average daily net assets.
In addition, Lord Abbett provides certain administrative services to the Fund pursuant to an Administrative Services Agreement in return for a fee at an annual rate of .04% of the Fund’s average daily net assets.
During the fiscal year ended December 31, 2016 and continuing through April 30, 2017, Lord Abbett has contractually agreed to waive its fees and reimburse expenses to the extent necessary to limit total net annual operating expenses to an annual rate of .85%. This agreement may be terminated only upon the approval of the Board.
The Company, on behalf of the Fund, has entered into services arrangements with certain insurance companies. Under these arrangements, certain insurance companies will be compensated up to .25% of the average daily net asset value (“NAV”) of the Fund’s Class VC Shares held in the insurance company’s separate account to service and maintain the Variable Contract owners’ accounts. This amount is included in Non 12b-1 service fees on the Statement of Operations. The Fund may also compensate certain insurance companies, third-party administrators and other entities for providing recordkeeping, sub-transfer agency and other administrative services to the Fund. This amount is included in Shareholder servicing on the Statement of Operations.
Two Directors and certain of the Company’s officers have an interest in Lord Abbett.
| 4. | DISTRIBUTIONS AND CAPITAL LOSS CARRYFORWARDS |
Dividends from net investment income, if any, are declared and paid at least semi-annually. Taxable net realized gains from investment transactions, reduced by allowable capital loss carryforwards, if any, are declared and distributed to shareholders at least annually. The capital loss carryforward amount, if any, is available to offset future net capital gains. Dividends and distributions to shareholders are recorded on the ex-dividend date. The amounts of dividends and distributions from net investment income and net realized capital gains are determined in accordance with federal income tax regulations, which may differ from U.S. GAAP. These book/tax differences are either considered temporary or permanent in nature. To the extent these differences are permanent in nature, such amounts are reclassified within the components of net assets based on their federal tax basis treatment; temporary differences do not require reclassification. Dividends and distributions that exceed earnings and profits for tax purposes are reported as a tax return of capital.
The tax character of distributions paid during the fiscal years ended December 31, 2016 and 2015 was as follows:
| | | Year Ended
12/31/2016 | | | Year Ended
12/31/2015 | |
| Distributions paid from: | | | | | | | | |
| Ordinary income | | $ | 4,821,625 | | | $ | 5,299,556 | |
| Net long-term capital gains | | | 8,282,898 | | | | 6,242,510 | |
| Total distributions paid | | $ | 13,104,523 | | | $ | 11,542,066 | |
21
Notes to Financial Statements (continued)
As of December 31, 2016, the components of accumulated gains on a tax-basis were as follows:
| Undistributed ordinary income – net | | $ | 1,216,635 | |
| Undistributed long-term capital gains | | | 696,061 | |
| Total undistributed earnings | | | 1,912,696 | |
| Temporary differences | | | (20,203 | ) |
| Unrealized gains – net | | | 4,866,095 | |
| Total accumulated gains – net | | $ | 6,758,588 | |
As of December 31, 2016, the aggregate unrealized security gains and losses based on cost for U.S. federal income tax purposes were as follows:
| Tax cost | | $ | 166,319,915 | |
| Gross unrealized gain | | | 8,066,778 | |
| Gross unrealized loss | | | (3,200,683 | ) |
| Net unrealized security gain | | $ | 4,866,095 | |
The difference between book-basis and tax-basis unrealized gains (losses) is attributable to wash sales.
| 5. | PORTFOLIO SECURITIES TRANSACTIONS |
Purchases and sales of investment securities (excluding short-term investments) for the fiscal year ended December 31, 2016 were as follows:
| Purchases | Sales |
| $157,793,354 | $108,703,756 |
There were no purchases or sales of U.S. Government securities for the fiscal year ended December 31, 2016.
| 6. | DISCLOSURES ABOUT DERIVATIVE INSTRUMENTS AND HEDGING ACTIVITIES |
The Fund entered into E-Mini S&P 500 Index futures contracts for the fiscal year ended December 31, 2016 (as described in note 2(g)) to manage cash. The Fund bears the risk that the underlying index will move unexpectedly, in which case the Fund may realize a loss. There is minimal counterparty credit risk to the Fund since futures are exchange traded and the exchange’s clearinghouse, as counterparty to all exchange traded futures, guarantees futures against default.
As of December 31, 2016, the Fund had futures contracts with unrealized depreciation of $(4,125), which is included in the Schedule of Investments. Only current day’s variation margin is reported within the Fund’s Statement of Assets and Liabilities. Amounts of $146,195 and $164 are included in the Statement of Operations related to futures contracts under the captions Net realized gain on futures contracts and Net change in unrealized appreciation/depreciation on futures contracts, respectively. The average number of futures contracts throughout the period was 10.
| 7. | DISCLOSURES ABOUT OFFSETTING ASSETS AND LIABILITIES |
The Financial Accounting Standards Board (“FASB”) requires disclosures intended to help better assess the effect or potential effect of offsetting arrangements on a fund’s financial position. The following tables illustrate gross and net information about recognized assets and liabilities eligible for offset in the statement of assets and liabilities; and disclose such amounts subject to an enforceable master netting agreement or similar agreement, by counterparty. A master netting agreement is an agreement between a fund and a counterparty which provides for the net settlement of amounts owed under all contracts traded under that agreement, as well as cash
22
Notes to Financial Statements (continued)
collateral, through a single payment by one party to the other in the event of default on or termination of any one contract. The Fund’s accounting policy with respect to balance sheet offsetting is that, absent an event of default by the counterparty or a termination of the agreement, the master netting agreement does not result in an offset of reported amounts of financial assets and liabilities in the statement of assets and liabilities across transactions between the Fund and the applicable counterparty:
| | | | | | Gross Amounts | | | Net Amounts of |
| | | | | | Offset in the | | | Assets Presented |
| | | Gross Amounts of | | | Statement of Assets | | | in the Statement of |
| Description | | Recognized Assets | | | and Liabilities | | | Assets and Liabilities |
| Repurchase Agreement | | | $1,684,987 | | | $ | – | | | | $1,684,987 |
| Total | | | $1,684,987 | | | $ | – | | | | $1,684,987 |
| | | Net Amounts | | | | | | |
| | | of Assets | | | Amounts Not Offset in the | | | |
| | | Presented in | | | Statement of Assets and Liabilities | | | |
| | | the Statement | | | | | | Cash | | | Securities | | | |
| | | of Assets and | | | Financial | | | Collateral | | | Collateral | | | Net |
| Counterparty | | Liabilities | | | Instruments | | | Received(a) | | | Received(a) | | | Amount(b) |
| Fixed Income Clearing Corp. | | | $1,684,987 | | | $ | – | | | $ | – | | | | $(1,684,987 | ) | | $ | – |
| Total | | | $1,684,987 | | | $ | – | | | $ | – | | | | $(1,684,987 | ) | | $ | – |
| (a) | Collateral disclosed is limited to an amount not to exceed 100% of the net amount of assets presented in the Statement of Assets and Liabilities, for each respective counterparty. |
| (b) | Net amount represents the amount owed to the Fund by the counterparty as of December 31, 2016. |
| 8. | DIRECTORS’ REMUNERATION |
The Company’s officers and two Directors, who are associated with Lord Abbett, do not receive any compensation from the Company for serving in such capacities. Independent Directors’ fees are allocated among all Lord Abbett-sponsored funds based on the net assets of each fund. There is an equity-based plan available to all Independent Directors under which Independent Directors must defer receipt of a portion of, and may elect to defer receipt of an additional portion of Directors’ fees. The deferred amounts are treated as though equivalent dollar amounts had been invested in the funds. Such amounts and earnings accrued thereon are included in Directors’ fees on the Statement of Operations and in Directors’ fees payable on the Statement of Assets and Liabilities and are not deductible for U.S. federal income tax purposes until such amounts are paid.
The Company has entered into an arrangement with its transfer agent and custodian, whereby credits realized as a result of uninvested cash balances are used to reduce a portion of the Fund’s expenses.
The Fund and certain other funds managed by Lord Abbett (collectively, the “Participating Funds”) entered into a syndicated line of credit facility with various lenders for $550 million (the “Facility”), whereas State Street Bank and Trust Company (“SSB”) participates as a lender and as agent for the lenders. The Facility is to be used for temporary or emergency purposes as an additional source of liquidity to satisfy redemptions. The Participating Funds are subject to graduated borrowing limits of one-third of Fund assets (if Fund assets are less than $750 million), $250 million, $300 million,
23
Notes to Financial Statements (concluded)
or $350 million, based on past borrowings and likelihood of future borrowings. The Facility will continue through August 28, 2017.
During the fiscal year ended December 31, 2016, the Fund did not utilize the Facility.
| 11. | INTERFUND LENDING PROGRAM |
On July 26, 2016, the U.S. Securities and Exchange Commission issued an exemptive order (“SEC exemptive order”) which permits certain registered open-end management investment companies managed by Lord Abbett, including the Fund, to participate in a joint lending and borrowing program (the “Interfund Lending Program”). The SEC exemptive order allows the Funds to borrow money from and lend money to each other for temporary or emergency purposes subject to the limitations and conditions.
During the fiscal year ended December 31, 2016, the Fund did not participate as a borrower or lender in the Interfund Lending Program.
| 12. | CUSTODIAN AND ACCOUNTING AGENT |
SSB is the Company’s custodian and accounting agent. SSB performs custodial, accounting and recordkeeping functions relating to portfolio transactions and calculating the Fund’s NAV.
The Fund is subject to the general risks and considerations associated with equity investing. The Fund invests primarily in equity securities of large and mid-sized company stocks that have a history of growing their dividends, but there is no guarantee that a company will pay a dividend. The value of the Fund’s investments in equity securities will fluctuate in response to general economic conditions and to the changes in the prospects of particular companies and/or sectors in the economy. If the Fund’s fundamental research and quantitative analysis fail to produce the intended result, the Fund may suffer losses or underperform its benchmark or other funds with the same investment objective or similar strategies, even in a rising market.
Large and mid-sized company stocks each may perform differently than the market as a whole and other types of stocks. This is because different types of stocks tend to shift in and out of favor depending on market and economic conditions. Mid-sized company stocks may be less able to weather economic shifts or other adverse developments than those of larger, more established companies.
The Fund’s exposure to foreign companies and markets presents increased market, liquidity, currency, political and other risks.
These factors can affect the Fund’s performance.
| 14. | SUMMARY OF CAPITAL TRANSACTIONS |
Transactions in shares of capital stock were as follows:
| | | Year Ended | | | Year Ended | |
| | | December 31, 2016 | | | December 31, 2015 | |
| Shares sold | | | 6,045,995 | | | | 2,104,100 | |
| Reinvestment of distributions | | | 893,876 | | | | 827,804 | |
| Shares reacquired | | | (2,821,771 | ) | | | (2,817,767 | ) |
| Increase | | | 4,118,100 | | | | 114,137 | |
24
Report of Independent Registered Public Accounting Firm
To the Board of Directors of Lord Abbett Series Fund, Inc. and the Shareholders of Calibrated Dividend Growth Portfolio:
We have audited the accompanying statement of assets and liabilities, including the schedule of investments, of the Calibrated Dividend Growth Portfolio, one of the portfolios constituting the Lord Abbett Series Fund, Inc. (the “Fund”) as of December 31, 2016, and the related statement of operations for the year then ended, the statements of changes in net assets for each of the two years in the period then ended, and the financial highlights for each of the five years in the period then ended. These financial statements and financial highlights are the responsibility of the Fund’s management. Our responsibility is to express an opinion on these financial statements and financial highlights based on our audits.
We conducted our audits in accordance with the standards of the Public Company Accounting Oversight Board (United States). Those standards require that we plan and perform the audit to obtain reasonable assurance about whether the financial statements and financial highlights are free of material misstatement. The Fund is not required to have, nor were we engaged to perform, an audit of its internal control over financial reporting. Our audits included consideration of internal control over financial reporting as a basis for designing audit procedures that are appropriate in the circumstances, but not for the purpose of expressing an opinion on the effectiveness of the Fund’s internal control over financial reporting. Accordingly, we express no such opinion. An audit also includes examining, on a test basis, evidence supporting the amounts and disclosures in the financial statements, assessing the accounting principles used and significant estimates made by management, as well as evaluating the overall financial statement presentation. Our procedures included confirmation of securities owned as of December 31, 2016, by correspondence with the custodian and brokers; when replies were not received from brokers, we performed other auditing procedures. We believe that our audits provide a reasonable basis for our opinion.
In our opinion, such financial statements and financial highlights referred to above present fairly, in all material respects, the financial position of Calibrated Dividend Growth Portfolio of the Lord Abbett Series Fund, Inc. as of December 31, 2016, the results of its operations for the year then ended, the changes in its net assets for each of the two years in the period then ended, and the financial highlights for each of the five years in the period then ended, in conformity with accounting principles generally accepted in the United States of America.
DELOITTE & TOUCHE LLP
New York, New York
February 15, 2017
25
Basic Information About Management
The Board is responsible for the management of the business and affairs of the Company in accordance with the laws of the State of Maryland. The Board elects officers who are responsible for the day-to-day operations of each Fund and who execute policies authorized by the Board. The Board also approves an investment adviser to each Fund and continues to monitor the cost and quality of the services the investment adviser provides, and annually considers whether to renew the contract with the adviser. Generally, each Director holds office until his/her successor is elected and qualified or until his/her earlier resignation or removal, as provided in the Company’s organizational documents.
Lord Abbett, a Delaware limited liability company, is the Fund’s investment adviser. Designated Lord Abbett personnel are responsible for the day-to-day management of the Funds.
Interested Directors
Ms. Foster and Mr. Sieg are affiliated with Lord Abbett and are “interested persons” of the Company as defined in the Act. Ms. Foster and Mr. Sieg are directors/trustees of each of the 12 investment companies in the Lord Abbett Family of Funds, which consist of 60 portfolios or series. Ms. Foster is an officer of the Lord Abbett Family of Funds.
Name, Address and
Year of Birth | | Current Position and
Length of Service
with the Company | | Principal Occupation and Other Directorships
During the Past Five Years |
Daria L. Foster
Lord, Abbett & Co. LLC
90 Hudson Street
Jersey City, NJ 07302
(1954) | | Director and President since 2006; Chief Executive Officer since 2012 | | Principal Occupation: Managing Partner of Lord Abbett, joined Lord Abbett in 1990.
Other Directorships: None. |
| | | | | |
Douglas B. Sieg
Lord, Abbett & Co. LLC
90 Hudson Street
Jersey City, NJ 07302
(1969) | | Director since 2016 | | Principal Occupation: Partner (since 2001) and Head of Client Services (since 2013), formerly Director of Marketing and Relationship Management, joined Lord Abbett in 1994.
Other Directorships: None. |
Independent Directors
The following Independent Directors also are directors/trustees of each of the 12 investment companies in the Lord Abbett Family of Funds, which consist of 60 portfolios or series.
Name, Address and
Year of Birth | | Current Position and
Length of Service
with the Company | | Principal Occupation and Other Directorships
During the Past Five Years |
Robert B. Calhoun, Jr.
Lord, Abbett & Co. LLC
c/o Legal Dept.
90 Hudson Street
Jersey City, NJ 07302
(1942) | | Director since 1998 | | Principal Occupation: Senior Advisor of Monitor Clipper Partners, a private equity investment fund (since 1997); President of Clipper Asset Management Corp. (1991–2009).
Other Directorships: None. |
26
Basic Information About Management (continued)
Name, Address and
Year of Birth | | Current Position and
Length of Service
with the Company | | Principal Occupation and Other Directorships
During the Past Five Years |
Eric C. Fast
Lord, Abbett & Co. LLC
c/o Legal Dept.
90 Hudson Street
Jersey City, NJ 07302
(1949) | | Director since 2014 | | Principal Occupation: Chief Executive Officer of Crane Co., an industrial products company (2001–2014).
Other Directorships: Currently serves as director of Automatic Data Processing, Inc. (since 2007) and Regions Financial Corporation (since 2010). Previously served as a director of Crane Co. (1999–2014). |
| | | | | |
Evelyn E. Guernsey
Lord, Abbett & Co. LLC
c/o Legal Dept.
90 Hudson Street
Jersey City, NJ 07302
(1955) | | Director since 2011 | | Principal Occupation: CEO, Americas of J.P. Morgan Asset Management (2004–2010).
Other Directorships: None. |
| | | | | |
Julie A. Hill
Lord, Abbett & Co. LLC
c/o Legal Dept.
90 Hudson Street
Jersey City, NJ 07302
(1946) | | Director since 2004 | | Principal Occupation: Owner and CEO of The Hill Company, a business consulting firm (since 1998).
Other Directorships: Currently serves as director of Anthem, Inc., a health benefits company (since 1994). |
| | | | | |
Franklin W. Hobbs
Lord, Abbett & Co. LLC
c/o Legal Dept.
90 Hudson Street
Jersey City, NJ 07302
(1947) | | Director since 2001 | | Principal Occupation: Advisor of One Equity Partners, a private equity firm (since 2004).
Other Directorships: Currently serves as director and Chairman of the Board of Ally Financial Inc., a financial services firm (since 2009), and as director of Molson Coors Brewing Company (since 2002). |
| | | | | |
James M. McTaggart
Lord, Abbett & Co. LLC
c/o Legal Dept.
90 Hudson Street
Jersey City, NJ 07302
(1947) | | Director since 2012 | | Principal Occupation: Independent management advisor and consultant (since 2012); Vice President, CRA International, Inc. (doing business as Charles River Associates), a global management consulting firm (2009–2012); Founder and Chairman of Marakon Associates, Inc., a strategy consulting firm (1978–2009); and Officer and Director of Trinsum Group, a holding company (2007–2009).
Other Directorships: Currently serves as director of Blyth, Inc., a home products company (since 2004). |
| | | | | |
Mark A. Schmid
Lord, Abbett & Co. LLC
c/o Legal Dept.
90 Hudson Street
Jersey City, NJ 07302
(1959) | | Director since 2016 | | Principal Occupation: Vice President and Chief Investment Officer of the University of Chicago (since 2009).
Other Directorships: None. |
27
Basic Information About Management (continued)
Name, Address and
Year of Birth | | Current Position and
Length of Service
with the Company | | Principal Occupation and Other Directorships
During the Past Five Years |
James L.L. Tullis
Lord, Abbett & Co. LLC
c/o Legal Dept.
90 Hudson Street
Jersey City, NJ 07302
(1947) | | Director since 2006;
Chairman since 2017 | | Principal Occupation: CEO of Tullis-Dickerson and Co. Inc., a venture capital management firm (since 1990); CEO of Tullis Health Investors Inc. (since 2012).
Other Directorships: Currently serves as director of Crane Co. (since 1998). |
Officers
None of the officers listed below have received compensation from the Company. All of the officers of the Company also may be officers of the other Lord Abbett Funds and maintain offices at 90 Hudson Street, Jersey City, NJ 07302. Unless otherwise indicated, the position(s) and title(s) listed under the “Principal Occupation During the Past Five Years” column indicate each officer’s position(s) and title(s) with Lord Abbett. Each officer serves for an indefinite term (i.e., until his or her death, resignation, retirement, or removal).
Name and
Year of Birth | | Current Position
with the Company | | Length of Service
of Current
Position | | Principal Occupation
During the Past Five Years |
Daria L. Foster
(1954) | | President and Chief Executive Officer | | Elected as President in 2006 and Chief Executive Officer in 2012 | | Managing Partner of Lord Abbett, joined Lord Abbett in 1990. |
| | | | | | | |
Sean J. Aurigemma
(1969) | | Executive Vice President | | Elected in 2010 | | Portfolio Manager, joined Lord Abbett in 2007. |
| | | | | | | |
Jeff D. Diamond
(1960) | | Executive Vice President | | Elected in 2008 | | Portfolio Manager, joined Lord Abbett in 2007. |
| | | | | | | |
Todd D. Jacobson
(1966) | | Executive Vice President | | Elected in 2005 | | Partner and Associate Director, joined Lord Abbett in 2003. |
| | | | | | | |
Robert A. Lee
(1969) | | Executive Vice President | | Elected in 2010 | | Partner and Chief Investment Officer, and was formerly Deputy Chief Investment Officer and Director of Taxable Fixed Income, joined Lord Abbett in 1997. |
| | | | | | | |
Thomas B. Maher
(1967) | | Executive Vice President | | Elected in 2010 | | Partner and Portfolio Manager, joined Lord Abbett in 2003. |
| | | | | | | |
Justin C. Maurer
(1969) | | Executive Vice President | | Elected in 2010 | | Partner and Portfolio Manager, joined Lord Abbett in 2001. |
| | | | | | | |
Vincent J. McBride
(1964) | | Executive Vice President | | Elected in 2010 | | Partner and Director, joined Lord Abbett in 2003. |
| | | | | | | |
Andrew H. O’Brien
(1973) | | Executive Vice President | | Elected in 2010 | | Partner and Portfolio Manager, joined Lord Abbett in 1998. |
28
Basic Information About Management (continued)
Name and
Year of Birth | | Current Position
with the Company | | Length of Service
of Current
Position | | Principal Occupation
During the Past Five Years |
F. Thomas O’Halloran, III
(1955) | | Executive Vice President | | Elected in 2010 | | Partner and Portfolio Manager, joined Lord Abbett in 2001. |
| | | | | | | |
Marc Pavese
(1972) | | Executive Vice President | | Elected in 2016 | | Partner and Portfolio Manager, joined Lord Abbett in 2008. |
| | | | | | | |
Walter H. Prahl
(1958) | | Executive Vice President | | Elected in 2012 | | Partner and Director, joined Lord Abbett in 1997. |
| | | | | | | |
Steven F. Rocco
(1979) | | Executive Vice President | | Elected in 2014 | | Partner and Portfolio Manager, joined Lord Abbett in 2004. |
| | | | | | | |
Didier O. Rosenfeld
(1976) | | Executive Vice President | | Elected in 2016 | | Director of Global Equity, joined Lord Abbett in 2015 and was formerly a Portfolio Manager and Senior Analyst at Cornerstone Capital Management (2014–2015) and Managing Director at State Street Global Advisors (2000–2013). |
| | | | | | | |
Frederick J. Ruvkun
(1957) | | Executive Vice President | | Elected in 2012 | | Partner and Portfolio Manager, joined Lord Abbett in 2006. |
| | | | | | | |
Paul J. Volovich
(1973) | | Executive Vice President | | Elected in 2005 | | Partner and Portfolio Manager, joined Lord Abbett in 1997. |
| | | | | | | |
A. Edward Allinson
(1961) | | Vice President | | Elected in 2011 | | Portfolio Manager, joined Lord Abbett in 2005. |
| | | | | | | |
John W. Ashbrook
(1964) | | Vice President and Assistant Secretary | | Elected in 2014 | | Assistant General Counsel, joined Lord Abbett in 2008. |
| | | | | | | |
Joan A. Binstock
(1954) | | Chief Financial Officer and Vice President | | Elected in 1999 | | Partner and Chief Financial Officer, and was formerly Chief Operations Officer, joined Lord Abbett in 1999. |
| | | | | | | |
Brooke A. Fapohunda
(1975) | | Vice President and Assistant Secretary | | Elected in 2014 | | Deputy General Counsel, joined Lord Abbett in 2006. |
| | | | | | | |
John K. Forst
(1960) | | Vice President and Assistant Secretary | | Elected in 2005 | | Partner and Deputy General Counsel, joined Lord Abbett in 2004. |
| | | | | | | |
Anthony W. Hipple
(1964) | | Vice President | | Elected in 2014 | | Portfolio Manager, joined Lord Abbett in 2002. |
| | | | | | | |
Lawrence H. Kaplan
(1957) | | Vice President and Secretary | | Elected in 1997 | | Partner and General Counsel, joined Lord Abbett in 1997. |
29
Basic Information About Management (concluded)
Name and
Year of Birth | | Current Position
with the Company | | Length of Service
of Current
Position | | Principal Occupation
During the Past Five Years |
Linda Y. Kim
(1980) | | Vice President and Assistant Secretary | | Elected in 2016 | | Counsel, joined Lord Abbett in 2015 and was formerly an Associate at Stroock & Stroock & Lavan LLP (2007–2015). |
| | | | | | | |
David J. Linsen
(1974) | | Vice President | | Elected in 2008 | | Partner and Director, joined Lord Abbett in 2001. |
| | | | | | | |
Joseph M. McGill
(1962) | | Chief Compliance Officer | | Elected in 2014 | | Partner and Chief Compliance Officer, joined Lord Abbett in 2014 and was formerly Managing Director and the Chief Compliance Officer at UBS Global Asset Management (2003–2013). |
| | | | | | | |
A. Edward Oberhaus, III
(1959) | | Vice President | | Elected in 1998 | | Partner and Director, joined Lord Abbett in 1983. |
| | | | | | | |
Noah Petrucci
(1970) | | Vice President | | Elected in 2013 | | Portfolio Manager, joined Lord Abbett in 2012 and was formerly a Portfolio Manager at Columbia Management Investment Advisers, LLC and Columbia Management Advisors, LLC (2002–2012). |
| | | | | | | |
Lawrence B. Stoller
(1963) | | Vice President and Assistant Secretary | | Elected in 2007 | | Partner and Senior Deputy General Counsel, joined Lord Abbett in 2007. |
| | | | | | | |
Leah G. Traub
(1979) | | Vice President | | Elected in 2016 | | Partner and Portfolio Manager, joined Lord Abbett in 2007. |
| | | | | | | |
Arthur K. Weise
(1970) | | Vice President | | Elected in 2010 | | Partner and Portfolio Manager, joined Lord Abbett in 2007. |
| | | | | | | |
Kewjin Yuoh
(1971) | | Vice President | | Elected in 2012 | | Partner and Portfolio Manager, joined Lord Abbett in 2010. |
| | | | | | | |
Scott S. Wallner
(1955) | | AML Compliance Officer | | Elected in 2011 | | Assistant General Counsel, joined Lord Abbett in 2004. |
| | | | | | | |
Bernard J. Grzelak
(1971) | | Treasurer | | Elected in 2003 | | Partner and Chief Operations Officer, and was formerly Director of Fund Administration, joined Lord Abbett in 2003. |
Please call 888-522-2388 for a copy of the statement of additional information, which contains further information about the Company’s Directors. It is available free upon request.
30
Approval of Advisory Contract
The Board, including all of the Directors who are not interested persons of the Fund or of Lord Abbett (the “Independent Board Members”), annually considers whether to approve the continuation of the existing management agreement between the Fund and Lord Abbett (the “Agreement”). In connection with its most recent approval, the Board reviewed materials relating specifically to the Agreement, as well as numerous materials received throughout the course of the year, including information about the Fund’s investment performance compared to the performance of its benchmark. Before making its decision as to the Fund, the Board had the opportunity to ask questions and request further information, taking into account its familiarity with Lord Abbett gained through its meetings and discussions. These meetings and discussions included the review of the portfolio management team conducted by members of the Contract Committee, the deliberations of the Contract Committee, and discussions between the Contract Committee and Lord Abbett’s management. The Independent Board Members also met with their independent legal counsel in a private session at which no representatives of management were present.
The materials received by the Board included, but were not limited to: (1) information provided by Morningstar Associates, LLC (“Morningstar”) regarding the investment performance of the Fund compared to the investment performance of certain funds with similar investment styles as determined by Morningstar, based, in part, on the Fund’s Morningstar category (the “performance peer group”), and the investment performance of two appropriate benchmarks; (2) information provided by Morningstar regarding the expense ratios, contractual and effective management fee rates, and other expense components for the Fund and certain funds in the same Morningstar category, with generally the same or similar share classes and operational characteristics, including asset size (the “expense peer group”); (3) certain supplemental investment performance information provided by Lord Abbett; (4) information provided by Lord Abbett on the expense ratios, management fee rates, and other expense components for the Fund; (5) sales and redemption information for the Fund; (6) information regarding Lord Abbett’s financial condition; (7) an analysis of the relative profitability of the Agreement to Lord Abbett; (8) information provided by Lord Abbett regarding the investment management fee schedules for Lord Abbett’s other advisory clients maintaining accounts with a similar investment strategy as the Fund; and (9) information regarding the personnel and other resources devoted by Lord Abbett to managing the Fund.
Investment Management Services Generally. The Board considered the investment management services provided by Lord Abbett to the Fund, including investment research, portfolio management, and trading, and Lord Abbett’s commitment to compliance with all applicable legal requirements. The Board also observed that Lord Abbett was solely engaged in the investment management business and accordingly did not experience the conflicts of interest that may result from being engaged in other lines of business. The Board considered the investment advisory services provided by Lord Abbett to other clients, the fees charged for the services, and the differences in the nature of the services provided to the Fund and other Lord Abbett Funds, on the one hand, and the services provided to other clients, on the other. After reviewing these and related factors, the Board concluded that the Fund was likely to continue to benefit from the nature, extent and quality of the investment services provided by Lord Abbett under the Agreement.
Investment Performance. The Board reviewed the Fund’s investment performance in relation to that of the performance peer group and two appropriate benchmarks as of various periods ended August 31, 2016. The Board observed that the Fund’s investment performance was above the median of the performance peer group for the one-year, three-year and ten-year periods and
31
Approval of Advisory Contract (continued)
below the median of the performance peer group for the five-year period. The Board also considered Lord Abbett’s performance and reputation generally, the performance of other Lord Abbett-managed funds overseen by the Board and the willingness of Lord Abbett to take steps intended to improve performance when necessary. After reviewing these and related factors, the Board concluded that the Fund’s investment performance was reasonable and supported the continuation of the Agreement.
Lord Abbett’s Personnel and Methods. The Board considered the qualifications of the personnel providing investment management services to the Fund, in light of its investment objective and discipline. Among other things, the Board considered the size, experience, and turnover of Lord Abbett’s investment management staff, Lord Abbett’s investment methodology and philosophy, and Lord Abbett’s approach to recruiting, training, and retaining investment management personnel.
Nature and Quality of Other Services. The Board considered the nature, quality, costs, and extent of compliance, administrative, and other services performed by Lord Abbett and the nature and extent of Lord Abbett’s supervision of third party service providers, including the Fund’s transfer agent and custodian.
Expenses. The Board considered the expense level of the Fund and the expense levels of the expense peer group. It also considered how the expense levels of the Fund related to those of the expense peer group and the amount and nature of the fees paid by shareholders. The Board observed that the overall expense level of the Fund was below the median of the expense peer group. After reviewing these and related factors, the Board concluded, within the context of its overall approval of the Agreement, that the expense level of the Fund was reasonable and supported the continuation of the Agreement.
Profitability. The Board considered the level of Lord Abbett’s operating margin in managing the Fund, including a review of Lord Abbett’s methodology for allocating its costs to its management of the Fund. It considered whether the Fund was profitable to Lord Abbett in connection with the operation of the Fund, including the fee that Lord Abbett receives from the Fund for providing administrative services to the Fund. The Board also considered the profits realized from other business segments of Lord Abbett, which may benefit from or be related to the Fund’s business. The Board considered Lord Abbett’s profit margins in comparison with available industry data, both accounting for and excluding marketing and distribution expenses, and how those profit margins could affect Lord Abbett’s ability to recruit and retain investment personnel. The Board recognized that Lord Abbett’s overall profitability was a factor in enabling it to attract and retain qualified investment management personnel to provide services to the Fund. After reviewing these and related factors, the Board concluded, within the context of its overall approval of the Agreement, that Lord Abbett’s profitability with respect to the Fund was not excessive.
Economies of Scale. The Board considered the extent to which there had been economies of scale in managing the Fund, whether the Fund’s shareholders had appropriately benefited from such economies of scale, and whether there was potential for realization of any further economies of scale. The Board concluded that the existing management fee schedule, with its breakpoints in the levels of the management fee, in conjunction with a proposed expense limitation agreement adequately addressed any economies of scale in managing the Fund.
Other Benefits to Lord Abbett. The Board considered the character and amount of fees paid by the Fund and the Fund’s shareholders to Lord Abbett and the Distributor for services other than
32
Approval of Advisory Contract (concluded)
investment advisory services. The Board also considered the revenues and profitability of Lord Abbett’s investment advisory business apart from its mutual fund business, and the intangible benefits enjoyed by Lord Abbett by virtue of its relationship with the Fund. The Board observed that the Distributor receives 12b-1 fees from certain of the Lord Abbett Funds as to shares held in accounts for which there is no other broker of record, may retain a portion of the 12b-1 fees it receives, and receives a portion of the sales charges on sales and redemptions of some classes of shares. In addition, the Board observed that Lord Abbett accrues certain benefits for its business of providing investment advice to clients other than the Lord Abbett Funds, but that business also benefits the Funds. The Board also noted that Lord Abbett, as disclosed in the prospectus of the Fund, has entered into revenue sharing arrangements with certain entities that distribute shares of the Fund. The Board also took into consideration the investment research that Lord Abbett receives as a result of Fund brokerage transactions.
Alternative Arrangements. The Board considered whether, instead of approving continuation of the Agreement, it might be in the best interests of the Fund to implement one or more alternative arrangements, such as continuing to employ Lord Abbett, but on different terms. After considering all of the relevant factors, the Board unanimously found that continuation of the Agreement was in the best interests of the Fund and its shareholders and voted unanimously to approve the continuation of the Agreement. In considering whether to approve the continuation of the Agreement, the Board did not identify any single factor as paramount or controlling. Individual Directors may have evaluated the information presented differently from one another, giving different weights to various factors. This summary does not discuss in detail all matters considered.
33
Householding
The Company has adopted a policy that allows it to send only one copy of the Fund’s prospectus, proxy material, annual report and semiannual report to certain shareholders residing at the same “household.” This reduces Fund expenses, which benefits you and other shareholders. If you need additional copies or do not want your mailings to be “householded,” please call Lord Abbett at 888-522-2388 or send a written request with your name, the name of your fund or funds and your account number or numbers to Lord Abbett Family of Funds, P.O. Box 219336, Kansas City, MO 64121.
Proxy Voting Policies, Procedures and Records
A description of the policies and procedures that Lord Abbett uses to vote proxies related to the Fund’s portfolio securities, and information on how Lord Abbett voted the Fund’s proxies during the 12-month period ended June 30 are available without charge, upon request, (i) by calling 888-522-2388; (ii) on Lord Abbett’s Website at www.lordabbett.com; and (iii) on the Securities and Exchange Commission’s (“SEC”) Website at www.sec.gov.
Shareholder Reports and Quarterly Portfolio Disclosure
The Fund is required to file its complete schedule of portfolio holdings with the SEC for its first and third fiscal quarters on Form N-Q. Copies of the filings are available without charge, upon request on the SEC’s Website at www.sec.gov and may be available by calling Lord Abbett at 888-522-2388. You can also obtain copies of Form N-Q by visiting the SEC’s Public Reference Room in Washington, DC (information on the operation of the Public Reference Room may be obtained by calling 800-SEC-0330).
Tax Information For corporate shareholders, 69% of the Fund’s ordinary income distributions qualified for the dividends received deduction. Additionally, of the distributions paid to the shareholders during the fiscal year ended December 31, 2016, $2,060,942 and $8,282,898, respectively, represent short-term capital gains and long-term capital gains. |
34


| This report, when not used for the general information of shareholders of the Fund, is to be distributed only if preceded or accompanied by a current fund prospectus. | | |
| | | |
Lord Abbett mutual fund shares are distributed by
LORD ABBETT DISTRIBUTOR LLC. | Lord Abbett Series Fund, Inc. Calibrated Dividend Growth Portfolio | SFCS-PORT-3 (02/17) |

2016 LORD ABBETT
ANNUAL REPORT
Lord Abbett
Series Fund—Classic Stock Portfolio
For the fiscal year ended December 31, 2016
Table of Contents
Lord Abbett Series Fund — Classic Stock Portfolio
Annual Report
For the fiscal year ended December 31, 2016

From left to right: James L.L. Tullis, Chairman of the Lord Abbett Funds and Daria L. Foster Director, President, and Chief Executive Officer of the Lord Abbett Funds.
Dear Shareholders: We are pleased to provide you with this overview of the performance of Lord Abbett Series Fund — Classic Stock Portfolio for the fiscal year ended December 31, 2016. On this page and the following pages, we discuss the major factors that influenced fiscal year performance. For additional information about the Fund, please visit our website at www.lordabbett.com, where you also can access the quarterly commentaries that provide updates on the Fund’s performance and other portfolio related updates.
Thank you for investing in Lord Abbett mutual funds. We value the trust that you place in us and look forward to serving your investment needs in the years to come.
Best regards,

Daria L. Foster
Director, President and Chief Executive Officer
For the fiscal year ended December 31, 2016, the Fund returned 12.44%, reflecting performance at the net asset value (NAV) of Class VC shares, with all distributions reinvested, compared to its benchmark, the Russell 1000® Index,1 which returned 12.05% over the same period.
Domestic equity markets (as represented by the S&P 500® Index2) returned 11.96% over the past year. Despite this general move higher, there were significant bouts of volatility within U.S. stock markets, including their worst start to a calendar year on record.
Crude oil prices played a significant role in the increased market volatility, as Brent oil prices fluctuated sharply throughout the fiscal year. In December, the Organization of Petroleum Exporting Countries (OPEC) agreed to reduce oil production effective 2017. Furthermore, global markets were affected by the devaluation of China’s currency and weak economic data out of the region. The Chinese economy advanced at an annual rate of 6.7% in the third quarter of 2016, a slower pace than in recent years.
1
Geopolitical events also contributed to volatility in global markets. The United Kingdom’s referendum in June to leave the European Union (“Brexit”) was a surprise that caused a sell-off in global markets.
In contrast to the equity market volatility, the U.S. economy continued to expand during the trailing 12-month period. The Federal Reserve (Fed) raised target rates in for the second time in 12 months in December, from 0.25%–0.50% to 0.50%–0.75%. U.S. gross domestic product (GDP) grew at a 3.2% pace during the third quarter, a significant increase over the second quarter. The U.S. Bureau of Economic Analysis stated that during the third-quarter personal consumption and federal government spending increased, quarter over quarter. In addition to GDP growth, the U.S. unemployment rate remained relatively steady throughout the period, and was reported at 4.6% in November.
The U.S. presidential election took an unexpected turn as Donald J. Trump was elected president, in contrast to indications from poll numbers before the election. Markets rallied on improved clarity in the U.S. political agenda, with the House and Senate also under Republican control.
The Fund modestly outperformed its index during the period. The largest contributors to relative performance during the 12-month period were the heath care and energy sectors. Within the health care sector, shares of UnitedHealth Group Inc., a diversified health and well-being company, rose in the fourth quarter
due to increased momentum in Medicare Advantage enrollment and 2017 earnings guidance that was well above consensus estimates. Shares of St. Jude Medical, Inc., a developer, manufacturer, and distributor of cardiovascular medical devices, surged in late April after it was announced that the company would be acquired by Abbott Laboratories at a substantial premium to its previous closing price, which validated our investment thesis that St. Jude’s underlying assets were more valuable than its share price implied. Within the energy sector, shares of Devon Energy Corp., a North American energy exploration and production company, rose as the company took several steps in 2016 to strengthen its balance sheet, including sale of valuable, but non-core, assets, which helped its shares rise as investors recognized this financial improvement. Shares of EOG Resources, Inc., an explorer, developer, producer, and marketer of natural gas and crude oil, also rose after the company released strong second quarter earnings and growth estimates. The company also advanced in the fourth quarter following OPEC’s agreement to reduce oil production for the first time in eight years.
The largest detractors to relative performance during the trailing 12-month period were the consumer staples and materials sectors. Within the consumer staples sector, shares of CVS Health Corporation, a pharmacy and health care company, fell after the California Public Employee’s Retirement System switched
2
their PBM (pharmacy benefit manager) contract to United Healthcare’s OptumRx. CVS was further hurt during the fourth quarter after the company revised its 2017 guidance expectations, which were well below consensus estimates. Shares of Colgate-Palmolive Co., a manufacturer and seller of consumer products, fell as the company experienced challenges from slower growth due to the headwinds from the macro-economic environment and pressures from competitors in China and India. Within the materials sector, shares of PPG Industries Inc., a manufacturer and distributor of coatings, specialty materials, and glass products, dropped as the
company’s large international exposure created challenges due to the uncertainty of macro-economic conditions, foreign exchange headwinds, and rising prices of raw materials. Shares of Dow Chemical Co., a diversified chemical company that provides chemical, plastic, and agricultural products and services to various customer markets, fell due to investor concerns of a potential global recession following “Brexit”.
The Fund’s portfolio is actively managed and, therefore, its holdings and the weightings of a particular issuer or particular sector as a percentage of portfolio assets are subject to change. Sectors may include many industries.
1 The Russell 1000® Index measures the performance of the 1,000 largest companies in the Russell 3000 Index, which represent approximately 92% of the total market capitalization of the Russell 3000 Index.
2 The S&P 500® Index is widely regarded as the standard for measuring large cap U.S. stock market performance and includes a representative sample of leading companies in leading industries.
Unless otherwise specified, indexes reflect total return, with all dividends reinvested. Indexes are unmanaged, do not reflect the deduction of fees or expenses, and are not available for direct investment.
Important Performance and Other Information
Performance data quoted in the following pages reflect past performance and are no guarantee of future results. Current performance may be higher or lower than the performance quoted. The investment return and principal value of an investment in the Funds will fluctuate so that shares, on any given day or when redeemed, may be worth more or less than their original cost. You can obtain performance data current to the most recent month end by calling Lord Abbett at 888-522-2388 or referring to www.lordabbett.com.
During certain periods shown, expense waivers and reimbursements were in place. Without such expense waivers and reimbursements, the Funds’ returns would have been lower.
The annual commentary above discusses the views of the Fund’s management and various portfolio holdings of the Funds as of December 31, 2016. These views and portfolio holdings may have changed after this date. Information provided in the commentary is not a recommendation to buy or sell securities. Because the Fund’s portfolio is actively managed and may change significantly, the Fund may no longer own the securities described above or may have otherwise changed their positions in the securities. For more recent information about the Fund’s portfolio holdings, please visit www.lordabbett.com.
A Note about Risk: See Notes to Financial Statements for a discussion of investment risks. For a more detailed discussion of the risks associated with each Fund, please see the Fund’s prospectus.
Mutual funds are not insured by the FDIC, are not deposits or other obligations of, or guaranteed by, banks, and are subject to investment risks including possible loss of principal amount invested.
The Fund serves as an underlying investment vehicle for variable annuity contracts and variable life insurance policies.
3
Investment Comparison
Below is a comparison of a $10,000 investment in Class VC shares with the same investment in both the Russell 1000® Index and the S&P 500® Index, assuming reinvestment of all dividends and distributions. The Fund’s shares are sold only to insurance company separate accounts that fund certain variable annuity and variable life contracts. This line graph comparison does not reflect the sales charges or other expenses of these contracts. If those sales charges and expenses were reflected, returns would be lower. The graph and performance table below do not reflect the deduction of taxes that a shareholder would pay on Fund distributions or the redemption or Fund shares. During certain periods, expenses of the Fund have been waived or reimbursed by Lord Abbett; without such waiver or reimbursement of expenses, the Fund’s returns would have been lower. Past performance is no guarantee of future results.
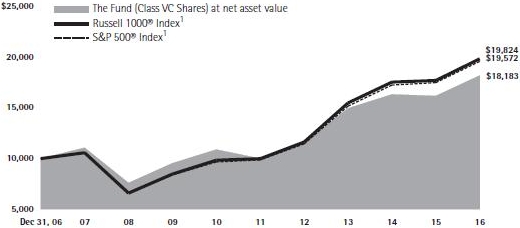
| | | Average Annual Total Returns for the |
| | | Periods Ended December 31, 2016 |
| | | 1 Year | | 5 Years | | 10 years | |
| Class VC | | 12.44% | | 12.69% | | 6.16% | |
1 Performance for each unmanaged index does not reflect any fees or expenses. The performance of each index is not necessarily representative of the Fund’s performance.
4
Expense Example
As a shareholder of the Fund, you incur ongoing costs, including management fees; expenses related to the Fund’s services arrangements with certain insurance companies; and other Fund expenses. This Example is intended to help you understand your ongoing costs (in dollars) of investing in the Fund and to compare these costs with the ongoing costs of investing in other mutual funds.
The Example is based on an investment of $1,000 invested at the beginning of the period and held for the entire period (July 1, 2016 through December 31, 2016).
The Example reflects only expenses that are deducted from the assets of the Fund. Fees and expenses, including sales charges applicable to the various insurance products that invest in the Fund, are not reflected in this Example. If such fees and expenses were reflected in the Example, the total expenses shown would be higher. Fees and expenses regarding such variable insurance products are separately described in the prospectus related to those products.
Actual Expenses
The first line of the table on the following page provides information about actual account values and actual expenses. You may use the information in this line, together with the amount you invested, to estimate the expenses that you paid over the period. Simply divide your account value by $1,000 (for example, an $8,600 account value divided by $1,000 = 8.6), then multiply the result by the number in the first line under the heading titled “Expenses Paid During Period 7/1/16 – 12/31/16” to estimate the expenses you paid on your account during this period.
Hypothetical Example for Comparison Purposes
The second line of the table on the following page provides information about hypothetical account values and hypothetical expenses based on the Fund’s actual expense ratio and an assumed rate of return of 5% per year before expenses, which is not the Fund’s actual return. The hypothetical account values and expenses may not be used to estimate the actual ending account balance or expenses you paid for the period. You may use this information to compare the ongoing costs of investing in the Fund and other funds. To do so, compare this 5% hypothetical example with the 5% hypothetical examples that appear in the shareholder reports of the other funds.
5
Please note that the expenses shown in the table are meant to highlight your ongoing costs only and do not reflect any transactional costs, such as sales charges. Therefore, the second line of the table is useful in comparing ongoing costs only, and will not help you determine the relative total costs of owning different funds. In addition, if these transactional costs were included, your costs would have been higher.
| | | Beginning | | Ending | | Expenses | |
| | | Account | | Account | | Paid During | |
| | | Value | | Value | | Period† | |
| | | | | | | | |
| | | | | | | 7/1/16 - | |
| | | 7/1/16 | | 12/31/16 | | 12/31/16 | |
| Class VC | | | | | | | |
| Actual | | $1,000.00 | | $1,095.30 | | $5.00 | |
| Hypothetical (5% Return Before Expenses) | | $1,000.00 | | $1,020.36 | | $4.82 | |
| † | Net expenses are equal to the Fund’s annualized expense ratio of 0.95%, multiplied by the average account value over the period, multiplied by 184/366 (to reflect one-half year period). |
Portfolio Holdings Presented by Sector
December 31, 2016
| Sector* | %** |
| Consumer Discretionary | 10.02 | % |
| Consumer Staples | 7.42 | % |
| Energy | 10.78 | % |
| Financials | 17.40 | % |
| Health Care | 11.91 | % |
| Industrials | 9.99 | % |
| Information Technology | 20.59 | % |
| Materials | 2.97 | % |
| Real Estate | 2.41 | % |
| Telecommunication Services | 1.33 | % |
| Utilities | 3.10 | % |
| Repurchase Agreement | 2.08 | % |
| Total | 100.00 | % |
| * | | A sector may comprise several industries. |
| ** | | Represents percent of total investments. |
6
Schedule of Investments
December 31, 2016
| Investments | | Shares | | | Fair
Value
(000) | |
| COMMON STOCKS 98.00% | | | | | | | | |
| | | | | | | | | |
| Aerospace & Defense 0.67% | | | | | | | | |
| TransDigm Group, Inc. | | | 1,209 | | | $ | 301 | |
| | | | | | | | | |
| Banks 8.05% | | | | | | | | |
| Citizens Financial Group, Inc. | | | 32,463 | | | | 1,157 | |
| East West Bancorp, Inc. | | | 16,354 | | | | 831 | |
| Wells Fargo & Co. | | | 29,974 | | | | 1,652 | |
| Total | | | | | | | 3,640 | |
| | | | | | | | | |
| Beverages 3.55% | | | | | | | | |
| PepsiCo, Inc. | | | 15,322 | | | | 1,603 | |
| | | | | | | | | |
| Biotechnology 0.93% | | | | | | | | |
| Celgene Corp.* | | | 3,631 | | | | 420 | |
| | | | | | | | | |
| Capital Markets 3.32% | | | | | | | | |
| Morgan Stanley | | | 10,724 | | | | 453 | |
| TD Ameritrade Holding Corp. | | | 24,019 | | | | 1,047 | |
| Total | | | | | | | 1,500 | |
| | | | | | | | | |
| Chemicals 2.97% | | | | | | | | |
| Dow Chemical Co. (The) | | | 11,720 | | | | 671 | |
| PPG Industries, Inc. | | | 7,108 | | | | 673 | |
| Total | | | | | | | 1,344 | |
| | | | | | | | | |
| Communications Equipment 2.27% | | | | | | | | |
| Cisco Systems, Inc. | | | 34,023 | | | | 1,028 | |
| | | | | | | | | |
| Consumer Finance 2.43% | | | | | | | | |
| Discover Financial Services | | | 15,213 | | | | 1,097 | |
| | | | | | | | | |
| Diversified Telecommunication Services 1.34% | | | | | | | | |
| AT&T, Inc. | | | 14,188 | | | | 603 | |
| | | | | | | | | |
| Electric: Utilities 3.10% | | | | | | | | |
| NextEra Energy, Inc. | | | 7,871 | | | | 940 | |
| PG&E Corp. | | | 7,593 | | | | 462 | |
| Total | | | | | | | 1,402 | |
| | | | | | | | | |
| Energy Equipment & Services 1.74% | | | | | | | | |
| Schlumberger Ltd. | | | 9,370 | | | | 787 | |
| Investments | | Shares | | | Fair
Value
(000) | |
| Equity Real Estate Investment Trusts 2.41% | | | | | | | | |
| Boston Properties, Inc. | | | 4,899 | | | $ | 616 | |
| Vornado Realty Trust | | | 4,537 | | | | 474 | |
| Total | | | | | | | 1,090 | |
| | | | | | | | | |
| Food & Staples Retailing 0.30% | | | | | | | | |
| CVS Health Corp. | | | 1,707 | | | | 135 | |
| | | | | | | | | |
| Food Products 3.10% | | | | | | | | |
| Mondelez International, Inc. Class A | | | 31,625 | | | | 1,402 | |
| | | | | | | | | |
| Health Care Equipment & Supplies 2.43% | | | | | | | | |
| Abbott Laboratories | | | 28,613 | | | | 1,099 | |
| | | | | | | | | |
| Health Care Providers & Services 3.48% | | | | | | | | |
| UnitedHealth Group, Inc. | | | 9,836 | | | | 1,574 | |
| | | | | | | | | |
| Hotels, Restaurants & Leisure 1.37% | | | | | | | | |
| Yum! Brands, Inc. | | | 9,798 | | | | 620 | |
| | | | | | | | | |
| Household Durables 1.10% | | | | | | | | |
| Lennar Corp. Class A | | | 11,543 | | | | 496 | |
| | | | | | | | | |
| Household Products 0.48% | | | | | | | | |
| Colgate-Palmolive Co. | | | 3,295 | | | | 216 | |
| | | | | | | | | |
| Industrial Conglomerates 4.93% | | | | | | | | |
| General Electric Co. | | | 39,869 | | | | 1,260 | |
| Honeywell International, Inc. | | | 8,361 | | | | 968 | |
| Total | | | | | | | 2,228 | |
| | | | | | | | | |
| Information Technology Services 1.88% | | | | | | | | |
| Fidelity National Information Services, Inc. | | | 11,212 | | | | 848 | |
| | | | | | | | | |
| Insurance 3.61% | | | | | | | | |
| Chubb Ltd. (Switzerland)(a) | | | 8,674 | | | | 1,146 | |
| Hartford Financial Services Group, Inc. (The) | | | 10,225 | | | | 487 | |
| Total | | | | | | | 1,633 | |
| | | | | | | | | |
| Internet Software & Services 3.62% | | | | | | | | |
| Alphabet, Inc. Class A* | | | 2,066 | | | | 1,637 | |
| | See Notes to Financial Statements. | 7 |
Schedule of Investments (continued)
| Investments | | Shares | | | Fair
Value
(000) | |
| Life Sciences Tools & Services 1.12% | | | | | | | | |
| Thermo Fisher Scientific, Inc. | | | 3,581 | | | $ | 505 | |
| | | | | | | | | |
| Machinery 2.84% | | | | | | | | |
| Caterpillar, Inc. | | | 5,314 | | | | 493 | |
| ITT, Inc. | | | 13,720 | | | | 529 | |
| PACCAR, Inc. | | | 4,064 | | | | 260 | |
| Total | | | | | | | 1,282 | |
| | | | | | | | | |
| Media 2.32% | | | | | | | | |
| Comcast Corp. Class A | | | 11,594 | | | | 801 | |
| Time Warner, Inc. | | | 2,563 | | | | 247 | |
| Total | | | | | | | 1,048 | |
| | | | | | | | | |
| Oil, Gas & Consumable Fuels 9.04% | | | | | | | | |
| Anadarko Petroleum Corp. | | | 11,751 | | | | 819 | |
| Devon Energy Corp. | | | 15,665 | | | | 715 | |
| EOG Resources, Inc. | | | 12,749 | | | | 1,289 | |
| Occidental Petroleum Corp. | | | 11,579 | | | | 825 | |
| Range Resources Corp. | | | 12,792 | | | | 440 | |
| Total | | | | | | | 4,088 | |
| | | | | | | | | |
| Pharmaceuticals 3.96% | | | | | | | | |
| Pfizer, Inc. | | | 55,069 | | | | 1,789 | |
| | | | | | | | | |
| Road & Rail 1.57% | | | | | | | | |
| CSX Corp. | | | 19,755 | | | | 710 | |
| | | | | | | | | |
| Semiconductors & Semiconductor Equipment 5.45% | | | | | | | | |
| Broadcom Ltd. (Singapore)(a) | | | 2,658 | | | | 470 | |
| Microchip Technology, Inc. | | | 11,485 | | | | 736 | |
| QUALCOMM, Inc. | | | 19,291 | | | | 1,258 | |
| Total | | | | | | | 2,464 | |
| | | | | | | | | |
| Software 3.28% | | | | | | | | |
| Microsoft Corp. | | | 23,876 | | | | 1,484 | |
| Investments | | Shares | | | Fair
Value
(000) | |
| Specialty Retail 5.24% | | | | | | | | |
| AutoZone, Inc.* | | | 1,479 | | | $ | 1,168 | |
| Foot Locker, Inc. | | | 8,094 | | | | 574 | |
| L Brands, Inc. | | | 9,523 | | | | 627 | |
| Total | | | | | | | 2,369 | |
| | | | | | | | | |
| Technology Hardware, Storage & Peripherals 4.10% | | | | | | | | |
| Apple, Inc. | | | 16,012 | | | | 1,854 | |
Total Common Stocks
(cost $39,928,641) | | | �� | | | | 44,296 | |
| | | | | | | | | |
| | | Principal
Amount
(000) | | | | | |
| SHORT-TERM INVESTMENT 2.08% | | | | | | | | |
| | | | | | | | | |
| Repurchase Agreement | | | | | | | | |
Repurchase Agreement dated 12/30/2016, 0.03% due 1/3/2017 with Fixed Income Clearing Corp. collateralized by $900,000 of U.S. Treasury Inflation Indexed Note at 0.125% due 4/15/2017; value: $959,829; proceeds: $938,803
(cost $938,800) | | | $939 | | | | 939 | |
Total Investments in Securities 100.08%
(cost $40,867,441) | | | | | | | 45,235 | |
| Liabilities in Excess of Other Assets (0.08)% | | | | | | | (38 | ) |
| Net Assets 100.00% | | | | | | $ | 45,197 | |
| * | | Non-income producing security. |
| (a) | | Foreign security traded in U.S. dollars. |
| 8 | See Notes to Financial Statements. |
Schedule of Investments (concluded)
The following is a summary of the inputs used as of December 31, 2016 in valuing the Fund’s investments carried at fair value(1):
| Investment Type(2)(3) | | Level 1
(000) | | | Level 2
(000) | | | Level 3
(000) | | | Total
(000) | |
| Common Stocks | | $ | 44,296 | | | $ | – | | | $ | – | | | $ | 44,296 | |
| Repurchase Agreement | | | – | | | | 939 | | | | – | | | | 939 | |
| Total | | $ | 44,296 | | | $ | 939 | | | $ | – | | | $ | 45,235 | |
| (1) | | Refer to Note 2(h) for a description of fair value measurements and the three-tier hierarchy of inputs. |
| (2) | | See Schedule of Investments for fair values in each industry and identification of foreign issuers and/or geography. |
| (3) | | There were no Level 1/Level 2 transfers during the fiscal year ended December 31, 2016. |
| | See Notes to Financial Statements. | 9 |
Statement of Assets and Liabilities
December 31, 2016
| ASSETS: | | | | |
| Investments in securities, at fair value (cost $40,867,441) | | $ | 45,235,172 | |
| Receivables: | | | | |
| Interest and dividends | | | 71,282 | |
| From advisor (See Note 3) | | | 14,427 | |
| Capital shares sold | | | 6,025 | |
| Prepaid expenses and other assets | | | 1,410 | |
| Total assets | | | 45,328,316 | |
| LIABILITIES: | | | | |
| Payables: | | | | |
| Management fee | | | 27,057 | |
| Capital shares reacquired | | | 18,729 | |
| Directors’ fees | | | 6,008 | |
| Fund administration | | | 1,546 | |
| Accrued expenses | | | 77,834 | |
| Total liabilities | | | 131,174 | |
| NET ASSETS | | $ | 45,197,142 | |
| COMPOSITION OF NET ASSETS: | | | | |
| Paid-in capital | | $ | 40,351,848 | |
| Distributions in excess of net investment income | | | (221 | ) |
| Accumulated net realized gain on investments | | | 477,784 | |
| Net unrealized appreciation on investments | | | 4,367,731 | |
| Net Assets | | $ | 45,197,142 | |
| Outstanding shares (50 million shares of common stock authorized, $.001 par value) | | | 3,612,556 | |
| Net asset value, offering and redemption price per share (Net assets divided by outstanding shares) | | | $12.51 | |
| 10 | See Notes to Financial Statements. |
Statement of Operations
For the Year Ended December 31, 2016
| Investment income: | | | | |
| Dividends | | $ | 864,632 | |
| Interest and other | | | 368 | |
| Total investment income | | | 865,000 | |
| Expenses: | | | | |
| Management fee | | | 280,967 | |
| Non 12b-1 service fees | | | 100,405 | |
| Shareholder servicing | | | 49,962 | |
| Fund administration | | | 16,055 | |
| Reports to shareholders | | | 29,585 | |
| Directors’ fees | | | 1,379 | |
| Professional | | | 42,815 | |
| Custody | | | 8,561 | |
| Other | | | 5,256 | |
| Gross expenses | | | 534,985 | |
| Expense reductions (See Note 8) | | | (158 | ) |
| Fees waived and expenses reimbursed (See Note 3) | | | (153,515 | ) |
| Net expenses | | | 381,312 | |
| Net investment income | | | 483,688 | |
| Net realized and unrealized gain: | | | | |
| Net realized gain on investments | | | 1,660,746 | |
| Net change in unrealized appreciation/depreciation on investments | | | 2,623,332 | |
| Net realized and unrealized gain | | | 4,284,078 | |
| Net Increase in Net Assets Resulting From Operations | | $ | 4,767,766 | |
| | See Notes to Financial Statements. | 11 |
Statements of Changes in Net Assets
| INCREASE (DECREASE) IN NET ASSETS | | For the Year Ended
December 31, 2016 | | | For the Year Ended
December 31, 2015 | |
| Operations: | | | | | | | | |
| Net investment income | | $ | 483,688 | | | $ | 312,587 | |
| Net realized gain on investments | | | 1,660,746 | | | | 5,555,517 | |
| Net change in unrealized appreciation/depreciation on investments | | | 2,623,332 | | | | (6,847,347 | ) |
| Net increase (decrease) in net assets resulting from operations | | | 4,767,766 | | | | (979,243 | ) |
| Distributions to shareholders from: | | | | | | | | |
| Net investment income | | | (442,540 | ) | | | (305,595 | ) |
| Net realized gain | | | (1,677,064 | ) | | | (6,419,296 | ) |
| Total distributions to shareholders | | | (2,119,604 | ) | | | (6,724,891 | ) |
| Capital share transactions (See Note 13): | | | | | | | | |
| Proceeds from sales of shares | | | 29,910,562 | | | | 25,924,123 | |
| Reinvestment of distributions | | | 2,119,575 | | | | 6,724,890 | |
| Cost of shares reacquired | | | (23,123,823 | ) | | | (34,599,609 | ) |
| Net increase (decrease) in net assets resulting from capital share transactions | | | 8,906,314 | | | | (1,950,596 | ) |
| Net increase (decrease) in net assets | | | 11,554,476 | | | | (9,654,730 | ) |
| NET ASSETS: | | | | | | | | |
| Beginning of year | | $ | 33,642,666 | | | $ | 43,297,396 | |
| End of year | | $ | 45,197,142 | | | $ | 33,642,666 | |
| Distributions in excess of net investment income | | $ | (221 | ) | | $ | (5,249 | ) |
| 12 | See Notes to Financial Statements. |
This page is intentionally left blank.
Financial Highlights
| | | | | | Per Share Operating Performance: |
| | | | | | Investment operations: | | Distributions to
shareholders from: |
| | | | | | | | | | | | Total | | | | | | | | | |
| | | | | | | | | Net | | from | | | | | | | | | |
| | | Net asset | | Net | | realized | | invest- | | | | | | | | | |
| | | value, | | invest- | | and | | ment | | Net | | Net | | Total |
| | | beginning | | ment | | unrealized | | opera- | | investment | | realized | | distri- |
| | | of period | | income(a) | | gain (loss) | | tions | | income | | gain | | butions |
| 12/31/2016 | | | $11.66 | | | | $0.14 | | | | $ 1.31 | | | | $ 1.45 | | | | $(0.13 | ) | | | $(0.47 | ) | | | $(0.60 | ) |
| 12/31/2015 | | | 14.15 | | | | 0.11 | | | | (0.23 | ) | | | (0.12 | ) | | | (0.11 | ) | | | (2.26 | ) | | | (2.37 | ) |
| 12/31/2014 | | | 14.77 | | | | 0.10 | | | | 1.25 | | | | 1.35 | | | | (0.11 | ) | | | 1.86 | | | | (1.97 | ) |
| 12/31/2013 | | | 12.77 | | | | 0.14 | | | | 3.64 | | | | 3.78 | | | | (0.15 | ) | | | (1.63 | ) | | | (1.78 | ) |
| 12/31/2012 | | | 11.21 | | | | 0.14 | | | | 1.55 | | | | 1.69 | | | | (0.13 | ) | | | – | | | | (0.13 | ) |
| (a) | Calculated using average shares outstanding during the period. |
| (b) | Total return does not consider the effects of sales charges or other expenses imposed by an insurance company and assumes the reinvestment of all distributions. |
| 14 | See Notes to Financial Statements. |
| | | | | | | Ratios to Average Net Assets: | | Supplemental Data: |
| | | | | | | | | | | | | | | | | | | |
| | | | | | | Total | | | | | | | | | | | | |
| | | | | | | expenses | | | | | | | | | | | | |
| Net | | | | | after | | | | | | | | Net | | | |
| asset | | | | | waivers | | | | | Net | | assets, | | Portfolio |
| value, | | Total | | and/or reim- | | Total | | investment | | end of | | turnover |
| end of | | return(b) | | bursements | | expenses | | income | | period | | rate |
| period | | (%) | | (%) | | (%) | | (%) | | (000) | | (%) |
| | $12.51 | | | | 12.44 | | | | 0.95 | | | | 1.33 | | | | 1.20 | | | | $45,197 | | | | 100.02 | |
| | 11.66 | | | | (0.90 | ) | | | 0.95 | | | | 1.32 | | | | 0.78 | | | | 33,643 | | | | 100.46 | |
| | 14.15 | | | | 9.14 | | | | 0.95 | | | | 1.30 | | | | 0.68 | | | | 43,297 | | | | 49.77 | |
| | 14.77 | | | | 29.85 | | | | 0.95 | | | | 1.31 | | | | 0.95 | | | | 45,458 | | | | 42.01 | |
| | 12.77 | | | | 15.09 | | | | 0.95 | | | | 1.32 | | | | 1.13 | | | | 39,909 | | | | 23.58 | |
| | See Notes to Financial Statements. | 15 |
Notes to Financial Statements
Lord Abbett Series Fund, Inc. (the “Company”) is registered under the Investment Company Act of 1940, as amended (the “Act”), as a diversified, open-end management investment company and was incorporated under Maryland law in 1989. The Company consists of thirteen separate portfolios. This report covers Classic Stock Portfolio (the “Fund”).
The Fund’s investment objective is growth of capital and growth of income consistent with reasonable risk. The Fund has Variable Contract class shares (“Class VC Shares”), which are currently issued and redeemed only in connection with investments in, and payments under, variable annuity contracts and variable life insurance policies issued by life insurance and insurance-related companies.
The preparation of the financial statements in conformity with accounting principles generally accepted in the United States of America (“U.S. GAAP”) requires management to make certain estimates and assumptions that affect the reported amounts of assets and liabilities and disclosure of contingent assets and liabilities at the date of the financial statements and the reported amounts of increases and decreases in net assets from operations during the reporting period. Actual results could differ from those estimates. The Fund is considered an investment company under U.S. GAAP and follows the accounting and reporting guidance applicable to investment companies.
| 2. | SIGNIFICANT ACCOUNTING POLICIES |
| (a) | Investment Valuation–Under procedures approved by the Fund’s Board of Directors (the “Board”), Lord, Abbett & Co. LLC (“Lord Abbett”), the Fund’s investment manager, has formed a Pricing Committee to administer the pricing and valuation of portfolio investments and to ensure that prices utilized reasonably reflect fair value. Among other things, these procedures allow the Fund to utilize independent pricing services, quotations from securities and financial instrument dealers and other market sources to determine fair value. |
| | |
| | Securities actively traded on any recognized U.S. or non-U.S. exchange or on The NASDAQ Stock Market LLC are valued at the last sale price or official closing price on the exchange or system on which they are principally traded. Events occurring after the close of trading on non-U.S. exchanges may result in adjustments to the valuation of foreign securities to reflect their fair value as of the close of regular trading on the New York Stock Exchange. The Fund may utilize an independent fair valuation service in adjusting the valuations of foreign securities. Unlisted equity securities are valued at the last quoted sale price or, if no sale price is available, at the mean between the most recently quoted bid and asked prices. |
| | |
| | Securities for which prices are not readily available are valued at fair value as determined by the Pricing Committee. The Pricing Committee considers a number of factors, including observable and unobservable inputs, when arriving at fair value. The Pricing Committee may use related or comparable assets or liabilities, recent transactions, market multiples, book values and other relevant information to determine the fair value of portfolio investments. The Board or a designated committee thereof regularly reviews fair value determinations made by the Pricing Committee and employs techniques such as reviewing related market activity, reviewing inputs and assumptions, and retrospectively comparing prices of subsequent purchases and sales transactions to fair value determinations made by the Pricing Committee. |
| | |
| | Short-term securities with 60 days or less remaining to maturity are valued using the amortized cost method, which approximates fair value. |
16
Notes to Financial Statements (continued)
| (b) | Security Transactions–Security transactions are recorded as of the date that the securities are purchased or sold (trade date). Realized gains and losses on sales of portfolio securities are calculated using the identified-cost method. |
| | |
| (c) | Investment Income–Dividend income is recorded on the ex-dividend date. Interest income is recorded on the accrual basis as earned. Discounts are accreted and premiums are amortized using the effective interest method and are included in Interest and other income on the Statement of Operations. Withholding taxes on foreign dividends have been provided for in accordance with the applicable country’s tax rules and rates. |
| | |
| (d) | Income Taxes–It is the policy of the Fund to meet the requirements of Subchapter M of the Internal Revenue Code applicable to regulated investment companies and to distribute substantially all taxable income and capital gains to its shareholders. Therefore, no income tax provision is required. |
| | |
| | The Fund files U.S. federal and various state and local tax returns. No income tax returns are currently under examination. The statute of limitations on the Fund’s filed U.S. federal tax returns remains open for the fiscal years ended December 31, 2013 through December 31, 2016. The statutes of limitations on the Company’s state and local tax returns may remain open for an additional year depending upon the jurisdiction. |
| | |
| (e) | Expenses–Expenses incurred by the Company that do not specifically relate to an individual fund are generally allocated to the funds within the Company on a pro rata basis by relative net assets. |
| | |
| (f) | Foreign Transactions–The books and records of the Fund are maintained in U.S. dollars and transactions denominated in foreign currencies are recorded in the Fund’s records at the rate prevailing when earned or recorded. Asset and liability accounts that are denominated in foreign currencies are adjusted daily to reflect current exchange rates and any unrealized gain (loss) is included in Net change in unrealized appreciation/depreciation on investments in the Fund’s Statement of Operations. The resultant exchange gains and losses upon settlement of such transactions are included in Net realized gain on investments in the Fund’s Statement of Operations. The Fund does not isolate that portion of the results of operations arising as a result of changes in the foreign exchange rates from the changes in market prices of the securities. |
| | |
| (g) | Repurchase Agreements–The Fund may enter into repurchase agreements with respect to securities. A repurchase agreement is a transaction in which a fund acquires a security and simultaneously commits to resell that security to the seller (a bank or securities dealer) at an agreed-upon price on an agreed-upon date. The Fund requires at all times that the repurchase agreement be collateralized by cash, or by securities of the U.S. Government, its agencies, its instrumentalities, or U.S. Government sponsored enterprises having a value equal to, or in excess of, the value of the repurchase agreement (including accrued interest). If the seller of the agreement defaults on its obligation to repurchase the underlying securities at a time when the fair value of these securities has declined, the Fund may incur a loss upon disposition of the securities. |
| | |
| (h) | Fair Value Measurements–Fair value is defined as the price that the Fund would receive upon selling an investment or transferring a liability in an orderly transaction to an independent buyer in the principal or most advantageous market of the investment. A three-tier hierarchy is used to maximize the use of observable market data and minimize the use of unobservable |
17
Notes to Financial Statements (continued)
| | inputs and to establish classification of fair value measurements for disclosure purposes. Inputs refer broadly to the assumptions that market participants would use in pricing the asset or liability, including assumptions about risk—for example, the risk inherent in a particular valuation technique used to measure fair value (such as a pricing model) and/or the risk inherent in the inputs to the valuation technique. Inputs may be observable or unobservable. Observable inputs reflect the assumptions market participants would use in pricing the asset or liability. Observable inputs are based on market data obtained from sources independent of the reporting entity. Unobservable inputs reflect the reporting entity’s own assumptions about the assumptions market participants would use in pricing the asset or liability. Unobservable inputs are based on the best information available in the circumstances. The three-tier hierarchy classification is determined based on the lowest level of inputs that is significant to the fair value measurement, and is summarized in the three broad Levels listed below: |
| • | Level 1 – | unadjusted quoted prices in active markets for identical investments; |
| | | |
| • | Level 2 – | other significant observable inputs (including quoted prices for similar investments, interest rates, prepayment speeds, credit risk, etc.); and |
| | | |
| • | Level 3 – | significant unobservable inputs (including the Fund’s own assumptions in determining the fair value of investments). |
| | A summary of inputs used in valuing the Fund’s investments as of December 31, 2016 and, if applicable, Level 1/Level 2 transfers and Level 3 rollforwards for the fiscal year then ended is included in the Fund’s Schedule of Investments. |
| | |
| | Changes in valuation techniques may result in transfers into or out of an assigned level within the three-tier hierarchy. All transfers between different levels within the three-tier hierarchy are deemed to have occurred as of the beginning of the reporting period. The inputs or methodology used for valuing securities are not necessarily an indication of the risk associated with investing in those securities. |
| 3. | MANAGEMENT FEE AND OTHER TRANSACTIONS WITH AFFILIATES |
Management Fee
The Company has a management agreement with Lord Abbett, pursuant to which Lord Abbett supplies the Fund with investment management services and executive and other personnel, provides office space and pays for ordinary and necessary office and clerical expenses relating to research and statistical work and supervision of the Fund’s investment portfolio.
The management fee is based on the Fund’s average daily net assets at the following annual rate:
| First $1 billion | .70% |
| Next $1 billion | .65% |
| Over $2 billion | .60% |
For the fiscal year ended December 31, 2016, the effective management fee, net of waivers, was at an annualized rate of .32% of the Fund’s average daily net assets.
In addition, Lord Abbett provides certain administrative services to the Fund pursuant to an Administrative Services Agreement in return for a fee at an annual rate of .04% of the Fund’s average daily net assets.
During the fiscal year ended December 31, 2016 and continuing through April 30, 2017, Lord Abbett has contractually agreed to waive its fees and reimburse expenses to the extent necessary
18
Notes to Financial Statements (continued)
to limit total net annual operating expenses, to an annual rate of ..95%. This agreement may be terminated only upon the approval of the Board.
The Company, on behalf of the Fund, has entered into services arrangements with certain insurance companies. Under these arrangements, certain insurance companies will be compensated up to .25% of the average daily net asset value (“NAV”) of the Fund’s Class VC Shares held in the insurance company’s separate account to service and maintain the Variable Contract owners’ accounts. This amount is included in Non 12b-1 service fees on the Statement of Operations. The Fund may also compensate certain insurance companies, third-party administrators and other entities for providing recordkeeping, sub-transfer agency and other administrative services to the Fund. This amount is included in Shareholder servicing on the Statement of Operations.
Two Directors and certain of the Company’s officers have an interest in Lord Abbett.
| 4. | DISTRIBUTIONS AND CAPITAL LOSS CARRYFORWARDS |
Dividends from net investment income, if any, are declared and paid at least semi-annually. Taxable net realized gains from investment transactions, reduced by allowable capital loss carryforwards, if any, are declared and distributed to shareholders at least annually. The capital loss carryforward amount, if any, is available to offset future net capital gains. Dividends and distributions to shareholders are recorded on the ex-dividend date. The amounts of dividends and distributions from net investment income and net realized capital gains are determined in accordance with federal income tax regulations, which may differ from U.S. GAAP. These book/tax differences are either considered temporary or permanent in nature. To the extent these differences are permanent in nature, such amounts are reclassified within the components of net assets based on their federal tax basis treatment; temporary differences do not require reclassification. Dividends and distributions that exceed earnings and profits for tax purposes are reported as a tax return of capital.
The tax character of distributions paid during the fiscal years ended December 31, 2016 and 2015 was as follows:
| | | Year Ended
12/31/2016 | | | Year Ended
12/31/2015 | |
| Distributions paid from: | | | | | | | | |
| Ordinary income | | $ | 442,540 | | | $ | 305,595 | |
| Net long-term capital gains | | | 1,677,064 | | | | 6,419,296 | |
| Total distributions paid | | $ | 2,119,604 | | | $ | 6,724,891 | |
As of December 31, 2016, the components of accumulated gains on a tax-basis were as follows:
| Undistributed ordinary income – net | | $ | 5,787 | |
| Undistributed long-term capital gains | | | 685,043 | |
| Total undistributed earnings | | | 690,830 | |
| Temporary differences | | | (6,008 | ) |
| Unrealized gains – net | | | 4,160,472 | |
| Total accumulated gains – net | | $ | 4,845,294 | |
As of December 31, 2016, the aggregate unrealized security gains and losses based on cost for U.S. federal income tax purposes were as follows:
| Tax cost | | $ | 41,074,700 | |
| Gross unrealized gain | | | 4,660,964 | |
| Gross unrealized loss | | | (500,492 | ) |
| Net unrealized security gain | | $ | 4,160,472 | |
19
Notes to Financial Statements (continued)
The difference between book-basis and tax-basis unrealized gains (losses) is attributable to the tax treatment of certain distributions received and wash sales.
Permanent items identified during the fiscal year ended December 31, 2016 have been reclassified among the components of net assets based on their tax basis treatment as follows:
| Distributions in | Accumulated |
| Excess of Net | Net Realized |
| Investment Income | Gain |
| $(36,120) | $36,120 |
The permanent differences are attributable to the tax treatment of certain distributions received.
| 5. | PORTFOLIO SECURITIES TRANSACTIONS |
Purchases and sales of investment securities (excluding short-term investments) for the fiscal year ended December 31, 2016 were as follows:
| Purchases | Sales |
| $45,795,535 | $39,309,303 |
There were no purchases or sales of U.S. Government securities for the fiscal year ended December 31, 2016.
| 6. | DISCLOSURES ABOUT OFFSETTING ASSETS AND LIABILITIES |
The Financial Accounting Standards Board (“FASB”) requires disclosures intended to help better assess the effect or potential effect of offsetting arrangements on a fund’s financial position. The following tables illustrate gross and net information about recognized assets and liabilities eligible for offset in the statement of assets and liabilities; and disclose such amounts subject to an enforceable master netting agreement or similar agreement, by counterparty. A master netting agreement is an agreement between a fund and a counterparty which provides for the net settlement of amounts owed under all contracts traded under that agreement, as well as cash collateral, through a single payment by one party to the other in the event of default on or termination of any one contract. The Fund’s accounting policy with respect to balance sheet offsetting is that, absent an event of default by the counterparty or a termination of the agreement, the master netting agreement does not result in an offset of reported amounts of financial assets and liabilities in the statement of assets and liabilities across transactions between the Fund and the applicable counterparty:
| Description | | Gross Amounts of
Recognized Assets | | | Gross Amounts
Offset in the
Statement of Assets
and Liabilities | | | Net Amounts of
Assets Presented
in the Statement of
Assets and Liabilities | |
| Repurchase Agreement | | | $938,800 | | | $ | – | | | | $938,800 | |
| Total | | | $938,800 | | | $ | – | | | | $938,800 | |
20
Notes to Financial Statements (continued)
| | | Net Amounts | | | | | | | | | | | | | |
| | | of Assets | | | Amounts Not Offset in the | | | | |
| | | Presented in | | | Statement of Assets and Liabilities | | | | |
| | | the Statement | | | | | | Cash | | | Securities | | | | |
| | | of Assets and | | | Financial | | | Collateral | | | Collateral | | | Net | |
| Counterparty | | Liabilities | | | Instruments | | | Received(a) | | | Received(a) | | | Amount(b) | |
| Fixed Income Clearing Corp. | | $938,800 | | | $ | – | | | $ | – | | | | $(938,800 | ) | | $ | – | |
| Total | | $938,800 | | | $ | – | | | $ | – | | | | $(938,800 | ) | | $ | – | |
| (a) | Collateral disclosed is limited to an amount not to exceed 100% of the net amount of assets presented in the Statement of Assets and Liabilities, for each respective counterparty. |
| (b) | Net amount represents the amount owed to the Fund by the counterparty as of December 31, 2016. |
| 7. | DIRECTORS’ REMUNERATION |
The Company’s officers and two Directors, who are associated with Lord Abbett, do not receive any compensation from the Company for serving in such capacities. Independent Directors’ fees are allocated among all Lord Abbett-sponsored funds based on the net assets of each fund. There is an equity-based plan available to all Independent Directors under which Independent Directors must defer receipt of a portion of, and may elect to defer receipt of an additional portion of Directors’ fees. The deferred amounts are treated as though equivalent dollar amounts had been invested in the funds. Such amounts and earnings accrued thereon are included in Directors’ fees on the Statement of Operations and in Directors’ fees payable on the Statement of Assets and Liabilities and are not deductible for U.S. federal income tax purposes until such amounts are paid.
The Company has entered into an arrangement with its transfer agent and custodian, whereby credits realized as a result of uninvested cash balances are used to reduce a portion of the Fund’s expenses.
The Fund and certain other funds managed by Lord Abbett (collectively, the “Participating Funds”) entered into a syndicated line of credit facility with various lenders for $550 million (the “Facility”), whereas State Street Bank and Trust Company (“SSB”) participates as a lender and as agent for the lenders. The Facility is to be used for temporary or emergency purposes as an additional source of liquidity to satisfy redemptions. The Participating Funds are subject to graduated borrowing limits of one-third of Fund assets (if Fund assets are less than $750 million), $250 million, $300 million, or $350 million, based on past borrowings and likelihood of future borrowings. The Facility will continue through August 28, 2017.
During the fiscal year ended December 31, 2016, the Fund did not utilize the Facility.
| 10. | INTERFUND LENDING PROGRAM |
On July 26, 2016, the U.S. Securities and Exchange Commission issued an exemptive order (“SEC exemptive order”) which permits certain registered open-end management investment companies managed by Lord Abbett, including the Fund, to participate in a joint lending and borrowing program (the “Interfund Lending Program”). The SEC exemptive order allows the Funds to borrow money from and lend money to each other for temporary or emergency purposes subject to the limitations and conditions.
21
Notes to Financial Statements (concluded)
During the fiscal year ended December 31, 2016, the Fund did not participate as a borrower or lender in the Interfund Lending Program.
| 11. | CUSTODIAN AND ACCOUNTING AGENT |
SSB is the Company’s custodian and accounting agent. SSB performs custodial, accounting and recordkeeping functions relating to portfolio transactions and calculating the Fund’s NAV.
The Fund is subject to the general risks and considerations associated with equity investing, as well as the particular risks associated with value and growth stocks. This means the value of your investment will fluctuate in response to movements in the equity securities market in general and to the changing prospects of individual companies in which the Fund invests. Large-cap value and growth stocks may perform differently than the market as a whole and differently than each other or other types of stocks, such as small company stocks. This is because different types of stocks tend to shift in and out of favor depending on market and economic conditions. The market may fail to recognize the intrinsic value of particular value stocks for a long time. Growth stocks may be more volatile than other stocks. In addition, if the Fund’s assessment of a company’s value or prospects for exceeding earnings expectations or market conditions is wrong, the Fund could suffer losses or produce poor performance relative to other funds, even in a rising market.
Due to its investment exposure to foreign companies and American Depositary Receipts, the Fund may experience increased market, liquidity, currency, political, information, and other risks.
These factors can affect the Fund’s performance.
| 13. | SUMMARY OF CAPITAL TRANSACTIONS |
Transactions in shares of capital stock were as follows:
| | Year Ended
December 31, 2016 | Year Ended
December 31, 2015 | |
| Shares sold | 2,570,120 | 1,904,507 | |
| Reinvestment of distributions | 169,122 | 558,469 | |
| Shares reacquired | (2,011,279) | (2,638,654 | ) |
| Increase (decrease) | 727,963 | (175,678 | ) |
22
Report of Independent Registered Public Accounting Firm
To the Board of Directors of Lord Abbett Series Fund, Inc. and the Shareholders of Classic Stock Portfolio:
We have audited the accompanying statement of assets and liabilities, including the schedule of investments, of the Classic Stock Portfolio, one of the portfolios constituting the Lord Abbett Series Fund, Inc. (the “Fund”) as of December 31, 2016, and the related statement of operations for the year then ended, the statements of changes in net assets for each of the two years in the period then ended, and the financial highlights for each of the five years in the period then ended. These financial statements and financial highlights are the responsibility of the Fund’s management. Our responsibility is to express an opinion on these financial statements and financial highlights based on our audits.
We conducted our audits in accordance with the standards of the Public Company Accounting Oversight Board (United States). Those standards require that we plan and perform the audit to obtain reasonable assurance about whether the financial statements and financial highlights are free of material misstatement. The Fund is not required to have, nor were we engaged to perform, an audit of its internal control over financial reporting. Our audits included consideration of internal control over financial reporting as a basis for designing audit procedures that are appropriate in the circumstances, but not for the purpose of expressing an opinion on the effectiveness of the Fund’s internal control over financial reporting. Accordingly, we express no such opinion. An audit also includes examining, on a test basis, evidence supporting the amounts and disclosures in the financial statements, assessing the accounting principles used and significant estimates made by management, as well as evaluating the overall financial statement presentation. Our procedures included confirmation of securities owned as of December 31, 2016, by correspondence with the custodian. We believe that our audits provide a reasonable basis for our opinion.
In our opinion, such financial statements and financial highlights referred to above present fairly, in all material respects, the financial position of Classic Stock Portfolio of the Lord Abbett Series Fund, Inc. as of December 31, 2016, the results of its operations for the year then ended, the changes in its net assets for each of the two years in the period then ended, and the financial highlights for each of the five years in the period then ended, in conformity with accounting principles generally accepted in the United States of America.
DELOITTE & TOUCHE LLP
New York, New York
February 15, 2017
23
Basic Information About Management
The Board is responsible for the management of the business and affairs of the Company in accordance with the laws of the State of Maryland. The Board elects officers who are responsible for the day-to-day operations of each Fund and who execute policies authorized by the Board. The Board also approves an investment adviser to each Fund and continues to monitor the cost and quality of the services the investment adviser provides, and annually considers whether to renew the contract with the adviser. Generally, each Director holds office until his/her successor is elected and qualified or until his/her earlier resignation or removal, as provided in the Company’s organizational documents.
Lord Abbett, a Delaware limited liability company, is the Fund’s investment adviser. Designated Lord Abbett personnel are responsible for the day-to-day management of the Funds.
Interested Directors
Ms. Foster and Mr. Sieg are affiliated with Lord Abbett and are “interested persons” of the Company as defined in the Act. Ms. Foster and Mr. Sieg are directors/trustees of each of the 12 investment companies in the Lord Abbett Family of Funds, which consist of 60 portfolios or series. Ms. Foster is an officer of the Lord Abbett Family of Funds.
Name, Address and
Year of Birth | | Current Position and
Length of Service
with the Company | | Principal Occupation and Other Directorships
During the Past Five Years |
Daria L. Foster
Lord, Abbett & Co. LLC
90 Hudson Street
Jersey City, NJ 07302
(1954) | | Director and President
since 2006; Chief
Executive Officer
since 2012
| | Principal Occupation: Managing Partner of Lord Abbett, joined Lord Abbett in 1990.
Other Directorships: None.
|
| | | | | |
Douglas B. Sieg
Lord, Abbett & Co. LLC
90 Hudson Street
Jersey City, NJ 07302
(1969)
| | Director since 2016
| | Principal Occupation: Partner (since 2001) and Head of Client Services (since 2013), formerly Director of Marketing and Relationship Management, joined Lord Abbett in 1994.
Other Directorships: None. |
Independent Directors
The following Independent Directors also are directors/trustees of each of the 12 investment companies in the Lord Abbett Family of Funds, which consist of 60 portfolios or series.
Name, Address and
Year of Birth | | Current Position and
Length of Service
with the Company | | Principal Occupation and Other Directorships
During the Past Five Years |
Robert B. Calhoun, Jr.
Lord, Abbett & Co. LLC
c/o Legal Dept.
90 Hudson Street
Jersey City, NJ 07302
(1942) | | Director since 1998
| | Principal Occupation: Senior Advisor of Monitor Clipper Partners, a private equity investment fund (since 1997); President of Clipper Asset Management Corp. (1991–2009).
Other Directorships: None. |
24
Basic Information About Management (continued)
Name, Address and
Year of Birth | | Current Position and
Length of Service
with the Company | | Principal Occupation and Other Directorships
During the Past Five Years |
Eric C. Fast
Lord, Abbett & Co. LLC
c/o Legal Dept.
90 Hudson Street
Jersey City, NJ 07302
(1949) | | Director since 2014 | | Principal Occupation: Chief Executive Officer of Crane Co., an industrial products company (2001–2014).
Other Directorships: Currently serves as director of Automatic Data Processing, Inc. (since 2007) and Regions Financial Corporation (since 2010). Previously served as a director of Crane Co. (1999–2014). |
| | | | | |
Evelyn E. Guernsey
Lord, Abbett & Co. LLC
c/o Legal Dept.
90 Hudson Street
Jersey City, NJ 07302
(1955) | | Director since 2011 | | Principal Occupation: CEO, Americas of J.P. Morgan Asset Management (2004–2010).
Other Directorships: None. |
| | | | | |
Julie A. Hill
Lord, Abbett & Co. LLC
c/o Legal Dept.
90 Hudson Street
Jersey City, NJ 07302
(1946) | | Director since 2004 | | Principal Occupation: Owner and CEO of The Hill Company, a business consulting firm (since 1998).
Other Directorships: Currently serves as director of Anthem, Inc., a health benefits company (since 1994). |
| | | | | |
Franklin W. Hobbs
Lord, Abbett & Co. LLC
c/o Legal Dept.
90 Hudson Street
Jersey City, NJ 07302
(1947) | | Director since 2001 | | Principal Occupation: Advisor of One Equity Partners, a private equity firm (since 2004).
Other Directorships: Currently serves as director and Chairman of the Board of Ally Financial Inc., a financial services firm (since 2009), and as director of Molson Coors Brewing Company (since 2002). |
| | | | | |
James M. McTaggart
Lord, Abbett & Co. LLC
c/o Legal Dept.
90 Hudson Street
Jersey City, NJ 07302
(1947) | | Director since 2012 | | Principal Occupation: Independent management advisor and consultant (since 2012); Vice President, CRA International, Inc. (doing business as Charles River Associates), a global management consulting firm (2009–2012); Founder and Chairman of Marakon Associates, Inc., a strategy consulting firm (1978–2009); and Officer and Director of Trinsum Group, a holding company (2007–2009).
Other Directorships: Currently serves as director of Blyth, Inc., a home products company (since 2004). |
| | | | | |
Mark A. Schmid
Lord, Abbett & Co. LLC
c/o Legal Dept.
90 Hudson Street
Jersey City, NJ 07302
(1959) | | Director since 2016 | | Principal Occupation: Vice President and Chief Investment Officer of the University of Chicago (since 2009).
Other Directorships: None. |
25
Basic Information About Management (continued)
Name, Address and
Year of Birth | | Current Position and
Length of Service
with the Company | | Principal Occupation and Other Directorships
During the Past Five Years |
James L.L. Tullis
Lord, Abbett & Co. LLC
c/o Legal Dept.
90 Hudson Street
Jersey City, NJ 07302
(1947) | | Director since 2006;
Chairman since 2017
| | Principal Occupation: CEO of Tullis-Dickerson and Co. Inc., a venture capital management firm (since 1990); CEO of Tullis Health Investors Inc. (since 2012).
Other Directorships: Currently serves as director of Crane Co. (since 1998). |
Officers
None of the officers listed below have received compensation from the Company. All of the officers of the Company also may be officers of the other Lord Abbett Funds and maintain offices at 90 Hudson Street, Jersey City, NJ 07302. Unless otherwise indicated, the position(s) and title(s) listed under the “Principal Occupation During the Past Five Years” column indicate each officer’s position(s) and title(s) with Lord Abbett. Each officer serves for an indefinite term (i.e., until his or her death, resignation, retirement, or removal).
Name and
Year of Birth | | Current Position
with the Company | | Length of Service
of Current
Position | | Principal Occupation
During the Past Five Years |
Daria L. Foster
(1954) | | President and Chief
Executive Officer | | Elected as President in 2006 and Chief Executive Officer in 2012 | | Managing Partner of Lord Abbett, joined Lord Abbett in 1990. |
| | | | | | | |
Sean J. Aurigemma
(1969) | | Executive Vice President | | Elected in 2010 | | Portfolio Manager, joined Lord Abbett in 2007. |
| | | | | | | |
Jeff D. Diamond
(1960) | | Executive Vice President | | Elected in 2008 | | Portfolio Manager, joined Lord Abbett in 2007. |
| | | | | | | |
Todd D. Jacobson
(1966) | | Executive Vice President | | Elected in 2005 | | Partner and Associate Director, joined Lord Abbett in 2003. |
| | | | | | | |
Robert A. Lee
(1969) | | Executive Vice President | | Elected in 2010 | | Partner and Chief Investment Officer, and was formerly Deputy Chief Investment Officer and Director of Taxable Fixed Income, joined Lord Abbett in 1997. |
| | | | | | | |
Thomas B. Maher
(1967) | | Executive Vice President | | Elected in 2010 | | Partner and Portfolio Manager, joined Lord Abbett in 2003. |
| | | | | | | |
Justin C. Maurer
(1969) | | Executive Vice President | | Elected in 2010 | | Partner and Portfolio Manager, joined Lord Abbett in 2001. |
| | | | | | | |
Vincent J. McBride
(1964) | | Executive Vice President | | Elected in 2010 | | Partner and Director, joined Lord Abbett in 2003. |
| | | | | | | |
Andrew H. O’Brien
(1973) | | Executive Vice President | | Elected in 2010 | | Partner and Portfolio Manager, joined Lord Abbett in 1998. |
26
Basic Information About Management (continued)
Name and
Year of Birth | | Current Position
with the Company | | Length of Service
of Current
Position | | Principal Occupation
During the Past Five Years |
F. Thomas O’Halloran, III
(1955)
| | Executive Vice President | | Elected in 2010 | | Partner and Portfolio Manager, joined Lord Abbett in 2001. |
| | | | | | | |
Marc Pavese
(1972)
| | Executive Vice President | | Elected in 2016 | | Partner and Portfolio Manager, joined Lord Abbett in 2008. |
| | | | | | | |
Walter H. Prahl
(1958) | | Executive Vice President | | Elected in 2012 | | Partner and Director, joined Lord Abbett in 1997. |
| | | | | | | |
Steven F. Rocco
(1979)
| | Executive Vice President | | Elected in 2014 | | Partner and Portfolio Manager, joined Lord Abbett in 2004. |
| | | | | | | |
Didier O. Rosenfeld
(1976) | | Executive Vice President | | Elected in 2016 | | Director of Global Equity, joined Lord Abbett in 2015 and was formerly a Portfolio Manager and Senior Analyst at Cornerstone Capital Management (2014–2015) and Managing Director at State Street Global Advisors (2000–2013). |
| | | | | | | |
Frederick J. Ruvkun
(1957)
| | Executive Vice President | | Elected in 2012 | | Partner and Portfolio Manager, joined Lord Abbett in 2006. |
| | | | | | | |
Paul J. Volovich
(1973)
| | Executive Vice President | | Elected in 2005 | | Partner and Portfolio Manager, joined Lord Abbett in 1997. |
| | | | | | | |
A. Edward Allinson
(1961) | | Vice President | | Elected in 2011 | | Portfolio Manager, joined Lord Abbett in 2005. |
| | | | | | | |
John W. Ashbrook
(1964) | | Vice President and
Assistant Secretary | | Elected in 2014 | | Assistant General Counsel, joined Lord Abbett in 2008. |
| | | | | | | |
Joan A. Binstock
(1954) | | Chief Financial Officer
and Vice President | | Elected in 1999 | | Partner and Chief Financial Officer, and was formerly Chief Operations Officer, joined Lord Abbett in 1999. |
| | | | | | | |
Brooke A. Fapohunda
(1975) | | Vice President and
Assistant Secretary | | Elected in 2014 | | Deputy General Counsel, joined Lord Abbett in 2006. |
| | | | | | | |
John K. Forst
(1960) | | Vice President and
Assistant Secretary
| | Elected in 2005 | | Partner and Deputy General Counsel, joined Lord Abbett in 2004. |
| | | | | | | |
Anthony W. Hipple
(1964) | | Vice President
| | Elected in 2014 | | Portfolio Manager, joined Lord Abbett in 2002. |
| | | | | | | |
Lawrence H. Kaplan
(1957) | | Vice President and
Secretary | | Elected in 1997 | | Partner and General Counsel, joined Lord Abbett in 1997. |
27
Basic Information About Management (concluded)
Name and
Year of Birth | | Current Position
with the Company | | Length of Service
of Current
Position | | Principal Occupation
During the Past Five Years |
Linda Y. Kim
(1980) | | Vice President and
Assistant Secretary | | Elected in 2016 | | Counsel, joined Lord Abbett in 2015 and was formerly an Associate at
Stroock & Stroock & Lavan LLP (2007–2015). |
| | | | | | | |
David J. Linsen
(1974) | | Vice President | | Elected in 2008 | | Partner and Director, joined Lord Abbett in 2001. |
| | | | | | | |
Joseph M. McGill
(1962) | | Chief Compliance Officer | | Elected in 2014 | | Partner and Chief Compliance Officer, joined Lord Abbett in 2014 and was formerly Managing Director and the Chief Compliance Officer at UBS Global Asset Management (2003–2013). |
| | | | | | | |
A. Edward Oberhaus, III
(1959) | | Vice President
| | Elected in 1998
| | Partner and Director, joined Lord Abbett in 1983. |
| | | | | | | |
Noah Petrucci
(1970) | | Vice President | | Elected in 2013 | | Portfolio Manager, joined Lord Abbett in 2012 and was formerly a Portfolio Manager at Columbia Management Investment Advisers, LLC and Columbia Management Advisors, LLC (2002–2012). |
| | | | | | | |
Lawrence B. Stoller
(1963) | | Vice President and
Assistant Secretary | | Elected in 2007 | | Partner and Senior Deputy General Counsel, joined Lord Abbett in 2007. |
| | | | | | | |
Leah G. Traub
(1979) | | Vice President | | Elected in 2016 | | Partner and Portfolio Manager, joined Lord Abbett in 2007. |
| | | | | | | |
Arthur K. Weise
(1970) | | Vice President | | Elected in 2010 | | Partner and Portfolio Manager, joined Lord Abbett in 2007. |
| | | | | | | |
Kewjin Yuoh
(1971) | | Vice President | | Elected in 2012 | | Partner and Portfolio Manager, joined Lord Abbett in 2010. |
| | | | | | | |
Scott S. Wallner
(1955) | | AML Compliance Officer | | Elected in 2011 | | Assistant General Counsel, joined Lord Abbett in 2004. |
| | | | | | | |
Bernard J. Grzelak
(1971) | | Treasurer | | Elected in 2003 | | Partner and Chief Operations Officer, and was formerly Director of Fund Administration, joined Lord Abbett in 2003. |
Please call 888-522-2388 for a copy of the statement of additional information, which contains further information about the Company’s Directors. It is available free upon request.
28
Approval of Advisory Contract
The Board, including all of the Directors who are not interested persons of the Fund or of Lord Abbett (the “Independent Board Members”), annually considers whether to approve the continuation of the existing management agreement between the Fund and Lord Abbett (the “Agreement”). In connection with its most recent approval, the Board reviewed materials relating specifically to the Agreement, as well as numerous materials received throughout the course of the year, including information about the Fund’s investment performance compared to the performance of its benchmark. Before making its decision as to the Fund, the Board had the opportunity to ask questions and request further information, taking into account its familiarity with Lord Abbett gained through its meetings and discussions. These meetings and discussions included the review of the portfolio management team conducted by members of the Contract Committee, the deliberations of the Contract Committee, and discussions between the Contract Committee and Lord Abbett’s management. The Independent Board Members also met with their independent legal counsel in a private session at which no representatives of management were present.
The materials received by the Board included, but were not limited to: (1) information provided by Morningstar Associates, LLC (“Morningstar”) regarding the investment performance of the Fund compared to the investment performance of certain funds with similar investment styles as determined by Morningstar, based, in part, on the Fund’s Morningstar category (the “performance peer group”), and the investment performance of two appropriate benchmarks; (2) information provided by Morningstar regarding the expense ratios, contractual and effective management fee rates, and other expense components for the Fund and certain funds in the same Morningstar category, with generally the same or similar share classes and operational characteristics, including asset size (the “expense peer group”); (3) certain supplemental investment performance information provided by Lord Abbett; (4) information provided by Lord Abbett on the expense ratios, management fee rates, and other expense components for the Fund; (5) sales and redemption information for the Fund; (6) information regarding Lord Abbett’s financial condition; (7) an analysis of the relative profitability of the Agreement to Lord Abbett; (8) information provided by Lord Abbett regarding the investment management fee schedules for Lord Abbett’s other advisory clients maintaining accounts with a similar investment strategy as the Fund; and (9) information regarding the personnel and other resources devoted by Lord Abbett to managing the Fund.
Investment Management Services Generally. The Board considered the investment management services provided by Lord Abbett to the Fund, including investment research, portfolio management, and trading, and Lord Abbett’s commitment to compliance with all applicable legal requirements. The Board also observed that Lord Abbett was solely engaged in the investment management business and accordingly did not experience the conflicts of interest that may result from being engaged in other lines of business. The Board considered the investment advisory services provided by Lord Abbett to other clients, the fees charged for the services, and the differences in the nature of the services provided to the Fund and other Lord Abbett Funds, on the one hand, and the services provided to other clients, on the other. After reviewing these and related factors, the Board concluded that the Fund was likely to continue to benefit from the nature, extent and quality of the investment services provided by Lord Abbett under the Agreement.
Investment Performance. The Board reviewed the Fund’s investment performance in relation to that of the performance peer group and two appropriate benchmarks as of various periods ended August 31, 2016. The Board observed that the Fund’s investment performance was above the median of the performance peer group for the one-year, three-year and ten-year periods and below the median of the performance peer group for the five-year period. The Board also considered Lord
29
Approval of Advisory Contract (continued)
Abbett’s performance and reputation generally, the performance of other Lord Abbett-managed funds overseen by the Board and the willingness of Lord Abbett to take steps intended to improve performance when necessary. After reviewing these and related factors, the Board concluded that the Fund’s investment performance was reasonable and supported the continuation of the Agreement.
Lord Abbett’s Personnel and Methods. The Board considered the qualifications of the personnel providing investment management services to the Fund, in light of its investment objective and discipline. Among other things, the Board considered the size, experience, and turnover of Lord Abbett’s investment management staff, Lord Abbett’s investment methodology and philosophy, and Lord Abbett’s approach to recruiting, training, and retaining investment management personnel.
Nature and Quality of Other Services. The Board considered the nature, quality, costs, and extent of compliance, administrative, and other services performed by Lord Abbett and the nature and extent of Lord Abbett’s supervision of third party service providers, including the Fund’s transfer agent and custodian.
Expenses. The Board considered the expense level of the Fund and the expense levels of the expense peer group. It also considered how the expense levels of the Fund related to those of the expense peer group and the amount and nature of the fees paid by shareholders. The Board observed that the overall expense level of the Fund was below the median of the expense peer group. After reviewing these and related factors, the Board concluded, within the context of its overall approval of the Agreement, that the expense level of the Fund was reasonable and supported the continuation of the Agreement.
Profitability. The Board considered the level of Lord Abbett’s operating margin in managing the Fund, including a review of Lord Abbett’s methodology for allocating its costs to its management of the Fund. It considered whether the Fund was profitable to Lord Abbett in connection with the operation of the Fund, including the fee that Lord Abbett receives from the Fund for providing administrative services to the Fund. The Board also considered the profits realized from other business segments of Lord Abbett, which may benefit from or be related to the Fund’s business. The Board considered Lord Abbett’s profit margins in comparison with available industry data, both accounting for and excluding marketing and distribution expenses, and how those profit margins could affect Lord Abbett’s ability to recruit and retain investment personnel. The Board recognized that Lord Abbett’s overall profitability was a factor in enabling it to attract and retain qualified investment management personnel to provide services to the Fund. After reviewing these and related factors, the Board concluded, within the context of its overall approval of the Agreement, that Lord Abbett’s profitability with respect to the Fund was not excessive.
Economies of Scale. The Board considered the extent to which there had been economies of scale in managing the Fund, whether the Fund’s shareholders had appropriately benefited from such economies of scale, and whether there was potential for realization of any further economies of scale. The Board concluded that the existing management fee schedule, with its breakpoints in the levels of the management fee, in conjunction with a proposed expense limitation agreement adequately addressed any economies of scale in managing the Fund.
Other Benefits to Lord Abbett. The Board considered the character and amount of fees paid by the Fund and the Fund’s shareholders to Lord Abbett and the Distributor for services other than investment advisory services. The Board also considered the revenues and profitability of Lord Abbett’s investment advisory business apart from its mutual fund business, and the intangible
30
Approval of Advisory Contract (concluded)
benefits enjoyed by Lord Abbett by virtue of its relationship with the Fund. The Board observed that the Distributor receives 12b-1 fees from certain of the Lord Abbett Funds as to shares held in accounts for which there is no other broker of record, may retain a portion of the 12b-1 fees it receives, and receives a portion of the sales charges on sales and redemptions of some classes of shares. In addition, the Board observed that Lord Abbett accrues certain benefits for its business of providing investment advice to clients other than the Lord Abbett Funds, but that business also benefits the Funds. The Board also noted that Lord Abbett, as disclosed in the prospectus of the Fund, has entered into revenue sharing arrangements with certain entities that distribute shares of the Fund. The Board also took into consideration the investment research that Lord Abbett receives as a result of Fund brokerage transactions.
Alternative Arrangements. The Board considered whether, instead of approving continuation of the Agreement, it might be in the best interests of the Fund to implement one or more alternative arrangements, such as continuing to employ Lord Abbett, but on different terms. After considering all of the relevant factors, the Board unanimously found that continuation of the Agreement was in the best interests of the Fund and its shareholders and voted unanimously to approve the continuation of the Agreement. In considering whether to approve the continuation of the Agreement, the Board did not identify any single factor as paramount or controlling. Individual Directors may have evaluated the information presented differently from one another, giving different weights to various factors. This summary does not discuss in detail all matters considered.
31
Householding
The Company has adopted a policy that allows it to send only one copy of the Fund’s prospectus, proxy material, annual report and semiannual report to certain shareholders residing at the same “household.” This reduces Fund expenses, which benefits you and other shareholders. If you need additional copies or do not want your mailings to be “householded,” please call Lord Abbett at 888-522-2388 or send a written request with your name, the name of your fund or funds and your account number or numbers to Lord Abbett Family of Funds, P.O. Box 219336, Kansas City, MO 64121.
Proxy Voting Policies, Procedures and Records
A description of the policies and procedures that Lord Abbett uses to vote proxies related to the Fund’s portfolio securities, and information on how Lord Abbett voted the Fund’s proxies during the 12-month period ended June 30 are available without charge, upon request, (i) by calling 888-522-2388; (ii) on Lord Abbett’s Website at www.lordabbett.com; and (iii) on the Securities and Exchange Commission’s (“SEC”) Website at www.sec.gov.
Shareholder Reports and Quarterly Portfolio Disclosure
The Fund is required to file its complete schedule of portfolio holdings with the SEC for its first and third fiscal quarters on Form N-Q. Copies of the filings are available without charge, upon request on the SEC’s Website at www.sec.gov and may be available by calling Lord Abbett at 888-522-2388. You can also obtain copies of Form N-Q by visiting the SEC’s Public Reference Room in Washington, DC (information on the operation of the Public Reference Room may be obtained by calling 800-SEC-0330).
| Tax Information |
| |
| For corporate shareholders, 100% of the Fund’s ordinary income distributions qualified for the dividends received deduction. |
| |
| Additionally, of the distributions paid to shareholders during the fiscal year ended December 31, 2016, $1,677,064 represents long-term capital gains. |
32


| | | |
| This report, when not used for the general information of shareholders of the Fund, is to be distributed only if preceded or accompanied by a current fund prospectus. | | |
| | Lord Abbett Series Fund, Inc. | |
| Lord Abbett mutual fund shares are distributed by | | SFCLASS-PORT-3 |
| LORD ABBETT DISTRIBUTOR LLC. | Classic Stock Portfolio | (02/17) |

2016 LORD ABBETT
ANNUAL REPORT
Lord Abbett
Series Fund—Developing Growth Portfolio
For the fiscal year ended December 31, 2016
Table of Contents
Lord Abbett Series Fund — Developing Growth Portfolio
Annual Report
For the fiscal year ended December 31, 2016

From left to right: James L.L. Tullis, Chairman of the Lord Abbett Funds and Daria L. Foster Director, President, and Chief Executive Officer of the Lord Abbett Funds.
Dear Shareholders: We are pleased to provide you with this overview of the performance of Lord Abbett Series Fund — Developing Growth Portfolio for the fiscal year ended December 31, 2016. On this page and the following pages, we discuss the major factors that influenced fiscal year performance. For additional information about the Fund, please visit our website at www.lordabbett.com, where you also can access the quarterly commentaries that provide updates on the Fund’s performance and other portfolio related updates.
Thank you for investing in Lord Abbett mutual funds. We value the trust that you place in us and look forward to serving your investment needs in the years to come.
Best regards,

Daria L. Foster
Director, President and Chief Executive Officer
For the fiscal year ended December 31, 2016, the Fund returned -2.60%, reflecting performance at the net asset value (NAV) of Class VC shares, with all distributions reinvested, compared to its benchmark, the Russell 2000 Growth® Index1, which returned 11.32% over the same period.
Domestic equity markets (as represented by the S&P 500® Index2) returned 11.96% over the past year. Despite this general move higher, there were significant bouts of volatility within U.S. stock markets, including their worst start to a calendar year on record.
Crude oil prices played a significant role in the increased market volatility, as Brent oil prices fluctuated sharply throughout the fiscal year. In December, the Organization of Petroleum Exporting Countries agreed to reduce oil production effective 2017. Furthermore, global markets were affected by the devaluation of China’s currency and weak economic data out of the region. The Chinese economy advanced at an annual rate of 6.7% in the third quarter of 2016, a slower pace than in recent years.
1
Geopolitical events also contributed to volatility in global markets. The United Kingdom’s referendum in June to leave the European Union (“Brexit”) was a surprise that caused a sell-off in global markets.
In contrast to the equity market volatility, the U.S. economy continued to expand during the trailing 12-month period. The Federal Reserve (Fed) raised target rates for the second time in 12 months in December, from 0.25%–0.50% to 0.50%–0.75%. U.S. gross domestic product (GDP) grew at a 3.2% pace during the third quarter, a significant increase over the second quarter. The U.S. Bureau of Economic Analysis stated that during the third-quarter personal consumption and federal government spending increased, quarter over quarter. In addition to GDP growth, the U.S. unemployment rate remained relatively steady throughout the period, and was reported at 4.6% in November.
The U.S. presidential election took an unexpected turn as Donald J. Trump was elected president, in contrast to indications from poll numbers before the election. Markets rallied on improved clarity in the U.S. political agenda, with the House and Senate also under Republican control.
The leading detractor from the Fund’s performance relative to the benchmark during the period was stock selection within the information technology sector. Within this sector, the Fund’s position in SunPower Corp., a global energy company, was a primary detractor. Shares of SunPower fell during the period as the company failed to
deliver on second quarter earnings expectations and lowered future revenue and margin guidance. Another detractor within the sector was the Fund’s position in Gogo, Inc., a provider of in-flight connectivity and wireless entertainment solutions. Shares of Gogo fell as the company reported mixed results for third quarter 2016; the growth of its average revenue per aircraft was expected to slow.
Stock selection in the industrials sector was another detractor from the Fund’s performance relative to the benchmark during the period. Within this sector, the Fund’s holdings of Dycom Industries, Inc., a North American provider of specialty contracting services, detracted most. Dycom experienced a pause in fiber deployment from an unnamed customer, which had a significant effect on its fiscal fourth quarter revenue.
The leading contributor to the Fund’s relative performance during the reporting period was security selection in the health care sector. Within this sector, the Fund’s holdings of Exelixis, Inc., a biopharmaceutical company, contributed most. Shares of Exelixis rose as its kidney cancer treatment, CABOMETYX, was approved in Europe. Another contributor within this sector over the past year was the Fund’s position in ZELTIQ Aesthetics, Inc., a medical technology company. Shares of ZELTIQ Aesthetics rose as improvements in its utilization and international growth helped it beat third quarter revenue and earnings expectations.
2
An underweight in the real estate sector also positively impacted the portfolio’s relative performance during the period. The real estate sector was negatively impacted by investors’ shift away from income-oriented securities, as the probability of a December Federal Reserve rate hike increased and ultimately materialized.
The Fund’s portfolio is actively managed and, therefore, its holdings and the weightings of a particular issuer or particular sector as a percentage of portfolio assets are subject to change. Sectors may include many industries.
1 The Russell 2000® Growth Index measures the performance of those Russell 2000 companies with higher price-to-book ratios and higher forecasted growth values.
2 The S&P 500® Index is widely regarded as the standard for measuring large cap U.S. stock market performance and includes a representative sample of leading companies in leading industries.
Unless otherwise specified, indexes reflect total return, with all dividends reinvested. Indexes are unmanaged, do not reflect the deduction of fees or expenses, and are not available for direct investment.
Important Performance and Other Information
Performance data quoted in the following pages reflect past performance and are no guarantee of future results. Current performance may be higher or lower than the performance quoted. The investment return and principal value of an investment in the Funds will fluctuate so that shares, on any given day or when redeemed, may be worth more or less than their original cost. You can obtain performance data current to the most recent month end by calling Lord Abbett at 888-522-2388 or referring to www.lordabbett.com.
During certain periods shown, expense waivers and reimbursements were in place. Without such expense waivers and reimbursements, the Funds’ returns would have been lower.
The annual commentary above discusses the views of the Fund’s management and various portfolio holdings of the Funds as of December 31, 2016. These views and portfolio holdings may have changed after this date. Information provided in the commentary is not a recommendation to buy or sell securities. Because the Fund’s portfolio is actively managed and may change significantly, the Fund may no longer own the securities described above or may have otherwise changed their positions in the securities. For more recent information about the Fund’s portfolio holdings, please visit www.lordabbett.com.
A Note about Risk: See Notes to Financial Statements for a discussion of investment risks. For a more detailed discussion of the risks associated with each Fund, please see the Fund’s prospectus.
Mutual funds are not insured by the FDIC, are not deposits or other obligations of, or guaranteed by, banks, and are subject to investment risks including possible loss of principal amount invested.
The Fund serves as an underlying investment vehicle for variable annuity contracts and variable life insurance policies.
3
Investment Comparison
Below is a comparison of a $10,000 investment in Class VC shares with the same investment in the Russell 2000® Growth Index, assuming reinvestment of all dividends and distributions. The Fund’s shares are sold only to insurance company separate accounts that fund certain variable annuity and variable life contracts. The line graph comparison does not reflect the sales charges or other expenses of these contracts. If those sales charges and expenses were reflected, returns would belower. The graph and performance table below do not reflect the deduction of taxes that a shareholder would pay on Fund distributions or the redemption of Fund shares. During the period, expenses of the Fund were waivedor reimbursed by Lord Abbett; without such waiver or reimbursement of expenses, the Fund’s returns would have been lower. Past performance is no guarantee of future results.

Average Annual Total Returns for the
Periods Ended December 31, 2016 |
| | | 1 Year | | 5 Years | | Life of Class |
| Class VC2 | | –2.60% | | 10.25% | | 10.79% |
1 Performance for the unmanaged index does not reflect any fees or expenses. The performance of the index is not necessarily representative of the Fund’s performance. Performance for the index began on May 1, 2010.
2 The Class VC shares commenced operations on April 23, 2010. Performance for the Class began on May 1, 2010.
4
Expense Example
As a shareholder of the Fund, you incur ongoing costs, including management fees; expenses related to the Fund’s services arrangements with certain insurance companies; and other Fund expenses. This Example is intended to help you understand your ongoing costs (in dollars) of investing in the Fund and to compare these costs with the ongoing costs of investing in other mutual funds.
The Example is based on an investment of $1,000 invested at the beginning of the period and held for the entire period (July 1, 2016 through December 31, 2016).
The Example reflects only expenses that are deducted from the assets of the Fund. Fees and expenses, including sales charges applicable to the various insurance products that invest in the Fund, are not reflected in this Example. If such fees and expenses were reflected in the Example, the total expenses shown would be higher. Fees and expenses regarding such variable insurance products are separately described in the prospectus related to those products.
Actual Expenses
The first line of the table on the following page provides information about actual account values and actual expenses. You may use the information in this line, together with the amount you invested, to estimate the expenses that you paid over the period. Simply divide your account value by $1,000 (for example, an $8,600 account value divided by $1,000 = 8.6), then multiply the result by the number in the first line under the heading titled “Expenses Paid During Period 7/1/16 – 12/31/16” to estimate the expenses you paid on your account during this period.
Hypothetical Example for Comparison Purposes
The second line of the table on the following page provides information about hypothetical account values and hypothetical expenses based on the Fund’s actual expense ratio and an assumed rate of return of 5% per year before expenses, which is not the Fund’s actual return. The hypothetical account values and expenses may not be used to estimate the actual ending account balance or expenses you paid for the period. You may use this information to compare the ongoing costs of investing in the Fund and other funds. To do so, compare this 5% hypothetical example with the 5% hypothetical examples that appear in the shareholder reports of the other funds.
5
Please note that the expenses shown in the table are meant to highlight your ongoing costs only and do not reflect any transactional costs, such as sales charges. Therefore, the second line of the table is useful in comparing ongoing costs only, and will not help you determine the relative total costs of owning different funds. In addition, if these transactional costs were included, your costs would have been higher.
| | | Beginning
Account
Value | | Ending
Account
Value | | Expenses
Paid During
Period† | |
| | | 7/1/16 | | 12/31/16 | | 7/1/16 -
12/31/16 | |
| Class VC | | | | | | | |
| Actual | | $1,000.00 | | $1,063.20 | | $4.67 | |
| Hypothetical (5% Return Before Expenses) | | $1,000.00 | | $1,020.61 | | $4.57 | |
| | |
| † | Net expenses are equal to the Fund’s annualized expense ratio of 0.90%, multiplied by the average account value over the period, multiplied by 184/366 (to reflect one-half year period). |
Portfolio Holdings Presented by Sector
December 31, 2016
| Sector* | %** | |
| Consumer Discretionary | 13.90 | % |
| Energy | 6.63 | % |
| Financials | 13.77 | % |
| Health Care | 15.88 | % |
| Industrials | 20.97 | % |
| Information Technology | 20.77 | % |
| Materials | 8.08 | % |
| Total | 100.00 | % |
| | | |
| * | | A sector may comprise several industries. |
| ** | | Represents percent of total investments. |
| | |
| 6 | See Notes to Financial Statements. |
Schedule of Investments
December 31, 2016
| Investments | | Shares | | | Fair
Value
(000) | |
| COMMON STOCKS 99.01% | | | | | | | | |
| | | | | | | | | |
| Aerospace & Defense 2.59% | | | | | | | | |
| DigitalGlobe, Inc.* | | | 16,947 | | | $ | 486 | |
| TASER International, Inc.* | | | 10,517 | | | | 255 | |
| Total | | | | | | | 741 | |
| | | | | | | | | |
| Air Freight & Logistics 0.93% | | | | | | | | |
| XPO Logistics, Inc.* | | | 6,135 | | | | 265 | |
| | | | | | | | | |
| Airlines 1.36% | | | | | | | | |
| Spirit Airlines, Inc.* | | | 6,707 | | | | 388 | |
| | | | | | | | | |
| Auto Components 0.50% | | | | | | | | |
| Tenneco, Inc.* | | | 2,285 | | | | 143 | |
| | | | | | | | | |
| Banks 11.30% | | | | | | | | |
| Chemical Financial Corp. | | | 4,137 | | | | 224 | |
| Columbia Banking System, Inc. | | | 3,414 | | | | 153 | |
| FCB Financial Holdings, Inc. Class A* | | | 948 | | | | 45 | |
| Glacier Bancorp, Inc. | | | 931 | | | | 34 | |
| Hancock Holding Co. | | | 3,576 | | | | 154 | |
| Home BancShares, Inc. | | | 5,718 | | | | 159 | |
| IBERIABANK Corp. | | | 2,801 | | | | 235 | |
| LegacyTexas Financial Group, Inc. | | | 4,141 | | | | 178 | |
| MB Financial, Inc. | | | 4,921 | | | | 232 | |
| Pinnacle Financial Partners, Inc. | | | 3,318 | | | | 230 | |
| Texas Capital Bancshares, Inc.* | | | 3,653 | | | | 286 | |
| Webster Financial Corp. | | | 7,035 | | | | 382 | |
| Western Alliance Bancorp* | | | 11,993 | | | | 584 | |
| Wintrust Financial Corp. | | | 4,611 | | | | 335 | |
| Total | | | | | | | 3,231 | |
| | | | | | | | | |
| Biotechnology 6.58% | | | | | | | | |
| ACADIA Pharmaceuticals, Inc.* | | | 2,750 | | | | 79 | |
| Agios Pharmaceuticals, Inc.* | | | 1,571 | | | | 66 | |
| ARIAD Pharmaceuticals, Inc.* | | | 17,495 | | | | 218 | |
| Blueprint Medicines Corp.* | | | 5,681 | | | | 159 | |
| Exact Sciences Corp.* | | | 5,063 | | | | 68 | |
| Exelixis, Inc.* | | | 28,540 | | | | 425 | |
| Sage Therapeutics, Inc.* | | | 4,491 | | | | 229 | |
| Investments | | Shares | | | Fair
Value
(000) | |
| Biotechnology (continued) | | | | | | | | |
| Spark Therapeutics, Inc.* | | | 4,267 | | | $ | 213 | |
| TESARO, Inc.* | | | 3,160 | | | | 425 | |
| Total | | | | | | | 1,882 | |
| | | | | | | | | |
| Building Products 1.91% | | | | | | | | |
| Apogee Enterprises, Inc. | | | 4,738 | | | | 254 | |
| Builders FirstSource, Inc.* | | | 26,499 | | | | 291 | |
| Total | | | | | | | 545 | |
| | | | | | | | | |
| Capital Markets 2.34% | | | | | | | | |
| Evercore Partners, Inc. Class A | | | 5,762 | | | | 396 | |
| WisdomTree Investments, Inc. | | | 24,560 | | | | 273 | |
| Total | | | | | | | 669 | |
| | | | | | | | | |
| Chemicals 2.54% | | | | | | | | |
| Huntsman Corp. | | | 18,380 | | | | 351 | |
| Minerals Technologies, Inc. | | | 4,862 | | | | 375 | |
| Total | | | | | | | 726 | |
| | | | | | | | | |
| Commercial Services & Supplies 0.51% | | | | | | | | |
| Tetra Tech, Inc. | | | 3,410 | | | | 147 | |
| | | | | | | | | |
| Construction & Engineering 2.98% | | | | | | | | |
| Granite Construction, Inc. | | | 2,506 | | | | 138 | |
| MasTec, Inc.* | | | 8,564 | | | | 327 | |
| Quanta Services, Inc.* | | | 11,123 | | | | 388 | |
| Total | | | | | | | 853 | |
| | | | | | | | | |
| Construction Materials 1.06% | | | | | | | | |
| Eagle Materials, Inc. | | | 3,064 | | | | 302 | |
| | | | | | | | | |
| Distributors 0.86% | | | | | | | | |
| Pool Corp. | | | 2,361 | | | | 246 | |
| | | | | | | | | |
| Electronic Equipment, Instruments & Components 3.29% |
| Belden, Inc. | | | 3,777 | | | | 282 | |
| Cognex Corp. | | | 6,060 | | | | 386 | |
| Coherent, Inc.* | | | 1,978 | | | | 272 | |
| Total | | | | | | | 940 | |
| | | | | | | | | |
| Energy Equipment & Services 2.78% | | | | | | | | |
| Nabors Industries Ltd. | | | 13,513 | | | | 222 | |
| Patterson-UTI Energy, Inc. | | | 8,157 | | | | 219 | |
| | See Notes to Financial Statements. | 7 |
Schedule of Investments (continued)
December 31, 2016
| Investments | | Shares | | | Fair
Value
(000) | |
| Energy Equipment & Services (continued) | | | | | | | | |
| U.S. Silica Holdings, Inc. | | | 6,266 | | | $ | 355 | |
| Total | | | | | | | 796 | |
| | | | | | | | | |
| Health Care Equipment & Supplies 5.56% | | | | | | | | |
| ABIOMED, Inc.* | | | 1,381 | | | | 156 | |
| Glaukos Corp.* | | | 6,424 | | | | 220 | |
| Insulet Corp.* | | | 5,792 | | | | 218 | |
| Masimo Corp.* | | | 2,202 | | | | 148 | |
| Nevro Corp.* | | | 1,827 | | | | 133 | |
| Penumbra, Inc.* | | | 3,395 | | | | 217 | |
| ZELTIQ Aesthetics, Inc.* | | | 11,475 | | | | 499 | |
| Total | | | | | | | 1,591 | |
| | | | | | | | | |
| Health Care Providers & Services 1.03% | | | | | | | | |
| HealthEquity, Inc.* | | | 7,313 | | | | 296 | |
| | | | | | | | | |
| Health Care Technology 1.86% | | | | | | | | |
| Cotiviti Holdings, Inc.* | | | 7,280 | | | | 251 | |
| Veeva Systems, Inc. Class A* | | | 6,884 | | | | 280 | |
| Total | | | | | | | 531 | |
| | | | | | | | | |
| Hotels, Restaurants & Leisure 4.24% | | | | | | | | |
| Dave & Buster’s Entertainment, Inc.* | | | 9,889 | | | | 557 | |
| Extended Stay America, Inc. Unit | | | 17,600 | | | | 284 | |
| Planet Fitness, Inc. Class A | | | 18,551 | | | | 373 | |
| Total | | | | | | | 1,214 | |
| | | | | | | | | |
| Household Durables 2.43% | | | | | | | | |
| iRobot Corp.* | | | 9,949 | | | | 582 | |
| Universal Electronics, Inc.* | | | 1,743 | | | | 112 | |
| Total | | | | | | | 694 | |
| | | | | | | | | |
| Information Technology Services 1.71% | | | | | | | | |
| Cardtronics plc Class A (United Kingdom)*(a) | | | 6,283 | | | | 343 | |
| CSRA, Inc. | | | 4,635 | | | | 147 | |
| Total | | | | | | | 490 | |
| | | | | | | | | |
| Internet & Direct Marketing Retail 0.96% | | | | | | | | |
| Etsy, Inc.* | | | 23,405 | | | | 276 | |
| Investments | | Shares | | | Fair
Value
(000) | |
| Internet Software & Services 6.08% | | | | | | | | |
| 2U, Inc.* | | | 6,858 | | | $ | 207 | |
| Five9, Inc.* | | | 12,452 | | | | 177 | |
| GoDaddy, Inc. Class A* | | | 3,082 | | | | 108 | |
| GrubHub, Inc.* | | | 4,042 | | | | 152 | |
| Match Group, Inc.* | | | 11,664 | | | | 199 | |
| Nutanix, Inc. Class A* | | | 2,570 | | | | 68 | |
| Shopify, Inc. Class A (Canada)*(a) | | | 3,453 | | | | 148 | |
| Stamps.com, Inc.* | | | 2,784 | | | | 319 | |
| Twilio, Inc. Class A* | | | 4,930 | | | | 142 | |
| Wix.com Ltd. (Israel)*(a) | | | 4,917 | | | | 219 | |
| Total | | | | | | | 1,739 | |
| | | | | | | | | |
| Life Sciences Tools & Services 0.69% | | | | | | | | |
| Bio-Techne Corp. | | | 1,393 | | | | 143 | |
| Pacific Biosciences of California, Inc.* | | | 14,260 | | | | 54 | |
| Total | | | | | | | 197 | |
| | | | | | | | | |
| Machinery 3.10% | | | | | | | | |
| Allison Transmission Holdings, Inc. | | | 7,541 | | | | 254 | |
| Astec Industries, Inc. | | | 2,538 | | | | 171 | |
| Nordson Corp. | | | 4,126 | | | | 463 | |
| Total | | | | | | | 888 | |
| | | | | | | | | |
| Media 2.19% | | | | | | | | |
| IMAX Corp. (Canada)*(a) | | | 9,445 | | | | 296 | |
| Live Nation Entertainment, Inc.* | | | 12,394 | | | | 330 | |
| Total | | | | | | | 626 | |
| | | | | | | | | |
| Metals & Mining 4.41% | | | | | | | | |
| AK Steel Holding Corp.* | | | 48,962 | | | | 500 | |
| Cliffs Natural Resources, Inc.* | | | 33,117 | | | | 279 | |
| United States Steel Corp. | | | 14,646 | | | | 483 | |
| Total | | | | | | | 1,262 | |
| | | | | | | | | |
| Multi-Line Retail 0.46% | | | | | | | | |
| Ollie’s Bargain Outlet Holdings, Inc.* | | | 4,685 | | | | 133 | |
| 8 | See Notes to Financial Statements. |
Schedule of Investments (concluded)
December 31, 2016
| Investments | | Shares | | | Fair
Value
(000) | |
| Oil, Gas & Consumable Fuels 3.78% | | | | | | | | |
| Arch Coal, Inc. Class A* | | | 1,760 | | | $ | 137 | |
| Callon Petroleum Co.* | | | 12,032 | | | | 185 | |
| GasLog Ltd. (Monaco)(a) | | | 26,940 | | | | 434 | |
| Oasis Petroleum, Inc.* | | | 14,533 | | | | 220 | |
| WildHorse Resource Development Corp.* | | | 7,172 | | | | 105 | |
| Total | | | | | | | 1,081 | |
| | | | | | | | | |
| Professional Services 1.50% | | | | | | | | |
| WageWorks, Inc.* | | | 5,917 | | | | 429 | |
| | | | | | | | | |
| Road & Rail 1.00% | | | | | | | | |
| Knight Transportation, Inc. | | | 4,289 | | | | 142 | |
| Swift Transportation Co.* | | | 5,956 | | | | 145 | |
| Total | | | | | | | 287 | |
| | | | | | | | | |
| Semiconductors & Semiconductor Equipment 5.57% |
| Acacia Communications, Inc.* | | | 1,013 | | | | 63 | |
| Cavium, Inc.* | | | 3,451 | | | | 215 | |
| Cirrus Logic, Inc.* | | | 5,371 | | | | 304 | |
| Inphi Corp.* | | | 6,386 | | | | 285 | |
| MACOM Technology Solutions Holdings, Inc.* | | | 5,943 | | | | 275 | |
| Monolithic Power Systems, Inc. | | | 4,704 | | | | 385 | |
| Silicon Motion Technology Corp. ADR | | | 1,577 | | | | 67 | |
| Total | | | | | | | 1,594 | |
| | | | | | | | | |
| Software 3.40% | | | | | | | | |
| 8x8, Inc.* | | | 12,755 | | | | 182 | |
| Atlassian Corp. plc Class A (Australia)*(a) | | | 4,422 | | | | 107 | |
| Investments | | Shares | | | Fair
Value
(000) | |
| Software (continued) | | | | | | | | |
| Blackline, Inc.* | | | 2,448 | | | $ | 68 | |
| BroadSoft, Inc.* | | | 1,757 | | | | 72 | |
| Gigamon, Inc.* | | | 2,937 | | | | 134 | |
| HubSpot, Inc.* | | | 2,898 | | | | 136 | |
| Materialise NV ADR* | | | 7,786 | | | | 60 | |
| Proofpoint, Inc.* | | | 3,015 | | | | 213 | |
| Total | | | | | | | 972 | |
| | | | | | | | | |
| Specialty Retail 2.11% | | | | | | | | |
| Burlington Stores, Inc.* | | | 3,841 | | | | 325 | |
| Five Below, Inc.* | | | 6,973 | | | | 279 | |
| Total | | | | | | | 604 | |
| | | | | | | | | |
| Technology Hardware, Storage & Peripherals 0.52% |
| Electronics For Imaging, Inc.* | | | 3,367 | | | | 148 | |
| | | | | | | | | |
| Trading Companies & Distributors 4.88% | | | | | | | | |
| Air Lease Corp. | | | 12,347 | | | | 424 | |
| Beacon Roofing Supply, Inc.* | | | 11,802 | | | | 544 | |
| MRC Global, Inc.* | | | 10,169 | | | | 206 | |
| MSC Industrial Direct Co., Inc. Class A | | | 2,403 | | | | 222 | |
| Total | | | | | | | 1,396 | |
Total Investments in Common Stock 99.01%
(cost $26,719,392) | | | | | | | 28,322 | |
| Other Assets in Excess of Liabilities 0.99% | | | | | | | 283 | |
| Net Assets 100.00% | | | | | | $ | 28,605 | |
| ADR | | American Depositary Receipt. |
| Unit | | More than one class of securities traded together. |
| * | | Non-income producing security |
| (a) | | Foreign security traded in U.S. dollars. |
The following is a summary of the inputs used as of December 31, 2016 in valuing the Fund’s investments carried at fair value(1):
| | | Level 1 | | Level 2 | | Level 3 | | | Total | |
| Investment Type(2)(3) | | (000) | | | (000) | | | (000) | | | (000) | |
| Common Stocks | | $ | 28,322 | | | $ | – | | | $ | – | | | $ | 28,322 | |
| Total | | $ | 28,322 | | | $ | – | | | $ | – | | | $ | 28,322 | |
| (1) | | Refer to Note 2(h) for a description of fair value measurements and the three-tier hierarchy of inputs. |
| (2) | | See Schedule of Investments for fair values in each industry and identification of foreign issuers and/or geography. |
| (3) | | There were no Level 1/Level 2 transfers during the fiscal year ended December 31, 2016. |
| | See Notes to Financial Statements. | 9 |
Statement of Assets and Liabilities
December 31, 2016
| ASSETS: | | | | |
| Investments in securities, at fair value (cost $26,719,392) | | $ | 28,321,838 | |
| Receivables: | | | | |
| Investment securities sold | | | 542,967 | |
| Capital shares sold | | | 18,682 | |
| From advisor (See Note 3) | | | 9,286 | |
| Dividends | | | 6,680 | |
| Prepaid expenses | | | 176 | |
| Total assets | | | 28,899,629 | |
| LIABILITIES: | | | | |
| Payables: | | | | |
| To bank | | | 156,865 | |
| Investment securities purchased | | | 33,148 | |
| Management fee | | | 19,359 | |
| Capital shares reacquired | | | 15,189 | |
| Directors’ fees | | | 1,760 | |
| Fund administration | | | 1,033 | |
| Accrued expenses | | | 67,528 | |
| Total liabilities | | | 294,882 | |
| NET ASSETS | | $ | 28,604,747 | |
| COMPOSITION OF NET ASSETS: | | | | |
| Paid-in capital | | $ | 31,305,703 | |
| Accumulated net investment loss | | | (1,760 | ) |
| Accumulated net realized loss on investments | | | (4,301,642 | ) |
| Net unrealized appreciation on investments | | | 1,602,446 | |
| Net Assets | | $ | 28,604,747 | |
| Outstanding shares (50 million shares of common stock authorized, $.001 par value) | | | 1,318,682 | |
Net asset value, offering and redemption price per share
(Net assets divided by outstanding shares) | | | $21.69 | |
| 10 | See Notes to Financial Statements. |
Statement of Operations
For the Year Ended December 31, 2016
| Investment income: | | | | |
| Dividends | | $ | 173,231 | |
| Interest | | | 282 | |
| Total investment income | | | 173,513 | |
| Expenses: | | | | |
| Management fee | | | 231,322 | |
| Non 12b-1 service fees | | | 77,145 | |
| Shareholder servicing | | | 47,481 | |
| Fund administration | | | 12,337 | |
| Reports to shareholders | | | 15,581 | |
| Directors’ fees | | | 1,086 | |
| Professional | | | 41,295 | |
| Custody | | | 36,998 | |
| Other | | | 3,452 | |
| Gross expenses | | | 466,697 | |
| Expense reductions (See Note 8) | | | (121 | ) |
| Fees waived and expenses reimbursed (See Note 3) | | | (188,990 | ) |
| Net expenses | | | 277,586 | |
| Net investment loss | | | (104,073 | ) |
| Net realized and unrealized gain (loss): | | | | |
| Net realized loss on investments | | | (1,968,606 | ) |
| Net change in unrealized appreciation/depreciation on investments | | | 1,799,143 | |
| Net realized and unrealized loss | | | (169,463 | ) |
| Net Decrease in Net Assets Resulting From Operations | | $ | (273,536 | ) |
| | See Notes to Financial Statements. | 11 |
Statements of Changes in Net Assets
| | | For the Year Ended | | | For the Year Ended | |
| INCREASE (DECREASE) IN NET ASSETS | | December 31, 2016 | | | December 31, 2015 | |
| Operations: | | | | | | | | | | |
| Net investment loss | | | $ | (104,073 | ) | | | $ | (152,458 | ) |
| Net realized loss on investments | | | | (1,968,606 | ) | | | | (1,527,619 | ) |
| Net change in unrealized appreciation/depreciation on investments | | | | 1,799,143 | | | | | (1,631,984 | ) |
| Net decrease in net assets resulting from operations | | | | (273,536 | ) | | | | (3,312,061 | ) |
| Distributions to shareholders from: | | | | | | | | | | |
| Net realized gain | | | | – | | | | | (235,366 | ) |
| Capital share transactions (See Note 13): | | | | | | | | | | |
| Proceeds from sales of shares | | | | 15,087,712 | | | | | 22,904,779 | |
| Reinvestment of distributions | | | | – | | | | | 235,366 | |
| Cost of shares reacquired | | | | (15,091,059 | ) | | | | (8,205,194 | ) |
| Net increase (decrease) in net assets resulting from capital share transactions | | | | (3,347 | ) | | | | 14,934,951 | |
| Net increase (decrease) in net assets | | | | (276,883 | ) | | | | 11,387,524 | |
| NET ASSETS: | | | | | | | | | | |
| Beginning of year | | | $ | 28,881,630 | | | | $ | 17,494,106 | |
| End of year | | | $ | 28,604,747 | | | | $ | 28,881,630 | |
| Accumulated net investment loss | | | $ | (1,760 | ) | | | $ | (1,069 | ) |
| 12 | See Notes to Financial Statements. |
This page is intentionally left blank.
Financial Highlights
| | | | | Per Share Operating Performance: | | |
| | | | | Investment operations: | | Distributions
to
shareholders
from: | | |
| | | | | | | | | | | | | | |
| | | Net asset
value,
beginning of
period | | Net
investment
income
(loss)(a) | | Net
realized and
unrealized
gain (loss) | | Total from
investment
operations | | | Net
realized
gain | | Net asset
value,
end of
period |
| 12/31/2016 | | | $22.28 | | | | $(0.07 | ) | | | $(0.52 | ) | | | $(0.59 | ) | | | | $ – | | | | $21.69 | |
| 12/31/2015 | | | 24.46 | | | | (0.14 | ) | | | (1.86 | ) | | | (2.00 | ) | | | | (0.18 | ) | | | 22.28 | |
| 12/31/2014 | | | 23.74 | | | | (0.16 | ) | | | 1.03 | | | | 0.87 | | | | | (0.15 | ) | | | 24.46 | |
| 12/31/2013 | | | 16.43 | | | | (0.16 | ) | | | 9.44 | | | | 9.28 | | | | | (1.97 | ) | | | 23.74 | |
| 12/31/2012 | | | 15.68 | | | | (0.08 | ) | | | 1.98 | | | | 1.90 | | | | | (1.15 | ) | | | 16.43 | |
| (a) | | Calculated using average shares outstanding during the period. |
| (b) | | Total return does not consider the effects of sales charges or other expenses imposed by an insurance company and assumes the reinvestment of all distributions. |
| 14 | See Notes to Financial Statements. |
| | | Ratios to Average Net Assets: | | Supplemental Data: |
| | | | | | | | | | | |
Total
return(b)
(%) | | Total
expenses after
waivers and/or
reimburse-
ments
(%) | | Total
expenses
(%) | | Net
investment
income (loss)
(%) | | Net assets,
end of
period
(000) | | Portfolio
turnover
rate
(%) |
| | (2.60 | ) | | | 0.90 | | | | 1.51 | | | | (0.34 | ) | | $ | 28,605 | | | | 222.26 | |
| | (8.21 | ) | | | 0.90 | | | | 1.56 | | | | (0.56 | ) | | | 28,882 | | | | 196.74 | |
| | 3.71 | | | | 0.90 | | | | 2.02 | | | | (0.68 | ) | | | 17,494 | | | | 235.07 | |
| | 56.68 | | | | 0.90 | | | | 6.47 | | | | (0.72 | ) | | | 4,294 | | | | 245.36 | |
| | 12.11 | | | | 0.90 | | | | 26.16 | | | | (0.48 | ) | | | 327 | | | | 176.45 | |
| | See Notes to Financial Statements. | 15 |
Notes to Financial Statements
Lord Abbett Series Fund, Inc. (the “Company”) is registered under the Investment Company Act of 1940, as amended (the “Act”), as a diversified, open-end management investment company and was incorporated under Maryland law in 1989. The Company consists of thirteen separate portfolios. This report covers Developing Growth Portfolio (the “Fund”).
The Fund’s investment objective is long-term growth of capital. The Fund has Variable Contract class shares (“Class VC Shares”), which are currently issued and redeemed only in connection with investments in, and payments under, variable annuity contracts and variable life insurance policies issued by life insurance and insurance-related companies.
The preparation of the financial statements in conformity with accounting principles generally accepted in the United States of America (“U.S. GAAP”) requires management to make certain estimates and assumptions that affect the reported amounts of assets and liabilities and disclosure of contingent assets and liabilities at the date of the financial statements and the reported amounts of increases and decreases in net assets from operations during the reporting period. Actual results could differ from those estimates. The Fund is considered an investment company under U.S. GAAP and follows the accounting and reporting guidance applicable to investment companies.
| 2. | SIGNIFICANT ACCOUNTING POLICIES |
| | |
| (a) | Investment Valuation–Under procedures approved by the Fund’s Board of Directors (the “Board”), Lord, Abbett & Co. LLC (“Lord Abbett”), the Fund’s investment manager, has formed a Pricing Committee to administer the pricing and valuation of portfolio investments and to ensure that prices utilized reasonably reflect fair value. Among other things, these procedures allow the Fund to utilize independent pricing services, quotations from securities and financial instrument dealers and other market sources to determine fair value. |
| | |
| | Securities actively traded on any recognized U.S. or non-U.S. exchange or on The NASDAQ Stock Market LLC are valued at the last sale price or official closing price on the exchange or system on which they are principally traded. Events occurring after the close of trading on non-U.S. exchanges may result in adjustments to the valuation of foreign securities to reflect their fair value as of the close of regular trading on the New York Stock Exchange. The Fund may utilize an independent fair valuation service in adjusting the valuations of foreign securities. Unlisted equity securities are valued at the last quoted sale price or, if no sale price is available, at the mean between the most recently quoted bid and asked prices. |
| | |
| | Securities for which prices are not readily available are valued at fair value as determined by the Pricing Committee. The Pricing Committee considers a number of factors, including observable and unobservable inputs, when arriving at fair value. The Pricing Committee may use related or comparable assets or liabilities, recent transactions, market multiples, book values and other relevant information to determine the fair value of portfolio investments. The Board or a designated committee thereof regularly reviews fair value determinations made by the Pricing Committee and employs techniques such as reviewing related market activity, reviewing inputs and assumptions, and retrospectively comparing prices of subsequent purchases and sales transactions to fair value determinations made by the Pricing Committee. |
| | |
| | Short-term securities with 60 days or less remaining to maturity are valued using the amortized cost method, which approximates fair value. |
16
Notes to Financial Statements (continued)
| (b) | Security Transactions–Security transactions are recorded as of the date that the securities are purchased or sold (trade date). Realized gains and losses on sales of portfolio securities are calculated using the identified-cost method. |
| | |
| (c) | Investment Income–Dividend income is recorded on the ex-dividend date. Interest income is recorded on the accrual basis as earned. Discounts are accreted and premiums are amortized using the effective interest method and are included in Interest and other income on the Statement of Operations. Withholding taxes on foreign dividends have been provided for in accordance with the applicable country’s tax rules and rates. |
| | |
| (d) | Income Taxes–It is the policy of the Fund to meet the requirements of Subchapter M of the Internal Revenue Code applicable to regulated investment companies and to distribute substantially all taxable income and capital gains to its shareholders. Therefore, no income tax provision is required. |
| | |
| | The Fund files U.S. federal and various state and local tax returns. No income tax returns are currently under examination. The statute of limitations on the Fund’s filed U.S. federal tax returns remains open for the fiscal years ended December 31, 2013 through December 31, 2016. The statutes of limitations on the Company’s state and local tax returns may remain open for an additional year depending upon the jurisdiction. |
| | |
| (e) | Expenses–Expenses incurred by the Company that do not specifically relate to an individual fund are generally allocated to the funds within the Company on a pro rata basis by relative net assets. |
| | |
| (f) | Foreign Transactions–The books and records of the Fund are maintained in U.S. dollars and transactions denominated in foreign currencies are recorded in the Fund’s records at the rate prevailing when earned or recorded. Asset and liability accounts that are denominated in foreign currencies are adjusted daily to reflect current exchange rates and any unrealized gain (loss) is included in Net change in unrealized appreciation/depreciation on investments in the Fund’s Statement of Operations. The resultant exchange gains and losses upon settlement of such transactions are included in Net realized loss on investments in the Fund’s Statement of Operations. The Fund does not isolate that portion of the results of operations arising as a result of changes in the foreign exchange rates from the changes in market prices of the securities. |
| | |
| (g) | Repurchase Agreements–The Fund may enter into repurchase agreements with respect to securities. A repurchase agreement is a transaction in which a fund acquires a security and simultaneously commits to resell that security to the seller (a bank or securities dealer) at an agreed-upon price on an agreed-upon date. The Fund requires at all times that the repurchase agreement be collateralized by cash, or by securities of the U.S. Government, its agencies, its instrumentalities, or U.S. Government sponsored enterprises having a value equal to, or in excess of, the value of the repurchase agreement (including accrued interest). If the seller of the agreement defaults on its obligation to repurchase the underlying securities at a time when the fair value of these securities has declined, the Fund may incur a loss upon disposition of the securities. |
| | |
| (h) | Fair Value Measurements–Fair value is defined as the price that the Fund would receive upon selling an investment or transferring a liability in an orderly transaction to an independent buyer in the principal or most advantageous market of the investment. A three-tier hierarchy is used to maximize the use of observable market data and minimize the use of unobservable inputs and to establish classification of fair value measurements for disclosure purposes. Inputs |
17
Notes to Financial Statements (continued)
| | refer broadly to the assumptions that market participants would use in pricing the asset or liability, including assumptions about risk—for example, the risk inherent in a particular valuation technique used to measure fair value (such as a pricing model) and/or the risk inherent in the inputs to the valuation technique. Inputs may be observable or unobservable. Observable inputs reflect the assumptions market participants would use in pricing the asset or liability. Observable inputs are based on market data obtained from sources independent of the reporting entity. Unobservable inputs reflect the reporting entity’s own assumptions about the assumptions market participants would use in pricing the asset or liability. Unobservable inputs are based on the best information available in the circumstances. The three-tier hierarchy classification is determined based on the lowest level of inputs that is significant to the fair value measurement, and is summarized in the three broad Levels listed below: |
| | |
| | Level 1 – | unadjusted quoted prices in active markets for identical investments; |
| | | |
| | Level 2 – | other significant observable inputs (including quoted prices for similar investments, interest rates, prepayment speeds, credit risk, etc.); and |
| | | |
| | Level 3 – | significant unobservable inputs (including the Fund’s own assumptions in determining the fair value of investments). |
| | | |
| | A summary of inputs used in valuing the Fund’s investments as of December 31, 2016 and, if applicable, Level 1/Level 2 transfers and Level 3 rollforwards for the fiscal year then ended is included in the Fund’s Schedule of Investments. |
| | |
| | Changes in valuation techniques may result in transfers into or out of an assigned level within the three-tier hierarchy. All transfers between different levels within the three-tier hierarchy are deemed to have occurred as of the beginning of the reporting period. The inputs or methodology used for valuing securities are not necessarily an indication of the risk associated with investing in those securities. |
| | |
| 3. | MANAGEMENT FEE AND OTHER TRANSACTIONS WITH AFFILIATES |
Management Fee
The Company has a management agreement with Lord Abbett, pursuant to which Lord Abbett supplies the Fund with investment management services and executive and other personnel, provides office space and pays for ordinary and necessary office and clerical expenses relating to research and statistical work and supervision of the Fund’s investment portfolio.
The management fee is based on the Fund’s average daily net assets at the following annual rate:
| First $100 million | .75% |
| Over $100 million | .50% |
For the fiscal year ended December 31, 2016, the effective management fee, net of waivers, was at an annualized rate of 0.14% of the Fund’s average daily net assets.
In addition, Lord Abbett provides certain administrative services to the Fund pursuant to an Administrative Services Agreement in return for a fee at an annual rate of ..04% of the Fund’s average daily net assets.
During the fiscal year ended December 31, 2016 and continuing through April 30, 2017, Lord Abbett has contractually agreed to waive its fees and reimburse expenses to the extent necessary to limit total net annual operating expenses to an annual rate of 0.90%. This agreement may be terminated only upon the approval of the Board.
18
Notes to Financial Statements (continued)
The Company, on behalf of the Fund, has entered into services arrangements with certain insurance companies. Under these arrangements, certain insurance companies will be compensated up to .25% of the average daily net asset value (“NAV”) of the Fund’s Class VC Shares held in the insurance company’s separate account to service and maintain the Variable Contract owners’ accounts. This amount is included in Non 12b-1 service fees on the Statement of Operations. The Fund may also compensate certain insurance companies, third-party administrators and other entities for providing recordkeeping, sub-transfer agency and other administrative services to the Fund. This amount is included in Shareholder servicing on the Statement of Operations.
Two Directors and certain of the Company’s officers have an interest in Lord Abbett.
| 4. | DISTRIBUTIONS AND CAPITAL LOSS CARRYFORWARDS |
Dividends from net investment income, if any, are declared and paid at least semi-annually. Taxable net realized gains from investment transactions, reduced by allowable capital loss carryforwards, if any, are declared and distributed to shareholders at least annually. The capital loss carryforward amount, if any, is available to offset future net capital gains. Dividends and distributions to shareholders are recorded on the ex-dividend date. The amounts of dividends and distributions from net investment income and net realized capital gains are determined in accordance with federal income tax regulations, which may differ from U.S. GAAP. These book/tax differences are either considered temporary or permanent in nature. To the extent these differences are permanent in nature, such amounts are reclassified within the components of net assets based on their federal tax basis treatment; temporary differences do not require reclassification. Dividends and distributions that exceed earnings and profits for tax purposes are reported as a tax return of capital.
The tax character of distributions paid during the fiscal years ended December 31, 2016 and 2015 was as follows:
| | | Year Ended
12/31/2016 | | | Year Ended
12/31/2015 | |
| Distributions paid from: | | | | | | | | |
| Ordinary income | | $ | – | | | $ | 187,754 | |
| Net long-term capital gains | | | – | | | | 47,612 | |
| Total distributions paid | | $ | – | | | $ | 235,366 | |
As of December 31, 2016, the components of accumulated losses on a tax-basis were as follows:
| Capital loss carryforwards* | | $ | (3,966,903 | ) |
| Temporary differences | | | (1,760 | ) |
| Unrealized gains – net | | | 1,267,707 | |
| Total accumulated losses – net | | $ | (2,700,956 | ) |
| | |
| * | The capital losses will carry forward indefinitely. |
As of December 31, 2016, the aggregate unrealized security gains and losses based on cost for U.S. federal income tax purposes were as follows:
| Tax cost | | $ | 27,054,131 | |
| Gross unrealized gain | | | 2,009,432 | |
| Gross unrealized loss | | | (741,725 | ) |
| Net unrealized security gain | | $ | 1,267,707 | |
The difference between book-basis and tax-basis unrealized gains (losses) is attributable to wash sales.
19
Notes to Financial Statements (continued)
Permanent items identified during the fiscal year ended December 31, 2016 have been reclassified among the components of net assets based on their tax basis treatment as follows:
Accumulated
Net Investment
Loss | | Accumulated
Net Realized
Loss | | Paid-in
Capital | |
| $103,382 | | $893 | | $(104,275 | ) |
The permanent differences are attributable to the tax treatment of net investment losses and certain distributions received.
| 5. | PORTFOLIO SECURITIES TRANSACTIONS |
Purchases and sales of investment securities (excluding short-term investments) for the fiscal year ended December 31, 2016 were as follows:
| Purchases | | Sales |
| $66,548,581 | | $66,528,730 |
There were no purchases or sales of U.S. Government securities for the fiscal year ended December 31, 2016.
| 6. | DISCLOSURES ABOUT OFFSETTING ASSETS AND LIABILITIES |
The Financial Accounting Standards Board (“FASB”) requires disclosures intended to help better assess the effect or potential effect of offsetting arrangements on a fund’s financial position. The following tables illustrate gross and net information about recognized assets and liabilities eligible for offset in the statement of assets and liabilities; and disclose such amounts subject to an enforceable master netting agreement or similar agreement, by counterparty. A master netting agreement is an agreement between a fund and a counterparty which provides for the net settlement of amounts owed under all contracts traded under that agreement, as well as cash collateral, through a single payment by one party to the other in the event of default on or termination of any one contract. The Fund’s accounting policy with respect to balance sheet offsetting is that, absent an event of default by the counterparty or a termination of the agreement, the master netting agreement does not result in an offset of reported amounts of financial assets and liabilities in the statement of assets and liabilities across transactions between the Fund and the applicable counterparty. As of December 31, 2016, the Fund did not have assets or liabilities subject to the FASB disclosure requirements.
| 7. | DIRECTORS’ REMUNERATION |
The Company’s officers and two Directors, who are associated with Lord Abbett, do not receive any compensation from the Company for serving in such capacities. Independent Directors’ fees are allocated among all Lord Abbett-sponsored funds based on the net assets of each fund. There is an equity-based plan available to all Independent Directors under which Independent Directors must defer receipt of a portion of, and may elect to defer receipt of an additional portion of Directors’ fees. The deferred amounts are treated as though equivalent dollar amounts had been invested in the funds. Such amounts and earnings accrued thereon are included in Directors’ fees on the Statement of Operations and in Directors’ fees payable on the Statement of Assets and Liabilities and are not deductible for U.S. federal income tax purposes until such amounts are paid.
20
Notes to Financial Statements (continued)
The Company has entered into an arrangement with its transfer agent and custodian, whereby credits realized as a result of uninvested cash balances are used to reduce a portion of the Fund’s expenses.
The Fund and certain other funds managed by Lord Abbett (collectively, the “Participating Funds”) entered into a syndicated line of credit facility with various lenders for $550 million (the “Facility”), whereas State Street Bank and Trust Company (“SSB”) participates as a lender and as agent for the lenders. The Facility is to be used for temporary or emergency purposes as an additional source of liquidity to satisfy redemptions. The Participating Funds are subject to graduated borrowing limits of one-third of Fund assets (if Fund assets are less than $750 million), $250 million, $300 million, or $350 million, based on past borrowings and likelihood of future borrowings. The Facility will continue through August 28, 2017.
During the fiscal year ended December 31, 2016, the Fund did not utilize the Facility.
| 10. | INTERFUND LENDING PROGRAM |
On July 26, 2016, the U.S. Securities and Exchange Commission issued an exemptive order (“SEC exemptive order”) which permits certain registered open-end management investment companies managed by Lord Abbett, including the Fund, to participate in a joint lending and borrowing program (the “Interfund Lending Program”). The SEC exemptive order allows the Funds to borrow money from and lend money to each other for temporary or emergency purposes subject to the limitations and conditions.
During the fiscal year ended December 31, 2016, the Fund did not participate as a borrower or lender in the Interfund Lending Program.
| 11. | CUSTODIAN AND ACCOUNTING AGENT |
SSB is the Company’s custodian and accounting agent. SSB performs custodial, accounting and recordkeeping functions relating to portfolio transactions and calculating the Fund’s NAV.
The Fund is subject to the general risks and considerations associated with equity investing. The value of an investment will fluctuate in response to movements in the equity securities markets in general and to the changing prospects of individual companies in which the Fund invests.
The Fund has particular risks associated with growth stocks. Different types of stocks shift in and out of favor depending on market and economic conditions. Growth stocks tend to be more volatile than other stocks. In addition, if the Fund’s assessment of a company’s potential for growth or market conditions is wrong, it could suffer losses or produce poor performance relative to other funds, even in a rising market. The Fund invests primarily in small-cap growth company stocks, which tend to be more volatile and can be less liquid than other types of stocks. Small-cap companies may also have more limited product lines, markets or financial resources, and typically experience a higher risk of failure than large-cap companies. Because the Fund may invest a portion of its assets in foreign securities and American Depositary Receipts, it may experience increased market, liquidity, currency, political, information and other risks.
21
Notes to Financial Statements (concluded)
These factors can affect the Fund’s performance.
| 13. | SUMMARY OF CAPITAL TRANSACTIONS |
Transactions in shares of capital stock were as follows:
| | | Year Ended
December 31, 2016 | | | Year Ended
December 31, 2015 | |
| Shares sold | | | 738,518 | | | | 905,924 | |
| Reinvestment of distributions | | | – | | | | 10,541 | |
| Shares reacquired | | | (716,390 | ) | | | (335,235 | ) |
| Increase | | | 22,128 | | | | 581,230 | |
22
Report of Independent Registered Public Accounting Firm
To the Board of Directors of Lord Abbett Series Fund, Inc. and the Shareholders of Developing Growth Portfolio:
We have audited the accompanying statement of assets and liabilities, including the schedule of investments, of the Developing Growth Portfolio, one of the portfolios constituting the Lord Abbett Series Fund, Inc. (the “Fund”) as of December 31, 2016, and the related statement of operations for the year then ended, the statements of changes in net assets for each of the two years in the period then ended, and the financial highlights for each of the five years in the period then ended. These financial statements and financial highlights are the responsibility of the Fund’s management. Our responsibility is to express an opinion on these financial statements and financial highlights based on our audits.
We conducted our audits in accordance with the standards of the Public Company Accounting Oversight Board (United States). Those standards require that we plan and perform the audit to obtain reasonable assurance about whether the financial statements and financial highlights are free of material misstatement. The Fund is not required to have, nor were we engaged to perform, an audit of its internal control over financial reporting. Our audits included consideration of internal control over financial reporting as a basis for designing audit procedures that are appropriate in the circumstances, but not for the purpose of expressing an opinion on the effectiveness of the Fund’s internal control over financial reporting. Accordingly, we express no such opinion. An audit also includes examining, on a test basis, evidence supporting the amounts and disclosures in the financial statements, assessing the accounting principles used and significant estimates made by management, as well as evaluating the overall financial statement presentation. Our procedures included confirmation of securities owned as of December 31, 2016, by correspondence with the custodian and brokers; when replies were not received from brokers, we performed other auditing procedures. We believe that our audits provide a reasonable basis for our opinion.
In our opinion, such financial statements and financial highlights referred to above present fairly, in all material respects, the financial position of Developing Growth Portfolio of the Lord Abbett Series Fund, Inc. as of December 31, 2016, the results of its operations for the year then ended, the changes in its net assets for each of the two years in the period then ended, and the financial highlights for each of the five years in the period then ended, in conformity with accounting principles generally accepted in the United States of America.
DELOITTE & TOUCHE LLP
New York, New York
February 15, 2017
23
Basic Information About Management
The Board is responsible for the management of the business and affairs of the Company in accordance with the laws of the State of Maryland. The Board elects officers who are responsible for the day-to-day operations of each Fund and who execute policies authorized by the Board. The Board also approves an investment adviser to each Fund and continues to monitor the cost and quality of the services the investment adviser provides, and annually considers whether to renew the contract with the adviser. Generally, each Director holds office until his/her successor is elected and qualified or until his/her earlier resignation or removal, as provided in the Company’s organizational documents.
Lord Abbett, a Delaware limited liability company, is the Fund’s investment adviser. Designated Lord Abbett personnel are responsible for the day-to-day management of the Funds.
Interested Directors
Ms. Foster and Mr. Sieg are affiliated with Lord Abbett and are “interested persons” of the Company as defined in the Act. Ms. Foster and Mr. Sieg are directors/trustees of each of the 12 investment companies in the Lord Abbett Family of Funds, which consist of 60 portfolios or series. Ms. Foster is an officer of the Lord Abbett Family of Funds.
Name, Address and
Year of Birth | | Current Position and
Length of Service
with the Company | | Principal Occupation and Other Directorships
During the Past Five Years |
Daria L. Foster
Lord, Abbett & Co. LLC
90 Hudson Street
Jersey City, NJ 07302
(1954) | | Director and President since 2006; Chief Executive Officer since 2012 | | Principal Occupation: Managing Partner of Lord Abbett, joined Lord Abbett in 1990. Other Directorships: None. |
| | | | | |
Douglas B. Sieg
Lord, Abbett & Co. LLC
90 Hudson Street
Jersey City, NJ 07302
(1969) | | Director since 2016 | | Principal Occupation: Partner (since 2001) and Head of Client Services (since 2013), formerly Director of Marketing and Relationship Management, joined Lord Abbett in 1994. Other Directorships: None. |
Independent Directors
The following Independent Directors also are directors/trustees of each of the 12 investment companies in the Lord Abbett Family of Funds, which consist of 60 portfolios or series.
Name, Address and
Year of Birth | | Current Position and
Length of Service
with the Company | | Principal Occupation and Other Directorships
During the Past Five Years |
Robert B. Calhoun, Jr.
Lord, Abbett & Co. LLC
c/o Legal Dept.
90 Hudson Street
Jersey City, NJ 07302
(1942) | | Director since 1998 | | Principal Occupation: Senior Advisor of Monitor Clipper Partners, a private equity investment fund (since 1997); President of Clipper Asset Management Corp. (1991–2009). Other Directorships: None. |
24
Basic Information About Management (continued)
Name, Address and
Year of Birth | | Current Position and
Length of Service
with the Company | | Principal Occupation and Other Directorships
During the Past Five Years |
Eric C. Fast
Lord, Abbett & Co. LLC
c/o Legal Dept.
90 Hudson Street
Jersey City, NJ 07302
(1949) | | Director since 2014 | | Principal Occupation: Chief Executive Officer of Crane Co., an industrial products company (2001–2014). Other Directorships: Currently serves as director of Automatic Data Processing, Inc. (since 2007) and Regions Financial Corporation (since 2010). Previously served as a director of Crane Co. (1999–2014). |
| | | | | |
Evelyn E. Guernsey
Lord, Abbett & Co. LLC
c/o Legal Dept.
90 Hudson Street
Jersey City, NJ 07302
(1955) | | Director since 2011 | | Principal Occupation: CEO, Americas of J.P. Morgan Asset Management (2004–2010). Other Directorships: None. |
| | | | | |
Julie A. Hill
Lord, Abbett & Co. LLC
c/o Legal Dept.
90 Hudson Street
Jersey City, NJ 07302
(1946) | | Director since 2004 | | Principal Occupation: Owner and CEO of The Hill Company, a business consulting firm (since 1998). Other Directorships: Currently serves as director of Anthem, Inc., a health benefits company (since 1994). |
| | | | | |
Franklin W. Hobbs
Lord, Abbett & Co. LLC
c/o Legal Dept.
90 Hudson Street
Jersey City, NJ 07302
(1947) | | Director since 2001 | | Principal Occupation: Advisor of One Equity Partners, a private equity firm (since 2004). Other Directorships: Currently serves as director and Chairman of the Board of Ally Financial Inc., a financial services firm (since 2009), and as director of Molson Coors Brewing Company (since 2002). |
| | | | | |
James M. McTaggart
Lord, Abbett & Co. LLC
c/o Legal Dept.
90 Hudson Street
Jersey City, NJ 07302
(1947) | | Director since 2012 | | Principal Occupation: Independent management advisor and consultant (since 2012); Vice President, CRA International, Inc. (doing business as Charles River Associates), a global management consulting firm (2009–2012); Founder and Chairman of Marakon Associates, Inc., a strategy consulting firm (1978–2009); and Officer and Director of Trinsum Group, a holding company (2007–2009). Other Directorships: Currently serves as director of Blyth, Inc., a home products company (since 2004). |
| | | | | |
Mark A. Schmid
Lord, Abbett & Co. LLC
c/o Legal Dept.
90 Hudson Street
Jersey City, NJ 07302
(1959) | | Director since 2016 | | Principal Occupation: Vice President and Chief Investment Officer of the University of Chicago (since 2009). Other Directorships: None. |
25
Basic Information About Management (continued)
Name, Address and
Year of Birth | | Current Position and
Length of Service
with the Company | | Principal Occupation and Other Directorships
During the Past Five Years |
James L.L. Tullis
Lord, Abbett & Co. LLC
c/o Legal Dept.
90 Hudson Street
Jersey City, NJ 07302
(1947) | | Director since 2006; Chairman since 2017 | | Principal Occupation: CEO of Tullis-Dickerson and Co. Inc., a venture capital management firm (since 1990); CEO of Tullis Health Investors Inc. (since 2012). Other Directorships: Currently serves as director of Crane Co. (since 1998). |
Officers
None of the officers listed below have received compensation from the Company. All of the officers of the Company also may be officers of the other Lord Abbett Funds and maintain offices at 90 Hudson Street, Jersey City, NJ 07302. Unless otherwise indicated, the position(s) and title(s) listed under the “Principal Occupation During the Past Five Years” column indicate each officer’s position(s) and title(s) with Lord Abbett. Each officer serves for an indefinite term (i.e., until his or her death, resignation, retirement, or removal).
Name and
Year of Birth | | Current Position
with the Company | | Length of Service
of Current
Position | | Principal Occupation
During the Past Five Years |
Daria L. Foster
(1954) | | President and Chief Executive Officer | | Elected as President in 2006 and Chief Executive Officer in 2012 | | Managing Partner of Lord Abbett, joined Lord Abbett in 1990. |
| | | | | | | |
Sean J. Aurigemma
(1969) | | Executive Vice President | | Elected in 2010 | | Portfolio Manager, joined Lord Abbett in 2007. |
| | | | | | | |
Jeff D. Diamond
(1960) | | Executive Vice President | | Elected in 2008 | | Portfolio Manager, joined Lord Abbett in 2007. |
| | | | | | | |
Todd D. Jacobson
(1966) | | Executive Vice President | | Elected in 2005 | | Partner and Associate Director, joined Lord Abbett in 2003. |
| | | | | | | |
Robert A. Lee
(1969) | | Executive Vice President | | Elected in 2010 | | Partner and Chief Investment Officer, and was formerly Deputy Chief Investment Officer and Director of Taxable Fixed Income, joined Lord Abbett in 1997. |
| | | | | | | |
Thomas B. Maher
(1967) | | Executive Vice President | | Elected in 2010 | | Partner and Portfolio Manager, joined Lord Abbett in 2003. |
| | | | | | | |
Justin C. Maurer
(1969) | | Executive Vice President | | Elected in 2010 | | Partner and Portfolio Manager, joined Lord Abbett in 2001. |
| | | | | | | |
Vincent J. McBride
(1964) | | Executive Vice President | | Elected in 2010 | | Partner and Director, joined Lord Abbett in 2003. |
| | | | | | | |
Andrew H. O’Brien
(1973) | | Executive Vice President | | Elected in 2010 | | Partner and Portfolio Manager, joined Lord Abbett in 1998. |
26
Basic Information About Management (continued)
Name and
Year of Birth | | Current Position
with the Company | | Length of Service
of Current
Position | | Principal Occupation
During the Past Five Years |
F. Thomas O’Halloran, III
(1955) | | Executive Vice President | | Elected in 2010 | | Partner and Portfolio Manager, joined Lord Abbett in 2001. |
| | | | | | | |
Marc Pavese
(1972) | | Executive Vice President | | Elected in 2016 | | Partner and Portfolio Manager, joined Lord Abbett in 2008. |
| | | | | | | |
Walter H. Prahl
(1958) | | Executive Vice President | | Elected in 2012 | | Partner and Director, joined Lord Abbett in 1997. |
| | | | | | | |
Steven F. Rocco
(1979) | | Executive Vice President | | Elected in 2014 | | Partner and Portfolio Manager, joined Lord Abbett in 2004. |
| | | | | | | |
Didier O. Rosenfeld
(1976) | | Executive Vice President | | Elected in 2016 | | Director of Global Equity, joined Lord Abbett in 2015 and was formerly a Portfolio Manager and Senior Analyst at Cornerstone Capital Management (2014–2015) and Managing Director at State Street Global Advisors (2000–2013). |
| | | | | | | |
Frederick J. Ruvkun
(1957) | | Executive Vice President | | Elected in 2012 | | Partner and Portfolio Manager, joined Lord Abbett in 2006. |
| | | | | | | |
Paul J. Volovich
(1973) | | Executive Vice President | | Elected in 2005 | | Partner and Portfolio Manager, joined Lord Abbett in 1997. |
| | | | | | | |
A. Edward Allinson
(1961) | | Vice President | | Elected in 2011 | | Portfolio Manager, joined Lord Abbett in 2005. |
| | | | | | | |
John W. Ashbrook
(1964) | | Vice President and Assistant Secretary | | Elected in 2014 | | Assistant General Counsel, joined Lord Abbett in 2008. |
| | | | | | | |
Joan A. Binstock
(1954) | | Chief Financial Officer and Vice President | | Elected in 1999 | | Partner and Chief Financial Officer, and was formerly Chief Operations Officer, joined Lord Abbett in 1999. |
| | | | | | | |
Brooke A. Fapohunda
(1975) | | Vice President and Assistant Secretary | | Elected in 2014 | | Deputy General Counsel, joined Lord Abbett in 2006. |
| | | | | | | |
John K. Forst
(1960) | | Vice President and Assistant Secretary | | Elected in 2005 | | Partner and Deputy General Counsel, joined Lord Abbett in 2004. |
| | | | | | | |
Anthony W. Hipple
(1964) | | Vice President | | Elected in 2014 | | Portfolio Manager, joined Lord Abbett in 2002. |
| | | | | | | |
Lawrence H. Kaplan
(1957) | | Vice President and Secretary | | Elected in 1997 | | Partner and General Counsel, joined Lord Abbett in 1997. |
27
Basic Information About Management (concluded)
Name and
Year of Birth | | Current Position
with the Company | | Length of Service
of Current
Position | | Principal Occupation
During the Past Five Years |
Linda Y. Kim
(1980) | | Vice President and Assistant Secretary | | Elected in 2016 | | Counsel, joined Lord Abbett in 2015 and was formerly an Associate at Stroock & Stroock & Lavan LLP (2007–2015). |
| | | | | | | |
David J. Linsen
(1974) | | Vice President | | Elected in 2008 | | Partner and Director, joined Lord Abbett in 2001. |
| | | | | | | |
Joseph M. McGill
(1962) | | Chief Compliance Officer | | Elected in 2014 | | Partner and Chief Compliance Officer, joined Lord Abbett in 2014 and was formerly Managing Director and the Chief Compliance Officer at UBS Global Asset Management (2003–2013). |
| | | | | | | |
A. Edward Oberhaus, III
(1959) | | Vice President | | Elected in 1998 | | Partner and Director, joined Lord Abbett in 1983. |
| | | | | | | |
Noah Petrucci
(1970) | | Vice President | | Elected in 2013 | | Portfolio Manager, joined Lord Abbett in 2012 and was formerly a Portfolio Manager at Columbia Management Investment Advisers, LLC and Columbia Management Advisors, LLC (2002–2012). |
| | | | | | | |
Lawrence B. Stoller
(1963) | | Vice President and Assistant Secretary | | Elected in 2007 | | Partner and Senior Deputy General Counsel, joined Lord Abbett in 2007. |
| | | | | | | |
Leah G. Traub
(1979) | | Vice President | | Elected in 2016 | | Partner and Portfolio Manager, joined Lord Abbett in 2007. |
| | | | | | | |
Arthur K. Weise
(1970) | | Vice President | | Elected in 2010 | | Partner and Portfolio Manager, joined Lord Abbett in 2007. |
| | | | | | | |
Kewjin Yuoh
(1971) | | Vice President | | Elected in 2012 | | Partner and Portfolio Manager, joined Lord Abbett in 2010. |
| | | | | | | |
Scott S. Wallner
(1955) | | AML Compliance Officer | | Elected in 2011 | | Assistant General Counsel, joined Lord Abbett in 2004. |
| | | | | | | |
Bernard J. Grzelak
(1971) | | Treasurer | | Elected in 2003 | | Partner and Chief Operations Officer, and was formerly Director of Fund Administration, joined Lord Abbett in 2003. |
Please call 888-522-2388 for a copy of the statement of additional information, which contains further information about the Company’s Directors. It is available free upon request.
28
Approval of Advisory Contract
The Board, including all of the Directors who are not interested persons of the Fund or of Lord Abbett (the “Independent Board Members”), annually considers whether to approve the continuation of the existing management agreement between the Fund and Lord Abbett (the “Agreement”). In connection with its most recent approval, the Board reviewed materials relating specifically to the Agreement, as well as numerous materials received throughout the course of the year, including information about the Fund’s investment performance compared to the performance of its benchmark. Before making its decision as to the Fund, the Board had the opportunity to ask questions and request further information, taking into account its familiarity with Lord Abbett gained through its meetings and discussions. These meetings and discussions included the review of the portfolio management team conducted by members of the Contract Committee, the deliberations of the Contract Committee, and discussions between the Contract Committee and Lord Abbett’s management. The Independent Board Members also met with their independent legal counsel in a private session at which no representatives of management were present.
The materials received by the Board included, but were not limited to: (1) information provided by Morningstar Associates, LLC (“Morningstar”) regarding the investment performance of the Fund compared to the investment performance of certain funds with similar investment styles as determined by Morningstar, based, in part, on the Fund’s Morningstar category (the “performance peer group”), and the investment performance of the Fund’s benchmark; (2) information provided by Morningstar regarding the expense ratios, contractual and effective management fee rates, and other expense components for the Fund and certain funds in the same Morningstar category, with generally the same or similar share classes and operational characteristics, including asset size (the “expense peer group”); (3) certain supplemental investment performance information provided by Lord Abbett; (4) information provided by Lord Abbett on the expense ratios, management fee rates, and other expense components for the Fund; (5) sales and redemption information for the Fund; (6) information regarding Lord Abbett’s financial condition; (7) an analysis of the relative profitability of the Agreement to Lord Abbett; (8) information provided by Lord Abbett regarding the investment management fee schedules for Lord Abbett’s other advisory clients maintaining accounts with a similar investment strategy as the Fund; and (9) information regarding the personnel and other resources devoted by Lord Abbett to managing the Fund.
Investment Management Services Generally. The Board considered the investment management services provided by Lord Abbett to the Fund, including investment research, portfolio management, and trading, and Lord Abbett’s commitment to compliance with all applicable legal requirements. The Board also observed that Lord Abbett was solely engaged in the investment management business and accordingly did not experience the conflicts of interest that may result from being engaged in other lines of business. The Board considered the investment advisory services provided by Lord Abbett to other clients, the fees charged for the services, and the differences in the nature of the services provided to the Fund and other Lord Abbett Funds, on the one hand, and the services provided to other clients, on the other. After reviewing these and related factors, the Board concluded that the Fund was likely to continue to benefit from the nature, extent and quality of the investment services provided by Lord Abbett under the Agreement.
Investment Performance. The Board reviewed the Fund’s investment performance in relation to that of the performance peer group and the Fund’s benchmark as of various periods ended August 31, 2016. The Board observed that the Fund’s investment performance was below the median of the performance peer group for the one-year, three-year and five-year periods. The Board noted a presentation on investment performance by Lord Abbett, which, among other things, indicated the
29
Approval of Advisory Contract (continued)
Fund’s “high growth” style may have impacted its relative ranking in the performance peer group. The Board also considered Lord Abbett’s performance and reputation generally, the performance of other Lord Abbett-managed funds overseen by the Board and the willingness of Lord Abbett to take steps intended to improve performance when necessary. After reviewing these and related factors, the Board concluded that the Fund’s investment performance was reasonable and supported the continuation of the Agreement.
Lord Abbett’s Personnel and Methods. The Board considered the qualifications of the personnel providing investment management services to the Fund, in light of its investment objective and discipline. Among other things, the Board considered the size, experience, and turnover of Lord Abbett’s investment management staff, Lord Abbett’s investment methodology and philosophy, and Lord Abbett’s approach to recruiting, training, and retaining investment management personnel.
Nature and Quality of Other Services. The Board considered the nature, quality, costs, and extent of compliance, administrative, and other services performed by Lord Abbett and the nature and extent of Lord Abbett’s supervision of third party service providers, including the Fund’s transfer agent and custodian.
Expenses. The Board considered the expense level of the Fund and the expense levels of the expense peer group. It also considered how the expense levels of the Fund related to those of the expense peer group and the amount and nature of the fees paid by shareholders. The Board observed that the overall expense level of the Fund was below the median of the expense peer group. After reviewing these and related factors, the Board concluded, within the context of its overall approval of the Agreement, that the expense level of the Fund was reasonable and supported the continuation of the Agreement.
Profitability. The Board considered the level of Lord Abbett’s operating margin in managing the Fund, including a review of Lord Abbett’s methodology for allocating its costs to its management of the Fund. It considered whether the Fund was profitable to Lord Abbett in connection with the operation of the Fund, including the fee that Lord Abbett receives from the Fund for providing administrative services to the Fund. The Board also considered the profits realized from other business segments of Lord Abbett, which may benefit from or be related to the Fund’s business. The Board considered Lord Abbett’s profit margins in comparison with available industry data, both accounting for and excluding marketing and distribution expenses, and how those profit margins could affect Lord Abbett’s ability to recruit and retain investment personnel. The Board recognized that Lord Abbett’s overall profitability was a factor in enabling it to attract and retain qualified investment management personnel to provide services to the Fund. After reviewing these and related factors, the Board concluded, within the context of its overall approval of the Agreement, that Lord Abbett’s profitability with respect to the Fund was not excessive.
Economies of Scale. The Board considered the extent to which there had been economies of scale in managing the Fund, whether the Fund’s shareholders had appropriately benefited from such economies of scale, and whether there was potential for realization of any further economies of scale. The Board concluded that the existing management fee schedule, with its breakpoint in the level of the management fee, in conjunction with a proposed expense limitation agreement adequately addressed any economies of scale in managing the Fund.
Other Benefits to Lord Abbett. The Board considered the character and amount of fees paid by the Fund and the Fund’s shareholders to Lord Abbett and the Distributor for services other than
30
Approval of Advisory Contract (concluded)
investment advisory services. The Board also considered the revenues and profitability of Lord Abbett’s investment advisory business apart from its mutual fund business, and the intangible benefits enjoyed by Lord Abbett by virtue of its relationship with the Fund. The Board observed that the Distributor receives 12b-1 fees from certain of the Lord Abbett Funds as to shares held in accounts for which there is no other broker of record, may retain a portion of the 12b-1 fees it receives, and receives a portion of the sales charges on sales and redemptions of some classes of shares. In addition, the Board observed that Lord Abbett accrues certain benefits for its business of providing investment advice to clients other than the Lord Abbett Funds, but that business also benefits the Funds. The Board also noted that Lord Abbett, as disclosed in the prospectus of the Fund, has entered into revenue sharing arrangements with certain entities that distribute shares of the Fund. The Board also took into consideration the investment research that Lord Abbett receives as a result of Fund brokerage transactions.
Alternative Arrangements. The Board considered whether, instead of approving continuation of the Agreement, it might be in the best interests of the Fund to implement one or more alternative arrangements, such as continuing to employ Lord Abbett, but on different terms. After considering all of the relevant factors, the Board unanimously found that continuation of the Agreement was in the best interests of the Fund and its shareholders and voted unanimously to approve the continuation of the Agreement. In considering whether to approve the continuation of the Agreement, the Board did not identify any single factor as paramount or controlling. Individual Directors may have evaluated the information presented differently from one another, giving different weights to various factors. This summary does not discuss in detail all matters considered.
31
Householding
The Company has adopted a policy that allows it to send only one copy of the Fund’s prospectus, proxy material, annual report and semiannual report to certain shareholders residing at the same “household.” This reduces Fund expenses, which benefits you and other shareholders. If you need additional copies or do not want your mailings to be “householded,” please call Lord Abbett at 888-522-2388 or send a written request with your name, the name of your fund or funds and your account number or numbers to Lord Abbett Family of Funds, P.O. Box 219336, Kansas City, MO 64121.
Proxy Voting Policies, Procedures and Records
A description of the policies and procedures that Lord Abbett uses to vote proxies related to the Fund’s portfolio securities, and information on how Lord Abbett voted the Fund’s proxies during the 12-month period ended June 30 are available without charge, upon request, (i) by calling 888-522-2388; (ii) on Lord Abbett’s Website at www.lordabbett.com; and (iii) on the Securities and Exchange Commission’s (“SEC”) Website at www.sec.gov.
Shareholder Reports and Quarterly Portfolio Disclosure
The Fund is required to file its complete schedule of portfolio holdings with the SEC for its first and third fiscal quarters on Form N-Q. Copies of the filings are available without charge, upon request on the SEC’s Website at www.sec.gov and may be available by calling Lord Abbett at 888-522-2388. You can also obtain copies of Form N-Q by visiting the SEC’s Public Reference Room in Washington, DC (information on the operation of the Public Reference Room may be obtained by calling 800-SEC-0330).
32


| This report, when not used for the general information of shareholders of the Fund, is to be distributed only if preceded or accompanied by a current fund prospectus. | | | | |
| | | | | |
Lord Abbett mutual fund shares are distributed by
LORD ABBETT DISTRIBUTOR LLC. | | Lord Abbett Series Fund, Inc. | | |
| | | Developing Growth Portfolio | | SFDG-PORT-3
(02/17) |

2016 LORD ABBETT
ANNUAL REPORT
Lord Abbett
Series Fund—Fundamental Equity Portfolio
For the fiscal year ended December 31, 2016
Table of Contents
Lord Abbett Series Fund — Fundamental Equity Portfolio
Annual Report
For the fiscal year ended December 31, 2016

From left to right: James L.L. Tullis, Chairman of the Lord Abbett Funds and Daria L. Foster Director, President, and Chief Executive Officer of the Lord Abbett Funds.
Dear Shareholders: We are pleased to provide you with this overview of the performance of Lord Abbett Series Fund — Fundamental Equity Portfolio for the fiscal year ended December 31, 2016. On this page and the following pages, we discuss the major factors that influenced fiscal year performance. For additional information about the Fund, please visit our website at www.lordabbett.com, where you also can access the quarterly commentaries that provide updates on the Fund’s performance and other portfolio related updates.
Thank you for investing in Lord Abbett mutual funds. We value the trust that you place in us and look forward to serving your investment needs in the years to come.to come.
Best regards,

Daria L. Foster
Director, President and Chief Executive Officer
For the fiscal year ended December 31, 2016, the Fund returned 15.74%, reflecting performance at the net asset value (NAV) of Class VC shares, with all distributions reinvested, compared to its benchmark, the Russell 1000® Value Index1, which returned 17.34% over the same period.
Domestic equity markets (as represented by the S&P 500® Index2) returned 11.96% over the past year. Despite this general move higher, there were significant bouts of volatility within U.S. stock markets, including their worst start to a calendar year on record.
Crude oil prices played a significant role in the increased market volatility, as Brent oil prices fluctuated sharply throughout the fiscal year. In December, the Organization of Petroleum Exporting Countries agreed to reduce oil production effective 2017. Furthermore, global markets were affected by the devaluation of China’s currency and weak economic data out of the region. The Chinese economy advanced at an annual rate of 6.7% in the third quarter of 2016, a slower pace than in recent years.
1
Geopolitical events also contributed to volatility in global markets. The United Kingdom’s referendum in June to leave the European Union (“Brexit”) was a surprise that caused a sell-off in global markets.
In contrast to the equity market volatility, the U.S. economy continued to expand during the trailing 12-month period. The Federal Reserve (Fed) raised target rates in for the second time in 12 months in December, from 0.25%–0.50% to 0.50%–0.75%. U.S. gross domestic product (GDP) grew at a 3.2% pace during the third quarter, a significant increase over the second quarter. The U.S. Bureau of Economic Analysis stated that during the third-quarter personal consumption and federal government spending increased, quarter over quarter. In addition to GDP growth, the U.S. unemployment rate remained relatively steady throughout the period, finishing at 4.6% in November.
The U.S. presidential election took an unexpected turn as Donald J. Trump was elected president, in contrast to indications from poll numbers before the election. Markets rallied on improved clarity in the U.S. political agenda, with the House and Senate also under Republican control.
The Fund underperformed its benchmark during the period. During the trailing 12-month period, stock selection within the materials and consumer staples sectors detracted from relative performance the most. Within the materials sector, shares of E.I. DuPont de Neumours and Co., a science and
technology-based company, declined as the company faced fundamental headwinds from agriculture volatility, weaker global currencies, and slowing industrial production. Shares of Reliance Steel & Aluminum Co., a metals service center company, also fell during the third quarter due to lower-than-expected steel prices and easing of the company’s gross margins. Within the consumer staples sector, shares of CVS Health Corporation, a pharmacy and health care company, fell after the California Public Employee’s Retirement System switched their PBM (pharmacy benefit manager) contract to United Healthcare’s OptumRx. CVS was further hurt during the fourth quarter after the company revised its 2017 guidance expectations, which were well below consensus estimates. Shares of Kroger Co., an operator of retail food and drug stores, also dropped, as meat and dairy prices deflated and competition offering discounted prices accelerated.
The largest contributors to relative performance during the trailing 12-month period were the health care and financials sectors. Within the health care sector, shares of UnitedHealth Group Inc., a diversified health and well-being company, rose in the fourth quarter due to increased momentum in Medicare Advantage enrollment and 2017 earnings guidance that was well above consensus estimates. Shares of Johnson & Johnson, a developer, manufacturer, and seller of consumer health care products, spiked from
2
improving fundamentals, strong organic growth, and better than estimated earnings and sales during the second quarter. Within the financials sector, shares of Citizens Financial Group, Inc., a retail and commercial bank holdings company, rose, reflecting the company’s continuous profitability improvement and the anticipation for higher interest rates and a better U.S. economy following the presidential election. Shares of J.P. Morgan Chase & Co., a financial services and retail
banking company, also rose after the presidential election due to the anticipation of a better macro-economic environment with higher rates, less regulation, and lower taxes.
The Fund’s portfolio is actively managed and, therefore, its holdings and the weightings of a particular issuer or particular sector as a percentage of portfolio assets are subject to change. Sectors may include many industries.
1 The Russell 1000® Value Index measures the performance of those Russell 1000 companies with lower price-to-book ratios and lower forecasted growth values.
2 The S&P 500® Index is widely regarded as the standard for measuring large cap U.S. stock market performance and includes a representative sample of leading companies in leading industries.
Unless otherwise specified, indexes reflect total return, with all dividends reinvested. Indexes are unmanaged, do not reflect the deduction of fees or expenses, and are not available for direct investment.
Important Performance and Other Information
Performance data quoted in the following pages reflect past performance and are no guarantee of future results. Current performance may be higher or lower than the performance quoted. The investment return and principal value of an investment in the Funds will fluctuate so that shares, on any given day or when redeemed, may be worth more or less than their original cost. You can obtain performance data current to the most recent month end by calling Lord Abbett at 888-522-2388 or referring to www.lordabbett.com.
During certain periods shown, expense waivers and reimbursements were in place. Without such expense
waivers and reimbursements, the Funds’ returns would have been lower.
The annual commentary above discusses the views of the Fund’s management and various portfolio holdings of the Funds as of December 31, 2016. These views and portfolio holdings may have changed after this date. Information provided in the commentary is not a recommendation to buy or sell securities. Because the Fund’s portfolio is actively managed and may change significantly, the Fund may no longer own the securities described above or may have otherwise changed their positions in the securities. For more recent information about the Fund’s portfolio holdings, please visit www.lordabbett.com.
A Note about Risk: See Notes to Financial Statements for a discussion of investment risks. For a more detailed discussion of the risks associated with each Fund, please see the Fund’s prospectus.
Mutual funds are not insured by the FDIC, are not deposits or other obligations of, or guaranteed by, banks, and are subject to investment risks including possible loss of principal amount invested.
The Fund serves as an underlying investment vehicle for variable annuity contracts and variable life insurance policies.
3
Investment Comparison
Below is a comparison of a $10,000 investment in Class VC shares with the same investment in the Russell 1000® Value Index, Russell 3000® Index, Russell 3000® Value Index, and S&P 500® Index, assuming reinvestment of all dividends and distributions. The Fund’s shares are sold only to insurance company separate accounts that fund certain variable annuity and variable life contracts. This line graph comparison does not reflect the sales charges or other expenses of these contracts. If those sales charges and expenses were reflected, returns would be lower. The graph and performance table below do not reflect the deduction of taxes that a shareholder would pay on Fund distributions or the redemption of Fund shares. During certain periods, expenses of the Fund have been waived or reimbursed by Lord Abbett; without such waiver or reimbursement of expenses, the Fund’s returns would have been lower. Past performance is no guarantee of future results.

| | | Average Annual Total Returns for the
Periods Ended December 31, 2016 |
| | | 1 Year | | | 5 Years | | | 10 Years | |
| Class VC | | 15.74 | % | | | 12.44 | % | | | 6.96% | |
1 Performance for each unmanaged index does not reflect any fees or expenses. The performance of each index is not necessarily representative of the Fund’s performance.
4
Expense Example
As a shareholder of the Fund, you incur ongoing costs, including management fees; expenses related to the Fund’s services arrangements with certain insurance companies; and other Fund expenses. This Example is intended to help you understand your ongoing costs (in dollars) of investing in the Fund and to compare these costs with the ongoing costs of investing in other mutual funds.
The Example is based on an investment of $1,000 invested at the beginning of the period and held for the entire period (July 1, 2016 through December 31, 2016).
The Example reflects only expenses that are deducted from the assets of the Fund. Fees and expenses, including sales charges applicable to the various insurance products that invest in the Fund, are not reflected in this Example. If such fees and expenses were reflected in the Example, the total expenses shown would be higher. Fees and expenses regarding such variable insurance products are separately described in the prospectus related to those products.
Actual Expenses
The first line of the table on the following page provides information about actual account values and actual expenses. You may use the information in this line, together with the amount you invested, to estimate the expenses that you paid over the period. Simply divide your account value by $1,000 (for example, an $8,600 account value divided by $1,000 = 8.6), then multiply the result by the number in the first line under the heading titled “Expenses Paid During Period 7/1/16 – 12/31/16” to estimate the expenses you paid on your account during this period.
Hypothetical Example for Comparison Purposes
The second line of the table on the following page provides information about hypothetical account values and hypothetical expenses based on the Fund’s actual expense ratio and an assumed rate of return of 5% per year before expenses, which is not the Fund’s actual return. The hypothetical account values and expenses may not be used to estimate the actual ending account balance or expenses you paid for the period. You may use this information to compare the ongoing costs of investing in the Fund and other funds. To do so, compare this 5% hypothetical example with the 5% hypothetical examples that appear in the shareholder reports of the other funds.
5
Please note that the expenses shown in the table are meant to highlight your ongoing costs only and do not reflect any transactional costs, such as sales charges. Therefore, the second line of the table is useful in comparing ongoing costs only, and will not help you determine the relative total costs of owning different funds. In addition, if these transactional costs were included, your costs would have been higher.
| | | Beginning | | Ending | | Expenses |
| | | Account | | Account | | Paid During |
| | | Value | | Value | | Period† |
| | | | | | | 7/1/16 - |
| | | 7/1/16 | | 12/31/16 | | 12/31/16† |
| Class VC | | | | | | |
| Actual | | $ | 1,000.00 | | | $ | 1,107.80 | | | $ | 6.09 | |
| Hypothetical (5% Return Before Expenses) | | $ | 1,000.00 | | | $ | 1,019.36 | | | $ | 5.84 | |
| † | Net expenses are equal to the Fund’s annualized expense ratio of 1.15%, multiplied by the average account value over the period, multiplied by 184/366 (to reflect one-half year period). |
Portfolio Holdings Presented by Sector
December 31, 2016
| Sector* | | | %** |
| Consumer Discretionary | | | 6.81 | % |
| Consumer Staples | | | 5.52 | % |
| Energy | | | 13.97 | % |
| Financials | | | 26.14 | % |
| Health Care | | | 11.25 | % |
| Industrials | | | 11.84 | % |
| Information Technology | | | 10.58 | % |
| Materials | | | 3.76 | % |
| Real Estate | | | 2.60 | % |
| Telecommunication Services | | | 2.74 | % |
| Utilities | | | 3.72 | % |
| Repurchase Agreement | | | 1.07 | % |
| Total | | | 100.00 | % |
| * | | A sector may comprise several industries. |
| ** | | Represents percent of total investments. |
6
Schedule of Investments
December 31, 2016
| Investments | | Shares | | | Fair
Value
(000) | |
| COMMON STOCKS 98.33% | | | | | | | | |
| | | | | | | | | |
| Aerospace & Defense 2.54% | | | | | | | | |
| General Dynamics Corp. | | | 56,949 | | | $ | 9,833 | |
| | | | | | | | | |
| Airlines 0.96% | | | | | | | | |
| Delta Air Lines, Inc. | | | 75,396 | | | | 3,709 | |
| | | | | | | | | |
| Banks 16.48% | | | | | | | | |
| Bank of America Corp. | | | 350,454 | | | | 7,745 | |
| Citizens Financial Group, Inc. | | | 313,580 | | | | 11,173 | |
| East West Bancorp, Inc. | | | 141,744 | | | | 7,205 | |
| JPMorgan Chase & Co. | | | 193,821 | | | | 16,725 | |
| Signature Bank* | | | 26,322 | | | | 3,954 | |
| Webster Financial Corp. | | | 130,932 | | | | 7,107 | |
| Wells Fargo & Co. | | | 180,412 | | | | 9,942 | |
| Total | | | | | | | 63,851 | |
| | | | | | | | | |
| Beverages 2.59% | | | | | | | | |
| PepsiCo, Inc. | | | 95,800 | | | | 10,024 | |
| | | | | | | | | |
| Capital Markets 3.16% | | | | | | | | |
| Invesco Ltd. | | | 182,414 | | | | 5,534 | |
| TD Ameritrade Holding Corp. | | | 153,978 | | | | 6,714 | |
| Total | | | | | | | 12,248 | |
| | | | | | | | | |
| Chemicals 3.05% | | | | | | | | |
| Dow Chemical Co. (The) | | | 142,650 | | | | 8,162 | |
| LyondellBasell Industries NV Class A | | | 42,769 | | | | 3,669 | |
| Total | | | | | | | 11,831 | |
| | | | | | | | | |
| Communications Equipment 1.93% | | | | | | | | |
| Cisco Systems, Inc. | | | 247,900 | | | | 7,492 | |
| | | | | | | | | |
| Consumer Finance 1.95% | | | | | | | | |
| Discover Financial Services | | | 104,840 | | | | 7,558 | |
| | | | | | | | | |
| Diversified Telecommunication Services 2.72% | | | | | | | | |
| AT&T, Inc. | | | 200,969 | | | | 8,547 | |
| Verizon Communications, Inc. | | | 37,300 | | | | 1,991 | |
| Total | | | | | | | 10,538 | |
| Investments | | Shares | | | Fair
Value
(000) | |
| Electric: Utilities 3.70% | | | | | | | | |
| Duke Energy Corp. | | | 82,295 | | | $ | 6,388 | |
| NextEra Energy, Inc. | | | 66,502 | | | | 7,944 | |
| Total | | | | | | | 14,332 | |
| | | | | | | | | |
| Energy Equipment & Services 1.93% | | | | | | | | |
| Halliburton Co. | | | 138,208 | | | | 7,476 | |
| | | | | | | | | |
| Equity Real Estate Investment Trusts 2.59% | | | | | | | | |
| Boston Properties, Inc. | | | 50,980 | | | | 6,413 | |
| Vornado Realty Trust | | | 34,600 | | | | 3,611 | |
| Total | | | | | | | 10,024 | |
| | | | | | | | | |
| Food & Staples Retailing 0.35% | | | | | | | | |
| CVS Health Corp. | | | 17,202 | | | | 1,357 | |
| | | | | | | | | |
| Food Products 2.07% | | | | | | | | |
| Mondelez International, Inc. Class A | | | 180,913 | | | | 8,020 | |
| | | | | | | | | |
| Health Care Equipment & Supplies 2.12% | | | | | | | | |
| Abbott Laboratories | | | 214,500 | | | | 8,239 | |
| | | | | | | | | |
| Health Care Providers & Services 2.97% | | | | | | | | |
| Aetna, Inc. | | | 21,704 | | | | 2,692 | |
| UnitedHealth Group, Inc. | | | 55,207 | | | | 8,835 | |
| Total | | | | | | | 11,527 | |
| | | | | | | | | |
| Hotels, Restaurants & Leisure 1.00% | | | | | | | | |
| Yum! Brands, Inc. | | | 61,011 | | | | 3,864 | |
| | | | | | | | | |
| Household Durables 1.10% | | | | | | | | |
| Lennar Corp. Class A | | | 99,121 | | | | 4,255 | |
| | | | | | | | | |
| Household Products 0.48% | | | | | | | | |
| Colgate-Palmolive Co. | | | 28,200 | | | | 1,845 | |
| | | | | | | | | |
| Industrial Conglomerates 2.27% | | | | | | | | |
| General Electric Co. | | | 278,600 | | | | 8,804 | |
| | | | | | | | | |
| Information Technology Services 1.41% | | | | | | | | |
| Fidelity National Information Services, Inc. | | | 72,096 | | | | 5,453 | |
| | See Notes to Financial Statements. | 7 |
Schedule of Investments (continued)
December 31, 2016
| Investments | | Shares | | | Fair
Value
(000) | |
| Insurance 4.39% | | | | | | | | |
| Chubb Ltd. (Switzerland)(a) | | | 68,100 | | | $ | 8,998 | |
| Hartford Financial Services Group, Inc. (The) | | | 168,063 | | | | 8,008 | |
| Total | | | | | | | 17,006 | |
| | | | | | | | | |
| Machinery 4.37% | | | | | | | | |
| Caterpillar, Inc. | | | 43,703 | | | | 4,053 | |
| Dover Corp. | | | 75,575 | | | | 5,663 | |
| ITT, Inc. | | | 126,612 | | | | 4,883 | |
| PACCAR, Inc. | | | 36,340 | | | | 2,322 | |
| Total | | | | | | | 16,921 | |
| | | | | | | | | |
| Media 2.06% | | | | | | | | |
| Comcast Corp. Class A | | | 100,153 | | | | 6,915 | |
| Time Warner, Inc. | | | 10,959 | | | | 1,058 | |
| Total | | | | | | | 7,973 | |
| | | | | | | | | |
| Metals & Mining 0.69% | | | | | | | | |
| Reliance Steel & Aluminum Co. | | | 33,472 | | | | 2,662 | |
| | | | | | | | | |
| Multi-Line Retail 0.96% | | | | | | | | |
| Target Corp. | | | 51,566 | | | | 3,725 | |
| | | | | | | | | |
| Oil, Gas & Consumable Fuels 11.95% | | | | | | | | |
| Anadarko Petroleum Corp. | | | 112,016 | | | | 7,811 | |
| Devon Energy Corp. | | | 118,800 | | | | 5,426 | |
| EOG Resources, Inc. | | | 87,497 | | | | 8,846 | |
| Exxon Mobil Corp. | | | 152,127 | | | | 13,731 | |
| Hess Corp. | | | 28,584 | | | | 1,780 | |
| Occidental Petroleum Corp. | | | 97,700 | | | | 6,959 | |
| Range Resources Corp. | | | 51,698 | | | | 1,776 | |
| Total | | | | | | | 46,329 | |
| | | | | | | | | |
| Pharmaceuticals 6.09% | | | | | | | | |
| Johnson & Johnson | | | 85,500 | | | | 9,850 | |
| Pfizer, Inc. | | | 422,900 | | | | 13,736 | |
| Total | | | | | | | 23,586 | |
| | | | | | | | | |
| Road & Rail 1.63% | | | | | | | | |
| CSX Corp. | | | 176,152 | | | | 6,329 | |
| Investments | | Shares | | | Fair
Value
(000) | |
| Semiconductors & Semiconductor Equipment 4.65% |
| Intel Corp. | | | 294,022 | | | $ | 10,664 | |
| Microchip Technology, Inc. | | | 31,704 | | | | 2,034 | |
| QUALCOMM, Inc. | | | 81,968 | | | | 5,344 | |
| Total | | | | | | | 18,042 | |
| | | | | | | | | |
| Software 1.28% | | | | | | | | |
| Microsoft Corp. | | | 79,864 | | | | 4,963 | |
| | | | | | | | | |
| Specialty Retail 1.65% | | | | | | | | |
| Foot Locker, Inc. | | | 25,538 | | | | 1,811 | |
| L Brands, Inc. | | | 69,717 | | | | 4,590 | |
| Total | | | | | | | 6,401 | |
| | | | | | | | | |
| Technology Hardware, Storage & Peripherals 1.24% |
| Hewlett Packard Enterprise Co. | | | 208,222 | | | | 4,818 | |
Total Common Stocks
(cost $343,922,023) | | | | | | | 381,035 | |
| | | | | | | | | |
| | | Principal
Amount
(000) | | | | | |
| SHORT-TERM INVESTMENT 1.06% | | | | | | | | |
| | | | | | | | | |
| Repurchase Agreement | | | | | | | | |
Repurchase Agreement dated 12/30/2016, 0.03% due 1/3/2017 with Fixed Income Clearing Corp. collateralized by $3,940,000 of U.S. Treasury Inflation Indexed Note at 0.125% due 4/15/2017; value: $4,201,919; proceeds: $4,116,416
(cost $4,116,402) | | | $4,116 | | | | 4,116 | |
Total Investments in Securities 99.39%
(cost $348,038,425) | | | | | | | 385,151 | |
| Other Assets in Excess of Liabilities 0.61% | | | | | | | 2,367 | |
| Net Assets 100.00% | | | | | | $ | 387,518 | |
| | | |
| * | | Non-income producing security. |
| (a) | | Foreign security traded in U.S. dollars. |
| 8 | See Notes to Financial Statements. | |
Schedule of Investments (concluded)
December 31, 2016
The following is a summary of the inputs used as of December 31, 2016 in valuing the Fund’s investments carried at fair value(1):
| Investment Type(2)(3) | | Level 1
(000) | | | Level 2
(000) | | | Level 3
(000) | | | Total
(000) | |
| Common Stocks | | $ | 381,035 | | | $ | – | | | $ | – | | | $ | 381,035 | |
| Repurchase Agreement | | | – | | | | 4,116 | | | | – | | | | 4,116 | |
| Total | | $ | 381,035 | | | $ | 4,116 | | | $ | – | | | $ | 385,151 | |
| (1) | | Refer to Note 2(h) for a description of fair value measurements and the three-tier hierarchy of inputs. |
| (2) | | See Schedule of Investments for fair values in each industry and identification of foreign issuers and/or geography. |
| (3) | | There were no Level 1/Level 2 transfers during the fiscal year ended December 31, 2016. |
| | See Notes to Financial Statements. | 9 |
Statement of Assets and Liabilities
December 31, 2016
| ASSETS: | | | |
| Investments in securities, at fair value (cost $348,038,425) | | $ | 385,150,816 | |
| Receivables: | | | | |
| Investment securities sold | | | 2,439,272 | |
| Interest and dividends | | | 511,811 | |
| Capital shares sold | | | 121,525 | |
| From advisor (See Note 3) | | | 19,250 | |
| Prepaid expenses and other assets | | | 12,269 | |
| Total assets | | | 388,254,943 | |
| LIABILITIES: | | | | |
| Payables: | | | | |
| Management fee | | | 250,540 | |
| Capital shares reacquired | | | 91,625 | |
| Directors’ fees | | | 48,682 | |
| Fund administration | | | 13,362 | |
| Accrued expenses | | | 332,438 | |
| Total liabilities | | | 736,647 | |
| NET ASSETS | | $ | 387,518,296 | |
| COMPOSITION OF NET ASSETS: | | | | |
| Paid-in capital | | $ | 351,696,050 | |
| Distributions in excess of net investment income | | | (48,682 | ) |
| Accumulated net realized loss on investments | | | (1,241,463 | ) |
| Net unrealized appreciation (depreciation) on investments | | | 37,112,391 | |
| Net Assets | | $ | 387,518,296 | |
| Outstanding shares (50 million shares of common stock authorized, $.001 par value) | | | 21,174,524 | |
| Net asset value, offering and redemption price per share (Net assets divided by outstanding shares) | | | $18.30 | |
| 10 | See Notes to Financial Statements. | |
Statement of Operations
For the Year Ended December 31, 2016
| Investment income: | | | |
| Dividends | | $ | 8,419,885 | |
| Interest | | | 2,712 | |
| Total investment income | | | 8,422,597 | |
| Expenses: | | | | |
| Management fee | | | 2,516,089 | |
| Non 12b-1 service fees | | | 839,524 | |
| Shareholder servicing | | | 376,067 | |
| Fund administration | | | 134,191 | |
| Reports to shareholders | | | 55,542 | |
| Directors’ fees | | | 11,338 | |
| Professional | | | 47,013 | |
| Custody | | | 28,239 | |
| Other | | | 34,740 | |
| Gross expenses | | | 4,042,743 | |
| Expense reductions (See Note 8) | | | (1,331 | ) |
| Fees waived and expenses reimbursed (See Note 3) | | | (183,409 | ) |
| Net expenses | | | 3,858,003 | |
| Net investment income | | | 4,564,594 | |
| Net realized and unrealized gain: | | | | |
| Net realized gain on investments | | | 7,678,555 | |
| Net change in unrealized appreciation/depreciation on investments | | | 39,219,549 | |
| Net realized and unrealized gain | | | 46,898,104 | |
| Net Increase in Net Assets Resulting From Operations | | $ | 51,462,698 | |
| | See Notes to Financial Statements. | 11 |
Statements of Changes in Net Assets
| INCREASE (DECREASE) IN NET ASSETS | | For the Year Ended
December 31, 2016 | | | For the Year Ended
December 31, 2015 | |
| Operations: | | | | | | | | |
| Net investment income | | $ | 4,564,594 | | | $ | 3,167,545 | |
| Net realized gain on investments | | | 7,678,555 | | | | 15,821,072 | |
| Net change in unrealized appreciation/depreciation on investments | | | 39,219,549 | | | | (35,286,125 | ) |
| Net increase (decrease) in net assets resulting from operations | | | 51,462,698 | | | | (16,297,508 | ) |
| Distributions to shareholders from: | | | | | | | | |
| Net investment income | | | (4,325,749 | ) | | | (3,161,652 | ) |
| Net realized gain | | | (7,059,588 | ) | | | (24,501,799 | ) |
| Total distributions to shareholders | | | (11,385,337 | ) | | | (27,663,451 | ) |
| Capital share transactions (See Note 13): | | | | | | | | |
| Proceeds from sales of shares | | | 248,253,422 | | | | 193,716,593 | |
| Reinvestment of distributions | | | 11,385,337 | | | | 27,663,450 | |
| Cost of shares reacquired | | | (173,204,196 | ) | | | (359,272,647 | ) |
| Net increase (decrease) in net assets resulting from capital share transactions | | | 86,434,563 | | | | (137,892,604 | ) |
| Net increase (decrease) in net assets | | | 126,511,924 | | | | (181,853,563 | ) |
| NET ASSETS: | | | | | | | | |
| Beginning of year | | $ | 261,006,372 | | | $ | 442,859,935 | |
| End of year | | $ | 387,518,296 | | | $ | 261,006,372 | |
| Distributions in excess of net investment income | | $ | (48,682 | ) | | $ | (44,359 | ) |
| 12 | See Notes to Financial Statements. | |
This page is intentionally left blank.
13
Financial Highlights
| | | | | | | Per Share Operating Performance: |
| | | | | | | Investment operations: | | Distributions to
shareholders from: |
| | | | | | | | | | | | | | | | |
| | | | Net asset
value,
beginning
of period | | Net
invest-
ment
income(a) | | Net
realized
and
unrealized
gain (loss) | | Total
from
invest-
ment
opera-
tions | | Net
investment
income | | Net
realized
gain | | Total
distri-
butions |
| 12/31/2016 | | | $ | 16.28 | | | $ | 0.23 | | | $ | 2.34 | | | $ | 2.57 | | | $ | (0.21 | ) | | $ | (0.34 | ) | | $ | (0.55 | ) |
| 12/31/2015 | | | | 18.61 | | | | 0.16 | | | | (0.79 | ) | | | (0.63 | ) | | | (0.21 | ) | | | (1.49 | ) | | | (1.70 | ) |
| 12/31/2014 | | | | 21.03 | | | | 0.09 | | | | 1.43 | | | | 1.52 | | | | (0.10 | ) | | | (3.84 | ) | | | (3.94 | ) |
| 12/31/2013 | | | | 17.61 | | | | 0.05 | | | | 6.18 | | | | 6.23 | | | | (0.05 | ) | | | (2.76 | ) | | | (2.81 | ) |
| 12/31/2012 | | | | 16.26 | | | | 0.10 | | | | 1.63 | | | | 1.73 | | | | (0.10 | ) | | | (0.28 | ) | | | (0.38 | ) |
| (a) | Calculated using average shares outstanding during the period. |
| (b) | Total return does not consider the effects of sales charges or other expenses imposed by an insurance company and assumes the reinvestment of all distributions. |
| 14 | See Notes to Financial Statements. |
| | | | | | | Ratios to Average Net Assets: | | Supplemental Data: | |
| | | | | | | | | | | | | |
Net
asset
value,
end of
period | | Total
return(b)
(%) | | Total
expenses
after
waivers
and/or reim-
bursements
(%) | | Total
expenses
(%) | | Net
investment
income
(%) | | Net
assets,
end of
period
(000) | | Portfolio
turnover
rate
(%) |
| $ | 18.30 | | | | 15.74 | | | | 1.15 | | | | 1.20 | | | | 1.36 | | | $ | 387,518 | | | | 131.92 | |
| | 16.28 | | | | (3.44 | ) | | | 1.15 | | | | 1.21 | | | | 0.90 | | | | 261,006 | | | | 135.25 | |
| | 18.61 | | | | 7.14 | | | | 1.15 | | | | 1.19 | | | | 0.43 | | | | 442,860 | | | | 131.55 | |
| | 21.03 | | | | 35.76 | | | | 1.15 | | | | 1.18 | | | | 0.26 | | | | 465,208 | | | | 86.75 | |
| | 17.61 | | | | 10.58 | | | | 1.15 | | | | 1.19 | | | | 0.60 | | | | 314,022 | | | | 78.16 | |
| | See Notes to Financial Statements. | 15 |
Notes to Financial Statements
Lord Abbett Series Fund, Inc. (the “Company”) is registered under the Investment Company Act of 1940, as amended (the “Act”), as a diversified, open-end management investment company and was incorporated under Maryland law in 1989. The Company consists of thirteen separate portfolios. This report covers Fundamental Equity Portfolio (the “Fund”).
The Fund’s investment objective is long-term growth of capital and income without excessive fluctuations in market value. The Fund has Variable Contract class shares (“Class VC Shares”), which are currently issued and redeemed only in connection with investments in, and payments under, variable annuity contracts and variable life insurance policies issued by life insurance and insurance-related companies.
The preparation of the financial statements in conformity with accounting principles generally accepted in the United States of America (“U.S. GAAP”) requires management to make certain estimates and assumptions that affect the reported amounts of assets and liabilities and disclosure of contingent assets and liabilities at the date of the financial statements and the reported amounts of increases and decreases in net assets from operations during the reporting period. Actual results could differ from those estimates. The Fund is considered an investment company under U.S. GAAP and follows the accounting and reporting guidance applicable to investment companies.
| 2. | SIGNIFICANT ACCOUNTING POLICIES |
| | |
| (a) | Investment Valuation–Under procedures approved by the Fund’s Board of Directors (the “Board”), Lord, Abbett & Co. LLC (“Lord Abbett”), the Fund’s investment manager, has formed a Pricing Committee to administer the pricing and valuation of portfolio investments and to ensure that prices utilized reasonably reflect fair value. Among other things, these procedures allow the Fund to utilize independent pricing services, quotations from securities and financial instrument dealers and other market sources to determine fair value. |
| | |
| | Securities actively traded on any recognized U.S. or non-U.S. exchange or on The NASDAQ Stock Market LLC are valued at the last sale price or official closing price on the exchange or system on which they are principally traded. Events occurring after the close of trading on non-U.S. exchanges may result in adjustments to the valuation of foreign securities to reflect their fair value as of the close of regular trading on the New York Stock Exchange. The Fund may utilize an independent fair valuation service in adjusting the valuations of foreign securities. Unlisted equity securities are valued at the last quoted sale price or, if no sale price is available, at the mean between the most recently quoted bid and asked prices. |
| | |
| | Securities for which prices are not readily available are valued at fair value as determined by the Pricing Committee. The Pricing Committee considers a number of factors, including observable and unobservable inputs, when arriving at fair value. The Pricing Committee may use related or comparable assets or liabilities, recent transactions, market multiples, book values and other relevant information to determine the fair value of portfolio investments. The Board or a designated committee thereof regularly reviews fair value determinations made by the Pricing Committee and employs techniques such as reviewing related market activity, reviewing inputs and assumptions, and retrospectively comparing prices of subsequent purchases and sales transactions to fair value determinations made by the Pricing Committee. |
16
Notes to Financial Statements (continued)
| | Short-term securities with 60 days or less remaining to maturity are valued using the amortized cost method, which approximates fair value. |
| | |
| (b) | Security Transactions–Security transactions are recorded as of the date that the securities are purchased or sold (trade date). Realized gains and losses on sales of portfolio securities are calculated using the identified-cost method. |
| | |
| (c) | Investment Income–Dividend income is recorded on the ex-dividend date. Interest income is recorded on the accrual basis as earned. Discounts are accreted and premiums are amortized using the effective interest method and are included in Interest and other income on the Statement of Operations. Withholding taxes on foreign dividends have been provided for in accordance with the applicable country’s tax rules and rates. |
| | |
| (d) | Income Taxes–It is the policy of the Fund to meet the requirements of Subchapter M of the Internal Revenue Code applicable to regulated investment companies and to distribute substantially all taxable income and capital gains to its shareholders. Therefore, no income tax provision is required. |
| | |
| | The Fund files U.S. federal and various state and local tax returns. No income tax returns are currently under examination. The statute of limitations on the Fund’s filed U.S. federal tax returns remains open for the fiscal years ended December 31, 2013 through December 31, 2016. The statutes of limitations on the Company’s state and local tax returns may remain open for an additional year depending upon the jurisdiction. |
| | |
| (e) | Expenses–Expenses incurred by the Company that do not specifically relate to an individual fund are generally allocated to the funds within the Company on a pro rata basis by relative net assets. |
| | |
| (f) | Foreign Transactions–The books and records of the Fund are maintained in U.S. dollars and transactions denominated in foreign currencies are recorded in the Fund’s records at the rate prevailing when earned or recorded. Asset and liability accounts that are denominated in foreign currencies are adjusted daily to reflect current exchange rates and any unrealized gain (loss) is included in Net change in unrealized appreciation/depreciation on investments in the Fund’s Statement of Operations. The resultant exchange gains and losses upon settlement of such transactions are included in Net realized gain on investments in the Fund’s Statement of Operations. The Fund does not isolate that portion of the results of operations arising as a result of changes in the foreign exchange rates from the changes in market prices of the securities. |
| | |
| (g) | Repurchase Agreements–The Fund may enter into repurchase agreements with respect to securities. A repurchase agreement is a transaction in which a fund acquires a security and simultaneously commits to resell that security to the seller (a bank or securities dealer) at an agreed-upon price on an agreed-upon date. The Fund requires at all times that the repurchase agreement be collateralized by cash, or by securities of the U.S. Government, its agencies, its instrumentalities, or U.S. Government sponsored enterprises having a value equal to, or in excess of, the value of the repurchase agreement (including accrued interest). If the seller of the agreement defaults on its obligation to repurchase the underlying securities at a time when the fair value of these securities has declined, the Fund may incur a loss upon disposition of the securities. |
17
Notes to Financial Statements (continued)
| (h) | Fair Value Measurements–Fair value is defined as the price that the Fund would receive upon selling an investment or transferring a liability in an orderly transaction to an independent buyer in the principal or most advantageous market of the investment. A three-tier hierarchy is used to maximize the use of observable market data and minimize the use of unobservable inputs and to establish classification of fair value measurements for disclosure purposes. Inputs refer broadly to the assumptions that market participants would use in pricing the asset or liability, including assumptions about risk—for example, the risk inherent in a particular valuation technique used to measure fair value (such as a pricing model) and/or the risk inherent in the inputs to the valuation technique. Inputs may be observable or unobservable. Observable inputs reflect the assumptions market participants would use in pricing the asset or liability. Observable inputs are based on market data obtained from sources independent of the reporting entity. Unobservable inputs reflect the reporting entity’s own assumptions about the assumptions market participants would use in pricing the asset or liability. Unobservable inputs are based on the best information available in the circumstances. The three-tier hierarchy classification is determined based on the lowest level of inputs that is significant to the fair value measurement, and is summarized in the three broad Levels listed below: |
| | • | Level 1 – unadjusted quoted prices in active markets for identical investments; |
| | • | Level 2 – other significant observable inputs (including quoted prices for similar investments, interest rates, prepayment speeds, credit risk, etc.); and |
| | • | Level 3 – significant unobservable inputs (including the Fund’s own assumptions in determining the fair value of investments). |
| | | | |
| | A summary of inputs used in valuing the Fund’s investments as of December 31, 2016 and, if applicable, Level 1/Level 2 transfers and Level 3 rollforwards for the fiscal year then ended is included in the Fund’s Schedule of Investments. Changes in valuation techniques may result in transfers into or out of an assigned level within the three-tier hierarchy. All transfers between different levels within the three-tier hierarchy are deemed to have occurred as of the beginning of the reporting period. The inputs or methodology used for valuing securities are not necessarily an indication of the risk associated with investing in those securities. |
| 3. | MANAGEMENT FEE AND OTHER TRANSACTIONS WITH AFFILIATES |
Management Fee
The Company has a management agreement with Lord Abbett, pursuant to which Lord Abbett supplies the Fund with investment management services and executive and other personnel, provides office space and pays for ordinary and necessary office and clerical expenses relating to research and statistical work and supervision of the Fund’s investment portfolio.
The management fee is based on the Fund’s average daily net assets at the following annual rate:
| First $1 billion | | | .75 | % |
| Next $1 billion | | | .70 | % |
| Over $2 billion | | | .65 | % |
For the fiscal year ended December 31, 2016, the effective management fee, net of waivers, was at an annualized rate of .70% of the Fund’s average daily net assets.
18
Notes to Financial Statements (continued)
In addition, Lord Abbett provides certain administrative services to the Fund pursuant to an Administrative Services Agreement in return for a fee at an annual rate of .04% of the Fund’s average daily net assets.
During the fiscal year ended December 31, 2016 and continuing through April 30, 2017, Lord Abbett has contractually agreed to waive its fees and reimburse expenses to the extent necessary to limit total net annual operating expenses to an annual rate of 1.15%. This agreement may be terminated only upon the approval of the Board.
The Company, on behalf of the Fund, has entered into services arrangements with certain insurance companies. Under these arrangements, certain insurance companies will be compensated up to ..25% of the average daily net asset value (“NAV”) of the Fund’s Class VC Shares held in the insurance company’s separate account to service and maintain the Variable Contract owners’ accounts. This amount is included in Non 12b-1 service fees on the Statement of Operations. The Fund may also compensate certain insurance companies, third-party administrators and other entities for providing recordkeeping, sub-transfer agency and other administrative services to the Fund. This amount is included in Shareholder servicing on the Statement of Operations.
Two Directors and certain of the Company’s officers have an interest in Lord Abbett.
| 4. | DISTRIBUTIONS AND CAPITAL LOSS CARRYFORWARDS |
Dividends from net investment income, if any, are declared and paid at least semi-annually. Taxable net realized gains from investment transactions, reduced by allowable capital loss carryforwards, if any, are declared and distributed to shareholders at least annually. The capital loss carryforward amount, if any, is available to offset future net capital gains. Dividends and distributions to shareholders are recorded on the ex-dividend date. The amounts of dividends and distributions from net investment income and net realized capital gains are determined in accordance with federal income tax regulations, which may differ from U.S. GAAP. These book/tax differences are either considered temporary or permanent in nature. To the extent these differences are permanent in nature, such amounts are reclassified within the components of net assets based on their federal tax basis treatment; temporary differences do not require reclassification. Dividends and distributions that exceed earnings and profits for tax purposes are reported as a tax return of capital.
The tax character of distributions paid during the fiscal years ended December 31, 2016 and 2015 was as follows:
| | | Year Ended
12/31/2016 | | | Year Ended
12/31/2015 | |
| Distributions paid from: | | | | | | | | |
| Ordinary income | | $ | 9,867,397 | | | $ | 5,438,690 | |
| Net long-term capital gains | | | 1,517,940 | | | | 22,224,761 | |
| Total distributions paid | | $ | 11,385,337 | | | $ | 27,663,451 | |
As of December 31, 2016, the components of accumulated gains on a tax-basis were as follows:
| Undistributed ordinary income – net | | $ | 3,204,712 | |
| Total undistributed earnings | | | 3,204,712 | |
| Temporary differences | | | (48,682 | ) |
| Unrealized gains – net | | | 32,666,216 | |
| Total accumulated gains – net | | $ | 35,822,246 | |
19
Notes to Financial Statements (continued)
As of December 31, 2016, the aggregate unrealized security gains and losses based on cost for U.S. federal income tax purposes were as follows:
| Tax cost | | $ | 352,484,600 | |
| Gross unrealized gain | | | 37,042,991 | |
| Gross unrealized loss | | | (4,376,775 | ) |
| Net unrealized security gain | | $ | 32,666,216 | |
The difference between book-basis and tax-basis unrealized gains (losses) is attributable to wash sales.
Permanent items identified during the fiscal year ended December 31, 2016 have been reclassified among the components of net assets based on their tax basis treatment as follows:
Distributions in
Excess of Net
Investment Income | | | Accumulated Net
Realized Loss | |
| | $(243,168 | ) | | | $243,168 | |
The permanent differences are attributable to the tax treatment of certain distributions.
| 5. | PORTFOLIO SECURITIES TRANSACTIONS |
Purchases and sales of investment securities (excluding short-term investments) for the fiscal year ended December 31, 2016 were as follows:
| Purchases | | | Sales | |
| $ | 510,433,719 | | | $ | 432,022,950 | |
There were no purchases or sales of U.S. Government securities for the fiscal year ended December 31, 2016.
| 6. | DISCLOSURES ABOUT OFFSETTING ASSETS AND LIABILITIES |
The Financial Accounting Standards Board (“FASB”) requires disclosures intended to help better assess the effect or potential effect of offsetting arrangements on a fund’s financial position. The following tables illustrate gross and net information about recognized assets and liabilities eligible for offset in the statement of assets and liabilities; and disclose such amounts subject to an enforceable master netting agreement or similar agreement, by counterparty. A master netting agreement is an agreement between a fund and a counterparty which provides for the net settlement of amounts owed under all contracts traded under that agreement, as well as cash collateral, through a single payment by one party to the other in the event of default on or termination of any one contract. The Fund’s accounting policy with respect to balance sheet offsetting is that, absent an event of default by the counterparty or a termination of the agreement, the master netting agreement does not result in an offset of reported amounts of financial assets and liabilities in the statement of assets and liabilities across transactions between the Fund and the applicable counterparty:
| Description | | Gross Amounts of
Recognized Assets | | | Gross Amounts
Offset in the
Statement of Assets
and Liabilities | | | Net Amounts of
Assets Presented
in the Statement of
Assets and Liabilities | |
| Repurchase Agreement | | | $4,116,402 | | | $ | – | | | $ | 4,116,402 | |
| Total | | | $4,116,402 | | | $ | – | | | $ | 4,116,402 | |
20
Notes to Financial Statements (continued)
| | | Net Amounts
of Assets
Presented in | | | Amounts Not Offset in the
Statement of Assets and Liabilities | | | | |
| Counterparty | | the Statement
of Assets and
Liabilities | | | Financial
Instruments | | | Cash
Collateral
Received(a) | | | Securities
Collateral
Received(a) | | | Net
Amount(b) | |
| Fixed Income Clearing Corp. | | $ | 4,116,402 | | | $ | – | | | $ | – | | | $ | (4,116,402 | ) | | $ | – | |
| Total | | $ | 4,116,402 | | | $ | – | | | $ | – | | | $ | (4,116,402 | ) | | $ | – | |
| (a) | Collateral disclosed is limited to an amount not to exceed 100% of the net amount of assets presented in the Statement of Assets and Liabilities, for each respective counterparty. |
| (b) | Net amount represents the amount owed to the Fund by the counterparty as of December 31, 2016. |
| 7. | DIRECTORS’ REMUNERATION |
The Company’s officers and two Directors, who are associated with Lord Abbett, do not receive any compensation from the Company for serving in such capacities. Independent Directors’ fees are allocated among all Lord Abbett-sponsored funds based on the net assets of each fund. There is an equity-based plan available to all Independent Directors under which Independent Directors must defer receipt of a portion of, and may elect to defer receipt of an additional portion of Directors’ fees. The deferred amounts are treated as though equivalent dollar amounts had been invested in the funds. Such amounts and earnings accrued thereon are included in Directors’ fees on the Statement of Operations and in Directors’ fees payable on the Statement of Assets and Liabilities and are not deductible for U.S. federal income tax purposes until such amounts are paid.
The Company has entered into an arrangement with its transfer agent and custodian, whereby credits realized as a result of uninvested cash balances are used to reduce a portion of the Fund’s expenses.
The Fund and certain other funds managed by Lord Abbett (collectively, the “Participating Funds”) entered into a syndicated line of credit facility with various lenders for $550 million (the “Facility”), whereas State Street Bank and Trust Company (“SSB”) participates as a lender and as agent for the lenders. The Facility is to be used for temporary or emergency purposes as an additional source of liquidity to satisfy redemptions. The Participating Funds are subject to graduated borrowing limits of one-third of Fund assets (if Fund assets are less than $750 million), $250 million, $300 million, or $350 million, based on past borrowings and likelihood of future borrowings. The Facility will continue through August 28, 2017.
During the fiscal year ended December 31, 2016, the Fund did not utilize the Facility.
| 10. | INTERFUND LENDING PROGRAM |
On July 26, 2016, the U.S. Securities and Exchange Commission issued an exemptive order (“SEC exemptive order”) which permits certain registered open-end management investment companies managed by Lord Abbett, including the Fund, to participate in a joint lending and borrowing program (the “Interfund Lending Program”). The SEC exemptive order allows the Funds to borrow money from and lend money to each other for temporary or emergency purposes subject to the limitations and conditions.
21
Notes to Financial Statements (concluded)
During the fiscal year ended December 31, 2016, the Fund did not participate as a borrower or lender in the Interfund Lending Program.
| 11. | CUSTODIAN AND ACCOUNTING AGENT |
SSB is the Company’s custodian and accounting agent. SSB performs custodial, accounting and recordkeeping functions relating to portfolio transactions and calculating the Fund’s NAV.
The Fund is subject to the general risks and considerations associated with investing in equity securities as well as the particular risks associated with value stocks. The value of an investment will fluctuate in response to movements in the equity securities market in general and to the changing prospects of individual companies in which the Fund invests. Large value stocks, in which the Fund invests a significant portion of its assets, may perform differently than the market as a whole and other types of stocks, such as mid-sized or small-company stocks and growth stocks. This is because different types of stocks tend to shift in and out of favor depending on market and economic conditions. Mid-cap and small-cap company stocks in which the Fund may invest may be more volatile and less liquid than large-cap stocks. The market may fail to recognize the intrinsic value of a particular value stock for a long time. In addition, if the Fund’s assessment of a company’s value or prospects for exceeding earnings expectations or market conditions is wrong, the Fund could suffer losses or produce poor performance relative to other funds, even in a rising market.
Due to the Fund’s investment exposure to foreign companies and American Depositary Receipts, the Fund may experience increased market, liquidity, currency, political, information, and other risks.
The Fund is subject to the risks associated with derivatives, which may be different and greater than the risks associated with investing directly in securities and other investments.
These factors can affect the Fund’s performance.
| 13. | SUMMARY OF CAPITAL TRANSACTIONS |
Transactions in shares of capital stock were as follows:
| | | Year Ended
December 31, 2016 | | | Year Ended
December 31, 2015 | |
| Shares sold | | | 15,238,804 | | | | 10,986,185 | |
| Reinvestment of distributions | | | 620,615 | | | | 1,644,621 | |
| Shares reacquired | | | (10,720,561 | ) | | | (20,394,034 | ) |
| Increase (decrease) | | | 5,138,858 | | | | (7,763,228 | ) |
22
Report of Independent Registered Public Accounting Firm
To the Board of Directors of Lord Abbett Series Fund, Inc. and the Shareholders of Fundamental Equity Portfolio:
We have audited the accompanying statement of assets and liabilities, including the schedule of investments, of the Fundamental Equity Portfolio, one of the portfolios constituting the Lord Abbett Series Fund, Inc. (the “Fund”) as of December 31, 2016, and the related statement of operations for the year then ended, the statements of changes in net assets for each of the two years in the period then ended, and the financial highlights for each of the five years in the period then ended. These financial statements and financial highlights are the responsibility of the Fund’s management. Our responsibility is to express an opinion on these financial statements and financial highlights based on our audits.
We conducted our audits in accordance with the standards of the Public Company Accounting Oversight Board (United States). Those standards require that we plan and perform the audit to obtain reasonable assurance about whether the financial statements and financial highlights are free of material misstatement. The Fund is not required to have, nor were we engaged to perform, an audit of its internal control over financial reporting. Our audits included consideration of internal control over financial reporting as a basis for designing audit procedures that are appropriate in the circumstances, but not for the purpose of expressing an opinion on the effectiveness of the Fund’s internal control over financial reporting. Accordingly, we express no such opinion. An audit also includes examining, on a test basis, evidence supporting the amounts and disclosures in the financial statements, assessing the accounting principles used and significant estimates made by management, as well as evaluating the overall financial statement presentation. Our procedures included confirmation of securities owned as of December 31, 2016, by correspondence with the custodian. We believe that our audits provide a reasonable basis for our opinion.
In our opinion, such financial statements and financial highlights referred to above present fairly, in all material respects, the financial position of Fundamental Equity Portfolio of the Lord Abbett Series Fund, Inc. as of December 31, 2016 the results of its operations for the year then ended, the changes in its net assets for each of the two years in the period then ended, and the financial highlights for each of the five years in the period then ended, in conformity with accounting principles generally accepted in the United States of America.
DELOITTE & TOUCHE LLP
New York, New York
February 15, 2017
23
Basic Information About Management
The Board is responsible for the management of the business and affairs of the Company in accordance with the laws of the State of Maryland. The Board elects officers who are responsible for the day-to-day operations of each Fund and who execute policies authorized by the Board. The Board also approves an investment adviser to each Fund and continues to monitor the cost and quality of the services the investment adviser provides, and annually considers whether to renew the contract with the adviser. Generally, each Director holds office until his/her successor is elected and qualified or until his/her earlier resignation or removal, as provided in the Company’s organizational documents.
Lord Abbett, a Delaware limited liability company, is the Fund’s investment adviser. Designated Lord Abbett personnel are responsible for the day-to-day management of the Funds.
Interested Directors
Ms. Foster and Mr. Sieg are affiliated with Lord Abbett and are “interested persons” of the Company as defined in the Act. Ms. Foster and Mr. Sieg are directors/trustees of each of the 12 investment companies in the Lord Abbett Family of Funds, which consist of 60 portfolios or series. Ms. Foster is an officer of the Lord Abbett Family of Funds.
Name, Address and
Year of Birth | | Current Position and
Length of Service
with the Company | | Principal Occupation and Other Directorships
During the Past Five Years |
Daria L. Foster
Lord, Abbett & Co. LLC
90 Hudson Street
Jersey City, NJ 07302
(1954) | | Director and President since 2006; Chief Executive Officer since 2012 | | Principal Occupation: Managing Partner of Lord Abbett, joined Lord Abbett in 1990. Other Directorships: None. |
| | | | | |
Douglas B. Sieg
Lord, Abbett & Co. LLC
90 Hudson Street
Jersey City, NJ 07302
(1969) | | Director since 2016 | | Principal Occupation: Partner (since 2001) and Head of Client Services (since 2013), formerly Director of Marketing and Relationship Management, joined Lord Abbett in 1994. Other Directorships: None. |
Independent Directors
The following Independent Directors also are directors/trustees of each of the 12 investment companies in the Lord Abbett Family of Funds, which consist of 60 portfolios or series.
Name, Address and
Year of Birth | | Current Position and
Length of Service
with the Company | | Principal Occupation and Other Directorships
During the Past Five Years |
Robert B. Calhoun, Jr.
Lord, Abbett & Co. LLC
c/o Legal Dept.
90 Hudson Street
Jersey City, NJ 07302
(1942) | | Director since 1998 | | Principal Occupation: Senior Advisor of Monitor Clipper Partners, a private equity investment fund (since 1997); President of Clipper Asset Management Corp. (1991–2009). Other Directorships: None. |
24
Basic Information About Management (continued)
Name, Address and
Year of Birth | | Current Position and
Length of Service
with the Company | | Principal Occupation and Other Directorships
During the Past Five Years |
Eric C. Fast
Lord, Abbett & Co. LLC
c/o Legal Dept.
90 Hudson Street
Jersey City, NJ 07302
(1949) | | Director since 2014 | | Principal Occupation: Chief Executive Officer of Crane Co., an industrial products company (2001–2014). Other Directorships: Currently serves as director of Automatic Data Processing, Inc. (since 2007) and Regions Financial Corporation (since 2010). Previously served as a director of Crane Co. (1999–2014). |
| | | | | |
Evelyn E. Guernsey
Lord, Abbett & Co. LLC
c/o Legal Dept.
90 Hudson Street
Jersey City, NJ 07302
(1955) | | Director since 2011 | | Principal Occupation: CEO, Americas of J.P. Morgan Asset Management (2004–2010). Other Directorships: None. |
| | | | | |
Julie A. Hill
Lord, Abbett & Co. LLC
c/o Legal Dept.
90 Hudson Street
Jersey City, NJ 07302
(1946) | | Director since 2004 | | Principal Occupation: Owner and CEO of The Hill Company, a business consulting firm (since 1998). Other Directorships: Currently serves as director of Anthem, Inc., a health benefits company (since 1994). |
| | | | | |
Franklin W. Hobbs
Lord, Abbett & Co. LLC
c/o Legal Dept.
90 Hudson Street
Jersey City, NJ 07302
(1947) | | Director since 2001 | | Principal Occupation: Advisor of One Equity Partners, a private equity firm (since 2004). Other Directorships: Currently serves as director and Chairman of the Board of Ally Financial Inc., a financial services firm (since 2009), and as director of Molson Coors Brewing Company (since 2002). |
| | | | | |
James M. McTaggart
Lord, Abbett & Co. LLC
c/o Legal Dept.
90 Hudson Street
Jersey City, NJ 07302
(1947) | | Director since 2012 | | Principal Occupation: Independent management advisor and consultant (since 2012); Vice President, CRA International, Inc. (doing business as Charles River Associates), a global management consulting firm (2009–2012); Founder and Chairman of Marakon Associates, Inc., a strategy consulting firm (1978–2009); and Officer and Director of Trinsum Group, a holding company (2007–2009). Other Directorships: Currently serves as director of Blyth, Inc., a home products company (since 2004). |
| | | | | |
Mark A. Schmid
Lord, Abbett & Co. LLC
c/o Legal Dept.
90 Hudson Street
Jersey City, NJ 07302
(1959) | | Director since 2016 | | Principal Occupation: Vice President and Chief Investment Officer of the University of Chicago (since 2009). Other Directorships: None. |
25
Basic Information About Management (continued)
Name, Address and
Year of Birth | | Current Position and
Length of Service
with the Company | | Principal Occupation and Other Directorships
During the Past Five Years |
James L.L. Tullis
Lord, Abbett & Co. LLC
c/o Legal Dept.
90 Hudson Street
Jersey City, NJ 07302
(1947) | | Director since 2006;
Chairman since 2017 | | Principal Occupation: CEO of Tullis-Dickerson and Co. Inc., a venture capital management firm (since 1990); CEO of Tullis Health Investors Inc. (since 2012). Other Directorships: Currently serves as director of Crane Co. (since 1998). |
Officers
None of the officers listed below have received compensation from the Company. All of the officers of the Company also may be officers of the other Lord Abbett Funds and maintain offices at 90 Hudson Street, Jersey City, NJ 07302. Unless otherwise indicated, the position(s) and title(s) listed under the “Principal Occupation During the Past Five Years” column indicate each officer’s position(s) and title(s) with Lord Abbett. Each officer serves for an indefinite term (i.e., until his or her death, resignation, retirement, or removal).
Name and
Year of Birth | | Current Position
with the Company | | Length of Service
of Current
Position | | Principal Occupation
During the Past Five Years |
Daria L. Foster
(1954) | | President and Chief Executive Officer | | Elected as President in 2006 and Chief Executive Officer in 2012 | | Managing Partner of Lord Abbett, joined Lord Abbett in 1990. |
| | | | | | | |
Sean J. Aurigemma
(1969) | | Executive Vice President | | Elected in 2010 | | Portfolio Manager, joined Lord Abbett in 2007. |
| | | | | | | |
Jeff D. Diamond
(1960) | | Executive Vice President | | Elected in 2008 | | Portfolio Manager, joined Lord Abbett in 2007. |
| | | | | | | |
Todd D. Jacobson
(1966) | | Executive Vice President | | Elected in 2005 | | Partner and Associate Director, joined Lord Abbett in 2003. |
| | | | | | | |
Robert A. Lee
(1969) | | Executive Vice President | | Elected in 2010 | | Partner and Chief Investment Officer, and was formerly Deputy Chief Investment Officer and Director of Taxable Fixed Income, joined Lord Abbett in 1997. |
| | | | | | | |
Thomas B. Maher
(1967) | | Executive Vice President | | Elected in 2010 | | Partner and Portfolio Manager, joined Lord Abbett in 2003. |
| | | | | | | |
Justin C. Maurer
(1969) | | Executive Vice President | | Elected in 2010 | | Partner and Portfolio Manager, joined Lord Abbett in 2001. |
| | | | | | | |
Vincent J. McBride
(1964) | | Executive Vice President | | Elected in 2010 | | Partner and Director, joined Lord Abbett in 2003. |
| | | | | | | |
Andrew H. O’Brien
(1973) | | Executive Vice President | | Elected in 2010 | | Partner and Portfolio Manager, joined Lord Abbett in 1998. |
26
Basic Information About Management (continued)
Name and
Year of Birth | | Current Position
with the Company | | Length of Service
of Current
Position | | Principal Occupation
During the Past Five Years |
F. Thomas O’Halloran, III
(1955) | | Executive Vice President | | Elected in 2010 | | Partner and Portfolio Manager, joined Lord Abbett in 2001. |
| | | | | | | |
Marc Pavese
(1972) | | Executive Vice President | | Elected in 2016 | | Partner and Portfolio Manager, joined Lord Abbett in 2008. |
| | | | | | | |
Walter H. Prahl
(1958) | | Executive Vice President | | Elected in 2012 | | Partner and Director, joined Lord Abbett in 1997. |
| | | | | | | |
Steven F. Rocco
(1979) | | Executive Vice President | | Elected in 2014 | | Partner and Portfolio Manager, joined Lord Abbett in 2004. |
| | | | | | | |
Didier O. Rosenfeld
(1976) | | Executive Vice President | | Elected in 2016 | | Director of Global Equity, joined Lord Abbett in 2015 and was formerly a Portfolio Manager and Senior Analyst at Cornerstone Capital Management (2014–2015) and Managing Director at State Street Global Advisors (2000–2013). |
| | | | | | | |
Frederick J. Ruvkun
(1957) | | Executive Vice President | | Elected in 2012 | | Partner and Portfolio Manager, joined Lord Abbett in 2006. |
| | | | | | | |
Paul J. Volovich
(1973) | | Executive Vice President | | Elected in 2005 | | Partner and Portfolio Manager, joined Lord Abbett in 1997. |
| | | | | | | |
A. Edward Allinson
(1961) | | Vice President | | Elected in 2011 | | Portfolio Manager, joined Lord Abbett in 2005. |
| | | | | | | |
John W. Ashbrook
(1964) | | Vice President and Assistant Secretary | | Elected in 2014 | | Assistant General Counsel, joined Lord Abbett in 2008. |
| | | | | | | |
Joan A. Binstock
(1954) | | Chief Financial Officer and Vice President | | Elected in 1999 | | Partner and Chief Financial Officer, and was formerly Chief Operations Officer, joined Lord Abbett in 1999. |
| | | | | | | |
Brooke A. Fapohunda
(1975) | | Vice President and Assistant Secretary | | Elected in 2014 | | Deputy General Counsel, joined Lord Abbett in 2006. |
| | | | | | | |
John K. Forst
(1960) | | Vice President and Assistant Secretary | | Elected in 2005 | | Partner and Deputy General Counsel, joined Lord Abbett in 2004. |
| | | | | | | |
Anthony W. Hipple
(1964) | | Vice President | | Elected in 2014 | | Portfolio Manager, joined Lord Abbett in 2002. |
| | | | | | | |
Lawrence H. Kaplan
(1957) | | Vice President and Secretary | | Elected in 1997 | | Partner and General Counsel, joined Lord Abbett in 1997. |
27
Basic Information About Management (concluded)
Name and
Year of Birth | | Current Position
with the Company | | Length of Service
of Current
Position | | Principal Occupation
During the Past Five Years |
Linda Y. Kim
(1980) | | Vice President and Assistant Secretary | | Elected in 2016 | | Counsel, joined Lord Abbett in 2015 and was formerly an Associate at Stroock & Stroock & Lavan LLP (2007–2015). |
| | | | | | | |
David J. Linsen
(1974) | | Vice President | | Elected in 2008 | | Partner and Director, joined Lord Abbett in 2001. |
| | | | | | | |
Joseph M. McGill
(1962) | | Chief Compliance Officer | | Elected in 2014 | | Partner and Chief Compliance Officer, joined Lord Abbett in 2014 and was formerly Managing Director and the Chief Compliance Officer at UBS Global Asset Management (2003–2013). |
| | | | | | | |
A. Edward Oberhaus, III
(1959) | | Vice President | | Elected in 1998 | | Partner and Director, joined Lord Abbett in 1983. |
| | | | | | | |
Noah Petrucci
(1970) | | Vice President | | Elected in 2013 | | Portfolio Manager, joined Lord Abbett in 2012 and was formerly a Portfolio Manager at Columbia Management Investment Advisers, LLC and Columbia Management Advisors, LLC (2002–2012). |
| | | | | | | |
Lawrence B. Stoller
(1963) | | Vice President and Assistant Secretary | | Elected in 2007 | | Partner and Senior Deputy General Counsel, joined Lord Abbett in 2007. |
| | | | | | | |
Leah G. Traub
(1979) | | Vice President | | Elected in 2016 | | Partner and Portfolio Manager, joined Lord Abbett in 2007. |
| | | | | | | |
Arthur K. Weise
(1970) | | Vice President | | Elected in 2010 | | Partner and Portfolio Manager, joined Lord Abbett in 2007. |
| | | | | | | |
Kewjin Yuoh
(1971) | | Vice President | | Elected in 2012 | | Partner and Portfolio Manager, joined Lord Abbett in 2010. |
| | | | | | | |
Scott S. Wallner
(1955) | | AML Compliance Officer | | Elected in 2011 | | Assistant General Counsel, joined Lord Abbett in 2004. |
| | | | | | | |
Bernard J. Grzelak
(1971) | | Treasurer | | Elected in 2003 | | Partner and Chief Operations Officer, and was formerly Director of Fund Administration, joined Lord Abbett in 2003. |
Please call 888-522-2388 for a copy of the statement of additional information, which contains further information about the Company’s Directors. It is available free upon request.
28
Approval of Advisory Contract
The Board, including all of the Directors who are not interested persons of the Fund or of Lord Abbett (the “Independent Board Members”), annually considers whether to approve the continuation of the existing management agreement between the Fund and Lord Abbett (the “Agreement”). In connection with its most recent approval, the Board reviewed materials relating specifically to the Agreement, as well as numerous materials received throughout the course of the year, including information about the Fund’s investment performance compared to the performance of its benchmark. Before making its decision as to the Fund, the Board had the opportunity to ask questions and request further information, taking into account its familiarity with Lord Abbett gained through its meetings and discussions. These meetings and discussions included the review of the portfolio management team conducted by members of the Contract Committee, the deliberations of the Contract Committee, and discussions between the Contract Committee and Lord Abbett’s management. The Independent Board Members also met with their independent legal counsel in a private session at which no representatives of management were present.
The materials received by the Board included, but were not limited to: (1) information provided by Morningstar Associates, LLC (“Morningstar”) regarding the investment performance of the Fund compared to the investment performance of certain funds with similar investment styles as determined by Morningstar, based, in part, on the Fund’s Morningstar category (the “performance peer group”), and the investment performance of two appropriate benchmarks; (2) information provided by Morningstar regarding the expense ratios, contractual and effective management fee rates, and other expense components for the Fund and certain funds in the same Morningstar category, with generally the same or similar share classes and operational characteristics, including asset size (the “expense peer group”); (3) certain supplemental investment performance information provided by Lord Abbett; (4) information provided by Lord Abbett on the expense ratios, management fee rates, and other expense components for the Fund; (5) sales and redemption information for the Fund; (6) information regarding Lord Abbett’s financial condition; (7) an analysis of the relative profitability of the Agreement to Lord Abbett; (8) information provided by Lord Abbett regarding the investment management fee schedules for Lord Abbett’s other advisory clients maintaining accounts with a similar investment strategy as the Fund; and (9) information regarding the personnel and other resources devoted by Lord Abbett to managing the Fund.
Investment Management Services Generally. The Board considered the investment management services provided by Lord Abbett to the Fund, including investment research, portfolio management, and trading, and Lord Abbett’s commitment to compliance with all applicable legal requirements. The Board also observed that Lord Abbett was solely engaged in the investment management business and accordingly did not experience the conflicts of interest that may result from being engaged in other lines of business. The Board considered the investment advisory services provided by Lord Abbett to other clients, the fees charged for the services, and the differences in the nature of the services provided to the Fund and other Lord Abbett Funds, on the one hand, and the services provided to other clients, on the other. After reviewing these and related factors, the Board concluded that the Fund was likely to continue to benefit from the nature, extent and quality of the investment services provided by Lord Abbett under the Agreement.
Investment Performance. The Board reviewed the Fund’s investment performance in relation to that of the performance peer group and two appropriate benchmarks as of various periods ended August 31, 2016. The Board observed that the Fund’s investment performance was above the median of the performance peer group for the one-year, three-year and ten-year periods and below the median of the performance peer group for the five-year period. The Board also
29
Approval of Advisory Contract (continued)
considered Lord Abbett’s performance and reputation generally, the performance of other Lord Abbett-managed funds overseen by the Board and the willingness of Lord Abbett to take steps intended to improve performance when necessary. After reviewing these and related factors, the Board concluded that the Fund’s investment performance was reasonable and supported the continuation of the Agreement.
Lord Abbett’s Personnel and Methods. The Board considered the qualifications of the personnel providing investment management services to the Fund, in light of its investment objective and discipline. Among other things, the Board considered the size, experience, and turnover of Lord Abbett’s investment management staff, Lord Abbett’s investment methodology and philosophy, and Lord Abbett’s approach to recruiting, training, and retaining investment management personnel.
Nature and Quality of Other Services. The Board considered the nature, quality, costs, and extent of compliance, administrative, and other services performed by Lord Abbett and the nature and extent of Lord Abbett’s supervision of third party service providers, including the Fund’s transfer agent and custodian.
Expenses. The Board considered the expense level of the Fund and the expense levels of the expense peer group. It also considered how the expense levels of the Fund related to those of the expense peer group and the amount and nature of the fees paid by shareholders. The Board observed that the overall expense level of the Fund was above the median of the expense peer group. After reviewing these and related factors, the Board concluded, within the context of its overall approval of the Agreement, that the expense level of the Fund was reasonable in light of the long-term performance of the Fund and the quality of the services received.
Profitability. The Board considered the level of Lord Abbett’s operating margin in managing the Fund, including a review of Lord Abbett’s methodology for allocating its costs to its management of the Fund. It considered whether the Fund was profitable to Lord Abbett in connection with the operation of the Fund, including the fee that Lord Abbett receives from the Fund for providing administrative services to the Fund. The Board also considered the profits realized from other business segments of Lord Abbett, which may benefit from or be related to the Fund’s business. The Board considered Lord Abbett’s profit margins in comparison with available industry data, both accounting for and excluding marketing and distribution expenses, and how those profit margins could affect Lord Abbett’s ability to recruit and retain investment personnel. The Board recognized that Lord Abbett’s overall profitability was a factor in enabling it to attract and retain qualified investment management personnel to provide services to the Fund. After reviewing these and related factors, the Board concluded, within the context of its overall approval of the Agreement, that Lord Abbett’s profitability with respect to the Fund was not excessive.
Economies of Scale. The Board considered the extent to which there had been economies of scale in managing the Fund, whether the Fund’s shareholders had appropriately benefited from such economies of scale, and whether there was potential for realization of any further economies of scale. The Board concluded that the existing management fee schedule, with its breakpoints in the levels of the management fee, in conjunction with a proposed expense limitation agreement adequately addressed any economies of scale in managing the Fund.
Other Benefits to Lord Abbett. The Board considered the character and amount of fees paid by the Fund and the Fund’s shareholders to Lord Abbett and the Distributor for services other than investment advisory services. The Board also considered the revenues and profitability of Lord
30
Approval of Advisory Contract (concluded)
Abbett’s investment advisory business apart from its mutual fund business, and the intangible benefits enjoyed by Lord Abbett by virtue of its relationship with the Fund. The Board observed that the Distributor receives 12b-1 fees from certain of the Lord Abbett Funds as to shares held in accounts for which there is no other broker of record, may retain a portion of the 12b-1 fees it receives, and receives a portion of the sales charges on sales and redemptions of some classes of shares. In addition, the Board observed that Lord Abbett accrues certain benefits for its business of providing investment advice to clients other than the Lord Abbett Funds, but that business also benefits the Funds. The Board also noted that Lord Abbett, as disclosed in the prospectus of the Fund, has entered into revenue sharing arrangements with certain entities that distribute shares of the Fund. The Board also took into consideration the investment research that Lord Abbett receives as a result of Fund brokerage transactions.
Alternative Arrangements. The Board considered whether, instead of approving continuation of the Agreement, it might be in the best interests of the Fund to implement one or more alternative arrangements, such as continuing to employ Lord Abbett, but on different terms. After considering all of the relevant factors, the Board unanimously found that continuation of the Agreement was in the best interests of the Fund and its shareholders and voted unanimously to approve the continuation of the Agreement. In considering whether to approve the continuation of the Agreement, the Board did not identify any single factor as paramount or controlling. Individual Directors may have evaluated the information presented differently from one another, giving different weights to various factors. This summary does not discuss in detail all matters considered.
31
Householding
The Company has adopted a policy that allows it to send only one copy of the Fund’s prospectus, proxy material, annual report and semiannual report to certain shareholders residing at the same “household.” This reduces Fund expenses, which benefits you and other shareholders. If you need additional copies or do not want your mailings to be “householded,” please call Lord Abbett at 888-522-2388 or send a written request with your name, the name of your fund or funds and your account number or numbers to Lord Abbett Family of Funds, P.O. Box 219336, Kansas City, MO 64121.
Proxy Voting Policies, Procedures and Records
A description of the policies and procedures that Lord Abbett uses to vote proxies related to the Fund’s portfolio securities, and information on how Lord Abbett voted the Fund’s proxies during the 12-month period ended June 30 are available without charge, upon request, (i) by calling 888-522-2388; (ii) on Lord Abbett’s Website at www.lordabbett.com; and (iii) on the Securities and Exchange Commission’s (“SEC”) Website at www.sec.gov.
Shareholder Reports and Quarterly Portfolio Disclosure
The Fund is required to file its complete schedule of portfolio holdings with the SEC for its first and third fiscal quarters on Form N-Q. Copies of the filings are available without charge, upon request on the SEC’s Website at www.sec.gov and may be available by calling Lord Abbett at 888-522-2388. You can also obtain copies of Form N-Q by visiting the SEC’s Public Reference Room in Washington, DC (information on the operation of the Public Reference Room may be obtained by calling 800-SEC-0330).
Tax Information For corporate shareholders, 65% of the Fund’s ordinary income distributions qualified for the dividends received deduction. Additionally, of the distribution paid to the shareholders during the fiscal year ended December 31, 2016, $5,566,559 and $1,517,940, respectively, represent short-term capital gains and long-term capital gains. |
32


| This report, when not used for the general information of shareholders of the Fund, is to be distributed only if preceded or accompanied by a current fund prospectus. | | | | |
| | | Lord Abbett Series Fund, Inc. | | |
Lord Abbett mutual fund shares are distributed by
LORD ABBETT DISTRIBUTOR LLC. | | Fundamental Equity Portfolio | | SFFE-PORT-3
(02/17) |

2016 LORD ABBETT
ANNUAL REPORT
Lord Abbett
Series Fund—Growth and Income Portfolio
For the fiscal year ended December 31, 2016
Lord Abbett Series Fund — Growth and Income Portfolio Annual Report
For the fiscal year ended December 31, 2016

From left to right: James L.L. Tullis, Chairman of the Lord Abbett Funds and Daria L. Foster Director, President, and Chief Executive Officer of the Lord Abbett Funds. | | Dear Shareholders: We are pleased to provide you with this overview of the performance of Lord Abbett Series Fund — Growth & Income Portfolio for the fiscal year ended December 31, 2016. On this page and the following pages, we discuss the major factors that influenced fiscal year performance. For additional information about the Fund, please visit our website at www.lordabbett.com, where you also can access the quarterly commentaries that provide updates on the Fund’s performance and other portfolio related updates. Thank you for investing in Lord Abbett mutual funds. We value the trust that you place in us and look forward to serving your investment needs in the years to come. Best regards, 
Daria L. Foster Director, President and Chief Executive Officer |
| | | |
For the fiscal year ended December 31, 2016, the Fund returned 17.11%, reflecting performance at the net asset value (NAV) of Class VC shares, with all distributions reinvested, compared to its benchmark, the Russell 1000® Value Index,1 which returned 17.34% over the same period.
Domestic equity markets (as represented by the S&P 500® Index2) returned 11.96% over the past year. Despite this general move higher, there were significant bouts of volatility within U.S. stock markets, including their worst start to a calendar year on record.
Crude oil prices played a significant role in the increased market volatility, as Brent oil prices fluctuated sharply throughout the fiscal year. In December, the Organization of Petroleum Exporting Countries agreed to reduce oil production effective 2017. Furthermore, global markets were affected by the devaluation of China’s currency and weak economic data out of the region. The Chinese economy advanced at an annual rate of 6.7% in the third quarter of 2016, a slower pace than in recent years.
1
Geopolitical events also contributed to volatility in global markets. The United Kingdom’s referendum in June to leave the European Union (“Brexit”) was a surprise that caused a sell-off in global markets.
In contrast to the equity market volatility, the U.S. economy continued to expand during the trailing 12-month period. The Federal Reserve (Fed) raised target rates in for the second time in 12 months in December, from 0.25%–0.50% to 0.50%–0.75%. U.S. gross domestic product (GDP) grew at a 3.2% pace during the third quarter, a significant increase over the second quarter. The U.S. Bureau of Economic Analysis stated that during the third-quarter personal consumption and federal government spending increased, quarter over quarter. In addition to GDP growth, the U.S. unemployment rate remained relatively steady throughout the period, finishing at 4.6% in November.
The U.S. presidential election took an unexpected turn as Donald J. Trump was elected president, in contrast to indications from poll numbers before the election. Markets rallied on improved clarity in the U.S. political agenda, with the House and Senate also under Republican control.
The Fund modestly underperformed its benchmark index for the period. During the trailing 12-month period, the materials and consumer staples sectors detracted from relative performance the most. Within the materials sector, shares of E.I. DuPont de Neumours and Co., a science and technology-based company, declined as the
company faced fundamental headwinds from agriculture volatility, weaker global currencies, and slowing industrial production. Shares of Reliance Steel & Aluminum Co., a metals service center company, also fell during the third quarter due to lower-than-expected steel prices and easing of the company’s gross margins. Within the consumer staples sector, shares of CVS Health Corporation, a pharmacy and health care company, fell after the California Public Employee’s Retirement System switched their PBM (pharmacy benefit manager) contract to United Healthcare’s OptumRx. CVS was further hurt during the fourth quarter after the company revised its 2017 guidance expectations, which were well below consensus estimates. Shares of Kroger Co., an operator of retail food and drug stores, also dropped, as meat and dairy prices deflated and competition offering discounted prices accelerated.
The largest contributor to relative performance during the trailing 12-month period was the financials sector. Shares of J.P. Morgan Chase & Co., a financial services and retail banking company, rose after the presidential election due to the anticipation of a better macro-economic environment with higher rates, less regulation, and lower taxes. Shares of Citizens Financial Group, Inc., a retail and commercial bank holdings company, also rose reflecting the company’s continuous profitability improvement and the anticipation for higher interest rates and a better U.S. economy following the presidential election.
2
Another contributor to relative performance during the trailing 12-month period was the Fund’s underweight to the real estate sector, as the sector performed the worst in the index over the timeframe.
The heath care sector also contributed to relative performance during the trailing 12-month period. Within the health care sector, shares of UnitedHealth Group Inc., a diversified health and well-being company, rose in the fourth quarter due to increased momentum in Medicare Advantage enrollment and 2017 earnings guidance that
was well above consensus estimates. Shares of Johnson & Johnson, a developer, manufacturer, and seller of consumer health care products, spiked as a result of improving fundamentals, strong organic growth, and better-than-estimated earnings and sales during the second quarter.
The Fund’s portfolio is actively managed and, therefore, its holdings and the weightings of a particular issuer or particular sector as a percentage of portfolio assets are subject to change. Sectors may include many industries.
1 The Russell 1000® Value Index measures the performance of those Russell 1000 companies with lower price-to-book ratios and lower forecasted growth values.
2 The S&P 500® Index is widely regarded as the standard for measuring large cap U.S. stock market performance and includes a representative sample of leading companies in leading industries.
Unless otherwise specified, indexes reflect total return, with all dividends reinvested. Indexes are unmanaged, do not reflect the deduction of fees or expenses, and are not available for direct investment.
Important Performance and Other Information
Performance data quoted in the following pages reflect past performance and are no guarantee of future results. Current performance may be higher or lower than the performance quoted. The investment return and principal value of an investment in the Funds will fluctuate so that shares, on any given day or when redeemed, may be worth more or less than their original cost. You can obtain performance data current to the most recent month end by calling Lord Abbett at 888-522-2388 or referring to www.lordabbett.com.
The annual commentary above discusses the views of the Fund’s management and various portfolio holdings of the Funds as of December 31, 2016. These views and portfolio holdings may have changed after this date. Information provided in the commentary is not a recommendation to buy or sell securities. Because the Fund’s portfolio is actively managed and may change significantly, the Fund may no longer own the securities described above or may have otherwise changed their positions in the securities. For more recent information about the Fund’s portfolio holdings, please visit www.lordabbett.com.
A Note about Risk: See Notes to Financial Statements for a discussion of investment risks. For a more detailed discussion of the risks associated with each Fund, please see the Fund’s prospectus.
Mutual funds are not insured by the FDIC, are not deposits or other obligations of, or guaranteed by, banks, and are subject to investment risks including possible loss of principal amount invested.
The Fund serves as an underlying investment vehicle for variable annuity contracts and variable life insurance policies.
3
Investment Comparison
Below is a comparison of a $10,000 investment in Class VC shares with the same investment in the Russell 1000® Value Index, the S&P 500® Index and the S&P 500® Value Index, assuming reinvestment of all dividends and distributions. The Fund’s shares are sold only to insurance company separate accounts that fund certain variable annuity and variable life contracts. This line graph comparison does not reflect the sales charges or other expenses of these contracts. If those sales charges and expenses were reflected, returns would be lower. The graph and performance table below do not reflect the deduction of taxes that a shareholder would pay on Fund distributions or the redemption of Fund shares. Past performance is no guarantee of future results.

| | Average Annual Total Returns for the |
| | Periods Ended December 31, 2016 |
| | 1 Year | 5 Years | 10 Years |
| Class VC | 17.11% | 13.28% | 4.87% |
1 Performance for each unmanaged index does not reflect any fees or expenses. The performance of each index is not necessarily representative of the Fund’s performance.
4
Expense Example
As a shareholder of the Fund, you incur ongoing costs, including management fees; expenses related to the Fund’s services arrangements with certain insurance companies; and other Fund expenses. This Example is intended to help you understand your ongoing costs (in dollars) of investing in the Fund and to compare these costs with the ongoing costs of investing in other mutual funds.
The Example is based on an investment of $1,000 invested at the beginning of the period and held for the entire period (July 1, 2016 through December 31, 2016).
The Example reflects only expenses that are deducted from the assets of the Fund. Fees and expenses, including sales charges applicable to the various insurance products that invest in the Fund, are not reflected in this Example. If such fees and expenses were reflected in the Example, the total expenses shown would be higher. Fees and expenses regarding such variable insurance products are separately described in the prospectus related to those products.
Actual Expenses
The first line of the table on the following page provides information about actual account values and actual expenses. You may use the information in this line, together with the amount you invested, to estimate the expenses that you paid over the period. Simply divide your account value by $1,000 (for example, an $8,600 account value divided by $1,000 = 8.6), then multiply the result by the number in the first line under the heading titled “Expenses Paid During Period 7/1/16 – 12/31/16” to estimate the expenses you paid on your account during this period.
Hypothetical Example for Comparison Purposes
The second line of the table on the following page provides information about hypothetical account values and hypothetical expenses based on the Fund’s actual expense ratio and an assumed rate of return of 5% per year before expenses, which is not the Fund’s actual return. The hypothetical account values and expenses may not be used to estimate the actual ending account balance or expenses you paid for the period. You may use this information to compare the ongoing costs of investing in the Fund and other funds. To do so, compare this 5% hypothetical example with the 5% hypothetical examples that appear in the shareholder reports of the other funds.
5
Please note that the expenses shown in the table are meant to highlight your ongoing costs only and do not reflect any transactional costs, such as sales charges. Therefore, the second line of the table is useful in comparing ongoing costs only, and will not help you determine the relative total costs of owning different funds. In addition, if these transactional costs were included, your costs would have been higher.
| | | Beginning
Account
Value | | Ending
Account
Value | | Expenses
Paid During
Period† | |
| | | 7/1/16 | | 12/31/16 | | 7/1/16 -
12/31/16 | |
| Class VC | | | | | | | |
| Actual | | $1,000.00 | | $1,116.70 | | $5.00 | |
| Hypothetical (5% Return Before Expenses) | | $1,000.00 | | $1,020.41 | | $4.77 | |
| | |
| † | Net expenses are equal to the Fund’s annualized expense ratio of 0.94%, multiplied by the average account value over the period, multiplied by 184/366 (to reflect one-half year period). |
Portfolio Holdings Presented by Sector
December 31, 2016
| Sector* | %** |
| Consumer Discretionary | 5.45 | % |
| Consumer Staples | 5.47 | % |
| Energy | 13.98 | % |
| Financials | 25.57 | % |
| Health Care | 11.95 | % |
| Industrials | 11.56 | % |
| Information Technology | 11.12 | % |
| Materials | 3.99 | % |
| Real Estate | 2.32 | % |
| Telecommunication Services | 3.21 | % |
| Utilities | 3.59 | % |
| Repurchase Agreement | 1.79 | % |
| Total | 100.00 | % |
| * | | A sector may comprise several industries. |
| ** | | Represents percent of total investments. |
6
Schedule of Investments
December 31, 2016
| Investments | | Shares | | | Fair
Value
(000) | |
| COMMON STOCKS 99.56% | | | | | | | | |
| | | | | | | | | |
| Aerospace & Defense 2.53% | | | | | | | | |
| General Dynamics Corp. | | | 105,377 | | | $ | 18,194 | |
| | | | | | | | | |
| Airlines 0.92% | | | | | | | | |
| Delta Air Lines, Inc. | | | 134,866 | | | | 6,634 | |
| | | | | | | | | |
| Banks 15.76% | | | | | | | | |
| Bank of America Corp. | | | 646,838 | | | | 14,295 | |
| Citizens Financial Group, Inc. | | | 644,240 | | | | 22,954 | |
| East West Bancorp, Inc. | | | 267,243 | | | | 13,584 | |
| JPMorgan Chase & Co. | | | 357,965 | | | | 30,889 | |
| Webster Financial Corp. | | | 249,072 | | | | 13,519 | |
| Wells Fargo & Co. | | | 326,343 | | | | 17,985 | |
| Total | | | | | | | 113,226 | |
| | | | | | | | | |
| Beverages 2.59% | | | | | | | | |
| PepsiCo, Inc. | | | 177,900 | | | | 18,614 | |
| | | | | | | | | |
| Capital Markets 3.40% | | | | | | | | |
| Invesco Ltd. | | | 370,061 | | | | 11,228 | |
| TD Ameritrade Holding Corp. | | | 302,116 | | | | 13,172 | |
| Total | | | | | | | 24,400 | |
| | | | | | | | | |
| Chemicals 3.34% | | | | | | | | |
| Dow Chemical Co. (The) | | | 263,231 | | | | 15,062 | |
| LyondellBasell Industries NV Class A | | | 104,299 | | | | 8,947 | |
| Total | | | | | | | 24,009 | |
| | | | | | | | | |
| Communications Equipment 2.11% | | | | | | | | |
| Cisco Systems, Inc. | | | 502,720 | | | | 15,192 | |
| | | | | | | | | |
| Consumer Finance 2.31% | | | | | | | | |
| Discover Financial Services | | | 230,473 | | | | 16,615 | |
| | | | | | | | | |
| Diversified Telecommunication Services 3.26% | | | | | | | | |
| AT&T, Inc. | | | 391,048 | | | | 16,631 | |
| Verizon Communications, Inc. | | | 126,600 | | | | 6,758 | |
| Total | | | | | | | 23,389 | |
| Investments | | Shares | | | Fair
Value
(000) | |
| Electric: Utilities 3.64% | | | | | | | | |
| Duke Energy Corp. | | | 147,499 | | | $ | 11,449 | |
| NextEra Energy, Inc. | | | 122,971 | | | | 14,690 | |
| Total | | | | | | | 26,139 | |
| | | | | | | | | |
| Energy Equipment & Services 2.03% | | | | | | | | |
| Halliburton Co. | | | 269,555 | | | | 14,580 | |
| | | | | | | | | |
| Equity Real Estate Investment Trusts 2.35% | | | | | | | | |
| Boston Properties, Inc. | | | 37,296 | | | | 4,691 | |
| Vornado Realty Trust | | | 116,900 | | | | 12,201 | |
| Total | | | | | | | 16,892 | |
| | | | | | | | | |
| Food & Staples Retailing 0.30% | | | | | | | | |
| CVS Health Corp. | | | 27,347 | | | | 2,158 | |
| | | | | | | | | |
| Food Products 2.18% | | | | | | | | |
| Mondelez International, Inc. | | | | | | | | |
| Class A | | | 353,941 | | | | 15,690 | |
| | | | | | | | | |
| Health Care Equipment & Supplies 2.38% | | | | | | | | |
| Abbott Laboratories | | | 446,029 | | | | 17,132 | |
| | | | | | | | | |
| Health Care Providers & Services 2.88% | | | | | | | | |
| Aetna, Inc. | | | 34,490 | | | | 4,277 | |
| UnitedHealth Group, Inc. | | | 102,359 | | | | 16,382 | |
| Total | | | | | | | 20,659 | |
| | | | | | | | | |
| Hotels, Restaurants & Leisure 0.51% | | | | | | | | |
| Yum! Brands, Inc. | | | 57,933 | | | | 3,669 | |
| | | | | | | | | |
| Household Durables 1.13% | | | | | | | | |
| Lennar Corp. Class A | | | 189,160 | | | | 8,121 | |
| | | | | | | | | |
| Household Products 0.48% | | | | | | | | |
| Colgate-Palmolive Co. | | | 52,100 | | | | 3,409 | |
| | | | | | | | | |
| Industrial Conglomerates 2.29% | | | | | | | | |
| General Electric Co. | | | 519,533 | | | | 16,417 | |
| | | | | | | | | |
| Information Technology Services 1.19% | | | | | | | | |
| Fidelity National Information Services, Inc. | | | 113,233 | | | | 8,565 | |
| | See Notes to Financial Statements. | 7 |
Schedule of Investments (continued)
December 31, 2016
| Investments | | Shares | | | Fair
Value
(000) | |
| Insurance 4.45% | | | | | | | | |
| Chubb Ltd. (Switzerland)(a) | | | 141,856 | | | $ | 18,742 | |
| Hartford Financial Services | | | | | | | | |
| Group, Inc. (The) | | | 277,997 | | | | 13,247 | |
| Total | | | | | | | 31,989 | |
| | | | | | | | | |
| Machinery 4.25% | | | | | | | | |
| Caterpillar, Inc. | | | 75,967 | | | | 7,045 | |
| Dover Corp. | | | 128,265 | | | | 9,611 | |
| ITT, Inc. | | | 219,493 | | | | 8,466 | |
| PACCAR, Inc. | | | 84,743 | | | | 5,415 | |
| Total | | | | | | | 30,537 | |
| | | | | | | | | |
| Media 2.12% | | | | | | | | |
| Comcast Corp. Class A | | | 192,570 | | | | 13,297 | |
| Time Warner, Inc. | | | 20,256 | | | | 1,955 | |
| Total | | | | | | | 15,252 | |
| | | | | | | | | |
| Metals & Mining 0.71% | | | | | | | | |
| Reliance Steel & Aluminum Co. | | | 63,751 | | | | 5,071 | |
| | | | | | | | | |
| Multi-Line Retail 0.58% | | | | | | | | |
| Target Corp. | | | 57,749 | | | | 4,171 | |
| | | | | | | | | |
| Oil, Gas & Consumable Fuels 12.14% | | | | | | | | |
| Anadarko Petroleum Corp. | | | 209,733 | | | | 14,625 | |
| Devon Energy Corp. | | | 217,600 | | | | 9,938 | |
| EOG Resources, Inc. | | | 179,168 | | | | 18,114 | |
| Exxon Mobil Corp. | | | 318,200 | | | | 28,721 | |
| Hess Corp. | | | 47,074 | | | | 2,932 | |
| Occidental Petroleum Corp. | | | 181,000 | | | | 12,892 | |
| Total | | | | | | | 87,222 | |
| | | | | | | | | |
| Pharmaceuticals 6.86% | | | | | | | | |
| Johnson & Johnson | | | 186,673 | | | | 21,507 | |
| Pfizer, Inc. | | | 854,900 | | | | 27,767 | |
| Total | | | | | | | 49,274 | |
| | | | | | | | | |
| Road & Rail 1.73% | | | | | | | | |
| CSX Corp. | | | 345,745 | | | | 12,423 | |
| Investments | | Shares | | | Fair
Value
(000) | |
| Semiconductors & Semiconductor Equipment 5.26% | | | | | | | | |
| Intel Corp. | | | 608,214 | | | $ | 22,060 | |
| Microchip Technology, Inc. | | | 58,773 | | | | 3,770 | |
| QUALCOMM, Inc. | | | 183,594 | | | | 11,970 | |
| Total | | | | | | | 37,800 | |
| | | | | | | | | |
| Software 1.05% | | | | | | | | |
| Microsoft Corp. | | | 121,043 | | | | 7,522 | |
| | | | | | | | | |
| Specialty Retail 1.18% | | | | | | | | |
| L Brands, Inc. | | | 129,144 | | | | 8,503 | |
| | | | | | | | | |
| Technology Hardware, Storage & Peripheral 1.65% | | | | | | | | |
| Hewlett Packard Enterprise Co. | | | 513,733 | | | | 11,888 | |
Total Common Stocks
(cost $623,991,762) | | | | | | | 715,356 | |
| | | | | | | | | |
| | | Principal
Amount
(000) | | | | | |
| SHORT-TERM INVESTMENT 1.81% | | | | | | | | |
| | | | | | | | | |
| Repurchase Agreement | | | | | | | | |
| Repurchase Agreement dated 12/30/2016, 0.03% due 1/3/2017 with Fixed Income Clearing Corp. collateralized by $12,440,000 of U.S. Treasury Inflation Indexed Note at 0.125% due 4/15/2017; value: $13,266,974; proceeds: $13,003,318 (cost $13,003,275) | | $ | 13,003 | | | | 13,003 | |
Total Investments in Securities 101.37%
(cost $636,995,037) | | | | | | | 728,359 | |
| Liabilities in Excess of Other Assets (1.37)% | | | | | | | (9,809 | ) |
| Net Assets 100.00% | | | | | | $ | 718,550 | |
| (a) | Foreign security traded in U.S. dollars. |
| 8 | See Notes to Financial Statements. | |
Schedule of Investments (concluded)
December 31, 2016
The following is a summary of the inputs used as of December 31, 2016 in valuing the Fund’s investments carried at fair value(1):
| Investment Type(2)(3) | | Level 1
(000) | | | Level 2
(000) | | | Level 3
(000) | | | Total
(000) | |
| Common Stocks | | $ | 715,356 | | | $ | – | | | $ | – | | | $ | 715,356 | |
| Repurchase Agreement | | | – | | | | 13,003 | | | | – | | | | 13,003 | |
| Total | | $ | 715,356 | | | $ | 13,003 | | | $ | – | | | $ | 728,359 | |
| (1) | Refer to Note 2(h) for a description of fair value measurements and the three-tier hierarchy of inputs. |
| (2) | See Schedule of Investments for fair values in each industry and identification of foreign issuers and/or geography. |
| (3) | There were no Level 1/Level 2 transfers during the fiscal year ended December 31, 2016. |
| | See Notes to Financial Statements. | 9 |
Statement of Assets and Liabilities
December 31, 2016
| ASSETS: | | | | |
| Investments in securities, at fair value (cost $636,995,037) | | $ | 728,358,861 | |
| Receivables: | | | | |
| Interest and dividends | | | 920,394 | |
| Capital shares sold | | | 83,058 | |
| Prepaid expenses and other assets | | | 94,399 | |
| Total assets | | | 729,456,712 | |
| LIABILITIES: | | | | |
| Payables: | | | | |
| Capital shares reacquired | | | 9,657,275 | |
| Management fee | | | 310,742 | |
| Directors’ fees | | | 212,408 | |
| Fund administration | | | 24,859 | |
| Accrued expenses | | | 701,401 | |
| Total liabilities | | | 10,906,685 | |
| NET ASSETS | | $ | 718,550,027 | |
| COMPOSITION OF NET ASSETS: | | | | |
| Paid-in capital | | $ | 629,897,781 | |
| Distributions in excess of net investment income | | | (212,408 | ) |
| Accumulated net realized loss on investments | | | (2,499,170 | ) |
| Net unrealized appreciation on investments | | | 91,363,824 | |
| Net Assets | | $ | 718,550,027 | |
| Outstanding shares (200 million shares of common stock authorized, $.001 par value) | | | 19,570,029 | |
| Net asset value, offering and redemption price per share (Net assets divided by outstanding shares) | | | $36.72 | |
| 10 | See Notes to Financial Statements. |
Statement of Operations
For the Year Ended December 31, 2016
| Investment income: | | | | |
| Dividends | | $ | 17,374,988 | |
| Interest | | | 3,794 | |
| Interest earned from Interfund Lending (See Note 10) | | | 269 | |
| Total investment income | | | 17,379,051 | |
| Expenses: | | | | |
| Management fee | | | 3,507,079 | |
| Non 12b-1 service fees | | | 1,753,058 | |
| Shareholder servicing | | | 765,582 | |
| Fund administration | | | 280,566 | |
| Reports to shareholders | | | 95,953 | |
| Professional | | | 60,521 | |
| Directors’ fees | | | 24,527 | |
| Custody | | | 14,348 | |
| Other | | | 69,395 | |
| Gross expenses | | | 6,571,029 | |
| Expense reductions (See Note 8) | | | (2,701 | ) |
| Net expenses | | | 6,568,328 | |
| Net investment income | | | 10,810,723 | |
| Net realized and unrealized gain: | | | | |
| Net realized gain on investments | | | 8,690,520 | |
| Net change in unrealized appreciation/depreciation on investments | | | 91,213,658 | |
| Net realized and unrealized gain | | | 99,904,178 | |
| Net Increase in Net Assets Resulting From Operations | | $ | 110,714,901 | |
| | See Notes to Financial Statements. | 11 |
Statements of Changes in Net Assets
| | | For the Year Ended | | | For the Year Ended | |
| DECREASE IN NET ASSETS | | December 31, 2016 | | | December 31, 2015 | |
| Operations: | | | | | | | | |
| Net investment income | | $ | 10,810,723 | | | $ | 9,241,205 | |
| Net realized gain on investments | | | 8,690,520 | | | | 42,515,767 | |
| Net change in unrealized appreciation/depreciation on investments | | | 91,213,658 | | | | (73,693,173 | ) |
| Net increase (decrease) in net assets resulting from operations | | | 110,714,901 | | | | (21,936,201 | ) |
| Distributions to shareholders from: | | | | | | | | |
| Net investment income | | | (10,267,052 | ) | | | (9,227,497 | ) |
| Net realized gain | | | (9,421,851 | ) | | | (39,500,983 | ) |
| Total distributions to shareholders | | | (19,688,903 | ) | | | (48,728,480 | ) |
| Capital share transactions (See Note 13): | | | | | | | | |
| Proceeds from sales of shares | | | 19,444,471 | | | | 26,361,103 | |
| Reinvestment of distributions | | | 19,688,903 | | | | 48,728,480 | |
| Cost of shares reacquired | | | (135,907,144 | ) | | | (162,506,468 | ) |
| Net decrease in net assets resulting from capital share transactions | | | (96,773,770 | ) | | | (87,416,885 | ) |
| Net decrease in net assets | | | (5,747,772 | ) | | | (158,081,566 | ) |
| NET ASSETS: | | | | | | | | |
| Beginning of year | | $ | 724,297,799 | | | $ | 882,379,365 | |
| End of year | | $ | 718,550,027 | | | $ | 724,297,799 | |
| Distributions in excess of net investment income | | $ | (212,408 | ) | | $ | (211,877 | ) |
| 12 | See Notes to Financial Statements. |
This page is intentionally left blank.
Financial Highlights
| | | | | | Per Share Operating Performance: |
| | | | | | Investment operations: | | Distributions to
shareholders from: |
| | | | | | | | | | | | Total | | | | | | | | | |
| | | | | | | | | Net | | from | | | | | | | | | |
| | | Net asset | | Net | | realized | | invest- | | | | | | | | | |
| | | value, | | invest- | | and | | ment | | Net | | Net | | Total |
| | | beginning | | ment | | unrealized | | opera- | | investment | | realized | | distri- |
| | | of period | | income(a) | | gain (loss) | | tions | | income | | gain | | butions |
| 12/31/2016 | | | $32.21 | | | | $0.52 | | | | $ 4.99 | | | | $ 5.51 | | | | $(0.52 | ) | | | $(0.48 | ) | | | $(1.00 | ) |
| 12/31/2015 | | | 35.54 | | | | 0.40 | | | | (1.43 | ) | | | (1.03 | ) | | | (0.44 | ) | | | (1.86 | ) | | | (2.30 | ) |
| 12/31/2014 | | | 33.24 | | | | 0.22 | | | | 2.33 | | | | 2.55 | | | | (0.25 | ) | | | – | | | | (0.25 | ) |
| 12/31/2013 | | | 24.59 | | | | 0.16 | | | | 8.66 | | | | 8.82 | | | | (0.17 | ) | | | – | | | | (0.17 | ) |
| 12/31/2012 | | | 22.15 | | | | 0.22 | | | | 2.46 | | | | 2.68 | | | | (0.24 | ) | | | – | | | | (0.24 | ) |
| (a) | Calculated using average shares outstanding during the period. |
| (b) | Total return does not consider the effects of sales loads and assumes the reinvestment of all distributions. |
| 14 | See Notes to Financial Statements. |
| | | | | | | Ratios to Average Net Assets: | | Supplemental Data: |
| | |
| | |
| | |
| Net | | | | | | | | | | | Net | | | |
| asset | | | | | | | | Net | | assets, | | Portfolio |
| value, | | Total | | Total | | investment | | end of | | turnover |
| end of | | return(b) | | expenses | | income | | period | | rate |
| period | | (%) | | (%) | | (%) | | (000) | | (%) |
| | $36.72 | | | | 17.11 | | | | 0.94 | | | | 1.54 | | | $ | 718,550 | | | | 97.53 | |
| | 32.21 | | | | (2.86 | ) | | | 0.94 | | | | 1.15 | | | | 724,298 | | | | 105.13 | |
| | 35.54 | | | | 7.65 | | | | 0.93 | | | | 0.65 | | | | 882,379 | | | | 121.75 | |
| | 33.24 | | | | 35.90 | | | | 0.92 | | | | 0.54 | | | | 1,011,786 | | | | 87.90 | |
| | 24.59 | | | | 12.09 | | | | 0.91 | | | | 0.94 | | | | 964,703 | | | | 72.59 | |
| | See Notes to Financial Statements. | 15 |
Notes to Financial Statements
Lord Abbett Series Fund, Inc. (the “Company”) is registered under the Investment Company Act of 1940, as amended (the “Act”), as a diversified, open-end management investment company and was incorporated under Maryland law in 1989. The Company consists of thirteen separate portfolios. This report covers Growth and Income Portfolio (the “Fund”).
The Fund’s investment objective is long-term growth of capital and income without excessive fluctuations in market value. The Fund’s Variable Contract class shares (“Class VC Shares”), are currently issued and redeemed only in connection with investments in, and payments under, variable annuity contracts and variable life insurance policies issued by life insurance and insurance-related companies.
The preparation of the financial statements in conformity with accounting principles generally accepted in the United States of America (“U.S. GAAP”) requires management to make certain estimates and assumptions that affect the reported amounts of assets and liabilities and disclosure of contingent assets and liabilities at the date of the financial statements and the reported amounts of increases and decreases in net assets from operations during the reporting period. Actual results could differ from those estimates. The Fund is considered an investment company under U.S. GAAP and follows the accounting and reporting guidance applicable to investment companies.
| 2. | SIGNIFICANT ACCOUNTING POLICIES |
| (a) | Investment Valuation–Under procedures approved by the Fund’s Board of Directors (the “Board”), Lord, Abbett & Co. LLC (“Lord Abbett”), the Fund’s investment manager, has formed a Pricing Committee to administer the pricing and valuation of portfolio investments and to ensure that prices utilized reasonably reflect fair value. Among other things, these procedures allow the Fund to utilize independent pricing services, quotations from securities and financial instrument dealers and other market sources to determine fair value. |
| | |
| | Securities actively traded on any recognized U.S. or non-U.S. exchange or on The NASDAQ Stock Market LLC are valued at the last sale price or official closing price on the exchange or system on which they are principally traded. Events occurring after the close of trading on non-U.S. exchanges may result in adjustments to the valuation of foreign securities to reflect their fair value as of the close of regular trading on the New York Stock Exchange. The Fund may utilize an independent fair valuation service in adjusting the valuations of foreign securities. Unlisted equity securities are valued at the last quoted sale price or, if no sale price is available, at the mean between the most recently quoted bid and asked prices. |
| | |
| | Securities for which prices are not readily available are valued at fair value as determined by the Pricing Committee. The Pricing Committee considers a number of factors, including observable and unobservable inputs, when arriving at fair value. The Pricing Committee may use related or comparable assets or liabilities, recent transactions, market multiples, book values and other relevant information to determine the fair value of portfolio investments. The Board or a designated committee thereof regularly reviews fair value determinations made by the Pricing Committee and employs techniques such as reviewing related market activity, reviewing inputs and assumptions, and retrospectively comparing prices of subsequent purchases and sales transactions to fair value determinations made by the Pricing Committee. |
| | |
| | Short-term securities with 60 days or less remaining to maturity are valued using the amortized cost method, which approximates fair value. |
16
Notes to Financial Statements (continued)
| (b) | Security Transactions–Security transactions are recorded as of the date that the securities are purchased or sold (trade date). Realized gains and losses on sales of portfolio securities are calculated using the identified-cost method. |
| | |
| (c) | Investment Income–Dividend income is recorded on the ex-dividend date. Interest income is recorded on the accrual basis as earned. Discounts are accreted and premiums are amortized using the effective interest method and are included in Interest and other income on the Statement of Operations. Withholding taxes on foreign dividends have been provided for in accordance with the applicable country’s tax rules and rates. |
| | |
| (d) | Income Taxes–It is the policy of the Fund to meet the requirements of Subchapter M of the Internal Revenue Code applicable to regulated investment companies and to distribute substantially all taxable income and capital gains to its shareholders. Therefore, no income tax provision is required. |
| | |
| | The Fund files U.S. federal and various state and local tax returns. No income tax returns are currently under examination. The statute of limitations on the Fund’s filed U.S. federal tax returns remains open for the fiscal years ended December 31, 2013 through December 31, 2016. The statutes of limitations on the Company’s state and local tax returns may remain open for an additional year depending upon the jurisdiction. |
| | |
| (e) | Expenses–Expenses incurred by the Company that do not specifically relate to an individual fund are generally allocated to the funds within the Company on a pro rata basis by relative net assets. |
| | |
| (f) | Foreign Transactions–The books and records of the Fund are maintained in U.S. dollars and transactions denominated in foreign currencies are recorded in the Fund’s records at the rate prevailing when earned or recorded. Asset and liability accounts that are denominated in foreign currencies are adjusted daily to reflect current exchange rates and any unrealized gain (loss) is included in Net change in unrealized appreciation/depreciation on investments in the Fund’s Statement of Operations. The resultant exchange gains and losses upon settlement of such transactions are included in Net realized loss on investments in the Fund’s Statement of Operations. The Fund does not isolate that portion of the results of operations arising as a result of changes in the foreign exchange rates from the changes in market prices of the securities. |
| | |
| (g) | Repurchase Agreements–The Fund may enter into repurchase agreements with respect to securities. A repurchase agreement is a transaction in which a fund acquires a security and simultaneously commits to resell that security to the seller (a bank or securities dealer) at an agreed-upon price on an agreed-upon date. The Fund requires at all times that the repurchase agreement be collateralized by cash, or by securities of the U.S. Government, its agencies, its instrumentalities, or U.S. Government sponsored enterprises having a value equal to, or in excess of, the value of the repurchase agreement (including accrued interest). If the seller of the agreement defaults on its obligation to repurchase the underlying securities at a time when the fair value of these securities has declined, the Fund may incur a loss upon disposition of the securities. |
| | |
| (h) | Fair Value Measurements–Fair value is defined as the price that the Fund would receive upon selling an investment or transferring a liability in an orderly transaction to an independent buyer in the principal or most advantageous market of the investment. A three-tier hierarchy is used to maximize the use of observable market data and minimize the use of unobservable inputs and to establish classification of fair value measurements for disclosure purposes. Inputs |
17
Notes to Financial Statements (continued)
| | refer broadly to the assumptions that market participants would use in pricing the asset or liability, including assumptions about risk-for example, the risk inherent in a particular valuation technique used to measure fair value (such as a pricing model) and/or the risk inherent in the inputs to the valuation technique. Inputs may be observable or unobservable. Observable inputs reflect the assumptions market participants would use in pricing the asset or liability. Observable inputs are based on market data obtained from sources independent of the reporting entity. Unobservable inputs reflect the reporting entity’s own assumptions about the assumptions market participants would use in pricing the asset or liability. Unobservable inputs are based on the best information available in the circumstances. The three-tier hierarchy classification is determined based on the lowest level of inputs that is significant to the fair value measurement, and is summarized in the three broad Levels listed below: |
| | • | Level 1 – | unadjusted quoted prices in active markets for identical investments; |
| | | |
| | • | Level 2 – | other significant observable inputs (including quoted prices for similar investments, interest rates, prepayment speeds, credit risk, etc.); and |
| | | |
| | • | Level 3 – | significant unobservable inputs (including the Fund’s own assumptions in determining the fair value of investments). |
| | A summary of inputs used in valuing the Fund’s investments as of December 31, 2016 and, if applicable, Level 1/Level 2 transfers and Level 3 rollforwards for the fiscal year then ended is included in the Fund’s Schedule of Investments. |
| | |
| | Changes in valuation techniques may result in transfers into or out of an assigned level within the three-tier hierarchy. All transfers between different levels within the three-tier hierarchy are deemed to have occurred as of the beginning of the reporting period. The inputs or methodology used for valuing securities are not necessarily an indication of the risk associated with investing in those securities. |
| 3. | MANAGEMENT FEE AND OTHER TRANSACTIONS WITH AFFILIATES |
Management Fee
The Company has a management agreement with Lord Abbett, pursuant to which Lord Abbett supplies the Fund with investment management services and executive and other personnel, provides office space and pays for ordinary and necessary office and clerical expenses relating to research and statistical work and supervision of the Fund’s investment portfolio.
The management fee is based on the Fund’s average daily net assets at the following annual rate:
| First $1 billion | .50% |
| Over $1 billion | .45% |
For the fiscal year ended December 31, 2016, the effective management fee paid to Lord Abbett was at an annualized rate of .50% of the Fund’s average daily net assets.
In addition, Lord Abbett provides certain administrative services to the Fund pursuant to an Administrative Services Agreement in return for a fee at an annual rate of .04% of the Fund’s average daily net assets.
The Company, on behalf of the Fund, has entered into services arrangements with certain insurance companies. Under these arrangements, certain insurance companies will be compensated up to .25% of the average daily net asset value (“NAV”) of the Fund’s Class VC Shares held in the insurance company’s separate account to service and maintain the Variable Contract
18
Notes to Financial Statements (continued)
owners’ accounts. This amount is included in Non 12b-1 service fees on the Statement of Operations. The Fund may also compensate certain insurance companies, third-party administrators and other entities for providing recordkeeping, sub-transfer agency and other administrative services to the Fund. This amount is included in Shareholder servicing on the Statement of Operations.
Two Directors and certain of the Company’s officers have an interest in Lord Abbett.
| 4. | DISTRIBUTIONS AND CAPITAL LOSS CARRYFORWARDS |
Dividends from net investment income, if any, are declared and paid at least semi-annually. Taxable net realized gains from investment transactions, reduced by allowable capital loss carryforwards, if any, are declared and distributed to shareholders at least annually. The capital loss carryforward amount, if any, is available to offset future net capital gains. Dividends and distributions to shareholders are recorded on the ex-dividend date. The amounts of dividends and distributions from net investment income and net realized capital gains are determined in accordance with federal income tax regulations, which may differ from U.S. GAAP. These book/tax differences are either considered temporary or permanent in nature. To the extent these differences are permanent in nature, such amounts are reclassified within the components of net assets based on their federal tax basis treatment; temporary differences do not require reclassification. Dividends and distributions that exceed earnings and profits for tax purposes are reported as a tax return of capital.
The tax character of distributions paid during the fiscal years ended December 31, 2016 and 2015 was as follows:
| | Year Ended | | Year Ended | |
| | | 12/31/2016 | | | 12/31/2015 | |
| Distributions paid from: | | | | | | | | |
| Ordinary income | | | $17,544,959 | | | | $ 9,226,920 | |
| Net long-term capital gains | | | 2,143,944 | | | | 39,501,560 | |
| Total distributions paid | | | $19,688,903 | | | | $48,728,480 | |
As of December 31, 2016, the components of accumulated gains on a tax-basis were as follows:
| Undistributed ordinary income – net | | $ | 4,812,150 | |
| Total undistributed earnings | | | 4,812,150 | |
| Temporary differences | | | (212,408 | ) |
| Unrealized gains – net | | | 84,052,504 | |
| Total accumulated gains – net | | $ | 88,652,246 | |
As of December 31, 2016, the aggregate unrealized security gains and losses based on cost for U.S. federal income tax purposes were as follows:
| Tax cost | | $ | 644,306,357 | |
| Gross unrealized gain | | | 91,214,526 | |
| Gross unrealized loss | | | (7,162,022 | ) |
| Net unrealized security gain | | $ | 84,052,504 | |
The difference between book-basis and tax-basis unrealized gains (losses) is attributable to wash sales.
19
Notes to Financial Statements (continued)
Permanent items identified during the fiscal year ended December 31, 2016 have been reclassified among the components of net assets based on their tax basis treatment as follows:
| Distributions in | Accumulated |
| Excess of Net | Net Realized |
| Investment Income | Loss |
| $(544,202) | $544,202 |
The permanent differences are attributable to the tax treatment of certain distributions.
| 5. | PORTFOLIO SECURITIES TRANSACTIONS |
Purchases and sales of investment securities (excluding short-term investments) for the fiscal year ended December 31, 2016 were as follows:
| Purchases | Sales |
| $675,273,057 | $780,771,296 |
There were no purchases or sales of U.S. Government securities for the fiscal year ended December 31, 2016.
| 6. | DISCLOSURES ABOUT OFFSETTING ASSETS AND LIABILITIES |
The Financial Accounting Standards Board (“FASB”) requires disclosures intended to help better assess the effect or potential effect of offsetting arrangements on a fund’s financial position. The following tables illustrate gross and net information about recognized assets and liabilities eligible for offset in the statement of assets and liabilities; and disclose such amounts subject to an enforceable master netting agreement or similar agreement, by counterparty. A master netting agreement is an agreement between a fund and a counterparty which provides for the net settlement of amounts owed under all contracts traded under that agreement, as well as cash collateral, through a single payment by one party to the other in the event of default on or termination of any one contract. The Fund’s accounting policy with respect to balance sheet offsetting is that, absent an event of default by the counterparty or a termination of the agreement, the master netting agreement does not result in an offset of reported amounts of financial assets and liabilities in the statement of assets and liabilities across transactions between the Fund and the applicable counterparty:
| | | | | Gross Amounts | | Net Amounts of |
| | | | | Offset in the | | Assets Presented |
| | | Gross Amounts of | | Statement of Assets | | in the Statement of |
| Description | | Recognized Assets | | and Liabilities | | Assets and Liabilities |
| Repurchase Agreement | | $13,003,275 | | $ – | | $13,003,275 |
| Total | | $13,003,275 | | $ – | | $13,003,275 |
| | | Net Amounts | | | | | | | | |
| | | of Assets | | Amounts Not Offset in the | | |
| | | Presented in | | Statement of Assets and Liabilities | | |
| | | the Statement | | | | Cash | | Securities | | |
| | | of Assets and | | Financial | | Collateral | | Collateral | | Net |
| Counterparty | | Liabilities | | Instruments | | Received(a) | | Received(a) | | Amount(b) |
| Fixed Income Clearing Corp. | | $13,003,275 | | $ – | | $ – | | $(13,003,275) | | $ – |
| Total | | $13,003,275 | | $ – | | $ – | | $(13,003,275) | | $ – |
| (a) | Collateral disclosed is limited to an amount not to exceed 100% of the net amount of assets presented in the Statement of Assets and Liabilities, for each respective counterparty. |
| (b) | Net amount represents the amount owed to the Fund by the counterparty as of December 31, 2016. |
20
Notes to Financial Statements (continued)
| 7. | DIRECTORS’ REMUNERATION |
The Company’s officers and two Directors, who are associated with Lord Abbett, do not receive any compensation from the Company for serving in such capacities. Independent Directors’ fees are allocated among all Lord Abbett-sponsored funds based on the net assets of each fund. There is an equity-based plan available to all Independent Directors under which Independent Directors must defer receipt of a portion of, and may elect to defer receipt of an additional portion of Directors’ fees. The deferred amounts are treated as though equivalent dollar amounts had been invested in the funds. Such amounts and earnings accrued thereon are included in Directors’ fees on the Statement of Operations and in Directors’ fees payable on the Statement of Assets and Liabilities and are not deductible for U.S. federal income tax purposes until such amounts are paid.
The Company has entered into an arrangement with its transfer agent and custodian, whereby credits realized as a result of uninvested cash balances are used to reduce a portion of the Fund’s expenses.
The Fund and certain other funds managed by Lord Abbett (collectively, the “Participating Funds”) entered into a syndicated line of credit facility with various lenders for $550 million (the “Facility”), whereas State Street Bank and Trust Company (“SSB”) participates as a lender and as agent for the lenders. The Facility is to be used for temporary or emergency purposes as an additional source of liquidity to satisfy redemptions. The Participating Funds are subject to graduated borrowing limits of one-third of Fund assets (if Fund assets are less than $750 million), $250 million, $300 million, or $350 million, based on past borrowings and likelihood of future borrowings. The Facility will continue through August 28, 2017.
During the fiscal year ended December 31, 2016, the Fund did not utilize the Facility.
| 10. | INTERFUND LENDING PROGRAM |
On July 26, 2016, the U.S. Securities and Exchange Commission issued an exemptive order (“SEC exemptive order”) which permits certain registered open-end management investment companies managed by Lord Abbett, including the Fund, to participate in a joint lending and borrowing program (the “Interfund Lending Program”). The SEC exemptive order allows the Funds to borrow money from and lend money to each other for temporary or emergency purposes subject to the limitations and conditions.
During the fiscal year ended December 31, 2016, the Fund participated as a lender in the Interfund Lending Program. The average amount loaned and interest rate were $13,565,965 and 0.725%, respectively. The Fund earned interest of $269, which is included in the Statement of Operations. There were no interfund loans outstanding as of December 31, 2016.
| 11. | CUSTODIAN AND ACCOUNTING AGENT |
SSB is the Company’s custodian and accounting agent. SSB performs custodial, accounting and recordkeeping functions relating to portfolio transactions and calculating the Fund’s NAV.
21
Notes to Financial Statements (concluded)
The Fund is subject to the general risks and considerations associated with equity investing, as well as the particular risks associated with value stocks. The value of an investment will fluctuate in response to movements in the equity securities market in general and to the changing prospects of individual companies in which the Fund invests. Large-cap value stocks may perform differently than the market as a whole and other types of stocks, such as small company stocks and growth stocks. This is because different types of stocks tend to shift in and out of favor depending on market and economic conditions. The market may fail to recognize the intrinsic value of particular value stocks for a long time. In addition, if the Fund’s assessment of a company’s value or prospects for exceeding earnings expectations or market conditions is wrong, the Fund could suffer losses or produce poor performance relative to other funds, even in a rising market.
Due to its investments in multinational companies, foreign companies and American Depositary Receipts, the Fund may experience increased market, liquidity, currency, political, information and other risks.
These factors can affect the Fund’s performance.
| 13. | SUMMARY OF CAPITAL TRANSACTIONS |
Transactions in shares of capital stock were as follows:
| | | Year Ended | | | Year Ended | |
| | December 31, 2016 | | December 31, 2015 | |
| Shares sold | | | 565,181 | | | | 762,180 | |
| Reinvestment of distributions | | | 534,694 | | | | 1,522,289 | |
| Shares reacquired | | | (4,015,682 | ) | | | (4,628,201 | ) |
| Decrease | | | (2,915,807 | ) | | | (2,343,732 | ) |
22
Report of Independent Registered Public Accounting Firm
To the Board of Directors of Lord Abbett Series Fund, Inc. and the Shareholders of Growth and Income Portfolio:
We have audited the accompanying statement of assets and liabilities, including the schedule of investments, of the Growth and Income Portfolio, one of the portfolios constituting the Lord Abbett Series Fund, Inc. (the “Fund”) as of December 31, 2016, and the related statement of operations for the year then ended, the statements of changes in net assets for each of the two years in the period then ended, and the financial highlights for each of the five years in the period then ended. These financial statements and financial highlights are the responsibility of the Fund’s management. Our responsibility is to express an opinion on these financial statements and financial highlights based on our audits.
We conducted our audits in accordance with the standards of the Public Company Accounting Oversight Board (United States). Those standards require that we plan and perform the audit to obtain reasonable assurance about whether the financial statements and financial highlights are free of material misstatement. The Fund is not required to have, nor were we engaged to perform, an audit of its internal control over financial reporting. Our audits included consideration of internal control over financial reporting as a basis for designing audit procedures that are appropriate in the circumstances, but not for the purpose of expressing an opinion on the effectiveness of the Fund’s internal control over financial reporting. Accordingly, we express no such opinion. An audit also includes examining, on a test basis, evidence supporting the amounts and disclosures in the financial statements, assessing the accounting principles used and significant estimates made by management, as well as evaluating the overall financial statement presentation. Our procedures included confirmation of securities owned as of December 31, 2016, by correspondence with the custodian. We believe that our audits provide a reasonable basis for our opinion.
In our opinion, such financial statements and financial highlights referred to above present fairly, in all material respects, the financial position of Growth and Income Portfolio of the Lord Abbett Series Fund, Inc. as of December 31, 2016, the results of its operations for the year then ended, the changes in its net assets for each of the two years in the period then ended, and the financial highlights for each of the five years in the period then ended, in conformity with accounting principles generally accepted in the United States of America.
DELOITTE & TOUCHE LLP
New York, New York
February 15, 2017
23
Basic Information About Management
The Board is responsible for the management of the business and affairs of the Company in accordance with the laws of the State of Maryland. The Board elects officers who are responsible for the day-to-day operations of each Fund and who execute policies authorized by the Board. The Board also approves an investment adviser to each Fund and continues to monitor the cost and quality of the services the investment adviser provides, and annually considers whether to renew the contract with the adviser. Generally, each Director holds office until his/her successor is elected and qualified or until his/her earlier resignation or removal, as provided in the Company’s organizational documents.
Lord Abbett, a Delaware limited liability company, is the Fund’s investment adviser. Designated Lord Abbett personnel are responsible for the day-to-day management of the Funds.
Interested Directors
Ms. Foster and Mr. Sieg are affiliated with Lord Abbett and are “interested persons” of the Company as defined in the Act. Ms. Foster and Mr. Sieg are directors/trustees of each of the 12 investment companies in the Lord Abbett Family of Funds, which consist of 60 portfolios or series. Ms. Foster is an officer of the Lord Abbett Family of Funds.
Name, Address and
Year of Birth | | Current Position and
Length of Service
with the Company | | Principal Occupation and Other Directorships
During the Past Five Years |
| | | | | |
Daria L. Foster
Lord, Abbett & Co. LLC
90 Hudson Street
Jersey City, NJ 07302
(1954) | | Director and President since 2006; Chief Executive Officer since 2012 | | Principal Occupation: Managing Partner of Lord Abbett, joined Lord Abbett in 1990.
Other Directorships: None. |
| | | | | |
Douglas B. Sieg
Lord, Abbett & Co. LLC
90 Hudson Street
Jersey City, NJ 07302
(1969) | | Director since 2016 | | Principal Occupation: Partner (since 2001) and Head of Client Services (since 2013), formerly Director of Marketing and Relationship Management, joined Lord Abbett in 1994.
Other Directorships: None. |
Independent Directors
The following Independent Directors also are directors/trustees of each of the 12 investment companies in the Lord Abbett Family of Funds, which consist of 60 portfolios or series.
Name, Address and
Year of Birth | | Current Position and
Length of Service
with the Company | | Principal Occupation and Other Directorships
During the Past Five Years |
| | | | | |
Robert B. Calhoun, Jr.
Lord, Abbett & Co. LLC
c/o Legal Dept.
90 Hudson Street
Jersey City, NJ 07302
(1942) | | Director since 1998 | | Principal Occupation: Senior Advisor of Monitor Clipper Partners, a private equity investment fund (since 1997); President of Clipper Asset Management Corp. (1991–2009).
Other Directorships: None. |
24
Basic Information About Management (continued)
Name, Address and
Year of Birth | | Current Position and
Length of Service
with the Company | | Principal Occupation and Other Directorships
During the Past Five Years |
| | | | | |
Eric C. Fast
Lord, Abbett & Co. LLC
c/o Legal Dept.
90 Hudson Street
Jersey City, NJ 07302
(1949) | | Director since 2014 | | Principal Occupation: Chief Executive Officer of Crane Co., an industrial products company (2001–2014).
Other Directorships: Currently serves as director of Automatic Data Processing, Inc. (since 2007) and Regions Financial Corporation (since 2010). Previously served as a director of Crane Co. (1999–2014). |
| | | | | |
Evelyn E. Guernsey Lord, Abbett & Co. LLC
c/o Legal Dept.
90 Hudson Street
Jersey City, NJ 07302
(1955) | | Director since 2011 | | Principal Occupation: CEO, Americas of J.P. Morgan Asset Management (2004–2010).
Other Directorships: None. |
| | | | | |
Julie A. Hill
Lord, Abbett & Co. LLC
c/o Legal Dept.
90 Hudson Street
Jersey City, NJ 07302
(1946) | | Director since 2004 | | Principal Occupation: Owner and CEO of The Hill Company, a business consulting firm (since 1998).
Other Directorships: Currently serves as director of Anthem, Inc., a health benefits company (since 1994). |
| | | | | |
Franklin W. Hobbs
Lord, Abbett & Co. LLC
c/o Legal Dept.
90 Hudson Street
Jersey City, NJ 07302
(1947) | | Director since 2001 | | Principal Occupation: Advisor of One Equity Partners, a private equity firm (since 2004).
Other Directorships: Currently serves as director and Chairman of the Board of Ally Financial Inc., a financial services firm (since 2009), and as director of Molson Coors Brewing Company (since 2002). |
| | | | | |
James M. McTaggart
Lord, Abbett & Co. LLC
c/o Legal Dept.
90 Hudson Street
Jersey City, NJ 07302
(1947) | | Director since 2012 | | Principal Occupation: Independent management advisor and consultant (since 2012); Vice President, CRA International, Inc. (doing business as Charles River Associates), a global management consulting firm (2009–2012); Founder and Chairman of Marakon Associates, Inc., a strategy consulting firm (1978– 2009); and Officer and Director of Trinsum Group, a holding company (2007–2009).
Other Directorships: Currently serves as director of Blyth, Inc., a home products company (since 2004). |
| | | | | |
Mark A. Schmid
Lord, Abbett & Co. LLC
c/o Legal Dept.
90 Hudson Street
Jersey City, NJ 07302
(1959) | | Director since 2016 | | Principal Occupation: Vice President and Chief Investment Officer of the University of Chicago (since 2009).
Other Directorships: None. |
25
Basic Information About Management (continued)
Name, Address and
Year of Birth | | Current Position and
Length of Service
with the Company | | Principal Occupation and Other Directorships
During the Past Five Years |
| | | | | |
James L.L. Tullis
Lord, Abbett & Co. LLC
c/o Legal Dept.
90 Hudson Street
Jersey City, NJ 07302
(1947) | | Director since 2006;
Chairman since 2017 | | Principal Occupation: CEO of Tullis-Dickerson and Co. Inc., a venture capital management firm (since 1990); CEO of Tullis Health Investors Inc. (since 2012).
Other Directorships: Currently serves as director of Crane Co. (since 1998). |
Officers
None of the officers listed below have received compensation from the Company. All of the officers of the Company also may be officers of the other Lord Abbett Funds and maintain offices at 90 Hudson Street, Jersey City, NJ 07302. Unless otherwise indicated, the position(s) and title(s) listed under the “Principal Occupation During the Past Five Years” column indicate each officer’s position(s) and title(s) with Lord Abbett. Each officer serves for an indefinite term (i.e., until his or her death, resignation, retirement, or removal).
Name and
Year of Birth | | Current Position
with the Company | | Length of Service
of Current
Position | | Principal Occupation
During the Past Five Years |
| | | | | | | |
Daria L. Foster
(1954) | | President and Chief
Executive Officer | | Elected as President in 2006 and Chief Executive Officer in 2012 | | Managing Partner of Lord Abbett, joined Lord Abbett in 1990. |
| | | | | | | |
Sean J. Aurigemma
(1969) | | Executive Vice President | | Elected in 2010 | | Portfolio Manager, joined Lord Abbett in 2007. |
| | | | | | | |
Jeff D. Diamond
(1960) | | Executive Vice President | | Elected in 2008 | | Portfolio Manager, joined Lord Abbett in 2007. |
| | | | | | | |
Todd D. Jacobson
(1966) | | Executive Vice President | | Elected in 2005 | | Partner and Associate Director, joined Lord Abbett in 2003. |
| | | | | | | |
Robert A. Lee
(1969) | | Executive Vice President | | Elected in 2010 | | Partner and Chief Investment Officer, and was formerly Deputy Chief Investment Officer and Director of Taxable Fixed Income, joined Lord Abbett in 1997. |
| | | | | | | |
Thomas B. Maher
(1967) | | Executive Vice President | | Elected in 2010 | | Partner and Portfolio Manager, joined Lord Abbett in 2003. |
| | | | | | | |
Justin C. Maurer
(1969) | | Executive Vice President | | Elected in 2010 | | Partner and Portfolio Manager, joined Lord Abbett in 2001. |
| | | | | | | |
Vincent J. McBride
(1964) | | Executive Vice President | | Elected in 2010 | | Partner and Director, joined Lord Abbett in 2003. |
| | | | | | | |
Andrew H. O’Brien
(1973) | | Executive Vice President | | Elected in 2010 | | Partner and Portfolio Manager, joined Lord Abbett in 1998. |
26
Basic Information About Management (continued)
Name and
Year of Birth | | Current Position
with the Company | | Length of Service
of Current
Position | | Principal Occupation
During the Past Five Years |
| | | | | | | |
F. Thomas O’Halloran, III
(1955) | | Executive Vice President | | Elected in 2010 | | Partner and Portfolio Manager, joined Lord Abbett in 2001. |
| | | | | | | |
Marc Pavese
(1972) | | Executive Vice President | | Elected in 2016 | | Partner and Portfolio Manager, joined Lord Abbett in 2008. |
| | | | | | | |
Walter H. Prahl
(1958) | | Executive Vice President | | Elected in 2012 | | Partner and Director, joined Lord Abbett in 1997. |
| | | | | | | |
Steven F. Rocco
(1979) | | Executive Vice President | | Elected in 2014 | | Partner and Portfolio Manager, joined Lord Abbett in 2004. |
| | | | | | | |
Didier O. Rosenfeld
(1976) | | Executive Vice President | | Elected in 2016 | | Director of Global Equity, joined Lord Abbett in 2015 and was formerly a Portfolio Manager and Senior Analyst at Cornerstone Capital Management (2014–2015) and Managing Director at State Street Global Advisors (2000–2013). |
| | | | | | | |
Frederick J. Ruvkun
(1957) | | Executive Vice President | | Elected in 2012 | | Partner and Portfolio Manager, joined Lord Abbett in 2006. |
| | | | | | | |
Paul J. Volovich
(1973) | | Executive Vice President | | Elected in 2005 | | Partner and Portfolio Manager, joined Lord Abbett in 1997. |
| | | | | | | |
A. Edward Allinson
(1961) | | Vice President | | Elected in 2011 | | Portfolio Manager, joined Lord Abbett in 2005. |
| | | | | | | |
John W. Ashbrook
(1964) | | Vice President and Assistant Secretary | | Elected in 2014 | | Assistant General Counsel, joined Lord Abbett in 2008. |
| | | | | | | |
Joan A. Binstock
(1954) | | Chief Financial Officer and Vice President | | Elected in 1999 | | Partner and Chief Financial Officer, and was formerly Chief Operations Officer, joined Lord Abbett in 1999. |
| | | | | | | |
Brooke A. Fapohunda
(1975) | | Vice President and Assistant Secretary | | Elected in 2014 | | Deputy General Counsel, joined Lord Abbett in 2006. |
| | | | | | | |
John K. Forst
(1960) | | Vice President and Assistant Secretary | | Elected in 2005 | | Partner and Deputy General Counsel, joined Lord Abbett in 2004. |
| | | | | | | |
Anthony W. Hipple
(1964) | | Vice President | | Elected in 2014 | | Portfolio Manager, joined Lord Abbett in 2002. |
| | | | | | | |
Lawrence H. Kaplan
(1957) | | Vice President and Secretary | | Elected in 1997 | | Partner and General Counsel, joined Lord Abbett in 1997. |
27
Basic Information About Management (concluded)
Name and
Year of Birth | | Current Position
with the Company | | Length of Service
of Current
Position | | Principal Occupation
During the Past Five Years |
| | | | | | | |
Linda Y. Kim
(1980) | | Vice President and Assistant Secretary | | Elected in 2016 | | Counsel, joined Lord Abbett in 2015 and was formerly an Associate at Stroock & Stroock & Lavan LLP (2007–2015). |
| | | | | | | |
David J. Linsen
(1974) | | Vice President | | Elected in 2008 | | Partner and Director, joined Lord Abbett in 2001. |
| | | | | | | |
Joseph M. McGill
(1962) | | Chief Compliance Officer | | Elected in 2014 | | Partner and Chief Compliance Officer, joined Lord Abbett in 2014 and was formerly Managing Director and the Chief Compliance Officer at UBS Global Asset Management (2003–2013). |
| | | | | | | |
A. Edward Oberhaus, III
(1959) | | Vice President | | Elected in 1998 | | Partner and Director, joined Lord Abbett in 1983. |
| | | | | | | |
Noah Petrucci
(1970) | | Vice President | | Elected in 2013 | | Portfolio Manager, joined Lord Abbett in 2012 and was formerly a Portfolio Manager at Columbia Management Investment Advisers, LLC and Columbia Management Advisors, LLC (2002–2012). |
| | | | | | | |
Lawrence B. Stoller
(1963) | | Vice President and Assistant Secretary | | Elected in 2007 | | Partner and Senior Deputy General Counsel, joined Lord Abbett in 2007. |
| | | | | | | |
Leah G. Traub
(1979) | | Vice President | | Elected in 2016 | | Partner and Portfolio Manager, joined Lord Abbett in 2007. |
| | | | | | | |
Arthur K. Weise
(1970) | | Vice President | | Elected in 2010 | | Partner and Portfolio Manager, joined Lord Abbett in 2007. |
| | | | | | | |
Kewjin Yuoh
(1971) | | Vice President | | Elected in 2012 | | Partner and Portfolio Manager, joined Lord Abbett in 2010. |
| | | | | | | |
Scott S. Wallner
(1955) | | AML Compliance Officer | | Elected in 2011 | | Assistant General Counsel, joined Lord Abbett in 2004. |
| | | | | | | |
Bernard J. Grzelak
(1971) | | Treasurer | | Elected in 2003 | | Partner and Chief Operations Officer, and was formerly Director of Fund Administration, joined Lord Abbett in 2003. |
Please call 888-522-2388 for a copy of the statement of additional information, which contains further information about the Company’s Directors. It is available free upon request.
28
Approval of Advisory Contract
The Board, including all of the Directors who are not interested persons of the Fund or of Lord Abbett (the “Independent Board Members”), annually considers whether to approve the continuation of the existing management agreement between the Fund and Lord Abbett (the “Agreement”). In connection with its most recent approval, the Board reviewed materials relating specifically to the Agreement, as well as numerous materials received throughout the course of the year, including information about the Fund’s investment performance compared to the performance of its benchmark. Before making its decision as to the Fund, the Board had the opportunity to ask questions and request further information, taking into account its familiarity with Lord Abbett gained through its meetings and discussions. These meetings and discussions included the review of the portfolio management team conducted by members of the Contract Committee, the deliberations of the Contract Committee, and discussions between the Contract Committee and Lord Abbett’s management. The Independent Board Members also met with their independent legal counsel in a private session at which no representatives of management were present.
The materials received by the Board included, but were not limited to: (1) information provided by Morningstar Associates, LLC (“Morningstar”) regarding the investment performance of the Fund compared to the investment performance of certain funds with similar investment styles as determined by Morningstar, based, in part, on the Fund’s Morningstar category (the “performance peer group”), and the investment performance of two appropriate benchmarks; (2) information provided by Morningstar regarding the expense ratios, contractual and effective management fee rates, and other expense components for the Fund and certain funds in the same Morningstar category, with generally the same or similar share classes and operational characteristics, including asset size (the “expense peer group”); (3) certain supplemental investment performance information provided by Lord Abbett; (4) information provided by Lord Abbett on the expense ratios, management fee rates, and other expense components for the Fund; (5) sales and redemption information for the Fund; (6) information regarding Lord Abbett’s financial condition; (7) an analysis of the relative profitability of the Agreement to Lord Abbett; (8) information provided by Lord Abbett regarding the investment management fee schedules for Lord Abbett’s other advisory clients maintaining accounts with a similar investment strategy as the Fund; and (9) information regarding the personnel and other resources devoted by Lord Abbett to managing the Fund.
Investment Management Services Generally. The Board considered the investment management services provided by Lord Abbett to the Fund, including investment research, portfolio management, and trading, and Lord Abbett’s commitment to compliance with all applicable legal requirements. The Board also observed that Lord Abbett was solely engaged in the investment management business and accordingly did not experience the conflicts of interest that may result from being engaged in other lines of business. The Board considered the investment advisory services provided by Lord Abbett to other clients, the fees charged for the services, and the differences in the nature of the services provided to the Fund and other Lord Abbett Funds, on the one hand, and the services provided to other clients, on the other. After reviewing these and related factors, the Board concluded that the Fund was likely to continue to benefit from the nature, extent and quality of the investment services provided by Lord Abbett under the Agreement.
Investment Performance. The Board reviewed the Fund’s investment performance in relation to that of the performance peer group and two appropriate benchmarks as of various periods ended August 31, 2016. The Board observed that the Fund’s investment performance was above the median of the performance peer group for the one-year and three-year periods and below the median of the performance peer group for the five-year and ten-year periods. The Board also
29
Approval of Advisory Contract (continued)
considered Lord Abbett’s performance and reputation generally, the performance of other Lord Abbett-managed funds overseen by the Board and the willingness of Lord Abbett to take steps intended to improve performance when necessary. After reviewing these and related factors, the Board concluded that the Fund’s investment performance was reasonable and supported the continuation of the Agreement.
Lord Abbett’s Personnel and Methods. The Board considered the qualifications of the personnel providing investment management services to the Fund, in light of its investment objective and discipline. Among other things, the Board considered the size, experience, and turnover of Lord Abbett’s investment management staff, Lord Abbett’s investment methodology and philosophy, and Lord Abbett’s approach to recruiting, training, and retaining investment management personnel.
Nature and Quality of Other Services. The Board considered the nature, quality, costs, and extent of compliance, administrative, and other services performed by Lord Abbett and the nature and extent of Lord Abbett’s supervision of third party service providers, including the Fund’s transfer agent and custodian.
Expenses. The Board considered the expense level of the Fund and the expense levels of the expense peer group. It also considered how the expense levels of the Fund related to those of the expense peer group and the amount and nature of the fees paid by shareholders. The Board observed that the overall expense level of the Fund was below the median of the expense peer group. After reviewing these and related factors, the Board concluded, within the context of its overall approval of the Agreement, that the expense level of the Fund was reasonable and supported the continuation of the Agreement.
Profitability. The Board considered the level of Lord Abbett’s operating margin in managing the Fund, including a review of Lord Abbett’s methodology for allocating its costs to its management of the Fund. It considered whether the Fund was profitable to Lord Abbett in connection with the operation of the Fund, including the fee that Lord Abbett receives from the Fund for providing administrative services to the Fund. The Board also considered the profits realized from other business segments of Lord Abbett, which may benefit from or be related to the Fund’s business. The Board considered Lord Abbett’s profit margins in comparison with available industry data, both accounting for and excluding marketing and distribution expenses, and how those profit margins could affect Lord Abbett’s ability to recruit and retain investment personnel. The Board recognized that Lord Abbett’s overall profitability was a factor in enabling it to attract and retain qualified investment management personnel to provide services to the Fund. After reviewing these and related factors, the Board concluded, within the context of its overall approval of the Agreement, that Lord Abbett’s profitability with respect to the Fund was not excessive.
Economies of Scale. The Board considered the extent to which there had been economies of scale in managing the Fund, whether the Fund’s shareholders had appropriately benefited from such economies of scale, and whether there was potential for realization of any further economies of scale. The Board concluded that the existing management fee schedule, with its breakpoint in the level of the management fee, adequately addressed any economies of scale in managing the Fund.
Other Benefits to Lord Abbett. The Board considered the character and amount of fees paid by the Fund and the Fund’s shareholders to Lord Abbett and the Distributor for services other than investment advisory services. The Board also considered the revenues and profitability of Lord Abbett’s investment advisory business apart from its mutual fund business, and the intangible
30
Approval of Advisory Contract (concluded)
benefits enjoyed by Lord Abbett by virtue of its relationship with the Fund. The Board observed that the Distributor receives 12b-1 fees from certain of the Lord Abbett Funds as to shares held in accounts for which there is no other broker of record, may retain a portion of the 12b-1 fees it receives, and receives a portion of the sales charges on sales and redemptions of some classes of shares. In addition, the Board observed that Lord Abbett accrues certain benefits for its business of providing investment advice to clients other than the Lord Abbett Funds, but that business also benefits the Funds. The Board also noted that Lord Abbett, as disclosed in the prospectus of the Fund, has entered into revenue sharing arrangements with certain entities that distribute shares of the Fund. The Board also took into consideration the investment research that Lord Abbett receives as a result of Fund brokerage transactions.
Alternative Arrangements. The Board considered whether, instead of approving continuation of the Agreement, it might be in the best interests of the Fund to implement one or more alternative arrangements, such as continuing to employ Lord Abbett, but on different terms. After considering all of the relevant factors, the Board unanimously found that continuation of the Agreement was in the best interests of the Fund and its shareholders and voted unanimously to approve the continuation of the Agreement. In considering whether to approve the continuation of the Agreement, the Board did not identify any single factor as paramount or controlling. Individual Directors may have evaluated the information presented differently from one another, giving different weights to various factors. This summary does not discuss in detail all matters considered.
31
Householding
The Company has adopted a policy that allows it to send only one copy of the Fund’s prospectus, proxy material, annual report and semiannual report to certain shareholders residing at the same “household.” This reduces Fund expenses, which benefits you and other shareholders. If you need additional copies or do not want your mailings to be “householded,” please call Lord Abbett at 888-522-2388 or send a written request with your name, the name of your fund or funds and your account number or numbers to Lord Abbett Family of Funds, P.O. Box 219336, Kansas City, MO 64121.
Proxy Voting Policies, Procedures and Records
A description of the policies and procedures that Lord Abbett uses to vote proxies related to the Fund’s portfolio securities, and information on how Lord Abbett voted the Fund’s proxies during the 12-month period ended June 30 are available without charge, upon request, (i) by calling 888-522-2388; (ii) on Lord Abbett’s Website at www.lordabbett.com; and (iii) on the Securities and Exchange Commission’s (“SEC”) Website at www.sec.gov.
Shareholder Reports and Quarterly Portfolio Disclosure
The Fund is required to file its complete schedule of portfolio holdings with the SEC for its first and third fiscal quarters on Form N-Q. Copies of the filings are available without charge, upon request on the SEC’s Website at www.sec.gov and may be available by calling Lord Abbett at 888-522-2388. You can also obtain copies of Form N-Q by visiting the SEC’s Public Reference Room in Washington, DC (information on the operation of the Public Reference Room may be obtained by calling 800-SEC-0330).
| Tax Information |
| For corporate shareholders, 77% of the Fund’s ordinary income distributions qualified for the dividends received deduction. |
| Additionally, of the distributions paid to the shareholders during the fiscal year ended December 31, 2016, $7,357,194 and $2,143,944, respectively, represent short-term capital gains and long-term capital gains. |
32


| This report, when not used for the general information of shareholders of the Fund, is to be distributed only if preceded or accompanied by a current fund prospectus. | | | |
| | | Lord Abbett Series Fund, Inc. | |
| | | | |
Lord Abbett mutual fund shares are distributed by
LORD ABBETT DISTRIBUTOR LLC. | | Growth and Income Portfolio | LASFGI-3
(02/16) |

2016 LORD ABBETT
ANNUAL REPORT
Lord Abbett
Series Fund—Growth Opportunities Portfolio
For the fiscal year ended December 31, 2016
Table of Contents
Lord Abbett Series Fund — Growth Opportunities Portfolio
Annual Report
For the fiscal year ended December 31, 2016

From left to right: James L.L. Tullis, Chairman of the Lord Abbett Funds and Daria L. Foster Director, President, and Chief Executive Officer of the Lord Abbett Funds.
Dear Shareholders: We are pleased to provide you with this overview of the performance of Lord Abbett Series Fund — Growth Opportunities Portfolio for the fiscal year ended December 31, 2016. On this page and the following pages, we discuss the major factors that influenced fiscal year performance. For additional information about the Fund, please visit our website at www.lordabbett.com, where you also can access the quarterly commentaries that provide updates on the Fund’s performance and other portfolio related updates.
Thank you for investing in Lord Abbett mutual funds. We value the trust that you place in us and look forward to serving your investment needs in the years to come.
Best regards,

Daria L. Foster
Director, President and Chief Executive Officer
For the fiscal year ended December 31, 2016, the Fund returned 1.23%, reflecting performance at the net asset value (NAV) of Class VC shares, with all distributions reinvested, compared to its benchmark, the Russell Midcap® Growth Index,1 which returned 7.33% over the same period.
Domestic equity markets (as represented by the S&P 500® Index2) returned 11.96% over the past year. Despite this general move higher, there were significant bouts of volatility within U.S. stock markets, including their worst start to a calendar year on record.
Crude oil prices played a significant role in the increased market volatility, as Brent oil prices fluctuated sharply throughout the fiscal year. In December, the Organization of Petroleum Exporting Countries agreed to reduce oil production effective 2017. Furthermore, global markets were affected by the devaluation of China’s currency and weak economic data out of the region. The Chinese economy advanced at an annual rate of 6.7% in the third quarter of 2016, a slower pace than in recent years.
1
Geopolitical events also contributed to volatility in global markets. The United Kingdom’s referendum in June to leave the European Union (“Brexit”) was a surprise that caused a sell-off in global markets.
In contrast to the equity market volatility, the U.S. economy continued to expand during the trailing 12-month period. The Federal Reserve (Fed) raised target rates in for the second time in 12 months in December, from 0.25%–0.50% to 0.50%–0.75%. U.S. gross domestic product (GDP) grew at a 3.2% pace during the third quarter, a significant increase over the second quarter. The U.S. Bureau of Economic Analysis stated that during the third-quarter personal consumption and federal government spending increased, quarter over quarter. In addition to GDP growth, the U.S. unemployment rate remained relatively steady throughout the period, finishing at 4.6% in November.
The U.S. presidential election took an unexpected turn as Donald J. Trump was elected president, in contrast to indications from poll numbers before the election. Markets rallied on improved clarity in the U.S. political agenda, with the House and Senate also under Republican control.
During the period, stock selection in the information technology and consumer discretionary sectors were the largest detractors from the Fund’s performance relative to its benchmark. Within the information technology sector, the Fund’s holdings of LinkedIn Corp., a social media company focused on professional
networks, detracted most. Shares of LinkedIn plummeted as it issued lower revenue growth guidance for 2016 and began exiting Bizo, a business marketing firm it acquired in 2014. The Fund’s position in Alliance Data Systems, Inc., a provider of outsourced marketing solutions, also detracted from performance. Shares fell as the Canadian economy struggled; approximately 12% of Alliance Data Systems’ revenue is derived from Canada. In addition, its credit card services and Loyalty One business fell short of consensus estimates.
Within the consumer discretionary sector, the Fund’s holdings of Delphi Automotive PLC, a vehicle components manufacturer, detracted the most from relative performance. Shares of Delphi Automotive fell as it provided earnings per share and organic growth targets that were below consensus estimates.
During the period, security selection in the health care and materials sectors were the largest contributors to the Fund’s relative performance. Within the health care sector, the Fund’s holdings of Medivation, Inc., a biopharmaceutical company, contributed most. Shares of Medivation rose after Pfizer completed its acquisition of the company in September 2016. IDEXX Laboratories, a multinational corporation engaged in the development, manufacture, and distribution of products and services for the companion animal veterinary, livestock and poultry, water testing, and dairy markets, also contributed
2
to performance. Shares of IDEXX Laboratories increased as instrument placement metrics strengthened, specifically its Sedivue Dx analyzer.
Within the materials sector, the Fund’s holdings of Vulcan Materials Co., a producer of construction materials, contributed the most. Shares of Vulcan Materials moved higher as the company experienced volume growth across all of its
markets and benefited from expectations for a strong Department of Transportation budget.
The Fund’s portfolio is actively managed and therefore, its holdings and the weightings of a particular issuer or particular sector as a percentage of portfolio assets are subject to change. Sectors may include many industries.
1 The Russell Midcap® Growth Index measures the performance of those Russell Midcap companies with higher price-to-book ratios and higher forecasted growth values.
2 The S&P 500® Index is widely regarded as the standard for measuring large cap U.S. stock market performance and includes a representative sample of leading companies in leading industries.
Unless otherwise specified, indexes reflect total return, with all dividends reinvested. Indexes are unmanaged, do not reflect the deduction of fees or expenses, and are not available for direct investment.
Important Performance and Other Information
Performance data quoted in the following pages reflect past performance and are no guarantee of future results. Current performance may be higher or lower than the performance quoted. The investment return and principal value of an investment in the Funds will fluctuate so that shares, on any given day or when redeemed, may be worth more or less than their original cost. You can obtain performance data current to the most recent month end by calling Lord Abbett at 888-522-2388 or referring to www.lordabbett.com.
During certain periods shown, expense waivers and reimbursements were in place. Without such expense
waivers and reimbursements, the Funds’ returns would have been lower.
The annual commentary above discusses the views of the Fund’s management and various portfolio holdings of the Funds as of December 31, 2016. These views and portfolio holdings may have changed after this date. Information provided in the commentary is not a recommendation to buy or sell securities. Because the Fund’s portfolio is actively managed and may change significantly, the Fund may no longer own the securities described above or may have otherwise changed their positions in the securities. For more recent information about the Fund’s portfolio holdings, please visit www.lordabbett.com.
A Note about Risk: See Notes to Financial Statements for a discussion of investment risks. For a more detailed discussion of the risks associated with each Fund, please see the Fund’s prospectus.
Mutual funds are not insured by the FDIC, are not deposits or other obligations of, or guaranteed by, banks, and are subject to investment risks including possible loss of principal amount invested.
The Fund serves as an underlying investment vehicle for variable annuity contracts and variable life insurance policies.
3
Investment Comparison
Below is a comparison of a $10,000 investment in Class VC shares with the same investment in both the Russell Midcap® Growth Index and the Russell Midcap® Index, assuming reinvestment of all dividends and distributions. The Fund’s shares are sold only to insurance company separate accounts that fund certain variable annuity and variable life contracts. The line graph comparison does not reflect the sales charges or other expenses of these contracts. If those sales charges and expenses were reflected, returns would be lower. The graph and performance table below do not reflect the deduction of taxes that a shareholder would pay on Fund distributions or the redemption of Fund shares. During certain periods, expenses of the Fund have been waived or reimbursed by Lord Abbett; without such waiver or reimbursement of expenses, the Fund’s returns would have been lower. Past performance is no guarantee of future results.

Average Annual Total Returns for the
Periods Ended December 31, 2016
| | 1 Year | | 5 Years | | 10 Years | |
| Class VC | 1.23% | | 11.52% | | 7.60% | |
1 Performance for each unmanaged index does not reflect any fees or expenses. The performance of each index is not necessarily representative of the Fund’s performance.
2 The Fund (Class VC shares) at net asset value.
4
Expense Example
As a shareholder of the Fund, you incur ongoing costs, including management fees; expenses related to the Fund’s services arrangements with certain insurance companies; and other Fund expenses. This Example is intended to help you understand your ongoing costs (in dollars) of investing in the Fund and to compare these costs with the ongoing costs of investing in other mutual funds.
The Example is based on an investment of $1,000 invested at the beginning of the period and held for the entire period (July 1, 2016 through December 31, 2016).
The Example reflects only expenses that are deducted from the assets of the Fund. Fees and expenses, including sales charges applicable to the various insurance products that invest in the Fund, are not reflected in this Example. If such fees and expenses were reflected in the Example, the total expenses shown would be higher. Fees and expenses regarding such variable insurance products are separately described in the prospectus related to those products.
Actual Expenses
The first line of the table on the following page provides information about actual account values and actual expenses. You may use the information in this line, together with the amount you invested, to estimate the expenses that you paid over the period. Simply divide your account value by $1,000 (for example, an $8,600 account value divided by $1,000 = 8.6), then multiply the result by the number in the first line under the heading titled “Expenses Paid During Period 7/1/16 – 12/31/16” to estimate the expenses you paid on your account during this period.
Hypothetical Example for Comparison Purposes
The second line of the table on the following page provides information about hypothetical account values and hypothetical expenses based on the Fund’s actual expense ratio and an assumed rate of return of 5% per year before expenses, which is not the Fund’s actual return. The hypothetical account values and expenses may not be used to estimate the actual ending account balance or expenses you paid for the period. You may use this information to compare the ongoing costs of investing in the Fund and other funds. To do so, compare this 5% hypothetical example with the 5% hypothetical examples that appear in the shareholder reports of the other funds.
5
Please note that the expenses shown in the table are meant to highlight your ongoing costs only and do not reflect any transactional costs, such as sales charges. Therefore, the second line of the table is useful in comparing ongoing costs only, and will not help you determine the relative total costs of owning different funds. In addition, if these transactional costs were included, your costs would have been higher.
| | | Beginning
Account
Value | | Ending
Account
Value | | Expenses
Paid During
Period† | |
| | | 7/1/16 | | 12/31/16 | | 7/1/16 –
12/31/16 | |
| Class VC | | | | | | | |
| Actual | | $1,000.00 | | $1,007.20 | | $5.55 | |
| Hypothetical (5% Return Before Expenses) | | $1,000.00 | | $1,019.61 | | $5.58 | |
| † | Net expenses are equal to the Fund’s annualized expense ratio of 1.10%, multiplied by the average account value over the period, multiplied by 184/366 (to reflect one-half year period). |
Portfolio Holdings Presented by Sector
December 31, 2016
| Sector* | %** |
| Consumer Discretionary | 26.05 | % |
| Consumer Staples | 1.74 | % |
| Energy | 1.17 | % |
| Financials | 11.57 | % |
| Health Care | 13.92 | % |
| Industrials | 18.01 | % |
| Information Technology | 17.79 | % |
| Materials | 7.39 | % |
| Telecommunication Services | 0.94 | % |
| Repurchase Agreement | 1.42 | % |
| Total | 100.00 | % |
| * | | A sector may comprise several industries. |
| ** | | Represents percent of total investments. |
6
Schedule of Investments
December 31, 2016
| Investments | | Shares | | | Fair
Value
(000) | |
| COMMON STOCKS 98.74% | | | | | | | | |
| | | | | | | | | |
| Banks 4.91% | | | | | | | | |
| Citizens Financial Group, Inc. | | | 41,399 | | | $ | 1,475 | |
| First Republic Bank | | | 19,271 | | | | 1,776 | |
| Signature Bank* | | | 10,284 | | | | 1,545 | |
| Western Alliance Bancorp* | | | 26,348 | | | | 1,283 | |
| Total | | | | | | | 6,079 | |
| | | | | | | | | |
| Beverages 0.53% | | | | | | | | |
| Brown-Forman Corp. Class B | | | 14,531 | | | | 653 | |
| | | | | | | | | |
| Biotechnology 1.69% | | | | | | | | |
| BioMarin Pharmaceutical, Inc.* | | | 11,362 | | | | 941 | |
| Incyte Corp., Ltd.* | | | 11,423 | | | | 1,146 | |
| Total | | | | | | | 2,087 | |
| | | | | | | | | |
| Building Products 2.06% | | | | | | | | |
| A.O. Smith Corp. | | | 19,141 | | | | 906 | |
| Allegion plc (Ireland)(a) | | | 13,940 | | | | 892 | |
| Johnson Controls International plc | | | 18,251 | | | | 752 | |
| Total | | | | | | | 2,550 | |
| | | | | | | | | |
| Capital Markets 5.72% | | | | | | | | |
| CBOE Holdings, Inc. | | | 11,563 | | | | 854 | |
| E*TRADE Financial Corp.* | | | 37,468 | | | | 1,298 | |
| MarketAxess Holdings, Inc. | | | 7,631 | | | | 1,121 | |
| Moody’s Corp. | | | 13,532 | | | | 1,276 | |
| TD Ameritrade Holding Corp. | | | 44,779 | | | | 1,952 | |
| WisdomTree Investments, Inc. | | | 51,312 | | | | 572 | |
| Total | | | | | | | 7,073 | |
| | | | | | | | | |
| Chemicals 4.23% | | | | | | | | |
| CF Industries Holdings, Inc. | | | 31,153 | | | | 981 | |
| FMC Corp. | | | 25,230 | | | | 1,427 | |
| RPM International, Inc. | | | 29,280 | | | | 1,576 | |
| Westlake Chemical Corp. | | | 22,269 | | | | 1,247 | |
| Total | | | | | | | 5,231 | |
| | | | | | | | | |
| Communications Equipment 1.09% | | | | | | | | |
| Palo Alto Networks, Inc.* | | | 10,782 | | | | 1,348 | |
| Investments | | Shares | | | Fair
Value
(000) | |
| Construction Materials 1.74% | | | | | | | | |
| Vulcan Materials Co. | | | 17,156 | | | $ | 2,147 | |
| | | | | | | | | |
| Containers & Packaging 1.44% | | | | | | | | |
| Ball Corp. | | | 12,293 | | | | 923 | |
| Owens-Illinois, Inc.* | | | 49,575 | | | | 863 | |
| Total | | | | | | | 1,786 | |
| | | | | | | | | |
| Distributors 0.82% | | | | | | | | |
| LKQ Corp.* | | | 33,278 | | | | 1,020 | |
| | | | | | | | | |
| Diversified Telecommunication Services 0.94% | | | | | | | | |
| Zayo Group Holdings, Inc.* | | | 35,398 | | | | 1,163 | |
| | | | | | | | | |
| Electrical Equipment 3.94% | | | | | | | | |
| AMETEK, Inc. | | | 35,133 | | | | 1,708 | |
| Hubbell, Inc. | | | 11,277 | | | | 1,316 | |
| Rockwell Automation, Inc. | | | 13,731 | | | | 1,845 | |
| Total | | | | | | | 4,869 | |
| | | | | | | | | |
| Electronic Equipment, Instruments & Components 0.90% |
| Trimble, Inc.* | | | 36,800 | | | | 1,110 | |
| | | | | | | | | |
| Food Products 1.21% | | | | | | | | |
| Hain Celestial Group, Inc. (The)* | | | 38,437 | | | | 1,500 | |
| | | | | | | | | |
| Health Care Equipment & Supplies 4.55% | | | | | | | | |
| C.R. Bard, Inc. | | | 5,198 | | | | 1,168 | |
| DENTSPLY SIRONA, Inc. | | | 20,741 | | | | 1,197 | |
| Edwards Lifesciences Corp.* | | | 13,398 | | | | 1,255 | |
| Hologic, Inc.* | | | 15,619 | | | | 627 | |
| Intuitive Surgical, Inc.* | | | 2,184 | | | | 1,385 | |
| Total | | | | | | | 5,632 | |
| | | | | | | | | |
| Health Care Providers & Services 1.85% | | | | | | | | |
| Centene Corp.* | | | 18,915 | | | | 1,069 | |
| Henry Schein, Inc.* | | | 8,081 | | | | 1,226 | |
| Total | | | | | | | 2,295 | |
| | | | | | | | | |
| Health Care Technology 1.09% | | | | | | | | |
| Veeva Systems, Inc. Class A* | | | 33,150 | | | | 1,349 | |
| | See Notes to Financial Statements. | 7 |
Schedule of Investments (continued)
December 31, 2016
| Investments | | Shares | | | Fair
Value
(000) | |
| Hotels, Restaurants & Leisure 7.10% | | | | | | | | |
| Hyatt Hotels Corp. Class A* | | | 12,017 | | | $ | 664 | |
| Marriott International, Inc. Class A | | | 30,642 | | | | 2,533 | |
| Norwegian Cruise Line Holdings Ltd.* | | | 35,477 | | | | 1,509 | |
| Panera Bread Co. Class A* | | | 5,425 | | | | 1,113 | |
| Vail Resorts, Inc. | | | 9,058 | | | | 1,461 | |
| Wynn Resorts Ltd. | | | 17,450 | | | | 1,510 | |
| Total | | | | | | | 8,790 | |
| | | | | | | | | |
| Industrial Conglomerates 1.13% | | | | | | | | |
| Roper Technologies, Inc. | | | 7,609 | | | | 1,393 | |
| | | | | | | | | |
| Information Technology Services 5.96% | | | | | | | | |
| Euronet Worldwide, Inc.* | | | 17,993 | | | | 1,303 | |
| FleetCor Technologies, Inc.* | | | 12,403 | | | | 1,756 | |
| Global Payments, Inc. | | | 25,430 | | | | 1,765 | |
| Sabre Corp. | | | 59,322 | | | | 1,480 | |
| Vantiv, Inc. Class A* | | | 18,064 | | | | 1,077 | |
| Total | | | | | | | 7,381 | |
| | | | | | | | | |
| Insurance 0.96% | | | | | | | | |
| Lincoln National Corp. | | | 17,886 | | | | 1,185 | |
| | | | | | | | | |
| Internet & Direct Marketing Retail 1.32% | | | | | | | | |
| Expedia, Inc. | | | 14,405 | | | | 1,632 | |
| | | | | | | | | |
| Internet Software & Services 1.36% | | | | | | | | |
| Akamai Technologies, Inc.* | | | 25,192 | | | | 1,680 | |
| | | | | | | | | |
| Leisure Products 1.21% | | | | | | | | |
| Hasbro, Inc. | | | 19,228 | | | | 1,496 | |
| | | | | | | | | |
| Life Sciences Tools & Services 3.18% | | | | | | | | |
| Agilent Technologies, Inc. | | | 30,423 | | | | 1,386 | |
| Mettler-Toledo International, Inc.* | | | 4,139 | | | | 1,732 | |
| Patheon NV (Netherlands)*(a) | | | 28,228 | | | | 811 | |
| Total | | | | | | | 3,929 | |
| Investments | | Shares | | | Fair
Value
(000) | |
| Machinery 6.35% | | | | | | | | |
| Donaldson Co., Inc. | | | 31,756 | | | $ | 1,336 | |
| IDEX Corp. | | | 14,412 | | | | 1,298 | |
| Ingersoll-Rand plc (Ireland) | | | 22,455 | | | | 1,685 | |
| Middleby Corp. (The)* | | | 7,803 | | | | 1,005 | |
| Nordson Corp. | | | 7,601 | | | | 852 | |
| Wabtec Corp. | | | 20,234 | | | | 1,680 | |
| Total | | | | | | | 7,856 | |
| | | | | | | | | |
| Media 2.96% | | | | | | | | |
| AMC Networks, Inc. Class A* | | | 15,436 | | | | 808 | |
| Cable One, Inc. | | | 2,064 | | | | 1,283 | |
| Scripps Networks Interactive, Inc. Class A | | | 22,065 | | | | 1,575 | |
| Total | | | | | | | 3,666 | |
| | | | | | | | | |
| Multi-Line Retail 2.56% | | | | | | | | |
| Dollar General Corp. | | | 24,323 | | | | 1,802 | |
| Dollar Tree, Inc.* | | | 17,685 | | | | 1,365 | |
| Total | | | | | | | 3,167 | |
| | | | | | | | | |
| Oil, Gas & Consumable Fuels 1.17% | | | | | | | | |
| Diamondback Energy, Inc.* | | | 6,996 | | | | 707 | |
| Parsley Energy, Inc. Class A* | | | 21,096 | | | | 743 | |
| Total | | | | | | | 1,450 | |
| | | | | | | | | |
| Pharmaceuticals 1.58% | | | | | | | | |
| Zoetis, Inc. | | | 36,623 | | | | 1,960 | |
| | | | | | | | | |
| Professional Services 0.82% | | | | | | | | |
| Nielsen Holdings plc | | | 24,099 | | | | 1,011 | |
| | | | | | | | | |
| Road & Rail 2.30% | | | | | | | | |
| Genesee & Wyoming, Inc. Class A* | | | 19,852 | | | | 1,378 | |
| J.B. Hunt Transport Services, Inc. | | | 15,156 | | | | 1,471 | |
| Total | | | | | | | 2,849 | |
| 8 | See Notes to Financial Statements. | |
Schedule of Investments (continued)
December 31, 2016
| Investments | | Shares | | | Fair
Value
(000) | |
| Semiconductors & Semiconductor Equipment 5.78% |
| Analog Devices, Inc. | | | 18,095 | | | $ | 1,314 | |
| Lam Research Corp. | | | 17,484 | | | | 1,849 | |
| Microchip Technology, Inc. | | | 31,402 | | | | 2,014 | |
| Skyworks Solutions, Inc. | | | 26,513 | | | | 1,980 | |
| Total | | | | | | | 7,157 | |
| | | | | | | | | |
| Software 2.73% | | | | | | | | |
| Red Hat, Inc.* | | | 24,465 | | | | 1,705 | |
| ServiceNow, Inc.* | | | 22,426 | | | | 1,667 | |
| Total | | | | | | | 3,372 | |
| | | | | | | | | |
| Specialty Retail 8.14% | | | | | | | | |
| AutoZone, Inc.* | | | 2,175 | | | | 1,718 | |
| L Brands, Inc. | | | 19,993 | | | | 1,316 | |
| Michaels Cos, Inc. (The)* | | | 39,304 | | | | 804 | |
| O’Reilly Automotive, Inc.* | | | 7,139 | | | | 1,987 | |
| Ross Stores, Inc. | | | 28,936 | | | | 1,898 | |
| Tiffany & Co. | | | 8,230 | | | | 637 | |
| Tractor Supply Co. | | | 22,564 | | | | 1,711 | |
| Total | | | | | | | 10,071 | |
| | | | | | | | | |
| Textiles, Apparel & Luxury Goods 1.97% | | | | | | | | |
| Carter’s, Inc. | | | 14,523 | | | | 1,254 | |
| Hanesbrands, Inc. | | | 55,107 | | | | 1,189 | |
| Total | | | | | | | 2,443 | |
| | | | | | | | | |
| Trading Companies & Distributors 1.45% | | | | | | | | |
| HD Supply Holdings, Inc.* | | | 42,112 | | | | 1,790 | |
Total Common Stocks
(cost $122,031,421) | | | | | | | 122,170 | |
| Investments | | Principal
Amount
(000) | | | Fair
Value
(000) | |
| SHORT-TERM INVESTMENT 1.42% | | | | | | | | |
| | | | | | | | | |
| Repurchase Agreement | | | | | | | | |
Repurchase Agreement dated 12/30/2016, 0.03% due 1/3/2017 with Fixed Income Clearing Corp. collateralized by $1,685,000 of U.S. Treasury Inflation Indexed Note at 0.125% due 4/15/2017;
value: $1,797,014; proceeds: $1,759,659
(cost $1,759,653) | | | $1,760 | | | $ | 1,760 | |
Total Investments in Securities 100.16%
(cost $123,791,074) | | | | | | | 123,930 | |
| Liabilities in Excess of Cash and Other Assets (0.16)% | | | | | | | (195 | ) |
| Net Assets 100.00% | | | | | | $ | 123,735 | |
| | | |
| * | | Non-income producing security. |
| (a) | | Foreign security traded in U.S. dollars. |
| | See Notes to Financial Statements. | 9 |
Schedule of Investments (concluded)
December 31, 2016
The following is a summary of the inputs used as of December 31, 2016 in valuing the Fund’s investments carried at fair value(1):
| Investment Type(2)(3) | | Level 1
(000) | | | Level 2
(000) | | | Level 3
(000) | | | Total
(000) | |
| Common Stocks | | $ | 122,170 | | | $ | – | | | $ | – | | | $ | 122,170 | |
| Repurchase Agreement | | | – | | | | 1,760 | | | | – | | | | 1,760 | |
| Total | | $ | 122,170 | | | $ | 1,760 | | | $ | – | | | $ | 123,930 | |
| (1) | | Refer to Note 2(h) for a description of fair value measurements and the three-tier hierarchy of inputs. |
| (2) | | See Schedule of Investments for fair values in each industry and identification of foreign issuers and/or geography. |
| (3) | | There were no Level 1/Level 2 transfers during the fiscal year ended December 31, 2016. |
| 10 | See Notes to Financial Statements. | |
Statement of Assets and Liabilities
December 31, 2016
| ASSETS: | | |
| Investments in securities, at fair value (cost $123,791,074) | | $ | 123,929,703 | |
| Cash | | | 8,438 | |
| Receivables: | | | | |
| Interest and dividends | | | 43,800 | |
| Capital shares sold | | | 41,854 | |
| From advisor (See Note 3) | | | 23,496 | |
| Prepaid expenses and other assets | | | 283 | |
| Total assets | | | 124,047,574 | |
| LIABILITIES: | | | | |
| Payables: | | | | |
| Management fee | | | 83,987 | |
| Capital shares reacquired | | | 37,774 | |
| Directors’ fees | | | 17,279 | |
| Fund administration | | | 4,199 | |
| Accrued expenses | | | 168,916 | |
| Total liabilities | | | 312,155 | |
| NET ASSETS | | $ | 123,735,419 | |
| COMPOSITION OF NET ASSETS: | | | | |
| Paid-in capital | | $ | 124,057,303 | |
| Accumulated net investment loss | | | (17,279 | ) |
| Accumulated net realized loss on investments | | | (443,234 | ) |
| Net unrealized appreciation on investments | | | 138,629 | |
| Net Assets | | $ | 123,735,419 | |
| Outstanding shares (50 million shares of common stock authorized, $.001 par value) | | | 10,347,211 | |
| Net asset value, offering and redemption price per share (Net assets divided by outstanding shares) | | | $11.96 | |
| | See Notes to Financial Statements. | 11 |
Statement of Operations
For the Year Ended December 31, 2016
| Investment income: | | |
| Dividends | | $ | 935,808 | |
| Interest | | | 557 | |
| Total investment income | | | 936,365 | |
| Expenses: | | | | |
| Management fee | | | 854,783 | |
| Non 12b-1 service fees | | | 267,376 | |
| Shareholder servicing | | | 130,571 | |
| Professional | | | 45,578 | |
| Fund administration | | | 42,739 | |
| Reports to shareholders | | | 34,558 | |
| Custody | | | 30,480 | |
| Directors’ fees | | | 3,697 | |
| Other | | | 12,178 | |
| Gross expenses | | | 1,421,960 | |
| Expense reductions (See Note 8) | | | (417 | ) |
| Fees waived and expenses reimbursed (See Note 3) | | | (218,324 | ) |
| Net expenses | | | 1,203,219 | |
| Net investment loss | | | (266,854 | ) |
| Net realized and unrealized gain (loss): | | | | |
| Net realized gain on investments | | | 1,180,737 | |
| Net change in unrealized appreciation/depreciation on investments | | | (1,435,580 | ) |
| Net realized and unrealized loss | | | (254,843 | ) |
| Net Decrease in Net Assets Resulting From Operations | | $ | (521,697 | ) |
| 12 | See Notes to Financial Statements. | |
Statements of Changes in Net Assets
| INCREASE IN NET ASSETS | | For the Year Ended
December 31, 2016 | | | For the Year Ended
December 31, 2015 | |
| Operations: | | | | | | | | |
| Net investment loss | | $ | (266,854 | ) | | $ | (443,994 | ) |
| Net realized gain on investments | | | 1,180,737 | | | | 9,932,960 | |
| Net change in unrealized appreciation/depreciation on investments | | | (1,435,580 | ) | | | (7,390,033 | ) |
| Net increase (decrease) in net assets resulting from operations | | | (521,697 | ) | | | 2,098,933 | |
| Distributions to shareholders from: | | | | | | | | |
| Net realized gain | | | (736,893 | ) | | | (9,756,067 | ) |
| Capital share transactions (See Note 13): | | | | | | | | |
| Proceeds from sales of shares | | | 141,471,322 | | | | 101,073,915 | |
| Reinvestment of distributions | | | 736,893 | | | | 9,756,067 | |
| Cost of shares reacquired | | | (109,191,183 | ) | | | (98,429,963 | ) |
| Net increase in net assets resulting from capital share transactions | | | 33,017,032 | | | | 12,400,019 | |
| Net increase in net assets | | | 31,758,442 | | | | 4,742,885 | |
| NET ASSETS: | | | | | | | | |
| Beginning of year | | $ | 91,976,977 | | | $ | 87,234,092 | |
| End of year | | $ | 123,735,419 | | | $ | 91,976,977 | |
| Accumulated net investment loss | | $ | (17,279 | ) | | $ | (15,935 | ) |
| | See Notes to Financial Statements. | 13 |
Financial Highlights
| | | | | Per Share Operating Performance: |
| | | | | Investment Operations: | | Distributions
to
shareholders
from: | | |
| | | Net asset
value,
beginning
of period | | Net
investment
income
(loss)(a) | | Net
realized and
unrealized
gain | | Total from
investment
operations | | Net
realized
gain | | Net asset
value,
end of
period |
| 12/31/2016 | | | $11.88 | | | | $(0.03 | ) | | | $0.18 | | | | $0.15 | | | | $(0.07 | ) | | | $11.96 | |
| 12/31/2015 | | | 12.91 | | | | (0.06 | ) | | | 0.41 | | | | 0.35 | | | | (1.38 | ) | | | 11.88 | |
| 12/31/2014 | | | 15.25 | | | | (0.04 | ) | | | 0.95 | | | | 0.91 | | | | (3.25 | ) | | | 12.91 | |
| 12/31/2013 | | | 13.19 | | | | (0.08 | ) | | | 4.93 | | | | 4.85 | | | | (2.79 | ) | | | 15.25 | |
| 12/31/2012 | | | 12.23 | | | | (0.02 | ) | | | 1.75 | | | | 1.73 | | | | (0.77 | ) | | | 13.19 | |
| (a) | | Calculated using average shares outstanding during the period. |
| (b) | | Total return does not consider the effects of sales charges or other expenses imposed by an insurance company and assumes the reinvestment of all distributions. |
| 14 | See Notes to Financial Statements. | |
| | | Ratios to Average Net Assets: | | Supplemental Data: |
| | | | | |
Total
return(b)
(%) | | Total
expenses after
waivers and/or
reimburse-
ments
(%) | | Total
expenses
(%) | | Net
investment
income
(loss)
(%) | | Net assets,
end of
period
(000) | | Portfolio
turnover
rate
(%) |
| | 1.23 | | | | 1.13 | | | | 1.33 | | | | (0.25 | ) | | | $123,735 | | | | 155.06 | |
| | 2.72 | | | | 1.20 | | | | 1.31 | | | | (0.42 | ) | | | 91,977 | | | | 125.17 | |
| | 6.07 | | | | 1.20 | | | | 1.32 | | | | (0.28 | ) | | | 87,234 | | | | 197.85 | |
| | 37.08 | | | | 1.20 | | | | 1.31 | | | | (0.49 | ) | | | 98,244 | | | | 120.75 | |
| | 14.10 | | | | 1.20 | | | | 1.31 | | | | (0.12 | ) | | | 89,376 | | | | 138.33 | |
| | See Notes to Financial Statements. | 15 |
Notes to Financial Statements
Lord Abbett Series Fund, Inc. (the “Company”) is registered under the Investment Company Act of 1940, as amended (“the Act”), as a diversified, open-end management investment company and was incorporated under Maryland law in 1989. The Company consists of thirteen separate portfolios. This report covers Growth Opportunities Portfolio (the “Fund”).
The Fund’s investment objective is capital appreciation. The Fund has Variable Contract class shares (“Class VC Shares”), which are currently issued and redeemed only in connection with investments in, and payments under, variable annuity contracts and variable life insurance policies issued by life insurance and insurance-related companies.
The preparation of the financial statements in conformity with accounting principles generally accepted in the United States of America (“U.S. GAAP”) requires management to make certain estimates and assumptions that affect the reported amounts of assets and liabilities and disclosure of contingent assets and liabilities at the date of the financial statements and the reported amounts of increases and decreases in net assets from operations during the reporting period. Actual results could differ from those estimates. The Fund is considered an investment company under U.S. GAAP and follows the accounting and reporting guidance applicable to investment companies.
| 2. | SIGNIFICANT ACCOUNTING POLICIES |
| (a) | Investment Valuation–Under procedures approved by the Fund’s Board of Directors (the “Board”), Lord, Abbett & Co. LLC (“Lord Abbett”), the Fund’s investment manager, has formed a Pricing Committee to administer the pricing and valuation of portfolio investments and to ensure that prices utilized reasonably reflect fair value. Among other things, these procedures allow the Fund to utilize independent pricing services, quotations from securities and financial instrument dealers and other market sources to determine fair value. |
| | |
| | Securities actively traded on any recognized U.S. or non-U.S. exchange or on The NASDAQ Stock Market LLC are valued at the last sale price or official closing price on the exchange or system on which they are principally traded. Events occurring after the close of trading on non-U.S. exchanges may result in adjustments to the valuation of foreign securities to reflect their fair value as of the close of regular trading on the New York Stock Exchange. The Fund may utilize an independent fair valuation service in adjusting the valuations of foreign securities. Unlisted equity securities are valued at the last quoted sale price or, if no sale price is available, at the mean between the most recently quoted bid and asked prices. |
| | |
| | Securities for which prices are not readily available are valued at fair value as determined by the Pricing Committee. The Pricing Committee considers a number of factors, including observable and unobservable inputs, when arriving at fair value. The Pricing Committee may use related or comparable assets or liabilities, recent transactions, market multiples, book values and other relevant information to determine the fair value of portfolio investments. The Board or a designated committee thereof regularly reviews fair value determinations made by the Pricing Committee and employs techniques such as reviewing related market activity, reviewing inputs and assumptions, and retrospectively comparing prices of subsequent purchases and sales transactions to fair value determinations made by the Pricing Committee. |
| | |
| | Short-term securities with 60 days or less remaining to maturity are valued using the amortized cost method, which approximates fair value. |
16
Notes to Financial Statements (continued)
| (b) | Security Transactions–Security transactions are recorded as of the date that the securities are purchased or sold (trade date). Realized gains and losses on sales of portfolio securities are calculated using the identified-cost method. |
| | |
| (c) | Investment Income–Dividend income is recorded on the ex-dividend date. Interest income is recorded on the accrual basis as earned. Discounts are accreted and premiums are amortized using the effective interest method and are included in Interest and other income on the Statement of Operations. Withholding taxes on foreign dividends have been provided for in accordance with the applicable country’s tax rules and rates. |
| | |
| (d) | Income Taxes–It is the policy of the Fund to meet the requirements of Subchapter M of the Internal Revenue Code applicable to regulated investment companies and to distribute substantially all taxable income and capital gains to its shareholders. Therefore, no income tax provision is required. |
| | |
| | The Fund files U.S. federal and various state and local tax returns. No income tax returns are currently under examination. The statute of limitations on the Fund’s filed U.S. federal tax returns remains open for the fiscal years ended December 31, 2013 through December 31, 2016. The statutes of limitations on the Company’s state and local tax returns may remain open for an additional year depending upon the jurisdiction. |
| | |
| (e) | Expenses–Expenses incurred by the Company that do not specifically relate to an individual fund are generally allocated to the funds within the Company on a pro rata basis by relative net assets. |
| | |
| (f) | Foreign Transactions–The books and records of the Fund are maintained in U.S. dollars and transactions denominated in foreign currencies are recorded in the Fund’s records at the rate prevailing when earned or recorded. Asset and liability accounts that are denominated in foreign currencies are adjusted daily to reflect current exchange rates and any unrealized gain (loss) is included in Net change in unrealized appreciation/depreciation on investments in the Fund’s Statement of Operations. The resultant exchange gains and losses upon settlement of such transactions are included in Net realized gain on investments in the Fund’s Statement of Operations. The Fund does not isolate that portion of the results of operations arising as a result of changes in the foreign exchange rates from the changes in market prices of the securities. |
| | |
| (g) | Repurchase Agreements–The Fund may enter into repurchase agreements with respect to securities. A repurchase agreement is a transaction in which a fund acquires a security and simultaneously commits to resell that security to the seller (a bank or securities dealer) at an agreed-upon price on an agreed-upon date. The Fund requires at all times that the repurchase agreement be collateralized by cash, or by securities of the U.S. Government, its agencies, its instrumentalities, or U.S. Government sponsored enterprises having a value equal to, or in excess of, the value of the repurchase agreement (including accrued interest). If the seller of the agreement defaults on its obligation to repurchase the underlying securities at a time when the fair value of these securities has declined, the Fund may incur a loss upon disposition of the securities. |
| | |
| (h) | Fair Value Measurements–Fair value is defined as the price that the Fund would receive upon selling an investment or transferring a liability in an orderly transaction to an independent buyer in the principal or most advantageous market of the investment. A three-tier hierarchy is used to maximize the use of observable market data and minimize the use of |
17
Notes to Financial Statements (continued)
| | unobservable inputs and to establish classification of fair value measurements for disclosure purposes. Inputs refer broadly to the assumptions that market participants would use in pricing the asset or liability, including assumptions about risk—for example, the risk inherent in a particular valuation technique used to measure fair value (such as a pricing model) and/or the risk inherent in the inputs to the valuation technique. Inputs may be observable or unobservable. Observable inputs reflect the assumptions market participants would use in pricing the asset or liability. Observable inputs are based on market data obtained from sources independent of the reporting entity. Unobservable inputs reflect the reporting entity’s own assumptions about the assumptions market participants would use in pricing the asset or liability. Unobservable inputs are based on the best information available in the circumstances. The three-tier hierarchy classification is determined based on the lowest level of inputs that is significant to the fair value measurement, and is summarized in the three broad Levels listed below: |
| | |
| | • | Level 1 – unadjusted quoted prices in active markets for identical investments; |
| | | | |
| | • | Level 2 – other significant observable inputs (including quoted prices for similar investments, interest rates, prepayment speeds, credit risk, etc.); and |
| | | | |
| | • | Level 3 – significant unobservable inputs (including the Fund’s own assumptions in determining the fair value of investments). |
A summary of inputs used in valuing the Fund’s investments as of December 31, 2016 and, if applicable, Level 1/Level 2 transfers and Level 3 rollforwards for the fiscal year then ended is included in the Fund’s Schedule of Investments.
Changes in valuation techniques may result in transfers into or out of an assigned level within the three-tier hierarchy. All transfers between different levels within the three-tier hierarchy are deemed to have occurred as of the beginning of the reporting period. The inputs or methodology used for valuing securities are not necessarily an indication of the risk associated with investing in those securities.
| 3. | MANAGEMENT FEE AND OTHER TRANSACTIONS WITH AFFILIATES |
Management Fee
The Company has a management agreement with Lord Abbett, pursuant to which Lord Abbett supplies the Fund with investment management services and executive and other personnel, provides office space and pays for ordinary and necessary office and clerical expenses relating to research and statistical work and supervision of the Fund’s investment portfolio.
The management fee is based on the Fund’s average daily net assets at the following annual rate:
| First $1 billion | .80% |
| Next $1 billion | .75% |
| Next $1 billion | .70% |
| Over $3 billion | .65% |
For the fiscal year ended December 31, 2016, the effective management fee, net of waivers, was at an annualized rate of .60% of the Fund’s average daily net assets.
In addition, Lord Abbett provides certain administrative services to the Fund pursuant to an Administrative Services Agreement in return for a fee at an annual rate of .04% of the Fund’s average daily net assets.
18
Notes to Financial Statements (continued)
Effective May 1, 2016 and continuing through April 30, 2017, Lord Abbett has contractually agreed to waive its fees and reimburse expenses to the extent necessary to limit total net annual operating expenses to an annual rate of 1.10%. This agreement may be terminated only upon the approval of the Board. Prior to May 1, 2016, Lord Abbett had contractually agreed to waive its fees and reimburse expenses to the extent necessary to limit total net operating expenses to an annual rate of 1.20%
The Company, on behalf of the Fund, has entered into services arrangements with certain insurance companies. Under these arrangements, certain insurance companies will be compensated up to .25% of the average daily net asset value (“NAV”) of the Fund’s Class VC Shares held in the insurance company’s separate account to service and maintain the Variable Contract owners’ accounts. This amount is included in Non 12b-1 service fees on the Statement of Operations. The Fund may also compensate certain insurance companies, third-party administrators and other entities for providing recordkeeping, sub-transfer agency and other administrative services to the Fund. This amount is included in Shareholder servicing on the Statement of Operations.
Two Directors and certain of the Company’s officers have an interest in Lord Abbett.
| 4. | DISTRIBUTIONS AND CAPITAL LOSS CARRYFORWARDS |
Dividends from net investment income, if any, are declared and paid at least semi-annually. Taxable net realized gains from investment transactions, reduced by allowable capital loss carryforwards, if any, are declared and distributed to shareholders at least annually. The capital loss carryforward amount, if any, is available to offset future net capital gains. Dividends and distributions to shareholders are recorded on the ex-dividend date. The amounts of dividends and distributions from net investment income and net realized capital gains are determined in accordance with federal income tax regulations, which may differ from U.S. GAAP. These book/tax differences are either considered temporary or permanent in nature. To the extent these differences are permanent in nature, such amounts are reclassified within the components of net assets based on their federal tax basis treatment; temporary differences do not require reclassification. Dividends and distributions that exceed earnings and profits for tax purposes are reported as a tax return of capital.
The tax character of distributions paid during the fiscal years ended December 31, 2016 and 2015 was as follows:
| | | Year Ended
12/31/2016 | | | Year Ended
12/31/2015 | |
| Distributions paid from: | | | | | | | | | | |
| Ordinary income | | | $ | – | | | | $ | 2,224,813 | |
| Net long-term capital gains | | | | 736,893 | | | | | 7,531,254 | |
| Total distributions paid | | | $ | 736,893 | | | | $ | 9,756,067 | |
As of December 31, 2016, the components of accumulated losses on a tax-basis were as follows:
| Undistributed long-term capital gains | | $ | 775,057 | |
| Total undistributed earnings | | | 775,057 | |
| Temporary differences | | | (17,279 | ) |
| Unrealized losses – net | | | (1,079,662 | ) |
| Total accumulated losses – net | | $ | (321,884 | ) |
19
Notes to Financial Statements (continued)
As of December 31, 2016, the aggregate unrealized security gains and losses based on cost for U.S. federal income tax purposes were as follows:
| Tax cost | | $ | 125,009,365 | |
| Gross unrealized gain | | | 4,616,059 | |
| Gross unrealized loss | | | (5,695,721 | ) |
| Net unrealized security loss | | $ | (1,079,662 | ) |
The difference between book-basis and tax basis unrealized gains (losses) is attributable to wash sales.
Permanent items identified during the fiscal year ended December 31, 2016 have been reclassified among the components of net assets based on their tax basis treatment as follows:
| Accumulated | | | Accumulated | | | | |
| Net Investment | | | Net Realized | | | Paid-in | |
| Loss | | | Loss | | | Capital | |
| $265,510 | | | | $15,742 | | | | $(281,252 | ) |
The permanent differences are attributable to the tax treatment of certain distributions received and net investment losses.
| 5. | PORTFOLIO SECURITIES TRANSACTIONS |
Purchases and sales of investment securities (excluding short-term investments) for the fiscal year ended December 31, 2016 were as follows:
| Purchases | | Sales |
| $196,319,320 | | $165,283,623 |
There were no purchases or sales of U.S. Government securities for the fiscal year ended December 31, 2016.
| 6. | DISCLOSURES ABOUT OFFSETTING ASSETS AND LIABILITIES |
The Financial Accounting Standards Board (“FASB”) requires disclosures intended to help better assess the effect or potential effect of offsetting arrangements on a fund’s financial position. The following tables illustrate gross and net information about recognized assets and liabilities eligible for offset in the statement of assets and liabilities; and disclose such amounts subject to an enforceable master netting agreement or similar agreement, by counterparty. A master netting agreement is an agreement between a fund and a counterparty which provides for the net settlement of amounts owed under all contracts traded under that agreement, as well as cash collateral, through a single payment by one party to the other in the event of default on or termination of any one contract. The Fund’s accounting policy with respect to balance sheet offsetting is that, absent an event of default by the counterparty or a termination of the agreement, the master netting agreement does not result in an offset of reported amounts of financial assets and liabilities in the statement of assets and liabilities across transactions between the Fund and the applicable counterparty:
20
Notes to Financial Statements (continued)
| Description | | Gross Amounts of
Recognized Assets | | | Gross Amounts
Offset in the
Statement of Assets
and Liabilities | | | Net Amounts of
Assets Presented
in the Statement of
Assets and Liabilities | |
| Repurchase Agreement | | | $1,759,653 | | | $ | – | | | $ | 1,759,653 | |
| Total | | | $1,759,653 | | | $ | – | | | $ | 1,759,653 | |
| | | Net Amounts | | | | | | | | | | | | | |
| | | of Assets | | | Amounts Not Offset in the | | | | |
| | | Presented in | | | Statement of Assets and Liabilities | | | | |
| Counterparty | | the Statement
of Assets and
Liabilities | | |
Financial
Instruments | | | Cash
Collateral
Received(a) | | | Securities
Collateral
Received(a) | | |
Net
Amount(b) | |
| Fixed Income Clearing Corp. | | $ | 1,759,653 | | | $ | – | | | $ | – | | | $ | (1,759,653 | ) | | $ | – | |
| Total | | $ | 1,759,653 | | | $ | – | | | $ | – | | | $ | (1,759,653 | ) | | $ | – | |
| (a) | Collateral disclosed is limited to an amount not to exceed 100% of the net amount of assets presented in the Statement of Assets and Liabilities, for each respective counterparty. |
| (b) | Net amount represents the amount owed to the Fund by the counterparty as of December 31, 2016. |
| 7. | DIRECTORS’ REMUNERATION |
The Company’s officers and two Directors, who are associated with Lord Abbett, do not receive any compensation from the Company for serving in such capacities. Independent Directors’ fees are allocated among all Lord Abbett-sponsored funds based on the net assets of each fund. There is an equity-based plan available to all Independent Directors under which Independent Directors must defer receipt of a portion of, and may elect to defer receipt of an additional portion of Directors’ fees. The deferred amounts are treated as though equivalent dollar amounts had been invested in the funds. Such amounts and earnings accrued thereon are included in Directors’ fees on the Statement of Operations and in Directors’ fees payable on the Statement of Assets and Liabilities and are not deductible for U.S. federal income tax purposes until such amounts are paid.
The Company has entered into an arrangement with its transfer agent and custodian, whereby credits realized as a result of uninvested cash balances are used to reduce a portion of the Fund’s expenses.
The Fund and certain other funds managed by Lord Abbett (collectively, the “Participating Funds”) entered into a syndicated line of credit facility with various lenders for $550 million (the “Facility”), whereas State Street Bank and Trust Company (“SSB”) participates as a lender and as agent for the lenders. The Facility is to be used for temporary or emergency purposes as an additional source of liquidity to satisfy redemptions. The Participating Funds are subject to graduated borrowing limits of one-third of Fund assets (if Fund assets are less than $750 million), $250 million, $300 million, or $350 million, based on past borrowings and likelihood of future borrowings. The Facility will continue through August 28, 2017.
During the fiscal year ended December 31, 2016, the Fund did not utilize the Facility.
21
Notes to Financial Statements (concluded)
| 10. | INTERFUND LENDING PROGRAM |
On July 26, 2016, the U.S. Securities and Exchange Commission issued an exemptive order (“SEC exemptive order”) which permits certain registered open-end management investment companies managed by Lord Abbett, including the Fund, to participate in a joint lending and borrowing program (the “Interfund Lending Program”). The SEC exemptive order allows the Funds to borrow money from and lend money to each other for temporary or emergency purposes subject to the limitations and conditions.
During the fiscal year ended December 31, 2016, the Fund did not participate as a borrower or lender in the Interfund Lending Program.
| 11. | CUSTODIAN AND ACCOUNTING AGENT |
SSB is the Company’s custodian and accounting agent. SSB performs custodial, accounting and recordkeeping functions relating to portfolio transactions and calculating the Fund’s NAV.
The Fund is subject to the general risks and considerations associated with equity investing. The value of an investment will fluctuate in response to movements in the equity securities market in general, and to the changing prospects of individual companies in which the Fund invests. The Fund has particular risks associated with growth stocks. Growth companies may grow faster than other companies, which may result in more volatility in their stock prices. In addition, if the Fund’s assessment of a company’s potential for growth or market conditions is wrong, it could suffer losses or produce poor performance relative to other funds, even in a rising market. The Fund invests largely in mid-sized company stocks, which may be less able to weather economic shifts or other adverse developments than those of larger, more established companies.
Due to the Fund’s investment exposure to foreign companies and American Depositary Receipts, the Fund may experience increased market, liquidity, currency, political, information, and other risks.
These factors can affect the Fund’s performance.
| 13. | SUMMARY OF CAPITAL TRANSACTIONS |
Transactions in shares of capital stock were as follows:
| | | | Year Ended
December 31, 2016 | | | | Year Ended
December 31, 2015 | |
| Shares sold | | | 12,040,758 | | | | 7,558,407 | |
| Reinvestment of distributions | | | 59,571 | | | | 815,710 | |
| Shares reacquired | | | (9,493,978 | ) | | | (7,389,904 | ) |
| Increase | | | 2,606,351 | | | | 984,213 | |
22
Report of Independent Registered Public Accounting Firm
To the Board of Directors of Lord Abbett Series Fund, Inc. and the Shareholders of Growth Opportunities Portfolio:
We have audited the accompanying statement of assets and liabilities, including the schedule of investments, of the Growth Opportunities Portfolio, one of the portfolios constituting the Lord Abbett Series Fund, Inc. (the “Fund”) as of December 31, 2016, and the related statement of operations for the year then ended, the statements of changes in net assets for each of the two years in the period then ended, and the financial highlights for each of the five years in the period then ended. These financial statements and financial highlights are the responsibility of the Fund’s management. Our responsibility is to express an opinion on these financial statements and financial highlights based on our audits.
We conducted our audits in accordance with the standards of the Public Company Accounting Oversight Board (United States). Those standards require that we plan and perform the audit to obtain reasonable assurance about whether the financial statements and financial highlights are free of material misstatement. The Fund is not required to have, nor were we engaged to perform, an audit of its internal control over financial reporting. Our audits included consideration of internal control over financial reporting as a basis for designing audit procedures that are appropriate in the circumstances, but not for the purpose of expressing an opinion on the effectiveness of the Fund’s internal control over financial reporting. Accordingly, we express no such opinion. An audit also includes examining, on a test basis, evidence supporting the amounts and disclosures in the financial statements, assessing the accounting principles used and significant estimates made by management, as well as evaluating the overall financial statement presentation. Our procedures included confirmation of securities owned as of December 31, 2016, by correspondence with the custodian. We believe that our audits provide a reasonable basis for our opinion.
In our opinion, such financial statements and financial highlights referred to above present fairly, in all material respects, the financial position of Growth Opportunities Portfolio of the Lord Abbett Series Fund, Inc. as of December 31, 2016, the results of its operations for the year then ended, the changes in its net assets for each of the two years in the period then ended, and the financial highlights for each of the five years in the period then ended, in conformity with accounting principles generally accepted in the United States of America.
DELOITTE & TOUCHE LLP
New York, New York
February 15, 2017
23
Basic Information About Management
The Board is responsible for the management of the business and affairs of the Company in accordance with the laws of the State of Maryland. The Board elects officers who are responsible for the day-to-day operations of each Fund and who execute policies authorized by the Board. The Board also approves an investment adviser to each Fund and continues to monitor the cost and quality of the services the investment adviser provides, and annually considers whether to renew the contract with the adviser. Generally, each Director holds office until his/her successor is elected and qualified or until his/her earlier resignation or removal, as provided in the Company’s organizational documents.
Lord Abbett, a Delaware limited liability company, is the Fund’s investment adviser. Designated Lord Abbett personnel are responsible for the day-to-day management of the Funds.
Interested Directors
Ms. Foster and Mr. Sieg are affiliated with Lord Abbett and are “interested persons” of the Company as defined in the Act. Ms. Foster and Mr. Sieg are directors/trustees of each of the 12 investment companies in the Lord Abbett Family of Funds, which consist of 60 portfolios or series. Ms. Foster is an officer of the Lord Abbett Family of Funds.
Name, Address and
Year of Birth | | Current Position and
Length of Service
with the Company | | Principal Occupation and Other Directorships
During the Past Five Years |
Daria L. Foster
Lord, Abbett & Co. LLC
90 Hudson Street
Jersey City, NJ 07302
(1954) | | Director and President since 2006; Chief Executive Officer since 2012 | | Principal Occupation: Managing Partner of Lord Abbett, joined Lord Abbett in 1990. Other Directorships: None. |
| | | | | |
Douglas B. Sieg
Lord, Abbett & Co. LLC
90 Hudson Street
Jersey City, NJ 07302
(1969) | | Director since 2016 | | Principal Occupation: Partner (since 2001) and Head of Client Services (since 2013), formerly Director of Marketing and Relationship Management, joined Lord Abbett in 1994.
Other Directorships: None. |
Independent Directors
The following Independent Directors also are directors/trustees of each of the 12 investment companies in the Lord Abbett Family of Funds, which consist of 60 portfolios or series.
Name, Address and
Year of Birth | | Current Position and
Length of Service
with the Company | | Principal Occupation and Other Directorships
During the Past Five Years |
Robert B. Calhoun, Jr.
Lord, Abbett & Co. LLC
c/o Legal Dept.
90 Hudson Street
Jersey City, NJ 07302
(1942) | | Director since 1998 | | Principal Occupation: Senior Advisor of Monitor Clipper Partners, a private equity investment fund (since 1997); President of Clipper Asset Management Corp. (1991–2009). Other Directorships: None. |
24
Basic Information About Management (continued)
Name, Address and
Year of Birth | | Current Position and
Length of Service
with the Company | | Principal Occupation and Other Directorships
During the Past Five Years |
Eric C. Fast
Lord, Abbett & Co. LLC
c/o Legal Dept.
90 Hudson Street
Jersey City, NJ 07302
(1949) | | Director since 2014 | | Principal Occupation: Chief Executive Officer of Crane Co., an industrial products company (2001–2014). Other Directorships: Currently serves as director of Automatic Data Processing, Inc. (since 2007) and Regions Financial Corporation (since 2010). Previously served as a director of Crane Co. (1999–2014). |
| | | | | |
Evelyn E. Guernsey
Lord, Abbett & Co. LLC
c/o Legal Dept.
90 Hudson Street
Jersey City, NJ 07302
(1955) | | Director since 2011 | | Principal Occupation: CEO, Americas of J.P. Morgan Asset Management (2004–2010). Other Directorships: None. |
| | | | | |
Julie A. Hill
Lord, Abbett & Co. LLC
c/o Legal Dept.
90 Hudson Street
Jersey City, NJ 07302
(1946) | | Director since 2004 | | Principal Occupation: Owner and CEO of The Hill Company, a business consulting firm (since 1998). Other Directorships: Currently serves as director of Anthem, Inc., a health benefits company (since 1994). |
| | | | | |
Franklin W. Hobbs
Lord, Abbett & Co. LLC
c/o Legal Dept.
90 Hudson Street
Jersey City, NJ 07302
(1947) | | Director since 2001 | | Principal Occupation: Advisor of One Equity Partners, a private equity firm (since 2004). Other Directorships: Currently serves as director and Chairman of the Board of Ally Financial Inc., a financial services firm (since 2009), and as director of Molson Coors Brewing Company (since 2002). |
| | | | | |
James M. McTaggart
Lord, Abbett & Co. LLC
c/o Legal Dept.
90 Hudson Street
Jersey City, NJ 07302
(1947) | | Director since 2012 | | Principal Occupation: Independent management advisor and consultant (since 2012); Vice President, CRA International, Inc. (doing business as Charles River Associates), a global management consulting firm (2009–2012); Founder and Chairman of Marakon Associates, Inc., a strategy consulting firm (1978–2009); and Officer and Director of Trinsum Group, a holding company (2007–2009). Other Directorships: Currently serves as director of Blyth, Inc., a home products company (since 2004). |
| | | | | |
Mark A. Schmid
Lord, Abbett & Co. LLC
c/o Legal Dept.
90 Hudson Street
Jersey City, NJ 07302
(1959) | | Director since 2016 | | Principal Occupation: Vice President and Chief Investment Officer of the University of Chicago (since 2009). Other Directorships: None. |
25
Basic Information About Management (continued)
Name, Address and
Year of Birth | | Current Position and
Length of Service
with the Company | | Principal Occupation and Other Directorships
During the Past Five Years |
James L.L. Tullis
Lord, Abbett & Co. LLC
c/o Legal Dept.
90 Hudson Street
Jersey City, NJ 07302
(1947) | | Director since 2006;
Chairman since 2017 | | Principal Occupation: CEO of Tullis-Dickerson and Co. Inc., a venture capital management firm (since 1990); CEO of Tullis Health Investors Inc. (since 2012). Other Directorships: Currently serves as director of Crane Co. (since 1998). |
Officers
None of the officers listed below have received compensation from the Company. All of the officers of the Company also may be officers of the other Lord Abbett Funds and maintain offices at 90 Hudson Street, Jersey City, NJ 07302. Unless otherwise indicated, the position(s) and title(s) listed under the “Principal Occupation During the Past Five Years” column indicate each officer’s position(s) and title(s) with Lord Abbett. Each officer serves for an indefinite term (i.e., until his or her death, resignation, retirement, or removal).
Name and
Year of Birth | | Current Position
with the Company | | Length of Service
of Current
Position | | Principal Occupation
During the Past Five Years |
Daria L. Foster
(1954) | | President and Chief Executive Officer | | Elected as President in 2006 and Chief Executive Officer in 2012 | | Managing Partner of Lord Abbett, joined Lord Abbett in 1990. |
| | | | | | | |
Sean J. Aurigemma
(1969) | | Executive Vice President | | Elected in 2010 | | Portfolio Manager, joined Lord Abbett in 2007. |
| | | | | | | |
Jeff D. Diamond
(1960) | | Executive Vice President | | Elected in 2008 | | Portfolio Manager, joined Lord Abbett in 2007. |
| | | | | | | |
Todd D. Jacobson
(1966) | | Executive Vice President | | Elected in 2005 | | Partner and Associate Director, joined Lord Abbett in 2003. |
| | | | | | | |
Robert A. Lee
(1969) | | Executive Vice President | | Elected in 2010 | | Partner and Chief Investment Officer, and was formerly Deputy Chief Investment Officer and Director of Taxable Fixed Income, joined Lord Abbett in 1997. |
| | | | | | | |
Thomas B. Maher
(1967) | | Executive Vice President | | Elected in 2010 | | Partner and Portfolio Manager, joined Lord Abbett in 2003. |
| | | | | | | |
Justin C. Maurer
(1969) | | Executive Vice President | | Elected in 2010 | | Partner and Portfolio Manager, joined Lord Abbett in 2001. |
| | | | | | | |
Vincent J. McBride
(1964) | | Executive Vice President | | Elected in 2010 | | Partner and Director, joined Lord Abbett in 2003. |
| | | | | | | |
Andrew H. O’Brien
(1973) | | Executive Vice President | | Elected in 2010 | | Partner and Portfolio Manager, joined Lord Abbett in 1998. |
26
Basic Information About Management (continued)
Name and
Year of Birth | | Current Position
with the Company | | Length of Service
of Current
Position | | Principal Occupation
During the Past Five Years |
F. Thomas O’Halloran, III
(1955) | | Executive Vice President | | Elected in 2010 | | Partner and Portfolio Manager, joined Lord Abbett in 2001. |
| | | | | | | |
Marc Pavese
(1972) | | Executive Vice President | | Elected in 2016 | | Partner and Portfolio Manager, joined Lord Abbett in 2008. |
| | | | | | | |
Walter H. Prahl
(1958) | | Executive Vice President | | Elected in 2012 | | Partner and Director, joined Lord Abbett in 1997. |
| | | | | | | |
Steven F. Rocco
(1979) | | Executive Vice President | | Elected in 2014 | | Partner and Portfolio Manager, joined Lord Abbett in 2004. |
| | | | | | | |
Didier O. Rosenfeld
(1976) | | Executive Vice President | | Elected in 2016 | | Director of Global Equity, joined Lord Abbett in 2015 and was formerly a Portfolio Manager and Senior Analyst at Cornerstone Capital Management (2014–2015) and Managing Director at State Street Global Advisors (2000–2013). |
| | | | | | | |
Frederick J. Ruvkun
(1957) | | Executive Vice President | | Elected in 2012 | | Partner and Portfolio Manager, joined Lord Abbett in 2006. |
| | | | | | | |
Paul J. Volovich
(1973) | | Executive Vice President | | Elected in 2005 | | Partner and Portfolio Manager, joined Lord Abbett in 1997. |
| | | | | | | |
A. Edward Allinson
(1961) | | Vice President | | Elected in 2011 | | Portfolio Manager, joined Lord Abbett in 2005. |
| | | | | | | |
John W. Ashbrook
(1964) | | Vice President and Assistant Secretary | | Elected in 2014 | | Assistant General Counsel, joined Lord Abbett in 2008. |
| | | | | | | |
Joan A. Binstock
(1954) | | Chief Financial Officer and Vice President | | Elected in 1999 | | Partner and Chief Financial Officer, and was formerly Chief Operations Officer, joined Lord Abbett in 1999. |
| | | | | | | |
Brooke A. Fapohunda
(1975) | | Vice President and Assistant Secretary | | Elected in 2014 | | Deputy General Counsel, joined Lord Abbett in 2006. |
| | | | | | | |
John K. Forst
(1960) | | Vice President and Assistant Secretary | | Elected in 2005 | | Partner and Deputy General Counsel, joined Lord Abbett in 2004. |
| | | | | | | |
Anthony W. Hipple
(1964) | | Vice President | | Elected in 2014 | | Portfolio Manager, joined Lord Abbett in 2002. |
| | | | | | | |
Lawrence H. Kaplan
(1957) | | Vice President and Secretary | | Elected in 1997 | | Partner and General Counsel, joined Lord Abbett in 1997. |
27
Basic Information About Management (concluded)
Name and
Year of Birth | | Current Position
with the Company | | Length of Service
of Current
Position | | Principal Occupation
During the Past Five Years |
Linda Y. Kim
(1980) | | Vice President and Assistant Secretary | | Elected in 2016 | | Counsel, joined Lord Abbett in 2015 and was formerly an Associate at Stroock & Stroock & Lavan LLP (2007–2015). |
| | | | | | | |
David J. Linsen
(1974) | | Vice President | | Elected in 2008 | | Partner and Director, joined Lord Abbett in 2001. |
| | | | | | | |
Joseph M. McGill
(1962) | | Chief Compliance Officer | | Elected in 2014 | | Partner and Chief Compliance Officer, joined Lord Abbett in 2014 and was formerly Managing Director and the Chief Compliance Officer at UBS Global Asset Management (2003–2013). |
| | | | | | | |
A. Edward Oberhaus, III
(1959) | | Vice President | | Elected in 1998 | | Partner and Director, joined Lord Abbett in 1983. |
| | | | | | | |
Noah Petrucci
(1970) | | Vice President | | Elected in 2013 | | Portfolio Manager, joined Lord Abbett in 2012 and was formerly a Portfolio Manager at Columbia Management Investment Advisers, LLC and Columbia Management Advisors, LLC (2002–2012). |
| | | | | | | |
Lawrence B. Stoller
(1963) | | Vice President and Assistant Secretary | | Elected in 2007 | | Partner and Senior Deputy General Counsel, joined Lord Abbett in 2007. |
| | | | | | | |
Leah G. Traub
(1979) | | Vice President | | Elected in 2016 | | Partner and Portfolio Manager, joined Lord Abbett in 2007. |
| | | | | | | |
Arthur K. Weise
(1970) | | Vice President | | Elected in 2010 | | Partner and Portfolio Manager, joined Lord Abbett in 2007. |
| | | | | | | |
Kewjin Yuoh
(1971) | | Vice President | | Elected in 2012 | | Partner and Portfolio Manager, joined Lord Abbett in 2010. |
| | | | | | | |
Scott S. Wallner
(1955) | | AML Compliance Officer | | Elected in 2011 | | Assistant General Counsel, joined Lord Abbett in 2004. |
| | | | | | | |
Bernard J. Grzelak
(1971) | | Treasurer | | Elected in 2003 | | Partner and Chief Operations Officer, and was formerly Director of Fund Administration, joined Lord Abbett in 2003. |
Please call 888-522-2388 for a copy of the statement of additional information, which contains further information about the Company’s Directors. It is available free upon request.
28
Approval of Advisory Contract
The Board, including all of the Directors who are not interested persons of the Fund or of Lord Abbett (the “Independent Board Members”), annually considers whether to approve the continuation of the existing management agreement between the Fund and Lord Abbett (the “Agreement”). In connection with its most recent approval, the Board reviewed materials relating specifically to the Agreement, as well as numerous materials received throughout the course of the year, including information about the Fund’s investment performance compared to the performance of its benchmark. Before making its decision as to the Fund, the Board had the opportunity to ask questions and request further information, taking into account its familiarity with Lord Abbett gained through its meetings and discussions. These meetings and discussions included the review of the portfolio management team conducted by members of the Contract Committee, the deliberations of the Contract Committee, and discussions between the Contract Committee and Lord Abbett’s management. The Independent Board Members also met with their independent legal counsel in a private session at which no representatives of management were present.
The materials received by the Board included, but were not limited to: (1) information provided by Morningstar Associates, LLC (“Morningstar”) regarding the investment performance of the Fund compared to the investment performance of certain funds with similar investment styles as determined by Morningstar, based, in part, on the Fund’s Morningstar category (the “performance peer group”), and the investment performance of two appropriate benchmarks; (2) information provided by Morningstar regarding the expense ratios, contractual and effective management fee rates, and other expense components for the Fund and certain funds in the same Morningstar category, with generally the same or similar share classes and operational characteristics, including asset size (the “expense peer group”); (3) certain supplemental investment performance information provided by Lord Abbett; (4) information provided by Lord Abbett on the expense ratios, management fee rates, and other expense components for the Fund; (5) sales and redemption information for the Fund; (6) information regarding Lord Abbett’s financial condition; (7) an analysis of the relative profitability of the Agreement to Lord Abbett; (8) information provided by Lord Abbett regarding the investment management fee schedules for Lord Abbett’s other advisory clients maintaining accounts with a similar investment strategy as the Fund; and (9) information regarding the personnel and other resources devoted by Lord Abbett to managing the Fund.
Investment Management Services Generally. The Board considered the investment management services provided by Lord Abbett to the Fund, including investment research, portfolio management, and trading, and Lord Abbett’s commitment to compliance with all applicable legal requirements. The Board also observed that Lord Abbett was solely engaged in the investment management business and accordingly did not experience the conflicts of interest that may result from being engaged in other lines of business. The Board considered the investment advisory services provided by Lord Abbett to other clients, the fees charged for the services, and the differences in the nature of the services provided to the Fund and other Lord Abbett Funds, on the one hand, and the services provided to other clients, on the other. After reviewing these and related factors, the Board concluded that the Fund was likely to continue to benefit from the nature, extent and quality of the investment services provided by Lord Abbett under the Agreement.
Investment Performance. The Board reviewed the Fund’s investment performance in relation to that of the performance peer group and two appropriate benchmarks as of various periods ended August 31, 2016. The Board observed that the Fund’s investment performance was above the
29
Approval of Advisory Contract (continued)
median of the performance peer group for the three-year and ten-year periods, equal to the median of the performance peer group for the five-year period and below the median of the performance peer group for the one-year period. The Board also considered Lord Abbett’s performance and reputation generally, the performance of other Lord Abbett-managed funds overseen by the Board and the willingness of Lord Abbett to take steps intended to improve performance when necessary. After reviewing these and related factors, the Board concluded that the Fund’s investment performance was reasonable and supported the continuation of the Agreement.
Lord Abbett’s Personnel and Methods. The Board considered the qualifications of the personnel providing investment management services to the Fund, in light of its investment objective and discipline. Among other things, the Board considered the size, experience, and turnover of Lord Abbett’s investment management staff, Lord Abbett’s investment methodology and philosophy, and Lord Abbett’s approach to recruiting, training, and retaining investment management personnel.
Nature and Quality of Other Services. The Board considered the nature, quality, costs, and extent of compliance, administrative, and other services performed by Lord Abbett and the nature and extent of Lord Abbett’s supervision of third party service providers, including the Fund’s transfer agent and custodian.
Expenses. The Board considered the expense level of the Fund and the expense levels of the expense peer group. It also considered how the expense levels of the Fund related to those of the expense peer group and the amount and nature of the fees paid by shareholders. The Board observed that the overall expense level of the Fund was below the median of the expense peer group. After reviewing these and related factors, the Board concluded, within the context of its overall approval of the Agreement, that the expense level of the Fund was reasonable and supported the continuation of the Agreement.
Profitability. The Board considered the level of Lord Abbett’s operating margin in managing the Fund, including a review of Lord Abbett’s methodology for allocating its costs to its management of the Fund. It considered whether the Fund was profitable to Lord Abbett in connection with the operation of the Fund, including the fee that Lord Abbett receives from the Fund for providing administrative services to the Fund. The Board also considered the profits realized from other business segments of Lord Abbett, which may benefit from or be related to the Fund’s business. The Board considered Lord Abbett’s profit margins in comparison with available industry data, both accounting for and excluding marketing and distribution expenses, and how those profit margins could affect Lord Abbett’s ability to recruit and retain investment personnel. The Board recognized that Lord Abbett’s overall profitability was a factor in enabling it to attract and retain qualified investment management personnel to provide services to the Fund. After reviewing these and related factors, the Board concluded, within the context of its overall approval of the Agreement, that Lord Abbett’s profitability with respect to the Fund was not excessive.
Economies of Scale. The Board considered the extent to which there had been economies of scale in managing the Fund, whether the Fund’s shareholders had appropriately benefited from such economies of scale, and whether there was potential for realization of any further economies of scale. The Board concluded that the existing management fee schedule, with its breakpoints in the levels of the management fee, in conjunction with a proposed expense limitation agreement adequately addressed any economies of scale in managing the Fund.
30
Approval of Advisory Contract (concluded)
Other Benefits to Lord Abbett. The Board considered the character and amount of fees paid by the Fund and the Fund’s shareholders to Lord Abbett and the Distributor for services other than investment advisory services. The Board also considered the revenues and profitability of Lord Abbett’s investment advisory business apart from its mutual fund business, and the intangible benefits enjoyed by Lord Abbett by virtue of its relationship with the Fund. The Board observed that the Distributor receives 12b-1 fees from certain of the Lord Abbett Funds as to shares held in accounts for which there is no other broker of record, may retain a portion of the 12b-1 fees it receives, and receives a portion of the sales charges on sales and redemptions of some classes of shares. In addition, the Board observed that Lord Abbett accrues certain benefits for its business of providing investment advice to clients other than the Lord Abbett Funds, but that business also benefits the Funds. The Board also noted that Lord Abbett, as disclosed in the prospectus of the Fund, has entered into revenue sharing arrangements with certain entities that distribute shares of the Fund. The Board also took into consideration the investment research that Lord Abbett receives as a result of Fund brokerage transactions.
Alternative Arrangements. The Board considered whether, instead of approving continuation of the Agreement, it might be in the best interests of the Fund to implement one or more alternative arrangements, such as continuing to employ Lord Abbett, but on different terms. After considering all of the relevant factors, the Board unanimously found that continuation of the Agreement was in the best interests of the Fund and its shareholders and voted unanimously to approve the continuation of the Agreement. In considering whether to approve the continuation of the Agreement, the Board did not identify any single factor as paramount or controlling. Individual Directors may have evaluated the information presented differently from one another, giving different weights to various factors. This summary does not discuss in detail all matters considered.
31
Householding
The Company has adopted a policy that allows it to send only one copy of the Fund’s prospectus, proxy material, annual report and semiannual report to certain shareholders residing at the same “household.” This reduces Fund expenses, which benefits you and other shareholders. If you need additional copies or do not want your mailings to be “householded,” please call Lord Abbett at 888-522-2388 or send a written request with your name, the name of your fund or funds and your account number or numbers to Lord Abbett Family of Funds, P.O. Box 219336, Kansas City, MO 64121.
Proxy Voting Policies, Procedures and Records
A description of the policies and procedures that Lord Abbett uses to vote proxies related to the Fund’s portfolio securities, and information on how Lord Abbett voted the Fund’s proxies during the 12-month period ended June 30 are available without charge, upon request, (i) by calling 888-522-2388; (ii) on Lord Abbett’s Website at www.lordabbett.com; and (iii) on the Securities and Exchange Commission’s (“SEC”) Website at www.sec.gov.
Shareholder Reports and Quarterly Portfolio Disclosure
The Fund is required to file its complete schedule of portfolio holdings with the SEC for its first and third fiscal quarters on Form N-Q. Copies of the filings are available without charge, upon request on the SEC’s Website at www.sec.gov and may be available by calling Lord Abbett at 888–522–2388. You can also obtain copies of Form N-Q by visiting the SEC’s Public Reference Room in Washington, DC (information on the operation of the Public Reference Room may be obtained by calling 800-SEC-0330).
Tax Information Of the distributions paid to the shareholders during the fiscal year ended December 31, 2016, $736,893 represents long-term capital gains.. |
32


| This report, when not used for the general information of shareholders of the Fund, is to be distributed only if preceded or accompanied by a current fund prospectus. | | | |
| | | | |
Lord Abbett mutual fund shares are distributed by
LORD ABBETT DISTRIBUTOR LLC. | | Lord Abbett Series Fund, Inc. Growth Opportunities Portfolio | LASFGO-3
(02/17) |

2016 LORD ABBETT
ANNUAL REPORT
Lord Abbett
Series Fund—International Core Equity Portfolio
For the fiscal year ended December 31, 2016
Lord Abbett Series Fund — International Core Equity Portfolio
Annual Report
For the fiscal year ended December 31, 2016

From left to right: James L.L. Tullis, Chairman of the Lord Abbett Funds and Daria L. Foster Director, President, and Chief Executive Officer of the Lord Abbett Funds. | | Dear Shareholders: We are pleased to provide you with this overview of the performance of Lord Abbett Series Fund — International Core Equity Portfolio for the fiscal year ended December 31, 2016. On this page and the following pages, we discuss the major factors that influenced fiscal year performance. For additional information about the Fund, please visit our website at www.lordabbett.com, where you also can access the quarterly commentaries that provide updates on the Fund’s performance and other portfolio related updates. Thank you for investing in Lord Abbett mutual funds. We value the trust that you place in us and look forward to serving your investment needs in the years to come. Best regards, 
Daria L. Foster Director, President and Chief Executive Officer |
| | | |
For the fiscal year ended December 31, 2016, the Fund returned -1.74%, reflecting performance at the net asset value (NAV) of Class VC Shares, with all distributions reinvested, compared to its benchmark, the MSCI EAFE® Index with Gross Dividends1, which returned 1.51% over the same period.
Over the period, global equity markets experienced significant volatility, as a result of continued central bank stimulus, sharp moves in commodity prices, the United Kingdom’s Brexit vote, uncertainty around Chinese economic growth, and the
U.S. election. Overall, European markets (as measured by the EURO STOXX 50®2) rose roughly 1.7% in U.S. dollars for the period, while Japan’s Nikkei 2253 rose 2.38%.
At the end of 2015, the Federal Reserve (Fed) raised interest rates, for the first time since the financial crisis, to a range between 0.25%–0.50%. At that time, Fed expectations were for 4 rate hikes in 2016. That did not materialize, but the Fed did raise rates again at the December 2016 Fed meeting, from a range of 0.25%–0.50% to a range of 0.50%–0.75%, and indicated that it was targeting three rate hikes in
1
2017. Similarly, other central banks continued their accommodative monetary policies, as the European Central Bank cut the deposit rate in the Eurozone from –0.2% to –0.3% in December 2015 and increased its existing monetary easing program to €80 billion per month in March 2016. In January 2016, the Bank of Japan introduced negative rates on excess reserves in an effort to stimulate economic growth and, at its September meeting, introduced “yield curve control” to regulate both short- and long-term rates. The Bank of Japan also committed itself to expand the monetary base until inflation—as measured by the Consumer Price Index—exceeds 2%.
By February of 2016, crude oil prices had fallen to under $27/bbl. By the end of the year, however, prices had recovered to above $50, helped by an OPEC agreement to cut 1.2mm barrels per day in production and a separate production cut deal with non-OPEC producers. Adding to the volatility during the year was the United Kingdom’s vote, to leave the European Union, which rattled global financial markets that had largely expected a “remain” vote. Following the vote, the British pound fell to a 30-year low and yields on U.K. bonds also fell to historical lows.
In November, Donald Trump won the U.S. presidential election, with Republicans seizing control of both the House of Representatives and the Senate, contributing to a strong U.S. market rally to finish 2016, which was fueled by
expectations for increased infrastructure and defense spending, broad tax reform, and decreased regulations. The Trump election drove the Japanese yen sharply lower, resulting in a double-digit rally in Japan’s Nikkei to close out the year. The Mexican peso also has suffered significantly since the election, as Trump repeatedly threatened to build a border wall with Mexico and took aim at multinational exporters and free-trade agreements. In Italy, a referendum on constitutional reforms was voted down, causing Prime Minister Matteo Renzi to submit his resignation. The Italian government also approved a €20 billion facility in December to provide stability to its banking sector after capital levels were criticized by the ECB.
During the period, the Fund’s underperformance relative to the benchmark was primarily driven by stock selection in the consumer discretionary and industrials sectors. Within the consumer discretionary sector, Berkeley Group Holdings plc, an English mixed-use property development company, detracted from relative performance. The company’s stock declined significantly after the United Kingdom’s Brexit vote, with a broad decline in the country’s biggest homebuilders. In addition, ITV plc, a United Kingdom-based media company, performed poorly over the period. The company suffered after the U.K.’s Brexit vote due to its significant operational exposure.
2
Within the industrials sector, Japan Airlines Co. Ltd., a Japan-based airline company, performed poorly over the period after company earnings decreased due to employee cost increases and decreased travel volume stemming from an increase in terrorist acts around the world.
Stock selection within the materials sector contributed to the Fund’s relative performance during the period. Within materials, shares of Fortescue Metals Group, an iron ore exploration, development, production, and processing company, rallied on the back of both higher iron ore prices and greater production. In addition, shares of South32 Ltd., an Australian metals and mining company, rose as the company was able to reduce
costs while its higher margin mining assets performed better than expected.
Stock selection within the utilities sector also contributed to the Fund’s relative performance during the period. Within the sector, shares of Snam S.p.A., an Italian natural-gas distribution network, performed well, as the company benefited from being viewed as a safety stock following volatility caused by the U.K.’s Brexit vote.
The Fund’s portfolio is actively managed and, therefore, its holdings and the weightings of a particular issuer or particular sector as a percentage of portfolio assets are subject to change. Sectors may include many industries.
1 The MSCI EAFE Index (Europe, Australasia, Far East) is a free float-adjusted market capitalization index that is designed to measure the equity market performance of developed markets, excluding the US & Canada. The MSCI EAFE Index consists of the following 21 developed market country indices: Australia, Austria, Belgium, Denmark, Finland, France, Germany, Hong Kong, Ireland, Israel, Italy, Japan, the Netherlands, New Zealand, Norway, Portugal, Singapore, Spain, Sweden, Switzerland, and the United Kingdom.
The MSCI EAFE Index with Gross Dividends approximates the maximum possible dividend reinvestment. The amount reinvested is the entire dividend distributed to individuals resident in the country of the company, but does not include tax credits.
2 The EURO STOXX 50® Index represents the performance of the 50 largest companies among the 19 supersectors in terms of free-float market cap in 12 eurozone countries. These countries include Austria, Belgium, Finland, France, Germany, Greece,
Ireland, Italy, Luxembourg, the Netherlands, Portugal and Spain. The index has a fixed number of components and is part of the STOXX blue-chip index family. The index captures about 60% of the free-float market cap of the EURO STOXX Total Market Index (TMI).
3 The Nikkei Stock Average, the Nikkei 225 is used around the globe as the premier index of Japanese stocks. Because of the prominent nature of the index, many financial products linked to the Nikkei 225 have been created are traded worldwide while the index has been sufficiently used as the indicator of the movement of Japanese stock markets. The Nikkei 225 is a price-weighted equity index, which consists of 225 stocks in the 1st section of the Tokyo Stock Exchange.
Unless otherwise specified, indexes reflect total return, with all dividends reinvested. Indexes are unmanaged, do not reflect the deduction of fees or expenses, and are not available for direct investment.
3
Important Performance and Other Information
Performance data quoted in the following pages reflect past performance and are no guarantee of future results. Current performance may be higher or lower than the performance quoted. The investment return and principal value of an investment in the Funds will fluctuate so that shares, on any given day or when redeemed, may be worth more or less than their original cost. You can obtain performance data current to the most recent month end by calling Lord Abbett at 888-522-2388 or referring to www.lordabbett.com.
During certain periods shown, expense waivers and reimbursements were in place. Without such expense waivers and reimbursements, the Funds’ returns would have been lower.
The annual commentary above discusses the views of the Fund’s management and various portfolio holdings of the Funds as of December 31, 2016. These views and portfolio holdings may have changed after
this date. Information provided in the commentary is not a recommendation to buy or sell securities. Because the Fund’s portfolio is actively managed and may change significantly, the Fund may no longer own the securities described above or may have otherwise changed their positions in the securities. For more recent information about the Fund’s portfolio holdings, please visit www.lordabbett.com.
A Note about Risk: See Notes to Financial Statements for a discussion of investment risks. For a more detailed discussion of the risks associated with each Fund, please see the Fund’s prospectus.
Mutual funds are not insured by the FDIC, are not deposits or other obligations of, or guaranteed by, banks, and are subject to investment risks including possible loss of principal amount invested.
The Fund serves as an underlying investment vehicle for variable annuity contracts and variable life insurance policies.
4
Investment Comparison
Below is a comparison of a $10,000 investment in Class VC shares with the same investment in the MSCI EAFE® Index with Gross Dividends and the MSCI EAFE® Index with Net Dividends, assuming reinvestment of all dividends and distributions. The Fund’s shares are sold only to insurance company separate accounts that fund certain variable annuity and variable life contracts. This line graph comparison does not reflect the sales charges or other expenses of these contracts. If those sales charges and expenses were reflected, returns would be lower. The graph and performance table below do not reflect the deduction of taxes that a shareholder would pay on Fund distributions or the redemption of Fund shares. During the period, expenses of the Fund were waived or reimbursed by Lord Abbett; without such waiver or reimbursement of expenses, the Fund’s returns would have been lower. Past performance is no guarantee of future results.

| | Average Annual Total Returns for the |
| | Period Ended December 31, 2016 |
| | 1 Year | 5 Years | Life of Class |
| Class VC2 | -1.74% | 4.38% | 2.19% |
1 Performance for each unmanaged index does not reflect any fees or expenses. The performance of each index is not necessarily representative of the Fund’s performance. Performance for each index began on May 1, 2010.
2 The Class VC shares commenced operations on April 16, 2010. Performance for the Class began on May 1, 2010.
5
Expense Example
As a shareholder of the Fund, you incur ongoing costs, including management fees; expenses related to the Fund’s services arrangements with certain insurance companies; and other Fund expenses. This Example is intended to help you understand your ongoing costs (in dollars) of investing in the Fund and to compare these costs with the ongoing costs of investing in other mutual funds.
The Example is based on an investment of $1,000 invested at the beginning of the period and held for the entire period (July 1, 2016 through December 31, 2016).
The Example reflects only expenses that are deducted from the assets of the Fund. Fees and expenses, including sales charges applicable to the various insurance products that invest in the Fund, are not reflected in this Example. If such fees and expenses were reflected in the Example, the total expenses shown would be higher. Fees and expenses regarding such variable insurance products are separately described in the prospectus related to those products.
Actual Expenses
The first line of the table on the following page provides information about actual account values and actual expenses. You may use the information in this line, together with the amount you invested, to estimate the expenses that you paid over the period. Simply divide your account value by $1,000 (for example, an $8,600 account value divided by $1,000 = 8.6), then multiply the result by the number in the first line under the heading titled “Expenses Paid During Period 7/1/16 – 12/31/16” to estimate the expenses you paid on your account during this period.
Hypothetical Example for Comparison Purposes
The second line of the table on the following page provides information about hypothetical account values and hypothetical expenses based on the Fund’s actual expense ratio and an assumed rate of return of 5% per year before expenses, which is not the Fund’s actual return. The hypothetical account values and expenses may not be used to estimate the actual ending account balance or expenses you paid for the period. You may use this information to compare the ongoing costs of investing in the Fund and other funds. To do so, compare this 5% hypothetical example with the 5% hypothetical examples that appear in the shareholder reports of the other funds.
6
Please note that the expenses shown in the table are meant to highlight your ongoing costs only and do not reflect any transactional costs, such as sales charges. Therefore, the second line of the table is useful in comparing ongoing costs only, and will not help you determine the relative total costs of owning different funds. In addition, if these transactional costs were included, your costs would have been higher.
| | | Beginning
Account
Value | | Ending
Account
Value | | Expenses
Paid During
Period† | |
| | | 7/1/16 | | 12/31/16 | | 7/1/16 -
12/31/16 | |
| Class VC | | | | | | | |
| Actual | | $1,000.00 | | $1,045.60 | | $4.47 | |
| Hypothetical (5% Return Before Expenses) | | $1,000.00 | | $1,020.76 | | $4.42 | |
| | |
| † | Net expenses are equal to the Fund’s annualized expense ratio of 0.87%, multiplied by the average account value over the period, multiplied by 184/366 (to reflect one-half year period). |
Portfolio Holdings Presented by Sector
December 31, 2016
| Sector* | %** |
| Consumer Discretionary | 9.93 | % |
| Consumer Staples | 8.94 | % |
| Energy | 5.62 | % |
| Financials | 24.16 | % |
| Health Care | 11.31 | % |
| Industrials | 13.62 | % |
| Information Technology | 6.72 | % |
| Materials | 8.44 | % |
| Real Estate | 2.41 | % |
| Telecommunication Services | 4.64 | % |
| Utilities | 2.34 | % |
| Repurchase Agreement | 1.87 | % |
| Total | 100.00 | % |
| * | | A sector may comprise several industries. |
| ** | | Represents percent of total investments. |
7
Schedule of Investments
December 31, 2016
| | | | | | U.S. $ | |
| | | | | | Fair Value | |
| Investments | | Shares | | | (000) | |
| COMMON STOCKS 97.94% | | | | | | | | |
| | | | | | | | | |
| Australia 1.58% | | | | | | | | |
| | | | | | | | | |
| Construction Materials 0.48% | | | | | | | | |
| CSR Ltd. | | | 84,477 | | | $ | 282 | |
| | | | | | | | | |
| Metals & Mining 1.10% | | | | | | | | |
| BlueScope Steel Ltd. | | | 30,192 | | | | 202 | |
| South32 Ltd. | | | 226,850 | | | | 450 | |
| | | | | | | | 652 | |
| Total Australia | | | | | | | 934 | |
| | | | | | | | | |
| Austria 1.00% | | | | | | | | |
| | | | | | | | | |
| Banks | | | | | | | | |
| Erste Group Bank AG* | | | 20,156 | | | | 590 | |
| | | | | | | | | |
| Belgium 2.61% | | | | | | | | |
| | | | | | | | | |
| Beverages 2.05% | | | | | | | | |
| Anheuser-Busch InBev SA/NV | | | 11,410 | | | | 1,208 | |
| | | | | | | | | |
| Chemicals 0.56% | | | | | | | | |
| Solvay SA | | | 2,848 | | | | 334 | |
| Total Belgium | | | | | | | 1,542 | |
| | | | | | | | | |
| Canada 1.41% | | | | | | | | |
| | | | | | | | | |
| Banks 0.21% | | | | | | | | |
| Bank of Nova Scotia (The) | | | 2,300 | | | | 128 | |
| | | | | | | | | |
| Electric: Utilities 1.20% | | | | | | | | |
| Emera, Inc. | | | 10,400 | | | | 352 | |
| Fortis, Inc. | | | 11,500 | | | | 355 | |
| | | | | | | | 707 | |
| Total Canada | | | | | | | 835 | |
| | | | | | | | | |
| Denmark 0.91% | | | | | | | | |
| | | | | | | | | |
| Banks | | | | | | | | |
| Danske Bank A/S | | | 17,766 | | | | 539 | |
| | | | | | U.S. $ | |
| | | | | | Fair Value | |
| Investments | | Shares | | | (000) | |
| Finland 1.35% | | | | | | | | |
| | | | | | | | | |
| Paper & Forest Products | | | | | | | | |
| Stora Enso OYJ R Shares | | | 16,779 | | | $ | 180 | |
| UPM-Kymmene OYJ | | | 24,988 | | | | 614 | |
| | | | | | | | 794 | |
| | | | | | | | | |
| France 15.89% | | | | | | | | |
| | | | | | | | | |
| Aerospace & Defense 0.83% | | | | | | | | |
| Thales SA | | | 2,069 | | | | 201 | |
| Zodiac Aerospace | | | 12,591 | | | | 289 | |
| | | | | | | | 490 | |
| | | | | | | | | |
| Auto Components 1.20% | | | | | | | | |
| Valeo SA | | | 12,324 | | | | 708 | |
| | | | | | | | | |
| Banks 3.22% | | | | | | | | |
| BNP Paribas SA | | | 13,824 | | | | 881 | |
| Societe Generale SA | | | 20,761 | | | | 1,022 | |
| | | | | | | | 1,903 | |
| | | | | | | | | |
| Construction & Engineering 1.27% | | | | | | | | |
| Vinci SA | | | 10,998 | | | | 749 | |
| | | | | | | | | |
| Diversified Telecommunication Services 1.30% | | | | | | | | |
| Orange SA | | | 50,489 | | | | 767 | |
| | | | | | | | | |
| Electrical Equipment 0.30% | | | | | | | | |
| Schneider Electric SE | | | 2,563 | | | | 178 | |
| | | | | | | | | |
| Food Products 1.81% | | | | | | | | |
| Danone SA | | | 16,805 | | | | 1,065 | |
| | | | | | | | | |
| Information Technology Services 0.48% | | | | | | | | |
| Atos SE | | | 2,703 | | | | 285 | |
| | | | | | | | | |
| Insurance 2.05% | | | | | | | | |
| AXA SA | | | 47,913 | | | | 1,210 | |
| | | | | | | | | |
| Machinery 0.49% | | | | | | | | |
| Alstom SA* | | | 10,472 | | | | 289 | |
| | | | | | | | | |
| Media 0.47% | | | | | | | | |
| Publicis Groupe SA | | | 4,022 | | | | 278 | |
| 8 | See Notes to Financial Statements. | |
Schedule of Investments (continued)
December 31, 2016
| | | | | | U.S. $ | |
| | | | | | Fair Value | |
| Investments | | Shares | | | (000) | |
| France (continued) | | | | | | | | |
| | | | | | | | | |
| Oil, Gas & Consumable Fuels 0.66% | | | | | | | | |
| Total SA | | | 7,556 | | | $ | 387 | |
| | | | | | | | | |
| Pharmaceuticals 1.29% | | | | | | | | |
| Sanofi | | | 9,426 | | | | 763 | |
| | | | | | | | | |
| Textiles, Apparel & Luxury Goods 0.52% | | | | | | | | |
| LVMH Moet Hennessy Louis Vuitton SE | | | 1,614 | | | | 308 | |
| Total France | | | | | | | 9,380 | |
| | | | | | | | | |
| Germany 7.63% | | | | | | | | |
| | | | | | | | | |
| Health Care Providers & Services 1.04% | | | | | | | | |
| Fresenius Medical Care AG & Co. KGaA | | | 7,258 | | | | 615 | |
| | | | | | | | | |
| Hotels, Restaurants & Leisure 1.18% | | | | | | | | |
| TUI AG | | | 48,709 | | | | 698 | |
| | | | | | | | | |
| Industrial Conglomerates 2.35% | | | | | | | | |
| Siemens AG Registered Shares | | | 11,278 | | | | 1,386 | |
| | | | | | | | | |
| Insurance 1.52% | | | | | | | | |
| Allianz SE Registered Shares | | | 3,735 | | | | 617 | |
| Muenchener Rueckversicherungs-Gesellschaft AG in Muenchen Registered Shares | | | 1,486 | | | | 281 | |
| | | | | | | | 898 | |
| | | | | | | | | |
| Life Sciences Tools & Services 0.65% | | | | | | | | |
| MorphoSys AG* | | | 7,444 | | | | 382 | |
| | | | | | | | | |
| Software 0.89% | | | | | | | | |
| SAP SE | | | 6,042 | | | | 527 | |
| Total Germany | | | | | | | 4,506 | |
| | | | | | | | | |
| Hong Kong 0.23% | | | | | | | | |
| | | | | | | | | |
| Equity Real Estate Investment Trusts | | | | | | | | |
| Link REIT | | | 21,000 | | | | 137 | |
| | | | | | U.S. $ | |
| | | | | | Fair Value | |
| Investments | | Shares | | | (000) | |
| India 0.61% | | | | | | | | |
| | | | | | | | | |
| Banks | | | | | | | | |
| ICICI Bank Ltd. ADR | | | 48,329 | | | $ | 362 | |
| | | | | | | | | |
| Ireland 0.79% | | | | | | | | |
| | | | | | | | | |
| Banks | | | | | | | | |
| Bank of Ireland * | | | 1,878,296 | | | | 465 | |
| | | | | | | | | |
| Italy 0.77% | | | | | | | | |
| | | | | | | | | |
| Electric: Utilities | | | | | | | | |
| Enel SpA | | | 102,756 | | | | 453 | |
| | | | | | | | | |
| Japan 27.99% | | | | | | | | |
| | | | | | | | | |
| Airlines 1.16% | | | | | | | | |
| Japan Airlines Co., Ltd. | | | 23,500 | | | | 687 | |
| | | | | | | | | |
| Auto Components 0.46% | | | | | | | | |
| Unipres Corp. | | | 13,800 | | | | 275 | |
| | | | | | | | | |
| Automobiles 3.01% | | | | | | | | |
| Fuji Heavy Industries Ltd. | | | 14,100 | | | | 576 | |
| Honda Motor Co., Ltd. | | | 23,900 | | | | 698 | |
| Mazda Motor Corp. | | | 30,900 | | | | 506 | |
| | | | | | | | 1,780 | |
| | | | | | | | | |
| Banks 5.10% | | | | | | | | |
| Mitsubishi UFJ Financial Group, Inc. | | | 236,900 | | | | 1,460 | |
| Sumitomo Mitsui Financial Group, Inc. | | | 32,000 | | | | 1,221 | |
| Sumitomo Mitsui Trust Holdings, Inc. | | | 9,300 | | | | 333 | |
| | | | | | | | 3,014 | |
| | | | | | | | | |
| Chemicals 3.41% | | | | | | | | |
| Asahi Kasei Corp. | | | 65,215 | | | | 569 | |
| Mitsubishi Chemical Holdings Corp. | | | 125,100 | | | | 811 | |
| Mitsubishi Gas Chemical Co., Inc. | | | 22,900 | | | | 391 | |
| Teijin Ltd. | | | 12,000 | | | | 243 | |
| | | | | | | | 2,014 | |
| | See Notes to Financial Statements. | 9 |
Schedule of Investments (continued)
December 31, 2016
| | | | | | U.S. $ | |
| | | | | | Fair Value | |
| Investments | | Shares | | | (000) | |
| Japan (continued) | | | | | | | | |
| | | | | | | | | |
| Construction & Engineering 1.65% | | | | | | | | |
| Obayashi Corp. | | | 28,800 | | | $ | 275 | |
| Shimizu Corp. | | | 48,000 | | | | 439 | |
| Taisei Corp. | | | 37,000 | | | | 259 | |
| | | | | | | | 973 | |
| | | | | | | | | |
| Diversified Financial Services 1.11% | | | | | | | | |
| ORIX Corp. | | | 42,000 | | | | 655 | |
| | | | | | | | | |
| Electronic Equipment, Instruments & Components 1.29% |
| Hitachi Ltd. | | | 141,000 | | | | 762 | |
| | | | | | | | | |
| Equity Real Estate Investment Trusts 0.09% | | | | | | | | |
| Nomura Real Estate Master Fund, Inc. | | | 34 | | | | 51 | |
| | | | | | | | | |
| Household Durables 0.46% | | | | | | | | |
| Sony Corp. | | | 9,800 | | | | 275 | |
| | | | | | | | | |
| Information Technology Services 0.83% | | | | | | | | |
| Fujitsu Ltd. | | | 88,000 | | | | 489 | |
| | | | | | | | | |
| Insurance 1.58% | | | | | | | | |
| T&D Holdings, Inc. | | | 32,600 | | | | 431 | |
| Tokio Marine Holdings, Inc. | | | 12,200 | | | | 501 | |
| | | | | | | | 932 | |
| | | | | | | | | |
| Machinery 0.49% | | | | | | | | |
| FANUC Corp. | | | 1,700 | | | | 288 | |
| | | | | | | | | |
| Marine 0.91% | | | | | | | | |
| Mitsui OSK Lines Ltd. | | | 81,000 | | | | 225 | |
| Nippon Yusen KK | | | 167,000 | | | | 310 | |
| | | | | | | | 535 | |
| | | | | | | | | |
| Metals & Mining 0.69% | | | | | | | | |
| JFE Holdings, Inc. | | | 19,500 | | | | 297 | |
| Nippon Steel & Sumitomo Metal Corp. | | | 4,900 | | | | 109 | |
| | | | | | | | 406 | |
| | | | | | U.S. $ | |
| | | | | | Fair Value | |
| Investments | | Shares | | | (000) | |
| Real Estate Management & Development 0.74% | | | |
| Daito Trust Construction Co., Ltd. | | | 2,900 | | | $ | 436 | |
| | | | | | | | | |
| Software 0.68% | | | | | | | | |
| Nintendo Co., Ltd. | | | 1,900 | | | | 399 | |
| | | | | | | | | |
| Technology Hardware, Storage & Peripherals 0.91% |
| NEC Corp. | | | 202,000 | | | | 536 | |
| | | | | | | | | |
| Trading Companies & Distributors 1.04% | | | | | | | | |
| Mitsubishi Corp. | | | 28,700 | | | | 611 | |
| | | | | | | | | |
| Wireless Telecommunication Services 2.38% | | | | | | | | |
| NTT DOCOMO, Inc. | | | 19,900 | | | | 454 | |
| SoftBank Group Corp. | | | 14,300 | | | | 950 | |
| | | | | | | | 1,404 | |
| Total Japan | | | | | | | 16,522 | |
| | | | | | | | | |
| Netherlands 6.70% | | | | | | | | |
| | | | | | | | | |
| Banks 1.47% | | | | | | | | |
| ING Groep NV | | | 61,510 | | | | 866 | |
| | | | | | | | | |
| Industrial Conglomerates 0.72% | | | | | | | | |
| Koninklijke Philips NV | | | 13,936 | | | | 425 | |
| | | | | | | | | |
| Insurance 1.18% | | | | | | | | |
| NN Group NV | | | 20,601 | | | | 698 | |
| | | | | | | | | |
| Oil, Gas & Consumable Fuels 3.33% | | | | | | | | |
| Royal Dutch Shell plc B Shares | | | 67,821 | | | | 1,968 | |
| Total Netherlands | | | | | | | 3,957 | |
| | | | | | | | | |
| New Zealand 0.37% | | | | | | | | |
| | | | | | | | | |
| Construction Materials | | | | | | | | |
| Fletcher Building Ltd. | | | 29,802 | | | | 219 | |
| | | | | | | | | |
| Portugal 0.78% | | | | | | | | |
| | | | | | | | | |
| Electric: Utilities 0.37% | | | | | | | | |
| EDP - Energias de Portugal SA | | | 71,476 | | | | 218 | |
| 10 | See Notes to Financial Statements. |
Schedule of Investments (continued)
December 31, 2016
| | | | | | U.S. $ | |
| | | | | | Fair Value | |
| Investments | | Shares | | | (000) | |
| Portugal (continued) | | | | | | | | |
| | | | | | | | | |
| Oil, Gas & Consumable Fuels 0.41% | | | | | | | | |
| Galp Energia SGPS SA | | | 16,247 | | | $ | 242 | |
| Total Portugal | | | | | | | 460 | |
| | | | | | | | | |
| Singapore 0.98% | | | | | | | | |
| | | | | | | | | |
| Equity Real Estate Investment Trusts 0.50% | | | | | | | | |
| Ascendas Real Estate Investment Trust | | | 186,800 | | | | 293 | |
| | | | | | | | | |
| Food Products 0.48% | | | | | | | | |
| Wilmar International Ltd. | | | 114,300 | | | | 283 | |
| Total Singapore | | | | | | | 576 | |
| | | | | | | | | |
| South Korea 1.51% | | | | | | | | |
| | | | | | | | | |
| Biotechnology 0.52% | | | | | | | | |
| Celltrion, Inc.* | | | 3,434 | | | | 305 | |
| | | | | | | | | |
| Technology Hardware, Storage & Peripherals 0.99% |
| Samsung Electronics Co., Ltd. | | | 394 | | | | 586 | |
| Total South Korea | | | | | | | 891 | |
| | | | | | | | | |
| Spain 2.17% | | | | | | | | |
| | | | | | | | | |
| Construction & Engineering 0.66% | | | | | | | | |
| Sacyr SA * | | | 166,580 | | | | 389 | |
| | | | | | | | | |
| Oil, Gas & Consumable Fuels 1.21% | | | | | | | | |
| Repsol SA | | | 50,675 | | | | 716 | |
| | | | | | | | | |
| Specialty Retail 0.30% | | | | | | | | |
| Industria de Diseno Textil SA | | | 5,085 | | | | 174 | |
| Total Spain | | | | | | | 1,279 | |
| | | | | | | | | |
| Sweden 1.50% | | | | | | | | |
| | | | | | | | | |
| Machinery 0.65% | | | | | | | | |
| Volvo AB B Shares | | | 32,597 | | | | 381 | |
| | | | | | | | | |
| Real Estate Management & Development 0.85% |
| Castellum AB | | | 36,586 | | | | 501 | |
| Total Sweden | | | | | | | 882 | |
| | | | | | U.S. $ | |
| | | | | | Fair Value | |
| Investments | | Shares | | | (000) | |
| Switzerland 7.62% | | | | | | | | |
| | | | | | | | | |
| Capital Markets 0.50% | | | | | | | | |
| Credit Suisse Group AG Registered Shares* | | | 20,588 | | | $ | 295 | |
| | | | | | | | | |
| Food Products 2.29% | | | | | | | | |
| Nestle SA Registered Shares | | | 18,836 | | | | 1,351 | |
| | | | | | | | | |
| Insurance 0.70% | | | | | | | | |
| Swiss Life Holding AG Registered Shares* | | | 1,465 | | | | 415 | |
| | | | | | | | | |
| Pharmaceuticals 4.13% | | | | | | | | |
| Novartis AG Registered Shares | | | 11,012 | | | | 801 | |
| Roche Holding AG | | | 7,169 | | | | 1,638 | |
| | | | | | | | 2,439 | |
| Total Switzerland | | | | | | | 4,500 | |
| | | | | | | | | |
| Taiwan 0.64% | | | | | | | | |
| | | | | | | | | |
| Semiconductors & Semiconductor Equipment | | | | | | | | |
| Taiwan Semiconductor Manufacturing Co., Ltd. | | | 67,000 | | | | 377 | |
| | | | | | | | | |
| United Kingdom 10.59% | | | | | | | | |
| | | | | | | | | |
| Aerospace & Defense 0.87% | | | | | | | | |
| BAE Systems plc | | | 70,209 | | | | 512 | |
| | | | | | | | | |
| Air Freight & Logistics 0.23% | | | | | | | | |
| Royal Mail plc | | | 23,433 | | | | 134 | |
| | | | | | | | | |
| Auto Components 1.58% | | | | | | | | |
| GKN plc | | | 227,955 | | | | 932 | |
| | | | | | | | | |
| Banks 1.01% | | | | | | | | |
| HSBC Holdings plc | | | 36,628 | | | | 296 | |
| Royal Bank of Scotland Group plc * | | | 107,629 | | | | 298 | |
| | | | | | | | 594 | |
| | | | | | | | | |
| Hotels, Restaurants & Leisure 0.71% | | | | | | | | |
| Compass Group plc | | | 16,467 | | | | 304 | |
| Merlin Entertainments plc† | | | 20,944 | | | | 116 | |
| | | | | | | | 420 | |
| | See Notes to Financial Statements. | 11 |
Schedule of Investments (continued)
December 31, 2016
| | | | | | U.S. $ | |
| | | | | | Fair Value | |
| Investments | | Shares | | | (000) | |
| United Kingdom (continued) | | | | | | | | |
| | | | | | | | | |
| Insurance 1.13% | | | | | | | | |
| Direct Line Insurance Group plc | | | 147,031 | | | $ | 669 | |
| | | | | | | | | |
| Metals & Mining 0.45% | | | | | | | | |
| Anglo American plc* | | | 18,779 | | | | 269 | |
| | | | | | | | | |
| Pharmaceuticals 1.36% | | | | | | | | |
| GlaxoSmithKline plc | | | 41,576 | | | | 800 | |
| | | | | | | | | |
| Tobacco 2.30% | | | | | | | | |
| British American Tobacco plc | | | 23,834 | | | | 1,358 | |
| | | | | | | | | |
| Wireless Telecommunication Services 0.95% | | | | | | | | |
| Vodafone Group plc | | | 229,046 | | | | 564 | |
| Total United Kingdom | | | | | | | 6,252 | |
| | | | | | | | | |
| United States 2.31% | | | | | | | | |
| | | | | | | | | |
| Biotechnology | | | | | | | | |
| Shire plc | | | 23,596 | | | | 1,362 | |
Total Common Stocks
(cost $56,303,958) | | | | | | | 57,814 | |
| | | Principal | | | U.S. $ | |
| | | Amount | | | Fair Value | |
| Investments | | (000) | | | (000) | |
| SHORT-TERM INVESTMENT 1.87% | | | | | | | | |
| | | | | | | | | |
| Repurchase Agreement | | | | | | | | |
Repurchase Agreement dated 12/30/2016, 0.03% due 1/3/2017 with Fixed Income Clearing Corp. collateralized by $1,060,000 of U.S. Treasury Inflation Indexed Note at 0.125% due 4/15/2017; value: $1,130,466; proceeds: $1,103,557
(cost $1,103,554) | | | $1,104 | | | $ | 1,104 | |
Total Investments in Securities 99.81%
(cost $57,407,512) | | | | | | | 58,918 | |
| Foreign Cash and Other Assets in Excess of Liabilities 0.19% | | | | | | | 111 | |
| Net Assets 100.00% | | | | | | $ | 59,029 | |
| ADR | | American Depositary Receipt. |
| * | | Non-income producing security. |
| † | | Security was purchased pursuant to Rule 144A under the Securities Act of 1933 and, unless registered under such Act or exempted from registration, may only be resold to qualified institutional buyers. |
| 12 | See Notes to Financial Statements. |
Schedule of Investments (concluded)
December 31, 2016
The following is a summary of the inputs used as of December 31, 2016 in valuing the Fund’s investments carried at fair value(1):
| | | Level 1 | | | Level 2 | | | Level 3 | | | Total | |
| Investment Type(2) | | (000) | | | (000) | | | (000) | | | (000) | |
| Common Stocks(3) | | | $57,814 | | | $ | – | | | $ | – | | | $ | 57,814 | |
| Repurchase Agreement | | | – | | | | 1,104 | | | | – | | | | 1,104 | |
| Total | | | $57,814 | | | $ | 1,104 | | | $ | – | | | $ | 58,918 | |
| (1) | | Refer to Note 2(i) for a description of fair value measurements and the three-tier hierarchy of inputs. |
| (2) | | See Schedule of Investments for fair values in each industry and identification of foreign issuers and/or geography. |
| (3) | | As of December 31, 2016, the Fund utilized the last sale or official closing price on the exchange or system on which foreign securities are principally traded which resulted in Level 1 inputs. As of December 31, 2015, the Fund utilized adjusted valuations for the majority of foreign securities which resulted in Level 2 inputs (as described in Note 2(a)). For the fiscal year ended December 31, 2016, total securities transferred from Level 2 to Level 1 amounted to $15,763,692. |
| | See Notes to Financial Statements. | 13 |
Statement of Assets and Liabilities
December 31, 2016
| ASSETS: | | | | |
| Investments in securities, at fair value (cost $57,407,512) | | $ | 58,918,039 | |
| Foreign cash, at value (cost $24,349) | | | 24,516 | |
| Receivables: | | | | |
| Interest and dividends | | | 130,034 | |
| Capital shares sold | | | 103,685 | |
| From advisor (See Note 3) | | | 18,264 | |
| Prepaid expenses | | | 341 | |
| Total assets | | | 59,194,879 | |
| LIABILITIES: | | | | |
| Payables: | | | | |
| Management fee | | | 37,199 | |
| Investment securities purchased | | | 23,093 | |
| Directors’ fees | | | 4,540 | |
| Fund administration | | | 1,984 | |
| Capital shares reacquired | | | 9 | |
| Accrued expenses | | | 98,951 | |
| Total liabilities | | | 165,776 | |
| NET ASSETS | | $ | 59,029,103 | |
| COMPOSITION OF NET ASSETS: | | | | |
| Paid-in capital | | $ | 66,535,802 | |
| Distributions in excess of net investment income | | | (52,131 | ) |
| Accumulated net realized loss on investments and foreign currency related translation | | | (8,960,368 | ) |
| Net unrealized appreciation on investments and translation of assets and liabilities denominated in foreign currencies | | | 1,505,800 | |
| Net Assets | | $ | 59,029,103 | |
| Outstanding shares (50 million shares of common stock authorized, $.001 par value) | | | 4,000,773 | |
| Net asset value, offering and redemption price per share (Net assets divided by outstanding shares) | | | $14.75 | |
| 14 | See Notes to Financial Statements. |
Statement of Operations
For the Year Ended December 31, 2016
| Investment income: | | | | |
| Dividends (net of foreign withholding taxes of $190,182) | | $ | 1,924,744 | |
| Total investment income | | | 1,924,744 | |
| Expenses: | | | | |
| Management fee | | | 437,720 | |
| Non 12b-1 service fees | | | 145,793 | |
| Shareholder servicing | | | 62,530 | |
| Professional | | | 54,220 | |
| Custody | | | 46,871 | |
| Reports to shareholders | | | 28,713 | |
| Fund administration | | | 23,345 | |
| Directors’ fees | | | 2,044 | |
| Other | | | 11,963 | |
| Gross expenses | | | 813,199 | |
| Expense reductions (See Note 8) | | | (225 | ) |
| Fees waived and expenses reimbursed (See Note 3) | | | (305,220 | ) |
| Net expenses | | | 507,754 | |
| Net investment income | | | 1,416,990 | |
| Net realized and unrealized gain (loss): | | | | |
| Net realized loss on investments (net of foreign capital gains tax of $1,186) | | | (4,277,647 | ) |
| Net realized gain on foreign currency related transactions | | | 43,274 | |
| Net change in unrealized appreciation/depreciation on investments | | | 1,852,801 | |
| Net change in unrealized appreciation/depreciation on translation of assets and liabilities denominated in foreign currencies | | | (1,538 | ) |
| Net realized and unrealized loss | | | (2,383,110 | ) |
| Net Decrease in Net Assets Resulting From Operations | | $ | (966,120 | ) |
| | See Notes to Financial Statements. | 15 |
Statements of Changes in Net Assets
| | | For the Year Ended | | | For the Year Ended | |
| INCREASE (DECREASE) IN NET ASSETS | | December 31, 2016 | | | December 31, 2015 | |
| Operations: | | | | | | | | |
| Net investment income | | $ | 1,416,990 | | | $ | 1,111,868 | |
| Net realized loss on investments and foreign currency related transactions | | | (4,234,373 | ) | | | (3,769,237 | ) |
| Net change in unrealized appreciation/depreciation on investments and translation of assets and liabilities denominated in foreign currencies | | | 1,851,263 | | | | 1,259,624 | |
| Net decrease in net assets resulting from operations | | | (966,120 | ) | | | (1,397,745 | ) |
| Distributions to shareholders from: | | | | | | | | |
| Net investment income | | | (1,555,460 | ) | | | (911,329 | ) |
| Tax return of capital | | | – | | | | (31,072 | ) |
| Total distributions to shareholders | | | (1,555,460 | ) | | | (942,311 | ) |
| Capital share transactions (See Note 13) | | | | | | | | |
| Proceeds from sales of shares | | | 3,545,976 | | | | 10,297,052 | |
| Reinvestment of distributions | | | 1,555,460 | | | | 942,311 | |
| Cost of shares reacquired | | | (3,775,290 | ) | | | (1,303,723 | ) |
| Net increase in net assets resulting from capital share transactions | | | 1,326,146 | | | | 9,935,640 | |
| Net increase (decrease) in net assets | | | (1,195,434 | ) | | | 7,595,584 | |
| NET ASSETS: | | | | | | | | |
| Beginning of year | | $ | 60,224,537 | | | $ | 52,628,953 | |
| End of year | | $ | 59,029,103 | | | $ | 60,224,537 | |
| Distributions in excess of net investment income | | $ | (52,131 | ) | | $ | (25,667 | ) |
| 16 | See Notes to Financial Statements. |
This page is intentionally left blank.
Financial Highlights
| | | | | | Per Share Operating Performance: |
| | | | | | | | | | | | | | | Distributions to |
| | | | | | Investment operations: | | shareholders from: |
| | | | | | | | | | | | Total | | | | | | | | | |
| | | | | | | | | Net | | from | | | | | | | | | |
| | | Net asset | | Net | | realized | | invest- | | | | | | | | | |
| | | value, | | invest- | | and | | ment | | Net | | Net | | Return |
| | | beginning
of period | | ment
income(a) | | unrealized
gain (loss) | | opera-
tions | | investment
income | | realized
gain | | of
capital |
| 12/31/2016 | | | $15.42 | | | | $0.36 | | | | $(0.63 | ) | | $ | (0.27 | ) | | | $(0.40 | ) | | $ | – | | | $ | – | |
| 12/31/2015 | | | 15.95 | | | | 0.30 | | | | (0.59 | ) | | | (0.29 | ) | | | (0.23 | ) | | | – | | | | (0.01 | ) |
| 12/31/2014 | | | 18.38 | | | | 0.26 | | | | (1.99 | ) | | | (1.73 | ) | | | (0.18 | ) | | | (0.52 | ) | | | – | |
| 12/31/2013 | | | 15.31 | | | | 0.22 | | | | 3.32 | | | | 3.54 | | | | (0.24 | ) | | | (0.23 | ) | | | – | |
| 12/31/2012 | | | 13.48 | | | | 0.29 | | | | 1.75 | | | | 2.04 | | | | (0.21 | ) | | | – | | | | – | |
| (a) | Calculated using average shares outstanding during the period. |
| (b) | Total return does not consider the effects of sales charges or other expenses imposed by an insurance company and assumes the reinvestment of all distributions. |
| 18 | See Notes to Financial Statements. |
| | | | | | | | | | Ratios to Average Net Assets: | | Supplemental Data: |
| | | | | | | | | | Total | | | | | | | | | | | | |
| | | | | | | | | | expenses | | | | | | | | | | | | |
| | | | Net | | | | | after | | | | | | | | Net | | | |
| | | | asset | | | | | waivers | | | | | Net | | assets, | | Portfolio |
| Total | | value, | | Total | | and/or reim- | | Total | | investment | | end of | | turnover |
| distri- | | end of | | return(b) | | bursements | | expenses | | income | | period | | rate |
| butions | | period | | (%) | | (%) | | (%) | | (%) | | (000) | | (%) |
| $(0.40 | ) | | $ | 14.75 | | | | (1.74 | ) | | | 0.87 | | | | 1.39 | | | | 2.43 | | | $ | 59,029 | | | | 190.31 | |
| | (0.24 | ) | | | 15.42 | | | | (1.78 | ) | | | 0.87 | | | | 1.43 | | | | 1.84 | | | | 60,225 | | | | 59.93 | |
| | (0.70 | ) | | | 15.95 | | | | (9.47 | ) | | | 0.87 | | | | 1.59 | | | | 1.49 | | | | 52,629 | | | | 57.80 | |
| | (0.47 | ) | | | 18.38 | | | | 23.16 | | | | 0.87 | | | | 2.02 | | | | 1.31 | | | | 31,923 | | | | 56.36 | |
| | (0.21 | ) | | | 15.31 | | | | 15.13 | | | | 0.87 | | | | 3.81 | | | | 2.03 | | | | 9,945 | | | | 78.47 | |
| | See Notes to Financial Statements. | 19 |
Notes to Financial Statements
Lord Abbett Series Fund, Inc. (the “Company”) is registered under the Investment Company Act of 1940, as amended (“the Act”), as a diversified, open-end management investment company and was incorporated under Maryland law in 1989. The Company consists of thirteen separate portfolios. This report covers International Core Equity Portfolio (the “Fund”).
The Fund’s investment objective is to seek long-term capital appreciation. The Fund has Variable Contract class shares (“Class VC Shares”), which are currently issued and redeemed only in connection with investments in, and payments under, variable annuity contracts and variable life insurance policies issued by life insurance and insurance-related companies.
The preparation of the financial statements in conformity with accounting principles generally accepted in the United States of America (“U.S. GAAP”) requires management to make certain estimates and assumptions that affect the reported amounts of assets and liabilities and disclosure of contingent assets and liabilities at the date of the financial statements and the reported amounts of increases and decreases in net assets from operations during the reporting period. Actual results could differ from those estimates. The Fund is considered an investment company under U.S. GAAP and follows the accounting and reporting guidance applicable to investment companies.
| 2. | SIGNIFICANT ACCOUNTING POLICIES |
| (a) | Investment Valuation–Under procedures approved by the Fund’s Board of Directors (the “Board”), Lord, Abbett & Co. LLC (“Lord Abbett”), the Fund’s investment manager, has formed a Pricing Committee to administer the pricing and valuation of portfolio investments and to ensure that prices utilized reasonably reflect fair value. Among other things, these procedures allow the Fund to utilize independent pricing services, quotations from securities and financial instrument dealers and other market sources to determine fair value. |
Securities actively traded on any recognized U.S. or non-U.S. exchange or on The NASDAQ Stock Market LLC are valued at the last sale price or official closing price on the exchange or system on which they are principally traded. Events occurring after the close of trading on non-U.S. exchanges may result in adjustments to the valuation of foreign securities to reflect their fair value as of the close of regular trading on the New York Stock Exchange. The Fund may utilize an independent fair valuation service in adjusting the valuations of foreign securities. Unlisted equity securities are valued at the last quoted sale price or, if no sale price is available, at the mean between the most recently quoted bid and asked prices.
Securities for which prices are not readily available are valued at fair value as determined by the Pricing Committee. The Pricing Committee considers a number of factors, including observable and unobservable inputs, when arriving at fair value. The Pricing Committee may use related or comparable assets or liabilities, recent transactions, market multiples, book values and other relevant information to determine the fair value of portfolio investments. The Board or a designated committee thereof regularly reviews fair value determinations made by the Pricing Committee and employs techniques such as reviewing related market activity, reviewing inputs and assumptions, and retrospectively comparing prices of subsequent purchases and sales transactions to fair value determinations made by the Pricing Committee.
Short-term securities with 60 days or less remaining to maturity are valued using the amortized cost method, which approximates fair value.
20
Notes to Financial Statements (continued)
| (b) | Security Transactions–Security transactions are recorded as of the date that the securities are purchased or sold (trade date). Realized gains and losses on sales of portfolio securities are calculated using the identified-cost method. |
| (c) | Investment Income–Dividend income is recorded on the ex-dividend date. Interest income is recorded on the accrual basis as earned. Discounts are accreted and premiums are amortized using the effective interest method and are included in Interest and other income on the Statement of Operations. Withholding taxes on foreign dividends have been provided for in accordance with the applicable country’s tax rules and rates. |
| (d) | Income Taxes–It is the policy of the Fund to meet the requirements of Subchapter M of the Internal Revenue Code applicable to regulated investment companies and to distribute substantially all taxable income and capital gains to its shareholders. Therefore, no income tax provision is required. |
The Fund files U.S. federal and various state and local tax returns. No income tax returns are currently under examination. The statute of limitations on the Fund’s filed U.S. federal tax returns remains open for the fiscal years ended December 31, 2013 through December 31, 2016. The statutes of limitations on the Company’s state and local tax returns may remain open for an additional year depending upon the jurisdiction.
| (e) | Expenses–Expenses incurred by the Company that do not specifically relate to an individual fund are generally allocated to the funds within the Company on a pro rata basis by relative net assets. |
| (f) | Foreign Transactions–The books and records of the Fund are maintained in U.S. dollars and transactions denominated in foreign currencies are recorded in the Fund’s records at the rate prevailing when earned or recorded. Asset and liability accounts that are denominated in foreign currencies are adjusted daily to reflect current exchange rates and any unrealized gain (loss) is included in Net change in unrealized appreciation/depreciation on translation of assets and liabilities denominated in foreign currencies in the Fund’s Statement of Operations. The resultant exchange gains and losses upon settlement of such transactions are included in Net realized loss on foreign currency related transactions in the Fund’s Statement of Operations. The Fund does not isolate that portion of the results of operations arising as a result of changes in the foreign exchange rates from the changes in market prices of the securities. |
The Fund uses foreign currency exchange contracts to facilitate transactions in foreign-denominated securities. Losses from these transactions may arise from changes in the value of the foreign currency or if the counterparties do not perform under the contracts’ terms.
| (g) | Forward Foreign Currency Exchange Contracts–The Fund may enter into forward foreign currency exchange contracts in order to reduce their exposure to changes in foreign currency exchange rates on their foreign portfolio holdings, or gain or reduce exposure to foreign currency solely for investment purposes. A forward foreign currency exchange contract is a commitment to purchase or sell a foreign currency at a future date at a negotiated rate. The contracts are valued daily at forward exchange rates and any unrealized gain (loss) is included in Net change in unrealized appreciation/depreciation on translation of assets and liabilities denominated in foreign currencies in the Fund’s Statement of Operations. The gain (loss) arising from the difference between the U.S. dollar cost of the original contract and the value of the foreign currency in U.S. dollars upon closing of such contracts is included in Net realized loss on foreign currency related transactions in the Fund’s Statement of Operations. |
21
Notes to Financial Statements (continued)
| (h) | Repurchase Agreements–The Fund may enter into repurchase agreements with respect to securities. A repurchase agreement is a transaction in which a fund acquires a security and simultaneously commits to resell that security to the seller (a bank or securities dealer) at an agreed-upon price on an agreed-upon date. The Fund requires at all times that the repurchase agreement be collateralized by cash, or by securities of the U.S. Government, its agencies, its instrumentalities, or U.S. Government sponsored enterprises having a value equal to, or in excess of, the value of the repurchase agreement (including accrued interest). If the seller of the agreement defaults on its obligation to repurchase the underlying securities at a time when the fair value of these securities has declined, the Fund may incur a loss upon disposition of the securities. |
| (i) | Fair Value Measurements–Fair value is defined as the price that the Fund would receive upon selling an investment or transferring a liability in an orderly transaction to an independent buyer in the principal or most advantageous market of the investment. A three-tier hierarchy is used to maximize the use of observable market data and minimize the use of unobservable inputs and to establish classification of fair value measurements for disclosure purposes. Inputs refer broadly to the assumptions that market participants would use in pricing the asset or liability, including assumptions about risk—for example, the risk inherent in a particular valuation technique used to measure fair value (such as a pricing model) and/or the risk inherent in the inputs to the valuation technique. Inputs may be observable or unobservable. Observable inputs reflect the assumptions market participants would use in pricing the asset or liability. Observable inputs are based on market data obtained from sources independent of the reporting entity. Unobservable inputs reflect the reporting entity’s own assumptions about the assumptions market participants would use in pricing the asset or liability. Unobservable inputs are based on the best information available in the circumstances. The three-tier hierarchy classification is determined based on the lowest level of inputs that is significant to the fair value measurement, and is summarized in the three broad Levels listed below: |
| • | Level 1 – | unadjusted quoted prices in active markets for identical investments; |
| | | |
| • | Level 2 – | other significant observable inputs (including quoted prices for similar investments, interest rates, prepayment speeds, credit risk, etc.); and |
| | | |
| • | Level 3 – | significant unobservable inputs (including the Fund’s own assumptions in determining the fair value of investments). |
A summary of inputs used in valuing the Fund’s investments as of December 31, 2016 and, if applicable, Level 1/Level 2 transfers and Level 3 rollforwards for the fiscal year then ended is included in the Fund’s Schedule of Investments.
Changes in valuation techniques may result in transfers into or out of an assigned level within the three-tier hierarchy. All transfers between different levels within the three-tier hierarchy are deemed to have occurred as of the beginning of the reporting period. The inputs or methodology used for valuing securities are not necessarily an indication of the risk associated with investing in those securities.
22
Notes to Financial Statements (continued)
| 3. | MANAGEMENT FEE AND OTHER TRANSACTIONS WITH AFFILIATES |
Management Fee
The Company has a management agreement with Lord Abbett, pursuant to which Lord Abbett supplies the Fund with investment management services and executive and other personnel, provides office space and pays for ordinary and necessary office and clerical expenses relating to research and statistical work and supervision of the Fund’s investment portfolio.
The management fee is based on the Fund’s average daily net assets at the following annual rate:
| First $1 billion | .75% |
| Next $1 billion | .70% |
| Over $2 billion | .65% |
For the fiscal year ended December 31, 2016, the effective management fee, net of waivers, was at an annualized rate of 0.23% of the Fund’s average daily net assets.
In addition, Lord Abbett provides certain administrative services to the Fund pursuant to an Administrative Services Agreement in return for a fee at an annual rate of .04% of the Fund’s average daily net assets.
During the fiscal year ended December 31, 2016 and continuing through April 30, 2017, Lord Abbett has contractually agreed to waive its fees and reimburse expenses to the extent necessary to limit total net annual operating expenses, excluding any acquired fund fees and expenses, to an annual rate of .87%. This agreement may be terminated only upon the approval of the Board.
The Company, on behalf of the Fund, has entered into services arrangements with certain insurance companies. Under these arrangements, certain insurance companies will be compensated up to ..25% of the average daily net asset value (“NAV”) of the Fund’s Class VC Shares held in the insurance company’s separate account to service and maintain the Variable Contract owners’ accounts. This amount is included in Non 12b-1 service fees on the Statement of Operations. The Fund may also compensate certain insurance companies, third-party administrators and other entities for providing recordkeeping, sub-transfer agency and other administrative services to the Fund. This amount is included in Shareholder servicing on the Statement of Operations.
Two Directors and certain of the Company’s officers have an interest in Lord Abbett.
| 4. | DISTRIBUTIONS AND CAPITAL LOSS CARRYFORWARDS |
Dividends from net investment income, if any, are declared and paid at least semi-annually. Taxable net realized gains from investment transactions, reduced by allowable capital loss carryforwards, if any, are declared and distributed to shareholders at least annually. The capital loss carryforward amount, if any, is available to offset future net capital gains. Dividends and distributions to shareholders are recorded on the ex-dividend date. The amounts of dividends and distributions from net investment income and net realized capital gains are determined in accordance with federal income tax regulations, which may differ from U.S. GAAP. These book/tax differences are either considered temporary or permanent in nature. To the extent these differences are permanent in nature, such amounts are reclassified within the components of net assets based on their federal tax basis treatment; temporary differences do not require reclassification. Dividends and distributions that exceed earnings and profits for tax purposes are reported as a tax return of capital.
23
Notes to Financial Statements (continued)
The tax character of distributions paid during the fiscal years ended December 31, 2016 and 2015 was as follows:
| | | Year Ended
12/31/2016 | | Year Ended
12/31/2015 |
| Distributions paid from: | | | | |
| Ordinary income | | $1,555,460 | | $911,239 |
| Return of capital | | – | | 31,072 |
| Total distributions paid | | $1,555,460 | | $942,311 |
As of December 31, 2016, the components of accumulated losses on a tax-basis were as follows:
| Capital loss carryforwards* | | $ | (8,417,878 | ) |
| Temporary differences | | | (13,012 | ) |
| Unrealized gains – net | | | 924,191 | |
| Total accumulated losses – net | | $ | (7,506,699 | ) |
* The capital losses will carry forward indefinitely.
At the Fund’s election, certain losses incurred within the taxable year (Qualified Late-Year Losses) are deemed to arise on the first business day of the Fund’s next taxable year. The Fund incurred and will elect to defer late-year ordinary losses of $8,472 during fiscal 2016.
As of December 31, 2016, the aggregate unrealized security gains and losses based on cost for U.S. federal income tax purposes were as follows:
| Tax cost | | $ | 57,989,121 | |
| Gross unrealized gain | | | 2,765,823 | |
| Gross unrealized loss | | | (1,836,905 | ) |
| Net unrealized security gain | | $ | 928,918 | |
The difference between book-basis and tax-basis unrealized gains (losses) is attributable to the tax treatment of certain foreign securities and wash sales.
Permanent items identified during the fiscal year ended December 31, 2016 have been reclassified among the components of net assets based on their tax basis treatment as follows:
Distributions
in Excess of
Net Investment
Income | Accumulated
Net Realized
Loss | | Paid-in
Capital | |
| $112,006 | $(95,405 | ) | $(16,601 | ) |
The permanent differences are attributable to the tax treatment of foreign currency transactions, certain expenses, certain distributions, and certain foreign securities.
| 5. | PORTFOLIO SECURITIES TRANSACTIONS |
Purchases and sales of investment securities (excluding short-term investments) for the fiscal year ended December 31, 2016 were as follows:
| Purchases | Sales |
| $110,408,183 | $108,278,226 |
There were no purchases or sales of U.S. Government securities for the fiscal year ended December 31, 2016.
24
Notes to Financial Statements (continued)
| 6. | DISCLOSURES ABOUT OFFSETTING ASSETS AND LIABILITIES |
The Financial Accounting Standards Board (“FASB”) requires disclosures intended to help better assess the effect or potential effect of offsetting arrangements on a fund’s financial position. The following tables illustrate gross and net information about recognized assets and liabilities eligible for offset in the statement of assets and liabilities; and disclose such amounts subject to an enforceable master netting agreement or similar agreement, by counterparty. A master netting agreement is an agreement between a fund and a counterparty which provides for the net settlement of amounts owed under all contracts traded under that agreement, as well as cash collateral, through a single payment by one party to the other in the event of default on or termination of any one contract. The Fund’s accounting policy with respect to balance sheet offsetting is that, absent an event of default by the counterparty or a termination of the agreement, the master netting agreement does not result in an offset of reported amounts of financial assets and liabilities in the statement of assets and liabilities across transactions between the Fund and the applicable counterparty:
| Description | | Gross Amounts of
Recognized Assets | | Gross Amounts
Offset in the
Statement of Assets
and Liabilities | | Net Amounts of
Assets Presented
in the Statement of
Assets and Liabilities |
| Repurchase Agreement | | $1,103,554 | | $ | – | | $1,103,554 |
| Total | | $1,103,554 | | $ | – | | $1,103,554 |
| | | Net Amounts
of Assets
Presented in | | Amounts Not Offset in the
Statement of Assets and Liabilities | | |
| Counterparty | | the Statement
of Assets and
Liabilities | | Financial
Instruments | | Cash
Collateral
Received(a) | | Securities
Collateral
Received(a) | | Net
Amount(b) |
| Fixed Income Clearing Corp. | | $1,103,554 | | $ | – | | $ | – | | $(1,103,554) | | $ | – |
| Total | | $1,103,554 | | $ | – | | $ | – | | $(1,103,554) | | $ | – |
| (a) | Collateral disclosed is limited to an amount not to exceed 100% of the net amount of assets presented in the Statement of Assets and Liabilities, for each respective counterparty. |
| (b) | Net amount represents the amount owed to the Fund by the counterparty as of December 31, 2016. |
| 7. | DIRECTORS’ REMUNERATION |
The Company’s officers and two Directors, who are associated with Lord Abbett, do not receive any compensation from the Company for serving in such capacities. Independent Directors’ fees are allocated among all Lord Abbett-sponsored funds based on the net assets of each fund. There is an equity-based plan available to all Independent Directors under which Independent Directors must defer receipt of a portion of, and may elect to defer receipt of an additional portion of Directors’ fees. The deferred amounts are treated as though equivalent dollar amounts had been invested in the funds. Such amounts and earnings accrued thereon are included in Directors’ fees on the Statement of Operations and in Directors’ fees payable on the Statement of Assets and Liabilities and are not deductible for U.S. federal income tax purposes until such amounts are paid.
The Company has entered into an arrangement with its transfer agent and custodian, whereby credits realized as a result of uninvested cash balances are used to reduce a portion of the Fund’s expenses.
25
Notes to Financial Statements (continued)
The Fund and certain other funds managed by Lord Abbett (collectively, the “Participating Funds”) entered into a syndicated line of credit facility with various lenders for $550 million (the “Facility”), whereas State Street Bank and Trust Company (“SSB”) participates as a lender and as agent for the lenders. The Facility is to be used for temporary or emergency purposes as an additional source of liquidity to satisfy redemptions. The Participating Funds are subject to graduated borrowing limits of one-third of Fund assets (if Fund assets are less than $750 million), $250 million, $300 million, or $350 million, based on past borrowings and likelihood of future borrowings. The Facility will continue through August 28, 2017.
During the fiscal year ended December 31, 2016, the Fund did not utilize the Facility.
| 10. | INTERFUND LENDING PROGRAM |
On July 26, 2016, the U.S. Securities and Exchange Commission issued an exemptive order (“SEC exemptive order”) which permits certain registered open-end management investment companies managed by Lord Abbett, including the Fund, to participate in a joint lending and borrowing program (the “Interfund Lending Program”). The SEC exemptive order allows the Funds to borrow money from and lend money to each other for temporary or emergency purposes subject to the limitations and conditions.
During the fiscal year ended December 31, 2016, the Fund did not participate as a borrower or lender in the Interfund Lending Program.
| 11. | CUSTODIAN AND ACCOUNTING AGENT |
SSB is the Company’s custodian and accounting agent. SSB performs custodial, accounting and recordkeeping functions relating to portfolio transactions and calculating the Fund’s NAV.
The Fund is subject to the general risks and considerations associated with equity investing. The value of an investment will fluctuate in response to movements in the equity securities markets in general and to the changing prospects of individual companies in which the Fund invests.
Large company value stocks, in which the Fund invests, may perform differently than the market as a whole and other types of stocks, such as small company stocks and growth stocks.
The Fund is subject to the risks of investing in foreign securities and derivatives. Foreign securities may pose greater risks than domestic securities, including greater price fluctuations and higher transaction costs. Foreign investments also may be affected by changes in currency rates or currency controls. These risks are generally greater for securities issued by companies in emerging market countries.
The Fund is also subject to the risks associated with derivatives, which may be different from and greater than the risks associated with investing directly in securities and other investments.
These factors can affect the Fund’s performance.
26
Notes to Financial Statements (concluded)
| 13. | SUMMARY OF CAPITAL TRANSACTIONS |
Transactions in shares of capital stock were as follows:
| | | Year Ended
December 31, 2016 | | | Year Ended
December 31, 2015 | |
| Shares sold | | | 241,082 | | | | 624,933 | |
| Reinvestment of distributions | | | 105,670 | | | | 61,468 | |
| Shares reacquired | | | (250,444 | ) | | | (81,333 | ) |
| Increase | | | 96,308 | | | | 605,068 | |
27
Report of Independent Registered Public Accounting Firm
To the Board of Directors of Lord Abbett Series Fund, Inc. and the Shareholders of International Core Equity Portfolio:
We have audited the accompanying statement of assets and liabilities, including the schedule of investments, of the International Core Equity Portfolio, one of the portfolios constituting the Lord Abbett Series Fund, Inc. (the “Fund”) as of December 31, 2016, and the related statement of operations for the year then ended, the statements of changes in net assets for each of the two years in the period then ended, and the financial highlights for each of the five years in the period then ended. These financial statements and financial highlights are the responsibility of the Fund’s management. Our responsibility is to express an opinion on these financial statements and financial highlights based on our audits.
We conducted our audits in accordance with the standards of the Public Company Accounting Oversight Board (United States). Those standards require that we plan and perform the audit to obtain reasonable assurance about whether the financial statements and financial highlights are free of material misstatement. The Fund is not required to have, nor were we engaged to perform, an audit of its internal control over financial reporting. Our audits included consideration of internal control over financial reporting as a basis for designing audit procedures that are appropriate in the circumstances, but not for the purpose of expressing an opinion on the effectiveness of the Fund’s internal control over financial reporting. Accordingly, we express no such opinion. An audit also includes examining, on a test basis, evidence supporting the amounts and disclosures in the financial statements, assessing the accounting principles used and significant estimates made by management, as well as evaluating the overall financial statement presentation. Our procedures included confirmation of securities owned as of December 31, 2016, by correspondence with the custodian. We believe that our audits provide a reasonable basis for our opinion.
In our opinion, such financial statements and financial highlights referred to above present fairly, in all material respects, the financial position of International Core Equity Portfolio of the Lord Abbett Series Fund, Inc. as of December 31, 2016, the results of its operations for the year then ended, the changes in its net assets for each of the two years in the period then ended, and the financial highlights for each of the five years in the period then ended, in conformity with accounting principles generally accepted in the United States of America.
DELOITTE & TOUCHE LLP
New York, New York
February 15, 2017
28
Basic Information About Management
The Board is responsible for the management of the business and affairs of the Company in accordance with the laws of the State of Maryland. The Board elects officers who are responsible for the day-to-day operations of each Fund and who execute policies authorized by the Board. The Board also approves an investment adviser to each Fund and continues to monitor the cost and quality of the services the investment adviser provides, and annually considers whether to renew the contract with the adviser. Generally, each Director holds office until his/her successor is elected and qualified or until his/her earlier resignation or removal, as provided in the Company’s organizational documents.
Lord Abbett, a Delaware limited liability company, is the Fund’s investment adviser. Designated Lord Abbett personnel are responsible for the day-to-day management of the Funds.
Interested Directors
Ms. Foster and Mr. Sieg are affiliated with Lord Abbett and are “interested persons” of the Company as defined in the Act. Ms. Foster and Mr. Sieg are directors/trustees of each of the 12 investment companies in the Lord Abbett Family of Funds, which consist of 60 portfolios or series. Ms. Foster is an officer of the Lord Abbett Family of Funds.
Name, Address and
Year of Birth | | Current Position and
Length of Service
with the Company | | Principal Occupation and Other Directorships
During the Past Five Years |
Daria L. Foster
Lord, Abbett & Co. LLC
90 Hudson Street
Jersey City, NJ 07302
(1954) | | Director and President since 2006; Chief Executive Officer since 2012 | | Principal Occupation: Managing Partner of Lord Abbett, joined Lord Abbett in 1990.
Other Directorships: None. |
| | | | | |
Douglas B. Sieg
Lord, Abbett & Co. LLC
90 Hudson Street
Jersey City, NJ 07302
(1969) | | Director since 2016 | | Principal Occupation: Partner (since 2001) and Head of Client Services (since 2013), formerly Director of Marketing and Relationship Management, joined Lord Abbett in 1994.
Other Directorships: None. |
Independent Directors
The following Independent Directors also are directors/trustees of each of the 12 investment companies in the Lord Abbett Family of Funds, which consist of 60 portfolios or series.
Name, Address and
Year of Birth | | Current Position and
Length of Service
with the Company | | Principal Occupation and Other Directorships
During the Past Five Years |
Robert B. Calhoun, Jr.
Lord, Abbett & Co. LLC
c/o Legal Dept.
90 Hudson Street
Jersey City, NJ 07302
(1942) | | Director since 1998 | | Principal Occupation: Senior Advisor of Monitor Clipper Partners, a private equity investment fund (since 1997); President of Clipper Asset Management Corp. (1991–2009).
Other Directorships: None. |
29
Basic Information About Management (continued)
Name, Address and
Year of Birth | | Current Position and
Length of Service
with the Company | | Principal Occupation and Other Directorships
During the Past Five Years |
Eric C. Fast
Lord, Abbett & Co. LLC
c/o Legal Dept.
90 Hudson Street
Jersey City, NJ 07302
(1949) | | Director since 2014 | | Principal Occupation: Chief Executive Officer of Crane Co., an industrial products company (2001–2014).
Other Directorships: Currently serves as director of Automatic Data Processing, Inc. (since 2007) and Regions Financial Corporation (since 2010). Previously served as a director of Crane Co. (1999–2014). |
| | | | | |
Evelyn E. Guernsey
Lord, Abbett & Co. LLC
c/o Legal Dept.
90 Hudson Street
Jersey City, NJ 07302
(1955) | | Director since 2011 | | Principal Occupation: CEO, Americas of J.P. Morgan Asset Management (2004–2010).
Other Directorships: None. |
| | | | | |
Julie A. Hill
Lord, Abbett & Co. LLC
c/o Legal Dept.
90 Hudson Street
Jersey City, NJ 07302
(1946) | | Director since 2004 | | Principal Occupation: Owner and CEO of The Hill Company, a business consulting firm (since 1998).
Other Directorships: Currently serves as director of Anthem, Inc., a health benefits company (since 1994). |
| | | | | |
Franklin W. Hobbs
Lord, Abbett & Co. LLC
c/o Legal Dept.
90 Hudson Street
Jersey City, NJ 07302
(1947) | | Director since 2001 | | Principal Occupation: Advisor of One Equity Partners, a private equity firm (since 2004).
Other Directorships: Currently serves as director and Chairman of the Board of Ally Financial Inc., a financial services firm (since 2009), and as director of Molson Coors Brewing Company (since 2002). |
| | | | | |
James M. McTaggart
Lord, Abbett & Co. LLC
c/o Legal Dept.
90 Hudson Street
Jersey City, NJ 07302
(1947) | | Director since 2012 | | Principal Occupation: Independent management advisor and consultant (since 2012); Vice President, CRA International, Inc. (doing business as Charles River Associates), a global management consulting firm (2009–2012); Founder and Chairman of Marakon Associates, Inc., a strategy consulting firm (1978–2009); and Officer and Director of Trinsum Group, a holding company (2007–2009).
Other Directorships: Currently serves as director of Blyth, Inc., a home products company (since 2004). |
| | | | | |
Mark A. Schmid
Lord, Abbett & Co. LLC
c/o Legal Dept.
90 Hudson Street
Jersey City, NJ 07302
(1959) | | Director since 2016 | | Principal Occupation: Vice President and Chief Investment Officer of the University of Chicago (since 2009).
Other Directorships: None. |
30
Basic Information About Management (continued)
Name, Address and
Year of Birth | | Current Position and
Length of Service
with the Company | | Principal Occupation and Other Directorships
During the Past Five Years |
James L.L. Tullis
Lord, Abbett & Co. LLC
c/o Legal Dept.
90 Hudson Street
Jersey City, NJ 07302
(1947) | | Director since 2006; Chairman since 2017 | | Principal Occupation: CEO of Tullis-Dickerson and Co. Inc., a venture capital management firm (since 1990); CEO of Tullis Health Investors Inc. (since 2012).
Other Directorships: Currently serves as director of Crane Co. (since 1998). |
Officers
None of the officers listed below have received compensation from the Company. All of the officers of the Company also may be officers of the other Lord Abbett Funds and maintain offices at 90 Hudson Street, Jersey City, NJ 07302. Unless otherwise indicated, the position(s) and title(s) listed under the “Principal Occupation During the Past Five Years” column indicate each officer’s position(s) and title(s) with Lord Abbett. Each officer serves for an indefinite term (i.e., until his or her death, resignation, retirement, or removal).
Name and
Year of Birth | | Current Position
with the Company | | Length of Service
of Current
Position | | Principal Occupation
During the Past Five Years |
Daria L. Foster
(1954) | | President and Chief Executive Officer | | Elected as President in 2006 and Chief Executive Officer in 2012 | | Managing Partner of Lord Abbett, joined Lord Abbett in 1990. |
| | | | | | | |
Sean J. Aurigemma
(1969) | | Executive Vice President | | Elected in 2010 | | Portfolio Manager, joined Lord Abbett in 2007. |
| | | | | | | |
Jeff D. Diamond
(1960) | | Executive Vice President | | Elected in 2008 | | Portfolio Manager, joined Lord Abbett in 2007. |
| | | | | | | |
Todd D. Jacobson
(1966) | | Executive Vice President | | Elected in 2005 | | Partner and Associate Director, joined Lord Abbett in 2003. |
| | | | | | | |
Robert A. Lee
(1969) | | Executive Vice President | | Elected in 2010 | | Partner and Chief Investment Officer, and was formerly Deputy Chief Investment Officer and Director of Taxable Fixed Income, joined Lord Abbett in 1997. |
| | | | | | | |
Thomas B. Maher
(1967) | | Executive Vice President | | Elected in 2010 | | Partner and Portfolio Manager, joined Lord Abbett in 2003. |
| | | | | | | |
Justin C. Maurer
(1969) | | Executive Vice President | | Elected in 2010 | | Partner and Portfolio Manager, joined Lord Abbett in 2001. |
| | | | | | | |
Vincent J. McBride
(1964) | | Executive Vice President | | Elected in 2010 | | Partner and Director, joined Lord Abbett in 2003. |
| | | | | | | |
Andrew H. O’Brien
(1973) | | Executive Vice President | | Elected in 2010 | | Partner and Portfolio Manager, joined Lord Abbett in 1998. |
31
Basic Information About Management (continued)
Name and
Year of Birth | | Current Position
with the Company | | Length of Service
of Current
Position | | Principal Occupation
During the Past Five Years |
F. Thomas O’Halloran, III
(1955) | | Executive Vice President | | Elected in 2010 | | Partner and Portfolio Manager, joined Lord Abbett in 2001. |
| | | | | | | |
Marc Pavese
(1972) | | Executive Vice President | | Elected in 2016 | | Partner and Portfolio Manager, joined Lord Abbett in 2008. |
| | | | | | | |
Walter H. Prahl
(1958) | | Executive Vice President | | Elected in 2012 | | Partner and Director, joined Lord Abbett in 1997. |
| | | | | | | |
Steven F. Rocco
(1979) | | Executive Vice President | | Elected in 2014 | | Partner and Portfolio Manager, joined Lord Abbett in 2004. |
| | | | | | | |
Didier O. Rosenfeld
(1976) | | Executive Vice President | | Elected in 2016 | | Director of Global Equity, joined Lord Abbett in 2015 and was formerly a Portfolio Manager and Senior Analyst at Cornerstone Capital Management (2014–2015) and Managing Director at State Street Global Advisors (2000–2013). |
| | | | | | | |
Frederick J. Ruvkun
(1957) | | Executive Vice President | | Elected in 2012 | | Partner and Portfolio Manager, joined Lord Abbett in 2006. |
| | | | | | | |
Paul J. Volovich
(1973) | | Executive Vice President | | Elected in 2005 | | Partner and Portfolio Manager, joined Lord Abbett in 1997. |
| | | | | | | |
A. Edward Allinson
(1961) | | Vice President | | Elected in 2011 | | Portfolio Manager, joined Lord Abbett in 2005. |
| | | | | | | |
John W. Ashbrook
(1964) | | Vice President and Assistant Secretary | | Elected in 2014 | | Assistant General Counsel, joined Lord Abbett in 2008. |
| | | | | | | |
Joan A. Binstock
(1954) | | Chief Financial Officer and Vice President | | Elected in 1999 | | Partner and Chief Financial Officer, and was formerly Chief Operations Officer, joined Lord Abbett in 1999. |
| | | | | | | |
Brooke A. Fapohunda
(1975) | | Vice President and Assistant Secretary | | Elected in 2014 | | Deputy General Counsel, joined Lord Abbett in 2006. |
| | | | | | | |
John K. Forst
(1960) | | Vice President and Assistant Secretary | | Elected in 2005 | | Partner and Deputy General Counsel, joined Lord Abbett in 2004. |
| | | | | | | |
Anthony W. Hipple
(1964) | | Vice President | | Elected in 2014 | | Portfolio Manager, joined Lord Abbett in 2002. |
| | | | | | | |
Lawrence H. Kaplan
(1957) | | Vice President and Secretary | | Elected in 1997 | | Partner and General Counsel, joined Lord Abbett in 1997. |
32
Basic Information About Management (concluded)
Name and
Year of Birth | | Current Position
with the Company | | Length of Service
of Current
Position | | Principal Occupation
During the Past Five Years |
Linda Y. Kim
(1980) | | Vice President and Assistant Secretary | | Elected in 2016 | | Counsel, joined Lord Abbett in 2015 and was formerly an Associate at Stroock & Stroock & Lavan LLP (2007–2015). |
| | | | | | | |
David J. Linsen
(1974) | | Vice President | | Elected in 2008 | | Partner and Director, joined Lord Abbett in 2001. |
| | | | | | | |
Joseph M. McGill
(1962) | | Chief Compliance Officer | | Elected in 2014 | | Partner and Chief Compliance Officer, joined Lord Abbett in 2014 and was formerly Managing Director and the Chief Compliance Officer at UBS Global Asset Management (2003–2013). |
| | | | | | | |
A. Edward Oberhaus, III
(1959) | | Vice President | | Elected in 1998 | | Partner and Director, joined Lord Abbett in 1983. |
| | | | | | | |
Noah Petrucci
(1970) | | Vice President | | Elected in 2013 | | Portfolio Manager, joined Lord Abbett in 2012 and was formerly a Portfolio Manager at Columbia Management Investment Advisers, LLC and Columbia Management Advisors, LLC (2002–2012). |
| | | | | | | |
Lawrence B. Stoller
(1963) | | Vice President and Assistant Secretary | | Elected in 2007 | | Partner and Senior Deputy General Counsel, joined Lord Abbett in 2007. |
| | | | | | | |
Leah G. Traub
(1979) | | Vice President | | Elected in 2016 | | Partner and Portfolio Manager, joined Lord Abbett in 2007. |
| | | | | | | |
Arthur K. Weise
(1970) | | Vice President | | Elected in 2010 | | Partner and Portfolio Manager, joined Lord Abbett in 2007. |
| | | | | | | |
Kewjin Yuoh
(1971) | | Vice President | | Elected in 2012 | | Partner and Portfolio Manager, joined Lord Abbett in 2010. |
| | | | | | | |
Scott S. Wallner
(1955) | | AML Compliance Officer | | Elected in 2011 | | Assistant General Counsel, joined Lord Abbett in 2004. |
| | | | | | | |
Bernard J. Grzelak
(1971) | | Treasurer | | Elected in 2003 | | Partner and Chief Operations Officer, and was formerly Director of Fund Administration, joined Lord Abbett in 2003. |
Please call 888-522-2388 for a copy of the statement of additional information, which contains further information about the Company’s Directors. It is available free upon request.
33
Approval of Advisory Contract
The Board, including all of the Directors who are not interested persons of the Fund or of Lord Abbett (the “Independent Board Members”), annually considers whether to approve the continuation of the existing management agreement between the Fund and Lord Abbett (the “Agreement”). In connection with its most recent approval, the Board reviewed materials relating specifically to the Agreement, as well as numerous materials received throughout the course of the year, including information about the Fund’s investment performance compared to the performance of its benchmark. Before making its decision as to the Fund, the Board had the opportunity to ask questions and request further information, taking into account its familiarity with Lord Abbett gained through its meetings and discussions. These meetings and discussions included the review of the portfolio management team conducted by members of the Contract Committee, the deliberations of the Contract Committee, and discussions between the Contract Committee and Lord Abbett’s management. The Independent Board Members also met with their independent legal counsel in a private session at which no representatives of management were present.
The materials received by the Board included, but were not limited to: (1) information provided by Morningstar Associates, LLC (“Morningstar”) regarding the investment performance of the Fund compared to the investment performance of certain funds with similar investment styles as determined by Morningstar, based, in part, on the Fund’s Morningstar category (the “performance peer group”), and the investment performance of two appropriate benchmarks; (2) information provided by Morningstar regarding the expense ratios, contractual and effective management fee rates, and other expense components for the Fund and certain funds in the same Morningstar category, with generally the same or similar share classes and operational characteristics, including asset size (the “expense peer group”); (3) certain supplemental investment performance information provided by Lord Abbett; (4) information provided by Lord Abbett on the expense ratios, management fee rates, and other expense components for the Fund; (5) sales and redemption information for the Fund; (6) information regarding Lord Abbett’s financial condition; (7) an analysis of the relative profitability of the Agreement to Lord Abbett; (8) information provided by Lord Abbett regarding the investment management fee schedules for Lord Abbett’s other advisory clients maintaining accounts with a similar investment strategy as the Fund; and (9) information regarding the personnel and other resources devoted by Lord Abbett to managing the Fund.
Investment Management Services Generally. The Board considered the investment management services provided by Lord Abbett to the Fund, including investment research, portfolio management, and trading, and Lord Abbett’s commitment to compliance with all applicable legal requirements. The Board also observed that Lord Abbett was solely engaged in the investment management business and accordingly did not experience the conflicts of interest that may result from being engaged in other lines of business. The Board considered the investment advisory services provided by Lord Abbett to other clients, the fees charged for the services, and the differences in the nature of the services provided to the Fund and other Lord Abbett Funds, on the one hand, and the services provided to other clients, on the other. After reviewing these and related factors, the Board concluded that the Fund was likely to continue to benefit from the nature, extent and quality of the investment services provided by Lord Abbett under the Agreement.
Investment Performance. The Board reviewed the Fund’s investment performance in relation to that of the performance peer group and two appropriate benchmarks as of various periods ended August 31, 2016. The Board observed that the Fund’s investment performance was above the median of the performance peer group for the one-year period and below the median of the performance peer group for the three-year and five-year periods. The Board also considered Lord
34
Approval of Advisory Contract (continued)
Abbett’s performance and reputation generally, the performance of other Lord Abbett-managed funds overseen by the Board and the willingness of Lord Abbett to take steps intended to improve performance when necessary. After reviewing these and related factors, the Board concluded that the Fund’s investment performance was reasonable and supported the continuation of the Agreement.
Lord Abbett’s Personnel and Methods. The Board considered the qualifications of the personnel providing investment management services to the Fund, in light of its investment objective and discipline. Among other things, the Board considered the size, experience, and turnover of Lord Abbett’s investment management staff, Lord Abbett’s investment methodology and philosophy, and Lord Abbett’s approach to recruiting, training, and retaining investment management personnel.
Nature and Quality of Other Services. The Board considered the nature, quality, costs, and extent of compliance, administrative, and other services performed by Lord Abbett and the nature and extent of Lord Abbett’s supervision of third party service providers, including the Fund’s transfer agent and custodian.
Expenses. The Board considered the expense level of the Fund and the expense levels of the expense peer group. It also considered how the expense levels of the Fund related to those of the expense peer group and the amount and nature of the fees paid by shareholders. The Board observed that the overall expense level of the Fund was below the median of the expense peer group. After reviewing these and related factors, the Board concluded, within the context of its overall approval of the Agreement, that the expense level of the Fund was reasonable and supported the continuation of the Agreement.
Profitability. The Board considered the level of Lord Abbett’s operating margin in managing the Fund, including a review of Lord Abbett’s methodology for allocating its costs to its management of the Fund. It considered whether the Fund was profitable to Lord Abbett in connection with the operation of the Fund, including the fee that Lord Abbett receives from the Fund for providing administrative services to the Fund. The Board also considered the profits realized from other business segments of Lord Abbett, which may benefit from or be related to the Fund’s business. The Board considered Lord Abbett’s profit margins in comparison with available industry data, both accounting for and excluding marketing and distribution expenses, and how those profit margins could affect Lord Abbett’s ability to recruit and retain investment personnel. The Board recognized that Lord Abbett’s overall profitability was a factor in enabling it to attract and retain qualified investment management personnel to provide services to the Fund. After reviewing these and related factors, the Board concluded, within the context of its overall approval of the Agreement, that Lord Abbett’s profitability with respect to the Fund was not excessive.
Economies of Scale. The Board considered the extent to which there had been economies of scale in managing the Fund, whether the Fund’s shareholders had appropriately benefited from such economies of scale, and whether there was potential for realization of any further economies of scale. The Board concluded that the existing management fee schedule, with its breakpoints in the levels of the management fee, in conjunction with a proposed expense limitation agreement adequately addressed any economies of scale in managing the Fund.
Other Benefits to Lord Abbett. The Board considered the character and amount of fees paid by the Fund and the Fund’s shareholders to Lord Abbett and the Distributor for services other than investment advisory services. The Board also considered the revenues and profitability of Lord Abbett’s investment advisory business apart from its mutual fund business, and the intangible
35
Approval of Advisory Contract (concluded)
benefits enjoyed by Lord Abbett by virtue of its relationship with the Fund. The Board observed that the Distributor receives 12b-1 fees from certain of the Lord Abbett Funds as to shares held in accounts for which there is no other broker of record, may retain a portion of the 12b-1 fees it receives, and receives a portion of the sales charges on sales and redemptions of some classes of shares. In addition, the Board observed that Lord Abbett accrues certain benefits for its business of providing investment advice to clients other than the Lord Abbett Funds, but that business also benefits the Funds. The Board also noted that Lord Abbett, as disclosed in the prospectus of the Fund, has entered into revenue sharing arrangements with certain entities that distribute shares of the Fund. The Board also took into consideration the investment research that Lord Abbett receives as a result of Fund brokerage transactions.
Alternative Arrangements. The Board considered whether, instead of approving continuation of the Agreement, it might be in the best interests of the Fund to implement one or more alternative arrangements, such as continuing to employ Lord Abbett, but on different terms. After considering all of the relevant factors, the Board unanimously found that continuation of the Agreement was in the best interests of the Fund and its shareholders and voted unanimously to approve the continuation of the Agreement. In considering whether to approve the continuation of the Agreement, the Board did not identify any single factor as paramount or controlling. Individual Directors may have evaluated the information presented differently from one another, giving different weights to various factors. This summary does not discuss in detail all matters considered.
36
Householding
The Company has adopted a policy that allows it to send only one copy of the Fund’s prospectus, proxy material, annual report and semiannual report to certain shareholders residing at the same “household.” This reduces Fund expenses, which benefits you and other shareholders. If you need additional copies or do not want your mailings to be “householded,” please call Lord Abbett at 888-522-2388 or send a written request with your name, the name of your fund or funds and your account number or numbers to Lord Abbett Family of Funds, P.O. Box 219336, Kansas City, MO 64121.
Proxy Voting Policies, Procedures and Records
A description of the policies and procedures that Lord Abbett uses to vote proxies related to the Fund’s portfolio securities, and information on how Lord Abbett voted the Fund’s proxies during the 12-month period ended June 30 are available without charge, upon request, (i) by calling 888-522-2388; (ii) on Lord Abbett’s Website at www.lordabbett.com; and (iii) on the Securities and Exchange Commission’s (“SEC”) Website at www.sec.gov.
Shareholder Reports and Quarterly Portfolio Disclosure
The Fund is required to file its complete schedule of portfolio holdings with the SEC for its first and third fiscal quarters on Form N-Q. Copies of the filings are available without charge, upon request on the SEC’s Website at www.sec.gov and may be available by calling Lord Abbett at 888-522-2388. You can also obtain copies of Form N-Q by visiting the SEC’s Public Reference Room in Washington, DC (information on the operation of the Public Reference Room may be obtained by calling 800-SEC-0330).
| Tax Information |
| |
| The Fund intends to pass through foreign source income of $2,114,407 and foreign taxes of $189,056. |
37


| This report, when not used for the general information of shareholders of the Fund, is to be distributed only if preceded or accompanied by a current fund prospectus. | | |
| | | |
Lord Abbett mutual fund shares are distributed by
LORD ABBETT DISTRIBUTOR LLC. | Lord Abbett Series Fund, Inc. International Core Equity Portfolio | SFICE-3 (02/17) |

2016 LORD ABBETT
ANNUAL REPORT
Lord Abbett
Series Fund—International Opportunities Portfolio
For the fiscal year ended December 31, 2016
Lord Abbett Series Fund — International Opportunities Portfolio
Annual Report
For the fiscal year ended December 31, 2016

From left to right: James L.L. Tullis, Chairman of the Lord Abbett Funds and Daria L. Foster Director, President, and Chief Executive Officer of the Lord Abbett Funds. | | Dear Shareholders: We are pleased to provide you with this overview of the performance of Lord Abbett Series Fund — International Opportunities Portfolio for the fiscal year ended December 31, 2016. On this page and the following pages, we discuss the major factors that influenced fiscal year performance. For additional information about the Fund, please visit our website at www.lordabbett.com, where you also can access the quarterly commentaries that provide updates on the Fund’s performance and other portfolio related updates. Thank you for investing in Lord Abbett mutual funds. We value the trust that you place in us and look forward to serving your investment needs in the years to come. Best regards, 
Daria L. Foster Director, President and Chief Executive Officer |
| | | |
For the fiscal year ended December 31, 2016, the Fund returned -4.28%, reflecting performance at the net asset value (NAV) of Class VC Shares, with all distributions reinvested, compared to its benchmark, the S&P Developed Ex US SmallCap® Index1, which returned 3.78% over the same period.
Over the period, global equity markets experienced significant volatility, as a result of continued central bank stimulus, sharp moves in commodity prices, the United Kingdom’s Brexit vote, uncertainty around Chinese economic growth, and the U.S. election. Overall, European markets (as measured by the EURO STOXX 50®2) rose
roughly 1.7% in U.S. dollars for the period, while Japan’s Nikkei 2253 rose 2.38%.
At the end of 2015, the Federal Reserve (Fed) raised interest rates, for the first time since the financial crisis, to a range between 0.25% - 0.50%. At that time, Fed expectations were for 4 rate hikes in 2016. That did not materialize, but the Fed did raise rates again at the December 2016 Fed meeting, to a range of 0.50%-0.75%, and indicated that it was targeting three rate hikes in 2017. Similarly, other central banks continued their accommodative monetary policies, as the European Central Bank cut the deposit rate in the Eurozone from -0.2% to -0.3% in December 2015 and increased
1
its existing monetary easing program to €80 billion per month in March 2016. In January 2016, the Bank of Japan introduced negative rates on excess reserves in an effort to stimulate economic growth and, at its September meeting, introduced “yield curve control” to regulate both short- and long-term rates. The Bank of Japan also committed itself to expand the monetary base until inflation–as measured by the Consumer Price Index - exceeds 2%.
By February of 2016, crude oil prices had fallen to under $27/bbl. By the end of the year, however, prices had recovered to above $50, helped by an OPEC agreement to cut 1.2mm barrels per day in production and a separate production cut deal with non-OPEC producers. Adding to the volatility during the year was the United Kingdom’s vote, to leave the European Union, which rattled global financial markets that had largely expected a “remain” vote. Following the vote, the British pound fell to a 30-year low and yields on U.K. bonds also fell to historical lows.
In November, Donald Trump won the U.S. presidential election, with Republicans seizing control of both the House of Representatives and the Senate, contributing to a strong U.S. market rally to finish 2016, which was fueled by expectations for increased infrastructure and defense spending, broad tax reform, and decreased regulations. The Trump election drove the Japanese yen sharply lower, resulting in a double-digit rally in Japan’s Nikkei to close out the year. The Mexican peso also has suffered significantly since the election, as Trump repeatedly threatened to build a border wall with Mexico and took aim at multinational exporters and free-trade
agreements. In Italy, a referendum on constitutional reforms was voted down, causing Prime Minister Matteo Renzi to submit his resignation. The Italian government also approved a €20 billion facility in December to provide stability to its banking sector after capital levels were criticized by the ECB.
Stock selection, most notably in the materials and consumer discretionary sectors, was the primary driver of relative underperformance during the period. Within materials, shares of Essentra plc, a United Kingdom-based manufacturer and distributor of tobacco supplies, declined after missing earnings for the first half of 2016 and experiencing a decline in revenue. In addition, Hill & Smith Holdings PLC, a United Kingdom-based manufacturer and supplier of infrastructure products and galvanizing services, detracted from performance as shares reversed from strong gains earlier in the year.
Within the consumer discretionary sector, shares of DFS Furniture PLC, a United Kingdom-based furniture and fixture manufacturer, declined after the U.K.’s Brexit vote in June and amid concerns for the housing market.
Conversely, stock selection in the information technology and consumer staples sectors contributed to relative performance. Within the information technology sector, shares of SUMCO Corp., a Japanese silicon manufacturer, rose as the company benefited from the yen’s weakening and the higher value of the company’s exports. In addition, shares of Hitachi High-Tech Corp., an electronic components manufacturer, also rose, as the company benefited from continued
2
growth in the science and medical systems segment and as the company’s exports benefited from a weaker yen.
Within the consumer staples sector, Treasury Wine Est. Ltd, an operator of vineyards and wineries, contributed to the Fund’s performance. The company’s stock rose as the company continued to focus on
growing margins with ambitious expansion initiatives.
The Fund’s portfolio is actively managed and, therefore, its holdings and the weightings of a particular issuer or particular sector as a percentage of portfolio assets are subject to change. Sectors may include many industries.
1 The S&P Developed Ex-U.S. SmallCap® Index captures the bottom 15% of companies domiciled in the developed markets (excluding the United States) within the S&P Global BMI with a float-adjusted market capitalization of at least US$100 million and a value traded of at least US$50 million for the past 12 months at the time of the annual reconstitution. Stocks are excluded if their market capitalization falls below US$75 million, or if the value traded is less than US$35 million at the time of reconstitution.
2 The EURO STOXX 50® Index represents the performance of the 50 largest companies among the 19 supersectors in terms of free-float market cap in 12 eurozone countries. These countries include Austria, Belgium, Finland, France, Germany, Greece, Ireland, Italy, Luxembourg, the Netherlands, Portugal and Spain. The index has a fixed number of components and is part of the STOXX blue-chip index family. The index captures about 60% of the free-float market cap of the EURO STOXX Total Market Index (TMI).
3 The Nikkei Stock Average, the Nikkei 225 is used around the globe as the premier index of Japanese stocks. Because of the prominent nature of the index, many financial products linked to the Nikkei 225 have been created are traded worldwide while the index has been sufficiently used as the indicator of the movement of Japanese stock markets. The Nikkei 225 is a price-weighted equity index, which consists of 225 stocks in the 1st section of the Tokyo Stock Exchange.
Unless otherwise specified, indexes reflect total return, with all dividends reinvested. Indexes are unmanaged, do not reflect the deduction of fees or expenses, and are not available for direct investment.
Important Performance and Other Information
Performance data quoted in the following pages reflect past performance and are no guarantee of future results. Current performance may be
higher or lower than the performance quoted. The investment return and principal value of an investment in the Funds will fluctuate so that shares, on any given day or when redeemed, may be worth more or less than their original cost. You can obtain performance data current to the most recent month end by calling Lord Abbett at 888-522-2388 or referring to www.lordabbett.com.
During certain periods shown, expense waivers and reimbursements were in place. Without such expense waivers and reimbursements, the Funds’ returns would have been lower.
The annual commentary above discusses the views of the Fund’s management and various portfolio holdings of the Funds as of December 31, 2016. These views and portfolio holdings may have changed after this date. Information provided in the commentary is not a recommendation to buy or sell securities. Because the Fund’s portfolio is actively managed and may change significantly, the Fund may no longer own the securities described above or may have otherwise changed their positions in the securities. For more recent information about the Fund’s portfolio holdings, please visit www.lordabbett.com.
A Note about Risk: See Notes to Financial Statements for a discussion of investment risks. For a more detailed discussion of the risks associated with each Fund, please see the Fund’s prospectus.
Mutual funds are not insured by the FDIC, are not deposits or other obligations of, or guaranteed by, banks, and are subject to investment risks including possible loss of principal amount invested.
The Fund serves as an underlying investment vehicle for variable annuity contracts and variable life insurance policies.
3
Investment Comparison
Below is a comparison of a $10,000 investment in Class VC shares with the same investment in the S&P Developed Ex-U.S. SmallCap Index, assuming reinvestment of all dividends and distributions. The Fund’s shares are sold only to insurance company separate accounts that fund certain variable annuity and variable life contracts. This line graph comparison does not reflect the sales charges or other expenses of these contracts. If those sales charges and expenses were reflected, returns would be lower. The graph and performance table below do not reflect the deduction of taxes that a shareholder would pay on Fund distributions or the redemption of Fund shares. During certain periods, expenses of the Fund have been waived or reimbursed by Lord Abbett; without such waiver or reimbursement of expenses, the Fund’s returns would have been lower. Past performance is no guarantee of future results.

Average Annual Total Returns for the
Periods Ended December 31, 2016
| | 1 Year | 5 Years | 10 Years | |
| Class VC | -4.28% | 9.70% | 2.00% | |
1 Performance for the unmanaged index does not reflect any fees or expenses. The performance of the index is not necessarily representative of the Fund’s performance.
4
Expense Example
As a shareholder of the Fund, you incur ongoing costs, including management fees; expenses related to the Fund’s services arrangements with certain insurance companies; and other Fund expenses. This Example is intended to help you understand your ongoing costs (in dollars) of investing in the Fund and to compare these costs with the ongoing costs of investing in other mutual funds.
The Example is based on an investment of $1,000 invested at the beginning of the period and held for the entire period (July 1, 2016 through December 31, 2016).
The Example reflects only expenses that are deducted from the assets of the Fund. Fees and expenses, including sales charges applicable to the various insurance products that invest in the Fund, are not reflected in this Example. If such fees and expenses were reflected in the Example, the total expenses shown would be higher. Fees and expenses regarding such variable insurance products are separately described in the prospectus related to those products.
Actual Expenses
The first line of the table on the following page provides information about actual account values and actual expenses. You may use the information in this line, together with the amount you invested, to estimate the expenses that you paid over the period. Simply divide your account value by $1,000 (for example, an $8,600 account value divided by $1,000 = 8.6), then multiply the result by the number in the first line under the heading titled “Expenses Paid During Period 7/1/16 – 12/31/16” to estimate the expenses you paid on your account during this period.
Hypothetical Example for Comparison Purposes
The second line of the table on the following page provides information about hypothetical account values and hypothetical expenses based on the Fund’s actual expense ratio and an assumed rate of return of 5% per year before expenses, which is not the Fund’s actual return. The hypothetical account values and expenses may not be used to estimate the actual ending account balance or expenses you paid for the period. You may use this information to compare the ongoing costs of investing in the Fund and other funds. To do so, compare this 5% hypothetical example with the 5% hypothetical examples that appear in the shareholder reports of the other funds.
5
Please note that the expenses shown in the table are meant to highlight your ongoing costs only and do not reflect any transactional costs, such as sales charges. Therefore, the second line of the table is useful in comparing ongoing costs only, and will not help you determine the relative total costs of owning different funds. In addition, if these transactional costs were included, your costs would have been higher.
| | | Beginning
Account
Value | | Ending
Account
Value | | Expenses
Paid During
Period† | |
| | | 7/1/16 | | 12/31/16 | | 7/1/16 -
12/31/16 | |
| Class VC | | | | | | | |
| Actual | | $1,000.00 | | $1,021.90 | | $6.10 | |
| Hypothetical (5% Return Before Expenses) | | $1,000.00 | | $1,019.10 | | $6.09 | |
| | |
| † | Net expenses are equal to the Fund’s annualized expense ratio of 1.20%, multiplied by the average account value over the period, multiplied by 184/366 (to reflect one-half year period). |
Portfolio Holdings Presented by Sector
December 31, 2016
| Sector* | %** |
| Closed-Ended Fund | 0.60 | % |
| Consumer Discretionary | 16.81 | % |
| Consumer Staples | 5.84 | % |
| Energy | 5.95 | % |
| Exchange-Traded Fund | 1.47 | % |
| Financials | 13.36 | % |
| Health Care | 4.59 | % |
| Industrials | 20.81 | % |
| Information Technology | 13.05 | % |
| Materials | 7.28 | % |
| Real Estate | 5.03 | % |
| Telecommunication Services | 1.75 | % |
| Utilities | 2.94 | % |
| Repurchase Agreement | 0.52 | % |
| Total | 100.00 | % |
| * | | A sector may comprise several industries. |
| ** | | Represents percent of total investments. |
6
Schedule of Investments
December 31, 2016
| | | | | | U.S. $ | |
| | | | | | Fair Value | |
| Investments | | Shares | | | (000) | |
| COMMON STOCKS 98.93% | | | | | | | | |
| | | | | | | | | |
| Australia 2.59% | | | | | | | | |
| | | | | | | | | |
| Beverages 0.43% | | | | | | | | |
| Treasury Wine Estates Ltd. | | | 23,821 | | | $ | 184 | |
| | | | | | | | | |
| Commercial Services & Supplies 0.66% | | | | | | | | |
| Spotless Group Holdings Ltd. | | | 397,523 | | | | 284 | |
| | | | | | | | | |
| Electric: Utilities 0.78% | | | | | | | | |
| AusNet Services | | | 293,849 | | | | 335 | |
| | | | | | | | | |
| Equity Real Estate Investment Trusts 0.25% | | | | | | | | |
| Charter Hall Group | | | 31,738 | | | | 108 | |
| | | | | | | | | |
| Hotels, Restaurants & Leisure 0.47% | | | | | | | | |
| Mantra Group Ltd. | | | 90,891 | | | | 202 | |
| Total Australia | | | | | | | 1,113 | |
| | | | | | | | | |
| Austria 0.36% | | | | | | | | |
| | | | | | | | | |
| Semiconductors & Semiconductor Equipment |
| ams AG | | | 5,375 | | | | 153 | |
| | | | | | | | | |
| Canada 7.63% | | | | | | | | |
| | | | | | | | | |
| Electric: Utilities 1.34% | | | | | | | | |
| Emera, Inc. | | | 17,000 | | | | 575 | |
| | | | | | | | | |
| Metals & Mining 0.78% | | | | | | | | |
| HudBay Minerals, Inc. | | | 58,569 | | | | 335 | |
| | | | | | | | | |
| Oil, Gas & Consumable Fuels 4.67% | | | | | | | | |
| Africa Oil Corp.* | | | 202,459 | | | | 404 | |
| Canacol Energy Ltd.* | | | 141,600 | | | | 483 | |
| Vermilion Energy, Inc. | | | 12,600 | | | | 530 | |
| Whitecap Resources, Inc. | | | 65,600 | | | | 594 | |
| | | | | | | | 2,011 | |
| | | | | | | | | |
| Paper & Forest Products 0.84% | | | | | | | | |
| Interfor Corp.* | | | 32,400 | | | | 362 | |
| Total Canada | | | | | | | 3,283 | |
| | | | | | U.S. $ | |
| | | | | | Fair Value | |
| Investments | | Shares | | | (000) | |
| China 0.48% | | | | | | | | |
| | | | | | | | | |
| Energy Equipment & Services | | | | | | | | |
| Hilong Holding Ltd. | | | 710,000 | | | $ | 206 | |
| | | | | | | | | |
| Finland 2.96% | | | | | | | | |
| | | | | | | | | |
| Leisure Product 0.77% | | | | | | | | |
| Amer Sports OYJ | | | 12,387 | | | | 329 | |
| | | | | | | | | |
| Metals & Mining 0.83% | | | | | | | | |
| Outotec OYJ* | | | 68,083 | | | | 358 | |
| | | | | | | | | |
| Trading Companies & Distributors 1.36% | | | | | | | | |
| Cramo OYJ | | | 23,386 | | | | 586 | |
| Total Finland | | | | | | | 1,273 | |
| | | | | | | | | |
| France 5.35% | | | | | | | | |
| | | | | | | | | |
| Health Care Providers & Services 0.80% | | | | | | | | |
| Korian SA | | | 11,770 | | | | 345 | |
| | | | | | | | | |
| Hotels, Restaurants & Leisure 1.12% | | | | | | | | |
| Elior Group+ | | | 21,112 | | | | 483 | |
| | | | | | | | | |
| Information Technology Services 1.44% | | | | | | | | |
| Altran Technologies SA* | | | 42,417 | | | | 620 | |
| | | | | | | | | |
| Life Sciences Tools & Services 0.28% | | | | | | | | |
| Genfit* | | | 5,356 | | | | 118 | |
| | | | | | | | | |
| Real Estate Management & Development 0.69% |
| Nexity SA* | | | 6,345 | | | | 297 | |
| | | | | | | | | |
| Specialty Retail 1.02% | | | | | | | | |
| Maisons du Monde SA*+ | | | 16,576 | | | | 437 | |
| Total France | | | | | | | 2,300 | |
| | | | | | | | | |
| Germany 5.09% | | | | | | | | |
| | | | | | | | | |
| Industrial Conglomerates 1.41% | | | | | | | | |
| Rheinmetall AG | | | 9,010 | | | | 606 | |
| | | | | | | | | |
| Internet Software & Services 1.15% | | | | | | | | |
| XING AG | | | 2,684 | | | | 496 | |
| | | |
| | See Notes to Financial Statements. | 7 |
Schedule of Investments (continued)
December 31, 2016
| | | | | | U.S. $ | |
| | | | | | Fair Value | |
| Investments | | Shares | | | (000) | |
| Germany (continued) | | | | | | | | |
| | | | | | | | | |
| Life Sciences Tools & Services 1.82% | | | | | | | | |
| Gerresheimer AG | | | 7,023 | | | $ | 522 | |
| MorphoSys AG* | | | 5,099 | | | | 262 | |
| | | | | | | | 784 | |
| | | | | | | | | |
| Machinery 0.71% | | | | | | | | |
| Deutz AG | | | 53,973 | | | | 303 | |
| Total Germany | | | | | | | 2,189 | |
| | | | | | | | | |
| Hong Kong 3.18% | | | | | | | | |
| | | | | | | | | |
| Communications Equipment 0.85% | | | | | | | | |
| VTech Holdings Ltd. | | | 27,400 | | | | 367 | |
| | | | | | | | | |
| Diversified Telecommunication Services 0.69% |
| HKBN Ltd. | | | 269,880 | | | | 296 | |
| | | | | | | | | |
| Household Durables 0.62% | | | | | | | | |
| Techtronic Industries Co., Ltd. | | | 74,000 | | | | 265 | |
| | | | | | | | | |
| Paper & Forest Products 1.02% | | | | | | | | |
| Lee & Man Paper Manufacturing Ltd. | | | 567,000 | | | | 440 | |
| Total Hong Kong | | | | | | | 1,368 | |
| | | | | | | | | |
| India 2.97% | | | | | | | | |
| | | | | | | | | |
| Consumer Finance 0.62% | | | | | | | | |
| Bharat Financial Inclusion Ltd.* | | | 30,725 | | | | 266 | |
| | | | | | | | | |
| Information Technology Services 0.80% | | | | | | | | |
| Vakrangee Ltd. | | | 85,650 | | | | 345 | |
| | | | | | | | | |
| Real Estate Management & Development 0.51% |
| Housing Development & Infrastructure Ltd.* | | | 248,191 | | | | 219 | |
| | | | | | | | | |
| Thrifts & Mortgage Finance 1.04% | | | | | | | | |
| Dewan Housing Finance Corp., Ltd. | | | 124,133 | | | | 446 | |
| Total India | | | | | | | 1,276 | |
| | | | | | U.S. $ | |
| | | | | | Fair Value | |
| Investments | | Shares | | | (000) | |
| Indonesia 1.35% | | | | | | | | |
| | | | | | | | | |
| Banks 1.01% | | | | | | | | |
| | | | | | | | | |
| Bank Tabungan Negara Persero Tbk PT | | | 3,371,196 | | | $ | 435 | |
| | | | | | | | | |
| Consumer Finance 0.34% | | | | | | | | |
| PT Clipan Finance Indonesia Tbk* | | | 8,129,400 | | | | 145 | |
| Total Indonesia | | | | | | | 580 | |
| | | | | | | | | |
| Ireland 4.92% | | | | | | | | |
| | | | | | | | | |
| Beverages 0.82% | | | | | | | | |
| C&C Group plc | | | 84,050 | | | | 352 | |
| | | | | | | | | |
| Equity Real Estate Investment Trusts 0.66% | | | | | | | | |
| Hibernia REIT plc | | | 219,892 | | | | 285 | |
| | | | | | | | | |
| Health Care Providers & Services 1.67% | | | | | | | | |
| UDG Healthcare plc | | | 86,903 | | | | 716 | |
| | | | | | | | | |
| Household Durables 1.77% | | | | | | | | |
| Cairn Homes plc* | | | 536,278 | | | | 762 | |
| Total Ireland | | | | | | | 2,115 | |
| | | | | | | | | |
| Israel 1.43% | | | | | | | | |
| | | | | | | | | |
| Chemicals | | | | | | | | |
| Frutarom Industries Ltd. | | | 12,012 | | | | 613 | |
| | | | | | | | | |
| Italy 4.07% | | | | | | | | |
| | | | | | | | | |
| Beverages 0.74% | | | | | | | | |
| Davide Campari-Milano SpA | | | 32,569 | | | | 318 | |
| | | | | | | | | |
| Capital Markets 0.75% | | | | | | | | |
| Anima Holding SpA+ | | | 59,480 | | | | 323 | |
| | | | | | | | | |
| Electrical Equipment 0.66% | | | | | | | | |
| Prysmian SpA | | | 11,023 | | | | 283 | |
| | | | | | | | | |
| Textiles, Apparel & Luxury Goods 1.92% | | | | | | | | |
| Brunello Cucinelli SpA | | | 16,103 | | | | 345 | |
| Moncler SpA | | | 27,585 | | | | 480 | |
| | | | | | | | 825 | |
| Total Italy | | | | | | | 1,749 | |
| | |
| 8 | See Notes to Financial Statements. |
Schedule of Investments (continued)
December 31, 2016
| | | | | | U.S. $ | |
| | | | | | Fair Value | |
| Investments | | Shares | | | (000) | |
| Japan 26.13% | | | | | | | | |
| | | | | | | | | |
| Banks 2.51% | | | | | | | | |
| Fukuoka Financial Group, Inc. | | | 124,000 | | | $ | 551 | |
| Shinsei Bank Ltd. | | | 315,000 | | | | 528 | |
| | | | | | | | 1,079 | |
| | | | | | | | | |
| Beverages 1.02% | | | | | | | | |
| Coca-Cola East Japan Co., Ltd. | | | 19,900 | | | | 439 | |
| | | | | | | | | |
| Construction & Engineering 1.22% | | | | | | | | |
| SHO-BOND Holdings Co., Ltd. | | | 12,600 | | | | 525 | |
| | | | | | | | | |
| Containers & Packaging 1.09% | | | | | | | | |
| Fuji Seal International, Inc. | | | 22,000 | | | | 470 | |
| | | | | | | | | |
| Electronic Equipment, Instruments & Components 1.97% |
| Hitachi High-Technologies Corp. | | | 11,700 | | | | 472 | |
| Taiyo Yuden Co. Ltd. | | | 31,200 | | | | 374 | |
| | | | | | | | 846 | |
| | | | | | | | | |
| Equity Real Estate Investment Trusts 1.88% | | | | | | | | |
| GLP J-Reit | | | 397 | | | | 457 | |
| Hulic Reit, Inc. | | | 208 | | | | 349 | |
| | | | | | | | 806 | |
| | | | | | | | | |
| Food & Staples Retailing 1.06% | | | | | | | | |
| Sundrug Co., Ltd. | | | 6,600 | | | | 457 | |
| | | | | | | | | |
| Food Products 0.69% | | | | | | | | |
| Nichirei Corp. | | | 14,400 | | | | 298 | |
| | | | | | | | | |
| Hotels, Restaurants & Leisure 2.14% | | | | | | | | |
| HIS Co., Ltd. | | | 10,200 | | | | 268 | |
| Resorttrust, Inc. | | | 9,100 | | | | 168 | |
| St. Marc Holdings Co., Ltd. | | | 15,900 | | | | 484 | |
| | | | | | | | 920 | |
| | | | | | U.S. $ | |
| | | | | | Fair Value | |
| Investments | | Shares | | | (000) | |
| Information Technology Services 2.29% | | | | | | | | |
| NS Solutions Corp. | | | 22,500 | | | $ | 405 | |
| Obic Co., Ltd. | | | 7,200 | | | | 315 | |
| SCSK Corp. | | | 7,600 | | | | 266 | |
| | | | | | | | 986 | |
| | | | | | | | | |
| Insurance 0.68% | | | | | | | | |
| Anicom Holdings, Inc. | | | 14,100 | | | | 292 | |
| | | | | | | | | |
| Machinery 3.93% | | | | | | | | |
| CKD Corp. | | | 33,800 | | | | 384 | |
| Nabtesco Corp. | | | 7,100 | | | | 165 | |
| Takeuchi Manufacturing Co., Ltd. | | | 21,700 | | | | 484 | |
| Tsubakimoto Chain Co. | | | 81,000 | | | | 658 | |
| | | | | | | | 1,691 | |
| | | | | | | | | |
| Professional Services 1.18% | | | | | | | | |
| en-japan, Inc. | | | 28,400 | | | | 509 | |
| | | | | | | | | |
| Semiconductors & Semiconductor Equipment 1.49% |
| Sumco Corp. | | | 49,600 | | | | 641 | |
| Software 0.95% | | | | | | | | |
| NSD Co., Ltd. | | | 8,200 | | | | 129 | |
| Trend Micro, Inc. | | | 7,900 | | | | 281 | |
| | | | | | | | 410 | |
| | | | | | | | | |
| Specialty Retail 0.97% | | | | | | | | |
| United Arrows Ltd. | | | 15,100 | | | | 417 | |
| | | | | | | | | |
| Wireless Telecommunication Services 1.06% |
| Okinawa Cellular Telephone Co. | | | 15,200 | | | | 453 | |
| Total Japan | | | | | | | 11,239 | |
| | | | | | | | | |
| Luxembourg 1.64% | | | | | | | | |
| | | | | | | | | |
| Machinery 0.92% | | | | | | | | |
| Stabilus SA* | | | 7,392 | | | | 397 | |
| | | | | | | | | |
| Multi-Line Retail 0.72% | | | | | | | | |
| B&M European Value Retail SA | | | 90,348 | | | | 310 | |
| Total Luxembourg | | | | | | | 707 | |
| | | |
| | See Notes to Financial Statements. | 9 |
Schedule of Investments (continued)
December 31, 2016
| | | | | | U.S. $ | |
| | | | | | Fair Value | |
| Investments | | Shares | | | (000) | |
| Netherlands 3.82% | | | | | | | | |
| | | | | | | | | |
| Air Freight & Logistics 1.09% | | | | | | | | |
| PostNL NV* | | | 108,657 | | | $ | 468 | |
| | | | | | | | | |
| Hotels, Restaurants & Leisure 1.11% | | | | | | | | |
| Basic-Fit NV*+ | | | 28,353 | | | | 478 | |
| | | | | | | | | |
| Insurance 0.52% | | | | | | | | |
| ASR Nederland NV* | | | 9,299 | | | | 221 | |
| | | | | | | | | |
| Machinery 1.10% | | | | | | | | |
| Aalberts Industries NV | | | 14,598 | | | | 474 | |
| Total Netherlands | | | | | | | 1,641 | |
| | | | | | | | | |
| Philippines 1.86% | | | | | | | | |
| | | | | | | | | |
| Banks 0.73% | | | | | | | | |
| Rizal Commercial Banking Corp. | | | 167,840 | | | | 113 | |
| Security Bank Corp. | | | 52,390 | | | | 200 | |
| | | | | | | | 313 | |
| | | | | | | | | |
| Hotels, Restaurants & Leisure 0.63% | | | | | | | | |
| Bloomberry Resorts Corp.* | | | 2,204,700 | | | | 273 | |
| | | | | | | | | |
| Real Estate Management & Development 0.50% |
| Filinvest Land, Inc. | | | 6,997,500 | | | | 215 | |
| Total Philippines | | | | | | | 801 | |
| | | | | | | | | |
| Portugal 0.81% | | | | | | | | |
| | | | | | | | | |
| Multi-Utilities | | | | | | | | |
| REN—Redes Energeticas Nacionais SGPS SA | | | 123,343 | | | | 350 | |
| | | | | | | | | |
| Spain 1.03% | | | | | | | | |
| | | | | | | | | |
| Equity Real Estate Investment Trusts 0.51% |
| Hispania Activos Inmobiliarios SOCIMI SA | | | 18,612 | | | | 220 | |
| | | | | | | | | |
| Food Products 0.52% | | | | | | | | |
| Ebro Foods SA | | | 10,653 | | | | 223 | |
| Total Spain | | | | | | | 443 | |
| | | | | | U.S. $ | |
| | | | | | Fair Value | |
| Investments | | Shares | | | (000) | |
| Sweden 3.10% | | | | | | | | |
| | | | | | | | | |
| Auto Components 0.32% | | | | | | | | |
| Dometic Group AB*+ | | | 18,731 | | | $ | 138 | |
| | | | | | | | | |
| Commercial Services & Supplies 1.45% | | | | | | | | |
| Loomis AB Class B | | | 20,910 | | | | 622 | |
| | | | | | | | | |
| Consumer Finance 0.81% | | | | | | | | |
| Hoist Finance AB+ | | | 37,312 | | | | 347 | |
| | | | | | | | | |
| Food & Staples Retailing 0.52% | | | | | | | | |
| Axfood AB | | | 14,315 | | | | 225 | |
| Total Sweden | | | | | | | 1,332 | |
| | | | | | | | | |
| Switzerland 1.30% | | | | | | | | |
| | | | | | | | | |
| Household Durables | | | | | | | | |
| Forbo Holding AG Registered Shares* | | | 434 | | | | 560 | |
| | | | | | | | | |
| Taiwan 0.77% | | | | | | | | |
| | | | | | | | | |
| Semiconductors & Semiconductor Equipment | | | | | |
| Realtek Semiconductor Corp. | | | 105,000 | | | | 332 | |
| | | | | | | | | |
| United Kingdom 13.14% | | | | | | | | |
| | | | | | | | | |
| Capital Markets 2.19% | | | | | | | | |
| Jupiter Fund Management plc | | | 42,956 | | | | 235 | |
| Man Group plc | | | 309,423 | | | | 451 | |
| TP ICAP plc | | | 47,506 | | | | 254 | |
| | | | | | | | 940 | |
| | | | | | | | | |
| Chemicals 0.30% | | | | | | | | |
| Essentra plc | | | 22,923 | | | | 130 | |
| | | | | | | | | |
| Consumer Finance 2.10% | | | | | | | | |
| Arrow Global Group plc | | | 246,467 | | | | 905 | |
| | | | | | | | | |
| Household Durables 0.77% | | | | | | | | |
| Countryside Properties plc*+ | | | 108,398 | | | | 332 | |
| | | | | | | | | |
| Internet & Direct Marketing Retail 1.06% | | | | | | | | |
| ASOS plc* | | | 7,472 | | | | 457 | |
| | |
| 10 | See Notes to Financial Statements. |
Schedule of Investments (continued)
December 31, 2016
| | | | | | U.S. $ | |
| | | | | | Fair Value | |
| Investments | | Shares | | | (000) | |
| United Kingdom (continued) | | | | | | | | |
| | | | | | | | | |
| Machinery 2.11% | | | | | | | | |
| Bodycote plc | | | 61,431 | | | $ | 487 | |
| Concentric AB | | | 33,528 | | | | 419 | |
| | | | | | | | 906 | |
| | | | | | | | | |
| Metals & Mining 0.95% | | | | | | | | |
| Hill & Smith Holdings plc | | | 27,616 | | | | 408 | |
| | | | | | | | | |
| Oil, Gas & Consumable Fuels 0.77% | | | | | | | | |
| Tullow Oil plc* | | | 85,538 | | | | 330 | |
| | | | | | | | | |
| Professional Services 1.55% | | | | | | | | |
| Exova Group plc | | | 164,187 | | | | 385 | |
| WS Atkins plc | | | 15,750 | | | | 283 | |
| | | | | | | | 668 | |
| | | | | | | | | |
| Trading Companies & Distributors 1.34% | | | | | | | | |
| Diploma plc | | | 44,992 | | | | 576 | |
| Total United Kingdom | | | | | | | 5,652 | |
| | | | | | | | | |
| United States 2.36% | | | | | | | | |
| | | | | | | | | |
| Exchange-Traded Fund 1.47% | | | | | | | | |
| VanEck Vectors Junior Gold Miners | | | 19,963 | | | | 630 | |
| | | | | | | | | |
| Semiconductors & Semiconductor Equipment 0.89% |
| CEVA, Inc.* | | | 11,449 | | | | 384 | |
| Total United States | | | | | | | 1,014 | |
| | | | | | | | | |
| Vietnam 0.59% | | | | | | | | |
| | | | | | | | | |
| Closed-Ended Fund | | | | | | | | |
| VinaCapital Vietnam Opportunity Fund Ltd.* | | | 75,213 | | | | 254 | |
Total Common Stocks
(cost $40,885,198) | | | | | | | 42,543 | |
| | | Principal | | | U.S. $ | |
| | | Amount | | | Fair Value | |
| Investments | | (000) | | | (000) | |
| SHORT-TERM INVESTMENT 0.51% | | | | | | | | |
| | | | | | | | | |
| Repurchase Agreement | | | | | | | | |
Repurchase Agreement dated 12/30/2016, 0.03% due 1/3/2017 with Fixed Income Clearing Corp. collateralized by $215,000 of U.S. Treasury Inflation Indexed Note at 0.125% due 4/15/2017; value: $229,293; proceeds: $221,368
(cost $221,368) | | $ | 221 | | | $ | 221 | |
Total Investments in Securities 99.44%
(cost $41,106,566) | | | | | | | 42,764 | |
| Foreign Cash and Other Assets in Excess of Liabilities 0.56% | | | | | | | 241 | |
| Net Assets 100.00% | | | | | | $ | 43,005 | |
| | | | | | | | | |
| * | | Non-income producing security. |
| + | | Security was purchased pursuant to Rule 144A under the Securities Act of 1933 and, unless registered under such Act or exempted from registration, may only be resold to qualified institutional buyers. |
| | | |
| | See Notes to Financial Statements. | 11 |
Schedule of Investments (concluded)
December 31, 2016
The following is a summary of the inputs used as of December 31, 2016 in valuing the Fund’s investments carried at fair value(1):
| | | Level 1 | | | Level 2 | | | Level 3 | | | Total | |
| Investment Type(2) | | (000) | | | (000) | | | (000) | | | (000) | |
| Common Stocks(3) | | $ | 42,543 | | | $ | – | | | $ | – | | | $ | 42,543 | |
| Repurchase Agreement | | | – | | | | 221 | | | | – | | | | 221 | |
| Total | | $ | 42,543 | | | $ | 221 | | | $ | – | | | $ | 42,764 | |
| | | |
| (1) | | Refer to Note 2(i) for a description of fair value measurements and the three-tier hierarchy of inputs. |
| (2) | | See Schedule of Investments for fair values in each industry and identification of foreign issuers and/or geography. |
| (3) | | As of December 31, 2016, the Fund utilized the last sale or official closing price on the exchange or system on which foreign securities are principally traded which resulted in Level 1 inputs. As of December 31, 2015, the Fund utilized adjusted valuations for the majority of foreign securities which resulted in Level 2 inputs (as described in Note 2(a)). For the fiscal year ended December 31, 2016, total securities transferred from Level 2 to Level 1 amounted to $32,210,871. |
| | |
| 12 | See Notes to Financial Statements. |
Statement of Assets and Liabilities
December 31, 2016
| ASSETS: | | | | |
| Investments in securities, at fair value (cost $41,106,566) | | $ | 42,763,969 | |
| Foreign cash, at value (cost $49,566) | | | 49,008 | |
| Receivables: | | | | |
| Investment securities sold | | | 268,858 | |
| Dividends | | | 66,081 | |
| From advisor (See Note 3) | | | 14,639 | |
| Capital shares sold | | | 18,539 | |
| Prepaid expenses | | | 287 | |
| Total assets | | | 43,181,381 | |
| LIABILITIES: | | | | |
| Payables: | | | | |
| Capital shares reacquired | | | 13,231 | |
| Investment securities purchased | | | 1,732 | |
| Management fee | | | 27,343 | |
| Directors’ fees | | | 8,169 | |
| Fund administration | | | 1,458 | |
| Accrued expenses | | | 124,899 | |
| Total liabilities | | | 176,832 | |
| NET ASSETS | | $ | 43,004,549 | |
| COMPOSITION OF NET ASSETS: | | | | |
| Paid-in capital | | $ | 43,551,360 | |
| Distributions in excess of net investment income | | | (151,918 | ) |
| Accumulated net realized loss on investments and foreign currency related translation | | | (2,049,902 | ) |
| Net unrealized appreciation on investments and translation of assets and liabilities denominated in foreign currencies | | | 1,655,009 | |
| Net Assets | | $ | 43,004,549 | |
| Outstanding shares (50 million shares of common stock authorized, $.001 par value) | | | 5,523,344 | |
| Net asset value, offering and redemption price per share (Net assets divided by outstanding shares) | | $ | 7.79 | |
| | See Notes to Financial Statements. | 13 |
Statement of Operations
For the Year Ended December 31, 2016
| Investment income: | | | | |
| Dividends (net of foreign withholding taxes of $95,603) | | $ | 1,022,147 | |
| Interest and other | | | 306 | |
| Total investment income | | | 1,022,453 | |
| Expenses: | | | | |
| Management fee | | | 352,976 | |
| Non 12b-1 service fees | | | 117,486 | |
| Shareholder servicing | | | 80,358 | |
| Fund administration | | | 18,825 | |
| Reports to shareholders | | | 30,661 | |
| Directors’ fees | | | 1,675 | |
| Professional | | | 61,324 | |
| Custody | | | 60,781 | |
| Other | | | 11,667 | |
| Gross expenses | | | 735,753 | |
| Expense reductions (See Note 8) | | | (182 | ) |
| Fees waived and expenses reimbursed (See Note 3) | | | (170,711 | ) |
| Net expenses | | | 564,860 | |
| Net investment income | | | 457,593 | |
| Net realized and unrealized loss: | | | | |
| Net realized loss on investments (net of foreign capital gains tax of $20,097) | | | (283,859 | ) |
| Net realized loss on foreign currency related transactions | | | (27,101 | ) |
| Net change in unrealized appreciation/depreciation on investments | | | (2,656,690 | ) |
| Net change in unrealized appreciation/depreciation on translation of assets and liabilities denominated in foreign currencies | | | 10 | |
| Net realized and unrealized loss | | | (2,967,640 | ) |
| Net Decrease in Net Assets Resulting From Operations | | $ | (2,510,047 | ) |
| 14 | See Notes to Financial Statements. |
Statements of Changes in Net Assets
| | | For the Year Ended | | | For the Year Ended | |
| INCREASE (DECREASE) IN NET ASSETS | | December 31, 2016 | | | December 31, 2015 | |
| Operations: | | | | | | | | |
| Net investment income | | $ | 457,593 | | | $ | 396,752 | |
| Net realized gain (loss) on investments and foreign currency related transactions | | | (310,960 | ) | | | 2,180,525 | |
| Net change in unrealized appreciation/depreciation on investments and translation of assets and liabilities denominated in foreign currencies | | | (2,656,680 | ) | | | 2,676,561 | |
| Net increase (decrease) in net assets resulting from operations | | | (2,510,047 | ) | | | 5,253,838 | |
| Distributions to shareholders from: | | | | | | | | |
| Net investment income | | | (435,134 | ) | | | (441,845 | ) |
| Net realized gain | | | – | | | | (4,088,313 | ) |
| Total distributions to shareholders | | | (435,134 | ) | | | (4,530,158 | ) |
| Capital share transactions (See Note 13): | | | | | | | | |
| Proceeds from sales of shares | | | 11,437,768 | | | | 26,580,824 | |
| Reinvestment of distributions | | | 435,134 | | | | 4,530,158 | |
| Cost of shares reacquired | | | (19,741,659 | ) | | | (26,523,881 | ) |
| Net increase (decrease) in net assets resulting from capital share transactions | | | (7,868,757 | ) | | | 4,587,101 | |
| Net increase (decrease) in net assets | | | (10,813,938 | ) | | | 5,310,781 | |
| NET ASSETS: | | | | | | | | |
| Beginning of year | | $ | 53,818,487 | | | $ | 48,507,706 | |
| End of year | | $ | 43,004,549 | | | $ | 53,818,487 | |
| Distributions in excess of net investment income | | $ | (151,918 | ) | | $ | (281,484 | ) |
| | See Notes to Financial Statements. | 15 |
Financial Highlights
| | | | | | Per Share Operating Performance: | |
| | | | | | | | | | | | | | | Distributions to | |
| | | | | | Investment operations: | | | shareholders from: | |
| | | | | | | | | | | | | | | | | | | | | |
| | | | | | | | | | | | Total | | | | | | | | | |
| | | | | | | | | Net | | from | | | | | | | | | |
| | | Net asset | | Net | | realized | | invest- | | | | | | | | | |
| | | value, | | invest- | | and | | ment | | Net | | Net | | Total |
| | | beginning | | ment | | unrealized | | oper- | | investment | | realized | | distri- |
| | | of period | | income(a) | | gain (loss) | | ations | | income | | gain | | butions |
| 12/31/2016 | | $ | 8.22 | | | $ | 0.08 | | | $ | (0.43 | ) | | $ | (0.35 | ) | | $ | (0.08 | ) | | $ | – | | | $ | (0.08 | ) |
| 12/31/2015 | | | 8.07 | | | | 0.06 | | | | 0.83 | | | | 0.89 | | | | (0.07 | ) | | | (0.67 | ) | | | (0.74 | ) |
| 12/31/2014 | | | 10.08 | | | | 0.09 | | | | (0.64 | ) | | | (0.55 | ) | | | (0.13 | ) | | | (1.33 | ) | | | (1.46 | ) |
| 12/31/2013 | | | 8.48 | | | | 0.09 | | | | 2.56 | | | | 2.65 | | | | (0.19 | ) | | | (0.86 | ) | | | (1.05 | ) |
| 12/31/2012 | | | 7.30 | | | | 0.12 | | | | 1.37 | | | | 1.49 | | | | (0.17 | ) | | | (0.14 | ) | | | (0.31 | ) |
| (a) | | Calculated using average shares outstanding during the period. |
| (b) | | Total return does not consider the effects of sales charges or other expenses imposed by an insurance company and assumes the reinvestment of all distributions. |
| 16 | See Notes to Financial Statements. |
| | | | | | | Ratios to Average Net Assets: | | | Supplemental Data: | |
| | | | | | | | | | | | | | | | | | | |
| | | | | | | Total | | | | | | | | | | | | |
| | | | | | | expenses | | | | | | | | | | | | |
| Net | | | | | after | | | | | | | | | | | | |
| asset | | | | | waivers | | | | | Net | | Net | | Portfolio |
| value, | | Total | | and/or | | Total | | investment | | assets, end | | turnover |
| end of | | return(b) | | reimbursements | | expenses | | income | | of period | | rate |
| period | | (%) | | (%) | | (%) | | (%) | | (000) | | (%) |
| $ | 7.79 | | | | (4.28 | ) | | | 1.20 | | | | 1.57 | | | | 0.97 | | | $ | 43,005 | | | | 84.36 | |
| | 8.22 | | | | 11.10 | | | | 1.20 | | | | 1.52 | | | | 0.73 | | | | 53,818 | | | | 87.07 | |
| | 8.07 | | | | (5.76 | ) | | | 1.20 | | | | 1.49 | | | | 0.90 | | | | 48,508 | | | | 64.58 | |
| | 10.08 | | | | 31.70 | | | | 1.20 | | | | 1.44 | | | | 0.93 | | | | 57,067 | | | | 89.28 | |
| | 8.48 | | | | 20.38 | | | | 1.20 | | | | 1.42 | | | | 1.44 | | | | 49,131 | | | | 100.44 | |
| | See Notes to Financial Statements. | 17 |
Notes to Financial Statements
Lord Abbett Series Fund, Inc. (the “Company”) is registered under the Investment Company Act of 1940, as amended (the “Act”), as a diversified, open-end management investment company and was incorporated under Maryland law in 1989. The Company consists of thirteen separate portfolios. This report covers International Opportunities Portfolio (the “Fund”).
The Fund’s investment objective is long-term capital appreciation. The Fund has Variable Contract class shares (“Class VC Shares”), which are currently issued and redeemed only in connection with investments in, and payments under, variable annuity contracts and variable life insurance policies issued by life insurance and insurance-related companies.
The preparation of the financial statements in conformity with accounting principles generally accepted in the United States of America (“U.S. GAAP”) requires management to make certain estimates and assumptions that affect the reported amounts of assets and liabilities and disclosure of contingent assets and liabilities at the date of the financial statements and the reported amounts of increases and decreases in net assets from operations during the reporting period. Actual results could differ from those estimates. The Fund is considered an investment company under U.S. GAAP and follows the accounting and reporting guidance applicable to investment companies.
| 2. | SIGNIFICANT ACCOUNTING POLICIES |
| (a) | Investment Valuation–Under procedures approved by the Fund’s Board of Directors (the “Board”), Lord, Abbett & Co. LLC (“Lord Abbett”), the Fund’s investment manager, has formed a Pricing Committee to administer the pricing and valuation of portfolio investments and to ensure that prices utilized reasonably reflect fair value. Among other things, these procedures allow the Fund to utilize independent pricing services, quotations from securities and financial instrument dealers and other market sources to determine fair value. |
| | |
| | Securities actively traded on any recognized U.S. or non-U.S. exchange or on The NASDAQ Stock Market LLC are valued at the last sale price or official closing price on the exchange or system on which they are principally traded. Events occurring after the close of trading on non-U.S. exchanges may result in adjustments to the valuation of foreign securities to reflect their fair value as of the close of regular trading on the New York Stock Exchange. The Fund may utilize an independent fair valuation service in adjusting the valuations of foreign securities. Unlisted equity securities are valued at the last quoted sale price or, if no sale price is available, at the mean between the most recently quoted bid and asked prices. |
| | |
| | Securities for which prices are not readily available are valued at fair value as determined by the Pricing Committee. The Pricing Committee considers a number of factors, including observable and unobservable inputs, when arriving at fair value. The Pricing Committee may use related or comparable assets or liabilities, recent transactions, market multiples, book values and other relevant information to determine the fair value of portfolio investments. The Board or a designated committee thereof regularly reviews fair value determinations made by the Pricing Committee and employs techniques such as reviewing related market activity, reviewing inputs and assumptions, and retrospectively comparing prices of subsequent purchases and sales transactions to fair value determinations made by the Pricing Committee. |
| | |
| | Short-term securities with 60 days or less remaining to maturity are valued using the amortized cost method, which approximates fair value. |
18
Notes to Financial Statements (continued)
| (b) | Security Transactions–Security transactions are recorded as of the date that the securities are purchased or sold (trade date). Realized gains and losses on sales of portfolio securities are calculated using the identified-cost method. |
| | |
| (c) | Investment Income–Dividend income is recorded on the ex-dividend date. Interest income is recorded on the accrual basis as earned. Discounts are accreted and premiums are amortized using the effective interest method and are included in Interest and other income on the Statement of Operations. Withholding taxes on foreign dividends have been provided for in accordance with the applicable country’s tax rules and rates. |
| | |
| (d) | Income Taxes–It is the policy of the Fund to meet the requirements of Subchapter M of the Internal Revenue Code applicable to regulated investment companies and to distribute substantially all taxable income and capital gains to its shareholders. Therefore, no income tax provision is required. |
| | |
| | The Fund files U.S. federal and various state and local tax returns. No income tax returns are currently under examination. The statute of limitations on the Fund’s filed U.S. federal tax returns remains open for the fiscal years ended December 31, 2013 through December 31, 2016. The statutes of limitations on the Company’s state and local tax returns may remain open for an additional year depending upon the jurisdiction. |
| | |
| (e) | Expenses–Expenses incurred by the Company that do not specifically relate to an individual fund are generally allocated to the funds within the Company on a pro rata basis by relative net assets. |
| | |
| (f) | Foreign Transactions–The books and records of the Fund are maintained in U.S. dollars and transactions denominated in foreign currencies are recorded in the Fund’s records at the rate prevailing when earned or recorded. Asset and liability accounts that are denominated in foreign currencies are adjusted daily to reflect current exchange rates and any unrealized gain (loss) is included in Net change in unrealized appreciation/depreciation on translation of assets and liabilities denominated in foreign currencies in the Fund’s Statement of Operations. The resultant exchange gains and losses upon settlement of such transactions are included in Net realized loss on foreign currency related transactions in the Fund’s Statement of Operations. The Fund does not isolate that portion of the results of operations arising as a result of changes in the foreign exchange rates from the changes in market prices of the securities. |
| | |
| | The Fund uses foreign currency exchange contracts to facilitate transactions in foreign-denominated securities. Losses from these transactions may arise from changes in the value of the foreign currency or if the counterparties do not perform under the contracts’ terms. |
| | |
| (g) | Forward Foreign Currency Exchange Contracts–The Fund may enter into forward foreign currency exchange contracts in order to reduce exposure to changes in foreign currency exchange rates on foreign portfolio holdings or gain or reduce exposure to foreign currency solely for investment purposes. A forward foreign currency exchange contract is a commitment to purchase or sell a foreign currency at a future date at a negotiated rate. The contracts are valued daily at forward exchange rates and any unrealized gain (loss) is included in Net change in unrealized appreciation/depreciation on translation of assets and liabilities denominated in foreign currencies in the Fund’s Statement of Operations. The gain (loss) arising from the difference between the U.S. dollar cost of the original contract and the value of the foreign currency in U.S. dollars upon closing of such contracts is included in Net realized loss on foreign currency related transactions in the Fund’s Statement of Operations. |
19
Notes to Financial Statements (continued)
| (h) | Repurchase Agreements–The Fund may enter into repurchase agreements with respect to securities. A repurchase agreement is a transaction in which a fund acquires a security and simultaneously commits to resell that security to the seller (a bank or securities dealer) at an agreed-upon price on an agreed-upon date. The Fund requires at all times that the repurchase agreement be collateralized by cash, or by securities of the U.S. Government, its agencies, its instrumentalities, or U.S. Government sponsored enterprises having a value equal to, or in excess of, the value of the repurchase agreement (including accrued interest). If the seller of the agreement defaults on its obligation to repurchase the underlying securities at a time when the fair value of these securities has declined, the Fund may incur a loss upon disposition of the securities. |
| | |
| (i) | Fair Value Measurements–Fair value is defined as the price that the Fund would receive upon selling an investment or transferring a liability in an orderly transaction to an independent buyer in the principal or most advantageous market of the investment. A three-tier hierarchy is used to maximize the use of observable market data and minimize the use of unobservable inputs and to establish classification of fair value measurements for disclosure purposes. Inputs refer broadly to the assumptions that market participants would use in pricing the asset or liability, including assumptions about risk – for example, the risk inherent in a particular valuation technique used to measure fair value (such as a pricing model) and/or the risk inherent in the inputs to the valuation technique. Inputs may be observable or unobservable. Observable inputs reflect the assumptions market participants would use in pricing the asset or liability. Observable inputs are based on market data obtained from sources independent of the reporting entity. Unobservable inputs reflect the reporting entity’s own assumptions about the assumptions market participants would use in pricing the asset or liability. Unobservable inputs are based on the best information available in the circumstances. The three-tier hierarchy classification is determined based on the lowest level of inputs that is significant to the fair value measurement, and is summarized in the three broad Levels listed below: |
| | |
| | • | Level 1 – | unadjusted quoted prices in active markets for identical investments; |
| | | | |
| | • | Level 2 – | other significant observable inputs (including quoted prices for similar investments, interest rates, prepayment speeds, credit risk, etc.); and |
| | | | |
| | • | Level 3 – | significant unobservable inputs (including the Fund’s own assumptions in determining the fair value of investments). |
| | | | |
| | A summary of inputs used in valuing the Fund’s investments as of December 31, 2016 and, if applicable, Level 1/Level 2 transfers and Level 3 rollforwards for the fiscal year then ended is included in the Fund’s Schedule of Investments. |
| | |
| | Changes in valuation techniques may result in transfers into or out of an assigned level within the three-tier hierarchy. All transfers between different levels within the three-tier hierarchy are deemed to have occurred as of the beginning of the reporting period. The inputs or methodology used for valuing securities are not necessarily an indication of the risk associated with investing in those securities. |
20
Notes to Financial Statements (continued)
| 3. | MANAGEMENT FEE AND OTHER TRANSACTIONS WITH AFFILIATES |
Management Fee
The Company has a management agreement with Lord Abbett, pursuant to which Lord Abbett supplies the Fund with investment management services and executive and other personnel, provides office space and pays for ordinary and necessary office and clerical expenses relating to research and statistical work and supervision of the Fund’s investment portfolio.
The management fee is based on the Fund’s average daily net assets at the following annual rate:
| First $1 billion | .75% |
| Next $1 billion | .70% |
| Over $2 billion | .65% |
For the fiscal year ended December 31, 2016, the effective management fee, net of waivers, was at an annualized rate of .39% of the Fund’s average daily net assets.
In addition, Lord Abbett provides certain administrative services to the Fund pursuant to an Administrative Services Agreement in return for a fee at an annual rate of .04% of the Fund’s average daily net assets.
During the fiscal year ended December 31, 2016 and continuing through April 30, 2017, Lord Abbett has contractually agreed to waive its fees and reimburse expenses to the extent necessary to limit total net annual operating expenses to an annual rate of 1.20%. This agreement may be terminated only upon the approval of the Board.
The Company, on behalf of the Fund, has entered into services arrangements with certain insurance companies. Under these arrangements, certain insurance companies will be compensated up to ..25% of the average daily net asset value (“NAV”) of the Fund’s Class VC Shares held in the insurance company’s separate account to service and maintain the Variable Contract owners’ accounts. This amount is included in Non 12b-1 service fees on the Statement of Operations. The Fund may also compensate certain insurance companies, third-party administrators and other entities for providing recordkeeping, sub-transfer agency and other administrative services to the Fund. This amount is included in Shareholder servicing on the Statement of Operations.
Two Directors and certain of the Company’s officers have an interest in Lord Abbett.
| 4. | DISTRIBUTIONS AND CAPITAL LOSS CARRYFORWARDS |
Dividends from net investment income, if any, are declared and paid at least semi-annually. Taxable net realized gains from investment transactions, reduced by allowable capital loss carryforwards, if any, are declared and distributed to shareholders at least annually. The capital loss carryforward amount, if any, is available to offset future net capital gains. Dividends and distributions to shareholders are recorded on the ex-dividend date. The amounts of dividends and distributions from net investment income and net realized capital gains are determined in accordance with federal income tax regulations, which may differ from U.S. GAAP. These book/tax differences are either considered temporary or permanent in nature. To the extent these differences are permanent in nature, such amounts are reclassified within the components of net assets based on their federal tax basis treatment; temporary differences do not require reclassification. Dividends and distributions that exceed earnings and profits for tax purposes are reported as a tax return of capital.
21
Notes to Financial Statements (continued)
The tax character of distributions paid during the fiscal years ended December 31, 2016 and 2015 was as follows:
| | | Year Ended
12/31/2016 | | | Year Ended
12/31/2015 | |
| Distributions paid from: | | | | | | | | |
| Ordinary income | | $ | 435,134 | | | $ | 1,143,859 | |
| Net long-term capital gains | | | – | | | | 3,386,299 | |
| Total distributions paid | | $ | 435,134 | | | $ | 4,530,158 | |
As of December 31, 2016, the components of accumulated losses on a tax-basis were as follows:
| Undistributed ordinary income – net | | $ | 29,201 | |
| Total undistributed earnings | | | 29,201 | |
| Capital loss carryforwards* | | | (1,785,796 | ) |
| Temporary differences | | | (8,166 | ) |
| Unrealized gains – net | | | 1,217,950 | |
| Total accumulated losses – net | | $ | (546,811 | ) |
| * | The capital losses will carry forward indefinitely. |
As of December 31, 2016, the aggregate unrealized security gains and losses based on cost for U.S. federal income tax purposes were as follows:
| Tax cost | | $ | 41,544,984 | |
| Gross unrealized gain | | | 3,693,232 | |
| Gross unrealized loss | | | (2,474,247 | ) |
| Net unrealized security gain | | $ | 1,218,985 | |
The difference between book-basis and tax-basis unrealized gains (losses) is attributable to the tax treatment of certain foreign securities and wash sales.
Permanent items identified during the fiscal year ended December 31, 2016 have been reclassified among the components of net assets based on their tax basis treatment as follows:
Distributions in
Excess of Net
Investment Income | | | Accumulated
Net Realized
Loss | |
| | $107,107 | | | | $(107,107 | ) |
The permanent differences are attributable to the tax treatment of certain foreign securities, certain expenses, and foreign currency transactions.
| 5. | PORTFOLIO SECURITIES TRANSACTIONS |
Purchases and sales of investment securities (excluding short-term investments) for the fiscal year ended December 31, 2016 were as follows:
| Purchases | | Sales |
| | $39,112,621 | | | $46,543,621 |
There were no purchases or sales of U.S. Government securities for the fiscal year ended December 31, 2016.
22
Notes to Financial Statements (continued)
| 6. | DISCLOSURES ABOUT OFFSETTING ASSETS AND LIABILITIES |
The Financial Accounting Standards Board (“FASB”) requires disclosures intended to help better assess the effect or potential effect of offsetting arrangements on a fund’s financial position. The following tables illustrate gross and net information about recognized assets and liabilities eligible for offset in the statement of assets and liabilities; and disclose such amounts subject to an enforceable master netting agreement or similar agreement, by counterparty. A master netting agreement is an agreement between a fund and a counterparty which provides for the net settlement of amounts owed under all contracts traded under that agreement, as well as cash collateral, through a single payment by one party to the other in the event of default on or termination of any one contract. The Fund’s accounting policy with respect to balance sheet offsetting is that, absent an event of default by the counterparty or a termination of the agreement, the master netting agreement does not result in an offset of reported amounts of financial assets and liabilities in the statement of assets and liabilities across transactions between the Fund and the applicable counterparty:
| Description | | Gross Amounts of
Recognized Assets | | | Gross Amounts
Offset in the
Statement of Assets
and Liabilities | | | Net Amounts of
Assets Presented
in the Statement of
Assets and Liabilities | |
| Repurchase Agreement | | $ | 221,368 | | | $ | – | | | $ | 221,368 | |
| Total | | $ | 221,368 | | | $ | – | | | $ | 221,368 | |
| | | Net Amounts
of Assets
Presented in | | | Amounts Not Offset in the
Statement of Assets and Liabilities | | | | |
| Counterparty | | the Statement
of Assets and
Liabilities | | | Financial
Instruments | | | Cash
Collateral
Received(a) | | | Securities
Collateral
Received(a) | | | Net
Amount(b) | |
| Fixed Income Clearing Corp. | | $ | 221,368 | | | $ | – | | | $ | – | | | $ | (221,368 | ) | | $ | – | |
| Total | | $ | 221,368 | | | $ | – | | | $ | – | | | $ | (221,368 | ) | | $ | – | |
| (a) | Collateral disclosed is limited to an amount not to exceed 100% of the net amount of assets presented in the Statement of Assets and Liabilities, for each respective counterparty. |
| (b) | Net amount represents the amount owed to the Fund by the counterparty as of December 31, 2016. |
| 7. | DIRECTORS’ REMUNERATION |
The Company’s officers and two Directors, who are associated with Lord Abbett, do not receive any compensation from the Company for serving in such capacities. Independent Directors’ fees are allocated among all Lord Abbett-sponsored funds based on the net assets of each fund. There is an equity-based plan available to all Independent Directors under which Independent Directors must defer receipt of a portion of, and may elect to defer receipt of an additional portion of Directors’ fees. The deferred amounts are treated as though equivalent dollar amounts had been invested in the funds. Such amounts and earnings accrued thereon are included in Directors’ fees on the Statement of Operations and in Directors’ fees payable on the Statement of Assets and Liabilities and are not deductible for U.S. federal income tax purposes until such amounts are paid.
The Company has entered into an arrangement with its transfer agent and custodian, whereby credits realized as a result of uninvested cash balances are used to reduce a portion of the Fund’s expenses.
23
Notes to Financial Statements (continued)
The Fund and certain other funds managed by Lord Abbett (collectively, the “Participating Funds”) entered into a syndicated line of credit facility with various lenders for $550 million (the “Facility”), whereas State Street Bank and Trust Company (“SSB”) participates as a lender and as agent for the lenders. The Facility is to be used for temporary or emergency purposes as an additional source of liquidity to satisfy redemptions. The Participating Funds are subject to graduated borrowing limits of one-third of Fund assets (if Fund assets are less than $750 million), $250 million, $300 million, or $350 million, based on past borrowings and likelihood of future borrowings. The Facility will continue through August 28, 2017.
During the fiscal year ended December 31, 2016, the Fund did not utilize the Facility.
| 10. | INTERFUND LENDING PROGRAM |
On July 26, 2016, the U.S. Securities and Exchange Commission issued an exemptive order (“SEC exemptive order”) which permits certain registered open-end management investment companies managed by Lord Abbett, including the Fund, to participate in a joint lending and borrowing program (the “Interfund Lending Program”). The SEC exemptive order allows the Funds to borrow money from and lend money to each other for temporary or emergency purposes subject to the limitations and conditions.
During the fiscal year ended December 31, 2016, the Fund did not participate as a borrower or lender in the Interfund Lending Program.
| 11. | CUSTODIAN AND ACCOUNTING AGENT |
SSB is the Company’s custodian and accounting agent. SSB performs custodial, accounting and recordkeeping functions relating to portfolio transactions and calculating the Fund’s NAV.
The Fund is subject to the general risks and considerations associated with equity investing. These include the risks of investing in equity markets in foreign countries, the risk of investing in derivatives, liquidity risk, and the risks from leverage. The value of an investment will fluctuate in response to movements in the stock market in general, and to the changing prospects of individual companies in which the Fund invests. The Fund is subject to the risks of investing in foreign securities and in the securities of small companies. Foreign securities may pose greater risks than domestic securities, including greater price fluctuations and higher transaction costs. Foreign investments also may be affected by changes in currency rates or currency controls. These risks are generally greater for securities issued by companies in emerging market countries. Investing in small companies generally involves greater risks than investing in the stocks of larger companies, including more volatility and less liquidity.
The Fund is also subject to the risks associated with derivatives, which may be different from and greater than the risks associated with investing directly in securities and other instruments.
These factors can affect the Fund’s performance.
24
Notes to Financial Statements (concluded)
| 13. | SUMMARY OF CAPITAL TRANSACTIONS |
Transactions in shares of capital stock were as follows:
| | | Year Ended
December 31, 2016 | | | Year Ended
December 31, 2015 | |
| Shares sold | | | 1,441,534 | | | | 3,003,758 | |
| Reinvestment of distributions | | | 56,070 | | | | 550,391 | |
| Shares reacquired | | | (2,519,824 | ) | | | (3,020,048 | ) |
| Increase (decrease) | | | (1,022,220 | ) | | | 534,101 | |
25
Report of Independent Registered Public Accounting Firm
To the Board of Directors of Lord Abbett Series Fund, Inc. and the Shareholders of International Opportunities Portfolio:
We have audited the accompanying statement of assets and liabilities, including the schedule of investments, of the International Opportunities Portfolio, one of the portfolios constituting the Lord Abbett Series Fund, Inc. (the “Fund”) as of December 31, 2016, and the related statement of operations for the year then ended, the statements of changes in net assets for each of the two years in the period then ended, and the financial highlights for each of the five years in the period then ended. These financial statements and financial highlights are the responsibility of the Fund’s management. Our responsibility is to express an opinion on these financial statements and financial highlights based on our audits.
We conducted our audits in accordance with the standards of the Public Company Accounting Oversight Board (United States). Those standards require that we plan and perform the audit to obtain reasonable assurance about whether the financial statements and financial highlights are free of material misstatement. The Fund is not required to have, nor were we engaged to perform, an audit of its internal control over financial reporting. Our audits included consideration of internal control over financial reporting as a basis for designing audit procedures that are appropriate in the circumstances, but not for the purpose of expressing an opinion on the effectiveness of the Fund’s internal control over financial reporting. Accordingly, we express no such opinion. An audit also includes examining, on a test basis, evidence supporting the amounts and disclosures in the financial statements, assessing the accounting principles used and significant estimates made by management, as well as evaluating the overall financial statement presentation. Our procedures included confirmation of securities owned as of December 31, 2016, by correspondence with the custodian and brokers; when replies were not received from brokers, we performed other auditing procedures. We believe that our audits provide a reasonable basis for our opinion.
In our opinion, such financial statements and financial highlights referred to above present fairly, in all material respects, the financial position of International Opportunities Portfolio of the Lord Abbett Series Fund, Inc. as of December 31, 2016, the results of its operations for the year then ended, the changes in its net assets for each of the two years in the period then ended, and the financial highlights for each of the five years in the period then ended, in conformity with accounting principles generally accepted in the United States of America.
DELOITTE & TOUCHE LLP
New York, New York
February 15, 2017
26
Basic Information About Management
The Board is responsible for the management of the business and affairs of the Company in accordance with the laws of the State of Maryland. The Board elects officers who are responsible for the day-to-day operations of each Fund and who execute policies authorized by the Board. The Board also approves an investment adviser to each Fund and continues to monitor the cost and quality of the services the investment adviser provides, and annually considers whether to renew the contract with the adviser. Generally, each Director holds office until his/her successor is elected and qualified or until his/her earlier resignation or removal, as provided in the Company’s organizational documents.
Lord Abbett, a Delaware limited liability company, is the Fund’s investment adviser. Designated Lord Abbett personnel are responsible for the day-to-day management of the Funds.
Interested Directors
Ms. Foster and Mr. Sieg are affiliated with Lord Abbett and are “interested persons” of the Company as defined in the Act. Ms. Foster and Mr. Sieg are directors/trustees of each of the 12 investment companies in the Lord Abbett Family of Funds, which consist of 60 portfolios or series. Ms. Foster is an officer of the Lord Abbett Family of Funds.
Name, Address and
Year of Birth | | Current Position and
Length of Service
with the Company | | Principal Occupation and Other Directorships
During the Past Five Years |
Daria L. Foster
Lord, Abbett & Co. LLC
90 Hudson Street
Jersey City, NJ 07302
(1954) | | Director and President since 2006; Chief Executive Officer since 2012 | | Principal Occupation: Managing Partner of Lord Abbett, joined Lord Abbett in 1990.
Other Directorships: None. |
| | | | | |
Douglas B. Sieg
Lord, Abbett & Co. LLC
90 Hudson Street
Jersey City, NJ 07302
(1969) | | Director since 2016 | | Principal Occupation: Partner (since 2001) and Head of Client Services (since 2013), formerly Director of Marketing and Relationship Management, joined Lord Abbett in 1994.
Other Directorships: None. |
Independent Directors
The following Independent Directors also are directors/trustees of each of the 12 investment companies in the Lord Abbett Family of Funds, which consist of 60 portfolios or series.
Name, Address and
Year of Birth | | Current Position and
Length of Service
with the Company | | Principal Occupation and Other Directorships
During the Past Five Years |
Robert B. Calhoun, Jr.
Lord, Abbett & Co. LLC
c/o Legal Dept.
90 Hudson Street
Jersey City, NJ 07302
(1942) | | Director since 1998 | | Principal Occupation: Senior Advisor of Monitor Clipper Partners, a private equity investment fund (since 1997); President of Clipper Asset Management Corp. (1991–2009).
Other Directorships: None. |
27
Basic Information About Management (continued)
Name, Address and
Year of Birth | | Current Position and
Length of Service
with the Company | | Principal Occupation and Other Directorships
During the Past Five Years |
Eric C. Fast
Lord, Abbett & Co. LLC
c/o Legal Dept.
90 Hudson Street
Jersey City, NJ 07302
(1949) | | Director since 2014 | | Principal Occupation: Chief Executive Officer of Crane Co., an industrial products company (2001–2014).
Other Directorships: Currently serves as director of Automatic Data Processing, Inc. (since 2007) and Regions Financial Corporation (since 2010). Previously served as a director of Crane Co. (1999–2014). |
| | | | | |
Evelyn E. Guernsey
Lord, Abbett & Co. LLC
c/o Legal Dept.
90 Hudson Street
Jersey City, NJ 07302
(1955) | | Director since 2011 | | Principal Occupation: CEO, Americas of J.P. Morgan Asset Management (2004–2010).
Other Directorships: None. |
| | | | | |
Julie A. Hill
Lord, Abbett & Co. LLC
c/o Legal Dept.
90 Hudson Street
Jersey City, NJ 07302
(1946) | | Director since 2004 | | Principal Occupation: Owner and CEO of The Hill Company, a business consulting firm (since 1998).
Other Directorships: Currently serves as director of Anthem, Inc., a health benefits company (since 1994). |
| | | | | |
Franklin W. Hobbs
Lord, Abbett & Co. LLC
c/o Legal Dept.
90 Hudson Street
Jersey City, NJ 07302
(1947) | | Director since 2001 | | Principal Occupation: Advisor of One Equity Partners, a private equity firm (since 2004).
Other Directorships: Currently serves as director and Chairman of the Board of Ally Financial Inc., a financial services firm (since 2009), and as director of Molson Coors Brewing Company (since 2002). |
| | | | | |
James M. McTaggart
Lord, Abbett & Co. LLC
c/o Legal Dept.
90 Hudson Street
Jersey City, NJ 07302
(1947) | | Director since 2012 | | Principal Occupation: Independent management advisor and consultant (since 2012); Vice President, CRA International, Inc. (doing business as Charles River Associates), a global management consulting firm (2009–2012); Founder and Chairman of Marakon Associates, Inc., a strategy consulting firm (1978– 2009); and Officer and Director of Trinsum Group, a holding company (2007–2009).
Other Directorships: Currently serves as director of Blyth, Inc., a home products company (since 2004). |
| | | | | |
Mark A. Schmid
Lord, Abbett & Co. LLC
c/o Legal Dept.
90 Hudson Street
Jersey City, NJ 07302
(1959) | | Director since 2016 | | Principal Occupation: Vice President and Chief Investment Officer of the University of Chicago (since 2009).
Other Directorships: None. |
28
Basic Information About Management (continued)
Name, Address and
Year of Birth | | Current Position and
Length of Service
with the Company | | Principal Occupation and Other Directorships
During the Past Five Years |
James L.L. Tullis
Lord, Abbett & Co. LLC
c/o Legal Dept.
90 Hudson Street
Jersey City, NJ 07302
(1947) | | Director since 2006; Chairman since 2017 | | Principal Occupation: CEO of Tullis-Dickerson and Co. Inc., a venture capital management firm (since 1990); CEO of Tullis Health Investors Inc. (since 2012).
Other Directorships: Currently serves as director of Crane Co. (since 1998). |
Officers
None of the officers listed below have received compensation from the Company. All of the officers of the Company also may be officers of the other Lord Abbett Funds and maintain offices at 90 Hudson Street, Jersey City, NJ 07302. Unless otherwise indicated, the position(s) and title(s) listed under the “Principal Occupation During the Past Five Years” column indicate each officer’s position(s) and title(s) with Lord Abbett. Each officer serves for an indefinite term (i.e., until his or her death, resignation, retirement, or removal).
Name and
Year of Birth | | Current Position
with the Company | | Length of Service
of Current
Position | | Principal Occupation
During the Past Five Years |
Daria L. Foster
(1954) | | President and Chief Executive Officer | | Elected as President in 2006 and Chief Executive Officer in 2012 | | Managing Partner of Lord Abbett, joined Lord Abbett in 1990. |
| | | | | | | |
Sean J. Aurigemma
(1969) | | Executive Vice President | | Elected in 2010 | | Portfolio Manager, joined Lord Abbett in 2007. |
| | | | | | | |
Jeff D. Diamond
(1960) | | Executive Vice President | | Elected in 2008 | | Portfolio Manager, joined Lord Abbett in 2007. |
| | | | | | | |
Todd D. Jacobson
(1966) | | Executive Vice President | | Elected in 2005 | | Partner and Associate Director, joined Lord Abbett in 2003. |
| | | | | | | |
Robert A. Lee
(1969) | | Executive Vice President | | Elected in 2010 | | Partner and Chief Investment Officer, and was formerly Deputy Chief Investment Officer and Director of Taxable Fixed Income, joined Lord Abbett in 1997. |
| | | | | | | |
Thomas B. Maher
(1967) | | Executive Vice President | | Elected in 2010 | | Partner and Portfolio Manager, joined Lord Abbett in 2003. |
| | | | | | | |
Justin C. Maurer
(1969) | | Executive Vice President | | Elected in 2010 | | Partner and Portfolio Manager, joined Lord Abbett in 2001. |
| | | | | | | |
Vincent J. McBride
(1964) | | Executive Vice President | | Elected in 2010 | | Partner and Director, joined Lord Abbett in 2003. |
| | | | | | | |
Andrew H. O’Brien
(1973) | | Executive Vice President | | Elected in 2010 | | Partner and Portfolio Manager, joined Lord Abbett in 1998. |
29
Basic Information About Management (continued)
Name and
Year of Birth | | Current Position
with the Company | | Length of Service
of Current
Position | | Principal Occupation
During the Past Five Years |
F. Thomas O’Halloran, III
(1955) | Executive Vice President | | Elected in 2010 | | Partner and Portfolio Manager, joined Lord Abbett in 2001. |
| | | | | | | |
Marc Pavese
(1972) | | Executive Vice President | | Elected in 2016 | | Partner and Portfolio Manager, joined Lord Abbett in 2008. |
| | | | | | | |
Walter H. Prahl
(1958) | | Executive Vice President | | Elected in 2012 | | Partner and Director, joined Lord Abbett in 1997. |
| | | | | | | |
Steven F. Rocco
(1979) | | Executive Vice President | | Elected in 2014 | | Partner and Portfolio Manager, joined Lord Abbett in 2004. |
| | | | | | | |
Didier O. Rosenfeld
(1976) | | Executive Vice President | | Elected in 2016 | | Director of Global Equity, joined Lord Abbett in 2015 and was formerly a Portfolio Manager and Senior Analyst at Cornerstone Capital Management (2014–2015) and Managing Director at State Street Global Advisors (2000–2013). |
| | | | | | | |
Frederick J. Ruvkun
(1957) | | Executive Vice President | | Elected in 2012 | | Partner and Portfolio Manager, joined Lord Abbett in 2006. |
| | | | | | | |
Paul J. Volovich
(1973) | | Executive Vice President | | Elected in 2005 | | Partner and Portfolio Manager, joined Lord Abbett in 1997. |
| | | | | | | |
A. Edward Allinson
(1961) | | Vice President | | Elected in 2011 | | Portfolio Manager, joined Lord Abbett in 2005. |
| | | | | | | |
John W. Ashbrook
(1964) | | Vice President and Assistant Secretary | | Elected in 2014 | | Assistant General Counsel, joined Lord Abbett in 2008. |
| | | | | | | |
Joan A. Binstock
(1954) | | Chief Financial Officer and Vice President | | Elected in 1999 | | Partner and Chief Financial Officer, and was formerly Chief Operations Officer, joined Lord Abbett in 1999. |
| | | | | | | |
Brooke A. Fapohunda
(1975) | | Vice President and Assistant Secretary | | Elected in 2014 | | Deputy General Counsel, joined Lord Abbett in 2006. |
| | | | | | | |
John K. Forst
(1960) | | Vice President and Assistant Secretary | | Elected in 2005 | | Partner and Deputy General Counsel, joined Lord Abbett in 2004. |
| | | | | | | |
Anthony W. Hipple
(1964) | | Vice President | | Elected in 2014 | | Portfolio Manager, joined Lord Abbett in 2002. |
| | | | | | | |
Lawrence H. Kaplan
(1957) | | Vice President and Secretary | | Elected in 1997 | | Partner and General Counsel, joined Lord Abbett in 1997. |
30
Basic Information About Management (concluded)
Name and
Year of Birth | | Current Position
with the Company | | Length of Service
of Current
Position | | Principal Occupation
During the Past Five Years |
Linda Y. Kim
(1980) | | Vice President and Assistant Secretary | | Elected in 2016 | | Counsel, joined Lord Abbett in 2015 and was formerly an Associate at Stroock & Stroock & Lavan LLP (2007–2015). |
| | | | | | | |
David J. Linsen
(1974) | | Vice President | | Elected in 2008 | | Partner and Director, joined Lord Abbett in 2001. |
| | | | | | | |
Joseph M. McGill
(1962) | | Chief Compliance Officer | | Elected in 2014 | | Partner and Chief Compliance Officer, joined Lord Abbett in 2014 and was formerly Managing Director and the Chief Compliance Officer at UBS Global Asset Management (2003–2013). |
| | | | | | | |
A. Edward Oberhaus, III
(1959) | | Vice President | | Elected in 1998 | | Partner and Director, joined Lord Abbett in 1983. |
| | | | | | | |
Noah Petrucci
(1970) | | Vice President | | Elected in 2013 | | Portfolio Manager, joined Lord Abbett in 2012 and was formerly a Portfolio Manager at Columbia Management Investment Advisers, LLC and Columbia Management Advisors, LLC (2002–2012). |
| | | | | | | |
Lawrence B. Stoller
(1963) | | Vice President and Assistant Secretary | | Elected in 2007 | | Partner and Senior Deputy General Counsel, joined Lord Abbett in 2007. |
| | | | | | | |
Leah G. Traub
(1979) | | Vice President | | Elected in 2016 | | Partner and Portfolio Manager, joined Lord Abbett in 2007. |
| | | | | | | |
Arthur K. Weise
(1970) | | Vice President | | Elected in 2010 | | Partner and Portfolio Manager, joined Lord Abbett in 2007. |
| | | | | | | |
Kewjin Yuoh
(1971) | | Vice President | | Elected in 2012 | | Partner and Portfolio Manager, joined Lord Abbett in 2010. |
| | | | | | | |
Scott S. Wallner
(1955) | | AML Compliance Officer | | Elected in 2011 | | Assistant General Counsel, joined Lord Abbett in 2004. |
| | | | | | | |
Bernard J. Grzelak
(1971) | | Treasurer | | Elected in 2003 | | Partner and Chief Operations Officer, and was formerly Director of Fund Administration, joined Lord Abbett in 2003. |
Please call 888-522-2388 for a copy of the statement of additional information, which contains further information about the Company’s Directors. It is available free upon request.
31
Approval of Advisory Contract
The Board, including all of the Directors who are not interested persons of the Fund or of Lord Abbett (the “Independent Board Members”), annually considers whether to approve the continuation of the existing management agreement between the Fund and Lord Abbett (the “Agreement”). In connection with its most recent approval, the Board reviewed materials relating specifically to the Agreement, as well as numerous materials received throughout the course of the year, including information about the Fund’s investment performance compared to the performance of its benchmark. Before making its decision as to the Fund, the Board had the opportunity to ask questions and request further information, taking into account its familiarity with Lord Abbett gained through its meetings and discussions. These meetings and discussions included the review of the portfolio management team conducted by members of the Contract Committee, the deliberations of the Contract Committee, and discussions between the Contract Committee and Lord Abbett’s management. The Independent Board Members also met with their independent legal counsel in a private session at which no representatives of management were present.
The materials received by the Board included, but were not limited to: (1) information provided by Morningstar Associates, LLC (“Morningstar”) regarding the investment performance of the Fund compared to the investment performance of certain funds with similar investment styles as determined by Morningstar, based, in part, on the Fund’s Morningstar category (the “performance peer group”), and the investment performance of the Fund’s benchmark; (2) information provided by Morningstar regarding the expense ratios, contractual and effective management fee rates, and other expense components for the Fund and certain funds in the same Morningstar category, with generally the same or similar share classes and operational characteristics, including asset size (the “expense peer group”); (3) certain supplemental investment performance information provided by Lord Abbett; (4) information provided by Lord Abbett on the expense ratios, management fee rates, and other expense components for the Fund; (5) sales and redemption information for the Fund; (6) information regarding Lord Abbett’s financial condition; (7) an analysis of the relative profitability of the Agreement to Lord Abbett; (8) information provided by Lord Abbett regarding the investment management fee schedules for Lord Abbett’s other advisory clients maintaining accounts with a similar investment strategy as the Fund; and (9) information regarding the personnel and other resources devoted by Lord Abbett to managing the Fund.
Investment Management Services Generally. The Board considered the investment management services provided by Lord Abbett to the Fund, including investment research, portfolio management, and trading, and Lord Abbett’s commitment to compliance with all applicable legal requirements. The Board also observed that Lord Abbett was solely engaged in the investment management business and accordingly did not experience the conflicts of interest that may result from being engaged in other lines of business. The Board considered the investment advisory services provided by Lord Abbett to other clients, the fees charged for the services, and the differences in the nature of the services provided to the Fund and other Lord Abbett Funds, on the one hand, and the services provided to other clients, on the other. After reviewing these and related factors, the Board concluded that the Fund was likely to continue to benefit from the nature, extent and quality of the investment services provided by Lord Abbett under the Agreement.
Investment Performance. The Board reviewed the Fund’s investment performance in relation to that of the performance peer group and the Fund’s benchmark as of various periods ended August 31, 2016. The Board observed that the Fund’s investment performance was above the median of the performance peer group for the three-year and five-year periods and below the median of the performance peer group for the one-year and ten-year periods. The Board also considered Lord
32
Approval of Advisory Contract (continued)
Abbett’s performance and reputation generally, the performance of other Lord Abbett-managed funds overseen by the Board and the willingness of Lord Abbett to take steps intended to improve performance when necessary. After reviewing these and related factors, the Board concluded that the Fund’s investment performance was reasonable and supported the continuation of the Agreement.
Lord Abbett’s Personnel and Methods. The Board considered the qualifications of the personnel providing investment management services to the Fund, in light of its investment objective and discipline. Among other things, the Board considered the size, experience, and turnover of Lord Abbett’s investment management staff, Lord Abbett’s investment methodology and philosophy, and Lord Abbett’s approach to recruiting, training, and retaining investment management personnel.
Nature and Quality of Other Services. The Board considered the nature, quality, costs, and extent of compliance, administrative, and other services performed by Lord Abbett and the nature and extent of Lord Abbett’s supervision of third party service providers, including the Fund’s transfer agent and custodian.
Expenses. The Board considered the expense level of the Fund and the expense levels of the expense peer group. It also considered how the expense levels of the Fund related to those of the expense peer group and the amount and nature of the fees paid by shareholders. The Board observed that the overall expense level of the Fund was below the median of the expense peer group. After reviewing these and related factors, the Board concluded, within the context of its overall approval of the Agreement, that the expense level of the Fund was reasonable and supported the continuation of the Agreement.
Profitability. The Board considered the level of Lord Abbett’s operating margin in managing the Fund, including a review of Lord Abbett’s methodology for allocating its costs to its management of the Fund. It considered whether the Fund was profitable to Lord Abbett in connection with the operation of the Fund, including the fee that Lord Abbett receives from the Fund for providing administrative services to the Fund. The Board also considered the profits realized from other business segments of Lord Abbett, which may benefit from or be related to the Fund’s business. The Board considered Lord Abbett’s profit margins in comparison with available industry data, both accounting for and excluding marketing and distribution expenses, and how those profit margins could affect Lord Abbett’s ability to recruit and retain investment personnel. The Board recognized that Lord Abbett’s overall profitability was a factor in enabling it to attract and retain qualified investment management personnel to provide services to the Fund. After reviewing these and related factors, the Board concluded, within the context of its overall approval of the Agreement, that Lord Abbett’s profitability with respect to the Fund was not excessive.
Economies of Scale. The Board considered the extent to which there had been economies of scale in managing the Fund, whether the Fund’s shareholders had appropriately benefited from such economies of scale, and whether there was potential for realization of any further economies of scale. The Board concluded that the existing management fee schedule, with its breakpoints in the levels of the management fee, in conjunction with a proposed expense limitation agreement adequately addressed any economies of scale in managing the Fund.
Other Benefits to Lord Abbett. The Board considered the character and amount of fees paid by the Fund and the Fund’s shareholders to Lord Abbett and the Distributor for services other than investment advisory services. The Board also considered the revenues and profitability of Lord
33
Approval of Advisory Contract (concluded)
Abbett’s investment advisory business apart from its mutual fund business, and the intangible benefits enjoyed by Lord Abbett by virtue of its relationship with the Fund. The Board observed that the Distributor receives 12b-1 fees from certain of the Lord Abbett Funds as to shares held in accounts for which there is no other broker of record, may retain a portion of the 12b-1 fees it receives, and receives a portion of the sales charges on sales and redemptions of some classes of shares. In addition, the Board observed that Lord Abbett accrues certain benefits for its business of providing investment advice to clients other than the Lord Abbett Funds, but that business also benefits the Funds. The Board also noted that Lord Abbett, as disclosed in the prospectus of the Fund, has entered into revenue sharing arrangements with certain entities that distribute shares of the Fund. The Board also took into consideration the investment research that Lord Abbett receives as a result of Fund brokerage transactions.
Alternative Arrangements. The Board considered whether, instead of approving continuation of the Agreement, it might be in the best interests of the Fund to implement one or more alternative arrangements, such as continuing to employ Lord Abbett, but on different terms. After considering all of the relevant factors, the Board unanimously found that continuation of the Agreement was in the best interests of the Fund and its shareholders and voted unanimously to approve the continuation of the Agreement. In considering whether to approve the continuation of the Agreement, the Board did not identify any single factor as paramount or controlling. Individual Directors may have evaluated the information presented differently from one another, giving different weights to various factors. This summary does not discuss in detail all matters considered.
34
Householding
The Company has adopted a policy that allows it to send only one copy of the Fund’s prospectus, proxy material, annual report and semiannual report to certain shareholders residing at the same “household.” This reduces Fund expenses, which benefits you and other shareholders. If you need additional copies or do not want your mailings to be “householded,” please call Lord Abbett at 888-522-2388 or send a written request with your name, the name of your fund or funds and your account number or numbers to Lord Abbett Family of Funds, P.O. Box 219336, Kansas City, MO 64121.
Proxy Voting Policies, Procedures and Records
A description of the policies and procedures that Lord Abbett uses to vote proxies related to the Fund’s portfolio securities, and information on how Lord Abbett voted the Fund’s proxies during the 12-month period ended June 30 are available without charge, upon request, (i) by calling 888-522-2388; (ii) on Lord Abbett’s Website at www.lordabbett.com; and (iii) on the Securities and Exchange Commission’s (“SEC”) Website at www.sec.gov.
Shareholder Reports and Quarterly Portfolio Disclosure
The Fund is required to file its complete schedule of portfolio holdings with the SEC for its first and third fiscal quarters on Form N-Q. Copies of the filings are available without charge, upon request on the SEC’s Website at www.sec.gov and may be available by calling Lord Abbett at 888-522-2388. You can also obtain copies of Form N-Q by visiting the SEC’s Public Reference Room in Washington, DC (information on the operation of the Public Reference Room may be obtained by calling 800-SEC-0330).
| | Tax Information |
| | |
| | The Fund intends to pass through foreign source income of $1,087,606 and foreign taxes of $114,867. |
35


| This report, when not used for the general information of shareholders of the Fund, is to be distributed only if preceded or accompanied by a current fund prospectus. | | | |
| | | Lord Abbett Series Fund, Inc. | |
Lord Abbett mutual fund shares are distributed by
LORD ABBETT DISTRIBUTOR LLC. | | International Opportunities Portfolio | SFIO-PORT-3
(02/17) |

2016 LORD ABBETT
ANNUAL REPORT
Lord Abbett
Series Fund—Mid Cap Stock Portfolio
For the fiscal year ended December 31, 2016
Lord Abbett Series Fund — Mid Cap Stock Portfolio
Annual Report
For the fiscal year ended December 31, 2016

From left to right: James L.L. Tullis, Chairman of the Lord Abbett Funds and Daria L. Foster Director, President, and Chief Executive Officer of the Lord Abbett Funds.
Dear Shareholders: We are pleased to provide you with this overview of the performance of Lord Abbett Series Fund — Mid Cap Stock Portfolio for the fiscal year ended December 31, 2016. On this page and the following pages, we discuss the major factors that influenced fiscal year performance. For additional information about the Fund, please visit our website at www.lordabbett.com, where you also can access the quarterly commentaries that provide updates on the Fund’s performance and other portfolio related updates.
Thank you for investing in Lord Abbett mutual funds. We value the trust that you place in us and look forward to serving your investment needs in the years to come.
Best regards,

Daria L. Foster
Director, President and Chief Executive Officer
For the fiscal year ended December 31, 2016, the Fund returned 16.39%, reflecting performance at the net asset value (NAV) of Class A shares, with all distributions reinvested, compared to its benchmark, the Russell Midcap® Value Index,1 which returned 20.00% over the same period.
Domestic equity markets (as represented by the S&P 500® Index2) returned 11.96% over the past year. Despite this general move higher, there were significant bouts of volatility within U.S. stock markets, including their worst start to a calendar year on record.
Crude oil prices played a significant role in the increased market volatility, as Brent oil prices fluctuated sharply throughout the fiscal year. In December, the Organization of Petroleum Exporting Countries agreed to reduce oil production effective 2017. Furthermore, global markets were affected by the devaluation of China’s currency and weak economic data out of the region. The Chinese economy advanced at an annual rate of 6.7% in the third quarter of 2016, a slower pace than in recent years.
1
Geopolitical events also contributed to volatility in global markets. The United Kingdom’s referendum in June to leave the European Union (“Brexit”) was a surprise that caused a sell-off in global markets.
In contrast to the equity market volatility, the U.S. economy continued to expand during the trailing 12-month period. The Federal Reserve (Fed) raised target rates for the second time in 12 months in December, from 0.25%–0.50% to 0.50%–0.75%. U.S. gross domestic product (GDP) grew at a 3.2% pace during the third quarter, a significant increase over the second quarter. The U.S. Bureau of Economic Analysis stated that during the third-quarter personal consumption and federal government spending increased, quarter over quarter. In addition to GDP growth, the U.S. unemployment rate remained relatively steady throughout the period, finishing at 4.6% in November.
The U.S. presidential election took an unexpected turn as Donald J. Trump was elected president, in contrast to indications from poll numbers before the election. Markets rallied on improved clarity in the U.S. political agenda, with the House and Senate also under Republican control.
During the period, stock selection and an underweight in the industrials sector were the largest detractors from the Fund’s performance relative to its benchmark. Within the industrials sector, the Fund’s holdings of Parker Hannifin Corp., a manufacturer of motion-control and fluid
systems and components within multiple industries, detracted most. Parker Hannifin fell as organic growth expectations remained flat, specifically its business segments in North America. The Fund’s position in Stanley Works, a provider of appliances and tools for various industrial applications, also detracted from performance. Shares fell as the company faced macro headwinds from declining industry sales and low growth in emerging market regions.
Stock selection in the information technology sector also detracted from the Fund’s performance. The Fund’s holdings of Verifone Systems, Inc., an electronic payment solutions company, detracted most. Shares of Verifone Systems, Inc. fell as it missed second quarter earnings estimates as macro challenges outside the United States created headwinds for future revenue growth and profitability.
During the period, security selection and an overweight in the energy sector were the largest contributors to the Fund’s relative performance. Within the energy sector, the Fund’s holdings of Patterson-UTI Energy, Inc., a domestic land-based drilling rigs and pressure pumping equipment operator, and Cimarex Energy Co., an independent oil and gas exploration and production company, both contributed to performance. Patterson and Cimarex benefitted as U.S. rig counts and oil prices increased throughout the calendar year.
Stock selection in the consumer discretionary sector also contributed to the
2
Fund’s performance. The Fund’s holding of Whirlpool Corp., a marketer and manufacturer of home appliances, contributed most. Whirlpool shares gained as the firm expected to implement cost-cutting and productivity measures that were expected to improve earnings growth despite a declining industry growth.
The Fund’s portfolio is actively managed and, therefore, its holdings and the weightings of a particular issuer or particular sector as a percentage of portfolio assets are subject to change. Sectors may include many industries.
1 The Russell Midcap® Value Index measures the performance of those Russell Midcap companies with lower price-to-book ratios and lower forecasted growth values. The stocks are also members of the Russell 1000® Value index.
2 The S&P 500® Index is widely regarded as the standard for measuring large cap U.S. stock market performance and includes a representative sample of leading companies in leading industries.
Unless otherwise specified, indexes reflect total return, with all dividends reinvested. Indexes are unmanaged, do not reflect the deduction of fees or expenses, and are not available for direct investment.
Important Performance and Other Information
Performance data quoted in the following pages reflect past performance and are no guarantee of future results. Current performance may be higher or lower than the performance quoted. The investment return and principal value of an investment in the Funds will fluctuate so that shares, on any given day or when redeemed, may be worth more or less than their original cost. You can obtain performance data current to the most recent month end by calling Lord Abbett at 888-522-2388 or referring to www.lordabbett.com.
The annual commentary above discusses the views of the Fund’s management and various portfolio holdings of the Funds as of December 31, 2016. These views and portfolio holdings may have changed after this date. Information provided in the commentary is not a recommendation to buy or sell securities. Because the Fund’s portfolio is actively managed and may change significantly, the Fund may no longer own the securities described above or may have otherwise changed their positions in the securities. For more recent information about the Fund’s portfolio holdings, please visit www.lordabbett.com.
A Note about Risk: See Notes to Financial Statements for a discussion of investment risks. For a more detailed discussion of the risks associated with each Fund, please see the Fund’s prospectus.
Mutual funds are not insured by the FDIC, are not deposits or other obligations of, or guaranteed by, banks, and are subject to investment risks including possible loss of principal amount invested.
The Fund serves as an underlying investment vehicle for variable annuity contracts and variable life insurance policies.
3
Investment Comparison
Below is a comparison of a $10,000 investment in Class VC shares with the same investment in both the Russell Midcap® Value Index and the S&P MidCap 400® Value Index assuming reinvestment of all dividends and distributions. the Fund’s shares are sold only to insurance company separate accounts that fund certain variable annuity and variable life contracts. This line graph comparison does not reflect the sales charges or other expenses of these contracts. If those sales charges and expenses were reflected, returns would be lower. The graph and performance table below do not reflect the deduction of taxes that a shareholder would pay on Fund distributions or the redemption of Fund shares. Past performance is no guarantee of future results.
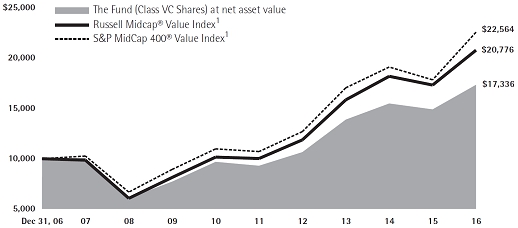
Average Annual Total Returns for the
Periods Ended December 31, 2016
| | 1 Year | 5 Years | 10 Years | |
| Class VC | 16.39% | 13.27% | 5.66% | |
1 Performance for each unmanaged index does not reflect any fees or expenses. The performance of each index is not necessarily representative of the Fund’s performance.
4
Expense Example
As a shareholder of the Fund, you incur ongoing costs, including management fees; expenses related to the Fund’s services arrangements with certain insurance companies; and other Fund expenses. This Example is intended to help you understand your ongoing costs (in dollars) of investing in the Fund and to compare these costs with the ongoing costs of investing in other mutual funds.
The Example is based on an investment of $1,000 invested at the beginning of the period and held for the entire period (July 1, 2016 through December 31, 2016).
The Example reflects only expenses that are deducted from the assets of the Fund. Fees and expenses, including sales charges applicable to the various insurance products that invest in the Fund, are not reflected in this Example. If such fees and expenses were reflected in the Example, the total expenses shown would be higher. Fees and expenses regarding such variable insurance products are separately described in the prospectus related to those products.
Actual Expenses
The first line of the table on the following page provides information about actual account values and actual expenses. You may use the information in this line, together with the amount you invested, to estimate the expenses that you paid over the period. Simply divide your account value by $1,000 (for example, an $8,600 account value divided by $1,000 = 8.6), then multiply the result by the number in the first line under the heading titled “Expenses Paid During Period 7/1/16 – 12/31/16” to estimate the expenses you paid on your account during this period.
Hypothetical Example for Comparison Purposes
The second line of the table on the following page provides information about hypothetical account values and hypothetical expenses based on the Fund’s actual expense ratio and an assumed rate of return of 5% per year before expenses, which is not the Fund’s actual return. The hypothetical account values and expenses may not be used to estimate the actual ending account balance or expenses you paid for the period. You may use this information to compare the ongoing costs of investing in the Fund and other funds. To do so, compare this 5% hypothetical example with the 5% hypothetical examples that appear in the shareholder reports of the other funds.
5
Please note that the expenses shown in the table are meant to highlight your ongoing costs only and do not reflect any transactional costs, such as sales charges. Therefore, the second line of the table is useful in comparing ongoing costs only, and will not help you determine the relative total costs of owning different funds. In addition, if these transactional costs were included, your costs would have been higher.
| | | Beginning | | Ending | | Expenses | |
| | | Account | | Account | | Paid During | |
| | | Value | | Value | | Period(a) | |
| | | | | | | 7/1/16 - | |
| | | 7/1/16 | | 12/31/16 | | 12/31/16 | |
| Class VC | | | | | | | |
| Actual | | $1,000.00 | | $1,102.40 | | $6.24 | |
| Hypothetical (5% Return Before Expenses) | | $1,000.00 | | $1,019.20 | | $5.99 | |
| (a) | Net expenses are equal to the Fund’s annualized expense ratio of 1.18%, multiplied by the average account value over the period, multiplied by 184/366 (to reflect one-half year period). |
Portfolio Holdings Presented by Sector
December 31, 2016
| Sector* | %** |
| Consumer Discretionary | 8.20 | % |
| Consumer Staples | 5.72 | % |
| Energy | 11.23 | % |
| Financials | 23.24 | % |
| Health Care | 5.25 | % |
| Industrials | 13.25 | % |
| Information Technology | 10.55 | % |
| Materials | 6.34 | % |
| Real Estate | 9.15 | % |
| Utilities | 6.20 | % |
| Repurchase Agreement | 0.87 | % |
| Total | 100.00 | % |
| * | | A sector may comprise several industries. |
| ** | | Represents percent of total investments. |
| 6 | See Notes to Financial Statements. |
Schedule of Investments
December 31, 2016
| Investments | | Shares | | | Fair
Value
(000) | |
| COMMON STOCKS 99.22% | | | | | | | | |
| | | | | | | | | |
| Aerospace & Defense 0.88% | | | | | | | | |
| Orbital ATK, Inc. | | | 35,554 | | | $ | 3,119 | |
| | | | | | | | | |
| Airlines 1.60% | | | | | | | | |
| Alaska Air Group, Inc. | | | 64,215 | | | | 5,698 | |
| | | | | | | | | |
| Banks 9.79% | | | | | | | | |
| CIT Group, Inc. | | | 124,199 | | | | 5,301 | |
| Citizens Financial Group, Inc. | | | 218,100 | | | | 7,771 | |
| East West Bancorp, Inc. | | | 127,000 | | | | 6,455 | |
| KeyCorp | | | 378,700 | | | | 6,919 | |
| M&T Bank Corp. | | | 28,600 | | | | 4,474 | |
| Webster Financial Corp. | | | 73,520 | | | | 3,991 | |
| Total | | | | | | | 34,911 | |
| | | | | | | | | |
| Beverages 2.77% | | | | | | | | |
| Coca-Cola European Partners plc (United Kingdom)(a) | | | 139,759 | | | | 4,388 | |
| Molson Coors Brewing Co. Class B | | | 56,456 | | | | 5,494 | |
| Total | | | | | | | 9,882 | |
| | | | | | | | | |
| Building Products 1.57% | | | | | | | | |
| Johnson Controls International plc | | | 135,730 | | | | 5,591 | |
| | | | | | | | | |
| Capital Markets 2.56% | | | | | | | | |
| E*TRADE Financial Corp.* | | | 194,400 | | | | 6,736 | |
| OM Asset Management plc (United Kingdom)(a) | | | 165,184 | | | | 2,395 | |
| Total | | | | | | | 9,131 | |
| | | | | | | | | |
| Chemicals 2.76% | | | | | | | | |
| Albemarle Corp. | | | 31,882 | | | | 2,744 | |
| Eastman Chemical Co. | | | 55,417 | | | | 4,168 | |
| FMC Corp. | | | 51,611 | | | | 2,919 | |
| Total | | | | | | | 9,831 | |
| | | | | | | | | |
| Communications Equipment 4.21% | | | | | | | | |
| Harris Corp. | | | 34,242 | | | | 3,509 | |
| Juniper Networks, Inc. | | | 193,600 | | | | 5,471 | |
| Motorola Solutions, Inc. | | | 72,800 | | | | 6,034 | |
| Total | | | | | | | 15,014 | |
| Investments | | Shares | | | Fair
Value
(000) | |
| Construction & Engineering 0.74% | | | | | | | | |
| Fluor Corp. | | | 50,126 | | | $ | 2,633 | |
| | | | | | | | | |
| Containers & Packaging 1.43% | | | | | | | | |
| Graphic Packaging Holding Co. | | | 263,200 | | | | 3,285 | |
| Packaging Corp. of America | | | 21,300 | | | | 1,806 | |
| Total | | | | | | | 5,091 | |
| | | | | | | | | |
| Electric: Utilities 6.20% | | | | | | | | |
| Edison International | | | 84,100 | | | | 6,054 | |
| Great Plains Energy, Inc. | | | 118,300 | | | | 3,236 | |
| Portland General Electric Co. | | | 157,200 | | | | 6,811 | |
| PPL Corp. | | | 176,800 | | | | 6,020 | |
| Total | | | | | | | 22,121 | |
| | | | | | | | | |
| Electrical Equipment 2.92% | | | | | | | | |
| AMETEK, Inc. | | | 90,701 | | | | 4,408 | |
| Hubbell, Inc. | | | 51,539 | | | | 6,015 | |
| Total | | | | | | | 10,423 | |
| | | | | | | | | |
| Energy Equipment & Services 3.00% | | | | | | | | |
| Nabors Industries Ltd. | | | 211,304 | | | | 3,466 | |
| Patterson-UTI Energy, Inc. | | | 89,312 | | | | 2,404 | |
| Superior Energy Services, Inc. | | | 285,200 | | | | 4,814 | |
| Total | | | | | | | 10,684 | |
| | | | | | | | | |
| Equity Real Estate Investment Trusts 9.15% | | | | | | | | |
| Alexandria Real Estate Equities, Inc. | | | 32,406 | | | | 3,601 | |
| Brixmor Property Group, Inc. | | | 173,360 | | | | 4,233 | |
| Duke Realty Corp. | | | 185,000 | | | | 4,914 | |
| Healthcare Trust of America, Inc. Class A | | | 101,740 | | | | 2,962 | |
| Highwoods Properties, Inc. | | | 64,900 | | | | 3,311 | |
| Kimco Realty Corp. | | | 149,500 | | | | 3,761 | |
| UDR, Inc. | | | 142,914 | | | | 5,214 | |
| Vornado Realty Trust | | | 44,509 | | | | 4,645 | |
| Total | | | | | | | 32,641 | |
| | See Notes to Financial Statements. | 7 |
Schedule of Investments (continued)
December 31, 2016
| Investments | | Shares | | | Fair
Value
(000) | |
| Food Products 2.96% | | | | | | | | |
| Bunge Ltd. | | | 56,017 | | | $ | 4,046 | |
| Pinnacle Foods, Inc. | | | 66,962 | | | | 3,579 | |
| Snyder’s-Lance, Inc. | | | 76,048 | | | | 2,916 | |
| Total | | | | | | | 10,541 | |
| | | | | | | | | |
| Health Care Equipment & Supplies 1.22% | | | | | | | | |
| Alere, Inc.* | | | 112,005 | | | | 4,365 | |
| | | | | | | | | |
| Health Care Providers & Services 1.76% | | | | | | | | |
| Cardinal Health, Inc. | | | 32,767 | | | | 2,358 | |
| HealthSouth Corp. | | | 95,074 | | | | 3,921 | |
| Total | | | | | | | 6,279 | |
| | | | | | | | | |
| Hotels, Restaurants & Leisure 3.00% | | | | | | | | |
| MGM Resorts International* | | | 194,178 | | | | 5,598 | |
| Royal Caribbean Cruises Ltd. | | | 62,200 | | | | 5,103 | |
| Total | | | | | | | 10,701 | |
| | | | | | | | | |
| Household Durables 3.74% | | | | | | | | |
| Lennar Corp. Class A | | | 52,400 | | | | 2,249 | |
| Newell Brands, Inc. | | | 106,019 | | | | 4,734 | |
| Whirlpool Corp. | | | 35,000 | | | | 6,362 | |
| Total | | | | | | | 13,345 | |
| | | | | | | | | |
| Information Technology Services 3.56% | | | | | | | | |
| CSRA, Inc. | | | 143,679 | | | | 4,575 | |
| Fidelity National Information Services, Inc. | | | 57,800 | | | | 4,372 | |
| Xerox Corp. | | | 427,678 | | | | 3,733 | |
| Total | | | | | | | 12,680 | |
| | | | | | | | | |
| Insurance 10.39% | | | | | | | | |
| Allied World Assurance Co. Holdings AG (Switzerland)(a) | | | 77,923 | | | | 4,185 | |
| Allstate Corp. (The) | | | 37,545 | | | | 2,783 | |
| Arch Capital Group Ltd.* | | | 39,100 | | | | 3,374 | |
| Argo Group International Holdings Ltd. | | | 39,867 | | | | 2,627 | |
| Brown & Brown, Inc. | | | 52,900 | | | | 2,373 | |
| Hanover Insurance Group, Inc. (The) | | | 52,838 | | | | 4,809 | |
| Investments | | Shares | | | Fair
Value
(000) | |
| Insurance (continued) | | | | | | | | |
| Hartford Financial Services | | | | | | | | |
| Group, Inc. (The) | | | 114,886 | | | $ | 5,474 | |
| Lincoln National Corp. | | | 52,700 | | | | 3,493 | |
| XL Group Ltd. | | | 212,500 | | | | 7,918 | |
| Total | | | | | | | 37,036 | |
| | | | | | | | | |
| Life Sciences Tools & Services 1.55% | | | | | | | | |
| Agilent Technologies, Inc. | | | 67,500 | | | | 3,075 | |
| PerkinElmer, Inc. | | | 47,000 | | | | 2,451 | |
| Total | | | | | | | 5,526 | |
| | | | | | | | | |
| Machinery 4.79% | | | | | | | | |
| Ingersoll-Rand plc (Ireland)(a) | | | 65,600 | | | | 4,923 | |
| ITT, Inc. | | | 99,627 | | | | 3,842 | |
| Kennametal, Inc. | | | 138,809 | | | | 4,339 | |
| Parker-Hannifin Corp. | | | 28,269 | | | | 3,958 | |
| Total | | | | | | | 17,062 | |
| | | | | | | | | |
| Metals & Mining 2.16% | | | | | | | | |
| Freeport-McMoRan, Inc.* | | | 242,182 | | | | 3,195 | |
| Steel Dynamics, Inc. | | | 126,900 | | | | 4,515 | |
| Total | | | | | | | 7,710 | |
| | | | | | | | | |
| Oil, Gas & Consumable Fuels 8.24% | | | | | | | | |
| Cimarex Energy Co. | | | 49,669 | | | | 6,750 | |
| Hess Corp. | | | 57,700 | | | | 3,594 | |
| Marathon Oil Corp. | | | 377,200 | | | | 6,529 | |
| Noble Energy, Inc. | | | 145,344 | | | | 5,532 | |
| Range Resources Corp. | | | 70,525 | | | | 2,423 | |
| Williams Cos., Inc. (The) | | | 146,300 | | | | 4,556 | |
| Total | | | | | | | 29,384 | |
| | | | | | | | | |
| Pharmaceuticals 0.72% | | | | | | | | |
| Mallinckrodt plc* | | | 51,605 | | | | 2,571 | |
| | | | | | | | | |
| Road & Rail 0.78% | | | | | | | | |
| Kansas City Southern | | | 32,667 | | | | 2,772 | |
| 8 | See Notes to Financial Statements. | |
Schedule of Investments (concluded)
| Investments | | Shares | | | Fair
Value
(000) | |
| Semiconductors & Semiconductor Equipment 2.79% |
| Micron Technology, Inc.* | | | 111,700 | | | $ | 2,448 | |
| ON Semiconductor Corp.* | | | 264,000 | | | | 3,369 | |
| Skyworks Solutions, Inc. | | | 55,509 | | | | 4,144 | |
| Total | | | | | | | 9,961 | |
| | | | | | | | | |
| Specialty Retail 0.72% | | | | | | | | |
| L Brands, Inc. | | | 39,060 | | | | 2,572 | |
| | | | | | | | | |
| Textiles, Apparel & Luxury Goods 0.74% | | | | | | | | |
| PVH Corp. | | | 29,400 | | | | 2,653 | |
| | | | | | | | | |
| Thrifts & Mortgage Finance 0.52% | | | | | | | | |
| Astoria Financial Corp. | | | 100,000 | | | | 1,865 | |
Total Common Stocks
(cost $313,045,251) | | | | | | | 353,793 | |
| Investments | | Principal
Amount
(000) | | | Fair
Value
(000) | |
| SHORT-TERM INVESTMENT 0.87% | | | | | | | | |
| | | | | | | | | |
| Repurchase Agreement | | | | | | | | |
Repurchase Agreement dated 12/30/2016, 0.03% due 1/3/2017 with Fixed Income Clearing Corp. collateralized by $2,950,000 of U.S. Treasury Inflation Indexed Note at 0.125% due 4/15/2017; value: $3,146,107; proceeds: $3,082,605
(cost $3,082,595) | | $ | 3,083 | | | $ | 3,083 | |
Total Investments in Securities 100.09%
(cost $316,127,846) | | | | 356,876 | |
| Liabilities in Excess of Cash and Other Assets (0.09)% | | | | (313 | ) |
| Net Assets 100.00% | | | | | | $ | 356,563 | |
| * | | Non-income producing security. |
| (a) | | Foreign security traded in U.S. dollars. |
The following is a summary of the inputs used as of December 31, 2016 in valuing the Fund’s investments carried at fair value(1):
| Investment Type(2)(3) | | Level 1
(000) | | | Level 2
(000) | | | Level 3
(000) | | | Total
(000) | |
| Common Stocks | | $ | 353,793 | | | $ | – | | | $ | – | | | $ | 353,793 | |
| Repurchase Agreement | | | – | | | | 3,083 | | | | – | | | | 3,083 | |
| Total | | $ | 353,793 | | | $ | 3,083 | | | $ | – | | | $ | 356,876 | |
| (1) | | Refer to Note 2(h) for a description of fair value measurements and the three-tier hierarchy of inputs. |
| (2) | | See Schedule of Investments for fair values in each industry and identification of foreign issuers and/or geography. |
| (3) | | There were no Level 1/Level 2 transfers during the fiscal year ended December 31, 2016. |
| | See Notes to Financial Statements. | 9 |
Statement of Assets and Liabilities
December 31, 2016
| ASSETS: | | | | |
| Investments in securities, at fair value (cost $316,127,846) | | $ | 356,876,382 | |
| Cash | | | 26,320 | |
| Receivables: | | | | |
| Interest and dividends | | | 749,582 | |
| Investment securities sold | | | 869,213 | |
| Capital shares sold | | | 49,927 | |
| Prepaid expenses | | | 2,433 | |
| Total assets | | | 358,573,857 | |
| LIABILITIES: | | | | |
| Payables: | | | | |
| Capital shares reacquired | | | 992,492 | |
| Management fee | | | 228,899 | |
| Directors’ fees | | | 107,369 | |
| Fund administration | | | 12,208 | |
| Accrued expenses | | | 670,320 | |
| Total liabilities | | | 2,011,288 | |
| NET ASSETS | | $ | 356,562,569 | |
| COMPOSITION OF NET ASSETS: | | | | |
| Paid-in capital | | $ | 310,472,092 | |
| Undistributed net investment income | | | 850 | |
| Accumulated net realized gain on investments | | | 5,341,091 | |
| Net unrealized appreciation on investments | | | 40,748,536 | |
| Net Assets | | $ | 356,562,569 | |
| Outstanding shares (200 million shares of common stock authorized, $.001 par value) | | | 13,970,922 | |
Net asset value, offering and redemption price per share
(Net assets divided by outstanding shares) | | | $25.52 | |
| 10 | See Notes to Financial Statements. |
Statement of Operations
For the Year Ended December 31, 2016
| Investment income: | | | | |
| Dividends | | $ | 5,807,660 | |
| Interest | | | 1,455 | |
| Total investment income | | | 5,809,115 | |
| Expenses: | | | | |
| Management fee | | | 2,578,087 | |
| Non 12b-1 service fees | | | 859,283 | |
| Shareholder servicing | | | 259,504 | |
| Fund administration | | | 137,498 | |
| Reports to shareholders | | | 67,135 | |
| Directors’ fees | | | 11,988 | |
| Professional | | | 57,201 | |
| Custody | | | 13,137 | |
| Other | | | 35,120 | |
| Gross expenses | | | 4,018,953 | |
| Expense reductions (See Note 8) | | | (1,330 | ) |
| Net expenses | | | 4,017,623 | |
| Net investment income | | | 1,791,492 | |
| Net realized and unrealized gain: | | | | |
| Net realized gain on investments | | | 24,359,673 | |
| Net change in unrealized appreciation/depreciation on investments | | | 26,147,065 | |
| Net realized and unrealized gain | | | 50,506,738 | |
| Net Increase in Net Assets Resulting From Operations | | $ | 52,298,230 | |
| | See Notes to Financial Statements. | 11 |
Statements of Changes in Net Assets
| | | For the Year Ended | | | For the Year Ended | |
| INCREASE (DECREASE) IN NET ASSETS | | December 31, 2016 | | | December 31, 2015 | |
| Operations: | | | | | | | | |
| Net investment income | | $ | 1,791,492 | | | $ | 2,184,144 | |
| Net realized gain on investments | | | 24,359,673 | | | | 46,095,610 | |
| Net change in unrealized appreciation/depreciation on investments | | | 26,147,065 | | | | (61,653,829 | ) |
| Net increase (decrease) in net assets resulting from operations | | | 52,298,230 | | | | (13,374,075 | ) |
| Distributions to shareholders from: | | | | | | | | |
| Net investment income | | | (1,708,602 | ) | | | (2,135,083 | ) |
| Net realized gain | | | (19,456,583 | ) | | | (21,990,439 | ) |
| Total distributions to shareholders | | | (21,165,185 | ) | | | (24,125,522 | ) |
| Capital share transactions (See Note 13): | | | | | | | | |
| Proceeds from sales of shares | | | 23,269,382 | | | | 20,306,034 | |
| Reinvestment of distributions | | | 21,165,186 | | | | 24,125,522 | |
| Cost of shares reacquired | | | (66,531,091 | ) | | | (77,570,107 | ) |
| Net decrease in net assets resulting from capital share transactions | | | (22,096,523 | ) | | | (33,138,551 | ) |
| Net increase (decrease) in net assets | | | 9,036,522 | | | | (70,638,148 | ) |
| NET ASSETS: | | | | | | | | |
| Beginning of year | | $ | 347,526,047 | | | $ | 418,164,195 | |
| End of year | | $ | 356,562,569 | | | $ | 347,526,047 | |
| Undistributed (distributions in excess of) net investment income | | $ | 850 | | | $ | (82,040 | ) |
| 12 | See Notes to Financial Statements. |
This page is intentionally left blank.
Financial Highlights
| | | | | | Per Share Operating Performance: |
| | | | | | Investment operations: | | Distributions to
shareholders from: |
| | | | | | | | | | | | Total | | | | | | | | |
| | | | | | | | | Net | | from | | | | | | | | |
| | | Net asset | | Net | | realized | | invest- | | | | | | | | |
| | | value, | | invest- | | and | | ment | | Net | | Net | | Total |
| | | beginning | | ment | | unrealized | | opera- | | investment | | realized | | distri- |
| | | of period | | income(a) | | gain (loss) | | tions | | income | | gain | | butions |
| 12/31/2016 | | | $23.28 | | | | $0.13 | | | | $ 3.69 | | | $ | 3.82 | | | | $(0.13 | ) | | | $(1.45 | ) | | | $(1.58 | ) |
| 12/31/2015 | | | 26.02 | | | | 0.15 | | | | (1.16 | ) | | | (1.01 | ) | | | (0.15 | ) | | | (1.58 | ) | | | (1.73 | ) |
| 12/31/2014 | | | 23.43 | | | | 0.10 | | | | 2.60 | | | | 2.70 | | | | (0.11 | ) | | | – | | | | (0.11 | ) |
| 12/31/2013 | | | 18.05 | | | | 0.10 | | | | 5.37 | | | | 5.47 | | | | (0.09 | ) | | | – | | | | (0.09 | ) |
| 12/31/2012 | | | 15.86 | | | | 0.11 | | | | 2.20 | | | | 2.31 | | | | (0.12 | ) | | | – | | | | (0.12 | ) |
| (a) | Calculated using average shares outstanding during the period. |
| (b) | Total return does not consider the effects of sales charges or other expenses imposed by an insurance company and assumes the reinvestment of all distributions. |
| 14 | See Notes to Financial Statements. |
| | | | | | | Ratios to Average Net Assets: | | Supplemental Data: | |
| | | | | | | | | | | | | | |
| Net | | | | | | | | | | Net | | | |
| asset | | | | | | | | Net | | assets, | | Portfolio | |
| value, | | Total | | Total | | | investment | | end of | | turnover | |
| end of | | return(b) | | expenses | | | income | | period | | rate | |
| period | | (%) | | (%) | | | (%) | | (000) | | (%) | |
| | $25.52 | | | | 16.39 | | | 1.17 | | | 0.52 | | | $356,563 | | | 66.66 | |
| | 23.28 | | | | (3.79 | ) | | 1.18 | | | 0.56 | | | 347,526 | | | 61.00 | |
| | 26.02 | | | | 11.53 | | | 1.16 | | | 0.40 | | | 418,164 | | | 58.45 | |
| | 23.43 | | | | 30.32 | | | 1.14 | | | 0.49 | | | 437,155 | | | 62.17 | |
| | 18.05 | | | | 14.55 | | | 1.16 | | | 0.66 | | | 399,199 | | | 65.70 | |
| | See Notes to Financial Statements. | 15 |
Notes to Financial Statements
Lord Abbett Series Fund, Inc. (the “Company”) is registered under the Investment Company Act of 1940, as amended (“the Act”), as a diversified, open-end management investment company and was incorporated under Maryland law in 1989. The Company consists of thirteen separate portfolios. This report covers Mid Cap Stock Portfolio (the “Fund”).
The Fund’s investment objective is to seek capital appreciation through investments, primarily in equity securities, which are believed to be undervalued in the marketplace. The Fund has Variable Contract class shares (“Class VC Shares”), which are currently issued and redeemed only in connection with investments in, and payments under, variable annuity contracts and variable life insurance policies issued by life insurance and insurance-related companies.
The preparation of the financial statements in conformity with accounting principles generally accepted in the United States of America (“U.S. GAAP”) requires management to make certain estimates and assumptions that affect the reported amounts of assets and liabilities and disclosure of contingent assets and liabilities at the date of the financial statements and the reported amounts of increases and decreases in net assets from operations during the reporting period. Actual results could differ from those estimates. The Fund is considered an investment company under U.S. GAAP and follows the accounting and reporting guidance applicable to investment companies.
| 2. | SIGNIFICANT ACCOUNTING POLICIES |
| (a) | Investment Valuation–Under procedures approved by the Fund’s Board of Directors (the “Board”), Lord, Abbett & Co. LLC (“Lord Abbett”), the Fund’s investment manager, has formed a Pricing Committee to administer the pricing and valuation of portfolio investments and to ensure that prices utilized reasonably reflect fair value. Among other things, these procedures allow the Fund to utilize independent pricing services, quotations from securities and financial instrument dealers and other market sources to determine fair value. |
| | |
| | Securities actively traded on any recognized U.S. or non-U.S. exchange or on The NASDAQ Stock Market LLC are valued at the last sale price or official closing price on the exchange or system on which they are principally traded. Events occurring after the close of trading on non-U.S. exchanges may result in adjustments to the valuation of foreign securities to reflect their fair value as of the close of regular trading on the New York Stock Exchange. The Fund may utilize an independent fair valuation service in adjusting the valuations of foreign securities. Unlisted equity securities are valued at the last quoted sale price or, if no sale price is available, at the mean between the most recently quoted bid and asked prices. |
| | |
| | Securities for which prices are not readily available are valued at fair value as determined by the Pricing Committee. The Pricing Committee considers a number of factors, including observable and unobservable inputs, when arriving at fair value. The Pricing Committee may use related or comparable assets or liabilities, recent transactions, market multiples, book values and other relevant information to determine the fair value of portfolio investments. The Board or a designated committee thereof regularly reviews fair value determinations made by the Pricing Committee and employs techniques such as reviewing related market activity, reviewing inputs and assumptions, and retrospectively comparing prices of subsequent purchases and sales transactions to fair value determinations made by the Pricing Committee. |
| | |
| | Short-term securities with 60 days or less remaining to maturity are valued using the amortized cost method, which approximates fair value. |
16
Notes to Financial Statements (continued)
| (b) | Security Transactions–Security transactions are recorded as of the date that the securities are purchased or sold (trade date). Realized gains and losses on sales of portfolio securities are calculated using the identified-cost method. |
| | |
| (c) | Investment Income–Dividend income is recorded on the ex-dividend date. Interest income is recorded on the accrual basis as earned. Discounts are accreted and premiums are amortized using the effective interest method and are included in Interest and other income on the Statement of Operations. Withholding taxes on foreign dividends have been provided for in accordance with the applicable country’s tax rules and rates. |
| | |
| (d) | Income Taxes–It is the policy of the Fund to meet the requirements of Subchapter M of the Internal Revenue Code applicable to regulated investment companies and to distribute substantially all taxable income and capital gains to its shareholders. Therefore, no income tax provision is required. |
| | |
| | The Fund files U.S. federal and various state and local tax returns. No income tax returns are currently under examination. The statute of limitations on the Fund’s filed U.S. federal tax returns remains open for the fiscal years ended December 31, 2013 through December 31, 2016. The statutes of limitations on the Company’s state and local tax returns may remain open for an additional year depending upon the jurisdiction. |
| | |
| (e) | Expenses–Expenses incurred by the Company that do not specifically relate to an individual fund are generally allocated to the funds within the Company on a pro rata basis by relative net assets. |
| | |
| (f) | Foreign Transactions–The books and records of the Fund are maintained in U.S. dollars and transactions denominated in foreign currencies are recorded in the Fund’s records at the rate prevailing when earned or recorded. Asset and liability accounts that are denominated in foreign currencies are adjusted daily to reflect current exchange rates and any unrealized gain (loss) is included in Net change in unrealized appreciation/depreciation on investments in the Fund’s Statement of Operations. The resultant exchange gains and losses upon settlement of such transactions are included in Net realized gain on investments in the Fund’s Statement of Operations. The Fund does not isolate that portion of the results of operations arising as a result of changes in the foreign exchange rates from the changes in market prices of the securities. |
| | |
| (g) | Repurchase Agreements–The Fund may enter into repurchase agreements with respect to securities. A repurchase agreement is a transaction in which a fund acquires a security and simultaneously commits to resell that security to the seller (a bank or securities dealer) at an agreed-upon price on an agreed-upon date. The Fund requires at all times that the repurchase agreement be collateralized by cash, or by securities of the U.S. Government, its agencies, its instrumentalities, or U.S. Government sponsored enterprises having a value equal to, or in excess of, the value of the repurchase agreement (including accrued interest). If the seller of the agreement defaults on its obligation to repurchase the underlying securities at a time when the fair value of these securities has declined, the Fund may incur a loss upon disposition of the securities. |
| | |
| (h) | Fair Value Measurements–Fair value is defined as the price that the Fund would receive upon selling an investment or transferring a liability in an orderly transaction to an independent buyer in the principal or most advantageous market of the investment. A three-tier hierarchy is used to maximize the use of observable market data and minimize the use of unobservable inputs and to establish classification of fair value measurements for disclosure purposes. Inputs refer |
17
Notes to Financial Statements (continued)
| | broadly to the assumptions that market participants would use in pricing the asset or liability, including assumptions about risk—for example, the risk inherent in a particular valuation technique used to measure fair value (such as a pricing model) and/or the risk inherent in the inputs to the valuation technique. Inputs may be observable or unobservable. Observable inputs reflect the assumptions market participants would use in pricing the asset or liability. Observable inputs are based on market data obtained from sources independent of the reporting entity. Unobservable inputs reflect the reporting entity’s own assumptions about the assumptions market participants would use in pricing the asset or liability. Unobservable inputs are based on the best information available in the circumstances. The three-tier hierarchy classification is determined based on the lowest level of inputs that is significant to the fair value measurement, and is summarized in the three broad Levels listed below: |
| | |
| | • | Level 1 – | unadjusted quoted prices in active markets for identical investments; |
| | | | |
| | • | Level 2 – | other significant observable inputs (including quoted prices for similar investments, interest rates, prepayment speeds, credit risk, etc.); and |
| | | | |
| | • | Level 3 – | significant unobservable inputs (including the Fund’s own assumptions in determining the fair value of investments). |
| | |
| | A summary of inputs used in valuing the Fund’s investments as of December 31, 2016 and, if applicable, Level 1/Level 2 transfers and Level 3 rollforwards for the fiscal year then ended is included in the Fund’s Schedule of Investments. |
| | |
| | Changes in valuation techniques may result in transfers into or out of an assigned level within the three-tier hierarchy. All transfers between different levels within the three-tier hierarchy are deemed to have occurred as of the beginning of the reporting period. The inputs or methodology used for valuing securities are not necessarily an indication of the risk associated with investing in those securities. |
| 3. | MANAGEMENT FEE AND OTHER TRANSACTIONS WITH AFFILIATES |
Management Fee
The Company has a management agreement with Lord Abbett, pursuant to which Lord Abbett supplies the Fund with investment management services and executive and other personnel, provides office space and pays for ordinary and necessary office and clerical expenses relating to research and statistical work and supervision of the Fund’s investment portfolio.
The management fee is based on the Fund’s average daily net assets at the following annual rate:
| First $1 billion | .75% |
| Next $1 billion | .70% |
| Over $2 billion | .65% |
For the fiscal year ended December 31, 2016, the effective management was at an annualized rate of .75% of the Fund’s average daily net assets.
In addition, Lord Abbett provides certain administrative services to the Fund pursuant to an Administrative Services Agreement in return for a fee at an annual rate of .04% of the Fund’s average daily net assets.
The Company, on behalf of the Fund, has entered into services arrangements with certain insurance companies. Under these arrangements, certain insurance companies will be compensated up to .25% of the average daily net asset value (“NAV”) of the Fund’s Class VC Shares held in the
18
Notes to Financial Statements (continued)
insurance company’s separate account to service and maintain the Variable Contract owners’ accounts. This amount is included in Non 12b-1 service fees on the Statement of Operations. The Fund may also compensate certain insurance companies, third-party administrators and other entities for providing recordkeeping, sub-transfer agency and other administrative services to the Fund. This amount is included in Shareholder servicing on the Statement of Operations.
Two Directors and certain of the Company’s officers have an interest in Lord Abbett.
| 4. | DISTRIBUTIONS AND CAPITAL LOSS CARRYFORWARDS |
Dividends from net investment income, if any, are declared and paid at least semi-annually. Taxable net realized gains from investment transactions, reduced by allowable capital loss carryforwards, if any, are declared and distributed to shareholders at least annually. The capital loss carryforward amount, if any, is available to offset future net capital gains. Dividends and distributions to shareholders are recorded on the ex-dividend date. The amounts of dividends and distributions from net investment income and net realized capital gains are determined in accordance with federal income tax regulations, which may differ from U.S. GAAP. These book/tax differences are either considered temporary or permanent in nature. To the extent these differences are permanent in nature, such amounts are reclassified within the components of net assets based on their federal tax basis treatment; temporary differences do not require reclassification. Dividends and distributions that exceed earnings and profits for tax purposes are reported as a tax return of capital.
The tax character of distributions paid during the fiscal years ended December 31, 2016 and 2015 was as follows:
| | | Year Ended
12/31/2016 | | | Year Ended
12/31/2015 | |
| Distributions paid from: | | | | | | | | |
| Ordinary income | | $ | 1,708,602 | | | $ | 2,135,083 | |
| Net long-term capital gains | | | 19,456,583 | | | | 21,990,439 | |
| Total distributions paid | | $ | 21,165,185 | | | $ | 24,125,522 | |
As of December 31, 2016, the components of accumulated gains on a tax-basis were as follows:
| Undistributed ordinary income – net | | $ | 198,039 | |
| Undistributed long-term capital gains | | | 6,479,470 | |
| Total undistributed earnings | | | 6,677,509 | |
| Temporary differences | | | (107,369 | ) |
| Unrealized gains – net | | | 39,520,337 | |
| Total accumulated gains – net | | $ | 46,090,477 | |
As of December 31, 2016, the aggregate unrealized security gains and losses based on cost for U.S. federal income tax purposes were as follows:
| Tax cost | | $ | 317,356,045 | |
| Gross unrealized gain | | | 46,515,719 | |
| Gross unrealized loss | | | (6,995,382 | ) |
| Net unrealized security gain | | $ | 39,520,337 | |
The difference between book-basis and tax-basis unrealized gains (losses) is attributable to wash sales.
19
Notes to Financial Statements (continued)
| 5. | PORTFOLIO SECURITIES TRANSACTIONS |
Purchases and sales of investment securities (excluding short-term investments) for the fiscal year ended December 31, 2016 were as follows:
| Purchases | Sales |
| $227,469,927 | | $266,251,600 |
There were no purchases or sales of U.S. Government securities for the fiscal year ended December 31, 2016.
| 6. | DISCLOSURES ABOUT OFFSETTING ASSETS AND LIABILITIES |
The Financial Accounting Standards Board (“FASB”) requires disclosures intended to help better assess the effect or potential effect of offsetting arrangements on a fund’s financial position. The following tables illustrate gross and net information about recognized assets and liabilities eligible for offset in the statement of assets and liabilities; and disclose such amounts subject to an enforceable master netting agreement or similar agreement, by counterparty. A master netting agreement is an agreement between a fund and a counterparty which provides for the net settlement of amounts owed under all contracts traded under that agreement, as well as cash collateral, through a single payment by one party to the other in the event of default on or termination of any one contract. The Fund’s accounting policy with respect to balance sheet offsetting is that, absent an event of default by the counterparty or a termination of the agreement, the master netting agreement does not result in an offset of reported amounts of financial assets and liabilities in the statement of assets and liabilities across transactions between the Fund and the applicable counterparty:
| Description | | Gross Amounts of
Recognized Assets | | | Gross Amounts
Offset in the
Statement of Assets
and Liabilities | | | Net Amounts of
Assets Presented
in the Statement of
Assets and Liabilities | |
| Repurchase Agreement | | $ | 3,082,595 | | | $ | – | | | $ | 3,082,595 | |
| Total | | $ | 3,082,595 | | | $ | – | | | $ | 3,082,595 | |
| | | Net Amounts | | | | | | | | | | | | | |
| | | of Assets | | | Amounts Not Offset in the | | | | |
| | | Presented in | | | Statement of Assets and Liabilities | | | | |
| Counterparty | | the Statement
of Assets and
Liabilities | | | Financial
Instruments | | | Cash
Collateral
Received(a) | | | Securities
Collateral
Received(a) | | | Net
Amount(b) | |
| Fixed Income Clearing Corp. | | $ | 3,082,595 | | | $ | – | | | $ | – | | | $ | (3,082,595 | ) | | $ | – | |
| Total | | $ | 3,082,595 | | | $ | – | | | $ | – | | | $ | (3,082,595 | ) | | $ | – | |
| (a) | Collateral disclosed is limited to an amount not to exceed 100% of the net amount of assets presented in the Statement of Assets and Liabilities, for each respective counterparty. |
| (b) | Net amount represents the amount owed to the Fund by the counterparty as of December 31, 2016. |
| 7. | DIRECTORS’ REMUNERATION |
The Company’s officers and two Directors, who are associated with Lord Abbett, do not receive any compensation from the Company for serving in such capacities. Independent Directors’ fees are allocated among all Lord Abbett-sponsored funds based on the net assets of each fund. There is an equity-based plan available to all Independent Directors under which Independent Directors must defer receipt of a portion of, and may elect to defer receipt of an additional portion of Directors’
20
Notes to Financial Statements (continued)
fees. The deferred amounts are treated as though equivalent dollar amounts had been invested in the funds. Such amounts and earnings accrued thereon are included in Directors’ fees on the Statement of Operations and in Directors’ fees payable on the Statement of Assets and Liabilities and are not deductible for U.S. federal income tax purposes until such amounts are paid.
The Company has entered into an arrangement with its transfer agent and custodian, whereby credits realized as a result of uninvested cash balances are used to reduce a portion of the Fund’s expenses.
The Fund and certain other funds managed by Lord Abbett (collectively, the “Participating Funds”) entered into a syndicated line of credit facility with various lenders for $550 million (the “Facility”), whereas State Street Bank and Trust Company (“SSB”) participates as a lender and as agent for the lenders. The Facility is to be used for temporary or emergency purposes as an additional source of liquidity to satisfy redemptions. The Participating Funds are subject to graduated borrowing limits of one-third of Fund assets (if Fund assets are less than $750 million), $250 million, $300 million, or $350 million, based on past borrowings and likelihood of future borrowings. The Facility will continue through August 28, 2017.
During the fiscal year ended December 31, 2016, the Fund did not utilize the Facility.
| 10. | INTERFUND LENDING PROGRAM |
On July 26, 2016, the U.S. Securities and Exchange Commission issued an exemptive order (“SEC exemptive order”) which permits certain registered open-end management investment companies managed by Lord Abbett, including the Fund, to participate in a joint lending and borrowing program (the “Interfund Lending Program”). The SEC exemptive order allows the Funds to borrow money from and lend money to each other for temporary or emergency purposes subject to the limitations and conditions.
During the fiscal year ended December 31, 2016, the Fund did not participate as a borrower or lender in the Interfund Lending Program.
| 11. | CUSTODIAN AND ACCOUNTING AGENT |
SSB is the Company’s custodian and accounting agent. SSB performs custodial, accounting and recordkeeping functions relating to portfolio transactions and calculating the Fund’s NAV.
The Fund is subject to the general risks and considerations associated with equity investing, as well as the particular risks associated with value and mid-sized company stocks. The value of an investment will fluctuate in response to movements in the equity securities market in general and to the changing prospects of individual companies in which the Fund invests. The market may fail to recognize for a long time the intrinsic value of particular value stocks the Fund may hold. The mid-sized company stocks in which the Fund invests may be less able to weather economic shifts or other adverse developments than those of larger, more established companies. In addition, if the Fund’s assessment of a company’s value or prospects for exceeding earnings expectations or market conditions is wrong, the Fund could suffer losses or produce poor performance relative to other funds, even in a rising market.
21
Notes to Financial Statements (concluded)
Due to the Fund’s investment exposure to foreign companies and American Depositary Receipts, the Fund may experience increased market, liquidity, currency, political, information, and other risks.
These factors can affect the Fund’s performance.
| 13. | SUMMARY OF CAPITAL TRANSACTIONS |
Transactions in shares of capital stock were as follows:
| | | | Year Ended
December 31, 2016 | | | | Year Ended
December 31, 2015 | |
| Shares sold | | | 972,000 | | | | 783,314 | |
| Reinvestment of distributions | | | 822,686 | | | | 1,050,654 | |
| Shares reacquired | | | (2,749,761 | ) | | | (2,978,195 | ) |
| Decrease | | | (955,075 | ) | | | (1,144,227 | ) |
22
Report of Independent Registered Public Accounting Firm
To the Board of Directors of Lord Abbett Series Fund, Inc. and the Shareholders of Mid Cap Stock Portfolio:
We have audited the accompanying statement of assets and liabilities, including the schedule of investments, of the Mid Cap Stock Portfolio, one of the portfolios constituting the Lord Abbett Series Fund, Inc. (the “Fund”) as of December 31, 2016, and the related statement of operations for the year then ended, the statements of changes in net assets for each of the two years in the period then ended, and the financial highlights for each of the five years in the period then ended. These financial statements and financial highlights are the responsibility of the Fund’s management. Our responsibility is to express an opinion on these financial statements and financial highlights based on our audits.
We conducted our audits in accordance with the standards of the Public Company Accounting Oversight Board (United States). Those standards require that we plan and perform the audit to obtain reasonable assurance about whether the financial statements and financial highlights are free of material misstatement. The Fund is not required to have, nor were we engaged to perform, an audit of its internal control over financial reporting. Our audits included consideration of internal control over financial reporting as a basis for designing audit procedures that are appropriate in the circumstances, but not for the purpose of expressing an opinion on the effectiveness of the Fund’s internal control over financial reporting. Accordingly, we express no such opinion. An audit also includes examining, on a test basis, evidence supporting the amounts and disclosures in the financial statements, assessing the accounting principles used and significant estimates made by management, as well as evaluating the overall financial statement presentation. Our procedures included confirmation of securities owned as of December 31, 2016, by correspondence with the custodian. We believe that our audits provide a reasonable basis for our opinion.
In our opinion, such financial statements and financial highlights referred to above present fairly, in all material respects, the financial position of Mid Cap Stock Portfolio of the Lord Abbett Series Fund, Inc. as of December 31, 2016, the results of its operations for the year then ended, the changes in its net assets for each of the two years in the period then ended, and the financial highlights for each of the five years in the period then ended, in conformity with accounting principles generally accepted in the United States of America.
DELOITTE & TOUCHE LLP
New York, New York
February 15, 2017
23
Basic Information About Management
The Board is responsible for the management of the business and affairs of the Company in accordance with the laws of the State of Maryland. The Board elects officers who are responsible for the day-to-day operations of each Fund and who execute policies authorized by the Board. The Board also approves an investment adviser to each Fund and continues to monitor the cost and quality of the services the investment adviser provides, and annually considers whether to renew the contract with the adviser. Generally, each Director holds office until his/her successor is elected and qualified or until his/her earlier resignation or removal, as provided in the Company’s organizational documents.
Lord Abbett, a Delaware limited liability company, is the Fund’s investment adviser. Designated Lord Abbett personnel are responsible for the day-to-day management of the Funds.
Interested Directors
Ms. Foster and Mr. Sieg are affiliated with Lord Abbett and are “interested persons” of the Company as defined in the Act. Ms. Foster and Mr. Sieg are directors/trustees of each of the 12 investment companies in the Lord Abbett Family of Funds, which consist of 60 portfolios or series. Ms. Foster is an officer of the Lord Abbett Family of Funds.
Name, Address and
Year of Birth | | Current Position and
Length of Service
with the Company | | Principal Occupation and Other Directorships
During the Past Five Years |
| | | | | |
Daria L. Foster
Lord, Abbett & Co. LLC
90 Hudson Street
Jersey City, NJ 07302
(1954) | | Director and President since 2006; Chief Executive Officer since 2012 | | Principal Occupation: Managing Partner of Lord Abbett, joined Lord Abbett in 1990.
Other Directorships: None. |
| | | | | |
Douglas B. Sieg
Lord, Abbett & Co. LLC
90 Hudson Street
Jersey City, NJ 07302
(1969) | | Director since 2016 | | Principal Occupation: Partner (since 2001) and Head of Client Services (since 2013), formerly Director of Marketing and Relationship Management, joined Lord Abbett in 1994.
Other Directorships: None. |
Independent Directors
The following Independent Directors also are directors/trustees of each of the 12 investment companies in the Lord Abbett Family of Funds, which consist of 60 portfolios or series.
Name, Address and
Year of Birth | | Current Position and
Length of Service
with the Company | | Principal Occupation and Other Directorships
During the Past Five Years |
| | | | | |
Robert B. Calhoun, Jr.
Lord, Abbett & Co. LLC
c/o Legal Dept.
90 Hudson Street
Jersey City, NJ 07302
(1942) | | Director since 1998 | | Principal Occupation: Senior Advisor of Monitor Clipper Partners, a private equity investment fund (since 1997); President of Clipper Asset Management Corp. (1991–2009).
Other Directorships: None. |
24
Basic Information About Management (continued)
Name, Address and
Year of Birth | | Current Position and
Length of Service
with the Company | | Principal Occupation and Other Directorships
During the Past Five Years |
| | | | | |
Eric C. Fast
Lord, Abbett & Co. LLC
c/o Legal Dept.
90 Hudson Street
Jersey City, NJ 07302
(1949) | | Director since 2014 | | Principal Occupation: Chief Executive Officer of Crane Co., an industrial products company (2001–2014).
Other Directorships: Currently serves as director of Automatic Data Processing, Inc. (since 2007) and Regions Financial Corporation (since 2010). Previously served as a director of Crane Co. (1999–2014). |
| | | | | |
Evelyn E. Guernsey
Lord, Abbett & Co. LLC
c/o Legal Dept.
90 Hudson Street
Jersey City, NJ 07302
(1955) | | Director since 2011 | | Principal Occupation: CEO, Americas of J.P. Morgan Asset Management (2004–2010).
Other Directorships: None. |
| | | | | |
Julie A. Hill
Lord, Abbett & Co. LLC
c/o Legal Dept.
90 Hudson Street
Jersey City, NJ 07302
(1946) | | Director since 2004 | | Principal Occupation: Owner and CEO of The Hill Company, a business consulting firm (since 1998).
Other Directorships: Currently serves as director of Anthem, Inc., a health benefits company (since 1994). |
| | | | | |
Franklin W. Hobbs
Lord, Abbett & Co. LLC
c/o Legal Dept.
90 Hudson Street
Jersey City, NJ 07302
(1947) | | Director since 2001 | | Principal Occupation: Advisor of One Equity Partners, a private equity firm (since 2004).
Other Directorships: Currently serves as director and Chairman of the Board of Ally Financial Inc., a financial services firm (since 2009), and as director of Molson Coors Brewing Company (since 2002). |
| | | | | |
James M. McTaggart
Lord, Abbett & Co. LLC
c/o Legal Dept.
90 Hudson Street
Jersey City, NJ 07302
(1947) | | Director since 2012 | | Principal Occupation: Independent management advisor and consultant (since 2012); Vice President, CRA International, Inc. (doing business as Charles River Associates), a global management consulting firm (2009–2012); Founder and Chairman of Marakon Associates, Inc., a strategy consulting firm (1978–2009); and Officer and Director of Trinsum Group, a holding company (2007–2009).
Other Directorships: Currently serves as director of Blyth, Inc., a home products company (since 2004). |
| | | | | |
Mark A. Schmid
Lord, Abbett & Co. LLC
c/o Legal Dept.
90 Hudson Street
Jersey City, NJ 07302
(1959) | | Director since 2016 | | Principal Occupation: Vice President and Chief Investment Officer of the University of Chicago (since 2009).
Other Directorships: None. |
25
Basic Information About Management (continued)
Name, Address and
Year of Birth | | Current Position and
Length of Service
with the Company | | Principal Occupation and Other Directorships
During the Past Five Years |
| | | | | |
James L.L. Tullis
Lord, Abbett & Co. LLC
c/o Legal Dept.
90 Hudson Street
Jersey City, NJ 07302
(1947) | | Director since 2006;
Chairman since 2017 | | Principal Occupation: CEO of Tullis-Dickerson and Co. Inc., a venture capital management firm (since1990); CEO of Tullis Health Investors Inc. (since 2012).
Other Directorships: Currently serves as director of Crane Co. (since 1998). |
Officers
None of the officers listed below have received compensation from the Company. All of the officers of the Company also may be officers of the other Lord Abbett Funds and maintain offices at 90 Hudson Street, Jersey City, NJ 07302. Unless otherwise indicated, the position(s) and title(s) listed under the “Principal Occupation During the Past Five Years” column indicate each officer’s position(s) and title(s) with Lord Abbett. Each officer serves for an indefinite term (i.e., until his or her death, resignation, retirement, or removal).
Name and
Year of Birth | | Current Position
with the Company | | Length of Service
of Current
Position | | Principal Occupation
During the Past Five Years |
| | | | | | | |
Daria L. Foster
(1954) | | President and Chief
Executive Officer | | Elected as President in 2006 and Chief Executive Officer in 2012 | | Managing Partner of Lord Abbett, joined Lord Abbett in 1990. |
| | | | | | | |
Sean J. Aurigemma
(1969) | | Executive Vice President | | Elected in 2010 | | Portfolio Manager, joined Lord Abbett in 2007. |
| | | | | | | |
Jeff D. Diamond
(1960) | | Executive Vice President | | Elected in 2008 | | Portfolio Manager, joined Lord Abbett in 2007. |
| | | | | | | |
Todd D. Jacobson
(1966) | | Executive Vice President | | Elected in 2005 | | Partner and Associate Director, joined Lord Abbett in 2003. |
| | | | | | | |
Robert A. Lee
(1969) | | Executive Vice President | | Elected in 2010 | | Partner and Chief Investment Officer, and was formerly Deputy Chief Investment Officer and Director of Taxable Fixed Income, joined Lord Abbett in 1997. |
| | | | | | | |
Thomas B. Maher
(1967) | | Executive Vice President | | Elected in 2010 | | Partner and Portfolio Manager, joined Lord Abbett in 2003. |
| | | | | | | |
Justin C. Maurer
(1969) | | Executive Vice President | | Elected in 2010 | | Partner and Portfolio Manager, joined Lord Abbett in 2001. |
| | | | | | | |
Vincent J. McBride
(1964) | | Executive Vice President | | Elected in 2010 | | Partner and Director, joined Lord Abbett in 2003. |
| | | | | | | |
Andrew H. O’Brien
(1973) | | Executive Vice President | | Elected in 2010 | | Partner and Portfolio Manager, joined Lord Abbett in 1998. |
26
Basic Information About Management (continued)
Name and
Year of Birth | | Current Position
with the Company | | Length of Service
of Current
Position | | Principal Occupation
During the Past Five Years |
| | | | | | | |
F. Thomas O’Halloran, III
(1955) | Executive Vice President | | Elected in 2010 | | Partner and Portfolio Manager, joined Lord Abbett in 2001. |
| | | | | | | |
Marc Pavese
(1972) | | Executive Vice President | | Elected in 2016 | | Partner and Portfolio Manager, joined Lord Abbett in 2008. |
| | | | | | | |
Walter H. Prahl
(1958) | | Executive Vice President | | Elected in 2012 | | Partner and Director, joined Lord Abbett in 1997. |
| | | | | | | |
Steven F. Rocco
(1979) | | Executive Vice President | | Elected in 2014 | | Partner and Portfolio Manager, joined Lord Abbett in 2004. |
| | | | | | | |
Didier O. Rosenfeld
(1976) | | Executive Vice President | | Elected in 2016 | | Director of Global Equity, joined Lord Abbett in 2015 and was formerly a Portfolio Manager and Senior Analyst at Cornerstone Capital Management (2014–2015) and Managing Director at State Street Global Advisors (2000–2013). |
| | | | | | | |
Frederick J. Ruvkun
(1957) | | Executive Vice President | | Elected in 2012 | | Partner and Portfolio Manager, joined Lord Abbett in 2006. |
| | | | | | | |
Paul J. Volovich
(1973) | | Executive Vice President | | Elected in 2005 | | Partner and Portfolio Manager, joined Lord Abbett in 1997. |
| | | | | | | |
A. Edward Allinson
(1961) | | Vice President | | Elected in 2011 | | Portfolio Manager, joined Lord Abbett in 2005. |
| | | | | | | |
John W. Ashbrook
(1964) | | Vice President and Assistant Secretary | | Elected in 2014 | | Assistant General Counsel, joined Lord Abbett in 2008. |
| | | | | | | |
Joan A. Binstock
(1954) | | Chief Financial Officer and Vice President | | Elected in 1999 | | Partner and Chief Financial Officer, and was formerly Chief Operations Officer, joined Lord Abbett in 1999. |
| | | | | | | |
Brooke A. Fapohunda
(1975) | | Vice President and Assistant Secretary | | Elected in 2014 | | Deputy General Counsel, joined Lord Abbett in 2006. |
| | | | | | | |
John K. Forst
(1960) | | Vice President and Assistant Secretary | | Elected in 2005 | | Partner and Deputy General Counsel, joined Lord Abbett in 2004. |
| | | | | | | |
Anthony W. Hipple
(1964) | | Vice President | | Elected in 2014 | | Portfolio Manager, joined Lord Abbett in 2002. |
| | | | | | | |
Lawrence H. Kaplan
(1957) | | Vice President and Secretary | | Elected in 1997 | | Partner and General Counsel, joined Lord Abbett in 1997. |
27
Basic Information About Management (concluded)
Name and
Year of Birth | | Current Position
with the Company | | Length of Service
of Current
Position | | Principal Occupation
During the Past Five Years |
| | | | | | | |
Linda Y. Kim
(1980) | | Vice President and Assistant Secretary | | Elected in 2016 | | Counsel, joined Lord Abbett in 2015 and was formerly an Associate at Stroock & Stroock & Lavan LLP (2007–2015). |
| | | | | | | |
David J. Linsen
(1974) | | Vice President | | Elected in 2008 | | Partner and Director, joined Lord Abbett in 2001. |
| | | | | | | |
Joseph M. McGill
(1962) | | Chief Compliance Officer | | Elected in 2014 | | Partner and Chief Compliance Officer, joined Lord Abbett in 2014 and was formerly Managing Director and the Chief Compliance Officer at UBS Global Asset Management (2003–2013). |
| | | | | | | |
A. Edward Oberhaus, III
(1959) | Vice President | | Elected in 1998 | | Partner and Director, joined Lord Abbett in 1983. |
| | | | | | | |
Noah Petrucci
(1970) | | Vice President | | Elected in 2013 | | Portfolio Manager, joined Lord Abbett in 2012 and was formerly a Portfolio Manager at Columbia Management Investment Advisers, LLC and Columbia Management Advisors, LLC (2002–2012). |
| | | | | | | |
Lawrence B. Stoller
(1963) | | Vice President and Assistant Secretary | | Elected in 2007 | | Partner and Senior Deputy General Counsel, joined Lord Abbett in 2007. |
| | | | | | | |
Leah G. Traub
(1979) | | Vice President | | Elected in 2016 | | Partner and Portfolio Manager, joined Lord Abbett in 2007. |
| | | | | | | |
Arthur K. Weise
(1970) | | Vice President | | Elected in 2010 | | Partner and Portfolio Manager, joined Lord Abbett in 2007. |
| | | | | | | |
Kewjin Yuoh
(1971) | | Vice President | | Elected in 2012 | | Partner and Portfolio Manager, joined Lord Abbett in 2010. |
| | | | | | | |
Scott S. Wallner
(1955) | | AML Compliance Officer | | Elected in 2011 | | Assistant General Counsel, joined Lord Abbett in 2004. |
| | | | | | | |
Bernard J. Grzelak
(1971) | | Treasurer | | Elected in 2003 | | Partner and Chief Operations Officer, and was formerly Director of Fund Administration, joined Lord Abbett in 2003. |
Please call 888-522-2388 for a copy of the statement of additional information, which contains further information about the Company’s Directors. It is available free upon request.
28
Approval of Advisory Contract
The Board, including all of the Directors who are not interested persons of the Fund or of Lord Abbett (the “Independent Board Members”), annually considers whether to approve the continuation of the existing management agreement between the Fund and Lord Abbett (the “Agreement”). In connection with its most recent approval, the Board reviewed materials relating specifically to the Agreement, as well as numerous materials received throughout the course of the year, including information about the Fund’s investment performance compared to the performance of its benchmark. Before making its decision as to the Fund, the Board had the opportunity to ask questions and request further information, taking into account its familiarity with Lord Abbett gained through its meetings and discussions. These meetings and discussions included the review of the portfolio management team conducted by members of the Contract Committee, the deliberations of the Contract Committee, and discussions between the Contract Committee and Lord Abbett’s management. The Independent Board Members also met with their independent legal counsel in a private session at which no representatives of management were present.
The materials received by the Board included, but were not limited to: (1) information provided by Morningstar Associates, LLC (“Morningstar”) regarding the investment performance of the Fund compared to the investment performance of certain funds with similar investment styles as determined by Morningstar, based, in part, on the Fund’s Morningstar category (the “performance peer group”), and the investment performance of two appropriate benchmarks; (2) information provided by Morningstar regarding the expense ratios, contractual and effective management fee rates, and other expense components for the Fund and certain funds in the same Morningstar category, with generally the same or similar share classes and operational characteristics, including asset size (the “expense peer group”); (3) certain supplemental investment performance information provided by Lord Abbett; (4) information provided by Lord Abbett on the expense ratios, management fee rates, and other expense components for the Fund; (5) sales and redemption information for the Fund; (6) information regarding Lord Abbett’s financial condition; (7) an analysis of the relative profitability of the Agreement to Lord Abbett; (8) information provided by Lord Abbett regarding the investment management fee schedules for Lord Abbett’s other advisory clients maintaining accounts with a similar investment strategy as the Fund; and (9) information regarding the personnel and other resources devoted by Lord Abbett to managing the Fund.
Investment Management Services Generally. The Board considered the investment management services provided by Lord Abbett to the Fund, including investment research, portfolio management, and trading, and Lord Abbett’s commitment to compliance with all applicable legal requirements. The Board also observed that Lord Abbett was solely engaged in the investment management business and accordingly did not experience the conflicts of interest that may result from being engaged in other lines of business. The Board considered the investment advisory services provided by Lord Abbett to other clients, the fees charged for the services, and the differences in the nature of the services provided to the Fund and other Lord Abbett Funds, on the one hand, and the services provided to other clients, on the other. After reviewing these and related factors, the Board concluded that the Fund was likely to continue to benefit from the nature, extent and quality of the investment services provided by Lord Abbett under the Agreement.
Investment Performance. The Board reviewed the Fund’s investment performance in relation to that of the performance peer group and two appropriate benchmarks as of various periods ended August 31, 2016. The Board observed that the Fund’s investment performance was above the median of the performance peer group for the three-year period and below the median of the performance peer group for the one-year, five-year and ten-year periods. The Board also considered
29
Approval of Advisory Contract (continued)
Lord Abbett’s performance and reputation generally, the performance of other Lord Abbett-managed funds overseen by the Board and the willingness of Lord Abbett to take steps intended to improve performance when necessary. After reviewing these and related factors, the Board concluded that the Fund’s investment performance was reasonable and supported the continuation of the Agreement.
Lord Abbett’s Personnel and Methods. The Board considered the qualifications of the personnel providing investment management services to the Fund, in light of its investment objective and discipline. Among other things, the Board considered the size, experience, and turnover of Lord Abbett’s investment management staff, Lord Abbett’s investment methodology and philosophy, and Lord Abbett’s approach to recruiting, training, and retaining investment management personnel.
Nature and Quality of Other Services. The Board considered the nature, quality, costs, and extent of compliance, administrative, and other services performed by Lord Abbett and the nature and extent of Lord Abbett’s supervision of third party service providers, including the Fund’s transfer agent and custodian.
Expenses. The Board considered the expense level of the Fund and the expense levels of the expense peer group. It also considered how the expense levels of the Fund related to those of the expense peer group and the amount and nature of the fees paid by shareholders. The Board observed that the overall expense level of the Fund was slightly above the median of the expense peer group. After reviewing these and related factors, the Board concluded, within the context of its overall approval of the Agreement, that the expense level of the Fund was reasonable and supported the continuation of the Agreement.
Profitability. The Board considered the level of Lord Abbett’s operating margin in managing the Fund, including a review of Lord Abbett’s methodology for allocating its costs to its management of the Fund. It considered whether the Fund was profitable to Lord Abbett in connection with the operation of the Fund, including the fee that Lord Abbett receives from the Fund for providing administrative services to the Fund. The Board also considered the profits realized from other business segments of Lord Abbett, which may benefit from or be related to the Fund’s business. The Board considered Lord Abbett’s profit margins in comparison with available industry data, both accounting for and excluding marketing and distribution expenses, and how those profit margins could affect Lord Abbett’s ability to recruit and retain investment personnel. The Board recognized that Lord Abbett’s overall profitability was a factor in enabling it to attract and retain qualified investment management personnel to provide services to the Fund. After reviewing these and related factors, the Board concluded, within the context of its overall approval of the Agreement, that Lord Abbett’s profitability with respect to the Fund was not excessive.
Economies of Scale. The Board considered the extent to which there had been economies of scale in managing the Fund, whether the Fund’s shareholders had appropriately benefited from such economies of scale, and whether there was potential for realization of any further economies of scale. The Board concluded that the existing management fee schedule, with its breakpoints in the levels of the management fee, adequately addressed any economies of scale in managing the Fund.
Other Benefits to Lord Abbett. The Board considered the character and amount of fees paid by the Fund and the Fund’s shareholders to Lord Abbett and the Distributor for services other than investment advisory services. The Board also considered the revenues and profitability of Lord Abbett’s investment advisory business apart from its mutual fund business, and the intangible benefits enjoyed by Lord Abbett by virtue of its relationship with the Fund. The Board observed that
30
Approval of Advisory Contract (concluded)
the Distributor receives 12b-1 fees from certain of the Lord Abbett Funds as to shares held in accounts for which there is no other broker of record, may retain a portion of the 12b-1 fees it receives, and receives a portion of the sales charges on sales and redemptions of some classes of shares. In addition, the Board observed that Lord Abbett accrues certain benefits for its business of providing investment advice to clients other than the Lord Abbett Funds, but that business also benefits the Funds. The Board also noted that Lord Abbett, as disclosed in the prospectus of the Fund, has entered into revenue sharing arrangements with certain entities that distribute shares of the Fund. The Board also took into consideration the investment research that Lord Abbett receives as a result of Fund brokerage transactions.
Alternative Arrangements. The Board considered whether, instead of approving continuation of the Agreement, it might be in the best interests of the Fund to implement one or more alternative arrangements, such as continuing to employ Lord Abbett, but on different terms. After considering all of the relevant factors, the Board unanimously found that continuation of the Agreement was in the best interests of the Fund and its shareholders and voted unanimously to approve the continuation of the Agreement. In considering whether to approve the continuation of the Agreement, the Board did not identify any single factor as paramount or controlling. Individual Directors may have evaluated the information presented differently from one another, giving different weights to various factors. This summary does not discuss in detail all matters considered.
31
Householding
The Company has adopted a policy that allows it to send only one copy of the Fund’s prospectus, proxy material, annual report and semiannual report to certain shareholders residing at the same “household.” This reduces Fund expenses, which benefits you and other shareholders. If you need additional copies or do not want your mailings to be “householded,” please call Lord Abbett at 888-522-2388 or send a written request with your name, the name of your fund or funds and your account number or numbers to Lord Abbett Family of Funds, P.O. Box 219336, Kansas City, MO 64121.
Proxy Voting Policies, Procedures and Records
A description of the policies and procedures that Lord Abbett uses to vote proxies related to the Fund’s portfolio securities, and information on how Lord Abbett voted the Fund’s proxies during the 12-month period ended June 30 are available without charge, upon request, (i) by calling 888-522-2388; (ii) on Lord Abbett’s Website at www.lordabbett.com; and (iii) on the Securities and Exchange Commission’s (“SEC”) Website at www.sec.gov.
Shareholder Reports and Quarterly Portfolio Disclosure
The Fund is required to file its complete schedule of portfolio holdings with the SEC for its first and third fiscal quarters on Form N-Q. Copies of the filings are available without charge, upon request on the SEC’s Website at www.sec.gov and may be available by calling Lord Abbett at 888-522-2388. You can also obtain copies of Form N-Q by visiting the SEC’s Public Reference Room in Washington, DC (information on the operation of the Public Reference Room may be obtained by calling 800-SEC-0330).
| Tax Information |
| For corporate shareholders, 100% of the Fund’s ordinary income distributions qualified for the dividends received deduction. |
| Additionally, of the distributions paid to shareholders during the fiscal year ended December 31, 2016, $19,456,583 represents long-term capital gains.. |
32


| This report, when not used for the general information of shareholders of the Fund, is to be distributed only if preceded or accompanied by a current fund prospectus. | | | |
| | | Lord Abbett Series Fund, Inc. | |
| | | | |
Lord Abbett mutual fund shares are distributed by
LORD ABBETT DISTRIBUTOR LLC. | | Mid Cap Stock Portfolio | LASFMCV-3
(02/17) |

2016 LORD ABBETT
ANNUAL REPORT
Lord Abbett
Series Fund—Short Duration Income Portfolio
For the fiscal year ended December 31, 2016
Table of Contents
Lord Abbett Series Fund — Short Duration Income Portfolio Annual Report
For the fiscal year ended December 31, 2016

From left to right: James L.L. Tullis, Chairman of the Lord Abbett Funds and Daria L. Foster Director, President, and Chief Executive Officer of the Lord Abbett Funds. | | Dear Shareholders: We are pleased to provide you with this overview of the performance of Lord Abbett Series Fund — Short Duration Income Portfolio for the fiscal year ended December 31, 2016. On this page and the following pages, we discuss the major factors that influenced fiscal year performance. For additional information about the Fund, please visit our website at www.lordabbett.com, where you also can access the quarterly commentaries that provide updates on the Fund’s performance and other portfolio related updates. Thank you for investing in Lord Abbett mutual funds. We value the trust that you place in us and look forward to serving your investment needs in the years to come. Best regards, 
Daria L. Foster Director, President and Chief Executive Officer |
| | | |
For the fiscal year ended December 31, 2016, the Fund returned 3.47%, reflecting performance at the net asset value (NAV) of Class VC shares, with all distributions reinvested, compared to its benchmark, the BofA Merrill Lynch 1-3 year U.S. Corporate Credit Index,1 which returned 2.39% over the same period.
Yields on longer-dated Treasury bonds were relatively flat, rising only slightly over the 12-month period ended December 31, 2016, while the yield on shorter-dated two-year Treasury notes increased 0.18%
over the same period, leading to a slight flattening of the Treasury yield curve. Corporate credit spreads narrowed over the 12-month period, particularly within lower-rated, investment grade debt. Consumer prices rose at a moderate pace, with the Consumer Price Index (CPI) rising 2.1% over the 12-month period ended December 31, 2016. Meanwhile, the employment picture continued to improve as the unemployment rate remained steady at 4.7%, with 156,000 jobs added in December 2016; employment growth has
1
averaged 165,000 per month, over the last three months. This compares with an unemployment rate of 5.0% a year earlier and a recent high of 10.0% in October 2009. In December, the U.S. Federal Reserve (Fed) raised its target for short-term interest rates 0.25%, to a range of 0.50% - 0.75%, as economic data continued to suggest a strengthening domestic economy.
Consistent with the Fund’s strategic design, the Fund maintained exposures to a variety of bond market sectors, in addition to the investment grade corporate bonds represented in the benchmark. This design allows for the flexibility to take advantage of relative value opportunities across sectors, and these weightings were important factors affecting performance. The primary factors contributing to the Fund’s relative performance over the period were allocations to high yield corporate bonds and commercial mortgage-backed securities (CMBS). High
1 The BofA Merrill Lynch 1-3 Year U.S. Corporate Credit Index is an unmanaged index comprised of U.S. dollar-denominated investment grade corporate debt securities publicly issued in the U.S. domestic market with between one and three years remaining to final maturity.
Unless otherwise specified, indexes reflect total return, with all dividends reinvested. Indexes are unmanaged, do not reflect the deduction of fees or expenses, and are not available for direct investment.
Important Performance and Other Information
Performance data quoted in the following pages reflect past performance and are no guarantee of future results. Current performance may be higher or lower than the performance quoted. The investment return and principal value of an investment in the Funds will fluctuate so that
yield bonds outperformed higher-rated securities as spreads tightened, contributing to the relative performance of the Fund. Additionally, the Fund maintained out-of-benchmark exposure to securitized sectors, including commercial mortgage-backed securities, which aided absolute performance, as these sectors outperformed investment grade corporate bonds during the 12-month period.
The Fund’s underweight to investment grade corporates detracted from performance during the 12-month period. However, security selection was positive as the Fund remained overweight ‘BBB’ rated securities, which outperformed higher-rated securities.
The Fund’s portfolio is actively managed and, therefore, its holdings and the weightings of a particular issuer or particular sector as a percentage of portfolio assets are subject to change. Sectors may include many industries.
shares, on any given day or when redeemed, may be worth more or less than their original cost. You can obtain performance data current to the most recent month end by calling Lord Abbett at 888-522-2388 or referring to www.lordabbett.com.
During certain periods shown, expense waivers and reimbursements were in place. Without such expense waivers and reimbursements, the Funds’ returns would have been lower.
The annual commentary above discusses the views of the Fund’s management and various portfolio holdings of the Funds as of December 31, 2016. These views and portfolio holdings may have changed after this date. Information provided in the commentary is not a recommendation to buy or sell securities. Because the Fund’s portfolio is actively managed and may change significantly, the Fund may no longer
2
own the securities described above or may have otherwise changed their positions in the securities. For more recent information about the Fund’s portfolio holdings, please visit www.lordabbett.com.
A Note about Risk: See Notes to Financial Statements for a discussion of investment risks. For a more detailed discussion of the risks associated with each Fund, please see the Fund’s prospectus.
Mutual funds are not insured by the FDIC, are not deposits or other obligations of, or guaranteed by, banks, and are subject to investment risks including possible loss of principal amount invested.
The Fund serves as an underlying investment vehicle for variable annuity contracts and variable life insurance policies.
3
Investment Comparison
Below is a comparison of a $10,000 investment in Class VC shares with the same investment in the BofA Merrill Lynch 1-3 Year U.S. Corporate Index, assuming reinvestment of all dividends and distributions. The Fund’s shares are sold only to insurance company separate accounts that fund certain variable annuity and variable life contracts. This line graph comparison does not reflect the sales charges or other expenses of these contracts. If those sales charges and expenses were reflected, returns would be lower. The graph and performance table below do not reflect the deduction of taxes that a shareholder would pay on Fund distributions or the redemption of Fund shares. During the period, expenses of the Fund were waived or reimbursed by Lord Abbett; without such waiver or reimbursement of expenses, the Fund’s returns would have been lower. Past performance is no guarantee of future results.

Average Annual Total Returns for the
Periods Ended December 31, 2016 |
| | 1 Year | Life of Class | |
| Class VC2 | 3.47% | 1.56% | |
1 Performance for the unmanaged index does not reflect any fees or expenses. The performance of the index is not necessarily representative of the Fund’s performance. Performance for the index began on April 14, 2014.
2 The Class VC shares commenced operations on April 4, 2014. Performance for the Class began on April 14, 2014.
4
Expense Example
As a shareholder of the Fund, you incur ongoing costs, including management fees; expenses related to the Fund’s services arrangements with certain insurance companies; and other Fund expenses. This Example is intended to help you understand your ongoing costs (in dollars) of investing in the Fund and to compare these costs with the ongoing costs of investing in other mutual funds.
The Example is based on an investment of $1,000 invested at the beginning of the period and held for the entire period (July 1, 2016 through December 31, 2016).
The Example reflects only expenses that are deducted from the assets of the Fund. Fees and expenses, including sales charges applicable to the various insurance products that invest in the Fund, are not reflected in this Example. If such fees and expenses were reflected in the Example, the total expenses shown would be higher. Fees and expenses regarding such variable insurance products are separately described in the prospectus related to those products.
Actual Expenses
The first line of the table on the following page provides information about actual account values and actual expenses. You may use the information in this line, together with the amount you invested, to estimate the expenses that you paid over the period. Simply divide your account value by $1,000 (for example, an $8,600 account value divided by $1,000 = 8.6), then multiply the result by the number in the first line under the heading titled “Expenses Paid During Period 7/1/16 – 12/31/16” to estimate the expenses you paid on your account during this period.
Hypothetical Example for Comparison Purposes
The second line of the table on the following page provides information about hypothetical account values and hypothetical expenses based on the Fund’s actual expense ratio and an assumed rate of return of 5% per year before expenses, which is not the Fund’s actual return. The hypothetical account values and expenses may not be used to estimate the actual ending account balance or expenses you paid for the period. You may use this information to compare the ongoing costs of investing in the Fund and other funds. To do so, compare this 5% hypothetical example with the 5% hypothetical examples that appear in the shareholder reports of the other funds.
5
Please note that the expenses shown in the table are meant to highlight your ongoing costs only and do not reflect any transactional costs, such as sales charges. Therefore, the second line of the table is useful in comparing ongoing costs only, and will not help you determine the relative total costs of owning different funds. In addition, if these transactional costs were included, your costs would have been higher.
| | | Beginning
Account
Value | | Ending
Account
Value | | Expenses
Paid During
Period† | |
| | | | | | | 7/1/16 - | |
| | | 7/1/16 | | 12/31/16 | | 12/31/16 | |
| Class VC | | | | | | | |
| Actual | | $1,000.00 | | $1,007.50 | | $4.04 | |
| Hypothetical (5% Return Before Expenses) | | $1,000.00 | | $1,021.11 | | $4.06 | |
| † | Net expenses are equal to the Fund’s annualized expense ratio of 0.80%, multiplied by the average account value over the period, multiplied by 184/366 (to reflect one-half year period). |
Portfolio Holdings Presented by Sector
December 31, 2016
| Sector* | | %** |
| Auto | | | 3.34 | % |
| Basic Industry | | | 0.86 | % |
| Capital Goods | | | 0.92 | % |
| Consumer Cyclical | | | 1.50 | % |
| Consumer Discretionary | | | 0.79 | % |
| Consumer Services | | | 1.87 | % |
| Consumer Staples | | | 1.00 | % |
| Energy | | | 10.43 | % |
| Financial Services | | | 58.27 | % |
| Foreign Government | | | 0.24 | % |
| Government | | | 2.97 | % |
| Health Care | | | 2.58 | % |
| Integrated Oils | | | 0.86 | % |
| Materials & Processing | | | 3.50 | % |
| Municipal | | | 0.30 | % |
| Other | | | 0.13 | % |
| Producer Durables | | | 0.91 | % |
| Technology | | | 2.84 | % |
| Telecommunications | | | 1.83 | % |
| Transportation | | | 0.66 | % |
| Utilities | | | 2.47 | % |
| Repurchase Agreement | | | 1.73 | % |
| Total | | | 100.00 | % |
| * | | A sector may comprise several industries. |
| ** | | Represents percent of total investments. |
6
Schedule of Investments
December 31, 2016
| Investments | | Interest
Rate | | Maturity
Date | | | Principal
Amount
(000) | | | | Fair
Value | |
| LONG-TERM INVESTMENTS 94.73% | | | | | | | | | | | | |
| ASSET-BACKED SECURITIES 19.70% | | | | | | | | | | | | |
| | | | | | | | | | | | | |
| Automobiles 8.85% | | | | | | | | | | | | |
| Ally Auto Receivables Trust 2014-2 A3 | | 1.25% | | 4/15/2019 | | $ | 12 | | | $ | 11,807 | |
| Ally Auto Receivables Trust 2015-2 A3 | | 1.49% | | 11/15/2019 | | | 8 | | | | 8,012 | |
| AmeriCredit Automobile Receivables Trust 2014-3 B | | 1.92% | | 11/8/2019 | | | 248 | | | | 248,848 | |
| AmeriCredit Automobile Receivables Trust 2016-4 A2A | | 1.34% | | 4/8/2020 | | | 35 | | | | 34,989 | |
| Avis Budget Rental Car Funding AESOP LLC 2012-3A A† | | 2.10% | | 3/20/2019 | | | 193 | | | | 193,247 | |
| Avis Budget Rental Car Funding AESOP LLC 2013-2A A† | | 2.97% | | 2/20/2020 | | | 200 | | | | 202,172 | |
| BMW Vehicle Owner Trust 2014-A A3 | | 0.97% | | 11/26/2018 | | | 6 | | | | 5,770 | |
| California Republic Auto Receivables Trust 2013-1 A2† | | 1.41% | | 9/17/2018 | | | 11 | | | | 10,868 | |
| California Republic Auto Receivables Trust 2014-3 A3 | | 1.09% | | 11/15/2018 | | | 8 | | | | 7,905 | |
| California Republic Auto Receivables Trust 2014-4 A3 | | 1.27% | | 1/15/2019 | | | 3 | | | | 3,389 | |
| California Republic Auto Receivables Trust 2015-1 A3 | | 1.33% | | 4/15/2019 | | | 3 | | | | 3,234 | |
| California Republic Auto Receivables Trust 2015-3 A4 | | 2.13% | | 5/17/2021 | | | 15 | | | | 15,080 | |
| California Republic Auto Receivables Trust 2015-4 A3† | | 2.04% | | 1/15/2020 | | | 11 | | | | 11,071 | |
| California Republic Auto Receivables Trust 2015-4 A4† | | 2.58% | | 6/15/2021 | | | 200 | | | | 201,909 | |
| California Republic Auto Receivables Trust 2015-4 B† | | 3.73% | | 11/15/2021 | | | 12 | | | | 12,275 | |
| California Republic Auto Receivables Trust 2016-1 A3 | | 1.89% | | 5/15/2020 | | | 30 | | | | 30,151 | |
| California Republic Auto Receivables Trust 2016-1 A4 | | 2.24% | | 10/15/2021 | | | 58 | | | | 58,344 | |
| California Republic Auto Receivables Trust 2016-2 A3 | | 1.56% | | 7/15/2020 | | | 11 | | | | 10,985 | |
| California Republic Auto Receivables Trust 2016-2 A4 | | 1.83% | | 12/15/2021 | | | 15 | | | | 14,916 | |
| Capital Auto Receivables Asset Trust 2013-4 C | | 2.67% | | 2/20/2019 | | | 66 | | | | 66,477 | |
| Capital Auto Receivables Asset Trust 2014-3 C† | | 2.71% | | 11/20/2019 | | | 21 | | | | 21,228 | |
| Capital Auto Receivables Asset Trust 2015-2 A2 | | 1.39% | | 9/20/2018 | | | 14 | | | | 14,009 | |
| Capital Auto Receivables Asset Trust 2015-3 B | | 2.43% | | 9/21/2020 | | | 11 | | | | 11,063 | |
| | See Notes to Financial Statements. | 7 |
Schedule of Investments (continued)
December 31, 2016
| Investments | | Interest
Rate | | Maturity
Date | | Principal
Amount
(000) | | | Fair
Value | |
| Automobiles (continued) | | | | | | | | | | | | |
| Capital Auto Receivables Asset Trust 2015-3 C | | 2.90% | | 12/21/2020 | | $ | 10 | | | $ | 10,125 | |
| Capital Auto Receivables Asset Trust 2015-3 D | | 3.34% | | 3/22/2021 | | | 9 | | | | 9,103 | |
| Capital Auto Receivables Asset Trust 2016-1 B | | 2.67% | | 12/21/2020 | | | 12 | | | | 11,983 | |
| Capital Auto Receivables Asset Trust 2016-2 A3 | | 1.46% | | 6/22/2020 | | | 21 | | | | 20,939 | |
| Capital Auto Receivables Asset Trust 2016-2 A4 | | 1.63% | | 1/20/2021 | | | 11 | | | | 10,896 | |
| CarMax Auto Owner Trust 2013-1 C | | 1.54% | | 12/15/2018 | | | 5 | | | | 5,005 | |
| CarMax Auto Owner Trust 2014-2 A3 | | 0.98% | | 1/15/2019 | | | 16 | | | | 15,526 | |
| CarMax Auto Owner Trust 2015-2 A2A | | 0.82% | | 6/15/2018 | | | 1 | (a) | | | 762 | |
| CarMax Auto Owner Trust 2016-3 A3 | | 1.39% | | 5/17/2021 | | | 32 | | | | 31,828 | |
| CarMax Auto Owner Trust 2016-3 A4 | | 1.60% | | 1/18/2022 | | | 32 | | | | 31,583 | |
| CarMax Auto Owner Trust 2016-4 A2 | | 1.21% | | 11/15/2019 | | | 36 | | | | 35,936 | |
| CarMax Auto Owner Trust 2016-4 A3 | | 1.40% | | 8/15/2021 | | | 17 | | | | 16,827 | |
| CarMax Auto Owner Trust 2016-4 A4 | | 1.60% | | 6/15/2022 | | | 21 | | | | 20,639 | |
| Chesapeake Funding II LLC 2016-2A A1† | | 1.88% | | 6/15/2028 | | | 200 | | | | 199,555 | |
| Chrysler Capital Auto Receivables Trust 2014-BA A3† | | 1.27% | | 5/15/2019 | | | 8 | | | | 8,337 | |
| Chrysler Capital Auto Receivables Trust 2015-BA B† | | 2.70% | | 12/15/2020 | | | 3 | | | | 3,030 | |
| Chrysler Capital Auto Receivables Trust 2016-AA A3† | | 1.77% | | 10/15/2020 | | | 42 | | | | 42,051 | |
| Chrysler Capital Auto Receivables Trust 2016-AA B† | | 2.88% | | 2/15/2022 | | | 11 | | | | 11,129 | |
| Drive Auto Receivables Trust 2015-AA B† | | 2.28% | | 6/17/2019 | | | 125 | | | | 125,462 | |
| Drive Auto Receivables Trust 2015-AA C† | | 3.06% | | 5/17/2021 | | | 63 | | | | 63,633 | |
| Drive Auto Receivables Trust 2015-BA C† | | 2.76% | | 7/15/2021 | | | 3 | | | | 3,020 | |
| Drive Auto Receivables Trust 2015-BA D† | | 3.84% | | 7/15/2021 | | | 5 | | | | 5,037 | |
| Drive Auto Receivables Trust 2015-DA C† | | 3.38% | | 11/15/2021 | | | 25 | | | | 25,417 | |
| Drive Auto Receivables Trust 2015-DA D† | | 4.59% | | 1/17/2023 | | | 22 | | | | 22,601 | |
| Drive Auto Receivables Trust 2016-AA B† | | 3.17% | | 5/15/2020 | | | 58 | | | | 58,523 | |
| Drive Auto Receivables Trust 2016-BA B† | | 2.56% | | 6/15/2020 | | | 20 | | | | 20,123 | |
| Drive Auto Receivables Trust 2016-BA C† | | 3.19% | | 7/15/2022 | | | 20 | | | | 20,161 | |
| Drive Auto Receivables Trust 2016-BA D† | | 4.53% | | 8/15/2023 | | | 41 | | | | 41,262 | |
| Drive Auto Receivables Trust 2016-CA B† | | 2.37% | | 11/16/2020 | | | 30 | | | | 29,940 | |
| Drive Auto Receivables Trust 2016-CA C† | | 3.02% | | 11/15/2021 | | | 78 | | | | 78,094 | |
| Drive Auto Receivables Trust 2016-CA D† | | 4.18% | | 3/15/2024 | | | 19 | | | | 18,877 | |
| Fifth Third Auto Trust 2014-3 A3 | | 0.96% | | 3/15/2019 | | | 15 | | | | 15,254 | |
| First Investors Auto Owner Trust 2016-2A A1† | | 1.53% | | 11/16/2020 | | | 41 | | | | 41,355 | |
| Flagship Credit Auto Trust 2015-2 A† | | 1.98% | | 10/15/2020 | | | 193 | | | | 193,100 | |
| Flagship Credit Auto Trust 2015-3 A† | | 2.38% | | 10/15/2020 | | | 6 | | | | 5,762 | |
| 8 | See Notes to Financial Statements. | |
Schedule of Investments (continued)
December 31, 2016
| Investments | | Interest
Rate | | Maturity
Date | | Principal
Amount
(000) | | | Fair
Value | |
| Automobiles (continued) | | | | | | | | | | | | |
| Ford Credit Auto Lease Trust 2016-A A3 | | 1.71% | | 4/15/2019 | | $ | 35 | | | $ | 35,132 | |
| Ford Credit Auto Owner Trust 2013-D A3 | | 0.67% | | 4/15/2018 | | | 1 | | | | 1,405 | |
| Ford Credit Auto Owner Trust 2016-C A2A | | 1.04% | | 9/15/2019 | | | 72 | | | | 71,857 | |
| Honda Auto Receivables Owner Trust 2016-4 A2 | | 1.04% | | 4/18/2019 | | | 70 | | | | 69,845 | |
| Huntington Auto Trust 2016-1 A3 | | 1.59% | | 11/16/2020 | | | 92 | | | | 91,850 | |
| Hyundai Auto Receivables Trust 2016-B C | | 2.19% | | 11/15/2022 | | | 72 | | | | 70,934 | |
| Mercedes-Benz Auto Lease Trust 2016-A A3 | | 1.52% | | 3/15/2019 | | | 43 | | | | 43,082 | |
| Mercedes-Benz Auto Receivables Trust 2016-1 A2A | | 1.11% | | 3/15/2019 | | | 114 | | | | 113,981 | |
| NextGear Floorplan Master Owner Trust 2015-2A A† | | 2.38% | | 10/15/2020 | | | 100 | | | | 100,488 | |
| Nissan Auto Receivables Owner Trust 2014-B A3 | | 1.11% | | 5/15/2019 | | | 33 | | | | 32,657 | |
| Nissan Auto Receivables Owner Trust 2016-B A3 | | 1.32% | | 1/15/2021 | | | 26 | | | | 25,854 | |
| OSCAR US Funding Trust V 2016-2A A2A† | | 2.31% | | 11/15/2019 | | | 80 | | | | 80,000 | |
| Santander Drive Auto Receivables Trust 2014-3 D | | 2.65% | | 8/17/2020 | | | 14 | | | | 14,167 | |
| Santander Drive Auto Receivables Trust 2014-4 C | | 2.60% | | 11/16/2020 | | | 23 | | | | 23,190 | |
| Santander Drive Auto Receivables Trust 2015-1 C | | 2.57% | | 4/15/2021 | | | 210 | | | | 211,918 | |
| Santander Drive Auto Receivables Trust 2015-3 B | | 2.07% | | 4/15/2020 | | | 11 | | | | 11,041 | |
| Santander Drive Auto Receivables Trust 2015-3 C | | 2.74% | | 1/15/2021 | | | 13 | | | | 13,135 | |
| Santander Drive Auto Receivables Trust 2015-4 C | | 2.97% | | 3/15/2021 | | | 77 | | | | 77,778 | |
| Santander Drive Auto Receivables Trust 2015-5 D | | 3.65% | | 12/15/2021 | | | 22 | | | | 22,564 | |
| Santander Drive Auto Receivables Trust 2016-1 D | | 4.02% | | 4/15/2022 | | | 14 | | | | 14,536 | |
| Santander Drive Auto Receivables Trust 2016-2 B | | 2.08% | | 2/16/2021 | | | 10 | | | | 10,012 | |
| Santander Drive Auto Receivables Trust 2016-3 A2 | | 1.34% | | 11/15/2019 | | | 38 | | | | 38,014 | |
| Santander Drive Auto Receivables Trust 2016-3 B | | 1.89% | | 6/15/2021 | | | 21 | | | | 20,895 | |
| SunTrust Auto Receivables Trust 2015-1A A3† | | 1.42% | | 9/16/2019 | | | 169 | | | | 169,002 | |
| TCF Auto Receivables Owner Trust 2015-1A A4† | | 1.96% | | 11/16/2020 | | | 34 | | | | 34,130 | |
| TCF Auto Receivables Owner Trust 2015-1A B† | | 2.49% | | 4/15/2021 | | | 29 | | | | 29,204 | |
| TCF Auto Receivables Owner Trust 2015-1A D† | | 3.53% | | 3/15/2022 | | | 10 | | | | 10,022 | |
| TCF Auto Receivables Owner Trust 2015-2A A2† | | 1.64% | | 1/15/2019 | | | 4 | | | | 3,643 | |
| TCF Auto Receivables Owner Trust 2015-2A B† | | 3.00% | | 9/15/2021 | | | 6 | | | | 6,090 | |
| TCF Auto Receivables Owner Trust 2015-2A C† | | 3.75% | | 12/15/2021 | | | 4 | | | | 4,092 | |
| TCF Auto Receivables Owner Trust 2015-2A D† | | 4.24% | | 8/15/2022 | | | 10 | | | | 10,149 | |
| TCF Auto Receivables Owner Trust 2016-1A A2† | | 1.39% | | 11/15/2019 | | | 72 | | | | 71,970 | |
| TCF Auto Receivables Owner Trust 2016-1A A4† | | 2.03% | | 2/15/2022 | | | 50 | | | | 49,620 | |
| TCF Auto Receivables Owner Trust 2016-1A B† | | 2.32% | | 6/15/2022 | | | 33 | | | | 32,587 | |
| TCF Auto Receivables Owner Trust 2016-PT1A A† | | 1.93% | | 6/15/2022 | | | 95 | | | | 94,934 | |
| Volkswagen Auto Loan Enhanced Trust 2013-2 A3 | | 0.70% | | 4/20/2018 | | | 9 | | | | 8,660 | |
| Westlake Automobile Receivables Trust 2016-3A B† | | 2.07% | | 12/15/2021 | | | 11 | | | | 10,957 | |
| Total | | | | | | | | | | | 4,180,019 | |
| | See Notes to Financial Statements. | 9 |
Schedule of Investments (continued)
December 31, 2016
| Investments | | Interest
Rate | | Maturity
Date | | Principal
Amount
(000) | | | Fair
Value | |
| Credit Cards 3.17% | | | | | | | | | | | | |
| BA Credit Card Trust 2016-A1 A | | 1.094% | # | 10/15/2021 | | $ | 48 | | | $ | 48,166 | |
| Barclays Dryrock Issuance Trust 2016-1 A | | 1.52% | | 5/16/2022 | | | 100 | | | | 99,125 | |
| Capital One Multi-Asset Execution Trust 2015-A3 | | 1.104% | # | 3/15/2023 | | | 50 | | | | 50,144 | |
| Capital One Multi-Asset Execution Trust 2015-A5 | | 1.60% | | 5/17/2021 | | | 28 | | | | 28,084 | |
| Capital One Multi-Asset Execution Trust 2016-A1 | | 1.154% | # | 2/15/2022 | | | 74 | | | | 74,336 | |
| Chase Issuance Trust 2012-A4 | | 1.58% | | 8/16/2021 | | | 150 | | | | 149,106 | |
| Chase Issuance Trust 2015-A5 | | 1.36% | | 4/15/2020 | | | 145 | | | | 144,949 | |
| Chase Issuance Trust 2016-A2 A | | 1.37% | | 6/15/2021 | | | 22 | | | | 21,800 | |
| Chase Issuance Trust 2016-A5 | | 1.27% | | 7/15/2021 | | | 100 | | | | 98,722 | |
| Discover Card Execution Note Trust 2015-A2 A | | 1.90% | | 10/17/2022 | | | 145 | | | | 144,489 | |
| Discover Card Execution Note Trust 2015-A4 | | 2.19% | | 4/17/2023 | | | 100 | | | | 100,248 | |
| Discover Card Execution Note Trust 2016-A2 | | 1.244% | # | 9/15/2021 | | | 100 | | | | 100,639 | |
| Discover Card Execution Note Trust 2016-A4 | | 1.39% | | 3/15/2022 | | | 234 | | | | 231,466 | |
| First National Master Note Trust 2015-1 A | | 1.474% | # | 9/15/2020 | | | 3 | | | | 3,010 | |
| Synchrony Credit Card Master Note Trust 2012-2 A | | 2.22% | | 1/15/2022 | | | 100 | | | | 100,805 | |
| Synchrony Credit Card Master Note Trust 2016-2 B | | 2.55% | | 5/15/2024 | | | 100 | | | | 101,906 | |
| Total | | | | | | | | | | | 1,496,995 | �� |
| | | | | | | | | | | | | |
| Other 7.68% | | | | | | | | | | | | |
| Ally Master Owner Trust 2012-5 A | | 1.54% | | 9/15/2019 | | | 100 | | | | 100,157 | |
| Ally Master Owner Trust 2014-4 A2 | | 1.43% | | 6/17/2019 | | | 128 | | | | 128,088 | |
| Ally Master Owner Trust 2014-5 A2 | | 1.60% | | 10/15/2019 | | | 17 | | | | 17,029 | |
| Ally Master Owner Trust 2015-3 A | | 1.63% | | 5/15/2020 | | | 140 | | | | 139,875 | |
| Ammc CLO 19 Ltd. 2016-19A A† | | 2.381% | # | 10/15/2028 | | | 250 | | | | 249,899 | |
| Ascentium Equipment Receivables Trust 2016-1A A2† | | 1.75% | | 11/13/2018 | | | 61 | | | | 61,638 | |
| Ascentium Equipment Receivables Trust 2016-2A A2† | | 1.46% | | 4/10/2019 | | | 27 | | | | 26,950 | |
| Ascentium Equipment Receivables Trust 2016-2A A3† | | 1.65% | | 5/10/2022 | | | 28 | | | | 27,759 | |
| BlueMountain CLO Ltd. 2014-4A A1R† | | 2.232% | # | 11/30/2026 | | | 250 | | | | 249,985 | |
| CNH Equipment Trust 2015-B A4 | | 1.89% | | 4/15/2022 | | | 11 | | | | 11,024 | |
| CNH Equipment Trust 2016-B A4 | | 1.97% | | 11/15/2021 | | | 6 | | | | 5,972 | |
| Dell Equipment Finance Trust 2016-1 A3† | | 1.65% | | 7/22/2021 | | | 100 | | | | 99,965 | |
| Dell Equipment Finance Trust 2016-1 B† | | 2.03% | | 7/22/2021 | | | 100 | | | | 99,859 | |
| Diamond Resorts Owner Trust 2015-2 A† | | 2.99% | | 5/22/2028 | | | 51 | | | | 50,368 | |
| Diamond Resorts Owner Trust 2016-1 A† | | 3.08% | | 11/20/2028 | | | 97 | | | | 96,133 | |
| Engs Commercial Finance Trust 2015-1A A2† | | 2.31% | | 10/22/2021 | | | 73 | | | | 73,247 | |
| Engs Commercial Finance Trust 2016-1A A2† | | 2.63% | | 2/22/2022 | | | 100 | | | | 99,474 | |
| 10 | See Notes to Financial Statements. | |
Schedule of Investments (continued)
December 31, 2016
| Investments | | Interest
Rate | | Maturity
Date | | Principal
Amount
(000) | | | Fair
Value | |
| Other (continued) | | | | | | | | | | | | |
| Ford Credit Floorplan Master Owner Trust A 2014-4 A1 | | 1.40% | | 8/15/2019 | | $ | 15 | | | $ | 15,012 | |
| Ford Credit Floorplan Master Owner Trust A 2016-1 A1 | | 1.76% | | 2/15/2021 | | | 300 | | | | 299,361 | |
| GoldenTree Loan Opportunities IX Ltd. 2014-9A AR† | | 2.238% | # | 10/29/2026 | | | 250 | | | | 250,023 | |
| MMAF Equipment Finance LLC 2016-AA A2† | | 1.39% | | 12/17/2018 | | | 100 | | | | 100,050 | |
| Nissan Master Owner Trust Receivables 2016-A A2 | | 1.54% | | 6/15/2021 | | | 35 | | | | 34,798 | |
| Oaktree EIF I Ltd. 2015-A1 A† | | 2.502% | # | 10/18/2027 | | | 250 | | | | 250,744 | |
| Octagon Investment Partners XIX Ltd. 2014-1A A† | | 2.40% | # | 4/15/2026 | | | 250 | | | | 250,427 | |
| OneMain Financial Issuance Trust 2015-2A A† | | 2.57% | | 7/18/2025 | | | 107 | | | | 107,138 | |
| OZLM VIII Ltd. 2014-8A A1A† | | 2.32% | # | 10/17/2026 | | | 250 | | | | 249,747 | |
| SLM Private Education Loan Trust 2012-A A1† | | 2.104% | # | 8/15/2025 | | | 4 | | | | 4,367 | |
| SLM Private Education Loan Trust 2013-B A1† | | 1.354% | # | 7/15/2022 | | | 19 | | | | 19,024 | |
| Taco Bell Funding LLC 2016-1A A2I† | | 3.832% | | 5/25/2046 | | | 25 | | | | 25,088 | |
| Tryon Park CLO Ltd. 2013-1A A1† | | 2.00% | # | 7/15/2025 | | | 250 | | | | 249,567 | |
| Wells Fargo Dealer Floorplan Master Note Trust 2012-2 A | | 1.489% | # | 4/22/2019 | | | 216 | | | | 216,263 | |
| Wells Fargo Dealer Floorplan Master Note Trust 2014-1 A | | 1.119% | # | 7/20/2019 | | | 15 | | | | 15,003 | |
| Total | | | | | | | | | | | 3,624,034 | |
| Total Asset-Backed Securities (cost $9,313,625) | | | | | | | | | | | 9,301,048 | |
| | | | | | | | | | | | | |
| | | | | | | | Shares
(000) | | | | | |
| | | | | | | | | | | | | |
| COMMON STOCK 0.00% | | | | | | | | | | | | |
| | | | | | | | | | | | | |
| Oil | | | | | | | | | | | | |
| Templar Energy LLC Class A | | | | | | | | | | | | |
| Total Common Stock (cost $728) | | | | | | | – | (a) | | | 546 | |
| | See Notes to Financial Statements. | 11 |
Schedule of Investments (continued)
December 31, 2016
| Investments | | Interest
Rate | | Maturity
Date | | Principal
Amount
(000) | | | Fair
Value | |
| CONVERTIBLE BONDS 0.05% | | | | | | | | | | | | |
| | | | | | | | | | | | | |
| Oil 0.01% | | | | | | | | | | | | |
| Chesapeake Energy Corp. | | 2.50% | | 5/15/2037 | | $ | 6 | | | $ | 6,082 | |
| | | | | | | | | | | | | |
| Retail 0.04% | | | | | | | | | | | | |
| Restoration Hardware Holdings, Inc.† | | Zero Coupon | | 6/15/2019 | | | 22 | | | | 18,879 | |
| Total Convertible Bonds (cost $24,531) | | | | | | | | | | | 24,961 | |
| | | | | | | | | | | | | |
| CORPORATE BONDS 45.24% | | | | | | | | | | | | |
| | | | | | | | | | | | | |
| Aerospace/Defense 0.13% | | | | | | | | | | | | |
| Harris Corp. | | 1.999% | | 4/27/2018 | | | 60 | | | | 60,056 | |
| | | | | | | | | | | | | |
| Air Transportation 0.01% | | | | | | | | | | | | |
| Continental Airlines 2012-1 Class B Pass Through Trust | | 6.25% | | 10/11/2021 | | | 3 | | | | 3,351 | |
| | | | | | | | | | | | | |
| Auto Parts: Original Equipment 0.58% | | | | | | | | | | | | |
| International Automotive Components Group SA (Luxembourg)†(b) | | 9.125% | | 6/1/2018 | | | 40 | | | | 39,200 | |
| | | | | | | | | | | | | |
| Auto Parts: Original Equipment | | | | | | | | | | | | |
| Nexteer Automotive Group Ltd.† | | 5.875% | | 11/15/2021 | | | 200 | | | | 208,500 | |
| Titan International, Inc. | | 6.875% | | 10/1/2020 | | | 25 | | | | 24,594 | |
| Total | | | | | | | | | | | 272,294 | |
| | | | | | | | | | | | | |
| Automotive 2.70% | | | | | | | | | | | | |
| Ford Motor Credit Co. LLC | | 6.625% | | 8/15/2017 | | | 350 | | | | 360,706 | |
| Ford Motor Credit Co. LLC | | 8.125% | | 1/15/2020 | | | 100 | | | | 115,397 | |
| General Motors Co. | | 3.50% | | 10/2/2018 | | | 31 | | | | 31,630 | |
| General Motors Financial Co., Inc. | | 2.40% | | 5/9/2019 | | | 126 | | | | 125,737 | |
| General Motors Financial Co., Inc. | | 3.10% | | 1/15/2019 | | | 80 | | | | 80,889 | |
| General Motors Financial Co., Inc. | | 3.20% | | 7/13/2020 | | | 85 | | | | 85,325 | |
| General Motors Financial Co., Inc. | | 3.25% | | 5/15/2018 | | | 5 | | | | 5,067 | |
| General Motors Financial Co., Inc. | | 4.75% | | 8/15/2017 | | | 12 | | | | 12,229 | |
| Hyundai Capital America† | | 2.00% | | 3/19/2018 | | | 25 | | | | 25,003 | |
| Hyundai Capital America† | | 2.40% | | 10/30/2018 | | | 17 | | | | 17,075 | |
| Navistar International Corp. | | 8.25% | | 11/1/2021 | | | 17 | | | | 17,255 | |
| Volkswagen Group of America Finance LLC† | | 1.60% | | 11/20/2017 | | | 200 | | | | 199,415 | |
| Volkswagen International Finance NV (Netherlands)†(b) | | 1.60% | | 11/20/2017 | | | 200 | | | | 199,521 | |
| Total | | | | | | | | | | | 1,275,249 | |
| 12 | See Notes to Financial Statements. | |
Schedule of Investments (continued)
December 31, 2016
| Investments | | Interest
Rate | | Maturity
Date | | Principal
Amount
(000) | | | Fair
Value | |
| Banks: Regional 6.84% | | | | | | | | | | | | |
| Associated Banc-Corp. | | 2.75% | | 11/15/2019 | | $ | 25 | | | $ | 25,081 | |
| Banco de Credito del Peru (Panama)†(b) | | 2.25% | | 10/25/2019 | | | 200 | | | | 197,750 | |
| Bank of America Corp. | | 2.151% | | 11/9/2020 | | | 20 | | | | 19,758 | |
| Bank of America Corp. | | 5.49% | | 3/15/2019 | | | 300 | | | | 318,584 | |
| Bank of America Corp. | | 5.625% | | 7/1/2020 | | | 53 | | | | 58,323 | |
| Bank of America Corp. | | 5.65% | | 5/1/2018 | | | 50 | | | | 52,405 | |
| Bank of America Corp. | | 7.625% | | 6/1/2019 | | | 165 | | | | 185,516 | |
| Capital One Financial Corp. | | 5.25% | | 2/21/2017 | | | 5 | | | | 5,024 | |
| Citigroup, Inc. | | 1.80% | | 2/5/2018 | | | 20 | | | | 19,994 | |
| Citigroup, Inc. | | 2.05% | | 12/7/2018 | | | 13 | | | | 13,005 | |
| Citigroup, Inc. | | 2.65% | | 10/26/2020 | | | 89 | | | | 89,143 | |
| Citigroup, Inc. | | 8.50% | | 5/22/2019 | | | 45 | | | | 51,366 | |
| Commonwealth Bank of Australia (Australia)†(b) | | 1.375% | | 9/6/2018 | | | 47 | | | | 46,704 | |
| Credit Suisse AG | | 1.70% | | 4/27/2018 | | | 250 | | | | 249,497 | |
| Discover Bank | | 2.60% | | 11/13/2018 | | | 250 | | | | 252,277 | |
| Goldman Sachs Group, Inc. (The) | | 2.30% | | 12/13/2019 | | | 65 | | | | 64,972 | |
| Goldman Sachs Group, Inc. (The) | | 5.75% | | 1/24/2022 | | | 25 | | | | 28,137 | |
| Goldman Sachs Group, Inc. (The) | | 5.95% | | 1/18/2018 | | | 8 | | | | 8,336 | |
| Goldman Sachs Group, Inc. (The) | | 6.00% | | 6/15/2020 | | | 19 | | | | 21,086 | |
| Goldman Sachs Group, Inc. (The) | | 6.15% | | 4/1/2018 | | | 10 | | | | 10,522 | |
| Goldman Sachs Group, Inc. (The) | | 7.50% | | 2/15/2019 | | | 55 | | | | 61,002 | |
| HBOS plc (United Kingdom)†(b) | | 6.75% | | 5/21/2018 | | | 300 | | | | 317,099 | |
| Huntington Bancshares, Inc. | | 2.60% | | 8/2/2018 | | | 41 | | | | 41,415 | |
| Huntington Bancshares, Inc. | | 7.00% | | 12/15/2020 | | | 13 | | | | 14,732 | |
| JPMorgan Chase & Co. | | 2.295% | | 8/15/2021 | | | 38 | | | | 37,320 | |
| Macquarie Bank Ltd. (Australia)†(b) | | 1.516% | # | 10/27/2017 | | | 150 | | | | 150,184 | |
| Macquarie Bank Ltd. (Australia)†(b) | | 1.60% | | 10/27/2017 | | | 50 | | | | 50,003 | |
| Morgan Stanley | | 2.80% | | 6/16/2020 | | | 11 | | | | 11,099 | |
| Morgan Stanley | | 7.30% | | 5/13/2019 | | | 100 | | | | 111,489 | |
| National City Corp. | | 6.875% | | 5/15/2019 | | | 47 | | | | 51,761 | |
| Popular, Inc. | | 7.00% | | 7/1/2019 | | | 57 | | | | 59,066 | |
| Royal Bank of Scotland NV (The) (Netherlands)(b) | | 4.65% | | 6/4/2018 | | | 44 | | | | 44,746 | |
| Royal Bank of Scotland plc (The) (United Kingdom)(b) | | 9.50% | # | 3/16/2022 | | | 140 | | | | 142,325 | |
| Santander UK Group Holdings plc (United Kingdom)(b) | | 2.875% | | 10/16/2020 | | | 41 | | | | 40,713 | |
| Santander UK Group Holdings plc (United Kingdom)(b) | | 3.125% | | 1/8/2021 | | | 7 | | | | 7,004 | |
| Santander UK plc (United Kingdom)(b) | | 1.65% | | 9/29/2017 | | | 3 | | | | 3,004 | |
| | See Notes to Financial Statements. | 13 |
Schedule of Investments (continued)
December 31, 2016
| Investments | | Interest
Rate | | Maturity
Date | | Principal
Amount
(000) | | | Fair
Value | |
| Banks: Regional (continued) | | | | | | | | | | | | |
| Santander UK plc (United Kingdom)(b) | | 2.00% | | 8/24/2018 | | $ | 10 | | | $ | 9,997 | |
| Santander UK plc (United Kingdom)(b) | | 2.50% | | 3/14/2019 | | | 38 | | | | 38,234 | |
| Santander UK plc (United Kingdom)(b) | | 3.05% | | 8/23/2018 | | | 15 | | | | 15,241 | |
| SVB Financial Group | | 5.375% | | 9/15/2020 | | | 5 | | | | 5,422 | |
| Synovus Financial Corp. | | 7.875% | | 2/15/2019 | | | 65 | | | | 71,581 | |
| UBS Group Funding Jersey Ltd. (Jersey)†(b) | | 2.95% | | 9/24/2020 | | | 200 | | | | 200,263 | |
| Wells Fargo & Co. | | 2.55% | | 12/7/2020 | | | 6 | | | | 6,010 | |
| Wells Fargo & Co. | | 2.60% | | 7/22/2020 | | | 23 | | | | 23,145 | |
| Total | | | | | | | | | | | 3,230,335 | |
| | | | | | | | | | | | | |
| Beverages 0.00% | | | | | | | | | | | | |
| Beam Suntory, Inc. | | 1.75% | | 6/15/2018 | | | 2 | | | | 1,996 | |
| | | | | | | | | | | | | |
| Building Materials 0.25% | | | | | | | | | | | | |
| Fortune Brands Home & Security, Inc. | | 3.00% | | 6/15/2020 | | | 5 | | | | 5,036 | |
| Martin Marietta Materials, Inc. | | 2.098%# | | 6/30/2017 | | | 78 | | | | 78,140 | |
| Martin Marietta Materials, Inc. | | 6.60% | | 4/15/2018 | | | 14 | | | | 14,787 | |
| Owens Corning | | 9.00% | | 6/15/2019 | | | 3 | | | | 3,423 | |
| Standard Industries, Inc.† | | 5.125% | | 2/15/2021 | | | 5 | | | | 5,237 | |
| Vulcan Materials Co. | | 7.50% | | 6/15/2021 | | | 10 | | | | 11,825 | |
| Total | | | | | | | | | | | 118,448 | |
| | | | | | | | | | | | | |
| Business Services 0.63% | | | | | | | | | | | | |
| APX Group, Inc. | | 6.375% | | 12/1/2019 | | | 23 | | | | 23,776 | |
| Chicago Parking Meters LLC† | | 5.489% | | 12/30/2020 | | | 20 | | | | 21,150 | |
| ERAC USA Finance LLC† | | 6.375% | | 10/15/2017 | | | 7 | | | | 7,254 | |
| NES Rentals Holdings, Inc.† | | 7.875% | | 5/1/2018 | | | 21 | | | | 21,000 | |
| Verisk Analytics, Inc. | | 4.875% | | 1/15/2019 | | | 17 | | | | 17,830 | |
| Western Union Co. (The) | | 2.875% | | 12/10/2017 | | | 100 | | | | 101,043 | |
| Western Union Co. (The) | | 3.35% | | 5/22/2019 | | | 75 | | | | 76,546 | |
| Western Union Co. (The) | | 3.65% | | 8/22/2018 | | | 27 | | | | 27,672 | |
| Total | | | | | | | | | | | 296,271 | |
| | | | | | | | | | | | | |
| Chemicals 1.37% | | | | | | | | | | | | |
| Albemarle Corp. | | 3.00% | | 12/1/2019 | | | 5 | | | | 5,117 | |
| Blue Cube Spinco, Inc. | | 9.75% | | 10/15/2023 | | | 112 | | | | 133,840 | |
| Celanese US Holdings LLC | | 5.875% | | 6/15/2021 | | | 55 | | | | 61,138 | |
| Cytec Industries, Inc. | | 8.95% | | 7/1/2017 | | | 50 | | | | 51,440 | |
| Equate Petrochemical BV (Netherlands)†(b) | | 3.00% | | 3/3/2022 | | | 200 | | | | 191,206 | |
| Rain CII Carbon LLC/CII Carbon Corp.† | | 8.00% | | 12/1/2018 | | | 32 | | | | 32,000 | |
| 14 | See Notes to Financial Statements. | |
Schedule of Investments (continued)
December 31, 2016
| Investments | | Interest
Rate | | Maturity
Date | | Principal
Amount
(000) | | | Fair
Value | |
| Chemicals (continued) | | | | | | | | | | | | |
| RPM International, Inc. | | 6.50% | | 2/15/2018 | | $ | 25 | | | $ | 26,208 | |
| Westlake Chemical Corp.† | | 4.625% | | 2/15/2021 | | | 46 | | | | 47,725 | |
| Westlake Chemical Corp.† | | 4.875% | | 5/15/2023 | | | 51 | | | | 53,040 | |
| Yara International ASA (Norway)†(b) | | 7.875% | | 6/11/2019 | | | 40 | | | | 44,748 | |
| Total | | | | | | | | | | | 646,462 | |
| | | | | | | | | | | | | |
| Computer Hardware 0.84% | | | | | | | | | | | | |
| Diamond 1 Finance Corp./Diamond 2 Finance Corp.† | | 3.48% | | 6/1/2019 | | | 127 | | | | 129,717 | |
| Diamond 1 Finance Corp./Diamond 2 Finance Corp.† | | 4.42% | | 6/15/2021 | | | 123 | | | | 127,399 | |
| Diamond 1 Finance Corp./Diamond 2 Finance Corp.† | | 5.875% | | 6/15/2021 | | | 25 | | | | 26,607 | |
| Hewlett Packard Enterprise Co. | | 2.45% | | 10/5/2017 | | | 19 | | | | 19,109 | |
| Hewlett Packard Enterprise Co. | | 2.738% | # | 10/5/2017 | | | 25 | | | | 25,240 | |
| Hewlett Packard Enterprise Co. | | 2.85% | | 10/5/2018 | | | 55 | | | | 55,556 | |
| Leidos Holdings, Inc. | | 4.45% | | 12/1/2020 | | | 11 | | | | 11,386 | |
| NetApp, Inc. | | 2.00% | | 12/15/2017 | | | 2 | | | | 2,006 | |
| Total | | | | | | | | | | | 397,020 | |
| | | | | | | | | | | | | |
| Computer Software 0.57% | | | | | | | | | | | | |
| Activision Blizzard, Inc.† | | 6.125% | | 9/15/2023 | | | 127 | | | | 139,009 | |
| Change Healthcare Holdings, Inc. | | 11.00% | | 12/31/2019 | | | 39 | | | | 40,277 | |
| Dun & Bradstreet Corp. (The) | | 3.25% | | 12/1/2017 | | | 63 | | | | 63,626 | |
| Fidelity National Information Services, Inc. | | 5.00% | | 3/15/2022 | | | 2 | | | | 2,055 | |
| First Data Corp.† | | 6.75% | | 11/1/2020 | | | 22 | | | | 22,871 | |
| Total | | | | | | | | | | | 267,838 | |
| | | | | | | | | | | | | |
| Construction/Homebuilding 0.18% | | | | | | | | | | | | |
| Brookfield Residential Properties, Inc. (Canada)†(b) | | 6.50% | | 12/15/2020 | | | 42 | | | | 43,155 | |
| William Lyon Homes, Inc. | | 8.50% | | 11/15/2020 | | | 41 | | | | 43,050 | |
| Total | | | | | | | | | | | 86,205 | |
| | | | | | | | | | | | | |
| Containers 0.32% | | | | | | | | | | | | |
| Reynolds Group Issuer, Inc./Reynolds Group Issuer LLC/Reynolds Group Issuer (Luxembourg) SA | | 5.75% | | 10/15/2020 | | | 148 | | | | 152,810 | |
| | | | | | | | | | | | | |
| Drugs 1.70% | | | | | | | | | | | | |
| Actavis Funding SCS (Luxembourg)(b) | | 2.35% | | 3/12/2018 | | | 10 | | | | 10,061 | |
| Capsugel SA PIK (Luxembourg)†(b) | | 7.00% | | 5/15/2019 | | | 61 | | | | 61,572 | |
| Forest Laboratories LLC† | | 4.375% | | 2/1/2019 | | | 186 | | | | 193,375 | |
| Forest Laboratories LLC† | | 5.00% | | 12/15/2021 | | | 20 | | | | 21,646 | |
| | See Notes to Financial Statements. | 15 |
Schedule of Investments (continued)
December 31, 2016
| Investments | | Interest
Rate | | Maturity
Date | | Principal
Amount
(000) | | | Fair
Value | |
| Drugs (continued) | | | | | | | | | | | | |
| Mylan NV† | | 3.00% | | 12/15/2018 | | $ | 66 | | | $ | 66,509 | |
| Mylan NV† | | 3.15% | | 6/15/2021 | | | 16 | | | | 15,718 | |
| Mylan NV† | | 3.75% | | 12/15/2020 | | | 25 | | | | 25,267 | |
| Mylan, Inc. | | 2.55% | | 3/28/2019 | | | 122 | | | | 121,804 | |
| Mylan, Inc. | | 2.60% | | 6/24/2018 | | | 88 | | | | 88,541 | |
| Nature’s Bounty Co. (The)† | | 7.625% | | 5/15/2021 | | | 29 | | | | 30,088 | |
| Shire Acquisitions Investments Ireland DAC (Ireland)(b) | | 1.90% | | 9/23/2019 | | | 53 | | | | 52,362 | |
| Zoetis, Inc. | | 1.875% | | 2/1/2018 | | | 117 | | | | 117,031 | |
| Total | | | | | | | | | | | 803,974 | |
| | | | | | | | | | | | | |
| Electric: Power 1.84% | | | | | | | | | | | | |
| American Electric Power Co., Inc. | | 1.65% | | 12/15/2017 | | | 10 | | | | 10,006 | |
| Dominion Resources, Inc. | | 2.962% | | 7/1/2019 | | | 37 | | | | 37,481 | |
| Dominion Resources, Inc. | | 4.104% | | 4/1/2021 | | | 77 | | | | 80,286 | |
| Duquesne Light Holdings, Inc.† | | 5.90% | | 12/1/2021 | | | 15 | | | | 16,800 | |
| Duquesne Light Holdings, Inc.† | | 6.40% | | 9/15/2020 | | | 10 | | | | 11,167 | |
| Exelon Generation Co. LLC | | 2.95% | | 1/15/2020 | | | 35 | | | | 35,441 | |
| Exelon Generation Co. LLC | | 5.20% | | 10/1/2019 | | | 1 | | | | 1,072 | |
| Exelon Generation Co. LLC | | 6.20% | | 10/1/2017 | | | 50 | | | | 51,689 | |
| ITC Holdings Corp.† | | 6.05% | | 1/31/2018 | | | 75 | | | | 78,238 | |
| Jersey Central Power & Light Co. | | 7.35% | | 2/1/2019 | | | 45 | | | | 49,313 | |
| Metropolitan Edison Co. | | 7.70% | | 1/15/2019 | | | 11 | | | | 12,110 | |
| Origin Energy Finance Ltd. (Australia)†(b) | | 3.50% | | 10/9/2018 | | | 200 | | | | 202,440 | |
| Pennsylvania Electric Co. | | 5.20% | | 4/1/2020 | | | 11 | | | | 11,789 | |
| Pennsylvania Electric Co. | | 6.05% | | 9/1/2017 | | | 4 | | | | 4,111 | |
| PPL Capital Funding, Inc. | | 1.90% | | 6/1/2018 | | | 76 | | | | 76,008 | |
| PPL WEM Ltd./Western Power Distribution Ltd. (United Kingdom)†(b) | | 5.375% | | 5/1/2021 | | | 5 | | | | 5,400 | |
| Progress Energy, Inc. | | 7.05% | | 3/15/2019 | | | 4 | | | | 4,424 | |
| PSEG Power LLC | | 5.125% | | 4/15/2020 | | | 3 | | | | 3,216 | |
| Public Service Co. of New Mexico | | 7.95% | | 5/15/2018 | | | 19 | | | | 20,518 | |
| Puget Energy, Inc. | | 6.00% | | 9/1/2021 | | | 35 | | | | 39,238 | |
| TECO Finance, Inc. | | 5.15% | | 3/15/2020 | | | 7 | | | | 7,439 | |
| TECO Finance, Inc. | | 6.572% | | 11/1/2017 | | | 7 | | | | 7,268 | |
| West Penn Power Co.† | | 5.95% | | 12/15/2017 | | | 100 | | | | 103,873 | |
| Total | | | | | | | | | | | 869,327 | |
| 16 | See Notes to Financial Statements. | |
Schedule of Investments (continued)
December 31, 2016
| Investments | | Interest
Rate | | Maturity
Date | | Principal
Amount
(000) | | | Fair
Value | |
| Electrical Equipment 0.64% | | | | | | | | | | | | |
| KLA-Tencor Corp. | | 2.375% | | 11/1/2017 | | $ | 20 | | | $ | 20,124 | |
| KLA-Tencor Corp. | | 3.375% | | 11/1/2019 | | | 71 | | | | 72,734 | |
| NXP BV/NXP Funding LLC (Netherlands)†(b) | | 5.75% | | 3/15/2023 | | | 200 | | | | 211,500 | |
| Total | | | | | | | | | | | 304,358 | |
| | | | | | | | | | | | | |
| Electronics 0.24% | | | | | | | | | | | | |
| Ingram Micro, Inc. | | 5.25% | | 9/1/2017 | | | 89 | | | | 90,323 | |
| Jabil Circuit, Inc. | | 8.25% | | 3/15/2018 | | | 22 | | | | 23,646 | |
| Total | | | | | | | | | | | 113,969 | |
| | | | | | | | | | | | | |
| Entertainment 0.31% | | | | | | | | | | | | |
| CCM Merger, Inc.† | | 9.125% | | 5/1/2019 | | | 20 | | | | 20,817 | |
| Churchill Downs, Inc. | | 5.375% | | 12/15/2021 | | | 46 | | | | 47,955 | |
| Eldorado Resorts, Inc. | | 7.00% | | 8/1/2023 | | | 11 | | | | 11,715 | |
| Greektown Holdings LLC/Greektown Mothership Corp.† | | 8.875% | | 3/15/2019 | | | 9 | | | | 9,506 | |
| Isle of Capri Casinos, Inc. | | 8.875% | | 6/15/2020 | | | 20 | | | | 21,000 | |
| Rivers Pittsburgh Borrower LP/Rivers Pittsburgh Finance Corp.† | | 6.125% | | 8/15/2021 | | | 5 | | | | 5,125 | |
| Shingle Springs Tribal Gaming Authority† | | 9.75% | | 9/1/2021 | | | 29 | | | | 31,683 | |
| Total | | | | | | | | | | | 147,801 | |
| | | | | | | | | | | | | |
| Financial Services 3.84% | | | | | | | | | | | | |
| Air Lease Corp. | | 5.625% | | 4/1/2017 | | | 322 | | | | 325,622 | |
| Bear Stearns Cos. LLC (The) | | 7.25% | | 2/1/2018 | | | 159 | | | | 168,286 | |
| CIT Group, Inc. | | 4.25% | | 8/15/2017 | | | 28 | | | | 28,420 | |
| CIT Group, Inc.† | | 5.50% | | 2/15/2019 | | | 126 | | | | 133,245 | |
| Discover Financial Services | | 6.45% | | 6/12/2017 | | | 68 | | | | 69,409 | |
| E*TRADE Financial Corp. | | 4.625% | | 9/15/2023 | | | 11 | | | | 11,231 | |
| E*TRADE Financial Corp. | | 5.375% | | 11/15/2022 | | | 52 | | | | 55,039 | |
| International Lease Finance Corp. | | 5.875% | | 4/1/2019 | | | 40 | | | | 42,579 | |
| International Lease Finance Corp. | | 6.25% | | 5/15/2019 | | | 98 | | | | 105,595 | |
| International Lease Finance Corp.† | | 7.125% | | 9/1/2018 | | | 61 | | | | 65,880 | |
| International Lease Finance Corp. | | 8.25% | | 12/15/2020 | | | 30 | | | | 35,025 | |
| International Lease Finance Corp. | | 8.875% | | 9/1/2017 | | | 7 | | | | 7,324 | |
| Jefferies Group LLC | | 8.50% | | 7/15/2019 | | | 146 | | | | 165,683 | |
| Lazard Group LLC | | 4.25% | | 11/14/2020 | | | 75 | | | | 78,577 | |
| Macquarie Group Ltd. (Australia)†(b) | | 6.00% | | 1/14/2020 | | | 75 | | | | 81,312 | |
| Nationstar Mortgage LLC/Nationstar Capital Corp. | | 7.875% | | 10/1/2020 | | | 58 | | | | 60,320 | |
| Nationstar Mortgage LLC/Nationstar Capital Corp. | | 9.625% | | 5/1/2019 | | | 27 | | | | 28,350 | |
| | See Notes to Financial Statements. | 17 |
Schedule of Investments (continued)
December 31, 2016
| Investments | | Interest
Rate | | Maturity
Date | | Principal
Amount
(000) | | | Fair
Value | |
| Financial Services (continued) | | | | | | | | | | | | |
| Navient Corp. | | 4.875% | | 6/17/2019 | | $ | 119 | | | $ | 123,462 | |
| Navient Corp. | | 5.50% | | 1/15/2019 | | | 42 | | | | 43,680 | |
| Navient Corp. | | 8.00% | | 3/25/2020 | | | 12 | | | | 13,343 | |
| Neuberger Berman Group LLC/Neuberger Berman Finance Corp.† | | 5.875% | | 3/15/2022 | | | 54 | | | | 55,890 | |
| NFP Corp.† | | 9.00% | | 7/15/2021 | | | 40 | | | | 42,350 | |
| SteelRiver Transmission Co. LLC† | | 4.71% | | 6/30/2017 | | | 67 | | | | 67,597 | |
| Synchrony Financial | | 2.287% | # | 11/9/2017 | | | 6 | | | | 6,040 | |
| Total | | | | | | | | | | | 1,814,259 | |
| | | | | | | | | | | | | |
| Food 0.66% | | | | | | | | | | | | |
| Bumble Bee Holdco SCA PIK (Luxembourg)†(b) | | 9.625% | | 3/15/2018 | | | 20 | | | | 19,525 | |
| Bumble Bee Holdings, Inc.† | | 9.00% | | 12/15/2017 | | | 25 | | | | 24,750 | |
| Dole Food Co., Inc.† | | 7.25% | | 5/1/2019 | | | 12 | | | | 12,270 | |
| Grupo Bimbo SAB de CV (Mexico)†(b) | | 4.875% | | 6/30/2020 | | | 100 | | | | 106,404 | |
| JBS USA LUX SA/JBS USA Finance, Inc. † | | 7.25% | | 6/1/2021 | | | 138 | | | | 143,521 | |
| JBS USA LUX SA/JBS USA Finance, Inc.† | | 8.25% | | 2/1/2020 | | | 6 | | | | 6,180 | |
| Total | | | | | | | | | | | 312,650 | |
| | | | | | | | | | | | | |
| Government 0.01% | | | | | | | | | | | | |
| Seminole Tribe of Florida, Inc.† | | 7.804% | | 10/1/2020 | | | 3 | | | | 3,000 | |
| | | | | | | | | | | | | |
| Health Care Products 0.31% | | | | | | | | | | | | |
| Life Technologies Corp. | | 6.00% | | 3/1/2020 | | | 50 | | | | 54,509 | |
| Zimmer Biomet Holdings, Inc. | | 2.00% | | 4/1/2018 | | | 16 | | | | 16,024 | |
| Zimmer Biomet Holdings, Inc. | | 2.70% | | 4/1/2020 | | | 75 | | | | 75,062 | |
| Total | | | | | | | | | | | 145,595 | |
| | | | | | | | | | | | | |
| Health Care Services 0.03% | | | | | | | | | | | | |
| Anthem, Inc. | | 2.25% | | 8/15/2019 | | | 5 | | | | 4,993 | |
| Universal Health Services, Inc.† | | 3.75% | | 8/1/2019 | | | 11 | | | | 11,096 | |
| Total | | | | | | | | | | | 16,089 | |
| | | | | | | | | | | | | |
| Household Equipment/Products 0.06% | | | | | | | | | | | | |
| Century Intermediate Holding Co. 2 PIK† | | 9.75% | | 2/15/2019 | | | 25 | | | | 24,844 | |
| Newell Brands, Inc. | | 6.25% | | 4/15/2018 | | | 2 | | | | 2,105 | |
| Total | | | | | | | | | | | 26,949 | |
| | | | | | | | | | | | | |
| Insurance 0.49% | | | | | | | | | | | | |
| CNA Financial Corp. | | 5.875% | | 8/15/2020 | | | 11 | | | | 12,162 | |
| HUB International Ltd.† | | 9.25% | | 2/15/2021 | | | 45 | | | | 46,631 | |
| Kemper Corp. | | 6.00% | | 5/15/2017 | | | 25 | | | | 25,372 | |
| 18 | See Notes to Financial Statements. | |
Schedule of Investments (continued)
December 31, 2016
| Investments | | Interest
Rate | | Maturity
Date | | Principal
Amount
(000) | | | Fair
Value | |
| Insurance (continued) | | | | | | | | | | | | |
| Lincoln National Corp. | | 7.00% | | 3/15/2018 | | $ | 5 | | | $ | 5,283 | |
| Lincoln National Corp. | | 8.75% | | 7/1/2019 | | | 10 | | | | 11,512 | |
| Protective Life Corp. | | 7.375% | | 10/15/2019 | | | 15 | | | | 17,000 | |
| TIAA Asset Management Finance Co. LLC† | | 2.95% | | 11/1/2019 | | | 76 | | | | 77,364 | |
| Willis North America, Inc. | | 6.20% | | 3/28/2017 | | | 34 | | | | 34,381 | |
| Total | | | | | | | | | | | 229,705 | |
| | | | | | | | | | | | | |
| Leasing 0.48% | | | | | | | | | | | | |
| Aviation Capital Group Corp.† | | 2.875% | | 9/17/2018 | | | 20 | | | | 20,275 | |
| Aviation Capital Group Corp.† | | 4.625% | | 1/31/2018 | | | 7 | | | | 7,210 | |
| Penske Truck Leasing Co. LP/PTL Finance Corp.† | | 2.50% | | 6/15/2019 | | | 7 | | | | 7,021 | |
| Penske Truck Leasing Co. LP/PTL Finance Corp.† | | 2.875% | | 7/17/2018 | | | 17 | | | | 17,226 | |
| Penske Truck Leasing Co. LP/PTL Finance Corp.† | | 3.20% | | 7/15/2020 | | | 63 | | | | 63,750 | |
| Penske Truck Leasing Co. LP/PTL Finance Corp.† | | 3.375% | | 3/15/2018 | | | 8 | | | | 8,143 | |
| Penske Truck Leasing Co. LP/PTL Finance Corp.† | | 3.75% | | 5/11/2017 | | | 100 | | | | 100,786 | |
| Total | | | | | | | | | | | 224,411 | |
| | | | | | | | | | | | | |
| Lodging 0.47% | | | | | | | | | | | | |
| Caesar’s Entertainment Resort Properties LLC/Caesar’s Entertainment Resort Properties Finance, Inc. | | 11.00% | | 10/1/2021 | | | 65 | | | | 71,337 | |
| Caesar’s Growth Properties Holdings LLC/Caesar’s Growth Properties Finance, Inc. | | 9.375% | | 5/1/2022 | | | 12 | | | | 12,997 | |
| Hilton Worldwide Finance LLC/Hilton Worldwide Finance Corp. | | 5.625% | | 10/15/2021 | | | 24 | | | | 24,794 | |
| Hyatt Hotels Corp.† | | 6.875% | | 8/15/2019 | | | 50 | | | | 55,708 | |
| Marriott International, Inc. | | 6.75% | | 5/15/2018 | | | 5 | | | | 5,332 | |
| Station Casinos LLC | | 7.50% | | 3/1/2021 | | | 48 | | | | 50,400 | |
| Total | | | | | | | | | | | 220,568 | |
| | | | | | | | | | | | | |
| Machinery: Agricultural 0.22% | | | | | | | | | | | | |
| Viterra, Inc. (Canada)†(b) | | 5.95% | | 8/1/2020 | | | 94 | | | | 102,130 | |
| | | | | | | | | | | | | |
| Machinery: Industrial/Specialty 0.08% | | | | | | | | | | | | |
| Cleaver-Brooks, Inc.† | | 8.75% | | 12/15/2019 | | | 21 | | | | 21,971 | |
| Milacron LLC/Mcron Finance Corp.† | | 7.75% | | 2/15/2021 | | | 17 | | | | 17,553 | |
| Total | | | | | | | | | | | 39,524 | |
| | | | | | | | | | | | | |
| Manufacturing 0.23% | | | | | | | | | | | | |
| Crane Co. | | 2.75% | | 12/15/2018 | | | 10 | | | | 10,130 | |
| Pentair Finance SA (Luxembourg)(b) | | 1.875% | | 9/15/2017 | | | 52 | | | | 52,087 | |
| Pentair Finance SA (Luxembourg)(b) | | 2.90% | | 9/15/2018 | | | 34 | | | | 34,407 | |
| | See Notes to Financial Statements. | 19 |
Schedule of Investments (continued)
December 31, 2016
| Investments | | Interest
Rate | | Maturity
Date | | Principal
Amount
(000) | | | Fair
Value | |
| Manufacturing (continued) | | | | | | | | | | | | |
| Smith & Wesson Holding Corp.† | | 5.00% | | 7/15/2018 | | $ | 5 | | | $ | 4,975 | |
| Textron, Inc. | | 5.60% | | 12/1/2017 | | | 7 | | | | 7,249 | |
| Total | | | | | | | | | | | 108,848 | |
| | | | | | | | | | | | | |
| Media 1.61% | | | | | | | | | | | | |
| Block Communications, Inc.† | | 7.25% | | 2/1/2020 | | | 22 | | | | 22,385 | |
| Cox Communications, Inc.† | | 6.25% | | 6/1/2018 | | | 5 | | | | 5,277 | |
| Cox Communications, Inc.† | | 9.375% | | 1/15/2019 | | | 70 | | | | 79,118 | |
| Discovery Communications LLC | | 5.625% | | 8/15/2019 | | | 23 | | | | 24,863 | |
| DISH DBS Corp. | | 5.875% | | 7/15/2022 | | | 55 | | | | 58,025 | |
| Mediacom LLC/Mediacom Capital Corp. | | 7.25% | | 2/15/2022 | | | 25 | | | | 25,844 | |
| NBCUniversal Enterprise, Inc.†(c) | | 5.25% | | – | | | 100 | | | | 105,250 | |
| Scripps Networks Interactive, Inc. | | 2.75% | | 11/15/2019 | | | 15 | | | | 15,223 | |
| Sirius XM Radio, Inc.† | | 5.25% | | 8/15/2022 | | | 100 | | | | 104,375 | |
| Sky plc (United Kingdom)†(b) | | 9.50% | | 11/15/2018 | | | 50 | | | | 56,672 | |
| Thomson Reuters Corp. | | 1.65% | | 9/29/2017 | | | 5 | | | | 5,006 | |
| Time Warner Cable LLC | | 8.25% | | 4/1/2019 | | | 58 | | | | 65,208 | |
| Time Warner Cable LLC | | 8.75% | | 2/14/2019 | | | 6 | | | | 6,765 | |
| Time Warner, Inc. | | 4.875% | | 3/15/2020 | | | 10 | | | | 10,683 | |
| Viacom, Inc. | | 2.20% | | 4/1/2019 | | | 30 | | | | 29,768 | |
| Viacom, Inc. | | 2.75% | | 12/15/2019 | | | 55 | | | | 54,967 | |
| Viacom, Inc. | | 6.125% | | 10/5/2017 | | | 39 | | | | 40,123 | |
| WaveDivision Escrow LLC/WaveDivision Escrow Corp.† | | 8.125% | | 9/1/2020 | | | 50 | | | | 52,062 | |
| Total | | | | | | | | | | | 761,614 | |
| | | | | | | | | | | | | |
| Metals & Minerals: Miscellaneous 1.18% | | | | | | | | | | | | |
| Alamos Gold, Inc. (Canada)†(b) | | 7.75% | | 4/1/2020 | | | 10 | | | | 10,450 | |
| Barrick Gold Corp. (Canada)(b) | | 6.95% | | 4/1/2019 | | | 2 | | | | 2,189 | |
| Barrick North America Finance LLC | | 4.40% | | 5/30/2021 | | | 8 | | | | 8,415 | |
| Barrick PD Australia Finance Pty Ltd. (Australia)(b) | | 4.95% | | 1/15/2020 | | | 2 | | | | 2,110 | |
| Coeur Mining, Inc. | | 7.875% | | 2/1/2021 | | | 5 | | | | 5,213 | |
| Corp. Nacional del Cobre de Chile (Chile)†(b) | | 3.875% | | 11/3/2021 | | | 200 | | | | 204,443 | |
| Eldorado Gold Corp. (Canada)†(b) | | 6.125% | | 12/15/2020 | | | 31 | | | | 31,620 | |
| Glencore Finance Canada Ltd. (Canada)†(b) | | 2.70% | | 10/25/2017 | | | 60 | | | | 60,471 | |
| Glencore Finance Canada Ltd. (Canada)†(b) | | 3.60% | | 1/15/2017 | | | 29 | | | | 29,013 | |
| Glencore Finance Canada Ltd. (Canada)†(b) | | 4.95% | | 11/15/2021 | | | 15 | | | | 16,067 | |
| Goldcorp, Inc. (Canada)(b) | | 2.125% | | 3/15/2018 | | | 18 | | | | 17,997 | |
| Goldcorp, Inc. (Canada)(b) | | 3.625% | | 6/9/2021 | | | 40 | | | | 40,676 | |
| Hecla Mining Co. | | 6.875% | | 5/1/2021 | | | 17 | | | | 17,468 | |
| 20 | See Notes to Financial Statements. | |
Schedule of Investments (continued)
December 31, 2016
| Investments | | Interest
Rate | | Maturity
Date | | Principal
Amount
(000) | | | Fair
Value | |
| Metals & Minerals: Miscellaneous (continued) | | | | | | | | | | | | |
| New Gold, Inc. (Canada)†(b) | | 7.00% | | 4/15/2020 | | $ | 59 | | | $ | 60,770 | |
| Teck Resources Ltd. (Canada)(b) | | 4.50% | | 1/15/2021 | | | 40 | | | | 40,400 | |
| Teck Resources Ltd. (Canada)†(b) | | 8.00% | | 6/1/2021 | | | 9 | | | | 9,923 | |
| Total | | | | | | | | | | | 557,225 | |
| | | | | | | | | | | | | |
| Natural Gas 0.49% | | | | | | | | | | | | |
| CenterPoint Energy Resources Corp. | | 4.50% | | 1/15/2021 | | | 10 | | | | 10,501 | |
| CenterPoint Energy Resources Corp. | | 6.00% | | 5/15/2018 | | | 5 | | | | 5,245 | |
| CenterPoint Energy Resources Corp. | | 6.125% | | 11/1/2017 | | | 105 | | | | 108,523 | |
| CenterPoint Energy, Inc. | | 5.95% | | 2/1/2017 | | | 50 | | | | 50,171 | |
| Sempra Energy | | 6.15% | | 6/15/2018 | | | 30 | | | | 31,794 | |
| Sempra Energy | | 9.80% | | 2/15/2019 | | | 18 | | | | 20,859 | |
| Spire, Inc. | | 1.656% | # | 8/15/2017 | | | 5 | | | | 5,002 | |
| Total | | | | | | | | | | | 232,095 | |
| | | | | | | | | | | | | |
| Oil 5.08% | | | | | | | | | | | | |
| Anadarko Holding Co. | | 7.05% | | 5/15/2018 | | | 4 | | | | 4,161 | |
| Anadarko Petroleum Corp. | | 6.95% | | 6/15/2019 | | | 63 | | | | 69,935 | |
| Anadarko Petroleum Corp. | | 8.70% | | 3/15/2019 | | | 142 | | | | 161,460 | |
| Bill Barrett Corp. | | 7.00% | | 10/15/2022 | | | 12 | | | | 11,520 | |
| Canadian Natural Resources Ltd. (Canada)(b) | | 1.75% | | 1/15/2018 | | | 50 | | | | 49,892 | |
| Canadian Natural Resources Ltd. (Canada)(b) | | 5.70% | | 5/15/2017 | | | 140 | | | | 142,097 | |
| Canadian Natural Resources Ltd. (Canada)(b) | | 5.90% | | 2/1/2018 | | | 2 | | | | 2,082 | |
| Canadian Oil Sands Ltd. (Canada)†(b) | | 9.40% | | 9/1/2021 | | | 5 | | | | 6,144 | |
| Carrizo Oil & Gas, Inc. | | 6.25% | | 4/15/2023 | | | 10 | | | | 10,300 | |
| Carrizo Oil & Gas, Inc. | | 7.50% | | 9/15/2020 | | | 93 | | | | 96,488 | |
| Cenovus Energy, Inc. (Canada)(b) | | 5.70% | | 10/15/2019 | | | 35 | | | | 37,465 | |
| Cimarex Energy Co. | | 5.875% | | 5/1/2022 | | | 49 | | | | 50,939 | |
| Clayton Williams Energy, Inc. | | 7.75% | | 4/1/2019 | | | 10 | | | | 10,100 | |
| CNOOC Finance 2013 Ltd. (Hong Kong)(b) | | 1.75% | | 5/9/2018 | | | 200 | | | | 199,080 | |
| Concho Resources, Inc. | | 6.50% | | 1/15/2022 | | | 53 | | | | 54,842 | |
| Contura Energy, Inc.† | | 10.00% | | 8/1/2021 | | | 9 | | | | 9,653 | |
| CrownRock LP/CrownRock Finance, Inc.† | | 7.125% | | 4/15/2021 | | | 23 | | | | 24,035 | |
| Denbury Resources, Inc. | | 5.50% | | 5/1/2022 | | | 29 | | | | 25,448 | |
| Devon Energy Corp. | | 4.00% | | 7/15/2021 | | | 2 | | | | 2,069 | |
| Eclipse Resources Corp. | | 8.875% | | 7/15/2023 | | | 24 | | | | 25,170 | |
| Encana Corp. (Canada)(b) | | 3.90% | | 11/15/2021 | | | 27 | | | | 27,261 | |
| Encana Corp. (Canada)(b) | | 6.50% | | 5/15/2019 | | | 112 | | | | 120,818 | |
| Endeavor Energy Resources LP/EER Finance, Inc.† | | 7.00% | | 8/15/2021 | | | 70 | | | | 73,150 | |
| | See Notes to Financial Statements. | 21 |
Schedule of Investments (continued)
December 31, 2016
| Investments | | Interest
Rate | | Maturity
Date | | Principal
Amount
(000) | | | Fair
Value | |
| Oil (continued) | | | | | | | | | | | | |
| Eni SpA (Italy)†(b) | | 4.15% | | 10/1/2020 | | $ | 100 | | | $ | 104,264 | |
| EOG Resources, Inc. | | 5.625% | | 6/1/2019 | | | 6 | | | | 6,487 | |
| MEG Energy Corp. (Canada)†(b) | | 6.50% | | 3/15/2021 | | | 14 | | | | 13,020 | |
| Newfield Exploration Co. | | 5.75% | | 1/30/2022 | | | 51 | | | | 53,996 | |
| Noble Energy, Inc. | | 5.625% | | 5/1/2021 | | | 69 | | | | 72,055 | |
| Northern Tier Energy LLC/Northern Tier Finance Corp. | | 7.125% | | 11/15/2020 | | | 3 | | | | 3,131 | |
| PDC Energy, Inc. | | 7.75% | | 10/15/2022 | | | 10 | | | | 10,700 | |
| Permian Resources LLC† | | 13.00% | | 11/30/2020 | | | 15 | | | | 17,700 | |
| Petroleos Mexicanos (Mexico)(b) | | 3.125% | | 1/23/2019 | | | 20 | | | | 19,880 | |
| Petroleos Mexicanos (Mexico)†(b) | | 5.375% | | 3/13/2022 | | | 12 | | | | 12,303 | |
| Petroleos Mexicanos (Mexico)†(b) | | 5.50% | | 2/4/2019 | | | 80 | | | | 83,071 | |
| Petroleos Mexicanos (Mexico)(b) | | 5.75% | | 3/1/2018 | | | 110 | | | | 114,042 | |
| Petroleos Mexicanos (Mexico)(b) | | 8.00% | | 5/3/2019 | | | 30 | | | | 33,000 | |
| Pioneer Natural Resources Co. | | 6.65% | | 3/15/2017 | | | 22 | | | | 22,226 | |
| Pioneer Natural Resources Co. | | 6.875% | | 5/1/2018 | | | 146 | | | | 155,048 | |
| Pioneer Natural Resources Co. | | 7.50% | | 1/15/2020 | | | 4 | | | | 4,550 | |
| Precision Drilling Corp. (Canada)(b) | | 6.625% | | 11/15/2020 | | | 22 | | | | 22,565 | |
| Range Resources Corp.† | | 5.75% | | 6/1/2021 | | | 29 | | | | 30,523 | |
| Range Resources Corp.† | | 5.875% | | 7/1/2022 | | | 75 | | | | 78,375 | |
| Sanchez Energy Corp. | | 6.125% | | 1/15/2023 | | | 23 | | | | 21,965 | |
| Seven Generations Energy Ltd. (Canada)†(b) | | 6.875% | | 6/30/2023 | | | 26 | | | | 27,690 | |
| Seven Generations Energy Ltd. (Canada)†(b) | | 8.25% | | 5/15/2020 | | | 42 | | | | 44,730 | |
| SM Energy Co. | | 6.125% | | 11/15/2022 | | | 6 | | | | 6,105 | |
| SM Energy Co. | | 6.50% | | 11/15/2021 | | | 68 | | | | 69,700 | |
| SM Energy Co. | | 6.50% | | 1/1/2023 | | | 2 | | | | 2,043 | |
| Suncor Energy, Inc. (Canada)(b) | | 6.10% | | 6/1/2018 | | | 15 | | | | 15,886 | |
| Sunoco, Inc. | | 5.75% | | 1/15/2017 | | | 26 | | | | 26,029 | |
| Valero Energy Corp. | | 9.375% | | 3/15/2019 | | | 76 | | | | 87,566 | |
| Western Refining, Inc. | | 6.25% | | 4/1/2021 | | | 23 | | | | 23,920 | |
| Total | | | | | | | | | | | 2,396,679 | |
| | | | | | | | | | | | | |
| Oil: Crude Producers 4.52% | | | | | | | | | | | | |
| Buckeye Partners LP | | 2.65% | | 11/15/2018 | | | 59 | | | | 59,414 | |
| Buckeye Partners LP | | 6.05% | | 1/15/2018 | | | 31 | | | | 32,224 | |
| Columbia Pipeline Group, Inc. | | 2.45% | | 6/1/2018 | | | 110 | | | | 110,576 | |
| Columbia Pipeline Group, Inc. | | 3.30% | | 6/1/2020 | | | 46 | | | | 46,897 | |
| DCP Midstream LLC† | | 9.75% | | 3/15/2019 | | | 71 | | | | 79,875 | |
| Enbridge Energy Partners LP | | 4.375% | | 10/15/2020 | | | 84 | | | | 87,768 | |
| 22 | See Notes to Financial Statements. | |
Schedule of Investments (continued)
December 31, 2016
| Investments | | Interest
Rate | | Maturity
Date | | Principal
Amount
(000) | | | Fair
Value | |
| Oil: Crude Producers (continued) | | | | | | | | | | | | |
| Enbridge Energy Partners LP | | 6.50% | | 4/15/2018 | | $ | 20 | | | $ | 21,052 | |
| Enbridge Energy Partners LP | | 9.875% | | 3/1/2019 | | | 32 | | | | 36,387 | |
| Energy Transfer Partners LP | | 2.50% | | 6/15/2018 | | | 6 | | | | 6,024 | |
| Energy Transfer Partners LP | | 4.65% | | 6/1/2021 | | | 40 | | | | 41,572 | |
| Energy Transfer Partners LP | | 9.00% | | 4/15/2019 | | | 84 | | | | 95,629 | |
| Energy Transfer Partners LP | | 9.70% | | 3/15/2019 | | | 42 | | | | 48,231 | |
| EnLink Midstream Partners LP/EnLink Midstream Finance Corp. | | 7.125% | | 6/1/2022 | | | 13 | | | | 13,629 | |
| Enterprise Products Operating LLC | | 6.30% | | 9/15/2017 | | | 30 | | | | 30,946 | |
| Florida Gas Transmission Co. LLC† | | 5.45% | | 7/15/2020 | | | 58 | | | | 62,452 | |
| Florida Gas Transmission Co. LLC† | | 7.90% | | 5/15/2019 | | | 29 | | | | 32,470 | |
| Gulf South Pipeline Co. LP† | | 6.30% | | 8/15/2017 | | | 132 | | | | 135,560 | |
| Hiland Partners Holdings LLC/Hiland Partners Finance Corp.† | | 5.50% | | 5/15/2022 | | | 28 | | | | 29,265 | |
| Holly Energy Partners LP/Holly Energy Finance Corp. | | 6.50% | | 3/1/2020 | | | 40 | | | | 41,300 | |
| Kinder Morgan Energy Partners LP | | 5.95% | | 2/15/2018 | | | 11 | | | | 11,477 | |
| Kinder Morgan Energy Partners LP | | 6.50% | | 4/1/2020 | | | 75 | | | | 83,077 | |
| Kinder Morgan Energy Partners LP | | 6.85% | | 2/15/2020 | | | 30 | | | | 33,467 | |
| Kinder Morgan, Inc. | | 7.25% | | 6/1/2018 | | | 23 | | | | 24,519 | |
| Midcontinent Express Pipeline LLC† | | 6.70% | | 9/15/2019 | | | 33 | | | | 34,815 | |
| MPLX LP | | 5.50% | | 2/15/2023 | | | 155 | | | | 161,280 | |
| ONEOK Partners LP | | 2.00% | | 10/1/2017 | | | 31 | | | | 31,091 | |
| Panhandle Eastern Pipeline Co. LP | | 6.20% | | 11/1/2017 | | | 6 | | | | 6,176 | |
| Panhandle Eastern Pipeline Co. LP | | 7.00% | | 6/15/2018 | | | 115 | | | | 121,359 | |
| Regency Energy Partners LP/Regency Energy Finance Corp. | | 5.50% | | 4/15/2023 | | | 45 | | | | 46,688 | |
| Regency Energy Partners LP/Regency Energy Finance Corp. | | 6.50% | | 7/15/2021 | | | 129 | | | | 133,246 | |
| Rockies Express Pipeline LLC† | | 6.00% | | 1/15/2019 | | | 37 | | | | 39,035 | |
| Rockies Express Pipeline LLC† | | 6.85% | | 7/15/2018 | | | 7 | | | | 7,429 | |
| Spectra Energy Capital LLC | | 6.20% | | 4/15/2018 | | | 2 | | | | 2,091 | |
| Tesoro Logistics LP/Tesoro Logistics Finance Corp. | | 5.875% | | 10/1/2020 | | | 30 | | | | 30,975 | |
| Tesoro Logistics LP/Tesoro Logistics Finance Corp. | | 6.125% | | 10/15/2021 | | | 125 | | | | 131,562 | |
| Texas Eastern Transmission LP† | | 4.125% | | 12/1/2020 | | | 5 | | | | 5,258 | |
| Texas Eastern Transmission LP† | | 6.00% | | 9/15/2017 | | | 14 | | | | 14,416 | |
| TransCanada PipeLines Ltd. (Canada)(b) | | 1.875% | | 1/12/2018 | | | 4 | | | | 4,007 | |
| TransCanada PipeLines Ltd. (Canada)(b) | | 6.50% | | 8/15/2018 | | | 1 | | | | 1,070 | |
| TransCanada PipeLines Ltd. (Canada)(b) | | 7.125% | | 1/15/2019 | | | 25 | | | | 27,447 | |
| | See Notes to Financial Statements. | 23 |
Schedule of Investments (continued)
December 31, 2016
| Investments | | Interest
Rate | | Maturity
Date | | Principal
Amount
(000) | | | Fair
Value | |
| Oil: Crude Producers (continued) | | | | | | | | | | | | |
| Williams Partners LP/ACMP Finance Corp. | | 4.875% | | 5/15/2023 | | $ | 11 | | | $ | 11,215 | |
| Williams Partners LP/ACMP Finance Corp. | | 6.125% | | 7/15/2022 | | | 158 | | | | 162,969 | |
| Total | | | | | | | | | | | 2,135,940 | |
| | | | | | | | | | | | | |
| Oil: Integrated Domestic 0.86% | | | | | | | | | | | | |
| Cameron International Corp. | | 1.40% | | 6/15/2017 | | | 4 | | | | 3,999 | |
| FMC Technologies, Inc. | | 2.00% | | 10/1/2017 | | | 92 | | | | 92,083 | |
| Halliburton Co. | | 6.15% | | 9/15/2019 | | | 3 | | | | 3,309 | |
| National Oilwell Varco, Inc. | | 1.35% | | 12/1/2017 | | | 125 | | | | 124,541 | |
| SESI LLC | | 6.375% | | 5/1/2019 | | | 46 | | | | 46,230 | |
| Trinidad Drilling Ltd. (Canada)†(b) | | 7.875% | | 1/15/2019 | | | 11 | | | | 11,027 | |
| Weatherford International Ltd. | | 7.75% | | 6/15/2021 | | | 18 | | | | 18,247 | |
| Weatherford International Ltd. | | 9.625% | | 3/1/2019 | | | 100 | | | | 107,250 | |
| Total | | | | | | | | | | | 406,686 | |
| | | | | | | | | | | | | |
| Paper & Forest Products 0.00% | | | | | | | | | | | | |
| International Paper Co. | | 9.375% | | 5/15/2019 | | | 2 | | | | 2,324 | |
| | | | | | | | | | | | | |
| Real Estate Investment Trusts 2.80% | | | | | | | | | | | | |
| American Tower Corp. | | 7.25% | | 5/15/2019 | | | 32 | | | | 35,175 | |
| Brandywine Operating Partnership LP | | 4.95% | | 4/15/2018 | | | 6 | | | | 6,204 | |
| Brandywine Operating Partnership LP | | 5.70% | | 5/1/2017 | | | 55 | | | | 55,698 | |
| DDR Corp. | | 4.75% | | 4/15/2018 | | | 25 | | | | 25,720 | |
| DDR Corp. | | 7.50% | | 4/1/2017 | | | 31 | | | | 31,429 | |
| DDR Corp. | | 7.50% | | 7/15/2018 | | | 5 | | | | 5,388 | |
| DDR Corp. | | 7.875% | | 9/1/2020 | | | 12 | | | | 13,986 | |
| Digital Realty Trust LP | | 3.40% | | 10/1/2020 | | | 20 | | | | 20,362 | |
| Digital Realty Trust LP | | 5.875% | | 2/1/2020 | | | 47 | | | | 51,260 | |
| DuPont Fabros Technology LP | | 5.875% | | 9/15/2021 | | | 25 | | | | 26,172 | |
| EPR Properties | | 7.75% | | 7/15/2020 | | | 91 | | | | 103,293 | |
| First Industrial LP | | 7.50% | | 12/1/2017 | | | 50 | | | | 52,395 | |
| HCP, Inc. | | 2.625% | | 2/1/2020 | | | 12 | | | | 12,024 | |
| HCP, Inc. | | 3.75% | | 2/1/2019 | | | 21 | | | | 21,599 | |
| HCP, Inc. | | 5.375% | | 2/1/2021 | | | 6 | | | | 6,560 | |
| HCP, Inc. | | 5.625% | | 5/1/2017 | | | 75 | | | | 76,003 | |
| Healthcare Realty Trust, Inc. | | 5.75% | | 1/15/2021 | | | 2 | | | | 2,200 | |
| Hospitality Properties Trust | | 6.70% | | 1/15/2018 | | | 5 | | | | 5,127 | |
| Kilroy Realty LP | | 4.80% | | 7/15/2018 | | | 25 | | | | 25,889 | |
| Kilroy Realty LP | | 6.625% | | 6/1/2020 | | | 50 | | | | 55,954 | |
| Mack-Cali Realty LP | | 2.50% | | 12/15/2017 | | | 200 | | | | 200,661 | |
| 24 | See Notes to Financial Statements. | |
Schedule of Investments (continued)
December 31, 2016
| Investments | | Interest
Rate | | Maturity
Date | | Principal
Amount
(000) | | | Fair
Value | |
| Real Estate Investment Trusts (continued) | | | | | | | | | | | | |
| MPT Operating Partnership LP/MPT Finance Corp. | | 6.375% | | 2/15/2022 | | $ | 8 | | | $ | 8,300 | |
| National Retail Properties, Inc. | | 6.875% | | 10/15/2017 | | | 10 | | | | 10,392 | |
| Select Income REIT | | 2.85% | | 2/1/2018 | | | 25 | | | | 25,113 | |
| SL Green Realty Corp. | | 5.00% | | 8/15/2018 | | | 8 | | | | 8,335 | |
| SL Green Realty Corp. | | 7.75% | | 3/15/2020 | | | 75 | | | | 84,731 | |
| Starwood Property Trust, Inc.† | | 5.00% | | 12/15/2021 | | | 9 | | | | 9,143 | |
| VEREIT Operating Partnership LP | | 3.00% | | 2/6/2019 | | | 118 | | | | 118,000 | |
| VEREIT Operating Partnership LP | | 4.125% | | 6/1/2021 | | | 35 | | | | 35,700 | |
| Vornado Realty LP | | 2.50% | | 6/30/2019 | | | 35 | | | | 35,144 | |
| Welltower, Inc. | | 2.25% | | 3/15/2018 | | | 75 | | | | 75,343 | |
| Welltower, Inc. | | 4.125% | | 4/1/2019 | | | 7 | | | | 7,271 | |
| Weyerhaeuser Co. | | 4.70% | | 3/15/2021 | | | 25 | | | | 26,556 | |
| Weyerhaeuser Co. | | 6.95% | | 8/1/2017 | | | 41 | | | | 42,163 | |
| Weyerhaeuser Co. | | 7.375% | | 10/1/2019 | | | 2 | | | | 2,247 | |
| Total | | | | | | | | | | | 1,321,537 | |
| | | | | | | | | | | | | |
| Retail 0.08% | | | | | | | | | | | | |
| Best Buy Co., Inc. | | 5.00% | | 8/1/2018 | | | 5 | | | | 5,236 | |
| Macy’s Retail Holdings, Inc. | | 7.45% | | 7/15/2017 | | | 5 | | | | 5,159 | |
| Neiman Marcus Group Ltd. LLC† | | 8.00% | | 10/15/2021 | | | 17 | | | | 12,707 | |
| Rite Aid Corp. | | 6.75% | | 6/15/2021 | | | 16 | | | | 16,818 | |
| Total | | | | | | | | | | | 39,920 | |
| | | | | | | | | | | | | |
| Steel 0.14% | | | | | | | | | | | | |
| BlueScope Steel Finance Ltd/BlueScope Steel Finance USA LLC (Australia)†(b) | | 6.50% | | 5/15/2021 | | | 24 | | | | 25,490 | |
| Nucor Corp. | | 5.75% | | 12/1/2017 | | | 5 | | | | 5,180 | |
| Nucor Corp. | | 5.85% | | 6/1/2018 | | | 2 | | | | 2,108 | |
| U.S. Steel Corp.† | | 8.375% | | 7/1/2021 | | | 30 | | | | 33,241 | |
| Total | | | | | | | | | | | 66,019 | |
| | | | | | | | | | | | | |
| Technology 0.73% | | | | | | | | | | | | |
| Baidu, Inc. (China)(b) | | 3.25% | | 8/6/2018 | | | 200 | | | | 203,538 | |
| eBay, Inc. | | 1.366% | # | 8/1/2019 | | | 75 | | | | 74,657 | |
| Expedia, Inc. | | 7.456% | | 8/15/2018 | | | 58 | | | | 62,754 | |
| Symantec Corp. | | 2.75% | | 6/15/2017 | | | 2 | | | | 2,007 | |
| Total | | | | | | | | | | | 342,956 | |
| | | | | | | | | | | | | |
| Telecommunications 1.52% | | | | | | | | | | | | |
| AT&T, Inc. | | 5.50% | | 2/1/2018 | | | 200 | | | | 207,853 | |
| FairPoint Communications, Inc.† | | 8.75% | | 8/15/2019 | | | 32 | | | | 33,440 | |
| | See Notes to Financial Statements. | 25 |
Schedule of Investments (continued)
December 31, 2016
| Investments | | Interest
Rate | | Maturity
Date | | Principal
Amount
(000) | | | Fair
Value | |
| Telecommunications (continued) | | | | | | | | | | | | |
| Frontier Communications Corp. | | 8.875% | | 9/15/2020 | | $ | 79 | | | $ | 84,431 | |
| GTE Corp. | | 6.84% | | 4/15/2018 | | | 40 | | | | 42,353 | |
| Nortel Networks Ltd. (Canada)(b)(d) | | 10.75% | | 7/15/2016 | | | 62 | | | | 62,465 | |
| Sprint Communications, Inc.† | | 9.00% | | 11/15/2018 | | | 10 | | | | 11,050 | |
| T-Mobile USA, Inc. | | 6.464% | | 4/28/2019 | | | 54 | | | | 55,013 | |
| T-Mobile USA, Inc. | | 6.542% | | 4/28/2020 | | | 60 | | | | 61,875 | |
| T-Mobile USA, Inc. | | 6.625% | | 11/15/2020 | | | 19 | | | | 19,451 | |
| Telefonica Emisiones SAU (Spain)(b) | | 6.221% | | 7/3/2017 | | | 87 | | | | 88,963 | |
| Windstream Services LLC | | 7.75% | | 10/1/2021 | | | 48 | | | | 49,584 | |
| Total | | | | | | | | | | | 716,478 | |
| | | | | | | | | | | | | |
| Textiles Products 0.04% | | | | | | | | | | | | |
| Springs Industries, Inc. | | 6.25% | | 6/1/2021 | | | 17 | | | | 17,680 | |
| | | | | | | | | | | | | |
| Toys 0.00% | | | | | | | | | | | | |
| Mattel, Inc. | | 1.70% | | 3/15/2018 | | | 2 | | | | 1,996 | |
| | | | | | | | | | | | | |
| Transportation: Miscellaneous 0.16% | | | | | | | | | | | | |
| Florida East Coast Holdings Corp.† | | 6.75% | | 5/1/2019 | | | 64 | | | | 66,400 | |
| Norfolk Southern Railway Co. | | 9.75% | | 6/15/2020 | | | 3 | | | | 3,711 | |
| XPO Logistics, Inc.† | | 6.50% | | 6/15/2022 | | | 3 | | | | 3,161 | |
| Total | | | | | | | | | | | 73,272 | |
| Total Corporate Bonds (cost $21,270,744) | | | | | | | | | | | 21,363,913 | |
| | | | | | | | | | | | | |
| FLOATING RATE LOANS(e) 5.23% | | | | | | | | | | | | |
| | | | | | | | | | | | | |
| Auto Parts: Original Equipment 0.06% | | | | | | | | | | | | |
| Allison Transmission, Inc. Term Loan B3 | | 3.256% | | 9/23/2022 | | | 8 | | | | 8,609 | |
| MPG Holdco I, Inc. 2015 Tranche B1 Term Loan | | 3.75% | | 10/20/2021 | | | 19 | | | | 18,928 | |
| Total | | | | | | | | | | | 27,537 | |
| | | | | | | | | | | | | |
| Beverages 0.05% | | | | | | | | | | | | |
| Molson Coors Brewing Co. Term Loan A | | 2.20% | | 12/14/2018 | | | 26 | | | | 25,935 | |
| | | | | | | | | | | | | |
| Business Services 0.03% | | | | | | | | | | | | |
| Neff Rental LLC 2nd Lien Closing Date Term Loan | | 7.543% | | 6/9/2021 | | | 13 | | | | 13,187 | |
| | | | | | | | | | | | | |
| Chemicals 0.17% | | | | | | | | | | | | |
| Celanese U.S. Holdings LLC Term Loan A | | 2.236% | | 7/15/2021 | | | 29 | | | | 29,087 | |
| INEOS US Finance LLC Cash Dollar Term Loan | | 3.75% | | 5/4/2018 | | | 51 | | | | 50,950 | |
| Total | | | | | | | | | | | 80,037 | |
| 26 | See Notes to Financial Statements. | |
Schedule of Investments (continued)
December 31, 2016
| Investments | | Interest
Rate | | Maturity
Date | | Principal
Amount
(000) | | | Fair
Value | |
| Computer Software 0.06% | | | | | | | | | | | | |
| Activision Blizzard, Inc. Term Loan | | 2.02% | | 8/23/2021 | | $ | 28 | | | $ | 28,049 | |
| | | | | | | | | | | | | |
| Containers 0.52% | | | | | | | | | | | | |
| Ball Corp. USD Term Loan A | | 2.52% | | 3/18/2021 | | | 74 | | | | 74,039 | |
| Ball UK Aquisition Ltd. EUR Term Loan A(f) | | 1.75% | | 3/18/2021 | | EUR | 21 | | | | 21,901 | |
| Owens llinois, Inc. Term Loan A | 2.416% - 2.880% | | 4/22/2020 | | $ | 30 | | | | 30,186 | |
| WestRock Co. Closing Date Term Loan | | 1.895% | | 7/1/2020 | | | 122 | | | | 121,614 | |
| Total | | | | | | | | | | | 247,740 | |
| | | | | | | | | | | | | |
| Electric: Power 0.21% | | | | | | | | | | | | |
| FirstEnergy Corp. Term Loan | | 2.43% | | 12/6/2021 | | | 100 | | | | 99,250 | |
| | | | | | | | | | | | | |
| Electrical Equipment 0.27% | | | | | | | | | | | | |
| Avago Technologies Cayman Ltd. Term Loan A | | 2.454% | | 2/1/2021 | | | 41 | | | | 40,832 | |
| Avago Technologies Cayman Ltd. Term Loan B3 | | 3.704% | | 2/1/2023 | | | 61 | | | | 62,214 | |
| Sensata Technologies B.V. 6th Amendment | | | | | | | | | | | | |
| Term Loan (Netherlands)(b) | | 3.021% | | 10/14/2021 | | | 25 | | | | 24,954 | |
| Total | | | | | | | | | | | 128,000 | |
| | | | | | | | | | | | | |
| Electronics 0.21% | | | | | | | | | | | | |
| Thermo Fisher Scientific Inc. Term Loan A | 1.961% - 4.500% | | 7/1/2019 | | | 97 | | | | 97,469 | |
| | | | | | | | | | | | | |
| Entertainment 0.04% | | | | | | | | | | | | |
| Kasima LLC Term Loan | 3.316% - 3.500% | | 5/17/2021 | | | 18 | | | | 18,593 | |
| | | | | | | | | | | | | |
| Food 0.14% | | | | | | | | | | | | |
| Amplify Snack Brands, Inc. Term Loan | | 6.50% | | 8/24/2023 | | | 26 | | | | 25,298 | |
| Dole Food Co., Inc. Tranche B Term Loan | 4.50% - 6.25% | | 11/1/2018 | | | 35 | | | | 35,080 | |
| Supervalu, Inc. Term Loan | | 5.50% | | 3/21/2019 | | | 5 | | | | 5,454 | |
| Total | | | | | | | | | | | 65,832 | |
| | | | | | | | | | | | | |
| Gaming 0.37% | | | | | | | | | | | | |
| Seminole Tribe of Florida Initial Term Loan | | 3.248% | | 4/29/2020 | | | 174 | | | | 174,716 | |
| | | | | | | | | | | | | |
| Health Care Products 0.24% | | | | | | | | | | | | |
| Medtronic, Inc. Term Loan | | 1.636% | | 1/26/2018 | | | 75 | | | | 74,672 | |
| Zimmer biomet Holdings, Inc. Term Loan A | | 2.02% | | 9/30/2019 | | | 25 | | | | 24,500 | |
| Zimmer Holdings, Inc. Term Loan | 2.039% - 2.145% | | 5/29/2019 | | | 14 | | | | 13,549 | |
| Total | | | | | | | | | | | 112,721 | |
| | | | | | | | | | | | | |
| Health Care Services 0.15% | | | | | | | | | | | | |
| Fresenius Medical Care AG & Co. KGaA | | | | | | | | | | | | |
| Tranche A Term Loan | | 2.137% | | 10/30/2019 | | | 54 | | | | 53,853 | |
| | See Notes to Financial Statements. | 27 |
Schedule of Investments (continued)
December 31, 2016
| Investments | | Interest
Rate | | Maturity
Date | | Principal
Amount
(000) | | | Fair
Value | |
| Health Care Services (continued) | | | | | | | | | | | | |
| Laboratory Corp. of America Holdings Term Loan | | 2.02% | | 12/19/2019 | | $ | 15 | | | $ | 15,033 | |
| Total | | | | | | | | | | | 68,886 | |
| | | | | | | | | | | | | |
| Household Equipment/Products 0.37% | | | | | | | | | | | | |
| Dell IInternational LLC Term Loan A1 | | 2.77% | | 12/31/2018 | | | 50 | | | | 50,020 | |
| Dell International LLC Term Loan A2 | | 3.02% | | 9/7/2021 | | | 127 | | | | 127,111 | |
| Total | | | | | | | | | | | 177,131 | |
| | | | | | | | | | | | | |
| Lodging 0.42% | | | | | | | | | | | | |
| Las Vegas Sands LLC Refinancing Term Loan | | 3.02% | | 12/19/2020 | | | 199 | | | | 200,211 | |
| | | | | | | | | | | | | |
| Machinery: Industrial/Specialty 0.10% | | | | | | | | | | | | |
| Flowserve Corp. 2012 Term Loan | | 2.248% | | 10/14/2020 | | | 47 | | | | 46,670 | |
| | | | | | | | | | | | | |
| Manufacturing 0.27% | | | | | | | | | | | | |
| Tyco International Holding sarl Term Loan (Luxembourg)(b) | | 2.30% | | 3/2/2020 | | | 130 | | | | 129,594 | |
| | | | | | | | | | | | | |
| Media 0.25% | | | | | | | | | | | | |
| AMC Networks, Inc. Term Loan A | | 2.149% | | 12/16/2019 | | | 75 | | | | 74,588 | |
| Charter Communications Operating LLC Term Loan E | | 3.02% | | 7/1/2020 | | | 45 | | | | 45,569 | |
| Total | | | | | | | | | | | 120,157 | |
| | | | | | | | | | | | | |
| Miscellaneous 0.13% | | | | | | | | | | | | |
| Harris Corp. 3 Year Tranche Term Loan | | 2.11% | | 3/16/2018 | | | 40 | | | | 40,307 | |
| Harris Corp. 5 Year Tranche Term Loan | | 2.11% | | 3/16/2020 | | | 19 | | | | 18,758 | |
| Total | | | | | | | | | | | 59,065 | |
| | | | | | | | | | | | | |
| Oil 0.05% | | | | | | | | | | | | |
| Noble Energy, Inc. Initial Term Loan | | 2.006% | | 1/6/2019 | | | 24 | | | | 23,527 | |
| | | | | | | | | | | | | |
| Oil: Crude Producers 0.04% | | | | | | | | | | | | |
| Buckeye Partners LP Delayed Draw Term Loan | | 2.12% | | 9/30/2019 | | | 17 | | | | 16,936 | |
| | | | | | | | | | | | | |
| Real Estate 0.33% | | | | | | | | | | | | |
| American Tower Corp. Term Loan | | 2.02% | | 1/31/2022 | | | 157 | | | | 155,620 | |
| | | | | | | | | | | | | |
| Retail 0.40% | | | | | | | | | | | | |
| Belk, Inc. 1st Lien Closing Date Term Loan | | 5.76% | | 12/12/2022 | | | 10 | | | | 8,658 | |
| BJ’s Wholesale Club, Inc. 2013 1st Lien Replacement Loan | | 4.50% | | 9/26/2019 | | | 42 | | | | 42,255 | |
| J. Crew Group, Inc. Initial Term Loan | | 4.00% | | 3/5/2021 | | | 67 | | | | 38,302 | |
| PVH Corp. Tranche A Term Loan | | 2.207% | | 5/19/2021 | | | 83 | | | | 82,886 | |
| 28 | See Notes to Financial Statements. | |
Schedule of Investments (continued)
December 31, 2016
| Investments | | Interest
Rate | | Maturity
Date | | Principal
Amount
(000) | | | Fair
Value | |
| Retail (continued) | | | | | | | | | | | | |
| Rite Aid Corp. 2nd Lien Tranche 2 Term Loan | | 4.875% | | 6/21/2021 | | $ | 18 | | | $ | 18,121 | |
| Total | | | | | | | | | | | 190,222 | |
| | | | | | | | | | | | | |
| Technology 0.04% | | | | | | | | | | | | |
| Zayo Group LLC 2021 Term Loan | | 3.75% | | 5/6/2021 | | | 18 | | | | 18,223 | |
| | | | | | | | | | | | | |
| Telecommunications 0.31% | | | | | | | | | | | | |
| AT&T, Inc. Tranche A Advance Term Loan | | 1.934% | | 3/2/2018 | | | 16 | | | | 15,637 | |
| Verizon Communications Inc. 5 year Term Loan | | 2.005% | | 7/31/2019 | | | 130 | | | | 130,027 | |
| Total | | | | | | | | | | | 145,664 | |
| Total Floating Rate Loans (cost $2,475,656) | | | | | | | | | | | 2,470,972 | |
| | | | | | | | | | | | | |
| Foreign Government Obligations(b) 0.24% | | | | | | | | | | | | |
| | | | | | | | | | | | | |
| Dominican Republic 0.01% | | | | | | | | | | | | |
| Dominican Republic† | | 9.04% | | 1/23/2018 | | | 3 | | | | 3,399 | |
| | | | | | | | | | | | | |
| Qatar 0.23% | | | | | | | | | | | | |
| State of Qatar† | | 5.25% | | 1/20/2020 | | | 100 | | | | 108,044 | |
| Total Foreign Government Obligations (cost $112,018) | | | | | | | | | | | 111,443 | |
| | | | | | | | | | | | | |
| GOVERNMENT SPONSORED ENTERPRISES COLLATERALIZED MORTGAGE OBLIGATIONS 1.40% |
| Federal Home Loan Mortgage Corp. 2011-K704 B† | | 4.69% | # | 10/25/2030 | | | 20 | | | | 20,715 | |
| Federal Home Loan Mortgage Corp. 2012-K707 B† | | 3.883% | # | 1/25/2047 | | | 143 | | | | 147,005 | |
| Federal Home Loan Mortgage Corp. 2012-K709 B† | | 3.872% | # | 4/25/2045 | | | 75 | | | | 76,521 | |
| Federal Home Loan Mortgage Corp. 2012-K710 B† | | 3.821% | # | 6/25/2047 | | | 104 | | | | 106,739 | |
| Federal Home Loan Mortgage Corp. 2012-K711 B† | | 3.562% | # | 8/25/2045 | | | 30 | | | | 30,560 | |
| Federal Home Loan Mortgage Corp. 2013-K502 C† | | 3.077% | # | 3/25/2045 | | | 11 | | | | 11,018 | |
| Federal Home Loan Mortgage Corp. 2013-K713 B† | | 3.165% | # | 4/25/2046 | | | 30 | | | | 30,262 | |
| Federal Home Loan Mortgage Corp. 2014-K503 B† | | 3.002% | # | 10/25/2047 | | | 39 | | | | 39,046 | |
| Government National Mortgage Assoc. 2014-109 A | | 2.325% | | 1/16/2046 | | | 15 | | | | 15,152 | |
| Government National Mortgage Assoc. 2014-112 A | | 3.00% | # | 1/16/2048 | | | 8 | | | | 8,189 | |
| Government National Mortgage Assoc. 2014-135 AS | | 2.30% | | 2/16/2047 | | | 18 | | | | 18,487 | |
| Government National Mortgage Assoc. 2014-64 A | | 2.20% | | 2/16/2045 | | | 33 | | | | 33,394 | |
| Government National Mortgage Assoc. 2014-64 IO | | 1.243% | # | 12/16/2054 | | | 362 | | | | 28,068 | |
| Government National Mortgage Assoc. 2014-78 A | | 2.20% | | 4/16/2047 | | | 1 | | | | 819 | |
| Government National Mortgage Assoc. 2014-78 IO | | 0.704% | # | 3/16/2056 | | | 61 | | | | 3,325 | |
| Government National Mortgage Assoc. 2015-47 AE | | 2.90% | # | 11/16/2055 | | | 12 | | | | 11,537 | |
| Government National Mortgage Assoc. 2015-48 AS | | 2.90% | # | 2/16/2049 | | | 29 | | | | 29,196 | |
| Government National Mortgage Assoc. 2015-73 AC | | 2.90% | # | 2/16/2053 | | | 50 | | | | 49,918 | |
| Total Government Sponsored Enterprises Collateralized Mortgage Obligations (cost $674,489) | | | | | | 659,951 | |
| | See Notes to Financial Statements. | 29 |
Schedule of Investments (continued)
December 31, 2016
| Investments | | Interest
Rate | | Maturity
Date | | Principal
Amount
(000) | | | Fair
Value | |
| GOVERNMENT SPONSORED ENTERPRISES PASS-THROUGHS 1.30% | | | | | | | | |
| Federal Home Loan Mortgage Corp. | | 0.875% | | 3/7/2018 | | $ | 103 | | | $ | 102,878 | |
| Federal Home Loan Mortgage Corp. | | 3.062% | # | 6/1/2041 | | | 17 | | | | 18,052 | |
| Federal Home Loan Mortgage Corp. | | 3.065% | # | 10/1/2043 | | | 17 | | | | 17,427 | |
| Federal Home Loan Mortgage Corp. | | 3.172% | # | 12/1/2040 | | | 35 | | | | 36,542 | |
| Federal Home Loan Mortgage Corp. | | 3.374% | # | 6/1/2042 | | | 13 | | | | 13,643 | |
| Federal National Mortgage Assoc. | | 2.702% | # | 12/1/2045 | | | 10 | | | | 10,213 | |
| Federal National Mortgage Assoc. | | 2.732% | # | 12/1/2045 | | | 47 | | | | 47,997 | |
| Federal National Mortgage Assoc. | | 2.844% | # | 10/1/2045 | | | 11 | | | | 11,385 | |
| Federal National Mortgage Assoc. | | 2.909% | # | 6/1/2042 | | | 27 | | | | 27,448 | |
| Federal National Mortgage Assoc. | | 3.00% | | TBA | (g) | | 120 | | | | 123,150 | |
| Federal National Mortgage Assoc. | | 3.015% | # | 10/1/2036 | | | 58 | | | | 61,277 | |
| Federal National Mortgage Assoc. | | 3.14% | # | 3/1/2042 | | | 26 | | | | 27,225 | |
| Federal National Mortgage Assoc. | | 3.348% | # | 12/1/2040 | | | 3 | | | | 2,961 | |
| Federal National Mortgage Assoc. | | 3.41% | # | 12/1/2040 | | | 5 | | | | 5,608 | |
| Federal National Mortgage Assoc. | | 3.492% | # | 10/1/2040 | | | 2 | | | | 2,058 | |
| Federal National Mortgage Assoc. | | 3.704% | # | 1/1/2042 | | | 53 | | | | 54,626 | |
| Federal National Mortgage Assoc. | | 3.72% | # | 4/1/2040 | | | 48 | | | | 50,918 | |
| Total Government Sponsored Enterprises Pass-Throughs (cost $618,381) | | | | | | 613,408 | |
| | | | | | | | | | | | | |
| GOVERNMENT SPONSORED ENTERPRISES SECURITY 0.34% | | | | | | | | | | | | |
Federal Home Loan Bank
(cost $160,608) | | 1.125% | | 4/25/2018 | | | 160 | | | | 160,144 | |
| | | | | | | | | | | | | |
| Municipal Bonds 0.20% | | | | | | | | | | | | |
| | | | | | | | | | | | | |
| Miscellaneous | | | | | | | | | | | | |
| Illinois | | 3.90% | | 1/1/2018 | | | 5 | | | | 5,053 | |
| Illinois | | 5.163% | | 2/1/2018 | | | 50 | | | | 51,222 | |
| Illinois | | 5.665% | | 3/1/2018 | | | 25 | | | | 25,897 | |
| Illinois | | 5.877% | | 3/1/2019 | | | 10 | | | | 10,623 | |
| Total Municipal Bonds (cost $93,153) | | | | | | | | | | | 92,795 | |
| | | | | | | | | | | | | |
| NON-AGENCY COMMERCIAL MORTGAGE-BACKED SECURITIES 20.05% | | | | | | | | | |
| A10 Bridge Asset Financing LLC 2015-AA A† | | 3.504% | # | 5/15/2030 | | | 160 | | | | 160,000 | |
| Americold LLC Trust 2010-ARTA A1† | | 3.847% | | 1/14/2029 | | | 47 | | | | 48,609 | |
| Assurant Commercial Mortgage Trust 2016-1A A1† | | 1.362% | | 5/15/2049 | | | 23 | | | | 23,082 | |
| Aventura Mall Trust 2013-AVM A† | | 3.743% | # | 12/5/2032 | | | 100 | | | | 105,171 | |
| BAMLL-DB Trust 2012-OSI A1† | | 2.343% | | 4/13/2029 | | | 15 | | | | 14,972 | |
| Banc of America Merrill Lynch Commercial Mortgage, Inc. 2005-1 AJ | | 5.349% | # | 11/10/2042 | | | 2 | | | | 1,783 | |
| Banc of America Re-REMIC Trust 2010-RC30 A5B† | | 5.334% | | 12/16/2043 | | | 92 | | | | 91,688 | |
| 30 | See Notes to Financial Statements. | |
Schedule of Investments (continued)
December 31, 2016
| Investments | | Interest
Rate | | Maturity
Date | | Principal
Amount
(000) | | | Fair
Value | |
| NON-AGENCY COMMERCIAL MORTGAGE-BACKED SECURITIES (continued) | | | | | | | | |
| Bancorp Commercial Mortgage Trust 2016-CRE1 A† | | 2.134% | # | 11/15/2033 | | $ | 100 | | | $ | 100,089 | |
| BB-UBS Trust 2012-TFT A† | | 2.892% | | 6/5/2030 | | | 200 | | | | 197,725 | |
| BB-UBS Trust 2012-TFT B† | | 3.468% | # | 6/5/2030 | | | 100 | | | | 98,588 | |
| BB-UBS Trust 2012-TFT C† | | 3.468% | # | 6/5/2030 | | | 100 | | | | 97,020 | |
| BBCMS Trust 2013-TYSN E† | | 3.708% | | 9/5/2032 | | | 135 | | | | 136,032 | |
| Bear Stearns Commercial Mortgage Securities Trust 2004-PWR6 E† | | 5.406% | # | 11/11/2041 | | | 15 | | | | 15,620 | |
| Bear Stearns Commercial Mortgage Securities Trust 2004-PWR6 F† | | 5.67% | # | 11/11/2041 | | | 25 | | | | 26,007 | |
| CCRESG Commercial Mortgage Trust 2016-HEAT B† | | 4.114% | | 4/10/2029 | | | 29 | | | | 29,138 | |
| CCRESG Commercial Mortgage Trust 2016-HEAT C† | | 4.919% | | 4/10/2029 | | | 29 | | | | 29,233 | |
| CFCRE Commercial Mortgage Trust 2016-C6 XA IO | | 1.223% | # | 11/10/2049 | | | 196 | | | | 17,126 | |
| CFCRE Commercial Mortgage Trust 2016-C7 XA IO | | 0.801% | # | 12/10/2054 | | | 193 | | | | 11,392 | |
| CGGS Commercial Mortgage Trust 2016-RNDA DFX† | | 4.387% | | 2/10/2033 | | | 100 | | | | 101,797 | |
| Citigroup Commercial Mortgage Trust 2007-C6 A4 | | 5.711% | # | 12/10/2049 | | | 1 | | | | 1,009 | |
| Citigroup Commercial Mortgage Trust 2007-C6 AM | | 5.711% | # | 12/10/2049 | | | 35 | | | | 35,506 | |
| Citigroup Commercial Mortgage Trust 2013-SMP D† | | 2.911% | # | 1/12/2030 | | | 100 | | | | 99,522 | |
| Citigroup Commercial Mortgage Trust 2014-GC19 A1 | | 1.199% | | 3/10/2047 | | | 10 | | | | 10,284 | |
| Citigroup Commercial Mortgage Trust 2015-GC31 XA IO | | 0.465% | # | 6/10/2048 | | | 990 | | | | 28,322 | |
| Citigroup Commercial Mortgage Trust 2015-SHP2 XCP IO† | | 0.114% | # | 7/15/2027 | | | 46,545 | | | | 29,016 | |
| Citigroup Commercial Mortgage Trust 2015-SSHP C† | | 2.804% | # | 9/15/2027 | | | 100 | | | | 98,396 | |
| Citigroup Commercial Mortgage Trust 2016-SMPL A† | | 2.228% | | 9/10/2031 | | | 100 | | | | 97,599 | |
| Citigroup Commercial Mortgage Trust 2016-SMPL E† | | 4.509% | | 9/10/2031 | | | 100 | | | | 97,440 | |
| COBALT CMBS Commercial Mortgage Trust 2007-C3 AM | | 5.761% | # | 5/15/2046 | | | 100 | | | | 101,334 | |
| Commercial Mortgage Loan Trust 2008-LS1 ASM | | 6.095% | # | 12/10/2049 | | | 50 | | | | 50,960 | |
| | See Notes to Financial Statements. | 31 |
Schedule of Investments (continued)
December 31, 2016
| Investments | | Interest
Rate | | Maturity
Date | | Principal
Amount
(000) | | | Fair
Value | |
| NON-AGENCY COMMERCIAL MORTGAGE-BACKED SECURITIES (continued) | | | | | | | | |
| Commercial Mortgage Pass-Through Certificates 2004-LB2A G† | | 5.54% | # | 3/10/2039 | | $ | 35 | | | $ | 37,026 | |
| Commercial Mortgage Pass-Through Certificates 2012-CR3 B† | | 3.922% | | 10/15/2045 | | | 100 | | | | 103,698 | |
| Commercial Mortgage Pass-Through Certificates 2013-CR11 A2 | | 3.047% | | 10/10/2046 | | | 10 | | | | 10,172 | |
| Commercial Mortgage Pass-Through Certificates 2013-CR6 A2 | | 2.122% | | 3/10/2046 | | | 10 | | | | 10,065 | |
| Commercial Mortgage Pass-Through Certificates 2013-LC6 A2 | | 1.906% | | 1/10/2046 | | | 32 | | | | 32,116 | |
| Commercial Mortgage Pass-Through Certificates 2013-SFS A1† | | 1.873% | | 4/12/2035 | | | 134 | | | | 131,342 | |
| Commercial Mortgage Pass-Through Certificates 2013-THL D† | | 3.299% | # | 6/8/2030 | | | 100 | | | | 100,057 | |
| Commercial Mortgage Pass-Through Certificates 2013-THL E† | | 4.399% | # | 6/8/2030 | | | 100 | | | | 100,065 | |
| Commercial Mortgage Pass-Through Certificates 2014-UBS5 XB1 IO† | | 0.099% | # | 9/10/2047 | | | 2,000 | | | | 21,694 | |
| Commercial Mortgage Pass-Through Certificates 2015-PC1 XA IO† | | 0.783% | # | 7/10/2050 | | | 99 | | | | 4,088 | |
| Commercial Mortgage Pass-Through Certificates 2016-GCT D† | | 3.461% | # | 8/10/2029 | | | 100 | | | | 97,311 | |
| Commercial Mortgage Pass-Through Certificates 2016-GCT XA IO† | | 0.784% | | 8/10/2029 | | | 4,000 | | | | 111,362 | |
| Commercial Mortgage Pass-Through Certificates 2016-SAVA A† | | 2.424% | # | 10/15/2034 | | | 106 | | | | 106,638 | |
| Commercial Mortgage Pass-Through Certificates 2016-SAVA B† | | 3.004% | # | 10/15/2034 | | | 100 | | | | 100,635 | |
| Commercial Mortgage Pass-Through Certificates 2016-SAVA XCP IO† | | 2.867% | # | 10/15/2034 | | | 578 | | | | 22,241 | |
| Commericial Mortgage Trust 2016-CD1 XA IO | | 1.446% | # | 8/10/2049 | | | 183 | | | | 18,180 | |
| Core Industrial Trust 2015-CALW C† | | 3.555% | | 2/10/2034 | | | 25 | | | | 25,485 | |
| Core Industrial Trust 2015-CALW XA IO† | | 0.81% | # | 2/10/2034 | | | 1,006 | | | | 37,034 | |
| Cosmopolitan Hotel Trust 2016-CSMO B† | | 2.804% | # | 11/15/2033 | | | 24 | | | | 24,155 | |
| Cosmopolitan Hotel Trust 2016-CSMO E† | | 5.354% | # | 11/15/2033 | | | 32 | | | | 32,360 | |
| Credit Suisse First Boston Mortgage Securities Corp. 2006-OMA B1† | | 5.466% | | 5/15/2023 | | | 50 | | | | 53,114 | |
| Credit Suisse First Boston Mortgage Securities Corp. 2006-OMA B2† | | 5.538% | | 5/15/2023 | | | 100 | | | | 107,404 | |
| Credit Suisse Mortgage Capital Certificates 2014-TIKI C† | | 2.504% | # | 9/15/2038 | | | 100 | | | | 98,053 | |
| 32 | See Notes to Financial Statements. | |
Schedule of Investments (continued)
December 31, 2016
| Investments | | Interest
Rate | | Maturity
Date | | Principal
Amount
(000) | | | Fair
Value | |
| NON-AGENCY COMMERCIAL MORTGAGE-BACKED SECURITIES (continued) | | | | | | | | |
| Credit Suisse Mortgage Capital Certificates 2016-MFF B† | | 3.204% | # | 11/15/2033 | | $ | 50 | | | $ | 50,111 | |
| Credit Suisse Mortgage Capital Certificates 2016-MFF C† | | 4.204% | # | 11/15/2033 | | | 50 | | | | 50,146 | |
| CSAIL Commercial Mortgage Trust 2015-C4 A2 | | 3.157% | | 11/15/2048 | | | 10 | | | | 10,276 | |
| CSAIL Commercial Mortgage Trust 2016-C6 XA IO | | 1.816% | # | 1/15/2049 | | | 998 | | | | 114,988 | |
| DBJPM Mortgage Trust 2016-C3 XA IO | | 1.521% | # | 9/10/2049 | | | 200 | | | | 21,882 | |
| DBRR Trust 2013-EZ3 A† | | 1.636% | # | 12/18/2049 | | | 15 | | | | 14,829 | |
| DBUBS Mortgage Trust 2011-LC2A D† | | 5.543% | # | 7/10/2044 | | | 100 | | | | 102,417 | |
| DBWF Mortgage Trust 2015-LCM A1† | | 2.998% | | 6/10/2034 | | | 22 | | | | 22,280 | |
| DBWF Mortgage Trust 2016-85T XA IO† | | 0.013% | # | 12/10/2036 | | | 3,140 | | | | 14,224 | |
| EQTY Mortgage Trust 2014-INNS D† | | 2.999% | # | 5/8/2031 | | | 100 | | | | 99,033 | |
| Federal Home Loan Mortgage Corp. 2011-KAIV B† | | 4.944% | | 6/25/2046 | | | 50 | | | | 53,191 | |
| GAHR Commercial Mortgage Trust 2015-NRF CFX† | | 3.382% | # | 12/15/2034 | | | 100 | | | | 100,580 | |
| GAHR Commericial Mortgage Trust 2015-NRF EFX† | | 3.382% | # | 12/15/2034 | | | 20 | | | | 19,472 | |
| Great Wolf Trust 2015-WOLF E† | | 4.985% | # | 5/15/2034 | | | 100 | | | | 100,171 | |
| GS Mortgage Securities Corp. II 2013-GC10 A3 | | 2.613% | | 2/10/2046 | | | 100 | | | | 101,032 | |
| GS Mortgage Securities Corp. Trust 2012-ALOH A† | | 3.551% | | 4/10/2034 | | | 100 | | | | 104,649 | |
| GS Mortgage Securities Corp. Trust 2013-NYC5 A† | | 2.318% | | 1/10/2030 | | | 100 | | | | 100,456 | |
| GS Mortgage Securities Trust 2006-GG8 AM | | 5.591% | | 11/10/2039 | | | 22 | | | | 22,149 | |
| GS Mortgage Securities Trust 2012-GC6 XA IO† | | 1.968% | # | 1/10/2045 | | | 308 | | | | 24,463 | |
| GS Mortgage Securities Trust 2012-GCJ7 B | | 4.74% | | 5/10/2045 | | | 10 | | | | 10,677 | |
| GS Mortgage Securities Trust 2013-G1 A2† | | 3.557% | # | 4/10/2031 | | | 100 | | | | 100,042 | |
| GS Mortgage Securities Trust 2013-GC14 A1 | | 1.217% | | 8/10/2046 | | | 17 | | | | 17,368 | |
| GS Mortgage Securities Trust 2015-GS1 XB IO | | 0.185% | # | 11/10/2048 | | | 1,082 | | | | 19,579 | |
| GS Mortgage Securities Trust 2016-GS4 225A† | | 2.636% | | 11/10/2029 | | | 15 | | | | 14,798 | |
| GS Mortgage Securities Trust 2016-GS4 225C† | | 3.778% | | 11/10/2029 | | | 26 | | | | 25,565 | |
| GS Mortgage Securities Trust 2016-GS4 225D† | | 4.766% | | 11/10/2029 | | | 35 | | | | 34,321 | |
| GS Mortgage Securities Trust 2016-RENT C† | | 4.067% | # | 2/10/2029 | | | 100 | | | | 100,856 | |
| H/2 Asset Funding 2015-1A-AFL | | 1.837% | # | 6/24/2049 | | | 24 | | | | 23,992 | |
| H/2 Asset Funding 2015-1A-AFX | | 3.353% | # | 6/24/2049 | | | 24 | | | | 23,784 | |
| H/2 Asset Funding 2015-1A-BFX | | 3.993% | # | 6/24/2049 | | | 25 | | | | 23,987 | |
| Hudsons Bay Simon JV Trust 2015-HB7 A7† | | 3.914% | | 8/5/2034 | | | 100 | | | | 102,736 | |
| Hudsons Bay Simon JV Trust 2015-HB7 B7† | | 4.666% | | 8/5/2034 | | | 179 | | | | 179,434 | |
| Hudsons Bay Simon JV Trust 2015-HB7 XA7 IO† | | 1.245% | # | 8/5/2034 | | | 1,000 | | | | 64,245 | |
| Irvine Core Office Trust 2013-IRV A1† | | 2.068% | | 5/15/2048 | | | 34 | | | | 33,464 | |
| JPMorgan Chase Commercial Mortgage Securities Trust 2004-LN2 A2 | | 5.115% | | 7/15/2041 | | | 2 | | | | 2,307 | |
| | See Notes to Financial Statements. | 33 |
Schedule of Investments (continued)
December 31, 2016
| Investments | | Interest
Rate | | Maturity
Date | | Principal
Amount
(000) | | | Fair
Value | |
| NON-AGENCY COMMERCIAL MORTGAGE-BACKED SECURITIES (continued) | | | | | | | | |
| JPMorgan Chase Commercial Mortgage Securities Trust 2007-CB19 AM | | 5.713% | # | 2/12/2049 | | $ | 85 | | | $ | 85,831 | |
| JPMorgan Chase Commercial Mortgage Securities Trust 2009-IWST C† | | 7.445% | # | 12/5/2027 | | | 25 | | | | 27,750 | |
| JPMorgan Chase Commercial Mortgage Securities Trust 2012-WLDN A† | | 3.905% | | 5/5/2030 | | | 97 | | | | 100,835 | |
| JPMorgan Chase Commercial Mortgage Securities Trust 2014-C19 A2 | | 3.046% | | 4/15/2047 | | | 25 | | | | 25,607 | |
| JPMorgan Chase Commercial Mortgage Securities Trust 2014-C24 A1 | | 1.539% | | 11/15/2047 | | | 7 | | | | 7,082 | |
| JPMorgan Chase Commercial Mortgage Securities Trust 2014-C26 XA IO | | 1.172% | # | 1/15/2048 | | | 989 | | | | 55,059 | |
| JPMorgan Chase Commercial Mortgage Securities Trust 2014-DSTY A† | | 3.429% | | 6/10/2027 | | | 100 | | | | 102,340 | |
| JPMorgan Chase Commercial Mortgage Securities Trust 2015-C30 XA IO | | 0.704% | # | 7/15/2048 | | | 988 | | | | 35,386 | |
| JPMorgan Chase Commercial Mortgage Securities Trust 2016-ATRM A† | | 2.962% | | 10/5/2028 | | | 50 | | | | 50,332 | |
| JPMorgan Chase Commercial Mortgage Securities Trust 2016-JP4 XA IO | | 0.826% | # | 12/15/2049 | | | 1,000 | | | | 50,883 | |
| JPMorgan Chase Commercial Mortgage Securities Trust 2016-WIKI A† | | 2.798% | | 10/5/2031 | | | 30 | | | | 30,157 | |
| JPMorgan Chase Commercial Mortgage Securities Trust 2016-WIKI B† | | 3.201% | | 10/5/2031 | | | 15 | | | | 15,116 | |
| JPMorgan Chase Commercial Mortgage Securities Trust 2016-WIKI C† | | 3.554% | | 10/5/2031 | | | 20 | | | | 20,186 | |
| JPMorgan Chase Commercial Mortgage Securities Trust 2016-WIKI D† | | 4.009% | # | 10/5/2031 | | | 35 | | | | 34,886 | |
| JPMorgan Chase Commercial Mortgage Securities Trust 2016-WIKI E† | | 4.009% | # | 10/5/2031 | | | 30 | | | | 29,055 | |
| JPMorgan Chase Commercial Mortgage Securities Trust 2016-WIKI XB IO† | | 0.657% | # | 10/5/2031 | | | 1,000 | | | | 28,333 | |
| JPMorgan Chase Commercial Mortgage Securities Trust 2016-WPT A† | | 2.154% | # | 10/15/2033 | | | 68 | | | | 68,287 | |
| JPMorgan Chase Commercial Mortgage Securities Trust 2016-WPT C† | | 3.554% | # | 10/15/2033 | | | 10 | | | | 10,077 | |
| JPMorgan Chase Commercial Mortgage Securities Trust 2016-WPT D† | | 4.454% | # | 10/15/2033 | | | 27 | | | | 27,246 | |
| JPMorgan Chase Commercial Mortgage Securities Trust 2016-WPT XCP IO† | | 1.198% | # | 10/15/2018 | | | 4,967 | | | | 107,113 | |
| LB-UBS Commercial Mortgage Trust 2007-C1 AM | | 5.455% | | 2/15/2040 | | | 25 | | | | 25,019 | |
| LMREC, Inc. 2015-CRE1 A† | | 2.274% | # | 2/22/2032 | | | 100 | | | | 99,130 | |
| 34 | See Notes to Financial Statements. | |
Schedule of Investments (continued)
December 31, 2016
| Investments | | Interest
Rate | | Maturity
Date | | Principal
Amount
(000) | | | Fair
Value | |
| NON-AGENCY COMMERCIAL MORTGAGE-BACKED SECURITIES (continued) | | | | | | | | | |
| LSTAR Commercial Mortgage Trust 2016-4 XA IO† | | 1.956% | # | 3/10/2049 | | $ | 998 | | | $ | 89,947 | |
| Morgan Stanley Bank of America Merrill Lynch Trust 2012-CKSV A1† | | 2.117% | | 10/15/2030 | | | 63 | | | | 62,111 | |
| Morgan Stanley Bank of America Merrill Lynch Trust 2013-C12 A2 | | 3.001% | | 10/15/2046 | | | 10 | | | | 10,203 | |
| Morgan Stanley Bank of America Merrill Lynch Trust 2015-C23 XA IO | | 0.751% | # | 7/15/2050 | | | 494 | | | | 19,165 | |
| Morgan Stanley Bank of America Merrill Lynch Trust 2016-C31 XA IO | | 1.472% | # | 11/15/2049 | | | 999 | | | | 97,217 | |
| Morgan Stanley Capital Barclays Bank Trust 2016-MART B† | | 2.48% | | 9/13/2031 | | | 50 | | | | 48,554 | |
| Morgan Stanley Capital Barclays Bank Trust 2016-MART C† | | 2.817% | | 9/13/2031 | | | 100 | | | | 97,679 | |
| Morgan Stanley Capital Barclays Bank Trust 2016-MART XCP IO† | | 0.316% | # | 9/13/2031 | | | 9,863 | | | | 55,995 | |
| Morgan Stanley Capital I Trust 2007-HQ12 AM | | 5.775% | # | 4/12/2049 | | | 162 | | | | 161,905 | |
| Morgan Stanley Capital I Trust 2011-C3 A4 | | 4.118% | | 7/15/2049 | | | 61 | | | | 65,585 | |
| Morgan Stanley Capital I Trust 2014-MP A† | | 3.469% | | 8/11/2029 | | | 100 | | | | 103,759 | |
| Morgan Stanley Capital I Trust 2016-UB11 XB IO | | 0.997% | # | 8/15/2049 | | | 1,000 | | | | 78,581 | |
| Morgan Stanley Re-REMIC Trust 2009-GG10 A4B† | | 5.793% | # | 8/12/2045 | | | 100 | | | | 100,577 | |
| Morgan Stanley Re-REMIC Trust 2010-GG10 A4B† | | 5.793% | # | 8/15/2045 | | | 100 | | | | 100,387 | |
| Motel 6 Trust 2015-MTL6 D† | | 4.532% | | 2/5/2030 | | | 100 | | | | 100,565 | |
| MSCG Trust 2015-ALDR A1† | | 2.612% | | 6/7/2035 | | | 22 | | | | 21,570 | |
| MSCG Trust 2016-SNR A† | | 3.348% | # | 11/15/2034 | | | 69 | | | | 68,830 | |
| MSCG Trust 2016-SNR B† | | 4.181% | | 11/15/2034 | | | 33 | | | | 32,956 | |
| MSCG Trust 2016-SNR C† | | 5.205% | | 11/15/2034 | | | 25 | | | | 25,063 | |
| Nationslink Funding Corp. 1999-LTL1 D† | | 6.45% | | 1/22/2026 | | | 50 | | | | 51,687 | |
| Palisades Center Trust 2016-PLSD D† | | 4.737% | | 4/13/2033 | | | 67 | | | | 66,801 | |
| Palisades Center Trust 2016-PLSD XCP IO† | | 0.965% | # | 5/13/2018 | | | 1,000 | | | | 13,965 | |
| Prima Capital Ltd 2015-4A MR-A+ | | 2.55% | | 8/24/2049 | | | 100 | | | | 99,239 | |
| Prima Capital Ltd. 2016-6A A+ | | 2.85% | | 8/25/2040 | | | 142 | | | | 140,099 | |
| ReadyCap Commercial Mortgage Trust 2015-2 A† | | 3.804% | | 6/25/2055 | | | 43 | | | | 43,532 | |
| Readycap Mortgage Trust 2016-3 A† | | 2.94% | | 11/20/2038 | | | 250 | | | | 248,685 | |
| Shops at Crystals Trust 2016-CSTL XB IO† | | 0.203% | # | 7/5/2036 | | | 1,000 | | | | 19,895 | |
| UBS-Barclays Commercial Mortgage Trust 2012-C4 A5 | | 2.85% | | 12/10/2045 | | | 75 | | | | 75,785 | |
| UBS-Barclays Commercial Mortgage Trust 2012-C4 AAB | | 2.459% | | 12/10/2045 | | | 25 | | | | 25,153 | |
| UBS-Barclays Commercial Mortgage Trust 2013-C5 XA IO† | | 1.033% | # | 3/10/2046 | | | 941 | | | | 46,031 | |
| | See Notes to Financial Statements. | 35 |
Schedule of Investments (continued)
December 31, 2016
| Investments | | Interest
Rate | | Maturity
Date | | Principal
Amount
(000) | | | Fair
Value | |
| NON-AGENCY COMMERCIAL MORTGAGE-BACKED SECURITIES (continued) | | | | | | | | |
| UBS-Citigroup Commercial Mortgage Trust 2011-C1 A3 | | 3.595% | | 1/10/2045 | | $ | 20 | | | $ | 20,694 | |
| VNDO Mortgage Trust 2012-6AVE A† | | 2.996% | | 11/15/2030 | | | 100 | | | | 101,083 | |
| Wachovia Bank Commercial Mortgage Trust 2005-C21 D | | 5.291% | # | 10/15/2044 | | | 10 | | | | 9,935 | |
| Wachovia Bank Commercial Mortgage Trust 2006-C27 AM | | 5.795% | # | 7/15/2045 | | | 2 | | | | 1,544 | |
| Wachovia Bank Commercial Mortgage Trust 2007-C30 AM | | 5.383% | | 12/15/2043 | | | 150 | | | | 150,042 | |
| Wachovia Bank Commercial Mortgage Trust 2007-C31 AM | | 5.591% | # | 4/15/2047 | | | 60 | | | | 60,385 | |
| Waldorf Astoria Boca Raton Trust 2016-BOCA C† | | 3.204% | # | 6/15/2029 | | | 100 | | | | 100,284 | |
| Waldorf Astoria Boca Raton Trust 2016-BOCA E† | | 5.054% | # | 6/15/2029 | | | 27 | | | | 27,105 | |
| Wells Fargo Commercial Mortgage Trust 2010-C1 C† | | 5.599% | # | 11/15/2043 | | | 100 | | | | 107,027 | |
| Wells Fargo Commercial Mortgage Trust 2015-C29 XB IO | | 0.018% | # | 6/15/2048 | | | 2,000 | | | | 7,196 | |
| Wells Fargo Commercial Mortgage Trust 2015-NXS4 A2A | | 3.075% | | 12/15/2048 | | | 10 | | | | 10,269 | |
| Wells Fargo Commercial Mortgage Trust 2015-NXS4 A2B | | 4.602% | # | 12/15/2048 | | | 36 | | | | 39,087 | |
| Wells Fargo Commercial Mortgage Trust 2015-SG1 XA IO | | 0.811% | # | 12/15/2047 | | | 986 | | | | 48,172 | |
| Wells Fargo Commercial Mortgage Trust 2016-BNK1 XA IO | | 1.809% | # | 8/15/2049 | | | 997 | | | | 127,659 | |
| WF-RBS Commercial Mortgage Trust 2011-C4 A3† | | 4.394% | | 6/15/2044 | | | 72 | | | | 74,243 | |
| WF-RBS Commercial Mortgage Trust 2012-C8 A2 | | 1.881% | | 8/15/2045 | | | 22 | | | | 22,085 | |
| WF-RBS Commercial Mortgage Trust 2012-C8 XA IO† | | 1.989% | # | 8/15/2045 | | | 406 | | | | 29,768 | |
| WF-RBS Commercial Mortgage Trust 2013-C11 A2 | | 2.029% | | 3/15/2045 | | | 79 | | | | 79,386 | |
| Total Non-Agency Commercial Mortgage-Backed Securities (cost $9,598,454) | | | | | | | 9,465,454 | |
| | | | | | | | | | | | | |
| | | | | | | Shares
(000) | | | | | |
| | | | | | | | | | | | | |
| PREFERRED STOCK 0.03% | | | | | | | | | | | | |
| | | | | | | | | | | | | |
| Oil | | | | | | | | | | | | |
Templar Energy LLC
(cost $10,450) | | | | | | | 1 | | | | 15,675 | |
| 36 | See Notes to Financial Statements. | |
Schedule of Investments (continued)
December 31, 2016
| Investments | | Interest
Rate | | Maturity
Date | | Principal
Amount
(000) | | | Fair
Value | |
| U.S. TREASURY OBLIGATION 0.95% | | | | | | | | | | | | |
| | | | | | | | | | | | | |
| Government | | | | | | | | | | | | |
U.S. Treasury Note
(cost $446,146) | | 1.375% | | 6/30/2018 | | $ | 444 | | | $ | 446,133 | |
| Total Long-Term Investments (cost $44,798,983) | | | | | | | | | | | 44,726,443 | |
| | | | | | | | | | | | | |
| SHORT-TERM INVESTMENTS 5.00% | | | | | | | | | | | | |
| | | | | | | | | | | | | |
| CORPORATE BONDS 3.17% | | | | | | | | | | | | |
| | | | | | | | | | | | | |
| Banks: Regional 1.49% | | | | | | | | | | | | |
| Bank of America Corp. | | 6.00% | | 9/1/2017 | | | 35 | | | | 36,020 | |
| Bank of America Corp. | | 6.40% | | 8/28/2017 | | | 18 | | | | 18,555 | |
| Capital One Financial Corp. | | 6.75% | | 9/15/2017 | | | 35 | | | | 36,256 | |
| Compass Bank | | 1.85% | | 9/29/2017 | | | 250 | | | | 249,477 | |
| Compass Bank | | 6.40% | | 10/1/2017 | | | 100 | | | | 103,067 | |
| Deutsche Bank AG (United Kingdom)(b) | | 1.35% | | 5/30/2017 | | | 7 | | | | 6,986 | |
| Deutsche Bank AG (United Kingdom)(b) | | 1.512% | # | 2/13/2017 | | | 28 | | | | 27,994 | |
| Deutsche Bank AG (United Kingdom)(b) | | 6.00% | | 9/1/2017 | | | 25 | | | | 25,596 | |
| Intesa Sanpaolo SpA (Italy)(b) | | 2.375% | | 1/13/2017 | | | 200 | | | | 200,029 | |
| Total | | | | | | | | | | | 703,980 | |
| | | | | | | | | | | | | |
| Beverages 0.14% | | | | | | | | | | | | |
| Beam Suntory, Inc. | | 1.875% | | 5/15/2017 | | | 62 | | | | 62,094 | |
| Constellation Brands, Inc. | | 7.25% | | 5/15/2017 | | | 4 | | | | 4,085 | |
| Total | | | | | | | | | | | 66,179 | |
| | | | | | | | | | | | | |
| Chemicals 0.01% | | | | | | | | | | | | |
| Valspar Corp. (The) | | 6.05% | | 5/1/2017 | | | 5 | | | | 5,069 | |
| | | | | | | | | | | | | |
| Drugs 0.02% | | | | | | | | | | | | |
| Actavis Funding SCS (Luxembourg)(b) | | 1.30% | | 6/15/2017 | | | 9 | | | | 8,996 | |
| | | | | | | | | | | | | |
| Electric: Power 0.41% | | | | | | | | | | | | |
| Appalachian Power Co. | | 5.00% | | 6/1/2017 | | | 25 | | | | 25,338 | |
| Exelon Corp. | | 1.55% | | 6/9/2017 | | | 2 | | | | 1,997 | |
| Jersey Central Power & Light Co. | | 5.65% | | 6/1/2017 | | | 15 | | | | 15,236 | |
| Monongahela Power Co.† | | 5.70% | | 3/15/2017 | | | 25 | | | | 25,204 | |
| TransAlta Corp. (Canada)(b) | | 1.90% | | 6/3/2017 | | | 125 | | | | 124,844 | |
| Total | | | | | | | | | | | 192,619 | |
| | | | | | | | | | | | | |
| Electronics 0.02% | | | | | | | | | | | | |
| Tech Data Corp. | | 3.75% | | 9/21/2017 | | | 10 | | | | 10,125 | |
| | See Notes to Financial Statements. | 37 |
Schedule of Investments (continued)
December 31, 2016
| Investments | | Interest
Rate | | Maturity
Date | | Principal
Amount
(000) | | | Fair
Value | |
| Financial Services 0.25% | | | | | | | | | | | | |
| International Lease Finance Corp. | | 8.75% | | 3/15/2017 | | $ | 19 | | | $ | 19,271 | |
| Synchrony Financial | | 1.875% | | 8/15/2017 | | | 100 | | | | 100,094 | |
| Total | | | | | | | | | | | 119,365 | |
| | | | | | | | | | | | | |
| Health Care Products 0.05% | | | | | | | | | | | | |
| Zimmer Biomet Holdings, Inc. | | 1.45% | | 4/1/2017 | | | 25 | | | | 25,008 | |
| | | | | | | | | | | | | |
| Health Care Services 0.08% | | | | | | | | | | | | |
| Anthem, Inc. | | 5.875% | | 6/15/2017 | | | 35 | | | | 35,712 | |
| | | | | | | | | | | | | |
| Insurance 0.09% | | | | | | | | | | | | |
| Fidelity National Financial, Inc. | | 6.60% | | 5/15/2017 | | | 43 | | | | 43,739 | |
| | | | | | | | | | | | | |
| Lodging 0.08% | | | | | | | | | | | | |
| Marriott International, Inc. | | 6.375% | | 6/15/2017 | | | 25 | | | | 25,546 | |
| Wyndham Worldwide Corp. | | 2.95% | | 3/1/2017 | | | 11 | | | | 11,011 | |
| Total | | | | | | | | | | | 36,557 | |
| | | | | | | | | | | | | |
| Machinery: Agricultural 0.00% | | | | | | | | | | | | |
| Bunge Ltd. Finance Corp. | | 3.20% | | 6/15/2017 | | | 2 | | | | 2,015 | |
| | | | | | | | | | | | | |
| Metals & Minerals: Miscellaneous 0.15% | | | | | | | | | | | | |
| Teck Resources Ltd. (Canada)(b) | | 3.15% | | 1/15/2017 | | | 70 | | | | 69,989 | |
| | | | | | | | | | | | | |
| Natural Gas 0.11% | | | | | | | | | | | | |
| Sempra Energy | | 2.30% | | 4/1/2017 | | | 50 | | | | 50,101 | |
| | | | | | | | | | | | | |
| Oil: Crude Producers 0.07% | | | | | | | | | | | | |
| Enbridge, Inc. (Canada)(b) | | 1.384% | # | 6/2/2017 | | | 29 | | | | 29,004 | |
| Kinder Morgan, Inc. | | 7.00% | | 6/15/2017 | | | 5 | | | | 5,117 | |
| Total | | | | | | | | | | | 34,121 | |
| | | | | | | | | | | | | |
| Real Estate Investment Trusts 0.11% | | | | | | | | | | | | |
| First Industrial LP | | 5.95% | | 5/15/2017 | | | 49 | | | | 49,754 | |
| Highwoods Realty LP | | 5.85% | | 3/15/2017 | | | 3 | | | | 3,025 | |
| Total | | | | | | | | | | | 52,779 | |
| | | | | | | | | | | | | |
| Savings & Loan 0.07% | | | | | | | | | | | | |
| Astoria Financial Corp. | | 5.00% | | 6/19/2017 | | | 31 | | | | 31,391 | |
| | | | | | | | | | | | | |
| Transportation: Miscellaneous 0.02% | | | | | | | | | | | | |
| Ryder System, Inc. | | 3.50% | | 6/1/2017 | | | 11 | | | | 11,094 | |
| Total Corporate Bonds (cost $1,499,280) | | | | | | | | | | | 1,498,839 | |
| 38 | See Notes to Financial Statements. | |
Schedule of Investments (continued)
December 31, 2016
| Investments | | Interest
Rate | | Maturity
Date | | Principal
Amount
(000) | | | Fair
Value | |
| MUNICIPAL BOND 0.11% | | | | | | | | | | | | |
| | | | | | | | | | | | | |
| Miscellaneous | | | | | | | | | | | | |
New Jersey Econ Dev Auth
(cost $50,008) | | 1.348% | | 3/1/2017 | | $ | 50 | | | $ | 50,006 | |
| | | | | | | | | | | | | |
| REPURCHASE AGREEMENT 1.72% | | | | | | | | | | | | |
Repurchase Agreement dated 12/30/2016, 0.03% due 1/3/2017 with Fixed Income Clearing Corp. collateralized by $780,000 of U.S. Treasury Inflation Indexed Note at 0.125% due 4/15/2017; value: $ 831,852; proceeds: $ 813,871
(cost $813,868) | | | | | | | 814 | | | | 813,868 | |
| Total Short-Term Investments (cost $2,363,156) | | | | | | | | | | | 2,362,713 | |
| Total Investments in Securities 99.73% (cost $47,162,139) | | | | | | | | | | | 47,089,156 | |
| Cash, Foreign Cash and Other Assets in Excess of Liabilities(h) 0.27% | | | | | | | | | | | 129,442 | |
| Net Assets 100.00% | | | | | | | | | | $ | 47,218,598 | |
| EUR | | euro. |
| IO | | Interest Only. |
| PIK | | Payment-in-kind. |
| † | | Security was purchased pursuant to Rule 144A under the Securities Act of 1933 and, unless registered under such Act or exempted from registration, may only be resold to qualified institutional buyers. |
| # | | Variable rate security. The interest rate represents the rate in effect at December 31, 2016. |
| (a) | | Amount is less than $1,000. |
| (b) | | Foreign security traded in U.S. dollars. |
| (c) | | Security is perpetual in nature and has no stated maturity. |
| (d) | | Defaulted (non-income producing security). |
| (e) | | Floating Rate Loans in which the Fund invests generally pay interest at rates which are periodically re-determined at a margin above the London Interbank Offered Rate (“LIBOR”) or the prime rate offered by major U.S. banks. The rate(s) shown is the rate(s) in effect at December 31, 2016. |
| (f) | | Investment in non-U.S. dollar denominated securities. |
| (g) | | To-be-announced (“TBA”). Security purchased on a forward commitment basis with an approximate principal and maturity date. Actual principal and maturity will be determined upon settlement when the specific mortgage pools are assigned. |
| (h) | | Cash, Foreign Cash and Other Assets in Excess of Liabilities include net unrealized appreciation (depreciation) on open forward foreign currency exchange contracts and futures contracts as follows: |
| | See Notes to Financial Statements. | 39 |
Schedule of Investments (continued)
December 31, 2016
| Forward | | | | | | | | | | |
| Foreign | | | | | | U.S. $ | | | | |
| Currency | | | | | | Cost on | U.S. $ | | | |
| Exchange | Transaction | | | Expiration | Foreign | Origination | Current | Unrealized | |
| Contracts | Type | | Counterparty | Date | Currency | Date | Value | Appreciation | |
| euro | Buy | | State Street Bank and Trust | 2/16/2017 | 2,400 | $ 2,512 | $ 2,532 | | $ 20 | |
| euro | Sell | | State Street Bank and Trust | 2/16/2017 | 24,000 | 26,261 | 25,317 | | 944 | |
| Unrealized Appreciation on Forward Foreign Currency Exchange Contracts | | | $ 964 | |
Open Futures Contracts at December 31, 2016:
| | | | | Notional | | Unrealized | |
| Type | Expiration | Contracts | Position | Value | | Appreciation | |
| U.S. 5-Year Treasury Note | March 2017 | 5 | Short | $(588,320 | ) | $1,241 | |
| | | | | | | | |
| | | | | Notional | | Unrealized | |
| Type | Expiration | Contracts | Position | Value | | Depreciation | |
| U.S. 2-Year Treasury Note | March 2017 | 55 | Long | $11,917,813 | | $(2,785 | ) |
| 40 | See Notes to Financial Statements. | |
Schedule of Investments (continued)
December 31, 2016
The following is a summary of the inputs used as of December 31, 2016 in valuing the Fund’s investments carried at fair value(1):
| Investment Type(2)(3) | | Level 1 | | | Level 2 | | | Level 3 | | | Total | |
| Asset-Backed Securities | | | | | | | | | | | | | | | | |
| Other | | $ | – | | | $ | 3,524,560 | | | $ | 99,474 | (4) | | $ | 3,624,034 | |
| Remaining Industries | | | – | | | | 5,677,014 | | | | – | | | | 5,677,014 | |
| Common Stock | | | – | | | | 546 | | | | – | | | | 546 | |
| Convertible Bonds | | | – | | | | 24,961 | | | | – | | | | 24,961 | |
| Corporate Bonds | | | – | | | | 22,862,752 | | | | – | | | | 22,862,752 | |
| Floating Rate Loans(5) | | | | | | | | | | | | | | | | |
| Auto Parts: Original Equipment | | | – | | | | 27,537 | | | | – | | | | 27,537 | |
| Beverages | | | – | | | | – | | | | 25,935 | | | | 25,935 | |
| Business Services | | | – | | | | 13,187 | | | | – | | | | 13,187 | |
| Chemicals | | | – | | | | 80,037 | | | | – | | | | 80,037 | |
| Computer Software | | | – | | | | 28,049 | | | | – | | | | 28,049 | |
| Containers | | | – | | | | 30,186 | | | | 217,554 | | | | 247,740 | |
| Electric: Power | | | – | | | | – | | | | 99,250 | | | | 99,250 | |
| Electrical Equipment | | | – | | | | 128,000 | | | | – | | | | 128,000 | |
| Electronics | | | – | | | | – | | | | 97,469 | | | | 97,469 | |
| Entertainment | | | – | | | | 18,593 | | | | – | | | | 18,593 | |
| Food | | | – | | | | 65,832 | | | | – | | | | 65,832 | |
| Gaming | | | – | | | | 174,716 | | | | – | | | | 174,716 | |
| Health Care Products | | | – | | | | 74,672 | | | | 38,049 | | | | 112,721 | |
| Health Care Services | | | – | | | | 53,853 | | | | 15,033 | | | | 68,886 | |
| Household Equipment/Products | | | – | | | | 177,131 | | | | – | | | | 177,131 | |
| Lodging | | | – | | | | 200,211 | | | | – | | | | 200,211 | |
| Machinery: Industrial/Specialty | | | – | | | | – | | | | 46,670 | | | | 46,670 | |
| Manufacturing | | | – | | | | – | | | | 129,594 | | | | 129,594 | |
| Media | | | – | | | | 120,157 | | | | – | | | | 120,157 | |
| Miscellaneous | | | – | | | | – | | | | 59,065 | | | | 59,065 | |
| Oil | | | – | | | | – | | | | 23,527 | | | | 23,527 | |
| Oil: Crude Producers | | | – | | | | 16,936 | | | | – | | | | 16,936 | |
| Real Estate | | | – | | | | – | | | | 155,620 | | | | 155,620 | |
| Retail | | | – | | | | 190,222 | | | | – | | | | 190,222 | |
| Technology | | | – | | | | 18,223 | | | | – | | | | 18,223 | |
| Telecommunications | | | – | | | | 130,027 | | | | 15,637 | | | | 145,664 | |
| Foreign Government Obligations | | | – | | | | 111,443 | | | | – | | | | 111,443 | |
| Government Sponsored Enterprises Collateralized Mortgage Obligations | | | – | | | | 659,951 | | | | – | | | | 659,951 | |
| Government Sponsored Enterprises Pass-Throughs | | | – | | | | 613,408 | | | | – | | | | 613,408 | |
| Government Sponsored Enterprises Security | | | – | | | | 160,144 | | | | – | | | | 160,144 | |
| Municipal Bonds | | | – | | | | 142,801 | | | | – | | | | 142,801 | |
| Non-Agency Commercial Mortgage-Backed Securities | | | – | | | | 8,757,733 | | | | 707,721 | (4)(6) | | | 9,465,454 | |
| Preferred Stock | | | – | | | | 15,675 | | | | – | | | | 15,675 | |
| U.S. Treasury Obligation | | | – | | | | 446,133 | | | | – | | | | 446,133 | |
| Repurchase Agreement | | | – | | | | 813,868 | | | | – | | | | 813,868 | |
| Total | | $ | – | | | $ | 45,358,558 | | | $ | 1,730,598 | | | $ | 47,089,156 | |
| | See Notes to Financial Statements. | 41 |
Schedule of Investments (concluded)
December 31, 2016
| Other Financial Instruments | | Level 1 | | | Level 2 | | | Level 3 | | | Total | |
| Forward Foreign Currency Exchange Contracts | | | | | | | | | | | | | | | | |
| Assets | | $ | – | | | $ | 964 | | | $ | – | | | $ | 964 | |
| Futures Contracts | | | | | | | | | | | | | | | | |
| Assets | | | 1,241 | | | | – | | | | – | | | | 1,241 | |
| Liabilities | | | (2,785 | ) | | | – | | | | – | | | | (2,785 | ) |
| Total | | $ | (1,544 | ) | | $ | 964 | | | $ | – | | | $ | (580 | ) |
| (1) | | Refer to Note 2(l) for a description of fair value measurements and the three-tier hierarchy of inputs. |
| (2) | | See Schedule of Investments for fair values in each industry and identification of foreign issuers and/or geography. The table above is presented by Investment Type. Industries are presented within an Investment Type should such Investment Type include securities classified as two or more levels within the three-tier fair value hierarchy. |
| (3) | | There were no Level 1/Level 2 transfers during the fiscal year ended December 31, 2016. |
| (4) | | Includes securities valued using third party pricing information without adjustment. Such valuations are based on unobservable inputs. A significant change in third party information could result in a significantly lower or higher value of such Level 3 investments. |
| (5) | | Floating Rate Loans categorized as Level 3 are valued based on a single quotation obtained from a dealer. Accounting principles generally accepted in the United States of America do not require the Fund to create quantitative unobservable inputs that were not developed by the Fund. Therefore, the Fund does not have access to unobservable inputs and cannot disclose such inputs in the valuation. |
| (6) | | Non-Agency Commercial Mortgage-Backed Securities categorized as Level 3 investment includes A10 Bridge Asset Financing LLC 2015-AA A, Commercial Mortgage Pass-Through Certificates 2016-GCT XA IO, Commercial Mortgage Pass-Through Certificates 2016-SAVA XCP IO, GS Mortgage Securities Trust 2016-GS4 225A, GS Mortgage Securities Trust 2016-GS4 225C, GS Mortgage Securities Trust 2016-GS4 225D, H/2 Asset Funding 2015-1A-AFL, H/2 Asset Funding 2015-1A-AFX, H/2 Asset Funding 2015-1A-BFX, JPMorgan Chase Commercial Mortgage Securities Trust 2016-WIKI XB IO, Prima Capital CRE Securization 2006-1 and Public Utilities Commission. |
The following is a reconciliation of investments with unobservable inputs (Level 3) that were used in determining fair value:
| Investment Type | | Asset-Backed
Securities | | | Corporate
Bonds | | | Floating
Rate Loans | | | Non-Agency
Commercial
Mortgage-Backed
Securities | |
| Balance as of January 1, 2016 | | $ | 380,147 | | | $ | 3,850 | | | $ | 68,224 | | | $ | 420,319 | |
| Accrued discounts/premiums | | | – | | | | (30 | ) | | | 383 | | | | (11,848 | ) |
| Realized gain (loss) | | | 9 | | | | (7,039 | ) | | | 1,868 | | | | – | |
| Change in unrealized appreciation/depreciation | | | (481 | ) | | | 3,219 | | | | (204 | ) | | | (1,444 | ) |
| Purchases | | | 99,985 | | | | – | | | | 1,011,685 | | | | 475,533 | |
| Sales | | | (16,007 | ) | | | – | | | | (154,128 | ) | | | (26,707 | ) |
| Net transfers in or out of Level 3 | | | (364,179 | ) | | | – | | | | (4,425 | ) | | | (148,132 | ) |
| Balance as of December 31, 2016 | | $ | 99,474 | | | $ | – | | | $ | 923,403 | | | $ | 707,721 | |
| 42 | See Notes to Financial Statements. |
Statement of Assets and Liabilities
December 31, 2016
| ASSETS: | | | | |
| Investments in securities, at fair value (cost $47,162,139) | | $ | 47,089,156 | |
| Cash | | | 5,441 | |
| Deposits with brokers for futures collateral | | | 28,100 | |
| Foreign cash, at value (cost $1,024) | | | 1,020 | |
| Receivables: | | | | |
| Interest | | | 364,125 | |
| Investment securities sold | | | 189,675 | |
| Capital shares sold | | | 55,957 | |
| From advisor (See Note 3) | | | 4,706 | |
| Variation margin | | | 1,634 | |
| Unrealized appreciation on forward foreign currency exchange contracts | | | 964 | |
| Prepaid expenses | | | 146 | |
| Total assets | | | 47,740,924 | |
| LIABILITIES: | | | | |
| Payables: | | | | |
| Investment securities purchased | | | 407,628 | |
| Management fee | | | 13,777 | |
| Capital shares reacquired | | | 3,036 | |
| Fund administration | | | 1,575 | |
| Directors’ fees | | | 1,016 | |
| Accrued expenses | | | 95,294 | |
| Total liabilities | | | 522,326 | |
| NET ASSETS | | $ | 47,218,598 | |
| COMPOSITION OF NET ASSETS: | | | | |
| Paid-in capital | | $ | 48,270,730 | |
| Undistributed net investment income | | | 1,788 | |
| Accumulated net realized loss on investments, futures contracts and foreign currency related transactions | | | (980,352 | ) |
| Net unrealized depreciation on investments, futures contracts and translation of assets and liabilities denominated in foreign currencies | | | (73,568 | ) |
| Net Assets | | $ | 47,218,598 | |
| Outstanding shares (200 million shares of common stock authorized, $.001 par value) | | | 3,240,994 | |
| Net asset value, offering and redemption price per share (Net assets divided by outstanding shares) | | | $14.57 | |
| | See Notes to Financial Statements. | 43 |
Statement of Operations
For the Year Ended December 31, 2016
| Investment income: | | | |
| Interest and other | | $ | 904,415 | |
| Total investment income | | | 904,415 | |
| Expenses: | | | | |
| Management fee | | | 104,784 | |
| Non 12b-1 service fees | | | 75,087 | |
| Shareholder servicing | | | 21,325 | |
| Fund administration | | | 11,976 | |
| Reports to shareholders | | | 25,886 | |
| Directors’ fees | | | 918 | |
| Professional | | | 53,603 | |
| Custody | | | 16,144 | |
| Other | | | 3,927 | |
| Gross expenses | | | 313,650 | |
| Expense reductions (See Note 9) | | | (113 | ) |
| Fees waived and expenses reimbursed (See Note 3) | | | (74,029 | ) |
| Net expenses | | | 239,508 | |
| Net investment income | | | 664,907 | |
| Net realized and unrealized gain (loss): | | | | |
| Net realized loss on investments | | | (19,515 | ) |
| Net realized loss on futures contracts and foreign currency related transactions | | | (59,024 | ) |
| Net change in unrealized appreciation/depreciation on investments | | | 244,191 | |
| Net change in unrealized appreciation/depreciation on futures contracts and translation of assets and liabilities denominated in foreign currencies | | | 2,896 | |
| Net realized and unrealized gain | | | 168,548 | |
| Net Increase in Net Assets Resulting From Operations | | $ | 833,455 | |
| 44 | See Notes to Financial Statements. |
Statements of Changes in Net Assets
| INCREASE IN NET ASSETS | For the Year Ended
December 31, 2016 | | For the Year Ended
December 31, 2015 | |
| Operations: | | | | | | | | |
| Net investment income | | $ | 664,907 | | | $ | 248,388 | |
| Net realized loss on investments, futures contracts and foreign currency related transactions | | | (78,539 | ) | | | (42,214 | ) |
| Net change in unrealized appreciation/depreciation on investments, futures contracts and translation of assets and liabilities denominated in foreign currencies | | | 247,087 | | | | (253,204 | ) |
| Net increase (decrease) in net assets resulting from operations | | | 833,455 | | | | (47,030 | ) |
| Distributions to shareholders from: | | | | | | | | |
| Net investment income | | | (1,192,100 | ) | | | (510,223 | ) |
| Return of capital | | | – | | | | (9,512 | ) |
| Total distributions to shareholders | | | (1,192,100 | ) | | | (519,735 | ) |
| Capital share transactions (See Note 14): | | | | | | | | |
| Proceeds from sales of shares | | | 32,551,047 | | | | 15,992,964 | |
| Reinvestment of distributions | | | 1,192,100 | | | | 519,735 | |
| Cost of shares reacquired | | | (7,969,058 | ) | | | (1,822,380 | ) |
| Net increase in net assets resulting from capital share transactions | | | 25,774,089 | | | | 14,690,319 | |
| Net increase in net assets | | | 25,415,444 | | | | 14,123,554 | |
| NET ASSETS: | | | | | | | | |
| Beginning of period | | $ | 21,803,154 | | | $ | 7,679,600 | |
| End of period | | $ | 47,218,598 | | | $ | 21,803,154 | |
| Undistributed (distributions in excess of) net investment income | | $ | 1,788 | | | $ | (483 | ) |
| | See Notes to Financial Statements. | 45 |
Financial Highlights
| | | | Per Share Operating Performance: |
| | | | Investment operations: | | Distributions to
shareholders from: | |
| | | Net asset
value,
beginning
of period | | Net
investment
income(a) | | Net
realized
and
unrealized
gain (loss) | | Total
from
investment
operations | | Net
investment
income | | Return
of
capital | | |
| 12/31/2016 | | | $14.43 | | | | $0.33 | | | | $ 0.19 | | | | $0.52 | | | | $(0.38 | ) | | | $ – | | |
| 12/31/2015 | | | 14.72 | | | | 0.27 | | | | (0.21 | ) | | | 0.06 | | | | (0.34 | ) | | | (0.01 | ) | |
| 12/31/2014(c)(d) | | | 15.00 | | | | 0.18 | | | | (0.15 | ) | | | 0.03 | | | | (0.31 | ) | | | – | | |
| (a) | Calculated using average shares outstanding during the period. |
| (b) | Total return does not consider the effects of sales charges or other expenses imposed by an insurance company and assumes the reinvestment of all distributions. |
| (c) | Commencement of operations was 4/4/2014, SEC effective date was 4/14/2014 and date shares first became available to the public was 5/1/2014. |
| (d) | Net investment income, net realized and unrealized gain (loss) amounted to less than $.01 for the period 4/4/2014 through 4/14/2014. |
| (e) | Not annualized. |
| (f) | Total return for the period 4/14/2014 through 12/31/2014 was also 0.22% |
| (g) | Annualized. |
| 46 | See Notes to Financial Statements. |
| | | | | | | | | | | | | | | |
| | | | | | | | | | | | | Ratios to Average Net Assets: | | Supplemental Data: |
Total
distri-
butions | | Net
asset
value,
end of
period | | Total
return(b)
(%) | | Total expenses
after waivers and/or
reimbursements
(%) | | Total
expenses
(%) | | Net
investment
income
(%) | | Net
assets,
end of
period
(000) | | Portfolio
turnover
rate
(%) |
| | $(0.38 | ) | | $ | 14.57 | | | | 3.47 | | | | 0.80 | | | | 1.04 | | | | 2.21 | | | $ | 47,219 | | | | 69.28 | |
| | (0.35 | ) | | | 14.43 | | | | 0.58 | | | | 0.80 | | | | 1.45 | | | | 1.79 | | | | 21,803 | | | | 61.27 | |
| | (0.31 | ) | | | 14.72 | | | | 0.22 | (e)(f) | | | 0.80 | (g) | | | 2.02 | (g) | | | 1.61 | (g) | | | 7,680 | | | | 102.97 | (e) |
| | See Notes to Financial Statements. | 47 |
Notes to Financial Statements
Lord Abbett Series Fund, Inc. (the “Company”) is registered under the Investment Company Act of 1940, as amended (the “Act”), as a diversified, open-end management investment company and was incorporated under Maryland law in 1989. The Company consists of thirteen separate portfolios. This report covers Short Duration Income Portfolio (the “Fund”).
The Fund’s investment objective is to seek a high level of income consistent with preservation of capital. The Fund has Variable Contract class shares (“Class VC Shares”), which are currently issued and redeemed only in connection with investments in, and payments under, variable annuity contracts and variable life insurance policies issued by life insurance and insurance-related companies.
The preparation of the financial statements in conformity with accounting principles generally accepted in the United States of America (“U.S. GAAP”) requires management to make certain estimates and assumptions that affect the reported amounts of assets and liabilities and disclosure of contingent assets and liabilities at the date of the financial statements and the reported amounts of increases and decreases in net assets from operations during the reporting period. Actual results could differ from those estimates. The Fund is considered an investment company under U.S. GAAP and follows the accounting and reporting guidance applicable to investment companies.
2. | SIGNIFICANT ACCOUNTING POLICIES |
| (a) | Investment Valuation–Under procedures approved by the Fund’s Board of Directors (the “Board”), Lord, Abbett & Co. LLC (“Lord Abbett”), the Fund’s investment manager, has formed a Pricing Committee to administer the pricing and valuation of portfolio investments and to ensure that prices utilized reasonably reflect fair value. Among other things, these procedures allow the Fund to utilize independent pricing services, quotations from securities and financial instrument dealers and other market sources to determine fair value. |
| | |
| | Securities actively traded on any recognized U.S. or non-U.S. exchange or on The NASDAQ Stock Market LLC are valued at the last sale price or official closing price on the exchange or system on which they are principally traded. Events occurring after the close of trading on non-U.S. exchanges may result in adjustments to the valuation of foreign securities to reflect their fair value as of the close of regular trading on the New York Stock Exchange. The Fund may utilize an independent fair valuation service in adjusting the valuations of foreign securities. Unlisted equity securities are valued at the last quoted sale price or, if no sale price is available, at the mean between the most recently quoted bid and asked prices. Fixed income securities are valued based on evaluated prices supplied by independent pricing services, which reflect broker/dealer supplied valuations and the independent pricing services’ own electronic data processing techniques. Exchange traded options and futures contracts are valued at the last sale price in the market where they are principally traded. If no sale has occurred, the mean between the most recently quoted bid and asked prices is used. Floating rate loans are valued at the average of bid and ask quotations obtained from dealers in loans on the basis of prices supplied by independent pricing services. Forward foreign currency exchange contracts are valued using daily forward exchange rates. |
| | |
| | Securities for which prices are not readily available are valued at fair value as determined by the Pricing Committee. The Pricing Committee considers a number of factors, including observable and unobservable inputs, when arriving at fair value. The Pricing Committee may use related or comparable assets or liabilities, recent transactions, market multiples, book |
48
Notes to Financial Statements (continued)
| | values, yield curves, broker quotes, observable trading activity, option adjusted spread models and other relevant information to determine the fair value of portfolio investments. The Board or a designated committee thereof regularly reviews fair value determinations made by the Pricing Committee and employs techniques such as reviewing related market activity, reviewing inputs and assumptions, and retrospectively comparing prices of subsequent purchases and sales transactions to fair value determinations made by the Pricing Committee. |
| | |
| | Short-term securities with 60 days or less remaining to maturity are valued using the amortized cost method, which approximates fair value. |
| | |
| (b) | Security Transactions–Security transactions are recorded as of the date that the securities are purchased or sold (trade date). Realized gains and losses on sales of portfolio securities are calculated using the identified-cost method. |
| | |
| (c) | Investment Income–Dividend income is recorded on the ex-dividend date. Interest income is recorded on the accrual basis as earned. Discounts are accreted and premiums are amortized using the effective interest method and are included in Interest and other income on the Statement of Operations. Withholding taxes on foreign dividends have been provided for in accordance with the applicable country’s tax rules and rates. |
| | |
| (d) | Income Taxes–It is the policy of the Fund to meet the requirements of Subchapter M of the Internal Revenue Code applicable to regulated investment companies and to distribute substantially all taxable income and capital gains to its shareholders. Therefore, no income tax provision is required. |
| | |
| | The Fund files U.S. federal and various state and local tax returns. No income tax returns are currently under examination. The statute of limitations on the Fund’s filed U.S. federal tax returns remain open for the fiscal years ended December 31, 2014 through December 31, 2016. The statutes of limitations on the Company’s state and local tax returns may remain open for an additional year depending on jurisdiction |
| | |
| (e) | Expenses–Expenses incurred by the Company that do not specifically relate to an individual fund are generally allocated to the funds within the Company on a pro rata basis by relative net assets. Offering costs incurred by the Fund are amortized over a twelve month period beginning at the commencement of operations and are included in the Fund’s Statement of Operations. |
| | |
| (f) | Foreign Transactions–The books and records of the Fund are maintained in U.S. dollars and transactions denominated in foreign currencies are recorded in the Fund’s records at the rate prevailing when earned or recorded. Asset and liability accounts that are denominated in foreign currencies are adjusted daily to reflect current exchange rates and any unrealized gain (loss) is included in Net change in unrealized appreciation/depreciation on futures contracts and translation of assets and liabilities denominated in foreign currencies on the Fund’s Statement of Operations. The resultant exchange gains and losses upon settlement of such transactions, if any, are included in Net realized loss on futures contracts and foreign currency related transactions on the Fund’s Statement of Operations. The Fund does not isolate that portion of the results of operations arising as a result of changes in the foreign exchange rates from the changes in market prices of the securities. |
| | |
| (g) | Forward Foreign Currency Exchange Contracts–The Fund may enter into forward foreign currency exchange contracts in order to reduce exposure to changes in foreign currency exchange rates on foreign portfolio holdings, or gain or reduce exposure to foreign currency |
49
Notes to Financial Statements (continued)
| | solely for investment purposes. A forward foreign currency exchange contract is a commitment to purchase or sell a foreign currency at a future date at a negotiated rate. The contracts are valued daily at forward exchange rates and any unrealized gain (loss) is included in Net change in unrealized appreciation/depreciation on futures contracts and translation of assets and liabilities denominated in foreign currencies in the Fund’s Statement of Operations. The gain (loss) arising from the difference between the U.S. dollar cost of the original contract and the value of the foreign currency in U.S. dollars upon closing of such contracts is included in Net realized gain on futures contracts and foreign currency related transactions in the Fund’s Statement of Operations. |
| | |
| (h) | Futures Contracts–The Fund may purchase and sell futures contracts to enhance returns, to attempt to economically hedge some of its investment risk, or as a substitute position in lieu of holding the underlying asset on which the instrument is based. At the time of entering into a futures transaction, an investor is required to deposit and maintain a specified amount of cash or eligible securities called “initial margin.” Subsequent payments made or received by the Fund called “variation margin” are made on a daily basis as the market price of the futures contract fluctuates. The Fund will record an unrealized gain (loss) based on the amount of variation margin. When a contract is closed, a realized gain (loss) is recorded equal to the difference between the opening and closing value of the contract. |
| | |
| (i) | When-Issued, Forward Transactions or To-Be-Announced (“TBA”) Transactions–The Fund may purchase portfolio securities on a when-issued or forward basis. When-issued, forward transactions or TBA transactions involve a commitment by a fund to purchase securities, with payment and delivery (“settlement”) to take place in the future, in order to secure what is considered to be an advantageous price or yield at the time of entering into the transaction. During the period between purchase and settlement, the fair value of the securities will fluctuate and assets consisting of cash and/or marketable securities (normally short-term U.S. Government or U.S. Government sponsored enterprise securities) marked to market daily in an amount sufficient to make payment at settlement will be segregated at the Fund’s custodian in order to pay for the commitment. At the time the Fund makes the commitment to purchase a security on a when-issued basis, it will record the transaction and reflect the liability for the purchase and fair value of the security in determining its net asset value (“NAV”). The Fund, generally, has the ability to close out a purchase obligation on or before the settlement date rather than take delivery of the security. Under no circumstances will settlement for such securities take place more than 120 days after the purchase date. |
| | |
| (j) | Repurchase Agreements–The Fund may enter into repurchase agreements with respect to securities. A repurchase agreement is a transaction in which a fund acquires a security and simultaneously commits to resell that security to the seller (a bank or securities dealer) at an agreed-upon price on an agreed-upon date. The Fund requires at all times that the repurchase agreement be collateralized by cash, or by securities of the U.S. Government, its agencies, its instrumentalities, or U.S. Government sponsored enterprises having a value equal to, or in excess of, the value of the repurchase agreement (including accrued interest). If the seller of the agreement defaults on its obligation to repurchase the underlying securities at a time when the fair value of these securities has declined, the Fund may incur a loss upon disposition of the securities. |
| | |
| (k) | Floating Rate Loans–The Fund may invest in floating rate loans, which usually take the form of loan participations and assignments. Loan participations and assignments are agreements |
50
Notes to Financial Statements (continued)
| | to make money available to U.S. or foreign corporations, partnerships or other business entities (the “Borrower”) in a specified amount, at a specified rate and within a specified time. A loan is typically originated, negotiated and structured by a U.S. or foreign bank, insurance company or other financial institution (the “Agent”) for a group of loan investors (“Loan Investors”). The Agent typically administers and enforces the loan on behalf of the other Loan Investors in the syndicate and may hold any collateral on behalf of the Loan Investors. Such loan participations and assignments are typically senior, secured and collateralized in nature. The Fund records an investment when the Borrower withdraws money and records interest as earned. These loans pay interest at rates which are periodically reset by reference to a base lending rate plus a spread. These base lending rates are generally the prime rate offered by a designated U.S. bank or London InterBank Offered Rate (“LIBOR”). |
| | |
| | The loans in which the Fund invests may be subject to some restrictions on resale. For example, the Fund may be contractually obligated to receive approval from the Agent and/or Borrower prior to the sale of these investments. The Fund generally has no right to enforce compliance with the terms of the loan agreement with the Borrower. As a result, the Fund assumes the credit risk of the Borrower, the selling participant and any other persons interpositioned between the Fund and the Borrower (“Intermediate Participants”). In the event that the Borrower, selling participant or Intermediate Participants become insolvent or enter into bankruptcy, the Fund may incur certain costs and delays in realizing payment or may suffer a loss of principal and/or interest. |
| | |
| | Unfunded commitments represent the remaining obligation of the Fund to the Borrower. At any point in time, up to the maturity date of the issue, the Borrower may demand the unfunded portion. Until demanded by the Borrower, unfunded commitments are not recognized as an asset on the Statement of Assets and Liabilities. Unrealized appreciation/depreciation on unfunded commitments presented on the Statement of Assets and Liabilities represents mark to market of the unfunded portion of the Fund’s floating rate notes. As of December 31, 2016, the Fund did not have unfunded loan commitments. |
| | |
| (l) | Fair Value Measurements–Fair value is defined as the price that the Fund would receive upon selling an investment or transferring a liability in an orderly transaction to an independent buyer in the principal or most advantageous market of the investment. A three-tier hierarchy is used to maximize the use of observable market data and minimize the use of unobservable inputs and to establish classification of fair value measurements for disclosure purposes. Inputs refer broadly to the assumptions that market participants would use in pricing the asset or liability, including assumptions about risk – for example, the risk inherent in a particular valuation technique used to measure fair value (such as a pricing model) and/or the risk inherent in the inputs to the valuation technique. Inputs may be observable or unobservable. Observable inputs reflect the assumptions market participants would use in pricing the asset or liability. Observable inputs are based on market data obtained from sources independent of the reporting entity. Unobservable inputs reflect the reporting entity’s own assumptions about the assumptions market participants would use in pricing the asset or liability. Unobservable inputs are based on the best information available in the circumstances. The three-tier hierarchy classification is determined based on the lowest level of inputs that is significant to the fair value measurement, and is summarized in the three broad Levels listed below: |
| | • | Level 1 – | unadjusted quoted prices in active markets for identical investments; |
51
Notes to Financial Statements (continued)
| | • | Level 2 – | other significant observable inputs (including quoted prices for similar investments, interest rates, prepayment speeds, credit risk, etc.); and |
| | | | |
| | • | Level 3 – | significant unobservable inputs (including the Fund’s own assumptions in determining the fair value of investments). |
| | A summary of inputs used in valuing the Fund’s investments and other financial instruments as of December 31, 2016 and, if applicable, Level 1/Level 2 transfers and Level 3 rollforwards for the fiscal year then ended is included in the Fund’s Schedule of Investments. |
| | |
| | Changes in valuation techniques may result in transfers into or out of an assigned level within the three-tier hierarchy. All transfers between different levels within the three-tier hierarchy are deemed to have occurred as of the beginning of the reporting period. The inputs or methodology used for valuing securities are not necessarily an indication of the risk associated with investing in those securities. |
| 3. | MANAGEMENT FEE AND OTHER TRANSACTIONS WITH AFFILIATES |
Management Fee
The Company has a management agreement with Lord Abbett, pursuant to which Lord Abbett supplies the Fund with investment management services and executive and other personnel, provides office space and pays for ordinary and necessary office and clerical expenses relating to research and statistical work and supervision of the Fund’s investment portfolio.
The management fee is based on the Fund’s average daily net assets at the following annual rate:
| First $1 billion | .35% | |
| Next $1 billion | .30% | |
| Over $2 billion | .25% | |
For the fiscal year ended December 31, 2016, the effective management fee, net of waivers, was at an annualized rate of 0.10% of the Fund’s average daily net assets.
In addition, Lord Abbett provides certain administrative services to the Fund pursuant to an Administrative Services Agreement in return for a fee at an annual rate of .04% of the Fund’s average daily net assets.
During the fiscal year ended December 31, 2016 and continuing through April 30, 2017, Lord Abbett has contractually agreed to waive its fees and reimburse expenses to the extent necessary to limit total net operating expenses to an annual rate of .80%. This agreement may be terminated only upon the approval of the Board.
The Company, on behalf of the Fund, has entered into services arrangements with certain insurance companies. Under these arrangements, certain insurance companies will be compensated up to .25% of the average daily net asset value (“NAV”) of the Fund’s Class VC Shares held in the insurance company’s separate account to service and maintain the Variable Contract owners’ accounts. This amount is included in Non 12b-1 service fees on the Statement of Operations. The Fund may also compensate certain insurance companies, third-party administrators and other entities for providing recordkeeping, sub-transfer agency and other administrative services to the Fund. This amount is included in Shareholder servicing on the Statement of Operations.
Two Directors and certain of the Company’s officers have an interest in Lord Abbett.
52
Notes to Financial Statements (continued)
4. | DISTRIBUTIONS AND CAPITAL LOSS CARRYFORWARDS |
Dividends from net investment income, if any, are declared and paid at least semi-annually. Taxable net realized gains from investment transactions, reduced by allowable capital loss carryforwards, if any, are declared and distributed to shareholders at least annually. The capital loss carryforward amount, if any, is available to offset future net capital gains. Dividends and distributions to shareholders are recorded on the ex-dividend date. The amounts of dividends and distributions from net investment income and net realized capital gains are determined in accordance with federal income tax regulations, which may differ from U.S. GAAP. These book/tax differences are either considered temporary or permanent in nature. To the extent these differences are permanent in nature, such amounts are reclassified within the components of net assets based on their federal tax basis treatment; temporary differences do not require reclassification. Dividends and distributions that exceed earnings and profits for tax purposes are reported as a tax return of capital.
The tax character of distributions paid during the fiscal years ended December 31, 2016 and December 31, 2015 was as follows:
| | | Year Ended
12/31/2016 | | | Year Ended
12/31/2015 | |
| Distributions paid from: | | | | | | | | |
| Ordinary income | | $ | 1,192,100 | | | $ | 510,107 | |
| Return of capital | | | – | | | | 9,628 | |
| Total distributions paid | | $ | 1,192,100 | | | $ | 519,735 | |
As of December 31, 2016, the components of accumulated losses on a tax-basis were as follows:
| Undistributed ordinary income – net | | $ | 3,150 | |
| Total undistributed earnings | | | 3,150 | |
| Capital loss carryforwards* | | | (442,173 | ) |
| Temporary differences | | | (1,016 | ) |
| Unrealized losses – net | | | (612,093 | ) |
| Total accumulated losses – net | | $ | (1,052,132 | ) |
| * | The capital losses will carryforward indefinitely |
As of December 31, 2016, the aggregate unrealized security gains and losses based on cost for U.S. federal income tax purposes were as follows:
| Tax cost | | $ | 47,701,244 | |
| Gross unrealized gain | | | 209,894 | |
| Gross unrealized loss | | | (821,982 | ) |
| Net unrealized security loss | | $ | (612,088 | ) |
The difference between book-basis and tax-basis unrealized gains (losses) is due to tax treatment of premium amortization, certain securities and wash sales.
53
Notes to Financial Statements (continued)
Permanent items identified during the fiscal year ended December 31, 2016 have been reclassified among the components of net assets based on their tax basis treatment as follows:
Undistributed
Net Investment
Income | | | Accumulated
Net Realized
Loss | | | Paid-in
Capital | |
| | $529,464 | | | | $(529,348 | ) | | | $(116 | ) |
The permanent differences are attributable to the tax treatment of foreign currency transactions, premium amortization, certain distributions, certain securities, and principal paydown gains and losses.
| 5. | PORTFOLIO SECURITIES TRANSACTIONS |
Purchases and sales of investment securities (excluding short-term investments) for the fiscal year ended December 31, 2016 were as follows:
| U.S. | | Non-U.S. | | U.S. | | Non-U.S. |
| Government | | Government | | Government | | Government |
| Purchases* | | Purchases | | Sales* | | Sales |
| $4,357,172 | | $41,824,997 | | $4,118,233 | | $15,606,992 |
| * | Includes U.S. Government sponsored enterprises securities. |
The Fund is permitted to purchase and sell securities (“cross-trade”) from and to other Lord Abbett funds or client accounts pursuant to procedures approved by the Board in compliance with Rule 17a-7 under the Act (the “Rule”). Each cross-trade is executed at a fair market price in compliance with provisions of the Rule. For the period ended December 31, 2016, the Fund engaged in cross-trades purchases of $572,967 and sales of $379,569, which resulted in net realized loss of $(4,833).
| 6. | DISCLOSURES ABOUT DERIVATIVE INSTRUMENTS AND HEDGING ACTIVITIES |
The Fund entered into forward foreign currency exchange contracts for the fiscal year ended December 31, 2016 (as described in note 2(g)). A forward foreign currency exchange contract reduces the Fund’s exposure to changes in the value of the currency it will deliver (or settle in cash) and increases its exposure to changes in the value of the currency it will receive (or settle in cash) for the duration of the contract. The Fund’s use of forward foreign currency exchange contracts involves the risk that Lord Abbett will not accurately predict currency movements, and the Fund’s returns could be reduced as a result. Forward foreign currency exchange contracts are subject to the risk that those currencies will decline in value relative to the U.S. dollar, or, in the case of hedged positions, that the U.S. dollar will decline relative to the currency being hedged. Currency rates in foreign countries may fluctuate significantly over short periods of time. The Fund’s risk of loss from counterparty credit risk is the unrealized appreciation on forward foreign currency exchange contracts and deposits with brokers as collateral.
The Fund entered into U.S. Treasury futures contracts for the fiscal year ended December 31, 2016 (as described in note 2(h)) to hedge against changes in interest rates. The Fund bears the risk of interest rates moving unexpectedly, in which case the Fund may not achieve the anticipated benefits of the futures contracts and realize a loss. There is minimal counterparty credit risk to the Fund since futures are exchange traded and the exchange’s clearinghouse, as counterparty to all exchange traded futures, guarantees futures against default.
54
Notes to Financial Statements (continued)
As of December 31, 2016, the Fund had the following derivatives at fair value, grouped into appropriate risk categories that illustrate the Funds use of derivative instruments:
| Asset Derivatives | | Interest Rate
Contracts | | Foreign
Currency
Contracts |
| Forward Foreign Currency Exchange Contracts(1) | | – | | $964 |
| Futures Contracts(2) | | $1,241 | | – |
|
| | | | | |
| Liability Derivatives | | | | |
| Futures Contracts(2) | | $2,785 | | – |
| (1) | Statements of Assets and Liabilities location: Unrealized appreciation on forward foreign currency exchange contracts. |
| (2) | Statements of Assets and Liabilities location: Includes cumulative unrealized appreciation/depreciation of futures contracts as reported in the Schedule of Investments. Only current day’s variation margin is reported within the Statements of Assets and Liabilities. |
Transactions in derivative instruments for the year ended December 31, 2016, were as follows:
| | | Interest Rate
Contracts | | | Forward
Currency
Contracts | |
| Net Realized Gain (Loss)(1) | | | | | | | | |
| Futures Contracts | | $ | (59,522 | ) | | $ | – | |
| Net Change in Unrealized Appreciation/Depreciation(2) | | | | | | | | |
| Forward Foreign Currency Exchange Contracts | | $ | – | | | $ | 964 | |
| Futures Contracts | | | 1,936 | | | | – | |
| Average Number of Contracts/Notional Amounts* | | | | | | | | |
| Forward Foreign Currency Exchange Contracts(3) | | $ | – | | | $ | 6,253 | |
| Futures Contracts(4) | | | 51 | | | | – | |
| * | Calculated based on the number of contracts or notional amounts for the fiscal year ended December 31, 2016. |
| (1) | Statements of Operations location: Net realized loss on futures contracts and foreign currency related transactions. |
| (2) | Statements of Operations location: Net change in unrealized appreciation/depreciation on futures contracts and translation of assets and liabilities denominated in foreign currencies. |
| (3) | Amount represents notional amounts in U.S. dollars. |
| (4) | Amount represents number of contracts. |
| 7. | DISCLOSURES ABOUT OFFSETTING ASSETS AND LIABILITIES |
The Financial Accounting Standards Board (“FASB”) requires disclosures intended to help better assess the effect or potential effect of offsetting arrangements on a fund’s financial position. The following tables illustrate gross and net information about recognized assets and liabilities eligible for offset in the statement of assets and liabilities; and disclose such amounts subject to an enforceable master netting agreement or similar agreement, by counterparty. A master netting agreement is an agreement between a fund and a counterparty which provides for the net settlement of amounts owed under all contracts traded under that agreement, as well as cash collateral, through a single payment by one party to the other in the event of default on or termination of any one contract. The Fund’s accounting policy with respect to balance sheet offsetting is that, absent an event of default by the counterparty or a termination of the agreement, the master netting agreement does not result in an offset of reported amounts of financial assets and liabilities in the statement of assets and liabilities across transactions between the Fund and the applicable counterparty:
55
Notes to Financial Statements (continued)
| | | | | | Gross Amounts | | | Net Amounts of | |
| | | | | | Offset in the | | | Assets Presented | |
| | | Gross Amounts of | | | Statement of Assets | | | in the Statement of | |
| Description | | Recognized Assets | | | and Liabilities | | | Assets and Liabilities | |
| Forward Foreign Currency Exchange Contracts | | $ | 964 | | | $ | – | | | $ | 964 | |
| Repurchase Agreements | | | 813,868 | | | | – | | | | 813,868 | |
| Total | | $ | 814,832 | | | $ | – | | | $ | 814,832 | |
| | | Net Amounts | | | | | | | | | | | | |
| | | of Assets | | Amounts Not Offset in the | | | |
| | | Presented in | | Statement of Assets and Liabilities | | | |
| | | the Statement | | | | | Cash | | | Securities | | | | |
| | | of Assets and | | Financial | | | Collateral | | | Collateral | | | Net | |
| Counterparty | | Liabilities | | Instruments | | | Received(a) | | | Received(a) | | | Amount(b) | |
| Fixed Income Clearing Corp. | | $813,868 | | $ | – | | | $ | – | | | $ | (813,868 | ) | | $ | – | |
| State Street Bank and Trust | | 964 | | | – | | | | – | | | | – | | | | 964 | |
| Total | | $814,832 | | $ | – | | | $ | 813,868 | | | $ | – | | | $ | 964 | |
| (a) | Collateral disclosed is limited to an amount not to exceed 100% of the net amount of assets presented in the Statement of Assets and Liabilities, for each respective counterparty. |
| (b) | Net amount represents the amount owed to the Fund by the counterparty as of December 31, 2016. |
| 8. | DIRECTORS’ REMUNERATION |
The Company’s officers and two Directors, who are associated with Lord Abbett, do not receive any compensation from the Company for serving in such capacities. Independent Directors’ fees are allocated among all Lord Abbett-sponsored funds based on the net assets of each fund. There is an equity-based plan available to all Independent Directors under which Independent Directors must defer receipt of a portion of, and may elect to defer receipt of an additional portion of Directors’ fees. The deferred amounts are treated as though equivalent dollar amounts had been invested in the funds. Such amounts and earnings accrued thereon are included in Directors’ fees on the Statement of Operations and in Directors’ fees payable on the Statement of Assets and Liabilities and are not deductible for U.S. federal income tax purposes until such amounts are paid.
The Company has entered into an arrangement with its transfer agent and custodian, whereby credits realized as a result of uninvested cash balances are used to reduce a portion of the Fund’s expenses.
The Fund and certain other funds managed by Lord Abbett (collectively, the “Participating Funds”) entered into a syndicated line of credit facility with various lenders for $550 million (the “Facility”), whereas State Street Bank and Trust Company (“SSB”) participates as a lender and as agent for the lenders. The Facility is to be used for temporary or emergency purposes as an additional source of liquidity to satisfy redemptions. The Participating Funds are subject to graduated borrowing limits of one-third of Fund assets (if Fund assets are less than $750 million), $250 million, $300 million, or $350 million, based on past borrowings and likelihood of future borrowings. The Facility will continue through August 28, 2017.
During the fiscal year ended December 31, 2016, the Fund did not utilize the Facility.
56
Notes to Financial Statements (continued)
| 11. | INTERFUND LENDING PROGRAM |
On July 26, 2016, the U.S. Securities and Exchange Commission issued an exemptive order (“SEC exemptive order”) which permits certain registered open-end management investment companies managed by Lord Abbett, including the Fund, to participate in a joint lending and borrowing program (the “Interfund Lending Program”). The SEC exemptive order allows the Funds to borrow money from and lend money to each other for temporary or emergency purposes subject to the limitations and conditions.
During the fiscal year ended December 31, 2016, the Fund did not participate as a borrower or lender in the Interfund Lending Program.
| 12. | CUSTODIAN AND ACCOUNTING AGENT |
SSB is the Company’s custodian and accounting agent. SSB performs custodial, accounting and recordkeeping functions relating to portfolio transactions and calculating the Fund’s NAV.
The Fund is subject to the general risks and considerations associated with investing in fixed income securities. The value of an investment will change as interest rates fluctuate and in response to market movements. When interest rates rise, the prices of fixed income securities are likely to decline; when interest rates fall, such prices tend to rise. Longer-term securities are usually more sensitive to interest rate changes. There is also the risk that an issuer of a fixed income security will fail to make timely payments of principal and/or interest to the Fund, a risk that is greater with high-yield bonds (sometimes called “junk bonds”) in which the Fund may substantially invest. Some issuers, particularly of high-yield bonds, may default as to principal and/or interest payments after the Fund purchases its securities. A default, or concerns in the market about an increase in risk of default, may result in losses to the Fund. High-yield bonds are subject to greater price fluctuations, as well as additional risks.
The Fund is subject to the general risks and considerations associated with investing in convertible securities, which have both equity and fixed income risk characteristics. Generally, convertible securities offer lower interest or dividend yields than non-convertible securities of similar quality and less potential for gains or capital appreciation in a rising equity securities market than equity securities. They tend to be more volatile than other fixed income securities, and the markets for convertible securities may be less liquid than markets for stocks or bonds. A significant portion of convertible securities have below investment grade credit ratings and are subject to increased credit and liquidity risks.
The Fund’s investment exposure to foreign (which may include emerging market) companies presents increased market, liquidity, currency, political, information and other risks. The cost of the Fund’s potential use of forward foreign currency exchange contracts varies with factors such as the currencies involved, the length of the contract period and the market conditions prevailing.
The Fund is subject to the risks associated with derivatives, which may be different from and greater than the risks associated with directly investing in securities. Derivatives may be subject to risks such as liquidity risk, leveraging risk, interest rate risk, market risk, and credit risk. Illiquid securities may lower the Fund’s returns since the Fund may be unable to sell these securities at their desired time or price. Derivatives also may involve the risk of mispricing or improper valuation and the risk that changes in the value of the derivative may not correlate perfectly with the value
57
Notes to Financial Statements (concluded)
of the underlying asset, rate or index. Whether the Fund’s use of derivatives is successful will depend on, among other things, the Fund’s ability to correctly forecast market movements, changes in foreign exchange and interest rates, and other factors. If the Fund incorrectly forecasts these and other factors, its performance could suffer. The Fund’s use of derivatives could result in a loss exceeding the amount of the Fund’s investment in these instruments.
The Fund may invest in swap contracts. Swap contracts are bi-lateral agreements between a fund and its counterparty. Each party is exposed to the risk of default by the other. In addition, they may involve a small investment of cash compared to the risk assumed with the result that small changes may produce disproportionate and substantial gains or losses to the Fund.
The Fund may invest in credit default swap contracts. The risks associated with the Fund’s investment in credit default swaps are greater than if the Fund invested directly in the reference obligation because they are subject to illiquidity risk, counterparty risk, and credit risk at both the counterparty and underlying issuer levels.
The Fund may invest in floating rate or adjustable rate senior loans, which are subject to increased credit and liquidity risks. Senior loans are business loans made to borrowers that may be U.S. or foreign corporations, partnerships or other business entities. The senior loans in which the Fund may invest may consist primarily of senior loans that are rated below investment grade or, if unrated, deemed by Lord Abbett to be equivalent to below investment grade securities. Below investment grade senior loans, as in the case of high-yield debt securities, or junk bonds, are usually more credit sensitive than interest rate sensitive, although the value of these instruments may be impacted by broader interest rate swings in the overall fixed income market.
The Fund may invest in mortgage-related securities, including those of such Government sponsored enterprises as Federal Home Loan Mortgage Corporation and Federal National Mortgage Association. In addition, the Fund may invest in non-agency backed and mortgage related securities, which are issued by the private institutions, not by the government-sponsored enterprises. Such securities may be particularly sensitive to changes in economic conditions, including delinquencies and/or defaults, and changes in prevailing interest rates. These changes can affect the value, income and/or liquidity of such positions. When interest rates are declining, the value of these securities with prepayment features may not increase as much as other fixed income securities. Early principal repayment may deprive the Fund of income payments above current markets rates. The prepayment rate also will affect the price and volatility of a mortgage-related security. In addition, securities of government sponsored enterprises are guaranteed with respect to the timely payment of interest and principal by the particular enterprise involved, not by the U.S. Government.
These factors can affect the Fund’s performance.
| 14. | SUMMARY OF CAPITAL TRANSACTIONS |
Transactions in shares of capital stock were as follows:
| | | Year Ended | | | Year Ended | |
| | | December 31, 2016 | | | December 31, 2015 | |
| Shares sold | | | 2,190,614 | | | | 1,075,441 | |
| Reinvestment of distributions | | | 81,988 | | | | 36,013 | |
| Shares reacquired | | | (542,280 | ) | | | (122,435 | ) |
| Increase | | | 1,730,322 | | | | 989,019 | |
58
Report of Independent Registered Public Accounting Firm
To the Board of Directors of Lord Abbett Series Fund, Inc. and the Shareholders of Short Duration Income Portfolio:
We have audited the accompanying statement of assets and liabilities, including the schedule of investments, of the Short Duration Income Portfolio, one of the portfolios constituting the Lord Abbett Series Fund, Inc. (the “Fund”) as of December 31, 2016, and the related statement of operations for the year then ended, the statements of changes in net assets for each of the two years in the period then ended, and the financial highlights for each of the periods presented. These financial statements and financial highlights are the responsibility of the Fund’s management. Our responsibility is to express an opinion on these financial statements and financial highlights based on our audits.
We conducted our audits in accordance with the standards of the Public Company Accounting Oversight Board (United States). Those standards require that we plan and perform the audit to obtain reasonable assurance about whether the financial statements and financial highlights are free of material misstatement. The Fund is not required to have, nor were we engaged to perform, an audit of its internal control over financial reporting. Our audits included consideration of internal control over financial reporting as a basis for designing audit procedures that are appropriate in the circumstances, but not for the purpose of expressing an opinion on the effectiveness of the Fund’s internal control over financial reporting. Accordingly, we express no such opinion. An audit also includes examining, on a test basis, evidence supporting the amounts and disclosures in the financial statements, assessing the accounting principles used and significant estimates made by management, as well as evaluating the overall financial statement presentation. Our procedures included confirmation of securities owned as of December 31, 2016, by correspondence with the custodian, brokers, and agent banks; when replies were not received from brokers and agent banks, we performed other auditing procedures. We believe that our audits provide a reasonable basis for our opinion.
In our opinion, such financial statements and financial highlights referred to above present fairly, in all material respects, the financial position of Short Duration Income Portfolio of the Lord Abbett Series Fund, Inc. as of December 31, 2016, the results of its operations for the year then ended, the changes in its net assets, and the financial highlights for each of the periods presented, in conformity with accounting principles generally accepted in the United States of America.
DELOITTE & TOUCHE LLP
New York, New York
February 15, 2017
59
Basic Information About Management
The Board is responsible for the management of the business and affairs of the Company in accordance with the laws of the State of Maryland. The Board elects officers who are responsible for the day-to-day operations of each Fund and who execute policies authorized by the Board. The Board also approves an investment adviser to each Fund and continues to monitor the cost and quality of the services the investment adviser provides, and annually considers whether to renew the contract with the adviser. Generally, each Director holds office until his/her successor is elected and qualified or until his/her earlier resignation or removal, as provided in the Company’s organizational documents.
Lord Abbett, a Delaware limited liability company, is the Fund’s investment adviser. Designated Lord Abbett personnel are responsible for the day-to-day management of the Funds.
Interested Directors
Ms. Foster and Mr. Sieg are affiliated with Lord Abbett and are “interested persons” of the Company as defined in the Act. Ms. Foster and Mr. Sieg are directors/trustees of each of the 12 investment companies in the Lord Abbett Family of Funds, which consist of 60 portfolios or series. Ms. Foster is an officer of the Lord Abbett Family of Funds.
Name, Address and
Year of Birth | | Current Position and
Length of Service
with the Company | | Principal Occupation and Other Directorships
During the Past Five Years |
| | | | | |
Daria L. Foster
Lord, Abbett & Co. LLC
90 Hudson Street
Jersey City, NJ 07302
(1954) | | Director and President since 2006; Chief Executive Officer since 2012 | | Principal Occupation: Managing Partner of Lord Abbett, joined Lord Abbett in 1990.
Other Directorships: None. |
| | | | | |
Douglas B. Sieg
Lord, Abbett & Co. LLC
90 Hudson Street
Jersey City, NJ 07302
(1969) | | Director since 2016 | | Principal Occupation: Partner (since 2001) and Head of Client Services (since 2013), formerly Director of Marketing and Relationship Management, joined Lord Abbett in 1994.
Other Directorships: None. |
Independent Directors
The following Independent Directors also are directors/trustees of each of the 12 investment companies in the Lord Abbett Family of Funds, which consist of 60 portfolios or series.
Name, Address and
Year of Birth | | Current Position and
Length of Service
with the Company | | Principal Occupation and Other Directorships
During the Past Five Years |
| | | | | |
Robert B. Calhoun, Jr.
Lord, Abbett & Co. LLC
c/o Legal Dept.
90 Hudson Street
Jersey City, NJ 07302
(1942) | | Director since 1998 | | Principal Occupation: Senior Advisor of Monitor Clipper Partners, a private equity investment fund (since 1997); President of Clipper Asset Management Corp. (1991–2009).
Other Directorships: None. |
60
Basic Information About Management (continued)
Name, Address and
Year of Birth | | Current Position and
Length of Service
with the Company | | Principal Occupation and Other Directorships
During the Past Five Years |
| | | | | |
Eric C. Fast
Lord, Abbett & Co. LLC
c/o Legal Dept.
90 Hudson Street
Jersey City, NJ 07302
(1949) | | Director since 2014 | | Principal Occupation: Chief Executive Officer of Crane Co., an industrial products company (2001–2014).
Other Directorships: Currently serves as director of Automatic Data Processing, Inc. (since 2007) and Regions Financial Corporation (since 2010). Previously served as a director of Crane Co. (1999–2014). |
| | | | | |
Evelyn E. Guernsey
Lord, Abbett & Co. LLC
c/o Legal Dept.
90 Hudson Street
Jersey City, NJ 07302
(1955) | | Director since 2011 | | Principal Occupation: CEO, Americas of J.P. Morgan Asset Management (2004–2010).
Other Directorships: None. |
| | | | | |
Julie A. Hill
Lord, Abbett & Co. LLC
c/o Legal Dept.
90 Hudson Street
Jersey City, NJ 07302
(1946) | | Director since 2004 | | Principal Occupation: Owner and CEO of The Hill Company, a business consulting firm (since 1998).
Other Directorships: Currently serves as director of Anthem, Inc., a health benefits company (since 1994). |
| | | | | |
Franklin W. Hobbs
Lord, Abbett & Co. LLC
c/o Legal Dept.
90 Hudson Street
Jersey City, NJ 07302
(1947) | | Director since 2001 | | Principal Occupation: Advisor of One Equity Partners, a private equity firm (since 2004).
Other Directorships: Currently serves as director and Chairman of the Board of Ally Financial Inc., a financial services firm (since 2009), and as director of Molson Coors Brewing Company (since 2002). |
| | | | | |
James M. McTaggart
Lord, Abbett & Co. LLC
c/o Legal Dept.
90 Hudson Street
Jersey City, NJ 07302
(1947) | | Director since 2012 | | Principal Occupation: Independent management advisor and consultant (since 2012); Vice President, CRA International, Inc. (doing business as Charles River Associates), a global management consulting firm (2009–2012); Founder and Chairman of Marakon Associates, Inc., a strategy consulting firm (1978–2009); and Officer and Director of Trinsum Group, a holding company (2007–2009).
Other Directorships: Currently serves as director of Blyth, Inc., a home products company (since 2004). |
| | | | | |
Mark A. Schmid
Lord, Abbett & Co. LLC
c/o Legal Dept.
90 Hudson Street
Jersey City, NJ 07302
(1959) | | Director since 2016 | | Principal Occupation: Vice President and Chief Investment Officer of the University of Chicago (since 2009).
Other Directorships: None. |
61
Basic Information About Management (continued)
Name, Address and
Year of Birth | | Current Position and
Length of Service
with the Company | | Principal Occupation and Other Directorships
During the Past Five Years |
| | | | | |
James L.L. Tullis
Lord, Abbett & Co. LLC
c/o Legal Dept.
90 Hudson Street
Jersey City, NJ 07302
(1947) | | Director since 2006; Chairman since 2017 | | Principal Occupation: CEO of Tullis-Dickerson and Co. Inc., a venture capital management firm (since 1990); CEO of Tullis Health Investors Inc. (since 2012).
Other Directorships: Currently serves as director of Crane Co. (since 1998). |
Officers
None of the officers listed below have received compensation from the Company. All of the officers of the Company also may be officers of the other Lord Abbett Funds and maintain offices at 90 Hudson Street, Jersey City, NJ 07302. Unless otherwise indicated, the position(s) and title(s) listed under the “Principal Occupation During the Past Five Years” column indicate each officer’s position(s) and title(s) with Lord Abbett. Each officer serves for an indefinite term (i.e., until his or her death, resignation, retirement, or removal).
Name and
Year of Birth | | Current Position
with the Company | | Length of Service
of Current
Position | | Principal Occupation
During the Past Five Years |
| | | | | | | |
Daria L. Foster
(1954) | | President and Chief Executive Officer | | Elected as President in 2006 and Chief Executive Officer in 2012 | | Managing Partner of Lord Abbett, joined Lord Abbett in 1990. |
| | | | | | | |
Sean J. Aurigemma
(1969) | | Executive Vice President | | Elected in 2010 | | Portfolio Manager, joined Lord Abbett in 2007. |
| | | | | | | |
Jeff D. Diamond
(1960) | | Executive Vice President | | Elected in 2008 | | Portfolio Manager, joined Lord Abbett in 2007. |
| | | | | | | |
Todd D. Jacobson
(1966) | | Executive Vice President | | Elected in 2005 | | Partner and Associate Director, joined Lord Abbett in 2003. |
| | | | | | | |
Robert A. Lee
(1969) | | Executive Vice President | | Elected in 2010 | | Partner and Chief Investment Officer, and was formerly Deputy Chief Investment Officer and Director of Taxable Fixed Income, joined Lord Abbett in 1997. |
| | | | | | | |
Thomas B. Maher
(1967) | | Executive Vice President | | Elected in 2010 | | Partner and Portfolio Manager, joined Lord Abbett in 2003. |
| | | | | | | |
Justin C. Maurer
(1969) | | Executive Vice President | | Elected in 2010 | | Partner and Portfolio Manager, joined Lord Abbett in 2001. |
| | | | | | | |
Vincent J. McBride
(1964) | | Executive Vice President | | Elected in 2010 | | Partner and Director, joined Lord Abbett in 2003. |
| | | | | | | |
Andrew H. O’Brien
(1973) | | Executive Vice President | | Elected in 2010 | | Partner and Portfolio Manager, joined Lord Abbett in 1998. |
62
Basic Information About Management (continued)
Name and
Year of Birth | | Current Position
with the Company | | Length of Service
of Current
Position | | Principal Occupation
During the Past Five Years |
| | | | | | | |
F. Thomas O’Halloran, III
(1955) | | Executive Vice President | | Elected in 2010 | | Partner and Portfolio Manager, joined Lord Abbett in 2001. |
| | | | | | | |
Marc Pavese
(1972) | | Executive Vice President | | Elected in 2016 | | Partner and Portfolio Manager, joined Lord Abbett in 2008. |
| | | | | | | |
Walter H. Prahl
(1958) | | Executive Vice President | | Elected in 2012 | | Partner and Director, joined Lord Abbett in 1997. |
| | | | | | | |
Steven F. Rocco
(1979) | | Executive Vice President | | Elected in 2014 | | Partner and Portfolio Manager, joined Lord Abbett in 2004. |
| | | | | | | |
Didier O. Rosenfeld
(1976) | | Executive Vice President | | Elected in 2016 | | Director of Global Equity, joined Lord Abbett in 2015 and was formerly a Portfolio Manager and Senior Analyst at Cornerstone Capital Management (2014–2015) and Managing Director at State Street Global Advisors (2000–2013). |
| | | | | | | |
Frederick J. Ruvkun
(1957) | | Executive Vice President | | Elected in 2012 | | Partner and Portfolio Manager, joined Lord Abbett in 2006. |
| | | | | | | |
Paul J. Volovich
(1973) | | Executive Vice President | | Elected in 2005 | | Partner and Portfolio Manager, joined Lord Abbett in 1997. |
| | | | | | | |
A. Edward Allinson
(1961) | | Vice President | | Elected in 2011 | | Portfolio Manager, joined Lord Abbett in 2005. |
| | | | | | | |
John W. Ashbrook
(1964) | | Vice President and Assistant Secretary | | Elected in 2014 | | Assistant General Counsel, joined Lord Abbett in 2008. |
| | | | | | | |
Joan A. Binstock
(1954) | | Chief Financial Officer and Vice President | | Elected in 1999 | | Partner and Chief Financial Officer, and was formerly Chief Operations Officer, joined Lord Abbett in 1999. |
| | | | | | | |
Brooke A. Fapohunda
(1975) | | Vice President and Assistant Secretary | | Elected in 2014 | | Deputy General Counsel, joined Lord Abbett in 2006. |
| | | | | | | |
John K. Forst
(1960) | | Vice President and Assistant Secretary | | Elected in 2005 | | Partner and Deputy General Counsel, joined Lord Abbett in 2004. |
| | | | | | | |
Anthony W. Hipple
(1964) | | Vice President | | Elected in 2014 | | Portfolio Manager, joined Lord Abbett in 2002. |
| | | | | | | |
Lawrence H. Kaplan
(1957) | | Vice President and Secretary | | Elected in 1997 | | Partner and General Counsel, joined Lord Abbett in 1997. |
63
Basic Information About Management (concluded)
Name and
Year of Birth | | Current Position
with the Company | | Length of Service
of Current
Position | | Principal Occupation
During the Past Five Years |
| | | | | | | |
Linda Y. Kim
(1980) | | Vice President and Assistant Secretary | | Elected in 2016 | | Counsel, joined Lord Abbett in 2015 and was formerly an Associate at Stroock & Stroock & Lavan LLP (2007–2015). |
| | | | | | | |
David J. Linsen
(1974) | | Vice President | | Elected in 2008 | | Partner and Director, joined Lord Abbett in 2001. |
| | | | | | | |
Joseph M. McGill
(1962) | | Chief Compliance Officer | | Elected in 2014 | | Partner and Chief Compliance Officer, joined Lord Abbett in 2014 and was formerly Managing Director and the Chief Compliance Officer at UBS Global Asset Management (2003–2013). |
| | | | | | | |
A. Edward Oberhaus, III
(1959) | | Vice President | | Elected in 1998 | | Partner and Director, joined Lord Abbett in 1983. |
| | | | | | | |
Noah Petrucci
(1970) | | Vice President | | Elected in 2013 | | Portfolio Manager, joined Lord Abbett in 2012 and was formerly a Portfolio Manager at Columbia Management Investment Advisers, LLC and Columbia Management Advisors, LLC (2002–2012). |
| | | | | | | |
Lawrence B. Stoller
(1963) | | Vice President and Assistant Secretary | | Elected in 2007 | | Partner and Senior Deputy General Counsel, joined Lord Abbett in 2007. |
| | | | | | | |
Leah G. Traub
(1979) | | Vice President | | Elected in 2016 | | Partner and Portfolio Manager, joined Lord Abbett in 2007. |
| | | | | | | |
Arthur K. Weise
(1970) | | Vice President | | Elected in 2010 | | Partner and Portfolio Manager, joined Lord Abbett in 2007. |
| | | | | | | |
Kewjin Yuoh
(1971) | | Vice President | | Elected in 2012 | | Partner and Portfolio Manager, joined Lord Abbett in 2010. |
| | | | | | | |
Scott S. Wallner
(1955) | | AML Compliance Officer | | Elected in 2011 | | Assistant General Counsel, joined Lord Abbett in 2004. |
| | | | | | | |
Bernard J. Grzelak
(1971) | | Treasurer | | Elected in 2003 | | Partner and Chief Operations Officer, and was formerly Director of Fund Administration, joined Lord Abbett in 2003. |
Please call 888-522-2388 for a copy of the statement of additional information, which contains further information about the Company’s Directors. It is available free upon request.
64
Approval of Advisory Contract
The Board, including all of the Directors who are not interested persons of the Fund or of Lord Abbett (the “Independent Board Members”), annually considers whether to approve the continuation of the existing management agreement between the Fund and Lord Abbett (the “Agreement”). In connection with its most recent approval, the Board reviewed materials relating specifically to the Agreement, as well as numerous materials received throughout the course of the year, including information about the Fund’s investment performance compared to the performance of its benchmark. Before making its decision as to the Fund, the Board had the opportunity to ask questions and request further information, taking into account its familiarity with Lord Abbett gained through its meetings and discussions. These meetings and discussions included the review of the portfolio management team conducted by members of the Contract Committee, the deliberations of the Contract Committee, and discussions between the Contract Committee and Lord Abbett’s management. The Independent Board Members also met with their independent legal counsel in a private session at which no representatives of management were present.
The materials received by the Board included, but were not limited to: (1) information provided by Morningstar Associates, LLC (“Morningstar”) regarding the investment performance of the Fund compared to the investment performance of certain funds with similar investment styles as determined by Morningstar, based, in part, on the Fund’s Morningstar category (the “performance peer group”), and the investment performance of the Fund’s benchmark; (2) information provided by Morningstar regarding the expense ratios, contractual and effective management fee rates, and other expense components for the Fund and certain funds in the same Morningstar category, with generally the same or similar share classes and operational characteristics, including asset size (the “expense peer group”); (3) certain supplemental investment performance information provided by Lord Abbett; (4) information provided by Lord Abbett on the expense ratios, management fee rates, and other expense components for the Fund; (5) sales and redemption information for the Fund; (6) information regarding Lord Abbett’s financial condition; (7) an analysis of the relative profitability of the Agreement to Lord Abbett; (8) information provided by Lord Abbett regarding the investment management fee schedules for Lord Abbett’s other advisory clients maintaining accounts with a similar investment strategy as the Fund; and (9) information regarding the personnel and other resources devoted by Lord Abbett to managing the Fund.
Investment Management Services Generally. The Board considered the investment management services provided by Lord Abbett to the Fund, including investment research, portfolio management, and trading, and Lord Abbett’s commitment to compliance with all applicable legal requirements. The Board also observed that Lord Abbett was solely engaged in the investment management business and accordingly did not experience the conflicts of interest that may result from being engaged in other lines of business. The Board considered the investment advisory services provided by Lord Abbett to other clients, the fees charged for the services, and the differences in the nature of the services provided to the Fund and other Lord Abbett Funds, on the one hand, and the services provided to other clients, on the other. After reviewing these and related factors, the Board concluded that the Fund was likely to continue to benefit from the nature, extent and quality of the investment services provided by Lord Abbett under the Agreement.
Investment Performance. The Board reviewed the Fund’s investment performance in relation to that of the performance peer group and the Fund’s benchmark as of the trailing one-year period ended August 31, 2016. The Board observed that the Fund’s investment performance was above the median of the performance peer group for the period. The Board also considered Lord Abbett’s performance and reputation generally, the performance of other Lord Abbett-managed funds
65
Approval of Advisory Contract (continued)
overseen by the Board and the willingness of Lord Abbett to take steps intended to improve performance when necessary. After reviewing these and related factors, the Board concluded that the Fund’s investment performance was reasonable and supported the continuation of the Agreement.
Lord Abbett’s Personnel and Methods. The Board considered the qualifications of the personnel providing investment management services to the Fund, in light of its investment objective and discipline. Among other things, the Board considered the size, experience, and turnover of Lord Abbett’s investment management staff, Lord Abbett’s investment methodology and philosophy, and Lord Abbett’s approach to recruiting, training, and retaining investment management personnel.
Nature and Quality of Other Services. The Board considered the nature, quality, costs, and extent of compliance, administrative, and other services performed by Lord Abbett and the nature and extent of Lord Abbett’s supervision of third party service providers, including the Fund’s transfer agent and custodian.
Expenses. The Board considered the expense level of the Fund and the expense levels of the expense peer group. It also considered how the expense levels of the Fund related to those of the expense peer group and the amount and nature of the fees paid by shareholders. The Board observed that the overall expense level of the Fund was equal to the median of the expense peer group. After reviewing these and related factors, the Board concluded, within the context of its overall approval of the Agreement, that the expense level of the Fund was reasonable and supported the continuation of the Agreement.
Profitability. The Board considered the level of Lord Abbett’s operating margin in managing the Fund, including a review of Lord Abbett’s methodology for allocating its costs to its management of the Fund. It considered whether the Fund was profitable to Lord Abbett in connection with the operation of the Fund, including the fee that Lord Abbett receives from the Fund for providing administrative services to the Fund. The Board also considered the profits realized from other business segments of Lord Abbett, which may benefit from or be related to the Fund’s business. The Board considered Lord Abbett’s profit margins in comparison with available industry data, both accounting for and excluding marketing and distribution expenses, and how those profit margins could affect Lord Abbett’s ability to recruit and retain investment personnel. The Board recognized that Lord Abbett’s overall profitability was a factor in enabling it to attract and retain qualified investment management personnel to provide services to the Fund. After reviewing these and related factors, the Board concluded, within the context of its overall approval of the Agreement, that Lord Abbett’s profitability with respect to the Fund was not excessive.
Economies of Scale. The Board considered the extent to which there had been economies of scale in managing the Fund, whether the Fund’s shareholders had appropriately benefited from such economies of scale, and whether there was potential for realization of any further economies of scale. The Board concluded that the existing management fee schedule, with its breakpoints in the levels of the management fee, in conjunction with a proposed expense limitation agreement adequately addressed any economies of scale in managing the Fund.
Other Benefits to Lord Abbett. The Board considered the character and amount of fees paid by the Fund and the Fund’s shareholders to Lord Abbett and the Distributor for services other than investment advisory services. The Board also considered the revenues and profitability of Lord Abbett’s investment advisory business apart from its mutual fund business, and the intangible
66
Approval of Advisory Contract (concluded)
benefits enjoyed by Lord Abbett by virtue of its relationship with the Fund. The Board observed that the Distributor receives 12b-1 fees from certain of the Lord Abbett Funds as to shares held in accounts for which there is no other broker of record, may retain a portion of the 12b-1 fees it receives, and receives a portion of the sales charges on sales and redemptions of some classes of shares. In addition, the Board observed that Lord Abbett accrues certain benefits for its business of providing investment advice to clients other than the Lord Abbett Funds, but that business also benefits the Funds. The Board also noted that Lord Abbett, as disclosed in the prospectus of the Fund, has entered into revenue sharing arrangements with certain entities that distribute shares of the Fund. The Board also took into consideration the investment research that Lord Abbett receives as a result of Fund brokerage transactions.
Alternative Arrangements. The Board considered whether, instead of approving continuation of the Agreement, it might be in the best interests of the Fund to implement one or more alternative arrangements, such as continuing to employ Lord Abbett, but on different terms. After considering all of the relevant factors, the Board unanimously found that continuation of the Agreement was in the best interests of the Fund and its shareholders and voted unanimously to approve the continuation of the Agreement. In considering whether to approve the continuation of the Agreement, the Board did not identify any single factor as paramount or controlling. Individual Directors may have evaluated the information presented differently from one another, giving different weights to various factors. This summary does not discuss in detail all matters considered.
67
Householding
The Company has adopted a policy that allows it to send only one copy of the Fund’s prospectus, proxy material, annual report and semiannual report to certain shareholders residing at the same “household.” This reduces Fund expenses, which benefits you and other shareholders. If you need additional copies or do not want your mailings to be “householded,” please call Lord Abbett at 888-522-2388 or send a written request with your name, the name of your fund or funds and your account number or numbers to Lord Abbett Family of Funds, P.O. Box 219336, Kansas City, MO 64121.
Proxy Voting Policies, Procedures and Records
A description of the policies and procedures that Lord Abbett uses to vote proxies related to the Fund’s portfolio securities, and information on how Lord Abbett voted the Fund’s proxies during the 12-month period ended June 30 are available without charge, upon request, (i) by calling 888-522-2388; (ii) on Lord Abbett’s Website at www.lordabbett.com; and (iii) on the Securities and Exchange Commission’s (“SEC”) Website at www.sec.gov.
Shareholder Reports and Quarterly Portfolio Disclosure
The Fund is required to file its complete schedule of portfolio holdings with the SEC for its first and third fiscal quarters on Form N-Q. Copies of the filings are available without charge, upon request on the SEC’s Website at www.sec.gov and may be available by calling Lord Abbett at 888-522-2388. You can also obtain copies of Form N-Q by visiting the SEC’s Public Reference Room in Washington, DC (information on the operation of the Public Reference Room may be obtained by calling 800-SEC-0330).
68


| This report, when not used for the general information of shareholders of the Fund, is to be distributed only if preceded or accompanied by a current fund prospectus. | | | |
| | | Lord Abbett Series Fund, Inc. | |
Lord Abbett mutual fund shares are distributed by
LORD ABBETT DISTRIBUTOR LLC. | | Short Duration Income Portfolio | SFSDI-PORT-3
(02/17) |

2016 LORD ABBETT
ANNUAL REPORT
Lord Abbett
Series Fund—Total Return Portfolio
For the fiscal year ended December 31, 2016
Table of Contents
Lord Abbett Series Fund — Total Return Portfolio
Annual Report
For the fiscal year ended December 31, 2016

From left to right: James L.L. Tullis, Chairman of the Lord Abbett Funds and Daria L. Foster Director, President, and Chief Executive Officer of the Lord Abbett Funds.
Dear Shareholders: We are pleased to provide you with this overview of the performance of Lord Abbett Series Fund - Total Return Portfolio for the fiscal year ended December 31, 2016. On this page and the following pages, we discuss the major factors that influenced fiscal year performance. For additional information about the Fund, please visit our website at www.lordabbett.com, where you also can access the quarterly commentaries that provide updates on the Fund’s performance and other portfolio related updates.
Thank you for investing in Lord Abbett mutual funds. We value the trust that you place in us and look forward to serving your investment needs in the years to come.
Best regards,

Daria L. Foster
Director, President and Chief Executive Officer
For the fiscal year ended December 31, 2016, the Fund returned 4.26%, reflecting performance at the net asset value (NAV) of Class VC shares, with all distributions reinvested, compared to its benchmark, the Bloomberg Barclays U.S. Universal Index,1 which returned 3.91% over the same period.
Yields on longer-dated Treasury bonds were relatively flat, rising only slightly over the 12-month period ended December 31, 2016, while the yield on shorter-dated two-year Treasury notes increased 0.18% over
the same period, leading to a slight flattening of the Treasury yield curve. Corporate credit spreads narrowed over the 12-month period, particularly within lower-rated, investment grade debt. Consumer prices rose at a moderate pace, with the Consumer Price Index (CPI) rising 2.1% over the 12-month period ended December 31, 2016. Meanwhile, the employment picture continued to improve as the unemployment rate remained steady at 4.7%, with 156,000 jobs added in December 2016; employment growth has averaged 165,000 per month,
1
over the last three months. This compares with an unemployment rate of 5.0% a year earlier and a recent high of 10.0% in October 2009. In December, the U.S. Federal Reserve (Fed) raised its target for short-term interest rates 0.25%, to a range of 0.50% - 0.75%, as economic data continued to suggest a strengthening domestic economy.
Spreads on investment grade corporates tightened from January 2016 to December 2016, while spreads on high yield corporates narrowed much more significantly. In the 12-month period ended December 2016, high yield corporates comfortably outperformed the investment grade segment of the fixed income market, including both investment grade corporates and Treasuries.
Security selection within the corporate bond allocation was a significant
contributor to performance of the Fund relative to the benchmark during the period. Within the investment grade corporate sector, the Fund concentrated on ‘BBB’ rated bonds, which outperformed higher-rated issues. The Fund’s overweight to high yield corporate bonds also contributed to relative performance.
The Fund’s sector allocation related to the sovereign issues of both developed countries and emerging markets detracted from relative performance, as sovereign debt outperformed the broad fixed income market.
The Fund’s portfolio is actively managed and, therefore, its holdings and the weightings of a particular issuer or particular sector as a percentage of portfolio assets are subject to change. Sectors may include many industries.
1 The Bloomberg Barclays U.S. Universal Index represents the union of the U.S. Aggregate Index, the U.S High Yield Corporate Index, the 144A Index, the Eurodollar Index, the Emerging Markets Index, and the non-ERISA portion of the CMBS Index. Municipal debt, private placements, and non-dollar-denominated issues are excluded from the Universal Index. The only constituent of the index that includes floating-rate debt is the Emerging Markets Index.
Unless otherwise specified, indexes reflect total return, with all dividends reinvested. Indexes are unmanaged, do not reflect the deduction of fees or expenses, and are not available for direct investment.
Important Performance and Other Information
Performance data quoted in the following pages reflect past performance and are no guarantee of future results. Current performance may be higher or lower than the performance quoted. The investment return and principal value of an investment in the Funds will fluctuate so that shares, on any given day or when redeemed, may
be worth more or less than their original cost. You can obtain performance data current to the most recent month end by calling Lord Abbett at 888-522-2388 or referring to www.lordabbett.com.
During certain periods shown, expense waivers and reimbursements were in place. Without such expense waivers and reimbursements, the Funds’ returns would have been lower.
The annual commentary above discusses the views of the Fund’s management and various portfolio holdings of the Funds as of December 31, 2016. These views and portfolio holdings may have changed after this date. Information provided in the commentary is not a recommendation to buy or sell securities. Because the Fund’s portfolio is actively managed and may change significantly, the Fund may no longer own the securities described above or may have otherwise changed their positions in the securities. For more recent information about the Fund’s portfolio holdings, please visit www.lordabbett.com.
2
A Note about Risk: See Notes to Financial Statements for a discussion of investment risks. For a more detailed discussion of the risks associated with each Fund, please see the Fund’s prospectus.
Mutual funds are not insured by the FDIC, are not deposits or other obligations of, or guaranteed by,
banks, and are subject to investment risks including possible loss of principal amount invested.
The Fund serves as an underlying investment vehicle for variable annuity contracts and variable life insurance policies.
3
Investment Comparison
Below is a comparison of a $10,000 investment in Class VC shares with the same investment in both the Bloomberg Barclays U.S. Universal Index and the Bloomberg Barclays U.S. Aggregate Bond Index, assuming reinvestment of all dividends and distributions. The Fund’s shares are sold only to insurance company separate accounts that fund certain variable annuity and variable life contracts. The line graph comparison does not reflect the sales charges or other expenses of these contracts. If those sales charges and expenses were reflected, returns would be lower. The graph and performance table below do not reflect the deduction of taxes that a shareholder would pay on Fund distributions or the redemption of Fund shares. During the period, expenses of the Fund were waived or reimbursed by Lord Abbett; without such waiver or reimbursement of expenses, the Fund’s returns would have been lower. Past performance is no guarantee of future results.

| | Average Annual Total Returns for the
Periods Ended December 31, 2016 |
| | 1 Year | 5 Years | Life of Class |
| Class VC2 | 4.26% | 3.03% | 4.30% |
1 Performance for each unmanaged index does not reflect any fees or expenses. The performance of each index is not necessarily representative of the Fund’s performance. Performance for each index began on May 1, 2010.
2 The Class VC shares commenced operations on April 16, 2010. Performance for the Class began on May 1, 2010.
4
Expense Example
As a shareholder of the Fund, you incur ongoing costs, including management fees; expenses related to the Fund’s services arrangements with certain insurance companies; and other Fund expenses. This Example is intended to help you understand your ongoing costs (in dollars) of investing in the Fund and to compare these costs with the ongoing costs of investing in other mutual funds.
The Example is based on an investment of $1,000 invested at the beginning of the period and held for the entire period (July 1, 2016 through December 31, 2016).
The Example reflects only expenses that are deducted from the assets of the Fund. Fees and expenses, including sales charges applicable to the various insurance products that invest in the Fund, are not reflected in this Example. If such fees and expenses were reflected in the Example, the total expenses shown would be higher. Fees and expenses regarding such variable insurance products are separately described in the prospectus related to those products.
Actual Expenses
The first line of the table on the following page provides information about actual account values and actual expenses. You may use the information in this line, together with the amount you invested, to estimate the expenses that you paid over the period. Simply divide your account value by $1,000 (for example, an $8,600 account value divided by $1,000 = 8.6), then multiply the result by the number in the first line under the heading titled “Expenses Paid During Period 7/1/16 – 12/31/16” to estimate the expenses you paid on your account during this period.
Hypothetical Example for Comparison Purposes
The second line of the table on the following page provides information about hypothetical account values and hypothetical expenses based on the Fund’s actual expense ratio and an assumed rate of return of 5% per year before expenses, which is not the Fund’s actual return. The hypothetical account values and expenses may not be used to estimate the actual ending account balance or expenses you paid for the period. You may use this information to compare the ongoing costs of investing in the Fund and other funds. To do so, compare this 5% hypothetical example with the 5% hypothetical examples that appear in the shareholder reports of the other funds.
5
Please note that the expenses shown in the table are meant to highlight your ongoing costs only and do not reflect any transactional costs, such as sales charges. Therefore, the second line of the table is useful in comparing ongoing costs only, and will not help you determine the relative total costs of owning different funds. In addition, if these transactional costs were included, your costs would have been higher.
| | | Beginning | | Ending | | Expenses | |
| | | Account | | Account | | Paid During | |
| | | Value | | Value | | Period† | |
| | | | | | | 7/1/16 - | |
| | | 7/1/16 | | 12/31/16 | | 12/31/16 | |
| Class VC | | | | | | | |
| Actual | | $1,000.00 | | $ 987.30 | | $3.20 | |
| Hypothetical (5% Return Before Expenses) | | $1,000.00 | | $1,021.92 | | $3.25 | |
| † | Net expenses are equal to the Fund’s annualized expense ratio of 0.64%, multiplied by the average account value over the period, multiplied by 184/366 (to reflect one-half year period). |
Portfolio Holdings Presented by Sector
December 31, 2016
| Sector* | %** |
| Auto | 0.61 | % |
| Basic Industry | 0.04 | % |
| Capital Goods | 0.12 | % |
| Consumer Cyclical | 0.86 | % |
| Consumer Discretionary | 0.36 | % |
| Consumer Services | 1.96 | % |
| Consumer Staples | 0.59 | % |
| Energy | 3.34 | % |
| Financial Services | 30.39 | % |
| Foreign Government | 3.15 | % |
| Government | 50.98 | % |
| Health Care | 0.40 | % |
| Integrated Oils | 0.69 | % |
| Materials & Processing | 2.27 | % |
| Municipal | 0.39 | % |
| Producer Durables | 0.29 | % |
| Technology | 1.07 | % |
| Telecommunications | 1.13 | % |
| Transportation | 0.24 | % |
| Utilities | 0.99 | % |
| Repurchase Agreement | 0.13 | % |
| Total | 100.00 | % |
| * | A sector may comprise several industries. |
| ** | Represents percent of total investments. |
6
Schedule of Investments
December 31, 2016
| Investments | | Interest
Rate | | Maturity
Date | | Principal
Amount
(000) | | | Fair
Value | |
| LONG-TERM INVESTMENTS 111.85% | | | | | | | | | | | | |
| | | | | | | | | | | | | |
| ASSET-BACKED SECURITIES 23.12% | | | | | | | | | | | | |
| | | | | | | | | | | | | |
| Automobiles 12.81% | | | | | | | | | | | | |
| American Credit Acceptance Receivables Trust 2015-1 C† | | 4.29% | | 4/12/2021 | | $ | 717 | | | $ | 729,783 | |
| AmeriCredit Automobile Receivables Trust 2013-1 C | | 1.57% | | 1/8/2019 | | | 106 | | | | 106,365 | |
| AmeriCredit Automobile Receivables Trust 2014-1 A3 | | 0.90% | | 2/8/2019 | | | 65 | | | | 64,675 | |
| AmeriCredit Automobile Receivables Trust 2014-1 C | | 2.15% | | 3/9/2020 | | | 402 | | | | 404,359 | |
| AmeriCredit Automobile Receivables Trust 2014-2 A3 | | 0.94% | | 2/8/2019 | | | 243 | | | | 242,927 | |
| AmeriCredit Automobile Receivables Trust 2014-4 A3 | | 1.27% | | 7/8/2019 | | | 630 | | | | 629,793 | |
| AmeriCredit Automobile Receivables Trust 2015-2 C | | 2.40% | | 1/8/2021 | | | 1,977 | | | | 1,994,395 | |
| AmeriCredit Automobile Receivables Trust 2015-3 A3 | | 1.54% | | 3/9/2020 | | | 475 | | | | 475,525 | |
| AmeriCredit Automobile Receivables Trust 2016-2 A2A | | 1.42% | | 10/8/2019 | | | 249 | | | | 249,639 | |
| AmeriCredit Automobile Receivables Trust 2016-3 A3 | | 1.46% | | 5/10/2021 | | | 1,140 | | | | 1,134,716 | |
| AmeriCredit Automobile Receivables Trust 2016-4 A2A | | 1.34% | | 4/8/2020 | | | 438 | | | | 437,865 | |
| Avis Budget Rental Car Funding AESOP LLC 2011-5A A† | | 3.27% | | 2/20/2018 | | | 134 | | | | 134,241 | |
| Avis Budget Rental Car Funding AESOP LLC 2012-2A A† | | 2.802% | | 5/20/2018 | | | 957 | | | | 959,458 | |
| Avis Budget Rental Car Funding AESOP LLC 2012-3A A† | | 2.10% | | 3/20/2019 | | | 525 | | | | 525,673 | |
| Avis Budget Rental Car Funding AESOP LLC 2013-1A A† | | 1.92% | | 9/20/2019 | | | 1,070 | | | | 1,065,045 | |
| Avis Budget Rental Car Funding AESOP LLC 2013-2A A† | | 2.97% | | 2/20/2020 | | | 535 | | | | 540,811 | |
| Avis Budget Rental Car Funding AESOP LLC 2014-1A A† | | 2.46% | | 7/20/2020 | | | 592 | | | | 590,940 | |
| Avis Budget Rental Car Funding AESOP LLC 2014-2A A† | | 2.50% | | 2/20/2021 | | | 758 | | | | 755,471 | |
| Avis Budget Rental Car Funding AESOP LLC 2015-1A A† | | 2.50% | | 7/20/2021 | | | 970 | | | | 963,460 | |
| | See Notes to Financial Statements. | 7 |
Schedule of Investments (continued)
December 31, 2016
| Investments | | Interest
Rate | | Maturity
Date | | Principal
Amount
(000) | | | Fair
Value | |
| Automobiles (continued) | | | | | | | | | | | | |
| Avis Budget Rental Car Funding AESOP LLC 2015-2A A† | | 2.63% | | 12/20/2021 | | $ | 367 | | | $ | 362,864 | |
| BMW Vehicle Lease Trust 2015-1 A3 | | 1.24% | | 12/20/2017 | | | 731 | | | | 731,225 | |
| BMW Vehicle Owner Trust 2013-A A4 | | 1.12% | | 4/27/2020 | | | 119 | | | | 118,655 | |
| California Republic Auto Receivables Trust 2014-3 B | | 2.66% | | 8/17/2020 | | | 376 | | | | 378,298 | |
| California Republic Auto Receivables Trust 2015-2 A4 | | 1.75% | | 1/15/2021 | | | 525 | | | | 525,136 | |
| California Republic Auto Receivables Trust 2015-2 B | | 2.53% | | 6/15/2021 | | | 908 | | | | 900,493 | |
| California Republic Auto Receivables Trust 2015-3 B | | 2.70% | | 9/15/2021 | | | 120 | | | | 120,157 | |
| California Republic Auto Receivables Trust 2016-1 A2 | | 1.50% | | 12/17/2018 | | | 556 | | | | 556,881 | |
| California Republic Auto Receivables Trust 2016-1 A4 | | 2.24% | | 10/15/2021 | | | 1,633 | | | | 1,642,677 | |
| California Republic Auto Receivables Trust 2016-2 A3 | | 1.56% | | 7/15/2020 | | | 183 | | | | 182,745 | |
| California Republic Auto Receivables Trust 2016-2 A4 | | 1.83% | | 12/15/2021 | | | 240 | | | | 238,655 | |
| Capital Auto Receivables Asset Trust 2014-3 B† | | 2.35% | | 7/22/2019 | | | 938 | | | | 945,471 | |
| Capital Auto Receivables Asset Trust 2015-1 A3 | | 1.61% | | 6/20/2019 | | | 680 | | | | 681,489 | |
| Capital Auto Receivables Asset Trust 2015-2 A1A | | 0.99% | | 10/20/2017 | | | 61 | | | | 61,197 | |
| Capital Auto Receivables Asset Trust 2015-2 A2 | | 1.39% | | 9/20/2018 | | | 485 | | | | 485,320 | |
| Capital Auto Receivables Asset Trust 2016-2 A3 | | 1.46% | | 6/22/2020 | | | 368 | | | | 366,936 | |
| Capital Auto Receivables Asset Trust 2016-2 A4 | | 1.63% | | 1/20/2021 | | | 193 | | | | 191,172 | |
| CarMax Auto Owner Trust 2014-1 A4 | | 1.32% | | 7/15/2019 | | | 331 | | | | 331,037 | |
| CarMax Auto Owner Trust 2015-2 A2A | | 0.82% | | 6/15/2018 | | | 27 | | | | 27,110 | |
| CarMax Auto Owner Trust 2015-2 A3 | | 1.37% | | 3/16/2020 | | | 201 | | | | 201,091 | |
| CarMax Auto Owner Trust 2015-4 A3 | | 1.56% | | 11/16/2020 | | | 382 | | | | 382,263 | |
| CarMax Auto Owner Trust 2016-1 A2A | | 1.30% | | 4/15/2019 | | | 448 | | | | 447,741 | |
| CarMax Auto Owner Trust 2016-3 A2 | | 1.17% | | 8/15/2019 | | | 738 | | | | 737,654 | |
| CarMax Auto Owner Trust 2016-3 A3 | | 1.39% | | 5/17/2021 | | | 553 | | | | 550,030 | |
| CarMax Auto Owner Trust 2016-3 A4 | | 1.60% | | 1/18/2022 | | | 549 | | | | 541,852 | |
| CarMax Auto Owner Trust 2016-4 A2 | | 1.21% | | 11/15/2019 | | | 374 | | | | 373,334 | |
| CarMax Auto Owner Trust 2016-4 A3 | | 1.40% | | 8/15/2021 | | | 173 | | | | 171,236 | |
| CarMax Auto Owner Trust 2016-4 A4 | | 1.60% | | 6/15/2022 | | | 223 | | | | 219,168 | |
| Chesapeake Funding II LLC 2016-2A A1† | | 1.88% | | 6/15/2028 | | | 811 | | | | 809,194 | |
| Chrysler Capital Auto Receivables Trust 2014-BA A3† | | 1.27% | | 5/15/2019 | | | 276 | | | | 275,747 | |
| 8 | See Notes to Financial Statements. | |
Schedule of Investments (continued)
December 31, 2016
| Investments | | Interest
Rate | | Maturity
Date | | Principal
Amount
(000) | | | Fair
Value | |
| Automobiles (continued) | | | | | | | | | | | | |
| Chrysler Capital Auto Receivables Trust 2014-BA D† | | 3.44% | | 8/16/2021 | | $ | 367 | | | $ | 371,790 | |
| Chrysler Capital Auto Receivables Trust 2016-AA A2† | | 1.47% | | 4/15/2019 | | | 354 | | | | 354,294 | |
| Chrysler Capital Auto Receivables Trust 2016-AA B† | | 2.88% | | 2/15/2022 | | | 195 | | | | 197,279 | |
| Chrysler Capital Auto Receivables Trust 2016-AA C† | | 3.25% | | 6/15/2022 | | | 134 | | | | 133,713 | |
| CPS Auto Receivables Trust 2016-B D† | | 6.58% | | 3/15/2022 | | | 250 | | | | 261,714 | |
| Drive Auto Receivables Trust 2015-AA B† | | 2.28% | | 6/17/2019 | | | 151 | | | | 151,052 | |
| Drive Auto Receivables Trust 2015-AA C† | | 3.06% | | 5/17/2021 | | | 242 | | | | 244,433 | |
| Drive Auto Receivables Trust 2015-BA B† | | 2.12% | | 6/17/2019 | | | 141 | | | | 141,139 | |
| Drive Auto Receivables Trust 2015-CA B† | | 2.23% | | 9/16/2019 | | | 123 | | | | 122,987 | |
| Drive Auto Receivables Trust 2015-DA C† | | 3.38% | | 11/15/2021 | | | 585 | | | | 594,756 | |
| Drive Auto Receivables Trust 2015-DA D† | | 4.59% | | 1/17/2023 | | | 607 | | | | 623,594 | |
| Drive Auto Receivables Trust 2016-BA A2† | | 1.38% | | 8/15/2018 | | | 404 | | | | 403,896 | |
| Drive Auto Receivables Trust 2016-BA A3† | | 1.67% | | 7/15/2019 | | | 809 | | | | 809,770 | |
| Drive Auto Receivables Trust 2016-CA B† | | 2.37% | | 11/16/2020 | | | 284 | | | | 283,429 | |
| Drive Auto Receivables Trust 2016-CA C† | | 3.02% | | 11/15/2021 | | | 756 | | | | 756,909 | |
| Drive Auto Receivables Trust 2016-CA D† | | 4.18% | | 3/15/2024 | | | 180 | | | | 178,836 | |
| First Investors Auto Owner Trust 2013-2A D† | | 3.58% | | 6/15/2020 | | | 261 | | | | 262,257 | |
| First Investors Auto Owner Trust 2015-2A A1† | | 1.59% | | 12/16/2019 | | | 424 | | | | 423,903 | |
| First Investors Auto Owner Trust 2016-2A A1† | | 1.53% | | 11/16/2020 | | | 514 | | | | 513,854 | |
| Ford Credit Auto Owner Trust 2013-D A3 | | 0.67% | | 4/15/2018 | | | 29 | | | | 29,188 | |
| Ford Credit Auto Owner Trust 2014-C A3 | | 1.06% | | 5/15/2019 | | | 573 | | | | 572,270 | |
| Ford Credit Auto Owner Trust 2016-B A2A | | 1.08% | | 3/15/2019 | | | 866 | | | | 865,845 | |
| Ford Credit Auto Owner Trust 2016-C A2A | | 1.04% | | 9/15/2019 | | | 752 | | | | 750,504 | |
| Ford Credit Auto Owner Trust 2016-C B | | 1.73% | | 3/15/2022 | | | 356 | | | | 351,647 | |
| Ford Credit Auto Owner Trust 2016-C C | | 1.93% | | 4/15/2023 | | | 224 | | | | 220,342 | |
| GM Financial Automobile Leasing Trust 2014-2A A3† | | 1.22% | | 1/22/2018 | | | 109 | | | | 108,887 | |
| Harley-Davidson Motorcycle Trust 2015-2 A4 | | 1.66% | | 12/15/2022 | | | 299 | | | | 299,825 | |
| Honda Auto Receivables Owner Trust 2014-4 A3 | | 0.99% | | 9/17/2018 | | | 530 | | | | 530,089 | |
| Honda Auto Receivables Owner Trust 2015-1 A3 | | 1.05% | | 10/15/2018 | | | 613 | | | | 612,255 | |
| Honda Auto Receivables Owner Trust 2016-4 A2 | | 1.04% | | 4/18/2019 | | | 729 | | | | 727,385 | |
| Huntington Auto Trust 2016-1 A3 | | 1.59% | | 11/16/2020 | | | 863 | | | | 861,590 | |
| Hyundai Auto Receivables Trust 2013-B A4 | | 1.01% | | 2/15/2019 | | | 116 | | | | 115,936 | |
| M&T Bank Auto Receivables Trust 2013-1A A4† | | 1.57% | | 8/15/2018 | | | 442 | | | | 442,676 | |
| Mercedes-Benz Auto Lease Trust 2016-A A2A | | 1.34% | | 7/16/2018 | | | 840 | | | | 840,529 | |
| | See Notes to Financial Statements. | 9 |
Schedule of Investments (continued)
December 31, 2016
| Investments | | Interest
Rate | | Maturity
Date | | Principal
Amount
(000) | | | Fair
Value | |
| Automobiles (continued) | | | | | | | | | | | | |
| Mercedes-Benz Auto Receivables Trust 2016-1 A2A | | 1.11% | | 3/15/2019 | | $ | 1,425 | | | $ | 1,424,766 | |
| NextGear Floorplan Master Owner Trust 2016-1A A2† | | 2.74% | | 4/15/2021 | | | 657 | | | | 660,914 | |
| Porsche Financial Auto Securitization Trust 2014-1 A4† | | 1.14% | | 12/23/2021 | | | 1,228 | | | | 1,227,932 | |
| Porsche Innovative Lease Owner Trust 2014-1 A3† | | 1.03% | | 11/20/2017 | | | 59 | | | | 58,867 | |
| Santander Drive Auto Receivables Trust 2014-2 C | | 2.33% | | 11/15/2019 | | | 375 | | | | 376,936 | |
| Santander Drive Auto Receivables Trust 2014-3 C | | 2.13% | | 8/17/2020 | | | 2,302 | | | | 2,310,726 | |
| Santander Drive Auto Receivables Trust 2014-4 B | | 1.82% | | 5/15/2019 | | | 293 | | | | 293,401 | |
| Santander Drive Auto Receivables Trust 2014-4 C | | 2.60% | | 11/16/2020 | | | 638 | | | | 643,280 | |
| Santander Drive Auto Receivables Trust 2015-1 C | | 2.57% | | 4/15/2021 | | | 1,924 | | | | 1,941,577 | |
| Santander Drive Auto Receivables Trust 2015-5 A3 | | 1.58% | | 9/16/2019 | | | 457 | | | | 457,539 | |
| Santander Drive Auto Receivables Trust 2016-2 A2A | | 1.38% | | 7/15/2019 | | | 323 | | | | 323,637 | |
| Santander Drive Auto Receivables Trust 2016-2 B | | 2.08% | | 2/16/2021 | | | 190 | | | | 190,220 | |
| Santander Drive Auto Receivables Trust 2016-3 A2 | | 1.34% | | 11/15/2019 | | | 483 | | | | 483,179 | |
| Santander Drive Auto Receivables Trust 2016-3 B | | 1.89% | | 6/15/2021 | | | 264 | | | | 262,681 | |
| SunTrust Auto Receivables Trust 2015-1A A2† | | 0.99% | | 6/15/2018 | | | 118 | | | | 117,764 | |
| SunTrust Auto Receivables Trust 2015-1A A3† | | 1.42% | | 9/16/2019 | | | 2,091 | | | | 2,091,022 | |
| SunTrust Auto Receivables Trust 2015-1A D† | | 3.24% | | 1/16/2023 | | | 754 | | | | 736,780 | |
| TCF Auto Receivables Owner Trust 2015-1A A3† | | 1.49% | | 12/16/2019 | | | 1,117 | | | | 1,117,709 | |
| TCF Auto Receivables Owner Trust 2015-1A B† | | 2.49% | | 4/15/2021 | | | 791 | | | | 796,555 | |
| TCF Auto Receivables Owner Trust 2016-PT1A B† | | 2.92% | | 10/17/2022 | | | 443 | | | | 441,497 | |
| Toyota Auto Receivables Owner Trust 2016-B A2A | | 1.02% | | 10/15/2018 | | | 563 | | | | 562,714 | |
| Wheels SPV 2 LLC 2016-1A A2† | | 1.59% | | 5/20/2025 | | | 868 | | | | 864,473 | |
| World Omni Automobile Lease Securitization Trust 2014-A A3 | | 1.16% | | 9/15/2017 | | | 177 | | | | 176,690 | |
| Total | | | | | | | | | | | 57,281,401 | |
| | | | | | | | | | | | | |
| Credit Cards 2.59% | | | | | | | | | | | | |
| Capital One Multi-Asset Execution Trust 2014-A1 | | 1.08% | # | 11/15/2019 | | | 1,771 | | | | 1,771,018 | |
| Capital One Multi-Asset Execution Trust 2014-A2 | | 1.26% | | 1/15/2020 | | | 424 | | | | 424,245 | |
| Capital One Multi-Asset Execution Trust 2015-A1 | | 1.39% | | 1/15/2021 | | | 370 | | | | 369,918 | |
| Capital One Multi-Asset Execution Trust 2016-A1 | | 1.154% | # | 2/15/2022 | | | 1,335 | | | | 1,341,063 | |
| Chase Issuance Trust 2014-A1 | | 1.15% | | 1/15/2019 | | | 1,940 | | | | 1,940,022 | |
| Chase Issuance Trust 2014-A6 | | 1.26% | | 7/15/2019 | | | 800 | | | | 800,561 | |
| Chase Issuance Trust 2015-A2 | | 1.59% | | 2/18/2020 | | | 279 | | | | 279,848 | |
| Citibank Credit Card Issuance Trust 2014-A2 | | 1.02% | | 2/22/2019 | | | 1,699 | | | | 1,698,972 | |
| Discover Card Execution Note Trust 2014-A3 | | 1.22% | | 10/15/2019 | | | 2,440 | | | | 2,440,949 | |
| Synchrony Credit Card Master Note Trust 2016-2 B | | 2.55% | | 5/15/2024 | | | 504 | | | | 513,608 | |
| Total | | | | | | | | | | | 11,580,204 | |
| 10 | See Notes to Financial Statements. | |
Schedule of Investments (continued)
December 31, 2016
| Investments | | Interest
Rate | | Maturity
Date | | Principal
Amount
(000) | | | Fair
Value | |
| Home Equity 0.08% | | | | | | | | | | | | |
| Asset Backed Securities Corp. Home Equity Loan | | | | | | | | | | | | |
| Trust Series NC 2006-HE4 A5 | | 0.916% | # | 5/25/2036 | | $ | 33 | | | $ | 31,832 | |
| Meritage Mortgage Loan Trust 2004-2 M3 | | 1.731% | # | 1/25/2035 | | | 290 | | | | 278,182 | |
| New Century Home Equity Loan Trust 2005-A A6 | | 4.884% | | 8/25/2035 | | | 50 | | | | 50,412 | |
| Total | | | | | | | | | | | 360,426 | |
| | | | | | | | | | | | | |
| Other 7.64% | | | | | | | | | | | | |
| Ally Master Owner Trust 2012-4 A | | 1.72% | | 7/15/2019 | | | 821 | | | | 823,103 | |
| Ally Master Owner Trust 2012-5 A | | 1.54% | | 9/15/2019 | | | 1,129 | | | | 1,130,774 | |
| Ally Master Owner Trust 2014-4 A2 | | 1.43% | | 6/17/2019 | | | 1,402 | | | | 1,402,964 | |
| Ally Master Owner Trust 2014-5 A2 | | 1.60% | | 10/15/2019 | | | 1,114 | | | | 1,115,912 | |
| Apollo Credit Funding IV Ltd. 4A A1† | | 2.35% | # | 4/15/2027 | | | 1,000 | | | | 1,003,008 | |
| Ascentium Equipment Receivables Trust 2016-2A A2† | | 1.46% | | 4/10/2019 | | | 276 | | | | 275,487 | |
| Ascentium Equipment Receivables Trust 2016-2A A3† | | 1.65% | | 5/10/2022 | | | 283 | | | | 280,563 | |
| Ascentium Equipment Receivables Trust 2016-2A B† | | 2.50% | | 9/12/2022 | | | 182 | | | | 179,363 | |
| Ballyrock CLO Ltd. 2016-1A A† | | 2.406% | # | 10/15/2028 | | | 1,100 | | | | 1,102,330 | |
| BlueMountain CLO Ltd. 2014-4A A1R† | | 2.232% | # | 11/30/2026 | | | 1,000 | | | | 999,942 | |
| Carlyle Global Market Strategies CLO Ltd. 2013-2A A1† | | 2.032% | # | 4/18/2025 | | | 400 | | | | 400,160 | |
| Carlyle Global Market Strategies CLO Ltd. 2013-4A A2R† | | 2.40% | # | 10/15/2025 | | | 350 | | | | 350,571 | |
| Carlyle Global Market Strategies CLO Ltd. 2015-2A A1† | | 2.356% | # | 4/27/2027 | | | 850 | | | | 851,321 | |
| Cent CLO Ltd. 2013-19A A1A† | | 2.217% | # | 10/29/2025 | | | 850 | | | | 850,514 | |
| CIFC Funding II Ltd. 2014-2A A1L† | | 2.41% | # | 5/24/2026 | | | 250 | | | | 250,650 | |
| CNH Equipment Trust 2014-C A3 | | 1.05% | | 11/15/2019 | | | 231 | | | | 230,644 | |
| CNH Equipment Trust 2015-B A4 | | 1.89% | | 4/15/2022 | | | 373 | | | | 373,802 | |
| Dell Equipment Finance Trust 2015-2 A3† | | 1.72% | | 9/22/2020 | | | 259 | | | | 259,592 | |
| Dell Equipment Finance Trust 2016-1 A3† | | 1.65% | | 7/22/2021 | | | 100 | | | | 99,965 | |
| Diamond Resorts Owner Trust 2015-2 A† | | 2.99% | | 5/22/2028 | | | 160 | | | | 159,164 | |
| Diamond Resorts Owner Trust 2016-1 A† | | 3.08% | | 11/20/2028 | | | 220 | | | | 218,223 | |
| DRB Prime Student Loan Trust 2015-D A2† | | 3.20% | | 1/25/2040 | | | 983 | | | | 977,531 | |
| Engs Commercial Finance Trust 2015-1A A2† | | 2.31% | | 10/22/2021 | | | 877 | | | | 876,444 | |
| Ford Credit Floorplan Master Owner Trust 2012-2 A | | 1.92% | | 1/15/2019 | | | 750 | | | | 750,206 | |
| Ford Credit Floorplan Master Owner Trust 2014-1 A1 | | 1.20% | | 2/15/2019 | | | 720 | | | | 720,052 | |
| | See Notes to Financial Statements. | 11 |
Schedule of Investments (continued)
December 31, 2016
| Investments | | Interest
Rate | | Maturity
Date | | Principal
Amount
(000) | | | Fair
Value | |
| Other (continued) | | | | | | | | | | | | |
| Fortress Credit BSL II Ltd. 2013-2A A1F† | | 2.378% | # | 10/19/2025 | | $ | 200 | | | $ | 200,210 | |
| Fortress Credit BSL Ltd. 2013-1A A† | | 2.058% | # | 1/19/2025 | | | 900 | | | | 900,485 | |
| GMF Floorplan Owner Revolving Trust 2015-1 B† | | 1.97% | | 5/15/2020 | | | 394 | | | | 393,119 | |
| Hempstead CLO LP 2013-1A A1† | | 2.38% | # | 1/15/2026 | | | 1,000 | | | | 1,001,223 | |
| Jackson Mill CLO Ltd. 2015-1A A† | | 2.42% | # | 4/15/2027 | | | 350 | | | | 350,415 | |
| JFIN Revolver CLO Ltd. 2015-4A A† | | 2.032% | # | 4/22/2020 | | | 791 | | | | 792,208 | |
| John Deere Owner Trust 2014-A A3 | | 0.92% | | 4/16/2018 | | | 115 | | | | 114,646 | |
| KKR CLO Ltd. 11-A† | | 2.40% | # | 4/15/2027 | | | 1,250 | | | | 1,251,224 | |
| Leaf Receivables Funding 10 LLC 2015-1 A4† | | 2.03% | | 8/17/2020 | | | 535 | | | | 535,262 | |
| Macquarie Equipment Funding Trust 2014-A A3† | | 1.23% | | 7/20/2021 | | | 485 | | | | 484,317 | |
| Marathon CLO IV Ltd. 2012-4A A1† | | 2.301% | # | 5/20/2023 | | | 430 | | | | 430,323 | |
| NCF Dealer Floorplan Master Trust 2016-1A B† | | 6.062% | # | 3/21/2022 | | | 178 | | | | 174,481 | |
| NCF Dealer Floorplan Master Trust 2016-1A C† | | 9.062% | # | 3/21/2022 | | | 698 | | | | 702,920 | |
| Nissan Master Owner Trust Receivables 2016-A A2 | | 1.54% | | 6/15/2021 | | | 321 | | | | 319,143 | |
| Oaktree CLO Ltd. 2014-2A A1A† | | 2.411% | # | 10/20/2026 | | | 1,000 | | | | 999,552 | |
| Oaktree EIF I Series Ltd. 2015-A1 B† | | 3.482% | # | 10/18/2027 | | | 900 | | | | 904,412 | |
| Octagon Investment Partners XIX Ltd. 2014-1A A† | | 2.40% | # | 4/15/2026 | | | 500 | | | | 500,853 | |
| OneMain Financial Issuance Trust 2016-1A A† | | 3.66% | | 2/20/2029 | | | 315 | | | | 318,680 | |
| OZLM Funding Ltd. 2012-1A A1R† | | 2.402% | # | 7/22/2027 | | | 1,400 | | | | 1,399,001 | |
| OZLM Funding Ltd. 2012-1A A2R† | | 3.232% | # | 7/22/2027 | | | 750 | | | | 751,261 | |
| OZLM VII Ltd. 2014-7A A1B† | | 2.37% | # | 7/17/2026 | | | 1,000 | | | | 1,000,679 | |
| OZLM VIII Ltd. 2014-8A A1A† | | 2.32% | # | 10/17/2026 | | | 410 | | | | 409,586 | |
| PFS Financing Corp. 2016-BA A† | | 1.87% | | 10/15/2021 | | | 237 | | | | 234,926 | |
| Sheridan Square CLO Ltd. 2013-1A A1† | | 1.93% | # | 4/15/2025 | | | 500 | | | | 499,161 | |
| SLM Private Education Loan Trust 2010-A 2A† | | 3.954% | # | 5/16/2044 | | | 36 | | | | 37,636 | |
| SLM Private Education Loan Trust 2012-A A1† | | 2.104% | # | 8/15/2025 | | | 13 | | | | 12,881 | |
| SLM Private Education Loan Trust 2012-E A1† | | 1.454% | # | 10/16/2023 | | | 35 | | | | 35,245 | |
| SLM Student Loan Trust 2011-1 A1 | | 1.276% | # | 3/25/2026 | | | 27 | | | | 27,109 | |
| Sound Point CLO IV Ltd. 2013-3A A† | | 2.251% | # | 1/21/2026 | | | 2,000 | | | | 1,997,674 | |
| Tryon Park CLO Ltd. 2013-1A A1† | | 2.00% | # | 7/15/2025 | | | 800 | | | | 798,615 | |
| Venture XVIII CLO Ltd. 2014-18A A† | | 2.33% | # | 10/15/2026 | | | 500 | | | | 500,603 | |
| Wells Fargo Dealer Floorplan Master Note Trust 2012-2 A | | 1.489% | # | 4/22/2019 | | | 337 | | | | 337,410 | |
| Westchester CLO Ltd. 2007-1A A1A† | | 1.111% | # | 8/1/2022 | | | 54 | | | | 53,779 | |
| Total | | | | | | | | | | | 34,151,324 | |
| Total Asset-Backed Securities (cost $103,338,495) | | | | | | | | | | | 103,373,355 | |
| 12 | See Notes to Financial Statements. | |
Schedule of Investments (continued)
December 31, 2016
| Investments | | Interest
Rate | | Maturity
Date | | Principal
Amount
(000) | | | Fair
Value | |
| CORPORATE BONDS 24.03% | | | | | | | | | | | | |
| | | | | | | | | | | | | |
| Aerospace/Defense 0.00% | | | | | | | | | | | | |
| Embraer SA (Brazil)(a) | | 5.15% | | 6/15/2022 | | $ | 10 | | | $ | 10,432 | |
| | | | | | | | | | | | | |
| Air Transportation 0.06% | | | | | | | | | | | | |
| Air Canada (Canada)†(a) | | 7.75% | | 4/15/2021 | | | 70 | | | | 78,575 | |
| American Airlines 2013-2 Class B Pass-Through Trust† | | 5.60% | | 1/15/2022 | | | 188 | | | | 194,957 | |
| Total | | | | | | | | | | | 273,532 | |
| | | | | | | | | | | | | |
| Auto Parts: Original Equipment 0.12% | | | | | | | | | | | | |
| International Automotive Components Group SA (Luxembourg)†(a) | | 9.125% | | 6/1/2018 | | | 280 | | | | 274,400 | |
| MPG Holdco I, Inc. | | 7.375% | | 10/15/2022 | | | 253 | | | | 265,650 | |
| Total | | | | | | | | | | | 540,050 | |
| | | | | | | | | | | | | |
| Automotive 0.56% | | | | | | | | | | | | |
| Ford Motor Co. | | 6.375% | | 2/1/2029 | | | 57 | | | | 65,159 | |
| Ford Motor Co. | | 7.45% | | 7/16/2031 | | | 626 | | | | 787,527 | |
| General Motors Co. | | 6.60% | | 4/1/2036 | | | 1,439 | | | | 1,649,418 | |
| Total | | | | | | | | | | | 2,502,104 | |
| | | | | | | | | | | | | |
| Banks: Regional 4.47% | | | | | | | | | | | | |
| Banco de Bogota SA (Colombia)†(a) | | 6.25% | | 5/12/2026 | | | 400 | | | | 409,000 | |
| Banco de Credito e Inversiones (Chile)†(a) | | 4.00% | | 2/11/2023 | | | 400 | | | | 408,788 | |
| Bank of America Corp. | | 3.95% | | 4/21/2025 | | | 400 | | | | 398,894 | |
| Bank of America Corp. | | 4.20% | | 8/26/2024 | | | 728 | | | | 742,823 | |
| Bank of America Corp. | | 4.25% | | 10/22/2026 | | | 314 | | | | 318,435 | |
| Bank of America Corp. | | 4.45% | | 3/3/2026 | | | 315 | | | | 325,229 | |
| BBVA Banco Continental SA (Peru)†(a) | | 5.25% | # | 9/22/2029 | | | 200 | | | | 206,000 | |
| Citigroup, Inc. | | 4.45% | | 9/29/2027 | | | 89 | | | | 90,602 | |
| Citigroup, Inc. | | 4.60% | | 3/9/2026 | | | 359 | | | | 371,750 | |
| Citigroup, Inc. | | 5.50% | | 9/13/2025 | | | 1,389 | | | | 1,529,189 | |
| Goldman Sachs Group, Inc. (The) | | 6.25% | | 2/1/2041 | | | 338 | | | | 420,401 | |
| Goldman Sachs Group, Inc. (The) | | 6.75% | | 10/1/2037 | | | 1,123 | | | | 1,390,937 | |
| Intesa Sanpaolo SpA (Italy)†(a) | | 5.71% | | 1/15/2026 | | | 523 | | | | 499,951 | |
| JPMorgan Chase & Co. | | 2.112% | # | 10/24/2023 | | | 1,147 | | | | 1,170,987 | |
| JPMorgan Chase & Co. | | 3.90% | | 7/15/2025 | | | 559 | | | | 575,416 | |
| JPMorgan Chase & Co. | | 4.25% | | 10/1/2027 | | | 627 | | | | 645,584 | |
| Lloyds Banking Group plc (United Kingdom)(a) | | 4.582% | | 12/10/2025 | | | 743 | | | | 747,950 | |
| Morgan Stanley | | 3.125% | | 7/27/2026 | | | 482 | | | | 461,431 | |
| | See Notes to Financial Statements. | 13 |
Schedule of Investments (continued)
December 31, 2016
| Investments | | Interest
Rate | | Maturity
Date | | Principal
Amount
(000) | | | Fair
Value | |
| Banks: Regional (continued) | | | | | | | | | | | | |
| Morgan Stanley | | 3.875% | | 1/27/2026 | | $ | 366 | | | $ | 370,401 | |
| Morgan Stanley | | 4.00% | | 7/23/2025 | | | 770 | | | | 790,688 | |
| Morgan Stanley | | 7.25% | | 4/1/2032 | | | 84 | | | | 114,101 | |
| Santander UK Group Holdings plc (United Kingdom)†(a) | | 4.75% | | 9/15/2025 | | | 545 | | | | 535,163 | |
| Santander UK plc (United Kingdom)(a) | | 7.95% | | 10/26/2029 | | | 862 | | | | 1,013,193 | |
| Toronto-Dominion Bank (The) (Canada)(a) | | 3.625% | # | 9/15/2031 | | | 309 | | | | 302,351 | |
| Turkiye Garanti Bankasi AS (Turkey)†(a) | | 6.25% | | 4/20/2021 | | | 200 | | | | 203,816 | |
| UBS Group Funding Jersey Ltd. (Jersey)†(a) | | 4.125% | | 4/15/2026 | | | 1,931 | | | | 1,978,674 | |
| Wells Fargo & Co. | | 3.00% | | 10/23/2026 | | | 914 | | | | 871,585 | |
| Wells Fargo & Co. | | 4.10% | | 6/3/2026 | | | 673 | | | | 682,671 | |
| Wells Fargo Bank NA | | 5.85% | | 2/1/2037 | | | 880 | | | | 1,038,497 | |
| Wells Fargo Bank NA | | 6.60% | | 1/15/2038 | | | 437 | | | | 556,924 | |
| Westpac Banking Corp. (Australia)(a) | | 4.322% | # | 11/23/2031 | | | 812 | | | | 816,213 | |
| Total | | | | | | | | | | | 19,987,644 | |
| | | | | | | | | | | | | |
| Beverages 0.49% | | | | | | | | | | | | |
| Anheuser-Busch InBev Finance, Inc. | | 4.70% | | 2/1/2036 | | | 1,264 | | | | 1,333,721 | |
| Becle SA de CV (Mexico)†(a) | | 3.75% | | 5/13/2025 | | | 350 | | | | 334,147 | |
| Central American Bottling Corp. (Guatemala)†(a) | | 6.75% | | 2/9/2022 | | | 205 | | | | 210,125 | |
| Corporacion Lindley SA (Peru)†(a) | | 4.625% | | 4/12/2023 | | | 27 | | | | 27,675 | |
| Fomento Economico Mexicano SAB de CV (Mexico)(a) | | 4.375% | | 5/10/2043 | | | 300 | | | | 286,174 | |
| Total | | | | | | | | | | | 2,191,842 | |
| | | | | | | | | | | | | |
| Building Materials 0.32% | | | | | | | | | | | | |
| Standard Industries, Inc.† | | 5.50% | | 2/15/2023 | | | 272 | | | | 282,907 | |
| Standard Industries, Inc.† | | 6.00% | | 10/15/2025 | | | 1,086 | | | | 1,148,445 | |
| Total | | | | | | | | | | | 1,431,352 | |
| | | | | | | | | | | | | |
| Business Services 0.02% | | | | | | | | | | | | |
| Brand Energy & Infrastructure Services, Inc.† | | 8.50% | | 12/1/2021 | | | 91 | | | | 93,503 | |
| | | | | | | | | | | | | |
| Chemicals 0.62% | | | | | | | | | | | | |
| Blue Cube Spinco, Inc. | | 10.00% | | 10/15/2025 | | | 1,143 | | | | 1,385,887 | |
| Chemours Co. (The) | | 7.00% | | 5/15/2025 | | | 269 | | | | 266,310 | |
| Equate Petrochemical BV (Netherlands)†(a) | | 4.25% | | 11/3/2026 | | | 700 | | | | 670,278 | |
| GCP Applied Technologies, Inc.† | | 9.50% | | 2/1/2023 | | | 94 | | | | 108,100 | |
| Mexichem SAB de CV (Mexico)†(a) | | 4.875% | | 9/19/2022 | | | 205 | | | | 214,225 | |
| Valvoline, Inc.† | | 5.50% | | 7/15/2024 | | | 116 | | | | 120,350 | |
| Total | | | | | | | | | | | 2,765,150 | |
| 14 | See Notes to Financial Statements. | |
Schedule of Investments (continued)
December 31, 2016
| Investments | | Interest
Rate | | Maturity
Date | | Principal
Amount
(000) | | | Fair
Value | |
| Computer Hardware 0.31% | | | | | | | | | | | | |
| Diamond 1 Finance Corp./Diamond 2 Finance Corp.† | | 6.02% | | 6/15/2026 | | $ | 563 | | | $ | 610,981 | |
| Diamond 1 Finance Corp./Diamond 2 Finance Corp.† | | 7.125% | | 6/15/2024 | | | 294 | | | | 326,576 | |
| Diamond 1 Finance Corp./Diamond 2 Finance Corp.† | | 8.10% | | 7/15/2036 | | | 392 | | | | 467,533 | |
| Total | | | | | | | | | | | 1,405,090 | |
| | | | | | | | | | | | | |
| Computer Software 0.03% | | | | | | | | | | | | |
| Camelot Finance SA (Luxembourg)†(a) | | 7.875% | | 10/15/2024 | | | 141 | | | | 146,288 | |
| | | | | | | | | | | | | |
| Containers 0.05% | | | | | | | | | | | | |
| Coveris Holdings SA (Luxembourg)†(a) | | 7.875% | | 11/1/2019 | | | 200 | | | | 199,500 | |
| | | | | | | | | | | | | |
| Drugs 0.32% | | | | | | | | | | | | |
| Forest Laboratories LLC† | | 5.00% | | 12/15/2021 | | | 790 | | | | 855,032 | |
| Mylan N.V.† | | 3.95% | | 6/15/2026 | | | 625 | | | | 586,037 | |
| Total | | | | | | | | | | | 1,441,069 | |
| | | | | | | | | | | | | |
| Electric: Power 0.92% | | | | | | | | | | | | |
| AES Gener SA (Chile)†(a) | | 5.00% | | 7/14/2025 | | | 400 | | | | 397,758 | |
| Appalachian Power Co. | | 7.00% | | 4/1/2038 | | | 529 | | | | 699,775 | |
| Berkshire Hathaway Energy Co. | | 6.50% | | 9/15/2037 | | | 560 | | | | 731,231 | |
| Dominion Resources, Inc. | | 7.00% | | 6/15/2038 | | | 266 | | | | 340,765 | |
| Exelon Generation Co. LLC | | 5.60% | | 6/15/2042 | | | 390 | | | | 362,259 | |
| Exelon Generation Co. LLC | | 6.25% | | 10/1/2039 | | | 692 | | | | 698,863 | |
| Massachusetts Electric Co.† | | 4.004% | | 8/15/2046 | | | 475 | | | | 457,215 | |
| Origin Energy Finance Ltd. (Australia)†(a) | | 3.50% | | 10/9/2018 | | | 375 | | | | 379,575 | |
| Red Oak Power LLC | | 8.54% | | 11/30/2019 | | | 52 | | | | 52,368 | |
| Total | | | | | | | | | | | 4,119,809 | |
| | | | | | | | | | | | | |
| Electrical Equipment 0.13% | | | | | | | | | | | | |
| QUALCOMM, Inc. | | 4.65% | | 5/20/2035 | | | 567 | | | | 600,490 | |
| | | | | | | | | | | | | |
| Engineering & Contracting Services 0.25% | | | | | | | | | | | | |
| China Railway Resources Huitung Ltd. (Hong Kong)(a) | | 3.85% | | 2/5/2023 | | | 900 | | | | 911,608 | |
| Mexico City Airport Trust (Mexico)†(a) | | 4.25% | | 10/31/2026 | | | 200 | | | | 196,500 | |
| Total | | | | | | | | | | | 1,108,108 | |
| | | | | | | | | | | | | |
| Entertainment 0.35% | | | | | | | | | | | | |
| AMC Entertainment Holdings, Inc. | | 5.75% | | 6/15/2025 | | | 448 | | | | 460,320 | |
| CCM Merger, Inc.† | | 9.125% | | 5/1/2019 | | | 188 | | | | 195,678 | |
| Eldorado Resorts, Inc. | | 7.00% | | 8/1/2023 | | | 100 | | | | 106,500 | |
| | See Notes to Financial Statements. | 15 |
Schedule of Investments (continued)
December 31, 2016
| Investments | | Interest
Rate | | Maturity
Date | | Principal
Amount
(000) | | | Fair
Value | |
| Entertainment (continued) | | | | | | | | | | | | |
| Mohegan Tribal Gaming Authority† | | 7.875% | | 10/15/2024 | | $ | 409 | | | $ | 418,714 | |
| Seminole Tribe of Florida, Inc.† | | 6.535% | | 10/1/2020 | | | 390 | | | | 393,900 | |
| Total | | | | | | | | | | | 1,575,112 | |
| | | | | | | | | | | | | |
| Financial Services 1.05% | | | | | | | | | | | | |
| Affiliated Managers Group, Inc. | | 3.50% | | 8/1/2025 | | | 125 | | | | 118,158 | |
| Affiliated Managers Group, Inc. | | 4.25% | | 2/15/2024 | | | 248 | | | | 249,675 | |
| International Lease Finance Corp. | | 5.875% | | 4/1/2019 | | | 1,398 | | | | 1,488,143 | |
| Nationstar Mortgage LLC/Nationstar Capital Corp. | | 7.875% | | 10/1/2020 | | | 386 | | | | 401,440 | |
| Navient Corp. | | 6.625% | | 7/26/2021 | | | 182 | | | | 192,920 | |
| Neuberger Berman Group LLC/Neuberger Berman Finance Corp.† | | 5.875% | | 3/15/2022 | | | 749 | | | | 775,215 | |
| OM Asset Management plc (United Kingdom)(a) | | 4.80% | | 7/27/2026 | | | 489 | | | | 464,184 | |
| Scottrade Financial Services, Inc.† | | 6.125% | | 7/11/2021 | | | 868 | | | | 982,368 | |
| Total | | | | | | | | | | | 4,672,103 | |
| | | | | | | | | | | | | |
| Food 0.18% | | | | | | | | | | | | |
| Arcor SAIC (Argentina)†(a) | | 6.00% | | 7/6/2023 | | | 297 | | | | 310,365 | |
| Gruma SAB de CV (Mexico)†(a) | | 4.875% | | 12/1/2024 | | | 200 | | | | 209,600 | |
| Kraft Heinz Foods Co. | | 6.875% | | 1/26/2039 | | | 217 | | | | 273,481 | |
| Total | | | | | | | | | | | 793,446 | |
| | | | | | | | | | | | | |
| Health Care Services 0.12% | | | | | | | | | | | | |
| Acadia Healthcare Co., Inc. | | 5.625% | | 2/15/2023 | | | 274 | | | | 275,370 | |
| Acadia Healthcare Co., Inc. | | 6.50% | | 3/1/2024 | | | 60 | | | | 61,500 | |
| MPH Acquisition Holdings LLC† | | 7.125% | | 6/1/2024 | | | 97 | | | | 102,345 | |
| Surgical Care Affiliates, Inc.† | | 6.00% | | 4/1/2023 | | | 91 | | | | 94,412 | |
| Total | | | | | | | | | | | 533,627 | |
| | | | | | | | | | | | | |
| Household Equipment/Products 0.14% | | | | | | | | | | | | |
| Central Garden & Pet Co. | | 6.125% | | 11/15/2023 | | | 513 | | | | 543,780 | |
| Kimberly-Clark de Mexico SAB de CV (Mexico)†(a) | | 3.80% | | 4/8/2024 | | | 100 | | | | 98,976 | |
| Total | | | | | | | | | | | 642,756 | |
| | | | | | | | | | | | | |
| Insurance 0.39% | | | | | | | | | | | | |
| Lincoln National Corp. | | 6.30% | | 10/9/2037 | | | 100 | | | | 118,506 | |
| Teachers Insurance & Annuity Association of America† | | 4.90% | | 9/15/2044 | | | 945 | | | | 1,024,653 | |
| Willis North America, Inc. | | 7.00% | | 9/29/2019 | | | 524 | | | | 583,364 | |
| Total | | | | | | | | | | | 1,726,523 | |
| 16 | See Notes to Financial Statements. | |
Schedule of Investments (continued)
December 31, 2016
| Investments | | Interest
Rate | | Maturity
Date | | Principal
Amount
(000) | | | Fair
Value | |
| Leisure 0.36% | | | | | | | | | | | | |
| Carlson Travel, Inc.† | | 6.75% | | 12/15/2023 | | $ | 236 | | | $ | 246,030 | |
| Carnival plc (United Kingdom)(a) | | 7.875% | | 6/1/2027 | | | 277 | | | | 351,101 | |
| Royal Caribbean Cruises Ltd. | | 7.50% | | 10/15/2027 | | | 870 | | | | 1,030,950 | |
| Total | | | | | | | | | | | 1,628,081 | |
| | | | | | | | | | | | | |
| Lodging 0.19% | | | | | | | | | | | | |
| Caesar’s Entertainment Resort Properties LLC/Caesar’s Entertainment Resort Properties Finance, Inc. | | 11.00% | | 10/1/2021 | | | 526 | | | | 577,285 | |
| Sugarhouse HSP Gaming Prop. Mezz. LP/Sugarhouse HSP Gaming Finance Corp.† | | 6.375% | | 6/1/2021 | | | 269 | | | | 269,672 | |
| Total | | | | | | | | | | | 846,957 | |
| | | | | | | | | | | | | |
| Machinery: Agricultural 0.02% | | | | | | | | | | | | |
| Reynolds American, Inc. | | 8.125% | | 5/1/2040 | | | 78 | | | | 104,464 | |
| | | | | | | | | | | | | |
| Machinery: Industrial/Specialty 0.07% | | | | | | | | | | | | |
| SPX FLOW, Inc.† | | 5.625% | | 8/15/2024 | | | 300 | | | | 303,000 | |
| | | | | | | | | | | | | |
| Manufacturing 0.24% | | | | | | | | | | | | |
| Gates Global LLC/Gates Global Co.† | | 6.00% | | 7/15/2022 | | | 537 | | | | 527,871 | |
| Trinity Industries, Inc. | | 4.55% | | 10/1/2024 | | | 559 | | | | 538,333 | |
| Total | | | | | | | | | | | 1,066,204 | |
| | | | | | | | | | | | | |
| Media 2.19% | | | | | | | | | | | | |
| 21st Century Fox America, Inc. | | 6.20% | | 12/15/2034 | | | 106 | | | | 124,881 | |
| 21st Century Fox America, Inc. | | 6.90% | | 8/15/2039 | | | 753 | | | | 948,567 | |
| Block Communications, Inc.† | | 7.25% | | 2/1/2020 | | | 195 | | | | 198,413 | |
| Cablevision Systems Corp. | | 5.875% | | 9/15/2022 | | | 453 | | | | 442,808 | |
| CCO Holdings LLC/CCO Holdings Capital Corp.† | | 5.75% | | 2/15/2026 | | | 278 | | | | 288,425 | |
| Comcast Corp. | | 6.95% | | 8/15/2037 | | | 489 | | | | 668,190 | |
| Cox Communications, Inc.† | | 8.375% | | 3/1/2039 | | | 716 | | | | 895,426 | |
| CSC Holdings LLC† | | 10.875% | | 10/15/2025 | | | 206 | | | | 245,655 | |
| Discovery Communications LLC | | 6.35% | | 6/1/2040 | | | 583 | | | | 621,016 | |
| DISH DBS Corp. | | 7.75% | | 7/1/2026 | | | 397 | | | | 448,610 | |
| Globo Comunicacao e Participacoes SA (Brazil)†(a) | | 4.875% | | 4/11/2022 | | | 800 | | | | 802,240 | |
| Grupo Televisa SAB (Mexico)(a) | | 6.625% | | 1/15/2040 | | | 335 | | | | 353,155 | |
| Myriad International Holdings BV (Netherlands)†(a) | | 5.50% | | 7/21/2025 | | | 350 | | | | 353,703 | |
| SFR Group SA (France)†(a) | | 6.00% | | 5/15/2022 | | | 500 | | | | 515,000 | |
| Time Warner Cable, Inc. | | 7.30% | | 7/1/2038 | | | 1,032 | | | | 1,273,271 | |
| Time Warner Entertainment Co. LP | | 8.375% | | 7/15/2033 | | | 320 | | | | 420,307 | |
| | See Notes to Financial Statements. | 17 |
Schedule of Investments (continued)
December 31, 2016
| Investments | | Interest
Rate | | Maturity
Date | | Principal
Amount
(000) | | | Fair
Value | |
| Media (continued) | | | | | | | | | | | | |
| Univision Communications, Inc.† | | 5.125% | | 2/15/2025 | | $ | 24 | | | $ | 23,040 | |
| Viacom, Inc. | | 4.85% | | 12/15/2034 | | | 44 | | | | 39,337 | |
| Viacom, Inc. | | 6.875% | | 4/30/2036 | | | 553 | | | | 604,680 | |
| VTR Finance BV (Netherlands)†(a) | | 6.875% | | 1/15/2024 | | | 507 | | | | 524,745 | |
| Total | | | | | | | | | | | 9,791,469 | |
| | | | | | | | | | | | | |
| Metal Fabricating 0.04% | | | | | | | | | | | | |
| Grinding Media, Inc./MC Grinding Media Canada, Inc.† | | 7.375% | | 12/15/2023 | | | 180 | | | | 189,558 | |
| | | | | | | | | | | | | |
| Metals & Minerals: Miscellaneous 1.32% | | | | | | | | | | | | |
| Aleris International, Inc.† | | 9.50% | | 4/1/2021 | | | 160 | | | | 172,400 | |
| Barrick Gold Corp. (Canada)(a) | | 4.10% | | 5/1/2023 | | | 91 | | | | 93,481 | |
| Barrick International Barbados Corp. (Barbados)†(a) | | 6.35% | | 10/15/2036 | | | 158 | | | | 164,385 | |
| Coeur Mining, Inc. | | 7.875% | | 2/1/2021 | | | 108 | | | | 112,590 | |
| Corp. Nacional del Cobre de Chile (Chile)†(a) | | 4.50% | | 9/16/2025 | | | 1,200 | | | | 1,221,233 | |
| Freeport-McMoRan, Inc. | | 3.875% | | 3/15/2023 | | | 490 | | | | 452,025 | |
| Glencore Finance Canada Ltd. (Canada)†(a) | | 6.00% | | 11/15/2041 | | | 648 | | | | 643,574 | |
| Glencore Funding LLC† | | 4.625% | | 4/29/2024 | | | 88 | | | | 90,310 | |
| Goldcorp, Inc. (Canada)(a) | | 5.45% | | 6/9/2044 | | | 427 | | | | 420,310 | |
| HudBay Minerals, Inc. (Canada)†(a) | | 7.25% | | 1/15/2023 | | | 72 | | | | 74,700 | |
| HudBay Minerals, Inc. (Canada)†(a) | | 7.625% | | 1/15/2025 | | | 107 | | | | 111,481 | |
| MMC Norilsk Nickel OJSC via MMC Finance DAC (Ireland)†(a) | | 6.625% | | 10/14/2022 | | | 440 | | | | 491,480 | |
| New Gold, Inc. (Canada)†(a) | | 6.25% | | 11/15/2022 | | | 820 | | | | 844,600 | |
| Teck Resources Ltd. (Canada)(a) | | 4.75% | | 1/15/2022 | | | 986 | | | | 993,395 | |
| Total | | | | | | | | | | | 5,885,964 | |
| | | | | | | | | | | | | |
| Natural Gas 0.17% | | | | | | | | | | | | |
| Dominion Gas Holdings LLC | | 4.60% | | 12/15/2044 | | | 776 | | | | 775,117 | |
| | | | | | | | | | | | | |
| Oil 1.92% | | | | | | | | | | | | |
| Afren plc (United Kingdom)†(a)(b) | | 6.625% | | 12/9/2020 | | | 244 | | | | 1,269 | |
| Delek & Avner Tamar Bond Ltd. (Israel)†(a) | | 5.412% | | 12/30/2025 | | | 137 | | | | 138,713 | |
| Eni SpA (Italy)†(a) | | 5.70% | | 10/1/2040 | | | 1,650 | | | | 1,639,783 | |
| EP Energy LLC/Everest Acquisition Finance, Inc.† | | 8.00% | | 11/29/2024 | | | 761 | | | | 821,652 | |
| Gazprom OAO via Gaz Capital SA (Luxembourg)†(a) | | 4.95% | | 2/6/2028 | | | 200 | | | | 197,176 | |
| Helmerich & Payne International Drilling Co. | | 4.65% | | 3/15/2025 | | | 150 | | | | 155,248 | |
| Kerr-McGee Corp. | | 7.125% | | 10/15/2027 | | | 36 | | | | 41,214 | |
| Kerr-McGee Corp. | | 7.875% | | 9/15/2031 | | | 528 | | | | 677,710 | |
| LUKOIL International Finance BV (Netherlands)†(a) | | 4.563% | | 4/24/2023 | | | 450 | | | | 455,215 | |
| 18 | See Notes to Financial Statements. | |
Schedule of Investments (continued)
December 31, 2016
| Investments | | Interest
Rate | | Maturity
Date | | Principal
Amount
(000) | | | Fair
Value | |
| Oil (continued) | | | | | | | | | | | | |
| LUKOIL International Finance BV (Netherlands)†(a) | | 6.656% | | 6/7/2022 | | $ | 100 | | | $ | 111,604 | |
| MEG Energy Corp. (Canada)†(a) | | 6.375% | | 1/30/2023 | | | 14 | | | | 12,530 | |
| MEG Energy Corp. (Canada)†(a) | | 7.00% | | 3/31/2024 | | | 450 | | | | 409,500 | |
| Murphy Oil Corp. | | 6.875% | | 8/15/2024 | | | 92 | | | | 98,210 | |
| Noble Holding International Ltd. | | 7.75% | | 1/15/2024 | | | 676 | | | | 637,536 | |
| Petrobras Global Finance BV (Netherlands)(a) | | 4.375% | | 5/20/2023 | | | 358 | | | | 313,680 | |
| Petroleos Mexicanos (Mexico)(a) | | 4.50% | | 1/23/2026 | | | 680 | | | | 621,180 | |
| Precision Drilling Corp. (Canada)†(a) | | 7.75% | | 12/15/2023 | | | 196 | | | | 207,760 | |
| Shell International Finance BV (Netherlands)(a) | | 6.375% | | 12/15/2038 | | | 161 | | | | 208,029 | |
| Sinopec Group Overseas Development Ltd.† | | 4.375% | | 10/17/2023 | | | 364 | | | | 381,442 | |
| Tengizchevroil Finance Co. International Ltd. (Kazakhstan)†(a) | | 4.00% | | 8/15/2026 | | | 500 | | | | 471,187 | |
| Valero Energy Corp. | | 10.50% | | 3/15/2039 | | | 327 | | | | 501,467 | |
| YPF SA (Argentina)†(a) | | 8.50% | | 7/28/2025 | | | 481 | | | | 488,936 | |
| Total | | | | | | | | | | | 8,591,041 | |
| | | | | | | | | | | | | |
| Oil: Crude Producers 1.65% | | | | | | | | | | | | |
| Enbridge Energy Partners LP | | 9.875% | | 3/1/2019 | | | 707 | | | | 803,931 | |
| Energy Transfer Partners LP | | 7.50% | | 7/1/2038 | | | 897 | | | | 1,043,004 | |
| GNL Quintero SA (Chile)†(a) | | 4.634% | | 7/31/2029 | | | 200 | | | | 197,500 | |
| Gulfstream Natural Gas System LLC† | | 4.60% | | 9/15/2025 | | | 370 | | | | 384,011 | |
| IFM US Colonial Pipeline 2 LLC† | | 6.45% | | 5/1/2021 | | | 370 | | | | 403,234 | |
| Kinder Morgan Energy Partners LP | | 7.40% | | 3/15/2031 | | | 57 | | | | 67,597 | |
| Kinder Morgan, Inc. | | 7.75% | | 1/15/2032 | | | 1,383 | | | | 1,698,822 | |
| Kinder Morgan, Inc. | | 7.80% | | 8/1/2031 | | | 157 | | | | 194,551 | |
| Regency Energy Partners LP/Regency Energy Finance Corp. | | 5.00% | | 10/1/2022 | | | 23 | | | | 24,402 | |
| Regency Energy Partners LP/Regency Energy Finance Corp. | | 5.875% | | 3/1/2022 | | | 137 | | | | 150,870 | |
| Ruby Pipeline LLC† | | 6.00% | | 4/1/2022 | | | 899 | | | | 923,770 | |
| Tennessee Gas Pipeline Co. LLC | | 8.375% | | 6/15/2032 | | | 67 | | | | 83,695 | |
| Tesoro Logistics LP/Tesoro Logistics Finance Corp. | | 5.25% | | 1/15/2025 | | | 185 | | | | 189,625 | |
| Transportadora de Gas Internacional SA ESP (Colombia)†(a) | | 5.70% | | 3/20/2022 | | | 200 | | | | 207,000 | |
| Williams Cos., Inc. (The) | | 8.75% | | 3/15/2032 | | | 811 | | | | 983,337 | |
| Total | | | | | | | | | | | 7,355,349 | |
| | | | | | | | | | | | | |
| Oil: Integrated Domestic 0.77% | | | | | | | | | | | | |
| FTS International, Inc.† | | 8.463% | # | 6/15/2020 | | | 586 | | | | 586,732 | |
| Halliburton Co. | | 6.70% | | 9/15/2038 | | | 114 | | | | 142,501 | |
| | See Notes to Financial Statements. | 19 |
Schedule of Investments (continued)
December 31, 2016
| Investments | | Interest
Rate | | Maturity
Date | | Principal
Amount
(000) | | | Fair
Value | |
| Oil: Integrated Domestic (continued) | | | | | | | | | | | | |
| Halliburton Co. | | 7.45% | | 9/15/2039 | | $ | 227 | | | $ | 305,870 | |
| National Oilwell Varco, Inc. | | 2.60% | | 12/1/2022 | | | 275 | | | | 255,196 | |
| Oceaneering International, Inc. | | 4.65% | | 11/15/2024 | | | 451 | | | | 445,571 | |
| Transocean Proteus Ltd.† | | 6.25% | | 12/1/2024 | | | 401 | | | | 406,766 | |
| Trinidad Drilling Ltd. (Canada)†(a) | | 7.875% | | 1/15/2019 | | | 501 | | | | 502,252 | |
| Weatherford International Ltd. | | 9.875% | | 3/1/2039 | | | 795 | | | | 791,025 | |
| Total | | | | | | | | | | | 3,435,913 | |
| | | | | | | | | | | | | |
| Real Estate Investment Trusts 1.27% | | | | | | | | | | | | |
| Communications Sales & Leasing, Inc./CSL Capital LLC | | 8.25% | | 10/15/2023 | | | 620 | | | | 660,300 | |
| EPR Properties | | 4.75% | | 12/15/2026 | | | 665 | | | | 659,794 | |
| EPR Properties | | 5.25% | | 7/15/2023 | | | 1,150 | | | | 1,196,839 | |
| Equinix, Inc. | | 5.875% | | 1/15/2026 | | | 207 | | | | 218,385 | |
| MGM Growth Properties Operating Partnership LP/MGP Finance Co-Issuer, Inc.† | | 5.625% | | 5/1/2024 | | | 224 | | | | 235,200 | |
| Omega Healthcare Investors, Inc. | | 4.95% | | 4/1/2024 | | | 127 | | | | 128,875 | |
| Omega Healthcare Investors, Inc. | | 5.875% | | 3/15/2024 | | | 639 | | | | 659,229 | |
| VEREIT Operating Partnership LP | | 3.00% | | 2/6/2019 | | | 1,919 | | | | 1,919,000 | |
| Total | | | | | | | | | | | 5,677,622 | |
| | | | | | | | | | | | | |
| Retail 0.36% | | | | | | | | | | | | |
| New Albertson’s, Inc. | | 7.45% | | 8/1/2029 | | | 198 | | | | 188,100 | |
| PetSmart, Inc.† | | 7.125% | | 3/15/2023 | | | 367 | | | | 375,258 | |
| PVH Corp. | | 7.75% | | 11/15/2023 | | | 561 | | | | 654,967 | |
| Tops Holding LLC/Top Markets II Corp.† | | 8.00% | | 6/15/2022 | | | 470 | | | | 406,550 | |
| Total | | | | | | | | | | | 1,624,875 | |
| | | | | | | | | | | | | |
| Retail: Specialty 0.04% | | | | | | | | | | | | |
| Revlon Consumer Products Corp. | | 6.25% | | 8/1/2024 | | | 186 | | | | 191,115 | |
| | | | | | | | | | | | | |
| Technology 0.85% | | | | | | | | | | | | |
| Alibaba Group Holding Ltd. (China)(a) | | 3.60% | | 11/28/2024 | | | 965 | | | | 957,092 | |
| Amazon.com, Inc. | | 4.80% | | 12/5/2034 | | | 1,388 | | | | 1,532,323 | |
| Baidu, Inc. (China)(a) | | 3.50% | | 11/28/2022 | | | 200 | | | | 200,895 | |
| Netflix, Inc.† | | 4.375% | | 11/15/2026 | | | 605 | | | | 587,606 | |
| Tencent Holdings Ltd. (China)†(a) | | 3.375% | | 5/2/2019 | | | 510 | | | | 521,804 | |
| Total | | | | | | | | | | | 3,799,720 | |
| | | | | | | | | | | | | |
| Telecommunications 1.27% | | | | | | | | | | | | |
| AT&T, Inc. | | 6.00% | | 8/15/2040 | | | 1,281 | | | | 1,412,545 | |
| AT&T, Inc. | | 6.50% | | 9/1/2037 | | | 803 | | | | 947,232 | |
| 20 | See Notes to Financial Statements. | |
Schedule of Investments (continued)
December 31, 2016
| Investments | | Interest
Rate | | Maturity
Date | | Principal
Amount
(000) | | | Fair
Value | |
| Telecommunications (continued) | | | | | | | | | | | | |
| Digicel Group Ltd. (Jamaica)†(a) | | 7.125% | | 4/1/2022 | | $ | 400 | | | $ | 312,296 | |
| Digicel Ltd. (Jamaica)†(a) | | 6.75% | | 3/1/2023 | | | 200 | | | | 181,326 | |
| Frontier Communications Corp. | | 11.00% | | 9/15/2025 | | | 53 | | | | 54,921 | |
| GTH Finance BV (Netherlands)†(a) | | 7.25% | | 4/26/2023 | | | 200 | | | | 215,146 | |
| Millicom International Cellular SA (Luxembourg)†(a) | | 4.75% | | 5/22/2020 | | | 200 | | | | 203,250 | |
| MTN Mauritius Investment Ltd. (Mauritius)†(a) | | 4.755% | | 11/11/2024 | | | 200 | | | | 184,240 | |
| Ooredoo International Finance Ltd.† | | 3.75% | | 6/22/2026 | | | 300 | | | | 294,324 | |
| Sprint Corp. | | 7.125% | | 6/15/2024 | | | 745 | | | | 769,213 | |
| T-Mobile USA, Inc. | | 6.542% | | 4/28/2020 | | | 440 | | | | 453,750 | |
| Verizon Communications, Inc. | | 5.05% | | 3/15/2034 | | | 350 | | | | 369,622 | |
| Verizon Communications, Inc. | | 6.40% | | 9/15/2033 | | | 232 | | | | 280,671 | |
| Total | | | | | | | | | | | 5,678,536 | |
| | | | | | | | | | | | | |
| Transportation: Miscellaneous 0.21% | | | | | | | | | | | | |
| Autoridad del Canal de Panama (Panama)†(a) | | 4.95% | | 7/29/2035 | | | 200 | | | | 212,000 | |
| Florida East Coast Holdings Corp.† | | 6.75% | | 5/1/2019 | | | 496 | | | | 514,600 | |
| XPO Logistics, Inc.† | | 6.125% | | 9/1/2023 | | | 180 | | | | 188,775 | |
| Total | | | | | | | | | | | 915,375 | |
| | | | | | | | | | | | | |
| Utilities 0.19% | | | | | | | | | | | | |
| Aquarion Co.† | | 4.00% | | 8/15/2024 | | | 824 | | | | 824,302 | |
| Total Corporate Bonds (cost $107,246,871) | | | | | | | | | | | 107,444,192 | |
| | | | | | | | | | | | | |
| FOREIGN GOVERNMENT OBLIGATIONS 3.62% | | | | | | | | | | | | |
| | | | | | | | | | | | | |
| Argentina 0.14% | | | | | | | | | | | | |
| Provincia de Mendoza†(a) | | 8.375% | | 5/19/2024 | | | 400 | | | | 413,000 | |
| Republic of Argentina(a) | | 8.28% | | 12/31/2033 | | | 206 | | | | 221,042 | |
| Total | | | | | | | | | | | 634,042 | |
| | | | | | | | | | | | | |
| Bahamas 0.07% | | | | | | | | | | | | |
| Commonwealth of Bahamas†(a) | | 6.95% | | 11/20/2029 | | | 300 | | | | 325,737 | |
| | | | | | | | | | | | | |
| Bermuda 0.09% | | | | | | | | | | | | |
| Government of Bermuda† | | 3.717% | | 1/25/2027 | | | 430 | | | | 408,500 | |
| | | | | | | | | | | | | |
| Brazil 0.16% | | | | | | | | | | | | |
| Federal Republic of Brazil(a) | | 4.25% | | 1/7/2025 | | | 600 | | | | 561,750 | |
| Federal Republic of Brazil(a) | | 5.00% | | 1/27/2045 | | | 200 | | | | 163,240 | |
| Total | | | | | | | | | | | 724,990 | |
| | See Notes to Financial Statements. | 21 |
Schedule of Investments (continued)
December 31, 2016
| Investments | | Interest
Rate | | Maturity
Date | | Principal
Amount
(000) | | | Fair
Value | |
| Chile 0.37% | | | | | | | | | | | | |
| Republic of Chile(a) | | 3.125% | | 3/27/2025 | | $ | 356 | | | $ | 353,473 | |
| Republic of Chile(a) | | 3.125% | | 1/21/2026 | | | 1,300 | | | | 1,283,750 | |
| Total | | | | | | | | | | | 1,637,223 | |
| | | | | | | | | | | | | |
| Dominican Republic 0.05% | | | | | | | | | | | | |
| Dominican Republic†(a) | | 6.85% | | 1/27/2045 | | | 250 | | | | 237,430 | |
| | | | | | | | | | | | | |
| Ethiopia 0.04% | | | | | | | | | | | | |
| Republic of Ethiopia†(a) | | 6.625% | | 12/11/2024 | | | 200 | | | | 184,992 | |
| | | | | | | | | | | | | |
| Honduras 0.12% | | | | | | | | | | | | |
| Honduras Government†(a) | | 7.50% | | 3/15/2024 | | | 500 | | | | 536,700 | |
| | | | | | | | | | | | | |
| Hungary 0.10% | | | | | | | | | | | | |
| Republic of Hungary(a) | | 5.375% | | 3/25/2024 | | | 420 | | | | 459,121 | |
| | | | | | | | | | | | | |
| Indonesia 0.36% | | | | | | | | | | | | |
| Perusahaan Penerbit SBSN†(a) | | 4.00% | | 11/21/2018 | | | 200 | | | | 207,500 | |
| Perusahaan Penerbit SBSN†(a) | | 4.325% | | 5/28/2025 | | | 275 | | | | 274,643 | |
| Republic of Indonesia†(a) | | 3.70% | | 1/8/2022 | | | 200 | | | | 200,949 | |
| Republic of Indonesia†(a) | | 4.35% | | 1/8/2027 | | | 645 | | | | 647,981 | |
| Republic of Indonesia†(a) | | 5.875% | | 1/15/2024 | | | 250 | | | | 276,451 | |
| Total | | | | | | | | | | | 1,607,524 | |
| | | | | | | | | | | | | |
| Ivory Coast 0.04% | | | | | | | | | | | | |
| Ivory Coast Bond†(a) | | 6.375% | | 3/3/2028 | | | 200 | | | | 195,875 | |
| | | | | | | | | | | | | |
| Latvia 0.06% | | | | | | | | | | | | |
| Republic of Latvia†(a) | | 5.25% | | 6/16/2021 | | | 258 | | | | 287,182 | |
| | | | | | | | | | | | | |
| Lithuania 0.15% | | | | | | | | | | | | |
| Republic of Lithuania†(a) | | 7.375% | | 2/11/2020 | | | 592 | | | | 676,212 | |
| | | | | | | | | | | | | |
| Mexico 0.42% | | | | | | | | | | | | |
| United Mexican States(a) | | 4.00% | | 10/2/2023 | | | 1,864 | | | | 1,873,134 | |
| | | | | | | | | | | | | |
| Panama 0.09% | | | | | | | | | | | | |
| Republic of Panama(a) | | 4.00% | | 9/22/2024 | | | 200 | | | | 204,500 | |
| Republic of Panama(a) | | 6.70% | | 1/26/2036 | | | 142 | | | | 173,027 | |
| Total | | | | | | | | | | | 377,527 | |
| | | | | | | | | | | | | |
| Paraguay 0.24% | | | | | | | | | | | | |
| Republic of Paraguay†(a) | | 4.625% | | 1/25/2023 | | | 1,050 | | | | 1,064,742 | |
| 22 | See Notes to Financial Statements. | |
Schedule of Investments (continued)
December 31, 2016
| Investments | | Interest
Rate | | Maturity
Date | | Principal
Amount
(000) | | | Fair
Value | |
| Peru 0.14% | | | | | | | | | | | | |
| Republic of Peru(a) | | 4.125% | | 8/25/2027 | | $ | 583 | | | $ | 608,506 | |
| | | | | | | | | | | | | |
| Qatar 0.32% | | | | | | | | | | | | |
| State of Qatar†(a) | | 3.25% | | 6/2/2026 | | | 1,475 | | | | 1,426,453 | |
| | | | | | | | | | | | | |
| Romania 0.01% | | | | | | | | | | | | |
| Republic of Romania†(a) | | 6.125% | | 1/22/2044 | | | 49 | | | | 57,385 | |
| | | | | | | | | | | | | |
| Russia 0.19% | | | | | | | | | | | | |
| Russia Eurobonds†(a) | | 4.875% | | 9/16/2023 | | | 800 | | | | 845,346 | |
| | | | | | | | | | | | | |
| Sri Lanka 0.09% | | | | | | | | | | | | |
| Republic of Sri Lanka†(a) | | 6.25% | | 7/27/2021 | | | 200 | | | | 203,711 | |
| Republic of Sri Lanka†(a) | | 6.85% | | 11/3/2025 | | | 200 | | | | 197,406 | |
| Total | | | | | | | | | | | 401,117 | |
| | | | | | | | | | | | | |
| Trinidad And Tobago 0.05% | | | | | | | | | | | | |
| Republic of Trinidad & Tobago†(a) | | 4.375% | | 1/16/2024 | | | 200 | | | | 198,890 | |
| | | | | | | | | | | | | |
| Turkey 0.30% | | | | | | | | | | | | |
| Republic of Turkey(a) | | 3.25% | | 3/23/2023 | | | 220 | | | | 195,479 | |
| Republic of Turkey(a) | | 5.625% | | 3/30/2021 | | | 616 | | | | 633,094 | |
| Republic of Turkey(a) | | 5.75% | | 3/22/2024 | | | 510 | | | | 513,383 | |
| Total | | | | | | | | | | | 1,341,956 | |
| | | | | | | | | | | | | |
| Uruguay 0.02% | | | | | | | | | | | | |
| Republic of Uruguay PIK(a) | | 7.875% | | 1/15/2033 | | | 61 | | | | 77,095 | |
| Total Foreign Government Obligations (cost $16,659,930) | | | | | | | | | | | 16,187,679 | |
| | | | | | | | | | | | | |
| GOVERNMENT SPONSORED ENTERPRISES BONDS 4.12% | | | | | | | | | | | | |
| Federal Home Loan Mortgage Corp. | | 0.75% | | 4/9/2018 | | | 11,929 | | | | 11,886,473 | |
| Federal Home Loan Mortgage Corp. | | 0.875% | | 3/7/2018 | | | 6,532 | | | | 6,524,286 | |
| Total Government Sponsored Enterprises Bonds (cost $18,454,876) | | | | | | | 18,410,759 | |
| | | | | | | | | | | | | |
| GOVERNMENT SPONSORED ENTERPRISES COLLATERALIZED MORTGAGE OBLIGATIONS 0.71% | |
| Federal Home Loan Mortgage Corp. Q001 XA IO | | 2.335% | # | 2/25/2032 | | | 2,907 | | | | 482,163 | |
| Government National Mortgage Assoc. 2014-78 A | | 2.20% | | 4/16/2047 | | | 36 | | | | 35,632 | |
| Government National Mortgage Assoc. 2015-47 AE | | 2.90% | # | 11/16/2055 | | | 1,407 | | | | 1,409,786 | |
| Government National Mortgage Assoc. 2015-48 AS | | 2.90% | # | 2/16/2049 | | | 866 | | | | 875,888 | |
| Government National Mortgage Assoc. 2015-73 AC | | 2.90% | # | 2/16/2053 | | | 361 | | | | 363,040 | |
| Total Government Sponsored Enterprises Collateralized Mortgage Obligations (cost $3,227,000) | | | | | 3,166,509 | |
| | See Notes to Financial Statements. | 23 |
Schedule of Investments (continued)
December 31, 2016
| Investments | | Interest
Rate | | Maturity
Date | | Principal
Amount
(000) | | | Fair
Value | |
| GOVERNMENT SPONSORED ENTERPRISES PASS-THROUGHS 19.58% | | | |
| Federal Home Loan Mortgage Corp. | | 3.50% | | 2/1/2046 -
3/1/2046 | | $ | 2,823 | | | $ | 2,901,726 | |
| Federal Home Loan Mortgage Corp. | | 4.00% | | 12/1/2044 | | | 1,234 | | | | 1,311,724 | |
| Federal Home Loan Mortgage Corp. | | 5.00% | | 9/1/2019 - 6/1/2026 | | | 253 | | | | 260,276 | |
| Federal National Mortgage Assoc. (c) | | 3.00% | | TBA | | | 32,804 | | | | 32,875,832 | |
| Federal National Mortgage Assoc. | | 3.14% | # | 3/1/2042 | | | 1,162 | | | | 1,225,146 | |
| Federal National Mortgage Assoc. | | 3.50% | | 4/1/2043 - 4/1/2046 | | | 17,118 | | | | 17,618,622 | |
| Federal National Mortgage Assoc.(c) | | 3.50% | | TBA | | | 8,290 | | | | 8,497,250 | |
| Federal National Mortgage Assoc. | | 4.00% | | 10/1/2040 - 11/1/2044 | | | 4,173 | | | | 4,404,647 | |
| Federal National Mortgage Assoc.(c) | | 4.00% | | TBA | | | 13,800 | | | | 14,509,137 | |
| Federal National Mortgage Assoc.(c) | | 4.50% | | TBA | | | 2,250 | | | | 2,420,420 | |
| Federal National Mortgage Assoc. | | 5.50% | | 11/1/2034 - 9/1/2036 | | | 1,363 | | | | 1,527,093 | |
| Total Government Sponsored Enterprises Pass-Throughs (cost $89,030,702) | | | | | | | | 87,551,873 | |
| | | | | | | | | | | | | |
| MUNICIPAL BONDS 0.34% | | | | | | | | | | | | |
| | | | | | | | | | | | | |
| Miscellaneous | | | | | | | | | | | | |
| Municipal Elec Auth of Georgia | | 7.055% | | 4/1/2057 | | | 557 | | | | 633,677 | |
| North Texas Tollway Auth | | 8.91% | | 2/1/2030 | | | 538 | | | | 631,015 | |
| Pennsylvania | | 5.35% | | 5/1/2030 | | | 235 | | | | 256,079 | |
| Total Municipal Bonds (cost $1,491,657) | | | | | | | | | | | 1,520,771 | |
| | | | | | | | | | | | | |
| NON-AGENCY COMMERCIAL MORTGAGE-BACKED SECURITIES 3.02% | | | |
| Banc of America Commercial Mortgage Trust 2015-UBS7 C | | 4.366% | # | 9/15/2048 | | | 94 | | | | 91,699 | |
| CGBAM Commercial Mortgage Trust 2015-SMRT B† | | 3.213% | | 4/10/2028 | | | 212 | | | | 212,595 | |
| CGBAM Commercial Mortgage Trust 2015-SMRT C† | | 3.516% | | 4/10/2028 | | | 159 | | | | 159,522 | |
| Citigroup Commercial Mortgage Trust 2016-GC36 D† | | 2.85% | | 2/10/2049 | | | 1,250 | | | | 863,746 | |
| Citigroup Commercial Mortgage Trust 2016-P3 C | | 4.836% | # | 4/15/2049 | | | 260 | | | | 263,790 | |
| Citigroup Commercial Mortgage Trust 2016-P3 D† | | 2.804% | # | 4/15/2049 | | | 203 | | | | 145,357 | |
| Citigroup Commercial Mortgage Trust 2016-P4 C | | 3.977% | # | 7/10/2049 | | | 506 | | | | 476,370 | |
| COBALT CMBS Commercial Mortgage Trust 2007-C2 AMFX | | 5.526% | # | 4/15/2047 | | | 165 | | | | 168,094 | |
| Commercial Mortgage Pass-Through Certificates 2014-CR19 XA IO | | 1.265% | # | 8/10/2047 | | | 745 | | | | 44,359 | |
| 24 | See Notes to Financial Statements. | |
Schedule of Investments (continued)
December 31, 2016
| Investments | | Interest
Rate | | Maturity
Date | | Principal
Amount
(000) | | | Fair
Value | |
| NON-AGENCY COMMERCIAL MORTGAGE-BACKED SECURITIES (continued) | | | | | |
| Commercial Mortgage Pass-Through Certificates 2015-LC23 C | | 4.646% | # | 10/10/2053 | | $ | 350 | | | $ | 345,036 | |
| Commercial Mortgage Pass-Through Certificates 2015-LC23 D† | | 3.646% | # | 10/10/2053 | | | 606 | | | | 485,742 | |
| Commercial Mortgage Pass-Through Certificates 2015-PC1 B | | 4.591% | # | 7/10/2050 | | | 178 | | | | 176,152 | |
| Commercial Mortgage Pass-Through Certificates 2015-PC1 C | | 4.591% | # | 7/10/2050 | | | 410 | | | | 353,194 | |
| Commercial Mortgage Pass-Through Certificates 2016-SAVA A† | | 2.424% | # | 10/15/2034 | | | 1,073 | | | | 1,079,460 | |
| CSAIL Commercial Mortgage Trust 2015-C2 C | | 4.211% | # | 6/15/2057 | | | 700 | | | | 665,271 | |
| DBWF Mortgage Trust 2015-LCM D† | | 3.421% | # | 6/10/2034 | | | 257 | | | | 228,328 | |
| GAHR Commercial Mortgage Trust 2015-NRF DFX† | | 3.382% | # | 12/15/2034 | | | 278 | | | | 276,679 | |
| GS Mortgage Securities Trust 2014-GC26 D† | | 4.511% | # | 11/10/2047 | | | 117 | | | | 95,342 | |
| GS Mortgage Securities Trust 2015-GC32 C | | 4.412% | # | 7/10/2048 | | | 195 | | | | 193,321 | |
| Hudsons Bay Simon JV Trust 2015-HB7 B7† | | 4.666% | | 8/5/2034 | | | 668 | | | | 669,621 | |
| Hudsons Bay Simon JV Trust 2015-HB7 D7† | | 5.159% | # | 8/5/2034 | | | 629 | | | | 591,743 | |
| JPMorgan Chase Commercial Mortgage Securities Trust 2014-C19 AS | | 4.243% | # | 4/15/2047 | | | 300 | | | | 318,241 | |
| JPMorgan Chase Commercial Mortgage Securities Trust 2014-C26 D† | | 3.926% | # | 1/15/2048 | | | 112 | | | | 90,233 | |
| JPMorgan Chase Commercial Mortgage Securities Trust 2015-C30 C | | 4.31% | # | 7/15/2048 | | | 157 | | | | 138,749 | |
| MASTR Asset Securitization Trust 2006-3 1A3 | | 6.00% | | 10/25/2036 | | | 8 | | | | 7,721 | |
| MASTR Asset Securitization Trust 2006-3 1A8 | | 6.00% | | 10/25/2036 | | | 18 | | | | 17,356 | |
| Merrill Lynch Mortgage Investors Trust 2006-AF2 AF1 | | 6.25% | | 10/25/2036 | | | 20 | | | | 16,868 | |
| Morgan Stanley Bank of America Merrill Lynch Trust 2015-C23 XA IO | | 0.751% | # | 7/15/2050 | | | 19,745 | | | | 766,586 | |
| Motel 6 Trust 2015-MTL6 D† | | 4.532% | | 2/5/2030 | | | 1,012 | | | | 1,017,718 | |
| SFAVE Commercial Mortgage Securities Trust 2015-5AVE A2B† | | 4.144% | # | 1/5/2043 | | | 250 | | | | 249,899 | |
| Structured Asset Securities Corp. 2006-3H 1A2 | | 5.75% | | 12/25/2035 | | | 12 | | | | 12,175 | |
| UBS-BAMLL Trust 2012-WRM E† | | 4.379% | # | 6/10/2030 | | | 595 | | | | 560,034 | |
| UBS-Barclays Commercial Mortgage Trust 2012-C3 B† | | 4.365% | # | 8/10/2049 | | | 200 | | | | 210,633 | |
| Wells Fargo Commercial Mortgage Trust 2013-120B D† | | 2.71% | # | 3/18/2028 | | | 44 | | | | 42,597 | |
| Wells Fargo Commercial Mortgage Trust 2013-LC12 D† | | 4.296% | # | 7/15/2046 | | | 364 | | | | 320,288 | |
| | See Notes to Financial Statements. | 25 |
Schedule of Investments (continued)
December 31, 2016
| Investments | | Interest
Rate | | Maturity
Date | | Principal
Amount
(000) | | | Fair
Value | |
| NON-AGENCY COMMERCIAL MORTGAGE-BACKED SECURITIES (continued) | | | | | |
| Wells Fargo Commercial Mortgage Trust 2015-C28 D | | 4.136% | # | 5/15/2048 | | $ | 1,489 | | | $ | 1,121,713 | |
| Wells Fargo Commercial Mortgage Trust 2016-C35 C | | 4.176% | # | 7/15/2048 | | | 750 | | | | 711,730 | |
| Wells Fargo Commercial Mortgage Trust 2016-NXS5 E† | | 4.882% | # | 1/15/2059 | | | 434 | | | | 324,646 | |
| Total Non-Agency Commercial Mortgage-Backed Securities (cost $13,614,990) | | | | | | 13,512,608 | |
| | | | | | | | |
| U.S. TREASURY OBLIGATIONS 33.31% | | | | | | | | | | | | |
| U.S. Treasury Bond | | 2.25% | | 8/15/2046 | | | 18,246 | | | | 15,342,332 | |
| U.S. Treasury Bond | | 3.00% | | 5/15/2045 | | | 3,493 | | | | 3,446,676 | |
| U.S. Treasury Inflation Indexed Note(d) | | 0.625% | | 1/15/2026 | | | 4,883 | | | | 4,928,440 | |
| U.S. Treasury Note | | 0.875% | | 10/15/2017 | | | 21,041 | | | | 21,046,744 | |
| U.S. Treasury Note | | 1.25% | | 11/15/2018 | | | 6,676 | | | | 6,687,216 | |
| U.S. Treasury Note | | 1.25% | | 3/31/2021 | | | 5,378 | | | | 5,254,580 | |
| U.S. Treasury Note | | 1.25% | | 10/31/2021 | | | 11,576 | | | | 11,226,463 | |
| U.S. Treasury Note | | 1.375% | | 6/30/2018 | | | 16,296 | | | | 16,374,302 | |
| U.S. Treasury Note | | 1.375% | | 5/31/2021 | | | 2,934 | | | | 2,876,065 | |
| U.S. Treasury Note | | 1.75% | | 10/31/2020 | | | 4,159 | | | | 4,168,017 | |
| U.S. Treasury Note | | 1.75% | | 11/30/2021 | | | 21,300 | | | | 21,143,999 | |
| U.S. Treasury Note | | 2.00% | | 12/31/2021 | | | 4,650 | | | | 4,667,530 | |
| U.S. Treasury Note | | 2.00% | | 11/15/2026 | | | 10,815 | | | | 10,407,112 | |
| U.S. Treasury Note | | 2.125% | | 8/15/2021 | | | 16,842 | | | | 17,004,828 | |
| U.S. Treasury Note | | 2.625% | | 11/15/2020 | | | 4,247 | | | | 4,390,421 | |
| Total U.S. Treasury Obligations (cost $150,391,441) | | | | | | | | | | | 148,964,725 | |
| Total Long-Term Investments (cost $503,455,962) | | | | | | | | | | $ | 500,132,471 | |
| 26 | See Notes to Financial Statements. | |
Schedule of Investments (continued)
December 31, 2016
| | | Principal | | | | |
| | | Amount | | | Fair | |
| Investments | | | (000) | | | | Value | |
| SHORT-TERM INVESTMENT 0.15% | | | | | | | | |
| | | | | | | | | |
| REPURCHASE AGREEMENT | | | | | | | | |
Repurchase Agreement dated 12/30/2016, 0.03% due 1/3/2017 with Fixed Income Clearing Corp. collateralized by $630,000 of U.S. Treasury Inflation Indexed Note at 0.125% due 4/15/2017; value: $671,881; proceeds: $658,416 (cost $658,414) | | $ | 658 | | | $ | 658,414 | |
| Total Investments in Securities 112.00% (cost $504,114,376) | | | | | | | 500,790,885 | |
| Liabilities in Excess of Other Assets(e) (12.00%) | | | | | | | (53,675,532) | |
| Net Assets 100.00% | | | | | | $ | 447,115,353 | |
| IO | | Interest Only. |
| PIK | | Payment-in-kind. |
| † | | Security was purchased pursuant to Rule 144A under the Securities Act of 1933 and, unless registered under such Act or exempted from registration, may only be resold to qualified institutional buyers. |
| # | | Variable rate security. The interest rate represents the rate in effect at December 31, 2016. |
| (a) | | Foreign security traded in U.S. dollars. |
| (b) | | Defaulted (non-income producing security). |
| (c) | | To-be-announced (“TBA”). Security purchased on a forward commitment basis with an approximate principal and maturity date. Actual principal and maturity will be determined upon settlement when the specific mortgage pools are assigned. |
| (d) | | Treasury Inflation Protected Security. A U.S. Treasury Note or Bond that offers protection from inflation by paying a fixed rate of interest on principal amount that is adjusted for inflation based on the Consumer Price Index. |
| (e) | | Liabilities in Excess of Other Assets include net unrealized appreciation/depreciation on futures contracts as follows: |
| Open Futures Contracts at December 31, 2016: | | | | | | | | | | |
| | | | | | | | | Notional | | | Unrealized | |
| Type | | Expiration | | | Contracts | | | Position | | | Value | | | Appreciation | |
| U.S. 10-Year Treasury Note | | | March 2017 | | | | 80 | | | | Short | | | | $(9,942,500 | ) | | | $ 54,863 | |
| | | | | | | | | | | | | | | | | | | | | |
| | | | | | | | | | | | | | | | Notional | | | | Unrealized | |
| Type | | | Expiration | | | | Contracts | | | | Position | | | | Value | | | | Depreciation | |
| U.S. 5-Year Treasury Note | | | March 2017 | | | | 236 | | | | Long | | | | $27,768,719 | | | | $(44,674) | |
| | See Notes to Financial Statements. | 27 |
Schedule of Investments (concluded)
December 31, 2016
The following is a summary of the inputs used as of December 31, 2016 in valuing the Fund’s investments carried at fair value(1):
| Investment Type(2)(3) | | Level 1 | | | | Level 2 | | | Level 3 | | | | Total | |
| Asset-Backed Securities | | $ | – | | | $ | 103,373,355 | | | $ | – | | | $ | 103,373,355 | |
| Corporate Bonds | | | – | | | | 107,444,192 | | | | – | | | | 107,444,192 | |
| Foreign Government Obligations | | | – | | | | 16,187,679 | | | | – | | | | 16,187,679 | |
| Government Sponsored Enterprises Bonds | | | – | | | | 18,410,759 | | | | – | | | | 18,410,759 | |
| Government Sponsored Enterprises Collateralized Mortgage Obligations | | | – | | | | 3,166,509 | | | | – | | | | 3,166,509 | |
| Government Sponsored Enterprises Pass-Throughs | | | – | | | | 87,551,873 | | | | – | | | | 87,551,873 | |
| Municipal Bonds | | | – | | | | 1,520,771 | | | | – | | | | 1,520,771 | |
| Non-Agency Commercial Mortgage-Backed Securities | | | – | | | | 13,512,608 | | | | – | | | | 13,512,608 | |
| U.S. Treasury Obligations | | | – | | | | 148,964,725 | | | | – | | | | 148,964,725 | |
| Repurchase Agreement | | | – | | | | 658,414 | | | | – | | | | 658,414 | |
| Total | | $ | – | | | $ | 500,790,885 | | | $ | – | | | $ | 500,790,885 | |
| | | | | | | | | | | | | | | | | |
| Other Financial Instruments | | | | | | | | | | | | | | | | |
| Futures Contracts | | | | | | | | | | | | | | | | |
| Assets | | $ | 54,863 | | | $ | – | | | $ | – | | | $ | 54,863 | |
| Liabilities | | | (44,674 | ) | | | – | | | | – | | | | (44,674 | ) |
| Total | | $ | 10,189 | | | $ | – | | | $ | – | | | $ | 10,189 | |
| | (1) | Refer to Note 2(k) for a description of fair value measurements and the three-tier hierarchy of inputs. |
| | (2) | See Schedule of Investments for fair values in each industry and identification of foreign issuers and/or geography. |
| | (3) | There were no Level 1/Level 2 transfers during the fiscal year ended December 31, 2016. |
| | | | | | Government | |
| | | | | | Sponsored Enterprises | |
| | | Asset-Back | | | Collateralized | |
| Investment Type | | Securities | | | Mortgage Obligations | |
| Balance as of January 1, 2016 | | $ | 1,252,335 | | | $ | 539,804 | |
| Accrued discounts/premiums | | | – | | | | – | |
| Realized gain (loss) | | | – | | | | – | |
| Change in unrealized appreciation/depreciation | | | – | | | | – | |
| Purchases | | | – | | | | – | |
| Sales | | | – | | | | – | |
| Net transfers in or out of Level 3 | | | (1,252,335 | ) | | | (539,804 | ) |
| Balance as of December 31, 2016 | | $ | – | | | $ | – | |
| 28 | See Notes to Financial Statements. |
Statement of Assets and Liabilities
December 31, 2016
| ASSETS: | | | | |
| Investments in securities, at fair value (cost $504,114,376) | | $ | 500,790,885 | |
| Deposits with brokers for futures collateral | | | 371,667 | |
| Receivables: | | | | |
| Investment securities sold | | | 8,867,373 | |
| Interest | | | 2,892,938 | |
| Capital shares sold | | | 792,235 | |
| From advisor (See Note 3) | | | 95,128 | |
| Variation margin | | | 11,330 | |
| Prepaid expenses | | | 2,542 | |
| Total assets | | | 513,824,098 | |
| LIABILITIES: | | | | |
| Payables: | | | | |
| Investment securities purchased | | | 65,957,218 | |
| Capital shares reacquired | | | 221,677 | |
| Management fee | | | 168,447 | |
| Directors’ fees | | | 26,670 | |
| Fund administration | | | 14,973 | |
| Accrued expenses | | | 319,760 | |
| Total liabilities | | | 66,708,745 | |
| NET ASSETS | | $ | 447,115,353 | |
| COMPOSITION OF NET ASSETS: | | | | |
| Paid-in capital | | $ | 457,012,059 | |
| Distributions in excess of net investment income | | | (16,313 | ) |
| Accumulated net realized loss on investments and futures contracts | | | (6,567,091 | ) |
| Net unrealized depreciation on investments and futures contracts | | | (3,313,302 | ) |
| Net Assets | | $ | 447,115,353 | |
| Outstanding shares (50 million shares of common stock authorized, $.001 par value) | | | 27,225,128 | |
Net asset value, offering and redemption price per share
(Net assets divided by outstanding shares) | | | $16.42 | |
| | | |
| | See Notes to Financial Statements. | 29 |
Statement of Operations
For the Year Ended December 31, 2016
| Investment income: | | | | |
| Interest and other | | $ | 11,776,705 | |
| Total investment income | | | 11,776,705 | |
| Expenses: | | | | |
| Management fee | | | 1,894,318 | |
| Non 12b-1 service fees | | | 1,052,771 | |
| Shareholder servicing | | | 449,641 | |
| Fund administration | | | 168,384 | |
| Professional | | | 53,428 | |
| Reports to shareholders | | | 44,967 | |
| Custody | | | 18,549 | |
| Directors’ fees | | | 14,376 | |
| Other | | | 36,771 | |
| Gross expenses | | | 3,733,205 | |
| Expense reductions (See Note 9) | | | (1,624 | ) |
| Fees waived and expenses reimbursed (See Note 3) | | | (1,037,439 | ) |
| Net expenses | | | 2,694,142 | |
| Net investment income | | | 9,082,563 | |
| | | | | |
| Net realized and unrealized gain (loss): | | | | |
| Net realized gain on investments | | | 412,908 | |
| Net realized loss on futures contracts | | | (109,574 | ) |
| Net change in unrealized appreciation/depreciation on investments | | | 6,662,825 | |
| Net change in unrealized appreciation/depreciation on futures contracts | | | 23,366 | |
| Net realized and unrealized gain | | | 6,989,525 | |
| Net Increase in Net Assets Resulting From Operations | | $ | 16,072,088 | |
| | |
| 30 | See Notes to Financial Statements. |
Statements of Changes in Net Assets
| | | | For the Year Ended | | For the Year Ended | |
| INCREASE IN NET ASSETS | | | December 31, 2016 | | December 31, 2015 | |
| Operations: | | | | | | | | |
| Net investment income | | | $ | 9,082,563 | | $ | 7,790,264 | |
| Net realized gain on investments and futures contracts | | | | 303,334 | | | 1,096,299 | |
| Net change in unrealized appreciation/depreciation on investments and futures contracts | | | | 6,686,191 | | | (11,971,137 | ) |
| Net increase (decrease) in net assets resulting from operations | | | | 16,072,088 | | | (3,084,574 | ) |
| Distributions to shareholders from: | | | | | | | | |
| Net investment income | | | | (11,678,719 | ) | | (10,557,123 | ) |
| Net realized gain | | | | (1,693,962 | ) | | (517,492 | ) |
| Total distributions to shareholders | | | | (13,372,681 | ) | | (11,074,615 | ) |
| Capital share transactions (See Note 14): | | | | | | | | |
| Proceeds from sales of shares | | | | 98,161,165 | | | 112,443,645 | |
| Reinvestment of distributions | | | | 13,372,681 | | | 11,074,615 | |
| Cost of shares reacquired | | | | (57,272,642 | ) | | (36,936,737 | ) |
| Net increase in net assets resulting from capital share transactions | | | | 54,261,204 | | | 86,581,523 | |
| Net increase in net assets | | | | 56,960,611 | | | 72,422,334 | |
| NET ASSETS: | | | | | | | | |
| Beginning of year | | | $ | 390,154,742 | | $ | 317,732,408 | |
| End of year | | | $ | 447,115,353 | | $ | 390,154,742 | |
| Undistributed (distributions in excess of) net investment income | | | $ | (16,313 | ) | $ | 40,752 | |
| See Notes to Financial Statements. | 31 |
Financial Highlights
| | | | | | Per Share Operating Performance: |
| | | | | | | Investment Operations: | | Distributions to
shareholders from: |
| | | Net asset
value,
beginning
of period | | Net
invest-
ment
income(a) | | Net
realized
and
unrealized
gain (loss) | | Total
from
invest-
ment
opera-
tions | | Net
investment
income | | Net
realized
gain | | Total
distri-
butions |
| 12/31/2016 | | | $16.25 | | | | $0.36 | | | | $ 0.31 | | | | $ 0.67 | | | | $(0.44 | ) | | | $(0.06 | ) | | | $(0.50 | ) |
| 12/31/2015 | | | 16.85 | | | | 0.36 | | | | (0.47 | ) | | | (0.11 | ) | | | (0.47 | ) | | | (0.02 | ) | | | (0.49 | ) |
| 12/31/2014 | | | 16.22 | | | | 0.32 | | | | 0.66 | | | | 0.98 | | | | (0.32 | ) | | | (0.03 | ) | | | (0.35 | ) |
| 12/31/2013 | | | 16.73 | | | | 0.29 | | | | (0.47 | ) | | | (0.18 | ) | | | (0.32 | ) | | | (0.01 | ) | | | (0.33 | ) |
| 12/31/2012 | | | 16.06 | | | | 0.31 | | | | 0.78 | | | | 1.09 | | | | (0.30 | ) | | | (0.12 | ) | | | (0.42 | ) |
| (a) | Calculated using average shares outstanding during the period. |
| (b) | Total return does not consider the effects of sales charges or other expenses imposed by an insurance company and assumes the reinvestment of all distributions. |
| | |
| 32 | See Notes to Financial Statements. |
| | | | | Ratios to Average Net Assets: | | Supplemental Data: |
| | | | | | | | | | | | | |
| | | | | Total | | | | | | | | |
| | | | | expenses | | | | | | | | |
| Net | | | | after | | | | | | Net | | |
| asset | | | | waivers | | | | Net | | assets, | | Portfolio |
| value, | | Total | | and/or reim- | | Total | | investment | | end of | | turnover |
| end of | | return(b) | | bursements | | expenses | | income | | period | | rate |
| period | | (%) | | (%) | | (%) | | (%) | | (000) | | (%) |
| $ | 16.42 | | | | 4.26 | | | | 0.64 | | | | 0.89 | | | | 2.16 | | | | $447,115 | | | | 443.36 | |
| | 16.25 | | | | (0.66 | ) | | | 0.64 | | | | 0.89 | | | | 2.11 | | | | 390,155 | | | | 431.81 | |
| | 16.85 | | | | 6.08 | | | | 0.64 | | | | 0.90 | | | | 1.87 | | | | 317,732 | | | | 466.40 | |
| | 16.22 | | | | (1.10 | ) | | | 0.64 | | | | 0.95 | | | | 1.74 | | | | 147,670 | | | | 625.23 | |
| | 16.73 | | | | 6.82 | | | | 0.64 | | | | 1.16 | | | | 1.85 | | | | 50,239 | | | | 588.93 | |
| | | |
| | See Notes to Financial Statements. | 33 |
Notes to Financial Statements
Lord Abbett Series Fund, Inc. (the “Company”) is registered under the Investment Company Act of 1940, as amended (“the Act”), as a diversified, open-end management investment company and was incorporated under Maryland law in 1989. The Company consists of thirteen separate portfolios. This report covers Total Return Portfolio (the “Fund”).
The Fund’s investment objective is to seek income and capital appreciation to produce a high total return. The Fund has Variable Contract class shares (“Class VC Shares”), which are currently issued and redeemed only in connection with investments in, and payments under, variable annuity contracts and variable life insurance policies issued by life insurance and insurance-related companies.
The preparation of the financial statements in conformity with accounting principles generally accepted in the United States of America (“U.S. GAAP”) requires management to make certain estimates and assumptions that affect the reported amounts of assets and liabilities and disclosure of contingent assets and liabilities at the date of the financial statements and the reported amounts of increases and decreases in net assets from operations during the reporting period. Actual results could differ from those estimates. The Fund is considered an investment company under U.S. GAAP and follows the accounting and reporting guidance applicable to investment companies.
| 2. | SIGNIFICANT ACCOUNTING POLICIES |
| (a) | Investment Valuation–Under procedures approved by the Fund’s Board of Directors (the “Board”), Lord, Abbett & Co. LLC (“Lord Abbett”), the Fund’s investment manager, has formed a Pricing Committee to administer the pricing and valuation of portfolio investments and to ensure that prices utilized reasonably reflect fair value. Among other things, these procedures allow the Fund to utilize independent pricing services, quotations from securities and financial instrument dealers and other market sources to determine fair value. |
| | |
| | Securities actively traded on any recognized U.S. or non-U.S. exchange or on The NASDAQ Stock Market LLC are valued at the last sale price or official closing price on the exchange or system on which they are principally traded. Events occurring after the close of trading on non-U.S. exchanges may result in adjustments to the valuation of foreign securities to reflect their fair value as of the close of regular trading on the New York Stock Exchange. The Fund may utilize an independent fair valuation service in adjusting the valuations of foreign securities. Unlisted equity securities are valued at the last quoted sale price or, if no sale price is available, at the mean between the most recently quoted bid and asked prices. Fixed income securities are valued based on evaluated prices supplied by independent pricing services, which reflect broker/dealer supplied valuations and the independent pricing services’ own electronic data processing techniques. Exchange traded options and futures contracts are valued at the last sale price in the market where they are principally traded. If no sale has occurred, the mean between the most recently quoted bid and asked prices is used. |
| | |
| | Securities for which prices are not readily available are valued at fair value as determined by the Pricing Committee. The Pricing Committee considers a number of factors, including observable and unobservable inputs, when arriving at fair value. The Pricing Committee may use related or comparable assets or liabilities, recent transactions, market multiples, book values, yield curves, broker quotes, observable trading activity, option adjusted spread models |
34
Notes to Financial Statements (continued)
| | and other relevant information to determine the fair value of portfolio investments. The Board or a designated committee thereof regularly reviews fair value determinations made by the Pricing Committee and employs techniques such as reviewing related market activity, reviewing inputs and assumptions, and retrospectively comparing prices of subsequent purchases and sales transactions to fair value determinations made by the Pricing Committee. |
| | |
| | Short-term securities with 60 days or less remaining to maturity are valued using the amortized cost method, which approximates fair value. |
| | |
| (b) | Security Transactions–Security transactions are recorded as of the date that the securities are purchased or sold (trade date). Realized gains and losses on sales of portfolio securities are calculated using the identified-cost method. |
| | |
| (c) | Investment Income–Dividend income is recorded on the ex-dividend date. Interest income is recorded on the accrual basis as earned. Discounts are accreted and premiums are amortized using the effective interest method and are included in Interest and other income on the Statement of Operations. Withholding taxes on foreign dividends have been provided for in accordance with the applicable country’s tax rules and rates. |
| | |
| (d) | Income Taxes–It is the policy of the Fund to meet the requirements of Subchapter M of the Internal Revenue Code applicable to regulated investment companies and to distribute substantially all taxable income and capital gains to its shareholders. Therefore, no income tax provision is required. |
| | |
| | The Fund files U.S. federal and various state and local tax returns. No income tax returns are currently under examination. The statute of limitations on the Fund’s filed U.S. federal tax returns remains open for the fiscal years ended December 31, 2013 through December 31, 2016. The statutes of limitations on the Company’s state and local tax returns may remain open for an additional year depending upon the jurisdiction. |
| | |
| (e) | Expenses–Expenses incurred by the Company that do not specifically relate to an individual fund are generally allocated to the funds within the Company on a pro rata basis by relative net assets. |
| | |
| (f) | Foreign Transactions–The books and records of the Fund are maintained in U.S. dollars and transactions denominated in foreign currencies are recorded in the Fund’s records at the rate prevailing when earned or recorded. Asset and liability accounts that are denominated in foreign currencies are adjusted daily to reflect current exchange rates and any unrealized gain (loss) is included in Net change in unrealized appreciation/depreciation on futures contracts in the Fund’s Statement of Operations. The resultant exchange gains and losses upon settlement of such transactions are included in Net realized gain on futures contracts in the Fund’s Statement of Operations. The Fund does not isolate that portion of the results of operations arising as a result of changes in the foreign exchange rates from the changes in market prices of the securities. |
| | |
| (g) | Futures Contracts–The Fund may purchase and sell futures contracts to enhance returns, to attempt to economically hedge some of its investment risk, or as a substitute position in lieu of holding the underlying asset on which the instrument is based. At the time of entering into a futures transaction, an investor is required to deposit and maintain a specified amount of cash or eligible securities called “initial margin.” Subsequent payments made or received by the Fund called “variation margin” are made on a daily basis as the market price of the futures |
35
Notes to Financial Statements (continued)
| | contract fluctuates. The Fund will record an unrealized gain (loss) based on the amount of variation margin. When a contract is closed, a realized gain (loss) is recorded equal to the difference between the opening and closing value of the contract. |
| | |
| (h) | Repurchase Agreements–The Fund may enter into repurchase agreements with respect to securities. A repurchase agreement is a transaction in which a fund acquires a security and simultaneously commits to resell that security to the seller (a bank or securities dealer) at an agreed-upon price on an agreed-upon date. The Fund requires at all times that the repurchase agreement be collateralized by cash, or by securities of the U.S. Government, its agencies, its instrumentalities, or U.S. Government sponsored enterprises having a value equal to, or in excess of, the value of the repurchase agreement (including accrued interest). If the seller of the agreement defaults on its obligation to repurchase the underlying securities at a time when the fair value of these securities has declined, the Fund may incur a loss upon disposition of the securities. |
| | |
| (i) | When-Issued, Forward Transactions or To-Be-Announced (“TBA”) Transactions–The Fund may purchase portfolio securities on a when-issued or forward basis. When-issued, forward transactions or TBA transactions involve a commitment by a fund to purchase securities, with payment and delivery (“settlement”) to take place in the future, in order to secure what is considered to be an advantageous price or yield at the time of entering into the transaction. During the period between purchase and settlement, the fair value of the securities will fluctuate and assets consisting of cash and/or marketable securities (normally short-term U.S. Government or U.S. Government sponsored enterprise securities) marked to market daily in an amount sufficient to make payment at settlement will be segregated at the Fund’s custodian in order to pay for the commitment. At the time the Fund makes the commitment to purchase a security on a when-issued basis, it will record the transaction and reflect the liability for the purchase and fair value of the security in determining its net asset value (“NAV”). The Fund, generally, has the ability to close out a purchase obligation on or before the settlement date rather than take delivery of the security. Under no circumstances will settlement for such securities take place more than 120 days after the purchase date. |
| | |
| (j) | Mortgage Dollar Rolls–The Fund may enter into mortgage dollar rolls in which a fund sells mortgage-backed securities for delivery in the current month and simultaneously contracts with the same counterparty to repurchase similar (same type, coupon and maturity) but not identical securities on a specified future date. During the roll period, the Fund loses the right to receive principal (including prepayments of principal) and interest paid on the securities sold. |
| | |
| (k) | Fair Value Measurements–Fair value is defined as the price that the Fund would receive upon selling an investment or transferring a liability in an orderly transaction to an independent buyer in the principal or most advantageous market of the investment. A three-tier hierarchy is used to maximize the use of observable market data and minimize the use of unobservable inputs and to establish classification of fair value measurements for disclosure purposes. Inputs refer broadly to the assumptions that market participants would use in pricing the asset or liability, including assumptions about risk—for example, the risk inherent in a particular valuation technique used to measure fair value (such as a pricing model) and/or the risk inherent in the inputs to the valuation technique. Inputs may be observable or unobservable. Observable inputs reflect the assumptions market participants would use in pricing the asset or liability. Observable inputs are based on market data obtained from sources |
36
Notes to Financial Statements (continued)
| | independent of the reporting entity. Unobservable inputs reflect the reporting entity’s own assumptions about the assumptions market participants would use in pricing the asset or liability. Unobservable inputs are based on the best information available in the circumstances. The three-tier hierarchy classification is determined based on the lowest level of inputs that is significant to the fair value measurement, and is summarized in the three broad Levels listed below: |
| • | Level 1 – | unadjusted quoted prices in active markets for identical investments; |
| | | |
| • | Level 2 – | other significant observable inputs (including quoted prices for similar investments, interest rates, prepayment speeds, credit risk, etc.); and |
| | | |
| • | Level 3 – | significant unobservable inputs (including the Fund’s own assumptions in determining the fair value of investments). |
| | A summary of inputs used in valuing the Fund’s investments as of December 31, 2016 and, if applicable, Level 1/Level 2 transfers and Level 3 rollforwards for the fiscal year then ended is included in the Fund’s Schedule of Investments. |
| | |
| | Changes in valuation techniques may result in transfers into or out of an assigned level within the three-tier hierarchy. All transfers between different levels within the three-tier hierarchy are deemed to have occurred as of the beginning of the reporting period. The inputs or methodology used for valuing securities are not necessarily an indication of the risk associated with investing in those securities. |
| 3. | MANAGEMENT FEE AND OTHER TRANSACTIONS WITH AFFILIATES |
Management Fee
The Company has a management agreement with Lord Abbett, pursuant to which Lord Abbett supplies the Fund with investment management services and executive and other personnel, provides office space and pays for ordinary and necessary office and clerical expenses relating to research and statistical work and supervision of the Fund’s investment portfolio.
The management fee is based on the Fund’s average daily net assets at the following annual rate:
| First $1 billion | .45% |
| Next $1 billion | .40% |
| Over $2 billion | .35% |
For the fiscal year ended December 31, 2016, the effective management fee, net of waivers, was at an annualized rate of .20% of the Fund’s average daily net assets.
In addition, Lord Abbett provides certain administrative services to the Fund pursuant to an Administrative Services Agreement in return for a fee at an annual rate of ..04% of the Fund’s average daily net assets.
During the fiscal year ended December 31, 2016 and continuing through April 30, 2017, Lord Abbett has contractually agreed to waive its fees and reimburse expenses to the extent necessary to limit total net annual operating expenses to an annual rate of .64%. This agreement may be terminated only by the approval of the Board.
The Company, on behalf of the Fund, has entered into services arrangements with certain insurance companies. Under these arrangements, certain insurance companies will be compensated up to .25% of the average daily net asset value (“NAV”) of the Fund’s Class VC Shares held in the insurance company’s separate account to service and maintain the Variable Contract
37
Notes to Financial Statements (continued)
owners’ accounts. This amount is included in Non 12b-1 service fees on the Statement of Operations. The Fund may also compensate certain insurance companies, third-party administrators and other entities for providing recordkeeping, sub-transfer agency and other administrative services to the Fund. This amount is included in Shareholder servicing on the Statement of Operations.
Two Directors and certain of the Company’s officers have an interest in Lord Abbett.
| 4. | DISTRIBUTIONS AND CAPITAL LOSS CARRYFORWARDS |
Dividends from net investment income, if any, are declared and paid at least semi-annually. Taxable net realized gains from investment transactions, reduced by allowable capital loss carryforwards, if any, are declared and distributed to shareholders at least annually. The capital loss carryforward amount, if any, is available to offset future net capital gains. Dividends and distributions to shareholders are recorded on the ex-dividend date. The amounts of dividends and distributions from net investment income and net realized capital gains are determined in accordance with federal income tax regulations, which may differ from U.S. GAAP. These book/tax differences are either considered temporary or permanent in nature. To the extent these differences are permanent in nature, such amounts are reclassified within the components of net assets based on their federal tax basis treatment; temporary differences do not require reclassification. Dividends and distributions that exceed earnings and profits for tax purposes are reported as a tax return of capital.
The tax character of distributions paid during the fiscal years ended December 31, 2016 and 2015 was as follows:
| | | Year Ended | | | Year Ended |
| | | 12/31/2016 | | | 12/31/2015 |
| Distributions paid from: | | | | | | | |
| Ordinary income | | $ | 13,372,681 | | | $ | 11,074,615 |
| Total distributions paid | | $ | 13,372,681 | | | $ | 11,074,615 |
As of December 31, 2016, the components of accumulated losses on a tax-basis were as follows:
| Undistributed ordinary income – net | | $ | 10,357 | |
| Total undistributed earnings | | | 10,357 | |
| Temporary differences | | | (4,583,145 | ) |
| Unrealized losses – net | | | (5,323,918 | ) |
| Total accumulated losses – net | | $ | (9,896,706 | ) |
At the Fund’s election, certain losses incurred within the taxable year (Qualified Late-Year Losses) are deemed to arise on the first business day of the Fund’s next taxable year. The Fund incurred and will elect to defer post-October capital losses of $4,556,475 during fiscal 2016.
As of December 31, 2016, the aggregate unrealized security gains and losses based on cost for U.S. federal income tax purposes were as follows:
| Tax cost | | $ | 506,017,693 | |
| Gross unrealized gain | | | 3,490,073 | |
| Gross unrealized loss | | | (8,716,881 | ) |
| Net unrealized security loss | | $ | (5,226,808 | ) |
The difference between book-basis and tax-basis unrealized gains (losses) is attributable to the tax treatment of premium amortization and wash sales.
38
Notes to Financial Statements (continued)
Permanent items identified during the fiscal year ended December 31, 2016 have been reclassified among the components of net assets based on their tax basis treatment as follows:
| Distributions in | Accumulated | |
| Excess of Net | Net Realized | |
| Investment Income | Loss | |
| $2,539,091 | $(2,539,091 | ) |
The permanent differences are attributable to the tax treatment of premium amortization, principal paydown gains and losses, certain securities and certain distributions.
| 5. | PORTFOLIO SECURITIES TRANSACTIONS |
Purchases and sales of investment securities (excluding short-term investments) for the fiscal year ended December 31, 2016 were as follows:
| U.S. | | Non-U.S. | U.S. | | Non-U.S. |
| Government | | Government | Government | | Government |
| Purchases | * | Purchases | Sales | * | Sales |
| $1,945,905,931 | | $171,972,548 | $1,874,649,460 | | $120,243,092 |
| * | Includes U.S. Government sponsored enterprises securities. |
The Fund is permitted to purchase and sell securities ( “cross-trade”) from and to other Lord Abbett funds or client accounts pursuant to procedures approved by the Board in compliance with Rule 17a-7 under the Act (the “Rule”). Each cross-trade is executed at a fair market price in compliance with provisions of the Rule. For the period ended December 31, 2016, the Fund engaged in cross-trades purchases of $813,952 and sales of $474,154, which resulted in net realized gain of $27,926.
| 6. | DISCLOSURES ABOUT DERIVATIVE INSTRUMENTS AND HEDGING ACTIVITIES |
The Fund entered into U.S. Treasury futures contracts for the fiscal year ended December 31, 2016 (as described in note 2(g)) to hedge against changes in interest rates. The Fund bears the risk of interest rates moving unexpectedly, in which case the Fund may not achieve the anticipated benefits of the futures contracts and realize a loss. There is minimal counterparty credit risk to the Fund since futures are exchange traded and the exchange’s clearinghouse, as counterparty to all exchange traded futures, guarantees futures against default.
As of December 31, 2016, the Fund had futures contracts with unrealized appreciation of $54,863 and depreciation of $44,674 which is included in the Schedule of Investments. Only current day’s variation margin is reported within the Fund’s Statement of Assets and Liabilities. Net realized loss of $(109,574) and net change in unrealized appreciation of $23,366 are included on the Statement of Operations related to futures contracts under the captions Net realized gain on futures contracts and Net change in unrealized appreciation/depreciation on futures contracts, respectively. The average number of futures contracts throughout the period was 366.
| 7. | DISCLOSURES ABOUT OFFSETTING ASSETS AND LIABILITIES |
The Financial Accounting Standards Board (“FASB”) requires disclosures intended to help better assess the effect or potential effect of offsetting arrangements on a fund’s financial position. The following tables illustrate gross and net information about recognized assets and liabilities eligible for offset in the statement of assets and liabilities; and disclose such amounts subject to an enforceable master netting agreement or similar agreement, by counterparty. A master netting agreement is an agreement between a fund and a counterparty which provides for the net
39
Notes to Financial Statements (continued)
settlement of amounts owed under all contracts traded under that agreement, as well as cash collateral, through a single payment by one party to the other in the event of default on or termination of any one contract. The Fund’s accounting policy with respect to balance sheet offsetting is that, absent an event of default by the counterparty or a termination of the agreement, the master netting agreement does not result in an offset of reported amounts of financial assets and liabilities in the statement of assets and liabilities across transactions between the Fund and the applicable counterparty:
| | | | | Gross Amounts | | Net Amounts of |
| | | | | Offset in the | | Assets Presented |
| | | Gross Amounts of | | Statement of Assets | | in the Statement of |
| Description | | Recognized Assets | | and Liabilities | | Assets and Liabilities |
| Repurchase Agreement | | $658,414 | | $ – | | $658,414 |
| Total | | $658,414 | | $ – | | $658,414 |
| | | Net Amounts | | | | | | | | |
| | | of Assets | | Amounts Not Offset in the | | |
| | | Presented in | | Statement of Assets and Liabilities | | |
| | | the Statement | | | | Cash | | Securities | | |
| | | of Assets and | | Financial | | Collateral | | Collateral | | Net |
| Counterparty | | Liabilities | | Instruments | | Received(a) | | Received(a) | | Amount(b) |
| Fixed Income Clearing Corp. | | $658,414 | | $ – | | $ – | | $(658,414) | | $ – |
| Total | | $658,414 | | $ – | | $ – | | $(658,414) | | $ – |
| (a) | Collateral disclosed is limited to an amount not to exceed 100% of the net amount of assets presented in the Statement of Assets and Liabilities, for each respective counterparty. |
| (b) | Net amount represents the amount owed to the Fund by the counterparty as of December 31, 2016. |
| 8. | DIRECTORS’ REMUNERATION |
The Company’s officers and two Directors, who are associated with Lord Abbett, do not receive any compensation from the Company for serving in such capacities. Independent Directors’ fees are allocated among all Lord Abbett-sponsored funds based on the net assets of each fund. There is an equity-based plan available to all Independent Directors under which Independent Directors must defer receipt of a portion of, and may elect to defer receipt of an additional portion of Directors’ fees. The deferred amounts are treated as though equivalent dollar amounts had been invested in the funds. Such amounts and earnings accrued thereon are included in Directors’ fees on the Statement of Operations and in Directors’ fees payable on the Statement of Assets and Liabilities and are not deductible for U.S. federal income tax purposes until such amounts are paid.
The Company has entered into an arrangement with its transfer agent and custodian, whereby credits realized as a result of uninvested cash balances are used to reduce a portion of the Fund’s expenses.
The Fund and certain other funds managed by Lord Abbett (collectively, the “Participating Funds”) entered into a syndicated line of credit facility with various lenders for $550 million (the “Facility”), whereas State Street Bank and Trust Company (“SSB”) participates as a lender and as agent for the lenders. The Facility is to be used for temporary or emergency purposes as an additional source of liquidity to satisfy redemptions. The Participating Funds are subject to graduated borrowing limits of one-third of Fund assets (if Fund assets are less than $750 million), $250 million, $300 million,
40
Notes to Financial Statements (continued)
or $350 million, based on past borrowings and likelihood of future borrowings. The Facility will continue through August 28, 2017.
During the fiscal year ended December 31, 2016, the Fund did not utilize the Facility.
| 11. | INTERFUND LENDING PROGRAM |
On July 26, 2016, the U.S. Securities and Exchange Commission issued an exemptive order (“SEC exemptive order”) which permits certain registered open-end management investment companies managed by Lord Abbett, including the Fund, to participate in a joint lending and borrowing program (the “Interfund Lending Program”). The SEC exemptive order allows the Funds to borrow money from and lend money to each other for temporary or emergency purposes subject to the limitations and conditions.
During the fiscal year ended December 31, 2016, the Fund did not participate as a borrower or lender in the Interfund Lending Program.
| 12. | CUSTODIAN AND ACCOUNTING AGENT |
SSB is the Company’s custodian and accounting agent. SSB performs custodial, accounting and recordkeeping functions relating to portfolio transactions and calculating the Fund’s NAV.
The Fund is subject to the general risks and considerations associated with investing in fixed income securities. The value of an investment will change as interest rates fluctuate in response to market movements. When interest rates rise, the prices of fixed income securities are likely to decline; when interest rates fall, such prices tend to rise.
The Fund may invest a significant portion of its assets in asset backed securities and mortgage related securities, including those of such government sponsored enterprises as Federal Home Loan Mortgage Corporation and Federal National Mortgage Association. In addition, the Fund may invest in non-agency asset backed and mortgage related securities, which are issued by private institutions, not by government-sponsored enterprises. Such securities may be particularly sensitive to changes in economic conditions, including delinquencies and/or defaults, and changes in prevailing interest rates. These changes can affect the value, income and/or liquidity of such positions. When interest rates are declining, the value of these securities with prepayment features may not increase as much as other fixed income securities. Early principal repayment may deprive the Fund of income payments above current market rates. The prepayment rate also will affect the price and volatility of these securities. In addition, securities of government sponsored enterprises are guaranteed with respect to the timely payment of interest and principal by the particular enterprises involved, not by the U.S. Government.
The lower-rated or high-yield bonds (also known as “junk” bonds) in which the Fund may invest are subject to greater price fluctuations, as well as additional risks.
The Fund is subject to the risks associated with derivatives, which may be different from and greater than the risks associated with directly investing in securities. Derivatives may be subject to risks such as liquidity risk, leveraging risk, interest rate risk, market risk, and credit risk. Illiquid securities may lower the Fund’s returns since the Fund may be unable to sell these securities at their desired time or price. Derivatives also may involve the risk of mispricing or improper valuation and the risk that changes in the value of the derivative may not correlate perfectly with the value
41
Notes to Financial Statements (concluded)
of the underlying asset, rate or index. Whether the Fund’s use of derivatives is successful will depend on, among other things, the Fund’s ability to correctly forecast market movements, changes in foreign exchange and interest rates, and other factors. If the Fund incorrectly forecasts these and other factors, its performance could suffer.
The Fund’s investment exposure to foreign (which may include emerging market) companies presents increased market, liquidity, currency, political, information and other risks. The cost of the Fund’s use of forward foreign currency exchange contracts varies with factors such as the currencies involved, the length of the contract period and the market conditions prevailing. The Fund’s exposure to inflation-linked investments, such as Treasury Inflation Protected Securities, may be vulnerable to changes in expectations of inflation or interest rates.
The Fund may invest in floating rate or adjustable rate senior loans, which are subject to increased credit and liquidity risks. Senior loans are business loans made to borrowers that may be U.S. or foreign corporations, partnerships or other business entities. The senior loans in which the Fund invests may consist primarily of senior loans that are rated below investment grade or, if unrated, deemed by Lord Abbett to be equivalent to below investment grade securities. Below investment grade senior loans, as in the case of high-yield debt securities, or junk bonds, are usually more credit sensitive than interest rate sensitive, although the value of these instruments may be impacted by broader interest rate swings in the overall fixed income market.
These factors can affect the Fund’s performance.
| 14. | SUMMARY OF CAPITAL TRANSACTIONS |
Transactions in shares of capital stock were as follows:
| | | Year Ended | | | Year Ended | |
| | | December 31, 2016 | | | December 31, 2015 | |
| Shares sold | | | 5,779,565 | | | | 6,664,833 | |
| Reinvestment of distributions | | | 819,226 | | | | 680,589 | |
| Shares reacquired | | | (3,388,823 | ) | | | (2,188,823 | ) |
| Increase | | | 3,209,968 | | | | 5,156,599 | |
42
Report of Independent Registered Public Accounting Firm
To the Board of Directors of Lord Abbett Series Fund, Inc. and the Shareholders of Total Return Portfolio:
We have audited the accompanying statement of assets and liabilities, including the schedule of investments, of the Total Return Portfolio, one of the portfolios constituting the Lord Abbett Series Fund, Inc. (the “Fund”) as of December 31, 2016, and the related statement of operations for the year then ended, the statements of changes in net assets for each of the two years in the period then ended, and the financial highlights for each of the five years in the period then ended. These financial statements and financial highlights are the responsibility of the Fund’s management. Our responsibility is to express an opinion on these financial statements and financial highlights based on our audits.
We conducted our audits in accordance with the standards of the Public Company Accounting Oversight Board (United States). Those standards require that we plan and perform the audit to obtain reasonable assurance about whether the financial statements and financial highlights are free of material misstatement. The Fund is not required to have, nor were we engaged to perform, an audit of its internal control over financial reporting. Our audits included consideration of internal control over financial reporting as a basis for designing audit procedures that are appropriate in the circumstances, but not for the purpose of expressing an opinion on the effectiveness of the Fund’s internal control over financial reporting. Accordingly, we express no such opinion. An audit also includes examining, on a test basis, evidence supporting the amounts and disclosures in the financial statements, assessing the accounting principles used and significant estimates made by management, as well as evaluating the overall financial statement presentation. Our procedures included confirmation of securities owned as of December 31, 2016, by correspondence with the custodian and brokers; when replies were not received from brokers, we performed other auditing procedures. We believe that our audits provide a reasonable basis for our opinion.
In our opinion, such financial statements and financial highlights referred to above present fairly, in all material respects, the financial position of Total Return Portfolio of the Lord Abbett Series Fund, Inc. as of December 31, 2016, the results of its operations for the year then ended, the changes in its net assets for each of the two years in the period then ended, and the financial highlights for each of the five years in the period then ended, in conformity with accounting principles generally accepted in the United States of America.
DELOITTE & TOUCHE LLP
New York, New York
February 15, 2017
43
Basic Information About Management
The Board is responsible for the management of the business and affairs of the Company in accordance with the laws of the State of Maryland. The Board elects officers who are responsible for the day-to-day operations of each Fund and who execute policies authorized by the Board. The Board also approves an investment adviser to each Fund and continues to monitor the cost and quality of the services the investment adviser provides, and annually considers whether to renew the contract with the adviser. Generally, each Director holds office until his/her successor is elected and qualified or until his/her earlier resignation or removal, as provided in the Company’s organizational documents.
Lord Abbett, a Delaware limited liability company, is the Fund’s investment adviser. Designated Lord Abbett personnel are responsible for the day-to-day management of the Funds.
Interested Directors
Ms. Foster and Mr. Sieg are affiliated with Lord Abbett and are “interested persons” of the Company as defined in the Act. Ms. Foster and Mr. Sieg are directors/trustees of each of the 12 investment companies in the Lord Abbett Family of Funds, which consist of 60 portfolios or series. Ms. Foster is an officer of the Lord Abbett Family of Funds.
Name, Address and
Year of Birth | | Current Position and
Length of Service
with the Company | | Principal Occupation and Other Directorships
During the Past Five Years |
| | | | | |
Daria L. Foster
Lord, Abbett & Co. LLC
90 Hudson Street
Jersey City, NJ 07302
(1954) | | Director and President since 2006; Chief Executive Officer since 2012 | | Principal Occupation: Managing Partner of Lord Abbett, joined Lord Abbett in 1990.
Other Directorships: None. |
| | | | | |
Douglas B. Sieg
Lord, Abbett & Co. LLC
90 Hudson Street
Jersey City, NJ 07302
(1969) | | Director since 2016 | | Principal Occupation: Partner (since 2001) and Head of Client Services (since 2013), formerly Director of Marketing and Relationship Management, joined Lord Abbett in 1994.
Other Directorships: None. |
Independent Directors
The following Independent Directors also are directors/trustees of each of the 12 investment companies in the Lord Abbett Family of Funds, which consist of 60 portfolios or series.
Name, Address and
Year of Birth | | Current Position and
Length of Service
with the Company | | Principal Occupation and Other Directorships
During the Past Five Years |
| | | | | |
Robert B. Calhoun, Jr.
Lord, Abbett & Co. LLC
c/o Legal Dept.
90 Hudson Street
Jersey City, NJ 07302
(1942) | | Director since 1998 | | Principal Occupation: Senior Advisor of Monitor Clipper Partners, a private equity investment fund (since 1997); President of Clipper Asset Management Corp. (1991–2009).
Other Directorships: None. |
44
Basic Information About Management (continued)
Name, Address and
Year of Birth | | Current Position and
Length of Service
with the Company | | Principal Occupation and Other Directorships
During the Past Five Years |
| | | | | |
Eric C. Fast
Lord, Abbett & Co. LLC
c/o Legal Dept.
90 Hudson Street
Jersey City, NJ 07302
(1949) | | Director since 2014 | | Principal Occupation: Chief Executive Officer of Crane Co., an industrial products company (2001–2014).
Other Directorships: Currently serves as director of Automatic Data Processing, Inc. (since 2007) and Regions Financial Corporation (since 2010). Previously served as a director of Crane Co. (1999–2014). |
| | | | | |
Evelyn E. Guernsey
Lord, Abbett & Co. LLC
c/o Legal Dept.
90 Hudson Street
Jersey City, NJ 07302
(1955) | | Director since 2011 | | Principal Occupation: CEO, Americas of J.P. Morgan Asset Management (2004–2010).
Other Directorships: None. |
| | | | | |
Julie A. Hill
Lord, Abbett & Co. LLC
c/o Legal Dept.
90 Hudson Street
Jersey City, NJ 07302
(1946) | | Director since 2004 | | Principal Occupation: Owner and CEO of The Hill Company, a business consulting firm (since 1998).
Other Directorships: Currently serves as director of Anthem, Inc., a health benefits company (since 1994). |
| | | | | |
Franklin W. Hobbs
Lord, Abbett & Co. LLC
c/o Legal Dept.
90 Hudson Street
Jersey City, NJ 07302
(1947) | | Director since 2001 | | Principal Occupation: Advisor of One Equity Partners, a private equity firm (since 2004).
Other Directorships: Currently serves as director and Chairman of the Board of Ally Financial Inc., a financial services firm (since 2009), and as director of Molson Coors Brewing Company (since 2002). |
| | | | | |
James M. McTaggart
Lord, Abbett & Co. LLC
c/o Legal Dept.
90 Hudson Street
Jersey City, NJ 07302
(1947) | | Director since 2012 | | Principal Occupation: Independent management advisor and consultant (since 2012); Vice President, CRA International, Inc. (doing business as Charles River Associates), a global management consulting firm (2009–2012); Founder and Chairman of Marakon Associates, Inc., a strategy consulting firm (1978–2009); and Officer and Director of Trinsum Group, a holding company (2007–2009).
Other Directorships: Currently serves as director of Blyth, Inc., a home products company (since 2004). |
| | | | | |
Mark A. Schmid
Lord, Abbett & Co. LLC
c/o Legal Dept.
90 Hudson Street
Jersey City, NJ 07302
(1959) | | Director since 2016 | | Principal Occupation: Vice President and Chief Investment Officer of the University of Chicago (since 2009).
Other Directorships: None. |
45
Basic Information About Management (continued)
Name, Address and
Year of Birth | | Current Position and
Length of Service
with the Company | | Principal Occupation and Other Directorships
During the Past Five Years |
| | | | | |
James L.L. Tullis
Lord, Abbett & Co. LLC
c/o Legal Dept.
90 Hudson Street
Jersey City, NJ 07302
(1947) | | Director since 2006;
Chairman since 2017 | | Principal Occupation: CEO of Tullis-Dickerson and Co. Inc., a venture capital management firm (since 1990); CEO of Tullis Health Investors Inc. (since 2012).
Other Directorships: Currently serves as director of Crane Co. (since 1998). |
Officers
None of the officers listed below have received compensation from the Company. All of the officers of the Company also may be officers of the other Lord Abbett Funds and maintain offices at 90 Hudson Street, Jersey City, NJ 07302. Unless otherwise indicated, the position(s) and title(s) listed under the “Principal Occupation During the Past Five Years” column indicate each officer’s position(s) and title(s) with Lord Abbett. Each officer serves for an indefinite term (i.e., until his or her death, resignation, retirement, or removal).
Name and
Year of Birth | | Current Position
with the Company | | Length of Service
of Current
Position | | Principal Occupation
During the Past Five Years |
| | | | | | | |
Daria L. Foster
(1954) | | President and Chief
Executive Officer | | Elected as President in 2006 and Chief Executive Officer in 2012 | | Managing Partner of Lord Abbett, joined Lord Abbett in 1990. |
| | | | | | | |
Sean J. Aurigemma
(1969) | | Executive Vice President | | Elected in 2010 | | Portfolio Manager, joined Lord Abbett in 2007. |
| | | | | | | |
Jeff D. Diamond
(1960) | | Executive Vice President | | Elected in 2008 | | Portfolio Manager, joined Lord Abbett in 2007. |
| | | | | | | |
Todd D. Jacobson
(1966) | | Executive Vice President | | Elected in 2005 | | Partner and Associate Director, joined Lord Abbett in 2003. |
| | | | | | | |
Robert A. Lee
(1969) | | Executive Vice President | | Elected in 2010 | | Partner and Chief Investment Officer, and was formerly Deputy Chief Investment Officer and Director of Taxable Fixed Income, joined Lord Abbett in 1997. |
| | | | | | | |
Thomas B. Maher
(1967) | | Executive Vice President | | Elected in 2010 | | Partner and Portfolio Manager, joined Lord Abbett in 2003. |
| | | | | | | |
Justin C. Maurer
(1969) | | Executive Vice President | | Elected in 2010 | | Partner and Portfolio Manager, joined Lord Abbett in 2001. |
| | | | | | | |
Vincent J. McBride
(1964) | | Executive Vice President | | Elected in 2010 | | Partner and Director, joined Lord Abbett in 2003. |
| | | | | | | |
Andrew H. O’Brien
(1973) | | Executive Vice President | | Elected in 2010 | | Partner and Portfolio Manager, joined Lord Abbett in 1998. |
46
Basic Information About Management (continued)
Name and
Year of Birth | | Current Position
with the Company | | Length of Service
of Current
Position | | Principal Occupation
During the Past Five Years |
| | | | | | | |
F. Thomas O’Halloran, III
(1955) | | Executive Vice President | | Elected in 2010 | | Partner and Portfolio Manager, joined Lord Abbett in 2001. |
| | | | | | | |
Marc Pavese
(1972) | | Executive Vice President | | Elected in 2016 | | Partner and Portfolio Manager, joined Lord Abbett in 2008. |
| | | | | | | |
Walter H. Prahl
(1958) | | Executive Vice President | | Elected in 2012 | | Partner and Director, joined Lord Abbett in 1997. |
| | | | | | | |
Steven F. Rocco
(1979) | | Executive Vice President | | Elected in 2014 | | Partner and Portfolio Manager, joined Lord Abbett in 2004. |
| | | | | | | |
Didier O. Rosenfeld
(1976) | | Executive Vice President | | Elected in 2016 | | Director of Global Equity, joined Lord Abbett in 2015 and was formerly a Portfolio Manager and Senior Analyst at Cornerstone Capital Management (2014–2015) and Managing Director at State Street Global Advisors (2000–2013). |
| | | | | | | |
Frederick J. Ruvkun
(1957) | | Executive Vice President | | Elected in 2012 | | Partner and Portfolio Manager, joined Lord Abbett in 2006. |
| | | | | | | |
Paul J. Volovich
(1973) | | Executive Vice President | | Elected in 2005 | | Partner and Portfolio Manager, joined Lord Abbett in 1997. |
| | | | | | | |
A. Edward Allinson
(1961) | | Vice President | | Elected in 2011 | | Portfolio Manager, joined Lord Abbett in 2005. |
| | | | | | | |
John W. Ashbrook
(1964) | | Vice President and Assistant Secretary | | Elected in 2014 | | Assistant General Counsel, joined Lord Abbett in 2008. |
| | | | | | | |
Joan A. Binstock
(1954) | | Chief Financial Officer and Vice President | | Elected in 1999 | | Partner and Chief Financial Officer, and was formerly Chief Operations Officer, joined Lord Abbett in 1999. |
| | | | | | | |
Brooke A. Fapohunda
(1975) | | Vice President and Assistant Secretary | | Elected in 2014 | | Deputy General Counsel, joined Lord Abbett in 2006. |
| | | | | | | |
John K. Forst
(1960) | | Vice President and Assistant Secretary | | Elected in 2005 | | Partner and Deputy General Counsel, joined Lord Abbett in 2004. |
| | | | | | | |
Anthony W. Hipple
(1964) | | Vice President | | Elected in 2014 | | Portfolio Manager, joined Lord Abbett in 2002. |
| | | | | | | |
Lawrence H. Kaplan
(1957) | | Vice President and Secretary | | Elected in 1997 | | Partner and General Counsel, joined Lord Abbett in 1997. |
47
Basic Information About Management (concluded)
Name and
Year of Birth | | Current Position
with the Company | | Length of Service
of Current
Position | | Principal Occupation
During the Past Five Years |
| | | | | | | |
Linda Y. Kim
(1980) | | Vice President and Assistant Secretary | | Elected in 2016 | | Counsel, joined Lord Abbett in 2015 and was formerly an Associate at Stroock & Stroock & Lavan LLP (2007–2015). |
| | | | | | | |
David J. Linsen
(1974) | | Vice President | | Elected in 2008 | | Partner and Director, joined Lord Abbett in 2001. |
| | | | | | | |
Joseph M. McGill
(1962) | | Chief Compliance Officer | | Elected in 2014 | | Partner and Chief Compliance Officer, joined Lord Abbett in 2014 and was formerly Managing Director and the Chief Compliance Officer at UBS Global Asset Management (2003–2013). |
| | | | | | | |
A. Edward Oberhaus, III
(1959) | | Vice President | | Elected in 1998 | | Partner and Director, joined Lord Abbett in 1983. |
| | | | | | | |
Noah Petrucci
(1970) | | Vice President | | Elected in 2013 | | Portfolio Manager, joined Lord Abbett in 2012 and was formerly a Portfolio Manager at Columbia Management Investment Advisers, LLC and Columbia Management Advisors, LLC (2002–2012). |
| | | | | | | |
Lawrence B. Stoller
(1963) | | Vice President and Assistant Secretary | | Elected in 2007 | | Partner and Senior Deputy General Counsel, joined Lord Abbett in 2007. |
| | | | | | | |
Leah G. Traub
(1979) | | Vice President | | Elected in 2016 | | Partner and Portfolio Manager, joined Lord Abbett in 2007. |
| | | | | | | |
Arthur K. Weise
(1970) | | Vice President | | Elected in 2010 | | Partner and Portfolio Manager, joined Lord Abbett in 2007. |
| | | | | | | |
Kewjin Yuoh
(1971) | | Vice President | | Elected in 2012 | | Partner and Portfolio Manager, joined Lord Abbett in 2010. |
| | | | | | | |
Scott S. Wallner
(1955) | | AML Compliance Officer | | Elected in 2011 | | Assistant General Counsel, joined Lord Abbett in 2004. |
| | | | | | | |
Bernard J. Grzelak
(1971) | | Treasurer | | Elected in 2003 | | Partner and Chief Operations Officer, and was formerly Director of Fund Administration, joined Lord Abbett in 2003. |
Please call 888-522-2388 for a copy of the statement of additional information, which contains further information about the Company’s Directors. It is available free upon request.
48
Approval of Advisory Contract
The Board, including all of the Directors who are not interested persons of the Fund or of Lord Abbett (the “Independent Board Members”), annually considers whether to approve the continuation of the existing management agreement between the Fund and Lord Abbett (the “Agreement”). In connection with its most recent approval, the Board reviewed materials relating specifically to the Agreement, as well as numerous materials received throughout the course of the year, including information about the Fund’s investment performance compared to the performance of its benchmark. Before making its decision as to the Fund, the Board had the opportunity to ask questions and request further information, taking into account its familiarity with Lord Abbett gained through its meetings and discussions. These meetings and discussions included the review of the portfolio management team conducted by members of the Contract Committee, the deliberations of the Contract Committee, and discussions between the Contract Committee and Lord Abbett’s management. The Independent Board Members also met with their independent legal counsel in a private session at which no representatives of management were present.
The materials received by the Board included, but were not limited to: (1) information provided by Morningstar Associates, LLC (“Morningstar”) regarding the investment performance of the Fund compared to the investment performance of certain funds with similar investment styles as determined by Morningstar, based, in part, on the Fund’s Morningstar category (the “performance peer group”), and the investment performance of two appropriate benchmarks; (2) information provided by Morningstar regarding the expense ratios, contractual and effective management fee rates, and other expense components for the Fund and certain funds in the same Morningstar category, with generally the same or similar share classes and operational characteristics, including asset size (the “expense peer group”); (3) certain supplemental investment performance information provided by Lord Abbett; (4) information provided by Lord Abbett on the expense ratios, management fee rates, and other expense components for the Fund; (5) sales and redemption information for the Fund; (6) information regarding Lord Abbett’s financial condition; (7) an analysis of the relative profitability of the Agreement to Lord Abbett; (8) information provided by Lord Abbett regarding the investment management fee schedules for Lord Abbett’s other advisory clients maintaining accounts with a similar investment strategy as the Fund; and (9) information regarding the personnel and other resources devoted by Lord Abbett to managing the Fund.
Investment Management Services Generally. The Board considered the investment management services provided by Lord Abbett to the Fund, including investment research, portfolio management, and trading, and Lord Abbett’s commitment to compliance with all applicable legal requirements. The Board also observed that Lord Abbett was solely engaged in the investment management business and accordingly did not experience the conflicts of interest that may result from being engaged in other lines of business. The Board considered the investment advisory services provided by Lord Abbett to other clients, the fees charged for the services, and the differences in the nature of the services provided to the Fund and other Lord Abbett Funds, on the one hand, and the services provided to other clients, on the other. After reviewing these and related factors, the Board concluded that the Fund was likely to continue to benefit from the nature, extent and quality of the investment services provided by Lord Abbett under the Agreement.
Investment Performance. The Board reviewed the Fund’s investment performance in relation to that of the performance peer group and two appropriate benchmarks as of various periods ended August 31, 2016. The Board observed that the Fund’s investment performance was below the median of the performance peer group for the one-year, three-year and five-year periods. The Board also observed that the Fund’s investment performance was above the investment
49
Approval of Advisory Contract (continued)
performance of the two benchmarks for the one-year, three-year and five-year periods. The Board considered Lord Abbett’s performance and reputation generally, the performance of other Lord Abbett-managed funds overseen by the Board and the willingness of Lord Abbett to take steps intended to improve performance when necessary. After reviewing these and related factors, the Board concluded that the Fund’s investment performance was reasonable and supported the continuation of the Agreement.
Lord Abbett’s Personnel and Methods. The Board considered the qualifications of the personnel providing investment management services to the Fund, in light of its investment objective and discipline. Among other things, the Board considered the size, experience, and turnover of Lord Abbett’s investment management staff, Lord Abbett’s investment methodology and philosophy, and Lord Abbett’s approach to recruiting, training, and retaining investment management personnel.
Nature and Quality of Other Services. The Board considered the nature, quality, costs, and extent of compliance, administrative, and other services performed by Lord Abbett and the nature and extent of Lord Abbett’s supervision of third party service providers, including the Fund’s transfer agent and custodian.
Expenses. The Board considered the expense level of the Fund and the expense levels of the expense peer group. It also considered how the expense levels of the Fund related to those of the expense peer group and the amount and nature of the fees paid by shareholders. The Board observed that the overall expense level of the Fund was below the median of the expense peer group. After reviewing these and related factors, the Board concluded, within the context of its overall approval of the Agreement, that the expense level of the Fund was reasonable and supported the continuation of the Agreement.
Profitability. The Board considered the level of Lord Abbett’s operating margin in managing the Fund, including a review of Lord Abbett’s methodology for allocating its costs to its management of the Fund. It considered whether the Fund was profitable to Lord Abbett in connection with the operation of the Fund, including the fee that Lord Abbett receives from the Fund for providing administrative services to the Fund. The Board also considered the profits realized from other business segments of Lord Abbett, which may benefit from or be related to the Fund’s business. The Board considered Lord Abbett’s profit margins in comparison with available industry data, both accounting for and excluding marketing and distribution expenses, and how those profit margins could affect Lord Abbett’s ability to recruit and retain investment personnel. The Board recognized that Lord Abbett’s overall profitability was a factor in enabling it to attract and retain qualified investment management personnel to provide services to the Fund. After reviewing these and related factors, the Board concluded, within the context of its overall approval of the Agreement, that Lord Abbett’s profitability with respect to the Fund was not excessive.
Economies of Scale. The Board considered the extent to which there had been economies of scale in managing the Fund, whether the Fund’s shareholders had appropriately benefited from such economies of scale, and whether there was potential for realization of any further economies of scale. The Board concluded that the existing management fee schedule, with its breakpoints in the levels of the management fee, in conjunction with a proposed expense limitation agreement adequately addressed any economies of scale in managing the Fund.
Other Benefits to Lord Abbett. The Board considered the character and amount of fees paid by the Fund and the Fund’s shareholders to Lord Abbett and the Distributor for services other than
50
Approval of Advisory Contract (concluded)
investment advisory services. The Board also considered the revenues and profitability of Lord Abbett’s investment advisory business apart from its mutual fund business, and the intangible benefits enjoyed by Lord Abbett by virtue of its relationship with the Fund. The Board observed that the Distributor receives 12b-1 fees from certain of the Lord Abbett Funds as to shares held in accounts for which there is no other broker of record, may retain a portion of the 12b-1 fees it receives, and receives a portion of the sales charges on sales and redemptions of some classes of shares. In addition, the Board observed that Lord Abbett accrues certain benefits for its business of providing investment advice to clients other than the Lord Abbett Funds, but that business also benefits the Funds. The Board also noted that Lord Abbett, as disclosed in the prospectus of the Fund, has entered into revenue sharing arrangements with certain entities that distribute shares of the Fund. The Board also took into consideration the investment research that Lord Abbett receives as a result of Fund brokerage transactions.
Alternative Arrangements. The Board considered whether, instead of approving continuation of the Agreement, it might be in the best interests of the Fund to implement one or more alternative arrangements, such as continuing to employ Lord Abbett, but on different terms. After considering all of the relevant factors, the Board unanimously found that continuation of the Agreement was in the best interests of the Fund and its shareholders and voted unanimously to approve the continuation of the Agreement. In considering whether to approve the continuation of the Agreement, the Board did not identify any single factor as paramount or controlling. Individual Directors may have evaluated the information presented differently from one another, giving different weights to various factors. This summary does not discuss in detail all matters considered.
51
Householding
The Company has adopted a policy that allows it to send only one copy of the Fund’s prospectus, proxy material, annual report and semiannual report to certain shareholders residing at the same “household.” This reduces Fund expenses, which benefits you and other shareholders. If you need additional copies or do not want your mailings to be “householded,” please call Lord Abbett at 888-522-2388 or send a written request with your name, the name of your fund or funds and your account number or numbers to Lord Abbett Family of Funds, P.O. Box 219336, Kansas City, MO 64121.
Proxy Voting Policies, Procedures and Records
A description of the policies and procedures that Lord Abbett uses to vote proxies related to the Fund’s portfolio securities, and information on how Lord Abbett voted the Fund’s proxies during the 12-month period ended June 30 are available without charge, upon request, (i) by calling 888-522-2388; (ii) on Lord Abbett’s Website at www.lordabbett.com; and (iii) on the Securities and Exchange Commission’s (“SEC”) Website at www.sec.gov.
Shareholder Reports and Quarterly Portfolio Disclosure
The Fund is required to file its complete schedule of portfolio holdings with the SEC for its first and third fiscal quarters on Form N-Q. Copies of the filings are available without charge, upon request on the SEC’s Website at www.sec.gov and may be available by calling Lord Abbett at 888-522-2388. You can also obtain copies of Form N-Q by visiting the SEC’s Public Reference Room in Washington, DC (information on the operation of the Public Reference Room may be obtained by calling 800-SEC-0330).
Tax Information Of the distributions paid to shareholders during the fiscal year ended December 31, 2016, $1,692,157 represents short-term capital gains. |
52


| This report, when not used for the general information of shareholders of the Fund, is to be distributed only if preceded or accompanied by a current fund prospectus. | | | |
| | | Lord Abbett Series Fund, Inc. | |
| | | | |
Lord Abbett mutual fund shares are distributed by
LORD ABBETT DISTRIBUTOR LLC. | | Total Return Portfolio | SFTR-PORT-3
(02/17) |

2016 LORD ABBETT
ANNUAL REPORT
Lord Abbett
Series Fund—Value Opportunities Portfolio
For the fiscal year ended December 31, 2016
Table of Contents
Lord Abbett Series Fund — Value Opportunities Portfolio
Annual Report
For the fiscal year ended December 31, 2016

From left to right: James L.L. Tullis, Chairman of the Lord Abbett Funds and Daria L. Foster Director, President, and Chief Executive Officer of the Lord Abbett Funds.
Dear Shareholders: We are pleased to provide you with this overview of the performance of Lord Abbett Series Fund — Value Opportunities Portfolio for the fiscal year ended December 31, 2016. On this page and the following pages, we discuss the major factors that influenced fiscal year performance. For additional information about the Fund, please visit our website at www.lordabbett.com, where you also can access the quarterly commentaries that provide updates on the Fund’s performance and other portfolio related updates.
Thank you for investing in Lord Abbett mutual funds. We value the trust that you place in us and look forward to serving your investment needs in the years to come.
Best regards,

Daria L. Foster
Director, President and Chief Executive Officer
For the fiscal year ended December 31, 2016, the Fund returned 17.02%, reflecting performance at the net asset value (NAV) of Class VC shares, with all distributions reinvested, compared to its benchmark, the Russell 2500™ Index,1 which returned 17.59% over the same period.
Domestic equity markets (as represented by the S&P 500® Index2) returned 11.96% over the past year. Despite this general move higher, there were significant bouts of volatility within U.S. stock markets, including their worst start to a calendar year on record.
Crude oil prices played a significant role in the increased market volatility, as Brent oil prices fluctuated sharply throughout the fiscal year. In December, the Organization of Petroleum Exporting Countries agreed to reduce oil production effective 2017. Furthermore, global markets were affected by the devaluation of China’s currency and weak economic data out of the region. The Chinese economy advanced at an annual rate of 6.7% in the third quarter of 2016, a slower pace than in recent years.
1
Geopolitical events also contributed to volatility in global markets. The United Kingdom’s referendum in June to leave the European Union (“Brexit”) was a surprise that caused a sell-off in global markets.
In contrast to the equity market volatility, the U.S. economy continued to expand during the trailing 12-month period. The Federal Reserve (Fed) raised target rates for the second time in 12 months in December, from 0.25%–0.50% to 0.50%–0.75%. U.S. gross domestic product (GDP) grew at a 3.2% pace during the third quarter, a significant increase over the second quarter. The U.S. Bureau of Economic Analysis stated that during the third-quarter personal consumption and federal government spending increased, quarter over quarter. In addition to GDP growth, the U.S. unemployment rate remained relatively steady throughout the period, finishing at 4.6% in November.
The U.S. presidential election took an unexpected turn as Donald J. Trump was elected president, in contrast to indications from poll numbers before the election. Markets rallied on improved clarity in the U.S. political agenda, with the House and Senate also under Republican control.
Security selection in the consumer discretionary sector, as well as security selection and an underweight in the industrials sector, were main detractors from the Fund’s relative performance during the period. Within the consumer discretionary sector, SeaWorld Entertainment Inc., a theme park and
entertainment company, detracted most. Shares of SeaWorld Entertainment fell as the company missed consensus revenue and earnings expectations, largely due to a miss in expected attendance in the second quarter of 2016. AMC Networks Inc., an owner and operator of entertainment businesses and assets, also detracted. Shares of AMC Networks suffered as increased competition and lower-than-expected new show viewership belabored the company.
Within the industrials sector, Snap-On, Inc., a manufacturer of diagnostic and repair solutions, detracted from performance. Snap-On posted strong fourth quarter earnings but faced headwinds from a soft commercial and industrial production market.
Conversely, security selection in the health care and energy sectors contributed to the Fund’s performance relative to the benchmark. Within the health care sector, ExamWorks Group, Inc., a provider of independent medical examinations and medical-related services, contributed most. Shares of ExamWorks increased following the announcement that the company would be acquired by Leonard Green & Partners, L.P. HealthSouth Corp., an owner and operator of inpatient rehabilitation hospitals, also contributed. HealthSouth beat consensus first quarter earnings expectations due to strong growth and free cash flow.
Within the energy sector, Rice Energy, Inc., an independent natural gas and oil
2
company, contributed most. Shares of Rice Energy rose due to increased production and a reduction in costs.
The Fund’s portfolio is actively managed and, therefore, its holdings and
the weightings of a particular issuer or particular sector as a percentage of portfolio assets are subject to change. Sectors may include many industries.
1 The Russell 2500™ Index is a market cap weighted index that includes the smallest 2,500 companies covered in the Russell 3000® universe of United States-based listed equities.
2 The S&P 500® Index is widely regarded as the standard for measuring large cap U.S. stock market performance and includes a representative sample of leading companies in leading industries.
Unless otherwise specified, indexes reflect total return, with all dividends reinvested. Indexes are unmanaged, do not reflect the deduction of fees or expenses, and are not available for direct investment.
Important Performance and Other Information
Performance data quoted in the following pages reflect past performance and are no guarantee of future results. Current performance may be higher or lower than the performance quoted. The investment return and principal value of an investment in the Funds will fluctuate so that shares, on any given day or when redeemed, may be worth more or less than their original cost. You can obtain performance data current to the most recent month end by calling Lord Abbett at 888-522-2388 or referring to www.lordabbett.com.
During certain periods shown, expense waivers and reimbursements were in place. Without such expense
waivers and reimbursements, the Funds’ returns would have been lower.
The annual commentary above discusses the views of the Fund’s management and various portfolio holdings of the Funds as of December 31, 2016. These views and portfolio holdings may have changed after this date. Information provided in the commentary is not a recommendation to buy or sell securities. Because the Fund’s portfolio is actively managed and may change significantly, the Fund may no longer own the securities described above or may have otherwise changed their positions in the securities. For more recent information about the Fund’s portfolio holdings, please visit www.lordabbett.com.
A Note about Risk: See Notes to Financial Statements for a discussion of investment risks. For a more detailed discussion of the risks associated with each Fund, please see the Fund’s prospectus.
Mutual funds are not insured by the FDIC, are not deposits or other obligations of, or guaranteed by, banks, and are subject to investment risks including possible loss of principal amount invested.
The Fund serves as an underlying investment vehicle for variable annuity contracts and variable life insurance policies.
3
Investment Comparison
Below is a comparison of a $10,000 investment in Class VC shares with the same investment in the Russell 2500™ Index and the Russell 2500™ Value Index, assuming reinvestment of all dividends and distributions. The Fund’s shares are sold only to insurance company separate accounts that fund certain variable annuity and variable life contracts. The line graph comparison does not reflect the sales charges or other expenses of these contracts. If those sales charges and expenses were reflected, returns would be lower. The graph and performance table below do not reflect the deduction of taxes that a shareholder would pay on Fund distributions or the redemption of Fund shares. During the period, expenses of the Fund were waived or reimbursed by Lord Abbett; without such waiver or reimbursement of expenses, the Fund’s returns would have been lower. Past performance is no guarantee of future results.

Average Annual Total Returns for the
Periods Ended December 31, 2016
| | 1 Year | 5 Years | Life of Class | |
| Class VC2 | 17.02% | 13.85% | 11.13% | |
1 Performance for each unmanaged index does not reflect any fees or expenses. The performance of each index is not necessarily representative of the Fund’s performance. Performance for each index began on May 1, 2010.
2 The Class VC shares commenced operations on April 23, 2010. Performance for the Class began on May 1, 2010.
4
Expense Example
As a shareholder of the Fund, you incur ongoing costs, including management fees; expenses related to the Fund’s services arrangements with certain insurance companies; and other Fund expenses. This Example is intended to help you understand your ongoing costs (in dollars) of investing in the Fund and to compare these costs with the ongoing costs of investing in other mutual funds.
The Example is based on an investment of $1,000 invested at the beginning of the period and held for the entire period (July 1, 2016 through December 31, 2016).
The Example reflects only expenses that are deducted from the assets of the Fund. Fees and expenses, including sales charges applicable to the various insurance products that invest in the Fund, are not reflected in this Example. If such fees and expenses were reflected in the Example, the total expenses shown would be higher. Fees and expenses regarding such variable insurance products are separately described in the prospectus related to those products.
Actual Expenses
The first line of the table on the following page provides information about actual account values and actual expenses. You may use the information in this line, together with the amount you invested, to estimate the expenses that you paid over the period. Simply divide your account value by $1,000 (for example, an $8,600 account value divided by $1,000 = 8.6), then multiply the result by the number in the first line under the heading titled “Expenses Paid During Period 7/1/16 – 12/31/16” to estimate the expenses you paid on your account during this period.
Hypothetical Example for Comparison Purposes
The second line of the table on the following page provides information about hypothetical account values and hypothetical expenses based on the Fund’s actual expense ratio and an assumed rate of return of 5% per year before expenses, which is not the Fund’s actual return. The hypothetical account values and expenses may not be used to estimate the actual ending account balance or expenses you paid for the period. You may use this information to compare the ongoing costs of investing in the Fund and other funds. To do so, compare this 5% hypothetical example with the 5% hypothetical examples that appear in the shareholder reports of the other funds.
5
Please note that the expenses shown in the table are meant to highlight your ongoing costs only and do not reflect any transactional costs, such as sales charges. Therefore, the second line of the table is useful in comparing ongoing costs only, and will not help you determine the relative total costs of owning different funds. In addition, if these transactional costs were included, your costs would have been higher.
| | | Beginning | | Ending | | Expenses | |
| | | Account | | Account | | Paid During | |
| | | Value | | Value | | Period† | |
| | | | | | | 7/1/16- | |
| | | 7/1/16 | | 12/31/16 | | 12/31/16 | |
| Class VC | | | | | | | |
| Actual | | $1,000.00 | | $1,110.20 | | $5.83 | |
| Hypothetical (5% Return Before Expenses) | | $1,000.00 | | $1,019.61 | | $5.58 | |
| † | Net expenses are equal to the Fund’s annualized expense ratio of 1.10%, multiplied by the average account value over the period, multiplied by 184/366 (to reflect one-half year period). |
Portfolio Holdings Presented by Sector
December 31, 2016
| Sector* | %** |
| Consumer Discretionary | 9.10 | % |
| Consumer Staples | 1.94 | % |
| Energy | 4.99 | % |
| Financials | 22.67 | % |
| Health Care | 8.42 | % |
| Industrials | 14.37 | % |
| Information Technology | 18.33 | % |
| Materials | 9.11 | % |
| Real Estate | 5.35 | % |
| Telecommunication Services | 1.78 | % |
| Utilities | 3.94 | % |
| Total | 100.00 | % |
| * | | A sector may comprise several industries. |
| ** | | Represents percent of total investments. |
6
Schedule of Investments
December 31, 2016
| | | | | | Fair | |
| Investments | | Shares | | | Value | |
| COMMON STOCKS 107.13% | | | | | | | | |
| | | | | | | | | |
| Airlines 2.58% | | | | | | | | |
| Alaska Air Group, Inc. | | | 119 | | | $ | 10,559 | |
| | | | | | | | | |
| Automobiles 0.95% | | | | | | | | |
| Thor Industries, Inc. | | | 39 | | | | 3,902 | |
| | | | | | | | | |
| Banks 12.15% | | | | | | | | |
| Bank of Hawaii Corp. | | | 97 | | | | 8,603 | |
| Chemical Financial Corp. | | | 79 | | | | 4,279 | |
| Citizens Financial Group, Inc. | | | 229 | | | | 8,159 | |
| East West Bancorp, Inc. | | | 154 | | | | 7,828 | |
| First Horizon National Corp. | | | 278 | | | | 5,563 | |
| Webster Financial Corp. | | | 93 | | | | 5,048 | |
| Western Alliance Bancorp* | | | 211 | | | | 10,278 | |
| Total | | | | | | | 49,758 | |
| | | | | | | | | |
| Capital Markets 3.15% | | | | | | | | |
| Moelis & Co. Class A | | | 144 | | | | 4,882 | |
| Raymond James Financial, Inc. | | | 116 | | | | 8,035 | |
| Total | | | | | | | 12,917 | |
| | | | | | | | | |
| Chemicals 2.66% | | | | | | | | |
| Ingevity Corp.* | | | 14 | | | | 768 | |
| RPM International, Inc. | | | 91 | | | | 4,899 | |
| Trinseo SA | | | 88 | | | | 5,218 | |
| Total | | | | | | | 10,885 | |
| | | | | | | | | |
| Commercial Services & Supplies 3.23% | | | | | | | | |
| Herman Miller, Inc. | | | 150 | | | | 5,130 | |
| KAR Auction Services, Inc. | | | 190 | | | | 8,098 | |
| Total | | | | | | | 13,228 | |
| | | | | | | | | |
| Communications Equipment 1.62% | | | | | | | | |
| ARRIS International plc* | | | 220 | | | | 6,629 | |
| | | | | | | | | |
| Construction & Engineering 3.69% | | | | | | | | |
| AECOM* | | | 249 | | | | 9,054 | |
| Jacobs Engineering Group, Inc.* | | | 106 | | | | 6,042 | |
| Total | | | | | | | 15,096 | |
| | | | | | Fair | |
| Investments | | Shares | | | Value | |
| Containers & Packaging 3.95% | | | | | | | | |
| Berry Plastics Group, Inc.* | | | 138 | | | $ | 6,725 | |
| Sealed Air Corp. | | | 117 | | | | 5,305 | |
| WestRock Co. | | | 82 | | | | 4,163 | |
| Total | | | | | | | 16,193 | |
| | | | | | | | | |
| Diversified Telecommunication Services 1.91% | | | |
| Zayo Group Holdings, Inc.* | | | 238 | | | | 7,821 | |
| | | | | | | | | |
| Electrical Equipment 1.48% | | | | | | | | |
| Hubbell, Inc. | | | 52 | | | | 6,068 | |
| | | | | | | | | |
| Electronic Equipment, Instruments & Components 2.38% | |
| Amphenol Corp. Class A | | | 66 | | | | 4,435 | |
| Belden, Inc. | | | 71 | | | | 5,309 | |
| Total | | | | | | | 9,744 | |
| | | | | | | | | |
| Energy Equipment & Services 0.93% | | | | | | | | |
| Helmerich & Payne, Inc. | | | 49 | | | | 3,793 | |
| | | | | | | | | |
| Equity Real Estate Investment Trusts 5.73% | | | |
| Federal Realty Investment Trust | | | 53 | | | | 7,532 | |
| Highwoods Properties, Inc. | | | 122 | | | | 6,223 | |
| Physicians Realty Trust | | | 288 | | | | 5,461 | |
| Retail Opportunity | | | | | | | | |
| Investments Corp. | | | 202 | | | | 4,268 | |
| Total | | | | | | | 23,484 | |
| | | | | | | | | |
| Food Products 2.07% | | | | | | | | |
| Pinnacle Foods, Inc. | | | 159 | | | | 8,499 | |
| | | | | | | | | |
| Health Care Equipment & Supplies 2.83% | | | |
| Cooper Cos., Inc. (The) | | | 40 | | | | 6,997 | |
| STERIS plc (United Kingdom)(a) | | | 68 | | | | 4,583 | |
| Total | | | | | | | 11,580 | |
| | | | | | | | | |
| Health Care Providers & Services 3.94% | | | |
| ExamWorks Group, Inc.* | | | 204 | | | | 7,150 | |
| HealthSouth Corp. | | | 218 | | | | 8,990 | |
| Total | | | | | | | 16,140 | |
| | | | | | | | | |
| Hotels, Restaurants & Leisure 1.59% | | | |
| Aramark | | | 182 | | | | 6,501 | |
| | | | | | | | | |
| | See Notes to Financial Statements. | 7 |
Schedule of Investments (continued)
December 31, 2016
| | | | | | Fair | |
| Investments | | Shares | | | Value | |
| Household Durables 1.58% | | | | | | | | |
| Lennar Corp. Class A | | | 97 | | | $ | 4,164 | |
| Newell Brands, Inc. | | | 52 | | | | 2,322 | |
| Total | | | | | | | 6,486 | |
| | | | | | | | | |
| Information Technology Services 9.37% | | | |
| Acxiom Corp.* | | | 260 | | | | 6,968 | |
| Amdocs Ltd. | | | 113 | | | | 6,582 | |
| Booz Allen Hamilton Holding Corp. | | | 260 | | | | 9,378 | |
| Cardtronics plc Class A (United Kingdom)*(a) | | | 77 | | | | 4,202 | |
| Fidelity National Information Services, Inc. | | | 104 | | | | 7,867 | |
| Vantiv, Inc. Class A* | | | 57 | | | | 3,398 | |
| Total | | | | | | | 38,395 | |
| | | | | | | | | |
| Insurance 7.91% | | | | | | | | |
| Arch Capital Group Ltd.* | | | 124 | | | | 10,700 | |
| Hartford Financial Services Group, Inc. (The) | | | 146 | | | | 6,957 | |
| Markel Corp.* | | | 5 | | | | 4,523 | |
| RenaissanceRe Holdings Ltd. | | | 75 | | | | 10,216 | |
| Total | | | | | | | 32,396 | |
| | | | | | | | | |
| Internet Software & Services 1.46% | | | | | | | | |
| Akamai Technologies, Inc.* | | | 90 | | | | 6,001 | |
| | | | | | | | | |
| Life Sciences Tools & Services 1.43% | | | |
| PerkinElmer, Inc. | | | 112 | | | | 5,841 | |
| | | | | | | | | |
| Machinery 1.42% | | | | | | | | |
| Wabtec Corp. | | | 70 | | | | 5,811 | |
| | | | | | | | | |
| Media 2.10% | | | | | | | | |
| AMC Networks, Inc. Class* | | | 61 | | | | 3,193 | |
| New York Times Co. (The) Class | | | 408 | | | | 5,426 | |
| Total | | | | | | | 8,619 | |
| | | | | | | | | |
| Metals & Mining 3.15% | | | | | | | | |
| Reliance Steel & Aluminum Co. | | | 104 | | | | 8,272 | |
| United States Steel Corp. | | | 140 | | | | 4,622 | |
| Total | | | | | | | 12,894 | |
| | | | | | Fair | |
| Investments | | Shares | | | Value | |
| Multi-Line Retail 1.01% | | | | | | | | |
| Nordstrom, Inc. | | | 86 | | | $ | 4,122 | |
| | | | | | | | | |
| Multi-Utilities 3.22% | | | | | | | | |
| Black Hills Corp. | | | 86 | | | | 5,275 | |
| CMS Energy Corp. | | | 190 | | | | 7,908 | |
| Total | | | | | | | 13,183 | |
| | | | | | | | | |
| Oil, Gas & Consumable Fuels 4.42% | | | | | | | | |
| Carrizo Oil & Gas, Inc.* | | | 83 | | | | 3,100 | |
| Cimarex Energy Co. | | | 38 | | | | 5,164 | |
| EQT Corp. | | | 58 | | | | 3,793 | |
| Rice Energy, Inc.* | | | 283 | | | | 6,042 | |
| Total | | | | | | | 18,099 | |
| | | | | | | | | |
| Pharmaceuticals 0.83% | | | | | | | | |
| Prestige Brands Holdings, Inc.* | | | 65 | | | | 3,386 | |
| | | | | | | | | |
| Professional Services 0.54% | | | | | | | | |
| Robert Half International, Inc. | | | 45 | | | | 2,195 | |
| | | | | | | | | |
| Road & Rail 2.46% | | | | | | | | |
| Genesee & Wyoming, Inc. Class* | | | 66 | | | | 4,581 | |
| Old Dominion Freight Line, Inc.* | | | 64 | | | | 5,491 | |
| Total | | | | | | | 10,072 | |
| | | | | | | | | |
| Semiconductors & Semiconductor Equipment 3.99% | |
| Cypress Semiconductor Corp. | | | 190 | | | | 2,174 | |
| Lam Research Corp. | | | 36 | | | | 3,806 | |
| MACOM Technology Solutions | | | | | | | | |
| Holdings, Inc.* | | | 117 | | | | 5,415 | |
| Synaptics, Inc.* | | | 92 | | | | 4,929 | |
| Total | | | | | | | 16,324 | |
| | | | | | | | | |
| Software 0.81% | | | | | | | | |
| FireEye, Inc.* | | | 278 | | | | 3,308 | |
| | | | | | | | | |
| Textiles, Apparel & Luxury Goods 2.51% | | | |
| Ralph Lauren Corp. | | | 39 | | | | 3,522 | |
| Steven Madden Ltd.* | | | 189 | | | | 6,757 | |
| Total | | | | | | | 10,279 | |
| 8 | See Notes to Financial Statements. |
Schedule of Investments (concluded)
December 31, 2016
| | | | | | Fair | |
| Investments | | Shares | | | Value | |
| Thrifts & Mortgage Finance 1.07% | | | | | | | | |
| Essent Group Ltd.* | | | 136 | | | $ | 4,402 | |
| | | | | | | | | |
| Water Utilities 1.01% | | | | | | | | |
| American Water Works Co., Inc. | | | 57 | | | | 4,124 | |
| Total Investments in Common Stock 107.13% (cost $368,288) | | | | | | | 438,734 | |
Liabilities in Excess of Cash and Other
Assets (7.13)% | | | | | | | (29,194 | ) |
| Net Assets 100% | | | | | | $ | 409,540 | |
| * | | Non-income producing security. |
| (a) | | Foreign security traded in U.S. dollars. |
The following is a summary of the inputs used as of December 31, 2016 in valuing the Fund’s investments carried at fair value(1):
| Investment Type(2)(3) | | Level 1 | | | Level 2 | | | Level 3 | | | Total |
| Common Stocks | | | | | | | | | | | | | | | |
| Health Care Providers & Services | | $ | 8,990 | | | $ | – | | | $ | 7,150 | (4) | | $ | 16,140 |
| Remaining Industries | | | 422,594 | | | | – | | | | – | | | | 422,594 |
| Total | | $ | 431,584 | | | $ | – | | | $ | 7,150 | | | $ | 438,734 |
| (1) | | Refer to Note 2(f) for a description of fair value measurements and the three-tier hierarchy of inputs. |
| (2) | | See Schedule of Investments for fair values in each industry and identification of foreign issuers and/or geography. |
| (3) | | There were no Level 1/Level 2 transfers during the fiscal year ended December 31, 2016. |
| (4) | | Fair valued security utilizing a prior transaction cost without adjustment. |
The following is a reconciliation of investments with unobservable inputs (Level 3) that were used in determining fair value:
| Investment Type | | Common Stock | |
| Balance as of January 1, 2016 | | $ | – | |
| Accrued discounts/premiums | �� | | – | |
| Realized gain (loss) | | | 104 | |
| Change in unrealized appreciation/depreciation | | | 1,710 | |
| Purchases | | | – | |
| Sales | | | (596 | ) |
| Net transfers in or out of Level 3 | | | 5,932 | |
| Balance as of December 31, 2016 | | $ | 7,150 | |
| | See Notes to Financial Statements. | 9 |
Statement of Assets and Liabilities
December 31, 2016
| ASSETS: | | | | |
| Investments in securities, at fair value (cost $368,288) | | $ | 438,734 | |
| Cash | | | 3,422 | |
| Receivables: | | | | |
| From advisor (See Note 3) | | | 3,986 | |
| Dividends | | | 679 | |
| Prepaid expenses | | | 2 | |
| Total assets | | | 446,823 | |
| LIABILITIES: | | | | |
| Payables: | | | | |
| Investment securities purchased | | | 1,391 | |
| Directors’ fees | | | 41 | |
| Fund administration | | | 14 | |
| Accrued expenses | | | 35,837 | |
| Total liabilities | | | 37,283 | |
| NET ASSETS | | $ | 409,540 | |
| COMPOSITION OF NET ASSETS: | | | | |
| Paid-in capital | | $ | 340,072 | |
| Undistributed net investment income | | | 252 | |
| Accumulated net realized loss on investments | | | (1,230 | ) |
| Net unrealized appreciation on investments | | | 70,446 | |
| Net Assets | | $ | 409,540 | |
| Outstanding shares (50 million shares of common stock authorized, $.001 par value) | | | 20,113 | |
Net asset value, offering and redemption price per share
(Net assets divided by outstanding shares) | | $ | 20.36 | |
| 10 | See Notes to Financial Statements. |
Statement of Operations
For the Year Ended December 31, 2016
| Investment income: | | | | |
| Dividends | | $ | 5,273 | |
| Total investment income | | | 5,273 | |
| Expenses: | | | | |
| Professional | | | 33,943 | |
| Reports to shareholders | | | 11,171 | |
| Custody | | | 6,399 | |
| Management fee | | | 2,788 | |
| Shareholder servicing | | | 791 | |
| Fund administration | | | 148 | |
| Non 12b-1 service fees | | | 24 | |
| Directors’ fees | | | 13 | |
| Other | | | 1,417 | |
| Gross expenses | | | 56,694 | |
| Expense reductions (See Note 8) | | | (1 | ) |
| Fees waived and expenses reimbursed (See Note 3) | | | (52,605 | ) |
| Net expenses | | | 4,088 | |
| Net investment income | | | 1,185 | |
| Net realized and unrealized gain: | | | | |
| Net realized gain on investments | | | 17,759 | |
| Net change in unrealized appreciation/depreciation on investments | | | 41,217 | |
| Net realized and unrealized gain | | | 58,976 | |
| Net Increase in Net Assets Resulting From Operations | | $ | 60,161 | |
| | See Notes to Financial Statements. | 11 |
Statements of Changes in Net Assets
| | | For the Year Ended | | | For the Year Ended | |
| INCREASE (DECREASE) IN NET ASSETS | | December 31, 2016 | | | December 31, 2015 | |
| Operations: | | | | | | | | |
| Net investment income | | $ | 1,185 | | | $ | 54 | |
| Net realized gain on investments | | | 17,759 | | | | 16,033 | |
| Net change in unrealized appreciation/depreciation on investments | | | 41,217 | | | | (25,869 | ) |
| Net increase (decrease) in net assets resulting from operations | | | 60,161 | | | | (9,782 | ) |
| Distributions to shareholders from: | | | | | | | | |
| Net investment income | | | (897 | ) | | | (146 | ) |
| Net realized gain | | | (23,704 | ) | | | (12,894 | ) |
| Total distributions to shareholders | | | (24,601 | ) | | | (13,040 | ) |
| Capital share transactions (See Note 12): | | | | | | | | |
| Proceeds from sales of shares | | | – | | | | 3,575 | |
| Reinvestment of distributions | | | 24,601 | | | | 13,040 | |
| Cost of shares reacquired | | | (7,674 | ) | | | (15,898 | ) |
| Net increase in net assets resulting from capital share transactions | | | 16,927 | | | | 717 | |
| Net increase (decrease) in net assets | | | 52,487 | | | | (22,105 | ) |
| NET ASSETS: | | | | | | | | |
| Beginning of year | | $ | 357,053 | | | $ | 379,158 | |
| End of year | | $ | 409,540 | | | $ | 357,053 | |
| Undistributed (distributions in excess of) net investment income | | $ | 252 | | | $ | (35 | ) |
| 12 | See Notes to Financial Statements. |
This page is intentionally left blank.
Financial Highlights
| | | | | | Per Share Operating Performance: |
| | | | | | | | | | | | | | | Distributions to | |
| | | | | | Investment operations: | | shareholders from: |
| | | | | | | | | | | | | | | | | | | | | |
| | | | | | | | | | | | Total | | | | | | | | | |
| | | | | | | | | Net | | from | | | | | | | | | |
| | | Net asset | | Net | | realized | | invest- | | | | | | | | | |
| | | value, | | invest- | | and | | ment | | Net | | Net | | Total |
| | | beginning | | ment | | unrealized | | oper- | | investment | | realized | | distri- |
| | | of period | | income(a) | | gain (loss) | | ations | | income | | gain | | butions |
| 12/31/2016 | | | $18.50 | | | | $0.06 | | | $ | 3.09 | | | $ | 3.15 | | | | $(0.05 | ) | | | $(1.24 | ) | | | $(1.29 | ) |
| 12/31/2015 | | | 19.66 | | | | – | (c) | | | (0.49 | ) | | | (0.49 | ) | | | (0.01 | ) | | | (0.66 | ) | | | (0.67 | ) |
| 12/31/2014 | | | 21.09 | | | | 0.02 | | | | 1.83 | | | | 1.85 | | | | (0.02 | ) | | | (3.26 | ) | | | (3.28 | ) |
| 12/31/2013 | | | 17.02 | | | | 0.03 | | | | 6.56 | | | | 6.59 | | | | (0.09 | ) | | | (2.43 | ) | | | (2.52 | ) |
| 12/31/2012 | | | 15.38 | | | | 0.04 | | | | 1.64 | | | | 1.68 | | | | (0.04 | ) | | | – | | | | (0.04 | ) |
| (a) | Calculated using average shares outstanding during the period. |
| (b) | Total return does not consider the effects of sales charges or other expenses imposed by an insurance company and assumes the reinvestment of all distributions. |
| (c) | Amount less than $0.01. |
| 14 | See Notes to Financial Statements. |
| | | | | | | Ratios to Average Net Assets: | | Supplemental Data: |
| | | | | | | | | | | | | | | | | | | |
| | | | | | | Total | | | | | | | | | | | | |
| | | | | | | expenses | | | | | | | | | | | | |
| Net | | | | | after | | | | | | | | | | | | |
| asset | | | | | waivers | | | | | Net | | Net | | Portfolio |
| value, | | Total | | and/or | | Total | | investment | | assets, end | | turnover |
| end of | | return(b) | | reimbursements | | expenses | | income | | of period | | rate |
| period | | (%) | | (%) | | (%) | | (%) | | (000) | | (%) |
| $ | 20.36 | | | | 17.02 | | | | 1.10 | | | | 15.24 | | | | 0.32 | | | $ | 410 | | | | 43.18 | |
| | 18.50 | | | | (2.53 | ) | | | 1.10 | | | | 15.21 | | | | 0.01 | | | | 357 | | | | 55.58 | |
| | 19.66 | | | | 8.92 | | | | 1.10 | | | | 14.53 | | | | 0.10 | | | | 379 | | | | 72.37 | |
| | 21.09 | | | | 38.82 | | | | 1.10 | | | | 23.61 | | | | 0.14 | | | | 318 | | | | 65.96 | |
| | 17.02 | | | | 10.92 | | | | 1.10 | | | | 28.69 | | | | 0.28 | | | | 229 | | | | 62.36 | |
| | See Notes to Financial Statements. | 15 |
Notes to Financial Statements
Lord Abbett Series Fund, Inc. (the “Company”) is registered under the Investment Company Act of 1940, as amended (the “Act”), as a diversified, open-end management investment company and was incorporated under Maryland law in 1989. The Company consists of thirteen separate portfolios. This report covers Value Opportunities Portfolio (the “Fund”).
The Fund’s investment objective is long-term capital appreciation. The Fund offers Variable Contract class shares (“Class VC Shares”), which are currently issued and redeemed only in connection with investments in, and payments under, variable annuity contracts and variable life insurance policies issued by life insurance and insurance-related companies.
The preparation of the financial statements in conformity with accounting principles generally accepted in the United States of America (“U.S. GAAP”) requires management to make certain estimates and assumptions that affect the reported amounts of assets and liabilities and disclosure of contingent assets and liabilities at the date of the financial statements and the reported amounts of increases and decreases in net assets from operations during the reporting period. Actual results could differ from those estimates. The Fund is considered an investment company under U.S. GAAP and follows the accounting and reporting guidance applicable to investment companies.
| 2. | SIGNIFICANT ACCOUNTING POLICIES |
| (a) | Investment Valuation–Under procedures approved by the Fund’s Board of Directors (the “Board”), Lord, Abbett & Co. LLC (“Lord Abbett”), the Fund’s investment manager, has formed a Pricing Committee to administer the pricing and valuation of portfolio investments and to ensure that prices utilized reasonably reflect fair value. Among other things, these procedures allow the Fund to utilize independent pricing services, quotations from securities and financial instrument dealers and other market sources to determine fair value. |
| | |
| | Securities actively traded on any recognized U.S. or non-U.S. exchange or on The NASDAQ Stock Market LLC are valued at the last sale price or official closing price on the exchange or system on which they are principally traded. Events occurring after the close of trading on non-U.S. exchanges may result in adjustments to the valuation of foreign securities to reflect their fair value as of the close of regular trading on the New York Stock Exchange. The Fund may utilize an independent fair valuation service in adjusting the valuations of foreign securities. Unlisted equity securities are valued at the last quoted sale price or, if no sale price is available, at the mean between the most recently quoted bid and asked prices. |
| | |
| | Securities for which prices are not readily available are valued at fair value as determined by the Pricing Committee. The Pricing Committee considers a number of factors, including observable and unobservable inputs, when arriving at fair value. The Pricing Committee may use related or comparable assets or liabilities, recent transactions, market multiples, book values and other relevant information to determine the fair value of portfolio investments. The Board or a designated committee thereof regularly reviews fair value determinations made by the Pricing Committee and employs techniques such as reviewing related market activity, reviewing inputs and assumptions, and retrospectively comparing prices of subsequent purchases and sales transactions to fair value determinations made by the Pricing Committee. |
| | |
| | Short-term securities with 60 days or less remaining to maturity are valued using the amortized cost method, which approximates fair value. |
16
Notes to Financial Statements (continued)
| (b) | Security Transactions–Security transactions are recorded as of the date that the securities are purchased or sold (trade date). Realized gains and losses on sales of portfolio securities are calculated using the identified-cost method. |
| | |
| (c) | Investment Income–Dividend income is recorded on the ex-dividend date. Interest income is recorded on the accrual basis as earned. Discounts are accreted and premiums are amortized using the effective interest method and are included in Interest and other income on the Statement of Operations. Withholding taxes on foreign dividends have been provided for in accordance with the applicable country’s tax rules and rates. |
| | |
| (d) | Income Taxes–It is the policy of the Fund to meet the requirements of Subchapter M of the Internal Revenue Code applicable to regulated investment companies and to distribute substantially all taxable income and capital gains to its shareholders. Therefore, no income tax provision is required. |
| | |
| | The Fund files U.S. federal and various state and local tax returns. No income tax returns are currently under examination. The statute of limitations on the Fund’s filed U.S. federal tax returns remains open for the fiscal years ended December 31, 2013 through December 31, 2016. The statutes of limitations on the Company’s state and local tax returns may remain open for an additional year depending upon the jurisdiction. |
| | |
| (e) | Expenses–Expenses incurred by the Company that do not specifically relate to an individual fund are generally allocated to the funds within the Company on a pro rata basis by relative net assets. |
| | |
| (f) | Repurchase Agreements–The Fund may enter into repurchase agreements with respect to securities. A repurchase agreement is a transaction in which a fund acquires a security and simultaneously commits to resell that security to the seller (a bank or securities dealer) at an agreed-upon price on an agreed-upon date. The Fund requires at all times that the repurchase agreement be collateralized by cash, or by securities of the U.S. Government, its agencies, its instrumentalities, or U.S. Government sponsored enterprises having a value equal to, or in excess of, the value of the repurchase agreement (including accrued interest). If the seller of the agreement defaults on its obligation to repurchase the underlying securities at a time when the fair value of these securities has declined, the Fund may incur a loss upon disposition of the securities. |
| | |
| (g) | Fair Value Measurements–Fair value is defined as the price that the Fund would receive upon selling an investment or transferring a liability in an orderly transaction to an independent buyer in the principal or most advantageous market of the investment. A three-tier hierarchy is used to maximize the use of observable market data and minimize the use of unobservable inputs and to establish classification of fair value measurements for disclosure purposes. Inputs refer broadly to the assumptions that market participants would use in pricing the asset or liability, including assumptions about risk—for example, the risk inherent in a particular valuation technique used to measure fair value (such as a pricing model) and/or the risk inherent in the inputs to the valuation technique. Inputs may be observable or unobservable. Observable inputs reflect the assumptions market participants would use in pricing the asset or liability. Observable inputs are based on market data obtained from sources independent of the reporting entity. Unobservable inputs reflect the reporting entity’s own assumptions about the assumptions market participants would use in pricing the asset or liability. Unobservable inputs are based on the best information available in the circumstances. |
17
Notes to Financial Statements (continued)
| | The three-tier hierarchy classification is determined based on the lowest level of inputs that is significant to the fair value measurement, and is summarized in the three broad Levels listed below: |
| | • | Level 1 – | unadjusted quoted prices in active markets for identical investments; |
| | | |
| | • | Level 2 – | other significant observable inputs (including quoted prices for similar investments, interest rates, prepayment speeds, credit risk, etc.); and |
| | | |
| | • | Level 3 – | significant unobservable inputs (including the Fund’s own assumptions in determining the fair value of investments). |
| | A summary of inputs used in valuing the Fund’s investments as of December 31, 2016 and, if applicable, Level 1/Level 2 transfers and Level 3 rollforwards for the fiscal year then ended is included in the Fund’s Schedule of Investments. |
| | |
| | Changes in valuation techniques may result in transfers into or out of an assigned level within the three-tier hierarchy. All transfers between different levels within the three-tier hierarchy are deemed to have occurred as of the beginning of the reporting period. The inputs or methodology used for valuing securities are not necessarily an indication of the risk associated with investing in those securities. |
| 3. | MANAGEMENT FEE AND OTHER TRANSACTIONS WITH AFFILIATES |
Management Fee
The Company has a management agreement with Lord Abbett, pursuant to which Lord Abbett supplies the Fund with investment management services and executive and other personnel, provides office space and pays for ordinary and necessary office and clerical expenses relating to research and statistical work and supervision of the Fund’s investment portfolio.
The management fee is based on the Fund’s average daily net assets at the following annual rate:
| First $1 billion | .75% |
| Next $1 billion | .70% |
| Over $2 billion | .65% |
For the fiscal year ended December 31, 2016, the effective management fee, net of waivers, was at an annualized rate of .00% of the Fund’s average daily net assets.
In addition, Lord Abbett provides certain administrative services to the Fund pursuant to an Administrative Services Agreement in return for a fee at an annual rate of .04% of the Fund’s average daily net assets.
During the fiscal year ended December 31, 2016 and continuing through April 30, 2017, Lord Abbett has contractually agreed to waive its fees and reimburse expenses to the extent necessary to limit total net annual operating expenses to an annual rate of 1.10%. This agreement may be terminated only upon the approval of the Board.
The Company, on behalf of the Fund, has entered into services arrangements with certain insurance companies. Under these arrangements, certain insurance companies will be compensated up to .25% of the average daily net asset value (“NAV”) of the Fund’s Class VC Shares held in the insurance company’s separate account to service and maintain the Variable Contract owners’ accounts. This amount is included in Non 12b-1 service fees on the Statement of Operations. The Fund may also compensate certain insurance companies, third-party administrators and other entities for providing recordkeeping, sub-transfer agency and other
18
Notes to Financial Statements (continued)
administrative services to the Fund. This amount is included in Shareholder servicing on the Statement of Operations.
Two Directors and certain of the Company’s officers have an interest in Lord Abbett.
| 4. | DISTRIBUTIONS AND CAPITAL LOSS CARRYFORWARDS |
Dividends from net investment income, if any, are declared and paid at least semi-annually. Taxable net realized gains from investment transactions, reduced by allowable capital loss carryforwards, if any, are declared and distributed to shareholders at least annually. The capital loss carryforward amount, if any, is available to offset future net capital gains. Dividends and distributions to shareholders are recorded on the ex-dividend date. The amounts of dividends and distributions from net investment income and net realized capital gains are determined in accordance with federal income tax regulations, which may differ from U.S. GAAP. These book/tax differences are either considered temporary or permanent in nature. To the extent these differences are permanent in nature, such amounts are reclassified within the components of net assets based on their federal tax basis treatment; temporary differences do not require reclassification. Dividends and distributions that exceed earnings and profits for tax purposes are reported as a tax return of capital.
The tax character of distributions paid during the fiscal years ended December 31, 2016 and 2015 was as follows:
| | | Year Ended | | | Year Ended | |
| | | 12/31/2016 | | | 12/31/2015 | |
| Distributions paid from: | | | | | | | | |
| Ordinary income | | $ | 898 | | | $ | 39 | |
| Net long-term capital gains | | | 23,703 | | | | 13,001 | |
| Total distributions paid | | $ | 24,601 | | | $ | 13,040 | |
As of December 31, 2016, the components of accumulated gains on a tax-basis were as follows:
| Undistributed ordinary income – net | | $ | 293 | |
| Total undistributed earnings | | | 293 | |
| Temporary differences | | | (889 | ) |
| Unrealized gains – net | | | 70,064 | |
| Total accumulated gains – net | | $ | 69,468 | |
At the Fund’s election, certain losses incurred within the taxable year (Qualified Late-Year Losses) are deemed to arise on the first business day of the Fund’s next taxable year. The Fund’s incurred and will elect to defer post-October capital losses of $848 during fiscal 2016.
As of December 31, 2016, the aggregate unrealized security gains and losses based on cost for U.S. federal income tax purposes were as follows:
| Tax cost | | $ | 368,670 | |
| Gross unrealized gain | | | 75,567 | |
| Gross unrealized loss | | | (5,503 | ) |
| Net unrealized security gain | | $ | 70,064 | |
The difference between book-basis and tax-basis unrealized gains (losses) is attributable to wash sales.
19
Notes to Financial Statements (continued)
Permanent items identified during the fiscal year ended December 31, 2016 have been reclassified among the components of net assets based on their tax basis treatment as follows:
Undistributed
Net Investment
Income | | | Accumulated Net
Realized Loss | | | Paid-in Capital | |
| $ (1 | ) | | | $ 47 | | | | $ (46 | ) |
The permanent differences are attributable to the tax treatment of certain distributions, certain securities, and net investment losses.
| 5. | PORTFOLIO SECURITIES TRANSACTIONS |
Purchases and sales of investment securities (excluding short-term investments) for the fiscal year ended December 31, 2016 were as follows:
| Purchases | Sales |
| $176,377 | $167,667 |
There were no purchases or sales of U.S. Government securities for the fiscal year ended December 31, 2016.
| 6. | DISCLOSURES ABOUT OFFSETTING ASSETS AND LIABILITIES |
The Financial Accounting Standards Board (“FASB”) requires disclosures intended to help better assess the effect or potential effect of offsetting arrangements on a fund’s financial position. The following tables illustrate gross and net information about recognized assets and liabilities eligible for offset in the statement of assets and liabilities; and disclose such amounts subject to an enforceable master netting agreement or similar agreement, by counterparty. A master netting agreement is an agreement between a fund and a counterparty which provides for the net settlement of amounts owed under all contracts traded under that agreement, as well as cash collateral, through a single payment by one party to the other in the event of default on or termination of any one contract. The Fund’s accounting policy with respect to balance sheet offsetting is that, absent an event of default by the counterparty or a termination of the agreement, the master netting agreement does not result in an offset of reported amounts of financial assets and liabilities in the statement of assets and liabilities across transactions between the Fund and the applicable counterparty. As of December 31, 2016, the Fund did not have assets or liabilities subject to the FASB disclosure requirements.
| 7. | DIRECTORS’ REMUNERATION |
The Company’s officers and two Directors, who are associated with Lord Abbett, do not receive any compensation from the Company for serving in such capacities. Independent Directors’ fees are allocated among all Lord Abbett-sponsored funds based on the net assets of each fund. There is an equity-based plan available to all Independent Directors under which Independent Directors must defer receipt of a portion of, and may elect to defer receipt of an additional portion of Directors’ fees. The deferred amounts are treated as though equivalent dollar amounts had been invested in the funds. Such amounts and earnings accrued thereon are included in Directors’ fees on the Statement of Operations and in Directors’ fees payable on the Statement of Assets and Liabilities and are not deductible for U.S. federal income tax purposes until such amounts are paid.
20
Notes to Financial Statements (concluded)
The Company has entered into an arrangement with its transfer agent and custodian, whereby credits realized as a result of uninvested cash balances are used to reduce a portion of the Fund’s expenses.
| 9. | INTERFUND LENDING PROGRAM |
On July 26, 2016, the U.S. Securities and Exchange Commission issued an exemptive order (“SEC exemptive order”) which permits certain registered open-end management investment companies managed by Lord Abbett, including the Fund, to participate in a joint lending and borrowing program (the “Interfund Lending Program”). The SEC exemptive order allows the Funds to borrow money from and lend money to each other for temporary or emergency purposes subject to the limitations and conditions.
During the fiscal year ended December 31, 2016, the Fund did not participate as a borrower or lender in the Interfund Lending Program.
| 10. | CUSTODIAN AND ACCOUNTING AGENT |
State Street Bank and Trust Company (“SSB”) is the Company’s custodian and accounting agent. SSB performs custodial, accounting and recordkeeping functions relating to portfolio transactions and calculating the Fund’s NAV.
The Fund is subject to the general risks and considerations associated with equity investing, as well as the particular risks associated with value stocks. The value of an investment will fluctuate in response to movements in the equity securities market in general and to the changing prospects of individual companies in which the Fund invests. Small and mid-sized company stocks, in which the Fund invests, may perform differently than the market as a whole and other types of stocks, such as large-company and growth stocks. This is because different types of stocks tend to shift in and out of favor depending on market and economic conditions. The market may fail to recognize the intrinsic value of particular value stocks for a long time. In addition, if the Fund’s assessment of a company’s value or prospects for exceeding earnings expectations or market conditions is wrong, the Fund could suffer losses or produce poor performance relative to other funds, even in a rising market.
Due to the Fund’s investment exposure to foreign companies and American Depositary Receipts, the Fund may experience increased market, liquidity, currency, political, information and other risks.
These factors can affect the Fund’s performance.
| 12. | SUMMARY OF CAPITAL TRANSACTIONS |
Transactions in shares of capital stock were as follows:
| | | Year Ended | | | Year Ended | |
| | December 31, 2016 | | | December 31, 2015 | |
| Shares sold | | | – | | | | 185 | |
| Reinvestment of distributions | | | 1,199 | | | | 695 | |
| Shares reacquired | | | (389 | ) | | | (863 | ) |
| Increase | | | 810 | | | | 17 | |
21
Report of Independent Registered Public Accounting Firm
To the Board of Directors of Lord Abbett Series Fund, Inc. and the Shareholders of Value Opportunities Portfolio:
We have audited the accompanying statement of assets and liabilities, including the schedule of investments, of the Value Opportunities Portfolio, one of the portfolios constituting the Lord Abbett Series Fund, Inc. (the “Fund”) as of December 31, 2016, and the related statement of operations for the year then ended, the statements of changes in net assets for each of the two years in the period then ended, and the financial highlights for each of the five years in the period then ended. These financial statements and financial highlights are the responsibility of the Fund’s management. Our responsibility is to express an opinion on these financial statements and financial highlights based on our audits.
We conducted our audits in accordance with the standards of the Public Company Accounting Oversight Board (United States). Those standards require that we plan and perform the audit to obtain reasonable assurance about whether the financial statements and financial highlights are free of material misstatement. The Fund is not required to have, nor were we engaged to perform, an audit of its internal control over financial reporting. Our audits included consideration of internal control over financial reporting as a basis for designing audit procedures that are appropriate in the circumstances, but not for the purpose of expressing an opinion on the effectiveness of the Fund’s internal control over financial reporting. Accordingly, we express no such opinion. An audit also includes examining, on a test basis, evidence supporting the amounts and disclosures in the financial statements, assessing the accounting principles used and significant estimates made by management, as well as evaluating the overall financial statement presentation. Our procedures included confirmation of securities owned as of December 31, 2016, by correspondence with the custodian and brokers; when replies were not received from brokers, we performed other auditing procedures. We believe that our audits provide a reasonable basis for our opinion.
In our opinion, such financial statements and financial highlights referred to above present fairly, in all material respects, the financial position of Value Opportunities Portfolio of the Lord Abbett Series Fund, Inc. as of December 31, 2016, the results of its operations for the year then ended, the changes in its net assets for each of the two years in the period then ended, and the financial highlights for each of the five years in the period then ended, in conformity with accounting principles generally accepted in the United States of America.
DELOITTE & TOUCHE LLP
New York, New York
February 15, 2017
22
Basic Information About Management
The Board is responsible for the management of the business and affairs of the Company in accordance with the laws of the State of Maryland. The Board elects officers who are responsible for the day-to-day operations of each Fund and who execute policies authorized by the Board. The Board also approves an investment adviser to each Fund and continues to monitor the cost and quality of the services the investment adviser provides, and annually considers whether to renew the contract with the adviser. Generally, each Director holds office until his/her successor is elected and qualified or until his/her earlier resignation or removal, as provided in the Company’s organizational documents.
Lord Abbett, a Delaware limited liability company, is the Fund’s investment adviser. Designated Lord Abbett personnel are responsible for the day-to-day management of the Funds.
Interested Directors
Ms. Foster and Mr. Sieg are affiliated with Lord Abbett and are “interested persons” of the Company as defined in the Act. Ms. Foster and Mr. Sieg are directors/trustees of each of the 12 investment companies in the Lord Abbett Family of Funds, which consist of 60 portfolios or series. Ms. Foster is an officer of the Lord Abbett Family of Funds.
Name, Address and
Year of Birth | | Current Position and
Length of Service
with the Company | | Principal Occupation and Other Directorships
During the Past Five Years |
| | | | | |
Daria L. Foster
Lord, Abbett & Co. LLC
90 Hudson Street
Jersey City, NJ 07302
(1954) | | Director and President since 2006; Chief Executive Officer since 2012 | | Principal Occupation: Managing Partner of Lord Abbett, joined Lord Abbett in 1990. Other Directorships: None. |
| | | | | |
Douglas B. Sieg
Lord, Abbett & Co. LLC
90 Hudson Street
Jersey City, NJ 07302
(1969) | | Director since 2016 | | Principal Occupation: Partner (since 2001) and Head of Client Services (since 2013), formerly Director of Marketing and Relationship Management, joined Lord Abbett in 1994. Other Directorships: None. |
Independent Directors
The following Independent Directors also are directors/trustees of each of the 12 investment companies in the Lord Abbett Family of Funds, which consist of 60 portfolios or series.
Name, Address and
Year of Birth | | Current Position and
Length of Service
with the Company | | Principal Occupation and Other Directorships
During the Past Five Years |
| | | | | |
Robert B. Calhoun, Jr.
Lord, Abbett & Co. LLC
c/o Legal Dept.
90 Hudson Street
Jersey City, NJ 07302
(1942) | | Director since 1998 | | Principal Occupation: Senior Advisor of Monitor Clipper Partners, a private equity investment fund (since 1997); President of Clipper Asset Management Corp. (1991–2009). Other Directorships: None. |
23
Basic Information About Management (continued)
Name, Address and
Year of Birth | | Current Position and
Length of Service
with the Company | | Principal Occupation and Other Directorships
During the Past Five Years |
| | | | | |
Eric C. Fast
Lord, Abbett & Co. LLC
c/o Legal Dept.
90 Hudson Street
Jersey City, NJ 07302
(1949) | | Director since 2014 | | Principal Occupation: Chief Executive Officer of Crane Co., an industrial products company (2001–2014). Other Directorships: Currently serves as director of Automatic Data Processing, Inc. (since 2007) and Regions Financial Corporation (since 2010). Previously served as a director of Crane Co. (1999–2014). |
| | | | | |
Evelyn E. Guernsey
Lord, Abbett & Co. LLC
c/o Legal Dept.
90 Hudson Street
Jersey City, NJ 07302
(1955) | | Director since 2011 | | Principal Occupation: CEO, Americas of J.P. Morgan Asset Management (2004–2010). Other Directorships: None. |
| | | | | |
Julie A. Hill
Lord, Abbett & Co. LLC
c/o Legal Dept.
90 Hudson Street
Jersey City, NJ 07302
(1946) | | Director since 2004 | | Principal Occupation: Owner and CEO of The Hill Company, a business consulting firm (since 1998). Other Directorships: Currently serves as director of Anthem, Inc., a health benefits company (since 1994). |
| | | | | |
Franklin W. Hobbs
Lord, Abbett & Co. LLC
c/o Legal Dept.
90 Hudson Street
Jersey City, NJ 07302
(1947) | | Director since 2001 | | Principal Occupation: Advisor of One Equity Partners, a private equity firm (since 2004). Other Directorships: Currently serves as director and Chairman of the Board of Ally Financial Inc., a financial services firm (since 2009), and as director of Molson Coors Brewing Company (since 2002). |
| | | | | |
James M. McTaggart
Lord, Abbett & Co. LLC
c/o Legal Dept.
90 Hudson Street
Jersey City, NJ 07302
(1947) | | Director since 2012 | | Principal Occupation: Independent management advisor and consultant (since 2012); Vice President, CRA International, Inc. (doing business as Charles River Associates), a global management consulting firm (2009–2012); Founder and Chairman of Marakon Associates, Inc., a strategy consulting firm (1978– 2009); and Officer and Director of Trinsum Group, a holding company (2007–2009). Other Directorships: Currently serves as director of Blyth, Inc., a home products company (since 2004). |
| | | | | |
Mark A. Schmid
Lord, Abbett & Co. LLC
c/o Legal Dept.
90 Hudson Street
Jersey City, NJ 07302
(1959) | | Director since 2016 | | Principal Occupation: Vice President and Chief Investment Officer of the University of Chicago (since 2009). Other Directorships: None. |
24
Basic Information About Management (continued)
Name, Address and
Year of Birth | | Current Position and
Length of Service
with the Company | | Principal Occupation and Other Directorships
During the Past Five Years |
| | | | | |
James L.L. Tullis
Lord, Abbett & Co. LLC
c/o Legal Dept.
90 Hudson Street
Jersey City, NJ 07302
(1947) | | Director since 2006; Chairman since 2017 | | Principal Occupation: CEO of Tullis-Dickerson and Co. Inc., a venture capital management firm (since 1990); CEO of Tullis Health Investors Inc. (since 2012). Other Directorships: Currently serves as director of Crane Co. (since 1998). |
Officers
None of the officers listed below have received compensation from the Company. All of the officers of the Company also may be officers of the other Lord Abbett Funds and maintain offices at 90 Hudson Street, Jersey City, NJ 07302. Unless otherwise indicated, the position(s) and title(s) listed under the “Principal Occupation During the Past Five Years” column indicate each officer’s position(s) and title(s) with Lord Abbett. Each officer serves for an indefinite term (i.e., until his or her death, resignation, retirement, or removal).
Name and
Year of Birth | | Current Position
with the Company | | Length of Service
of Current
Position | | Principal Occupation
During the Past Five Years |
| | | | | | | |
Daria L. Foster
(1954) | | President and Chief Executive Officer | | Elected as President in 2006 and Chief Executive Officer in 2012 | | Managing Partner of Lord Abbett, joined Lord Abbett in 1990. |
| | | | | | | |
Sean J. Aurigemma
(1969) | | Executive Vice President | | Elected in 2010 | | Portfolio Manager, joined Lord Abbett in 2007. |
| | | | | | | |
Jeff D. Diamond
(1960) | | Executive Vice President | | Elected in 2008 | | Portfolio Manager, joined Lord Abbett in 2007. |
| | | | | | | |
Todd D. Jacobson
(1966) | | Executive Vice President | | Elected in 2005 | | Partner and Associate Director, joined Lord Abbett in 2003. |
| | | | | | | |
Robert A. Lee
(1969) | | Executive Vice President | | Elected in 2010 | | Partner and Chief Investment Officer, and was formerly Deputy Chief Investment Officer and Director of Taxable Fixed Income, joined Lord Abbett in 1997. |
| | | | | | | |
Thomas B. Maher
(1967) | | Executive Vice President | | Elected in 2010 | | Partner and Portfolio Manager, joined Lord Abbett in 2003. |
| | | | | | | |
Justin C. Maurer
(1969) | | Executive Vice President | | Elected in 2010 | | Partner and Portfolio Manager, joined Lord Abbett in 2001. |
| | | | | | | |
Vincent J. McBride
(1964) | | Executive Vice President | | Elected in 2010 | | Partner and Director, joined Lord Abbett in 2003. |
| | | | | | | |
Andrew H. O’Brien
(1973) | | Executive Vice President | | Elected in 2010 | | Partner and Portfolio Manager, joined Lord Abbett in 1998. |
25
Basic Information About Management (continued)
Name and
Year of Birth | | Current Position
with the Company | | Length of Service
of Current
Position | | Principal Occupation
During the Past Five Years |
| | | | | | | |
F. Thomas O’Halloran, III
(1955) | | Executive Vice President | | Elected in 2010 | | Partner and Portfolio Manager, joined Lord Abbett in 2001. |
| | | | | | | |
Marc Pavese
(1972) | | Executive Vice President | | Elected in 2016 | | Partner and Portfolio Manager, joined Lord Abbett in 2008. |
| | | | | | | |
Walter H. Prahl
(1958) | | Executive Vice President | | Elected in 2012 | | Partner and Director, joined Lord Abbett in 1997. |
| | | | | | | |
Steven F. Rocco
(1979) | | Executive Vice President | | Elected in 2014 | | Partner and Portfolio Manager, joined Lord Abbett in 2004. |
| | | | | | | |
Didier O. Rosenfeld
(1976) | | Executive Vice President | | Elected in 2016 | | Director of Global Equity, joined Lord Abbett in 2015 and was formerly a Portfolio Manager and Senior Analyst at Cornerstone Capital Management (2014– 2015) and Managing Director at State Street Global Advisors (2000– 2013). |
| | | | | | | |
Frederick J. Ruvkun
(1957) | | Executive Vice President | | Elected in 2012 | | Partner and Portfolio Manager, joined Lord Abbett in 2006. |
| | | | | | | |
Paul J. Volovich
(1973) | | Executive Vice President | | Elected in 2005 | | Partner and Portfolio Manager, joined Lord Abbett in 1997. |
| | | | | | | |
A. Edward Allinson
(1961) | | Vice President | | Elected in 2011 | | Portfolio Manager, joined Lord Abbett in 2005. |
| | | | | | | |
John W. Ashbrook
(1964) | | Vice President and Assistant Secretary | | Elected in 2014 | | Assistant General Counsel, joined Lord Abbett in 2008. |
| | | | | | | |
Joan A. Binstock
(1954) | | Chief Financial Officer and Vice President | | Elected in 1999 | | Partner and Chief Financial Officer, and was formerly Chief Operations Officer, joined Lord Abbett in 1999. |
| | | | | | | |
Brooke A. Fapohunda
(1975) | | Vice President and Assistant Secretary | | Elected in 2014 | | Deputy General Counsel, joined Lord Abbett in 2006. |
| | | | | | | |
John K. Forst
(1960) | | Vice President and Assistant Secretary | | Elected in 2005 | | Partner and Deputy General Counsel, joined Lord Abbett in 2004. |
| | | | | | | |
Anthony W. Hipple
(1964) | | Vice President | | Elected in 2014 | | Portfolio Manager, joined Lord Abbett in 2002. |
| | | | | | | |
Lawrence H. Kaplan
(1957) | | Vice President and Secretary | | Elected in 1997 | | Partner and General Counsel, joined Lord Abbett in 1997. |
26
Basic Information About Management (concluded)
Name and
Year of Birth | | Current Position
with the Company | | Length of Service
of Current
Position | | Principal Occupation
During the Past Five Years |
| | | | | | | |
Linda Y. Kim
(1980) | | Vice President and Assistant Secretary | | Elected in 2016 | | Counsel, joined Lord Abbett in 2015 and was formerly an Associate at Stroock & Stroock & Lavan LLP (2007–2015). |
| | | | | | | |
David J. Linsen
(1974) | | Vice President | | Elected in 2008 | | Partner and Director, joined Lord Abbett in 2001. |
| | | | | | | |
Joseph M. McGill
(1962) | | Chief Compliance Officer | | Elected in 2014 | | Partner and Chief Compliance Officer, joined Lord Abbett in 2014 and was formerly Managing Director and the Chief Compliance Officer at UBS Global Asset Management
(2003–2013). |
| | | | | | | |
A. Edward Oberhaus, III
(1959) | | Vice President | | Elected in 1998 | | Partner and Director, joined Lord Abbett in 1983. |
| | | | | | | |
Noah Petrucci
(1970) | | Vice President | | Elected in 2013 | | Portfolio Manager, joined Lord Abbett in 2012 and was formerly a Portfolio Manager at Columbia Management Investment Advisers, LLC and Columbia Management Advisors, LLC (2002–2012). |
| | | | | | | |
Lawrence B. Stoller
(1963) | | Vice President and Assistant Secretary | | Elected in 2007 | | Partner and Senior Deputy General Counsel, joined Lord Abbett in 2007. |
| | | | | | | |
Leah G. Traub
(1979) | | Vice President | | Elected in 2016 | | Partner and Portfolio Manager, joined Lord Abbett in 2007. |
| | | | | | | |
Arthur K. Weise
(1970) | | Vice President | | Elected in 2010 | | Partner and Portfolio Manager, joined Lord Abbett in 2007. |
| | | | | | | |
Kewjin Yuoh
(1971) | | Vice President | | Elected in 2012 | | Partner and Portfolio Manager, joined Lord Abbett in 2010. |
| | | | | | | |
Scott S. Wallner
(1955) | | AML Compliance Officer | | Elected in 2011 | | Assistant General Counsel, joined Lord Abbett in 2004. |
| | | | | | | |
Bernard J. Grzelak
(1971) | | Treasurer | | Elected in 2003 | | Partner and Chief Operations Officer, and was formerly Director of Fund Administration, joined Lord Abbett in 2003. |
Please call 888-522-2388 for a copy of the statement of additional information, which contains further information about the Company’s Directors. It is available free upon request.
27
Approval of Advisory Contract
The Board, including all of the Directors who are not interested persons of the Fund or of Lord Abbett (the “Independent Board Members”), annually considers whether to approve the continuation of the existing management agreement between the Fund and Lord Abbett (the “Agreement”). In connection with its most recent approval, the Board reviewed materials relating specifically to the Agreement, as well as numerous materials received throughout the course of the year, including information about the Fund’s investment performance compared to the performance of its benchmark. Before making its decision as to the Fund, the Board had the opportunity to ask questions and request further information, taking into account its familiarity with Lord Abbett gained through its meetings and discussions. These meetings and discussions included the review of the portfolio management team conducted by members of the Contract Committee, the deliberations of the Contract Committee, and discussions between the Contract Committee and Lord Abbett’s management. The Independent Board Members also met with their independent legal counsel in a private session at which no representatives of management were present.
The materials received by the Board included, but were not limited to: (1) information provided by Morningstar Associates, LLC (“Morningstar”) regarding the investment performance of the Fund compared to the investment performance of certain funds with similar investment styles as determined by Morningstar, based, in part, on the Fund’s Morningstar category (the “performance peer group”), and the investment performance of two appropriate benchmarks; (2) information provided by Morningstar regarding the expense ratios, contractual and effective management fee rates, and other expense components for the Fund and certain funds in the same Morningstar category, with generally the same or similar share classes and operational characteristics, including asset size (the “expense peer group”); (3) certain supplemental investment performance information provided by Lord Abbett; (4) information provided by Lord Abbett on the expense ratios, management fee rates, and other expense components for the Fund; (5) sales and redemption information for the Fund; (6) information regarding Lord Abbett’s financial condition; (7) an analysis of the relative profitability of the Agreement to Lord Abbett; (8) information provided by Lord Abbett regarding the investment management fee schedules for Lord Abbett’s other advisory clients maintaining accounts with a similar investment strategy as the Fund; and (9) information regarding the personnel and other resources devoted by Lord Abbett to managing the Fund.
Investment Management Services Generally. The Board considered the investment management services provided by Lord Abbett to the Fund, including investment research, portfolio management, and trading, and Lord Abbett’s commitment to compliance with all applicable legal requirements. The Board also observed that Lord Abbett was solely engaged in the investment management business and accordingly did not experience the conflicts of interest that may result from being engaged in other lines of business. The Board considered the investment advisory services provided by Lord Abbett to other clients, the fees charged for the services, and the differences in the nature of the services provided to the Fund and other Lord Abbett Funds, on the one hand, and the services provided to other clients, on the other. After reviewing these and related factors, the Board concluded that the Fund was likely to continue to benefit from the nature, extent and quality of the investment services provided by Lord Abbett under the Agreement.
Investment Performance. The Board reviewed the Fund’s investment performance in relation to that of the performance peer group and two appropriate benchmarks as of various periods ended August 31, 2016. The Board observed that the Fund’s investment performance was above the median of the performance peer group for the one-year, three-year and five-year periods. The Board also considered Lord Abbett’s performance and reputation generally, the performance of other Lord
28
Approval of Advisory Contract (continued)
Abbett-managed funds overseen by the Board and the willingness of Lord Abbett to take steps intended to improve performance when necessary. After reviewing these and related factors, the Board concluded that the Fund’s investment performance was reasonable and supported the continuation of the Agreement.
Lord Abbett’s Personnel and Methods. The Board considered the qualifications of the personnel providing investment management services to the Fund, in light of its investment objective and discipline. Among other things, the Board considered the size, experience, and turnover of Lord Abbett’s investment management staff, Lord Abbett’s investment methodology and philosophy, and Lord Abbett’s approach to recruiting, training, and retaining investment management personnel.
Nature and Quality of Other Services. The Board considered the nature, quality, costs, and extent of compliance, administrative, and other services performed by Lord Abbett and the nature and extent of Lord Abbett’s supervision of third party service providers, including the Fund’s transfer agent and custodian.
Expenses. The Board considered the expense level of the Fund and the expense levels of the expense peer group. It also considered how the expense levels of the Fund related to those of the expense peer group and the amount and nature of the fees paid by shareholders. The Board observed that the overall expense level of the Fund was above the median of the expense peer group. After reviewing these and related factors, the Board concluded, within the context of its overall approval of the Agreement, that the expense level of the Fund was not unreasonable in light of the Fund’s small size.
Profitability. The Board considered the level of Lord Abbett’s operating margin in managing the Fund, including a review of Lord Abbett’s methodology for allocating its costs to its management of the Fund. It considered whether the Fund was profitable to Lord Abbett in connection with the operation of the Fund, including the fee that Lord Abbett receives from the Fund for providing administrative services to the Fund. The Board also considered the profits realized from other business segments of Lord Abbett, which may benefit from or be related to the Fund’s business. The Board considered Lord Abbett’s profit margins in comparison with available industry data, both accounting for and excluding marketing and distribution expenses, and how those profit margins could affect Lord Abbett’s ability to recruit and retain investment personnel. The Board recognized that Lord Abbett’s overall profitability was a factor in enabling it to attract and retain qualified investment management personnel to provide services to the Fund. After reviewing these and related factors, the Board concluded, within the context of its overall approval of the Agreement, that Lord Abbett’s profitability with respect to the Fund was not excessive.
Economies of Scale. The Board considered the extent to which there had been economies of scale in managing the Fund, whether the Fund’s shareholders had appropriately benefited from such economies of scale, and whether there was potential for realization of any further economies of scale. The Board concluded that the existing management fee schedule, with its breakpoints in the levels of the management fee, in conjunction with a proposed expense limitation agreement adequately addressed any economies of scale in managing the Fund.
Other Benefits to Lord Abbett. The Board considered the character and amount of fees paid by the Fund and the Fund’s shareholders to Lord Abbett and the Distributor for services other than investment advisory services. The Board also considered the revenues and profitability of Lord Abbett’s investment advisory business apart from its mutual fund business, and the intangible benefits enjoyed by Lord Abbett by virtue of its relationship with the Fund. The Board observed that
29
Approval of Advisory Contract (concluded)
the Distributor receives 12b-1 fees from certain of the Lord Abbett Funds as to shares held in accounts for which there is no other broker of record, may retain a portion of the 12b-1 fees it receives, and receives a portion of the sales charges on sales and redemptions of some classes of shares. In addition, the Board observed that Lord Abbett accrues certain benefits for its business of providing investment advice to clients other than the Lord Abbett Funds, but that business also benefits the Funds. The Board also noted that Lord Abbett, as disclosed in the prospectus of the Fund, has entered into revenue sharing arrangements with certain entities that distribute shares of the Fund. The Board also took into consideration the investment research that Lord Abbett receives as a result of Fund brokerage transactions.
Alternative Arrangements. The Board considered whether, instead of approving continuation of the Agreement, it might be in the best interests of the Fund to implement one or more alternative arrangements, such as continuing to employ Lord Abbett, but on different terms. After considering all of the relevant factors, the Board unanimously found that continuation of the Agreement was in the best interests of the Fund and its shareholders and voted unanimously to approve the continuation of the Agreement. In considering whether to approve the continuation of the Agreement, the Board did not identify any single factor as paramount or controlling. Individual Directors may have evaluated the information presented differently from one another, giving different weights to various factors. This summary does not discuss in detail all matters considered.
30
Householding
The Company has adopted a policy that allows it to send only one copy of the Fund’s prospectus, proxy material, annual report and semiannual report to certain shareholders residing at the same “household.” This reduces Fund expenses, which benefits you and other shareholders. If you need additional copies or do not want your mailings to be “householded,” please call Lord Abbett at 888-522-2388 or send a written request with your name, the name of your fund or funds and your account number or numbers to Lord Abbett Family of Funds, P.O. Box 219336, Kansas City, MO 64121.
Proxy Voting Policies, Procedures and Records
A description of the policies and procedures that Lord Abbett uses to vote proxies related to the Fund’s portfolio securities, and information on how Lord Abbett voted the Fund’s proxies during the 12-month period ended June 30 are available without charge, upon request, (i) by calling 888-522-2388; (ii) on Lord Abbett’s Website at www.lordabbett.com; and (iii) on the Securities and Exchange Commission’s (“SEC”) Website at www.sec.gov.
Shareholder Reports and Quarterly Portfolio Disclosure
The Fund is required to file its complete schedule of portfolio holdings with the SEC for its first and third fiscal quarters on Form N-Q. Copies of the filings are available without charge, upon request on the SEC’s Website at www.sec.gov and may be available by calling Lord Abbett at 888-522-2388. You can also obtain copies of Form N-Q by visiting the SEC’s Public Reference Room in Washington, DC (information on the operation of the Public Reference Room may be obtained by calling 800-SEC-0330).
| | Tax Information |
| | |
| | 100% of the ordinary income distributions paid by the Fund during the year is qualified dividend income. |
| | |
| | For corporate shareholders, 100% of the Fund’s ordinary income distributions qualified for the dividends received deduction. |
| | |
| | Additionally, of the distributions paid to shareholders during the fiscal year ended December 31, 2016, $23,703, represents long-term capital gains. |
31


| This report, when not used for the general information of shareholders of the Fund, is to be distributed only if preceded or accompanied by a current fund prospectus. | | |
Lord Abbett mutual fund shares are distributed by
LORD ABBETT DISTRIBUTOR LLC. | Lord Abbett Series Fund, Inc. Value Opportunities Portfolio | SFVALOPP-PORT-3 (02/17) |
| (a) | In accordance with applicable requirements, the Registrant adopted a Sarbanes-Oxley Code of Ethics on June 19, 2003 that applies to the principal executive officer and senior financial officers of the Registrant (“Code of Ethics”). The Code of Ethics was in effect during the fiscal year ended December 31, 2016 (the “Period”). |
| (c) | The Registrant has not amended the Code of Ethics as described in Form N-CSR during the Period. |
| (d) | The Registrant has not granted any waiver, including an implicit waiver, from a provision of the Code of Ethics as described in Form N-CSR during the Period. |
| (f) | See Item 12(a)(1) concerning the filing of the Code of Ethics. |
| Item 3: | Audit Committee Financial Expert. |
The Registrant’s board of directors has determined that each of the following independent directors who are members of the audit committee is an audit committee financial expert: Robert B. Calhoun, Evelyn E. Guernsey, and Mark A. Schmid. Each of these persons is independent within the meaning of the Form N-CSR.
| Item 4: | Principal Accountant Fees and Services. |
In response to sections (a), (b), (c) and (d) of Item 4, the aggregate fees billed to the Registrant for the fiscal years ended December 31, 2016 and 2015 by the Registrant’s principal accounting firm, Deloitte & Touche LLP, the member firms of Deloitte Touche Tohmatsu and their respective affiliates (collectively, “Deloitte”) were as follows:
| | | Fiscal year ended: | |
| | | 2016 | | 2015 | |
| Audit Fees {a} | | $507,800 | | $502,000 | |
| Audit-Related Fees | | - 0 - | | - 0 - | |
| Total audit and audit-related fees | | 507,800 | | 502,000 | |
| | | | | | |
| Tax Fees {b} | | 122,938 | | 122,522 | |
| All Other Fees | | - 0 - | | - 0 - | |
| | | | | | |
| Total Fees | | $630,738 | | $624,522 | |
{a} Consists of fees for audits of the Registrant’s annual financial statements.
{b} Fees for the fiscal year ended December 31, 2016 and 2015 consist of fees for preparing the U.S. Income Tax Return for Regulated Investment Companies, New Jersey Corporation Business Tax Return, New Jersey Annual Report Form, U.S. Return of Excise Tax on Undistributed Income of Investment Companies, IRS Forms 1099-MISC and 1096 Annual Summary and Transmittal of U.S. Information Returns.
(e) (1) Pursuant to Rule 2-01(c) (7) of Regulation S-X, the Registrant’s Audit Committee has adopted pre-approval policies and procedures. Such policies and procedures generally provide that the Audit Committee must pre-approve:
| · | any audit, audit-related, tax, and other services to be provided to the Lord Abbett Funds, including the Registrant, and |
| · | any audit-related, tax, and other services to be provided to the Registrant’s investment adviser and any entity controlling, controlled by or under common control with the investment adviser that provides ongoing services to one or more Funds comprising the Registrant if the engagement relates directly to operations and financial reporting of a Fund, by the independent auditor to assure that the provision of such services does not impair the auditor’s independence. |
The Audit Committee has delegated pre-approval authority to its Chairman, subject to a fee limit of $10,000 per event, and not to exceed $25,000 annually. The Chairman will report any pre-approval decisions to the Audit Committee at its next scheduled meeting. Unless a type of service to be provided by the independent auditor has received general pre-approval, it must be pre-approved by the Audit Committee. Any proposed services exceeding pre-approved cost levels will require specific pre-approval by the Audit Committee.
(e) (2) The Registrant’s Audit Committee has approved 100% of the services described in this Item 4 (b) through (d).
(f) Not applicable.
(g) The aggregate non-audit fees billed by Deloitte for services rendered to the Registrant are shown above in the response to Item 4 (a), (b), (c) and (d) as “All Other Fees”.
The aggregate non-audit fees billed by Deloitte for services rendered to the Registrant’s investment adviser, Lord, Abbett & Co. LLC (“Lord Abbett”), for the fiscal years ended December 31, 2016 and 2015 were:
| | Fiscal year ended: |
| | | 2016 | | 2015 | |
| All Other Fees {a} | | $95,230 | | $215,031 | |
{a} Consist of fees for Independent Services Auditors’ Report on Controls Placed in Operation and Tests of Operating Effectiveness related to Lord Abbett’s Asset Management Services (“SOC-1 Report”).
The aggregate non-audit fees billed by Deloitte for services rendered to entities under the common control of Lord Abbett for the fiscal years ended December 31, 2016 and 2015 were:
| | Fiscal year ended: |
| | | 2016 | | 2015 | |
| All Other Fees | | $ - 0 - | | $ - 0 - | |
(h) The Registrant’s Audit Committee has considered the provision of non-audit services that were rendered to the Registrant’s investment adviser, and any entity controlling, controlled by or under common control with the investment adviser that provides ongoing services to the Registrant, that were not pre-approved pursuant to Rule 2-01 (c)(7)(ii) of Regulation S-X and has determined that the provision of such services is compatible with maintaining Deloitte’s independence.
| Item 5: | Audit Committee of Listed Registrants. |
| | |
| | Not applicable. |
| | |
| Item 6: | Investments. |
| | |
| | Not applicable. |
| | |
| Item 7: | Disclosure of Proxy Voting Policies and Procedures for Closed-End Management Investment Companies. |
| | |
| | Not applicable. |
| | |
| Item 8: | Portfolio Managers of Closed-End Management Investment Companies. |
| | |
| | Not applicable. |
| | |
| Item 9: | Purchases of Equity Securities by Closed-End Management Investment Company and Affiliated Purchasers. |
| | |
| | Not applicable. |
| | |
| Item 10: | Submission of Matters to a Vote of Security Holders. |
| | |
| | Not applicable. |
| | |
| Item 11: | Controls and Procedures. |
| (a) | Based on their evaluation of the Registrant’s disclosure controls and procedures (as defined in Rule 30a-3(c) under the Investment Company Act of 1940) as of a date within 90 days prior to the filing date of this report, the Chief Executive Officer and Chief Financial Officer of the Registrant have concluded that such disclosure controls and procedures are reasonably designed and effective to ensure that material information relating to the Registrant, including its consolidated subsidiaries, is made known to them by others within those entities. |
| (b) | There were no changes in the Registrant’s internal control over financial reporting (as defined in Rule 30a-3(d) under the Investment Company Act of 1940) that occurred during the second fiscal quarter of the period covered by this report that have materially affected, or are reasonably likely to materially affect, the Registrant’s internal control over financial reporting. |
| (a)(1) | The Lord Abbett Family of Funds Sarbanes Oxley Code of Ethics for the Principal Executive Officer and Senior Financial Officers is attached hereto as part of Ex-99. CODEETH. |
| (a)(2) | Certification of each Principal Executive Officer and Principal Financial Officer of the Registrant as required by Rule 30a-2 under the Investment Company Act of 1940 is attached hereto as a part of EX-99.CERT. |
| (b) | Certification of each Principal Executive Officer and Principal Financial Officer of the Registrant as required by Section 906 of the Sarbanes-Oxley Act of 2002 is provided as a part of EX-99.906CERT. |
SIGNATURES
Pursuant to the requirements of the Securities Exchange Act of 1934 and the Investment Company Act of 1940, the Registrant has duly caused this report to be signed on its behalf by the undersigned, thereunto duly authorized.
| | | LORD ABBETT SERIES FUND, INC. |
| | | |
| | By: | /s/ Daria L. Foster |
| | | Daria L. Foster |
| | | President and Chief Executive Officer |
Date: February 15, 2017
| | By: | /s/ Joan A. Binstock |
| | | Joan A. Binstock |
| | | Chief Financial Officer and Vice President |
Date: February 15, 2017
Pursuant to the requirements of the Securities Exchange Act of 1934 and the Investment Company Act of 1940, this report has been signed below by the following persons on behalf of the Registrant and in the capacities and on the dates indicated.
| | By: | /s/ Daria L. Foster |
| | | Daria L. Foster |
| | | President and Chief Executive Officer |
Date: February 15, 2017
| | By: | /s/ Joan A. Binstock |
| | | Joan A. Binstock |
| | | Chief Financial Officer and Vice President |
Date: February 15, 2017