UNITED STATES
SECURITIES AND EXCHANGE COMMISSION
Washington, D.C. 20549
FORM N-CSR
CERTIFIED SHAREHOLDER REPORT OF REGISTERED
MANAGEMENT INVESTMENT COMPANIES
Investment Company Act File Number: 811-05876
LORD ABBETT SERIES FUND, INC.
(Exact name of Registrant as specified in charter)
90 Hudson Street, Jersey City, NJ 07302
(Address of principal executive offices) (Zip code)
John T. Fitzgerald, Esq., Vice President & Assistant Secretary
90 Hudson Street, Jersey City, NJ 07302
(Name and address of agent for service)
Registrant’s telephone number, including area code:(800) 201-6984
Date of fiscal year end: 12/31
Date of reporting period: 12/31/2018
| Item 1: | Report(s) to Shareholders. |
![]()
LORD ABBETT
ANNUAL REPORT
Lord Abbett
Series Fund—Bond Debenture Portfolio
For the fiscal year ended December 31, 2018
Table of Contents
Lord Abbett Series Fund — Bond Debenture Portfolio
Annual Report
For the fiscal year ended December 31, 2018
From left to right: James L.L. Tullis, Independent Chairman of the Lord Abbett Funds and Douglas B. Sieg, Director, President, and Chief Executive Officer of the Lord Abbett Funds. | Dear Shareholders:We are pleased to provide you with this overview of the performance of Lord Abbett Series Fund – Bond Debenture Portfolio for the fiscal year ended December 31, 2018. On this page and the following pages, we discuss the major factors that influenced fiscal year performance. For additional information about the Fund, please visit our website at www.lordabbett.com, where you also can access the quarterly commentaries that provide updates on the Fund’s performance and other portfolio related updates. Thank you for investing in Lord Abbett mutual funds. We value the trust that you place in us and look forward to serving your investment needs in the years to come.
Best regards,
Douglas B. Sieg Director, President and Chief Executive Officer |


For the fiscal year ended December 31, 2018, the Fund returned –4.02%, reflecting performance at the net asset value (NAV) of Class VC shares with all distributions reinvested, compared to its benchmark, the Bloomberg Barclays U.S. Aggregate Bond Index,1which returned 0.01% over the same period.
During the period, there were several market-moving events. In June 2018, the White House announced its intent to impose additional tariffs on $200 billion worth of Chinese goods, on top of the $50 billion previously announced. The aggressive U.S. trade posture continued
into September with trade tensions mounting between the U.S. and China. While the impact has yet to fully be realized, many corporations anticipate that the retaliatory tariffs will weigh on profits. In 2018, the Fed raised its target for short-term interest rates by 0.25% at each of its March, June, September and December meetings, raising the target range to 2.25%–2.50%. As the Fed continued to raise rates, the U.S. Treasury yield curve flattened throughout the year. The yield on 10-year U.S. Treasury securities (“Treasuries”) reached multi-year highs in November, and pulled back in December as
1
risk averse sentiment roiled the markets and investors to flocked to safety. Amid rising concerns surrounding escalating trade tensions, slowing global growth, and increasing interest rates, the Nasdaq experienced the largest monthly drop since 2008 in October 2018. US equity markets were volatile to finish out the year, with the S&P 500® suffering the largest December decline since the Great Depression, culminating in the worst year since the financial crisis. Additionally, leveraged credit segments of the market experienced a sharp sell-off, notably in December, due to concerns over slower growth, falling oil prices, year-end technical pressures and general risk averse sentiment. Despite the sell-off, the U.S. economy continued to expand by more than 2% during each quarter of the trailing 12-month period, with domestic GDP growth ranging between 2.2% to 4.2% from the third quarter of 2017 to the third quarter of 2018. The 4.2% GDP growth in the second quarter marked the strongest growth rate since the third quarter of 2014. Inflation, as measured by the Consumer Price Index (CPI), gained 1.9%, a decline of 0.1% year-over-year, mainly driven lower by falling energy prices. Oil prices suffered sharp declines due to oversupply concerns.
During the 12-month period the leveraged credit sectors of the U.S. fixed income market, including high yield bonds and loans, experienced mixed returns, with high yield bonds underperforming and
bank loans outperforming investment grade bonds. High yield credit spreads widened during the period, most notably in December, as the fourth quarter risk averse sentiment took a toll on risk assets. Returns within the high yield market were driven lower primarily by the lower-rated issues, as ‘CCC’ rated bonds underperformed higher-rated issues over the 12-month period.
As it has in the past, the Fund maintained a significant allocation to high yield bonds, as we remained positive on the high yield market from a fundamental perspective. The Fund’s exposure to high yield bonds detracted from relative performance, as the high yield market significantly underperformed investment grade bonds, as represented by the Fund’s benchmark the Bloomberg Barclays US Aggregate Bond Index1.
The Fund maintained an allocation to equities throughout the period, which also detracted from relative performance, as the asset class came under pressure during the year, most notably in the fourth quarter, as general risk averse sentiment caused a broad-based sell-off.
The Fund’s modest allocation to bank loans contributed to relative performance during the period. Despite volatility late in the year, the asset class performed relatively well in relation to other risk assets.
The Fund’s portfolio is actively managed and, therefore, its holdings and the weightings of a particular issuer or particular sector as a percentage of portfolio assets are subject to change. Sectors may include many industries.
2
1 The Bloomberg Barclays U.S. Aggregate Bond Index is an index of U.S dollar-denominated, investment-grade U.S. government and corporate securities, and mortgage pass-through securities, and asset-backed securities. Indexes are unmanaged, do not reflect the deduction of fees or expenses, and an investor cannot invest directly in an index.
Unless otherwise specified, indexes reflect total return, with all dividends reinvested. Indexes are unmanaged, do not reflect the deduction of fees or expenses, and are not available for direct investment.
Important Performance and Other Information
Performance data quoted in the following pages reflect past performance and are no guarantee of future results. Current performance may be higher or lower than the performance quoted. The investment return and principal value of an investment in the Fund will fluctuate so that shares, on any given day or when redeemed, may be worth more or less than their original cost. You can obtain performance data current to the most recent month end by calling Lord Abbett at 888-522-2388 or referring to www.lordabbett.com.
During certain periods shown, expense waivers and reimbursements were in place. Without such expense waivers and reimbursements, the Fund’s returns would have been lower.
The annual commentary above discusses the views of the Fund’s management and various portfolio holdings of the Fund as of December 31, 2018. These views and portfolio holdings may have changed after this date. Information provided in the commentary is not a recommendation to buy or sell securities. Because the Fund’s portfolio is actively managed and may change significantly, the Fund may no longer own the securities described above or may have otherwise changed its position in the securities. For more recent information about the Fund’s portfolio holdings, please visit www.lordabbett.com.
A Note about Risk:See Notes to Financial Statements for a discussion of investment risks. For a more detailed discussion of the risks associated with the Fund, please see the Fund’s prospectus.
Mutual funds are not insured by the FDIC, are not deposits or other obligations of, or guaranteed by, banks, and are subject to investment risks including possible loss of principal amount invested.
The Fund serves as an underlying investment vehicle for variable annuity contracts and variable life insurance policies.
3
Below is a comparison of a $10,000 investment in Class VC shares with the same investment in the Bloomberg Barclays U.S. Aggregate Bond Index and the ICE BofA Merrill Lynch U.S. High Yield Constrained Index, assuming reinvestment of all dividends and distributions. The Fund’s shares are sold only to insurance company separate accounts that fund certain variable annuity and variable life contracts. This line graph comparison does not reflect the sales charges or other expenses of these contracts. If those sales charges and expenses were reflected, returns would be lower. The graph and performance table below do not reflect the deduction of taxes that a shareholder would pay on Fund distributions or the redemption of Fund shares. During certain periods, expenses of the Fund have been waived or reimbursed by Lord Abbett; without such waiver or reimbursement of expenses, the Fund’s returns would have been lower.Past performance is no guarantee of future results.

Average Annual Total Returns for the
Periods Ended December 31, 2018
| 1 Year | 5 Years | 10 Years | |||
| Class VC | –4.02% | 3.85% | 8.76% |
1 Performance for each unmanaged index does not reflect any fees or expenses. The performance of each index is not necessarily representative of the Fund’s performance.
4
As a shareholder of the Fund, you incur ongoing costs, including management fees; expenses related to the Fund’s services arrangements with certain insurance companies; and other Fund expenses. This Example is intended to help you understand your ongoing costs (in dollars) of investing in the Fund and to compare these costs with the ongoing costs of investing in other mutual funds.
The Example is based on an investment of $1,000 invested at the beginning of the period and held for the entire period (July 1, 2018 through December 31, 2018).
The Example reflects only expenses that are deducted from the assets of the Fund. Fees and expenses, including sales charges applicable to the various insurance products that invest in the Fund, are not reflected in this Example. If such fees and expenses were reflected in the Example, the total expenses shown would be higher. Fees and expenses regarding such variable insurance products are separately described in the prospectus related to those products.
Actual Expenses
The first line of the table on the following page provides information about actual account values and actual expenses. You may use the information in this line, together with the amount you invested, to estimate the expenses that you paid over the period. Simply divide your account value by $1,000 (for example, an $8,600 account value divided by $1,000 = 8.6), then multiply the result by the number in the first line under the heading titled “Expenses Paid During Period 7/1/18 – 12/31/18” to estimate the expenses you paid on your account during this period.
Hypothetical Example for Comparison Purposes
The second line of the table on the following page provides information about hypothetical account values and hypothetical expenses based on the Fund’s actual expense ratio and an assumed rate of return of 5% per year before expenses, which is not the Fund’s actual return. The hypothetical account values and expenses may not be used to estimate the actual ending account balance or expenses you paid for the period. You may use this information to compare the ongoing costs of investing in the Fund and other funds. To do so, compare this 5% hypothetical example with the 5% hypothetical examples that appear in the shareholder reports of the other funds.
5
Please note that the expenses shown in the table are meant to highlight your ongoing costs only and do not reflect any transactional costs, such as sales charges. Therefore, the second line of the table is useful in comparing ongoing costs only, and will not help you determine the relative total costs of owning different funds. In addition, if these transactional costs were included, your costs would have been higher.
| Beginning | Ending | Expenses | |||||||
| Account | Account | Paid During | |||||||
| Value | Value | Period† | |||||||
| 7/1/18 – | |||||||||
| 7/1/18 | 12/31/18 | 12/31/18 | |||||||
| Class VC | |||||||||
| Actual | $1,000.00 | $ | 970.80 | $4.57 | |||||
| Hypothetical (5% Return Before Expenses) | $1,000.00 | $ | 1,020.57 | $4.69 | |||||
| † | Net expenses are equal to the Fund’s annualized expense ratio of .92%, multiplied by the average account value over the period, multiplied by 184/365 (to reflect one-half year period). |
Portfolio Holdings Presented by Sector
December 31, 2018
| Sector* | %** | |||
| Asset Backed | 0.79 | % | ||
| Automotive | 1.15 | % | ||
| Banking | 4.11 | % | ||
| Basic Industry | 5.17 | % | ||
| Capital Goods | 2.96 | % | ||
| Commercial Mortgage Backed | 0.37 | % | ||
| Consumer Goods | 5.00 | % | ||
| Energy | 7.52 | % | ||
| Financial Services | 3.81 | % | ||
| Foreign Government | 6.14 | % | ||
| Healthcare | 8.50 | % | ||
| Insurance | 1.92 | % | ||
| Leisure | 3.63 | % | ||
| Media | 3.82 | % | ||
| Municipal | 3.52 | % | ||
| Real Estate | 1.17 | % | ||
| Retail | 7.27 | % | ||
| Services | 3.09 | % | ||
| Technology & Electronics | 5.15 | % | ||
| Telecommunications | 4.12 | % | ||
| Transportation | 2.89 | % | ||
| U.S. Government | 10.58 | % | ||
| Utility | 5.15 | % | ||
| Repurchase Agreement | 2.17 | % | ||
| Total | 100.00 | % | ||
| * | A sector may comprise several industries. | |
| ** | Represents percent of total investments. |
6
December 31, 2018
| Investments | Interest Rate | Maturity Date | Principal Amount (000) | Fair Value | ||||||||
| LONG-TERM INVESTMENTS 106.30% | ||||||||||||
| ASSET-BACKED SECURITIES 2.52% | ||||||||||||
| Automobiles 0.19% | ||||||||||||
| ACC Trust 2018-1 B† | 4.82% | 5/20/2021 | $ | 582 | $ | 583,741 | ||||||
| ACC Trust 2018-1 C† | 6.81% | 2/21/2023 | 500 | 501,988 | ||||||||
| TCF Auto Receivables Owner Trust 2016-1A B† | 2.32% | 6/15/2022 | 979 | 963,436 | ||||||||
| Westlake Automobile Receivables Trust 2016-3A B† | 2.07% | 12/15/2021 | 47 | 46,914 | ||||||||
| Total | 2,096,079 | |||||||||||
| Other 2.33% | ||||||||||||
| ALM XIX Ltd. 2016-19A C† | 6.786% (3 Mo. LIBOR + 4.35% | )# | 7/15/2028 | 462 | 462,849 | |||||||
| AMMC CLO XII Ltd. 2013-12A DR† | 5.318% (3 Mo. LIBOR + 2.70% | )# | 11/10/2030 | 391 | 356,205 | |||||||
| Anchorage Capital CLO 9 Ltd. 2016-9A D† | 6.436% (3 Mo. LIBOR + 4.00% | )# | 1/15/2029 | 1,150 | 1,134,342 | |||||||
| Ascentium Equipment Receivables Trust 2016-2A B† | 2.50% | 9/12/2022 | 417 | 414,726 | ||||||||
| BlueMountain CLO XXIII Ltd. 2018-23A D† | 5.365% (3 Mo. LIBOR + 2.90% | )# | 10/20/2031 | 369 | 345,995 | |||||||
| Cedar Funding VI CLO Ltd. 2016-6A DR† | 5.469% (3 Mo. LIBOR + 3.00% | )# | 10/20/2028 | 657 | 615,421 | |||||||
| Conn’s Receivables Funding LLC 2017-B C† | 5.95% | 11/15/2022 | 2,250 | 2,286,073 | ||||||||
| Halcyon Loan Advisors Funding Ltd. 2015-2A CR† | 4.64% (3 Mo. LIBOR + 2.15% | )# | 7/25/2027 | 465 | 451,158 | |||||||
| Hardee’s Funding LLC 2018-1A A2II† | 4.959% | 6/20/2048 | 3,332 | 3,397,283 | ||||||||
| Jamestown CLO VII Ltd. 2015-7A BR† | 4.14% (3 Mo. LIBOR + 1.65% | )# | 7/25/2027 | 1,202 | 1,139,287 | |||||||
| Madison Park Funding XIV Ltd. 2014-14A DRR† | 5.419% (3 Mo. LIBOR + 2.95% | )# | 10/22/2030 | 333 | 313,540 | |||||||
| Mariner CLO LLC 2017-4A D† | 5.558% (3 Mo. LIBOR + 3.05% | )# | 10/26/2029 | 694 | 656,052 | |||||||
| Mountain View CLO X Ltd. 2015-10A BR† | 3.786% (3 Mo. LIBOR + 1.35% | )# | 10/13/2027 | 1,336 | 1,307,335 | |||||||
| Octagon Investment Partners 39 Ltd. 2018-3A D† | 5.415% (3 Mo. LIBOR + 2.95% | )# | 10/20/2030 | 322 | 303,055 | |||||||
| Palmer Square Loan Funding Ltd. 2018-1A A1† | 3.036% (3 Mo. LIBOR + .60% | )# | 4/15/2026 | 2,344 | 2,329,517 | |||||||
| Palmer Square Loan Funding Ltd. 2018-1A A2† | 3.486% (3 Mo. LIBOR + 1.05% | )# | 4/15/2026 | 884 | 846,558 | |||||||
| Palmer Square Loan Funding Ltd. 2018-1A B† | 3.836% (3 Mo. LIBOR + 1.40% | )# | 4/15/2026 | 670 | 627,312 | |||||||
| See Notes to Financial Statements. | 7 |
Schedule of Investments (continued)
December 31, 2018
| Investments | Interest Rate | Maturity Date | Principal Amount (000) | Fair Value | ||||||||
| Other (continued) | ||||||||||||
| Planet Fitness Master Issuer LLC 2018-1A A2I† | 4.262% | 9/5/2048 | $ | 1,551 | $ | 1,561,284 | ||||||
| Planet Fitness Master Issuer LLC 2018-1A A2II† | 4.666% | 9/5/2048 | 1,939 | 1,967,494 | ||||||||
| Regatta VI Funding Ltd. 2016-1A DR† | 5.169% (3 Mo. LIBOR + 2.70% | )# | 7/20/2028 | 250 | 235,362 | |||||||
| THL Credit Wind River CLO Ltd. 2018-3A D† | 5.776% (3 Mo. LIBOR + 2.95% | )# | 1/20/2031 | 608 | 565,131 | |||||||
| Voya CLO Ltd. 2016-2A C† | 6.70% (3 Mo. LIBOR + 4.25% | )# | 7/19/2028 | 750 | 750,258 | |||||||
| West CLO Ltd. 2014-2A BR† | 4.186% (3 Mo. LIBOR + 1.75% | )# | 1/16/2027 | 459 | 446,867 | |||||||
| Westcott Park CLO Ltd. 2016-1A D† | 6.819% (3 Mo. LIBOR + 4.35% | )# | 7/20/2028 | 850 | 851,228 | |||||||
| Wingstop Funding LLC 2018-1 A2† | 4.97% | 12/5/2048 | 1,678 | 1,718,104 | ||||||||
| Total | 25,082,436 | |||||||||||
| Total Asset-Backed Securities (cost $27,421,926) | 27,178,515 | |||||||||||
| Shares (000) | ||||||||||||
| COMMON STOCKS 9.25% | ||||||||||||
| Aerospace/Defense 0.11% | ||||||||||||
| HEICO Corp. | 15 | 1,159,256 | ||||||||||
| Air Transportation 0.26% | ||||||||||||
| Alaska Air Group, Inc. | 28 | 1,699,419 | ||||||||||
| Spirit Airlines, Inc.* | 20 | 1,143,514 | ||||||||||
| Total | 2,842,933 | |||||||||||
| Auto Parts & Equipment 0.14% | ||||||||||||
| Chassix Holdings, Inc. | 59 | 1,486,875 | ||||||||||
| Banking 0.34% | ||||||||||||
| American Express Co. | 22 | 2,058,531 | ||||||||||
| Western Alliance Bancorp* | 42 | 1,649,774 | ||||||||||
| Total | 3,708,305 | |||||||||||
| Beverages 0.10% | ||||||||||||
| Pernod Ricard SA(a) | EUR | 7 | 1,085,821 | |||||||||
| Building & Construction 0.10% | ||||||||||||
| PulteGroup, Inc. | 42 | 1,086,902 | ||||||||||
| 8 | See Notes to Financial Statements. |
Schedule of Investments (continued)
December 31, 2018
| Investments | Shares (000) | Fair Value | ||||||
| Building Materials 0.21% | ||||||||
| RPM International, Inc. | 19 | $ | 1,130,104 | |||||
| Vulcan Materials Co. | 12 | 1,164,062 | ||||||
| Total | 2,294,166 | |||||||
| Chemicals 0.10% | ||||||||
| Ecolab, Inc. | 8 | 1,122,954 | ||||||
| Discount Stores 0.12% | ||||||||
| Amazon.com, Inc.* | – | (b) | 1,302,208 | |||||
| Diversified Capital Goods 0.11% | ||||||||
| Dover Corp. | 16 | 1,142,863 | ||||||
| Electric: Generation 0.10% | ||||||||
| AES Corp. | 77 | 1,110,861 | ||||||
| Electric: Integrated 0.50% | ||||||||
| Ameren Corp. | 24 | 1,561,737 | ||||||
| OGE Energy Corp. | 54 | 2,133,386 | ||||||
| Portland General Electric Co. | 37 | 1,705,482 | ||||||
| Total | 5,400,605 | |||||||
| Electronics 0.17% | ||||||||
| Zebra Technologies Corp. Class A* | 11 | 1,791,815 | ||||||
| Energy: Exploration & Production 0.19% | ||||||||
| Chaparral Energy, Inc. Class A* | 60 | 296,533 | ||||||
| MEG Energy Corp.*(a) | CAD | 299 | 1,689,169 | |||||
| Templar Energy LLC Class A Units | 46 | 28,887 | ||||||
| Total | 2,014,589 | |||||||
| Food & Drug Retailers 0.16% | ||||||||
| Kroger Co. (The) | 60 | 1,662,485 | ||||||
| Food: Wholesale 0.34% | ||||||||
| Lamb Weston Holdings, Inc. | 22 | 1,623,469 | ||||||
| McCormick & Co., Inc. | 15 | 2,079,689 | ||||||
| Total | 3,703,158 | |||||||
| Gas Distribution 0.15% | ||||||||
| ONE Gas, Inc. | 20 | 1,572,816 | ||||||
| Health Facilities 0.24% | ||||||||
| HCA Healthcare, Inc. | 21 | 2,613,575 | ||||||
| See Notes to Financial Statements. | 9 |
Schedule of Investments (continued)
December 31, 2018
| Investments | Shares (000) | Fair Value | ||||||
| Health Services 0.11% | ||||||||
| PRA Health Sciences, Inc.* | 13 | $ | 1,169,823 | |||||
| Insurance Brokerage 0.16% | ||||||||
| Aon plc (United Kingdom)(c) | 12 | 1,700,712 | ||||||
| Investments & Miscellaneous Financial Services 0.68% | ||||||||
| Arthur J Gallagher & Co. | 30 | 2,179,530 | ||||||
| BlackRock, Inc. | 3 | 1,163,533 | ||||||
| CME Group, Inc. | 9 | 1,762,120 | ||||||
| FactSet Research Systems, Inc. | 6 | 1,137,939 | ||||||
| Thomson Reuters Corp. (Canada)(c) | 22 | 1,071,564 | ||||||
| Total | 7,314,686 | |||||||
| Machinery 0.11% | ||||||||
| Roper Technologies, Inc. | 4 | 1,156,430 | ||||||
| Media: Content 0.11% | ||||||||
| AMC Networks, Inc. Class A* | 21 | 1,130,912 | ||||||
| Media: Diversified 0.16% | ||||||||
| Walt Disney Co. (The) | 16 | 1,757,141 | ||||||
| Medical Products 0.16% | ||||||||
| Edwards Lifesciences Corp.* | 11 | 1,759,770 | ||||||
| Packaging 0.20% | ||||||||
| AptarGroup, Inc. | 22 | 2,114,317 | ||||||
| Personal & Household Products 0.32% | ||||||||
| Church & Dwight Co., Inc. | 19 | 1,262,000 | ||||||
| Gibson Brands, Inc. | 9 | 912,300 | (d) | |||||
| Procter & Gamble Co. (The) | 12 | 1,095,686 | ||||||
| Remington Outdoor Co., Inc.* | 16 | 158,506 | ||||||
| Total | 3,428,492 | |||||||
| Pharmaceuticals 0.37% | ||||||||
| Amgen, Inc. | 6 | 1,137,846 | ||||||
| Canopy Growth Corp.*(a) | CAD | 40 | 1,075,614 | |||||
| Eli Lilly & Co. | 15 | 1,779,542 | ||||||
| Total | 3,993,002 | |||||||
| Real Estate Investment Trusts 0.25% | ||||||||
| Americold Realty Trust | 62 | 1,596,148 | ||||||
| Medical Properties Trust, Inc. | 71 | 1,134,573 | ||||||
| Total | 2,730,721 | |||||||
| 10 | See Notes to Financial Statements. |
Schedule of Investments (continued)
December 31, 2018
| Investments | Shares (000) | Fair Value | ||||||
| Restaurants 0.39% | ||||||||
| Shake Shack, Inc. Class A* | 56 | $ | 2,558,327 | |||||
| Texas Roadhouse, Inc. | 28 | 1,674,883 | ||||||
| Total | 4,233,210 | |||||||
| Software/Services 0.76% | ||||||||
| Atlassian Corp. plc Class A (Australia)*(c) | 34 | 3,030,659 | ||||||
| MongoDB, Inc.* | 15 | 1,256,183 | ||||||
| Tableau Software, Inc. Class A* | 14 | 1,721,160 | ||||||
| Trade Desk, Inc. (The) Class A* | 18 | 2,141,075 | ||||||
| Total | 8,149,077 | |||||||
| Specialty Retail 1.15% | ||||||||
| Claires Holdings LLC | 1 | 893,804 | ||||||
| Columbia Sportswear Co. | 26 | 2,204,251 | ||||||
| Deckers Outdoor Corp.* | 22 | 2,874,653 | ||||||
| Etsy, Inc.* | 28 | 1,312,789 | ||||||
| Lululemon Athletica, Inc. (Canada)*(c) | 14 | 1,679,677 | ||||||
| NIKE, Inc. Class B | 31 | 2,333,408 | ||||||
| Ollie’s Bargain Outlet Holdings, Inc.* | 17 | 1,098,679 | ||||||
| Total | 12,397,261 | |||||||
| Support: Services 0.26% | ||||||||
| Bright Horizons Family Solutions, Inc.* | 15 | 1,700,504 | ||||||
| TripAdvisor, Inc.* | 21 | 1,120,010 | ||||||
| Total | 2,820,514 | |||||||
| Technology Hardware & Equipment 0.11% | ||||||||
| Cisco Systems, Inc. | 27 | 1,152,795 | ||||||
| Telecommunications: Wireless 0.25% | ||||||||
| American Tower Corp. | 17 | 2,684,643 | ||||||
| Theaters & Entertainment 0.26% | ||||||||
| Live Nation Entertainment, Inc.* | 35 | 1,714,245 | ||||||
| Tencent Music Entertainment Group ADR* | 86 | 1,131,962 | ||||||
| Total | 2,846,207 | |||||||
| Total Common Stocks (cost $104,846,413) | 99,641,900 | |||||||
| See Notes to Financial Statements. | 11 |
Schedule of Investments (continued)
December 31, 2018
| Investments | Interest Rate | Maturity Date | Principal Amount (000) | Fair Value | ||||||||
| CONVERTIBLE BONDS 0.48% | ||||||||||||
| Automakers 0.16% | ||||||||||||
| Tesla, Inc. | 1.25% | 3/1/2021 | $ | 1,465 | $ | 1,649,313 | ||||||
| Software/Services 0.32% | ||||||||||||
| Twilio, Inc.† | 0.25% | 6/1/2023 | 1,258 | 1,798,979 | ||||||||
| Weibo Corp. (China)†(c) | 1.25% | 11/15/2022 | 1,828 | 1,670,116 | ||||||||
| Total | 3,469,095 | |||||||||||
| Total Convertible Bonds (cost $5,087,822) | 5,118,408 | |||||||||||
| FLOATING RATE LOANS(e)6.50% | ||||||||||||
| Air Transportation 0.20% | ||||||||||||
| American Airlines, Inc. 2018 Replacement Term Loan | 4.256% (1 Mo. LIBOR + 1.75% | ) | 6/27/2025 | 2,338 | 2,197,720 | |||||||
| Department Stores 0.24% | ||||||||||||
| Belk, Inc. 1st Lien Closing Date Term Loan | 7.365% (3 Mo. LIBOR + 4.75% | ) | 12/12/2022 | 1,352 | 1,096,651 | |||||||
| Neiman Marcus Group Ltd LLC Other Term Loan | 5.63% (3 Mo. LIBOR + 3.25% | ) | 10/25/2020 | 1,703 | 1,444,539 | |||||||
| Total | 2,541,190 | |||||||||||
| Diversified Capital Goods 0.06% | ||||||||||||
| Graftech International Ltd. Initial Term Loan | 6.022% (1 Mo. LIBOR + 3.50% | ) | 2/12/2025 | 729 | 691,801 | (f) | ||||||
| Electric: Generation 0.74% | ||||||||||||
| Astoria Energy LLC Advance Term Loan B | 6.53% (3 Mo. LIBOR + 4.00% | ) | 12/24/2021 | 1,408 | 1,387,559 | |||||||
| Edgewater Generation, L.L.C. Term Loan | 6.272% (3 Mo. LIBOR + 3.75% | ) | 12/13/2025 | 1,282 | 1,257,963 | |||||||
| Frontera Generation Holdings LLC Initial Term Loan | 6.629% (3 Mo. LIBOR + 4.25% | ) | 5/2/2025 | 1,160 | 1,119,776 | |||||||
| Helix Gen Funding, LLC Term Loan | – | (g) | 6/3/2024 | 240 | 225,245 | |||||||
| Lightstone Holdco LLC Refinancing Term Loan B | 6.272% (3 Mo. LIBOR + 3.75% | ) | 1/30/2024 | 2,526 | 2,397,488 | |||||||
| Lightstone Holdco LLC Refinancing Term Loan C | 6.272% (3 Mo. LIBOR + 3.75% | ) | 1/30/2024 | 136 | 128,767 | |||||||
| Longview Power, LLC Advance Term Loan B | – | (g) | 4/13/2021 | 194 | 164,836 | |||||||
| Moxie Patriot LLC Construction Advances Term Loan B1 | 8.553% (3 Mo. LIBOR + 5.75% | ) | 12/19/2020 | 187 | 183,639 | |||||||
| Moxie Patriot LLC Construction Advances Term Loan B2 | 8.553% (3 Mo. LIBOR + 6.50% | ) | 12/19/2020 | 1,097 | 1,076,405 | |||||||
| Total | 7,941,678 | |||||||||||
| 12 | See Notes to Financial Statements. |
Schedule of Investments (continued)
December 31, 2018
| Investments | Interest Rate | Maturity Date | Principal Amount (000) | Fair Value | ||||||||
| Electronics 0.12% | ||||||||||||
| EXC Holdings III Corp. 1st Lien Initial Dollar Term Loan | 6.303% (3 Mo. LIBOR + 3.50% | ) | 12/2/2024 | $ | 1,383 | $ | 1,338,079 | |||||
| Food: Wholesale 0.38% | ||||||||||||
| H-Food Holdings, LLC Initial Term Loan | 6.21% (3 Mo. LIBOR + 3.69% | ) | 5/23/2025 | 1,129 | 1,085,813 | |||||||
| Post Holdings, Inc. Incremental Term Loan | – | (g) | 5/24/2024 | 3,122 | 3,016,633 | |||||||
| Total | 4,102,446 | |||||||||||
| Gaming 0.42% | ||||||||||||
| MGM Growth Properties Operating Partnership LP Term Loan B | – | (g) | 3/21/2025 | 2,332 | 2,241,232 | |||||||
| VICI Properties 1 LLC Term Loan B | – | (g) | 12/20/2024 | 2,338 | 2,240,470 | |||||||
| Total | 4,481,702 | |||||||||||
| Gas Distribution 0.11% | ||||||||||||
| NorthRiver Midstream Finance LP Initial Term Loan B (Canada)(c) | 5.646% (3 Mo. LIBOR + 3.25% | ) | 10/1/2025 | 1,168 | 1,142,698 | |||||||
| Health Services 0.20% | ||||||||||||
| Regionalcare Hospital Partners Holdings, Inc. 1st Lien Term Loan B | 7.129% (3 Mo. LIBOR + 4.50% | ) | 11/16/2025 | 2,305 | 2,193,357 | |||||||
| Insurance Brokerage 0.14% | ||||||||||||
| Hub International Limited Initial Term Loan | 5.24% (3 Mo. LIBOR + 3.00% | ) | 4/25/2025 | 1,607 | 1,521,814 | |||||||
| Investments & Miscellaneous Financial Services 0.20% | ||||||||||||
| Edelman Financial Center, LLC, (The) 1st Lien Initial Term Loan | 5.686% (3 Mo. LIBOR + 3.25% | ) | 7/21/2025 | 602 | 581,788 | |||||||
| Vertafore, Inc. 1st Lien Initial Term Loan | 6.053% (3 Mo. LIBOR + 3.25% | ) | 7/2/2025 | 1,695 | 1,615,867 | |||||||
| Total | 2,197,655 | |||||||||||
| Media: Content 0.02% | ||||||||||||
| Univision Communications Inc. 2017 1st Lien Replacement Repriced Term Loan | – | (g) | 3/15/2024 | 193 | 175,665 | |||||||
| Oil Field Equipment & Services 0.13% | ||||||||||||
| Apergy Corp. Initial Term Loan | 5.063% (1 Mo. LIBOR + 2.50% | ) | 5/9/2025 | 1,512 | 1,424,659 | (f) | ||||||
| See Notes to Financial Statements. | 13 |
Schedule of Investments (continued)
December 31, 2018
| Investments | Interest Rate | Maturity Date | Principal Amount (000) | Fair Value | ||||||||
| Personal & Household Products 0.59% | ||||||||||||
| Anastasia Parent, LLC Closing Date Term Loan | 6.272% (1 Mo. LIBOR + 3.75% | ) | 8/11/2025 | $ | 2,269 | $ | 2,150,174 | (f) | ||||
| Britax U.S. Holdings Inc. Initial Dollar Term Loan | 6.303% (3 Mo. LIBOR + 3.50% | ) | 10/15/2020 | 1,340 | 1,047,608 | |||||||
| Energizer Holdings, Inc. Bridge Term Loan | – | (g) | 6/30/2022 | 910 | 910,000 | |||||||
| FGI Operating Company, LLC Exit Term Loan | 12.616% (3 Mo. LIBOR + 10.00% | ) | 5/15/2022 | 100 | 99,508 | (f) | ||||||
| Revlon Consumer Products Corp. Initial Term Loan B | 6.207% (3 Mo. LIBOR + 3.50% | ) | 9/7/2023 | 1,417 | 1,014,957 | |||||||
| TGP Holdings III LLC 1st Lien Refinancing Term Loan | 7.053% (3 Mo. LIBOR + 4.25% | ) | 9/25/2024 | 1,147 | 1,102,483 | |||||||
| Total | 6,324,730 | |||||||||||
| Recreation & Travel 0.39% | ||||||||||||
| Intrawest Resorts Holdings, Inc. Initial Bluebird Term Loan | 5.506% (1 Mo. LIBOR + 3.00% | ) | 7/31/2024 | 2,172 | 2,088,411 | |||||||
| Kingpin Intermediate Holdings LLC 1st Lien Refinancing Term Loan | 6.02% (1 Mo. LIBOR + 3.50% | ) | 7/3/2024 | 1,184 | 1,152,553 | |||||||
| Silk Bidco AS Facility Term Loan B(a) | 3.75% (6 Mo. Euribor + 4.00% | ) | 2/22/2025 | EUR | 897 | 1,018,956 | ||||||
| Total | 4,259,920 | |||||||||||
| Restaurants 0.40% | ||||||||||||
| CEC Entertainment, Inc. Term Loan B | 5.772% (1 Mo. LIBOR + 3.25% | ) | 2/12/2021 | $ | 1,248 | 1,158,317 | ||||||
| IRB Holding Corp. Term Loan B | 5.682% (1 Mo. LIBOR + 3.25% | ) | 2/5/2025 | 1,803 | 1,724,078 | |||||||
| Panera Bread Co. Term Loan | 4.25% (1 Mo. LIBOR + 1.75% | ) | 7/18/2022 | 1,511 | 1,460,334 | |||||||
| Total | 4,342,729 | |||||||||||
| Specialty Retail 1.04% | ||||||||||||
| Ascena Retail Group, Inc. Tranche B Term Loan | 7.063% (3 Mo. LIBOR + 4.50% | ) | 8/21/2022 | 1,047 | 977,481 | |||||||
| Bass Pro Group, LLC Initial Term Loan | 7.522% (1 Mo. LIBOR + 5.00% | ) | 9/25/2024 | 1,037 | 996,524 | |||||||
| BJ’s Wholesale Club, Inc. 1st Lien Tranche B Term Loan | 5.432% (1 Mo. LIBOR + 3.00% | ) | 2/3/2024 | 2,190 | 2,134,531 | |||||||
| Boardriders, Inc. Initial Term Loan | 9.022% (1 Mo. LIBOR + 6.50% | ) | 4/23/2024 | 1,390 | 1,386,540 | |||||||
| Claire’s Stores, Inc. Revolving Credit Term Loan | – | (g) | 9/22/2022 | 42 | 42,005 | (f) | ||||||
| Claire’s Stores, Inc. Term Loan | 8.631% (1 Mo. LIBOR + 6.25% | ) | 9/15/2038 | 140 | 219,365 | |||||||
| 14 | See Notes to Financial Statements. |
Schedule of Investments (continued)
December 31, 2018
| Investments | Interest Rate | Maturity Date | Principal Amount (000) | Fair Value | ||||||||
| Specialty Retail (continued) | ||||||||||||
| EG Group Limited Additional Facility Term Loan B (United Kingdom)(c) | 6.813% (3 Mo. LIBOR +4.00% | ) | 2/7/2025 | $ | 878 | $ | 848,405 | |||||
| EG Group Limited Facility Term Loan B (United Kingdom)(c) | 6.813% (3 Mo. LIBOR + 4.00% | ) | 2/7/2025 | 711 | 686,961 | |||||||
| GOBP Holdings, Inc. 1st Lien Initial Term Loan | – | (g) | 10/22/2025 | 1,369 | 1,341,648 | |||||||
| J. Crew Group, Inc. Amended Term Loan | 5.742% (3 Mo. LIBOR + 3.22%) – 6.023% | 3/5/2021 | 1,472 | 1,166,665 | ||||||||
| Mavis Tire Express Services Corp. 1st Lien Closing Date Term Loan | 5.754% (1 Mo. LIBOR + 3.25% | ) | 3/20/2025 | 1,256 | 1,215,255 | |||||||
| Mavis Tire Express Services Corp. 1st Lien Delayed Draw Term Loan | 5.754% (1 Mo. LIBOR + 3.25% | ) | 3/20/2025 | 203 | 196,098 | |||||||
| Total | 11,211,478 | |||||||||||
| Support: Services 0.56% | ||||||||||||
| AVSC Holding Corp. 1st Lien Initial Term Loan | 6.00% (3 Mo. LIBOR +3.25%) – 6.053% | 3/3/2025 | 1,157 | 1,100,359 | ||||||||
| Pike Corp. Initial Term Loan | 6.03% (3 Mo. LIBOR + 3.50% | ) | 3/23/2025 | 1,634 | 1,604,073 | |||||||
| Southern Graphics Inc. 1st Lien Refinancing Term Loan | 5.745% (2 Mo. LIBOR + 3.25% | ) | 12/31/2022 | 1,734 | 1,635,734 | |||||||
| Trans Union LLC 2018 Incremental Term Loan B4 | 4.522% (1 Mo. LIBOR +2.00% | ) | 6/19/2025 | 1,713 | 1,656,786 | |||||||
| Total | 5,996,952 | |||||||||||
| Telecommunications: Wireless 0.21% | ||||||||||||
| Sprint Communications, Inc. Initial Term Loan | 5.063% (1 Mo. LIBOR + 2.50% | ) | 2/2/2024 | 2,332 | 2,225,187 | |||||||
| Theaters & Entertainment 0.25% | ||||||||||||
| SeaWorld Parks & Entertainment, Inc. Term Loan B5 | 5.522% (1 Mo. LIBOR + 3.00% | ) | 4/1/2024 | 2,807 | 2,687,302 | |||||||
| Transportation: Infrastructure/Services 0.10% | ||||||||||||
| Commercial Barge Line Co. Initial Term Loan | 11.272% (1 Mo. LIBOR + 8.75% | ) | 11/12/2020 | 1,421 | 1,031,307 | |||||||
| Total Floating Rate Loans (cost $72,448,716) | 70,030,069 | |||||||||||
| FOREIGN BOND(a)0.10% | ||||||||||||
| Netherlands | ||||||||||||
| Hema Bondco I BV† (cost $1,296,166) | 6.25% (3 Mo. Euribor + 6.25% | )# | 7/15/2022 | EUR | 1,130 | 1,104,351 | ||||||
| See Notes to Financial Statements. | 15 |
Schedule of Investments (continued)
December 31, 2018
| Principal | ||||||||||||
| Interest | Maturity | Amount | Fair | |||||||||
| Investments | Rate | Date | (000) | Value | ||||||||
| FOREIGN GOVERNMENT OBLIGATIONS 6.83% | ||||||||||||
| Angola 0.09% | ||||||||||||
| Republic of Angola†(c) | 8.25% | 5/9/2028 | $ | 1,075 | $ | 1,015,235 | ||||||
| Argentina 0.75% | ||||||||||||
| City of Buenos Aires†(c) | 7.50% | 6/1/2027 | 1,475 | 1,257,437 | ||||||||
| Province of Santa Fe†(c) | 6.90% | 11/1/2027 | 1,601 | 1,188,743 | ||||||||
| Provincia de Cordoba†(c) | 7.125% | 6/10/2021 | 1,292 | 1,143,420 | ||||||||
| Provincia de Cordoba†(c) | 7.45% | 9/1/2024 | 936 | 767,520 | ||||||||
| Provincia de Mendoza†(c) | 8.375% | 5/19/2024 | 2,487 | 2,026,905 | ||||||||
| Republic of Argentina(c) | 6.875% | 4/22/2021 | 1,846 | 1,674,802 | ||||||||
| Total | 8,058,827 | |||||||||||
| Australia 0.15% | ||||||||||||
| Australian Government(a) | 4.25% | 4/21/2026 | AUD | 2,084 | 1,670,182 | |||||||
| Bahrain 0.16% | ||||||||||||
| Bahrain Government International Bond†(c) | 6.75% | 9/20/2029 | $ | 1,800 | 1,768,390 | |||||||
| Bermuda 0.29% | ||||||||||||
| Government of Bermuda† | 4.138% | 1/3/2023 | 1,350 | 1,371,829 | ||||||||
| Government of Bermuda† | 4.75% | 2/15/2029 | 1,107 | 1,129,140 | ||||||||
| Government of Bermuda† | 4.854% | 2/6/2024 | 580 | 605,619 | ||||||||
| Total | 3,106,588 | |||||||||||
| Brazil 0.32% | ||||||||||||
| Federal Republic of Brazil(c) | 4.625% | 1/13/2028 | 3,587 | 3,455,214 | ||||||||
| Canada 0.21% | ||||||||||||
| Province of British Columbia Canada(a) | 2.85% | 6/18/2025 | CAD | 3,000 | 2,236,398 | |||||||
| Chile 0.21% | ||||||||||||
| Republic of Chile(c) | 3.125% | 1/21/2026 | $ | 2,301 | 2,226,183 | |||||||
| Ecuador 0.34% | ||||||||||||
| Republic of Ecuador†(c) | 8.875% | 10/23/2027 | 4,197 | 3,625,159 | ||||||||
| Egypt 0.30% | ||||||||||||
| Arab Republic of Egypt†(c) | 5.577% | 2/21/2023 | 3,376 | 3,208,368 | ||||||||
| El Salvador 0.19% | ||||||||||||
| Republic of EI Salvador†(c) | 6.375% | 1/18/2027 | 2,275 | 2,092,431 | ||||||||
| 16 | See Notes to Financial Statements. |
Schedule of Investments (continued)
December 31, 2018
| Investments | Interest Rate | Maturity Date | Principal Amount (000) | Fair Value | ||||||||
| Greece 0.17% | ||||||||||||
| Hellenic Republic†(a) | 4.375% | 8/1/2022 | EUR | 1,500 | $ | 1,789,543 | ||||||
| Honduras 0.16% | ||||||||||||
| Honduras Government†(c) | 6.25% | 1/19/2027 | $ | 1,716 | 1,703,302 | |||||||
| Ivory Coast 0.21% | ||||||||||||
| Ivory Coast Bond†(c) | 5.375% | 7/23/2024 | 2,458 | 2,260,549 | ||||||||
| Jamaica 0.42% | ||||||||||||
| Government of Jamaica(c) | 6.75% | 4/28/2028 | 2,073 | 2,218,110 | ||||||||
| Government of Jamaica(c) | 8.00% | 3/15/2039 | 2,031 | 2,335,650 | ||||||||
| Total | 4,553,760 | |||||||||||
| Kenya 0.26% | ||||||||||||
| Republic of Kenya†(c) | 7.25% | 2/28/2028 | 1,918 | 1,719,529 | ||||||||
| Republic of Kenya†(c) | 8.25% | 2/28/2048 | 1,229 | 1,050,815 | ||||||||
| Total | 2,770,344 | |||||||||||
| Mongolia 0.21% | ||||||||||||
| Development Bank of Mongolia LLC†(c) | 7.25% | 10/23/2023 | 2,254 | 2,215,772 | ||||||||
| Paraguay 0.21% | ||||||||||||
| Republic of Paraguay†(c) | 5.60% | 3/13/2048 | 2,304 | 2,275,200 | ||||||||
| Qatar 0.21% | ||||||||||||
| State of Qatar†(c) | 3.25% | 6/2/2026 | 2,302 | 2,229,146 | ||||||||
| Senegal 0.14% | ||||||||||||
| Republic of Senegal†(c) | 6.25% | 7/30/2024 | 1,596 | 1,554,927 | ||||||||
| South Africa 0.16% | ||||||||||||
| Republic of South Africa(c) | 4.30% | 10/12/2028 | 1,919 | 1,713,667 | ||||||||
| Sri Lanka 0.17% | ||||||||||||
| Republic of Sri Lanka(c) | 6.825% | 7/18/2026 | 2,024 | 1,877,570 | ||||||||
| Suriname 0.12% | ||||||||||||
| Republic of Suriname†(c) | 9.25% | 10/26/2026 | 1,375 | 1,330,312 | ||||||||
| Turkey 0.54% | ||||||||||||
| Republic of Turkey(a) | 3.25% | 6/14/2025 | EUR | 2,236 | 2,342,119 | |||||||
| Republic of Turkey(c) | 7.25% | 12/23/2023 | $ | 3,396 | 3,496,029 | |||||||
| Total | 5,838,148 | |||||||||||
| See Notes to Financial Statements. | 17 |
Schedule of Investments (continued)
December 31, 2018
| Investments | Interest Rate | Maturity Date | Principal Amount (000) | Fair Value | ||||||||
| United Arab Emirates 0.37% | ||||||||||||
| Abu Dhabi Government International†(c) | 3.125% | 5/3/2026 | $ | 4,107 | $ | 3,978,718 | ||||||
| Uruguay 0.25% | ||||||||||||
| Republic of Uruguay†(a) | 8.50% | 3/15/2028 | UYU | 40,699 | 1,073,505 | |||||||
| Uruguay Monetary Regulation Bill(a) | Zero Coupon | 5/3/2019 | UYU | 52,404 | 1,568,492 | |||||||
| Total | 2,641,997 | |||||||||||
| Vietnam 0.22% | ||||||||||||
| Socialist Republic of Vietnam†(c) | 4.80% | 11/19/2024 | $ | 2,302 | 2,327,168 | |||||||
| Total Foreign Government Obligations(cost $75,536,072) | 73,523,098 | |||||||||||
| GOVERNMENT SPONSORED ENTERPRISES PASS-THROUGH 8.54% | ||||||||||||
| Federal National Mortgage Assoc.(h) (cost $91,484,446) | 4.50% | TBA | 88,800 | 92,009,862 | ||||||||
| HIGH YIELD CORPORATE BONDS 64.33% | ||||||||||||
| Advertising 0.07% | ||||||||||||
| Lamar Media Corp. | 5.75% | 2/1/2026 | 770 | 782,513 | ||||||||
| Aerospace/Defense 0.94% | ||||||||||||
| BBA US Holdings, Inc.† | 5.375% | 5/1/2026 | 1,006 | 955,690 | ||||||||
| Bombardier, Inc. (Canada)†(c) | 7.50% | 12/1/2024 | 1,704 | 1,610,280 | ||||||||
| Bombardier, Inc. (Canada)†(c) | 7.50% | 3/15/2025 | 4,079 | 3,859,754 | ||||||||
| United Technologies Corp. | 4.125% | 11/16/2028 | 3,709 | 3,690,315 | ||||||||
| Total | 10,116,039 | |||||||||||
| Air Transportation 0.59% | ||||||||||||
| Air Canada (Canada)†(c) | 7.75% | 4/15/2021 | 1,140 | 1,210,965 | ||||||||
| Air Canada 2013-1 Class A Pass Through Trust(Canada)†(c) | 4.125% | 11/15/2026 | 802 | 796,364 | ||||||||
| Azul Investments LLP† | 5.875% | 10/26/2024 | 3,034 | 2,844,405 | ||||||||
| British Airways 2018-1 Class A Pass Through Trust(United Kingdom)†(c) | 4.125% | 3/20/2033 | 782 | 773,640 | ||||||||
| British Airways 2018-1 Class AA Pass ThroughTrust (United Kingdom)†(c) | 3.80% | 3/20/2033 | 800 | 786,813 | ||||||||
| Total | 6,412,187 | |||||||||||
| Auto Loans 0.10% | ||||||||||||
| General Motors Financial Co., Inc. | 3.85% | 1/5/2028 | 1,218 | 1,063,128 | ||||||||
| Auto Parts & Equipment 0.11% | ||||||||||||
| Allison Transmission, Inc.† | 5.00% | 10/1/2024 | 1,250 | 1,204,687 | ||||||||
| 18 | See Notes to Financial Statements. |
Schedule of Investments (continued)
December 31, 2018
| Investments | Interest Rate | Maturity Date | Principal Amount (000) | Fair Value | ||||||||
| Automakers 0.75% | ||||||||||||
| General Motors Co. | 5.00% | 10/1/2028 | $ | 1,699 | $ | 1,613,834 | ||||||
| Navistar International Corp.† | 6.625% | 11/1/2025 | 1,112 | 1,078,640 | ||||||||
| Tesla, Inc.† | 5.30% | 8/15/2025 | 6,126 | 5,344,935 | ||||||||
| Total | 8,037,409 | |||||||||||
| Banking 3.92% | ||||||||||||
| ABN AMRO Bank NV (Netherlands)†(c) | 4.75% | 7/28/2025 | 2,705 | 2,696,728 | ||||||||
| AIB Group plc (Ireland)†(c) | 4.75% | 10/12/2023 | 1,909 | 1,891,985 | ||||||||
| Ally Financial, Inc. | 4.625% | 3/30/2025 | 1,957 | 1,903,183 | ||||||||
| American Express Co. | 3.40% | 2/27/2023 | 1,891 | 1,875,091 | ||||||||
| ANZ New Zealand Int’l Ltd. (United Kingdom)†(c) | 2.125% | 7/28/2021 | 1,510 | 1,460,472 | ||||||||
| Associated Banc-Corp. | 4.25% | 1/15/2025 | 901 | 907,236 | ||||||||
| Australia & New Zealand Banking Group Ltd.(United Kingdom)†(c) | 6.75% (USD Swap + 5.17% | )# | – | (i) | 2,026 | 1,993,078 | ||||||
| Banco Mercantil del Norte SA† | 7.625% | #(j) | – | (i) | 428 | 416,234 | ||||||
| Banco Safra SA† | 4.125% | 2/8/2023 | 1,768 | 1,712,750 | ||||||||
| Bank of America Corp. | 4.45% | 3/3/2026 | 1,137 | 1,126,679 | ||||||||
| Bank of Ireland Group plc (Ireland)†(c) | 4.50% | 11/25/2023 | 1,526 | 1,496,544 | ||||||||
| BankUnited, Inc. | 4.875% | 11/17/2025 | 2,178 | 2,224,674 | ||||||||
| BBVA Bancomer SA† | 5.125% | #(j) | 1/18/2033 | 3,126 | 2,723,559 | |||||||
| CIT Group, Inc. | 5.25% | 3/7/2025 | 603 | 590,940 | ||||||||
| CIT Group, Inc. | 6.125% | 3/9/2028 | 1,056 | 1,053,360 | ||||||||
| Citigroup, Inc. | 4.45% | 9/29/2027 | 1,164 | 1,123,580 | ||||||||
| Compass Bank | 3.875% | 4/10/2025 | 2,353 | 2,259,707 | ||||||||
| Fifth Third Bancorp | 8.25% | 3/1/2038 | 377 | 501,627 | ||||||||
| Goldman Sachs Group, Inc. (The) | 3.50% | 11/16/2026 | 1,520 | 1,406,113 | ||||||||
| Goldman Sachs Group, Inc. (The) | 4.25% | 10/21/2025 | 1,600 | 1,534,232 | ||||||||
| Home BancShares, Inc. | 5.625% (3 Mo. LIBOR + 3.58% | )# | 4/15/2027 | 1,656 | 1,692,874 | |||||||
| Huntington Bancshares, Inc. | 5.70% | #(j) | – | (i) | 1,217 | 1,082,369 | ||||||
| JPMorgan Chase & Co. | 3.54% (3 Mo. LIBOR + 1.38% | )# | 5/1/2028 | 1,306 | 1,247,306 | |||||||
| JPMorgan Chase & Co. | 6.10% (3 Mo. LIBOR + 3.33% | )# | – | (i) | 1,088 | 1,082,560 | ||||||
| Macquarie Bank Ltd. (United Kingdom)(c) | 6.125% (5 Yr Swap rate + 3.70% | )# | – | (i) | 2,489 | 2,131,206 | ||||||
| Morgan Stanley | 3.125% | 7/27/2026 | 2,144 | 1,980,842 | ||||||||
| Morgan Stanley | 3.625% | 1/20/2027 | 776 | 738,666 | ||||||||
| Popular, Inc. | 6.125% | 9/14/2023 | 1,370 | 1,362,301 | ||||||||
| Washington Mutual Bank(k) | 6.875% | 6/15/2011 | 1,250 | 125 | (l) | |||||||
| Total | 42,216,021 | |||||||||||
| See Notes to Financial Statements. | 19 |
Schedule of Investments (continued)
December 31, 2018
| Investments | Interest Rate | Maturity Date | Principal Amount (000) | Fair Value | ||||||||
| Beverages 1.09% | ||||||||||||
| Bacardi Ltd.† | 2.75% | 7/15/2026 | $ | 1,749 | $ | 1,506,557 | ||||||
| Bacardi Ltd.† | 4.70% | 5/15/2028 | 2,538 | 2,444,953 | ||||||||
| Beverages (continued) | ||||||||||||
| Becle SAB de CV (Mexico)†(c) | 3.75% | 5/13/2025 | 1,438 | 1,373,821 | ||||||||
| Brown-Forman Corp. | 3.50% | 4/15/2025 | 797 | 794,632 | ||||||||
| Brown-Forman Corp. | 4.50% | 7/15/2045 | 1,572 | 1,658,968 | ||||||||
| Coca-Cola Icecek AS (Turkey)†(c) | 4.215% | 9/19/2024 | 2,401 | 2,254,013 | ||||||||
| PepsiCo, Inc. | 3.60% | 3/1/2024 | 1,653 | 1,678,965 | ||||||||
| Total | 11,711,909 | |||||||||||
| Building & Construction 1.20% | ||||||||||||
| Ashton Woods USA LLC/Ashton Woods Finance Co.† | 6.75% | 8/1/2025 | 1,194 | 1,044,750 | ||||||||
| Ashton Woods USA LLC/Ashton Woods Finance Co.† | 6.875% | 2/15/2021 | 1,023 | 987,195 | ||||||||
| ITR Concession Co. LLC† | 5.183% | 7/15/2035 | 785 | 762,996 | ||||||||
| Lennar Corp. | 4.75% | 11/15/2022 | 1,304 | 1,269,770 | ||||||||
| Lennar Corp. | 4.75% | 5/30/2025 | 518 | 487,567 | ||||||||
| Lennar Corp. | 4.75% | 11/29/2027 | 440 | 398,750 | ||||||||
| PulteGroup, Inc. | 5.00% | 1/15/2027 | 1,613 | 1,465,814 | ||||||||
| PulteGroup, Inc. | 6.375% | 5/15/2033 | 2,250 | 2,064,375 | ||||||||
| Shea Homes LP/Shea Homes Funding Corp.† | 6.125% | 4/1/2025 | 1,261 | 1,122,290 | ||||||||
| Toll Brothers Finance Corp. | 5.625% | 1/15/2024 | 1,208 | 1,189,880 | ||||||||
| William Lyon Homes, Inc. | 5.875% | 1/31/2025 | 2,466 | 2,108,430 | ||||||||
| Total | 12,901,817 | |||||||||||
| Building Materials 0.10% | ||||||||||||
| Hillman Group, Inc. (The)† | 6.375% | 7/15/2022 | 1,311 | 1,075,020 | ||||||||
| Cable & Satellite Television 2.12% | ||||||||||||
| Altice France SA (France)†(c) | 7.375% | 5/1/2026 | 3,898 | 3,586,160 | ||||||||
| Altice France SA (France)†(c) | 8.125% | 2/1/2027 | 1,167 | 1,102,815 | ||||||||
| CCO Holdings LLC/CCO Holdings Capital Corp.† | 5.125% | 5/1/2027 | 2,783 | 2,599,044 | ||||||||
| CCO Holdings LLC/CCO Holdings Capital Corp.† | 5.75% | 2/15/2026 | 6,025 | 5,919,562 | ||||||||
| CCO Holdings LLC/CCO Holdings Capital Corp.† | 5.875% | 4/1/2024 | 1,035 | 1,032,413 | ||||||||
| CSC Holdings LLC† | 10.875% | 10/15/2025 | 1,430 | 1,609,351 | ||||||||
| DISH DBS Corp. | 7.75% | 7/1/2026 | 3,581 | 2,972,230 | ||||||||
| UPCB Finance IV Ltd.† | 5.375% | 1/15/2025 | 1,929 | 1,808,669 | ||||||||
| Ziggo BV (Netherlands)†(c) | 5.50% | 1/15/2027 | 2,431 | 2,181,822 | ||||||||
| Total | 22,812,066 | |||||||||||
| 20 | See Notes to Financial Statements. |
Schedule of Investments (continued)
December 31, 2018
| Investments | Interest Rate | Maturity Date | Principal Amount (000) | Fair Value | ||||||||
| Chemicals 0.96% | ||||||||||||
| CF Industries, Inc.† | 4.50% | 12/1/2026 | $ | 2,502 | $ | 2,450,522 | ||||||
| CF Industries, Inc. | 4.95% | 6/1/2043 | 253 | 197,024 | ||||||||
| CF Industries, Inc. | 5.15% | 3/15/2034 | 422 | 356,590 | ||||||||
| CNAC HK Finbridge Co. Ltd. (Hong Kong)(c) | 4.125% | 7/19/2027 | 244 | 231,166 | ||||||||
| CVR Partners LP/CVR Nitrogen Finance Corp.† | 9.25% | 6/15/2023 | 1,123 | 1,172,131 | ||||||||
| International Flavors & Fragrances, Inc. | 5.00% | 9/26/2048 | 1,840 | 1,842,286 | ||||||||
| Mexichem SAB de CV (Mexico)†(c) | 5.875% | 9/17/2044 | 1,238 | 1,119,585 | ||||||||
| OCI NV (Netherlands)†(c) | 6.625% | 4/15/2023 | 1,138 | 1,123,775 | ||||||||
| Yingde Gases Investment Ltd. (Hong Kong)†(c) | 6.25% | 1/19/2023 | 1,933 | 1,821,776 | ||||||||
| Total | 10,314,855 | |||||||||||
| Consumer/Commercial/Lease Financing 1.00% | ||||||||||||
| Curo Group Holdings Corp.† | 8.25% | 9/1/2025 | 1,794 | 1,417,260 | ||||||||
| Freedom Mortgage Corp.† | 8.125% | 11/15/2024 | 792 | 683,100 | ||||||||
| Freedom Mortgage Corp.† | 8.25% | 4/15/2025 | 894 | 768,840 | ||||||||
| Nationstar Mortgage Holdings, Inc.† | 9.125% | 7/15/2026 | 1,783 | 1,738,425 | ||||||||
| Navient Corp. | 6.125% | 3/25/2024 | 2,478 | 2,137,275 | ||||||||
| Navient Corp. | 6.75% | 6/25/2025 | 2,114 | 1,807,470 | ||||||||
| Quicken Loans, Inc.† | 5.25% | 1/15/2028 | 2,480 | 2,204,100 | ||||||||
| Total | 10,756,470 | |||||||||||
| Department Stores 0.34% | ||||||||||||
| Kohl’s Corp. | 5.55% | 7/17/2045 | 2,288 | 2,149,342 | ||||||||
| Seven & i Holdings Co. Ltd. (Japan)†(c) | 3.35% | 9/17/2021 | 1,527 | 1,531,953 | ||||||||
| Total | 3,681,295 | |||||||||||
| Discount Stores 1.00% | ||||||||||||
| Amazon.com, Inc. | 3.15% | 8/22/2027 | 1,014 | 980,050 | ||||||||
| Amazon.com, Inc. | 4.25% | 8/22/2057 | 2,325 | 2,269,132 | ||||||||
| Amazon.com, Inc. | 4.80% | 12/5/2034 | 3,679 | 3,951,088 | ||||||||
| Amazon.com, Inc. | 5.20% | 12/3/2025 | 3,295 | 3,624,210 | ||||||||
| Total | 10,824,480 | |||||||||||
| Diversified Capital Goods 1.12% | ||||||||||||
| BCD Acquisition, Inc.† | 9.625% | 9/15/2023 | 1,028 | 1,061,410 | ||||||||
| General Electric Co. | 2.70% | 10/9/2022 | 3,452 | 3,205,849 | ||||||||
| General Electric Co. | 3.10% | 1/9/2023 | 2,189 | 2,044,352 | ||||||||
| Griffon Corp. | 5.25% | 3/1/2022 | 1,163 | 1,056,876 | ||||||||
| KOC Holding AS (Turkey)†(c) | 5.25% | 3/15/2023 | 1,333 | 1,250,425 | ||||||||
| Siemens Financieringsmaatschappij NV(Netherlands)†(c) | 3.25% | 5/27/2025 | 1,235 | 1,211,883 | ||||||||
| See Notes to Financial Statements. | 21 |
Schedule of Investments (continued)
December 31, 2018
| Investments | Interest Rate | Maturity Date | Principal Amount (000) | Fair Value | ||||||||
| Diversified Capital Goods (continued) | ||||||||||||
| SPX FLOW, Inc.† | 5.625% | 8/15/2024 | $ | 873 | $ | 829,350 | ||||||
| SPX FLOW, Inc.† | 5.875% | 8/15/2026 | 1,465 | 1,369,775 | ||||||||
| Total | 12,029,920 | |||||||||||
| Electric: Distribution/Transportation 0.67% | ||||||||||||
| Atlantic City Electric Co. | 4.00% | 10/15/2028 | 1,149 | 1,183,984 | ||||||||
| Cemig Geracao e Transmissao SA (Brazil)†(c) | 9.25% | 12/5/2024 | 1,164 | 1,243,152 | ||||||||
| Oklahoma Gas & Electric Co. | 4.15% | 4/1/2047 | 1,087 | 1,057,402 | ||||||||
| State Grid Overseas Investment 2016 Ltd.† | 3.50% | 5/4/2027 | 3,836 | 3,701,191 | ||||||||
| Total | 7,185,729 | |||||||||||
| Electric: Generation 1.35% | ||||||||||||
| Acwa Power Management & Investments One Ltd.(Sounth Africa)†(c) | 5.95% | 12/15/2039 | 1,386 | 1,306,762 | ||||||||
| Calpine Corp. | 5.75% | 1/15/2025 | 3,598 | 3,301,165 | ||||||||
| Clearway Energy Operating LLC† | 5.75% | 10/15/2025 | 1,344 | 1,288,560 | ||||||||
| NextEra Energy Operating Partners LP† | 4.50% | 9/15/2027 | 1,709 | 1,527,419 | ||||||||
| NRG Energy, Inc. | 5.75% | 1/15/2028 | 2,930 | 2,823,787 | ||||||||
| NSG Holdings LLC/NSG Holdings, Inc.† | 7.75% | 12/15/2025 | 1,638 | 1,736,570 | ||||||||
| Rio Energy SA/UGEN SA/UENSA SA (Argentina)†(c) | 6.875% | 2/1/2025 | 1,631 | 1,215,095 | ||||||||
| Talen Energy Supply LLC | 4.60% | 12/15/2021 | 17 | 15,385 | ||||||||
| Vistra Operations Co. LLC† | 5.50% | 9/1/2026 | 1,360 | 1,314,100 | ||||||||
| Total | 14,528,843 | |||||||||||
| Electric: Integrated 2.12% | ||||||||||||
| Aegea Finance Sarl (Brazil)†(c) | 5.75% | 10/10/2024 | 1,782 | 1,706,283 | ||||||||
| AES Corp. (The) | 4.50% | 3/15/2023 | 1,019 | 997,346 | ||||||||
| AES Corp. (The) | 5.125% | 9/1/2027 | 71 | 68,337 | ||||||||
| Arizona Public Service Co. | 2.95% | 9/15/2027 | 1,333 | 1,264,501 | ||||||||
| Ausgrid Finance Pty Ltd. (Australia)†(c) | 4.35% | 8/1/2028 | 1,217 | 1,216,077 | ||||||||
| Black Hills Corp. | 4.35% | 5/1/2033 | 1,155 | 1,161,538 | ||||||||
| El Paso Electric Co. | 5.00% | 12/1/2044 | 1,953 | 2,041,319 | ||||||||
| Entergy Arkansas LLC | 4.00% | 6/1/2028 | 1,589 | 1,624,335 | ||||||||
| Entergy Arkansas LLC | 4.95% | 12/15/2044 | 1,109 | 1,113,179 | ||||||||
| Entergy Louisiana LLC | 4.00% | 3/15/2033 | 958 | 971,425 | ||||||||
| Entergy Mississippi LLC | 2.85% | 6/1/2028 | 1,547 | 1,448,911 | ||||||||
| Indianapolis Power & Light Co.† | 4.05% | 5/1/2046 | 2,203 | 2,019,722 | ||||||||
| Louisville Gas & Electric Co. | 4.375% | 10/1/2045 | 1,017 | 1,020,846 | ||||||||
| Monongahela Power Co.† | 3.55% | 5/15/2027 | 1,188 | 1,166,718 | ||||||||
| Ohio Power Co. | 4.15% | 4/1/2048 | 2,395 | 2,372,837 | ||||||||
| 22 | See Notes to Financial Statements. |
Schedule of Investments (continued)
December 31, 2018
| Investments | Interest Rate | Maturity Date | Principal Amount (000) | Fair Value | ||||||||
| Electric: Integrated (continued) | ||||||||||||
| Puget Sound Energy, Inc. | 4.223% | 6/15/2048 | $ | 1,174 | $ | 1,178,748 | ||||||
| Puget Sound Energy, Inc. | 7.02% | 12/1/2027 | 314 | 386,359 | ||||||||
| Rochester Gas & Electric Corp.† | 3.10% | 6/1/2027 | 1,113 | 1,063,578 | ||||||||
| Total | 22,822,059 | |||||||||||
| Electronics 0.82% | ||||||||||||
| Nokia OYJ (Finland)(c) | 4.375% | 6/12/2027 | 1,208 | 1,126,460 | ||||||||
| NVIDIA Corp. | 3.20% | 9/16/2026 | 2,872 | 2,731,483 | ||||||||
| QUALCOMM, Inc. | 3.25% | 5/20/2027 | 1,537 | 1,437,906 | ||||||||
| Trimble, Inc. | 4.75% | 12/1/2024 | 2,232 | 2,253,056 | ||||||||
| Xilinx, Inc. | 2.95% | 6/1/2024 | 1,345 | 1,284,633 | ||||||||
| Total | 8,833,538 | |||||||||||
| Energy: Exploration & Production 3.02% | ||||||||||||
| Alta Mesa Holdings LP/Alta Mesa Finance Services Corp. | 7.875% | 12/15/2024 | 1,563 | 976,875 | ||||||||
| California Resources Corp.† | 8.00% | 12/15/2022 | 3,265 | 2,220,200 | ||||||||
| Centennial Resource Production LLC† | 5.375% | 1/15/2026 | 1,155 | 1,079,925 | ||||||||
| Chesapeake Energy Corp. | 7.00% | 10/1/2024 | 2,872 | 2,498,640 | ||||||||
| Chesapeake Energy Corp. | 7.50% | 10/1/2026 | 1,150 | 989,000 | ||||||||
| Denbury Resources, Inc.† | 7.50% | 2/15/2024 | 1,115 | 903,150 | ||||||||
| Eclipse Resources Corp. | 8.875% | 7/15/2023 | 1,187 | 1,023,788 | ||||||||
| Endeavor Energy Resources LP/EER Finance, Inc.† | 5.50% | 1/30/2026 | 1,083 | 1,114,136 | ||||||||
| EP Energy LLC/Everest Acquisition Finance, Inc.† | 8.00% | 11/29/2024 | 1,138 | 853,500 | ||||||||
| Gulfport Energy Corp. | 6.375% | 5/15/2025 | 586 | 520,808 | ||||||||
| Gulfport Energy Corp. | 6.375% | 1/15/2026 | 658 | 570,815 | ||||||||
| HighPoint Operating Corp. | 7.00% | 10/15/2022 | 1,042 | 953,430 | ||||||||
| Hilcorp Energy I LP/Hilcorp Finance Co.† | 5.00% | 12/1/2024 | 1,270 | 1,130,300 | ||||||||
| Hilcorp Energy I LP/Hilcorp Finance Co.† | 5.75% | 10/1/2025 | 707 | 632,765 | ||||||||
| Hilcorp Energy I LP/Hilcorp Finance Co.† | 6.25% | 11/1/2028 | 1,095 | 967,706 | ||||||||
| Hunt Oil Co. of Peru LLC Sucursal Del Peru (Peru)†(c) | 6.375% | 6/1/2028 | 2,300 | 2,338,295 | ||||||||
| Indigo Natural Resources LLC† | 6.875% | 2/15/2026 | 1,192 | 1,031,080 | ||||||||
| Jonah Energy LLC/Jonah Energy Finance Corp.† | 7.25% | 10/15/2025 | 1,853 | 1,204,450 | ||||||||
| MEG Energy Corp. (Canada)†(c) | 6.50% | 1/15/2025 | 1,210 | 1,232,687 | ||||||||
| MEG Energy Corp. (Canada)†(c) | 7.00% | 3/31/2024 | 2,073 | 1,990,080 | ||||||||
| Murphy Oil Corp. | 6.875% | 8/15/2024 | 517 | 515,463 | ||||||||
| Range Resources Corp. | 4.875% | 5/15/2025 | 1,193 | 984,225 | ||||||||
| SM Energy Co. | 6.625% | 1/15/2027 | 710 | 635,450 | ||||||||
| SM Energy Co. | 6.75% | 9/15/2026 | 1,121 | 1,008,900 | ||||||||
| Southwestern Energy Co. | 7.75% | 10/1/2027 | 1,089 | 1,039,995 | ||||||||
| See Notes to Financial Statements. | 23 |
Schedule of Investments (continued)
December 31, 2018
| Investments | Interest Rate | Maturity Date | Principal Amount (000) | Fair Value | ||||||||
| Energy: Exploration & Production (continued) | ||||||||||||
| RC Energy, Inc. | 6.25% | 12/1/2025 | $ | 1,833 | $ | 1,530,555 | ||||||
| Texaco Capital, Inc. | 8.625% | 11/15/2031 | 1,223 | 1,799,056 | ||||||||
| WildHorse Resource Development Corp. | 6.875% | 2/1/2025 | 777 | 738,150 | ||||||||
| Total | 32,483,424 | |||||||||||
| Environmental 0.27% | ||||||||||||
| Darling Global Finance BV†(a) | 3.625% | 5/15/2026 | EUR | 674 | 766,810 | |||||||
| Paprec Holding SA(a) | 4.00% | 3/31/2025 | EUR | 1,095 | 1,066,720 | |||||||
| Waste Pro USA, Inc.† | 5.50% | 2/15/2026 | $ | 1,143 | 1,057,275 | |||||||
| Total | 2,890,805 | |||||||||||
| Food & Drug Retailers 0.84% | ||||||||||||
| Albertsons Cos LLC/Safeway, Inc./Albertsons LP/Albertson’s LLC | 5.75% | 3/15/2025 | 2,773 | 2,440,240 | ||||||||
| Albertsons Cos LLC/Safeway, Inc./Albertsons LP/Albertson’s LLC | 6.625% | 6/15/2024 | 2,029 | 1,892,043 | ||||||||
| CVS Health Corp. | 4.30% | 3/25/2028 | 2,076 | 2,036,621 | ||||||||
| Ingles Markets, Inc. | 5.75% | 6/15/2023 | 1,690 | 1,677,325 | ||||||||
| Kroger Co. (The) | 2.65% | 10/15/2026 | 691 | 616,132 | ||||||||
| Kroger Co. (The) | 4.65% | 1/15/2048 | 385 | 355,057 | ||||||||
| Total | 9,017,418 | |||||||||||
| Food: Wholesale 1.62% | ||||||||||||
| Arcor SAIC (Argentina)†(c) | 6.00% | 7/6/2023 | 1,863 | 1,723,089 | ||||||||
| B&G Foods, Inc. | 5.25% | 4/1/2025 | 1,260 | 1,176,525 | ||||||||
| Campbell Soup Co. | 4.15% | 3/15/2028 | 2,009 | 1,874,964 | ||||||||
| Chobani LLC/Chobani Finance Corp., Inc.† | 7.50% | 4/15/2025 | 1,312 | 1,039,760 | ||||||||
| Conagra Brands, Inc. | 4.60% | 11/1/2025 | 1,444 | 1,451,282 | ||||||||
| FAGE International SA/FAGE USA Dairy Industry,Inc. (Luxembourg)†(c) | 5.625% | 8/15/2026 | 1,241 | 1,065,709 | ||||||||
| JBS USA LUX SA/JBS USA Finance, Inc.† | 5.875% | 7/15/2024 | 1,165 | 1,146,069 | ||||||||
| JBS USA LUX SA/JBS USA Finance, Inc.† | 6.75% | 2/15/2028 | 1,179 | 1,153,946 | ||||||||
| Kernel Holding SA (Ukraine)†(c) | 8.75% | 1/31/2022 | 907 | 872,160 | ||||||||
| Lamb Weston Holdings, Inc.† | 4.625% | 11/1/2024 | 1,299 | 1,266,525 | ||||||||
| McCormick & Co., Inc. | 4.20% | 8/15/2047 | 1,893 | 1,777,466 | ||||||||
| MHP Lux SA (Luxembourg)†(c) | 6.95% | 4/3/2026 | 2,024 | 1,749,950 | ||||||||
| Nvent Finance Sarl (Luxembourg)(c) | 4.55% | 4/15/2028 | 1,190 | 1,168,783 | ||||||||
| Total | 17,466,228 | |||||||||||
| Foreign Sovereign 0.10% | ||||||||||||
| CMA CGM SA†(a) | 5.25% | 1/15/2025 | EUR | 1,151 | 1,106,464 | |||||||
| 24 | See Notes to Financial Statements. |
Schedule of Investments (continued)
December 31, 2018
| Investments | Interest Rate | Maturity Date | Principal Amount (000) | Fair Value | ||||||||
| Forestry/Paper 0.60% | ||||||||||||
| Norbord, Inc. (Canada)†(c) | 6.25% | 4/15/2023 | $ | 1,991 | $ | 2,001,672 | ||||||
| Rayonier AM Products, Inc.† | 5.50% | 6/1/2024 | 1,159 | 1,025,715 | ||||||||
| Suzano Austria GmbH (Brazil)†(c) | 5.75% | 7/14/2026 | 1,275 | 1,303,688 | ||||||||
| Suzano Austria GmbH (Brazil)†(c) | 6.00% | 1/15/2029 | 771 | 788,733 | ||||||||
| West Fraser Timber Co. Ltd. (Canada)†(c) | 4.35% | 10/15/2024 | 1,345 | 1,334,305 | ||||||||
| Total | 6,454,113 | |||||||||||
| Gaming 1.12% | ||||||||||||
| Boyd Gaming Corp. | 6.00% | 8/15/2026 | 1,127 | 1,057,971 | ||||||||
| Eldorado Resorts, Inc.† | 6.00% | 9/15/2026 | 1,101 | 1,043,198 | ||||||||
| Eldorado Resorts, Inc. | 6.00% | 4/1/2025 | 552 | 535,241 | ||||||||
| Everi Payments, Inc.† | 7.50% | 12/15/2025 | 1,093 | 1,036,984 | ||||||||
| GLP Capital LP/GLP Financing II, Inc. | 5.75% | 6/1/2028 | 1,666 | 1,688,908 | ||||||||
| Jacobs Entertainment, Inc.† | 7.875% | 2/1/2024 | 1,821 | 1,880,182 | ||||||||
| Mohegan Gaming & Entertainment† | 7.875% | 10/15/2024 | 1,181 | 1,108,664 | ||||||||
| Penn National Gaming, Inc.† | 5.625% | 1/15/2027 | 1,770 | 1,588,575 | ||||||||
| Stars Group Holdings BV/Stars Group USCo-Borrower LLC (Netherlands)†(c) | 7.00% | 7/15/2026 | 1,147 | 1,118,325 | ||||||||
| Station Casinos LLC† | 5.00% | 10/1/2025 | 1,110 | 1,007,325 | ||||||||
| Total | 12,065,373 | |||||||||||
| Gas Distribution 2.17% | ||||||||||||
| Cheniere Corpus Christi Holdings LLC | 5.125% | 6/30/2027 | 2,154 | 2,041,561 | ||||||||
| Cheniere Corpus Christi Holdings LLC | 5.875% | 3/31/2025 | 1,059 | 1,056,353 | ||||||||
| Dominion Energy Gas Holdings LLC | 3.60% | 12/15/2024 | 1,175 | 1,168,607 | ||||||||
| Florida Gas Transmission Co. LLC† | 4.35% | 7/15/2025 | 1,145 | 1,170,978 | ||||||||
| IFM US Colonial Pipeline 2 LLC† | 6.45% | 5/1/2021 | 1,400 | 1,462,435 | ||||||||
| LBC Tank Terminals Holding Netherlands BV(Belgium)†(c) | 6.875% | 5/15/2023 | 1,208 | 1,087,200 | ||||||||
| NGPL PipeCo LLC† | 4.875% | 8/15/2027 | 2,762 | 2,613,542 | ||||||||
| Northern Natural Gas Co.† | 4.30% | 1/15/2049 | 1,811 | 1,771,991 | ||||||||
| ONE Gas, Inc. | 4.50% | 11/1/2048 | 1,149 | 1,187,359 | ||||||||
| Plains All American Pipeline LP | 6.125% | #(j) | – | (i) | 1,193 | 1,005,103 | ||||||
| Rockies Express Pipeline LLC† | 6.875% | 4/15/2040 | 1,942 | 2,039,100 | ||||||||
| Sabal Trail Transmission LLC† | 4.246% | 5/1/2028 | 1,775 | 1,752,178 | ||||||||
| Southern Star Central Corp.† | 5.125% | 7/15/2022 | 1,145 | 1,104,925 | ||||||||
| Targa Resources Partners LP/Targa Resources Partners Finance Corp. | 4.25% | 11/15/2023 | 748 | 694,705 | ||||||||
| See Notes to Financial Statements. | 25 |
Schedule of Investments (continued)
December 31, 2018
| Investments | Interest Rate | Maturity Date | Principal Amount (000) | Fair Value | ||||||||
| Gas Distribution (continued) | ||||||||||||
| Targa Resources Partners LP/Targa ResourcesPartners Finance Corp.† | 5.875% | 4/15/2026 | $ | 1,131 | $ | 1,105,553 | ||||||
| Transportadora de Gas Internacional SA ESP(Colombia)†(c) | 5.55% | 11/1/2028 | 2,056 | 2,084,270 | ||||||||
| Total | 23,345,860 | |||||||||||
| Health Facilities 3.56% | ||||||||||||
| AHP Health Partners, Inc.† | 9.75% | 7/15/2026 | 1,193 | 1,213,877 | ||||||||
| Ascension Health | 3.945% | 11/15/2046 | 1,017 | 983,274 | ||||||||
| CHS/Community Health Systems, Inc. | 8.00% | 11/15/2019 | 2,452 | 2,341,660 | ||||||||
| Dignity Health | 3.812% | 11/1/2024 | 675 | 680,090 | ||||||||
| HCA, Inc. | 4.75% | 5/1/2023 | 496 | 489,800 | ||||||||
| HCA, Inc. | 5.25% | 4/15/2025 | 1,612 | 1,607,970 | ||||||||
| HCA, Inc. | 5.25% | 6/15/2026 | 763 | 759,185 | ||||||||
| HCA, Inc. | 5.375% | 2/1/2025 | 536 | 523,940 | ||||||||
| HCA, Inc. | 5.50% | 6/15/2047 | 4,319 | 4,103,050 | ||||||||
| HCA, Inc. | 5.875% | 3/15/2022 | 1,715 | 1,762,162 | ||||||||
| HCA, Inc. | 5.875% | 2/15/2026 | 151 | 150,623 | ||||||||
| HCA, Inc. | 7.05% | 12/1/2027 | 390 | 412,425 | ||||||||
| HCA, Inc. | 7.50% | 2/15/2022 | 1,352 | 1,439,880 | ||||||||
| HCA, Inc. | 7.58% | 9/15/2025 | 552 | 587,880 | ||||||||
| HCA, Inc. | 7.69% | 6/15/2025 | 1,240 | 1,323,700 | ||||||||
| HCA, Inc. | 8.36% | 4/15/2024 | 261 | 288,405 | ||||||||
| Memorial Sloan-Kettering Cancer Center | 4.20% | 7/1/2055 | 1,478 | 1,490,577 | ||||||||
| MPT Operating Partnership LP/MPT Finance Corp. | 5.00% | 10/15/2027 | 1,192 | 1,092,915 | ||||||||
| New York & Presbyterian Hospital (The) | 4.063% | 8/1/2056 | 1,770 | 1,716,581 | ||||||||
| NYU Langone Hospitals | 4.368% | 7/1/2047 | 1,191 | 1,188,854 | ||||||||
| Rede D’or Finance Sarl (Luxembourg)†(c) | 4.95% | 1/17/2028 | 2,506 | 2,220,942 | ||||||||
| RegionalCare Hospital Partners Holdings, Inc.† | 8.25% | 5/1/2023 | 1,034 | 1,048,218 | ||||||||
| RegionalCare Hospital Partners Holdings, Inc./LifePoint Health, Inc.† | 9.75% | 12/1/2026 | 2,223 | 2,111,850 | ||||||||
| Tenet Healthcare Corp. | 4.625% | 7/15/2024 | 646 | 603,203 | ||||||||
| Tenet Healthcare Corp. | 5.125% | 5/1/2025 | 5,730 | 5,357,550 | ||||||||
| Tenet Healthcare Corp. | 6.75% | 6/15/2023 | 2,987 | 2,815,247 | ||||||||
| Total | 38,313,858 | |||||||||||
| Health Services 1.03% | ||||||||||||
| DaVita, Inc. | 5.00% | 5/1/2025 | 1,677 | 1,528,167 | ||||||||
| DaVita, Inc. | 5.125% | 7/15/2024 | 1,000 | 940,000 | ||||||||
| 26 | See Notes to Financial Statements. |
Schedule of Investments (continued)
December 31, 2018
| Investments | Interest Rate | Maturity Date | Principal Amount (000) | Fair Value | ||||||||
| Health Services (continued) | ||||||||||||
| Jaguar Holding Co. II/Pharmaceutical ProductDevelopment LLC† | 6.375% | 8/1/2023 | $ | 1,136 | $ | 1,088,390 | ||||||
| Montefiore Obligated Group | 5.246% | 11/1/2048 | 1,553 | 1,507,583 | ||||||||
| MPH Acquisition Holdings LLC† | 7.125% | 6/1/2024 | 1,034 | 966,790 | ||||||||
| NVA Holdings, Inc.† | 6.875% | 4/1/2026 | 1,125 | 1,012,500 | ||||||||
| Syneos Health, Inc./inVentiv Health, Inc./inVentivHealth Clinical, Inc.† | 7.50% | 10/1/2024 | 596 | 622,820 | ||||||||
| Verscend Escrow Corp.† | 9.75% | 8/15/2026 | 1,692 | 1,596,825 | ||||||||
| West Street Merger Sub, Inc.† | 6.375% | 9/1/2025 | 2,006 | 1,785,340 | ||||||||
| Total | 11,048,415 | |||||||||||
| Hotels 0.54% | ||||||||||||
| ESH Hospitality, Inc.† | 5.25% | 5/1/2025 | 1,168 | 1,089,160 | ||||||||
| Hilton Domestic Operating Co., Inc. | 4.25% | 9/1/2024 | 1,254 | 1,188,165 | ||||||||
| Hilton Domestic Operating Co., Inc.† | 5.125% | 5/1/2026 | 1,983 | 1,908,637 | ||||||||
| Wyndham Destinations, Inc. | 5.75% | 4/1/2027 | 712 | 655,930 | ||||||||
| Wyndham Destinations, Inc. | 6.35% | 10/1/2025 | 998 | 973,050 | ||||||||
| Total | 5,814,942 | |||||||||||
| Insurance Brokerage 0.50% | ||||||||||||
| Acrisure LLC/Acrisure Finance, Inc.† | 7.00% | 11/15/2025 | 1,930 | 1,654,975 | ||||||||
| Alliant Holdings Intermediate LLC/AlliantHoldings Co-Issuer† | 8.25% | 8/1/2023 | 1,639 | 1,633,870 | ||||||||
| Farmers Insurance Exchange† | 4.747% (3 Mo. LIBOR + 3.23% | )# | 11/1/2057 | 1,230 | 1,091,194 | |||||||
| HUB International Ltd.† | 7.00% | 5/1/2026 | 1,133 | 1,031,030 | ||||||||
| Total | 5,411,069 | |||||||||||
| Integrated Energy 0.68% | ||||||||||||
| Cheniere Energy Partners LP | 5.25% | 10/1/2025 | 1,149 | 1,075,751 | ||||||||
| Cheniere Energy Partners LP† | 5.625% | 10/1/2026 | 1,539 | 1,442,813 | ||||||||
| Exxon Mobil Corp. | 3.043% | 3/1/2026 | 1,101 | 1,075,662 | ||||||||
| Rio Oil Finance Trust Series 2018-1 (Brazil)†(c) | 8.20% | 4/6/2028 | 1,121 | 1,177,050 | ||||||||
| Shell International Finance BV (Netherlands)(c) | 6.375% | 12/15/2038 | 1,973 | 2,507,779 | ||||||||
| Total | 7,279,055 | |||||||||||
| Investments & Miscellaneous Financial Services 1.03% | ||||||||||||
| BrightSphere Investment Group plc(United Kingdom)(c) | 4.80% | 7/27/2026 | 1,293 | 1,247,665 | ||||||||
| MSCI, Inc.† | 5.375% | 5/15/2027 | 201 | 197,231 | ||||||||
| MSCI, Inc.† | 5.75% | 8/15/2025 | 1,434 | 1,451,925 | ||||||||
| See Notes to Financial Statements. | 27 |
Schedule of Investments (continued)
December 31, 2018
| Investments | Interest Rate | Maturity Date | Principal Amount (000) | Fair Value | ||||||||
| Investments & Miscellaneous Financial Services (continued) | ||||||||||||
| Neuberger Berman Group LLC/NeubergerBerman Finance Corp.† | 4.50% | 3/15/2027 | $ | 1,263 | $ | 1,264,696 | ||||||
| Neuberger Berman Group LLC/NeubergerBerman Finance Corp.† | 4.875% | 4/15/2045 | 3,597 | 3,221,763 | ||||||||
| Power Finance Corp. Ltd. (India)†(c) | 6.15% | 12/6/2028 | 956 | 940,313 | ||||||||
| S&P Global, Inc. | 6.55% | 11/15/2037 | 1,391 | 1,738,181 | ||||||||
| VFH Parent LLC/Orchestra Co-Issuer, Inc.† | 6.75% | 6/15/2022 | 1,087 | 1,057,586 | ||||||||
| Total | 11,119,360 | |||||||||||
| Life Insurance 0.47% | ||||||||||||
| Northwestern Mutual Life Insurance Co. (The)† | 3.85% | 9/30/2047 | 2,206 | 2,005,611 | ||||||||
| Nuveen Finance LLC† | 4.125% | 11/1/2024 | 703 | 716,939 | ||||||||
| Teachers Insurance & Annuity Associationof America† | 4.27% | 5/15/2047 | 889 | 854,154 | ||||||||
| Teachers Insurance & Annuity Associationof America† | 4.90% | 9/15/2044 | 1,424 | 1,481,780 | ||||||||
| Total | 5,058,484 | |||||||||||
| Machinery 0.24% | ||||||||||||
| Roper Technologies, Inc. | 4.20% | 9/15/2028 | 1,665 | 1,652,687 | ||||||||
| Xylem, Inc. | 3.25% | 11/1/2026 | 1,004 | 956,198 | ||||||||
| Total | 2,608,885 | |||||||||||
| Managed Care 1.27% | ||||||||||||
| Anthem, Inc. | 3.65% | 12/1/2027 | 1,004 | 961,611 | ||||||||
| Centene Corp. | 4.75% | 1/15/2025 | 2,336 | 2,236,720 | ||||||||
| Centene Corp.† | 5.375% | 6/1/2026 | 2,615 | 2,549,625 | ||||||||
| Centene Corp. | 6.125% | 2/15/2024 | 2,044 | 2,097,655 | ||||||||
| Kaiser Foundation Hospitals | 4.15% | 5/1/2047 | 1,648 | 1,632,617 | ||||||||
| Polaris Intermediate Corp. PIK 8.50%† | 8.50% | 12/1/2022 | 1,603 | 1,468,140 | ||||||||
| WellCare Health Plans, Inc. | 5.25% | 4/1/2025 | 2,829 | 2,733,521 | ||||||||
| Total | 13,679,889 | |||||||||||
| Media: Content 1.32% | ||||||||||||
| Activision Blizzard, Inc. | 4.50% | 6/15/2047 | 1,670 | 1,505,891 | ||||||||
| AMC Networks, Inc. | 4.75% | 8/1/2025 | 2,332 | 2,122,120 | ||||||||
| Gray Television, Inc.† | 5.125% | 10/15/2024 | 572 | 528,814 | ||||||||
| Gray Television, Inc.† | 5.875% | 7/15/2026 | 938 | 876,842 | ||||||||
| Netflix, Inc.(a) | 3.625% | 5/15/2027 | EUR | 2,498 | 2,780,084 | |||||||
| Netflix, Inc.† | 4.625% | 5/15/2029 | $ | 959 | 1,081,534 | |||||||
| Netflix, Inc. | 4.875% | 4/15/2028 | 553 | 505,995 | ||||||||
| 28 | See Notes to Financial Statements. |
Schedule of Investments (continued)
December 31, 2018
| Investments | Interest Rate | Maturity Date | Principal Amount (000) | Fair Value | ||||||||
| Media: Content (continued) | �� | |||||||||||
| Netflix, Inc. | 5.875% | 2/15/2025 | $ | 1,105 | $ | 1,117,431 | ||||||
| Sirius XM Radio, Inc.† | 5.00% | 8/1/2027 | 1,192 | 1,093,660 | ||||||||
| Sirius XM Radio, Inc.† | 6.00% | 7/15/2024 | 1,075 | 1,081,719 | ||||||||
| Univision Communications, Inc.† | 5.125% | 5/15/2023 | 968 | 871,216 | ||||||||
| Univision Communications, Inc.† | 5.125% | 2/15/2025 | 692 | 608,960 | ||||||||
| Total | 14,174,266 | |||||||||||
| Media: Diversified 0.21% | ||||||||||||
| 21st Century Fox America, Inc. | 7.75% | 12/1/2045 | 1,525 | 2,249,498 | ||||||||
| Medical Products 0.68% | ||||||||||||
| Boston Scientific Corp. | 7.00% | 11/15/2035 | 1,473 | 1,848,605 | ||||||||
| Edwards Lifesciences Corp. | 4.30% | 6/15/2028 | 2,411 | 2,443,654 | ||||||||
| Ortho-Clinical Diagnostics, Inc./Ortho-ClinicalDiagnostics SA† | 6.625% | 5/15/2022 | 2,325 | 2,104,125 | ||||||||
| Teleflex, Inc. | 4.625% | 11/15/2027 | 641 | 596,931 | ||||||||
| Teleflex, Inc. | 4.875% | 6/1/2026 | 383 | 367,680 | ||||||||
| Total | 7,360,995 | |||||||||||
| Metals/Mining (Excluding Steel) 2.02% | ||||||||||||
| Alcoa Nederland Holding BV (Netherlands)†(c) | 6.75% | 9/30/2024 | 1,227 | 1,251,540 | ||||||||
| Baffinland Iron Mines Corp. (Canada)†(c) | 8.75% | 7/15/2026 | 1,143 | 1,029,923 | ||||||||
| Cleveland-Cliffs, Inc. | 5.75% | 3/1/2025 | 2,912 | 2,628,080 | ||||||||
| Eterna Capital Pte Ltd. PIK 8.00% (Singapore)(c) | 8.00% | 12/11/2022 | 2,307 | 2,023,174 | ||||||||
| Freeport-McMoRan, Inc. | 3.875% | 3/15/2023 | 6,205 | 5,755,137 | ||||||||
| Grinding Media, Inc./Moly-Cop AltaSteel Ltd.† | 7.375% | 12/15/2023 | 686 | 667,135 | ||||||||
| Imperial Metals Corp. (Canada)†(c) | 7.00% | 3/15/2019 | 1,037 | 699,975 | ||||||||
| Mirabela Nickel Ltd. (Australia)(c) | 1.00% | 9/10/2044 | 15 | 2 | (l) | |||||||
| Nexa Resources SA (Brazil)†(c) | 5.375% | 5/4/2027 | 1,233 | 1,197,551 | ||||||||
| Novelis Corp.† | 5.875% | 9/30/2026 | 1,000 | 887,500 | ||||||||
| Novelis Corp.† | 6.25% | 8/15/2024 | 974 | 917,995 | ||||||||
| Peabody Energy Corp.† | 6.375% | 3/31/2025 | 2,210 | 2,060,825 | ||||||||
| Rain CII Carbon LLC/CII Carbon Corp.† | 7.25% | 4/1/2025 | 1,905 | 1,733,550 | ||||||||
| Warrior Met Coal, Inc.† | 8.00% | 11/1/2024 | 941 | 936,295 | ||||||||
| Total | 21,788,682 | |||||||||||
| Monoline Insurance 0.11% | ||||||||||||
| MGIC Investment Corp. | 5.75% | 8/15/2023 | 1,204 | 1,202,495 | ||||||||
| Non-Electric Utilities 0.12% | ||||||||||||
| Brooklyn Union Gas Co. (The)† | 3.407% | 3/10/2026 | 1,368 | 1,342,066 | ||||||||
| See Notes to Financial Statements. | 29 |
Schedule of Investments (continued)
December 31, 2018
| Investments | Interest Rate | Maturity Date | Principal Amount (000) | Fair Value | ||||||||
| Oil Field Equipment & Services 1.42% | ||||||||||||
| Abu Dhabi Crude Oil Pipeline LLC(United Arab Emirates)†(c) | 4.60% | 11/2/2047 | $ | 2,529 | $ | 2,475,879 | ||||||
| CSI Compressco LP/CSI Compressco Finance, Inc.† | 7.50% | 4/1/2025 | 1,407 | 1,315,545 | ||||||||
| Ensco plc (United Kingdom)(c) | 4.50% | 10/1/2024 | 1,587 | 1,039,485 | ||||||||
| Ensco plc (United Kingdom)(c) | 5.20% | 3/15/2025 | 2,858 | 1,914,860 | ||||||||
| Forum Energy Technologies, Inc. | 6.25% | 10/1/2021 | 1,011 | 894,735 | ||||||||
| Noble Holding International Ltd.† | 7.875% | 2/1/2026 | 2,169 | 1,857,206 | ||||||||
| Pioneer Energy Services Corp. | 6.125% | 3/15/2022 | 637 | 391,755 | ||||||||
| Precision Drilling Corp. (Canada)(c) | 5.25% | 11/15/2024 | 1,236 | 1,032,060 | ||||||||
| Rowan Cos., Inc. | 4.75% | 1/15/2024 | 1,297 | 985,720 | ||||||||
| Transocean Phoenix 2 Ltd.† | 7.75% | 10/15/2024 | 818 | 818,400 | ||||||||
| Transocean Pontus Ltd.† | 6.125% | 8/1/2025 | 583 | 565,510 | ||||||||
| Transocean Proteus Ltd.† | 6.25% | 12/1/2024 | 799 | 769,230 | ||||||||
| Transocean, Inc.† | 7.50% | 1/15/2026 | 1,144 | 1,009,580 | ||||||||
| Unit Corp. | 6.625% | 5/15/2021 | 276 | 252,540 | ||||||||
| Total | 15,322,505 | |||||||||||
| Oil Refining & Marketing 0.31% | ||||||||||||
| Citgo Holding, Inc.† | 10.75% | 2/15/2020 | 1,985 | 2,029,662 | ||||||||
| Tupras Turkiye Petrol Rafinerileri AS (Turkey)†(c) | 4.50% | 10/18/2024 | 1,471 | 1,291,038 | ||||||||
| Total | 3,320,700 | |||||||||||
| Packaging 0.33% | ||||||||||||
| Crown Cork & Seal Co., Inc. | 7.375% | 12/15/2026 | 1,295 | 1,385,650 | ||||||||
| Pactiv LLC | 7.95% | 12/15/2025 | 1,152 | 1,128,960 | ||||||||
| Sealed Air Corp.† | 6.875% | 7/15/2033 | 1,060 | 1,062,650 | ||||||||
| Total | 3,577,260 | |||||||||||
| Personal & Household Products 0.85% | ||||||||||||
| Church & Dwight Co., Inc. | 3.15% | 8/1/2027 | 1,908 | 1,799,106 | ||||||||
| Church & Dwight Co., Inc. | 3.95% | 8/1/2047 | 465 | 425,343 | ||||||||
| Energizer Gamma Acquisition, Inc.† | 6.375% | 7/15/2026 | 1,072 | 986,240 | ||||||||
| Gibson Brands, Inc.†(k) | 8.875% | 8/1/2018 | 1,725 | 1,440,375 | ||||||||
| Mattel, Inc. | 2.35% | 8/15/2021 | 2,385 | 2,122,650 | ||||||||
| Mattel, Inc.† | 6.75% | 12/31/2025 | 1,176 | 1,052,155 | ||||||||
| SC Johnson & Son, Inc.† | 4.75% | 10/15/2046 | 1,177 | 1,280,052 | ||||||||
| Total | 9,105,921 | |||||||||||
| Pharmaceuticals 1.61% | ||||||||||||
| Bausch Health Cos., Inc.†(a) | 4.50% | 5/15/2023 | EUR | 2,705 | 2,938,355 | |||||||
| Bausch Health Cos., Inc.† | 5.50% | 3/1/2023 | $ | 1,975 | 1,807,994 | |||||||
| Bausch Health Cos., Inc.† | 5.625% | 12/1/2021 | 3,395 | 3,346,197 | ||||||||
| 30 | See Notes to Financial Statements. |
Schedule of Investments (continued)
December 31, 2018
| Investments | Interest Rate | Maturity Date | Principal Amount (000) | Fair Value | ||||||||
| Pharmaceuticals (continued) | ||||||||||||
| Bausch Health Cos., Inc.† | 5.875% | 5/15/2023 | $ | 1,811 | $ | 1,681,966 | ||||||
| Bausch Health Cos., Inc.† | 7.00% | 3/15/2024 | 1,332 | 1,348,650 | ||||||||
| Elanco Animal Health, Inc.† | 4.90% | 8/28/2028 | 1,154 | 1,177,173 | ||||||||
| Teva Pharmaceutical Finance Netherlands II BV(a) | 1.875% | 3/31/2027 | EUR | 1,123 | 1,032,256 | |||||||
| Teva Pharmaceutical Finance Netherlands III BV(Netherlands)(c) | 3.15% | 10/1/2026 | $ | 1,714 | 1,310,966 | |||||||
| Valeant Pharmaceuticals International† | 8.50% | 1/31/2027 | 1,621 | 1,576,423 | ||||||||
| Zoetis, Inc. | 3.90% | 8/20/2028 | 1,159 | 1,138,449 | ||||||||
| Total | 17,358,429 | |||||||||||
| Printing & Publishing 0.16% | ||||||||||||
| Meredith Corp.† | 6.875% | 2/1/2026 | 1,710 | 1,675,800 | ||||||||
| Property & Casualty 0.22% | ||||||||||||
| Allstate Corp. (The) | 3.28% | 12/15/2026 | 1,244 | 1,221,964 | ||||||||
| Arch Capital Finance LLC | 4.011% | 12/15/2026 | 1,172 | 1,172,900 | ||||||||
| Total | 2,394,864 | |||||||||||
| Rail 0.48% | ||||||||||||
| Central Japan Railway Co. (Japan)†(c) | 4.25% | 11/24/2045 | 1,524 | 1,598,385 | ||||||||
| China Railway Xunjie Co. Ltd. (China)(c) | 3.25% | 7/28/2026 | 392 | 366,801 | ||||||||
| Rumo Luxembourg Sarl (Luxembourg)†(c) | 5.875% | 1/18/2025 | 1,799 | 1,725,934 | ||||||||
| Rumo Luxembourg Sarl (Luxembourg)†(c) | 7.375% | 2/9/2024 | 1,459 | 1,524,509 | ||||||||
| Total | 5,215,629 | |||||||||||
| Real Estate Investment Trusts 0.82% | ||||||||||||
| Alexandria Real Estate Equities, Inc. | 3.95% | 1/15/2028 | 1,194 | 1,156,074 | ||||||||
| EPR Properties | 4.50% | 6/1/2027 | 1,152 | 1,112,844 | ||||||||
| EPR Properties | 4.75% | 12/15/2026 | 768 | 761,298 | ||||||||
| Goodman US Finance Four LLC† | 4.50% | 10/15/2037 | 1,137 | 1,087,098 | ||||||||
| Goodman US Finance Three LLC† | 3.70% | 3/15/2028 | 769 | 733,729 | ||||||||
| National Retail Properties, Inc. | 4.30% | 10/15/2028 | 1,724 | 1,736,919 | ||||||||
| Prologis LP | 3.875% | 9/15/2028 | 781 | 797,151 | ||||||||
| VEREIT Operating Partnership LP | 4.875% | 6/1/2026 | 1,483 | 1,485,289 | ||||||||
| Total | 8,870,402 | |||||||||||
| Real Estate Management & Development 0.19% | ||||||||||||
| Ontario Teachers’ Cadillac Fairview Properties Trust(Canada)†(c) | 3.875% | 3/20/2027 | 2,039 | 2,032,605 | ||||||||
| Recreation & Travel 0.57% | ||||||||||||
| eDreams ODIGEO SA†(a) | 5.50% | 9/1/2023 | EUR | 987 | 1,062,766 | |||||||
| Royal Caribbean Cruises Ltd. | 7.50% | 10/15/2027 | $ | 1,450 | 1,726,674 | |||||||
| See Notes to Financial Statements. | 31 |
Schedule of Investments (continued)
December 31, 2018
| Principal | ||||||||||||
| Interest | Maturity | Amount | Fair | |||||||||
| Investments | Rate | Date | (000) | Value | ||||||||
| Recreation & Travel (continued) | ||||||||||||
| Silversea Cruise Finance Ltd.† | 7.25% | 2/1/2025 | $ | 1,587 | $ | 1,685,711 | ||||||
| Six Flags Entertainment Corp.† | 4.875% | 7/31/2024 | 1,182 | 1,116,990 | ||||||||
| Six Flags Entertainment Corp.† | 5.50% | 4/15/2027 | 593 | 560,385 | ||||||||
| Total | 6,152,526 | |||||||||||
| Reinsurance 0.48% | ||||||||||||
| AXIS Specialty Finance plc (United Kingdom)(c) | 5.15% | 4/1/2045 | 1,345 | 1,296,112 | ||||||||
| Berkshire Hathaway, Inc. | 2.75% | 3/15/2023 | 907 | 890,852 | ||||||||
| Berkshire Hathaway, Inc. | 3.125% | 3/15/2026 | 907 | 880,381 | ||||||||
| Transatlantic Holdings, Inc. | 8.00% | 11/30/2039 | 1,584 | 2,120,441 | ||||||||
| Total | 5,187,786 | |||||||||||
| Restaurants 0.51% | ||||||||||||
| Darden Restaurants, Inc. | 3.85% | 5/1/2027 | 384 | 370,262 | ||||||||
| Darden Restaurants, Inc. | 4.55% | 2/15/2048 | 691 | 638,383 | ||||||||
| IRB Holding Corp.† | 6.75% | 2/15/2026 | 1,177 | 1,032,818 | ||||||||
| KFC Holding Co./Pizza Hut Holdings LLC/ | ||||||||||||
| Taco Bell of America LLC† | 4.75% | 6/1/2027 | 2,083 | 1,942,397 | ||||||||
| KFC Holding Co./Pizza Hut Holdings LLC/ | ||||||||||||
| Taco Bell of America LLC† | 5.00% | 6/1/2024 | 1,610 | 1,557,675 | ||||||||
| Total | 5,541,535 | |||||||||||
| Software/Services 2.33% | ||||||||||||
| Alibaba Group Holding Ltd. (China)(c) | 3.125% | 11/28/2021 | 1,150 | 1,138,355 | ||||||||
| Autodesk, Inc. | 3.50% | 6/15/2027 | 2,446 | 2,279,956 | ||||||||
| Banff Merger Sub, Inc.† | 9.75% | 9/1/2026 | 1,100 | 1,009,250 | ||||||||
| Citrix Systems, Inc. | 4.50% | 12/1/2027 | 1,222 | 1,170,770 | ||||||||
| First Data Corp.† | 5.75% | 1/15/2024 | 2,563 | 2,512,611 | ||||||||
| j2 Cloud Services LLC/j2 Global Co-Obligor, Inc.† | 6.00% | 7/15/2025 | 565 | 554,406 | ||||||||
| Match Group, Inc.† | 5.00% | 12/15/2027 | 2,419 | 2,231,528 | ||||||||
| Microsoft Corp. | 2.40% | 8/8/2026 | 792 | 741,919 | ||||||||
| Microsoft Corp. | 3.125% | 11/3/2025 | 2,817 | 2,790,024 | ||||||||
| Microsoft Corp. | 4.50% | 2/6/2057 | 1,921 | 2,055,887 | ||||||||
| salesforce.com, Inc. | 3.70% | 4/11/2028 | 1,580 | 1,591,115 | ||||||||
| Tencent Holdings Ltd. (China)†(c) | 3.595% | 1/19/2028 | 1,766 | 1,662,143 | ||||||||
| Tencent Holdings Ltd. (China)†(c) | 3.925% | 1/19/2038 | 1,995 | 1,783,015 | ||||||||
| VeriSign, Inc. | 4.75% | 7/15/2027 | 750 | 706,163 | ||||||||
| VeriSign, Inc. | 5.25% | 4/1/2025 | 1,593 | 1,583,044 | ||||||||
| Visa, Inc. | 3.15% | 12/14/2025 | 1,289 | 1,268,476 | ||||||||
| Total | 25,078,662 | |||||||||||
| 32 | See Notes to Financial Statements. |
Schedule of Investments (continued)
December 31, 2018
| Principal | ||||||||||||
| Interest | Maturity | Amount | Fair | |||||||||
| Investments | Rate | Date | (000) | Value | ||||||||
| Specialty Retail 1.38% | ||||||||||||
| Asbury Automotive Group, Inc. | 6.00% | 12/15/2024 | $ | 1,102 | $ | 1,060,675 | ||||||
| Best Buy Co., Inc. | 4.45% | 10/1/2028 | 2,299 | 2,198,434 | ||||||||
| Claire’s Stores, Inc. | 14.00% | 3/15/2039 | 146 | 234,213 | ||||||||
| Guitar Center Escrow Issuer, Inc.† | 9.50% | 10/15/2021 | 1,192 | 1,105,580 | ||||||||
| Hot Topic, Inc.† | 9.25% | 6/15/2021 | 915 | 901,275 | ||||||||
| Levi Strauss & Co.(a) | 3.375% | 3/15/2027 | EUR | 957 | 1,095,527 | |||||||
| PetSmart, Inc.† | 5.875% | 6/1/2025 | $ | 1,427 | 1,038,143 | |||||||
| PVH Corp.(a) | 3.125% | 12/15/2027 | EUR | 986 | 1,060,185 | |||||||
| Tapestry, Inc. | 4.125% | 7/15/2027 | $ | 1,682 | 1,577,479 | |||||||
| Tiffany & Co. | 4.90% | 10/1/2044 | 1,485 | 1,336,514 | ||||||||
| Under Armour, Inc. | 3.25% | 6/15/2026 | 1,340 | 1,118,200 | ||||||||
| Weight Watchers International, Inc.† | 8.625% | 12/1/2025 | 2,134 | 2,184,682 | ||||||||
| Total | 14,910,907 | |||||||||||
| Steel Producers/Products 0.32% | ||||||||||||
| Allegheny Technologies, Inc. | 7.875% | 8/15/2023 | 1,633 | 1,671,784 | ||||||||
| Joseph T Ryerson & Son, Inc.† | 11.00% | 5/15/2022 | 723 | 730,230 | ||||||||
| Steel Dynamics, Inc. | 4.125% | 9/15/2025 | 604 | 557,945 | ||||||||
| Steel Dynamics, Inc. | 5.00% | 12/15/2026 | 502 | 476,900 | ||||||||
| Total | 3,436,859 | |||||||||||
| Support: Services 2.27% | ||||||||||||
| AECOM | 5.125% | 3/15/2027 | 274 | 235,640 | ||||||||
| Ahern Rentals, Inc.† | 7.375% | 5/15/2023 | 1,190 | 957,950 | ||||||||
| Ashtead Capital, Inc.† | 4.375% | 8/15/2027 | 1,393 | 1,260,665 | ||||||||
| Brand Industrial Services, Inc.† | 8.50% | 7/15/2025 | 1,671 | 1,432,883 | ||||||||
| Brink’s Co. (The)† | 4.625% | 10/15/2027 | 1,766 | 1,616,296 | ||||||||
| Cleveland Clinic Foundation (The) | 4.858% | 1/1/2114 | 1,100 | 1,132,005 | ||||||||
| Cloud Crane LLC† | 10.125% | 8/1/2024 | 990 | 1,019,700 | ||||||||
| Garda World Security Corp. (Canada)†(c) | 8.75% | 5/15/2025 | 1,173 | 1,073,295 | ||||||||
| IHS Markit Ltd. (United Kingdom)†(c) | 4.00% | 3/1/2026 | 2,627 | 2,449,677 | ||||||||
| IHS Markit Ltd. (United Kingdom)(c) | 4.75% | 8/1/2028 | 1,550 | 1,515,171 | ||||||||
| Jurassic Holdings III, Inc.† | 6.875% | 2/15/2021 | 1,467 | 1,246,950 | ||||||||
| Marble II Pte Ltd. (Singapore)†(c) | 5.30% | 6/20/2022 | 2,449 | 2,370,343 | ||||||||
| Metropolitan Museum of Art (The) | 3.40% | 7/1/2045 | 1,975 | 1,869,239 | ||||||||
| Monitronics International, Inc. | 9.125% | 4/1/2020 | 1,185 | 306,619 | ||||||||
| Prime Security Services Borrower LLC/Prime Finance, Inc.† | 9.25% | 5/15/2023 | 1,298 | 1,341,808 | ||||||||
| Ritchie Bros Auctioneers, Inc. (Canada)†(c) | 5.375% | 1/15/2025 | 1,130 | 1,101,750 | ||||||||
| United Rentals North America, Inc. | 4.875% | 1/15/2028 | 2,047 | 1,801,360 | ||||||||
| See Notes to Financial Statements. | 33 |
Schedule of Investments (continued)
December 31, 2018
| Principal | ||||||||||||
| Interest | Maturity | Amount | Fair | |||||||||
| Investments | Rate | Date | (000) | Value | ||||||||
| Support: Services (continued) | ||||||||||||
| United Rentals North America, Inc. | 5.875% | 9/15/2026 | $ | 755 | $ | 714,419 | ||||||
| WeWork Cos., Inc.† | 7.875% | 5/1/2025 | 1,184 | 1,056,720 | ||||||||
| Total | 24,502,490 | |||||||||||
| Technology Hardware & Equipment 0.97% | ||||||||||||
| Banff Merger Sub, Inc.†(a) | 8.375% | 9/1/2026 | EUR | 991 | 1,054,002 | |||||||
| CDW LLC/CDW Finance Corp. | 5.50% | 12/1/2024 | $ | 1,425 | 1,414,313 | |||||||
| Dell International LLC/EMC Corp.† | 6.02% | 6/15/2026 | 2,552 | 2,568,408 | ||||||||
| Dell International LLC/EMC Corp.† | 7.125% | 6/15/2024 | 2,055 | 2,092,544 | ||||||||
| HP, Inc. | 6.00% | 9/15/2041 | 1,212 | 1,210,626 | ||||||||
| Western Digital Corp. | 4.75% | 2/15/2026 | 2,402 | 2,092,742 | ||||||||
| Total | 10,432,635 | |||||||||||
| Telecommunications: Satellite 0.51% | ||||||||||||
| Intelsat Connect Finance SA (Luxembourg)†(c) | 9.50% | 2/15/2023 | 1,220 | 1,055,300 | ||||||||
| Intelsat Jackson Holdings SA (Luxembourg)(c) | 5.50% | 8/1/2023 | 2,605 | 2,279,375 | ||||||||
| Intelsat Jackson Holdings SA (Luxembourg)†(c) | 8.50% | 10/15/2024 | 2,221 | 2,165,475 | ||||||||
| Total | 5,500,150 | |||||||||||
| Telecommunications: Wireless 1.31% | ||||||||||||
| Sprint Capital Corp. | 6.875% | 11/15/2028 | 8,834 | 8,370,215 | ||||||||
| T-Mobile USA, Inc. | 6.375% | 3/1/2025 | 2,386 | 2,421,695 | ||||||||
| T-Mobile USA, Inc. | 6.50% | 1/15/2026 | 3,228 | 3,300,630 | ||||||||
| Total | 14,092,540 | |||||||||||
| Telecommunications: Wireline Integrated & Services 2.20% | ||||||||||||
| CenturyLink, Inc. | 5.625% | 4/1/2025 | 1,902 | 1,678,515 | ||||||||
| CenturyLink, Inc. | 7.50% | 4/1/2024 | 4,708 | 4,554,990 | ||||||||
| DKT Finance ApS (Denmark)†(c) | 9.375% | 6/17/2023 | 1,653 | 1,698,457 | ||||||||
| Equinix, Inc.(a) | 2.875% | 2/1/2026 | EUR | 2,781 | 3,028,368 | |||||||
| GCI LLC | 6.875% | 4/15/2025 | $ | 1,230 | 1,199,250 | |||||||
| InterXion Holding NV†(a) | 4.75% | 6/15/2025 | EUR | 1,449 | 1,706,189 | |||||||
| Level 3 Financing, Inc. | 5.25% | 3/15/2026 | $ | 801 | 734,918 | |||||||
| Motorola Solutions, Inc. | 4.60% | 2/23/2028 | 1,213 | 1,188,925 | ||||||||
| Uniti Group LP/Uniti Group Finance, Inc./CSL Capital LLC | 8.25% | 10/15/2023 | 1,832 | 1,603,000 | ||||||||
| Verizon Communications, Inc. | 2.625% | 8/15/2026 | 5,735 | 5,211,108 | ||||||||
| WTT Investment Ltd. (Hong Kong)†(c) | 5.50% | 11/21/2022 | 1,168 | 1,142,559 | ||||||||
| Total | 23,746,279 | |||||||||||
| 34 | See Notes to Financial Statements. |
Schedule of Investments (continued)
December 31, 2018
| Principal | ||||||||||||
| Interest | Maturity | Amount | Fair | |||||||||
| Investments | Rate | Date | (000) | Value | ||||||||
| Theaters & Entertainment 0.06% | ||||||||||||
| AMC Entertainment Holdings, Inc. | 5.875% | 11/15/2026 | $ | 804 | $ | 691,440 | ||||||
| Tobacco 0.15% | ||||||||||||
| Imperial Brands Finance PLC (United Kingdom)†(c) | 4.25% | 7/21/2025 | 1,647 | 1,622,970 | ||||||||
| Transportation: Infrastructure/Services 0.99% | ||||||||||||
| Aeropuerto Internacional de Tocumen SA(Panama)†(c) | 6.00% | 11/18/2048 | 1,935 | 1,927,647 | ||||||||
| Autopistas del Sol SA (Costa Rica)†(c) | 7.375% | 12/30/2030 | 1,360 | 1,244,176 | ||||||||
| Autoridad del Canal de Panama (Panama)†(c) | 4.95% | 7/29/2035 | 1,000 | 1,022,510 | ||||||||
| CH Robinson Worldwide, Inc. | 4.20% | 4/15/2028 | 1,736 | 1,745,140 | ||||||||
| Kirby Corp. | 4.20% | 3/1/2028 | 1,575 | 1,544,133 | ||||||||
| Promontoria Holding BV†(a) | 6.75% | 8/15/2023 | EUR | 980 | 1,090,746 | |||||||
| Stena AB (Sweden)†(c) | 7.00% | 2/1/2024 | $ | 1,217 | 1,113,555 | |||||||
| XPO CNW, Inc. | 6.70% | 5/1/2034 | 1,155 | 987,525 | ||||||||
| Total | 10,675,432 | |||||||||||
| Total High Yield Corporate Bonds(cost $726,597,546) | 693,037,955 | |||||||||||
| MUNICIPAL BONDS 4.38% | ||||||||||||
| Air Transportation 0.23% | ||||||||||||
| Miami-Dade Cnty, FL | 3.982% | 10/1/2041 | 970 | 933,586 | ||||||||
| Miami-Dade Cnty, FL | 4.28% | 10/1/2041 | 1,550 | 1,570,321 | ||||||||
| Total | 2,503,907 | |||||||||||
| Education 1.06% | ||||||||||||
| California St Univ | 3.899% | 11/1/2047 | 2,675 | 2,621,661 | ||||||||
| Ohio Univ | 5.59% | 12/1/2114 | 1,000 | 1,142,960 | ||||||||
| Permanent University Fund - Texas A&M | ||||||||||||
| University System | 3.66% | 7/1/2047 | 6,640 | 6,392,726 | ||||||||
| Univ of California Bd of Regents | 6.548% | 5/15/2048 | 1,000 | 1,321,990 | ||||||||
| Total | 11,479,337 | |||||||||||
| General Obligation 1.44% | ||||||||||||
| California | 7.55% | 4/1/2039 | 1,285 | 1,845,247 | ||||||||
| Chicago Transit Auth, IL | 6.899% | 12/1/2040 | 1,000 | 1,280,040 | ||||||||
| Chicago, IL | 5.432% | 1/1/2042 | 2,292 | 2,036,786 | ||||||||
| Chicago, IL | 6.314% | 1/1/2044 | 2,167 | 2,139,739 | ||||||||
| District of Columbia | 5.591% | 12/1/2034 | 1,445 | 1,718,351 | ||||||||
| Honolulu City & Cnty, HI | 5.418% | 12/1/2027 | 740 | 870,825 | ||||||||
| Los Angeles Unif Sch Dist, CA | 5.75% | 7/1/2034 | 1,000 | 1,185,670 | ||||||||
| New York City | 5.985% | 12/1/2036 | 1,134 | 1,373,920 | ||||||||
| See Notes to Financial Statements. | 35 |
Schedule of Investments (continued)
December 31, 2018
| Principal | ||||||||||||
| Interest | Maturity | Amount | Fair | |||||||||
| Investments | Rate | Date | (000) | Value | ||||||||
| General Obligation (continued) | ||||||||||||
| Ohio St Univ | 4.048% | 12/1/2056 | $ | 676 | $ | 673,823 | ||||||
| Pennsylvania | 5.45% | 2/15/2030 | 1,336 | 1,540,194 | ||||||||
| The Bd of Governors of the Univ of North Carolina | 3.847% | 12/1/2034 | 855 | 892,005 | ||||||||
| Total | 15,556,600 | |||||||||||
| Government Guaranteed 0.05% | ||||||||||||
| City & County of San Francisco CA | 5.45% | 6/15/2025 | 460 | 520,550 | ||||||||
| Lease Obligations 0.07% | ||||||||||||
| Wisconsin | 3.294% | 5/1/2037 | 790 | 717,249 | ||||||||
| Miscellaneous 0.58% | ||||||||||||
| Chicago Transit Auth, IL | 6.20% | 12/1/2040 | 1,030 | 1,253,510 | ||||||||
| Dallas Convention Center Hotel Dev Corp., TX | 7.088% | 1/1/2042 | 1,210 | 1,559,629 | ||||||||
| Pasadena Public Fing Auth | 7.148% | 3/1/2043 | 2,445 | 3,428,037 | ||||||||
| Total | 6,241,176 | |||||||||||
| Tax Revenue 0.62% | ||||||||||||
| Massachusetts Sch Bldg Auth | 5.715% | 8/15/2039 | 1,720 | 2,110,990 | ||||||||
| Memphis-Shelby County Industrial Development Board, TN | 7.00% | 7/1/2045 | 1,225 | 1,273,792 | ||||||||
| New York City Indl Dev Agy† | 11.00% | 3/1/2029 | 2,475 | 3,264,327 | ||||||||
| Total | 6,649,109 | |||||||||||
| Transportation 0.16% | ||||||||||||
| Port of Seattle, WA | 3.571% | 5/1/2032 | 650 | 637,916 | ||||||||
| Port of Seattle, WA | 3.755% | 5/1/2036 | 1,105 | 1,086,823 | ||||||||
| Total | 1,724,739 | |||||||||||
| Utilities 0.17% | ||||||||||||
| San Antonio, TX | 5.718% | 2/1/2041 | 1,480 | 1,843,473 | ||||||||
| Total Municipal Bonds (cost $47,728,437) | 47,236,140 | |||||||||||
| NON-AGENCY COMMERCIAL MORTGAGE-BACKED SECURITY 0.41% | ||||||||||||
| Caesars Palace Las Vegas Trust 2017-VICI D† (cost $4,417,857) | 4.354% | #(m) | 10/15/2034 | 4,354 | 4,362,721 | |||||||
| 36 | See Notes to Financial Statements. |
Schedule of Investments (continued)
December 31, 2018
| Dividend | Maturity | Shares | Fair | |||||||||
| Investments | Rate | Date | (000) | Value | ||||||||
| PREFERRED STOCK 0.01% | ||||||||||||
| Energy: Exploration & Production | ||||||||||||
| Templar Energy LLC (cost $418,206) | Zero Coupon | 42 | $ | 125,946 | ||||||||
| Principal | ||||||||||||
| Interest | Amount | |||||||||||
| Rate | (000) | |||||||||||
| U.S. TREASURY OBLIGATIONS 2.95% | ||||||||||||
| U.S. Treasury Note | 2.75% | 5/31/2023 | $ | 10,985 | 11,106,688 | |||||||
| U.S. Treasury Note | 3.125% | 11/15/2028 | 7,955 | 8,258,327 | ||||||||
| U.S. Treasury Inflation Indexed Note(n) | 0.50% | 1/15/2028 | 13,022 | 12,435,961 | ||||||||
| Total U.S. Treasury Obligations(cost $31,348,053) | 31,800,976 | |||||||||||
| Exercise | Expiration | Shares | ||||||||||
| Price | Date | (000) | ||||||||||
| WARRANT 0.00% | ||||||||||||
| Personal & Household Products | ||||||||||||
| Remington Outdoor Co., Inc.* (cost $86,340) | $35.05 | 5/15/2022 | 16 | 164 | (d) | |||||||
| Total Long-Term Investments (cost $1,188,718,000) | 1,145,170,105 | |||||||||||
| Principal | ||||||||||||
| Amount | ||||||||||||
| (000) | ||||||||||||
| SHORT-TERM INVESTMENT 2.36% | ||||||||||||
| REPURCHASE AGREEMENT | ||||||||||||
| Repurchase Agreement dated 12/31/2018, 1.45% due 1/2/2019 with Fixed Income Clearing Corp. collateralized by $25,620,000 of U.S. Treasury Note at 2.75% due 2/15/2028; value: $25,914,912; proceeds: $25,405,788 (cost $25,403,742) | $ | 25,404 | 25,403,742 | |||||||||
| Total Investments in Securities 108.66% (cost $1,214,121,742) | 1,170,573,847 | |||||||||||
| Less Unfunded Commitment (.11%) (cost $1,147,878) | (1,141,230 | ) | ||||||||||
| Net Investment 108.55% (cost $1,212,973,864) | 1,169,432,617 | |||||||||||
| Liabilities in Excess of Cash, Foreign Cash and Other Assets(o)(8.55%) | (92,128,007 | ) | ||||||||||
| Net Assets 100.00% | $ | 1,077,304,610 | ||||||||||
| See Notes to Financial Statements. | 37 |
Schedule of Investments (continued)
December 31, 2018
| AUD | Australian dollar. | |
| CAD | Canadian dollar. | |
| EUR | euro. | |
| UYU | Uruguayan Peso. | |
| ADR | American Depositary Receipt. | |
| EURIBOR | Euro Interbank Offered Rate. | |
| LIBOR | London Interbank Offered Rate. | |
| PIK | Payment-in-kind. | |
| Units | More than one class of securities traded together. | |
| † | Security was purchased pursuant to Rule 144A under the Securities Act of 1933 and, unless registered under such Act or exempted from registration, may only be resold to qualified institutional buyers. | |
| # | Variable rate security. The interest rate represents the rate in effect at December 31, 2018. | |
| * | Non-income producing security. | |
| (a) | Investment in non-U.S. dollar denominated securities. | |
| (b) | Amount represents less than 1,000 shares. | |
| (c) | Foreign security traded in U.S. dollars. | |
| (d) | Level 3 Investment as described in Note 2(p) in the Notes to Financials. Security valued utilizing third party pricing information without adjustment. Such valuations are based on unobservable inputs. A significant change in third party information could result in a significantly lower or higher value of such Level 3 investments. | |
| (e) | Floating Rate Loans in which the Fund invests generally pay interest at rates which are periodically re-determined at a margin above the London Interbank Offered Rate (“LIBOR”) or the prime rate offered by major U.S. banks. The rate(s) shown is the rate(s) in effect at December 31, 2018. | |
| (f) | Level 3 Investment as described in Note 2(p) in the Notes to Financials. Floating Rate Loans categorized as Level 3 are valued based on a single quotation obtained from a dealer. Accounting principles generally accepted in the United States of America do not require the Fund to create quantitative unobservable inputs that were not developed by the Fund. Therefore, the Fund does not have access to unobservable inputs and cannot disclose such inputs in the valuation. | |
| (g) | Interest rate to be determined. | |
| (h) | To-be-announced (“TBA”). Security purchased on a forward commitment basis with an approximate principal and maturity date. Actual principal and maturity will be determined upon settlement when the specific mortgage pools are assigned. | |
| (i) | Security is perpetual in nature and has no stated maturity. | |
| (j) | Variable Rate is Fixed to Float: Rate remains fixed until a designated future date. | |
| (k) | Defaulted (non-income producing security). | |
| (l) | Level 3 Investment as described in Note 2(p) in the Notes to Financials. Security fair valued by the Pricing Committee. | |
| (m) | Interest rate is based on the weighted average interest rates of the underlying mortgages within the mortgage pool. | |
| (n) | Treasury Inflation Protected Security. A U.S. Treasury Note or Bond that offers protection from inflation by paying a fixed rate of interest on principal amount that is adjusted for inflation based on the Consumer Price Index. | |
| (o) | Liabilities in Excess of Cash, Foreign Cash and Other Assets include net unrealized appreciation/depreciation on forward foreign currency exchange contracts, futures contracts and swaps as follows: |
Centrally Cleared Credit Default Swaps on Indexes - Buy Protection at December 31, 2018(1):
| Central | Fund | |||||||||||||
| Referenced | Clearing | Pays | Termination | Notional | Notional | Payments | Unrealized | |||||||
| Index | party | (Quarterly) | Date | Amount | Value | Upfront(2) | Appreciation(3) | |||||||
| Markit CDX.NA.IG.31(4)(5) | Credit Suisse | 1.00% | 12/20/2023 | $73,751,000 | $74,162,199 | $(1,105,220) | $694,021 |
| (1) | If the Fund is a buyer of protection and a credit event occurs, as defined under the terms of that particular swap agreement, the Fund will either (i) receive from the seller of protection an amount equal to the notional amount of the swap and take delivery of the referenced obligation or underlying securities comprising the referenced index or (ii) pay a net settlement amount in the form of cash or securities equal to the notional amount of the swap less the recovery value of the referenced obligation or underlying securities. | |
| (2) | Upfront payments received by Central Clearing Party are presented net of amortization (See Note 2(m)). | |
| (3) | Total unrealized appreciation on Credit Default Swaps on Indexes amounted to $694,021. Total unrealized depreciation on Credit Default Swaps on Indexes amounted to $0. | |
| (4) | Central Clearinghouse: Intercontinental Exchange (ICE). | |
| (5) | The Referenced Index is for the Centrally Cleared Credit Default Swaps on Indexes, which is comprised of a basket of investment grade securities. |
| 38 | See Notes to Financial Statements. |
Schedule of Investments (continued)
December 31, 2018
Credit Default Swaps on Indexes/Issuer - Sell Protection at December 31, 2018(1):
| Credit | ||||||||||||||||||||||||
| Default | ||||||||||||||||||||||||
| Swap | ||||||||||||||||||||||||
| Fund | Termi- | Unrealized | Agreements | |||||||||||||||||||||
| Referenced | Swap | Receives | nation | Notional | Notional | Payments | Appreciation | Payable at | ||||||||||||||||
| Index/Issuer | Counterparty | (Quarterly) | Date | Amount | Value | Upfront(2) | (Depreciation)(3) | Fair Value(4) | ||||||||||||||||
| Markit CMBX NA.BBB.9 | Credit Suisse | 3.00% | 9/17/2058 | $2,112,000 | $1,855,524 | $ | (173,740 | ) | $ | (82,736) | $ | (256,476 | ) | |||||||||||
| Markit CMBX NA.BBB.10 | Credit Suisse | 3.00% | 11/17/2059 | 4,667,000 | 4,130,129 | (321,562 | ) | (215,309) | (536,871 | ) | ||||||||||||||
| Markit CMBX. NA.BBB.9 | Deutsche Bank | 3.00% | 9/17/2058 | 3,363,000 | 2,954,607 | (276,651 | ) | (131,742) | (408,393 | ) | ||||||||||||||
| Markit CMBX. NA.BBB.10 | Deutsche Bank | 3.00% | 11/17/2059 | 851,000 | 753,105 | (58,635 | ) | (39,260) | (97,895 | ) | ||||||||||||||
| Markit CMBX. NA.BBB.11 | Deutsche Bank | 3.00% | 11/18/2054 | 838,000 | 732,446 | (55,405 | ) | (50,149) | (105,554 | ) | ||||||||||||||
| Markit CMBX. NA.BBB.9 | Goldman Sachs | 3.00% | 9/17/2058 | 1,153,000 | 1,012,982 | (94,850 | ) | (45,168) | (140,018 | ) | ||||||||||||||
| Markit CMBX. NA.BBB.10 | Goldman Sachs | 3.00% | 11/17/2059 | 3,573,000 | 3,161,978 | (246,184 | ) | (164,838) | (411,022 | ) | ||||||||||||||
| Markit CMBX. NA.BBB.11 | J.P. Morgan Chase | 3.00% | 11/18/2054 | 393,000 | 343,498 | (25,984 | ) | (23,518) | (49,502 | ) | ||||||||||||||
| Markit CMBX. NA.BBB.9 | Morgan Stanley | 3.00% | 9/17/2058 | 4,977,000 | 4,372,605 | (409,425 | ) | (194,970) | (604,395 | ) | ||||||||||||||
| Markit CMBX. NA.BBB.11 | Morgan Stanley | 3.00% | 11/18/2054 | 10,501,000 | 9,178,303 | (694,284 | ) | (628,413) | (1,322,697 | ) | ||||||||||||||
| Markit CMBX. NA.BBB.10 | Morgan Stanley | 3.00% | 11/17/2059 | 4,812,000 | 4,258,450 | (331,552 | ) | (221,998) | (553,550 | ) | ||||||||||||||
| Tesla | J.P. Morgan Chase | 1.00% | 6/20/2020 | 1,358,000 | 1,306,673 | (84,579 | ) | 33,252 | (51,327 | ) | ||||||||||||||
| $ | (2,772,851 | ) | $ | (1,764,849) | $ | (4,537,700 | ) | |||||||||||||||||
| (1) | If the Fund is a seller of protection and a credit event occurs, as defined under the terms of that particular swap agreement, the Fund will either (i) receive from the seller of protection an amount equal to the notional amount of the swap and take delivery of the referenced obligation or underlying securities comprising the referenced index or (ii) pay a net settlement amount in the form of cash or securities equal to the notional amount of the swap less the recovery value of the referenced obligation or underlying securities. | |
| (2) | Upfront payments received are presented net of amortization (See Note 2(m)). | |
| (3) | Total unrealized appreciation on Credit Default Swaps on Indexes amounted to $33,252. Total unrealized depreciation on Credit Default Swaps on Indexes amounted to $1,798,101. | |
| (4) | Includes upfront payments received. |
Total Return Swap Contracts at December 31, 2018:
| Swap | Referenced | Referenced | Termination | Notional | Notional | Unrealized | ||||||||||||||||||
| Counterparty | Index* | Spread | Units | Position | Date | Amount | Value | Appreciation | ||||||||||||||||
| J.P. Morgan Chase | IBXXLL | 3 Mo. LIBOR+ .00% | 12,894 | Long | 3/20/2019 | $ | 2,121,000 | $ | (2,101,112 | ) | $ | 19,888 | ||||||||||||
| Morgan Stanley | IBXXLL | 3 Mo. LIBOR+ .00% | 7,156 | Long | 3/20/2019 | 1,179,000 | (1,166,173 | ) | 12,827 | |||||||||||||||
| Goldman Sachs | IBXXLL | 3 Mo. LIBOR+ .00% | 13,184 | Long | 3/20/2019 | 2,200,000 | (2,148,353 | ) | 51,647 | |||||||||||||||
| $ | 5,500,000 | $ | (5,415,638 | ) | $ | 84,362 | ||||||||||||||||||
| * | iBoxx Leverage Loan Index. |
| See Notes to Financial Statements. | 39 |
Schedule of Investments (continued)
December 31, 2018
Open Forward Foreign Currency Exchange Contracts at December 31, 2018:
| Forward | |||||||||||||||||
| Foreign | U.S. $ | ||||||||||||||||
| Currency | Cost on | U.S. $ | |||||||||||||||
| Exchange | Transaction | Expiration | Foreign | Origination | Current | Unrealized | |||||||||||
| Contracts | Type | Counterparty | Date | Currency | Date | Value | Appreciation | ||||||||||
| euro | Buy | J.P. Morgan Chase | 2/19/2019 | 193,000 | $219,972 | $221,998 | $ | 2,026 | |||||||||
| euro | Buy | Toronto Dominion Bank | 4/10/2019 | 500,000 | 575,207 | 577,642 | 2,435 | ||||||||||
| Unrealized Appreciation on Forward Foreign Currency Exchange Contracts | $ | 4,461 | |||||||||||||||
| Forward | |||||||||||||||||
| Foreign | U.S. $ | ||||||||||||||||
| Currency | Cost on | U.S. $ | |||||||||||||||
| Exchange | Transaction | Expiration | Foreign | Origination | Current | Unrealized | |||||||||||
| Contracts | Type | Counterparty | Date | Currency | Date | Value | Depreciation | ||||||||||
| euro | Sell | State Street Bank and Trust | 2/19/2019 | 8,230,000 | $9,399,157 | $9,466,551 | $ | (67,394 | ) | ||||||||
| euro | Sell | Toronto Dominion Bank | 3/7/2019 | 16,316,000 | 18,640,443 | 18,792,898 | (152,455 | ) | |||||||||
| euro | Sell | State Street Bank and Trust | 4/10/2019 | 860,000 | 988,330 | 993,545 | (5,215 | ) | |||||||||
| Unrealized Depreciation on Forward Foreign Currency Exchange Contracts | $ | (225,064 | ) | ||||||||||||||
Open Futures Contracts at December 31, 2018:
| Notional | Notional | Unrealized | |||||||||||||
| Type | Expiration | Contracts | Position | Amount | Value | Appreciation | |||||||||
| U.S. 2-Year Treasury Note | March 2019 | 761 | Long | $160,843,407 | $161,569,812 | $ | 726,405 | ||||||||
| U.S. 5-Year Treasury Note | March 2019 | 1,143 | Long | 129,095,529 | 131,087,790 | 1,992,261 | |||||||||
| Total Unrealized Appreciation on Open Futures Contracts | $ | 2,718,666 | |||||||||||||
| Notional | Notional | Unrealized | |||||||||||||
| Type | Expiration | Contracts | Position | Amount | Value | Depreciation | |||||||||
| Euro-Bobl | March 2019 | 6 | Short | EUR (793,849) | EUR (795,120) | $ | (1,456 | ) | |||||||
| U.S. 10-Year Treasury Note | March 2019 | 22 | Short | $(2,620,196) | $(2,684,343) | (64,147 | ) | ||||||||
| U.S. 10-Year Ultra Treasury Bond | March 2019 | 23 | Short | (2,898,318) | (2,991,797) | (93,479 | ) | ||||||||
| U.S. Long Bond | March 2019 | 749 | Short | (104,320,293) | (109,354,000) | (5,033,707 | ) | ||||||||
| Ultra Long U.S. Treasury Bond | March 2019 | 10 | Short | (1,521,779) | (1,606,562) | (84,783 | ) | ||||||||
| Total Unrealized Depreciation on Open Futures Contracts | $ | (5,277,572 | ) | ||||||||||||
| 40 | See Notes to Financial Statements. |
Schedule of Investments (continued)
December 31, 2018
The following is a summary of the inputs used as of December 31, 2018 in valuing the Fund’s investments carried at fair value(1):
| Investment Type(2)(3) | Level 1 | Level 2 | Level 3 | Total | ||||||||||||
| Long-Term Investments | ||||||||||||||||
| Asset-Backed Securities | $ | – | $ | 27,178,515 | $ | – | $ | 27,178,515 | ||||||||
| Common Stocks | ||||||||||||||||
| Auto Parts & Equipment | – | 1,486,875 | – | 1,486,875 | ||||||||||||
| Beverages | – | 1,085,821 | – | 1,085,821 | ||||||||||||
| Energy: Exploration & Production | 1,985,702 | 28,887 | – | 2,014,589 | ||||||||||||
| Personal & Household Products | 2,357,686 | 158,506 | 912,300 | 3,428,492 | ||||||||||||
| Specialty Retail | 11,503,457 | 893,804 | – | 12,397,261 | ||||||||||||
| Remaining Industries | 79,228,862 | – | – | 79,228,862 | ||||||||||||
| Convertible Bonds | – | 5,118,408 | – | 5,118,408 | ||||||||||||
| Floating Rate Loans | ||||||||||||||||
| Diversified Capital Goods | – | – | 691,801 | 691,801 | ||||||||||||
| Oil Field Equipment & Services | – | – | 1,424,659 | 1,424,659 | ||||||||||||
| Personal & Household Products | – | 3,165,048 | 2,249,682 | 5,414,730 | ||||||||||||
| Specialty Retail | – | 10,980,248 | – | 10,980,248 | ||||||||||||
| Remaining Industries | – | 50,377,401 | – | 50,377,401 | ||||||||||||
| Foreign Bond | – | 1,104,351 | – | 1,104,351 | ||||||||||||
| Foreign Government Obligations | – | 73,523,098 | – | 73,523,098 | ||||||||||||
| Government Sponsored Enterprises | ||||||||||||||||
| Pass-Through | – | 92,009,862 | – | 92,009,862 | ||||||||||||
| High Yield Corporate Bonds | ||||||||||||||||
| Banking | – | 42,215,896 | 125 | 42,216,021 | ||||||||||||
| Metals/Mining (Excluding Steel) | – | 21,788,680 | 2 | 21,788,682 | ||||||||||||
| Remaining Industries | – | 629,033,252 | – | 629,033,252 | ||||||||||||
| Municipal Bonds | – | 47,236,140 | – | 47,236,140 | ||||||||||||
| Non-Agency Commercial | ||||||||||||||||
| Mortgage-Backed Security | – | 4,362,721 | – | 4,362,721 | ||||||||||||
| Preferred Stock | – | 125,946 | – | 125,946 | ||||||||||||
| U.S. Treasury Obligations | – | 31,800,976 | – | 31,800,976 | ||||||||||||
| Warrant | – | – | 164 | 164 | ||||||||||||
| Short-Term Investment | ||||||||||||||||
| Repurchase Agreement | – | 25,403,742 | – | 25,403,742 | ||||||||||||
| Total | $ | 95,075,707 | $ | 1,069,078,177 | $ | 5,278,733 | $ | 1,169,432,617 | ||||||||
| See Notes to Financial Statements. | 41 |
Schedule of Investments (continued)
December 31, 2018
| Other Financial Instruments | Level 1 | Level 2 | Level 3 | Total | ||||||||||||
| Centrally Cleared Credit Default Swap Contracts | ||||||||||||||||
| Assets | $ | $ | 694,021 | $ | – | $ | 694,021 | |||||||||
| Liabilities | – | – | – | – | ||||||||||||
| Credit Default Swap Contracts | ||||||||||||||||
| Assets | – | – | – | – | ||||||||||||
| Liabilities | – | (4,537,700 | ) | – | (4,537,700 | ) | ||||||||||
| Forward Foreign Currency Exchange Contracts | ||||||||||||||||
| Assets | – | 4,461 | – | 4,461 | ||||||||||||
| Liabilities | – | (225,064 | ) | – | (225,064 | ) | ||||||||||
| Futures Contracts | ||||||||||||||||
| Assets | 2,718,666 | – | – | 2,718,666 | ||||||||||||
| Liabilities | (5,277,572 | ) | – | – | (5,277,572 | ) | ||||||||||
| Total Return Swaps Contracts | ||||||||||||||||
| Assets | – | 84,362 | – | 84,362 | ||||||||||||
| Liabilities | – | – | – | – | ||||||||||||
| Unfunded Commitments | ||||||||||||||||
| Assets | – | – | – | – | ||||||||||||
| Liabilities | – | (6,648 | ) | – | (6,648 | ) | ||||||||||
| Total | $ | (2,558,906 | ) | $ | (3,986,568 | ) | $ | – | $ | (6,545,474 | ) | |||||
| (1) | Refer to Note 2(p) for a description of fair value measurements and the three-tier hierarchy of inputs. | |
| (2) | See Schedule of Investments for fair values in each industry and identification of foreign issuers and/or geography. The table above is presented by Investment Type. Industries are presented within an Investment Type should such Investment Type include securities classified as two or more levels within the three-tier fair value hierarchy. Each Level 3 security is identified on the Schedule of Investments along with the valuation technique utilized. | |
| (3) | There were no Level 1/Level 2 transfers during the fiscal year ended December 31, 2018. |
| 42 | See Notes to Financial Statements. |
Schedule of Investments (concluded)
December 31, 2018
The following is a reconciliation of investments with unobservable inputs (Level 3) that were used in determining fair value:
| High Yield | ||||||||||||||||||||
| Asset-Backed | Common | Floating | Corporate | |||||||||||||||||
| Investment Type | Securities | Stocks | Rate Loans | Bonds | Warrant | |||||||||||||||
| Balance as of January 1, 2018 | $ | 2,273,600 | $ | – | $ | 3,137,076 | $ | 319,757 | $ | – | ||||||||||
| Accrued Discounts (Premiums) | – | – | 21,360 | (3,784 | ) | – | ||||||||||||||
| Realized Gain (Loss) | – | – | 12,658 | (30,794 | ) | – | ||||||||||||||
| Change in Unrealized Appreciation (Depreciation) | – | 198,969 | (587,217 | ) | 42,159 | (86,178 | ) | |||||||||||||
| Purchases | – | 713,331 | 8,563,322 | 430,278 | 86,342 | |||||||||||||||
| Sales | – | – | (6,781,057 | ) | (513,940 | ) | – | |||||||||||||
| Transfers into Level 3 | – | – | – | – | – | |||||||||||||||
| Transfers out of Level 3 | (2,273,600 | ) | – | – | (243,549 | ) | – | |||||||||||||
| Balance as of December 31, 2018 | $ | – | $ | 912,300 | $ | 4,366,142 | $ | 127 | $ | 164 | ||||||||||
| Change in unrealized appreciation/depreciation for year ended December 31, 2018, related to Level 3 investments held at December 31, 2018 | $ | – | $ | 198,969 | $ | (223,551 | ) | $ | – | $ | (86,176 | ) | ||||||||
| See Notes to Financial Statements. | 43 |
Statement of Assets and Liabilities
December 31, 2018
| ASSETS: | ||||
| Investments in securities, at fair value (cost $1,212,973,864) | $ | 1,169,432,617 | ||
| Cash | 266,327 | |||
| Deposits with brokers for futures collateral | 1,687,998 | |||
| Deposits with brokers for swaps collateral | 4,806,664 | |||
| Foreign cash, at value (cost $1,273) | 3 | |||
| Receivables: | ||||
| Interest and dividends | 13,214,466 | |||
| Investment securities sold | 2,323,016 | |||
| Capital shares sold | 269,225 | |||
| Total return swap, at fair value | 84,362 | |||
| Unrealized appreciation on forward foreign currency exchange contracts | 4,461 | |||
| Prepaid expenses and other assets | 5,588 | |||
| Total assets | 1,192,094,727 | |||
| LIABILITIES: | ||||
| Payables: | ||||
| Investment securities purchased | 106,865,424 | |||
| Capital shares reacquired | 1,051,810 | |||
| Management fee | 457,093 | |||
| Variation margin on futures contracts | 263,148 | |||
| Directors’ fees | 158,504 | |||
| Fund administration | 36,856 | |||
| Variation margin for centrally cleared credit default swap agreements | 48,414 | |||
| Unrealized depreciation on forward foreign currency exchange contracts | 225,064 | |||
| Credit default swap agreements payable, at fair value (including upfront payments of $2,772,851) | 4,537,700 | |||
| Unrealized depreciation on unfunded commitments | 6,648 | |||
| Accrued expenses and other liabilities | 1,139,456 | |||
| Total liabilities | 114,790,117 | |||
| NET ASSETS | $ | 1,077,304,610 | ||
| COMPOSITION OF NET ASSETS: | ||||
| Paid-in capital | $ | 1,138,432,607 | ||
| Total distributable earnings (loss) | (61,127,997 | ) | ||
| Net Assets | $ | 1,077,304,610 | ||
| Outstanding shares (200 million shares of common stock authorized, $.001 par value) | 97,190,009 | |||
| Net asset value, offering and redemption price per share (Net assets divided by outstanding shares) | $11.08 |
| 44 | See Notes to Financial Statements. |
For the Year Ended December 31, 2018
| Investment income: | ||||
| Dividends (net of foreign withholding taxes of $25,961) | $ | 1,582,463 | ||
| Interest and other (net of foreign withholding taxes of $18,154) | 55,391,925 | |||
| Total investment income | 56,974,388 | |||
| Expenses: | ||||
| Management fee | 5,668,326 | |||
| Non 12b-1 service fees | 2,871,553 | |||
| Shareholder servicing | 1,229,150 | |||
| Fund administration | 459,407 | |||
| Reports to shareholders | 132,179 | |||
| Custody | 91,376 | |||
| Professional | 75,817 | |||
| Directors’ fees | 40,158 | |||
| Other | 86,795 | |||
| Gross expenses | 10,654,761 | |||
| Expense reductions (See Note 9) | (26,741 | ) | ||
| Fees waived and expenses reimbursed (See Note 3) | (75,381 | ) | ||
| Net expenses | 10,552,639 | |||
| Net investment income | 46,421,749 | |||
| Net realized and unrealized gain (loss): | ||||
| Net realized loss on investments | (2,026,848 | ) | ||
| Net realized gain on futures contracts | 7,364,043 | |||
| Net realized gain on foreign currency exchange contracts | 1,530,860 | |||
| Net realized loss on swap contracts | (118,170 | ) | ||
| Net realized gain on foreign currency related transactions | 90,031 | |||
| Net change in unrealized appreciation/depreciation on investments | (97,594,204 | ) | ||
| Net change in unrealized appreciation/depreciation on futures contracts | (2,177,820 | ) | ||
| Net change in unrealized appreciation/depreciation on foreign currency exchange contracts | 105,625 | |||
| Net change in unrealized appreciation/depreciation on swap contracts | 713,197 | |||
| Net change in unrealized appreciation/depreciation on translation of assets and liabilities denominated in foreign currencies | (5,078 | ) | ||
| Net change in unrealized appreciation/depreciation on unfunded commitments | (6,648 | ) | ||
| Net realized and unrealized loss | (92,125,012 | ) | ||
| Net Decrease in Net Assets Resulting From Operations | $ | (45,703,263 | ) |
| See Notes to Financial Statements. | 45 |
Statements of Changes in Net Assets
| INCREASE (DECREASE) IN NET ASSETS | For the Year Ended December 31, 2018 | For the Year Ended December 31, 2017 | ||||||
| Operations: | ||||||||
| Net investment income | $ | 46,421,749 | $ | 46,435,962 | ||||
| Net realized gain on investments, futures contracts, forward currency exchange contracts, swaps and foreign currency related transactions | 6,839,916 | 45,448,213 | ||||||
| Net change in unrealized appreciation/depreciation on investments, futures contracts, forward currency exchange contracts, swaps, unfunded commitments and translation of assets and liabilities denominated in foreign currencies | (98,964,928 | ) | 6,990,239 | |||||
| Net increase (decrease) in net assets resulting from operations | (45,703,263 | ) | 98,874,414 | |||||
| Distributions to shareholders(1) | (73,991,299 | ) | (59,089,628 | ) | ||||
| Capital share transactions (See Note 14): | ||||||||
| Proceeds from sales of shares | 123,044,541 | 146,613,258 | ||||||
| Reinvestment of distributions | 73,991,366 | 59,089,628 | ||||||
| Cost of shares reacquired | (173,257,966 | ) | (138,899,244 | ) | ||||
| Net increase in net assets resulting from capital share transactions | 23,777,941 | 66,803,642 | ||||||
| Net increase (decrease) in net assets | (95,916,621 | ) | 106,588,428 | |||||
| NET ASSETS: | ||||||||
| Beginning of year | $ | 1,173,221,231 | $ | 1,066,632,803 | ||||
| End of year | $ | 1,077,304,610 | $ | 1,173,221,231 | ||||
| Undistributed net investment income(2) | $ | – | $ | – | ||||
| (1) | The SEC eliminated the requirement to disclose the source of distributions paid in 2018. For the year ended December 31, 2017, the source of distributions was net investment income $(47,823,337) and net realized gain $(11,266,291). |
| (2) | The SEC eliminated the requirement to disclose undistributed net investment income in 2018. For the year ended December 31, 2017, the undistributed net investment income was $110,404. |
| 46 | See Notes to Financial Statements. |
This page is intentionally left blank.
47
| Per Share Operating Performance: | ||||||||||||||||||||||||||||
| Investment operations: | Distributions to shareholders from: | |||||||||||||||||||||||||||
| Net asset value, beginning of period | Net invest- ment income(a) | Net realized and unrealized gain (loss) | Total from invest- ment operations | Net invest- ment income | Net realized gain | Total distributions | ||||||||||||||||||||||
| 12/31/2018 | $12.38 | $0.49 | $(0.99 | ) | $(0.50 | ) | $(0.53 | ) | $(0.27 | ) | $(0.80 | ) | ||||||||||||||||
| 12/31/2017 | 11.94 | 0.52 | 0.58 | 1.10 | (0.53 | ) | (0.13 | ) | (0.66 | ) | ||||||||||||||||||
| 12/31/2016 | 11.14 | 0.52 | 0.83 | 1.35 | (0.55 | ) | – | (0.55 | ) | |||||||||||||||||||
| 12/31/2015 | 11.89 | 0.47 | (0.65 | ) | (0.18 | ) | (0.49 | ) | (0.08 | ) | (0.57 | ) | ||||||||||||||||
| 12/31/2014 | 12.31 | 0.54 | (0.01 | ) | 0.53 | (0.61 | ) | (0.34 | ) | (0.95 | ) | |||||||||||||||||
| (a) | Calculated using average shares outstanding during the period. |
| (b) | Total return does not consider the effects of sales charges or other expenses imposed by an insurance company and assumes the reinvestment of all distributions. |
| 48 | See Notes to Financial Statements. |
| Ratios to Average Net Assets: | Supplemental Data: | |||||||||||||||||||||||||
| Net asset value, end of period | Total return(b) (%) | Total expenses after waivers and/or reimburse- ments (%) | Total expenses (%) | Net investment income (%) | Net assets, end of period (000) | Portfolio turnover rate (%) | ||||||||||||||||||||
| $11.08 | (4.02 | ) | 0.92 | 0.93 | 4.04 | $1,077,305 | 153 | |||||||||||||||||||
| 12.38 | 9.21 | 0.90 | 0.92 | 4.13 | 1,173,221 | 121 | ||||||||||||||||||||
| 11.94 | 12.13 | 0.90 | 0.93 | 4.41 | 1,066,633 | 120 | ||||||||||||||||||||
| 11.14 | (1.53 | ) | 0.90 | 0.94 | 3.91 | 978,129 | 116 | |||||||||||||||||||
| 11.89 | 4.35 | 0.90 | 0.93 | 4.26 | 913,108 | 90 | ||||||||||||||||||||
| See Notes to Financial Statements. | 49 |
| 1. | ORGANIZATION |
Lord Abbett Series Fund, Inc. (the “Company”) is registered under the Investment Company Act of 1940, as amended (the “Act”), as a diversified, open-end management investment company and was incorporated under Maryland law in 1989. The Company consists of twelve separate portfolios. This report covers Bond-Debenture Portfolio (the “Fund”).
The Fund’s investment objective is to seek high current income and the opportunity for capital appreciation to produce a high total return. The Fund has Variable Contract class shares (“Class VC Shares”), which are currently issued and redeemed only in connection with investments in, and payments under, variable annuity contracts and variable life insurance policies issued by life insurance and insurance-related companies.
The preparation of the financial statements in conformity with accounting principles generally accepted in the United States of America (“U.S. GAAP”) requires management to make certain estimates and assumptions that affect the reported amounts of assets and liabilities and disclosure of contingent assets and liabilities at the date of the financial statements and the reported amounts of increases and decreases in net assets from operations during the reporting period. Actual results could differ from those estimates. The Fund is considered an investment company under U.S. GAAP and follows the accounting and reporting guidance applicable to investment companies.
| 2. | SIGNIFICANT ACCOUNTING POLICIES |
| (a) | Investment Valuation–Under procedures approved by the Fund’s Board of Directors (the “Board”), Lord, Abbett & Co. LLC (“Lord Abbett”), the Fund’s investment manager, has formed a Pricing Committee to administer the pricing and valuation of portfolio investments and to ensure that prices utilized reasonably reflect fair value. Among other things, these procedures allow the Fund to utilize independent pricing services, quotations from securities and financial instrument dealers and other market sources to determine fair value. |
| Securities actively traded on any recognized U.S. or non-U.S. exchange or on The NASDAQ Stock Market LLC are valued at the last sale price or official closing price on the exchange or system on which they are principally traded. Events occurring after the close of trading on non-U.S. exchanges may result in adjustments to the valuation of foreign securities to reflect their fair value as of the close of regular trading on the New York Stock Exchange. The Fund may utilize an independent fair valuation service in adjusting the valuations of foreign securities. Unlisted equity securities are valued at the last quoted sale price or, if no sale price is available, at the mean between the most recently quoted bid and asked prices. Fixed income securities are valued based on evaluated prices supplied by independent pricing services, which reflect broker/dealer supplied valuations and the independent pricing services’ own electronic data processing techniques. Exchange traded options and futures contracts are valued at the last quoted sale price in the market where they are principally traded. If no sale has occurred, the mean between the most recently quoted bid and asked prices is used. Floating rate loans are valued at the average of bid and ask quotations obtained from dealers in loans on the basis of prices supplied by independent pricing services. Forward foreign currency exchange contracts are valued using daily forward exchange rates. Swaps are valued daily using independent pricing services or quotations from broker/dealers to the extent available. | |
| Securities for which prices are not readily available are valued at fair value as determined by the Pricing Committee. The Pricing Committee considers a number of factors, including observable and unobservable inputs, when arriving at fair value. The Pricing Committee may |
50
Notes to Financial Statements (continued)
| use related or comparable assets or liabilities, recent transactions, market multiples, book values, yield curves, broker quotes, observable trading activity, option adjusted spread models and other relevant information to determine the fair value of portfolio investments. The Board or a designated committee thereof regularly reviews fair value determinations made by the Pricing Committee and may employ techniques such as reviewing related market activity, reviewing inputs and assumptions, and retrospectively comparing prices of subsequent purchases and sales transactions to fair value determinations made by the Pricing Committee. | |
| Short-term securities with 60 days or less remaining to maturity are valued using the amortized cost method, which approximates fair value. | |
| (b) | Security Transactions–Security transactions are recorded as of the date that the securities are purchased or sold (trade date). Realized gains and losses on sales of portfolio securities are calculated using the identified-cost method. |
| (c) | Investment Income–Dividend income is recorded on the ex-dividend date. Interest income is recorded on the accrual basis as earned. Discounts are accreted and premiums are amortized using the effective interest method and are included in Interest and other income on the Statement of Operations. Withholding taxes on foreign dividends have been provided for in accordance with the applicable country’s tax rules and rates. |
| (d) | Income Taxes–It is the policy of the Fund to meet the requirements of Subchapter M of the Internal Revenue Code applicable to regulated investment companies and to distribute substantially all taxable income and capital gains to its shareholders. Therefore, no income tax provision is required. |
| The Fund files U.S. federal and various state and local tax returns. No income tax returns are currently under examination. The statute of limitations on the Fund’s filed U.S. federal tax returns remains open for the fiscal years ended December 31, 2015 through December 31, 2018. The statutes of limitations on the Company’s state and local tax returns may remain open for an additional year depending upon the jurisdiction. | |
| (e) | Expenses–Expenses incurred by the Company that do not specifically relate to an individual fund are generally allocated to the funds within the Company on a pro rata basis by relative net assets. |
| (f) | Foreign Transactions–The books and records of the Fund are maintained in U.S. dollars and transactions denominated in foreign currencies are recorded in the Fund’s records at the rate prevailing when earned or recorded. Asset and liability accounts that are denominated in foreign currencies are adjusted daily to reflect current exchange rates and any unrealized gain (loss) is included in Net change in unrealized appreciation/depreciation translation of assets and liabilities denominated in foreign currencies on the Fund’s Statement of Operations. The resultant exchange gains and losses upon settlement of such transactions are included in Net realized gain on foreign currency related transactions on the Fund’s Statement of Operations. The Fund does not isolate that portion of the results of operations arising as a result of changes in the foreign exchange rates from the changes in market prices of the securities. |
| The Fund uses foreign currency exchange contracts to facilitate transactions in foreign-denominated securities. Losses from these transactions may arise from changes in the value of the foreign currency or if the counterparties do not perform under the contracts’ terms. |
51
Notes to Financial Statements (continued)
| (g) | Forward Foreign Currency Exchange Contracts–The Fund may enter into forward foreign currency exchange contracts in order to reduce exposure to changes in foreign currency exchange rates on foreign portfolio holdings, or gain or reduce exposure to foreign currency solely for investment purposes. A forward foreign currency exchange contract is a commitment to purchase or sell a foreign currency at a future date at a negotiated rate. The contracts are valued daily at forward exchange rates and any unrealized gain (loss) is included in Net change in unrealized appreciation/depreciation on foreign currency exchange contracts on the Fund’s Statement of Operations. The gain (loss) arising from the difference between the U.S. dollar cost of the original contract and the value of the foreign currency in U.S. dollars upon closing of such contracts is included in Net realized gain on foreign currency exchange contracts on the Fund’s Statement of Operations. |
| (h) | Futures Contracts–The Fund may purchase and sell futures contracts to enhance returns, to attempt to economically hedge some of its investment risk, or as a substitute position in lieu of holding the underlying asset on which the instrument is based. At the time of entering into a futures transaction, an investor is required to deposit and maintain a specified amount of cash or eligible securities called “initial margin.” Subsequent payments made or received by the Fund called “variation margin” are made on a daily basis as the market price of the futures contract fluctuates. The Fund will record an unrealized gain (loss) based on the amount of variation margin. When a contract is closed, a realized gain (loss) is recorded equal to the difference between the opening and closing value of the contract. |
| (i) | When–Issued, Forward Transactions or To–Be–Announced (“TBA”) Transactions–The Fund may purchase portfolio securities on a when-issued or forward basis. When-issued, forward transactions or TBA transactions involve a commitment by a fund to purchase securities, with payment and delivery (“settlement”) to take place in the future, in order to secure what is considered to be an advantageous price or yield at the time of entering into the transaction. During the period between purchase and settlement, the fair value of the securities will fluctuate and assets consisting of cash and/or marketable securities (normally short-term U.S. Government or U.S. Government sponsored enterprise securities) marked to market daily in an amount sufficient to make payment at settlement will be segregated at the Fund’s custodian in order to pay for the commitment. At the time the Fund makes the commitment to purchase a security on a when-issued basis, it will record the transaction and reflect the liability for the purchase and fair value of the security in determining its net asset value (“NAV”). The Fund, generally, has the ability to close out a purchase obligation on or before the settlement date rather than take delivery of the security. Under no circumstances will settlement for such securities take place more than 120 days after the purchase date. |
| (j) | TBA Sale Commitments–The Fund may enter into TBA sale commitments to hedge its positions or to sell mortgage-backed securities it owns under delayed delivery arrangements. Proceeds of TBA sale commitments are not received until the contractual settlement date. During the time a TBA sale commitment is outstanding, equivalent deliverable securities, or an offsetting TBA purchase commitment deliverable on or before the sale commitment date, are held as “cover” for the transaction. Unsettled TBA sale commitments are valued at the current market value of the underlying securities, according to the procedures described under “Investment Valuation” above. The contract is adjusted to market value daily and the change in market value is recorded by the Fund as unrealized appreciation (depreciation). If the TBA sale (purchase) commitment is closed through the acquisition of an offsetting purchase (sale) |
52
Notes to Financial Statements (continued)
| commitment, the Fund realizes a gain or loss from the sale of the securities based upon the unit price established at the date the commitment was entered into. | |
| (k) | Mortgage Dollar Rolls–The Fund may enter into mortgage dollar rolls in which a Fund sells mortgage-backed securities for delivery in the current month and simultaneously contracts with the same counterparty to repurchase similar (same type, coupon and maturity) but not identical securities on a specified future date. During the roll period, the Fund loses the right to receive principal (including prepayments of principal) and interest paid on the securities sold. |
| (l) | Repurchase Agreements–The Fund may enter into repurchase agreements with respect to securities. A repurchase agreement is a transaction in which a fund acquires a security and simultaneously commits to resell that security to the seller (a bank or securities dealer) at an agreed-upon price on an agreed-upon date. The Fund requires at all times that the repurchase agreement be collateralized by cash, or by securities of the U.S. Government, its agencies, its instrumentalities, or U.S. Government sponsored enterprises having a value equal to, or in excess of, the value of the repurchase agreement (including accrued interest). If the seller of the agreement defaults on its obligation to repurchase the underlying securities at a time when the fair value of these securities has declined, the Fund may incur a loss upon disposition of the securities. |
| (m) | Credit Default Swaps–The Fund may enter into credit default swap contracts in order to hedge credit risk or for speculation purposes. As a seller of a credit default swap contract (“seller of protection”), the Fund is required to pay the notional amount or other agreed-upon value of a referenced debt obligation to the counterparty in the event of a default by or other credit event involving the referenced issuer, obligation or index. In return, the Fund receives from the counterparty a periodic stream of payments over the term of the contract. |
| As a purchaser of a credit default swap contract (“buyer of protection”), the Fund would receive the notional amount or other agreed upon value of a referenced debt obligation from the counterparty in the event of default by or other credit event involving the referenced issuer, obligation or index. In return, the Fund would make periodic payments to the counterparty over the term of the contracts, provided no event of default has occurred. | |
| These credit default swaps may have as a reference obligation corporate or sovereign issuers or credit indices. These credit indices are comprised of a basket of securities representing a particular sector of the market. | |
| Credit default swaps are fair valued based upon quotations from counterparties, brokers or market-makers and the change in value, if any, is recorded as an unrealized appreciation or depreciation. For a credit default swap sold by the Fund, payment of the agreed-upon amount made by the Fund in the event of default of the referenced debt obligation is recorded as the cost of the referenced debt obligation purchased/received. For a credit default swap purchased by the Fund, the agreed-upon amount received by the Fund in the event of default of the referenced debt obligation is recorded as proceeds from sale/delivery of the referenced debt obligation and the resulting gain or loss realized on the referenced debt obligation is recorded as such by the Fund. | |
| Any upfront payments made or received upon entering a credit default swap contract would be amortized or accreted over the life of the swap and recorded as realized gains or losses. Collateral, in the form of cash or securities, may be required to be held in segregated accounts with the custodian bank or broker in accordance with the swap agreement. The value and credit |
53
Notes to Financial Statements (continued)
| rating of each credit default swap where the Fund is the seller of protection, are both measures of the current payment/performance risk of the swap. As the value of the swap changes as a positive or negative percentage of the total notional amount, the payment/performance risk may decrease or increase, respectively. The maximum potential amount of future payments (undiscounted) that the Fund as a seller of protection could be required to make under a credit default swap agreement would be an amount equal to the notional amount of the agreement. These potential amounts would be partially offset by any recovery values of the respective referenced obligations, upfront payments received upon entering into the agreement, or net amounts received from the settlement of buy protection credit default swap agreements entered into by the Fund for the same referenced entity or entities. | |
| Entering into credit default swaps involves credit and market risk. Such risks involve the possibility that there will be no liquid market for these agreements, that the counterparty to the agreements may default on its obligation to perform or disagree as to the meaning of the contractual terms in the agreements, and that there may be unfavorable changes in interest rates, and that Lord Abbett does not correctly predict the creditworthiness of the issuers of the reference obligation on which the credit default swap is based. For the centrally cleared credit default swaps, there was minimal counterparty risk to the Fund, since such credit default swaps entered into were traded through a central clearinghouse, which guarantees against default. | |
| (n) | Total Return Swaps–The Fund may enter into total return swap agreements to obtain exposure to a security or market without owning such security or investing directly in that market. The Fund may agree to make payments that are the equivalent of interest in exchange for the right to receive payments equivalent to any appreciation in the value of an underlying security, index or other asset, as well as receive payments equivalent to any distributions made on that asset, over the term of the swap. If the value of the asset underlying a total return swap declines over the term of the swap, the Fund also may be required to pay an amount equal to that decline in value to their counterparty. |
| (o) | Floating Rate Loans–The Fund may invest in floating rate loans, which usually take the form of loan participations and assignments. Loan participations and assignments are agreements to make money available to U.S. or foreign corporations, partnerships or other business entities (the “Borrower”) in a specified amount, at a specified rate and within a specified time. A loan is typically originated, negotiated and structured by a U.S. or foreign bank, insurance company or other financial institution (the “Agent”) for a group of loan investors (“Loan Investors”). The Agent typically administers and enforces the loan on behalf of the other Loan Investors in the syndicate and may hold any collateral on behalf of the Loan Investors. Such loan participations and assignments are typically senior, secured and collateralized in nature. The Fund records an investment when the Borrower withdraws money and records interest as earned. These loans pay interest at rates which are periodically reset by reference to a base lending rate plus a spread. These base lending rates are generally the prime rate offered by a designated U.S. bank or London InterBank Offered Rate (“LIBOR”). |
| The loans in which the Fund invests may be subject to some restrictions on resale. For example, the Fund may be contractually obligated to receive approval from the Agent and/or Borrower prior to the sale of these investments. The Fund generally has no right to enforce compliance with the terms of the loan agreement with the Borrower. As a result, the Fund assumes the credit risk of the Borrower, the selling participant and any other persons interpositioned |
54
Notes to Financial Statements (continued)
| between the Fund and the Borrower (“Intermediate Participants”). In the event that the Borrower, selling participant or Intermediate Participants become insolvent or enter into bankruptcy, the Fund may incur certain costs and delays in realizing payment or may suffer a loss of principal and/or interest. | |
| Unfunded commitments represent the remaining obligation of the Fund to the Borrower. At any point in time, up to the maturity date of the issue, the Borrower may demand the unfunded portion. Until demanded by the Borrower, unfunded commitments are not recognized as an asset on the Statement of Assets and Liabilities. Unrealized appreciation/depreciation on unfunded commitments presented on the Statement of Assets and Liabilities represents mark to market of the unfunded portion of the Fund’s floating rate notes. As of December 31, 2018, the Fund had the following unfunded loan commitments: |
| Mavis Tire Express Service Corp. Delayed Draw Term Loan | $ | 195,583 | ||
| Energizer Holdings, Inc. Bridge Term Loan | 910,000 | |||
| Claire’s Store, Inc. Revolving Credit Term Loan | 42,005 | |||
| Total | $ | 1,147,588 |
| (p) | Fair Value Measurements–Fair value is defined as the price that the Fund would receive upon selling an investment or transferring a liability in an orderly transaction to an independent buyer in the principal or most advantageous market of the investment. A three-tier hierarchy is used to maximize the use of observable market data and minimize the use of unobservable inputs and to establish classification of fair value measurements for disclosure purposes. Inputs refer broadly to the assumptions that market participants would use in pricing the asset or liability, including assumptions about risk—for example, the risk inherent in a particular valuation technique used to measure fair value (such as a pricing model) and/or the risk inherent in the inputs to the valuation technique. Inputs may be observable or unobservable. Observable inputs reflect the assumptions market participants would use in pricing the asset or liability. Observable inputs are based on market data obtained from sources independent of the reporting entity. Unobservable inputs reflect the reporting entity’s own assumptions about the assumptions market participants would use in pricing the asset or liability. Unobservable inputs are based on the best information available in the circumstances. The three-tier hierarchy classification is determined based on the lowest level of inputs that is significant to the fair value measurement, and is summarized in the three broad Levels listed below: |
| · | Level 1 – | unadjusted quoted prices in active markets for identical investments; |
| · | Level 2 – | other significant observable inputs (including quoted prices for similar investments, interest rates, prepayment speeds, credit risk, etc.); and |
| · | Level 3 – | significant unobservable inputs (including the Fund’s own assumptions in determining the fair value of investments). |
| A summary of inputs used in valuing the Fund’s investments and other financial instruments as of December 31, 2018 and, if applicable, Level 1/Level 2 transfers and Level 3 rollforwards for the fiscal year then ended is included in the Fund’s Schedule of Investments. | |
| Changes in valuation techniques may result in transfers into or out of an assigned level within the three-tier hierarchy. All transfers between different levels within the three-tier hierarchy are deemed to have occurred as of the beginning of the reporting period. The inputs or methodology used for valuing securities are not necessarily an indication of the risk associated with investing in those securities. |
55
Notes to Financial Statements (continued)
| 3. | MANAGEMENT FEE AND OTHER TRANSACTIONS WITH AFFILIATES |
Management Fee
The Company has a management agreement with Lord Abbett, pursuant to which Lord Abbett supplies the Fund with investment management services and executive and other personnel, provides office space and pays for ordinary and necessary office and clerical expenses relating to research and statistical work and supervision of the Fund’s investment portfolio.
The management fee is based on the Fund’s average daily net assets at the following annual rate:
| First $1 billion | .50% |
| Over $1 billion | .45% |
For the fiscal year ended December 31, 2018, the effective management fee, net of waivers, was at an annualized rate of .49% of the Fund’s average daily net assets.
In addition, Lord Abbett provides certain administrative services to the Fund pursuant to an Administrative Services Agreement in return for a fee at an annual rate of .04% of the Fund’s average daily net assets.
For the period January 1, 2018 through April 30, 2018, Lord Abbett contractually agreed to waive its fees and reimburse expenses to the extent necessary to limit total net annual operating expenses to an annual rate of .90%. Effective May 1, 2018, Lord Abbett discontinued the agreement.
The Company, on behalf of the Fund, has entered into services arrangements with certain insurance companies. Under these arrangements, certain insurance companies will be compensated up to ..25% of the average daily NAV of the Fund’s Class VC Shares held in the insurance company’s separate account to service and maintain the Variable Contract owners’ accounts. This amount is included in Non 12b-1 service fees on the Statement of Operations. The Fund may also compensate certain insurance companies, third-party administrators and other entities for providing recordkeeping, sub-transfer agency and other administrative services to the Fund. This amount is included in Shareholder servicing on the Statement of Operations.
One Director and certain of the Company’s officers have an interest in Lord Abbett.
| 4. | DISTRIBUTIONS AND CAPITAL LOSS CARRYFORWARDS |
Dividends from net investment income, if any, are declared and paid at least semi-annually. Taxable net realized gains from investment transactions, reduced by allowable capital loss carryforwards, if any, are declared and distributed to shareholders at least annually. The capital loss carryforward amount, if any, is available to offset future net capital gains. Dividends and distributions to shareholders are recorded on the ex-dividend date. The amounts of dividends and distributions from net investment income and net realized capital gains are determined in accordance with federal income tax regulations, which may differ from U.S. GAAP. These book/tax differences are either considered temporary or permanent in nature. To the extent these differences are permanent in nature, such amounts are reclassified within the components of net assets based on their federal tax basis treatment; temporary differences do not require reclassification. Dividends and distributions that exceed earnings and profits for tax purposes are reported as a tax return of capital.
56
Notes to Financial Statements (continued)
The tax character of distributions paid during the fiscal years ended December 31, 2018 and 2017 was as follows:
| Year Ended 12/31/ 2018 | Year Ended 12/31/ 2017 | |||||||||
| Distributions paid from: | ||||||||||
| Ordinary income | $ | 56,836,725 | $ | 55,855,286 | ||||||
| Net long-term capital gains | 17,154,574 | 3,234,342 | ||||||||
| Total distributions paid | $ | 73,991,299 | $ | 59,089,628 | ||||||
As of December 31, 2018, the components of accumulated losses on a tax-basis were as follows:
| Undistributed ordinary income – net | $ | 129,379 | ||
| Total undistributed earnings | 129,379 | |||
| Temporary differences | (12,782,970 | ) | ||
| Unrealized losses – net | (48,474,406 | ) | ||
| Total accumulated losses – net | $ | (61,127,997 | ) |
At the Fund’s election, certain losses incurred within the taxable year (Qualified Late-Year Losses) are deemed to arise on the first business day of the Fund’s next taxable year. The Fund incurred and will elect to defer post-October capital losses of $12,624,467 during fiscal 2018.
As of December 31, 2018, the aggregate unrealized security gains and losses on investments and other financial instruments based on cost for U.S. federal income tax purposes were as follows:
| Tax cost | $ | 1,214,132,884 | ||
| Gross unrealized gain | 11,223,209 | |||
| Gross unrealized loss | (59,689,451 | ) | ||
| Net unrealized security loss | $ | (48,466,242 | ) |
The difference between book-basis and tax-basis unrealized gains (losses) is attributable to the tax treatment of certain securities, other financial instruments, amortization of premium and wash sales.
| 5. | PORTFOLIO SECURITIES TRANSACTIONS |
Purchases and sales of investment securities (excluding short-term investments) for the fiscal year ended December 31, 2018 were as follows:
| U.S. Government Purchases | Non-U.S. Government Purchases | U.S. Government Sales | Non-U.S. Government Sales | |||||||||||
| $641,629,453 | $1,212,749,281 | $535,714,604 | $1,239,483,015 |
The Fund is permitted to purchase and sell securities (“cross-trade”) from and to other Lord Abbett funds or client accounts pursuant to procedures approved by the Board in compliance with Rule 17a-7 under the Act (the “Rule”). Each cross-trade is executed at a fair market price in compliance with provisions of the Rule. For the fiscal year ended December 31, 2018, the Fund engaged in cross-trades purchases of $1,187,066 and sales of $12,251,425, which resulted in net realized gains of $246,863.
57
Notes to Financial Statements (continued)
| 6. | DISCLOSURES ABOUT DERIVATIVE INSTRUMENTS AND HEDGING ACTIVITIES |
The Fund entered into forward foreign currency exchange contracts for the fiscal year ended December 31, 2018 (as described in note 2(g)). A forward foreign currency exchange contract reduces the Fund’s exposure to changes in the value of the currency it will deliver (or settle in cash) and increases its exposure to changes in the value of the currency it will receive (or settle in cash) for the duration of the contract. The Fund’s use of forward foreign currency exchange contracts involves the risk that Lord Abbett will not accurately predict currency movements, and the Fund’s returns could be reduced as a result. Forward foreign currency exchange contracts are subject to the risk that those currencies will decline in value relative to the U.S. dollar, or, in the case of hedged positions, that the U.S. dollar will decline relative to the currency being hedged. Currency rates in foreign countries may fluctuate significantly over short periods of time. The Fund’s risk of loss from counterparty credit risk is the unrealized appreciation on forward foreign currency exchange contracts and deposits with brokers as collateral.
The Fund entered into U.S. Treasury futures contracts for the fiscal year ended December 31, 2018 (as described in note 2(h)) to economically hedge against changes in interest rates. The Fund bears the risk of interest rates moving unexpectedly, in which case the Fund may not achieve the anticipated benefits of the futures contracts and realize a loss. There is minimal counterparty credit risk to the Fund since futures are exchange traded and the exchange’s clearinghouse, as counterparty to all exchange traded futures, guarantees futures against default.
The Fund entered into credit default swaps for the fiscal year ended December 31, 2018 (as described in note 2(m)) to economically hedge credit risk. Credit default swaps involve the exchange of a fixed rate premium for protection against the loss in value of an underlying security within the index in the event of a defined credit event, such as payment default or bankruptcy. Under a credit default swap one party acts as a guarantor by receiving the fixed periodic payment in exchange for the commitment to purchase the underlying security at par if the defined credit event occurs. The Fund’s maximum risk of loss from counterparty risk, either as the protection seller or as the protection buyer, is the fair value of the contract. For the centrally cleared credit default swaps, there is minimal counterparty credit risk to the Fund since these credit default swaps are traded through a central clearinghouse. As a counterparty to all centrally cleared credit default swaps, the clearinghouse guarantees credit default swaps against default.
As of December 31, 2018, the Fund had the following derivatives at fair value, grouped into appropriate risk categories that illustrate the Fund’s use of derivative instruments:
| Asset Derivatives | Interest Rate Contracts | Foreign Currency Contracts | Credit Contracts | Equity Contracts | ||||||||||||
| Centrally Cleared Credit Default Swaps Contracts(1) | – | – | $ | 694,021 | – | |||||||||||
| Total Return Swap Contracts(2) | – | – | – | $ | 84,362 | |||||||||||
| Forward Foreign Currency Exchange Contracts(3) | – | $ | 4,461 | – | – | |||||||||||
| Futures Contracts(4) | $ | 2,718,666 | – | – | – | |||||||||||
58
Notes to Financial Statements (continued)
| Liability Derivatives | Interest Rate Contracts | Foreign Currency Contracts | Credit Contracts | Equity Contracts | ||||||||||||
| Credit Default Swap Contracts(5) | – | – | $ | 4,537,700 | – | |||||||||||
| Forward Foreign Currency Exchange Contracts(6) | – | $ | 225,064 | – | – | |||||||||||
| Futures Contracts(4) | $ | 5,277,572 | – | – | – | |||||||||||
| (1) | Statement of Assets and Liabilities location: Includes cumulative unrealized appreciation/depreciation of centrally cleared swap contracts as reported in the Schedule of Investments. Only current day’s variation margin is reported within the Statement of Assets and Liabilities. |
| (2) | Statement of Assets and Liabilities location: Total Return Swap, at fair value. |
| (3) | Statement of Assets and Liabilities location: Unrealized appreciation on forward foreign currency exchange contracts. |
| (4) | Statement of Assets and Liabilities location: Includes cumulative unrealized appreciation/depreciation of futures contracts as reported in the Schedule of Investment. Only current day’s variation margin is reported within the Statement of Assets and Liabilities. |
| (5) | Statement of Assets and Liabilities location: Credit default swap agreements payable, at fair value. |
| (6) | Statement of Assets and Liabilities location: Unrealized depreciation on forward foreign currency exchange contracts. |
Transactions in derivative instruments for the fiscal year ended December 31, 2018, were as follows:
| Interest Rate Contracts | Foreign Currency Contracts | Credit Contracts | Equity Contracts | |||||||||||||
| Net Realized Gain (Loss) | ||||||||||||||||
| Credit Default Swaps Contracts(1) | – | – | $ | (118,170 | ) | – | ||||||||||
| Forward Foreign Currency Exchange Contracts(2) | – | $ | 1,530,860 | – | – | |||||||||||
| Futures Contracts(3) | $ | 7,364,043 | – | – | – | |||||||||||
| Net Change in Unrealized Appreciation/Depreciation | ||||||||||||||||
| Credit Default Swaps Contracts(4) | – | – | $ | 628,835 | – | |||||||||||
| Total Return Swap(4) | – | – | – | $ | 84,362 | |||||||||||
| Forward Foreign Currency Exchange Contracts(5) | – | $ | 105,625 | – | – | |||||||||||
| Futures Contracts(6) | $ | (2,177,820 | ) | – | – | – | ||||||||||
| Average Number of Contracts/Notional Amounts* | ||||||||||||||||
| Credit Default Swaps Contracts(7) | – | – | $ | 193,526,078 | – | |||||||||||
| Total Return Swap Contracts(7) | – | – | $ | 592,308 | ||||||||||||
| Forward Foreign Currency Exchange Contracts(7) | – | $ | 37,313,934 | – | – | |||||||||||
| Futures Contracts(8) | 3,115 | – | – | – | ||||||||||||
| * | Calculated based on the number of contracts or notional amounts for the year ended December 31, 2018. |
| (1) | Statements of Operations location: Net realized loss on swap contracts. |
| (2) | Statements of Operations location: Net realized gain on foreign currency exchange contracts. |
| (3) | Statements of Operations location: Net realized gain on futures contracts. |
| (4) | Statements of Operations location: Net change in unrealized appreciation/depreciation on swap contracts. |
| (5) | Statements of Operations location: Net change in unrealized appreciation/depreciation on foreign currency exchange contracts. |
| (6) | Statements of Operations location: Net change in unrealized appreciation/depreciation on futures contracts. |
| (7) | Amount represents notional amounts in U.S. dollars. |
| (8) | Amount represents number of contracts. |
59
Notes to Financial Statements (continued)
| 7. | DISCLOSURES ABOUT OFFSETTING ASSETS AND LIABILITIES |
The Financial Accounting Standards Board (“FASB”) requires disclosures intended to help better assess the effect or potential effect of offsetting arrangements on a fund’s financial position. The following tables illustrate gross and net information about recognized assets and liabilities eligible for offset in the statement of assets and liabilities; and disclose such amounts subject to an enforceable master netting agreement or similar agreement, by counterparty. A master netting agreement is an agreement between a fund and a counterparty which provides for the net settlement of amounts owed under all contracts traded under that agreement, as well as cash collateral, through a single payment by one party to the other in the event of default on or termination of any one contract. The Fund’s accounting policy with respect to balance sheet offsetting is that, absent an event of default by the counterparty or a termination of the agreement, the master netting agreement does not result in an offset of reported amounts of financial assets and liabilities in the statement of assets and liabilities across transactions between the Fund and the applicable counterparty:
| Description | Gross Amounts of Recognized Assets | Gross Amounts Offset in the Statement of Assets and Liabilities | Net Amounts of Assets Presented in the Statement of Assets and Liabilities | |||||||||
| Forward Foreign Currency Exchange Contracts | $ 4,461 | $ – | $ 4,461 | |||||||||
| Repurchase Agreements | 25,403,742 | – | 25,403,742 | |||||||||
| Total Return Swap Contracts | 84,362 | – | 84,362 | |||||||||
| Total | $25,492,565 | $ – | $25,492,565 | |||||||||
| Net Amounts | ||||||||||||||||||||
| of Assets | Amounts Not Offset in the | |||||||||||||||||||
| Presented in | Statement of Assets and Liabilities | |||||||||||||||||||
| Counterparty | the Statement of Assets and Liabilities | Financial Instruments | Cash Collateral Received(a) | Securities Collateral Received(a) | Net Amount(b) | |||||||||||||||
| Fixed Income Clearing Corp. | $25,403,742 | $ – | $ – | $(25,403,742 | ) | $ – | ||||||||||||||
| Goldman Sachs | 51,647 | (51,647 | ) | – | – | – | ||||||||||||||
| J.P. Morgan Chase | 21,914 | (21,914 | ) | – | – | – | ||||||||||||||
| Morgan Stanley | 12,827 | (12,827 | ) | – | – | – | ||||||||||||||
| Toronto Dominion Bank | 2,435 | (2,435 | ) | – | – | – | ||||||||||||||
| Total | $25,492,565 | $(88,823 | ) | $ – | $(25,403,742 | ) | $ – | |||||||||||||
| Description | Gross Amounts of Recognized Liabilities | Gross Amounts Offset in the Statement of Assets and Liabilities | Net Amounts of Liabilities Presented in the Statement of Assets and Liabilities | |||||||||
| Credit Default Swap Contracts | $4,537,700 | $ – | $4,537,700 | |||||||||
| Forward Foreign Currency Exchange Contracts | 225,064 | – | 225,064 | |||||||||
| Total | $4,762,764 | $ – | $4,762,764 | |||||||||
60
Notes to Financial Statements (continued)
| Net Amounts | ||||||||||||||||||||
| of Liabilities | Amounts Not Offset in the | |||||||||||||||||||
| Presented in | Statement of Assets and Liabilities | |||||||||||||||||||
| Counterparty | the Statement of Assets and Liabilities | Financial Instruments | Cash Collateral Pledged(a) | Securities Collateral Pledged(a) | Net Amount(c) | |||||||||||||||
| Credit Suisse | $ 793,347 | $ – | $ – | $ – | $ 793,347 | |||||||||||||||
| Deutsche Bank | 611,842 | – | – | – | 611,842 | |||||||||||||||
| Goldman Sachs | 551,040 | (51,647 | ) | – | – | 499,393 | ||||||||||||||
| J.P. Morgan Chase | 100,829 | (21,914 | ) | – | – | 78,915 | ||||||||||||||
| Morgan Stanley | 2,480,642 | (12,827 | ) | (2,467,815 | ) | – | – | |||||||||||||
| State Street Bank and Trust | 72,609 | – | – | – | 72,609 | |||||||||||||||
| Toronto Dominion Bank | 152,455 | (2,435 | ) | – | – | 150,020 | ||||||||||||||
| Total | $4,762,764 | $(88,823 | ) | $(2,467,815 | ) | $ – | $2,206,126 | |||||||||||||
| (a) | Collateral disclosed is limited to an amount not to exceed 100% of the net amount of assets (liabilities) presented in the Statement of Assets and Liabilities, for each respective counterparty. |
| (b) | Net amount represents the amount owed to the Fund by the counterparty as of December 31, 2018. |
| (c) | Net amount represents the amount owed by the Fund to the counterparty as of December 31, 2018. |
| 8. | DIRECTORS’ REMUNERATION |
The Company’s officers and one Director, who are associated with Lord Abbett, do not receive any compensation from the Company for serving in such capacities. Independent Directors’ fees are allocated among all Lord Abbett-sponsored funds based on the net assets of each fund. There is an equity-based plan available to all Independent Directors under which Independent Directors must defer receipt of a portion of, and may elect to defer receipt of an additional portion of Directors’ fees. The deferred amounts are treated as though equivalent dollar amounts had been invested in the funds. Such amounts and earnings accrued thereon are included in Directors’ fees on the Statement of Operations and in Directors’ fees payable on the Statement of Assets and Liabilities and are not deductible for U.S. federal income tax purposes until such amounts are paid.
| 9. | EXPENSE REDUCTIONS |
The Company has entered into an arrangement with its transfer agent and custodian, whereby credits realized as a result of uninvested cash balances are used to reduce a portion of the Fund’s expenses.
| 10. | LINE OF CREDIT |
During the period ended August 8, 2018, the Fund and certain other funds managed by Lord Abbett (collectively, the “Participating Funds”) participated in a syndicated line of credit facility with various lenders for $600 million (the “Facility”), whereas State Street Bank and Trust Company (“SSB”) participates as a lender and as agent for the lenders. The Facility is to be used for temporary or emergency purposes as an additional source of liquidity to satisfy redemptions. The Participating Funds are subject to graduated borrowing limits of one-third of Fund assets (if Fund assets are less than $750 million), $250 million, $300 million, or $350 million, based on past borrowings and likelihood of future borrowings. During the period ended August 8, 2018, the Fund did not utilize the Facility.
For the period August 9, 2018 through December 20, 2018, the Participating Funds entered into an amended syndicated line of credit facility with various lenders for $1.06 billion (the “Syndicated Facility”), whereas SSB participates as a lender and as agent for the lenders. Under the Syndicated
61
Notes to Financial Statements (continued)
Facility, the Participating Funds are subject to graduated borrowing limits of one-third of Fund assets (if Fund assets are less than $750 million), $250 million, $300 million, $350 million, or $1 billion, based on past borrowings and likelihood of future borrowings. Effective December 21, 2018, the Participating Funds entered into an amended Syndicated Facility with various lenders for $1.1 billion based on the same terms as described above.
Effective August 9, 2018, the Participating Funds entered into an additional line of credit facility with SSB for $250 million (the “Bilateral Facility,” and together with the Syndicated Facility, the “Facilities”). Under the Bilateral Facility, each Participating Fund may borrow up to the lesser of $250 million or one-third of Fund assets. The Facilities are to be used for temporary or emergency purposes to satisfy redemption requests and manage liquidity.
For the period from August 9, 2018 through December 31, 2018, the Fund did not utilize the Facilities.
| 11. | INTERFUND LENDING PROGRAM |
Pursuant to an exemptive order issued by the U.S. Securities and Exchange Commission (“SEC exemptive order”), certain registered open-end management investment companies managed by Lord Abbett, including the Fund, participate in a joint lending and borrowing program (the “Interfund Lending Program”). The SEC exemptive order allows the Funds to borrow money from and lend money to each other for temporary or emergency purposes subject to the limitations and conditions.
During the fiscal year ended December 31, 2018, the Fund did not participate as a borrower or lender in the Interfund Lending Program.
| 12. | CUSTODIAN AND ACCOUNTING AGENT |
SSB is the Company’s custodian and accounting agent. SSB performs custodial, accounting and recordkeeping functions relating to portfolio transactions and calculating the Fund’s NAV.
| 13. | INVESTMENT RISKS |
The Fund is subject to the general risks and considerations associated with investing in debt securities and to the changing prospects of individual companies and/or sectors in which the Fund invests. The value of an investment will change as interest rates fluctuate and in response to market movements. When interest rates rise, the prices of debt securities are likely to decline; when rates fall, such prices tend to rise. Longer-term debt securities are usually more sensitive to interest rate changes. There is also the risk that an issuer of a debt security will fail to make timely payments of principal or interest to the Fund, a risk that is greater with high-yield securities (sometimes called “lower-rated bonds” or “junk bonds”) in which the Fund may substantially invest. Some issuers, particularly of high-yield securities, may default as to principal and/or interest payments after the Fund purchases its securities. A default, or concerns in the market about an increase in risk of default, may result in losses to the Fund. High-yield securities are subject to greater price fluctuations, as well as additional risks. The market for below investment grade securities may be less liquid, which may make such securities more difficult to sell at an acceptable price, especially during periods of financial distress, increased market volatility, or significant market decline.
The Fund is subject to the risk of investing in securities issued or guaranteed by the U.S. Government or its agencies and instrumentalities (such as the Government National Mortgage Association (“Ginnie Mae”), the Federal National Mortgage Association (“Fannie Mae”), or the
62
Notes to Financial Statements (continued)
Federal Home Loan Mortgage Corporation (“Freddie Mac”)). Unlike Ginnie Mae securities, securities issued or guaranteed by U.S. Government-related organizations such as Fannie Mae and Freddie Mac are not backed by the full faith and credit of the U.S. Government and no assurance can be given that the U.S. Government would provide financial support to its agencies and instrumentalities if not required to do so by law. Consequently, the Fund may be required to look principally to the agency issuing or guaranteeing the obligation.
The asset backed securities and mortgage-related securities in which the Fund may invest may be particularly sensitive to changes in prevailing interest rates and economic conditions, including delinquencies and/or defaults. These changes can affect the value, income and/or liquidity of such positions. When interest rates are declining, the value of these securities with prepayment features may not increase as much as other fixed income securities. Early principal repayment may deprive the Fund of income payments above current market rates. Alternatively, rising interest rates may cause prepayments to occur at a slower-than-expected rate, extending the duration of a security and typically reducing its value. The payment rate will thus affect the price and volatility of a mortgage-related security. In addition, the Fund may invest in non-agency asset backed and mortgage-related securities, which are issued by private institutions, not by government sponsored enterprises.
The Fund may invest up to 20% of its net assets in equity securities, the value of which fluctuates in response to movements in the equity securities market in general, changing prospects of individual companies in which the Fund invests, or an individual company’s financial condition.
The Fund may invest in convertible securities, which have both equity and fixed income risk characteristics, including market, credit, liquidity, and interest rate risks. Generally, convertible securities offer lower interest or dividend yields than non-convertible securities of similar quality and less potential for gains or capital appreciation in a rising equity securities market than equity securities. They tend to be more volatile than other fixed income securities, and the market for convertible securities may be less liquid than the markets for stocks or bonds. A significant portion of convertible securities have below investment grade credit ratings and are subject to increased credit and liquidity risks.
Due to the Fund’s investment exposure to foreign companies and American Depositary Receipts, the Fund may experience increased market, industry and sector, liquidity, currency, political, information and other risks. The securities of foreign companies also may be subject to inadequate exchange control regulations, the imposition of economic sanctions or other government restrictions, higher transaction and other costs, and delays in settlement to the extent they are traded on non-U.S. exchanges or markets.
The Fund is subject to the risks associated with derivatives, which may be different from and greater than the risks associated with directly investing in securities. Derivatives may be subject to risks such as liquidity risk, leveraging risk, interest rate risk, market risk, and credit risk. Illiquid securities may lower the Fund’s returns since the Fund may be unable to sell these securities at their desired time or price. Derivatives also may involve the risk of mispricing or improper valuation and the risk that changes in the value of the derivative may not correlate perfectly with the value of the underlying asset, rate or index. Whether the Fund’s use of derivatives is successful will depend on, among other things, the Fund’s ability to correctly forecast market movements and other factors. If the Fund incorrectly forecasts these and other factors, the Fund’s performance could suffer. The Fund’s use of derivatives could result in a loss exceeding the amount of the Fund’s investment in these instruments.
63
Notes to Financial Statements (concluded)
The Fund may invest up to 15% of its net assets in floating rate or adjustable rate senior loans, including bridge loans, novations, assignments, and participations, which are subject to increased credit and liquidity risks. Senior loans are business loans made to borrowers that may be U.S. or foreign corporations, partnerships or other business entities. The senior loans in which the Fund invests may consist primarily of senior loans that are rated below investment grade or, if unrated, deemed by Lord Abbett to be equivalent to below investment grade securities. Below investment grade senior loans, as in the case of high-yield debt securities, or junk bonds, are usually more credit sensitive than interest rate sensitive, although the value of these instruments may be impacted by broader interest rate swings in the overall fixed income market. Below investment grade senior loans may be affected by interest rate swings in the overall fixed income market. In addition, senior loans may be subject to structural subordination.
These factors can affect the Fund’s performance.
| 14. | SUMMARY OF CAPITAL TRANSACTIONS |
Transactions in shares of capital stock were as follows:
| Year Ended | Year Ended | |||||||
| December 31, 2018 | December 31, 2017 | |||||||
| Shares sold | 10,012,434 | 11,707,991 | ||||||
| Reinvestment of distributions | 6,608,633 | 4,788,463 | ||||||
| Shares reacquired | (14,182,529 | ) | (11,090,027 | ) | ||||
| Increase | 2,438,538 | 5,406,427 | ||||||
64
Report of Independent Registered Public Accounting Firm
To the shareholders and the Board of Directors of Lord Abbett Series Fund, Inc.:
Opinion on the Financial Statements and Financial Highlights
We have audited the accompanying statement of assets and liabilities, including the schedule of investments, of the Bond Debenture Portfolio, one of the portfolios constituting the Lord Abbett Series Fund, Inc. (the “Fund”), as of December 31, 2018, the related statement of operations for the year then ended, the statements of changes in net assets for each of the two years in the period then ended, the financial highlights for each of the five years in the period then ended, and the related notes. In our opinion, the financial statements and financial highlights present fairly, in all material respects, the financial position of the Bond Debenture Portfolio of the Fund as of December 31, 2018, and the results of its operations for the year then ended, the changes in its net assets for each of the two years in the period then ended, and the financial highlights for each of the five years in the period then ended in conformity with accounting principles generally accepted in the United States of America.
Basis for Opinion
These financial statements and financial highlights are the responsibility of the Fund’s management. Our responsibility is to express an opinion on the Fund’s financial statements and financial highlights based on our audits. We are a public accounting firm registered with the Public Company Accounting Oversight Board (United States) (PCAOB) and are required to be independent with respect to the Fund in accordance with the U.S. federal securities laws and the applicable rules and regulations of the Securities and Exchange Commission and the PCAOB.
We conducted our audits in accordance with the standards of the PCAOB. Those standards require that we plan and perform the audit to obtain reasonable assurance about whether the financial statements and financial highlights are free of material misstatement, whether due to error or fraud. The Fund is not required to have, nor were we engaged to perform, an audit of its internal control over financial reporting. As part of our audits we are required to obtain an understanding of internal control over financial reporting but not for the purpose of expressing an opinion on the effectiveness of the Fund’s internal control over financial reporting. Accordingly, we express no such opinion.
Our audits included performing procedures to assess the risks of material misstatement of the financial statements and financial highlights, whether due to error or fraud, and performing procedures that respond to those risks. Such procedures included examining, on a test basis, evidence regarding the amounts and disclosures in the financial statements and financial highlights. Our audits also included evaluating the accounting principles used and significant estimates made by management, as well as evaluating the overall presentation of the financial statements and financial highlights. Our procedures included confirmation of securities owned as of December 31, 2018, by correspondence with the custodian and brokers; when replies were not received from brokers, we performed other auditing procedures. We believe that our audits provide a reasonable basis for our opinion.
DELOITTE & TOUCHE LLP
New York, New York
February 15, 2019
We have served as the auditor of one or more Lord Abbett Family of Funds’ investment companies since 1932.
65
Basic Information About Management
The Board is responsible for the management of the business and affairs of the Company in accordance with the laws of the State of Maryland. The Board elects officers who are responsible for the day-to-day operations of the Fund and who execute policies authorized by the Board. The Board also approves an investment adviser to the Fund and continues to monitor the cost and quality of the services the investment adviser provides, and annually considers whether to renew the contract with the adviser. Generally, each Director holds office until his/her successor is elected and qualified or until his/her earlier resignation or removal, as provided in the Company’s organizational documents.
Lord Abbett, a Delaware limited liability company, is the Fund’s investment adviser. Designated Lord Abbett personnel are responsible for the day-to-day management of the Fund.
Interested Directors
Mr. Sieg is affiliated with Lord Abbett and is an “interested person” of the Company as defined in the Act. Mr. Sieg is director/trustee of each of the 13 investment companies in the Lord Abbett Family of Funds, which consist of 62 portfolios or series. Mr. Sieg is an officer of the Lord Abbett Family of Funds.
| Name, Address and Year of Birth | Current Position and Length of Service with the Company | Principal Occupation and Other Directorships During the Past Five Years | ||
| Douglas B. Sieg Lord, Abbett & Co. LLC 90 Hudson Street Jersey City, NJ 07302 (1969) | Director since 2016; President and Chief Executive Officer since 2018 | Principal Occupation:Managing Partner (since 2018) and was formerly Head of Client Services, joined Lord Abbett in 1994.
Other Directorships:None.
|
Independent Directors
The following Independent Directors also are directors/trustees of each of the 13 investment companies in the Lord Abbett Family of Funds, which consist of 62 portfolios or series.
| Name, Address and Year of Birth | Current Position and Length of Service with the Company | Principal Occupation and Other Directorships During the Past Five Years | ||
| Eric C. Fast Lord, Abbett & Co. LLC c/o Legal Dept. 90 Hudson Street Jersey City, NJ 07302 (1949) | Director since 2014 | Principal Occupation:Chief Executive Officer of Crane Co., an industrial products company (2001–2014).
Other Directorships:Currently serves as director of Automatic Data Processing, Inc. (since 2007) and Regions Financial Corporation (since 2010). Previously served as a director of Crane Co. (1999–2014). | ||
| Evelyn E. Guernsey Lord, Abbett & Co. LLC c/o Legal Dept. 90 Hudson Street Jersey City, NJ 07302 (1955) | Director since 2011 | Principal Occupation:CEO, Americas of J.P. Morgan Asset Management (2004–2010).
Other Directorships:None.
|
66
Basic Information About Management (continued)
| Name, Address and Year of Birth | Current Position and Length of Service with the Company | Principal Occupation and Other Directorships During the Past Five Years | ||
| Julie A. Hill Lord, Abbett & Co. LLC c/o Legal Dept. 90 Hudson Street Jersey City, NJ 07302 (1946) | Director since 2004 | Principal Occupation:Owner and CEO of The Hill Company, a business consulting firm (since 1998).
Other Directorships:Currently serves as director of Anthem, Inc., a health benefits company (since 1994). | ||
| Kathleen M. Lutito Lord, Abbett & Co. LLC c/o Legal Dept. 90 Hudson Street Jersey City, NJ 07302 (1963) | Director since 2017 | Principal Occupation:President and Chief Investment Officer of CenturyLink Investment Management Company (since 2006).
Other Directorships:None | ||
| James M. McTaggart Lord, Abbett & Co. LLC c/o Legal Dept. 90 Hudson Street Jersey City, NJ 07302 (1947) | Director since 2012 | Principal Occupation:Independent management advisor and consultant (since 2012); Vice President, CRA International, Inc. (doing business as Charles River Associates), a global management consulting firm (2009–2012); Founder and Chairman of Marakon Associates, Inc., a strategy consulting firm (1978–2009); and Officer and Director of Trinsum Group, a holding company (2007–2009).
Other Directorships:Blyth, Inc., a home products company (2004–2015). | ||
| Karla M. Rabusch Lord, Abbett & Co. LLC c/o Legal Dept. 90 Hudson Street Jersey City, NJ 07302 (1959) | Director since 2017 | Principal Occupation:President and Director of Wells Fargo Funds Management, LLC (2003–2017); President of Wells Fargo Funds (2003–2016).
Other Directorships:None. | ||
| Mark A. Schmid Lord, Abbett & Co. LLC c/o Legal Dept. 90 Hudson Street Jersey City, NJ 07302 (1959) | Director since 2016 | Principal Occupation:Vice President and Chief Investment Officer of the University of Chicago (since 2009). Other Directorships:None. | ||
| James L.L. Tullis Lord, Abbett & Co. LLC c/o Legal Dept. 90 Hudson Street Jersey City, NJ 07302 (1947) | Director since 2006; Chairman since 2017 | Principal Occupation:CEO of Tullis-Dickerson and Co. Inc., a venture capital management firm (since 1990); CEO of Tullis Health Investors Inc. (since 2012). Other Directorships:Currently serves as director of Crane Co. (since 1998). |
Officers
None of the officers listed below have received compensation from the Company. All of the officers of the Company also may be officers of the other Lord Abbett Funds and maintain offices at 90 Hudson Street, Jersey City, NJ 07302. Unless otherwise indicated, the position(s) and title(s) listed under the “Principal Occupation During the Past Five Years” column indicate each officer’s position(s) and title(s) with Lord Abbett. Each officer serves for an indefinite term (i.e., until his or her death, resignation, retirement, or removal).
67
Basic Information About Management (continued)
| Name and Year of Birth | Current Position with the Company | Length of Service of Current Position | Principal Occupation During the Past Five Years | |||
| Douglas B. Sieg (1969) | President and Chief Executive Officer | Elected as President and Chief Executive Officer in 2018 | Managing Partner of Lord Abbett (since 2018) and was formerly Head of Client Services, joined Lord Abbett in 1994. | |||
| Jeff D. Diamond (1960) | Executive Vice President | Elected in 2008 | Portfolio Manager, joined Lord Abbett in 2007. | |||
| Todd D. Jacobson (1966) | Executive Vice President | Elected in 2005 | Partner and Associate Director, joined Lord Abbett in 2003. | |||
| Robert A. Lee (1969) | Executive Vice President | Elected in 2010 | Partner and Chief Investment Officer, and was formerly Deputy Chief Investment Officer and Director of Taxable Fixed Income, joined Lord Abbett in 1997. | |||
| David J. Linsen (1974) | Executive Vice President | Elected in 2008 | Partner and Director of Equities, joined Lord Abbett in 2001. | |||
| Vincent J. McBride (1964) | Executive Vice President | Elected in 2010 | Partner and Director, joined Lord Abbett in 2003. | |||
| Andrew H. O’Brien (1973) | Executive Vice President | Elected in 2010 | Partner and Portfolio Manager, joined Lord Abbett in 1998. | |||
| F. Thomas O’Halloran (1955) | Executive Vice President | Elected in 2010 | Partner and Portfolio Manager, joined Lord Abbett in 2001. | |||
| Marc Pavese (1972) | Executive Vice President | Elected in 2016 | Partner and Portfolio Manager, joined Lord Abbett in 2008. | |||
| Walter H. Prahl (1958) | Executive Vice President | Elected in 2012 | Partner and Director, joined Lord Abbett in 1997. | |||
| Eli Rabinowich (1975) | Executive Vice President | Elected in 2018 | Portfolio Manager, joined Lord Abbett in 2018 and was formerly a Portfolio Manager, Partner, and Analyst at Pzena Investment Management from (2004–2018). |
68
Basic Information About Management (continued)
| Name and Year of Birth | Current Position with the Company | Length of Service of Current Position | Principal Occupation During the Past Five Years | |||
| Jeffrey Rabinowitz (1972) | Executive Vice President | Elected in 2017 | Portfolio Manager, joined Lord Abbett in 2017 and was formerly Managing Director and Portfolio Manager/Technology Analyst at Jennison Associates LLC (2014–2017) and Managing Director and Portfolio Manager/ Technology Analyst for U.S. Growth Equity at Goldman Sachs Asset Management (1999–2014). | |||
| Steven F. Rocco (1979) | Executive Vice President | Elected in 2014 | Partner and Director of Taxable Fixed Income, joined Lord Abbett in 2004. | |||
| A. Edward Allinson (1961) | Vice President | Elected in 2011 | Portfolio Manager, joined Lord Abbett in 2005. | |||
| Vernon T. Bice (1974) | Vice President | Elected in 2011 | Portfolio Manager, joined Lord Abbett in 2011. | |||
| Pamela P. Chen (1978) | Vice President, Assistant Secretary and Privacy Officer | Elected in 2018 | Associate General Counsel, joined Lord Abbett in 2017 and was formerly Special Counsel at Schulte, Roth & Zabel LLP (2005–2017). | |||
| Robert S. Clark (1975) | Vice President | Elected in 2018 | Portfolio Manager, joined Lord Abbett in 2010. | |||
| Matthew R. DeCicco (1977) | Vice President | Elected in 2003 | Managing Director and Portfolio Manager, joined Lord Abbett in 1999. | |||
| John T. Fitzgerald (1975) | Vice President and Assistant Secretary | Elected in 2018 | Deputy General Counsel, joined Lord Abbett in 2018 and was formerly Deputy Head of U.S. Funds Legal, Executive Director and Assistant General Counsel at JPMorgan Chase (2005–2018). | |||
| Christopher J. Gizzo (1986) | Vice President | Elected in 2018 | Managing Director and Portfolio Manager, joined Lord Abbett in 2008. | |||
| Bernard J. Grzelak (1971) | Chief Financial Officer and Vice President | Elected in 2017 | Partner, Chief Operating Officer, Global Funds and Risk, joined Lord Abbett in 2003. |
69
Basic Information About Management (concluded)
| Name and Year of Birth | Current Position with the Company | Length of Service of Current Position | Principal Occupation During the Past Five Years | |||
| Linda Y. Kim (1980) | Vice President and Assistant Secretary | Elected in 2016 | Counsel, joined Lord Abbett in 2015 and was formerly an Associate at Stroock & Stroock & Lavan LLP (2007–2015). | |||
| So Young Lee (1971) | Vice President | Elected in 2018 | Portfolio Manager, joined Lord Abbett in 2013. | |||
| Joseph M. McGill (1962) | Chief Compliance Officer | Elected in 2014 | Partner and Chief Compliance Officer, joined Lord Abbett in 2014 and was formerly Managing Director and the Chief Compliance Officer at UBS Global Asset Management (2003–2013). | |||
| A. Edward Oberhaus, III (1959) | Vice President | Elected in 1998 | Partner and Director, joined Lord Abbett in 1983. | |||
| Amanda S. Ryan (1978) | Vice President and Assistant Secretary | Elected in 2018 | Counsel, joined Lord Abbett in 2016 and was formerly a Director and Corporate Counsel at PGIM Investments (2012–2016). | |||
| Lawrence B. Stoller (1963) | Vice President, Secretary and Chief Legal Officer | Elected in 2007 | Partner and General Counsel, joined Lord Abbett in 2007. | |||
| Leah G. Traub (1979) | Vice President | Elected in 2016 | Partner and Portfolio Manager, joined Lord Abbett in 2007. | |||
| Kewjin Yuoh (1971) | Vice President | Elected in 2012 | Partner and Portfolio Manager, joined Lord Abbett in 2010. | |||
| Jackson C. Chan (1964) | AML Compliance Officer | Elected in 2018 | Deputy Chief Compliance Officer and Director of Regulatory Affairs, joined Lord Abbett in 2014 and was formerly Director at UBS Global Asset Management (2005–2014). | |||
| Vito A. Fronda (1969) | Treasurer | Elected in 2018 | Partner and Director of Taxation, joined Lord Abbett in 2003. |
Please call 888-522-2388 for a copy of the statement of additional information, which contains further information about the Company’s Directors. It is available free upon request.
70
Approval of Advisory Contract
The Board, including all of the Directors who are not “interested persons” of the Company or of Lord Abbett, as defined in the Investment Company Act of 1940, as amended (the “Independent Directors”), annually considers whether to approve the continuation of the existing management agreement between the Fund and Lord Abbett (the “Agreement”). In connection with its most recent approval, which included the approval of a proposal to reduce the management fee schedule effective May 1, 2019, the Board reviewed materials relating specifically to the Agreement, as well as numerous materials received throughout the course of the year, including information about the Fund’s investment performance compared to the performance of its benchmarks. Before making its decision as to the Fund, the Board had the opportunity to ask questions and request further information, taking into account its knowledge of Lord Abbett gained through its meetings and discussions. These meetings and discussions included reviews of Fund performance conducted by members of the Contract Committee, the deliberations of the Contract Committee, and discussions between the Contract Committee and Lord Abbett’s management. The Independent Directors also met with their independent legal counsel in various private sessions at which no representatives of management were present.
The materials received by the Board included, but were not limited to: (1) information provided by Broadridge Financial Solutions (“Broadridge”) regarding the investment performance of the Fund compared to the investment performance of certain funds with similar investment styles as determined by Broadridge, based, in part, on the Fund’s Morningstar category (the “performance peer group”), and the investment performance of two appropriate benchmarks; (2) information provided by Broadridge regarding the expense ratios, contractual and actual management fee rates, and other expense components for the Fund and certain funds in the same Morningstar category, with generally the same or similar share classes and operational characteristics, including asset size (the “expense peer group”); (3) certain supplemental investment performance information provided by Lord Abbett; (4) information provided by Lord Abbett on the expense ratios, management fee rates, and other expense components for the Fund; (5) sales and redemption information for the Fund; (6) information regarding Lord Abbett’s financial condition; (7) an analysis of the relative profitability of the Agreement to Lord Abbett; (8) information provided by Lord Abbett regarding the investment management fee schedules for Lord Abbett’s other advisory clients maintaining accounts with a similar investment strategy as the Fund; and (9) information regarding the personnel and other resources devoted by Lord Abbett to managing the Fund.
Investment Management and Related Services Generally.The Board considered the services provided by Lord Abbett to the Fund, including investment research, portfolio management, and trading, and Lord Abbett’s commitment to compliance with all applicable legal requirements. The Board also observed that Lord Abbett was solely engaged in the investment management business and accordingly did not experience the conflicts of interest that may result from being engaged in other lines of business. The Board considered the investment advisory services provided by Lord Abbett to other clients, the fees charged for the services, and the differences in the nature of the services provided to the Fund and other Lord Abbett Funds, on the one hand, and the services provided to other clients, on the other. After reviewing these and related factors, the Board concluded that the Fund was likely to continue to benefit from the nature, extent and quality of the investment services provided by Lord Abbett under the Agreement.
Investment Performance.The Board reviewed the Fund’s investment performance in relation to that of the performance peer group and two appropriate benchmarks as of various periods ended August 31, 2018. The Board observed that the Fund’s investment performance was above the
71
Approval of Advisory Contract (continued)
median of the performance peer group for the one-, three-, five-, and ten-year periods. The Board further considered Lord Abbett’s performance and reputation generally, the performance of other Lord Abbett-managed funds overseen by the Board, and the willingness of Lord Abbett to take steps intended to improve performance when appropriate. After reviewing these and related factors, the Board concluded that the Fund’s Agreement, as revised with a reduced management fee schedule effective May 1, 2019, should be continued.
Lord Abbett’s Personnel and Methods.The Board considered the qualifications of the personnel providing investment management services to the Fund, in light of its investment objective and discipline, and other services provided to the Fund by Lord Abbett. Among other things, the Board considered the size, experience, and turnover of Lord Abbett’s staff, Lord Abbett’s investment methodology and philosophy, and Lord Abbett’s approach to recruiting, training, and retaining personnel.
Nature and Quality of Other Services.The Board considered the nature, quality, and extent of compliance, administrative, and other services performed by Lord Abbett and the nature and extent of Lord Abbett’s supervision of third party service providers, including the Fund’s transfer agent and custodian.
Expenses.The Board considered the expense level of the Fund, including the contractual and actual management fee rates under the terms of the current Agreement, and the expense levels of the Fund’s expense peer group. It also considered how the expense level of the Fund related to those of the expense peer group and the amount and nature of the fees paid by shareholders. The Board observed that the net total expense ratio of the Fund was below the median of the expense peer group. The Board further considered that the Fund’s management fee schedule would be reduced, effective May 1, 2019. After reviewing these and related factors, the Board concluded, within the context of its overall approval of the Agreement, that the expense level of the Fund was reasonable and supported the continuation of the Agreement.
Profitability.The Board considered the level of Lord Abbett’s operating margin in managing the Fund, including a review of Lord Abbett’s methodology for allocating its costs to its management of the Fund. It considered whether the Fund was profitable to Lord Abbett in connection with the Fund’s operation, including the fee that Lord Abbett receives from the Fund for providing administrative services to the Fund. The Board also considered the profits realized from other business segments of Lord Abbett, which may benefit from or be related to the Fund’s business. The Board considered Lord Abbett’s profit margins excluding Lord Abbett’s marketing and distribution expenses. The Board also considered Lord Abbett’s profit margins, without those exclusions, in comparison with available industry data and how those profit margins could affect Lord Abbett’s ability to recruit and retain personnel. The Board recognized that Lord Abbett’s overall profitability was a factor in enabling it to attract and retain qualified personnel to provide services to the Fund. After reviewing these and related factors, the Board concluded, within the context of its overall approval of the Agreement, that Lord Abbett’s profitability with respect to the Fund was not excessive.
Economies of Scale.The Board considered the extent to which there had been economies of scale in managing the Fund, whether the Fund’s shareholders had appropriately benefited from such economies of scale, and whether there was potential for realization of any further economies of scale. The Board concluded that the reduced management fee schedule, which included certain breakpoints in the management fee schedule, adequately addressed any economies of scale in managing the Fund.
72
Approval of Advisory Contract (concluded)
Other Benefits to Lord Abbett.The Board considered the amount and nature of the fees paid by the Fund and the Fund’s shareholders to Lord Abbett for services other than investment advisory services, such as the fee that Lord Abbett receives from the Fund for providing administrative services to the Fund. The Board also considered the revenues and profitability of Lord Abbett’s investment advisory business apart from its mutual fund business, and the intangible benefits enjoyed by Lord Abbett by virtue of its relationship with the Fund. The Board observed that the Distributor receives 12b-1 fees from certain of the Lord Abbett Funds as to shares held in accounts for which there is no other broker of record, may retain a portion of the 12b-1 fees it receives, and receives a portion of the sales charges on sales and redemptions of some classes of shares of the Lord Abbett Funds. In addition, the Board observed that Lord Abbett accrues certain benefits for its business of providing investment advice to clients other than the Lord Abbett Funds, but that business also benefits the Funds. The Board also noted that Lord Abbett, as disclosed in the prospectus of the Fund, has entered into revenue sharing arrangements with certain entities that distribute shares of the Lord Abbett Funds. The Board also took into consideration the investment research that Lord Abbett receives as a result of client brokerage transactions.
Alternative Arrangements.The Board considered whether, instead of approving continuation of the Agreement, it might be in the best interests of the Fund to implement one or more alternative arrangements, such as continuing to employ Lord Abbett, but on different terms. After considering all of the relevant factors, the Board unanimously found that continuation of the Agreement, as revised, was in the best interests of the Fund and its shareholders and voted unanimously to approve the continuation of the Agreement. In considering whether to approve the continuation of the Agreement, the Board did not identify any single factor as paramount or controlling. Individual Directors may have evaluated the information presented differently from one another, giving different weights to various factors. This summary does not discuss in detail all matters considered.
73
Householding
The Company has adopted a policy that allows it to send only one copy of the Fund’s prospectus, proxy material, annual report and semiannual report to certain shareholders residing at the same “household.” This reduces Fund expenses, which benefits you and other shareholders. If you need additional copies or do not want your mailings to be “householded,” please call Lord Abbett at 888-522-2388 or send a written request with your name, the name of your fund or funds and your account number or numbers to Lord Abbett Family of Funds, P.O. Box 219336, Kansas City, MO 64121.
Proxy Voting Policies, Procedures and Records
A description of the policies and procedures that Lord Abbett uses to vote proxies related to the Fund’s portfolio securities, and information on how Lord Abbett voted the Fund’s proxies during the 12-month period ended June 30 are available without charge, upon request, (i) by calling 888-522-2388; (ii) on Lord Abbett’s Website at www.lordabbett.com; and (iii) on the Securities and Exchange Commission’s (“SEC”) Website at www.sec.gov.
Shareholder Reports and Quarterly Portfolio Disclosure
The Fund is required to file its complete schedule of portfolio holdings with the SEC for its first and third fiscal quarters on Form N-Q. Copies of the filings are available without charge, upon request on the SEC’s Website at www.sec.gov and may be available by calling Lord Abbett at 888-522-2388.
Tax Information
For corporate shareholders, 2% the Fund’s ordinary income distributions qualified for the dividends received deduction.
Additionally, of the distribution paid to the shareholders during the fiscal year ended December 31, 2018, $7,826,024 and $17,154,574, respectively, represent short-term capital gains and long-term capital gains.
74


| This report, when not used for the general information of shareholders of the Fund, is to be distributed only if preceded or accompanied by a current fund prospectus. | |||
| Lord Abbett mutual fund shares are distributed by LORD ABBETT DISTRIBUTOR LLC. | Lord Abbett Series Fund, Inc.
Bond-Debenture Portfolio | LASFBD-3 (02/19) |
![]()
LORD ABBETT
ANNUAL REPORT
Lord Abbett
Series Fund—Calibrated Dividend Growth Portfolio
For the fiscal year ended December 31, 2018
Table of Contents
Lord Abbett Series Fund — Calibrated Dividend Growth Portfolio
Annual Report
For the fiscal year ended December 31, 2018

From left to right: James L.L. Tullis, Independent Chairman of the Lord Abbett Funds and Douglas B. Sieg, Director, President, and Chief Executive Officer of the Lord Abbett Funds.
Dear Shareholders:We are pleased to provide you with this overview of the performance of Lord Abbett Series Fund — Calibrated Dividend Growth Portfolio for the fiscal year ended December 31, 2018. On this page and the following pages, we discuss the major factors that influenced fiscal year performance. For additional information about the Fund, please visit our website at www.lordabbett.com, where you also can access the quarterly commentaries that provide updates on the Fund’s performance and other portfolio related updates.
Thank you for investing in Lord Abbett mutual funds. We value the trust that you place in us and look forward to serving your investment needs in the years to come.
Best regards,

Douglas B. Sieg
Director, President and Chief Executive Officer
For the fiscal year ended December 31, 2018, the Fund returned –4.67%, reflecting performance at the net asset value (NAV) of Class VC shares with all distributions reinvested, compared to its benchmark, the S&P 500® Index1, which returned –4.38% over the same period.
Domestic equity returns were negative over the past year, with large cap stocks, as represented by the S&P 500® Index1, falling –4.38% during the period, while small cap stocks, as represented by the Russell 2000® Index2, were down –11.01%. During the period, there were several
market-moving events. Notably, Congress passed the largest rewrite of the U.S. tax code in decades, which went into effect in January 2018. The tax bill reduced the corporate tax rate from 35% to 21% and allowed for a one-time repatriation tax of 15.5%, rather than the standard repatriation tax rate of 35%. In June 2018, the White House announced its intent to impose additional tariffs on $200 billion worth of Chinese goods on top of the $50 billion previously announced. The aggressive U.S. trade posture continued into the third quarter with trade tensions
1
mounting between the U.S. and China. In December, the White House announced a trade truce between the U.S. and China following a meeting between President Trump and President Xi Jinping at the G20 summit. The U.S. agreed to maintain a 10% tariff rate on $200 billion worth of Chinese imports at the start of 2019 as opposed to the originally planned 25% tariff rate. In return, China agreed to purchase a substantial amount of U.S. agriculture, industrial, and energy products to further reduce the trade imbalance. While the impact has yet to fully be realized, many corporations anticipate that the retaliatory tariffs will weigh on profits. Trade discussions between Mexico, Canada, and the U.S., however, took a more favorable turn as the negotiations resulted in a revised version of the North American Free Trade Agreement (NAFTA) called the U.S.-Mexico-Canada Agreement. In March 2018, the Federal Reserve (the “Fed”) raised its target for short-term interest rates by 0.25%, to a range of 1.50%–1.75%, and followed with rate hikes of 0.25% at each of its June, September, and December meetings, raising the target range to 2.25%–2.50%. Amid rising concerns surrounding escalating trade tensions, slowing global growth, and increasing interest rates, the Nasdaq experienced the largest monthly drop since 2008 in October 2018. Following the prior month’s volatility, domestic equity markets rallied in November and partially reversed October’s losses, however the S&P 500® returned to
negative territory in December, posting its worst month since February 2009.
Stock selection within the industrials and information technology sectors detracted from relative performance over the period. Within the industrials sector, the Fund’s holding of 3M Company, a diversified technology company, was one of the top detractors. Shares of the firm sold off after the company missed third quarter profit estimates and lowered the full year earnings guidance. The Fund’s position in Northrop Grumman Corp. also detracted from relative performance. Shares of the government and commercial security company recently came under pressure as investors may have grown wary of the implications of the escalating trade war on the firm’s profits. Additionally, within the information technology sector, International Business Machines (IBM) Corp., an integrated technology company, detracted from relative performance. Shares fell after the market seemingly priced in some doubt about the $34 billion deal between IBM and Red Hat, Inc.
Conversely, stock selection within the consumer staples and financials sectors contributed positively to relative performance during the period. Within the consumer staples sector, Coca-Cola Company, a beverage company, also contributed positively to relative performance. Shares of Coca-Cola rose throughout the year on the back of accelerating business performance as underlying sales growth improved. The
2
company’s total beverage portfolio strategy is steadily building traction with positive growth and share gains across both its core sparkling portfolio and higher growth categories such as water and sports drinks. Costco Wholesale Corp., a multinational membership-only warehouse chain, also contributed positively to relative performance. Shares of the company rose as the firm consistently beat total and U.S. same store sales compared to the previous year, fueled in part by the firm’s continued investment in the digital and e-commerce space. Within the
financials sector, RenaissanceRe Holdings Ltd., a reinsurance and insurance coverage provider, was one of the top contributors to relative performance. The company benefited from the recent acquisition of Tokio Marine Holdings, Inc.’s reinsurance platform, which the market likely believes to be income accretive going forward.
The Fund’s portfolio is actively managed and, therefore, its holdings and the weightings of a particular issuer or particular sector as a percentage of portfolio assets are subject to change. Sectors may include many industries.
3
1 The S&P 500® Index is widely regarded as the standard for measuring large cap U.S. stock market performance and includes a representative sample of leading companies in leading industries.
2 The Russell 2000® Index measures the performance of the 2,000 smallest companies in the Russell 3000® Index, which represents approximately 10% of the total market capitalization of the Russell 3000® Index.
Unless otherwise specified, indexes reflect total return, with all dividends reinvested. Indexes are unmanaged, do not reflect the deduction of fees or expenses, and are not available for direct investment.
Important Performance and Other Information
Performance data quoted in the following pages reflect past performance and are no guarantee of future results. Current performance may be higher or lower than the performance quoted. The investment return and principal value of an investment in the Fund will fluctuate so that shares, on any given day or when redeemed, may be worth more or less than their original cost. You can obtain performance data current to the most recent month end by calling Lord Abbett at 888-522-2388 or referring to www.lordabbett.com.
During certain periods shown, expense waivers and reimbursements were in place. Without such expense
waivers and reimbursements, the Fund’s returns would have been lower.
The annual commentary above discusses the views of the Fund’s management and various portfolio holdings of the Fund as of December 31, 2018. These views and portfolio holdings may have changed after this date. Information provided in the commentary is not a recommendation to buy or sell securities. Because the Fund’s portfolio is actively managed and may change significantly, the Fund may no longer own the securities described above or may have otherwise changed its position in the securities. For more recent information about the Fund’s portfolio holdings, please visit www.lordabbett.com.
A Note about Risk:See Notes to Financial Statements for a discussion of investment risks. For a more detailed discussion of the risks associated with the Fund, please see the Fund’s prospectus.
Mutual funds are not insured by the FDIC, are not deposits or other obligations of, or guaranteed by, banks, and are subject to investment risks including possible loss of principal amount invested.
The Fund serves as an underlying investment vehicle for variable annuity contracts and variable life insurance policies.
4
Below is a comparison of a $10,000 investment in Class VC shares with the same investment in the S&P 500® Index, assuming reinvestment of all dividends and distributions. The Fund’s shares are sold only to insurance company separate accounts that fund certain variable annuity and variable life contracts. The line graph comparison does not reflect the sales charges or other expenses of these contracts. If those sales charges and expenses were reflected, returns would be lower. The graph and performance table below do not reflect the deduction of taxes that a shareholder would pay on Fund distributions or the redemption of Fund shares. During certain periods, expenses of the Fund have been waived or reimbursed by Lord Abbett; without such waiver or reimbursement of expenses, the Fund’s returns would have been lower.Past performance is no guarantee of future results.

| Average Annual Total Returns for the Periods Ended December 31, 2018 | ||||||
| 1 Year | 5 Years | 10 Years | ||||
| Class VC | -4.67% | 7.37% | 11.28% | |||
| 1 | Performance for the unmanaged index does not reflect transaction costs, management fees or sales charges. The performance of the index is not necessarily representative of the Fund’s performance. |
5
As a shareholder of the Fund, you incur ongoing costs, including management fees; expenses related to the Fund’s services arrangements with certain insurance companies; and other Fund expenses. This Example is intended to help you understand your ongoing costs (in dollars) of investing in the Fund and to compare these costs with the ongoing costs of investing in other mutual funds.
The Example is based on an investment of $1,000 invested at the beginning of the period and held for the entire period (July 1, 2018 through December 31, 2018).
The Example reflects only expenses that are deducted from the assets of the Fund. Fees and expenses, including sales charges applicable to the various insurance products that invest in the Fund, are not reflected in this Example. If such fees and expenses were reflected in the Example, the total expenses shown would be higher. Fees and expenses regarding such variable insurance products are separately described in the prospectus related to those products.
Actual Expenses
The first line of the table on the following page provides information about actual account values and actual expenses. You may use the information in this line, together with the amount you invested, to estimate the expenses that you paid over the period. Simply divide your account value by $1,000 (for example, an $8,600 account value divided by $1,000 = 8.6), then multiply the result by the number in the first line under the heading titled “Expenses Paid During Period 7/1/18 – 12/31/18” to estimate the expenses you paid on your account during this period.
Hypothetical Example for Comparison Purposes
The second line of the table on the following page provides information about hypothetical account values and hypothetical expenses based on the Fund’s actual expense ratio and an assumed rate of return of 5% per year before expenses, which is not the Fund’s actual return. The hypothetical account values and expenses may not be used to estimate the actual ending account balance or expenses you paid for the period. You may use this information to compare the ongoing costs of investing in the Fund and other funds. To do so, compare this 5% hypothetical example with the 5% hypothetical examples that appear in the shareholder reports of the other funds.
6
Please note that the expenses shown in the table are meant to highlight your ongoing costs only and do not reflect any transactional costs, such as sales charges. Therefore, the second line of the table is useful in comparing ongoing costs only, and will not help you determine the relative total costs of owning different funds. In addition, if these transactional costs were included, your costs would have been higher.
| Beginning Account Value | Ending Account Value | Expenses Paid During Period† | ||||
| 7/1/18 | 12/31/18 | 7/1/18 – 12/31/18 | ||||
| Class VC | ||||||
| Actual | $1,000.00 | $ 967.80 | $4.46 | |||
| Hypothetical (5% Return Before Expenses) | $1,000.00 | $1,020.67 | $4.58 |
| † | Net expenses are equal to the Fund’s annualized expense ratio of 0.90%, multiplied by the average account value over the period, multiplied by 184/365 (to reflect one-half year period). |
Portfolio Holdings Presented by Sector
December 31, 2018
| Sector* | %** | |||
| Communication Services | 4.44 | % | ||
| Consumer Discretionary | 9.27 | % | ||
| Consumer Staples | 16.30 | % | ||
| Energy | 4.88 | % | ||
| Financials | 6.36 | % | ||
| Health Care | 12.24 | % | ||
| Industrials | 19.97 | % | ||
| Information Technology | 12.21 | % | ||
| Materials | 5.00 | % | ||
| Utilities | 8.30 | % | ||
| Repurchase Agreement | 1.03 | % | ||
| Total | 100.00 | % | ||
| * | A sector may comprise several industries. | |
| ** | Represents percent of total investments. |
7
December 31, 2018
| Fair | ||||||||
| Value | ||||||||
| Investments | Shares | (000) | ||||||
| COMMON STOCKS 99.91% | ||||||||
| Aerospace & Defense 5.87% | ||||||||
| General Dynamics Corp. | 9,600 | $ | 1,509 | |||||
| Harris Corp. | 11,100 | 1,495 | ||||||
| Lockheed Martin Corp. | 6,892 | 1,805 | ||||||
| Northrop Grumman Corp. | 7,000 | 1,714 | ||||||
| Raytheon Co. | 11,300 | 1,733 | ||||||
| Total | 8,256 | |||||||
| Air Freight & Logistics 0.99% | ||||||||
| CH Robinson Worldwide, Inc. | 7,200 | 605 | ||||||
| FedEx Corp. | 4,900 | 791 | ||||||
| Total | 1,396 | |||||||
| Banks 0.41% | ||||||||
| Commerce Bancshares, Inc. | 10,125 | 571 | ||||||
| Beverages 4.10% | ||||||||
| Coca-Cola Co. (The) | 72,468 | 3,431 | ||||||
| PepsiCo, Inc. | 21,124 | 2,334 | ||||||
| Total | 5,765 | |||||||
| Biotechnology 1.85% | ||||||||
| AbbVie, Inc. | 28,199 | 2,600 | ||||||
| Capital Markets 1.95% | ||||||||
| S&P Global, Inc. | 10,900 | 1,853 | ||||||
| T. Rowe Price Group, Inc. | 9,600 | 886 | ||||||
| Total | 2,739 | |||||||
| Chemicals 4.02% | ||||||||
| Air Products & Chemicals, Inc. | 4,300 | 688 | ||||||
| Ecolab, Inc. | 10,100 | 1,488 | ||||||
| PPG Industries, Inc. | 17,206 | 1,759 | ||||||
| Sherwin-Williams Co. (The) | 4,375 | 1,722 | ||||||
| Total | 5,657 | |||||||
| Commercial Services & Supplies 1.13% | ||||||||
| Cintas Corp. | 1,700 | 286 | ||||||
| Waste Management, Inc. | 14,600 | 1,299 | ||||||
| Total | 1,585 | |||||||
| Fair | ||||||||
| Value | ||||||||
| Investments | Shares | (000) | ||||||
| Diversified Telecommunication Services 4.49% | ||||||||
| AT&T, Inc. | 92,608 | $ | 2,643 | |||||
| Verizon Communications, Inc. | 65,200 | 3,666 | ||||||
| Total | 6,309 | |||||||
| Electric: Utilities 5.49% | ||||||||
| Alliant Energy Corp. | 27,400 | 1,158 | ||||||
| Duke Energy Corp. | 26,600 | 2,295 | ||||||
| Edison International | 18,800 | 1,067 | ||||||
| Eversource Energy | 24,400 | 1,587 | ||||||
| NextEra Energy, Inc. | 5,400 | 939 | ||||||
| Xcel Energy, Inc. | 13,600 | 670 | ||||||
| Total | 7,716 | |||||||
| Electrical Equipment 1.07% | ||||||||
| Emerson Electric Co. | 6,600 | 394 | ||||||
| Hubbell, Inc. | 11,200 | 1,113 | ||||||
| Total | 1,507 | |||||||
| Food & Staples Retailing 6.24% | ||||||||
| Costco Wholesale Corp. | 13,600 | 2,770 | ||||||
| Sysco Corp. | 31,100 | 1,949 | ||||||
| Walgreens Boots Alliance, Inc. | 25,321 | 1,730 | ||||||
| Walmart, Inc. | 24,980 | 2,327 | ||||||
| Total | 8,776 | |||||||
| Food Products 1.81% | ||||||||
| Flowers Foods, Inc. | 37,300 | 689 | ||||||
| Hormel Foods Corp. | 14,700 | 627 | ||||||
| J.M. Smucker Co. (The) | 6,800 | 636 | ||||||
| Kellogg Co. | 10,400 | 593 | ||||||
| Total | 2,545 | |||||||
| Gas Utilities 0.65% | ||||||||
| UGI Corp. | 17,000 | 907 | ||||||
| Health Care Equipment & Supplies 6.04% | ||||||||
| Abbott Laboratories | 34,900 | 2,524 | ||||||
| Becton, Dickinson & Co. | 6,800 | 1,532 | ||||||
| Medtronic plc (Ireland)(a) | 39,991 | 3,638 | ||||||
| West Pharmaceutical Services, Inc. | 8,200 | 804 | ||||||
| Total | 8,498 | |||||||
| 8 | See Notes to Financial Statements. |
Schedule of Investments (continued)
December 31, 2018
| Fair | ||||||||
| Value | ||||||||
| Investments | Shares | (000) | ||||||
| Health Care Providers & Services 2.69% | ||||||||
| AmerisourceBergen Corp. | 16,900 | $ | 1,257 | |||||
| CVS Health Corp. | 38,500 | 2,523 | ||||||
| Total | 3,780 | |||||||
| Hotels, Restaurants & Leisure 2.21% | ||||||||
| McDonald’s Corp. | 17,474 | 3,103 | ||||||
| Household Products 4.30% | ||||||||
| Church & Dwight Co., Inc. | 6,200 | 408 | ||||||
| Clorox Co. (The) | 10,500 | 1,618 | ||||||
| Kimberly-Clark Corp. | 15,335 | 1,747 | ||||||
| Procter & Gamble Co. (The) | 24,800 | 2,280 | ||||||
| Total | 6,053 | |||||||
| Industrial Conglomerates 3.16% | ||||||||
| 3M Co. | 13,667 | 2,604 | ||||||
| Roper Technologies, Inc. | 6,900 | 1,839 | ||||||
| Total | 4,443 | |||||||
| Information Technology Services 4.33% | ||||||||
| Accenture plc Class A(Ireland)(a) | 14,900 | 2,101 | ||||||
| Automatic Data Processing, Inc. | 16,400 | 2,150 | ||||||
| International Business Machines Corp. | 16,187 | 1,840 | ||||||
| Total | 6,091 | |||||||
| Insurance 4.06% | ||||||||
| Chubb Ltd. (Switzerland)(a) | 18,200 | 2,351 | ||||||
| RenaissanceRe Holdings Ltd. | 4,700 | 628 | ||||||
| Torchmark Corp. | 15,000 | 1,118 | ||||||
| Travelers Cos., Inc. (The) | 13,500 | 1,617 | ||||||
| Total | 5,714 | |||||||
| Machinery 2.40% | ||||||||
| Caterpillar, Inc. | 4,600 | 585 | ||||||
| Cummins, Inc. | 10,800 | 1,443 | ||||||
| Pentair plc (United Kingdom)(a) | 12,700 | 480 | ||||||
| Stanley Black & Decker, Inc. | 7,200 | 862 | ||||||
| Total | 3,370 | |||||||
| Fair | ||||||||
| Value | ||||||||
| Investments | Shares | (000) | ||||||
| Metals & Mining 1.02% | ||||||||
| Nucor Corp. | 27,700 | $ | 1,435 | |||||
| Multi-Line Retail 1.31% | ||||||||
| Target Corp. | 27,800 | 1,837 | ||||||
| Multi-Utilities 2.25% | ||||||||
| Consolidated Edison, Inc. | 10,400 | 795 | ||||||
| Dominion Energy, Inc. | 33,100 | 2,365 | ||||||
| Total | 3,160 | |||||||
| Oil, Gas & Consumable Fuels 4.92% | ||||||||
| Chevron Corp. | 35,849 | 3,900 | ||||||
| Exxon Mobil Corp. | 8,400 | 573 | ||||||
| Occidental Petroleum Corp. | 30,273 | 1,858 | ||||||
| ONEOK, Inc. | 11,000 | 593 | ||||||
| Total | 6,924 | |||||||
| Pharmaceuticals 1.78% | ||||||||
| Johnson & Johnson | 19,419 | 2,506 | ||||||
| Professional Services 0.92% | ||||||||
| Robert Half International, Inc. | 22,700 | 1,298 | ||||||
| Road & Rail 3.83% | ||||||||
| CSX Corp. | 11,300 | 702 | ||||||
| J.B. Hunt Transport Services, Inc. | 13,400 | 1,247 | ||||||
| Union Pacific Corp. | 24,900 | 3,442 | ||||||
| Total | 5,391 | |||||||
| Semiconductors & Semiconductor Equipment 4.50% | ||||||||
| Microchip Technology, Inc. | 7,166 | 515 | ||||||
| QUALCOMM, Inc. | 39,857 | 2,268 | ||||||
| Texas Instruments, Inc. | 33,800 | 3,194 | ||||||
| Xilinx, Inc. | 4,200 | 358 | ||||||
| Total | 6,335 | |||||||
| Software 3.49% | ||||||||
| CDK Global, Inc. | 20,700 | 991 | ||||||
| Microsoft Corp. | 38,600 | 3,921 | ||||||
| Total | 4,912 | |||||||
| See Notes to Financial Statements. | 9 |
Schedule of Investments (continued)
December 31, 2018
| Fair | ||||||||
| Value | ||||||||
| Investments | Shares | (000) | ||||||
| Specialty Retail 3.56% | ||||||||
| Lowe’s Cos., Inc. | 34,025 | $ | 3,142 | |||||
| TJX Cos., Inc. (The) | 41,700 | 1,866 | ||||||
| Total | 5,008 | |||||||
| Textiles, Apparel & Luxury Goods 2.28% | ||||||||
| NIKE, Inc. Class B | 43,300 | 3,210 | ||||||
| Trading Companies & Distributors 0.79% | ||||||||
| Fastenal Co. | 21,300 | 1,114 | ||||||
| Total Common Stocks (cost $139,961,561) | 140,511 | |||||||
| Principal | Fair | |||||||
| Amount | Value | |||||||
| Investments | (000) | (000) | ||||||
| SHORT-TERM INVESTMENT 1.04% | ||||||||
| Repurchase Agreement | ||||||||
| Repurchase Agreement dated 12/31/2018, 1.45% due 1/2/2019 with Fixed Income Clearing Corp. collateralized by $1,550,000 of U.S. Treasury Note at 2.00% due 8/15/2025; value: $1,500,836; proceeds: $1,467,889 (cost $1,467,770) | $1,468 | $ | 1,468 | |||||
| Total Investments in Securities 100.95% (cost $141,429,331) | 141,979 | |||||||
| Liabilities in Excess ofOther Assets(b)(0.95)% | (1,340 | ) | ||||||
| Net Assets 100.00% | $ | 140,639 | ||||||
| (a) | Foreign security traded in U.S. dollars. | |
| (b) | Liabilities in Excess of Other Assets include net unrealized depreciation on futures contracts as follows: |
Open Futures Contracts at December 31, 2018:
| Notional | Notional | Unrealized | |||||||||||
| Type | Expiration | Contracts | Position | Amount | Value | Depreciation | |||||||
| E-Mini S&P 500 Index | March 2019 | 9 | Long | $1,128,869 | $1,127,340 | $(1,529) |
| 10 | See Notes to Financial Statements. |
Schedule of Investments (concluded)
December 31, 2018
The following is a summary of the inputs used as of December 31, 2018 in valuing the Fund’s investments carried at fair value(1):
| Level 1 | Level 2 | Level 3 | Total | |||||||||||||
| Investment Type(2)(3) | (000) | (000) | (000) | (000) | ||||||||||||
| Common Stocks | $ | 140,511 | $ | – | $ | – | $ | 140,511 | ||||||||
| Short-Term Investments | ||||||||||||||||
| Repurchase Agreement | – | 1,468 | – | 1,468 | ||||||||||||
| Total | $ | 140,511 | $ | 1,468 | $ | – | $ | 141,979 | ||||||||
| Other Financial Instruments | ||||||||||||||||
| Futures Contracts | ||||||||||||||||
| Assets | $ | – | $ | – | $ | – | $ | – | ||||||||
| Liabilities | (2 | ) | – | – | (2) | |||||||||||
| Total | $ | (2 | ) | $ | – | $ | – | $ | (2) | |||||||
| (1) | Refer to Note 2(i) for a description of fair value measurements and the three-tier hierarchy of inputs. | |
| (2) | See Schedule of Investments for fair values in each industry and identification of foreign issuers and/or geography. | |
| (3) | There were no Level 1/Level 2 transfers during the fiscal year ended December 31, 2018. |
| See Notes to Financial Statements. | 11 |
Statement of Assets and Liabilities
December 31, 2018
| ASSETS: | ||||
| Investments in securities, at fair value (cost $141,429,331) | $ | 141,979,022 | ||
| Deposits with brokers for futures collateral | 54,000 | |||
| Receivables: | ||||
| Interest and dividends | 191,145 | |||
| Capital shares sold | 46,338 | |||
| From advisor (See Note 3) | 38,604 | |||
| Variation margin for futures contracts | 8,748 | |||
| Prepaid expenses | 719 | |||
| Total assets | 142,318,576 | |||
| LIABILITIES: | ||||
| Payables: | ||||
| Capital shares reacquired | 1,423,032 | |||
| Management fee | 96,131 | �� | ||
| Directors’ fees | 24,398 | |||
| Fund administration | 5,127 | |||
| Accrued expenses | 130,557 | |||
| Total liabilities | 1,679,245 | |||
| NET ASSETS | $ | 140,639,331 | ||
| COMPOSITION OF NET ASSETS: | ||||
| Paid-in capital | $ | 140,171,100 | ||
| Total distributable earnings | 468,231 | |||
| Net Assets | $ | 140,639,331 | ||
| Outstanding shares (50 million shares of common stock authorized, $.001 par value) | 10,434,515 | |||
| Net asset value, offering and redemption price per share (Net assets divided by outstanding shares) | $13.48 |
| 12 | See Notes to Financial Statements. |
For the Year Ended December 31, 2018
| Investment income: | ||||
| Dividends | $ | 4,527,099 | ||
| Interest | 14,461 | |||
| Total investment income | 4,541,560 | |||
| Expenses: | ||||
| Management fee | 1,331,599 | |||
| Non 12b-1 service fees | 443,615 | |||
| Shareholder servicing | 190,528 | |||
| Fund administration | 71,019 | |||
| Professional | 51,808 | |||
| Reports to shareholders | 38,487 | |||
| Custody | 13,234 | |||
| Directors’ fees | 6,313 | |||
| Other | 21,239 | |||
| Gross expenses | 2,167,842 | |||
| Expense reductions (See Note 9) | (4,147 | ) | ||
| Fees waived and expenses reimbursed (See Note 3) | (596,101 | ) | ||
| Net expenses | 1,567,594 | |||
| Net investment income | 2,973,966 | |||
| Net realized and unrealized gain (loss): | ||||
| Net realized gain on investments | 13,972,002 | |||
| Net realized gain on futures contracts | 16,764 | |||
| Net realized gain on foreign currency related transactions | 4,111 | |||
| Net change in unrealized appreciation/depreciation on investments | (24,278,640 | ) | ||
| Net change in unrealized appreciation/depreciation on futures contracts | (6,223 | ) | ||
| Net realized and unrealized loss | (10,291,986 | ) | ||
| Net Decrease in Net Assets Resulting From Operations | $ | (7,318,020 | ) |
| See Notes to Financial Statements. | 13 |
Statements of Changes in Net Assets
| For the Year Ended | For the Year Ended | |||||||
| INCREASE (DECREASE) IN NET ASSETS | December 31, 2018 | December 31, 2017 | ||||||
| Operations: | ||||||||
| Net investment income | $ | 2,973,966 | $ | 3,069,437 | ||||
| Net realized gain on investments, futures contracts and foreign currency related transactions | 13,992,877 | 10,163,338 | ||||||
| Net change in unrealized appreciation/depreciation on investments and futures contracts | (24,284,863 | ) | 18,400,668 | |||||
| Net increase (decrease) in net assets resulting from operations | (7,318,020 | ) | 31,633,443 | |||||
| Distributions to shareholders(1) | (17,013,093 | ) | (13,592,687 | ) | ||||
| Capital share transactions (See Note 14): | ||||||||
| Proceeds from sales of shares | 32,964,166 | 21,128,282 | ||||||
| Reinvestment of distributions | 17,013,093 | 13,592,687 | ||||||
| Cost of shares reacquired | (77,228,521 | ) | (31,869,957 | ) | ||||
| Net increase (decrease) in net assets resulting from capital share transactions | (27,251,262 | ) | 2,851,012 | |||||
| Net increase (decrease) in net assets | (51,582,375 | ) | 20,891,768 | |||||
| NET ASSETS: | ||||||||
| Beginning of year | $ | 192,221,706 | $ | 171,329,938 | ||||
| End of year | $ | 140,639,331 | $ | 192,221,706 | ||||
| Distributions in excess of net investment income(2) | $ | – | $ | – | ||||
| (1) | The SEC eliminated the requirement to disclose the source of distributions paid in 2018. For the year ended December 31, 2017, the source of distributions was net investment income $(3,082,034) and net realized gain $(10,510,653). | |
| (2) | The SEC eliminated the requirement to disclose distributions in excess of net investment income in 2018. For the year ended December 31, 2017, the distributions in excess of net investment income was $(21,797). | |
| 14 | See Notes to Financial Statements. |
This page is intentionally left blank.
15
| Per Share Operating Performance: | ||||||||||||||||||||||||||||
| Distributions to | ||||||||||||||||||||||||||||
| Investment operations: | shareholders from: | |||||||||||||||||||||||||||
| Total | ||||||||||||||||||||||||||||
| Net | from | |||||||||||||||||||||||||||
| Net asset | Net | realized | invest- | |||||||||||||||||||||||||
| value, | invest- | and | ment | Net | Net | Total | ||||||||||||||||||||||
| beginning | ment | unrealized | opera- | investment | realized | distri- | ||||||||||||||||||||||
| of period | income(a) | gain (loss) | tions | income | gain | butions | ||||||||||||||||||||||
| 12/31/2018 | $16.02 | $0.27 | $(1.03 | ) | $(0.76 | ) | $(0.30 | ) | $(1.48 | ) | $(1.78 | ) | ||||||||||||||||
| 12/31/2017 | 14.47 | 0.26 | 2.49 | 2.75 | (0.27 | ) | (0.93 | ) | (1.20 | ) | ||||||||||||||||||
| 12/31/2016 | 13.60 | 0.28 | 1.78 | 2.06 | (0.25 | ) | (0.94 | ) | (1.19 | ) | ||||||||||||||||||
| 12/31/2015 | 15.55 | 0.27 | (0.60 | ) | (0.33 | ) | (0.27 | ) | (1.35 | ) | (1.62 | ) | ||||||||||||||||
| 12/31/2014 | 16.27 | 0.27 | 1.60 | 1.87 | (0.29 | ) | (2.30 | ) | (2.59 | ) | ||||||||||||||||||
| (a) | Calculated using average shares outstanding during the period. |
| (b) | Total return does not consider the effects of sales loads and assumes the reinvestment of all distributions. |
| 16 | See Notes to Financial Statements. |
| Ratios to Average Net Assets: | Supplemental Data: | |||||||||||||||||||||||||
| Total | ||||||||||||||||||||||||||
| expenses | ||||||||||||||||||||||||||
| Net | after | Net | ||||||||||||||||||||||||
| asset | waivers | Net | assets, | Portfolio | ||||||||||||||||||||||
| value, | Total | and/or reim- | Total | investment | end of | turnover | ||||||||||||||||||||
| end of | return(b) | bursements | expenses | income | period | rate | ||||||||||||||||||||
| period | (%) | (%) | (%) | (%) | (000) | (%) | ||||||||||||||||||||
| $13.48 | (4.67 | ) | 0.88 | 1.22 | 1.68 | $140,639 | 58 | |||||||||||||||||||
| 16.02 | 19.12 | 0.85 | 1.21 | 1.71 | 192,222 | 58 | ||||||||||||||||||||
| 14.47 | 15.10 | 0.85 | 1.25 | 1.89 | 171,330 | 75 | ||||||||||||||||||||
| 13.60 | (2.13 | ) | 0.85 | 1.28 | 1.76 | 105,016 | 70 | |||||||||||||||||||
| 15.55 | 11.54 | 0.85 | 1.25 | 1.63 | 118,300 | 79 | ||||||||||||||||||||
| See Notes to Financial Statements. | 17 |
| 1. | ORGANIZATION |
Lord Abbett Series Fund, Inc. (the “Company”) is registered under the Investment Company Act of 1940, as amended (the “Act”), as a diversified, open-end management investment company and was incorporated under Maryland law in 1989. The Company consists of twelve separate portfolios. This report covers Calibrated Dividend Growth Portfolio (the “Fund”).
The Fund’s investment objective is to seek current income and capital appreciation. The Fund has Variable Contract class shares (“Class VC Shares”), which are currently issued and redeemed only in connection with investments in, and payments under, variable annuity contracts and variable life insurance policies issued by life insurance and insurance-related companies.
The preparation of the financial statements in conformity with accounting principles generally accepted in the United States of America (“U.S. GAAP”) requires management to make certain estimates and assumptions that affect the reported amounts of assets and liabilities and disclosure of contingent assets and liabilities at the date of the financial statements and the reported amounts of increases and decreases in net assets from operations during the reporting period. Actual results could differ from those estimates. The Fund is considered an investment company under U.S. GAAP and follows the accounting and reporting guidance applicable to investment companies.
| 2. | SIGNIFICANT ACCOUNTING POLICIES |
| (a) | Investment Valuation–Under procedures approved by the Fund’s Board of Directors (the “Board”), Lord, Abbett & Co. LLC (“Lord Abbett”), the Fund’s investment manager, has formed a Pricing Committee to administer the pricing and valuation of portfolio investments and to ensure that prices utilized reasonably reflect fair value. Among other things, these procedures allow the Fund to utilize independent pricing services, quotations from securities and financial instrument dealers and other market sources to determine fair value. |
| Securities actively traded on any recognized U.S. or non-U.S. exchange or on The NASDAQ Stock Market LLC are valued at the last sale price or official closing price on the exchange or system on which they are principally traded. Events occurring after the close of trading on non-U.S. exchanges may result in adjustments to the valuation of foreign securities to reflect their fair value as of the close of regular trading on the New York Stock Exchange. The Fund may utilize an independent fair valuation service in adjusting the valuations of foreign securities. Unlisted equity securities are valued at the last quoted sale price or, if no sale price is available, at the mean between the most recently quoted bid and asked prices. Exchange traded options and futures contracts are valued at the last sale price in the market where they are principally traded. If no sale has occurred, the mean between the most recently quoted bid and asked prices is used. | |
| Securities for which prices are not readily available are valued at fair value as determined by the Pricing Committee. The Pricing Committee considers a number of factors, including observable and unobservable inputs, when arriving at fair value. The Pricing Committee may use related or comparable assets or liabilities, recent transactions, market multiples, book values and other relevant information to determine the fair value of portfolio investments. The Board or a designated committee thereof regularly reviews fair value determinations made by the Pricing Committee and may employ techniques such as reviewing related market activity, reviewing inputs and assumptions, and retrospectively comparing prices of subsequent purchases and sales transactions to fair value determinations made by the Pricing Committee. |
18
Notes to Financial Statements (continued)
| Short-term securities with 60 days or less remaining to maturity are valued using the amortized cost method, which approximates fair value. | |
| (b) | Security Transactions–Security transactions are recorded as of the date that the securities are purchased or sold (trade date). Realized gains and losses on sales of portfolio securities are calculated using the identified-cost method. |
| (c) | Investment Income–Dividend income is recorded on the ex-dividend date. Interest income is recorded on the accrual basis as earned. Discounts are accreted and premiums are amortized using the effective interest method and are included in Interest on the Statement of Operations. Withholding taxes on foreign dividends have been provided for in accordance with the applicable country’s tax rules and rates. |
| (d) | Income Taxes–It is the policy of the Fund to meet the requirements of Subchapter M of the Internal Revenue Code applicable to regulated investment companies and to distribute substantially all taxable income and capital gains to its shareholders. Therefore, no income tax provision is required. |
| The Fund files U.S. federal and various state and local tax returns. No income tax returns are currently under examination. The statute of limitations on the Fund’s filed U.S. federal tax returns remains open for the fiscal years ended December 31, 2015 through December 31, 2018. The statutes of limitations on the Company’s state and local tax returns may remain open for an additional year depending upon the jurisdiction. | |
| (e) | Expenses–Expenses incurred by the Company that do not specifically relate to an individual fund are generally allocated to the funds within the Company on a pro rata basis by relative net assets. |
| (f) | Foreign Transactions–The books and records of the Fund are maintained in U.S. dollars and transactions denominated in foreign currencies are recorded in the Fund’s records at the rate prevailing when earned or recorded. Asset and liability accounts that are denominated in foreign currencies are adjusted daily to reflect current exchange rates and any unrealized gain (loss), if applicable, is included in Net change in unrealized appreciation/depreciation on translation of assets and liabilities denominated in foreign currencies in the Fund’s Statement of Operations. The resultant exchange gains and losses upon settlement of such transactions are included in Net realized gain on foreign currency related transactions in the Fund’s Statement of Operations. The Fund does not isolate that portion of the results of operations arising as a result of changes in the foreign exchange rates from the changes in market prices of the securities. |
| (g) | Futures Contracts–The Fund may purchase and sell index futures contracts to manage cash, or as a substitute position in lieu of holding the underlying asset on which the instrument is based. At the time of entering into a futures transaction, an investor is required to deposit and maintain a specified amount of cash or eligible securities called “initial margin.” Subsequent payments made or received by the Fund called “variation margin” are made on a daily basis as the market price of the futures contract fluctuates. The Fund will record an unrealized gain (loss) based on the amount of variation margin. When a contract is closed, a realized gain (loss) is recorded equal to the difference between the opening and closing value of the contract. |
| (h) | Repurchase Agreements–The Fund may enter into repurchase agreements with respect to securities. A repurchase agreement is a transaction in which a fund acquires a security and simultaneously commits to resell that security to the seller (a bank or securities dealer) at an |
19
Notes to Financial Statements (continued)
| agreed-upon price on an agreed-upon date. The Fund requires at all times that the repurchase agreement be collateralized by cash, or by securities of the U.S. Government, its agencies, its instrumentalities, or U.S. Government sponsored enterprises having a value equal to, or in excess of, the value of the repurchase agreement (including accrued interest). If the seller of the agreement defaults on its obligation to repurchase the underlying securities at a time when the fair value of these securities has declined, the Fund may incur a loss upon disposition of the securities. | |
| (i) | Fair Value Measurements–Fair value is defined as the price that the Fund would receive upon selling an investment or transferring a liability in an orderly transaction to an independent buyer in the principal or most advantageous market of the investment. A three-tier hierarchy is used to maximize the use of observable market data and minimize the use of unobservable inputs and to establish classification of fair value measurements for disclosure purposes. Inputs refer broadly to the assumptions that market participants would use in pricing the asset or liability, including assumptions about risk – for example, the risk inherent in a particular valuation technique used to measure fair value (such as a pricing model) and/or the risk inherent in the inputs to the valuation technique. Inputs may be observable or unobservable. Observable inputs reflect the assumptions market participants would use in pricing the asset or liability. Observable inputs are based on market data obtained from sources independent of the reporting entity. Unobservable inputs reflect the reporting entity’s own assumptions about the assumptions market participants would use in pricing the asset or liability. Unobservable inputs are based on the best information available in the circumstances. The three-tier hierarchy classification is determined based on the lowest level of inputs that is significant to the fair value measurement, and is summarized in the three broad Levels listed below: |
| • | Level 1 – | unadjusted quoted prices in active markets for identical investments; | |
| • | Level 2 – | other significant observable inputs (including quoted prices for similar investments, interest rates, prepayment speeds, credit risk, etc.); and | |
| • | Level 3 – | significant unobservable inputs (including the Fund’s own assumptions in determining the fair value of investments). |
A summary of inputs used in valuing the Fund’s investments and other financial instruments as of December 31, 2018 and, if applicable, Level 1/Level 2 transfers and Level 3 rollforwards for the fiscal year then ended is included in the Fund’s Schedule of Investments.
Changes in valuation techniques may result in transfers into or out of an assigned level within the three-tier hierarchy. All transfers between different levels within the three-tier hierarchy are deemed to have occurred as of the beginning of the reporting period. The inputs or methodology used for valuing securities are not necessarily an indication of the risk associated with investing in those securities.
| 3. | MANAGEMENT FEE AND OTHER TRANSACTIONS WITH AFFILIATES |
Management Fee
The Company has a management agreement with Lord Abbett, pursuant to which Lord Abbett supplies the Fund with investment management services and executive and other personnel, provides office space and pays for ordinary and necessary office and clerical expenses relating to research and statistical work and supervision of the Fund’s investment portfolio.
20
Notes to Financial Statements (continued)
The management fee is based on the Fund’s average daily net assets at the following annual rate:
| First $1 billion | .75% |
| Next $1 billion | .70% |
| Over $2 billion | .65% |
For the fiscal year ended December 31, 2018, the effective management fee, net of waivers, was at an annualized rate of .41% of the Fund’s average daily net assets.
In addition, Lord Abbett provides certain administrative services to the Fund pursuant to an Administrative Services Agreement in return for a fee at an annual rate of .04% of the Fund’s average daily net assets.
Effective May 1, 2018 and continuing through April 30, 2019, Lord Abbett has contractually agreed to waive its fees and reimburse expenses to the extent necessary to limit total net annual operating expenses to an annual rate of .90%. This agreement may be terminated only upon the approval of the Board. Prior to May 1, 2018, Lord Abbett contractually agreed to waive its fees and reimburse expenses to the extent necessary to limit total net annual operating expenses to an annual rate of .85%.
The Company, on behalf of the Fund, has entered into services arrangements with certain insurance companies. Under these arrangements, certain insurance companies will be compensated up to .25% of the average daily net asset value (“NAV”) of the Fund’s Class VC Shares held in the insurance company’s separate account to service and maintain the Variable Contract owners’ accounts. This amount is included in Non 12b-1 service fees on the Statement of Operations. The Fund may also compensate certain insurance companies, third-party administrators and other entities for providing recordkeeping, sub-transfer agency and other administrative services to the Fund. This amount is included in Shareholder servicing on the Statement of Operations.
One Director and certain of the Company’s officers have an interest in Lord Abbett.
| 4. | DISTRIBUTIONS AND CAPITAL LOSS CARRYFORWARDS |
Dividends from net investment income, if any, are declared and paid at least semi-annually. Taxable net realized gains from investment transactions, reduced by allowable capital loss carryforwards, if any, are declared and distributed to shareholders at least annually. The capital loss carryforward amount, if any, is available to offset future net capital gains. Dividends and distributions to shareholders are recorded on the ex-dividend date. The amounts of dividends and distributions from net investment income and net realized capital gains are determined in accordance with federal income tax regulations, which may differ from U.S. GAAP. These book/tax differences are either considered temporary or permanent in nature. To the extent these differences are permanent in nature, such amounts are reclassified within the components of net assets based on their federal tax basis treatment; temporary differences do not require reclassification. Dividends and distributions that exceed earnings and profits for tax purposes are reported as a tax return of capital.
21
Notes to Financial Statements (continued)
The tax character of distributions paid during the fiscal years ended December 31, 2018 and 2017 was as follows:
| Year Ended 12/31/2018 | Year Ended 12/31/2017 | |||||||||
| Distributions paid from: | ||||||||||
| Ordinary income | $ | 5,997,659 | $ | 9,776,911 | ||||||
| Net long-term capital gains | 11,015,434 | 3,815,776 | ||||||||
| Total distributions paid | $ | 17,013,093 | $ | 13,592,687 | ||||||
As of December 31, 2018, the components of accumulated gains on a tax-basis were as follows:
| Undistributed ordinary income – net | $ | 8,827 | ||
| Undistributed long-term capital gains | 2,882,207 | |||
| Total undistributed earnings | 2,891,034 | |||
| Temporary differences | (826,491 | ) | ||
| Unrealized losses – net | (1,596,312 | ) | ||
| Total accumulated gains – net | $ | 468,231 |
At the Fund’s election, certain losses incurred within the taxable year (Qualified Late-Year Losses) are deemed to arise on the first business day of the Fund’s next taxable year. The Fund incurred and will elect to defer post-October capital losses of $802,094 during fiscal year 2018.
As of December 31, 2018, the aggregate unrealized security gains and losses on investments and other financial instruments based on cost for U.S. federal income tax purposes were as follows:
| Tax cost | $ | 143,573,805 | ||
| Gross unrealized gain | 6,379,846 | |||
| Gross unrealized loss | (7,976,158 | ) | ||
| Net unrealized security loss | $ | (1,596,312 | ) |
The difference between book-basis and tax-basis unrealized gains (losses) is attributable to the tax treatment of other financial instruments, certain distributions and wash sales.
| 5. | PORTFOLIO SECURITIES TRANSACTIONS |
Purchases and sales of investment securities (excluding short-term investments) for the fiscal year ended December 31, 2018 were as follows:
| Purchases | Sales | |
| $102,147,075 | $141,634,343 |
There were no purchases or sales of U.S. Government securities for the fiscal year ended December 31, 2018.
The Fund is permitted to purchase and sell securities (“cross-trade”) from and to other Lord Abbett funds or client accounts pursuant to procedures approved by the Board in compliance with Rule 17a-7 under the Act (the “Rule”). Each cross-trade is executed at a fair market price in compliance with provisions of the Rule. For the fiscal year ended December 31, 2018, the Fund engaged in cross-trades purchases of $5,163,742 and sales of $744,984, which resulted in net realized gains of $92,801.
22
Notes to Financial Statements (continued)
| 6. | DISCLOSURES ABOUT DERIVATIVE INSTRUMENTS AND HEDGING ACTIVITIES |
The Fund entered into E-Mini S&P 500®Index futures contracts for the fiscal year ended December 31, 2018 (as described in note 2(g)) to manage cash. The Fund bears the risk that the underlying index will move unexpectedly, in which case the Fund may realize a loss. There is minimal counterparty credit risk to the Fund since futures are exchange traded and the exchange’s clearinghouse, as counterparty to all exchange traded futures, guarantees futures against default.
As of December 31, 2018, the Fund had futures contracts with unrealized depreciation of $(1,529), which is included in the Schedule of Investments. Only current day’s variation margin is reported within the Fund’s Statement of Assets and Liabilities. Amounts of $16,764 and $(6,223) are included in the Statement of Operations related to futures contracts under the captions Net realized gain on futures contracts and Net change in unrealized appreciation/depreciation on futures contracts, respectively. The average number of futures contracts throughout the fiscal year was 9.
| 7. | DISCLOSURES ABOUT OFFSETTING ASSETS AND LIABILITIES |
The Financial Accounting Standards Board (“FASB”) requires disclosures intended to help better assess the effect or potential effect of offsetting arrangements on a fund’s financial position. The following tables illustrate gross and net information about recognized assets and liabilities eligible for offset in the statement of assets and liabilities; and disclose such amounts subject to an enforceable master netting agreement or similar agreement, by counterparty. A master netting agreement is an agreement between a fund and a counterparty which provides for the net settlement of amounts owed under all contracts traded under that agreement, as well as cash collateral, through a single payment by one party to the other in the event of default on or termination of any one contract. The Fund’s accounting policy with respect to balance sheet offsetting is that, absent an event of default by the counterparty or a termination of the agreement, the master netting agreement does not result in an offset of reported amounts of financial assets and liabilities in the statement of assets and liabilities across transactions between the Fund and the applicable counterparty:
| Description | Gross Amounts of Recognized Assets | Gross Amounts Offset in the Statement of Assets and Liabilities | Net Amounts of Assets Presented in the Statement of Assets and Liabilities | |||||||||
| Repurchase Agreement | $1,467,770 | $ | – | $ | 1,467,770 | |||||||
| Total | $1,467,770 | $ | – | $ | 1,467,770 | |||||||
| Net Amounts | ||||||||||||||||||||
| of Assets | Amounts Not Offset in the | |||||||||||||||||||
| Presented in | Statement of Assets and Liabilities | |||||||||||||||||||
| Counterparty | the Statement of Assets and Liabilities | Financial Instruments | Cash Collateral Received(a) | Securities Collateral Received(a) | Net Amount(b) | |||||||||||||||
| Fixed Income Clearing Corp. | $ | 1,467,770 | $ | – | $ | – | $ | (1,467,770 | ) | $ | – | |||||||||
| Total | $ | 1,467,770 | $ | – | $ | – | $ | (1,467,770 | ) | $ | – | |||||||||
| (a) | Collateral disclosed is limited to an amount not to exceed 100% of the net amount of assets presented in the Statement of Assets and Liabilities, for each respective counterparty. |
| (b) | Net amount represents the amount owed to the Fund by the counterparty as of December 31, 2018. |
23
Notes to Financial Statements (continued)
| 8. | DIRECTORS’ REMUNERATION |
The Company’s officers and one Director, who are associated with Lord Abbett, do not receive any compensation from the Company for serving in such capacities. Independent Directors’ fees are allocated among all Lord Abbett-sponsored funds based on the net assets of each fund. There is an equity-based plan available to all Independent Directors under which Independent Directors must defer receipt of a portion of, and may elect to defer receipt of an additional portion of Directors’ fees. The deferred amounts are treated as though equivalent dollar amounts had been invested in the funds. Such amounts and earnings accrued thereon are included in Directors’ fees on the Statement of Operations and in Directors’ fees payable on the Statement of Assets and Liabilities and are not deductible for U.S. federal income tax purposes until such amounts are paid.
| 9. | EXPENSE REDUCTIONS |
The Company has entered into an arrangement with its transfer agent and custodian, whereby credits realized as a result of uninvested cash balances are used to reduce a portion of the Fund’s expenses.
| 10. | LINE OF CREDIT |
During the period ended August 8, 2018, the Fund and certain other funds managed by Lord Abbett (collectively, the “Participating Funds”) participated in a syndicated line of credit facility with various lenders for $600 million (the “Facility”), whereas State Street Bank and Trust Company (“SSB”) participates as a lender and as agent for the lenders. The Facility is to be used for temporary or emergency purposes as an additional source of liquidity to satisfy redemptions. The Participating Funds are subject to graduated borrowing limits of one-third of Fund assets (if Fund assets are less than $750 million), $250 million, $300 million, or $350 million, based on past borrowings and likelihood of future borrowings. During the period ended August 8, 2018, the Fund did not utilize the Facility.
For the period August 9, 2018 through December 20, 2018, the Participating Funds entered into an amended syndicated line of credit facility with various lenders for $1.06 billion (the “Syndicated Facility”), whereas SSB participates as a lender and as agent for the lenders. Under the Syndicated Facility, the Participating Funds are subject to graduated borrowing limits of one-third of Fund assets (if Fund assets are less than $750 million), $250 million, $300 million, $350 million, or $1 billion, based on past borrowings and likelihood of future borrowings. Effective December 21, 2018, the Participating Funds entered into an amended Syndicated Facility with various lenders for $1.1 billion based on the same terms as described above.
Effective August 9, 2018, the Participating Funds entered into an additional line of credit facility with SSB for $250 million (the “Bilateral Facility,” and together with the Syndicated Facility, the “Facilities”). Under the Bilateral Facility, each Participating Fund may borrow up to the lesser of $250 million or one-third of Fund assets. The Facilities are to be used for temporary or emergency purposes to satisfy redemption requests and manage liquidity.
For the period from August 9, 2018 through December 31, 2018, the Fund did not utilize the Facilities.
| 11. | INTERFUND LENDING PROGRAM |
Pursuant to an exemptive order issued by the U.S. Securities and Exchange Commission (“SEC exemptive order”), certain registered open-end management investment companies managed by Lord Abbett, including the Fund, participate in a joint lending and borrowing program (the
24
Notes to Financial Statements (concluded)
“Interfund Lending Program”). The SEC exemptive order allows the Funds to borrow money from and lend money to each other for temporary or emergency purposes subject to the limitations and conditions. During the fiscal year ended December 31, 2018, the Fund did not participate as a borrower or lender in the Interfund Lending Program.
| 12. | CUSTODIAN AND ACCOUNTING AGENT |
SSB is the Company’s custodian and accounting agent. SSB performs custodial, accounting and recordkeeping functions relating to portfolio transactions and calculating the Fund’s NAV.
| 13. | INVESTMENT RISKS |
The Fund is subject to the general risks and considerations associated with equity investing. The Fund invests primarily in equity securities of large and mid-sized company stocks that have a history of growing their dividends, but there is no guarantee that a company will pay a dividend. At times, the performance of dividend paying companies may lag the performance of other companies or the broader market as a whole. The value of the Fund’s investments in equity securities will fluctuate in response to general economic conditions and to the changes in the prospects of particular companies and/or sectors in the economy. If the Fund’s fundamental research and quantitative analysis fail to produce the intended result, the Fund may suffer losses or underperform its benchmark or other funds with the same investment objective or similar strategies, even in a favorable market.
Large and mid-sized company stocks each may perform differently than the market as a whole and other types of stocks. This is because different types of stocks tend to shift in and out of favor over time depending on market and economic conditions. Mid-sized company stocks may be less able to weather economic shifts or other adverse developments than those of larger, more established companies. Although investing in mid-sized companies offers the potential for above average returns, these companies may not succeed and the value of their stock could decline significantly. Mid-sized companies also may fall out of favor relative to larger companies in certain market cycles, causing the Fund to incur losses or under perform.
The Fund’s exposure to foreign companies and markets presents increased market, industry and sector, liquidity, currency, political and other risks. The securities of foreign companies also may be subject to inadequate exchange control regulations, the imposition of economic sanctions or other government restrictions, higher transaction and other costs, and delays in settlement to the extent they are traded on non-U.S. exchanges or markets.
These factors can affect the Fund’s performance.
| 14 | SUMMARY OF CAPITAL TRANSACTIONS |
Transactions in shares of capital stock were as follows:
| Year Ended December 31, 2018 | Year Ended December 31, 2017 | |||||||
| Shares sold | 2,056,130 | 1,365,645 | ||||||
| Reinvestment of distributions | 1,257,879 | 854,365 | ||||||
| Shares reacquired | (4,880,648 | ) | (2,057,388 | ) | ||||
| Increase (decrease) | (1,566,639 | ) | 162,622 | |||||
25
Report of Independent Registered Public Accounting Firm
To the shareholders and the Board of Directors of Lord Abbett Series Fund, Inc.:
Opinion on the Financial Statements and Financial Highlights
We have audited the accompanying statement of assets and liabilities, including the schedule of investments, of the Calibrated Dividend Growth Portfolio, one of the portfolios constituting the Lord Abbett Series Fund, Inc. (the “Fund”), as of December 31, 2018, the related statement of operations for the year then ended, the statements of changes in net assets for each of the two years in the period then ended, the financial highlights for each of the five years in the period then ended, and the related notes. In our opinion, the financial statements and financial highlights present fairly, in all material respects, the financial position of the Calibrated Dividend Growth Portfolio of the Fund as of December 31, 2018, and the results of its operations for the year then ended, the changes in its net assets for each of the two years in the period then ended, and the financial highlights for each of the five years in the period then ended in conformity with accounting principles generally accepted in the United States of America.
Basis for Opinion
These financial statements and financial highlights are the responsibility of the Fund’s management. Our responsibility is to express an opinion on the Fund’s financial statements and financial highlights based on our audits. We are a public accounting firm registered with the Public Company Accounting Oversight Board (United States) (PCAOB) and are required to be independent with respect to the Fund in accordance with the U.S. federal securities laws and the applicable rules and regulations of the Securities and Exchange Commission and the PCAOB.
We conducted our audits in accordance with the standards of the PCAOB. Those standards require that we plan and perform the audit to obtain reasonable assurance about whether the financial statements and financial highlights are free of material misstatement, whether due to error or fraud. The Fund is not required to have, nor were we engaged to perform, an audit of its internal control over financial reporting. As part of our audits we are required to obtain an understanding of internal control over financial reporting but not for the purpose of expressing an opinion on the effectiveness of the Fund’s internal control over financial reporting. Accordingly, we express no such opinion.
Our audits included performing procedures to assess the risks of material misstatement of the financial statements and financial highlights, whether due to error or fraud, and performing procedures that respond to those risks. Such procedures included examining, on a test basis, evidence regarding the amounts and disclosures in the financial statements and financial highlights. Our audits also included evaluating the accounting principles used and significant estimates made by management, as well as evaluating the overall presentation of the financial statements and financial highlights. Our procedures included confirmation of securities owned as of December 31, 2018, by correspondence with the custodian and brokers. We believe that our audits provide a reasonable basis for our opinion.
DELOITTE & TOUCHE LLP
New York, New York
February 15, 2019
We have served as the auditor of one or more Lord Abbett Family of Funds’ investment companies since 1932.
26
Basic Information About Management
The Board is responsible for the management of the business and affairs of the Company in accordance with the laws of the State of Maryland. The Board elects officers who are responsible for the day-to-day operations of the Fund and who execute policies authorized by the Board. The Board also approves an investment adviser to the Fund and continues to monitor the cost and quality of the services the investment adviser provides, and annually considers whether to renew the contract with the adviser. Generally, each Director holds office until his/her successor is elected and qualified or until his/her earlier resignation or removal, as provided in the Company’s organizational documents.
Lord Abbett, a Delaware limited liability company, is the Fund’s investment adviser. Designated Lord Abbett personnel are responsible for the day-to-day management of the Fund.
Interested Directors
Mr. Sieg is affiliated with Lord Abbett and is an “interested person” of the Company as defined in the Act. Mr. Sieg is director/trustee of each of the 13 investment companies in the Lord Abbett Family of Funds, which consist of 62 portfolios or series. Mr. Sieg is an officer of the Lord Abbett Family of Funds.
| Name, Address and Year of Birth | Current Position and Length of Service with the Company | Principal Occupation and Other Directorships During the Past Five Years | ||
| Douglas B. Sieg Lord, Abbett & Co. LLC 90 Hudson Street Jersey City, NJ 07302 (1969) | Director since 2016; President and Chief Executive Officer since 2018 | Principal Occupation:Managing Partner (since 2018) and was formerly Head of Client Services, joined Lord Abbett in 1994.
Other Directorships:None. |
Independent Directors
The following Independent Directors also are directors/trustees of each of the 13 investment companies in the Lord Abbett Family of Funds, which consist of 62 portfolios or series.
| Name, Address and Year of Birth | Current Position and Length of Service with the Company | Principal Occupation and Other Directorships During the Past Five Years | ||
| Eric C. Fast Lord, Abbett & Co. LLC c/o Legal Dept. 90 Hudson Street Jersey City, NJ 07302 (1949) | Director since 2014 | Principal Occupation:Chief Executive Officer of Crane Co., an industrial products company (2001–2014).
Other Directorships:Currently serves as director of Automatic Data Processing, Inc. (since 2007) and Regions Financial Corporation (since 2010). Previously served as a director of Crane Co. (1999–2014). | ||
| Evelyn E. Guernsey Lord, Abbett & Co. LLC c/o Legal Dept. 90 Hudson Street Jersey City, NJ 07302 (1955) | Director since 2011 | Principal Occupation:CEO, Americas of J.P. Morgan Asset Management (2004–2010).
Other Directorships:None. |
27
Basic Information About Management (continued)
| Name, Address and Year of Birth | Current Position and Length of Service with the Company | Principal Occupation and Other Directorships During the Past Five Years | ||
| Julie A. Hill Lord, Abbett & Co. LLC c/o Legal Dept. 90 Hudson Street Jersey City, NJ 07302 (1946) | Director since 2004 | Principal Occupation:Owner and CEO of The Hill Company, a business consulting firm (since 1998).
Other Directorships:Currently serves as director of Anthem, Inc., a health benefits company (since 1994). | ||
| Kathleen M. Lutito Lord, Abbett & Co. LLC c/o Legal Dept. 90 Hudson Street Jersey City, NJ 07302 (1963) | Director since 2017 | Principal Occupation:President and Chief Investment Officer of CenturyLink Investment Management Company (since 2006).
Other Directorships:None | ||
| James M. McTaggart Lord, Abbett & Co. LLC c/o Legal Dept. 90 Hudson Street Jersey City, NJ 07302 (1947) | Director since 2012 | Principal Occupation:Independent management advisor and consultant (since 2012); Vice President, CRA International, Inc. (doing business as Charles River Associates), a global management consulting firm (2009–2012); Founder and Chairman of Marakon Associates, Inc., a strategy consulting firm (1978–2009); and Officer and Director of Trinsum Group, a holding company (2007–2009).
Other Directorships:Blyth, Inc., a home products company (2004–2015). | ||
| Karla M. Rabusch Lord, Abbett & Co. LLC c/o Legal Dept. 90 Hudson Street Jersey City, NJ 07302 (1959) | Director since 2017 | Principal Occupation:President and Director of Wells Fargo Funds Management, LLC (2003–2017); President of Wells Fargo Funds (2003–2016).
Other Directorships:None. | ||
| Mark A. Schmid Lord, Abbett & Co. LLC c/o Legal Dept. 90 Hudson Street Jersey City, NJ 07302 (1959) | Director since 2016 | Principal Occupation:Vice President and Chief Investment Officer of the University of Chicago (since 2009).
Other Directorships:None. | ||
| James L.L. Tullis Lord, Abbett & Co. LLC c/o Legal Dept. 90 Hudson Street Jersey City, NJ 07302 (1947) | Director since 2006; Chairman since 2017 | Principal Occupation:CEO of Tullis-Dickerson and Co. Inc., a venture capital management firm (since 1990); CEO of Tullis Health Investors Inc. (since 2012).
Other Directorships:Currently serves as director of Crane Co. (since 1998). |
Officers
None of the officers listed below have received compensation from the Company. All of the officers of the Company also may be officers of the other Lord Abbett Funds and maintain offices at 90 Hudson Street, Jersey City, NJ 07302. Unless otherwise indicated, the position(s) and title(s) listed under the “Principal Occupation During the Past Five Years” column indicate each officer’s position(s) and title(s) with Lord Abbett. Each officer serves for an indefinite term (i.e., until his or her death, resignation, retirement, or removal).
28
Basic Information About Management (continued)
| Name and Year of Birth | Current Position with the Company | Length of Service of Current Position | Principal Occupation During the Past Five Years | |||
| Douglas B. Sieg (1969) | President and Chief Executive Officer | Elected as President and Chief Executive Officer in 2018 | Managing Partner of Lord Abbett, (since 2018) and was formerly Head of Client Services, joined Lord Abbett in 1994. | |||
| Jeff D. Diamond (1960) | Executive Vice President | Elected in 2008 | Portfolio Manager, joined Lord Abbett in 2007. | |||
| Todd D. Jacobson (1966) | Executive Vice President | Elected in 2005 | Partner and Associate Director, joined Lord Abbett in 2003. | |||
| Robert A. Lee (1969) | Executive Vice President | Elected in 2010 | Partner and Chief Investment Officer, and was formerly Deputy Chief Investment Officer and Director of Taxable Fixed Income, joined Lord Abbett in 1997. | |||
| David J. Linsen (1974) | Executive Vice President | Elected in 2008 | Partner and Director of Equities, joined Lord Abbett in 2001. | |||
| Vincent J. McBride (1964) | Executive Vice President | Elected in 2010 | Partner and Director, joined Lord Abbett in 2003. | |||
| Andrew H. O’Brien (1973) | Executive Vice President | Elected in 2010 | Partner and Portfolio Manager, joined Lord Abbett in 1998. | |||
| F. Thomas O’Halloran (1955) | Executive Vice President | Elected in 2010 | Partner and Portfolio Manager, joined Lord Abbett in 2001. | |||
| Marc Pavese (1972) | Executive Vice President | Elected in 2016 | Partner and Portfolio Manager, joined Lord Abbett in 2008. | |||
| Walter H. Prahl (1958) | Executive Vice President | Elected in 2012 | Partner and Director, joined Lord Abbett in 1997. | |||
| Eli Rabinowich (1975) | Executive Vice President | Elected in 2018 | Portfolio Manager, joined Lord Abbett in 2018 and was formerly a Portfolio Manager, Partner, and Analyst at Pzena Investment Management from (2004–2018). |
29
Basic Information About Management (continued)
| Name and Year of Birth | Current Position with the Company | Length of Service of Current Position | Principal Occupation During the Past Five Years | |||
| Jeffrey Rabinowitz (1972) | Executive Vice President | Elected in 2017 | Portfolio Manager, joined Lord Abbett in 2017 and was formerly Managing Director and Portfolio Manager/Technology Analyst at Jennison Associates LLC (2014–2017) and Managing Director and Portfolio Manager/Technology Analyst for U.S. Growth Equity at Goldman Sachs Asset Management (1999–2014). | |||
| Steven F. Rocco (1979) | Executive Vice President | Elected in 2014 | Partner and Director of Taxable Fixed Income, joined Lord Abbett in 2004. | |||
| A. Edward Allinson (1961) | Vice President | Elected in 2011 | Portfolio Manager, joined Lord Abbett in 2005. | |||
| Vernon T. Bice (1974) | Vice President | Elected in 2011 | Portfolio Manager, joined Lord Abbett in 2011. | |||
| Pamela P. Chen (1978) | Vice President, Assistant Secretary and Privacy Officer | Elected in 2018 | Associate General Counsel, joined Lord Abbett in 2017 and was formerly Special Counsel at Schulte, Roth & Zabel LLP (2005–2017). | |||
| Robert S. Clark (1975) | Vice President | Elected in 2018 | Portfolio Manager, joined Lord Abbett in 2010. | |||
| Matthew R. DeCicco (1977) | Vice President | Elected in 2003 | Managing Director and Portfolio Manager, joined Lord Abbett in 1999. | |||
| John T. Fitzgerald (1975) | Vice President and Assistant Secretary | Elected in 2018 | Deputy General Counsel, joined Lord Abbett in 2018 and was formerly Deputy Head of U.S. Funds Legal, Executive Director and Assistant General Counsel at JPMorgan Chase (2005–2018). | |||
| Christopher J. Gizzo (1986) | Vice President | Elected in 2018 | Managing Director and Portfolio Manager, joined Lord Abbett in 2008. | |||
| Bernard J. Grzelak (1971) | Chief Financial Officer and Vice President | Elected in 2017 | Partner, Chief Operating Officer, Global Funds and Risk, joined Lord Abbett in 2003. |
30
Basic Information About Management (concluded)
| Name and Year of Birth | Current Position with the Company | Length of Service of Current Position | Principal Occupation During the Past Five Years | |||
| Linda Y. Kim (1980) | Vice President and Assistant Secretary | Elected in 2016 | Counsel, joined Lord Abbett in 2015 and was formerly an Associate at Stroock & Stroock & Lavan LLP (2007–2015). | |||
| So Young Lee (1971) | Vice President | Elected in 2018 | Portfolio Manager, joined Lord Abbett in 2013. | |||
| Joseph M. McGill (1962) | Chief Compliance Officer | Elected in 2014 | Partner and Chief Compliance Officer, joined Lord Abbett in 2014 and was formerly Managing Director and the Chief Compliance Officer at UBS Global Asset Management (2003–2013). | |||
| A. Edward Oberhaus, III (1959) | Vice President | Elected in 1998 | Partner and Director, joined Lord Abbett in 1983. | |||
| Amanda S. Ryan (1978) | Vice President and Assistant Secretary | Elected in 2018 | Counsel, joined Lord Abbett In 2016 and was formerly a Director and Corporate Counsel at PGIM Investments (2012–2016). | |||
| Lawrence B. Stoller (1963) | Vice President, Secretary and Chief Legal Officer | Elected in 2007 | Partner and General Counsel, joined Lord Abbett in 2007. | |||
| Leah G. Traub (1979) | Vice President | Elected in 2016 | Partner and Portfolio Manager, joined Lord Abbett in 2007. | |||
| Kewjin Yuoh (1971) | Vice President | Elected in 2012 | Partner and Portfolio Manager, joined Lord Abbett in 2010. | |||
| Jackson C. Chan (1964) | AML Compliance Officer | Elected in 2018 | Deputy Chief Compliance Officer and Director of Regulatory Affairs, joined Lord Abbett in 2014 and was formerly Director at UBS Global Asset Management (2005–2014). | |||
| Vito A. Fronda (1969) | Treasurer | Elected in 2018 | Partner and Director of Taxation, joined Lord Abbett in 2003. |
Please call 888-522-2388 for a copy of the statement of additional information, which contains further information about the Company’s Directors. It is available free upon request.
31
Approval of Advisory Contract
The Board, including all of the Directors who are not “interested persons” of the Company or of Lord Abbett, as defined in the Investment Company Act of 1940, as amended (the “Independent Directors”), annually considers whether to approve the continuation of the existing management agreement between the Fund and Lord Abbett (the “Agreement”). In connection with its most recent approval, which included the approval of a proposal to reduce the management fee schedule effective May 1, 2019, the Board reviewed materials relating specifically to the Agreement, as well as numerous materials received throughout the course of the year, including information about the Fund’s investment performance compared to the performance of its benchmark. Before making its decision as to the Fund, the Board had the opportunity to ask questions and request further information, taking into account its knowledge of Lord Abbett gained through its meetings and discussions. These meetings and discussions included reviews of Fund performance conducted by members of the Contract Committee, the deliberations of the Contract Committee, and discussions between the Contract Committee and Lord Abbett’s management. The Independent Directors also met with their independent legal counsel in various private sessions at which no representatives of management were present.
The materials received by the Board included, but were not limited to: (1) information provided by Broadridge Financial Solutions (“Broadridge”) regarding the investment performance of the Fund compared to the investment performance of certain funds with similar investment styles as determined by Broadridge, based, in part, on the Fund’s Morningstar category (the “performance peer group”), and the investment performance of two appropriate benchmarks; (2) information provided by Broadridge regarding the expense ratios, contractual and actual management fee rates, and other expense components for the Fund and certain funds in the same Morningstar category, with generally the same or similar share classes and operational characteristics, including asset size (the “expense peer group”); (3) certain supplemental investment performance information provided by Lord Abbett; (4) information provided by Lord Abbett on the expense ratios, management fee rates, and other expense components for the Fund; (5) sales and redemption information for the Fund; (6) information regarding Lord Abbett’s financial condition; (7) an analysis of the relative profitability of the Agreement to Lord Abbett; (8) information provided by Lord Abbett regarding the investment management fee schedules for Lord Abbett’s other advisory clients maintaining accounts with a similar investment strategy as the Fund; and (9) information regarding the personnel and other resources devoted by Lord Abbett to managing the Fund.
Investment Management and Related Services Generally.The Board considered the services provided by Lord Abbett to the Fund, including investment research, portfolio management, and trading, and Lord Abbett’s commitment to compliance with all applicable legal requirements. The Board also observed that Lord Abbett was solely engaged in the investment management business and accordingly did not experience the conflicts of interest that may result from being engaged in other lines of business. The Board considered the investment advisory services provided by Lord Abbett to other clients, the fees charged for the services, and the differences in the nature of the services provided to the Fund and other Lord Abbett Funds, on the one hand, and the services provided to other clients, on the other. After reviewing these and related factors, the Board concluded that the Fund was likely to continue to benefit from the nature, extent and quality of the investment services provided by Lord Abbett under the Agreement.
Investment Performance.The Board reviewed the Fund’s investment performance in relation to that of the performance peer group and two appropriate benchmark as of various periods ended
32
Approval of Advisory Contract (continued)
August 31, 2018. The Board observed that the Fund’s investment performance was above the median of the performance peer group for the one-, three-, five-, and ten-year periods and took into account actions taken by Lord Abbett to attempt to improve equity fund performance. The Board further considered Lord Abbett’s performance and reputation generally, the performance of other Lord Abbett-managed funds overseen by the Board, and the willingness of Lord Abbett to take steps intended to improve performance when appropriate. After reviewing these and related factors, the Board concluded that the Fund’s Agreement, as revised with a reduced management fee schedule effective May 1, 2019, should be continued.
Lord Abbett’s Personnel and Methods.The Board considered the qualifications of the personnel providing investment management services to the Fund, in light of its investment objective and discipline, and other services provided to the Fund by Lord Abbett. Among other things, the Board considered the size, experience, and turnover of Lord Abbett’s staff, Lord Abbett’s investment methodology and philosophy, and Lord Abbett’s approach to recruiting, training, and retaining personnel.
Nature and Quality of Other Services.The Board considered the nature, quality, and extent of compliance, administrative, and other services performed by Lord Abbett and the nature and extent of Lord Abbett’s supervision of third party service providers, including the Fund’s transfer agent and custodian.
Expenses.The Board considered the expense level of the Fund, including the contractual and actual management fee rates under the terms of the current Agreement, and the expense levels of the Fund’s expense peer group. It also considered how the expense level of the Fund related to those of the expense peer group and the amount and nature of the fees paid by shareholders. The Board observed that the net total expense ratio of the Fund was below the median of the expense peer group. The Board further considered that the Fund’s management fee schedule would be reduced, effective May 1, 2019. After reviewing these and related factors, the Board concluded, within the context of its overall approval of the Agreement, that the expense level of the Fund was reasonable and supported the continuation of the Agreement.
Profitability.The Board considered the level of Lord Abbett’s operating margin in managing the Fund, including a review of Lord Abbett’s methodology for allocating its costs to its management of the Fund. It considered whether the Fund was profitable to Lord Abbett in connection with the Fund’s operation, including the fee that Lord Abbett receives from the Fund for providing administrative services to the Fund. The Board also considered the profits realized from other business segments of Lord Abbett, which may benefit from or be related to the Fund’s business. The Board considered Lord Abbett’s profit margins excluding Lord Abbett’s marketing and distribution expenses. The Board also considered Lord Abbett’s profit margins, without those exclusions, in comparison with available industry data and how those profit margins could affect Lord Abbett’s ability to recruit and retain personnel. The Board recognized that Lord Abbett’s overall profitability was a factor in enabling it to attract and retain qualified personnel to provide services to the Fund. After reviewing these and related factors, the Board concluded, within the context of its overall approval of the Agreement, that Lord Abbett’s profitability with respect to the Fund was not excessive.
Economies of Scale.The Board considered the extent to which there had been economies of scale in managing the Fund, whether the Fund’s shareholders had appropriately benefited from such economies of scale, and whether there was potential for realization of any further economies of scale. The Board concluded that the reduced management fee schedule, which included a
33
Approval of Advisory Contract (concluded)
breakpoint in the management fee schedule, in conjunction with the proposed expense limitation agreement, adequately addressed any economies of scale in managing the Fund.
Other Benefits to Lord Abbett.The Board considered the amount and nature of the fees paid by the Fund and the Fund’s shareholders to Lord Abbett for services other than investment advisory services, such as the fee that Lord Abbett receives from the Fund for providing administrative services to the Fund. The Board also considered the revenues and profitability of Lord Abbett’s investment advisory business apart from its mutual fund business, and the intangible benefits enjoyed by Lord Abbett by virtue of its relationship with the Fund. The Board observed that the Distributor receives 12b-1 fees from certain of the Lord Abbett Funds as to shares held in accounts for which there is no other broker of record, may retain a portion of the 12b-1 fees it receives, and receives a portion of the sales charges on sales and redemptions of some classes of shares of the Lord Abbett Funds. In addition, the Board observed that Lord Abbett accrues certain benefits for its business of providing investment advice to clients other than the Lord Abbett Funds, but that business also benefits the Funds. The Board also noted that Lord Abbett, as disclosed in the prospectus of the Fund, has entered into revenue sharing arrangements with certain entities that distribute shares of the Lord Abbett Funds. The Board also took into consideration the investment research that Lord Abbett receives as a result of client brokerage transactions.
Alternative Arrangements.The Board considered whether, instead of approving continuation of the Agreement, it might be in the best interests of the Fund to implement one or more alternative arrangements, such as continuing to employ Lord Abbett, but on different terms. After considering all of the relevant factors, the Board unanimously found that continuation of the Agreement, as revised, was in the best interests of the Fund and its shareholders and voted unanimously to approve the continuation of the Agreement. In considering whether to approve the continuation of the Agreement, the Board did not identify any single factor as paramount or controlling. Individual Directors may have evaluated the information presented differently from one another, giving different weights to various factors. This summary does not discuss in detail all matters considered.
34
Householding
The Company has adopted a policy that allows it to send only one copy of the Fund’s prospectus, proxy material, annual report and semiannual report to certain shareholders residing at the same “household.” This reduces Fund expenses, which benefits you and other shareholders. If you need additional copies or do not want your mailings to be “householded,” please call Lord Abbett at 888-522-2388 or send a written request with your name, the name of your fund or funds and your account number or numbers to Lord Abbett Family of Funds, P.O. Box 219336, Kansas City, MO 64121.
Proxy Voting Policies, Procedures and Records
A description of the policies and procedures that Lord Abbett uses to vote proxies related to the Fund’s portfolio securities, and information on how Lord Abbett voted the Fund’s proxies during the 12-month period ended June 30 are available without charge, upon request, (i) by calling 888-522-2388; (ii) on Lord Abbett’s Website at www.lordabbett.com; and (iii) on the Securities and Exchange Commission’s (“SEC”) Website at www.sec.gov.
Shareholder Reports and Quarterly Portfolio Disclosure
The Fund is required to file its complete schedule of portfolio holdings with the SEC for its first and third fiscal quarters on Form N-Q. Copies of the filings are available without charge, upon request on the SEC’s Website at www.sec.gov and may be available by calling Lord Abbett at 888-522-2388.
Tax Information
For corporate shareholders, 75% of the Fund’s ordinary income distributions qualified for the dividends received deduction.
Additionally, of the distribution paid to the shareholders during the fiscal year ended December 31, 2018, $3,207,095 and $11,015,434, respectively, represent short-term capital gains and long-term capital gains. |
35


| This report, when not used for the general information of shareholders of the Fund, is to be distributed only if preceded or accompanied by a current fund prospectus. | |||
| Lord Abbett mutual fund shares are distributed by LORD ABBETT DISTRIBUTOR LLC. | Lord Abbett Series Fund, Inc.
Calibrated Dividend Growth Portfolio | SFCS-PORT-3 (02/19) |
![]()
LORD ABBETT
ANNUAL REPORT
Lord Abbett
Series Fund—Classic Stock Portfolio
For the fiscal year ended December 31, 2018
Table of Contents
Lord Abbett Series Fund — Classic Stock Portfolio
Annual Report
For the fiscal year ended December 31, 2018

From left to right: James L.L. Tullis, Independent Chairman of the Lord Abbett Funds and Douglas B. Sieg, Director, President, and Chief Executive Officer of the Lord Abbett Funds.
Dear Shareholders:We are pleased to provide you with this overview of the performance of Lord Abbett Series Fund — Classic Stock Portfolio for the fiscal year ended December 31, 2018. On this page and the following pages, we discuss the major factors that influenced fiscal year performance. For additional information about the Fund, please visit our website at www.lordabbett.com, where you also can access the quarterly commentaries that provide updates on the Fund’s performance and other portfolio related updates.
Thank you for investing in Lord Abbett mutual funds. We value the trust that you place in us and look forward to serving your investment needs in the years to come.
Best regards,

Douglas B. Sieg
Director, President and Chief Executive Officer
For the fiscal year ended December 31, 2018, the Fund returned -7.80%, reflecting performance at the net asset value (NAV) of Class VC shares with all distributions reinvested, compared to its benchmark, the Russell 1000® Index1, which returned –4.78% over the same period.
Domestic equity returns were negative over the past year, with large cap stocks, as represented by the S&P 500® Index2, falling –4.38% during the period, while small cap stocks, as represented by the Russell 2000® Index3, were down –11.01%. During the period, there were several market-moving events. Notably, Congress
passed the largest rewrite of the U.S. tax code in decades, which went into effect in January 2018. The tax bill reduced the corporate tax rate from 35% to 21% and allowed for a one-time repatriation tax of 15.5%, rather than the standard repatriation tax rate of 35%. In June 2018, the White House announced its intent to impose additional tariffs on $200 billion worth of Chinese goods on top of the $50 billion previously announced. The aggressive U.S. trade posture continued into the third quarter with trade tensions mounting between the U.S. and China. In December, the White House announced a trade truce
1
between the U.S. and China following a meeting between President Trump and President Xi Jinping at the G20 summit. The U.S. agreed to maintain a 10% tariff rate on $200 billion worth of Chinese imports at the start of 2019 as opposed to the originally planned 25% tariff rate. In return, China agreed to purchase a substantial amount of U.S. agriculture, industrial, and energy products to further reduce the trade imbalance. While the impact has yet to fully be realized, many corporations anticipate that the retaliatory tariffs will weigh on profits. Trade discussions between Mexico, Canada, and the U.S., however, took a more favorable turn as the negotiations resulted in a revised version of the North American Free Trade Agreement (NAFTA) called the U.S.-Mexico-Canada Agreement. In March 2018, the Federal Reserve (the “Fed”) raised its target for short-term interest rates by 0.25%, to a range of 1.50%–1.75%, and followed with rate hikes of 0.25% at each of its June, September, and December meetings, raising the target range to 2.25%–2.50%. Amid rising concerns surrounding escalating trade tensions, slowing global growth, and increasing interest rates, the Nasdaq experienced the largest monthly drop since 2008 in October 2018. Following the prior month’s volatility, domestic equity markets rallied in November and partially reversed October’s losses, however the S&P 500 returned to negative territory in December, posting its worst month since February 2009.
Stock selection within the financials and information technology sectors detracted from relative performance over the period. Within the financials sector, the Fund’s holding of Citizens Financial Group, Inc., a regional bank, was one of the top detractors. Shares of the firm sold off as investors grew wary of the relatively high deposit beta, whereby the firm gives individual depositors higher returns for their cash than its peers. In turn, the firm may face higher costs. The Fund’s holding of SVB Financial Group, a financial services company, also detracted from relative performance. Shares of SVB Financial decreased following Investor Day in December as investors were disappointed with the 2019 outlook, and more specifically, expressed disappointment with potentially lower margin expansion due to fewer projected rate hikes by the Fed. In the back half of 2018, most banks underperformed as a result of intensified late cycle concerns surrounding net interest margin contraction and increasing credit costs. Additionally, within the information technology sector, NVIDIA Corp., a computer graphics processor manufacturer, detracted from relative performance. Shares of NVIDIA sold off after management issued revenue guidance of $2.7 billion, which fell drastically short of expectations of $3.4 billion.
Conversely, stock selection within the consumer discretionary and health care sectors contributed positively to relative performance during the period. Within the
2
consumer discretionary sector, O’Reilly Automotive, Inc., an automotive aftermarket parts retailer, was a top contributor to relative performance. Shares of O’Reilly Automotive rose following favorable economic conditions, benefits from its expansive distribution network, and increases in average miles driven and vehicle age. The Fund’s position in Yum! Brands, Inc., a quick service restaurant franchise, also contributed to relative performance. Shares of the company increased following the announcement of a partnership with GrubHub as well as solid second quarter results with both the top and bottom lines beating consensus
estimates. Within the industrials sector, CSX Corp., a rail based freight transportation company, contributed the most to relative performance. Shares of CSX rose throughout the year after activist activity resulted in management changes, which brought about a turnaround strategy that resulted in a successful third quarter, where the firm reported doubled earnings per share year over year.
The Fund’s portfolio is actively managed and, therefore, its holdings and the weightings of a particular issuer or particular sector as a percentage of portfolio assets are subject to change. Sectors may include many industries.
1 The Russell 1000 Index®measures the performance of the 1,000 largest companies in the Russell 3000 Index, which represent approximately 92% of the total market capitalization of the Russell 3000 Index.
2 The S&P 500® Index is widely regarded as the standard for measuring large cap U.S. stock market performance and includes a representative sample of leading companies in leading industries.
3 The Russell 2000® Index measures the performance of the 2,000 smallest companies in the Russell 3000® Index, which represents approximately 10% of the total market capitalization of the Russell 3000® Index.
Unless otherwise specified, indexes reflect total return, with all dividends reinvested. Indexes are unmanaged, do not reflect the deduction of fees or expenses, and are not available for direct investment.
Important Performance and Other Information
Performance data quoted in the following pages reflect past performance and are no guarantee of future results. Current performance may be higher or lower than the performance quoted. The investment return and principal value of an investment in the Fund will fluctuate so that shares, on any given day or when redeemed, may be worth more or less than their original cost. You can obtain performance data current to the most recent month end by calling Lord Abbett at 888-522-2388 or referring to www.lordabbett.com.
During certain periods shown, expense waivers and reimbursements were in place. Without such expense waivers and reimbursements, the Fund’s returns would have been lower.
The annual commentary above discusses the views of the Fund’s management and various portfolio holdings of the Fund as of December 31, 2018. These views and portfolio holdings may have changed after this date. Information provided in the commentary is not a recommendation to buy or sell securities. Because the Fund’s portfolio is actively managed and may change significantly, the Fund may no longer own the securities described above or may have otherwise changed its position in the securities. For more recent information about the Fund’s portfolio holdings, please visit www.lordabbett.com.
A Note about Risk:See Notes to Financial Statements for a discussion of investment risks. For a more detailed discussion of the risks associated with the Fund, please see the Fund’s prospectus.
Mutual funds are not insured by the FDIC, are not deposits or other obligations of, or guaranteed by, banks, and are subject to investment risks including possible loss of principal amount invested.
The Fund serves as an underlying investment vehicle for variable annuity contracts and variable life insurance policies.
3
Below is a comparison of a $10,000 investment in Class VC shares with the same investment in both the Russell 1000® Index and the S&P 500® Index, assuming reinvestment of all dividends and distributions. The Fund’s shares are sold only to insurance company separate accounts that fund certain variable annuity and variable life contracts. This line graph comparison does not reflect the sales charges or other expenses of these contracts. If those sales charges and expenses were reflected, returns would be lower. The graph and performance table below do not reflect the deduction of taxes that a shareholder would pay on Fund distributions or the redemption of Fund shares. During certain periods, expenses of the Fund have been waived or reimbursed by Lord Abbett; without such waiver or reimbursement of expenses, the Fund’s returns would have been lower.Past performance is no guarantee of future results.

Average Annual Total Returns for the Periods Ended December 31, 2018 | |||||||
| 1 Year | 5 Years | 10 years | |||||
| Class VC | –7.80% | 5.55% | 9.92% | ||||
| 1 | Performance for each unmanaged index does not reflect any fees or expenses. The performance of each index is not necessarily representative of the Fund’s performance. |
4
As a shareholder of the Fund, you incur ongoing costs, including management fees; expenses related to the Fund’s services arrangements with certain insurance companies; and other Fund expenses. This Example is intended to help you understand your ongoing costs (in dollars) of investing in the Fund and to compare these costs with the ongoing costs of investing in other mutual funds.
The Example is based on an investment of $1,000 invested at the beginning of the period and held for the entire period (July 1, 2018 through December 31, 2018).
The Example reflects only expenses that are deducted from the assets of the Fund. Fees and expenses, including sales charges applicable to the various insurance products that invest in the Fund, are not reflected in this Example. If such fees and expenses were reflected in the Example, the total expenses shown would be higher. Fees and expenses regarding such variable insurance products are separately described in the prospectus related to those products.
Actual Expenses
The first line of the table on the following page provides information about actual account values and actual expenses. You may use the information in this line, together with the amount you invested, to estimate the expenses that you paid over the period. Simply divide your account value by $1,000 (for example, an $8,600 account value divided by $1,000 = 8.6), then multiply the result by the number in the first line under the heading titled “Expenses Paid During Period 7/1/18 – 12/31/18” to estimate the expenses you paid on your account during this period.
Hypothetical Example for Comparison Purposes
The second line of the table on the following page provides information about hypothetical account values and hypothetical expenses based on the Fund’s actual expense ratio and an assumed rate of return of 5% per year before expenses, which is not the Fund’s actual return. The hypothetical account values and expenses may not be used to estimate the actual ending account balance or expenses you paid for the period. You may use this information to compare the ongoing costs of investing in the Fund and other funds. To do so, compare this 5% hypothetical example with the 5% hypothetical examples that appear in the shareholder reports of the other funds.
5
Please note that the expenses shown in the table are meant to highlight your ongoing costs only and do not reflect any transactional costs, such as sales charges. Therefore, the second line of the table is useful in comparing ongoing costs only, and will not help you determine the relative total costs of owning different funds. In addition, if these transactional costs were included, your costs would have been higher.
| Beginning | Ending | Expenses | |||||
| Account | Account | Paid During | |||||
| Value | Value | Period† | |||||
| 7/1/18 – | |||||||
| 7/1/18 | 12/31/18 | 12/31/18 | |||||
| Class VC | |||||||
| Actual | $1,000.00 | $ 908.40 | $4.81 | ||||
| Hypothetical (5% Return Before Expenses) | $1,000.00 | $1,020.16 | $5.09 |
| † | Net expenses are equal to the Fund’s annualized expense ratio of 1.00%, multiplied by the average account value over the period, multiplied by 184/365 (to reflect one-half year period). |
Portfolio Holdings Presented by Sector
December 31, 2018
| Sector* | %** | |
| Communication Services | 14.00 | % |
| Consumer Discretionary | 8.14 | % |
| Consumer Staples | 7.20 | % |
| Energy | 5.95 | % |
| Financials | 14.43 | % |
| Health Care | 13.08 | % |
| Industrials | 8.80 | % |
| Information Technology | 13.83 | % |
| Materials | 3.57 | % |
| Real Estate | 2.16 | % |
| Utilities | 2.44 | % |
| Repurchase Agreement | 6.40 | % |
| Total | 100.00 | % |
| * | A sector may comprise several industries. | |
| ** | Represents percent of total investments. |
6
December 31, 2018
| Fair | ||||||||
| Value | ||||||||
| Investments | Shares | (000) | ||||||
| COMMON STOCKS 94.92% | ||||||||
| Auto Components 1.05% | ||||||||
| Lear Corp. | 1,904 | $ | 234 | |||||
| Banks 6.70% | ||||||||
| Citizens Financial Group, Inc. | 10,189 | 303 | ||||||
| East West Bancorp, Inc. | 3,241 | 141 | ||||||
| Signature Bank | 4,144 | 426 | ||||||
| SVB Financial Group* | 1,059 | 201 | ||||||
| Wells Fargo & Co. | 9,293 | 428 | ||||||
| Total | 1,499 | |||||||
| Beverages 2.28% | ||||||||
| Coca-Cola Co. (The) | 10,781 | 510 | ||||||
| Biotechnology 2.73% | ||||||||
| Vertex Pharmaceuticals, Inc.* | 3,686 | 611 | ||||||
| Capital Markets 3.23% | ||||||||
| Charles Schwab Corp. (The) | 5,708 | 237 | ||||||
| Morgan Stanley | 12,240 | 485 | ||||||
| Total | 722 | |||||||
| Chemicals 2.19% | ||||||||
| DowDuPont, Inc. | 9,162 | 490 | ||||||
| Commercial Banks 0.44% | ||||||||
| Royal Bank of Scotland Group PLC ADR | 17,446 | 98 | ||||||
| Consumer Finance 1.73% | ||||||||
| Discover Financial Services | 6,581 | 388 | ||||||
| Diversified Telecommunication Services 0.72% | ||||||||
| AT&T, Inc. | 5,656 | 161 | ||||||
| Electric: Utilities 2.47% | ||||||||
| NextEra Energy, Inc. | 3,179 | 553 | ||||||
| Electrical Equipment 2.62% | ||||||||
| AMETEK, Inc. | 5,362 | 363 | ||||||
| Hubbell, Inc. | 2,260 | 225 | ||||||
| Total | 588 | |||||||
| Fair | ||||||||
| Value | ||||||||
| Investments | Shares | (000) | ||||||
| Energy Equipment & Services 1.80% | ||||||||
| Halliburton Co. | 7,035 | $ | 187 | |||||
| National Oilwell Varco, Inc. | 8,373 | 215 | ||||||
| Total | 402 | |||||||
| Entertainment 7.78% | ||||||||
| Netflix, Inc.* | 3,568 | 955 | ||||||
| Nintendo Co. Ltd. ADR | 10,150 | 336 | ||||||
| Walt Disney Co. (The) | 4,105 | 450 | ||||||
| Total | 1,741 | |||||||
| Equity Real Estate Investment Trusts 2.19% | ||||||||
| Prologis, Inc. | 8,350 | 490 | ||||||
| Food & Staples Retailing 2.56% | ||||||||
| Walmart, Inc. | 6,141 | 572 | ||||||
| Food Products 0.63% | ||||||||
| Mondelez International, Inc. Class A | 3,537 | 142 | ||||||
| Health Care Equipment & Supplies 2.69% | ||||||||
| Baxter International, Inc. | 9,155 | 603 | ||||||
| Health Care Providers & Services 1.55% | ||||||||
| Anthem, Inc. | 1,317 | 346 | ||||||
| Hotels, Restaurants & Leisure 1.99% | ||||||||
| Yum! Brands, Inc. | 4,850 | 446 | ||||||
| Household Products 1.00% | ||||||||
| Clorox Co. (The) | 1,459 | 225 | ||||||
| Industrial Conglomerates 2.84% | ||||||||
| Honeywell International, Inc. | 4,811 | 636 | ||||||
| Information Technology Services 1.01% | ||||||||
| Worldpay, Inc. Class A* | 2,967 | 227 | ||||||
| Insurance 2.55% | ||||||||
| Chubb Ltd. (Switzerland)(a) | 2,058 | 266 | ||||||
| Hartford Financial Services Group, Inc. (The) | 6,843 | 304 | ||||||
| Total | 570 | |||||||
| See Notes to Financial Statements. | 7 |
Schedule of Investments (continued)
December 31, 2018
| Fair | ||||||||
| Value | ||||||||
| Investments | Shares | (000) | ||||||
| Interactive Media & Services 5.70% | ||||||||
| Alphabet, Inc. Class A* | 879 | $ | 918 | |||||
| Tencent Holdings Ltd. ADR | 9,070 | 358 | ||||||
| Total | 1,276 | |||||||
| Internet & Direct Marketing Retail 1.96% | ||||||||
| Alibaba Group Holding Ltd. ADR* | 3,205 | 439 | ||||||
| Machinery 2.98% | ||||||||
| Caterpillar, Inc. | 790 | 101 | ||||||
| Parker-Hannifin Corp. | 1,410 | 210 | ||||||
| Stanley Black & Decker, Inc. | 2,972 | 356 | ||||||
| Total | 667 | |||||||
| Media 1.24% | ||||||||
| Charter Communications, Inc. Class A* | 644 | 184 | ||||||
| Interpublic Group of Cos., Inc. (The) | 1,769 | 36 | ||||||
| Omnicom Group, Inc. | 779 | 57 | ||||||
| Total | 277 | |||||||
| Metals & Mining 1.43% | ||||||||
| Nucor Corp. | 4,175 | 216 | ||||||
| Steel Dynamics, Inc. | 3,459 | 104 | ||||||
| Total | 320 | |||||||
| Oil, Gas & Consumable Fuels 4.24% | ||||||||
| EOG Resources, Inc. | 2,952 | 258 | ||||||
| Marathon Petroleum Corp. | 6,920 | 408 | ||||||
| Noble Energy, Inc. | 15,085 | 283 | ||||||
| Total | 949 | |||||||
| Pharmaceuticals 6.30% | ||||||||
| Bristol-Myers Squibb Co. | 3,420 | 178 | ||||||
| Jazz Pharmaceuticals plc (Ireland)*(a) | 850 | 105 | ||||||
| Johnson & Johnson | 5,276 | 681 | ||||||
| Novartis AG ADR | 5,199 | 446 | ||||||
| Total | 1,410 | |||||||
| Road & Rail 0.48% | ||||||||
| CSX Corp. | 1,724 | 107 | ||||||
| Fair | ||||||||
| Value | ||||||||
| Investments | Shares | (000) | ||||||
| Semiconductors & Semiconductor Equipment 0.80% | ||||||||
| Texas Instruments, Inc. | 1,888 | $ | 178 | |||||
| Software 6.96% | ||||||||
| Microsoft Corp. | 15,352 | 1,559 | ||||||
| Specialty Retail 2.01% | ||||||||
| Foot Locker, Inc. | 3,133 | 166 | ||||||
| O’Reilly Automotive, Inc.* | 827 | 285 | ||||||
| Total | 451 | |||||||
| Technology Hardware, Storage & Peripherals 5.25% | ||||||||
| Apple, Inc. | 5,536 | 873 | ||||||
| HP, Inc. | 14,799 | 303 | ||||||
| Total | 1,176 | |||||||
| Tobacco 0.82% | ||||||||
| Philip Morris International, Inc. | 2,764 | 185 | ||||||
| Total Common Stocks (cost $21,228,795) | 21,248 | |||||||
| Principal | ||||||||
| Amount | ||||||||
| (000) | ||||||||
| SHORT-TERM INVESTMENT 6.49% | ||||||||
| Repurchase Agreement | ||||||||
| Repurchase Agreement dated 12/31/2018, 1.45% due 1/2/2019 with Fixed Income Clearing Corp. collateralized by $1,445,000 of U.S. Treasury Note at 2.875% due 7/31/2025; value: $1,482,717; proceeds: $1,453,608 (cost $1,453,491) | $ | 1,454 | 1,454 | |||||
| Total Investments in Securities 101.41% (cost $22,682,286) | 22,702 | |||||||
| Liabilities in Excess of Other Assets (1.41)% | (316 | ) | ||||||
| Net Assets 100.00% | $ | 22,386 | ||||||
| 8 | See Notes to Financial Statements. |
Schedule of Investments (concluded)
December 31, 2018
| ADR | American Depositary Receipt. | |
| * | Non-income producing security. | |
| (a) | Foreign security traded in U.S. dollars. |
The following is a summary of the inputs used as of December 31, 2018 in valuing the Fund’s investments carried at fairvalue(1):
| Level 1 | Level 2 | Level 3 | Total | |||||||||||||
| Investment Type(2)(3) | (000) | (000) | (000) | (000) | ||||||||||||
| Common Stocks | $ | 21,248 | $ | – | $ | – | $ | 21,248 | ||||||||
| Short-Term Investments | ||||||||||||||||
| Repurchase Agreement | – | 1,454 | – | 1,454 | ||||||||||||
| Total | $ | 21,248 | $ | 1,454 | $ | – | $ | 22,702 | ||||||||
| (1) | Refer to Note 2(h) for a description of fair value measurements and the three-tier hierarchy of inputs. | |
| (2) | See Schedule of Investments for fair values in each industry and identification of foreign issuers and/or geography. | |
| (3) | There were no Level 1/Level 2 transfers during the fiscal year ended December 31, 2018. |
| See Notes to Financial Statements. | 9 |
Statement of Assets and Liabilities
December 31, 2018
| ASSETS: | |||
| Investments in securities, at fair value (cost $22,682,286) | $22,701,810 | ||
| Receivables: | |||
| Investment securities sold | 50,937 | ||
| Interest and dividends | 28,291 | ||
| From advisor (See Note 3) | 11,300 | ||
| Capital shares sold | 1,220 | ||
| Prepaid expenses | 209 | ||
| Total assets | 22,793,767 | ||
| LIABILITIES: | |||
| Payables: | |||
| Investment securities purchased | 311,975 | ||
| Management fee | 13,870 | ||
| Directors’ fees | 6,819 | ||
| Capital shares reacquired | 3,117 | ||
| Fund administration | 793 | ||
| Accrued expenses | 70,908 | ||
| Total liabilities | 407,482 | ||
| NET ASSETS | $22,386,285 | ||
| COMPOSITION OF NET ASSETS: | |||
| Paid-in capital | $20,630,171 | ||
| Total distributable earnings | 1,756,114 | ||
| Net Assets | $22,386,285 | ||
| Outstanding shares (50 million shares of common stock authorized, $.001 par value) | 2,207,618 | ||
| Net asset value, offering and redemption price per share (Net assets divided by outstanding shares) | $10.14 |
| 10 | See Notes to Financial Statements. |
For the Year Ended December 31, 2018
| Investment income: | ||||
| Dividends (net of foreign withholding taxes of $6,004) | $ | 597,379 | ||
| Interest | 5,839 | |||
| Total investment income | 603,218 | |||
| Expenses: | ||||
| Management fee | 282,467 | |||
| Non 12b-1 service fees | 100,729 | |||
| Shareholder servicing | 43,456 | |||
| Professional | 42,387 | |||
| Reports to shareholders | 31,738 | |||
| Fund administration | 16,141 | |||
| Custody | 3,078 | |||
| Directors’ fees | 1,514 | |||
| Other | 6,990 | |||
| Gross expenses | 528,500 | |||
| Expense reductions (See Note 8) | (917 | ) | ||
| Fees waived and expenses reimbursed (See Note 3) | (131,357 | ) | ||
| Net expenses | 396,226 | |||
| Net investment income | 206,992 | |||
| Net realized and unrealized gain (loss): | ||||
| Net realized gain on investments | 5,103,494 | |||
| Net change in unrealized appreciation/depreciation on investments | (6,949,108 | ) | ||
| Net realized and unrealized loss | (1,845,614 | ) | ||
| Net Decrease in Net Assets Resulting From Operations | $ | (1,638,622 | ) |
| See Notes to Financial Statements. | 11 |
Statements of Changes in Net Assets
| For the Year Ended | For the Year Ended | |||||||
| INCREASE (DECREASE) IN NET ASSETS | December 31, 2018 | December 31, 2017 | ||||||
| Operations: | ||||||||
| Net investment income | $ | 206,992 | $ | 333,417 | ||||
| Net realized gain on investments | 5,103,494 | 3,973,533 | ||||||
| Net change in unrealized appreciation/depreciation on investments | (6,949,108 | ) | 2,600,901 | |||||
| Net increase (decrease) in net assets resulting from operations | (1,638,622 | ) | 6,907,851 | |||||
| Distributions to shareholders(1) | (4,327,282 | ) | (4,031,127 | ) | ||||
| Capital share transactions (See Note 13): | ||||||||
| Proceeds from sales of shares | 8,154,149 | 1,448,843 | ||||||
| Reinvestment of distributions | 4,327,282 | 4,031,127 | ||||||
| Cost of shares reacquired | (29,336,653 | ) | (8,346,425 | ) | ||||
| Net decrease in net assets resulting from capital share transactions | (16,855,222 | ) | (2,866,455 | ) | ||||
| Net increase (decrease) in net assets | (22,821,126 | ) | 10,269 | |||||
| NET ASSETS: | ||||||||
| Beginning of year | $ | 45,207,411 | $ | 45,197,142 | ||||
| End of year | $ | 22,386,285 | $ | 45,207,411 | ||||
| Distributions in excess of net investment income(2) | $ | – | $ | – | ||||
| (1) | The SEC eliminated the requirement to disclose the source of distributions paid in 2018. For the year ended December 31, 2017, the source of distributions was Net investment income $(358,909) and Net realized gain $(3,672,218). | |
| (2) | The SEC eliminated the requirement to disclose distributions in excess of net investment income in 2018. For the year ended December 31, 2017, the distributions in excess of net investment income was $(6,310). |
| 12 | See Notes to Financial Statements. |
This page is intentionally left blank.
13
| Per Share Operating Performance: | ||||||||||||||||||||||||||||||
| Investment operations: | Distributions to shareholders from: | |||||||||||||||||||||||||||||
| Total | ||||||||||||||||||||||||||||||
| Net | from | |||||||||||||||||||||||||||||
| Net asset | Net | realized | invest- | |||||||||||||||||||||||||||
| value, | invest- | and | ment | Net | Net | Total | ||||||||||||||||||||||||
| beginning | ment | unrealized | opera- | investment | realized | distri- | ||||||||||||||||||||||||
| of period | income(a) | gain (loss) | tions | income | gain | butions | ||||||||||||||||||||||||
| 12/31/2018 | $13.33 | $0.07 | $(1.11 | ) | $(1.04 | ) | $(0.10 | ) | $(2.05 | ) | $(2.15 | ) | ||||||||||||||||||
| 12/31/2017 | 12.51 | 0.10 | 1.99 | 2.09 | (0.11 | ) | (1.16 | ) | (1.27 | ) | ||||||||||||||||||||
| 12/31/2016 | 11.66 | 0.14 | 1.31 | 1.45 | (0.13 | ) | (0.47 | ) | (0.60 | ) | ||||||||||||||||||||
| 12/31/2015 | 14.15 | 0.11 | (0.23 | ) | (0.12 | ) | (0.11 | ) | (2.26 | ) | (2.37 | ) | ||||||||||||||||||
| 12/31/2014 | 14.77 | 0.10 | 1.25 | 1.35 | (0.11 | ) | 1.86 | (1.97 | ) | |||||||||||||||||||||
| (a) | Calculated using average shares outstanding during the period. |
| (b) | Total return does not consider the effects of sales charges or other expenses imposed by an insurance company and assumes the reinvestment of all distributions. |
| 14 | See Notes to Financial Statements. |
| Ratios to Average Net Assets: | Supplemental Data: | |||||||||||||||||||||||||
| Total | ||||||||||||||||||||||||||
| expenses | ||||||||||||||||||||||||||
| Net | after | Net | ||||||||||||||||||||||||
| asset | waivers | Net | assets, | Portfolio | ||||||||||||||||||||||
| value, | Total | and/or reim- | Total | investment | end of | turnover | ||||||||||||||||||||
| end of | return(b) | bursements | expenses | income | period | rate | ||||||||||||||||||||
| period | (%) | (%) | (%) | (%) | (000) | (%) | ||||||||||||||||||||
| $10.14 | (7.80 | ) | 0.98 | 1.31 | 0.51 | $22,386 | 30 | |||||||||||||||||||
| 13.33 | 16.84 | 0.95 | 1.26 | 0.75 | 45,207 | 71 | ||||||||||||||||||||
| 12.51 | 12.44 | 0.95 | 1.33 | 1.20 | 45,197 | 100 | ||||||||||||||||||||
| 11.66 | (0.90 | ) | 0.95 | 1.32 | 0.78 | 33,643 | 100 | |||||||||||||||||||
| 14.15 | 9.14 | 0.95 | 1.30 | 0.68 | 43,297 | 50 | ||||||||||||||||||||
| See Notes to Financial Statements. | 15 |
| 1. | ORGANIZATION |
Lord Abbett Series Fund, Inc. (the “Company”) is registered under the Investment Company Act of 1940, as amended (the “Act”), as a diversified, open-end management investment company and was incorporated under Maryland law in 1989. The Company consists of twelve separate portfolios. This report covers Classic Stock Portfolio (the “Fund”).
The Fund’s investment objective is growth of capital and growth of income consistent with reasonable risk. The Fund has Variable Contract class shares (“Class VC Shares”), which are currently issued and redeemed only in connection with investments in, and payments under, variable annuity contracts and variable life insurance policies issued by life insurance and insurance-related companies.
The preparation of the financial statements in conformity with accounting principles generally accepted in the United States of America (“U.S. GAAP”) requires management to make certain estimates and assumptions that affect the reported amounts of assets and liabilities and disclosure of contingent assets and liabilities at the date of the financial statements and the reported amounts of increases and decreases in net assets from operations during the reporting period. Actual results could differ from those estimates. The Fund is considered an investment company under U.S. GAAP and follows the accounting and reporting guidance applicable to investment companies.
| 2. | SIGNIFICANT ACCOUNTING POLICIES |
| (a) | Investment Valuation–Under procedures approved by the Fund’s Board of Directors (the “Board”), Lord, Abbett & Co. LLC (“Lord Abbett”), the Fund’s investment manager, has formed a Pricing Committee to administer the pricing and valuation of portfolio investments and to ensure that prices utilized reasonably reflect fair value. Among other things, these procedures allow the Fund to utilize independent pricing services, quotations from securities and financial instrument dealers and other market sources to determine fair value. |
| Securities actively traded on any recognized U.S. or non-U.S. exchange or on The NASDAQ Stock Market LLC are valued at the last sale price or official closing price on the exchange or system on which they are principally traded. Events occurring after the close of trading on non-U.S. exchanges may result in adjustments to the valuation of foreign securities to reflect their fair value as of the close of regular trading on the New York Stock Exchange. The Fund may utilize an independent fair valuation service in adjusting the valuations of foreign securities. Unlisted equity securities are valued at the last quoted sale price or, if no sale price is available, at the mean between the most recently quoted bid and asked prices. | |
| Securities for which prices are not readily available are valued at fair value as determined by the Pricing Committee. The Pricing Committee considers a number of factors, including observable and unobservable inputs, when arriving at fair value. The Pricing Committee may use related or comparable assets or liabilities, recent transactions, market multiples, book values and other relevant information to determine the fair value of portfolio investments. The Board or a designated committee thereof regularly reviews fair value determinations made by the Pricing Committee and may employ techniques such as reviewing related market activity, reviewing inputs and assumptions, and retrospectively comparing prices of subsequent purchases and sales transactions to fair value determinations made by the Pricing Committee. | |
| Short-term securities with 60 days or less remaining to maturity are valued using the amortized cost method, which approximates fair value. |
16
Notes to Financial Statements (continued)
| (b) | Security Transactions–Security transactions are recorded as of the date that the securities are purchased or sold (trade date). Realized gains and losses on sales of portfolio securities are calculated using the identified-cost method. |
| (c) | Investment Income–Dividend income is recorded on the ex-dividend date. Interest income is recorded on the accrual basis as earned. Discounts are accreted and premiums are amortized using the effective interest method and are included in Interest and other income on the Statement of Operations. Withholding taxes on foreign dividends have been provided for in accordance with the applicable country’s tax rules and rates. |
| (d) | Income Taxes–It is the policy of the Fund to meet the requirements of Subchapter M of the Internal Revenue Code applicable to regulated investment companies and to distribute substantially all taxable income and capital gains to its shareholders. Therefore, no income tax provision is required. |
| The Fund files U.S. federal and various state and local tax returns. No income tax returns are currently under examination. The statute of limitations on the Fund’s filed U.S. federal tax returns remains open for the fiscal years ended December 31, 2015 through December 31, 2018. The statutes of limitations on the Company’s state and local tax returns may remain open for an additional year depending upon the jurisdiction. | |
| (e) | Expenses–Expenses incurred by the Company that do not specifically relate to an individual fund are generally allocated to the funds within the Company on a pro rata basis by relative net assets. |
| (f) | Foreign Transactions–The books and records of the Fund are maintained in U.S. dollars and transactions denominated in foreign currencies are recorded in the Fund’s records at the rate prevailing when earned or recorded. Asset and liability accounts that are denominated in foreign currencies are adjusted daily to reflect current exchange rates and any unrealized gain (loss), if applicable, is included in Net change in unrealized appreciation/depreciation on translation of assets and liabilities denominated in foreign currencies in the Fund’s Statement of Operations. The resultant exchange gains and losses upon settlement of such transactions are included in Net realized gain (loss), if applicable, on foreign currency related transactions in the Fund’s Statement of Operations. The Fund does not isolate that portion of the results of operations arising as a result of changes in the foreign exchange rates from the changes in market prices of the securities. |
| (g) | Repurchase Agreements–The Fund may enter into repurchase agreements with respect to securities. A repurchase agreement is a transaction in which a fund acquires a security and simultaneously commits to resell that security to the seller (a bank or securities dealer) at an agreed-upon price on an agreed-upon date. The Fund requires at all times that the repurchase agreement be collateralized by cash, or by securities of the U.S. Government, its agencies, its instrumentalities, or U.S. Government sponsored enterprises having a value equal to, or in excess of, the value of the repurchase agreement (including accrued interest). If the seller of the agreement defaults on its obligation to repurchase the underlying securities at a time when the fair value of these securities has declined, the Fund may incur a loss upon disposition of the securities. |
| (h) | Fair Value Measurements–Fair value is defined as the price that the Fund would receive upon selling an investment or transferring a liability in an orderly transaction to an independent buyer in the principal or most advantageous market of the investment. A three-tier hierarchy is used |
17
Notes to Financial Statements (continued)
| to maximize the use of observable market data and minimize the use of unobservable inputs and to establish classification of fair value measurements for disclosure purposes. Inputs refer broadly to the assumptions that market participants would use in pricing the asset or liability, including assumptions about risk — for example, the risk inherent in a particular valuation technique used to measure fair value (such as a pricing model) and/or the risk inherent in the inputs to the valuation technique. Inputs may be observable or unobservable. Observable inputs reflect the assumptions market participants would use in pricing the asset or liability. Observable inputs are based on market data obtained from sources independent of the reporting entity. Unobservable inputs reflect the reporting entity’s own assumptions about the assumptions market participants would use in pricing the asset or liability. Unobservable inputs are based on the best information available in the circumstances. The three-tier hierarchy classification is determined based on the lowest level of inputs that is significant to the fair value measurement, and is summarized in the three broad Levels listed below: | |
| • | Level 1 – | unadjusted quoted prices in active markets for identical investments; | |
| • | Level 2 – | other significant observable inputs (including quoted prices for similar investments, interest rates, prepayment speeds, credit risk, etc.); and | |
| • | Level 3 – | significant unobservable inputs (including the Fund’s own assumptions in determining the fair value of investments). | |
| A summary of inputs used in valuing the Fund’s investments as of December 31, 2018 and, if applicable, Level 1/Level 2 transfers and Level 3 rollforwards for the fiscal year then ended is included in the Fund’s Schedule of Investments. | |
| Changes in valuation techniques may result in transfers into or out of an assigned level within the three-tier hierarchy. All transfers between different levels within the three-tier hierarchy are deemed to have occurred as of the beginning of the reporting period. The inputs or methodology used for valuing securities are not necessarily an indication of the risk associated with investing in those securities. |
| 3. | MANAGEMENT FEE AND OTHER TRANSACTIONS WITH AFFILIATES |
Management Fee
The Company has a management agreement with Lord Abbett, pursuant to which Lord Abbett supplies the Fund with investment management services and executive and other personnel, provides office space and pays for ordinary and necessary office and clerical expenses relating to research and statistical work and supervision of the Fund’s investment portfolio.
The management fee is based on the Fund’s average daily net assets at the following annual rate:
| First $1 billion | .70% |
| Next $1 billion | .65% |
| Over $2 billion | .60% |
For the fiscal year ended December 31, 2018, the effective management fee, net of waivers, was at an annualized rate of .38% of the Fund’s average daily net assets.
In addition, Lord Abbett provides certain administrative services to the Fund pursuant to an Administrative Services Agreement in return for a fee at an annual rate of .04% of the Fund’s average daily net assets.
18
Notes to Financial Statements (continued)
Effective May 1, 2018 and continuing through April 30, 2019, Lord Abbett has contractually agreed to waive its fees and reimburse expenses to the extent necessary to limit total net annual operating expenses to an annual rate of 1.00%. This agreement may be terminated only upon the approval of the Board. Prior to May 1, 2018, Lord Abbett contractually agreed to waive its fees and reimburse expenses to the extent necessary to limit total net annual operating expenses to an annual rate of 0.95%.
The Company, on behalf of the Fund, has entered into services arrangements with certain insurance companies. Under these arrangements, certain insurance companies will be compensated up to .25% of the average daily net asset value (“NAV”) of the Fund’s Class VC Shares held in the insurance company’s separate account to service and maintain the Variable Contract owners’ accounts. This amount is included in Non 12b-1 service fees on the Statement of Operations. The Fund may also compensate certain insurance companies, third-party administrators and other entities for providing recordkeeping, sub-transfer agency and other administrative services to the Fund. This amount is included in Shareholder servicing on the Statement of Operations.
One Director and certain of the Company’s officers have an interest in Lord Abbett.
| 4. | DISTRIBUTIONS AND CAPITAL LOSS CARRYFORWARDS |
Dividends from net investment income, if any, are declared and paid at least semi-annually. Taxable net realized gains from investment transactions, reduced by allowable capital loss carryforwards, if any, are declared and distributed to shareholders at least annually. The capital loss carryforward amount, if any, is available to offset future net capital gains. Dividends and distributions to shareholders are recorded on the ex-dividend date. The amounts of dividends and distributions from net investment income and net realized capital gains are determined in accordance with federal income tax regulations, which may differ from U.S. GAAP. These book/tax differences are either considered temporary or permanent in nature. To the extent these differences are permanent in nature, such amounts are reclassified within the components of net assets based on their federal tax basis treatment; temporary differences do not require reclassification. Dividends and distributions that exceed earnings and profits for tax purposes are reported as a tax return of capital.
The tax character of distributions paid during the fiscal years ended December 31, 2018 and 2017 were as follows:
| Year Ended 12/31/2018 | Year Ended 12/31/2017 | |||||||||
| Distributions paid from: | ||||||||||
| Ordinary income | $ | 655,200 | $ | 1,067,214 | ||||||
| Net long-term capital gains | 3,672,082 | 2,963,913 | ||||||||
| Total distributions paid | $ | 4,327,282 | $ | 4,031,127 | ||||||
As of December 31, 2018, the components of accumulated gains on a tax-basis were as follows:
| Undistributed ordinary income – net | $ | 4,003 | ||
| Undistributed long-term capital gains | 2,149,527 | |||
| Total undistributed earnings | 2,153,530 | |||
| Temporary differences | (406,302 | ) | ||
| Unrealized gains – net | 8,886 | |||
| Total accumulated gains – net | $ | 1,756,114 |
19
Notes to Financial Statements (continued)
At the Fund’s election, certain losses incurred within the taxable year (Qualified Late-Year Losses) are deemed to arise on the first business day of the Fund’s next taxable year. The Fund incurred and will elect to defer post-October capital losses of $399,483 during fiscal year 2018.
As of December 31, 2018, the aggregate unrealized security gains and losses on investments and other financial instruments based on cost for U.S. federal income tax purposes were as follows:
| Tax cost | $ | 22,692,924 | ||
| Gross unrealized gain | 1,768,857 | |||
| Gross unrealized loss | (1,759,971 | ) | ||
| Net unrealized security gain | $ | 8,886 |
The difference between book-basis and tax-basis unrealized gains (losses) is attributable to the tax treatment of wash sales.
| 5. | PORTFOLIO SECURITIES TRANSACTIONS |
Purchases and sales of investment securities (excluding short-term investments) for the fiscal year ended December 31, 2018 were as follows:
| Purchases | Sales | |
| $11,655,177 | $32,879,718 |
There were no purchases or sales of U.S. Government securities for the fiscal year ended December 31, 2018.
| 6. | DISCLOSURES ABOUT OFFSETTING ASSETS AND LIABILITIES |
The Financial Accounting Standards Board (“FASB”) requires disclosures intended to help better assess the effect or potential effect of offsetting arrangements on a fund’s financial position. The following tables illustrate gross and net information about recognized assets and liabilities eligible for offset in the statement of assets and liabilities; and disclose such amounts subject to an enforceable master netting agreement or similar agreement, by counterparty. A master netting agreement is an agreement between a fund and a counterparty which provides for the net settlement of amounts owed under all contracts traded under that agreement, as well as cash collateral, through a single payment by one party to the other in the event of default on or termination of any one contract. The Fund’s accounting policy with respect to balance sheet offsetting is that, absent an event of default by the counterparty or a termination of the agreement, the master netting agreement does not result in an offset of reported amounts of financial assets and liabilities in the statement of assets and liabilities across transactions between the Fund and the applicable counterparty:
| Description | Gross Amounts of Recognized Assets | Gross Amounts Offset in the Statement of Assets and Liabilities | Net Amounts of Assets Presented in the Statement of Assets and Liabilities | |||||||||
| Repurchase Agreement | $ | 1,453,491 | $ | — | $ | 1,453,491 | ||||||
| Total | $ | 1,453,491 | $ | — | $ | 1,453,491 | ||||||
20
Notes to Financial Statements (continued)
| Net Amounts | ||||||||||||||||||||
| of Assets | Amounts Not Offset in the | |||||||||||||||||||
| Presented in | Statement of Assets and Liabilities | |||||||||||||||||||
| the Statement | Cash | Securities | ||||||||||||||||||
| of Assets and | Financial | Collateral | Collateral | Net | ||||||||||||||||
| Counterparty | Liabilities | Instruments | Received(a) | Received(a) | Amount(b) | |||||||||||||||
| Fixed Income Clearing Corp. | $ | 1,453,491 | $ | – | $ | – | $ | (1,453,491 | ) | $ | – | |||||||||
| Total | $ | 1,453,491 | $ | – | $ | – | $ | (1,453,491 | ) | $ | – | |||||||||
| (a) | Collateral disclosed is limited to an amount not to exceed 100% of the net amount of assets presented in the Statement of Assets and Liabilities, for each respective counterparty. |
| (b) | Net amount represents the amount owed to the Fund by the counterparty as of December 31, 2018. |
| 7. | DIRECTORS’ REMUNERATION |
The Company’s officers and one Director, who are associated with Lord Abbett, do not receive any compensation from the Company for serving in such capacities. Independent Directors’ fees are allocated among all Lord Abbett-sponsored funds based on the net assets of each fund. There is an equity-based plan available to all Independent Directors under which Independent Directors must defer receipt of a portion of, and may elect to defer receipt of an additional portion of Directors’ fees. The deferred amounts are treated as though equivalent dollar amounts had been invested in the funds. Such amounts and earnings accrued thereon are included in Directors’ fees on the Statement of Operations and in Directors’ fees payable on the Statement of Assets and Liabilities and are not deductible for U.S. federal income tax purposes until such amounts are paid.
| 8. | EXPENSE REDUCTIONS |
The Company has entered into an arrangement with its transfer agent and custodian, whereby credits realized as a result of uninvested cash balances are used to reduce a portion of the Fund’s expenses.
| 9. | LINE OF CREDIT |
During the period ended August 8, 2018, the Fund and certain other funds managed by Lord Abbett (collectively, the “Participating Funds”) participated in a syndicated line of credit facility with various lenders for $600 million (the “Facility”), whereas State Street Bank and Trust Company (“SSB”) participates as a lender and as agent for the lenders. The Facility is to be used for temporary or emergency purposes as an additional source of liquidity to satisfy redemptions. The Participating Funds are subject to graduated borrowing limits of one-third of Fund assets (if Fund assets are less than $750 million), $250 million, $300 million, or $350 million, based on past borrowings and likelihood of future borrowings. During the period ended August 8, 2018, the Fund did not utilize the Facility.
For the period August 9, 2018 through December 20, 2018, the Participating Funds entered into an amended syndicated line of credit facility with various lenders for $1.06 billion (the “Syndicated Facility”), whereas SSB participates as a lender and as agent for the lenders. Under the Syndicated Facility, the Participating Funds are subject to graduated borrowing limits of one-third of Fund assets (if Fund assets are less than $750 million), $250 million, $300 million, $350 million, or $1 billion, based on past borrowings and likelihood of future borrowings. Effective December 21, 2018, the Participating Funds entered into an amended Syndicated Facility with various lenders for $1.1 billion based on the same terms as described above.
Effective August 9, 2018, the Participating Funds entered into an additional line of credit facility with SSB for $250 million (the “Bilateral Facility,” and together with the Syndicated Facility, the “Facilities”). Under the Bilateral Facility, each Participating Fund may borrow up to the lesser of
21
Notes to Financial Statements (continued)
$250 million or one-third of Fund assets. The Facilities are to be used for temporary or emergency purposes to satisfy redemption requests and manage liquidity.
For the period from August 9, 2018 through December 31, 2018, the Fund did not utilize the Facilities.
| 10. | INTERFUND LENDING PROGRAM |
Pursuant to an exemptive order issued by the U.S. Securities and Exchange Commission (“SEC exemptive order”), certain registered open-end management investment companies managed by Lord Abbett, including the Fund, participate in a joint lending and borrowing program (the “Interfund Lending Program”). The SEC exemptive order allows the Funds to borrow money from and lend money to each other for temporary or emergency purposes subject to the limitations and conditions.
During the fiscal year ended December 31, 2018, the Fund did not participate as a borrower or lender in the Interfund Lending Program.
| 11. | CUSTODIAN AND ACCOUNTING AGENT |
SSB is the Company’s custodian and accounting agent. SSB performs custodial, accounting and recordkeeping functions relating to portfolio transactions and calculating the Fund’s NAV.
| 12. | INVESTMENT RISKS |
The Fund is subject to the general risks and considerations associated with equity investing, as well as the particular risks associated with value and growth stocks. This means the value of your investment will fluctuate in response to movements in the equity securities market in general and to the changing prospects of individual companies in which the Fund invests. Large-cap value and growth stocks may perform differently than the market as a whole and differently than each other or other types of stocks, such as small company stocks. This is because different types of stocks tend to shift in and out of favor depending on market and economic conditions. The market may fail to recognize the intrinsic value of particular value stocks for a long time. Growth stocks may be more volatile than other stocks. In addition, if the Fund’s assessment of a company’s value or prospects for exceeding earnings expectations or market conditions is wrong, the Fund could suffer losses or produce poor performance relative to other funds, even in a rising market.
Due to its investment exposure to foreign companies and American Depositary Receipts, the Fund may experience increased market, industry and sector liquidity, currency, political, information, and other risks. The securities of foreign companies also may be subject to inadequate exchange control regulations, the imposition of economic sanctions or other government restrictions, higher transaction and other costs, and delays in settlement to the extent they are traded on non-U.S. exchanges or markets.
These factors can affect the Fund’s performance.
| 13. | SUMMARY OF CAPITAL TRANSACTIONS |
Transactions in shares of capital stock were as follows:
| Year Ended December 31, 2018 | Year Ended December 31, 2017 | |||||||
| Shares sold | 635,290 | 108,740 | ||||||
| Reinvestment of distributions | 410,828 | 302,332 | ||||||
| Shares reacquired | (2,230,364 | ) | (631,764 | ) | ||||
| Decrease | (1,184,246 | ) | (220,692 | ) | ||||
22
Notes to Financial Statements (concluded)
| 14. | SUBSEQUENT EVENT |
On January 29, 2019, the Board of Directors of the Company approved a plan of liquidation (the “Plan”) pursuant to which the Fund will be liquidated and dissolved. It is anticipated that the liquidation and dissolution of the Fund will be completed on or about August 1, 2019 (the “Liquidation Date”). Any Fund shares outstanding on the Liquidation Date will be automatically redeemed on the Liquidation Date. The proceeds of any such redemption will be equal to the net asset value (“NAV”) of such shares after dividend distributions required to eliminate any Fund-level taxes are made and the Fund’s expenses and liabilities have been paid or otherwise provided for as directed by the Plan.
At any time before the Liquidation Date, shareholders may redeem their Fund shares at the NAV of such shares pursuant to the procedures set forth under “Purchases and Redemptions” in the prospectus. As stated in the prospectus, Fund shares are not offered directly to the public. Rather, Fund shares are offered only to separate accounts of certain insurance companies. Variable contract owners may not purchase or redeem Fund shares directly and should contact their insurance company for information on how the liquidation of the Fund will impact them.
23
Report of Independent Registered Public Accounting Firm
To the shareholders and the Board of Directors of Lord Abbett Series Fund, Inc.:
Opinion on the Financial Statements and Financial Highlights
We have audited the accompanying statement of assets and liabilities, including the schedule of investments, of the Classic Stock Portfolio, one of the portfolios constituting the Lord Abbett Series Fund, Inc. (the “Fund”), as of December 31, 2018, the related statement of operations for the year then ended, the statements of changes in net assets for each of the two years in the period then ended, the financial highlights for each of the five years in the period then ended, and the related notes. In our opinion, the financial statements and financial highlights present fairly, in all material respects, the financial position of the Classic Stock Portfolio of the Fund as of December 31, 2018, and the results of its operations for the year then ended, the changes in its net assets for each of the two years in the period then ended, and the financial highlights for each of the five years in the period then ended in conformity with accounting principles generally accepted in the United States of America.
Basis for Opinion
These financial statements and financial highlights are the responsibility of the Fund’s management. Our responsibility is to express an opinion on the Fund’s financial statements and financial highlights based on our audits. We are a public accounting firm registered with the Public Company Accounting Oversight Board (United States) (PCAOB) and are required to be independent with respect to the Fund in accordance with the U.S. federal securities laws and the applicable rules and regulations of the Securities and Exchange Commission and the PCAOB.
We conducted our audits in accordance with the standards of the PCAOB. Those standards require that we plan and perform the audit to obtain reasonable assurance about whether the financial statements and financial highlights are free of material misstatement, whether due to error or fraud. The Fund is not required to have, nor were we engaged to perform, an audit of its internal control over financial reporting. As part of our audits we are required to obtain an understanding of internal control over financial reporting but not for the purpose of expressing an opinion on the effectiveness of the Fund’s internal control over financial reporting. Accordingly, we express no such opinion.
Our audits included performing procedures to assess the risks of material misstatement of the financial statements and financial highlights, whether due to error or fraud, and performing procedures that respond to those risks. Such procedures included examining, on a test basis, evidence regarding the amounts and disclosures in the financial statements and financial highlights. Our audits also included evaluating the accounting principles used and significant estimates made by management, as well as evaluating the overall presentation of the financial statements and financial highlights. Our procedures included confirmation of securities owned as of December 31, 2018, by correspondence with the custodian and brokers; when replies were not received from brokers, we performed other auditing procedures. We believe that our audits provide a reasonable basis for our opinion.
DELOITTE & TOUCHE LLP
New York, New York
February 15, 2019
We have served as the auditor of one or more Lord Abbett Family of Funds’ investment companies since 1932.
24
Basic Information About Management
The Board is responsible for the management of the business and affairs of the Company in accordance with the laws of the State of Maryland. The Board elects officers who are responsible for the day-to-day operations of the Fund and who execute policies authorized by the Board. The Board also approves an investment adviser to the Fund and continues to monitor the cost and quality of the services the investment adviser provides, and annually considers whether to renew the contract with the adviser. Generally, each Director holds office until his/her successor is elected and qualified or until his/her earlier resignation or removal, as provided in the Company’s organizational documents.
Lord Abbett, a Delaware limited liability company, is the Fund’s investment adviser. Designated Lord Abbett personnel are responsible for the day-to-day management of the Fund.
Interested Directors
Mr. Sieg is affiliated with Lord Abbett and is an “interested person” of the Company as defined in the Act. Mr. Sieg is director/trustee of each of the 13 investment companies in the Lord Abbett Family of Funds, which consist of 62 portfolios or series. Mr. Sieg is an officer of the Lord Abbett Family of Funds.
| Name, Address and Year of Birth | Current Position and Length of Service with the Company | Principal Occupation and Other Directorships During the Past Five Years | ||
| Douglas B. Sieg Lord, Abbett & Co. LLC 90 Hudson Street Jersey City, NJ 07302 (1969) | Director since 2016; President and Chief Executive Officer since 2018 | Principal Occupation: Managing Partner (since 2018) and was formerly Head of Client Services, joined Lord Abbett in 1994. Other Directorships: None. |
Independent Directors
The following Independent Directors also are directors/trustees of each of the 13 investment companies in the Lord Abbett Family of Funds, which consist of 62 portfolios or series.
| Name, Address and Year of Birth | Current Position and Length of Service with the Company | Principal Occupation and Other Directorships During the Past Five Years | ||
| Eric C. Fast Lord, Abbett & Co. LLC c/o Legal Dept. 90 Hudson Street Jersey City, NJ 07302 (1949) | Director since 2014 | Principal Occupation: Chief Executive Officer of Crane Co., an industrial products company (2001–2014) Other Directorships: Currently serves as director of Automatic Data Processing, Inc. (since 2007) and Regions Financial Corporation (since 2010). Previously served as a director of Crane Co. (1999–2014). | ||
| Evelyn E. Guernsey Lord, Abbett & Co. LLC c/o Legal Dept. 90 Hudson Street Jersey City, NJ 07302 (1955) | Director since 2011 | Principal Occupation: CEO, Americas of J.P. Morgan Asset Management (2004–2010). Other Directorships: None. |
25
Basic Information About Management (continued)
| Name, Address and Year of Birth | Current Position and Length of Service with the Company | Principal Occupation and Other Directorships During the Past Five Years | ||
| Julie A. Hill Lord, Abbett & Co. LLC c/o Legal Dept. 90 Hudson Street Jersey City, NJ 07302 (1946) | Director since 2004 | Principal Occupation: Owner and CEO of The Hill Company, a business consulting firm (since 1998). Other Directorships: Currently serves as director of Anthem, Inc., a health benefits company (since 1994). | ||
| Kathleen M. Lutito Lord, Abbett & Co. LLC c/o Legal Dept. 90 Hudson Street Jersey City, NJ 07302 (1963) | Director since 2017 | Principal Occupation: President and Chief Investment Officer of CenturyLink Investment Management Company (since 2006). Other Directorships: None | ||
| James M. McTaggart Lord, Abbett & Co. LLC c/o Legal Dept. 90 Hudson Street Jersey City, NJ 07302 (1947) | Director since 2012 | Principal Occupation: Independent management advisor and consultant (since 2012); Vice President, CRA International, Inc. (doing business as Charles River Associates), a global management consulting firm (2009–2012); Founder and Chairman of Marakon Associates, Inc., a strategy consulting firm (1978–2009); and Officer and Director of Trinsum Group, a holding company (2007–2009). Other Directorships: Blyth, Inc., a home products company (2004–2015). | ||
| Karla M. Rabusch Lord, Abbett & Co. LLC c/o Legal Dept. 90 Hudson Street Jersey City, NJ 07302 (1959) | Director since 2017 | Principal Occupation: President and Director of Wells Fargo Funds Management, LLC (2003–2017); President of Wells Fargo Funds (2003–2016). Other Directorships: None. | ||
| Mark A. Schmid Lord, Abbett & Co. LLC c/o Legal Dept. 90 Hudson Street Jersey City, NJ 07302 (1959) | Director since 2016 | Principal Occupation: Vice President and Chief Investment Officer of the University of Chicago (since 2009). Other Directorships: None. | ||
| James L.L. Tullis Lord, Abbett & Co. LLC c/o Legal Dept. 90 Hudson Street Jersey City, NJ 07302 (1947) | Director since 2006; Chairman since 2017 | Principal Occupation: CEO of Tullis-Dickerson and Co. Inc., a venture capital management firm (since 1990); CEO of Tullis Health Investors Inc. (since 2012). Other Directorships: Currently serves as director of Crane Co. (since 1998). |
Officers
None of the officers listed below have received compensation from the Company. All of the officers of the Company also may be officers of the other Lord Abbett Funds and maintain offices at 90 Hudson Street, Jersey City, NJ 07302. Unless otherwise indicated, the position(s) and title(s) listed under the “Principal Occupation During the Past Five Years” column indicate each officer’s position(s) and title(s) with Lord Abbett. Each officer serves for an indefinite term (i.e., until his or her death, resignation, retirement, or removal).
26
Basic Information About Management (continued)
| Name and Year of Birth | Current Position with the Company | Length of Service of Current Position | Principal Occupation During the Past Five Years | |||
| Douglas B. Sieg (1969) | President and Chief Executive Officer | Elected as President and Chief Executive Officer in 2018 | Managing Partner of Lord Abbett (since 2018) and was formerly Head of Client Services, joined Lord Abbett in 1994. | |||
| Jeff D. Diamond (1960) | Executive Vice President | Elected in 2008 | Portfolio Manager, joined Lord Abbett in 2007. | |||
| Todd D. Jacobson (1966) | Executive Vice President | Elected in 2005 | Partner and Associate Director, joined Lord Abbett in 2003. | |||
| Robert A. Lee (1969) | Executive Vice President | Elected in 2010 | Partner and Chief Investment Officer, and was formerly Deputy Chief Investment Officer and Director of Taxable Fixed Income, joined Lord Abbett in 1997. | |||
| David J. Linsen (1974) | Executive Vice President | Elected in 2008 | Partner and Director of Equities, joined Lord Abbett in 2001. | |||
| Vincent J. McBride (1964) | Executive Vice President | Elected in 2010 | Partner and Director, joined Lord Abbett in 2003. | |||
| Andrew H. O’Brien (1973) | Executive Vice President | Elected in 2010 | Partner and Portfolio Manager, joined Lord Abbett in 1998. | |||
| F. Thomas O’Halloran (1955) | Executive Vice President | Elected in 2010 | Partner and Portfolio Manager, joined Lord Abbett in 2001. | |||
| Marc Pavese (1972) | Executive Vice President | Elected in 2016 | Partner and Portfolio Manager, joined Lord Abbett in 2008. | |||
| Walter H. Prahl (1958) | Executive Vice President | Elected in 2012 | Partner and Director, joined Lord Abbett in 1997. | |||
| Eli Rabinowich (1975) | Executive Vice President | Elected in 2018 | Portfolio Manager, joined Lord Abbett in 2018 and was formerly a Portfolio Manager, Partner, and Analyst at Pzena Investment Management from (2004–2018). |
27
Basic Information About Management (continued)
| Name and Year of Birth | Current Position with the Company | Length of Service of Current Position | Principal Occupation During the Past Five Years | |||
| Jeffrey Rabinowitz (1972) | Executive Vice President | Elected in 2017 | Portfolio Manager, joined Lord Abbett in 2017 and was formerly Managing Director and Portfolio Manager/Technology Analyst at Jennison Associates LLC (2014–2017) and Managing Director and Portfolio Manager/Technology Analyst for U.S. Growth Equity at Goldman Sachs Asset Management (1999–2014). | |||
| Steven F. Rocco (1979) | Executive Vice President | Elected in 2014 | Partner and Director of Taxable Fixed Income, joined Lord Abbett in 2004. | |||
| A. Edward Allinson (1961) | Vice President | Elected in 2011 | Portfolio Manager, joined Lord Abbett in 2005. | |||
| Vernon T. Bice (1974) | Vice President | Elected in 2011 | Portfolio Manager, joined Lord Abbett in 2011. | |||
| Pamela P. Chen (1978) | Vice President, Assistant Secretary and Privacy Officer | Elected in 2018 | Associate General Counsel, joined Lord Abbett in 2017 and was formerly Special Counsel at Schulte, Roth & Zabel LLP (2005–2017). | |||
| Robert S. Clark (1975) | Vice President | Elected in 2018 | Portfolio Manager, joined Lord Abbett in 2010. | |||
| Matthew R. DeCicco (1977) | Vice President | Elected in 2003 | Managing Director and Portfolio Manager, joined Lord Abbett in 1999. | |||
| John T. Fitzgerald (1975) | Vice President and Assistant Secretary | Elected in 2018 | Deputy General Counsel, joined Lord Abbett in 2018 and was formerly Deputy Head of U.S. Funds Legal, Executive Director and Assistant General Counsel at JPMorgan Chase (2005–2018). | |||
| Christopher J. Gizzo (1986) | Vice President | Elected in 2018 | Managing Director and Portfolio Manager, joined Lord Abbett in 2008. | |||
| Bernard J. Grzelak (1971) | Chief Financial Officer and Vice President | Elected in 2017 | Partner, Chief Operating Officer, Global Funds and Risk, joined Lord Abbett in 2003. |
28
Basic Information About Management (concluded)
| Name and Year of Birth | Current Position with the Company | Length of Service of Current Position | Principal Occupation During the Past Five Years | |||
| Linda Y. Kim (1980) | Vice President and Assistant Secretary | Elected in 2016 | Counsel, joined Lord Abbett in 2015 and was formerly an Associate at Stroock & Stroock & Lavan LLP (2007–2015). | |||
| So Young Lee (1971) | Vice President | Elected in 2018 | Portfolio Manager, joined Lord Abbett in 2013. | |||
| Joseph M. McGill (1962) | Chief Compliance Officer | Elected in 2014 | Partner and Chief Compliance Officer, joined Lord Abbett in 2014 and was formerly Managing Director and the Chief Compliance Officer at UBS Global Asset Management (2003–2013). | |||
| A. Edward Oberhaus, III (1959) | Vice President | Elected in 1998 | Partner and Director, joined Lord Abbett in 1983. | |||
| Amanda S. Ryan (1978) | Vice President and Assistant Secretary | Elected in 2018 | Counsel, joined Lord Abbett In 2016 and was formerly a Director and Corporate Counsel at PGIM Investments (2012–2016). | |||
| Lawrence B. Stoller (1963) | Vice President, Secretary and Chief Legal Officer | Elected in 2007 | Partner and General Counsel, joined Lord Abbett in 2007. | |||
| Leah G. Traub (1979) | Vice President | Elected in 2016 | Partner and Portfolio Manager, joined Lord Abbett in 2007. | |||
| Kewjin Yuoh (1971) | Vice President | Elected in 2012 | Partner and Portfolio Manager, joined Lord Abbett in 2010. | |||
| Jackson C. Chan (1964) | AML Compliance Officer | Elected in 2018 | Deputy Chief Compliance Officer and Director of Regulatory Affairs, joined Lord Abbett in 2014 and was formerly Director at UBS Global Asset Management (2005–2014). | |||
| Vito A. Fronda (1969) | Treasurer | Elected in 2018 | Partner and Director of Taxation, joined Lord Abbett in 2003. |
Please call 888-522-2388 for a copy of the statement of additional information, which contains further information about the Company’s Directors. It is available free upon request.
29
Approval of Advisory Contract
The Board, including all of the Directors who are not “interested persons” of the Company or of Lord Abbett, as defined in the Investment Company Act of 1940, as amended (the “Independent Directors”), annually considers whether to approve the continuation of the existing management agreement between the Fund and Lord Abbett (the “Agreement”). In connection with its most recent approval, the Board reviewed materials relating specifically to the Agreement, as well as numerous materials received throughout the course of the year, including information about the Fund’s investment performance compared to the performance of its benchmark. Before making its decision as to the Fund, the Board had the opportunity to ask questions and request further information, taking into account its knowledge of Lord Abbett gained through its meetings and discussions. These meetings and discussions included reviews of Fund performance conducted by members of the Contract Committee, the deliberations of the Contract Committee, and discussions between the Contract Committee and Lord Abbett’s management. The Independent Directors also met with their independent legal counsel in various private sessions at which no representatives of management were present.
The materials received by the Board included, but were not limited to: (1) information provided by Broadridge Financial Solutions (“Broadridge”) regarding the investment performance of the Fund compared to the investment performance of certain funds with similar investment styles as determined by Broadridge, based, in part, on the Fund’s Morningstar category (the “performance peer group”), and the investment performance of two appropriate benchmarks; (2) information provided by Broadridge regarding the expense ratios, contractual and actual management fee rates, and other expense components for the Fund and certain funds in the same Morningstar category, with generally the same or similar share classes and operational characteristics, including asset size (the “expense peer group”); (3) certain supplemental investment performance information provided by Lord Abbett; (4) information provided by Lord Abbett on the expense ratios, management fee rates, and other expense components for the Fund; (5) sales and redemption information for the Fund; (6) information regarding Lord Abbett’s financial condition; (7) an analysis of the relative profitability of the Agreement to Lord Abbett; (8) information provided by Lord Abbett regarding the investment management fee schedules for Lord Abbett’s other advisory clients maintaining accounts with a similar investment strategy as the Fund; and (9) information regarding the personnel and other resources devoted by Lord Abbett to managing the Fund.
Investment Management and Related Services Generally.The Board considered the services provided by Lord Abbett to the Fund, including investment research, portfolio management, and trading, and Lord Abbett’s commitment to compliance with all applicable legal requirements. The Board also observed that Lord Abbett was solely engaged in the investment management business and accordingly did not experience the conflicts of interest that may result from being engaged in other lines of business. The Board considered the investment advisory services provided by Lord Abbett to other clients, the fees charged for the services, and the differences in the nature of the services provided to the Fund and other Lord Abbett Funds, on the one hand, and the services provided to other clients, on the other. After reviewing these and related factors, the Board concluded that the Fund was likely to continue to benefit from the nature, extent and quality of the investment services provided by Lord Abbett under the Agreement.
Investment Performance.The Board reviewed the Fund’s investment performance in relation to that of the performance peer group and two appropriate benchmarks as of various periods ended August 31, 2018. The Board observed that the Fund’s investment performance was above the median of the performance peer group for the one-, three-, five-, and ten-year periods and took
30
Approval of Advisory Contract (continued)
into account recent changes to the portfolio management team and other actions taken by Lord Abbett to attempt to improve equity fund performance. The Board further considered Lord Abbett’s performance and reputation generally, the performance of other Lord Abbett-managed funds overseen by the Board, and the willingness of Lord Abbett to take steps intended to improve performance when appropriate. After reviewing these and related factors, the Board concluded that the Fund’s Agreement should be continued.
Lord Abbett’s Personnel and Methods.The Board considered the qualifications of the personnel providing investment management services to the Fund, in light of its investment objective and discipline, and other services provided to the Fund by Lord Abbett. Among other things, the Board considered the size, experience, and turnover of Lord Abbett’s staff, Lord Abbett’s investment methodology and philosophy, and Lord Abbett’s approach to recruiting, training, and retaining personnel.
Nature and Quality of Other Services.The Board considered the nature, quality, and extent of compliance, administrative, and other services performed by Lord Abbett and the nature and extent of Lord Abbett’s supervision of third party service providers, including the Fund’s transfer agent and custodian.
Expenses.The Board considered the expense level of the Fund, including the contractual and actual management fee rates, and the expense levels of the Fund’s expense peer group. It also considered how the expense level of the Fund related to those of the expense peer group and the amount and nature of the fees paid by shareholders. The Board observed that the net total expense ratio of the Fund was above the median of the expense peer group. After reviewing these and related factors, the Board concluded, within the context of its overall approval of the Agreement, that the expense level of the Fund was reasonable and supported the continuation of the Agreement.
Profitability.The Board considered the level of Lord Abbett’s operating margin in managing the Fund, including a review of Lord Abbett’s methodology for allocating its costs to its management of the Fund. It considered whether the Fund was profitable to Lord Abbett in connection with the Fund’s operation, including the fee that Lord Abbett receives from the Fund for providing administrative services to the Fund. The Board also considered the profits realized from other business segments of Lord Abbett, which may benefit from or be related to the Fund’s business. The Board considered Lord Abbett’s profit margins excluding Lord Abbett’s marketing and distribution expenses. The Board also considered Lord Abbett’s profit margins, without those exclusions, in comparison with available industry data and how those profit margins could affect Lord Abbett’s ability to recruit and retain personnel. The Board recognized that Lord Abbett’s overall profitability was a factor in enabling it to attract and retain qualified personnel to provide services to the Fund. After reviewing these and related factors, the Board concluded, within the context of its overall approval of the Agreement, that Lord Abbett’s profitability with respect to the Fund was not excessive.
Economies of Scale.The Board considered the extent to which there had been economies of scale in managing the Fund, whether the Fund’s shareholders had appropriately benefited from such economies of scale, and whether there was potential for realization of any further economies of scale. The Board concluded that the existing management fee schedule, with its breakpoints in the level of the management fee, adequately addressed any economies of scale in managing the Fund.
Other Benefits to Lord Abbett.The Board considered the amount and nature of the fees paid by the Fund and the Fund’s shareholders to Lord Abbett for services other than investment advisory services, such as the fee that Lord Abbett receives from the Fund for providing administrative services to the Fund. The Board also considered the revenues and profitability of Lord Abbett’s
31
Approval of Advisory Contract (concluded)
investment advisory business apart from its mutual fund business, and the intangible benefits enjoyed by Lord Abbett by virtue of its relationship with the Fund. The Board observed that the Distributor receives 12b-1 fees from certain of the Lord Abbett Funds as to shares held in accounts for which there is no other broker of record, may retain a portion of the 12b-1 fees it receives, and receives a portion of the sales charges on sales and redemptions of some classes of shares of the Lord Abbett Funds. In addition, the Board observed that Lord Abbett accrues certain benefits for its business of providing investment advice to clients other than the Lord Abbett Funds, but that business also benefits the Funds. The Board also noted that Lord Abbett, as disclosed in the prospectus of the Fund, has entered into revenue sharing arrangements with certain entities that distribute shares of the Lord Abbett Funds. The Board also took into consideration the investment research that Lord Abbett receives as a result of client brokerage transactions.
Alternative Arrangements.The Board considered whether, instead of approving continuation of the Agreement, it might be in the best interests of the Fund to implement one or more alternative arrangements, such as continuing to employ Lord Abbett, but on different terms. After considering all of the relevant factors, the Board unanimously found that continuation of the Agreement was in the best interests of the Fund and its shareholders and voted unanimously to approve the continuation of the Agreement. In considering whether to approve the continuation of the Agreement, the Board did not identify any single factor as paramount or controlling. Individual Directors may have evaluated the information presented differently from one another, giving different weights to various factors. This summary does not discuss in detail all matters considered.
32
Householding
The Company has adopted a policy that allows it to send only one copy of the Fund’s prospectus, proxy material, annual report and semiannual report to certain shareholders residing at the same “household.” This reduces Fund expenses, which benefits you and other shareholders. If you need additional copies or do not want your mailings to be “householded,” please call Lord Abbett at 888-522-2388 or send a written request with your name, the name of your fund or funds and your account number or numbers to Lord Abbett Family of Funds, P.O. Box 219336, Kansas City, MO 64121.
Proxy Voting Policies, Procedures and Records
A description of the policies and procedures that Lord Abbett uses to vote proxies related to the Fund’s portfolio securities, and information on how Lord Abbett voted the Fund’s proxies during the 12-month period ended June 30 are available without charge, upon request, (i) by calling 888-522-2388; (ii) on Lord Abbett’s Website at www.lordabbett.com; and (iii) on the Securities and Exchange Commission’s (“SEC”) Website at www.sec.gov.
Shareholder Reports and Quarterly Portfolio Disclosure
The Fund is required to file its complete schedule of portfolio holdings with the SEC for its first and third fiscal quarters on Form N-Q. Copies of the filings are available without charge, upon request on the SEC’s Website at www.sec.gov and may be available by calling Lord Abbett at 888-522-2388.
Tax Information
For corporate shareholders, 87% of the Fund’s ordinary income distributions qualified for the dividends received deduction.
Additionally, of the distribution paid to the shareholders during the fiscal year ended December 31, 2018, $467,859 and $3,672,082, respectively, represent short-term capital gains and long-term capital gains.
33


| This report, when not used for the general information of shareholders of the Fund, is to be distributed only if preceded or accompanied by a current fund prospectus. | |||
| Lord Abbett mutual fund shares are distributed by LORD ABBETT DISTRIBUTOR LLC. | Lord Abbett Series Fund, Inc.
Classic Stock Portfolio | SFCLASS-PORT-3 (02/19) |
![]()
LORD ABBETT
ANNUAL REPORT
Lord Abbett
Series Fund—Developing Growth Portfolio
For the fiscal year ended December 31, 2018
Table of Contents
Lord Abbett Series Fund — Developing Growth Portfolio
Annual Report
For the fiscal year ended December 31, 2018

From left to right: James L.L. Tullis, Independent Chairman of the Lord Abbett Funds and Douglas B. Sieg, Director, President, and Chief Executive Officer of the Lord Abbett Funds.
Dear Shareholders:We are pleased to provide you with this overview of the performance of Lord Abbett Series Fund — Developing Growth Portfolio for the fiscal year ended December 31, 2018. On this page and the following pages, we discuss the major factors that influenced fiscal year performance. For additional information about the Fund, please visit our website at www.lordabbett.com, where you also can access the quarterly commentaries that provide updates on the Fund’s performance and other portfolio related updates.
Thank you for investing in Lord Abbett mutual funds. We value the trust that you place in us and look forward to serving your investment needs in the years to come.
Best regards,

Douglas B. Sieg
Director, President and Chief Executive Officer
For the fiscal year ended December 31, 2018, the Fund returned 4.88%, reflecting performance at the net asset value (NAV) of Class VC shares with all distributions reinvested, compared to its benchmark, the Russell 2000® Growth Index,1which returned –9.31% over the same period.
Domestic equity returns were negative over the past year, with large cap stocks, as represented by the S&P 500® Index,2falling –4.38% during the period, while small cap stocks, as represented by the Russell 2000® Index,3were down –11.01%.
During the period, there were several market-moving events. Notably, Congress passed the largest rewrite of the U.S. tax code in decades, which went into effect in January 2018. The tax bill reduced the corporate tax rate from 35% to 21% and allowed for a one-time repatriation tax of 15.5%, rather than the standard repatriation tax rate of 35%. In June 2018, the White House announced its intent to impose additional tariffs on $200 billion worth of Chinese goods on top of the $50 billion previously announced. The
1
aggressive U.S. trade posture continued into September with trade tensions mounting between the U.S. and China. In December, the White House announced a trade truce between the U.S. and China following a meeting between President Trump and President Xi Jinping at the G20 summit. The U.S. agreed to maintain a 10% tariff rate on $200 billion worth of Chinese imports at the start of 2019 as opposed to the originally planned 25% tariff rate. In return, China agreed to purchase a substantial amount of U.S. agriculture, industrial, and energy products to further reduce the trade imbalance. While the impact has yet to fully be realized, many corporations anticipate that the retaliatory tariffs will weigh on profits. Trade discussions between Mexico, Canada, and the U.S., however, took a more favorable turn as the negotiations resulted in a revised version of the North American Free Trade Agreement (NAFTA) called the U.S.–Mexico–Canada Agreement.
In March 2018, the Federal Reserve (the “Fed”) raised its target for short-term interest rates by 0.25%, to a range of 1.50%–1.75%, and followed with rate hikes of 0.25% at each of its June, September, and December meetings, raising the target range to 2.25%–2.50%. Amid rising concerns surrounding escalating trade tensions, slowing global growth, and increasing interest rates, the Nasdaq experienced the largest monthly drop since 2008 in October 2018. Following the prior month’s volatility, domestic
equity markets rallied in November and partially reversed October’s losses, however the S&P 500® returned to negative territory in December, posting its worst month since February 2009.
The leading contributor to the Fund’s relative performance during the reporting period was security selection in the information technology sector. Within this sector, the Fund’s holdings of Twilio, Inc., a provider of a cloud-based communications software platform, contributed most to relative performance. Shares of Twilio benefited from the firm’s ability to capitalize on its vast and growing addressable market, through the introduction of new products like Flex, a cloud contact application, and expansion of the firm’s footprint with its acquisition of SendGrid, Inc. Another contributor to relative performance within this sector during the reporting period was the Fund’s position in Everbridge, Inc., a developer of critical event management software and applications. Shares of Everbridge appreciated as the company reported successive quarters of robust revenue and earnings growth, while continuing to expand internationally and completing a key acquisition of Unified Messaging Systems ASA.
Security selection within the health care sector also positively impacted the Fund’s relative performance during the reporting period. Within this sector, the Fund’s holdings of Foundation Medicine, Inc., a molecular diagnostic company,
2
contributed as Roche Holding AG acquired the firm in an effort to expand Roche’s existing capabilities.
The leading detractors from the Fund’s performance relative to the benchmark during the reporting period were security selection in and an underweight to the financials sector. Within this sector, the Fund’s position in Western Alliance Bancorporation, a provider of various banking services, detracted. Shares of Western Alliance Bancoporation declined as investors were concerned about a possible moderation in growth due to increased competition for loans among banks and non-banks. Another detractor within the sector was the Fund’s position in CenterState Banks, Inc., a bank holding company. U.S. banks, like Western Alliance and CenterState, faced headwinds during the latter half of the year as investors expected commercial and industrial loan growth to slow, while the industry continued to face tougher competition from non-bank lenders and corporate clients.
Security selection in the communication services (formerly telecommunication services) sector also detracted from the Fund’s performance relative to the benchmark during the reporting period. Within this sector, the Fund’s holdings of Eventbrite, Inc., an operator of a self-service online ticketing platform, detracted. Following the September initial public offering, shares of Eventbrite declined during the period as investors were concerned about valuation and the pending expiration of a share lockup. Additionally, though it beat consensus estimates in its first public reporting, Eventbrite’s performance was not of the magnitude that investors expected.
The Fund’s portfolio is actively managed and, therefore, its holdings and the weightings of a particular issuer or particular sector as a percentage of portfolio assets are subject to change. Sectors may include many industries.
1 The Russell 2000®Growth Index measures the performance of those Russell 2000® companies with higher price-to-book ratios and higher forecasted growth values.
2 The S&P 500®Index is widely regarded as the standard for measuring large cap U.S. stock market performance and includes a representative sample of leading companies in leading industries.
3 The Russell 2000®Index measures the performance of the 2,000 smallest companies in the Russell 3000 Index, which represents approximately 10% of the total market capitalization of the Russell 3000 Index.
Unless otherwise specified, indexes reflect total return, with all dividends reinvested. Indexes are unmanaged, do not reflect the deduction of fees or expenses, and are not available for direct investment.
Important Performance and Other Information
Performance data quoted in the following pages reflect past performance and are no guarantee of future results. Current performance may be higher or lower than the performance quoted. The investment return and principal value of an investment in the Fund will fluctuate so that shares, on any given day or when redeemed, may be worth more or less than their original cost. You can obtain performance data current to the most recent month end by calling Lord Abbett at 888-522-2388 or referring to www.lordabbett.com.
3
During certain periods shown, expense waivers and reimbursements were in place. Without such expense waivers and reimbursements, the Fund’s returns would have been lower.
The annual commentary above discusses the views of the Fund’s management and various portfolio holdings of the Fund as of December 31, 2018. These views and portfolio holdings may have changed after this date. Information provided in the commentary is not a recommendation to buy or sell securities. Because the Fund’s portfolio is actively managed and may change significantly, the Fund may no longer own the securities described above or may have otherwise changed its position in the securities. For
more recent information about the Fund’s portfolio holdings, please visit www.lordabbett.com.
A Note about Risk:See Notes to Financial Statements for a discussion of investment risks. For a more detailed discussion of the risks associated with the Fund, please see the Fund’s prospectus.
Mutual funds are not insured by the FDIC, are not deposits or other obligations of, or guaranteed by, banks, and are subject to investment risks including possible loss of principal amount invested.
The Fund serves as an underlying investment vehicle for variable annuity contracts and variable life insurance policies.
4
Below is a comparison of a $10,000 investment in Class VC shares with the same investment in the Russell 2000® Growth Index, assuming reinvestment of all dividends and distributions. The Fund’s shares are sold only to insurance company separate accounts that fund certain variable annuity and variable life contracts. The line graph comparison does not reflect the sales charges or other expenses of these contracts. If those sales charges and expenses were reflected, returns would be lower. The graph and performance table below do not reflect the deduction of taxes that a shareholder would pay on Fund distributions or the redemption of Fund shares. During the period, expenses of the Fund have been waived or reimbursed by Lord Abbett; without such waiver or reimbursement of expenses, the Fund’s returns would have been lower.Past performance is no guarantee of future results.
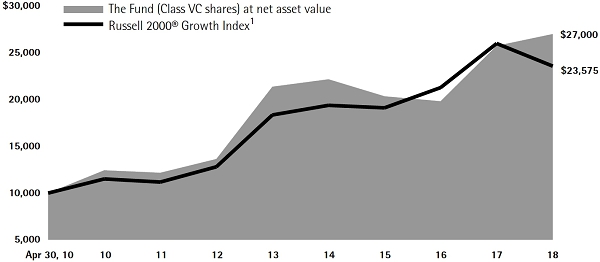
| Average Annual Total Returns for the Periods Ended December 31, 2018 | ||||||
| 1 Year | 5 Years | Life of Class | ||||
| Class VC2 | 4.88% | 4.79% | 12.14% | |||
| 1 Performance for the unmanaged index does not reflect any fees or expenses. The performance of the index is not necessarily representative of the Fund’s performance. Performance for the index began on May 1, 2010. | 2 The Class VC shares commenced operations on April 23, 2010. Performance for the Class began on May 1, 2010. |
5
As a shareholder of the Fund, you incur ongoing costs, including management fees; expenses related to the Fund’s services arrangements with certain insurance companies; and other Fund expenses. This Example is intended to help you understand your ongoing costs (in dollars) of investing in the Fund and to compare these costs with the ongoing costs of investing in other mutual funds.
The Example is based on an investment of $1,000 invested at the beginning of the period and held for the entire period (July 1, 2018 through December 31, 2018).
The Example reflects only expenses that are deducted from the assets of the Fund. Fees and expenses, including sales charges applicable to the various insurance products that invest in the Fund, are not reflected in this Example. If such fees and expenses were reflected in the Example, the total expenses shown would be higher. Fees and expenses regarding such variable insurance products are separately described in the prospectus related to those products.
Actual Expenses
The first line of the table on the following page provides information about actual account values and actual expenses. You may use the information in this line, together with the amount you invested, to estimate the expenses that you paid over the period. Simply divide your account value by $1,000 (for example, an $8,600 account value divided by $1,000 = 8.6), then multiply the result by the number in the first line under the heading titled “Expenses Paid During Period 7/1/18 – 12/31/18” to estimate the expenses you paid on your account during this period.
Hypothetical Example for Comparison Purposes
The second line of the table on the following page provides information about hypothetical account values and hypothetical expenses based on the Fund’s actual expense ratio and an assumed rate of return of 5% per year before expenses, which is not the Fund’s actual return. The hypothetical account values and expenses may not be used to estimate the actual ending account balance or expenses you paid for the period. You may use this information to compare the ongoing costs of investing in the Fund and other funds. To do so, compare this 5% hypothetical example with the 5% hypothetical examples that appear in the shareholder reports of the other funds.
6
Please note that the expenses shown in the table are meant to highlight your ongoing costs only and do not reflect any transactional costs, such as sales charges. Therefore, the second line of the table is useful in comparing ongoing costs only, and will not help you determine the relative total costs of owning different funds. In addition, if these transactional costs were included, your costs would have been higher.
| Beginning | Ending | Expenses | |||||
| Account | Account | Paid During | |||||
| Value | Value | Period† | |||||
| 7/1/18- | |||||||
| 7/1/18 | 12/31/18 | 12/31/18 | |||||
| Class VC | |||||||
| Actual | $1,000.00 | $852.30 | $4.44 | ||||
| Hypothetical (5% Return Before Expenses) | $1,000.00 | $1,020.42 | $4.84 |
| † | Net expenses are equal to the Fund’s annualized expense ratio of 0.95%, multiplied by the average account value over the period, multiplied by 184/365 (to reflect one-half year period). |
Portfolio Holdings Presented by Sector
December 31, 2018
| Sector* | %** | |
| Communication Services | 3.79 | % |
| Consumer Discretionary | 19.23 | % |
| Consumer Staples | 3.25 | % |
| Energy | 0.93 | % |
| Financials | 3.05 | % |
| Health Care | 26.94 | % |
| Industrials | 14.13 | % |
| Information Technology | 25.49 | % |
| Repurchase Agreement | 3.19 | % |
| Total | 100.00 | % |
| * | A sector may comprise several industries. | |
| ** | Represents percent of total investments. |
| See Notes to Financial Statements. | 7 |
December 31, 2018
| Fair | ||||||||
| Value | ||||||||
| Investments | Shares | (000) | ||||||
| COMMON STOCKS 96.78% | ||||||||
| Aerospace & Defense 3.87% | ||||||||
| Aerovironment, Inc.* | 16,099 | $ | 1,094 | |||||
| Axon Enterprise, Inc.* | 12,987 | 568 | ||||||
| Curtiss-Wright Corp. | 4,494 | 459 | ||||||
| Total | 2,121 | |||||||
| Auto Components 0.76% | ||||||||
| Fox Factory Holding Corp.* | 7,075 | 417 | ||||||
| Banks 2.79% | ||||||||
| CenterState Bank Corp. | 23,896 | 503 | ||||||
| Webster Financial Corp. | 8,637 | 426 | ||||||
| Western Alliance Bancorp* | 7,252 | 286 | ||||||
| Wintrust Financial Corp. | 4,744 | 315 | ||||||
| Total | 1,530 | |||||||
| Biotechnology 11.11% | ||||||||
| Agios Pharmaceuticals, Inc.* | 4,595 | 212 | ||||||
| Allogene Therapeutics, Inc.* | 9,963 | 268 | ||||||
| Amarin Corp. plc ADR* | 23,684 | 322 | ||||||
| Argenx SE ADR* | 4,560 | 438 | ||||||
| Audentes Therapeutics, Inc.* | 6,756 | 144 | ||||||
| Blueprint Medicines Corp.* | 7,928 | 427 | ||||||
| CareDx, Inc.* | 23,206 | 583 | ||||||
| Denali Therapeutics, Inc.* | 20,015 | 414 | ||||||
| Emergent BioSolutions, Inc.* | 7,579 | 449 | ||||||
| FibroGen, Inc.* | 3,797 | 176 | ||||||
| Immunomedics, Inc.* | 13,577 | 194 | ||||||
| Loxo Oncology, Inc.* | 5,592 | 783 | ||||||
| Myovant Sciences Ltd. (United Kingdom)*(a) | 23,329 | 383 | ||||||
| Repligen Corp.* | 14,719 | 776 | ||||||
| Sage Therapeutics, Inc.* | 2,605 | 250 | ||||||
| Sarepta Therapeutics, Inc.* | 2,408 | 263 | ||||||
| Total | 6,082 | |||||||
| Building Products 1.17% | ||||||||
| Trex Co., Inc.* | 10,771 | 639 | ||||||
| Fair | ||||||||
| Value | ||||||||
| Investments | Shares | (000) | ||||||
| Capital Markets 0.25% | ||||||||
| Evercore, Inc. Class A | 1,913 | $ | 137 | |||||
| Communications Equipment 0.25% | ||||||||
| Acacia Communications, Inc.* | 3,571 | 136 | ||||||
| Construction & Engineering 0.78% | ||||||||
| NV5 Global, Inc.* | 7,050 | 427 | ||||||
| Diversified Consumer Services 6.61% | ||||||||
| Bright Horizons Family Solutions, Inc.* | 7,722 | 861 | ||||||
| Chegg, Inc.* | 45,921 | 1,305 | ||||||
| Grand Canyon Education, Inc.* | 10,523 | 1,012 | ||||||
| Strategic Education, Inc. | 3,461 | 392 | ||||||
| Weight Watchers International, Inc.* | 1,320 | 51 | ||||||
| Total | 3,621 | |||||||
| Electrical Equipment 1.66% | ||||||||
| Generac Holdings, Inc.* | 18,290 | 909 | ||||||
| Energy Equipment & Services 0.93% | ||||||||
| Cactus, Inc. Class A* | 18,529 | 508 | ||||||
| Entertainment 1.84% | ||||||||
| Live Nation Entertainment, Inc.* | 3,603 | 177 | ||||||
| World Wrestling Entertainment, Inc. Class A | 11,128 | 832 | ||||||
| Total | 1,009 | |||||||
| Food & Staples Retailing 2.00% | ||||||||
| BJ’s Wholesale Club Holdings, Inc.* | 27,906 | 618 | ||||||
| Sprouts Farmers Market, Inc.* | 20,195 | 475 | ||||||
| Total | 1,093 | |||||||
| Food Products 1.25% | ||||||||
| Calavo Growers, Inc. | 9,377 | 684 | ||||||
| Health Care Equipment & Supplies 11.45% | ||||||||
| Glaukos Corp.* | 21,400 | 1,202 | ||||||
| Haemonetics Corp.* | 5,148 | 515 | ||||||
| Inogen, Inc.* | 1,119 | 139 | ||||||
| 8 | See Notes to Financial Statements. |
Schedule of Investments (continued)
December 31, 2018
| Fair | ||||||||
| Value | ||||||||
| Investments | Shares | (000) | ||||||
| Health Care Equipment & Supplies (continued) | ||||||||
| Insulet Corp.* | 8,953 | $ | 710 | |||||
| iRhythm Technologies, Inc.* | 11,974 | 832 | ||||||
| Masimo Corp.* | 7,368 | 791 | ||||||
| Penumbra, Inc.* | 8,820 | 1,078 | ||||||
| Tandem Diabetes Care, Inc.* | 26,384 | 1,002 | ||||||
| Total | 6,269 | |||||||
| Health Care Providers & Services 1.99% | ||||||||
| Guardant Health, Inc.* | 11,245 | 423 | ||||||
| HealthEquity, Inc.* | 11,128 | 664 | ||||||
| Total | 1,087 | |||||||
| Health Care Technology 1.46% | ||||||||
| Inspire Medical Systems, Inc.* | 12,278 | 519 | ||||||
| Teladoc, Inc.* | 5,613 | 278 | ||||||
| Total | 797 | |||||||
| Hotels, Restaurants & Leisure 3.69% | ||||||||
| Dave & Buster’s Entertainment, Inc. | 9,559 | 426 | ||||||
| Planet Fitness, Inc. Class A* | 29,685 | 1,592 | ||||||
| Total | 2,018 | |||||||
| Household Durables 2.28% | ||||||||
| iRobot Corp.* | 9,219 | 772 | ||||||
| Roku, Inc.* | 8,241 | 252 | ||||||
| Sonos, Inc.* | 22,604 | 222 | ||||||
| Total | 1,246 | |||||||
| Information Technology Services 3.44% | ||||||||
| EPAM Systems, Inc.* | 3,716 | 431 | ||||||
| Okta, Inc.* | 12,943 | 826 | ||||||
| Twilio, Inc. Class A* | 7,023 | 627 | ||||||
| Total | 1,884 | |||||||
| Interactive Media & Services 1.95% | ||||||||
| Cargurus, Inc.* | 15,827 | 534 | ||||||
| Eventbrite, Inc. Class A* | 19,199 | 534 | ||||||
| Total | 1,068 | |||||||
| Fair | ||||||||
| Value | ||||||||
| Investments | Shares | (000) | ||||||
| Internet & Direct Marketing Retail 2.82% | ||||||||
| Etsy, Inc.* | 28,785 | $ | 1,369 | |||||
| Stamps.com, Inc.* | 1,114 | 174 | ||||||
| Total | 1,543 | |||||||
| Leisure Products 0.93% | ||||||||
| Malibu Boats, Inc. Class A* | 14,557 | 507 | ||||||
| Machinery 3.60% | ||||||||
| Chart Industries, Inc.* | 7,978 | 519 | ||||||
| Proto Labs, Inc.* | 4,276 | 482 | ||||||
| RBC Bearings, Inc.* | 7,394 | 969 | ||||||
| Total | 1,970 | |||||||
| Pharmaceuticals 0.93% | ||||||||
| GW Pharmaceuticals plc ADR* | 5,234 | 510 | ||||||
| Professional Services 2.35% | ||||||||
| Insperity, Inc. | 13,797 | 1,288 | ||||||
| Semiconductors & Semiconductor Equipment 2.48% | ||||||||
| Inphi Corp.* | 4,279 | 137 | ||||||
| Monolithic Power Systems, Inc. | 5,464 | 635 | ||||||
| Semtech Corp.* | 12,790 | 587 | ||||||
| Total | 1,359 | |||||||
| Software 19.31% | ||||||||
| Alteryx, Inc. Class A* | 10,860 | 646 | ||||||
| Anaplan, Inc.* | 12,651 | 336 | ||||||
| Appian Corp.* | 8,945 | 239 | ||||||
| Coupa Software, Inc.* | 11,574 | 728 | ||||||
| Elastic NV* | 4,959 | 355 | ||||||
| Everbridge, Inc.* | 17,660 | 1,002 | ||||||
| Five9, Inc.* | 24,752 | 1,082 | ||||||
| HubSpot, Inc.* | 5,186 | 652 | ||||||
| Mimecast Ltd.* | 18,294 | 615 | ||||||
| New Relic, Inc.* | 9,676 | 783 | ||||||
| Paycom Software, Inc.* | 4,590 | 562 | ||||||
| Paylocity Holding Corp.* | 8,611 | 519 | ||||||
| RingCentral, Inc. Class A* | 10,215 | 842 | ||||||
| SendGrid, Inc.* | 19,438 | 839 | ||||||
| See Notes to Financial Statements. | 9 |
Schedule of Investments (concluded)
December 31, 2018
| Fair | ||||||||
| Value | ||||||||
| Investments | Shares | (000) | ||||||
| Software (continued) | ||||||||
| Trade Desk, Inc. (The) Class A* | 6,779 | $ | 787 | |||||
| Zendesk, Inc.* | 1,223 | 71 | ||||||
| Zscaler, Inc.* | 13,139 | 515 | ||||||
| Total | 10,573 | |||||||
| Specialty Retail 1.37% | ||||||||
| At Home Group, Inc.* | 22,412 | 418 | ||||||
| National Vision Holdings, Inc.* | 11,757 | 331 | ||||||
| Total | 749 | |||||||
| Textiles, Apparel & Luxury Goods 0.77% | ||||||||
| Canada Goose Holdings, Inc. (Canada)*(a) | 9,690 | 424 | ||||||
| Trading Companies & Distributors 0.69% | ||||||||
| Air Lease Corp. | 12,588 | 380 | ||||||
| Total Common Stocks (cost $54,143,572) | 52,985 | |||||||
| Principal | Fair | |||||||
| Amount | Value | |||||||
| Investments | (000) | (000) | ||||||
| SHORT-TERM INVESTMENT 3.19% | ||||||||
| Repurchase Agreement | ||||||||
| Repurchase Agreement dated 12/31/2018, 1.45% due 1/2/2019 with Fixed Income Clearing Corp. collateralized by $1,840,000 of U.S. Treasury Note at 2.00% due 8/15/2025; value: $1,781,637; proceeds: $1,746,151 (cost $1,746,010) | $ | 1,746 | $ | 1,746 | ||||
| Total Investments in Securities 99.97% (cost $55,889,582) | 54,731 | |||||||
| Other Assets in Excess of Liabilities 0.03% | 18 | |||||||
| Net Assets 100.00% | $ | 54,749 | ||||||
| ADR | American Depositary Receipt. | |
| * | Non-income producing security. | |
| (a) | Foreign security traded in U.S. dollars. |
The following is a summary of the inputs used as of December 31, 2018 in valuing the Fund’s investments carried at fairvalue(1):
| Level 1 | Level 2 | Level 3 | Total | |||||||||||||
| Investment Type(2)(3) | (000) | (000) | (000) | (000) | ||||||||||||
| Common Stocks | $ | 52,985 | $ | – | $ | – | $ | 52,985 | ||||||||
| Short-Term Investment | ||||||||||||||||
| Repurchase Agreement | – | 1,746 | – | 1,746 | ||||||||||||
| Total | $ | 52,985 | $ | 1,746 | $ | – | $ | 54,731 | ||||||||
| (1) | Refer to Note 2(h) for a description of fair value measurements and the three-tier hierarchy of inputs. | |
| (2) | See Schedule of Investments for fair values in each industry and identification of foreign issuers and/or geography. | |
| (3) | There were no Level 1/Level 2 transfers during the fiscal year ended December 31, 2018. |
| 10 | See Notes to Financial Statements. |
Statement of Assets and Liabilities
December 31, 2018
| ASSETS: | |||
| Investments in securities, at fair value (cost $55,889,582) | $54,730,505 | ||
| Receivables: | |||
| Capital shares sold | 150,274 | ||
| From advisor (See Note 3) | 21,178 | ||
| Interest and dividends | 5,304 | ||
| Prepaid expenses | 242 | ||
| Total assets | 54,907,503 | ||
| LIABILITIES: | |||
| Payables: | |||
| Management fee | 35,509 | ||
| Capital shares reacquired | 33,026 | ||
| Directors’ fees | 3,552 | ||
| Fund administration | 1,894 | ||
| Accrued expenses | 84,929 | ||
| Total liabilities | 158,910 | ||
| NET ASSETS | $54,748,593 | ||
| COMPOSITION OF NET ASSETS: | |||
| Paid-in capital | $56,547,658 | ||
| Total distributable earnings (loss) | (1,799,065 | ) | |
| Net Assets | $54,748,593 | ||
| Outstanding shares (50 million shares of common stock authorized, $.001 par value) | 2,192,230 | ||
| Net asset value, offering and redemption price per share (Net assets divided by outstanding shares) | $24.97 | ||
| See Notes to Financial Statements. | 11 |
For the Year Ended December 31, 2018
| Investment income: | ||||
| Dividends | $ | 148,575 | ||
| Interest | 19,037 | |||
| Total investment income | 167,612 | |||
| Expenses: | ||||
| Management fee | 410,572 | |||
| Non 12b-1 service fees | 137,067 | |||
| Shareholder servicing | 57,255 | |||
| Professional | 40,655 | |||
| Reports to shareholders | 29,618 | |||
| Fund administration | 21,897 | |||
| Custody | 10,910 | |||
| Directors’ fees | 1,915 | |||
| Other | 7,609 | |||
| Gross expenses | 717,498 | |||
| Expense reductions (See Note 8) | (1,332 | ) | ||
| Fees waived and expenses reimbursed (See Note 3) | (203,141 | ) | ||
| Net expenses | 513,025 | |||
| Net investment loss | (345,413 | ) | ||
| Net realized and unrealized gain (loss): | ||||
| Net realized gain on investments | 8,921,414 | |||
| Net change in unrealized appreciation/depreciation on investments | (8,760,781 | ) | ||
| Net realized and unrealized gain | 160,633 | |||
| Net Decrease in Net Assets Resulting From Operations | $ | (184,780 | ) | |
| 12 | See Notes to Financial Statements. |
Statements of Changes in Net Assets
| For the Year Ended | For the Year Ended | |||||||
| INCREASE IN NET ASSETS | December 31, 2018 | December 31, 2017 | ||||||
| Operations: | ||||||||
| Net investment loss | $ | (345,413 | ) | $ | (178,826 | ) | ||
| Net realized gain on investments | 8,921,414 | 3,225,081 | ||||||
| Net change in unrealized appreciation/depreciation on investments | (8,760,781 | ) | 5,999,258 | |||||
| Net increase (decrease) in net assets resulting from operations | (184,780 | ) | 9,045,513 | |||||
| Distributions to shareholders | (8,137,620 | ) | – | |||||
| Capital share transactions (See Note 13): | ||||||||
| Proceeds from sales of shares | 30,041,903 | 9,093,518 | ||||||
| Reinvestment of distributions | 8,137,608 | – | ||||||
| Cost of shares reacquired | (14,766,834 | ) | (7,085,462 | ) | ||||
| Net increase in net assets resulting from capital share transactions | 23,412,677 | 2,008,056 | ||||||
| Net increase in net assets | 15,090,277 | 11,053,569 | ||||||
| NET ASSETS: | ||||||||
| Beginning of year | $ | 39,658,316 | $ | 28,604,747 | ||||
| End of year | $ | 54,748,593 | $ | 39,658,316 | ||||
| Accumulated net investment loss(1) | $ | – | $ | – | ||||
| (1) | The SEC eliminated the requirement to disclose accumulated net investment loss in 2018. For the year ended December 31, 2017, the accumulated net investment income was $(2,269). |
| See Notes to Financial Statements. | 13 |
| Per Share Operating Performance: | ||||||||||||||||||||||||
| Investment operations: | Distributions to shareholders from: | |||||||||||||||||||||||
| Net asset value, beginning of period | Net investment income (loss)(a) | Net realized and unrealized gain (loss) | Total from investment operations | Net realized gain | Net asset value, end of period | |||||||||||||||||||
| 12/31/2018 | $28.18 | $(0.21 | ) | $ 1.41 | $ 1.20 | $(4.41 | ) | $24.97 | ||||||||||||||||
| 12/31/2017 | 21.69 | (0.13 | ) | 6.62 | 6.49 | — | 28.18 | |||||||||||||||||
| 12/31/2016 | 22.28 | (0.07 | ) | (0.52 | ) | (0.59 | ) | — | 21.69 | |||||||||||||||
| 12/31/2015 | 24.46 | (0.14 | ) | (1.86 | ) | (2.00 | ) | (0.18 | ) | 22.28 | ||||||||||||||
| 12/31/2014 | 23.74 | (0.16 | ) | 1.03 | 0.87 | (0.15 | ) | 24.46 | ||||||||||||||||
| (a) | Calculated using average shares outstanding during the period. | |
| (b) | Total return does not consider the effects of sales charges or other expenses imposed by an insurance company and assumes the reinvestment of all distributions. |
| 14 | See Notes to Financial Statements. |
| Ratios to Average Net Assets: | Supplemental Data: | |||||||||||||||||||||
| Total return(b) (%) | Total expenses after waivers and/or reimburse- ments (%) | Total expenses (%) | Net investment income (loss) (%) | Net assets, end of period (000) | Portfolio turnover rate (%) | |||||||||||||||||
| 4.88 | 0.94 | 1.31 | (0.63 | ) | $54,749 | 112 | ||||||||||||||||
| 29.92 | 0.90 | 1.38 | (0.52 | ) | 39,658 | 103 | ||||||||||||||||
| (2.60 | ) | 0.90 | 1.51 | (0.34 | ) | 28,605 | 222 | |||||||||||||||
| (8.21 | ) | 0.90 | 1.56 | (0.56 | ) | 28,882 | 197 | |||||||||||||||
| 3.71 | 0.90 | 2.02 | (0.68 | ) | 17,494 | 235 | ||||||||||||||||
| See Notes to Financial Statements. | 15 |
| 1. | ORGANIZATION |
Lord Abbett Series Fund, Inc. (the “Company”) is registered under the Investment Company Act of 1940, as amended (the “Act”), as a diversified, open-end management investment company and was incorporated under Maryland law in 1989. The Company consists of twelve separate portfolios. This report covers Developing Growth Portfolio (the “Fund”).
The Fund’s investment objective is long-term growth of capital. The Fund has Variable Contract class shares (“Class VC Shares”), which are currently issued and redeemed only in connection with investments in, and payments under, variable annuity contracts and variable life insurance policies issued by life insurance and insurance-related companies.
The preparation of the financial statements in conformity with accounting principles generally accepted in the United States of America (“U.S. GAAP”) requires management to make certain estimates and assumptions that affect the reported amounts of assets and liabilities and disclosure of contingent assets and liabilities at the date of the financial statements and the reported amounts of increases and decreases in net assets from operations during the reporting period. Actual results could differ from those estimates. The Fund is considered an investment company under U.S. GAAP and follows the accounting and reporting guidance applicable to investment companies.
| 2. | SIGNIFICANT ACCOUNTING POLICIES |
| (a) | Investment Valuation–Under procedures approved by the Fund’s Board of Directors (the “Board”), Lord, Abbett & Co. LLC (“Lord Abbett”), the Fund’s investment manager, has formed a Pricing Committee to administer the pricing and valuation of portfolio investments and to ensure that prices utilized reasonably reflect fair value. Among other things, these procedures allow the Fund to utilize independent pricing services, quotations from securities and financial instrument dealers and other market sources to determine fair value. |
| Securities actively traded on any recognized U.S. or non-U.S. exchange or on The NASDAQ Stock Market LLC are valued at the last sale price or official closing price on the exchange or system on which they are principally traded. Events occurring after the close of trading on non-U.S. exchanges may result in adjustments to the valuation of foreign securities to reflect their fair value as of the close of regular trading on the New York Stock Exchange. The Fund may utilize an independent fair valuation service in adjusting the valuations of foreign securities. Unlisted equity securities are valued at the last quoted sale price or, if no sale price is available, at the mean between the most recently quoted bid and asked prices. | |
| Securities for which prices are not readily available are valued at fair value as determined by the Pricing Committee. The Pricing Committee considers a number of factors, including observable and unobservable inputs, when arriving at fair value. The Pricing Committee may use related or comparable assets or liabilities, recent transactions, market multiples, book values and other relevant information to determine the fair value of portfolio investments. The Board or a designated committee thereof regularly reviews fair value determinations made by the Pricing Committee and may employ techniques such as reviewing related market activity, reviewing inputs and assumptions, and retrospectively comparing prices of subsequent purchases and sales transactions to fair value determinations made by the Pricing Committee. | |
| Short-term securities with 60 days or less remaining to maturity are valued using the amortized cost method, which approximates fair value. |
16
Notes to Financial Statements (continued)
| (b) | Security Transactions–Security transactions are recorded as of the date that the securities are purchased or sold (trade date). Realized gains and losses on sales of portfolio securities are calculated using the identified-cost method. |
| (c) | Investment Income–Dividend income is recorded on the ex-dividend date. Interest income is recorded on the accrual basis as earned. Discounts are accreted and premiums are amortized using the effective interest method and are included in Interest on the Statement of Operations. Withholding taxes on foreign dividends have been provided for in accordance with the applicable country’s tax rules and rates. |
| (d) | Income Taxes–It is the policy of the Fund to meet the requirements of Subchapter M of the Internal Revenue Code applicable to regulated investment companies and to distribute substantially all taxable income and capital gains to its shareholders. Therefore, no income tax provision is required. |
| The Fund files U.S. federal and various state and local tax returns. No income tax returns are currently under examination. The statute of limitations on the Fund’s filed U.S. federal tax returns remains open for the fiscal years ended December 31, 2015 through December 31, 2018. The statutes of limitations on the Company’s state and local tax returns may remain open for an additional year depending upon the jurisdiction. | |
| (e) | Expenses–Expenses incurred by the Company that do not specifically relate to an individual fund are generally allocated to the funds within the Company on a pro rata basis by relative net assets. |
| (f) | Foreign Transactions–The books and records of the Fund are maintained in U.S. dollars and transactions denominated in foreign currencies are recorded in the Fund’s records at the rate prevailing when earned or recorded. Asset and liability accounts that are denominated in foreign currencies are adjusted daily to reflect current exchange rates and any unrealized gain (loss), if applicable, is included in Net change in unrealized appreciation/depreciation on translation of assets and liabilities denominated in foreign currencies in the Fund’s Statement of Operations. The resultant exchange gains and losses upon settlement of such transactions, if applicable, are included in Net realized gain on foreign currency related transactions in the Fund’s Statement of Operations. The Fund does not isolate that portion of the results of operations arising as a result of changes in the foreign exchange rates from the changes in market prices of the securities. |
| (g) | Repurchase Agreements–The Fund may enter into repurchase agreements with respect to securities. A repurchase agreement is a transaction in which a fund acquires a security and simultaneously commits to resell that security to the seller (a bank or securities dealer) at an agreed-upon price on an agreed-upon date. The Fund requires at all times that the repurchase agreement be collateralized by cash, or by securities of the U.S. Government, its agencies, its instrumentalities, or U.S. Government sponsored enterprises having a value equal to, or in excess of, the value of the repurchase agreement (including accrued interest). If the seller of the agreement defaults on its obligation to repurchase the underlying securities at a time when the fair value of these securities has declined, the Fund may incur a loss upon disposition of the securities. |
| (h) | Fair Value Measurements–Fair value is defined as the price that the Fund would receive upon selling an investment or transferring a liability in an orderly transaction to an independent buyer in the principal or most advantageous market of the investment. A three-tier hierarchy |
17
Notes to Financial Statements (continued)
| is used to maximize the use of observable market data and minimize the use of unobservable inputs and to establish classification of fair value measurements for disclosure purposes. Inputs refer broadly to the assumptions that market participants would use in pricing the asset or liability, including assumptions about risk – for example, the risk inherent in a particular valuation technique used to measure fair value (such as a pricing model) and/or the risk inherent in the inputs to the valuation technique. Inputs may be observable or unobservable. Observable inputs reflect the assumptions market participants would use in pricing the asset or liability. Observable inputs are based on market data obtained from sources independent of the reporting entity. Unobservable inputs reflect the reporting entity’s own assumptions about the assumptions market participants would use in pricing the asset or liability. Unobservable inputs are based on the best information available in the circumstances. The three-tier hierarchy classification is determined based on the lowest level of inputs that is significant to the fair value measurement, and is summarized in the three broad Levels listed below: |
| • | Level 1 – | unadjusted quoted prices in active markets for identical investments; |
| • | Level 2 – | other significant observable inputs (including quoted prices for similar investments, interest rates, prepayment speeds, credit risk, etc.); and |
| • | Level 3 – | significant unobservable inputs (including the Fund’s own assumptions in determining the fair value of investments). |
| A summary of inputs used in valuing the Fund’s investments as of December 31, 2018 and, if applicable, Level 1/Level 2 transfers and Level 3 rollforwards for the fiscal year then ended is included in the Fund’s Schedule of Investments. | |
| Changes in valuation techniques may result in transfers into or out of an assigned level within the three-tier hierarchy. All transfers between different levels within the three-tier hierarchy are deemed to have occurred as of the beginning of the reporting period. The inputs or methodology used for valuing securities are not necessarily an indication of the risk associated with investing in those securities. |
| 3. | MANAGEMENT FEE AND OTHER TRANSACTIONS WITH AFFILIATES |
Management Fee
The Company has a management agreement with Lord Abbett, pursuant to which Lord Abbett supplies the Fund with investment management services and executive and other personnel, provides office space and pays for ordinary and necessary office and clerical expenses relating to research and statistical work and supervision of the Fund’s investment portfolio.
The management fee is based on the Fund’s average daily net assets at the following annual rate:
| First $100 million | .75% |
| Over $100 million | .50% |
For the fiscal year ended December 31, 2018, the effective management fee, net of waivers, was at an annualized rate of 0.38% of the Fund’s average daily net assets.
In addition, Lord Abbett provides certain administrative services to the Fund pursuant to an Administrative Services Agreement in return for a fee at an annual rate of .04% of the Fund’s average daily net assets.
Effective May 1, 2018 and continuing through April 30, 2019, Lord Abbett has contractually agreed to waive its fees and reimburse expenses to the extent necessary to limit total net annual operating
18
Notes to Financial Statements (continued)
expenses to an annual rate of 0.95%. This agreement may be terminated only upon the approval of the Board. Prior to May 1, 2018, Lord Abbett contractually agreed to waive its fees and reimburse expenses to the extent necessary to limit total net annual operating expenses to an annual rate of 0.90%.
The Company, on behalf of the Fund, has entered into services arrangements with certain insurance companies. Under these arrangements, certain insurance companies will be compensated up to .25% of the average daily net asset value (“NAV”) of the Fund’s Class VC Shares held in the insurance company’s separate account to service and maintain the Variable Contract owners’ accounts. This amount is included in Non 12b-1 service fees on the Statement of Operations. The Fund may also compensate certain insurance companies, third-party administrators and other entities for providing recordkeeping, sub-transfer agency and other administrative services to the Fund. This amount is included in Shareholder servicing on the Statement of Operations.
One Director and certain of the Company’s officers have an interest in Lord Abbett.
| 4. | DISTRIBUTIONS AND CAPITAL LOSS CARRYFORWARDS |
Dividends from net investment income, if any, are declared and paid at least semi-annually. Taxable net realized gains from investment transactions, reduced by allowable capital loss carryforwards, if any, are declared and distributed to shareholders at least annually. The capital loss carryforward amount, if any, is available to offset future net capital gains. Dividends and distributions to shareholders are recorded on the ex-dividend date. The amounts of dividends and distributions from net investment income and net realized capital gains are determined in accordance with federal income tax regulations, which may differ from U.S. GAAP. These book/tax differences are either considered temporary or permanent in nature. To the extent these differences are permanent in nature, such amounts are reclassified within the components of net assets based on their federal tax basis treatment; temporary differences do not require reclassification. Dividends and distributions that exceed earnings and profits for tax purposes are reported as a tax return of capital.
The tax character of distributions paid during the fiscal year ended December 31, 2018 and fiscal year ended December 31, 2017 was as follows:
| Year Ended 12/31/2018 | Year Ended 12/31/2017 | |||||||||
| Distributions paid from: | ||||||||||
| Ordinary income | $ | 1,901,367 | $0 | |||||||
| Net long-term capital gains | 6,236,253 | 0 | ||||||||
| Total distributions paid | $ | 8,137,620 | $0 | |||||||
As of December 31, 2018, the components of accumulated losses on a tax-basis were as follows:
| Temporary differences | $ | (450,576 | ) | |
| Unrealized losses – net | (1,348,489 | ) | ||
| Total accumulated losses – net | $ | (1,799,065 | ) |
At the Fund’s election, certain losses incurred within the taxable year (Qualified Late-Year Losses) are deemed to arise on the first business day of the Fund’s next taxable year. The Fund incurred and will elect to defer post-October capital losses of $447,024 during fiscal year 2018.
As of December 31, 2018, the aggregate unrealized security gains and losses on investments and other financial instruments based on cost for U.S. federal income tax purposes were as follows:
19
Notes to Financial Statements (continued)
| Tax cost | $ | 56,078,994 | ||
| Gross unrealized gain | 4,496,871 | |||
| Gross unrealized loss | (5,845,360 | ) | ||
| Net unrealized security loss | $ | (1,348,489 | ) |
The difference between book-basis and tax-basis unrealized gains (losses) is attributable to the tax treatment of wash sales.
Permanent items identified during the fiscal year ended December 31, 2018 have been reclassified among the components of net assets based on their tax basis treatment as follows:
| Total | ||||||
| distributable | Paid-in | |||||
| earnings (loss) | Capital | |||||
| $461 | $(461 | ) | ||||
The permanent differences are primarily attributable to the tax treatment of certain distributions.
| 5. | PORTFOLIO SECURITIES TRANSACTIONS |
Purchases and sales of investment securities (excluding short-term investments) for the fiscal year ended December 31, 2018 were as follows:
| Purchases | Sales | |
| $72,259,373 | $58,793,988 |
There were no purchases or sales of U.S. Government securities for the fiscal year ended December 31, 2018.
The Fund is permitted to purchase and sell securities (“cross-trade”) from and to other Lord Abbett funds or client accounts pursuant to procedures approved by the Board in compliance with Rule 17a-7 under the Act (the “Rule”). Each cross-trade is executed at a fair market price in compliance with provisions of the Rule. For the fiscal year ended December 31, 2018, the Fund engaged in cross-trades purchases of $249,174 and sales of $2,805 which resulted in net realized gains of $1,350.
| 6. | DISCLOSURES ABOUT OFFSETTING ASSETS AND LIABILITIES |
The Financial Accounting Standards Board (“FASB”) requires disclosures intended to help better assess the effect or potential effect of offsetting arrangements on a fund’s financial position. The following tables illustrate gross and net information about recognized assets and liabilities eligible for offset in the statement of assets and liabilities; and disclose such amounts subject to an enforceable master netting agreement or similar agreement, by counterparty. A master netting agreement is an agreement between a fund and a counterparty which provides for the net settlement of amounts owed under all contracts traded under that agreement, as well as cash collateral, through a single payment by one party to the other in the event of default on or termination of any one contract. The Fund’s accounting policy with respect to balance sheet offsetting is that, absent an event of default by the counterparty or a termination of the agreement, the master netting agreement does not result in an offset of reported amounts of financial assets and liabilities in the statement of assets and liabilities across transactions between the Fund and the applicable counterparty:
20
Notes to Financial Statements (continued)
| Description | Gross Amounts of Recognized Assets | Gross Amounts Offset in the Statement of Assets and Liabilities | Net Amounts of Assets Presented in the Statement of Assets and Liabilities | ||||||||
| Repurchase Agreement | $1,746,010 | $ | – | $1,746,010 | |||||||
| Total | $1,746,010 | $ | – | $1,746,010 | |||||||
| Net Amounts of Assets Presented in | Amounts Not Offset in the Statement of Assets and Liabilities | ||||||||||||||||||
| Counterparty | the Statement of Assets and Liabilities | Financial Instruments | Cash Collateral Received(a) | Securities Collateral Received(a) | Net Amount(b) | ||||||||||||||
| Fixed Income Clearing Corp. | $1,746,010 | $ | – | $ | – | $(1,746,010 | ) | $ | – | ||||||||||
| Total | $1,746,010 | $ | – | $ | – | $(1,746,010 | ) | $ | – | ||||||||||
| (a) | Collateral disclosed is limited to an amount not to exceed 100% of the net amount of assets presented in the Statement of Assets and Liabilities, for each respective counterparty. |
| (b) | Net amount represents the amount owed to the Fund by the counterparty as of December 31, 2018. |
| 7. | DIRECTORS’ REMUNERATION |
The Company’s officers and one Director, who are associated with Lord Abbett, do not receive any compensation from the Company for serving in such capacities. Independent Directors’ fees are allocated among all Lord Abbett-sponsored funds based on the net assets of each fund. There is an equity-based plan available to all Independent Directors under which Independent Directors must defer receipt of a portion of, and may elect to defer receipt of an additional portion of Directors’ fees. The deferred amounts are treated as though equivalent dollar amounts had been invested in the funds. Such amounts and earnings accrued thereon are included in Directors’ fees on the Statement of Operations and in Directors’ fees payable on the Statement of Assets and Liabilities and are not deductible for U.S. federal income tax purposes until such amounts are paid.
| 8. | EXPENSE REDUCTIONS |
The Company has entered into an arrangement with its transfer agent and custodian, whereby credits realized as a result of uninvested cash balances are used to reduce a portion of the Fund’s expenses.
| 9. | LINE OF CREDIT |
During the period ended August 8, 2018, the Fund and certain other funds managed by Lord Abbett (collectively, the “Participating Funds”) participated in a syndicated line of credit facility with various lenders for $600 million (the “Facility”), whereas State Street Bank and Trust Company (“SSB”) participates as a lender and as agent for the lenders. The Facility is to be used for temporary or emergency purposes as an additional source of liquidity to satisfy redemptions. The Participating Funds are subject to graduated borrowing limits of one-third of Fund assets (if Fund assets are less than $750 million), $250 million, $300 million, or $350 million, based on past borrowings and likelihood of future borrowings. During the period ended August 8, 2018, the Fund did not utilize the Facility.
For the period August 9, 2018 through December 20, 2018, the Participating Funds entered into an amended syndicated line of credit facility with various lenders for $1.06 billion (the “Syndicated Facility”), whereas SSB participates as a lender and as agent for the lenders. Under the Syndicated
21
Notes to Financial Statements (continued)
Facility, the Participating Funds are subject to graduated borrowing limits of one-third of Fund assets (if Fund assets are less than $750 million), $250 million, $300 million, $350 million, or $1 billion, based on past borrowings and likelihood of future borrowings. Effective December 21, 2018, the Participating Funds entered into an amended Syndicated Facility with various lenders for $1.1 billion based on the same terms as described above.
Effective August 9, 2018, the Participating Funds entered into an additional line of credit facility with SSB for $250 million (the “Bilateral Facility,” and together with the Syndicated Facility, the “Facilities”). Under the Bilateral Facility, each Participating Fund may borrow up to the lesser of $250 million or one-third of Fund assets. The Facilities are to be used for temporary or emergency purposes to satisfy redemption requests and manage liquidity.
For the period from August 9, 2018 through December 31, 2018, the Fund did not utilize the Facilities.
| 10. | INTERFUND LENDING PROGRAM |
Pursuant to an exemptive order issued by the U.S. Securities and Exchange Commission (“SEC exemptive order”), certain registered open-end management investment companies managed by Lord Abbett, including the Fund, participate in a joint lending and borrowing program (the “Interfund Lending Program”). The SEC exemptive order allows the Funds to borrow money from and lend money to each other for temporary or emergency purposes subject to the limitations and conditions. During the fiscal year ended December 31, 2018, the Fund did not participate as a borrower or lender in the Interfund Lending Program.
| 11. | CUSTODIAN AND ACCOUNTING AGENT |
SSB is the Company’s custodian and accounting agent. SSB performs custodial, accounting and recordkeeping functions relating to portfolio transactions and calculating the Fund’s NAV.
| 12. | INVESTMENT RISKS |
The Fund is subject to the general risks and considerations associated with equity investing. The value of an investment will fluctuate in response to movements in the equity securities markets in general and to the changing prospects of individual companies in which the Fund invests.
The Fund has particular risks associated with growth stocks. Different types of stocks shift in and out of favor over time depending on market and economic conditions. Growth stocks tend to be more volatile than other stocks. Growth stocks are often more sensitive to marker fluctuations than other securities because their market prices are highly sensitive to future earnings expectations. In addition, if the Fund’s assessment of a company’s potential for growth or market conditions is wrong, it could suffer losses or produce poor performance relative to other funds, even in a favorable market. The Fund invests primarily in small-cap growth company stocks, which tend to be more volatile and can be less liquid than other types of stocks. The shares of small and mid-sized companies tend to trade less frequently than those of larger, more established companies, which can adversely affect the pricing of these securities and the ability to sell these securities in the future. Small-cap companies may also have more limited product lines, markets or financial resources, and typically experience a higher risk of failure than large-cap companies. Because the Fund may invest a portion of its assets in foreign securities and American Depositary Receipts, it may experience increased market, industry and sector, liquidity, currency, political, information and other risks. The securities of foreign companies also may be subject to inadequate
22
Notes to Financial Statements (concluded)
exchange control regulations, the imposition of economic sanctions or other government restrictions, higher transaction and other costs, and delays in settlement to the extent they are traded on non-U.S. exchanges or markets.
These factors can affect the Fund’s performance.
| 13. | SUMMARY OF CAPITAL TRANSACTIONS |
Transactions in shares of capital stock were as follows:
| Year Ended | Year Ended | |||||||
| December 31, 2018 | December 31, 2017 | |||||||
| Shares sold | 893,328 | 371,336 | ||||||
| Reinvestment of distributions | 338,785 | – | ||||||
| Shares reacquired | (447,289 | ) | (282,612 | ) | ||||
| Increase | 784,824 | 88,724 | ||||||
23
Report of Independent Registered Public Accounting Firm
To the shareholders and the Board of Directors of Lord Abbett Series Fund, Inc.:
Opinion on the Financial Statements and Financial Highlights
We have audited the accompanying statement of assets and liabilities, including the schedule of investments, of the Developing Growth Portfolio, one of the portfolios constituting the Lord Abbett Series Fund, Inc. (the “Fund”), as of December 31, 2018, the related statement of operations for the year then ended, the statements of changes in net assets for each of the two years in the period then ended, the financial highlights for each of the five years in the period then ended, and the related notes. In our opinion, the financial statements and financial highlights present fairly, in all material respects, the financial position of the Developing Growth Portfolio of the Fund as of December 31, 2018, and the results of its operations for the year then ended, the changes in its net assets for each of the two years in the period then ended, and the financial highlights for each of the five years in the period then ended in conformity with accounting principles generally accepted in the United States of America.
Basis for Opinion
These financial statements and financial highlights are the responsibility of the Fund’s management. Our responsibility is to express an opinion on the Fund’s financial statements and financial highlights based on our audits. We are a public accounting firm registered with the Public Company Accounting Oversight Board (United States) (PCAOB) and are required to be independent with respect to the Fund in accordance with the U.S. federal securities laws and the applicable rules and regulations of the Securities and Exchange Commission and the PCAOB.
We conducted our audits in accordance with the standards of the PCAOB. Those standards require that we plan and perform the audit to obtain reasonable assurance about whether the financial statements and financial highlights are free of material misstatement, whether due to error or fraud. The Fund is not required to have, nor were we engaged to perform, an audit of its internal control over financial reporting. As part of our audits we are required to obtain an understanding of internal control over financial reporting but not for the purpose of expressing an opinion on the effectiveness of the Fund’s internal control over financial reporting. Accordingly, we express no such opinion.
Our audits included performing procedures to assess the risks of material misstatement of the financial statements and financial highlights, whether due to error or fraud, and performing procedures that respond to those risks. Such procedures included examining, on a test basis, evidence regarding the amounts and disclosures in the financial statements and financial highlights. Our audits also included evaluating the accounting principles used and significant estimates made by management, as well as evaluating the overall presentation of the financial statements and financial highlights. Our procedures included confirmation of securities owned as of December 31, 2018, by correspondence with the custodian and brokers. We believe that our audits provide a reasonable basis for our opinion.
DELOITTE & TOUCHE LLP
New York, New York
February 15, 2019
We have served as the auditor of one or more Lord Abbett Family of Funds’ investment companies since 1932.
24
Basic Information About Management
The Board is responsible for the management of the business and affairs of the Company in accordance with the laws of the State of Maryland. The Board elects officers who are responsible for the day-to-day operations of the Fund and who execute policies authorized by the Board. The Board also approves an investment adviser to the Fund and continues to monitor the cost and quality of the services the investment adviser provides, and annually considers whether to renew the contract with the adviser. Generally, each Director holds office until his/her successor is elected and qualified or until his/her earlier resignation or removal, as provided in the Company’s organizational documents.
Lord Abbett, a Delaware limited liability company, is the Fund’s investment adviser. Designated Lord Abbett personnel are responsible for the day-to-day management of the Fund.
Interested Directors
Mr. Sieg is affiliated with Lord Abbett and is an “interested person” of the Company as defined in the Act. Mr. Sieg is director/trustee of each of the 13 investment companies in the Lord Abbett Family of Funds, which consist of 62 portfolios or series. Mr. Sieg is an officer of the Lord Abbett Family of Funds.
| Name, Address and Year of Birth | Current Position and Length of Service with the Company | Principal Occupation and Other Directorships During the Past Five Years | ||
| Douglas B. Sieg Lord, Abbett & Co. LLC 90 Hudson Street Jersey City, NJ 07302 (1969) | Director since 2016; President and Chief Executive Officer since 2018 | Principal Occupation: Managing Partner (since 2018) and was formerly Head of Client Services, joined Lord Abbett in 1994. Other Directorships: None. |
Independent Directors
The following Independent Directors also are directors/trustees of each of the 13 investment companies in the Lord Abbett Family of Funds, which consist of 62 portfolios or series.
| Name, Address and Year of Birth | Current Position and Length of Service with the Company | Principal Occupation and Other Directorships During the Past Five Years | ||
| Eric C. Fast Lord, Abbett & Co. LLC c/o Legal Dept. 90 Hudson Street Jersey City, NJ 07302 (1949) | Director since 2014 | Principal Occupation: Chief Executive Officer of Crane Co., an industrial products company (2001–2014). Other Directorships: Currently serves as director of Automatic Data Processing, Inc. (since 2007) and Regions Financial Corporation (since 2010). Previously served as a director of Crane Co. (1999–2014). | ||
| Evelyn E. Guernsey Lord, Abbett & Co. LLC c/o Legal Dept. 90 Hudson Street Jersey City, NJ 07302 (1955) | Director since 2011 | Principal Occupation: CEO, Americas of J.P. Morgan Asset Management (2004–2010). Other Directorships: None. |
25
Basic Information About Management (continued)
| Name, Address and Year of Birth | Current Position and Length of Service with the Company | Principal Occupation and Other Directorships During the Past Five Years | ||
| Julie A. Hill Lord, Abbett & Co. LLC c/o Legal Dept. 90 Hudson Street Jersey City, NJ 07302 (1946) | Director since 2004 | Principal Occupation: Owner and CEO of The Hill Company, a business consulting firm (since 1998). Other Directorships: Currently serves as director of Anthem, Inc., a health benefits company (since 1994). | ||
| Kathleen M. Lutito Lord, Abbett & Co. LLC c/o Legal Dept. 90 Hudson Street Jersey City, NJ 07302 (1963) | Director since 2017 | Principal Occupation: President and Chief Investment Officer of CenturyLink Investment Management Company (since 2006). Other Directorships: None | ||
| James M. McTaggart Lord, Abbett & Co. LLC c/o Legal Dept. 90 Hudson Street Jersey City, NJ 07302 (1947) | Director since 2012 | Principal Occupation: Independent management advisor and consultant (since 2012); Vice President, CRA International, Inc. (doing business as Charles River Associates), a global management consulting firm (2009–2012); Founder and Chairman of Marakon Associates, Inc., a strategy consulting firm (1978–2009); and Officer and Director of Trinsum Group, a holding company (2007–2009). Other Directorships: Blyth, Inc., a home products company (2004–2015). | ||
| Karla M. Rabusch Lord, Abbett & Co. LLC c/o Legal Dept. 90 Hudson Street Jersey City, NJ 07302 (1959) | Director since 2017 | Principal Occupation: President and Director of Wells Fargo Funds Management, LLC (2003–2017); President of Wells Fargo Funds (2003–2016). Other Directorships: None. | ||
| Mark A. Schmid Lord, Abbett & Co. LLC c/o Legal Dept. 90 Hudson Street Jersey City, NJ 07302 (1959) | Director since 2016 | Principal Occupation: Vice President and Chief Investment Officer of the University of Chicago (since 2009). Other Directorships: None. | ||
| James L.L. Tullis Lord, Abbett & Co. LLC c/o Legal Dept. 90 Hudson Street Jersey City, NJ 07302 (1947) | Director since 2006; Chairman since 2017 | Principal Occupation: CEO of Tullis-Dickerson and Co. Inc., a venture capital management firm (since 1990); CEO of Tullis Health Investors Inc. (since 2012). Other Directorships:Currently serves as director of Crane Co. (since 1998). |
Officers
None of the officers listed below have received compensation from the Company. All of the officers of the Company also may be officers of the other Lord Abbett Funds and maintain offices at 90 Hudson Street, Jersey City, NJ 07302. Unless otherwise indicated, the position(s) and title(s) listed under the “Principal Occupation During the Past Five Years” column indicate each officer’s position(s) and title(s) with Lord Abbett. Each officer serves for an indefinite term (i.e., until his or her death, resignation, retirement, or removal).
26
Basic Information About Management (continued)
| Name and Year of Birth | Current Position with the Company | Length of Service of Current Position | Principal Occupation During the Past Five Years | |||
| Douglas B. Sieg (1969) | President and Chief Executive Officer | Elected as President and Chief Executive Officer in 2018 | Managing Partner of Lord Abbett (since 2018) and was formerly Head of Client Services, joined Lord Abbett in 1994. | |||
| Jeff D. Diamond (1960) | Executive Vice President | Elected in 2008 | Portfolio Manager, joined Lord Abbett in 2007. | |||
| Todd D. Jacobson (1966) | Executive Vice President | Elected in 2005 | Partner and Associate Director, joined Lord Abbett in 2003. | |||
| Robert A. Lee (1969) | Executive Vice President | Elected in 2010 | Partner and Chief Investment Officer, and was formerly Deputy Chief Investment Officer and Director of Taxable Fixed Income, joined Lord Abbett in 1997. | |||
| David J. Linsen (1974) | Executive Vice President | Elected in 2008 | Partner and Director of Equities, joined Lord Abbett in 2001. | |||
| Vincent J. McBride (1964) | Executive Vice President | Elected in 2010 | Partner and Director, joined Lord Abbett in 2003. | |||
| Andrew H. O’Brien (1973) | Executive Vice President | Elected in 2010 | Partner and Portfolio Manager, joined Lord Abbett in 1998. | |||
| F. Thomas O’Halloran (1955) | Executive Vice President | Elected in 2010 | Partner and Portfolio Manager, joined Lord Abbett in 2001. | |||
| Marc Pavese (1972) | Executive Vice President | Elected in 2016 | Partner and Portfolio Manager, joined Lord Abbett in 2008. | |||
| Walter H. Prahl (1958) | Executive Vice President | Elected in 2012 | Partner and Director, joined Lord Abbett in 1997. | |||
| Eli Rabinowich (1975) | Executive Vice President | Elected in 2018 | Portfolio Manager, joined Lord Abbett in 2018 and was formerly a Portfolio Manager, Partner, and Analyst at Pzena Investment Management from (2004–2018). |
27
Basic Information About Management (continued)
| Name and Year of Birth | Current Position with the Company | Length of Service of Current Position | Principal Occupation During the Past Five Years | |||
| Jeffrey Rabinowitz (1972) | Executive Vice President | Elected in 2017 | Portfolio Manager, joined Lord Abbett in 2017 and was formerly Managing Director and Portfolio Manager/Technology Analyst at Jennison Associates LLC (2014–2017) and Managing Director and Portfolio Manager/Technology Analyst for U.S. Growth Equity at Goldman Sachs Asset Management (1999–2014). | |||
| Steven F. Rocco (1979) | Executive Vice President | Elected in 2014 | Partner and Director of Taxable Fixed Income, joined Lord Abbett in 2004. | |||
| A. Edward Allinson (1961) | Vice President | Elected in 2011 | Portfolio Manager, joined Lord Abbett in 2005. | |||
| Vernon T. Bice (1974) | Vice President | Elected in 2011 | Portfolio Manager, joined Lord Abbett in 2011. | |||
| Pamela P. Chen (1978) | Vice President, Assistant Secretary and Privacy Officer | Elected in 2018 | Associate General Counsel, joined Lord Abbett in 2017 and was formerly Special Counsel at Schulte, Roth & Zabel LLP (2005–2017). | |||
| Robert S. Clark (1975) | Vice President | Elected in 2018 | Portfolio Manager, joined Lord Abbett in 2010. | |||
| Matthew R. DeCicco (1977) | Vice President | Elected in 2003 | Managing Director and Portfolio Manager, joined Lord Abbett in 1999. | |||
| John T. Fitzgerald (1975) | Vice President and Assistant Secretary | Elected in 2018 | Deputy General Counsel, joined Lord Abbett in 2018 and was formerly Deputy Head of U.S. Funds Legal, Executive Director and Assistant General Counsel at JPMorgan Chase (2005–2018). | |||
| Christopher J. Gizzo (1986) | Vice President | Elected in 2018 | Managing Director and Portfolio Manager, joined Lord Abbett in 2008. | |||
| Bernard J. Grzelak (1971) | Chief Financial Officer and Vice President | Elected in 2017 | Partner, Chief Operating Officer, Global Funds and Risk, joined Lord Abbett in 2003. |
28
Basic Information About Management (concluded)
| Name and Year of Birth | Current Position with the Company | Length of Service of Current Position | Principal Occupation During the Past Five Years | |||
| Linda Y. Kim (1980) | Vice President and Assistant Secretary | Elected in 2016 | Counsel, joined Lord Abbett in 2015 and was formerly an Associate at Stroock & Stroock & Lavan LLP (2007–2015). | |||
| So Young Lee (1971) | Vice President | Elected in 2018 | Portfolio Manager, joined Lord Abbett in 2013. | |||
| Joseph M. McGill (1962) | Chief Compliance Officer | Elected in 2014 | Partner and Chief Compliance Officer, joined Lord Abbett in 2014 and was formerly Managing Director and the Chief Compliance Officer at UBS Global Asset Management (2003–2013). | |||
| A. Edward Oberhaus, III (1959) | Vice President | Elected in 1998 | Partner and Director, joined Lord Abbett in 1983. | |||
| Amanda S. Ryan (1978) | Vice President and Assistant Secretary | Elected in 2018 | Counsel, joined Lord Abbett in 2016 and was formerly a Director and Corporate Counsel at PGIM Investments (2012–2016). | |||
| Lawrence B. Stoller (1963) | Vice President, Secretary and Chief Legal Officer | Elected in 2007 | Partner and General Counsel, joined Lord Abbett in 2007. | |||
| Leah G. Traub (1979) | Vice President | Elected in 2016 | Partner and Portfolio Manager, joined Lord Abbett in 2007. | |||
| Kewjin Yuoh (1971) | Vice President | Elected in 2012 | Partner and Portfolio Manager, joined Lord Abbett in 2010. | |||
| Jackson C. Chan (1964) | AML Compliance Officer | Elected in 2018 | Deputy Chief Compliance Officer and Director of Regulatory Affairs, joined Lord Abbett in 2014 and was formerly Director at UBS Global Asset Management (2005–2014). | |||
| Vito A. Fronda (1969) | Treasurer | Elected in 2018 | Partner and Director of Taxation, joined Lord Abbett in 2003. |
Please call 888-522-2388 for a copy of the statement of additional information, which contains further information about the Company’s Directors. It is available free upon request.
29
Approval of Advisory Contract
The Board, including all of the Directors who are not “interested persons” of the Company or of Lord Abbett, as defined in the Investment Company Act of 1940, as amended (the “Independent Directors”), annually considers whether to approve the continuation of the existing management agreement between the Fund and Lord Abbett (the “Agreement”). In connection with its most recent approval, the Board reviewed materials relating specifically to the Agreement, as well as numerous materials received throughout the course of the year, including information about the Fund’s investment performance compared to the performance of its benchmark. Before making its decision as to the Fund, the Board had the opportunity to ask questions and request further information, taking into account its knowledge of Lord Abbett gained through its meetings and discussions. These meetings and discussions included reviews of Fund performance conducted by members of the Contract Committee, the deliberations of the Contract Committee, and discussions between the Contract Committee and Lord Abbett’s management. The Independent Directors also met with their independent legal counsel in various private sessions at which no representatives of management were present.
The materials received by the Board included, but were not limited to: (1) information provided by Broadridge Financial Solutions (“Broadridge”) regarding the investment performance of the Fund compared to the investment performance of certain funds with similar investment styles as determined by Broadridge, based, in part, on the Fund’s Morningstar category (the “performance peer group”), and the investment performance of the Fund’s benchmark; (2) information provided by Broadridge regarding the expense ratios, contractual and actual management fee rates, and other expense components for the Fund and certain funds in the same Morningstar category, with generally the same or similar share classes and operational characteristics, including asset size (the “expense peer group”); (3) certain supplemental investment performance information provided by Lord Abbett; (4) information provided by Lord Abbett on the expense ratios, management fee rates, and other expense components for the Fund; (5) sales and redemption information for the Fund; (6) information regarding Lord Abbett’s financial condition; (7) an analysis of the relative profitability of the Agreement to Lord Abbett; (8) information provided by Lord Abbett regarding the investment management fee schedules for Lord Abbett’s other advisory clients maintaining accounts with a similar investment strategy as the Fund; and (9) information regarding the personnel and other resources devoted by Lord Abbett to managing the Fund.
Investment Management and Related Services Generally.The Board considered the services provided by Lord Abbett to the Fund, including investment research, portfolio management, and trading, and Lord Abbett’s commitment to compliance with all applicable legal requirements. The Board also observed that Lord Abbett was solely engaged in the investment management business and accordingly did not experience the conflicts of interest that may result from being engaged in other lines of business. The Board considered the investment advisory services provided by Lord Abbett to other clients, the fees charged for the services, and the differences in the nature of the services provided to the Fund and other Lord Abbett Funds, on the one hand, and the services provided to other clients, on the other. After reviewing these and related factors, the Board concluded that the Fund was likely to continue to benefit from the nature, extent and quality of the investment services provided by Lord Abbett under the Agreement.
Investment Performance.The Board reviewed the Fund’s investment performance in relation to that of the performance peer group and the Fund’s benchmark as of various periods ended August 31, 2018. The Board observed that the Fund’s investment performance was above the median of the performance peer group for the one-year period (ranking in the 1st percentile of the peer
30
Approval of Advisory Contract (continued)
group), and below the median of the performance peer group for the three- and five-year periods and took into account recent changes to the portfolio management team and other actions taken by Lord Abbett to attempt to improve equity fund performance. The Board further considered Lord Abbett’s performance and reputation generally, the performance of other Lord Abbett-managed funds overseen by the Board, and the willingness of Lord Abbett to take steps intended to improve performance when appropriate. After reviewing these and related factors, the Board concluded that the Fund’s Agreement should be continued.
Lord Abbett’s Personnel and Methods.The Board considered the qualifications of the personnel providing investment management services to the Fund, in light of its investment objective and discipline, and other services provided to the Fund by Lord Abbett. Among other things, the Board considered the size, experience, and turnover of Lord Abbett’s staff, Lord Abbett’s investment methodology and philosophy, and Lord Abbett’s approach to recruiting, training, and retaining personnel.
Nature and Quality of Other Services.The Board considered the nature, quality, and extent of compliance, administrative, and other services performed by Lord Abbett and the nature and extent of Lord Abbett’s supervision of third party service providers, including the Fund’s transfer agent and custodian.
Expenses.The Board considered the expense level of the Fund, including the contractual and actual management fee rates, and the expense levels of the Fund’s expense peer group. It also considered how the expense level of the Fund related to those of the expense peer group and the amount and nature of the fees paid by shareholders. The Board observed that the net total expense ratio of the Fund was below the median of the expense peer group. After reviewing these and related factors, the Board concluded, within the context of its overall approval of the Agreement, that the expense level of the Fund was reasonable and supported the continuation of the Agreement.
Profitability.The Board considered the level of Lord Abbett’s operating margin in managing the Fund, including a review of Lord Abbett’s methodology for allocating its costs to its management of the Fund. It considered whether the Fund was profitable to Lord Abbett in connection with the Fund’s operation, including the fee that Lord Abbett receives from the Fund for providing administrative services to the Fund. The Board also considered the profits realized from other business segments of Lord Abbett, which may benefit from or be related to the Fund’s business. The Board considered Lord Abbett’s profit margins excluding Lord Abbett’s marketing and distribution expenses. The Board also considered Lord Abbett’s profit margins, without those exclusions, in comparison with available industry data and how those profit margins could affect Lord Abbett’s ability to recruit and retain personnel. The Board recognized that Lord Abbett’s overall profitability was a factor in enabling it to attract and retain qualified personnel to provide services to the Fund. After reviewing these and related factors, the Board concluded, within the context of its overall approval of the Agreement, that Lord Abbett’s profitability with respect to the Fund was not excessive.
Economies of Scale.The Board considered the extent to which there had been economies of scale in managing the Fund, whether the Fund’s shareholders had appropriately benefited from such economies of scale, and whether there was potential for realization of any further economies of scale. The Board concluded that the existing management fee schedule, with its breakpoint in the level of the management fee, in conjunction with the Fund’s proposed expense limitation agreement, adequately addressed any economies of scale in managing the Fund.
31
Approval of Advisory Contract (concluded)
Other Benefits to Lord Abbett.The Board considered the amount and nature of the fees paid by the Fund and the Fund’s shareholders to Lord Abbett for services other than investment advisory services, such as the fee that Lord Abbett receives from the Fund for providing administrative services to the Fund. The Board also considered the revenues and profitability of Lord Abbett’s investment advisory business apart from its mutual fund business, and the intangible benefits enjoyed by Lord Abbett by virtue of its relationship with the Fund. The Board observed that the Distributor receives 12b-1 fees from certain of the Lord Abbett Funds as to shares held in accounts for which there is no other broker of record, may retain a portion of the 12b-1 fees it receives, and receives a portion of the sales charges on sales and redemptions of some classes of shares of the Lord Abbett Funds. In addition, the Board observed that Lord Abbett accrues certain benefits for its business of providing investment advice to clients other than the Lord Abbett Funds, but that business also benefits the Funds. The Board also noted that Lord Abbett, as disclosed in the prospectus of the Fund, has entered into revenue sharing arrangements with certain entities that distribute shares of the Lord Abbett Funds. The Board also took into consideration the investment research that Lord Abbett receives as a result of client brokerage transactions.
Alternative Arrangements.The Board considered whether, instead of approving continuation of the Agreement, it might be in the best interests of the Fund to implement one or more alternative arrangements, such as continuing to employ Lord Abbett, but on different terms. After considering all of the relevant factors, the Board unanimously found that continuation of the Agreement was in the best interests of the Fund and its shareholders and voted unanimously to approve the continuation of the Agreement. In considering whether to approve the continuation of the Agreement, the Board did not identify any single factor as paramount or controlling. Individual Directors may have evaluated the information presented differently from one another, giving different weights to various factors. This summary does not discuss in detail all matters considered.
32
Householding
The Company has adopted a policy that allows it to send only one copy of the Fund’s prospectus, proxy material, annual report and semiannual report to certain shareholders residing at the same “household.” This reduces Fund expenses, which benefits you and other shareholders. If you need additional copies or do not want your mailings to be “householded,” please call Lord Abbett at 888-522-2388 or send a written request with your name, the name of your fund or funds and your account number or numbers to Lord Abbett Family of Funds, P.O. Box 219336, Kansas City, MO 64121.
Proxy Voting Policies, Procedures and Records
A description of the policies and procedures that Lord Abbett uses to vote proxies related to the Fund’s portfolio securities, and information on how Lord Abbett voted the Fund’s proxies during the 12-month period ended June 30 are available without charge, upon request, (i) by calling 888-522-2388; (ii) on Lord Abbett’s Website at www.lordabbett.com; and (iii) on the Securities and Exchange Commission’s (“SEC”) Website at www.sec.gov.
Shareholder Reports and Quarterly Portfolio Disclosure
The Fund is required to file its complete schedule of portfolio holdings with the SEC for its first and third fiscal quarters on Form N-Q. Copies of the filings are available without charge, upon request on the SEC’s Website at www.sec.gov and may be available by calling Lord Abbett at 888-522-2388.
Tax Information
For corporate shareholders, 8% of the Fund’s ordinary income distributions qualified for the dividends received deduction.
Additionally, of the distribution paid to the shareholders during the fiscal year ended December 31, 2018, $1,901,367 and $6,236,253, respectively, represent short-term capital gains and long-term capital gains. |
33


| This report, when not used for the general information of shareholders of the Fund, is to be distributed only if preceded or accompanied by a current fund prospectus. | ||||
| Lord Abbett Series Fund, Inc. | ||||
| Lord Abbett mutual fund shares are distributed by LORD ABBETT DISTRIBUTOR LLC. | Developing Growth Portfolio | SFDG-PORT-3 (02/19) |
![]()
LORD ABBETT
ANNUAL REPORT
Lord Abbett
Series Fund—Fundamental Equity Portfolio
For the fiscal year ended December 31, 2018
Table of Contents
Lord Abbett Series Fund — Fundamental Equity Portfolio
Annual Report
For the fiscal year ended December 31, 2018

From left to right: James L.L. Tullis, Independent Chairman of the Lord Abbett Funds and Douglas B. Sieg, Director, President, and Chief Executive Officer of the Lord Abbett Funds.
Dear Shareholders:We are pleased to provide you with this overview of the performance of Lord Abbett Series Fund — Fundamental Equity Portfolio for the fiscal year ended December 31, 2018. On this page and the following pages, we discuss the major factors that influenced fiscal year performance. For additional information about the Fund, please visit our website at www.lordabbett.com, where you also can access the quarterly commentaries that provide updates on the Fund’s performance and other portfolio related updates.
Thank you for investing in Lord Abbett mutual funds. We value the trust that you place in us and look forward to serving your investment needs in the years to come.
Best regards,

Douglas B. Sieg
Director, President and Chief Executive Officer
For the fiscal year ended December 31, 2018, the Fund returned -8.16%, reflecting performance at the net asset value (NAV) of Class VC shares with all distributions reinvested, compared to its benchmark, the Russell 1000® Value Index1, which returned –8.27% over the same period.
Domestic equity returns were negative over the past year, with large cap stocks, as represented by the S&P 500® Index2, falling –4.38% during the period, while small cap stocks, as represented by the Russell 2000® Index3, were down –11.01%. During the period, there were several market-moving events. Notably, Congress
passed the largest rewrite of the U.S. tax code in decades, which went into effect in January 2018. The tax bill reduced the corporate tax rate from 35% to 21% and allowed for a one-time repatriation tax of 15.5%, rather than the standard repatriation tax rate of 35%. In June 2018, the White House announced its intent to impose additional tariffs on $200 billion worth of Chinese goods on top of the $50 billion previously announced. The aggressive U.S. trade posture continued into the third quarter with trade tensions mounting between the U.S. and China. In December, the White House announced a trade truce
1
between the U.S. and China following a meeting between President Trump and President Xi Jinping at the G20 summit. The U.S. agreed to maintain a 10% tariff rate on $200 billion worth of Chinese imports at the start of 2019 as opposed to the originally planned 25% tariff rate. In return, China agreed to purchase a substantial amount of U.S. agriculture, industrial, and energy products to further reduce the trade imbalance. While the impact has yet to fully be realized, many corporations anticipate that the retaliatory tariffs will weigh on profits. Trade discussions between Mexico, Canada, and the U.S., however, took a more favorable turn as the negotiations resulted in a revised version of the North American Free Trade Agreement (NAFTA) called the U.S.-Mexico-Canada Agreement. In March 2018, the Federal Reserve (the “Fed”) raised its target for short-term interest rates by 0.25%, to a range of 1.50%-1.75%, and followed with rate hikes of 0.25% at each of its June, September, and December meetings, raising the target range to 2.25%-2.50%. Amid rising concerns surrounding escalating trade tensions, slowing global growth, and increasing interest rates, the Nasdaq experienced the largest monthly drop since 2008 in October 2018. Following the prior month’s volatility, domestic equity markets rallied in November and partially reversed October’s losses, however the S&P 500® returned to negative territory in December, posting its worst month since February 2009.
Stock selection within the consumer discretionary and health care sectors contributed positively to relative performance during the period. Within the consumer discretionary sector, O’Reilly Automotive, Inc., an automotive aftermarket parts retailer, contributed the most to relative performance. Shares of O’Reilly Automotive rose following favorable economic conditions, benefits from its expansive distribution network, and increases in average miles driven and vehicle age. The Fund’s position in Yum! Brands, Inc., a quick service restaurant franchise, also contributed to relative performance. Shares of the company increased following the announcement of a partnership with GrubHub Inc. as well as solid second quarter results with both the top and bottom lines beating consensus estimates. Within the health care sector, Merck & Co., Inc., a health care solutions provider, contributed the most to relative performance. Shares of Merck rose throughout the year as investors grew hopeful of the potential for income growth from the large portfolio of high-margin drugs as well as a full pipeline of new drugs.
Conversely, stock selection within the financials and materials sectors detracted from relative performance over the period. Within the financials sector, the Fund’s holding of Citizens Financial Group, Inc., a regional bank, was the top detractor. Shares of the firm sold off as investors grew wary of the relatively high deposit beta, whereby the firm gives individual depositors higher
2
returns for their cash than its peers. In turn, the firm may face higher costs. The Fund’s holding of SVB Financial Group, a financial services company, also detracted from relative performance. Shares of SVB Financial decreased following Investor Day in December as investors were disappointed with the 2019 outlook, and more specifically, expressed disappointment with potentially lower margin expansion due to fewer projected rate hikes by the Fed. In the back half of 2018, most banks underperformed as a result of intensified late-cycle concerns surrounding net
interest margin contraction and increasing credit costs. Additionally, within the materials sector, DowDuPont Inc., a multinational chemical company, detracted from relative performance. Shares trailed as the market focused on the potential contagion effect from lower oil prices on customer destocking.
The Fund’s portfolio is actively managed and, therefore, its holdings and the weightings of a particular issuer or particular sector as a percentage of portfolio assets are subject to change. Sectors may include many industries.
1 The Russell 1000®Value Index measures the performance of those Russell 1000 companies with lower price-to-book ratios and lower forecasted growth values.
2 The S&P 500®Index is widely regarded as the standard for measuring large cap U.S. stock market performance and includes a representative sample of leading companies in leading industries.
3 The Russell 2000®Index measures the performance of the 2,000 smallest companies in the Russell 3000® Index, which represents approximately 10% of the total market capitalization of the Russell 3000® Index.
Unless otherwise specified, indexes reflect total return, with all dividends reinvested. Indexes are unmanaged, do not reflect the deduction of fees or expenses, and are not available for direct investment.
Important Performance and Other Information
Performance data quoted in the following pages reflect past performance and are no guarantee of future results. Current performance may be higher or lower than the performance quoted. The investment return and principal value of an investment in the Fund will fluctuate so that shares, on any given day or when redeemed, may be worth more or less than their original cost. You can obtain performance data current to the most recent month end by calling Lord Abbett at 888-522-2388 or referring to www.lordabbett.com.
During certain periods shown, expense waivers and reimbursements were in place. Without such expense waivers and reimbursements, the Fund’s returns would have been lower.
The annual commentary above discusses the views of the Fund’s management and various portfolio holdings of the Fund as of December 31, 2018. These views and portfolio holdings may have changed after this date. Information provided in the commentary is not a recommendation to buy or sell securities. Because the Fund’s portfolio is actively managed and may change significantly, the Fund may no longer own the securities described above or may have otherwise changed its position in the securities. For more recent information about the Fund’s portfolio holdings, please visit www.lordabbett.com.
A Note about Risk:See Notes to Financial Statements for a discussion of investment risks. For a more detailed discussion of the risks associated with the Fund, please see the Fund’s prospectus.
Mutual funds are not insured by the FDIC, are not deposits or other obligations of, or guaranteed by, banks, and are subject to investment risks including possible loss of principal amount invested.
The Fund serves as an underlying investment vehicle for variable annuity contracts and variable life insurance policies.
3
Below is a comparison of a $10,000 investment in Class VC shares with the same investment in the Russell 1000® Value Index, Russell 3000® Index, Russell 3000® Value Index, and S&P 500® Index, assuming reinvestment of all dividends and distributions. The Fund’s shares are sold only to insurance company separate accounts that fund certain variable annuity and variable life contracts. This line graph comparison does not reflect the sales charges or other expenses of these contracts. If those sales charges and expenses were reflected, returns would be lower. The graph and performance table below do not reflect the deduction of taxes that a shareholder would pay on Fund distributions or the redemption of Fund shares. During certain periods, expenses of the Fund have been waived or reimbursed by Lord Abbett; without such waiver or reimbursement of expenses, the Fund’s returns would have been lower.Past performance is no guarantee of future results.
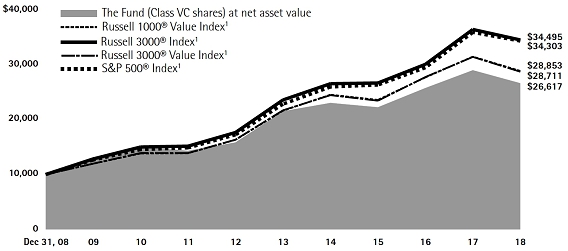
Average Annual Total Returns for the
Periods Ended December 31, 2018
| 1 Year | 5 Years | 10 Years | |||||
| Class VC | -8.16% | 4.36% | 10.28% |
1 Performance for each unmanaged index does not reflect any fees or expenses. The performance of each index is not necessarily representative of the Fund’s performance.
4
As a shareholder of the Fund, you incur ongoing costs, including management fees; expenses related to the Fund’s services arrangements with certain insurance companies; and other Fund expenses. This Example is intended to help you understand your ongoing costs (in dollars) of investing in the Fund and to compare these costs with the ongoing costs of investing in other mutual funds.
The Example is based on an investment of $1,000 invested at the beginning of the period and held for the entire period (July 1, 2018 through December 31, 2018).
The Example reflects only expenses that are deducted from the assets of the Fund. Fees and expenses, including sales charges applicable to the various insurance products that invest in the Fund, are not reflected in this Example. If such fees and expenses were reflected in the Example, the total expenses shown would be higher. Fees and expenses regarding such variable insurance products are separately described in the prospectus related to those products.
Actual Expenses
The first line of the table on the following page provides information about actual account values and actual expenses. You may use the information in this line, together with the amount you invested, to estimate the expenses that you paid over the period. Simply divide your account value by $1,000 (for example, an $8,600 account value divided by $1,000 = 8.6), then multiply the result by the number in the first line under the heading titled “Expenses Paid During Period 7/1/18 – 12/31/18” to estimate the expenses you paid on your account during this period.
Hypothetical Example for Comparison Purposes
The second line of the table on the following page provides information about hypothetical account values and hypothetical expenses based on the Fund’s actual expense ratio and an assumed rate of return of 5% per year before expenses, which is not the Fund’s actual return. The hypothetical account values and expenses may not be used to estimate the actual ending account balance or expenses you paid for the period. You may use this information to compare the ongoing costs of investing in the Fund and other funds. To do so, compare this 5% hypothetical example with the 5% hypothetical examples that appear in the shareholder reports of the other funds.
5
Please note that the expenses shown in the table are meant to highlight your ongoing costs only and do not reflect any transactional costs, such as sales charges. Therefore, the second line of the table is useful in comparing ongoing costs only, and will not help you determine the relative total costs of owning different funds. In addition, if these transactional costs were included, your costs would have been higher.
| Beginning Account Value | Ending Account Value | Expenses Paid During Period† | |||||||
| 7/1/18 | 12/31/18 | 7/1/18 – 12/31/18 | |||||||
| Class VC | |||||||||
| Actual | $1,000.00 | $ | 947.60 | $5.84 | |||||
| Hypothetical (5% Return Before Expenses) | $1,000.00 | $ | 1,019.21 | $6.06 | |||||
| † | Net expenses are equal to the Fund’s annualized expense ratio of 1.19%, multiplied by the average account value over the period, multiplied by 184/365 (to reflect one-half year period). |
Portfolio Holdings Presented by Sector
December 31, 2018
| Sector* | %** | |
| Communication Services | 7.28 | % |
| Consumer Discretionary | 7.70 | % |
| Consumer Staples | 6.78 | % |
| Energy | 10.01 | % |
| Financials | 19.79 | % |
| Health Care | 16.60 | % |
| Industrials | 8.25 | % |
| Information Technology | 8.23 | % |
| Materials | 4.02 | % |
| Real Estate | 2.69 | % |
| Utilities | 4.64 | % |
| Repurchase Agreement | 4.01 | % |
| Total | 100.00 | % |
| * | A sector may comprise several industries. | |
| ** | Represents percent of total investments. |
6
December 31, 2018
| Investments | Shares | Fair Value (000) | ||||||
| COMMON STOCKS 98.83% | ||||||||
| Airlines 0.86% | ||||||||
| Delta Air Lines, Inc. | 35,896 | $ | 1,791 | |||||
| Auto Components 0.97% | ||||||||
| Lear Corp. | 16,374 | 2,012 | ||||||
| Banks 15.20% | ||||||||
| Bank of America Corp. | 294,527 | 7,257 | ||||||
| Citizens Financial Group, Inc. | 99,837 | 2,968 | ||||||
| Comerica, Inc. | 44,424 | 3,051 | ||||||
| East West Bancorp, Inc. | 48,845 | 2,126 | ||||||
| JPMorgan Chase & Co. | 86,321 | 8,427 | ||||||
| Royal Bank of Scotland Group plc(a) | GBP | 197,457 | 548 | |||||
| Signature Bank | 16,113 | 1,657 | ||||||
| SVB Financial Group* | 7,268 | 1,380 | ||||||
| Wells Fargo & Co. | 90,333 | 4,163 | ||||||
| Total | 31,577 | |||||||
| Beverages 2.35% | ||||||||
| Coca-Cola Co. (The) | 57,721 | 2,733 | ||||||
| PepsiCo, Inc. | 19,500 | 2,154 | ||||||
| Total | 4,887 | |||||||
| Biotechnology 0.72% | ||||||||
| Gilead Sciences, Inc. | 23,800 | 1,489 | ||||||
| Capital Markets 0.43% | ||||||||
| Goldman Sachs Group, Inc. (The) | 5,324 | 889 | ||||||
| Chemicals 2.68% | ||||||||
| DowDuPont, Inc. | 104,300 | 5,578 | ||||||
| Communications Equipment 3.61% | ||||||||
| Cisco Systems, Inc. | 173,200 | 7,505 | ||||||
| Consumer Finance 0.97% | ||||||||
| Discover Financial Services | 34,068 | 2,009 | ||||||
| Investments | Shares | Fair Value (000) | ||||||
| Diversified Telecommunication Services 4.26% | ||||||||
| AT&T, Inc. | 96,369 | $ | 2,751 | |||||
| Verizon Communications, Inc. | 108,400 | 6,094 | ||||||
| Total | 8,845 | |||||||
| Electric: Utilities 4.78% | ||||||||
| Duke Energy Corp. | 54,545 | 4,707 | ||||||
| NextEra Energy, Inc. | 30,052 | 5,224 | ||||||
| Total | 9,931 | |||||||
| Electrical Equipment 3.10% | ||||||||
| AMETEK, Inc. | 64,086 | 4,338 | ||||||
| Hubbell, Inc. | 21,198 | 2,106 | ||||||
| Total | 6,444 | |||||||
| Energy Equipment & Services 0.97% | ||||||||
| National Oilwell Varco, Inc. | 78,504 | 2,017 | ||||||
| Entertainment 1.96% | ||||||||
| Walt Disney Co. (The) | 37,091 | 4,067 | ||||||
| Equity Real Estate Investment Trusts 2.77% | ||||||||
| Boston Properties, Inc. | 15,173 | 1,708 | ||||||
| Prologis, Inc. | 68,893 | 4,045 | ||||||
| Total | 5,753 | |||||||
| Food & Staples Retailing 2.17% | ||||||||
| Walmart, Inc. | 48,489 | 4,517 | ||||||
| Food Products 0.84% | ||||||||
| Mondelez International, Inc. | ||||||||
| Class A | 43,563 | 1,744 | ||||||
| Health Care Equipment & Supplies 2.55% | ||||||||
| Abbott Laboratories | 40,100 | 2,901 | ||||||
| Boston Scientific Corp.* | 67,972 | 2,402 | ||||||
| Total | 5,303 | |||||||
| Health Care Providers & Services 1.57% | ||||||||
| Anthem, Inc. | 12,395 | 3,255 | ||||||
| Hotels, Restaurants & Leisure 1.61% | ||||||||
| Yum! Brands, Inc. | 36,311 | 3,338 | ||||||
| See Notes to Financial Statements. | 7 |
Schedule of Investments (continued)
December 31, 2018
| Investments | Shares | Fair Value (000) | ||||||
| Industrial Conglomerates 2.44% | ||||||||
| Honeywell International, Inc. | 38,304 | $ | 5,061 | |||||
| Insurance 3.77% | ||||||||
| Chubb Ltd. (Switzerland)(b) | 34,950 | 4,515 | ||||||
| Hartford Financial Services Group, Inc. (The) | 74,863 | 3,327 | ||||||
| Total | 7,842 | |||||||
| Interactive Media & Services 1.28% | ||||||||
| Alphabet, Inc. Class A* | 2,552 | 2,667 | ||||||
| Internet & Direct Marketing Retail 0.23% | ||||||||
| Alibaba Group Holding Ltd. ADR* | 3,463 | 475 | ||||||
| Machinery 1.61% | ||||||||
| Stanley Black & Decker, Inc. | 27,869 | 3,337 | ||||||
| Media 0.43% | ||||||||
| Interpublic Group of Cos., Inc. (The) | 16,718 | 345 | ||||||
| Omnicom Group, Inc. | 7,365 | 539 | ||||||
| Total | 884 | |||||||
| Metals & Mining 1.45% | ||||||||
| Nucor Corp. | 39,262 | 2,034 | ||||||
| Steel Dynamics, Inc. | 32,673 | 982 | ||||||
| Total | 3,016 | |||||||
| Multi-Line Retail 0.70% | ||||||||
| Dollar Tree, Inc.* | 16,048 | 1,449 | ||||||
| Oil, Gas & Consumable Fuels 9.34% | ||||||||
| Chevron Corp. | 67,768 | 7,373 | ||||||
| ConocoPhillips | 25,989 | $ | 1,620 | |||||
| EOG Resources, Inc. | 4,741 | 413 | ||||||
| Marathon Petroleum Corp. | 65,300 | 3,853 | ||||||
| Noble Energy, Inc. | 149,237 | 2,800 | ||||||
| Royal Dutch Shell plc Class A ADR | 57,312 | 3,340 | ||||||
| Total | 19,399 | |||||||
| Investments | Shares | Fair Value (000) | ||||||
| Personal Products 1.12% | ||||||||
| Unilever NV Registered Shares (United Kingdom)(b) | 43,388 | $ | 2,334 | |||||
| Pharmaceuticals 12.25% | ||||||||
| Allergan plc | 17,652 | 2,359 | ||||||
| Jazz Pharmaceuticals plc (Ireland)*(b) | 8,026 | 995 | ||||||
| Johnson & Johnson | 61,609 | 7,950 | ||||||
| Merck & Co., Inc. | 90,132 | 6,887 | ||||||
| Novartis AG ADR | 14,925 | 1,281 | ||||||
| Pfizer, Inc. | 136,991 | 5,980 | ||||||
| Total | 25,452 | |||||||
| Road & Rail 0.48% | ||||||||
| CSX Corp. | 16,202 | 1,007 | ||||||
| Semiconductors & Semiconductor Equipment 0.52% | ||||||||
| Intel Corp. | 22,942 | 1,077 | ||||||
| Software 2.97% | ||||||||
| Microsoft Corp. | 49,264 | 5,004 | ||||||
| Oracle Corp. | 25,805 | 1,165 | ||||||
| Total | 6,169 | |||||||
| Specialty Retail 4.01% | ||||||||
| Foot Locker, Inc. | 29,579 | 1,573 | ||||||
| Home Depot, Inc. (The) | 22,353 | 3,841 | ||||||
| O’Reilly Automotive, Inc.* | 8,442 | 2,907 | ||||||
| Total | 8,321 | |||||||
| Technology Hardware, Storage & Peripherals 1.37% | ||||||||
| HP, Inc. | 139,673 | 2,858 | ||||||
| Tobacco 0.49% | ||||||||
| Philip Morris International, Inc. | 15,120 | 1,009 | ||||||
| Total Common Stocks (cost $219,466,092) | 205,308 | |||||||
| 8 | See Notes to Financial Statements. |
Schedule of Investments (concluded)
December 31, 2018
| Investments | Principal Amount (000) | Fair Value (000) | ||||||
| SHORT-TERM INVESTMENT 4.13% | ||||||||
| Repurchase Agreement | ||||||||
| Repurchase Agreement dated 12/31/2018, 1.45% due 1/2/2019 with Fixed Income Clearing Corp. collateralized by $8,645,000 of U.S. Treasury Note at 2.750% due 2/15/2028; value: $8,744,513; proceeds: $8,573,301 (cost $8,572,611) | $8,573 | $ | 8,573 | |||||
| Total Investments in Securities 102.96% (cost $228,038,703) | 213,881 | |||||||
| Liabilities in Excess of Other Assets (2.96)% | (6,153 | ) | ||||||
| Net Assets 100.00% | $ | 207,728 | ||||||
| ADR | American Depositary Receipt. | |
| GBP | British pound. | |
| * | Non-income producing security. | |
| (a) | Investment in non-U.S. dollar denominated securities. | |
| (b) | Foreign security traded in U.S. dollars. |
The following is a summary of the inputs used as of December 31, 2018 in valuing the Fund’s investments carried at fair value(1):
| Investment Type(2)(3) | Level 1 (000) | Level 2 (000) | Level 3 (000) | Total (000) | ||||||||||||
| Common Stocks | ||||||||||||||||
| Banks | $ | 31,029 | $ | 548 | $ | – | $ | 31,577 | ||||||||
| Remaining Industries | 173,731 | – | – | 173,731 | ||||||||||||
| Short-Term Investment | ||||||||||||||||
| Repurchase Agreement | – | 8,573 | – | 8,573 | ||||||||||||
| Total | $ | 204,760 | $ | 9,121 | $ | – | $ | 213,881 | ||||||||
| (1) | Refer to Note 2(h) for a description of fair value measurements and the three-tier hierarchy of inputs. | |
| (2) | See Schedule of Investments for fair values in each industry and identification of foreign issuers and/or geography. | |
| (3) | There were no Level 1/Level 2 transfers during the fiscal year ended December 31, 2018. |
| See Notes to Financial Statements. | 9 |
Statement of Assets and Liabilities
December 31, 2018
| ASSETS: | ||||
| Investments in securities, at fair value (cost $228,038,703) | $ | 213,880,734 | ||
| Receivables: | ||||
| Investment securities sold | 1,013,849 | |||
| Interest and dividends | 318,630 | |||
| Capital shares sold | 35,620 | |||
| Prepaid expenses | 1,375 | |||
| Total assets | 215,250,208 | |||
| LIABILITIES: | ||||
| Payables: | ||||
| Capital shares reacquired | 4,863,670 | |||
| Investment securities purchased | 2,206,005 | |||
| Management fee | 138,019 | |||
| Directors’ fees | 55,759 | |||
| Fund administration | 7,361 | |||
| Accrued expenses | 251,890 | |||
| Total liabilities | 7,522,704 | |||
| NET ASSETS | $ | 207,727,504 | ||
| COMPOSITION OF NET ASSETS: | ||||
| Paid-in capital | $ | 223,909,492 | ||
| Total distributable earnings (loss) | (16,181,988 | ) | ||
| Net Assets | $ | 207,727,504 | ||
| Outstanding shares (50 million shares of common stock authorized, $.001 par value) | 14,703,843 | |||
| Net asset value, offering and redemption price per share (Net assets divided by outstanding shares) | $14.13 | |||
| 10 | See Notes to Financial Statements. |
For the Year Ended December 31, 2018
| Investment income: | ||||
| Dividends (net of foreign withholding taxes of $98,050) | $ | 7,510,113 | ||
| Interest | 54,013 | |||
| Total investment income | 7,564,126 | |||
| Expenses: | ||||
| Management fee | 2,500,718 | |||
| Non 12b-1 service fees | 832,384 | |||
| Shareholder servicing | 358,462 | |||
| Fund administration | 133,371 | |||
| Professional | 47,202 | |||
| Reports to shareholders | 39,097 | |||
| Directors’ fees | 12,397 | |||
| Custody | 10,783 | |||
| Other | 38,663 | |||
| Gross expenses | 3,973,077 | |||
| Expense reductions (See Note 8) | (7,529 | ) | ||
| Fees waived and expenses reimbursed (See Note 3) | (46,900 | ) | ||
| Net expenses | 3,918,648 | |||
| Net investment income | 3,645,478 | |||
| Net realized and unrealized gain (loss): | ||||
| Net realized gain on investments | 33,830,697 | |||
| Net change in unrealized appreciation/depreciation on investments | (62,035,949 | ) | ||
| Net change in unrealized appreciation/depreciation on translation of assets and liabilities denominated in foreign currencies | (1,012 | ) | ||
| Net realized and unrealized loss | (28,206,264 | ) | ||
| Net Decrease in Net Assets Resulting From Operations | $ | (24,560,786 | ) |
| See Notes to Financial Statements. | 11 |
Statements of Changes in Net Assets
| INCREASE (DECREASE) IN NET ASSETS | For the Year Ended December 31, 2018 | For the Year Ended December 31, 2017 | ||||||
| Operations: | ||||||||
| Net investment income | $ | 3,645,478 | $ | 3,855,557 | ||||
| Net realized gain on investments | 33,830,697 | 31,007,779 | ||||||
| Net change in unrealized appreciation/depreciation on investments and translation of assets and liabilities denominated in foreign currencies | (62,036,961 | ) | 10,765,589 | |||||
| Net increase (decrease) in net assets resulting from operations | (24,560,786 | ) | 45,628,925 | |||||
| Distributions to shareholders(1) | (39,892,158 | ) | (33,180,215 | ) | ||||
| Capital share transactions (See Note 13): | ||||||||
| Proceeds from sales of shares | 169,751,566 | 13,642,490 | ||||||
| Reinvestment of distributions | 39,892,159 | 33,180,215 | ||||||
| Cost of shares reacquired | (326,261,878 | ) | (57,991,110 | ) | ||||
| Net decrease in net assets resulting from capital share transactions | (116,618,153 | ) | (11,168,405 | ) | ||||
| Net increase (decrease) in net assets | (181,071,097 | ) | 1,280,305 | |||||
| NET ASSETS: | ||||||||
| Beginning of year | $ | 388,798,601 | $ | 387,518,296 | ||||
| End of year | $ | 207,727,504 | $ | 388,798,601 | ||||
| Distributions in excess of net investment income(2) | $ | – | $ | – | ||||
| (1) | The SEC eliminated the requirement to disclose the source of distributions paid in 2018. For the year ended December 31, 2017, the source of distributions was net investment income $(3,948,579) and net realized gain $(29,231,636). | |
| (2) | The SEC eliminated the requirement to disclose distributions in excess of net investment income in 2018. For the year ended December 31, 2017, the distributions in excess of net investment income was $(51,644). |
| 12 | See Notes to Financial Statements. |
This page is intentionally left blank.
13
| Per Share Operating Performance: | ||||||||||||||||||||||||||||
| Investment operations: | Distributions to shareholders from: | |||||||||||||||||||||||||||
| Net asset value, beginning of period | Net invest- ment income(a) | Net realized and unrealized gain (loss) | Total from invest- ment opera- tions | Net investment income | Net realized gain | Total distri- butions | ||||||||||||||||||||||
| 12/31/2018 | $18.86 | $0.20 | $(1.78 | ) | $(1.58 | ) | $(0.28 | ) | $(2.87 | ) | $(3.15 | ) | ||||||||||||||||
| 12/31/2017 | 18.30 | 0.19 | 2.10 | 2.29 | (0.21 | ) | (1.52 | ) | (1.73 | ) | ||||||||||||||||||
| 12/31/2016 | 16.28 | 0.23 | 2.34 | 2.57 | (0.21 | ) | (0.34 | ) | (0.55 | ) | ||||||||||||||||||
| 12/31/2015 | 18.61 | 0.16 | (0.79 | ) | (0.63 | ) | (0.21 | ) | (1.49 | ) | (1.70 | ) | ||||||||||||||||
| 12/31/2014 | 21.03 | 0.09 | 1.43 | 1.52 | (0.10 | ) | (3.84 | ) | (3.94 | ) | ||||||||||||||||||
| (a) | Calculated using average shares outstanding during the period. |
| (b) | Total return does not consider the effects of sales charges or other expenses imposed by an insurance company and assumes the reinvestment of all distributions. |
| 14 | See Notes to Financial Statements. |
| Ratios to Average Net Assets: | Supplemental Data: | |||||||||||||||||||||||||
| Net asset value, end of period | Total return(b) (%) | Total expenses after waivers and/or reim- bursements (%) | Total expenses (%) | Net investment income (%) | Net assets, end of period (000) | Portfolio turnover rate (%) | ||||||||||||||||||||
| $14.13 | (8.16 | ) | 1.18 | 1.19 | 1.09 | $207,728 | 117 | |||||||||||||||||||
| 18.86 | 12.57 | 1.15 | 1.19 | 1.01 | 388,799 | 106 | ||||||||||||||||||||
| 18.30 | 15.74 | 1.15 | 1.20 | 1.36 | 387,518 | 132 | ||||||||||||||||||||
| 16.28 | (3.44 | ) | 1.15 | 1.21 | 0.90 | 261,006 | 135 | |||||||||||||||||||
| 18.61 | 7.14 | 1.15 | 1.19 | 0.43 | 442,860 | 132 | ||||||||||||||||||||
| See Notes to Financial Statements. | 15 |
| 1. | ORGANIZATION |
Lord Abbett Series Fund, Inc. (the “Company”) is registered under the Investment Company Act of 1940, as amended (the “Act”), as a diversified, open-end management investment company and was incorporated under Maryland law in 1989. The Company consists of twelve separate portfolios. This report covers Fundamental Equity Portfolio (the “Fund”).
The Fund’s investment objective is long-term growth of capital and income without excessive fluctuations in market value. The Fund has Variable Contract class shares (“Class VC Shares”), which are currently issued and redeemed only in connection with investments in, and payments under, variable annuity contracts and variable life insurance policies issued by life insurance and insurance-related companies.
The preparation of the financial statements in conformity with accounting principles generally accepted in the United States of America (“U.S. GAAP”) requires management to make certain estimates and assumptions that affect the reported amounts of assets and liabilities and disclosure of contingent assets and liabilities at the date of the financial statements and the reported amounts of increases and decreases in net assets from operations during the reporting period. Actual results could differ from those estimates. The Fund is considered an investment company under U.S. GAAP and follows the accounting and reporting guidance applicable to investment companies.
| 2. | SIGNIFICANT ACCOUNTING POLICIES |
| (a) | Investment Valuation–Under procedures approved by the Fund’s Board of Directors (the “Board”), Lord, Abbett & Co. LLC (“Lord Abbett”), the Fund’s investment manager, has formed a Pricing Committee to administer the pricing and valuation of portfolio investments and to ensure that prices utilized reasonably reflect fair value. Among other things, these procedures allow the Fund to utilize independent pricing services, quotations from securities and financial instrument dealers and other market sources to determine fair value. |
| Securities actively traded on any recognized U.S. or non-U.S. exchange or on The NASDAQ Stock Market LLC are valued at the last sale price or official closing price on the exchange or system on which they are principally traded. Events occurring after the close of trading on non-U.S. exchanges may result in adjustments to the valuation of foreign securities to reflect their fair value as of the close of regular trading on the New York Stock Exchange. The Fund may utilize an independent fair valuation service in adjusting the valuations of foreign securities. Unlisted equity securities are valued at the last quoted sale price or, if no sale price is available, at the mean between the most recently quoted bid and asked prices. | |
| Securities for which prices are not readily available are valued at fair value as determined by the Pricing Committee. The Pricing Committee considers a number of factors, including observable and unobservable inputs, when arriving at fair value. The Pricing Committee may use related or comparable assets or liabilities, recent transactions, market multiples, book values and other relevant information to determine the fair value of portfolio investments. The Board or a designated committee thereof regularly reviews fair value determinations made by the Pricing Committee and may employ techniques such as reviewing related market activity, reviewing inputs and assumptions, and retrospectively comparing prices of subsequent purchases and sales transactions to fair value determinations made by the Pricing Committee. |
16
Notes to Financial Statements (continued)
| Short-term securities with 60 days or less remaining to maturity are valued using the amortized cost method, which approximates fair value. | |
| (b) | Security Transactions–Security transactions are recorded as of the date that the securities are purchased or sold (trade date). Realized gains and losses on sales of portfolio securities are calculated using the identified-cost method. |
| (c) | Investment Income–Dividend income is recorded on the ex-dividend date. Interest income is recorded on the accrual basis as earned. Discounts are accreted and premiums are amortized using the effective interest method and are included in Interest and other income on the Statement of Operations. Withholding taxes on foreign dividends have been provided for in accordance with the applicable country’s tax rules and rates. |
| (d) | Income Taxes–It is the policy of the Fund to meet the requirements of Subchapter M of the Internal Revenue Code applicable to regulated investment companies and to distribute substantially all taxable income and capital gains to its shareholders. Therefore, no income tax provision is required. |
| The Fund files U.S. federal and various state and local tax returns. No income tax returns are currently under examination. The statute of limitations on the Fund’s filed U.S. federal tax returns remains open for the fiscal years ended December 31, 2015 through December 31, 2018. The statutes of limitations on the Company’s state and local tax returns may remain open for an additional year depending upon the jurisdiction. | |
| (e) | Expenses–Expenses incurred by the Company that do not specifically relate to an individual fund are generally allocated to the funds within the Company on a pro rata basis by relative net assets. |
| (f) | Foreign Transactions–The books and records of the Fund are maintained in U.S. dollars and transactions denominated in foreign currencies are recorded in the Fund’s records at the rate prevailing when earned or recorded. Asset and liability accounts that are denominated in foreign currencies are adjusted daily to reflect current exchange rates and any unrealized gain (loss) is included in Net change in unrealized appreciation/depreciation on translation of assets and liabilities denominated in foreign currencies in the Fund’s Statement of Operations. The resultant exchange gains and losses upon settlement of such transactions are included in Net realized gain (loss), if applicable on foreign currency related transactions in the Fund’s Statement of Operations. The Fund does not isolate that portion of the results of operations arising as a result of changes in the foreign exchange rates from the changes in market prices of the securities. |
| (g) | Repurchase Agreements–The Fund may enter into repurchase agreements with respect to securities. A repurchase agreement is a transaction in which a fund acquires a security and simultaneously commits to resell that security to the seller (a bank or securities dealer) at an agreed-upon price on an agreed-upon date. The Fund requires at all times that the repurchase agreement be collateralized by cash, or by securities of the U.S. Government, its agencies, its instrumentalities, or U.S. Government sponsored enterprises having a value equal to, or in excess of, the value of the repurchase agreement (including accrued interest). If the seller of the agreement defaults on its obligation to repurchase the underlying securities at a time when the fair value of these securities has declined, the Fund may incur a loss upon disposition of the securities. |
| (h) | Fair Value Measurements–Fair value is defined as the price that the Fund would receive upon selling an investment or transferring a liability in an orderly transaction to an independent |
17
Notes to Financial Statements (continued)
| buyer in the principal or most advantageous market of the investment. A three-tier hierarchy is used to maximize the use of observable market data and minimize the use of unobservable inputs and to establish classification of fair value measurements for disclosure purposes. Inputs refer broadly to the assumptions that market participants would use in pricing the asset or liability, including assumptions about risk—for example, the risk inherent in a particular valuation technique used to measure fair value (such as a pricing model) and/or the risk inherent in the inputs to the valuation technique. Inputs may be observable or unobservable. Observable inputs reflect the assumptions market participants would use in pricing the asset or liability. Observable inputs are based on market data obtained from sources independent of the reporting entity. Unobservable inputs reflect the reporting entity’s own assumptions about the assumptions market participants would use in pricing the asset or liability. Unobservable inputs are based on the best information available in the circumstances. The three-tier hierarchy classification is determined based on the lowest level of inputs that is significant to the fair value measurement, and is summarized in the three broad Levels listed below: |
| • | Level 1 – | unadjusted quoted prices in active markets for identical investments; |
| • | Level 2 – | other significant observable inputs (including quoted prices for similar investments, interest rates, prepayment speeds, credit risk, etc.); and |
| • | Level 3 – | significant unobservable inputs (including the Fund’s own assumptions in determining the fair value of investments). |
| A summary of inputs used in valuing the Fund’s investments as of December 31, 2018 and, if applicable, Level 1/Level 2 transfers and Level 3 rollforwards for the fiscal year then ended is included in the Fund’s Schedule of Investments. | |
| Changes in valuation techniques may result in transfers into or out of an assigned level within the three-tier hierarchy. All transfers between different levels within the three-tier hierarchy are deemed to have occurred as of the beginning of the reporting period. The inputs or methodology used for valuing securities are not necessarily an indication of the risk associated with investing in those securities. |
| 3. | MANAGEMENT FEE AND OTHER TRANSACTIONS WITH AFFILIATES |
Management Fee
The Company has a management agreement with Lord Abbett, pursuant to which Lord Abbett supplies the Fund with investment management services and executive and other personnel, provides office space and pays for ordinary and necessary office and clerical expenses relating to research and statistical work and supervision of the Fund’s investment portfolio.
The management fee is based on the Fund’s average daily net assets at the following annual rate:
| First $1 billion | .75% |
| Next $1 billion | .70% |
| Over $2 billion | .65% |
For the fiscal year ended December 31, 2018, the effective management fee, net of waivers, was at an annualized rate of .74% of the Fund’s average daily net assets.
In addition, Lord Abbett provides certain administrative services to the Fund pursuant to an Administrative Services Agreement in return for a fee at an annual rate of .04% of the Fund’s average daily net assets.
18
Notes to Financial Statements (continued)
For the period January 1, 2018 through April 30, 2018, Lord Abbett contractually agreed to waive its fees and reimburse expenses to the extent necessary to limit total net annual operating expenses to an annual rate of 1.15%. Effective May 1, 2018, Lord Abbett discontinued the agreement.
The Company, on behalf of the Fund, has entered into services arrangements with certain insurance companies. Under these arrangements, certain insurance companies will be compensated up to ..25% of the average daily net asset value (“NAV”) of the Fund’s Class VC Shares held in the insurance company’s separate account to service and maintain the Variable Contract owners’ accounts. This amount is included in Non 12b-1 service fees on the Statement of Operations. The Fund may also compensate certain insurance companies, third-party administrators and other entities for providing recordkeeping, sub-transfer agency and other administrative services to the Fund. This amount is included in Shareholder servicing on the Statement of Operations.
One Director and certain of the Company’s officers have an interest in Lord Abbett.
| 4. | DISTRIBUTIONS AND CAPITAL LOSS CARRYFORWARDS |
Dividends from net investment income, if any, are declared and paid at least semi-annually. Taxable net realized gains from investment transactions, reduced by allowable capital loss carryforwards, if any, are declared and distributed to shareholders at least annually. The capital loss carryforward amount, if any, is available to offset future net capital gains. Dividends and distributions to shareholders are recorded on the ex-dividend date. The amounts of dividends and distributions from net investment income and net realized capital gains are determined in accordance with federal income tax regulations, which may differ from U.S. GAAP. These book/tax differences are either considered temporary or permanent in nature. To the extent these differences are permanent in nature, such amounts are reclassified within the components of net assets based on their federal tax basis treatment; temporary differences do not require reclassification. Dividends and distributions that exceed earnings and profits for tax purposes are reported as a tax return of capital.
The tax character of distributions paid during the fiscal years ended December 31, 2018 and 2017 was as follows:
| Year Ended 12/31/2018 | Year Ended 12/31/2017 | ||||||||
| Distributions paid from: | |||||||||
| Ordinary income | $ | 11,597,508 | $ | 24,955,446 | |||||
| Net long-term capital gains | 28,294,650 | 8,224,769 | |||||||
| Total distributions paid | $ | 39,892,158 | $ | 33,180,215 | |||||
As of December 31, 2018, the components of accumulated losses on a tax-basis were as follows:
| Undistributed ordinary income – net | $ | 30,467 | ||
| Total undistributed earnings | 30,467 | |||
| Temporary differences | (118,220 | ) | ||
| Unrealized losses – net | (16,094,235 | ) | ||
| Total accumulated losses – net | $ | (16,181,988 | ) |
At the Fund’s election, certain losses incurred within the taxable year (Qualified Late-Year Losses) are deemed to arise on the first business day of the Fund’s next taxable year. The Fund incurred and will elect to defer post-October capital losses of $62,461 during fiscal year 2018.
As of December 31, 2018, the aggregate unrealized security gains and losses on investments and other financial instruments based on cost for U.S. federal income tax purposes were as follows:
19
Notes to Financial Statements (continued)
| Tax cost | $ | 229,973,957 | ||
| Gross unrealized gain | 5,299,015 | |||
| Gross unrealized loss | (21,392,238 | ) | ||
| Net unrealized security loss | $ | (16,093,223 | ) |
The difference between book-basis and tax-basis unrealized gains (losses) is attributable to the tax treatment of wash sales.
| 5. | PORTFOLIO SECURITIES TRANSACTIONS |
Purchases and sales of investment securities (excluding short-term investments) for the fiscal year ended December 31, 2018 were as follows:
| Purchases | Sales | |
| $379,447,935 | $527,896,269 |
There were no purchases or sales of U.S. Government securities for the fiscal year ended December 31, 2018.
The Fund is permitted to purchase and sell securities (“cross-trade”) from and to other Lord Abbett funds or client accounts pursuant to procedures approved by the Board in compliance with Rule 17a-7 under the Act (the “Rule”). Each cross-trade is executed at a fair market price in compliance with provisions of the Rule. For the fiscal year ended December 31, 2018, the Fund engaged in cross-trades purchases of $550,712 and sales of $5,322,097, which resulted in net realized gains of $15,723.
| 6. | DISCLOSURES ABOUT OFFSETTING ASSETS AND LIABILITIES |
The Financial Accounting Standards Board (“FASB”) requires disclosures intended to help better assess the effect or potential effect of offsetting arrangements on a fund’s financial position. The following tables illustrate gross and net information about recognized assets and liabilities eligible for offset in the statement of assets and liabilities; and disclose such amounts subject to an enforceable master netting agreement or similar agreement, by counterparty. A master netting agreement is an agreement between a fund and a counterparty which provides for the net settlement of amounts owed under all contracts traded under that agreement, as well as cash collateral, through a single payment by one party to the other in the event of default on or termination of any one contract. The Fund’s accounting policy with respect to balance sheet offsetting is that, absent an event of default by the counterparty or a termination of the agreement, the master netting agreement does not result in an offset of reported amounts of financial assets and liabilities in the statement of assets and liabilities across transactions between the Fund and the applicable counterparty:
| Description | Gross Amounts of Recognized Assets | Gross Amounts Offset in the Statement of Assets and Liabilities | Net Amounts of Assets Presented in the Statement of Assets and Liabilities | |||||||||
| Repurchase Agreement | $8,572,611 | $ | – | $ | 8,572,611 | |||||||
| Total | $8,572,611 | $ | – | $ | 8,572,611 | |||||||
20
Notes to Financial Statements (continued)
| Net Amounts | ||||||||||||||||||||
| of Assets | Amounts Not Offset in the | |||||||||||||||||||
| Presented in | Statement of Assets and Liabilities | |||||||||||||||||||
| Counterparty | the Statement of Assets and Liabilities | Financial Instruments | Cash Collateral Received(a) | Securities Collateral Received(a) | Net Amount(b) | |||||||||||||||
| Fixed Income Clearing Corp. | $ | 8,572,611 | $ | – | $ | – | $ | (8,572,611 | ) | $ | – | |||||||||
| Total | $ | 8,572,611 | $ | – | $ | – | $ | (8,572,611 | ) | $ | – | |||||||||
| (a) | Collateral disclosed is limited to an amount not to exceed 100% of the net amount of assets presented in the Statement of Assets and Liabilities, for each respective counterparty. |
| (b) | Net amount represents the amount owed to the Fund by the counterparty as of December 31, 2018. |
| 7. | DIRECTORS’ REMUNERATION |
The Company’s officers and one Director, who are associated with Lord Abbett, do not receive any compensation from the Company for serving in such capacities. Independent Directors’ fees are allocated among all Lord Abbett-sponsored funds based on the net assets of each fund. There is an equity-based plan available to all Independent Directors under which Independent Directors must defer receipt of a portion of, and may elect to defer receipt of an additional portion of Directors’ fees. The deferred amounts are treated as though equivalent dollar amounts had been invested in the funds. Such amounts and earnings accrued thereon are included in Directors’ fees on the Statement of Operations and in Directors’ fees payable on the Statement of Assets and Liabilities and are not deductible for U.S. federal income tax purposes until such amounts are paid.
| 8. | EXPENSE REDUCTIONS |
The Company has entered into an arrangement with its transfer agent and custodian, whereby credits realized as a result of uninvested cash balances are used to reduce a portion of the Fund’s expenses.
| 9. | LINE OF CREDIT |
During the period ended August 8, 2018, the Fund and certain other funds managed by Lord Abbett (collectively, the “Participating Funds”) participated in a syndicated line of credit facility with various lenders for $600 million (the “Facility”), whereas State Street Bank and Trust Company (“SSB”) participates as a lender and as agent for the lenders. The Facility is to be used for temporary or emergency purposes as an additional source of liquidity to satisfy redemptions. The Participating Funds are subject to graduated borrowing limits of one-third of Fund assets (if Fund assets are less than $750 million), $250 million, $300 million, or $350 million, based on past borrowings and likelihood of future borrowings. During the period ended August 8, 2018, the Fund did not utilize the Facility.
For the period August 9, 2018 through December 20, 2018, the Participating Funds entered into an amended syndicated line of credit facility with various lenders for $1.06 billion (the “Syndicated Facility”), whereas SSB participates as a lender and as agent for the lenders. Under the Syndicated Facility, the Participating Funds are subject to graduated borrowing limits of one-third of Fund assets (if Fund assets are less than $750 million), $250 million, $300 million, $350 million, or $1 billion, based on past borrowings and likelihood of future borrowings. Effective December 21, 2018, the Participating Funds entered into an amended Syndicated Facility with various lenders for $1.1 billion based on the same terms as described above.
Effective August 9, 2018, the Participating Funds entered into an additional line of credit facility with SSB for $250 million (the “Bilateral Facility,” and together with the Syndicated Facility, the
21
Notes to Financial Statements (continued)
“Facilities”). Under the Bilateral Facility, each Participating Fund may borrow up to the lesser of $250 million or one-third of Fund assets. The Facilities are to be used for temporary or emergency purposes to satisfy redemption requests and manage liquidity.
For the period from August 9, 2018 through December 31, 2018, the Fund did not utilize the Facilities.
| 10. | INTERFUND LENDING PROGRAM |
Pursuant to an exemptive order issued by the U.S. Securities and Exchange Commission (“SEC exemptive order”), certain registered open-end management investment companies managed by Lord Abbett, including the Fund, participate in a joint lending and borrowing program (the “Interfund Lending Program”). The SEC exemptive order allows the Funds to borrow money from and lend money to each other for temporary or emergency purposes subject to the limitations and conditions.
During the fiscal year ended December 31, 2018, the Fund did not participate as a borrower or lender in the Interfund Lending Program.
| 11. | CUSTODIAN AND ACCOUNTING AGENT |
SSB is the Company’s custodian and accounting agent. SSB performs custodial, accounting and recordkeeping functions relating to portfolio transactions and calculating the Fund’s NAV.
| 12. | INVESTMENT RISKS |
The Fund is subject to the general risks and considerations associated with investing in equity securities as well as the particular risks associated with value stocks. The value of an investment will fluctuate in response to movements in the equity securities market in general and to the changing prospects of individual companies in which the Fund invests. Value investing also is subject to the risk that a company judged to be undervalued may actually be appropriately priced or even overpriced. Large value stocks, in which the Fund invests a significant portion of its assets, may perform differently than the market as a whole and other types of stocks, such as mid-sized or small-company stocks and growth stocks. This is because different types of stocks tend to shift in and out of favor over time depending on market and economic conditions as well as investor sentiment. In addition, large companies may have smaller rates of growth as compared to successful but well established smaller companies. Mid-cap and small-cap company stocks in which the Fund may invest may be more volatile and less liquid than large-cap stocks, especially over the short term. The market may fail to recognize the intrinsic value of a particular value stock for a long time. In addition, if the Fund’s assessment of a company’s value or prospects for exceeding earnings expectations or market conditions is wrong, the Fund could suffer losses or produce poor performance relative to other funds, even in a favorable market.
Due to the Fund’s investment exposure to foreign companies and American Depositary Receipts, the Fund may experience increased market, industry and sector, liquidity, currency, political, information, and other risks. The securities of foreign companies also may be subject to inadequate exchange control regulations, the imposition of economic sanctions or other government restrictions, higher transaction and other costs, and delays in settlement to the extent they are traded on non-U.S. exchanges or markets.
The Fund is subject to the risks associated with derivatives, which may be different and greater than the risks associated with investing directly in securities and other investments. Derivatives may be subject to risks such as liquidity risk, leveraging risk, interest rate risk, market risk, and credit risk. Illiquid securities may lower the Fund’s returns since the Fund may be unable to sell these securities
22
Notes to Financial Statements (concluded)
at their desired time or price. Derivatives also may involve the risk of mispricing or improper valuation and the risk that changes in the value of the derivative may not correlate perfectly with the value of the underlying asset, rate or index. Whether the Fund’s use of derivatives is successful will depend on, among other things, the Fund’s ability to correctly forecast market movements, changes in foreign exchange and interest rates, and other factors. If the Fund incorrectly forecasts these and other factors, its performance could suffer. The Fund’s use of derivatives could result in a loss exceeding the amount of the Fund’s investment in these instruments.
These factors can affect the Fund’s performance.
| 13. | SUMMARY OF CAPITAL TRANSACTIONS |
Transactions in shares of capital stock were as follows:
| Year Ended December 31, 2018 | Year Ended December 31, 2017 | |||||||
| Shares sold | 9,227,349 | 723,908 | ||||||
| Reinvestment of distributions | 2,819,102 | 1,762,529 | ||||||
| Shares reacquired | (17,955,994 | ) | (3,047,575 | ) | ||||
| Decrease | (5,909,543 | ) | (561,138 | ) | ||||
23
Report of Independent Registered Public Accounting Firm
To the shareholders and the Board of Directors of Lord Abbett Series Fund, Inc.:
Opinion on the Financial Statements and Financial Highlights
We have audited the accompanying statement of assets and liabilities, including the schedule of investments, of the Fundamental Equity Portfolio, one of the portfolios constituting the Lord Abbett Series Fund, Inc. (the “Fund”), as of December 31, 2018, the related statement of operations for the year then ended, the statements of changes in net assets for each of the two years in the period then ended, the financial highlights for each of the five years in the period then ended, and the related notes. In our opinion, the financial statements and financial highlights present fairly, in all material respects, the financial position of the Fundamental Equity Portfolio of the Fund as of December 31, 2018, and the results of its operations for the year then ended, the changes in its net assets for each of the two years in the period then ended, and the financial highlights for each of the five years in the period then ended in conformity with accounting principles generally accepted in the United States of America.
Basis for Opinion
These financial statements and financial highlights are the responsibility of the Fund’s management. Our responsibility is to express an opinion on the Fund’s financial statements and financial highlights based on our audits. We are a public accounting firm registered with the Public Company Accounting Oversight Board (United States) (PCAOB) and are required to be independent with respect to the Fund in accordance with the U.S. federal securities laws and the applicable rules and regulations of the Securities and Exchange Commission and the PCAOB.
We conducted our audits in accordance with the standards of the PCAOB. Those standards require that we plan and perform the audit to obtain reasonable assurance about whether the financial statements and financial highlights are free of material misstatement, whether due to error or fraud. The Fund is not required to have, nor were we engaged to perform, an audit of its internal control over financial reporting. As part of our audits we are required to obtain an understanding of internal control over financial reporting but not for the purpose of expressing an opinion on the effectiveness of the Fund’s internal control over financial reporting. Accordingly, we express no such opinion.
Our audits included performing procedures to assess the risks of material misstatement of the financial statements and financial highlights, whether due to error or fraud, and performing procedures that respond to those risks. Such procedures included examining, on a test basis, evidence regarding the amounts and disclosures in the financial statements and financial highlights. Our audits also included evaluating the accounting principles used and significant estimates made by management, as well as evaluating the overall presentation of the financial statements and financial highlights. Our procedures included confirmation of securities owned as of December 31, 2018, by correspondence with the custodian and brokers; when replies were not received from brokers, we performed other auditing procedures. We believe that our audits provide a reasonable basis for our opinion.
DELOITTE & TOUCHE LLP
New York, New York
February 15, 2019
We have served as the auditor of one or more Lord Abbett Family of Funds’ investment companies since 1932.
24
Basic Information About Management
The Board is responsible for the management of the business and affairs of the Company in accordance with the laws of the State of Maryland. The Board elects officers who are responsible for the day-to-day operations of the Fund and who execute policies authorized by the Board. The Board also approves an investment adviser to the Fund and continues to monitor the cost and quality of the services the investment adviser provides, and annually considers whether to renew the contract with the adviser. Generally, each Director holds office until his/her successor is elected and qualified or until his/her earlier resignation or removal, as provided in the Company’s organizational documents.
Lord Abbett, a Delaware limited liability company, is the Fund’s investment adviser. Designated Lord Abbett personnel are responsible for the day-to-day management of the Fund.
Interested Directors
Mr. Sieg is affiliated with Lord Abbett and is an “interested person” of the Company as defined in the Act. Mr. Sieg is director/trustee of each of the 13 investment companies in the Lord Abbett Family of Funds, which consist of 62 portfolios or series. Mr. Sieg is an officer of the Lord Abbett Family of Funds.
| Name, Address and Year of Birth | Current Position and Length of Service with the Company | Principal Occupation and Other Directorships During the Past Five Years | ||
| Douglas B. Sieg Lord, Abbett & Co. LLC 90 Hudson Street Jersey City, NJ 07302 (1969) | Director since 2016; President and Chief Executive Officer since 2018 | Principal Occupation:Managing Partner (since 2018) and was formerly Head of Client Services, joined Lord Abbett in 1994.
Other Directorships:None. |
Independent Directors
The following Independent Directors also are directors/trustees of each of the 13 investment companies in the Lord Abbett Family of Funds, which consist of 62 portfolios or series.
| Name, Address and Year of Birth | Current Position and Length of Service with the Company | Principal Occupation and Other Directorships During the Past Five Years | ||
| Eric C. Fast Lord, Abbett & Co. LLC c/o Legal Dept. 90 Hudson Street Jersey City, NJ 07302 (1949) | Director since 2014 | Principal Occupation:Chief Executive Officer of Crane Co., an industrial products company (2001–2014)
Other Directorships:Currently serves as director of Automatic Data Processing, Inc. (since 2007) and Regions Financial Corporation (since 2010). Previously served as a director of Crane Co. (1999–2014). | ||
| Evelyn E. Guernsey Lord, Abbett & Co. LLC c/o Legal Dept. 90 Hudson Street Jersey City, NJ 07302 (1955) | Director since 2011 | Principal Occupation:CEO, Americas of J.P. Morgan Asset Management (2004–2010).
Other Directorships:None. |
25
Basic Information About Management (continued)
| Name, Address and Year of Birth | Current Position and Length of Service with the Company | Principal Occupation and Other Directorships During the Past Five Years | ||
| Julie A. Hill Lord, Abbett & Co. LLC c/o Legal Dept. 90 Hudson Street Jersey City, NJ 07302 (1946) | Director since 2004 | Principal Occupation:Owner and CEO of The Hill Company, a business consulting firm (since 1998).
Other Directorships:Currently serves as director of Anthem, Inc., a health benefits company (since 1994). | ||
| Kathleen M. Lutito Lord, Abbett & Co. LLC c/o Legal Dept. 90 Hudson Street Jersey City, NJ 07302 (1963) | Director since 2017 | Principal Occupation:President and Chief Investment Officer of CenturyLink Investment Management Company (since 2006).
Other Directorships:None | ||
| James M. McTaggart Lord, Abbett & Co. LLC c/o Legal Dept. 90 Hudson Street Jersey City, NJ 07302 (1947) | Director since 2012 | Principal Occupation:Independent management advisor and consultant (since 2012); Vice President, CRA International, Inc. (doing business as Charles River Associates), a global management consulting firm (2009–2012); Founder and Chairman of Marakon Associates, Inc., a strategy consulting firm (1978–2009); and Officer and Director of Trinsum Group, a holding company (2007–2009).
Other Directorships:Blyth, Inc., a home products company (2004–2015). | ||
| Karla M. Rabusch Lord, Abbett & Co. LLC c/o Legal Dept. 90 Hudson Street Jersey City, NJ 07302 (1959) | Director since 2017 | Principal Occupation:President and Director of Wells Fargo Funds Management, LLC (2003–2017); President of Wells Fargo Funds (2003–2016).
Other Directorships:None. | ||
| Mark A. Schmid Lord, Abbett & Co. LLC c/o Legal Dept. 90 Hudson Street Jersey City, NJ 07302 (1959) | Director since 2016 | Principal Occupation:Vice President and Chief Investment Officer of the University of Chicago (since 2009).
Other Directorships:None. | ||
| James L.L. Tullis Lord, Abbett & Co. LLC c/o Legal Dept. 90 Hudson Street Jersey City, NJ 07302 (1947) | Director since 2006; Chairman since 2017 | Principal Occupation:CEO of Tullis-Dickerson and Co. Inc., a venture capital management firm (since 1990); CEO of Tullis Health Investors Inc. (since 2012).
Other Directorships:Currently serves as director of Crane Co. (since 1998). | ||
Officers
None of the officers listed below have received compensation from the Company. All of the officers of the Company also may be officers of the other Lord Abbett Funds and maintain offices at 90 Hudson Street, Jersey City, NJ 07302. Unless otherwise indicated, the position(s) and title(s) listed under the “Principal Occupation During the Past Five Years” column indicate each officer’s position(s) and title(s) with Lord Abbett. Each officer serves for an indefinite term (i.e., until his or her death, resignation, retirement, or removal).
26
Basic Information About Management (continued)
| Name and Year of Birth | Current Position with the Company | Length of Service of Current Position | Principal Occupation During the Past Five Years | |||
| Douglas B. Sieg (1969) | President and Chief Executive Officer | Elected as President and Chief Executive Officer in 2018 | Managing Partner of Lord Abbett (since 2018) and formerly Head of Client Services, joined Lord Abbett in 1994. | |||
| Jeff D. Diamond (1960) | Executive Vice President | Elected in 2008 | Portfolio Manager, joined Lord Abbett in 2007. | |||
| Todd D. Jacobson (1966) | Executive Vice President | Elected in 2005 | Partner and Associate Director, joined Lord Abbett in 2003. | |||
| Robert A. Lee (1969) | Executive Vice President | Elected in 2010 | Partner and Chief Investment Officer, and was formerly Deputy Chief Investment Officer and Director of Taxable Fixed Income, joined Lord Abbett in 1997. | |||
| David J. Linsen (1974) | Executive Vice President | Elected in 2008 | Partner and Director of Equities, joined Lord Abbett in 2001. | |||
| Vincent J. McBride (1964) | Executive Vice President | Elected in 2010 | Partner and Director, joined Lord Abbett in 2003. | |||
| Andrew H. O’Brien (1973) | Executive Vice President | Elected in 2010 | Partner and Portfolio Manager, joined Lord Abbett in 1998. | |||
| F. Thomas O’Halloran (1955) | Executive Vice President | Elected in 2010 | Partner and Portfolio Manager, joined Lord Abbett in 2001. | |||
| Marc Pavese (1972) | Executive Vice President | Elected in 2016 | Partner and Portfolio Manager, joined Lord Abbett in 2008. | |||
| Walter H. Prahl (1958) | Executive Vice President | Elected in 2012 | Partner and Director, joined Lord Abbett in 1997. | |||
| Eli Rabinowich (1975) | Executive Vice President | Elected in 2018 | Portfolio Manager, joined Lord Abbett in 2018 and was formerly a Portfolio Manager, Partner, and Analyst at Pzena Investment Management from (2004–2018). |
27
Basic Information About Management (continued)
| Name and Year of Birth | Current Position with the Company | Length of Service of Current Position | Principal Occupation During the Past Five Years | |||
| Jeffrey Rabinowitz (1972) | Executive Vice President | Elected in 2017 | Portfolio Manager, joined Lord Abbett in 2017 and was formerly Managing Director and Portfolio Manager/Technology Analyst at Jennison Associates LLC (2014–2017) and Managing Director and Portfolio Manager/Technology Analyst for U.S. Growth Equity at Goldman Sachs Asset Management (1999–2014). | |||
| Steven F. Rocco (1979) | Executive Vice President | Elected in 2014 | Partner and Director of Taxable Fixed Income, joined Lord Abbett in 2004. | |||
| A. Edward Allinson (1961) | Vice President | Elected in 2011 | Portfolio Manager, joined Lord Abbett in 2005. | |||
| Vernon T. Bice (1974) | Vice President | Elected in 2011 | Portfolio Manager, joined Lord Abbett in 2011. | |||
| Pamela P. Chen (1978) | Vice President, Assistant Secretary and Privacy Officer | Elected in 2018 | Associate General Counsel, joined Lord Abbett in 2017 and was formerly Special Counsel at Schulte, Roth & Zabel LLP (2005–2017). | |||
| Robert S. Clark (1975) | Vice President | Elected in 2018 | Portfolio Manager, joined Lord Abbett in 2010. | |||
| Matthew R. DeCicco (1977) | Vice President | Elected in 2003 | Managing Director and Portfolio Manager, joined Lord Abbett in 1999. | |||
| John T. Fitzgerald (1975) | Vice President and Assistant Secretary | Elected in 2018 | Deputy General Counsel, joined Lord Abbett in 2018 and was formerly Deputy Head of U.S. Funds Legal, Executive Director and Assistant General Counsel at JPMorgan Chase (2005–2018). | |||
| Christopher J. Gizzo (1986) | Vice President | Elected in 2018 | Managing Director and Portfolio Manager, joined Lord Abbett in 2008. | |||
| Bernard J. Grzelak (1971) | Chief Financial Officer and Vice President | Elected in 2017 | Partner, Chief Operating Officer, Global Funds and Risk, joined Lord Abbett in 2003. |
28
Basic Information About Management (concluded)
| Name and Year of Birth | Current Position with the Company | Length of Service of Current Position | Principal Occupation During the Past Five Years | |||
| Linda Y. Kim (1980) | Vice President and Assistant Secretary | Elected in 2016 | Counsel, joined Lord Abbett in 2015 and was formerly an Associate at Stroock & Stroock & Lavan LLP (2007–2015). | |||
| So Young Lee (1971) | Vice President | Elected in 2018 | Portfolio Manager, joined Lord Abbett in 2013. | |||
| Joseph M. McGill (1962) | Chief Compliance Officer | Elected in 2014 | Partner and Chief Compliance Officer, joined Lord Abbett in 2014 and was formerly Managing Director and the Chief Compliance Officer at UBS Global Asset Management (2003–2013). | |||
| A. Edward Oberhaus, III (1959) | Vice President | Elected in 1998 | Partner and Director, joined Lord Abbett in 1983. | |||
| Amanda S. Ryan (1978) | Vice President and Assistant Secretary | Elected in 2018 | Counsel, joined Lord Abbett In 2016 and was formerly a Director and Corporate Counsel at PGIM Investments (2012–2016). | |||
| Lawrence B. Stoller (1963) | Vice President, Secretary and Chief Legal Officer | Elected in 2007 | Partner and General Counsel, joined Lord Abbett in 2007. | |||
| Leah G. Traub (1979) | Vice President | Elected in 2016 | Partner and Portfolio Manager, joined Lord Abbett in 2007. | |||
| Kewjin Yuoh (1971) | Vice President | Elected in 2012 | Partner and Portfolio Manager, joined Lord Abbett in 2010. | |||
| Jackson C. Chan (1964) | AML Compliance Officer | Elected in 2018 | Deputy Chief Compliance Officer and Director of Regulatory Affairs, joined Lord Abbett in 2014 and was formerly Director at UBS Global Asset Management (2005–2014). | |||
| Vito A. Fronda (1969) | Treasurer | Elected in 2018 | Partner and Director of Taxation, joined Lord Abbett in 2003. |
Please call 888-522-2388 for a copy of the statement of additional information, which contains further information about the Company’s Directors. It is available free upon request.
29
Approval of Advisory Contract
The Board, including all of the Directors who are not “interested persons” of the Company or of Lord Abbett, as defined in the Investment Company Act of 1940, as amended (the “Independent Directors”), annually considers whether to approve the continuation of the existing management agreement between the Fund and Lord Abbett (the “Agreement”). In connection with its most recent approval, which included the approval of a proposal to reduce the management fee schedule effective May 1, 2019, the Board reviewed materials relating specifically to the Agreement, as well as numerous materials received throughout the course of the year, including information about the Fund’s investment performance compared to the performance of its benchmarks. Before making its decision as to the Fund, the Board had the opportunity to ask questions and request further information, taking into account its knowledge of Lord Abbett gained through its meetings and discussions. These meetings and discussions included reviews of Fund performance conducted by members of the Contract Committee, the deliberations of the Contract Committee, and discussions between the Contract Committee and Lord Abbett’s management. The Independent Directors also met with their independent legal counsel in various private sessions at which no representatives of management were present.
The materials received by the Board included, but were not limited to: (1) information provided by Broadridge Financial Solutions (“Broadridge”) regarding the investment performance of the Fund compared to the investment performance of certain funds with similar investment styles as determined by Broadridge, based, in part, on the Fund’s Morningstar category (the “performance peer group”), and the investment performance of two appropriate benchmarks; (2) information provided by Broadridge regarding the expense ratios, contractual and actual management fee rates, and other expense components for the Fund and certain funds in the same Morningstar category, with generally the same or similar share classes and operational characteristics, including asset size (the “expense peer group”); (3) certain supplemental investment performance information provided by Lord Abbett; (4) information provided by Lord Abbett on the expense ratios, management fee rates, and other expense components for the Fund; (5) sales and redemption information for the Fund; (6) information regarding Lord Abbett’s financial condition; (7) an analysis of the relative profitability of the Agreement to Lord Abbett; (8) information provided by Lord Abbett regarding the investment management fee schedules for Lord Abbett’s other advisory clients maintaining accounts with a similar investment strategy as the Fund; and (9) information regarding the personnel and other resources devoted by Lord Abbett to managing the Fund.
Investment Management and Related Services Generally.The Board considered the services provided by Lord Abbett to the Fund, including investment research, portfolio management, and trading, and Lord Abbett’s commitment to compliance with all applicable legal requirements. The Board also observed that Lord Abbett was solely engaged in the investment management business and accordingly did not experience the conflicts of interest that may result from being engaged in other lines of business. The Board considered the investment advisory services provided by Lord Abbett to other clients, the fees charged for the services, and the differences in the nature of the services provided to the Fund and other Lord Abbett Funds, on the one hand, and the services provided to other clients, on the other. After reviewing these and related factors, the Board concluded that the Fund was likely to continue to benefit from the nature, extent and quality of the investment services provided by Lord Abbett under the Agreement.
Investment Performance.The Board reviewed the Fund’s investment performance in relation to that of the performance peer group and two appropriate benchmarks as of various periods ended August 31, 2018. The Board observed that the Fund’s investment performance was above the
30
Approval of Advisory Contract (continued)
median of the performance peer group for the one-, three-, and ten-year periods and below the median of the performance peer group for the five-year period. The Board also took into account recent changes to the portfolio management team and other actions taken by Lord Abbett to attempt to improve equity fund performance. The Board further considered Lord Abbett’s performance and reputation generally, the performance of other Lord Abbett-managed funds overseen by the Board, and the willingness of Lord Abbett to take steps intended to improve performance when appropriate. After reviewing these and related factors, the Board concluded that the Fund’s Agreement, as revised with a reduced management fee schedule effective May 1, 2019, should be continued.
Lord Abbett’s Personnel and Methods.The Board considered the qualifications of the personnel providing investment management services to the Fund, in light of its investment objective and discipline, and other services provided to the Fund by Lord Abbett. Among other things, the Board considered the size, experience, and turnover of Lord Abbett’s staff, Lord Abbett’s investment methodology and philosophy, and Lord Abbett’s approach to recruiting, training, and retaining personnel.
Nature and Quality of Other Services.The Board considered the nature, quality, and extent of compliance, administrative, and other services performed by Lord Abbett and the nature and extent of Lord Abbett’s supervision of third party service providers, including the Fund’s transfer agent and custodian.
Expenses.The Board considered the expense level of the Fund, including the contractual and actual management fee rates under the terms of the current Agreement, and the expense levels of the Fund’s expense peer group. It also considered how the expense level of the Fund related to those of the expense peer group and the amount and nature of the fees paid by shareholders. The Board observed that the net total expense ratio of the Fund was above the median of the expense peer group. The Board further considered that the Fund’s management fee schedule would be reduced, effective May 1, 2019. After reviewing these and related factors, the Board concluded, within the context of its overall approval of the Agreement, that the expense level of the Fund was reasonable and supported the continuation of the Agreement.
Profitability.The Board considered the level of Lord Abbett’s operating margin in managing the Fund, including a review of Lord Abbett’s methodology for allocating its costs to its management of the Fund. It considered whether the Fund was profitable to Lord Abbett in connection with the Fund’s operation, including the fee that Lord Abbett receives from the Fund for providing administrative services to the Fund. The Board also considered the profits realized from other business segments of Lord Abbett, which may benefit from or be related to the Fund’s business. The Board considered Lord Abbett’s profit margins excluding Lord Abbett’s marketing and distribution expenses. The Board also considered Lord Abbett’s profit margins, without those exclusions, in comparison with available industry data and how those profit margins could affect Lord Abbett’s ability to recruit and retain personnel. The Board recognized that Lord Abbett’s overall profitability was a factor in enabling it to attract and retain qualified personnel to provide services to the Fund. After reviewing these and related factors, the Board concluded, within the context of its overall approval of the Agreement, that Lord Abbett’s profitability with respect to the Fund was not excessive.
Economies of Scale.The Board considered the extent to which there had been economies of scale in managing the Fund, whether the Fund’s shareholders had appropriately benefited from such economies of scale, and whether there was potential for realization of any further economies of scale. The Board concluded that the reduced management fee schedule, which included certain
31
Approval of Advisory Contract (concluded)
breakpoints in the management fee schedule, in conjunction with the proposed expense limitation agreement, adequately addressed any economies of scale in managing the Fund.
Other Benefits to Lord Abbett.The Board considered the amount and nature of the fees paid by the Fund and the Fund’s shareholders to Lord Abbett for services other than investment advisory services, such as the fee that Lord Abbett receives from the Fund for providing administrative services to the Fund. The Board also considered the revenues and profitability of Lord Abbett’s investment advisory business apart from its mutual fund business, and the intangible benefits enjoyed by Lord Abbett by virtue of its relationship with the Fund. The Board observed that the Distributor receives 12b-1 fees from certain of the Lord Abbett Funds as to shares held in accounts for which there is no other broker of record, may retain a portion of the 12b-1 fees it receives, and receives a portion of the sales charges on sales and redemptions of some classes of shares of the Lord Abbett Funds. In addition, the Board observed that Lord Abbett accrues certain benefits for its business of providing investment advice to clients other than the Lord Abbett Funds, but that business also benefits the Funds. The Board also noted that Lord Abbett, as disclosed in the prospectus of the Fund, has entered into revenue sharing arrangements with certain entities that distribute shares of the Lord Abbett Funds. The Board also took into consideration the investment research that Lord Abbett receives as a result of client brokerage transactions.
Alternative Arrangements.The Board considered whether, instead of approving continuation of the Agreement, it might be in the best interests of the Fund to implement one or more alternative arrangements, such as continuing to employ Lord Abbett, but on different terms. After considering all of the relevant factors, the Board unanimously found that continuation of the Agreement, as revised, was in the best interests of the Fund and its shareholders and voted unanimously to approve the continuation of the Agreement. In considering whether to approve the continuation of the Agreement, the Board did not identify any single factor as paramount or controlling. Individual Directors may have evaluated the information presented differently from one another, giving different weights to various factors. This summary does not discuss in detail all matters considered.
32
Householding
The Company has adopted a policy that allows it to send only one copy of the Fund’s prospectus, proxy material, annual report and semiannual report to certain shareholders residing at the same “household.” This reduces Fund expenses, which benefits you and other shareholders. If you need additional copies or do not want your mailings to be “householded,” please call Lord Abbett at 888-522-2388 or send a written request with your name, the name of your fund or funds and your account number or numbers to Lord Abbett Family of Funds, P.O. Box 219336, Kansas City, MO 64121.
Proxy Voting Policies, Procedures and Records
A description of the policies and procedures that Lord Abbett uses to vote proxies related to the Fund’s portfolio securities, and information on how Lord Abbett voted the Fund’s proxies during the 12-month period ended June 30 are available without charge, upon request, (i) by calling 888-522-2388; (ii) on Lord Abbett’s Website at www.lordabbett.com; and (iii) on the Securities and Exchange Commission’s (“SEC”) Website at www.sec.gov.
Shareholder Reports and Quarterly Portfolio Disclosure
The Fund is required to file its complete schedule of portfolio holdings with the SEC for its first and third fiscal quarters on Form N-Q. Copies of the filings are available without charge, upon request on the SEC’s Website at www.sec.gov and may be available by calling Lord Abbett at 888-522-2388.
Tax Information
For corporate shareholders, 59% of the Fund’s ordinary income distributions qualified for the dividends received deduction.
Additionally, of the distribution paid to the shareholders during the fiscal year ended December 31, 2018, $8,079,141 and $28,294,650, respectively, represent short-term capital gains and long-term capital gains.
33


| This report, when not used for the general information of shareholders of the Fund, is to be distributed only if preceded or accompanied by a current fund prospectus. | |||
| Lord Abbett mutual fund shares are distributed by LORD ABBETT DISTRIBUTOR LLC. | Lord Abbett Series Fund, Inc.
Fundamental Equity Portfolio | SFFE-PORT-3 (02/19) |
![]()
LORD ABBETT
ANNUAL REPORT
Lord Abbett
Series Fund—Growth and Income Portfolio
For the fiscal year ended December 31, 2018
Table of Contents
Lord Abbett Series Fund — Growth and Income Portfolio
Annual Report
For the fiscal year ended December 31, 2018

From left to right: James L.L. Tullis, Independent Chairman of the Lord Abbett Funds and Douglas B. Sieg, Director, President, and Chief Executive Officer of the Lord Abbett Funds.
Dear Shareholders:We are pleased to provide you with this overview of the performance of Lord Abbett Series Fund — Growth and Income Portfolio for the fiscal year ended December 31, 2018. On this page and the following pages, we discuss the major factors that influenced fiscal year performance. For additional information about the Fund, please visit our website at www.lordabbett.com, where you also can access the quarterly commentaries that provide updates on the Fund’s performance and other portfolio related updates.
Thank you for investing in Lord Abbett mutual funds. We value the trust that you place in us and look forward to serving your investment needs in the years to come.
Best regards,

Douglas B. Sieg
Director, President and Chief Executive Officer
For the fiscal year ended December 31, 2018, the Fund returned -8.14%, reflecting performance at the net asset value (NAV) of Class VC shares with all distributions reinvested, compared to its benchmark, the Russell 1000® Value Index1, which returned -8.27% over the same period.
Domestic equity returns were negative over the past year, with large cap stocks, as represented by the S&P 500® Index2, falling -4.38% during the period, while small cap stocks, as represented by the Russell 2000® Index3, were down -11.01%. During the period, there were several market-moving events. Notably, Congress passed the
largest rewrite of the U.S. tax code in decades, which went into effect in January 2018. The tax bill reduced the corporate tax rate from 35% to 21% and allowed for a one-time repatriation tax of 15.5%, rather than the standard repatriation tax rate of 35%. In June 2018, the White House announced its intent to impose additional tariffs on $200 billion worth of Chinese goods on top of the $50 billion previously announced. The aggressive U.S. trade posture continued into the third quarter with trade tensions mounting between the U.S. and China. In December, the White House announced a trade truce between
1
the U.S. and China following a meeting between President Trump and President Xi Jinping at the G20 summit. The U.S. agreed to maintain a 10% tariff rate on $200 billion worth of Chinese imports at the start of 2019 as opposed to the originally planned 25% tariff rate. In return, China agreed to purchase a substantial amount of U.S. agriculture, industrial, and energy products to further reduce the trade imbalance. While the impact has yet to fully be realized, many corporations anticipate that the retaliatory tariffs will weigh on profits. Trade discussions between Mexico, Canada, and the U.S., however, took a more favorable turn as the negotiations resulted in a revised version of the North American Free Trade Agreement (NAFTA) called the U.S.-Mexico-Canada Agreement. In March 2018, the Federal Reserve (the “Fed”) raised its target for short-term interest rates by 0.25%, to a range of 1.50%-1.75%, and followed with rate hikes of 0.25% at each of its June, September, and December meetings, raising the target range to 2.25%-2.50%. Amid rising concerns surrounding escalating trade tensions, slowing global growth, and increasing interest rates, the Nasdaq experienced the largest monthly drop since 2008 in October 2018. Following the prior month’s volatility, domestic equity markets rallied in November and partially reversed October’s losses, however the S&P 500 returned to negative territory in December, posting its worst month since February 2009.
Stock selection within the consumer discretionary and health care sectors contributed positively to relative performance during the period. Within the consumer discretionary sector, the Fund’s position in Yum! Brands, Inc., a quick service restaurant franchise, contributed to relative performance. Shares of the company increased following the announcement of a partnership with GrubHub Inc. as well as solid second quarter results with both the top and bottom lines beating consensus estimates. The Fund’s position in O’Reilly Automotive, Inc., an automotive aftermarket parts retailer, contributed the most to relative performance. Shares of O’Reilly Automotive rose following favorable economic conditions, benefits from its expansive distribution network, and increases in average miles driven and vehicle age. Within the health care sector, Merck & Co., Inc., a health care solutions provider, contributed the most to relative performance. Shares of Merck rose throughout the year as investors grew hopeful of the potential for income growth from the large portfolio of high-margin drugs as well as a full pipeline of new drugs.
Conversely, stock selection within the financials and materials sectors detracted from relative performance over the period. Within the financials sector, the Fund’s holding of Citizens Financial Group, a regional bank, was a top detractor. Shares of the firm sold off as investors grew wary of the relatively high deposit beta, whereby
2
the firm gives individual depositors higher returns for their cash than its peers. In turn, the firm may face higher costs. The Fund’s holding of SVB Financial Group, a financial services company, also detracted from relative performance. Shares of SVB Financial decreased following Investor Day in December as investors were disappointed with the 2019 outlook, and more specifically, expressed disappointment with potentially lower margin expansion due to fewer projected rate hikes by the Fed. In the back half of 2018, most banks underperformed as a result of intensified late-cycle concerns surrounding net interest margin contraction
and increasing credit costs. Additionally, within the materials sector, DowDuPont Inc., a multinational chemical company, detracted from relative performance. Shares trailed as the market focused on the potential contagion effect from lower oil prices on customer destocking.
The Fund’s portfolio is actively managed and, therefore, its holdings and the weightings of a particular issuer or particular sector as a percentage of portfolio assets are subject to change. Sectors may include many industries.
1 The Russell 1000® Value Index measures the performance of those Russell 1000® companies with lower price-to-book ratios and lower forecasted growth values.
2 The S&P 500® Index is widely regarded as the standard for measuring large cap U.S. stock market performance and includes a representative sample of leading companies in leading industries.
3 The Russell 2000® Index measures the performance of the 2,000 smallest companies in the Russell 3000® Index, which represents approximately 10% of the total market capitalization of the Russell 3000® Index.
Unless otherwise specified, indexes reflect total return, with all dividends reinvested. Indexes are unmanaged, do not reflect the deduction of fees or expenses, and are not available for direct investment.
Important Performance and Other Information
Performance data quoted in the following pages reflect past performance and are no guarantee of future results. Current performance may be higher or lower than the performance quoted. The investment return and principal value of an investment in the Fund will fluctuate so that shares, on any given day or when redeemed, may be worth more or less than their original cost. You can obtain performance data current to the most recent month
end by calling Lord Abbett at 888-522-2388 or referring to www.lordabbett.com.
The annual commentary above discusses the views of the Fund’s management and various portfolio holdings of the Fund as of December 31, 2018. These views and portfolio holdings may have changed after this date. Information provided in the commentary is not a recommendation to buy or sell securities. Because the Fund’s portfolio is actively managed and may change significantly, the Fund may no longer own the securities described above or may have otherwise changed its position in the securities. For more recent information about the Fund’s portfolio holdings, please visit www.lordabbett.com.
A Note about Risk:See Notes to Financial Statements for a discussion of investment risks. For a more detailed discussion of the risks associated with the Fund, please see the Fund’s prospectus.
Mutual funds are not insured by the FDIC, are not deposits or other obligations of, or guaranteed by, banks, and are subject to investment risks including possible loss of principal amount invested.
The Fund serves as an underlying investment vehicle for variable annuity contracts and variable life insurance policies.
3
Below is a comparison of a $10,000 investment in Class VC shares with the same investment in the Russell 1000® Value Index, the S&P 500® Index and the S&P 500® Value Index, assuming reinvestment of all dividends and distributions. The Fund’s shares are sold only to insurance company separate accounts that fund certain variable annuity and variable life contracts. This line graph comparison does not reflect the sales charges or other expenses of these contracts. If those sales charges and expenses were reflected, returns would be lower. The graph and performance table below do not reflect the deduction of taxes that a shareholder would pay on Fund distributions or the redemption of Fund shares.Past performance is no guarantee of future results.

Average Annual Total Returns for the
Periods Ended December 31, 2018
| 1 Year | 5 Years | 10 Years | ||||
| Class VC | –8.14% | 4.99% | 9.80% |
1 Performance for each unmanaged index does not reflect any fees or expenses. The performance of each index is not necessarily representative of the Fund’s performance.
4
As a shareholder of the Fund, you incur ongoing costs, including management fees; expenses related to the Fund’s services arrangements with certain insurance companies; and other Fund expenses. This Example is intended to help you understand your ongoing costs (in dollars) of investing in the Fund and to compare these costs with the ongoing costs of investing in other mutual funds.
The Example is based on an investment of $1,000 invested at the beginning of the period and held for the entire period (July 1, 2018 through December 31, 2018).
The Example reflects only expenses that are deducted from the assets of the Fund. Fees and expenses, including sales charges applicable to the various insurance products that invest in the Fund, are not reflected in this Example. If such fees and expenses were reflected in the Example, the total expenses shown would be higher. Fees and expenses regarding such variable insurance products are separately described in the prospectus related to those products.
Actual Expenses
The first line of the table on the following page provides information about actual account values and actual expenses. You may use the information in this line, together with the amount you invested, to estimate the expenses that you paid over the period. Simply divide your account value by $1,000 (for example, an $8,600 account value divided by $1,000 = 8.6), then multiply the result by the number in the first line under the heading titled “Expenses Paid During Period 7/1/18 – 12/31/18” to estimate the expenses you paid on your account during this period.
Hypothetical Example for Comparison Purposes
The second line of the table on the following page provides information about hypothetical account values and hypothetical expenses based on the Fund’s actual expense ratio and an assumed rate of return of 5% per year before expenses, which is not the Fund’s actual return. The hypothetical account values and expenses may not be used to estimate the actual ending account balance or expenses you paid for the period. You may use this information to compare the ongoing costs of investing in the Fund and other funds. To do so, compare this 5% hypothetical example with the 5% hypothetical examples that appear in the shareholder reports of the other funds.
5
Please note that the expenses shown in the table are meant to highlight your ongoing costs only and do not reflect any transactional costs, such as sales charges. Therefore, the second line of the table is useful in comparing ongoing costs only, and will not help you determine the relative total costs of owning different funds. In addition, if these transactional costs were included, your costs would have been higher.
| Beginning | Ending | Expenses | |||||
| Account | Account | Paid During | |||||
| Value | Value | Period† | |||||
| 7/1/18 – | |||||||
| 7/1/18 | 12/31/18 | 12/31/18 | |||||
| Class VC | |||||||
| Actual | $1,000.00 | $ 947.10 | $4.56 | ||||
| Hypothetical (5% Return Before Expenses) | $1,000.00 | $1,020.52 | $4.74 |
| † | Net expenses are equal to the Fund’s annualized expense ratio of 0.93%, multiplied by the average account value over the period, multiplied by 184/365 (to reflect one-half year period). |
Portfolio Holdings Presented by Sector
December 31, 2018
| Sector* | %** | |||
| Communication Services | 6.81 | % | ||
| Consumer Discretionary | 7.06 | % | ||
| Consumer Staples | 6.71 | % | ||
| Energy | 9.92 | % | ||
| Financials | 20.25 | % | ||
| Health Care | 16.85 | % | ||
| Industrials | 8.32 | % | ||
| Information Technology | 9.15 | % | ||
| Materials | 4.00 | % | ||
| Real Estate | 2.65 | % | ||
| Utilities | 4.65 | % | ||
| Repurchase Agreement | 3.63 | % | ||
| Total | 100.00 | % | ||
| * | A sector may comprise several industries. |
| ** | Represents percent of total investments. |
6
December 31, 2018
| Fair | ||||||||
| Value | ||||||||
| Investments | Shares | (000) | ||||||
| COMMON STOCKS 96.83% | ||||||||
| Airlines 0.83% | ||||||||
| Delta Air Lines, Inc. | 90,616 | $ | 4,522 | |||||
| Auto Components 1.00% | ||||||||
| Lear Corp. | 44,500 | 5,467 | ||||||
| Banks 14.94% | ||||||||
| Bank of America Corp. | 795,270 | 19,595 | ||||||
| Citizens Financial Group, Inc. | 259,925 | 7,728 | ||||||
| Comerica, Inc. | 112,669 | 7,739 | ||||||
| East West Bancorp, Inc. | 124,341 | 5,413 | ||||||
| JPMorgan Chase & Co. | 220,765 | 21,551 | ||||||
| Royal Bank of Scotland Group plc (United Kingdom)(a) | 506,992 | 1,406 | ||||||
| Signature Bank | 42,115 | 4,330 | ||||||
| SVB Financial Group* | 18,369 | 3,489 | ||||||
| Wells Fargo & Co. | 229,968 | 10,597 | ||||||
| Total | 81,848 | |||||||
| Beverages 2.28% | ||||||||
| Coca-Cola Co. (The) | 148,916 | 7,051 | ||||||
| PepsiCo, Inc. | 49,400 | 5,458 | ||||||
| Total | 12,509 | |||||||
| Biotechnology 0.69% | ||||||||
| Gilead Sciences, Inc. | 60,878 | 3,808 | ||||||
| Capital Markets 0.84% | ||||||||
| Goldman Sachs Group, Inc. (The) | 27,450 | 4,585 | ||||||
| Chemicals 2.60% | ||||||||
| DowDuPont, Inc. | 265,831 | 14,217 | ||||||
| Communications Equipment 3.22% | ||||||||
| Cisco Systems, Inc. | 407,470 | 17,656 | ||||||
| Consumer Finance 0.94% | ||||||||
| Discover Financial Services | 87,073 | 5,135 | ||||||
| Diversified Telecommunication Services 4.11% | ||||||||
| AT&T, Inc. | 249,148 | 7,111 | ||||||
| Fair | ||||||||
| Value | ||||||||
| Investments | Shares | (000) | ||||||
| Verizon Communications, Inc. | 274,220 | $ | 15,416 | |||||
| Total | 22,527 | |||||||
| Electric: Utilities 4.68% | ||||||||
| Duke Energy Corp. | 140,599 | 12,133 | ||||||
| NextEra Energy, Inc. | 77,521 | 13,475 | ||||||
| Total | 25,608 | |||||||
| Electrical Equipment 3.13% | ||||||||
| AMETEK, Inc. | 171,051 | 11,580 | ||||||
| Hubbell, Inc. | 56,023 | 5,565 | ||||||
| Total | 17,145 | |||||||
| Energy Equipment & Services 0.96% | ||||||||
| National Oilwell Varco, Inc. | 203,872 | 5,239 | ||||||
| Entertainment 1.43% | ||||||||
| Walt Disney Co. (The) | 71,479 | 7,838 | ||||||
| Equity Real Estate Investment Trusts 2.66% | ||||||||
| Boston Properties, Inc. | 37,908 | 4,266 | ||||||
| Prologis, Inc. | 175,235 | 10,290 | ||||||
| Total | 14,556 | |||||||
| Food & Staples Retailing 2.10% | ||||||||
| Walmart, Inc. | 123,443 | 11,499 | ||||||
| Food Products 0.81% | ||||||||
| Mondelez International, Inc. Class A | 110,341 | 4,417 | ||||||
| Health Care Equipment & Supplies 2.72% | ||||||||
| Abbott Laboratories | 120,929 | 8,747 | ||||||
| Boston Scientific Corp.* | 173,673 | 6,137 | ||||||
| Total | 14,884 | |||||||
| Health Care Providers & Services 1.53% | ||||||||
| Anthem, Inc. | 31,947 | 8,390 | ||||||
| Hotels, Restaurants & Leisure 0.96% | ||||||||
| Yum! Brands, Inc. | 57,083 | 5,247 | ||||||
| Industrial Conglomerates 2.35% | ||||||||
| Honeywell International, Inc. | 97,591 | 12,894 | ||||||
| See Notes to Financial Statements. | 7 |
Schedule of Investments (continued)
December 31, 2018
| Fair | ||||||||
| Value | ||||||||
| Investments | Shares | (000) | ||||||
| Insurance 3.62% | ||||||||
| Chubb Ltd. (Switzerland)(a) | 87,256 | $ | 11,272 | |||||
| Hartford Financial Services Group, Inc. (The) | 192,647 | 8,563 | ||||||
| Total | 19,835 | |||||||
| Interactive Media & Services 1.30% | ||||||||
| Alphabet, Inc. Class A* | 6,821 | 7,128 | ||||||
| Internet & Direct Marketing Retail 0.23% | ||||||||
| Alibaba Group Holding Ltd.ADR* | 9,102 | 1,248 | ||||||
| Machinery 1.58% | ||||||||
| Stanley Black & Decker, Inc. | 72,375 | 8,666 | ||||||
| Media 0.42% | ||||||||
| Interpublic Group of Cos., Inc. (The) | 43,785 | 903 | ||||||
| Omnicom Group, Inc. | 18,890 | 1,384 | ||||||
| Total | 2,287 | |||||||
| Metals & Mining 1.43% | ||||||||
| Nucor Corp. | 101,972 | 5,283 | ||||||
| Steel Dynamics, Inc. | 84,063 | 2,525 | ||||||
| Total | 7,808 | |||||||
| Multi-Line Retail 0.68% | ||||||||
| Dollar Tree, Inc.* | 41,039 | 3,707 | ||||||
| Oil, Gas & Consumable Fuels 9.01% | ||||||||
| Chevron Corp. | 172,201 | 18,734 | ||||||
| ConocoPhillips | 66,168 | 4,126 | ||||||
| EOG Resources, Inc. | 11,986 | 1,045 | ||||||
| Marathon Petroleum Corp. | 168,613 | 9,950 | ||||||
| Noble Energy, Inc. | 371,727 | 6,974 | ||||||
| Royal Dutch Shell plc Class A ADR | 146,036 | 8,509 | ||||||
| Total | 49,338 | |||||||
| Fair | ||||||||
| Value | ||||||||
| Investments | Shares | (000) | ||||||
| Personal Products 1.08% | ||||||||
| Unilever NV Registered Shares(United Kingdom)(a) | 110,060 | $ | 5,921 | |||||
| Pharmaceuticals 11.98% | ||||||||
| Allergan plc | 44,461 | 5,943 | ||||||
| Jazz Pharmaceuticals plc(Ireland)*(a) | 20,680 | 2,563 | ||||||
| Johnson & Johnson | 166,623 | 21,503 | ||||||
| Merck & Co., Inc. | 224,707 | 17,170 | ||||||
| Novartis AG ADR | 38,076 | 3,267 | ||||||
| Pfizer, Inc. | 348,062 | 15,193 | ||||||
| Total | 65,639 | |||||||
| Road & Rail 0.47% | ||||||||
| CSX Corp. | 41,345 | 2,569 | ||||||
| Semiconductors & Semiconductor Equipment 1.10% | ||||||||
| Intel Corp. | 128,914 | 6,050 | ||||||
| Software 3.52% | ||||||||
| Microsoft Corp. | 126,593 | 12,858 | ||||||
| Oracle Corp. | 142,738 | 6,445 | ||||||
| Total | 19,303 | |||||||
| Specialty Retail 3.82% | ||||||||
| Foot Locker, Inc. | 76,208 | 4,054 | ||||||
| Home Depot, Inc. (The) | 55,256 | 9,494 | ||||||
| O’Reilly Automotive, Inc.* | 21,376 | 7,361 | ||||||
| Total | 20,909 | |||||||
| Technology Hardware, Storage & Peripherals 1.34% | ||||||||
| HP, Inc. | 359,855 | 7,363 | ||||||
| Tobacco 0.47% | ||||||||
| Philip Morris International, Inc. | 38,229 | 2,552 | ||||||
| Total Common Stocks (cost $536,865,637) | 530,314 | |||||||
| 8 | See Notes to Financial Statements. |
Schedule of Investments (concluded)
December 31, 2018
| Principal | Fair | |||||||
| Amount | Value | |||||||
| Investments | (000) | (000) | ||||||
| SHORT-TERM INVESTMENT 3.65% | ||||||||
| Repurchase Agreement | ||||||||
| Repurchase Agreement dated 12/31/2018, 1.45% due 1/2/2019 with Fixed Income Clearing Corp. collateralized by $19,840,000 of U.S. Treasury Note at 2.875% due 7/31/2025; value: $20,357,864; proceeds: $19,958,873 (cost $19,957,265) | $ | 19,957 | $ | 19,957 | ||||
| Total Investments in Securities 100.48% (cost $556,822,902) | 550,271 | |||||||
| Liabilities in Excess of Other Assets (0.48)% | (2,604 | ) | ||||||
| Net Assets 100.00% | $ | 547,667 | ||||||
| ADR | American Depositary Receipt. | |
| * | Non-income producing security. | |
| (a) | Foreign security traded in U.S. dollars. |
The following is a summary of the inputs used as of December 31, 2018 in valuing the Fund’s investments carried at fair value(1):
| Level 1 | Level 2 | Level 3 | Total | |||||||||||||
| Investment Type(2)(3) | (000) | (000) | (000) | (000) | ||||||||||||
| Common Stocks | ||||||||||||||||
| Bank | $ | 80,442 | $ | 1,406 | $ | – | $ | 81,848 | ||||||||
| Remaining Industries | 448,466 | – | – | 448,466 | ||||||||||||
| Short-Term Investment | ||||||||||||||||
| Repurchase Agreement | – | 19,957 | – | 19,957 | ||||||||||||
| Total | $ | 528,908 | $ | 21,363 | $ | – | $ | 550,271 | ||||||||
| (1) | Refer to Note 2(h) for a description of fair value measurements and the three-tier hierarchy of inputs. | |
| (2) | See Schedule of Investments for fair values in each industry and identification of foreign issuers and/or geography. | |
| (3) | There were no Level 1/Level 2 transfers during the fiscal year ended December 31, 2018. |
| See Notes to Financial Statements. | 9 |
Statement of Assets and Liabilities
December 31, 2018
| ASSETS: | ||||
| Investments in securities, at fair value (cost $556,822,902) | $ | 550,270,908 | ||
| Receivables: | ||||
| Investment securities sold | 2,517,611 | |||
| Capital shares sold | 1,096,127 | |||
| Interest and dividends | 744,920 | |||
| Prepaid expenses | 3,370 | |||
| Total assets | 554,632,936 | |||
| LIABILITIES: | ||||
| Payables: | ||||
| Investment securities purchased | 5,711,101 | |||
| Management fee | 238,773 | |||
| Directors’ fees | 200,950 | |||
| Capital shares reacquired | 159,772 | |||
| Fund administration | 19,102 | |||
| Accrued expenses | 636,101 | |||
| Total liabilities | 6,965,799 | |||
| NET ASSETS | $ | 547,667,137 | ||
| COMPOSITION OF NET ASSETS: | ||||
| Paid-in capital | $ | 552,472,246 | ||
| Total distributable earnings (loss) | (4,805,109 | ) | ||
| Net Assets | $ | 547,667,137 | ||
| Outstanding shares (200 million shares of common stock authorized, $.001 par value) | 17,869,598 | |||
| Net asset value, offering and redemption price per share (Net assets divided by outstanding shares) | $30.65 |
| 10 | See Notes to Financial Statements. |
For the Year Ended December 31, 2018
| Investment income: | ||||
| Dividends (net of foreign withholding taxes of $184,099) | $ | 14,510,201 | ||
| Interest and other | 122,972 | |||
| Total investment income | 14,633,173 | |||
| Expenses: | ||||
| Management fee | 3,209,808 | |||
| Non 12b-1 service fees | 1,604,035 | |||
| Shareholder servicing | 688,178 | |||
| Fund administration | 256,785 | |||
| Professional | 60,735 | |||
| Reports to shareholders | 59,677 | |||
| Directors’ fees | 22,777 | |||
| Custody | 9,324 | |||
| Other | 73,043 | |||
| Gross expenses | 5,984,362 | |||
| Expense reductions (See Note 8) | (14,889 | ) | ||
| Net expenses | 5,969,473 | |||
| Net investment income | 8,663,700 | |||
| Net realized and unrealized gain (loss): | ||||
| Net realized gain on investments | 49,459,494 | |||
| Net change in unrealized appreciation/depreciation on investments | (106,553,534 | ) | ||
| Net change in unrealized appreciation/depreciation on translation of assets and liabilities denominated in foreign currencies | (2,598 | ) | ||
| Net realized and unrealized loss | (57,096,638 | ) | ||
| Net Decrease in Net Assets Resulting From Operations | $ | (48,432,938 | ) |
| See Notes to Financial Statements. | 11 |
Statements of Changes in Net Assets
| For the Year Ended | For the Year Ended | |||||||
| DECREASE IN NET ASSETS | December 31, 2018 | December 31, 2017 | ||||||
| Operations: | ||||||||
| Net investment income | $ | 8,663,700 | $ | 8,775,945 | ||||
| Net realized gain on investments | 49,459,494 | 70,166,662 | ||||||
| Net change in unrealized appreciation/depreciation on investments and translation of assets and liabilities denominated in foreign currencies | (106,556,132 | ) | 8,637,716 | |||||
| Net increase (decrease) in net assets resulting from operations | (48,432,938 | ) | 87,580,323 | |||||
| Distributions to shareholders(1) | (56,851,415 | ) | (75,753,325 | ) | ||||
| Capital share transactions (See Note 13): | ||||||||
| Proceeds from sales of shares | 18,918,349 | 17,368,355 | ||||||
| Reinvestment of distributions | 56,833,112 | 75,753,394 | ||||||
| Cost of shares reacquired | (119,363,930 | ) | (126,934,815 | ) | ||||
| Net decrease in net assets resulting from capital share transactions | (43,612,469 | ) | (33,813,066 | ) | ||||
| Net decrease in net assets | (148,896,822 | ) | (21,986,068 | ) | ||||
| NET ASSETS: | ||||||||
| Beginning of year | $ | 696,563,959 | $ | 718,550,027 | ||||
| End of year | $ | 547,667,137 | $ | 696,563,959 | ||||
| Distributions in excess of net investment income(2) | $ | – | $ | – | ||||
| (1) | The SEC eliminated the requirement to disclose the source of distributions paid in 2018. For the year ended December 31, 2017, the source of distributions was net investment income $(9,018,929) and net realized gain $(66,734,396). |
| (2) | The SEC eliminated the requirement to disclose distributions in excess of net investment income in 2018. For the year ended December 31, 2017, the distributions in excess of net investment income was $(205,674). |
| 12 | See Notes to Financial Statements. |
This page is intentionally left blank.
| Per Share Operating Performance: | ||||||||||||||||||||||||||||||
| Distributions to | ||||||||||||||||||||||||||||||
| Investment Operations: | shareholders from: | |||||||||||||||||||||||||||||
| Total | ||||||||||||||||||||||||||||||
| Net | from | |||||||||||||||||||||||||||||
| Net asset | Net | realized | invest- | Net | ||||||||||||||||||||||||||
| value | invest- | and | ment | invest- | Net | Total | ||||||||||||||||||||||||
| beginning | ment | unrealized | oper- | ment | realized | distri- | ||||||||||||||||||||||||
| of period | income(a) | gain (loss) | ations | income | gain | butions | ||||||||||||||||||||||||
| 12/31/2018 | $ 37.15 | $ 0.50 | $ (3.53 | ) | $ | (3.03 | ) | $ (0.52 | ) | $ (2.95 | ) | $ | (3.47 | ) | ||||||||||||||||
| 12/31/2017 | 36.72 | 0.48 | 4.39 | 4.87 | (0.53 | ) | (3.91 | ) | (4.44 | ) | ||||||||||||||||||||
| 12/31/2016 | 32.21 | 0.52 | 4.99 | 5.51 | (0.52 | ) | (0.48 | ) | (1.00 | ) | ||||||||||||||||||||
| 12/31/2015 | 35.54 | 0.40 | (1.43 | ) | (1.03 | ) | (0.44 | ) | (1.86 | ) | (2.30 | ) | ||||||||||||||||||
| 12/31/2014 | 33.24 | 0.22 | 2.33 | 2.55 | (0.25 | ) | – | (0.25 | ) | |||||||||||||||||||||
| (a) | Calculated using average shares outstanding during the period. | |
| (b) | Total return does not consider the effects of sales loads and assumes the reinvestment of all distributions. |
| 14 | See Notes to Financial Statements. |
| Ratios to Average Net Assets: | Supplemental Data: | |||||||||||||||||||||
| Net | Net | |||||||||||||||||||||
| asset | Net | assets, | Portfolio | |||||||||||||||||||
| value, | Total | Total | investment | end of | turnover | |||||||||||||||||
| end of | return(b) | expenses | income | period | rate | |||||||||||||||||
| period | (%) | (%) | (%) | (000) | (%) | |||||||||||||||||
| $ | 30.65 | (8.14 | ) | 0.93 | 1.35 | $ | 547,667 | 89 | ||||||||||||||
| 37.15 | 13.38 | 0.93 | 1.26 | 696,564 | 97 | |||||||||||||||||
| 36.72 | 17.11 | 0.94 | 1.54 | 718,550 | 98 | |||||||||||||||||
| 32.21 | (2.86 | ) | 0.94 | 1.15 | 724,298 | 105 | ||||||||||||||||
| 35.54 | 7.65 | 0.93 | 0.65 | 882,379 | 122 | |||||||||||||||||
| See Notes to Financial Statements. | 15 |
| 1. | ORGANIZATION |
Lord Abbett Series Fund, Inc. (the “Company”) is registered under the Investment Company Act of 1940, as amended (the “Act”), as a diversified, open-end management investment company and was incorporated under Maryland law in 1989. The Company consists of twelve separate portfolios. This report covers Growth and Income Portfolio (the “Fund”).
The Fund’s investment objective is long-term growth of capital and income without excessive fluctuations in market value. The Fund’s Variable Contract class shares (“Class VC Shares”), are currently issued and redeemed only in connection with investments in, and payments under, variable annuity contracts and variable life insurance policies issued by life insurance and insurance-related companies.
The preparation of the financial statements in conformity with accounting principles generally accepted in the United States of America (“U.S. GAAP”) requires management to make certain estimates and assumptions that affect the reported amounts of assets and liabilities and disclosure of contingent assets and liabilities at the date of the financial statements and the reported amounts of increases and decreases in net assets from operations during the reporting period. Actual results could differ from those estimates. The Fund is considered an investment company under U.S. GAAP and follows the accounting and reporting guidance applicable to investment companies.
| 2. | SIGNIFICANT ACCOUNTING POLICIES |
| (a) | Investment Valuation–Under procedures approved by the Fund’s Board of Directors (the “Board”), Lord, Abbett & Co. LLC (“Lord Abbett”), the Fund’s investment manager, has formed a Pricing Committee to administer the pricing and valuation of portfolio investments and to ensure that prices utilized reasonably reflect fair value. Among other things, these procedures allow the Fund to utilize independent pricing services, quotations from securities and financial instrument dealers and other market sources to determine fair value. |
| Securities actively traded on any recognized U.S. or non-U.S. exchange or on The NASDAQ Stock Market LLC are valued at the last sale price or official closing price on the exchange or system on which they are principally traded. Events occurring after the close of trading on non-U.S. exchanges may result in adjustments to the valuation of foreign securities to reflect their fair value as of the close of regular trading on the New York Stock Exchange. The Fund may utilize an independent fair valuation service in adjusting the valuations of foreign securities. Unlisted equity securities are valued at the last quoted sale price or, if no sale price is available, at the mean between the most recently quoted bid and asked prices. | |
| Securities for which prices are not readily available are valued at fair value as determined by the Pricing Committee. The Pricing Committee considers a number of factors, including observable and unobservable inputs, when arriving at fair value. The Pricing Committee may use related or comparable assets or liabilities, recent transactions, market multiples, book values and other relevant information to determine the fair value of portfolio investments. The Board or a designated committee thereof regularly reviews fair value determinations made by the Pricing Committee and may employ techniques such as reviewing related market activity, reviewing inputs and assumptions, and retrospectively comparing prices of subsequent purchases and sales transactions to fair value determinations made by the Pricing Committee. | |
| Short-term securities with 60 days or less remaining to maturity are valued using the amortized cost method, which approximates fair value. |
16
Notes to Financial Statements (continued)
| (b) | Security Transactions–Security transactions are recorded as of the date that the securities are purchased or sold (trade date). Realized gains and losses on sales of portfolio securities are calculated using the identified-cost method. |
| (c) | Investment Income–Dividend income is recorded on the ex-dividend date. Interest income is recorded on the accrual basis as earned. Discounts are accreted and premiums are amortized using the effective interest method and are included in Interest and other income on the Statement of Operations. Withholding taxes on foreign dividends have been provided for in accordance with the applicable country’s tax rules and rates. |
| (d) | Income Taxes–It is the policy of the Fund to meet the requirements of Subchapter M of the Internal Revenue Code applicable to regulated investment companies and to distribute substantially all taxable income and capital gains to its shareholders. Therefore, no income tax provision is required. |
| The Fund files U.S. federal and various state and local tax returns. No income tax returns are currently under examination. The statute of limitations on the Fund’s filed U.S. federal tax returns remains open for the fiscal years ended December 31, 2015 through December 31, 2018. The statutes of limitations on the Company’s state and local tax returns may remain open for an additional year depending upon the jurisdiction. | |
| (e) | Expenses–Expenses incurred by the Company that do not specifically relate to an individual fund are generally allocated to the funds within the Company on a pro rata basis by relative net assets. |
| (f) | Foreign Transactions–The books and records of the Fund are maintained in U.S. dollars and transactions denominated in foreign currencies are recorded in the Fund’s records at the rate prevailing when earned or recorded. Asset and liability accounts that are denominated in foreign currencies are adjusted daily to reflect current exchange rates and any unrealized gain (loss), if applicable, is included in Net change in unrealized appreciation/depreciation on translation of asset and liabilities denominated in foreign currencies in the Fund’s Statement of Operations. The resultant exchange gains and losses upon settlement of such transactions are included in Net realized gain (loss), if applicable, on foreign currency related transactions in the Fund’s Statement of Operations. The Fund does not isolate that portion of the results of operations arising as a result of changes in the foreign exchange rates from the changes in market prices of the securities. |
| (g) | Repurchase Agreements–The Fund may enter into repurchase agreements with respect to securities. A repurchase agreement is a transaction in which a fund acquires a security and simultaneously commits to resell that security to the seller (a bank or securities dealer) at an agreed-upon price on an agreed-upon date. The Fund requires at all times that the repurchase agreement be collateralized by cash, or by securities of the U.S. Government, its agencies, its instrumentalities, or U.S. Government sponsored enterprises having a value equal to, or in excess of, the value of the repurchase agreement (including accrued interest). If the seller of the agreement defaults on its obligation to repurchase the underlying securities at a time when the fair value of these securities has declined, the Fund may incur a loss upon disposition of the securities. |
| (h) | Fair Value Measurements–Fair value is defined as the price that the Fund would receive upon selling an investment or transferring a liability in an orderly transaction to an independent buyer in the principal or most advantageous market of the investment. A three-tier hierarchy is used to maximize the use of observable market data and minimize the use of unobservable inputs and |
17
Notes to Financial Statements (continued)
| to establish classification of fair value measurements for disclosure purposes. Inputs refer broadly to the assumptions that market participants would use in pricing the asset or liability, including assumptions about risk—for example, the risk inherent in a particular valuation technique used to measure fair value (such as a pricing model) and/or the risk inherent in the inputs to the valuation technique. Inputs may be observable or unobservable. Observable inputs reflect the assumptions market participants would use in pricing the asset or liability. Observable inputs are based on market data obtained from sources independent of the reporting entity. Unobservable inputs reflect the reporting entity’s own assumptions about the assumptions market participants would use in pricing the asset or liability. Unobservable inputs are based on the best information available in the circumstances. The three-tier hierarchy classification is determined based on the lowest level of inputs that is significant to the fair value measurement, and is summarized in the three broad Levels listed below: |
| • | Level 1 – | unadjusted quoted prices in active markets for identical investments; | |
| • | Level 2 – | other significant observable inputs (including quoted prices for similar investments, interest rates, prepayment speeds, credit risk, etc.); and | |
| • | Level 3 – | significant unobservable inputs (including the Fund’s own assumptions in determining the fair value of investments). |
| A summary of inputs used in valuing the Fund’s investments as of December 31, 2018 and, if applicable, Level 1/Level 2 transfers and Level 3 rollforwards for the fiscal year then ended is included in the Fund’s Schedule of Investments. | |
| Changes in valuation techniques may result in transfers into or out of an assigned level within the three-tier hierarchy. All transfers between different levels within the three-tier hierarchy are deemed to have occurred as of the beginning of the reporting period. The inputs or methodology used for valuing securities are not necessarily an indication of the risk associated with investing in those securities. |
| 3. | MANAGEMENT FEE AND OTHER TRANSACTIONS WITH AFFILIATES |
Management Fee
The Company has a management agreement with Lord Abbett, pursuant to which Lord Abbett supplies the Fund with investment management services and executive and other personnel, provides office space and pays for ordinary and necessary office and clerical expenses relating to research and statistical work and supervision of the Fund’s investment portfolio.
The management fee is based on the Fund’s average daily net assets at the following annual rate:
| First $1 billion | .50% |
| Over $1 billion | .45% |
For the fiscal year ended December 31, 2018, the effective management fee paid to Lord Abbett was at an annualized rate of .50% of the Fund’s average daily net assets.
In addition, Lord Abbett provides certain administrative services to the Fund pursuant to an Administrative Services Agreement in return for a fee at an annual rate of .04% of the Fund’s average daily net assets.
The Company, on behalf of the Fund, has entered into services arrangements with certain insurance companies. Under these arrangements, certain insurance companies will be compensated up to
18
Notes to Financial Statements (continued)
.25% of the average daily net asset value (“NAV”) of the Fund’s Class VC Shares held in the insurance company’s separate account to service and maintain the Variable Contract owners’ accounts. This amount is included in Non 12b-1 service fees on the Statement of Operations. The Fund may also compensate certain insurance companies, third-party administrators and other entities for providing recordkeeping, sub-transfer agency and other administrative services to the Fund. This amount is included in Shareholder servicing on the Statement of Operations.
One Director and certain of the Company’s officers have an interest in Lord Abbett.
| 4. | DISTRIBUTIONS AND CAPITAL LOSS CARRYFORWARDS |
Dividends from net investment income, if any, are declared and paid at least semi-annually. Taxable net realized gains from investment transactions, reduced by allowable capital loss carryforwards, if any, are declared and distributed to shareholders at least annually. The capital loss carryforward amount, if any, is available to offset future net capital gains. Dividends and distributions to shareholders are recorded on the ex-dividend date. The amounts of dividends and distributions from net investment income and net realized capital gains are determined in accordance with federal income tax regulations, which may differ from U.S. GAAP. These book/tax differences are either considered temporary or permanent in nature. To the extent these differences are permanent in nature, such amounts are reclassified within the components of net assets based on their federal tax basis treatment; temporary differences do not require reclassification. Dividends and distributions that exceed earnings and profits for tax purposes are reported as a tax return of capital.
The tax character of distributions paid during the fiscal years ended December 31, 2018 and 2017 were as follows:
| Year Ended 12/31/2018 | Year Ended 12/31/2017 | |||||||||
| Distributions paid from: | ||||||||||
| Ordinary income | $ | 19,004,931 | $ | 33,415,693 | ||||||
| Net long-term capital gains | 37,846,484 | 42,337,632 | ||||||||
| Total distributions paid | $ | 56,851,415 | $ | 75,753,325 | ||||||
As of December 31, 2018, the components of accumulated losses on a tax-basis were as follows:
| Undistributed ordinary income – net | $ | 65,313 | ||
| Undistributed long-term capital gains | 7,092,454 | |||
| Total undistributed earnings | 7,157,767 | |||
| Temporary differences | (4,254,656 | ) | ||
| Unrealized losses – net | (7,708,220 | ) | ||
| Total accumulated losses – net | $ | (4,805,109 | ) |
At the Fund’s election, certain losses incurred within the taxable year (Qualified Late-Year Losses) are deemed to arise on the first business day of the Fund’s next taxable year. The Fund incurred and will elect to defer post-October capital losses of $4,053,706 during fiscal year 2018.
As of December 31, 2018, the aggregate unrealized security gains and losses on investments and other financial instruments based on cost for U.S. federal income tax purposes were as follows:
| Tax cost | $ | 557,976,530 | ||
| Gross unrealized gain | 29,814,977 | |||
| Gross unrealized loss | (37,520,599 | ) | ||
| Net unrealized security loss | $ | (7,705,622 | ) |
19
Notes to Financial Statements (continued)
The difference between book-basis and tax-basis unrealized gains (losses) is attributable to the tax treatment of wash sales.
| 5. | PORTFOLIO SECURITIES TRANSACTIONS |
Purchases and sales of investment securities (excluding short-term investments) for the fiscal year ended December 31, 2018 were as follows:
| Purchases | Sales | |
| $554,895,909 | $653,735,630 |
There were no purchases or sales of U.S. Government securities for the fiscal year ended December 31, 2018.
The Fund is permitted to purchase and sell securities (“cross-trade”) from and to other Lord Abbett funds or client accounts pursuant to procedures approved by the Board in compliance with Rule 17a-7 under the Act (the “Rule”). Each cross-trade is executed at a fair market price in compliance with provisions of the Rule. For the fiscal year ended December 31, 2018, the Fund engaged in cross-trades purchases of $997,326 and sales of $4,250,702 which resulted in net realized gains of $207,353.
| 6. | DISCLOSURES ABOUT OFFSETTING ASSETS AND LIABILITIES |
The Financial Accounting Standards Board (“FASB”) requires disclosures intended to help better assess the effect or potential effect of offsetting arrangements on a fund’s financial position. The following tables illustrate gross and net information about recognized assets and liabilities eligible for offset in the statement of assets and liabilities; and disclose such amounts subject to an enforceable master netting agreement or similar agreement, by counterparty. A master netting agreement is an agreement between a fund and a counterparty which provides for the net settlement of amounts owed under all contracts traded under that agreement, as well as cash collateral, through a single payment by one party to the other in the event of default on or termination of any one contract. The Fund’s accounting policy with respect to balance sheet offsetting is that, absent an event of default by the counterparty or a termination of the agreement, the master netting agreement does not result in an offset of reported amounts of financial assets and liabilities in the statement of assets and liabilities across transactions between the Fund and the applicable counterparty:
| Description | Gross Amounts of Recognized Assets | Gross Amounts Offset in the Statement of Assets and Liabilities | Net Amounts of Assets Presented in the Statement of Assets and Liabilities | |||||||||
| Repurchase Agreement | $ | 19,957,265 | $ | – | $ | 19,957,265 | ||||||
| Total | $ | 19,957,265 | $ | – | $ | 19,957,265 | ||||||
| Net Amounts | ||||||||||||||||||||
| of Assets | Amounts Not Offset in the | |||||||||||||||||||
| Presented in | Statement of Assets and Liabilities | |||||||||||||||||||
| Counterparty | the Statement of Assets and Liabilities | Financial Instruments | Cash Collateral Received(a) | Securities Collateral Received(a) | Net Amount(b) | |||||||||||||||
| Fixed Income Clearing Corp. | $ | 19,957,265 | $ | – | $ | – | $ | (19,957,265 | ) | $ | – | |||||||||
| Total | $ | 19,957,265 | $ | – | $ | – | $ | (19,957,265 | ) | $ | – | |||||||||
| (a) | Collateral disclosed is limited to an amount not to exceed 100% of the net amount of assets presented in the Statement of Assets and Liabilities, for each respective counterparty. |
| (b) | Net amount represents the amount owed to the Fund by the counterparty as of December 31, 2018. |
20
Notes to Financial Statements (continued)
| 7. | DIRECTORS’ REMUNERATION |
The Company’s officers and one Director, who are associated with Lord Abbett, do not receive any compensation from the Company for serving in such capacities. Independent Directors’ fees are allocated among all Lord Abbett-sponsored funds based on the net assets of each fund. There is an equity-based plan available to all Independent Directors under which Independent Directors must defer receipt of a portion of, and may elect to defer receipt of an additional portion of Directors’ fees. The deferred amounts are treated as though equivalent dollar amounts had been invested in the funds. Such amounts and earnings accrued thereon are included in Directors’ fees on the Statement of Operations and in Directors’ fees payable on the Statement of Assets and Liabilities and are not deductible for U.S. federal income tax purposes until such amounts are paid.
| 8. | EXPENSE REDUCTIONS |
The Company has entered into an arrangement with its transfer agent and custodian, whereby credits realized as a result of uninvested cash balances are used to reduce a portion of the Fund’s expenses.
| 9. | LINE OF CREDIT |
During the period ended August 8, 2018, the Fund and certain other funds managed by Lord Abbett (collectively, the “Participating Funds”) participated in a syndicated line of credit facility with various lenders for $600 million (the “Facility”), whereas State Street Bank and Trust Company (“SSB”) participates as a lender and as agent for the lenders. The Facility is to be used for temporary or emergency purposes as an additional source of liquidity to satisfy redemptions. The Participating Funds are subject to graduated borrowing limits of one-third of Fund assets (if Fund assets are less than $750 million), $250 million, $300 million, or $350 million, based on past borrowings and likelihood of future borrowings. During the period ended August 8, 2018, the Fund did not utilize the Facility.
For the period August 9, 2018 through December 20, 2018, the Participating Funds entered into an amended syndicated line of credit facility with various lenders for $1.06 billion (the “Syndicated Facility”), whereas SSB participates as a lender and as agent for the lenders. Under the Syndicated Facility, the Participating Funds are subject to graduated borrowing limits of one-third of Fund assets (if Fund assets are less than $750 million), $250 million, $300 million, $350 million, or $1 billion, based on past borrowings and likelihood of future borrowings. Effective December 21, 2018, the Participating Funds entered into an amended Syndicated Facility with various lenders for $1.1 billion based on the same terms as described above.
Effective August 9, 2018, the Participating Funds entered into an additional line of credit facility with SSB for $250 million (the “Bilateral Facility,” and together with the Syndicated Facility, the “Facilities”). Under the Bilateral Facility, each Participating Fund may borrow up to the lesser of $250 million or one-third of Fund assets. The Facilities are to be used for temporary or emergency purposes to satisfy redemption requests and manage liquidity.
For the period from August 9, 2018 through December 31, 2018, the Fund did not utilize the Facilities.
| 10. | INTERFUND LENDING PROGRAM |
Pursuant to an exemptive order issued by the U.S. Securities and Exchange Commission (“SEC exemptive order”) certain registered open-end management investment companies managed by Lord Abbett, including the Fund, participate in a joint lending and borrowing program (the
21
Notes to Financial Statements (concluded)
Interfund Lending Program”). The SEC exemptive order allows the Funds to borrow money from and lend money to each other for temporary emergency purposes subject to the limitations and conditions. During the fiscal year ended December 31, 2018, the Fund did not participate as a borrower or lender in the Interfund Lending Program.
| 11. | CUSTODIAN AND ACCOUNTING AGENT |
SSB is the Company’s custodian and accounting agent. SSB performs custodial, accounting and recordkeeping functions relating to portfolio transactions and calculating the Fund’s NAV.
| 12. | INVESTMENT RISKS |
The Fund is subject to the general risks and considerations associated with equity investing, as well as the particular risks associated with value stocks. The value of an investment will fluctuate in response to movements in the equity securities market in general and to the changing prospects of individual companies in which the Fund invests. Value investing also is subject to the risk that a company judged to be undervalued may actually be appropriately priced or even overpriced. Large-cap value stocks may perform differently than the market as a whole and other types of stocks, such as small company stocks and growth stocks. This is because different types of stocks tend to shift in and out of favor over time depending on market and economic conditions as well as investor sentiment. In addition, large companies may have smaller rates of growth as compared to successful but well established smaller companies. The market may fail to recognize the intrinsic value of particular value stocks for a long time. In addition, if the Fund’s assessment of a company’s value or prospects for exceeding earnings expectations or market conditions is wrong, the Fund could suffer losses or produce poor performance relative to other funds, even in a favorable market.
Due to its investments in multinational companies, foreign companies and American Depositary Receipts, the Fund may experience increased market, industry and sector, liquidity, currency, political, information and other risks. The securities of foreign companies also may be subject to inadequate exchange control regulations, the imposition of economic sanctions or other government restrictions, higher transaction and other costs, and delays in settlement to the extent they are traded on non-U.S. exchanges or markets.
These factors can affect the Fund’s performance.
| 13. | SUMMARY OF CAPITAL TRANSACTIONS |
Transactions in shares of capital stock were as follows:
| Year Ended | Year Ended | |||||||
| December 31, 2018 | December 31, 2017 | |||||||
| Shares sold | 532,820 | 459,722 | ||||||
| Reinvestment of distributions | 1,833,178 | 2,044,858 | ||||||
| Shares reacquired | (3,246,152 | ) | (3,324,857 | ) | ||||
| Decrease | (880,154 | ) | (820,277 | ) | ||||
22
Report of Independent Registered Public Accounting Firm
To the shareholders and the Board of Directors of Lord Abbett Series Fund, Inc.:
Opinion on the Financial Statements and Financial Highlights
We have audited the accompanying statement of assets and liabilities, including the schedule of investments, of the Growth and Income Portfolio, one of the portfolios constituting the Lord Abbett Series Fund, Inc. (the “Fund”), as of December 31, 2018, the related statement of operations for the year then ended, the statements of changes in net assets for each of the two years in the period then ended, the financial highlights for each of the five years in the period then ended, and the related notes. In our opinion, the financial statements and financial highlights present fairly, in all material respects, the financial position of the Growth and Income Portfolio of the Fund as of December 31, 2018, and the results of its operations for the year then ended, the changes in its net assets for each of the two years in the period then ended, and the financial highlights for each of the five years in the period then ended in conformity with accounting principles generally accepted in the United States of America.
Basis for Opinion
These financial statements and financial highlights are the responsibility of the Fund’s management. Our responsibility is to express an opinion on the Fund’s financial statements and financial highlights based on our audits. We are a public accounting firm registered with the Public Company Accounting Oversight Board (United States) (PCAOB) and are required to be independent with respect to the Fund in accordance with the U.S. federal securities laws and the applicable rules and regulations of the Securities and Exchange Commission and the PCAOB.
We conducted our audits in accordance with the standards of the PCAOB. Those standards require that we plan and perform the audit to obtain reasonable assurance about whether the financial statements and financial highlights are free of material misstatement, whether due to error or fraud. The Fund is not required to have, nor were we engaged to perform, an audit of its internal control over financial reporting. As part of our audits we are required to obtain an understanding of internal control over financial reporting but not for the purpose of expressing an opinion on the effectiveness of the Fund’s internal control over financial reporting. Accordingly, we express no such opinion.
Our audits included performing procedures to assess the risks of material misstatement of the financial statements and financial highlights, whether due to error or fraud, and performing procedures that respond to those risks. Such procedures included examining, on a test basis, evidence regarding the amounts and disclosures in the financial statements and financial highlights. Our audits also included evaluating the accounting principles used and significant estimates made by management, as well as evaluating the overall presentation of the financial statements and financial highlights. Our procedures included confirmation of securities owned as of December 31, 2018, by correspondence with the custodian and brokers; when replies were not received from brokers, we performed other auditing procedures. We believe that our audits provide a reasonable basis for our opinion.
DELOITTE & TOUCHE LLP
New York, New York
February 15, 2019
We have served as the auditor of one or more Lord Abbett Family of Funds’ investment companies since 1932.
23
Basic Information About Management
The Board is responsible for the management of the business and affairs of the Company in accordance with the laws of the State of Maryland. The Board elects officers who are responsible for the day-to-day operations of the Fund and who execute policies authorized by the Board. The Board also approves an investment adviser to the Fund and continues to monitor the cost and quality of the services the investment adviser provides, and annually considers whether to renew the contract with the adviser. Generally, each Director holds office until his/her successor is elected and qualified or until his/her earlier resignation or removal, as provided in the Company’s organizational documents.
Lord Abbett, a Delaware limited liability company, is the Fund’s investment adviser. Designated Lord Abbett personnel are responsible for the day-to-day management of the Fund.
Interested Directors
Mr. Sieg is affiliated with Lord Abbett and is an “interested person” of the Company as defined in the Act. Mr. Sieg is director/trustee of each of the 13 investment companies in the Lord Abbett Family of Funds, which consist of 62 portfolios or series. Mr. Sieg is an officer of the Lord Abbett Family of Funds.
| Name, Address and Year of Birth | Current Position and Length of Service with the Company | Principal Occupation and Other Directorships During the Past Five Years | ||
| Douglas B. Sieg Lord, Abbett & Co. LLC 90 Hudson Street Jersey City, NJ 07302 (1969) | Director since 2016; President and Chief Executive Officer since 2018 | Principal Occupation: Managing Partner (since 2018) and was formerly Head of Client Services, joined Lord Abbett in 1994. Other Directorships: None. |
Independent Directors
The following Independent Directors also are directors/trustees of each of the 13 investment companies in the Lord Abbett Family of Funds, which consist of 62 portfolios or series.
| Name, Address and Year of Birth | Current Position and Length of Service with the Company | Principal Occupation and Other Directorships During the Past Five Years | ||
| Eric C. Fast Lord, Abbett & Co. LLC c/o Legal Dept. 90 Hudson Street Jersey City, NJ 07302 (1949) | Director since 2014 | Principal Occupation: Chief Executive Officer of Crane Co., an industrial products company (2001–2014). Other Directorships: Currently serves as director of Automatic Data Processing, Inc. (since 2007) and Regions Financial Corporation (since 2010). Previously served as a director of Crane Co. (1999–2014). | ||
| Evelyn E. Guernsey Lord, Abbett & Co. LLC c/o Legal Dept. 90 Hudson Street Jersey City, NJ 07302 (1955) | Director since 2011 | Principal Occupation: CEO, Americas of J.P. Morgan Asset Management (2004–2010). Other Directorships: None. |
24
Basic Information About Management (continued)
| Name, Address and Year of Birth | Current Position and Length of Service with the Company | Principal Occupation and Other Directorships During the Past Five Years | ||
| Julie A. Hill Lord, Abbett & Co. LLC c/o Legal Dept. 90 Hudson Street Jersey City, NJ 07302 (1946) | Director since 2004 | Principal Occupation: Owner and CEO of The Hill Company, a business consulting firm (since 1998). Other Directorships: Currently serves as director of Anthem, Inc., a health benefits company (since 1994). | ||
| Kathleen M. Lutito Lord, Abbett & Co. LLC c/o Legal Dept. 90 Hudson Street Jersey City, NJ 07302 (1963) | Director since 2017 | Principal Occupation: President and Chief Investment Officer of CenturyLink Investment Management Company (since 2006). Other Directorships: None | ||
| James M. McTaggart Lord, Abbett & Co. LLC c/o Legal Dept. 90 Hudson Street Jersey City, NJ 07302 (1947) | Director since 2012 | Principal Occupation: Independent management advisor and consultant (since 2012); Vice President, CRA International, Inc. (doing business as Charles River Associates), a global management consulting firm (2009–2012); Founder and Chairman of Marakon Associates, Inc., a strategy consulting firm (1978–2009); and Officer and Director of Trinsum Group, a holding company (2007–2009). Other Directorships: Blyth, Inc., a home products company (2004–2015). | ||
| Karla M. Rabusch Lord, Abbett & Co. LLC c/o Legal Dept. 90 Hudson Street Jersey City, NJ 07302 (1959) | Director since 2017 | Principal Occupation: President and Director of Wells Fargo Funds Management, LLC (2003–2017); President of Wells Fargo Funds (2003–2016). Other Directorships: None. | ||
| Mark A. Schmid Lord, Abbett & Co. LLC c/o Legal Dept. 90 Hudson Street Jersey City, NJ 07302 (1959) | Director since 2016 | Principal Occupation: Vice President and Chief Investment Officer of the University of Chicago (since 2009). Other Directorships: None. | ||
| James L.L. Tullis Lord, Abbett & Co. LLC c/o Legal Dept. 90 Hudson Street Jersey City, NJ 07302 (1947) | Director since 2006; Chairman since 2017 | Principal Occupation: CEO of Tullis-Dickerson and Co. Inc., a venture capital management firm (since 1990); CEO of Tullis Health Investors Inc. (since 2012). Other Directorships: Currently serves as director of Crane Co. (since 1998). |
Officers
None of the officers listed below have received compensation from the Company. All of the officers of the Company also may be officers of the other Lord Abbett Funds and maintain offices at 90 Hudson Street, Jersey City, NJ 07302. Unless otherwise indicated, the position(s) and title(s) listed under the “Principal Occupation During the Past Five Years” column indicate each officer’s position(s) and title(s) with Lord Abbett. Each officer serves for an indefinite term (i.e., until his or her death, resignation, retirement, or removal).
25
Basic Information About Management (continued)
| Name and Year of Birth | Current Position with the Company | Length of Service of Current Position | Principal Occupation During the Past Five Years | |||
| Douglas B. Sieg (1969) | President and Chief Executive Officer | Elected as President and Chief Executive Officer in 2018 | Managing Partner of Lord Abbett (since 2018) and was formerly Head of Client Services, joined Lord Abbett in 1994. | |||
| Jeff D. Diamond (1960) | Executive Vice President | Elected in 2008 | Portfolio Manager, joined Lord Abbett in 2007. | |||
| Todd D. Jacobson (1966) | Executive Vice President | Elected in 2005 | Partner and Associate Director, joined Lord Abbett in 2003. | |||
| Robert A. Lee (1969) | Executive Vice President | Elected in 2010 | Partner and Chief Investment Officer, and was formerly Deputy Chief Investment Officer and Director of Taxable Fixed Income, joined Lord Abbett in 1997. | |||
| David J. Linsen (1974) | Executive Vice President | Elected in 2008 | Partner and Director of Equities, joined Lord Abbett in 2001. | |||
| Vincent J. McBride (1964) | Executive Vice President | Elected in 2010 | Partner and Director, joined Lord Abbett in 2003. | |||
| Andrew H. O’Brien (1973) | Executive Vice President | Elected in 2010 | Partner and Portfolio Manager, joined Lord Abbett in 1998. | |||
| F. Thomas O’Halloran (1955) | Executive Vice President | Elected in 2010 | Partner and Portfolio Manager, joined Lord Abbett in 2001. | |||
| Marc Pavese (1972) | Executive Vice President | Elected in 2016 | Partner and Portfolio Manager, joined Lord Abbett in 2008. | |||
| Walter H. Prahl (1958) | Executive Vice President | Elected in 2012 | Partner and Director, joined Lord Abbett in 1997. | |||
| Eli Rabinowich (1975) | Executive Vice President | Elected in 2018 | Portfolio Manager, joined Lord Abbett in 2018 and was formerly a Portfolio Manager, Partner, and Analyst at Pzena Investment Management from (2004–2018). |
26
Basic Information About Management (continued)
| Name and Year of Birth | Current Position with the Company | Length of Service of Current Position | Principal Occupation During the Past Five Years | |||
| Jeffrey Rabinowitz (1972) | Executive Vice President | Elected in 2017 | Portfolio Manager, joined Lord Abbett in 2017 and was formerly Managing Director and Portfolio Manager/Technology Analyst at Jennison Associates LLC (2014–2017) and Managing Director and Portfolio Manager/Technology Analyst for U.S. Growth Equity at Goldman Sachs Asset Management (1999–2014). | |||
| Steven F. Rocco (1979) | Executive Vice President | Elected in 2014 | Partner and Director of Taxable Fixed Income, joined Lord Abbett in 2004. | |||
| A. Edward Allinson (1961) | Vice President | Elected in 2011 | Portfolio Manager, joined Lord Abbett in 2005. | |||
| Vernon T. Bice (1974) | Vice President | Elected in 2011 | Portfolio Manager, joined Lord Abbett in 2011. | |||
| Pamela P. Chen (1978) | Vice President, Assistant Secretary and Privacy Officer | Elected in 2018 | Associate General Counsel, joined Lord Abbett in 2017 and was formerly Special Counsel at Schulte, Roth & Zabel LLP (2005–2017). | |||
| Robert S. Clark (1975) | Vice President | Elected in 2018 | Portfolio Manager, joined Lord Abbett in 2010. | |||
| Matthew R. DeCicco (1977) | Vice President | Elected in 2003 | Managing Director and Portfolio Manager, joined Lord Abbett in 1999. | |||
| John T. Fitzgerald (1975) | Vice President and Assistant Secretary | Elected in 2018 | Deputy General Counsel, joined Lord Abbett in 2018 and was formerly Deputy Head of U.S. Funds Legal, Executive Director and Assistant General Counsel at JPMorgan Chase (2005–2018). | |||
| Christopher J. Gizzo (1986) | Vice President | Elected in 2018 | Managing Director and Portfolio Manager, joined Lord Abbett in 2008. | |||
| Bernard J. Grzelak (1971) | Chief Financial Officer and Vice President | Elected in 2017 | Partner, Chief Operating Officer, Global Funds and Risk, joined Lord Abbett in 2003. |
27
Basic Information About Management (concluded)
| Name and Year of Birth | Current Position with the Company | Length of Service of Current Position | Principal Occupation During the Past Five Years | |||
| Linda Y. Kim (1980) | Vice President and Assistant Secretary | Elected in 2016 | Counsel, joined Lord Abbett in 2015 and was formerly an Associate at Stroock & Stroock & Lavan LLP (2007–2015). | |||
| So Young Lee (1971) | Vice President | Elected in 2018 | Portfolio Manager, joined Lord Abbett in 2013. | |||
| Joseph M. McGill (1962) | Chief Compliance Officer | Elected in 2014 | Partner and Chief Compliance Officer, joined Lord Abbett in 2014 and was formerly Managing Director and the Chief Compliance Officer at UBS Global Asset Management (2003–2013). | |||
| A. Edward Oberhaus, III (1959) | Vice President | Elected in 1998 | Partner and Director, joined Lord Abbett in 1983. | |||
| Amanda S. Ryan (1978) | Vice President and Assistant Secretary | Elected in 2018 | Counsel, joined Lord Abbett In 2016 and was formerly a Director and Corporate Counsel at PGIM Investments (2012–2016). | |||
| Lawrence B. Stoller (1963) | Vice President, Secretary and Chief Legal Officer | Elected in 2007 | Partner and General Counsel, joined Lord Abbett in 2007. | |||
| Leah G. Traub (1979) | Vice President | Elected in 2016 | Partner and Portfolio Manager, joined Lord Abbett in 2007. | |||
| Kewjin Yuoh (1971) | Vice President | Elected in 2012 | Partner and Portfolio Manager, joined Lord Abbett in 2010. | |||
| Jackson C. Chan (1964) | AML Compliance Officer | Elected in 2018 | Deputy Chief Compliance Officer and Director of Regulatory Affairs, joined Lord Abbett in 2014 and was formerly Director at UBS Global Asset Management (2005–2014). | |||
| Vito A. Fronda (1969) | Treasurer | Elected in 2018 | Partner and Director of Taxation, joined Lord Abbett in 2003. |
Please call 888-522-2388 for a copy of the statement of additional information, which contains further information about the Company’s Directors. It is available free upon request.
28
Approval of Advisory Contract
The Board, including all of the Directors who are not “interested persons” of the Company or of Lord Abbett, as defined in the Investment Company Act of 1940, as amended (the “Independent Directors”), annually considers whether to approve the continuation of the existing management agreement between the Fund and Lord Abbett (the “Agreement”). In connection with its most recent approval, the Board reviewed materials relating specifically to the Agreement, as well as numerous materials received throughout the course of the year, including information about the Fund’s investment performance compared to the performance of its benchmark. Before making its decision as to the Fund, the Board had the opportunity to ask questions and request further information, taking into account its knowledge of Lord Abbett gained through its meetings and discussions. These meetings and discussions included reviews of Fund performance conducted by members of the Contract Committee, the deliberations of the Contract Committee, and discussions between the Contract Committee and Lord Abbett’s management. The Independent Directors also met with their independent legal counsel in various private sessions at which no representatives of management were present.
The materials received by the Board included, but were not limited to: (1) information provided by Broadridge Financial Solutions (“Broadridge”) regarding the investment performance of the Fund compared to the investment performance of certain funds with similar investment styles as determined by Broadridge, based, in part, on the Fund’s Morningstar category (the “performance peer group”), and the investment performance of two appropriate benchmarks; (2) information provided by Broadridge regarding the expense ratios, contractual and actual management fee rates, and other expense components for the Fund and certain funds in the same Morningstar category, with generally the same or similar share classes and operational characteristics, including asset size (the “expense peer group”); (3) certain supplemental investment performance information provided by Lord Abbett; (4) information provided by Lord Abbett on the expense ratios, management fee rates, and other expense components for the Fund; (5) sales and redemption information for the Fund; (6) information regarding Lord Abbett’s financial condition; (7) an analysis of the relative profitability of the Agreement to Lord Abbett; (8) information provided by Lord Abbett regarding the investment management fee schedules for Lord Abbett’s other advisory clients maintaining accounts with a similar investment strategy as the Fund; and (9) information regarding the personnel and other resources devoted by Lord Abbett to managing the Fund.
Investment Management and Related Services Generally.The Board considered the services provided by Lord Abbett to the Fund, including investment research, portfolio management, and trading, and Lord Abbett’s commitment to compliance with all applicable legal requirements. The Board also observed that Lord Abbett was solely engaged in the investment management business and accordingly did not experience the conflicts of interest that may result from being engaged in other lines of business. The Board considered the investment advisory services provided by Lord Abbett to other clients, the fees charged for the services, and the differences in the nature of the services provided to the Fund and other Lord Abbett Funds, on the one hand, and the services provided to other clients, on the other. After reviewing these and related factors, the Board concluded that the Fund was likely to continue to benefit from the nature, extent and quality of the investment services provided by Lord Abbett under the Agreement.
Investment Performance.The Board reviewed the Fund’s investment performance in relation to that of the performance peer group and two appropriate benchmarks as of various periods ended August 31, 2018. The Board observed that the Fund’s investment performance was above the median of the performance peer group for the one-, three-, five-, and ten-year periods and took into account recent changes to the portfolio management team and other actions taken by Lord
29
Approval of Advisory Contract (continued)
Abbett to attempt to improve equity fund performance. The Board further considered Lord Abbett’s performance and reputation generally, the performance of other Lord Abbett-managed funds overseen by the Board, and the willingness of Lord Abbett to take steps intended to improve performance when appropriate. After reviewing these and related factors, the Board concluded that the Fund’s Agreement should be continued.
Lord Abbett’s Personnel and Methods.The Board considered the qualifications of the personnel providing investment management services to the Fund, in light of its investment objective and discipline, and other services provided to the Fund by Lord Abbett. Among other things, the Board considered the size, experience, and turnover of Lord Abbett’s staff, Lord Abbett’s investment methodology and philosophy, and Lord Abbett’s approach to recruiting, training, and retaining personnel.
Nature and Quality of Other Services.The Board considered the nature, quality, and extent of compliance, administrative, and other services performed by Lord Abbett and the nature and extent of Lord Abbett’s supervision of third party service providers, including the Fund’s transfer agent and custodian.
Expenses.The Board considered the expense level of the Fund, including the contractual and actual management fee rates, and the expense levels of the Fund’s expense peer group. It also considered how the expense level of the Fund related to those of the expense peer group and the amount and nature of the fees paid by shareholders. The Board observed that the net total expense ratio of the Fund was below the median of the expense peer group. After reviewing these and related factors, the Board concluded, within the context of its overall approval of the Agreement, that the expense level of the Fund was reasonable and supported the continuation of the Agreement.
Profitability.The Board considered the level of Lord Abbett’s operating margin in managing the Fund, including a review of Lord Abbett’s methodology for allocating its costs to its management of the Fund. It considered whether the Fund was profitable to Lord Abbett in connection with the Fund’s operation, including the fee that Lord Abbett receives from the Fund for providing administrative services to the Fund. The Board also considered the profits realized from other business segments of Lord Abbett, which may benefit from or be related to the Fund’s business. The Board considered Lord Abbett’s profit margins excluding Lord Abbett’s marketing and distribution expenses. The Board also considered Lord Abbett’s profit margins, without those exclusions, in comparison with available industry data and how those profit margins could affect Lord Abbett’s ability to recruit and retain personnel. The Board recognized that Lord Abbett’s overall profitability was a factor in enabling it to attract and retain qualified personnel to provide services to the Fund. After reviewing these and related factors, the Board concluded, within the context of its overall approval of the Agreement, that Lord Abbett’s profitability with respect to the Fund was not excessive.
Economies of Scale.The Board considered the extent to which there had been economies of scale in managing the Fund, whether the Fund’s shareholders had appropriately benefited from such economies of scale, and whether there was potential for realization of any further economies of scale. The Board concluded that the existing management fee schedule, with its breakpoint in the level of the management fee, adequately addressed any economies of scale in managing the Fund.
Other Benefits to Lord Abbett.The Board considered the amount and nature of the fees paid by the Fund and the Fund’s shareholders to Lord Abbett for services other than investment advisory services, such as the fee that Lord Abbett receives from the Fund for providing administrative services to the Fund. The Board also considered the revenues and profitability of Lord Abbett’s
30
Approval of Advisory Contract (concluded)
investment advisory business apart from its mutual fund business, and the intangible benefits enjoyed by Lord Abbett by virtue of its relationship with the Fund. The Board observed that the Distributor receives 12b-1 fees from certain of the Lord Abbett Funds as to shares held in accounts for which there is no other broker of record, may retain a portion of the 12b-1 fees it receives, and receives a portion of the sales charges on sales and redemptions of some classes of shares of the Lord Abbett Funds. In addition, the Board observed that Lord Abbett accrues certain benefits for its business of providing investment advice to clients other than the Lord Abbett Funds, but that business also benefits the Funds. The Board also noted that Lord Abbett, as disclosed in the prospectus of the Fund, has entered into revenue sharing arrangements with certain entities that distribute shares of the Lord Abbett Funds. The Board also took into consideration the investment research that Lord Abbett receives as a result of client brokerage transactions.
Alternative Arrangements.The Board considered whether, instead of approving continuation of the Agreement, it might be in the best interests of the Fund to implement one or more alternative arrangements, such as continuing to employ Lord Abbett, but on different terms. After considering all of the relevant factors, the Board unanimously found that continuation of the Agreement was in the best interests of the Fund and its shareholders and voted unanimously to approve the continuation of the Agreement. In considering whether to approve the continuation of the Agreement, the Board did not identify any single factor as paramount or controlling. Individual Directors may have evaluated the information presented differently from one another, giving different weights to various factors. This summary does not discuss in detail all matters considered.
31
Householding
The Company has adopted a policy that allows it to send only one copy of the Fund’s prospectus, proxy material, annual report and semiannual report to certain shareholders residing at the same “household.” This reduces Fund expenses, which benefits you and other shareholders. If you need additional copies or do not want your mailings to be “householded,” please call Lord Abbett at 888–522–2388 or send a written request with your name, the name of your fund or funds and your account number or numbers to Lord Abbett Family of Funds, P.O. Box 219336, Kansas City, MO 64121.
Proxy Voting Policies, Procedures and Records
A description of the policies and procedures that Lord Abbett uses to vote proxies related to the Fund’s portfolio securities, and information on how Lord Abbett voted the Fund’s proxies during the 12-month period ended June 30 are available without charge, upon request, (i) by calling 888–522–2388; (ii) on Lord Abbett’s Website at www.lordabbett.com; and (iii) on the Securities and Exchange Commission’s (“SEC”) Website at www.sec.gov.
Shareholder Reports and Quarterly Portfolio Disclosure
The Fund is required to file its complete schedule of portfolio holdings with the SEC for its first and third fiscal quarters on Form N-Q. Copies of the filings are available without charge, upon request on the SEC’s Website at www.sec.gov and may be available by calling Lord Abbett at 888–522–2388.
Tax Information
For corporate shareholders, 72% of the Fund’s ordinary income distributions qualified for the dividends received deduction.
Additionally, of the distribution paid to the shareholders during the fiscal year ended December 31, 2018, $10,612,215 and $37,846,484, respectively, represent short-term capital gains and long-term capital gains.
32


| This report, when not used for the general information of shareholders of the Fund, is to be distributed only if preceded or accompanied by a current fund prospectus. | |||
| Lord Abbett mutual fund shares are distributed by LORD ABBETT DISTRIBUTOR LLC. | Lord Abbett Series Fund, Inc.
Growth and Income Portfolio | LASFGI-3 (02/19) |
LORD ABBETT
ANNUAL REPORT
Lord Abbett
Series Fund—Growth Opportunities Portfolio
For the fiscal year ended December 31, 2018
Table of Contents
Lord Abbett Series Fund – Growth Opportunities Portfolio
Annual Report
For the fiscal year ended December 31, 2018

From left to right: James L.L. Tullis, Independent Chairman of the Lord Abbett Funds and Douglas B. Sieg, Director, President, and Chief Executive Officer of the Lord Abbett Funds.
Dear Shareholders:We are pleased to provide you with this overview of the performance of Lord Abbett Series Fund — Growth Opportunities Portfolio for the fiscal year ended December 31, 2018. On this page and the following pages, we discuss the major factors that influenced fiscal year performance. For additional information about the Fund, please visit our website at www.lordabbett.com, where you also can access the quarterly commentaries that provide updates on the Fund’s performance and other portfolio related updates.
Thank you for investing in Lord Abbett mutual funds. We value the trust that you place in us and look forward to serving your investment needs in the years to come.
Best regards,

Douglas B. Sieg
Director, President and Chief Executive Officer
For the fiscal year ended December 31, 2018, the Fund returned -2.89%, reflecting performance at the net asset value (NAV) of Class VC shares with all distributions reinvested, compared to its benchmark, the Russell Midcap® Growth Index,1which returned -4.75% over the same period.
Domestic equity returns were negative over the past year, with large cap stocks, as represented by the S&P 500® Index,2 falling –4.38% during the period, while small cap stocks, as represented by the Russell 2000® Index,3were down –11.01%. During the period, there were several market-moving events. Notably, Congress
passed the largest rewrite of the U.S. tax code in decades, which went into effect in January 2018. The tax bill reduced the corporate tax rate from 35% to 21% and allowed for a one-time repatriation tax of 15.5%, rather than the standard repatriation tax rate of 35%. In June 2018, the White House announced its intent to impose additional tariffs on $200 billion worth of Chinese goods on top of the $50 billion previously announced. The aggressive U.S. trade posture continued into September with trade tensions mounting between the U.S. and China. In December, the White House announced a
1
trade truce between the U.S. and China following a meeting between President Trump and President Xi Jinping at the G20 summit. The U.S. agreed to maintain a 10% tariff rate on $200 billion worth of Chinese imports at the start of 2019 as opposed to the originally planned 25% tariff rate. In return, China agreed to purchase a substantial amount of U.S. agriculture, industrial, and energy products to further reduce the trade imbalance. While the impact has yet to fully be realized, many corporations anticipate that the retaliatory tariffs will weigh on profits. Trade discussions between Mexico, Canada, and the U.S., however, took a more favorable turn as the negotiations resulted in a revised version of the North American Free Trade Agreement (NAFTA) called the U.S.–Mexico–Canada Agreement.
In March 2018, the Federal Reserve (the “Fed”) raised its target for short-term interest rates by 0.25%, to a range of 1.50%–1.75%, and followed with rate hikes of 0.25% at each of its June, September, and December meetings, raising the target range to 2.25%–2.50%. Amid rising concerns surrounding escalating trade tensions, slowing global growth, and increasing interest rates, the Nasdaq experienced the largest monthly drop since 2008 in October 2018. Following the prior month’s volatility, domestic equity markets rallied in November and partially reversed October’s losses, however the S&P 500® returned to negative territory in December, posting its worst month since February 2009.
Security selection within the industrials sector contributed to relative performance during the trailing 12-month period. Within the sector, the Fund’s position in Cintas Corp., a supply and uniform rental company, contributed most to relative performance. Shares of Cintas rose as investors expected cost synergies and improving revenue from its acquisition of G&K Services, Inc. to accelerate revenue growth. Another contributor to relative performance within this sector during the reporting period was the Fund’s position in Expeditors International of Washington, Inc., a provider of global logistics services. Shares of Expeditors International appreciated as price increases continued to strengthen operating margins due to steady demand.
Security selection within the financials sector also contributed to relative performance during the period. Within this sector, the Fund’s positioning in shares of Goosehead Insurance, Inc., an insurance holding company, contributed. Shares of Goosehead steadily rose following the initial public offering in May as robust revenue growth and a continued increase in the company’s sales force and franchises outpaced expectations.
Security selection within the energy sector detracted from relative performance during the period. Within this sector, the Fund’s position in Cimarex Energy Co., an independent oil and gas production company, detracted. Shares of Cimarex came under pressure as headwinds within
2
the Permian Basin caused differentials between oil and gas prices to increase, impacting Cimarex’s cash flow. Shares of Parsley Energy, Inc., an oil and natural gas firm, also detracted as investors’ increasing concerns over a supply glut in oil and a slowdown in global economic growth caused Western Texas Intermediate prices to plummet.
During the period, security selection in the consumer staples sector also detracted from relative performance. Specifically, the
Fund’s position in Brown-Forman Corp., an alcoholic beverage distributor, detracted. Shares of Brown-Forman declined as European tariffs led to weaker sales growth and investors were concerned about the firm’s valuation.
The Fund’s portfolio is actively managed and, therefore, its holdings and the weightings of a particular issuer or particular sector as a percentage of portfolio assets are subject to change. Sectors may include many industries.
1 The Russell Midcap® Growth Index measures the performance of those Russell Midcap® companies with higher price-to-book ratios and higher forecasted growth values.
2 The S&P 500® Index is widely regarded as the standard for measuring large cap U.S. stock market performance and includes a representative sample of leading companies in leading industries.
3 The Russell 2000® Index measures the performance of the 2,000 smallest companies in the Russell 3000 Index, which represents approximately 10% of the total market capitalization of the Russell 3000 Index.
Unless otherwise specified, indexes reflect total return, with all dividends reinvested. Indexes are unmanaged, do not reflect the deduction of fees or expenses, and are not available for direct investment.
Important Performance and Other Information
Performance data quoted in the following pages reflect past performance and are no guarantee of future results. Current performance may be higher or lower than the performance quoted. The investment return and principal value of an investment in the Fund will fluctuate so that shares, on any given day or when redeemed, may be worth more or less than their original cost. You can obtain performance data current to the most recent month end by calling Lord Abbett at 888-522-2388 or referring to www.lordabbett.com.
During certain periods shown, expense waivers and reimbursements were in place. Without such expense waivers and reimbursements, the Fund’s returns would have been lower.
The annual commentary above discusses the views of the Fund’s management and various portfolio holdings of the Fund as of December 31, 2018. These views and portfolio holdings may have changed after this date. Information provided in the commentary is not a recommendation to buy or sell securities. Because the Fund’s portfolio is actively managed and may change significantly, the Fund may no longer own the securities described above or may have otherwise changed its position in the securities. For more recent information about the Fund’s portfolio holdings, please visit www.lordabbett.com.
A Note about Risk:See Notes to Financial Statements for a discussion of investment risks. For a more detailed discussion of the risks associated with the Fund, please see the Fund’s prospectus.
Mutual funds are not insured by the FDIC, are not deposits or other obligations of, or guaranteed by, banks, and are subject to investment risks including possible loss of principal amount invested.
The Fund serves as an underlying investment vehicle for variable annuity contracts and variable life insurance policies.
3
Below is a comparison of a $10,000 investment in Class VC shares with the same investment in both the Russell Midcap® Growth Index and the Russell Midcap® Index, assuming reinvestment of all dividends and distributions. The Fund’s shares are sold only to insurance company separate accounts that fund certain variable annuity and variable life contracts. The line graph comparison does not reflect the sales charges or other expenses of these contracts. If those sales charges and expenses were reflected, returns would be lower. The graph and performance table below do not reflect the deduction of taxes that a shareholder would pay on Fund distributions or the redemption of Fund shares. During certain periods, expenses of the Fund have been waived or reimbursed by Lord Abbett; without such waiver or reimbursement of expenses, the Fund’s returns would have been lower.Past performance is no guarantee of future results.

Average Annual Total Returns for the
Periods Ended December 31, 2018
| 1 Year | 5 Years | 10 Years | |||||
| Class VC | –2.89% | 5.65% | 12.73% |
1 Performance for each unmanaged index does not reflect any fees or expenses. The performance of each index is not necessarily representative of the Fund’s performance.
4
As a shareholder of the Fund, you incur ongoing costs, including management fees; expenses related to the Fund’s services arrangements with certain insurance companies; and other Fund expenses. This Example is intended to help you understand your ongoing costs (in dollars) of investing in the Fund and to compare these costs with the ongoing costs of investing in other mutual funds.
The Example is based on an investment of $1,000 invested at the beginning of the period and held for the entire period (July 1, 2018 through December 31, 2018).
The Example reflects only expenses that are deducted from the assets of the Fund. Fees and expenses, including sales charges applicable to the various insurance products that invest in the Fund, are not reflected in this Example. If such fees and expenses were reflected in the Example, the total expenses shown would be higher. Fees and expenses regarding such variable insurance products are separately described in the prospectus related to those products.
Actual Expenses
The first line of the table on the following page provides information about actual account values and actual expenses. You may use the information in this line, together with the amount you invested, to estimate the expenses that you paid over the period. Simply divide your account value by $1,000 (for example, an $8,600 account value divided by $1,000 = 8.6), then multiply the result by the number in the first line under the heading titled “Expenses Paid During Period 7/1/18 – 12/31/18” to estimate the expenses you paid on your account during this period.
Hypothetical Example for Comparison Purposes
The second line of the table on the following page provides information about hypothetical account values and hypothetical expenses based on the Fund’s actual expense ratio and an assumed rate of return of 5% per year before expenses, which is not the Fund’s actual return. The hypothetical account values and expenses may not be used to estimate the actual ending account balance or expenses you paid for the period. You may use this information to compare the ongoing costs of investing in the Fund and other funds. To do so, compare this 5% hypothetical example with the 5% hypothetical examples that appear in the shareholder reports of the other funds.
5
Please note that the expenses shown in the table are meant to highlight your ongoing costs only and do not reflect any transactional costs, such as sales charges. Therefore, the second line of the table is useful in comparing ongoing costs only, and will not help you determine the relative total costs of owning different funds. In addition, if these transactional costs were included, your costs would have been higher.
| Beginning Account Value | Ending Account Value | Expenses Paid During Period† | |||||||
| 7/1/18 – | |||||||||
| 7/1/18 | 12/31/18 | 12/31/18 | |||||||
| Class VC | |||||||||
| Actual | $1,000.00 | $ | 929.90 | $5.59 | |||||
| Hypothetical (5% Return Before Expenses) | $1,000.00 | $ | 1,019.41 | $5.85 | |||||
| † | Net expenses are equal to the Fund’s annualized expense ratio of 1.15%, multiplied by the average account value over the period, multiplied by 184/365 (to reflect one-half year period). |
Portfolio Holdings Presented by Sector
December 31, 2018
| Sector* | %** | |
| Communication Services | 1.88 | % |
| Consumer Discretionary | 15.13 | % |
| Consumer Staples | 2.91 | % |
| Energy | 1.07 | % |
| Financials | 8.00 | % |
| Health Care | 16.01 | % |
| Industrials | 16.65 | % |
| Information Technology | 30.86 | % |
| Materials | 5.48 | % |
| Real Estate | 1.79 | % |
| Repurchase Agreement | 0.22 | % |
| Total | 100.00 | % |
| * | A sector may comprise several industries. | |
| ** | Represents percent of total investments. |
6
December 31, 2018
| Investments | Shares | Fair Value (000) | ||||||
| COMMON STOCKS 103.97% | ||||||||
| Aerospace & Defense 1.66% | ||||||||
| TransDigm Group, Inc.* | 3,253 | $ | 1,106 | |||||
| Air Freight & Logistics 1.01% | ||||||||
| Expeditors International of Washington, Inc. | 9,859 | 671 | ||||||
| Banks 1.41% | ||||||||
| First Republic Bank | 5,384 | 468 | ||||||
| Western Alliance Bancorp* | 11,943 | 472 | ||||||
| Total | 940 | |||||||
| Beverages 1.56% | ||||||||
| Brown-Forman Corp. Class B | 21,864 | 1,040 | ||||||
| Biotechnology 3.92% | ||||||||
| Amarin Corp. plc ADR* | 9,005 | 123 | ||||||
| AnaptysBio, Inc.* | 3,534 | 225 | ||||||
| BioMarin Pharmaceutical, Inc.* | 9,196 | 783 | ||||||
| Myovant Sciences Ltd. (United Kingdom)*(a) | 19,630 | 322 | ||||||
| Neurocrine Biosciences, Inc.* | 4,936 | 352 | ||||||
| Sarepta Therapeutics, Inc.* | 3,233 | 353 | ||||||
| Vertex Pharmaceuticals, Inc.* | 2,719 | 451 | ||||||
| Total | 2,609 | |||||||
| Building Products 1.54% | ||||||||
| Allegion plc (Ireland)(a) | 12,817 | 1,022 | ||||||
| Capital Markets 4.22% | ||||||||
| E*TRADE Financial Corp. | 15,227 | 668 | ||||||
| MarketAxess Holdings, Inc. | 2,864 | 605 | ||||||
| Moody’s Corp. | 6,666 | 934 | ||||||
| MSCI, Inc. | 4,041 | 596 | ||||||
| Total | 2,803 | |||||||
| Chemicals 1.86% | ||||||||
| Ashland Global Holdings, Inc. | 6,359 | 451 | ||||||
| Axalta Coating Systems Ltd.* | 14,264 | 334 | ||||||
| FMC Corp. | 6,090 | 451 | ||||||
| Total | 1,236 | |||||||
| Investments | Shares | Fair Value (000) | ||||||
| Commercial Services & Supplies 2.02% | ||||||||
| Cintas Corp. | 3,372 | $ | 567 | |||||
| Healthcare Services Group, Inc. | 19,323 | 776 | ||||||
| Total | 1,343 | |||||||
| Construction Materials 1.53% | ||||||||
| Vulcan Materials Co. | 10,296 | 1,017 | ||||||
| Consumer Finance 0.74% | ||||||||
| SLM Corp.* | 59,437 | 494 | ||||||
| Containers & Packaging 2.32% | ||||||||
| Avery Dennison Corp. | 9,750 | 876 | ||||||
| Owens-Illinois, Inc.* | 38,560 | 665 | ||||||
| Total | 1,541 | |||||||
| Diversified Consumer Services 1.04% | ||||||||
| Service Corp. International | 17,102 | 689 | ||||||
| Electrical Equipment 2.35% | ||||||||
| AMETEK, Inc. | 13,055 | 884 | ||||||
| Hubbell, Inc. | 6,862 | 681 | ||||||
| Total | 1,565 | |||||||
| Electronic Equipment, Instruments & Components 1.56% | ||||||||
| Keysight Technologies, Inc.* | 9,112 | 566 | ||||||
| Trimble, Inc.* | 14,419 | 474 | ||||||
| Total | 1,040 | |||||||
| Equity Real Estate Investment Trusts 1.87% | ||||||||
| SBA Communications Corp.* | 7,673 | 1,242 | ||||||
| Health Care Equipment & Supplies 5.00% | ||||||||
| ABIOMED, Inc.* | 1,407 | 457 | ||||||
| Align Technology, Inc.* | 2,736 | 573 | ||||||
| Edwards Lifesciences Corp.* | 7,930 | 1,215 | ||||||
| Insulet Corp.* | 2,341 | 186 | ||||||
| Teleflex, Inc. | 3,457 | 893 | ||||||
| Total | 3,324 | |||||||
| See Notes to Financial Statements. | 7 |
Schedule of Investments (continued)
December 31, 2018
| Investments | Shares | Fair Value (000) | ||||||
| Health Care Providers & Services 2.10% | ||||||||
| Centene Corp.* | 9,919 | $ | 1,143 | |||||
| Guardant Health, Inc.* | 6,724 | 253 | ||||||
| Total | 1,396 | |||||||
| Hotels, Restaurants & Leisure 4.22% | ||||||||
| Aramark | 32,328 | 937 | ||||||
| Hilton Worldwide Holdings, Inc. | 10,154 | 729 | ||||||
| Norwegian Cruise Line Holdings Ltd.* | 12,129 | 514 | ||||||
| Vail Resorts, Inc. | 2,983 | 629 | ||||||
| Total | 2,809 | |||||||
| Household Products 1.46% | ||||||||
| Church & Dwight Co., Inc. | 14,804 | 974 | ||||||
| Industrial Conglomerates 1.51% | ||||||||
| Roper Technologies, Inc. | 3,772 | 1,005 | ||||||
| Information Technology Services 10.32% | ||||||||
| DXC Technology Co. | 8,781 | 467 | ||||||
| Euronet Worldwide, Inc.* | 6,943 | 711 | ||||||
| Fidelity National Information Services, Inc. | 10,732 | 1,100 | ||||||
| FleetCor Technologies, Inc.* | 3,463 | 643 | ||||||
| Global Payments, Inc. | 13,644 | 1,407 | ||||||
| GoDaddy, Inc. Class A* | 12,723 | 835 | ||||||
| Square, Inc. Class A* | 2,295 | 129 | ||||||
| Total System Services, Inc. | 9,372 | 762 | ||||||
| Worldpay, Inc. Class A* | 10,600 | 810 | ||||||
| Total | 6,864 | |||||||
| Insurance 1.97% | ||||||||
| Goosehead Insurance, Inc. Class A* | 21,821 | 573 | ||||||
| RenaissanceRe Holdings Ltd. | 5,503 | 736 | ||||||
| Total | 1,309 | |||||||
| Interactive Media & Services 1.96% | ||||||||
| IAC/InterActiveCorp.* | 5,473 | 1,002 | ||||||
| Twitter, Inc.* | 10,429 | 300 | ||||||
| Total | 1,302 | |||||||
| Investments | Shares | Fair Value (000) | ||||||
| Internet & Direct Marketing Retail 0.54% | ||||||||
| GrubHub, Inc.* | 4,696 | $ | 361 | |||||
| Life Sciences Tools & Services 3.90% | ||||||||
| Agilent Technologies, Inc. | 10,496 | 708 | ||||||
| Charles River Laboratories International, Inc.* | 6,873 | 778 | ||||||
| Illumina, Inc.* | 1,133 | 340 | ||||||
| Mettler-Toledo International, Inc.* | 1,351 | 764 | ||||||
| Total | 2,590 | |||||||
| Machinery 4.39% | ||||||||
| Fortive Corp. | 16,858 | 1,141 | ||||||
| IDEX Corp. | 7,623 | 962 | ||||||
| Stanley Black & Decker, Inc. | 6,826 | 817 | ||||||
| Total | 2,920 | |||||||
| Multi-Line Retail 3.11% | ||||||||
| Dollar General Corp. | 11,692 | 1,264 | ||||||
| Dollar Tree, Inc.* | 8,933 | 807 | ||||||
| Total | 2,071 | |||||||
| Oil, Gas & Consumable Fuels 1.12% | ||||||||
| Cimarex Energy Co. | 7,198 | 444 | ||||||
| Parsley Energy, Inc. Class A* | 18,729 | 299 | ||||||
| Total | 743 | |||||||
| Pharmaceuticals 1.77% | ||||||||
| Elanco Animal Health, Inc.* | 12,060 | 380 | ||||||
| Zoetis, Inc. | 9,297 | 796 | ||||||
| Total | 1,176 | |||||||
| Professional Services 1.05% | ||||||||
| CoStar Group, Inc.* | 2,060 | 695 | ||||||
| Road & Rail 1.82% | ||||||||
| Genesee & Wyoming, Inc. Class A* | 7,664 | 567 | ||||||
| J.B. Hunt Transport Services, Inc. | 6,881 | 640 | ||||||
| Total | 1,207 | |||||||
| 8 | See Notes to Financial Statements. |
Schedule of Investments (continued)
December 31, 2018
| Investments | Shares | Fair Value (000) | ||||||
| Semiconductors & Semiconductor Equipment 6.20% | ||||||||
| Advanced Micro Devices, Inc.* | 23,062 | $ | 426 | |||||
| Analog Devices, Inc. | 8,742 | 750 | ||||||
| Lam Research Corp. | 4,830 | 658 | ||||||
| MACOM Technology Solutions Holdings, Inc.* | 13,002 | 189 | ||||||
| Marvell Technology Group Ltd. | 17,659 | 286 | ||||||
| Microchip Technology, Inc. | 5,778 | 415 | ||||||
| Skyworks Solutions, Inc. | 5,794 | 388 | ||||||
| Universal Display Corp. | 4,304 | 403 | ||||||
| Xilinx, Inc. | 7,128 | 607 | ||||||
| Total | 4,122 | |||||||
| Software 12.61% | ||||||||
| Anaplan, Inc.* | 9,854 | 262 | ||||||
| New Relic, Inc.* | 6,126 | 496 | ||||||
| Palo Alto Networks, Inc.* | 5,144 | 969 | ||||||
| PTC, Inc.* | 5,062 | 420 | ||||||
| Red Hat, Inc.* | 6,811 | 1,196 | ||||||
| RingCentral, Inc. Class A* | 10,511 | 867 | ||||||
| ServiceNow, Inc.* | 9,949 | 1,771 | ||||||
| Splunk, Inc.* | 10,610 | 1,112 | ||||||
| Ultimate Software Group, Inc. (The)* | 5,266 | 1,289 | ||||||
| Total | 8,382 | |||||||
| Specialty Retail 6.55% | ||||||||
| Burlington Stores, Inc.* | 8,463 | 1,377 | ||||||
| O’Reilly Automotive, Inc.* | 3,911 | 1,346 | ||||||
| Tractor Supply Co. | 9,430 | 787 | ||||||
| Ulta Salon, Cosmetics & Fragrance, Inc.* | 3,446 | 844 | ||||||
| Total | 4,354 | |||||||
| Technology Hardware, Storage & Peripherals 0.92% | ||||||||
| NetApp, Inc. | 10,210 | 609 | ||||||
| Textiles, Apparel & Luxury Goods 0.84% | ||||||||
| Carter’s, Inc. | 6,863 | 560 | ||||||
| Total Common Stocks (cost $66,192,213) | 69,131 | |||||||
| Investments | Principal Amount (000) | Fair Value (000) | ||||||
| SHORT-TERM INVESTMENT 0.23% | ||||||||
| Repurchase Agreement | ||||||||
| Repurchase Agreement dated 12/31/2018, 1.45% due 1/2/2019 with Fixed Income Clearing Corp. collateralized by $160,000 of U.S. Treasury Note at 2.00% due 8/15/2025 value: $154,925; proceeds: $151,488 (cost $151,476) | $151 | $ | 151 | |||||
| Total Investments in Securities 104.20% (cost $66,343,689) | 69,282 | |||||||
| Liabilities in Excess of Other Assets (4.20)% | (2,790 | ) | ||||||
| Net Assets 100.00% | $ | 66,492 | ||||||
| ADR | American Depositary Receipt. | |
| * | Non-income producing security. | |
| (a) | Foreign security traded in U.S. dollars. |
| See Notes to Financial Statements. | 9 |
Schedule of Investments (concluded)
December 31, 2018
The following is a summary of the inputs used as of December 31, 2018 in valuing the Fund’s investments carried at fair value(1):
| Investment Type(2)(3) | Level 1 (000) | Level 2 (000) | Level 3 (000) | Total (000) | ||||||||||||
| Common Stocks | $ | 69,131 | $ | – | $ | – | $ | 69,131 | ||||||||
| Short-Term Investment | ||||||||||||||||
| Repurchase Agreement | – | 151 | – | 151 | ||||||||||||
| Total | $ | 69,131 | $ | 151 | $ | – | $ | 69,282 | ||||||||
| (1) | Refer to Note 2(h) for a description of fair value measurements and the three-tier hierarchy of inputs. | |
| (2) | See Schedule of Investments for fair values in each industry and identification of foreign issuers and/or geography. | |
| (3) | There were no Level 1/Level 2 transfers during the fiscal year ended December 31, 2018. |
| 10 | See Notes to Financial Statements. |
Statement of Assets and Liabilities
December 31, 2018
| ASSETS: | ||||
| Investments in securities, at fair value (cost $66,343,689) | $ | 69,282,008 | ||
| Receivables: | ||||
| Investment securities sold | 280,786 | |||
| Capital shares sold | 58,297 | |||
| Interest and dividends | 16,393 | |||
| From advisor (See Note 3) | 15,643 | |||
| Prepaid expenses and other assets | 141 | |||
| Total assets | 69,653,268 | |||
| LIABILITIES: | ||||
| Payables: | ||||
| Capital shares reacquired | 2,948,169 | |||
| Management fee | 48,076 | |||
| Directors’ fees | 19,822 | |||
| Fund administration | 2,404 | |||
| Accrued expenses | 142,841 | |||
| Total liabilities | 3,161,312 | |||
| NET ASSETS | $ | 66,491,956 | ||
| COMPOSITION OF NET ASSETS: | ||||
| Paid-in capital | $ | 61,910,420 | ||
| Total distributable earnings | 4,581,536 | |||
| Net Assets | $ | 66,491,956 | ||
| Outstanding shares (50 million shares of common stock authorized, $.001 par value) | 6,345,217 | |||
| Net asset value, offering and redemption price per share (Net assets divided by outstanding shares) | $10.48 |
| See Notes to Financial Statements. | 11 |
For the Year Ended December 31, 2018
| Investment income: | ||||
| Dividends | $ | 811,740 | ||
| Interest | 10,280 | |||
| Total investment income | 822,020 | |||
| Expenses: | ||||
| Management fee | 967,531 | |||
| Non 12b-1 service fees | 302,041 | |||
| Shareholder servicing | 129,960 | |||
| Fund administration | 48,377 | |||
| Professional | 44,367 | |||
| Reports to shareholders | 37,242 | |||
| Custody | 4,771 | |||
| Directors’ fees | 4,569 | |||
| Other | 16,105 | |||
| Gross expenses | 1,554,963 | |||
| Expense reductions (See Note 8) | (2,719 | ) | ||
| Fees waived and expenses reimbursed (See Note 3) | (183,484 | ) | ||
| Net expenses | 1,368,760 | |||
| Net investment loss | (546,740 | ) | ||
| Net realized and unrealized gain (loss): | ||||
| Net realized gain on investments | 18,773,332 | |||
| Net realized gain on foreign currency related transactions | 49 | |||
| Net change in unrealized appreciation/depreciation on investments | (18,439,611 | ) | ||
| Net realized and unrealized gain | 333,770 | |||
| Net Decrease in Net Assets Resulting From Operations | $ | (212,970 | ) |
| 12 | See Notes to Financial Statements. |
Statements of Changes in Net Assets
| INCREASE (DECREASE) IN NET ASSETS | For the Year Ended December 31, 2018 | For the Year Ended December 31, 2017 | ||||||
| Operations: | ||||||||
| Net investment loss | $ | (546,740 | ) | $ | (383,896 | ) | ||
| Net realized gain on investments and foreign currency related transactions | 18,773,381 | 6,248,087 | ||||||
| Net change in unrealized appreciation/depreciation on investments | (18,439,611 | ) | 21,239,301 | |||||
| Net increase (decrease) in net assets resulting from operations | (212,970 | ) | 27,103,492 | |||||
| Distributions to shareholders(1) | (17,386,671 | ) | (4,600,431 | ) | ||||
| Capital share transactions (See Note 13): | ||||||||
| Proceeds from sales of shares | 28,497,917 | 5,748,922 | ||||||
| Reinvestment of distributions | 17,386,647 | 4,600,431 | ||||||
| Cost of shares reacquired | (95,994,025 | ) | (22,386,775 | ) | ||||
| Net decrease in net assets resulting from capital share transactions | (50,109,461 | ) | (12,037,422 | ) | ||||
| Net increase (decrease) in net assets | (67,709,102 | ) | 10,465,639 | |||||
| NET ASSETS: | ||||||||
| Beginning of year | $ | 134,201,058 | $ | 123,735,419 | ||||
| End of year | $ | 66,491,956 | $ | 134,201,058 | ||||
| Accumulated net investment loss(2) | $ | – | $ | – | ||||
| (1) | The SEC eliminated the requirement to disclose the source of distributions paid in 2018. For the year ended December 31, 2017, the source of distributions represents realized gain. | |
| (2) | The SEC eliminated the requirement to disclose accumulated net investment income in 2018. For the year ended December 31, 2017, the accumulated net investment loss was $(18,184). |
| See Notes to Financial Statements. | 13 |
| Per Share Operating Performance: | ||||||||||||||||||||||||
| Investment Operations: | Distributions to shareholders from: | |||||||||||||||||||||||
| Net asset value, beginning of period | Net investment income (loss)(a) | Net realized and unrealized gain (loss) | Total from investment operations | Net realized gain | Net asset value, end of period | |||||||||||||||||||
| 12/31/2018 | $14.20 | $(0.07 | ) | $(0.42 | ) | $(0.49 | ) | $(3.23 | ) | $10.48 | ||||||||||||||
| 12/31/2017 | 11.96 | (0.04 | ) | 2.77 | 2.73 | (0.49 | ) | 14.20 | ||||||||||||||||
| 12/31/2016 | 11.88 | (0.03 | ) | 0.18 | 0.15 | (0.07 | ) | 11.96 | ||||||||||||||||
| 12/31/2015 | 12.91 | (0.06 | ) | 0.41 | 0.35 | (1.38 | ) | 11.88 | ||||||||||||||||
| 12/31/2014 | 15.25 | (0.04 | ) | 0.95 | 0.91 | (3.25 | ) | 12.91 | ||||||||||||||||
| (a) | Calculated using average shares outstanding during the period. | |
| (b) | Total return does not consider the effects of sales charges or other expenses imposed by an insurance company and assumes the reinvestment of all distributions. |
| 14 | See Notes to Financial Statements. |
| Ratios to Average Net Assets: | Supplemental Data: | |||||||||||||||||||||
| Total return(b) (%) | Total expenses after waivers and/or reimburse- ments (%) | Total expenses (%) | Net investment income (loss) (%) | Net assets, end of period (000) | Portfolio turnover rate (%) | |||||||||||||||||
| (2.89 | ) | 1.13 | 1.29 | (0.45 | ) | $ 66,492 | 39 | |||||||||||||||
| 22.91 | 1.10 | 1.27 | (0.29 | ) | 134,201 | 69 | ||||||||||||||||
| 1.23 | 1.13 | 1.33 | (0.25 | ) | 123,735 | 155 | ||||||||||||||||
| 2.72 | 1.20 | 1.31 | (0.42 | ) | 91,977 | 125 | ||||||||||||||||
| 6.07 | 1.20 | 1.32 | (0.28 | ) | 87,234 | 198 | ||||||||||||||||
| See Notes to Financial Statements. | 15 |
| 1. | ORGANIZATION |
Lord Abbett Series Fund, Inc. (the “Company”) is registered under the Investment Company Act of 1940, as amended (the “Act”), as a diversified, open-end management investment company and was incorporated under Maryland law in 1989. The Company consists of twelve separate portfolios. This report covers Growth Opportunities Portfolio (the “Fund”).
The Fund’s investment objective is capital appreciation. The Fund has Variable Contract class shares (“Class VC Shares”), which are currently issued and redeemed only in connection with investments in, and payments under, variable annuity contracts and variable life insurance policies issued by life insurance and insurance-related companies.
The preparation of the financial statements in conformity with accounting principles generally accepted in the United States of America (“U.S. GAAP”) requires management to make certain estimates and assumptions that affect the reported amounts of assets and liabilities and disclosure of contingent assets and liabilities at the date of the financial statements and the reported amounts of increases and decreases in net assets from operations during the reporting period. Actual results could differ from those estimates. The Fund is considered an investment company under U.S. GAAP and follows the accounting and reporting guidance applicable to investment companies.
| 2. | SIGNIFICANT ACCOUNTING POLICIES |
| (a) | Investment Valuation–Under procedures approved by the Fund’s Board of Directors (the “Board”), Lord, Abbett & Co. LLC (“Lord Abbett”), the Fund’s investment manager, has formed a Pricing Committee to administer the pricing and valuation of portfolio investments and to ensure that prices utilized reasonably reflect fair value. Among other things, these procedures allow the Fund to utilize independent pricing services, quotations from securities and financial instrument dealers and other market sources to determine fair value. |
| Securities actively traded on any recognized U.S. or non-U.S. exchange or on The NASDAQ Stock Market LLC are valued at the last sale price or official closing price on the exchange or system on which they are principally traded. Events occurring after the close of trading on non-U.S. exchanges may result in adjustments to the valuation of foreign securities to reflect their fair value as of the close of regular trading on the New York Stock Exchange. The Fund may utilize an independent fair valuation service in adjusting the valuations of foreign securities. Unlisted equity securities are valued at the last quoted sale price or, if no sale price is available, at the mean between the most recently quoted bid and asked prices. | |
| Securities for which prices are not readily available are valued at fair value as determined by the Pricing Committee. The Pricing Committee considers a number of factors, including observable and unobservable inputs, when arriving at fair value. The Pricing Committee may use related or comparable assets or liabilities, recent transactions, market multiples, book values and other relevant information to determine the fair value of portfolio investments. The Board or a designated committee thereof regularly reviews fair value determinations made by the Pricing Committee and may employ techniques such as reviewing related market activity, reviewing inputs and assumptions, and retrospectively comparing prices of subsequent purchases and sales transactions to fair value determinations made by the Pricing Committee. | |
| Short-term securities with 60 days or less remaining to maturity are valued using the amortized cost method, which approximates fair value. |
16
Notes to Financial Statements (continued)
| (b) | Security Transactions–Security transactions are recorded as of the date that the securities are purchased or sold (trade date). Realized gains and losses on sales of portfolio securities are calculated using the identified-cost method. |
| (c) | Investment Income–Dividend income is recorded on the ex-dividend date. Interest income is recorded on the accrual basis as earned. Discounts are accreted and premiums are amortized using the effective interest method and are included in Interest on the Statement of Operations. Withholding taxes on foreign dividends have been provided for in accordance with the applicable country’s tax rules and rates. |
| (d) | Income Taxes–It is the policy of the Fund to meet the requirements of Subchapter M of the Internal Revenue Code applicable to regulated investment companies and to distribute substantially all taxable income and capital gains to its shareholders. Therefore, no income tax provision is required. |
| The Fund files U.S. federal and various state and local tax returns. No income tax returns are currently under examination. The statute of limitations on the Fund’s filed U.S. federal tax returns remains open for the fiscal years ended December 31, 2015 through December 31, 2018. The statutes of limitations on the Company’s state and local tax returns may remain open for an additional year depending upon the jurisdiction. | |
| (e) | Expenses–Expenses incurred by the Company that do not specifically relate to an individual fund are generally allocated to the funds within the Company on a pro rata basis by relative net assets. |
| (f) | Foreign Transactions–The books and records of the Fund are maintained in U.S. dollars and transactions denominated in foreign currencies are recorded in the Fund’s records at the rate prevailing when earned or recorded. Asset and liability accounts that are denominated in foreign currencies are adjusted daily to reflect current exchange rates and any unrealized gain (loss), if applicable, is included in Net change in unrealized appreciation/depreciation on translation of assets and liabilities in foreign currencies in the Fund’s Statement of Operations. The resultant exchange gains and losses upon settlement of such transactions are included in Net realized gain (loss), if applicable, on foreign currency related transactions in the Fund’s Statement of Operations. The Fund does not isolate that portion of the results of operations arising as a result of changes in the foreign exchange rates from the changes in market prices of the securities. |
| (g) | Repurchase Agreements–The Fund may enter into repurchase agreements with respect to securities. A repurchase agreement is a transaction in which a fund acquires a security and simultaneously commits to resell that security to the seller (a bank or securities dealer) at an agreed-upon price on an agreed-upon date. The Fund requires at all times that the repurchase agreement be collateralized by cash, or by securities of the U.S. Government, its agencies, its instrumentalities, or U.S. Government sponsored enterprises having a value equal to, or in excess of, the value of the repurchase agreement (including accrued interest). If the seller of the agreement defaults on its obligation to repurchase the underlying securities at a time when the fair value of these securities has declined, the Fund may incur a loss upon disposition of the securities. |
| (h) | Fair Value Measurements–Fair value is defined as the price that the Fund would receive upon selling an investment or transferring a liability in an orderly transaction to an independent buyer in the principal or most advantageous market of the investment. A three-tier hierarchy is used to maximize the use of observable market data and minimize the use of unobservable |
17
Notes to Financial Statements (continued)
| inputs and to establish classification of fair value measurements for disclosure purposes. Inputs refer broadly to the assumptions that market participants would use in pricing the asset or liability, including assumptions about risk—for example, the risk inherent in a particular valuation technique used to measure fair value (such as a pricing model) and/or the risk inherent in the inputs to the valuation technique. Inputs may be observable or unobservable. Observable inputs reflect the assumptions market participants would use in pricing the asset or liability. Observable inputs are based on market data obtained from sources independent of the reporting entity. Unobservable inputs reflect the reporting entity’s own assumptions about the assumptions market participants would use in pricing the asset or liability. Unobservable inputs are based on the best information available in the circumstances. The three-tier hierarchy classification is determined based on the lowest level of inputs that is significant to the fair value measurement, and is summarized in the three broad Levels listed below: |
| • | Level 1 – | unadjusted quoted prices in active markets for identical investments; |
| • | Level 2 – | other significant observable inputs (including quoted prices for similar investments, interest rates, prepayment speeds, credit risk, etc.); and |
| • | Level 3 – | significant unobservable inputs (including the Fund’s own assumptions in determining the fair value of investments). |
| A summary of inputs used in valuing the Fund’s investments as of December 31, 2018 and, if applicable, Level 1/Level 2 transfers and Level 3 rollforwards for the fiscal year then ended is included in the Fund’s Schedule of Investments. | |
| Changes in valuation techniques may result in transfers into or out of an assigned level within the three-tier hierarchy. All transfers between different levels within the three-tier hierarchy are deemed to have occurred as of the beginning of the reporting period. The inputs or methodology used for valuing securities are not necessarily an indication of the risk associated with investing in those securities. |
| 3. | MANAGEMENT FEE AND OTHER TRANSACTIONS WITH AFFILIATES |
Management Fee
The Company has a management agreement with Lord Abbett, pursuant to which Lord Abbett supplies the Fund with investment management services and executive and other personnel, provides office space and pays for ordinary and necessary office and clerical expenses relating to research and statistical work and supervision of the Fund’s investment portfolio.
The management fee is based on the Fund’s average daily net assets at the following annual rate:
| First $1 billion | .80% |
| Next $1 billion | .75% |
| Next $1 billion | .70% |
| Over $3 billion | .65% |
For the fiscal year ended December 31, 2018, the effective management fee, net of waivers, was at an annualized rate of 0.65% of the Fund’s average daily net assets.
In addition, Lord Abbett provides certain administrative services to the Fund pursuant to an Administrative Services Agreement in return for a fee at an annual rate of .04% of the Fund’s average daily net assets.
18
Notes to Financial Statements (continued)
Effective May 1, 2018 and continuing through April 30, 2019, Lord Abbett has contractually agreed to waive its fees and reimburse expenses to the extent necessary to limit total net annual operating expenses to an annual rate of 1.15%. This agreement may be terminated only upon the approval of the Board. Prior to May 1, 2018, Lord Abbett contractually agreed to waive its fees and reimburse expenses to the extent necessary to limit total net annual operating expenses to an annual rate of 1.10%.
The Company, on behalf of the Fund, has entered into services arrangements with certain insurance companies. Under these arrangements, certain insurance companies will be compensated up to .25% of the average daily net asset value (“NAV”) of the Fund’s Class VC Shares held in the insurance company’s separate account to service and maintain the Variable Contract owners’ accounts. This amount is included in Non 12b-1 service fees on the Statement of Operations. The Fund may also compensate certain insurance companies, third-party administrators and other entities for providing recordkeeping, sub-transfer agency and other administrative services to the Fund. This amount is included in Shareholder servicing on the Statement of Operations.
One Director and certain of the Company’s officers have an interest in Lord Abbett.
| 4. | DISTRIBUTIONS AND CAPITAL LOSS CARRYFORWARDS |
Dividends from net investment income, if any, are declared and paid at least semi-annually. Taxable net realized gains from investment transactions, reduced by allowable capital loss carryforwards, if any, are declared and distributed to shareholders at least annually. The capital loss carryforward amount, if any, is available to offset future net capital gains. Dividends and distributions to shareholders are recorded on the ex-dividend date. The amounts of dividends and distributions from net investment income and net realized capital gains are determined in accordance with federal income tax regulations, which may differ from U.S. GAAP. These book/tax differences are either considered temporary or permanent in nature. To the extent these differences are permanent in nature, such amounts are reclassified within the components of net assets based on their federal tax basis treatment; temporary differences do not require reclassification. Dividends and distributions that exceed earnings and profits for tax purposes are reported as a tax return of capital.
The tax character of distributions paid during the fiscal years ended December 31, 2018 and 2017 were as follows:
| Year Ended 12/31/2018 | Year Ended 12/31/2017 | |||||||||
| Distributions paid from: | ||||||||||
| Ordinary income | $ | 1,416,794 | $ | 1,521,325 | ||||||
| Net long-term capital gains | 15,969,877 | 3,079,106 | ||||||||
| Total distributions paid | $ | 17,386,671 | $ | 4,600,431 | ||||||
As of December 31, 2018, the components of accumulated gains and losses on a tax-basis were as follows:
| Undistributed long-term capital gains | $ | 2,982,287 | ||
| Total undistributed earnings | $ | 2,982,287 | ||
| Temporary differences | (359,564 | ) | ||
| Unrealized gains – net | 1,958,813 | |||
| Total accumulated gains – net | $ | 4,581,536 |
19
Notes to Financial Statements (continued)
At the Fund’s election, certain losses incurred within the taxable year (Qualified Late-Year Losses) are deemed to arise on the first business day of the Fund’s next taxable year. The Fund incurred and will elect to defer post-October capital losses of $339,742 during fiscal year 2018.
As of December 31, 2018, the aggregate unrealized security gains and losses on investments and other financial instruments based on cost for U.S. federal income tax purposes were as follows:
| Tax cost | $ | 67,323,195 | ||
| Gross unrealized gain | 7,041,497 | |||
| Gross unrealized loss | (5,082,684 | ) | ||
| Net unrealized security gain | $ | 1,958,813 |
The difference between book-basis and tax basis unrealized gains (losses) is attributable to the tax treatment of wash sales.
| 5. | PORTFOLIO SECURITIES TRANSACTIONS |
Purchases and sales of investment securities (excluding short-term investments) for the fiscal year ended December 31, 2018 were as follows:
| Purchases | Sales | |
| $46,458,695 | $111,822,621 |
There were no purchases or sales of U.S. Government securities for the fiscal year ended December 31, 2018.
The Fund is permitted to purchase and sell securities (“cross-trade”) from and to other Lord Abbett funds or client accounts pursuant to procedures approved by the Board in compliance with Rule 17a-7 under the Act (the “Rule”). Each cross-trade is executed at a fair market price in compliance with provisions of the Rule. For the fiscal year ended December 31, 2018, the Fund engaged in cross-trades purchases of $367,380, and sales of $374,595, which resulted in net realized gains of $85,311.
| 6. | DISCLOSURES ABOUT OFFSETTING ASSETS AND LIABILITIES |
The Financial Accounting Standards Board (“FASB”) requires disclosures intended to help better assess the effect or potential effect of offsetting arrangements on a fund’s financial position. The following tables illustrate gross and net information about recognized assets and liabilities eligible for offset in the statement of assets and liabilities; and disclose such amounts subject to an enforceable master netting agreement or similar agreement, by counterparty. A master netting agreement is an agreement between a fund and a counterparty which provides for the net settlement of amounts owed under all contracts traded under that agreement, as well as cash collateral, through a single payment by one party to the other in the event of default on or termination of any one contract. The Fund’s accounting policy with respect to balance sheet offsetting is that, absent an event of default by the counterparty or a termination of the agreement, the master netting agreement does not result in an offset of reported amounts of financial assets and liabilities in the statement of assets and liabilities across transactions between the Fund and the applicable counterparty:
20
Notes to Financial Statements (continued)
| Description | Gross Amounts of Recognized Assets | Gross Amounts Offset in the Statement of Assets and Liabilities | Net Amounts of Assets Presented in the Statement of Assets and Liabilities | |||||||||
| Repurchase Agreement | $151,476 | $ | – | $151,476 | ||||||||
| Total | $151,476 | $ | – | $151,476 | ||||||||
| Net Amounts of Assets Presented in | Amounts Not Offset in the Statement of Assets and Liabilities | |||||||||||||||||||
| Counterparty | the Statement of Assets and Liabilities | Financial Instruments | Cash Collateral Received(a) | Securities Collateral Received(a) | Net Amount(b) | |||||||||||||||
| Fixed Income Clearing Corp. | $151,476 | $ | – | $ | – | $(151,476 | ) | $ | – | |||||||||||
| Total | $151,476 | $ | – | $ | – | $(151,476 | ) | $ | – | |||||||||||
| (a) | Collateral disclosed is limited to an amount not to exceed 100% of the net amount of assets presented in the Statement of Assets and Liabilities, for each respective counterparty. |
| (b) | Net amount represents the amount owed to the Fund by the counterparty as of December 31, 2018. |
| 7. | DIRECTORS’ REMUNERATION |
The Company’s officers and one Director, who are associated with Lord Abbett, do not receive any compensation from the Company for serving in such capacities. Independent Directors’ fees are allocated among all Lord Abbett-sponsored funds based on the net assets of each fund. There is an equity-based plan available to all Independent Directors under which Independent Directors must defer receipt of a portion of, and may elect to defer receipt of an additional portion of Directors’ fees. The deferred amounts are treated as though equivalent dollar amounts had been invested in the funds. Such amounts and earnings accrued thereon are included in Directors’ fees on the Statement of Operations and in Directors’ fees payable on the Statement of Assets and Liabilities and are not deductible for U.S. federal income tax purposes until such amounts are paid.
| 8. | EXPENSE REDUCTIONS |
The Company has entered into an arrangement with its transfer agent and custodian, whereby credits realized as a result of uninvested cash balances are used to reduce a portion of the Fund’s expenses.
| 9. | LINE OF CREDIT |
During the period ended August 8, 2018, the Fund and certain other funds managed by Lord Abbett (collectively, the “Participating Funds”) participated in a syndicated line of credit facility with various lenders for $600 million (the “Facility”), whereas State Street Bank and Trust Company (“SSB”) participates as a lender and as agent for the lenders. The Facility is to be used for temporary or emergency purposes as an additional source of liquidity to satisfy redemptions. The Participating Funds are subject to graduated borrowing limits of one-third of Fund assets (if Fund assets are less than $750 million), $250 million, $300 million, or $350 million, based on past borrowings and likelihood of future borrowings. During the period ended August 8, 2018, the Fund did not utilize the Facility.
For the period August 9, 2018 through December 20, 2018, the Participating Funds entered into an amended syndicated line of credit facility with various lenders for $1.06 billion (the “Syndicated Facility”), whereas SSB participates as a lender and as agent for the lenders. Under the Syndicated
21
Notes to Financial Statements (continued)
Facility, the Participating Funds are subject to graduated borrowing limits of one-third of Fund assets (if Fund assets are less than $750 million), $250 million, $300 million, $350 million, or $1 billion, based on past borrowings and likelihood of future borrowings. Effective December 21, 2018, the Participating Funds entered into an amended Syndicated Facility with various lenders for $1.1 billion based on the same terms as described above.
Effective August 9, 2018, the Participating Funds entered into an additional line of credit facility with SSB for $250 million (the “Bilateral Facility,” and together with the Syndicated Facility, the “Facilities”). Under the Bilateral Facility, each Participating Fund may borrow up to the lesser of $250 million or one-third of Fund assets. The Facilities are to be used for temporary or emergency purposes to satisfy redemption requests and manage liquidity.
For the period from August 9, 2018 through December 31, 2018, the Fund did not utilize the Facilities.
| 10. | INTERFUND LENDING PROGRAM |
Pursuant to an exemptive order issued by the U.S. Securities and Exchange Commission (“SEC exemptive order”), certain registered open-end management investment companies managed by Lord Abbett, including the Fund, participate in a joint lending and borrowing program (the “Interfund Lending Program”). The SEC exemptive order allows the Funds to borrow money from and lend money to each other for temporary or emergency purposes subject to the limitations and conditions.
During the fiscal year ended December 31, 2018, the Fund did not participate as a borrower or lender in the Interfund Lending Program.
| 11. | CUSTODIAN AND ACCOUNTING AGENT |
SSB is the Company’s custodian and accounting agent. SSB performs custodial, accounting and recordkeeping functions relating to portfolio transactions and calculating the Fund’s NAV.
| 12. | INVESTMENT RISKS |
The Fund is subject to the general risks and considerations associated with equity investing. The value of an investment will fluctuate in response to movements in the equity securities markets in general, the changing prospects of individual companies in which the Fund invests, or an individual company’s financial condition. The Fund has particular risks associated with growth stocks. Growth companies may grow faster than other companies, which may result in more volatility in their stock prices. Growth stocks are often more sensitive to market fluctuations than other securities because their market prices are highly sensitive to future earnings expectations. In addition, if the Fund’s assessment of a company’s potential for growth or market conditions is wrong, it could suffer losses or produce poor performance relative to other funds, even in a favorable market. The Fund invests largely in mid-sized company stocks, which may be less able to weather economic shifts or other adverse developments than those of larger, more established companies. Although investing in mid-sized companies offers the potential for above average returns, these companies may not succeed and the value of their stock could decline significantly. Mid-sized companies also may fall out of favor relative to larger companies in certain market cycles, causing the Fund to incur losses or under perform.
Due to the Fund’s investment exposure to foreign companies and American Depositary Receipts, the Fund may experience increased market, industry and sector, liquidity, currency, political,
22
Notes to Financial Statements (concluded)
information, and other risks. The securities of foreign companies also may be subject to inadequate exchange control regulations, the imposition of economic sanctions or other government restrictions, higher transaction and other costs, and delays in settlement to the extent they are traded on non-U.S. exchanges or markets.
These factors can affect the Fund’s performance.
| 13. | SUMMARY OF CAPITAL TRANSACTIONS |
Transactions in shares of capital stock were as follows:
| Year Ended December 31, 2018 | Year Ended December 31, 2017 | |||||||
| Shares sold | 2,019,933 | �� | 442,997 | |||||
| Reinvestment of distributions | 1,664,823 | 326,154 | ||||||
| Shares reacquired | (6,791,466 | ) | (1,664,435 | ) | ||||
| Decrease | (3,106,710 | ) | (895,284 | ) | ||||
23
Report of Independent Registered Public Accounting Firm
To the shareholders and the Board of Directors of Lord Abbett Series Fund, Inc.:
Opinion on the Financial Statements and Financial Highlights
We have audited the accompanying statement of assets and liabilities, including the schedule of investments, of the Growth Opportunities Portfolio, one of the portfolios constituting the Lord Abbett Series Fund, Inc. (the “Fund”), as of December 31, 2018, the related statement of operations for the year then ended, the statements of changes in net assets for each of the two years in the period then ended, the financial highlights for each of the five years in the period then ended, and the related notes. In our opinion, the financial statements and financial highlights present fairly, in all material respects, the financial position of the Growth Opportunities Portfolio of the Fund as of December 31, 2018, and the results of its operations for the year then ended, the changes in its net assets for each of the two years in the period then ended, and the financial highlights for each of the five years in the period then ended in conformity with accounting principles generally accepted in the United States of America.
Basis for Opinion
These financial statements and financial highlights are the responsibility of the Fund’s management. Our responsibility is to express an opinion on the Fund’s financial statements and financial highlights based on our audits. We are a public accounting firm registered with the Public Company Accounting Oversight Board (United States) (PCAOB) and are required to be independent with respect to the Fund in accordance with the U.S. federal securities laws and the applicable rules and regulations of the Securities and Exchange Commission and the PCAOB.
We conducted our audits in accordance with the standards of the PCAOB. Those standards require that we plan and perform the audit to obtain reasonable assurance about whether the financial statements and financial highlights are free of material misstatement, whether due to error or fraud. The Fund is not required to have, nor were we engaged to perform, an audit of its internal control over financial reporting. As part of our audits we are required to obtain an understanding of internal control over financial reporting but not for the purpose of expressing an opinion on the effectiveness of the Fund’s internal control over financial reporting. Accordingly, we express no such opinion.
Our audits included performing procedures to assess the risks of material misstatement of the financial statements and financial highlights, whether due to error or fraud, and performing procedures that respond to those risks. Such procedures included examining, on a test basis, evidence regarding the amounts and disclosures in the financial statements and financial highlights. Our audits also included evaluating the accounting principles used and significant estimates made by management, as well as evaluating the overall presentation of the financial statements and financial highlights. Our procedures included confirmation of securities owned as of December 31, 2018, by correspondence with the custodian and brokers. We believe that our audits provide a reasonable basis for our opinion.
DELOITTE & TOUCHE LLP
New York, New York
February 15, 2019
We have served as the auditor of one or more Lord Abbett Family of Funds’ investment companies since 1932.
24
Basic Information About Management
The Board is responsible for the management of the business and affairs of the Company in accordance with the laws of the State of Maryland. The Board elects officers who are responsible for the day-to-day operations of the Fund and who execute policies authorized by the Board. The Board also approves an investment adviser to the Fund and continues to monitor the cost and quality of the services the investment adviser provides, and annually considers whether to renew the contract with the adviser. Generally, each Director holds office until his/her successor is elected and qualified or until his/her earlier resignation or removal, as provided in the Company’s organizational documents.
Lord Abbett, a Delaware limited liability company, is the Fund’s investment adviser. Designated Lord Abbett personnel are responsible for the day-to-day management of the Fund.
Interested Directors
Mr. Sieg is affiliated with Lord Abbett and is an “interested person” of the Company as defined in the Act. Mr. Sieg is director/trustee of each of the 13 investment companies in the Lord Abbett Family of Funds, which consist of 62 portfolios or series. Mr. Sieg is an officer of the Lord Abbett Family of Funds.
| Name, Address and Year of Birth | Current Position and Length of Service with the Company | Principal Occupation and Other Directorships During the Past Five Years | ||
| Douglas B. Sieg Lord, Abbett & Co. LLC 90 Hudson Street Jersey City, NJ 07302 (1969) | Director since 2016;President and ChiefExecutive Officersince 2018 | Principal Occupation:Managing Partner (since 2018)and was formerly Head of Client Services, joined LordAbbett in 1994.
Other Directorships:None. |
Independent Directors
The following Independent Directors also are directors/trustees of each of the 13 investment companies in the Lord Abbett Family of Funds, which consist of 62 portfolios or series.
| Name, Address and Year of Birth | Current Position and Length of Service with the Company | Principal Occupation and Other Directorships During the Past Five Years | ||
| Eric C. Fast Lord, Abbett & Co. LLC c/o Legal Dept. 90 Hudson Street Jersey City, NJ 07302 (1949) | Director since 2014 | Principal Occupation:Chief Executive Officer ofCrane Co., an industrial products company(2001–2014)
Other Directorships:Currently serves as directorof Automatic Data Processing, Inc. (since 2007)and Regions Financial Corporation (since 2010).Previously served as a director of Crane Co.(1999–2014). | ||
| Evelyn E. Guernsey Lord, Abbett & Co. LLC c/o Legal Dept. 90 Hudson Street Jersey City, NJ 07302 (1955) | Director since 2011 | Principal Occupation:CEO, Americas of J.P. MorganAsset Management (2004–2010).
Other Directorships:None. |
25
Basic Information About Management (continued)
| Name, Address and Year of Birth | Current Position and Length of Service with the Company | Principal Occupation and Other Directorships During the Past Five Years | ||
| Julie A. Hill Lord, Abbett & Co. LLC c/o Legal Dept. 90 Hudson Street Jersey City, NJ 07302 (1946) | Director since 2004 | Principal Occupation:Owner and CEO of The HillCompany, a business consulting firm (since 1998).
Other Directorships:Currently serves as director ofAnthem, Inc., a health benefits company (since 1994).
| ||
| Kathleen M. Lutito Lord, Abbett & Co. LLC c/o Legal Dept. 90 Hudson Street Jersey City, NJ 07302 (1963) | Director since 2017 | Principal Occupation:President and ChiefInvestment Officer of CenturyLink InvestmentManagement Company (since 2006).
Other Directorships:None
| ||
| James M. McTaggart Lord, Abbett & Co. LLC c/o Legal Dept. 90 Hudson Street Jersey City, NJ 07302 (1947) | Director since 2012 | Principal Occupation:Independent managementadvisor and consultant (since 2012); Vice President,CRA International, Inc. (doing business as CharlesRiver Associates), a global management consultingfirm (2009–2012); Founder and Chairman ofMarakon Associates, Inc., a strategy consulting firm(1978–2009); and Officer and Director of TrinsumGroup, a holding company (2007–2009).
Other Directorships:Blyth, Inc., a home productscompany (2004–2015).
| ||
| Karla M. Rabusch Lord, Abbett & Co. LLC c/o Legal Dept. 90 Hudson Street Jersey City, NJ 07302 (1959) | Director since 2017 | Principal Occupation:President and Director ofWells Fargo Funds Management, LLC (2003–2017);President of Wells Fargo Funds (2003–2016).
Other Directorships:None.
| ||
| Mark A. Schmid Lord, Abbett & Co. LLC c/o Legal Dept. 90 Hudson Street Jersey City, NJ 07302 (1959) | Director since 2016 | Principal Occupation:Vice President and ChiefInvestment Officer of the University of Chicago(since 2009).
Other Directorships:None.
| ||
| James L.L. Tullis Lord, Abbett & Co. LLC c/o Legal Dept. 90 Hudson Street Jersey City, NJ 07302 (1947) | Director since 2006;Chairman since 2017 | Principal Occupation:CEO of Tullis-Dickerson andCo. Inc., a venture capital management firm (since1990); CEO of Tullis Health Investors Inc. (since 2012).
Other Directorships:Currently serves as director ofCrane Co. (since 1998). |
Officers
None of the officers listed below have received compensation from the Company. All of the officers of the Company also may be officers of the other Lord Abbett Funds and maintain offices at 90 Hudson Street, Jersey City, NJ 07302. Unless otherwise indicated, the position(s) and title(s) listed under the “Principal Occupation During the Past Five Years” column indicate each officer’s position(s) and title(s) with Lord Abbett. Each officer serves for an indefinite term (i.e., until his or her death, resignation, retirement, or removal).
26
Basic Information About Management (continued)
| Name and Year of Birth | Current Position with the Company | Length of Service of Current Position | Principal Occupation During the Past Five Years | |||
| Douglas B. Sieg (1969) | President and Chief Executive Officer | Elected asPresident andChief ExecutiveOfficer in 2018 | Managing Partner of LordAbbett (since 2018) andwas formerly Head ofClient Services, joinedLord Abbett in 1994. | |||
| Jeff D. Diamond (1960) | Executive Vice President | Elected in 2008 | Portfolio Manager, joinedLord Abbett in 2007. | |||
| Todd D. Jacobson (1966) | Executive Vice President | Elected in 2005 | Partner and AssociateDirector, joined LordAbbett in 2003. | |||
| Robert A. Lee (1969) | Executive Vice President | Elected in 2010 | Partner and ChiefInvestment Officer, andwas formerly DeputyChief Investment Officerand Director of TaxableFixed Income, joined LordAbbett in 1997. | |||
| David J. Linsen (1974) | Executive Vice President | Elected in 2008 | Partner and Director ofEquities, joined LordAbbett in 2001. | |||
| Vincent J. McBride (1964) | Executive Vice President | Elected in 2010 | Partner and Director,joined Lord Abbett in2003. | |||
| Andrew H. O’Brien (1973) | Executive Vice President | Elected in 2010 | Partner and PortfolioManager, joined LordAbbett in 1998. | |||
| F. Thomas O’Halloran (1955) | Executive Vice President | Elected in 2010 | Partner and PortfolioManager, joined LordAbbett in 2001. | |||
| Marc Pavese (1972) | Executive Vice President | Elected in 2016 | Partner and PortfolioManager, joined LordAbbett in 2008. | |||
| Walter H. Prahl (1958) | Executive Vice President | Elected in 2012 | Partner and Director,joined Lord Abbett in1997. | |||
| Eli Rabinowich (1975) | Executive Vice President | Elected in 2018 | Portfolio Manager, joinedLord Abbett in 2018 andwas formerly a PortfolioManager, Partner, andAnalyst at PzenaInvestment Managementfrom (2004–2018). |
27
Basic Information About Management (continued)
| Name and Year of Birth | Current Position with the Company | Length of Service of Current Position | Principal Occupation During the Past Five Years | |||
| Jeffrey Rabinowitz (1972) | Executive Vice President | Elected in 2017 | Portfolio Manager, joinedLord Abbett in 2017 andwas formerly ManagingDirector and PortfolioManager/TechnologyAnalyst at JennisonAssociates LLC (2014–2017)and Managing Directorand Portfolio Manager/Technology Analyst for U.S. Growth Equity atGoldman Sachs AssetManagement (1999–2014). | |||
| Steven F. Rocco (1979) | Executive Vice President | Elected in 2014 | Partner and Director ofTaxable Fixed Income,joined Lord Abbett in 2004. | |||
| A. Edward Allinson (1961) | Vice President | Elected in 2011 | Portfolio Manager, joinedLord Abbett in 2005. | |||
| Vernon T. Bice (1974) | Vice President | Elected in 2011 | Portfolio Manager, joinedLord Abbett in 2011. | |||
| Pamela P. Chen (1978) | Vice President,Assistant Secretaryand Privacy Officer | Elected in 2018 | Associate General Counsel,joined Lord Abbett in2017 and was formerlySpecial Counsel atSchulte, Roth & Zabel LLP(2005–2017). | |||
| Robert S. Clark (1975) | Vice President | Elected in 2018 | Portfolio Manager, joinedLord Abbett in 2010. | |||
| Matthew R. DeCicco (1977) | Vice President | Elected in 2003 | Managing Director andPortfolio Manager, joinedLord Abbett in 1999. | |||
| John T. Fitzgerald (1975) | Vice President andAssistant Secretary | Elected in 2018 | Deputy General Counsel,joined Lord Abbett in2018 and was formerlyDeputy Head of U.S.Funds Legal, ExecutiveDirector and AssistantGeneral Counsel atJPMorgan Chase(2005–2018). | |||
| Christopher J. Gizzo (1986) | Vice President | Elected in 2018 | Managing Director andPortfolio Manager, joinedLord Abbett in 2008. | |||
| Bernard J. Grzelak (1971) | Chief Financial Officerand Vice President | Elected in 2017 | Partner, Chief OperatingOfficer, Global Funds andRisk, joined Lord Abbett in2003. |
28
Basic Information About Management (concluded)
| Name and Year of Birth | Current Position with the Company | Length of Service of Current Position | Principal Occupation During the Past Five Years | |||
| Linda Y. Kim (1980) | Vice President andAssistant Secretary | Elected in 2016 | Counsel, joined LordAbbett in 2015 and wasformerly an Associate atStroock & Stroock &Lavan LLP (2007–2015). | |||
| So Young Lee (1971) | Vice President | Elected in 2018 | Portfolio Manager, joinedLord Abbett in 2013. | |||
| Joseph M. McGill (1962) | Chief Compliance Officer | Elected in 2014 | Partner and ChiefCompliance Officer,joined Lord Abbett in2014 and was formerlyManaging Director andthe Chief ComplianceOfficer at UBS GlobalAsset Management(2003–2013). | |||
| A. Edward Oberhaus, III (1959) | Vice President | Elected in 1998 | Partner and Director,joined Lord Abbett in 1983. | |||
| Amanda S. Ryan (1978) | Vice President andAssistant Secretary | Elected in 2018 | Counsel, joined LordAbbett In 2016 and wasformerly a Director andCorporate Counsel atPGIM Investments(2012–2016). | |||
| Lawrence B. Stoller (1963) | Vice President,Secretary andChief Legal Officer | Elected in 2007 | Partner and GeneralCounsel, joined LordAbbett in 2007. | |||
| Leah G. Traub (1979) | Vice President | Elected in 2016 | Partner and PortfolioManager, joined LordAbbett in 2007. | |||
| Kewjin Yuoh (1971) | Vice President | Elected in 2012 | Partner and PortfolioManager, joined LordAbbett in 2010. | |||
| Jackson C. Chan (1964) | AML Compliance Officer | Elected in 2018 | Deputy Chief ComplianceOfficer and Director ofRegulatory Affairs, joinedLord Abbett in 2014 andwas formerly Director atUBS Global AssetManagement (2005–2014). | |||
| Vito A. Fronda (1969) | Treasurer | Elected in 2018 | Partner and Director ofTaxation, joined LordAbbett in 2003. |
Please call 888-522-2388 for a copy of the statement of additional information, which contains further information about the Company’s Directors. It is available free upon request.
29
Approval of Advisory Contract
The Board, including all of the Directors who are not “interested persons” of the Company or of Lord Abbett, as defined in the Investment Company Act of 1940, as amended (the “Independent Directors”), annually considers whether to approve the continuation of the existing management agreement between the Fund and Lord Abbett (the “Agreement”). In connection with its most recent approval, which included the approval of a proposal to reduce the management fee schedule effective May 1, 2019, the Board reviewed materials relating specifically to the Agreement, as well as numerous materials received throughout the course of the year, including information about the Fund’s investment performance compared to the performance of its benchmark. Before making its decision as to the Fund, the Board had the opportunity to ask questions and request further information, taking into account its knowledge of Lord Abbett gained through its meetings and discussions. These meetings and discussions included reviews of Fund performance conducted by members of the Contract Committee, the deliberations of the Contract Committee, and discussions between the Contract Committee and Lord Abbett’s management. The Independent Directors also met with their independent legal counsel in various private sessions at which no representatives of management were present.
The materials received by the Board included, but were not limited to: (1) information provided by Broadridge Financial Solutions (“Broadridge”) regarding the investment performance of the Fund compared to the investment performance of certain funds with similar investment styles as determined by Broadridge, based, in part, on the Fund’s Morningstar category (the “performance peer group”), and the investment performance of two appropriate benchmarks; (2) information provided by Broadridge regarding the expense ratios, contractual and actual management fee rates, and other expense components for the Fund and certain funds in the same Morningstar category, with generally the same or similar share classes and operational characteristics, including asset size (the “expense peer group”); (3) certain supplemental investment performance information provided by Lord Abbett; (4) information provided by Lord Abbett on the expense ratios, management fee rates, and other expense components for the Fund; (5) sales and redemption information for the Fund; (6) information regarding Lord Abbett’s financial condition; (7) an analysis of the relative profitability of the Agreement to Lord Abbett; (8) information provided by Lord Abbett regarding the investment management fee schedules for Lord Abbett’s other advisory clients maintaining accounts with a similar investment strategy as the Fund; and (9) information regarding the personnel and other resources devoted by Lord Abbett to managing the Fund.
Investment Management and Related Services Generally.The Board considered the services provided by Lord Abbett to the Fund, including investment research, portfolio management, and trading, and Lord Abbett’s commitment to compliance with all applicable legal requirements. The Board also observed that Lord Abbett was solely engaged in the investment management business and accordingly did not experience the conflicts of interest that may result from being engaged in other lines of business. The Board considered the investment advisory services provided by Lord Abbett to other clients, the fees charged for the services, and the differences in the nature of the services provided to the Fund and other Lord Abbett Funds, on the one hand, and the services provided to other clients, on the other. After reviewing these and related factors, the Board concluded that the Fund was likely to continue to benefit from the nature, extent and quality of the investment services provided by Lord Abbett under the Agreement.
Investment Performance.The Board reviewed the Fund’s investment performance in relation to that of the performance peer group and two appropriate benchmarks as of various periods ended August 31, 2018. The Board observed that the Fund’s investment performance was below the
30
Approval of Advisory Contract (continued)
median of the performance peer group for the one-, three-, five-, and ten-year periods. The Board took into account recent changes to the portfolio management team and other actions taken by Lord Abbett to attempt to improve equity fund performance. The Board further considered Lord Abbett’s performance and reputation generally, the performance of other Lord Abbett-managed funds overseen by the Board, and the willingness of Lord Abbett to take steps intended to improve performance when appropriate. After reviewing these and related factors, the Board concluded that the Fund’s Agreement, as revised with a reduced management fee schedule effective May 1, 2019, should be continued.
Lord Abbett’s Personnel and Methods.The Board considered the qualifications of the personnel providing investment management services to the Fund, in light of its investment objective and discipline, and other services provided to the Fund by Lord Abbett. Among other things, the Board considered the size, experience, and turnover of Lord Abbett’s staff, Lord Abbett’s investment methodology and philosophy, and Lord Abbett’s approach to recruiting, training, and retaining personnel.
Nature and Quality of Other Services.The Board considered the nature, quality, and extent of compliance, administrative, and other services performed by Lord Abbett and the nature and extent of Lord Abbett’s supervision of third party service providers, including the Fund’s transfer agent and custodian.
Expenses.The Board considered the expense level of the Fund, including the contractual and actual management fee rates under the terms of the current Agreement, and the expense levels of the Fund’s expense peer group. It also considered how the expense level of the Fund related to those of the expense peer group and the amount and nature of the fees paid by shareholders. The Board observed that the net total expense ratio of the Fund was equal to the median of the expense peer group. The Board further considered that the Fund’s management fee schedule would be reduced, effective May 1, 2019. After reviewing these and related factors, the Board concluded, within the context of its overall approval of the Agreement, that the expense level of the Fund was reasonable and supported the continuation of the Agreement.
Profitability.The Board considered the level of Lord Abbett’s operating margin in managing the Fund, including a review of Lord Abbett’s methodology for allocating its costs to its management of the Fund. It considered whether the Fund was profitable to Lord Abbett in connection with the Fund’s operation, including the fee that Lord Abbett receives from the Fund for providing administrative services to the Fund. The Board also considered the profits realized from other business segments of Lord Abbett, which may benefit from or be related to the Fund’s business. The Board considered Lord Abbett’s profit margins excluding Lord Abbett’s marketing and distribution expenses. The Board also considered Lord Abbett’s profit margins, without those exclusions, in comparison with available industry data and how those profit margins could affect Lord Abbett’s ability to recruit and retain personnel. The Board recognized that Lord Abbett’s overall profitability was a factor in enabling it to attract and retain qualified personnel to provide services to the Fund. After reviewing these and related factors, the Board concluded, within the context of its overall approval of the Agreement, that Lord Abbett’s profitability with respect to the Fund was not excessive.
Economies of Scale.The Board considered the extent to which there had been economies of scale in managing the Fund, whether the Fund’s shareholders had appropriately benefited from such economies of scale, and whether there was potential for realization of any further economies of scale. The Board concluded that the reduced management fee schedule, which included certain
31
Approval of Advisory Contract (concluded)
breakpoints in the management fee schedule, adequately addressed any economies of scale in managing the Fund.
Other Benefits to Lord Abbett.The Board considered the amount and nature of the fees paid by the Fund and the Fund’s shareholders to Lord Abbett for services other than investment advisory services, such as the fee that Lord Abbett receives from the Fund for providing administrative services to the Fund. The Board also considered the revenues and profitability of Lord Abbett’s investment advisory business apart from its mutual fund business, and the intangible benefits enjoyed by Lord Abbett by virtue of its relationship with the Fund. The Board observed that the Distributor receives 12b-1 fees from certain of the Lord Abbett Funds as to shares held in accounts for which there is no other broker of record, may retain a portion of the 12b-1 fees it receives, and receives a portion of the sales charges on sales and redemptions of some classes of shares of the Lord Abbett Funds. In addition, the Board observed that Lord Abbett accrues certain benefits for its business of providing investment advice to clients other than the Lord Abbett Funds, but that business also benefits the Funds. The Board also noted that Lord Abbett, as disclosed in the prospectus of the Fund, has entered into revenue sharing arrangements with certain entities that distribute shares of the Lord Abbett Funds. The Board also took into consideration the investment research that Lord Abbett receives as a result of client brokerage transactions.
Alternative Arrangements.The Board considered whether, instead of approving continuation of the Agreement, it might be in the best interests of the Fund to implement one or more alternative arrangements, such as continuing to employ Lord Abbett, but on different terms. After considering all of the relevant factors, the Board unanimously found that continuation of the Agreement, as revised, was in the best interests of the Fund and its shareholders and voted unanimously to approve the continuation of the Agreement. In considering whether to approve the continuation of the Agreement, the Board did not identify any single factor as paramount or controlling. Individual Directors may have evaluated the information presented differently from one another, giving different weights to various factors. This summary does not discuss in detail all matters considered.
32
Householding
The Company has adopted a policy that allows it to send only one copy of the Fund’s prospectus, proxy material, annual report and semiannual report to certain shareholders residing at the same “household.” This reduces Fund expenses, which benefits you and other shareholders. If you need additional copies or do not want your mailings to be “householded,” please call Lord Abbett at 888-522-2388 or send a written request with your name, the name of your fund or funds and your account number or numbers to Lord Abbett Family of Funds, P.O. Box 219336, Kansas City, MO 64121.
Proxy Voting Policies, Procedures and Records
A description of the policies and procedures that Lord Abbett uses to vote proxies related to the Fund’s portfolio securities, and information on how Lord Abbett voted the Fund’s proxies during the 12-month period ended June 30 are available without charge, upon request, (i) by calling 888-522-2388; (ii) on Lord Abbett’s Website at www.lordabbett.com; and (iii) on the Securities and Exchange Commission’s (“SEC”) Website at www.sec.gov.
Shareholder Reports and Quarterly Portfolio Disclosure
The Fund is required to file its complete schedule of portfolio holdings with the SEC for its first and third fiscal quarters on Form N-Q. Copies of the filings are available without charge, upon request on the SEC’s Website at www.sec.gov and may be available by calling Lord Abbett at 888-522-2388.
Tax Information
For corporate shareholders, 74% of the Fund’s ordinary income distributions qualified for the dividends received deduction.
Additionally, of the distribution paid to the shareholders during the fiscal year ended December 31, 2018, $1,416,794 and $15,969,877, respectively, represent short-term capital gains and long-term capital gains. |
33


| This report, when not used for the general information of shareholders of the Fund, is to be distributed only if preceded or accompanied by a current fund prospectus. | |||
| Lord Abbett mutual fund shares are distributed by LORD ABBETT DISTRIBUTOR LLC. | Lord Abbett Series Fund, Inc.
Growth Opportunities Portfolio | LASFGO-3 (02/19) |
![]()
LORD ABBETT
ANNUAL REPORT
Lord Abbett
Series Fund—International Equity Portfolio
For the fiscal year ended December 31, 2018
Table of Contents
Lord Abbett Series Fund — International Equity Portfolio Annual Report
For the fiscal year ended December 31, 2018

From left to right: James L.L. Tullis, Independent Chairman of the Lord Abbett Funds and Douglas B. Sieg, Director, President, and Chief Executive Officer of the Lord Abbett Funds.
Dear Shareholders:We are pleased to provide you with this overview of the performance of Lord Abbett Series Fund — International Equity Portfolio for the fiscal year ended December 31, 2018. On this page and the following pages, we discuss the major factors that influenced fiscal year performance. For additional information about the Fund, please visit our website at www.lordabbett.com, where you also can access the quarterly commentaries that provide updates on the Fund’s performance and other portfolio related updates.
Thank you for investing in Lord Abbett mutual funds. We value the trust that you place in us and look forward to serving your investment needs in the years to come.
Best regards,

Douglas B. Sieg
Director, President and Chief Executive Officer
For the fiscal year ended December 31, 2018, the Fund returned -18.34%, reflecting performance at the net asset value (NAV) of Class VC Shares with all distributions reinvested, compared to its benchmark, the MSCI ACWI ex-USA Index with Net Dividends1, which returned -14.20% over the same period.
Over the period, global equity markets experienced significant negative performance, despite most central banks remaining accommodative, interest rates remaining low, and unemployment steadily declining. In addition, corporate earnings
continued to grow, while global economic growth has showed signs of peaking and plateauing. Overall, European markets (as measured by the EURO STOXX 50® Index2) fell roughly 18.4% in U.S. dollars for the period, while Japan’s Nikkei 2253fell 10.35% in U.S. dollars.
In March 2018, the Federal Reserve (the “Fed”) raised its target for short-term interest rates by 0.25%, to a range of 1.50%-1.75%, and followed with rate hikes of 0.25% at each of its June, September, and December meetings, raising the target range to 2.25%-2.50%. Meanwhile, other
1
central banks have continued their accommodative policies. The European Central Bank (ECB) has kept its benchmark refinancing rate unchanged at 0% since March 2016, and at its December 2018 meeting, the ECB confirmed the end of its asset purchase program (APP) later in the month. The Bank of Japan (BoJ) also maintained its stimulative monetary policy as short term interest rates remained unchanged, at -0.1%, at its December 2018 meeting, and the bank kept its 10-year government bond yield target at around 0%. The BoJ also maintained its upbeat view on Japan’s domestic economy despite slowing growth in China, uncertainty from Sino-U.S. trade dispute and volatile financial markets.
The International Monetary Fund lowered global growth estimates by 0.2 percentage points to 3.7% for both 2018 and 2019, reflecting “surprises that suppressed activity in early 2018 in some major advanced economies, the negative effects of the trade measures implemented or approved between April and mid-September, as well as a weaker outlook for some key emerging markets and developing economies arising from country-specific factors, tighter financial conditions, geopolitical tensions, and higher oil import bills”. Unemployment steadily declined in most developed countries, falling to 7.9% in the Euro area, 3.9% in the United States, 2.5% in Japan, and 3.8% in China, all multiyear lows. GDP growth has remained positive in most developed countries, while
inflation remained subdued, allowing central banks to continue their stimulative monetary policies.
Volatility, as measured by the VIX index, has crept back up this year after remaining near all-time low levels for most of 2017. Sources of tension throughout the year have come from aggressive U.S. trade posture with trade tensions mounting between the U.S. and China, remaining uncertainty regarding a potential hard “Brexit” outcome, and the gradual and continuous rise of rates by the Fed.
During the period, the Fund’s underperformance relative to its benchmark was driven by stock selection, particularly within the industrials and consumer discretionary sectors. Within the industrials sector, an overweight position in Loomis AB detracted from relative performance. Shares of the Swedish armored car services company fell as the long-term structural decline in the usage of cash in society put a damper on the valuation. Additionally, shares of en-japan inc. also detracted from relative performance. Shares of the Japanese internet-based recruiting solutions company declined amid structural concerns around Japan’s declining working-age population and general labor shortages.
Security selection in the consumer discretionary sector also detracted from relative performance. Within the consumer discretionary sector, an overweight position in GVC Holdings PLC detracted from relative performance. Shares of the
2
electronic gaming company fell after the U.K. budget announcement of an increase in remote gambling duty (RGD) as well as the implementation of maximum stakes for fixed-odds betting terminals.
Conversely, stock selection within the financials and real estate sectors contributed to relative performance over the period. Within the financials sector, shares of Swiss Life Holding AG contributed to relative performance. The Switzerland-based insurance company’s shares rose as it continues to make a strong case for better margins, more cash flow, and a commitment to attractive capital management. ASR Nederland N.V., a Netherlands-based insurance company, also contributed to relative performance. The company benefited as a result of new
financial targets that were marginally better than expected, and from a continued focus on solvency ratios that have kept the company less sensitive to equity market declines.
Within the real estate sector, shares of Aroundtown SA, a Luxembourg-based real estate company, contributed to performance. The company has continued to benefit from its focus in regions with solid economic fundamentals and from the improvement of rental and occupancy levels in the German office property markets.
The Fund’s portfolio is activelymanaged and, therefore, its holdings andthe weightings of a particular issuer orparticular sector as a percentage ofportfolio assets are subject to change.Sectors may include many industries.
1 The MSCI ACWI (All Country World Index) ex-USA Index is a subset of the MSCI ACWI Index. The MSCI ACWI (All Country World Index) Index is a free float-adjusted market capitalization weighted index that is designed to measure the equity market performance of developed and emerging markets. The MSCI ACWI Ex-USA Index with Gross Dividends approximates the maximum possible dividend reinvestment. The amount reinvested is the entire dividend distributed to individuals resident in the country of the company, but does not include tax credits. The MSCI ACWI Ex-USA Index with Net Dividends approximates the minimum possible dividend reinvestment. The dividend is reinvested after deduction of withholding tax, applying the rate to non-resident individuals who do not benefit from double taxation treaties. MSCI uses withholding tax rates applicable to Luxembourg holding companies, as Luxembourg applies the highest rates.
2 The EURO STOXX 50® Index represents the performance of the 50 largest companies among the 19 supersectors in terms of free-float market cap in 12 eurozone countries. These countries include Austria, Belgium, Finland, France, Germany, Greece, Ireland, Italy, Luxembourg, the Netherlands, Portugal
and Spain. The Index has a fixed number of components and is part of the STOXX® blue-chip index family. The Index captures about 60% of the free-float market cap of the EURO STOXX® Total Market Index (TMI).
3 The Nikkei Stock Average, the Nikkei 225 is used around the globe as the premier index of Japanese stocks. Because of the prominent nature of the index, many financial products linked to the Nikkei 225 that have been created are traded worldwide, and the index has been sufficiently used as the indicator of the movement of Japanese stock markets. The Nikkei 225 is a price-weighted equity index, which consists of 225 stocks in the first section of the Tokyo Stock Exchange.
Unless otherwise specified, indexes reflect total return, with all dividends reinvested. Indexes are unmanaged, do not reflect the deduction of fees or expenses, and are not available for direct investment.
Important Performance and Other Information
Performance data quoted in the following pages reflect past performance and are no guarantee of future results. Current performance may be higher or lower than the performance quoted.
3
The investment return and principal value of an investment in the Fund will fluctuate so that shares, on any given day or when redeemed, may be worth more or less than their original cost. You can obtain performance data current to the most recent month end by calling Lord Abbett at 888-522-2388 or referring to www.lordabbett.com.
During certain periods shown, expense waivers and reimbursements were in place. Without such expense waivers and reimbursements, the Fund’s returns would have been lower.
The annual commentary above discusses the views of the Fund’s management and various portfolio holdings of the Fund as of December 31, 2018. These views and portfolio holdings may have changed after this date. Information provided in the commentary is not a recommendation to buy or sell securities. Because the Fund’s portfolio is actively managed and
may change significantly, the Fund may no longer own the securities described above or may have otherwise changed its position in the securities. For more recent information about the Fund’s portfolio holdings, please visit www.lordabbett.com.
A Note about Risk:See Notes to Financial Statements for a discussion of investment risks. For a more detailed discussion of the risks associated with the Fund, please see the Fund’s prospectus.
Mutual funds are not insured by the FDIC, are not deposits or other obligations of, or guaranteed by, banks, and are subject to investment risks including possible loss of principal amount invested.
The Fund serves as an underlying investment vehicle for variable annuity contracts and variable life insurance policies.
4
Below is a comparison of a $10,000 investment in Class VC shares with the same investment in the Morgan Stanley Capital International (MSCI) All Country World Index (ACWI) ex-USA® Index with Gross Dividends and the MSCI ACWI ex-USA® Index with Net Dividends, assuming reinvestment of all dividends and distributions. The Fund’s shares are sold only to insurance company separate accounts that fund certain variable annuity and variable life contracts. This line graph comparison does not reflect the sales charges or other expenses of these contracts. If those sales charges and expenses were reflected, returns would be lower. The graph and performance table below do not reflect the deduction of taxes that a shareholder would pay on Fund distributions or the redemption of Fund shares. During the period, expenses of the Fund were waived or reimbursed by Lord Abbett; without such waiver or reimbursement of expenses, the Fund’s returns would have been lower.Past performance is no guarantee of future results.

| Average Annual Total Returns for the Period Ended December 31, 2018 | |||||||
| 1 Year | 5 Years | Life of Class | |||||
| Class VC2 | –18.34% | –2.16% | 1.98% | ||||
1 Performance for each unmanaged index does not reflect any fees or expenses. The performance of each index is not necessarily representative of the Fund’s performance. Performance for each index began on May 1, 2010.
2 The Class VC shares commenced operations on April 16, 2010. Performance for the Class began on May 1, 2010.
5
As a shareholder of the Fund, you incur ongoing costs, including management fees; expenses related to the Fund’s services arrangements with certain insurance companies; and other Fund expenses. This Example is intended to help you understand your ongoing costs (in dollars) of investing in the Fund and to compare these costs with the ongoing costs of investing in other mutual funds.
The Example is based on an investment of $1,000 invested at the beginning of the period and held for the entire period (July 1, 2018 through December 31, 2018).
The Example reflects only expenses that are deducted from the assets of the Fund. Fees and expenses, including sales charges applicable to the various insurance products that invest in the Fund, are not reflected in this Example. If such fees and expenses were reflected in the Example, the total expenses shown would be higher. Fees and expenses regarding such variable insurance products are separately described in the prospectus related to those products.
Actual Expenses
The first line of the table on the following page provides information about actual account values and actual expenses. You may use the information in this line, together with the amount you invested, to estimate the expenses that you paid over the period. Simply divide your account value by $1,000 (for example, an $8,600 account value divided by $1,000 = 8.6), then multiply the result by the number in the first line under the heading titled “Expenses Paid During Period 7/1/18 – 12/31/18” to estimate the expenses you paid on your account during this period.
Hypothetical Example for Comparison Purposes
The second line of the table on the following page provides information about hypothetical account values and hypothetical expenses based on the Fund’s actual expense ratio and an assumed rate of return of 5% per year before expenses, which is not the Fund’s actual return. The hypothetical account values and expenses may not be used to estimate the actual ending account balance or expenses you paid for the period. You may use this information to compare the ongoing costs of investing in the Fund and other funds. To do so, compare this 5% hypothetical example with the 5% hypothetical examples that appear in the shareholder reports of the other funds.
6
Please note that the expenses shown in the table are meant to highlight your ongoing costs only and do not reflect any transactional costs, such as sales charges. Therefore, the second line of the table is useful in comparing ongoing costs only, and will not help you determine the relative total costs of owning different funds. In addition, if these transactional costs were included, your costs would have been higher.
| Beginning Account Value | Ending Account Value | ExpensesPaid DuringPeriod† | ||||||
| 7/1/18 | 12/31/18 | 7/1/18 – 12/31/18 | ||||||
| Class VC | ||||||||
| Actual | $1,000.00 | $ 872.20 | $4.34 | |||||
| Hypothetical (5% Return Before Expenses) | $1,000.00 | $1,020.57 | $4.69 |
| † | Net expenses are equal to the Fund’s annualized expense ratio of 0.92%, multiplied by the average account value over the period, multiplied by 184/365 (to reflect one-half year period). |
Portfolio Holdings Presented by Sector
December 31, 2018
| Sector* | %** | |
| Communication Services | 7.80 | % |
| Consumer Discretionary | 10.85 | % |
| Consumer Staples | 11.09 | % |
| Energy | 6.27 | % |
| Financials | 24.62 | % |
| Health Care | 8.99 | % |
| Industrials | 9.86 | % |
| Information Technology | 6.32 | % |
| Materials | 7.12 | % |
| Real Estate | 2.71 | % |
| Utilities | 0.96 | % |
| Repurchase Agreement | 3.41 | % |
| Total | 100.00 | % |
| * | A sector may comprise several industries. |
| ** | Represents percent of total investments. |
7
December 31, 2018
| Investments | Shares | U.S. $ Fair Value (000) | ||||||
| COMMON STOCKS 95.92% | ||||||||
| Australia 1.65% | ||||||||
| Metals & Mining | ||||||||
| BHP Group Ltd. | 39,728 | $ | 960 | |||||
| Brazil 2.49% | ||||||||
| Banks 1.51% | ||||||||
| Itau Unibanco Holding SA ADR | 96,091 | 878 | ||||||
| Wireless Telecommunication Services 0.98% | ||||||||
| TIM Participacoes SA | 187,200 | 572 | ||||||
| Total Brazil | 1,450 | |||||||
| Brunei 1.02% | ||||||||
| Insurance | ||||||||
| Hiscox Ltd. | 28,696 | 593 | ||||||
| Canada 2.75% | ||||||||
| Aerospace & Defense 1.57% | ||||||||
| CAE, Inc. | 49,900 | 917 | ||||||
| Metals & Mining 1.18% | ||||||||
| Lundin Mining Corp. | 166,700 | 689 | ||||||
| Total Canada | 1,606 | |||||||
| China 4.85% | ||||||||
| Insurance 1.15% | ||||||||
| Ping An Insurance Group Co. of China Ltd. Class H | 76,000 | 670 | ||||||
| Interactive Media & Services 1.23% | ||||||||
| Tencent Holdings Ltd. | 17,900 | 717 | ||||||
| Internet & Direct Marketing Retail 1.82% | ||||||||
| Alibaba Group Holding Ltd. ADR* | 7,759 | 1,064 | ||||||
| Oil, Gas & Consumable Fuels 0.65% | ||||||||
| CNOOC Ltd. | 244,000 | 376 | ||||||
| Total China | 2,827 | |||||||
| Investments | Shares | U.S. $ Fair Value (000) | ||||||
| Denmark 1.10% | ||||||||
| Insurance | ||||||||
| Tryg A/S | 25,458 | $ | 642 | |||||
| Finland 0.84% | ||||||||
| Communications Equipment | ||||||||
| Nokia OYJ | 84,695 | 492 | ||||||
| France 12.19% | ||||||||
| Aerospace & Defense 0.95% | ||||||||
| Thales SA | 4,728 | 552 | ||||||
| Beverages 1.37% | ||||||||
| Pernod Ricard SA | 3,022 | 496 | ||||||
| Remy Cointreau SA | 2,652 | 301 | ||||||
| 797 | ||||||||
| Construction & Engineering 1.57% | ||||||||
| Vinci SA | 11,171 | 919 | ||||||
| Diversified Telecommunication Services 2.37% | ||||||||
| Orange SA | 37,015 | 600 | ||||||
| Vivendi SA | 32,267 | 782 | ||||||
| 1,382 | ||||||||
| Food Products 1.00% | ||||||||
| Danone SA | 8,303 | 585 | ||||||
| Oil, Gas & Consumable Fuels 1.92% | ||||||||
| Total SA | 21,196 | 1,118 | ||||||
| Personal Products 1.11% | ||||||||
| L’Oreal SA | 2,844 | 651 | ||||||
| Pharmaceuticals 1.39% | ||||||||
| Sanofi | 9,349 | 811 | ||||||
| Textiles, Apparel & Luxury Goods 0.51% | ||||||||
| LVMH Moet Hennessy Louis Vuitton SE | 1,013 | 296 | ||||||
| Total France | 7,111 | |||||||
| 8 | See Notes to Financial Statements. |
Schedule of Investments (continued)
December 31, 2018
| Investments | Shares | U.S. $ Fair Value (000) | ||||||
| Germany 11.65% | ||||||||
| Automobiles 1.08% | ||||||||
| Volkswagen AG | 3,952 | $ | 632 | |||||
| Chemicals 0.92% | ||||||||
| Symrise AG | 7,216 | 535 | ||||||
| Diversified Telecommunication Services 1.16% | ||||||||
| Deutsche Telekom AG Registered Shares | 39,704 | 675 | ||||||
| Industrial Conglomerates 0.78% | ||||||||
| Rheinmetall AG | 5,132 | 455 | ||||||
| Information Technology Services 0.59% | ||||||||
| Wirecard AG | 2,270 | 342 | ||||||
| Insurance 1.63% | ||||||||
| Allianz SE Registered Shares | 4,745 | 954 | ||||||
| Life Sciences Tools & Services 0.54% | ||||||||
| MorphoSys AG* | 3,092 | 316 | ||||||
| Real Estate Management & Development 2.69% | ||||||||
| Aroundtown SA | 119,818 | 994 | ||||||
| Vonovia SE | 12,833 | 578 | ||||||
| 1,572 | ||||||||
| Software 1.54% | ||||||||
| SAP SE | 9,029 | 896 | ||||||
| Textiles, Apparel & Luxury Goods 0.72% | ||||||||
| adidas AG | 2,007 | 419 | ||||||
| Total Germany | 6,796 | |||||||
| Hong Kong 4.14% | ||||||||
| Auto Components 0.53% | ||||||||
| Xinyi Glass Holdings Ltd. | 280,000 | 309 | ||||||
| Capital Markets 0.71% | ||||||||
| Hong Kong Exchanges & Clearing Ltd. | 14,200 | 411 | ||||||
| Investments | Shares | U.S. $ Fair Value (000) | ||||||
| Hotels, Restaurants & Leisure 0.79% | ||||||||
| Galaxy Entertainment Group Ltd. | 73,000 | $ | 461 | |||||
| Insurance 2.11% | ||||||||
| AIA Group Ltd. | 148,400 | 1,233 | ||||||
| Total Hong Kong | 2,414 | |||||||
| India 2.25% | ||||||||
| Banks 1.40% | ||||||||
| ICICI Bank Ltd. ADR | 79,553 | 819 | ||||||
| Commercial Banks 0.85% | ||||||||
| HDFC Bank Ltd. | 4,772 | 494 | ||||||
| Total India | 1,313 | |||||||
| Indonesia 2.65% | ||||||||
| Banks 1.63% | ||||||||
| Bank Rakyat Indonesia Persero Tbk PT | 3,732,200 | 951 | ||||||
| Commercial Banks 1.02% | ||||||||
| Bank Mandiri Persero Tbk PT | 1,163,200 | 597 | ||||||
| Total Indonesia | 1,548 | |||||||
| Ireland 2.41% | ||||||||
| Banks 0.80% | ||||||||
| Bank of Ireland Group plc | 84,141 | 468 | ||||||
| Construction Materials 0.62% | ||||||||
| CRH plc | 13,665 | 362 | ||||||
| Life Sciences Tools & Services 0.99% | ||||||||
| ICON plc* | 4,460 | 576 | ||||||
| Total Ireland | 1,406 | |||||||
| Israel 1.09% | ||||||||
| Software | ||||||||
| Nice Ltd. ADR* | 5,845 | 633 | ||||||
| See Notes to Financial Statements. | 9 |
Schedule of Investments (continued)
December 31, 2018
| Investments | Shares | U.S. $ Fair Value (000) | ||||||
| Japan 15.00% | ||||||||
| Automobiles 1.33% | ||||||||
| Toyota Motor Corp. | 13,400 | $ | 776 | |||||
| Building Products 1.11% | ||||||||
| Daikin Industries Ltd. | 6,100 | 648 | ||||||
| Chemicals 0.71% | ||||||||
| Kansai Paint Co. Ltd. | 21,700 | 417 | ||||||
| Commercial Services & Supplies 0.80% | ||||||||
| Secom Co. Ltd. | 5,600 | 464 | ||||||
| Construction & Engineering 1.08% | ||||||||
| Taisei Corp. | 14,700 | 630 | ||||||
| Diversified Financial Services 1.39% | ||||||||
| ORIX Corp. | 55,400 | 809 | ||||||
| Food & Staples Retailing 1.30% | ||||||||
| Seven & i Holdings Co., Ltd. | 17,400 | 756 | ||||||
| Health Care Equipment & Supplies 1.39% | ||||||||
| Hoya Corp. | 13,400 | 808 | ||||||
| Household Durables 1.97% | ||||||||
| Sony Corp. | 23,800 | 1,147 | ||||||
| Machinery 0.41% | ||||||||
| Komatsu Ltd. | 11,200 | 241 | ||||||
| Personal Products 1.05% | ||||||||
| Shiseido Co., Ltd. | 9,800 | 614 | ||||||
| Specialty Retail 0.67% | ||||||||
| Bic Camera, Inc. | 30,600 | 388 | ||||||
| Trading Companies & Distributors 1.08% | ||||||||
| Mitsubishi Corp. | 23,030 | 631 | ||||||
| Wireless Telecommunication Services 0.71% | ||||||||
| NTT DOCOMO, Inc. | 18,500 | 416 | ||||||
| Total Japan | 8,745 | |||||||
| Investments | Shares | U.S. $ Fair Value (000) | ||||||
| Luxembourg 0.53% | ||||||||
| Multi-Line Retail | ||||||||
| B&M European Value Retail SA | 86,910 | $ | 312 | |||||
| Netherlands 5.64% | ||||||||
| Banks 1.14% | ||||||||
| ING Groep NV | 61,944 | 666 | ||||||
| Health Care Equipment & Supplies 1.30% | ||||||||
| Koninklijke Philips NV | 21,603 | 758 | ||||||
| Insurance 0.53% | ||||||||
| ASR Nederland NV | 7,765 | 307 | ||||||
| Oil, Gas & Consumable Fuels 1.97% | ||||||||
| Royal Dutch Shell plc B Shares | 38,499 | 1,151 | ||||||
| Semiconductors & Semiconductor Equipment 0.70% | ||||||||
| ASML Holding NV | 2,587 | 405 | ||||||
| Total Netherlands | 3,287 | |||||||
| New Zealand 0.56% | ||||||||
| Diversified Telecommunication Services | ||||||||
| Spark New Zealand Ltd. | 117,453 | 328 | ||||||
| Norway 0.29% | ||||||||
| Banks | ||||||||
| Sparebank 1 Oestlandet | 17,663 | 170 | ||||||
| Philippines 1.80% | ||||||||
| Banks | ||||||||
| Metropolitan Bank & Trust Co. | 677,852 | 1,047 | ||||||
| Singapore 1.47% | ||||||||
| Banks | ||||||||
| United Overseas Bank Ltd. | 47,400 | 857 | ||||||
| 10 | See Notes to Financial Statements. |
Schedule of Investments (continued)
December 31, 2018
| Investments | Shares | U.S. $ Fair Value (000) | ||||||
| South Africa 0.72% | ||||||||
| Paper & Forest Products | ||||||||
| Mondi plc | 20,191 | $ | 421 | |||||
| Sweden 1.59% | ||||||||
| Communications Equipment 0.77% | ||||||||
| Telefonaktiebolaget LM Ericsson | 50,554 | 447 | ||||||
| Specialty Retail 0.82% | ||||||||
| Hennes & Mauritz AB B Shares | 33,654 | 479 | ||||||
| Total Sweden | 926 | |||||||
| Switzerland 5.50% | ||||||||
| Food Products 1.90% | ||||||||
| Nestle SA Registered Shares | 13,656 | 1,108 | ||||||
| Insurance 2.05% | ||||||||
| Swiss Life Holding AG Registered Shares* | 3,102 | 1,197 | ||||||
| Pharmaceuticals 1.55% | ||||||||
| Novartis AG Registered Shares | 10,549 | 904 | ||||||
| Total Switzerland | 3,209 | |||||||
| Taiwan 0.76% | ||||||||
| Semiconductors & Semiconductor Equipment | ||||||||
| Taiwan Semiconductor Manufacturing Co., Ltd. ADR | 12,053 | 445 | ||||||
| Turkey 0.73% | ||||||||
| Wireless Telecommunication Services | ||||||||
| Turkcell Iletisim Hizmetleri AS | 185,525 | 425 | ||||||
| United Kingdom 10.25% | ||||||||
| Banks 0.85% | ||||||||
| Royal Bank of Scotland Group plc | 178,019 | 494 | ||||||
| Investments | Shares | U.S. $ Fair Value (000) | ||||||
| Beverages 0.98% | ||||||||
| Coca-Cola European Partners plc* | 12,460 | $ | 574 | |||||
| Household Products 0.69% | ||||||||
| Reckitt Benckiser Group plc | 5,249 | 402 | ||||||
| Metals & Mining 1.27% | ||||||||
| Anglo American plc | 33,046 | 739 | ||||||
| Multi-Utilities 0.95% | ||||||||
| National Grid plc | 56,697 | 555 | ||||||
| Oil, Gas & Consumable Fuels 1.69% | ||||||||
| BP plc | 155,732 | 984 | ||||||
| Personal Products 1.61% | ||||||||
| Unilever NV CVA | 17,302 | 937 | ||||||
| Pharmaceuticals 1.77% | ||||||||
| AstraZeneca plc | 13,870 | 1,035 | ||||||
| Trading Companies & Distributors 0.44% | ||||||||
| Ashtead Group plc | 12,262 | 256 | ||||||
| Total United Kingdom | 5,976 | |||||||
| Total Common Stocks (cost $58,669,014) | 55,939 | |||||||
| See Notes to Financial Statements. | 11 |
Schedule of Investments (continued)
December 31, 2018
| Investments | Principal Amount (000) | U.S. $ Fair Value (000) | ||||||
| SHORT-TERM INVESTMENT 3.38% | ||||||||
| Repurchase Agreement | ||||||||
| Repurchase Agreement dated 12/31/2018, 1.45% due 1/2/2019 with Fixed Income Clearing Corp. collateralized by $2,080,000 of U.S. Treasury Note at 2.00% due 8/15/2025; value: $2,014,024; proceeds: $1,972,449 (cost $1,972,290) | $ | 1,972 | $ | 1,972 | ||||
| Total Investments in Securities 99.30% (cost $60,641,304) | 57,911 | |||||||
| Foreign Cash and Other Assets in Excess of Liabilities 0.70% | 407 | |||||||
| Net Assets 100.00% | $ | 58,318 | ||||||
| ADR | American Depositary Receipt. | |
| CVA | Company Voluntary Arrangement. | |
| * | Non-income producing security. |
| 12 | See Notes to Financial Statements. |
Schedule of Investments (concluded)
December 31, 2018
The following is a summary of the inputs used as of December 31, 2018 in valuing the Fund’s investments carried at fair value(1):
| Investment Type(2) | Level 1 (000) | Level 2 (000) | Level 3 (000) | Total (000) | ||||||||||||
| Long-Term Investments | ||||||||||||||||
| Common Stocks | ||||||||||||||||
| Australia | $ | – | $ | 960 | $ | – | $ | 960 | ||||||||
| Brazil | 878 | 572 | – | 1,450 | ||||||||||||
| Brunei(3) | – | 593 | – | 593 | ||||||||||||
| Canada | 1,606 | – | – | 1,606 | ||||||||||||
| China | 1,064 | 1,763 | – | 2,827 | ||||||||||||
| Denmark | – | 642 | – | 642 | ||||||||||||
| Finland | – | 492 | – | 492 | ||||||||||||
| France(3) | 301 | 6,810 | – | 7,111 | ||||||||||||
| Germany(3) | – | 6,796 | – | 6,796 | ||||||||||||
| Hong Kong | – | 2,414 | – | 2,414 | ||||||||||||
| India | 1,313 | – | – | 1,313 | ||||||||||||
| Indonesia(3) | – | 1,548 | – | 1,548 | ||||||||||||
| Ireland(3) | 576 | 830 | – | 1,406 | ||||||||||||
| Israel | 633 | – | – | 633 | ||||||||||||
| Japan | – | 8,745 | – | 8,745 | ||||||||||||
| Luxembourg | – | 312 | – | 312 | ||||||||||||
| Netherlands | – | 3,287 | – | 3,287 | ||||||||||||
| New Zealand | – | 328 | – | 328 | ||||||||||||
| Norway(3) | – | 170 | – | 170 | ||||||||||||
| Philippines | – | 1,047 | – | 1,047 | ||||||||||||
| Singapore | – | 857 | – | 857 | ||||||||||||
| South Africa | – | 421 | – | 421 | ||||||||||||
| Sweden | – | 926 | – | 926 | ||||||||||||
| Switzerland | – | 3,209 | – | 3,209 | ||||||||||||
| Taiwan | 445 | – | – | 445 | ||||||||||||
| Turkey | – | 425 | – | 425 | ||||||||||||
| United Kingdom | – | 5,976 | – | 5,976 | ||||||||||||
| Short-Term Investment | ||||||||||||||||
| Repurchase Agreement | – | 1,972 | – | 1,972 | ||||||||||||
| Total | $ | 6,816 | $ | 51,095 | $ | – | $ | 57,911 | ||||||||
| (1) | Refer to Note 2(i) for a description of fair value measurements and the three-tier hierarchy of inputs. | |
| (2) | See Schedule of Investments for fair values in each industry and identification of foreign issuers and/or geography. | |
| (3) | Securities in the amount of $2,875,332 were transferred from Level 1 to Level 2 due to a change in valuation technique resulting in adjusted valuations (as described in Note 2(a)) on December 31, 2018. Securities in the amount of $922,222 were transferred from Level 2 to Level 1 as a result of utilizing the last sale or official closing price on the exchange or system on which the securities are principally traded on December 31, 2018. |
| See Notes to Financial Statements. | 13 |
Statement of Assets and Liabilities
December 31, 2018
| ASSETS: | ||||
| Investments in securities, at fair value (cost $60,641,304) | $ | 57,910,797 | ||
| Foreign cash, at value (cost $830,323) | 817,983 | |||
| Receivables: | ||||
| Capital shares sold | 127,044 | |||
| Interest and dividends | 94,649 | |||
| From advisor (See Note 3) | 19,662 | |||
| Prepaid expenses and other assets | 1,089 | |||
| Total assets | 58,971,224 | |||
| LIABILITIES: | ||||
| Payables: | ||||
| Investment securities purchased | 489,974 | |||
| Management fee | 37,379 | |||
| Directors’ fees | 6,568 | |||
| Fund administration | 1,994 | |||
| Capital shares reacquired | 12 | |||
| Accrued expenses | 117,209 | |||
| Total liabilities | 653,136 | |||
| NET ASSETS | $ | 58,318,088 | ||
| COMPOSITION OF NET ASSETS: | ||||
| Paid-in capital | $ | 66,394,544 | ||
| Total distributable earnings (loss) | (8,076,456 | ) | ||
| Net Assets | $ | 58,318,088 | ||
| Outstanding shares (50 million shares of common stock authorized, $.001 par value) | 4,000,282 | |||
| Net asset value, offering and redemption price per share (Net assets divided by outstanding shares) | $14.58 |
| 14 | See Notes to Financial Statements. |
For the Year Ended December 31, 2018
| Investment income: | ||||
| Dividends (net of foreign withholding taxes of $172,970) | $ | 1,605,001 | ||
| Interest | 17,415 | |||
| Total investment income | 1,622,416 | |||
| Expenses: | ||||
| Management fee | 483,912 | |||
| Non 12b-1 service fees | 161,277 | |||
| Shareholder servicing | 69,114 | |||
| Professional | 60,136 | |||
| Reports to shareholders | 33,061 | |||
| Custody | 31,649 | |||
| Fund administration | 25,809 | |||
| Directors’ fees | 2,270 | |||
| Other | 17,117 | |||
| Gross expenses | 884,345 | |||
| Expense reductions (See Note 9) | (1,498 | ) | ||
| Fees waived and expenses reimbursed (See Note 3) | (300,260 | ) | ||
| Net expenses | 582,587 | |||
| Net investment income | 1,039,829 | |||
| Net realized and unrealized loss: | ||||
| Net realized loss on investments (net of foreign capital gains tax of $35,683) | (2,202,496 | ) | ||
| Net realized loss on foreign currency exchange contracts | (96,183 | ) | ||
| Net realized gain on foreign currency related transactions | 37,496 | |||
| Net change in unrealized appreciation/depreciation on investments | (11,429,805 | ) | ||
| Net change in unrealized appreciation/depreciation on translation of assets and liabilities denominated in foreign currencies | (42,092 | ) | ||
| Net realized and unrealized loss | (13,733,080 | ) | ||
| Net Decrease in Net Assets Resulting From Operations | $ | (12,693,251 | ) |
| See Notes to Financial Statements. | 15 |
Statements of Changes in Net Assets
| For the Year Ended | For the Year Ended | |||||||
| INCREASE (DECREASE) IN NET ASSETS | December 31, 2018 | December 31, 2017 | ||||||
| Operations: | ||||||||
| Net investment income | $ | 1,039,829 | $ | 1,027,514 | ||||
| Net realized gain (loss) on investments, forward currency exchange contracts and foreign currency related transactions | (2,261,183 | ) | 6,179,085 | |||||
| Net change in unrealized appreciation/depreciation on investments and translation of assets and liabilities denominated in foreign currencies | (11,471,897 | ) | 7,223,373 | |||||
| Net increase (decrease) in net assets resulting from operations | (12,693,251 | ) | 14,429,972 | |||||
| Distributions to shareholders(1) | (1,103,224 | ) | (1,203,254 | ) | ||||
| Capital share transactions (See Note 14): | ||||||||
| Proceeds from sales of shares | 7,146,266 | 1,733,223 | ||||||
| Reinvestment of distributions | 1,103,224 | 1,203,254 | ||||||
| Cost of shares reacquired | (2,956,902 | ) | (8,370,323 | ) | ||||
| Net increase (decrease) in net assets resulting from capital share transactions | 5,292,588 | (5,433,846 | ) | |||||
| Net increase (decrease) in net assets | (8,503,887 | ) | 7,792,872 | |||||
| NET ASSETS: | ||||||||
| Beginning of year | $ | 66,821,975 | $ | 59,029,103 | ||||
| End of year | $ | 58,318,088 | $ | 66,821,975 | ||||
| Distributions in excess of net investment income(2) | $ | – | $ | – | ||||
| (1) | The SEC eliminated the requirement to disclose the source of distributions paid in 2018. For the year ended December 31, 2017, the source of distributions represents net investment income. |
| (2) | The SEC eliminated the requirement to disclose distributions in excess of net investment income in 2018. For the year ended December 31, 2017, the distributions in excess of net investment income was $(113,574). |
| 16 | See Notes to Financial Statements. |
This page is intentionally left blank.
17
| Per Share Operating Performance: | ||||||||||||||||||||||||||||
| Distributions to | ||||||||||||||||||||||||||||
| Investment operations: | shareholders from: | |||||||||||||||||||||||||||
| Total | ||||||||||||||||||||||||||||
| Net | from | |||||||||||||||||||||||||||
| Net asset | Net | realized | invest- | |||||||||||||||||||||||||
| value, | invest- | and | ment | Net | Net | Return | ||||||||||||||||||||||
| beginning | ment | unrealized | opera- | investment | realized | of | ||||||||||||||||||||||
| of period | income(a) | gain (loss) | tions | income | gain | capital | ||||||||||||||||||||||
| 12/31/2018 | $18.20 | $0.28 | $(3.62 | ) | $(3.34 | ) | $(0.28 | ) | $ | – | $ | – | ||||||||||||||||
| 12/31/2017 | 14.75 | 0.27 | 3.51 | 3.78 | (0.33 | ) | – | – | ||||||||||||||||||||
| 12/31/2016 | 15.42 | 0.36 | (0.63 | ) | (0.27 | ) | (0.40 | ) | – | – | ||||||||||||||||||
| 12/31/2015 | 15.95 | 0.30 | (0.59 | ) | (0.29 | ) | (0.23 | ) | – | (0.01 | ) | |||||||||||||||||
| 12/31/2014 | 18.38 | 0.26 | (1.99 | ) | (1.73 | ) | (0.18 | ) | (0.52 | ) | – | |||||||||||||||||
| (a) | Calculated using average shares outstanding during the period. |
| (b) | Total return does not consider the effects of sales charges or other expenses imposed by an insurance company and assumes the reinvestment of all distributions. |
| 18 | See Notes to Financial Statements. |
| Ratios to Average Net Assets: | Supplemental Data: | |||||||||||||||||||||||||||||
| Total | ||||||||||||||||||||||||||||||
| expenses | ||||||||||||||||||||||||||||||
| Net | after | Net | ||||||||||||||||||||||||||||
| asset | waivers | Net | assets, | Portfolio | ||||||||||||||||||||||||||
| Total | value, | Total | and/or reim- | Total | investment | end of | turnover | |||||||||||||||||||||||
| distri- | end of | return(b) | bursements | expenses | income | period | rate | |||||||||||||||||||||||
| butions | period | (%) | (%) | (%) | (%) | (000) | (%) | |||||||||||||||||||||||
| $ | (0.28 | ) | $ | 14.58 | (18.34 | ) | 0.90 | 1.37 | 1.61 | $ | 58,318 | 134 | ||||||||||||||||||
| (0.33 | ) | 18.20 | 25.67 | 0.87 | 1.41 | 1.62 | 66,822 | 137 | ||||||||||||||||||||||
| (0.40 | ) | 14.75 | (1.74 | ) | 0.87 | 1.39 | 2.43 | 59,029 | 190 | |||||||||||||||||||||
| (0.24 | ) | 15.42 | (1.78 | ) | 0.87 | 1.43 | 1.84 | 60,225 | 60 | |||||||||||||||||||||
| (0.70 | ) | 15.95 | (9.47 | ) | 0.87 | 1.59 | 1.49 | 52,629 | 58 | |||||||||||||||||||||
| See Notes to Financial Statements. | 19 |
| 1. | ORGANIZATION |
Lord Abbett Series Fund, Inc. (the “Company”) is registered under the Investment Company Act of 1940, as amended (the “Act”), as a diversified, open-end management investment company and was incorporated under Maryland law in 1989. The Company consists of twelve separate portfolios. This report covers International Equity Portfolio (the “Fund”).
The Fund’s investment objective is to seek long-term capital appreciation. The Fund has Variable Contract class shares (“Class VC Shares”), which are currently issued and redeemed only in connection with investments in, and payments under, variable annuity contracts and variable life insurance policies issued by life insurance and insurance-related companies.
The preparation of the financial statements in conformity with accounting principles generally accepted in the United States of America (“U.S. GAAP”) requires management to make certain estimates and assumptions that affect the reported amounts of assets and liabilities and disclosure of contingent assets and liabilities at the date of the financial statements and the reported amounts of increases and decreases in net assets from operations during the reporting period. Actual results could differ from those estimates. The Fund is considered an investment company under U.S. GAAP and follows the accounting and reporting guidance applicable to investment companies.
| 2. | SIGNIFICANT ACCOUNTING POLICIES |
| (a) | Investment Valuation–Under procedures approved by the Fund’s Board of Directors (the “Board”), Lord, Abbett & Co. LLC (“Lord Abbett”), the Fund’s investment manager, has formed a Pricing Committee to administer the pricing and valuation of portfolio investments and to ensure that prices utilized reasonably reflect fair value. Among other things, these procedures allow the Fund to utilize independent pricing services, quotations from securities and financial instrument dealers and other market sources to determine fair value. |
| Securities actively traded on any recognized U.S. or non-U.S. exchange or on The NASDAQ Stock Market LLC are valued at the last sale price or official closing price on the exchange or system on which they are principally traded. Events occurring after the close of trading on non-U.S. exchanges may result in adjustments to the valuation of foreign securities to reflect their fair value as of the close of regular trading on the New York Stock Exchange. The Fund may utilize an independent fair valuation service in adjusting the valuations of foreign securities. Unlisted equity securities are valued at the last quoted sale price or, if no sale price is available, at the mean between the most recently quoted bid and asked prices. Exchange traded options and futures contracts are valued at the last quoted sale price in the market where they are principally traded. If no sale has occurred, the mean between the most recently quoted bid and asked prices is used. Forward foreign currency exchange contracts are valued using daily forward exchange rates. | |
| Securities for which prices are not readily available are valued at fair value as determined by the Pricing Committee. The Pricing Committee considers a number of factors, including observable and unobservable inputs, when arriving at fair value. The Pricing Committee may use related or comparable assets or liabilities, recent transactions, market multiples, book values and other relevant information to determine the fair value of portfolio investments. The Board or a designated committee thereof regularly reviews fair value determinations made by the Pricing Committee and may employ techniques such as reviewing related market activity, reviewing inputs and assumptions, and retrospectively comparing prices of subsequent purchases and sales transactions to fair value determinations made by the Pricing Committee. |
20
Notes to Financial Statements (continued)
| Short-term securities with 60 days or less remaining to maturity are valued using the amortized cost method, which approximates fair value. | |
| (b) | Security Transactions–Security transactions are recorded as of the date that the securities are purchased or sold (trade date). Realized gains and losses on sales of portfolio securities are calculated using the identified-cost method. |
| (c) | Investment Income–Dividend income is recorded on the ex-dividend date. Interest income is recorded on the accrual basis as earned. Discounts are accreted and premiums are amortized using the effective interest method and are included in Interest on the Statement of Operations. Withholding taxes on foreign dividends have been provided for in accordance with the applicable country’s tax rules and rates. |
| (d) | Income Taxes–It is the policy of the Fund to meet the requirements of Subchapter M of the Internal Revenue Code applicable to regulated investment companies and to distribute substantially all taxable income and capital gains to its shareholders. Therefore, no income tax provision is required. |
| The Fund files U.S. federal and various state and local tax returns. No income tax returns are currently under examination. The statute of limitations on the Fund’s filed U.S. federal tax returns remains open for the fiscal years ended December 31, 2015 through December 31, 2018. The statutes of limitations on the Company’s state and local tax returns may remain open for an additional year depending upon the jurisdiction. | |
| (e) | Expenses–Expenses incurred by the Company that do not specifically relate to an individual fund are generally allocated to the funds within the Company on a pro rata basis by relative net assets. |
| (f) | Foreign Transactions–The books and records of the Fund are maintained in U.S. dollars and transactions denominated in foreign currencies are recorded in the Fund’s records at the rate prevailing when earned or recorded. Asset and liability accounts that are denominated in foreign currencies are adjusted daily to reflect current exchange rates and any unrealized gain (loss) is included in Net change in unrealized appreciation/depreciation on translation of assets and liabilities denominated in foreign currencies in the Fund’s Statement of Operations. The resultant exchange gains and losses upon settlement of such transactions are included in Net realized gain on foreign currency related transactions in the Fund’s Statement of Operations. The Fund does not isolate that portion of the results of operations arising as a result of changes in the foreign exchange rates from the changes in market prices of the securities. |
| The Fund uses foreign currency exchange contracts to facilitate transactions in foreign-denominated securities. Losses from these transactions may arise from changes in the value of the foreign currency or if the counterparties do not perform under the contracts’ terms. | |
| (g) | Forward Foreign Currency Exchange Contracts–The Fund may enter into forward foreign currency exchange contracts in order to reduce their exposure to changes in foreign currency exchange rates on their foreign portfolio holdings, or gain or reduce exposure to foreign currency solely for investment purposes. A forward foreign currency exchange contract is a commitment to purchase or sell a foreign currency at a future date at a negotiated rate. The contracts are valued daily at forward exchange rates and any unrealized gain (loss) is included in Net change in unrealized appreciation/depreciation on foreign currency exchange contracts in the Fund’s Statement of Operations. The gain (loss) arising from the difference between the U.S. dollar cost of the original contract and the value of the foreign currency in U.S. dollars |
21
Notes to Financial Statements (continued)
| upon closing of such contracts is included in Net realized loss on foreign currency exchange contracts in the Fund’s Statement of Operations. | |
| (h) | Repurchase Agreements–The Fund may enter into repurchase agreements with respect to securities. A repurchase agreement is a transaction in which a fund acquires a security and simultaneously commits to resell that security to the seller (a bank or securities dealer) at an agreed-upon price on an agreed-upon date. The Fund requires at all times that the repurchase agreement be collateralized by cash, or by securities of the U.S. Government, its agencies, its instrumentalities, or U.S. Government sponsored enterprises having a value equal to, or in excess of, the value of the repurchase agreement (including accrued interest). If the seller of the agreement defaults on its obligation to repurchase the underlying securities at a time when the fair value of these securities has declined, the Fund may incur a loss upon disposition of the securities. |
| (i) | Fair Value Measurements–Fair value is defined as the price that the Fund would receive upon selling an investment or transferring a liability in an orderly transaction to an independent buyer in the principal or most advantageous market of the investment. A three-tier hierarchy is used to maximize the use of observable market data and minimize the use of unobservable inputs and to establish classification of fair value measurements for disclosure purposes. Inputs refer broadly to the assumptions that market participants would use in pricing the asset or liability, including assumptions about risk—for example, the risk inherent in a particular valuation technique used to measure fair value (such as a pricing model) and/or the risk inherent in the inputs to the valuation technique. Inputs may be observable or unobservable. Observable inputs reflect the assumptions market participants would use in pricing the asset or liability. Observable inputs are based on market data obtained from sources independent of the reporting entity. Unobservable inputs reflect the reporting entity’s own assumptions about the assumptions market participants would use in pricing the asset or liability. Unobservable inputs are based on the best information available in the circumstances. The three-tier hierarchy classification is determined based on the lowest level of inputs that is significant to the fair value measurement, and is summarized in the three broad Levels listed below: |
| • | Level 1 – | unadjusted quoted prices in active markets for identical investments; | |
| • | Level 2 – | other significant observable inputs (including quoted prices for similar investments, interest rates, prepayment speeds, credit risk, etc.); and | |
| • | Level 3 – | significant unobservable inputs (including the Fund’s own assumptions in determining the fair value of investments). | |
| A summary of inputs used in valuing the Fund’s investments as of December 31, 2018 and, if applicable, Level 1/Level 2 transfers and Level 3 rollforwards for the fiscal year then ended is included in the Fund’s Schedule of Investments. | |
| Changes in valuation techniques may result in transfers into or out of an assigned level within the three-tier hierarchy. All transfers between different levels within the three-tier hierarchy are deemed to have occurred as of the beginning of the reporting period. The inputs or methodology used for valuing securities are not necessarily an indication of the risk associated with investing in those securities. |
22
Notes to Financial Statements (continued)
| 3. | MANAGEMENT FEE AND OTHER TRANSACTIONS WITH AFFILIATES |
Management Fee
The Company has a management agreement with Lord Abbett, pursuant to which Lord Abbett supplies the Fund with investment management services and executive and other personnel, provides office space and pays for ordinary and necessary office and clerical expenses relating to research and statistical work and supervision of the Fund’s investment portfolio.
The management fee is based on the Fund’s average daily net assets at the following annual rate:
| First $1 billion | .75% |
| Next $1 billion | .70% |
| Over $2 billion | .65% |
For the fiscal year ended December 31, 2018, the effective management fee, net of waivers, was at an annualized rate of 0.28% of the Fund’s average daily net assets.
In addition, Lord Abbett provides certain administrative services to the Fund pursuant to an Administrative Services Agreement in return for a fee at an annual rate of .04% of the Fund’s average daily net assets.
Effective May 1, 2018 and continuing through April 30, 2019, Lord Abbett has contractually agreed to waive its fees and reimburse expenses to the extent necessary to limit total net annual operating expenses to an annual rate of .92%. This agreement may be terminated only upon the approval of the Board. Prior to May 1, 2018, Lord Abbett contractually agreed to waive its fees and reimburse expenses to the extent necessary to limit total net annual operating expenses to an annual rate of .87%.
The Company, on behalf of the Fund, has entered into services arrangements with certain insurance companies. Under these arrangements, certain insurance companies will be compensated up to .25% of the average daily net asset value (“NAV”) of the Fund’s Class VC Shares held in the insurance company’s separate account to service and maintain the Variable Contract owners’ accounts. This amount is included in Non 12b-1 service fees on the Statement of Operations. The Fund may also compensate certain insurance companies, third-party administrators and other entities for providing recordkeeping, sub-transfer agency and other administrative services to the Fund. This amount is included in Shareholder servicing on the Statement of Operations.
One Director and certain of the Company’s officers have an interest in Lord Abbett.
| 4. | DISTRIBUTIONS AND CAPITAL LOSS CARRYFORWARDS |
Dividends from net investment income, if any, are declared and paid at least semi-annually. Taxable net realized gains from investment transactions, reduced by allowable capital loss carryforwards, if any, are declared and distributed to shareholders at least annually. The capital loss carryforward amount, if any, is available to offset future net capital gains. Dividends and distributions to shareholders are recorded on the ex-dividend date. The amounts of dividends and distributions from net investment income and net realized capital gains are determined in accordance with federal income tax regulations, which may differ from U.S. GAAP. These book/tax differences are either considered temporary or permanent in nature. To the extent these differences are permanent in nature, such amounts are reclassified within the components of net assets based on their federal tax basis treatment; temporary differences do not require reclassification. Dividends and distributions that exceed earnings and profits for tax purposes are reported as a tax return of capital.
23
Notes to Financial Statements (continued)
The tax character of distributions paid during the fiscal year ended December 31, 2018 and fiscal year ended December 31, 2017 was as follows:
| Year Ended | Year Ended | |||||||||
| 12/31/2018 | 12/31/2017 | |||||||||
| Distributions paid from: | ||||||||||
| Ordinary income | $ | 1,103,224 | $ | 1,203,254 | ||||||
| Total distributions paid | $ | 1,103,224 | $ | 1,203,254 | ||||||
As of December 31, 2018, the components of accumulated losses on a tax-basis were as follows:
| Capital loss Carryforward* | $ | (4,681,571 | ) | |
| Temporary differences | (60,380 | ) | ||
| Unrealized losses – net | (3,334,505 | ) | ||
| Total accumulated losses – net | $ | (8,076,456 | ) |
| * | The capital losses will carry forward indefinitely. |
At the Fund’s election, certain losses incurred within the taxable year (Qualified Late-Year Losses) are deemed to arise on the first business day of the Fund’s next taxable year. The Fund incurred and will elect to defer late-year ordinary losses of $53,812 during fiscal year 2018.
As of December 31, 2018, the aggregate unrealized security gains and losses on investments and other financial instruments based on cost for U.S. federal income tax purposes were as follows:
| Tax cost | $ | 61,233,085 | ||
| Gross unrealized gain | 1,194,207 | |||
| Gross unrealized loss | (4,516,495 | ) | ||
| Net unrealized security loss | $ | (3,322,288 | ) |
The difference between book-basis and tax-basis unrealized gains (losses) is attributable to the tax treatment of other financial instruments, certain securities, and wash sales.
| 5. | PORTFOLIO SECURITIES TRANSACTIONS |
Purchases and sales of investment securities (excluding short-term investments) for the fiscal year ended December 31, 2018 were as follows:
| Purchases | Sales | |
| $87,815,348 | $83,340,431 |
There were no purchases or sales of U.S. Government securities for the fiscal year ended December 31, 2018.
The Fund is permitted to purchase and sell securities (“cross-trade”) from and to other Lord Abbett funds or client accounts pursuant to procedures approved by the Board in compliance with Rule 17a-7 under the Act (the “Rule”). Each cross-trade is executed at a fair market price in compliance with provisions of the Rule. For the fiscal year ended December 31, 2018, the Fund engaged in cross-trades purchases of $27,633.
| 6. | DISCLOSURES ABOUT DERIVATIVE INSTRUMENTS AND HEDGING ACTIVITIES |
The Fund entered into forward foreign currency exchange contracts for the fiscal year ended December 31, 2018 (as described in note 2(g)). A forward foreign currency exchange contract reduces the Fund’s exposure to changes in the value of the currency it will deliver (or settle in cash) and increases its exposure to changes in the value of the currency it will receive (or settle in cash)
24
Notes to Financial Statements (continued)
for the duration of the contract. The Fund’s use of forward foreign currency exchange contracts involves the risk that Lord Abbett will not accurately predict currency movements, and the Fund’s returns could be reduced as a result. Forward foreign currency exchange contracts are subject to the risk that those currencies will decline in value relative to the U.S. dollar, or, in the case of hedged positions, that the U.S. dollar will decline relative to the currency being hedged. Currency rates in foreign countries may fluctuate significantly over short periods of time. The Fund’s risk of loss from counterparty credit risk is the unrealized appreciation on forward foreign currency exchange contracts and deposits with brokers as collateral.
As of December 31, 2018, the Fund had no forward foreign currency exchange contracts outstanding. An amount of $(96,183) is included in the Statement of Operations related to forward foreign currency exchange contracts under the caption Net realized loss on foreign currency exchange contracts. The average notional amounts in U.S. dollars of forward foreign currency exchange contracts throughout the period was $2,679,280.
| 7. | DISCLOSURES ABOUT OFFSETTING ASSETS AND LIABILITIES |
The Financial Accounting Standards Board (“FASB”) requires disclosures intended to help better assess the effect or potential effect of offsetting arrangements on a fund’s financial position. The following tables illustrate gross and net information about recognized assets and liabilities eligible for offset in the statement of assets and liabilities; and disclose such amounts subject to an enforceable master netting agreement or similar agreement, by counterparty. A master netting agreement is an agreement between a fund and a counterparty which provides for the net settlement of amounts owed under all contracts traded under that agreement, as well as cash collateral, through a single payment by one party to the other in the event of default on or termination of any one contract. The Fund’s accounting policy with respect to balance sheet offsetting is that, absent an event of default by the counterparty or a termination of the agreement, the master netting agreement does not result in an offset of reported amounts of financial assets and liabilities in the statement of assets and liabilities across transactions between the Fund and the applicable counterparty:
| Gross Amounts | Net Amounts of | |||||||||||
| Offset in the | Assets Presented | |||||||||||
| Gross Amounts of | Statement of Assets | in the Statement of | ||||||||||
| Description | Recognized Assets | and Liabilities | Assets and Liabilities | |||||||||
| Repurchase Agreement | $ | 1,972,290 | $ | – | $ | 1,972,290 | ||||||
| Total | $ | 1,972,290 | $ | – | $ | 1,972,290 | ||||||
| Net Amounts | ||||||||||||||||||||
| of Assets | Amounts Not Offset in the | |||||||||||||||||||
| Presented in | Statement of Assets and Liabilities | |||||||||||||||||||
| the Statement | Cash | Securities | ||||||||||||||||||
| of Assets and | Financial | Collateral | Collateral | Net | ||||||||||||||||
| Counterparty | Liabilities | Instruments | Received(a) | Received(a) | Amount(b) | |||||||||||||||
| Fixed Income Clearing Corp. | $ | 1,972,290 | $ | – | $ | – | $ | (1,972,290 | ) | $ | – | |||||||||
| Total | $ | 1,972,290 | $ | – | $ | – | $ | (1,972,290 | ) | $ | – | |||||||||
| (a) | Collateral disclosed is limited to an amount not to exceed 100% of the net amount of assets presented in the Statement of Assets and Liabilities, for each respective counterparty. |
| (b) | Net amount represents the amount owed to the Fund by the counterparty as of December 31, 2018. |
25
Notes to Financial Statements (continued)
| 8. | DIRECTORS’ REMUNERATION |
The Company’s officers and one Director, who are associated with Lord Abbett, do not receive any compensation from the Company for serving in such capacities. Independent Directors’ fees are allocated among all Lord Abbett-sponsored funds based on the net assets of each fund. There is an equity-based plan available to all Independent Directors under which Independent Directors must defer receipt of a portion of, and may elect to defer receipt of an additional portion of Directors’ fees. The deferred amounts are treated as though equivalent dollar amounts had been invested in the funds. Such amounts and earnings accrued thereon are included in Directors’ fees on the Statement of Operations and in Directors’ fees payable on the Statement of Assets and Liabilities and are not deductible for U.S. federal income tax purposes until such amounts are paid.
| 9. | EXPENSE REDUCTIONS |
The Company has entered into an arrangement with its transfer agent and custodian, whereby credits realized as a result of uninvested cash balances are used to reduce a portion of the Fund’s expenses.
| 10. | LINE OF CREDIT |
During the period ended August 8, 2018, the Fund and certain other funds managed by Lord Abbett (collectively, the “Participating Funds”) participated in a syndicated line of credit facility with various lenders for $600 million (the “Facility”), whereas State Street Bank and Trust Company (“SSB”) participates as a lender and as agent for the lenders. The Facility is to be used for temporary or emergency purposes as an additional source of liquidity to satisfy redemptions. The Participating Funds are subject to graduated borrowing limits of one-third of Fund assets (if Fund assets are less than $750 million), $250 million, $300 million, or $350 million, based on past borrowings and likelihood of future borrowings. During the period ended August 8, 2018, the Fund did not utilize the Facility.
For the period August 9, 2018 through December 20, 2018, the Participating Funds entered into an amended syndicated line of credit facility with various lenders for $1.06 billion (the “Syndicated Facility”), whereas SSB participates as a lender and as agent for the lenders. Under the Syndicated Facility, the Participating Funds are subject to graduated borrowing limits of one-third of Fund assets (if Fund assets are less than $750 million), $250 million, $300 million, $350 million, or $1 billion, based on past borrowings and likelihood of future borrowings. Effective December 21, 2018, the Participating Funds entered into an amended Syndicated Facility with various lenders for $1.1 billion based on the same terms as described above.
Effective August 9, 2018, the Participating Funds entered into an additional line of credit facility with SSB for $250 million (the “Bilateral Facility,” and together with the Syndicated Facility, the “Facilities”). Under the Bilateral Facility, each Participating Fund may borrow up to the lesser of $250 million or one-third of Fund assets. The Facilities are to be used for temporary or emergency purposes to satisfy redemption requests and manage liquidity.
For the period from August 9, 2018 through December 31, 2018, the Fund did not utilize the Facilities.
| 11. | INTERFUND LENDING PROGRAM |
Pursuant to an exemptive order issued by the U.S. Securities and Exchange Commission (“SEC exemptive order”), certain registered open-end management investment companies managed by Lord
26
Notes to Financial Statements (continued)
Abbett, including the Fund, participate in a joint lending and borrowing program (the “Interfund Lending Program”). The SEC exemptive order allows the Funds to borrow money from and lend money to each other for temporary or emergency purposes subject to the limitations and conditions.
During the fiscal year ended December 31, 2018, the Fund did not participate as a borrower or lender in the Interfund Lending Program.
| 12. | CUSTODIAN AND ACCOUNTING AGENT |
SSB is the Company’s custodian and accounting agent. SSB performs custodial, accounting and recordkeeping functions relating to portfolio transactions and calculating the Fund’s NAV.
| 13. | INVESTMENT RISKS |
The Fund is subject to the general risks and considerations associated with equity investing. The value of an investment will fluctuate in response to movements in the equity securities markets in general and to the changing prospects of individual companies in which the Fund invests.
Large company value stocks, in which the Fund invests, may perform differently than the market as a whole and other types of stocks, such as small company stocks and growth stocks. This is because different types of stocks tend to shift in and out of favor over time depending on market and economic conditions as well as investor sentiment. In addition, large companies may have smaller rates of growth as compared to successful but well established smaller companies.
The Fund is subject to the risks of investing in foreign securities and derivatives. Foreign securities may pose greater risks than domestic securities, including greater price fluctuations and higher transaction costs. Foreign investments also may be affected by changes in currency rates or currency controls. These risks are generally greater for securities issued by companies in emerging market countries. As compared with companies organized and operated in the U.S., these companies may be more vulnerable to economic, political and social instability and subject to less government supervision, lack of transparency, inadequate regulatory and accounting standards, and foreign taxes. The securities of foreign companies also may be subject to inadequate exchange control regulations, the imposition of economic sanctions or other government restrictions, higher transaction and other costs, and delays in settlement to the extent they are traded on non-U.S. exchanges or markets.
The Fund is also subject to the risks associated with derivatives, which may be different from and greater than the risks associated with investing directly in securities and other investments. Derivatives may be subject to risks such as liquidity risk, leveraging risk, interest rate risk, market risk, and credit risk. Illiquid securities may lower the Fund’s returns since the Fund may be unable to sell these securities at their desired time or price. Derivatives also may involve the risk of mispricing or improper valuation and the risk that changes in the value of the derivative may not correlate perfectly with the value of the underlying asset, rate or index. Whether the Fund’s use of derivatives is successful will depend on, among other things, the Fund’s ability to correctly forecast market movements, changes in foreign exchange and interest rates, and other factors. If the Fund incorrectly forecasts these and other factors, its performance could suffer. The Fund’s use of derivatives could result in a loss exceeding the amount of the Fund’s investment in these instruments.
These factors can affect the Fund’s performance.
27
Notes to Financial Statements (concluded)
| 14. | SUMMARY OF CAPITAL TRANSACTIONS |
Transactions in shares of capital stock were as follows:
| Year Ended | Year Ended | |||||||
| December 31, 2018 | December 31, 2017 | |||||||
| Shares sold | 420,266 | 106,804 | ||||||
| Reinvestment of distributions | 75,577 | 66,810 | ||||||
| Shares reacquired | (168,010 | ) | (501,938 | ) | ||||
| Increase (decrease) | 327,833 | (328,324 | ) | |||||
| 15. | SUBSEQUENT EVENT |
On January 29, 2019, the Board of Directors of the Company approved a plan of liquidation (the “Plan”) pursuant to which the Fund will be liquidated and dissolved. It is anticipated that the liquidation and dissolution of the Fund will be completed on or about May 1, 2019 (the Liquidation Date”). Any Fund shares outstanding on the Liquidation Date will be automatically redeemed on the Liquidation Date. The proceeds of any such redemption will be equal to the net asset value (“NAV”) of such shares after dividend distributions required to eliminate any Fund-level taxes are made and the Fund’s expenses and liabilities have been paid or otherwise provided for as directed by the Plan.
At any time before the Liquidation Date, shareholders may redeem their Fund shares at the NAV of such shares pursuant to the procedures set forth under “Purchases and Redemptions” in the prospectus. As stated in the prospectus, Fund shares are not offered directly to the public. Rather, Fund shares are offered only to separate accounts of certain insurance companies. Variable contract owners may not purchase or redeem Fund shares directly and should contact their insurance company for information on how the liquidation of the Fund will impact them.
28
Report of Independent Registered Public Accounting Firm
To the shareholders and the Board of Directors of Lord Abbett Series Fund, Inc.:
Opinion on the Financial Statements and Financial Highlights
We have audited the accompanying statement of assets and liabilities, including the schedule of investments, of the International Equity Portfolio, one of the portfolios constituting the Lord Abbett Series Fund, Inc. (the “Fund”), as of December 31, 2018, the related statement of operations for the year then ended, the statements of changes in net assets for each of the two years in the period then ended, the financial highlights for each of the five years in the period then ended, and the related notes. In our opinion, the financial statements and financial highlights present fairly, in all material respects, the financial position of the International Equity Portfolio of the Fund as of December 31, 2018, and the results of its operations for the year then ended, the changes in its net assets for each of the two years in the period then ended, and the financial highlights for each of the five years in the period then ended in conformity with accounting principles generally accepted in the United States of America.
Basis for Opinion
These financial statements and financial highlights are the responsibility of the Fund’s management. Our responsibility is to express an opinion on the Fund’s financial statements and financial highlights based on our audits. We are a public accounting firm registered with the Public Company Accounting Oversight Board (United States) (PCAOB) and are required to be independent with respect to the Fund in accordance with the U.S. federal securities laws and the applicable rules and regulations of the Securities and Exchange Commission and the PCAOB.
We conducted our audits in accordance with the standards of the PCAOB. Those standards require that we plan and perform the audit to obtain reasonable assurance about whether the financial statements and financial highlights are free of material misstatement, whether due to error or fraud. The Fund is not required to have, nor were we engaged to perform, an audit of its internal control over financial reporting. As part of our audits we are required to obtain an understanding of internal control over financial reporting but not for the purpose of expressing an opinion on the effectiveness of the Fund’s internal control over financial reporting. Accordingly, we express no such opinion.
Our audits included performing procedures to assess the risks of material misstatement of the financial statements and financial highlights, whether due to error or fraud, and performing procedures that respond to those risks. Such procedures included examining, on a test basis, evidence regarding the amounts and disclosures in the financial statements and financial highlights. Our audits also included evaluating the accounting principles used and significant estimates made by management, as well as evaluating the overall presentation of the financial statements and financial highlights. Our procedures included confirmation of securities owned as of December 31, 2018, by correspondence with the custodian and brokers; when replies were not received from brokers, we performed other auditing procedures. We believe that our audits provide a reasonable basis for our opinion.
DELOITTE & TOUCHE LLP
New York, New York
February 15, 2019
We have served as the auditor of one or more Lord Abbett Family of Funds’ investment companies since 1932.
29
Basic Information About Management
The Board is responsible for the management of the business and affairs of the Company in accordance with the laws of the State of Maryland. The Board elects officers who are responsible for the day-to-day operations of the Fund and who execute policies authorized by the Board. The Board also approves an investment adviser to the Fund and continues to monitor the cost and quality of the services the investment adviser provides, and annually considers whether to renew the contract with the adviser. Generally, each Director holds office until his/her successor is elected and qualified or until his/her earlier resignation or removal, as provided in the Company’s organizational documents.
Lord Abbett, a Delaware limited liability company, is the Fund’s investment adviser. Designated Lord Abbett personnel are responsible for the day-to-day management of the Fund.
Interested Directors
Mr. Sieg is affiliated with Lord Abbett and is an “interested person” of the Company as defined in the Act. Mr. Sieg is director/trustee of each of the 13 investment companies in the Lord Abbett Family of Funds, which consist of 62 portfolios or series. Mr. Sieg is an officer of the Lord Abbett Family of Funds.
| Name, Address and Year of Birth | Current Position and Length of Service with the Company | Principal Occupation and Other Directorships During the Past Five Years | ||
| Douglas B. Sieg Lord, Abbett & Co. LLC 90 Hudson Street Jersey City, NJ 07302 (1969) | Director since 2016; President and Chief Executive Officer since 2018 | Principal Occupation: Managing Partner (since 2018) and was formerly Head of Client Services, joined Lord Abbett in 1994. Other Directorships:None. |
Independent Directors
The following Independent Directors also are directors/trustees of each of the 13 investment companies in the Lord Abbett Family of Funds, which consist of 62 portfolios or series.
| Name, Address and Year of Birth | Current Position and Length of Service with the Company | Principal Occupation and Other Directorships During the Past Five Years | ||
| Eric C. Fast Lord, Abbett & Co. LLC c/o Legal Dept. 90 Hudson Street Jersey City, NJ 07302 (1949) | Director since 2014 | Principal Occupation:Chief Executive Officer of Crane Co., an industrial products company (2001–2014).
Other Directorships:Currently serves as director of Automatic Data Processing, Inc. (since 2007) and Regions Financial Corporation (since 2010). Previously served as a director of Crane Co. (1999–2014). | ||
| Evelyn E. Guernsey Lord, Abbett & Co. LLC c/o Legal Dept. 90 Hudson Street Jersey City, NJ 07302 (1955) | Director since 2011 | Principal Occupation:CEO, Americas of J.P. Morgan Asset Management (2004–2010).
Other Directorships:None. |
30
Basic Information About Management (continued)
| Name, Address and Year of Birth | Current Position and Length of Service with the Company | Principal Occupation and Other Directorships During the Past Five Years | ||
| Julie A. Hill Lord, Abbett & Co. LLC c/o Legal Dept. 90 Hudson Street Jersey City, NJ 07302 (1946) | Director since 2004 | Principal Occupation:Owner and CEO of The Hill Company, a business consulting firm (since 1998).
Other Directorships:Currently serves as director of Anthem, Inc., a health benefits company (since 1994). | ||
| Kathleen M. Lutito Lord, Abbett & Co. LLC c/o Legal Dept. 90 Hudson Street Jersey City, NJ 07302 (1963) | Director since 2017 | Principal Occupation:President and Chief Investment Officer of CenturyLink Investment Management Company (since 2006).
Other Directorships:None | ||
| James M. McTaggart Lord, Abbett & Co. LLC c/o Legal Dept. 90 Hudson Street Jersey City, NJ 07302 (1947) | Director since 2012 | Principal Occupation:Independent management advisor and consultant (since 2012); Vice President, CRA International, Inc. (doing business as Charles River Associates), a global management consulting firm (2009–2012); Founder and Chairman of Marakon Associates, Inc., a strategy consulting firm (1978–2009); and Officer and Director of Trinsum Group, a holding company (2007–2009).
Other Directorships:Blyth, Inc., a home products company (2004–2015). | ||
| Karla M. Rabusch Lord, Abbett & Co. LLC c/o Legal Dept. 90 Hudson Street Jersey City, NJ 07302 (1959) | Director since 2017 | Principal Occupation:President and Director of Wells Fargo Funds Management, LLC (2003–2017); President of Wells Fargo Funds (2003–2016).
Other Directorships:None. | ||
| Mark A. Schmid Lord, Abbett & Co. LLC c/o Legal Dept. 90 Hudson Street Jersey City, NJ 07302 (1959) | Director since 2016 | Principal Occupation:Vice President and Chief Investment Officer of the University of Chicago (since 2009).
Other Directorships:None. | ||
| James L.L. Tullis Lord, Abbett & Co. LLC c/o Legal Dept. 90 Hudson Street Jersey City, NJ 07302 (1947) | Director since 2006; Chairman since 2017 | Principal Occupation:CEO of Tullis-Dickerson and Co. Inc., a venture capital management firm (since 1990); CEO of Tullis Health Investors Inc. (since 2012).
Other Directorships:Currently serves as director of Crane Co. (since 1998). |
Officers
None of the officers listed below have received compensation from the Company. All of the officers of the Company also may be officers of the other Lord Abbett Funds and maintain offices at 90 Hudson Street, Jersey City, NJ 07302. Unless otherwise indicated, the position(s) and title(s) listed under the “Principal Occupation During the Past Five Years” column indicate each officer’s position(s) and title(s) with Lord Abbett. Each officer serves for an indefinite term (i.e., until his or her death, resignation, retirement, or removal).
31
Basic Information About Management (continued)
| Name and Year of Birth | Current Position with the Company | Length of Service of Current Position | Principal Occupation During the Past Five Years | |||
| Douglas B. Sieg (1969) | President and Chief Executive Officer | Elected as President and Chief Executive Officer in 2018 | Managing Partner of Lord Abbett (since 2018) and was formerly Head of Client Services, joined Lord Abbett in 1994. | |||
| Jeff D. Diamond (1960) | Executive Vice President | Elected in 2008 | Portfolio Manager, joined Lord Abbett in 2007. | |||
| Todd D. Jacobson (1966) | Executive Vice President | Elected in 2005 | Partner and Associate Director, joined Lord Abbett in 2003. | |||
| Robert A. Lee (1969) | Executive Vice President | Elected in 2010 | Partner and Chief Investment Officer, and was formerly Deputy Chief Investment Officer and Director of Taxable Fixed Income, joined Lord Abbett in 1997. | |||
| David J. Linsen (1974) | Executive Vice President | Elected in 2008 | Partner and Director of Equities, joined Lord Abbett in 2001. | |||
| Vincent J. McBride (1964) | Executive Vice President | Elected in 2010 | Partner and Director, joined Lord Abbett in 2003. | |||
| Andrew H. O’Brien (1973) | Executive Vice President | Elected in 2010 | Partner and Portfolio Manager, joined Lord Abbett in 1998. | |||
| F. Thomas O’Halloran (1955) | Executive Vice President | Elected in 2010 | Partner and Portfolio Manager, joined Lord Abbett in 2001. | |||
| Marc Pavese (1972) | Executive Vice President | Elected in 2016 | Partner and Portfolio Manager, joined Lord Abbett in 2008. | |||
| Walter H. Prahl (1958) | Executive Vice President | Elected in 2012 | Partner and Director, joined Lord Abbett in 1997. | |||
| Eli Rabinowich (1975) | Executive Vice President | Elected in 2018 | Portfolio Manager, joined Lord Abbett in 2018 and was formerly a Portfolio Manager, Partner, and Analyst at Pzena Investment Management from (2004–2018). |
32
Basic Information About Management (continued)
| Name and Year of Birth | Current Position with the Company | Length of Service of Current Position | Principal Occupation During the Past Five Years | |||
| Jeffrey Rabinowitz (1972) | Executive Vice President | Elected in 2017 | Portfolio Manager, joined Lord Abbett in 2017 and was formerly Managing Director and Portfolio Manager/Technology Analyst at Jennison Associates LLC (2014–2017) and Managing Director and Portfolio Manager/Technology Analyst for U.S. Growth Equity at Goldman Sachs Asset Management (1999–2014). | |||
| Steven F. Rocco (1979) | Executive Vice President | Elected in 2014 | Partner and Director of Taxable Fixed Income, joined Lord Abbett in 2004. | |||
| A. Edward Allinson (1961) | Vice President | Elected in 2011 | Portfolio Manager, joined Lord Abbett in 2005. | |||
| Vernon T. Bice (1974) | Vice President | Elected in 2011 | Portfolio Manager, joined Lord Abbett in 2011. | |||
| Pamela P. Chen (1978) | Vice President, Assistant Secretary and Privacy Officer | Elected in 2018 | Associate General Counsel, joined Lord Abbett in 2017 and was formerly Special Counsel at Schulte, Roth & Zabel LLP (2005–2017). | |||
| Robert S. Clark (1975) | Vice President | Elected in 2018 | Portfolio Manager, joined Lord Abbett in 2010. | |||
| Matthew R. DeCicco (1977) | Vice President | Elected in 2003 | Managing Director and Portfolio Manager, joined Lord Abbett in 1999. | |||
| John T. Fitzgerald (1975) | Vice President and Assistant Secretary | Elected in 2018 | Deputy General Counsel, joined Lord Abbett in 2018 and was formerly Deputy Head of U.S. Funds Legal, Executive Director and Assistant General Counsel at JPMorgan Chase (2005–2018). | |||
| Christopher J. Gizzo (1986) | Vice President | Elected in 2018 | Managing Director and Portfolio Manager, joined Lord Abbett in 2008. | |||
| Bernard J. Grzelak (1971) | Chief Financial Officer and Vice President | Elected in 2017 | Partner, Chief Operating Officer, Global Funds and Risk, joined Lord Abbett in 2003. |
33
Basic Information About Management (concluded)
| Name and Year of Birth | Current Position with the Company | Length of Service of Current Position | Principal Occupation During the Past Five Years | |||
| Linda Y. Kim (1980) | Vice President and Assistant Secretary | Elected in 2016 | Counsel, joined Lord Abbett in 2015 and was formerly an Associate at Stroock & Stroock & Lavan LLP (2007–2015). | |||
| So Young Lee (1971) | Vice President | Elected in 2018 | Portfolio Manager, joined Lord Abbett in 2013. | |||
| Joseph M. McGill (1962) | Chief Compliance Officer | Elected in 2014 | Partner and Chief Compliance Officer, joined Lord Abbett in 2014 and was formerly Managing Director and the Chief Compliance Officer at UBS Global Asset Management (2003–2013). | |||
| A. Edward Oberhaus, III (1959) | Vice President | Elected in 1998 | Partner and Director, joined Lord Abbett in 1983. | |||
| Amanda S. Ryan (1978) | Vice President and Assistant Secretary | Elected in 2018 | Counsel, joined Lord Abbett in 2016 and was formerly a Director and Corporate Counsel at PGIM Investments (2012–2016). | |||
| Lawrence B. Stoller (1963) | Vice President, Secretary and Chief Legal Officer | Elected in 2007 | Partner and General Counsel, joined Lord Abbett in 2007. | |||
| Leah G. Traub (1979) | Vice President | Elected in 2016 | Partner and Portfolio Manager, joined Lord Abbett in 2007. | |||
| Kewjin Yuoh (1971) | Vice President | Elected in 2012 | Partner and Portfolio Manager, joined Lord Abbett in 2010. | |||
| Jackson C. Chan (1964) | AML Compliance Officer | Elected in 2018 | Deputy Chief Compliance Officer and Director of Regulatory Affairs, joined Lord Abbett in 2014 and was formerly Director at UBS Global Asset Management (2005–2014). | |||
| Vito A. Fronda (1969) | Treasurer | Elected in 2018 | Partner and Director of Taxation, joined Lord Abbett in 2003. |
Please call 888-522-2388 for a copy of the statement of additional information, which contains further information about the Company’s Directors. It is available free upon request.
34
Approval of Advisory Contract
The Board, including all of the Directors who are not “interested persons” of the Company or of Lord Abbett, as defined in the Investment Company Act of 1940, as amended (the “Independent Directors”), annually considers whether to approve the continuation of the existing management agreement between the Fund and Lord Abbett (the “Agreement”). In connection with its most recent approval, which included the approval of a proposal to reduce the management fee schedule effective May 1, 2019, the Board reviewed materials relating specifically to the Agreement, as well as numerous materials received throughout the course of the year, including information about the Fund’s investment performance compared to the performance of its benchmark. Before making its decision as to the Fund, the Board had the opportunity to ask questions and request further information, taking into account its knowledge of Lord Abbett gained through its meetings and discussions. These meetings and discussions included reviews of Fund performance conducted by members of the Contract Committee, the deliberations of the Contract Committee, and discussions between the Contract Committee and Lord Abbett’s management. The Independent Directors also met with their independent legal counsel in various private sessions at which no representatives of management were present.
The materials received by the Board included, but were not limited to: (1) information provided by Broadridge Financial Solutions (“Broadridge”) regarding the investment performance of the Fund compared to the investment performance of certain funds with similar investment styles as determined by Broadridge, based, in part, on the Fund’s Morningstar category (the “performance peer group”), and the investment performance of two appropriate benchmarks; (2) information provided by Broadridge regarding the expense ratios, contractual and actual management fee rates, and other expense components for the Fund and certain funds in the same Morningstar category, with generally the same or similar share classes and operational characteristics, including asset size (the “expense peer group”); (3) certain supplemental investment performance information provided by Lord Abbett; (4) information provided by Lord Abbett on the expense ratios, management fee rates, and other expense components for the Fund; (5) sales and redemption information for the Fund; (6) information regarding Lord Abbett’s financial condition; (7) an analysis of the relative profitability of the Agreement to Lord Abbett; (8) information provided by Lord Abbett regarding the investment management fee schedules for Lord Abbett’s other advisory clients maintaining accounts with a similar investment strategy as the Fund; and (9) information regarding the personnel and other resources devoted by Lord Abbett to managing the Fund.
Investment Management and Related Services Generally.The Board considered the services provided by Lord Abbett to the Fund, including investment research, portfolio management, and trading, and Lord Abbett’s commitment to compliance with all applicable legal requirements. The Board also observed that Lord Abbett was solely engaged in the investment management business and accordingly did not experience the conflicts of interest that may result from being engaged in other lines of business. The Board considered the investment advisory services provided by Lord Abbett to other clients, the fees charged for the services, and the differences in the nature of the services provided to the Fund and other Lord Abbett Funds, on the one hand, and the services provided to other clients, on the other. After reviewing these and related factors, the Board concluded that the Fund was likely to continue to benefit from the nature, extent and quality of the investment services provided by Lord Abbett under the Agreement.
Investment Performance.The Board reviewed the Fund’s investment performance in relation to that of the performance peer group and two appropriate benchmarks as of various periods ended August 31, 2018. The Board observed that the Fund’s investment performance was below the
35
Approval of Advisory Contract (continued)
median of the performance peer group for the one-, three-, and five-year periods and took into account changes to the portfolio management team and other actions taken by Lord Abbett to attempt to improve equity fund performance. The Board further considered Lord Abbett’s performance and reputation generally, the performance of other Lord Abbett-managed funds overseen by the Board, and the willingness of Lord Abbett to take steps intended to improve performance when appropriate. After reviewing these and related factors, the Board concluded that the Fund’s Agreement, as revised with a reduced management fee schedule effective May 1, 2019, should be continued.
Lord Abbett’s Personnel and Methods.The Board considered the qualifications of the personnel providing investment management services to the Fund, in light of its investment objective and discipline, and other services provided to the Fund by Lord Abbett. Among other things, the Board considered the size, experience, and turnover of Lord Abbett’s staff, Lord Abbett’s investment methodology and philosophy, and Lord Abbett’s approach to recruiting, training, and retaining personnel.
Nature and Quality of Other Services.The Board considered the nature, quality, and extent of compliance, administrative, and other services performed by Lord Abbett and the nature and extent of Lord Abbett’s supervision of third party service providers, including the Fund’s transfer agent and custodian.
Expenses.The Board considered the expense level of the Fund, including the contractual and actual management fee rates under the terms of the current Agreement, and the expense levels of the Fund’s expense peer group. It also considered how the expense level of the Fund related to those of the expense peer group and the amount and nature of the fees paid by shareholders. The Board observed that the net total expense ratio of the Fund was below the median of the expense peer group. The Board further considered that the Fund’s management fee schedule would be reduced, effective May 1, 2019. After reviewing these and related factors, the Board concluded, within the context of its overall approval of the Agreement, that the expense level of the Fund was reasonable and supported the continuation of the Agreement.
Profitability.The Board considered the level of Lord Abbett’s operating margin in managing the Fund, including a review of Lord Abbett’s methodology for allocating its costs to its management of the Fund. It considered whether the Fund was profitable to Lord Abbett in connection with the Fund’s operation, including the fee that Lord Abbett receives from the Fund for providing administrative services to the Fund. The Board also considered the profits realized from other business segments of Lord Abbett, which may benefit from or be related to the Fund’s business. The Board considered Lord Abbett’s profit margins excluding Lord Abbett’s marketing and distribution expenses. The Board also considered Lord Abbett’s profit margins, without those exclusions, in comparison with available industry data and how those profit margins could affect Lord Abbett’s ability to recruit and retain personnel. The Board recognized that Lord Abbett’s overall profitability was a factor in enabling it to attract and retain qualified personnel to provide services to the Fund. After reviewing these and related factors, the Board concluded, within the context of its overall approval of the Agreement, that Lord Abbett’s profitability with respect to the Fund was not excessive.
Economies of Scale.The Board considered the extent to which there had been economies of scale in managing the Fund, whether the Fund’s shareholders had appropriately benefited from such economies of scale, and whether there was potential for realization of any further economies of scale. The Board concluded that the reduced management fee schedule, which included certain
36
Approval of Advisory Contract (concluded)
breakpoints in the management fee schedule, adequately addressed any economies of scale in managing the Fund.
Other Benefits to Lord Abbett.The Board considered the amount and nature of the fees paid by the Fund and the Fund’s shareholders to Lord Abbett for services other than investment advisory services, such as the fee that Lord Abbett receives from the Fund for providing administrative services to the Fund. The Board also considered the revenues and profitability of Lord Abbett’s investment advisory business apart from its mutual fund business, and the intangible benefits enjoyed by Lord Abbett by virtue of its relationship with the Fund. The Board observed that the Distributor receives 12b-1 fees from certain of the Lord Abbett Funds as to shares held in accounts for which there is no other broker of record, may retain a portion of the 12b-1 fees it receives, and receives a portion of the sales charges on sales and redemptions of some classes of shares of the Lord Abbett Funds. In addition, the Board observed that Lord Abbett accrues certain benefits for its business of providing investment advice to clients other than the Lord Abbett Funds, but that business also benefits the Funds. The Board also noted that Lord Abbett, as disclosed in the prospectus of the Fund, has entered into revenue sharing arrangements with certain entities that distribute shares of the Lord Abbett Funds. The Board also took into consideration the investment research that Lord Abbett receives as a result of client brokerage transactions.
Alternative Arrangements.The Board considered whether, instead of approving continuation of the Agreement, it might be in the best interests of the Fund to implement one or more alternative arrangements, such as continuing to employ Lord Abbett, but on different terms. After considering all of the relevant factors, the Board unanimously found that continuation of the Agreement, as revised, was in the best interests of the Fund and its shareholders and voted unanimously to approve the continuation of the Agreement. In considering whether to approve the continuation of the Agreement, the Board did not identify any single factor as paramount or controlling. Individual Directors may have evaluated the information presented differently from one another, giving different weights to various factors. This summary does not discuss in detail all matters considered.
37
Householding
The Company has adopted a policy that allows it to send only one copy of the Fund’s prospectus, proxy material, annual report and semiannual report to certain shareholders residing at the same “household.” This reduces Fund expenses, which benefits you and other shareholders. If you need additional copies or do not want your mailings to be “householded,” please call Lord Abbett at 888-522-2388 or send a written request with your name, the name of your fund or funds and your account number or numbers to Lord Abbett Family of Funds, P.O. Box 219336, Kansas City, MO 64121.
Proxy Voting Policies, Procedures and Records
A description of the policies and procedures that Lord Abbett uses to vote proxies related to the Fund’s portfolio securities, and information on how Lord Abbett voted the Fund’s proxies during the 12-month period ended June 30 are available without charge, upon request, (i) by calling 888-522-2388; (ii) on Lord Abbett’s Website at www.lordabbett.com; and (iii) on the Securities and Exchange Commission’s (“SEC”) Website at www.sec.gov.
Shareholder Reports and Quarterly Portfolio Disclosure
The Fund is required to file its complete schedule of portfolio holdings with the SEC for its first and third fiscal quarters on Form N-Q. Copies of the filings are available without charge, upon request on the SEC’s Website at www.sec.gov and may be available by calling Lord Abbett at 888-522-2388.
Tax Information
The Fund intends to pass through foreign source income of $1,740,980 and foreign taxes of $208,469. |
38


| This report, when not used for the general information of shareholders of the Fund, is to be distributed only if preceded or accompanied by a current fund prospectus. | |||
Lord Abbett mutual fund shares are distributed by | Lord Abbett Series Fund, Inc.
International Equity Portfolio | SFICE-3 |
![]()
LORD ABBETT
ANNUAL REPORT
Lord Abbett
Series Fund—International Opportunities Portfolio
For the fiscal year ended December 31, 2018
Table of Contents
Lord Abbett Series Fund — International Opportunities Portfolio
Annual Report
For the fiscal year ended December 31, 2018

From left to right: James L.L. Tullis, Independent Chairman of the Lord Abbett Funds and Douglas B. Sieg, Director, President, and Chief Executive Officer of the Lord Abbett Funds.
Dear Shareholders:We are pleased to provide you with this overview of the performance of Lord Abbett Series Fund - International Opportunities Portfolio for the fiscal year ended December 31, 2018. On this page and the following pages, we discuss the major factors that influenced fiscal year performance. For additional information about the Fund, please visit our website at www.lordabbett.com, where you also can access the quarterly commentaries that provide updates on the Fund’s performance and other portfolio related updates.
Thank you for investing in Lord Abbett mutual funds. We value the trust that you place in us and look forward to serving your investment needs in the years to come.
Best regards,

Douglas B. Sieg
Director, President and Chief Executive Officer
For the fiscal year ended December 31, 2018, the Fund returned -23.67%, reflecting performance at the net asset value (NAV) of Class VC Shares with all distributions reinvested, compared to its benchmark, the S&P Developed Ex U.S. SmallCap® Index1, which returned –18.41% over the same period.
Over the period, global equity markets experienced significant negative performance, despite most central banks remaining accommodative, interest rates remaining low, and unemployment steadily declining. In addition, corporate earnings
continued to grow, while global economic growth has showed signs of peaking and plateauing. Overall, European markets (as measured by the EURO STOXX 50® Index2) fell roughly 18.4% in U.S. dollars for the period, while Japan’s Nikkei 2253fell 10.35%.
In March 2018, the Federal Reserve (the “Fed”) raised its target for short-term interest rates by 0.25%, to a range of 1.50% - 1.75%, and followed with rate hikes of 0.25% at each of its June, September, and December meetings, raising the target range to 2.25% - 2.50%.
1
Meanwhile, other central banks have continued their accommodative policies. The European Central Bank (ECB) has kept its benchmark refinancing rate unchanged at 0% since March 2016, and at its December 2018 meeting, the ECB confirmed the end of its asset purchase program (APP) later in the month. The Bank of Japan (BoJ) also maintained its stimulative monetary policy as short term interest rates remained unchanged, at –0.1%, at its December 2018 meeting, and the bank kept its 10-year government bond yield target at around 0%. The BoJ also maintained its upbeat view on the domestic economy despite slowing growth in China, uncertainty from Sino-U.S. trade dispute and volatile financial markets.
The International Monetary Fund lowered global growth estimates by 0.2 percentage points to 3.7% for both 2018 and 2019, reflecting “surprises that suppressed activity in early 2018 in some major advanced economies, the negative effects of the trade measures implemented or approved between April and mid-September, as well as a weaker outlook for some key emerging markets and developing economies arising from country-specific factors, tighter financial conditions, geopolitical tensions, and higher oil import bills”. Unemployment steadily declined in most developed countries, falling to 7.9% in the Euro area, 3.9% in the United States, 2.5% in Japan, and 3.8% in China, all multiyear lows. GDP growth has remained positive in most
developed countries, while inflation remained subdued, allowing central banks to continue their stimulative monetary policies.
Volatility, as measured by the VIX index, has crept back up this year after remaining near all-time low levels for most of 2017. Sources of tension throughout the year have come from aggressive U.S. trade posture with trade tensions mounting between the U.S. and China, remaining uncertainty regarding a potential hard “Brexit” outcome, and the gradual and continuous rise of rates by the Fed.
Stock selection, most notably in the financials and real estate sectors, was the primary driver of relative underperformance during the period. Within the financials sector, shares of Arrow Global Group Plc detracted from relative performance. Shares of the British debt management solutions company fell as margins continued to be pressured and as low money multiples at this stage in the cycle translate into lower returns. In addition, shares of TP ICAP Plc detracted from relative performance. The British financial markets brokering services company’s stock fell after the company fired its CEO and warned that returns will be lower than expected this year.
Within the real estate sector, shares of Aedas Homes Sa detracted from relative performance over the period. Shares of the Spanish residential home builder retreated throughout the year as it suffered from building permit concerns
2
and heightened construction costs, both of which have been prevalent themes in Spain’s construction sector this year.
Conversely, stock selection in the consumer discretionary and consumer staples sectors contributed to relative performance. Within the consumer discretionary sector, shares of Moncler SpA contributed to relative performance. Shares of the Italian luxury apparel company rose as first half 2018 earnings results demonstrated accelerating momentum and incremental support from its Fragment Genius launch. In addition, holdings of Basic-Fit N.V. also contributed to relative performance during the period. Shares of the Dutch health and fitness club company rose, as it increased previous
guidance and expects to open more clubs in 2018.
Within the consumer staples sector, an overweight position to Nichirei Corp. contributed to relative performance, as shares of the company rose during the year. The Japanese packaged foods company benefited as management described a clear cut recovery plan for its second half operations, and analysts cited expectations for faster growth in household-prepared foods and a recovery in Thailand.
The Fund’s portfolio is actively managed and, therefore, its holdings and the weightings of a particular issuer or particular sector as a percentage of portfolio assets are subject to change. Sectors may include many industries.
3
1 The S&P Developed Ex-U.S. SmallCap® Index captures the bottom 15% of companies domiciled in the developed markets (excluding the United States) within the S&P Global BMI with a float-adjusted market capitalization of at least US$100 million and a value traded of at least US$50 million for the past 12 months at the time of the annual reconstitution. Stocks are excluded if their market capitalization falls below US$75 million, or if the value traded is less than US$35 million at the time of reconstitution.
2 The EURO STOXX 50®Index represents the performance of the 50 largest companies among the 19 supersectors in terms of free-float market cap in 12 Eurozone countries. These countries include Austria, Belgium, Finland, France, Germany, Greece, Ireland, Italy, Luxembourg, the Netherlands, Portugal and Spain. The Index has a fixed number of components and is part of the STOXX blue-chip index family. The Index captures about 60% of the free-float market cap of the EURO STOXX Total Market Index (TMI).
3 The Nikkei Stock Average, the Nikkei 225 is used around the globe as the premier index of Japanese stocks. Because of the prominent nature of the index, many financial products linked to the Nikkei 225 have been created are traded worldwide while the index has been sufficiently used as the indicator of the movement of Japanese stock markets. The Nikkei 225 is a price-weighted equity index, which consists of 225 stocks in the 1st section of the Tokyo Stock Exchange.
Unless otherwise specified, indexes reflect total return, with all dividends reinvested. Indexes are unmanaged, do not reflect the deduction of fees or expenses, and are not available for direct investment.
Important Performance and Other Information
Performance data quoted in the following pages reflect past performance and are no guarantee of
future results. Current performance may be higher or lower than the performance quoted. The investment return and principal value of an investment in the Fund will fluctuate so that shares, on any given day or when redeemed, may be worth more or less than their original cost. You can obtain performance data current to the most recent month end by calling Lord Abbett at 888-522-2388 or referring to www.lordabbett.com.
During certain periods shown, expense waivers and reimbursements were in place. Without such expense waivers and reimbursements, the Fund’s returns would have been lower.
The annual commentary above discusses the views of the Fund’s management and various portfolio holdings of the Fund as of December 31, 2018. These views and portfolio holdings may have changed after this date. Information provided in the commentary is not a recommendation to buy or sell securities. Because the Fund’s portfolio is actively managed and may change significantly, the Fund may no longer own the securities described above or may have otherwise changed its position in the securities. For more recent information about the Fund’s portfolio holdings, please visit www.lordabbett.com.
A Note about Risk:See Notes to Financial Statements for a discussion of investment risks. For a more detailed discussion of the risks associated with the Fund, please see the Fund’s prospectus.
Mutual funds are not insured by the FDIC, are not deposits or other obligations of, or guaranteed by, banks, and are subject to investment risks including possible loss of principal amount invested.
The Fund serves as an underlying investment vehicle for variable annuity contracts and variable life insurance policies.
4
Below is a comparison of a $10,000 investment in Class VC shares with the same investment in the S&P Developed Ex-U.S. SmallCap® Index, assuming reinvestment of all dividends and distributions. The Fund’s shares are sold only to insurance company separate accounts that fund certain variable annuity and variable life contracts. This line graph comparison does not reflect the sales charges or other expenses of these contracts. If those sales charges and expenses were reflected, returns would be lower. The graph and performance table below do not reflect the deduction of taxes that a shareholder would pay on Fund distributions or the redemption of Fund shares. During certain periods, expenses of the Fund have been waived or reimbursed by Lord Abbett; without such waiver or reimbursement of expenses, the Fund’s returns would have been lower.Past performance is no guarantee of future results.

Average Annual Total Returns for the | |||||||
| 1 Year | 5 Years | 10 Years | |||||
| Class VC | –23.67% | 1.27% | 9.82% | ||||
1 Performance for the unmanaged index does not reflect any fees or expenses. The performance of the index is not necessarily representative of the Fund’s performance.
5
As a shareholder of the Fund, you incur ongoing costs, including management fees; expenses related to the Fund’s services arrangements with certain insurance companies; and other Fund expenses. This Example is intended to help you understand your ongoing costs (in dollars) of investing in the Fund and to compare these costs with the ongoing costs of investing in other mutual funds.
The Example is based on an investment of $1,000 invested at the beginning of the period and held for the entire period (July 1, 2018 through December 31, 2018).
The Example reflects only expenses that are deducted from the assets of the Fund. Fees and expenses, including sales charges applicable to the various insurance products that invest in the Fund, are not reflected in this Example. If such fees and expenses were reflected in the Example, the total expenses shown would be higher. Fees and expenses regarding such variable insurance products are separately described in the prospectus related to those products.
Actual Expenses
The first line of the table on the following page provides information about actual account values and actual expenses. You may use the information in this line, together with the amount you invested, to estimate the expenses that you paid over the period. Simply divide your account value by $1,000 (for example, an $8,600 account value divided by $1,000 = 8.6), then multiply the result by the number in the first line under the heading titled “Expenses Paid During Period 7/1/18 – 12/31/18” to estimate the expenses you paid on your account during this period.
Hypothetical Example for Comparison Purposes
The second line of the table on the following page provides information about hypothetical account values and hypothetical expenses based on the Fund’s actual expense ratio and an assumed rate of return of 5% per year before expenses, which is not the Fund’s actual return. The hypothetical account values and expenses may not be used to estimate the actual ending account balance or expenses you paid for the period. You may use this information to compare the ongoing costs of investing in the Fund and other funds. To do so, compare this 5% hypothetical example with the 5% hypothetical examples that appear in the shareholder reports of the other funds.
6
Please note that the expenses shown in the table are meant to highlight your ongoing costs only and do not reflect any transactional costs, such as sales charges. Therefore, the second line of the table is useful in comparing ongoing costs only, and will not help you determine the relative total costs of owning different funds. In addition, if these transactional costs were included, your costs would have been higher.
| Beginning | Ending | Expenses | |||||||
| Account | Account | Paid During | |||||||
| Value | Value | Period† | |||||||
| 7/1/18 - | |||||||||
| 7/1/18 | 12/31/18 | 12/31/18 | |||||||
| Class VC | |||||||||
| Actual | $1,000.00 | $ | 813.70 | $5.71 | |||||
| Hypothetical (5% Return Before Expenses) | $1,000.00 | $ | 1,018.90 | $6.36 | |||||
| † | Net expenses are equal to the Fund’s annualized expense ratio of 1.25%, multiplied by the average account value over the period, multiplied by 184/365 (to reflect one-half year period). |
Portfolio Holdings Presented by Sector
December 31, 2018
| Sector* | %** | |
| Communication Services | 5.22 | % |
| Consumer Discretionary | 15.64 | % |
| Consumer Staples | 10.04 | % |
| Energy | 3.15 | % |
| Financials | 16.42 | % |
| Health Care | 8.16 | % |
| Industrials | 18.77 | % |
| Information Technology | 3.47 | % |
| Materials | 8.78 | % |
| Real Estate | 7.95 | % |
| Utilities | 2.14 | % |
| Repurchase Agreement | 0.26 | % |
| Total | 100.00 | % |
| * | A sector may comprise several industries. | |
| ** | Represents percent of total investments. |
7
December 31, 2018
| Investments | Shares | U.S. $ Fair Value (000) | ||||||
| COMMON STOCKS 97.41% | ||||||||
| Australia 4.22% | ||||||||
| Auto Components 1.04% | ||||||||
| GUD Holdings Ltd. | 52,396 | $ | 415 | |||||
| Beverages 1.03% | ||||||||
| Coca-Cola Amatil Ltd. | 71,493 | 412 | ||||||
| Diversified Financial Services 1.18% | ||||||||
| IMF Bentham Ltd. | 211,563 | 468 | ||||||
| Electric: Utilities 0.97% | ||||||||
| AusNet Services | 351,034 | 385 | ||||||
| Total Australia | 1,680 | |||||||
| Canada 10.22% | ||||||||
| Aerospace & Defense 1.63% | ||||||||
| CAE, Inc. | 35,200 | 647 | ||||||
| Entertainment 1.80% | ||||||||
| Entertainment One Ltd. | 158,048 | 718 | ||||||
| Metals & Mining 2.69% | ||||||||
| Hudbay Minerals, Inc. | 141,402 | 669 | ||||||
| Lundin Mining Corp. | 96,800 | 400 | ||||||
| 1,069 | ||||||||
| Oil, Gas & Consumable Fuels 3.08% | ||||||||
| Africa Oil Corp.* | 276,667 | 217 | ||||||
| Arrow Exploration Corp.* | 25,683 | 7 | ||||||
| Canacol Energy Ltd.* | 186,500 | 552 | ||||||
| Vermilion Energy, Inc. | 21,300 | 449 | ||||||
| 1,225 | ||||||||
| Paper & Forest Products 1.02% | ||||||||
| Interfor Corp.* | 38,600 | 408 | ||||||
| Total Canada | 4,067 | |||||||
| Denmark 1.21% | ||||||||
| Construction & Engineering | ||||||||
| FLSmidth & Co. A/S | 10,642 | 480 | ||||||
| Investments | Shares | U.S. $ Fair Value (000) | ||||||
| Finland 1.66% | ||||||||
| Health Care Providers & Services 0.46% | ||||||||
| Terveystalo OYJ*† | 19,846 | $ | 182 | |||||
| Machinery 0.47% | ||||||||
| Konecranes OYJ | 6,107 | 185 | ||||||
| Trading Companies & Distributors 0.73% | ||||||||
| Cramo OYJ | 17,098 | 293 | ||||||
| Total Finland | 660 | |||||||
| France 2.78% | ||||||||
| Construction Materials 0.47% | ||||||||
| Vicat SA | 3,940 | 187 | ||||||
| Health Care Providers & Services 1.77% | ||||||||
| Korian SA | 19,840 | 706 | ||||||
| Specialty Retail 0.54% | ||||||||
| Maisons du Monde SA† | 11,161 | 214 | ||||||
| Total France | 1,107 | |||||||
| Germany 6.15% | ||||||||
| Industrial Conglomerates 1.12% | ||||||||
| Rheinmetall AG | 5,027 | 446 | ||||||
| Interactive Media & Services 0.86% | ||||||||
| XING SE | 1,261 | 343 | ||||||
| Life Sciences Tools & Services 2.06% | ||||||||
| Gerresheimer AG | 8,909 | 586 | ||||||
| MorphoSys AG* | 2,286 | 233 | ||||||
| 819 | ||||||||
| Machinery 0.86% | ||||||||
| Deutz AG | 57,878 | 341 | ||||||
| Real Estate Management & Development 1.25% | ||||||||
| PATRIZIA Immobilien AG | 25,997 | 497 | ||||||
| Total Germany | 2,446 | |||||||
| 8 | See Notes to Financial Statements. |
Schedule of Investments (continued)
December 31, 2018
| Investments | Shares | U.S. $ Fair Value (000) | ||||||
| Hong Kong 3.95% | ||||||||
| Auto Components 1.59% | ||||||||
| Xinyi Glass Holdings Ltd. | 574,000 | $ | 634 | |||||
| Consumer Finance 1.14% | ||||||||
| Sun Hung Kai & Co., Ltd. | 956,000 | 452 | ||||||
| Hotels, Restaurants & Leisure 0.66% | ||||||||
| Melco International Development Ltd. | 129,000 | 261 | ||||||
| Pharmaceuticals 0.56% | ||||||||
| SSY Group Ltd. | 302,000 | 224 | ||||||
| Total Hong Kong | 1,571 | |||||||
| India 2.17% | ||||||||
| Consumer Finance 0.67% | ||||||||
| Satin Creditcare Network Ltd.* | 74,741 | 266 | ||||||
| Thrifts & Mortgage Finance 1.50% | ||||||||
| Dewan Housing Finance Corp., Ltd. | 62,044 | 221 | ||||||
| Indiabulls Housing Finance Ltd. | 30,920 | 378 | ||||||
| 599 | ||||||||
| Total India | 865 | |||||||
| Indonesia 1.62% | ||||||||
| Banks 1.21% | ||||||||
| PT Bank Tabungan Negara Persero Tbk | 2,728,000 | 483 | ||||||
| Consumer Finance 0.41% | ||||||||
| PT Clipan Finance Indonesia Tbk* | 7,426,600 | 162 | ||||||
| Total Indonesia | 645 | |||||||
| Ireland 6.46% | ||||||||
| Beverages 1.60% | ||||||||
| C&C Group plc | 204,040 | 637 | ||||||
| Investments | Shares | U.S. $ Fair Value (000) | ||||||
| Equity Real Estate Investment Trusts 1.35% | ||||||||
| Hibernia REIT plc | 374,697 | $ | 537 | |||||
| Health Care Providers & Services 1.57% | ||||||||
| UDG Healthcare plc | 81,914 | 624 | ||||||
| Household Durables 1.53% | ||||||||
| Cairn Homes plc* | 139,833 | 172 | ||||||
| Glenveagh Properties plc*† | 541,671 | 438 | ||||||
| 610 | ||||||||
| Information Technology Services 0.41% | ||||||||
| Keywords Studios plc | 11,739 | 160 | ||||||
| Total Ireland | 2,568 | |||||||
| Israel 0.80% | ||||||||
| Food Products | ||||||||
| Strauss Group Ltd. | 13,948 | 317 | ||||||
| Italy 4.17% | ||||||||
| Capital Markets 0.56% | ||||||||
| Anima Holding SpA† | 60,084 | 223 | ||||||
| �� | ||||||||
| Construction Materials 1.75% | ||||||||
| Buzzi Unicem SpA | 40,280 | 695 | ||||||
| Diversified Financial Services 0.82% | ||||||||
| doBank SpA† | 30,744 | 326 | ||||||
| Textiles, Apparel & Luxury Goods 1.04% | ||||||||
| Brunello Cucinelli SpA | 12,043 | 415 | ||||||
| Total Italy | 1,659 | |||||||
| Japan 19.84% | ||||||||
| Banks 0.28% | ||||||||
| Shinsei Bank Ltd. | 9,500 | 113 | ||||||
| Chemicals 0.57% | ||||||||
| Kansai Paint Co. Ltd. | 11,700 | 225 | ||||||
| Construction & Engineering 1.60% | ||||||||
| SHO-BOND Holdings Co., Ltd. | 8,600 | 638 | ||||||
| See Notes to Financial Statements. | 9 |
Schedule of Investments (continued)
December 31, 2018
| Investments | Shares | U.S. $ Fair Value (000) | ||||||
| Japan (continued) | ||||||||
| Containers & Packaging 0.76% | ||||||||
| Fuji Seal International, Inc. | 8,600 | $ | 303 | |||||
| Distributors 0.81% | ||||||||
| PALTAC Corp. | 6,800 | 321 | ||||||
| Diversified Financial Services 0.53% | ||||||||
| Aruhi Corp. | 11,600 | 210 | ||||||
| Electronic Equipment, Instruments & Components 1.22% | ||||||||
| Azbil Corp. | 15,300 | 302 | ||||||
| Topcon Corp. | 13,700 | 182 | ||||||
| 484 | ||||||||
| Entertainment 0.53% | ||||||||
| Capcom Co., Ltd. | 10,700 | 212 | ||||||
| Equity Real Estate Investment Trusts 1.65% | ||||||||
| GLP J-REIT | 644 | 656 | ||||||
| Food Products 1.63% | ||||||||
| Nichirei Corp. | 23,700 | 649 | ||||||
| Health Care Providers & Services 0.51% | ||||||||
| Japan Lifeline Co., Ltd. | 15,700 | 202 | ||||||
| Hotels, Restaurants & Leisure 1.52% | ||||||||
| HIS Co., Ltd. | 14,000 | 509 | ||||||
| St. Marc Holdings Co., Ltd. | 4,200 | 94 | ||||||
| 603 | ||||||||
| Information Technology Services 0.70% | ||||||||
| NS Solutions Corp. | 11,600 | 278 | ||||||
| Machinery 0.76% | ||||||||
| DMG Mori Co., Ltd. | 27,100 | 304 | ||||||
| Professional Services 1.67% | ||||||||
| en-japan, Inc. | 5,700 | 176 | ||||||
| TechnoPro Holdings, Inc. | 11,900 | 489 | ||||||
| 665 | ||||||||
| Investments | Shares | U.S. $ Fair Value (000) | ||||||
| Real Estate Management & Development 1.20% | ||||||||
| Kenedix, Inc. | 111,700 | $ | 479 | |||||
| Specialty Retail 2.75% | ||||||||
| Bic Camera, Inc. | 43,500 | 551 | ||||||
| United Arrows Ltd. | 17,000 | 542 | ||||||
| 1,093 | ||||||||
| Wireless Telecommunication Services 1.15% | ||||||||
| Okinawa Cellular Telephone Co. | 13,900 | 457 | ||||||
| Total Japan | 7,892 | |||||||
| Luxembourg 0.99% | ||||||||
| Multi-Line Retail | ||||||||
| B&M European Value Retail SA | 109,666 | 394 | ||||||
| Netherlands 3.80% | ||||||||
| Air Freight & Logistics 0.59% | ||||||||
| PostNL NV | 103,413 | 236 | ||||||
| Hotels, Restaurants & Leisure 1.06% | ||||||||
| Basic-Fit NV*† | 14,150 | 421 | ||||||
| Insurance 1.17% | ||||||||
| ASR Nederland NV | 11,742 | 465 | ||||||
| Machinery 0.98% | ||||||||
| Aalberts Industries NV | 11,722 | 390 | ||||||
| Total Netherlands | 1,512 | |||||||
| Philippines 2.47% | ||||||||
| Industrial Conglomerates 1.32% | ||||||||
| Alliance Global Group, Inc. | 2,327,300 | 526 | ||||||
| Real Estate Management & Development 1.15% | ||||||||
| Filinvest Land, Inc. | 17,052,500 | 456 | ||||||
| Total Philippines | 982 | |||||||
| Portugal 1.12% | ||||||||
| Multi-Utilities | ||||||||
| REN—Redes Energeticas Nacionais SGPS SA | 159,458 | 445 | ||||||
| 10 | See Notes to Financial Statements. |
Schedule of Investments (continued)
December 31, 2018
| Investments | Shares | U.S. $ Fair Value (000) | ||||||
| South Korea 1.01% | ||||||||
| Food & Staples Retailing | ||||||||
| GS Retail Co., Ltd. | 11,122 | $ | 403 | |||||
| Spain 5.20% | ||||||||
| Food Products 1.09% | ||||||||
| Ebro Foods SA | 21,738 | 434 | ||||||
| Household Durables 1.13% | ||||||||
| Neinor Homes SA*† | 30,111 | 448 | ||||||
| Professional Services 1.81% | ||||||||
| Applus Services SA | 64,942 | 721 | ||||||
| Real Estate Management & Development 1.17% | ||||||||
| Aedas Homes SAU*† | 18,331 | 465 | ||||||
| Total Spain | 2,068 | |||||||
| Sweden 3.32% | ||||||||
| Commercial Services & Supplies 2.64% | ||||||||
| Bravida Holding AB† | 89,936 | 624 | ||||||
| Loomis AB Class B | 13,260 | 427 | ||||||
| 1,051 | ||||||||
| Food & Staples Retailing 0.68% | ||||||||
| Axfood AB | 15,822 | 271 | ||||||
| Total Sweden | 1,322 | |||||||
| Switzerland 1.31% | ||||||||
| Containers & Packaging | ||||||||
| SIG Combibloc Group AG* | 48,855 | 522 | ||||||
| Taiwan 0.42% | ||||||||
| Semiconductors & Semiconductor Equipment | ||||||||
| Realtek Semiconductor Corp. | 36,000 | 167 | ||||||
| Turkey 0.75% | ||||||||
| Diversified Telecommunication Services | ||||||||
| Turkcell Iletisim Hizmetleri AS | 130,445 | 299 | ||||||
| Investments | Shares | U.S. $ Fair Value (000) | ||||||
| United Kingdom 8.79% | ||||||||
| Beverages 1.95% | ||||||||
| Britvic plc | 76,189 | $ | 776 | |||||
| Capital Markets 0.58% | ||||||||
| Man Group plc | 135,642 | 230 | ||||||
| Consumer Finance 1.13% | ||||||||
| Arrow Global Group plc | 199,674 | 449 | ||||||
| Electronic Equipment, Instruments & Components 0.65% | ||||||||
| accesso Technology Group plc * | 14,045 | 260 | ||||||
| Insurance 1.89% | ||||||||
| Lancashire Holdings Ltd. | 97,185 | 750 | ||||||
| Machinery 0.93% | ||||||||
| Concentric AB | 27,311 | 369 | ||||||
| Media 0.62% | ||||||||
| Huntsworth plc | 180,605 | 249 | ||||||
| Pharmaceuticals 1.04% | ||||||||
| Dechra Pharmaceuticals plc | 15,637 | 413 | ||||||
| Total United Kingdom | 3,496 | |||||||
| United States 1.54% | ||||||||
| Exchange-Traded Funds | ||||||||
| VanEck Vectors Junior Gold Miners | 20,240 | 612 | ||||||
| Vietnam 1.44% | ||||||||
| Closed-Ended Fund | ||||||||
| VinaCapital Vietnam Opportunity Fund Ltd. | 134,290 | 572 | ||||||
| Total Common Stocks (cost $45,783,654) | 38,751 | |||||||
| See Notes to Financial Statements. | 11 |
Schedule of Investments (continued)
December 31, 2018
| Investments | Principal Amount (000) | U.S. $ Fair Value (000) | ||||||
| SHORT-TERM INVESTMENT 0.26% | ||||||||
| Repurchase Agreement | ||||||||
| Repurchase Agreement dated 12/31/2018, 1.45% due 1/2/2019 with Fixed Income Clearing Corp. collateralized by $105,000 of U.S. Treasury Note at 2.87% due 7/31/2025; value: $107,741; proceeds: $102,083 (cost $102,075) | $102 | $ | 102 | |||||
| Total Investments in Securities 97.67% (cost $45,885,729) | 38,853 | |||||||
| Cash, Foreign Cash and Other Assets in Excess Liabilities 2.33% | 927 | |||||||
| Net Assets 100.00% | $ | 39,780 | ||||||
| REIT | Real Estate Investment Trust | |
| * | Non-income producing security. | |
| † | Security was purchased pursuant to Rule 144A under the Securities Act of 1933 and, unless registered under such Act or exempted from registration, may only be resold to qualified institutional buyers. |
| 12 | See Notes to Financial Statements. |
Schedule of Investments (concluded)
December 31, 2018
The following is a summary of the inputs used as of December 31, 2018 in valuing the Fund’s investments carried at fair value(1):
| Investment Type(2) | Level 1 (000) | Level 2 (000) | Level 3 (000) | Total (000) | ||||||||||||
| Long-Term Investments | ||||||||||||||||
| Common Stocks | ||||||||||||||||
| Australia | $ | – | $ | 1,680 | $ | – | $ | 1,680 | ||||||||
| Canada(3) | 3,132 | 935 | – | 4,067 | ||||||||||||
| Denmark | – | 480 | – | 480 | ||||||||||||
| Finland(3) | – | 660 | – | 660 | ||||||||||||
| France(3) | – | 1,107 | – | 1,107 | ||||||||||||
| Germany | – | 2,446 | – | 2,446 | ||||||||||||
| Hong Kong | – | 1,571 | – | 1,571 | ||||||||||||
| India | – | 865 | – | 865 | ||||||||||||
| Indonesia(3) | – | 645 | – | 645 | ||||||||||||
| Ireland(3) | 1,784 | 784 | – | 2,568 | ||||||||||||
| Israel | – | 317 | – | 317 | ||||||||||||
| Italy(3) | – | 1,659 | – | 1,659 | ||||||||||||
| Japan(3) | – | 7,892 | – | 7,892 | ||||||||||||
| Luxembourg | – | 394 | – | 394 | ||||||||||||
| Netherlands(3) | – | 1,512 | – | 1,512 | ||||||||||||
| Philippines(3) | – | 982 | – | 982 | ||||||||||||
| Portugal(3) | – | 445 | – | 445 | ||||||||||||
| South Korea | – | 403 | – | 403 | ||||||||||||
| Spain(3) | 465 | 1,603 | – | 2,068 | ||||||||||||
| Sweden(3) | – | 1,322 | – | 1,322 | ||||||||||||
| Switzerland | – | 522 | – | 522 | ||||||||||||
| Taiwan | – | 167 | – | 167 | ||||||||||||
| Turkey | – | 299 | – | 299 | ||||||||||||
| United Kingdom(3) | 249 | 3,247 | – | 3,496 | ||||||||||||
| United States | 612 | – | – | 612 | ||||||||||||
| Vietnam | – | 572 | – | 572 | ||||||||||||
| Short-Term Investment | ||||||||||||||||
| Repurchase Agreement | – | 102 | – | 102 | ||||||||||||
| Total | $ | 6,242 | $ | 32,611 | $ | – | $ | 38,853 | ||||||||
| (1) | Refer to Note 2(i) for a description of fair value measurements and the three-tier hierarchy of inputs. | |
| (2) | See Schedule of Investments for fair values in each industry and identification of foreign issuers and/or geography. | |
| (3) | Securities in the amount of $9,241,149 were transferred from Level 1 to Level 2 due to a change in valuation technique resulting in adjusted valuations (as described in Note 2(a)) on December 31, 2018. Securities in the amount of $684,317 were transferred from Level 2 to Level 1 as a result of utilizing the last sale or official closing price on the exchange or system on which the securities are principally traded on December 31, 2018. |
| See Notes to Financial Statements. | 13 |
Statement of Assets and Liabilities
December 31, 2018
| ASSETS: | ||||
| Investments in securities, at fair value (cost $45,885,729) | $ | 38,852,930 | ||
| Cash | 98,267 | |||
| Foreign cash, at value (cost $871,325) | 872,760 | |||
| Receivables: | ||||
| Interest and dividends | 66,738 | |||
| Capital shares sold | 38,706 | |||
| From advisor (See Note 3) | 24,834 | |||
| Prepaid expenses | 211 | |||
| Total assets | 39,954,446 | |||
| LIABILITIES: | ||||
| Payables: | ||||
| Management fee | 25,538 | |||
| Directors’ fees | 8,841 | |||
| Capital shares reacquired | 4,736 | |||
| Fund administration | 1,362 | |||
| Accrued expenses | 134,021 | |||
| Total liabilities | 174,498 | |||
| NET ASSETS | $ | 39,779,948 | ||
| COMPOSITION OF NET ASSETS: | ||||
| Paid-in capital | $ | 47,376,997 | ||
| Total distributable earnings (loss) | (7,597,049 | ) | ||
| Net Assets | $ | 39,779,948 | ||
| Outstanding shares (50 million shares of common stock authorized, $.001 par value) | 6,209,508 | |||
| Net asset value, offering and redemption price per share (Net assets divided by outstanding shares) | $6.41 |
| 14 | See Notes to Financial Statements. |
For the Year Ended December 31, 2018
| Investment income: | ||||
| Dividends (net of foreign withholding taxes of $112,354) | $ | 1,049,236 | ||
| Interest | 8,603 | |||
| Total investment income | 1,057,839 | |||
| Expenses: | ||||
| Management fee | 374,983 | |||
| Non 12b-1 service fees | 124,916 | |||
| Custody | 65,683 | |||
| Professional | 61,229 | |||
| Shareholder servicing | 55,032 | |||
| Reports to shareholders | 31,295 | |||
| Fund administration | 19,999 | |||
| Directors’ fees | 1,787 | |||
| Other | 13,090 | |||
| Gross expenses | 748,014 | |||
| Expense reductions (See Note 9) | (1,141 | ) | ||
| Fees waived and expenses reimbursed (See Note 3) | (131,241 | ) | ||
| Net expenses | 615,632 | |||
| Net investment income | 442,207 | |||
| Net realized and unrealized gain (loss): | ||||
| Net realized gain on investments (net of foreign capital gains tax of $31,907) | 4,163,940 | |||
| Net realized loss on foreign currency exchange contracts | (27,633 | ) | ||
| Net realized gain on foreign currency related transactions | 20,545 | |||
| Net change in unrealized appreciation/depreciation on investments | (17,142,944 | ) | ||
| Net change in unrealized appreciation/depreciation on translation of assets and liabilities denominated in foreign currencies | (13,820 | ) | ||
| Net realized and unrealized loss | (12,999,912 | ) | ||
| Net Decrease in Net Assets Resulting From Operations | $ | (12,557,705 | ) |
| See Notes to Financial Statements. | 15 |
Statements of Changes in Net Assets
| INCREASE (DECREASE) IN NET ASSETS | For the Year Ended December 31, 2018 | For the Year Ended December 31, 2017 | ||||||
| Operations: | ||||||||
| Net investment income | $ | 442,207 | $ | 251,313 | ||||
| Net realized gain on investments, forward currency exchange contracts and foreign currency related transactions | 4,156,852 | 8,169,890 | ||||||
| Net change in unrealized appreciation/depreciation on investments and translation of assets and liabilities denominated in foreign currencies | (17,156,764 | ) | 8,470,593 | |||||
| Net increase (decrease) in net assets resulting from operations | (12,557,705 | ) | 16,891,796 | |||||
| Distributions to shareholders(1) | (6,316,048 | ) | (5,068,281 | ) | ||||
| Capital share transactions (See Note 14): | ||||||||
| Proceeds from sales of shares | 11,712,753 | 24,321,830 | ||||||
| Reinvestment of distributions | 6,316,048 | 5,068,281 | ||||||
| Cost of shares reacquired | (16,036,773 | ) | (27,556,502 | ) | ||||
| Net increase in net assets resulting from capital share transactions | 1,992,028 | 1,833,609 | ||||||
| Net increase (decrease) in net assets | (16,881,725 | ) | 13,657,124 | |||||
| NET ASSETS: | ||||||||
| Beginning of year | $ | 56,661,673 | $ | 43,004,549 | ||||
| End of year | $ | 39,779,948 | $ | 56,661,673 | ||||
| Distributions in excess of net investment income(2) | $ | – | $ | – | ||||
| (1) | The SEC eliminated the requirement to disclose the source of distributions paid in 2018. For the year ended December 31, 2017, the source of distributions was net investment income $(580,813) and net realized gain $(4,487,468). | |
| (2) | The SEC eliminated the requirement to disclose distributions in excess of net investment income in 2018. For the year ended December 31, 2017, the distributions in excess of net investment income was $(299,300). |
| 16 | See Notes to Financial Statements. |
This page is intentionally left blank.
17
| Per Share Operating Performance: | ||||||||||||||||||||||||||||
| Investment operations: | Distributions to shareholders from: | |||||||||||||||||||||||||||
| Net asset value, beginning of period | Net invest- ment income(a) | Net realized and unrealized gain (loss) | Total from invest- ment oper- ations | Net investment income | Net realized gain | Total distri- butions | ||||||||||||||||||||||
| 12/31/2018 | $9.86 | $0.08 | $(2.37 | ) | $(2.29 | ) | $(0.08 | ) | $(1.08 | ) | $(1.16 | ) | ||||||||||||||||
| 12/31/2017 | 7.79 | 0.05 | 2.99 | 3.04 | (0.11 | ) | (0.86 | ) | (0.97 | ) | ||||||||||||||||||
| 12/31/2016 | 8.22 | 0.08 | (0.43 | ) | (0.35 | ) | (0.08 | ) | – | (0.08 | ) | |||||||||||||||||
| 12/31/2015 | 8.07 | 0.06 | 0.83 | 0.89 | (0.07 | ) | (0.67 | ) | (0.74 | ) | ||||||||||||||||||
| 12/31/2014 | 10.08 | 0.09 | (0.64 | ) | (0.55 | ) | (0.13 | ) | (1.33 | ) | (1.46 | ) | ||||||||||||||||
| (a) | Calculated using average shares outstanding during the period. |
| (b) | Total return does not consider the effects of sales charges or other expenses imposed by an insurance company and assumes the reinvestment of all distributions. |
| 18 | See Notes to Financial Statements. |
| Ratios to Average Net Assets: | Supplemental Data: | |||||||||||||||||||||||||
| Net asset value, end of period | Total return(b) (%) | Total expenses after waivers and/or reimbursements (%) | Total expenses (%) | Net Investment income (%) | Net assets, end of period (000) | Portfolio turnover rate (%) | ||||||||||||||||||||
| $ | 6.41 | (23.67 | ) | 1.23 | 1.50 | 0.89 | $ | 39,780 | 81 | |||||||||||||||||
| 9.86 | 39.21 | 1.20 | 1.44 | 0.48 | 56,662 | 75 | ||||||||||||||||||||
| 7.79 | (4.28 | ) | 1.20 | 1.57 | 0.97 | 43,005 | 84 | |||||||||||||||||||
| 8.22 | 11.10 | 1.20 | 1.52 | 0.73 | 53,818 | 87 | ||||||||||||||||||||
| 8.07 | (5.76 | ) | 1.20 | 1.49 | 0.90 | 48,508 | 65 | |||||||||||||||||||
| See Notes to Financial Statements. | 19 |
| 1. | ORGANIZATION |
Lord Abbett Series Fund, Inc. (the “Company”) is registered under the Investment Company Act of 1940, as amended (the “Act”), as a diversified, open-end management investment company and was incorporated under Maryland law in 1989. The Company consists of twelve separate portfolios. This report covers International Opportunities Portfolio (the “Fund”).
The Fund’s investment objective is long-term capital appreciation. The Fund has Variable Contract class shares (“Class VC Shares”), which are currently issued and redeemed only in connection with investments in, and payments under, variable annuity contracts and variable life insurance policies issued by life insurance and insurance-related companies.
��
The preparation of the financial statements in conformity with accounting principles generally accepted in the United States of America (“U.S. GAAP”) requires management to make certain estimates and assumptions that affect the reported amounts of assets and liabilities and disclosure of contingent assets and liabilities at the date of the financial statements and the reported amounts of increases and decreases in net assets from operations during the reporting period. Actual results could differ from those estimates. The Fund is considered an investment company under U.S. GAAP and follows the accounting and reporting guidance applicable to investment companies.
| 2. | SIGNIFICANT ACCOUNTING POLICIES |
| (a) | Investment Valuation—Under procedures approved by the Fund’s Board of Directors (the “Board”), Lord, Abbett & Co. LLC (“Lord Abbett”), the Fund’s investment manager, has formed a Pricing Committee to administer the pricing and valuation of portfolio investments and to ensure that prices utilized reasonably reflect fair value. Among other things, these procedures allow the Fund to utilize independent pricing services, quotations from securities and financial instrument dealers and other market sources to determine fair value. |
| Securities actively traded on any recognized U.S. or non-U.S. exchange or on The NASDAQ Stock Market LLC are valued at the last sale price or official closing price on the exchange or system on which they are principally traded. Events occurring after the close of trading on non-U.S. exchanges may result in adjustments to the valuation of foreign securities to reflect their fair value as of the close of regular trading on the New York Stock Exchange. The Fund may utilize an independent fair valuation service in adjusting the valuations of foreign securities. Unlisted equity securities are valued at the last quoted sale price or, if no sale price is available, at the mean between the most recently quoted bid and asked prices. Exchange traded options and futures contracts are valued at the last sale price in the market where they are principally traded. If no sale has occurred, the mean between the most recently quoted bid and asked prices is used. Forward foreign currency exchange contracts are valued using daily forward exchange rates. | |
| Securities for which prices are not readily available are valued at fair value as determined by the Pricing Committee. The Pricing Committee considers a number of factors, including observable and unobservable inputs, when arriving at fair value. The Pricing Committee may use related or comparable assets or liabilities, recent transactions, market multiples, book values and other relevant information to determine the fair value of portfolio investments. The Board or a designated committee thereof regularly reviews fair value determinations made by the Pricing Committee and may employ techniques such as reviewing related market activity, reviewing inputs and assumptions, and retrospectively comparing prices of subsequent purchases and sales transactions to fair value determinations made by the Pricing Committee. |
20
Notes to Financial Statements (continued)
| Short-term securities with 60 days or less remaining to maturity are valued using the amortized cost method, which approximates fair value. | |
| (b) | Security Transactions–Security transactions are recorded as of the date that the securities are purchased or sold (trade date). Realized gains and losses on sales of portfolio securities are calculated using the identified-cost method. |
| (c) | Investment Income–Dividend income is recorded on the ex-dividend date. Interest income is recorded on the accrual basis as earned. Discounts are accreted and premiums are amortized using the effective interest method and are included in Interest on the Statement of Operations. Withholding taxes on foreign dividends have been provided for in accordance with the applicable country’s tax rules and rates. |
| (d) | Income Taxes–It is the policy of the Fund to meet the requirements of Subchapter M of the Internal Revenue Code applicable to regulated investment companies and to distribute substantially all taxable income and capital gains to its shareholders. Therefore, no income tax provision is required. |
| The Fund files U.S. federal and various state and local tax returns. No income tax returns are currently under examination. The statute of limitations on the Fund’s filed U.S. federal tax returns remains open for the fiscal years ended December 31, 2015 through December 31, 2018. The statutes of limitations on the Company’s state and local tax returns may remain open for an additional year depending upon the jurisdiction. | |
| (e) | Expenses–Expenses incurred by the Company that do not specifically relate to an individual fund are generally allocated to the funds within the Company on a pro rata basis by relative net assets. |
| (f) | Foreign Transactions–The books and records of the Fund are maintained in U.S. dollars and transactions denominated in foreign currencies are recorded in the Fund’s records at the rate prevailing when earned or recorded. Asset and liability accounts that are denominated in foreign currencies are adjusted daily to reflect current exchange rates and any unrealized gain (loss) is included in Net change in unrealized appreciation/depreciation on translation of assets and liabilities denominated in foreign currencies in the Fund’s Statement of Operations. The resultant exchange gains and losses upon settlement of such transactions are included in Net realized gain on foreign currency related transactions in the Fund’s Statement of Operations. The Fund does not isolate that portion of the results of operations arising as a result of changes in the foreign exchange rates from the changes in market prices of the securities. |
| The Fund uses foreign currency exchange contracts to facilitate transactions in foreign-denominated securities. Losses from these transactions may arise from changes in the value of the foreign currency or if the counterparties do not perform under the contracts’ terms. | |
| (g) | Forward Foreign Currency Exchange Contracts–The Fund may enter into forward foreign currency exchange contracts in order to reduce exposure to changes in foreign currency exchange rates on foreign portfolio holdings or gain or reduce exposure to foreign currency solely for investment purposes. A forward foreign currency exchange contract is a commitment to purchase or sell a foreign currency at a future date at a negotiated rate. The contracts are valued daily at forward exchange rates and any unrealized gain (loss), if applicable, is included in Net change in unrealized appreciation/depreciation on foreign currency exchange contracts in the Fund’s Statement of Operations. The gain (loss) arising from the difference between the U.S. dollar cost of the original contract and the value of the |
21
Notes to Financial Statements (continued)
| foreign currency in U.S. dollars upon closing of such contracts is included in Net realized loss on foreign currency exchange contracts in the Fund’s Statement of Operations. | |
| (h) | Repurchase Agreements–The Fund may enter into repurchase agreements with respect to securities. A repurchase agreement is a transaction in which a fund acquires a security and simultaneously commits to resell that security to the seller (a bank or securities dealer) at an agreed-upon price on an agreed-upon date. The Fund requires at all times that the repurchase agreement be collateralized by cash, or by securities of the U.S. Government, its agencies, its instrumentalities, or U.S. Government sponsored enterprises having a value equal to, or in excess of, the value of the repurchase agreement (including accrued interest). If the seller of the agreement defaults on its obligation to repurchase the underlying securities at a time when the fair value of these securities has declined, the Fund may incur a loss upon disposition of the securities. |
| (i) | Fair Value Measurements–Fair value is defined as the price that the Fund would receive upon selling an investment or transferring a liability in an orderly transaction to an independent buyer in the principal or most advantageous market of the investment. A three-tier hierarchy is used to maximize the use of observable market data and minimize the use of unobservable inputs and to establish classification of fair value measurements for disclosure purposes. Inputs refer broadly to the assumptions that market participants would use in pricing the asset or liability, including assumptions about risk—for example, the risk inherent in a particular valuation technique used to measure fair value (such as a pricing model) and/or the risk inherent in the inputs to the valuation technique. Inputs may be observable or unobservable. Observable inputs reflect the assumptions market participants would use in pricing the asset or liability. Observable inputs are based on market data obtained from sources independent of the reporting entity. Unobservable inputs reflect the reporting entity’s own assumptions about the assumptions market participants would use in pricing the asset or liability. Unobservable inputs are based on the best information available in the circumstances. The three-tier hierarchy classification is determined based on the lowest level of inputs that is significant to the fair value measurement, and is summarized in the three broad Levels listed below: |
| • | Level 1 – | unadjusted quoted prices in active markets for identical investments; |
| • | Level 2 – | other significant observable inputs (including quoted prices for similar investments, interest rates, prepayment speeds, credit risk, etc.); and |
| • | Level 3 – | significant unobservable inputs (including the Fund’s own assumptions in determining the fair value of investments). |
| A summary of inputs used in valuing the Fund’s investments as of December 31, 2018 and, if applicable, Level 1/Level 2 transfers and Level 3 rollforwards for the fiscal year then ended is included in the Fund’s Schedule of Investments. | |
| Changes in valuation techniques may result in transfers into or out of an assigned level within the three-tier hierarchy. All transfers between different levels within the three-tier hierarchy are deemed to have occurred as of the beginning of the reporting period. The inputs or methodology used for valuing securities are not necessarily an indication of the risk associated with investing in those securities. |
22
Notes to Financial Statements (continued)
| 3. | MANAGEMENT FEE AND OTHER TRANSACTIONS WITH AFFILIATES |
Management Fee
The Company has a management agreement with Lord Abbett, pursuant to which Lord Abbett supplies the Fund with investment management services and executive and other personnel, provides office space and pays for ordinary and necessary office and clerical expenses relating to research and statistical work and supervision of the Fund’s investment portfolio.
The management fee is based on the Fund’s average daily net assets at the following annual rate:
| First $1 billion | .75% |
| Next $1 billion | .70% |
| Over $2 billion | .65% |
For the fiscal year ended December 31, 2018, the effective management fee, net of waivers, was at an annualized rate of .49% of the Fund’s average daily net assets.
In addition, Lord Abbett provides certain administrative services to the Fund pursuant to an Administrative Services Agreement in return for a fee at an annual rate of .04% of the Fund’s average daily net assets.
Effective May 1, 2018 and continuing through April 30, 2019, Lord Abbett has contractually agreed to waive its fees and reimburse expenses to the extent necessary to limit total net annual operating expenses to an annual rate of 1.25%. This agreement may be terminated only upon the approval of the Board. Prior to May 1, 2018, Lord Abbett contractually agreed to waive its fees and reimburse expenses to the extent necessary to limit total net annual operating expenses to an annual rate of 1.20%.
The Company, on behalf of the Fund, has entered into services arrangements with certain insurance companies. Under these arrangements, certain insurance companies will be compensated up to .25% of the average daily net asset value (“NAV”) of the Fund’s Class VC Shares held in the insurance company’s separate account to service and maintain the Variable Contract owners’ accounts. This amount is included in Non 12b-1 service fees on the Statement of Operations. The Fund may also compensate certain insurance companies, third-party administrators and other entities for providing recordkeeping, sub-transfer agency and other administrative services to the Fund. This amount is included in Shareholder servicing on the Statement of Operations.
One Director and certain of the Company’s officers have an interest in Lord Abbett.
| 4. | DISTRIBUTIONS AND CAPITAL LOSS CARRYFORWARDS |
Dividends from net investment income, if any, are declared and paid at least semi-annually. Taxable net realized gains from investment transactions, reduced by allowable capital loss carryforwards, if any, are declared and distributed to shareholders at least annually. The capital loss carryforward amount, if any, is available to offset future net capital gains. Dividends and distributions to shareholders are recorded on the ex-dividend date. The amounts of dividends and distributions from net investment income and net realized capital gains are determined in accordance with federal income tax regulations, which may differ from U.S. GAAP. These book/tax differences are either considered temporary or permanent in nature. To the extent these differences are permanent in nature, such amounts are reclassified within the components of net assets based on their federal tax basis treatment; temporary differences do not require reclassification. Dividends and distributions that exceed earnings and profits for tax purposes are reported as a tax return of capital.
23
Notes to Financial Statements (continued)
The tax character of distributions paid during the fiscal years ended December 31, 2018 and 2017 were as follows:
| Year Ended 12/31/2018 | Year Ended 12/31/2017 | |||||||||
| Distributions paid from: | ||||||||||
| Ordinary income | $ | 1,190,859 | $ | 669,964 | ||||||
| Net long-term capital gains | 5,125,189 | 4,398,317 | ||||||||
| Total distributions paid | $ | 6,316,048 | $ | 5,068,281 | ||||||
As of December 31, 2018, the components of accumulated losses on a tax-basis were as follows:
| Temporary differences | $ | (257,070 | ) | |
| Unrealized losses – net | (7,339,979 | ) | ||
| Total accumulated losses – net | $ | (7,597,049 | ) |
At the Fund’s election, certain losses incurred within the taxable year (Qualified Late-Year Losses) are deemed to arise on the first business day of the Fund’s next taxable year. The Fund incurred and will elect to defer post-October capital losses of $245,589 and late-year ordinary losses of $2,643 during fiscal year 2018.
As of December 31, 2018, the aggregate unrealized security gains and losses on investments and other financial instruments based on cost for U.S. federal income tax purposes were as follows:
| Tax cost | $ | 46,194,546 | ||
| Gross unrealized gain | 1,134,153 | |||
| Gross unrealized loss | (8,475,769 | ) | ||
| Net unrealized security loss | $ | (7,341,616 | ) |
The difference between book-basis and tax-basis unrealized gains (losses) is attributable to the tax treatment of certain securities and wash sales.
| 5. | PORTFOLIO SECURITIES TRANSACTIONS |
Purchases and sales of investment securities (excluding short-term investments) for the fiscal year ended December 31, 2018 were as follows:
| Purchases | Sales | |
| $39,205,623 | $42,407,178 |
There were no purchases or sales of U.S. Government securities for the fiscal year ended December 31, 2018.
The Fund is permitted to purchase and sell securities (“cross-trade”) from and to other Lord Abbett funds or client accounts pursuant to procedures approved by the Board in compliance with Rule 17a-7 under the Act (the “Rule”). Each cross-trade is executed at a fair market price in compliance with provisions of the Rule. For the fiscal year ended December 31, 2018, the Fund engaged in cross-trades purchases of $14,601 and sales of $125,567, which resulted in net realized gains of $37,595.
| 6. | DISCLOSURES ABOUT DERIVATIVE INSTRUMENTS AND HEDGING ACTIVITIES |
The Fund entered into forward foreign currency exchange contracts for the fiscal year ended December 31, 2018 (as described in note 2(g)). A forward foreign currency exchange contract reduces the Fund’s exposure to changes in the value of the currency it will deliver (or settle in cash)
24
Notes to Financial Statements (continued)
and increases its exposure to changes in the value of the currency it will receive (or settle in cash) for the duration of the contract. The Fund’s use of forward foreign currency exchange contracts involves the risk that Lord Abbett will not accurately predict currency movements, and the Fund’s returns could be reduced as a result. Forward foreign currency exchange contracts are subject to the risk that those currencies will decline in value relative to the U.S. dollar, or, in the case of hedged positions, that the U.S. dollar will decline relative to the currency being hedged. Currency rates in foreign countries may fluctuate significantly over short periods of time. The Fund’s risk of loss from counterparty credit risk is the unrealized appreciation on forward foreign currency exchange contracts and deposits with brokers as collateral.
As of December 31, 2018, the Fund had no forward foreign currency exchange contracts outstanding. An amount of $(27,633) is included in the Statement of Operations related to forward foreign currency exchange contracts under the caption Net realized loss on foreign currency exchange contracts. The average notional amounts in U.S. dollars of forward foreign currency exchange contracts throughout the fiscal year was $776,545.
| 7. | DISCLOSURES ABOUT OFFSETTING ASSETS AND LIABILITIES |
The Financial Accounting Standards Board (“FASB”) requires disclosures intended to help better assess the effect or potential effect of offsetting arrangements on a fund’s financial position. The following tables illustrate gross and net information about recognized assets and liabilities eligible for offset in the statement of assets and liabilities; and disclose such amounts subject to an enforceable master netting agreement or similar agreement, by counterparty. A master netting agreement is an agreement between a fund and a counterparty which provides for the net settlement of amounts owed under all contracts traded under that agreement, as well as cash collateral, through a single payment by one party to the other in the event of default on or termination of any one contract. The Fund’s accounting policy with respect to balance sheet offsetting is that, absent an event of default by the counterparty or a termination of the agreement, the master netting agreement does not result in an offset of reported amounts of financial assets and liabilities in the statement of assets and liabilities across transactions between the Fund and the applicable counterparty:
| Description | Gross Amounts of Recognized Assets | Gross Amounts Offset in the Statement of Assets and Liabilities | Net Amounts of in the Statement of Assets and Liabilities | |||||||||
| Repurchase Agreement | $102,075 | $ | – | $102,075 | ||||||||
| Total | $102,075 | $ | – | $102,075 | ||||||||
| Net Amounts of Assets Presented in | Amounts Not Offset in the Statement of Assets and Liabilities | |||||||||||||||||||
| Counterparty | the Statement of Assets and Liabilities | Financial Instruments | Cash Collateral Received(a) | Securities Collateral Received(a) | Net Amount(b) | |||||||||||||||
| Fixed Income Clearing Corp. | $102,075 | $ | – | $ | – | $(102,075 | ) | $ | – | |||||||||||
| Total | $102,075 | $ | – | $ | – | $(102,075 | ) | $ | – | |||||||||||
| (a) | Collateral disclosed is limited to an amount not to exceed 100% of the net amount of assets presented in the Statement of Assets and Liabilities, for each respective counterparty. |
| (b) | Net amount represents the amount owed to the Fund by the counterparty as of December 31, 2018. |
25
Notes to Financial Statements (continued)
| 8. | DIRECTORS’ REMUNERATION |
The Company’s officers and one Director, who are associated with Lord Abbett, do not receive any compensation from the Company for serving in such capacities. Independent Directors’ fees are allocated among all Lord Abbett-sponsored funds based on the net assets of each fund. There is an equity-based plan available to all Independent Directors under which Independent Directors must defer receipt of a portion of, and may elect to defer receipt of an additional portion of Directors’ fees. The deferred amounts are treated as though equivalent dollar amounts had been invested in the funds. Such amounts and earnings accrued thereon are included in Directors’ fees on the Statement of Operations and in Directors’ fees payable on the Statement of Assets and Liabilities and are not deductible for U.S. federal income tax purposes until such amounts are paid.
| 9. | EXPENSE REDUCTIONS |
The Company has entered into an arrangement with its transfer agent and custodian, whereby credits realized as a result of uninvested cash balances are used to reduce a portion of the Fund’s expenses.
| 10. | LINE OF CREDIT |
During the period ended August 8, 2018, the Fund and certain other funds managed by Lord Abbett (collectively, the “Participating Funds”) participated in a syndicated line of credit facility with various lenders for $600 million (the “Facility”), whereas State Street Bank and Trust Company (“SSB”) participates as a lender and as agent for the lenders. The Facility is to be used for temporary or emergency purposes as an additional source of liquidity to satisfy redemptions. The Participating Funds are subject to graduated borrowing limits of one-third of Fund assets (if Fund assets are less than $750 million), $250 million, $300 million, or $350 million, based on past borrowings and likelihood of future borrowings. During the period ended August 8, 2018, the Fund did not utilize the Facility.
For the period August 9, 2018 through December 20, 2018, the Participating Funds entered into an amended syndicated line of credit facility with various lenders for $1.06 billion (the “Syndicated Facility”), whereas SSB participates as a lender and as agent for the lenders. Under the Syndicated Facility, the Participating Funds are subject to graduated borrowing limits of one-third of Fund assets (if Fund assets are less than $750 million), $250 million, $300 million, $350 million, or $1 billion, based on past borrowings and likelihood of future borrowings. Effective December 21, 2018, the Participating Funds entered into an amended Syndicated Facility with various lenders for $1.1 billion based on the same terms as described above.
Effective August 9, 2018, the Participating Funds entered into an additional line of credit facility with SSB for $250 million (the “Bilateral Facility,” and together with the Syndicated Facility, the “Facilities”). Under the Bilateral Facility, each Participating Fund may borrow up to the lesser of $250 million or one-third of Fund assets. The Facilities are to be used for temporary or emergency purposes to satisfy redemption requests and manage liquidity.
For the period from August 9, 2018 through December 31, 2018, the Fund did not utilize the Facilities.
| 11. | INTERFUND LENDING PROGRAM |
Pursuant to an exemptive order issued by the U.S. Securities and Exchange Commission (“SEC exemptive order”), certain registered open-end management investment companies managed by Lord Abbett, including the Fund, participate in a joint lending and borrowing program (the “Interfund
26
Notes to Financial Statements (concluded)
Lending Program”). The SEC exemptive order allows the Funds to borrow money from and lend money to each other for temporary or emergency purposes subject to the limitations and conditions.
During the fiscal year ended December 31, 2018, the Fund did not participate as a borrower or lender in the Interfund Lending Program.
| 12. | CUSTODIAN AND ACCOUNTING AGENT |
SSB is the Company’s custodian and accounting agent. SSB performs custodial, accounting and recordkeeping functions relating to portfolio transactions and calculating the Fund’s NAV.
| 13. | INVESTMENT RISKS |
The Fund is subject to the general risks and considerations associated with equity investing. These include the risks of investing in equity markets in foreign countries, the risk of investing in derivatives, liquidity risk, and the risks from leverage. The value of an investment will fluctuate in response to movements in the stock market in general, and to the changing prospects of individual companies in which the Fund invests. The Fund is subject to the risks of investing in foreign securities and in the securities of small companies. Foreign securities may pose greater risks than domestic securities, including greater price fluctuations and higher transaction costs. The securities of foreign companies also may be subject to inadequate exchange control regulations, the imposition of economic sanctions or other government restrictions, higher transaction and other costs, and delays in settlement to the extent they are traded on non-U.S. exchanges or markets. Foreign investments also may be affected by changes in currency rates or currency controls. These risks are generally greater for securities issued by companies in emerging market countries. Investing in small companies generally involves greater risks than investing in the stocks of larger companies, including more volatility and less liquidity.
The Fund is also subject to the risks associated with derivatives, which may be different from and greater than the risks associated with investing directly in securities and other instruments. Derivatives may be subject to risks such as liquidity risk, leveraging risk, interest rate risk, market risk, and credit risk. Illiquid securities may lower the Fund’s returns since the Fund may be unable to sell these securities at their desired time or price. Derivatives also may involve the risk of mispricing or improper valuation and the risk that changes in the value of the derivative may not correlate perfectly with the value of the underlying asset, rate or index. Whether the Fund’s use of derivatives is successful will depend on, among other things, the Fund’s ability to correctly forecast market movements, changes in foreign exchange and interest rates, and other factors. If the Fund incorrectly forecasts these and other factors, its performance could suffer. The Fund’s use of derivatives could result in a loss exceeding the amount of the Fund’s investment in these instruments.
These factors can affect the Fund’s performance.
| 14. | SUMMARY OF CAPITAL TRANSACTIONS |
Transactions in shares of capital stock were as follows:
| Year Ended December 31, 2018 | Year Ended December 31, 2017 | |||||||
| Shares sold | 1,302,475 | 2,634,183 | ||||||
| Reinvestment of distributions | 924,425 | 523,558 | ||||||
| Shares reacquired | (1,766,094 | ) | (2,932,383 | ) | ||||
| Increase | 460,806 | 225,358 | ||||||
27
Notes to Financial Statements (concluded)
| 15. | SUBSEQUENT EVENT |
On January 29, 2019, the Board of Directors of the Company approved a plan of liquidation (the “Plan”) pursuant to which the Fund will be liquidated and dissolved. It is anticipated that the liquidation and dissolution of the Fund will be completed on or about August 1, 2019 (the Liquidation Date”). Any Fund shares outstanding on the Liquidation Date will be automatically redeemed on the Liquidation Date. The proceeds of any such redemption will be equal to the net asset value (“NAV”) of such shares after dividend distributions required to eliminate any Fund-level taxes are made and the Fund’s expenses and liabilities have been paid or otherwise provided for as directed by the Plan.
At any time before the Liquidation Date, shareholders may redeem their Fund shares at the NAV of such shares pursuant to the procedures set forth under “Purchases and Redemptions” in the prospectus. As stated in the prospectus, Fund shares are not offered directly to the public. Rather, Fund shares are offered only to separate accounts of certain insurance companies. Variable contract owners may not purchase or redeem Fund shares directly and should contact their insurance company for information on how the liquidation of the Fund will impact them.
28
Report of Independent Registered Public Accounting Firm
To the shareholders and the Board of Directors of Lord Abbett Series Fund, Inc.:
Opinion on the Financial Statements and Financial Highlights
We have audited the accompanying statement of assets and liabilities, including the schedule of investments, of the International Opportunities Portfolio, one of the portfolios constituting the Lord Abbett Series Fund, Inc. (the “Fund”), as of December 31, 2018, the related statement of operations for the year then ended, the statements of changes in net assets for each of the two years in the period then ended, the financial highlights for each of the five years in the period then ended, and the related notes. In our opinion, the financial statements and financial highlights present fairly, in all material respects, the financial position of the International Opportunities Portfolio of the Fund as of December 31, 2018, and the results of its operations for the year then ended, the changes in its net assets for each of the two years in the period then ended, and the financial highlights for each of the five years in the period then ended in conformity with accounting principles generally accepted in the United States of America.
Basis for Opinion
These financial statements and financial highlights are the responsibility of the Fund’s management. Our responsibility is to express an opinion on the Fund’s financial statements and financial highlights based on our audits. We are a public accounting firm registered with the Public Company Accounting Oversight Board (United States) (PCAOB) and are required to be independent with respect to the Fund in accordance with the U.S. federal securities laws and the applicable rules and regulations of the Securities and Exchange Commission and the PCAOB.
We conducted our audits in accordance with the standards of the PCAOB. Those standards require that we plan and perform the audit to obtain reasonable assurance about whether the financial statements and financial highlights are free of material misstatement, whether due to error or fraud. The Fund is not required to have, nor were we engaged to perform, an audit of its internal control over financial reporting. As part of our audits we are required to obtain an understanding of internal control over financial reporting but not for the purpose of expressing an opinion on the effectiveness of the Fund’s internal control over financial reporting. Accordingly, we express no such opinion.
Our audits included performing procedures to assess the risks of material misstatement of the financial statements and financial highlights, whether due to error or fraud, and performing procedures that respond to those risks. Such procedures included examining, on a test basis, evidence regarding the amounts and disclosures in the financial statements and financial highlights. Our audits also included evaluating the accounting principles used and significant estimates made by management, as well as evaluating the overall presentation of the financial statements and financial highlights. Our procedures included confirmation of securities owned as of December 31, 2018, by correspondence with the custodian and brokers. We believe that our audits provide a reasonable basis for our opinion.
DELOITTE & TOUCHE LLP
New York, New York
February 15, 2019
We have served as the auditor of one or more Lord Abbett Family of Funds’ investment companies since 1932.
29
Basic Information About Management
The Board is responsible for the management of the business and affairs of the Company in accordance with the laws of the State of Maryland. The Board elects officers who are responsible for the day-to-day operations of the Fund and who execute policies authorized by the Board. The Board also approves an investment adviser to the Fund and continues to monitor the cost and quality of the services the investment adviser provides, and annually considers whether to renew the contract with the adviser. Generally, each Director holds office until his/her successor is elected and qualified or until his/her earlier resignation or removal, as provided in the Company’s organizational documents.
Lord Abbett, a Delaware limited liability company, is the Fund’s investment adviser. Designated Lord Abbett personnel are responsible for the day-to-day management of the Fund.
Interested Directors
Mr. Sieg is affiliated with Lord Abbett and is an “interested person” of the Company as defined in the Act. Mr. Sieg is director/trustee of each of the 13 investment companies in the Lord Abbett Family of Funds, which consist of 62 portfolios or series. Mr. Sieg is an officer of the Lord Abbett Family of Funds.
| Name, Address and Year of Birth | Current Position and Length of Service with the Company | Principal Occupation and Other Directorships During the Past Five Years | ||
| Douglas B. Sieg Lord, Abbett & Co. LLC 90 Hudson Street Jersey City, NJ 07302 (1969) | Director since 2016; President and Chief Executive Officer since 2018 | Principal Occupation:Managing Partner (since 2018) and was formerly Head of Client Services, joined Lord Abbett in 1994. Other Directorships:None. |
Independent Directors
The following Independent Directors also are directors/trustees of each of the 13 investment companies in the Lord Abbett Family of Funds, which consist of 62 portfolios or series.
| Name, Address and Year of Birth | Current Position and Length of Service with the Company | Principal Occupation and Other Directorships During the Past Five Years | ||
| Eric C. Fast Lord, Abbett & Co. LLC c/o Legal Dept. 90 Hudson Street Jersey City, NJ 07302 (1949) | Director since 2014 | Principal Occupation:Chief Executive Officer of Crane Co., an industrial products company (2001–2014) Other Directorships:Currently serves as director of Automatic Data Processing, Inc. (since 2007) and Regions Financial Corporation (since 2010). Previously served as a director of Crane Co. (1999–2014). | ||
| Evelyn E. Guernsey Lord, Abbett & Co. LLC c/o Legal Dept. 90 Hudson Street Jersey City, NJ 07302 (1955) | Director since 2011 | Principal Occupation:CEO, Americas of J.P. Morgan Asset Management (2004–2010). Other Directorships:None. |
30
Basic Information About Management (continued)
| Name, Address and Year of Birth | Current Position and Length of Service with the Company | Principal Occupation and Other Directorships During the Past Five Years | ||
| Julie A. Hill Lord, Abbett & Co. LLC c/o Legal Dept. 90 Hudson Street Jersey City, NJ 07302 (1946) | Director since 2004 | Principal Occupation:Owner and CEO of The Hill Company, a business consulting firm (since 1998). Other Directorships:Currently serves as director of Anthem, Inc., a health benefits company (since 1994). | ||
| Kathleen M. Lutito Lord, Abbett & Co. LLC c/o Legal Dept. 90 Hudson Street Jersey City, NJ 07302 (1963) | Director since 2017 | Principal Occupation:President and Chief Investment Officer of CenturyLink Investment Management Company (since 2006). Other Directorships:None | ||
| James M. McTaggart Lord, Abbett & Co. LLC c/o Legal Dept. 90 Hudson Street Jersey City, NJ 07302 (1947) | Director since 2012 | Principal Occupation:Independent management advisor and consultant (since 2012); Vice President, CRA International, Inc. (doing business as Charles River Associates), a global management consulting firm (2009–2012); Founder and Chairman of Marakon Associates, Inc., a strategy consulting firm (1978–2009); and Officer and Director of Trinsum Group, a holding company (2007–2009). Other Directorships:Blyth, Inc., a home products company (2004–2015). | ||
| Karla M. Rabusch Lord, Abbett & Co. LLC c/o Legal Dept. 90 Hudson Street Jersey City, NJ 07302 (1959) | Director since 2017 | Principal Occupation:President and Director of Wells Fargo Funds Management, LLC (2003–2017); President of Wells Fargo Funds (2003–2016). Other Directorships:None. | ||
| Mark A. Schmid Lord, Abbett & Co. LLC c/o Legal Dept. 90 Hudson Street Jersey City, NJ 07302 (1959) | Director since 2016 | Principal Occupation:Vice President and Chief Investment Officer of the University of Chicago (since 2009). Other Directorships:None. | ||
| James L.L. Tullis Lord, Abbett & Co. LLC c/o Legal Dept. 90 Hudson Street Jersey City, NJ 07302 (1947) | Director since 2006; Chairman since 2017 | Principal Occupation:CEO of Tullis-Dickerson and Co. Inc., a venture capital management firm (since 1990); CEO of Tullis Health Investors Inc. (since 2012). Other Directorships:Currently serves as director of Crane Co. (since 1998). |
Officers
None of the officers listed below have received compensation from the Company. All of the officers of the Company also may be officers of the other Lord Abbett Funds and maintain offices at 90 Hudson Street, Jersey City, NJ 07302. Unless otherwise indicated, the position(s) and title(s) listed under the “Principal Occupation During the Past Five Years” column indicate each officer’s position(s) and title(s) with Lord Abbett. Each officer serves for an indefinite term (i.e., until his or her death, resignation, retirement, or removal).
31
Basic Information About Management (continued)
| Name and Year of Birth | Current Position with the Company | Length of Service of Current Position | Principal Occupation During the Past Five Years | |||
| Douglas B. Sieg (1969) | President and Chief Executive Officer | Elected as President and Chief Executive Officer in 2018 | Managing Partner of Lord Abbett (since 2018) and was formerly Head of Client Services, joined Lord Abbett in 1994. | |||
| Jeff D. Diamond (1960) | Executive Vice President | Elected in 2008 | Portfolio Manager, joined Lord Abbett in 2007. | |||
| Todd D. Jacobson (1966) | Executive Vice President | Elected in 2005 | Partner and Associate Director, joined Lord Abbett in 2003. | |||
| Robert A. Lee (1969) | Executive Vice President | Elected in 2010 | Partner and Chief Investment Officer, and was formerly Deputy Chief Investment Officer and Director of Taxable Fixed Income, joined Lord Abbett in 1997. | |||
| David J. Linsen (1974) | Executive Vice President | Elected in 2008 | Partner and Director of Equities, joined Lord Abbett in 2001. | |||
| Vincent J. McBride (1964) | Executive Vice President | Elected in 2010 | Partner and Director, joined Lord Abbett in 2003. | |||
| Andrew H. O’Brien (1973) | Executive Vice President | Elected in 2010 | Partner and Portfolio Manager, joined Lord Abbett in 1998. | |||
| F. Thomas O’Halloran (1955) | Executive Vice President | Elected in 2010 | Partner and Portfolio Manager, joined Lord Abbett in 2001. | |||
| Marc Pavese (1972) | Executive Vice President | Elected in 2016 | Partner and Portfolio Manager, joined Lord Abbett in 2008. | |||
| Walter H. Prahl (1958) | Executive Vice President | Elected in 2012 | Partner and Director, joined Lord Abbett in 1997. | |||
| Eli Rabinowich (1975) | Executive Vice President | Elected in 2018 | Portfolio Manager, joined Lord Abbett in 2018 and was formerly a Portfolio Manager, Partner, and Analyst at Pzena Investment Management from (2004–2018). |
32
Basic Information About Management (continued)
| Name and Year of Birth | Current Position with the Company | Length of Service of Current Position | Principal Occupation During the Past Five Years | |||
| Jeffrey Rabinowitz (1972) | Executive Vice President | Elected in 2017 | Portfolio Manager, joined Lord Abbett in 2017 and was formerly Managing Director and Portfolio Manager/Technology Analyst at Jennison Associates LLC (2014–2017) and Managing Director and Portfolio Manager/Technology Analyst for U.S. Growth Equity at Goldman Sachs Asset Management (1999–2014). | |||
| Steven F. Rocco (1979) | Executive Vice President | Elected in 2014 | Partner and Director of Taxable Fixed Income, joined Lord Abbett in 2004. | |||
| A. Edward Allinson (1961) | Vice President | Elected in 2011 | Portfolio Manager, joined Lord Abbett in 2005. | |||
| Vernon T. Bice (1974) | Vice President | Elected in 2011 | Portfolio Manager, joined Lord Abbett in 2011. | |||
| Pamela P. Chen (1978) | Vice President, Assistant Secretary and Privacy Officer | Elected in 2018 | Associate General Counsel, joined Lord Abbett in 2017 and was formerly Special Counsel at Schulte, Roth & Zabel LLP (2005–2017). | |||
| Robert S. Clark (1975) | Vice President | Elected in 2018 | Portfolio Manager, joined Lord Abbett in 2010. | |||
| Matthew R. DeCicco (1977) | Vice President | Elected in 2003 | Managing Director and Portfolio Manager, joined Lord Abbett in 1999. | |||
| John T. Fitzgerald (1975) | Vice President and Assistant Secretary | Elected in 2018 | Deputy General Counsel, joined Lord Abbett in 2018 and was formerly Deputy Head of U.S. Funds Legal, Executive Director and Assistant General Counsel at JPMorgan Chase (2005–2018). | |||
| Christopher J. Gizzo (1986) | Vice President | Elected in 2018 | Managing Director and Portfolio Manager, joined Lord Abbett in 2008. | |||
| Bernard J. Grzelak (1971) | Chief Financial Officer and Vice President | Elected in 2017 | Partner, Chief Operating Officer, Global Funds and Risk, joined Lord Abbett in 2003. |
33
Basic Information About Management (concluded)
| Name and Year of Birth | Current Position with the Company | Length of Service of Current Position | Principal Occupation During the Past Five Years | |||
| Linda Y. Kim (1980) | Vice President and Assistant Secretary | Elected in 2016 | Counsel, joined Lord Abbett in 2015 and was formerly an Associate at Stroock & Stroock & Lavan LLP (2007–2015). | |||
| So Young Lee (1971) | Vice President | Elected in 2018 | Portfolio Manager, joined Lord Abbett in 2013. | |||
| Joseph M. McGill (1962) | Chief Compliance Officer | Elected in 2014 | Partner and Chief Compliance Officer, joined Lord Abbett in 2014 and was formerly Managing Director and the Chief Compliance Officer at UBS Global Asset Management (2003–2013). | |||
| A. Edward Oberhaus, III (1959) | Vice President | Elected in 1998 | Partner and Director, joined Lord Abbett in 1983. | |||
| Amanda S. Ryan (1978) | Vice President and Assistant Secretary | Elected in 2018 | Counsel, joined Lord Abbett In 2016 and was formerly a Director and Corporate Counsel at PGIM Investments (2012–2016). | |||
| Lawrence B. Stoller (1963) | Vice President, Secretary and Chief Legal Officer | Elected in 2007 | Partner and General Counsel, joined Lord Abbett in 2007. | |||
| Leah G. Traub (1979) | Vice President | Elected in 2016 | Partner and Portfolio Manager, joined Lord Abbett in 2007. | |||
| Kewjin Yuoh (1971) | Vice President | Elected in 2012 | Partner and Portfolio Manager, joined Lord Abbett in 2010. | |||
| Jackson C. Chan (1964) | AML Compliance Officer | Elected in 2018 | Deputy Chief Compliance Officer and Director of Regulatory Affairs, joined Lord Abbett in 2014 and was formerly Director at UBS Global Asset Management (2005–2014). | |||
| Vito A. Fronda (1969) | Treasurer | Elected in 2018 | Partner and Director of Taxation, joined Lord Abbett in 2003. |
Please call 888-522-2388 for a copy of the statement of additional information, which contains further information about the Company’s Directors. It is available free upon request.
34
Approval of Advisory Contract
The Board, including all of the Directors who are not “interested persons” of the Company or of Lord Abbett, as defined in the Investment Company Act of 1940, as amended (the “Independent Directors”), annually considers whether to approve the continuation of the existing management agreement between the Fund and Lord Abbett (the “Agreement”). In connection with its most recent approval, the Board reviewed materials relating specifically to the Agreement, as well as numerous materials received throughout the course of the year, including information about the Fund’s investment performance compared to the performance of its benchmark. Before making its decision as to the Fund, the Board had the opportunity to ask questions and request further information, taking into account its knowledge of Lord Abbett gained through its meetings and discussions. These meetings and discussions included reviews of Fund performance conducted by members of the Contract Committee, the deliberations of the Contract Committee, and discussions between the Contract Committee and Lord Abbett’s management. The Independent Directors also met with their independent legal counsel in various private sessions at which no representatives of management were present.
The materials received by the Board included, but were not limited to: (1) information provided by Broadridge Financial Solutions (“Broadridge”) regarding the investment performance of the Fund compared to the investment performance of certain funds with similar investment styles as determined by Broadridge, based, in part, on the Fund’s Morningstar category (the “performance peer group”), and the investment performance of the Fund’s benchmark; (2) information provided by Broadridge regarding the expense ratios, contractual and actual management fee rates, and other expense components for the Fund and certain funds in the same Morningstar category, with generally the same or similar share classes and operational characteristics, including asset size (the “expense peer group”); (3) certain supplemental investment performance information provided by Lord Abbett; (4) information provided by Lord Abbett on the expense ratios, management fee rates, and other expense components for the Fund; (5) sales and redemption information for the Fund; (6) information regarding Lord Abbett’s financial condition; (7) an analysis of the relative profitability of the Agreement to Lord Abbett; (8) information provided by Lord Abbett regarding the investment management fee schedules for Lord Abbett’s other advisory clients maintaining accounts with a similar investment strategy as the Fund; and (9) information regarding the personnel and other resources devoted by Lord Abbett to managing the Fund.
Investment Management and Related Services Generally.The Board considered the services provided by Lord Abbett to the Fund, including investment research, portfolio management, and trading, and Lord Abbett’s commitment to compliance with all applicable legal requirements. The Board also observed that Lord Abbett was solely engaged in the investment management business and accordingly did not experience the conflicts of interest that may result from being engaged in other lines of business. The Board considered the investment advisory services provided by Lord Abbett to other clients, the fees charged for the services, and the differences in the nature of the services provided to the Fund and other Lord Abbett Funds, on the one hand, and the services provided to other clients, on the other. After reviewing these and related factors, the Board concluded that the Fund was likely to continue to benefit from the nature, extent and quality of the investment services provided by Lord Abbett under the Agreement.
Investment Performance.The Board reviewed the Fund’s investment performance in relation to that of the performance peer group and the Fund’s benchmark as of various periods ended August 31, 2018. The Board observed that the Fund’s investment performance was below the median of the performance peer group for the one-, three-, five-, and ten-year periods and took
35
Approval of Advisory Contract (continued)
into account actions taken by Lord Abbett to attempt to improve equity fund performance. The Board further considered Lord Abbett’s performance and reputation generally, the performance of other Lord Abbett-managed funds overseen by the Board, and the willingness of Lord Abbett to take steps intended to improve performance when appropriate. After reviewing these and related factors, the Board concluded that the Fund’s Agreement should be continued.
Lord Abbett’s Personnel and Methods.The Board considered the qualifications of the personnel providing investment management services to the Fund, in light of its investment objective and discipline, and other services provided to the Fund by Lord Abbett. Among other things, the Board considered the size, experience, and turnover of Lord Abbett’s staff, Lord Abbett’s investment methodology and philosophy, and Lord Abbett’s approach to recruiting, training, and retaining personnel.
Nature and Quality of Other Services.The Board considered the nature, quality, and extent of compliance, administrative, and other services performed by Lord Abbett and the nature and extent of Lord Abbett’s supervision of third party service providers, including the Fund’s transfer agent and custodian.
Expenses.The Board considered the expense level of the Fund, including the contractual and actual management fee rates, and the expense levels of the Fund’s expense peer group. It also considered how the expense level of the Fund related to those of the expense peer group and the amount and nature of the fees paid by shareholders. The Board observed that the net total expense ratio of the Fund was below the median of the expense peer group. After reviewing these and related factors, the Board concluded, within the context of its overall approval of the Agreement, that the expense level of the Fund was reasonable and supported the continuation of the Agreement.
Profitability.The Board considered the level of Lord Abbett’s operating margin in managing the Fund, including a review of Lord Abbett’s methodology for allocating its costs to its management of the Fund. It considered whether the Fund was profitable to Lord Abbett in connection with the Fund’s operation, including the fee that Lord Abbett receives from the Fund for providing administrative services to the Fund. The Board also considered the profits realized from other business segments of Lord Abbett, which may benefit from or be related to the Fund’s business. The Board considered Lord Abbett’s profit margins excluding Lord Abbett’s marketing and distribution expenses. The Board also considered Lord Abbett’s profit margins, without those exclusions, in comparison with available industry data and how those profit margins could affect Lord Abbett’s ability to recruit and retain personnel. The Board recognized that Lord Abbett’s overall profitability was a factor in enabling it to attract and retain qualified personnel to provide services to the Fund. After reviewing these and related factors, the Board concluded, within the context of its overall approval of the Agreement, that Lord Abbett’s profitability with respect to the Fund was not excessive.
Economies of Scale.The Board considered the extent to which there had been economies of scale in managing the Fund, whether the Fund’s shareholders had appropriately benefited from such economies of scale, and whether there was potential for realization of any further economies of scale. The Board concluded that the existing management fee schedule, with its breakpoints in the level of the management fee, adequately addressed any economies of scale in managing the Fund.
Other Benefits to Lord Abbett.The Board considered the amount and nature of the fees paid by the Fund and the Fund’s shareholders to Lord Abbett for services other than investment advisory services, such as the fee that Lord Abbett receives from the Fund for providing administrative services to the Fund. The Board also considered the revenues and profitability of Lord Abbett’s
36
Approval of Advisory Contract (concluded)
investment advisory business apart from its mutual fund business, and the intangible benefits enjoyed by Lord Abbett by virtue of its relationship with the Fund. The Board observed that the Distributor receives 12b-1 fees from certain of the Lord Abbett Funds as to shares held in accounts for which there is no other broker of record, may retain a portion of the 12b-1 fees it receives, and receives a portion of the sales charges on sales and redemptions of some classes of shares of the Lord Abbett Funds. In addition, the Board observed that Lord Abbett accrues certain benefits for its business of providing investment advice to clients other than the Lord Abbett Funds, but that business also benefits the Funds. The Board also noted that Lord Abbett, as disclosed in the prospectus of the Fund, has entered into revenue sharing arrangements with certain entities that distribute shares of the Lord Abbett Funds. The Board also took into consideration the investment research that Lord Abbett receives as a result of client brokerage transactions.
Alternative Arrangements.The Board considered whether, instead of approving continuation of the Agreement, it might be in the best interests of the Fund to implement one or more alternative arrangements, such as continuing to employ Lord Abbett, but on different terms. After considering all of the relevant factors, the Board unanimously found that continuation of the Agreement was in the best interests of the Fund and its shareholders and voted unanimously to approve the continuation of the Agreement. In considering whether to approve the continuation of the Agreement, the Board did not identify any single factor as paramount or controlling. Individual Directors may have evaluated the information presented differently from one another, giving different weights to various factors. This summary does not discuss in detail all matters considered.
37
Householding
The Company has adopted a policy that allows it to send only one copy of the Fund’s prospectus, proxy material, annual report and semiannual report to certain shareholders residing at the same “household.” This reduces Fund expenses, which benefits you and other shareholders. If you need additional copies or do not want your mailings to be “householded,” please call Lord Abbett at 888-522-2388 or send a written request with your name, the name of your fund or funds and your account number or numbers to Lord Abbett Family of Funds, P.O. Box 219336, Kansas City, MO 64121.
Proxy Voting Policies, Procedures and Records
A description of the policies and procedures that Lord Abbett uses to vote proxies related to the Fund’s portfolio securities, and information on how Lord Abbett voted the Fund’s proxies during the 12-month period ended June 30 are available without charge, upon request, (i) by calling 888-522-2388; (ii) on Lord Abbett’s Website at www.lordabbett.com; and (iii) on the Securities and Exchange Commission’s (“SEC”) Website at www.sec.gov.
Shareholder Reports and Quarterly Portfolio Disclosure
The Fund is required to file its complete schedule of portfolio holdings with the SEC for its first and third fiscal quarters on Form N-Q. Copies of the filings are available without charge, upon request on the SEC’s Website at www.sec.gov and may be available by calling Lord Abbett at 888-522-2388.
Tax Information
Of the distribution paid to the shareholders during the fiscal year ended December 31, 2018, $744,079 and $5,125,189 respectively, represent short-term capital gains and long-term capital gains.
The Fund intends to pass through foreign source income of $1,157,254 and foreign taxes of $144,261.
|
38
![]()

| This report, when not used for the general information of shareholders of the Fund, is to be distributed only if preceded or accompanied by a current fund prospectus. | |||
| Lord Abbett Series Fund, Inc. | |||
| Lord Abbett mutual fund shares are distributed by LORD ABBETT DISTRIBUTOR LLC. |
International Opportunities Portfolio | SFIO-PORT-3 (02/19) |
![]()
LORD ABBETT
ANNUAL REPORT
Lord Abbett
Series Fund—Mid Cap Stock Portfolio
For the fiscal year ended December 31, 2018
Table of Contents
Lord Abbett Series Fund — Mid Cap Stock Portfolio
Annual Report
For the fiscal year ended December 31, 2018

From left to right: James L.L. Tullis, Independent Chairman of the Lord Abbett Funds and Douglas B. Sieg, Director, President, and Chief Executive Officer of the Lord Abbett Funds.
Dear Shareholders:We are pleased to provide you with this overview of the performance of Lord Abbett Series Fund – Mid Cap Stock Portfolio for the fiscal year ended December 31, 2018. On this page and the following pages, we discuss the major factors that influenced fiscal year performance. For additional information about the Fund, please visit our website at www.lordabbett.com, where you also can access the quarterly commentaries that provide updates on the Fund’s performance and other portfolio related updates.
Thank you for investing in Lord Abbett mutual funds. We value the trust that you place in us and look forward to serving your investment needs in the years to come.
Best regards,

Douglas B. Sieg
Director, President and Chief Executive Officer
For the fiscal year ended December 31, 2018, the Fund returned –15.04%, reflecting performance at the net asset value (NAV) of Class VC shares with all distributions reinvested, compared to its benchmark, the Russell MidCap® Value Index1, which returned –12.29% over the same period.
Domestic equity returns were negative over the past year, with large cap stocks, as represented by the S&P 500® Index2, falling –4.38% during the period, while small cap stocks, as represented by the Russell 2000® Index3, were down -11.01%.
During the period, there were several market-moving events. Notably, Congress passed the largest rewrite of the U.S. tax code in decades, which went into effect in January 2018. The tax bill reduced the corporate tax rate from 35% to 21% and allowed for a one-time repatriation tax of 15.5%, rather than the standard repatriation tax rate of 35%. In June 2018, the White House announced its intent to impose additional tariffs on $200 billion worth of Chinese goods on top of the $50 billion previously announced. The aggressive U.S. trade posture continued
1
into the third quarter with trade tensions mounting between the U.S. and China. In December, the White House announced a trade truce between the U.S. and China following a meeting between President Trump and President Xi Jinping at the G20 summit. The U.S. agreed to maintain a 10% tariff rate on $200 billion worth of Chinese imports at the start of 2019 as opposed to the originally planned 25% tariff rate. In return, China agreed to purchase a substantial amount of U.S. agriculture, industrial, and energy products to further reduce the trade imbalance. While the impact has yet to fully be realized, many corporations anticipate that the retaliatory tariffs will weigh on profits. Trade discussions between Mexico, Canada, and the U.S., however, took a more favorable turn as the negotiations resulted in a revised version of the North American Free Trade Agreement (NAFTA) called the U.S.-Mexico-Canada Agreement. In March 2018, the Federal Reserve (the “Fed”) raised its target for short-term interest rates by 0.25%, to a range of 1.50% – 1.75%, and followed with rate hikes of 0.25% at each of its June, September, and December meetings, raising the target range to 2.25% – 2.50%. Amid rising concerns surrounding escalating trade tensions, slowing global growth, and increasing interest rates, the Nasdaq experienced the largest monthly drop since 2008 in October 2018. Following the prior month’s volatility, domestic equity markets rallied in November and partially reversed October’s
losses, however the S&P 500® returned to negative territory in December, posting its worst month since February 2009.
Stock selection within the information technology and industrials sectors detracted from relative performance over the period. Within the information technology sector, the Fund’s holding of Flex Ltd., a supply chain insight and logistics provider, was one of the top detractors. Shares of the firm sold off following the downward revision to guidance, news of the CEO’s retirement, and announcement that the firm planned to exit its relationship with Nike. The Fund’s holding of Conduent, Inc., a business process services provider, also detracted from relative performance. Shares of Conduent pulled back following an earnings guidance reduction on the third quarter earnings call. However, we do not believe the company is facing structural issues and anticipate that the new business wins already in the pipeline will lead to positive revenue growth. Additionally, within the industrials sector, ADT Inc., a monitored security provider, detracted from relative performance. Shares of ADT came under pressure after the company’s IPO as investors grew wary of intensifying competition from both existing and new firms, such as Ring and SimpliSafe.
Conversely, stock selection within the financials and utilities sectors contributed positively to relative performance during the period. Within the financials sector, Argo Group International Holdings, Ltd., a
2
specialty property and casualty insurance company, was a top contributor to relative performance. Shares of Argo Group International rose as the firm continued to lower risk through portfolio remixing and cost cuts. The Fund’s position in RenaissanceRe Holdings Ltd., a reinsurance and insurance coverage provider, was another top contributor to relative performance. The company benefited from the recent acquisition of Tokio Marine Holdings, Inc.’s reinsurance platform, which the market likely believes to be income accretive going forward. Within
the utilities sector, FirstEnergy Corp., an energy generation, transmission, and distribution company, contributed the most to relative performance. Shares of FirstEnergy rose throughout the year after the firm received an equity investment totaling $2.5 billion from a group of prominent investors.
The Fund’s portfolio is actively managed and, therefore, its holdings and the weightings of a particular issuer or particular sector as a percentage of portfolio assets are subject to change. Sectors may include many industries.
1 The Russell Midcap® Value Index measures the performance of those Russell Midcap companies with lower price-to-book ratios and lower forecasted growth values. The stocks are also members of the Russell 1000® Value index.
2 The S&P 500® Index is widely regarded as the standard for measuring large cap U.S. stock market performance and includes a representative sample of leading companies in leading industries.
3 The Russell 2000® Index measures the performance of the 2,000 smallest companies in the Russell 3000® Index, which represents approximately 10% of the total market capitalization of the Russell 3000® Index.
Unless otherwise specified, indexes reflect total return, with all dividends reinvested. Indexes are unmanaged, do not reflect the deduction of fees or expenses, and are not available for direct investment.
Important Performance and Other Information
Performance data quoted in the following pages reflect past performance and are no guarantee of future results. Current performance may be higher or lower than the performance quoted. The investment return and principal value of an investment in the Fund will fluctuate so that shares, on any given day or when redeemed, may be worth more or less than their original cost. You can obtain performance data current to the most recent month end by calling Lord Abbett at 888-522-2388 or referring to www.lordabbett.com.
The annual commentary above discusses the views of the Fund’s management and various portfolio holdings of the Fund as of December 31, 2018. These views and portfolio holdings may have changed after this date. Information provided in the commentary is not a recommendation to buy or sell securities. Because the Fund’s portfolio is actively managed and may change significantly, the Fund may no longer own the securities described above or may have otherwise changed its position in the securities. For more recent information about the Fund’s portfolio holdings, please visit www.lordabbett.com.
A Note about Risk:See Notes to Financial Statements for a discussion of investment risks. For a more detailed discussion of the risks associated with the Fund, please see the Fund’s prospectus.
Mutual funds are not insured by the FDIC, are not deposits or other obligations of, or guaranteed by, banks, and are subject to investment risks including possible loss of principal amount invested.
The Fund serves as an underlying investment vehicle for variable annuity contracts and variable life insurance policies.
3
Below is a comparison of a $10,000 investment in Class VC shares with the same investment in both the Russell Midcap® Value Index and the S&P MidCap 400® Value Index assuming reinvestment of all dividends and distributions. The Fund’s shares are sold only to insurance company separate accounts that fund certain variable annuity and variable life contracts. This line graph comparison does not reflect the sales charges or other expenses of these contracts. If those sales charges and expenses were reflected, returns would be lower. The graph and performance table below do not reflect the deduction of taxes that a shareholder would pay on Fund distributions or the redemption of Fund shares.Past performance is no guarantee of future results.

| Average Annual Total Returns for the | |||||||
| Periods Ended December 31, 2018 | |||||||
| 1 Year | 5 Years | 10 Years | |||||
| Class VC | –15.04% | 2.54% | 9.94% | ||||
1 Performance for each unmanaged index does not reflect any fees or expenses. The performance of each index is not necessarily representative of the Fund’s performance.
4
As a shareholder of the Fund, you incur ongoing costs, including management fees; expenses related to the Fund’s services arrangements with certain insurance companies; and other Fund expenses. This Example is intended to help you understand your ongoing costs (in dollars) of investing in the Fund and to compare these costs with the ongoing costs of investing in other mutual funds.
The Example is based on an investment of $1,000 invested at the beginning of the period and held for the entire period (July 1, 2018 through December 31, 2018).
The Example reflects only expenses that are deducted from the assets of the Fund. Fees and expenses, including sales charges applicable to the various insurance products that invest in the Fund, are not reflected in this Example. If such fees and expenses were reflected in the Example, the total expenses shown would be higher. Fees and expenses regarding such variable insurance products are separately described in the prospectus related to those products.
Actual Expenses
The first line of the table on the following page provides information about actual account values and actual expenses. You may use the information in this line, together with the amount you invested, to estimate the expenses that you paid over the period. Simply divide your account value by $1,000 (for example, an $8,600 account value divided by $1,000 = 8.6), then multiply the result by the number in the first line under the heading titled “Expenses Paid During Period 7/1/18 – 12/31/18” to estimate the expenses you paid on your account during this period.
Hypothetical Example for Comparison Purposes
The second line of the table on the following page provides information about hypothetical account values and hypothetical expenses based on the Fund’s actual expense ratio and an assumed rate of return of 5% per year before expenses, which is not the Fund’s actual return. The hypothetical account values and expenses may not be used to estimate the actual ending account balance or expenses you paid for the period. You may use this information to compare the ongoing costs of investing in the Fund and other funds. To do so, compare this 5% hypothetical example with the 5% hypothetical examples that appear in the shareholder reports of the other funds.
5
Please note that the expenses shown in the table are meant to highlight your ongoing costs only and do not reflect any transactional costs, such as sales charges. Therefore, the second line of the table is useful in comparing ongoing costs only, and will not help you determine the relative total costs of owning different funds. In addition, if these transactional costs were included, your costs would have been higher.
| Beginning | Ending | Expenses | |||||||
| Account | Account | Paid During | |||||||
| Value | Value | Period† | |||||||
| 7/1/18 – | |||||||||
| 7/1/18 | 12/31/18 | 12/31/18 | |||||||
| Class VC | |||||||||
| Actual | $1,000.00 | $ | 857.00 | $5.48 | |||||
| Hypothetical (5% Return Before Expenses) | $1,000.00 | $ | 1,019.31 | $5.96 | |||||
| † | Net expenses are equal to the Fund’s annualized expense ratio of 1.17% multiplied by the average account value over the period, multiplied by 184/365 (to reflect one-half year period). |
Portfolio Holdings Presented by Sector
December 31, 2018
| Sector* | %** | |
| Consumer Discretionary | 10.83 | % |
| Consumer Staples | 5.15 | % |
| Energy | 5.87 | % |
| Financials | 19.27 | % |
| Health Care | 7.25 | % |
| Industrials | 14.49 | % |
| Information Technology | 7.92 | % |
| Materials | 7.83 | % |
| Real Estate | 9.74 | % |
| Utilities | 9.55 | % |
| Repurchase Agreement | 2.10 | % |
| Total | 100.00 | % |
| * | A sector may comprise several industries. | |
| ** | Represents percent of total investments. |
| 6 | See Notes to Financial Statements. |
December 31, 2018
| Fair | ||||||||
| Value | ||||||||
| Investments | Shares | (000) | ||||||
| COMMON STOCKS 98.15% | ||||||||
| Aerospace & Defense 2.90% | ||||||||
| Huntington Ingalls Industries, Inc. | 16,500 | $ | 3,140 | |||||
| Textron, Inc. | 83,468 | 3,839 | ||||||
| Total | 6,979 | |||||||
| Airlines 1.42% | ||||||||
| Alaska Air Group, Inc. | 56,415 | 3,433 | ||||||
| Auto Components 1.00% | ||||||||
| Lear Corp. | 19,600 | 2,408 | ||||||
| Banks 8.68% | ||||||||
| CIT Group, Inc. | 81,754 | 3,129 | ||||||
| Citizens Financial Group, Inc. | 144,000 | 4,281 | ||||||
| East West Bancorp, Inc. | 50,400 | 2,194 | ||||||
| First Horizon National Corp. | 172,200 | 2,266 | ||||||
| KeyCorp | 349,100 | 5,160 | ||||||
| Signature Bank | 13,816 | 1,420 | ||||||
| Sterling Bancorp | 149,962 | 2,476 | ||||||
| Total | 20,926 | |||||||
| Beverages 2.86% | ||||||||
| Coca-Cola European Partners plc (UnitedKingdom)*(a) | 74,959 | 3,437 | ||||||
| Cott Corp. | 247,700 | 3,453 | ||||||
| Total | 6,890 | |||||||
| Capital Markets 1.96% | ||||||||
| BrightSphere InvestmentGroup plc (United Kingdom)(a) | 143,230 | 1,529 | ||||||
| E*TRADE Financial Corp. | 72,900 | 3,199 | ||||||
| Total | 4,728 | |||||||
| Chemicals 4.58% | ||||||||
| Ashland Global Holdings, Inc. | 50,193 | 3,562 | ||||||
| Axalta Coating Systems Ltd.* | 79,931 | 1,872 | ||||||
| Eastman Chemical Co. | 29,217 | 2,136 | ||||||
| FMC Corp. | 24,311 | 1,798 | ||||||
| Platform Specialty Products Corp.* | 160,506 | 1,658 | ||||||
| Total | 11,026 | |||||||
| Fair | ||||||||
| Value | ||||||||
| Investments | Shares | (000) | ||||||
| Construction & Engineering 1.34% | ||||||||
| Jacobs Engineering Group, Inc. | 55,200 | $ | 3,227 | |||||
| Containers & Packaging 1.39% | ||||||||
| Graphic Packaging Holding Co. | 248,436 | 2,644 | ||||||
| Packaging Corp. of America | 8,402 | 701 | ||||||
| Total | 3,345 | |||||||
| Electric: Utilities 8.10% | ||||||||
| Edison International | 77,600 | 4,405 | ||||||
| Entergy Corp. | 34,839 | 2,999 | ||||||
| Evergy, Inc. | 97,944 | 5,560 | ||||||
| FirstEnergy Corp. | 174,395 | 6,549 | ||||||
| Total | 19,513 | |||||||
| Electrical Equipment 3.55% | ||||||||
| AMETEK, Inc. | 35,401 | 2,397 | ||||||
| Hubbell, Inc. | 39,839 | 3,957 | ||||||
| nVent Electric plc(United Kingdom)(a) | 97,899 | 2,199 | ||||||
| Total | 8,553 | |||||||
| Electronic Equipment, Instruments & Components 3.76% | ||||||||
| Corning, Inc. | 138,300 | 4,178 | ||||||
| Flex Ltd.* | 175,500 | 1,335 | ||||||
| Keysight Technologies, Inc.* | 57,326 | 3,559 | ||||||
| Total | 9,072 | |||||||
| Energy Equipment & Services 0.73% | ||||||||
| National Oilwell Varco, Inc. | 68,200 | 1,753 | ||||||
| Equity Real Estate Investment Trusts 9.76% | ||||||||
| Alexandria Real Estate Equities, Inc. | 36,706 | 4,230 | ||||||
| Boston Properties, Inc. | 33,900 | 3,815 | ||||||
| Camden Property Trust | 35,500 | 3,126 | ||||||
| Duke Realty Corp. | 132,401 | 3,429 | ||||||
| Healthcare Trust of America, Inc. Class A | 119,840 | 3,033 | ||||||
| Highwoods Properties, Inc. | 51,100 | 1,977 | ||||||
| See Notes to Financial Statements. | 7 |
Schedule of Investments (continued)
December 31, 2018
| Fair | ||||||||
| Value | ||||||||
| Investments | Shares | (000) | ||||||
| Equity Real Estate Investment Trusts (continued) | ||||||||
| UDR, Inc. | 98,759 | $ | 3,913 | |||||
| Total | 23,523 | |||||||
| Food Products 2.31% | ||||||||
| Bunge Ltd. | 27,217 | 1,455 | ||||||
| Conagra Brands, Inc. | 89,674 | 1,915 | ||||||
| TreeHouse Foods, Inc.* | 43,225 | 2,192 | ||||||
| Total | 5,562 | |||||||
| Health Care Equipment & Supplies 2.42% | ||||||||
| Hill-Rom Holdings, Inc. | 28,181 | 2,495 | ||||||
| Zimmer Biomet Holdings, Inc. | 32,200 | 3,340 | ||||||
| Total | 5,835 | |||||||
| Health Care Providers & Services 2.26% | ||||||||
| Centene Corp.* | 24,216 | 2,792 | ||||||
| Encompass Health Corp. | 43,074 | 2,658 | ||||||
| Total | 5,450 | |||||||
| Hotels, Restaurants & Leisure 2.49% | ||||||||
| Aramark | 93,700 | 2,714 | ||||||
| MGM Resorts International | 135,778 | 3,294 | ||||||
| Total | 6,008 | |||||||
| Household Durables 1.33% | ||||||||
| Lennar Corp. Class A | 48,100 | 1,883 | ||||||
| Mohawk Industries, Inc.* | 11,200 | 1,310 | ||||||
| Total | 3,193 | |||||||
| Information Technology Services 1.28% | ||||||||
| Conduent, Inc.* | 290,303 | 3,086 | ||||||
| Insurance 8.68% | ||||||||
| Argo Group International Holdings Ltd. | 63,232 | 4,252 | ||||||
| Axis Capital Holdings Ltd. | 57,100 | 2,949 | ||||||
| Hanover Insurance Group, Inc. (The) | 32,248 | 3,766 | ||||||
| Hartford Financial Services Group, Inc. (The) | 88,486 | 3,933 | ||||||
| Lincoln National Corp. | 52,200 | 2,678 | ||||||
| RenaissanceRe Holdings Ltd. | 24,897 | 3,329 | ||||||
| Total | 20,907 | |||||||
| Fair | ||||||||
| Value | ||||||||
| Investments | Shares | (000) | ||||||
| Life Sciences Tools & Services 1.39% | ||||||||
| PerkinElmer, Inc. | 42,600 | $ | 3,346 | |||||
| Machinery 5.32% | ||||||||
| Flowserve Corp. | 51,946 | 1,975 | ||||||
| ITT, Inc. | 47,727 | 2,304 | ||||||
| Parker-Hannifin Corp. | 11,869 | 1,770 | ||||||
| Pentair plc(United Kingdom)(a) | 77,099 | 2,913 | ||||||
| Stanley Black & Decker, Inc. | 32,270 | 3,864 | ||||||
| Total | 12,826 | |||||||
| Media 1.48% | ||||||||
| Cable One, Inc. | 2,000 | 1,640 | ||||||
| Interpublic Group of Cos., Inc. (The) | 34,656 | 715 | ||||||
| Omnicom Group, Inc. | 16,500 | 1,209 | ||||||
| Total | 3,564 | |||||||
| Metals & Mining 1.88% | ||||||||
| Lundin Mining Corp.(b) | CAD | 312,266 | 1,290 | |||||
| Nucor Corp. | 34,400 | 1,782 | ||||||
| Steel Dynamics, Inc. | 48,800 | 1,466 | ||||||
| Total | 4,538 | |||||||
| Multi-Line Retail 1.46% | ||||||||
| Dollar Tree, Inc.* | 38,853 | 3,509 | ||||||
| Multi-Utilities 1.48% | ||||||||
| CMS Energy Corp. | 71,786 | 3,564 | ||||||
| Oil, Gas & Consumable Fuels 5.16% | ||||||||
| Concho Resources, Inc.* | 12,900 | 1,326 | ||||||
| Hess Corp. | 54,800 | 2,219 | ||||||
| Marathon Petroleum Corp. | 62,278 | 3,675 | ||||||
| Noble Energy, Inc. | 167,044 | 3,134 | ||||||
| ONEOK, Inc. | 38,346 | 2,069 | ||||||
| Total | 12,423 | |||||||
| Pharmaceuticals 1.19% | ||||||||
| Jazz Pharmaceuticals plc(Ireland)*(a) | 9,200 | 1,141 | ||||||
| Mylan NV* | 63,365 | 1,736 | ||||||
| Total | 2,877 | |||||||
| 8 | See Notes to Financial Statements. |
Schedule of Investments (concluded)
December 31, 2018
| Fair | ||||||||
| Value | ||||||||
| Investments | Shares | (000) | ||||||
| Semiconductors & Semiconductor Equipment 1.87% | ||||||||
| Marvell Technology Group Ltd. | 120,200 | $ | 1,946 | |||||
| Qorvo, Inc.* | 42,178 | 2,561 | ||||||
| Total | 4,507 | |||||||
| Specialty Retail 2.18% | ||||||||
| Advance Auto Parts, Inc. | 21,900 | 3,449 | ||||||
| Foot Locker, Inc. | 33,990 | 1,808 | ||||||
| Total | 5,257 | |||||||
| Technology Hardware, Storage & Peripherals 1.02% | ||||||||
| NetApp, Inc. | 41,262 | 2,462 | ||||||
| Textiles, Apparel & Luxury Goods 0.92% | ||||||||
| Tapestry, Inc. | 65,700 | 2,217 | ||||||
| Total Common Stocks (cost $252,621,675) | 236,507 | |||||||
| Principal | Fair | |||||||
| Amount | Value | |||||||
| Investments | (000) | (000) | ||||||
| SHORT-TERM INVESTMENT 2.10% | ||||||||
| Repurchase Agreement | ||||||||
| Repurchase Agreement dated 12/31/2018, 1.45% due 1/2/2019 with Fixed Income Clearing Corp. collateralized by $5,045,000 of U.S. Treasury Note at 2.875% due 7/31/2025; value: $5,176,685; proceeds: $5,073,349 (cost $5,072,941) | $5,073 | $ | 5,073 | |||||
| Total Investments in Securities 100.25% (cost $257,694,616) | 241,580 | |||||||
| Liabilities in Excess of Foreign Cash and Other Assets (0.25)% | (609 | ) | ||||||
| Net Assets 100.00% | $ | 240,971 | ||||||
| CAD | Canadian Dollar | |
| * | Non-income producing security. | |
| (a) | Foreign security traded in U.S. dollars. | |
| (b) | Investment in non-U.S. dollar denominated securities. |
The following is a summary of the inputs used as of December 31, 2018 in valuing the Fund’s investments carried at fair value(1):
| Level 1 | Level 2 | Level 3 | Total | |||||||||||||
| Investment Type(2)(3) | (000) | (000) | (000) | (000) | ||||||||||||
| Common Stocks | $ | 236,507 | $ | – | $ | – | $ | 236,507 | ||||||||
| Short-Term Investment | ||||||||||||||||
| Repurchase Agreement | – | 5,073 | – | 5,073 | ||||||||||||
| Total | $ | 236,507 | $ | 5,073 | $ | – | $ | 241,580 | ||||||||
| (1) | Refer to Note 2(i) for a description of fair value measurements and the three-tier hierarchy of inputs. | |
| (2) | See Schedule of Investments for fair values in each industry and identification of foreign issuers and/or geography. | |
| (3) | There were no Level 1/Level 2 transfers during the fiscal year ended December 31, 2018. |
| See Notes to Financial Statements. | 9 |
Statement of Assets and Liabilities
December 31, 2018
| ASSETS: | ||||
| Investments in securities, at fair value (cost $257,694,616) | $ | 241,580,304 | ||
| Foreign cash, at value (cost $228) | 211 | |||
| Receivables: | ||||
| Capital shares sold | 1,090,554 | |||
| Interest and dividends | 358,698 | |||
| Investment securities sold | 249,724 | |||
| Prepaid expenses | 1,624 | |||
| Total assets | 243,281,115 | |||
| LIABILITIES: | ||||
| Payables: | ||||
| Investment securities purchased | 1,388,008 | |||
| Management fee | 159,850 | |||
| Directors’ fees | 101,021 | |||
| Capital shares reacquired | 42,498 | |||
| Fund administration | 8,525 | |||
| Accrued expenses | 609,972 | |||
| Total liabilities | 2,309,874 | |||
| NET ASSETS | $ | 240,971,241 | ||
| COMPOSITION OF NET ASSETS: | ||||
| Paid-in capital | $ | 260,753,179 | ||
| Total distributable earnings (loss) | (19,781,938 | ) | ||
| Net Assets | $ | 240,971,241 | ||
| Outstanding shares (200 million shares of common stock authorized, $.001 par value) | 12,130,290 | |||
| Net asset value, offering and redemption price per share (Net assets divided by outstanding shares) | $19.87 |
| 10 | See Notes to Financial Statements. |
For the Year Ended December 31, 2018
| Investment income: | ||||
| Dividends (net of foreign withholding taxes of $9,813) | $ | 5,433,149 | ||
| Interest | 72,204 | |||
| Total investment income | 5,505,353 | |||
| Expenses: | ||||
| Management fee | 2,285,062 | |||
| Non 12b-1 service fees | 760,932 | |||
| Shareholder servicing | 235,630 | |||
| Fund administration | 121,870 | |||
| Professional | 57,967 | |||
| Reports to shareholders | 46,999 | |||
| Custody | 12,212 | |||
| Directors’ fees | 10,925 | |||
| Other | 35,594 | |||
| Gross expenses | 3,567,191 | |||
| Expense reductions (See Note 9) | (7,035 | ) | ||
| Net expenses | 3,560,156 | |||
| Net investment income | 1,945,197 | |||
| Net realized and unrealized gain (loss): | ||||
| Net realized gain on investments | 7,786,830 | |||
| Net realized gain on foreign currency exchange contracts | 9,067 | |||
| Net realized gain on foreign currency related transactions | 704 | |||
| Net change in unrealized appreciation/depreciation on investments | (53,111,569 | ) | ||
| Net change in unrealized appreciation/depreciation on translation of assets and liabilities denominated in foreign currencies | (17 | ) | ||
| Net realized and unrealized loss | (45,314,985 | ) | ||
| Net Decrease in Net Assets Resulting From Operations | $ | (43,369,788 | ) |
| See Notes to Financial Statements. | 11 |
Statements of Changes in Net Assets
| For the Year Ended | For the Year Ended | |||||||
| DECREASE IN NET ASSETS | December 31, 2018 | December 31, 2017 | ||||||
| Operations: | ||||||||
| Net investment income | $ | 1,945,197 | $ | 1,880,601 | ||||
| Net realized gain on investments, forward currency exchange contracts and foreign currency related transactions | 7,796,601 | 24,410,967 | ||||||
| Net change in unrealized appreciation/depreciation on investments and translation of assets and liabilities denominated in foreign currencies | (53,111,586 | ) | (3,751,279 | ) | ||||
| Net increase (decrease) in net assets resulting from operations | (43,369,788 | ) | 22,540,289 | |||||
| Distributions to shareholders(1) | (11,050,110 | ) | (33,995,704 | ) | ||||
| Capital share transactions (See Note 14): | ||||||||
| Proceeds from sales of shares | 25,115,342 | 23,848,124 | ||||||
| Reinvestment of distributions | 11,050,110 | 33,995,704 | ||||||
| Cost of shares reacquired | (72,162,141 | ) | (71,563,154 | ) | ||||
| Net decrease in net assets resulting from capital share transactions | (35,996,689 | ) | (13,719,326 | ) | ||||
| Net decrease in net assets | (90,416,587 | ) | (25,174,741 | ) | ||||
| NET ASSETS: | ||||||||
| Beginning of year | $ | 331,387,828 | $ | 356,562,569 | ||||
| End of year | $ | 240,971,241 | $ | 331,387,828 | ||||
| Distributions in excess of net investment income(2) | $ | – | $ | – | ||||
| (1) | The SEC eliminated the requirement to disclose the source of distributions paid in 2018. For the year ended December 31, 2017, the source of distributions was net investment income $(1,987,686) and net realized gain $(32,008,018). | |
| (2) | The SEC eliminated the requirement to disclose distributions in excess of net investment income in 2018. For the year ended December 31, 2017, the distributions in excess of net investment income was $(103,835). |
| 12 | See Notes to Financial Statements. |
This page is intentionally left blank.
13
| Per Share Operating Performance: | ||||||||||||||||||||||||||||
| Distributions to | ||||||||||||||||||||||||||||
| Investment Operations: | shareholders from: | |||||||||||||||||||||||||||
| Total | ||||||||||||||||||||||||||||
| Net | from | |||||||||||||||||||||||||||
| Net asset | Net | realized | invest- | |||||||||||||||||||||||||
| value, | invest- | and | ment | Net | Net | Total | ||||||||||||||||||||||
| beginning | ment | unrealized | opera- | investment | realized | distri- | ||||||||||||||||||||||
| of period | income(a) | gain (loss) | tions | income | gain | butions | ||||||||||||||||||||||
| 12/31/2018 | $24.51 | $0.15 | $(3.83 | ) | $(3.68 | ) | $(0.17 | ) | $(0.79 | ) | $(0.96 | ) | ||||||||||||||||
| 12/31/2017 | 25.52 | 0.14 | 1.58 | 1.72 | (0.16 | ) | (2.57 | ) | (2.73 | ) | ||||||||||||||||||
| 12/31/2016 | 23.28 | 0.13 | 3.69 | 3.82 | (0.13 | ) | (1.45 | ) | (1.58 | ) | ||||||||||||||||||
| 12/31/2015 | 26.02 | 0.15 | (1.16 | ) | (1.01 | ) | (0.15 | ) | (1.58 | ) | (1.73 | ) | ||||||||||||||||
| 12/31/2014 | 23.43 | 0.10 | 2.60 | 2.70 | (0.11 | ) | – | (0.11 | ) | |||||||||||||||||||
| (a) | Calculated using average shares outstanding during the period. |
| (b) | Total return does not consider the effects of sales charges or other expenses imposed by an insurance company and assumes the reinvestment of all distributions. |
| 14 | See Notes to Financial Statements. |
| Ratios to Average Net Assets: | Supplemental Data: | |||||||||||||||||||||
| Net | Net | |||||||||||||||||||||
| asset | Net | assets, | Portfolio | |||||||||||||||||||
| value, | Total | Total | investment | end of | turnover | |||||||||||||||||
| end of | return(b) | expenses | income | period | rate | |||||||||||||||||
| period | (%) | (%) | (%) | (000) | (%) | |||||||||||||||||
| $ | 19.87 | (15.04 | ) | 1.17 | 0.64 | $ | 240,971 | 50 | ||||||||||||||
| 24.51 | 6.83 | 1.16 | 0.55 | 331,388 | 70 | |||||||||||||||||
| 25.52 | 16.39 | 1.17 | 0.52 | 356,563 | 67 | |||||||||||||||||
| 23.28 | (3.79 | ) | 1.18 | 0.56 | 347,526 | 61 | ||||||||||||||||
| 26.02 | 11.53 | 1.16 | 0.40 | 418,164 | 58 | |||||||||||||||||
| See Notes to Financial Statements. | 15 |
| 1. | ORGANIZATION |
Lord Abbett Series Fund, Inc. (the “Company”) is registered under the Investment Company Act of 1940, as amended (the “Act”), as a diversified, open-end management investment company and was incorporated under Maryland law in 1989. The Company consists of twelve separate portfolios. This report covers Mid Cap Stock Portfolio (the “Fund”).
The Fund’s investment objective is to seek capital appreciation through investments, primarily in equity securities, which are believed to be undervalued in the marketplace. The Fund has Variable Contract class shares (“Class VC Shares”), which are currently issued and redeemed only in connection with investments in, and payments under, variable annuity contracts and variable life insurance policies issued by life insurance and insurance-related companies.
The preparation of the financial statements in conformity with accounting principles generally accepted in the United States of America (“U.S. GAAP”) requires management to make certain estimates and assumptions that affect the reported amounts of assets and liabilities and disclosure of contingent assets and liabilities at the date of the financial statements and the reported amounts of increases and decreases in net assets from operations during the reporting period. Actual results could differ from those estimates. The Fund is considered an investment company under U.S. GAAP and follows the accounting and reporting guidance applicable to investment companies.
| 2. | SIGNIFICANT ACCOUNTING POLICIES |
| (a) | Investment Valuation–Under procedures approved by the Fund’s Board of Directors (the “Board”), Lord, Abbett & Co. LLC (“Lord Abbett”), the Fund’s investment manager, has formed a Pricing Committee to administer the pricing and valuation of portfolio investments and to ensure that prices utilized reasonably reflect fair value. Among other things, these procedures allow the Fund to utilize independent pricing services, quotations from securities and financial instrument dealers and other market sources to determine fair value. |
| Securities actively traded on any recognized U.S. or non-U.S. exchange or on The NASDAQ Stock Market LLC are valued at the last sale price or official closing price on the exchange or system on which they are principally traded. Events occurring after the close of trading on non-U.S. exchanges may result in adjustments to the valuation of foreign securities to reflect their fair value as of the close of regular trading on the New York Stock Exchange. The Fund may utilize an independent fair valuation service in adjusting the valuations of foreign securities. Unlisted equity securities are valued at the last quoted sale price or, if no sale price is available, at the mean between the most recently quoted bid and asked prices. Forward foreign currency exchange contracts are valued using daily forward exchange rates. | |
| Securities for which prices are not readily available are valued at fair value as determined by the Pricing Committee. The Pricing Committee considers a number of factors, including observable and unobservable inputs, when arriving at fair value. The Pricing Committee may use related or comparable assets or liabilities, recent transactions, market multiples, book values and other relevant information to determine the fair value of portfolio investments. The Board or a designated committee thereof regularly reviews fair value determinations made by the Pricing Committee and may employ techniques such as reviewing related market activity, reviewing inputs and assumptions, and retrospectively comparing prices of subsequent purchases and sales transactions to fair value determinations made by the Pricing Committee. |
16
Notes to Financial Statements (continued)
| Short-term securities with 60 days or less remaining to maturity are valued using the amortized cost method, which approximates fair value. | |
| (b) | Security Transactions–Security transactions are recorded as of the date that the securities are purchased or sold (trade date). Realized gains and losses on sales of portfolio securities are calculated using the identified-cost method. |
| (c) | Investment Income–Dividend income is recorded on the ex-dividend date. Interest income is recorded on the accrual basis as earned. Discounts are accreted and premiums are amortized using the effective interest method and are included in Interest and other income on the Statement of Operations. Withholding taxes on foreign dividends have been provided for in accordance with the applicable country’s tax rules and rates. |
| (d) | Income Taxes–It is the policy of the Fund to meet the requirements of Subchapter M of the Internal Revenue Code applicable to regulated investment companies and to distribute substantially all taxable income and capital gains to its shareholders. Therefore, no income tax provision is required. |
| The Fund files U.S. federal and various state and local tax returns. No income tax returns are currently under examination. The statute of limitations on the Fund’s filed U.S. federal tax returns remains open for the fiscal years ended December 31, 2015 through December 31, 2018. The statutes of limitations on the Company’s state and local tax returns may remain open for an additional year depending upon the jurisdiction. | |
| (e) | Expenses–Expenses incurred by the Company that do not specifically relate to an individual fund are generally allocated to the funds within the Company on a pro rata basis by relative net assets. |
| (f) | Foreign Transactions–The books and records of the Fund are maintained in U.S. dollars and transactions denominated in foreign currencies are recorded in the Fund’s records at the rate prevailing when earned or recorded. Asset and liability accounts that are denominated in foreign currencies are adjusted daily to reflect current exchange rates and any unrealized gain (loss) is included in Net change in unrealized appreciation/depreciation on translation of assets and liabilities denominated in foreign currencies in the Fund’s Statement of Operations. The resultant exchange gains and losses upon settlement of such transactions are included in Net realized gain on foreign currency related transactions in the Fund’s Statement of Operations. The Fund does not isolate that portion of the results of operations arising as a result of changes in the foreign exchange rates from the changes in market prices of the securities. |
| (g) | Forward Foreign Currency Exchange Contracts–The Fund may enter into forward foreign currency exchange contracts in order to reduce exposure to changes in foreign currency exchange rates on foreign portfolio holdings, or gain or reduce exposure to foreign currency solely for investment purposes. A forward foreign currency exchange contract is a commitment to purchase or sell a foreign currency at a future date at a negotiated rate. The contracts are valued daily at forward exchange rates and any unrealized gain (loss) is included in Net change in unrealized appreciation/depreciation on foreign currency exchange contracts in the Fund’s Statement of Operations. The gain (loss) arising from the difference between the U.S. dollar cost of the original contract and the value of the foreign currency in U.S. dollars upon closing of such contracts is included in Net realized gain on foreign currency exchange contracts in the Fund’s Statement of Operations. |
17
Notes to Financial Statements (continued)
| (h) | Repurchase Agreements–The Fund may enter into repurchase agreements with respect to securities. A repurchase agreement is a transaction in which a fund acquires a security and simultaneously commits to resell that security to the seller (a bank or securities dealer) at an agreed-upon price on an agreed-upon date. The Fund requires at all times that the repurchase agreement be collateralized by cash, or by securities of the U.S. Government, its agencies, its instrumentalities, or U.S. Government sponsored enterprises having a value equal to, or in excess of, the value of the repurchase agreement (including accrued interest). If the seller of the agreement defaults on its obligation to repurchase the underlying securities at a time when the fair value of these securities has declined, the Fund may incur a loss upon disposition of the securities. |
| (i) | Fair Value Measurements–Fair value is defined as the price that the Fund would receive upon selling an investment or transferring a liability in an orderly transaction to an independent buyer in the principal or most advantageous market of the investment. A three-tier hierarchy is used to maximize the use of observable market data and minimize the use of unobservable inputs and to establish classification of fair value measurements for disclosure purposes. Inputs refer broadly to the assumptions that market participants would use in pricing the asset or liability, including assumptions about risk – for example, the risk inherent in a particular valuation technique used to measure fair value (such as a pricing model) and/or the risk inherent in the inputs to the valuation technique. Inputs may be observable or unobservable. Observable inputs reflect the assumptions market participants would use in pricing the asset or liability. Observable inputs are based on market data obtained from sources independent of the reporting entity. Unobservable inputs reflect the reporting entity’s own assumptions about the assumptions market participants would use in pricing the asset or liability. Unobservable inputs are based on the best information available in the circumstances. The three-tier hierarchy classification is determined based on the lowest level of inputs that is significant to the fair value measurement, and is summarized in the three broad Levels listed below: |
| • | Level 1 – | unadjusted quoted prices in active markets for identical investments; |
| • | Level 2 – | other significant observable inputs (including quoted prices for similar investments, interest rates, prepayment speeds, credit risk, etc.); and |
| • | Level 3 – | significant unobservable inputs (including the Fund’s own assumptions in determining the fair value of investments). |
| A summary of inputs used in valuing the Fund’s investments as of December 31, 2018 and, if applicable, Level 1/Level 2 transfers and Level 3 rollforwards for the fiscal year then ended is included in the Fund’s Schedule of Investments. | |
| Changes in valuation techniques may result in transfers into or out of an assigned level within the three-tier hierarchy. All transfers between different levels within the three-tier hierarchy are deemed to have occurred as of the beginning of the reporting period. The inputs or methodology used for valuing securities are not necessarily an indication of the risk associated with investing in those securities. |
| 3. | MANAGEMENT FEE AND OTHER TRANSACTIONS WITH AFFILIATES |
Management Fee
The Company has a management agreement with Lord Abbett, pursuant to which Lord Abbett supplies the Fund with investment management services and executive and other personnel,
18
Notes to Financial Statements (continued)
provides office space and pays for ordinary and necessary office and clerical expenses relating to research and statistical work and supervision of the Fund’s investment portfolio.
The management fee is based on the Fund’s average daily net assets at the following annual rate:
| First $1 billion | .75% |
| Next $1 billion | .70% |
| Over $2 billion | .65% |
For the fiscal year ended December 31, 2018, the effective management was at an annualized rate of .75% of the Fund’s average daily net assets.
In addition, Lord Abbett provides certain administrative services to the Fund pursuant to an Administrative Services Agreement in return for a fee at an annual rate of .04% of the Fund’s average daily net assets.
The Company, on behalf of the Fund, has entered into services arrangements with certain insurance companies. Under these arrangements, certain insurance companies will be compensated up to .25% of the average daily net asset value (“NAV”) of the Fund’s Class VC Shares held in the insurance company’s separate account to service and maintain the Variable Contract owners’ accounts. This amount is included in Non 12b-1 service fees on the Statement of Operations. The Fund may also compensate certain insurance companies, third-party administrators and other entities for providing recordkeeping, sub-transfer agency and other administrative services to the Fund. This amount is included in Shareholder servicing on the Statement of Operations.
One Director and certain of the Company’s officers have an interest in Lord Abbett.
| 4. | DISTRIBUTIONS AND CAPITAL LOSS CARRYFORWARDS |
Dividends from net investment income, if any, are declared and paid at least semi-annually. Taxable net realized gains from investment transactions, reduced by allowable capital loss carryforwards, if any, are declared and distributed to shareholders at least annually. The capital loss carryforward amount, if any, is available to offset future net capital gains. Dividends and distributions to shareholders are recorded on the ex-dividend date. The amounts of dividends and distributions from net investment income and net realized capital gains are determined in accordance with federal income tax regulations, which may differ from U.S. GAAP. These book/tax differences are either considered temporary or permanent in nature. To the extent these differences are permanent in nature, such amounts are reclassified within the components of net assets based on their federal tax basis treatment; temporary differences do not require reclassification. Dividends and distributions that exceed earnings and profits for tax purposes are reported as a tax return of capital.
The tax character of distributions paid during the fiscal years ended December 31, 2018 and 2017 was as follows:
| Year Ended 12/31/2018 | Year Ended 12/31/2017 | |||||||||
| Distributions paid from: | ||||||||||
| Ordinary income | $ | 1,912,376 | $ | 5,200,449 | ||||||
| Net long-term capital gains | 9,137,734 | 28,795,255 | ||||||||
| Total distributions paid | $ | 11,050,110 | $ | 33,995,704 | ||||||
19
Notes to Financial Statements (continued)
As of December 31, 2018, the components of accumulated losses on a tax-basis were as follows:
| Undistributed ordinary income – net | $ | 30,712 | ||
| Total Undistributed earnings | 30,712 | |||
| Temporary differences | $ | (2,358,180 | ) | |
| Unrealized losses – net | $ | (17,454,470 | ) | |
| Total accumulated losses – net | $ | (19,781,938 | ) |
At the Fund’s election, certain losses incurred within the taxable year (Qualified Late-Year Losses) are deemed to arise on the first business day of the Fund’s next taxable year. The Fund incurred and will elect to defer post-October capital losses of $2,257,159 during fiscal year 2018.
As of December 31, 2018, the aggregate unrealized security gains and losses on investments and other financial instruments based on cost for U.S. federal income tax purposes were as follows:
| Tax cost | $ | 259,034,757 | ||
| Gross unrealized gain | 13,388,435 | |||
| Gross unrealized loss | (30,842,888 | ) | ||
| Net unrealized security loss | $ | (17,454,453 | ) |
The difference between book-basis and tax-basis unrealized gains (losses) is attributable to the tax treatment of wash sales.
| 5. | PORTFOLIO SECURITIES TRANSACTIONS |
Purchases and sales of investment securities (excluding short-term investments) for the fiscal year ended December 31, 2018 were as follows:
| Purchases | Sales | |
| $148,942,462 | $183,992,609 |
There were no purchases or sales of U.S. Government securities for the fiscal year ended December 31, 2018.
The Fund is permitted to purchase and sell securities (“cross-trade”) from and to other Lord Abbett funds or client accounts pursuant to procedures approved by the Board in compliance with Rule 17a-7 under the Act (the “Rule”). Each cross-trade is executed at a fair market price in compliance with provisions of the Rule. For the fiscal year ended December 31, 2018, the Fund engaged in cross-trades purchases of $1,764,839 and sales of $705,741 which resulted in net realized gains of $159,681.
| 6. | DISCLOSURES ABOUT DERIVATIVE INSTRUMENTS AND HEDGING ACTIVITIES |
The Fund entered into forward foreign currency exchange contracts for the year ended December 31, 2018 (as described in note 2(g)). A forward foreign currency exchange contract reduces the Fund’s exposure to changes in the value of the currency it will deliver (or settle in cash) and increases its exposure to changes in the value of the currency it will receive (or settle in cash) for the duration of the contract. The Fund’s use of forward foreign currency exchange contracts involves the risk that Lord Abbett will not accurately predict currency movements, and the Fund’s returns could be reduced as a result. Forward foreign currency exchange contracts are subject to the risk that those currencies will decline in value relative to the U.S. dollar, or, in the case of hedged positions, that the U.S. dollar will decline relative to the currency being hedged. Currency rates in foreign countries may fluctuate significantly over short periods of time. The Fund’s risk of
20
Notes to Financial Statements (continued)
loss from counterparty credit risk is the unrealized appreciation on forward foreign currency exchange contracts and deposits with brokers as collateral.
As of December 31, 2018, the Fund had no forward foreign currency exchange contracts outstanding. An amount of $9,067 is included in the Statement of Operations related to forward foreign currency exchange contracts under the caption Net realized gain on foreign currency exchange contracts. The average notional amounts in U.S. dollars of forward foreign currency exchange contracts throughout the fiscal year was $759,240.
| 7. | DISCLOSURES ABOUT OFFSETTING ASSETS AND LIABILITIES |
The Financial Accounting Standards Board (“FASB”) requires disclosures intended to help better assess the effect or potential effect of offsetting arrangements on a fund’s financial position. The following tables illustrate gross and net information about recognized assets and liabilities eligible for offset in the statement of assets and liabilities; and disclose such amounts subject to an enforceable master netting agreement or similar agreement, by counterparty. A master netting agreement is an agreement between a fund and a counterparty which provides for the net settlement of amounts owed under all contracts traded under that agreement, as well as cash collateral, through a single payment by one party to the other in the event of default on or termination of any one contract. The Fund’s accounting policy with respect to balance sheet offsetting is that, absent an event of default by the counterparty or a termination of the agreement, the master netting agreement does not result in an offset of reported amounts of financial assets and liabilities in the statement of assets and liabilities across transactions between the Fund and the applicable counterparty:
| Description | Gross Amounts of Recognized Assets | Gross Amounts Offset in the Statement of Assets and Liabilities | Net Amounts of Assets Presented in the Statement of Assets and Liabilities | |||||||||
| Repurchase Agreement | $5,072,941 | $ | – | $ | 5,072,941 | |||||||
| Total | $5,072,941 | $ | – | $ | 5,072,941 | |||||||
| Net Amounts | ||||||||||||||||||||
| of Assets | Amounts Not Offset in the | |||||||||||||||||||
| Presented in | Statement of Assets and Liabilities | |||||||||||||||||||
| Counterparty | the Statement of Assets and Liabilities | Financial Instruments | Cash Collateral Received(a) | Securities Collateral Received(a) | Net Amount(b) | |||||||||||||||
| Fixed Income Clearing Corp. | $ | 5,072,941 | $ | – | $ | – | $ | (5,072,941 | ) | $ | – | |||||||||
| Total | $ | 5,072,941 | $ | – | $ | – | $ | (5,072,941 | ) | $ | – | |||||||||
| (a) | Collateral disclosed is limited to an amount not to exceed 100% of the net amount of assets presented in the Statement of Assets and Liabilities, for each respective counterparty. |
| (b) | Net amount represents the amount owed to the Fund by the counterparty as of December 31, 2018. |
| 8. | DIRECTORS’ REMUNERATION |
The Company’s officers and one Director, who are associated with Lord Abbett, do not receive any compensation from the Company for serving in such capacities. Independent Directors’ fees are allocated among all Lord Abbett-sponsored funds based on the net assets of each fund. There is an equity-based plan available to all Independent Directors under which Independent Directors must defer receipt of a portion of, and may elect to defer receipt of an additional portion of Directors’ fees. The deferred amounts are treated as though equivalent dollar amounts had been invested in
21
Notes to Financial Statements (continued)
the funds. Such amounts and earnings accrued thereon are included in Directors’ fees on the Statement of Operations and in Directors’ fees payable on the Statement of Assets and Liabilities and are not deductible for U.S. federal income tax purposes until such amounts are paid.
| 9. | EXPENSE REDUCTIONS |
The Company has entered into an arrangement with its transfer agent and custodian, whereby credits realized as a result of uninvested cash balances are used to reduce a portion of the Fund’s expenses.
| 10. | LINE OF CREDIT |
During the period ended August 8, 2018, the Fund and certain other funds managed by Lord Abbett (collectively, the “Participating Funds”) participated in a syndicated line of credit facility with various lenders for $600 million (the “Facility”), whereas State Street Bank and Trust Company (“SSB”) participates as a lender and as agent for the lenders. The Facility is to be used for temporary or emergency purposes as an additional source of liquidity to satisfy redemptions. The Participating Funds are subject to graduated borrowing limits of one-third of Fund assets (if Fund assets are less than $750 million), $250 million, $300 million, or $350 million, based on past borrowings and likelihood of future borrowings. During the period ended August 8, 2018, the Fund did not utilize the Facility.
For the period August 9, 2018 through December 20, 2018, the Participating Funds entered into an amended syndicated line of credit facility with various lenders for $1.06 billion (the “Syndicated Facility”), whereas SSB participates as a lender and as agent for the lenders. Under the Syndicated Facility, the Participating Funds are subject to graduated borrowing limits of one-third of Fund assets (if Fund assets are less than $750 million), $250 million, $300 million, $350 million, or $1 billion, based on past borrowings and likelihood of future borrowings. Effective December 21, 2018, the Participating Funds entered into an amended Syndicated Facility with various lenders for $1.1 billion based on the same terms as described above.
Effective August 9, 2018, the Participating Funds entered into an additional line of credit facility with SSB for $250 million (the “Bilateral Facility,” and together with the Syndicated Facility, the “Facilities”). Under the Bilateral Facility, each Participating Fund may borrow up to the lesser of $250 million or one-third of Fund assets. The Facilities are to be used for temporary or emergency purposes to satisfy redemption requests and manage liquidity.
For the period from August 9, 2018 through December 31, 2018, the Fund did not utilize the Facilities.
| 11. | INTERFUND LENDING PROGRAM |
Pursuant to an exemptive order issued by the U.S. Securities and Exchange Commission (“SEC exemptive order”), certain registered open-end management investment companies managed by Lord Abbett, including the Fund, participate in a joint lending and borrowing program (the “Interfund Lending Program”). The SEC exemptive order allows the Funds to borrow money from and lend money to each other for temporary or emergency purposes subject to the limitations and conditions.
During the fiscal year ended December 31, 2018, the Fund did not participate as a borrower or lender in the Interfund Lending Program.
22
Notes to Financial Statements (concluded)
| 12. | CUSTODIAN AND ACCOUNTING AGENT |
SSB is the Company’s custodian and accounting agent. SSB performs custodial, accounting and recordkeeping functions relating to portfolio transactions and calculating the Fund’s NAV.
| 13. | INVESTMENT RISKS |
The Fund is subject to the general risks and considerations associated with equity investing, as well as the particular risks associated with value and mid-sized company stocks. The value of an investment will fluctuate in response to movements in the equity securities market in general and to the changing prospects of individual companies in which the Fund invests. The market may fail to recognize for a long time the intrinsic value of particular value stocks the Fund may hold. Value investing also is subject to the risk that a company judged to be undervalued may actually be appropriately priced or even overpriced. The mid-sized company stocks in which the Fund invests may be less able to weather economic shifts or other adverse developments than those of larger, more established companies. Although investing in mid-sized companies offers the potential for above average returns, these companies may not succeed and the value of their stock could decline significantly. Mid-sized companies also may fall out of favor relative to larger companies in certain market cycles, causing the Fund to incur losses or under perform. In addition, if the Fund’s assessment of a company’s value or prospects for exceeding earnings expectations or market conditions is wrong, the Fund could suffer losses or produce poor performance relative to other funds, even in a rising market.
Due to the Fund’s investment exposure to foreign companies and American Depositary Receipts, the Fund may experience increased market, industry and sector liquidity, currency, political, information, and other risks. The securities of foreign companies also may be subject to inadequate exchange control regulations, the imposition of economic sanctions or other government restrictions, higher transaction and other costs, and delays in settlement to the extent they are traded on non-U.S. exchanges or markets.
These factors can affect the Fund’s performance.
| 14. | SUMMARY OF CAPITAL TRANSACTIONS |
Transactions in shares of capital stock were as follows:
| Year Ended December 31, 2018 | Year Ended December 31, 2017 | |||||||
| Shares sold | 1,051,803 | 917,562 | ||||||
| Reinvestment of distributions | 561,489 | 1,373,182 | ||||||
| Shares reacquired | (3,005,419 | ) | (2,739,249 | ) | ||||
| Decrease | (1,392,127 | ) | (448,505 | ) | ||||
23
Report of Independent Registered Public Accounting Firm
To the shareholders and the Board of Directors of Lord Abbett Series Fund, Inc.:
Opinion on the Financial Statements and Financial Highlights
We have audited the accompanying statement of assets and liabilities, including the schedule of investments, of the Mid Cap Stock Portfolio, one of the portfolios constituting the Lord Abbett Series Fund, Inc. (the “Fund”), as of December 31, 2018, the related statement of operations for the year then ended, the statements of changes in net assets for each of the two years in the period then ended, the financial highlights for each of the five years in the period then ended, and the related notes. In our opinion, the financial statements and financial highlights present fairly, in all material respects, the financial position of the Mid Cap Stock Portfolio of the Fund as of December 31, 2018, and the results of its operations for the year then ended, the changes in its net assets for each of the two years in the period then ended, and the financial highlights for each of the five years in the period then ended in conformity with accounting principles generally accepted in the United States of America.
Basis for Opinion
These financial statements and financial highlights are the responsibility of the Fund’s management. Our responsibility is to express an opinion on the Fund’s financial statements and financial highlights based on our audits. We are a public accounting firm registered with the Public Company Accounting Oversight Board (United States) (PCAOB) and are required to be independent with respect to the Fund in accordance with the U.S. federal securities laws and the applicable rules and regulations of the Securities and Exchange Commission and the PCAOB.
We conducted our audits in accordance with the standards of the PCAOB. Those standards require that we plan and perform the audit to obtain reasonable assurance about whether the financial statements and financial highlights are free of material misstatement, whether due to error or fraud. The Fund is not required to have, nor were we engaged to perform, an audit of its internal control over financial reporting. As part of our audits we are required to obtain an understanding of internal control over financial reporting but not for the purpose of expressing an opinion on the effectiveness of the Fund’s internal control over financial reporting. Accordingly, we express no such opinion.
Our audits included performing procedures to assess the risks of material misstatement of the financial statements and financial highlights, whether due to error or fraud, and performing procedures that respond to those risks. Such procedures included examining, on a test basis, evidence regarding the amounts and disclosures in the financial statements and financial highlights. Our audits also included evaluating the accounting principles used and significant estimates made by management, as well as evaluating the overall presentation of the financial statements and financial highlights. Our procedures included confirmation of securities owned as of December 31, 2018, by correspondence with the custodian and brokers; when replies were not received from brokers, we performed other auditing procedures. We believe that our audits provide a reasonable basis for our opinion.
DELOITTE & TOUCHE LLP
New York, New York
February 15, 2019
We have served as the auditor of one or more Lord Abbett Family of Funds’ investment companies since 1932.
24
Basic Information About Management
The Board is responsible for the management of the business and affairs of the Company in accordance with the laws of the State of Maryland. The Board elects officers who are responsible for the day-to-day operations of the Fund and who execute policies authorized by the Board. The Board also approves an investment adviser to the Fund and continues to monitor the cost and quality of the services the investment adviser provides, and annually considers whether to renew the contract with the adviser. Generally, each Director holds office until his/her successor is elected and qualified or until his/her earlier resignation or removal, as provided in the Company’s organizational documents.
Lord Abbett, a Delaware limited liability company, is the Fund’s investment adviser. Designated Lord Abbett personnel are responsible for the day-to-day management of the Fund.
Interested Directors
Mr. Sieg is affiliated with Lord Abbett and is an “interested person” of the Company as defined in the Act. Mr. Sieg is director/trustee of each of the 13 investment companies in the Lord Abbett Family of Funds, which consist of 62 portfolios or series. Mr. Sieg is an officer of the Lord Abbett Family of Funds.
| Name, Address and Year of Birth | Current Position and Length of Service with the Company | Principal Occupation and Other Directorships During the Past Five Years | ||
| Douglas B. Sieg Lord, Abbett & Co. LLC 90 Hudson Street Jersey City, NJ 07302 (1969) | Director since 2016; President and Chief Executive Officer since 2018 | Principal Occupation: Managing Partner (since 2018) and was formerly Head of Client Services, joined Lord Abbett in 1994. Other Directorships: None. |
Independent Directors
The following Independent Directors also are directors/trustees of each of the 13 investment companies in the Lord Abbett Family of Funds, which consist of 62 portfolios or series.
| Name, Address and Year of Birth | Current Position and Length of Service with the Company | Principal Occupation and Other Directorships During the Past Five Years | ||
| Eric C. Fast Lord, Abbett & Co. LLC c/o Legal Dept. 90 Hudson Street Jersey City, NJ 07302 (1949) | Director since 2014 | Principal Occupation: Chief Executive Officer of Crane Co., an industrial products company (2001–2014). Other Directorships: Currently serves as director of Automatic Data Processing, Inc. (since 2007) and Regions Financial Corporation (since 2010). Previously served as a director of Crane Co. (1999–2014). | ||
| Evelyn E. Guernsey Lord, Abbett & Co. LLC c/o Legal Dept. 90 Hudson Street Jersey City, NJ 07302 (1955) | Director since 2011 | Principal Occupation: CEO, Americas of J.P. Morgan Asset Management (2004–2010). Other Directorships: None. |
25
Basic Information About Management (continued)
| Name, Address and Year of Birth | Current Position and Length of Service with the Company | Principal Occupation and Other Directorships During the Past Five Years | ||
| Julie A. Hill Lord, Abbett & Co. LLC c/o Legal Dept. 90 Hudson Street Jersey City, NJ 07302 (1946) | Director since 2004 | Principal Occupation: Owner and CEO of The Hill Company, a business consulting firm (since 1998). Other Directorships: Currently serves as director of Anthem, Inc., a health benefits company (since 1994). | ||
| Kathleen M. Lutito Lord, Abbett & Co. LLC c/o Legal Dept. 90 Hudson Street Jersey City, NJ 07302 (1963) | Director since 2017 | Principal Occupation: President and Chief Investment Officer of CenturyLink Investment Management Company (since 2006). Other Directorships: None | ||
| James M. McTaggart Lord, Abbett & Co. LLC c/o Legal Dept. 90 Hudson Street Jersey City, NJ 07302 (1947) | Director since 2012 | Principal Occupation: Independent management advisor and consultant (since 2012); Vice President, CRA International, Inc. (doing business as Charles River Associates), a global management consulting firm (2009–2012); Founder and Chairman of Marakon Associates, Inc., a strategy consulting firm (1978–2009); and Officer and Director of Trinsum Group, a holding company (2007–2009). Other Directorships: Blyth, Inc., a home products company (2004–2015). | ||
| Karla M. Rabusch Lord, Abbett & Co. LLC c/o Legal Dept. 90 Hudson Street Jersey City, NJ 07302 (1959) | Director since 2017 | Principal Occupation: President and Director of Wells Fargo Funds Management, LLC (2003–2017); President of Wells Fargo Funds (2003–2016). Other Directorships: None. | ||
| Mark A. Schmid Lord, Abbett & Co. LLC c/o Legal Dept. 90 Hudson Street Jersey City, NJ 07302 (1959) | Director since 2016 | Principal Occupation: Vice President and Chief Investment Officer of the University of Chicago (since 2009). Other Directorships: None. | ||
| James L.L. Tullis Lord, Abbett & Co. LLC c/o Legal Dept. 90 Hudson Street Jersey City, NJ 07302 (1947) | Director since 2006; Chairman since 2017 | Principal Occupation: CEO of Tullis-Dickerson and Co. Inc., a venture capital management firm (since 1990); CEO of Tullis Health Investors Inc. (since 2012). Other Directorships: Currently serves as director of Crane Co. (since 1998). |
Officers
None of the officers listed below have received compensation from the Company. All of the officers of the Company also may be officers of the other Lord Abbett Funds and maintain offices at 90 Hudson Street, Jersey City, NJ 07302. Unless otherwise indicated, the position(s) and title(s) listed under the “Principal Occupation During the Past Five Years” column indicate each officer’s position(s) and title(s) with Lord Abbett. Each officer serves for an indefinite term (i.e., until his or her death, resignation, retirement, or removal).
26
Basic Information About Management (continued)
| Name and Year of Birth | Current Position with the Company | Length of Service of Current Position | Principal Occupation During the Past Five Years | |||
| Douglas B. Sieg (1969) | President and Chief Executive Officer | Elected as President and Chief Executive Officer in 2018 | Managing Partner of Lord Abbett (since 2018) and was formerly Head of Client Services, joined Lord Abbett in 1994. | |||
| Jeff D. Diamond (1960) | Executive Vice President | Elected in 2008 | Portfolio Manager, joined Lord Abbett in 2007. | |||
| Todd D. Jacobson (1966) | Executive Vice President | Elected in 2005 | Partner and Associate Director, joined Lord Abbett in 2003. | |||
| Robert A. Lee (1969) | Executive Vice President | Elected in 2010 | Partner and Chief Investment Officer, and was formerly Deputy Chief Investment Officer and Director of Taxable Fixed Income, joined Lord Abbett in 1997. | |||
| David J. Linsen (1974) | Executive Vice President | Elected in 2008 | Partner and Director of Equities, joined Lord Abbett in 2001. | |||
| Vincent J. McBride (1964) | Executive Vice President | Elected in 2010 | Partner and Director, joined Lord Abbett in 2003. | |||
| Andrew H. O’Brien (1973) | Executive Vice President | Elected in 2010 | Partner and Portfolio Manager, joined Lord Abbett in 1998. | |||
| F. Thomas O’Halloran (1955) | Executive Vice President | Elected in 2010 | Partner and Portfolio Manager, joined Lord Abbett in 2001. | |||
| Marc Pavese (1972) | Executive Vice President | Elected in 2016 | Partner and Portfolio Manager, joined Lord Abbett in 2008. | |||
| Walter H. Prahl (1958) | Executive Vice President | Elected in 2012 | Partner and Director, joined Lord Abbett in 1997. | |||
| Eli Rabinowich (1975) | Executive Vice President | Elected in 2018 | Portfolio Manager, joined Lord Abbett in 2018 and was formerly a Portfolio Manager, Partner, and Analyst at Pzena Investment Management from (2004–2018). |
27
Basic Information About Management (continued)
| Name and Year of Birth | Current Position with the Company | Length of Service of Current Position | Principal Occupation During the Past Five Years | |||
| Jeffrey Rabinowitz (1972) | Executive Vice President | Elected in 2017 | Portfolio Manager, joined Lord Abbett in 2017 and was formerly Managing Director and Portfolio Manager/Technology Analyst at Jennison Associates LLC (2014–2017) and Managing Director and Portfolio Manager/Technology Analyst for U.S. Growth Equity at Goldman Sachs Asset Management (1999–2014). | |||
| Steven F. Rocco (1979) | Executive Vice President | Elected in 2014 | Partner and Director of Taxable Fixed Income, joined Lord Abbett in 2004. | |||
| A. Edward Allinson (1961) | Vice President | Elected in 2011 | Portfolio Manager, joined Lord Abbett in 2005. | |||
| Vernon T. Bice (1974) | Vice President | Elected in 2011 | Portfolio Manager, joined Lord Abbett in 2011. | |||
| Pamela P. Chen (1978) | Vice President, Assistant Secretary and Privacy Officer | Elected in 2018 | Associate General Counsel, joined Lord Abbett in 2017 and was formerly Special Counsel at Schulte, Roth & Zabel LLP (2005–2017). | |||
| Robert S. Clark (1975) | Vice President | Elected in 2018 | Portfolio Manager, joined Lord Abbett in 2010. | |||
| Matthew R. DeCicco (1977) | Vice President | Elected in 2003 | Managing Director and Portfolio Manager, joined Lord Abbett in 1999. | |||
| John T. Fitzgerald (1975) | Vice President and Assistant Secretary | Elected in 2018 | Deputy General Counsel, joined Lord Abbett in 2018 and was formerly Deputy Head of U.S. Funds Legal, Executive Director and Assistant General Counsel at JPMorgan Chase (2005–2018). | |||
| Christopher J. Gizzo (1986) | Vice President | Elected in 2018 | Managing Director and Portfolio Manager, joined Lord Abbett in 2008. | |||
| Bernard J. Grzelak (1971) | Chief Financial Officer and Vice President | Elected in 2017 | Partner, Chief Operating Officer, Global Funds and Risk, joined Lord Abbett in 2003. |
28
Basic Information About Management (concluded)
| Name and Year of Birth | Current Position with the Company | Length of Service of Current Position | Principal Occupation During the Past Five Years | |||
| Linda Y. Kim (1980) | Vice President and Assistant Secretary | Elected in 2016 | Counsel, joined Lord Abbett in 2015 and was formerly an Associate at Stroock & Stroock & Lavan LLP (2007–2015). | |||
| So Young Lee (1971) | Vice President | Elected in 2018 | Portfolio Manager, joined Lord Abbett in 2013. | |||
| Joseph M. McGill (1962) | Chief Compliance Officer | Elected in 2014 | Partner and Chief Compliance Officer, joined Lord Abbett in 2014 and was formerly Managing Director and the Chief Compliance Officer at UBS Global Asset Management (2003–2013). | |||
| A. Edward Oberhaus, III (1959) | Vice President | Elected in 1998 | Partner and Director, joined Lord Abbett in 1983. | |||
| Amanda S. Ryan (1978) | Vice President and Assistant Secretary | Elected in 2018 | Counsel, joined Lord Abbett in 2016 and was formerly a Director and Corporate Counsel at PGIM Investments (2012–2016). | |||
| Lawrence B. Stoller (1963) | Vice President, Secretary and Chief Legal Officer | Elected in 2007 | Partner and General Counsel, joined Lord Abbett in 2007. | |||
| Leah G. Traub (1979) | Vice President | Elected in 2016 | Partner and Portfolio Manager, joined Lord Abbett in 2007. | |||
| Kewjin Yuoh (1971) | Vice President | Elected in 2012 | Partner and Portfolio Manager, joined Lord Abbett in 2010. | |||
| Jackson C. Chan (1964) | AML Compliance Officer | Elected in 2018 | Deputy Chief Compliance Officer and Director of Regulatory Affairs, joined Lord Abbett in 2014 and was formerly Director at UBS Global Asset Management (2005–2014). | |||
| Vito A. Fronda (1969) | Treasurer | Elected in 2018 | Partner and Director of Taxation, joined Lord Abbett in 2003. |
Please call 888-522-2388 for a copy of the statement of additional information, which contains further information about the Company’s Directors. It is available free upon request.
29
Approval of Advisory Contract
The Board, including all of the Directors who are not “interested persons” of the Company or of Lord Abbett, as defined in the Investment Company Act of 1940, as amended (the “Independent Directors”), annually considers whether to approve the continuation of the existing management agreement between the Fund and Lord Abbett (the “Agreement”). In connection with its most recent approval, which included the approval of a proposal to reduce the management fee schedule effective May 1, 2019, the Board reviewed materials relating specifically to the Agreement, as well as numerous materials received throughout the course of the year, including information about the Fund’s investment performance compared to the performance of its benchmark. Before making its decision as to the Fund, the Board had the opportunity to ask questions and request further information, taking into account its knowledge of Lord Abbett gained through its meetings and discussions. These meetings and discussions included reviews of Fund performance conducted by members of the Contract Committee, the deliberations of the Contract Committee, and discussions between the Contract Committee and Lord Abbett’s management. The Independent Directors also met with their independent legal counsel in various private sessions at which no representatives of management were present.
The materials received by the Board included, but were not limited to: (1) information provided by Broadridge Financial Solutions (“Broadridge”) regarding the investment performance of the Fund compared to the investment performance of certain funds with similar investment styles as determined by Broadridge, based, in part, on the Fund’s Morningstar category (the “performance peer group”), and the investment performance of two appropriate benchmarks; (2) information provided by Broadridge regarding the expense ratios, contractual and actual management fee rates, and other expense components for the Fund and certain funds in the same Morningstar category, with generally the same or similar share classes and operational characteristics, including asset size (the “expense peer group”); (3) certain supplemental investment performance information provided by Lord Abbett; (4) information provided by Lord Abbett on the expense ratios, management fee rates, and other expense components for the Fund; (5) sales and redemption information for the Fund; (6) information regarding Lord Abbett’s financial condition; (7) an analysis of the relative profitability of the Agreement to Lord Abbett; (8) information provided by Lord Abbett regarding the investment management fee schedules for Lord Abbett’s other advisory clients maintaining accounts with a similar investment strategy as the Fund; and (9) information regarding the personnel and other resources devoted by Lord Abbett to managing the Fund.
Investment Management and Related Services Generally.The Board considered the services provided by Lord Abbett to the Fund, including investment research, portfolio management, and trading, and Lord Abbett’s commitment to compliance with all applicable legal requirements. The Board also observed that Lord Abbett was solely engaged in the investment management business and accordingly did not experience the conflicts of interest that may result from being engaged in other lines of business. The Board considered the investment advisory services provided by Lord Abbett to other clients, the fees charged for the services, and the differences in the nature of the services provided to the Fund and other Lord Abbett Funds, on the one hand, and the services provided to other clients, on the other. After reviewing these and related factors, the Board concluded that the Fund was likely to continue to benefit from the nature, extent and quality of the investment services provided by Lord Abbett under the Agreement.
Investment Performance.The Board reviewed the Fund’s investment performance in relation to that of the performance peer group and two appropriate benchmarks as of various periods ended August 31, 2018. The Board observed that the Fund’s investment performance was below the
30
Approval of Advisory Contract (continued)
median of the performance peer group for the one-, three-, five-, and ten-year periods and took into account recent changes to the portfolio management team and other actions taken by Lord Abbett to attempt to improve equity fund performance. The Board further considered Lord Abbett’s performance and reputation generally, the performance of other Lord Abbett-managed funds overseen by the Board, and the willingness of Lord Abbett to take steps intended to improve performance when appropriate. After reviewing these and related factors, the Board concluded that the Fund’s Agreement, as revised with a reduced management fee schedule effective May 1, 2019, should be continued.
Lord Abbett’s Personnel and Methods.The Board considered the qualifications of the personnel providing investment management services to the Fund, in light of its investment objective and discipline, and other services provided to the Fund by Lord Abbett. Among other things, the Board considered the size, experience, and turnover of Lord Abbett’s staff, Lord Abbett’s investment methodology and philosophy, and Lord Abbett’s approach to recruiting, training, and retaining personnel.
Nature and Quality of Other Services.The Board considered the nature, quality, and extent of compliance, administrative, and other services performed by Lord Abbett and the nature and extent of Lord Abbett’s supervision of third party service providers, including the Fund’s transfer agent and custodian.
Expenses.The Board considered the expense level of the Fund, including the contractual and actual management fee rates under the terms of the current Agreement, and the expense levels of the Fund’s expense peer group. It also considered how the expense level of the Fund related to those of the expense peer group and the amount and nature of the fees paid by shareholders. The Board observed that although the Fund’s net total expense ratio was above the median of the expense peer group, the Fund’s advisory fee rate was equal to the median of the expense peer group. The Board further considered that the Fund’s management fee schedule would be reduced, effective May 1, 2019. After reviewing these and related factors, the Board concluded, within the context of its overall approval of the Agreement, that the expense level of the Fund was reasonable and supported the continuation of the Agreement.
Profitability.The Board considered the level of Lord Abbett’s operating margin in managing the Fund, including a review of Lord Abbett’s methodology for allocating its costs to its management of the Fund. It considered whether the Fund was profitable to Lord Abbett in connection with the Fund’s operation, including the fee that Lord Abbett receives from the Fund for providing administrative services to the Fund. The Board also considered the profits realized from other business segments of Lord Abbett, which may benefit from or be related to the Fund’s business. The Board considered Lord Abbett’s profit margins excluding Lord Abbett’s marketing and distribution expenses. The Board also considered Lord Abbett’s profit margins, without those exclusions, in comparison with available industry data and how those profit margins could affect Lord Abbett’s ability to recruit and retain personnel. The Board recognized that Lord Abbett’s overall profitability was a factor in enabling it to attract and retain qualified personnel to provide services to the Fund. After reviewing these and related factors, the Board concluded, within the context of its overall approval of the Agreement, that Lord Abbett’s profitability with respect to the Fund was not excessive.
Economies of Scale.The Board considered the extent to which there had been economies of scale in managing the Fund, whether the Fund’s shareholders had appropriately benefited from such economies of scale, and whether there was potential for realization of any further economies of scale. The Board concluded that the reduced management fee schedule, which included certain
31
Approval of Advisory Contract (concluded)
breakpoints in the management fee schedule, adequately addressed any economies of scale in managing the Fund.
Other Benefits to Lord Abbett.The Board considered the amount and nature of the fees paid by the Fund and the Fund’s shareholders to Lord Abbett for services other than investment advisory services, such as the fee that Lord Abbett receives from the Fund for providing administrative services to the Fund. The Board also considered the revenues and profitability of Lord Abbett’s investment advisory business apart from its mutual fund business, and the intangible benefits enjoyed by Lord Abbett by virtue of its relationship with the Fund. The Board observed that the Distributor receives 12b-1 fees from certain of the Lord Abbett Funds as to shares held in accounts for which there is no other broker of record, may retain a portion of the 12b-1 fees it receives, and receives a portion of the sales charges on sales and redemptions of some classes of shares of the Lord Abbett Funds. In addition, the Board observed that Lord Abbett accrues certain benefits for its business of providing investment advice to clients other than the Lord Abbett Funds, but that business also benefits the Funds. The Board also noted that Lord Abbett, as disclosed in the prospectus of the Fund, has entered into revenue sharing arrangements with certain entities that distribute shares of the Lord Abbett Funds. The Board also took into consideration the investment research that Lord Abbett receives as a result of client brokerage transactions.
Alternative Arrangements.The Board considered whether, instead of approving continuation of the Agreement, it might be in the best interests of the Fund to implement one or more alternative arrangements, such as continuing to employ Lord Abbett, but on different terms. After considering all of the relevant factors, the Board unanimously found that continuation of the Agreement, as revised, was in the best interests of the Fund and its shareholders and voted unanimously to approve the continuation of the Agreement. In considering whether to approve the continuation of the Agreement, the Board did not identify any single factor as paramount or controlling. Individual Directors may have evaluated the information presented differently from one another, giving different weights to various factors. This summary does not discuss in detail all matters considered.
32
Householding
The Company has adopted a policy that allows it to send only one copy of the Fund’s prospectus, proxy material, annual report and semiannual report to certain shareholders residing at the same “household.” This reduces Fund expenses, which benefits you and other shareholders. If you need additional copies or do not want your mailings to be “householded,” please call Lord Abbett at 888-522-2388 or send a written request with your name, the name of your fund or funds and your account number or numbers to Lord Abbett Family of Funds, P.O. Box 219336, Kansas City, MO 64121.
Proxy Voting Policies, Procedures and Records
A description of the policies and procedures that Lord Abbett uses to vote proxies related to the Fund’s portfolio securities, and information on how Lord Abbett voted the Fund’s proxies during the 12-month period ended June 30 are available without charge, upon request, (i) by calling 888-522-2388; (ii) on Lord Abbett’s Website at www.lordabbett.com; and (iii) on the Securities and Exchange Commission’s (“SEC”) Website at www.sec.gov.
Shareholder Reports and Quarterly Portfolio Disclosure
The Fund is required to file its complete schedule of portfolio holdings with the SEC for its first and third fiscal quarters on Form N-Q. Copies of the filings are available without charge, upon request on the SEC’s Website at www.sec.gov and may be available by calling Lord Abbett at 888-522-2388.
Tax Information
For corporate shareholders, 100% of the Fund’s ordinary income distributions qualified for the dividends received deduction.
Additionally, of the distribution paid to the shareholders during the fiscal year ended December 31, 2018, $9,137,734 represent long-term capital gains.
33


| This report, when not used for the general information of shareholders of the Fund, is to be distributed only if preceded or accompanied by a current fund prospectus. | |||
| Lord Abbett mutual fund shares are distributed by LORD ABBETT DISTRIBUTOR LLC. | Lord Abbett Series Fund, Inc.
Mid Cap Stock Portfolio | LASFMCV-3 (02/19) |
![]()
LORD ABBETT
ANNUAL REPORT
Lord Abbett
Series Fund—Short Duration Income Portfolio
For the fiscal year ended December 31, 2018
Table of Contents
Lord Abbett Series Fund — Short Duration Income
Portfolio Annual Report
For the fiscal year ended December 31, 2018

From left to right: James L.L. Tullis, Independent Chairman of the Lord Abbett Funds and Douglas B. Sieg, Director, President, and Chief Executive Officer of the Lord Abbett Funds.
Dear Shareholders:We are pleased to provide you with this overview of the performance of Lord Abbett Series Fund – Short Duration Income Portfolio for the fiscal year ended December 31, 2018. On this page and the following pages, we discuss the major factors that influenced fiscal year performance. For additional information about the Fund, please visit our website at www.lordabbett.com, where you also can access the quarterly commentaries that provide updates on the Fund’s performance and other portfolio related updates.
Thank you for investing in Lord Abbett mutual funds. We value the trust that you place in us and look forward to serving your investment needs in the years to come.
Best regards,

Douglas B. Sieg
Director, President and Chief Executive Officer
For the fiscal year ended December 31, 2018, the Fund returned 1.15%, reflecting performance at the net asset value (NAV) of Class VC shares with all distributions reinvested, compared to its benchmark, the ICE BofA Merrill Lynch 1-3 Year U.S. Corporate Credit Index,1which returned 1.62% over the same period.
During the period, there were several market-moving events. In June 2018, the White House announced its intent to impose additional tariffs on $200 billion worth of Chinese goods, on top of the $50
billion previously announced. The aggressive U.S. trade posture continued into September with trade tensions mounting between the U.S. and China. While the impact has yet to fully be realized, many corporations anticipate that the retaliatory tariffs will weigh on profits. In 2018, the U.S. Federal Reserve (“Fed”) raised its target for short-term interest rates by 0.25% at each of its March, June, September and December meetings, raising the target range to 2.25%–2.50%. As the Fed continued to raise rates, the U.S.
1
Treasury yield curve flattened throughout the year. The yield on 10-year U.S. Treasury securities (“Treasuries”) reached multi-year highs in November, and pulled back in December as risk-off sentiment roiled the markets and caused investors to flocked to safety. Amid rising concerns surrounding escalating trade tensions, slowing global growth, and increasing interest rates, the Nasdaq experienced the largest monthly drop since 2008 in October. US equity markets were volatile to finish out the year, with the S&P 5002suffering the largest decline in December 2018 since the Great Depression, culminating in the worst year since the financial crisis. Additionally, leveraged credit segments of the market experienced a sharp sell-off, notably in December, due to concerns over slower growth, falling oil prices, year-end technical pressures and general risk-off sentiment. Despite the sell-off, the U.S. economy continued to expand by more than 2% during each quarter of the trailing 12-month period, with domestic GDP growth ranging between 2.2% to 4.2% from the third quarter of 2017 to the third quarter of 2018. The 4.2% GDP growth in the second quarter marked the strongest growth rate since the third quarter of 2014. Inflation, as measured by the Consumer Price Index (CPI), gained 1.9%, a decline of 0.1% year-over-year, mainly driven lower by falling energy prices. Oil prices suffered sharp declines due to oversupply concerns.
Consistent with the Fund’s strategic design, the Fund maintained exposure to a variety of bond market sectors in addition to the investment grade corporate bonds represented in the benchmark. This design provides portfolio diversification and allows for the flexibility to pursue relative value opportunities across sectors. In our view, these sector weightings were important factors that affected performance.
For the trailing 12-month period, security selection in investment grade corporate bonds was the primary detractor from relative performance. Specifically, exposure to “BBB”-rated corporate bonds detracted as lower quality tiers underperformed higher credit quality tiers during the period. Additionally, security selection within the financials sector detracted from performance as these securities were hurt amid Italian political risk and Brexit uncertainty. The Fund’s allocation to sovereign securities also detracted from relative performance. Sovereign securities were negatively impacted by global economic weakness, trade tensions, geopolitical pressures with China, and Turkey and Argentina concerns.
The Fund’s allocation to commercial mortgage-backed securities (CMBS) was the primary contributor to relative performance during the period. CMBS outperformed investment grade corporate bonds as corporate spread widening accelerated in the fourth quarter amid a negative environment for risk assets. We
2
remain attracted to CMBS’s domestic orientation and find attractive valuations within single-asset, single-borrower issues. The Fund’s allocation to asset-backed securities (ABS) also contributed to relative performance. Despite modest spread widening during the period, ABS outperformed investment grade corporates. We believe this sector offers superior risk-adjusted returns compared to
corporate bonds, while providing additional liquidity, which help particularly within the fourth quarter.
The Fund’s portfolio is actively managed and, therefore, its holdings and the weightings of a particular issuer or particular sector as a percentage of portfolio assets are subject to change. Sectors may include many industries.
1 The ICE BofA Merrill Lynch 1-3 Year U.S. Corporate Credit Index is an unmanaged index comprised of U.S. dollar-denominated investment grade corporate debt securities publicly issued in the U.S. domestic market with between one and three years remaining to final maturity.
2 The S&P 500® Index is widely regarded as the standard for measuring large cap U.S. stock market performance and includes a representative sample of leading companies in leading industries.
Unless otherwise specified, indexes reflect total return, with all dividends reinvested. Indexes are unmanaged, do not reflect the deduction of fees or expenses, and are not available for direct investment.
Important Performance and Other Information
Performance data quoted in the following pages reflect past performance and are no guarantee of future results. Current performance may be higher or lower than the performance quoted. The investment return and principal value of an investment in the Fund will fluctuate so that shares, on any given day or when redeemed, may be worth more or less than their original cost. You can obtain performance data current to the most recent month end by calling Lord Abbett at 888-522-2388 or referring to www.lordabbett.com.
During certain periods shown, expense waivers and reimbursements were in place. Without such expense waivers and reimbursements, the Fund’s returns would have been lower.
The annual commentary above discusses the views of the Fund’s management and various portfolio holdings of the Fund as of December 31, 2018. These views and portfolio holdings may have changed after this date. Information provided in the commentary is not a recommendation to buy or sell securities. Because the Fund’s portfolio is actively managed and may change significantly, the Fund may no longer own the securities described above or may have otherwise changed its position in the securities. For more recent information about the Fund’s portfolio holdings, please visit www.lordabbett.com.
A Note about Risk:See Notes to Financial Statements for a discussion of investment risks. For a more detailed discussion of the risks associated with the Fund, please see the Fund’s prospectus.
Mutual funds are not insured by the FDIC, are not deposits or other obligations of, or guaranteed by, banks, and are subject to investment risks including possible loss of principal amount invested.
The Fund serves as an underlying investment vehicle for variable annuity contracts and variable life insurance policies.
3
Below is a comparison of a $10,000 investment in Class VC shares with the same investment in the ICE BofA Merrill Lynch 1-3 Year U.S. Corporate® Index, assuming reinvestment of all dividends and distributions. The Fund’s shares are sold only to insurance company separate accounts that fund certain variable annuity and variable life contracts. This line graph comparison does not reflect the sales charges or other expenses of these contracts. If those sales charges and expenses were reflected, returns would be lower. The graph and performance table below do not reflect the deduction of taxes that a shareholder would pay on Fund distributions or the redemption of Fund shares. During the period, expenses of the Fund were waived or reimbursed by Lord Abbett; without such waiver or reimbursement of expenses, the Fund’s returns would have been lower.Past performance is no guarantee of future results.
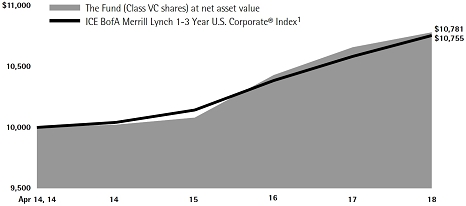
Average Annual Total Returns for the
Periods Ended December 31, 2018
| 1 Year | Life of Class | |
| Class VC2 | 1.15% | 1.61% |
1 Performance for the unmanaged index does not reflect any fees or expenses. The performance of the index is not necessarily representative of the Fund’s performance. Performance for the index began on April 14, 2014.
2 The Class VC shares commenced operations on April 4, 2014. Performance for the Class began on April 14, 2014.
4
As a shareholder of the Fund, you incur ongoing costs, including management fees; expenses related to the Fund’s services arrangements with certain insurance companies; and other Fund expenses. This Example is intended to help you understand your ongoing costs (in dollars) of investing in the Fund and to compare these costs with the ongoing costs of investing in other mutual funds.
The Example is based on an investment of $1,000 invested at the beginning of the period and held for the entire period (July 1, 2018 through December 31, 2018).
The Example reflects only expenses that are deducted from the assets of the Fund. Fees and expenses, including sales charges applicable to the various insurance products that invest in the Fund, are not reflected in this Example. If such fees and expenses were reflected in the Example, the total expenses shown would be higher. Fees and expenses regarding such variable insurance products are separately described in the prospectus related to those products.
Actual Expenses
The first line of the table on the following page provides information about actual account values and actual expenses. You may use the information in this line, together with the amount you invested, to estimate the expenses that you paid over the period. Simply divide your account value by $1,000 (for example, an $8,600 account value divided by $1,000 = 8.6), then multiply the result by the number in the first line under the heading titled “Expenses Paid During Period 7/1/18 – 12/31/18” to estimate the expenses you paid on your account during this period.
Hypothetical Example for Comparison Purposes
The second line of the table on the following page provides information about hypothetical account values and hypothetical expenses based on the Fund’s actual expense ratio and an assumed rate of return of 5% per year before expenses, which is not the Fund’s actual return. The hypothetical account values and expenses may not be used to estimate the actual ending account balance or expenses you paid for the period. You may use this information to compare the ongoing costs of investing in the Fund and other funds. To do so, compare this 5% hypothetical example with the 5% hypothetical examples that appear in the shareholder reports of the other funds.
5
Please note that the expenses shown in the table are meant to highlight your ongoing costs only and do not reflect any transactional costs, such as sales charges. Therefore, the second line of the table is useful in comparing ongoing costs only, and will not help you determine the relative total costs of owning different funds. In addition, if these transactional costs were included, your costs would have been higher.
| Beginning | Ending | Expenses | |||||
| Account | Account | Paid During | |||||
| Value | Value | Period† | |||||
| 7/1/18 - | |||||||
| 7/1/18 | 12/31/18 | 12/31/18 | |||||
| Class VC | |||||||
| Actual | $1,000.00 | $1,009.40 | $4.31 | ||||
| Hypothetical (5% Return Before Expenses) | $1,000.00 | $1,020.92 | $4.33 |
| † | Net expenses are equal to the Fund’s annualized expense ratio of 0.85%, multiplied by the average account value over the period, multiplied by 184/365 (to reflect one-half year period). |
Portfolio Holdings Presented by Sector
December 31, 2018
| Sector* | %** | |||
| Auto | 2.18 | % | ||
| Basic Industry | 0.38 | % | ||
| Capital Goods | 0.49 | % | ||
| Consumer Cyclical | 1.12 | % | ||
| Consumer Discretionary | 0.71 | % | ||
| Consumer Services | 0.82 | % | ||
| Consumer Staples | 0.34 | % | ||
| Energy | 8.21 | % | ||
| Financial Services | 61.71 | % | ||
| Foreign Government | 0.16 | % | ||
| Healthcare | 2.47 | % | ||
| Integrated Oils | 0.31 | % | ||
| Materials & Processing | 4.31 | % | ||
| Municipal | 0.11 | % | ||
| Other | 0.05 | % | ||
| Producer Durables | 1.62 | % | ||
| Technology | 2.46 | % | ||
| Telecommunications | 0.51 | % | ||
| Transportation | 0.62 | % | ||
| U.S. Government | 3.24 | % | ||
| Utilities | 2.63 | % | ||
| Repurchase Agreement | 5.55 | % | ||
| Total | 100.00 | % | ||
| * | A sector may comprise several industries. | |
| ** | Represents percent of total investments. |
| 6 | See Notes to Financial Statements. |
December 31, 2018
| Investments | Interest Rate | Maturity Date | Principal Amount (000) | Fair Value | ||||||||
| LONG-TERM INVESTMENTS 91.99% | ||||||||||||
| ASSET-BACKED SECURITIES 25.44% | ||||||||||||
| Automobiles 8.91% | ||||||||||||
| ACC Trust 2018-1 A† | 3.70% | 12/21/2020 | $ | 55 | $ | 54,893 | ||||||
| American Credit Acceptance Receivables Trust 2015-3 C† | 4.84% | 10/12/2021 | 60 | 60,261 | ||||||||
| AmeriCredit Automobile Receivables Trust 2016-3 A3 | 1.46% | 5/10/2021 | 20 | 19,805 | ||||||||
| AmeriCredit Automobile Receivables Trust 2016-3 B | 1.80% | 10/8/2021 | 31 | 30,659 | ||||||||
| AmeriCredit Automobile Receivables Trust 2017-2 B | 2.40% | 5/18/2022 | 43 | 42,480 | ||||||||
| AmeriCredit Automobile Receivables Trust 2017-2 C | 2.97% | 3/20/2023 | 64 | 63,545 | ||||||||
| AmeriCredit Automobile Receivables Trust 2017-3 A2A | 1.69% | 12/18/2020 | 16 | 15,747 | ||||||||
| AmeriCredit Automobile Receivables Trust 2017-3 B | 2.24% | 6/19/2023 | 29 | 28,643 | ||||||||
| AmeriCredit Automobile Receivables Trust 2017-4 A2A | 1.83% | 5/18/2021 | 27 | 27,283 | ||||||||
| AmeriCredit Automobile Receivables Trust 2017-4 A3 | 2.04% | 7/18/2022 | 97 | 95,869 | ||||||||
| AmeriCredit Automobile Receivables Trust 2017-4 B | 2.36% | 12/19/2022 | 42 | 41,483 | ||||||||
| Bank of The West Auto Trust 2017-1 A3† | 2.11% | 1/15/2023 | 100 | 98,813 | ||||||||
| Bank of The West Auto Trust 2017-1 A4† | 2.33% | 9/15/2023 | 100 | 98,662 | ||||||||
| California Republic Auto Receivables Trust 2015-3 A4 | 2.13% | 5/17/2021 | 8 | 7,780 | ||||||||
| California Republic Auto Receivables Trust 2015-4 A4† | 2.58% | 6/15/2021 | 138 | 137,913 | ||||||||
| California Republic Auto Receivables Trust 2015-4 B† | 3.73% | 11/15/2021 | 12 | 12,026 | ||||||||
| California Republic Auto Receivables Trust 2016-1 A4 | 2.24% | 10/15/2021 | 47 | 46,372 | ||||||||
| California Republic Auto Receivables Trust 2016-1 B | 3.43% | 2/15/2022 | 335 | 334,993 | ||||||||
| California Republic Auto Receivables Trust 2016-2 A4 | 1.83% | 12/15/2021 | 14 | 14,365 | ||||||||
| California Republic Auto Receivables Trust 2018-1 A2 | 2.86% | 3/15/2021 | 336 | 335,427 | ||||||||
| See Notes to Financial Statements. | 7 |
Schedule of Investments (continued)
December 31, 2018
| Investments | Interest Rate | Maturity Date | Principal Amount (000) | Fair Value | ||||||||
| Automobiles (continued) | ||||||||||||
| California Republic Auto Receivables Trust 2018-1 A3 | 3.14% | 8/15/2022 | $ | 97 | $ | 97,255 | ||||||
| Capital Auto Receivables Asset Trust 2015-2 C | 2.67% | 8/20/2020 | 132 | 131,749 | ||||||||
| Capital Auto Receivables Asset Trust 2015-3 B | 2.43% | 9/21/2020 | 11 | 10,982 | ||||||||
| Capital Auto Receivables Asset Trust 2015-3 C | 2.90% | 12/21/2020 | 10 | 9,994 | ||||||||
| Capital Auto Receivables Asset Trust 2015-3 D | 3.34% | 3/22/2021 | 9 | 9,020 | ||||||||
| Capital Auto Receivables Asset Trust 2016-1 A4 | 1.98% | 10/20/2020 | 14 | 14,030 | ||||||||
| Capital Auto Receivables Asset Trust 2016-1 B | 2.67% | 12/21/2020 | 12 | 11,972 | ||||||||
| Capital Auto Receivables Asset Trust 2016-2 A3 | 1.46% | 6/22/2020 | 2 | 2,114 | ||||||||
| Capital Auto Receivables Asset Trust 2016-2 A4 | 1.63% | 1/20/2021 | 24 | 23,891 | ||||||||
| Capital Auto Receivables Asset Trust 2016-2 B | 2.11% | 3/22/2021 | 4 | 3,971 | ||||||||
| Capital Auto Receivables Asset Trust 2017-1 A2† | 1.76% | 6/22/2020 | 15 | 15,027 | ||||||||
| Capital Auto Receivables Asset Trust 2017-1 A3† | 2.02% | 8/20/2021 | 28 | 27,760 | ||||||||
| Capital Auto Receivables Asset Trust 2017-1 A4† | 2.22% | 3/21/2022 | 17 | 16,753 | ||||||||
| Capital Auto Receivables Asset Trust 2018-2 A2† | 3.02% | 2/22/2021 | 188 | 187,926 | ||||||||
| Capital Auto Receivables Asset Trust 2018-2 A3† | 3.27% | 6/20/2023 | 80 | 80,187 | ||||||||
| CarMax Auto Owner Trust 2016-3 A3 | 1.39% | 5/17/2021 | 19 | 19,262 | ||||||||
| CarMax Auto Owner Trust 2016-3 A4 | 1.60% | 1/18/2022 | 15 | 14,708 | ||||||||
| CarMax Auto Owner Trust 2016-4 A3 | 1.40% | 8/15/2021 | 22 | 21,389 | ||||||||
| CarMax Auto Owner Trust 2016-4 A4 | 1.60% | 6/15/2022 | 21 | 20,509 | ||||||||
| CarMax Auto Owner Trust 2017-3 A4 | 2.22% | 11/15/2022 | 49 | 48,346 | ||||||||
| CarMax Auto Owner Trust 2017-4 A3 | 2.11% | 10/17/2022 | 125 | 123,752 | ||||||||
| Chesapeake Funding II LLC 2016-1A A1† | 2.11% | 3/15/2028 | 49 | 49,220 | ||||||||
| Chesapeake Funding II LLC 2016-2A A1† | 1.88% | 6/15/2028 | 69 | 68,990 | ||||||||
| Chesapeake Funding II LLC 2017-2A A1† | 1.99% | 5/15/2029 | 67 | 66,438 | ||||||||
| Chesapeake Funding II LLC 2017-3A A1† | 1.91% | 8/15/2029 | 147 | 144,866 | ||||||||
| Chesapeake Funding II LLC 2017-4A A1† | 2.12% | 11/15/2029 | 187 | 184,920 | ||||||||
| Chrysler Capital Auto Receivables Trust 2015-BA B† | 2.70% | 12/15/2020 | 3 | 2,998 | ||||||||
| Chrysler Capital Auto Receivables Trust 2016-AA A3† | 1.77% | 10/15/2020 | 1 | (a) | 636 | |||||||
| Chrysler Capital Auto Receivables Trust 2016-AA B† | 2.88% | 6/15/2022 | 11 | 10,987 | ||||||||
| CPS Auto Receivables Trust 2017-C A† | 1.78% | 9/15/2020 | 12 | 12,099 | ||||||||
| CPS Auto Receivables Trust 2017-C B† | 2.30% | 7/15/2021 | 100 | 99,551 | ||||||||
| CPS Auto Receivables Trust 2018-B A† | 2.72% | 9/15/2021 | 64 | 63,468 | ||||||||
| CPS Auto Receivables Trust 2018-B B† | 3.23% | 7/15/2022 | 100 | 99,951 | ||||||||
| CPS Auto Receivables Trust 2018-B C† | 3.58% | 3/15/2023 | 100 | 100,317 | ||||||||
| Drive Auto Receivables Trust 2015-AA C† | 3.06% | 5/17/2021 | 1 | 1,141 | ||||||||
| Drive Auto Receivables Trust 2015-BA D† | 3.84% | 7/15/2021 | 3 | 3,480 | ||||||||
| Drive Auto Receivables Trust 2015-BA E† | 5.15% | 8/15/2022 | 50 | 50,345 | ||||||||
| Drive Auto Receivables Trust 2015-DA C† | 3.38% | 11/15/2021 | 3 | 3,496 | ||||||||
| 8 | See Notes to Financial Statements. |
Schedule of Investments (continued)
December 31, 2018
| Investments | Interest Rate | Maturity Date | Principal Amount (000) | Fair Value | ||||||||
| Automobiles (continued) | ||||||||||||
| Drive Auto Receivables Trust 2015-DA D† | 4.59% | 1/17/2023 | $ | 22 | $ | 22,146 | ||||||
| Drive Auto Receivables Trust 2016-BA C† | 3.19% | 7/15/2022 | 8 | 7,511 | ||||||||
| Drive Auto Receivables Trust 2016-BA D† | 4.53% | 8/15/2023 | 41 | 41,271 | ||||||||
| Drive Auto Receivables Trust 2016-CA C† | 3.02% | 11/15/2021 | 60 | 59,933 | ||||||||
| Drive Auto Receivables Trust 2016-CA D† | 4.18% | 3/15/2024 | 27 | 27,145 | ||||||||
| Drive Auto Receivables Trust 2017-2 B | 2.25% | 6/15/2021 | 8 | 7,953 | ||||||||
| Drive Auto Receivables Trust 2017-2 C | 2.75% | 9/15/2023 | 42 | 41,920 | ||||||||
| Drive Auto Receivables Trust 2017-2 D | 3.49% | 9/15/2023 | 180 | 180,668 | ||||||||
| Drive Auto Receivables Trust 2017-BA C† | 2.61% | 8/16/2021 | 34 | 34,241 | ||||||||
| Drive Auto Receivables Trust 2017-BA D† | 3.72% | 10/17/2022 | 173 | 173,373 | ||||||||
| Drive Auto Receivables Trust 2018-3 B | 3.37% | 9/15/2022 | 49 | 49,040 | ||||||||
| Drive Auto Receivables Trust 2018-3 C | 3.72% | 9/16/2024 | 118 | 118,336 | ||||||||
| Drive Auto Receivables Trust 2018-4 B | 3.36% | 10/17/2022 | 58 | 57,906 | ||||||||
| Drive Auto Receivables Trust 2018-4 C | 3.66% | 11/15/2024 | 113 | 113,503 | ||||||||
| Drive Auto Receivables Trust 2018-4 D | 4.09% | 1/15/2026 | 34 | 34,352 | ||||||||
| Drive Auto Receivables Trust 2018-5 C | 3.99% | 1/15/2025 | 84 | 84,795 | ||||||||
| Exeter Automobile Receivables Trust 2017-3A A† | 2.05% | 12/15/2021 | 21 | 20,538 | ||||||||
| Exeter Automobile Receivables Trust 2017-3A B† | 2.81% | 9/15/2022 | 50 | 49,671 | ||||||||
| First Investors Auto Owner Trust 2017-1A A1† | 1.69% | 4/15/2021 | 5 | 4,913 | ||||||||
| First Investors Auto Owner Trust 2017-3A A1† | 2.00% | 3/15/2022 | 22 | 21,512 | ||||||||
| First Investors Auto Owner Trust 2018-1A B† | 3.51% | 5/15/2023 | 100 | 100,505 | ||||||||
| First Investors Auto Owner Trust 2018-2A C† | 4.03% | 1/15/2025 | 16 | 16,265 | ||||||||
| First Investors Auto Owner Trust 2018-2A D† | 4.28% | 1/15/2025 | 10 | 10,204 | ||||||||
| Flagship Credit Auto Trust 2015-3 A† | 2.38% | 10/15/2020 | – | (a) | 319 | |||||||
| Flagship Credit Auto Trust 2016-2 A2† | 3.05% | 8/16/2021 | 30 | 29,824 | ||||||||
| Flagship Credit Auto Trust 2016-4 A2† | 1.96% | 2/16/2021 | 4 | 3,783 | ||||||||
| Flagship Credit Auto Trust 2017-3 A† | 1.88% | 10/15/2021 | 27 | 26,686 | ||||||||
| Flagship Credit Auto Trust 2017-3 B† | 2.59% | 7/15/2022 | 30 | 29,647 | ||||||||
| Flagship Credit Auto Trust 2017-4 A† | 2.07% | 4/15/2022 | 44 | 44,132 | ||||||||
| Flagship Credit Auto Trust 2018-3 A† | 3.07% | 2/15/2023 | 272 | 271,899 | ||||||||
| Ford Credit Auto Owner Trust 2017-2 A† | 2.36% | 3/15/2029 | 100 | 97,502 | ||||||||
| Ford Credit Auto Owner Trust 2018-2 A† | 3.47% | 1/15/2030 | 100 | 101,015 | ||||||||
| Hyundai Auto Receivables Trust 2016-B C | 2.19% | 11/15/2022 | 72 | 71,021 | ||||||||
| Nissan Auto Receivables Owner Trust 2016-B A3 | 1.32% | 1/15/2021 | 14 | 13,557 | ||||||||
| Santander Drive Auto Receivables Trust 2015-3 C | 2.74% | 1/15/2021 | 4 | 3,912 | ||||||||
| Santander Drive Auto Receivables Trust 2015-4 C | 2.97% | 3/15/2021 | 35 | 34,683 | ||||||||
| Santander Drive Auto Receivables Trust 2015-5 D | 3.65% | 12/15/2021 | 22 | 22,053 | ||||||||
| Santander Drive Auto Receivables Trust 2016-1 D | 4.02% | 4/15/2022 | 264 | 266,503 | ||||||||
| See Notes to Financial Statements. | 9 |
Schedule of Investments (continued)
December 31, 2018
| Investments | Interest Rate | Maturity Date | Principal Amount (000) | Fair Value | ||||||||
| Automobiles (continued) | ||||||||||||
| Santander Drive Auto Receivables Trust 2016-2 B | 2.08% | 2/16/2021 | $ | 1 | $ | 1,482 | ||||||
| Santander Drive Auto Receivables Trust 2017-1 D | 3.17% | 4/17/2023 | 14 | 13,960 | ||||||||
| Santander Drive Auto Receivables Trust 2017-2 D | 3.49% | 7/17/2023 | 88 | 87,580 | ||||||||
| Santander Drive Auto Receivables Trust 2017-3 C | 2.76% | 12/15/2022 | 20 | 19,887 | ||||||||
| Santander Drive Auto Receivables Trust 2018-3 A3 | 3.03% | 2/15/2022 | 64 | 64,048 | ||||||||
| Santander Drive Auto Receivables Trust 2018-3 B | 3.29% | 10/17/2022 | 98 | 98,102 | ||||||||
| Santander Drive Auto Receivables Trust 2018-4 C | 3.56% | 7/15/2024 | 54 | 54,433 | ||||||||
| Santander Drive Auto Receivables Trust 2018-5 B | 3.52% | 12/15/2022 | 84 | 84,093 | ||||||||
| Santander Drive Auto Receivables Trust 2018-5 C | 3.81% | 12/16/2024 | 78 | 78,577 | ||||||||
| TCF Auto Receivables Owner Trust 2015-1A A4† | 1.96% | 11/16/2020 | 126 | 125,623 | ||||||||
| TCF Auto Receivables Owner Trust 2015-1A B��� | 2.49% | 4/15/2021 | 29 | 28,953 | ||||||||
| TCF Auto Receivables Owner Trust 2015-1A D† | 3.53% | 3/15/2022 | 10 | 9,969 | ||||||||
| TCF Auto Receivables Owner Trust 2015-2A B† | 3.00% | 9/15/2021 | 6 | 5,987 | ||||||||
| TCF Auto Receivables Owner Trust 2015-2A C† | 3.75% | 12/15/2021 | 4 | 4,006 | ||||||||
| TCF Auto Receivables Owner Trust 2016-1A A4† | 2.03% | 2/15/2022 | 50 | 49,600 | ||||||||
| TCF Auto Receivables Owner Trust 2016-1A B† | 2.32% | 6/15/2022 | 33 | 32,475 | ||||||||
| TCF Auto Receivables Owner Trust 2016-PT1A A† | 1.93% | 6/15/2022 | 36 | 35,322 | ||||||||
| Toyota Auto Receivables Owner Trust 2016-A A3 | 1.25% | 3/16/2020 | 9 | 9,018 | ||||||||
| Toyota Auto Receivables Owner Trust 2016-D A3 | 1.23% | 10/15/2020 | 24 | 23,822 | ||||||||
| Westlake Automobile Receivables Trust 2016-2A C† | 2.83% | 5/17/2021 | 6 | 5,644 | ||||||||
| Westlake Automobile Receivables Trust 2016-3A B† | 2.07% | 12/15/2021 | 2 | 1,863 | ||||||||
| Westlake Automobile Receivables Trust 2017-1A B† | 2.30% | 10/17/2022 | 79 | 78,860 | ||||||||
| Westlake Automobile Receivables Trust 2017-2A A2A† | 1.80% | 7/15/2020 | 23 | 22,971 | ||||||||
| Westlake Automobile Receivables Trust 2017-2A B† | 2.25% | 12/15/2020 | 67 | 66,592 | ||||||||
| Westlake Automobile Receivables Trust 2018-3A A2A† | 2.98% | 1/18/2022 | 167 | 166,948 | ||||||||
| World Omni Auto Receivables Trust 2018-D A4 | 3.44% | 12/16/2024 | 39 | 39,700 | ||||||||
| World Omni Auto Receivables Trust 2018-D B | 3.67% | 12/16/2024 | 48 | 49,001 | ||||||||
| World Omni Select Auto Trust 2018-1A B† | 3.68% | 7/15/2023 | 17 | 17,206 | ||||||||
| World Omni Select Auto Trust 2018-1A D† | 4.13% | 1/15/2025 | 60 | 61,065 | ||||||||
| Total | 7,051,543 | |||||||||||
| Credit Cards 6.50% | ||||||||||||
| American Express Credit Account Master Trust 2017-6 A | 2.04% | 5/15/2023 | 167 | 164,490 | ||||||||
| American Express Credit Account Master Trust 2017-7 A | 2.35% | 5/15/2025 | 229 | 225,138 | ||||||||
| BA Credit Card Trust 2017-A2 | 1.84% | 1/17/2023 | 140 | 137,545 | ||||||||
| Barclays Dryrock Issuance Trust 2016-1 A | 1.52% | 5/16/2022 | 100 | 99,200 | ||||||||
| 10 | See Notes to Financial Statements. |
Schedule of Investments (continued)
December 31, 2018
| Investments | Interest Rate | Maturity Date | Principal Amount (000) | Fair Value | ||||||||
| Credit Cards (continued) | ||||||||||||
| Barclays Dryrock Issuance Trust 2017-1 A | 2.785% (1 Mo. LIBOR + .33% | )# | 3/15/2023 | $ | 320 | $ | 320,208 | |||||
| Barclays Dryrock Issuance Trust 2017-2 A | 2.755% (1 Mo. LIBOR + .30% | )# | 5/15/2023 | 221 | 220,726 | |||||||
| Barclays Dryrock Issuance Trust 2018-1 A | 2.785% | # | 7/15/2024 | 100 | 99,776 | |||||||
| Capital One Multi-Asset Execution Trust 2015-A3 | 2.855% (1 Mo. LIBOR + .40% | )# | 3/15/2023 | 50 | 50,103 | |||||||
| Capital One Multi-Asset Execution Trust 2016-A4 | 1.33% | 6/15/2022 | 28 | 27,721 | ||||||||
| Capital One Multi-Asset Execution Trust 2017-A4 | 1.99% | 7/17/2023 | 235 | 231,441 | ||||||||
| Capital One Multi-Asset Execution Trust 2017-A6 | 2.29% | 7/15/2025 | 133 | 129,976 | ||||||||
| Citibank Credit Card Issuance Trust 2014-A1 | 2.88% | 1/23/2023 | 135 | 134,980 | ||||||||
| Citibank Credit Card Issuance Trust 2017-A3 | 1.92% | 4/7/2022 | 100 | 98,752 | ||||||||
| Citibank Credit Card Issuance Trust 2017-A8 | 1.86% | 8/8/2022 | 178 | 175,158 | ||||||||
| Citibank Credit Card Issuance Trust 2018-A6 | 3.21% | 12/7/2024 | 337 | 340,713 | ||||||||
| Discover Card Execution Note Trust 2015-A2 A | 1.90% | 10/17/2022 | 145 | 143,044 | ||||||||
| Discover Card Execution Note Trust 2015-A4 | 2.19% | 4/17/2023 | 100 | 99,034 | ||||||||
| Discover Card Execution Note Trust 2017-A6 | 1.88% | 2/15/2023 | 161 | 158,599 | ||||||||
| First National Master Note Trust 2017-2 A | 2.895% (1 Mo. LIBOR + .44% | )# | 10/16/2023 | 172 | 171,736 | |||||||
| Golden Credit Card Trust 2018-1A A† | 2.62% | 1/15/2023 | 168 | 167,199 | ||||||||
| Golden Credit Card Trust 2018-4A A† | 3.44% | 10/15/2025 | 151 | 150,398 | ||||||||
| Master Credit Card Trust II Series 2018-1A A† | 2.969% (1 Mo. LIBOR + .49% | )# | 7/21/2024 | 100 | 99,755 | |||||||
| Synchrony Credit Card Master Note Trust 2015-1 A | 2.37% | 3/15/2023 | 24 | 23,817 | ||||||||
| Synchrony Credit Card Master Note Trust 2016-2 A | 2.21% | 5/15/2024 | 179 | 175,736 | ||||||||
| Synchrony Credit Card Master Note Trust 2016-2 B | 2.55% | 5/15/2024 | 100 | 98,661 | ||||||||
| Synchrony Credit Card Master Note Trust 2017-1 A | 1.93% | 6/15/2023 | 99 | 97,475 | ||||||||
| Synchrony Credit Card Master Note Trust 2017-1 B | 2.19% | 6/15/2023 | 202 | 199,438 | ||||||||
| Synchrony Credit Card Master Note Trust 2017-2 A | 2.62% | 10/15/2025 | 129 | 127,362 | ||||||||
| Synchrony Credit Card Master Note Trust 2017-2 B | 2.82% | 10/15/2025 | 100 | 98,296 | ||||||||
| Synchrony Credit Card Master Note Trust 2018-2 A | 3.47% | 5/15/2026 | 99 | 100,279 | ||||||||
| World Financial Network Credit Card Master Trust 2012-A | 3.14% | 1/17/2023 | 17 | 16,999 | ||||||||
| World Financial Network Credit Card Master Trust 2015-B A | 2.55% | 6/17/2024 | 49 | 48,585 | ||||||||
| World Financial Network Credit Card Master Trust 2016-A | 2.03% | 4/15/2025 | 134 | 130,558 | ||||||||
| World Financial Network Credit Card Master Trust 2017-A | 2.12% | 3/15/2024 | 150 | 148,011 | ||||||||
| See Notes to Financial Statements. | 11 |
Schedule of Investments (continued)
December 31, 2018
| Investments | Interest Rate | Maturity Date | Principal Amount (000) | Fair Value | ||||||||
| Credit Cards (continued) | ||||||||||||
| World Financial Network Credit Card Master Trust 2017-B A | 1.98% | 6/15/2023 | $ | 131 | $ | 130,278 | ||||||
| World Financial Network Credit Card Master Trust 2017-C A | 2.31% | 8/15/2024 | 56 | 55,241 | ||||||||
| World Financial Network Credit Card Master Trust 2018-C A | 3.55% | 8/15/2025 | 213 | 215,856 | ||||||||
| World Financial Network Credit Card Master Trust 2018-C M | 3.95% | 8/15/2025 | 36 | 36,487 | ||||||||
| Total | 5,148,771 | |||||||||||
| Other 10.03% | ||||||||||||
| Access Point Funding I LLC 2017-A† | 3.06% | 4/15/2029 | 88 | 88,018 | ||||||||
| Ammc CLO 19 Ltd. 2016-19A A† | 3.936% (3 Mo. LIBOR + 1.50% | )# | 10/15/2028 | 250 | 250,217 | |||||||
| Arbor Realty Collateralized Loan Obligation Ltd. 2017-FL3 A† | 3.445% (1 Mo. LIBOR + .99% | )# | 12/15/2027 | 100 | 99,512 | |||||||
| Arbor Realty Commercial Real Estate Notes Ltd. 2018-FL1 A† | 3.605% (1 Mo. LIBOR + 1.15% | )# | 6/15/2028 | 100 | 99,125 | |||||||
| Ascentium Equipment Receivables Trust 2016-2A A3† | 1.65% | 5/10/2022 | 17 | 17,124 | ||||||||
| Ascentium Equipment Receivables Trust 2017-1A A3† | 2.29% | 6/10/2021 | 20 | 19,854 | ||||||||
| Ascentium Equipment Receivables Trust 2017-2A A2† | 2.00% | 5/11/2020 | 15 | 14,580 | ||||||||
| Avery Point V CLO Ltd. 2014-5A AR† | 3.429% (3 Mo. LIBOR + .98% | )# | 7/17/2026 | 205 | 204,248 | |||||||
| AXIS Equipment Finance Receivables VI LLC 2018-2A A2† | 3.89% | 7/20/2022 | 100 | 100,634 | ||||||||
| BlueMountain CLO Ltd. 2012-2A AR2† | 3.695% (3 Mo. LIBOR + 1.05% | )# | 11/20/2028 | 250 | 248,676 | |||||||
| CNH Equipment Trust 2015-B A4 | 1.89% | 4/15/2022 | 11 | 10,970 | ||||||||
| CNH Equipment Trust 2015-C A3 | 1.66% | 11/16/2020 | 11 | 11,265 | ||||||||
| Conn’s Receivables Funding LLC 2018-A† | 3.25% | 1/15/2023 | 53 | 52,632 | ||||||||
| CoreVest American Finance Trust 2018-1 A | 3.804% | 6/15/2051 | 99 | 99,522 | ||||||||
| Dell Equipment Finance Trust 2016-1 B† | 2.03% | 7/22/2021 | 29 | 28,815 | ||||||||
| Dell Equipment Finance Trust 2017-1 A3† | 2.14% | 4/22/2022 | 80 | 79,494 | ||||||||
| Diamond Resorts Owner Trust 2015-2 A† | 2.99% | 5/22/2028 | 17 | 16,575 | ||||||||
| Diamond Resorts Owner Trust 2016-1 A† | 3.08% | 11/20/2028 | 26 | 26,335 | ||||||||
| Diamond Resorts Owner Trust 2018-1 A† | 3.70% | 1/21/2031 | 107 | 107,819 | ||||||||
| Diamond Resorts Owner Trust 2018-1 B† | 4.19% | 1/21/2031 | 87 | 87,637 | ||||||||
| DLL LLC 2018-1 A2† | 2.81% | 11/17/2020 | 100 | 99,887 | ||||||||
| 12 | See Notes to Financial Statements. |
Schedule of Investments (continued)
December 31, 2018
| Investments | Interest Rate | Maturity Date | Principal Amount (000) | Fair Value | ||||||||
| Other (continued) | ||||||||||||
| DLL LLC 2018-1 A3† | 3.10% | 4/18/2022 | $ | 182 | $ | 182,173 | ||||||
| DLL LLC 2018-1 A4† | 3.27% | 4/17/2026 | 109 | 110,180 | ||||||||
| DLL Securitization Trust 2017-A A2† | 1.89% | 7/15/2020 | 55 | 54,868 | ||||||||
| DLL Securitization Trust 2017-A A3† | 2.14% | 12/15/2021 | 100 | 99,027 | ||||||||
| DLL Securitization Trust 2017-A A4† | 2.43% | 11/17/2025 | 100 | 98,702 | ||||||||
| Dryden 30 Senior Loan Fund 2013-30A AR† | 3.434% (3 Mo. LIBOR + .82% | )# | 11/15/2028 | 250 | 246,732 | |||||||
| Engs Commercial Finance Trust 2016-1A A2† | 2.63% | 2/22/2022 | 40 | 39,643 | ||||||||
| Ford Credit Floorplan Master Owner Trust 2015-2 A1 | 1.98% | 1/15/2022 | 23 | 22,756 | ||||||||
| Ford Credit Floorplan Master Owner Trust 2017-2 A1 | 2.16% | 9/15/2022 | 100 | 98,555 | ||||||||
| FREED ABS TRUST 2018-2 A† | 3.99% | 10/20/2025 | 146 | 146,430 | ||||||||
| Greystone Commercial Real Estate Notes Ltd. 2017-FL1A A† | 4.005% (1 Mo. LIBOR + 1.55% | )# | 3/15/2027 | 229 | 229,054 | |||||||
| Greystone Commercial Real Estate Notes Ltd. 2017-FL1A B† | 5.205% (1 Mo. LIBOR + 2.75% | )# | 3/15/2027 | 100 | 100,176 | |||||||
| Greystone Commercial Real Estate Notes Ltd. 2018-HC1 A† | 4.005% (1 Mo. LIBOR + 1.55% | )# | 9/15/2028 | 124 | 124,018 | |||||||
| Greystone Commercial Real Estate Notes Ltd. 2018-HC1 AS† | 4.605% (1 Mo. LIBOR + 2.15% | )# | 9/15/2028 | 38 | 38,013 | |||||||
| Halcyon Loan Advisors Funding Ltd. 2015-2A AR† | 3.57% (3 Mo. LIBOR + 1.08% | )# | 7/25/2027 | 250 | 248,493 | |||||||
| KREF Ltd. 2018-FL1 A† | 3.402% (1 Mo. LIBOR + 1.10% | )# | 6/15/2036 | 100 | 99,910 | |||||||
| LCM XXIV Ltd. 24A A† | 3.779% (3 Mo. LIBOR + 1.31% | )# | 3/20/2030 | 250 | 249,104 | |||||||
| Magnetite VII Ltd. 2012-7A A1R2† | 3.236% (3 Mo. LIBOR + .80% | )# | 1/15/2028 | 250 | 246,164 | |||||||
| Mountain Hawk III CLO Ltd. 2014-3A AR† | 3.645% (3 Mo. LIBOR + 1.20% | )# | 4/18/2025 | 192 | 192,299 | |||||||
| MVW Owner Trust 2017-1A A† | 2.42% | 12/20/2034 | 71 | 69,972 | ||||||||
| Navient Student Loan Trust 2018-1A A1† | 2.696% (1 Mo. LIBOR + .19% | )# | 3/25/2067 | 39 | 38,784 | |||||||
| NextGear Floorplan Master Owner Trust 2016-2A A2† | 2.19% | 9/15/2021 | 100 | 99,300 | ||||||||
| NextGear Floorplan Master Owner Trust 2017-1A A2† | 2.54% | 4/18/2022 | 100 | 99,360 | ||||||||
| NextGear Floorplan Master Owner Trust 2018-2A A2† | 3.69% | 10/16/2023 | 100 | 100,843 | ||||||||
| NextGear Floorplan Master Owner Trust 2018-2A B† | 4.01% | 10/16/2023 | 100 | 100,907 | ||||||||
| Nissan Master Owner Trust Receivables 2016-A A2 | 1.54% | 6/15/2021 | 35 | 34,769 | ||||||||
| Nissan Master Owner Trust Receivables 2017-B A | 2.885% (1 Mo. LIBOR + .43% | )# | 4/18/2022 | 78 | 78,001 | |||||||
| Octagon Investment Partners XXI Ltd. 2014-1A A1AR† | 3.964% (3 Mo. LIBOR + 1.35% | )# | 11/14/2026 | 250 | 250,088 | |||||||
| See Notes to Financial Statements. | 13 |
Schedule of Investments (continued)
December 31, 2018
| Investments | Interest Rate | Maturity Date | Principal Amount (000) | Fair Value | ||||||||
| Other (continued) | ||||||||||||
| OHA Loan Funding Ltd. 2015-1A AR† | 4.026% (3 Mo. LIBOR + 1.41% | )# | 8/15/2029 | $ | 250 | $ | 250,285 | |||||
| OneMain Financial Issuance Trust 2015-1A A† | 3.19% | 3/18/2026 | 19 | 19,447 | ||||||||
| Orec Ltd. 2018-CRE1 A† | 3.487% (1 Mo. LIBOR + 1.18% | )# | 6/15/2036 | 136 | 135,524 | |||||||
| OZLM VIII Ltd. 2014-8A A1RR† | 3.625% (3 Mo. LIBOR + 1.17% | )# | 10/17/2029 | 250 | 249,010 | |||||||
| Palmer Square Loan Funding Ltd. 2018-5A A1† | 3.32% (3 Mo. LIBOR + .85% | )# | 1/20/2027 | 250 | 249,358 | |||||||
| PFS Financing Corp. 2018-B A† | 2.89% | 2/15/2023 | 122 | 121,052 | ||||||||
| Ready Capital Mortgage Financing LLC 2018-FL2 A† | 3.356% (1 Mo. LIBOR + .85% | )# | 6/25/2035 | 85 | 84,776 | |||||||
| Salem Fields CLO Ltd. 2016-2A A1R† | 3.64% (3 Mo. LIBOR + 1.15% | )# | 10/25/2028 | 250 | 248,648 | |||||||
| SCF Equipment Leasing LLC 2017-2A A† | 3.41% | 12/20/2023 | 64 | 64,042 | ||||||||
| SCF Equipment Leasing LLC 2018-1A A1† | 2.81% | 4/20/2021 | 67 | 66,877 | ||||||||
| SCF Equipment Leasing LLC 2018-1A A2† | 3.63% | 10/20/2024 | 161 | 161,388 | ||||||||
| SLC Student Loan Trust 2008-1 A4A | 4.388% (3 Mo. LIBOR + 1.60% | )# | 12/15/2032 | 63 | 64,334 | |||||||
| SoFi Professional Loan Program 2017-D A1FX† | 1.72% | 9/25/2040 | 34 | 33,379 | ||||||||
| SoFi Professional Loan Program LLC 2017-C A2A† | 1.75% | 7/25/2040 | 33 | 32,768 | ||||||||
| SoFi Professional Loan Program LLC 2017-E A2A† | 1.86% | 11/26/2040 | 76 | 75,245 | ||||||||
| SoFi Professional Loan Program LLC 2017-F A1FX† | 2.05% | 1/25/2041 | 60 | 59,280 | ||||||||
| THL Credit Wind River CLO Ltd. 2012-1A BR† | 4.286% (3 Mo. LIBOR + 1.85% | )# | 1/15/2026 | 250 | 248,976 | |||||||
| Towd Point Asset Trust 2018-SL1 A† | 3.106% (1 Mo. LIBOR + .60% | )# | 1/25/2046 | 127 | 126,585 | |||||||
| TPG Real Estate Finance Issuer Ltd. 2018-FL2 A† | 3.585% (1 Mo. LIBOR + 1.13% | )# | 11/15/2037 | 138 | 137,252 | |||||||
| Wells Fargo Dealer Floorplan Master Note Trust 2015-2 A | 3.12% (1 Mo. LIBOR + .65% | )# | 1/20/2022 | 5 | 5,012 | |||||||
| West CLO Ltd. 2014-2A A1AR† | 3.306% (3 Mo. LIBOR + .87% | )# | 1/16/2027 | 250 | 248,919 | |||||||
| Total | 7,943,417 | |||||||||||
| Total Asset-Backed Securities (cost $20,216,573) | 20,143,731 | |||||||||||
| Shares (000) | ||||||||||||
| COMMON STOCK 0.00% | ||||||||||||
| Oil | ||||||||||||
| Templar Energy LLC Class A Units (cost $728) | – | (b) | 45 | |||||||||
| 14 | See Notes to Financial Statements. |
Schedule of Investments (continued)
December 31, 2018
| Investments | Interest Rate | Maturity Date | Principal Amount (000) | Fair Value | ||||||||
| CONVERTIBLE BONDS 0.08% | ||||||||||||
| Electric: Power 0.01% | ||||||||||||
| Clearway Energy, Inc.† | 3.25% | 6/1/2020 | $ | 11 | $ | 10,516 | ||||||
| Energy Equipment & Services 0.01% | ||||||||||||
| Tesla Energy Operations, Inc. | 1.625% | 11/1/2019 | 10 | 9,386 | ||||||||
| Real Estate Investment Trusts 0.06% | ||||||||||||
| VEREIT, Inc. | 3.75% | 12/15/2020 | 44 | 43,428 | ||||||||
| Total Convertible Bonds (cost $64,665) | 63,330 | |||||||||||
| CORPORATE BONDS 36.66% | ||||||||||||
| Aerospace/Defense 0.44% | ||||||||||||
| Bombardier, Inc. (Canada)†(c) | 6.00% | 10/15/2022 | 2 | 1,885 | ||||||||
| Bombardier, Inc. (Canada)†(c) | 6.125% | 1/15/2023 | 106 | 99,640 | ||||||||
| Bombardier, Inc. (Canada)†(c) | 8.75% | 12/1/2021 | 89 | 92,004 | ||||||||
| Embraer Overseas Ltd.† | 5.696% | 9/16/2023 | 33 | 34,527 | ||||||||
| Embraer SA (Brazil)(c) | 5.15% | 6/15/2022 | 2 | 2,062 | ||||||||
| L3 Technologies, Inc. | 4.95% | 2/15/2021 | 6 | 6,142 | ||||||||
| Triumph Group, Inc. | 4.875% | 4/1/2021 | 38 | 34,295 | ||||||||
| United Technologies Corp. | 3.65% | 8/16/2023 | 81 | 80,763 | ||||||||
| Total | 351,318 | |||||||||||
| Air Transportation 0.38% | ||||||||||||
| Air Canada 2015-1 Class B Pass-Through Trust (Canada)†(c) | 3.875% | 9/15/2024 | 16 | 15,086 | ||||||||
| Air Canada 2015-2 Class B Pass-Through Trust (Canada)†(c) | 5.00% | 6/15/2025 | 8 | 8,450 | ||||||||
| American Airlines 2013-2 Class B Pass-Through Trust† | 5.60% | 1/15/2022 | 126 | 127,574 | ||||||||
| American Airlines 2014-1 Class B Pass-Through Trust | 4.375% | 4/1/2024 | 65 | 64,627 | ||||||||
| Continental Airlines 2012-1 Class B Pass-Through Trust | 6.25% | 10/11/2021 | 2 | 2,248 | ||||||||
| Delta Airlines 2011-1 Class A Pass Through Trust | 5.30% | 10/15/2020 | 19 | 18,987 | ||||||||
| UAL 2007-1 Pass Through Trust | 7.336% | 1/2/2021 | 6 | 6,047 | ||||||||
| United Airlines 2014-1 Class B Pass-Through Trust | 4.75% | 10/11/2023 | 10 | 10,258 | ||||||||
| US Airways 2012-2 Class B Pass-Through Trust | 6.75% | 12/3/2022 | 10 | 10,581 | ||||||||
| US Airways 2013-1 Class B Pass-Through Trust | 5.375% | 5/15/2023 | 34 | 34,887 | ||||||||
| Total | 298,745 | |||||||||||
| See Notes to Financial Statements. | 15 |
Schedule of Investments (continued)
December 31, 2018
| Investments | Interest Rate | Maturity Date | Principal Amount (000) | Fair Value | ||||||||
| Auto Parts: Original Equipment 0.29% | ||||||||||||
| American Axle & Manufacturing, Inc. | 6.625% | 10/15/2022 | $ | 12 | $ | 11,910 | ||||||
| Nexteer Automotive Group Ltd.† | 5.875% | 11/15/2021 | 200 | 203,400 | ||||||||
| Titan International, Inc. | 6.50% | 11/30/2023 | 16 | 14,400 | ||||||||
| Total | 229,710 | |||||||||||
| Automotive 1.75% | ||||||||||||
| American Honda Finance Corp. | 1.65% | 7/12/2021 | 18 | 17,346 | ||||||||
| American Honda Finance Corp. | 1.70% | 9/9/2021 | 6 | 5,770 | ||||||||
| Daimler Finance North America LLC† | 2.875% | 3/10/2021 | 150 | 148,210 | ||||||||
| Daimler Finance North America LLC† | 3.75% | 11/5/2021 | 150 | 150,563 | ||||||||
| Deck Chassis Acquisition, Inc.† | 10.00% | 6/15/2023 | 19 | 18,335 | ||||||||
| Ford Motor Credit Co. LLC | 8.125% | 1/15/2020 | 300 | 311,497 | ||||||||
| General Motors Co. | 4.875% | 10/2/2023 | 71 | 71,231 | ||||||||
| General Motors Financial Co., Inc. | 3.15% | 6/30/2022 | 103 | 98,264 | ||||||||
| General Motors Financial Co., Inc. | 3.20% | 7/6/2021 | 46 | 44,958 | ||||||||
| General Motors Financial Co., Inc. | 4.20% | 3/1/2021 | 85 | 84,988 | ||||||||
| General Motors Financial Co., Inc. | 4.375% | 9/25/2021 | 50 | 50,234 | ||||||||
| Hyundai Capital America† | 1.75% | 9/27/2019 | 36 | 35,548 | ||||||||
| Hyundai Capital America† | 2.00% | 7/1/2019 | 5 | 4,969 | ||||||||
| Hyundai Capital America† | 2.50% | 3/18/2019 | 117 | 116,812 | ||||||||
| Hyundai Capital America† | 3.25% | 9/20/2022 | 31 | 30,173 | ||||||||
| Volkswagen Group of America Finance LLC† | 4.00% | 11/12/2021 | 200 | 200,535 | ||||||||
| Total | 1,389,433 | |||||||||||
| Banks: Regional 5.40% | ||||||||||||
| ABN AMRO Bank NV (Netherlands)(c) | 6.25% | 4/27/2022 | 400 | 424,184 | ||||||||
| Associated Banc-Corp. | 2.75% | 11/15/2019 | 29 | 28,869 | ||||||||
| Associated Bank NA | 3.50% | 8/13/2021 | 47 | 46,910 | ||||||||
| Banco de Credito del Peru (Panama)†(c) | 2.25% | 10/25/2019 | 200 | 198,140 | ||||||||
| Bank of America Corp. | 2.328% (3 Mo. LIBOR + .63% | )# | 10/1/2021 | 59 | 57,861 | |||||||
| Bank of America Corp. | 2.369% (3 Mo. LIBOR + .66% | )# | 7/21/2021 | 37 | 36,345 | |||||||
| Bank of America Corp. | 5.49% | 3/15/2019 | 300 | 301,377 | ||||||||
| Barclays Bank plc (United Kingdom)†(c) | 10.179% | 6/12/2021 | 160 | 179,956 | ||||||||
| CIT Group, Inc. | 4.125% | 3/9/2021 | 28 | 27,650 | ||||||||
| Citigroup, Inc. | 2.876% (3 Mo. LIBOR + .95% | )# | 7/24/2023 | 61 | 59,063 | |||||||
| Citigroup, Inc. | 2.90% | 12/8/2021 | 70 | 68,913 | ||||||||
| Citigroup, Inc. | 3.199% (3 Mo. LIBOR + .69% | )# | 10/27/2022 | 91 | 88,843 | |||||||
| Citigroup, Inc. | 4.05% | 7/30/2022 | 42 | 42,224 | ||||||||
| Citigroup, Inc. | 8.50% | 5/22/2019 | 45 | 45,923 | ||||||||
| 16 | See Notes to Financial Statements. |
Schedule of Investments (continued)
December 31, 2018
| Investments | Interest Rate | Maturity Date | Principal Amount (000) | Fair Value | ||||||||
| Banks: Regional (continued) | ||||||||||||
| Compass Bank | 5.50% | 4/1/2020 | $ | 68 | $ | 69,524 | ||||||
| Credit Suisse AG | 5.40% | 1/14/2020 | 22 | 22,343 | ||||||||
| Discover Bank | 7.00% | 4/15/2020 | 250 | 260,318 | ||||||||
| Discover Bank | 8.70% | 11/18/2019 | 250 | 260,800 | ||||||||
| Goldman Sachs Group, Inc. (The) | 2.876% (3 Mo. LIBOR + .82% | )# | 10/31/2022 | 96 | 93,269 | |||||||
| Goldman Sachs Group, Inc. (The) | 2.908% (3 Mo. LIBOR + 1.05% | )# | 6/5/2023 | 67 | 64,368 | |||||||
| Goldman Sachs Group, Inc. (The) | 3.618% (3 Mo. LIBOR + 1.11% | )# | 4/26/2022 | 72 | 71,223 | |||||||
| Goldman Sachs Group, Inc. (The) | 5.25% | 7/27/2021 | 103 | 106,958 | ||||||||
| Goldman Sachs Group, Inc. (The) | 5.375% | 3/15/2020 | 119 | 121,667 | ||||||||
| Goldman Sachs Group, Inc. (The) | 5.75% | 1/24/2022 | 24 | 25,138 | ||||||||
| Goldman Sachs Group, Inc. (The) | 6.00% | 6/15/2020 | 19 | 19,672 | ||||||||
| Intesa Sanpaolo SpA (Italy)(c) | 3.875% | 1/15/2019 | 200 | 199,965 | ||||||||
| Macquarie Bank Ltd. (Australia)†(c) | 6.625% | 4/7/2021 | 95 | 100,547 | ||||||||
| Macquarie Group Ltd. (Australia)†(c) | 3.189% (3 Mo. LIBOR + 1.02% | )# | 11/28/2023 | 12 | 11,555 | |||||||
| Macquarie Group Ltd. (Australia)†(c) | 4.15% (3 Mo. LIBOR + 1.33% | )# | 3/27/2024 | 75 | 75,076 | |||||||
| Macquarie Group Ltd. (Australia)†(c) | 6.00% | 1/14/2020 | 75 | 77,000 | ||||||||
| Macquarie Group Ltd. (Australia)†(c) | 7.625% | 8/13/2019 | 75 | 76,954 | ||||||||
| Morgan Stanley | 2.80% | 6/16/2020 | 11 | 10,931 | ||||||||
| Morgan Stanley | 3.414% (3 Mo. LIBOR + .80% | )# | 2/14/2020 | 56 | 56,002 | |||||||
| Morgan Stanley | 3.649% (3 Mo. LIBOR + 1.18% | )# | 1/20/2022 | 59 | 58,824 | |||||||
| Morgan Stanley | 4.875% | 11/1/2022 | 84 | 86,632 | ||||||||
| Nordea Bank Abp (Finland)†(c) | 4.875% | 5/13/2021 | 200 | 203,523 | ||||||||
| Popular, Inc. | 6.125% | 9/14/2023 | 23 | 22,871 | ||||||||
| Royal Bank of Scotland Group plc (United Kingdom)(c) | 6.125% | 12/15/2022 | 22 | 22,314 | ||||||||
| Santander UK Group Holdings plc (United Kingdom)(c) | 3.125% | 1/8/2021 | 173 | 170,178 | ||||||||
| SVB Financial Group | 5.375% | 9/15/2020 | 5 | 5,160 | ||||||||
| UBS AG | 7.625% | 8/17/2022 | 250 | 266,875 | ||||||||
| Wells Fargo & Co. | 3.069% | 1/24/2023 | 117 | 114,017 | ||||||||
| Total | 4,279,962 | |||||||||||
| Beverages 0.16% | ||||||||||||
| Keurig Dr Pepper, Inc. | 3.20% | 11/15/2021 | 46 | 45,226 | ||||||||
| Keurig Dr Pepper, Inc.† | 4.057% | 5/25/2023 | 84 | 83,737 | ||||||||
| Total | 128,963 | |||||||||||
| See Notes to Financial Statements. | 17 |
Schedule of Investments (continued)
December 31, 2018
| Investments | Interest Rate | Maturity Date | Principal Amount (000) | Fair Value | ||||||||
| Biotechnology Research & Production 0.06% | ||||||||||||
| Sotera Health Topco, Inc. PIK 8.875%† | 8.125% | 11/1/2021 | $ | 48 | $ | 45,240 | ||||||
| Building Materials 0.57% | ||||||||||||
| Boral Finance Pty Ltd. (Australia)†(c) | 3.00% | 11/1/2022 | 19 | 18,372 | ||||||||
| CPG Merger Sub LLC† | 8.00% | 10/1/2021 | 43 | 41,925 | ||||||||
| Griffon Corp. | 5.25% | 3/1/2022 | 61 | 55,434 | ||||||||
| Holcim US Finance Sarl & Cie SCS (Luxembourg)†(c) | 6.00% | 12/30/2019 | 208 | 213,073 | ||||||||
| Martin Marietta Materials, Inc. | 3.327% (3 Mo. LIBOR + .65% | )# | 5/22/2020 | 10 | 9,948 | |||||||
| Standard Industries, Inc.† | 5.375% | 11/15/2024 | 18 | 16,965 | ||||||||
| Summit Materials LLC/Summit Materials Finance Corp. | 8.50% | 4/15/2022 | 13 | 13,634 | ||||||||
| Vulcan Materials Co. | 3.388% (3 Mo. LIBOR + .65% | )# | 3/1/2021 | 20 | 19,856 | |||||||
| Vulcan Materials Co. | 3.388% (3 Mo. LIBOR + .60% | )# | 6/15/2020 | 65 | 64,604 | |||||||
| Total | 453,811 | |||||||||||
| Business Services 0.26% | ||||||||||||
| APX Group, Inc. | 8.75% | 12/1/2020 | 92 | 87,860 | ||||||||
| Chicago Parking Meters LLC† | 5.489% | 12/30/2020 | 30 | 31,098 | ||||||||
| Equifax, Inc. | 3.60% | 8/15/2021 | 24 | 23,978 | ||||||||
| ERAC USA Finance LLC† | 5.25% | 10/1/2020 | 25 | 25,805 | ||||||||
| IHS Markit Ltd. (United Kingdom)(c) | 4.125% | 8/1/2023 | 23 | 22,794 | ||||||||
| Verisk Analytics, Inc. | 4.875% | 1/15/2019 | 17 | 17,006 | ||||||||
| Total | 208,541 | |||||||||||
| Chemicals 1.14% | ||||||||||||
| Blue Cube Spinco LLC | 9.75% | 10/15/2023 | 10 | 11,025 | ||||||||
| Blue Cube Spinco LLC | 10.00% | 10/15/2025 | 4 | 4,540 | ||||||||
| Celanese US Holdings LLC | 4.625% | 11/15/2022 | 160 | 164,590 | ||||||||
| Celanese US Holdings LLC | 5.875% | 6/15/2021 | 86 | 90,451 | ||||||||
| DowDuPont, Inc. | 4.205% | 11/15/2023 | 48 | 49,132 | ||||||||
| Platform Specialty Products Corp.† | 6.50% | 2/1/2022 | 104 | 104,390 | ||||||||
| Rayonier AM Products, Inc.† | 5.50% | 6/1/2024 | 8 | 7,080 | ||||||||
| Syngenta Finance NV (Netherlands)†(c) | 3.698% | 4/24/2020 | 200 | 198,586 | ||||||||
| Syngenta Finance NV (Netherlands)†(c) | 3.933% | 4/23/2021 | 200 | 197,368 | ||||||||
| Yara International ASA (Norway)†(c) | 7.875% | 6/11/2019 | 72 | 73,356 | ||||||||
| Total | 900,518 | |||||||||||
| Coal 0.05% | ||||||||||||
| Eterna Capital Pte Ltd. PIK 1.00% (Singapore)(c) | 7.50% | 12/11/2022 | 32 | 31,233 | ||||||||
| Peabody Energy Corp.† | 6.00% | 3/31/2022 | 8 | 7,790 | ||||||||
| Total | 39,023 | |||||||||||
| 18 | See Notes to Financial Statements. |
Schedule of Investments (continued)
December 31, 2018
| Investments | Interest Rate | Maturity Date | Principal Amount (000) | Fair Value | ||||||||
| Computer Hardware 0.32% | ||||||||||||
| Dell International LLC/EMC Corp.† | 4.42% | 6/15/2021 | $ | 93 | $ | 92,958 | ||||||
| Dell International LLC/EMC Corp.† | 5.45% | 6/15/2023 | 109 | 111,021 | ||||||||
| Dell International LLC/EMC Corp.† | 5.875% | 6/15/2021 | 30 | 30,042 | ||||||||
| GCI LLC | 6.75% | 6/1/2021 | 16 | 16,076 | ||||||||
| Total | 250,097 | |||||||||||
| Computer Software 0.28% | ||||||||||||
| Dun & Bradstreet Corp. (The) | 4.25% | 6/15/2020 | 3 | 3,043 | ||||||||
| First Data Corp.† | 5.75% | 1/15/2024 | 31 | 30,391 | ||||||||
| Infor Software Parent LLC/Infor Software Parent, Inc. PIK 7.875%† | 7.125% | 5/1/2021 | 26 | 25,415 | ||||||||
| Informatica LLC† | 7.125% | 7/15/2023 | 51 | 49,923 | ||||||||
| Sophia LP/Sophia Finance, Inc.† | 9.00% | 9/30/2023 | 58 | 58,290 | ||||||||
| TIBCO Software, Inc.† | 11.375% | 12/1/2021 | 55 | 57,750 | ||||||||
| Total | 224,812 | |||||||||||
| Construction/Homebuilding 0.48% | ||||||||||||
| Ashton Woods USA LLC/Ashton Woods Finance Co.† | 6.875% | 2/15/2021 | 11 | 10,615 | ||||||||
| Brookfield Residential Properties, Inc. (Canada)†(c) | 6.50% | 12/15/2020 | 98 | 98,123 | ||||||||
| Century Communities, Inc. | 6.875% | 5/15/2022 | 30 | 29,325 | ||||||||
| DR Horton, Inc. | 3.75% | 3/1/2019 | 60 | 59,997 | ||||||||
| DR Horton, Inc. | 4.75% | 2/15/2023 | 7 | 7,096 | ||||||||
| DR Horton, Inc. | 5.75% | 8/15/2023 | 9 | 9,471 | ||||||||
| M/I Homes, Inc. | 6.75% | 1/15/2021 | 103 | 102,871 | ||||||||
| Taylor Morrison Communities, Inc. | 6.625% | 5/15/2022 | 16 | 16,040 | ||||||||
| William Lyon Homes, Inc. | 7.00% | 8/15/2022 | 50 | 49,625 | ||||||||
| Total | 383,163 | |||||||||||
| Containers 0.32% | ||||||||||||
| OI European Group BV (Netherlands)†(c) | 4.00% | 3/15/2023 | 20 | 18,750 | ||||||||
| Reynolds Group Issuer, Inc./Reynolds Group Issuer | ||||||||||||
| LLC/Reynolds Group Issuer (Luxembourg) SA | 6.875% | 2/15/2021 | 35 | 34,697 | ||||||||
| Reynolds Group Issuer, Inc./Reynolds Group Issuer | ||||||||||||
| LLC/Reynolds Group Issuer (Luxembourg) SA | 5.75% | 10/15/2020 | 199 | 198,419 | ||||||||
| Total | 251,866 | |||||||||||
| Drugs 0.42% | ||||||||||||
| AmerisourceBergen Corp. | 3.50% | 11/15/2021 | 14 | 14,051 | ||||||||
| Bayer US Finance II LLC† | 2.75% | 7/15/2021 | 32 | 31,185 | ||||||||
| Elanco Animal Health, Inc.† | 3.912% | 8/27/2021 | 19 | 19,129 | ||||||||
| Elanco Animal Health, Inc.† | 4.272% | 8/28/2023 | 22 | 22,003 | ||||||||
| Express Scripts Holding Co. | 4.75% | 11/15/2021 | 24 | 24,703 | ||||||||
| See Notes to Financial Statements. | 19 |
Schedule of Investments (continued)
December 31, 2018
| Investments | Interest Rate | Maturity Date | Principal Amount (000) | Fair Value | ||||||||
| Drugs (continued) | ||||||||||||
| Takeda Pharmaceutical Co. Ltd. (Japan)†(c) | 3.80% | 11/26/2020 | $ | 200 | $ | 201,258 | ||||||
| Teva Pharmaceutical Finance Co. BV (Curacao)(c) | 3.65% | 11/10/2021 | 9 | 8,532 | ||||||||
| Teva Pharmaceutical Finance Netherlands III BV (Netherlands)(c) | 1.70% | 7/19/2019 | 16 | 15,792 | ||||||||
| Total | 336,653 | |||||||||||
| Electric: Power 2.25% | ||||||||||||
| AES Corp. (The) | 4.875% | 5/15/2023 | 31 | 30,380 | ||||||||
| Ausgrid Finance Pty Ltd. (Australia)†(c) | 3.85% | 5/1/2023 | 114 | 113,852 | ||||||||
| Dominion Energy, Inc. | 2.962% | 7/1/2019 | 37 | 36,873 | ||||||||
| Dominion Energy, Inc. | 4.104% | 4/1/2021 | 77 | 77,637 | ||||||||
| Duquesne Light Holdings, Inc.† | 5.90% | 12/1/2021 | 19 | 20,115 | ||||||||
| Duquesne Light Holdings, Inc.† | 6.40% | 9/15/2020 | 192 | 200,279 | ||||||||
| Emera US Finance LP | 2.70% | 6/15/2021 | 115 | 112,094 | ||||||||
| Enel Finance International NV (Netherlands)†(c) | 2.875% | 5/25/2022 | 200 | 188,582 | ||||||||
| Entergy Texas, Inc. | 7.125% | 2/1/2019 | 27 | 27,075 | ||||||||
| Exelon Generation Co. LLC | 3.40% | 3/15/2022 | 7 | 6,895 | ||||||||
| Exelon Generation Co. LLC | 4.25% | 6/15/2022 | 2 | 2,029 | ||||||||
| Jersey Central Power & Light Co.† | 4.70% | 4/1/2024 | 54 | 56,282 | ||||||||
| Jersey Central Power & Light Co. | 7.35% | 2/1/2019 | 107 | 107,329 | ||||||||
| Metropolitan Edison Co. | 7.70% | 1/15/2019 | 11 | 11,016 | ||||||||
| Oklahoma Gas & Electric Co. | 8.25% | 1/15/2019 | 100 | 100,179 | ||||||||
| Origin Energy Finance Ltd. (Australia)†(c) | 5.45% | 10/14/2021 | 110 | 114,328 | ||||||||
| Pennsylvania Electric Co. | 5.20% | 4/1/2020 | 11 | 11,277 | ||||||||
| PNM Resources, Inc. | 3.25% | 3/9/2021 | 28 | 27,788 | ||||||||
| PPL Capital Funding, Inc. | 3.50% | 12/1/2022 | 20 | 19,692 | ||||||||
| PPL WEM Ltd./Western Power Distribution Ltd. (United Kingdom)†(c) | 5.375% | 5/1/2021 | 20 | 20,661 | ||||||||
| PSEG Power LLC | 3.85% | 6/1/2023 | 78 | 78,137 | ||||||||
| PSEG Power LLC | 5.125% | 4/15/2020 | 3 | 3,080 | ||||||||
| Puget Energy, Inc. | 6.00% | 9/1/2021 | 54 | 57,156 | ||||||||
| San Diego Gas & Electric Co. | 1.914% | 2/1/2022 | 15 | 14,722 | ||||||||
| SCANA Corp. | 4.125% | 2/1/2022 | 33 | 33,033 | ||||||||
| SCANA Corp. | 4.75% | 5/15/2021 | 91 | 92,162 | ||||||||
| SCANA Corp. | 6.25% | 4/1/2020 | 39 | 39,966 | ||||||||
| Sempra Energy | 2.936% (3 Mo. LIBOR + .50% | )# | 1/15/2021 | 37 | 36,389 | |||||||
| TECO Finance, Inc. | 5.15% | 3/15/2020 | 7 | 7,160 | ||||||||
| TransAlta Corp. (Canada)(c) | 4.50% | 11/15/2022 | 5 | 4,887 | ||||||||
| Vistra Energy Corp. | 7.375% | 11/1/2022 | 124 | 128,340 | ||||||||
| Total | 1,779,395 | |||||||||||
| 20 | See Notes to Financial Statements. |
Schedule of Investments (continued)
December 31, 2018
| Investments | Interest Rate | Maturity Date | Principal Amount (000) | Fair Value | ||||||||
| Electrical Equipment 0.33% | ||||||||||||
| Broadcom Corp./Broadcom Cayman Finance Ltd. | 2.65% | 1/15/2023 | $ | 71 | $ | 66,134 | ||||||
| Broadcom Corp./Broadcom Cayman Finance Ltd. | 3.00% | 1/15/2022 | 148 | 142,428 | ||||||||
| Marvell Technology Group Ltd Term Loan | 4.20% | 6/22/2023 | 50 | 49,902 | ||||||||
| Total | 258,464 | |||||||||||
| Electronics 0.17% | ||||||||||||
| PerkinElmer, Inc. | 5.00% | 11/15/2021 | 52 | 53,681 | ||||||||
| Tech Data Corp. | 3.70% | 2/15/2022 | 28 | 27,490 | ||||||||
| Trimble, Inc. | 4.15% | 6/15/2023 | 53 | 53,330 | ||||||||
| Total | 134,501 | |||||||||||
| Engineering & Contracting Services 0.04% | ||||||||||||
| StandardAero Aviation Holdings, Inc.† | 10.00% | 7/15/2023 | 27 | 28,890 | ||||||||
| Entertainment 0.22% | ||||||||||||
| Eldorado Resorts, Inc. | 7.00% | 8/1/2023 | 11 | 11,330 | ||||||||
| Scientific Games International, Inc. | 6.25% | 9/1/2020 | 31 | 29,915 | ||||||||
| Scientific Games International, Inc. | 6.625% | 5/15/2021 | 36 | 34,290 | ||||||||
| Scientific Games International, Inc. | 10.00% | 12/1/2022 | 94 | 95,527 | ||||||||
| WMG Acquisition Corp.† | 5.625% | 4/15/2022 | 2 | 2,002 | ||||||||
| Total | 173,064 | |||||||||||
| Financial Services 3.27% | ||||||||||||
| Aircastle Ltd. | 4.40% | 9/25/2023 | 29 | 28,550 | ||||||||
| Aircastle Ltd. | 5.00% | 4/1/2023 | 70 | 70,338 | ||||||||
| Aircastle Ltd. | 5.125% | 3/15/2021 | 148 | 150,483 | ||||||||
| Aircastle Ltd. | 5.50% | 2/15/2022 | 133 | 136,183 | ||||||||
| Aircastle Ltd. | 7.625% | 4/15/2020 | 71 | 74,276 | ||||||||
| Discover Financial Services | 5.20% | 4/27/2022 | 144 | 149,497 | ||||||||
| E*TRADE Financial Corp. | 2.95% | 8/24/2022 | 36 | 34,954 | ||||||||
| GE Capital International Funding Co. Unlimited Co. (Ireland)(c) | 2.342% | 11/15/2020 | 400 | 386,182 | ||||||||
| International Lease Finance Corp. | 5.875% | 4/1/2019 | 34 | 34,141 | ||||||||
| International Lease Finance Corp. | 6.25% | 5/15/2019 | 104 | 104,930 | ||||||||
| International Lease Finance Corp. | 8.25% | 12/15/2020 | 380 | 408,902 | ||||||||
| International Lease Finance Corp. | 8.625% | 1/15/2022 | 2 | 2,225 | ||||||||
| Jefferies Financial Group, Inc. | 5.50% | 10/18/2023 | 195 | 198,868 | ||||||||
| Jefferies Group LLC | 6.875% | 4/15/2021 | 32 | 34,069 | ||||||||
| Jefferies Group LLC | 8.50% | 7/15/2019 | 379 | 388,969 | ||||||||
| Lazard Group LLC | 4.25% | 11/14/2020 | 29 | 29,393 | ||||||||
| Nationstar Mortgage Holdings, Inc.† | 8.125% | 7/15/2023 | 71 | 69,402 | ||||||||
| See Notes to Financial Statements. | 21 |
Schedule of Investments (continued)
December 31, 2018
| Investments | Interest Rate | Maturity Date | Principal Amount (000) | Fair Value | ||||||||
| Nationstar Mortgage LLC/Nationstar Capital Corp. | 6.50% | 7/1/2021 | $ | 89 | $ | 86,997 | ||||||
| Navient Corp. | 4.875% | 6/17/2019 | 9 | 8,972 | ||||||||
| Navient Corp. | 5.00% | 10/26/2020 | 112 | 107,520 | ||||||||
| Navient Corp. | 5.875% | 3/25/2021 | 22 | 21,147 | ||||||||
| Navient Corp. | 6.625% | 7/26/2021 | 58 | 56,115 | ||||||||
| VFH Parent LLC/Orchestra Co-Issuer, Inc.† | 6.75% | 6/15/2022 | 7 | 6,811 | ||||||||
| Total | 2,588,924 | |||||||||||
| Food 0.17% | ||||||||||||
| B&G Foods, Inc. | 4.625% | 6/1/2021 | 8 | 7,830 | ||||||||
| Conagra Brands, Inc. | 3.80% | 10/22/2021 | 55 | 55,053 | ||||||||
| Conagra Brands, Inc. | 4.30% | 5/1/2024 | 47 | 46,768 | ||||||||
| Smithfield Foods, Inc.† | 2.70% | 1/31/2020 | 17 | 16,772 | ||||||||
| Smithfield Foods, Inc.† | 3.35% | 2/1/2022 | 10 | 9,570 | ||||||||
| Total | 135,993 | |||||||||||
| Health Care Products 0.96% | ||||||||||||
| Becton Dickinson & Co. | 3.678% (3 Mo. LIBOR + .88% | )# | 12/29/2020 | 52 | 51,492 | |||||||
| Kinetic Concepts, Inc./KCI USA, Inc.† | 7.875% | 2/15/2021 | 59 | 59,811 | ||||||||
| Kinetic Concepts, Inc./KCI USA, Inc.† | 12.50% | 11/1/2021 | 6 | 6,450 | ||||||||
| Life Technologies Corp. | 5.00% | 1/15/2021 | 430 | 440,742 | ||||||||
| Life Technologies Corp. | 6.00% | 3/1/2020 | 182 | 187,125 | ||||||||
| Zimmer Biomet Holdings, Inc. | 3.70% | 3/19/2023 | 14 | 13,863 | ||||||||
| Total | 759,483 | |||||||||||
| Health Care Services 0.95% | ||||||||||||
| Acadia Healthcare Co., Inc. | 6.125% | 3/15/2021 | 18 | 17,910 | ||||||||
| Centene Corp. | 5.625% | 2/15/2021 | 264 | 265,320 | ||||||||
| Cigna Corp.† | 3.138% (3 Mo. LIBOR + .35% | )# | 3/17/2020 | 8 | 7,950 | |||||||
| Eagle Holding Co. II LLC PIK 8.375%† | 7.625% | 5/15/2022 | 24 | 22,980 | ||||||||
| Fresenius Medical Care US Finance II, Inc.† | 4.125% | 10/15/2020 | 7 | 7,011 | ||||||||
| Fresenius Medical Care US Finance II, Inc.† | 5.875% | 1/31/2022 | 194 | 202,394 | ||||||||
| Fresenius Medical Care US Finance, Inc.† | 5.75% | 2/15/2021 | 6 | 6,183 | ||||||||
| HCA, Inc. | 5.875% | 3/15/2022 | 8 | 8,220 | ||||||||
| Surgery Center Holdings, Inc.† | 8.875% | 4/15/2021 | 39 | 39,097 | ||||||||
| Syneos Health, Inc./inVentiv Health, Inc./inVentiv Health Clinical, Inc.† | 7.50% | 10/1/2024 | 37 | 38,665 | ||||||||
| Universal Health Services, Inc.† | 4.75% | 8/1/2022 | 136 | 135,660 | ||||||||
| Total | 751,390 | |||||||||||
| 22 | See Notes to Financial Statements. |
Schedule of Investments (continued)
December 31, 2018
| Investments | Interest Rate | Maturity Date | Principal Amount (000) | Fair Value | ||||||||
| Household Equipment/Products 0.43% | ||||||||||||
| Newell Brands, Inc. | 3.85% | 4/1/2023 | $ | 159 | $ | 156,813 | ||||||
| Newell Brands, Inc. | 5.00% | 11/15/2023 | 18 | 18,326 | ||||||||
| Scotts Miracle-Gro Co. (The) | 6.00% | 10/15/2023 | 109 | 109,000 | ||||||||
| Spectrum Brands Holdings, Inc. | 7.75% | 1/15/2022 | 52 | 52,780 | ||||||||
| Spectrum Brands, Inc. | 6.625% | 11/15/2022 | 6 | 6,090 | ||||||||
| Total | 343,009 | |||||||||||
| Insurance 0.33% | ||||||||||||
| Alliant Holdings Intermediate LLC/Alliant Holdings Co-Issuer† | 8.25% | 8/1/2023 | 36 | 35,887 | ||||||||
| American International Group, Inc. | 4.125% | 2/15/2024 | 18 | 18,093 | ||||||||
| American International Group, Inc. | 4.875% | 6/1/2022 | 4 | 4,153 | ||||||||
| Assurant, Inc. | 4.20% | 9/27/2023 | 45 | 45,176 | ||||||||
| AXA Equitable Holdings, Inc.† | 3.90% | 4/20/2023 | 23 | 22,736 | ||||||||
| CNA Financial Corp. | 5.875% | 8/15/2020 | 11 | 11,414 | ||||||||
| CNO Financial Group, Inc. | 4.50% | 5/30/2020 | 5 | 4,963 | ||||||||
| Liberty Mutual Group, Inc.† | 5.00% | 6/1/2021 | 17 | 17,468 | ||||||||
| Protective Life Corp. | 7.375% | 10/15/2019 | 15 | 15,423 | ||||||||
| Willis North America, Inc. | 7.00% | 9/29/2019 | 44 | 45,018 | ||||||||
| Willis Towers Watson plc (United Kingdom)(c) | 5.75% | 3/15/2021 | 14 | 14,648 | ||||||||
| WR Berkley Corp. | 5.375% | 9/15/2020 | 24 | 24,720 | ||||||||
| Total | 259,699 | |||||||||||
| Leasing 0.13% | ||||||||||||
| Aviation Capital Group LLC† | 3.875% | 5/1/2023 | 38 | 37,264 | ||||||||
| Avolon Holdings Funding Ltd. (Ireland)†(c) | 5.50% | 1/15/2023 | 6 | 5,835 | ||||||||
| DAE Funding LLC (United Arab Emirates)†(c) | 4.00% | 8/1/2020 | 18 | 17,595 | ||||||||
| Park Aerospace Holdings Ltd. (Ireland)†(c) | 5.25% | 8/15/2022 | 16 | �� | 15,540 | |||||||
| Park Aerospace Holdings Ltd. (Ireland)†(c) | 4.50% | 3/15/2023 | 30 | 28,125 | ||||||||
| Total | 104,359 | |||||||||||
| Leisure 0.45% | ||||||||||||
| LTF Merger Sub, Inc.† | 8.50% | 6/15/2023 | 164 | 166,870 | ||||||||
| NCL Corp. Ltd.† | 4.75% | 12/15/2021 | 11 | 10,945 | ||||||||
| Royal Caribbean Cruises Ltd. | 5.25% | 11/15/2022 | 120 | 126,151 | ||||||||
| Silversea Cruise Finance Ltd.† | 7.25% | 2/1/2025 | 46 | 48,861 | ||||||||
| Total | 352,827 | |||||||||||
| Lodging 0.03% | ||||||||||||
| Wyndham Destinations, Inc. | 5.625% | 3/1/2021 | 20 | 20,000 | ||||||||
| See Notes to Financial Statements. | 23 |
Schedule of Investments (continued)
December 31, 2018
| Investments | Interest Rate | Maturity Date | Principal Amount (000) | Fair Value | ||||||||
| Machinery: Agricultural 0.31% | ||||||||||||
| BAT Capital Corp. | 3.222% | 8/15/2024 | $ | 80 | $ | 73,770 | ||||||
| Philip Morris International, Inc. | 2.375% | 8/17/2022 | 6 | 5,769 | ||||||||
| Pyxus International, Inc. | 9.875% | 7/15/2021 | 39 | 29,737 | ||||||||
| Reynolds American, Inc. | 4.85% | 9/15/2023 | 38 | 38,492 | ||||||||
| Viterra, Inc. (Canada)†(c) | 5.95% | 8/1/2020 | 92 | 94,836 | ||||||||
| Total | 242,604 | |||||||||||
| Machinery: Industrial/Specialty 0.44% | ||||||||||||
| CNH Industrial Capital LLC | 4.20% | 1/15/2024 | 24 | 23,738 | ||||||||
| CNH Industrial Capital LLC | 4.375% | 11/6/2020 | 14 | 14,112 | ||||||||
| CNH Industrial Capital LLC | 4.375% | 4/5/2022 | 79 | 79,537 | ||||||||
| CNH Industrial Capital LLC | 4.875% | 4/1/2021 | 60 | 61,116 | ||||||||
| CNH Industrial NV (United Kingdom)(c) | 4.50% | 8/15/2023 | 62 | 62,459 | ||||||||
| Nvent Finance Sarl (Luxembourg)(c) | 3.95% | 4/15/2023 | 69 | 68,569 | ||||||||
| Roper Technologies, Inc. | 3.65% | 9/15/2023 | 40 | 40,069 | ||||||||
| Total | 349,600 | |||||||||||
| Manufacturing 0.80% | ||||||||||||
| Gates Global LLC/Gates Global Co.† | 6.00% | 7/15/2022 | 45 | 44,269 | ||||||||
| General Electric Co. | 2.70% | 10/9/2022 | 54 | 50,150 | ||||||||
| General Electric Co. | 3.10% | 1/9/2023 | 8 | 7,471 | ||||||||
| General Electric Co. | 3.15% | 9/7/2022 | 23 | 21,754 | ||||||||
| General Electric Co. | 4.375% | 9/16/2020 | 16 | 15,981 | ||||||||
| General Electric Co. | 4.625% | 1/7/2021 | 42 | 42,127 | ||||||||
| General Electric Co. | 4.65% | 10/17/2021 | 146 | 146,527 | ||||||||
| General Electric Co. | 5.30% | 2/11/2021 | 177 | 177,301 | ||||||||
| General Electric Co. | 5.50% | 1/8/2020 | 34 | 34,405 | ||||||||
| Pentair Finance Sarl (Luxembourg)(c) | 2.65% | 12/1/2019 | 96 | 95,290 | ||||||||
| Total | 635,275 | |||||||||||
| Media 0.78% | ||||||||||||
| CCO Holdings LLC/CCO Holdings Capital Corp. | 5.25% | 3/15/2021 | 76 | 76,095 | ||||||||
| Charter Communications Operating LLC/Charter Communications Operating Capital | 4.50% | 2/1/2024 | 58 | 57,973 | ||||||||
| Cox Communications, Inc.† | 2.95% | 6/30/2023 | 58 | 55,864 | ||||||||
| Cox Communications, Inc.† | 3.25% | 12/15/2022 | 199 | 194,573 | ||||||||
| NBCUniversal Enterprise, Inc.† | 5.25% | – | (d) | 200 | 203,000 | |||||||
| Time Warner Cable LLC | 8.25% | 4/1/2019 | 22 | 22,248 | ||||||||
| Time Warner Cable LLC | 8.75% | 2/14/2019 | 6 | 6,034 | ||||||||
| Total | 615,787 | |||||||||||
| 24 | See Notes to Financial Statements. |
Schedule of Investments (continued)
December 31, 2018
| Investments | Interest Rate | Maturity Date | Principal Amount (000) | Fair Value | ||||||||
| Metal Fabricating 0.09% | ||||||||||||
| Grinding Media, Inc./Moly-Cop AltaSteel Ltd.† | 7.375% | 12/15/2023 | $ | 39 | $ | 37,927 | ||||||
| Zekelman Industries, Inc.† | 9.875% | 6/15/2023 | 28 | 29,610 | ||||||||
| Total | 67,537 | |||||||||||
| Metals & Minerals: Miscellaneous 1.95% | ||||||||||||
| Anglo American Capital plc (United Kingdom)†(c) | 4.125% | 9/27/2022 | 200 | 197,852 | ||||||||
| Century Aluminum Co.† | 7.50% | 6/1/2021 | 80 | 79,200 | ||||||||
| First Quantum Minerals Ltd. (Canada)†(c) | 7.00% | 2/15/2021 | 16 | 15,390 | ||||||||
| FMG Resources August 2006 Pty Ltd. (Australia)†(c) | 5.125% | 5/15/2024 | 17 | 15,704 | ||||||||
| Freeport-McMoRan, Inc. | 4.00% | 11/14/2021 | 14 | 13,668 | ||||||||
| Freeport-McMoRan, Inc. | 6.875% | 2/15/2023 | 17 | 17,595 | ||||||||
| Glencore Finance Canada Ltd. (Canada)†(c) | 4.25% | 10/25/2022 | 99 | 98,768 | ||||||||
| Glencore Finance Canada Ltd. (Canada)†(c) | 4.95% | 11/15/2021 | 267 | 272,892 | ||||||||
| Glencore Funding LLC† | 3.00% | 10/27/2022 | 11 | 10,501 | ||||||||
| Glencore Funding LLC† | 3.125% | 4/29/2019 | 83 | 82,591 | ||||||||
| Glencore Funding LLC† | 4.125% | 5/30/2023 | 24 | 23,587 | ||||||||
| Glencore Funding LLC† | 4.625% | 4/29/2024 | 16 | 15,916 | ||||||||
| Goldcorp, Inc. (Canada)(c) | 3.625% | 6/9/2021 | 80 | 79,632 | ||||||||
| Goldcorp, Inc. (Canada)(c) | 3.70% | 3/15/2023 | 36 | 35,790 | ||||||||
| Hecla Mining Co. | 6.875% | 5/1/2021 | 23 | 22,612 | ||||||||
| Hudbay Minerals, Inc. (Canada)†(c) | 7.25% | 1/15/2023 | 35 | 34,737 | ||||||||
| Joseph T Ryerson & Son, Inc.† | 11.00% | 5/15/2022 | 35 | 35,350 | ||||||||
| Kinross Gold Corp. (Canada)(c) | 5.125% | 9/1/2021 | 17 | 17,043 | ||||||||
| Kinross Gold Corp. (Canada)(c) | 5.95% | 3/15/2024 | 57 | 57,000 | ||||||||
| Newmont Mining Corp. | 3.50% | 3/15/2022 | 17 | 16,834 | ||||||||
| Newmont Mining Corp. | 5.125% | 10/1/2019 | 67 | 67,680 | ||||||||
| Teck Resources Ltd. (Canada)†(c) | 8.50% | 6/1/2024 | 311 | 333,936 | ||||||||
| Total | 1,544,278 | |||||||||||
| Natural Gas 0.09% | ||||||||||||
| CenterPoint Energy Resources Corp. | 4.50% | 1/15/2021 | 10 | 10,205 | ||||||||
| National Fuel Gas Co. | 3.75% | 3/1/2023 | 8 | 7,813 | ||||||||
| National Fuel Gas Co. | 4.90% | 12/1/2021 | 26 | 26,492 | ||||||||
| National Fuel Gas Co. | 7.395% | 3/30/2023 | 25 | 27,660 | ||||||||
| Total | 72,170 | |||||||||||
| Office Furniture & Business Equipment 0.02% | ||||||||||||
| Xerox Corp. | 3.625% | 3/15/2023 | 7 | 6,303 | ||||||||
| Xerox Corp. | 5.625% | 12/15/2019 | 10 | 10,077 | ||||||||
| Total | 16,380 | |||||||||||
| See Notes to Financial Statements. | 25 |
Schedule of Investments (continued)
December 31, 2018
| Investments | Interest Rate | Maturity Date | Principal Amount (000) | Fair Value | ||||||||
| Oil 3.63% | ||||||||||||
| Anadarko Petroleum Corp. | 4.85% | 3/15/2021 | $ | 29 | $ | 29,706 | ||||||
| Anadarko Petroleum Corp. | 6.95% | 6/15/2019 | 7 | 7,098 | ||||||||
| Antero Resources Corp. | 5.125% | 12/1/2022 | 132 | 124,575 | ||||||||
| Canadian Oil Sands Ltd. (Canada)†(c) | 7.75% | 5/15/2019 | 13 | 13,221 | ||||||||
| Canadian Oil Sands Ltd. (Canada)†(c) | 9.40% | 9/1/2021 | 63 | 70,302 | ||||||||
| Carrizo Oil & Gas, Inc. | 6.25% | 4/15/2023 | 61 | 56,730 | ||||||||
| Cenovus Energy, Inc. (Canada)(c) | 5.70% | 10/15/2019 | 13 | 13,705 | ||||||||
| Chaparral Energy, Inc.† | 8.75% | 7/15/2023 | 82 | 59,040 | ||||||||
| CNOOC Finance 2015 Australia Pty Ltd. (Australia)(c) | 2.625% | 5/5/2020 | 200 | 198,218 | ||||||||
| CNX Resources Corp. | 5.875% | 4/15/2022 | 28 | 26,950 | ||||||||
| Continental Resources, Inc. | 4.50% | 4/15/2023 | 128 | 126,089 | ||||||||
| Continental Resources, Inc. | 5.00% | 9/15/2022 | 329 | 327,031 | ||||||||
| Devon Energy Corp. | 6.30% | 1/15/2019 | 6 | 6,005 | ||||||||
| Diamondback Energy, Inc.† | 4.75% | 11/1/2024 | 45 | 43,650 | ||||||||
| Diamondback Energy, Inc. | 4.75% | 11/1/2024 | 32 | 31,040 | ||||||||
| Eclipse Resources Corp. | 8.875% | 7/15/2023 | 31 | 26,738 | ||||||||
| Encana Corp. (Canada)(c) | 6.50% | 5/15/2019 | 186 | 187,930 | ||||||||
| Energen Corp. | 4.625% | 9/1/2021 | 31 | 30,845 | ||||||||
| Eni SpA (Italy)†(c) | 4.15% | 10/1/2020 | 100 | 100,598 | ||||||||
| Gazprom OAO Via Gaz Capital SA (Luxembourg)†(c) | 6.51% | 3/7/2022 | 100 | 104,679 | ||||||||
| Gulfport Energy Corp. | 6.625% | 5/1/2023 | 33 | 31,350 | ||||||||
| HighPoint Operating Corp. | 7.00% | 10/15/2022 | 17 | 15,555 | ||||||||
| Laredo Petroleum, Inc. | 5.625% | 1/15/2022 | 55 | 49,638 | ||||||||
| Marathon Petroleum Corp.† | 5.375% | 10/1/2022 | 43 | 43,387 | ||||||||
| MEG Energy Corp. (Canada)†(c) | 6.50% | 1/15/2025 | 3 | 3,056 | ||||||||
| Motiva Enterprises LLC† | 5.75% | 1/15/2020 | 37 | 37,654 | ||||||||
| Newfield Exploration Co. | 5.75% | 1/30/2022 | 51 | 51,637 | ||||||||
| Oasis Petroleum, Inc. | 6.875% | 3/15/2022 | 205 | 193,725 | ||||||||
| Petrobras Global Finance BV (Netherlands)(c) | 6.125% | 1/17/2022 | 9 | 9,259 | ||||||||
| Petroleos Mexicanos (Mexico)(c) | 3.50% | 1/30/2023 | 80 | 72,600 | ||||||||
| Petroleos Mexicanos (Mexico)(c) | 4.625% | 9/21/2023 | 178 | 167,498 | ||||||||
| Petroleos Mexicanos (Mexico)(c) | 5.50% | 1/21/2021 | 26 | 25,942 | ||||||||
| Petroleos Mexicanos (Mexico)(c) | 6.375% | 2/4/2021 | 174 | 176,349 | ||||||||
| Phillips 66 | 3.289% (3 Mo. LIBOR + .60% | )# | 2/26/2021 | 19 | 18,793 | |||||||
| Pioneer Natural Resources Co. | 7.50% | 1/15/2020 | 10 | 10,393 | ||||||||
| Range Resources Corp. | 5.00% | 8/15/2022 | 77 | 69,204 | ||||||||
| Range Resources Corp. | 5.00% | 3/15/2023 | 16 | 14,140 | ||||||||
| Range Resources Corp. | 5.75% | 6/1/2021 | 28 | 27,230 | ||||||||
| 26 | See Notes to Financial Statements. |
Schedule of Investments (continued)
December 31, 2018
| Investments | Interest Rate | Maturity Date | Principal Amount (000) | Fair Value | ||||||||
| Oil (continued) | ||||||||||||
| Range Resources Corp. | 5.875% | 7/1/2022 | $ | 13 | $ | 12,090 | ||||||
| Resolute Energy Corp. | 8.50% | 5/1/2020 | 61 | 60,161 | ||||||||
| Sable Permian Resources Land LLC/AEPB Finance Corp.† | 13.00% | 11/30/2020 | 27 | 28,350 | ||||||||
| Seven Generations Energy Ltd. (Canada)†(c) | 6.75% | 5/1/2023 | 81 | 80,595 | ||||||||
| Seven Generations Energy Ltd. (Canada)†(c) | 6.875% | 6/30/2023 | 81 | 80,190 | ||||||||
| SM Energy Co. | 6.125% | 11/15/2022 | 16 | 15,200 | ||||||||
| Total | 2,878,146 | |||||||||||
| Oil: Crude Producers 3.96% | ||||||||||||
| Andeavor Logistics LP/Tesoro Logistics Finance Corp. | 5.50% | 10/15/2019 | 38 | 38,324 | ||||||||
| Andeavor Logistics LP/Tesoro Logistics Finance Corp. | 6.25% | 10/15/2022 | 28 | 28,630 | ||||||||
| Andeavor Logistics LP/Tesoro Logistics Finance Corp. | 6.375% | 5/1/2024 | 149 | 154,401 | ||||||||
| Boardwalk Pipelines LP | 5.75% | 9/15/2019 | 7 | 7,084 | ||||||||
| Buckeye Partners LP | 5.50% | 8/15/2019 | 50 | 50,542 | ||||||||
| Columbia Pipeline Group, Inc. | 3.30% | 6/1/2020 | 110 | 109,643 | ||||||||
| Enable Midstream Partners LP | 2.40% | 5/15/2019 | 50 | 49,721 | ||||||||
| Enable Oklahoma Intrastate Transmission LLC† | 6.25% | 3/15/2020 | 79 | 81,280 | ||||||||
| Enbridge Energy Partners LP | 5.20% | 3/15/2020 | 100 | 102,155 | ||||||||
| Enbridge Energy Partners LP | 9.875% | 3/1/2019 | 110 | 111,134 | ||||||||
| Energy Transfer LP | 4.25% | 3/15/2023 | 99 | 95,535 | ||||||||
| Energy Transfer Operating LP | 4.65% | 6/1/2021 | 40 | 40,717 | ||||||||
| Energy Transfer Operating LP | 9.00% | 4/15/2019 | 222 | 225,761 | ||||||||
| Energy Transfer Operating LP | 9.70% | 3/15/2019 | 129 | 130,539 | ||||||||
| Florida Gas Transmission Co. LLC† | 5.45% | 7/15/2020 | 228 | 234,774 | ||||||||
| Florida Gas Transmission Co. LLC† | 7.90% | 5/15/2019 | 164 | 166,480 | ||||||||
| Gulf South Pipeline Co. LP | 4.00% | 6/15/2022 | 30 | 29,750 | ||||||||
| Kinder Morgan Energy Partners LP | 5.30% | 9/15/2020 | 15 | 15,409 | ||||||||
| Kinder Morgan Energy Partners LP | 5.80% | 3/1/2021 | 62 | 64,733 | ||||||||
| Kinder Morgan Energy Partners LP | 6.50% | 4/1/2020 | 194 | 200,963 | ||||||||
| Kinder Morgan Energy Partners LP | 6.85% | 2/15/2020 | 70 | 72,498 | ||||||||
| Kinder Morgan Energy Partners LP | 9.00% | 2/1/2019 | 112 | 112,486 | ||||||||
| Kinder Morgan, Inc.† | 5.00% | 2/15/2021 | 32 | 32,794 | ||||||||
| Kinder Morgan, Inc.† | 5.625% | 11/15/2023 | 66 | 69,909 | ||||||||
| Kinder Morgan, Inc. | 6.50% | 9/15/2020 | 9 | 9,431 | ||||||||
| Midcontinent Express Pipeline LLC† | 6.70% | 9/15/2019 | 33 | 33,475 | ||||||||
| NGPL PipeCo LLC† | 4.375% | 8/15/2022 | 9 | 8,865 | ||||||||
| Northern Natural Gas Co.† | 4.25% | 6/1/2021 | 14 | 14,284 | ||||||||
| ONEOK Partners LP | 8.625% | 3/1/2019 | 19 | 19,135 | ||||||||
| See Notes to Financial Statements. | 27 |
Schedule of Investments (continued)
December 31, 2018
| Investments | Interest Rate | Maturity Date | Principal Amount (000) | Fair Value | ||||||||
| Oil: Crude Producers (continued) | ||||||||||||
| ONEOK, Inc. | 7.50% | 9/1/2023 | $ | 62 | $ | 70,512 | ||||||
| Rockies Express Pipeline LLC† | 6.00% | 1/15/2019 | 37 | 37,023 | ||||||||
| Sabine Pass Liquefaction LLC | 5.625% | 2/1/2021 | 240 | 247,328 | ||||||||
| Sabine Pass Liquefaction LLC | 5.625% | 4/15/2023 | 400 | 421,789 | ||||||||
| Spectra Energy Partners LP | 4.60% | 6/15/2021 | 5 | 5,141 | ||||||||
| Texas Eastern Transmission LP† | 2.80% | 10/15/2022 | 5 | 4,812 | ||||||||
| Texas Eastern Transmission LP† | 4.125% | 12/1/2020 | 5 | 5,042 | ||||||||
| Texas Gas Transmission LLC† | 4.50% | 2/1/2021 | 25 | 25,275 | ||||||||
| Williams Cos., Inc. (The) | 7.875% | 9/1/2021 | 9 | 9,840 | ||||||||
| Total | 3,137,214 | |||||||||||
| Oil: Integrated Domestic 0.31% | ||||||||||||
| Baker Hughes a GE Co. LLC/Baker Hughes Co-Obligor, Inc. | 2.773% | 12/15/2022 | 2 | 1,920 | ||||||||
| National Oilwell Varco, Inc. | 2.60% | 12/1/2022 | 149 | 140,773 | ||||||||
| SESI LLC | 7.125% | 12/15/2021 | 87 | 74,385 | ||||||||
| TechnipFMC plc (United Kingdom)(c) | 3.45% | 10/1/2022 | 26 | 25,685 | ||||||||
| Total | 242,763 | |||||||||||
| Real Estate Investment Trusts 0.84% | ||||||||||||
| Brixmor Operating Partnership LP | 3.25% | 9/15/2023 | 49 | 47,374 | ||||||||
| Corporate Office Properties LP | 3.70% | 6/15/2021 | 84 | 83,334 | ||||||||
| EPR Properties | 5.25% | 7/15/2023 | 9 | 9,289 | ||||||||
| EPR Properties | 5.75% | 8/15/2022 | 51 | 53,509 | ||||||||
| HCP, Inc. | 4.25% | 11/15/2023 | 5 | 5,013 | ||||||||
| Healthcare Trust of America Holdings LP | 2.95% | 7/1/2022 | 10 | 9,727 | ||||||||
| Highwoods Realty LP | 3.20% | 6/15/2021 | 8 | 7,907 | ||||||||
| Reckson Operating Partnership LP | 7.75% | 3/15/2020 | 75 | 78,493 | ||||||||
| Senior Housing Properties Trust | 3.25% | 5/1/2019 | 51 | 50,749 | ||||||||
| SITE Centers Corp. | 4.625% | 7/15/2022 | 11 | 11,302 | ||||||||
| SL Green Operating Partnership LP | 3.25% | 10/15/2022 | 3 | 2,901 | ||||||||
| SL Green Realty Corp. | 4.50% | 12/1/2022 | 26 | 26,333 | ||||||||
| Vereit Operating Partnership LP | 3.00% | 2/6/2019 | 123 | 122,929 | ||||||||
| Vereit Operating Partnership LP | 4.125% | 6/1/2021 | 41 | 41,397 | ||||||||
| Vereit Operating Partnership LP | 4.60% | 2/6/2024 | 83 | 83,998 | ||||||||
| Welltower, Inc. | 4.50% | 1/15/2024 | 6 | 6,159 | ||||||||
| Weyerhaeuser Co. | 4.70% | 3/15/2021 | 25 | 25,633 | ||||||||
| Weyerhaeuser Co. | 7.375% | 10/1/2019 | 2 | 2,055 | ||||||||
| Total | 668,102 | |||||||||||
| 28 | See Notes to Financial Statements. |
Schedule of Investments (continued)
December 31, 2018
| Investments | Interest Rate | Maturity Date | Principal Amount (000) | Fair Value | ||||||||
| Retail 0.02% | ||||||||||||
| Dollar Tree, Inc. | 3.70% | 5/15/2023 | $ | 18 | $ | 17,619 | ||||||
| Savings & Loan 0.13% | ||||||||||||
| People’s United Financial, Inc. | 3.65% | 12/6/2022 | 102 | 102,174 | ||||||||
| Technology 0.86% | ||||||||||||
| Alibaba Group Holding Ltd. (China)(c) | 2.80% | 6/6/2023 | 200 | 193,709 | ||||||||
| Baidu, Inc. (China)(c) | 3.875% | 9/29/2023 | 200 | 199,395 | ||||||||
| Baidu, Inc. (China)(c) | 4.375% | 5/14/2024 | 200 | 202,045 | ||||||||
| eBay, Inc. | 3.021% (3 Mo. LIBOR + .48% | )# | 8/1/2019 | 75 | 74,951 | |||||||
| VeriSign, Inc. | 4.625% | 5/1/2023 | 8 | 7,900 | ||||||||
| Total | 678,000 | |||||||||||
| Telecommunications 0.30% | ||||||||||||
| AT&T, Inc. | 3.956% (3 Mo. LIBOR + 1.18% | )# | 6/12/2024 | 18 | 17,473 | |||||||
| Level 3 Parent LLC | 5.75% | 12/1/2022 | 31 | 30,522 | ||||||||
| T-Mobile USA, Inc. | 6.00% | 4/15/2024 | 73 | 73,183 | ||||||||
| Vodafone Group plc (United Kingdom)(c) | 3.426% (3 Mo. LIBOR + .99% | )# | 1/16/2024 | 47 | 45,879 | |||||||
| Vodafone Group plc (United Kingdom)(c) | 3.75% | 1/16/2024 | 70 | 69,068 | ||||||||
| Total | 236,125 | |||||||||||
| Toys 0.01% | ||||||||||||
| Mattel, Inc. | 2.35% | 8/15/2021 | 9 | 8,010 | ||||||||
| Transportation: Miscellaneous 0.06% | ||||||||||||
| Watco Cos. LLC/Watco Finance Corp.† | 6.375% | 4/1/2023 | 25 | 25,188 | ||||||||
| XPO Logistics, Inc.† | 6.50% | 6/15/2022 | 25 | 24,875 | ||||||||
| Total | 50,063 | |||||||||||
| Utilities 0.01% | ||||||||||||
| United Utilities plc (United Kingdom)(c) | 5.375% | 2/1/2019 | 10 | 10,014 | ||||||||
| Total Corporate Bonds (cost $29,482,658) | 29,033,714 | |||||||||||
| FLOATING RATE LOANS(e)1.46% | ||||||||||||
| Aerospace/Defense 0.01% | ||||||||||||
| Gol Luxco SA Term Loan (Luxembourg)(c) | 6.50% | 8/31/2020 | 6 | 6,154 | ||||||||
| Air Transportation 0.04% | ||||||||||||
| American Airlines, Inc. 2017 Replacement Term Loan | – | (f) | 10/10/2021 | 34 | 33,121 | |||||||
| See Notes to Financial Statements. | 29 |
Schedule of Investments (continued)
December 31, 2018
| Investments | Interest Rate | Maturity Date | Principal Amount (000) | Fair Value | ||||||||
| Computer Hardware 0.23% | ||||||||||||
| Dell International LLC Replacement Term Loan A2 | 4.28% (1 Mo. LIBOR + 1.75% | ) | 9/7/2021 | $ | 185 | $ | 180,174 | |||||
| Containers 0.06% | ||||||||||||
| Ball Corp. Dollar Term Loan A | 4.022% (1 Mo. LIBOR + 1.50% | ) | 3/18/2021 | 43 | 42,527 | |||||||
| Berry Global, Inc. Term Loan S | – | (f) | 2/8/2020 | 4 | 3,944 | |||||||
| Berry Global, Inc. Term Loan T | – | (f) | 1/6/2021 | 4 | 3,917 | |||||||
| Total | 50,388 | |||||||||||
| Electrical Equipment 0.16% | ||||||||||||
| Analog Devices, Inc. Three Year Term Loan | 3.475% (1 Mo. LIBOR + 1.13% | ) | 3/10/2020 | 20 | 20,205 | (g) | ||||||
| Marvell Technology Group Ltd Term Loan A | 3.755% (3 Mo. LIBOR + 1.38% | ) | 7/6/2021 | 103 | 103,240 | |||||||
| Total | 123,445 | |||||||||||
| Entertainment 0.03% | ||||||||||||
| GLP Capital, L.P. Incremental Tranche A1 Term Loan | 4.004% (1 Mo. LIBOR + 1.50% | ) | 4/28/2021 | 16 | 15,710 | |||||||
| Yonkers Racing Corp. 1st Lien Initial Term Loan | 7.75% (3 Mo. Prime + 2.25% | ) | 5/31/2024 | 12 | 12,058 | |||||||
| Total | 27,768 | |||||||||||
| Financial Services 0.05% | ||||||||||||
| Delos Finance 2018 Sarl New Term Loan (Luxembourg)(c) | 4.553% (3 Mo. LIBOR + 1.75% | ) | 10/6/2023 | 32 | 31,561 | |||||||
| Flying Fortress Holdings, LLC 2018 New Term Loan | – | (f) | 10/30/2022 | 9 | 8,845 | |||||||
| Total | 40,406 | |||||||||||
| Health Care Products 0.03% | ||||||||||||
| Zimmer Biomet Holdings, Inc. Term Loan | 3.69% (1 Mo. LIBOR + 1.25% | ) | 9/30/2019 | 21 | 21,180 | (g) | ||||||
| Investment Management Companies 0.04% | ||||||||||||
| RPI Finance Trust Term Loan A4 | 4.022% (1 Mo. LIBOR + 1.50% | ) | 5/4/2022 | 30 | 28,959 | |||||||
| Lodging 0.04% | ||||||||||||
| Hilton Worldwide Finance, LLC Term Loan B2 | – | (f) | 10/25/2023 | 36 | 34,418 | |||||||
| Machinery: Industrial/Specialty 0.03% | ||||||||||||
| Flowserve Corp. 2012 Term Loan | 4.303% (3 Mo. LIBOR + 1.50% | ) | 10/14/2020 | 22 | 21,670 | (g) | ||||||
| 30 | See Notes to Financial Statements. |
Schedule of Investments (continued)
December 31, 2018
| Investments | Interest Rate | Maturity Date | Principal Amount (000) | Fair Value | ||||||||
| Manufacturing 0.01% | ||||||||||||
| Tyco International Holding S.a.r.I. Term Loan (Luxembourg)(c) | 4.158% (3 Mo. LIBOR + 1.25% | ) | 3/2/2020 | $ | 10 | $ | 10,426 | |||||
| Media 0.04% | ||||||||||||
| Unitymedia Hessen GmbH & Co. KG Facility Term Loan B | 4.705% (1 Mo. LIBOR + 2.25% | ) | 9/30/2025 | 32 | 31,008 | |||||||
| Metal Fabricating 0.01% | ||||||||||||
| Doncasters US Finance LLC 2nd Lien Term Loan | 11.053% (3 Mo. LIBOR + 8.25% | ) | 10/9/2020 | 8 | 6,325 | |||||||
| Miscellaneous 0.05% | ||||||||||||
| Reynolds Group Holdings Inc. Incremental U.S. Term Loan | – | (f) | 2/5/2023 | 26 | 24,841 | |||||||
| Utex Industries, Inc. 1st Lien Initial Term Loan | 6.522% (1 Mo. LIBOR + 4.00% | ) | 5/21/2021 | 14 | 12,730 | |||||||
| Utex Industries, Inc. 2nd Lien Initial Term Loan | 9.772% (1 Mo. LIBOR + 7.25% | ) | 5/20/2022 | 6 | 5,190 | |||||||
| Total | 42,761 | |||||||||||
| Oil 0.02% | ||||||||||||
| Petroleos Mexicanos Term Loan (Mexico)(c) | 3.31% (1 Mo. LIBOR + .85% | ) | 2/14/2020 | 20 | 19,900 | (g) | ||||||
| Oil: Crude Producers 0.02% | ||||||||||||
| Buckeye Partners LP Delayed Draw Term Loan | 3.88% (1 Mo. LIBOR + 1.35% | ) | 9/30/2019 | 17 | 16,957 | (g) | ||||||
| Real Estate Investment Trusts 0.13% | ||||||||||||
| Invitation Homes Operating Partnership LP Initial Term Loan | 4.204% (1 Mo. LIBOR + 1.70% | ) | 2/6/2022 | 106 | 102,290 | (g) | ||||||
| Retail 0.27% | ||||||||||||
| Panera Bread Co. Term Loan | 4.25% (1 Mo. LIBOR + 1.75% | ) | 7/18/2022 | 86 | 82,934 | |||||||
| PVH Corp. Tranche A Term Loan | 3.955% (1 Mo. LIBOR + 1.50% | ) | 5/19/2021 | 128 | 127,388 | |||||||
| Total | 210,322 | |||||||||||
| Technology 0.00% | ||||||||||||
| Symantec Corp. Term Loan A2 | 4.063% (1 Mo. LIBOR + 1.50% | ) | 8/1/2019 | 2 | 1,491 | |||||||
| See Notes to Financial Statements. | 31 |
Schedule of Investments (continued)
December 31, 2018
| Investments | Interest Rate | Maturity Date | Principal Amount (000) | Fair Value | ||||||||
| Telecommunications 0.19% | ||||||||||||
| AT&T Inc. Advance Tranche A Term Loan | 3.595% (1 Mo. LIBOR + 1.13% | ) | 12/14/2020 | $ | 66 | $ | 66,151 | |||||
| CenturyLink, Inc. Initial Term Loan A | 5.272% (1 Mo. LIBOR + 2.75% | ) | 11/1/2022 | 85 | 82,648 | |||||||
| Total | 148,799 | |||||||||||
| Total Floating Rate Loans (cost $1,174,038) | 1,157,962 | |||||||||||
| FOREIGN GOVERNMENT OBLIGATIONS 0.16% | ||||||||||||
| Argentina | ||||||||||||
| Republic of Argentina(c) | 4.625% | 1/11/2023 | 130 | 103,106 | ||||||||
| Republic of Argentina(c) | 5.625% | 1/26/2022 | 25 | 21,188 | ||||||||
| Total | 124,294 | |||||||||||
| Total Foreign Government Obligations(cost $139,737) | 124,294 | |||||||||||
| GOVERNMENT SPONSORED ENTERPRISES COLLATERALIZED MORTGAGE OBLIGATIONS 1.61% | ||||||||||||
| Government National Mortgage Assoc. 2014-64 A | 2.20% | 2/16/2045 | 23 | 22,860 | ||||||||
| Government National Mortgage Assoc. 2014-64 IO | 1.158% | #(h) | 12/16/2054 | 279 | 15,397 | |||||||
| Government National Mortgage Assoc. 2014-78 A | 2.20% | 4/16/2047 | 1 | (a) | 581 | |||||||
| Government National Mortgage Assoc. 2014-78 IO | 0.57% | #(h) | 3/16/2056 | 53 | 1,740 | |||||||
| Government National Mortgage Assoc. 2014-109 A | 2.325% | 1/16/2046 | 11 | 11,066 | ||||||||
| Government National Mortgage Assoc. 2014-112 A | 3.00% | #(h) | 1/16/2048 | 5 | 5,397 | |||||||
| Government National Mortgage Assoc. 2014-135 AS | 2.30% | 2/16/2047 | 16 | 15,270 | ||||||||
| Government National Mortgage Assoc. 2015-48 AS | 2.90% | #(h) | 2/16/2049 | 26 | 25,383 | |||||||
| Government National Mortgage Assoc. 2015-73 AC | 2.90% | #(h) | 2/16/2053 | 38 | 37,277 | |||||||
| Government National Mortgage Assoc. 2017 20 AS | 2.50% | 2/16/2057 | 55 | 52,531 | ||||||||
| Government National Mortgage Assoc. 2017-22 GA | 2.60% | #(h) | 8/16/2051 | 28 | 26,372 | |||||||
| Government National Mortgage Assoc. 2017 23 AB | 2.60% | 12/16/2057 | 39 | 37,252 | ||||||||
| Government National Mortgage Assoc. 2017-28 AB | 2.50% | 10/16/2051 | 66 | 62,149 | ||||||||
| Government National Mortgage Assoc. 2017-44 AD | 2.65% | 11/17/2048 | 57 | 54,766 | ||||||||
| Government National Mortgage Assoc. 2017-51 AS | 2.75% | 4/16/2058 | 89 | 86,265 | ||||||||
| Government National Mortgage Assoc. 2017-53 B | 2.75% | 3/16/2050 | 86 | 83,570 | ||||||||
| Government National Mortgage Assoc. 2017-54 AD | 2.75% | 1/16/2057 | 82 | 79,346 | ||||||||
| Government National Mortgage Assoc. 2017-61 A | 2.60% | 8/16/2058 | 59 | 56,535 | ||||||||
| Government National Mortgage Assoc. 2017-69 AS | 2.75% | 2/16/2058 | 73 | 70,646 | ||||||||
| Government National Mortgage Assoc. 2017-71 AS | 2.70% | 4/16/2057 | 48 | 46,046 | ||||||||
| Government National Mortgage Assoc. 2017-72 AM | 2.60% | 9/16/2051 | 29 | 27,864 | ||||||||
| Government National Mortgage Assoc. 2017-74 AS | 2.60% | 10/16/2057 | 29 | 28,111 | ||||||||
| Government National Mortgage Assoc. 2017-76 AS | 2.65% | 11/16/2050 | 59 | 56,911 | ||||||||
| Government National Mortgage Assoc. 2017-89 AB | 2.60% | 7/16/2058 | 47 | 44,006 | ||||||||
| 32 | See Notes to Financial Statements. |
Schedule of Investments (continued)
December 31, 2018
| Investments | Interest Rate | Maturity Date | Principal Amount (000) | Fair Value | ||||||||
| GOVERNMENT SPONSORED ENTERPRISES COLLATERALIZED MORTGAGE OBLIGATIONS (continued) | ||||||||||||
| Government National Mortgage Assoc. 2017-90 AS | 2.70% | 7/16/2057 | $ | 65 | $ | 62,601 | ||||||
| Government National Mortgage Assoc. 2017-92 AS | 2.75% | 6/16/2058 | 59 | 56,880 | ||||||||
| Government National Mortgage Assoc. 2017-100 AS | 2.75% | 2/16/2058 | 48 | 46,440 | ||||||||
| Government National Mortgage Assoc. 2017-168 AS | 2.70% | 8/16/2058 | 169 | 162,209 | ||||||||
| Total Government Sponsored Enterprises Collateralized Mortgage Obligations (cost $1,325,382) | 1,275,471 | |||||||||||
| GOVERNMENT SPONSORED ENTERPRISES PASS-THROUGHS 0.26% | ||||||||||||
| Federal Home Loan Mortgage Corp. | 3.106% (12 Mo. LIBOR + 1.64% | )# | 10/1/2043 | 8 | 7,647 | |||||||
| Federal Home Loan Mortgage Corp. | 4.019% (12 Mo. LIBOR + 1.84% | )# | 6/1/2042 | 6 | 6,663 | |||||||
| Federal Home Loan Mortgage Corp. | 4.407% (12 Mo. LIBOR + 1.81% | )# | 6/1/2041 | 9 | 9,700 | |||||||
| Federal Home Loan Mortgage Corp. | 4.616% (12 Mo. LIBOR + 1.90% | )# | 12/1/2040 | 14 | 15,088 | |||||||
| Federal National Mortgage Assoc. | 2.679% (12 Mo. LIBOR + 1.60% | )# | 12/1/2045 | 7 | 7,280 | |||||||
| Federal National Mortgage Assoc. | 2.717% (12 Mo. LIBOR + 1.60% | )# | 12/1/2045 | 27 | 27,548 | |||||||
| Federal National Mortgage Assoc. | 2.825% (12 Mo. LIBOR + 1.60% | )# | 10/1/2045 | 9 | 8,734 | |||||||
| Federal National Mortgage Assoc. | 2.923% (12 Mo. LIBOR + 1.72% | )# | 6/1/2042 | 18 | 17,644 | |||||||
| Federal National Mortgage Assoc. | 3.673% (12 Mo. LIBOR + 1.82% | )# | 1/1/2042 | 31 | 31,934 | |||||||
| Federal National Mortgage Assoc. | 3.961% (12 Mo. LIBOR + 1.78% | )# | 3/1/2042 | 12 | 12,472 | |||||||
| Federal National Mortgage Assoc. | 3.982% (12 Mo. LIBOR + 1.82% | )# | 4/1/2040 | 22 | 23,299 | |||||||
| Federal National Mortgage Assoc. | 4.216% (12 Mo. LIBOR + 1.78% | )# | 10/1/2036 | 30 | 31,652 | |||||||
| Federal National Mortgage Assoc. | 4.428% (12 Mo. LIBOR + 1.82% | )# | 12/1/2040 | 2 | 2,283 | |||||||
| Federal National Mortgage Assoc. | 4.512% (12 Mo. LIBOR + 1.80% | )# | 10/1/2040 | 1 | (a) | 610 | ||||||
| Federal National Mortgage Assoc. | 4.528% (12 Mo. LIBOR + 1.81% | )# | 12/1/2040 | 1 | 1,111 | |||||||
| Total Government Sponsored Enterprises Pass-Throughs (cost $206,981) | 203,665 | |||||||||||
| See Notes to Financial Statements. | 33 |
Schedule of Investments (continued)
December 31, 2018
| Investments | Interest Rate | Maturity Date | Principal Amount (000) | Fair Value | ||||||||
| MUNICIPAL BONDS 0.10% | ||||||||||||
| Miscellaneous | ||||||||||||
| Illinois | 4.95% | 6/1/2023 | $ | 7 | $ | 7,111 | ||||||
| Illinois | 5.877% | 3/1/2019 | 75 | 75,334 | ||||||||
| Total | 82,445 | |||||||||||
| Total Municipal Bonds (cost $82,334) | 82,445 | |||||||||||
| NON-AGENCY COMMERCIAL MORTGAGE-BACKED SECURITIES 24.86% | ||||||||||||
| Americold LLC 2010-ARTA A1† | 3.847% | 1/14/2029 | 25 | 25,280 | ||||||||
| AOA Mortgage Trust 2015-1177 A† | 2.957% | 12/13/2029 | 100 | 99,590 | ||||||||
| AREIT Trust 2018-CRE2 A† | 3.287% (1 Mo. LIBOR + .98%% | )# | 11/14/2035 | 100 | 100,187 | |||||||
| Atrium Hotel Portfolio Trust 2017-ATRM A† | 3.385% (1 Mo. LIBOR + .93% | )# | 12/15/2036 | 100 | 99,283 | |||||||
| Atrium Hotel Portfolio Trust 2018-ATRM A† | 3.405% (1 Mo. LIBOR + .95% | )# | 6/15/2035 | 100 | 99,608 | |||||||
| Atrium Hotel Portfolio Trust 2018-ATRM B† | 3.885% (1 Mo. LIBOR + 1.43% | )# | 6/15/2035 | 100 | 99,386 | |||||||
| Atrium Hotel Portfolio Trust 2018-ATRM C† | 4.105% (1 Mo. LIBOR + 1.65% | )# | 6/15/2035 | 100 | 99,278 | |||||||
| Aventura Mall Trust 2013-AVM C† | 3.743% | #(h) | 12/5/2032 | 100 | 101,671 | |||||||
| BAMLL Trust 2011-FSHN A† | 4.42% | 7/11/2033 | 100 | 102,731 | ||||||||
| Bancorp Commercial Mortgage Trust (The) 2018-CR3 A† | 3.305% (1 Mo. LIBOR + .85% | )# | 1/15/2033 | 52 | 51,318 | |||||||
| BB-UBS Trust 2012-TFT A† | 2.892% | 6/5/2030 | 200 | 196,897 | ||||||||
| BB-UBS Trust 2012-TFT B† | 3.468% | #(h) | 6/5/2030 | 100 | 97,546 | |||||||
| BB-UBS Trust 2012-TFT C† | 3.468% | #(h) | 6/5/2030 | 100 | 97,136 | |||||||
| BBCMS Mortgage Trust 2018-TALL A† | 3.177% (1 Mo. LIBOR + .72% | )# | 3/15/2037 | 200 | 196,822 | |||||||
| BBCMS Mortgage Trust 2018-TALL E† | 4.892% (1 Mo. LIBOR + 2.44% | )# | 3/15/2037 | 132 | 128,693 | |||||||
| BBCMS Trust 2018-BXH A† | 3.455% (1 Mo. LIBOR + 1.00%% | )# | 10/15/2037 | 82 | 81,514 | |||||||
| BDS 2018-FL1 A† | 3.305% (1 Mo. LIBOR + .85% | )# | 1/15/2035 | 86 | 84,697 | |||||||
| Bear Stearns Commercial Mortgage Securities Trust 2004-PWR6 E† | 5.406% | #(h) | 11/11/2041 | 15 | 15,064 | |||||||
| Bear Stearns Commercial Mortgage Securities Trust 2004-PWR6 F† | 5.677% | #(h) | 11/11/2041 | 25 | 25,133 | |||||||
| BX Commercial Mortgage Trust 2018-BIOA A† | 3.126% (1 Mo. LIBOR + .67% | )# | 3/15/2037 | 209 | 205,308 | |||||||
| BX Trust 2017-SLCT A† | 3.375% (1 Mo. LIBOR + .92% | )# | 7/15/2034 | 40 | 39,312 | |||||||
| BX Trust 2017-SLCT B† | 3.655% (1 Mo. LIBOR + 1.20% | )# | 7/15/2034 | 40 | 39,532 | |||||||
| 34 | See Notes to Financial Statements. |
Schedule of Investments (continued)
December 31, 2018
| Investments | Interest Rate | Maturity Date | Principal Amount (000) | Fair Value | ||||||||
| NON-AGENCY COMMERCIAL MORTGAGE-BACKED SECURITIES (continued) | ||||||||||||
| BX Trust 2017-SLCT D† | 4.505% (1 Mo. LIBOR + 2.05% | )# | 7/15/2034 | $ | 62 | $ | 61,160 | |||||
| BX Trust 2017-SLCT E† | 5.605% (1 Mo. LIBOR + 3.15% | )# | 7/15/2034 | 51 | 50,525 | |||||||
| BX Trust 2018-BILT A† | 3.255% (1 Mo. LIBOR + .80% Floor .80% | )# | 5/15/2030 | 46 | 45,743 | |||||||
| BX Trust 2018-BILT D† | 4.225% (1 Mo. LIBOR + 1.77% Floor 1.77% | )# | 5/15/2030 | 19 | 18,835 | |||||||
| BX Trust 2018-GW A† | 3.255% (1 Mo. LIBOR + .80% | )# | 5/15/2035 | 29 | 28,425 | |||||||
| BX Trust 2018-GW D† | 4.225% (1 Mo. LIBOR + 1.77% Floor 1.77% | )# | 5/15/2035 | 15 | 14,734 | |||||||
| BXP Trust 2017-CQHP A† | 3.305% (1 Mo. LIBOR + .85% | )# | 11/15/2034 | 43 | 42,491 | |||||||
| Caesars Palace Las Vegas Trust 2017-VICI A† | 3.531% | 10/15/2034 | 371 | 373,525 | ||||||||
| Caesars Palace Las Vegas Trust 2017-VICI B† | 3.835% | 10/15/2034 | 140 | 140,532 | ||||||||
| Caesars Palace Las Vegas Trust 2017-VICI C† | 4.138% | 10/15/2034 | 166 | 166,948 | ||||||||
| Caesars Palace Las Vegas Trust 2017-VICI D† | 4.354% | #(h) | 10/15/2034 | 40 | 40,080 | |||||||
| Caesars Palace Las Vegas Trust 2017-VICI E† | 4.354% | #(h) | 10/15/2034 | 300 | 293,554 | |||||||
| Caesars Palace Las Vegas Trust 2017-VICI XA IO† | 0.823% | #(h) | 10/15/2034 | 1,000 | 28,863 | |||||||
| Caesars Palace Las Vegas Trust 2017-VICI XB IO† | 0.393% | #(h) | 10/15/2034 | 1,000 | 14,715 | |||||||
| CCRESG Commercial Mortgage Trust 2016-HEAT B† | 4.114% | 4/10/2029 | 29 | 29,280 | ||||||||
| CCRESG Commercial Mortgage Trust 2016-HEAT C† | 4.919% | 4/10/2029 | 29 | 29,558 | ||||||||
| CFCRE Commercial Mortgage Trust 2016-C6 XA IO | 1.187% | #(h) | 11/10/2049 | 192 | 13,593 | |||||||
| CFCRE Commercial Mortgage Trust 2016-C7 XA IO | 0.753% | #(h) | 12/10/2054 | 188 | 9,013 | |||||||
| CFCRE Commercial Mortgage Trust 2018-TAN A† | 4.236% | 2/15/2033 | 134 | 137,647 | ||||||||
| CHT Mortgage Trust 2017-CSMO A† | 3.385% (1 Mo. LIBOR + 1.93% | )# | 11/15/2036 | 282 | 279,013 | |||||||
| CHT Mortgage Trust 2017-CSMO B† | 3.855% (1 Mo. LIBOR + 1.40% | )# | 11/15/2036 | 100 | 98,990 | |||||||
| CHT Mortgage Trust 2017-CSMO D† | 4.705% (1 Mo. LIBOR + 2.25% | )# | 11/15/2036 | 100 | 98,038 | |||||||
| Citigroup Commercial Mortgage Trust 2013-375P A† | 3.251% | 5/10/2035 | 100 | 99,904 | ||||||||
| Citigroup Commercial Mortgage Trust 2013-375P B† | 3.518% | #(h) | 5/10/2035 | 110 | 109,585 | |||||||
| Citigroup Commercial Mortgage Trust 2015-GC27 AAB | 2.944% | 2/10/2048 | 10 | 9,920 | ||||||||
| Citigroup Commercial Mortgage Trust 2015-GC31 XA IO | 0.401% | #(h) | 6/10/2048 | 961 | 20,455 | |||||||
| Citigroup Commercial Mortgage Trust 2015-SHP2 XCP IO† | Zero Coupon | #(h) | 7/15/2027 | 46,545 | 382 | |||||||
| Cold Storage Trust 2017-ICE3 A† | 3.455% (1 Mo. LIBOR + 1.00% | )# | 4/15/2036 | 100 | 98,354 | |||||||
| See Notes to Financial Statements. | 35 |
Schedule of Investments (continued)
December 31, 2018
| Investments | Interest Rate | Maturity Date | Principal Amount (000) | Fair Value | ||||||||
| NON-AGENCY COMMERCIAL MORTGAGE-BACKED SECURITIES (continued) | ||||||||||||
| Commercial Mortgage Loan Trust 2008-LS1 ASM | 6.05% | #(h) | 12/10/2049 | $ | 3 | $ | 2,672 | |||||
| Commercial Mortgage Pass-Through Certificates 2012-CR3 B† | 3.922% | 10/15/2045 | 200 | 199,019 | ||||||||
| Commercial Mortgage Pass-Through Certificates 2012-LTRT A2† | 3.40% | 10/5/2030 | 100 | 98,007 | ||||||||
| Commercial Mortgage Pass-Through Certificates 2013-CR11 A2 | 3.047% | 8/10/2050 | 20 | 19,983 | ||||||||
| Commercial Mortgage Pass-Through Certificates 2013-CR7 A4 | 3.213% | 3/10/2046 | 94 | 94,166 | ||||||||
| Commercial Mortgage Pass-Through Certificates 2013-SFS A1† | 1.873% | 4/12/2035 | 94 | 91,699 | ||||||||
| Commercial Mortgage Pass-Through Certificates 2014-CR18 A5 | 3.828% | 7/15/2047 | 70 | 71,502 | ||||||||
| Commercial Mortgage Pass-Through Certificates 2014-CR19 A4 | 3.532% | 8/10/2047 | 33 | 33,296 | ||||||||
| Commercial Mortgage Pass-Through Certificates 2014-LC15 A3 | 3.727% | 4/10/2047 | 100 | 101,888 | ||||||||
| Commercial Mortgage Pass-Through Certificates 2014-UBS3 A4 | 3.819% | 6/10/2047 | 13 | 13,284 | ||||||||
| Commercial Mortgage Pass-Through Certificates 2014-UBS5 XB1 IO† | 0.097% | #(h) | 9/10/2047 | 2,000 | 16,809 | |||||||
| Commercial Mortgage Pass-Through Certificates 2015-PC1 XA IO† | 0.717% | #(h) | 7/10/2050 | 96 | 2,904 | |||||||
| Commercial Mortgage Pass-Through Certificates 2016-GCT C† | 3.461% | #(h) | 8/10/2029 | 319 | 314,694 | |||||||
| Commercial Mortgage Pass-Through Certificates 2016-GCT D† | 3.461% | #(h) | 8/10/2029 | 100 | 97,932 | |||||||
| Commercial Mortgage Pass-Through Certificates 2016-GCT XA IO† | 0.784% | 8/10/2029 | 4,000 | 64,620 | ||||||||
| Commercial Mortgage Pass-Through Certificates 2016-SAVA A† | 4.069% (1 Mo. LIBOR + 1.72% | )# | 10/15/2034 | 67 | 66,940 | |||||||
| Commercial Mortgage Pass-Through Certificates 2016-SAVA B† | 4.649% (1 Mo. LIBOR + 2.30% | )# | 10/15/2034 | 100 | 100,141 | |||||||
| Commercial Mortgage Trust 2016-CD1 XA IO | 1.425% | #(h) | 8/10/2049 | 56 | 4,434 | |||||||
| Core Industrial Trust 2015-CALW XA IO† | 0.81% | #(h) | 2/10/2034 | 954 | 20,497 | |||||||
| Credit Suisse First Boston Mortgage Securities Corp. 2006-OMA B1† | 5.466% | 5/15/2023 | 31 | 31,569 | ||||||||
| Credit Suisse First Boston Mortgage Securities Corp. 2006-OMA B2† | 5.538% | 5/15/2023 | 200 | 203,687 | ||||||||
| Credit Suisse Mortgage Capital Certificates 2014-USA X1 IO† | 0.552% | #(h) | 9/15/2037 | 1,000 | 29,721 | |||||||
| 36 | See Notes to Financial Statements. |
Schedule of Investments (continued)
December 31, 2018
| Investments | Interest Rate | Maturity Date | Principal Amount (000) | Fair Value | ||||||||
| NON-AGENCY COMMERCIAL MORTGAGE-BACKED SECURITIES (continued) | ||||||||||||
| Credit Suisse Mortgage Capital Certificates 2016-MFF B† | 4.955% (1 Mo. LIBOR + 2.50% | )# | 11/15/2033 | $ | 50 | $ | 50,095 | |||||
| Credit Suisse Mortgage Capital Certificates 2016-MFF C† | 5.955% (1 Mo. LIBOR + 3.50% | )# | 11/15/2033 | 50 | 50,196 | |||||||
| Credit Suisse Mortgage Capital Certificates 2017-HD A† | 3.405% (1 Mo. LIBOR + .95% | )# | 2/15/2031 | 50 | 49,819 | |||||||
| Credit Suisse Mortgage Capital Certificates 2017-HD D† | 4.955% (1 Mo. LIBOR + 2.50% | )# | 2/15/2031 | 50 | 49,769 | |||||||
| Credit Suisse Mortgage Capital Certificates 2017-LSTK A† | 2.761% | 4/5/2033 | 364 | 360,951 | ||||||||
| Credit Suisse Mortgage Capital Certificates 2017-LSTK B† | 3.03% | 4/5/2033 | 50 | 49,434 | ||||||||
| Credit Suisse Mortgage Capital Certificates 2017-LSTK C† | 3.229% | 4/5/2033 | 50 | 49,353 | ||||||||
| Credit Suisse Mortgage Capital Certificates 2017-LSTK D† | 3.331% | #(h) | 4/5/2033 | 50 | 49,053 | |||||||
| Credit Suisse Mortgage Capital Certificates 2017-MOON A† | 3.197% | 7/10/2034 | 60 | 60,125 | ||||||||
| Credit Suisse Mortgage Capital Certificates 2017-MOON B† | 3.197% | #(h) | 7/10/2034 | 50 | 49,785 | |||||||
| Credit Suisse Mortgage Capital Certificates 2017-MOON C† | 3.197% | #(h) | 7/10/2034 | 109 | 107,435 | |||||||
| Credit Suisse Mortgage Capital Certificates 2017-MOON D† | 3.197% | #(h) | 7/10/2034 | 50 | 48,344 | |||||||
| Credit Suisse Mortgage Capital Certificates 2017-MOON X IO† | 0.09% | #(h) | 7/10/2034 | 28,675 | 34,783 | |||||||
| Credit Suisse Mortgage Capital Certificates Trust 2017-PFHP A† | 3.405% (1 Mo. LIBOR + .95% | )# | 12/15/2030 | 50 | 49,841 | |||||||
| CSAIL Commercial Mortgage Trust 2015-C4 A2 | 3.157% | 11/15/2048 | 10 | 9,974 | ||||||||
| CSAIL Commercial Mortgage Trust 2016-C6 XA IO | 1.795% | #(h) | 1/15/2049 | 984 | 87,562 | |||||||
| DBGS Mortgage Trust 2018-BIOD A† | 3.258% (1 Mo. LIBOR + .80% | )# | 5/15/2035 | 93 | 92,463 | |||||||
| DBJPM Mortgage Trust 2016-C3 XA IO | 1.50% | #(h) | 9/10/2049 | 197 | 17,528 | |||||||
| DBUBS Mortgage Trust 2011-LC2A A4† | 4.537% | 7/10/2044 | 100 | 102,849 | ||||||||
| DBWF Mortgage Trust 2015-LCM A1† | 2.998% | 6/10/2034 | 18 | 17,654 | ||||||||
| DBWF Mortgage Trust 2016-85T XA IO† | 0.014% | #(h) | 12/10/2036 | 3,140 | 11,775 | |||||||
| DBWF Mortgage Trust 2018-AMXP A† | 3.747% | #(h) | 5/5/2035 | 325 | 329,929 | |||||||
| DBWF Mortgage Trust 2018-AMXP B† | 3.996% | #(h) | 5/5/2035 | 100 | 101,516 | |||||||
| DBWF Mortgage Trust 2018-AMXP C† | 3.83% | #(h) | 5/5/2035 | 100 | 100,658 | |||||||
| DBWF Mortgage Trust 2018-GLKS A† | 3.41% (1 Mo. LIBOR + 1.03% | )# | 11/19/2035 | 134 | 133,776 | |||||||
| See Notes to Financial Statements. | 37 |
Schedule of Investments (continued)
December 31, 2018
| Investments | Interest Rate | Maturity Date | Principal Amount (000) | Fair Value | ||||||||
| NON-AGENCY COMMERCIAL MORTGAGE-BACKED SECURITIES (continued) | ||||||||||||
| DBWF Mortgage Trust 2018-GLKS B† | 3.73% (1 Mo. LIBOR + 1.35% | )# | 11/19/2035 | $ | 100 | $ | 99,950 | |||||
| DBWF Mortgage Trust 2018-GLKS C† | 4.13% (1 Mo. LIBOR + 1.75% | )# | 11/19/2035 | 100 | 99,955 | |||||||
| DBWF Mortgage Trust 2018-GLKS D† | 4.78% (1 Mo. LIBOR + 2.40% | )# | 11/19/2035 | 100 | 99,980 | |||||||
| GAHR Commercial Mortgage Trust 2015-NRF BFX† | 3.382% | #(h) | 12/15/2034 | 100 | 99,574 | |||||||
| GAHR Commercial Mortgage Trust 2015-NRF CFX† | 3.382% | #(h) | 12/15/2034 | 323 | 320,292 | |||||||
| GRACE Mortgage Trust 2014-GRCE A† | 3.369% | 6/10/2028 | 100 | 100,315 | ||||||||
| GS Mortgage Securities Corp. II 2012-BWTR A† | 2.954% | 11/5/2034 | 214 | 212,173 | ||||||||
| GS Mortgage Securities Corp. II 2012-TMSQ A† | 3.007% | 12/10/2030 | 100 | 98,962 | ||||||||
| GS Mortgage Securities Corp. Trust 2012-SHOP A† | 2.933% | 6/5/2031 | 236 | 235,543 | ||||||||
| GS Mortgage Securities Corp. Trust 2016-RENT C† | 4.067% (1 Mo. LIBOR + 2.30% Floor 2.30% | )# | 2/10/2029 | 100 | 100,357 | |||||||
| GS Mortgage Securities Corp. Trust 2017-485L XB IO† | 0.111% | #(h) | 2/10/2037 | 1,590 | 18,690 | (i) | ||||||
| GS Mortgage Securities Corp. Trust 2017-GPTX A† | 2.856% | 5/10/2034 | 100 | 99,198 | ||||||||
| GS Mortgage Securities Corp. Trust 2017-GPTX C† | 3.302% | 5/10/2034 | 100 | 99,450 | ||||||||
| GS Mortgage Securities Corp. Trust 2017-STAY A† | 3.305% (1 Mo. LIBOR + .85% | )# | 7/15/2032 | 100 | 99,225 | |||||||
| GS Mortgage Securities Corp. Trust 2018-FBLU A† | 3.405% (1 Mo. LIBOR + .95% | )# | 11/15/2035 | 133 | 132,601 | |||||||
| GS Mortgage Securities Corp. Trust 2018-RIVR A† | 3.405% (1 Mo. LIBOR + .95% | )# | 7/15/2035 | 100 | 99,819 | |||||||
| GS Mortgage Securities Trust 2011-GC5 B† | 5.391% | #(h) | 8/10/2044 | 107 | 110,846 | |||||||
| GS Mortgage Securities Trust 2012-GC6 XA IO† | 1.945% | #(h) | 1/10/2045 | 293 | 13,667 | |||||||
| GS Mortgage Securities Trust 2012-GCJ7 B | 4.74% | 5/10/2045 | 20 | 20,503 | ||||||||
| GS Mortgage Securities Trust 2013-G1 A2† | 3.557% | #(h) | 4/10/2031 | 100 | 100,001 | |||||||
| GS Mortgage Securities Trust 2013-GC14 A5 | 4.243% | 8/10/2046 | 100 | 103,987 | ||||||||
| GS Mortgage Securities Trust 2015-GS1 XB IO | 0.183% | #(h) | 11/10/2048 | 1,082 | 15,738 | |||||||
| GS Mortgage Securities Trust 2016-GS4 225A† | 2.636% | 11/10/2029 | 15 | 14,643 | (i) | |||||||
| GS Mortgage Securities Trust 2016-GS4 225C† | 3.778% | 11/10/2029 | 26 | 25,559 | (i) | |||||||
| GS Mortgage Securities Trust 2016-GS4 225D† | 4.766% | 11/10/2029 | 35 | 34,668 | (i) | |||||||
| Hilton Orlando Trust 2018-ORL A† | 3.225% (1 Mo. LIBOR + .77% | )# | 12/15/2034 | 41 | 40,751 | |||||||
| Hilton Orlando Trust 2018-ORL D† | 4.155% (1 Mo. LIBOR + 1.70% | )# | 12/15/2034 | 34 | 33,575 | |||||||
| HMH Trust 2017-NSS A† | 3.062% | 7/5/2031 | 100 | 97,991 | ||||||||
| HMH Trust 2017-NSS B† | 3.343% | 7/5/2031 | 100 | 98,138 | ||||||||
| HMH Trust 2017-NSS C† | 3.787% | 7/5/2031 | 100 | 96,955 | ||||||||
| 38 | See Notes to Financial Statements. |
Schedule of Investments (continued)
December 31, 2018
| Investments | Interest Rate | Maturity Date | Principal Amount (000) | Fair Value | ||||||||
| NON-AGENCY COMMERCIAL MORTGAGE-BACKED SECURITIES (continued) | ||||||||||||
| HMH Trust 2017-NSS D† | 4.723% | 7/5/2031 | $ | 100 | $ | 97,928 | ||||||
| Hospitality Mortgage Trust 2017-HIT D† | 4.537% (1 Mo. LIBOR + 2.15% | )# | 5/8/2030 | 100 | 98,666 | |||||||
| Hospitality Mortgage Trust 2017-HIT E† | 5.937% (1 Mo. LIBOR + 3.55% | )# | 5/8/2030 | 100 | 98,969 | |||||||
| Hudsons Bay Simon JV Trust 2015-HB7 A7† | 3.914% | 8/5/2034 | 100 | 99,887 | ||||||||
| Hudsons Bay Simon JV Trust 2015-HB7 B7† | 4.666% | 8/5/2034 | 179 | 175,911 | ||||||||
| Hudsons Bay Simon JV Trust 2015-HB7 XA7 IO† | 1.245% | #(h) | 8/5/2034 | 1,000 | 42,145 | |||||||
| Irvine Core Office Trust 2013-IRV A1† | 2.068% | 5/15/2048 | 24 | 23,392 | ||||||||
| Irvine Core Office Trust 2013-IRV A2† | 3.173% | #(h) | 5/15/2048 | 27 | 26,948 | |||||||
| JPMorgan Chase Commercial Mortgage Securities Trust 2009-IWST C† | 7.445% | #(h) | 12/5/2027 | 25 | 25,853 | |||||||
| JPMorgan Chase Commercial Mortgage Securities Trust 2012-C6 B | 4.819% | #(h) | 5/15/2045 | 11 | 11,259 | |||||||
| JPMorgan Chase Commercial Mortgage Securities Trust 2012-WLDN A† | 3.905% | 5/5/2030 | 185 | 187,045 | ||||||||
| JPMorgan Chase Commercial Mortgage Securities Trust 2013-C14 A4 | 4.133% | #(h) | 8/15/2046 | 32 | 33,017 | |||||||
| JPMorgan Chase Commercial Mortgage Securities Trust 2014-C19 A2 | 3.046% | 4/15/2047 | 22 | 22,247 | ||||||||
| JPMorgan Chase Commercial Mortgage Securities Trust 2014-C19 A4 | 3.997% | 4/15/2047 | 76 | 78,122 | ||||||||
| JPMorgan Chase Commercial Mortgage Securities Trust 2014-C26 XA IO | 1.088% | #(h) | 1/15/2048 | 935 | 37,197 | |||||||
| JPMorgan Chase Commercial Mortgage Securities Trust 2014-DSTY A† | 3.429% | 6/10/2027 | 200 | 198,693 | ||||||||
| JPMorgan Chase Commercial Mortgage Securities Trust 2015-C28 A2 | 2.773% | 10/15/2048 | 43 | 43,038 | ||||||||
| JPMorgan Chase Commercial Mortgage Securities Trust 2015-C30 XA IO | 0.608% | #(h) | 7/15/2048 | 915 | 25,543 | |||||||
| JPMorgan Chase Commercial Mortgage Securities Trust 2015-C32 ASB | 3.358% | 11/15/2048 | 33 | 33,008 | ||||||||
| JPMorgan Chase Commercial Mortgage Securities Trust 2016-JP4 XA IO | 0.798% | #(h) | 12/15/2049 | 964 | 36,668 | |||||||
| JPMorgan Chase Commercial Mortgage Securities Trust 2016-WIKI A† | 2.798% | 10/5/2031 | 225 | 221,449 | ||||||||
| JPMorgan Chase Commercial Mortgage Securities Trust 2016-WIKI B† | 3.201% | 10/5/2031 | 25 | 24,587 | ||||||||
| JPMorgan Chase Commercial Mortgage Securities Trust 2016-WIKI C† | 3.554% | 10/5/2031 | 20 | 19,676 | ||||||||
| See Notes to Financial Statements. | 39 |
Schedule of Investments (continued)
December 31, 2018
| Investments | Interest Rate | Maturity Date | Principal Amount (000) | Fair Value | ||||||||
| NON-AGENCY COMMERCIAL MORTGAGE-BACKED SECURITIES (continued) | ||||||||||||
| JPMorgan Chase Commercial Mortgage Securities Trust 2016-WIKI D† | 4.009% | #(h) | 10/5/2031 | $ | 35 | $ | 34,325 | |||||
| JPMorgan Chase Commercial Mortgage Securities Trust 2016-WIKI E† | 4.009% | #(h) | 10/5/2031 | 12 | 11,555 | |||||||
| JPMorgan Chase Commercial Mortgage Securities Trust 2016-WIKI XB IO† | 0.657% | #(h) | 10/5/2031 | 1,000 | 16,075 | |||||||
| JPMorgan Chase Commercial Mortgage Securities Trust 2017-JP7 XA IO | 1.085% | #(h) | 9/15/2050 | 994 | 65,336 | |||||||
| JPMorgan Chase Commercial Mortgage Securities Trust 2017-MARK A† | 3.392% | 6/5/2032 | 67 | 66,811 | ||||||||
| JPMorgan Chase Commercial Mortgage Securities Trust 2017-MARK B† | 3.795% | 6/5/2032 | 27 | 26,940 | ||||||||
| JPMorgan Chase Commercial Mortgage Securities Trust 2017-MARK C† | 4.036% | #(h) | 6/5/2032 | 20 | 19,922 | |||||||
| JPMorgan Chase Commercial Mortgage Securities Trust 2017-MAUI C† | 3.637% (1 Mo. LIBOR + 1.25% | )# | 7/15/2034 | 20 | 19,764 | |||||||
| JPMorgan Chase Commercial Mortgage Securities Trust 2017-MAUI D† | 4.337% (1 Mo. LIBOR + 1.95% | )# | 7/15/2034 | 31 | 30,510 | |||||||
| JPMorgan Chase Commercial Mortgage Securities Trust 2018-BCON A† | 3.735% | 1/5/2031 | 243 | 247,082 | ||||||||
| JPMorgan Chase Commercial Mortgage Securities Trust 2018-LAQ A† | 3.455% (1 Mo. LIBOR + 1.00% | )# | 6/15/2032 | 206 | 202,254 | |||||||
| JPMorgan Chase Commercial Mortgage Securities Trust 2018-LAQ B† | 3.755% (1 Mo. LIBOR + 1.30% | )# | 6/15/2032 | 68 | 67,214 | |||||||
| JPMorgan Chase Commercial Mortgage Securities Trust 2018-LAQ C† | 4.055% (1 Mo. LIBOR + 1.60% | )# | 6/15/2032 | 52 | 51,262 | |||||||
| JPMorgan Chase Commercial Mortgage Securities Trust 2018-LAQ E† | 5.455% (1 Mo. LIBOR + 3.00% | )# | 6/15/2035 | 10 | 9,789 | |||||||
| JPMorgan Chase Commercial Mortgage Securities Trust 2018-LAQ XCP IO† | 1.285% | #(h) | 6/15/2032 | 20,156 | 244,914 | |||||||
| JPMorgan Chase Commercial Mortgage Securities Trust 2018-PTC A† | 3.655% (1 Mo. LIBOR + 1.20% | )# | 4/15/2031 | 90 | 90,082 | |||||||
| JPMorgan Chase Commercial Mortgage Securities Trust 2018-PTC B† | 4.355% (1 Mo. LIBOR + 1.90% Floor 1.90% | )# | 4/15/2031 | 24 | 24,017 | |||||||
| JPMorgan Chase Commercial Mortgage Securities Trust 2018-PTC C† | 4.755% (1 Mo. LIBOR + 2.30% | )# | 4/15/2031 | 18 | 18,018 | |||||||
| JPMorgan Chase Commercial Mortgage Securities Trust 2018-PTC D† | 5.575% (1 Mo. LIBOR + 3.12% Floor 3.12% | )# | 4/15/2031 | 10 | 10,019 | |||||||
| JPMorgan Chase Commercial Mortgage Securities Trust 2018-WPT AFL† | 3.329% (1 Mo. LIBOR + .95% | )# | 7/5/2033 | 45 | 44,943 | |||||||
| 40 | See Notes to Financial Statements. |
Schedule of Investments (continued)
December 31, 2018
| Investments | Interest Rate | Maturity Date | Principal Amount (000) | Fair Value | ||||||||
| NON-AGENCY COMMERCIAL MORTGAGE-BACKED SECURITIES (continued) | ||||||||||||
| JPMorgan Chase Commercial Mortgage Securities Trust 2018-WPT AFX† | 4.248% | 7/5/2033 | $ | 138 | $ | 143,389 | ||||||
| JPMorgan Chase Commercial Mortgage Securities Trust 2018-WPT BFX† | 4.549% | 7/5/2033 | 41 | 42,496 | ||||||||
| JPMorgan Chase Commercial Mortgage Securities Trust 2018-WPT CFL† | 4.379% (1 Mo. LIBOR + 1.65% | )# | 7/5/2033 | 16 | 15,981 | |||||||
| JPMorgan Chase Commercial Mortgage Securities Trust 2018-WPT CFX† | 4.95% | 7/5/2033 | 54 | 55,838 | ||||||||
| JPMorgan Chase Commercial Mortgage Securities Trust 2018-WPT DFL† | 4.929% (1 Mo. LIBOR + 2.25% | )# | 7/5/2033 | 16 | 16,009 | |||||||
| JPMorgan Chase Commercial Mortgage Securities Trust 2018-WPT DFX† | 5.35% | 7/5/2033 | 62 | 63,965 | ||||||||
| LMREC, Inc. 2015-CRE1 AR† | 3.484% (1 Mo. LIBOR + .98% | )# | 2/22/2032 | 122 | 121,676 | |||||||
| LMREC, Inc. 2015-CRE1 BR† | 4.754% (1 Mo. LIBOR + 2.25% | )# | 2/22/2032 | 100 | 100,068 | |||||||
| LSTAR Commercial Mortgage Trust 2015-3 A2† | 2.729% | #(h) | 4/20/2048 | 4 | 4,422 | |||||||
| LSTAR Commercial Mortgage Trust 2015-3 A3† | 3.127% | #(h) | 4/20/2048 | 56 | 55,621 | |||||||
| LSTAR Commercial Mortgage Trust 2016-4 XA IO† | 1.885% | #(h) | 3/10/2049 | 907 | 61,740 | |||||||
| LSTAR Commercial Mortgage Trust 2017-5 A1† | 2.417% | 3/10/2050 | 41 | 40,073 | ||||||||
| LSTAR Commercial Mortgage Trust 2017-5 A2† | 2.776% | 3/10/2050 | 100 | 98,493 | ||||||||
| LSTAR Commercial Mortgage Trust 2017-5 A3† | 4.50% | 3/10/2050 | 100 | 103,621 | ||||||||
| Morgan Stanley Bank of America Merrill Lynch Trust 2012-CKSV A1† | 2.117% | 10/15/2030 | 43 | 41,540 | ||||||||
| Morgan Stanley Bank of America Merrill Lynch Trust 2012-CKSV A2† | 3.277% | 10/15/2030 | 100 | 97,905 | ||||||||
| Morgan Stanley Bank of America Merrill Lynch Trust 2013-C11 A4 | 4.137% | #(h) | 8/15/2046 | 139 | 144,923 | |||||||
| Morgan Stanley Bank of America Merrill Lynch Trust 2013-C7 A4 | 2.918% | 2/15/2046 | 10 | 9,863 | ||||||||
| Morgan Stanley Bank of America Merrill Lynch Trust 2015-C23 XA IO | 0.694% | #(h) | 7/15/2050 | 477 | 13,339 | |||||||
| Morgan Stanley Bank of America Merrill Lynch Trust 2015-C24 ASB | 3.479% | 5/15/2048 | 21 | 21,200 | ||||||||
| Morgan Stanley Bank of America Merrill Lynch Trust 2016-C31 XA IO | 1.437% | #(h) | 11/15/2049 | 977 | 77,224 | |||||||
| Morgan Stanley Capital Barclays Bank Trust 2016-MART B† | 2.48% | 9/13/2031 | 50 | 48,887 | ||||||||
| Morgan Stanley Capital Barclays Bank Trust 2016-MART C† | 2.817% | 9/13/2031 | 100 | 97,953 | ||||||||
| See Notes to Financial Statements. | 41 |
Schedule of Investments (continued)
December 31, 2018
| Investments | Interest Rate | Maturity Date | Principal Amount (000) | Fair Value | ||||||||
| NON-AGENCY COMMERCIAL MORTGAGE-BACKED SECURITIES (continued) | ||||||||||||
| Morgan Stanley Capital Barclays Bank Trust 2016-MART XCP IO† | Zero Coupon | #(h) | 9/13/2031 | $ | 9,863 | $ | 99 | |||||
| Morgan Stanley Capital I Trust 2014-CPT A† | 3.35% | 7/13/2029 | 140 | 140,447 | ||||||||
| Morgan Stanley Capital I Trust 2014-MP A† | 3.469% | 8/11/2033 | 100 | 101,230 | ||||||||
| Morgan Stanley Capital I Trust 2015-UBS8 ASB | 3.626% | 12/15/2048 | 12 | 12,179 | ||||||||
| Morgan Stanley Capital I Trust 2016-UB11 XB IO | 0.994% | #(h) | 8/15/2049 | 1,000 | 64,541 | |||||||
| Motel 6 Trust 2017-MTL6 E† | 5.705% (1 Mo. LIBOR + 3.25% | )# | 8/15/2034 | 206 | 204,292 | |||||||
| Motel 6 Trust 2017-MTL6 F† | 6.705% (1 Mo. LIBOR + 4.25% | )# | 8/15/2034 | 63 | 63,461 | |||||||
| MSCG Trust 2015-ALDR A1† | 2.612% | 6/7/2035 | 17 | 16,589 | ||||||||
| MSCG Trust 2016-SNR A† | 3.348% | #(h) | 11/15/2034 | 49 | 47,981 | |||||||
| MSCG Trust 2016-SNR B† | 4.181% | 11/15/2034 | 28 | 27,565 | ||||||||
| MSCG Trust 2016-SNR C† | 5.205% | 11/15/2034 | 21 | 21,046 | ||||||||
| Nationslink Funding Corp. 1999-LTL1 D† | 6.45% | 1/22/2026 | 9 | 8,796 | ||||||||
| Natixis Commercial Mortgage Securities Trust 2018-285M A† | 3.79% | #(h) | 11/15/2032 | 98 | 99,311 | |||||||
| Natixis Commercial Mortgage Securities Trust 2018-285M B† | 3.79% | #(h) | 11/15/2032 | 24 | 24,022 | |||||||
| Palisades Center Trust 2016-PLSD A† | 2.713% | 4/13/2033 | 10 | 9,834 | ||||||||
| Palisades Center Trust 2016-PLSD D† | 4.737% | 4/13/2033 | 77 | 75,726 | ||||||||
| PFP Ltd. 2017-3 A† | 3.505% (1 Mo. LIBOR + 1.05% | )# | 1/14/2035 | 7 | 7,265 | |||||||
| PFP Ltd. 2017-3 B† | 4.205% (1 Mo. LIBOR + 1.75% | )# | 1/14/2035 | 100 | 100,213 | |||||||
| PFP Ltd. 2017-3 D† | 5.955% (1 Mo. LIBOR + 3.50% | )# | 1/14/2035 | 100 | 100,186 | |||||||
| Prima Capital CRE Securitization 2015-5A C† | 4.50% | 12/24/2050 | 121 | 119,821 | ||||||||
| Prima Capital CRE Securitization Ltd. 2016-6A A† | 2.85% | 8/24/2040 | 127 | 126,022 | ||||||||
| RAIT Trust 2017-FL7 A† | 3.405% (1 Mo. LIBOR + .95% | )# | 6/15/2037 | 87 | 86,613 | |||||||
| RAIT Trust 2017-FL8 A† | 3.305% (1 Mo. LIBOR + .85% | )# | 12/15/2037 | 30 | 30,430 | |||||||
| RBS Commercial Funding, Inc. Trust 2013-SMV A† | 3.26% | 3/11/2031 | 100 | 99,246 | ||||||||
| ReadyCap Commercial Mortgage Trust 2015-2 A† | 3.804% | 6/25/2055 | 23 | 23,373 | ||||||||
| ReadyCap Commercial Mortgage Trust 2018-4 A† | 3.39% | 2/27/2051 | 100 | 100,392 | ||||||||
| ReadyCap Mortgage Trust 2016-3 A† | 2.94% | 11/20/2038 | 75 | 74,439 | ||||||||
| Shelter Growth CRE Issuer Ltd. 2018-FL1 A† | 3.455% (1 Mo. LIBOR + 1.00% | )# | 1/15/2035 | 49 | 48,744 | |||||||
| Shops at Crystals Trust 2016-CSTL XB IO† | 0.203% | #(h) | 7/5/2036 | 1,000 | 16,175 | |||||||
| SLIDE 2018-FUN A† | 3.355% (1 Mo. LIBOR + .90% | )# | 6/15/2031 | 70 | 69,227 | |||||||
| SLIDE 2018-FUN B† | 3.705% (1 Mo. LIBOR + 1.25% | )# | 6/15/2031 | 15 | 14,812 | |||||||
| SLIDE 2018-FUN C† | 4.005% (1 Mo. LIBOR + 1.55% | )# | 6/15/2031 | 13 | 12,823 | |||||||
| SLIDE 2018-FUN D† | 4.305% (1 Mo. LIBOR + 1.85% | )# | 6/15/2031 | 20 | 19,704 | |||||||
| 42 | See Notes to Financial Statements. |
Schedule of Investments (continued)
December 31, 2018
| Investments | Interest Rate | Maturity Date | Principal Amount (000) | Fair Value | ||||||||
| NON-AGENCY COMMERCIAL MORTGAGE-BACKED SECURITIES (continued) | ||||||||||||
| SLIDE 2018-FUN XCP IO† | 0.976% | #(h) | 12/15/2020 | $ | 1,648 | $ | 29,824 | (i) | ||||
| Stonemont Portfolio Trust 2017-MONT D† | 4.52% (1 Mo. LIBOR + 2.05% | )# | 8/20/2030 | 98 | 98,045 | |||||||
| Stonemont Portfolio Trust 2017-MONT E† | 5.22% (1 Mo. LIBOR + 2.75% | )# | 8/20/2030 | 146 | 146,277 | |||||||
| Stonemont Portfolio Trust 2017-MONT F† | 6.07% (1 Mo. LIBOR + 3.60% | )# | 8/20/2030 | 94 | 94,381 | |||||||
| Stonemont Portfolio Trust 2017-MONT XCP IO† | 0.638% | #(h) | 8/20/2030 | 14,750 | 295 | |||||||
| UBS-BAMLL Trust 2012-WRM D† | 4.238% | #(h) | 6/10/2030 | 100 | 93,304 | |||||||
| UBS-Barclays Commercial Mortgage Trust 2012-C2 A4 | 3.525% | 5/10/2063 | 34 | 34,388 | ||||||||
| UBS-Barclays Commercial Mortgage Trust 2012-C4 A5 | 2.85% | 12/10/2045 | 200 | 197,827 | ||||||||
| UBS-Barclays Commercial Mortgage Trust 2013-C5 A4 | 3.185% | 3/10/2046 | 77 | 77,018 | ||||||||
| UBS-Barclays Commercial Mortgage Trust 2013-C5 XA IO† | 0.967% | #(h) | 3/10/2046 | 875 | 28,815 | |||||||
| UBS-Citigroup Commercial Mortgage Trust 2011-C1 A3 | 3.595% | 1/10/2045 | 82 | 82,215 | ||||||||
| VNDO Mortgage Trust 2012-6AVE A† | 2.996% | 11/15/2030 | 300 | 297,526 | ||||||||
| Waldorf Astoria Boca Raton Trust 2016-BOCA C† | 4.955% (1 Mo. LIBOR + 2.50% | )# | 6/15/2029 | 100 | 99,569 | |||||||
| Waldorf Astoria Boca Raton Trust 2016-BOCA E† | 6.805% (1 Mo. LIBOR + 4.35% | )# | 6/15/2029 | 27 | 26,901 | |||||||
| Wells Fargo Commercial Mortgage Trust 2010-C1 C† | 5.597% | #(h) | 11/15/2043 | 100 | 102,283 | |||||||
| Wells Fargo Commercial Mortgage Trust 2015-C26 ASB | 2.991% | 2/15/2048 | 21 | 20,823 | ||||||||
| Wells Fargo Commercial Mortgage Trust 2015-C29 ASB | 3.40% | 6/15/2048 | 10 | 10,099 | ||||||||
| Wells Fargo Commercial Mortgage Trust 2015-C29 XB IO | 0.018% | #(h) | 6/15/2048 | 2,000 | 5,704 | |||||||
| Wells Fargo Commercial Mortgage Trust 2015-NXS4 A2A | 3.075% | 12/15/2048 | 10 | 9,975 | ||||||||
| Wells Fargo Commercial Mortgage Trust 2015-NXS4 A2B | 4.599% | #(h) | 12/15/2048 | 36 | 36,940 | |||||||
| Wells Fargo Commercial Mortgage Trust 2015-SG1 XA IO | 0.748% | #(h) | 9/15/2048 | 958 | 35,269 | |||||||
| Wells Fargo Commercial Mortgage Trust 2016-BNK1 XA IO | 1.782% | #(h) | 8/15/2049 | 978 | 101,573 | |||||||
| Wells Fargo Commercial Mortgage Trust 2018-C44 A2 | 4.178% | 5/15/2051 | 35 | 36,312 | ||||||||
| See Notes to Financial Statements. | 43 |
Schedule of Investments (continued)
December 31, 2018
| Investments | Interest Rate | Maturity Date | Principal Amount (000) | Fair Value | ||||||||
| NON-AGENCY COMMERCIAL MORTGAGE-BACKED SECURITIES (continued) | ||||||||||||
| West Town Mall Trust 2017-KNOX A† | 3.823% | 7/5/2030 | $ | 74 | $ | 74,274 | ||||||
| West Town Mall Trust 2017-KNOX B† | 4.322% | 7/5/2030 | 31 | 31,306 | ||||||||
| West Town Mall Trust 2017-KNOX C† | 4.346% | #(h) | 7/5/2030 | 25 | 24,848 | |||||||
| West Town Mall Trust 2017-KNOX D† | 4.346% | #(h) | 7/5/2030 | 25 | 24,415 | |||||||
| West Town Mall Trust 2017-KNOX X IO† | 0.376% | #(h) | 7/5/2030 | 1,604 | 19,738 | |||||||
| WF-RBS Commercial Mortgage Trust 2011-C2 A4† | 4.869% | #(h) | 2/15/2044 | 24 | 24,691 | |||||||
| WF-RBS Commercial Mortgage Trust 2011-C4 A3† | 4.394% | 6/15/2044 | 6 | 5,804 | ||||||||
| WF-RBS Commercial Mortgage Trust 2012-C7 A2 | 3.431% | 6/15/2045 | 50 | 50,309 | ||||||||
| WF-RBS Commercial Mortgage Trust 2012-C7 B | 4.756% | #(h) | 6/15/2045 | 25 | 25,540 | |||||||
| WF-RBS Commercial Mortgage Trust 2012-C7 XA IO† | 1.405% | #(h) | 6/15/2045 | 75 | 2,740 | |||||||
| WF-RBS Commercial Mortgage Trust 2012-C8 XA IO† | 1.836% | #(h) | 8/15/2045 | 344 | 18,299 | |||||||
| WF-RBS Commercial Mortgage Trust 2012-C9 A3 | 2.87% | 11/15/2045 | 311 | 308,885 | ||||||||
| Total Non-Agency Commercial Mortgage-Backed Securities (cost $19,886,567) | 19,688,207 | |||||||||||
| Shares (000) | ||||||||||||
| PREFERRED STOCK 0.00% | ||||||||||||
| Oil | ||||||||||||
| Templar Energy LLC (cost $11,530) | 1 | 3,472 | ||||||||||
| Principal Amount (000) | ||||||||||||
| U.S. TREASURY OBLIGATIONS 1.36% | ||||||||||||
| U.S. Treasury Inflation Indexed Note(j) | 0.125% | 4/15/2022 | $ | 173 | 167,039 | |||||||
| U.S. Treasury Inflation Indexed Note(j) | 0.625% | 4/15/2023 | 913 | 898,406 | ||||||||
| U.S. Treasury Note | 2.875% | 10/31/2023 | 9 | 9,150 | ||||||||
| Total U.S. Treasury Obligations (cost $1,074,121) | 1,074,595 | |||||||||||
| Total Long-Term Investments (cost $73,665,314) | 72,850,931 | |||||||||||
| SHORT-TERM INVESTMENTS 7.46% | ||||||||||||
| COMMERCIAL PAPER 1.38% | ||||||||||||
| Automotive 0.12% | ||||||||||||
| Ford Motor Credit Co. LLC | 4.39% | 11/25/2019 | 100 | 96,459 | ||||||||
| 44 | See Notes to Financial Statements. |
Schedule of Investments (continued)
December 31, 2018
| Principal | ||||||||||||
| Interest | Maturity | Amount | Fair | |||||||||
| Investments | Rate | Date | (000) | Value | ||||||||
| Business Services 0.31% | ||||||||||||
| TYCO INTL HLDG SARL | 2.839% | 1/2/2019 | $ | 250 | $ | 250,000 | ||||||
| Electric: Power 0.31% | ||||||||||||
| South Carolina Fuel | 3.876% | 1/17/2019 | 250 | 249,603 | ||||||||
| Leisure 0.32% | ||||||||||||
| Royal Caribbean Cruise | 3.168% | 1/2/2019 | 250 | 250,000 | ||||||||
| Oil: Crude Producers 0.32% | ||||||||||||
| Energy Transfer Partners | 3.347% | 1/2/2019 | 250 | 250,000 | ||||||||
| Total Commercial Paper (cost $1,095,732) | 1,096,062 | |||||||||||
| CONVERTIBLE BOND 0.03% | ||||||||||||
| Technology | ||||||||||||
| Vipshop Holdings Ltd. (China)(c) (cost $23,865) | 1.50% | 3/15/2019 | 24 | 23,700 | ||||||||
| CORPORATE BONDS 0.53% | ||||||||||||
| Advertising 0.01% | ||||||||||||
| Aimia, Inc. (Canada)(k) | 6.85% | 5/17/2019 | CAD | 10 | 7,435 | |||||||
| Banks: Regional 0.25% | ||||||||||||
| Sberbank of Russia Via SB Capital SA(Luxembourg)(c) | 4.15% | 3/6/2019 | $ | 200 | 199,978 | |||||||
| Computer Hardware 0.11% | ||||||||||||
| HP, Inc. | 3.376% (3 Mo. LIBOR + .94% | )# | 1/14/2019 | 90 | 90,015 | |||||||
| Drugs 0.04% | ||||||||||||
| Shire Acquisitions Investments Ireland DAC(Ireland)(c) | 1.90% | 9/23/2019 | 31 | 30,571 | ||||||||
| Electric: Power 0.02% | ||||||||||||
| Sempra Energy | 9.80% | 2/15/2019 | 18 | 18,121 | ||||||||
| Metals & Minerals: Miscellaneous 0.01% | ||||||||||||
| Glencore Funding LLC† | 2.50% | 1/15/2019 | 11 | 11,006 | ||||||||
| Oil 0.05% | ||||||||||||
| Rowan Cos., Inc. | 7.875% | 8/1/2019 | 27 | 26,797 | ||||||||
| Anadarko Petroleum Corp. | 8.70% | 3/15/2019 | 8 | 8,083 | ||||||||
| Total | 34,880 | |||||||||||
| See Notes to Financial Statements. | 45 |
Schedule of Investments (continued)
December 31, 2018
| Principal | ||||||||||||
| Interest | Maturity | Amount | Fair | |||||||||
| Investments | Rate | Date | (000) | Value | ||||||||
| Oil: Crude Producers 0.01% | ||||||||||||
| Kinder Morgan Energy Partners LP | 2.65% | 2/1/2019 | $ | 7 | $ | 6,996 | ||||||
| Telecommunications 0.03% | ||||||||||||
| Hughes Satellite Systems Corp. | 6.50% | 6/15/2019 | 20 | 20,213 | ||||||||
| Total Corporate Bonds (cost $420,437) | 419,215 | |||||||||||
| REPURCHASE AGREEMENT | ||||||||||||
| Repurchase Agreement dated 12/31/2018,1.45% due 1/2/2019 with Fixed IncomeClearing Corp. collateralized by $4,350,000of U.S. Treasury Note at 2.875% due 7/31/2025;value: value: $4,463,544; proceeds: $4,372,127 (cost $4,371,775) | 4,372 | 4,371,775 | ||||||||||
| Total Short-Term Investment (cost $5,911,809) | 5,910,752 | |||||||||||
| Total Investments in Securities 99.45% (cost $79,577,123) | 78,761,683 | |||||||||||
| Other Assets in Excess of Liabilities(l)0.55% | 435,632 | |||||||||||
| Net Assets 100.00% | $ | 79,197,315 | ||||||||||
| CAD | Canadian dollar. | |
| IO | Interest Only. | |
| LIBOR | London Interbank Offered Rate. | |
| PIK | Payment-in-kind. | |
| Units | More than one class of securities traded together. | |
| † | Security was purchased pursuant to Rule 144A under the Securities Act of 1933 and, unless registered under such Act or exempted from registration, may only be resold to qualified institutional buyers. | |
| # | Variable rate security. The interest rate represents the rate in effect at December 31, 2018. | |
| (a) | Amount is less than $1,000. | |
| (b) | Amount represents less than 1,000 shares. | |
| (c) | Foreign security traded in U.S. dollars. | |
| (d) | Security is perpetual in nature and has no stated maturity. | |
| (e) | Floating Rate Loans in which the Fund invests generally pay interest at rates which are periodically re-determined at a margin above the London Interbank Offered Rate (“LIBOR”) or the prime rate offered by major U.S. banks. The rate(s) shown is the rate(s) in effect at December 31, 2018. | |
| (f) | Interest rate to be determined. | |
| (g) | Level 3 Investment as described in Note 2(l) in the Notes to Financials. Floating Rate Loans categorized as Level 3 are valued based on a single quotation obtained from a dealer. Accounting principles generally accepted in the United States of America do not require the Fund to create quantitative unobservable inputs that were not developed by the Fund. Therefore, the Fund does not have access to unobservable inputs and cannot disclose such inputs in the valuation. | |
| (h) | Interest rate is based on the weighted average interest rates of the underlying mortgages within the mortgage pool. | |
| (i) | Level 3 Investment as described in Note 2(l) in the Notes to Financials. Security valued utilizing third party pricing information without adjustment. Such valuations are based on unobservable inputs. A significant change in third party information could result in a significantly lower or higher value of such Level 3 investments. | |
| (j) | Treasury Inflation Protected Security. A U.S. Treasury Note or Bond that offers protection from inflation by paying a fixed rate of interest on principal amount that is adjusted for inflation based on the Consumer Price Index. | |
| (k) | Investment in non-U.S. dollar denominated securities. | |
| (l) | Other Assets in Excess of Liabilities include net unrealized appreciation/depreciation on forward foreign currency exchange contracts and futures contracts as follows: |
| 46 | See Notes to Financial Statements. |
Schedule of Investments (continued)
December 31, 2018
Open Forward Foreign Currency Exchange Contracts at December 31, 2018:
| Forward | |||||||||||||||
| Foreign | U.S. $ | ||||||||||||||
| Currency | Cost on | U.S. $ | |||||||||||||
| Exchange | Transaction | Expiration | Foreign | Origination | Current | Unrealized | |||||||||
| Contracts | Type | Counterparty | Date | Currency | Date | Value | Appreciation | ||||||||
| Canadian dollar | Sell | State Street Bank and Trust | 3/5/2019 | 10,000 | $7,561 | $7,336 | $225 |
Open Futures Contracts at December 31, 2018:
| Notional | Notional | Unrealized | |||||||||||||
| Type | Expiration | Contracts | Position | Amount | Value | Appreciation | |||||||||
| U.S. 2-Year Treasury Note | March 2019 | 68 | Long | $14,361,337 | $14,437,250 | $75,913 | |||||||||
| Notional | Notional | Unrealized | |||||||||||||
| Type | Expiration | Contracts | Position | Amount | Value | Depreciation | |||||||||
| U.S. 5-Year Treasury Note | March 2019 | 2 | Short | $(227,201) | $(229,375) | $(2,174) |
| See Notes to Financial Statements. | 47 |
Schedule of Investments (continued)
December 31, 2018
The following is a summary of the inputs used as of December 31, 2018 in valuing the Fund’s investments carried at fair value(1):
| Investment Type(2)(3) | Level 1 | Level 2 | Level 3 | Total | ||||||||||||
| Long-Term Investments | ||||||||||||||||
| Asset-Backed Securities | $ | – | $ | 20,143,731 | $ | – | $ | 20,143,731 | ||||||||
| Common Stock | – | 45 | – | 45 | ||||||||||||
| Convertible Bonds | – | 63,330 | – | 63,330 | ||||||||||||
| Corporate Bonds | – | 29,033,714 | – | 29,033,714 | ||||||||||||
| Floating Rate Loans | ||||||||||||||||
| Electrical Equipment | – | 103,240 | 20,205 | 123,445 | ||||||||||||
| Health Care Products | – | – | 21,180 | 21,180 | ||||||||||||
| Machinery: Industrial/Specialty | – | – | 21,670 | 21,670 | ||||||||||||
| Oil | – | – | 19,900 | 19,900 | ||||||||||||
| Oil: Crude Producers | – | – | 16,957 | 16,957 | ||||||||||||
| Real Estate Investment Trusts | – | – | 102,290 | 102,290 | ||||||||||||
| Remaining Industries | – | 852,520 | – | 852,520 | ||||||||||||
| Foreign Government Obligations | – | 124,294 | – | 124,294 | ||||||||||||
| Government Sponsored Enterprises Collateralized Mortgage Obligations | – | 1,275,471 | – | 1,275,471 | ||||||||||||
| Government Sponsored Enterprises Pass-Throughs | – | 203,665 | – | 203,665 | ||||||||||||
| Municipal Bonds | – | 82,445 | – | 82,445 | ||||||||||||
| Non-Agency Commercial Mortgage-Backed Securities | – | 19,564,823 | 123,384 | 19,688,207 | ||||||||||||
| Preferred Stock | – | 3,472 | – | 3,472 | ||||||||||||
| U.S. Treasury Obligations | – | 1,074,595 | – | 1,074,595 | ||||||||||||
| Short-Term Investments | ||||||||||||||||
| Commercial Paper | – | 1,096,062 | – | 1,096,062 | ||||||||||||
| Convertible Bond | – | 23,700 | – | 23,700 | ||||||||||||
| Corporate Bonds | – | 419,215 | – | 419,215 | ||||||||||||
| Repurchase Agreement | – | 4,371,775 | – | 4,371,775 | ||||||||||||
| Total | $ | – | $ | 78,436,097 | $ | 325,586 | $ | 78,761,683 | ||||||||
| Other Financial Instruments | ||||||||||||||||
| Forward Foreign Currency Exchange Contracts | ||||||||||||||||
| Assets | $ | – | $ | 225 | $ | – | $ | 225 | ||||||||
| Liabilities | – | – | – | – | ||||||||||||
| Futures Contracts | ||||||||||||||||
| Assets | 75,913 | – | – | 75,913 | ||||||||||||
| Liabilities | (2,174 | ) | – | – | (2,174 | ) | ||||||||||
| Total | $ | 73,739 | $ | 225 | $ | – | $ | 73,964 | ||||||||
| (1) | Refer to Note 2(l) for a description of fair value measurements and the three-tier hierarchy of inputs. | |
| (2) | See Schedule of Investments for fair values in each industry and identification of foreign issuers and/or geography. The table above is presented by Investment Type. Industries are presented within an Investment Type should such Investment Type include securities classified as two or more levels within the three-tier fair value hierarchy. Each Level 3 security is identified on the Schedule of Investments along with the valuation technique utilized. | |
| (3) | There were no Level 1/Level 2 transfers during the fiscal year ended December 31, 2018. |
| 48 | See Notes to Financial Statements. |
Schedule of Investments (concluded)
December 31, 2018
The following is a reconciliation of investments with unobservable inputs (Level 3) that were used in determining fair value:
| Non-Agency | ||||||||||||
| Commercial | ||||||||||||
| Corporate | Floating | Mortgage-Backed | ||||||||||
| Investment Type | Bonds | Rate Loans | Securities | |||||||||
| Balance as of January 1, 2018 | $ | 10,506 | $ | 1,114,857 | $ | 318,739 | ||||||
| Accrued Discounts (Premiums) | – | 612 | (67,246 | ) | ||||||||
| Realized Gain (Loss) | – | 298 | (757 | ) | ||||||||
| Change in Unrealized Appreciation (Depreciation) | – | (2,487 | ) | 1,203 | ||||||||
| Purchases | – | 120,508 | 33,574 | |||||||||
| Sales | – | (1,031,586 | ) | (140,185 | ) | |||||||
| Transfers into Level 3 | – | – | – | |||||||||
| Transfers out of Level 3 | (10,506 | ) | – | (21,944 | ) | |||||||
| Balance as of December 31, 2018 | $ | – | $ | 202,202 | $ | 123,384 | ||||||
| Change in unrealized appreciation/depreciation for year ended December 31, 2018, related to Level 3 investments held at December 31, 2018 | $ | – | $ | (3,491 | ) | $ | (430 | ) | ||||
| See Notes to Financial Statements. | 49 |
Statement of Assets and Liabilities
December 31, 2018
| ASSETS: | ||||
| Investments in securities, at fair value (cost $79,577,123) | $ | 78,761,683 | ||
| Deposits with brokers for futures collateral | 32,575 | |||
| Receivables: | ||||
| Interest and dividends | 545,596 | |||
| Capital shares sold | 169,524 | |||
| Investment securities sold | 62,452 | |||
| From advisor (See Note 3) | 9,063 | |||
| Variation margin on futures contracts | 4,812 | |||
| Unrealized appreciation on forward foreign currency exchange contracts | 225 | |||
| Prepaid expenses | 295 | |||
| Total assets | 79,586,225 | |||
| LIABILITIES: | ||||
| Payables: | ||||
| Investment securities purchased | 188,464 | |||
| Capital shares reacquired | 48,047 | |||
| Management fee | 22,534 | |||
| Directors’ fees | 3,591 | |||
| Fund administration | 2,575 | |||
| To bank | 68 | |||
| Accrued expenses | 123,631 | |||
| Total liabilities | 388,910 | |||
| NET ASSETS | $ | 79,197,315 | ||
| COMPOSITION OF NET ASSETS: | ||||
| Paid-in capital | $ | 82,916,914 | ||
| Total distributable earnings (loss) | (3,719,599 | ) | ||
| Net Assets | $ | 79,197,315 | ||
| Outstanding shares (200 million shares of common stock authorized, $.001 par value) | 5,636,915 | |||
| Net asset value, offering and redemption price per share (Net assets divided by outstanding shares) | $ | 14.05 | ||
| 50 | See Notes to Financial Statements. |
For the Year Ended December 31, 2018
| Investment income: | ||||
| Dividends | $ | 845 | ||
| Interest and other (net of foreign withholding taxes of $34) | 2,275,132 | |||
| Total investment income | 2,275,977 | |||
| Expenses: | ||||
| Management fee | 239,774 | |||
| Non 12b-1 service fees | 171,500 | |||
| Shareholder servicing | 79,988 | |||
| Professional | 52,477 | |||
| Reports to shareholders | 29,494 | |||
| Fund administration | 27,403 | |||
| Custody | 18,004 | |||
| Directors’ fees | 2,321 | |||
| Other | 9,341 | |||
| Gross expenses | 630,302 | |||
| Expense reductions (See Note 9) | (1,621 | ) | ||
| Fees waived and expenses reimbursed (See Note 3) | (56,762 | ) | ||
| Net expenses | 571,919 | |||
| Net investment income | 1,704,058 | |||
| Net realized and unrealized loss: | ||||
| Net realized loss on investments | (102,817 | ) | ||
| Net realized loss on futures contracts | (95,105 | ) | ||
| Net realized gain on foreign currency exchange contracts | 19 | |||
| Net realized loss on foreign currency related transactions | (126 | ) | ||
| Net change in unrealized appreciation/depreciation on investments | (707,222 | ) | ||
| Net change in unrealized appreciation/depreciation on futures contracts | 84,401 | |||
| Net change in unrealized appreciation/depreciation on foreign currency exchange contracts | 425 | |||
| Net change in unrealized appreciation/depreciation on translation of assets and liabilities denominated in foreign currencies | 15 | |||
| Net realized and unrealized loss | (820,410 | ) | ||
| Net Increase in Net Assets Resulting From Operations | $ | 883,648 | ||
| See Notes to Financial Statements. | 51 |
Statements of Changes in Net Assets
| INCREASE IN NET ASSETS | For the Year Ended December 31, 2018 | For the Year Ended December 31, 2017 | ||||||
| Operations: | ||||||||
| Net investment income | $ | 1,704,058 | $ | 1,093,316 | ||||
| Net realized gain (loss) on investments, futures contracts, forward currency exchange contracts and foreign currency related transactions | (198,029 | ) | 33,358 | |||||
| Net change in unrealized appreciation/depreciation on investments, futures contracts, forward currency exchange contracts and translation of assets and liabilities denominated in foreign currencies | (622,381 | ) | (45,528 | ) | ||||
| Net increase in net assets resulting from operations | 883,648 | 1,081,146 | ||||||
| Distributions to shareholders(1) | (2,584,971 | ) | (2,047,290 | ) | ||||
| Capital share transactions (See Note 14): | ||||||||
| Proceeds from sales of shares | 40,985,837 | 33,186,207 | ||||||
| Reinvestment of distributions | 2,584,971 | 2,047,290 | ||||||
| Cost of shares reacquired | (22,560,074 | ) | (21,598,047 | ) | ||||
| Net increase in net assets resulting from capital share transactions | 21,010,734 | 13,635,450 | ||||||
| Net increase in net assets | 19,309,411 | 12,669,306 | ||||||
| NET ASSETS: | ||||||||
| Beginning of year | $ | 59,887,904 | $ | 47,218,598 | ||||
| End of year | $ | 79,197,315 | $ | 59,887,904 | ||||
| Undistributed net investment income(2) | $ | – | $ | – | ||||
| (1) | The SEC eliminated the requirement to disclose the source of distributions paid in 2018. For the year ended December 31, 2017, the source of distributions represents net investment income. | |
| (2) | The SEC eliminated the requirement to disclose undistributed net investment income in 2018. For the year ended December 31, 2017, the undistributed net investment income was $11,873. |
| 52 | See Notes to Financial Statements. |
This page is intentionally left blank.
53
| Per Share Operating Performance: | ||||||||||||||||||||||||
| Distributions to | ||||||||||||||||||||||||
| Investment operations: | shareholders from: | |||||||||||||||||||||||
| Net asset value, beginning of period | Net investment income(a) | Net realized and unrealized gain (loss) | Total from investment operations | Net investment income | Return of capital | |||||||||||||||||||
| 12/31/2018 | $14.38 | $0.36 | $(0.20 | ) | $0.16 | $(0.49 | ) | $ – | ||||||||||||||||
| 12/31/2017 | 14.57 | 0.30 | 0.02 | 0.32 | (0.51 | ) | – | |||||||||||||||||
| 12/31/2016 | 14.43 | 0.33 | 0.19 | 0.52 | (0.38 | ) | – | |||||||||||||||||
| 12/31/2015 | 14.72 | 0.27 | (0.21 | ) | 0.06 | (0.34 | ) | (0.01 | ) | |||||||||||||||
| 4/4/2014 to 12/31/2014(c)(d) | 15.00 | 0.18 | (0.15 | ) | 0.03 | (0.31 | ) | – | ||||||||||||||||
| (a) | Calculated using average shares outstanding during the period. |
| (b) | Total return does not consider the effects of sales charges or other expenses imposed by an insurance company and assumes the reinvestment of all distributions. |
| (c) | Commencement of operations was 4/4/2014, SEC effective date was 4/14/2014 and the date shares first became available to the public was 5/1/2014. |
| (d) | Net investment income, net realized and unrealized gain (loss) amounted to less than $.01 for the period 4/4/2014 through 4/14/2014. |
| (e) | Not annualized. |
| (f) | Total return for the period 4/14/2014 through 12/31/2014 was also 0.22%. |
| (g) | Annualized. |
| 54 | See Notes to Financial Statements. |
| Ratios to Average Net Assets: | Supplemental Data: | |||||||||||||||||||||||||||||
Total | Net | Total | Total expenses | Total | Net | Net | Portfolio | |||||||||||||||||||||||
| $(0.49 | ) | $14.05 | 1.15 | 0.83 | 0.92 | 2.48 | $79,197 | 65 | ||||||||||||||||||||||
| (0.51 | ) | 14.38 | 2.19 | 0.80 | 0.94 | 2.05 | 59,888 | 75 | ||||||||||||||||||||||
| (0.38 | ) | 14.57 | 3.47 | 0.80 | 1.04 | 2.21 | 47,219 | 69 | ||||||||||||||||||||||
| (0.35 | ) | 14.43 | 0.58 | 0.80 | 1.45 | 1.79 | 21,803 | 61 | ||||||||||||||||||||||
| (0.31 | ) | 14.72 | 0.22 | (e)(f) | 0.80 | (g) | 2.02 | (g) | 1.61 | (g) | 7,680 | 103 | (e) | |||||||||||||||||
| See Notes to Financial Statements. | 55 |
| 1. | ORGANIZATION |
| Lord Abbett Series Fund, Inc. (the “Company”) is registered under the Investment Company Act of 1940, as amended (the “Act”), as a diversified, open-end management investment company and was incorporated under Maryland law in 1989. The Company consists of twelve separate portfolios. This report covers Short Duration Income Portfolio (the “Fund”). |
| The Fund’s investment objective is to seek a high level of income consistent with preservation of capital. The Fund has Variable Contract class shares (“Class VC Shares”), which are currently issued and redeemed only in connection with investments in, and payments under, variable annuity contracts and variable life insurance policies issued by life insurance and insurance-related companies. |
| The preparation of the financial statements in conformity with accounting principles generally accepted in the United States of America (“U.S. GAAP”) requires management to make certain estimates and assumptions that affect the reported amounts of assets and liabilities and disclosure of contingent assets and liabilities at the date of the financial statements and the reported amounts of increases and decreases in net assets from operations during the reporting period. Actual results could differ from those estimates. The Fund is considered an investment company under U.S. GAAP and follows the accounting and reporting guidance applicable to investment companies. |
| 2. | SIGNIFICANT ACCOUNTING POLICIES |
| (a) | Investment Valuation–Under procedures approved by the Fund’s Board of Directors (the “Board”), Lord, Abbett & Co. LLC (“Lord Abbett”), the Fund’s investment manager, has formed a Pricing Committee to administer the pricing and valuation of portfolio investments and to ensure that prices utilized reasonably reflect fair value. Among other things, these procedures allow the Fund to utilize independent pricing services, quotations from securities and financial instrument dealers and other market sources to determine fair value. |
| Securities actively traded on any recognized U.S. or non-U.S. exchange or on The NASDAQ Stock Market LLC are valued at the last sale price or official closing price on the exchange or system on which they are principally traded. Events occurring after the close of trading on non-U.S. exchanges may result in adjustments to the valuation of foreign securities to reflect their fair value as of the close of regular trading on the New York Stock Exchange. The Fund may utilize an independent fair valuation service in adjusting the valuations of foreign securities. Unlisted equity securities are valued at the last quoted sale price or, if no sale price is available, at the mean between the most recently quoted bid and asked prices. Fixed income securities are valued based on evaluated prices supplied by independent pricing services, which reflect broker/dealer supplied valuations and the independent pricing services’ own electronic data processing techniques. Exchange traded options and futures contracts are valued at the last quoted sale price in the market where they are principally traded. If no sale has occurred, the mean between the most recently quoted bid and asked prices is used. Floating rate loans are valued at the average of bid and ask quotations obtained from dealers in loans on the basis of prices supplied by independent pricing services. Forward foreign currency exchange contracts are valued using daily forward exchange rates. | |
| Securities for which prices are not readily available are valued at fair value as determined by the Pricing Committee. The Pricing Committee considers a number of factors, including observable and unobservable inputs, when arriving at fair value. The Pricing Committee may use related or comparable assets or liabilities, recent transactions, market multiples, book values, yield curves, broker quotes, observable trading activity, option adjusted spread models |
56
Notes to Financial Statements (continued)
| and other relevant information to determine the fair value of portfolio investments. The Board or a designated committee thereof regularly reviews fair value determinations made by the Pricing Committee and may employ techniques such as reviewing related market activity, reviewing inputs and assumptions, and retrospectively comparing prices of subsequent purchases and sales transactions to fair value determinations made by the Pricing Committee. | |
| Short-term securities with 60 days or less remaining to maturity are valued using the amortized cost method, which approximates fair value. | |
| (b) | Security Transactions–Security transactions are recorded as of the date that the securities are purchased or sold (trade date). Realized gains and losses on sales of portfolio securities are calculated using the identified-cost method. |
| (c) | Investment Income–Dividend income is recorded on the ex-dividend date. Interest income is recorded on the accrual basis as earned. Discounts are accreted and premiums are amortized using the effective interest method and are included in Interest and other income on the Statement of Operations. Withholding taxes on foreign dividends have been provided for in accordance with the applicable country’s tax rules and rates. |
| (d) | Income Taxes–It is the policy of the Fund to meet the requirements of Subchapter M of the Internal Revenue Code applicable to regulated investment companies and to distribute substantially all taxable income and capital gains to its shareholders. Therefore, no income tax provision is required. |
| The Fund files U.S. federal and various state and local tax returns. No income tax returns are currently under examination. The statute of limitations on the Fund’s filed U.S. federal tax returns remains open for the fiscal years ended December 31, 2015 through December 31, 2018. The statutes of limitations on the Company’s state and local tax returns may remain open for an additional year depending upon the jurisdiction. | |
| (e) | Expenses–Expenses incurred by the Company that do not specifically relate to an individual fund are generally allocated to the funds within the Company on a pro rata basis by relative net assets. |
| (f) | Foreign Transactions–The books and records of the Fund are maintained in U.S. dollars and transactions denominated in foreign currencies are recorded in the Fund’s records at the rate prevailing when earned or recorded. Asset and liability accounts that are denominated in foreign currencies are adjusted daily to reflect current exchange rates and any unrealized gain (loss) is included in Net change in unrealized appreciation/depreciation on translation of assets and liabilities denominated in foreign currencies on the Fund’s Statement of Operations. The resultant exchange gains and losses upon settlement of such transactions, if any, are included in Net realized loss on foreign currency related transactions on the Fund’s Statement of Operations. The Fund does not isolate that portion of the results of operations arising as a result of changes in the foreign exchange rates from the changes in market prices of the securities. |
| (g) | Forward Foreign Currency Exchange Contracts–The Fund may enter into forward foreign currency exchange contracts in order to reduce exposure to changes in foreign currency exchange rates on foreign portfolio holdings, or gain or reduce exposure to foreign currency solely for investment purposes. A forward foreign currency exchange contract is a commitment to purchase or sell a foreign currency at a future date at a negotiated rate. The contracts are valued daily at forward exchange rates and any unrealized gain (loss) is included |
57
Notes to Financial Statements (continued)
| in Net change in unrealized appreciation/depreciation on foreign currency exchange contracts in the Fund’s Statement of Operations. The gain (loss) arising from the difference between the U.S. dollar cost of the original contract and the value of the foreign currency in U.S. dollars upon closing of such contracts is included in Net realized gain on foreign currency exchange contracts in the Fund’s Statement of Operations. | |
| (h) | Futures Contracts–The Fund may purchase and sell futures contracts to enhance returns, to attempt to economically hedge some of its investment risk, or as a substitute position in lieu of holding the underlying asset on which the instrument is based. At the time of entering into a futures transaction, an investor is required to deposit and maintain a specified amount of cash or eligible securities called “initial margin.” Subsequent payments made or received by the Fund called “variation margin” are made on a daily basis as the market price of the futures contract fluctuates. The Fund will record an unrealized gain (loss) based on the amount of variation margin. When a contract is closed, a realized gain (loss) is recorded equal to the difference between the opening and closing value of the contract. |
| (i) | When-Issued, Forward Transactions or To-Be-Announced (“TBA”) Transactions–The Fund may purchase portfolio securities on a when-issued or forward basis. When-issued, forward transactions or TBA transactions involve a commitment by a fund to purchase securities, with payment and delivery (“settlement”) to take place in the future, in order to secure what is considered to be an advantageous price or yield at the time of entering into the transaction. During the period between purchase and settlement, the fair value of the securities will fluctuate and assets consisting of cash and/or marketable securities (normally short-term U.S. Government or U.S. Government sponsored enterprise securities) marked to market daily in an amount sufficient to make payment at settlement will be segregated at the Fund’s custodian in order to pay for the commitment. At the time the Fund makes the commitment to purchase a security on a when-issued basis, it will record the transaction and reflect the liability for the purchase and fair value of the security in determining its net asset value (“NAV”). The Fund, generally, has the ability to close out a purchase obligation on or before the settlement date rather than take delivery of the security. Under no circumstances will settlement for such securities take place more than 120 days after the purchase date. |
| (j) | Repurchase Agreements–The Fund may enter into repurchase agreements with respect to securities. A repurchase agreement is a transaction in which a fund acquires a security and simultaneously commits to resell that security to the seller (a bank or securities dealer) at an agreed-upon price on an agreed-upon date. The Fund requires at all times that the repurchase agreement be collateralized by cash, or by securities of the U.S. Government, its agencies, its instrumentalities, or U.S. Government sponsored enterprises having a value equal to, or in excess of, the value of the repurchase agreement (including accrued interest). If the seller of the agreement defaults on its obligation to repurchase the underlying securities at a time when the fair value of these securities has declined, the Fund may incur a loss upon disposition of the securities. |
| (k) | Floating Rate Loans–The Fund may invest in floating rate loans, which usually take the form of loan participations and assignments. Loan participations and assignments are agreements to make money available to U.S. or foreign corporations, partnerships or other business entities (the “Borrower”) in a specified amount, at a specified rate and within a specified time. A loan is typically originated, negotiated and structured by a U.S. or foreign bank, insurance company or other financial institution (the “Agent”) for a group of loan investors (“Loan Investors”). The |
58
Notes to Financial Statements (continued)
| Agent typically administers and enforces the loan on behalf of the other Loan Investors in the syndicate and may hold any collateral on behalf of the Loan Investors. Such loan participations and assignments are typically senior, secured and collateralized in nature. The Fund records an investment when the Borrower withdraws money and records interest as earned. These loans pay interest at rates which are periodically reset by reference to a base lending rate plus a spread. These base lending rates are generally the prime rate offered by a designated U.S. bank or London InterBank Offered Rate (“LIBOR”). | |
| The loans in which the Fund invests may be subject to some restrictions on resale. For example, the Fund may be contractually obligated to receive approval from the Agent and/or Borrower prior to the sale of these investments. The Fund generally has no right to enforce compliance with the terms of the loan agreement with the Borrower. As a result, the Fund assumes the credit risk of the Borrower, the selling participant and any other persons interpositioned between the Fund and the Borrower (“Intermediate Participants”). In the event that the Borrower, selling participant or Intermediate Participants become insolvent or enter into bankruptcy, the Fund may incur certain costs and delays in realizing payment or may suffer a loss of principal and/or interest. | |
| Unfunded commitments represent the remaining obligation of the Fund to the Borrower. At any point in time, up to the maturity date of the issue, the Borrower may demand the unfunded portion. Until demanded by the Borrower, unfunded commitments are not recognized as an asset on the Statement of Assets and Liabilities. Unrealized appreciation/depreciation on unfunded commitments presented on the Statement of Assets and Liabilities represents mark to market of the unfunded portion of the Fund’s floating rate notes. As of December 31, 2018, the Fund did not have unfunded loan commitments. | |
| (l) | Fair Value Measurements–Fair value is defined as the price that the Fund would receive upon selling an investment or transferring a liability in an orderly transaction to an independent buyer in the principal or most advantageous market of the investment. A three-tier hierarchy is used to maximize the use of observable market data and minimize the use of unobservable inputs and to establish classification of fair value measurements for disclosure purposes. Inputs refer broadly to the assumptions that market participants would use in pricing the asset or liability, including assumptions about risk — for example, the risk inherent in a particular valuation technique used to measure fair value (such as a pricing model) and/or the risk inherent in the inputs to the valuation technique. Inputs may be observable or unobservable. Observable inputs reflect the assumptions market participants would use in pricing the asset or liability. Observable inputs are based on market data obtained from sources independent of the reporting entity. Unobservable inputs reflect the reporting entity’s own assumptions about the assumptions market participants would use in pricing the asset or liability. Unobservable inputs are based on the best information available in the circumstances. The three-tier hierarchy classification is determined based on the lowest level of inputs that is significant to the fair value measurement, and is summarized in the three broad Levels listed below: |
| • | Level 1 – | unadjusted quoted prices in active markets for identical investments; |
| • | Level 2 – | other significant observable inputs (including quoted prices for similar investments, interest rates, prepayment speeds, credit risk, etc.); and |
| • | Level 3 – | significant unobservable inputs (including the Fund’s own assumptions in determining the fair value of investments). |
59
Notes to Financial Statements (continued)
| A summary of inputs used in valuing the Fund’s investments and other financial instruments as of December 31, 2018 and, if applicable, Level 1/Level 2 transfers and Level 3 rollforwards for the fiscal year then ended is included in the Fund’s Schedule of Investments. | |
| Changes in valuation techniques may result in transfers into or out of an assigned level within the three-tier hierarchy. All transfers between different levels within the three-tier hierarchy are deemed to have occurred as of the beginning of the reporting period. The inputs or methodology used for valuing securities are not necessarily an indication of the risk associated with investing in those securities. |
| 3. | MANAGEMENT FEE AND OTHER TRANSACTIONS WITH AFFILIATES |
Management Fee
The Company has a management agreement with Lord Abbett, pursuant to which Lord Abbett supplies the Fund with investment management services and executive and other personnel, provides office space and pays for ordinary and necessary office and clerical expenses relating to research and statistical work and supervision of the Fund’s investment portfolio.
The management fee is based on the Fund’s average daily net assets at the following annual rate:
| First $1 billion | .35% |
| Next $1 billion | .30% |
| Over $2 billion | .25% |
For the fiscal year ended December 31, 2018, the effective management fee, net of waivers, was at an annualized rate of 0.27% of the Fund’s average daily net assets.
In addition, Lord Abbett provides certain administrative services to the Fund pursuant to an Administrative Services Agreement in return for a fee at an annual rate of .04% of the Fund’s average daily net assets.
Effective May 1, 2018 and continuing through April 30, 2019, Lord Abbett has contractually agreed to waive its fees and reimburse expenses to the extent necessary to limit total net annual operating expenses to an annual rate of .85%. This agreement may be terminated only upon the approval of the Board. Prior to May 1, 2018, Lord Abbett contractually agreed to waive its fees and reimburse expenses to the extent necessary to limit total net annual operating expenses to an annual rate of .80%.
The Company, on behalf of the Fund, has entered into services arrangements with certain insurance companies. Under these arrangements, certain insurance companies will be compensated up to .25% of the average daily net asset value (“NAV”) of the Fund’s Class VC Shares held in the insurance company’s separate account to service and maintain the Variable Contract owners’ accounts. This amount is included in Non 12b-1 service fees on the Statement of Operations. The Fund may also compensate certain insurance companies, third-party administrators and other entities for providing recordkeeping, sub-transfer agency and other administrative services to the Fund. This amount is included in Shareholder servicing on the Statement of Operations.
One Director and certain of the Company’s officers have an interest in Lord Abbett.
| 4. | DISTRIBUTIONS AND CAPITAL LOSS CARRYFORWARDS |
Dividends from net investment income, if any, are declared and paid at least semi-annually. Taxable net realized gains from investment transactions, reduced by allowable capital loss carryforwards, if
60
Notes to Financial Statements (continued)
any, are declared and distributed to shareholders at least annually. The capital loss carryforward amount, if any, is available to offset future net capital gains. Dividends and distributions to shareholders are recorded on the ex-dividend date. The amounts of dividends and distributions from net investment income and net realized capital gains are determined in accordance with federal income tax regulations, which may differ from U.S. GAAP. These book/tax differences are either considered temporary or permanent in nature. To the extent these differences are permanent in nature, such amounts are reclassified within the components of net assets based on their federal tax basis treatment; temporary differences do not require reclassification. Dividends and distributions that exceed earnings and profits for tax purposes are reported as a tax return of capital.
The tax character of distributions paid during the fiscal years ended December 31, 2018 and 2017 was as follows:
| Year Ended | Year Ended | |||||||||
| 12/31/2018 | 12/31/2017 | |||||||||
| Distributions paid from: | ||||||||||
| Ordinary income | $ | 2,584,971 | $ | 2,047,290 | ||||||
| Total distributions paid | $ | 2,584,971 | $ | 2,047,290 | ||||||
As of December 31, 2018, the components of accumulated losses on a tax-basis were as follows:
| Undistributed ordinary income – Net | $ | 190,555 | ||
| Total undistributed earnings | 190,555 | |||
| Capital loss carryforwards* | (1,481,819 | ) | ||
| Temporary differences | (3,591 | ) | ||
| Unrealized losses – net | (2,424,744 | ) | ||
| Total accumulated losses | $ | (3,719,599 | ) |
* The capital losses will carry forward indefinitely.
As of December 31, 2018, the aggregate unrealized security gains and losses on investments and other financial instruments based on cost for U.S. federal income tax purposes were as follows:
| Tax cost | $ | 81,260,390 | ||
| Gross unrealized gain | 200,057 | |||
| Gross unrealized loss | (2,624,800 | ) | ||
| Net unrealized security loss | $ | (2,424,743 | ) |
The difference between book-basis unrealized gains (losses) is attributable to the tax treatment of certain securities, other financial instruments, amortization of premium and wash sales.
| 5. | PORTFOLIO SECURITIES TRANSACTIONS |
Purchases and sales of investment securities (excluding short-term investments) for the fiscal year ended December 31, 2018 were as follows:
| U.S. | Non-U.S. | U.S. | Non-U.S. | |||
| Government | Government | Government | Government | |||
| Purchases | Purchases | Sales | Sales | |||
| $12,500,623 | $47,051,029 | $12,333,442 | $30,393,090 |
The Fund is permitted to purchase and sell securities (“cross-trade”) from and to other Lord Abbett funds or client accounts pursuant to procedures approved by the Board in compliance with Rule 17a-7 under the Act (the “Rule”). Each cross-trade is executed at a fair market price in compliance
61
Notes to Financial Statements (continued)
with provisions of the Rule. For the fiscal year ended December 31, 2018, the Fund engaged in cross-trades purchases of $502,987 and sales of $445,954 which resulted in net realized gains of $1,567.
| 6. | DISCLOSURES ABOUT DERIVATIVE INSTRUMENTS AND HEDGING ACTIVITIES |
The Fund entered into forward foreign currency exchange contracts for the fiscal year ended December 31, 2018 (as described in note 2(g)). A forward foreign currency exchange contract reduces the Fund’s exposure to changes in the value of the currency it will deliver (or settle in cash) and increases its exposure to changes in the value of the currency it will receive (or settle in cash) for the duration of the contract. The Fund’s use of forward foreign currency exchange contracts involves the risk that Lord Abbett will not accurately predict currency movements, and the Fund’s returns could be reduced as a result. Forward foreign currency exchange contracts are subject to the risk that those currencies will decline in value relative to the U.S. dollar, or, in the case of hedged positions, that the U.S. dollar will decline relative to the currency being hedged. Currency rates in foreign countries may fluctuate significantly over short periods of time. The Fund’s risk of loss from counterparty credit risk is the unrealized appreciation on forward foreign currency exchange contracts and deposits with brokers as collateral.
The Fund entered into U.S. Treasury futures contracts for the fiscal year ended December 31, 2018 (as described in note 2(h)) to hedge against changes in interest rates. The Fund bears the risk of interest rates moving unexpectedly, in which case the Fund may not achieve the anticipated benefits of the futures contracts and realize a loss. There is minimal counterparty credit risk to the Fund since futures are exchange traded and the exchange’s clearinghouse, as counterparty to all exchange traded futures, guarantees futures against default.
As of December 31, 2018, the Fund had the following derivatives at fair value, grouped into appropriate risk categories that illustrate the Funds use of derivative instruments:
| Foreign | ||||
| Interest Rate | Currency | |||
| Asset Derivatives | Contracts | Contracts | ||
| Forward Foreign Currency Exchange Contracts(1) | – | $225 | ||
| Futures Contracts(2) | $75,913 | – | ||
| Liability Derivatives | ||||
| Futures Contracts(2) | $ 2,174 | – | ||
| (1) | Statements of Assets and Liabilities location: Unrealized appreciation on forward foreign currency exchange contracts. |
| (2) | Statements of Assets and Liabilities location: Includes cumulative unrealized appreciation/depreciation of futures contracts as reported in the Schedule of Investments. Only the current day’s variation margin is reported within the Statement of Assets and Liabilities. |
62
Notes to Financial Statements (continued)
Transactions in derivative instruments for the fiscal year ended December 31, 2018, were as follows:
| Foreign | |||||
| Interest Rate | Currency | ||||
| Contracts | Contracts | ||||
| Net Realized Gain (Loss) | |||||
| Forward Foreign Currency Exchange Contracts(1) | – | $ | 19 | ||
| Futures Contracts(2) | $(95,105 | ) | – | ||
| Net Change in Unrealized Appreciation/Depreciation | |||||
| Forward Foreign Currency Exchange Contracts(3) | – | $ | 425 | ||
| Futures Contracts(4) | $84,401 | – | |||
| Average Number of Contracts/Notional Amounts* | |||||
| Forward Foreign Currency Exchange Contracts(5) | – | $ | 5,709 | ||
| Futures Contracts(6) | 68 | – | |||
| * | Calculated based on the number of contracts or notional amounts for the year ended December 31, 2018. |
| (1) | Statements of Operations location: Net realized gain on foreign currency exchange contracts. |
| (2) | Statements of Operations location: Net realized loss on futures contracts. |
| (3) | Statements of Operations location: Net change in unrealized appreciation/depreciation on foreign currency exchange contracts. |
| (4) | Statements of Operations location: Net change in unrealized appreciation/depreciation on futures contracts. |
| (5) | Amount represents notional amounts in U.S. dollars. |
| (6) | Amount represents number of contracts. |
| 7. | DISCLOSURES ABOUT OFFSETTING ASSETS AND LIABILITIES |
The Financial Accounting Standards Board (“FASB”) requires disclosures intended to help better assess the effect or potential effect of offsetting arrangements on a fund’s financial position. The following tables illustrate gross and net information about recognized assets and liabilities eligible for offset in the statement of assets and liabilities; and disclose such amounts subject to an enforceable master netting agreement or similar agreement, by counterparty. A master netting agreement is an agreement between a fund and a counterparty which provides for the net settlement of amounts owed under all contracts traded under that agreement, as well as cash collateral, through a single payment by one party to the other in the event of default on or termination of any one contract. The Fund’s accounting policy with respect to balance sheet offsetting is that, absent an event of default by the counterparty or a termination of the agreement, the master netting agreement does not result in an offset of reported amounts of financial assets and liabilities in the statement of assets and liabilities across transactions between the Fund and the applicable counterparty:
| Gross Amounts | Net Amounts of | |||||||||||
| Offset in the | Assets Presented | |||||||||||
| Gross Amounts of | Statement of Assets | in the Statement of | ||||||||||
| Description | Recognized Assets | and Liabilities | Assets and Liabilities | |||||||||
| Forward Foreign Currency Exchange Contracts | $ | 225 | $ | – | $ | 225 | ||||||
| Repurchase Agreement | 4,371,775 | – | 4,371,775 | |||||||||
| Total | $ | 4,372,000 | $ | – | $ | 4,372,000 | ||||||
63
Notes to Financial Statements (continued)
| Net Amounts | |||||||||||||||||||
| of Assets | Amounts Not Offset in the | ||||||||||||||||||
| Presented in | Statement of Assets and Liabilities | ||||||||||||||||||
| the Statement | Cash | Securities | |||||||||||||||||
| of Assets and | Financial | Collateral | Collateral | Net | |||||||||||||||
| Counterparty | Liabilities | Instruments | Received(a) | Received(a) | Amount(b) | ||||||||||||||
| Fixed Income Clearing Corp. | $4,371,775 | $ – | $ – | $(4,371,775 | ) | $ | – | ||||||||||||
| State Street Bank and Trust | 225 | – | – | – | 225 | ||||||||||||||
| Total | $4,372,000 | $ – | $ – | $(4,371,775 | ) | $ | 225 | ||||||||||||
| (a) | Collateral disclosed is limited to an amount not to exceed 100% of the net amount of assets presented in the Statement of Assets and Liabilities, for each respective counterparty. |
| (b) | Net amount represents the amount owed to the Fund by the counterparty as of December 31, 2018. |
| 8. | DIRECTORS’ REMUNERATION |
The Company’s officers and one Director, who are associated with Lord Abbett, do not receive any compensation from the Company for serving in such capacities. Independent Directors’ fees are allocated among all Lord Abbett-sponsored funds based on the net assets of each fund. There is an equity-based plan available to all Independent Directors under which Independent Directors must defer receipt of a portion of, and may elect to defer receipt of an additional portion of Directors’ fees. The deferred amounts are treated as though equivalent dollar amounts had been invested in the funds. Such amounts and earnings accrued thereon are included in Directors’ fees on the Statement of Operations and in Directors’ fees payable on the Statement of Assets and Liabilities and are not deductible for U.S. federal income tax purposes until such amounts are paid.
| 9. | EXPENSE REDUCTIONS |
The Company has entered into an arrangement with its transfer agent and custodian, whereby credits realized as a result of uninvested cash balances are used to reduce a portion of the Fund’s expenses.
| 10. | LINE OF CREDIT |
During the period ended August 8, 2018, the Fund and certain other funds managed by Lord Abbett (collectively, the “Participating Funds”) participated in a syndicated line of credit facility with various lenders for $600 million (the “Facility”), whereas State Street Bank and Trust Company (“SSB”) participates as a lender and as agent for the lenders. The Facility is to be used for temporary or emergency purposes as an additional source of liquidity to satisfy redemptions. The Participating Funds are subject to graduated borrowing limits of one-third of Fund assets (if Fund assets are less than $750 million), $250 million, $300 million, or $350 million, based on past borrowings and likelihood of future borrowings. During the period ended August 8, 2018, the Fund did not utilize the Facility.
For the period August 9, 2018 through December 20, 2018, the Participating Funds entered into an amended syndicated line of credit facility with various lenders for $1.06 billion (the “Syndicated Facility”), whereas SSB participates as a lender and as agent for the lenders. Under the Syndicated Facility, the Participating Funds are subject to graduated borrowing limits of one-third of Fund assets (if Fund assets are less than $750 million), $250 million, $300 million, $350 million, or $1 billion, based on past borrowings and likelihood of future borrowings. Effective December 21, 2018, the Participating Funds entered into an amended Syndicated Facility with various lenders for $1.1 billion based on the same terms as described above.
64
Notes to Financial Statements (continued)
Effective August 9, 2018, the Participating Funds entered into an additional line of credit facility with SSB for $250 million (the “Bilateral Facility,” and together with the Syndicated Facility, the “Facilities”). Under the Bilateral Facility, each Participating Fund may borrow up to the lesser of $250 million or one-third of Fund assets. The Facilities are to be used for temporary or emergency purposes to satisfy redemption requests and manage liquidity.
For the period from August 9, 2018 through December 31, 2018, the Fund did not utilize the Facilities.
| 11. | INTERFUND LENDING PROGRAM |
Pursuant to an exemptive order issued by the U.S. Securities and Exchange Commission (“SEC exemptive order”), certain registered open-end management investment companies managed by Lord Abbett, including the Fund, participate in a joint lending and borrowing program (the “Interfund Lending Program”). The SEC exemptive order allows the Funds to borrow money from and lend money to each other for temporary or emergency purposes subject to the limitations and conditions.
During the fiscal year ended December 31, 2018, the Fund did not participate as a borrower or lender in the Interfund Lending Program.
| 12. | CUSTODIAN AND ACCOUNTING AGENT |
SSB is the Company’s custodian and accounting agent. SSB performs custodial, accounting and recordkeeping functions relating to portfolio transactions and calculating the Fund’s NAV.
| 13. | INVESTMENT RISKS |
The Fund is subject to the general risks and considerations associated with investing in fixed income securities, including the risk that issuers will fail to make timely payments of principal or interest or default altogether. The value of an investment will change as interest rates fluctuate and in response to market movements. When interest rates rise, the prices of fixed income securities are likely to decline; when interest rates fall, such prices tend to rise. Longer-term securities are usually more sensitive to interest rate changes. There is also the risk that an issuer of a fixed income security will fail to make timely payments of principal and/or interest to the Fund, a risk that is greater with high-yield bonds (sometimes called “junk bonds”) in which the Fund may substantially invest. Some issuers, particularly of high-yield bonds, may default as to principal and/or interest payments after the Fund purchases its securities. A default, or concerns in the market about an increase in risk of default, may result in losses to the Fund. High-yield bonds are subject to greater price fluctuations, as well as additional risks. The market for below investment grade securities may be less liquid, which may make such securities more difficult to sell at an acceptable price, especially during periods of financial distress, increased market volatility, or significant market decline.
The Fund is subject to the general risks and considerations associated with investing in convertible securities, which have both equity and fixed income risk characteristics, including market, credit, liquidity, and interest rate risks. Generally, convertible securities offer lower interest or dividend yields than non-convertible securities of similar quality and less potential for gains or capital appreciation in a rising equity securities market than equity securities. They tend to be more volatile than other fixed income securities, and the markets for convertible securities may be less liquid than markets for stocks or bonds. A significant portion of convertible securities have below investment grade credit ratings and are subject to increased credit and liquidity risks.
65
Notes to Financial Statements (continued)
The Fund’s investment exposure to foreign (which may include emerging market) companies presents increased market, liquidity, currency, political, information and other risks. As compared with companies organized and operated in the U.S., these companies may be more vulnerable to economic, political and social instability and subject to less government supervision, lack of transparency, inadequate regulatory and accounting standards, and foreign taxes. The securities of foreign companies also may be subject to inadequate exchange control regulations, the imposition of economic sanctions or other government restrictions, higher transaction and other costs, and delays in settlement to the extent they are traded on non-U.S. exchanges or markets. The cost of the Fund’s potential use of forward foreign currency exchange contracts varies with factors such as the currencies involved, the length of the contract period and the market conditions prevailing.
The Fund is subject to the risks associated with derivatives, which may be different from and greater than the risks associated with directly investing in securities. Derivatives may be subject to risks such as liquidity risk, leveraging risk, interest rate risk, market risk, and credit risk. Illiquid securities may lower the Fund’s returns since the Fund may be unable to sell these securities at their desired time or price. Derivatives also may involve the risk of mispricing or improper valuation and the risk that changes in the value of the derivative may not correlate perfectly with the value of the underlying asset, rate or index. Whether the Fund’s use of derivatives is successful will depend on, among other things, the Fund’s ability to correctly forecast market movements, changes in foreign exchange and interest rates, and other factors. If the Fund incorrectly forecasts these and other factors, its performance could suffer. The Fund’s use of derivatives could result in a loss exceeding the amount of the Fund’s investment in these instruments.
The Fund may invest in swap contracts. Swap contracts are bi-lateral agreements between a fund and its counterparty. Each party is exposed to the risk of default by the other. In addition, they may involve a small investment of cash compared to the risk assumed with the result that small changes may produce disproportionate and substantial gains or losses to the Fund.
The Fund may invest in credit default swap contracts. The risks associated with the Fund’s investment in credit default swaps are greater than if the Fund invested directly in the reference obligation because they are subject to illiquidity risk, counterparty risk, and credit risk at both the counterparty and underlying issuer levels.
The Fund may invest in floating rate or adjustable rate senior loans, which are subject to increased credit and liquidity risks. Senior loans are business loans made to borrowers that may be U.S. or foreign corporations, partnerships, or other business entities. The senior loans in which the Fund may invest may consist primarily of senior loans that are rated below investment grade or, if unrated, deemed by Lord Abbett to be equivalent to below investment grade securities. Below investment grade senior loans, as in the case of high-yield debt securities, or junk bonds, are usually more credit sensitive than interest rate sensitive, although the value of these instruments may be impacted by broader interest rate swings in the overall fixed income market. In addition, senior loans may be subject to structural subordination.
The Fund is subject to the risk of investing a significant portion of its assets in securities issued or guaranteed by the U.S. Government or its agencies and instrumentalities (such as the Government National Mortgage Association (“Ginnie Mae”), the Federal National Mortgage Association (“Fannie Mae”), or the Federal Home Loan Mortgage Corporation (“Freddie Mac”). Unlike Ginnie Mae securities, securities issued or guaranteed by U.S. Government-related organizations such as Fannie Mae and Freddie Mac are not backed by the full faith and credit of the U.S. Government and no assurance can be given that the U.S. Government would provide financial support to its agencies
66
Notes to Financial Statements (concluded)
and instrumentalities if not required to do so by law. Consequently, the Fund may be required to look principally to the agency issuing or guaranteeing the obligation. In addition, the Fund may invest in non-agency backed and mortgage related securities, which are issued by the private institutions, not by the government-sponsored enterprises. Such securities may be particularly sensitive to changes in economic conditions, including delinquencies and/or defaults, and changes in prevailing interest rates. These changes can affect the value, income and/or liquidity of such positions. When interest rates are declining, the value of these securities with prepayment features may not increase as much as other fixed income securities. Early principal repayment may deprive the Fund of income payments above current markets rates. The prepayment rate also will affect the price and volatility of a mortgage-related security. In addition, securities of government sponsored enterprises are guaranteed with respect to the timely payment of interest and principal by the particular enterprise involved, not by the U.S. Government.
These factors can affect the Fund’s performance.
| 14. | SUMMARY OF CAPITAL TRANSACTIONS |
Transactions in shares of capital stock were as follows:
| Year Ended | Year Ended | |||||||
| December 31, 2018 | December 31, 2017 | |||||||
| Shares sold | 2,853,571 | 2,247,989 | ||||||
| Reinvestment of distributions | 184,481 | 142,561 | ||||||
| Shares reacquired | (1,567,064 | ) | (1,465,617 | ) | ||||
| Increase | 1,470,988 | 924,933 | ||||||
67
Report of Independent Registered Public Accounting Firm
To the shareholders and the Board of Directors of Lord Abbett Series Fund, Inc.:
Opinion on the Financial Statements and Financial Highlights
We have audited the accompanying statement of assets and liabilities, including the schedule of investments, of the Short Duration Income Portfolio, one of the portfolios constituting the Lord Abbett Series Fund, Inc. (the “Fund”), as of December 31, 2018, the related statement of operations for the year then ended, the statements of changes in net assets for each of the two years in the period then ended, the financial highlights for each of the five years in the period then ended, and the related notes. In our opinion, the financial statements and financial highlights present fairly, in all material respects, the financial position of the Short Duration Income Portfolio of the Fund as of December 31, 2018, and the results of its operations for the year then ended, the changes in its net assets for each of the two years in the period then ended, and the financial highlights for each of the five years in the period then ended in conformity with accounting principles generally accepted in the United States of America.
Basis for Opinion
These financial statements and financial highlights are the responsibility of the Fund’s management. Our responsibility is to express an opinion on the Fund’s financial statements and financial highlights based on our audits. We are a public accounting firm registered with the Public Company Accounting Oversight Board (United States) (PCAOB) and are required to be independent with respect to the Fund in accordance with the U.S. federal securities laws and the applicable rules and regulations of the Securities and Exchange Commission and the PCAOB.
We conducted our audits in accordance with the standards of the PCAOB. Those standards require that we plan and perform the audit to obtain reasonable assurance about whether the financial statements and financial highlights are free of material misstatement, whether due to error or fraud. The Fund is not required to have, nor were we engaged to perform, an audit of its internal control over financial reporting. As part of our audits we are required to obtain an understanding of internal control over financial reporting but not for the purpose of expressing an opinion on the effectiveness of the Fund’s internal control over financial reporting. Accordingly, we express no such opinion.
Our audits included performing procedures to assess the risks of material misstatement of the financial statements and financial highlights, whether due to error or fraud, and performing procedures that respond to those risks. Such procedures included examining, on a test basis, evidence regarding the amounts and disclosures in the financial statements and financial highlights. Our audits also included evaluating the accounting principles used and significant estimates made by management, as well as evaluating the overall presentation of the financial statements and financial highlights. Our procedures included confirmation of securities owned as of December 31, 2018, by correspondence with the custodian and brokers; when replies were not received from brokers, we performed other auditing procedures. We believe that our audits provide a reasonable basis for our opinion.
DELOITTE & TOUCHE LLP
New York, New York
February 15, 2019
We have served as the auditor of one or more Lord Abbett Family of Funds’ investment companies since 1932.
68
Basic Information About Management
The Board is responsible for the management of the business and affairs of the Company in accordance with the laws of the State of Maryland. The Board elects officers who are responsible for the day-to-day operations of the Fund and who execute policies authorized by the Board. The Board also approves an investment adviser to the Fund and continues to monitor the cost and quality of the services the investment adviser provides, and annually considers whether to renew the contract with the adviser. Generally, each Director holds office until his/her successor is elected and qualified or until his/her earlier resignation or removal, as provided in the Company’s organizational documents.
Lord Abbett, a Delaware limited liability company, is the Fund’s investment adviser. Designated Lord Abbett personnel are responsible for the day-to-day management of the Fund.
Interested Directors
Mr. Sieg is affiliated with Lord Abbett and is an “interested person” of the Company as defined in the Act. Mr. Sieg is director/trustee of each of the 13 investment companies in the Lord Abbett Family of Funds, which consist of 62 portfolios or series. Mr. Sieg is an officer of the Lord Abbett Family of Funds.
| Name, Address and Year of Birth | Current Position and Length of Service with the Company | Principal Occupation and Other Directorships During the Past Five Years | ||
| Douglas B. Sieg Lord, Abbett & Co. LLC 90 Hudson Street Jersey City, NJ 07302 (1969) | Director since 2016; President and Chief Executive Officer since 2018 | Principal Occupation: Managing Partner (since 2018) and was formerly Head of Client Services, joined Lord Abbett in 1994. Other Directorships: None. |
Independent Directors
The following Independent Directors also are directors/trustees of each of the 13 investment companies in the Lord Abbett Family of Funds, which consist of 62 portfolios or series.
| Name, Address and Year of Birth | Current Position and Length of Service with the Company | Principal Occupation and Other Directorships During the Past Five Years | ||
| Eric C. Fast Lord, Abbett & Co. LLC c/o Legal Dept. 90 Hudson Street Jersey City, NJ 07302 (1949) | Director since 2014 | Principal Occupation:Chief Executive Officer of Crane Co., an industrial products company (2001–2014).
Other Directorships:Currently serves as director of Automatic Data Processing, Inc. (since 2007) and Regions Financial Corporation (since 2010). Previously served as a director of Crane Co. (1999–2014). | ||
| Evelyn E. Guernsey Lord, Abbett & Co. LLC c/o Legal Dept. 90 Hudson Street Jersey City, NJ 07302 (1955) | Director since 2011 | Principal Occupation:CEO, Americas of J.P. Morgan Asset Management (2004–2010).
Other Directorships:None. |
69
Basic Information About Management (continued)
| Name, Address and Year of Birth | Current Position and Length of Service with the Company | Principal Occupation and Other Directorships During the Past Five Years | ||
| Julie A. Hill Lord, Abbett & Co. LLC c/o Legal Dept. 90 Hudson Street Jersey City, NJ 07302 (1946) | Director since 2004 | Principal Occupation:Owner and CEO of The Hill Company, a business consulting firm (since 1998).
Other Directorships:Currently serves as director of Anthem, Inc., a health benefits company (since 1994). | ||
| Kathleen M. Lutito Lord, Abbett & Co. LLC c/o Legal Dept. 90 Hudson Street Jersey City, NJ 07302 (1963) | Director since 2017 | Principal Occupation:President and Chief Investment Officer of CenturyLink Investment Management Company (since 2006).
Other Directorships:None | ||
| James M. McTaggart Lord, Abbett & Co. LLC c/o Legal Dept. 90 Hudson Street Jersey City, NJ 07302 (1947) | Director since 2012 | Principal Occupation:Independent management advisor and consultant (since 2012); Vice President, CRA International, Inc. (doing business as Charles River Associates), a global management consulting firm (2009–2012); Founder and Chairman of Marakon Associates, Inc., a strategy consulting firm (1978–2009); and Officer and Director of Trinsum Group, a holding company (2007–2009).
Other Directorships:Blyth, Inc., a home products company (2004–2015). | ||
| Karla M. Rabusch Lord, Abbett & Co. LLC c/o Legal Dept. 90 Hudson Street Jersey City, NJ 07302 (1959) | Director since 2017 | Principal Occupation:President and Director of Wells Fargo Funds Management, LLC (2003–2017); President of Wells Fargo Funds (2003–2016).
Other Directorships:None. | ||
| Mark A. Schmid Lord, Abbett & Co. LLC c/o Legal Dept. 90 Hudson Street Jersey City, NJ 07302 (1959) | Director since 2016 | Principal Occupation:Vice President and Chief Investment Officer of the University of Chicago (since 2009).
Other Directorships:None. | ||
| James L.L. Tullis Lord, Abbett & Co. LLC c/o Legal Dept. 90 Hudson Street Jersey City, NJ 07302 (1947) | Director since 2006; Chairman since 2017 | Principal Occupation:CEO of Tullis-Dickerson and Co. Inc., a venture capital management firm (since 1990); CEO of Tullis Health Investors Inc. (since 2012).
Other Directorships:Currently serves as director of Crane Co. (since 1998). | ||
Officers
None of the officers listed below have received compensation from the Company. All of the officers of the Company also may be officers of the other Lord Abbett Funds and maintain offices at 90 Hudson Street, Jersey City, NJ 07302. Unless otherwise indicated, the position(s) and title(s) listed under the “Principal Occupation During the Past Five Years” column indicate each officer’s position(s) and title(s) with Lord Abbett. Each officer serves for an indefinite term (i.e., until his or her death, resignation, retirement, or removal).
70
Basic Information About Management (continued)
| Name and Year of Birth | Current Position with the Company | Length of Service of Current Position | Principal Occupation During the Past Five Years | |||
| Douglas B. Sieg (1969) | President and Chief Executive Officer | Elected as President and Chief Executive Officer in 2018 | Managing Partner of Lord Abbett (since 2018) and was formerly Head of Client Services, joined Lord Abbett in 1994. | |||
| Jeff D. Diamond (1960) | Executive Vice President | Elected in 2008 | Portfolio Manager, joined Lord Abbett in 2007. | |||
| Todd D. Jacobson (1966) | Executive Vice President | Elected in 2005 | Partner and Associate Director, joined Lord Abbett in 2003. | |||
| Robert A. Lee (1969) | Executive Vice President | Elected in 2010 | Partner and Chief Investment Officer, and was formerly Deputy Chief Investment Officer and Director of Taxable Fixed Income, joined Lord Abbett in 1997. | |||
| David J. Linsen (1974) | Executive Vice President | Elected in 2008 | Partner and Director of Equities, joined Lord Abbett in 2001. | |||
| Vincent J. McBride (1964) | Executive Vice President | Elected in 2010 | Partner and Director, joined Lord Abbett in 2003. | |||
| Andrew H. O’Brien (1973) | Executive Vice President | Elected in 2010 | Partner and Portfolio Manager, joined Lord Abbett in 1998. | |||
| F. Thomas O’Halloran (1955) | Executive Vice President | Elected in 2010 | Partner and Portfolio Manager, joined Lord Abbett in 2001. | |||
| Marc Pavese (1972) | Executive Vice President | Elected in 2016 | Partner and Portfolio Manager, joined Lord Abbett in 2008. | |||
| Walter H. Prahl (1958) | Executive Vice President | Elected in 2012 | Partner and Director, joined Lord Abbett in 1997. | |||
| Eli Rabinowich (1975) | Executive Vice President | Elected in 2018 | Portfolio Manager, joined Lord Abbett in 2018 and was formerly a Portfolio Manager, Partner, and Analyst at Pzena Investment Management from (2004–2018). |
71
Basic Information About Management (continued)
| Name and Year of Birth | Current Position with the Company | Length of Service of Current Position | Principal Occupation During the Past Five Years | |||
| Jeffrey Rabinowitz (1972) | Executive Vice President | Elected in 2017 | Portfolio Manager, joined Lord Abbett in 2017 and was formerly Managing Director and Portfolio Manager/Technology Analyst at Jennison Associates LLC (2014–2017) and Managing Director and Portfolio Manager/Technology Analyst for U.S. Growth Equity at Goldman Sachs Asset Management (1999–2014). | |||
| Steven F. Rocco (1979) | Executive Vice President | Elected in 2014 | Partner and Director of Taxable Fixed Income, joined Lord Abbett in 2004. | |||
| A. Edward Allinson (1961) | Vice President | Elected in 2011 | Portfolio Manager, joined Lord Abbett in 2005. | |||
| Vernon T. Bice (1974) | Vice President | Elected in 2011 | Portfolio Manager, joined Lord Abbett in 2011. | |||
| Pamela P. Chen (1978) | Vice President, Assistant Secretary and Privacy Officer | Elected in 2018 | Associate General Counsel, joined Lord Abbett in 2017 and was formerly Special Counsel at Schulte, Roth & Zabel LLP (2005–2017). | |||
| Robert S. Clark (1975) | Vice President | Elected in 2018 | Portfolio Manager, joined Lord Abbett in 2010. | |||
| Matthew R. DeCicco (1977) | Vice President | Elected in 2003 | Managing Director and Portfolio Manager, joined Lord Abbett in 1999. | |||
| John T. Fitzgerald (1975) | Vice President and Assistant Secretary | Elected in 2018 | Deputy General Counsel, joined Lord Abbett in 2018 and was formerly Deputy Head of U.S. Funds Legal, Executive Director and Assistant General Counsel at JPMorgan Chase (2005–2018). | |||
| Christopher J. Gizzo (1986) | Vice President | Elected in 2018 | Managing Director and Portfolio Manager, joined Lord Abbett in 2008. | |||
| Bernard J. Grzelak (1971) | Chief Financial Officer and Vice President | Elected in 2017 | Partner, Chief Operating Officer, Global Funds and Risk, joined Lord Abbett in 2003. |
72
Basic Information About Management (concluded)
| Name and Year of Birth | Current Position with the Company | Length of Service of Current Position | Principal Occupation During the Past Five Years | |||
| Linda Y. Kim (1980) | Vice President and Assistant Secretary | Elected in 2016 | Counsel, joined Lord Abbett in 2015 and was formerly an Associate at Stroock & Stroock & Lavan LLP (2007–2015). | |||
| So Young Lee (1971) | Vice President | Elected in 2018 | Portfolio Manager, joined Lord Abbett in 2013. | |||
| Joseph M. McGill (1962) | Chief Compliance Officer | Elected in 2014 | Partner and Chief Compliance Officer, joined Lord Abbett in 2014 and was formerly Managing Director and the Chief Compliance Officer at UBS Global Asset Management (2003–2013). | |||
| A. Edward Oberhaus, III (1959) | Vice President | Elected in 1998 | Partner and Director, joined Lord Abbett in 1983. | |||
| Amanda S. Ryan (1978) | Vice President and Assistant Secretary | Elected in 2018 | Counsel, joined Lord Abbett in 2016 and was formerly a Director and Corporate Counsel at PGIM Investments (2012–2016). | |||
| Lawrence B. Stoller (1963) | Vice President, Assistant Secretary, and Chief Legal Officer | Elected in 2007 | Partner and General Counsel, joined Lord Abbett in 2007. | |||
| Leah G. Traub (1979) | Vice President | Elected in 2016 | Partner and Portfolio Manager, joined Lord Abbett in 2007. | |||
| Kewjin Yuoh (1971) | Vice President | Elected in 2012 | Partner and Portfolio Manager, joined Lord Abbett in 2010. | |||
| Jackson C. Chan (1964) | AML Compliance Officer | Elected in 2018 | Deputy Chief Compliance Officer and Director of Regulatory Affairs, joined Lord Abbett in 2014 and was formerly Director at UBS Global Asset Management (2005–2014). | |||
| Vito A. Fronda (1969) | Treasurer | Elected in 2018 | Partner and Director of Taxation, joined Lord Abbett in 2003. |
Please call 888-522-2388 for a copy of the statement of additional information, which contains further information about the Company’s Directors. It is available free upon request.
73
Approval of Advisory Contract
The Board, including all of the Directors who are not “interested persons” of the Company or of Lord Abbett, as defined in the Investment Company Act of 1940, as amended (the “Independent Directors”), annually considers whether to approve the continuation of the existing management agreement between the Fund and Lord Abbett (the “Agreement”). In connection with its most recent approval, the Board reviewed materials relating specifically to the Agreement, as well as numerous materials received throughout the course of the year, including information about the Fund’s investment performance compared to the performance of its benchmark. Before making its decision as to the Fund, the Board had the opportunity to ask questions and request further information, taking into account its knowledge of Lord Abbett gained through its meetings and discussions. These meetings and discussions included reviews of Fund performance conducted by members of the Contract Committee, the deliberations of the Contract Committee, and discussions between the Contract Committee and Lord Abbett’s management. The Independent Directors also met with their independent legal counsel in various private sessions at which no representatives of management were present.
The materials received by the Board included, but were not limited to: (1) information provided by Broadridge Financial Solutions (“Broadridge”) regarding the investment performance of the Fund compared to the investment performance of certain funds with similar investment styles as determined by Broadridge, based, in part, on the Fund’s Morningstar category (the “performance peer group”), and the investment performance of the Fund’s benchmark; (2) information provided by Broadridge regarding the expense ratios, contractual and actual management fee rates, and other expense components for the Fund and certain funds in the same Morningstar category, with generally the same or similar share classes and operational characteristics, including asset size (the “expense peer group”); (3) certain supplemental investment performance information provided by Lord Abbett; (4) information provided by Lord Abbett on the expense ratios, management fee rates, and other expense components for the Fund; (5) sales and redemption information for the Fund; (6) information regarding Lord Abbett’s financial condition; (7) an analysis of the relative profitability of the Agreement to Lord Abbett; (8) information provided by Lord Abbett regarding the investment management fee schedules for Lord Abbett’s other advisory clients maintaining accounts with a similar investment strategy as the Fund; and (9) information regarding the personnel and other resources devoted by Lord Abbett to managing the Fund.
Investment Management and Related Services Generally.The Board considered the services provided by Lord Abbett to the Fund, including investment research, portfolio management, and trading, and Lord Abbett’s commitment to compliance with all applicable legal requirements. The Board also observed that Lord Abbett was solely engaged in the investment management business and accordingly did not experience the conflicts of interest that may result from being engaged in other lines of business. The Board considered the investment advisory services provided by Lord Abbett to other clients, the fees charged for the services, and the differences in the nature of the services provided to the Fund and other Lord Abbett Funds, on the one hand, and the services provided to other clients, on the other. After reviewing these and related factors, the Board concluded that the Fund was likely to continue to benefit from the nature, extent and quality of the investment services provided by Lord Abbett under the Agreement.
Investment Performance.The Board reviewed the Fund’s investment performance in relation to that of the performance peer group and the Fund’s benchmark as of various periods ended August 31, 2018. The Board observed that the Fund’s investment performance was above the median of the performance peer group for the one- and three-year periods. The Board further considered
74
Approval of Advisory Contract (continued)
Lord Abbett’s performance and reputation generally, the performance of other Lord Abbett-managed funds overseen by the Board, and the willingness of Lord Abbett to take steps intended to improve performance when appropriate. After reviewing these and related factors, the Board concluded that the Fund’s Agreement should be continued.
Lord Abbett’s Personnel and Methods.The Board considered the qualifications of the personnel providing investment management services to the Fund, in light of its investment objective and discipline, and other services provided to the Fund by Lord Abbett. Among other things, the Board considered the size, experience, and turnover of Lord Abbett’s staff, Lord Abbett’s investment methodology and philosophy, and Lord Abbett’s approach to recruiting, training, and retaining personnel.
Nature and Quality of Other Services.The Board considered the nature, quality, and extent of compliance, administrative, and other services performed by Lord Abbett and the nature and extent of Lord Abbett’s supervision of third party service providers, including the Fund’s transfer agent and custodian.
Expenses.The Board considered the expense level of the Fund, including the contractual and actual management fee rates, and the expense levels of the Fund’s expense peer group. It also considered how the expense level of the Fund related to those of the expense peer group and the amount and nature of the fees paid by shareholders. The Board observed that, while the Fund’s net total expense ratio was above the median of the expense peer group, the Fund’s advisory fee rate was below the median of the expense peer group. After reviewing these and related factors, the Board concluded, within the context of its overall approval of the Agreement, that the expense level of the Fund was reasonable and supported the continuation of the Agreement.
Profitability.The Board considered the level of Lord Abbett’s operating margin in managing the Fund, including a review of Lord Abbett’s methodology for allocating its costs to its management of the Fund. It considered whether the Fund was profitable to Lord Abbett in connection with the Fund’s operation, including the fee that Lord Abbett receives from the Fund for providing administrative services to the Fund. The Board also considered the profits realized from other business segments of Lord Abbett, which may benefit from or be related to the Fund’s business. The Board considered Lord Abbett’s profit margins excluding Lord Abbett’s marketing and distribution expenses. The Board also considered Lord Abbett’s profit margins, without those exclusions, in comparison with available industry data and how those profit margins could affect Lord Abbett’s ability to recruit and retain personnel. The Board recognized that Lord Abbett’s overall profitability was a factor in enabling it to attract and retain qualified personnel to provide services to the Fund. After reviewing these and related factors, the Board concluded, within the context of its overall approval of the Agreement, that Lord Abbett’s profitability with respect to the Fund was not excessive.
Economies of Scale.The Board considered the extent to which there had been economies of scale in managing the Fund, whether the Fund’s shareholders had appropriately benefited from such economies of scale, and whether there was potential for realization of any further economies of scale. The Board concluded that the existing management fee schedule, with its breakpoints in the level of the management fee, adequately addressed any economies of scale in managing the Fund.
Other Benefits to Lord Abbett.The Board considered the amount and nature of the fees paid by the Fund and the Fund’s shareholders to Lord Abbett for services other than investment advisory services, such as the fee that Lord Abbett receives from the Fund for providing administrative services to the Fund. The Board also considered the revenues and profitability of Lord Abbett’s
75
Approval of Advisory Contract (concluded)
investment advisory business apart from its mutual fund business, and the intangible benefits enjoyed by Lord Abbett by virtue of its relationship with the Fund. The Board observed that the Distributor receives 12b-1 fees from certain of the Lord Abbett Funds as to shares held in accounts for which there is no other broker of record, may retain a portion of the 12b-1 fees it receives, and receives a portion of the sales charges on sales and redemptions of some classes of shares of the Lord Abbett Funds. In addition, the Board observed that Lord Abbett accrues certain benefits for its business of providing investment advice to clients other than the Lord Abbett Funds, but that business also benefits the Funds. The Board also noted that Lord Abbett, as disclosed in the prospectus of the Fund, has entered into revenue sharing arrangements with certain entities that distribute shares of the Lord Abbett Funds. The Board also took into consideration the investment research that Lord Abbett receives as a result of client brokerage transactions.
Alternative Arrangements.The Board considered whether, instead of approving continuation of the Agreement, it might be in the best interests of the Fund to implement one or more alternative arrangements, such as continuing to employ Lord Abbett, but on different terms. After considering all of the relevant factors, the Board unanimously found that continuation of the Agreement was in the best interests of the Fund and its shareholders and voted unanimously to approve the continuation of the Agreement. In considering whether to approve the continuation of the Agreement, the Board did not identify any single factor as paramount or controlling. Individual Directors may have evaluated the information presented differently from one another, giving different weights to various factors. This summary does not discuss in detail all matters considered.
76
Householding
The Company has adopted a policy that allows it to send only one copy of the Fund’s prospectus, proxy material, annual report and semiannual report to certain shareholders residing at the same “household.” This reduces Fund expenses, which benefits you and other shareholders. If you need additional copies or do not want your mailings to be “householded,” please call Lord Abbett at 888-522-2388 or send a written request with your name, the name of your fund or funds and your account number or numbers to Lord Abbett Family of Funds, P.O. Box 219336, Kansas City, MO 64121.
Proxy Voting Policies, Procedures and Records
A description of the policies and procedures that Lord Abbett uses to vote proxies related to the Fund’s portfolio securities, and information on how Lord Abbett voted the Fund’s proxies during the 12-month period ended June 30 are available without charge, upon request, (i) by calling 888-522-2388; (ii) on Lord Abbett’s Website at www.lordabbett.com; and (iii) on the Securities and Exchange Commission’s (“SEC”) Website at www.sec.gov.
Shareholder Reports and Quarterly Portfolio Disclosure
The Fund is required to file its complete schedule of portfolio holdings with the SEC for its first and third fiscal quarters on Form N-Q. Copies of the filings are available without charge, upon request on the SEC’s Website at www.sec.gov and may be available by calling Lord Abbett at 888-522-2388.
77


| This report, when not used for the general information ofshareholders of the Fund, is to be distributed only if precededor accompanied by a current fund prospectus. | |||
| Lord Abbett Series Fund, Inc. | |||
| Lord Abbett mutual fund shares are distributed by | SFSDI-PORT-3 | ||
| LORD ABBETT DISTRIBUTOR LLC. | Short Duration Income Portfolio | (02/19) |
![]()
LORD ABBETT
ANNUAL REPORT
Lord Abbett
Series Fund—Total Return Portfolio
For the fiscal year ended December 31, 2018
Table of Contents
Lord Abbett Series Fund — Total Return Portfolio
Annual Report
For the fiscal year ended December 31, 2018

From left to right: James L.L. Tullis, Independent Chairman of the Lord Abbett Funds and Douglas B. Sieg, Director, President, and Chief Executive Officer of the Lord Abbett Funds.
Dear Shareholders:We are pleased to provide you with this overview of the performance of Lord Abbett Series Fund - Total Return Portfolio for the fiscal year ended December 31, 2018. On this page and the following pages, we discuss the major factors that influenced fiscal year performance. For additional information about the Fund, please visit our website at www.lordabbett.com, where you also can access the quarterly commentaries that provide updates on the Fund’s performance and other portfolio related updates.
Thank you for investing in Lord Abbett mutual funds. We value the trust that you place in us and look forward to serving your investment needs in the years to come.
Best regards,

Douglas B. Sieg
Director, President and Chief Executive Officer
For the fiscal year ended December 31, 2018, the Fund returned -1.03%, reflecting performance at the net asset value (NAV) of Class VC shares with all distributions reinvested, compared to its benchmark, the Bloomberg Barclays U.S. Universal® Index,1which returned –0.26% over the same period.
During the period, there were several market-moving events. In June 2018, the White House announced its intent to impose additional tariffs on $200 billion worth of Chinese goods, on top of the $50 billion previously announced. The aggressive U.S. trade posture continued
into September with trade tensions mounting between the U.S. and China. While the impact has yet to be fully realized, many corporations anticipate that the retaliatory tariffs will weigh on profits. In 2018, the Federal Reserve (the “Fed”) hiked short-term interest rates by 0.25% at each of its March, June, September and December meetings, raising the target range to 2.25% - 2.50%. As the Fed continued to raise rates, the U.S. Treasury yield curve flattened throughout the year. The yield on 10-year U.S. Treasury securities (“Treasuries”) reached multi-year highs in November, and pulled back in
1
December as risk-off sentiment roiled the markets and investors flocked to safety. Amid rising concerns surrounding escalating trade tensions, slowing global growth, and increasing interest rates, the Nasdaq experienced it’s largest monthly drop since 2008 in October 2018. US equity markets were volatile to finish out the year, with the S&P 500 suffering the largest December decline since the Great Depression, culminating in the worst year since the financial 2007 - 2008 crisis. Additionally, leveraged credit segments of the market experienced a sharp sell-off, notably in December, due to concerns over slower growth, falling oil prices, year-end technical pressures and general risk-off sentiment. Despite the sell-off, the U.S. economy continued to expand by more than 2% during each quarter of the trailing 12-month period, with domestic GDP growth ranging between 2.2% to 4.2% from the third quarter of 2017 to the third quarter of 2018. The 4.2% GDP growth in the second quarter marked the strongest growth rate since the third quarter of 2014. Inflation, as measured by the Consumer Price Index (CPI), gained 1.9%, which was a decline of 0.1% year-over-year, mainly driven lower by falling energy prices. Oil prices suffered sharp declines due to oversupply concerns.
For the 12-month period ended December 2018, the Fund’s overweight to and security selection within high yield corporates detracted from performance. The asset class came under pressure during
the 4th quarter as spreads widened due to falling oil prices and concerns around slowing global growth. An underweight position to Treasuries also detracted. Treasuries benefited from a flight to quality during the 4th quarter, amid increased volatility in risk assets. Lastly, security selection within high-quality mortgage-backed securities (MBS) detracted from relative performance.
The Fund’s overweight to asset-backed securities (ABS) was the largest contributor to relative performance. Notable contributions came from the Fund’s positioning in ‘A’ and ‘BBB’ rated ABS. Over the year we have found relative value in credit card, auto-related, equipment dealer and franchise-related ABS. An overweight to and security selection within commercial mortgage-backed securities (CMBS) also contributed over the period. We continue to favor structured products, which we believe tend to have less international exposure and be less affected by global weakness than corporate bonds.
The Fund’s portfolio is actively managed and, therefore, its holdings and the weightings of a particular issuer or particular sector as a percentage of portfolio assets are subject to change. Sectors may include many industries.
2
1 The Bloomberg Barclays U.S. Universal® Index represents the union of the U.S. Aggregate Index, the U.S High Yield Corporate Index, the 144A Index, the Eurodollar Index, the Emerging Markets Index, and the non-ERISA portion of the CMBS Index. Municipal debt, private placements, and non-dollar-denominated issues are excluded from the Universal Index. The only constituent of the Index that includes floating-rate debt is the Emerging Markets Index.
Unless otherwise specified, indexes reflect total return, with all dividends reinvested. Indexes are unmanaged, do not reflect the deduction of fees or expenses, and are not available for direct investment.
Important Performance and Other Information
Performance data quoted in the following pages reflect past performance and are no guarantee of future results. Current performance may be higher or lower than the performance quoted. The investment return and principal value of an investment in the Fund will fluctuate so that shares, on any given day or when redeemed, may be worth more or less than their original cost. You can obtain performance data current to the most recent month end by calling Lord Abbett at 888-522-2388 or referring to www.lordabbett.com.
During certain periods shown, expense waivers and reimbursements were in place. Without such expense waivers and reimbursements, the Fund’s returns would have been lower.
The annual commentary above discusses the views of the Fund’s management and various portfolio holdings of the Fund as of December 31, 2018. These views and portfolio holdings may have changed after this date. Information provided in the commentary is not a recommendation to buy or sell securities. Because the Fund’s portfolio is actively managed and may change significantly, the Fund may no longer own the securities described above or may have otherwise changed its position in the securities. For more recent information about the Fund’s portfolio holdings, please visit www.lordabbett.com.
A Note about Risk:See Notes to Financial Statements for a discussion of investment risks. For a more detailed discussion of the risks associated with the Fund, please see the Fund’s prospectus.
Mutual funds are not insured by the FDIC, are not deposits or other obligations of, or guaranteed by, banks, and are subject to investment risks including possible loss of principal amount invested.
The Fund serves as an underlying investment vehicle for variable annuity contracts and variable life insurance policies.
3
Below is a comparison of a $10,000 investment in Class VC shares with the same investment in both the Bloomberg Barclays U.S. Universal® Index and the Bloomberg Barclays U.S. Aggregate Bond® Index, assuming reinvestment of all dividends and distributions. The Fund’s shares are sold only to insurance company separate accounts that fund certain variable annuity and variable life contracts. The line graph comparison does not reflect the sales charges or other expenses of these contracts. If those sales charges and expenses were reflected, returns would be lower. The graph and performance table below do not reflect the deduction of taxes that a shareholder would pay on Fund distributions or the redemption of Fund shares. During the period, expenses of the Fund were waived or reimbursed by Lord Abbett; without such waiver or reimbursement of expenses, the Fund’s returns would have been lower.Past performance is no guarantee of future results.
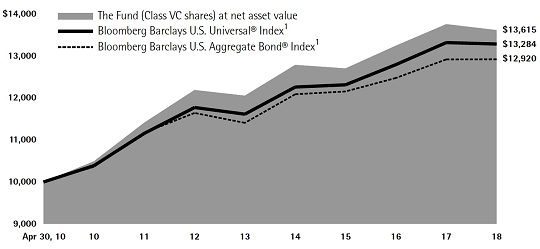
Average Annual Total Returns for the
Periods Ended December 31, 2018
| 1 Year | 5 Years | Life of Class | ||||
| Class VC2 | –1.03% | 2.47% | 3.62% | |||
1 Performance for each unmanaged index does not reflect any fees or expenses. The performance of each index is not necessarily representative of the Fund’s performance. Performance for each index began on May 1, 2010.
2 The Class VC shares commenced operations on April 16, 2010. Performance for the Class began on May 1, 2010.
4
As a shareholder of the Fund, you incur ongoing costs, including management fees; expenses related to the Fund’s services arrangements with certain insurance companies; and other Fund expenses. This Example is intended to help you understand your ongoing costs (in dollars) of investing in the Fund and to compare these costs with the ongoing costs of investing in other mutual funds.
The Example is based on an investment of $1,000 invested at the beginning of the period and held for the entire period (July 1, 2018 through December 31, 2018).
The Example reflects only expenses that are deducted from the assets of the Fund. Fees and expenses, including sales charges applicable to the various insurance products that invest in the Fund, are not reflected in this Example. If such fees and expenses were reflected in the Example, the total expenses shown would be higher. Fees and expenses regarding such variable insurance products are separately described in the prospectus related to those products.
Actual Expenses
The first line of the table on the following page provides information about actual account values and actual expenses. You may use the information in this line, together with the amount you invested, to estimate the expenses that you paid over the period. Simply divide your account value by $1,000 (for example, an $8,600 account value divided by $1,000 = 8.6), then multiply the result by the number in the first line under the heading titled “Expenses Paid During Period 7/1/18 – 12/31/18” to estimate the expenses you paid on your account during this period.
Hypothetical Example for Comparison Purposes
The second line of the table on the following page provides information about hypothetical account values and hypothetical expenses based on the Fund’s actual expense ratio and an assumed rate of return of 5% per year before expenses, which is not the Fund’s actual return. The hypothetical account values and expenses may not be used to estimate the actual ending account balance or expenses you paid for the period. You may use this information to compare the ongoing costs of investing in the Fund and other funds. To do so, compare this 5% hypothetical example with the 5% hypothetical examples that appear in the shareholder reports of the other funds.
5
Please note that the expenses shown in the table are meant to highlight your ongoing costs only and do not reflect any transactional costs, such as sales charges. Therefore, the second line of the table is useful in comparing ongoing costs only, and will not help you determine the relative total costs of owning different funds. In addition, if these transactional costs were included, your costs would have been higher.
| Beginning | Ending | Expenses | |||||
| Account | Account | Paid During | |||||
| Value | Value | Period† | |||||
| 7/1/18 – | |||||||
| 7/1/18 | 12/31/18 | 12/31/18 | |||||
| Class VC | |||||||
| Actual | $1,000.00 | $1,008.50 | $3.49 | ||||
| Hypothetical (5% Return Before Expenses) | $1,000.00 | $1,021.73 | $3.52 |
| † | Net expenses are equal to the Fund’s annualized expense ratio of 0.69%, multiplied by the average account value over the period, multiplied by 184/365 (to reflect one-half year period). |
Portfolio Holdings Presented by Sector
December 31, 2018
| Sector* | %** | |||
| Auto | 0.66 | % | ||
| Basic Industry | 0.10 | % | ||
| Consumer Cyclical | 0.42 | % | ||
| Consumer Discretionary | 0.40 | % | ||
| Consumer Services | 1.34 | % | ||
| Consumer Staples | 0.72 | % | ||
| Energy | 2.27 | % | ||
| Financial Services | 33.48 | % | ||
| Foreign Government | 2.04 | % | ||
| Health Care | 0.88 | % | ||
| Integrated Oils | 0.34 | % | ||
| Materials & Processing | 1.94 | % | ||
| Municipal | 0.11 | % | ||
| Producer Durables | 0.65 | % | ||
| Technology | 1.20 | % | ||
| Telecommunications | 0.48 | % | ||
| Transportation | 0.17 | % | ||
| U.S. Government | 49.59 | % | ||
| Utilities | 1.14 | % | ||
| Repurchase Agreement | 2.07 | % | ||
| Total | 100.00 | % | ||
| * | A sector may comprise several industries. | |
| ** | Represents percent of total investments. |
| 6 | See Notes to Financial Statements. |
December 31, 2018
| Principal | ||||||||||||
| Interest | Maturity | Amount | Fair | |||||||||
| Investments | Rate | Date | (000) | Value | ||||||||
| LONG-TERM INVESTMENTS 119.66% | ||||||||||||
| ASSET-BACKED SECURITIES 32.51% | ||||||||||||
| Automobiles 14.63% | ||||||||||||
| ACC Trust 2018-1 B† | 4.82% | 5/20/2021 | $ | 289 | $ | 289,864 | ||||||
| Ally Auto Receivables Trust 2017-5 A2 | 1.81% | 6/15/2020 | 121 | 120,850 | ||||||||
| American Credit Acceptance Receivables Trust 2016-2 C† | 6.09% | 5/12/2022 | 272 | 276,362 | ||||||||
| American Credit Acceptance Receivables Trust 2018-1 A† | 2.72% | 3/10/2021 | 599 | 598,439 | ||||||||
| American Credit Acceptance Receivables Trust 2018-4 A† | 3.38% | 12/13/2021 | 1,670 | 1,670,496 | ||||||||
| AmeriCredit Automobile Receivables Trust 2015-2 C | 2.40% | 1/8/2021 | 1,512 | 1,509,380 | ||||||||
| AmeriCredit Automobile Receivables Trust 2015-2 D | 3.00% | 6/8/2021 | 1,365 | 1,361,297 | ||||||||
| AmeriCredit Automobile Receivables Trust 2015-3 B | 2.08% | 9/8/2020 | 65 | 64,572 | ||||||||
| AmeriCredit Automobile Receivables Trust 2016-2 C | 2.87% | 11/8/2021 | 2,600 | 2,593,626 | ||||||||
| AmeriCredit Automobile Receivables Trust 2017-2 A2A | 1.65% | 9/18/2020 | 236 | 235,661 | ||||||||
| AmeriCredit Automobile Receivables Trust 2017-2 C | 2.97% | 3/20/2023 | 669 | 664,245 | ||||||||
| AmeriCredit Automobile Receivables Trust 2017-3 A2A | 1.69% | 12/18/2020 | 148 | 147,552 | ||||||||
| AmeriCredit Automobile Receivables Trust 2017-3 B | 2.24% | 6/19/2023 | 275 | 271,614 | ||||||||
| Americredit Automobile Receivables Trust 2018-2 A2A | 2.86% | 11/18/2021 | 3,560 | 3,553,544 | ||||||||
| Americredit Automobile Receivables Trust 2018-3 A2A | 3.11% | 1/18/2022 | 862 | 862,778 | ||||||||
| Americredit Automobile Receivables Trust 2018-3 A2B | 2.705% (1 Mo. LIBOR + .25% | )# | 1/18/2022 | 862 | 862,156 | |||||||
| Avis Budget Rental Car Funding AESOP LLC 2013-2A A† | 2.97% | 2/20/2020 | 178 | 178,261 | ||||||||
| Avis Budget Rental Car Funding AESOP LLC 2014-1A A† | 2.46% | 7/20/2020 | 592 | 590,316 | ||||||||
| BMW Vehicle Owner Trust 2018-A A2A | 2.09% | 11/25/2020 | 1,308 | 1,303,525 | ||||||||
| California Republic Auto Receivables Trust 2014-3 B | 2.66% | 8/17/2020 | 293 | 292,808 | ||||||||
| See Notes to Financial Statements. | 7 |
Schedule of Investments (continued)
December 31, 2018
| Principal | ||||||||||||
| Interest | Maturity | Amount | Fair | |||||||||
| Investments | Rate | Date | (000) | Value | ||||||||
| Automobiles (continued) | ||||||||||||
| California Republic Auto Receivables Trust 2015-1 A4 | 1.82% | 9/15/2020 | $ | 146 | $ | 145,539 | ||||||
| California Republic Auto Receivables Trust 2015-2 B | 2.53% | 6/15/2021 | 908 | 903,024 | ||||||||
| California Republic Auto Receivables Trust 2015-3 B | 2.70% | 9/15/2021 | 120 | 119,478 | ||||||||
| California Republic Auto Receivables Trust 2016-2 B | 2.52% | 5/16/2022 | 328 | 324,268 | ||||||||
| California Republic Auto Receivables Trust 2017-1 A3 | 1.90% | 3/15/2021 | 662 | 659,336 | ||||||||
| California Republic Auto Receivables Trust 2018-1 A2 | 2.86% | 3/15/2021 | 1,447 | 1,444,533 | ||||||||
| California Republic Auto Receivables Trust 2018-1 B | 3.56% | 3/15/2023 | 1,037 | 1,045,173 | ||||||||
| Capital Auto Receivables Asset Trust 2016-2 A3 | 1.46% | 6/22/2020 | 37 | 37,042 | ||||||||
| Capital Auto Receivables Asset Trust 2017-1 B† | 2.43% | 5/20/2022 | 462 | 455,692 | ||||||||
| Capital Auto Receivables Asset Trust 2017-1 C† | 2.70% | 9/20/2022 | 656 | 649,968 | ||||||||
| Capital Auto Receivables Asset Trust 2017-1 D† | 3.15% | 2/20/2025 | 427 | 426,067 | ||||||||
| CarMax Auto Owner Trust 2016-3 A3 | 1.39% | 5/17/2021 | 335 | 332,876 | ||||||||
| Chesapeake Funding II LLC 2016-1A A1† | 2.11% | 3/15/2028 | 129 | 128,219 | ||||||||
| Chesapeake Funding II LLC 2016-2A A1† | 1.88% | 6/15/2028 | 699 | 696,112 | ||||||||
| Chesapeake Funding II LLC 2017-2A A1† | 1.99% | 5/15/2029 | 541 | 535,489 | ||||||||
| Chesapeake Funding II LLC 2017-3A A1† | 1.91% | 8/15/2029 | 1,182 | 1,166,624 | ||||||||
| Chrysler Capital Auto Receivables Trust 2016-AA B† | 2.88% | 6/15/2022 | 195 | 194,761 | ||||||||
| Chrysler Capital Auto Receivables Trust 2016-AA C† | 3.25% | 6/15/2022 | 134 | 134,193 | ||||||||
| CPS Auto Receivables Trust 2016-B D† | 6.58% | 3/15/2022 | 150 | 156,653 | ||||||||
| CPS Auto Receivables Trust 2017-D A† | 1.87% | 3/15/2021 | 380 | 378,532 | ||||||||
| CPS Auto Receivables Trust 2018-A B† | 2.77% | 4/18/2022 | 319 | 316,503 | ||||||||
| CPS Auto Receivables Trust 2018-A C† | 3.05% | 12/15/2023 | 260 | 258,417 | ||||||||
| CPS Auto Receivables Trust 2018-B D† | 4.26% | 3/15/2024 | 417 | 424,575 | ||||||||
| CPS Auto Trust 2018-C A† | 2.87% | 9/15/2021 | 792 | 791,673 | ||||||||
| CPS Auto Trust 2018-C B† | 3.43% | 7/15/2022 | 331 | 331,264 | ||||||||
| Drive Auto Receivables Trust 2015-AA C† | 3.06% | 5/17/2021 | 4 | 4,383 | ||||||||
| Drive Auto Receivables Trust 2015-BA D† | 3.84% | 7/15/2021 | 1,650 | 1,652,302 | ||||||||
| Drive Auto Receivables Trust 2015-DA C† | 3.38% | 11/15/2021 | 82 | 81,812 | ||||||||
| Drive Auto Receivables Trust 2015-DA D† | 4.59% | 1/17/2023 | 607 | 611,035 | ||||||||
| Drive Auto Receivables Trust 2016-AA C† | 3.91% | 5/17/2021 | 353 | 354,087 | ||||||||
| Drive Auto Receivables Trust 2016-BA D† | 4.53% | 8/15/2023 | 979 | 985,467 | ||||||||
| Drive Auto Receivables Trust 2016-CA C† | 3.02% | 11/15/2021 | 1,215 | 1,214,797 | ||||||||
| Drive Auto Receivables Trust 2016-CA D† | 4.18% | 3/15/2024 | 254 | 255,362 | ||||||||
| Drive Auto Receivables Trust 2017-3 C | 2.80% | 7/15/2022 | 1,459 | 1,455,522 | ||||||||
| Drive Auto Receivables Trust 2017-AA D† | 4.16% | 5/15/2024 | 447 | 452,202 | ||||||||
| Drive Auto Receivables Trust 2018-3 A2 | 2.75% | 10/15/2020 | 1,877 | 1,875,815 | ||||||||
| 8 | See Notes to Financial Statements. |
Schedule of Investments (continued)
December 31, 2018
| Principal | ||||||||||||
| Interest | Maturity | Amount | Fair | |||||||||
| Investments | Rate | Date | (000) | Value | ||||||||
| Automobiles (continued) | ||||||||||||
| Drive Auto Receivables Trust 2018-3 A3 | 3.01% | 11/15/2021 | $ | 1,048 | $ | 1,046,794 | ||||||
| Drive Auto Receivables Trust 2018-3 B | 3.37% | 9/15/2022 | 414 | 414,342 | ||||||||
| Drive Auto Receivables Trust 2018-3 C | 3.72% | 9/16/2024 | 987 | 989,808 | ||||||||
| Drive Auto Receivables Trust 2018-4 A2A | 2.78% | 10/15/2020 | 1,004 | 1,002,969 | ||||||||
| Drive Auto Receivables Trust 2018-4 A3 | 3.04% | 11/15/2021 | 1,568 | 1,565,778 | ||||||||
| Drive Auto Receivables Trust 2018-5 A2A | 3.08% | 7/15/2021 | 1,437 | 1,436,827 | ||||||||
| Drive Auto Receivables Trust 2018-5 A2B | 2.775% (1 Mo. LIBOR + .32% | )# | 7/15/2021 | 1,179 | 1,177,410 | |||||||
| Enterprise Fleet Financing LLC 2017-1 A2† | 2.13% | 7/20/2022 | 292 | 290,347 | ||||||||
| First Investors Auto Owner Trust 2017-3A A2† | 2.41% | 12/15/2022 | 571 | 566,682 | ||||||||
| First Investors Auto Owner Trust 2017-3A B† | 2.72% | 4/17/2023 | 218 | 216,149 | ||||||||
| First Investors Auto Owner Trust 2018-2A A1† | 3.23% | 12/15/2022 | 967 | 968,466 | ||||||||
| Flagship Credit Auto Trust 2017-1 A† | 1.93% | 12/15/2021 | 206 | 205,378 | ||||||||
| Flagship Credit Auto Trust 2017-3 A† | 1.88% | 10/15/2021 | 252 | 250,440 | ||||||||
| Flagship Credit Auto Trust 2017-3 B† | 2.59% | 7/15/2022 | 300 | 296,466 | ||||||||
| Flagship Credit Auto Trust 2017-4 A† | 2.07% | 4/15/2022 | 407 | 404,097 | ||||||||
| Flagship Credit Auto Trust 2018-1 A† | 2.59% | 6/15/2022 | 664 | 660,178 | ||||||||
| Flagship Credit Auto Trust 2018-3 A† | 3.07% | 2/15/2023 | 2,208 | 2,207,129 | ||||||||
| Flagship Credit Auto Trust 2018-3 B† | 3.59% | 12/16/2024 | 725 | 727,661 | ||||||||
| Ford Credit Auto Lease Trust 2017-B A2A | 1.80% | 6/15/2020 | 646 | 644,377 | ||||||||
| Ford Credit Auto Owner Trust 2014-2 A† | 2.31% | 4/15/2026 | 2,909 | 2,889,168 | ||||||||
| Ford Credit Auto Owner Trust 2017-1 A† | 2.62% | 8/15/2028 | 1,238 | 1,220,716 | ||||||||
| Ford Credit Auto Owner Trust 2017-2 B† | 2.60% | 3/15/2029 | 108 | 105,216 | ||||||||
| Ford Credit Auto Owner Trust 2018-2 A† | 3.47% | 1/15/2030 | 3,712 | 3,749,670 | ||||||||
| Ford Credit Auto Owner Trust/Ford Credit 2014-1 A† | 2.26% | 11/15/2025 | 2,624 | 2,616,131 | ||||||||
| Foursight Capital Automobile Receivables Trust 2016-1 A2† | 2.87% | 10/15/2021 | 195 | 195,038 | ||||||||
| Foursight Capital Automobile Receivables Trust 2018-1 A2† | 2.85% | 8/16/2021 | 510 | 508,656 | ||||||||
| Foursight Capital Automobile Receivables Trust 2018-1 A3† | 3.24% | 9/15/2022 | 830 | 830,699 | ||||||||
| Foursight Capital Automobile Receivables Trust 2018-1 B† | 3.53% | 4/17/2023 | 412 | 413,511 | ||||||||
| Foursight Capital Automobile Receivables Trust 2018-1 C† | 3.68% | 8/15/2023 | 194 | 194,573 | ||||||||
| GM Financial Automobile Leasing Trust 2016-3 A3 | 1.61% | 12/20/2019 | 103 | 103,169 | ||||||||
| GM Financial Automobile Leasing Trust 2017-2 A2A | 1.72% | 1/21/2020 | 111 | 111,112 | ||||||||
| GM Financial Consumer Automobile Receivables Trust 2017-3A A2A† | 1.71% | 9/16/2020 | 723 | 720,376 | ||||||||
| Harley-Davidson Motorcycle Trust 2015-2 A4 | 1.66% | 12/15/2022 | 147 | 146,821 | ||||||||
| See Notes to Financial Statements. | 9 |
Schedule of Investments (continued)
December 31, 2018
| Principal | ||||||||||||
| Interest | Maturity | Amount | Fair | |||||||||
| Investments | Rate | Date | (000) | Value | ||||||||
| Automobiles (continued) | ||||||||||||
| Honda Auto Receivables Owner Trust 2016-2 A3 | 1.39% | 4/15/2020 | $ | 79 | $ | 78,238 | ||||||
| Huntington Auto Trust 2016-1 A3 | 1.59% | 11/16/2020 | 1,092 | 1,086,951 | ||||||||
| Hyundai Auto Lease Securitization Trust 2017-C A2A† | 1.89% | 3/16/2020 | 787 | 783,881 | ||||||||
| Mercedes-Benz Auto Lease Trust 2018-A A2 | 2.20% | 4/15/2020 | 937 | 934,617 | ||||||||
| Mercedes-Benz Auto Lease Trust 2018-B A2 | 3.04% | 12/15/2020 | 2,302 | 2,303,668 | ||||||||
| Mercedes-Benz Auto Receivables Trust 2016-1 A3 | 1.26% | 2/16/2021 | 277 | 274,369 | ||||||||
| Santander Drive Auto Receivables Trust 2015-1 C | 2.57% | 4/15/2021 | 88 | 87,667 | ||||||||
| Santander Drive Auto Receivables Trust 2015-4 C | 2.97% | 3/15/2021 | 1,346 | 1,344,984 | ||||||||
| Santander Drive Auto Receivables Trust 2016-2 B | 2.08% | 2/16/2021 | 28 | 28,164 | ||||||||
| Santander Drive Auto Receivables Trust 2016-3 B | 1.89% | 6/15/2021 | 151 | 150,579 | ||||||||
| Santander Drive Auto Receivables Trust 2017-2 B | 2.21% | 10/15/2021 | 1,359 | 1,355,344 | ||||||||
| Santander Drive Auto Receivables Trust 2017-3 C | 2.76% | 12/15/2022 | 192 | 190,912 | ||||||||
| Santander Drive Auto Receivables Trust 2018-1 A2 | 2.10% | 11/16/2020 | 408 | 407,266 | ||||||||
| Santander Drive Auto Receivables Trust 2018-3 A2A | 2.78% | 3/15/2021 | 1,297 | 1,295,205 | ||||||||
| SunTrust Auto Receivables Trust 2015-1A A4† | 1.78% | 1/15/2021 | 251 | 250,033 | ||||||||
| SunTrust Auto Receivables Trust 2015-1A D† | 3.24% | 1/16/2023 | 754 | 753,536 | ||||||||
| TCF Auto Receivables Owner Trust 2015-1A B† | 2.49% | 4/15/2021 | 791 | 789,731 | ||||||||
| TCF Auto Receivables Owner Trust 2016-PT1A B† | 2.92% | 10/17/2022 | 598 | 594,131 | ||||||||
| Westlake Automobile Receivables Trust 2017-2A A2A† | 1.80% | 7/15/2020 | 260 | 259,406 | ||||||||
| Wheels SPV 2 LLC 2016-1A A2† | 1.59% | 5/20/2025 | 123 | 123,015 | ||||||||
| Wheels SPV 2 LLC 2018-1A A2† | 3.06% | 4/20/2027 | 541 | 541,140 | ||||||||
| World Omni Select Auto Trust 2018-1A A2† | 3.24% | 4/15/2022 | 1,208 | 1,210,341 | ||||||||
| Total | 82,165,473 | |||||||||||
| Credit Cards 7.70% | ||||||||||||
| American Express Credit Account Master Trust 2017-1 A | 1.93% | 9/15/2022 | 1,415 | 1,398,624 | ||||||||
| American Express Credit Account Master Trust 2017-4 A | 1.64% | 12/15/2021 | 4,540 | 4,519,020 | ||||||||
| American Express Credit Account Master Trust 2018-6 A | 3.06% | 2/15/2024 | 5,294 | 5,314,944 | ||||||||
| Barclays Dryrock Issuance Trust 2014-3 A | 2.41% | 7/15/2022 | 927 | 923,005 | ||||||||
| Capital One Multi-Asset Execution Trust 2016-A4 | 1.33% | 6/15/2022 | 1,230 | 1,217,727 | ||||||||
| Chase Issuance Trust 2012-A4 | 1.58% | 8/15/2021 | 813 | 806,468 | ||||||||
| Chase Issuance Trust 2016-A5 | 1.27% | 7/15/2021 | 1,651 | 1,636,677 | ||||||||
| Citibank Credit Card Issuance Trust 2017-A2 | 1.74% | 1/19/2021 | 2,773 | 2,771,239 | ||||||||
| Citibank Credit Card Issuance Trust 2017-A9 | 1.80% | 9/20/2021 | 2,112 | 2,095,260 | ||||||||
| Citibank Credit Card Issuance Trust 2018-A6 | 3.21% | 12/7/2024 | 1,175 | 1,187,946 | ||||||||
| 10 | See Notes to Financial Statements. |
Schedule of Investments (continued)
December 31, 2018
| Principal | ||||||||||||
| Interest | Maturity | Amount | Fair | |||||||||
| Investments | Rate | Date | (000) | Value | ||||||||
| Credit Cards (continued) | ||||||||||||
| Discover Card Execution Note Trust 2012-A6 | 1.67% | 1/18/2022 | $ | 3,001 | $ | 2,981,819 | ||||||
| Discover Card Execution Note Trust 2014-A1 | 2.885% (1 Mo. LIBOR + .43% | )# | 7/15/2021 | 2,761 | 2,761,336 | |||||||
| Discover Card Execution Note Trust 2014-A4 | 2.12% | 12/15/2021 | 967 | 963,472 | ||||||||
| Discover Card Execution Note Trust 2016-A1 | 1.64% | 7/15/2021 | 619 | 618,546 | ||||||||
| Discover Card Execution Note Trust 2016-A4 | 1.39% | 3/15/2022 | 980 | 969,337 | ||||||||
| Master Credit Card Trust II Series 2018-1A B† | 3.245% | 7/21/2024 | 943 | 940,040 | ||||||||
| Synchrony Credit Card Master Note Trust 2016-1 A | 2.04% | 3/15/2022 | 1,225 | 1,222,560 | ||||||||
| Synchrony Credit Card Master Note Trust 2016-3 A | 1.58% | 9/15/2022 | 862 | 853,646 | ||||||||
| Synchrony Credit Card Master Note Trust 2017-2 A | 2.62% | 10/15/2025 | 814 | 803,662 | ||||||||
| Synchrony Credit Card Master Note Trust 2018-2 A | 3.47% | 5/15/2026 | 767 | 776,905 | ||||||||
| World Financial Network Credit Card Master Trust 2012-A | 3.14% | 1/17/2023 | 890 | 889,943 | ||||||||
| World Financial Network Credit Card Master Trust 2017-B A | 1.98% | 6/15/2023 | 1,217 | 1,210,290 | ||||||||
| World Financial Network Credit Card Master Trust 2017-C A | 2.31% | 8/15/2024 | 2,151 | 2,121,848 | ||||||||
| World Financial Network Credit Card Master Trust 2017-C M | 2.66% | 8/15/2024 | 946 | 934,437 | ||||||||
| World Financial Network Credit Card Master Trust 2018-B A | 3.46% | 7/15/2025 | 3,274 | 3,310,180 | ||||||||
| Total | 43,228,931 | |||||||||||
| Home Equity 0.02% | ||||||||||||
| Meritage Mortgage Loan Trust 2004-2 M3 | 3.481% (1 Mo. LIBOR + .98% | )# | 1/25/2035 | 112 | 110,058 | |||||||
| New Century Home Equity Loan Trust 2005-A A6 | 4.682% | #(a) | 8/25/2035 | 20 | 20,080 | |||||||
| Total | 130,138 | |||||||||||
| Other 10.16% | ||||||||||||
| Access Point Funding I LLC 2017-A† | 3.06% | 4/15/2029 | 182 | 181,316 | ||||||||
| Allegro CLO IV Ltd. 2016-1A† | 3.836% (3 Mo. LIBOR + 1.40% | )# | 1/15/2029 | 1,650 | 1,652,507 | |||||||
| ALM VII Ltd. 2012-7A A1R† | 3.916% (3 Mo. LIBOR + 1.48% | )# | 10/15/2028 | 746 | 747,297 | |||||||
| Apidos CLO XVI 2013-16A CR† | 5.45% (3 Mo. LIBOR + 3.00% | )# | 1/19/2025 | 250 | 250,107 | |||||||
| Ares XLI Clo Ltd. 2016-41A A† | 3.846% (3 Mo. LIBOR + 1.41% | )# | 1/15/2029 | 2,463 | 2,465,255 | |||||||
| Ares XXXIII CLO Ltd. 2015-1A A1R† | 4.101% (3 Mo. LIBOR + 1.35% | )# | 12/5/2025 | 250 | 250,615 | |||||||
| See Notes to Financial Statements. | 11 |
Schedule of Investments (continued)
December 31, 2018
| Principal | ||||||||||||
| Interest | Maturity | Amount | Fair | |||||||||
| Investments | Rate | Date | (000) | Value | ||||||||
| Other (continued) | ||||||||||||
| Ascentium Equipment Receivables Trust 2016-2A A3† | 1.65% | 5/10/2022 | $ | 174 | $ | 173,075 | ||||||
| Ascentium Equipment Receivables Trust 2016-2A B† | 2.50% | 9/12/2022 | 182 | 181,007 | ||||||||
| Ascentium Equipment Receivables Trust 2017-1A A2† | 1.87% | 7/10/2019 | 29 | 28,825 | ||||||||
| Ascentium Equipment Receivables Trust 2017-1A A3† | 2.29% | 6/10/2021 | 183 | 181,666 | ||||||||
| Avery Point IV CLO Ltd. 2014-1A BR† | 4.09% (3 Mo. LIBOR + 1.60% | )# | 4/25/2026 | 322 | 321,478 | |||||||
| Avery Point V CLO Ltd. 2014-5A BR† | 3.949% (3 Mo. LIBOR + 1.50% | )# | 7/17/2026 | 372 | 368,576 | |||||||
| Avery Point VII CLO Ltd. 2015-7A A1† | 3.936% (3 Mo. LIBOR + 1.50% | )# | 1/15/2028 | 1,184 | 1,184,731 | |||||||
| Benefit Street Partners CLO IV Ltd. 2014-IVA A1R† | 3.959% (3 Mo. LIBOR + 1.49% | )# | 1/20/2029 | 500 | 500,254 | |||||||
| Benefit Street Partners CLO IV Ltd. 2014-IVA A2R† | 4.519% (3 Mo. LIBOR + 2.05% | )# | 1/20/2029 | 673 | 669,830 | |||||||
| Benefit Street Partners CLO IV Ltd. 2014-IVA BR† | 5.369% (3 Mo. LIBOR + 2.90% | )# | 1/20/2029 | 500 | 499,073 | |||||||
| BlueMountain CLO 2013-1 Ltd. 2013-1A A1R† | 3.869% (3 Mo. LIBOR + 1.40% | )# | 1/20/2029 | 1,660 | 1,665,070 | |||||||
| Cedar Funding VI CLO Ltd. 2016-6A BR† | 4.069% (3 Mo. LIBOR + 1.60% | )# | 10/20/2028 | 650 | 634,121 | |||||||
| Cent CLO Ltd. 2013-19A A1A† | 3.839% (3 Mo. LIBOR + 1.33% | )# | 10/29/2025 | 670 | 670,762 | |||||||
| Conn’s Receivables Funding LLC 2017-B C† | 5.95% | 11/15/2022 | 1,063 | 1,080,042 | ||||||||
| Daimler Trucks Retail Trust 2018-1 A2† | 2.60% | 5/15/2020 | 1,195 | 1,193,757 | ||||||||
| Diamond Resorts Owner Trust 2015-2 A† | 2.99% | 5/22/2028 | 88 | 87,684 | ||||||||
| Diamond Resorts Owner Trust 2016-1 A† | 3.08% | 11/20/2028 | 60 | 59,781 | ||||||||
| Diamond Resorts Owner Trust 2017-1A B† | 4.11% | 10/22/2029 | 443 | 443,428 | ||||||||
| DLL LLC 2018-1 A3† | 3.10% | 4/18/2022 | 1,510 | 1,511,439 | ||||||||
| DLL LLC 2018-ST2 A2† | 3.14% | 10/20/2020 | 2,232 | 2,228,740 | ||||||||
| DRB Prime Student Loan Trust 2015-D A2† | 3.20% | 1/25/2040 | 465 | 465,749 | ||||||||
| Engs Commercial Finance Trust 2018-1A A1† | 2.97% | 2/22/2021 | 1,035 | 1,032,148 | ||||||||
| Ford Credit Floorplan Master Owner Trust 2017-2 A1 | 2.16% | 9/15/2022 | 942 | 928,390 | ||||||||
| Ford Credit Floorplan Master Owner Trust 2018 4 A | 4.06% | 11/15/2030 | 721 | 724,624 | ||||||||
| GMF Floorplan Owner Revolving Trust 2016-1 A1† | 1.96% | 5/17/2021 | 1,109 | 1,104,004 | ||||||||
| Halcyon Loan Advisors Funding Ltd. 2015-2A CR† | 4.64% (3 Mo. LIBOR + 2.15% | )# | 7/25/2027 | 250 | 242,558 | |||||||
| 12 | See Notes to Financial Statements. |
Schedule of Investments (continued)
December 31, 2018
| Principal | ||||||||||||
| Interest | Maturity | Amount | Fair | |||||||||
| Investments | Rate | Date | (000) | Value | ||||||||
| Other (continued) | ||||||||||||
| Hardee’s Funding LLC 2018-1A A2II† | 4.959% | 6/20/2048 | $ | 1,167 | $ | 1,190,066 | ||||||
| ICG US CLO Ltd. 2015-2A AR† | 3.286% (3 Mo. LIBOR + .85% | )# | 1/16/2028 | 1,231 | 1,223,652 | |||||||
| Jamestown CLO VII Ltd. 2015-7A CR† | 5.09% (3 Mo. LIBOR + 2.60% | )# | 7/25/2027 | 611 | 579,748 | |||||||
| LCM XXII Ltd. 22A-A1† | 3.949% (3 Mo. LIBOR + 1.48% | )# | 10/20/2028 | 318 | 319,397 | |||||||
| LCM XXIV Ltd. 24A A† | 3.779% (3 Mo. LIBOR + 1.31% | )# | 3/20/2030 | 679 | 676,568 | |||||||
| Madison Park Funding XXI Ltd. 2016-21A A1† | 4.02% (3 Mo. LIBOR + 1.53% | )# | 7/25/2029 | 324 | 325,546 | |||||||
| Massachusetts Educational Financing Authority 2008-1 A1 | 3.44% (3 Mo. LIBOR + .95% | )# | 4/25/2038 | 584 | 585,279 | |||||||
| Mountain Hawk III CLO Ltd. 2014-3A AR† | 3.645% (3 Mo. LIBOR + 1.20% | )# | 4/18/2025 | 1,807 | 1,807,612 | |||||||
| Mountain View CLO X Ltd. 2015-10A BR† | 3.786% (3 Mo. LIBOR + 1.35% | )# | 10/13/2027 | 623 | 609,633 | |||||||
| Navient Private Education Refi Loan Trust 2018-DA A2A† | 4.00% | 12/15/2059 | 570 | 583,144 | ||||||||
| Navient Student Loan Trust 2016-7A A† | 3.656% (1 Mo. LIBOR + 1.15% | )# | 3/25/2066 | 662 | 665,492 | |||||||
| Navient Student Loan Trust 2017-2A A† | 3.556% (1 Mo. LIBOR + 1.05% | )# | 12/27/2066 | 1,261 | 1,262,738 | |||||||
| NextGear Floorplan Master Owner Trust 2016-1A A2† | 2.74% | 4/15/2021 | 4,315 | 4,310,265 | ||||||||
| OHA Loan Funding Ltd. 2016-1A B1† | 4.269% (3 Mo. LIBOR + 1.80% | )# | 1/20/2028 | 1,574 | 1,570,280 | |||||||
| OneMain Financial Issuance Trust 2015-1A A† | 3.19% | 3/18/2026 | 94 | 94,124 | ||||||||
| OneMain Financial Issuance Trust 2016-1A A† | 3.66% | 2/20/2029 | 315 | 315,622 | ||||||||
| OneMain Financial Issuance Trust 2016-2A B† | 5.94% | 3/20/2028 | 100 | 101,583 | ||||||||
| Orec Ltd. 2018-CRE1 A† | 3.487% (1 Mo. LIBOR + 1.18% | )# | 6/15/2036 | 1,030 | 1,026,393 | |||||||
| Palmer Square Loan Funding Ltd. 2018-1A A1† | 3.036% (3 Mo. LIBOR + .60% | )# | 4/15/2026 | 1,098 | 1,091,402 | |||||||
| Palmer Square Loan Funding Ltd. 2018-1A A2† | 3.486% (3 Mo. LIBOR + 1.05% | )# | 4/15/2026 | 414 | 396,465 | |||||||
| Palmer Square Loan Funding Ltd. 2018-1A B† | 3.836% (3 Mo. LIBOR + 1.40% | )# | 4/15/2026 | 314 | 293,994 | |||||||
| Palmer Square Loan Funding Ltd. 2018-5A A1† | 3.32% (3 Mo. LIBOR + .85% | )# | 1/20/2027 | 1,071 | 1,068,251 | |||||||
| Palmer Square Loan Funding Ltd. 2018-5A A2† | 3.87% (3 Mo. LIBOR + 1.40% | )# | 1/20/2027 | 255 | 250,823 | |||||||
| Pennsylvania Higher Education Assistance Agency 2006-1 B | 2.76% (3 Mo. LIBOR + .27% | )# | 4/25/2038 | 302 | 290,589 | |||||||
| See Notes to Financial Statements. | 13 |
Schedule of Investments (continued)
December 31, 2018
| Principal | ||||||||||||
| Interest | Maturity | Amount | Fair | |||||||||
| Investments | Rate | Date | (000) | Value | ||||||||
| Other (continued) | ||||||||||||
| PFS Financing Corp. 2018-B† | 3.08% | 2/15/2023 | $ | 469 | $ | 464,756 | ||||||
| Recette CLO Ltd. 2015-1A AR† | 3.389% (3 Mo. LIBOR + .92% | )# | 10/20/2027 | 500 | 494,538 | |||||||
| Regatta VI Funding Ltd. 2016-1A CR† | 4.519% (3 Mo. LIBOR + 2.05% | )# | 7/20/2028 | 485 | 462,078 | |||||||
| Riserva Clo Ltd. 2016-3A A† | 3.905% (3 Mo. LIBOR + 1.46% | )# | 10/18/2028 | 250 | 250,138 | |||||||
| SCF Equipment Leasing LLC 2017-2A A† | 3.41% | 12/20/2023 | 298 | 297,157 | ||||||||
| SCF Equipment Leasing LLC 2018-1A A2† | 3.63% | 10/20/2024 | 1,328 | 1,331,204 | ||||||||
| Shackleton CLO Ltd. 2016-9A B† | 4.369% (3 Mo. LIBOR + 1.90% | )# | 10/20/2028 | 499 | 496,656 | |||||||
| SLC Student Loan Trust 2008-1 A4A | 4.388% (3 Mo. LIBOR + 1.60% | )# | 12/15/2032 | 1,648 | 1,689,418 | |||||||
| SLM Private Education Loan Trust 2010-A 2A† | 5.705% (1 Mo. LIBOR + 3.25% | )# | 5/16/2044 | 12 | 11,688 | |||||||
| SLM Student Loan Trust 2011-1 A1 | 3.026% (1 Mo. LIBOR + .52% | )# | 3/25/2026 | 10 | 10,145 | |||||||
| Sound Point CLO XI Ltd. 2016-1A AR† | 3.558% (3 Mo. LIBOR + 1.10% | )# | 7/20/2028 | 591 | 587,831 | |||||||
| TCI-Symphony CLO Ltd. 2016-1A A† | 3.916% (3 Mo. LIBOR + 1.48% | )# | 10/13/2029 | 250 | 250,398 | |||||||
| THL Credit Wind River CLO Ltd. 2012-1A BR† | 4.286% (3 Mo. LIBOR + 1.85% | )# | 1/15/2026 | 1,700 | 1,693,034 | |||||||
| Towd Point Asset Trust 2018-SL1 A† | 3.106% (1 Mo. LIBOR + .60% | )# | 1/25/2046 | 1,025 | 1,022,091 | |||||||
| TPG Real Estate Finance Issuer Ltd. 2018-FL2 A† | 3.585% (1 Mo. LIBOR + 1.13% | )# | 11/15/2037 | 1,050 | 1,044,307 | |||||||
| Westgate Resorts LLC 2018-1A A† | 3.38% | 12/20/2031 | 423 | 422,668 | ||||||||
| WhiteHorse VIII Ltd. 2014-1A AR† | 3.441% (3 Mo. LIBOR + .90% | )# | 5/1/2026 | 1,323 | 1,317,576 | |||||||
| Wingstop Funding LLC 2018-1 A2† | 4.97% | 12/5/2048 | 850 | 870,315 | ||||||||
| Total | 57,082,573 | |||||||||||
| Total Asset-Backed Securities (cost $182,931,058) | 182,607,115 | |||||||||||
| CORPORATE BONDS 24.88% | ||||||||||||
| Aerospace/Defense 0.55% | ||||||||||||
| Bombardier, Inc.(Canada)†(b) | 7.50% | 3/15/2025 | 1,065 | 1,007,756 | ||||||||
| Embraer SA (Brazil)(b) | 5.15% | 6/15/2022 | 10 | 10,313 | ||||||||
| Kratos Defense & Security Solutions, Inc.† | 6.50% | 11/30/2025 | 811 | 826,206 | ||||||||
| United Technologies Corp. | 3.65% | 8/16/2023 | 1,227 | 1,223,403 | ||||||||
| Total | 3,067,678 | |||||||||||
| 14 | See Notes to Financial Statements. |
Schedule of Investments (continued)
December 31, 2018
| Principal | ||||||||||||
| Interest | Maturity | Amount | Fair | |||||||||
| Investments | Rate | Date | (000) | Value | ||||||||
| Air Transportation 0.03% | ||||||||||||
| American Airlines 2013-2 Class B Pass-Through Trust† | 5.60% | 1/15/2022 | $ | 150 | $ | 151,813 | ||||||
| Apparel 0.11% | ||||||||||||
| PVH Corp. | 7.75% | 11/15/2023 | 561 | 622,710 | ||||||||
| Automotive 0.89% | ||||||||||||
| Aston Martin Capital Holdings Ltd. (Jersey)†(b) | 6.50% | 4/15/2022 | 200 | 190,000 | ||||||||
| Daimler Finance North America LLC† | 3.75% | 2/22/2028 | 1,150 | 1,083,735 | ||||||||
| Ford Motor Co. | 7.45% | 7/16/2031 | 1,597 | 1,650,953 | ||||||||
| General Motors Co. | 6.60% | 4/1/2036 | 1,574 | 1,537,470 | ||||||||
| Tesla, Inc.† | 5.30% | 8/15/2025 | 609 | 531,352 | ||||||||
| Total | 4,993,510 | |||||||||||
| Banks: Regional 4.47% | ||||||||||||
| Banco de Credito e Inversiones SA (Chile)†(b) | 3.50% | 10/12/2027 | 535 | 482,503 | ||||||||
| Bank of America Corp. | 3.593% (3 Mo. LIBOR + 1.37% | )# | 7/21/2028 | 1,128 | 1,071,475 | |||||||
| Bank of America Corp. | 3.95% | 4/21/2025 | 250 | 242,538 | ||||||||
| Bank of America Corp. | 4.00% | 1/22/2025 | 728 | 710,038 | ||||||||
| Bank of America Corp. | 4.45% | 3/3/2026 | 315 | 312,141 | ||||||||
| Citigroup, Inc. | 3.887% (3 Mo. LIBOR + 1.56% | )# | 1/10/2028 | 2,363 | 2,275,312 | |||||||
| Citigroup, Inc. | 4.45% | 9/29/2027 | 552 | 532,832 | ||||||||
| Goldman Sachs Group, Inc. (The) | 4.223% | #(c) | 5/1/2029 | 491 | 473,712 | |||||||
| Goldman Sachs Group, Inc. (The) | 6.25% | 2/1/2041 | 588 | 672,663 | ||||||||
| Intesa Sanpaolo SpA (Italy)†(b) | 3.875% | 1/12/2028 | 621 | 531,638 | ||||||||
| JPMorgan Chase & Co. | 3.54% (3 Mo. LIBOR + 1.38% | )# | 5/1/2028 | 553 | 528,147 | |||||||
| JPMorgan Chase & Co. | 3.782% (3 Mo. LIBOR + 1.34% | )# | 2/1/2028 | 2,626 | 2,553,112 | |||||||
| Macquarie Group Ltd. (Australia)†(b) | 4.654% | #(c) | 3/27/2029 | 1,431 | 1,404,029 | |||||||
| Morgan Stanley | 3.625% | 1/20/2027 | 55 | 52,354 | ||||||||
| Morgan Stanley | 3.875% | 1/27/2026 | 593 | 579,202 | ||||||||
| Morgan Stanley | 4.00% | 7/23/2025 | 770 | 760,634 | ||||||||
| Morgan Stanley | 7.25% | 4/1/2032 | 84 | 106,085 | ||||||||
| Popular, Inc. | 6.125% | 9/14/2023 | 107 | 106,399 | ||||||||
| Royal Bank of Canada (Canada)†(b) | 3.35% | 10/22/2021 | 3,144 | 3,177,923 | ||||||||
| Santander UK plc (United Kingdom)†(b) | 5.00% | 11/7/2023 | 223 | 218,235 | ||||||||
| Santander UK plc (United Kingdom)(b) | 7.95% | 10/26/2029 | 902 | 1,065,481 | ||||||||
| Toronto-Dominion Bank (The) (Canada)(b) | 3.625% (5 Yr Swap rate + 2.21% | )# | 9/15/2031 | 1,594 | 1,507,744 | |||||||
| Turkiye Garanti Bankasi AS (Turkey)†(b) | 6.25% | 4/20/2021 | 200 | 199,143 | ||||||||
| UBS AG | 7.625% | 8/17/2022 | 1,234 | 1,317,295 | ||||||||
| UBS AG (Switzerland)(b) | 5.125% | 5/15/2024 | 835 | 832,971 | ||||||||
| See Notes to Financial Statements. | 15 |
Schedule of Investments (continued)
December 31, 2018
| Principal | ||||||||||||
| Interest | Maturity | Amount | Fair | |||||||||
| Investments | Rate | Date | (000) | Value | ||||||||
| Banks: Regional (continued) | ||||||||||||
| Wachovia Corp. | 7.574% | #(c) | 8/1/2026 | $ | 596 | $ | 707,030 | |||||
| Wells Fargo Bank NA | 5.85% | 2/1/2037 | 1,880 | 2,119,066 | ||||||||
| Wells Fargo Bank NA | 6.60% | 1/15/2038 | 437 | 541,952 | ||||||||
| Total | 25,081,654 | |||||||||||
| Beverages 0.44% | ||||||||||||
| Anheuser-Busch Cos., LLC/Anheuser-Busch InBev Worldwide, Inc.† | 3.65% | 2/1/2026 | 1,325 | 1,253,596 | ||||||||
| Anheuser-Busch Cos., LLC/Anheuser-Busch InBev Worldwide, Inc.† | 4.70% | 2/1/2036 | 624 | 582,725 | ||||||||
| Becle SAB de CV (Mexico)†(b) | 3.75% | 5/13/2025 | 350 | 334,379 | ||||||||
| Fomento Economico Mexicano SAB de CV (Mexico)(b) | 4.375% | 5/10/2043 | 300 | 288,818 | ||||||||
| Total | 2,459,518 | |||||||||||
| Business Services 0.65% | ||||||||||||
| Adani Ports & Special Economic Zone Ltd. (India)†(b) | 4.00% | 7/30/2027 | 275 | 246,193 | ||||||||
| Ahern Rentals, Inc.† | 7.375% | 5/15/2023 | 1,451 | 1,168,055 | ||||||||
| Brink’s Co. (The)† | 4.625% | 10/15/2027 | 921 | 842,927 | ||||||||
| United Rentals North America, Inc. | 4.875% | 1/15/2028 | 704 | 619,520 | ||||||||
| Weight Watchers International, Inc.† | 8.625% | 12/1/2025 | 754 | 771,908 | ||||||||
| Total | 3,648,603 | |||||||||||
| Chemicals 0.68% | ||||||||||||
| Ashland LLC | 6.875% | 5/15/2043 | 539 | 533,610 | ||||||||
| Braskem Netherlands Finance BV (Netherlands)†(b) | 4.50% | 1/10/2028 | 550 | 510,406 | ||||||||
| CNAC HK Finbridge Co. Ltd. (Hong Kong)(b) | 3.50% | 7/19/2022 | 580 | 565,706 | ||||||||
| Mexichem SAB de CV (Mexico)†(b) | 4.875% | 9/19/2022 | 205 | 206,794 | ||||||||
| Phosagro OAO Via Phosagro Bond Funding DAC (Ireland)†(b) | 3.949% | 4/24/2023 | 960 | 899,543 | ||||||||
| Rain CII Carbon LLC/CII Carbon Corp.† | 7.25% | 4/1/2025 | 1,181 | 1,074,710 | ||||||||
| Total | 3,790,769 | |||||||||||
| Coal 0.23% | ||||||||||||
| Peabody Energy Corp.† | 6.375% | 3/31/2025 | 788 | 734,810 | ||||||||
| Warrior Met Coal, Inc.† | 8.00% | 11/1/2024 | 532 | 529,340 | ||||||||
| Total | 1,264,150 | |||||||||||
| Computer Hardware 0.47% | ||||||||||||
| Dell International LLC/EMC Corp.† | 5.45% | 6/15/2023 | 251 | 255,655 | ||||||||
| Dell International LLC/EMC Corp.† | 6.02% | 6/15/2026 | 158 | 159,016 | ||||||||
| 16 | See Notes to Financial Statements. |
Schedule of Investments (continued)
December 31, 2018
| Investments | Interest Rate | Maturity Date | Principal Amount (000) | Fair Value | ||||||||
| Computer Hardware (continued) | ||||||||||||
| Dell International LLC/EMC Corp.† | 7.125% | 6/15/2024 | $ | 1,053 | $ | 1,072,238 | ||||||
| Dell International LLC/EMC Corp.† | 8.35% | 7/15/2046 | 1,068 | 1,160,823 | ||||||||
| Total | 2,647,732 | |||||||||||
| Computer Software 0.14% | ||||||||||||
| Oracle Corp. | 6.125% | 7/8/2039 | 675 | 812,626 | ||||||||
| Construction/Homebuilding 0.48% | ||||||||||||
| Century Communities, Inc. | 5.875% | 7/15/2025 | 576 | 510,480 | ||||||||
| PulteGroup, Inc. | 7.875% | 6/15/2032 | 442 | 459,680 | ||||||||
| Taylor Morrison Communities, Inc. | 6.625% | 5/15/2022 | 416 | 417,040 | ||||||||
| TRI Pointe Group, Inc. | 5.25% | 6/1/2027 | 310 | 245,288 | ||||||||
| William Lyon Homes, Inc. | 5.875% | 1/31/2025 | 307 | 262,485 | ||||||||
| William Lyon Homes, Inc. | 6.00% | 9/1/2023 | 605 | 547,525 | ||||||||
| Williams Scotsman International, Inc.† | 6.875% | 8/15/2023 | 281 | 270,462 | ||||||||
| Total | 2,712,960 | |||||||||||
| Containers 0.04% | ||||||||||||
| BWAY Holding Co.† | 7.25% | 4/15/2025 | 274 | 246,942 | ||||||||
| Drugs 0.23% | ||||||||||||
| Bausch Health Cos., Inc.† | 5.625% | 12/1/2021 | 402 | 396,221 | ||||||||
| Bayer Corp.† | 6.65% | 2/15/2028 | 271 | 308,037 | ||||||||
| Valeant Pharmaceuticals International† | 9.25% | 4/1/2026 | 594 | 595,485 | ||||||||
| Total | 1,299,743 | |||||||||||
| Electric: Power 1.32% | ||||||||||||
| Ausgrid Finance Pty Ltd. (Australia)†(b) | 4.35% | 8/1/2028 | 1,000 | 999,242 | ||||||||
| Berkshire Hathaway Energy Co. | 3.80% | 7/15/2048 | 314 | 282,965 | ||||||||
| Calpine Corp. | 5.75% | 1/15/2025 | �� | 916 | 840,430 | |||||||
| Electricite de France SA (France)†(b) | 5.00% | 9/21/2048 | 1,398 | 1,243,086 | ||||||||
| Emirates Semb Corp., Water & Power Co. PJSC (United Arab Emirates)†(b) | 4.45% | 8/1/2035 | 275 | 258,114 | ||||||||
| Entergy Louisiana LLC | 4.00% | 3/15/2033 | 411 | 416,759 | ||||||||
| Exelon Generation Co. LLC | 5.60% | 6/15/2042 | 238 | 233,930 | ||||||||
| Exelon Generation Co. LLC | 6.25% | 10/1/2039 | 592 | 619,827 | ||||||||
| Massachusetts Electric Co.† | 4.004% | 8/15/2046 | 501 | 473,249 | ||||||||
| Minejesa Capital BV (Netherlands)†(b) | 4.625% | 8/10/2030 | 250 | 223,771 | ||||||||
| PSEG Power LLC | 8.625% | 4/15/2031 | 347 | 451,695 | ||||||||
| South Carolina Electric & Gas Co. | 6.05% | 1/15/2038 | 707 | 830,086 | ||||||||
| South Carolina Electric & Gas Co. | 6.625% | 2/1/2032 | 246 | 298,127 | ||||||||
| See Notes to Financial Statements. | 17 |
Schedule of Investments (continued)
December 31, 2018
| Investments | Interest Rate | Maturity Date | Principal Amount (000) | Fair Value | ||||||||
| Electric: Power (continued) | ||||||||||||
| Vistra Energy Corp. | 7.625% | 11/1/2024 | $ | 241 | $ | 254,857 | ||||||
| Total | 7,426,138 | |||||||||||
| Electronics 0.00% | ||||||||||||
| Trimble, Inc. | 4.90% | 6/15/2028 | 13 | 12,832 | ||||||||
| Engineering & Contracting Services 0.46% | ||||||||||||
| Brand Industrial Services, Inc.† | 8.50% | 7/15/2025 | 1,297 | 1,112,177 | ||||||||
| China Railway Resources Huitung Ltd. (Hong Kong)†(b) | 3.85% | 2/5/2023 | 900 | 901,543 | ||||||||
| Indika Energy Capital III Pte Ltd. (Singapore)†(b) | 5.875% | 11/9/2024 | 640 | 559,658 | ||||||||
| Total | 2,573,378 | |||||||||||
| Entertainment 0.52% | ||||||||||||
| Eldorado Resorts, Inc. | 6.00% | 4/1/2025 | 1,143 | 1,108,299 | ||||||||
| Jacobs Entertainment, Inc.† | 7.875% | 2/1/2024 | 445 | 459,462 | ||||||||
| Mohegan Gaming & Entertainment† | 7.875% | 10/15/2024 | 587 | 551,046 | ||||||||
| Six Flags Entertainment Corp.† | 5.50% | 4/15/2027 | 860 | 812,700 | ||||||||
| Total | 2,931,507 | |||||||||||
| Financial Services 1.37% | ||||||||||||
| Affiliated Managers Group, Inc. | 3.50% | 8/1/2025 | 125 | 121,630 | ||||||||
| Affiliated Managers Group, Inc. | 4.25% | 2/15/2024 | 248 | 253,173 | ||||||||
| Ally Financial, Inc. | 8.00% | 11/1/2031 | 577 | 643,355 | ||||||||
| BrightSphere Investment Group plc (United Kingdom)(b) | 4.80% | 7/27/2026 | 489 | 471,855 | ||||||||
| GE Capital International Funding Co. Unlimited Co. (Ireland)(b) | 4.418% | 11/15/2035 | 2,377 | 2,005,414 | ||||||||
| International Lease Finance Corp. | 5.875% | 4/1/2019 | 1,433 | 1,438,937 | ||||||||
| International Lease Finance Corp. | 5.875% | 8/15/2022 | 156 | 163,528 | ||||||||
| Navient Corp. | 6.625% | 7/26/2021 | 796 | 770,130 | ||||||||
| Navient Corp. | 6.75% | 6/25/2025 | 323 | 276,165 | ||||||||
| Neuberger Berman Group LLC/Neuberger Berman Finance Corp.† | 4.50% | 3/15/2027 | 427 | 427,573 | ||||||||
| Neuberger Berman Group LLC/Neuberger Berman Finance Corp.† | 4.875% | 4/15/2045 | 677 | 606,376 | ||||||||
| Quicken Loans, Inc.† | 5.25% | 1/15/2028 | 299 | 265,736 | ||||||||
| SURA Asset Management SA (Colombia)†(b) | 4.375% | 4/11/2027 | 280 | 261,100 | ||||||||
| Total | 7,704,972 | |||||||||||
| 18 | See Notes to Financial Statements. |
Schedule of Investments (continued)
December 31, 2018
| Investments | Interest Rate | Maturity Date | Principal Amount (000) | Fair Value | ||||||||
| Food 0.55% | ||||||||||||
| Albertsons Cos LLC/Safeway, Inc./Albertsons LP/Albertson’s LLC | 6.625% | 6/15/2024 | $ | 1,166 | $ | 1,087,295 | ||||||
| Arcor SAIC (Argentina)†(b) | 6.00% | 7/6/2023 | 297 | 274,695 | ||||||||
| Campbell Soup Co. | 3.80% | 8/2/2042 | 486 | 364,958 | ||||||||
| Chobani LLC/Chobani Finance Corp., Inc.† | 7.50% | 4/15/2025 | 370 | 293,225 | ||||||||
| Gruma SAB de CV (Mexico)†(b) | 4.875% | 12/1/2024 | 200 | 201,002 | ||||||||
| Lamb Weston Holdings, Inc.† | 4.875% | 11/1/2026 | 871 | 840,515 | ||||||||
| Total | 3,061,690 | |||||||||||
| Health Care Services 0.97% | ||||||||||||
| Acadia Healthcare Co., Inc. | 5.625% | 2/15/2023 | 739 | 703,897 | ||||||||
| Acadia Healthcare Co., Inc. | 6.50% | 3/1/2024 | 389 | 377,330 | ||||||||
| CHS/Community Health Systems, Inc. | 8.00% | 11/15/2019 | 657 | 627,435 | ||||||||
| HCA, Inc. | 5.25% | 6/15/2026 | 828 | 823,860 | ||||||||
| HCA, Inc. | 5.50% | 6/15/2047 | 598 | 568,100 | ||||||||
| HCA, Inc. | 7.50% | 11/6/2033 | 125 | 131,875 | ||||||||
| MPH Acquisition Holdings LLC† | 7.125% | 6/1/2024 | 97 | 90,695 | ||||||||
| Polaris Intermediate Corp. PIK 8.50%† | 8.50% | 12/1/2022 | 1,146 | 1,049,587 | ||||||||
| WellCare Health Plans, Inc. | 5.25% | 4/1/2025 | 1,107 | 1,069,639 | ||||||||
| Total | 5,442,418 | |||||||||||
| Household Equipment/Products 0.02% | ||||||||||||
| Kimberly-Clark de Mexico SAB de CV (Mexico)†(b) | 3.80% | 4/8/2024 | 100 | 97,979 | ||||||||
| Insurance 0.26% | ||||||||||||
| CNO Financial Group, Inc. | 5.25% | 5/30/2025 | 547 | 522,727 | ||||||||
| Teachers Insurance & Annuity Association of America† | 4.90% | 9/15/2044 | 373 | 388,135 | ||||||||
| Willis North America, Inc. | 7.00% | 9/29/2019 | 524 | 536,128 | ||||||||
| Total | 1,446,990 | |||||||||||
| Leisure 0.16% | ||||||||||||
| Carnival plc | 7.875% | 6/1/2027 | 277 | 345,830 | ||||||||
| Silversea Cruise Finance Ltd.† | 7.25% | 2/1/2025 | 495 | 525,789 | ||||||||
| Total | 871,619 | |||||||||||
| Machinery: Industrial/Specialty 0.59% | ||||||||||||
| Kennametal, Inc. | 4.625% | 6/15/2028 | 553 | 552,384 | ||||||||
| Nvent Finance Sarl (Luxembourg)(b) | 4.55% | 4/15/2028 | 2,038 | 2,001,664 | ||||||||
| SPX FLOW, Inc.† | 5.625% | 8/15/2024 | 825 | 783,750 | ||||||||
| Total | 3,337,798 | |||||||||||
| See Notes to Financial Statements. | 19 |
Schedule of Investments (continued)
December 31, 2018
| Investments | Interest Rate | Maturity Date | Principal Amount (000) | Fair Value | ||||||||
| Manufacturing 0.29% | ||||||||||||
| General Electric Co. | 2.962% (3 Mo. LIBOR + .38% | )# | 5/5/2026 | $ | 717 | $ | 577,782 | |||||
| General Electric Co. | 6.15% | 8/7/2037 | 199 | 194,830 | ||||||||
| Siemens Financieringsmaatschappij NV (Netherlands)†(b) | 2.35% | 10/15/2026 | 954 | 870,546 | ||||||||
| Total | 1,643,158 | |||||||||||
| Media 1.82% | ||||||||||||
| 21st Century Fox America, Inc. | 7.75% | 12/1/2045 | 451 | 665,261 | ||||||||
| AMC Networks, Inc. | 4.75% | 8/1/2025 | 900 | 819,000 | ||||||||
| Cablevision Systems Corp. | 5.875% | 9/15/2022 | 1,123 | 1,106,155 | ||||||||
| CCO Holdings LLC/CCO Holdings Capital Corp.† | 5.75% | 2/15/2026 | 1,405 | 1,380,413 | ||||||||
| Comcast Corp. | 3.969% | 11/1/2047 | 747 | 670,318 | ||||||||
| Cox Communications, Inc.† | 4.50% | 6/30/2043 | 531 | 449,888 | ||||||||
| Cox Communications, Inc.† | 4.70% | 12/15/2042 | 455 | 402,461 | ||||||||
| Cox Communications, Inc.† | 8.375% | 3/1/2039 | 694 | 868,110 | ||||||||
| Myriad International Holdings BV (Netherlands)†(b) | 5.50% | 7/21/2025 | 770 | 777,809 | ||||||||
| Time Warner Cable LLC | 6.55% | 5/1/2037 | 110 | 113,296 | ||||||||
| Time Warner Cable LLC | 7.30% | 7/1/2038 | 1,091 | 1,186,995 | ||||||||
| Time Warner Entertainment Co. LP | 8.375% | 7/15/2033 | 502 | 613,804 | ||||||||
| Time Warner, Inc. | 6.25% | 3/29/2041 | 695 | 738,199 | ||||||||
| VTR Finance BV (Chile)†(b) | 6.875% | 1/15/2024 | 455 | 456,706 | ||||||||
| Total | 10,248,415 | |||||||||||
| Metal Fabricating 0.02% | ||||||||||||
| Grinding Media, Inc./Moly-Cop AltaSteel Ltd.† | 7.375% | 12/15/2023 | 130 | 126,425 | ||||||||
| Metals & Minerals: Miscellaneous 0.81% | ||||||||||||
| Anglo American Capital plc (United Kingdom)†(b) | 4.00% | 9/11/2027 | 1,457 | 1,317,943 | ||||||||
| Anglo American Capital plc (United Kingdom)†(b) | 4.75% | 4/10/2027 | 789 | 756,808 | ||||||||
| Barrick North America Finance LLC | 7.50% | 9/15/2038 | 200 | 245,397 | ||||||||
| Corp. Nacional del Cobre de Chile (Chile)†(b) | 4.50% | 9/16/2025 | 700 | 710,622 | ||||||||
| Freeport-McMoRan, Inc. | 3.875% | 3/15/2023 | 291 | 269,903 | ||||||||
| Glencore Finance Canada Ltd. (Canada)†(b) | 5.55% | 10/25/2042 | 647 | 583,614 | ||||||||
| Kinross Gold Corp. (Canada)(b) | 5.95% | 3/15/2024 | 281 | 281,000 | ||||||||
| MMC Norilsk Nickel OJSC via MMC Finance DAC (Ireland)†(b) | 4.10% | 4/11/2023 | 430 | 410,284 | ||||||||
| Total | 4,575,571 | |||||||||||
| Natural Gas 0.18% | ||||||||||||
| Dominion Energy Gas Holdings LLC | 4.60% | 12/15/2044 | 1,026 | 1,016,650 | ||||||||
| 20 | See Notes to Financial Statements. |
Schedule of Investments (continued)
December 31, 2018
| Investments | Interest Rate | Maturity Date | Principal Amount (000) | Fair Value | ||||||||
| Oil 1.99% | ||||||||||||
| Afren plc (United Kingdom)†(b)(d) | 6.625% | 12/9/2020 | $ | 244 | $ | 1,003 | ||||||
| Berry Petroleum Co. LLC† | 7.00% | 2/15/2026 | 289 | 261,545 | ||||||||
| California Resources Corp.† | 8.00% | 12/15/2022 | 885 | 601,800 | ||||||||
| Chesapeake Energy Corp. | 7.50% | 10/1/2026 | 285 | 245,100 | ||||||||
| Continental Resources, Inc. | 4.50% | 4/15/2023 | 770 | 758,502 | ||||||||
| Ecopetrol SA (Colombia)(b) | 5.875% | 5/28/2045 | 289 | 273,550 | ||||||||
| Eni SpA (Italy)†(b) | 5.70% | 10/1/2040 | 1,800 | 1,870,714 | ||||||||
| Equinor ASA (Norway)(b) | 7.15% | 11/15/2025 | 605 | 722,431 | ||||||||
| Gazprom OAO via Gaz Capital SA (Luxembourg)†(b) | 4.95% | 2/6/2028 | 200 | 191,354 | ||||||||
| Hilcorp Energy I LP/Hilcorp Finance Co.† | 6.25% | 11/1/2028 | 287 | 253,636 | ||||||||
| Indigo Natural Resources LLC† | 6.875% | 2/15/2026 | 291 | 251,715 | ||||||||
| Kerr-McGee Corp. | 7.875% | 9/15/2031 | 479 | 575,216 | ||||||||
| MEG Energy Corp. (Canada)†(b) | 7.00% | 3/31/2024 | 450 | 432,000 | ||||||||
| Pertamina Persero PT (Indonesia)†(b) | 5.625% | 5/20/2043 | 200 | 189,900 | ||||||||
| Petrobras Global Finance BV (Netherlands)(b) | 4.375% | 5/20/2023 | 358 | 342,201 | ||||||||
| Petrobras Global Finance BV (Netherlands)(b) | 7.25% | 3/17/2044 | 737 | 728,624 | ||||||||
| Petroleos Mexicanos (Mexico)(b) | 4.50% | 1/23/2026 | 956 | 826,462 | ||||||||
| Precision Drilling Corp. (Canada)(b) | 7.75% | 12/15/2023 | 147 | 136,159 | ||||||||
| Sinopec Group Overseas Development Ltd.† | 4.375% | 10/17/2023 | 364 | 372,687 | ||||||||
| SM Energy Co. | 6.625% | 1/15/2027 | 569 | 509,255 | ||||||||
| Valero Energy Corp. | 10.50% | 3/15/2039 | 668 | 1,024,418 | ||||||||
| WPX Energy, Inc. | 5.25% | 9/15/2024 | 374 | 340,340 | ||||||||
| YPF SA (Argentina)†(b) | 8.50% | 7/28/2025 | 281 | 253,251 | ||||||||
| Total | 11,161,863 | |||||||||||
| Oil: Crude Producers 0.68% | ||||||||||||
| Abu Dhabi Crude Oil Pipeline LLC (United Arab Emirates)†(b) | 4.60% | 11/2/2047 | 320 | 313,278 | ||||||||
| Cheniere Corpus Christi Holdings LLC | 5.125% | 6/30/2027 | 1,425 | 1,350,615 | ||||||||
| Colonial Pipeline Co.† | 4.25% | 4/15/2048 | 714 | 687,283 | ||||||||
| Energy Transfer Partners LP | 7.50% | 7/1/2038 | 233 | 261,030 | ||||||||
| Energy Transfer Partners LP/Regency Energy Finance Corp. | 5.00% | 10/1/2022 | 23 | 23,490 | ||||||||
| IFM US Colonial Pipeline 2 LLC† | 6.45% | 5/1/2021 | 620 | 647,650 | ||||||||
| Northern Natural Gas Co.† | 4.30% | 1/15/2049 | 371 | 363,009 | ||||||||
| Peru LNG Srl (Peru)†(b) | 5.375% | 3/22/2030 | 200 | 194,510 | ||||||||
| Total | 3,840,865 | |||||||||||
| See Notes to Financial Statements. | 21 |
Schedule of Investments (continued)
December 31, 2018
| Investments | Interest Rate | Maturity Date | Principal Amount (000) | Fair Value | ||||||||
| Oil: Integrated Domestic 0.46% | ||||||||||||
| Baker Hughes a GE Co. LLC/Baker Hughes Co-Obligor, Inc. | 4.08% | 12/15/2047 | $ | 1,894 | $ | 1,566,570 | ||||||
| Halliburton Co. | 7.45% | 9/15/2039 | 195 | 243,336 | ||||||||
| Transocean Proteus Ltd.† | 6.25% | 12/1/2024 | 789 | 759,220 | ||||||||
| Total | 2,569,126 | |||||||||||
| Paper & Forest Products 0.09% | ||||||||||||
| Fibria Overseas Finance Ltd. (Brazil)(b) | 4.00% | 1/14/2025 | 552 | 522,606 | ||||||||
| Real Estate Investment Trusts 0.88% | ||||||||||||
| China Evergrande Group (China)(b) | 8.75% | 6/28/2025 | 1,000 | 846,419 | ||||||||
| Country Garden Holdings Co. Ltd. (China)(b) | 4.75% | 9/28/2023 | 374 | 331,364 | ||||||||
| Country Garden Holdings Co. Ltd. (China)(b) | 4.75% | 1/17/2023 | 226 | 201,633 | ||||||||
| EPR Properties | 4.75% | 12/15/2026 | 501 | 496,628 | ||||||||
| Equinix, Inc. | 5.875% | 1/15/2026 | 500 | 505,000 | ||||||||
| MGM Growth Properties Operating Partnership LP/MGP Finance Co-Issuer, Inc. | 5.625% | 5/1/2024 | 195 | 193,781 | ||||||||
| Shimao Property Holdings Ltd. (Hong Kong)(b) | 4.75% | 7/3/2022 | 500 | 472,237 | ||||||||
| VEREIT Operating Partnership LP | 4.875% | 6/1/2026 | 1,916 | 1,918,958 | ||||||||
| Total | 4,966,020 | |||||||||||
| Retail 0.31% | ||||||||||||
| CEC Entertainment, Inc. | 8.00% | 2/15/2022 | 841 | 740,080 | ||||||||
| IRB Holding Corp.† | 6.75% | 2/15/2026 | 1,130 | 991,575 | ||||||||
| Total | 1,731,655 | |||||||||||
| Steel 0.18% | ||||||||||||
| Cleveland-Cliffs, Inc. | 5.75% | 3/1/2025 | 863 | 778,857 | ||||||||
| Vale Overseas Ltd. (Brazil)(b) | 6.875% | 11/10/2039 | 188 | 218,080 | ||||||||
| Total | 996,937 | |||||||||||
| Technology 0.46% | ||||||||||||
| Alibaba Group Holding Ltd. (China)(b) | 4.20% | 12/6/2047 | 521 | 463,697 | ||||||||
| Baidu, Inc. (China)(b) | 3.50% | 11/28/2022 | 433 | 429,039 | ||||||||
| Netflix, Inc. | 4.375% | 11/15/2026 | 1,855 | 1,688,050 | ||||||||
| Total | 2,580,786 | |||||||||||
| Telecommunications 0.65% | ||||||||||||
| AT&T, Inc. | 6.00% | 8/15/2040 | 523 | 535,542 | ||||||||
| CenturyLink, Inc. | 6.75% | 12/1/2023 | 536 | 517,910 | ||||||||
| Intelsat Connect Finance SA (Luxembourg)†(b) | 9.50% | 2/15/2023 | 579 | 500,835 | ||||||||
| Ooredoo International Finance Ltd.† | 3.75% | 6/22/2026 | 300 | 288,038 | ||||||||
| 22 | See Notes to Financial Statements. |
Schedule of Investments (continued)
December 31, 2018
| Investments | Interest Rate | Maturity Date | Principal Amount (000) | Fair Value | ||||||||
| Telecommunications (continued) | ||||||||||||
| Sprint Capital Corp. | 6.875% | 11/15/2028 | $ | 243 | $ | 230,243 | ||||||
| Sprint Corp. | 7.875% | 9/15/2023 | 1,082 | 1,113,107 | ||||||||
| Verizon Communications, Inc. | 3.716% (3 Mo. LIBOR + 1.10% | )# | 5/15/2025 | 475 | 460,960 | |||||||
| Total | 3,646,635 | |||||||||||
| Transportation: Miscellaneous 0.20% | ||||||||||||
| Autoridad del Canal de Panama (Panama)†(b) | 4.95% | 7/29/2035 | 200 | 204,502 | ||||||||
| Burlington Northern Santa Fe LLC | 5.75% | 5/1/2040 | 200 | 234,939 | ||||||||
| Pelabuhan Indonesia III Persero PT (Indonesia)†(b) | 4.50% | 5/2/2023 | 220 | 216,275 | ||||||||
| Rumo Luxembourg Sarl (Luxembourg)†(b) | 7.375% | 2/9/2024 | 458 | 478,564 | ||||||||
| Total | 1,134,280 | |||||||||||
| Utilities 0.23% | ||||||||||||
| Aegea Finance Sarl (Brazil)†(b) | 5.75% | 10/10/2024 | 574 | 549,611 | ||||||||
| Aquarion Co.† | 4.00% | 8/15/2024 | 724 | 736,124 | ||||||||
| Total | 1,285,735 | |||||||||||
| Total Corporate Bonds (cost $146,963,145) | 139,754,456 | |||||||||||
| FOREIGN GOVERNMENT OBLIGATIONS 2.76% | ||||||||||||
| Angola 0.11% | ||||||||||||
| Republic of Angola†(b) | 9.50% | 11/12/2025 | 560 | 590,781 | ||||||||
| Argentina 1.25% | ||||||||||||
| City of Buenos Aires(e) | 51.476% (BADLAR + 3.25% | )# | 3/29/2024 | ARS | 1,800 | 41,671 | ||||||
| Provincia de Buenos Aires†(b) | 6.50% | 2/15/2023 | $ | 226 | 183,060 | |||||||
| Provincia de Mendoza†(b) | 8.375% | 5/19/2024 | 400 | 326,000 | ||||||||
| Republic of Argentina(b) | 4.625% | 1/11/2023 | 305 | 241,903 | ||||||||
| Republic of Argentina(b) | 5.625% | 1/26/2022 | 3,473 | 2,943,368 | ||||||||
| Republic of Argentina(b) | 6.875% | 4/22/2021 | 3,000 | 2,721,780 | ||||||||
| Republic of Argentina(b) | 8.28% | 12/31/2033 | 714 | 560,205 | ||||||||
| Total | 7,017,987 | |||||||||||
| Bahamas 0.12% | ||||||||||||
| Commonwealth of Bahamas†(b) | 6.00% | 11/21/2028 | 370 | 378,325 | ||||||||
| Commonwealth of Bahamas†(b) | 6.95% | 11/20/2029 | 300 | 318,750 | ||||||||
| Total | 697,075 | |||||||||||
| Bermuda 0.07% | ||||||||||||
| Government of Bermuda† | 3.717% | 1/25/2027 | 430 | 411,153 | ||||||||
| See Notes to Financial Statements. | 23 |
Schedule of Investments (continued)
December 31, 2018
| Investments | Interest Rate | Maturity Date | Principal Amount (000) | Fair Value | ||||||||
| Dominican Republic 0.03% | ||||||||||||
| Dominican Republic†(b) | 6.50% | 2/15/2048 | $ | 200 | $ | 189,500 | ||||||
| Egypt 0.07% | ||||||||||||
| Arab Republic of Egypt†(b) | 6.125% | 1/31/2022 | 220 | 216,307 | ||||||||
| Arab Republic of Egypt†(b) | 7.903% | 2/21/2048 | 200 | 172,830 | ||||||||
| Total | 389,137 | |||||||||||
| Ghana 0.04% | ||||||||||||
| Republic of Ghana†(b) | 7.875% | 8/7/2023 | 225 | 220,889 | ||||||||
| Latvia 0.05% | ||||||||||||
| Republic of Latvia†(b) | 5.25% | 6/16/2021 | 258 | 269,711 | ||||||||
| Lithuania 0.11% | ||||||||||||
| Republic of Lithuania†(b) | 7.375% | 2/11/2020 | 592 | 620,025 | ||||||||
| Mexico 0.25% | ||||||||||||
| United Mexican States(b) | 3.75% | 1/11/2028 | 600 | 562,656 | ||||||||
| United Mexican States(b) | 4.00% | 10/2/2023 | 834 | 831,152 | ||||||||
| Total | 1,393,808 | |||||||||||
| Nigeria 0.04% | ||||||||||||
| Republic of Nigeria†(b) | 7.143% | 2/23/2030 | 275 | 244,074 | ||||||||
| Qatar 0.20% | ||||||||||||
| State of Qatar†(b) | 3.25% | 6/2/2026 | 825 | 798,890 | ||||||||
| State of Qatar†(b) | 5.103% | 4/23/2048 | 310 | 326,314 | ||||||||
| Total | 1,125,204 | |||||||||||
| Romania 0.01% | ||||||||||||
| Republic of Romania†(b) | 6.125% | 1/22/2044 | 49 | 54,497 | ||||||||
| Sri Lanka 0.07% | ||||||||||||
| Republic of Sri Lanka†(b) | 6.25% | 7/27/2021 | 200 | 193,179 | ||||||||
| Republic of Sri Lanka†(b) | 6.85% | 11/3/2025 | 200 | 187,472 | ||||||||
| Total | 380,651 | |||||||||||
| Turkey 0.34% | ||||||||||||
| Republic of Turkey(b) | 3.25% | 3/23/2023 | 220 | 197,923 | ||||||||
| Republic of Turkey(b) | 5.625% | 3/30/2021 | 1,206 | 1,209,724 | ||||||||
| Republic of Turkey(b) | 5.75% | 3/22/2024 | 510 | 494,391 | ||||||||
| Total | 1,902,038 | |||||||||||
| Total Foreign Government Obligations (cost $16,564,410) | 15,506,530 | |||||||||||
| 24 | See Notes to Financial Statements. |
Schedule of Investments (continued)
December 31, 2018
| Investments | Interest Rate | Maturity Date | Principal Amount (000) | Fair Value | ||||||||
| GOVERNMENT SPONSORED ENTERPRISES COLLATERALIZED MORTGAGE OBLIGATIONS 1.59% | ||||||||||||
| Federal Home Loan Mortgage Corp. K072 A2 | 3.444% | 12/25/2027 | $ | 1,019 | $ | 1,030,710 | ||||||
| Federal Home Loan Mortgage Corp. Q001 XA IO | 2.267% | #(a) | 2/25/2032 | 2,803 | 404,402 | |||||||
| Government National Mortgage Assoc. 2014-78 A | 2.20% | 4/16/2047 | 26 | 25,274 | ||||||||
| Government National Mortgage Assoc. 2015-47 AE | 2.90% | #(a) | 11/16/2055 | 1,180 | 1,158,597 | |||||||
| Government National Mortgage Assoc. 2015-48 AS | 2.90% | #(a) | 2/16/2049 | 777 | 761,493 | |||||||
| Government National Mortgage Assoc. 2015-73 AC | 2.90% | #(a) | 2/16/2053 | 277 | 271,107 | |||||||
| Government National Mortgage Assoc. 2017-168 AS | 2.70% | 8/16/2058 | 1,594 | 1,528,721 | ||||||||
| Government National Mortgage Assoc. 2017-41 AS | 2.60% | 6/16/2057 | 1,271 | 1,211,815 | ||||||||
| Government National Mortgage Assoc. 2017-69 AS | 2.75% | 2/16/2058 | 661 | 641,469 | ||||||||
| Government National Mortgage Assoc. 2017-71 AS | 2.70% | 4/16/2057 | 434 | 418,097 | ||||||||
| Government National Mortgage Assoc. 2017-86 AS | 2.75% | 2/16/2058 | 506 | 490,236 | ||||||||
| Government National Mortgage Assoc. 2017-89 AB | 2.60% | 7/16/2058 | 426 | 398,802 | ||||||||
| Government National Mortgage Assoc. 2017-90 AS | 2.70% | 7/16/2057 | 593 | 569,493 | ||||||||
| Total Government Sponsored Enterprises Collateralized Mortgage Obligations (cost $9,198,742) | 8,910,216 | |||||||||||
| GOVERNMENT SPONSORED ENTERPRISES PASS-THROUGHS 35.89% | ||||||||||||
| Federal Home Loan Mortgage Corp. | 5.00% | 9/1/2019 - 6/1/2026 | 43 | 43,396 | ||||||||
| Federal National Mortgage Assoc.(f) | 3.50% | TBA | 8,500 | 8,501,845 | ||||||||
| Federal National Mortgage Assoc. | 3.961% (12 Mo. LIBOR + 1.78% | )# | 3/1/2042 | 537 | 561,233 | |||||||
| Federal National Mortgage Assoc.(f) | 4.00% | TBA | 61,550 | 62,767,837 | ||||||||
| Federal National Mortgage Assoc.(f) | 4.50% | TBA | 124,300 | 128,793,083 | ||||||||
| Federal National Mortgage Assoc. | 5.50% | 12/1/2034 - 9/1/2036 | 840 | 904,777 | ||||||||
| Federal National Mortgage Assoc. | 5.50% | 2/1/2035 | 1 | 1,005 | ||||||||
| Total Government Sponsored Enterprises Pass-Throughs (cost $200,265,527) | 201,573,176 | |||||||||||
| MUNICIPAL BONDS 0.14% | ||||||||||||
| Miscellaneous | ||||||||||||
| North Texas Tollway Auth | 8.91% | 2/1/2030 | 538 | 569,215 | ||||||||
| Pennsylvania | 5.35% | 5/1/2030 | 235 | 241,119 | ||||||||
| Total Municipal Bonds (cost $808,916) | 810,334 | |||||||||||
| NON-AGENCY COMMERCIAL MORTGAGE-BACKED SECURITIES 5.27% | ||||||||||||
| Atrium Hotel Portfolio Trust 2018-ATRM A† | 3.405% (1 Mo. LIBOR + .95% | )# | 6/15/2035 | 537 | 534,893 | |||||||
| Bancorp Commercial Mortgage Trust (The) 2018-CR3 A† | 3.305% (1 Mo. LIBOR + .85% | )# | 1/15/2033 | 446 | 441,859 | |||||||
| BB-UBS Trust 2012-SHOW A† | 3.43% | 11/5/2036 | 1,342 | 1,344,428 | ||||||||
| BWAY Mortgage Trust 2015-1740 A† | 2.917% | 1/10/2035 | 880 | 854,329 | ||||||||
| See Notes to Financial Statements. | 25 |
Schedule of Investments (continued)
December 31, 2018
| Investments | Interest Rate | Maturity Date | Principal Amount (000) | Fair Value | ||||||||
| NON-AGENCY COMMERCIAL MORTGAGE-BACKED SECURITIES (continued) | ||||||||||||
| BX Trust 2018-GW A† | 3.255% (1 Mo. LIBOR + .80% | )# | 5/15/2035 | $ | 1,467 | $ | 1,437,903 | |||||
| Caesars Palace Las Vegas Trust 2017-VICI A† | 3.531% | 10/15/2034 | 1,474 | 1,484,032 | ||||||||
| Caesars Palace Las Vegas Trust 2017-VICI B† | 3.835% | 10/15/2034 | 901 | 904,425 | ||||||||
| CGBAM Commercial Mortgage Trust 2015-SMRT B† | 3.213% | 4/10/2028 | 212 | 211,697 | ||||||||
| CGBAM Commercial Mortgage Trust 2015-SMRT C† | 3.516% | 4/10/2028 | 159 | 159,146 | ||||||||
| Citigroup Commercial Mortgage Trust 2016-GC36 D† | 2.85% | 2/10/2049 | 1,250 | 987,866 | ||||||||
| Commercial Mortgage Pass-Through Certificates 2014-CR17 A5 | 3.977% | 5/10/2047 | 1,000 | 1,030,624 | ||||||||
| Commercial Mortgage Pass-Through Certificates 2014-CR19 XA IO | 1.176% | #(a) | 8/10/2047 | 715 | 28,846 | |||||||
| Commercial Mortgage Pass-Through Certificates 2015-PC1 B | 4.44% | #(a) | 7/10/2050 | 178 | 179,380 | |||||||
| Commercial Mortgage Pass-Through Certificates 2015-PC1 C | 4.44% | #(a) | 7/10/2050 | 410 | 403,956 | |||||||
| Commercial Mortgage Pass-Through Certificates 2015-PC1 D | 4.44% | #(a) | 7/10/2050 | 574 | 511,247 | |||||||
| Commercial Mortgage Pass-Through Certificates 2016-SAVA A† | 4.069% (1 Mo. LIBOR + 1.72% | )# | 10/15/2034 | 678 | 677,609 | |||||||
| CSAIL Commercial Mortgage Trust 2015-C2 C | 4.205% | #(a) | 6/15/2057 | 700 | 676,788 | |||||||
| DBWF Mortgage Trust 2015-LCM D† | 3.421% | #(a) | 6/10/2034 | 257 | 225,058 | |||||||
| DBWF Mortgage Trust 2018-GLKS A† | 3.41% (1 Mo. LIBOR + 1.03% | )# | 11/19/2035 | 1,008 | 1,006,314 | |||||||
| GAHR Commercial Mortgage Trust 2015-NRF DFX† | 3.382% | #(a) | 12/15/2034 | 278 | 274,505 | |||||||
| GS Mortgage Securities Corp. Trust 2018-FBLU A† | 3.405% (1 Mo. LIBOR + .95% | )# | 11/15/2035 | 1,007 | 1,003,979 | |||||||
| GS Mortgage Securities Corp. Trust 2018-RIVR A† | 3.405% (1 Mo. LIBOR + .95% | )# | 7/15/2035 | 683 | 681,767 | |||||||
| GS Mortgage Securities Trust 2015-GC32 C | 4.411% | #(a) | 7/10/2048 | 195 | 193,193 | |||||||
| Hudsons Bay Simon JV Trust 2015-HB7 B7† | 4.666% | 8/5/2034 | 668 | 656,473 | ||||||||
| Hudsons Bay Simon JV Trust 2015-HB7 D7† | 5.159% | #(a) | 8/5/2034 | 629 | 578,505 | |||||||
| JPMorgan Chase Commercial Mortgage Securities Trust2018-LAQ D† | 4.555% (1 Mo. LIBOR + 2.10% | )# | 6/15/2032 | 799 | 786,281 | |||||||
| JPMorgan Chase Commercial Mortgage Securities Corp.2018-AON A† | 4.128% | 7/5/2031 | 1,673 | 1,735,655 | ||||||||
| JPMorgan Chase Commercial Mortgage Securities Trust2015-C30 C | 4.297% | #(a) | 7/15/2048 | 374 | 360,098 | |||||||
| JPMorgan Chase Commercial Mortgage Securities Trust2018-LAQ A† | 3.455% (1 Mo. LIBOR + 1.00% | )# | 6/15/2032 | 1,600 | 1,570,909 | |||||||
| JPMorgan Chase Commercial Mortgage Securities Trust2018-MINN A† | 3.475% (1 Mo. LIBOR + 1.02% | )# | 11/15/2035 | 542 | 541,626 | |||||||
| 26 | See Notes to Financial Statements. |
Schedule of Investments (continued)
December 31, 2018
| Investments | Interest Rate | Maturity Date | Principal Amount (000) | Fair Value | ||||||||
| NON-AGENCY COMMERCIAL MORTGAGE-BACKED SECURITIES (continued) | ||||||||||||
| JPMorgan Chase Commercial Mortgage Securities Trust 2018-WPT AFL† | 3.329% (1 Mo. LIBOR + .95% | )# | 7/5/2033 | $ | 377 | $ | 376,520 | |||||
| JPMorgan Chase Commercial Mortgage Securities Trust 2018-WPT AFX† | 4.248% | 7/5/2033 | 1,056 | 1,097,241 | ||||||||
| JPMorgan Chase Commercial Mortgage Securities Trust 2018-WPT BFL† | 3.979% | #(a) | 7/5/2033 | 1,130 | 1,128,609 | |||||||
| JPMorgan Chase Commercial Mortgage Securities Trust 2018-WPT BFX† | 4.549% | 7/5/2033 | 340 | 352,407 | ||||||||
| JPMorgan Chase Commercial Mortgage Securities Trust 2018-WPT CFX† | 4.95% | 7/5/2033 | 453 | 468,419 | ||||||||
| Merrill Lynch Mortgage Investors Trust 2006-AF2 AF1 | 6.25% | 10/25/2036 | 15 | 12,122 | ||||||||
| Morgan Stanley Bank of America Merrill Lynch Trust 2015-C23 XA IO | 0.694% | #(a) | 7/15/2050 | 19,080 | 533,559 | |||||||
| SFAVE Commercial Mortgage Securities Trust 2015-5AVE A2B† | 4.144% | #(a) | 1/5/2043 | 250 | 236,465 | |||||||
| Structured Asset Securities Corp. 2006-3H 1A2 | 5.75% | 12/25/2035 | 8 | 7,769 | ||||||||
| UBS-BAMLL Trust 2012-WRM E† | 4.238% | #(a) | 6/10/2030 | 595 | 549,034 | |||||||
| UBS-Barclays Commercial Mortgage Trust 2012-C3 B† | 4.365% | #(a) | 8/10/2049 | 200 | 203,700 | |||||||
| Wells Fargo Commercial Mortgage Trust 2013-LC12 D† | 4.287% | #(a) | 7/15/2046 | 364 | 307,839 | |||||||
| Wells Fargo Commercial Mortgage Trust 2015-C28 D | 4.128% | #(a) | 5/15/2048 | 1,489 | 1,295,664 | |||||||
| Wells Fargo Commercial Mortgage Trust 2016-NXS5 E† | 4.878% | #(a) | 1/15/2059 | 434 | 392,209 | (g) | ||||||
| WFRBS Commercial Mortgage Trust 2014-C22 A4 | 3.488% | 9/15/2057 | 1,125 | �� | 1,130,372 | |||||||
| Total Non-Agency Commercial Mortgage-Backed Securities (cost $29,254,243) | 29,575,320 | |||||||||||
| U.S. TREASURY OBLIGATIONS 16.62% | ||||||||||||
| U.S. Treasury Bond | 2.75% | 11/15/2042 | 11,565 | 11,082,638 | ||||||||
| U.S. Treasury Bond | 3.00% | 8/15/2048 | 26,465 | 26,393,212 | ||||||||
| U.S. Treasury Inflation Indexed Note(h) | 0.50% | 1/15/2028 | 6,730 | 6,427,498 | ||||||||
| U.S. Treasury Inflation Indexed Note(h) | 0.625% | 4/15/2023 | 26,307 | 25,881,496 | ||||||||
| U.S. Treasury Note | 1.875% | 12/15/2020 | 5,335 | 5,271,523 | ||||||||
| U.S. Treasury Note | 2.875% | 10/31/2023 | 10,299 | 10,471,278 | ||||||||
| U.S. Treasury Note | 2.875% | 11/15/2021 | 1,773 | 1,792,860 | ||||||||
| U.S. Treasury Note | 3.125% | 11/15/2028 | 5,786 | 6,006,623 | ||||||||
| Total U.S. Treasury Obligations (cost $91,552,297) | 93,327,128 | |||||||||||
| Total Long-Term Investments (cost $677,538,338) | 672,064,275 | |||||||||||
| See Notes to Financial Statements. | 27 |
Schedule of Investments (continued)
December 31, 2018
| Investments | Interest Rate | Maturity Date | Principal Amount (000) | Fair Value | ||||||||
| SHORT-TERM INVESTMENTS 15.99% | ||||||||||||
| GOVERNMENT SPONSORED ENTERPRISES SECURITIES 4.15% | ||||||||||||
| Federal Home Loan Bank | Zero Coupon | 1/31/2019 | $ | 7,924 | $ | 7,908,873 | ||||||
| Federal Home Loan Bank | Zero Coupon | 2/6/2019 | 1,983 | 1,978,391 | ||||||||
| Federal Home Loan Bank | Zero Coupon | 2/15/2019 | 13,451 | 13,411,710 | ||||||||
| Total Government Sponsored Enterprises Securities (cost $23,298,573) | 23,298,974 | |||||||||||
| REPURCHASE AGREEMENT 2.82% | ||||||||||||
| Repurchase Agreement dated 12/31/2018, 1.45% due 1/2/2019 with Fixed Income Clearing Corp. collateralized by $15,720,000 of U.S. Treasury Note at 2.875% due 7/31/2025; value: $16,130,323; proceeds: $15,812,753 (cost $15,811,479) | 15,811 | 15,811,479 | ||||||||||
| U.S. TREASURY OBLIGATION 9.02% | ||||||||||||
| Government | ||||||||||||
| U.S. Treasury Bill (cost $50,647,602) | Zero Coupon | 3/14/2019 | 50,889 | 50,645,790 | ||||||||
| Total Short-Term Investment (cost $89,757,654) | 89,756,243 | |||||||||||
| Total Investments in Securities 135.65%(cost $767,295,992) | 761,820,518 | |||||||||||
| Liabilities in Excess of Cash and Other Assets(i)(35.65%) | (200,210,245 | ) | ||||||||||
| Net Assets 100.00% | $ | 561,610,273 | ||||||||||
| ARS | Argentine Peso. | |
| BADLAR | Banco de la Republica Argentina. | |
| IO | Interest Only. | |
| LIBOR | London Interbank Offered Rate. | |
| PIK | Payment-in-kind. | |
| † | Security was purchased pursuant to Rule 144A under the Securities Act of 1933 and, unless registered under such Act or exempted from registration, may only be resold to qualified institutional buyers. | |
| # | Variable rate security. The interest rate represents the rate in effect at December 31, 2018. | |
| (a) | Interest rate is based on the weighted average interest rates of the underlying mortgages within the mortgage pool. | |
| (b) | Foreign security traded in U.S. dollars. | |
| (c) | Variable Rate is Fixed to Float: Rate remains fixed until designated future date. | |
| (d) | Defaulted (non-income producing security). | |
| (e) | Investment in non-U.S. dollar denominated securities. | |
| (f) | To-be-announced (“TBA”). Security purchased on a forward commitment basis with an approximate principal and maturity date. Actual principal and maturity will be determined upon settlement when the specific mortgage pools are assigned. | |
| (g) | Level 3 Investment as described in Note 2(k) in the Notes to Financials. Security valued utilizing third party pricing information without adjustment. Such valuations are based on unobservable inputs. A significant change in third party information could result in a significantly lower or higher value of such Level 3 investments. | |
| (h) | Treasury Inflation Protected Security. A U.S. Treasury Note or Bond that offers protection from inflation by paying a fixed rate of interest on principal amount that is adjusted for inflation based on the Consumer Price Index. | |
| (i) | Liabilities in Excess of Cash and Other Assets include net unrealized appreciation/depreciation on futures contracts as follows: |
| 28 | See Notes to Financial Statements. |
Schedule of Investments (continued)
December 31, 2018
Open Futures Contracts at December 31, 2018:
| Type | Expiration | Contracts | Position | Notional Amount | Notional Value | Unrealized Appreciation | |||||||||||||
| U.S. 5-Year Treasury Note | March 2019 | 386 | Long | $ | 43,734,911 | $ | 44,269,375 | $ | 534,464 | ||||||||||
| U.S. Long Bond | March 2019 | 246 | Long | 34,325,111 | 35,915,991 | 1,590,880 | |||||||||||||
| Total Unrealized Appreciation on Open Futures Contracts | $ | 2,125,344 | |||||||||||||||||
| Type | Expiration | Contracts | Position | Notional Amount | Notional Value | Unrealized Depreciation | |||||||||||||
| U.S. 2-Year Treasury Note | March 2019 | 95 | Long | $ | 20,170,910 | $ | 20,169,697 | $ | (1,213 | ) | |||||||||
| U.S. 10-Year Treasury Note | March 2019 | 92 | Short | (10,957,184 | ) | (11,225,437 | ) | (268,253 | ) | ||||||||||
| U.S. 10-Year Ultra Treasury Bond | March 2019 | 11 | Long | 1,431,910 | 1,430,859 | (1,051 | ) | ||||||||||||
| Ultra Long U.S. Treasury Bond | March 2019 | 130 | Short | (19,996,944 | ) | (20,885,313 | ) | (888,369 | ) | ||||||||||
| Total Unrealized Depreciation on Open Futures Contracts | $ | (1,158,886 | ) | ||||||||||||||||
| See Notes to Financial Statements. | 29 |
Schedule of Investments (continued)
December 31, 2018
The following is a summary of the inputs used as of December 31, 2018 in valuing the Fund’s investments carried at fair value(1):
| Investment Type(2)(3) | Level 1 | Level 2 | Level 3 | Total | ||||||||||||
| Long-Term Investments | ||||||||||||||||
| Asset-Backed Securities | $ | – | $ | 182,607,115 | $ | – | $ | 182,607,115 | ||||||||
| Corporate Bonds | – | 139,754,456 | – | 139,754,456 | ||||||||||||
| Foreign Government Obligations | – | 15,506,530 | – | 15,506,530 | ||||||||||||
| Government Sponsored Enterprises Collateralized Mortgage Obligations | – | 8,910,216 | – | 8,910,216 | ||||||||||||
| Government Sponsored Enterprises Pass-Throughs | – | 201,573,176 | – | 201,573,176 | ||||||||||||
| Municipal Bonds | – | 810,334 | – | 810,334 | ||||||||||||
| Non-Agency Commercial Mortgage-Backed Securities | – | 29,183,111 | 392,209 | 29,575,320 | ||||||||||||
| U.S. Treasury Obligations | – | 93,327,128 | – | 93,327,128 | ||||||||||||
| Short-Term Investments | ||||||||||||||||
| Government Sponsored Enterprises Securities | – | 23,298,974 | – | 23,298,974 | ||||||||||||
| Repurchase Agreement | – | 15,811,479 | – | 15,811,479 | ||||||||||||
| U.S. Treasury Obligation | – | 50,645,790 | – | 50,645,790 | ||||||||||||
| Total | $ | – | $ | 761,428,309 | $ | 392,209 | $ | 761,820,518 | ||||||||
| Other Financial Instruments | ||||||||||||||||
| Futures Contracts | ||||||||||||||||
| Assets | $ | 2,125,344 | $ | – | $ | – | $ | 2,125,344 | ||||||||
| Liabilities | (1,158,886 | ) | – | – | (1,158,886 | ) | ||||||||||
| Total | $ | 966,458 | $ | – | $ | – | $ | 966,458 | ||||||||
| (1) | Refer to Note 2(k) for a description of fair value measurements and the three-tier hierarchy of inputs. | |
| (2) | See Schedule of Investments for fair values in each industry and identification of foreign issuers and/or geography. The table above is presented by Investment Type. Industries are presented within an Investment Type should such Investment Type include securities classified as two or more levels within the three-tier fair value hierarchy. Each Level 3 security is identified on the Schedule of Investments along with the valuation technique utilized. | |
| (3) | There were no Level 1/Level 2 transfers during the fiscal year ended December 31, 2018. |
| 30 | See Notes to Financial Statements. |
Schedule of Investments (concluded)
December 31, 2018
The following is a reconciliation of investments with unobservable inputs (Level 3) that were used in determining fair value:
| Investment Type | Asset-Backed Securities | Non-Agency Commercial Mortgage- Backed Securities | ||||||
| Balance as of January 1, 2018 | $ | 4,488,220 | $ | – | ||||
| Accrued Discounts (Premiums) | – | 508 | ||||||
| Realized Gain (Loss) | 10,063 | – | ||||||
| Change in Unrealized Appreciation (Depreciation) | 45 | 32,283 | ||||||
| Purchases | – | – | ||||||
| Sales | (1,742,063 | ) | – | |||||
| Transfers into Level 3 | – | 359,418 | ||||||
| Transfers out of Level 3 | (2,756,265 | ) | – | |||||
| Balance as of December 31, 2018 | $ | – | $ | 392,209 | ||||
| Change in unrealized appreciation/depreciation for period ended December 31, 2018, related to Level 3 investments held at December 31, 2018 | $ | – | $ | 32,283 | ||||
| See Notes to Financial Statements. | 31 |
Statement of Assets and Liabilities
December 31, 2018
| ASSETS: | ||||
| Investments in securities, at fair value (cost $767,295,992) | $ | 761,820,518 | ||
| Cash | 1,440 | |||
| Deposits with brokers for futures collateral | 565,032 | |||
| Receivables: | ||||
| Interest and dividends | 3,437,939 | |||
| Investment securities sold | 2,030,703 | |||
| Capital shares sold | 143,873 | |||
| From advisor (See Note 3) | 114,508 | |||
| Prepaid expenses | 2,340 | |||
| Total assets | 768,116,353 | |||
| LIABILITIES: | ||||
| Payables: | ||||
| Investment securities purchased | 201,078,304 | |||
| Capital shares reacquired | 4,697,711 | |||
| Management fee | 215,940 | |||
| Directors’ fees | 45,613 | |||
| Variation margin on futures contracts | 26,711 | |||
| Fund administration | 19,195 | |||
| Accrued expenses | 422,606 | |||
| Total liabilities | 206,506,080 | |||
| NET ASSETS | $ | 561,610,273 | ||
| COMPOSITION OF NET ASSETS: | ||||
| Paid-in capital | $ | 589,663,069 | ||
| Total distributable earnings (loss) | (28,052,796 | ) | ||
| Net Assets | $ | 561,610,273 | ||
| Outstanding shares (50 million shares of common stock authorized, $.001 par value) | 35,180,457 | |||
| Net asset value, offering and redemption price per share (Net assets divided by outstanding shares) | $15.96 | |||
| 32 | See Notes to Financial Statements. |
For the Year Ended December 31, 2018
| Investment income: | ||||
| Interest and other | $ | 19,047,989 | ||
| Interest earned from Interfund Lending (See Note 11) | 769 | |||
| Total investment income | 19,048,758 | |||
| Expenses: | ||||
| Management fee | 2,537,051 | |||
| Non 12b-1 service fees | 1,409,782 | |||
| Shareholder servicing | 604,718 | |||
| Fund administration | 225,516 | |||
| Reports to shareholders | 69,802 | |||
| Professional | 54,272 | |||
| Custody | 21,008 | |||
| Directors’ fees | 19,537 | |||
| Other | 60,189 | |||
| Gross expenses | 5,001,875 | |||
| Expense reductions (See Note 9) | (13,185 | ) | ||
| Fees waived and expenses reimbursed (See Note 3) | (1,189,244 | ) | ||
| Net expenses | 3,799,446 | |||
| Net investment income | 15,249,312 | |||
| Net realized and unrealized gain (loss): | ||||
| Net realized loss on investments | (11,717,911 | ) | ||
| Net realized loss on futures contracts | (671,026 | ) | ||
| Net realized loss on foreign currency related transactions | (5,961 | ) | ||
| Net change in unrealized appreciation/depreciation on investments | (9,157,108 | ) | ||
| Net change in unrealized appreciation/depreciation on futures contracts | 1,091,607 | |||
| Net change in unrealized appreciation/depreciation on translation of assets and liabilities denominated in foreign currencies | 307 | |||
| Net realized and unrealized loss | (20,460,092 | ) | ||
| Net Decrease in Net Assets Resulting From Operations | $ | (5,210,780 | ) |
| See Notes to Financial Statements. | 33 |
Statements of Changes in Net Assets
| For the Year Ended | For the Year Ended | |||||||
| INCREASE IN NET ASSETS | December 31, 2018 | December 31, 2017 | ||||||
| Operations: | ||||||||
| Net investment income | $ | 15,249,312 | $ | 10,725,398 | ||||
| Net realized gain (loss) on investments, futures contracts and foreign currency related transactions | (12,394,898 | ) | 609,800 | |||||
| Net change in unrealized appreciation/depreciation on investments, futures contracts and translation of assets and liabilities denominated in foreign currencies | (8,065,194 | ) | 6,869,409 | |||||
| Net increase (decrease) in net assets resulting from operations | (5,210,780 | ) | 18,204,607 | |||||
| Distributions to shareholders(1) | (18,110,707 | ) | (13,065,635 | ) | ||||
| Capital share transactions (See Note 14): | ||||||||
| Proceeds from sales of shares | 99,983,765 | 141,989,369 | ||||||
| Reinvestment of distributions | 18,110,707 | 13,065,635 | ||||||
| Cost of shares reacquired | (87,540,643 | ) | (52,931,398 | ) | ||||
| Net increase in net assets resulting from capital share transactions | 30,553,829 | 102,123,606 | ||||||
| Net increase in net assets | 7,232,342 | 107,262,578 | ||||||
| NET ASSETS: | ||||||||
| Beginning of year | $ | 554,377,931 | $ | 447,115,353 | ||||
| End of year | $ | 561,610,273 | $ | 554,377,931 | ||||
| Distributions in excess of net investment income(2) | $ | – | $ | – | ||||
| (1) | The SEC eliminated the requirement to disclose the source of distributions paid in 2018. For the year ended December 31, 2017, the source of distributions represents net investment income. | |
| (2) | The SEC eliminated the requirement to disclose distributions in excess of net investment income in 2018. For the year ended December 31, 2017, the distributions in excess of net investment income was $(33,848). |
| 34 | See Notes to Financial Statements. |
This page is intentionally left blank.
35
| Per Share Operating Performance: | ||||||||||||||||||||||||||||
| Investment Operations: | Distributions to shareholders from: | |||||||||||||||||||||||||||
| Net asset value, beginning of period | Net invest- ment income(a) | Net realized and unrealized gain (loss) | Total from invest- ment opera- tions | Net investment income | Net realized gain | Total distri- butions | ||||||||||||||||||||||
| 12/31/2018 | $ | 16.65 | $ | 0.44 | $ | (0.60 | ) | $ | (0.16 | ) | $ | (0.53 | ) | $ | – | $ | (0.53 | ) | ||||||||||
| 12/31/2017 | 16.42 | 0.36 | 0.27 | 0.63 | (0.40 | ) | – | (0.40 | ) | |||||||||||||||||||
| 12/31/2016 | 16.25 | 0.36 | 0.31 | 0.67 | (0.44 | ) | (0.06 | ) | (0.50 | ) | ||||||||||||||||||
| 12/31/2015 | 16.85 | 0.36 | (0.47 | ) | (0.11 | ) | (0.47 | ) | (0.02 | ) | (0.49 | ) | ||||||||||||||||
| 12/31/2014 | 16.22 | 0.32 | 0.66 | 0.98 | (0.32 | ) | (0.03 | ) | (0.35 | ) | ||||||||||||||||||
| (a) | Calculated using average shares outstanding during the period. |
| (b) | Total return does not consider the effects of sales charges or other expenses imposed by an insurance company and assumes the reinvestment of all distributions. |
| 36 | See Notes to Financial Statements. |
| Ratios to Average Net Assets: | Supplemental Data: | ||||||||||||||||||||||||
| Net asset value, end of period | Total return(b) (%) | Total expenses after waivers and/or reim- bursements (%) | Total expenses (%) | Net investment income (%) | Net assets, end of period (000) | Portfolio turnover rate (%) | |||||||||||||||||||
| $15.96 | (1.03 | ) | 0.67 | 0.89 | 2.70 | $561,610 | 611 | ||||||||||||||||||
| 16.65 | 3.86 | 0.64 | 0.88 | 2.16 | 554,378 | 452 | |||||||||||||||||||
| 16.42 | 4.26 | 0.64 | 0.89 | 2.16 | 447,115 | 443 | |||||||||||||||||||
| 16.25 | (0.66 | ) | 0.64 | 0.89 | 2.11 | 390,155 | 432 | ||||||||||||||||||
| 16.85 | 6.08 | 0.64 | 0.90 | 1.87 | 317,732 | 466 | |||||||||||||||||||
| See Notes to Financial Statements. | 37 |
| 1. | ORGANIZATION |
Lord Abbett Series Fund, Inc. (the “Company”) is registered under the Investment Company Act of 1940, as amended (the “Act”), as a diversified, open-end management investment company and was incorporated under Maryland law in 1989. The Company consists of twelve separate portfolios. This report covers Total Return Portfolio (the “Fund”).
The Fund’s investment objective is to seek income and capital appreciation to produce a high total return. The Fund has Variable Contract class shares (“Class VC Shares”), which are currently issued and redeemed only in connection with investments in, and payments under, variable annuity contracts and variable life insurance policies issued by life insurance and insurance-related companies.
The preparation of the financial statements in conformity with accounting principles generally accepted in the United States of America (“U.S. GAAP”) requires management to make certain estimates and assumptions that affect the reported amounts of assets and liabilities and disclosure of contingent assets and liabilities at the date of the financial statements and the reported amounts of increases and decreases in net assets from operations during the reporting period. Actual results could differ from those estimates. The Fund is considered an investment company under U.S. GAAP and follows the accounting and reporting guidance applicable to investment companies.
| 2. | SIGNIFICANT ACCOUNTING POLICIES |
| (a) | Investment Valuation–Under procedures approved by the Fund’s Board of Directors (the “Board”), Lord, Abbett & Co. LLC (“Lord Abbett”), the Fund’s investment manager, has formed a Pricing Committee to administer the pricing and valuation of portfolio investments and to ensure that prices utilized reasonably reflect fair value. Among other things, these procedures allow the Fund to utilize independent pricing services, quotations from securities and financial instrument dealers and other market sources to determine fair value. |
| Securities actively traded on any recognized U.S. or non-U.S. exchange or on The NASDAQ Stock Market LLC are valued at the last sale price or official closing price on the exchange or system on which they are principally traded. Events occurring after the close of trading on non-U.S. exchanges may result in adjustments to the valuation of foreign securities to reflect their fair value as of the close of regular trading on the New York Stock Exchange. The Fund may utilize an independent fair valuation service in adjusting the valuations of foreign securities. Unlisted equity securities are valued at the last quoted sale price or, if no sale price is available, at the mean between the most recently quoted bid and asked prices. Fixed income securities are valued based on evaluated prices supplied by independent pricing services, which reflect broker/dealer supplied valuations and the independent pricing services’ own electronic data processing techniques. Exchange traded options and futures contracts are valued at the last quoted sale price in the market where they are principally traded. If no sale has occurred, the mean between the most recently quoted bid and asked prices is used. | |
| Securities for which prices are not readily available are valued at fair value as determined by the Pricing Committee. The Pricing Committee considers a number of factors, including observable and unobservable inputs, when arriving at fair value. The Pricing Committee may use related or comparable assets or liabilities, recent transactions, market multiples, book values, yield curves, broker quotes, observable trading activity, option adjusted spread models and other relevant information to determine the fair value of portfolio investments. The Board or a designated committee thereof regularly reviews fair value determinations made by the |
38
Notes to Financial Statements (continued)
| Pricing Committee and may employ techniques such as reviewing related market activity, reviewing inputs and assumptions, and retrospectively comparing prices of subsequent purchases and sales transactions to fair value determinations made by the Pricing Committee. | |
| Short-term securities with 60 days or less remaining to maturity are valued using the amortized cost method, which approximates fair value. | |
| (b) | Security Transactions–Security transactions are recorded as of the date that the securities are purchased or sold (trade date). Realized gains and losses on sales of portfolio securities are calculated using the identified-cost method. |
| (c) | Investment Income–Dividend income is recorded on the ex-dividend date. Interest income is recorded on the accrual basis as earned. Discounts are accreted and premiums are amortized using the effective interest method and are included in Interest and other income on the Statement of Operations. Withholding taxes on foreign dividends have been provided for in accordance with the applicable country’s tax rules and rates. |
| (d) | Income Taxes–It is the policy of the Fund to meet the requirements of Subchapter M of the Internal Revenue Code applicable to regulated investment companies and to distribute substantially all taxable income and capital gains to its shareholders. Therefore, no income tax provision is required. |
| The Fund files U.S. federal and various state and local tax returns. No income tax returns are currently under examination. The statute of limitations on the Fund’s filed U.S. federal tax returns remains open for the fiscal years ended December 31, 2015 through December 31, 2018. The statutes of limitations on the Company’s state and local tax returns may remain open for an additional year depending upon the jurisdiction. | |
| (e) | Expenses–Expenses incurred by the Company that do not specifically relate to an individual fund are generally allocated to the funds within the Company on a pro rata basis by relative net assets. |
| (f) | Foreign Transactions–The books and records of the Fund are maintained in U.S. dollars and transactions denominated in foreign currencies are recorded in the Fund’s records at the rate prevailing when earned or recorded. Asset and liability accounts that are denominated in foreign currencies are adjusted daily to reflect current exchange rates and any unrealized gain (loss), if applicable, is included in Net change in unrealized appreciation/depreciation on translation of assets and liabilities denominated in foreign currencies in the Fund’s Statement of Operations. The resultant exchange gains and losses upon settlement of such transactions are included in Net realized gain (loss), if applicable, on foreign currency related transactions in the Fund’s Statement of Operations. The Fund does not isolate that portion of the results of operations arising as a result of changes in the foreign exchange rates from the changes in market prices of the securities. |
| The Fund uses foreign currency exchange contracts to facilitate transactions in foreign-denominated securities. Losses from these transactions may arise from changes in the value of the foreign currency or if the counterparties do not perform under the contracts’ terms. | |
| (g) | Futures Contracts–The Fund may purchase and sell futures contracts to enhance returns, to attempt to economically hedge some of its investment risk, or as a substitute position in lieu of holding the underlying asset on which the instrument is based. At the time of entering into a futures transaction, an investor is required to deposit and maintain a specified amount of |
39
Notes to Financial Statements (continued)
| cash or eligible securities called “initial margin.” Subsequent payments made or received by the Fund called “variation margin” are made on a daily basis as the market price of the futures contract fluctuates. The Fund will record an unrealized gain (loss) based on the amount of variation margin. When a contract is closed, a realized gain (loss) is recorded equal to the difference between the opening and closing value of the contract. | |
| (h) | Repurchase Agreements–The Fund may enter into repurchase agreements with respect to securities. A repurchase agreement is a transaction in which a fund acquires a security and simultaneously commits to resell that security to the seller (a bank or securities dealer) at an agreed-upon price on an agreed-upon date. The Fund requires at all times that the repurchase agreement be collateralized by cash, or by securities of the U.S. Government, its agencies, its instrumentalities, or U.S. Government sponsored enterprises having a value equal to, or in excess of, the value of the repurchase agreement (including accrued interest). If the seller of the agreement defaults on its obligation to repurchase the underlying securities at a time when the fair value of these securities has declined, the Fund may incur a loss upon disposition of the securities. |
| (i) | When-Issued, Forward Transactions or To-Be-Announced (“TBA”) Transactions–The Fund may purchase portfolio securities on a when-issued or forward basis. When-issued, forward transactions or TBA transactions involve a commitment by a fund to purchase securities, with payment and delivery (“settlement”) to take place in the future, in order to secure what is considered to be an advantageous price or yield at the time of entering into the transaction. During the period between purchase and settlement, the fair value of the securities will fluctuate and assets consisting of cash and/or marketable securities (normally short-term U.S. Government or U.S. Government sponsored enterprise securities) marked to market daily in an amount sufficient to make payment at settlement will be segregated at the Fund’s custodian in order to pay for the commitment. At the time the Fund makes the commitment to purchase a security on a when-issued basis, it will record the transaction and reflect the liability for the purchase and fair value of the security in determining its net asset value (“NAV”). The Fund, generally, has the ability to close out a purchase obligation on or before the settlement date rather than take delivery of the security. Under no circumstances will settlement for such securities take place more than 120 days after the purchase date. |
| (j) | Mortgage Dollar Rolls–The Fund may enter into mortgage dollar rolls in which a Fund sells mortgage-backed securities for delivery in the current month and simultaneously contracts with the same counterparty to repurchase similar (same type, coupon and maturity) but not identical securities on a specified future date. During the roll period, the Fund loses the right to receive principal (including prepayments of principal) and interest paid on the securities sold. |
| (k) | Fair Value Measurements–Fair value is defined as the price that the Fund would receive upon selling an investment or transferring a liability in an orderly transaction to an independent buyer in the principal or most advantageous market of the investment. A three-tier hierarchy is used to maximize the use of observable market data and minimize the use of unobservable inputs and to establish classification of fair value measurements for disclosure purposes. Inputs refer broadly to the assumptions that market participants would use in pricing the asset or liability, including assumptions about risk—for example, the risk inherent in a particular valuation technique used to measure fair value (such as a pricing model) and/or the risk inherent in the inputs to the valuation technique. Inputs may be observable or unobservable. Observable inputs reflect the assumptions market participants would use in pricing the asset or liability. Observable inputs are |
40
Notes to Financial Statements (continued)
| based on market data obtained from sources independent of the reporting entity. Unobservable inputs reflect the reporting entity’s own assumptions about the assumptions market participants would use in pricing the asset or liability. Unobservable inputs are based on the best information available in the circumstances. The three-tier hierarchy classification is determined based on the lowest level of inputs that is significant to the fair value measurement, and is summarized in the three broad Levels listed below: |
| • | Level 1 – unadjusted quoted prices in active markets for identical investments; | |
| • | Level 2 – other significant observable inputs (including quoted prices for similar investments, interest rates, prepayment speeds, credit risk, etc.); and | |
| • | Level 3 – significant unobservable inputs (including the Fund’s own assumptions in determining the fair value of investments). |
| A summary of inputs used in valuing the Fund’s investments as of December 31, 2018 and, if applicable, Level 1/Level 2 transfers and Level 3 rollforwards for the fiscal year then ended is included in the Fund’s Schedule of Investments. | |
| Changes in valuation techniques may result in transfers into or out of an assigned level within the three-tier hierarchy. All transfers between different levels within the three-tier hierarchy are deemed to have occurred as of the beginning of the reporting period. The inputs or methodology used for valuing securities are not necessarily an indication of the risk associated with investing in those securities. |
| 3. | MANAGEMENT FEE AND OTHER TRANSACTIONS WITH AFFILIATES |
Management Fee
The Company has a management agreement with Lord Abbett, pursuant to which Lord Abbett supplies the Fund with investment management services and executive and other personnel, provides office space and pays for ordinary and necessary office and clerical expenses relating to research and statistical work and supervision of the Fund’s investment portfolio.
The management fee is based on the Fund’s average daily net assets at the following annual rate:
| First $1 billion | .45% |
| Next $1 billion | .40% |
| Over $2 billion | .35% |
For the fiscal year ended December 31, 2018, the effective management fee, net of waivers, was at an annualized rate of .24% of the Fund’s average daily net assets.
In addition, Lord Abbett provides certain administrative services to the Fund pursuant to an Administrative Services Agreement in return for a fee at an annual rate of .04% of the Fund’s average daily net assets.
Effective May 1, 2018 and continuing through April 30, 2019, Lord Abbett has contractually agreed to waive its fees and reimburse expenses to the extent necessary to limit total net annual operating expenses to an annual rate of .69%. This agreement may be terminated only upon the approval of the Board. Prior to May 1, 2018, Lord Abbett contractually agreed to waive its fees and reimburse expenses to the extent necessary to limit total net annual operating expenses to an annual rate of .64%.
The Company, on behalf of the Fund, has entered into services arrangements with certain insurance companies. Under these arrangements, certain insurance companies will be
41
Notes to Financial Statements (continued)
compensated up to .25% of the average daily net asset value (“NAV”) of the Fund’s Class VC Shares held in the insurance company’s separate account to service and maintain the Variable Contract owners’ accounts. This amount is included in Non 12b-1 service fees on the Statement of Operations. The Fund may also compensate certain insurance companies, third-party administrators and other entities for providing recordkeeping, sub-transfer agency and other administrative services to the Fund. This amount is included in Shareholder servicing on the Statement of Operations.
One Director and certain of the Company’s officers have an interest in Lord Abbett.
| 4. | DISTRIBUTIONS AND CAPITAL LOSS CARRYFORWARDS |
Dividends from net investment income, if any, are declared and paid at least semi-annually. Taxable net realized gains from investment transactions, reduced by allowable capital loss carryforwards, if any, are declared and distributed to shareholders at least annually. The capital loss carryforward amount, if any, is available to offset future net capital gains. Dividends and distributions to shareholders are recorded on the ex-dividend date. The amounts of dividends and distributions from net investment income and net realized capital gains are determined in accordance with federal income tax regulations, which may differ from U.S. GAAP. These book/tax differences are either considered temporary or permanent in nature. To the extent these differences are permanent in nature, such amounts are reclassified within the components of net assets based on their federal tax basis treatment; temporary differences do not require reclassification. Dividends and distributions that exceed earnings and profits for tax purposes are reported as a tax return of capital.
The tax character of distributions paid during the fiscal years ended December 31, 2018 and 2017, was as follows:
| Year Ended | Year Ended | ||||||||
| 12/31/2018 | 12/31/2017 | ||||||||
| Distributions paid from: | |||||||||
| Ordinary income | $ | 18,110,707 | $ | 13,065,635 | |||||
| Total distributions paid | $ | 18,110,707 | $ | 13,065,635 | |||||
As of December 31, 2018, the components of accumulated losses on a tax-basis were as follows:
| Undistributed ordinary income – net | $ | 15,288 | ||
| Total undistributed earnings | 15,288 | |||
| Capital loss carryforwards* | (18,973,335 | ) | ||
| Temporary differences | (45,613 | ) | ||
| Unrealized losses – net | (9,049,136 | ) | ||
| Total accumulated losses – net | $ | (28,052,796 | ) | |
| * | The capital losses will carry forward indefinitely. |
As of December 31, 2018, the aggregate unrealized security gains and losses on investments and other financial instruments based on cost for U.S. federal income tax purposes were as follows:
| Tax cost | $ | 771,836,041 | ||
| Gross unrealized gain | 6,539,500 | |||
| Gross unrealized loss | (15,588,556 | ) | ||
| Net unrealized security loss | $ | (9,049,056 | ) | |
The difference between book-basis and tax-basis unrealized gains (losses) is attributable to the tax treatment of other financial instruments, premium amortization and wash sales.
42
Notes to Financial Statements (continued)
| 5. | PORTFOLIO SECURITIES TRANSACTIONS |
Purchases and sales of investment securities (excluding short-term investments) for the fiscal year ended December 31, 2018 were as follows:
| U.S. | Non-U.S. | U.S. | Non-U.S. | |||||||||||
| Government | Government | Government | Government | |||||||||||
| Purchases | Purchases | Sales | Sales | |||||||||||
| $3,515,710,890 | $407,283,655 | $3,486,016,286 | $333,798,096 | |||||||||||
The Fund is permitted to purchase and sell securities (“cross-trade”) from and to other Lord Abbett funds or client accounts pursuant to procedures approved by the Board in compliance with Rule 17a-7 under the Act (the “Rule”). Each cross-trade is executed at a fair market price in compliance with provisions of the Rule. For the fiscal year ended December 31, 2018, the Fund engaged in cross-trade purchases of $1,071,956 and sales of $1,123,449, which resulted in net realized gains of $47,691.
| 6. | DISCLOSURES ABOUT DERIVATIVE INSTRUMENTS AND HEDGING ACTIVITIES |
The Fund entered into U.S. Treasury futures contracts for the fiscal year ended December 31, 2018 (as described in note 2(g)) to hedge against changes in interest rates. The Fund bears the risk of interest rates moving unexpectedly, in which case the Fund may not achieve the anticipated benefits of the futures contracts and realize a loss. There is minimal counterparty credit risk to the Fund since futures are exchange traded and the exchange’s clearinghouse, as counterparty to all exchange traded futures, guarantees futures against default.
As of December 31, 2018, the Fund had futures contracts with unrealized appreciation of $2,125,344 and depreciation of $(1,158,886) which is included in the Schedule of Investments. Only current day’s variation margin is reported within the Fund’s Statement of Assets and Liabilities. Net realized loss of $(671,026) and net change in unrealized appreciation/depreciation of $1,091,607 are included on the Statement of Operations related to futures contracts under the captions Net realized loss on futures contracts and Net change in unrealized appreciation/depreciation on futures contracts, respectively. The average number of futures contracts throughout the fiscal year was 514.
| 7. | DISCLOSURES ABOUT OFFSETTING ASSETS AND LIABILITIES |
The Financial Accounting Standards Board (“FASB”) requires disclosures intended to help better assess the effect or potential effect of offsetting arrangements on a fund’s financial position. The following tables illustrate gross and net information about recognized assets and liabilities eligible for offset in the statement of assets and liabilities; and disclose such amounts subject to an enforceable master netting agreement or similar agreement, by counterparty. A master netting agreement is an agreement between a fund and a counterparty which provides for the net settlement of amounts owed under all contracts traded under that agreement, as well as cash collateral, through a single payment by one party to the other in the event of default on or termination of any one contract. The Fund’s accounting policy with respect to balance sheet offsetting is that, absent an event of default by the counterparty or a termination of the agreement, the master netting agreement does not result in an offset of reported amounts of financial assets and liabilities in the statement of assets and liabilities across transactions between the Fund and the applicable counterparty:
43
Notes to Financial Statements (continued)
| Gross Amounts | Net Amounts of | ||||||||||
| Offset in the | Assets Presented | ||||||||||
| Gross Amounts of | Statement of Assets | in the Statement of | |||||||||
| Description | Recognized Assets | and Liabilities | Assets and Liabilities | ||||||||
| Repurchase Agreement | $ | 15,811,479 | $ | – | $ | 15,811,479 | |||||
| Total | $ | 15,811,479 | $ | – | $ | 15,811,479 | |||||
| Net Amounts | |||||||||||||||||||
| of Assets | Amounts Not Offset in the | ||||||||||||||||||
| Presented in | Statement of Assets and Liabilities | ||||||||||||||||||
| the Statement | Cash | Securities | |||||||||||||||||
| of Assets and | Financial | Collateral | Collateral | Net | |||||||||||||||
| Counterparty | Liabilities | Instruments | Received(a) | Received(a) | Amount(b) | ||||||||||||||
| Fixed Income Clearing Corp. | $ | 15,811,479 | $ | – | $ | – | $ | (15,811,479 | ) | $ | – | ||||||||
| Total | $ | 15,811,479 | $ | – | $ | – | $ | (15,811,479 | ) | $ | – | ||||||||
| (a) | Collateral disclosed is limited to an amount not to exceed 100% of the net amount of assets presented in the Statement of Assets and Liabilities, for each respective counterparty. |
| (b) | Net amount represents the amount owed to the Fund by the counterparty as of December 31, 2018. |
| 8. | DIRECTORS’ REMUNERATION |
The Company’s officers and one Director, who are associated with Lord Abbett, do not receive any compensation from the Company for serving in such capacities. Independent Directors’ fees are allocated among all Lord Abbett-sponsored funds based on the net assets of each fund. There is an equity-based plan available to all Independent Directors under which Independent Directors must defer receipt of a portion of, and may elect to defer receipt of an additional portion of Directors’ fees. The deferred amounts are treated as though equivalent dollar amounts had been invested in the funds. Such amounts and earnings accrued thereon are included in Directors’ fees on the Statement of Operations and in Directors’ fees payable on the Statement of Assets and Liabilities and are not deductible for U.S. federal income tax purposes until such amounts are paid.
| 9. | EXPENSE REDUCTIONS |
The Company has entered into an arrangement with its transfer agent and custodian, whereby credits realized as a result of uninvested cash balances are used to reduce a portion of the Fund’s expenses.
| 10. | LINE OF CREDIT |
During the period ended August 8, 2018, the Fund and certain other funds managed by Lord Abbett (collectively, the “Participating Funds”) participated in a syndicated line of credit facility with various lenders for $600 million (the “Facility”), whereas State Street Bank and Trust Company (“SSB”) participates as a lender and as agent for the lenders. The Facility is to be used for temporary or emergency purposes as an additional source of liquidity to satisfy redemptions. The Participating Funds are subject to graduated borrowing limits of one-third of Fund assets (if Fund assets are less than $750 million), $250 million, $300 million, or $350 million, based on past borrowings and likelihood of future borrowings. During the period ended August 8, 2018, the Fund did not utilize the Facility.
For the period August 9, 2018 through December 20, 2018, the Participating Funds entered into an amended syndicated line of credit facility with various lenders for $1.06 billion (the “Syndicated Facility”), whereas SSB participates as a lender and as agent for the lenders. Under the Syndicated Facility, the Participating Funds are subject to graduated borrowing limits of one-third of Fund assets (if Fund assets are less than $750 million), $250 million, $300 million, $350 million, or $1
44
Notes to Financial Statements (continued)
billion, based on past borrowings and likelihood of future borrowings. Effective December 21, 2018, the Participating Funds entered into an amended Syndicated Facility with various lenders for $1.1 billion based on the same terms as described above.
Effective August 9, 2018, the Participating Funds entered into an additional line of credit facility with SSB for $250 million (the “Bilateral Facility,” and together with the Syndicated Facility, the “Facilities”). Under the Bilateral Facility, each Participating Fund may borrow up to the lesser of $250 million or one-third of Fund assets. The Facilities are to be used for temporary or emergency purposes to satisfy redemption requests and manage liquidity.
For the period from August 9, 2018 through December 31, 2018, the Fund did not utilize the Facilities.
| 11. | INTERFUND LENDING PROGRAM |
Pursuant to an exemptive order issued by the U.S. Securities and Exchange Commission (“SEC exemptive order”), certain registered open-end management investment companies managed by Lord Abbett, including the Fund, participate in a joint lending and borrowing program (the “Interfund Lending Program”). The SEC exemptive order allows the Funds to borrow money from and lend money to each other for temporary or emergency purposes subject to the limitations and conditions.
During the year ended December 31, 2018, the Fund participated as a lender in the Interfund Lending Program. For the period in which the loan was outstanding, the average amount loaned, interest rate and interest income were as follows:
| Average | Average | Interest | |
| Loan | Interest Rate | Income | * |
| $12,593,213 | 2.23% | 769 |
| * | Included in the Statement of Operations |
| 12. | CUSTODIAN AND ACCOUNTING AGENT |
SSB is the Company’s custodian and accounting agent. SSB performs custodial, accounting and recordkeeping functions relating to portfolio transactions and calculating the Fund’s NAV.
| 13. | INVESTMENT RISKS |
The Fund is subject to the general risks and considerations associated with investing in fixed income securities, including the risk that issuers will fail to make timely payments of principal or interest or default altogether. The value of an investment will change as interest rates fluctuate in response to market movements. When interest rates rise, the prices of fixed income securities are likely to decline; when interest rates fall, such prices tend to rise.
The Fund is subject to the risk of investing a significant portion of its assets in securities issued or guaranteed by the U.S. Government or its agencies and instrumentalities (such as the Government National Mortgage Association (“Ginnie Mae”), the Federal National Mortgage Association (“Fannie Mae”), or the Federal Home Loan Mortgage Corporation (“Freddie Mac”)). Unlike Ginnie Mae securities, securities issued or guaranteed by U.S. Government-related organizations such as Fannie Mae and Freddie Mac are not backed by the full faith and credit of the U.S. Government and no assurance can be given that the U.S. Government would provide financial support to its agencies and instrumentalities if not required to do so by law. Consequently, the Fund may be required to look principally to the agency issuing or guaranteeing the obligation. In addition, the Fund may invest in non-agency asset backed and mortgage related securities, which are issued by private
45
Notes to Financial Statements (continued)
institutions, not by government-sponsored enterprises. Such securities may be particularly sensitive to changes in economic conditions, including delinquencies and/or defaults, and changes in prevailing interest rates. These changes can affect the value, income and/or liquidity of such positions. When interest rates are declining, the value of these securities with prepayment features may not increase as much as other fixed income securities. Early principal repayment may deprive the Fund of income payments above current market rates. The prepayment rate also will affect the price and volatility of these securities. In addition, securities of government sponsored enterprises are guaranteed with respect to the timely payment of interest and principal by the particular enterprises involved, not by the U.S. Government.
The lower-rated or high-yield bonds (also known as “junk” bonds) in which the Fund may invest are subject to greater price fluctuations, as well as additional risks. The market for below investment grade securities may be less liquid, which may make such securities more difficult to sell at an acceptable price, especially during periods of financial distress, increased market volatility, or significant market decline.
The Fund is subject to the risks associated with derivatives, which may be different from and greater than the risks associated with directly investing in securities. Derivatives may be subject to risks such as liquidity risk, leveraging risk, interest rate risk, market risk, and credit risk. Illiquid securities may lower the Fund’s returns since the Fund may be unable to sell these securities at their desired time or price. Derivatives also may involve the risk of mispricing or improper valuation and the risk that changes in the value of the derivative may not correlate perfectly with the value of the underlying asset, rate or index. Whether the Fund’s use of derivatives is successful will depend on, among other things, the Fund’s ability to correctly forecast market movements, changes in foreign exchange and interest rates, and other factors. Losses may also arise from the failure of a derivative counterparty to meet its contractual obligations. If the Fund incorrectly forecasts these and other factors, its performance could suffer.
The Fund’s investment exposure to foreign (which may include emerging market) companies presents increased market, industry and sector, liquidity, currency, political, information and other risks. As compared with companies organized and operated in the U.S., these companies may be more vulnerable to economic, political and social instability and subject to less government supervision, lack of transparency, inadequate regulatory and accounting standards, and foreign taxes. The securities of foreign companies also may be subject to inadequate exchange control regulations, the imposition of economic sanctions or other government restrictions, higher transaction and other costs, and delays in settlement to the extent they are traded on non-U.S. exchanges or markets. The cost of the Fund’s use of forward foreign currency exchange contracts varies with factors such as the currencies involved, the length of the contract period and the market conditions prevailing. The Fund’s exposure to inflation-linked investments, such as Treasury Inflation Protected Securities, may be vulnerable to changes in expectations of inflation or interest rates.
The Fund may invest in floating rate or adjustable rate senior loans, which are subject to increased credit and liquidity risks. Senior loans are business loans made to borrowers that may be U.S. or foreign corporations, partnerships or other business entities. The senior loans in which the Fund invests may consist primarily of senior loans that are rated below investment grade or, if unrated, deemed by Lord Abbett to be equivalent to below investment grade securities. Below investment grade senior loans, as in the case of high-yield debt securities, or junk bonds, are usually more credit sensitive than interest rate sensitive, although the value of these instruments may be
46
Notes to Financial Statements (concluded)
impacted by broader interest rate swings in the overall fixed income market. In addition, senior loans may be subject to structural subordination.
These factors can affect the Fund’s performance.
| 14. | SUMMARY OF CAPITAL TRANSACTIONS |
Transactions in shares of capital stock were as follows:
| Year Ended | Year Ended | |||||||
| December 31, 2018 | December 31, 2017 | |||||||
| Shares sold | 6,114,426 | 8,429,040 | ||||||
| Reinvestment of distributions | 1,139,038 | 788,496 | ||||||
| Shares reacquired | (5,360,418 | ) | (3,155,253 | ) | ||||
| Increase | 1,893,046 | 6,062,283 | ||||||
47
Report of Independent Registered Public Accounting Firm
To the shareholders and the Board of Directors of Lord Abbett Series Fund, Inc.:
Opinion on the Financial Statements and Financial Highlights
We have audited the accompanying statement of assets and liabilities, including the schedule of investments, of the Total Return Portfolio, one of the portfolios constituting the Lord Abbett Series Fund, Inc. (the “Fund”), as of December 31, 2018, the related statement of operations for the year then ended, the statements of changes in net assets for each of the two years in the period then ended, the financial highlights for each of the five years in the period then ended, and the related notes. In our opinion, the financial statements and financial highlights present fairly, in all material respects, the financial position of the Total Return Portfolio of the Fund as of December 31, 2018, and the results of its operations for the year then ended, the changes in its net assets for each of the two years in the period then ended, and the financial highlights for each of the five years in the period then ended in conformity with accounting principles generally accepted in the United States of America.
Basis for Opinion
These financial statements and financial highlights are the responsibility of the Fund’s management. Our responsibility is to express an opinion on the Fund’s financial statements and financial highlights based on our audits. We are a public accounting firm registered with the Public Company Accounting Oversight Board (United States) (PCAOB) and are required to be independent with respect to the Fund in accordance with the U.S. federal securities laws and the applicable rules and regulations of the Securities and Exchange Commission and the PCAOB.
We conducted our audits in accordance with the standards of the PCAOB. Those standards require that we plan and perform the audit to obtain reasonable assurance about whether the financial statements and financial highlights are free of material misstatement, whether due to error or fraud. The Fund is not required to have, nor were we engaged to perform, an audit of its internal control over financial reporting. As part of our audits we are required to obtain an understanding of internal control over financial reporting but not for the purpose of expressing an opinion on the effectiveness of the Fund’s internal control over financial reporting. Accordingly, we express no such opinion.
Our audits included performing procedures to assess the risks of material misstatement of the financial statements and financial highlights, whether due to error or fraud, and performing procedures that respond to those risks. Such procedures included examining, on a test basis, evidence regarding the amounts and disclosures in the financial statements and financial highlights. Our audits also included evaluating the accounting principles used and significant estimates made by management, as well as evaluating the overall presentation of the financial statements and financial highlights. Our procedures included confirmation of securities owned as of December 31, 2018, by correspondence with the custodian and brokers; when replies were not received from brokers, we performed other auditing procedures. We believe that our audits provide a reasonable basis for our opinion.
DELOITTE & TOUCHE LLP
New York, New York
February 15, 2019
We have served as the auditor of one or more Lord Abbett Family of Funds’ investment companies since 1932.
48
Basic Information About Management
The Board is responsible for the management of the business and affairs of the Company in accordance with the laws of the State of Maryland. The Board elects officers who are responsible for the day-to-day operations of the Fund and who execute policies authorized by the Board. The Board also approves an investment adviser to the Fund and continues to monitor the cost and quality of the services the investment adviser provides, and annually considers whether to renew the contract with the adviser. Generally, each Director holds office until his/her successor is elected and qualified or until his/her earlier resignation or removal, as provided in the Company’s organizational documents.
Lord Abbett, a Delaware limited liability company, is the Fund’s investment adviser. Designated Lord Abbett personnel are responsible for the day-to-day management of the Fund.
Interested Directors
Mr. Sieg is affiliated with Lord Abbett and is an “interested person” of the Company as defined in the Act. Mr. Sieg is director/trustee of each of the 13 investment companies in the Lord Abbett Family of Funds, which consist of 62 portfolios or series. Mr. Sieg is an officer of the Lord Abbett Family of Funds.
| Name, Address and Year of Birth | Current Position and Length of Service with the Company | Principal Occupation and Other Directorships During the Past Five Years | ||
| Douglas B. Sieg Lord, Abbett & Co. LLC 90 Hudson Street Jersey City, NJ 07302 (1969) | Director since 2016; President and Chief Executive Officer since 2018 | Principal Occupation:Managing Partner (since 2018) and was formerly Head of Client Services, joined Lord Abbett in 1994.
Other Directorships:None. |
Independent Directors
The following Independent Directors also are directors/trustees of each of the 13 investment companies in the Lord Abbett Family of Funds, which consist of 62 portfolios or series.
| Name, Address and Year of Birth | Current Position and Length of Service with the Company | Principal Occupation and Other Directorships During the Past Five Years | ||
| Eric C. Fast Lord, Abbett & Co. LLC c/o Legal Dept. 90 Hudson Street Jersey City, NJ 07302 (1949) | Director since 2014 | Principal Occupation:Chief Executive Officer of Crane Co., an industrial products company (2001–2014).
Other Directorships:Currently serves as director of Automatic Data Processing, Inc. (since 2007) and Regions Financial Corporation (since 2010). Previously served as a director of Crane Co. | ||
| Evelyn E. Guernsey Lord, Abbett & Co. LLC c/o Legal Dept. 90 Hudson Street Jersey City, NJ 07302 (1955) | Director since 2011 | Principal Occupation:CEO, Americas of J.P. Morgan Asset Management (2004–2010).
Other Directorships:None. |
49
Basic Information About Management (continued)
| Name, Address and Year of Birth | Current Position and Length of Service with the Company | Principal Occupation and Other Directorships During the Past Five Years | ||
| Julie A. Hill Lord, Abbett & Co. LLC c/o Legal Dept. 90 Hudson Street Jersey City, NJ 07302 (1946) | Director since 2004 | Principal Occupation:Owner and CEO of The Hill Company, a business consulting firm (since 1998).
Other Directorships:Currently serves as director of Anthem, Inc., a health benefits company (since 1994). | ||
| Kathleen M. Lutito Lord, Abbett & Co. LLC c/o Legal Dept. 90 Hudson Street Jersey City, NJ 07302 (1963) | Director since 2017 | Principal Occupation:President and Chief Investment Officer of CenturyLink Investment Management Company (since 2006).
Other Directorships:None | ||
| James M. McTaggart Lord, Abbett & Co. LLC c/o Legal Dept. 90 Hudson Street Jersey City, NJ 07302 (1947) | Director since 2012 | Principal Occupation:Independent management advisor and consultant (since 2012); Vice President, CRA International, Inc. (doing business as Charles River Associates), a global management consulting firm (2009–2012); Founder and Chairman of Marakon Associates, Inc., a strategy consulting firm (1978–2009); and Officer and Director of Trinsum Group, a holding company (2007–2009).
Other Directorships:Blyth, Inc., a home products company (2004–2015). | ||
| Karla M. Rabusch Lord, Abbett & Co. LLC c/o Legal Dept. 90 Hudson Street Jersey City, NJ 07302 (1959) | Director since 2017 | Principal Occupation:President and Director of Wells Fargo Funds Management, LLC (2003–2017); President of Wells Fargo Funds (2003–2016).
Other Directorships:None. | ||
| Mark A. Schmid Lord, Abbett & Co. LLC c/o Legal Dept. 90 Hudson Street Jersey City, NJ 07302 (1959) | Director since 2016 | Principal Occupation:Vice President and Chief Investment Officer of the University of Chicago (since 2009).
Other Directorships:None. | ||
| James L.L. Tullis Lord, Abbett & Co. LLC c/o Legal Dept. 90 Hudson Street Jersey City, NJ 07302 (1947) | Director since 2006; Chairman since 2017 | Principal Occupation:CEO of Tullis-Dickerson and Co. Inc., a venture capital management firm (since 1990); CEO of Tullis Health Investors Inc. (since 2012).
Other Directorships:Currently serves as director of Crane Co. (since 1998). |
Officers
None of the officers listed below have received compensation from the Company. All of the officers of the Company also may be officers of the other Lord Abbett Funds and maintain offices at 90 Hudson Street, Jersey City, NJ 07302. Unless otherwise indicated, the position(s) and title(s) listed under the “Principal Occupation During the Past Five Years” column indicate each officer’s position(s) and title(s) with Lord Abbett. Each officer serves for an indefinite term (i.e., until his or her death, resignation, retirement, or removal).
50
Basic Information About Management (continued)
| Name and Year of Birth | Current Position with the Company | Length of Service of Current Position | Principal Occupation During the Past Five Years | |||
| Douglas B. Sieg (1969) | President and Chief Executive Officer | Elected as President and Chief Executive Officer in 2018 | Managing Partner of Lord Abbett (since 2018) and was formerly Head of Clients Services, joined Lord Abbett in 1994. | |||
| Jeff D. Diamond (1960) | Executive Vice President | Elected in 2008 | Portfolio Manager, joined Lord Abbett in 2007. | |||
| Todd D. Jacobson (1966) | Executive Vice President | Elected in 2005 | Partner and Associate Director, joined Lord Abbett in 2003. | |||
| Robert A. Lee (1969) | Executive Vice President | Elected in 2010 | Partner and Chief Investment Officer, and was formerly Deputy Chief Investment Officer and Director of Taxable Fixed Income, joined Lord Abbett in 1997. | |||
| David J. Linsen (1974) | Executive Vice President | Elected in 2008 | Partner and Director of Equities, joined Lord Abbett in 2001. | |||
| Vincent J. McBride (1964) | Executive Vice President | Elected in 2010 | Partner and Director, joined Lord Abbett in 2003. | |||
| Andrew H. O’Brien (1973) | Executive Vice President | Elected in 2010 | Partner and Portfolio Manager, joined Lord Abbett in 1998. | |||
| F. Thomas O’Halloran (1955) | Executive Vice President | Elected in 2010 | Partner and Portfolio Manager, joined Lord Abbett in 2001. | |||
| Marc Pavese (1972) | Executive Vice President | Elected in 2016 | Partner and Portfolio Manager, joined Lord Abbett in 2008. | |||
| Walter H. Prahl (1958) | Executive Vice President | Elected in 2012 | Partner and Director, joined Lord Abbett in 1997. | |||
| Eli Rabinowich (1975) | Executive Vice President | Elected in 2018 | Portfolio Manager, joined Lord Abbett in 2018 and was formerly a Portfolio Manager, Partner, and Analyst at Pzena Investment Management from (2004–2018). |
51
Basic Information About Management (continued)
| Name and Year of Birth | Current Position with the Company | Length of Service of Current Position | Principal Occupation During the Past Five Years | |||
| Jeffrey Rabinowitz (1972) | Executive Vice President | Elected in 2017 | Portfolio Manager, joined Lord Abbett in 2017 and was formerly Managing Director and Portfolio Manager/Technology Analyst at Jennison Associates LLC (2014–2017) and Managing Director and Portfolio Manager/Technology Analyst for U.S. Growth Equity at Goldman Sachs Asset Management (1999–2014). | |||
| Steven F. Rocco (1979) | Executive Vice President | Elected in 2014 | Partner and Director of Taxable Fixed Income, joined Lord Abbett in 2004. | |||
| A. Edward Allinson (1961) | Vice President | Elected in 2011 | Portfolio Manager, joined Lord Abbett in 2005. | |||
| Vernon T. Bice (1974) | Vice President | Elected in 2011 | Portfolio Manager, joined Lord Abbett in 2011. | |||
| Pamela P. Chen (1978) | Vice President, Assistant Secretary and Privacy Officer | Elected in 2018 | Associate General Counsel, joined Lord Abbett in 2017 and was formerly Special Counsel at Schulte, Roth & Zabel LLP (2005–2017). | |||
| Robert S. Clark (1975) | Vice President | Elected in 2018 | Portfolio Manager, joined Lord Abbett in 2010. | |||
| Matthew R. DeCicco (1977) | Vice President | Elected in 2003 | Managing Director and Portfolio Manager, joined Lord Abbett in 1999. | |||
| John T. Fitzgerald (1975) | Vice President and Assistant Secretary | Elected in 2018 | Deputy General Counsel, joined Lord Abbett in 2018 and was formerly Deputy Head of U.S. Funds Legal, Executive Director and Assistant General Counsel at JPMorgan Chase (2005–2018). | |||
| Christopher J. Gizzo (1986) | Vice President | Elected in 2018 | Managing Director and Portfolio Manager, joined Lord Abbett in 2008. | |||
| Bernard J. Grzelak (1971) | Chief Financial Officer and Vice President | Elected in 2017 | Partner, Chief Operating Officer, Global Funds and Risk, joined Lord Abbett in 2003. |
52
Basic Information About Management (concluded)
| Name and Year of Birth | Current Position with the Company | Length of Service of Current Position | Principal Occupation During the Past Five Years | |||
| Linda Y. Kim (1980) | Vice President and Assistant Secretary | Elected in 2016 | Counsel, joined Lord Abbett in 2015 and was formerly an Associate at Stroock & Stroock & Lavan LLP (2007–2015). | |||
| So Young Lee (1971) | Vice President | Elected in 2018 | Portfolio Manager, joined Lord Abbett in 2013. | |||
| Joseph M. McGill (1962) | Chief Compliance Officer | Elected in 2014 | Partner and Chief Compliance Officer, joined Lord Abbett in 2014 and was formerly Managing Director and the Chief Compliance Officer at UBS Global Asset Management (2003–2013). | |||
| A. Edward Oberhaus, III (1959) | Vice President | Elected in 1998 | Partner and Director, joined Lord Abbett in 1983. | |||
| Amanda S. Ryan (1978) | Vice President and Assistant Secretary | Elected in 2018 | Counsel, joined Lord Abbett in 2016 and was formerly a Director and Corporate Counsel at PGIM Investments (2012–2016). | |||
| Lawrence B. Stoller (1963) | Vice President, Secretary and Chief Legal Officer | Elected in 2007 | Partner and General Counsel, joined Lord Abbett in 2007. | |||
| Leah G. Traub (1979) | Vice President | Elected in 2016 | Partner and Portfolio Manager, joined Lord Abbett in 2007. | |||
| Kewjin Yuoh (1971) | Vice President | Elected in 2012 | Partner and Portfolio Manager, joined Lord Abbett in 2010. | |||
| Jackson C. Chan (1964) | AML Compliance Officer | Elected in 2018 | Deputy Chief Compliance Officer and Director of Regulatory Affairs, joined Lord Abbett in 2014 and was formerly Director at UBS Global Asset Management (2005–2014). | |||
| Vito A. Fronda (1969) | Treasurer | Elected in 2018 | Partner and Director of Taxation, joined Lord Abbett in 2003. |
Please call 888-522-2388 for a copy of the statement of additional information, which contains further information about the Company’s Directors. It is available free upon request.
53
Approval of Advisory Contract
The Board, including all of the Directors who are not “interested persons” of the Company or of Lord Abbett, as defined in the Investment Company Act of 1940, as amended (the “Independent Directors”), annually considers whether to approve the continuation of the existing management agreement between the Fund and Lord Abbett (the “Agreement”). In connection with its most recent approval, which included the approval of a proposal to reduce the management fee schedule effective May 1, 2019, the Board reviewed materials relating specifically to the Agreement, as well as numerous materials received throughout the course of the year, including information about the Fund’s investment performance compared to the performance of its benchmark. Before making its decision as to the Fund, the Board had the opportunity to ask questions and request further information, taking into account its knowledge of Lord Abbett gained through its meetings and discussions. These meetings and discussions included reviews of Fund performance conducted by members of the Contract Committee, the deliberations of the Contract Committee, and discussions between the Contract Committee and Lord Abbett’s management. The Independent Directors also met with their independent legal counsel in various private sessions at which no representatives of management were present.
The materials received by the Board included, but were not limited to: (1) information provided by Broadridge Financial Solutions (“Broadridge”) regarding the investment performance of the Fund compared to the investment performance of certain funds with similar investment styles as determined by Broadridge, based, in part, on the Fund’s Morningstar category (the “performance peer group”), and the investment performance of two appropriate benchmarks; (2) information provided by Broadridge regarding the expense ratios, contractual and actual management fee rates, and other expense components for the Fund and certain funds in the same Morningstar category, with generally the same or similar share classes and operational characteristics, including asset size (the “expense peer group”); (3) certain supplemental investment performance information provided by Lord Abbett; (4) information provided by Lord Abbett on the expense ratios, management fee rates, and other expense components for the Fund; (5) sales and redemption information for the Fund; (6) information regarding Lord Abbett’s financial condition; (7) an analysis of the relative profitability of the Agreement to Lord Abbett; (8) information provided by Lord Abbett regarding the investment management fee schedules for Lord Abbett’s other advisory clients maintaining accounts with a similar investment strategy as the Fund; and (9) information regarding the personnel and other resources devoted by Lord Abbett to managing the Fund.
Investment Management and Related Services Generally.The Board considered the services provided by Lord Abbett to the Fund, including investment research, portfolio management, and trading, and Lord Abbett’s commitment to compliance with all applicable legal requirements. The Board also observed that Lord Abbett was solely engaged in the investment management business and accordingly did not experience the conflicts of interest that may result from being engaged in other lines of business. The Board considered the investment advisory services provided by Lord Abbett to other clients, the fees charged for the services, and the differences in the nature of the services provided to the Fund and other Lord Abbett Funds, on the one hand, and the services provided to other clients, on the other. After reviewing these and related factors, the Board concluded that the Fund was likely to continue to benefit from the nature, extent and quality of the investment services provided by Lord Abbett under the Agreement.
Investment Performance.The Board reviewed the Fund’s investment performance in relation to that of the performance peer group and two appropriate benchmarks as of various periods ended August 31, 2018. The Board observed that although the Fund’s investment performance was below
54
Approval of Advisory Contract (continued)
the median of the performance peer group for the one-, three-, and five-year periods, the Fund outperformed both benchmarks for the one-, three-, and five-year periods. The Board considered Lord Abbett’s performance and reputation generally, the performance of other Lord Abbett-managed funds overseen by the Board, and the willingness of Lord Abbett to take steps intended to improve performance when appropriate. After reviewing these and related factors, the Board concluded that the Fund’s Agreement, as revised with a reduced management fee schedule effective May 1, 2019, should be continued.
Lord Abbett’s Personnel and Methods.The Board considered the qualifications of the personnel providing investment management services to the Fund, in light of its investment objective and discipline, and other services provided to the Fund by Lord Abbett. Among other things, the Board considered the size, experience, and turnover of Lord Abbett’s staff, Lord Abbett’s investment methodology and philosophy, and Lord Abbett’s approach to recruiting, training, and retaining personnel.
Nature and Quality of Other Services.The Board considered the nature, quality, and extent of compliance, administrative, and other services performed by Lord Abbett and the nature and extent of Lord Abbett’s supervision of third party service providers, including the Fund’s transfer agent and custodian.
Expenses.The Board considered the expense level of the Fund, including the contractual and actual management fee rates under the terms of the current Agreement, and the expense levels of the Fund’s expense peer group. It also considered how the expense level of the Fund related to those of the expense peer group and the amount and nature of the fees paid by shareholders. The Board observed that the net total expense ratio of the Fund was below the median of the expense peer group. The Board further considered that the Fund’s management fee schedule would be reduced, effective May 1, 2019. After reviewing these and related factors, the Board concluded, within the context of its overall approval of the Agreement, that the expense level of the Fund was reasonable and supported the continuation of the Agreement.
Profitability.The Board considered the level of Lord Abbett’s operating margin in managing the Fund, including a review of Lord Abbett’s methodology for allocating its costs to its management of the Fund. It considered whether the Fund was profitable to Lord Abbett in connection with the Fund’s operation, including the fee that Lord Abbett receives from the Fund for providing administrative services to the Fund. The Board also considered the profits realized from other business segments of Lord Abbett, which may benefit from or be related to the Fund’s business. The Board considered Lord Abbett’s profit margins excluding Lord Abbett’s marketing and distribution expenses. The Board also considered Lord Abbett’s profit margins, without those exclusions, in comparison with available industry data and how those profit margins could affect Lord Abbett’s ability to recruit and retain personnel. The Board recognized that Lord Abbett’s overall profitability was a factor in enabling it to attract and retain qualified personnel to provide services to the Fund. After reviewing these and related factors, the Board concluded, within the context of its overall approval of the Agreement, that Lord Abbett’s profitability with respect to the Fund was not excessive.
Economies of Scale.The Board considered the extent to which there had been economies of scale in managing the Fund, whether the Fund’s shareholders had appropriately benefited from such economies of scale, and whether there was potential for realization of any further economies of scale. The Board concluded that the reduced management fee schedule, which included certain breakpoints in the management fee schedule, adequately addressed any economies of scale in managing the Fund.
55
Approval of Advisory Contract (concluded)
Other Benefits to Lord Abbett.The Board considered the amount and nature of the fees paid by the Fund and the Fund’s shareholders to Lord Abbett for services other than investment advisory services, such as the fee that Lord Abbett receives from the Fund for providing administrative services to the Fund. The Board also considered the revenues and profitability of Lord Abbett’s investment advisory business apart from its mutual fund business, and the intangible benefits enjoyed by Lord Abbett by virtue of its relationship with the Fund. The Board observed that the Distributor receives 12b-1 fees from certain of the Lord Abbett Funds as to shares held in accounts for which there is no other broker of record, may retain a portion of the 12b-1 fees it receives, and receives a portion of the sales charges on sales and redemptions of some classes of shares of the Lord Abbett Funds. In addition, the Board observed that Lord Abbett accrues certain benefits for its business of providing investment advice to clients other than the Lord Abbett Funds, but that business also benefits the Funds. The Board also noted that Lord Abbett, as disclosed in the prospectus of the Fund, has entered into revenue sharing arrangements with certain entities that distribute shares of the Lord Abbett Funds. The Board also took into consideration the investment research that Lord Abbett receives as a result of client brokerage transactions.
Alternative Arrangements.The Board considered whether, instead of approving continuation of the Agreement, it might be in the best interests of the Fund to implement one or more alternative arrangements, such as continuing to employ Lord Abbett, but on different terms. After considering all of the relevant factors, the Board unanimously found that continuation of the Agreement, as revised, was in the best interests of the Fund and its shareholders and voted unanimously to approve the continuation of the Agreement. In considering whether to approve the continuation of the Agreement, the Board did not identify any single factor as paramount or controlling. Individual Directors may have evaluated the information presented differently from one another, giving different weights to various factors. This summary does not discuss in detail all matters considered.
56
Householding
The Company has adopted a policy that allows it to send only one copy of the Fund’s prospectus, proxy material, annual report and semiannual report to certain shareholders residing at the same “household.” This reduces Fund expenses, which benefits you and other shareholders. If you need additional copies or do not want your mailings to be “householded,” please call Lord Abbett at 888-522-2388 or send a written request with your name, the name of your fund or funds and your account number or numbers to Lord Abbett Family of Funds, P.O. Box 219336, Kansas City, MO 64121.
Proxy Voting Policies, Procedures and Records
A description of the policies and procedures that Lord Abbett uses to vote proxies related to the Fund’s portfolio securities, and information on how Lord Abbett voted the Fund’s proxies during the 12-month period ended June 30 are available without charge, upon request, (i) by calling 888-522-2388; (ii) on Lord Abbett’s Website at www.lordabbett.com; and (iii) on the Securities and Exchange Commission’s (“SEC”) Website at www.sec.gov.
Shareholder Reports and Quarterly Portfolio Disclosure
The Fund is required to file its complete schedule of portfolio holdings with the SEC for its first and third fiscal quarters on Form N-Q. Copies of the filings are available without charge, upon request on the SEC’s Website at www.sec.gov and may be available by calling Lord Abbett at 888-522-2388.
57


This report, when not used for the general information of shareholders of the Fund, is to be distributed only if preceded or accompanied by a current fund prospectus. Lord Abbett mutual fund shares are distributed by LORD ABBETT DISTRIBUTOR LLC. | Lord Abbett Series Fund, Inc. Total Return Portfolio | SFTR-PORT-3 (02/19) |
| Item 2: | Code of Ethics. |
| (a) | In accordance with applicable requirements, the Registrant adopted a Sarbanes-Oxley Code of Ethics on June 19, 2003 that applies to the principal executive officer and senior financial officers of the Registrant (“Code of Ethics”). The Code of Ethics was in effect during the fiscal year ended December 31, 2018 (the “Period”). |
| (b) | Not applicable. |
| (c) | The Registrant has not amended the Code of Ethics as described in Form N-CSR during the Period. |
| (d) | The Registrant has not granted any waiver, including an implicit waiver, from a provision of the Code of Ethics as described in Form N-CSR during the Period. |
| (e) | Not applicable. |
| (f) | See Item 12(a)(1) concerning the filing of the Code of Ethics. |
| Item 3: | Audit Committee Financial Expert. |
The Registrant’s board of directors has determined that each of the following independent directorswho are members of the audit committee is an audit committee financial expert: Evelyn E. Guernsey, Karla M. Rabusch and Mark A. Schmid. Each of these persons is independent within the meaning of the Form N-CSR.
| Item 4: | Principal Accountant Fees and Services. |
In response to sections (a), (b), (c) and (d) of Item 4, the aggregate fees billed to the Registrant for the fiscal years ended December 31, 2018 and 2017 by the Registrant��s principal accounting firm, Deloitte & Touche LLP, the member firms of Deloitte Touche Tohmatsu and their respective affiliates (collectively, “Deloitte”) were as follows:
| Fiscal year ended: | ||||||||
| 2018 | 2017 | |||||||
| Audit Fees {a} | $464,200 | $464,200 | ||||||
| Audit-Related Fees | - 0 - | - 0 - | ||||||
| Total audit and audit-related fees | 464,200 | 464,200 | ||||||
| Tax Fees {b} | 115,804 | 123,098 | ||||||
| All Other Fees | - 0 - | - 0 - | ||||||
| Total Fees | $580,004 | $587,298 | ||||||
{a} Consists of fees for audits of the Registrant’s annual financial statements.
{b} Fees for the fiscal year ended December 31, 2018 and 2017 consist of fees for preparing the U.S. Income Tax Return for Regulated Investment Companies, New Jersey Corporation Business Tax Return, New Jersey Annual Report Form, U.S. Return of Excise Tax on Undistributed Income of Investment Companies, IRS Forms 1099-MISC and 1096 Annual Summary and Transmittal of U.S. Information Returns.
(e) (1) Pursuant to Rule 2-01(c) (7) of Regulation S-X, the Registrant’s Audit Committee has adopted pre-approval policies and procedures. Such policies and procedures generally provide that the Audit Committee must pre-approve:
| · | any audit, audit-related, tax, and other services to be provided to the Lord Abbett Funds, including the Registrant, and |
| · | any audit-related, tax, and other services to be provided to the Registrant’s investment adviser and any entity controlling, controlled by or under common control with the investment adviser that provides ongoing services to one or more Funds comprising the Registrant if the engagement relates directly to operations and financial reporting of a Fund, by the independent auditor to assure that the provision of such services does not impair the auditor’s independence. |
The Audit Committee has delegated pre-approval authority to its Chairman, subject to a fee limit of $10,000 per event, and not to exceed $25,000 annually. The Chairman will report any pre-approval decisions to the Audit Committee at its next scheduled meeting. Unless a type of service to be provided by the independent auditor has received general pre-approval, it must be pre-approved by the Audit Committee. Any proposed services exceeding pre-approved cost levels will require specific pre-approval by the Audit Committee.
(e) (2) The Registrant’s Audit Committee has approved 100% of the services described in this Item 4 (b) through (d).
(f) Not applicable.
(g) The aggregate non-audit fees billed by Deloitte for services rendered to the Registrant are shown above in the response to Item 4 (a), (b), (c) and (d) as “All Other Fees”.
The aggregate non-audit fees billed by Deloitte for services rendered to the Registrant’s investment adviser, Lord, Abbett & Co. LLC (“Lord Abbett”), for the fiscal years ended December 31, 2018 and 2017 were:
| Fiscal year ended: | ||||||||
| 2018 | 2017 | |||||||
| All Other Fees {a} | $200,339 | 201,416 | ||||||
{a} Consist of fees for Independent Services Auditors’ Report on Controls Placed in Operation and Tests of Operating Effectiveness related to Lord Abbett’s Asset Management Services (“SOC-1 Report”).
The aggregate non-audit fees billed by Deloitte for services rendered to entities under the common control of Lord Abbett for the fiscal years ended December 31, 2018 and 2017 were:
| Fiscal year ended: | ||||||||
| 2018 | 2017 | |||||||
| All Other Fees | $ - 0 - | $ - 0 - | ||||||
(h) The Registrant’s Audit Committee has considered the provision of non-audit services that were rendered to the Registrant’s investment adviser, and any entity controlling, controlled by or under common control with the investment adviser that provides ongoing services to the Registrant, that were not pre-approved pursuant to Rule 2-01 (c)(7)(ii) of Regulation S-X and has determined that the provision of such services is compatible with maintaining Deloitte’s independence.
| Item 5: | Audit Committee of Listed Registrants. |
| Not applicable. | |
| Item 6: | Investments. |
| Not applicable. | |
| Item 7: | Disclosure of Proxy Voting Policies and Procedures for Closed-End Management Investment Companies. |
| Not applicable. | |
| Item 8: | Portfolio Managers of Closed-End Management Investment Companies. |
| Not applicable. | |
| Item 9: | Purchases of Equity Securities by Closed-End Management Investment Company and Affiliated Purchasers. |
| Not applicable. | |
| Item 10: | Submission of Matters to a Vote of Security Holders. |
| Not applicable. |
| Item 11: | Controls and Procedures. |
| (a) | Based on their evaluation of the Registrant’s disclosure controls and procedures (as defined in Rule 30a-3(c) under the Investment Company Act of 1940) as of a date within 90 days prior to the filing date of this report, the Chief Executive |
Officer and Chief Financial Officer of the Registrant have concluded that such disclosure controls and procedures are reasonably designed and effective to ensure that material information relating to the Registrant, including its consolidated subsidiaries, is made known to them by others within those entities.
| (b) | There were no changes in the Registrant’s internal control over financial reporting (as defined in Rule 30a-3(d) under the Investment Company Act of 1940) that occurred during the second fiscal quarter of the period covered by this report that have materially affected, or are reasonably likely to materially affect, the Registrant’s internal control over financial reporting. |
| Item 12: | Exhibits. |
| (a)(1) | The Lord Abbett Family of Funds Sarbanes Oxley Code of Ethics for the Principal Executive Officer and Senior Financial Officers is attached hereto as part of Ex-99. CODEETH. |
| (a)(2) | Certification of each Principal Executive Officer and Principal Financial Officer of the Registrant as required by Rule 30a-2 under the Investment Company Act of 1940 is attached hereto as a part of EX-99.CERT. |
| (b) | Certification of each Principal Executive Officer and Principal Financial Officer of the Registrant as required by Section 906 of the Sarbanes-Oxley Act of 2002 is provided as a part of EX-99.906CERT. |
SIGNATURES
Pursuant to the requirements of the Securities Exchange Act of 1934 and the Investment Company Act of 1940, the Registrant has duly caused this report to be signed on its behalf by the undersigned, thereunto duly authorized.
| LORD ABBETT SERIES FUND, INC. | ||
| By: | /s/ Douglas B. Sieg | |
| Douglas B. Sieg | ||
| President and Chief Executive Officer | ||
Date: February 15, 2019
| By: | /s/ Bernard J. Grzelak | |
| Bernard J. Grzelak | ||
| Chief Financial Officer and Vice President |
Date: February 15, 2019
Pursuant to the requirements of the Securities Exchange Act of 1934 and the Investment Company Act of 1940, this report has been signed below by the following persons on behalf of the Registrant and in the capacities and on the dates indicated.
| By: | /s/ Douglas B. Sieg | |
| Douglas B. Sieg | ||
| President and Chief Executive Officer |
Date: February 15, 2019
| By: | /s/ Bernard J. Grzelak | |
| Bernard J. Grzelak | ||
| Chief Financial Officer and Vice President |
Date: February 15, 2019