Exhibit (c)(1)
Project SUN November 12, 2009
Discussion Materials for the Special Committee of the Board of Directors
Confidential
HOULIHAN LOKEY
www.HL.com U.S. 800.788.5300 Europe +44.20.7839.3355 China +86.10.8588.2300 Hong Kong +852.3551.2300 Japan +81.3.4577.6000
Los Angeles • New York • Chicago • San Francisco • Minneapolis • Washington, D.C. • Dallas • Atlanta • London • Paris • Frankfurt • Hong Kong • Tokyo • Beijing
Project SUN Disclaimer
This presentation, and any supplemental information (written or oral) or other documents provided in connection therewith (collectively, the “materials”), are provided solely for the information of the Special Committee of the Board of Directors (the “Committee”) of Silicon Storage Technology Inc. (the “Company”) by Houlihan Lokey in connection with the Committee’s consideration of a potential transaction (the “Transaction”) involving the Company. This presentation is incomplete without reference to, and should be considered in conjunction with, any supplemental information provided by and discussions with Houlihan Lokey in connection therewith. Any defined terms used herein shall have the meanings set forth herein, even if such defined terms have been given different meanings elsewhere in the materials.
The materials are for discussion purposes only and may not be relied upon by any person or entity for any purpose except as expressly permitted by Houlihan Lokey’s engagement letter. The materials were prepared for specific persons familiar with the business and affairs of the Company for use in a specific context and were not prepared with a view to public disclosure or to conform with any disclosure standards under any state, federal or international securities laws or other laws, rules or regulations, and neither the Committee, the Board, the Company nor Houlihan Lokey takes any responsibility for the use of the materials by persons other than the Committee.
The materials are provided on a confidential basis solely for the information of the Committee and may not be disclosed, summarized, reproduced, disseminated or quoted or otherwise referred to, in whole or in part, without Houlihan Lokey’s express prior written consent. Notwithstanding anything to the contrary set forth herein, Houlihan Lokey imposes no restrictions on the disclosure by the Company (including any of its employees, representatives or agents) of the tax treatment or tax structure of any transaction, including those portions of any materials containing such information that are provided by Houlihan Lokey to the Company; provided, however, that (a) any such information and materials shall be kept confidential to the extent necessary to comply with any applicable securities laws, and (b) the foregoing does not constitute an authorization to disclose (i) the name of, or other information that would identify, any party to any transaction, or (ii) confidential commercial, financial or structural information regarding any transaction, except to the extent relating to such tax treatment or tax structure. If the Company plans to disclose information or materials pursuant to the preceding sentence the Company shall inform those to whom it discloses any such information or materials that they may not rely upon such information or materials for any purpose without Houlihan Lokey’s prior written consent. Houlihan Lokey is not an expert on, and nothing contained in the materials should be construed as advice with regard to, legal, accounting, regulatory, insurance, tax or other specialist matters. Any statement contained in the materials as to tax matters was neither written nor intended by Houlihan Lokey or any of its affiliates to be used, and cannot be used by any taxpayer, for the purpose of avoiding tax penalties that may be imposed on such taxpayer. If any person uses or refers to any such tax statement in promoting, marketing or recommending a partnership or other entity, investment plan or arrangement to any taxpayer, then such statement is being delivered to support the promotion or marketing of the transaction or matter addressed and such person should seek advice based on its particular circumstances from an independent tax advisor.
The materials necessarily are based on financial, economic, market and other conditions as in effect on, and the information available to Houlihan Lokey as of, the date of the materials. Although subsequent developments may affect the contents of the materials, Houlihan Lokey has not undertaken, and is under no obligation, to update, revise or reaffirm the materials, except as expressly contemplated by Houlihan Lokey’s engagement letter. The materials are not intended to provide the sole basis for evaluation of the Transaction and do not purport to contain all information that may be required. The materials do not address the underlying business decision of the Company or any other party to proceed with or effect the Transaction, or the relative merits of the Transaction as compared to any alternative business strategies that might exist for the Company or any other party. The materials do not constitute any opinion, nor do the materials constitute a recommendation to the Committee, any security holder of the Company or any other person as to how to vote or act with respect to any matter relating to the Transaction or whether to buy or sell any assets or securities of any company. Houlihan Lokey’s only opinion is the opinion that is delivered to the Committee.
CONFIDENTIAL
Project SUN Disclaimer
The preparation of the materials was a complex process involving quantitative and qualitative judgments and determinations with respect to the financial, comparative and other analytic methods employed and the adaptation and application of these methods to the unique facts and circumstances presented and, therefore, is not readily susceptible to partial analysis or summary description. Furthermore, Houlihan Lokey did not attribute any particular weight to any analysis or factor considered by it, but rather made qualitative judgments as to the significance and relevance of each analysis and factor. Each analytical technique has inherent strengths and weaknesses, and the nature of the available information may further affect the value of particular techniques. Accordingly, the analyses contained in the materials must be considered as a whole. Selecting portions of the analyses, analytic methods and factors without considering all analyses and factors could create a misleading or incomplete view. The materials reflect judgments and assumptions with regard to industry performance, general business, economic, regulatory, market and financial conditions and other matters, many of which are beyond the control of the participants in the Transaction. Any estimates of value contained in the materials are not necessarily indicative of actual value or predictive of future results or values, which may be significantly more or less favorable. In addition, any analyses relating to the value of assets, businesses or securities do not purport to be appraisals or to reflect the prices at which any assets, businesses or securities may actually be sold. In preparing the materials, Houlihan Lokey has not conducted any physical inspection or independent appraisal or evaluation of any of the assets, properties or liabilities (contingent or otherwise) of the Company or any other participant in the Transaction.
All budgets, projections, estimates, financial analyses, reports and other information with respect to operations (including estimates of potential cost savings and expenses) reflected in the materials have been prepared by management of the relevant party or are derived from such budgets, projections, estimates, financial analyses, reports and other information or from other sources, which involve numerous and significant subjective determinations made by management of the relevant party and/or which such management has reviewed and found reasonable. The budgets, projections and estimates contained in the materials may or may not be achieved and differences between projected results and those actually achieved may be material. Houlihan Lokey has relied upon representations made by management of the Company and other participants in the Transaction that such budgets, projections and estimates have been reasonably prepared in good faith on bases reflecting the best currently available estimates and judgments of such management (or, with respect to information obtained from public sources, represent reasonable estimates), and Houlihan Lokey expresses no opinion with respect to such budgets, projections or estimates or the assumptions on which they are based.
Houlihan Lokey has assumed and relied upon the accuracy and completeness of the financial and other information provided to or reviewed by it without (and without assuming responsibility for) independent verification of such information, makes no representation or warranty (express or implied) in respect of the accuracy or completeness of such information and has further relied upon the assurances of the Company that they are not aware of any facts or circumstances that would make such information inaccurate or misleading. In addition, Houlihan Lokey has relied upon representations made by management of the Company, without independent verification, that there has been no material change in the business, assets, liabilities, financial condition, results of operations, cash flows or prospects of the Company or any other participant in the Transaction since the date of the most recent financial statements provided to Houlihan Lokey, and that the final forms of any draft documents reviewed by Houlihan Lokey will not differ in any material respect from such draft documents.
The materials do not constitute a commitment by Houlihan Lokey or any of its affiliates to underwrite, subscribe for or place any securities, to extend or arrange credit, or to provide any other services. In the ordinary course of business, certain of Houlihan Lokey’s affiliates, as well as investment funds in which they may have financial interests, may acquire, hold or sell, long or short positions, or trade or otherwise effect transactions, in debt, equity, and other securities and financial instruments (including loans and other obligations) of, or investments in, one or more parties that may be involved in the Transaction and their respective affiliates or any currency or commodity that may be involved in the Transaction.
CONFIDENTIAL
Project SUN Table of Contents
Transaction Background I
Financial Analyses II
Other Information III
Appendix A
CONFIDENTIAL
Transaction Background
Transaction Summary of Process – Parties Contacted 1
Background
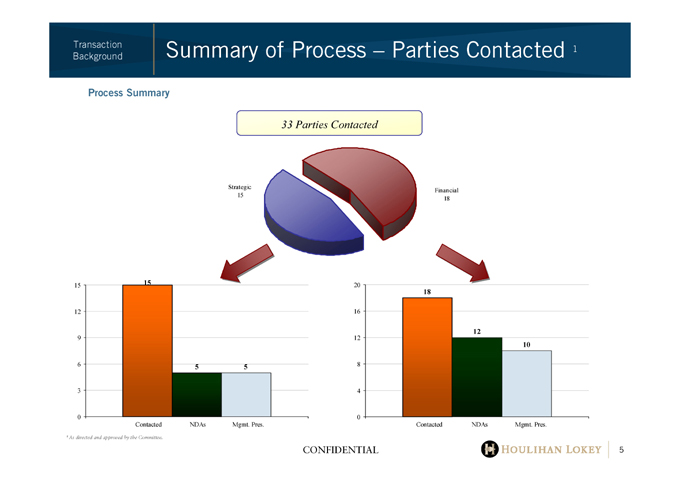
Process Summary
33 Parties Contacted
Strategic Financial
15 18
15 12 9 6 3 0
15 5 5
Contacted NDAs Mgmt. Pres.
20 16 12 8 4 0
18 12 10
Contacted NDAs Mgmt. Pres.
CONFIDENTIAL
Transaction Summary of Selected Transaction Terms 1
Background
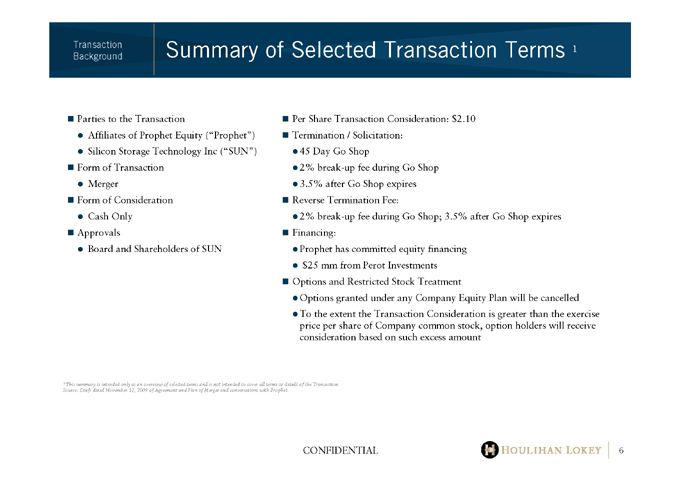
Parties to the Transaction
Affiliates of Prophet Equity (“Prophet”)
Silicon Storage Technology Inc (“SUN”)
Form of Transaction
Merger
Form of Consideration
Cash Only
Approvals
Board and Shareholders of SUN
Per Share Transaction Consideration: $2.10
Termination / Solicitation:
45 Day Go Shop
2% break-up fee during Go Shop
3.5% after Go Shop expires
Reverse Termination Fee:
2% break-up fee during Go Shop; 3.5% after Go Shop expires
Financing:
Prophet has committed equity financing
$25 mm from Perot Investments
Options and Restricted Stock Treatment
Options granted under any Company Equity Plan will be cancelled To the extent the Transaction Consideration is greater than the exercise price per share of Company common stock, option holders will receive consideration based on such excess amount
CONFIDENTIAL
¹ This summary is intended only as an overview of selected terms and is not intended to cover all terms or details of the Transaction.
Source: Draft dated November 11, 2009 of Agreement and Plan of Merger and conversations with Prophet.
CONFIDENTIAL
Transaction SUN Stock Trading History
Background
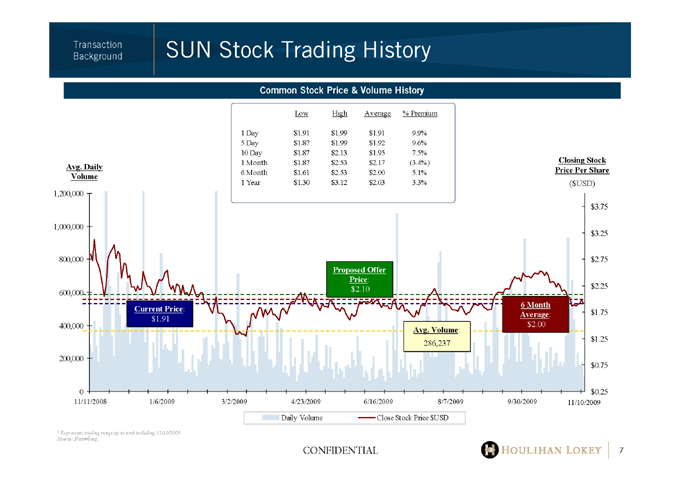
Common Stock Price & Volume History
Low High Average % Premium
1 | | Day $1.91 $1.99 $1.91 9.9% |
5 | | Day $1.87 $1.99 $1.92 9.6% |
10 Day $1.87 $2.13 $1.95 7.5%
1 | | Month $1.87 $2.53 $2.17 (3.4%) |
6 | | Month $1.61 $2.53 $2.00 5.1% |
1 | | Year $1.30 $3.12 $2.03 3.3% |
Avg. Daily Volume Closing Stock
Price Per Share
($USD)
1,200,000
$3.75
1,000,000
$3.25
800,000 $2.75
Proposed Offer
Price::
$2.25
600,000 $2.10
Current Price: Average: $1.75
$1.91
400,000 $2.00
Avg. Volume:
286,237 $1.25
200,000
$0.75
0 $0.25
11/11/2008 1/6/2009 3/2/2009 4/23/2009 6/16/2009 8/7/2009 9/30/2009 11/10/2009
Daily Volume Close Stock Price $USD
1 | | Represents trading range up to and including 11/10/2009. |
Source: Bloomberg.
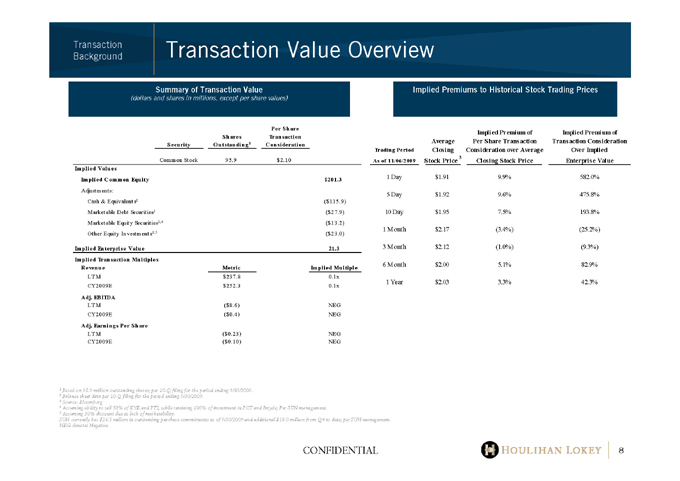
Transaction Background Transaction Value Overview
Implied Premiums to Historical Stock Trading Prices
Summary of Transaction Value
(dollars and shares in millions, except per share values)
Security Shares Outstanding 1 Per Share Transaction Consideration
Common Stock 95.9 $2.10
Implied Values
Implied Common Equity $201.3
Adjustments:
Cash & Equivalents2 ($115.9)
Marketable Debt Securities2 ($27.9)
Marketable Equity Securities2,4 ($13.2)
Other Equity Investments2,5 ($23.0)
Implied Enterprise Value 21.3
Implied Transaction Multiples
Revenue Metric Implied Multiples
LTM $237.8 0.1x
CY2009E $252.3 0.1x
Adj. EBITDA
LTM ($8.6) NEG
CY2009E ($0.4) NEG
Adj. Earnings Per Share
LTM ($0.23) NEG
CY2009E ($0.10) NEG
Trading Period As of 11/06/2009 Average Closing Stock Price 3 Implied Premium of Per Share Transaction Consideration over Average Closing Stock Price Implied Premium of Transaction Consideration Over Implied Enterprise Value
10 Day $1.95 7.5% 193.8%
1 | | Month $2.17 (3.4%) (25.2%) |
3 | | Month $2.12 (1.0%) (9.3%) |
1 Based on 95.9 million outstanding shares; per 10-Q filing for the period ending 9/30/2009. 2 Balance sheet data per 10-Q filing for the period ending 9/30/2009.
4 Assuming ability to sell 50% of KYE and PTI, while retaining 100% of investment in PCT and Insyde; Per SUN management.
5 | | Assuming 30% discount due to lack of marketability. |
SUN currently has $26.5 million in outstanding purchase commitments as of 9/30/2009 and additional $18.0 million from Q4 to date; per SUN management. NEG denotes Negative.
CONFIDENTIAL
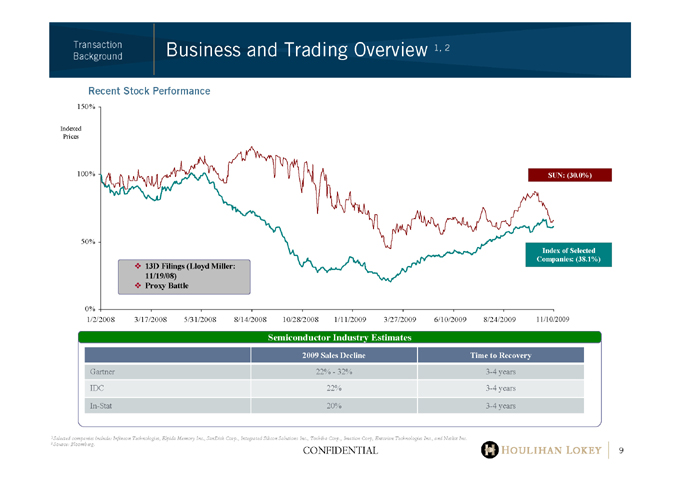
Transaction Background Business and Trading Overview 1, 2
Recent Stock Performance
150%
Indexed
Prices
100%
50%
0%
SUN: (30.0%)
Index of Selected
Companies: (38.1%)
13D Filings (Lloyd Miller: 11/19/08)
Proxy Battle
1/2/2008 3/17/2008 5/31/2008 8/14/2008 10/28/2008 1/11/2009 3/27/2009 6/10/2009 8/24/2009 11/10/2009
Semiconductor Industry Estimates
2009 Sales Decline Time to Recovery
Gartner 22%—32% 3-4 years
IDC 22% 3-4 years
In-Stat 20% 3-4
years
1 Selected companies include: Infineon Technologies, Elpida Memory Inc., SanDisk Corp., Integrated Silicon Solutions Inc., Toshiba Corp., Imation Corp, Entorian Technologies Inc., and Netlist Inc. 2 Source: Bloomberg.
CONFIDENTIAL
9
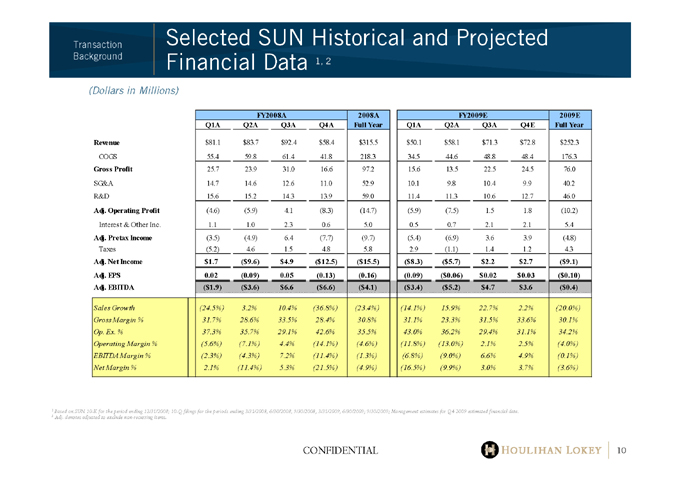
Transaction Background Selected SUN Historical and Projected Financial Data 1, 2
(Dollars in Millions)
FY2008A 2008A FY2009E 2009E
Q1A Q2A Q3A Q4A Full Year Q1A Q2A Q3A Q4E Full Year
Revenue $81.1 $83.7 $92.4 $58.4 $315.5 $50.1 $58.1 $71.3 $72.8 $252.3
COGS 55.4 59.8 61.4 41.8 218.3 34.5 44.6 48.8 48.4 176.3
Gross Profit 25.7 23.9 31.0 16.6 97.2 15.6 13.5 22.5 24.5 76.0
SG&A 14.7 14.6 12.6 11.0 52.9 10.1 9.8 10.4 9.9 40.2
R&D 15.6 15.2 14.3 13.9 59.0 11.4 11.3 10.6 12.7 46.0
Adj. Operating Profit (4.6) (5.9) 4.1 (8.3) (14.7) (5.9) (7.5) 1.5 1.8 (10.2)
Interest & Other Inc. 1.1 1.0 2.3 0.6 5.0 0.5 0.7 2.1 2.1 5.4
Adj. Pretax Income (3.5) (4.9) 6.4 (7.7) (9.7) (5.4) (6.9) 3.6 3.9 (4.8)
Taxes (5.2) 4.6 1.5 4.8 5.8 2.9 (1.1) 1.4 1.2 4.3
Adj. Net Income $1.7 ($9.6) $4.9 ($12.5) ($15.5) ($8.3) ($5.7) $2.2 $2.7 ($9.1)
Adj. EPS 0.02 (0.09) 0.05 (0.13) (0.16) (0.09) ($0.06) $0.02 $0.03 ($0.10)
Adj. EBITDA ($1.9) ($3.6) $6.6 ($6.6) ($4.1) ($3.4) ($5.2) $4.7 $3.6 ($0.4)
Sales Growth (24.5%) 3.2% 10.4% (36.8%) (23.4%) (14.1%) 15.9% 22.7% 2.2% (20.0%)
Gross Margin % 31.7% 28.6% 33.5% 28.4% 30.8% 31.1% 23.3% 31.5% 33.6% 30.1%
Op. Ex. % 37.3% 35.7% 29.1% 42.6% 35.5% 43.0% 36.2% 29.4% 31.1% 34.2%
Operating Margin % (5.6%) (7.1%) 4.4% (14.1%) (4.6%) (11.8%) (13.0%) 2.1% 2.5% (4.0%)
EBITDA Margin % (2.3%) (4.3%) 7.2% (11.4%) (1.3%) (6.8%) (9.0%) 6.6% 4.9% (0.1%)
Net Margin % 2.1% (11.4%) 5.3% (21.5%) (4.9%) (16.5%) (9.9%) 3.0% 3.7% (3.6%)
1 Based on SUN 10-K for the period ending 12/31/2008; 10-Q filings for the periods ending 3/31/2008, 6/30/2008, 9/30/2008, 3/31/2009, 6/30/2009; 9/30/2009; Management estimates for Q4 2009 estimated financial data.
2 | | Adj. denotes adjusted to exclude non-recurring items. |
CONFIDENTIAL
10

Financial Analyses
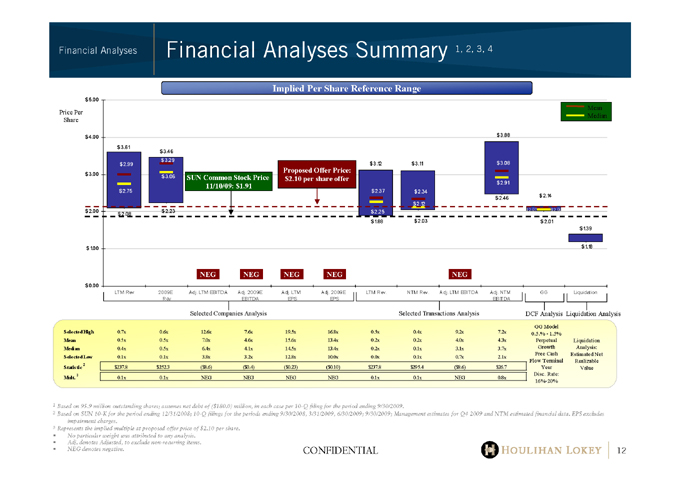
Financial Analyses Financial Analyses Summary 1, 2, 3, 4
Implied Per Share Reference Range
Price Per Share $ 5.00
$ 4.00
$ 3.00
$ 2.00
$ 1.00
Mean Median
$ 3.61
$3.46
$ 3.29
$2.99 $ 3.12 $3.11 $3.08
Proposed Offer Price:
$ 3.06 SUN Common Stock Price $2.10 per share offer
11/10/09: $1.91 $2.91
$2.75 $2.37 $ 2.34
$ 2.46 $ 2.14
$ 2.12
$ 2.23 $2.25 $2.07 $2.06
$ 2.08
$1.88 $ 2.03 $ 2.01
$ 1.39
$ 1.18
NEG NEG NEG NEG NEG
NEG NEG NEG NEG NEG
$ 0.00
LTM Rev 2009E Adj. LTM EBITDA Adj. 2009E Adj. LTM Adj. 2009E LTM Rev. NTM Rev. Adj. LTM EBITDA Adj. NTM GG Liquidation
Rev EBITDA EPS EPS EBITDA
Selected Companies Analysis Selected Transactions Analysis DCF Analysis Liquidation Analysis
GG Model
Selected High 0.7x 0.6x 12.6x 7.6x 19.5x 16.8x 0.5x 0.4x 9.2x 7.2x 0.5.%—1.5%
Mean 0.5x 0.5x 7.0x 4.6x 15.6x 13.4x 0.2x 0.2x 4.0x 4.3x Perpetual Liquidation
Median 0.4x 0.5x 6.4x 4.1x 14.5x 13.4x 0.2x 0.1x 3.1x 3.7x Growth Analysis:
Selected Low 0.1x 0.1x 3.8x 3.2x 12.8x 10.0x 0.0x 0.1x 0.7x 2.1x Free Cash Estimated Net
Flow Terminal Realizable
Statistic 2 $237.8 $252.3 ($8.6) ($0.4) ($0.23) ($0.10) $237.8 $295.4 ($8.6) $26.7 Year Value
Mult. 0.1x 0.1x NEG NEG NEG NEG 0.1x 0.1x NEG 0.8x
16%-20%
1 Based on 95.9 million outstanding shares; assumes net debt of ($180.0) million, in each case per 10-Q filing for the period ending 9/30/2009.
2 Based on SUN 10-K for the period ending 12/31/2008; 10-Q filings for the periods ending 9/30/2008, 3/31/2009, 6/30/2009; 9/30/2009; Management estimates for Q4 2009 and NTM estimated financial data. EPS excludes impairment charges.
3 Represents the implied multiple at proposed offer price of $2.10 per share.
No particular weight was attributed to any analysis. Adj. denotes Adjusted, to exclude non-recurring items.
NEG denotes negative. CONFIDENTIAL 12
12
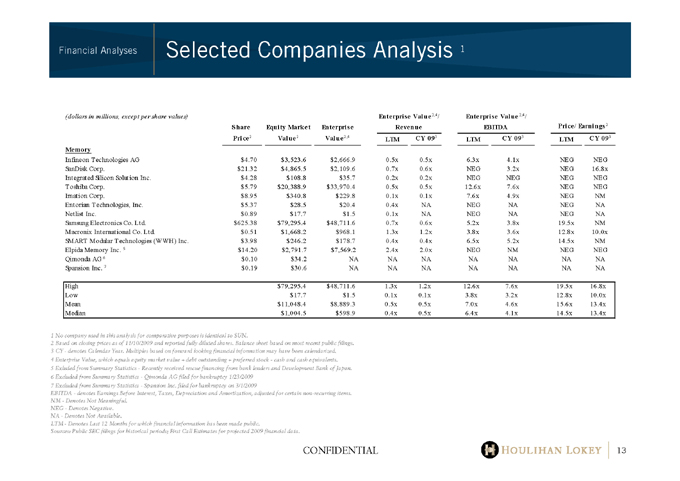
Financial Analyses Selected Companies Analysis 1
(dollars in millions, except per share values) Enterprise Value 2,4/ Ente rprise Value 2,4/
(dollars in millions, except per share values) Enterprise Value2,4/ Enterprise Value2,4/
Share Equity Market Enterprise Revenue EBITDA Price/ Earnings2
Price2 Value2 Value2,4 LTM CY093 LTM CY093 LTM CY093
Memory
Infineon Technologies AG $4.70 $3,523.6 $2,666.9 0.5x 0.5x 6.3x 4.1x NEG NEG
SanDisk Corp. $21.32 $4,865.5 $2,109.6 0.7x 0.6x NEG 3.2x NEG 16.8x
Integrated Silicon Solution Inc. $4.28 $108.8 $35.7 0.2x 0.2x NEG NEG NEG NEG
Toshiba Corp. $5.79 $20,388.9 $33,970.4 0.5x 0.5x 12.6x 7.6x NEG NEG
Imation Corp. $8.95 $340.8 $229.8 0.1x 0.1x 7.6x 4.9x NEG NM
Entorian Technologies, Inc. $5.37 $28.5 $20.4 0.4x NA NEG NA NEG NA
Netlist Inc. $0.89 $17.7 $1.5 0.1x NA NEG NA NEG NA
Samsung Electronics Co. Ltd. $625.38 $79,295.4 $48,711.6 0.7x 0.6x 5.2x 3.8x 19.5x NM
Macronix International Co. Ltd. $0.51 $1,668.2 $968.1 1.3x 1.2x 3.8x 3.6x 12.8x 10.0x
SMART Modular Technologies (WWH) Inc. $3.98 $246.2 $178.7 0.4x 0.4x 6.5x 5.2x 14.5x NM
Elpida Memory Inc. 5 $14.20 $2,791.7 $7,569.2 2.4x 2.0x NEG NM NEG NEG
Qimonda AG6 $0.10 $34.2 ndaA NA NA NA NA NA NA
Spansion Inc. 7 $0.19 $30.6 NA NA NA NA NA NA NA
High $79,295.4 $48,711.6 1.3x 1.2x 12.6x 7.6x 19.5x 16.8x
Low $17.7 $1.5 3.2x 3.2x 3.8x 3.2x 12.8x 10.0x
Mean $11,048.4 $8,889.3 5.6x 5.6x 7.0x 4.6x 15.6x 13.4x
Median $1,004.5 $598.9 4.1x 4.1x 6.4x 4.1x 14.5x 13.4x
1 | | No company used in this analysis for comparative purposes is identical to SUN. |
2 Based on closing prices as of 11/10/2009 and reported fully diluted shares. Balance sheet based on most recent public filings.
3 | | CY—denotes Calendar Year. Multiples based on forward looking financial information may have been calendarized. |
4 | | Enterprise Value, which equals equity market value + debt outstanding + preferred stock—cash and cash equivalents. |
5 | | Exluded from Summary Statistics—Recently received rescue financing from bank lenders and Development Bank of Japan. |
6 | | Excluded from Summary Statistics—Qimonda AG filed for bankruptcy 1/23/2009 |
7 | | Excluded from Summary Statistics—Spansion Inc. filed for bankruptcy on 3/1/2009 |
EBITDA—denotes Earnings Before Interest, Taxes, Depreciation and Amortization, adjusted for certain non-recurring items. NM—Denotes Not Meaningful.
NEG—Denotes Negative. NA—Denotes Not Available.
LTM—Denotes Last 12 Months for which financial information has been made public.
Sources: Public SEC filings for historical periods; First Call Estimates for projected 2009 financial data.
CONFIDENTIAL
[Graphic Appears Here]
13
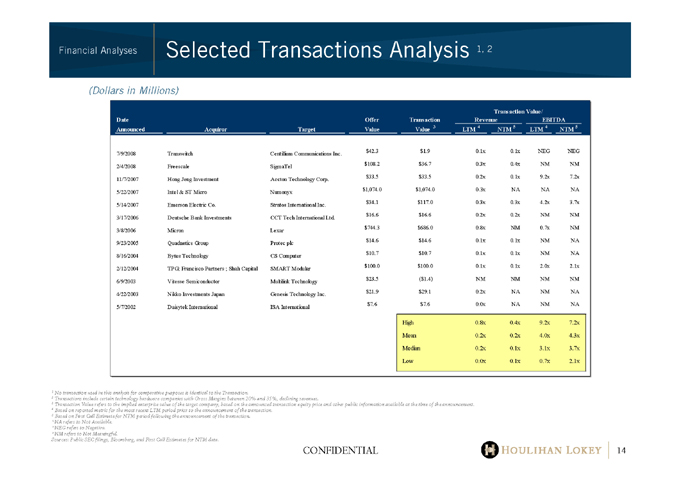
Financial Analyses Selected Transactions Analysis 1, 2
(Dollars in Millions)
Transaction Value/
Date Offer Transaction Revenue EBITDA
Announced Acquiror Target Value Value 3 LTM 4 NTM 5 LTM 4 NTM 5
7/9/2008 Transwitch Centillium Communications Inc. $42.3 $1.9 0.1x 0.1x NEG NEG
2/4/2008 Freescale SigmaTel $108.2 $36.7 0.3x 0.4x NM NM
11/7/2007 Hong Jeng Investment Accton Technology Corp. $33.5 $33.5 0.2x 0.1x 9.2x 7.2x
5/22/2007 Intel & ST Micro Numonyx $1,074.0 $1,074.0 0.3x NA NA NA
5/14/2007 Emerson Electric Co. Stratos International Inc. $34.1 $117.0 0.3x 0.3x 4.2x 3.7x
3/17/2006 Deutsche Bank Investments CCT Tech International Ltd. $16.6 $16.6 0.2x 0.2x NM NM
3/8/2006 Micron Lexar $744.3 $686.0 0.8x NM 0.7x NM
9/23/2005 Quadnetics Group Protec plc $14.6 $14.6 0.1x 0.1x NM NA
8/16/2004 Bytes Technology CS Computer $10.7 $10.7 0.1x 0.1x NM NA
2/12/2004 TPG; Francisco Partners ; Shah Capital SMART Modular $100.0 $100.0 0.1x 0.1x 2.0x 2.1x
6/9/2003 Vitesse Semiconductor Multilink Technology $23.5 ($1.4) NM NM NM NM
4/22/2003 Nikko Investments Japan Genesis Technology Inc. $21.9 $29.1 0.2x NA NM NA
5/7/2002 Daisytek International ISA International $7.6 $7.6 0.0x NA NM NA
High 0.8x 0.4x 9.2x 7.2x
Mean 0.2x 0.2x 4.0x 4.3x
Median 0.2x 0.1x 3.1x 3.7x
Low 0.0x 0.1x 0.7x 2.1x
1 | | No transaction used in this analysis for comparative purposes is identical to the Transaction. |
2 Transactions include certain technology hardware companies with Gross Margins between 20% and 35%, declining revenues.
3 Transaction Value refers to the implied enterprise value of the target company, based on the announced transaction equity price and other public information available at the time of the announcement.
4 | | Based on reported metric for the most recent LTM period prior to the announcement of the transaction. |
5 | | Based on First Call Estimate for NTM period following the announcement of the transaction. |
*NA refers to Not Available. *NEG refers to Negative. *NM refers to Not Meaningful.
Sources: Public SEC filings, Bloomberg, and First Call Estimates for NTM data.
CONFIDENTIAL
[Graphic Appears Here]
14
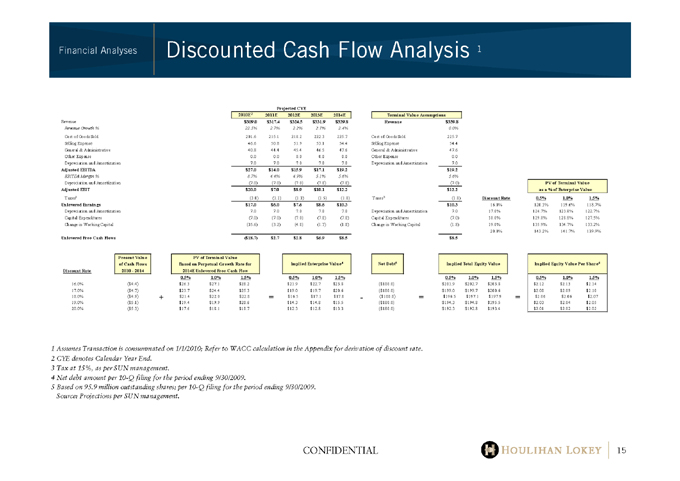
Financial Analyses Discounted Cash Flow Analysis 1
Pro ected CYE
| 2010E2 2011E 2012E 2013E 2014E | | Terminal Value Assumptio |
Revenue $309.0 $317.4 $324.5 $339 $339.8 Revenue $339.8
Revenue Growth % 22.5% 2.7% 2.7% 2.3% 2.4% 0.0%
Cost of Goods Sold 201.6 215.1 218.2 222.3 225.7 Cost of Goods Sold 225.7
Silling Expense 46.6 50.8 51.9 53.1 54.4 Selling Expense 54.4
General & Administrative 40.8 445.44 45.4 46.5 47.6 General & Administrative 47.6
Other Expense 0.0 0.0 0.0 0.0 0.0 Other Expense 0.0
Depreciation and Amortization 7.0 7.0 7.0 7.0 7.0 Depreciation and Amortization 7.0
Adjusted EBITDA $27.0 $14.0 $15.9 $17.1 $19.2 $19.2
EBITDA Margin % 8.7% 4.4% 4.9% 5.1% 5.6% 5.6%
Depreciation and Amortization (7.0) (7.0) (7.0) (7.0) (7.0) (7.0) PV of Terminal Val
Adjusted EBIT $20.0 $7.0 $8.9 $10.1 $12.2 $12.2 as a % of Enterprise Va lue
Taxes3 (3.0) (1.1) (1.3) (1.5) (1.8) Taxes3 (1.8) Discount Rate 0.5% 1.0% 1.5%
Unlevered Earnings $17.0 $6.0 $7.6 $8.6 $10.3 $10.3 16.0% 120.3% 119.6% 118.7%
Depreciation and Amortization 7.0 7.0 7.0 7.0 7.0 Depreciation and Amortization 7.0 17.0% 124.7% 123.8% 122.7%
Capital Expenditures (7.0) (7.0) (7.0) (7.0) (7.0) Capital Expenditures (7.0) 18.0% 129.8% 128.8% 127.5%
Change in Working Capital (35.6) (3.2) (4.8) (1.7) (1.8) Change in Working Capital (1.8) 19.0% 135.9% 134.7% 133.2%
20.0% 143.2% 141.7% 139.9%
Unlevered Free Cash Flows ($18.7) $2.7 $2.8 $6.9 $8.5 $8.5
0.5% 1.0% 1.5% 0.5% 1.0% 1.5% 0.5% 1.0% 1.5% 0.5% 1.0% 1.5%
16.0% ($4.4) $26.3 $27.1 $28.2 $21.9 $22.7 $203.8 ($180.0) $201.9 $202.7 $203.8 $2.12 $2.13 $2.14
17.0% ($4.7) $23.7 $24.4 $25.3 $2.0 $19.7 $20.6 ($180.0) $2.10 $199.7 $200.6 $2.08 $2.09 $2.10
18.0% ($4.9) + $21.4 $22.0 $22.8 = $16.5 $17.1 $17.8 ($180.0) = $196.5 $197.1 $197.9 = $2.06 $2.06 $2.07
19.0% ($5.1) $19.4 $19.4$19 $20.6 $14.3 $14.8 $15.5 ($180.0) $2.03 $194.8 $2.05 $2.03 $2.04 $2.05
20.0% ($5.3) $17.6 $18.1 $18.7 $12.3 $12.8 $13 ($180.0) $192.3 $192.8 $193.4 $2.01 $2.02 $2.02
Projected CYE
20
Discount Rate
Present Value of Cash Flows 2010 - 2014
PV of Terminal Value
Based on Perpetual Growth Rate for 2014E Unlevered Free Cash Flow
Implied Enterprise Val ue 4
Net Debt5
Implied Total Equity Value
Implied Equity Value Per Share 6
1 Assumes Transaction is consummated on 1/1/2010; Refer to WACC calculation in the Appendix for derivation of discount rate.
2 | | CYE denotes Calendar Year End. |
3 | | Tax at 15%, as per SUN management. |
4 | | Net debt amount per 10-Q filing for the period ending 9/30/2009. |
5 Based on 95.9 million outstanding shares; per 10-Q filing for the period ending 9/30/2009. Source: Projections per SUN management.
CONFIDENTIAL
[Graphic Appears Here]
15

Other Information
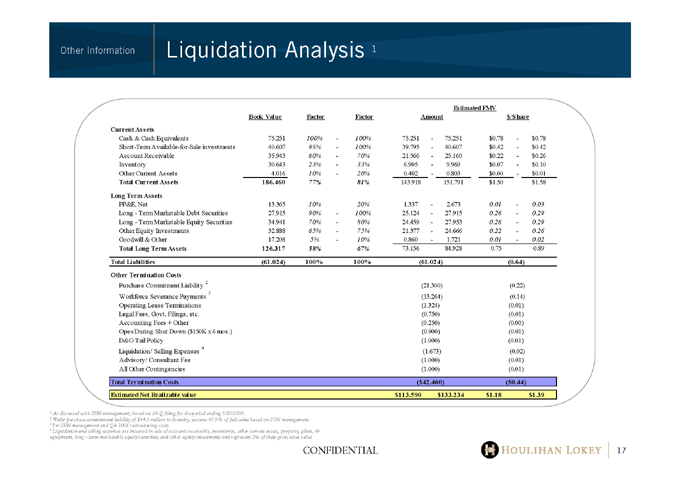
Other Information Liquidation Analysis 1
Estimated FMV
Book Value Factor Factor Amount $/Share
Current Assets
Cash & Cash Equivalents 75.251 100% — 100% 75.251 — 75.251 $0.78 — $0.78
Short-Term Available-for-Sale investments 40.607 98% — 100% 39.795 — 40.607 $0.42 — $0.42
Account Receivable 35.943 60% — 70% 21.566 — 25.160 $0.22 — $0.26
Inventory 30.643 23% — 33% 6.905 — 9.969 $0.07 — $0.10
Other Current Assets 4.016 10% — 20% 0.402 — 0.803 $0.00 — $0.01
Total Current Assets 186.460 77% 81% 143.918 151.791 $1.50 $1.58
Long Term Assets
PP&E, Net 13.365 10% 20% 1.337 — 2.673 0.01 — 0.03
Long—Term Marketable Debt Securities 27.915 90% — 100% 25.124 — 27.915 0.26 — 0.29
Long—Term Marketable Equity Securities 34.941 70% — 80% 24.459 — 27.953 0.26 — 0.29
Other Equity Investments 32.888 65% — 75% 21.377 — 24.666 0.22 — 0.26
Goodwill & Other 17.208 5% — 10% 0.860 — 1.721 0.01 — 0.02
Total Long Term Assets 126.317 58% 67% 73.156 84.928 0.75 0.89
Total Liabilities (61.024) 100% 100% (61.024) (0.64)
Other Termination Costs
Purchase Commitment Liability 2 (21.300) (0.22)
Workforce Severance Payments 3 (13.264) (0.14)
Operating Lease Terminations (1.324) (0.01)
Legal Fees, Govt. Filings, etc. (0.750) (0.01)
Accounting Fees + Other (0.250) (0.00)
Opex During Shut Down ($150K x 6 mos.) (0.900) (0.01)
D&O Tail Policy (1.000) (0.01)
Liquidation/ Selling Expenses 4 (1.673) (0.02)
Advisory/ Consultant Fee (1.000) (0.01)
All Other Contingencies (1.000) (0.01)
Total Termination Costs ($42.460) ($0.44)
Estimated Net Realizable value $113.590 $133.234 $1.18 $1.39
1 | | As discussed with SUN management; based on 10-Q filing for the period ending 9/30/2009. |
2 | | Wafer purchase commitment liability of $44.5 million to foundry; assume 47.9% of full value based on SUN management. |
3 | | Per SUN management and Q4 2008 restructuring costs. |
4 Liquidation and selling expenses are incurred in sale of accounts receivable, inventories, other current assets, property, plant, &
equipment, long – term marketable equity securities, and other equity investments and represent 2% of their gross asset value
CONFIDENTIAL
[Graphic Appears Here]
17

Other Information Waterfall Analysis
Other Information Waterfall Analysis
(Dollars in Millions, Except per Share Data)
Waterfall P&L Statement (1)
FY10E FY11E FY12E FY13E FY14E
Licensing Revenue $40.0 $30.0 $20.0 $10.0 $2.0
COGS 0.0 0.0 0.0 0.0 0.0
Gross Profit $40.0 $30.0 $20.0 $10.0 $2.0
S&M 3.0 3.0 3.0 2.0 0.5
G&A 6.0 6.0 6.0 4.0 2.0
R&D 11.0 11.0 8.0 5.0 0.0
Total Restructuring Expense 12.6 0.0 0.5 0.9 2.7
Other Restructuring/Purchase Cancellation 21.3 0.0 0.0 0.0 0.0
Total:
Operating Profit (Loss) ($13.9) $10.0 $2.5 ($1.9) ($3.2) ($7.7 Million)
Taxes $0.0 ($1.0) ($0.3) $0.0 $0.0
Unlevered Earnings ($13.9) $9.0 $2.3 ($1.9) ($3.2)
Depreciation & Amortization $0.2 $0.2 $0.2 $0.2 $0.2
Capital Expenditures ($0.2) ($0.2) ($0.2) ($0.2) ($0.2)
Unlevered Free Cash Flow ($13.9) $9.0 $2.3 ($1.9) ($3.2)
Revenue Growth % (3.2%) (25.0%) (33.3%) (50.0%) (80.0%)
Gross Margin % 100.0% 100.0% 100.0% 100.0% NM
S&M Margin % 7.5% 10.0% 15.0% 20.0% NM
G&A Margin % 15.0% 20.0% 30.0% 40.0% NM
R&D Margin % 27.5% 36.7% 40.0% 50.0% NM
Operating Margin % (34.8%) 33.3% 12.7% (19.2%) NM
1 | | As discussed with SUN management; based on SUN management estimates. CONFIDENTIAL 18 |
2 | | Per diluted share count of 95,886,677 shares. |
[Graphic Appears Here]
18
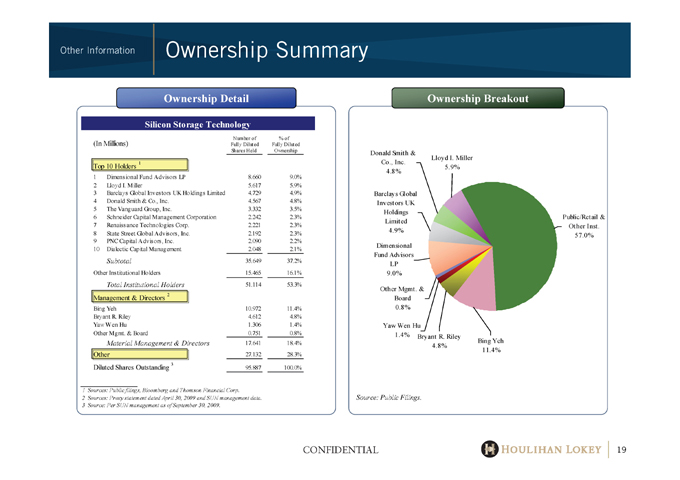
Other Information Ownership Summary
Ownership Detail
Silicon Storage Technology
Number of % of
(In Millions) Fully Diluted Fully Diluted
Shares Held Ownership
Top 10 Holders 1
1 | | Dimensional Fund Advisors LP 8.660 9.0% |
2 | | Lloyd I. Miller 5.617 5.9% |
3 | | Barclays Global Investors UK Holdings Limited 4.729 4.9% |
4 | | Donald Smith & Co., Inc. 4.567 4.8% |
5 | | The Vanguard Group, Inc. 3.332 3.5% |
6 | | Schneider Capital Management Corporation 2.242 2.3% |
7 | | Renaissance Technologies Corp. 2.221 2.3% |
8 | | State Street Global Advisors, Inc. 2.192 2.3% |
9 PNC Capital Advisors, Inc. 2.090 2.2%
10 Dialectic Capital Management 2.048 2.1%
Subtotal 35.649 37.2%
Other Institutional Holders 15.465 16.1%
Total Institutional Holders 51.114 53.3%
Management & Directors 2
Bing Yeh 10.972 11.4%
Bryant R. Riley 4.612 4.8%
Yaw Wen Hu 1.306 1.4%
Other Mgmt. & Board 0.751 0.8%
Material Management & Directors 17.641 18.4%
Other 27.132 28.3%
Diluted Shares Outstanding 3 95.887 100.0%
Ownership Breakout
[Graphic Appears Here]
1 | | Sources: Public filings, Bloomberg and Thomson Financial Corp. |
2 | | Sources: Proxy statement dated April 30, 2009 and SUN management data. Source: Public Filings. |
3 | | Source: Per SUN management as of September 30, 2009. |
CONFIDENTIAL
[Graphic Appears Here]
19
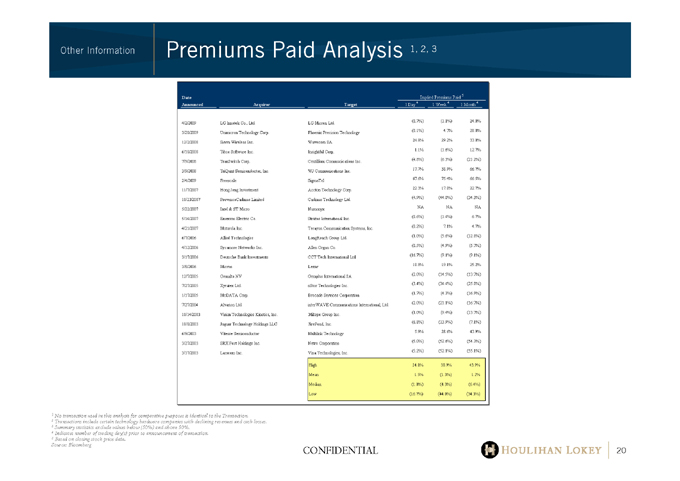
Other Information Premiums Paid Analysis 1, 2, 3
[Graphic Appears Here]
Date Implied Premiums Paid 5
Announced Acquiror Target 1 Day 4 1 Week 4 1 Month 4
4/2/2009 LG Innotek Co., Ltd. LG Micron Ltd.
3/20/2009 Unimicron Technology Corp. Phoenix Precision Technology
12/2/2008 Sierra Wireless Inc. Wavecom SA
6/18/2008 Tibco Software Inc. Insightful Corp.
7/9/2008 TranSwitch Corp. Centillium Communications Inc.
3/9/2008 TriQuint Semiconductor, Inc. WJ Communications Inc.
2/4/2009 Freescale SigmaTel
11/7/2007 Hong Jeng Investment Accton Technology Corp.
10/23/2007 ProvencoCadmus Limited Cadmus Technology Ltd.
5/22/2007 Intel & ST Micro Numonyx
5/14/2007 Emerson Electric Co. Stratos International Inc.
4/21/2007 Motorola Inc. Terayon Communication Systems, Inc.
6/7/2006 Allied Technologies LongReach Group Ltd.
4/12/2006 Sycamore Networks Inc. Allen Organ Co.
3/17/2006 Deutsche Bank Investments CCT Tech International Ltd.
3/8/2006 Micron Lexar
12/7/2005 Gemalto NV Gemplus International SA
7/27/2005 Xyratex Ltd. nStor Technologies Inc.
1/17/2005 McDATA Corp. Brocade Services Corporation
7/27/2004 Alvarion Ltd. interWAVE Communications International, Ltd.
10/14/2003 Vision Technologies Kinetics, Inc. Miltope Group Inc.
10/8/2003 Jaguar Technology Holdings LLC FirePond, Inc.
6/9/2003 Vitesse Semiconductor Multilink Technology
3/27/2003 SRX Post Holdings Inc. Netro Corporation
3/17/2003 Larscom Inc. Vina Technologies, Inc.
(0.7%) (1.1%) 24.0%
(0.1%) 4.7% 28.0%
24.8% 29.2% 33.0%
1.1% (1.6%) 12.7%
(4.8%) (6.3%) (21.2%)
17.7% 38.9% 66.7%
67.6% 75.4% 66.5%
22.3% 17.0% 22.7%
(4.9%) (44.0%) (34.3%)
NA NA NA
(0.6%) (1.4%) 6.7%
(0.2%) 7.1% 4.7%
(1.0%) (5.6%) (12.8%)
(0.5%) (4.9%) (5.7%)
(16.7%) (9.1%) (9.1%)
18.8% 19.1% 25.2%
(2.0%) (14.5%) (13.7%)
(3.4%) (34.4%) (25.0%)
(1.7%) (4.3%) (16.9%)
(2.0%) (21.1%) (16.7%)
(1.0%) (9.4%) (13.7%)
(6.8%) (13.9%) (7.1%)
5.9% 28.6% 43.9%
(5.0%) (52.6%) (54.3%)
(5.2%) (52.1%) (55.1%)
High 24.8% 38.9% 43.9% Mean 1.5% (1.3%) 1.2% Median (1.0%) (4.3%) (6.4%) Low (16.7%) (44.0%) (34.3%)
1 | | No transaction used in this analysis for comparative purposes is identical to the Transaction. |
2 | | Transactions include certain technology hardware companies with declining revenues and cash losses. |
3 | | Summary statistics exclude values below (50%) and above 50%. |
4 | | Indicates number of trading day(s) prior to announcement of transaction. |
5 | | Based on closing stock price data. |
Source: Bloomberg
CONFIDENTIAL 20
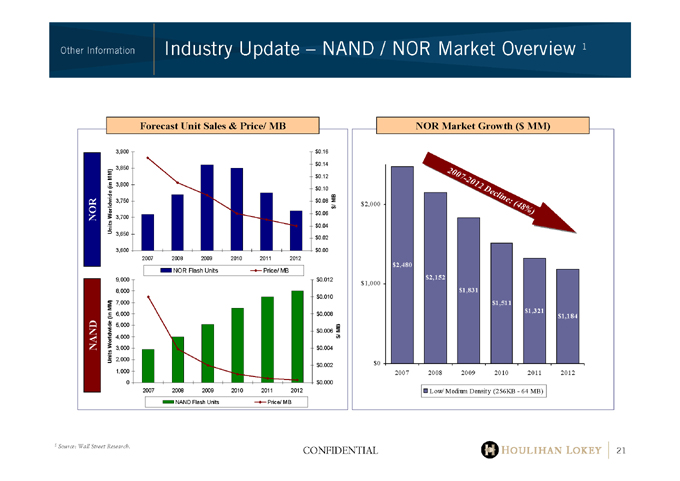
Other Information Industry Update – NAND / NOR Market Overview 1
Forecast Unit Sales & Price/ MB
NOR Market Growth ($ MM)
1 | | Source: Wall Street Research. |
CONFIDENTIAL 21
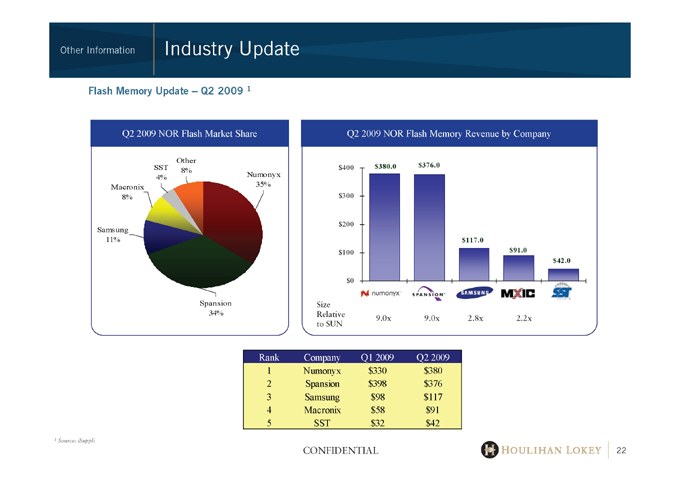
Other Information Industry Update
Flash Memory Update – Q2 2009 1
Q2 2009 NOR Flash Market Share Q2 2009 NOR Flash Memory Revenue by Company
$307.3
Rank Company Q1 2009 Q2 2009
CONFIDENTIAL 22
1 | | Other Information Industry Update |
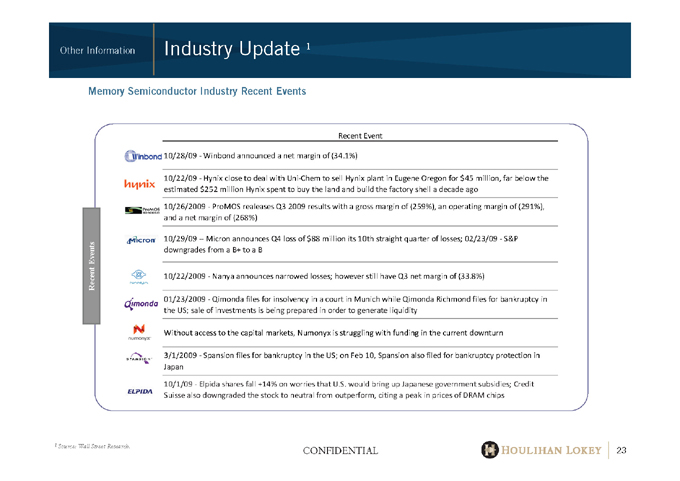
Memory Semiconductor Industry Recent Events
Recent Event
Winbond 10/28/09—Winbond announced a net margin of (34.1%)
10/22/09—Hynix close to deal with Uni-Chem to sell Hynix plant in Eugene Oregon for $45 million, far below the
Hynix
estimated $252 million Hynix spent to buy the land and build the factory shell a decade ago
10/26/2009—ProMOS realeases Q3 2009 results with a gross margin of (259%), an operating margin of (291%),
ProMOS
and a net margin of (268%)
10/29/09 — Micron announces Q4 loss of $88 million its 10th straight quarter of losses; 02/23/09—S&P
Micron
Events downgrades from a B+ to a B
Recent Nanya 10/22/2009—Nanya announces narrowed losses; however still have Q3 net margin of (33.8%)
01/23/2009—Qimonda files for insolvency in a court in Munich while Qimonda Richmond files for bankruptcy in
Qimonda
the US; sale of investments is being prepared in order to generate liquidity
Numonyx Without access to the capital markets, Numonyx is struggling with funding in the current downturn
3/1/2009—Spansion files for bankruptcy in the US; on Feb 10, Spansion also filed for bankruptcy protection in
Spansion
Japan
10/1/09—Elpida shares fall +14% on worries that U.S. would bring up Japanese government subsidies; Credit
Suisse also downgraded the stock to neutral from outperform, citing a peak in prices of DRAM chips
1 | | Source: Wall Street Research. |
CONFIDENTIAL 23
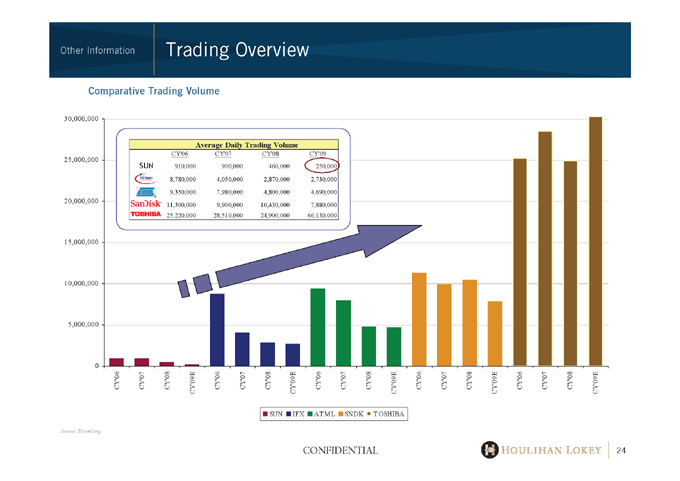
Other Information Trading Overview
Comparative Trading Volume
.Source: Bloomberg.
CONFIDENTIAL 24
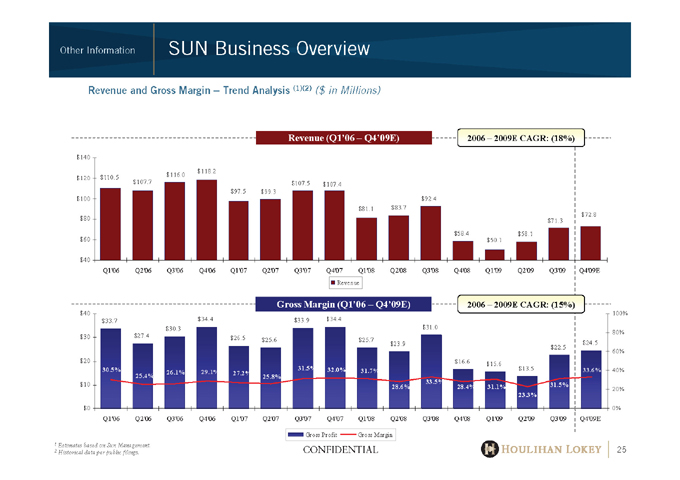
Other Information SUN Business Overview
Revenue and Gross Margin – Trend Analysis (1)(2) ($ in Millions)
1 | | Estimates based on Sun Management. |
2 | | Historical data per public filings. CONFIDENTIAL 25 |
Revenue (Q1’06 – Q4’09E) 2006 – 2009E CAGR: (18%)
Gross Margin (Q1’06 – Q4’09E) 2006 – 2009E CAGR: (15%)
$33.9 $34.4
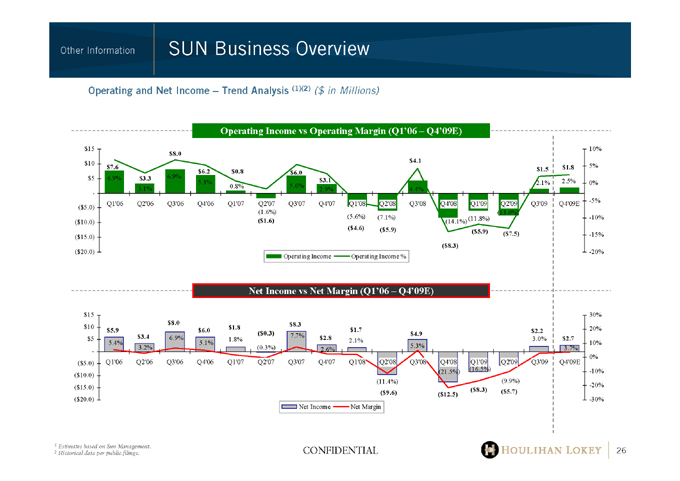
Other Information SUN Business Overview
Operating and Net Income – Trend Analysis (1)(2) ($ in Millions)
Operating Income vs Operating Margin (Q1’06 – Q4’09E)
Net Income vs Net Margin (Q1’06 – Q4’09E)
1 | | Estimates based on Sun Management. |
2 | | Historical data per public filings. CONFIDENTIAL 26 |
Appendix
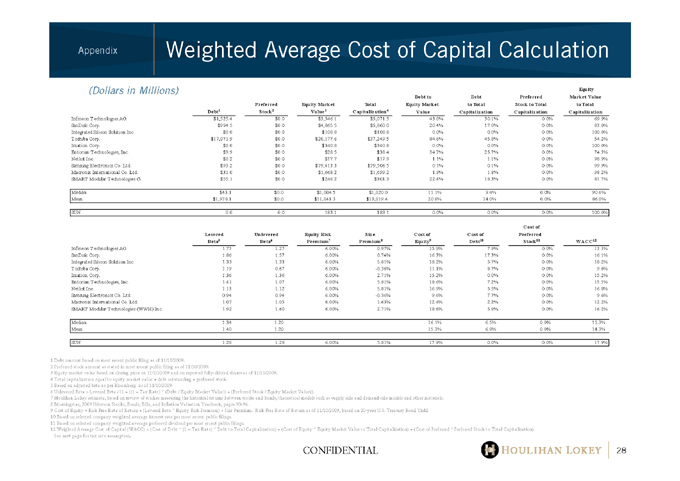
Appendix Weighted Average Cost of Capital Calculation
(Dollars in Millions) Equity
De bt1 Preferred Stock 2 Equity Market Value 3 Total Capitalization 4 Debt to Equity Market Value Debt to Total Capitalization Preferred Stock to Total Capitalization Market Value to Total Capitalization
Infineon Technologies AG $1,525.4 $0.0 $3,546.1 $5,071.5 43.0% 30.1% 0.0% 69.9%
SanDisk Corp. $994.5 $0.0 $4,865.5 $5,860.0 20.4% 17.0% 0.0% 83.0%
Integrated Silicon Solution Inc. $0.0 $0.0 $108.8 $108.8 0.0% 0.0% 0.0% 100.0%
Toshiba Corp. $17,071.9 $0.0 $20,177.6 $37,249.5 84.6% 45.8% 0.0% 54.2%
Imation Corp. $0.0 $0.0 $340.8 $340.8 0.0% 0.0% 0.0% 100.0%
Entorian Technologies, Inc. $9.9 $0.0 $28.5 $38.4 34.7% 25.7% 0.0% 74.3%
Netlist Inc. $0.2 $0.0 $17.7 $17.9 1.1% 1.1% 0.0% 98.9%
Samsung Electronics Co. Ltd. $93.2 $0.0 $79,413.3 $79,506.5 0.1% 0.1% 0.0% 99.9%
Macronix International Co. Ltd. $31.0 $0.0 $1,668.2 $1,699.2 1.9% 1.8% 0.0% 98.2%
SMART Modular Technologies (WWH)# Inc. $55.1 $0.0 $246.2 $301.3 22.4% 18.3% 0.0% 81.7%
Median $43.1 $0.0 $1,004.5 $1,020.0 11.1% 9.4% 0.0% 90.6%
Mean $1,978.1 $0.0 $11,041.3 $13,019.4 20.8% 14.0% 0.0% 86.0%
SUN 0.0 0 0.0 183.1 183.1 0.0% 0.0% 0.0% 100.0%
Levered Beta5 Unlevered Beta6 Equity Risk Premium7 Size Premium8 Cost of Equity9 Cost of Debt10 Cost of Preferred Stock11 WACC12
Infineon Technologies AG 1.77 1.27 6.00% 0.97% 15.9% 7.9% 0.0% 13.3%
SanDisk Corp. 1.86 1.57 6.00% 0.74% 16.3% 17.3% 0.0% 16.1%
Integrated Silicon Solution Inc. 1.33 1.33 6.00% 5.81% 18.2% 5.7% 0.0% 18.2%
Toshiba Corp. 1.19 0.67 6.00% -0.36% 11.1% 8.7% 0.0% 9.6%
Imation Corp. 1.36 1.36 6.00% 2.71% 15.2% 0.0% 0.0% 15.2%
Entorian Technologies, Inc. 1.41 1.07 6.00% 5.81% 18.6% 7.2% 0.0% 15.5%
Netlist Inc. 1.13 1.12 6.00% 5.81% 16.9% 5.5% 0.0% 16.8%
Samsung Electronics Co. Ltd. 0.94 0.94 6.00% -0.36% 9.6% 7.7% 0.0% 9.6%
Macronix International Co. Ltd. 1.07 1.05 6.00% 1.63% 12.4% 2.2% 0.0% 12.2%
SMART Modular Technologies (WWH) Inc. 1.92 1.60 6.00% 2.71% 18.6% 5.8% 0.0% 16.2%
Median 1.34 1.20 16.1% 6.5% 0.0% 15.3%
Mean 1.40 1.20 15.3% 6.8% 0.0% 14.3%
SUN 1.28 1.28 6.00% 5.81% 17.9% 0.0% 0.0% 17.9%
1 | | Debt amount based on most recent public filing as of 11/10/2009. |
2 | | Preferred stock amount as stated in most recent public filing as of 11/10/2009. |
3 | | Equity market value based on closing price on 11/10/2009 and on reported fully-diluted shares as of 11/10/2009. |
4 | | Total capitalization equal to equity market value + debt outstanding + preferred stock. |
5 | | Based on adjusted beta as per Bloomberg as of 11/10/2009. |
6 Unlevered Beta = Levered Beta / (1 + ((1 – Tax Rate) * (Debt / Equity Market Value)) + (Preferred Stock / Equity Market Value)).
7 Houlihan Lokey estimate, based on review of studies measuring the historical returns between stocks and bonds, theoretical models such as supply side and demand side models and other materials.
8 | | Morningstar, 2009 Ibbotson Stocks, Bonds, Bills, and Inflation Valuation Yearbook, pages 90-96. |
9 Cost of Equity = Risk Free Rate of Return + (Levered Beta * Equity Risk Premium) + Size Premium. Risk Free Rate of Return as of 11/10/2009, based on 20-year U.S. Treasury Bond Yield.
10 Based on selected company weighted average interest rate per most recent public filings.
11 Based on selected company weighted average preferred dividend per most recent public filings.
12 Weighted Average Cost of Capital (WACC) = (Cost of Debt * (1 – Tax Rate) * Debt to Total Capitalization) + (Cost of Equity * Equity Market Value to Total Capitalization) + (Cost of Preferred * Preferred Stock to Total Capitalization).
See next page for tax rate assumption.
CONFIDENTIAL 28
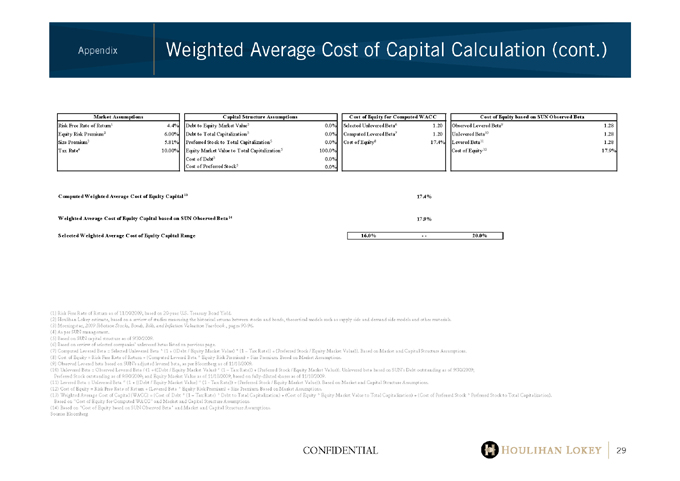
Appendix Weighted Average Cost of Capital Calculation (cont.)
Market Assumptions Capital Structure Assumptions Cost of Equity for Computed WACC Cost of Equity based on SUN O bserved Beta
Risk Free Rate of Return1 4.4% Debt to Equity Market Value5 0.0% Selected Unlevered Beta6 1.20 Observed Levered Beta9 1.28
Equity Risk Premium2 6.00% Debt to T otal Capitalization 5 0.0% Comput ed Levered Beta7 1.20 Unlevered Beta10 1.28
Size Premium3 5.81% Preferred St ock to T otal Capitalizat ion 5 0.0% Cost of Equity8 17.4% Levered Beta11 1.28
T ax Rate4 10.00% Equity Market Value t o T otal Capitalization 5 100.0% Cost of Equity 12 17.9%
Cost of Debt 5 0.0%
Cost of Preferred Stock5 0.0%
Company Specific Decile Bet a 1.41
Computed Weighted Average Cost of Equity Capital 13 17.4%
Weighted Average Cost of Equity Capital based on SUN O bserved Beta 14 17.9%
C heck Selected C ompany Decile with MM and Trans Approaches Selected Weighted Average Cost of Equity Capital Range 16.0%—- 20.0%
(1) | | Risk Free Rate of Return as of 11/10/2009, based on 20-year U.S. Treasury Bond Yield. |
(2) Houlihan Lokey estimate, based on a review of studies measuring the historical returns between stocks and bonds, theoretical models such as supply side and demand side models and other materials. (3) Morningstar, 2009 Ibbotson Stocks, Bonds, Bills, and Inflation Valuation Yearbook , pages 90-96.
(4) | | As per SUN management. |
(5) | | Based on SUN capital structure as of 9/30/2009. |
(6) | | Based on review of selected companies’ unlevered betas listed on previous page. |
(7) Computed Levered Beta = Selected Unlevered Beta * (1 + ((Debt / Equity Market Value) * (1 – Tax Rate)) + (Preferred Stock / Equity Market Value)). Based on Market and Capital Structure Assumptions. (8) Cost of Equity = Risk Free Rate of Return + (Computed Levered Beta * Equity Risk Premium) + Size Premium. Based on Market Assumptions.
(9) | | Observed Levered beta based on SUN’s adjusted levered beta, as per Bloomberg as of 11/10/2009. |
(10) Unlevered Beta = Observed Levered Beta / (1 + ((Debt / Equity Market Value) * (1 – Tax Rate)) + (Preferred Stock / Equity Market Value)). Unlevered beta based on SUN’s Debt outstanding as of 9/30/2009; Preferred Stock outstanding as of 9/30/2009; and Equity Market Value as of 11/10/2009, based on fully-diluted shares as of 11/10/2009.
(11) Levered Beta = Unlevered Beta * (1 + ((Debt / Equity Market Value) * (1—Tax Rate)) + (Preferred Stock / Equity Market Value)). Based on Market and Capital Structure Assumptions. (12) Cost of Equity = Risk Free Rate of Return + (Levered Beta * Equity Risk Premium) + Size Premium. Based on Market Assumptions.
(13) Weighted Average Cost of Capital (WACC) = (Cost of Debt * (1 – Tax Rate) * Debt to Total Capitalization) + (Cost of Equity * Equity Market Value to Total Capitalization) + (Cost of Preferred Stock * Preferred Stock to Total Capitalization). Based on “Cost of Equity for Computed WACC” and Market and Capital Structure Assumptions.
(14) Based on “Cost of Equity based on SUN Observed Beta” and Market and Capital Structure Assumptions. Source: Bloomberg
CONFIDENTIAL 29