UNITED STATES
SECURITIES AND EXCHANGE COMMISSION
Washington, D.C. 20549
FORM N-CSR
CERTIFIED SHAREHOLDER REPORT OF REGISTERED
MANAGEMENT INVESTMENT COMPANIES
Investment Company Act File Number: 811-05986
T. Rowe Price Index Trust, Inc.
(Exact name of registrant as specified in charter)
100 East Pratt Street, Baltimore, MD 21202
(Address of principal executive offices)
David Oestreicher
100 East Pratt Street, Baltimore, MD 21202
(Name and address of agent for service)
Registrant’s telephone number, including area code: (410) 345-2000
Date of fiscal year end: December 31
Date of reporting period: December 31, 2024
Item 1. Reports to Shareholders
(a) Report pursuant to Rule 30e-1
Annual Shareholder Report
December 31, 2024
Total Equity Market Index Fund
This annual shareholder report contains important information about Total Equity Market Index Fund (the "fund") for the period of January 1, 2024 to December 31, 2024. You can find the fund’s prospectus, financial information on Form N‑CSR (which includes required tax information for dividends), holdings, proxy voting information, and other information atwww.troweprice.com/prospectus. You can also request this information without charge by contacting T. Rowe Price at 1‑800‑638‑5660 or info@troweprice.com or contacting your intermediary.
What were the fund costs for the last year? (based on a hypothetical $10,000 investment)
| | Costs of a $10,000 investment | Costs paid as a percentage of a $10,000 investment |
|---|
| Total Equity Market Index Fund | $20 | 0.18% |
|---|
What drove fund performance during the past 12 months?
U.S. stocks produced strong gains for the second consecutive year in 2024, and various equity indexes reached all-time highs during the year. In the final months of the period, equity investors generally welcomed not only looser monetary policy, but also the U.S. election results. Former President Donald Trump defeated Vice President Kamala Harris in the presidential election, and Republican victories in the House of Representatives and Senate races gave them majorities in both chambers of Congress.
Information technology names produced robust results during the period as the sector benefited from strong investor interest in companies expected to benefit from artificial intelligence developments. Semiconductors and semiconductor equipment and software companies performed very well during the year, as NVIDIA and Microsoft were two of the top-performing companies in the portfolio.
No sectors detracted from absolute returns during the reporting period.
The trajectories of the economy, corporate earnings, and interest rates are unpredictable, and investor sentiment toward the broad market and various market segments could change without warning. Our main task is not to determine which stocks or sectors may perform best but, rather, to replicate the structure of the S&P Total Market Index and closely track its performance.
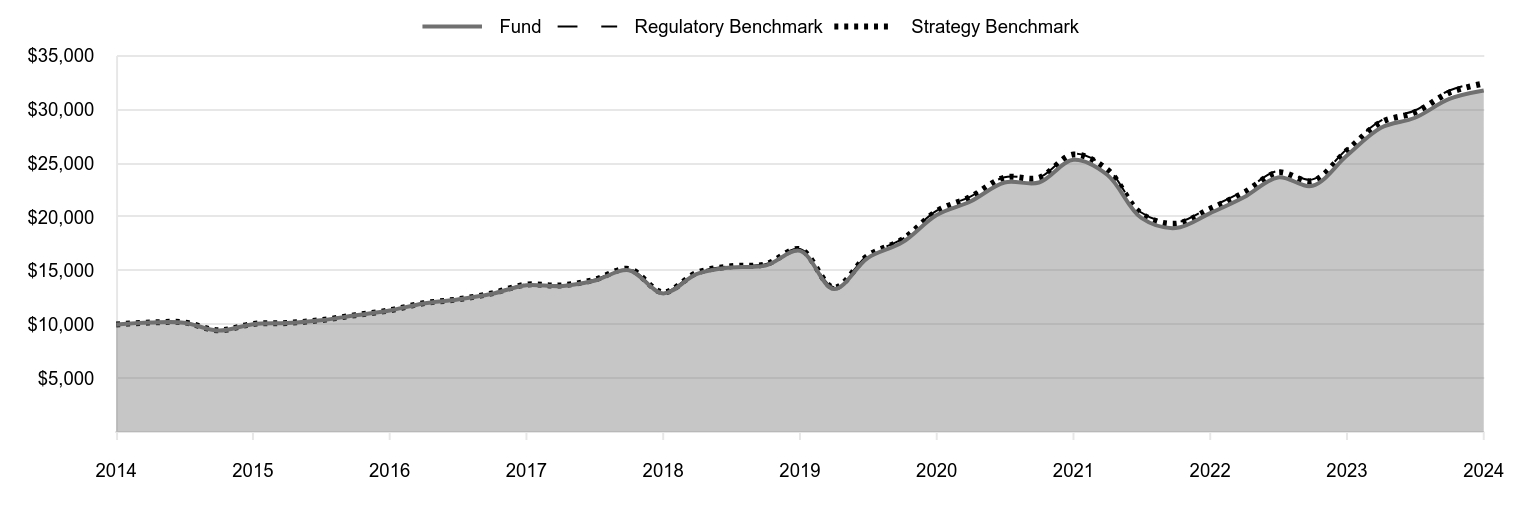
How has the fund performed?
Cumulative Returns of a Hypothetical $10,000 Investment as of December 31, 2024
| Fund | Regulatory Benchmark | Strategy Benchmark |
|---|
| 2014 | 10,000 | 10,000 | 10,000 |
|---|
| 2015 | 10,175 | 10,180 | 10,180 |
|---|
| 2015 | 10,171 | 10,194 | 10,193 |
|---|
| 2015 | 9,433 | 9,455 | 9,453 |
|---|
| 2015 | 10,033 | 10,048 | 10,047 |
|---|
| 2016 | 10,133 | 10,145 | 10,140 |
|---|
| 2016 | 10,390 | 10,412 | 10,405 |
|---|
| 2016 | 10,852 | 10,870 | 10,868 |
|---|
| 2016 | 11,306 | 11,327 | 11,318 |
|---|
| 2017 | 11,957 | 11,978 | 11,973 |
|---|
| 2017 | 12,323 | 12,339 | 12,333 |
|---|
| 2017 | 12,858 | 12,903 | 12,897 |
|---|
| 2017 | 13,658 | 13,721 | 13,713 |
|---|
| 2018 | 13,567 | 13,633 | 13,630 |
|---|
| 2018 | 14,070 | 14,163 | 14,158 |
|---|
| 2018 | 15,045 | 15,172 | 15,164 |
|---|
| 2018 | 12,894 | 13,002 | 12,987 |
|---|
| 2019 | 14,701 | 14,828 | 14,810 |
|---|
| 2019 | 15,311 | 15,435 | 15,416 |
|---|
| 2019 | 15,474 | 15,614 | 15,591 |
|---|
| 2019 | 16,849 | 17,035 | 17,000 |
|---|
| 2020 | 13,295 | 13,475 | 13,437 |
|---|
| 2020 | 16,200 | 16,443 | 16,405 |
|---|
| 2020 | 17,636 | 17,957 | 17,893 |
|---|
| 2020 | 20,188 | 20,593 | 20,534 |
|---|
| 2021 | 21,445 | 21,900 | 21,858 |
|---|
| 2021 | 23,207 | 23,705 | 23,670 |
|---|
| 2021 | 23,207 | 23,681 | 23,642 |
|---|
| 2021 | 25,319 | 25,877 | 25,803 |
|---|
| 2022 | 23,930 | 24,512 | 24,410 |
|---|
| 2022 | 19,912 | 20,418 | 20,300 |
|---|
| 2022 | 18,973 | 19,506 | 19,374 |
|---|
| 2022 | 20,353 | 20,907 | 20,764 |
|---|
| 2023 | 21,831 | 22,408 | 22,268 |
|---|
| 2023 | 23,676 | 24,288 | 24,137 |
|---|
| 2023 | 22,903 | 23,497 | 23,343 |
|---|
| 2023 | 25,722 | 26,334 | 26,175 |
|---|
| 2024 | 28,310 | 28,973 | 28,804 |
|---|
| 2024 | 29,231 | 29,904 | 29,737 |
|---|
| 2024 | 30,978 | 31,767 | 31,569 |
|---|
| 2024 | 31,759 | 32,604 | 32,424 |
|---|
202501-4140694, 202502-4108483
Average Annual Total Returns
| | 1 Year | 5 Years | 10 Years |
|---|
| Total Equity Market Index Fund | 23.47% | 13.52% | 12.25% |
|---|
| Russell 3000 Index (Regulatory Benchmark) | 23.81 | 13.86 | 12.55 |
|---|
| S&P Total Market Index (Strategy Benchmark) | 23.87 | 13.78 | 12.48 |
|---|
The preceding line graph shows the value of a hypothetical $10,000 investment in the fund over the past 10 fiscal year periods or since inception (for funds lacking 10-year records). The fund’s performance information included in the line graph and table above is compared with a regulatory required index that represents an overall securities market (Regulatory Benchmark). In addition, the line graph and table may also include one or more indexes that more closely aligns to the fund's investment strategy (Strategy Benchmark(s)). Due to new SEC Rules on shareholder reporting the fund adopted a new broad-based securities market index, referred to as the Regulatory Benchmark. Market index returns do not include expenses, which are deducted from fund returns. The fund's total return figures reflect the reinvestment of dividends and capital gains, if any.Neither the fund’s returns nor the index returns reflect the deduction of taxes that a shareholder would pay on fund distributions or redemptions of fund shares.The fund’s past performance is not a good predictor of the fund’s future performance.Updated performance information can be found at www.troweprice.com.
What are some fund statistics?
- Total Net Assets (000s)$2,905,305
- Number of Portfolio Holdings1,215
- Investment Advisory Fees Paid (000s)$2,354
- Portfolio Turnover Rate6.1%
What did the fund invest in?
Sector Allocation (as a % of Net Assets)
| Information Technology | 30.5% |
| Financials | 14.1 |
| Consumer Discretionary | 11.4 |
| Health Care | 10.3 |
| Industrials & Business Services | 9.4 |
| Communication Services | 8.7 |
| Consumer Staples | 5.1 |
| Energy | 3.3 |
| Real Estate | 2.5 |
| Other | 4.7 |
Top Ten Holdings (as a % of Net Assets)
| Apple | 6.6% |
| NVIDIA | 5.8 |
| Microsoft | 5.5 |
| Amazon.com | 3.6 |
| Alphabet | 3.5 |
| Meta Platforms | 2.3 |
| Tesla | 2.0 |
| Broadcom | 1.9 |
| Berkshire Hathaway | 1.4 |
| JPMorgan Chase | 1.2 |
If you invest directly with T. Rowe Price, you can elect to receive future shareholder reports or other important documents through electronic delivery by enrolling at www.troweprice.com/paperless. If you invest through a financial intermediary such as an investment advisor, a bank, retirement plan sponsor or a brokerage firm, please contact that organization and ask if it can provide electronic delivery.
Frank Russell Company "LSE" and S&P do not accept any liability for any errors or omissions in the indexes or data, and hereby expressly disclaim all warranties of originality, accuracy, completeness, timeliness, merchantability and fitness for a particular purpose. No party may rely on any indexes or data contained in this communication. Visit www.troweprice.com/en/us/market-data-disclosures for additional legal notices & disclaimers.
Total Equity Market Index Fund
(POMIX)
T. Rowe Price Investment Services, Inc.
100 East Pratt Street
Baltimore, MD 21202
Item 1. (b) Notice pursuant to Rule 30e-3.
Not applicable.
Item 2. Code of Ethics.
The registrant has adopted a code of ethics, as defined in Item 2 of Form N-CSR, applicable to its principal executive officer, principal financial officer, principal accounting officer or controller, or persons performing similar functions. A copy of this code of ethics is filed as an exhibit to this Form N-CSR. No substantive amendments were approved or waivers were granted to this code of ethics during the period covered by this report.
Item 3. Audit Committee Financial Expert.
The registrant’s Board of Directors has determined that Mr. Paul F. McBride qualifies as an audit committee financial expert, as defined in Item 3 of Form N-CSR. Mr. McBride is considered independent for purposes of Item 3 of Form N-CSR.
Item 4. Principal Accountant Fees and Services.
(a) – (d) Aggregate fees billed for the last two fiscal years for professional services rendered to, or on behalf of, the registrant by the registrant’s principal accountant were as follows:
| | | | | | | | | | |
| | | 2024 | | | | 2023 | | | |
Audit Fees | | $ | 23,525 | | | $ | 24,714 | | | |
Audit-Related Fees | | | - | | | | - | | | |
Tax Fees | | | - | | | | - | | | |
All Other Fees | | | - | | | | - | | | |
Audit fees include amounts related to the audit of the registrant’s annual financial statements and services normally provided by the accountant in connection with statutory and regulatory filings. Audit-related fees include amounts reasonably related to the performance of the audit of the registrant’s financial statements and specifically include the issuance of a report on internal controls and, if applicable, agreed-upon procedures related to fund acquisitions. Tax fees include amounts related to services for tax compliance, tax planning, and tax advice. The nature of these services specifically includes the review of distribution calculations and the preparation of Federal, state, and excise tax returns. All other fees include the registrant’s pro-rata share of amounts for agreed-upon procedures in conjunction with service contract approvals by the registrant’s Board of Directors/Trustees.
(e)(1) The registrant’s audit committee has adopted a policy whereby audit and non-audit services performed by the registrant’s principal accountant for the registrant, its investment adviser, and any entity controlling, controlled by, or under common control with the investment adviser that provides ongoing services to the registrant require pre-approval in advance at regularly scheduled audit committee meetings. If such a service is required between regularly scheduled audit committee meetings, pre-approval may be authorized by one audit committee member with ratification at the next scheduled audit committee meeting. Waiver of pre-approval for audit or non-audit services requiring fees of a de minimis amount is not permitted.
(2) No services included in (b) – (d) above were approved pursuant to paragraph (c)(7)(i)(C) of Rule 2-01 of Regulation S-X.
(f) Less than 50 percent of the hours expended on the principal accountant’s engagement to audit the registrant’s financial statements for the most recent fiscal year were attributed to work performed by persons other than the principal accountant’s full-time, permanent employees.
(g) The aggregate fees billed for the most recent fiscal year and the preceding fiscal year by the registrant’s principal accountant for non-audit services rendered to the registrant, its investment adviser, and any entity controlling, controlled by, or under common control with the investment adviser that provides ongoing services to the registrant were $1,262,000 and $1,524,000, respectively.
(h) All non-audit services rendered in (g) above were pre-approved by the registrant’s audit committee. Accordingly, these services were considered by the registrant’s audit committee in maintaining the principal accountant’s independence.
(i) Not applicable.
(j) Not applicable.
Item 5. Audit Committee of Listed Registrants.
Not applicable.
Item 6. Investments.
(a) Not applicable. The complete schedule of investments is included in Item 7 of this Form N-CSR.
(b) Not applicable.
Item 7. Financial Statements and Financial Highlights for Open-End Management Investment Companies.
(a – b) Report pursuant to Regulation S-X.
Financial
Highlights
Portfolio
of
Investments
Financial
Statements
and
Notes
Additional
Fund
Information
Financial
Statements
and
Other
Information
For
more
insights
from
T.
Rowe
Price
investment
professionals,
go
to
troweprice.com
.
T.
ROWE
PRICE
POMIX
Total
Equity
Market
Index
Fund
T.
ROWE
PRICE
Total
Equity
Market
Index
Fund
For
a
share
outstanding
throughout
each
period
The
accompanying
notes
are
an
integral
part
of
these
financial
statements.
..
Year
..
..
Ended
.
12/31/24
12/31/23
12/31/22
12/31/21
12/31/20
NET
ASSET
VALUE
Beginning
of
period
$
51.10
$
41.03
$
51.79
$
41.94
$
35.56
Investment
activities
Net
investment
income
(1)(2)
0.68
0.67
0.59
0.49
0.54
Net
realized
and
unrealized
gain/loss
11.35
10.14
(10.74)
10.15
6.49
Total
from
investment
activities
12.03
10.81
(10.15)
10.64
7.03
Distributions
Net
investment
income
(0.66)
(0.61)
(0.60)
(0.53)
(0.49)
Net
realized
gain
(0.43)
(0.13)
(0.01)
(0.26)
(0.16)
Total
distributions
(1.09)
(0.74)
(0.61)
(0.79)
(0.65)
NET
ASSET
VALUE
End
of
period
$
62.04
$
51.10
$
41.03
$
51.79
$
41.94
Ratios/Supplemental
Data
Total
return
(2)(3)
23.47%
26.38%
(19.61)%
25.41%
19.82%
Ratios
to
average
net
assets:
(2)
Gross
expenses
before
waivers/payments
by
Price
Associates
0.18%
0.19%
0.21%
0.26%
0.30%
Net
expenses
after
waivers/
payments
by
Price
Associates
0.18%
0.19%
0.21%
0.26%
0.30%
Net
investment
income
1.17%
1.45%
1.34%
1.03%
1.52%
Portfolio
turnover
rate
6.1%
5.8%
4.8%
20.0%
10.1%
Net
assets,
end
of
period
(in
millions)
$2,905
$2,278
$1,870
$2,661
$2,431
0%
0%
0%
0%
0%
(1)
Per
share
amounts
calculated
using
average
shares
outstanding
method.
(2)
Includes
the
impact
of
expense-related
arrangements
with
Price
Associates.
(3)
Total
return
reflects
the
rate
that
an
investor
would
have
earned
on
an
investment
in
the
fund
during
each
period,
assuming
reinvestment
of
all
distributions,
and
payment
of
no
redemption
or
account
fees,
if
applicable.
T.
ROWE
PRICE
Total
Equity
Market
Index
Fund
December
31,
2024
Shares/Par
$
Value
(Cost
and
value
in
$000s)
‡
COMMON
STOCKS
99.6%
COMMUNICATION
SERVICES
8.7%
Diversified
Telecommunication
Services
0.6%
AT&T
339,201
7,724
ATN
International
7,701
129
GCI
Liberty,
Class
A,
EC (1)(2)
6,211
—
Globalstar (2)(3)
187,300
388
Iridium
Communications
21,263
617
Liberty
Global,
Class
A (2)
9,307
119
Liberty
Global,
Class
C (2)
10,107
133
Lumen
Technologies (2)
78,409
416
Verizon
Communications
194,883
7,793
17,319
Entertainment
1.4%
AMC
Entertainment
Holdings,
Class
A (2)
1,817
7
Electronic
Arts
10,140
1,484
Liberty
Media
Corp-Liberty
Formula
One,
Class
A (2)
5,476
460
Liberty
Media
Corp-Liberty
Formula
One,
Class
C (2)
14,803
1,372
Live
Nation
Entertainment (2)
8,600
1,114
Madison
Square
Garden
Sports (2)
1,033
233
Netflix (2)
21,997
19,606
Playtika
Holding
34,200
237
ROBLOX,
Class
A (2)
27,210
1,574
Roku (2)
7,141
531
Sphere
Entertainment (2)(3)
6,533
263
Take-Two
Interactive
Software (2)
7,767
1,430
TKO
Group
Holdings (2)
5,524
785
Walt
Disney
86,523
9,634
Warner
Bros
Discovery (2)
100,896
1,067
Warner
Music
Group,
Class
A
10,663
331
40,128
Interactive
Media
&
Services
5.9%
Alphabet,
Class
A
294,419
55,734
Alphabet,
Class
C
241,498
45,991
IAC (2)
4,312
186
Match
Group (2)
19,288
631
Meta
Platforms,
Class
A
111,599
65,342
Pinterest,
Class
A (2)
44,275
1,284
Snap,
Class
A (2)
53,961
581
Vimeo (2)
42,108
270
Ziff
Davis (2)
4,900
266
T.
ROWE
PRICE
Total
Equity
Market
Index
Fund
Shares/Par
$
Value
(Cost
and
value
in
$000s)
‡
ZoomInfo
Technologies (2)
19,500
205
170,490
Media
0.6%
AMC
Networks,
Class
A (2)(3)
22,825
226
Charter
Communications,
Class
A (2)
5,264
1,804
Comcast,
Class
A
194,642
7,305
EchoStar,
Class
A (2)(3)
14,326
328
Entravision
Communications,
Class
A
32,400
76
Fox,
Class
A
10,506
510
Gray
Television
45,900
145
Interpublic
Group
14,039
393
Liberty
Broadband,
Class
C (2)
9,531
713
New
York
Times,
Class
A
7,800
406
News,
Class
A
28,141
775
News,
Class
B
5,665
172
Nexstar
Media
Group
1,413
223
Omnicom
Group
7,700
663
Paramount
Global,
Class
B
41,994
439
Scholastic
10,500
224
TEGNA
21,400
392
Trade
Desk,
Class
A (2)
24,132
2,836
17,630
Wireless
Telecommunication
Services
0.2%
Telephone
&
Data
Systems
10,915
372
T-Mobile
U.S.
25,434
5,614
United
States
Cellular (2)
3,196
201
6,187
Total
Communication
Services
251,754
CONSUMER
DISCRETIONARY
11.4%
Automobile
Components
0.1%
Aptiv (2)
13,200
798
Autoliv
7,700
722
BorgWarner
16,517
525
Fox
Factory
Holding (2)
2,600
79
Lear
1,400
133
Mobileye
Global,
Class
A (2)
7,360
147
Modine
Manufacturing (2)
6,543
758
Phinia
5,803
280
QuantumScape (2)(3)
47,100
244
Standard
Motor
Products
5,700
177
Stoneridge (2)
25,600
160
Visteon (2)
3,600
319
T.
ROWE
PRICE
Total
Equity
Market
Index
Fund
Shares/Par
$
Value
(Cost
and
value
in
$000s)
‡
XPEL (2)
3,100
124
4,466
Automobiles
2.1%
Ford
Motor
157,752
1,562
General
Motors
52,720
2,808
Rivian
Automotive,
Class
A (2)
44,353
590
Tesla (2)
140,151
56,599
Thor
Industries (3)
4,800
459
Winnebago
Industries
4,499
215
62,233
Broadline
Retail
3.7%
Amazon.com (2)
474,268
104,050
eBay
22,937
1,421
Etsy (2)
5,215
276
Kohl's (3)
18,656
262
Ollie's
Bargain
Outlet
Holdings (2)
4,699
515
106,524
Distributors
0.1%
Genuine
Parts
5,800
677
LKQ
14,800
544
Pool
1,805
616
1,837
Diversified
Consumer
Services
0.1%
Adtalem
Global
Education (2)
4,200
382
Bright
Horizons
Family
Solutions (2)
3,644
404
Duolingo (2)
2,944
954
Frontdoor (2)
8,450
462
H&R
Block
8,652
457
Service
Corp.
International
10,807
863
Strategic
Education
4,544
424
3,946
Hotels,
Restaurants
&
Leisure
2.2%
Airbnb,
Class
A (2)
20,039
2,633
Aramark
9,000
336
Bloomin'
Brands
9,500
116
Booking
Holdings
1,764
8,764
Boyd
Gaming
3,800
276
Brinker
International (2)
4,550
602
Caesars
Entertainment (2)
5,784
193
Carnival (2)
40,434
1,008
Cava
Group (2)
5,274
595
T.
ROWE
PRICE
Total
Equity
Market
Index
Fund
Shares/Par
$
Value
(Cost
and
value
in
$000s)
‡
Chipotle
Mexican
Grill (2)
74,517
4,493
Cracker
Barrel
Old
Country
Store (3)
3,424
181
Darden
Restaurants
3,800
709
Domino's
Pizza
2,533
1,063
DoorDash,
Class
A (2)
16,895
2,834
DraftKings,
Class
A (2)
31,555
1,174
Expedia
Group (2)
5,871
1,094
Flutter
Entertainment (2)
7,194
1,859
Hilton
Grand
Vacations (2)
5,040
196
Hilton
Worldwide
Holdings
15,209
3,759
Jack
in
the
Box (3)
1,518
63
Las
Vegas
Sands
27,505
1,413
Light
&
Wonder (2)
2,700
233
Marriott
International,
Class
A
12,841
3,582
Marriott
Vacations
Worldwide
2,386
214
McDonald's
37,733
10,938
MGM
Resorts
International (2)
15,417
534
Norwegian
Cruise
Line
Holdings (2)
35,670
918
Papa
John's
International
3,500
144
Penn
Entertainment (2)
9,484
188
Planet
Fitness,
Class
A (2)
5,402
534
Royal
Caribbean
Cruises
12,600
2,907
Six
Flags
Entertainment
3,959
191
Starbucks
55,335
5,049
Sweetgreen,
Class
A (2)(3)
13,511
433
Texas
Roadhouse
6,639
1,198
Travel
+
Leisure
8,330
420
United
Parks
&
Resorts (2)
4,800
270
Vail
Resorts
2,131
400
Wendy's
17,675
288
Wingstop
3,349
952
Wyndham
Hotels
&
Resorts
5,203
524
Wynn
Resorts
7,004
604
Yum!
Brands
7,063
948
64,830
Household
Durables
0.5%
DR
Horton
13,855
1,937
Ethan
Allen
Interiors
11,113
312
Garmin
6,657
1,373
Helen
of
Troy (2)
1,800
108
Hovnanian
Enterprises,
Class
A (2)
1,943
260
iRobot (2)
20,900
162
La-Z-Boy
9,300
405
T.
ROWE
PRICE
Total
Equity
Market
Index
Fund
Shares/Par
$
Value
(Cost
and
value
in
$000s)
‡
Leggett
&
Platt
12,800
123
Lennar,
Class
A
12,393
1,690
Mohawk
Industries (2)
2,113
252
Newell
Brands
17,554
175
NVR (2)
190
1,554
PulteGroup
12,239
1,333
Taylor
Morrison
Home (2)
14,919
913
Toll
Brothers
8,038
1,012
TopBuild (2)
2,237
697
Tri
Pointe
Homes (2)
18,536
672
Whirlpool (3)
2,822
323
13,301
Leisure
Products
0.1%
Brunswick
7,200
466
Hasbro
6,700
374
Mattel (2)
24,300
431
Polaris
2,500
144
YETI
Holdings (2)
4,600
177
1,592
Specialty
Retail
2.1%
Advance
Auto
Parts
7,385
349
American
Eagle
Outfitters
8,947
149
AutoZone (2)
1,024
3,279
Bath
&
Body
Works
25,839
1,002
Best
Buy
7,845
673
Burlington
Stores (2)
6,449
1,838
Carvana (2)
8,384
1,705
Dick's
Sporting
Goods
5,554
1,271
Five
Below (2)
3,757
394
Floor
&
Decor
Holdings,
Class
A (2)
7,799
778
Foot
Locker (2)
3,003
65
GameStop,
Class
A (2)
8,800
276
Group
1
Automotive
700
295
Home
Depot
50,695
19,720
Lithia
Motors
1,300
465
Lowe's
29,818
7,359
Murphy
USA
741
372
O'Reilly
Automotive (2)
3,536
4,193
PetMed
Express (2)(3)
49,700
239
RH (2)
1,100
433
Ross
Stores
20,758
3,140
Sleep
Number (2)(3)
9,250
141
TJX
59,446
7,182
T.
ROWE
PRICE
Total
Equity
Market
Index
Fund
Shares/Par
$
Value
(Cost
and
value
in
$000s)
‡
Tractor
Supply
21,795
1,156
Ulta
Beauty (2)
2,681
1,166
Upbound
Group
9,052
264
Valvoline (2)
5,943
215
Victoria's
Secret (2)
6,080
252
Wayfair,
Class
A (2)(3)
6,266
278
Williams-Sonoma
6,232
1,154
59,803
Textiles,
Apparel
&
Luxury
Goods
0.4%
Carter's (3)
3,300
179
Columbia
Sportswear (3)
3,600
302
Crocs (2)
3,700
405
Deckers
Outdoor (2)
8,208
1,667
Lululemon
Athletica (2)
6,261
2,394
Movado
Group
13,000
256
NIKE,
Class
B
58,891
4,456
Ralph
Lauren
2,766
639
Skechers
USA,
Class
A (2)
6,386
430
Tapestry
17,373
1,135
Unifi (2)
21,432
134
VF
15,007
322
12,319
Total
Consumer
Discretionary
330,851
CONSUMER
STAPLES
5.1%
Beverages
1.0%
Boston
Beer,
Class
A (2)
712
214
Brown-Forman,
Class
B
4,730
180
Celsius
Holdings (2)
10,056
265
Coca-Cola
205,354
12,785
Coca-Cola
Consolidated
350
441
Constellation
Brands,
Class
A
9,916
2,191
Keurig
Dr
Pepper
70,112
2,252
Molson
Coors
Beverage,
Class
B
4,202
241
Monster
Beverage (2)
35,607
1,871
PepsiCo
64,080
9,744
30,184
Consumer
Staples
Distribution
&
Retail
1.8%
BJ's
Wholesale
Club
Holdings (2)
7,600
679
Casey's
General
Stores
1,686
668
Chefs'
Warehouse (2)
7,700
380
Costco
Wholesale
22,081
20,232
Dollar
General
14,559
1,104
T.
ROWE
PRICE
Total
Equity
Market
Index
Fund
Shares/Par
$
Value
(Cost
and
value
in
$000s)
‡
Dollar
Tree (2)
13,257
994
Kroger
28,439
1,739
Performance
Food
Group (2)
8,869
750
PriceSmart
4,549
419
Sprouts
Farmers
Market (2)
6,839
869
Sysco
23,137
1,769
Target
24,379
3,296
United
Natural
Foods (2)
9,900
270
Walgreens
Boots
Alliance
41,374
386
Walmart
222,329
20,087
53,642
Food
Products
0.6%
Archer-Daniels-Midland
21,372
1,080
Bunge
Global
5,771
449
Campbell's
3,023
127
Conagra
Brands
40,884
1,134
Darling
Ingredients (2)
16,200
546
Flowers
Foods
27,273
563
Fresh
Del
Monte
Produce
15,400
511
General
Mills
20,971
1,337
Hershey
2,442
414
Hormel
Foods
23,100
725
Ingredion
2,302
317
J
M
Smucker
3,971
437
John
B.
Sanfilippo
&
Son
5,200
453
Kellanova
10,147
822
Kraft
Heinz
43,553
1,337
Lamb
Weston
Holdings
7,285
487
McCormick
12,833
978
Mondelez
International,
Class
A
69,793
4,169
Post
Holdings (2)
2,320
265
Simply
Good
Foods (2)
7,018
274
Tootsie
Roll
Industries (3)
10,752
348
TreeHouse
Foods (2)
3,428
120
Tyson
Foods,
Class
A
16,076
923
Vital
Farms (2)
8,454
319
18,135
Household
Products
1.0%
Church
&
Dwight
6,039
632
Clorox
5,429
882
Colgate-Palmolive
46,532
4,230
Energizer
Holdings
4,298
150
Kimberly-Clark
20,482
2,684
T.
ROWE
PRICE
Total
Equity
Market
Index
Fund
Shares/Par
$
Value
(Cost
and
value
in
$000s)
‡
Procter
&
Gamble
118,623
19,887
Spectrum
Brands
Holdings
900
76
28,541
Personal
Care
Products
0.2%
BellRing
Brands (2)
5,655
426
Edgewell
Personal
Care
4,448
150
elf
Beauty (2)
5,050
634
Estee
Lauder,
Class
A
11,246
843
Herbalife (2)
20,600
138
Kenvue
121,653
2,597
4,788
Tobacco
0.5%
Altria
Group
73,597
3,848
Philip
Morris
International
82,323
9,908
13,756
Total
Consumer
Staples
149,046
ENERGY
3.3%
Energy
Equipment
&
Services
0.4%
Atlas
Energy
Solutions (3)
12,507
277
Baker
Hughes
48,758
2,000
Expro
Group
Holdings (2)
36,842
460
Halliburton
41,170
1,119
Helmerich
&
Payne
8,569
274
Kodiak
Gas
Services
13,618
556
Noble
15,602
490
NOV
9,383
137
Oceaneering
International (2)
6,153
161
Schlumberger
75,716
2,903
TechnipFMC
49,801
1,441
Tidewater (2)
3,520
193
Weatherford
International
7,858
563
10,574
Oil,
Gas
&
Consumable
Fuels
2.9%
APA
26,672
616
Cheniere
Energy
9,332
2,005
Chevron
85,151
12,333
Chord
Energy
436
51
Civitas
Resources
5,422
249
CNX
Resources (2)
10,600
389
ConocoPhillips
68,744
6,817
Coterra
Energy
15,430
394
T.
ROWE
PRICE
Total
Equity
Market
Index
Fund
Shares/Par
$
Value
(Cost
and
value
in
$000s)
‡
Devon
Energy
35,333
1,157
Diamondback
Energy
10,819
1,773
Dorian
LPG
8,030
196
EOG
Resources
29,890
3,664
EQT
33,356
1,538
Expand
Energy
19,848
1,976
Exxon
Mobil
225,097
24,214
Hess
13,968
1,858
International
Seaways (3)
1,400
50
Kinder
Morgan
104,173
2,854
Magnolia
Oil
&
Gas,
Class
A
18,431
431
Marathon
Petroleum
19,191
2,677
Matador
Resources
5,460
307
Murphy
Oil (3)
13,543
410
Occidental
Petroleum
24,766
1,224
ONEOK
23,916
2,401
Ovintiv
3,131
127
Par
Pacific
Holdings (2)
13,687
224
PBF
Energy,
Class
A
4,800
127
Peabody
Energy
4,100
86
Permian
Resources
50,096
720
Phillips
66
20,872
2,378
Range
Resources
19,946
718
SM
Energy
7,152
277
Targa
Resources
12,493
2,230
Texas
Pacific
Land (3)
965
1,067
Valero
Energy
17,735
2,174
Viper
Energy
10,325
507
Williams
64,032
3,465
World
Kinect (3)
14,500
399
84,083
Total
Energy
94,657
FINANCIALS
14.1%
Banks
3.7%
1st
Source
6,568
383
Ameris
Bancorp
5,753
360
Bank
of
America
349,423
15,357
Bank
of
Hawaii (3)
6,288
448
Bank
OZK
6,200
276
BankUnited
13,400
512
Berkshire
Hills
Bancorp
11,700
333
Cadence
Bank
8,900
307
Capitol
Federal
Financial
33,700
199
T.
ROWE
PRICE
Total
Equity
Market
Index
Fund
Shares/Par
$
Value
(Cost
and
value
in
$000s)
‡
Citigroup
105,218
7,406
Citizens
Financial
Group
23,521
1,029
Comerica
9,516
589
Cullen/Frost
Bankers
4,260
572
Customers
Bancorp (2)
5,400
263
CVB
Financial
15,739
337
East
West
Bancorp
9,828
941
Fifth
Third
Bancorp
49,543
2,095
First
BanCorp
Puerto
Rico
38,184
710
First
Citizens
BancShares,
Class
A
519
1,097
First
Financial
Bancorp
13,370
359
First
Merchants
10,330
412
Flagstar
Financial (3)
18,057
168
Flushing
Financial
23,950
342
Fulton
Financial
19,774
381
Glacier
Bancorp
7,700
387
Hancock
Whitney
4,482
245
Home
BancShares
16,400
464
Huntington
Bancshares
114,612
1,865
JPMorgan
Chase
140,534
33,687
KeyCorp
64,015
1,097
M&T
Bank
6,222
1,170
Metropolitan
Bank
Holding (2)
7,681
449
National
Bank
Holdings,
Class
A
10,200
439
NBT
Bancorp
9,400
449
Northfield
Bancorp
27,300
317
OFG
Bancorp
5,686
241
Old
National
Bancorp
19,280
418
Pacific
Premier
Bancorp
18,300
456
Park
National
3,715
637
Peoples
Bancorp
13,197
418
Pinnacle
Financial
Partners
4,100
469
PNC
Financial
Services
Group
16,269
3,137
Popular
11,960
1,125
Prosperity
Bancshares
3,400
256
Regions
Financial
50,445
1,186
Renasant
5,175
185
Seacoast
Banking
12,900
355
SouthState
4,788
476
Synovus
Financial
5,828
299
Towne
Bank
14,400
490
Truist
Financial
56,125
2,435
U.S.
Bancorp
73,785
3,529
T.
ROWE
PRICE
Total
Equity
Market
Index
Fund
Shares/Par
$
Value
(Cost
and
value
in
$000s)
‡
UMB
Financial
2,896
327
United
Bankshares
10,000
376
WaFd
4,342
140
Webster
Financial
14,696
812
Wells
Fargo
169,328
11,894
WesBanco
14,800
482
Western
Alliance
Bancorp
14,141
1,181
WSFS
Financial
7,000
372
Zions
Bancorp
8,501
461
107,602
Capital
Markets
3.2%
Affiliated
Managers
Group
1,300
240
Ameriprise
Financial
4,346
2,314
Ares
Management,
Class
A
11,996
2,124
Artisan
Partners
Asset
Management,
Class
A
6,600
284
Bank
of
New
York
Mellon
43,150
3,315
BGC
Group,
Class
A
33,996
308
Blackrock
6,401
6,562
Blackstone
33,533
5,782
Blue
Owl
Capital
40,217
935
Cboe
Global
Markets
7,642
1,493
Charles
Schwab
83,503
6,180
CME
Group
19,448
4,516
Coinbase
Global,
Class
A (2)
10,270
2,550
Donnelley
Financial
Solutions (2)
7,925
497
Evercore,
Class
A
2,877
798
FactSet
Research
Systems
1,720
826
Franklin
Resources
8,000
162
Goldman
Sachs
Group
15,355
8,793
Intercontinental
Exchange
29,425
4,385
Invesco
30,900
540
Janus
Henderson
Group
9,941
423
Jefferies
Financial
Group
12,300
964
KKR
34,965
5,172
Lazard
10,067
518
LPL
Financial
Holdings
2,941
960
MarketAxess
Holdings
2,138
483
Moody's
6,399
3,029
Morgan
Stanley
62,180
7,817
Morningstar
3,246
1,093
MSCI
3,617
2,170
Nasdaq
15,210
1,176
Northern
Trust
9,768
1,001
T.
ROWE
PRICE
Total
Equity
Market
Index
Fund
Shares/Par
$
Value
(Cost
and
value
in
$000s)
‡
Open
Lending (2)
20,600
123
Raymond
James
Financial
9,965
1,548
Robinhood
Markets,
Class
A (2)
37,294
1,390
S&P
Global
14,964
7,453
SEI
Investments
4,700
388
State
Street
19,682
1,932
StepStone
Group,
Class
A
13,763
797
StoneX
Group (2)
4,394
431
TPG
15,089
948
Tradeweb
Markets,
Class
A
11,009
1,441
Virtus
Investment
Partners
2,975
656
94,517
Consumer
Finance
0.7%
Ally
Financial
15,718
566
American
Express
27,970
8,301
Bread
Financial
Holdings
4,204
257
Capital
One
Financial
18,813
3,355
Discover
Financial
Services
12,877
2,231
LendingClub (2)
13,800
223
Navient
15,900
211
OneMain
Holdings
14,344
748
SLM
24,652
680
SoFi
Technologies (2)
52,200
804
Synchrony
Financial
28,171
1,831
19,207
Financial
Services
4.3%
Affirm
Holdings (2)
12,500
761
Apollo
Global
Management
27,137
4,482
Berkshire
Hathaway,
Class
B (2)
90,811
41,163
Block (2)
32,060
2,725
Corebridge
Financial
21,137
633
Corpay (2)
6,048
2,047
Equitable
Holdings
26,566
1,253
Euronet
Worldwide (2)
2,274
234
Fidelity
National
Information
Services
24,235
1,957
Fiserv (2)
33,154
6,810
Global
Payments
16,637
1,864
Jack
Henry
&
Associates
3,451
605
Mastercard,
Class
A
41,854
22,039
MGIC
Investment
22,400
531
Mr.
Cooper
Group (2)
7,828
752
Payoneer
Global (2)
93,122
935
PayPal
Holdings (2)
46,911
4,004
T.
ROWE
PRICE
Total
Equity
Market
Index
Fund
Shares/Par
$
Value
(Cost
and
value
in
$000s)
‡
PennyMac
Financial
Services
2,937
300
Radian
Group
11,700
371
Remitly
Global (2)
22,470
507
Shift4
Payments,
Class
A (2)
4,368
453
Visa,
Class
A
88,741
28,046
Voya
Financial
11,661
803
Western
Union
36,989
392
WEX (2)
1,030
181
123,848
Insurance
2.1%
Aflac
24,052
2,488
Allstate
16,444
3,170
American
Financial
Group
6,350
870
American
International
Group
28,949
2,107
Aon,
Class
A
9,688
3,480
Arch
Capital
Group
14,433
1,333
Arthur
J
Gallagher
8,783
2,493
Assurant
3,500
746
Axis
Capital
Holdings
9,100
806
Brown
&
Brown
7,939
810
Chubb
20,881
5,769
Cincinnati
Financial
6,967
1,001
Erie
Indemnity,
Class
A
1,800
742
Everest
Group
2,000
725
Fidelity
National
Financial
16,896
949
First
American
Financial
8,285
517
Genworth
Financial (2)
71,300
498
Globe
Life
3,573
398
Hanover
Insurance
Group
4,737
733
Hartford
Financial
Services
Group
21,925
2,399
Horace
Mann
Educators
10,005
393
Kemper
5,500
365
Loews
5,827
493
Markel
Group (2)
420
725
Marsh
&
McLennan
26,579
5,646
MBIA (3)
32,600
211
MetLife
39,412
3,227
Old
Republic
International
13,187
477
Palomar
Holdings (2)
2,853
301
Principal
Financial
Group
11,100
859
Progressive
28,407
6,807
Prudential
Financial
14,700
1,742
Reinsurance
Group
of
America
3,187
681
T.
ROWE
PRICE
Total
Equity
Market
Index
Fund
Shares/Par
$
Value
(Cost
and
value
in
$000s)
‡
RenaissanceRe
Holdings
4,919
1,224
Skyward
Specialty
Insurance
Group (2)
5,326
269
Travelers
12,698
3,059
TWFG (2)
11,051
340
United
Fire
Group
19,000
541
Unum
Group
7,364
538
W
R
Berkley
12,757
747
Willis
Towers
Watson
5,175
1,621
62,300
Mortgage
Real
Estate
Investment
Trusts
0.1%
AG
Mortgage
Investment
Trust,
REIT (3)
34,500
230
AGNC
Investment,
REIT (3)
3,500
32
Annaly
Capital
Management,
REIT
58,702
1,074
Ares
Commercial
Real
Estate,
REIT (3)
29,900
176
Chimera
Investment,
REIT (3)
15,166
212
Franklin
BSP
Realty
Trust,
REIT
18,840
236
Granite
Point
Mortgage
Trust,
REIT (3)
25,800
72
New
York
Mortgage
Trust,
REIT
23,275
141
Redwood
Trust,
REIT
25,700
168
Rithm
Capital,
REIT
47,960
519
Starwood
Property
Trust,
REIT
9,800
186
TPG
RE
Finance
Trust,
REIT
28,900
246
Two
Harbors
Investment,
REIT
16,575
196
3,488
Total
Financials
410,962
HEALTH
CARE
10.3%
Biotechnology
2.1%
AbbVie
86,951
15,451
ACADIA
Pharmaceuticals (2)
27,331
502
Akero
Therapeutics (2)
15,107
420
Alkermes (2)
23,166
666
Alnylam
Pharmaceuticals (2)
7,045
1,658
Amgen
26,388
6,878
Apellis
Pharmaceuticals (2)
5,800
185
Apogee
Therapeutics (2)(3)
7,761
352
Arcturus
Therapeutics
Holdings (2)(3)
5,522
94
Avidity
Biosciences (2)
23,700
689
Beam
Therapeutics (2)
14,401
357
Biogen (2)
11,326
1,732
Biohaven (2)
8,296
310
BioMarin
Pharmaceutical (2)
8,800
578
Blueprint
Medicines (2)
6,733
587
T.
ROWE
PRICE
Total
Equity
Market
Index
Fund
Shares/Par
$
Value
(Cost
and
value
in
$000s)
‡
Celldex
Therapeutics (2)
8,113
205
Crinetics
Pharmaceuticals (2)
6,543
335
Dynavax
Technologies (2)
11,700
149
Exact
Sciences (2)
10,849
610
Gilead
Sciences
59,228
5,471
GRAIL (2)(3)
5,338
95
Ideaya
Biosciences (2)
12,089
311
IGM
Biosciences (2)(3)
23,076
141
Incyte (2)
8,900
615
Insmed (2)
15,970
1,103
Ionis
Pharmaceuticals (2)
18,694
654
Kymera
Therapeutics (2)
5,336
215
Madrigal
Pharmaceuticals (2)
1,522
470
Moderna (2)
19,436
808
Mural
Oncology (2)
17,210
55
Natera (2)
8,417
1,332
Neurocrine
Biosciences (2)
8,720
1,190
Nurix
Therapeutics (2)
22,814
430
Nuvalent,
Class
A (2)
5,004
392
Olema
Pharmaceuticals (2)
9,100
53
Praxis
Precision
Medicines (2)
5,333
410
Prothena (2)
13,736
190
Regeneron
Pharmaceuticals (2)
5,580
3,975
Replimune
Group (2)
23,321
282
REVOLUTION
Medicines (2)
21,828
955
Sarepta
Therapeutics (2)
5,432
660
Scholar
Rock
Holding (2)
10,142
438
Soleno
Therapeutics (2)
6,408
288
SpringWorks
Therapeutics (2)(3)
8,318
301
Spyre
Therapeutics (2)
6,023
140
Stoke
Therapeutics (2)
14,400
159
Tenaya
Therapeutics (2)
31,453
45
Ultragenyx
Pharmaceutical (2)
9,700
408
United
Therapeutics (2)
2,335
824
Vaxcyte (2)
9,766
799
Vera
Therapeutics (2)
6,314
267
Vertex
Pharmaceuticals (2)
12,498
5,033
Vir
Biotechnology (2)
35,350
259
Xencor (2)
24,029
552
61,078
Health
Care
Equipment
&
Supplies
2.2%
Abbott
Laboratories
83,376
9,431
Align
Technology (2)
4,004
835
T.
ROWE
PRICE
Total
Equity
Market
Index
Fund
Shares/Par
$
Value
(Cost
and
value
in
$000s)
‡
Baxter
International
31,719
925
Becton
Dickinson
&
Company
15,718
3,566
Boston
Scientific (2)
66,019
5,897
Cooper (2)
11,638
1,070
DENTSPLY
SIRONA
21,219
403
Dexcom (2)
19,955
1,552
Edwards
Lifesciences (2)
29,821
2,208
Embecta
13,600
281
Envista
Holdings (2)
12,877
248
GE
HealthCare
Technologies
21,106
1,650
Globus
Medical,
Class
A (2)
7,291
603
Haemonetics (2)
4,888
382
Hologic (2)
6,847
494
ICU
Medical (2)
2,029
315
IDEXX
Laboratories (2)
4,151
1,716
Inspire
Medical
Systems (2)
2,235
414
Insulet (2)
4,158
1,085
Intuitive
Surgical (2)
18,627
9,723
Lantheus
Holdings (2)
5,170
462
Medtronic
67,573
5,398
Merit
Medical
Systems (2)
5,443
526
Nevro (2)(3)
65,500
244
Novocure (2)
14,200
423
Omnicell (2)
8,500
378
Penumbra (2)
3,753
891
QuidelOrtho (2)
3,437
153
ResMed
8,316
1,902
Solventum (2)
7,339
485
STERIS
5,295
1,088
Stryker
18,201
6,553
Teleflex
4,057
722
Zimmer
Biomet
Holdings
12,087
1,277
63,300
Health
Care
Providers
&
Services
2.0%
Acadia
Healthcare (2)
6,379
253
agilon
health (2)
56,453
107
Alignment
Healthcare (2)
15,773
177
AMN
Healthcare
Services (2)
4,652
111
BrightSpring
Health
Services (2)(3)
10,348
176
Cardinal
Health
12,366
1,463
Cencora
11,482
2,580
Centene (2)
21,007
1,273
Cigna
Group
15,093
4,168
T.
ROWE
PRICE
Total
Equity
Market
Index
Fund
Shares/Par
$
Value
(Cost
and
value
in
$000s)
‡
Concentra
Group
Holdings
Parent
17,057
337
CorVel (2)
5,250
584
CVS
Health
57,670
2,589
DaVita (2)
2,198
329
Elevance
Health
12,355
4,558
Encompass
Health
8,097
748
Ensign
Group
3,917
520
Guardant
Health (2)
10,800
330
HCA
Healthcare
10,186
3,057
Henry
Schein (2)
7,199
498
Humana
6,060
1,538
Labcorp
Holdings
2,228
511
McKesson
7,472
4,258
ModivCare (2)(3)
8,000
95
Molina
Healthcare (2)
3,743
1,089
OPKO
Health (2)(3)
124,700
183
Option
Care
Health (2)
16,696
387
Oscar
Health,
Class
A (2)
22,831
307
Quest
Diagnostics
7,602
1,147
Select
Medical
Holdings
21,138
398
Surgery
Partners (2)(3)
12,333
261
Tenet
Healthcare (2)
6,872
868
UnitedHealth
Group
47,007
23,779
Universal
Health
Services,
Class
B
1,319
237
58,916
Health
Care
Technology
0.1%
Phreesia (2)
13,429
338
Teladoc
Health (2)
26,248
239
Veeva
Systems,
Class
A (2)
7,784
1,636
2,213
Life
Sciences
Tools
&
Services
1.1%
10X
Genomics,
Class
A (2)
21,228
305
Agilent
Technologies
17,629
2,368
Avantor (2)
35,338
744
Bio-Rad
Laboratories,
Class
A (2)
1,100
361
Bio-Techne
9,863
710
Charles
River
Laboratories
International (2)
3,554
656
CryoPort (2)(3)
25,300
197
Danaher
35,063
8,049
Fortrea
Holdings (2)
5,395
101
Illumina (2)
8,043
1,075
IQVIA
Holdings (2)
6,955
1,367
Mettler-Toledo
International (2)
1,260
1,542
T.
ROWE
PRICE
Total
Equity
Market
Index
Fund
Shares/Par
$
Value
(Cost
and
value
in
$000s)
‡
Omniab,
Earn
Out
Shares
$12.50 (2)
722
—
Omniab,
Earn
Out
Shares
$15.00 (2)
722
—
Repligen (2)
5,465
787
Revvity
7,354
821
Thermo
Fisher
Scientific
19,847
10,325
Waters (2)
1,284
476
West
Pharmaceutical
Services
4,155
1,361
31,245
Pharmaceuticals
2.8%
Amneal
Pharmaceuticals (2)
35,400
280
Arvinas (2)
10,400
199
Axsome
Therapeutics (2)
3,700
313
Bristol-Myers
Squibb
96,954
5,484
Cassava
Sciences (2)(3)
5,900
14
Elanco
Animal
Health (2)
49,101
595
Eli
Lilly
40,589
31,335
Intra-Cellular
Therapies (2)
6,000
501
Jazz
Pharmaceuticals (2)
2,844
350
Johnson
&
Johnson
115,298
16,674
Ligand
Pharmaceuticals (2)
1,904
204
Merck
123,940
12,330
Organon
19,423
290
Perrigo
7,998
206
Pfizer
269,286
7,144
Prestige
Consumer
Healthcare (2)
4,483
350
Royalty
Pharma,
Class
A
13,819
353
Theravance
Biopharma (2)
24,071
226
Viatris
96,505
1,201
Zoetis
23,946
3,902
81,951
Total
Health
Care
298,703
INDUSTRIALS
&
BUSINESS
SERVICES
9.4%
Aerospace
&
Defense
1.8%
Axon
Enterprise (2)
3,700
2,199
Boeing (2)
39,436
6,980
BWX
Technologies
5,038
561
General
Dynamics
12,994
3,424
General
Electric
56,261
9,384
HEICO,
Class
A
4,276
796
Hexcel
7,504
470
Howmet
Aerospace
24,942
2,728
Huntington
Ingalls
Industries
2,831
535
T.
ROWE
PRICE
Total
Equity
Market
Index
Fund
Shares/Par
$
Value
(Cost
and
value
in
$000s)
‡
Kratos
Defense
&
Security
Solutions (2)(3)
18,817
496
L3Harris
Technologies
11,763
2,473
Lockheed
Martin
9,659
4,694
Northrop
Grumman
7,588
3,561
RTX
62,974
7,287
Spirit
AeroSystems
Holdings,
Class
A (2)(3)
14,046
479
Textron
14,458
1,106
TransDigm
Group
2,928
3,711
Triumph
Group (2)
22,400
418
Woodward
2,800
466
51,768
Air
Freight
&
Logistics
0.3%
CH
Robinson
Worldwide
7,146
738
Expeditors
International
of
Washington
4,194
465
FedEx
12,645
3,557
GXO
Logistics (2)
6,500
283
United
Parcel
Service,
Class
B
39,109
4,932
9,975
Building
Products
0.7%
A.O.
Smith
9,430
643
AAON
7,304
860
Allegion
4,236
554
AZEK (2)
10,151
482
AZZ
5,464
448
Builders
FirstSource (2)
5,318
760
Carlisle
2,600
959
Carrier
Global
43,839
2,992
Fortune
Brands
Innovations
7,600
519
Gibraltar
Industries (2)
5,500
324
Johnson
Controls
International
32,118
2,535
Lennox
International
1,137
693
Masco
12,917
937
Owens
Corning
7,565
1,288
Trane
Technologies
11,923
4,404
Trex (2)
9,228
637
19,035
Commercial
Services
&
Supplies
0.6%
ACCO
Brands
61,567
323
Aris
Water
Solutions,
Class
A
9,600
230
Brady,
Class
A
6,500
480
BrightView
Holdings (2)
15,000
240
Cintas
14,028
2,563
T.
ROWE
PRICE
Total
Equity
Market
Index
Fund
Shares/Par
$
Value
(Cost
and
value
in
$000s)
‡
Clean
Harbors (2)
3,706
853
Copart (2)
50,294
2,886
CoreCivic (2)
20,698
450
Ennis
18,900
399
Enviri (2)
47,600
366
MillerKnoll
16,400
370
MSA
Safety
1,422
236
Pitney
Bowes
44,000
319
RB
Global
7,300
658
Republic
Services
8,620
1,734
Rollins
11,625
539
Steelcase,
Class
A
30,300
358
Tetra
Tech
9,725
387
UniFirst
1,422
243
Veralto
11,081
1,129
Vestis
4,566
70
VSE
2,500
238
Waste
Management
15,242
3,076
18,147
Construction
&
Engineering
0.3%
API
Group (2)
17,449
628
Arcosa
5,500
532
Bowman
Consulting
Group (2)
8,700
217
Comfort
Systems
USA
1,981
840
Dycom
Industries (2)
3,800
662
EMCOR
Group
2,988
1,356
Fluor (2)
15,158
748
Granite
Construction
8,167
716
MasTec (2)
6,150
837
Quanta
Services
8,174
2,583
WillScot
Holdings (2)
23,242
778
9,897
Electrical
Equipment
0.9%
AMETEK
14,232
2,566
Atkore
3,329
278
Beam
Global (2)(3)
19,600
62
Eaton
19,025
6,314
Emerson
Electric
27,470
3,404
GE
Vernova
14,214
4,675
GrafTech
International (2)(3)
95,600
165
Hubbell
3,341
1,400
nVent
Electric
11,046
753
Regal
Rexnord
4,755
738
T.
ROWE
PRICE
Total
Equity
Market
Index
Fund
Shares/Par
$
Value
(Cost
and
value
in
$000s)
‡
Rockwell
Automation
6,987
1,997
Sensata
Technologies
Holding
14,832
406
Sunrun (2)
17,966
166
Thermon
Group
Holdings (2)
10,400
299
Vertiv
Holdings,
Class
A
20,288
2,305
Vicor (2)
4,500
217
25,745
Ground
Transportation
0.9%
Avis
Budget
Group (2)(3)
2,079
168
CSX
117,628
3,796
JB
Hunt
Transport
Services
4,864
830
Landstar
System
3,177
546
Lyft,
Class
A (2)
20,931
270
Norfolk
Southern
13,279
3,116
Old
Dominion
Freight
Line
10,776
1,901
Saia (2)
2,584
1,178
Uber
Technologies (2)
109,917
6,630
Union
Pacific
29,184
6,655
Werner
Enterprises (3)
6,275
225
25,315
Industrial
Conglomerates
0.5%
3M
29,357
3,789
Honeywell
International
33,909
7,660
Roper
Technologies
5,696
2,961
14,410
Machinery
1.8%
AGCO
6,389
597
Alamo
Group
2,740
509
Atmus
Filtration
Technologies
8,225
322
Caterpillar
23,443
8,504
Chart
Industries (2)
2,435
465
Cummins
8,615
3,003
Deere
12,110
5,131
Dover
7,692
1,443
Enpro
2,768
477
Esab
8,229
987
ESCO
Technologies
3,357
447
Flowserve
9,531
548
Fortive
20,735
1,555
Graco
6,061
511
Helios
Technologies
4,900
219
IDEX
5,706
1,194
T.
ROWE
PRICE
Total
Equity
Market
Index
Fund
Shares/Par
$
Value
(Cost
and
value
in
$000s)
‡
Illinois
Tool
Works
11,730
2,974
Ingersoll
Rand
24,293
2,198
ITT
5,400
772
John
Bean
Technologies
5,509
700
Lincoln
Electric
Holdings
3,300
619
Middleby (2)
5,155
698
Mueller
Water
Products,
Class
A
27,380
616
Nordson
2,800
586
Otis
Worldwide
22,723
2,104
PACCAR
19,878
2,068
Parker-Hannifin
6,810
4,331
RBC
Bearings (2)
3,636
1,088
Snap-on
2,636
895
Stanley
Black
&
Decker
16,903
1,357
Terex
6,100
282
Timken
5,100
364
Toro
9,000
721
Watts
Water
Technologies,
Class
A
3,200
651
Westinghouse
Air
Brake
Technologies
8,088
1,534
Xylem
10,934
1,269
51,739
Marine
Transportation
0.0%
Matson
4,400
593
Pangaea
Logistics
Solutions
17,500
94
687
Passenger
Airlines
0.2%
Alaska
Air
Group (2)
7,700
499
Allegiant
Travel
4,700
442
American
Airlines
Group (2)
17,286
301
Delta
Air
Lines
23,198
1,404
JetBlue
Airways (2)(3)
42,800
337
Southwest
Airlines
42,426
1,426
United
Airlines
Holdings (2)
13,546
1,315
5,724
Professional
Services
0.9%
Amentum
Holdings (2)(3)
3,700
78
Automatic
Data
Processing
19,275
5,642
Barrett
Business
Services
10,400
452
Booz
Allen
Hamilton
Holding
8,179
1,053
Broadridge
Financial
Solutions
8,645
1,955
CACI
International,
Class
A (2)
1,317
532
Clarivate (2)
44,275
225
T.
ROWE
PRICE
Total
Equity
Market
Index
Fund
Shares/Par
$
Value
(Cost
and
value
in
$000s)
‡
Dayforce (2)(3)
12,670
920
Equifax
7,158
1,824
First
Advantage (2)
18,281
342
Forrester
Research (2)
16,481
258
Franklin
Covey (2)
7,200
271
FTI
Consulting (2)
2,560
489
Genpact
7,500
322
Huron
Consulting
Group (2)
4,372
543
Insperity
4,400
341
Jacobs
Solutions
3,700
494
Korn
Ferry
7,000
472
Leidos
Holdings
8,719
1,256
ManpowerGroup
2,900
167
Mastech
Digital (2)
18,002
268
Maximus
3,800
284
Parsons (2)
2,600
240
Paychex
12,423
1,742
Paycom
Software
2,022
415
Paylocity
Holding (2)
3,552
709
Science
Applications
International
2,334
261
SS&C
Technologies
Holdings
14,472
1,097
TransUnion
14,701
1,363
TrueBlue (2)
17,600
148
Upwork (2)
21,162
346
Verisk
Analytics
7,668
2,112
Verra
Mobility (2)
18,476
447
27,068
Trading
Companies
&
Distributors
0.5%
Air
Lease
10,687
515
Beacon
Roofing
Supply (2)
6,100
620
Boise
Cascade
2,976
354
Core
&
Main,
Class
A (2)
11,191
570
DNOW (2)
22,030
287
Fastenal
30,867
2,220
Ferguson
Enterprises
9,832
1,706
GATX
2,700
418
GMS (2)
7,143
606
McGrath
RentCorp
3,600
403
MSC
Industrial
Direct,
Class
A
6,200
463
SiteOne
Landscape
Supply (2)
6,576
866
United
Rentals
2,609
1,838
Watsco
2,025
960
WW
Grainger
2,006
2,114
T.
ROWE
PRICE
Total
Equity
Market
Index
Fund
Shares/Par
$
Value
(Cost
and
value
in
$000s)
‡
Xometry,
Class
A (2)(3)
9,000
384
14,324
Total
Industrials
&
Business
Services
273,834
INFORMATION
TECHNOLOGY
30.5%
Communications
Equipment
0.9%
ADTRAN
Holdings (2)
38,700
322
Arista
Networks (2)
53,484
5,912
Ciena (2)
12,692
1,076
Cisco
Systems
195,233
11,558
Extreme
Networks (2)
15,033
252
F5 (2)
2,000
503
Juniper
Networks
13,580
508
Lumentum
Holdings (2)
5,248
440
Motorola
Solutions
7,926
3,664
Ubiquiti
1,400
465
Viasat (2)(3)
18,400
157
24,857
Electronic
Equipment,
Instruments
&
Components
0.8%
Amphenol,
Class
A
64,074
4,450
Arrow
Electronics (2)
2,700
305
Belden
4,158
468
CDW
5,500
957
Cognex
15,422
553
Coherent (2)
8,004
758
Corning
50,634
2,406
FARO
Technologies (2)
14,900
378
Insight
Enterprises (2)
2,150
327
IPG
Photonics (2)
3,700
269
Jabil
4,822
694
Keysight
Technologies (2)
11,187
1,797
Knowles (2)
24,200
482
Littelfuse
1,900
448
MicroVision (2)(3)
162,300
213
Napco
Security
Technologies
5,414
193
Novanta (2)
2,964
453
Sanmina (2)
4,702
356
TE
Connectivity
18,776
2,684
Teledyne
Technologies (2)
3,728
1,730
Trimble (2)
14,580
1,030
TTM
Technologies (2)
9,200
228
Vishay
Intertechnology
13,620
231
Vontier
8,300
303
T.
ROWE
PRICE
Total
Equity
Market
Index
Fund
Shares/Par
$
Value
(Cost
and
value
in
$000s)
‡
Zebra
Technologies,
Class
A (2)
3,744
1,446
23,159
IT
Services
1.3%
Accenture,
Class
A
33,256
11,699
Akamai
Technologies (2)
4,600
440
Cloudflare,
Class
A (2)
15,100
1,626
Cognizant
Technology
Solutions,
Class
A
25,300
1,946
DXC
Technology (2)
13,700
274
EPAM
Systems (2)
3,347
783
Fastly,
Class
A (2)
23,876
225
Gartner (2)
3,744
1,814
GoDaddy,
Class
A (2)
11,455
2,261
International
Business
Machines
44,756
9,839
Kyndryl
Holdings (2)
13,205
457
MongoDB (2)
2,063
480
Okta (2)
7,659
603
Snowflake,
Class
A (2)
17,722
2,736
Twilio,
Class
A (2)
8,386
906
VeriSign (2)
1,979
410
36,499
Semiconductors
&
Semiconductor
Equipment
10.4%
Advanced
Micro
Devices (2)
81,557
9,851
Analog
Devices
26,901
5,715
Applied
Materials
41,835
6,804
Broadcom
235,928
54,698
Cirrus
Logic (2)
3,287
327
Diodes (2)
6,440
397
Enphase
Energy (2)
6,120
420
Entegris
11,716
1,161
First
Solar (2)
5,394
951
Intel
209,715
4,205
KLA
6,738
4,246
Kulicke
&
Soffa
Industries
5,197
242
Lam
Research
67,800
4,897
Lattice
Semiconductor (2)
10,200
578
Marvell
Technology
49,876
5,509
Microchip
Technology
27,819
1,595
Micron
Technology
56,073
4,719
MKS
Instruments
8,672
905
Monolithic
Power
Systems
2,721
1,610
NVIDIA
1,247,996
167,593
NXP
Semiconductors
14,488
3,011
ON
Semiconductor (2)
27,236
1,717
T.
ROWE
PRICE
Total
Equity
Market
Index
Fund
Shares/Par
$
Value
(Cost
and
value
in
$000s)
‡
Onto
Innovation (2)
2,917
486
Power
Integrations
5,700
352
Qorvo (2)
1,652
116
QUALCOMM
58,969
9,059
Rambus (2)
16,120
852
Skyworks
Solutions
8,317
738
Teradyne
8,628
1,086
Texas
Instruments
44,663
8,375
Wolfspeed (2)(3)
59,266
395
302,610
Software
10.2%
A10
Networks
13,562
250
Adobe (2)
21,455
9,541
ANSYS (2)
4,341
1,464
Appfolio,
Class
A (2)
1,895
468
AppLovin,
Class
A (2)
12,142
3,932
Asana,
Class
A (2)
15,713
318
Aspen
Technology (2)
2,296
573
Atlassian,
Class
A (2)
9,857
2,399
Autodesk (2)
11,492
3,397
BILL
Holdings (2)
5,700
483
Braze,
Class
A (2)
12,104
507
Cadence
Design
Systems (2)
14,987
4,503
CCC
Intelligent
Solutions
Holdings (2)
46,225
542
Cerence (2)
28,437
223
Commvault
Systems (2)
3,000
453
Confluent,
Class
A (2)
22,217
621
Consensus
Cloud
Solutions (2)
12,000
286
Crowdstrike
Holdings,
Class
A (2)
11,553
3,953
Datadog,
Class
A (2)
16,842
2,407
Digital
Turbine (2)(3)
59,000
100
DocuSign (2)
12,977
1,167
Dolby
Laboratories,
Class
A
5,000
390
Dynatrace (2)
16,616
903
Fair
Isaac (2)
1,480
2,947
Five9 (2)
7,669
312
Fortinet (2)
34,953
3,302
Gen
Digital
32,434
888
Guidewire
Software (2)
5,698
961
HashiCorp,
Class
A (2)
7,674
262
HubSpot (2)
3,709
2,584
Informatica,
Class
A (2)
5,778
150
InterDigital
2,200
426
T.
ROWE
PRICE
Total
Equity
Market
Index
Fund
Shares/Par
$
Value
(Cost
and
value
in
$000s)
‡
Intuit
14,832
9,322
Manhattan
Associates (2)
3,293
890
Microsoft
376,747
158,799
MicroStrategy,
Class
A (2)
9,700
2,809
Nutanix,
Class
A (2)
22,777
1,393
Oracle
80,313
13,383
PagerDuty (2)
15,146
277
Palantir
Technologies,
Class
A (2)
104,808
7,927
Palo
Alto
Networks (2)
32,626
5,937
Procore
Technologies (2)(3)
8,410
630
PTC (2)
8,904
1,637
RingCentral,
Class
A (2)
5,181
181
Riot
Platforms (2)
19,893
203
Salesforce
49,022
16,389
Samsara,
Class
A (2)
27,530
1,203
ServiceNow (2)
10,956
11,615
Smartsheet,
Class
A (2)
9,200
515
Sprout
Social,
Class
A (2)(3)
7,900
243
Synopsys (2)
8,734
4,239
Tyler
Technologies (2)
2,002
1,154
UiPath,
Class
A (2)
29,797
379
Unity
Software (2)
22,207
499
Upland
Software (2)(3)
23,900
104
Workday,
Class
A (2)
11,559
2,983
Workiva (2)
4,500
493
Zoom
Communications (2)
11,198
914
Zscaler (2)
7,178
1,295
296,125
Technology
Hardware,
Storage
&
Peripherals
6.9%
Apple
763,425
191,177
Dell
Technologies,
Class
C
14,619
1,685
Hewlett
Packard
Enterprise
55,481
1,184
HP
39,222
1,280
NetApp
8,542
991
Pure
Storage,
Class
A (2)
17,200
1,057
Seagate
Technology
Holdings
9,209
795
Turtle
Beach (2)
14,800
256
Western
Digital (2)
24,078
1,436
199,861
Total
Information
Technology
883,111
T.
ROWE
PRICE
Total
Equity
Market
Index
Fund
Shares/Par
$
Value
(Cost
and
value
in
$000s)
‡
MATERIALS
2.1%
Chemicals
1.2%
Air
Products
&
Chemicals
9,793
2,840
Axalta
Coating
Systems (2)
11,200
383
Cabot
5,120
468
Celanese
3,941
273
CF
Industries
Holdings
12,240
1,044
Chemours
11,980
202
Corteva
34,735
1,979
Dow
30,260
1,214
DuPont
de
Nemours
17,861
1,362
Eastman
Chemical
3,840
351
Ecolab
11,011
2,580
FMC
12,579
611
HB
Fuller
4,200
283
Huntsman
20,279
366
Ingevity (2)
5,412
221
International
Flavors
&
Fragrances
11,175
945
Kronos
Worldwide
12,600
123
Linde
24,855
10,406
LyondellBasell
Industries,
Class
A
8,582
637
Minerals
Technologies
7,500
572
Mosaic
33,514
824
PPG
Industries
8,557
1,022
Quaker
Chemical
2,300
324
RPM
International
11,044
1,359
Scotts
Miracle-Gro
6,877
456
Sherwin-Williams
12,770
4,341
Westlake
1,701
195
35,381
Construction
Materials
0.2%
CRH
29,753
2,753
Eagle
Materials
1,240
306
Martin
Marietta
Materials
3,079
1,590
Summit
Materials,
Class
A (2)
19,015
962
Vulcan
Materials
5,166
1,329
6,940
Containers
&
Packaging
0.3%
Amcor
96,978
912
Avery
Dennison
2,900
543
Ball
18,000
992
Berry
Global
Group
6,200
401
T.
ROWE
PRICE
Total
Equity
Market
Index
Fund
Shares/Par
$
Value
(Cost
and
value
in
$000s)
‡
Crown
Holdings
4,496
372
International
Paper
21,444
1,154
Myers
Industries
23,260
257
O-I
Glass (2)
11,987
130
Packaging
Corp.
of
America
7,967
1,794
Sealed
Air
10,577
358
Smurfit
WestRock
22,412
1,207
8,120
Metals
&
Mining
0.4%
Carpenter
Technology
3,459
587
Cleveland-Cliffs (2)
34,600
325
Coeur
Mining (2)
66,790
382
Commercial
Metals
10,600
526
Compass
Minerals
International
7,000
79
Freeport-McMoRan
72,530
2,762
Hecla
Mining
87,800
431
McEwen
Mining (2)
17,900
139
Metallus (2)
18,100
256
Newmont
50,454
1,878
Nucor
11,822
1,380
Reliance
4,388
1,182
Royal
Gold
3,300
435
Steel
Dynamics
10,740
1,225
Warrior
Met
Coal
7,381
400
11,987
Paper
&
Forest
Products
0.0%
Clearwater
Paper (2)
3,264
97
Louisiana-Pacific
9,000
932
1,029
Total
Materials
63,457
REAL
ESTATE
2.5%
Diversified
Real
Estate
Investment
Trusts
0.0%
One
Liberty
Properties,
REIT
6,399
174
WP
Carey,
REIT
7,502
409
583
Health
Care
Real
Estate
Investment
Trusts
0.2%
Alexandria
Real
Estate
Equities,
REIT
7,903
771
Healthpeak
Properties,
REIT
22,595
458
Universal
Health
Realty
Income
Trust,
REIT
11,100
413
Ventas,
REIT
26,768
1,576
T.
ROWE
PRICE
Total
Equity
Market
Index
Fund
Shares/Par
$
Value
(Cost
and
value
in
$000s)
‡
Welltower,
REIT
28,078
3,539
6,757
Hotel
&
Resort
Real
Estate
Investment
Trusts
0.1%
Apple
Hospitality
REIT,
REIT
15,007
231
Chatham
Lodging
Trust,
REIT
42,600
381
Host
Hotels
&
Resorts,
REIT
40,980
718
Ryman
Hospitality
Properties,
REIT
4,430
462
1,792
Industrial
Real
Estate
Investment
Trusts
0.3%
EastGroup
Properties,
REIT
2,637
423
First
Industrial
Realty
Trust,
REIT
11,010
552
Innovative
Industrial
Properties,
REIT
2,700
180
Lineage,
REIT
5,841
342
Prologis,
REIT
44,581
4,712
Rexford
Industrial
Realty,
REIT
19,249
744
Terreno
Realty,
REIT
9,634
570
7,523
Office
Real
Estate
Investment
Trusts
0.1%
BXP,
REIT
4,970
369
Cousins
Properties,
REIT
5,931
182
Douglas
Emmett,
REIT
12,900
239
Highwoods
Properties,
REIT
9,024
276
JBG
SMITH
Properties,
REIT
13,975
215
Kilroy
Realty,
REIT
12,105
490
NET
Lease
Office
Properties,
REIT (3)
5,980
187
SL
Green
Realty,
REIT
8,765
595
Vornado
Realty
Trust,
REIT
18,254
767
3,320
Real
Estate
Management
&
Development
0.2%
CBRE
Group,
Class
A (2)
15,080
1,980
CoStar
Group (2)
20,094
1,439
Douglas
Elliman (2)
43,708
73
eXp
World
Holdings (3)
14,096
162
Jones
Lang
LaSalle (2)
1,727
437
Newmark
Group,
Class
A
19,318
248
Opendoor
Technologies (2)
87,710
140
Redfin (2)
21,700
171
RMR
Group,
Class
A
14,531
300
Seritage
Growth
Properties,
Class
A (2)(3)
31,050
128
St.
Joe
8,500
382
Zillow
Group,
Class
A (2)
6,692
474
T.
ROWE
PRICE
Total
Equity
Market
Index
Fund
Shares/Par
$
Value
(Cost
and
value
in
$000s)
‡
Zillow
Group,
Class
C (2)
7,500
555
6,489
Residential
Real
Estate
Investment
Trusts
0.3%
American
Homes
4
Rent,
Class
A,
REIT
16,636
623
AvalonBay
Communities,
REIT
9,493
2,088
Camden
Property
Trust,
REIT
2,778
322
Elme
Communities,
REIT
14,002
214
Equity
LifeStyle
Properties,
REIT
13,383
891
Equity
Residential,
REIT
24,632
1,768
Essex
Property
Trust,
REIT
5,175
1,477
Invitation
Homes,
REIT
15,333
490
Mid-America
Apartment
Communities,
REIT
3,543
548
Sun
Communities,
REIT
9,339
1,148
UDR,
REIT
6,063
263
9,832
Retail
Real
Estate
Investment
Trusts
0.4%
Acadia
Realty
Trust,
REIT
27,771
671
Agree
Realty,
REIT
6,060
427
Curbline
Properties,
REIT
10,504
244
Federal
Realty
Investment
Trust,
REIT
2,942
329
Getty
Realty,
REIT (3)
7,958
240
Kimco
Realty,
REIT
40,462
948
Kite
Realty
Group
Trust,
REIT
15,600
394
Macerich,
REIT
23,200
462
NNN
REIT,
REIT
5,100
208
Realty
Income,
REIT
32,859
1,755
Regency
Centers,
REIT
13,803
1,020
Retail
Opportunity
Investments,
REIT
26,500
460
Simon
Property
Group,
REIT
15,045
2,591
SITE
Centers,
REIT
3,452
53
Urban
Edge
Properties,
REIT
17,659
380
Whitestone
REIT,
REIT
28,900
410
10,592
Specialized
Real
Estate
Investment
Trusts
0.9%
American
Tower,
REIT
22,272
4,085
Crown
Castle,
REIT
18,332
1,664
CubeSmart,
REIT
21,513
922
Digital
Realty
Trust,
REIT
14,284
2,533
EPR
Properties,
REIT
7,971
353
Equinix,
REIT
4,312
4,066
Extra
Space
Storage,
REIT
9,802
1,466
Four
Corners
Property
Trust,
REIT
11,452
311
T.
ROWE
PRICE
Total
Equity
Market
Index
Fund
Shares/Par
$
Value
(Cost
and
value
in
$000s)
‡
Gaming
&
Leisure
Properties,
REIT
8,060
388
Iron
Mountain,
REIT
14,836
1,559
Lamar
Advertising,
Class
A,
REIT
6,434
783
National
Storage
Affiliates
Trust,
REIT
9,800
371
PotlatchDeltic,
REIT
8,100
318
Public
Storage,
REIT
9,418
2,820
Rayonier,
REIT
15,592
407
Safehold,
REIT
10,000
185
SBA
Communications,
REIT
5,600
1,141
VICI
Properties,
REIT
31,838
930
Weyerhaeuser,
REIT
48,864
1,376
25,678
Total
Real
Estate
72,566
UTILITIES
2.2%
Electric
Utilities
1.3%
Alliant
Energy
6,323
374
American
Electric
Power
19,792
1,825
Constellation
Energy
17,920
4,009
Duke
Energy
32,759
3,529
Edison
International
8,498
679
Entergy
25,864
1,961
Evergy
17,644
1,086
Eversource
Energy
7,924
455
Exelon
61,855
2,328
FirstEnergy
33,868
1,347
Hawaiian
Electric
Industries (2)
17,758
173
IDACORP
6,485
709
MGE
Energy
6,339
596
NextEra
Energy
107,373
7,698
NRG
Energy
12,239
1,104
OGE
Energy
13,600
561
Otter
Tail
3,399
251
PG&E
134,026
2,705
PPL
44,428
1,442
Southern
47,732
3,929
Xcel
Energy
36,721
2,479
39,240
Gas
Utilities
0.1%
Atmos
Energy
8,683
1,209
National
Fuel
Gas
10,300
625
ONE
Gas
6,700
464
Spire
5,613
381
T.
ROWE
PRICE
Total
Equity
Market
Index
Fund
Shares/Par
$
Value
(Cost
and
value
in
$000s)
‡
UGI
12,800
361
3,040
Independent
Power
&
Renewable
Electricity
Producers
0.1%
AES
31,155
401
Vistra
18,910
2,607
3,008
Multi-Utilities
0.6%
Ameren
17,883
1,594
Avista
11,410
418
Black
Hills
7,160
419
CenterPoint
Energy
14,401
457
CMS
Energy
22,914
1,527
Consolidated
Edison
11,576
1,033
Dominion
Energy
45,990
2,477
DTE
Energy
10,497
1,268
NiSource
25,760
947
Public
Service
Enterprise
Group
24,008
2,028
Sempra
32,467
2,848
WEC
Energy
Group
16,815
1,581
16,597
Water
Utilities
0.1%
American
States
Water
8,300
645
American
Water
Works
8,500
1,058
Cadiz (2)(3)
42,400
221
California
Water
Service
Group
9,825
445
Essential
Utilities
15,646
568
2,937
Total
Utilities
64,822
Total
Common
Stocks
(Cost
$1,017,059)
2,893,763
SHORT-TERM
INVESTMENTS
0.3%
Money
Market
Funds
0.3%
T.
Rowe
Price
Government
Reserve
Fund,
4.53% (4)(5)
9,291,006
9,291
9,291
U.S.
Treasury
Obligations
0.0%
U.S.
Treasury
Bills,
4.688%,
3/13/25 (6)
600,000
595
595
Total
Short-Term
Investments
(Cost
$9,886)
9,886
T.
ROWE
PRICE
Total
Equity
Market
Index
Fund
Shares/Par
$
Value
(Cost
and
value
in
$000s)
‡
SECURITIES
LENDING
COLLATERAL
0.4%
INVESTMENTS
IN
A
POOLED
ACCOUNT
THROUGH
SECURITIES
LENDING
PROGRAM
WITH
STATE
STREET
BANK
AND
TRUST
COMPANY 0.4%
Money
Market
Funds 0.4%
T.
Rowe
Price
Government
Reserve
Fund,
4.53% (4)(5)
11,704,063
11,704
Total
Investments
in
a
Pooled
Account
through
Securities
Lending
Program
with
State
Street
Bank
and
Trust
Company
11,704
Total
Securities
Lending
Collateral
(Cost
$11,704)
11,704
Total
Investments
in
Securities
100.3%
of
Net
Assets
(Cost
$1,038,649)
$
2,915,353
‡
Shares/Par
and
Notional
Amount
are
denominated
in
U.S.
dollars
unless
otherwise
noted.
(1)
See
Note
2.
Level
3
in
fair
value
hierarchy.
(2)
Non-income
producing
(3)
See
Note
4.
All
or
a
portion
of
this
security
is
on
loan
at
December
31,
2024.
(4)
Seven-day
yield
(5)
Affiliated
Companies
(6)
At
December
31,
2024,
all
or
a
portion
of
this
security
is
pledged
as
collateral
and/or
margin
deposit
to
cover
future
funding
obligations.
EC
Escrow
CUSIP;
represents
a
beneficial
interest
in
a
residual
pool
of
assets;
the
amount
and
timing
of
future
distributions,
if
any,
is
uncertain;
when
presented,
interest
rate
and
maturity
date
are
those
of
the
original
security.
REIT
A
domestic
Real
Estate
Investment
Trust
whose
distributions
pass-through
with
original
tax
character
to
the
shareholder
T.
ROWE
PRICE
Total
Equity
Market
Index
Fund
FUTURES
CONTRACTS
($000s)
Expiration
Date
Notional
Amount
Value
and
Unrealized
Gain
(Loss)
Long,
11
Russell
2000
E-Mini
Index
contracts
3/25
1,237
$
(74)
Long,
33
S&P
500
E-Mini
Index
contracts
3/25
9,794
(332)
Net
payments
(receipts)
of
variation
margin
to
date
369
Variation
margin
receivable
(payable)
on
open
futures
contracts
$
(37)
T.
ROWE
PRICE
Total
Equity
Market
Index
Fund
The
accompanying
notes
are
an
integral
part
of
these
financial
statements.
AFFILIATED
COMPANIES
($000s)
The
fund
may
invest
in
certain
securities
that
are
considered
affiliated
companies.
As
defined
by
the
1940
Act,
an
affiliated
company
is
one
in
which
the
fund
owns
5%
or
more
of
the
outstanding
voting
securities,
or
a
company
that
is
under
common
ownership
or
control.
The
following
securities
were
considered
affiliated
companies
for
all
or
some
portion
of
the
year
ended
December
31,
2024.
Net
realized
gain
(loss),
investment
income,
change
in
net
unrealized
gain/loss,
and
purchase
and
sales
cost
reflect
all
activity
for
the
period
then
ended.
Affiliate
Net
Realized
Gain
(Loss)
Change
in
Net
Unrealized
Gain/Loss
Investment
Income
T.
Rowe
Price
Government
Reserve
Fund,
4.53%
$
—
$
—
$
489++
Totals
$
—#
$
—
$
489+
Supplementary
Investment
Schedule
Affiliate
Value
12/31/23
Purchase
Cost
Sales
Cost
Value
12/31/24
T.
Rowe
Price
Government
Reserve
Fund,
4.53%
$
26,893
¤
¤
$
20,995
Total
$
20,995^
#
Capital
gain
distributions
from
underlying
Price
funds
represented
$0
of
the
net
realized
gain
(loss).
++
Excludes
earnings
on
securities
lending
collateral,
which
are
subject
to
rebates
and
fees
as
described
in
Note
4.
+
Investment
income
comprised
$489
of
dividend
income
and
$0
of
interest
income.
¤
Purchase
and
sale
information
not
shown
for
cash
management
funds.
^
The
cost
basis
of
investments
in
affiliated
companies
was
$20,995.
T.
ROWE
PRICE
Total
Equity
Market
Index
Fund
December
31,
2024
Statement
of
Assets
and
Liabilities
($000s,
except
shares
and
per
share
amounts)
The
accompanying
notes
are
an
integral
part
of
these
financial
statements.
Assets
Investments
in
securities,
at
value
(cost
$1,038,649)
$
2,915,353
Receivable
for
shares
sold
2,002
Dividends
receivable
1,895
Other
assets
52
Total
assets
2,919,302
Liabilities
Obligation
to
return
securities
lending
collateral
11,704
Payable
for
shares
redeemed
1,800
Investment
management
fees
payable
228
Due
to
affiliates
97
Variation
margin
payable
on
futures
contracts
37
Payable
to
directors
2
Other
liabilities
129
Total
liabilities
13,997
NET
ASSETS
$
2,905,305
Net
Assets
Consist
of:
Total
distributable
earnings
(loss)
$
1,878,653
Paid-in
capital
applicable
to
46,828,709
shares
of
$0.0001
par
value
capital
stock
outstanding;
2,000,000,000
shares
of
the
Corporation
authorized
1,026,652
NET
ASSETS
$
2,905,305
NET
ASSET
VALUE
PER
SHARE
$
62.04
T.
ROWE
PRICE
Total
Equity
Market
Index
Fund
The
accompanying
notes
are
an
integral
part
of
these
financial
statements.
Year
Ended
12/31/24
Investment
Income
(Loss)
Income
Dividend
(net
of
foreign
taxes
of
$14)
$
35,223
Securities
lending
155
.
Interest
35
Total
income
35,413
Expenses
Investment
management
2,354
Shareholder
servicing
2,051
Prospectus
and
shareholder
reports
39
Custody
and
accounting
240
Registration
45
Legal
and
audit
29
Directors
8
Miscellaneous
19
Total
expenses
4,785
Net
investment
income
30,628
Realized
and
Unrealized
Gain
/
Loss
–
Net
realized
gain
(loss)
Securities
27,045
Futures
2,633
Net
realized
gain
29,678
Change
in
net
unrealized
gain
/
loss
Securities
484,333
Futures
(923)
Change
in
net
unrealized
gain
/
loss
483,410
Net
realized
and
unrealized
gain
/
loss
513,088
INCREASE
IN
NET
ASSETS
FROM
OPERATIONS
$
543,716
T.
ROWE
PRICE
Total
Equity
Market
Index
Fund
Statement
of
Changes
in
Net
Assets
The
accompanying
notes
are
an
integral
part
of
these
financial
statements.
Year
.
.
.
.
.
.
.
.
.
.
.
.
.
.
Ended
.
.
.
.
.
.
.
.
.
.
.
.
.
.
12/31/24
12/31/23
Increase
(Decrease)
in
Net
Assets
Operations
Net
investment
income
$
30,628
$
29,608
Net
realized
gain
29,678
22,903
Change
in
net
unrealized
gain
/
loss
483,410
428,714
Increase
in
net
assets
from
operations
543,716
481,225
Distributions
to
shareholders
Net
earnings
(50,379)
(32,830)
Capital
share
transactions
*
Shares
sold
430,610
177,782
Distributions
reinvested
45,700
29,719
Shares
redeemed
(341,866)
(248,468)
Increase
(decrease)
in
net
assets
from
capital
share
transactions
134,444
(40,967)
Net
Assets
Increase
during
period
627,781
407,428
Beginning
of
period
2,277,524
1,870,096
End
of
period
$
2,905,305
$
2,277,524
*Share
information
(000s)
Shares
sold
7,484
3,841
Distributions
reinvested
711
589
Shares
redeemed
(5,938)
(5,440)
Increase
(decrease)
in
shares
outstanding
2,257
(1,010)
T.
ROWE
PRICE
Total
Equity
Market
Index
Fund
NOTES
TO
FINANCIAL
STATEMENTS
T.
Rowe
Price
Index
Trust,
Inc. (the
corporation) is
registered
under
the
Investment
Company
Act
of
1940
(the
1940
Act).
The
Total
Equity
Market
Index
Fund
(the
fund)
is
an
open-end
management
investment
company
established
by
the
corporation
and
intends
to
be
diversified
in
approximately
the
same
proportion
as
the
index
it
tracks
is
diversified.
The
fund
may
become
nondiversified
for
periods
of
time
solely
as
a
result
of
changes
in
the
composition
of
the
index
(for
example,
changes
in
the
relative
market
capitalization
or
index
weighting
of
one
or
more
securities
represented
in
the
index). The
fund
seeks to
match
the
performance
of
the
entire
U.S.
stock
market.
NOTE
1
-
SIGNIFICANT
ACCOUNTING
POLICIES
Basis
of
Preparation
The fund
is
an
investment
company
and
follows
accounting
and
reporting
guidance
in
the
Financial
Accounting
Standards
Board
(FASB)
Accounting
Standards
Codification
Topic
946
(ASC
946).
The
accompanying
financial
statements
were
prepared
in
accordance
with
accounting
principles
generally
accepted
in
the
United
States
of
America
(GAAP),
including,
but
not
limited
to,
ASC
946.
GAAP
requires
the
use
of
estimates
made
by
management.
Management
believes
that
estimates
and
valuations
are
appropriate;
however,
actual
results
may
differ
from
those
estimates,
and
the
valuations
reflected
in
the
accompanying
financial
statements
may
differ
from
the
value
ultimately
realized
upon
sale
or
maturity.
Investment
Transactions,
Investment
Income,
and
Distributions
Investment
transactions
are
accounted
for
on
the
trade
date
basis.
Income
and
expenses
are
recorded
on
the
accrual
basis.
Realized
gains
and
losses
are
reported
on
the
identified
cost
basis. Premiums
and
discounts
on
debt
securities
are
amortized
for
financial
reporting
purposes. Income
tax-related
interest
and
penalties,
if
incurred,
are
recorded
as
income
tax
expense. Dividends
received
from other
investment
companies are
reflected
as
dividend income;
capital
gain
distributions
are
reflected
as
realized
gain/loss. Dividend
income and
capital
gain
distributions
are
recorded
on
the
ex-dividend
date. Distributions
from
REITs
are
initially
recorded
as
dividend
income
and,
to
the
extent
such
represent
a
return
of
capital
or
capital
gain
for
tax
purposes,
are
reclassified
when
such
information
becomes
available. Non-cash
dividends,
if
any,
are
recorded
at
the
fair
market
value
of
the
asset
received. Proceeds
from
litigation
payments,
if
any,
are
included
in
either
net
realized
gain
(loss)
or
change
T.
ROWE
PRICE
Total
Equity
Market
Index
Fund
in
net
unrealized
gain/loss
from
securities. Distributions
to
shareholders
are
recorded
on
the
ex-dividend
date. Income
distributions,
if
any,
are
declared
and
paid annually. A
capital
gain
distribution,
if
any, may
also
be
declared
and
paid
by
the
fund
annually.
Capital
Transactions
Each
investor’s
interest
in
the
net
assets
of the
fund
is
represented
by
fund
shares. The
fund’s
net
asset
value
(NAV)
per
share
is
computed
at
the
close
of
the
New
York
Stock
Exchange
(NYSE),
normally
4
p.m.
Eastern
time,
each
day
the
NYSE
is
open
for
business.
However,
the
NAV
per
share
may
be
calculated
at
a
time
other
than
the
normal
close
of
the
NYSE
if
trading
on
the
NYSE
is
restricted,
if
the
NYSE
closes
earlier,
or
as
may
be
permitted
by
the
SEC.
Purchases
and
redemptions
of
fund
shares
are
transacted
at
the
next-computed
NAV
per
share,
after
receipt
of
the
transaction
order
by
T.
Rowe
Price
Associates,
Inc.,
or
its
agents.
New
Accounting
Guidance
In December
2023,
the
FASB
issued
Accounting
Standards
Update
(ASU),
ASU
2023-09,
Income
Taxes
(Topic
740)
–
Improvements
to
Income
Taxes
Disclosures,
which
enhances
the
transparency
of
income
tax
disclosures.
The
ASU
requires
public
entities,
on
an
annual
basis,
to
provide
disclosure
of
specific
categories
in
the
rate
reconciliation,
as
well
as
disclosure
of
income
taxes
paid
disaggregated
by
jurisdiction.
The
amendments
under
this
ASU
are
required
to
be
applied
prospectively
and
are
effective
for
fiscal
years
beginning
after
December
15,
2024.
Management
expects
that
adoption
of
the
guidance
will
not
have
a
material
impact
on
the
fund’s
financial
statements.
Indemnification
In
the
normal
course
of
business, the
fund
may
provide
indemnification
in
connection
with
its
officers
and
directors,
service
providers,
and/or
private
company
investments. The
fund’s
maximum
exposure
under
these
arrangements
is
unknown;
however,
the
risk
of
material
loss
is
currently
considered
to
be
remote.
NOTE
2
-
VALUATION
Fair
Value
The
fund’s
financial
instruments
are
valued
at
the
close
of
the
NYSE
and
are
reported
at
fair
value,
which
GAAP
defines
as
the
price
that
would
be
received
to
sell
an
asset
or
paid
to
transfer
a
liability
in
an
orderly
transaction
between
market
participants
at
the
measurement
date. The fund’s
Board
of
Directors
(the
Board)
has
designated
T.
Rowe
Price
Associates,
Inc.
as
the
fund’s
valuation
designee
(Valuation
Designee).
Subject
to
oversight
by
the
Board,
the
Valuation
Designee
performs
the
following
functions
in
T.
ROWE
PRICE
Total
Equity
Market
Index
Fund
performing
fair
value
determinations:
assesses
and
manages
valuation
risks;
establishes
and
applies
fair
value
methodologies;
tests
fair
value
methodologies;
and
evaluates
pricing
vendors
and
pricing
agents.
The
duties
and
responsibilities
of
the
Valuation
Designee
are
performed
by
its
Valuation
Committee. The
Valuation
Designee provides
periodic
reporting
to
the
Board
on
valuation
matters.
Various
valuation
techniques
and
inputs
are
used
to
determine
the
fair
value
of
financial
instruments.
GAAP
establishes
the
following
fair
value
hierarchy
that
categorizes
the
inputs
used
to
measure
fair
value:
Level
1
–
quoted
prices
(unadjusted)
in
active
markets
for
identical
financial
instruments
that
the
fund
can
access
at
the
reporting
date
Level
2
–
inputs
other
than
Level
1
quoted
prices
that
are
observable,
either
directly
or
indirectly
(including,
but
not
limited
to,
quoted
prices
for
similar
financial
instruments
in
active
markets,
quoted
prices
for
identical
or
similar
financial
instruments
in
inactive
markets,
interest
rates
and
yield
curves,
implied
volatilities,
and
credit
spreads)
Level
3
–
unobservable
inputs
(including
the Valuation
Designee’s assumptions
in
determining
fair
value)
Observable
inputs
are
developed
using
market
data,
such
as
publicly
available
information
about
actual
events
or
transactions,
and
reflect
the
assumptions
that
market
participants
would
use
to
price
the
financial
instrument.
Unobservable
inputs
are
those
for
which
market
data
are
not
available
and
are
developed
using
the
best
information
available
about
the
assumptions
that
market
participants
would
use
to
price
the
financial
instrument.
GAAP
requires
valuation
techniques
to
maximize
the
use
of
relevant
observable
inputs
and
minimize
the
use
of
unobservable
inputs.
When
multiple
inputs
are
used
to
derive
fair
value,
the
financial
instrument
is
assigned
to
the
level
within
the
fair
value
hierarchy
based
on
the
lowest-level
input
that
is
significant
to
the
fair
value
of
the
financial
instrument.
Input
levels
are
not
necessarily
an
indication
of
the
risk
or
liquidity
associated
with
financial
instruments
at
that
level
but
rather
the
degree
of
judgment
used
in
determining
those
values.
Valuation
Techniques
Equity
securities,
including
exchange-traded
funds, listed
or
regularly
traded
on
a
securities
exchange
or
in
the
over-the-
counter
(OTC)
market
are
valued
at
the
last
quoted
sale
price
or,
for
certain
markets,
the
official
closing
price
at
the
time
the
valuations
are
made.
OTC
Bulletin
Board
securities
are
valued
at
the
mean
of
the
closing
bid
and
asked
prices.
A
security
that
is
listed
or
traded
on
more
than
one
exchange
is
valued
T.
ROWE
PRICE
Total
Equity
Market
Index
Fund
at
the
quotation
on
the
exchange
determined
to
be
the
primary
market
for
such
security.
Listed
securities
not
traded
on
a
particular
day
are
valued
at
the
mean
of
the
closing
bid
and
asked
prices
for
domestic
securities.
Debt
securities
generally
are
traded
in
the over-the-counter
(OTC)
market
and
are
valued
at
prices
furnished
by
independent
pricing
services
or
by
broker
dealers
who
make
markets
in
such
securities.
When
valuing
securities,
the
independent
pricing
services
consider
factors
such
as,
but
not
limited
to,
the
yield
or
price
of
bonds
of
comparable
quality,
coupon,
maturity,
and
type,
as
well
as
prices
quoted
by
dealers
who
make
markets
in
such
securities.
Investments
in
mutual
funds
are
valued
at
the
mutual
fund’s
closing
NAV
per
share
on
the
day
of
valuation.
Futures
contracts
are
valued
at
closing
settlement
prices.
Assets
and
liabilities
other
than
financial
instruments,
including
short-
term
receivables
and
payables,
are
carried
at
cost,
or
estimated
realizable
value,
if
less,
which
approximates
fair
value.
Investments
for
which
market
quotations are
not
readily
available
or
deemed
unreliable
are
valued
at
fair
value
as
determined
in
good
faith
by
the
Valuation
Designee.
The
Valuation
Designee
has
adopted
methodologies
for
determining
the
fair
value
of
investments
for
which
market
quotations
are
not
readily
available
or
deemed
unreliable,
including
the
use
of
other
pricing
sources.
Factors
used
in
determining
fair
value
vary
by
type
of
investment
and
may
include
market
or
investment
specific
considerations.
The
Valuation
Designee typically
will
afford
greatest
weight
to
actual
prices
in
arm’s
length
transactions,
to
the
extent
they
represent
orderly
transactions
between
market
participants,
transaction
information
can
be
reliably
obtained,
and
prices
are
deemed
representative
of
fair
value.
However,
the
Valuation
Designee may
also
consider
other
valuation
methods
such
as
market-based
valuation
multiples;
a
discount
or
premium
from
market
value
of
a
similar,
freely
traded
security
of
the
same
issuer;
discounted
cash
flows;
yield
to
maturity;
or
some
combination.
Fair
value
determinations
are
reviewed
on
a
regular
basis.
Because
any
fair
value
determination
involves
a
significant
amount
of
judgment,
there
is
a
degree
of
subjectivity
inherent
in
such
pricing
decisions. Fair
value
prices
determined
by
the
Valuation
Designee could
differ
from
those
of
other
market
participants,
and
it
is
possible
that
the
fair
value
determined
for
a
security
may
be
materially
different
from
the
value
that
could
be
realized
upon
the
sale
of
that
security.
T.
ROWE
PRICE
Total
Equity
Market
Index
Fund
Valuation
Inputs
The
following
table
summarizes
the
fund’s
financial
instruments,
based
on
the
inputs
used
to
determine
their
fair
values
on
December
31,
2024
(for
further
detail
by
category,
please
refer
to
the
accompanying
Portfolio
of
Investments):
NOTE
3
-
DERIVATIVE
INSTRUMENTS
During
the
year ended
December
31,
2024,
the
fund
invested
in
derivative
instruments.
As
defined
by
GAAP,
a
derivative
is
a
financial
instrument
whose
value
is
derived
from
an
underlying
security
price,
foreign
exchange
rate,
interest
rate,
index
of
prices
or
rates,
or
other
variable;
it
requires
little
or
no
initial
investment
and
permits
or
requires
net
settlement
or
delivery
of
cash
or
other
assets.
The
fund
invests
in
derivatives
only
if
the
expected
risks
and
rewards
are
consistent
with
its
investment
objectives,
policies,
and
overall
risk
profile,
as
described
in
its
prospectus
and
Statement
of
Additional
Information.
The
fund
may
use
derivatives
for
a
variety
of
purposes
and
may
use
them
to
establish
both
long
and
short
positions
within
the
fund’s
portfolio.
Potential
uses
include
to
hedge
against
declines
in
principal
value,
increase
yield,
invest
in
an
asset
with
greater
efficiency
and
at
a
lower
cost
than
is
possible
through
direct
investment,
to
enhance
return,
or
to
adjust
credit
exposure.
The
risks
associated
with
the
use
of
derivatives
are
different
from,
and
potentially
much
greater
than,
the
risks
associated
with
investing
directly
in
the
instruments
on
which
the
derivatives
are
based.
($000s)
Level
1
Level
2
Level
3
Total
Value
Assets
Common
Stocks
$
2,893,763
$
—
$
—
$
2,893,763
Short-Term
Investments
9,291
595
—
9,886
Securities
Lending
Collateral
11,704
—
—
11,704
Total
$
2,914,758
$
595
$
—
$
2,915,353
Liabilities
Futures
Contracts*
$
406
$
—
$
—
$
406
*
The
fair
value
presented
includes
cumulative
gain
(loss)
on
open
futures
contracts;
however,
the
net
value
reflected
on
the
accompanying
Portfolio
of
Investments
is
only
the
unsettled
variation
margin
receivable
(payable)
at
that
date.
T.
ROWE
PRICE
Total
Equity
Market
Index
Fund
The
fund
values
its
derivatives
at
fair
value
and
recognizes
changes
in
fair
value
currently
in
its
results
of
operations.
Accordingly,
the
fund
does
not
follow
hedge
accounting,
even
for
derivatives
employed
as
economic
hedges.
Generally,
the
fund
accounts
for
its
derivatives
on
a
gross
basis.
It
does
not
offset
the
fair
value
of
derivative
liabilities
against
the
fair
value
of
derivative
assets
on
its
financial
statements,
nor
does
it
offset
the
fair
value
of
derivative
instruments
against
the
right
to
reclaim
or
obligation
to
return
collateral.
The
following
table
summarizes
the
fair
value
of
the
fund’s
derivative
instruments
held
as
of
December
31,
2024,
and
the
related
location
on
the
accompanying
Statement
of
Assets
and
Liabilities,
presented
by
primary
underlying
risk
exposure:
Additionally,
the
amount
of
gains
and
losses
on
derivative
instruments
recognized
in
fund
earnings
during
the
year ended
December
31,
2024,
and
the
related
location
on
the
accompanying
Statement
of
Operations
is
summarized
in
the
following
table
by
primary
underlying
risk
exposure:
($000s)
Location
on
Statement
of
Assets
and
Liabilities
Fair
Value*
*
Liabilities
Equity
derivatives
Futures
$
406
Total
$
406
*
The
fair
value
presented
includes
cumulative
gain
(loss)
on
open
futures
contracts;
however,
the
value
reflected
on
the
accompanying
Statement
of
Assets
and
Liabilities
is
only
the
unsettled
variation
margin
receivable
(payable)
at
that
date.
($000s)
Location
of
Gain
(Loss)
on
Statement
of
Operations
Futures
Realized
Gain
(Loss)
Equity
derivatives
$
2,633
Total
$
2,633
T.
ROWE
PRICE
Total
Equity
Market
Index
Fund
Counterparty
Risk
and
Collateral
The
fund
invests
in
exchange-traded
and/or
centrally
cleared
derivative
contracts,
such
as
futures,
exchange-traded
options,
and
centrally
cleared
swaps.
Counterparty
risk
on
such
derivatives
is
minimal
because
the
clearinghouse
provides
protection
against
counterparty
defaults.
For
futures
and
centrally
cleared
swaps,
the
fund
is
required
to
deposit
collateral
in
an
amount
specified
by
the
clearinghouse
and
the
clearing
firm
(margin
requirement),
and
the
margin
requirement
must
be
maintained
over
the
life
of
the
contract.
Each
clearinghouse
and
clearing
firm,
in
its
sole
discretion,
may
adjust
the
margin
requirements
applicable
to
the
fund.
Collateral may
be
in
the
form
of
cash
or
debt
securities
issued
by
the
U.S.
government
or
related
agencies.
Cash
posted
by
the
fund
is
reflected
as
cash
deposits
in
the
accompanying
financial
statements
and
generally
is
restricted
from
withdrawal
by
the
fund;
securities
posted
by
the
fund
are
so
noted
in
the
accompanying
Portfolio
of
Investments;
both
remain
in
the
fund’s
assets.
While
typically
not
sold
in
the
same
manner
as
equity
or
fixed
income
securities,
exchange-traded
or
centrally
cleared
derivatives
may
be
closed
out
only
on
the
exchange
or
clearinghouse
where
the
contracts
were
cleared.
This
ability
is
subject
to
the
liquidity
of
underlying
positions. As
of
December
31,
2024,
securities
valued
at $595,000
had
been
posted
by
the
fund
for
exchange-traded
and/or
centrally
cleared
derivatives.
Futures
Contracts
The
fund
is
subject
to equity
price
risk in
the
normal
course
of
pursuing
its
investment
objectives
and
uses
futures
contracts
to
help
manage
such
risk.
The
fund
may
enter
into
futures
contracts
as
an
efficient
means
of
maintaining
liquidity
while
being
invested
in
the
market,
to
facilitate
trading,
or
to
reduce
transaction
costs. A
futures
contract
provides
for
the
future
sale
by
one
party
and
purchase
by
another
of
a
specified
amount
of
a
specific
underlying
financial
instrument
at
an
agreed-upon
price,
date,
time,
and
place.
The
fund
currently
invests
only
in
exchange-traded
futures,
which
generally
are
standardized
as
to
maturity
date,
underlying
financial
instrument,
and
other
contract
terms.
Payments
are
made
or
received
by
the
fund
each
day
($000s)
Location
of
Gain
(Loss)
on
Statement
of
Operations
Futures
Change
in
Unrealized
Gain
(Loss)
Equity
derivatives
$
(923)
Total
$
(923)
T.
ROWE
PRICE
Total
Equity
Market
Index
Fund
to
settle
daily
fluctuations
in
the
value
of
the
contract
(variation
margin),
which
reflect
changes
in
the
value
of
the
underlying
financial
instrument.
Variation
margin
is
recorded
as
unrealized
gain
or
loss
until
the
contract
is
closed.
The
value
of
a
futures
contract
included
in
net
assets
is
the
amount
of
unsettled
variation
margin;
net
variation
margin
receivable
is
reflected
as
an
asset
and
net
variation
margin
payable
is
reflected
as
a
liability
on
the
accompanying
Statement
of
Assets
and
Liabilities.
When
a
contract
is
closed,
a
realized
gain
or
loss
is
recorded
on
the
accompanying
Statement
of
Operations.
Risks
related
to
the
use
of
futures
contracts
include
possible
illiquidity
of
the
futures
markets,
contract
prices
that
can
be
highly
volatile
and
imperfectly
correlated
to
movements
in
hedged
security
values,
and
potential
losses
in
excess
of
the
fund’s
initial
investment.
During
the
year ended
December
31,
2024,
the
volume
of
the
fund’s
activity
in
futures,
based
on
underlying
notional
amounts,
was
generally
less
than
1%
of
net
assets.
NOTE
4
-
OTHER
INVESTMENT
TRANSACTIONS
Consistent
with
its
investment
objective, the
fund
engages
in
the
following
practices
to
manage
exposure
to
certain
risks
and/or
to
enhance
performance.
The
investment
objective,
policies,
program,
and
risk
factors
of the
fund
are
described
more
fully
in the
fund’s prospectus
and
Statement
of
Additional
Information.
Securities
Lending
The fund
may
lend
its
securities
to
approved
borrowers
to
earn
additional
income.
Its
securities
lending
activities
are
administered
by
a
lending
agent
in
accordance
with
a
securities
lending
agreement.
Security
loans
generally
do
not
have
stated
maturity
dates,
and
the
fund
may
recall
a
security
at
any
time.
The
fund
receives
collateral
in
the
form
of
cash
or
U.S.
government
securities.
Collateral
is
maintained
over
the
life
of
the
loan
in
an
amount
not
less
than
the
value
of
loaned
securities;
any
additional
collateral
required
due
to
changes
in
security
values
is
delivered
to
the
fund
the
next
business
day.
Cash
collateral
is
invested
in
accordance
with
investment
guidelines
approved
by
fund
management.
Additionally,
the
lending
agent
indemnifies
the
fund
against
losses
resulting
from
borrower
default.
Although
risk
is
mitigated
by
the
collateral
and
indemnification,
the
fund
could
experience
a
delay
in
recovering
its
securities
and
a
possible
loss
of
income
or
value
if
the
borrower
fails
to
return
the
securities,
collateral
investments
decline
in
value,
and
the
lending
agent
fails
to
perform.
Securities
lending
revenue
consists
of
earnings
on
invested
collateral
and
borrowing
fees,
net
of
any
rebates
to
the
borrower,
compensation
to
the
lending
agent,
and
other
administrative
costs.
In
accordance
with
GAAP,
T.
ROWE
PRICE
Total
Equity
Market
Index
Fund
investments
made
with
cash
collateral
are
reflected
in
the
accompanying
financial
statements,
but
collateral
received
in
the
form
of
securities
is
not.
At
December
31,
2024,
the
value
of
loaned
securities
was
$11,304,000;
the
value
of
cash
collateral
and
related
investments
was
$11,704,000.
Other
Purchases
and
sales
of
portfolio
securities
other
than
in-kind
transactions,
if
any,
and short-term securities
aggregated $275,560,000 and
$158,276,000,
respectively,
for
the
year ended
December
31,
2024.
NOTE
5
-
FEDERAL
INCOME
TAXES
Generally,
no
provision
for
federal
income
taxes
is
required
since
the
fund
intends
to continue
to
qualify
as
a
regulated
investment
company
under
Subchapter
M
of
the
Internal
Revenue
Code
and
distribute
to
shareholders
all
of
its taxable
income
and
gains.
Distributions
determined
in
accordance
with
federal
income
tax
regulations
may
differ
in
amount
or
character
from
net
investment
income
and
realized
gains
for
financial
reporting
purposes.
The
fund
files
U.S.
federal,
state,
and
local
tax
returns
as
required.
The
fund’s
tax
returns
are
subject
to
examination
by
the
relevant
tax
authorities
until
expiration
of
the
applicable
statute
of
limitations,
which
is
generally
three
years
after
the
filing
of
the
tax
return
but
which
can
be
extended
to
six
years
in
certain
circumstances.
Tax
returns
for
open
years
have
incorporated
no
uncertain
tax
positions
that
require
a
provision
for
income
taxes.
Capital
accounts
within
the
financial
reporting
records
are
adjusted
for
permanent
book/tax
differences
to
reflect
tax
character
but
are
not
adjusted
for
temporary
differences.
The
permanent
book/tax
adjustments,
if
any,
have
no
impact
on
results
of
operations
or
net
assets.
The
permanent
book/tax
adjustments
relate
primarily
to
deemed
distributions
on
shareholder
redemptions.
T.
ROWE
PRICE
Total
Equity
Market
Index
Fund
The
tax
character
of
distributions
paid
for
the
periods
presented
was
as
follows:
At
December
31,
2024,
the
tax-basis
cost
of
investments
(including
derivatives,
if
any)
and
gross
unrealized
appreciation
and
depreciation
were as
follows:
At
December
31,
2024,
the
tax-basis
components
of
accumulated
net
earnings
(loss)
were
as
follows:
Temporary
differences
between
book-basis
and
tax-basis
components
of
total
distributable
earnings
(loss)
arise
when
certain
items
of
income,
gain,
or
loss
are
recognized
in
different
periods
for
financial
statement
purposes
versus
for
tax
purposes;
these
differences
will
reverse
in
a
subsequent
reporting
period.
The
temporary
differences
relate
primarily
to
the
deferral
of
losses
from
wash
sales.
($000s)
December
31,
2024
December
31,
2023
Ordinary
income
(including
short-term
capital
gains,
if
any)
$
32,547
$
27,035
Long-term
capital
gain
17,832
5,795
Total
distributions
$
50,379
$
32,830
($000s)
Cost
of
investments
$
1,040,013
Unrealized
appreciation
$
1,933,458
Unrealized
depreciation
(58,118)
Net
unrealized
appreciation
(depreciation)
$
1,875,340
($000s)
Undistributed
ordinary
income
$
178
Undistributed
long-term
capital
gain
3,135
Net
unrealized
appreciation
(depreciation)
1,875,340
Total
distributable
earnings
(loss)
$
1,878,653
T.
ROWE
PRICE
Total
Equity
Market
Index
Fund
NOTE
6
-
FOREIGN TAXES
The
fund
is
subject
to
foreign
income
taxes
imposed
by
certain
countries
in
which
it
invests.
Additionally,
capital
gains
realized
upon
disposition
of
securities
issued
in
or
by
certain
foreign
countries
are
subject
to
capital
gains
tax
imposed
by
those
countries.
All
taxes
are
computed
in
accordance
with
the
applicable
foreign
tax
law,
and,
to
the
extent
permitted,
capital
losses
are
used
to
offset
capital
gains.
Taxes
attributable
to
income
are
accrued
by
the
fund
as
a
reduction
of
income.
Current
and
deferred
tax
expense
attributable
to
capital
gains
is
reflected
as
a
component
of
realized
or
change
in
unrealized
gain/
loss
on
securities
in
the
accompanying
financial
statements.
To
the
extent
that
the
fund
has
country
specific
capital
loss
carryforwards,
such
carryforwards
are
applied
against
net
unrealized
gains
when
determining
the
deferred
tax
liability.
Any
deferred
tax
liability
incurred
by
the
fund
is
included
in
either
Other
liabilities
or
Deferred
tax
liability
on
the
accompanying
Statement
of
Assets
and
Liabilities.
NOTE
7
-
RELATED
PARTY
TRANSACTIONS
The
fund
is
managed
by
T.
Rowe
Price
Associates,
Inc.
(Price
Associates),
a
wholly
owned
subsidiary
of
T.
Rowe
Price
Group,
Inc.
(Price
Group). Price
Associates
has
entered
into
a
sub-advisory
agreement(s)
with
one
or
more
of
its
wholly
owned
subsidiaries,
to
provide
investment
advisory
services
to
the
fund. The
investment
management
agreement
between
the
fund
and
Price
Associates
provides
for
an
annual
investment
management
fee
equal
to 0.09%
of
the
fund’s
average
daily
net
assets.
The
fee
is
computed
daily
and
paid
monthly.
The fund is
subject
to
a
contractual
expense
limitation
through
the
expense
limitation
date
indicated
in
the
table
below.
This
agreement
will
continue
through
the
expense
limitation
date
indicated
in
the
table
below,
and
may
be
renewed,
revised,
or
revoked
only
with
approval
of
the
fund’s
Board.
During
the
limitation
period,
Price
Associates
is required
to
waive
or
pay
any
expenses
(excluding
interest;
expenses
related
to
borrowings,
taxes,
and
brokerage;
non-recurring,
extraordinary
expenses;
and
acquired
fund
fees
and
expenses)
that
would
otherwise
cause
the fund’s
ratio
of
annualized
total
expenses
to
average
net
assets
(net
expense
ratio)
to
exceed
its
expense
limitation.
The
Fund
is
required
to
repay
Price
Associates
for
expenses
previously
waived/paid
to
the
extent
its net
assets
grow
or
expenses
decline
sufficiently
to
allow
repayment
without
causing
the fund’s
net
expense
ratio
(after
the
repayment
is
taken
into
account)
T.
ROWE
PRICE
Total
Equity
Market
Index
Fund
to
exceed
the
lesser
of:
(1)
the
expense
limitation
in
place
at
the
time
such
amounts
were
waived;
or
(2)
the fund’s
current
expense
limitation.
However,
no
repayment
will
be
made
more
than
three
years
after
the
date
of
a
payment
or
waiver.
In
addition, the
fund
is
subject
to
a
permanent
contractual
expense
limitation,
pursuant
to
which
Price
Associates
is
required
to
waive or
pay
any
expenses
(excluding
interest;
expenses
related
to
borrowings,
taxes,
and
brokerage;
non-
recurring,
extraordinary
expenses;
and
acquired
fund
fees
and
expenses)
that
would
otherwise
cause
the fund’s
ratio
of
annualized
total
expenses
to
average
net
assets
(net
expense
ratio)
to
exceed
0.30%.
The
agreement
may
only
be
terminated
with
approval
by
the
fund’s
shareholders.
The
fund is
required
to
repay
Price
Associates
for
expenses
previously
waived/paid
to
the
extent
the fund’s
net
assets
grow
or
expenses
decline
sufficiently
to
allow
repayment
without
causing
the fund’s
net
expense
ratio
(after
the
repayment
is
taken
into
account)
to
exceed
the
lesser
of:
(1)
the
expense
limitation
in
place
at
the
time
such
amounts
were
waived;
or
(2)
the fund’s
current
expense
limitation.
However,
no
repayment
will
be
made
more
than
three
years
after
the
date
of
a
payment
or
waiver. No
management
fees
were
waived
or
any
expenses
paid
under
this
arrangement
for
the
year ended
December
31,
2024.
In
addition,
the
fund
has
entered
into
service
agreements
with
Price
Associates
and
two
wholly
owned
subsidiaries
of
Price
Associates,
each
an
affiliate
of
the
fund
(collectively,
Price).
Price
Associates
provides
certain
accounting
and
administrative
services
to
the
fund.
T.
Rowe
Price
Services,
Inc.
provides
shareholder
and
administrative
services
in
its
capacity
as
the
fund’s
transfer
and
dividend-disbursing
agent.
T.
Rowe
Price
Retirement
Plan
Services,
Inc.
provides
subaccounting
and
recordkeeping
services
for
certain
retirement
accounts
invested
in
the
fund.
For
the
year
ended
December
31,
2024,
expenses
incurred
pursuant
to
these
service
agreements
were
$116,000
for
Price
Associates;
$930,000
for
T.
Rowe
Price
Services,
Inc.;
and
$185,000
for
T.
Rowe
Price
Retirement
Plan
Services,
Inc.
All
amounts
due
to
and
due
from
Price,
exclusive
of
investment
management
fees
payable,
are
presented
net
on
the
accompanying
Statement
of
Assets
and
Liabilities.
Expense
limitation
0.22%
Expense
limitation
date
04/30/26
(Waived)/repaid
during
the
period
($000s)
$—
T.
ROWE
PRICE
Total
Equity
Market
Index
Fund
T.
Rowe
Price
Investment
Services,
Inc.
(Investment
Services)
serves
as
distributor
to
the
fund.
Pursuant
to
an
underwriting
agreement,
no
compensation
for
any
distribution
services
provided
is
paid
to
Investment
Services
by
the
fund
(except
for
12b-1
fees
under
a
Board-approved
Rule
12b-1
plan).
The fund
may
invest
its
cash
reserves
in
certain
open-end
management
investment
companies
managed
by
Price
Associates
and
considered
affiliates
of
the
fund:
the
T.
Rowe
Price
Government
Reserve
Fund
or
the
T.
Rowe
Price
Treasury
Reserve
Fund,
organized
as
money
market
funds
(together,
the
Price
Reserve
Funds).
The
Price
Reserve
Funds
are
offered
as
short-term
investment
options
to
mutual
funds,
trusts,
and
other
accounts
managed
by
Price
Associates
or
its
affiliates
and
are
not
available
for
direct
purchase
by
members
of
the
public.
Cash
collateral
from
securities
lending,
if
any,
is
invested
in
the
T.
Rowe
Price
Government
Reserve Fund. The
Price
Reserve
Funds
pay
no
investment
management
fees.
The fund may
participate
in
securities
purchase
and
sale
transactions
with
other
funds
or
accounts
advised
by
Price
Associates
(cross
trades),
in
accordance
with
procedures
adopted
by the
fund’s
Board
and
Securities
and
Exchange
Commission
rules,
which
require,
among
other
things,
that
such
purchase
and
sale
cross
trades
be
effected
at
the
independent
current
market
price
of
the
security.
During
the
year
ended
December
31,
2024,
the
fund
had
no
purchases
or
sales
cross
trades
with
other
funds
or
accounts
advised
by
Price
Associates.
NOTE
8
-
SEGMENT
REPORTING
Operating
segments
are
defined
as
components
of
a
company
that
engage
in
business
activities
and
for
which
discrete
financial
information
is
available
and
regularly
reviewed
by
the
chief
operating
decision
maker
(CODM)
in
deciding
how
to
allocate
resources
and
assess
performance.
The
Management
Committee
of
Price
Associates
acts
as
the
fund’s
CODM.
The
fund
makes
investments
in
accordance
with
its
investment
objective
as
outlined
in
the
Prospectus
and
is
considered
one
reportable
segment
because
the
CODM
allocates
resources
and
assesses
the
operating
results
of
the
fund
on
the
whole.
The
fund’s
revenue
is
derived
from
investments
in
portfolio
of
securities.
The
CODM
allocates
resources
and
assesses
performance
based
on
the
operating
results
of
the
fund,
which
is
consistent
with
the
results
presented
in
T.
ROWE
PRICE
Total
Equity
Market
Index
Fund
the
statement
of
operations,
statement
of
changes
in
net
assets
and
financial
highlights.
The
CODM
compares
the
fund’s
performance
to
its
benchmark
index
and
evaluates
the
positioning
of
the
fund
in
relation
to
its
investment
objective.
The
measure
of
segment
assets
is
net
assets
of
the
fund
which
is
disclosed
in
the
statement
of
assets
and
liabilities.
The
accounting
policies
of
the
segment
are
the
same
as
those
described
in
the
summary
of
significant
accounting
policies.
The
financial
statements
include
all
details
of
the
segment
assets,
segment
revenue
and
expenses;
and
reflect
the
financial
results
of
the
segment.
NOTE
9
-
OTHER
MATTERS
Unpredictable environmental,
political,
social
and
economic
events,
including
but
not
limited
to,
environmental
or
natural
disasters,
war
and
conflict
(including
Russia’s
military
invasion
of
Ukraine
and
the
conflict
in
Israel,
Gaza
and
surrounding
areas),
terrorism,
geopolitical
developments
(including
trading
and
tariff
arrangements,
sanctions
and
cybersecurity
attacks),
and
public
health
epidemics
(including
the
global
outbreak
of
COVID-19)
and
similar
public
health
threats,
may
significantly
affect
the
economy
and
the
markets
and
issuers
in
which
a
fund
invests.
The
extent
and
duration
of
such
events
and
resulting
market
disruptions
cannot
be
predicted.
These
and
other
similar
events
may
cause
instability
across
global
markets,
including
reduced
liquidity
and
disruptions
in
trading
markets,
while
some
events
may
affect
certain
geographic
regions,
countries,
sectors,
and
industries
more
significantly
than
others,
and
exacerbate
other
pre-existing
political,
social,
and
economic
risks.
The
fund’s
performance
could
be
negatively
impacted
if
the
value
of
a
portfolio
holding
were
harmed
by
these
or
such
events.
Management
actively
monitors
the
risks
and
financial
impacts
arising
from
such
events.
T.
ROWE
PRICE
Total
Equity
Market
Index
Fund
REPORT
OF
INDEPENDENT
REGISTERED
PUBLIC
ACCOUNTING
FIRM
To
the
Board
of
Directors
of
T.
Rowe
Price
Index
Trust,
Inc.
and
Shareholders
of
T.
Rowe
Price
Total
Equity
Market
Index
Fund
Opinion
on
the
Financial
Statements
We
have
audited
the
accompanying
statement
of
assets
and
liabilities,
including
the
portfolio
of
investments,
of
T.
Rowe
Price
Total
Equity
Market
Index
Fund
(one
of
the
funds
constituting
T.
Rowe
Price
Index
Trust,
Inc.,
referred
to
hereafter
as
the
"Fund")
as
of
December
31,
2024,
the
related
statement
of
operations
for
the
year
ended
December
31,
2024,
the
statement
of
changes
in
net
assets
for
each
of
the
two
years
in
the
period
ended
December
31,
2024,
including
the
related
notes,
and
the
financial
highlights
for
each
of
the
five
years
in
the
period
ended
December
31,
2024
(collectively
referred
to
as
the
“financial
statements”).
In
our
opinion,
the
financial
statements
present
fairly,
in
all
material
respects,
the
financial
position
of
the
Fund
as
of
December
31,
2024,
the
results
of
its
operations
for
the
year
then
ended,
the
changes
in
its
net
assets
for
each
of
the
two
years
in
the
period
ended
December
31,
2024
and
the
financial
highlights
for
each
of
the
five
years
in
the
period
ended
December
31,
2024
in
conformity
with
accounting
principles
generally
accepted
in
the
United
States
of
America.
Basis
for
Opinion
These
financial
statements
are
the
responsibility
of
the
Fund’s
management.
Our
responsibility
is
to
express
an
opinion
on
the
Fund’s
financial
statements
based
on
our
audits.
We
are
a
public
accounting
firm
registered
with
the
Public
Company
Accounting
Oversight
Board
(United
States)
(PCAOB)
and
are
required
to
be
independent
with
respect
to
the
Fund
in
accordance
with
the
U.S.
federal
securities
laws
and
the
applicable
rules
and
regulations
of
the
Securities
and
Exchange
Commission
and
the
PCAOB.
We
conducted
our
audits
of
these
financial
statements
in
accordance
with
the
standards
of
the
PCAOB.
Those
standards
require
that
we
plan
and
perform
the
audit
to
obtain
reasonable
assurance
about
whether
the
financial
statements
are
free
of
material
misstatement,
whether
due
to
error
or
fraud.
T.
ROWE
PRICE
Total
Equity
Market
Index
Fund
Our
audits
included
performing
procedures
to
assess
the
risks
of
material
misstatement
of
the
financial
statements,
whether
due
to
error
or
fraud,
and
performing
procedures
that
respond
to
those
risks.
Such
procedures
included
examining,
on
a
test
basis,
evidence
regarding
the
amounts
and
disclosures
in
the
financial
statements.
Our
audits
also
included
evaluating
the
accounting
principles
used
and
significant
estimates
made
by
management,
as
well
as
evaluating
the
overall
presentation
of
the
financial
statements.
Our
procedures
included
confirmation
of
securities
owned
as
of
December
31,
2024
by
correspondence
with
the
custodian,
transfer
agent
and
brokers;
when
replies
were
not
received
from
brokers,
we
performed
other
auditing
procedures.
We
believe
that
our
audits
provide
a
reasonable
basis
for
our
opinion.
/s/
PricewaterhouseCoopers
LLP
Baltimore,
Maryland
February
18,
2025
We
have
served
as
the
auditor
of
one
or
more
investment
companies
in
the
T.
Rowe
Price
group
of
investment
companies
since
1973.
REPORT
OF
INDEPENDENT
REGISTERED
PUBLIC
ACCOUNTING
FIRM
(continued)
T.
ROWE
PRICE
Total
Equity
Market
Index
Fund
TAX
INFORMATION
(UNAUDITED)
FOR
THE
TAX
YEAR
ENDED 12/31/24
We
are
providing
this
information
as
required
by
the
Internal
Revenue
Code.
The
amounts
shown
may
differ
from
those
elsewhere
in
this
report
because
of
differences
between
tax
and
financial
reporting
requirements.
The
fund’s
distributions
to
shareholders
included:
$27,405,000
from
long-term
capital
gains,
subject
to
a
long-term
capital
gains
tax
rate
of
not
greater
than
20%
For
nonresident
alien
shareholders,
100%
of
short-term
capital
gain
dividends
distributed
by
the
fund
for
the
fiscal
year
are
qualified
short-term
capital
gains.
For
taxable
non-corporate
shareholders,
$32,039,000
of
the
fund's
income
represents
qualified
dividend
income
subject
to
a
long-term
capital
gains
tax
rate
of
not
greater
than
20%.
For
corporate
shareholders,
$30,484,000
of
the
fund's
income
qualifies
for
the
dividends-received
deduction.
For
individuals
and
certain
trusts
and
estates
which
are
entitled
to
claim
a
deduction
of
up
to
20%
of
their
combined
qualified
real
estate
investment
trust
(REIT)
dividends,
$1,790,000
of
the
fund's
income
qualifies
as
qualified
real
estate
investment
trust
(REIT)
dividends.
100
East
Pratt
Street
Baltimore,
MD
21202
T.
Rowe
Price
Investment
Services,
Inc.
Call
1-800-225-5132
to
request
a
prospectus
or
summary
prospectus;
each
includes
investment
objectives,
risks,
fees,
expenses,
and
other
information
that
you
should
read
and
consider
carefully
before
investing.
F123-050
2/25
Item 8. Changes in and Disagreements with Accountants for Open-End Management Investment Companies.
Not applicable.
Item 9. Proxy Disclosures for Open-End Management Investment Companies.
Not applicable.
Item 10. Remuneration Paid to Directors, Officers, and Others of Open-End Management Investment Companies.
Remuneration paid to Directors is included in Item 7 of this Form N-CSR.
Item 11. Statement Regarding Basis for Approval of Investment Advisory Contract.
If applicable, see Item 7.
Item 12. Disclosure of Proxy Voting Policies and Procedures for Closed-End Management Investment Companies.
Not applicable.
Item 13. Portfolio Managers of Closed-End Management Investment Companies.
Not applicable.
Item 14. Purchases of Equity Securities by Closed-End Management Investment Company and Affiliated Purchasers.
Not applicable.
Item 15. Submission of Matters to a Vote of Security Holders.
There has been no change to the procedures by which shareholders may recommend nominees to the registrant’s board of directors.
Item 16. Controls and Procedures.
(a) The registrant’s principal executive officer and principal financial officer have evaluated the registrant’s disclosure controls and procedures within 90 days of this filing and have concluded that the registrant’s disclosure controls and procedures were effective, as of that date, in ensuring that information required to be disclosed by the registrant in this Form N-CSR was recorded, processed, summarized, and reported timely.
(b) The registrant’s principal executive officer and principal financial officer are aware of no change in the registrant’s internal control over financial reporting that occurred during the period covered by this report that has materially affected, or is reasonably likely to materially affect, the registrant’s internal control over financial reporting.
Item 17. Disclosure of Securities Lending Activities for Closed-End Management Investment Companies.
Not applicable.
Item 18. Recovery of Erroneously Awarded Compensation.
Not applicable.
Item 19. Exhibits.
SIGNATURES
Pursuant to the requirements of the Securities Exchange Act of 1934 and the Investment Company Act of 1940, the registrant has duly caused this report to be signed on its behalf by the undersigned, thereunto duly authorized.
| | | | |
| T. Rowe Price Index Trust, Inc. |
| | |
| By | | /s/ David Oestreicher | | |
| | David Oestreicher | | |
| | Principal Executive Officer | | |
| | |
| Date | | February 18, 2025 | | |
Pursuant to the requirements of the Securities Exchange Act of 1934 and the Investment Company Act of 1940, this report has been signed below by the following persons on behalf of the registrant and in the capacities and on the dates indicated.
| | | | |
| By | | /s/ David Oestreicher | | |
| | David Oestreicher | | |
| | Principal Executive Officer | | |
| | |
| Date | | February 18, 2025 | | |
| | | | |
| By | | /s/ Alan S. Dupski | | |
| | Alan S. Dupski | | |
| | Principal Financial Officer | | |
| | |
| Date | | February 18, 2025 | | |