UNITED STATES
SECURITIES AND EXCHANGE COMMISSION
Washington, D.C. 20549
FORM N-CSR
CERTIFIED SHAREHOLDER REPORT OF REGISTERED
MANAGEMENT INVESTMENT COMPANIES
Investment Company Act File Number: 811-05986
T. Rowe Price Index Trust, Inc.
(Exact name of registrant as specified in charter)
100 East Pratt Street, Baltimore, MD 21202
(Address of principal executive offices)
David Oestreicher
100 East Pratt Street, Baltimore, MD 21202
(Name and address of agent for service)
Registrant’s telephone number, including area code: (410) 345-2000
Date of fiscal year end: December 31
Date of reporting period: December 31, 2024
Item 1. Reports to Shareholders
(a) Report pursuant to Rule 30e-1
Annual Shareholder Report
December 31, 2024
This annual shareholder report contains important information about Equity Index 500 Fund (the "fund") for the period of January 1, 2024 to December 31, 2024. You can find the fund’s prospectus, financial information on Form N‑CSR (which includes required tax information for dividends), holdings, proxy voting information, and other information atwww.troweprice.com/prospectus. You can also request this information without charge by contacting T. Rowe Price at 1‑800‑638‑5660 or info@troweprice.com or contacting your intermediary.
What were the fund costs for the last year? (based on a hypothetical $10,000 investment)
| | Costs of a $10,000 investment | Costs paid as a percentage of a $10,000 investment |
|---|
| Equity Index 500 Fund - Investor Class | $21 | 0.18% |
|---|
What drove fund performance during the past 12 months?
U.S. stocks produced strong gains for the second consecutive year in 2024, and various equity indexes reached all-time highs during the year. In the final months of the period, equity investors generally welcomed not only looser monetary policy but also the U.S. election results. Former President Donald Trump defeated Vice President Kamala Harris in the presidential election, and Republican victories in the House of Representatives and Senate races gave them majorities in both chambers of Congress.
Information technology names produced robust results during the period as the sector benefited from strong investor interest in companies expected to benefit from artificial intelligence developments. Semiconductors and semiconductor equipment and hardware companies performed very well during the year, as NVIDIA and Apple were two of the top-performing companies in the portfolio.
No sectors detracted from absolute returns during the reporting period.
The trajectories of the economy, corporate earnings, and interest rates are unpredictable, and investor sentiment toward the broad market and various market segments could change without warning. Our main task is not to determine which stocks or sectors may perform best but, rather, to replicate the structure of the S&P 500 Index and closely track its performance.
How has the fund performed?
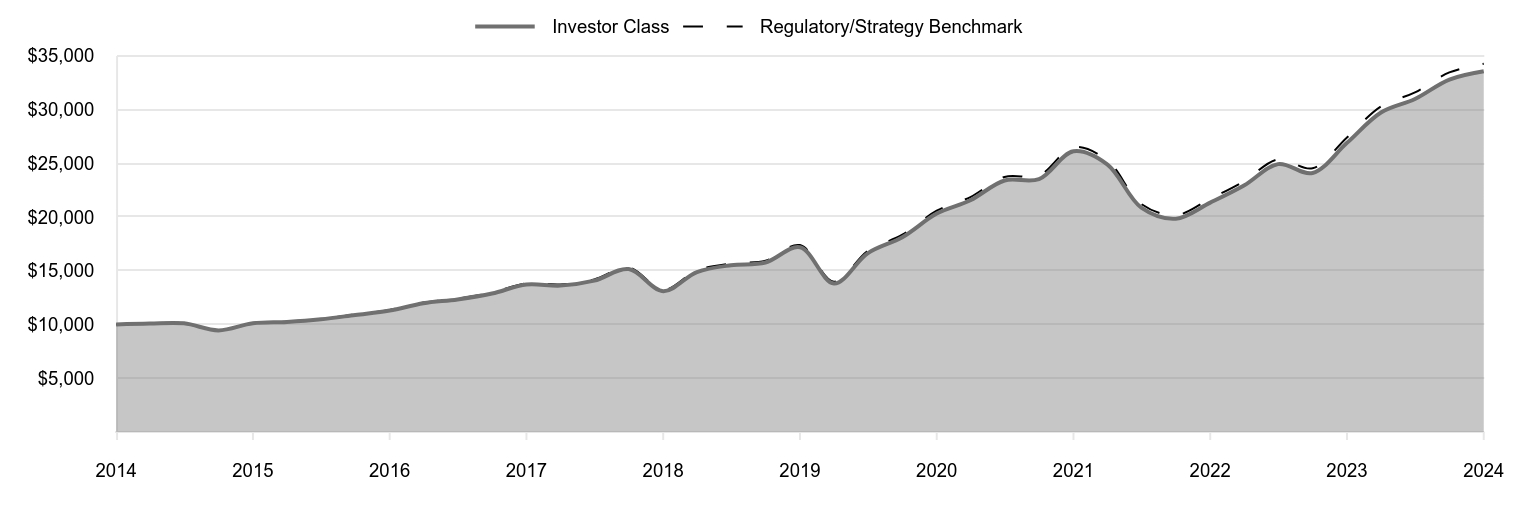
Cumulative Returns of a Hypothetical $10,000 Investment as of December 31, 2024
| Investor Class | Regulatory/Strategy Benchmark |
|---|
| 2014 | 10,000 | 10,000 |
|---|
| 2015 | 10,090 | 10,095 |
|---|
| 2015 | 10,111 | 10,123 |
|---|
| 2015 | 9,453 | 9,471 |
|---|
| 2015 | 10,111 | 10,138 |
|---|
| 2016 | 10,240 | 10,275 |
|---|
| 2016 | 10,486 | 10,527 |
|---|
| 2016 | 10,885 | 10,933 |
|---|
| 2016 | 11,294 | 11,351 |
|---|
| 2017 | 11,973 | 12,039 |
|---|
| 2017 | 12,332 | 12,411 |
|---|
| 2017 | 12,878 | 12,967 |
|---|
| 2017 | 13,728 | 13,829 |
|---|
| 2018 | 13,616 | 13,724 |
|---|
| 2018 | 14,077 | 14,195 |
|---|
| 2018 | 15,155 | 15,290 |
|---|
| 2018 | 13,099 | 13,223 |
|---|
| 2019 | 14,880 | 15,027 |
|---|
| 2019 | 15,514 | 15,674 |
|---|
| 2019 | 15,767 | 15,940 |
|---|
| 2019 | 17,190 | 17,386 |
|---|
| 2020 | 13,814 | 13,979 |
|---|
| 2020 | 16,644 | 16,850 |
|---|
| 2020 | 18,122 | 18,355 |
|---|
| 2020 | 20,317 | 20,585 |
|---|
| 2021 | 21,563 | 21,856 |
|---|
| 2021 | 23,396 | 23,724 |
|---|
| 2021 | 23,523 | 23,863 |
|---|
| 2021 | 26,108 | 26,494 |
|---|
| 2022 | 24,896 | 25,276 |
|---|
| 2022 | 20,876 | 21,206 |
|---|
| 2022 | 19,846 | 20,170 |
|---|
| 2022 | 21,336 | 21,696 |
|---|
| 2023 | 22,926 | 23,322 |
|---|
| 2023 | 24,918 | 25,361 |
|---|
| 2023 | 24,090 | 24,531 |
|---|
| 2023 | 26,895 | 27,399 |
|---|
| 2024 | 29,721 | 30,291 |
|---|
| 2024 | 30,980 | 31,589 |
|---|
| 2024 | 32,785 | 33,448 |
|---|
| 2024 | 33,560 | 34,254 |
|---|
202501-4140694, 202502-4108467
Average Annual Total Returns
| | 1 Year | 5 Years | 10 Years |
|---|
| Equity Index 500 Fund (Investor Class) | 24.78% | 14.32% | 12.87% |
|---|
| S&P 500 Index (Regulatory/Strategy Benchmark) | 25.02 | 14.53 | 13.10 |
|---|
The preceding line graph shows the value of a hypothetical $10,000 investment in the fund over the past 10 fiscal year periods or since inception (for funds lacking 10-year records). The fund’s performance information included in the line graph and table above is compared with a regulatory required index that represents an overall securities market (Regulatory Benchmark). In addition, the line graph and table may also include one or more indexes that more closely aligns to the fund's investment strategy (Strategy Benchmark(s)). Due to new SEC Rules on shareholder reporting the fund adopted a new broad-based securities market index, referred to as the Regulatory Benchmark. Market index returns do not include expenses, which are deducted from fund returns. The fund's total return figures reflect the reinvestment of dividends and capital gains, if any.Neither the fund’s returns nor the index returns reflect the deduction of taxes that a shareholder would pay on fund distributions or redemptions of fund shares.The fund’s past performance is not a good predictor of the fund’s future performance.Updated performance information can be found at www.troweprice.com.
What are some fund statistics?
- Total Net Assets (000s)$34,057,034
- Number of Portfolio Holdings506
- Investment Advisory Fees Paid (000s)$5,627
- Portfolio Turnover Rate3.6%
What did the fund invest in?
Sector Allocation (as a % of Net Assets)
| Information Technology | 32.2% |
| Financials | 13.6 |
| Consumer Discretionary | 11.2 |
| Health Care | 10.1 |
| Communication Services | 9.4 |
| Industrials & Business Services | 8.2 |
| Consumer Staples | 5.6 |
| Energy | 3.1 |
| Utilities | 2.3 |
| Other | 4.3 |
Top Ten Holdings (as a % of Net Assets)
| Apple | 7.6% |
| NVIDIA | 6.6 |
| Microsoft | 6.3 |
| Amazon.com | 4.1 |
| Alphabet | 4.0 |
| Meta Platforms | 2.6 |
| Tesla | 2.3 |
| Broadcom | 2.2 |
| Berkshire Hathaway | 1.7 |
| JPMorgan Chase | 1.4 |
If you invest directly with T. Rowe Price, you can elect to receive future shareholder reports or other important documents through electronic delivery by enrolling at www.troweprice.com/paperless. If you invest through a financial intermediary such as an investment advisor, a bank, retirement plan sponsor or a brokerage firm, please contact that organization and ask if it can provide electronic delivery.
S&P does not accept any liability for any errors or omissions in the indexes or data, and hereby expressly disclaim all warranties of originality, accuracy, completeness, timeliness, merchantability and fitness for a particular purpose. No party may rely on any indexes or data contained in this communication. Visit www.troweprice.com/en/us/market-data-disclosures for additional legal notices & disclaimers.
Equity Index 500 Fund
Investor Class (PREIX)
T. Rowe Price Investment Services, Inc.
100 East Pratt Street
Baltimore, MD 21202
Annual Shareholder Report
December 31, 2024
This annual shareholder report contains important information about Equity Index 500 Fund (the "fund") for the period of January 1, 2024 to December 31, 2024. You can find the fund’s prospectus, financial information on Form N‑CSR (which includes required tax information for dividends), holdings, proxy voting information, and other information atwww.troweprice.com/prospectus. You can also request this information without charge by contacting T. Rowe Price at 1‑800‑638‑5660 or info@troweprice.com or contacting your intermediary.
What were the fund costs for the last year? (based on a hypothetical $10,000 investment)
| | Costs of a $10,000 investment | Costs paid as a percentage of a $10,000 investment |
|---|
| Equity Index 500 Fund - I Class | $6 | 0.05% |
|---|
What drove fund performance during the past 12 months?
U.S. stocks produced strong gains for the second consecutive year in 2024, and various equity indexes reached all-time highs during the year. In the final months of the period, equity investors generally welcomed not only looser monetary policy but also the U.S. election results. Former President Donald Trump defeated Vice President Kamala Harris in the presidential election, and Republican victories in the House of Representatives and Senate races gave them majorities in both chambers of Congress.
Information technology names produced robust results during the period as the sector benefited from strong investor interest in companies expected to benefit from artificial intelligence developments. Semiconductors and semiconductor equipment and hardware companies performed very well during the year, as NVIDIA and Apple were two of the top-performing companies in the portfolio.
No sectors detracted from absolute returns during the reporting period.
The trajectories of the economy, corporate earnings, and interest rates are unpredictable, and investor sentiment toward the broad market and various market segments could change without warning. Our main task is not to determine which stocks or sectors may perform best but, rather, to replicate the structure of the S&P 500 Index and closely track its performance.
How has the fund performed?
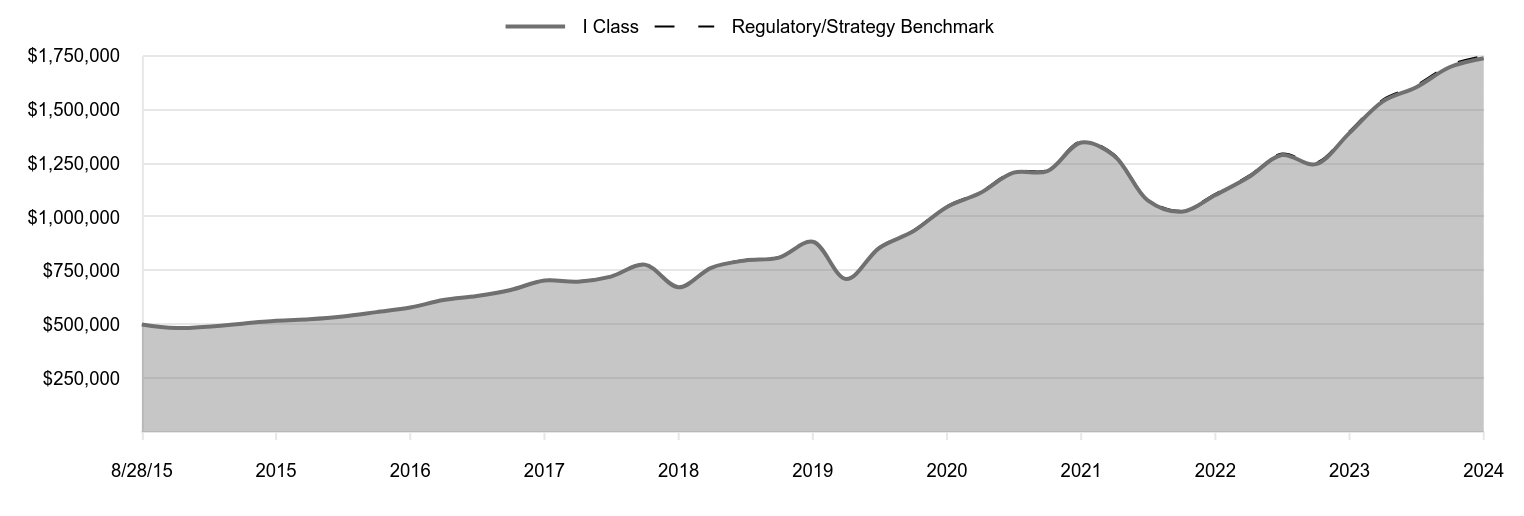
Cumulative Returns of a Hypothetical $500,000 Investment as of December 31, 2024
| I Class | Regulatory/Strategy Benchmark |
|---|
| 8/28/15 | 500,000 | 500,000 |
|---|
| 9/30/15 | 483,488 | 483,593 |
|---|
| 12/31/15 | 517,329 | 517,650 |
|---|
| 3/31/16 | 524,208 | 524,627 |
|---|
| 6/30/16 | 536,965 | 537,508 |
|---|
| 9/30/16 | 557,497 | 558,213 |
|---|
| 12/31/16 | 578,742 | 579,561 |
|---|
| 3/31/17 | 613,693 | 614,718 |
|---|
| 6/30/17 | 632,423 | 633,701 |
|---|
| 9/30/17 | 660,710 | 662,093 |
|---|
| 12/31/17 | 704,478 | 706,088 |
|---|
| 3/31/18 | 699,009 | 700,728 |
|---|
| 6/30/18 | 722,906 | 724,790 |
|---|
| 9/30/18 | 778,517 | 780,677 |
|---|
| 12/31/18 | 673,213 | 675,131 |
|---|
| 3/31/19 | 764,954 | 767,272 |
|---|
| 6/30/19 | 797,823 | 800,294 |
|---|
| 9/30/19 | 811,162 | 813,886 |
|---|
| 12/31/19 | 884,545 | 887,705 |
|---|
| 3/31/20 | 711,182 | 713,733 |
|---|
| 6/30/20 | 857,045 | 860,357 |
|---|
| 9/30/20 | 933,469 | 937,182 |
|---|
| 12/31/20 | 1,046,756 | 1,051,032 |
|---|
| 3/31/21 | 1,111,256 | 1,115,933 |
|---|
| 6/30/21 | 1,206,039 | 1,211,332 |
|---|
| 9/30/21 | 1,212,903 | 1,218,383 |
|---|
| 12/31/21 | 1,346,492 | 1,352,735 |
|---|
| 3/31/22 | 1,284,516 | 1,290,529 |
|---|
| 6/30/22 | 1,077,427 | 1,082,740 |
|---|
| 9/30/22 | 1,024,736 | 1,029,874 |
|---|
| 12/31/22 | 1,102,135 | 1,107,743 |
|---|
| 3/31/23 | 1,184,709 | 1,190,792 |
|---|
| 6/30/23 | 1,288,050 | 1,294,892 |
|---|
| 9/30/23 | 1,245,710 | 1,252,505 |
|---|
| 12/31/23 | 1,391,223 | 1,398,942 |
|---|
| 3/31/24 | 1,537,861 | 1,546,614 |
|---|
| 6/30/24 | 1,603,519 | 1,612,867 |
|---|
| 9/30/24 | 1,697,572 | 1,707,810 |
|---|
| 12/31/24 | 1,738,358 | 1,748,954 |
|---|
202501-4140694, 202502-4108467
Average Annual Total Returns
| | 1 Year | 5 Years | Since Inception 8/28/15 |
|---|
| Equity Index 500 Fund (I Class) | 24.95% | 14.47% | 14.27% |
|---|
| S&P 500 Index (Regulatory/Strategy Benchmark) | 25.02 | 14.53 | 14.34 |
|---|
The preceding line graph shows the value of a hypothetical $500,000 investment in the fund over the past 10 fiscal year periods or since inception (for funds lacking 10-year records). The fund’s performance information included in the line graph and table above is compared with a regulatory required index that represents an overall securities market (Regulatory Benchmark). In addition, the line graph and table may also include one or more indexes that more closely aligns to the fund's investment strategy (Strategy Benchmark(s)). Due to new SEC Rules on shareholder reporting the fund adopted a new broad-based securities market index, referred to as the Regulatory Benchmark. Market index returns do not include expenses, which are deducted from fund returns. The fund's total return figures reflect the reinvestment of dividends and capital gains, if any.Neither the fund’s returns nor the index returns reflect the deduction of taxes that a shareholder would pay on fund distributions or redemptions of fund shares.The fund’s past performance is not a good predictor of the fund’s future performance.Updated performance information can be found at www.troweprice.com.
What are some fund statistics?
- Total Net Assets (000s)$34,057,034
- Number of Portfolio Holdings506
- Investment Advisory Fees Paid (000s)$5,627
- Portfolio Turnover Rate3.6%
What did the fund invest in?
Sector Allocation (as a % of Net Assets)
| Information Technology | 32.2% |
| Financials | 13.6 |
| Consumer Discretionary | 11.2 |
| Health Care | 10.1 |
| Communication Services | 9.4 |
| Industrials & Business Services | 8.2 |
| Consumer Staples | 5.6 |
| Energy | 3.1 |
| Utilities | 2.3 |
| Other | 4.3 |
Top Ten Holdings (as a % of Net Assets)
| Apple | 7.6% |
| NVIDIA | 6.6 |
| Microsoft | 6.3 |
| Amazon.com | 4.1 |
| Alphabet | 4.0 |
| Meta Platforms | 2.6 |
| Tesla | 2.3 |
| Broadcom | 2.2 |
| Berkshire Hathaway | 1.7 |
| JPMorgan Chase | 1.4 |
If you invest directly with T. Rowe Price, you can elect to receive future shareholder reports or other important documents through electronic delivery by enrolling at www.troweprice.com/paperless. If you invest through a financial intermediary such as an investment advisor, a bank, retirement plan sponsor or a brokerage firm, please contact that organization and ask if it can provide electronic delivery.
S&P does not accept any liability for any errors or omissions in the indexes or data, and hereby expressly disclaim all warranties of originality, accuracy, completeness, timeliness, merchantability and fitness for a particular purpose. No party may rely on any indexes or data contained in this communication. Visit www.troweprice.com/en/us/market-data-disclosures for additional legal notices & disclaimers.
Equity Index 500 Fund
I Class (PRUIX)
T. Rowe Price Investment Services, Inc.
100 East Pratt Street
Baltimore, MD 21202
Annual Shareholder Report
December 31, 2024
This annual shareholder report contains important information about Equity Index 500 Fund (the "fund") for the period of January 1, 2024 to December 31, 2024. You can find the fund’s prospectus, financial information on Form N‑CSR (which includes required tax information for dividends), holdings, proxy voting information, and other information atwww.troweprice.com/prospectus. You can also request this information without charge by contacting T. Rowe Price at 1‑800‑638‑5660 or info@troweprice.com or contacting your intermediary.
What were the fund costs for the last year? (based on a hypothetical $10,000 investment)
| | Costs of a $10,000 investment | Costs paid as a percentage of a $10,000 investment |
|---|
| Equity Index 500 Fund - Z Class | $0 | 0.00% |
|---|
What drove fund performance during the past 12 months?
U.S. stocks produced strong gains for the second consecutive year in 2024, and various equity indexes reached all-time highs during the year. In the final months of the period, equity investors generally welcomed not only looser monetary policy but also the U.S. election results. Former President Donald Trump defeated Vice President Kamala Harris in the presidential election, and Republican victories in the House of Representatives and Senate races gave them majorities in both chambers of Congress.
Information technology names produced robust results during the period as the sector benefited from strong investor interest in companies expected to benefit from artificial intelligence developments. Semiconductors and semiconductor equipment and hardware companies performed very well during the year, as NVIDIA and Apple were two of the top-performing companies in the portfolio.
No sectors detracted from absolute returns during the reporting period.
The trajectories of the economy, corporate earnings, and interest rates are unpredictable, and investor sentiment toward the broad market and various market segments could change without warning. Our main task is not to determine which stocks or sectors may perform best but, rather, to replicate the structure of the S&P 500 Index and closely track its performance.
How has the fund performed?
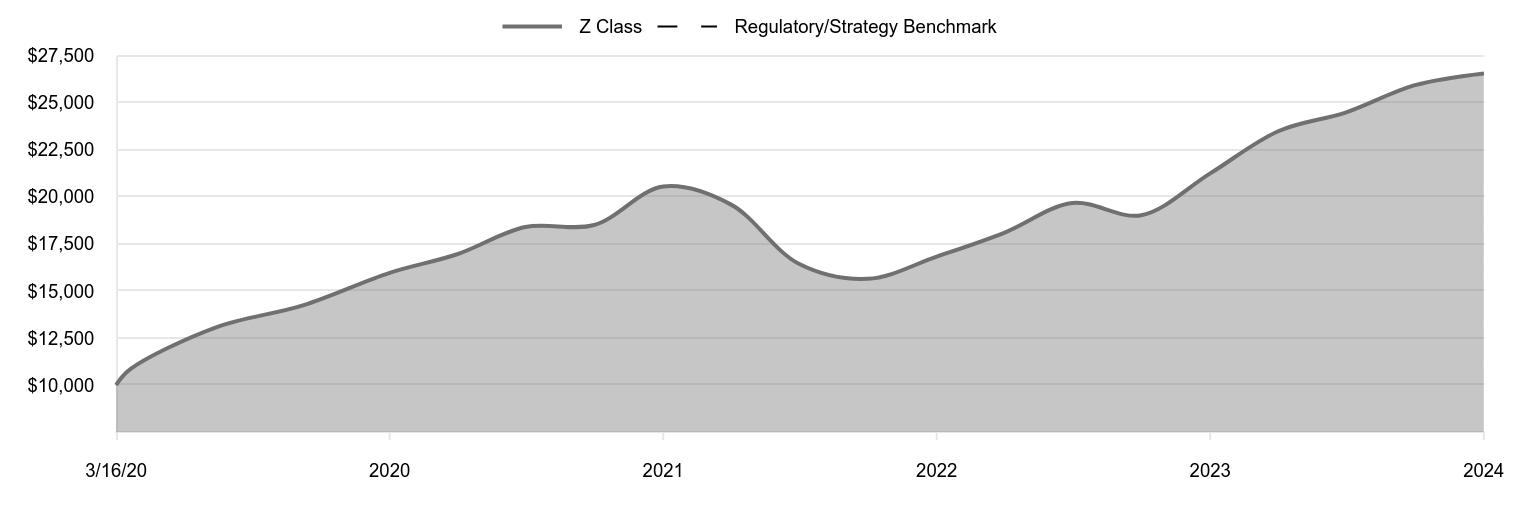
Cumulative Returns of a Hypothetical $10,000 Investment as of December 31, 2024
| Z Class | Regulatory/Strategy Benchmark |
|---|
| 3/16/20 | 10,000 | 10,000 |
|---|
| 3/31/20 | 10,840 | 10,839 |
|---|
| 6/30/20 | 13,066 | 13,066 |
|---|
| 9/30/20 | 14,233 | 14,233 |
|---|
| 12/31/20 | 15,962 | 15,962 |
|---|
| 3/31/21 | 16,948 | 16,947 |
|---|
| 6/30/21 | 18,397 | 18,396 |
|---|
| 9/30/21 | 18,503 | 18,503 |
|---|
| 12/31/21 | 20,544 | 20,544 |
|---|
| 3/31/22 | 19,599 | 19,599 |
|---|
| 6/30/22 | 16,443 | 16,443 |
|---|
| 9/30/22 | 15,640 | 15,640 |
|---|
| 12/31/22 | 16,824 | 16,823 |
|---|
| 3/31/23 | 18,087 | 18,084 |
|---|
| 6/30/23 | 19,667 | 19,665 |
|---|
| 9/30/23 | 19,023 | 19,021 |
|---|
| 12/31/23 | 21,248 | 21,245 |
|---|
| 3/31/24 | 23,488 | 23,488 |
|---|
| 6/30/24 | 24,494 | 24,494 |
|---|
| 9/30/24 | 25,936 | 25,936 |
|---|
| 12/31/24 | 26,561 | 26,561 |
|---|
202501-4140694, 202502-4108467
Average Annual Total Returns
| | 1 Year | Since Inception 3/16/20 |
|---|
| Equity Index 500 Fund (Z Class) | 25.01% | 22.60% |
|---|
| S&P 500 Index (Regulatory/Strategy Benchmark) | 25.02 | 22.60 |
|---|
The preceding line graph shows the value of a hypothetical $10,000 investment in the fund over the past 10 fiscal year periods or since inception (for funds lacking 10-year records). The fund’s performance information included in the line graph and table above is compared with a regulatory required index that represents an overall securities market (Regulatory Benchmark). In addition, the line graph and table may also include one or more indexes that more closely aligns to the fund's investment strategy (Strategy Benchmark(s)). Due to new SEC Rules on shareholder reporting the fund adopted a new broad-based securities market index, referred to as the Regulatory Benchmark. Market index returns do not include expenses, which are deducted from fund returns. The fund's total return figures reflect the reinvestment of dividends and capital gains, if any.Neither the fund’s returns nor the index returns reflect the deduction of taxes that a shareholder would pay on fund distributions or redemptions of fund shares.The fund’s past performance is not a good predictor of the fund’s future performance.Updated performance information can be found at www.troweprice.com.
What are some fund statistics?
- Total Net Assets (000s)$34,057,034
- Number of Portfolio Holdings506
- Investment Advisory Fees Paid (000s)$5,627
- Portfolio Turnover Rate3.6%
What did the fund invest in?
Sector Allocation (as a % of Net Assets)
| Information Technology | 32.2% |
| Financials | 13.6 |
| Consumer Discretionary | 11.2 |
| Health Care | 10.1 |
| Communication Services | 9.4 |
| Industrials & Business Services | 8.2 |
| Consumer Staples | 5.6 |
| Energy | 3.1 |
| Utilities | 2.3 |
| Other | 4.3 |
Top Ten Holdings (as a % of Net Assets)
| Apple | 7.6% |
| NVIDIA | 6.6 |
| Microsoft | 6.3 |
| Amazon.com | 4.1 |
| Alphabet | 4.0 |
| Meta Platforms | 2.6 |
| Tesla | 2.3 |
| Broadcom | 2.2 |
| Berkshire Hathaway | 1.7 |
| JPMorgan Chase | 1.4 |
If you invest directly with T. Rowe Price, you can elect to receive future shareholder reports or other important documents through electronic delivery by enrolling at www.troweprice.com/paperless. If you invest through a financial intermediary such as an investment advisor, a bank, retirement plan sponsor or a brokerage firm, please contact that organization and ask if it can provide electronic delivery.
S&P does not accept any liability for any errors or omissions in the indexes or data, and hereby expressly disclaim all warranties of originality, accuracy, completeness, timeliness, merchantability and fitness for a particular purpose. No party may rely on any indexes or data contained in this communication. Visit www.troweprice.com/en/us/market-data-disclosures for additional legal notices & disclaimers.
Equity Index 500 Fund
Z Class (TRHZX)
T. Rowe Price Investment Services, Inc.
100 East Pratt Street
Baltimore, MD 21202
Item 1. (b) Notice pursuant to Rule 30e-3.
Not applicable.
Item 2. Code of Ethics.
The registrant has adopted a code of ethics, as defined in Item 2 of Form N-CSR, applicable to its principal executive officer, principal financial officer, principal accounting officer or controller, or persons performing similar functions. A copy of this code of ethics is filed as an exhibit to this Form N-CSR. No substantive amendments were approved or waivers were granted to this code of ethics during the period covered by this report.
Item 3. Audit Committee Financial Expert.
The registrant’s Board of Directors has determined that Mr. Paul F. McBride qualifies as an audit committee financial expert, as defined in Item 3 of Form N-CSR. Mr. McBride is considered independent for purposes of Item 3 of Form N-CSR.
Item 4. Principal Accountant Fees and Services.
(a) – (d) Aggregate fees billed for the last two fiscal years for professional services rendered to, or on behalf of, the registrant by the registrant’s principal accountant were as follows:
| | | | | | | | | | |
| | | 2024 | | | 2023 | | | |
Audit Fees | | $ | 23,525 | | | $ | 23,064 | |
Audit-Related Fees | | | - | | | | - | |
Tax Fees | | | - | | | | - | |
All Other Fees | | | - | | | | - | |
Audit fees include amounts related to the audit of the registrant’s annual financial statements and services normally provided by the accountant in connection with statutory and regulatory filings. Audit-related fees include amounts reasonably related to the performance of the audit of the registrant’s financial statements and specifically include the issuance of a report on internal controls and, if applicable, agreed-upon procedures related to fund acquisitions. Tax fees include amounts related to services for tax compliance, tax planning, and tax advice. The nature of these services specifically includes the review of distribution calculations and the preparation of Federal, state, and excise tax returns. All other fees include the registrant’s pro-rata share of amounts for agreed-upon procedures in conjunction with service contract approvals by the registrant’s Board of Directors/Trustees.
(e)(1) The registrant’s audit committee has adopted a policy whereby audit and non-audit services performed by the registrant’s principal accountant for the registrant, its investment adviser, and any entity controlling, controlled by, or under common control with the investment adviser that provides ongoing services to the registrant require pre-approval in advance at regularly scheduled audit committee meetings. If such a service is required between regularly scheduled audit committee meetings, pre-approval may be authorized by one audit committee member with ratification at the next scheduled audit committee meeting. Waiver of pre-approval for audit or non-audit services requiring fees of a de minimis amount is not permitted.
(2) No services included in (b) – (d) above were approved pursuant to paragraph (c)(7)(i)(C) of Rule 2-01 of Regulation S-X.
(f) Less than 50 percent of the hours expended on the principal accountant’s engagement to audit the registrant’s financial statements for the most recent fiscal year were attributed to work performed by persons other than the principal accountant’s full-time, permanent employees.
(g) The aggregate fees billed for the most recent fiscal year and the preceding fiscal year by the registrant’s principal accountant for non-audit services rendered to the registrant, its investment adviser, and any entity controlling, controlled by, or under common control with the investment adviser that provides ongoing services to the registrant were $1,262,000 and $1,524,000, respectively.
(h) All non-audit services rendered in (g) above were pre-approved by the registrant’s audit committee. Accordingly, these services were considered by the registrant’s audit committee in maintaining the principal accountant’s independence.
(i) Not applicable.
(j) Not applicable.
Item 5. Audit Committee of Listed Registrants.
Not applicable.
Item 6. Investments.
(a) Not applicable. The complete schedule of investments is included in Item 7 of this Form N-CSR.
(b) Not applicable.
Item 7. Financial Statements and Financial Highlights for Open-End Management Investment Companies.
(a – b) Report pursuant to Regulation S-X.
Financial
Highlights
Portfolio
of
Investments
Financial
Statements
and
Notes
Additional
Fund
Information
Financial
Statements
and
Other
Information
For
more
insights
from
T.
Rowe
Price
investment
professionals,
go
to
troweprice.com
.
T.
ROWE
PRICE
PREIX
Equity
Index
500
Fund
PRUIX
Equity
Index
500
Fund–
.
I Class
TRHZX
Equity
Index
500
Fund–
.
Z Class
T.
ROWE
PRICE
Equity
Index
500
Fund
For
a
share
outstanding
throughout
each
period
The
accompanying
notes
are
an
integral
part
of
these
financial
statements.
Investor
Class
..
Year
..
..
Ended
.
12/31/24
12/31/23
12/31/22
12/31/21
12/31/20
NET
ASSET
VALUE
Beginning
of
period
$
125.41
$
100.94
$
125.31
$
99.17
$
85.83
Investment
activities
Net
investment
income
(1)(2)
1.69
1.65
1.50
1.36
1.52
Net
realized
and
unrealized
gain/loss
29.30
24.48
(24.35)
26.74
13.77
Total
from
investment
activities
30.99
26.13
(22.85)
28.10
15.29
Distributions
Net
investment
income
(1.74)
(1.66)
(1.52)
(1.44)
(1.55)
Net
realized
gain
(0.06)
—
—
(0.52)
(0.40)
Total
distributions
(1.80)
(1.66)
(1.52)
(1.96)
(1.95)
NET
ASSET
VALUE
End
of
period
$
154.60
$
125.41
$
100.94
$
125.31
$
99.17
Ratios/Supplemental
Data
Total
return
(2)(3)
24.78%
26.06%
(18.28)%
28.50%
18.19%
Ratios
to
average
net
assets:
(2)
Gross
expenses
before
waivers/payments
by
Price
Associates
0.18%
0.19%
0.20%
0.16%
0.19%
Net
expenses
after
waivers/
payments
by
Price
Associates
0.18%
0.19%
0.20%
0.16%
0.19%
Net
investment
income
1.19%
1.46%
1.38%
1.21%
1.82%
Portfolio
turnover
rate
3.6%
5.8%
3.1%
3.1%
13.6%
Net
assets,
end
of
period
(in
millions)
$8,258
$7,218
$5,704
$11,145
$9,002
0%
0%
0%
0%
0%
(1)
Per
share
amounts
calculated
using
average
shares
outstanding
method.
(2)
Includes
the
impact
of
expense-related
arrangements
with
Price
Associates.
(3)
Total
return
reflects
the
rate
that
an
investor
would
have
earned
on
an
investment
in
the
fund
during
each
period,
assuming
reinvestment
of
all
distributions,
and
payment
of
no
redemption
or
account
fees,
if
applicable.
T.
ROWE
PRICE
Equity
Index
500
Fund
For
a
share
outstanding
throughout
each
period
The
accompanying
notes
are
an
integral
part
of
these
financial
statements.
I
Class
..
Year
..
..
Ended
.
12/31/24
12/31/23
12/31/22
12/31/21
12/31/20
NET
ASSET
VALUE
Beginning
of
period
$
125.41
$
100.93
$
125.32
$
99.16
$
85.84
Investment
activities
Net
investment
income
(1)(2)
1.89
1.80
1.68
1.47
1.54
Net
realized
and
unrealized
gain/loss
29.30
24.49
(24.36)
26.75
13.85
Total
from
investment
activities
31.19
26.29
(22.68)
28.22
15.39
Distributions
Net
investment
income
(1.92)
(1.81)
(1.71)
(1.54)
(1.67)
Net
realized
gain
(0.06)
—
—
(0.52)
(0.40)
Total
distributions
(1.98)
(1.81)
(1.71)
(2.06)
(2.07)
NET
ASSET
VALUE
End
of
period
$
154.62
$
125.41
$
100.93
$
125.32
$
99.16
Ratios/Supplemental
Data
Total
return
(2)(3)
24.95%
26.23%
(18.15)%
28.63%
18.34%
Ratios
to
average
net
assets:
(2)
Gross
expenses
before
waivers/payments
by
Price
Associates
0.08%
0.08%
0.08%
0.10%
0.07%
Net
expenses
after
waivers/payments
by
Price
Associates
0.05%
0.05%
0.05%
0.06%
0.06%
Net
investment
income
1.32%
1.60%
1.57%
1.31%
1.88%
Portfolio
turnover
rate
3.6%
5.8%
3.1%
3.1%
13.6%
Net
assets,
end
of
period
(in
millions)
$10,824
$7,970
$6,020
$3,507
$3,232
0%
0%
0%
0%
0%
(1)
Per
share
amounts
calculated
using
average
shares
outstanding
method.
(2)
Includes
the
impact
of
expense-related
arrangements
with
Price
Associates.
(3)
Total
return
reflects
the
rate
that
an
investor
would
have
earned
on
an
investment
in
the
fund
during
each
period,
assuming
reinvestment
of
all
distributions,
and
payment
of
no
redemption
or
account
fees,
if
applicable.
T.
ROWE
PRICE
Equity
Index
500
Fund
For
a
share
outstanding
throughout
each
period
The
accompanying
notes
are
an
integral
part
of
these
financial
statements.
Z
Class
(1)
..
Year
..
..
Ended
.
3/16/20
(1)
Through
12/31/20
12/31/24
12/31/23
12/31/22
12/31/21
NET
ASSET
VALUE
Beginning
of
period
$
125.38
$
100.90
$
125.27
$
99.13
$
63.64
Investment
activities
Net
investment
income
(2)(3)
1.96
1.86
1.71
1.54
1.40
Net
realized
and
unrealized
gain/loss
29.29
24.48
(24.34)
26.73
36.19
Total
from
investment
activities
31.25
26.34
(22.63)
28.27
37.59
Distributions
Net
investment
income
(1.99)
(1.86)
(1.74)
(1.61)
(1.70)
Net
realized
gain
(0.06)
—
—
(0.52)
(0.40)
Total
distributions
(2.05)
(1.86)
(1.74)
(2.13)
(2.10)
NET
ASSET
VALUE
End
of
period
$
154.58
$
125.38
$
100.90
$
125.27
$
99.13
Ratios/Supplemental
Data
Total
return
(3)(4)
25.01%
26.30%
(18.11)%
28.70%
59.62%
Ratios
to
average
net
assets:
(3)
Gross
expenses
before
waivers/payments
by
Price
Associates
0.05%
0.05%
0.05%
0.06%
0.06%
(5)
Net
expenses
after
waivers/
payments
by
Price
Associates
0.00%
0.00%
0.00%
0.00%
0.00%
(5)
Net
investment
income
1.37%
1.65%
1.57%
1.37%
2.03%
(5)
Portfolio
turnover
rate
3.6%
5.8%
3.1%
3.1%
13.6%
Net
assets,
end
of
period
(in
millions)
$14,975
$13,269
$11,283
$19,852
$21,289
0%
0%
0%
0%
0%
(1)
Inception
date
(2)
Per
share
amounts
calculated
using
average
shares
outstanding
method.
(3)
Includes
the
impact
of
expense-related
arrangements
with
Price
Associates.
(4)
Total
return
reflects
the
rate
that
an
investor
would
have
earned
on
an
investment
in
the
fund
during
each
period,
assuming
reinvestment
of
all
distributions,
and
payment
of
no
redemption
or
account
fees,
if
applicable.
Total
return
is
not
annualized
for
periods
less
than
one
year.
(5)
Annualized
T.
ROWE
PRICE
Equity
Index
500
Fund
December
31,
2024
Shares
$
Value
(Cost
and
value
in
$000s)
‡
COMMON
STOCKS
99.7%
COMMUNICATION
SERVICES
9.4%
Diversified
Telecommunication
Services
0.7%
AT&T
4,878,266
111,078
Verizon
Communications
2,871,864
114,846
225,924
Entertainment
1.4%
Electronic
Arts
164,530
24,071
Live
Nation
Entertainment (1)
105,758
13,696
Netflix (1)
291,117
259,478
Take-Two
Interactive
Software (1)
111,521
20,529
Walt
Disney
1,236,691
137,705
Warner
Bros
Discovery (1)
1,532,515
16,199
471,678
Interactive
Media
&
Services
6.6%
Alphabet,
Class
A
3,982,609
753,908
Alphabet,
Class
C
3,243,602
617,711
Match
Group (1)
173,486
5,675
Meta
Platforms,
Class
A
1,485,980
870,056
2,247,350
Media
0.5%
Charter
Communications,
Class
A (1)
66,648
22,845
Comcast,
Class
A
2,603,437
97,707
Fox,
Class
A
153,177
7,441
Fox,
Class
B
91,029
4,164
Interpublic
Group
256,582
7,189
News,
Class
A
258,087
7,108
News,
Class
B (2)
74,984
2,282
Omnicom
Group
134,106
11,539
Paramount
Global,
Class
B
409,689
4,285
164,560
Wireless
Telecommunication
Services
0.2%
T-Mobile
U.S.
333,507
73,615
73,615
Total
Communication
Services
3,183,127
CONSUMER
DISCRETIONARY
11.2%
Automobile
Components
0.0%
Aptiv (1)
157,807
9,544
BorgWarner
152,503
4,848
14,392
T.
ROWE
PRICE
Equity
Index
500
Fund
Shares
$
Value
(Cost
and
value
in
$000s)
‡
Automobiles
2.5%
Ford
Motor
2,675,613
26,489
General
Motors
748,063
39,849
Tesla (1)
1,903,581
768,742
835,080
Broadline
Retail
4.2%
Amazon.com (1)
6,379,954
1,399,698
eBay
324,769
20,120
1,419,818
Distributors
0.1%
Genuine
Parts
95,472
11,147
LKQ
179,648
6,602
Pool (2)
26,172
8,923
26,672
Hotels,
Restaurants
&
Leisure
1.9%
Airbnb,
Class
A (1)
294,503
38,701
Booking
Holdings
22,578
112,177
Caesars
Entertainment (1)
147,518
4,930
Carnival (1)
709,618
17,684
Chipotle
Mexican
Grill (1)
928,306
55,977
Darden
Restaurants
81,183
15,156
Domino's
Pizza
24,074
10,105
Expedia
Group (1)
84,795
15,800
Hilton
Worldwide
Holdings
165,898
41,003
Las
Vegas
Sands
239,855
12,319
Marriott
International,
Class
A
157,006
43,795
McDonald's
489,168
141,805
MGM
Resorts
International (1)(2)
154,967
5,370
Norwegian
Cruise
Line
Holdings (1)
299,320
7,701
Royal
Caribbean
Cruises
168,986
38,983
Starbucks
769,300
70,199
Wynn
Resorts
63,792
5,496
Yum!
Brands
187,836
25,200
662,401
Household
Durables
0.3%
DR
Horton
198,077
27,695
Garmin
105,510
21,762
Lennar,
Class
A
162,005
22,093
Mohawk
Industries (1)
35,668
4,249
NVR (1)
2,105
17,217
T.
ROWE
PRICE
Equity
Index
500
Fund
Shares
$
Value
(Cost
and
value
in
$000s)
‡
PulteGroup
141,901
15,453
108,469
Leisure
Products
0.0%
Hasbro
89,366
4,996
4,996
Specialty
Retail
1.8%
AutoZone (1)
11,499
36,820
Best
Buy
133,672
11,469
CarMax (1)
106,605
8,716
Home
Depot
676,480
263,144
Lowe's
386,903
95,488
O'Reilly
Automotive (1)
39,310
46,614
Ross
Stores
225,580
34,123
TJX
769,207
92,928
Tractor
Supply
368,960
19,577
Ulta
Beauty (1)
32,490
14,131
623,010
Textiles,
Apparel
&
Luxury
Goods
0.4%
Deckers
Outdoor (1)
104,600
21,243
Lululemon
Athletica (1)
76,745
29,348
NIKE,
Class
B
811,316
61,392
Ralph
Lauren
27,357
6,319
Tapestry
157,980
10,321
128,623
Total
Consumer
Discretionary
3,823,461
CONSUMER
STAPLES
5.6%
Beverages
1.2%
Brown-Forman,
Class
B
124,896
4,744
Coca-Cola
2,645,914
164,735
Constellation
Brands,
Class
A
107,318
23,717
Keurig
Dr
Pepper
773,115
24,832
Molson
Coors
Beverage,
Class
B
118,250
6,778
Monster
Beverage (1)
471,214
24,767
PepsiCo
936,732
142,439
392,012
Consumer
Staples
Distribution
&
Retail
2.0%
Costco
Wholesale
301,771
276,504
Dollar
General
150,671
11,424
Dollar
Tree (1)
137,106
10,275
Kroger
451,409
27,604
Sysco
336,693
25,743
T.
ROWE
PRICE
Equity
Index
500
Fund
Shares
$
Value
(Cost
and
value
in
$000s)
‡
Target
313,504
42,379
Walgreens
Boots
Alliance
494,955
4,618
Walmart
2,956,251
267,097
665,644
Food
Products
0.6%
Archer-Daniels-Midland (1)
326,923
16,516
Bunge
Global
97,025
7,545
Conagra
Brands
329,844
9,153
General
Mills
381,396
24,322
Hershey
101,358
17,165
Hormel
Foods
198,092
6,214
J
M
Smucker
73,240
8,065
Kellanova
184,189
14,914
Kraft
Heinz
603,717
18,540
Lamb
Weston
Holdings
98,022
6,551
McCormick
169,861
12,950
Mondelez
International,
Class
A
916,136
54,721
The
Campbell's
Company (2)
134,348
5,627
Tyson
Foods,
Class
A
195,221
11,213
213,496
Household
Products
1.1%
Church
&
Dwight
167,453
17,534
Clorox
84,903
13,789
Colgate-Palmolive
559,535
50,867
Kimberly-Clark
226,624
29,697
Procter
&
Gamble
1,603,931
268,899
380,786
Personal
Care
Products
0.1%
Estee
Lauder,
Class
A
159,811
11,983
Kenvue
1,312,622
28,024
40,007
Tobacco
0.6%
Altria
Group
1,154,841
60,387
Philip
Morris
International
1,057,510
127,271
187,658
Total
Consumer
Staples
1,879,603
ENERGY
3.1%
Energy
Equipment
&
Services
0.2%
Baker
Hughes
680,129
27,899
Halliburton
605,856
16,473
T.
ROWE
PRICE
Equity
Index
500
Fund
Shares
$
Value
(Cost
and
value
in
$000s)
‡
Schlumberger
960,451
36,824
81,196
Oil,
Gas
&
Consumable
Fuels
2.9%
APA
252,051
5,820
Chevron
1,140,627
165,208
ConocoPhillips
882,037
87,472
Coterra
Energy
502,752
12,840
Devon
Energy
448,759
14,688
Diamondback
Energy
128,236
21,009
EOG
Resources
382,906
46,937
EQT
407,366
18,784
Exxon
Mobil
2,993,936
322,058
Hess
187,937
24,997
Kinder
Morgan
1,321,952
36,221
Marathon
Petroleum
218,363
30,462
Occidental
Petroleum
457,211
22,591
ONEOK
400,581
40,218
Phillips
66
280,709
31,981
Targa
Resources
149,912
26,759
Texas
Pacific
Land (2)
12,784
14,139
Valero
Energy
214,953
26,351
Williams
835,990
45,244
993,779
Total
Energy
1,074,975
FINANCIALS
13.6%
Banks
3.4%
Bank
of
America
4,556,663
200,265
Citigroup
1,289,715
90,783
Citizens
Financial
Group
292,962
12,820
Fifth
Third
Bancorp
454,360
19,210
Huntington
Bancshares
983,252
15,998
JPMorgan
Chase
1,918,403
459,860
KeyCorp
677,170
11,607
M&T
Bank
111,408
20,946
PNC
Financial
Services
Group
268,858
51,849
Regions
Financial
627,425
14,757
Truist
Financial
903,199
39,181
U.S.
Bancorp
1,056,966
50,555
Wells
Fargo
2,272,251
159,603
1,147,434
Capital
Markets
3.1%
Ameriprise
Financial
65,976
35,128
T.
ROWE
PRICE
Equity
Index
500
Fund
Shares
$
Value
(Cost
and
value
in
$000s)
‡
Bank
of
New
York
Mellon
494,644
38,003
Blackrock
99,456
101,953
Blackstone
492,411
84,901
Cboe
Global
Markets
71,749
14,020
Charles
Schwab
1,014,933
75,115
CME
Group
244,309
56,736
FactSet
Research
Systems
25,615
12,302
Franklin
Resources (2)
209,252
4,246
Goldman
Sachs
Group
214,163
122,634
Intercontinental
Exchange
389,328
58,014
Invesco
306,290
5,354
KKR
458,102
67,758
MarketAxess
Holdings
25,765
5,824
Moody's
106,117
50,233
Morgan
Stanley
846,139
106,377
MSCI
52,896
31,738
Nasdaq
284,081
21,962
Northern
Trust
137,246
14,068
Raymond
James
Financial
123,954
19,254
S&P
Global
216,577
107,862
State
Street
198,619
19,494
T.
Rowe
Price
Group (3)
151,955
17,184
1,070,160
Consumer
Finance
0.6%
American
Express
379,643
112,674
Capital
One
Financial
261,474
46,626
Discover
Financial
Services
171,891
29,777
Synchrony
Financial
269,253
17,501
206,578
Financial
Services
4.4%
Apollo
Global
Management
305,363
50,434
Berkshire
Hathaway,
Class
B (1)
1,249,158
566,218
Corpay (1)
47,339
16,021
Fidelity
National
Information
Services
365,813
29,547
Fiserv (1)
387,878
79,678
Global
Payments
174,580
19,563
Jack
Henry
&
Associates
49,849
8,739
Mastercard,
Class
A
558,323
293,996
PayPal
Holdings (1)
683,071
58,300
Visa,
Class
A
1,177,352
372,090
1,494,586
T.
ROWE
PRICE
Equity
Index
500
Fund
Shares
$
Value
(Cost
and
value
in
$000s)
‡
Insurance
2.1%
Aflac
340,004
35,170
Allstate
181,087
34,912
American
International
Group
423,915
30,861
Aon,
Class
A
147,297
52,903
Arch
Capital
Group
254,470
23,500
Arthur
J
Gallagher
170,811
48,485
Assurant
35,327
7,532
Brown
&
Brown
162,429
16,571
Chubb
255,523
70,601
Cincinnati
Financial
107,117
15,393
Erie
Indemnity,
Class
A (2)
17,181
7,082
Everest
Group
29,630
10,740
Globe
Life
55,862
6,230
Hartford
Financial
Services
Group
196,570
21,505
Loews
124,642
10,556
Marsh
&
McLennan
334,762
71,107
MetLife
395,379
32,373
Principal
Financial
Group
143,433
11,103
Progressive
398,092
95,387
Prudential
Financial
244,671
29,001
Travelers
154,427
37,200
W
R
Berkley
205,911
12,050
Willis
Towers
Watson
68,305
21,396
701,658
Total
Financials
4,620,416
HEALTH
CARE
10.1%
Biotechnology
1.6%
AbbVie
1,203,150
213,800
Amgen
365,278
95,206
Biogen (1)
99,963
15,286
Gilead
Sciences
851,383
78,642
Incyte (1)
109,120
7,537
Moderna (1)
231,699
9,634
Regeneron
Pharmaceuticals (1)
71,695
51,071
Vertex
Pharmaceuticals (1)
175,655
70,736
541,912
Health
Care
Equipment
&
Supplies
2.3%
Abbott
Laboratories
1,179,823
133,450
Align
Technology (1)
48,083
10,026
Baxter
International
350,278
10,214
Becton
Dickinson
&
Company
198,235
44,974
T.
ROWE
PRICE
Equity
Index
500
Fund
Shares
$
Value
(Cost
and
value
in
$000s)
‡
Boston
Scientific (1)
1,006,836
89,931
Cooper (1)
135,786
12,483
Dexcom (1)
264,760
20,590
Edwards
Lifesciences (1)
400,794
29,671
GE
HealthCare
Technologies
313,778
24,531
Hologic (1)
159,163
11,474
IDEXX
Laboratories (1)
56,402
23,319
Insulet (1)
48,007
12,533
Intuitive
Surgical (1)
243,322
127,004
Medtronic
874,150
69,827
ResMed
100,913
23,078
Solventum (1)
94,194
6,222
STERIS
67,295
13,833
Stryker
234,415
84,401
Teleflex
32,175
5,727
Zimmer
Biomet
Holdings
134,512
14,208
767,496
Health
Care
Providers
&
Services
2.0%
Cardinal
Health
166,955
19,746
Cencora
119,399
26,826
Centene (1)
342,264
20,734
Cigna
Group
189,447
52,314
CVS
Health
862,765
38,729
DaVita (1)
30,844
4,613
Elevance
Health
157,262
58,014
HCA
Healthcare
124,059
37,236
Henry
Schein (1)
86,342
5,975
Humana
82,450
20,918
Labcorp
Holdings
57,521
13,191
McKesson
86,448
49,268
Molina
Healthcare (1)
38,541
11,217
Quest
Diagnostics
76,228
11,500
UnitedHealth
Group
626,890
317,119
Universal
Health
Services,
Class
B
40,651
7,294
694,694
Life
Sciences
Tools
&
Services
1.1%
Agilent
Technologies
195,107
26,211
Bio-Techne
107,658
7,755
Charles
River
Laboratories
International (1)
35,283
6,513
Danaher
436,907
100,292
IQVIA
Holdings (1)
118,676
23,321
Mettler-Toledo
International (1)
14,569
17,828
Revvity
82,597
9,219
T.
ROWE
PRICE
Equity
Index
500
Fund
Shares
$
Value
(Cost
and
value
in
$000s)
‡
Thermo
Fisher
Scientific
261,303
135,938
Waters (1)
40,823
15,144
West
Pharmaceutical
Services
49,736
16,291
358,512
Pharmaceuticals
3.1%
Bristol-Myers
Squibb
1,377,188
77,894
Eli
Lilly
536,862
414,457
Johnson
&
Johnson
1,639,472
237,100
Merck
1,721,610
171,266
Pfizer
3,851,953
102,192
Viatris
816,320
10,163
Zoetis
307,252
50,061
1,063,133
Total
Health
Care
3,425,747
INDUSTRIALS
&
BUSINESS
SERVICES
8.2%
Aerospace
&
Defense
1.8%
Axon
Enterprise (1)
49,142
29,206
Boeing (1)
510,704
90,395
General
Dynamics
176,860
46,601
General
Electric
739,171
123,286
Howmet
Aerospace
274,054
29,973
Huntington
Ingalls
Industries
26,758
5,056
L3Harris
Technologies
129,855
27,306
Lockheed
Martin
143,790
69,873
Northrop
Grumman
93,223
43,749
RTX
904,763
104,699
Textron
127,343
9,741
TransDigm
Group
38,483
48,769
628,654
Air
Freight
&
Logistics
0.4%
CH
Robinson
Worldwide
80,172
8,283
Expeditors
International
of
Washington
96,659
10,707
FedEx
152,108
42,793
United
Parcel
Service,
Class
B
496,106
62,559
124,342
Building
Products
0.5%
A.O.
Smith
81,888
5,586
Allegion
59,566
7,784
Builders
FirstSource (1)
79,461
11,357
Carrier
Global
572,542
39,082
Johnson
Controls
International
458,115
36,159
T.
ROWE
PRICE
Equity
Index
500
Fund
Shares
$
Value
(Cost
and
value
in
$000s)
‡
Lennox
International
21,902
13,345
Masco
148,502
10,777
Trane
Technologies
153,308
56,624
180,714
Commercial
Services
&
Supplies
0.5%
Cintas
234,617
42,865
Copart (1)
599,457
34,403
Republic
Services
138,897
27,943
Rollins
188,133
8,720
Veralto
169,006
17,213
Waste
Management
247,433
49,929
181,073
Construction
&
Engineering
0.1%
Quanta
Services
101,045
31,935
31,935
Electrical
Equipment
0.8%
AMETEK
157,566
28,403
Eaton
269,511
89,443
Emerson
Electric
390,817
48,434
GE
Vernova
188,204
61,906
Generac
Holdings (1)
41,059
6,366
Hubbell
36,710
15,377
Rockwell
Automation
77,903
22,264
272,193
Ground
Transportation
0.9%
CSX
1,312,417
42,351
JB
Hunt
Transport
Services
55,102
9,404
Norfolk
Southern
154,801
36,332
Old
Dominion
Freight
Line
129,069
22,768
Uber
Technologies (1)
1,436,920
86,675
Union
Pacific
413,459
94,285
291,815
Industrial
Conglomerates
0.5%
3M
370,777
47,864
Honeywell
International
441,950
99,832
Roper
Technologies
73,521
38,220
185,916
Machinery
1.6%
Caterpillar
329,388
119,489
Cummins
93,817
32,705
Deere
173,457
73,494
T.
ROWE
PRICE
Equity
Index
500
Fund
Shares
$
Value
(Cost
and
value
in
$000s)
‡
Dover
94,321
17,695
Fortive
232,208
17,416
IDEX
51,828
10,847
Illinois
Tool
Works
182,968
46,393
Ingersoll
Rand
274,444
24,826
Nordson
37,216
7,787
Otis
Worldwide
274,342
25,407
PACCAR
359,532
37,398
Parker-Hannifin
88,158
56,071
Pentair
113,309
11,403
Snap-on
36,059
12,241
Stanley
Black
&
Decker
105,434
8,465
Westinghouse
Air
Brake
Technologies
116,598
22,106
Xylem
166,797
19,352
543,095
Passenger
Airlines
0.2%
Delta
Air
Lines
435,999
26,378
Southwest
Airlines
410,568
13,803
United
Airlines
Holdings (1)
225,409
21,887
62,068
Professional
Services
0.6%
Automatic
Data
Processing
276,721
81,005
Broadridge
Financial
Solutions
79,663
18,011
Dayforce (1)(2)
107,581
7,815
Equifax
84,989
21,660
Jacobs
Solutions
85,767
11,460
Leidos
Holdings
91,818
13,227
Paychex
219,643
30,798
Paycom
Software
33,124
6,789
Verisk
Analytics
95,898
26,413
217,178
Trading
Companies
&
Distributors
0.3%
Fastenal
391,987
28,188
United
Rentals
44,609
31,424
WW
Grainger
29,909
31,526
91,138
Total
Industrials
&
Business
Services
2,810,121
INFORMATION
TECHNOLOGY
32.2%
Communications
Equipment
0.9%
Arista
Networks (1)
706,700
78,112
Cisco
Systems
2,720,311
161,042
T.
ROWE
PRICE
Equity
Index
500
Fund
Shares
$
Value
(Cost
and
value
in
$000s)
‡
F5 (1)
39,443
9,919
Juniper
Networks
225,042
8,428
Motorola
Solutions
114,426
52,891
310,392
Electronic
Equipment,
Instruments
&
Components
0.6%
Amphenol,
Class
A
817,368
56,766
CDW
91,345
15,898
Corning
523,316
24,868
Jabil
76,764
11,046
Keysight
Technologies (1)
119,248
19,155
TE
Connectivity
203,280
29,063
Teledyne
Technologies (1)
32,075
14,887
Trimble (1)
167,144
11,810
Zebra
Technologies,
Class
A (1)
35,438
13,687
197,180
IT
Services
1.1%
Accenture,
Class
A
425,158
149,566
Akamai
Technologies (1)
103,721
9,921
Cognizant
Technology
Solutions,
Class
A
339,944
26,142
EPAM
Systems (1)
38,879
9,091
Gartner (1)
52,786
25,573
GoDaddy,
Class
A (1)
96,675
19,081
International
Business
Machines
631,669
138,860
VeriSign (1)
56,979
11,792
390,026
Semiconductors
&
Semiconductor
Equipment
11.4%
Advanced
Micro
Devices (1)
1,108,616
133,910
Analog
Devices
337,010
71,601
Applied
Materials
562,215
91,433
Broadcom
3,183,453
738,052
Enphase
Energy (1)
92,662
6,364
First
Solar (1)
73,103
12,884
Intel
2,946,415
59,076
KLA
91,126
57,420
Lam
Research
876,789
63,330
Microchip
Technology
367,642
21,084
Micron
Technology
755,631
63,594
Monolithic
Power
Systems
33,049
19,555
NVIDIA
16,724,531
2,245,937
NXP
Semiconductors
174,401
36,249
ON
Semiconductor (1)
292,993
18,473
QUALCOMM
757,932
116,434
T.
ROWE
PRICE
Equity
Index
500
Fund
Shares
$
Value
(Cost
and
value
in
$000s)
‡
Skyworks
Solutions
109,325
9,695
Teradyne
109,783
13,824
Texas
Instruments
622,327
116,693
3,895,608
Software
10.3%
Adobe (1)
300,362
133,565
ANSYS (1)
59,976
20,232
Autodesk (1)
145,504
43,007
Cadence
Design
Systems (1)
187,795
56,425
Crowdstrike
Holdings,
Class
A (1)
158,347
54,180
Fair
Isaac (1)
16,556
32,962
Fortinet (1)
435,324
41,129
Gen
Digital
370,703
10,150
Intuit
191,504
120,360
Microsoft
5,069,052
2,136,605
Oracle
1,093,980
182,301
Palantir
Technologies,
Class
A (1)
1,400,326
105,907
Palo
Alto
Networks (1)
447,121
81,358
PTC (1)
82,374
15,146
Salesforce
652,622
218,191
ServiceNow (1)
140,161
148,588
Synopsys (1)
104,929
50,928
Tyler
Technologies (1)
29,280
16,884
Workday,
Class
A (1)
145,510
37,546
3,505,464
Technology
Hardware,
Storage
&
Peripherals
7.9%
Apple
10,306,136
2,580,863
Dell
Technologies,
Class
C
209,838
24,182
Hewlett
Packard
Enterprise
887,171
18,941
HP
653,519
21,324
NetApp
141,052
16,373
Seagate
Technology
Holdings
141,692
12,229
Super
Micro
Computer (1)
345,471
10,530
Western
Digital (1)
236,169
14,083
2,698,525
Total
Information
Technology
10,997,195
MATERIALS
1.9%
Chemicals
1.3%
Air
Products
&
Chemicals
152,471
44,223
Albemarle
80,988
6,971
Celanese
75,271
5,210
CF
Industries
Holdings
117,006
9,983
T.
ROWE
PRICE
Equity
Index
500
Fund
Shares
$
Value
(Cost
and
value
in
$000s)
‡
Corteva
470,829
26,818
Dow
480,723
19,291
DuPont
de
Nemours
286,772
21,866
Eastman
Chemical
79,922
7,298
Ecolab
171,495
40,185
FMC (2)
84,953
4,130
International
Flavors
&
Fragrances
174,971
14,794
Linde
324,912
136,031
LyondellBasell
Industries,
Class
A
177,006
13,146
Mosaic
216,949
5,333
PPG
Industries
160,171
19,132
Sherwin-Williams
157,032
53,380
427,791
Construction
Materials
0.1%
Martin
Marietta
Materials
41,824
21,602
Vulcan
Materials
90,370
23,246
44,848
Containers
&
Packaging
0.2%
Amcor
989,629
9,312
Avery
Dennison
54,108
10,125
Ball
206,830
11,403
International
Paper (2)
238,737
12,849
Packaging
Corp.
of
America
61,108
13,757
Smurfit
WestRock
336,754
18,138
75,584
Metals
&
Mining
0.3%
Freeport-McMoRan
985,448
37,526
Newmont
773,484
28,789
Nucor
157,280
18,356
Steel
Dynamics
97,577
11,131
95,802
Total
Materials
644,025
REAL
ESTATE
2.1%
Health
Care
Real
Estate
Investment
Trusts
0.3%
Alexandria
Real
Estate
Equities,
REIT
105,990
10,339
Healthpeak
Properties,
REIT
481,778
9,766
Ventas,
REIT
282,580
16,641
Welltower,
REIT
404,119
50,931
87,677
T.
ROWE
PRICE
Equity
Index
500
Fund
Shares
$
Value
(Cost
and
value
in
$000s)
‡
Hotel
&
Resort
Real
Estate
Investment
Trusts
0.0%
Host
Hotels
&
Resorts,
REIT
480,107
8,411
8,411
Industrial
Real
Estate
Investment
Trusts
0.2%
Prologis,
REIT
628,450
66,427
66,427
Office
Real
Estate
Investment
Trusts
0.0%
BXP,
REIT
99,267
7,382
7,382
Real
Estate
Management
&
Development
0.1%
CBRE
Group,
Class
A (1)
206,142
27,064
CoStar
Group (1)
281,381
20,144
47,208
Residential
Real
Estate
Investment
Trusts
0.3%
AvalonBay
Communities,
REIT
97,472
21,441
Camden
Property
Trust,
REIT
71,275
8,271
Equity
Residential,
REIT
233,038
16,723
Essex
Property
Trust,
REIT
43,997
12,559
Invitation
Homes,
REIT
390,469
12,483
Mid-America
Apartment
Communities,
REIT
78,724
12,168
UDR,
REIT
205,258
8,910
92,555
Retail
Real
Estate
Investment
Trusts
0.3%
Federal
Realty
Investment
Trust,
REIT
51,074
5,718
Kimco
Realty,
REIT
458,747
10,748
Realty
Income,
REIT
597,277
31,901
Regency
Centers,
REIT
111,586
8,249
Simon
Property
Group,
REIT
210,206
36,200
92,816
Specialized
Real
Estate
Investment
Trusts
0.9%
American
Tower,
REIT
316,843
58,112
Crown
Castle,
REIT
297,455
26,997
Digital
Realty
Trust,
REIT
213,012
37,774
Equinix,
REIT
65,915
62,151
Extra
Space
Storage,
REIT
145,487
21,765
Iron
Mountain,
REIT
201,216
21,150
Public
Storage,
REIT
108,082
32,364
SBA
Communications,
REIT
73,745
15,029
VICI
Properties,
REIT
716,574
20,931
T.
ROWE
PRICE
Equity
Index
500
Fund
Shares
$
Value
(Cost
and
value
in
$000s)
‡
Weyerhaeuser,
REIT
498,947
14,045
310,318
Total
Real
Estate
712,794
UTILITIES
2.3%
Electric
Utilities
1.5%
Alliant
Energy
175,569
10,383
American
Electric
Power
364,949
33,659
Constellation
Energy
214,128
47,903
Duke
Energy
523,700
56,423
Edison
International
264,214
21,095
Entergy
292,574
22,183
Evergy
157,305
9,682
Eversource
Energy
250,306
14,375
Exelon
679,654
25,582
FirstEnergy
351,509
13,983
NextEra
Energy
1,397,672
100,199
NRG
Energy
136,622
12,326
PG&E
1,487,802
30,024
Pinnacle
West
Capital (2)
77,475
6,568
PPL
504,553
16,378
Southern
749,909
61,732
Xcel
Energy
392,292
26,488
508,983
Gas
Utilities
0.0%
Atmos
Energy
106,473
14,829
14,829
Independent
Power
&
Renewable
Electricity
Producers
0.1%
AES
486,111
6,256
Vistra
231,279
31,887
38,143
Multi-Utilities
0.6%
Ameren
182,414
16,260
CenterPoint
Energy
439,793
13,955
CMS
Energy
204,209
13,611
Consolidated
Edison
234,771
20,949
Dominion
Energy
574,288
30,931
DTE
Energy
142,061
17,154
NiSource
318,878
11,722
Public
Service
Enterprise
Group
340,991
28,810
Sempra
434,304
38,097
T.
ROWE
PRICE
Equity
Index
500
Fund
Shares
$
Value
(Cost
and
value
in
$000s)
‡
WEC
Energy
Group (2)
216,996
20,406
211,895
Water
Utilities
0.1%
American
Water
Works
133,730
16,648
16,648
Total
Utilities
790,498
Total
Common
Stocks
(Cost
$9,420,732)
33,961,962
SHORT-TERM
INVESTMENTS
0.3%
Money
Market
Funds
0.3%
T.
Rowe
Price
Government
Reserve
Fund,
4.53% (3)(4)
85,245,137
85,245
Total
Short-Term
Investments
(Cost
$85,245)
85,245
SECURITIES
LENDING
COLLATERAL
0.1%
INVESTMENTS
IN
A
POOLED
ACCOUNT
THROUGH
SECURITIES
LENDING
PROGRAM
WITH
STATE
STREET
BANK
AND
TRUST
COMPANY 0.1%
Money
Market
Funds 0.1%
T.
Rowe
Price
Government
Reserve
Fund,
4.53% (3)(4)
31,705,243
31,705
Total
Investments
in
a
Pooled
Account
through
Securities
Lending
Program
with
State
Street
Bank
And
Trust
Company
31,705
Total
Securities
Lending
Collateral
(Cost
$31,705)
31,705
Total
Investments
in
Securities
100.1%
of
Net
Assets
(Cost
$9,537,682)
$
34,078,912
‡
Shares
and
Notional
Amount
are
denominated
in
U.S.
dollars
unless
otherwise
noted.
(1)
Non-income
producing
(2)
See
Note
4.
All
or
a
portion
of
this
security
is
on
loan
at
December
31,
2024.
(3)
Affiliated
Companies
(4)
Seven-day
yield
REIT
A
domestic
Real
Estate
Investment
Trust
whose
distributions
pass-through
with
original
tax
character
to
the
shareholder
T.
ROWE
PRICE
Equity
Index
500
Fund
FUTURES
CONTRACTS
($000s)
Expiration
Date
Notional
Amount
Value
and
Unrealized
Gain
(Loss)
Long,
356
S&P
500
E-Mini
Index
contracts
3/25
105,656
$
(2,273)
Net
payments
(receipts)
of
variation
margin
to
date
1,899
Variation
margin
receivable
(payable)
on
open
futures
contracts
$
(374)
T.
ROWE
PRICE
Equity
Index
500
Fund
The
accompanying
notes
are
an
integral
part
of
these
financial
statements.
AFFILIATED
COMPANIES
($000s)
The
fund
may
invest
in
certain
securities
that
are
considered
affiliated
companies.
As
defined
by
the
1940
Act,
an
affiliated
company
is
one
in
which
the
fund
owns
5%
or
more
of
the
outstanding
voting
securities,
or
a
company
that
is
under
common
ownership
or
control.
The
following
securities
were
considered
affiliated
companies
for
all
or
some
portion
of
the
year
ended
December
31,
2024.
Net
realized
gain
(loss),
investment
income,
change
in
net
unrealized
gain/loss,
and
purchase
and
sales
cost
reflect
all
activity
for
the
period
then
ended.
Affiliate
Net
Realized
Gain
(Loss)
Change
in
Net
Unrealized
Gain/Loss
Investment
Income
T.
Rowe
Price
Group
$
326
$
482
$
773
T.
Rowe
Price
Government
Reserve
Fund,
4.53%
—
—
3,464++
Totals
$
326#
$
482
$
4,237+
Supplementary
Investment
Schedule
Affiliate
Value
12/31/23
Purchase
Cost
Sales
Cost
Value
12/31/24
T.
Rowe
Price
Group
$
17,190
$
296
$
784
$
17,184
T.
Rowe
Price
Government
Reserve
Fund,
4.53%
218,349
¤
¤
116,950
Total
$
134,134^
#
Capital
gain
distributions
from
underlying
Price
funds
represented
$0
of
the
net
realized
gain
(loss).
++
Excludes
earnings
on
securities
lending
collateral,
which
are
subject
to
rebates
and
fees
as
described
in
Note
4.
+
Investment
income
comprised
$4,237
of
dividend
income
and
$0
of
interest
income.
¤
Purchase
and
sale
information
not
shown
for
cash
management
funds.
^
The
cost
basis
of
investments
in
affiliated
companies
was
$123,658.
T.
ROWE
PRICE
Equity
Index
500
Fund
December
31,
2024
Statement
of
Assets
and
Liabilities
($000s,
except
shares
and
per
share
amounts)
Assets
Investments
in
securities,
at
value
(cost
$9,537,682)
$
34,078,912
Receivable
for
investment
securities
sold
75,693
Dividends
and
interest
receivable
20,869
Receivable
for
shares
sold
16,381
Cash
deposits
on
futures
contracts
4,376
Due
from
affiliates
231
Other
assets
629
Total
assets
34,197,091
Liabilities
Payable
for
shares
redeemed
105,650
Obligation
to
return
securities
lending
collateral
31,705
Investment
management
fees
payable
1,478
Variation
margin
payable
on
futures
contracts
374
Payable
to
directors
26
Other
liabilities
824
Total
liabilities
140,057
Commitments
and
Contingent
Liabilities
(note
7
)
NET
ASSETS
$
34,057,034
T.
ROWE
PRICE
Equity
Index
500
Fund
December
31,
2024
Statement
of
Assets
and
Liabilities
($000s,
except
shares
and
per
share
amounts)
The
accompanying
notes
are
an
integral
part
of
these
financial
statements.
Net
Assets
Consist
of:
Total
distributable
earnings
(loss)
$
24,444,830
Paid-in
capital
applicable
to
220,291,284
shares
of
$0.01
par
value
capital
stock
outstanding;
2,000,000,000
shares
of
the
Corporation
authorized
9,612,204
NET
ASSETS
$
34,057,034
NET
ASSET
VALUE
PER
SHARE
Investor
Class
(Net
assets:
$8,258,276;
Shares
outstanding:
53,415,479)
$
154.60
I
Class
(Net
assets:
$10,823,502;
Shares
outstanding:
70,000,685)
$
154.62
Z
Class
(Net
assets:
$14,975,256;
Shares
outstanding:
96,875,120)
$
154.58
T.
ROWE
PRICE
Equity
Index
500
Fund
Year
Ended
12/31/24
Investment
Income
(Loss)
Income
Dividend
(net
of
foreign
taxes
of
$84)
$
437,228
.
Interest
324
Securities
lending
120
Other
61
Total
income
437,733
Expenses
Investment
management
15,959
Shareholder
servicing
Investor
Class
$
10,135
I
Class
2,335
12,470
Prospectus
and
shareholder
reports
Investor
Class
115
I
Class
9
Z
Class
3
127
Custody
and
accounting
678
Registration
141
Directors
104
Legal
and
audit
30
Miscellaneous
35
Waived
/
paid
by
Price
Associates
(10,332)
Total
expenses
19,212
Net
investment
income
418,521
T.
ROWE
PRICE
Equity
Index
500
Fund
The
accompanying
notes
are
an
integral
part
of
these
financial
statements.
Year
Ended
12/31/24
Realized
and
Unrealized
Gain
/
Loss
–
Net
realized
gain
(loss)
Securities
756,769
Futures
19,754
Net
realized
gain
776,523
Change
in
net
unrealized
gain
/
loss
Securities
5,775,055
Futures
(4,113)
Change
in
net
unrealized
gain
/
loss
5,770,942
Net
realized
and
unrealized
gain
/
loss
6,547,465
INCREASE
IN
NET
ASSETS
FROM
OPERATIONS
$
6,965,986
T.
ROWE
PRICE
Equity
Index
500
Fund
Statement
of
Changes
in
Net
Assets
Year
.
.
.
.
.
.
.
.
.
.
.
.
.
.
Ended
.
.
.
.
.
.
.
.
.
.
.
.
.
.
12/31/24
12/31/23
Increase
(Decrease)
in
Net
Assets
Operations
Net
investment
income
$
418,521
$
407,362
Net
realized
gain
776,523
502,371
Change
in
net
unrealized
gain
/
loss
5,770,942
5,109,051
Increase
in
net
assets
from
operations
6,965,986
6,018,784
Distributions
to
shareholders
Net
earnings
Investor
Class
(98,418)
(93,863)
I
Class
(134,132)
(111,081)
Z
Class
(205,466)
(202,479)
Decrease
in
net
assets
from
distributions
(438,016)
(407,423)
Capital
share
transactions
*
Shares
sold
Investor
Class
1,449,435
1,203,054
I
Class
1,875,658
929,324
Z
Class
1,694,234
1,659,719
Distributions
reinvested
Investor
Class
93,564
89,367
I
Class
124,990
103,409
Z
Class
205,466
202,479
Shares
redeemed
Investor
Class
(2,116,744)
(1,163,721)
I
Class
(1,085,103)
(583,631)
Z
Class
(3,168,940)
(2,602,069)
Decrease
in
net
assets
from
capital
share
transactions
(927,440)
(162,069)
T.
ROWE
PRICE
Equity
Index
500
Fund
Statement
of
Changes
in
Net
Assets
The
accompanying
notes
are
an
integral
part
of
these
financial
statements.
Year
.
.
.
.
.
.
.
.
.
.
.
.
.
.
Ended
.
.
.
.
.
.
.
.
.
.
.
.
.
.
12/31/24
12/31/23
Net
Assets
Increase
during
period
5,600,530
5,449,292
Beginning
of
period
28,456,504
23,007,212
End
of
period
$
34,057,034
$
28,456,504
*Share
information
(000s)
Shares
sold
Investor
Class
10,205
10,630
I
Class
13,170
8,167
Z
Class
12,363
14,918
Distributions
reinvested
Investor
Class
632
781
I
Class
843
904
Z
Class
1,389
1,774
Shares
redeemed
Investor
Class
(14,976)
(10,364)
I
Class
(7,566)
(5,162)
Z
Class
(22,705)
(22,687)
Decrease
in
shares
outstanding
(6,645)
(1,039)
T.
ROWE
PRICE
Equity
Index
500
Fund
NOTES
TO
FINANCIAL
STATEMENTS
T.
Rowe
Price
Index
Trust,
Inc. (the
corporation) is
registered
under
the
Investment
Company
Act
of
1940
(the
1940
Act).
The
Equity
Index
500
Fund
(the
fund)
is
an
open-end
management
investment
company
established
by
the
corporation
and
intends
to
be
diversified
in
approximately
the
same
proportion
as
the
index
it
tracks
is
diversified.
The
fund
may
become
nondiversified
for
periods
of
time
solely
as
a
result
of
changes
in
the
composition
of
the
index
(for
example,
changes
in
the
relative
market
capitalization
or
index
weighting
of
one
or
more
securities
represented
in
the
index). The
fund
seeks to
track
the
performance
of
a
benchmark
index
that
measures
the
investment
return
of
large-capitalization
U.S.
stocks.
The
fund
has three classes
of
shares:
the
Equity
Index
500
Fund
(Investor
Class),
the
Equity
Index
500
Fund–I
Class
(I
Class)
and
the
Equity
Index
500
Fund–Z
Class
(Z
Class).
I
Class
shares
require
a
$500,000
initial
investment
minimum,
although
the
minimum
generally
is
waived
or
reduced
for
financial
intermediaries,
eligible
retirement
plans,
and
certain
other
accounts.
The
Z
Class
is
only
available
to
funds
advised
by
T.
Rowe
Price
Associates,
Inc.
and
its
affiliates
and
other
clients
that
are
subject
to
a
contractual
fee
for
investment
management
services. Each
class
has
exclusive
voting
rights
on
matters
related
solely
to
that
class;
separate
voting
rights
on
matters
that
relate
to
all
classes;
and,
in
all
other
respects,
the
same
rights
and
obligations
as
the
other
classes.
NOTE
1
-
SIGNIFICANT
ACCOUNTING
POLICIES
Basis
of
Preparation
The fund
is
an
investment
company
and
follows
accounting
and
reporting
guidance
in
the
Financial
Accounting
Standards
Board
(FASB)
Accounting
Standards
Codification
Topic
946
(ASC
946).
The
accompanying
financial
statements
were
prepared
in
accordance
with
accounting
principles
generally
accepted
in
the
United
States
of
America
(GAAP),
including,
but
not
limited
to,
ASC
946.
GAAP
requires
the
use
of
estimates
made
by
management.
Management
believes
that
estimates
and
valuations
are
appropriate;
however,
actual
results
may
differ
from
those
estimates,
and
the
valuations
reflected
in
the
accompanying
financial
statements
may
differ
from
the
value
ultimately
realized
upon
sale
or
maturity.
Investment
Transactions,
Investment
Income,
and
Distributions
Investment
transactions
are
accounted
for
on
the
trade
date
basis.
Income
and
expenses
are
recorded
on
the
accrual
basis.
Realized
gains
and
losses
are
reported
on
the
identified
cost
basis. Premiums
and
discounts
on
debt
securities
are
T.
ROWE
PRICE
Equity
Index
500
Fund
amortized
for
financial
reporting
purposes. Income
tax-related
interest
and
penalties,
if
incurred,
are
recorded
as
income
tax
expense. Dividends
received
from other
investment
companies are
reflected
as
dividend income;
capital
gain
distributions
are
reflected
as
realized
gain/loss. Dividend
income and
capital
gain
distributions
are
recorded
on
the
ex-dividend
date. Distributions
from
REITs
are
initially
recorded
as
dividend
income
and,
to
the
extent
such
represent
a
return
of
capital
or
capital
gain
for
tax
purposes,
are
reclassified
when
such
information
becomes
available. Non-cash
dividends,
if
any,
are
recorded
at
the
fair
market
value
of
the
asset
received. Proceeds
from
litigation
payments,
if
any,
are
included
in
either
net
realized
gain
(loss)
or
change
in
net
unrealized
gain/loss
from
securities. Distributions
to
shareholders
are
recorded
on
the
ex-dividend
date. Income
distributions,
if
any,
are
declared
and
paid
by
each
class quarterly. A
capital
gain
distribution,
if
any, may
also
be
declared
and
paid
by
the
fund
annually.
Class
Accounting
Shareholder
servicing,
prospectus,
and
shareholder
report
expenses
incurred
by
each
class
are
charged
directly
to
the
class
to
which
they
relate.
Expenses
common
to
all
classes,
investment
income,
and
realized
and
unrealized
gains
and
losses
are
allocated
to
the
classes
based
upon
the
relative
daily
net
assets
of
each
class.
In-Kind
Redemptions
In
accordance
with
guidelines
described
in
the
fund’s
prospectus,
and
when
considered
to
be
in
the
best
interest
of
all
shareholders,
the
fund
may
distribute
portfolio
securities
rather
than
cash
as
payment
for
a
redemption
of
fund
shares
(in-kind
redemption).
Gains
and
losses
realized
on
in-kind
redemptions
are
not
recognized
for
tax
purposes
and
are
reclassified
from
undistributed
realized
gain
(loss)
to
paid-in
capital.
During
the
year ended
December
31,
2024,
the
fund
realized
$316,497,000 of
net
gain
on
$409,343,000
of
in-kind
redemptions.
Capital
Transactions
Each
investor’s
interest
in
the
net
assets
of the
fund
is
represented
by
fund
shares. The
fund’s
net
asset
value
(NAV)
per
share
is
computed
at
the
close
of
the
New
York
Stock
Exchange
(NYSE),
normally
4
p.m.
Eastern
time,
each
day
the
NYSE
is
open
for
business.
However,
the
NAV
per
share
may
be
calculated
at
a
time
other
than
the
normal
close
of
the
NYSE
if
trading
on
the
NYSE
is
restricted,
if
the
NYSE
closes
earlier,
or
as
may
be
permitted
by
the
SEC.
Purchases
and
redemptions
of
fund
shares
are
transacted
at
the
next-computed
NAV
per
share,
after
receipt
of
the
transaction
order
by
T.
Rowe
Price
Associates,
Inc.,
or
its
agents.
T.
ROWE
PRICE
Equity
Index
500
Fund
New
Accounting
Guidance
In December
2023,
the
FASB
issued
Accounting
Standards
Update
(ASU),
ASU
2023-09,
Income
Taxes
(Topic
740)
–
Improvements
to
Income
Taxes
Disclosures,
which
enhances
the
transparency
of
income
tax
disclosures.
The
ASU
requires
public
entities,
on
an
annual
basis,
to
provide
disclosure
of
specific
categories
in
the
rate
reconciliation,
as
well
as
disclosure
of
income
taxes
paid
disaggregated
by
jurisdiction.
The
amendments
under
this
ASU
are
required
to
be
applied
prospectively
and
are
effective
for
fiscal
years
beginning
after
December
15,
2024.
Management
expects
that
adoption
of
the
guidance
will
not
have
a
material
impact
on
the
fund’s
financial
statements.
Indemnification
In
the
normal
course
of
business, the
fund
may
provide
indemnification
in
connection
with
its
officers
and
directors,
service
providers,
and/or
private
company
investments. The
fund’s
maximum
exposure
under
these
arrangements
is
unknown;
however,
the
risk
of
material
loss
is
currently
considered
to
be
remote.
NOTE
2
-
VALUATION
Fair
Value
The
fund’s
financial
instruments
are
valued
at
the
close
of
the
NYSE
and
are
reported
at
fair
value,
which
GAAP
defines
as
the
price
that
would
be
received
to
sell
an
asset
or
paid
to
transfer
a
liability
in
an
orderly
transaction
between
market
participants
at
the
measurement
date. The fund’s
Board
of
Directors
(the
Board)
has
designated
T.
Rowe
Price
Associates,
Inc.
as
the
fund’s
valuation
designee
(Valuation
Designee).
Subject
to
oversight
by
the
Board,
the
Valuation
Designee
performs
the
following
functions
in
performing
fair
value
determinations:
assesses
and
manages
valuation
risks;
establishes
and
applies
fair
value
methodologies;
tests
fair
value
methodologies;
and
evaluates
pricing
vendors
and
pricing
agents.
The
duties
and
responsibilities
of
the
Valuation
Designee
are
performed
by
its
Valuation
Committee. The
Valuation
Designee provides
periodic
reporting
to
the
Board
on
valuation
matters.
Various
valuation
techniques
and
inputs
are
used
to
determine
the
fair
value
of
financial
instruments.
GAAP
establishes
the
following
fair
value
hierarchy
that
categorizes
the
inputs
used
to
measure
fair
value:
Level
1
–
quoted
prices
(unadjusted)
in
active
markets
for
identical
financial
instruments
that
the
fund
can
access
at
the
reporting
date
T.
ROWE
PRICE
Equity
Index
500
Fund
Level
2
–
inputs
other
than
Level
1
quoted
prices
that
are
observable,
either
directly
or
indirectly
(including,
but
not
limited
to,
quoted
prices
for
similar
financial
instruments
in
active
markets,
quoted
prices
for
identical
or
similar
financial
instruments
in
inactive
markets,
interest
rates
and
yield
curves,
implied
volatilities,
and
credit
spreads)
Level
3
–
unobservable
inputs
(including
the Valuation
Designee’s assumptions
in
determining
fair
value)
Observable
inputs
are
developed
using
market
data,
such
as
publicly
available
information
about
actual
events
or
transactions,
and
reflect
the
assumptions
that
market
participants
would
use
to
price
the
financial
instrument.
Unobservable
inputs
are
those
for
which
market
data
are
not
available
and
are
developed
using
the
best
information
available
about
the
assumptions
that
market
participants
would
use
to
price
the
financial
instrument.
GAAP
requires
valuation
techniques
to
maximize
the
use
of
relevant
observable
inputs
and
minimize
the
use
of
unobservable
inputs.
When
multiple
inputs
are
used
to
derive
fair
value,
the
financial
instrument
is
assigned
to
the
level
within
the
fair
value
hierarchy
based
on
the
lowest-level
input
that
is
significant
to
the
fair
value
of
the
financial
instrument.
Input
levels
are
not
necessarily
an
indication
of
the
risk
or
liquidity
associated
with
financial
instruments
at
that
level
but
rather
the
degree
of
judgment
used
in
determining
those
values.
Valuation
Techniques
Equity
securities,
including
exchange-traded
funds, listed
or
regularly
traded
on
a
securities
exchange
or
in
the
over-the-
counter
(OTC)
market
are
valued
at
the
last
quoted
sale
price
or,
for
certain
markets,
the
official
closing
price
at
the
time
the
valuations
are
made.
OTC
Bulletin
Board
securities
are
valued
at
the
mean
of
the
closing
bid
and
asked
prices.
A
security
that
is
listed
or
traded
on
more
than
one
exchange
is
valued
at
the
quotation
on
the
exchange
determined
to
be
the
primary
market
for
such
security.
Listed
securities
not
traded
on
a
particular
day
are
valued
at
the
mean
of
the
closing
bid
and
asked
prices
for
domestic
securities.
Investments
in
mutual
funds
are
valued
at
the
mutual
fund’s
closing
NAV
per
share
on
the
day
of
valuation.
Futures
contracts
are
valued
at
closing
settlement
prices.
Assets
and
liabilities
other
than
financial
instruments,
including
short-
term
receivables
and
payables,
are
carried
at
cost,
or
estimated
realizable
value,
if
less,
which
approximates
fair
value.
Investments
for
which
market
quotations are
not
readily
available
or
deemed
unreliable
are
valued
at
fair
value
as
determined
in
good
faith
by
the
Valuation
Designee.
The
Valuation
Designee
has
adopted
methodologies
T.
ROWE
PRICE
Equity
Index
500
Fund
for
determining
the
fair
value
of
investments
for
which
market
quotations
are
not
readily
available
or
deemed
unreliable,
including
the
use
of
other
pricing
sources.
Factors
used
in
determining
fair
value
vary
by
type
of
investment
and
may
include
market
or
investment
specific
considerations.
The
Valuation
Designee typically
will
afford
greatest
weight
to
actual
prices
in
arm’s
length
transactions,
to
the
extent
they
represent
orderly
transactions
between
market
participants,
transaction
information
can
be
reliably
obtained,
and
prices
are
deemed
representative
of
fair
value.
However,
the
Valuation
Designee may
also
consider
other
valuation
methods
such
as
market-based
valuation
multiples;
a
discount
or
premium
from
market
value
of
a
similar,
freely
traded
security
of
the
same
issuer;
discounted
cash
flows;
yield
to
maturity;
or
some
combination.
Fair
value
determinations
are
reviewed
on
a
regular
basis.
Because
any
fair
value
determination
involves
a
significant
amount
of
judgment,
there
is
a
degree
of
subjectivity
inherent
in
such
pricing
decisions. Fair
value
prices
determined
by
the
Valuation
Designee could
differ
from
those
of
other
market
participants,
and
it
is
possible
that
the
fair
value
determined
for
a
security
may
be
materially
different
from
the
value
that
could
be
realized
upon
the
sale
of
that
security.
Valuation
Inputs
On
December
31,
2024,
all
of
the
fund’s
financial
instruments
were
classified
as
Level
1,
based
on
the
inputs
used
to
determine
their
fair
values.
NOTE
3
-
DERIVATIVE
INSTRUMENTS
During
the
year ended
December
31,
2024,
the
fund
invested
in
derivative
instruments.
As
defined
by
GAAP,
a
derivative
is
a
financial
instrument
whose
value
is
derived
from
an
underlying
security
price,
foreign
exchange
rate,
interest
rate,
index
of
prices
or
rates,
or
other
variable;
it
requires
little
or
no
initial
investment
and
permits
or
requires
net
settlement
or
delivery
of
cash
or
other
assets.
The
fund
invests
in
derivatives
only
if
the
expected
risks
and
rewards
are
consistent
with
its
investment
objectives,
policies,
and
overall
risk
profile,
as
described
in
its
prospectus
and
Statement
of
Additional
Information.
The
fund
may
use
derivatives
for
a
variety
of
purposes
and
may
use
them
to
establish
both
long
and
short
positions
within
the
fund’s
portfolio.
Potential
uses
include
to
hedge
against
declines
in
principal
value,
increase
yield,
invest
in
an
asset
with
greater
efficiency
and
at
a
lower
cost
than
is
possible
through
direct
investment,
to
enhance
return,
or
to
adjust
credit
exposure.
The
risks
associated
with
the
use
of
derivatives
are
different
from,
and
potentially
much
greater
than,
the
risks
associated
with
investing
directly
in
the
instruments
on
which
the
derivatives
are
based.
T.
ROWE
PRICE
Equity
Index
500
Fund
The
fund
values
its
derivatives
at
fair
value
and
recognizes
changes
in
fair
value
currently
in
its
results
of
operations.
Accordingly,
the
fund
does
not
follow
hedge
accounting,
even
for
derivatives
employed
as
economic
hedges.
Generally,
the
fund
accounts
for
its
derivatives
on
a
gross
basis.
It
does
not
offset
the
fair
value
of
derivative
liabilities
against
the
fair
value
of
derivative
assets
on
its
financial
statements,
nor
does
it
offset
the
fair
value
of
derivative
instruments
against
the
right
to
reclaim
or
obligation
to
return
collateral.
The
following
table
summarizes
the
fair
value
of
the
fund’s
derivative
instruments
held
as
of
December
31,
2024,
and
the
related
location
on
the
accompanying
Statement
of
Assets
and
Liabilities,
presented
by
primary
underlying
risk
exposure:
Additionally,
the
amount
of
gains
and
losses
on
derivative
instruments
recognized
in
fund
earnings
during
the
year ended
December
31,
2024,
and
the
related
location
on
the
accompanying
Statement
of
Operations
is
summarized
in
the
following
table
by
primary
underlying
risk
exposure:
($000s)
Location
on
Statement
of
Assets
and
Liabilities
Fair
Value*
*
Liabilities
Equity
derivatives
Futures
$
2,273
Total
$
2,273
*
The
fair
value
presented
includes
cumulative
gain
(loss)
on
open
futures
contracts;
however,
the
value
reflected
on
the
accompanying
Statement
of
Assets
and
Liabilities
is
only
the
unsettled
variation
margin
receivable
(payable)
at
that
date.
($000s)
Location
of
Gain
(Loss)
on
Statement
of
Operations
Futures
Realized
Gain
(Loss)
Equity
derivatives
$
19,754
Total
$
19,754
T.
ROWE
PRICE
Equity
Index
500
Fund
Counterparty
Risk
and
Collateral
The
fund
invests
in
exchange-traded
and/or
centrally
cleared
derivative
contracts,
such
as
futures,
exchange-traded
options,
and
centrally
cleared
swaps.
Counterparty
risk
on
such
derivatives
is
minimal
because
the
clearinghouse
provides
protection
against
counterparty
defaults.
For
futures
and
centrally
cleared
swaps,
the
fund
is
required
to
deposit
collateral
in
an
amount
specified
by
the
clearinghouse
and
the
clearing
firm
(margin
requirement),
and
the
margin
requirement
must
be
maintained
over
the
life
of
the
contract.
Each
clearinghouse
and
clearing
firm,
in
its
sole
discretion,
may
adjust
the
margin
requirements
applicable
to
the
fund.
Collateral may
be
in
the
form
of
cash
or
debt
securities
issued
by
the
U.S.
government
or
related
agencies.
Cash
posted
by
the
fund
is
reflected
as
cash
deposits
in
the
accompanying
financial
statements
and
generally
is
restricted
from
withdrawal
by
the
fund;
securities
posted
by
the
fund
are
so
noted
in
the
accompanying
Portfolio
of
Investments;
both
remain
in
the
fund’s
assets.
While
typically
not
sold
in
the
same
manner
as
equity
or
fixed
income
securities,
exchange-traded
or
centrally
cleared
derivatives
may
be
closed
out
only
on
the
exchange
or
clearinghouse
where
the
contracts
were
cleared.
This
ability
is
subject
to
the
liquidity
of
underlying
positions. As
of
December
31,
2024,
cash
of $4,376,000 had
been
posted
by
the
fund
for
exchange-traded
and/or
centrally
cleared
derivatives.
Futures
Contracts
The
fund
is
subject
to equity
price
risk in
the
normal
course
of
pursuing
its
investment
objectives
and
uses
futures
contracts
to
help
manage
such
risk.
The
fund
may
enter
into
futures
contracts
as
an
efficient
means
of
maintaining
liquidity
while
being
invested
in
the
market,
to
facilitate
trading,
or
to
reduce
transaction
costs. A
futures
contract
provides
for
the
future
sale
by
one
party
and
purchase
by
another
of
a
specified
amount
of
a
specific
underlying
financial
instrument
at
an
agreed-upon
price,
date,
time,
and
place.
The
fund
currently
invests
only
in
exchange-traded
futures,
which
generally
are
standardized
as
to
maturity
date,
underlying
financial
instrument,
and
other
contract
terms.
Payments
are
made
or
received
by
the
fund
each
day
($000s)
Location
of
Gain
(Loss)
on
Statement
of
Operations
Futures
Change
in
Unrealized
Gain
(Loss)
Equity
derivatives
$
(4,113)
Total
$
(4,113)
T.
ROWE
PRICE
Equity
Index
500
Fund
to
settle
daily
fluctuations
in
the
value
of
the
contract
(variation
margin),
which
reflect
changes
in
the
value
of
the
underlying
financial
instrument.
Variation
margin
is
recorded
as
unrealized
gain
or
loss
until
the
contract
is
closed.
The
value
of
a
futures
contract
included
in
net
assets
is
the
amount
of
unsettled
variation
margin;
net
variation
margin
receivable
is
reflected
as
an
asset
and
net
variation
margin
payable
is
reflected
as
a
liability
on
the
accompanying
Statement
of
Assets
and
Liabilities.
When
a
contract
is
closed,
a
realized
gain
or
loss
is
recorded
on
the
accompanying
Statement
of
Operations.
Risks
related
to
the
use
of
futures
contracts
include
possible
illiquidity
of
the
futures
markets,
contract
prices
that
can
be
highly
volatile
and
imperfectly
correlated
to
movements
in
hedged
security
values,
and
potential
losses
in
excess
of
the
fund’s
initial
investment.
During
the
year ended
December
31,
2024,
the
volume
of
the
fund’s
activity
in
futures,
based
on
underlying
notional
amounts,
was
generally
less
than
1%
of
net
assets.
NOTE
4
-
OTHER
INVESTMENT
TRANSACTIONS
Consistent
with
its
investment
objective, the
fund
engages
in
the
following
practices
to
manage
exposure
to
certain
risks
and/or
to
enhance
performance.
The
investment
objective,
policies,
program,
and
risk
factors
of the
fund
are
described
more
fully
in the
fund’s prospectus
and
Statement
of
Additional
Information.
Securities
Lending
The fund
may
lend
its
securities
to
approved
borrowers
to
earn
additional
income.
Its
securities
lending
activities
are
administered
by
a
lending
agent
in
accordance
with
a
securities
lending
agreement.
Security
loans
generally
do
not
have
stated
maturity
dates,
and
the
fund
may
recall
a
security
at
any
time.
The
fund
receives
collateral
in
the
form
of
cash
or
U.S.
government
securities.
Collateral
is
maintained
over
the
life
of
the
loan
in
an
amount
not
less
than
the
value
of
loaned
securities;
any
additional
collateral
required
due
to
changes
in
security
values
is
delivered
to
the
fund
the
next
business
day.
Cash
collateral
is
invested
in
accordance
with
investment
guidelines
approved
by
fund
management.
Additionally,
the
lending
agent
indemnifies
the
fund
against
losses
resulting
from
borrower
default.
Although
risk
is
mitigated
by
the
collateral
and
indemnification,
the
fund
could
experience
a
delay
in
recovering
its
securities
and
a
possible
loss
of
income
or
value
if
the
borrower
fails
to
return
the
securities,
collateral
investments
decline
in
value,
and
the
lending
agent
fails
to
perform.
Securities
lending
revenue
consists
of
earnings
on
invested
collateral
and
borrowing
fees,
net
of
any
rebates
to
the
borrower,
compensation
to
the
lending
agent,
and
other
administrative
costs.
In
accordance
with
GAAP,
T.
ROWE
PRICE
Equity
Index
500
Fund
investments
made
with
cash
collateral
are
reflected
in
the
accompanying
financial
statements,
but
collateral
received
in
the
form
of
securities
is
not.
At
December
31,
2024,
the
value
of
loaned
securities
was
$31,167,000;
the
value
of
cash
collateral
and
related
investments
was
$31,705,000.
Other
Purchases
and
sales
of
portfolio
securities
other
than
in-kind
transactions,
if
any,
and short-term securities
aggregated $1,134,909,000 and
$1,624,342,000,
respectively,
for
the
year ended
December
31,
2024.
NOTE
5
-
FEDERAL
INCOME
TAXES
Generally,
no
provision
for
federal
income
taxes
is
required
since
the
fund
intends
to continue
to
qualify
as
a
regulated
investment
company
under
Subchapter
M
of
the
Internal
Revenue
Code
and
distribute
to
shareholders
all
of
its taxable
income
and
gains.
Distributions
determined
in
accordance
with
federal
income
tax
regulations
may
differ
in
amount
or
character
from
net
investment
income
and
realized
gains
for
financial
reporting
purposes.
The
fund
files
U.S.
federal,
state,
and
local
tax
returns
as
required.
The
fund’s
tax
returns
are
subject
to
examination
by
the
relevant
tax
authorities
until
expiration
of
the
applicable
statute
of
limitations,
which
is
generally
three
years
after
the
filing
of
the
tax
return
but
which
can
be
extended
to
six
years
in
certain
circumstances.
Tax
returns
for
open
years
have
incorporated
no
uncertain
tax
positions
that
require
a
provision
for
income
taxes.
Capital
accounts
within
the
financial
reporting
records
are
adjusted
for
permanent
book/tax
differences
to
reflect
tax
character
but
are
not
adjusted
for
temporary
differences.
The
permanent
book/tax
adjustments,
if
any,
have
no
impact
on
results
of
operations
or
net
assets.
The
permanent
book/tax
adjustments
relate
primarily
to
redemptions
in
kind
and
deemed
distributions
on
shareholder
redemptions.
T.
ROWE
PRICE
Equity
Index
500
Fund
The
tax
character
of
distributions
paid
for
the
periods
presented
was
as
follows:
At
December
31,
2024,
the
tax-basis
cost
of
investments
(including
derivatives,
if
any)
and
gross
unrealized
appreciation
and
depreciation
were as
follows:
At
December
31,
2024,
the
tax-basis
components
of
accumulated
net
earnings
(loss)
were
as
follows:
Temporary
differences
between
book-basis
and
tax-basis
components
of
total
distributable
earnings
(loss)
arise
when
certain
items
of
income,
gain,
or
loss
are
recognized
in
different
periods
for
financial
statement
purposes
versus
for
tax
purposes;
these
differences
will
reverse
in
a
subsequent
reporting
period.
The
temporary
differences
relate
primarily
to
the
deferral
of
losses
from
wash
sales.
Other
temporary
differences
relate
primarily
to
differences
in
treatment
of
corporate
actions.
($000s)
December
31,
2024
December
31,
2023
Ordinary
income
(including
short-term
capital
gains,
if
any)
$
437,444
$
407,423
Long-term
capital
gain
572
—
Total
distributions
$
438,016
$
407,423
($000s)
Cost
of
investments
$
9,679,208
Unrealized
appreciation
$
24,951,680
Unrealized
depreciation
(551,976)
Net
unrealized
appreciation
(depreciation)
$
24,399,704
($000s)
Undistributed
ordinary
income
$
310
Undistributed
long-term
capital
gain
44,854
Net
unrealized
appreciation
(depreciation)
24,399,704
Other
temporary
differences
(38)
Total
distributable
earnings
(loss)
$
24,444,830
T.
ROWE
PRICE
Equity
Index
500
Fund
NOTE
6
-
FOREIGN TAXES
The
fund
is
subject
to
foreign
income
taxes
imposed
by
certain
countries
in
which
it
invests.
Additionally,
capital
gains
realized
upon
disposition
of
securities
issued
in
or
by
certain
foreign
countries
are
subject
to
capital
gains
tax
imposed
by
those
countries.
All
taxes
are
computed
in
accordance
with
the
applicable
foreign
tax
law,
and,
to
the
extent
permitted,
capital
losses
are
used
to
offset
capital
gains.
Taxes
attributable
to
income
are
accrued
by
the
fund
as
a
reduction
of
income.
Current
and
deferred
tax
expense
attributable
to
capital
gains
is
reflected
as
a
component
of
realized
or
change
in
unrealized
gain/
loss
on
securities
in
the
accompanying
financial
statements.
To
the
extent
that
the
fund
has
country
specific
capital
loss
carryforwards,
such
carryforwards
are
applied
against
net
unrealized
gains
when
determining
the
deferred
tax
liability.
Any
deferred
tax
liability
incurred
by
the
fund
is
included
in
either
Other
liabilities
or
Deferred
tax
liability
on
the
accompanying
Statement
of
Assets
and
Liabilities.
NOTE
7
-
RELATED
PARTY
TRANSACTIONS
The
fund
is
managed
by
T.
Rowe
Price
Associates,
Inc.
(Price
Associates),
a
wholly
owned
subsidiary
of
T.
Rowe
Price
Group,
Inc.
(Price
Group). Price
Associates
has
entered
into
a
sub-advisory
agreement(s)
with
one
or
more
of
its
wholly
owned
subsidiaries,
to
provide
investment
advisory
services
to
the
fund. The
investment
management
agreement
between
the
fund
and
Price
Associates
provides
for
an
annual
investment
management
fee
equal
to 0.05%
of
the
fund’s
average
daily
net
assets.
The
fee
is
computed
daily
and
paid
monthly.
The Investor
Class is
subject
to
a
contractual
expense
limitation
through
the
expense
limitation
date
indicated
in
the
table
below.
This
agreement
will
continue
through
the
expense
limitation
date
indicated
in
the
table
below,
and
may
be
renewed,
revised,
or
revoked
only
with
approval
of
the
fund’s
Board.
During
the
limitation
period,
Price
Associates
is required
to
waive
or
pay
any
expenses
(excluding
interest;
expenses
related
to
borrowings,
taxes,
and
brokerage;
non-recurring,
extraordinary
expenses;
and
acquired
fund
fees
and
expenses)
that
would
otherwise
cause
the class’s ratio
of
annualized
total
expenses
to
average
net
assets
(net
expense
ratio)
to
exceed
its
expense
limitation.
The
class
is
required
to
repay
Price
Associates
for
expenses
previously
waived/paid
to
the
extent
the
class’s net
assets
grow
or
expenses
decline
sufficiently
to
allow
repayment
without
causing
the class’s net
expense
T.
ROWE
PRICE
Equity
Index
500
Fund
ratio
(after
the
repayment
is
taken
into
account)
to
exceed
the
lesser
of:
(1)
the
expense
limitation
in
place
at
the
time
such
amounts
were
waived;
or
(2)
the class’s
current
expense
limitation.
However,
no
repayment
will
be
made
more
than
three
years
after
the
date
of
a
payment
or
waiver.
The
I
Class
is
also
subject
to
an
operating
expense
limitation
(I
Class
Limit)
pursuant
to
which
Price
Associates
is
contractually
required
to
pay
all
operating
expenses
of
the
I
Class,
excluding
management
fees;
interest;
expenses
related
to
borrowings,
taxes,
and
brokerage; non-recurring,
extraordinary expenses; and
acquired
fund
fees
and
expenses, to
the
extent
such
operating
expenses,
on
an
annualized
basis,
exceed
the
I
Class
Limit. This
agreement
will
continue
through
the
expense
limitation
date
indicated
in
the
table
below,
and
may
be
renewed,
revised,
or
revoked
only
with
approval
of
the
fund’s
Board.
The
I
Class
is
required
to
repay
Price
Associates
for
expenses
previously
paid
to
the
extent
the
class’s
net
assets
grow
or
expenses
decline
sufficiently
to
allow
repayment
without
causing
the
class’s
operating
expenses
(after
the
repayment
is
taken
into
account)
to
exceed
the
lesser
of:
(1)
the
I
Class
Limit
in
place
at
the
time
such
amounts
were
paid;
or
(2)
the
current
I
Class
Limit.
However,
no
repayment
will
be
made
more
than
three
years
after
the
date
of
a
payment
or
waiver.
The
Z
Class
is
also
subject
to
a
contractual
expense
limitation
agreement
whereby
Price
Associates
has
agreed
to
waive
and/or
bear
all
of
the
Z
Class’
expenses
(excluding
interest;
expenses
related
to
borrowings,
taxes,
and
brokerage;
non-recurring,
extraordinary
expenses;
and
acquired
fund
fees
and
expenses)
in
their
entirety.
This
fee
waiver
and/or
expense
reimbursement
arrangement
is
expected
to
remain
in
place
indefinitely,
and
the
agreement
may
only
be
amended
or
terminated
with
approval
by
the
fund’s
Board.
Expenses
of
the
fund
waived/paid
by
the
manager
are
not
subject
to
later
repayment
by
the
fund.
Pursuant
to
these
agreements,
expenses
were waived/paid
by
and/or
repaid
to
Price
Associates
during
the year
ended December
31,
2024 as
indicated
in
the
table
below.
Including
these
amounts,
expenses
previously
waived/paid
by
Price
Associates
in
the
amount
of $6,302,000 remain
subject
to
repayment
by
the
fund
at
December
31,
2024. Any
repayment
of
expenses
previously
waived/paid
by
Price
Associates
during
the
period
would
be
included
in
the
net
investment
income
and
expense
ratios
presented
on
the
accompanying
Financial
Highlights.
T.
ROWE
PRICE
Equity
Index
500
Fund
In
addition,
the
fund
has
entered
into
service
agreements
with
Price
Associates
and
two
wholly
owned
subsidiaries
of
Price
Associates,
each
an
affiliate
of
the
fund
(collectively,
Price).
Price
Associates
provides
certain
accounting
and
administrative
services
to
the
fund.
T.
Rowe
Price
Services,
Inc.
provides
shareholder
and
administrative
services
in
its
capacity
as
the
fund’s
transfer
and
dividend-disbursing
agent.
T.
Rowe
Price
Retirement
Plan
Services,
Inc.
provides
subaccounting
and
recordkeeping
services
for
certain
retirement
accounts
invested
in
the
Investor
Class.
For
the
year
ended
December
31,
2024,
expenses
incurred
pursuant
to
these
service
agreements
were
$116,000
for
Price
Associates;
$5,585,000
for
T.
Rowe
Price
Services,
Inc.;
and
$2,080,000
for
T.
Rowe
Price
Retirement
Plan
Services,
Inc.
All
amounts
due
to
and
due
from
Price,
exclusive
of
investment
management
fees
payable,
are
presented
net
on
the
accompanying
Statement
of
Assets
and
Liabilities.
T.
Rowe
Price
Investment
Services,
Inc.
(Investment
Services)
serves
as
distributor
to
the
fund.
Pursuant
to
an
underwriting
agreement,
no
compensation
for
any
distribution
services
provided
is
paid
to
Investment
Services
by
the
fund
(except
for
12b-1
fees
under
a
Board-approved
Rule
12b-1
plan).
Additionally,
the
fund
is
one
of
several
mutual
funds
in
which
certain
college
savings
plans
managed
by
Price
Associates invests.
As
approved
by
the
fund’s
Board
of
Directors,
shareholder
servicing
costs
associated
with
each
college
savings
plan
are
borne
by
the
fund
in
proportion
to
the
average
daily
value
of
its
shares
owned
by
the
college
savings
plan.
Price
has
agreed
to waive/reimburse
shareholder
servicing
costs in
excess
of
0.05%
of
the
fund’s
average
daily
value
of
its
shares
owned
by
the
college
savings
plan.
Any
amounts
waived/
paid
by
Price
under
this
voluntary
agreement
are
not
subject
to
repayment
by
the
fund.
Price
may
amend
or
terminate
this
voluntary
arrangement
at
any
time
without
prior
notice.
For
the
year ended
December
31,
2024,
the
fund
was
charged $953,000 for
shareholder
servicing
costs
related
to
the
college
savings
plans, of
which
$244,000
was
for
services
provided
by
Price.
All
amounts
due
to
and
due
from
Price,
exclusive
of
investment
management
fees
payable,
are
Investor
Class
I
Class
Z
Class
Expense
limitation/I
Class
Limit
0.21%
0.00%
0.00%
Expense
limitation
date
04/30/26
04/30/26
N/A
(Waived)/repaid
during
the
period
($000s)
$—
$(2,648)
$(7,684)
T.
ROWE
PRICE
Equity
Index
500
Fund
presented
net
on
the
accompanying
Statement
of
Assets
and
Liabilities. At
December
31,
2024,
approximately
22%
of
the
outstanding
shares
of
the
I
Class
were
held
by
college
savings
plans.
Mutual
funds,
trusts,
and
other
accounts
managed
by
Price
Associates
or
its
affiliates
(collectively,
Price
Funds
and
accounts)
may
invest
in
the
fund.
No
Price
fund
or
account
may
invest
for
the
purpose
of
exercising
management
or
control
over
the
fund.
At
December
31,
2024, 100%
of
the
Z
Class's
outstanding
shares
were
held
by
Price
Funds
and
accounts.
Consistent
with
its
investment
objective,
the
fund
may
invest
in
T.
Rowe
Price
Group,
Inc.
Additionally,
the fund
may
invest
its
cash
reserves
in
certain
open-
end
management
investment
companies
managed
by
Price
Associates
and
considered
affiliates
of
the
fund:
the
T.
Rowe
Price
Government
Reserve
Fund
or
the
T.
Rowe
Price
Treasury
Reserve
Fund,
organized
as
money
market
funds
(together,
the
Price
Reserve
Funds).
The
Price
Reserve
Funds
are
offered
as
short-term
investment
options
to
mutual
funds,
trusts,
and
other
accounts
managed
by
Price
Associates
or
its
affiliates
and
are
not
available
for
direct
purchase
by
members
of
the
public.
Cash
collateral
from
securities
lending,
if
any,
is
invested
in
the
T.
Rowe
Price
Government
Reserve Fund. The
Price
Reserve
Funds
pay
no
investment
management
fees.
The fund may
participate
in
securities
purchase
and
sale
transactions
with
other
funds
or
accounts
advised
by
Price
Associates
(cross
trades),
in
accordance
with
procedures
adopted
by the
fund’s
Board
and
Securities
and
Exchange
Commission
rules,
which
require,
among
other
things,
that
such
purchase
and
sale
cross
trades
be
effected
at
the
independent
current
market
price
of
the
security.
During
the
year
ended
December
31,
2024,
the
fund
had
no
purchases
or
sales
cross
trades
with
other
funds
or
accounts
advised
by
Price
Associates.
NOTE
8
-
SEGMENT
REPORTING
Operating
segments
are
defined
as
components
of
a
company
that
engage
in
business
activities
and
for
which
discrete
financial
information
is
available
and
regularly
reviewed
by
the
chief
operating
decision
maker
(CODM)
in
deciding
how
to
allocate
resources
and
assess
performance.
The
Management
Committee
of
Price
Associates
acts
as
the
fund’s
CODM.
The
fund
makes
investments
in
accordance
with
its
investment
objective
as
outlined
in
the
Prospectus
and
is
considered
one
reportable
segment
because
the
CODM
allocates
resources
and
assesses
the
operating
results
of
the
fund
on
the
whole.
T.
ROWE
PRICE
Equity
Index
500
Fund
The
fund’s
revenue
is
derived
from
investments
in
portfolio
of
securities.
The
CODM
allocates
resources
and
assesses
performance
based
on
the
operating
results
of
the
fund,
which
is
consistent
with
the
results
presented
in
the
statement
of
operations,
statement
of
changes
in
net
assets
and
financial
highlights.
The
CODM
compares
the
fund’s
performance
to
its
benchmark
index
and
evaluates
the
positioning
of
the
fund
in
relation
to
its
investment
objective.
The
measure
of
segment
assets
is
net
assets
of
the
fund
which
is
disclosed
in
the
statement
of
assets
and
liabilities.
The
accounting
policies
of
the
segment
are
the
same
as
those
described
in
the
summary
of
significant
accounting
policies.
The
financial
statements
include
all
details
of
the
segment
assets,
segment
revenue
and
expenses;
and
reflect
the
financial
results
of
the
segment.
NOTE
9
-
OTHER
MATTERS
Unpredictable environmental,
political,
social
and
economic
events,
including
but
not
limited
to,
environmental
or
natural
disasters,
war
and
conflict
(including
Russia’s
military
invasion
of
Ukraine
and
the
conflict
in
Israel,
Gaza
and
surrounding
areas),
terrorism,
geopolitical
developments
(including
trading
and
tariff
arrangements,
sanctions
and
cybersecurity
attacks),
and
public
health
epidemics
(including
the
global
outbreak
of
COVID-19)
and
similar
public
health
threats,
may
significantly
affect
the
economy
and
the
markets
and
issuers
in
which
a
fund
invests.
The
extent
and
duration
of
such
events
and
resulting
market
disruptions
cannot
be
predicted.
These
and
other
similar
events
may
cause
instability
across
global
markets,
including
reduced
liquidity
and
disruptions
in
trading
markets,
while
some
events
may
affect
certain
geographic
regions,
countries,
sectors,
and
industries
more
significantly
than
others,
and
exacerbate
other
pre-existing
political,
social,
and
economic
risks.
The
fund’s
performance
could
be
negatively
impacted
if
the
value
of
a
portfolio
holding
were
harmed
by
these
or
such
events.
Management
actively
monitors
the
risks
and
financial
impacts
arising
from
such
events.
T.
ROWE
PRICE
Equity
Index
500
Fund
REPORT
OF
INDEPENDENT
REGISTERED
PUBLIC
ACCOUNTING
FIRM
To
the
Board
of
Directors
of
T.
Rowe
Price
Index
Trust,
Inc.
and
Shareholders
of
T.
Rowe
Price
Equity
Index
500
Fund
Opinion
on
the
Financial
Statements
We
have
audited
the
accompanying
statement
of
assets
and
liabilities,
including
the
portfolio
of
investments,
of
T.
Rowe
Price
Equity
Index
500
Fund
(one
of
the
funds
constituting
T.
Rowe
Price
Index
Trust,
Inc.,
referred
to
hereafter
as
the
"Fund")
as
of
December
31,
2024,
the
related
statement
of
operations
for
the
year
ended
December
31,
2024,
the
statement
of
changes
in
net
assets
for
each
of
the
two
years
in
the
period
ended
December
31,
2024,
including
the
related
notes,
and
the
financial
highlights
for
each
of
the
periods
indicated
therein
(collectively
referred
to
as
the
“financial
statements”).
In
our
opinion,
the
financial
statements
present
fairly,
in
all
material
respects,
the
financial
position
of
the
Fund
as
of
December
31,
2024,
the
results
of
its
operations
for
the
year
then
ended,
the
changes
in
its
net
assets
for
each
of
the
two
years
in
the
period
ended
December
31,
2024
and
the
financial
highlights
for
each
of
the
periods
indicated
therein,
in
conformity
with
accounting
principles
generally
accepted
in
the
United
States
of
America.
Basis
for
Opinion
These
financial
statements
are
the
responsibility
of
the
Fund’s
management.
Our
responsibility
is
to
express
an
opinion
on
the
Fund’s
financial
statements
based
on
our
audits.
We
are
a
public
accounting
firm
registered
with
the
Public
Company
Accounting
Oversight
Board
(United
States)
(PCAOB)
and
are
required
to
be
independent
with
respect
to
the
Fund
in
accordance
with
the
U.S.
federal
securities
laws
and
the
applicable
rules
and
regulations
of
the
Securities
and
Exchange
Commission
and
the
PCAOB.
We
conducted
our
audits
of
these
financial
statements
in
accordance
with
the
standards
of
the
PCAOB.
Those
standards
require
that
we
plan
and
perform
the
audit
to
obtain
reasonable
assurance
about
whether
the
financial
statements
are
free
of
material
misstatement,
whether
due
to
error
or
fraud.
T.
ROWE
PRICE
Equity
Index
500
Fund
Our
audits
included
performing
procedures
to
assess
the
risks
of
material
misstatement
of
the
financial
statements,
whether
due
to
error
or
fraud,
and
performing
procedures
that
respond
to
those
risks.
Such
procedures
included
examining,
on
a
test
basis,
evidence
regarding
the
amounts
and
disclosures
in
the
financial
statements.
Our
audits
also
included
evaluating
the
accounting
principles
used
and
significant
estimates
made
by
management,
as
well
as
evaluating
the
overall
presentation
of
the
financial
statements.
Our
procedures
included
confirmation
of
securities
owned
as
of
December
31,
2024
by
correspondence
with
the
custodian,
transfer
agent
and
brokers;
when
replies
were
not
received
from
brokers,
we
performed
other
auditing
procedures.
We
believe
that
our
audits
provide
a
reasonable
basis
for
our
opinion.
/s/
PricewaterhouseCoopers
LLP
Baltimore,
Maryland
February
18,
2025
We
have
served
as
the
auditor
of
one
or
more
investment
companies
in
the
T.
Rowe
Price
group
of
investment
companies
since
1973.
REPORT
OF
INDEPENDENT
REGISTERED
PUBLIC
ACCOUNTING
FIRM
(continued)
T.
ROWE
PRICE
Equity
Index
500
Fund
TAX
INFORMATION
(UNAUDITED)
FOR
THE
TAX
YEAR
ENDED 12/31/24
We
are
providing
this
information
as
required
by
the
Internal
Revenue
Code.
The
amounts
shown
may
differ
from
those
elsewhere
in
this
report
because
of
differences
between
tax
and
financial
reporting
requirements.
The
fund’s
distributions
to
shareholders
included:
$283,106,000
from
long-term
capital
gains,
subject
to
a
long-term
capital
gains
tax
rate
of
not
greater
than
20%
For
nonresident
alien
shareholders,
100%
of
short-term
capital
gain
dividends
distributed
by
the
fund
for
the
fiscal
year
are
qualified
short-term
capital
gains.
For
taxable
non-corporate
shareholders,
$411,749,000
of
the
fund's
income
represents
qualified
dividend
income
subject
to
a
long-term
capital
gains
tax
rate
of
not
greater
than
20%.
For
corporate
shareholders,
$393,372,000
of
the
fund's
income
qualifies
for
the
dividends-received
deduction.
For
individuals
and
certain
trusts
and
estates
which
are
entitled
to
claim
a
deduction
of
up
to
20%
of
their
combined
qualified
real
estate
investment
trust
(REIT)
dividends,
$18,786,000
of
the
fund's
income
qualifies
as
qualified
real
estate
investment
trust
(REIT)
dividends.
100
East
Pratt
Street
Baltimore,
MD
21202
T.
Rowe
Price
Investment
Services,
Inc.
Call
1-800-225-5132
to
request
a
prospectus
or
summary
prospectus;
each
includes
investment
objectives,
risks,
fees,
expenses,
and
other
information
that
you
should
read
and
consider
carefully
before
investing.
F50-050
2/25
Item 8. Changes in and Disagreements with Accountants for Open-End Management Investment Companies.
Not applicable.
Item 9. Proxy Disclosures for Open-End Management Investment Companies.
Not applicable.
Item 10. Remuneration Paid to Directors, Officers, and Others of Open-End Management Investment Companies.
Remuneration paid to Directors is included in Item 7 of this Form N-CSR.
Item 11. Statement Regarding Basis for Approval of Investment Advisory Contract.
If applicable, see Item 7.
Item 12. Disclosure of Proxy Voting Policies and Procedures for Closed-End Management Investment Companies.
Not applicable.
Item 13. Portfolio Managers of Closed-End Management Investment Companies.
Not applicable.
Item 14. Purchases of Equity Securities by Closed-End Management Investment Company and Affiliated Purchasers.
Not applicable.
Item 15. Submission of Matters to a Vote of Security Holders.
There has been no change to the procedures by which shareholders may recommend nominees to the registrant’s board of directors.
Item 16. Controls and Procedures.
(a) The registrant’s principal executive officer and principal financial officer have evaluated the registrant’s disclosure controls and procedures within 90 days of this filing and have concluded that the registrant’s disclosure controls and procedures were effective, as of that date, in ensuring that information required to be disclosed by the registrant in this Form N-CSR was recorded, processed, summarized, and reported timely.
(b) The registrant’s principal executive officer and principal financial officer are aware of no change in the registrant’s internal control over financial reporting that occurred during the period covered by this report that has materially affected, or is reasonably likely to materially affect, the registrant’s internal control over financial reporting.
Item 17. Disclosure of Securities Lending Activities for Closed-End Management Investment Companies.
Not applicable.
Item 18. Recovery of Erroneously Awarded Compensation.
Not applicable.
Item 19. Exhibits.
(a)(1) The registrant’s code of ethics pursuant to Item 2 of Form N-CSR is attached.
(2) Listing standards relating to recovery of erroneously awarded compensation: not applicable.
(3) Separate certifications by the registrant’s principal executive officer and principal financial officer, pursuant to Section 302 of the Sarbanes-Oxley Act of 2002 and required by Rule 30a-2(a) under the Investment Company Act of 1940, are attached.
(b) A certification by the registrant’s principal executive officer and principal financial officer, pursuant to Section 906 of the Sarbanes-Oxley Act of 2002 and required by Rule 30a-2(b) under the Investment Company Act of 1940, is attached.
SIGNATURES
Pursuant to the requirements of the Securities Exchange Act of 1934 and the Investment Company Act of 1940, the registrant has duly caused this report to be signed on its behalf by the undersigned, thereunto duly authorized.
| | | | |
| T. Rowe Price Index Trust, Inc. |
| By | | /s/ David Oestreicher | | |
| | David Oestreicher | | |
| | Principal Executive Officer | | |
| | |
| Date | | February 18, 2025 | | |
Pursuant to the requirements of the Securities Exchange Act of 1934 and the Investment Company Act of 1940, this report has been signed below by the following persons on behalf of the registrant and in the capacities and on the dates indicated.
| | | | |
| By | | /s/ David Oestreicher | | |
| | David Oestreicher | | |
| | Principal Executive Officer | | |
| | |
| Date | | February 18, 2025 | | |
| | | | |
| By | | /s/ Alan S. Dupski | | |
| | Alan S. Dupski | | |
| | Principal Financial Officer | | |
| | |
| Date | | February 18, 2025 | | |