UNITED STATES
SECURITIES AND EXCHANGE COMMISSION
Washington, D.C. 20549
FORM N-CSR
CERTIFIED SHAREHOLDER REPORT OF REGISTERED
MANAGEMENT INVESTMENT COMPANIES
Investment Company Act File Number: 811-05986
T. Rowe Price Index Trust, Inc.
(Exact name of registrant as specified in charter)
100 East Pratt Street, Baltimore, MD 21202
(Address of principal executive offices)
David Oestreicher
100 East Pratt Street, Baltimore, MD 21202
(Name and address of agent for service)
Registrant’s telephone number, including area code: (410) 345-2000
Date of fiscal year end: December 31
Date of reporting period: December 31, 2024
Item 1. Reports to Shareholders
(a) Report pursuant to Rule 30e-1
Annual Shareholder Report
December 31, 2024
This annual shareholder report contains important information about Mid-Cap Index Fund (the "fund") for the period of January 1, 2024 to December 31, 2024. You can find the fund’s prospectus, financial information on Form N‑CSR (which includes required tax information for dividends), holdings, proxy voting information, and other information atwww.troweprice.com/prospectus. You can also request this information without charge by contacting T. Rowe Price at 1‑800‑638‑5660 or info@troweprice.com or contacting your intermediary.
What were the fund costs for the last year? (based on a hypothetical $10,000 investment)
| | Costs of a $10,000 investment | Costs paid as a percentage of a $10,000 investment |
|---|
| Mid-Cap Index Fund - Investor Class | $30 | 0.27% |
|---|
What drove fund performance during the past 12 months?
Mid-cap U.S. stocks produced strong gains in 2024, as equity investors generally welcomed not only looser monetary policy starting in September, but also reduced political uncertainty following U.S. election results.
Financials names produced robust results during the period, thanks in part to lower short-term interest rates and strong equity market gains. Capital markets companies performed very well during the year, as KKR and Robinhood Markets advanced strongly. The information technology sector also generated strong gains during the period, as the software segment performed particularly well.
No sectors detracted from absolute returns during the reporting period.
The fund, which is not available for direct purchase by members of the public, employs a full replication strategy, which involves investing substantially all of its assets in all of the stocks in the index and seeking to maintain holdings of each stock in proportion to its weight in the index. By replicating the structure of the Russell Select Mid Cap Index, our intention is to closely track its performance.
How has the fund performed?
Cumulative Returns of a Hypothetical $10,000 Investment as of December 31, 2024

| Investor Class | Regulatory Benchmark | Strategy Benchmark |
|---|
| 12/9/15 | 10,000 | 10,000 | 10,000 |
|---|
| 12/31/15 | 10,000 | 9,989 | 10,006 |
|---|
| 3/31/16 | 10,010 | 10,085 | 9,995 |
|---|
| 6/30/16 | 10,341 | 10,351 | 10,323 |
|---|
| 9/30/16 | 10,942 | 10,806 | 10,937 |
|---|
| 12/31/16 | 11,333 | 11,261 | 11,322 |
|---|
| 3/31/17 | 11,993 | 11,907 | 11,995 |
|---|
| 6/30/17 | 12,364 | 12,267 | 12,377 |
|---|
| 9/30/17 | 12,910 | 12,827 | 12,921 |
|---|
| 12/31/17 | 13,700 | 13,640 | 13,718 |
|---|
| 3/31/18 | 13,743 | 13,552 | 13,775 |
|---|
| 6/30/18 | 14,311 | 14,079 | 14,345 |
|---|
| 9/30/18 | 14,987 | 15,082 | 15,042 |
|---|
| 12/31/18 | 12,570 | 12,925 | 12,598 |
|---|
| 3/31/19 | 14,707 | 14,740 | 14,736 |
|---|
| 6/30/19 | 15,267 | 15,344 | 15,318 |
|---|
| 9/30/19 | 15,061 | 15,522 | 15,117 |
|---|
| 12/31/19 | 16,279 | 16,934 | 16,364 |
|---|
| 3/31/20 | 12,049 | 13,395 | 12,111 |
|---|
| 6/30/20 | 16,158 | 16,346 | 16,261 |
|---|
| 9/30/20 | 18,382 | 17,851 | 18,522 |
|---|
| 12/31/20 | 23,000 | 20,472 | 23,180 |
|---|
| 3/31/21 | 23,877 | 21,771 | 24,098 |
|---|
| 6/30/21 | 25,893 | 23,565 | 26,160 |
|---|
| 9/30/21 | 25,267 | 23,541 | 25,537 |
|---|
| 12/31/21 | 25,459 | 25,725 | 25,748 |
|---|
| 3/31/22 | 22,906 | 24,367 | 23,173 |
|---|
| 6/30/22 | 17,932 | 20,298 | 18,157 |
|---|
| 9/30/22 | 17,489 | 19,391 | 17,707 |
|---|
| 12/31/22 | 18,169 | 20,784 | 18,410 |
|---|
| 3/31/23 | 19,599 | 22,276 | 19,878 |
|---|
| 6/30/23 | 21,003 | 24,145 | 21,301 |
|---|
| 9/30/23 | 20,499 | 23,359 | 20,801 |
|---|
| 12/31/23 | 23,555 | 26,179 | 23,923 |
|---|
| 3/31/24 | 25,517 | 28,802 | 25,927 |
|---|
| 6/30/24 | 24,649 | 29,728 | 25,053 |
|---|
| 9/30/24 | 26,518 | 31,580 | 26,976 |
|---|
| 12/31/24 | 28,228 | 32,411 | 28,744 |
|---|
202501-4140694, 202502-4108663
Average Annual Total Returns
| | 1 Year | 5 Years | Since Inception 12/9/15 |
|---|
| Mid-Cap Index Fund (Investor Class) | 19.84% | 11.64% | 12.14% |
|---|
| Russell 3000 Index (Regulatory Benchmark) | 23.81 | 13.86 | 13.86 |
|---|
| Russell Select Mid Cap Index (Strategy Benchmark) | 20.15 | 11.93 | 12.36 |
|---|
The preceding line graph shows the value of a hypothetical $10,000 investment in the fund over the past 10 fiscal year periods or since inception (for funds lacking 10-year records). The fund’s performance information included in the line graph and table above is compared with a regulatory required index that represents an overall securities market (Regulatory Benchmark). In addition, the line graph and table may also include one or more indexes that more closely aligns to the fund's investment strategy (Strategy Benchmark(s)). Due to new SEC Rules on shareholder reporting the fund adopted a new broad-based securities market index, referred to as the Regulatory Benchmark. Market index returns do not include expenses, which are deducted from fund returns. The fund's total return figures reflect the reinvestment of dividends and capital gains, if any.Neither the fund’s returns nor the index returns reflect the deduction of taxes that a shareholder would pay on fund distributions or redemptions of fund shares.The fund’s past performance is not a good predictor of the fund’s future performance.Updated performance information can be found at www.troweprice.com.
What are some fund statistics?
- Total Net Assets (000s)$234,941
- Number of Portfolio Holdings509
- Investment Advisory Fees Paid (000s)$(190)
- Portfolio Turnover Rate31.7%
What did the fund invest in?
Sector Allocation (as a % of Net Assets)
| Information Technology | 19.9% |
| Financials | 18.2 |
| Industrials & Business Services | 16.9 |
| Consumer Discretionary | 12.7 |
| Health Care | 8.2 |
| Communication Services | 5.9 |
| Materials | 5.2 |
| Real Estate | 4.9 |
| Energy | 3.8 |
| Other | 4.3 |
Top Ten Holdings (as a % of Net Assets)
| Marvell Technology | 2.0% |
| AppLovin | 1.8 |
| Spotify Technology | 1.4 |
| CRH | 1.4 |
| DoorDash | 1.3 |
| Trade Desk | 1.1 |
| Coinbase Global | 1.1 |
| Snowflake | 1.1 |
| Cheniere Energy | 1.0 |
| MicroStrategy | 1.0 |
If you invest directly with T. Rowe Price, you can elect to receive future shareholder reports or other important documents through electronic delivery by enrolling at www.troweprice.com/paperless. If you invest through a financial intermediary such as an investment advisor, a bank, retirement plan sponsor or a brokerage firm, please contact that organization and ask if it can provide electronic delivery.
Frank Russell Company "LSE" does not accept any liability for any errors or omissions in the indexes or data, and hereby expressly disclaim all warranties of originality, accuracy, completeness, timeliness, merchantability and fitness for a particular purpose. No party may rely on any indexes or data contained in this communication. Visit www.troweprice.com/en/us/market-data-disclosures for additional legal notices & disclaimers.
Mid-Cap Index Fund
Investor Class (TRMNX)
T. Rowe Price Investment Services, Inc.
100 East Pratt Street
Baltimore, MD 21202
Annual Shareholder Report
December 31, 2024
This annual shareholder report contains important information about Mid-Cap Index Fund (the "fund") for the period of January 1, 2024 to December 31, 2024. You can find the fund’s prospectus, financial information on Form N‑CSR (which includes required tax information for dividends), holdings, proxy voting information, and other information atwww.troweprice.com/prospectus. You can also request this information without charge by contacting T. Rowe Price at 1‑800‑638‑5660 or info@troweprice.com or contacting your intermediary.
What were the fund costs for the last year? (based on a hypothetical $10,000 investment)
| | Costs of a $10,000 investment | Costs paid as a percentage of a $10,000 investment |
|---|
| Mid-Cap Index Fund - I Class | $15 | 0.14% |
|---|
What drove fund performance during the past 12 months?
Mid-cap U.S. stocks produced strong gains in 2024, as equity investors generally welcomed not only looser monetary policy starting in September, but also reduced political uncertainty following U.S. election results.
Financials names produced robust results during the period, thanks in part to lower short-term interest rates and strong equity market gains. Capital markets companies performed very well during the year, as KKR and Robinhood Markets advanced strongly. The information technology sector also generated strong gains during the period, as the software segment performed particularly well.
No sectors detracted from absolute returns during the reporting period.
The fund, which is not available for direct purchase by members of the public, employs a full replication strategy, which involves investing substantially all of its assets in all of the stocks in the index and seeking to maintain holdings of each stock in proportion to its weight in the index. By replicating the structure of the Russell Select Mid Cap Index, our intention is to closely track its performance.
How has the fund performed?
Cumulative Returns of a Hypothetical $10,000 Investment as of December 31, 2024
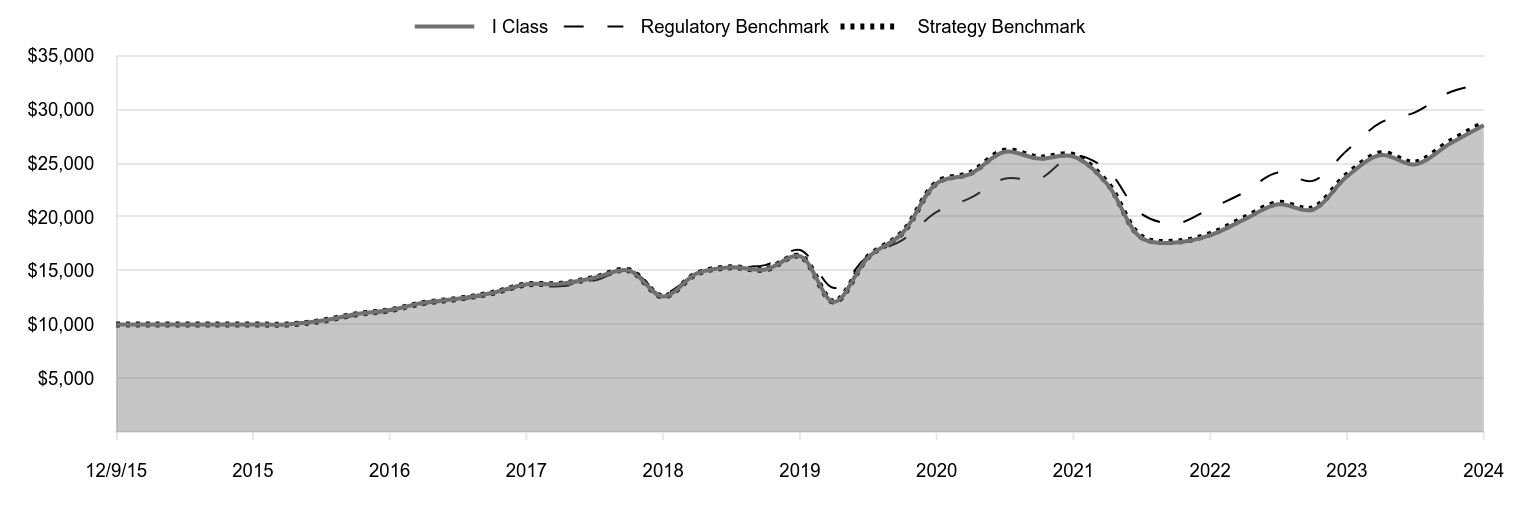
| I Class | Regulatory Benchmark | Strategy Benchmark |
|---|
| 12/9/15 | 10,000 | 10,000 | 10,000 |
|---|
| 12/31/15 | 10,000 | 9,989 | 10,006 |
|---|
| 3/31/16 | 10,010 | 10,085 | 9,995 |
|---|
| 6/30/16 | 10,341 | 10,351 | 10,323 |
|---|
| 9/30/16 | 10,952 | 10,806 | 10,937 |
|---|
| 12/31/16 | 11,343 | 11,261 | 11,322 |
|---|
| 3/31/17 | 12,014 | 11,907 | 11,995 |
|---|
| 6/30/17 | 12,396 | 12,267 | 12,377 |
|---|
| 9/30/17 | 12,932 | 12,827 | 12,921 |
|---|
| 12/31/17 | 13,735 | 13,640 | 13,718 |
|---|
| 3/31/18 | 13,778 | 13,552 | 13,775 |
|---|
| 6/30/18 | 14,348 | 14,079 | 14,345 |
|---|
| 9/30/18 | 15,036 | 15,082 | 15,042 |
|---|
| 12/31/18 | 12,612 | 12,925 | 12,598 |
|---|
| 3/31/19 | 14,756 | 14,740 | 14,736 |
|---|
| 6/30/19 | 15,329 | 15,344 | 15,318 |
|---|
| 9/30/19 | 15,123 | 15,522 | 15,117 |
|---|
| 12/31/19 | 16,356 | 16,934 | 16,364 |
|---|
| 3/31/20 | 12,100 | 13,395 | 12,111 |
|---|
| 6/30/20 | 16,235 | 16,346 | 16,261 |
|---|
| 9/30/20 | 18,490 | 17,851 | 18,522 |
|---|
| 12/31/20 | 23,136 | 20,472 | 23,180 |
|---|
| 3/31/21 | 24,015 | 21,771 | 24,098 |
|---|
| 6/30/21 | 26,062 | 23,565 | 26,160 |
|---|
| 9/30/21 | 25,434 | 23,541 | 25,537 |
|---|
| 12/31/21 | 25,628 | 25,725 | 25,748 |
|---|
| 3/31/22 | 23,065 | 24,367 | 23,173 |
|---|
| 6/30/22 | 18,070 | 20,298 | 18,157 |
|---|
| 9/30/22 | 17,626 | 19,391 | 17,707 |
|---|
| 12/31/22 | 18,306 | 20,784 | 18,410 |
|---|
| 3/31/23 | 19,758 | 22,276 | 19,878 |
|---|
| 6/30/23 | 21,182 | 24,145 | 21,301 |
|---|
| 9/30/23 | 20,676 | 23,359 | 20,801 |
|---|
| 12/31/23 | 23,775 | 26,179 | 23,923 |
|---|
| 3/31/24 | 25,763 | 28,802 | 25,927 |
|---|
| 6/30/24 | 24,889 | 29,728 | 25,053 |
|---|
| 9/30/24 | 26,783 | 31,580 | 26,976 |
|---|
| 12/31/24 | 28,528 | 32,411 | 28,744 |
|---|
202501-4140694, 202502-4108663
Average Annual Total Returns
| | 1 Year | 5 Years | Since Inception 12/9/15 |
|---|
| Mid-Cap Index Fund (I Class) | 19.99% | 11.77% | 12.27% |
|---|
| Russell 3000 Index (Regulatory Benchmark) | 23.81 | 13.86 | 13.86 |
|---|
| Russell Select Mid Cap Index (Strategy Benchmark) | 20.15 | 11.93 | 12.36 |
|---|
The preceding line graph shows the value of a hypothetical $10,000 investment in the fund over the past 10 fiscal year periods or since inception (for funds lacking 10-year records). The fund’s performance information included in the line graph and table above is compared with a regulatory required index that represents an overall securities market (Regulatory Benchmark). In addition, the line graph and table may also include one or more indexes that more closely aligns to the fund's investment strategy (Strategy Benchmark(s)). Due to new SEC Rules on shareholder reporting the fund adopted a new broad-based securities market index, referred to as the Regulatory Benchmark. Market index returns do not include expenses, which are deducted from fund returns. The fund's total return figures reflect the reinvestment of dividends and capital gains, if any.Neither the fund’s returns nor the index returns reflect the deduction of taxes that a shareholder would pay on fund distributions or redemptions of fund shares.The fund’s past performance is not a good predictor of the fund’s future performance.Updated performance information can be found at www.troweprice.com.
What are some fund statistics?
- Total Net Assets (000s)$234,941
- Number of Portfolio Holdings509
- Investment Advisory Fees Paid (000s)$(190)
- Portfolio Turnover Rate31.7%
What did the fund invest in?
Sector Allocation (as a % of Net Assets)
| Information Technology | 19.9% |
| Financials | 18.2 |
| Industrials & Business Services | 16.9 |
| Consumer Discretionary | 12.7 |
| Health Care | 8.2 |
| Communication Services | 5.9 |
| Materials | 5.2 |
| Real Estate | 4.9 |
| Energy | 3.8 |
| Other | 4.3 |
Top Ten Holdings (as a % of Net Assets)
| Marvell Technology | 2.0% |
| AppLovin | 1.8 |
| Spotify Technology | 1.4 |
| CRH | 1.4 |
| DoorDash | 1.3 |
| Trade Desk | 1.1 |
| Coinbase Global | 1.1 |
| Snowflake | 1.1 |
| Cheniere Energy | 1.0 |
| MicroStrategy | 1.0 |
If you invest directly with T. Rowe Price, you can elect to receive future shareholder reports or other important documents through electronic delivery by enrolling at www.troweprice.com/paperless. If you invest through a financial intermediary such as an investment advisor, a bank, retirement plan sponsor or a brokerage firm, please contact that organization and ask if it can provide electronic delivery.
Frank Russell Company "LSE" does not accept any liability for any errors or omissions in the indexes or data, and hereby expressly disclaim all warranties of originality, accuracy, completeness, timeliness, merchantability and fitness for a particular purpose. No party may rely on any indexes or data contained in this communication. Visit www.troweprice.com/en/us/market-data-disclosures for additional legal notices & disclaimers.
Mid-Cap Index Fund
I Class (TRMSX)
T. Rowe Price Investment Services, Inc.
100 East Pratt Street
Baltimore, MD 21202
Annual Shareholder Report
December 31, 2024
This annual shareholder report contains important information about Mid-Cap Index Fund (the "fund") for the period of January 1, 2024 to December 31, 2024. You can find the fund’s prospectus, financial information on Form N‑CSR (which includes required tax information for dividends), holdings, proxy voting information, and other information atwww.troweprice.com/prospectus. You can also request this information without charge by contacting T. Rowe Price at 1‑800‑638‑5660 or info@troweprice.com or contacting your intermediary.
What were the fund costs for the last year? (based on a hypothetical $10,000 investment)
| | Costs of a $10,000 investment | Costs paid as a percentage of a $10,000 investment |
|---|
| Mid-Cap Index Fund - Z Class | $0 | 0.00% |
|---|
What drove fund performance during the past 12 months?
Mid-cap U.S. stocks produced strong gains in 2024, as equity investors generally welcomed not only looser monetary policy starting in September, but also reduced political uncertainty following U.S. election results.
Financials names produced robust results during the period, thanks in part to lower short-term interest rates and strong equity market gains. Capital markets companies performed very well during the year, as KKR and Robinhood Markets advanced strongly. The information technology sector also generated strong gains during the period, as the software segment performed particularly well.
No sectors detracted from absolute returns during the reporting period.
The fund, which is not available for direct purchase by members of the public, employs a full replication strategy, which involves investing substantially all of its assets in all of the stocks in the index and seeking to maintain holdings of each stock in proportion to its weight in the index. By replicating the structure of the Russell Select Mid Cap Index, our intention is to closely track its performance.
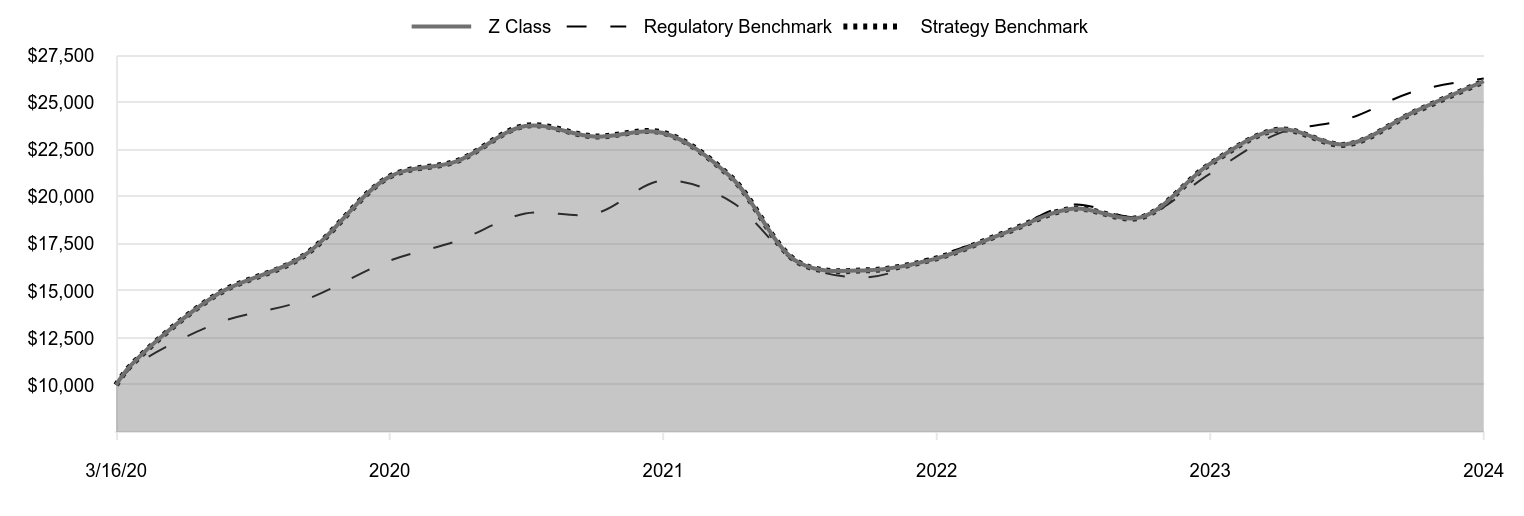
How has the fund performed?
Cumulative Returns of a Hypothetical $10,000 Investment as of December 31, 2024
| Z Class | Regulatory Benchmark | Strategy Benchmark |
|---|
| 3/16/20 | 10,000 | 10,000 | 10,000 |
|---|
| 3/31/20 | 11,017 | 10,865 | 11,008 |
|---|
| 6/30/20 | 14,785 | 13,259 | 14,781 |
|---|
| 9/30/20 | 16,840 | 14,480 | 16,836 |
|---|
| 12/31/20 | 21,074 | 16,606 | 21,071 |
|---|
| 3/31/21 | 21,898 | 17,659 | 21,905 |
|---|
| 6/30/21 | 23,764 | 19,115 | 23,779 |
|---|
| 9/30/21 | 23,203 | 19,095 | 23,212 |
|---|
| 12/31/21 | 23,391 | 20,867 | 23,404 |
|---|
| 3/31/22 | 21,064 | 19,765 | 21,064 |
|---|
| 6/30/22 | 16,505 | 16,464 | 16,505 |
|---|
| 9/30/22 | 16,099 | 15,729 | 16,095 |
|---|
| 12/31/22 | 16,731 | 16,859 | 16,734 |
|---|
| 3/31/23 | 18,069 | 18,069 | 18,069 |
|---|
| 6/30/23 | 19,371 | 19,585 | 19,362 |
|---|
| 9/30/23 | 18,921 | 18,948 | 18,908 |
|---|
| 12/31/23 | 21,765 | 21,235 | 21,746 |
|---|
| 3/31/24 | 23,584 | 23,362 | 23,567 |
|---|
| 6/30/24 | 22,798 | 24,114 | 22,773 |
|---|
| 9/30/24 | 24,543 | 25,616 | 24,521 |
|---|
| 12/31/24 | 26,144 | 26,290 | 26,128 |
|---|
202501-4140694, 202502-4108663
Average Annual Total Returns
| | 1 Year | Since Inception 3/16/20 |
|---|
| Mid-Cap Index Fund (Z Class) | 20.12% | 22.19% |
|---|
| Russell 3000 Index (Regulatory Benchmark) | 23.81 | 22.33 |
|---|
| Russell Select Mid Cap Index (Strategy Benchmark) | 20.15 | 22.18 |
|---|
The preceding line graph shows the value of a hypothetical $10,000 investment in the fund over the past 10 fiscal year periods or since inception (for funds lacking 10-year records). The fund’s performance information included in the line graph and table above is compared with a regulatory required index that represents an overall securities market (Regulatory Benchmark). In addition, the line graph and table may also include one or more indexes that more closely aligns to the fund's investment strategy (Strategy Benchmark(s)). Due to new SEC Rules on shareholder reporting the fund adopted a new broad-based securities market index, referred to as the Regulatory Benchmark. Market index returns do not include expenses, which are deducted from fund returns. The fund's total return figures reflect the reinvestment of dividends and capital gains, if any.Neither the fund’s returns nor the index returns reflect the deduction of taxes that a shareholder would pay on fund distributions or redemptions of fund shares.The fund’s past performance is not a good predictor of the fund’s future performance.Updated performance information can be found at www.troweprice.com.
What are some fund statistics?
- Total Net Assets (000s)$234,941
- Number of Portfolio Holdings509
- Investment Advisory Fees Paid (000s)$(190)
- Portfolio Turnover Rate31.7%
What did the fund invest in?
Sector Allocation (as a % of Net Assets)
| Information Technology | 19.9% |
| Financials | 18.2 |
| Industrials & Business Services | 16.9 |
| Consumer Discretionary | 12.7 |
| Health Care | 8.2 |
| Communication Services | 5.9 |
| Materials | 5.2 |
| Real Estate | 4.9 |
| Energy | 3.8 |
| Other | 4.3 |
Top Ten Holdings (as a % of Net Assets)
| Marvell Technology | 2.0% |
| AppLovin | 1.8 |
| Spotify Technology | 1.4 |
| CRH | 1.4 |
| DoorDash | 1.3 |
| Trade Desk | 1.1 |
| Coinbase Global | 1.1 |
| Snowflake | 1.1 |
| Cheniere Energy | 1.0 |
| MicroStrategy | 1.0 |
If you invest directly with T. Rowe Price, you can elect to receive future shareholder reports or other important documents through electronic delivery by enrolling at www.troweprice.com/paperless. If you invest through a financial intermediary such as an investment advisor, a bank, retirement plan sponsor or a brokerage firm, please contact that organization and ask if it can provide electronic delivery.
Frank Russell Company "LSE" does not accept any liability for any errors or omissions in the indexes or data, and hereby expressly disclaim all warranties of originality, accuracy, completeness, timeliness, merchantability and fitness for a particular purpose. No party may rely on any indexes or data contained in this communication. Visit www.troweprice.com/en/us/market-data-disclosures for additional legal notices & disclaimers.
Mid-Cap Index Fund
Z Class (TRSZX)
T. Rowe Price Investment Services, Inc.
100 East Pratt Street
Baltimore, MD 21202
Item 1. (b) Notice pursuant to Rule 30e-3.
Not applicable.
Item 2. Code of Ethics.
The registrant has adopted a code of ethics, as defined in Item 2 of Form N-CSR, applicable to its principal executive officer, principal financial officer, principal accounting officer or controller, or persons performing similar functions. A copy of this code of ethics is filed as an exhibit to this Form N-CSR. No substantive amendments were approved or waivers were granted to this code of ethics during the period covered by this report.
Item 3. Audit Committee Financial Expert.
The registrant’s Board of Directors has determined that Mr. Paul F. McBride qualifies as an audit committee financial expert, as defined in Item 3 of Form N-CSR. Mr. McBride is considered independent for purposes of Item 3 of Form N-CSR.
Item 4. Principal Accountant Fees and Services.
(a) – (d) Aggregate fees billed for the last two fiscal years for professional services rendered to, or on behalf of, the registrant by the registrant’s principal accountant were as follows:
| | | | | | |
| | | | 2024 | | 2023 |
| | Audit Fees | | $23,525 | | $23,064 |
| | Audit-Related Fees | | - | | - |
| | Tax Fees | | - | | - |
| | All Other Fees | | - | | - |
Audit fees include amounts related to the audit of the registrant’s annual financial statements and services normally provided by the accountant in connection with statutory and regulatory filings. Audit-related fees include amounts reasonably related to the performance of the audit of the registrant’s financial statements and specifically include the issuance of a report on internal controls and, if applicable, agreed-upon procedures related to fund acquisitions. Tax fees include amounts related to services for tax compliance, tax planning, and tax advice. The nature of these services specifically includes the review of distribution calculations and the preparation of Federal, state, and excise tax returns. All other fees include the registrant’s pro-rata share of amounts for agreed-upon procedures in conjunction with service contract approvals by the registrant’s Board of Directors/Trustees.
(e)(1) The registrant’s audit committee has adopted a policy whereby audit and non-audit services performed by the registrant’s principal accountant for the registrant, its investment adviser, and any entity controlling, controlled by, or under common control with the investment adviser that provides ongoing services to the registrant require pre-approval in advance at regularly scheduled audit committee meetings. If such a service is required between regularly scheduled audit committee meetings, pre-approval may be authorized by one audit committee member with ratification at the next scheduled audit committee meeting. Waiver of pre-approval for audit or non-audit services requiring fees of a de minimis amount is not permitted.
(2) No services included in (b) – (d) above were approved pursuant to paragraph (c)(7)(i)(C) of Rule 2-01 of Regulation S-X.
(f) Less than 50 percent of the hours expended on the principal accountant’s engagement to audit the registrant’s financial statements for the most recent fiscal year were attributed to work performed by persons other than the principal accountant’s full-time, permanent employees.
(g) The aggregate fees billed for the most recent fiscal year and the preceding fiscal year by the registrant’s principal accountant for non-audit services rendered to the registrant, its investment adviser, and any entity controlling, controlled by, or under common control with the investment adviser that provides ongoing services to the registrant were $1,262,000 and $1,524,000, respectively.
(h) All non-audit services rendered in (g) above were pre-approved by the registrant’s audit committee. Accordingly, these services were considered by the registrant’s audit committee in maintaining the principal accountant’s independence.
(i) Not applicable.
(j) Not applicable.
Item 5. Audit Committee of Listed Registrants.
Not applicable.
Item 6. Investments.
(a) Not applicable. The complete schedule of investments is included in Item 7 of this Form N-CSR.
(b) Not applicable.
Item 7. Financial Statements and Financial Highlights for Open-End Management Investment Companies.
(a – b) Report pursuant to Regulation S-X.
Financial
Highlights
Portfolio
of
Investments
Financial
Statements
and
Notes
Additional
Fund
Information
Financial
Statements
and
Other
Information
For
more
insights
from
T.
Rowe
Price
investment
professionals,
go
to
troweprice.com
.
T.
ROWE
PRICE
TRMNX
Mid-Cap
Index
Fund
TRMSX
Mid-Cap
Index
Fund–
.
I Class
TRSZX
Mid-Cap
Index
Fund–
.
Z Class
T.
ROWE
PRICE
Mid-Cap
Index
Fund
For
a
share
outstanding
throughout
each
period
The
accompanying
notes
are
an
integral
part
of
these
financial
statements.
Investor
Class
..
Year
..
..
Ended
.
12/31/24
12/31/23
12/31/22
12/31/21
12/31/20
NET
ASSET
VALUE
Beginning
of
period
$
17.65
$
13.72
$
19.55
$
18.37
$
13.47
Investment
activities
Net
investment
income
(1)(2)
0.15
0.15
0.16
0.13
0.11
Net
realized
and
unrealized
gain/loss
3.37
3.91
(5.74)
1.82
5.43
Total
from
investment
activities
3.52
4.06
(5.58)
1.95
5.54
Distributions
Net
investment
income
(0.10)
(0.13)
(0.14)
(0.11)
(0.11)
Net
realized
gain
(0.23)
—
(0.11)
(0.66)
(0.53)
Total
distributions
(0.33)
(0.13)
(0.25)
(0.77)
(0.64)
NET
ASSET
VALUE
End
of
period
$
20.84
$
17.65
$
13.72
$
19.55
$
18.37
Ratios/Supplemental
Data
Total
return
(2)(3)
19.84%
29.65%
(28.63)%
10.69%
41.29%
Ratios
to
average
net
assets:
(2)
Gross
expenses
before
waivers/payments
by
Price
Associates
0.30%
0.35%
2.54%
1.46%
3.14%
Net
expenses
after
waivers/
payments
by
Price
Associates
0.27%
0.27%
0.27%
0.30%
0.31%
Net
investment
income
0.82%
0.99%
1.00%
0.69%
0.75%
Portfolio
turnover
rate
31.7%
29.5%
23.4%
34.7%
38.3%
Net
assets,
end
of
period
(in
thousands)
$103
$214
$166
$237
$8,724
0%
0%
0%
0%
0%
(1)
Per
share
amounts
calculated
using
average
shares
outstanding
method.
(2)
Includes
the
impact
of
expense-related
arrangements
with
Price
Associates.
(3)
Total
return
reflects
the
rate
that
an
investor
would
have
earned
on
an
investment
in
the
fund
during
each
period,
assuming
reinvestment
of
all
distributions,
and
payment
of
no
redemption
or
account
fees,
if
applicable.
T.
ROWE
PRICE
Mid-Cap
Index
Fund
For
a
share
outstanding
throughout
each
period
The
accompanying
notes
are
an
integral
part
of
these
financial
statements.
I
Class
..
Year
..
..
Ended
.
12/31/24
12/31/23
12/31/22
12/31/21
12/31/20
NET
ASSET
VALUE
Beginning
of
period
$
17.70
$
13.75
$
19.60
$
18.42
$
13.49
Investment
activities
Net
investment
income
(1)(2)
0.19
0.17
0.18
0.18
0.12
Net
realized
and
unrealized
gain/loss
3.37
3.93
(5.76)
1.79
5.45
Total
from
investment
activities
3.56
4.10
(5.58)
1.97
5.57
Distributions
Net
investment
income
(0.18)
(0.15)
(0.16)
(0.13)
(0.11)
Net
realized
gain
(0.23)
—
(0.11)
(0.66)
(0.53)
Total
distributions
(0.41)
(0.15)
(0.27)
(0.79)
(0.64)
NET
ASSET
VALUE
End
of
period
$
20.85
$
17.70
$
13.75
$
19.60
$
18.42
Ratios/Supplemental
Data
Total
return
(2)(3)
19.99%
29.87%
(28.57)%
10.77%
41.45%
Ratios
to
average
net
assets:
(2)
Gross
expenses
before
waivers/payments
by
Price
Associates
0.30%
0.40%
0.44%
0.56%
3.06%
Net
expenses
after
waivers/payments
by
Price
Associates
0.14%
0.14%
0.14%
0.16%
0.18%
Net
investment
income
0.98%
1.12%
1.15%
0.86%
0.88%
Portfolio
turnover
rate
31.7%
29.5%
23.4%
34.7%
38.3%
Net
assets,
end
of
period
(in
thousands)
$138,433
$114,837
$80,256
$90,604
$460
0%
0%
0%
0%
0%
(1)
Per
share
amounts
calculated
using
average
shares
outstanding
method.
(2)
Includes
the
impact
of
expense-related
arrangements
with
Price
Associates.
(3)
Total
return
reflects
the
rate
that
an
investor
would
have
earned
on
an
investment
in
the
fund
during
each
period,
assuming
reinvestment
of
all
distributions,
and
payment
of
no
redemption
or
account
fees,
if
applicable.
T.
ROWE
PRICE
Mid-Cap
Index
Fund
For
a
share
outstanding
throughout
each
period
The
accompanying
notes
are
an
integral
part
of
these
financial
statements.
Z
Class
(1)
..
Year
..
..
Ended
.
3/16/20
(1)
Through
12/31/20
12/31/24
12/31/23
12/31/22
12/31/21
NET
ASSET
VALUE
Beginning
of
period
$
17.71
$
13.75
$
19.60
$
18.41
$
9.05
Investment
activities
Net
investment
income
(2)(3)
0.22
0.20
0.21
0.22
0.11
Net
realized
and
unrealized
gain/loss
3.37
3.93
(5.77)
1.79
9.89
Total
from
investment
activities
3.59
4.13
(5.56)
2.01
10.00
Distributions
Net
investment
income
(0.21)
(0.17)
(0.18)
(0.16)
(0.11)
Net
realized
gain
(0.23)
—
(0.11)
(0.66)
(0.53)
Total
distributions
(0.44)
(0.17)
(0.29)
(0.82)
(0.64)
NET
ASSET
VALUE
End
of
period
$
20.86
$
17.71
$
13.75
$
19.60
$
18.41
Ratios/Supplemental
Data
Total
return
(3)(4)
20.12%
30.09%
(28.47)%
11.00%
110.74%
Ratios
to
average
net
assets:
(3)
Gross
expenses
before
waivers/payments
by
Price
Associates
0.25%
0.32%
0.40%
0.60%
3.07%
(5)
Net
expenses
after
waivers/
payments
by
Price
Associates
0.00%
0.00%
0.00%
0.01%
0.00%
(5)
Net
investment
income
1.15%
1.31%
1.37%
1.09%
1.00%
(5)
Portfolio
turnover
rate
31.7%
29.5%
23.4%
34.7%
38.3%
Net
assets,
end
of
period
(in
thousands)
$96,405
$37,136
$11,404
$1,132
$204
0%
0%
0%
0%
0%
(1)
Inception
date
(2)
Per
share
amounts
calculated
using
average
shares
outstanding
method.
(3)
Includes
the
impact
of
expense-related
arrangements
with
Price
Associates.
(4)
Total
return
reflects
the
rate
that
an
investor
would
have
earned
on
an
investment
in
the
fund
during
each
period,
assuming
reinvestment
of
all
distributions,
and
payment
of
no
redemption
or
account
fees,
if
applicable.
Total
return
is
not
annualized
for
periods
less
than
one
year.
(5)
Annualized
T.
ROWE
PRICE
Mid-Cap
Index
Fund
December
31,
2024
Shares
$
Value
(Cost
and
value
in
$000s)
‡
COMMON
STOCKS
99.7%
COMMUNICATION
SERVICES
5.9%
Diversified
Telecommunication
Services
0.4%
Frontier
Communications
Parent (1)
12,458
432
GCI
Liberty,
Class
A,
EC (1)(2)
203
—
Iridium
Communications
5,699
166
Liberty
Global,
Class
A (1)
8,488
108
Liberty
Global,
Class
C (1)
7,823
103
809
Entertainment
3.2%
Liberty
Media
Corp-Liberty
Formula
One,
Class
A (1)
1,187
100
Liberty
Media
Corp-Liberty
Formula
One,
Class
C (1)
10,608
983
Liberty
Media
Corp-Liberty
Live,
Class
A (1)
1,013
67
Liberty
Media
Corp-Liberty
Live,
Class
C (1)
2,328
158
Madison
Square
Garden
Sports (1)
932
210
Playtika
Holding
3,816
27
ROBLOX,
Class
A (1)
26,545
1,536
Roku (1)
6,356
473
Spotify
Technology (1)
7,423
3,321
TKO
Group
Holdings (1)
3,968
564
7,439
Interactive
Media
&
Services
0.6%
IAC (1)
3,726
161
Pinterest,
Class
A (1)
30,405
882
TripAdvisor (1)
5,405
80
Trump
Media
&
Technology
Group (1)
3,737
127
ZoomInfo
Technologies (1)
15,222
160
1,410
Media
1.7%
Liberty
Broadband,
Class
A (1)
855
64
Liberty
Broadband,
Class
C (1)
5,550
415
New
York
Times,
Class
A
8,086
421
Nexstar
Media
Group
1,544
244
Sirius
XM
Holdings
10,791
246
Trade
Desk,
Class
A (1)
22,551
2,650
4,040
Total
Communication
Services
13,698
CONSUMER
DISCRETIONARY
12.7%
Automobile
Components
0.3%
Gentex
11,725
337
T.
ROWE
PRICE
Mid-Cap
Index
Fund
Shares
$
Value
(Cost
and
value
in
$000s)
‡
Lear
2,743
259
QuantumScape (1)(3)
18,069
94
690
Automobiles
0.5%
Harley-Davidson
6,011
181
Lucid
Group (1)
49,528
150
Rivian
Automotive,
Class
A (1)(3)
41,936
558
Thor
Industries (3)
2,551
244
1,133
Broadline
Retail
1.0%
Coupang (1)
58,558
1,287
Dillard's,
Class
A (3)
159
69
Etsy (1)
5,643
298
Kohl's (3)
5,533
78
Macy's
13,736
233
Nordstrom
5,104
123
Ollie's
Bargain
Outlet
Holdings (1)
3,098
340
2,428
Diversified
Consumer
Services
1.0%
ADT
16,568
115
Bright
Horizons
Family
Solutions (1)
2,891
320
Duolingo (1)
1,875
608
Grand
Canyon
Education (1)
1,448
237
H&R
Block
7,050
373
Service
Corp.
International
7,071
564
2,217
Hotels,
Restaurants
&
Leisure
4.0%
Aramark
13,172
491
Boyd
Gaming
3,179
231
Cava
Group (1)
3,829
432
Choice
Hotels
International
1,388
197
Churchill
Downs
3,505
468
DoorDash,
Class
A (1)
17,855
2,995
DraftKings,
Class
A (1)
22,894
852
Dutch
Bros,
Class
A (1)
5,481
287
Hyatt
Hotels,
Class
A
2,085
327
Light
&
Wonder (1)
4,455
385
Marriott
Vacations
Worldwide
1,743
156
Penn
Entertainment (1)
7,547
150
Planet
Fitness,
Class
A (1)
4,288
424
Texas
Roadhouse
3,377
609
Travel
+
Leisure
3,339
168
T.
ROWE
PRICE
Mid-Cap
Index
Fund
Shares
$
Value
(Cost
and
value
in
$000s)
‡
Vail
Resorts
1,903
357
Wendy's
8,642
141
Wingstop
1,488
423
Wyndham
Hotels
&
Resorts
3,809
384
9,477
Household
Durables
1.1%
Leggett
&
Platt
6,876
66
Newell
Brands
20,808
207
SharkNinja (1)
3,319
323
Tempur
Sealy
International
8,439
479
Toll
Brothers
5,092
641
TopBuild (1)
1,514
471
Whirlpool (3)
2,653
304
2,491
Leisure
Products
0.4%
Brunswick
3,282
212
Mattel (1)
16,974
301
Polaris
2,580
149
YETI
Holdings (1)
4,267
164
826
Specialty
Retail
3.5%
Advance
Auto
Parts
3,035
144
AutoNation (1)
1,275
217
Bath
&
Body
Works
11,064
429
Burlington
Stores (1)
3,206
914
Carvana (1)
5,472
1,113
Dick's
Sporting
Goods
2,832
648
Five
Below (1)
2,727
286
Floor
&
Decor
Holdings,
Class
A (1)
5,281
527
GameStop,
Class
A (1)
19,854
622
Gap
10,178
240
Lithia
Motors
1,320
472
Murphy
USA
921
462
Penske
Automotive
Group
924
141
RH (1)
757
298
Valvoline (1)
6,478
234
Wayfair,
Class
A (1)(3)
4,778
212
Williams-Sonoma
6,326
1,171
8,130
Textiles,
Apparel
&
Luxury
Goods
0.9%
Amer
Sports (1)
2,915
81
Birkenstock
Holding (1)
2,005
114
T.
ROWE
PRICE
Mid-Cap
Index
Fund
Shares
$
Value
(Cost
and
value
in
$000s)
‡
Capri
Holdings (1)
5,743
121
Carter's (3)
1,819
99
Columbia
Sportswear (3)
1,667
140
Crocs (1)
2,899
318
PVH
2,782
294
Skechers
USA,
Class
A (1)
6,628
446
Under
Armour,
Class
A (1)
9,705
80
Under
Armour,
Class
C (1)
9,829
73
VF
17,769
381
2,147
Total
Consumer
Discretionary
29,539
CONSUMER
STAPLES
3.0%
Beverages
0.3%
Boston
Beer,
Class
A (1)
442
132
Celsius
Holdings (1)
8,834
233
Coca-Cola
Consolidated
307
387
752
Consumer
Staples
Distribution
&
Retail
1.5%
Albertsons,
Class
A
21,212
417
BJ's
Wholesale
Club
Holdings (1)
6,636
593
Casey's
General
Stores
1,866
739
Grocery
Outlet
Holding (1)
4,737
74
Maplebear (1)
8,385
347
Performance
Food
Group (1)
7,705
651
U.S.
Foods
Holding (1)
11,544
779
3,600
Food
Products
0.7%
Darling
Ingredients (1)
7,953
268
Flowers
Foods
9,401
194
Freshpet (1)
2,365
350
Ingredion
3,296
454
Pilgrim's
Pride (1)
2,113
96
Post
Holdings (1)
2,397
274
Seaboard
12
29
1,665
Household
Products
0.1%
Reynolds
Consumer
Products
2,801
75
Spectrum
Brands
Holdings
1,359
115
190
Personal
Care
Products
0.4%
BellRing
Brands (1)
6,468
487
T.
ROWE
PRICE
Mid-Cap
Index
Fund
Shares
$
Value
(Cost
and
value
in
$000s)
‡
Coty,
Class
A (1)
19,108
133
elf
Beauty (1)
2,697
339
959
Total
Consumer
Staples
7,166
ENERGY
3.8%
Energy
Equipment
&
Services
0.5%
NOV
19,715
288
TechnipFMC
21,417
620
Weatherford
International
3,619
259
1,167
Oil,
Gas
&
Consumable
Fuels
3.3%
Antero
Midstream
17,003
257
Antero
Resources (1)
14,592
512
Cheniere
Energy
11,285
2,425
Chord
Energy
3,123
365
Civitas
Resources
4,978
228
DT
Midstream
4,885
486
Expand
Energy
11,666
1,161
HF
Sinclair
7,824
274
Matador
Resources
5,975
336
New
Fortress
Energy
4,006
61
Ovintiv
13,245
536
Permian
Resources
32,916
473
Range
Resources
12,030
433
Viper
Energy
5,158
253
7,800
Total
Energy
8,967
FINANCIALS
18.2%
Banks
4.1%
Bank
OZK
5,331
237
BOK
Financial
1,158
123
Columbia
Banking
System
10,459
282
Comerica
6,730
416
Commerce
Bancshares
6,263
390
Cullen/Frost
Bankers
2,986
401
East
West
Bancorp
6,957
666
First
Citizens
BancShares,
Class
A
606
1,280
First
Hawaiian
6,381
166
First
Horizon
26,864
541
FNB
17,842
264
NU
Holdings,
Class
A (1)
160,822
1,666
T.
ROWE
PRICE
Mid-Cap
Index
Fund
Shares
$
Value
(Cost
and
value
in
$000s)
‡
Pinnacle
Financial
Partners
3,845
440
Popular
3,624
341
Prosperity
Bancshares
4,559
344
Synovus
Financial
7,297
374
TFS
Financial
2,540
32
Webster
Financial
8,584
474
Western
Alliance
Bancorp
5,446
455
Wintrust
Financial
3,293
411
Zions
Bancorp
7,341
398
9,701
Capital
Markets
6.0%
Affiliated
Managers
Group
1,489
275
Ares
Management,
Class
A
9,351
1,655
Blue
Owl
Capital
26,180
609
Carlyle
Group
11,013
556
Coinbase
Global,
Class
A (1)
10,235
2,541
Evercore,
Class
A
1,819
504
Houlihan
Lokey
2,637
458
Interactive
Brokers
Group,
Class
A
5,339
943
Janus
Henderson
Group
6,465
275
Jefferies
Financial
Group
8,801
690
Lazard
5,490
283
LPL
Financial
Holdings
3,763
1,229
Morningstar
1,342
452
Robinhood
Markets,
Class
A (1)
33,970
1,266
SEI
Investments
5,071
418
Stifel
Financial
4,993
530
TPG
4,214
265
Tradeweb
Markets,
Class
A
5,850
766
Virtu
Financial,
Class
A
4,074
145
XP,
Class
A
20,465
243
14,103
Consumer
Finance
0.9%
Ally
Financial
13,807
497
Credit
Acceptance (1)(3)
311
146
OneMain
Holdings
5,661
295
SLM
10,661
294
SoFi
Technologies (1)
53,279
821
2,053
Financial
Services
3.0%
Affirm
Holdings (1)
13,063
795
Block (1)
28,062
2,385
T.
ROWE
PRICE
Mid-Cap
Index
Fund
Shares
$
Value
(Cost
and
value
in
$000s)
‡
Corebridge
Financial
14,870
445
Equitable
Holdings
16,000
755
Euronet
Worldwide (1)
2,145
221
MGIC
Investment
12,903
306
Rocket,
Class
A (1)(3)
7,121
80
Shift4
Payments,
Class
A (1)
3,115
323
Toast,
Class
A (1)
22,907
835
UWM
Holdings (3)
4,551
27
Voya
Financial
4,943
340
Western
Union
16,939
180
WEX (1)
2,014
353
7,045
Insurance
3.6%
American
Financial
Group
3,611
494
Assured
Guaranty
2,527
228
Axis
Capital
Holdings
3,898
345
Brighthouse
Financial (1)
3,006
144
CNA
Financial
1,143
55
Fidelity
National
Financial
13,082
734
First
American
Financial
5,012
313
Hanover
Insurance
Group
1,791
277
Kemper
3,038
202
Kinsale
Capital
Group
1,110
516
Lincoln
National
8,533
271
Markel
Group (1)
640
1,105
Old
Republic
International
11,888
430
Primerica
1,699
461
Reinsurance
Group
of
America
3,311
707
RenaissanceRe
Holdings
2,587
644
RLI
2,104
347
Ryan
Specialty
Holdings
5,186
333
Unum
Group
9,155
669
White
Mountains
Insurance
Group
125
243
8,518
Mortgage
Real
Estate
Investment
Trusts
0.6%
AGNC
Investment,
REIT (3)
41,317
381
Annaly
Capital
Management,
REIT
28,195
516
Rithm
Capital,
REIT
26,009
282
Starwood
Property
Trust,
REIT (3)
15,694
297
1,476
Total
Financials
42,896
T.
ROWE
PRICE
Mid-Cap
Index
Fund
Shares
$
Value
(Cost
and
value
in
$000s)
‡
HEALTH
CARE
8.2%
Biotechnology
3.1%
Alnylam
Pharmaceuticals (1)
6,511
1,532
Apellis
Pharmaceuticals (1)(3)
5,232
167
BioMarin
Pharmaceutical (1)
9,554
628
Exact
Sciences (1)
9,177
516
Exelixis (1)
14,156
471
GRAIL (1)(3)
1,437
26
Ionis
Pharmaceuticals (1)
7,848
274
Natera (1)
5,793
917
Neurocrine
Biosciences (1)
5,029
686
Roivant
Sciences (1)
21,338
252
Sarepta
Therapeutics (1)
4,555
554
Ultragenyx
Pharmaceutical (1)
4,504
189
United
Therapeutics (1)
2,201
777
Viking
Therapeutics (1)(3)
5,331
215
7,204
Health
Care
Equipment
&
Supplies
0.9%
DENTSPLY
SIRONA
10,137
192
Enovis (1)
2,774
122
Envista
Holdings (1)
8,609
166
Globus
Medical,
Class
A (1)
5,632
466
Inspire
Medical
Systems (1)
1,469
272
Masimo (1)
2,182
361
Penumbra (1)
1,854
440
QuidelOrtho (1)
3,115
139
2,158
Health
Care
Providers
&
Services
0.8%
Acadia
Healthcare (1)
4,558
181
Amedisys (1)
1,605
146
Chemed
754
399
Encompass
Health
4,978
460
Premier,
Class
A
5,085
108
Tenet
Healthcare (1)
4,811
607
1,901
Health
Care
Technology
0.8%
Certara (1)
6,221
66
Doximity,
Class
A (1)
6,218
332
Veeva
Systems,
Class
A (1)
7,454
1,567
1,965
T.
ROWE
PRICE
Mid-Cap
Index
Fund
Shares
$
Value
(Cost
and
value
in
$000s)
‡
Life
Sciences
Tools
&
Services
1.8%
10X
Genomics,
Class
A (1)
5,280
76
Avantor (1)
34,195
720
Azenta (1)
2,411
121
Bio-Rad
Laboratories,
Class
A (1)
956
314
Bruker
5,477
321
Fortrea
Holdings (1)
4,596
86
Illumina (1)
8,057
1,077
Medpace
Holdings (1)
1,278
425
QIAGEN
11,239
500
Repligen (1)
2,828
407
Sotera
Health (1)
7,711
105
4,152
Pharmaceuticals
0.8%
Elanco
Animal
Health (1)
24,694
299
Intra-Cellular
Therapies (1)
5,178
432
Jazz
Pharmaceuticals (1)
3,043
375
Organon
12,904
192
Perrigo
6,789
175
Royalty
Pharma,
Class
A
19,686
502
1,975
Total
Health
Care
19,355
INDUSTRIALS
&
BUSINESS
SERVICES
16.9%
Aerospace
&
Defense
1.6%
BWX
Technologies
4,586
511
Curtiss-Wright
1,932
686
HEICO
2,218
527
HEICO,
Class
A
4,095
762
Hexcel
4,082
256
Loar
Holdings (1)
1,510
111
Spirit
AeroSystems
Holdings,
Class
A (1)(3)
5,809
198
Standardaero (1)
3,467
86
Woodward
2,968
494
3,631
Air
Freight
&
Logistics
0.1%
GXO
Logistics (1)
5,888
256
256
Building
Products
1.8%
AAON
3,422
403
Advanced
Drainage
Systems
3,559
411
Armstrong
World
Industries
2,180
308
T.
ROWE
PRICE
Mid-Cap
Index
Fund
Shares
$
Value
(Cost
and
value
in
$000s)
‡
AZEK (1)
7,295
346
Carlisle
2,274
839
Fortune
Brands
Innovations
6,249
427
Hayward
Holdings (1)
7,286
111
Owens
Corning
4,348
741
Simpson
Manufacturing
2,153
357
Trex (1)
5,374
371
4,314
Commercial
Services
&
Supplies
1.0%
Clean
Harbors (1)
2,562
590
MSA
Safety
1,856
308
RB
Global
9,227
832
Tetra
Tech
13,403
534
Vestis
6,725
102
2,366
Construction
&
Engineering
1.8%
AECOM
6,744
720
API
Group (1)
11,544
415
Comfort
Systems
USA
1,771
751
EMCOR
Group
2,302
1,045
Everus
Construction
Group (1)
2,579
170
MasTec (1)
3,151
429
Valmont
Industries
998
306
WillScot
Holdings (1)
9,059
303
4,139
Electrical
Equipment
1.6%
Acuity
Brands
1,562
456
nVent
Electric
8,309
566
Regal
Rexnord
3,338
518
Sensata
Technologies
Holding
7,495
206
Vertiv
Holdings,
Class
A
18,087
2,055
3,801
Ground
Transportation
1.3%
Avis
Budget
Group (1)(3)
888
72
Knight-Swift
Transportation
Holdings
7,871
417
Landstar
System
1,762
303
Lyft,
Class
A (1)
18,431
238
Ryder
System
2,100
329
Saia (1)
1,332
607
Schneider
National,
Class
B
2,395
70
U-Haul
Holding (1)(3)
414
29
U-Haul
Holding,
Non-Voting
5,030
322
T.
ROWE
PRICE
Mid-Cap
Index
Fund
Shares
$
Value
(Cost
and
value
in
$000s)
‡
XPO (1)
5,761
755
3,142
Machinery
2.8%
AGCO
3,122
292
Allison
Transmission
Holdings
4,347
470
CNH
Industrial
43,913
498
Crane
2,484
377
Donaldson
6,095
411
Esab
2,837
340
Flowserve
6,669
384
Gates
Industrial (1)
11,870
244
Graco
8,433
711
ITT
4,156
594
Lincoln
Electric
Holdings
2,776
520
Middleby (1)
2,704
366
Oshkosh
3,271
311
RBC
Bearings (1)
1,442
431
Timken
3,241
231
Toro
5,184
415
6,595
Marine
Transportation
0.1%
Kirby (1)
2,909
308
308
Passenger
Airlines
0.4%
Alaska
Air
Group (1)
6,369
413
American
Airlines
Group (1)
33,121
577
990
Professional
Services
2.6%
Amentum
Holdings (1)
6,512
137
Booz
Allen
Hamilton
Holding
6,351
817
CACI
International,
Class
A (1)
1,120
453
Clarivate (1)
20,891
106
Concentrix
2,408
104
Dun
&
Bradstreet
Holdings (3)
15,171
189
FTI
Consulting (1)
1,788
342
Genpact
8,815
379
KBR
6,758
392
ManpowerGroup
2,361
136
Parsons (1)
2,294
212
Paycor
HCM (1)
4,103
76
Paylocity
Holding (1)
2,182
435
Robert
Half
5,139
362
T.
ROWE
PRICE
Mid-Cap
Index
Fund
Shares
$
Value
(Cost
and
value
in
$000s)
‡
Science
Applications
International
2,482
277
SS&C
Technologies
Holdings
10,830
821
TransUnion
9,818
910
6,148
Trading
Companies
&
Distributors
1.8%
Air
Lease
5,232
252
Core
&
Main,
Class
A (1)
9,651
491
Ferguson
Enterprises
10,224
1,775
MSC
Industrial
Direct,
Class
A
2,298
172
SiteOne
Landscape
Supply (1)
2,236
295
Watsco
1,741
825
WESCO
International
2,125
384
4,194
Total
Industrials
&
Business
Services
39,884
INFORMATION
TECHNOLOGY
19.9%
Communications
Equipment
0.4%
Ciena (1)
7,282
618
Lumentum
Holdings (1)
3,408
286
Ubiquiti
208
69
973
Electronic
Equipment,
Instruments
&
Components
1.2%
Arrow
Electronics (1)
2,632
298
Avnet
4,365
228
Cognex
8,622
309
Coherent (1)
6,289
596
Crane
NXT
2,455
143
Ingram
Micro
Holding (1)
888
17
IPG
Photonics (1)
1,349
98
Littelfuse
1,224
289
TD
SYNNEX
3,823
448
Vontier
7,586
277
2,703
IT
Services
3.4%
Amdocs
5,663
482
Cloudflare,
Class
A (1)
15,156
1,632
DXC
Technology (1)
8,972
179
Globant (1)
2,116
454
Kyndryl
Holdings (1)
11,542
399
MongoDB (1)
3,620
843
Okta (1)
8,162
643
Snowflake,
Class
A (1)
15,971
2,466
T.
ROWE
PRICE
Mid-Cap
Index
Fund
Shares
$
Value
(Cost
and
value
in
$000s)
‡
Twilio,
Class
A (1)
7,703
833
7,931
Semiconductors
&
Semiconductor
Equipment
3.9%
Allegro
MicroSystems (1)
6,153
134
Amkor
Technology
5,648
145
Astera
Labs (1)
5,451
722
Cirrus
Logic (1)
2,697
269
Entegris
7,590
752
GLOBALFOUNDRIES (1)(3)
4,933
212
Lattice
Semiconductor (1)
6,914
392
MACOM
Technology
Solutions
Holdings (1)
2,833
368
Marvell
Technology
43,273
4,779
MKS
Instruments
3,396
355
Onto
Innovation (1)
2,463
410
Qorvo (1)
4,810
336
Universal
Display
2,370
346
Wolfspeed (1)(3)
6,259
42
9,262
Software
10.6%
Appfolio,
Class
A (1)
1,137
281
AppLovin,
Class
A (1)
13,243
4,289
Aspen
Technology (1)
1,364
341
Atlassian,
Class
A (1)
8,044
1,958
Bentley
Systems,
Class
B
7,123
333
BILL
Holdings (1)
5,091
431
CCC
Intelligent
Solutions
Holdings (1)
22,680
266
Confluent,
Class
A (1)
12,580
352
Datadog,
Class
A (1)
15,102
2,158
DocuSign (1)
10,279
925
Dolby
Laboratories,
Class
A
2,932
229
DoubleVerify
Holdings (1)
7,260
139
Dropbox,
Class
A (1)
12,021
361
Dynatrace (1)
14,861
808
Elastic (1)
4,380
434
Five9 (1)
3,721
151
Gitlab,
Class
A (1)
6,201
349
Guidewire
Software (1)
4,127
696
HashiCorp,
Class
A (1)
7,285
249
HubSpot (1)
2,470
1,721
Informatica,
Class
A (1)
4,128
107
Manhattan
Associates (1)
3,084
833
MicroStrategy,
Class
A (1)
8,316
2,408
nCino (1)
4,183
140
T.
ROWE
PRICE
Mid-Cap
Index
Fund
Shares
$
Value
(Cost
and
value
in
$000s)
‡
Nutanix,
Class
A (1)
12,613
772
Pegasystems
2,236
208
Procore
Technologies (1)
5,430
407
RingCentral,
Class
A (1)
4,121
144
SentinelOne,
Class
A (1)
13,994
311
Smartsheet,
Class
A (1)
6,882
386
Teradata (1)
4,855
151
UiPath,
Class
A (1)
21,743
276
Unity
Software (1)
15,351
345
Zoom
Communications (1)
13,335
1,088
Zscaler (1)
4,710
850
24,897
Technology
Hardware,
Storage
&
Peripherals
0.4%
Pure
Storage,
Class
A (1)
15,527
954
954
Total
Information
Technology
46,720
MATERIALS
5.2%
Chemicals
1.1%
Ashland
2,449
175
Axalta
Coating
Systems (1)
11,056
378
Chemours
7,469
126
Element
Solutions
11,226
286
Huntsman
8,196
148
NewMarket
338
179
Olin
5,882
199
RPM
International
6,406
788
Scotts
Miracle-Gro
2,130
141
Westlake
1,681
193
2,613
Construction
Materials
1.6%
CRH
34,703
3,210
Eagle
Materials
1,689
417
3,627
Containers
&
Packaging
1.1%
AptarGroup
3,321
522
Berry
Global
Group
5,817
376
Crown
Holdings
5,882
486
Graphic
Packaging
Holding
15,076
410
Sealed
Air
7,296
247
Silgan
Holdings
4,157
216
T.
ROWE
PRICE
Mid-Cap
Index
Fund
Shares
$
Value
(Cost
and
value
in
$000s)
‡
Sonoco
Products
4,912
240
2,497
Metals
&
Mining
1.3%
Alcoa
12,456
471
ATI (1)
6,254
344
Cleveland-Cliffs (1)
24,171
227
MP
Materials (1)(3)
6,697
104
Reliance
2,712
730
Royal
Gold
3,303
436
Southern
Copper
4,427
403
United
States
Steel
11,320
385
3,100
Paper
&
Forest
Products
0.1%
Louisiana-Pacific
3,182
329
329
Total
Materials
12,166
REAL
ESTATE
4.9%
Diversified
Real
Estate
Investment
Trusts
0.3%
WP
Carey,
REIT
10,963
597
597
Health
Care
Real
Estate
Investment
Trusts
0.4%
Healthcare
Realty
Trust,
REIT
17,712
300
Medical
Properties
Trust,
REIT
30,320
120
Omega
Healthcare
Investors,
REIT
13,566
513
933
Hotel
&
Resort
Real
Estate
Investment
Trusts
0.1%
Park
Hotels
&
Resorts,
REIT
10,356
146
146
Industrial
Real
Estate
Investment
Trusts
0.8%
Americold
Realty
Trust,
REIT
14,253
305
EastGroup
Properties,
REIT
2,494
400
First
Industrial
Realty
Trust,
REIT
6,694
336
Lineage,
REIT
3,087
181
Rexford
Industrial
Realty,
REIT
11,074
428
STAG
Industrial,
REIT
9,076
307
1,957
Office
Real
Estate
Investment
Trusts
0.4%
Cousins
Properties,
REIT
8,073
248
Highwoods
Properties,
REIT
5,232
160
Kilroy
Realty,
REIT
5,862
237
T.
ROWE
PRICE
Mid-Cap
Index
Fund
Shares
$
Value
(Cost
and
value
in
$000s)
‡
Vornado
Realty
Trust,
REIT
8,901
374
1,019
Real
Estate
Management
&
Development
0.6%
Howard
Hughes
Holdings (1)
1,581
122
Jones
Lang
LaSalle (1)
2,377
602
Seaport
Entertainment
Group (1)(3)
400
11
Zillow
Group,
Class
A (1)
2,348
166
Zillow
Group,
Class
C (1)
7,819
579
1,480
Residential
Real
Estate
Investment
Trusts
0.9%
American
Homes
4
Rent,
Class
A,
REIT
17,082
639
Equity
LifeStyle
Properties,
REIT
9,550
636
Sun
Communities,
REIT
6,216
765
2,040
Retail
Real
Estate
Investment
Trusts
0.5%
Agree
Realty,
REIT (3)
5,428
382
Brixmor
Property
Group,
REIT
15,209
424
NNN
REIT,
REIT
9,473
387
1,193
Specialized
Real
Estate
Investment
Trusts
0.9%
CubeSmart,
REIT
11,255
482
EPR
Properties,
REIT
3,743
166
Gaming
&
Leisure
Properties,
REIT
13,177
635
Lamar
Advertising,
Class
A,
REIT
4,381
533
National
Storage
Affiliates
Trust,
REIT
3,506
133
Rayonier,
REIT
7,732
202
2,151
Total
Real
Estate
11,516
UTILITIES
1.0%
Electric
Utilities
0.3%
IDACORP
2,665
291
OGE
Energy
10,145
419
710
Gas
Utilities
0.3%
MDU
Resources
10,187
184
National
Fuel
Gas
4,569
277
UGI
10,782
304
765
T.
ROWE
PRICE
Mid-Cap
Index
Fund
Shares
$
Value
(Cost
and
value
in
$000s)
‡
Independent
Power
&
Renewable
Electricity
Producers
0.2%
Brookfield
Renewable (3)
6,778
188
Clearway
Energy,
Class
A
1,818
44
Clearway
Energy,
Class
C
4,190
109
341
Water
Utilities
0.2%
Essential
Utilities
12,666
460
460
Total
Utilities
2,276
Total
Common
Stocks
(Cost
$198,669)
234,183
EQUITY
MUTUAL
FUNDS
0.2%
SPDR
S&P
MidCap
400
ETF
Trust (3)
923
526
Total
Equity
Mutual
Funds
(Cost
$528)
526
SHORT-TERM
INVESTMENTS
0.3%
Money
Market
Funds
0.3%
T.
Rowe
Price
Government
Reserve
Fund,
4.53% (4)(5)
683,217
683
Total
Short-Term
Investments
(Cost
$683)
683
SECURITIES
LENDING
COLLATERAL
1.6%
INVESTMENTS
IN
A
POOLED
ACCOUNT
THROUGH
SECURITIES
LENDING
PROGRAM
WITH
STATE
STREET
BANK
AND
TRUST
COMPANY 1.6%
Money
Market
Funds 1.6%
T.
Rowe
Price
Government
Reserve
Fund,
4.53% (4)(5)
3,831,216
3,831
Total
Investments
in
a
Pooled
Account
through
Securities
Lending
Program
with
State
Street
Bank
and
Trust
Company
3,831
Total
Securities
Lending
Collateral
(Cost
$3,831)
3,831
Total
Investments
in
Securities
101.8%
of
Net
Assets
(Cost
$203,711)
$
239,223
T.
ROWE
PRICE
Mid-Cap
Index
Fund
‡
Shares
are
denominated
in
U.S.
dollars
unless
otherwise
noted.
(1)
Non-income
producing
(2)
See
Note
2.
Level
3
in
fair
value
hierarchy.
(3)
See
Note
3.
All
or
a
portion
of
this
security
is
on
loan
at
December
31,
2024.
(4)
Seven-day
yield
(5)
Affiliated
Companies
EC
Escrow
CUSIP;
represents
a
beneficial
interest
in
a
residual
pool
of
assets;
the
amount
and
timing
of
future
distributions,
if
any,
is
uncertain;
when
presented,
interest
rate
and
maturity
date
are
those
of
the
original
security.
ETF
Exchange-Traded
Fund
REIT
A
domestic
Real
Estate
Investment
Trust
whose
distributions
pass-through
with
original
tax
character
to
the
shareholder
T.
ROWE
PRICE
Mid-Cap
Index
Fund
The
accompanying
notes
are
an
integral
part
of
these
financial
statements.
AFFILIATED
COMPANIES
($000s)
The
fund
may
invest
in
certain
securities
that
are
considered
affiliated
companies.
As
defined
by
the
1940
Act,
an
affiliated
company
is
one
in
which
the
fund
owns
5%
or
more
of
the
outstanding
voting
securities,
or
a
company
that
is
under
common
ownership
or
control.
The
following
securities
were
considered
affiliated
companies
for
all
or
some
portion
of
the
year
ended
December
31,
2024.
Net
realized
gain
(loss),
investment
income,
change
in
net
unrealized
gain/loss,
and
purchase
and
sales
cost
reflect
all
activity
for
the
period
then
ended.
Affiliate
Net
Realized
Gain
(Loss)
Change
in
Net
Unrealized
Gain/Loss
Investment
Income
T.
Rowe
Price
Government
Reserve
Fund,
4.53%
$
—
$
—
$
17++
Totals
$
—#
$
—
$
17+
Supplementary
Investment
Schedule
Affiliate
Value
12/31/23
Purchase
Cost
Sales
Cost
Value
12/31/24
T.
Rowe
Price
Government
Reserve
Fund,
4.53%
$
4,984
¤
¤
$
4,514
Total
$
4,514^
#
Capital
gain
distributions
from
underlying
Price
funds
represented
$0
of
the
net
realized
gain
(loss).
++
Excludes
earnings
on
securities
lending
collateral,
which
are
subject
to
rebates
and
fees
as
described
in
Note
3.
+
Investment
income
comprised
$17
of
dividend
income
and
$0
of
interest
income.
¤
Purchase
and
sale
information
not
shown
for
cash
management
funds.
^
The
cost
basis
of
investments
in
affiliated
companies
was
$4,514.
T.
ROWE
PRICE
Mid-Cap
Index
Fund
December
31,
2024
Statement
of
Assets
and
Liabilities
($000s,
except
shares
and
per
share
amounts)
Assets
Investments
in
securities,
at
value
(cost
$203,711)
$
239,223
Receivable
for
shares
sold
306
Dividends
receivable
176
Due
from
affiliates
16
Other
assets
12
Total
assets
239,733
Liabilities
Obligation
to
return
securities
lending
collateral
3,831
Payable
for
investment
securities
purchased
804
Payable
for
shares
redeemed
76
Investment
management
fees
payable
19
Other
liabilities
62
Total
liabilities
4,792
Commitments
and
Contingent
Liabilities
(note
6
)
NET
ASSETS
$
234,941
T.
ROWE
PRICE
Mid-Cap
Index
Fund
December
31,
2024
Statement
of
Assets
and
Liabilities
($000s,
except
shares
and
per
share
amounts)
The
accompanying
notes
are
an
integral
part
of
these
financial
statements.
Net
Assets
Consist
of:
Total
distributable
earnings
(loss)
$
33,261
Paid-in
capital
applicable
to
11,264,211
shares
of
$0.0001
par
value
capital
stock
outstanding;
2,000,000,000
shares
of
the
Corporation
authorized
201,680
NET
ASSETS
$
234,941
NET
ASSET
VALUE
PER
SHARE
Investor
Class
(Net
assets:
$103;
Shares
outstanding:
4,922)
$
20.84
I
Class
(Net
assets:
$138,433;
Shares
outstanding:
6,638,791)
$
20.85
Z
Class
(Net
assets:
$96,405;
Shares
outstanding:
4,620,498)
$
20.86
T.
ROWE
PRICE
Mid-Cap
Index
Fund
The
accompanying
notes
are
an
integral
part
of
these
financial
statements.
Year
Ended
12/31/24
Investment
Income
(Loss)
Income
Dividend
(net
of
foreign
taxes
of
$4)
$
2,093
Securities
lending
60
Other
2
Total
income
2,155
Expenses
Investment
management
171
Shareholder
servicing
I
Class
52
Prospectus
and
shareholder
reports
I
Class
$
5
Z
Class
3
8
Custody
and
accounting
257
Legal
and
audit
34
Directors
1
Miscellaneous
15
Waived
/
paid
by
Price
Associates
(361)
Total
expenses
177
Net
investment
income
1,978
Realized
and
Unrealized
Gain
/
Loss
–
Net
realized
gain
on
securities
5,868
Change
in
net
unrealized
gain
/
loss
on
securities
27,587
Net
realized
and
unrealized
gain
/
loss
33,455
INCREASE
IN
NET
ASSETS
FROM
OPERATIONS
$
35,433
T.
ROWE
PRICE
Mid-Cap
Index
Fund
Statement
of
Changes
in
Net
Assets
Year
.
.
.
.
.
.
.
.
.
.
.
.
.
.
Ended
.
.
.
.
.
.
.
.
.
.
.
.
.
.
12/31/24
12/31/23
Increase
(Decrease)
in
Net
Assets
Operations
Net
investment
income
$
1,978
$
1,383
Net
realized
gain
(loss)
5,868
(566)
Change
in
net
unrealized
gain
/
loss
27,587
31,433
Increase
in
net
assets
from
operations
35,433
32,250
Distributions
to
shareholders
Net
earnings
Investor
Class
(1)
(2)
I
Class
(2,680)
(964)
Z
Class
(1,967)
(357)
Decrease
in
net
assets
from
distributions
(4,648)
(1,323)
Capital
share
transactions
*
Shares
sold
I
Class
15,317
14,270
Z
Class
59,186
23,014
Distributions
reinvested
I
Class
2,680
964
Z
Class
1,967
357
Shares
redeemed
Investor
Class
(148)
–
I
Class
(14,614)
(5,357)
Z
Class
(12,419)
(3,814)
Increase
in
net
assets
from
capital
share
transactions
51,969
29,434
T.
ROWE
PRICE
Mid-Cap
Index
Fund
Statement
of
Changes
in
Net
Assets
The
accompanying
notes
are
an
integral
part
of
these
financial
statements.
Year
.
.
.
.
.
.
.
.
.
.
.
.
.
.
Ended
.
.
.
.
.
.
.
.
.
.
.
.
.
.
12/31/24
12/31/23
Net
Assets
Increase
during
period
82,754
60,361
Beginning
of
period
152,187
91,826
End
of
period
$
234,941
$
152,187
*Share
information
(000s)
Shares
sold
I
Class
790
939
Z
Class
3,033
1,493
Distributions
reinvested
I
Class
121
56
Z
Class
89
21
Shares
redeemed
Investor
Class
(7)
–
I
Class
(759)
(345)
Z
Class
(599)
(246)
Increase
in
shares
outstanding
2,668
1,918
T.
ROWE
PRICE
Mid-Cap
Index
Fund
NOTES
TO
FINANCIAL
STATEMENTS
T.
Rowe
Price
Index
Trust,
Inc. (the
corporation) is
registered
under
the
Investment
Company
Act
of
1940
(the
1940
Act).
The
Mid-Cap
Index
Fund
(the
fund)
is
an
open-end
management
investment
company
established
by
the
corporation
and
intends
to
be
diversified
in
approximately
the
same
proportion
as
the
index
it
tracks
is
diversified.
The
fund
may
become
nondiversified
for
periods
of
time
solely
as
a
result
of
changes
in
the
composition
of
the
index
(for
example,
changes
in
the
relative
market
capitalization
or
index
weighting
of
one
or
more
securities
represented
in
the
index). The
fund
seeks to
track
the
performance
of
a
benchmark
index
that
measures
the
investment
return
of
mid-
capitalization
U.S.
stocks. The
fund
is
available
for
investment
only
by
mutual
funds,
college
savings
plans,
and
other
institutional
client
accounts
managed
by
T.
Rowe
Price
Associates,
Inc.,
or
its
affiliates
and
is
not
available
for
direct
purchase
by
members
of
the
public.
The
fund
has three classes
of
shares:
the
Mid-Cap
Index
Fund
(Investor
Class),
the
Mid-Cap
Index
Fund–I
Class
(I
Class)
and
the
Mid-Cap
Index
Fund–Z
Class
(Z
Class).
I
Class
shares
require
a
$500,000
initial
investment
minimum,
although
the
minimum
generally
is
waived
or
reduced
for
financial
intermediaries,
eligible
retirement
plans,
and
certain
other
accounts.
The
Z
Class
is
only
available
to
funds
advised
by
T.
Rowe
Price
Associates,
Inc.
and
its
affiliates
and
other
clients
that
are
subject
to
a
contractual
fee
for
investment
management
services. Each
class
has
exclusive
voting
rights
on
matters
related
solely
to
that
class;
separate
voting
rights
on
matters
that
relate
to
all
classes;
and,
in
all
other
respects,
the
same
rights
and
obligations
as
the
other
classes.
NOTE
1
-
SIGNIFICANT
ACCOUNTING
POLICIES
Basis
of
Preparation
The fund
is
an
investment
company
and
follows
accounting
and
reporting
guidance
in
the
Financial
Accounting
Standards
Board
(FASB)
Accounting
Standards
Codification
Topic
946
(ASC
946).
The
accompanying
financial
statements
were
prepared
in
accordance
with
accounting
principles
generally
accepted
in
the
United
States
of
America
(GAAP),
including,
but
not
limited
to,
ASC
946.
GAAP
requires
the
use
of
estimates
made
by
management.
Management
believes
that
estimates
and
valuations
are
appropriate;
however,
actual
results
may
differ
from
those
estimates,
and
the
valuations
reflected
in
the
accompanying
financial
statements
may
differ
from
the
value
ultimately
realized
upon
sale
or
maturity.
T.
ROWE
PRICE
Mid-Cap
Index
Fund
Investment
Transactions,
Investment
Income,
and
Distributions
Investment
transactions
are
accounted
for
on
the
trade
date
basis.
Income
and
expenses
are
recorded
on
the
accrual
basis.
Realized
gains
and
losses
are
reported
on
the
identified
cost
basis. Income
tax-related
interest
and
penalties,
if
incurred,
are
recorded
as
income
tax
expense. Dividends
received
from other
investment
companies are
reflected
as
dividend income;
capital
gain
distributions
are
reflected
as
realized
gain/loss. Dividend
income and
capital
gain
distributions
are
recorded
on
the
ex-dividend
date. Distributions
from
REITs
are
initially
recorded
as
dividend
income
and,
to
the
extent
such
represent
a
return
of
capital
or
capital
gain
for
tax
purposes,
are
reclassified
when
such
information
becomes
available. Non-cash
dividends,
if
any,
are
recorded
at
the
fair
market
value
of
the
asset
received. Proceeds
from
litigation
payments,
if
any,
are
included
in
either
net
realized
gain
(loss)
or
change
in
net
unrealized
gain/loss
from
securities. Distributions
to
shareholders
are
recorded
on
the
ex-dividend
date. Income
distributions,
if
any,
are
declared
and
paid
by
each
class annually. A
capital
gain
distribution,
if
any, may
also
be
declared
and
paid
by
the
fund
annually.
Class
Accounting
Shareholder
servicing,
prospectus,
and
shareholder
report
expenses
incurred
by
each
class
are
charged
directly
to
the
class
to
which
they
relate.
Expenses
common
to
all
classes,
investment
income,
and
realized
and
unrealized
gains
and
losses
are
allocated
to
the
classes
based
upon
the
relative
daily
net
assets
of
each
class.
Capital
Transactions
Each
investor’s
interest
in
the
net
assets
of the
fund
is
represented
by
fund
shares. The
fund’s
net
asset
value
(NAV)
per
share
is
computed
at
the
close
of
the
New
York
Stock
Exchange
(NYSE),
normally
4
p.m.
Eastern
time,
each
day
the
NYSE
is
open
for
business.
However,
the
NAV
per
share
may
be
calculated
at
a
time
other
than
the
normal
close
of
the
NYSE
if
trading
on
the
NYSE
is
restricted,
if
the
NYSE
closes
earlier,
or
as
may
be
permitted
by
the
SEC.
Purchases
and
redemptions
of
fund
shares
are
transacted
at
the
next-computed
NAV
per
share,
after
receipt
of
the
transaction
order
by
T.
Rowe
Price
Associates,
Inc.,
or
its
agents.
New
Accounting
Guidance
In December
2023,
the
FASB
issued
Accounting
Standards
Update
(ASU),
ASU
2023-09,
Income
Taxes
(Topic
740)
–
Improvements
to
Income
Taxes
Disclosures,
which
enhances
the
transparency
of
income
tax
disclosures.
The
ASU
requires
public
entities,
on
an
annual
basis,
to
provide
disclosure
of
specific
categories
in
the
rate
reconciliation,
as
well
as
disclosure
of
income
taxes
paid
disaggregated
by
jurisdiction.
The
amendments
under
this
ASU
are
required
to
be
applied
prospectively
and
are
effective
T.
ROWE
PRICE
Mid-Cap
Index
Fund
for
fiscal
years
beginning
after
December
15,
2024.
Management
expects
that
adoption
of
the
guidance
will
not
have
a
material
impact
on
the
fund’s
financial
statements.
Indemnification
In
the
normal
course
of
business, the
fund
may
provide
indemnification
in
connection
with
its
officers
and
directors,
service
providers,
and/or
private
company
investments. The
fund’s
maximum
exposure
under
these
arrangements
is
unknown;
however,
the
risk
of
material
loss
is
currently
considered
to
be
remote.
NOTE
2
-
VALUATION
Fair
Value
The
fund’s
financial
instruments
are
valued
at
the
close
of
the
NYSE
and
are
reported
at
fair
value,
which
GAAP
defines
as
the
price
that
would
be
received
to
sell
an
asset
or
paid
to
transfer
a
liability
in
an
orderly
transaction
between
market
participants
at
the
measurement
date. The fund’s
Board
of
Directors
(the
Board)
has
designated
T.
Rowe
Price
Associates,
Inc.
as
the
fund’s
valuation
designee
(Valuation
Designee).
Subject
to
oversight
by
the
Board,
the
Valuation
Designee
performs
the
following
functions
in
performing
fair
value
determinations:
assesses
and
manages
valuation
risks;
establishes
and
applies
fair
value
methodologies;
tests
fair
value
methodologies;
and
evaluates
pricing
vendors
and
pricing
agents.
The
duties
and
responsibilities
of
the
Valuation
Designee
are
performed
by
its
Valuation
Committee. The
Valuation
Designee provides
periodic
reporting
to
the
Board
on
valuation
matters.
Various
valuation
techniques
and
inputs
are
used
to
determine
the
fair
value
of
financial
instruments.
GAAP
establishes
the
following
fair
value
hierarchy
that
categorizes
the
inputs
used
to
measure
fair
value:
Level
1
–
quoted
prices
(unadjusted)
in
active
markets
for
identical
financial
instruments
that
the
fund
can
access
at
the
reporting
date
Level
2
–
inputs
other
than
Level
1
quoted
prices
that
are
observable,
either
directly
or
indirectly
(including,
but
not
limited
to,
quoted
prices
for
similar
financial
instruments
in
active
markets,
quoted
prices
for
identical
or
similar
financial
instruments
in
inactive
markets,
interest
rates
and
yield
curves,
implied
volatilities,
and
credit
spreads)
Level
3
–
unobservable
inputs
(including
the Valuation
Designee’s assumptions
in
determining
fair
value)
T.
ROWE
PRICE
Mid-Cap
Index
Fund
Observable
inputs
are
developed
using
market
data,
such
as
publicly
available
information
about
actual
events
or
transactions,
and
reflect
the
assumptions
that
market
participants
would
use
to
price
the
financial
instrument.
Unobservable
inputs
are
those
for
which
market
data
are
not
available
and
are
developed
using
the
best
information
available
about
the
assumptions
that
market
participants
would
use
to
price
the
financial
instrument.
GAAP
requires
valuation
techniques
to
maximize
the
use
of
relevant
observable
inputs
and
minimize
the
use
of
unobservable
inputs.
When
multiple
inputs
are
used
to
derive
fair
value,
the
financial
instrument
is
assigned
to
the
level
within
the
fair
value
hierarchy
based
on
the
lowest-level
input
that
is
significant
to
the
fair
value
of
the
financial
instrument.
Input
levels
are
not
necessarily
an
indication
of
the
risk
or
liquidity
associated
with
financial
instruments
at
that
level
but
rather
the
degree
of
judgment
used
in
determining
those
values.
Valuation
Techniques
Equity
securities,
including
exchange-traded
funds, listed
or
regularly
traded
on
a
securities
exchange
or
in
the
over-the-
counter
(OTC)
market
are
valued
at
the
last
quoted
sale
price
or,
for
certain
markets,
the
official
closing
price
at
the
time
the
valuations
are
made.
OTC
Bulletin
Board
securities
are
valued
at
the
mean
of
the
closing
bid
and
asked
prices.
A
security
that
is
listed
or
traded
on
more
than
one
exchange
is
valued
at
the
quotation
on
the
exchange
determined
to
be
the
primary
market
for
such
security.
Listed
securities
not
traded
on
a
particular
day
are
valued
at
the
mean
of
the
closing
bid
and
asked
prices
for
domestic
securities.
Investments
in
mutual
funds
are
valued
at
the
mutual
fund’s
closing
NAV
per
share
on
the
day
of
valuation.
Assets
and
liabilities
other
than
financial
instruments,
including
short-term
receivables
and
payables,
are
carried
at
cost,
or
estimated
realizable
value,
if
less,
which
approximates
fair
value.
Investments
for
which
market
quotations are
not
readily
available
or
deemed
unreliable
are
valued
at
fair
value
as
determined
in
good
faith
by
the
Valuation
Designee.
The
Valuation
Designee
has
adopted
methodologies
for
determining
the
fair
value
of
investments
for
which
market
quotations
are
not
readily
available
or
deemed
unreliable,
including
the
use
of
other
pricing
sources.
Factors
used
in
determining
fair
value
vary
by
type
of
investment
and
may
include
market
or
investment
specific
considerations.
The
Valuation
Designee typically
will
afford
greatest
weight
to
actual
prices
in
arm’s
length
transactions,
to
the
extent
they
represent
orderly
transactions
between
market
participants,
transaction
information
can
be
reliably
obtained,
and
prices
are
deemed
representative
of
fair
value.
However,
the
Valuation
Designee may
also
consider
other
valuation
methods
such
as
market-based
valuation
multiples;
T.
ROWE
PRICE
Mid-Cap
Index
Fund
a
discount
or
premium
from
market
value
of
a
similar,
freely
traded
security
of
the
same
issuer;
discounted
cash
flows;
yield
to
maturity;
or
some
combination.
Fair
value
determinations
are
reviewed
on
a
regular
basis.
Because
any
fair
value
determination
involves
a
significant
amount
of
judgment,
there
is
a
degree
of
subjectivity
inherent
in
such
pricing
decisions. Fair
value
prices
determined
by
the
Valuation
Designee could
differ
from
those
of
other
market
participants,
and
it
is
possible
that
the
fair
value
determined
for
a
security
may
be
materially
different
from
the
value
that
could
be
realized
upon
the
sale
of
that
security.
Valuation
Inputs
The
following
table
summarizes
the
fund’s
financial
instruments,
based
on
the
inputs
used
to
determine
their
fair
values
on
December
31,
2024
(for
further
detail
by
category,
please
refer
to
the
accompanying
Portfolio
of
Investments):
NOTE
3
-
OTHER
INVESTMENT
TRANSACTIONS
Consistent
with
its
investment
objective, the
fund
engages
in
the
following
practices
to
manage
exposure
to
certain
risks
and/or
to
enhance
performance.
The
investment
objective,
policies,
program,
and
risk
factors
of the
fund
are
described
more
fully
in the
fund’s prospectus
and
Statement
of
Additional
Information.
Securities
Lending
The fund
may
lend
its
securities
to
approved
borrowers
to
earn
additional
income.
Its
securities
lending
activities
are
administered
by
a
lending
agent
in
accordance
with
a
securities
lending
agreement.
Security
loans
generally
do
not
have
stated
maturity
dates,
and
the
fund
may
recall
a
security
at
any
time.
The
fund
receives
collateral
in
the
form
of
cash
or
U.S.
government
securities.
Collateral
is
maintained
over
the
life
of
the
loan
in
an
amount
not
less
than
the
value
of
loaned
securities;
any
additional
collateral
required
due
to
($000s)
Level
1
Level
2
Level
3
Total
Value
Assets
Common
Stocks
$
234,183
$
—
$
—
$
234,183
Equity
Mutual
Funds
526
—
—
526
Short-Term
Investments
683
—
—
683
Securities
Lending
Collateral
3,831
—
—
3,831
Total
$
239,223
$
—
$
—
$
239,223
T.
ROWE
PRICE
Mid-Cap
Index
Fund
changes
in
security
values
is
delivered
to
the
fund
the
next
business
day.
Cash
collateral
is
invested
in
accordance
with
investment
guidelines
approved
by
fund
management.
Additionally,
the
lending
agent
indemnifies
the
fund
against
losses
resulting
from
borrower
default.
Although
risk
is
mitigated
by
the
collateral
and
indemnification,
the
fund
could
experience
a
delay
in
recovering
its
securities
and
a
possible
loss
of
income
or
value
if
the
borrower
fails
to
return
the
securities,
collateral
investments
decline
in
value,
and
the
lending
agent
fails
to
perform.
Securities
lending
revenue
consists
of
earnings
on
invested
collateral
and
borrowing
fees,
net
of
any
rebates
to
the
borrower,
compensation
to
the
lending
agent,
and
other
administrative
costs.
In
accordance
with
GAAP,
investments
made
with
cash
collateral
are
reflected
in
the
accompanying
financial
statements,
but
collateral
received
in
the
form
of
securities
is
not.
At
December
31,
2024,
the
value
of
loaned
securities
was
$3,741,000;
the
value
of
cash
collateral
and
related
investments
was
$3,831,000.
Other
Purchases
and
sales
of
portfolio
securities
other
than
in-kind
transactions,
if
any,
and short-term securities
aggregated $109,792,000 and
$60,241,000,
respectively,
for
the
year ended
December
31,
2024.
NOTE
4
-
FEDERAL
INCOME
TAXES
Generally,
no
provision
for
federal
income
taxes
is
required
since
the
fund
intends
to continue
to
qualify
as
a
regulated
investment
company
under
Subchapter
M
of
the
Internal
Revenue
Code
and
distribute
to
shareholders
all
of
its taxable
income
and
gains.
Distributions
determined
in
accordance
with
federal
income
tax
regulations
may
differ
in
amount
or
character
from
net
investment
income
and
realized
gains
for
financial
reporting
purposes.
The
fund
files
U.S.
federal,
state,
and
local
tax
returns
as
required.
The
fund’s
tax
returns
are
subject
to
examination
by
the
relevant
tax
authorities
until
expiration
of
the
applicable
statute
of
limitations,
which
is
generally
three
years
after
the
filing
of
the
tax
return
but
which
can
be
extended
to
six
years
in
certain
circumstances.
Tax
returns
for
open
years
have
incorporated
no
uncertain
tax
positions
that
require
a
provision
for
income
taxes.
Capital
accounts
within
the
financial
reporting
records
are
adjusted
for
permanent
book/tax
differences
to
reflect
tax
character
but
are
not
adjusted
for
temporary
differences.
The
permanent
book/tax
adjustments,
if
any,
have
no
impact
on
results
of
operations
or
net
assets.
T.
ROWE
PRICE
Mid-Cap
Index
Fund
The
tax
character
of
distributions
paid
for
the
periods
presented
was
as
follows:
At
December
31,
2024,
the
tax-basis
cost
of
investments
(including
derivatives,
if
any)
and
gross
unrealized
appreciation
and
depreciation
were as
follows:
At
December
31,
2024,
the
tax-basis
components
of
accumulated
net
earnings
(loss)
were
as
follows:
Temporary
differences
between
book-basis
and
tax-basis
components
of
total
distributable
earnings
(loss)
arise
when
certain
items
of
income,
gain,
or
loss
are
recognized
in
different
periods
for
financial
statement
purposes
versus
for
tax
purposes;
these
differences
will
reverse
in
a
subsequent
reporting
period.
The
temporary
differences
relate
primarily
to
the
deferral
of
losses
from
wash
sales.
($000s)
December
31,
2024
December
31,
2023
Ordinary
income
(including
short-term
capital
gains,
if
any)
$
3,483
$
1,323
Long-term
capital
gain
1,165
—
Total
distributions
$
4,648
$
1,323
($000s)
Cost
of
investments
$
210,134
Unrealized
appreciation
$
51,631
Unrealized
depreciation
(22,542)
Net
unrealized
appreciation
(depreciation)
$
29,089
($000s)
Undistributed
ordinary
income
$
738
Undistributed
long-term
capital
gain
3,434
Net
unrealized
appreciation
(depreciation)
29,089
Total
distributable
earnings
(loss)
$
33,261
T.
ROWE
PRICE
Mid-Cap
Index
Fund
NOTE
5
-
FOREIGN TAXES
The
fund
is
subject
to
foreign
income
taxes
imposed
by
certain
countries
in
which
it
invests.
Additionally,
capital
gains
realized
upon
disposition
of
securities
issued
in
or
by
certain
foreign
countries
are
subject
to
capital
gains
tax
imposed
by
those
countries.
All
taxes
are
computed
in
accordance
with
the
applicable
foreign
tax
law,
and,
to
the
extent
permitted,
capital
losses
are
used
to
offset
capital
gains.
Taxes
attributable
to
income
are
accrued
by
the
fund
as
a
reduction
of
income.
Current
and
deferred
tax
expense
attributable
to
capital
gains
is
reflected
as
a
component
of
realized
or
change
in
unrealized
gain/
loss
on
securities
in
the
accompanying
financial
statements.
To
the
extent
that
the
fund
has
country
specific
capital
loss
carryforwards,
such
carryforwards
are
applied
against
net
unrealized
gains
when
determining
the
deferred
tax
liability.
Any
deferred
tax
liability
incurred
by
the
fund
is
included
in
either
Other
liabilities
or
Deferred
tax
liability
on
the
accompanying
Statement
of
Assets
and
Liabilities.
NOTE
6
-
RELATED
PARTY
TRANSACTIONS
The
fund
is
managed
by
T.
Rowe
Price
Associates,
Inc.
(Price
Associates),
a
wholly
owned
subsidiary
of
T.
Rowe
Price
Group,
Inc.
(Price
Group). The
investment
management
agreement
between
the
fund
and
Price
Associates
provides
for
an
annual
investment
management
fee
equal
to 0.09%
of
the
fund’s
average
daily
net
assets.
The
fee
is
computed
daily
and
paid
monthly.
The Investor
Class is
subject
to
a
contractual
expense
limitation
through
the
expense
limitation
date
indicated
in
the
table
below.
This
agreement
will
continue
through
the
expense
limitation
date
indicated
in
the
table
below,
and
may
be
renewed,
revised,
or
revoked
only
with
approval
of
the
fund’s
Board.
During
the
limitation
period,
Price
Associates
is required
to
waive
or
pay
any
expenses
(excluding
interest;
expenses
related
to
borrowings,
taxes,
and
brokerage;
non-recurring,
extraordinary
expenses;
and
acquired
fund
fees
and
expenses)
that
would
otherwise
cause
the class’s ratio
of
annualized
total
expenses
to
average
net
assets
(net
expense
ratio)
to
exceed
its
expense
limitation.
The
class
is
required
to
repay
Price
Associates
for
expenses
previously
waived/paid
to
the
extent
the
class’s net
assets
grow
or
expenses
decline
sufficiently
to
allow
repayment
without
causing
the class’s net
expense
ratio
(after
the
repayment
is
taken
into
account)
to
exceed
the
lesser
of:
(1)
T.
ROWE
PRICE
Mid-Cap
Index
Fund
the
expense
limitation
in
place
at
the
time
such
amounts
were
waived;
or
(2)
the class’s
current
expense
limitation.
However,
no
repayment
will
be
made
more
than
three
years
after
the
date
of
a
payment
or
waiver.
The
I
Class
is
also
subject
to
an
operating
expense
limitation
(I
Class
Limit)
pursuant
to
which
Price
Associates
is
contractually
required
to
pay
all
operating
expenses
of
the
I
Class,
excluding
management
fees;
interest;
expenses
related
to
borrowings,
taxes,
and
brokerage; non-recurring,
extraordinary expenses; and
acquired
fund
fees
and
expenses, to
the
extent
such
operating
expenses,
on
an
annualized
basis,
exceed
the
I
Class
Limit. This
agreement
will
continue
through
the
expense
limitation
date
indicated
in
the
table
below,
and
may
be
renewed,
revised,
or
revoked
only
with
approval
of
the
fund’s
Board.
The
I
Class
is
required
to
repay
Price
Associates
for
expenses
previously
paid
to
the
extent
the
class’s
net
assets
grow
or
expenses
decline
sufficiently
to
allow
repayment
without
causing
the
class’s
operating
expenses
(after
the
repayment
is
taken
into
account)
to
exceed
the
lesser
of:
(1)
the
I
Class
Limit
in
place
at
the
time
such
amounts
were
paid;
or
(2)
the
current
I
Class
Limit.
However,
no
repayment
will
be
made
more
than
three
years
after
the
date
of
a
payment
or
waiver.
The
Z
Class
is
also
subject
to
a
contractual
expense
limitation
agreement
whereby
Price
Associates
has
agreed
to
waive
and/or
bear
all
of
the
Z
Class’
expenses
(excluding
interest;
expenses
related
to
borrowings,
taxes,
and
brokerage;
non-recurring,
extraordinary
expenses;
and
acquired
fund
fees
and
expenses)
in
their
entirety.
This
fee
waiver
and/or
expense
reimbursement
arrangement
is
expected
to
remain
in
place
indefinitely,
and
the
agreement
may
only
be
amended
or
terminated
with
approval
by
the
fund’s
Board.
Expenses
of
the
fund
waived/paid
by
the
manager
are
not
subject
to
later
repayment
by
the
fund.
Pursuant
to
these
agreements,
expenses
were waived/paid
by
and/or
repaid
to
Price
Associates
during
the year
ended December
31,
2024 as
indicated
in
the
table
below.
Including
these
amounts,
expenses
previously
waived/paid
by
Price
Associates
in
the
amount
of $678,000 remain
subject
to
repayment
by
the
fund
at
December
31,
2024. Any
repayment
of
expenses
previously
waived/paid
by
Price
Associates
during
the
period
would
be
included
in
the
net
investment
income
and
expense
ratios
presented
on
the
accompanying
Financial
Highlights.
T.
ROWE
PRICE
Mid-Cap
Index
Fund
In
addition,
the
fund
has
entered
into
service
agreements
with
Price
Associates
and
a
wholly
owned
subsidiary
of
Price
Associates,
each
an
affiliate
of
the
fund
(collectively,
Price).
Price
Associates
provides
certain
accounting
and
administrative
services
to
the
fund.
T.
Rowe
Price
Services,
Inc.
provides
shareholder
and
administrative
services
in
its
capacity
as
the
fund’s
transfer
and
dividend-disbursing
agent.
For
the
year
ended
December
31,
2024,
expenses
incurred
pursuant
to
these
service
agreements
were
$116,000
for
Price
Associates
and
less
than
$1,000
for
T.
Rowe
Price
Services,
Inc.
All
amounts
due
to
and
due
from
Price,
exclusive
of
investment
management
fees
payable,
are
presented
net
on
the
accompanying
Statement
of
Assets
and
Liabilities.
T.
Rowe
Price
Investment
Services,
Inc.
(Investment
Services)
serves
as
distributor
to
the
fund.
Pursuant
to
an
underwriting
agreement,
no
compensation
for
any
distribution
services
provided
is
paid
to
Investment
Services
by
the
fund
(except
for
12b-1
fees
under
a
Board-approved
Rule
12b-1
plan).
Additionally,
the
fund
is
one
of
several
mutual
funds
in
which
certain
college
savings
plans
managed
by
Price
Associates invests.
As
approved
by
the
fund’s
Board
of
Directors,
shareholder
servicing
costs
associated
with
each
college
savings
plan
are
borne
by
the
fund
in
proportion
to
the
average
daily
value
of
its
shares
owned
by
the
college
savings
plan.
Price
has
agreed
to waive/reimburse
shareholder
servicing
costs in
excess
of
0.05%
of
the
fund’s
average
daily
value
of
its
shares
owned
by
the
college
savings
plan.
Any
amounts
waived/
paid
by
Price
under
this
voluntary
agreement
are
not
subject
to
repayment
by
the
fund.
Price
may
amend
or
terminate
this
voluntary
arrangement
at
any
time
without
prior
notice.
For
the
year ended
December
31,
2024,
the
fund
was
charged $52,000 for
shareholder
servicing
costs
related
to
the
college
savings
plans, of
which
$9,000
was
for
services
provided
by
Price.
All
amounts
due
to
and
due
from
Price,
exclusive
of
investment
management
fees
payable,
are
Investor
Class
I
Class
Z
Class
Expense
limitation/I
Class
Limit
0.27%
0.05%
0.00%
Expense
limitation
date
04/30/26
04/30/26
N/A
(Waived)/repaid
during
the
period
($000s)
$—
(1)
$(197)
$(164)
(1)
Amount
rounds
to
less
than
$1,000
T.
ROWE
PRICE
Mid-Cap
Index
Fund
presented
net
on
the
accompanying
Statement
of
Assets
and
Liabilities. At
December
31,
2024,
approximately
94%
of
the
outstanding
shares
of
the
I
Class
were
held
by
college
savings
plans.
Mutual
funds,
trusts,
and
other
accounts
managed
by
Price
Associates
or
its
affiliates
(collectively,
Price
Funds
and
accounts)
may
invest
in
the
fund.
No
Price
fund
or
account
may
invest
for
the
purpose
of
exercising
management
or
control
over
the
fund.
At
December
31,
2024, 100%
of
the
Z
Class's
outstanding
shares
were
held
by
Price
Funds
and
accounts.
The fund
may
invest
its
cash
reserves
in
certain
open-end
management
investment
companies
managed
by
Price
Associates
and
considered
affiliates
of
the
fund:
the
T.
Rowe
Price
Government
Reserve
Fund
or
the
T.
Rowe
Price
Treasury
Reserve
Fund,
organized
as
money
market
funds
(together,
the
Price
Reserve
Funds).
The
Price
Reserve
Funds
are
offered
as
short-term
investment
options
to
mutual
funds,
trusts,
and
other
accounts
managed
by
Price
Associates
or
its
affiliates
and
are
not
available
for
direct
purchase
by
members
of
the
public.
Cash
collateral
from
securities
lending,
if
any,
is
invested
in
the
T.
Rowe
Price
Government
Reserve Fund. The
Price
Reserve
Funds
pay
no
investment
management
fees.
As
of
December
31,
2024,
T.
Rowe
Price
Group,
Inc.,
or
its
wholly
owned
subsidiaries,
owned
4,922
shares
of
the
Investor
Class,
representing
100%
of
the
Investor
Class's
net
assets.
The fund may
participate
in
securities
purchase
and
sale
transactions
with
other
funds
or
accounts
advised
by
Price
Associates
(cross
trades),
in
accordance
with
procedures
adopted
by the
fund’s
Board
and
Securities
and
Exchange
Commission
rules,
which
require,
among
other
things,
that
such
purchase
and
sale
cross
trades
be
effected
at
the
independent
current
market
price
of
the
security.
During
the
year
ended
December
31,
2024,
the
fund
had
no
purchases
or
sales
cross
trades
with
other
funds
or
accounts
advised
by
Price
Associates.
NOTE
7
-
SEGMENT
REPORTING
Operating
segments
are
defined
as
components
of
a
company
that
engage
in
business
activities
and
for
which
discrete
financial
information
is
available
and
regularly
reviewed
by
the
chief
operating
decision
maker
(CODM)
in
deciding
how
to
allocate
resources
and
assess
performance.
The
Management
Committee
of
Price
Associates
acts
as
the
fund’s
CODM.
The
fund
makes
investments
in
accordance
with
its
investment
objective
as
outlined
in
the
T.
ROWE
PRICE
Mid-Cap
Index
Fund
Prospectus
and
is
considered
one
reportable
segment
because
the
CODM
allocates
resources
and
assesses
the
operating
results
of
the
fund
on
the
whole.
The
fund’s
revenue
is
derived
from
investments
in
portfolio
of
securities.
The
CODM
allocates
resources
and
assesses
performance
based
on
the
operating
results
of
the
fund,
which
is
consistent
with
the
results
presented
in
the
statement
of
operations,
statement
of
changes
in
net
assets
and
financial
highlights.
The
CODM
compares
the
fund’s
performance
to
its
benchmark
index
and
evaluates
the
positioning
of
the
fund
in
relation
to
its
investment
objective.
The
measure
of
segment
assets
is
net
assets
of
the
fund
which
is
disclosed
in
the
statement
of
assets
and
liabilities.
The
accounting
policies
of
the
segment
are
the
same
as
those
described
in
the
summary
of
significant
accounting
policies.
The
financial
statements
include
all
details
of
the
segment
assets,
segment
revenue
and
expenses;
and
reflect
the
financial
results
of
the
segment.
NOTE
8
-
OTHER
MATTERS
Unpredictable environmental,
political,
social
and
economic
events,
including
but
not
limited
to,
environmental
or
natural
disasters,
war
and
conflict
(including
Russia’s
military
invasion
of
Ukraine
and
the
conflict
in
Israel,
Gaza
and
surrounding
areas),
terrorism,
geopolitical
developments
(including
trading
and
tariff
arrangements,
sanctions
and
cybersecurity
attacks),
and
public
health
epidemics
(including
the
global
outbreak
of
COVID-19)
and
similar
public
health
threats,
may
significantly
affect
the
economy
and
the
markets
and
issuers
in
which
a
fund
invests.
The
extent
and
duration
of
such
events
and
resulting
market
disruptions
cannot
be
predicted.
These
and
other
similar
events
may
cause
instability
across
global
markets,
including
reduced
liquidity
and
disruptions
in
trading
markets,
while
some
events
may
affect
certain
geographic
regions,
countries,
sectors,
and
industries
more
significantly
than
others,
and
exacerbate
other
pre-existing
political,
social,
and
economic
risks.
The
fund’s
performance
could
be
negatively
impacted
if
the
value
of
a
portfolio
holding
were
harmed
by
these
or
such
events.
Management
actively
monitors
the
risks
and
financial
impacts
arising
from
such
events.
T.
ROWE
PRICE
Mid-Cap
Index
Fund
REPORT
OF
INDEPENDENT
REGISTERED
PUBLIC
ACCOUNTING
FIRM
To
the
Board
of
Directors
of
T.
Rowe
Price
Index
Trust,
Inc.
and
Shareholders
of
T.
Rowe
Price
Mid-Cap
Index
Fund
Opinion
on
the
Financial
Statements
We
have
audited
the
accompanying
statement
of
assets
and
liabilities,
including
the
portfolio
of
investments,
of
T.
Rowe
Price
Mid-Cap
Index
Fund
(one
of
the
funds
constituting
T.
Rowe
Price
Index
Trust,
Inc.,
referred
to
hereafter
as
the
"Fund")
as
of
December
31,
2024,
the
related
statement
of
operations
for
the
year
ended
December
31,
2024,
the
statement
of
changes
in
net
assets
for
each
of
the
two
years
in
the
period
ended
December
31,
2024,
including
the
related
notes,
and
the
financial
highlights
for
each
of
the
periods
indicated
therein
(collectively
referred
to
as
the
“financial
statements”).
In
our
opinion,
the
financial
statements
present
fairly,
in
all
material
respects,
the
financial
position
of
the
Fund
as
of
December
31,
2024,
the
results
of
its
operations
for
the
year
then
ended,
the
changes
in
its
net
assets
for
each
of
the
two
years
in
the
period
ended
December
31,
2024
and
the
financial
highlights
for
each
of
the
periods
indicated
therein,
in
conformity
with
accounting
principles
generally
accepted
in
the
United
States
of
America.
Basis
for
Opinion
These
financial
statements
are
the
responsibility
of
the
Fund’s
management.
Our
responsibility
is
to
express
an
opinion
on
the
Fund’s
financial
statements
based
on
our
audits.
We
are
a
public
accounting
firm
registered
with
the
Public
Company
Accounting
Oversight
Board
(United
States)
(PCAOB)
and
are
required
to
be
independent
with
respect
to
the
Fund
in
accordance
with
the
U.S.
federal
securities
laws
and
the
applicable
rules
and
regulations
of
the
Securities
and
Exchange
Commission
and
the
PCAOB.
We
conducted
our
audits
of
these
financial
statements
in
accordance
with
the
standards
of
the
PCAOB.
Those
standards
require
that
we
plan
and
perform
the
audit
to
obtain
reasonable
assurance
about
whether
the
financial
statements
are
free
of
material
misstatement,
whether
due
to
error
or
fraud.
T.
ROWE
PRICE
Mid-Cap
Index
Fund
Our
audits
included
performing
procedures
to
assess
the
risks
of
material
misstatement
of
the
financial
statements,
whether
due
to
error
or
fraud,
and
performing
procedures
that
respond
to
those
risks.
Such
procedures
included
examining,
on
a
test
basis,
evidence
regarding
the
amounts
and
disclosures
in
the
financial
statements.
Our
audits
also
included
evaluating
the
accounting
principles
used
and
significant
estimates
made
by
management,
as
well
as
evaluating
the
overall
presentation
of
the
financial
statements.
Our
procedures
included
confirmation
of
securities
owned
as
of
December
31,
2024
by
correspondence
with
the
custodian,
transfer
agent
and
brokers;
when
replies
were
not
received
from
brokers,
we
performed
other
auditing
procedures.
We
believe
that
our
audits
provide
a
reasonable
basis
for
our
opinion.
/s/
PricewaterhouseCoopers
LLP
Baltimore,
Maryland
February
20,
2025
We
have
served
as
the
auditor
of
one
or
more
investment
companies
in
the
T.
Rowe
Price
group
of
investment
companies
since
1973.
REPORT
OF
INDEPENDENT
REGISTERED
PUBLIC
ACCOUNTING
FIRM
(continued)
T.
ROWE
PRICE
Mid-Cap
Index
Fund
TAX
INFORMATION
(UNAUDITED)
FOR
THE
TAX
YEAR
ENDED 12/31/24
We
are
providing
this
information
as
required
by
the
Internal
Revenue
Code.
The
amounts
shown
may
differ
from
those
elsewhere
in
this
report
because
of
differences
between
tax
and
financial
reporting
requirements.
The
fund’s
distributions
to
shareholders
included:
$1,165,000
from
long-term
capital
gains,
subject
to
a
long-term
capital
gains
tax
rate
of
not
greater
than
20%
For
nonresident
alien
shareholders,
100%
of
short-term
capital
gain
dividends
distributed
by
the
fund
for
the
fiscal
year
are
qualified
short-term
capital
gains.
For
taxable
non-corporate
shareholders,
$1,562,000
of
the
fund's
income
represents
qualified
dividend
income
subject
to
a
long-term
capital
gains
tax
rate
of
not
greater
than
20%.
For
corporate
shareholders,
$1,423,000
of
the
fund's
income
qualifies
for
the
dividends-received
deduction.
For
individuals
and
certain
trusts
and
estates
which
are
entitled
to
claim
a
deduction
of
up
to
20%
of
their
combined
qualified
real
estate
investment
trust
(REIT)
dividends,
$297,000
of
the
fund's
income
qualifies
as
qualified
real
estate
investment
trust
(REIT)
dividends.
100
East
Pratt
Street
Baltimore,
MD
21202
T.
Rowe
Price
Investment
Services,
Inc.
Call
1-800-225-5132
to
request
a
prospectus
or
summary
prospectus;
each
includes
investment
objectives,
risks,
fees,
expenses,
and
other
information
that
you
should
read
and
consider
carefully
before
investing.
F32-050
2/25
Item 8. Changes in and Disagreements with Accountants for Open-End Management Investment Companies.
Not applicable.
Item 9. Proxy Disclosures for Open-End Management Investment Companies.
Not applicable.
Item 10. Remuneration Paid to Directors, Officers, and Others of Open-End Management Investment Companies.
Remuneration paid to Directors is included in Item 7 of this Form N-CSR.
Item 11. Statement Regarding Basis for Approval of Investment Advisory Contract.
If applicable, see Item 7.
Item 12. Disclosure of Proxy Voting Policies and Procedures for Closed-End Management Investment Companies.
Not applicable.
Item 13. Portfolio Managers of Closed-End Management Investment Companies.
Not applicable.
Item 14. Purchases of Equity Securities by Closed-End Management Investment Company and Affiliated Purchasers.
Not applicable.
Item 15. Submission of Matters to a Vote of Security Holders.
There has been no change to the procedures by which shareholders may recommend nominees to the registrant’s board of directors.
Item 16. Controls and Procedures.
(a) The registrant’s principal executive officer and principal financial officer have evaluated the registrant’s disclosure controls and procedures within 90 days of this filing and have concluded that the registrant’s disclosure controls and procedures were effective, as of that date, in ensuring that information required to be disclosed by the registrant in this Form N-CSR was recorded, processed, summarized, and reported timely.
(b) The registrant’s principal executive officer and principal financial officer are aware of no change in the registrant’s internal control over financial reporting that occurred during the period covered by this report that has materially affected, or is reasonably likely to materially affect, the registrant’s internal control over financial reporting.
Item 17. Disclosure of Securities Lending Activities for Closed-End Management Investment Companies.
Not applicable.
Item 18. Recovery of Erroneously Awarded Compensation.
Not applicable.
Item 19. Exhibits.
(a)(1) The registrant’s code of ethics pursuant to Item 2 of Form N-CSR is attached.
(2) Listing standards relating to recovery of erroneously awarded compensation: not applicable.
(3) Separate certifications by the registrant’s principal executive officer and principal financial officer, pursuant to Section 302 of the Sarbanes-Oxley Act of 2002 and required by Rule 30a-2(a) under the Investment Company Act of 1940, are attached.
(b) A certification by the registrant’s principal executive officer and principal financial officer, pursuant to Section 906 of the Sarbanes-Oxley Act of 2002 and required by Rule 30a-2(b) under the Investment Company Act of 1940, is attached.
SIGNATURES
Pursuant to the requirements of the Securities Exchange Act of 1934 and the Investment Company Act of 1940, the registrant has duly caused this report to be signed on its behalf by the undersigned, thereunto duly authorized.
| | | | |
| T. Rowe Price Index Trust, Inc. |
| By | | /s/ David Oestreicher | | |
| | David Oestreicher | | |
| | Principal Executive Officer | | |
| | |
| Date | | February 20, 2025 | | |
Pursuant to the requirements of the Securities Exchange Act of 1934 and the Investment Company Act of 1940, this report has been signed below by the following persons on behalf of the registrant and in the capacities and on the dates indicated.
| | | | |
| By | | /s/ David Oestreicher | | |
| | David Oestreicher | | |
| | Principal Executive Officer | | |
| | |
| Date | | February 20, 2025 | | |
| | | | |
| By | | /s/ Alan S. Dupski | | |
| | Alan S. Dupski | | |
| | Principal Financial Officer | | |
| | |
| Date | | February 20, 2025 | | |