UNITED STATES
SECURITIES AND EXCHANGE COMMISSION
Washington, D.C. 20549
FORM N-CSR
CERTIFIED SHAREHOLDER REPORT OF REGISTERED
MANAGEMENT INVESTMENT COMPANIES
Investment Company Act File Number: 811-05986
T. Rowe Price Index Trust, Inc.
(Exact name of registrant as specified in charter)
100 East Pratt Street, Baltimore, MD 21202
(Address of principal executive offices)
David Oestreicher
100 East Pratt Street, Baltimore, MD 21202
(Name and address of agent for service)
Registrant’s telephone number, including area code: (410) 345-2000
Date of fiscal year end: December 31
Date of reporting period: December 31, 2024
Item 1. Reports to Shareholders
(a) Report pursuant to Rule 30e-1
Annual Shareholder Report
December 31, 2024
This annual shareholder report contains important information about Small-Cap Index Fund (the "fund") for the period of January 1, 2024 to December 31, 2024. You can find the fund’s prospectus, financial information on Form N‑CSR (which includes required tax information for dividends), holdings, proxy voting information, and other information atwww.troweprice.com/prospectus. You can also request this information without charge by contacting T. Rowe Price at 1‑800‑638‑5660 or info@troweprice.com or contacting your intermediary.
What were the fund costs for the last year? (based on a hypothetical $10,000 investment)
| | Costs of a $10,000 investment | Costs paid as a percentage of a $10,000 investment |
|---|
| Small-Cap Index Fund - Investor Class | $31 | 0.29% |
|---|
What drove fund performance during the past 12 months?
Small-cap U.S. stocks produced strong gains in 2024, as equity investors generally welcomed not only looser monetary policy starting in September, but also reduced political uncertainty following U.S. election results.
Information technology names produced robust results during the period as the sector benefited from strong investor interest in companies expected to benefit from artificial intelligence developments. Hardware and software companies performed very well during the year, as Super Micro Computer and MicroStrategy were two of the top-performing companies in the portfolio. Industrials and business services also contributed to returns, as construction and engineering companies performed particularly well.
Energy was the only sector that detracted from absolute returns during the reporting period, albeit very modestly. Energy equipment and services names hurt the most, with Noble performing worst.
The fund, which is not available for direct purchase by members of the public, employs a full replication strategy, which involves investing substantially all of its assets in all of the stocks in the index and seeking to maintain holdings of each stock in proportion to its weight in the Russell 2000 Index. By replicating the structure of the index, our intention is to closely track its performance.
How has the fund performed?
Cumulative Returns of a Hypothetical $10,000 Investment as of December 31, 2024
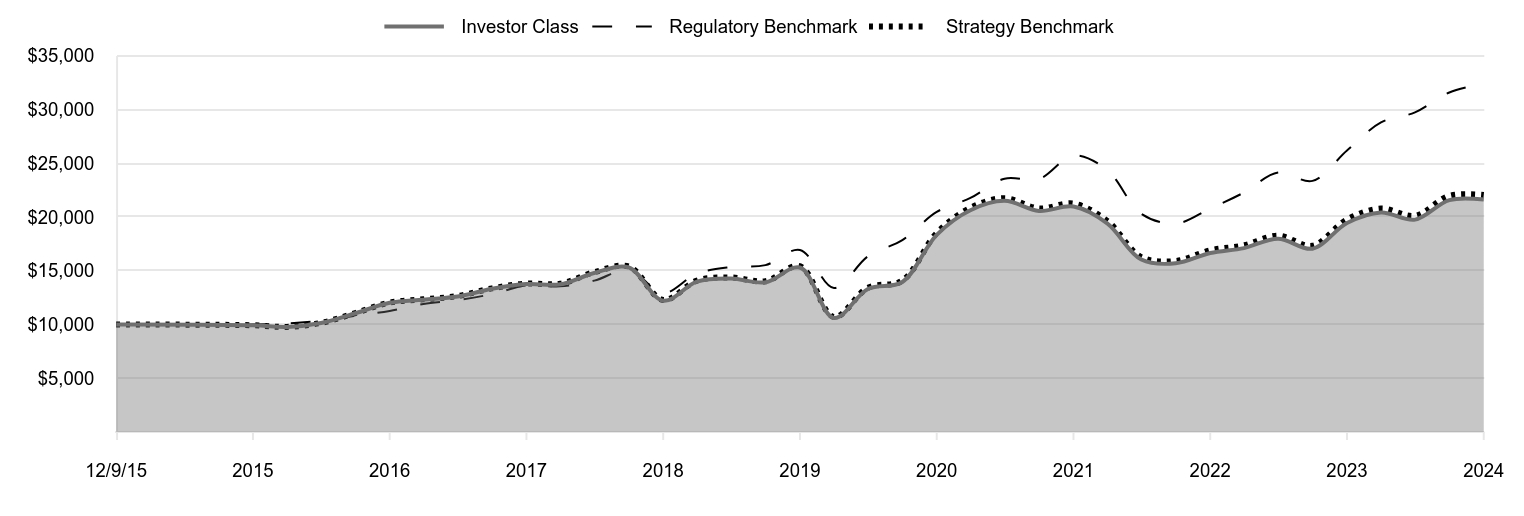
| Investor Class | Regulatory Benchmark | Strategy Benchmark |
|---|
| 12/9/15 | 10,000 | 10,000 | 10,000 |
|---|
| 12/31/15 | 9,925 | 9,989 | 9,927 |
|---|
| 3/31/16 | 9,765 | 10,085 | 9,777 |
|---|
| 6/30/16 | 10,135 | 10,351 | 10,147 |
|---|
| 9/30/16 | 11,047 | 10,806 | 11,065 |
|---|
| 12/31/16 | 12,015 | 11,261 | 12,043 |
|---|
| 3/31/17 | 12,312 | 11,907 | 12,340 |
|---|
| 6/30/17 | 12,600 | 12,267 | 12,644 |
|---|
| 9/30/17 | 13,319 | 12,827 | 13,361 |
|---|
| 12/31/17 | 13,758 | 13,640 | 13,807 |
|---|
| 3/31/18 | 13,736 | 13,552 | 13,795 |
|---|
| 6/30/18 | 14,794 | 14,079 | 14,865 |
|---|
| 9/30/18 | 15,312 | 15,082 | 15,396 |
|---|
| 12/31/18 | 12,209 | 12,925 | 12,286 |
|---|
| 3/31/19 | 13,983 | 14,740 | 14,078 |
|---|
| 6/30/19 | 14,270 | 15,344 | 14,373 |
|---|
| 9/30/19 | 13,923 | 15,522 | 14,028 |
|---|
| 12/31/19 | 15,299 | 16,934 | 15,422 |
|---|
| 3/31/20 | 10,609 | 13,395 | 10,701 |
|---|
| 6/30/20 | 13,305 | 16,346 | 13,421 |
|---|
| 9/30/20 | 13,957 | 17,851 | 14,083 |
|---|
| 12/31/20 | 18,341 | 20,472 | 18,501 |
|---|
| 3/31/21 | 20,633 | 21,771 | 20,850 |
|---|
| 6/30/21 | 21,501 | 23,565 | 21,745 |
|---|
| 9/30/21 | 20,556 | 23,541 | 20,797 |
|---|
| 12/31/21 | 20,967 | 25,725 | 21,242 |
|---|
| 3/31/22 | 19,401 | 24,367 | 19,643 |
|---|
| 6/30/22 | 16,044 | 20,298 | 16,266 |
|---|
| 9/30/22 | 15,689 | 19,391 | 15,910 |
|---|
| 12/31/22 | 16,652 | 20,784 | 16,901 |
|---|
| 3/31/23 | 17,106 | 22,276 | 17,364 |
|---|
| 6/30/23 | 17,986 | 24,145 | 18,268 |
|---|
| 9/30/23 | 17,052 | 23,359 | 17,331 |
|---|
| 12/31/23 | 19,442 | 26,179 | 19,762 |
|---|
| 3/31/24 | 20,428 | 28,802 | 20,786 |
|---|
| 6/30/24 | 19,753 | 29,728 | 20,105 |
|---|
| 9/30/24 | 21,575 | 31,580 | 21,969 |
|---|
| 12/31/24 | 21,627 | 32,411 | 22,042 |
|---|
202501-4140694, 202502-4108875
Average Annual Total Returns
| | 1 Year | 5 Years | Since Inception 12/9/15 |
|---|
| Small-Cap Index Fund (Investor Class) | 11.24% | 7.17% | 8.89% |
|---|
| Russell 3000 Index (Regulatory Benchmark) | 23.81 | 13.86 | 13.86 |
|---|
| Russell 2000 Index (Strategy Benchmark) | 11.54 | 7.40 | 9.12 |
|---|
The preceding line graph shows the value of a hypothetical $10,000 investment in the fund over the past 10 fiscal year periods or since inception (for funds lacking 10-year records). The fund’s performance information included in the line graph and table above is compared with a regulatory required index that represents an overall securities market (Regulatory Benchmark). In addition, the line graph and table may also include one or more indexes that more closely aligns to the fund's investment strategy (Strategy Benchmark(s)). Due to new SEC Rules on shareholder reporting the fund adopted a new broad-based securities market index, referred to as the Regulatory Benchmark. Market index returns do not include expenses, which are deducted from fund returns. The fund's total return figures reflect the reinvestment of dividends and capital gains, if any.Neither the fund’s returns nor the index returns reflect the deduction of taxes that a shareholder would pay on fund distributions or redemptions of fund shares.The fund’s past performance is not a good predictor of the fund’s future performance.Updated performance information can be found at www.troweprice.com.
What are some fund statistics?
- Total Net Assets (000s)$206,379
- Number of Portfolio Holdings1,983
- Investment Advisory Fees Paid (000s)$(189)
- Portfolio Turnover Rate24.7%
What did the fund invest in?
Sector Allocation (as a % of Net Assets)
| Financials | 18.4% |
| Industrials & Business Services | 17.6 |
| Health Care | 16.4 |
| Information Technology | 13.8 |
| Consumer Discretionary | 9.7 |
| Real Estate | 6.0 |
| Energy | 5.1 |
| Materials | 4.2 |
| Consumer Staples | 2.9 |
| Other | 5.9 |
Top Ten Holdings (as a % of Net Assets)
| FTAI Aviation | 0.5% |
| Sprouts Farmers Market | 0.5 |
| Insmed | 0.4 |
| Vaxcyte | 0.4 |
| Credo Technology Group Holding | 0.4 |
| Applied Industrial Technologies | 0.3 |
| Mueller Industries | 0.3 |
| Rocket Lab USA | 0.3 |
| Fluor | 0.3 |
| IonQ | 0.3 |
If you invest directly with T. Rowe Price, you can elect to receive future shareholder reports or other important documents through electronic delivery by enrolling at www.troweprice.com/paperless. If you invest through a financial intermediary such as an investment advisor, a bank, retirement plan sponsor or a brokerage firm, please contact that organization and ask if it can provide electronic delivery.
Frank Russell Company "LSE" does not accept any liability for any errors or omissions in the indexes or data, and hereby expressly disclaim all warranties of originality, accuracy, completeness, timeliness, merchantability and fitness for a particular purpose. No party may rely on any indexes or data contained in this communication. Visit www.troweprice.com/en/us/market-data-disclosures for additional legal notices & disclaimers.
Small-Cap Index Fund
Investor Class (TRSYX)
T. Rowe Price Investment Services, Inc.
100 East Pratt Street
Baltimore, MD 21202
Annual Shareholder Report
December 31, 2024
This annual shareholder report contains important information about Small-Cap Index Fund (the "fund") for the period of January 1, 2024 to December 31, 2024. You can find the fund’s prospectus, financial information on Form N‑CSR (which includes required tax information for dividends), holdings, proxy voting information, and other information atwww.troweprice.com/prospectus. You can also request this information without charge by contacting T. Rowe Price at 1‑800‑638‑5660 or info@troweprice.com or contacting your intermediary.
What were the fund costs for the last year? (based on a hypothetical $10,000 investment)
| | Costs of a $10,000 investment | Costs paid as a percentage of a $10,000 investment |
|---|
| Small-Cap Index Fund - I Class | $15 | 0.14% |
|---|
What drove fund performance during the past 12 months?
Small-cap U.S. stocks produced strong gains in 2024, as equity investors generally welcomed not only looser monetary policy starting in September, but also reduced political uncertainty following U.S. election results.
Information technology names produced robust results during the period as the sector benefited from strong investor interest in companies expected to benefit from artificial intelligence developments. Hardware and software companies performed very well during the year, as Super Micro Computer and MicroStrategy were two of the top-performing companies in the portfolio. Industrials and business services also contributed to returns, as construction and engineering companies performed particularly well.
Energy was the only sector that detracted from absolute returns during the reporting period, albeit very modestly. Energy equipment and services names hurt the most, with Noble performing worst.
The fund, which is not available for direct purchase by members of the public, employs a full replication strategy, which involves investing substantially all of its assets in all of the stocks in the index and seeking to maintain holdings of each stock in proportion to its weight in the Russell 2000 Index. By replicating the structure of the index, our intention is to closely track its performance.
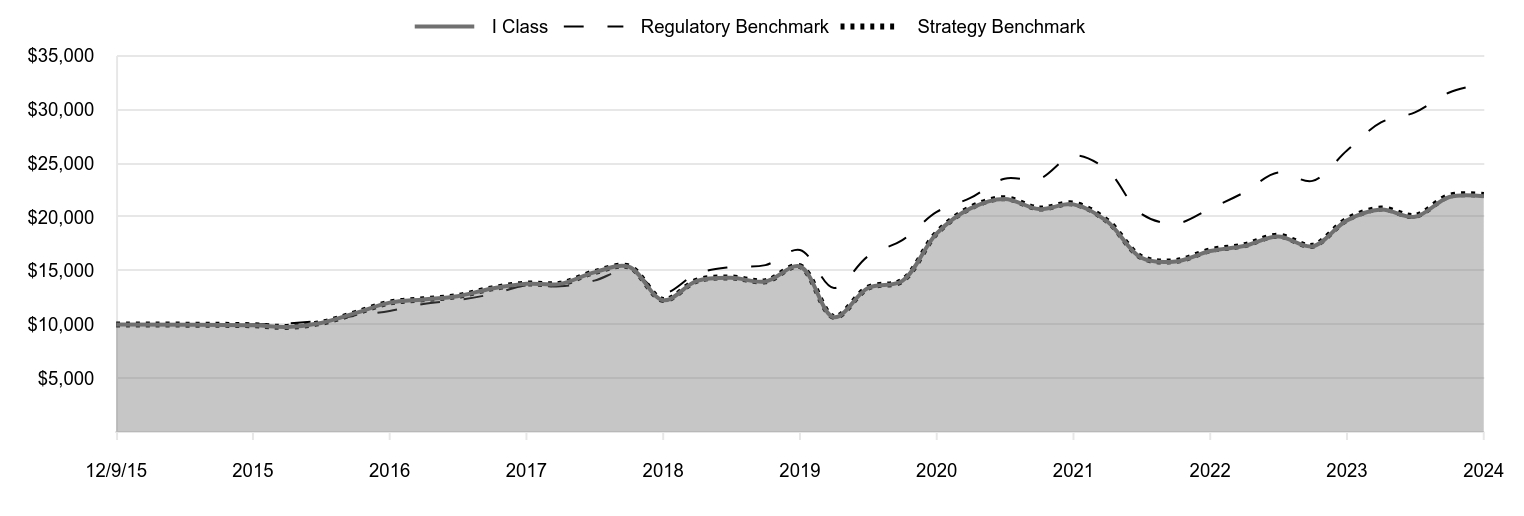
How has the fund performed?
Cumulative Returns of a Hypothetical $10,000 Investment as of December 31, 2024
| I Class | Regulatory Benchmark | Strategy Benchmark |
|---|
| 12/9/15 | 10,000 | 10,000 | 10,000 |
|---|
| 12/31/15 | 9,925 | 9,989 | 9,927 |
|---|
| 3/31/16 | 9,775 | 10,085 | 9,777 |
|---|
| 6/30/16 | 10,145 | 10,351 | 10,147 |
|---|
| 9/30/16 | 11,057 | 10,806 | 11,065 |
|---|
| 12/31/16 | 12,035 | 11,261 | 12,043 |
|---|
| 3/31/17 | 12,333 | 11,907 | 12,340 |
|---|
| 6/30/17 | 12,631 | 12,267 | 12,644 |
|---|
| 9/30/17 | 13,350 | 12,827 | 13,361 |
|---|
| 12/31/17 | 13,789 | 13,640 | 13,807 |
|---|
| 3/31/18 | 13,778 | 13,552 | 13,795 |
|---|
| 6/30/18 | 14,850 | 14,079 | 14,865 |
|---|
| 9/30/18 | 15,380 | 15,082 | 15,396 |
|---|
| 12/31/18 | 12,258 | 12,925 | 12,286 |
|---|
| 3/31/19 | 14,050 | 14,740 | 14,078 |
|---|
| 6/30/19 | 14,339 | 15,344 | 14,373 |
|---|
| 9/30/19 | 14,002 | 15,522 | 14,028 |
|---|
| 12/31/19 | 15,396 | 16,934 | 15,422 |
|---|
| 3/31/20 | 10,675 | 13,395 | 10,701 |
|---|
| 6/30/20 | 13,394 | 16,346 | 13,421 |
|---|
| 9/30/20 | 14,061 | 17,851 | 14,083 |
|---|
| 12/31/20 | 18,474 | 20,472 | 18,501 |
|---|
| 3/31/21 | 20,801 | 21,771 | 20,850 |
|---|
| 6/30/21 | 21,685 | 23,565 | 21,745 |
|---|
| 9/30/21 | 20,736 | 23,541 | 20,797 |
|---|
| 12/31/21 | 21,176 | 25,725 | 21,242 |
|---|
| 3/31/22 | 19,589 | 24,367 | 19,643 |
|---|
| 6/30/22 | 16,203 | 20,298 | 16,266 |
|---|
| 9/30/22 | 15,859 | 19,391 | 15,910 |
|---|
| 12/31/22 | 16,839 | 20,784 | 16,901 |
|---|
| 3/31/23 | 17,295 | 22,276 | 17,364 |
|---|
| 6/30/23 | 18,195 | 24,145 | 18,268 |
|---|
| 9/30/23 | 17,268 | 23,359 | 17,331 |
|---|
| 12/31/23 | 19,687 | 26,179 | 19,762 |
|---|
| 3/31/24 | 20,694 | 28,802 | 20,786 |
|---|
| 6/30/24 | 20,014 | 29,728 | 20,105 |
|---|
| 9/30/24 | 21,864 | 31,580 | 21,969 |
|---|
| 12/31/24 | 21,932 | 32,411 | 22,042 |
|---|
202501-4140694, 202502-4108875
Average Annual Total Returns
| | 1 Year | 5 Years | Since Inception 12/9/15 |
|---|
| Small-Cap Index Fund (I Class) | 11.40% | 7.33% | 9.05% |
|---|
| Russell 3000 Index (Regulatory Benchmark) | 23.81 | 13.86 | 13.86 |
|---|
| Russell 2000 Index (Strategy Benchmark) | 11.54 | 7.40 | 9.12 |
|---|
The preceding line graph shows the value of a hypothetical $10,000 investment in the fund over the past 10 fiscal year periods or since inception (for funds lacking 10-year records). The fund’s performance information included in the line graph and table above is compared with a regulatory required index that represents an overall securities market (Regulatory Benchmark). In addition, the line graph and table may also include one or more indexes that more closely aligns to the fund's investment strategy (Strategy Benchmark(s)). Due to new SEC Rules on shareholder reporting the fund adopted a new broad-based securities market index, referred to as the Regulatory Benchmark. Market index returns do not include expenses, which are deducted from fund returns. The fund's total return figures reflect the reinvestment of dividends and capital gains, if any.Neither the fund’s returns nor the index returns reflect the deduction of taxes that a shareholder would pay on fund distributions or redemptions of fund shares.The fund’s past performance is not a good predictor of the fund’s future performance.Updated performance information can be found at www.troweprice.com.
What are some fund statistics?
- Total Net Assets (000s)$206,379
- Number of Portfolio Holdings1,983
- Investment Advisory Fees Paid (000s)$(189)
- Portfolio Turnover Rate24.7%
What did the fund invest in?
Sector Allocation (as a % of Net Assets)
| Financials | 18.4% |
| Industrials & Business Services | 17.6 |
| Health Care | 16.4 |
| Information Technology | 13.8 |
| Consumer Discretionary | 9.7 |
| Real Estate | 6.0 |
| Energy | 5.1 |
| Materials | 4.2 |
| Consumer Staples | 2.9 |
| Other | 5.9 |
Top Ten Holdings (as a % of Net Assets)
| FTAI Aviation | 0.5% |
| Sprouts Farmers Market | 0.5 |
| Insmed | 0.4 |
| Vaxcyte | 0.4 |
| Credo Technology Group Holding | 0.4 |
| Applied Industrial Technologies | 0.3 |
| Mueller Industries | 0.3 |
| Rocket Lab USA | 0.3 |
| Fluor | 0.3 |
| IonQ | 0.3 |
If you invest directly with T. Rowe Price, you can elect to receive future shareholder reports or other important documents through electronic delivery by enrolling at www.troweprice.com/paperless. If you invest through a financial intermediary such as an investment advisor, a bank, retirement plan sponsor or a brokerage firm, please contact that organization and ask if it can provide electronic delivery.
Frank Russell Company "LSE" does not accept any liability for any errors or omissions in the indexes or data, and hereby expressly disclaim all warranties of originality, accuracy, completeness, timeliness, merchantability and fitness for a particular purpose. No party may rely on any indexes or data contained in this communication. Visit www.troweprice.com/en/us/market-data-disclosures for additional legal notices & disclaimers.
Small-Cap Index Fund
I Class (TRCSX)
T. Rowe Price Investment Services, Inc.
100 East Pratt Street
Baltimore, MD 21202
Annual Shareholder Report
December 31, 2024
This annual shareholder report contains important information about Small-Cap Index Fund (the "fund") for the period of January 1, 2024 to December 31, 2024. You can find the fund’s prospectus, financial information on Form N‑CSR (which includes required tax information for dividends), holdings, proxy voting information, and other information atwww.troweprice.com/prospectus. You can also request this information without charge by contacting T. Rowe Price at 1‑800‑638‑5660 or info@troweprice.com or contacting your intermediary.
What were the fund costs for the last year? (based on a hypothetical $10,000 investment)
| | Costs of a $10,000 investment | Costs paid as a percentage of a $10,000 investment |
|---|
| Small-Cap Index Fund - Z Class | $0 | 0.00% |
|---|
What drove fund performance during the past 12 months?
Small-cap U.S. stocks produced strong gains in 2024, as equity investors generally welcomed not only looser monetary policy starting in September, but also reduced political uncertainty following U.S. election results.
Information technology names produced robust results during the period as the sector benefited from strong investor interest in companies expected to benefit from artificial intelligence developments. Hardware and software companies performed very well during the year, as Super Micro Computer and MicroStrategy were two of the top-performing companies in the portfolio. Industrials and business services also contributed to returns, as construction and engineering companies performed particularly well.
Energy was the only sector that detracted from absolute returns during the reporting period, albeit very modestly. Energy equipment and services names hurt the most, with Noble performing worst.
The fund, which is not available for direct purchase by members of the public, employs a full replication strategy, which involves investing substantially all of its assets in all of the stocks in the index and seeking to maintain holdings of each stock in proportion to its weight in the Russell 2000 Index. By replicating the structure of the index, our intention is to closely track its performance.
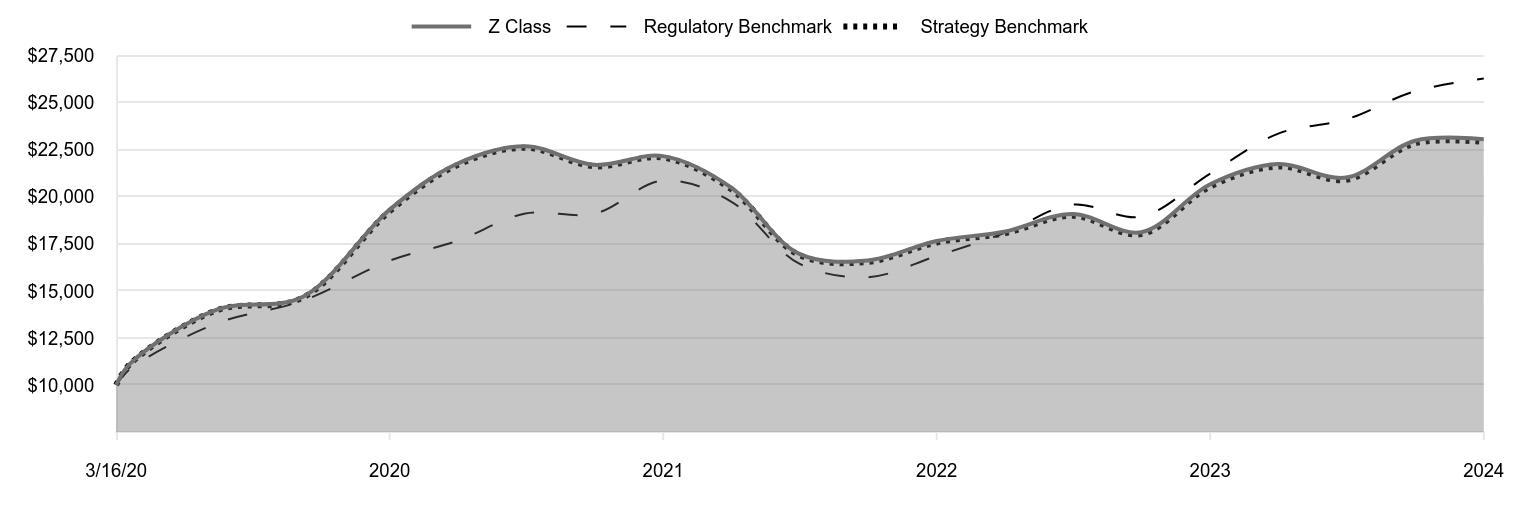
How has the fund performed?
Cumulative Returns of a Hypothetical $10,000 Investment as of December 31, 2024
| Z Class | Regulatory Benchmark | Strategy Benchmark |
|---|
| 3/16/20 | 10,000 | 10,000 | 10,000 |
|---|
| 3/31/20 | 11,146 | 10,865 | 11,127 |
|---|
| 6/30/20 | 13,992 | 13,259 | 13,955 |
|---|
| 9/30/20 | 14,690 | 14,480 | 14,643 |
|---|
| 12/31/20 | 19,322 | 16,606 | 19,237 |
|---|
| 3/31/21 | 21,758 | 17,659 | 21,680 |
|---|
| 6/30/21 | 22,683 | 19,115 | 22,610 |
|---|
| 9/30/21 | 21,703 | 19,095 | 21,624 |
|---|
| 12/31/21 | 22,164 | 20,867 | 22,088 |
|---|
| 3/31/22 | 20,515 | 19,765 | 20,425 |
|---|
| 6/30/22 | 16,980 | 16,464 | 16,913 |
|---|
| 9/30/22 | 16,620 | 15,729 | 16,543 |
|---|
| 12/31/22 | 17,655 | 16,859 | 17,574 |
|---|
| 3/31/23 | 18,148 | 18,069 | 18,055 |
|---|
| 6/30/23 | 19,092 | 19,585 | 18,995 |
|---|
| 9/30/23 | 18,120 | 18,948 | 18,020 |
|---|
| 12/31/23 | 20,668 | 21,235 | 20,549 |
|---|
| 3/31/24 | 21,740 | 23,362 | 21,613 |
|---|
| 6/30/24 | 21,025 | 24,114 | 20,905 |
|---|
| 9/30/24 | 22,983 | 25,616 | 22,843 |
|---|
| 12/31/24 | 23,067 | 26,290 | 22,919 |
|---|
202501-4140694, 202502-4108875
Average Annual Total Returns
| | 1 Year | Since Inception 3/16/20 |
|---|
| Small-Cap Index Fund (Z Class) | 11.61% | 19.04% |
|---|
| Russell 3000 Index (Regulatory Benchmark) | 23.81 | 22.33 |
|---|
| Russell 2000 Index (Strategy Benchmark) | 11.54 | 18.88 |
|---|
The preceding line graph shows the value of a hypothetical $10,000 investment in the fund over the past 10 fiscal year periods or since inception (for funds lacking 10-year records). The fund’s performance information included in the line graph and table above is compared with a regulatory required index that represents an overall securities market (Regulatory Benchmark). In addition, the line graph and table may also include one or more indexes that more closely aligns to the fund's investment strategy (Strategy Benchmark(s)). Due to new SEC Rules on shareholder reporting the fund adopted a new broad-based securities market index, referred to as the Regulatory Benchmark. Market index returns do not include expenses, which are deducted from fund returns. The fund's total return figures reflect the reinvestment of dividends and capital gains, if any.Neither the fund’s returns nor the index returns reflect the deduction of taxes that a shareholder would pay on fund distributions or redemptions of fund shares.The fund’s past performance is not a good predictor of the fund’s future performance.Updated performance information can be found at www.troweprice.com.
What are some fund statistics?
- Total Net Assets (000s)$206,379
- Number of Portfolio Holdings1,983
- Investment Advisory Fees Paid (000s)$(189)
- Portfolio Turnover Rate24.7%
What did the fund invest in?
Sector Allocation (as a % of Net Assets)
| Financials | 18.4% |
| Industrials & Business Services | 17.6 |
| Health Care | 16.4 |
| Information Technology | 13.8 |
| Consumer Discretionary | 9.7 |
| Real Estate | 6.0 |
| Energy | 5.1 |
| Materials | 4.2 |
| Consumer Staples | 2.9 |
| Other | 5.9 |
Top Ten Holdings (as a % of Net Assets)
| FTAI Aviation | 0.5% |
| Sprouts Farmers Market | 0.5 |
| Insmed | 0.4 |
| Vaxcyte | 0.4 |
| Credo Technology Group Holding | 0.4 |
| Applied Industrial Technologies | 0.3 |
| Mueller Industries | 0.3 |
| Rocket Lab USA | 0.3 |
| Fluor | 0.3 |
| IonQ | 0.3 |
If you invest directly with T. Rowe Price, you can elect to receive future shareholder reports or other important documents through electronic delivery by enrolling at www.troweprice.com/paperless. If you invest through a financial intermediary such as an investment advisor, a bank, retirement plan sponsor or a brokerage firm, please contact that organization and ask if it can provide electronic delivery.
Frank Russell Company "LSE" does not accept any liability for any errors or omissions in the indexes or data, and hereby expressly disclaim all warranties of originality, accuracy, completeness, timeliness, merchantability and fitness for a particular purpose. No party may rely on any indexes or data contained in this communication. Visit www.troweprice.com/en/us/market-data-disclosures for additional legal notices & disclaimers.
Small-Cap Index Fund
Z Class (TRZIX)
T. Rowe Price Investment Services, Inc.
100 East Pratt Street
Baltimore, MD 21202
Item 1. (b) Notice pursuant to Rule 30e-3.
Not applicable.
Item 2. Code of Ethics.
The registrant has adopted a code of ethics, as defined in Item 2 of Form N-CSR, applicable to its principal executive officer, principal financial officer, principal accounting officer or controller, or persons performing similar functions. A copy of this code of ethics is filed as an exhibit to this Form N-CSR. No substantive amendments were approved or waivers were granted to this code of ethics during the period covered by this report.
Item 3. Audit Committee Financial Expert.
The registrant’s Board of Directors has determined that Mr. Paul F. McBride qualifies as an audit committee financial expert, as defined in Item 3 of Form N-CSR. Mr. McBride is considered independent for purposes of Item 3 of Form N-CSR.
Item 4. Principal Accountant Fees and Services.
(a) – (d) Aggregate fees billed for the last two fiscal years for professional services rendered to, or on behalf of, the registrant by the registrant’s principal accountant were as follows:
| | | | | | | | | | |
| | | 2024 | | | | 2023 | | | |
Audit Fees | | $ | 23,525 | | | $ | 24,714 | | | |
Audit-Related Fees | | | - | | | | - | | | |
Tax Fees | | | - | | | | - | | | |
All Other Fees | | | - | | | | - | | | |
Audit fees include amounts related to the audit of the registrant’s annual financial statements and services normally provided by the accountant in connection with statutory and regulatory filings. Audit-related fees include amounts reasonably related to the performance of the audit of the registrant’s financial statements and specifically include the issuance of a report on internal controls and, if applicable, agreed-upon procedures related to fund acquisitions. Tax fees include amounts related to services for tax compliance, tax planning, and tax advice. The nature of these services specifically includes the review of distribution calculations and the preparation of Federal, state, and excise tax returns. All other fees include the registrant’s pro-rata share of amounts for agreed-upon procedures in conjunction with service contract approvals by the registrant’s Board of Directors/Trustees.
(e)(1) The registrant’s audit committee has adopted a policy whereby audit and non-audit services performed by the registrant’s principal accountant for the registrant, its investment adviser, and any entity controlling, controlled by, or under common control with the investment adviser that provides ongoing services to the registrant require pre-approval in advance at regularly scheduled audit committee meetings. If such a service is required between regularly scheduled audit committee meetings, pre-approval may be authorized by one audit committee member with ratification at the next scheduled audit committee meeting. Waiver of pre-approval for audit or non-audit services requiring fees of a de minimis amount is not permitted.
(2) No services included in (b) – (d) above were approved pursuant to paragraph (c)(7)(i)(C) of Rule 2-01 of Regulation S-X.
(f) Less than 50 percent of the hours expended on the principal accountant’s engagement to audit the registrant’s financial statements for the most recent fiscal year were attributed to work performed by persons other than the principal accountant’s full-time, permanent employees.
(g) The aggregate fees billed for the most recent fiscal year and the preceding fiscal year by the registrant’s principal accountant for non-audit services rendered to the registrant, its investment adviser, and any entity controlling, controlled by, or under common control with the investment adviser that provides ongoing services to the registrant were $1,262,000 and $1,524,000, respectively.
(h) All non-audit services rendered in (g) above were pre-approved by the registrant’s audit committee. Accordingly, these services were considered by the registrant’s audit committee in maintaining the principal accountant’s independence.
(i) Not applicable.
(j) Not applicable.
Item 5. Audit Committee of Listed Registrants.
Not applicable.
Item 6. Investments.
(a) Not applicable. The complete schedule of investments is included in Item 7 of this Form N-CSR.
(b) Not applicable.
Item 7. Financial Statements and Financial Highlights for Open-End Management Investment Companies.
(a – b) Report pursuant to Regulation S-X.
Financial
Highlights
Portfolio
of
Investments
Financial
Statements
and
Notes
Additional
Fund
Information
Financial
Statements
and
Other
Information
For
more
insights
from
T.
Rowe
Price
investment
professionals,
go
to
troweprice.com
.
T.
ROWE
PRICE
TRSYX
Small-Cap
Index
Fund
TRCSX
Small-Cap
Index
Fund–
.
I Class
TRZIX
Small-Cap
Index
Fund–
.
Z Class
T.
ROWE
PRICE
Small-Cap
Index
Fund
For
a
share
outstanding
throughout
each
period
The
accompanying
notes
are
an
integral
part
of
these
financial
statements.
Investor
Class
..
Year
..
..
Ended
.
12/31/24
12/31/23
12/31/22
12/31/21
12/31/20
NET
ASSET
VALUE
Beginning
of
period
$
14.40
$
12.48
$
15.93
$
14.16
$
12.20
Investment
activities
Net
investment
income
(1)(2)
0.18
0
.18
0.17
0.11
0.11
Net
realized
and
unrealized
gain/loss
1.46
1.90
(3.44)
1.91
2.30
Total
from
investment
activities
1.64
2.08
(3.27)
2.02
2.41
Distributions
Net
investment
income
(0.18)
(0.16)
(0.16)
(0.11)
(0.12)
Net
realized
gain
(0.26)
—
(0.02)
(0.14)
(0.33)
Total
distributions
(0.44)
(0.16)
(0.18)
(0.25)
(0.45)
NET
ASSET
VALUE
End
of
period
$
15.60
$
14.40
$
12.48
$
15.93
$
14.16
Ratios/Supplemental
Data
Total
return
(2)(3)
11.24%
16.75%
(20.58)%
14.32%
19.88%
Ratios
to
average
net
assets:
(2)
Gross
expenses
before
waivers/payments
by
Price
Associates
0.34%
0.35%
4.93%
1.87%
4.10%
Net
expenses
after
waivers/
payments
by
Price
Associates
0.29%
0.29%
0.29%
0.34%
0.35%
Net
investment
income
1.22%
1.39%
1.26%
0.70%
1.00%
Portfolio
turnover
rate
24.7%
27.2%
22.0%
29.0%
21.1%
Net
assets,
end
of
period
(in
thousands)
$98
$177
$154
$197
$6,726
0%
0%
0%
0%
0%
(1)
Per
share
amounts
calculated
using
average
shares
outstanding
method.
(2)
Includes
the
impact
of
expense-related
arrangements
with
Price
Associates.
(3)
Total
return
reflects
the
rate
that
an
investor
would
have
earned
on
an
investment
in
the
fund
during
each
period,
assuming
reinvestment
of
all
distributions,
and
payment
of
no
redemption
or
account
fees,
if
applicable.
T.
ROWE
PRICE
Small-Cap
Index
Fund
For
a
share
outstanding
throughout
each
period
The
accompanying
notes
are
an
integral
part
of
these
financial
statements.
I
Class
..
Year
..
..
Ended
.
12/31/24
12/31/23
12/31/22
12/31/21
12/31/20
NET
ASSET
VALUE
Beginning
of
period
$
14.47
$
12.54
$
16.01
$
14.21
$
12.23
Investment
activities
Net
investment
income
(1)(2)
0.21
0.20
0.19
0.18
0.13
Net
realized
and
unrealized
gain/loss
1.47
1.91
(3.46)
1.89
2.30
Total
from
investment
activities
1.68
2.11
(3.27)
2.07
2.43
Distributions
Net
investment
income
(0.24)
(0.18)
(0.18)
(0.13)
(0.12)
Net
realized
gain
(0.26)
—
(0.02)
(0.14)
(0.33)
Total
distributions
(0.50)
(0.18)
(0.20)
(0.27)
(0.45)
NET
ASSET
VALUE
End
of
period
$
15.65
$
14.47
$
12.54
$
16.01
$
14.21
Ratios/Supplemental
Data
Total
return
(2)(3)
11.40%
16.92%
(20.48)%
14.63%
20.00%
Ratios
to
average
net
assets:
(2)
Gross
expenses
before
waivers/payments
by
Price
Associates
0.31%
0.40%
0.42%
0.65%
3.93%
Net
expenses
after
waivers/payments
by
Price
Associates
0.14%
0.14%
0.14%
0.17%
0.20%
Net
investment
income
1.38%
1.55%
1.43%
1.12%
1.15%
Portfolio
turnover
rate
24.7%
27.2%
22.0%
29.0%
21.1%
Net
assets,
end
of
period
(in
thousands)
$132,082
$112,086
$85,393
$90,212
$355
0%
0%
0%
0%
0%
(1)
Per
share
amounts
calculated
using
average
shares
outstanding
method.
(2)
Includes
the
impact
of
expense-related
arrangements
with
Price
Associates.
(3)
Total
return
reflects
the
rate
that
an
investor
would
have
earned
on
an
investment
in
the
fund
during
each
period,
assuming
reinvestment
of
all
distributions,
and
payment
of
no
redemption
or
account
fees,
if
applicable.
T.
ROWE
PRICE
Small-Cap
Index
Fund
For
a
share
outstanding
throughout
each
period
The
accompanying
notes
are
an
integral
part
of
these
financial
statements.
Z
Class
(1)
..
Year
..
..
Ended
.
3/16/20
(1)
Through
12/31/20
12/31/24
12/31/23
12/31/22
12/31/21
NET
ASSET
VALUE
Beginning
of
period
$
14.46
$
12.53
$
15.99
$
14.20
$
7.59
Investment
activities
Net
investment
income
(2)(3)
0.24
0.23
0.22
0.23
0.11
Net
realized
and
unrealized
gain/loss
1.46
1.90
(3.47)
1.85
6.95
Total
from
investment
activities
1.70
2.13
(3.25)
2.08
7.06
Distributions
Net
investment
income
(0.25)
(0.20)
(0.19)
(0.15)
(0.12)
Net
realized
gain
(0.26)
—
(0.02)
(0.14)
(0.33)
Total
distributions
(0.51)
(0.20)
(0.21)
(0.29)
(0.45)
NET
ASSET
VALUE
End
of
period
$
15.65
$
14.46
$
12.53
$
15.99
$
14.20
Ratios/Supplemental
Data
Total
return
(3)(4)
11.61%
17.07%
(20.35)%
14.71%
93.22%
Ratios
to
average
net
assets:
(3)
Gross
expenses
before
waivers/payments
by
Price
Associates
0.26%
0.32%
0.38%
0.72%
3.86%
(5)
Net
expenses
after
waivers/
payments
by
Price
Associates
0.00%
0.00%
0.00%
0.01%
0.01%
(5)
Net
investment
income
1.55%
1.75%
1.67%
1.40%
1.30%
(5)
Portfolio
turnover
rate
24.7%
27.2%
22.0%
29.0%
21.1%
Net
assets,
end
of
period
(in
thousands)
$74,199
$36,196
$11,833
$1,104
$187
0%
0%
0%
0%
0%
(1)
Inception
date
(2)
Per
share
amounts
calculated
using
average
shares
outstanding
method.
(3)
Includes
the
impact
of
expense-related
arrangements
with
Price
Associates.
(4)
Total
return
reflects
the
rate
that
an
investor
would
have
earned
on
an
investment
in
the
fund
during
each
period,
assuming
reinvestment
of
all
distributions,
and
payment
of
no
redemption
or
account
fees,
if
applicable.
Total
return
is
not
annualized
for
periods
less
than
one
year.
(5)
Annualized
T.
ROWE
PRICE
Small-Cap
Index
Fund
December
31,
2024
Shares/Par
$
Value
(Cost
and
value
in
$000s)
‡
COMMON
STOCKS
99.6%
COMMUNICATION
SERVICES
2.7%
Diversified
Telecommunication
Services
0.6%
Anterix (1)
763
24
AST
SpaceMobile (1)(2)
10,291
217
ATN
International
760
13
Bandwidth,
Class
A (1)
1,838
31
Cogent
Communications
Holdings
3,368
260
Globalstar (1)
56,417
117
IDT,
Class
B
1,202
57
Liberty
Latin
America,
Class
A (1)
2,357
15
Liberty
Latin
America,
Class
C (1)
10,155
64
Lumen
Technologies (1)
77,424
411
Shenandoah
Telecommunications
3,828
48
1,257
Entertainment
0.5%
AMC
Entertainment
Holdings,
Class
A (1)
27,091
108
Atlanta
Braves
Holdings,
Class
A (1)
766
31
Atlanta
Braves
Holdings,
Class
C (1)
3,883
149
Cinemark
Holdings (1)
8,440
261
Eventbrite,
Class
A (1)
5,793
19
Golden
Matrix
Group (1)(2)
1,587
3
IMAX (1)
3,326
85
Lions
Gate
Entertainment,
Class
A (1)(2)
4,430
38
Lions
Gate
Entertainment,
Class
B (1)
9,475
72
LiveOne (1)
5,016
7
Madison
Square
Garden
Entertainment (1)
3,064
109
Marcus
1,846
40
Playstudios (1)
7,880
15
Reservoir
Media (1)
1,458
13
Sphere
Entertainment (1)(2)
2,111
85
Vivid
Seats,
Class
A (1)(2)
6,265
29
1,064
Interactive
Media
&
Services
0.6%
Bumble,
Class
A (1)
7,507
61
Cargurus (1)
6,664
243
Cars.com (1)
5,127
89
EverQuote,
Class
A (1)
1,869
37
fuboTV (1)(2)
24,153
30
Getty
Images
Holdings (1)
7,476
16
Grindr (1)
1,837
33
T.
ROWE
PRICE
Small-Cap
Index
Fund
Shares/Par
$
Value
(Cost
and
value
in
$000s)
‡
MediaAlpha,
Class
A (1)
2,409
27
Nextdoor
Holdings (1)
12,991
31
Outbrain (1)
3,077
22
QuinStreet (1)
4,087
94
Shutterstock
1,863
57
System1 (1)
2,295
2
TrueCar (1)
6,696
25
Vimeo (1)
11,086
71
Webtoon
Entertainment (1)(2)
1,074
15
Yelp (1)
4,975
193
Ziff
Davis (1)
3,417
186
ZipRecruiter,
Class
A (1)
5,407
39
1,271
Media
0.8%
Advantage
Solutions (1)
8,005
23
AMC
Networks,
Class
A (1)(2)
2,439
24
Boston
Omaha,
Class
A (1)(2)
1,983
28
Cable
One (2)
435
158
Cardlytics (1)(2)
2,821
10
Clear
Channel
Outdoor
Holdings (1)
26,208
36
EchoStar,
Class
A (1)(2)
9,359
214
Emerald
Holding (2)
1,038
5
Entravision
Communications,
Class
A
4,222
10
EW
Scripps,
Class
A (1)
4,845
11
Gambling.com
Group (1)
1,326
19
Gannett (1)
10,593
54
Gray
Television
6,638
21
Ibotta,
Class
A (1)(2)
1,195
78
iHeartMedia,
Class
A (1)
8,836
17
Innovid (1)
8,750
27
Integral
Ad
Science
Holding (1)
5,526
58
John
Wiley
&
Sons,
Class
A
3,038
133
Magnite (1)
9,729
155
National
CineMedia (1)
5,266
35
PubMatic,
Class
A (1)
3,295
48
Scholastic
1,735
37
Sinclair
2,397
39
Stagwell (1)
6,594
43
TechTarget (1)
2,097
42
TEGNA
12,719
233
Thryv
Holdings (1)
2,869
42
Townsquare
Media,
Class
A (2)
1,224
11
T.
ROWE
PRICE
Small-Cap
Index
Fund
Shares/Par
$
Value
(Cost
and
value
in
$000s)
‡
WideOpenWest (1)
3,828
19
1,630
Wireless
Telecommunication
Services
0.2%
Gogo (1)(2)
4,810
39
Spok
Holdings
1,331
22
Telephone
&
Data
Systems
7,574
258
319
Total
Communication
Services
5,541
CONSUMER
DISCRETIONARY
9.7%
Automobile
Components
1.1%
Adient (1)
6,735
116
American
Axle
&
Manufacturing
Holdings (1)
8,620
50
Cooper-Standard
Holdings (1)
1,333
18
Dana
10,122
117
Dorman
Products (1)
1,984
257
Fox
Factory
Holding (1)
3,284
99
Gentherm (1)
2,388
95
Goodyear
Tire
&
Rubber (1)
21,920
197
Holley (1)(2)
3,650
11
LCI
Industries
1,907
197
Luminar
Technologies (1)
1,794
10
Modine
Manufacturing (1)
3,973
461
Patrick
Industries
2,491
207
Phinia
3,234
156
Solid
Power (1)(2)
12,488
24
Standard
Motor
Products
1,588
49
Stoneridge (1)
1,949
12
Visteon (1)
2,114
188
XPEL (1)
1,902
76
2,340
Automobiles
0.1%
Canoo (1)
217
—
Livewire
Group (1)
1,171
6
Winnebago
Industries
2,186
104
110
Broadline
Retail
0.0%
1stdibs.com (1)
1,865
7
Groupon (1)(2)
1,852
22
Qurate
Retail,
Class
B (1)
65
—
Savers
Value
Village (1)
1,733
18
47
T.
ROWE
PRICE
Small-Cap
Index
Fund
Shares/Par
$
Value
(Cost
and
value
in
$000s)
‡
Distributors
0.0%
A-Mark
Precious
Metals
1,455
40
GigaCloud
Technology,
Class
A (1)(2)
1,740
32
Weyco
Group
432
16
88
Diversified
Consumer
Services
1.2%
Adtalem
Global
Education (1)
2,867
260
American
Public
Education (1)
1,228
26
Carriage
Services
1,021
41
Chegg (1)
8,619
14
Clear
Secure,
Class
A
6,803
181
Coursera (1)
10,685
91
European
Wax
Center,
Class
A (1)(2)
2,383
16
Frontdoor (1)
5,900
323
Graham
Holdings,
Class
B
246
214
KinderCare
Learning (1)
2,112
38
Laureate
Education (1)
10,093
185
Lincoln
Educational
Services (1)
2,115
33
Mister
Car
Wash (1)(2)
7,449
54
Nerdy (1)(2)
6,995
11
OneSpaWorld
Holdings
7,771
155
Perdoceo
Education
5,057
134
Strategic
Education
1,717
160
Stride (1)
3,260
339
Udemy (1)
6,894
57
Universal
Technical
Institute (1)
3,072
79
2,411
Hotels,
Restaurants
&
Leisure
2.0%
Accel
Entertainment (1)
3,967
42
Bally's (1)
1,790
32
Biglari
Holdings,
Class
B (1)
59
15
BJ's
Restaurants (1)
1,518
53
Bloomin'
Brands
6,018
73
Brinker
International (1)
3,372
446
Cheesecake
Factory (2)
3,743
178
Cracker
Barrel
Old
Country
Store (2)
1,717
91
Dave
&
Buster's
Entertainment (1)(2)
2,460
72
Denny's (1)
3,769
23
Despegar.com (1)
4,765
92
Dine
Brands
Global (2)
1,133
34
El
Pollo
Loco
Holdings (1)
1,885
22
Empire
Resorts,
EC (1)(3)
9
—
T.
ROWE
PRICE
Small-Cap
Index
Fund
Shares/Par
$
Value
(Cost
and
value
in
$000s)
‡
Everi
Holdings (1)
6,146
83
First
Watch
Restaurant
Group (1)(2)
2,291
43
Full
House
Resorts (1)(2)
2,270
9
Global
Business
Travel
Group
I (1)
9,741
90
Golden
Entertainment
1,536
49
Hilton
Grand
Vacations (1)
5,496
214
Inspired
Entertainment (1)
1,761
16
International
Game
Technology
8,711
154
Jack
in
the
Box (2)
1,492
62
Krispy
Kreme
6,498
64
Kura
Sushi
USA,
Class
A (1)
442
40
Life
Time
Group
Holdings (1)
4,790
106
Lindblad
Expeditions
Holdings (1)
2,862
34
Monarch
Casino
&
Resort
996
79
Nathan's
Famous
222
17
ONE
Group
Hospitality (1)
1,360
4
Papa
John's
International
2,570
106
PlayAGS (1)
3,130
36
Portillo's,
Class
A (1)(2)
3,991
37
Potbelly (1)
1,951
18
RCI
Hospitality
Holdings
659
38
Red
Rock
Resorts,
Class
A
3,800
176
Rush
Street
Interactive (1)
5,803
80
Sabre (1)
29,548
108
Shake
Shack,
Class
A (1)
2,910
378
Six
Flags
Entertainment
7,106
342
Super
Group
SGHC
11,664
73
Sweetgreen,
Class
A (1)
7,683
246
Target
Hospitality (1)
2,395
23
United
Parks
&
Resorts (1)
2,529
142
Vacasa,
Class
A (1)(2)
762
4
Xponential
Fitness,
Class
A (1)(2)
1,972
26
4,070
Household
Durables
1.9%
Beazer
Homes
USA (1)
2,260
62
Cavco
Industries (1)
635
283
Century
Communities
2,139
157
Champion
Homes (1)
4,107
362
Cricut,
Class
A
3,522
20
Dream
Finders
Homes,
Class
A (1)(2)
2,090
49
Ethan
Allen
Interiors
1,800
51
Flexsteel
Industries
334
18
GoPro,
Class
A (1)
10,250
11
T.
ROWE
PRICE
Small-Cap
Index
Fund
Shares/Par
$
Value
(Cost
and
value
in
$000s)
‡
Green
Brick
Partners (1)
2,381
134
Hamilton
Beach
Brands
Holding,
Class
A
617
10
Helen
of
Troy (1)
1,761
105
Hooker
Furnishings
806
11
Hovnanian
Enterprises,
Class
A (1)
388
52
Installed
Building
Products
1,835
322
iRobot (1)
2,490
19
KB
Home
4,980
327
Landsea
Homes (1)
1,362
12
La-Z-Boy
3,263
142
Legacy
Housing (1)
877
22
LGI
Homes (1)
1,608
144
Lifetime
Brands
916
5
Lovesac (1)(2)
1,092
26
M/I
Homes (1)
2,037
271
Meritage
Homes
2,748
423
Purple
Innovation (1)
3,083
2
Sonos (1)
9,323
140
Taylor
Morrison
Home (1)
7,870
482
Traeger (1)
2,404
6
Tri
Pointe
Homes (1)
7,051
256
United
Homes
Group (1)
302
1
Worthington
Enterprises
2,392
96
4,021
Leisure
Products
0.4%
Acushnet
Holdings (2)
2,190
156
AMMO (1)
5,813
6
Clarus
2,343
11
Escalade
722
10
Funko,
Class
A (1)
2,349
31
JAKKS
Pacific (1)
608
17
Johnson
Outdoors,
Class
A (2)
343
11
Latham
Group (1)
2,945
21
Malibu
Boats,
Class
A (1)
1,547
58
Marine
Products
561
5
MasterCraft
Boat
Holdings (1)
1,218
23
Peloton
Interactive,
Class
A (1)
27,020
235
Revelyst (1)
4,412
85
Smith
&
Wesson
Brands
3,429
35
Solo
Brands,
Class
A (1)(2)
2,408
3
Sturm
Ruger
1,297
46
Topgolf
Callaway
Brands (1)
11,050
87
840
T.
ROWE
PRICE
Small-Cap
Index
Fund
Shares/Par
$
Value
(Cost
and
value
in
$000s)
‡
Specialty
Retail
2.4%
1-800-Flowers.com,
Class
A (1)(2)
2,043
17
Abercrombie
&
Fitch,
Class
A (1)
3,866
578
Academy
Sports
&
Outdoors
5,279
304
aka
Brands
Holding (1)
83
2
American
Eagle
Outfitters
13,653
228
America's
Car-Mart (1)
555
28
Arhaus (2)
3,892
37
Arko
6,408
42
Asbury
Automotive
Group (1)
1,506
366
BARK (1)(2)
10,061
18
Beyond (1)
3,229
16
Boot
Barn
Holdings (1)
2,267
344
Buckle
2,387
121
Build-A-Bear
Workshop
967
44
Caleres (2)
2,656
61
Camping
World
Holdings,
Class
A
4,266
90
Citi
Trends (1)(2)
443
12
Designer
Brands,
Class
A (2)
3,447
18
Destination
XL
Group (1)(2)
4,340
12
EVgo (1)(2)
7,557
31
Foot
Locker (1)
6,459
140
Genesco (1)
818
35
Group
1
Automotive
1,014
427
GrowGeneration (1)
4,431
7
Haverty
Furniture
1,080
24
J
Jill
520
14
Lands'
End (1)
984
13
Leslie's (1)
13,343
30
MarineMax (1)
1,705
49
Monro
2,340
58
National
Vision
Holdings (1)
6,102
64
ODP (1)
2,475
56
OneWater
Marine,
Class
A (1)(2)
842
15
Petco
Health
&
Wellness (1)
6,290
24
RealReal (1)(2)
7,791
85
Revolve
Group (1)
2,969
99
RumbleON,
Class
B (1)(2)
1,227
7
Sally
Beauty
Holdings (1)
7,827
82
Shoe
Carnival
1,343
44
Signet
Jewelers
3,246
262
Sleep
Number (1)
1,571
24
Sonic
Automotive,
Class
A
1,130
72
T.
ROWE
PRICE
Small-Cap
Index
Fund
Shares/Par
$
Value
(Cost
and
value
in
$000s)
‡
Stitch
Fix,
Class
A (1)
8,128
35
ThredUp,
Class
A (1)
7,307
10
Tile
Shop
Holdings (1)
2,171
15
Tilly's,
Class
A (1)(2)
1,310
6
Torrid
Holdings (1)(2)
1,869
10
Upbound
Group
4,119
120
Urban
Outfitters (1)
4,864
267
Victoria's
Secret (1)
6,002
249
Warby
Parker,
Class
A (1)
6,846
166
Winmark
221
87
Zumiez (1)
1,188
23
4,988
Textiles,
Apparel
&
Luxury
Goods
0.6%
Figs,
Class
A (1)
10,177
63
G-III
Apparel
Group (1)
2,959
97
Hanesbrands (1)
27,154
221
Kontoor
Brands
4,214
360
Movado
Group
1,181
23
Oxford
Industries
1,125
89
Rocky
Brands
493
11
Steven
Madden
5,569
237
Superior
Group
918
15
Vera
Bradley (1)
1,839
7
Wolverine
World
Wide
6,095
135
1,258
Total
Consumer
Discretionary
20,173
CONSUMER
STAPLES
2.9%
Beverages
0.3%
MGP
Ingredients
1,057
42
National
Beverage
1,824
78
Primo
Brands
12,086
372
Vita
Coco (1)(2)
3,046
112
604
Consumer
Staples
Distribution
&
Retail
0.9%
Andersons
2,537
103
Chefs'
Warehouse (1)
2,712
134
Guardian
Pharmacy
Services,
Class
A (1)
652
13
HF
Foods
Group (1)
2,819
9
Ingles
Markets,
Class
A
1,093
70
Natural
Grocers
by
Vitamin
Cottage
748
30
PriceSmart
1,937
179
SpartanNash
2,588
47
T.
ROWE
PRICE
Small-Cap
Index
Fund
Shares/Par
$
Value
(Cost
and
value
in
$000s)
‡
Sprouts
Farmers
Market (1)
7,736
983
United
Natural
Foods (1)
4,554
124
Village
Super
Market,
Class
A
651
21
Weis
Markets
1,252
85
1,798
Food
Products
1.0%
Alico (2)
541
14
B&G
Foods (2)
5,758
40
Beyond
Meat (1)(2)
4,460
17
BRC,
Class
A (1)(2)
3,656
12
Calavo
Growers
1,267
32
Cal-Maine
Foods
3,142
323
Dole
5,712
77
Forafric
Global (1)
365
4
Fresh
Del
Monte
Produce
2,625
87
Hain
Celestial
Group (1)
7,074
44
J
&
J
Snack
Foods
1,179
183
John
B.
Sanfilippo
&
Son
685
60
Lancaster
Colony
1,502
260
Lifeway
Foods (1)(2)
353
9
Limoneira
1,259
31
Mama's
Creations (1)
2,726
22
Mission
Produce (1)
3,424
49
Seneca
Foods,
Class
A (1)(2)
375
30
Simply
Good
Foods (1)
6,981
272
SunOpta (1)
7,411
57
TreeHouse
Foods (1)
3,654
128
Utz
Brands
5,052
79
Vital
Farms (1)
2,531
95
Westrock
Coffee (1)
2,711
17
WK
Kellogg (2)
4,993
90
2,032
Household
Products
0.3%
Central
Garden
&
Pet (1)(2)
763
30
Central
Garden
&
Pet,
Class
A (1)
4,042
134
Energizer
Holdings
5,491
191
Oil-Dri
365
32
WD-40
1,046
254
641
Personal
Care
Products
0.3%
Beauty
Health (1)(2)
5,365
9
Edgewell
Personal
Care
3,766
127
T.
ROWE
PRICE
Small-Cap
Index
Fund
Shares/Par
$
Value
(Cost
and
value
in
$000s)
‡
Herbalife (1)
7,916
53
Honest (1)
6,528
45
Interparfums
1,393
183
Medifast (1)
748
13
Nature's
Sunshine
Products (1)
982
14
Nu
Skin
Enterprises,
Class
A
3,715
26
Olaplex
Holdings (1)(2)
9,831
17
USANA
Health
Sciences (1)
848
30
Veru (1)
9,733
6
Waldencast,
Class
A (1)
1,756
7
530
Tobacco
0.1%
Ispire
Technology (1)(2)
1,380
7
Turning
Point
Brands
1,299
78
Universal
1,826
100
185
Total
Consumer
Staples
5,790
ENERGY
5.1%
Energy
Equipment
&
Services
2.1%
Archrock
12,786
318
Atlas
Energy
Solutions (2)
5,250
116
Borr
Drilling (2)
18,426
72
Bristow
Group (1)
1,924
66
Cactus,
Class
A
5,109
298
ChampionX
14,605
397
Core
Laboratories (2)
3,581
62
DMC
Global (1)(2)
1,386
10
Drilling
Tools
International (1)
911
3
Expro
Group
Holdings (1)
7,371
92
Forum
Energy
Technologies (1)
841
13
Geospace
Technologies (1)
922
9
Helix
Energy
Solutions
Group (1)
10,941
102
Helmerich
&
Payne
7,394
237
Innovex
International (1)
2,544
36
Kodiak
Gas
Services
2,484
101
Liberty
Energy
12,166
242
Mammoth
Energy
Services (1)
1,558
5
Nabors
Industries (1)
676
39
Natural
Gas
Services
Group (1)
871
23
Noble
10,579
332
NPK
International (1)
6,623
51
Oceaneering
International (1)
7,775
203
T.
ROWE
PRICE
Small-Cap
Index
Fund
Shares/Par
$
Value
(Cost
and
value
in
$000s)
‡
Oil
States
International (1)
4,590
23
Patterson-UTI
Energy
29,904
247
ProFrac
Holding,
Class
A (1)(2)
1,652
13
ProPetro
Holding (1)
6,753
63
Ranger
Energy
Services,
Class
A
1,326
21
RPC (2)
6,305
37
SEACOR
Marine
Holdings (1)(2)
1,760
12
Seadrill (1)
5,362
209
Select
Water
Solutions
6,915
92
Solaris
Energy
Infrastructure
1,882
54
TETRA
Technologies (1)
9,349
33
Tidewater (1)
3,778
207
Transocean (1)(2)
56,096
210
Valaris (1)
4,741
210
4,258
Oil,
Gas
&
Consumable
Fuels
3.0%
Aemetis (1)
2,664
7
Amplify
Energy (1)(2)
2,772
17
Ardmore
Shipping
3,078
37
Berry
5,712
24
BKV (1)
1,090
26
California
Resources
5,275
274
Centrus
Energy,
Class
A (1)
1,097
73
Clean
Energy
Fuels (1)
12,762
32
CNX
Resources (1)
11,168
409
Comstock
Resources (1)(2)
7,023
128
CONSOL
Energy
2,238
239
Crescent
Energy,
Class
A
12,557
183
CVR
Energy
2,692
50
Delek
U.S.
Holdings
4,920
91
DHT
Holdings
10,453
97
Diversified
Energy
3,561
60
Dorian
LPG
2,830
69
Empire
Petroleum (1)(2)
1,272
10
Encore
Energy (1)
13,569
46
Energy
Fuels (1)(2)
14,620
75
Evolution
Petroleum
2,342
12
Excelerate
Energy,
Class
A
1,280
39
FLEX
LNG (2)
2,334
53
FutureFuel
1,804
10
Golar
LNG
7,583
321
Granite
Ridge
Resources (2)
3,938
25
Green
Plains (1)
4,768
45
T.
ROWE
PRICE
Small-Cap
Index
Fund
Shares/Par
$
Value
(Cost
and
value
in
$000s)
‡
Gulfport
Energy (1)
1,004
185
Hallador
Energy (1)(2)
1,849
21
HighPeak
Energy (2)
1,040
15
International
Seaways (2)
3,166
114
Kinetik
Holdings
2,958
168
Kosmos
Energy (1)
36,247
124
Magnolia
Oil
&
Gas,
Class
A
13,270
310
Murphy
Oil
10,990
333
NACCO
Industries,
Class
A
275
8
NextDecade (1)
9,036
70
Nordic
American
Tankers (2)
15,282
38
Northern
Oil
&
Gas (2)
7,586
282
Par
Pacific
Holdings (1)
4,244
70
PBF
Energy,
Class
A
7,717
205
Peabody
Energy
9,728
204
PrimeEnergy
Resources (1)
49
11
REX
American
Resources (1)
1,213
51
Riley
Exploration
Permian
925
29
Ring
Energy (1)
10,512
14
Sable
Offshore (1)
3,841
88
SandRidge
Energy
2,495
29
Scorpio
Tankers
3,445
171
SFL
9,962
102
Sitio
Royalties,
Class
A
6,229
119
SM
Energy
8,764
340
Talos
Energy (1)
10,982
107
Teekay
4,258
29
Teekay
Tankers,
Class
A
1,867
74
Uranium
Energy (1)
30,658
205
Ur-Energy (1)(2)
26,192
30
VAALCO
Energy
8,025
35
Verde
Clean
Fuels (1)
210
1
Vital
Energy (1)(2)
2,228
69
Vitesse
Energy (2)
1,879
47
W&T
Offshore (2)
7,003
12
World
Kinect
4,326
119
6,281
Total
Energy
10,539
FINANCIALS
18.4%
Banks
10.2%
1st
Source
1,399
82
ACNB
601
24
Amalgamated
Financial
1,413
47
T.
ROWE
PRICE
Small-Cap
Index
Fund
Shares/Par
$
Value
(Cost
and
value
in
$000s)
‡
Amerant
Bancorp
2,834
64
Ameris
Bancorp
5,044
316
Ames
National
629
10
Arrow
Financial
1,222
35
Associated
Banc-Corp
12,390
296
Atlantic
Union
Bankshares
6,839
259
Axos
Financial (1)
4,188
293
Banc
of
California
10,744
166
BancFirst
1,545
181
Bancorp (1)
3,605
190
Bank
First
734
73
Bank
of
Hawaii
3,005
214
Bank
of
Marin
Bancorp
1,249
30
Bank
of
NT
Butterfield
&
Son
3,441
126
Bank7
350
16
BankUnited
5,732
219
Bankwell
Financial
Group
463
14
Banner
2,627
175
Bar
Harbor
Bankshares
1,117
34
BayCom
756
20
BCB
Bancorp
1,137
13
Berkshire
Hills
Bancorp
3,264
93
Blue
Foundry
Bancorp (1)
1,455
14
Bridgewater
Bancshares (1)
1,556
21
Brookline
Bancorp
6,839
81
Burke
&
Herbert
Financial
Services
1,034
64
Business
First
Bancshares
1,811
47
Byline
Bancorp
2,424
70
Cadence
Bank
14,013
483
California
Bancorp (1)
1,883
31
Camden
National
1,146
49
Capital
Bancorp
694
20
Capital
City
Bank
Group
1,025
38
Capitol
Federal
Financial
9,474
56
Carter
Bankshares (1)
1,722
30
Cathay
General
Bancorp
5,324
253
Central
Pacific
Financial
2,038
59
Chemung
Financial
245
12
ChoiceOne
Financial
Services
634
23
Citizens
&
Northern
1,145
21
Citizens
Financial
Services
335
21
City
Holding
1,107
131
Civista
Bancshares
1,189
25
T.
ROWE
PRICE
Small-Cap
Index
Fund
Shares/Par
$
Value
(Cost
and
value
in
$000s)
‡
CNB
Financial
1,586
39
Coastal
Financial (1)
877
74
Colony
Bankcorp
1,343
22
Columbia
Financial (1)
2,033
32
Community
Financial
System
4,001
247
Community
Trust
Bancorp
1,172
62
Community
West
Bancshares
1,226
24
ConnectOne
Bancorp
2,816
65
CrossFirst
Bankshares (1)
3,540
54
Customers
Bancorp (1)
2,247
109
CVB
Financial
10,183
218
Dime
Community
Bancshares
2,743
84
Eagle
Bancorp
2,306
60
Eastern
Bankshares
14,758
255
Enterprise
Bancorp
785
31
Enterprise
Financial
Services
2,863
161
Equity
Bancshares,
Class
A
1,072
45
Esquire
Financial
Holdings
529
42
ESSA
Bancorp
641
13
Farmers
&
Merchants
Bancorp
970
29
Farmers
National
Banc
2,722
39
FB
Financial
2,740
141
Fidelity
D&D
Bancorp
371
18
Financial
Institutions
1,207
33
First
Bancorp
782
21
First
Bancorp
North
Carolina
3,090
136
First
BanCorp
Puerto
Rico
12,381
230
First
Bancshares
2,357
83
First
Bank
New
Jersey
1,532
22
First
Busey
4,143
98
First
Business
Financial
Services
641
30
First
Commonwealth
Financial
7,804
132
First
Community
Bankshares
1,330
55
First
Financial
881
41
First
Financial
Bancorp
7,263
195
First
Financial
Bankshares
9,963
359
First
Financial
Northwest
506
11
First
Foundation
4,846
30
First
Internet
Bancorp
633
23
First
Interstate
BancSystem,
Class
A
6,103
198
First
Merchants
4,456
178
First
Mid
Bancshares
1,782
66
First
of
Long
Island
1,563
18
T.
ROWE
PRICE
Small-Cap
Index
Fund
Shares/Par
$
Value
(Cost
and
value
in
$000s)
‡
First
Western
Financial (1)
552
11
Five
Star
Bancorp
1,244
37
Flagstar
Financial
19,495
182
Flushing
Financial
2,053
29
FS
Bancorp
512
21
Fulton
Financial
13,886
268
FVCBankcorp (1)
1,175
15
German
American
Bancorp
2,167
87
Glacier
Bancorp
8,716
438
Great
Southern
Bancorp
641
38
Greene
County
Bancorp
498
14
Guaranty
Bancshares
621
22
Hancock
Whitney
6,644
364
Hanmi
Financial
2,345
55
HarborOne
Bancorp
2,787
33
HBT
Financial
963
21
Heartland
Financial
USA
3,261
200
Heritage
Commerce
4,423
42
Heritage
Financial
2,616
64
Hilltop
Holdings
3,605
103
Hingham
Institution
For
Savings (2)
126
32
Home
Bancorp
545
25
Home
BancShares
14,261
404
HomeStreet (1)
1,331
15
HomeTrust
Bancshares
1,136
38
Hope
Bancorp
8,964
110
Horizon
Bancorp
3,246
52
Independent
Bank,
(MA)
3,263
209
Independent
Bank,
(MI)
1,560
54
Independent
Bank
Group
2,802
170
International
Bancshares
4,135
261
Investar
Holding
669
15
John
Marshall
Bancorp
946
19
Kearny
Financial
3,357
24
Lakeland
Financial
1,920
132
LCNB
970
15
LINKBANCORP (2)
1,607
12
Live
Oak
Bancshares
2,692
106
Mercantile
Bank
1,229
55
Metrocity
Bankshares
1,369
44
Metropolitan
Bank
Holding (1)
831
49
Mid
Penn
Bancorp
1,153
33
Middlefield
Banc
509
14
T.
ROWE
PRICE
Small-Cap
Index
Fund
Shares/Par
$
Value
(Cost
and
value
in
$000s)
‡
Midland
States
Bancorp
1,581
39
MidWestOne
Financial
Group
1,429
42
MVB
Financial
904
19
National
Bank
Holdings,
Class
A
2,849
123
National
Bankshares
411
12
NB
Bancorp (1)
2,930
53
NBT
Bancorp
3,557
170
Nicolet
Bankshares
1,043
109
Northeast
Bank
527
48
Northeast
Community
Bancorp
957
23
Northfield
Bancorp
2,934
34
Northrim
BanCorp
420
33
Northwest
Bancshares
9,833
130
Norwood
Financial
518
14
Oak
Valley
Bancorp
473
14
OceanFirst
Financial
4,465
81
OFG
Bancorp
3,558
151
Old
National
Bancorp
24,192
525
Old
Second
Bancorp
3,394
60
Orange
County
Bancorp
392
22
Origin
Bancorp
2,236
74
Orrstown
Financial
Services
1,453
53
Pacific
Premier
Bancorp
7,423
185
Park
National
1,108
190
Parke
Bancorp
831
17
Pathward
Financial
1,945
143
PCB
Bancorp
825
17
Peapack-Gladstone
Financial
1,240
40
Peoples
Bancorp
2,629
83
Peoples
Bancorp
of
North
Carolina
330
10
Peoples
Financial
Services
685
35
Pioneer
Bancorp (1)
898
10
Plumas
Bancorp
432
20
Preferred
Bank
967
84
Premier
Financial
2,743
70
Primis
Financial
1,593
19
Princeton
Bancorp
464
16
Provident
Bancorp (1)
1,127
13
Provident
Financial
Services
9,755
184
QCR
Holdings
1,243
100
RBB
Bancorp
1,230
25
Red
River
Bancshares
336
18
Renasant
4,828
173
T.
ROWE
PRICE
Small-Cap
Index
Fund
Shares/Par
$
Value
(Cost
and
value
in
$000s)
‡
Republic
Bancorp,
Class
A
614
43
S&T
Bancorp
2,944
113
Sandy
Spring
Bancorp
3,409
115
Seacoast
Banking
6,456
178
ServisFirst
Bancshares
3,885
329
Shore
Bancshares
2,291
36
Sierra
Bancorp
1,013
29
Simmons
First
National,
Class
A
9,541
212
SmartFinancial
1,180
37
South
Plains
Financial
909
32
Southern
First
Bancshares (1)
601
24
Southern
Missouri
Bancorp
723
41
Southern
States
Bancshares
613
20
Southside
Bancshares
2,188
70
SouthState
5,846
582
Stellar
Bancorp
3,730
106
Sterling
Bancorp (1)
1,460
7
Stock
Yards
Bancorp
1,964
141
Texas
Capital
Bancshares (1)
3,546
277
Third
Coast
Bancshares (1)
865
29
Timberland
Bancorp
594
18
Tompkins
Financial
970
66
Towne
Bank
5,370
183
TriCo
Bancshares
2,474
108
Triumph
Financial (1)
1,702
155
TrustCo
Bank
1,464
49
Trustmark
4,704
166
UMB
Financial
3,433
387
United
Bankshares
10,120
380
United
Community
Banks
9,168
296
Unity
Bancorp
561
24
Univest
Financial
2,253
66
USCB
Financial
Holdings
798
14
Valley
National
Bancorp
35,835
325
Veritex
Holdings
4,076
111
Virginia
National
Bankshares
324
12
WaFd
5,162
166
Washington
Trust
Bancorp
1,256
39
WesBanco
4,455
145
West
BanCorp
1,206
26
Westamerica
BanCorp
1,987
104
WSFS
Financial
4,523
240
21,076
T.
ROWE
PRICE
Small-Cap
Index
Fund
Shares/Par
$
Value
(Cost
and
value
in
$000s)
‡
Capital
Markets
1.8%
AlTi
Global (1)
2,438
11
Artisan
Partners
Asset
Management,
Class
A
4,843
209
B.
Riley
Financial
1,437
7
BGC
Group,
Class
A
27,866
252
Brightsphere
Investment
Group
2,069
55
Cohen
&
Steers
2,116
195
Diamond
Hill
Investment
Group
198
31
DigitalBridge
Group
12,254
138
Donnelley
Financial
Solutions (1)
2,001
126
Forge
Global
Holdings (1)
9,470
9
GCM
Grosvenor,
Class
A
3,177
39
Hamilton
Lane,
Class
A
2,939
435
MarketWise
1,695
1
Moelis,
Class
A
5,408
400
Open
Lending (1)
8,065
48
P10,
Class
A
3,047
38
Patria
Investments,
Class
A
4,379
51
Perella
Weinberg
Partners
3,968
95
Piper
Sandler
1,328
398
PJT
Partners,
Class
A
1,788
282
Silvercrest
Asset
Management
Group,
Class
A
726
13
StepStone
Group,
Class
A
5,036
291
StoneX
Group (1)
2,135
209
Value
Line
68
4
Victory
Capital
Holdings,
Class
A
3,162
207
Virtus
Investment
Partners
522
115
WisdomTree
10,785
113
3,772
Consumer
Finance
1.0%
Atlanticus
Holdings (1)
417
23
Bread
Financial
Holdings
3,821
233
Consumer
Portfolio
Services (1)
660
7
Dave (1)
615
53
Encore
Capital
Group (1)
1,783
85
Enova
International (1)
1,947
187
FirstCash
Holdings
2,952
306
Green
Dot,
Class
A (1)
4,243
45
LendingClub (1)
8,438
137
LendingTree (1)
740
29
Medallion
Financial (2)
1,359
13
Moneylion (1)
676
58
Navient
6,009
80
T.
ROWE
PRICE
Small-Cap
Index
Fund
Shares/Par
$
Value
(Cost
and
value
in
$000s)
‡
Nelnet,
Class
A
1,099
117
NerdWallet,
Class
A (1)
2,656
35
OppFi
1,542
12
PRA
Group (1)
3,036
63
PROG
Holdings
3,159
134
Regional
Management
623
21
Upstart
Holdings (1)
6,008
370
World
Acceptance (1)
257
29
2,037
Financial
Services
2.6%
Acacia
Research (1)
2,693
12
Alerus
Financial
1,672
32
AvidXchange
Holdings (1)
13,459
139
Banco
Latinoamericano
de
Comercio
Exterior,
Class
E
2,088
74
Burford
Capital
15,332
195
Cannae
Holdings
4,362
87
Cantaloupe (1)
4,366
41
Cass
Information
Systems
1,041
43
Compass
Diversified
Holdings
5,153
119
Enact
Holdings
2,183
71
Essent
Group
7,985
435
EVERTEC
4,985
172
Federal
Agricultural
Mortgage,
Class
C
700
138
Flywire (1)
9,355
193
HA
Sustainable
Infrastructure
Capital
8,862
238
I3
Verticals,
Class
A (1)
1,725
40
International
Money
Express (1)
2,389
50
Jackson
Financial,
Class
A
5,767
502
Marqeta,
Class
A (1)
36,570
139
Merchants
Bancorp
1,354
49
Mr.
Cooper
Group (1)
4,826
463
NCR
Atleos (1)
5,588
189
NewtekOne
1,986
25
NMI
Holdings,
Class
A (1)
6,029
222
Onity
Group (1)
468
14
Pagseguro
Digital,
Class
A (1)(2)
14,315
90
Payoneer
Global (1)
22,274
224
Paysafe (1)(2)
2,385
41
Paysign (1)
2,168
6
PennyMac
Financial
Services
2,040
208
Priority
Technology
Holdings (1)
1,624
19
Radian
Group
11,601
368
Remitly
Global (1)
11,448
258
T.
ROWE
PRICE
Small-Cap
Index
Fund
Shares/Par
$
Value
(Cost
and
value
in
$000s)
‡
Repay
Holdings (1)
6,567
50
Sezzle (1)
175
45
StoneCo,
Class
A (1)
22,121
176
SWK
Holdings (1)(2)
287
5
Velocity
Financial (1)
749
15
Walker
&
Dunlop
2,459
239
Waterstone
Financial
1,266
17
5,443
Insurance
1.9%
Ambac
Financial
Group (1)
3,599
46
American
Coastal
Insurance,
Class
C (1)(2)
1,763
24
AMERISAFE
1,481
76
Baldwin
Insurance
Group (1)
5,147
199
Bowhead
Specialty
Holdings (1)
900
32
CNO
Financial
Group
8,072
300
Crawford,
Class
A
1,196
14
Donegal
Group,
Class
A
1,219
19
Employers
Holdings
1,878
96
Enstar
Group (1)
971
313
F&G
Annuities
&
Life
1,456
60
Fidelis
Insurance
Holdings
3,970
72
Genworth
Financial (1)
33,079
231
GoHealth,
Class
A (1)
368
5
Goosehead
Insurance,
Class
A (1)
1,730
185
Greenlight
Capital
Re,
Class
A (1)
2,060
29
Hamilton
Insurance
Group,
Class
B (1)
3,087
59
HCI
Group
644
75
Heritage
Insurance
Holdings (1)
1,641
20
Hippo
Holdings (1)
1,595
43
Horace
Mann
Educators
3,177
125
Investors
Title
103
24
James
River
Group
Holdings
2,136
10
Kingsway
Financial
Services (1)(2)
939
8
Lemonade (1)(2)
3,970
146
Maiden
Holdings (1)
6,747
11
MBIA
3,396
22
Mercury
General
2,064
137
NI
Holdings (1)
507
8
Palomar
Holdings (1)
1,985
210
ProAssurance (1)
3,888
62
Root,
Class
A (1)
648
47
Safety
Insurance
Group
1,116
92
Selective
Insurance
Group
4,654
435
T.
ROWE
PRICE
Small-Cap
Index
Fund
Shares/Par
$
Value
(Cost
and
value
in
$000s)
‡
Selectquote (1)
10,761
40
SiriusPoint (1)
7,123
117
Skyward
Specialty
Insurance
Group (1)
2,863
145
Stewart
Information
Services
2,086
141
Tiptree
1,940
40
Trupanion (1)(2)
2,554
123
United
Fire
Group
1,661
47
Universal
Insurance
Holdings
1,781
38
3,926
Mortgage
Real
Estate
Investment
Trusts
0.9%
Advanced
Flower
Capital,
REIT (2)
1,292
11
AG
Mortgage
Investment
Trust,
REIT
2,051
14
Angel
Oak
Mortgage
REIT,
REIT
792
7
Apollo
Commercial
Real
Estate
Finance,
REIT (2)
10,497
91
Arbor
Realty
Trust,
REIT (2)
14,092
195
Ares
Commercial
Real
Estate,
REIT (2)
4,362
26
ARMOUR
Residential
REIT,
REIT
4,285
81
Blackstone
Mortgage
Trust,
Class
A,
REIT
13,339
232
BrightSpire
Capital,
REIT
10,117
57
Chicago
Atlantic
Real
Estate
Finance,
REIT
1,423
22
Chimera
Investment,
REIT
6,127
86
Claros
Mortgage
Trust (2)
6,439
29
Dynex
Capital,
REIT (2)
5,955
75
Ellington
Financial,
REIT (2)
6,564
80
Franklin
BSP
Realty
Trust,
REIT
6,253
78
Granite
Point
Mortgage
Trust,
REIT
3,857
11
Invesco
Mortgage
Capital,
REIT (2)
4,138
33
KKR
Real
Estate
Finance
Trust,
REIT
4,407
44
Ladder
Capital,
REIT
8,632
97
MFA
Financial,
REIT (2)
7,789
79
New
York
Mortgage
Trust,
REIT
6,742
41
Nexpoint
Real
Estate
Finance,
REIT
543
8
Orchid
Island
Capital,
REIT (2)
5,914
46
PennyMac
Mortgage
Investment
Trust,
REIT
6,612
83
Ready
Capital,
REIT (2)
12,294
84
Redwood
Trust,
REIT
10,041
66
Seven
Hills
Realty
Trust,
REIT
900
12
Sunrise
Realty
Trust,
REIT (2)
371
5
TPG
RE
Finance
Trust,
REIT
4,457
38
Two
Harbors
Investment,
REIT
7,849
93
1,824
Total
Financials
38,078
T.
ROWE
PRICE
Small-Cap
Index
Fund
Shares/Par
$
Value
(Cost
and
value
in
$000s)
‡
HEALTH
CARE
16.4%
Biotechnology
8.3%
2seventy
bio (1)(2)
3,405
10
4D
Molecular
Therapeutics (1)
3,754
21
89bio (1)
6,419
50
Absci (1)(2)
5,644
15
ACADIA
Pharmaceuticals (1)
9,258
170
ACELYRIN (1)
5,437
17
Achieve
Life
Sciences (1)
2,475
9
Acrivon
Therapeutics (1)
832
5
Actinium
Pharmaceuticals (1)(2)
2,219
3
Acumen
Pharmaceuticals (1)
3,108
5
ADC
Therapeutics (1)
6,204
12
ADMA
Biologics (1)
17,259
296
Aduro
Biotech,
CVR (1)(3)
35
—
Adverum
Biotechnologies (1)(2)
1,503
7
Aerovate
Therapeutics (1)
719
2
Agenus (1)(2)
1,464
4
Agios
Pharmaceuticals (1)
4,375
144
Akebia
Therapeutics (1)(2)
15,556
30
Akero
Therapeutics (1)
5,247
146
Aldeyra
Therapeutics (1)
3,836
19
Alector (1)
6,019
11
Alkermes (1)
12,329
355
Allogene
Therapeutics (1)(2)
9,283
20
Altimmune (1)(2)
5,280
38
ALX
Oncology
Holdings (1)(2)
2,369
4
Amicus
Therapeutics (1)
22,550
212
AnaptysBio (1)(2)
1,759
23
Anavex
Life
Sciences (1)(2)
5,849
63
Anika
Therapeutics (1)
926
15
Annexon (1)
7,339
38
Apogee
Therapeutics (1)
2,936
133
Applied
Therapeutics (1)
7,342
6
Arbutus
Biopharma (1)
11,618
38
Arcellx (1)
3,296
253
Arcturus
Therapeutics
Holdings (1)(2)
1,687
29
Arcus
Biosciences (1)
4,156
62
Arcutis
Biotherapeutics (1)
8,296
116
Ardelyx (1)
18,294
93
ArriVent
Biopharma (1)(2)
2,203
59
Arrowhead
Pharmaceuticals (1)
9,254
174
ARS
Pharmaceuticals (1)
3,875
41
T.
ROWE
PRICE
Small-Cap
Index
Fund
Shares/Par
$
Value
(Cost
and
value
in
$000s)
‡
Artiva
Biotherapeutics (1)
1,130
11
Astria
Therapeutics (1)
3,692
33
Atossa
Therapeutics (1)(2)
9,139
9
Aura
Biosciences (1)(2)
3,450
28
Aurinia
Pharmaceuticals (1)
10,419
94
Avid
Bioservices (1)
4,755
59
Avidity
Biosciences (1)
8,511
248
Avita
Medical (1)(2)
2,114
27
Beam
Therapeutics (1)
5,916
147
Bicara
Therapeutics (1)
1,463
26
BioCryst
Pharmaceuticals (1)
15,954
120
Biohaven (1)
6,624
247
Biomea
Fusion (1)(2)
2,035
8
Black
Diamond
Therapeutics (1)
2,659
6
Bluebird
Bio (1)(2)
615
5
Blueprint
Medicines (1)
4,865
424
Boundless
Bio (1)
1,891
5
Bridgebio
Pharma (1)
10,748
295
C4
Therapeutics (1)
4,982
18
Cabaletta
Bio (1)
3,025
7
CAMP4
Therapeutics (1)
522
3
Candel
Therapeutics (1)
1,831
16
Capricor
Therapeutics (1)
2,823
39
Cardiff
Oncology (1)(2)
2,920
13
CareDx (1)
3,850
82
Cargo
Therapeutics (1)
2,543
37
Caribou
Biosciences (1)(2)
5,667
9
Cartesian
Therapeutics (1)
760
14
Cartesian
Therapeutics,
CVR (1)(2)(3)
5,723
13
Catalyst
Pharmaceuticals (1)
8,548
178
Celcuity (1)
2,528
33
Celldex
Therapeutics (1)
4,990
126
Century
Therapeutics (1)
3,398
3
CervoMed (1)(2)
403
1
CG
oncology (1)
3,590
103
Chinook
Therapeutics,
CVR (1)(3)
2,945
—
Cibus (1)
1,082
3
Climb
Bio (1)
2,149
4
Cogent
Biosciences (1)
7,009
55
Coherus
Biosciences (1)(2)
9,190
13
Compass
Therapeutics (1)
9,153
13
Corbus
Pharmaceuticals
Holdings (1)
1,010
12
Crinetics
Pharmaceuticals (1)
6,714
343
T.
ROWE
PRICE
Small-Cap
Index
Fund
Shares/Par
$
Value
(Cost
and
value
in
$000s)
‡
Cullinan
Therapeutics (1)
4,158
51
Cytokinetics (1)
8,745
411
Day
One
Biopharmaceuticals (1)
3,976
50
Denali
Therapeutics (1)
9,560
195
Design
Therapeutics (1)(2)
2,333
14
Dianthus
Therapeutics (1)(2)
1,767
39
Disc
Medicine (1)
1,502
95
Dynavax
Technologies (1)
10,177
130
Dyne
Therapeutics (1)
6,352
150
Editas
Medicine (1)(2)
6,357
8
Elevation
Oncology (1)
3,790
2
Enanta
Pharmaceuticals (1)
1,572
9
Entrada
Therapeutics (1)
1,838
32
Erasca (1)
14,628
37
Fate
Therapeutics (1)(2)
8,305
14
Fennec
Pharmaceuticals (1)(2)
1,710
11
Fibrobiologics (1)
1,861
4
Foghorn
Therapeutics (1)
1,920
9
Galectin
Therapeutics (1)(2)
1,650
2
Generation
Bio (1)
4,214
4
Geron (1)
45,542
161
Greenwich
Lifesciences (1)
442
5
GTx,
CVR (1)(3)
1
—
Gyre
Therapeutics (1)(2)
534
6
Halozyme
Therapeutics (1)
9,543
456
Heron
Therapeutics (1)(2)
8,205
13
HilleVax (1)
2,200
5
Humacyte (1)(2)
6,543
33
Ideaya
Biosciences (1)
6,501
167
IGM
Biosciences (1)(2)
1,067
7
ImmunityBio (1)(2)
11,076
28
Immunome (1)
4,055
43
Immunovant (1)
4,486
111
Inhibrx,
CVR (1)(3)
2,250
—
Inhibrx
Biosciences (1)
798
12
Inmune
Bio (1)
900
4
Inovio
Pharmaceuticals (1)
1,808
3
Inozyme
Pharma (1)(2)
3,607
10
Insmed (1)
13,242
914
Intellia
Therapeutics (1)
7,661
89
Invivyd (1)
5,891
3
Iovance
Biotherapeutics (1)
20,900
155
Ironwood
Pharmaceuticals (1)
11,131
49
T.
ROWE
PRICE
Small-Cap
Index
Fund
Shares/Par
$
Value
(Cost
and
value
in
$000s)
‡
iTeos
Therapeutics (1)
1,860
14
Janux
Therapeutics (1)
2,166
116
Jasper
Therapeutics (1)
800
17
KalVista
Pharmaceuticals (1)
2,576
22
Keros
Therapeutics (1)
2,273
36
Kiniksa
Pharmaceuticals
International (1)
3,008
60
Kodiak
Sciences (1)
2,495
25
Korro
Bio (1)
434
17
Krystal
Biotech (1)
1,900
298
Kura
Oncology (1)
5,516
48
Kymera
Therapeutics (1)
3,575
144
Kyverna
Therapeutics (1)(2)
2,366
9
Larimar
Therapeutics (1)
2,961
11
LENZ
Therapeutics (2)
939
27
Lexeo
Therapeutics (1)(2)
1,720
11
Lexicon
Pharmaceuticals (1)(2)
8,220
6
Lineage
Cell
Therapeutics (1)(2)
10,661
5
Lyell
Immunopharma (1)
11,054
7
MacroGenics (1)(2)
4,854
16
Madrigal
Pharmaceuticals (1)
1,375
424
MannKind (1)
20,470
132
MeiraGTx
Holdings (1)
3,462
21
Mersana
Therapeutics (1)
8,565
12
Metagenomi (1)
2,226
8
MiMedx
Group (1)
8,983
86
Mineralys
Therapeutics (1)(2)
2,130
26
Mirum
Pharmaceuticals (1)
3,065
127
Monte
Rosa
Therapeutics (1)(2)
3,010
21
Myriad
Genetics (1)
6,920
95
Neurogene (1)
763
17
Nkarta (1)
3,723
9
Novavax (1)(2)
11,753
95
Nurix
Therapeutics (1)
5,352
101
Nuvalent,
Class
A (1)
2,700
211
Ocugen (1)
23,842
19
Olema
Pharmaceuticals (1)
2,969
17
Organogenesis
Holdings (1)
6,061
19
ORIC
Pharmaceuticals (1)
4,632
37
Outlook
Therapeutics (1)(2)
1,299
2
Ovid
therapeutics (1)
3,876
4
PepGen (1)
1,100
4
Perspective
Therapeutics (1)(2)
4,194
13
Poseida
Therapeutics (1)
5,437
52
T.
ROWE
PRICE
Small-Cap
Index
Fund
Shares/Par
$
Value
(Cost
and
value
in
$000s)
‡
Praxis
Precision
Medicines (1)
1,334
103
Precigen (1)(2)
11,755
13
Prelude
Therapeutics (1)(2)
1,020
1
Prime
Medicine (1)(2)
3,994
12
ProKidney (1)
7,581
13
Protagonist
Therapeutics (1)
4,516
174
Prothena (1)
3,178
44
PTC
Therapeutics (1)
5,825
263
Puma
Biotechnology (1)
3,003
9
Pyxis
Oncology (1)(2)
3,512
5
Q32
Bio (1)(2)
449
2
RAPT
Therapeutics (1)
1,901
3
Recursion
Pharmaceuticals,
Class
A (1)(2)
19,118
129
REGENXBIO (1)
3,432
27
Regulus
Therapeutics (1)
4,594
7
Relay
Therapeutics (1)
9,363
39
Renovaro (1)(2)
9,147
8
Replimune
Group (1)
4,766
58
REVOLUTION
Medicines (1)
12,866
563
Rhythm
Pharmaceuticals (1)
4,206
235
Rigel
Pharmaceuticals (1)(2)
1,407
24
Rocket
Pharmaceuticals (1)
5,134
65
Sage
Therapeutics (1)
4,292
23
Sana
Biotechnology (1)(2)
10,025
16
Savara (1)(2)
9,280
29
Scholar
Rock
Holding (1)
5,980
258
Sera
Prognostics,
Class
A (1)(2)
2,324
19
Shattuck
Labs (1)(2)
2,823
3
Skye
Bioscience (1)
1,254
4
Soleno
Therapeutics (1)
1,952
88
Solid
Biosciences (1)
1,637
7
SpringWorks
Therapeutics (1)
5,286
191
Spyre
Therapeutics (1)
2,713
63
Stoke
Therapeutics (1)
2,646
29
Summit
Therapeutics (1)(2)
7,126
127
Sutro
Biopharma (1)
5,814
11
Syndax
Pharmaceuticals (1)
6,363
84
Tango
Therapeutics (1)
3,332
10
Taysha
Gene
Therapies (1)
12,844
22
Tenaya
Therapeutics (1)(2)
4,112
6
Tevogen
Bio
Holdings (1)
2,273
2
TG
Therapeutics (1)
10,691
322
Tobira
Therapeutics,
CVR (1)(3)
25
—
T.
ROWE
PRICE
Small-Cap
Index
Fund
Shares/Par
$
Value
(Cost
and
value
in
$000s)
‡
Tourmaline
Bio (1)
1,711
35
Travere
Therapeutics (1)
5,850
102
TScan
Therapeutics (1)(2)
2,713
8
Twist
Bioscience (1)
4,506
209
Tyra
Biosciences (1)(2)
1,519
21
Upstream
Bio (1)
1,320
22
UroGen
Pharma (1)(2)
2,926
31
Vanda
Pharmaceuticals (1)(2)
4,465
21
Vaxcyte (1)
9,539
781
Vera
Therapeutics (1)
3,375
143
Veracyte (1)
5,902
234
Verastem (1)(2)
3,372
17
Vericel (1)
3,771
207
Verve
Therapeutics (1)
5,288
30
Vir
Biotechnology (1)
6,998
51
Viridian
Therapeutics (1)
5,572
107
Voyager
Therapeutics (1)
3,623
21
Werewolf
Therapeutics (1)
2,308
3
X4
Pharmaceuticals (1)(2)
13,342
10
XBiotech (1)
1,387
5
Xencor (1)
5,129
118
XOMA
Royalty (1)
595
16
Y-mAbs
Therapeutics (1)
2,731
21
Zenas
Biopharma (1)
1,164
10
Zentalis
Pharmaceuticals (1)(2)
4,970
15
Zura
Bio (1)(2)
3,266
8
Zymeworks (1)
4,131
60
17,077
Health
Care
Equipment
&
Supplies
3.0%
Accuray (1)
7,055
14
Alphatec
Holdings (1)(2)
7,988
73
AngioDynamics (1)
2,998
28
Artivion (1)
3,015
86
AtriCure (1)
3,657
112
Avanos
Medical (1)
3,453
55
Axogen (1)
3,170
52
Bioventus,
Class
A (1)
2,807
30
Ceribell (1)
933
24
Cerus (1)
14,104
22
CONMED
2,386
163
CVRx (1)
1,005
13
Embecta
4,500
93
Fractyl
Health (1)(2)
2,604
5
T.
ROWE
PRICE
Small-Cap
Index
Fund
Shares/Par
$
Value
(Cost
and
value
in
$000s)
‡
Glaukos (1)
3,762
564
Haemonetics (1)
3,847
300
ICU
Medical (1)
1,639
254
Inari
Medical (1)
4,067
208
Inmode (1)
5,451
91
Inogen (1)
1,691
16
Integer
Holdings (1)
2,553
338
Integra
LifeSciences
Holdings (1)
5,226
119
iRadimed
599
33
iRhythm
Technologies (1)
2,393
216
Lantheus
Holdings (1)
5,296
474
LeMaitre
Vascular
1,570
145
LivaNova (1)
4,174
193
Merit
Medical
Systems (1)
4,378
423
Neogen (1)
16,776
204
NeuroPace (1)
1,013
11
Nevro (1)
2,740
10
Novocure (1)
8,179
244
Omnicell (1)
3,530
157
OraSure
Technologies (1)
5,394
20
Orchestra
BioMed
Holdings (1)(2)
1,670
7
Orthofix
Medical (1)
2,703
47
OrthoPediatrics (1)
1,217
28
Paragon
28 (1)(2)
3,633
38
PROCEPT
BioRobotics (1)
3,420
275
Pulmonx (1)
2,685
18
Pulse
Biosciences (1)
1,325
23
RxSight (1)
2,774
95
Sanara
Medtech (1)
275
9
Semler
Scientific (1)
397
21
SI-BONE (1)
3,258
46
Sight
Sciences (1)
2,499
9
STAAR
Surgical (1)
3,833
93
Stereotaxis (1)
4,067
9
Surmodics (1)
1,024
41
Tactile
Systems
Technology (1)
1,768
30
Tandem
Diabetes
Care (1)(2)
5,071
183
TransMedics
Group (1)(2)
2,498
156
Treace
Medical
Concepts (1)
3,961
30
UFP
Technologies (1)
559
137
Utah
Medical
Products
251
15
Varex
Imaging (1)
2,907
42
Zimvie (1)
2,015
28
T.
ROWE
PRICE
Small-Cap
Index
Fund
Shares/Par
$
Value
(Cost
and
value
in
$000s)
‡
Zynex (1)(2)
1,133
9
6,179
Health
Care
Providers
&
Services
2.8%
Accolade (1)
5,988
21
AdaptHealth (1)
7,679
73
Addus
HomeCare (1)
1,342
168
agilon
health (1)
24,353
46
AirSculpt
Technologies (1)(2)
1,045
5
Alignment
Healthcare (1)
7,618
86
AMN
Healthcare
Services (1)
3,005
72
Ardent
Health
Partners (1)
859
15
Astrana
Health (1)
3,326
105
Aveanna
Healthcare
Holdings (1)(2)
3,820
17
BrightSpring
Health
Services (1)(2)
4,061
69
Brookdale
Senior
Living (1)(2)
14,867
75
Castle
Biosciences (1)
1,943
52
Community
Health
Systems (1)
9,385
28
Concentra
Group
Holdings
Parent
8,508
168
CorVel (1)
2,043
227
Cross
Country
Healthcare (1)
2,561
47
DocGo (1)(2)
8,225
35
Enhabit (1)
3,762
29
Ensign
Group
4,267
567
Fulgent
Genetics (1)(2)
1,514
28
GeneDx
Holdings (1)
993
76
Guardant
Health (1)
9,023
276
HealthEquity (1)
6,595
633
Hims
&
Hers
Health (1)
14,524
351
InfuSystem
Holdings (1)
1,766
15
Innovage
Holding (1)
1,322
5
Joint (1)
1,025
11
LifeStance
Health
Group (1)
10,630
78
ModivCare (1)
815
10
Nano-X
Imaging (1)(2)
4,056
29
National
HealthCare
970
104
National
Research
1,102
19
NeoGenomics (1)
9,857
162
OPKO
Health (1)(2)
24,266
36
Option
Care
Health (1)
13,147
305
Oscar
Health,
Class
A (1)
15,300
206
Owens
&
Minor (1)
5,863
77
PACS
Group (1)
2,899
38
Patterson
6,102
188
T.
ROWE
PRICE
Small-Cap
Index
Fund
Shares/Par
$
Value
(Cost
and
value
in
$000s)
‡
Pediatrix
Medical
Group (1)
6,682
88
Pennant
Group (1)
2,495
66
Performant
Healthcare (1)
5,148
16
Privia
Health
Group (1)
7,891
154
Progyny (1)
6,009
104
Quipt
Home
Medical (1)(2)
2,664
8
RadNet (1)
5,061
353
Select
Medical
Holdings
8,372
158
Sonida
Senior
Living (1)(2)
424
10
Surgery
Partners (1)
5,929
126
Talkspace (1)(2)
9,173
28
U.S.
Physical
Therapy
1,136
101
Viemed
Healthcare (1)
2,795
22
5,786
Health
Care
Technology
0.3%
Definitive
Healthcare (1)
3,765
15
Evolent
Health,
Class
A (1)
8,943
101
Health
Catalyst (1)
4,515
32
HealthStream
1,907
61
LifeMD (1)
3,033
15
OptimizeRx (1)
1,315
6
Phreesia (1)
4,214
106
Schrodinger (1)
4,302
83
Simulations
Plus
1,182
33
Teladoc
Health (1)
13,288
121
Waystar
Holding (1)
3,280
120
693
Life
Sciences
Tools
&
Services
0.3%
Adaptive
Biotechnologies (1)
9,033
54
Akoya
Biosciences (1)(2)
1,594
4
BioLife
Solutions (1)
2,808
73
ChromaDex (1)
3,559
19
Codexis (1)
6,438
31
Conduit
Pharmaceuticals (1)
2,132
—
CryoPort (1)
3,505
27
Cytek
Biosciences (1)
9,458
61
Harvard
Bioscience (1)
2,632
6
Lifecore
Biomedical (1)
1,566
12
Maravai
LifeSciences
Holdings,
Class
A (1)
8,238
45
MaxCyte (1)(2)
7,801
32
Mesa
Laboratories
403
53
Nautilus
Biotechnology (1)
3,273
6
Omniab (1)
6,953
25
T.
ROWE
PRICE
Small-Cap
Index
Fund
Shares/Par
$
Value
(Cost
and
value
in
$000s)
‡
Omniab,
Earn
Out
Shares
$12.50 (1)
233
—
Omniab,
Earn
Out
Shares
$15.00 (1)
233
—
Pacific
Biosciences
of
California (1)(2)
21,150
39
Quanterix (1)
2,669
28
Quantum-Si (1)(2)
8,603
23
Standard
BioTools (1)(2)
21,870
38
576
Pharmaceuticals
1.7%
Alto
Neuroscience (1)
1,555
7
Alumis (1)(2)
940
7
Amneal
Pharmaceuticals (1)
12,373
98
Amphastar
Pharmaceuticals (1)
2,914
108
ANI
Pharmaceuticals (1)
1,439
80
Aquestive
Therapeutics (1)
5,779
21
Arvinas (1)
4,866
93
Atea
Pharmaceuticals (1)
5,622
19
Avadel
Pharmaceuticals (1)(2)
7,207
76
Axsome
Therapeutics (1)
2,824
239
BioAge
Labs (1)
919
5
Biote,
Class
A (1)
1,931
12
Cassava
Sciences (1)(2)
3,016
7
Collegium
Pharmaceutical (1)
2,429
70
Contineum
Therapeutics,
Class
A (1)
916
13
Corcept
Therapeutics (1)(2)
6,195
312
CorMedix (1)
4,548
37
Edgewise
Therapeutics (1)
5,616
150
Enliven
Therapeutics (1)(2)
2,687
60
Esperion
Therapeutics (1)
14,093
31
Evolus (1)
4,235
47
EyePoint
Pharmaceuticals (1)
5,039
38
Fulcrum
Therapeutics (1)
5,003
23
Harmony
Biosciences
Holdings (1)
2,907
100
Harrow (1)
2,324
78
Innoviva (1)
4,300
75
Ligand
Pharmaceuticals (1)
1,341
144
Liquidia (1)
4,862
57
Lyra
Therapeutics (1)
5,483
1
MBX
Biosciences (1)
852
16
MediWound (1)(2)
585
10
Mind
Medicine
MindMed (1)(2)
6,192
43
Nektar
Therapeutics (1)
12,692
12
Neumora
Therapeutics (1)
6,420
68
Nuvation
Bio (1)(2)
13,796
37
T.
ROWE
PRICE
Small-Cap
Index
Fund
Shares/Par
$
Value
(Cost
and
value
in
$000s)
‡
Ocular
Therapeutix (1)(2)
12,039
103
Omeros (1)
4,431
44
Pacira
BioSciences (1)
3,471
65
Phathom
Pharmaceuticals (1)(2)
2,918
24
Phibro
Animal
Health,
Class
A
1,526
32
Pliant
Therapeutics (1)
4,473
59
Prestige
Consumer
Healthcare (1)
3,796
296
Rapport
Therapeutics (1)
659
12
Revance
Therapeutics (1)
7,721
23
Scilex
Holding (1)
2,710
1
scPharmaceuticals (1)(2)
2,863
10
Septerna (1)
1,408
32
SIGA
Technologies
3,626
22
Supernus
Pharmaceuticals (1)
3,874
140
Tarsus
Pharmaceuticals (1)
2,845
157
Telomir
Pharmaceuticals (1)
1,384
6
Terns
Pharmaceuticals (1)
5,426
30
Theravance
Biopharma (1)
2,753
26
Third
Harmonic
Bio (1)
1,493
15
Trevi
Therapeutics (1)
5,000
21
Ventyx
Biosciences (1)(2)
4,649
10
Verrica
Pharmaceuticals (1)(2)
1,287
1
WaVe
Life
Sciences (1)
7,031
87
Xeris
Biopharma
Holdings (1)
11,061
37
Zevra
Therapeutics (1)
4,078
34
3,481
Total
Health
Care
33,792
INDUSTRIALS
&
BUSINESS
SERVICES
17.6%
Aerospace
&
Defense
1.4%
AAR (1)
2,700
166
AeroVironment (1)
2,151
331
AerSale (1)
2,549
16
Archer
Aviation,
Class
A (1)(2)
17,874
174
Astronics (1)
2,167
35
Byrna
Technologies (1)(2)
1,365
39
Cadre
Holdings
1,990
64
Ducommun (1)
1,078
69
Eve
Holding (1)(2)
4,001
22
Intuitive
Machines (1)(2)
2,430
44
Kratos
Defense
&
Security
Solutions (1)
11,339
299
Leonardo
DRS (1)
5,703
184
Mercury
Systems (1)
4,019
169
Moog,
Class
A
2,173
428
T.
ROWE
PRICE
Small-Cap
Index
Fund
Shares/Par
$
Value
(Cost
and
value
in
$000s)
‡
National
Presto
Industries
401
40
Park
Aerospace
1,389
20
Redwire (1)(2)
1,830
30
Rocket
Lab
USA (1)
26,732
681
Triumph
Group (1)
5,574
104
V2X (1)
1,086
52
Virgin
Galactic
Holdings (1)(2)
2,276
13
VirTra (1)(2)
796
5
2,985
Air
Freight
&
Logistics
0.2%
Air
Transport
Services
Group (1)
3,901
86
Forward
Air (1)
1,961
63
Hub
Group,
Class
A
4,608
205
Radiant
Logistics (1)
2,795
19
373
Building
Products
1.4%
American
Woodmark (1)
1,207
96
Apogee
Enterprises
1,688
121
AZZ
2,246
184
Caesarstone (1)
1,525
6
CSW
Industrials
1,282
452
Gibraltar
Industries (1)
2,357
139
Griffon
2,891
206
Insteel
Industries
1,390
38
Janus
International
Group (1)
11,025
81
JELD-WEN
Holding (1)
6,396
52
Masterbrand (1)
9,761
143
Quanex
Building
Products
3,510
85
Resideo
Technologies (1)
11,169
257
Tecnoglass (2)
1,739
138
UFP
Industries
4,652
524
Zurn
Elkay
Water
Solutions
11,022
411
2,933
Commercial
Services
&
Supplies
1.8%
ABM
Industries
4,835
247
ACCO
Brands
6,990
37
ACV
Auctions,
Class
A (1)
11,319
244
Aris
Water
Solutions,
Class
A
2,110
50
Bridger
Aerospace
Group
Holdings (1)
759
2
BrightView
Holdings (1)
4,436
71
Brink's
3,398
315
Casella
Waste
Systems,
Class
A (1)
4,803
508
T.
ROWE
PRICE
Small-Cap
Index
Fund
Shares/Par
$
Value
(Cost
and
value
in
$000s)
‡
CECO
Environmental (1)
2,287
69
Cimpress (1)
1,293
93
CompX
International
107
3
CoreCivic (1)
8,445
184
Deluxe
3,432
77
Driven
Brands
Holdings (1)
4,659
75
Ennis
1,960
41
Enviri (1)
5,920
46
GEO
Group (1)
9,760
273
Healthcare
Services
Group (1)
5,842
68
HNI
3,654
184
Interface
4,355
106
LanzaTech
Global (1)(2)
8,002
11
Liquidity
Services (1)
1,604
52
Matthews
International,
Class
A
2,322
64
MillerKnoll
5,385
122
Montrose
Environmental
Group (1)
2,507
46
NL
Industries
586
5
OPENLANE (1)
8,301
165
Perma-Fix
Environmental
Services (1)
1,140
13
Pitney
Bowes
12,418
90
Quad/Graphics
2,475
17
Quest
Resource
Holding (1)(2)
1,245
8
Steelcase,
Class
A
7,038
83
UniFirst
1,162
199
Viad (1)
1,598
68
Virco
Mfg.
754
8
VSE
1,340
127
3,771
Construction
&
Engineering
1.7%
Ameresco,
Class
A (1)(2)
2,513
59
Arcosa
3,716
359
Argan
975
134
Bowman
Consulting
Group (1)
1,094
27
Centuri
Holdings (1)
1,270
25
Concrete
Pumping
Holdings (1)
1,947
13
Construction
Partners,
Class
A (1)
3,290
291
Dycom
Industries (1)
2,175
379
Fluor (1)
13,123
647
Granite
Construction
3,375
296
Great
Lakes
Dredge
&
Dock (1)
5,164
58
IES
Holdings (1)
634
127
Limbach
Holdings (1)
799
68
T.
ROWE
PRICE
Small-Cap
Index
Fund
Shares/Par
$
Value
(Cost
and
value
in
$000s)
‡
Matrix
Service (1)
1,977
24
MYR
Group (1)
1,236
184
Northwest
Pipe (1)
724
35
Orion
Group
Holdings (1)
2,697
20
Primoris
Services
4,093
313
Southland
Holdings (1)
912
3
Sterling
Infrastructure (1)
2,283
385
Tutor
Perini (1)
3,278
79
3,526
Electrical
Equipment
1.3%
Allient
1,193
29
American
Superconductor (1)
2,662
66
Amprius
Technologies (1)
1,594
4
Array
Technologies (1)(2)
11,896
72
Atkore
2,753
230
Blink
Charging (1)
6,804
9
Bloom
Energy,
Class
A (1)
15,389
342
ChargePoint
Holdings (1)(2)
29,381
31
Energy
Vault
Holdings (1)(2)
7,782
18
EnerSys
3,059
283
Enovix (1)(2)
12,542
136
Fluence
Energy (1)(2)
4,818
76
Freyr
Battery (1)(2)
9,407
24
FuelCell
Energy (1)(2)
1,290
12
GrafTech
International (1)(2)
19,809
34
LSI
Industries
2,153
42
NANO
Nuclear
Energy (1)(2)
387
10
Net
Power (1)(2)
1,768
19
NEXTracker,
Class
A (1)
11,039
403
NuScale
Power (1)
6,453
116
Plug
Power (1)(2)
60,711
129
Powell
Industries (2)
722
160
Preformed
Line
Products
181
23
SES
AI (1)(2)
10,951
24
Shoals
Technologies
Group,
Class
A (1)
12,950
72
SolarMax
Technology (1)
3,527
6
Solidion
Technology (1)
5,452
4
Stem (1)(2)
10,858
7
Sunrun (1)
16,706
154
Thermon
Group
Holdings (1)
2,592
75
TPI
Composites (1)(2)
3,457
7
Ultralife (1)
742
5
T.
ROWE
PRICE
Small-Cap
Index
Fund
Shares/Par
$
Value
(Cost
and
value
in
$000s)
‡
Vicor (1)
1,725
83
2,705
Ground
Transportation
0.4%
ArcBest
1,801
168
Covenant
Logistics
Group
625
34
FTAI
Infrastructure
7,691
56
Heartland
Express
3,466
39
Hertz
Global
Holdings (1)(2)
9,169
33
Marten
Transport
4,521
71
Pamt (1)
432
7
Proficient
Auto
Logistics (1)
1,073
9
RXO (1)
12,240
292
Universal
Logistics
Holdings (2)
509
23
Werner
Enterprises
4,714
169
901
Industrial
Conglomerates
0.0%
Brookfield
Business,
Class
A
2,039
49
49
Machinery
3.9%
374Water (1)(2)
4,150
3
3D
Systems (1)
9,685
32
Alamo
Group
793
147
Albany
International,
Class
A
2,388
191
Astec
Industries
1,706
57
Atmus
Filtration
Technologies
6,408
251
Barnes
Group
3,590
170
Blue
Bird (1)
2,522
97
Chart
Industries (1)
3,304
631
Columbus
McKinnon
2,144
80
Commercial
Vehicle
Group (1)
2,104
5
Douglas
Dynamics
1,684
40
Eastern
379
10
Energy
Recovery (1)
4,337
64
Enerpac
Tool
Group
4,161
171
Enpro
1,605
277
ESCO
Technologies
1,979
264
Federal
Signal
4,602
425
Franklin
Electric
3,470
338
Gencor
Industries (1)
824
15
Gorman-Rupp
1,636
62
Graham (1)
826
37
Greenbrier
2,365
144
T.
ROWE
PRICE
Small-Cap
Index
Fund
Shares/Par
$
Value
(Cost
and
value
in
$000s)
‡
Helios
Technologies
2,568
115
Hillenbrand
5,407
166
Hillman
Solutions (1)
15,140
147
Hyliion
Holdings (1)
10,655
28
Hyster-Yale
905
46
John
Bean
Technologies
3,596
457
Kadant
899
310
Kennametal
6,028
145
L
B
Foster,
Class
A (1)
646
17
Lindsay
822
97
Luxfer
Holdings
2,038
27
Manitowoc (1)
2,650
24
Mayville
Engineering (1)(2)
941
15
Miller
Industries
867
57
Mueller
Industries
8,587
681
Mueller
Water
Products,
Class
A
11,882
267
NN (1)
3,332
11
Omega
Flex
253
11
Park-Ohio
Holdings
642
17
Proto
Labs (1)
1,954
76
REV
Group
3,968
126
Shyft
Group
2,514
29
SPX
Technologies (1)
3,461
504
Standex
International
889
166
Taylor
Devices (1)
258
11
Tennant
1,437
117
Terex
5,097
236
Titan
International (1)
3,736
25
Trinity
Industries
6,281
220
Twin
Disc
811
10
Wabash
National
3,255
56
Watts
Water
Technologies,
Class
A
2,095
426
8,151
Marine
Transportation
0.3%
Costamare
3,239
42
Genco
Shipping
&
Trading
3,166
44
Golden
Ocean
Group
9,240
83
Himalaya
Shipping
2,252
11
Matson
2,507
338
Pangaea
Logistics
Solutions
2,295
12
Safe
Bulkers
4,741
17
547
T.
ROWE
PRICE
Small-Cap
Index
Fund
Shares/Par
$
Value
(Cost
and
value
in
$000s)
‡
Passenger
Airlines
0.5%
Allegiant
Travel
1,202
113
Blade
Air
Mobility (1)
4,565
20
Frontier
Group
Holdings (1)(2)
3,127
22
JetBlue
Airways (1)
24,195
190
Joby
Aviation (1)
33,336
271
SkyWest (1)
3,035
304
Sun
Country
Airlines
Holdings (1)
3,033
44
Wheels
Up
Experience (1)(2)
6,435
11
975
Professional
Services
2.2%
Alight,
Class
A
32,260
223
Asure
Software (1)
1,758
17
Barrett
Business
Services
1,986
86
BlackSky
Technology (1)(2)
1,960
21
CBIZ (1)
3,673
301
Conduent (1)
12,437
50
CRA
International
513
96
CSG
Systems
International
2,288
117
DLH
Holdings (1)
633
5
ExlService
Holdings (1)
12,085
536
Exponent
3,871
345
First
Advantage (1)
4,646
87
FiscalNote
Holdings (1)(2)
3,954
4
Forrester
Research (1)
822
13
Franklin
Covey (1)
841
32
Heidrick
&
Struggles
International
1,568
69
HireQuest (2)
364
5
Huron
Consulting
Group (1)
1,358
169
IBEX (1)
669
14
ICF
International
1,427
170
Innodata (1)
2,106
83
Insperity
2,760
214
Kelly
Services,
Class
A
2,296
32
Kforce
1,383
78
Korn
Ferry
3,971
268
Legalzoom.com (1)
9,707
73
Maximus
4,606
344
Mistras
Group (1)
1,521
14
NV5
Global (1)
4,346
82
Planet
Labs
PBC (1)
16,838
68
Resources
Connection
2,539
22
Spire
Global (1)(2)
1,742
25
T.
ROWE
PRICE
Small-Cap
Index
Fund
Shares/Par
$
Value
(Cost
and
value
in
$000s)
‡
TriNet
Group
2,456
223
TrueBlue (1)
2,161
18
TTEC
Holdings
1,529
8
Upwork (1)
9,632
158
Verra
Mobility (1)
12,628
305
Willdan
Group (1)
940
36
WNS
Holdings (1)
3,322
157
4,568
Trading
Companies
&
Distributors
2.5%
Alta
Equipment
Group (2)
1,906
12
Applied
Industrial
Technologies
2,956
708
Beacon
Roofing
Supply (1)
4,770
484
BlueLinx
Holdings (1)
634
65
Boise
Cascade
2,983
355
Custom
Truck
One
Source (1)
3,647
17
Distribution
Solutions
Group (1)(2)
774
27
DNOW (1)
8,152
106
DXP
Enterprises (1)
974
80
EVI
Industries
423
7
FTAI
Aviation
7,801
1,124
GATX
2,731
423
Global
Industrial
1,017
25
GMS (1)
3,028
257
H&E
Equipment
Services
2,490
122
Herc
Holdings
2,154
408
Hudson
Technologies (1)
3,382
19
Karat
Packaging
487
15
McGrath
RentCorp
1,876
210
MRC
Global (1)
6,394
82
Rush
Enterprises,
Class
A
4,653
255
Rush
Enterprises,
Class
B
682
37
Titan
Machinery (1)
1,593
22
Transcat (1)(2)
689
73
Willis
Lease
Finance (2)
225
47
Xometry,
Class
A (1)(2)
3,244
138
5,118
Transportation
Infrastructure
0.0%
Sky
Harbour
Group (1)
837
10
10
Total
Industrials
&
Business
Services
36,612
T.
ROWE
PRICE
Small-Cap
Index
Fund
Shares/Par
$
Value
(Cost
and
value
in
$000s)
‡
INFORMATION
TECHNOLOGY
13.8%
Communications
Equipment
0.7%
ADTRAN
Holdings (1)
5,997
50
Applied
Optoelectronics (1)
3,107
114
Aviat
Networks (1)
802
15
Calix (1)
4,534
158
Clearfield (1)
969
30
CommScope
Holding (1)(2)
16,653
87
Digi
International (1)
2,773
84
Extreme
Networks (1)
9,919
166
Harmonic (1)
8,529
113
Infinera (1)(2)
15,380
101
NETGEAR (1)
2,119
59
NetScout
Systems (1)
5,350
116
Ribbon
Communications (1)
6,843
28
Viasat (1)(2)
9,593
82
Viavi
Solutions (1)
17,017
172
1,375
Electronic
Equipment,
Instruments
&
Components
3.0%
908
Devices (1)
1,445
3
Advanced
Energy
Industries
2,867
332
Aeva
Technologies (1)(2)
1,561
7
Arlo
Technologies (1)
7,384
83
Badger
Meter
2,261
480
Bel
Fuse,
Class
A
126
11
Bel
Fuse,
Class
B
791
65
Belden
3,105
350
Benchmark
Electronics
2,756
125
Climb
Global
Solutions
335
43
CTS
2,326
123
Daktronics (1)
3,014
51
ePlus (1)
2,015
149
Evolv
Technologies
Holdings (1)(2)
10,449
41
Fabrinet (1)
2,804
617
FARO
Technologies (1)
1,539
39
Insight
Enterprises (1)
2,086
317
Itron (1)
3,458
376
Kimball
Electronics (1)
1,822
34
Knowles (1)
6,717
134
Lightwave
Logic (1)(2)
8,952
19
Methode
Electronics
2,608
31
MicroVision (1)(2)
16,858
22
T.
ROWE
PRICE
Small-Cap
Index
Fund
Shares/Par
$
Value
(Cost
and
value
in
$000s)
‡
Mirion
Technologies (1)
15,856
277
Napco
Security
Technologies
2,676
95
nLight (1)
3,462
36
Novanta (1)
2,745
419
OSI
Systems (1)
1,219
204
Ouster (1)(2)
3,484
43
PAR
Technology (1)
2,586
188
PC
Connection
884
61
Plexus (1)
2,053
321
Powerfleet (1)
7,414
49
Richardson
Electronics
1,095
15
Rogers (1)
1,453
148
Sanmina (1)
4,115
311
ScanSource (1)
1,809
86
SmartRent (1)
14,987
26
TTM
Technologies (1)
7,727
191
Vishay
Intertechnology
9,766
165
Vishay
Precision
Group (1)
952
22
6,109
IT
Services
0.5%
Applied
Digital (1)
14,610
112
ASGN (1)
3,311
276
Backblaze,
Class
A (1)
2,821
17
BigBear.ai
Holdings (1)(2)
8,293
37
BigCommerce
Holdings,
Series
1 (1)
5,266
32
Couchbase (1)
3,041
47
DigitalOcean
Holdings (1)
5,022
171
Fastly,
Class
A (1)
10,165
96
Grid
Dynamics
Holdings (1)
4,358
97
Hackett
Group
1,969
61
Information
Services
Group
2,741
9
Rackspace
Technology (1)(2)
4,762
11
Tucows,
Class
A (1)(2)
604
10
Unisys (1)
4,927
31
1,007
Semiconductors
&
Semiconductor
Equipment
2.6%
ACM
Research,
Class
A (1)(2)
3,885
59
Aehr
Test
Systems (1)(2)
2,273
38
Alpha
&
Omega
Semiconductor (1)
1,856
69
Ambarella (1)
2,895
211
Axcelis
Technologies (1)
2,493
174
CEVA (1)
1,775
56
Cohu (1)
3,522
94
T.
ROWE
PRICE
Small-Cap
Index
Fund
Shares/Par
$
Value
(Cost
and
value
in
$000s)
‡
Credo
Technology
Group
Holding (1)
10,763
723
Diodes (1)
3,480
215
Everspin
Technologies (1)
1,426
9
FormFactor (1)
5,944
261
GCT
Semiconductor
Holding (1)
632
1
Ichor
Holdings (1)
2,567
83
Impinj (1)
1,753
255
indie
Semiconductor,
Class
A (1)(2)
12,835
52
Kulicke
&
Soffa
Industries
4,082
190
MaxLinear (1)
6,083
120
Navitas
Semiconductor (1)(2)
10,386
37
NVE
366
30
PDF
Solutions (1)
2,360
64
Penguin
Solutions (1)(2)
3,938
76
Photronics (1)
4,766
112
Power
Integrations
4,329
267
QuickLogic (1)
997
11
Rambus (1)
8,174
432
Rigetti
Computing (1)(2)
12,028
184
Semtech (1)(2)
5,563
344
Silicon
Laboratories (1)
2,455
305
SiTime (1)
1,424
305
SkyWater
Technology (1)
2,171
30
Synaptics (1)
3,038
232
Ultra
Clean
Holdings (1)
3,416
123
Veeco
Instruments (1)
4,295
115
5,277
Software
6.5%
8x8 (1)
9,715
26
A10
Networks
5,554
102
ACI
Worldwide (1)
8,070
419
Adeia
8,281
116
Agilysys (1)
1,723
227
Airship
AI
Holdings (1)(2)
810
5
Alarm.com
Holdings (1)
3,639
221
Alkami
Technology (1)
4,087
150
Altair
Engineering,
Class
A (1)
4,156
453
Amplitude,
Class
A (1)
6,098
64
Appian,
Class
A (1)
3,059
101
Arteris (1)
2,318
24
Asana,
Class
A (1)
6,177
125
AudioEye (1)
511
8
Aurora
Innovation (1)
73,848
465
T.
ROWE
PRICE
Small-Cap
Index
Fund
Shares/Par
$
Value
(Cost
and
value
in
$000s)
‡
AvePoint (1)
9,907
164
Bit
Digital (1)
8,940
26
Blackbaud (1)
3,115
230
BlackLine (1)
4,413
268
Blend
Labs,
Class
A (1)
17,894
75
Box,
Class
A (1)
10,785
341
Braze,
Class
A (1)
5,068
212
C3.ai,
Class
A (1)
8,490
292
Cerence (1)
3,176
25
Cipher
Mining (1)(2)
15,456
72
Cleanspark (1)(2)
19,224
177
Clearwater
Analytics
Holdings,
Class
A (1)
13,687
377
Commvault
Systems (1)
3,357
507
Consensus
Cloud
Solutions (1)
1,344
32
Core
Scientific (1)
13,719
193
CS
Disco (1)
2,123
11
Daily
Journal (1)
105
60
Digimarc (1)(2)
1,128
42
Digital
Turbine (1)(2)
6,949
12
Domo,
Class
B (1)
2,470
17
D-Wave
Quantum (1)(2)
7,436
62
E2open
Parent
Holdings (1)
15,560
41
eGain (1)
1,280
8
Enfusion,
Class
A (1)
3,717
38
EverCommerce (1)
1,508
17
Freshworks,
Class
A (1)
15,814
256
Hut
8 (1)
6,229
128
Intapp (1)
4,114
264
InterDigital
1,936
375
Jamf
Holding (1)
6,229
88
Kaltura (1)
7,017
15
Life360 (1)
791
33
LiveRamp
Holdings (1)
5,061
154
Logility
Supply
Chain
Solutions,
Class
A
2,384
26
MARA
Holdings (1)(2)
21,786
365
Matterport (1)
20,183
96
Meridianlink (1)
2,507
52
Mitek
Systems (1)
3,451
38
N-able (1)
5,338
50
NCR
Voyix (1)
11,254
156
NextNav (1)
6,000
93
Olo,
Class
A (1)
8,151
63
ON24 (1)
2,212
14
T.
ROWE
PRICE
Small-Cap
Index
Fund
Shares/Par
$
Value
(Cost
and
value
in
$000s)
‡
OneSpan (1)
2,954
55
Ooma (1)
1,921
27
Pagaya
Technologies,
Class
A (1)(2)
2,722
25
PagerDuty (1)
6,936
127
Porch
Group (1)(2)
6,327
31
Prairie
Operating (1)
336
2
Progress
Software
3,267
213
PROS
Holdings (1)
3,464
76
Q2
Holdings (1)
4,500
453
Qualys (1)
2,841
398
Rapid7 (1)
4,794
193
Red
Violet (1)
843
30
Rekor
Systems (1)(2)
5,217
8
ReposiTrak (2)
838
19
Rimini
Street (1)
4,151
11
Riot
Platforms (1)
21,818
223
Roadzen (1)
2,691
6
Sapiens
International
2,403
65
SEMrush
Holdings,
Class
A (1)
2,923
35
Silvaco
Group (1)
429
3
SolarWinds
4,098
58
SoundHound
AI,
Class
A (1)(2)
23,720
471
SoundThinking (1)
865
11
Sprinklr,
Class
A (1)
8,837
75
Sprout
Social,
Class
A (1)
3,862
119
SPS
Commerce (1)
2,897
533
Telos (1)
3,984
14
Tenable
Holdings (1)
9,027
355
Terawulf (1)
20,376
115
Varonis
Systems (1)
8,439
375
Verint
Systems (1)
4,731
130
Vertex,
Class
A (1)
4,170
222
Viant
Technology,
Class
A (1)
1,114
21
Weave
Communications (1)
3,116
50
WM
Technology (1)
6,268
9
Workiva (1)
3,863
423
Xperi (1)
3,645
37
Yext (1)
8,357
53
Zeta
Global
Holdings,
Class
A (1)
13,669
246
Zuora,
Class
A (1)
10,602
105
13,493
Technology
Hardware,
Storage
&
Peripherals
0.5%
CompoSecure,
Class
A
1,962
30
T.
ROWE
PRICE
Small-Cap
Index
Fund
Shares/Par
$
Value
(Cost
and
value
in
$000s)
‡
Corsair
Gaming (1)
3,697
24
CPI
Card
Group (1)
361
11
Diebold
Nixdorf (1)
1,926
83
Eastman
Kodak (1)
4,743
31
Immersion
2,345
21
IonQ (1)
15,450
645
Turtle
Beach (1)
1,214
21
Xerox
Holdings (2)
8,776
74
940
Total
Information
Technology
28,201
MATERIALS
4.2%
Chemicals
1.8%
AdvanSix
2,004
57
American
Vanguard
1,718
8
Arcadium
Lithium (1)
82,932
425
Arq (1)
2,367
18
ASP
Isotopes (1)
4,238
19
Aspen
Aerogels (1)
4,647
55
Avient
6,905
282
Balchem
2,474
403
Cabot
4,105
375
Core
Molding
Technologies (1)
714
12
Danimer
Scientific,
Warrants,
7/15/25 (1)
1,921
—
Ecovyst (1)
9,102
69
Hawkins
1,489
183
HB
Fuller
4,198
283
Ingevity (1)
2,812
115
Innospec
1,916
211
Intrepid
Potash (1)(2)
818
18
Koppers
Holdings
1,531
50
Kronos
Worldwide
1,537
15
LSB
Industries (1)
3,985
30
Mativ
Holdings
4,255
46
Minerals
Technologies
2,449
187
Northern
Technologies
International
572
8
Orion
4,344
69
Perimeter
Solutions (1)
10,331
132
PureCycle
Technologies (1)
9,581
98
Quaker
Chemical
1,069
150
Rayonier
Advanced
Materials (1)
4,781
39
Sensient
Technologies
3,237
231
Stepan
1,651
107
Tronox
Holdings
9,195
93
T.
ROWE
PRICE
Small-Cap
Index
Fund
Shares/Par
$
Value
(Cost
and
value
in
$000s)
‡
Valhi (2)
173
4
3,792
Construction
Materials
0.5%
Knife
River (1)
4,346
442
Smith-Midland (1)
327
15
Summit
Materials,
Class
A (1)
9,314
471
United
States
Lime
&
Minerals
799
106
1,034
Containers
&
Packaging
0.2%
Ardagh
Metal
Packaging
10,686
32
Greif,
Class
A
1,947
119
Greif,
Class
B
361
24
Myers
Industries
2,843
31
O-I
Glass (1)
11,948
130
Pactiv
Evergreen
3,179
56
Ranpak
Holdings (1)
3,121
21
TriMas
3,156
78
491
Metals
&
Mining
1.6%
Alpha
Metallurgical
Resources (1)
840
168
Arch
Resources
1,362
192
Caledonia
Mining
1,239
12
Carpenter
Technology
3,658
621
Century
Aluminum (1)
4,094
74
Coeur
Mining (1)
30,231
173
Commercial
Metals
8,717
432
Compass
Minerals
International
2,573
29
Constellium (1)
10,011
103
Contango
ORE (1)
797
8
Dakota
Gold (1)
5,450
12
Hecla
Mining
45,141
222
i-80
Gold (1)
22,908
11
Ivanhoe
Electric (1)(2)
6,246
47
Kaiser
Aluminum
1,214
85
Lifezone
Metals (1)
2,990
21
MAC
Copper,
Class
A (1)
4,131
44
Materion
1,585
157
Metallus (1)
3,379
48
Novagold
Resources (1)
18,618
62
Olympic
Steel (2)
739
24
Perpetua
Resources (1)
3,037
32
Piedmont
Lithium (1)(2)
1,363
12
T.
ROWE
PRICE
Small-Cap
Index
Fund
Shares/Par
$
Value
(Cost
and
value
in
$000s)
‡
Radius
Recycling
1,960
30
Ramaco
Resources,
Class
A
1,984
20
Ramaco
Resources,
Class
B
447
4
Ryerson
Holding
2,151
40
SSR
Mining (1)
15,389
107
SunCoke
Energy
6,549
70
Tredegar (1)
2,214
17
Universal
Stainless
&
Alloy
Products (1)
651
29
Warrior
Met
Coal
3,984
216
Worthington
Steel
2,471
79
3,201
Paper
&
Forest
Products
0.1%
Clearwater
Paper (1)
1,283
38
Sylvamo
2,673
211
249
Total
Materials
8,767
REAL
ESTATE
6.0%
Diversified
Real
Estate
Investment
Trusts
0.6%
Alexander
&
Baldwin,
REIT
5,529
98
Alpine
Income
Property
Trust,
REIT
946
16
American
Assets
Trust,
REIT
3,723
98
Armada
Hoffler
Properties,
REIT
6,036
62
Broadstone
Net
Lease,
REIT
14,494
230
CTO
Realty
Growth,
REIT
2,219
44
Empire
State
Realty
Trust,
Class
A,
REIT
10,548
109
Essential
Properties
Realty
Trust,
REIT
13,425
420
Gladstone
Commercial,
REIT
3,181
51
Global
Net
Lease,
REIT
15,584
114
NexPoint
Diversified
Real
Estate
Trust,
REIT (2)
2,543
15
One
Liberty
Properties,
REIT
1,182
32
1,289
Health
Care
Real
Estate
Investment
Trusts
0.7%
American
Healthcare
REIT,
REIT
11,664
331
CareTrust
REIT,
REIT
14,236
385
Community
Healthcare
Trust,
REIT
2,021
39
Diversified
Healthcare
Trust,
REIT
16,326
38
Global
Medical
REIT,
REIT
4,542
35
LTC
Properties,
REIT
3,407
118
National
Health
Investors,
REIT (2)
3,216
223
Sabra
Health
Care
REIT,
REIT
18,122
314
Strawberry
Fields
REIT
450
5
T.
ROWE
PRICE
Small-Cap
Index
Fund
Shares/Par
$
Value
(Cost
and
value
in
$000s)
‡
Universal
Health
Realty
Income
Trust,
REIT
954
35
1,523
Hotel
&
Resort
Real
Estate
Investment
Trusts
0.8%
Apple
Hospitality
REIT,
REIT
17,434
268
Braemar
Hotels
&
Resorts,
REIT
4,625
14
Chatham
Lodging
Trust,
REIT
3,595
32
DiamondRock
Hospitality,
REIT
16,012
145
Pebblebrook
Hotel
Trust,
REIT
9,309
126
RLJ
Lodging
Trust,
REIT
11,778
120
Ryman
Hospitality
Properties,
REIT
4,511
471
Service
Properties
Trust,
REIT
12,267
31
Summit
Hotel
Properties,
REIT
8,208
56
Sunstone
Hotel
Investors,
REIT
15,754
186
Xenia
Hotels
&
Resorts,
REIT
7,877
117
1,566
Industrial
Real
Estate
Investment
Trusts
0.4%
Industrial
Logistics
Properties
Trust,
REIT
4,620
17
Innovative
Industrial
Properties,
REIT
2,182
145
LXP
Industrial
Trust,
REIT
22,519
183
Plymouth
Industrial
REIT,
REIT
3,125
56
Terreno
Realty,
REIT
7,308
432
833
Office
Real
Estate
Investment
Trusts
0.7%
Brandywine
Realty
Trust,
REIT
12,934
72
City
Office
REIT,
REIT
2,871
16
COPT
Defense
Properties,
REIT
8,610
266
Douglas
Emmett,
REIT
12,410
230
Easterly
Government
Properties,
REIT
7,386
84
Franklin
Street
Properties,
REIT
7,040
13
Hudson
Pacific
Properties,
REIT (2)
10,300
31
JBG
SMITH
Properties,
REIT
6,276
96
NET
Lease
Office
Properties,
REIT (2)
1,105
35
Orion
Office
REIT,
REIT
3,911
15
Paramount
Group,
REIT
14,082
70
Peakstone
Realty
Trust,
REIT
2,714
30
Piedmont
Office
Realty
Trust,
Class
A,
REIT
9,393
86
Postal
Realty
Trust,
Class
A,
REIT
1,786
23
SL
Green
Realty,
REIT
5,396
367
1,434
Real
Estate
Management
&
Development
0.6%
American
Realty
Investors (1)(2)
57
1
Anywhere
Real
Estate (1)
7,895
26
T.
ROWE
PRICE
Small-Cap
Index
Fund
Shares/Par
$
Value
(Cost
and
value
in
$000s)
‡
Compass,
Class
A (1)
28,191
165
Cushman
&
Wakefield (1)
17,512
229
eXp
World
Holdings (2)
6,242
72
Forestar
Group (1)
1,411
37
FRP
Holdings (1)
1,032
32
Kennedy-Wilson
Holdings
8,646
86
Marcus
&
Millichap
1,823
70
Maui
Land
&
Pineapple (1)
611
13
Newmark
Group,
Class
A
10,201
131
Offerpad
Solutions (1)
855
2
Opendoor
Technologies (1)
47,790
76
RE/MAX
Holdings,
Class
A (1)
1,531
16
Real
Brokerage (1)
7,992
37
Redfin (1)
9,102
72
RMR
Group,
Class
A
1,156
24
St.
Joe
2,783
125
Star
Holdings (1)
1,052
10
Stratus
Properties (1)
454
9
Tejon
Ranch (1)
1,565
25
Transcontinental
Realty
Investors (1)(2)
92
3
1,261
Residential
Real
Estate
Investment
Trusts
0.4%
Apartment
Investment
&
Management,
Class
A,
REIT (1)
6,996
64
BRT
Apartments,
REIT
896
16
Centerspace,
REIT
1,264
84
Clipper
Realty,
REIT
737
3
Elme
Communities,
REIT
6,811
104
Independence
Realty
Trust,
REIT
17,306
343
NexPoint
Residential
Trust,
REIT
1,712
72
UMH
Properties,
REIT
5,512
104
Veris
Residential,
REIT
6,078
101
891
Retail
Real
Estate
Investment
Trusts
1.4%
Acadia
Realty
Trust,
REIT
9,042
219
Alexander's,
REIT
159
32
CBL
&
Associates
Properties,
REIT
1,685
50
Curbline
Properties,
REIT
7,342
171
FrontView,
REIT
1,093
20
Getty
Realty,
REIT (2)
3,897
117
InvenTrust
Properties,
REIT
5,987
180
Kite
Realty
Group
Trust,
REIT
16,615
419
Macerich,
REIT
18,125
361
NETSTREIT,
REIT
5,912
84
T.
ROWE
PRICE
Small-Cap
Index
Fund
Shares/Par
$
Value
(Cost
and
value
in
$000s)
‡
Phillips
Edison,
REIT
9,401
352
Retail
Opportunity
Investments,
REIT
9,582
166
Saul
Centers,
REIT
836
32
SITE
Centers,
REIT
3,625
55
Tanger,
REIT
8,161
279
Urban
Edge
Properties,
REIT
9,673
208
Whitestone
REIT,
REIT
3,812
54
2,799
Specialized
Real
Estate
Investment
Trusts
0.4%
Farmland
Partners,
REIT (2)
3,267
38
Four
Corners
Property
Trust,
REIT
7,448
202
Gladstone
Land,
REIT
2,510
27
Outfront
Media,
REIT
11,602
206
PotlatchDeltic,
REIT
6,076
239
Safehold,
REIT
4,020
74
Uniti
Group,
REIT
18,474
102
888
Total
Real
Estate
12,484
TRUSTS
&
FUNDS
0.0%
Trusts
&
Mutual
Funds
0.0%
iShares
Russell
2000
ETF (2)
462
102
Total
Trusts
&
Funds
102
UTILITIES
2.8%
Electric
Utilities
0.8%
ALLETE
4,452
288
Genie
Energy,
Class
B
967
15
Hawaiian
Electric
Industries (1)
12,799
125
MGE
Energy
2,789
262
Otter
Tail
3,177
235
Portland
General
Electric
7,978
348
TXNM
Energy
6,896
339
1,612
Gas
Utilities
1.0%
Brookfield
Infrastructure,
Class
A (2)
9,190
368
Chesapeake
Utilities
1,675
203
New
Jersey
Resources
7,523
351
Northwest
Natural
Holding
2,979
118
ONE
Gas
4,316
299
RGC
Resources
591
12
Southwest
Gas
Holdings
4,665
330
T.
ROWE
PRICE
Small-Cap
Index
Fund
Shares/Par
$
Value
(Cost
and
value
in
$000s)
‡
Spire
4,354
295
1,976
Independent
Power
&
Renewable
Electricity
Producers
0.2%
Altus
Power (1)
5,940
24
Montauk
Renewables (1)(2)
5,182
21
Ormat
Technologies
4,428
300
Sunnova
Energy
International (1)(2)
8,626
29
374
Multi-Utilities
0.4%
Avista
6,018
221
Black
Hills
5,369
314
Northwestern
Energy
Group
4,735
253
Unitil
1,217
66
854
Water
Utilities
0.4%
American
States
Water
2,865
223
Cadiz (1)(2)
3,493
18
California
Water
Service
Group
4,579
207
Consolidated
Water
1,136
29
Global
Water
Resources
887
10
Middlesex
Water
1,343
71
Pure
Cycle (1)
1,731
22
SJW
Group
2,580
127
York
Water
1,063
35
742
Total
Utilities
5,558
Total
Common
Stocks
(Cost
$192,227)
205,637
SHORT-TERM
INVESTMENTS
0.6%
Money
Market
Funds
0.5%
T.
Rowe
Price
Government
Reserve
Fund,
4.53% (4)(5)
968,668
969
969
U.S.
Treasury
Obligations
0.1%
U.S.
Treasury
Bills,
4.272%,
3/20/25 (6)
30,000
30
U.S.
Treasury
Bills,
4.441%,
2/25/25
30,000
30
U.S.
Treasury
Bills,
4.497%,
3/13/25 (6)
60,000
59
119
Total
Short-Term
Investments
(Cost
$1,088)
1,088
T.
ROWE
PRICE
Small-Cap
Index
Fund
Shares/Par
$
Value
(Cost
and
value
in
$000s)
‡
SECURITIES
LENDING
COLLATERAL
6.0%
INVESTMENTS
IN
A
POOLED
ACCOUNT
THROUGH
SECURITIES
LENDING
PROGRAM
WITH
STATE
STREET
BANK
AND
TRUST
COMPANY 6.0%
Money
Market
Funds 6.0%
T.
Rowe
Price
Government
Reserve
Fund,
4.53% (4)(5)
12,367,861
12,368
Total
Investments
in
a
Pooled
Account
through
Securities
Lending
Program
with
State
Street
Bank
and
Trust
Company
12,368
Total
Securities
Lending
Collateral
(Cost
$12,368)
12,368
Total
Investments
in
Securities
106.2%
of
Net
Assets
(Cost
$205,683)
$
219,093
‡
Shares/Par
and
Notional
Amount
are
denominated
in
U.S.
dollars
unless
otherwise
noted.
(1)
Non-income
producing
(2)
See
Note
4
.
All
or
a
portion
of
this
security
is
on
loan
at
December
31,
2024.
(3)
See
Note
2.
Level
3
in
fair
value
hierarchy.
(4)
Seven-day
yield
(5)
Affiliated
Companies
(6)
At
December
31,
2024,
all
or
a
portion
of
this
security
is
pledged
as
collateral
and/or
margin
deposit
to
cover
future
funding
obligations.
CVR
Contingent
Value
Rights
EC
Escrow
CUSIP;
represents
a
beneficial
interest
in
a
residual
pool
of
assets;
the
amount
and
timing
of
future
distributions,
if
any,
is
uncertain;
when
presented,
interest
rate
and
maturity
date
are
those
of
the
original
security.
ETF
Exchange-Traded
Fund
REIT
A
domestic
Real
Estate
Investment
Trust
whose
distributions
pass-through
with
original
tax
character
to
the
shareholder
T.
ROWE
PRICE
Small-Cap
Index
Fund
FUTURES
CONTRACTS
($000s)
Expiration
Date
Notional
Amount
Value
and
Unrealized
Gain
(Loss)
Long,
5
Russell
2000
E-Mini
Index
contracts
3/25
562
$
(
2
)
Net
payments
(receipts)
of
variation
margin
to
date
3
Variation
margin
receivable
(payable)
on
open
futures
contracts
$
1
T.
ROWE
PRICE
Small-Cap
Index
Fund
The
accompanying
notes
are
an
integral
part
of
these
financial
statements.
AFFILIATED
COMPANIES
($000s)
The
fund
may
invest
in
certain
securities
that
are
considered
affiliated
companies.
As
defined
by
the
1940
Act,
an
affiliated
company
is
one
in
which
the
fund
owns
5%
or
more
of
the
outstanding
voting
securities,
or
a
company
that
is
under
common
ownership
or
control.
The
following
securities
were
considered
affiliated
companies
for
all
or
some
portion
of
the
year
ended
December
31,
2024.
Net
realized
gain
(loss),
investment
income,
change
in
net
unrealized
gain/loss,
and
purchase
and
sales
cost
reflect
all
activity
for
the
period
then
ended.
Affiliate
Net
Realized
Gain
(Loss)
Change
in
Net
Unrealized
Gain/Loss
Investment
Income
T.
Rowe
Price
Government
Reserve
Fund,
4.53%
$
—
$
—
$
44
++
Totals
$
—
#
$
—
$
44
+
Supplementary
Investment
Schedule
Affiliate
Value
12/31/23
Purchase
Cost
Sales
Cost
Value
12/31/24
T.
Rowe
Price
Government
Reserve
Fund,
4.53%
$
10,815
¤
¤
$
13,337
Total
$
13,337
^
#
Capital
gain
distributions
from
underlying
Price
funds
represented
$0
of
the
net
realized
gain
(loss).
++
Excludes
earnings
on
securities
lending
collateral,
which
are
subject
to
rebates
and
fees
as
described
in
Note
4
.
+
Investment
income
comprised
$44
of
dividend
income
and
$0
of
interest
income.
¤
Purchase
and
sale
information
not
shown
for
cash
management
funds.
^
The
cost
basis
of
investments
in
affiliated
companies
was
$13,337.
T.
ROWE
PRICE
Small-Cap
Index
Fund
December
31,
2024
Statement
of
Assets
and
Liabilities
($000s,
except
shares
and
per
share
amounts)
Assets
Investments
in
securities,
at
value
(cost
$205,683)
$
219,093
Receivable
for
shares
sold
250
Dividends
receivable
210
Due
from
affiliates
17
Variation
margin
receivable
on
futures
contracts
1
Other
assets
21
Total
assets
219,592
Liabilities
Obligation
to
return
securities
lending
collateral
12,368
Payable
for
investment
securities
purchased
697
Payable
for
shares
redeemed
70
Investment
management
fees
payable
16
Other
liabilities
62
Total
liabilities
13,213
Commitments
and
Contingent
Liabilities
(note
7
)
NET
ASSETS
$
206,379
T.
ROWE
PRICE
Small-Cap
Index
Fund
December
31,
2024
Statement
of
Assets
and
Liabilities
($000s,
except
shares
and
per
share
amounts)
The
accompanying
notes
are
an
integral
part
of
these
financial
statements.
Net
Assets
Consist
of:
Total
distributable
earnings
(loss)
$
10,294
Paid-in
capital
applicable
to
13,185,753
shares
of
$0.0001
par
value
capital
stock
outstanding;
2,000,000,000
shares
of
the
Corporation
authorized
196,085
NET
ASSETS
$
206,379
NET
ASSET
VALUE
PER
SHARE
Investor
Class
(Net
assets:
$98;
Shares
outstanding:
6,307)
$
15.60
I
Class
(Net
assets:
$132,082;
Shares
outstanding:
8,438,169)
$
15.65
Z
Class
(Net
assets:
$74,199;
Shares
outstanding:
4,741,277)
$
15.65
T.
ROWE
PRICE
Small-Cap
Index
Fund
Year
Ended
12/31/24
Investment
Income
(Loss)
Income
Dividend
(net
of
foreign
taxes
of
$6)
$
2,369
Securities
lending
176
Other,
non
cash
158
.
Interest
6
Other
2
Total
income
2,711
Expenses
Investment
management
159
Shareholder
servicing
I
Class
52
Prospectus
and
shareholder
reports
I
Class
$
5
Z
Class
2
7
Custody
and
accounting
251
Legal
and
audit
36
Directors
1
Miscellaneous
14
Waived
/
paid
by
Price
Associates
(
348
)
Total
expenses
172
Net
investment
income
2,539
T.
ROWE
PRICE
Small-Cap
Index
Fund
The
accompanying
notes
are
an
integral
part
of
these
financial
statements.
Year
Ended
12/31/24
Realized
and
Unrealized
Gain
/
Loss
–
Net
realized
gain
(loss)
Securities
3,516
Futures
175
Net
realized
gain
3,691
Change
in
net
unrealized
gain
/
loss
Securities
12,933
Futures
(
26
)
Change
in
net
unrealized
gain
/
loss
12,907
Net
realized
and
unrealized
gain
/
loss
16,598
INCREASE
IN
NET
ASSETS
FROM
OPERATIONS
$
19,137
T.
ROWE
PRICE
Small-Cap
Index
Fund
Statement
of
Changes
in
Net
Assets
Year
.
.
.
.
.
.
.
.
.
.
.
.
.
.
Ended
.
.
.
.
.
.
.
.
.
.
.
.
.
.
12/31/24
12/31/23
Increase
(Decrease)
in
Net
Assets
Operations
Net
investment
income
$
2,539
$
1,859
Net
realized
gain
(loss)
3,691
(
164
)
Change
in
net
unrealized
gain
/
loss
12,907
18,431
Increase
in
net
assets
from
operations
19,137
20,126
Distributions
to
shareholders
Net
earnings
Investor
Class
(
3
)
(
2
)
I
Class
(
4,053
)
(
1,381
)
Z
Class
(
2,351
)
(
488
)
Decrease
in
net
assets
from
distributions
(
6,407
)
(
1,871
)
Capital
share
transactions
*
Shares
sold
I
Class
18,791
15,759
Z
Class
48,436
23,412
Distributions
reinvested
I
Class
4,053
1,381
Z
Class
2,351
488
Shares
redeemed
Investor
Class
(
99
)
–
I
Class
(
12,097
)
(
5,002
)
Z
Class
(
16,245
)
(
3,214
)
Increase
in
net
assets
from
capital
share
transactions
45,190
32,824
T.
ROWE
PRICE
Small-Cap
Index
Fund
Statement
of
Changes
in
Net
Assets
The
accompanying
notes
are
an
integral
part
of
these
financial
statements.
Year
.
.
.
.
.
.
.
.
.
.
.
.
.
.
Ended
.
.
.
.
.
.
.
.
.
.
.
.
.
.
12/31/24
12/31/23
Net
Assets
Increase
during
period
57,920
51,079
Beginning
of
period
148,459
97,380
End
of
period
$
206,379
$
148,459
*Share
information
(000s)
Shares
sold
I
Class
1,249
1,215
Z
Class
3,152
1,770
Distributions
reinvested
I
Class
245
100
Z
Class
142
35
Shares
redeemed
Investor
Class
(
6
)
–
I
Class
(
804
)
(
377
)
Z
Class
(
1,056
)
(
246
)
Increase
in
shares
outstanding
2,922
2,497
T.
ROWE
PRICE
Small-Cap
Index
Fund
NOTES
TO
FINANCIAL
STATEMENTS
T.
Rowe
Price
Index
Trust,
Inc. (the
corporation) is
registered
under
the
Investment
Company
Act
of
1940
(the
1940
Act).
The
Small-Cap
Index
Fund
(the
fund)
is
an
open-end
management
investment
company
established
by
the
corporation
and
intends
to
be
diversified
in
approximately
the
same
proportion
as
the
index
it
tracks
is
diversified.
The
fund
may
become
nondiversified
for
periods
of
time
solely
as
a
result
of
changes
in
the
composition
of
the
index
(for
example,
changes
in
the
relative
market
capitalization
or
index
weighting
of
one
or
more
securities
represented
in
the
index). The
fund
seeks to
track
the
performance
of
a
benchmark
index
that
measures
the
investment
return
of
small-capitalization
U.S.
stocks. The
fund
is
available
for
investment
only
by
mutual
funds,
college
savings
plans,
and
other
institutional
client
accounts
managed
by
T.
Rowe
Price
Associates,
Inc.,
or
its
affiliates
and
is
not
available
for
direct
purchase
by
members
of
the
public.
The
fund
has three classes
of
shares:
the
Small-Cap
Index
Fund
(Investor
Class),
the
Small-Cap
Index
Fund–I
Class
(I
Class)
and
the
Small-Cap
Index
Fund–Z
Class
(Z
Class).
I
Class
shares
require
a
$500,000
initial
investment
minimum,
although
the
minimum
generally
is
waived
or
reduced
for
financial
intermediaries,
eligible
retirement
plans,
and
certain
other
accounts.
The
Z
Class
is
only
available
to
funds
advised
by
T.
Rowe
Price
Associates,
Inc.
and
its
affiliates
and
other
clients
that
are
subject
to
a
contractual
fee
for
investment
management
services. Each
class
has
exclusive
voting
rights
on
matters
related
solely
to
that
class;
separate
voting
rights
on
matters
that
relate
to
all
classes;
and,
in
all
other
respects,
the
same
rights
and
obligations
as
the
other
classes.
NOTE
1
-
SIGNIFICANT
ACCOUNTING
POLICIES
Basis
of
Preparation
The fund
is
an
investment
company
and
follows
accounting
and
reporting
guidance
in
the
Financial
Accounting
Standards
Board
(FASB)
Accounting
Standards
Codification
Topic
946
(ASC
946).
The
accompanying
financial
statements
were
prepared
in
accordance
with
accounting
principles
generally
accepted
in
the
United
States
of
America
(GAAP),
including,
but
not
limited
to,
ASC
946.
GAAP
requires
the
use
of
estimates
made
by
management.
Management
believes
that
estimates
and
valuations
are
appropriate;
however,
actual
results
may
differ
from
those
estimates,
and
the
valuations
reflected
in
the
accompanying
financial
statements
may
differ
from
the
value
ultimately
realized
upon
sale
or
maturity.
T.
ROWE
PRICE
Small-Cap
Index
Fund
Investment
Transactions,
Investment
Income,
and
Distributions
Investment
transactions
are
accounted
for
on
the
trade
date
basis.
Income
and
expenses
are
recorded
on
the
accrual
basis.
Realized
gains
and
losses
are
reported
on
the
identified
cost
basis. Premiums
and
discounts
on
debt
securities
are
amortized
for
financial
reporting
purposes. Income
tax-related
interest
and
penalties,
if
incurred,
are
recorded
as
income
tax
expense. Dividends
received
from other
investment
companies are
reflected
as
dividend income;
capital
gain
distributions
are
reflected
as
realized
gain/loss. Dividend
income and
capital
gain
distributions
are
recorded
on
the
ex-dividend
date. Distributions
from
REITs
are
initially
recorded
as
dividend
income
and,
to
the
extent
such
represent
a
return
of
capital
or
capital
gain
for
tax
purposes,
are
reclassified
when
such
information
becomes
available. Non-cash
dividends,
if
any,
are
recorded
at
the
fair
market
value
of
the
asset
received. Proceeds
from
litigation
payments,
if
any,
are
included
in
either
net
realized
gain
(loss)
or
change
in
net
unrealized
gain/loss
from
securities. Distributions
to
shareholders
are
recorded
on
the
ex-dividend
date. Income
distributions,
if
any,
are
declared
and
paid
by
each
class annually. A
capital
gain
distribution,
if
any, may
also
be
declared
and
paid
by
the
fund
annually.
Class
Accounting
Shareholder
servicing,
prospectus,
and
shareholder
report
expenses
incurred
by
each
class
are
charged
directly
to
the
class
to
which
they
relate.
Expenses
common
to
all
classes,
investment
income,
and
realized
and
unrealized
gains
and
losses
are
allocated
to
the
classes
based
upon
the
relative
daily
net
assets
of
each
class.
Capital
Transactions
Each
investor’s
interest
in
the
net
assets
of the
fund
is
represented
by
fund
shares. The
fund’s
net
asset
value
(NAV)
per
share
is
computed
at
the
close
of
the
New
York
Stock
Exchange
(NYSE),
normally
4
p.m.
Eastern
time,
each
day
the
NYSE
is
open
for
business.
However,
the
NAV
per
share
may
be
calculated
at
a
time
other
than
the
normal
close
of
the
NYSE
if
trading
on
the
NYSE
is
restricted,
if
the
NYSE
closes
earlier,
or
as
may
be
permitted
by
the
SEC.
Purchases
and
redemptions
of
fund
shares
are
transacted
at
the
next-computed
NAV
per
share,
after
receipt
of
the
transaction
order
by
T.
Rowe
Price
Associates,
Inc.,
or
its
agents.
New
Accounting
Guidance
In December
2023,
the
FASB
issued
Accounting
Standards
Update
(ASU),
ASU
2023-09,
Income
Taxes
(Topic
740)
–
Improvements
to
Income
Taxes
Disclosures,
which
enhances
the
transparency
of
income
tax
disclosures.
The
ASU
requires
public
entities,
on
an
annual
basis,
to
provide
disclosure
of
specific
categories
in
the
rate
reconciliation,
as
well
as
disclosure
of
income
taxes
paid
disaggregated
by
jurisdiction.
The
amendments
T.
ROWE
PRICE
Small-Cap
Index
Fund
under
this
ASU
are
required
to
be
applied
prospectively
and
are
effective
for
fiscal
years
beginning
after
December
15,
2024.
Management
expects
that
adoption
of
the
guidance
will
not
have
a
material
impact
on
the
fund’s
financial
statements.
Indemnification
In
the
normal
course
of
business, the
fund
may
provide
indemnification
in
connection
with
its
officers
and
directors,
service
providers,
and/or
private
company
investments. The
fund’s
maximum
exposure
under
these
arrangements
is
unknown;
however,
the
risk
of
material
loss
is
currently
considered
to
be
remote.
NOTE
2
-
VALUATION
Fair
Value
The
fund’s
financial
instruments
are
valued
at
the
close
of
the
NYSE
and
are
reported
at
fair
value,
which
GAAP
defines
as
the
price
that
would
be
received
to
sell
an
asset
or
paid
to
transfer
a
liability
in
an
orderly
transaction
between
market
participants
at
the
measurement
date. The fund’s
Board
of
Directors
(the
Board)
has
designated
T.
Rowe
Price
Associates,
Inc.
as
the
fund’s
valuation
designee
(Valuation
Designee).
Subject
to
oversight
by
the
Board,
the
Valuation
Designee
performs
the
following
functions
in
performing
fair
value
determinations:
assesses
and
manages
valuation
risks;
establishes
and
applies
fair
value
methodologies;
tests
fair
value
methodologies;
and
evaluates
pricing
vendors
and
pricing
agents.
The
duties
and
responsibilities
of
the
Valuation
Designee
are
performed
by
its
Valuation
Committee. The
Valuation
Designee provides
periodic
reporting
to
the
Board
on
valuation
matters.
Various
valuation
techniques
and
inputs
are
used
to
determine
the
fair
value
of
financial
instruments.
GAAP
establishes
the
following
fair
value
hierarchy
that
categorizes
the
inputs
used
to
measure
fair
value:
Level
1
–
quoted
prices
(unadjusted)
in
active
markets
for
identical
financial
instruments
that
the
fund
can
access
at
the
reporting
date
Level
2
–
inputs
other
than
Level
1
quoted
prices
that
are
observable,
either
directly
or
indirectly
(including,
but
not
limited
to,
quoted
prices
for
similar
financial
instruments
in
active
markets,
quoted
prices
for
identical
or
similar
financial
instruments
in
inactive
markets,
interest
rates
and
yield
curves,
implied
volatilities,
and
credit
spreads)
Level
3
–
unobservable
inputs
(including
the Valuation
Designee’s assumptions
in
determining
fair
value)
T.
ROWE
PRICE
Small-Cap
Index
Fund
Observable
inputs
are
developed
using
market
data,
such
as
publicly
available
information
about
actual
events
or
transactions,
and
reflect
the
assumptions
that
market
participants
would
use
to
price
the
financial
instrument.
Unobservable
inputs
are
those
for
which
market
data
are
not
available
and
are
developed
using
the
best
information
available
about
the
assumptions
that
market
participants
would
use
to
price
the
financial
instrument.
GAAP
requires
valuation
techniques
to
maximize
the
use
of
relevant
observable
inputs
and
minimize
the
use
of
unobservable
inputs.
When
multiple
inputs
are
used
to
derive
fair
value,
the
financial
instrument
is
assigned
to
the
level
within
the
fair
value
hierarchy
based
on
the
lowest-level
input
that
is
significant
to
the
fair
value
of
the
financial
instrument.
Input
levels
are
not
necessarily
an
indication
of
the
risk
or
liquidity
associated
with
financial
instruments
at
that
level
but
rather
the
degree
of
judgment
used
in
determining
those
values.
Valuation
Techniques
Equity
securities,
including
exchange-traded
funds, listed
or
regularly
traded
on
a
securities
exchange
or
in
the
over-the-
counter
(OTC)
market
are
valued
at
the
last
quoted
sale
price
or,
for
certain
markets,
the
official
closing
price
at
the
time
the
valuations
are
made.
OTC
Bulletin
Board
securities
are
valued
at
the
mean
of
the
closing
bid
and
asked
prices.
A
security
that
is
listed
or
traded
on
more
than
one
exchange
is
valued
at
the
quotation
on
the
exchange
determined
to
be
the
primary
market
for
such
security.
Listed
securities
not
traded
on
a
particular
day
are
valued
at
the
mean
of
the
closing
bid
and
asked
prices
for
domestic
securities.
Debt
securities
generally
are
traded
in
the over-the-counter
(OTC)
market
and
are
valued
at
prices
furnished
by
independent
pricing
services
or
by
broker
dealers
who
make
markets
in
such
securities.
When
valuing
securities,
the
independent
pricing
services
consider
factors
such
as,
but
not
limited
to,
the
yield
or
price
of
bonds
of
comparable
quality,
coupon,
maturity,
and
type,
as
well
as
prices
quoted
by
dealers
who
make
markets
in
such
securities.
Investments
in
mutual
funds
are
valued
at
the
mutual
fund’s
closing
NAV
per
share
on
the
day
of
valuation.
Futures
contracts
are
valued
at
closing
settlement
prices.
Assets
and
liabilities
other
than
financial
instruments,
including
short-
term
receivables
and
payables,
are
carried
at
cost,
or
estimated
realizable
value,
if
less,
which
approximates
fair
value.
Investments
for
which
market
quotations are
not
readily
available
or
deemed
unreliable
are
valued
at
fair
value
as
determined
in
good
faith
by
the
Valuation
Designee.
The
Valuation
Designee
has
adopted
methodologies
for
determining
the
fair
value
of
investments
for
which
market
quotations
are
not
readily
available
or
deemed
unreliable,
including
the
use
of
other
pricing
T.
ROWE
PRICE
Small-Cap
Index
Fund
sources.
Factors
used
in
determining
fair
value
vary
by
type
of
investment
and
may
include
market
or
investment
specific
considerations.
The
Valuation
Designee typically
will
afford
greatest
weight
to
actual
prices
in
arm’s
length
transactions,
to
the
extent
they
represent
orderly
transactions
between
market
participants,
transaction
information
can
be
reliably
obtained,
and
prices
are
deemed
representative
of
fair
value.
However,
the
Valuation
Designee may
also
consider
other
valuation
methods
such
as
market-based
valuation
multiples;
a
discount
or
premium
from
market
value
of
a
similar,
freely
traded
security
of
the
same
issuer;
discounted
cash
flows;
yield
to
maturity;
or
some
combination.
Fair
value
determinations
are
reviewed
on
a
regular
basis.
Because
any
fair
value
determination
involves
a
significant
amount
of
judgment,
there
is
a
degree
of
subjectivity
inherent
in
such
pricing
decisions. Fair
value
prices
determined
by
the
Valuation
Designee could
differ
from
those
of
other
market
participants,
and
it
is
possible
that
the
fair
value
determined
for
a
security
may
be
materially
different
from
the
value
that
could
be
realized
upon
the
sale
of
that
security.
Valuation
Inputs
The
following
table
summarizes
the
fund’s
financial
instruments,
based
on
the
inputs
used
to
determine
their
fair
values
on
December
31,
2024
(for
further
detail
by
category,
please
refer
to
the
accompanying
Portfolio
of
Investments):
($000s)
Level
1
Level
2
Level
3
Total
Value
Assets
Common
Stocks
$
205,623
$
1
$
13
$
205,637
Short-Term
Investments
969
119
—
1,088
Securities
Lending
Collateral
12,368
—
—
12,368
Total
$
218,960
$
120
$
13
$
219,093
Liabilities
Futures
Contracts*
$
2
$
—
$
—
$
2
*
The
fair
value
presented
includes
cumulative
gain
(loss)
on
open
futures
contracts;
however,
the
net
value
reflected
on
the
accompanying
Portfolio
of
Investments
is
only
the
unsettled
variation
margin
receivable
(payable)
at
that
date.
T.
ROWE
PRICE
Small-Cap
Index
Fund
NOTE
3
-
DERIVATIVE
INSTRUMENTS
During
the
year ended
December
31,
2024,
the
fund
invested
in
derivative
instruments.
As
defined
by
GAAP,
a
derivative
is
a
financial
instrument
whose
value
is
derived
from
an
underlying
security
price,
foreign
exchange
rate,
interest
rate,
index
of
prices
or
rates,
or
other
variable;
it
requires
little
or
no
initial
investment
and
permits
or
requires
net
settlement
or
delivery
of
cash
or
other
assets.
The
fund
invests
in
derivatives
only
if
the
expected
risks
and
rewards
are
consistent
with
its
investment
objectives,
policies,
and
overall
risk
profile,
as
described
in
its
prospectus
and
Statement
of
Additional
Information.
The
fund
may
use
derivatives
for
a
variety
of
purposes
and
may
use
them
to
establish
both
long
and
short
positions
within
the
fund’s
portfolio.
Potential
uses
include
to
hedge
against
declines
in
principal
value,
increase
yield,
invest
in
an
asset
with
greater
efficiency
and
at
a
lower
cost
than
is
possible
through
direct
investment,
to
enhance
return,
or
to
adjust
credit
exposure.
The
risks
associated
with
the
use
of
derivatives
are
different
from,
and
potentially
much
greater
than,
the
risks
associated
with
investing
directly
in
the
instruments
on
which
the
derivatives
are
based.
The
fund
values
its
derivatives
at
fair
value
and
recognizes
changes
in
fair
value
currently
in
its
results
of
operations.
Accordingly,
the
fund
does
not
follow
hedge
accounting,
even
for
derivatives
employed
as
economic
hedges.
Generally,
the
fund
accounts
for
its
derivatives
on
a
gross
basis.
It
does
not
offset
the
fair
value
of
derivative
liabilities
against
the
fair
value
of
derivative
assets
on
its
financial
statements,
nor
does
it
offset
the
fair
value
of
derivative
instruments
against
the
right
to
reclaim
or
obligation
to
return
collateral.
The
following
table
summarizes
the
fair
value
of
the
fund’s
derivative
instruments
held
as
of
December
31,
2024,
and
the
related
location
on
the
accompanying
Statement
of
Assets
and
Liabilities,
presented
by
primary
underlying
risk
exposure:
($000s)
Location
on
Statement
of
Assets
and
Liabilities
Fair
Value*
*
Liabilities
Equity
derivatives
Futures
$
2
Total
$
2
*
The
fair
value
presented
includes
cumulative
gain
(loss)
on
open
futures
contracts;
however,
the
value
reflected
on
the
accompanying
Statement
of
Assets
and
Liabilities
is
only
the
unsettled
variation
margin
receivable
(payable)
at
that
date.
T.
ROWE
PRICE
Small-Cap
Index
Fund
Additionally,
the
amount
of
gains
and
losses
on
derivative
instruments
recognized
in
fund
earnings
during
the
year ended
December
31,
2024,
and
the
related
location
on
the
accompanying
Statement
of
Operations
is
summarized
in
the
following
table
by
primary
underlying
risk
exposure:
Counterparty
Risk
and
Collateral
The
fund
invests
in
exchange-traded
and/or
centrally
cleared
derivative
contracts,
such
as
futures,
exchange-traded
options,
and
centrally
cleared
swaps.
Counterparty
risk
on
such
derivatives
is
minimal
because
the
clearinghouse
provides
protection
against
counterparty
defaults.
For
futures
and
centrally
cleared
swaps,
the
fund
is
required
to
deposit
collateral
in
an
amount
specified
by
the
clearinghouse
and
the
clearing
firm
(margin
requirement),
and
the
margin
requirement
must
be
maintained
over
the
life
of
the
contract.
Each
clearinghouse
and
clearing
firm,
in
its
sole
discretion,
may
adjust
the
margin
requirements
applicable
to
the
fund.
Collateral may
be
in
the
form
of
cash
or
debt
securities
issued
by
the
U.S.
government
or
related
agencies.
Cash
posted
by
the
fund
is
reflected
as
cash
deposits
in
the
accompanying
financial
statements
and
generally
is
restricted
from
withdrawal
by
the
fund;
securities
posted
by
the
fund
are
so
noted
in
the
accompanying
Portfolio
of
Investments;
both
remain
in
the
fund’s
assets.
While
typically
not
sold
in
the
same
manner
as
equity
or
fixed
income
securities,
exchange-traded
or
centrally
cleared
derivatives
may
be
closed
out
only
on
the
exchange
or
clearinghouse
where
the
contracts
were
cleared.
This
ability
is
subject
to
the
liquidity
of
underlying
positions. As
of
December
31,
2024,
securities
valued
at $46,000
had
been
posted
by
the
fund
for
exchange-traded
and/or
centrally
cleared
derivatives.
($000s)
Location
of
Gain
(Loss)
on
Statement
of
Operations
Futures
Realized
Gain
(Loss)
Equity
derivatives
$
175
Total
$
175
Change
in
Unrealized
Gain
(Loss)
Equity
derivatives
$
(26)
Total
$
(26)
T.
ROWE
PRICE
Small-Cap
Index
Fund
Futures
Contracts
The
fund
is
subject
to equity
price
risk in
the
normal
course
of
pursuing
its
investment
objectives
and
uses
futures
contracts
to
help
manage
such
risk.
The
fund
may
enter
into
futures
contracts
as
an
efficient
means
of
maintaining
liquidity
while
being
invested
in
the
market,
to
facilitate
trading,
or
to
reduce
transaction
costs. A
futures
contract
provides
for
the
future
sale
by
one
party
and
purchase
by
another
of
a
specified
amount
of
a
specific
underlying
financial
instrument
at
an
agreed-upon
price,
date,
time,
and
place.
The
fund
currently
invests
only
in
exchange-traded
futures,
which
generally
are
standardized
as
to
maturity
date,
underlying
financial
instrument,
and
other
contract
terms.
Payments
are
made
or
received
by
the
fund
each
day
to
settle
daily
fluctuations
in
the
value
of
the
contract
(variation
margin),
which
reflect
changes
in
the
value
of
the
underlying
financial
instrument.
Variation
margin
is
recorded
as
unrealized
gain
or
loss
until
the
contract
is
closed.
The
value
of
a
futures
contract
included
in
net
assets
is
the
amount
of
unsettled
variation
margin;
net
variation
margin
receivable
is
reflected
as
an
asset
and
net
variation
margin
payable
is
reflected
as
a
liability
on
the
accompanying
Statement
of
Assets
and
Liabilities.
When
a
contract
is
closed,
a
realized
gain
or
loss
is
recorded
on
the
accompanying
Statement
of
Operations.
Risks
related
to
the
use
of
futures
contracts
include
possible
illiquidity
of
the
futures
markets,
contract
prices
that
can
be
highly
volatile
and
imperfectly
correlated
to
movements
in
hedged
security
values,
and
potential
losses
in
excess
of
the
fund’s
initial
investment.
During
the
year ended
December
31,
2024,
the
volume
of
the
fund’s
activity
in
futures,
based
on
underlying
notional
amounts,
was
generally
less
than
1%
of
net
assets.
NOTE
4
-
OTHER
INVESTMENT
TRANSACTIONS
Consistent
with
its
investment
objective, the
fund
engages
in
the
following
practices
to
manage
exposure
to
certain
risks
and/or
to
enhance
performance.
The
investment
objective,
policies,
program,
and
risk
factors
of the
fund
are
described
more
fully
in the
fund’s prospectus
and
Statement
of
Additional
Information.
Securities
Lending
The fund
may
lend
its
securities
to
approved
borrowers
to
earn
additional
income.
Its
securities
lending
activities
are
administered
by
a
lending
agent
in
accordance
with
a
securities
lending
agreement.
Security
loans
generally
do
not
have
stated
maturity
dates,
and
the
fund
may
recall
a
security
at
any
time.
The
fund
receives
collateral
in
the
form
of
cash
or
U.S.
government
securities.
Collateral
is
maintained
over
the
life
of
the
loan
in
an
amount
not
less
than
the
value
of
loaned
securities;
any
additional
collateral
required
due
to
T.
ROWE
PRICE
Small-Cap
Index
Fund
changes
in
security
values
is
delivered
to
the
fund
the
next
business
day.
Cash
collateral
is
invested
in
accordance
with
investment
guidelines
approved
by
fund
management.
Additionally,
the
lending
agent
indemnifies
the
fund
against
losses
resulting
from
borrower
default.
Although
risk
is
mitigated
by
the
collateral
and
indemnification,
the
fund
could
experience
a
delay
in
recovering
its
securities
and
a
possible
loss
of
income
or
value
if
the
borrower
fails
to
return
the
securities,
collateral
investments
decline
in
value,
and
the
lending
agent
fails
to
perform.
Securities
lending
revenue
consists
of
earnings
on
invested
collateral
and
borrowing
fees,
net
of
any
rebates
to
the
borrower,
compensation
to
the
lending
agent,
and
other
administrative
costs.
In
accordance
with
GAAP,
investments
made
with
cash
collateral
are
reflected
in
the
accompanying
financial
statements,
but
collateral
received
in
the
form
of
securities
is
not.
At
December
31,
2024,
the
value
of
loaned
securities
was
$11,321,000;
the
value
of
cash
collateral
and
related
investments
was
$12,368,000.
Other
Purchases
and
sales
of
portfolio
securities
other
than
in-kind
transactions,
if
any,
and short-term securities
aggregated $85,263,000 and
$43,595,000,
respectively,
for
the
year ended
December
31,
2024.
NOTE
5
-
FEDERAL
INCOME
TAXES
Generally,
no
provision
for
federal
income
taxes
is
required
since
the
fund
intends
to continue
to
qualify
as
a
regulated
investment
company
under
Subchapter
M
of
the
Internal
Revenue
Code
and
distribute
to
shareholders
all
of
its taxable
income
and
gains.
Distributions
determined
in
accordance
with
federal
income
tax
regulations
may
differ
in
amount
or
character
from
net
investment
income
and
realized
gains
for
financial
reporting
purposes.
The
fund
files
U.S.
federal,
state,
and
local
tax
returns
as
required.
The
fund’s
tax
returns
are
subject
to
examination
by
the
relevant
tax
authorities
until
expiration
of
the
applicable
statute
of
limitations,
which
is
generally
three
years
after
the
filing
of
the
tax
return
but
which
can
be
extended
to
six
years
in
certain
circumstances.
Tax
returns
for
open
years
have
incorporated
no
uncertain
tax
positions
that
require
a
provision
for
income
taxes.
Capital
accounts
within
the
financial
reporting
records
are
adjusted
for
permanent
book/tax
differences
to
reflect
tax
character
but
are
not
adjusted
for
temporary
differences.
The
permanent
book/tax
adjustments,
if
any,
have
no
impact
on
results
of
operations
or
net
assets.
T.
ROWE
PRICE
Small-Cap
Index
Fund
The
tax
character
of
distributions
paid
for
the
periods
presented
was
as
follows:
At
December
31,
2024,
the
tax-basis
cost
of
investments
(including
derivatives,
if
any)
and
gross
unrealized
appreciation
and
depreciation
were as
follows:
At
December
31,
2024,
the
tax-basis
components
of
accumulated
net
earnings
(loss)
were
as
follows:
Temporary
differences
between
book-basis
and
tax-basis
components
of
total
distributable
earnings
(loss)
arise
when
certain
items
of
income,
gain,
or
loss
are
recognized
in
different
periods
for
financial
statement
purposes
versus
for
tax
purposes;
these
differences
will
reverse
in
a
subsequent
reporting
period.
The
temporary
differences
relate
primarily
to
the
deferral
of
losses
from
wash
sales
and
the
realization
of
gains/losses
on
passive
foreign
investment
companies.
The
loss
carryforwards
and
deferrals
primarily
relate
to
post-
October
loss
deferrals.
The
fund
has
elected
to
defer
certain
losses
to
the
first
($000s)
December
31,
2024
December
31,
2023
Ordinary
income
(including
short-term
capital
gains,
if
any)
$
3,561
$
1,871
Long-term
capital
gain
2,846
—
Total
distributions
$
6,407
$
1,871
($000s)
Cost
of
investments
$
209,030
Unrealized
appreciation
$
41,946
Unrealized
depreciation
(31,883)
Net
unrealized
appreciation
(depreciation)
$
10,063
($000s)
Undistributed
ordinary
income
$
325
Net
unrealized
appreciation
(depreciation)
10,063
Loss
carryforwards
and
deferrals
(94)
Total
distributable
earnings
(loss)
$
10,294
T.
ROWE
PRICE
Small-Cap
Index
Fund
day
of
the
following
fiscal
year
for
post-October
capital
loss
deferrals.
During
the
year
ended
December
31,
2024,
the
fund
utilized
$1,535,000
of
capital
loss
carryforwards.
NOTE
6
-
FOREIGN TAXES
The
fund
is
subject
to
foreign
income
taxes
imposed
by
certain
countries
in
which
it
invests.
Additionally,
capital
gains
realized
upon
disposition
of
securities
issued
in
or
by
certain
foreign
countries
are
subject
to
capital
gains
tax
imposed
by
those
countries.
All
taxes
are
computed
in
accordance
with
the
applicable
foreign
tax
law,
and,
to
the
extent
permitted,
capital
losses
are
used
to
offset
capital
gains.
Taxes
attributable
to
income
are
accrued
by
the
fund
as
a
reduction
of
income.
Current
and
deferred
tax
expense
attributable
to
capital
gains
is
reflected
as
a
component
of
realized
or
change
in
unrealized
gain/
loss
on
securities
in
the
accompanying
financial
statements.
To
the
extent
that
the
fund
has
country
specific
capital
loss
carryforwards,
such
carryforwards
are
applied
against
net
unrealized
gains
when
determining
the
deferred
tax
liability.
Any
deferred
tax
liability
incurred
by
the
fund
is
included
in
either
Other
liabilities
or
Deferred
tax
liability
on
the
accompanying
Statement
of
Assets
and
Liabilities.
NOTE
7
-
RELATED
PARTY
TRANSACTIONS
The
fund
is
managed
by
T.
Rowe
Price
Associates,
Inc.
(Price
Associates),
a
wholly
owned
subsidiary
of
T.
Rowe
Price
Group,
Inc.
(Price
Group). Price
Associates
has
entered
into
a
sub-advisory
agreement(s)
with
one
or
more
of
its
wholly
owned
subsidiaries,
to
provide
investment
advisory
services
to
the
fund. The
investment
management
agreement
between
the
fund
and
Price
Associates
provides
for
an
annual
investment
management
fee
equal
to 0.09%
of
the
fund’s
average
daily
net
assets.
The
fee
is
computed
daily
and
paid
monthly.
The Investor
Class is
subject
to
a
contractual
expense
limitation
through
the
expense
limitation
date
indicated
in
the
table
below.
This
agreement
will
continue
through
the
expense
limitation
date
indicated
in
the
table
below,
and
may
be
renewed,
revised,
or
revoked
only
with
approval
of
the
fund’s
Board.
During
the
limitation
period,
Price
Associates
is required
to
waive
or
pay
any
expenses
(excluding
interest;
expenses
related
to
borrowings,
taxes,
and
brokerage;
non-recurring,
extraordinary
expenses;
and
acquired
fund
fees
T.
ROWE
PRICE
Small-Cap
Index
Fund
and
expenses)
that
would
otherwise
cause
the class’s ratio
of
annualized
total
expenses
to
average
net
assets
(net
expense
ratio)
to
exceed
its
expense
limitation.
The
class
is
required
to
repay
Price
Associates
for
expenses
previously
waived/paid
to
the
extent
the
class’s net
assets
grow
or
expenses
decline
sufficiently
to
allow
repayment
without
causing
the class’s net
expense
ratio
(after
the
repayment
is
taken
into
account)
to
exceed
the
lesser
of:
(1)
the
expense
limitation
in
place
at
the
time
such
amounts
were
waived;
or
(2)
the class’s
current
expense
limitation.
However,
no
repayment
will
be
made
more
than
three
years
after
the
date
of
a
payment
or
waiver.
The
I
Class
is
also
subject
to
an
operating
expense
limitation
(I
Class
Limit)
pursuant
to
which
Price
Associates
is
contractually
required
to
pay
all
operating
expenses
of
the
I
Class,
excluding
management
fees;
interest;
expenses
related
to
borrowings,
taxes,
and
brokerage; non-recurring,
extraordinary expenses; and
acquired
fund
fees
and
expenses, to
the
extent
such
operating
expenses,
on
an
annualized
basis,
exceed
the
I
Class
Limit. This
agreement
will
continue
through
the
expense
limitation
date
indicated
in
the
table
below,
and
may
be
renewed,
revised,
or
revoked
only
with
approval
of
the
fund’s
Board.
The
I
Class
is
required
to
repay
Price
Associates
for
expenses
previously
paid
to
the
extent
the
class’s
net
assets
grow
or
expenses
decline
sufficiently
to
allow
repayment
without
causing
the
class’s
operating
expenses
(after
the
repayment
is
taken
into
account)
to
exceed
the
lesser
of:
(1)
the
I
Class
Limit
in
place
at
the
time
such
amounts
were
paid;
or
(2)
the
current
I
Class
Limit.
However,
no
repayment
will
be
made
more
than
three
years
after
the
date
of
a
payment
or
waiver.
The
Z
Class
is
also
subject
to
a
contractual
expense
limitation
agreement
whereby
Price
Associates
has
agreed
to
waive
and/or
bear
all
of
the
Z
Class’
expenses
(excluding
interest;
expenses
related
to
borrowings,
taxes,
and
brokerage;
non-recurring,
extraordinary
expenses;
and
acquired
fund
fees
and
expenses)
in
their
entirety.
This
fee
waiver
and/or
expense
reimbursement
arrangement
is
expected
to
remain
in
place
indefinitely,
and
the
agreement
may
only
be
amended
or
terminated
with
approval
by
the
fund’s
Board.
Expenses
of
the
fund
waived/paid
by
the
manager
are
not
subject
to
later
repayment
by
the
fund.
Pursuant
to
these
agreements,
expenses
were waived/paid
by
and/or
repaid
to
Price
Associates
during
the year
ended December
31,
2024 as
indicated
in
the
table
below.
Including
these
amounts,
expenses
previously
waived/paid
by
Price
Associates
in
the
amount
of $677,000 remain
subject
to
repayment
by
the
fund
at
December
31,
2024. Any
repayment
of
expenses
previously
T.
ROWE
PRICE
Small-Cap
Index
Fund
waived/paid
by
Price
Associates
during
the
period
would
be
included
in
the
net
investment
income
and
expense
ratios
presented
on
the
accompanying
Financial
Highlights.
In
addition,
the
fund
has
entered
into
service
agreements
with
Price
Associates
and
a
wholly
owned
subsidiary
of
Price
Associates,
each
an
affiliate
of
the
fund
(collectively,
Price).
Price
Associates
provides
certain
accounting
and
administrative
services
to
the
fund.
T.
Rowe
Price
Services,
Inc.
provides
shareholder
and
administrative
services
in
its
capacity
as
the
fund’s
transfer
and
dividend-disbursing
agent.
For
the
year
ended
December
31,
2024,
expenses
incurred
pursuant
to
these
service
agreements
were
$116,000
for
Price
Associates
and
less
than
$1,000
for
T.
Rowe
Price
Services,
Inc.
All
amounts
due
to
and
due
from
Price,
exclusive
of
investment
management
fees
payable,
are
presented
net
on
the
accompanying
Statement
of
Assets
and
Liabilities.
T.
Rowe
Price
Investment
Services,
Inc.
(Investment
Services)
serves
as
distributor
to
the
fund.
Pursuant
to
an
underwriting
agreement,
no
compensation
for
any
distribution
services
provided
is
paid
to
Investment
Services
by
the
fund
(except
for
12b-1
fees
under
a
Board-approved
Rule
12b-1
plan).
Additionally,
the
fund
is
one
of
several
mutual
funds
in
which
certain
college
savings
plans
managed
by
Price
Associates invests.
As
approved
by
the
fund’s
Board
of
Directors,
shareholder
servicing
costs
associated
with
each
college
savings
plan
are
borne
by
the
fund
in
proportion
to
the
average
daily
value
of
its
shares
owned
by
the
college
savings
plan.
Price
has
agreed
to waive/reimburse
shareholder
servicing
costs in
excess
of
0.05%
of
the
fund’s
average
daily
value
of
its
shares
owned
by
the
college
savings
plan.
Any
amounts
waived/
paid
by
Price
under
this
voluntary
agreement
are
not
subject
to
repayment
by
the
fund.
Price
may
amend
or
terminate
this
voluntary
arrangement
at
any
time
without
prior
notice.
For
the
year ended
December
31,
2024,
the
fund
was
charged $51,000 for
shareholder
servicing
costs
related
to
the
college
savings
plans, of
which
$9,000
was
for
services
provided
by
Price.
All
amounts
due
to
and
due
from
Price,
exclusive
of
investment
management
fees
payable,
are
Investor
Class
I
Class
Z
Class
Expense
limitation/I
Class
Limit
0.29%
0.05%
0.00%
Expense
limitation
date
04/30/26
04/30/26
N/A
(Waived)/repaid
during
the
period
($000s)
$—
(1)
$(205)
$(143)
(1)
Amount
rounds
to
less
than
$1,000
T.
ROWE
PRICE
Small-Cap
Index
Fund
presented
net
on
the
accompanying
Statement
of
Assets
and
Liabilities. At
December
31,
2024,
approximately
94%
of
the
outstanding
shares
of
the
I
Class
were
held
by
college
savings
plans.
Mutual
funds,
trusts,
and
other
accounts
managed
by
Price
Associates
or
its
affiliates
(collectively,
Price
Funds
and
accounts)
may
invest
in
the
fund.
No
Price
fund
or
account
may
invest
for
the
purpose
of
exercising
management
or
control
over
the
fund.
At
December
31,
2024, 100%
of
the
Z
Class's
outstanding
shares
were
held
by
Price
Funds
and
accounts.
The fund
may
invest
its
cash
reserves
in
certain
open-end
management
investment
companies
managed
by
Price
Associates
and
considered
affiliates
of
the
fund:
the
T.
Rowe
Price
Government
Reserve
Fund
or
the
T.
Rowe
Price
Treasury
Reserve
Fund,
organized
as
money
market
funds
(together,
the
Price
Reserve
Funds).
The
Price
Reserve
Funds
are
offered
as
short-term
investment
options
to
mutual
funds,
trusts,
and
other
accounts
managed
by
Price
Associates
or
its
affiliates
and
are
not
available
for
direct
purchase
by
members
of
the
public.
Cash
collateral
from
securities
lending,
if
any,
is
invested
in
the
T.
Rowe
Price
Government
Reserve Fund. The
Price
Reserve
Funds
pay
no
investment
management
fees.
As
of
December
31,
2024,
T.
Rowe
Price
Group,
Inc.,
or
its
wholly
owned
subsidiaries,
owned
6,307
shares
of
the
Investor
Class,
representing
100%
of
the
Investor
Class's
net
assets.
The fund may
participate
in
securities
purchase
and
sale
transactions
with
other
funds
or
accounts
advised
by
Price
Associates
(cross
trades),
in
accordance
with
procedures
adopted
by the
fund’s
Board
and
Securities
and
Exchange
Commission
rules,
which
require,
among
other
things,
that
such
purchase
and
sale
cross
trades
be
effected
at
the
independent
current
market
price
of
the
security.
During
the
year
ended
December
31,
2024,
the
fund
had
no
purchases
or
sales
cross
trades
with
other
funds
or
accounts
advised
by
Price
Associates.
NOTE
8
-
SEGMENT
REPORTING
Operating
segments
are
defined
as
components
of
a
company
that
engage
in
business
activities
and
for
which
discrete
financial
information
is
available
and
regularly
reviewed
by
the
chief
operating
decision
maker
(CODM)
in
deciding
how
to
allocate
resources
and
assess
performance.
The
Management
Committee
of
Price
Associates
acts
as
the
fund’s
CODM.
The
fund
makes
investments
in
accordance
with
its
investment
objective
as
outlined
in
the
T.
ROWE
PRICE
Small-Cap
Index
Fund
Prospectus
and
is
considered
one
reportable
segment
because
the
CODM
allocates
resources
and
assesses
the
operating
results
of
the
fund
on
the
whole.
The
fund’s
revenue
is
derived
from
investments
in
portfolio
of
securities.
The
CODM
allocates
resources
and
assesses
performance
based
on
the
operating
results
of
the
fund,
which
is
consistent
with
the
results
presented
in
the
statement
of
operations,
statement
of
changes
in
net
assets
and
financial
highlights.
The
CODM
compares
the
fund’s
performance
to
its
benchmark
index
and
evaluates
the
positioning
of
the
fund
in
relation
to
its
investment
objective.
The
measure
of
segment
assets
is
net
assets
of
the
fund
which
is
disclosed
in
the
statement
of
assets
and
liabilities.
The
accounting
policies
of
the
segment
are
the
same
as
those
described
in
the
summary
of
significant
accounting
policies.
The
financial
statements
include
all
details
of
the
segment
assets,
segment
revenue
and
expenses;
and
reflect
the
financial
results
of
the
segment.
NOTE
9
-
OTHER
MATTERS
Unpredictable environmental,
political,
social
and
economic
events,
including
but
not
limited
to,
environmental
or
natural
disasters,
war
and
conflict
(including
Russia’s
military
invasion
of
Ukraine
and
the
conflict
in
Israel,
Gaza
and
surrounding
areas),
terrorism,
geopolitical
developments
(including
trading
and
tariff
arrangements,
sanctions
and
cybersecurity
attacks),
and
public
health
epidemics
(including
the
global
outbreak
of
COVID-19)
and
similar
public
health
threats,
may
significantly
affect
the
economy
and
the
markets
and
issuers
in
which
a
fund
invests.
The
extent
and
duration
of
such
events
and
resulting
market
disruptions
cannot
be
predicted.
These
and
other
similar
events
may
cause
instability
across
global
markets,
including
reduced
liquidity
and
disruptions
in
trading
markets,
while
some
events
may
affect
certain
geographic
regions,
countries,
sectors,
and
industries
more
significantly
than
others,
and
exacerbate
other
pre-existing
political,
social,
and
economic
risks.
The
fund’s
performance
could
be
negatively
impacted
if
the
value
of
a
portfolio
holding
were
harmed
by
these
or
such
events.
Management
actively
monitors
the
risks
and
financial
impacts
arising
from
such
events.
T.
ROWE
PRICE
Small-Cap
Index
Fund
REPORT
OF
INDEPENDENT
REGISTERED
PUBLIC
ACCOUNTING
FIRM
To
the
Board
of
Directors
of
T.
Rowe
Price
Index
Trust,
Inc.
and
Shareholders
of
T.
Rowe
Price
Small-Cap
Index
Fund
Opinion
on
the
Financial
Statements
We
have
audited
the
accompanying
statement
of
assets
and
liabilities,
including
the
portfolio
of
investments,
of
T.
Rowe
Price
Small-Cap
Index
Fund
(one
of
the
funds
constituting
T.
Rowe
Price
Index
Trust,
Inc.,
referred
to
hereafter
as
the
"Fund")
as
of
December
31,
2024,
the
related
statement
of
operations
for
the
year
ended
December
31,
2024,
the
statement
of
changes
in
net
assets
for
each
of
the
two
years
in
the
period
ended
December
31,
2024,
including
the
related
notes,
and
the
financial
highlights
for
each
of
the
periods
indicated
therein
(collectively
referred
to
as
the
“financial
statements”).
In
our
opinion,
the
financial
statements
present
fairly,
in
all
material
respects,
the
financial
position
of
the
Fund
as
of
December
31,
2024,
the
results
of
its
operations
for
the
year
then
ended,
the
changes
in
its
net
assets
for
each
of
the
two
years
in
the
period
ended
December
31,
2024
and
the
financial
highlights
for
each
of
the
periods
indicated
therein,
in
conformity
with
accounting
principles
generally
accepted
in
the
United
States
of
America.
Basis
for
Opinion
These
financial
statements
are
the
responsibility
of
the
Fund’s
management.
Our
responsibility
is
to
express
an
opinion
on
the
Fund’s
financial
statements
based
on
our
audits.
We
are
a
public
accounting
firm
registered
with
the
Public
Company
Accounting
Oversight
Board
(United
States)
(PCAOB)
and
are
required
to
be
independent
with
respect
to
the
Fund
in
accordance
with
the
U.S.
federal
securities
laws
and
the
applicable
rules
and
regulations
of
the
Securities
and
Exchange
Commission
and
the
PCAOB.
We
conducted
our
audits
of
these
financial
statements
in
accordance
with
the
standards
of
the
PCAOB.
Those
standards
require
that
we
plan
and
perform
the
audit
to
obtain
reasonable
assurance
about
whether
the
financial
statements
are
free
of
material
misstatement,
whether
due
to
error
or
fraud.
T.
ROWE
PRICE
Small-Cap
Index
Fund
Our
audits
included
performing
procedures
to
assess
the
risks
of
material
misstatement
of
the
financial
statements,
whether
due
to
error
or
fraud,
and
performing
procedures
that
respond
to
those
risks.
Such
procedures
included
examining,
on
a
test
basis,
evidence
regarding
the
amounts
and
disclosures
in
the
financial
statements.
Our
audits
also
included
evaluating
the
accounting
principles
used
and
significant
estimates
made
by
management,
as
well
as
evaluating
the
overall
presentation
of
the
financial
statements.
Our
procedures
included
confirmation
of
securities
owned
as
of
December
31,
2024
by
correspondence
with
the
custodian,
transfer
agent
and
brokers;
when
replies
were
not
received
from
brokers,
we
performed
other
auditing
procedures.
We
believe
that
our
audits
provide
a
reasonable
basis
for
our
opinion.
/s/
PricewaterhouseCoopers
LLP
Baltimore,
Maryland
February
20,
2025
We
have
served
as
the
auditor
of
one
or
more
investment
companies
in
the
T.
Rowe
Price
group
of
investment
companies
since
1973.
REPORT
OF
INDEPENDENT
REGISTERED
PUBLIC
ACCOUNTING
FIRM
(continued)
T.
ROWE
PRICE
Small-Cap
Index
Fund
TAX
INFORMATION
(UNAUDITED)
FOR
THE
TAX
YEAR
ENDED 12/31/24
We
are
providing
this
information
as
required
by
the
Internal
Revenue
Code.
The
amounts
shown
may
differ
from
those
elsewhere
in
this
report
because
of
differences
between
tax
and
financial
reporting
requirements.
The
fund’s
distributions
to
shareholders
included:
$2,846,000
from
long-term
capital
gains,
subject
to
a
long-term
capital
gains
tax
rate
of
not
greater
than
20%
For
nonresident
alien
shareholders,
100%
of
short-term
capital
gain
dividends
distributed
by
the
fund
for
the
fiscal
year
are
qualified
short-term
capital
gains.
For
taxable
non-corporate
shareholders,
$1,765,000
of
the
fund's
income
represents
qualified
dividend
income
subject
to
a
long-term
capital
gains
tax
rate
of
not
greater
than
20%.
For
corporate
shareholders,
$1,588,000
of
the
fund's
income
qualifies
for
the
dividends-received
deduction.
For
individuals
and
certain
trusts
and
estates
which
are
entitled
to
claim
a
deduction
of
up
to
20%
of
their
combined
qualified
real
estate
investment
trust
(REIT)
dividends,
$252,000
of
the
fund's
income
qualifies
as
qualified
real
estate
investment
trust
(REIT)
dividends.
100
East
Pratt
Street
Baltimore,
MD
21202
T.
Rowe
Price
Investment
Services,
Inc.
Call
1-800-225-5132
to
request
a
prospectus
or
summary
prospectus;
each
includes
investment
objectives,
risks,
fees,
expenses,
and
other
information
that
you
should
read
and
consider
carefully
before
investing.
F33-050
2/25
Item 8. Changes in and Disagreements with Accountants for Open-End Management Investment Companies.
Not applicable.
Item 9. Proxy Disclosures for Open-End Management Investment Companies.
Not applicable.
Item 10. Remuneration Paid to Directors, Officers, and Others of Open-End Management Investment Companies.
Remuneration paid to Directors is included in Item 7 of this Form N-CSR.
Item 11. Statement Regarding Basis for Approval of Investment Advisory Contract.
If applicable, see Item 7.
Item 12. Disclosure of Proxy Voting Policies and Procedures for Closed-End Management Investment Companies.
Not applicable.
Item 13. Portfolio Managers of Closed-End Management Investment Companies.
Not applicable.
Item 14. Purchases of Equity Securities by Closed-End Management Investment Company and Affiliated Purchasers.
Not applicable.
Item 15. Submission of Matters to a Vote of Security Holders.
There has been no change to the procedures by which shareholders may recommend nominees to the registrant’s board of directors.
Item 16. Controls and Procedures.
(a) The registrant’s principal executive officer and principal financial officer have evaluated the registrant’s disclosure controls and procedures within 90 days of this filing and have concluded that the registrant’s disclosure controls and procedures were effective, as of that date, in ensuring that information required to be disclosed by the registrant in this Form N-CSR was recorded, processed, summarized, and reported timely.
(b) The registrant’s principal executive officer and principal financial officer are aware of no change in the registrant’s internal control over financial reporting that occurred during the period covered by this report that has materially affected, or is reasonably likely to materially affect, the registrant’s internal control over financial reporting.
Item 17. Disclosure of Securities Lending Activities for Closed-End Management Investment Companies.
Not applicable.
Item 18. Recovery of Erroneously Awarded Compensation.
Not applicable.
Item 19. Exhibits.
SIGNATURES
Pursuant to the requirements of the Securities Exchange Act of 1934 and the Investment Company Act of 1940, the registrant has duly caused this report to be signed on its behalf by the undersigned, thereunto duly authorized.
| | | | |
| T. Rowe Price Index Trust, Inc. |
| | |
| By | | /s/ David Oestreicher | | |
| | David Oestreicher | | |
| | Principal Executive Officer | | |
| | |
| Date | | February 20, 2025 | | |
Pursuant to the requirements of the Securities Exchange Act of 1934 and the Investment Company Act of 1940, this report has been signed below by the following persons on behalf of the registrant and in the capacities and on the dates indicated.
| | | | |
| By | | /s/ David Oestreicher | | |
| | David Oestreicher | | |
| | Principal Executive Officer | | |
| | |
| Date | | February 20, 2025 | | |
| | | | |
| By | | /s/ Alan S. Dupski | | |
| | Alan S. Dupski | | |
| | Principal Financial Officer | | |
| | |
| Date | | February 20, 2025 | | |