UNITED STATES
SECURITIES AND EXCHANGE COMMISSION
Washington, D.C. 20549
FORM N-CSR
CERTIFIED SHAREHOLDER REPORT
OF
REGISTERED MANAGEMENT INVESTMENT COMPANIES
Investment Company Act file number: 811-06083
Name of Registrant: Vanguard Ohio Tax-Free Funds
Address of Registrant:
P.O. Box 2600
Valley Forge, PA 19482
Name and address of agent for service:
Heidi Stam, Esquire
P.O. Box 876
Valley Forge, PA 19482
Registrant’s telephone number, including area code: (610) 669-1000
Date of fiscal year end: November 30
Date of reporting period: December 1, 2012 – November 30, 2013
Item 1: Reports to Shareholders

Annual Report | November 30, 2013
Vanguard Ohio Tax-Exempt Funds

Vanguard’s Principles for Investing Success
We want to give you the best chance of investment success. These principles, grounded in Vanguard’s research and experience, can put you on the right path.
Goals. Create clear, appropriate investment goals.
Balance. Develop a suitable asset allocation using broadly diversified funds. Cost. Minimize cost.
Discipline. Maintain perspective and long-term discipline.
A single theme unites these principles: Focus on the things you can control.
We believe there is no wiser course for any investor.
| |
| Contents | |
| Your Fund’s Total Returns. | 1 |
| Chairman’s Letter. | 2 |
| Advisor’s Report. | 9 |
| Ohio Tax-Exempt Money Market Fund. | 12 |
| Ohio Long-Term Tax-Exempt Fund. | 26 |
| About Your Fund’s Expenses. | 47 |
| Glossary. | 49 |
Please note: The opinions expressed in this report are just that—informed opinions. They should not be considered promises or advice.
Also, please keep in mind that the information and opinions cover the period through the date on the front of this report. Of course, the risks of investing in your fund are spelled out in the prospectus.
See the Glossary for definitions of investment terms used in this report.
About the cover: The ship's wheel represents leadership and guidance, essential qualities in navigating difficult seas.
This one is a replica based on an 18th-century British vessel. The HMS Vanguard, another ship of that era, served as the flagship for Admiral Horatio Nelson when he defeated a French fleet at the Battle of the Nile.
| | | | | |
| Your Fund’s Total Returns | | | | | |
| |
| |
| |
| |
| Fiscal Year Ended November 30, 2013 | | | | | |
| | | Taxable- | | | |
| | SEC | Equivalent | Income | Capital | Total |
| | Yield | Yield | Returns | Returns | Returns |
| Vanguard Ohio Tax-Exempt Money Market Fund | 0.01% | 0.02% | 0.02% | 0.00% | 0.02% |
| Spliced Ohio Tax-Exempt Money Market Funds | | | | | |
| Average | | | | | 0.00 |
| For a benchmark description, see the Glossary. | | | | | |
| Spliced Ohio Tax-Exempt Money Market Funds Average: Derived from data provided by Lipper, a Thomson Reuters Company. | |
| |
| Vanguard Ohio Long-Term Tax-Exempt Fund | 3.50% | 6.54% | 3.48% | -7.76% | -4.28% |
| Barclays OH Municipal Bond Index | | | | | -2.71 |
| Ohio Municipal Debt Funds Average | | | | | -5.49 |
| Ohio Municipal Debt Funds Average: Derived from data provided by Lipper, a Thomson Reuters Company. | | |
7-day SEC yield for the Ohio Tax-Exempt Money Market Fund; 30-day SEC yield for the Ohio Long-Term Tax-Exempt Fund.
The calculation of taxable-equivalent yield assumes a typical itemized tax return and is based on the maximum federal tax rate of 43.4% and the maximum income tax rate for the state. Local taxes were not considered. Please see the prospectus for a detailed explanation of the calculation.
Your Fund’s Performance at a Glance
November 30, 2012, Through November 30, 2013
| | | | |
| | | | Distributions Per Share |
| | Starting | Ending | | |
| | Share | Share | Income | Capital |
| | Price | Price | Dividends | Gains |
| Vanguard Ohio Tax-Exempt Money Market Fund | $1.00 | $1.00 | $0.000 | $0.000 |
| Vanguard Ohio Long-Term Tax-Exempt Fund | $12.96 | $11.93 | $0.454 | $0.027 |
1

Chairman’s Letter
Dear Shareholder,
The 12 months ended November 30, 2013, marked a difficult period for the bond market, mainly because of concerns about the next steps in the Federal Reserve’s stimulus program. For municipal bond investors, another layer of unease was added by Detroit’s bankruptcy filing and news reports highlighting Puerto Rico’s financial struggles.
Vanguard Ohio Long-Term Tax-Exempt Fund returned –4.28% for the fiscal year, lagging the –2.71% return of its state-specific benchmark. Most of the gap came from the fund’s more substantial holdings in longer-maturity bonds, which underperformed their shorter-term counterparts this time around. However, the fund was able to outpace the –5.49% average return of its peers, thanks in part to its underweighting of distressed Puerto Rico issuers, which significantly underperformed over the period.
With short-term rates still tacked down near zero by the Fed, Vanguard Ohio Tax-Exempt Money Market Fund returned 0.02% for the period; its benchmark returned 0.00%, which was also the average result for its new peer group. (The Lipper, the company that provides peer-group data has eliminated the Ohio money market category because of the small number of funds. The new peer group includes funds from other states.)
2
As bond prices fell, the Long-Term Fund’s 30-day SEC yield climbed from 2.13% on November 30, 2012, to 3.79% at the end of August before dropping back to 3.50% by the fiscal year-end. (Bond yields and prices move in opposite directions.) In contrast, the 7-day SEC yield for the Money Market Fund was little changed, inching down to 0.01% on November 30 from 0.05% a year earlier.
The funds are permitted to invest in securities whose income is subject to the alternative minimum tax (AMT). As of November 30, the Long-Term Fund owned no securities that would generate income distributions subject to the AMT, but the Money Market Fund did.
Before moving on to discuss the markets, I want to mention an important transition at Vanguard. We announced in early November that Robert F. Auwaerter, principal and head of Vanguard Fixed Income Group, intends to retire in March 2014. At the conclusion of this letter, I’ll have more to say about Bob’s important contributions to Vanguard in his 32-year career, and I’ll introduce his successor, Gregory Davis.
Bond prices fell as yields rose over the period’s second half
Bonds, which held onto slight gains through the first five months of the fiscal year, retreated in May. For the full period, the broad U.S. taxable bond market
| | | |
| Market Barometer | | | |
| | | Average Annual Total Returns |
| | | Periods Ended November 30, 2013 |
| | One | Three | Five |
| | Year | Years | Years |
| Bonds | | | |
| Barclays U.S. Aggregate Bond Index (Broad taxable | | | |
| market) | -1.61% | 3.09% | 5.33% |
| Barclays Municipal Bond Index (Broad tax-exempt market) | -3.51 | 4.23 | 6.26 |
| Citigroup Three-Month U.S. Treasury Bill Index | 0.05 | 0.07 | 0.10 |
| |
| Stocks | | | |
| Russell 1000 Index (Large-caps) | 30.96% | 17.78% | 18.33% |
| Russell 2000 Index (Small-caps) | 40.99 | 17.89 | 20.97 |
| Russell 3000 Index (Broad U.S. market) | 31.71 | 17.78 | 18.54 |
| MSCI All Country World Index ex USA (International) | 18.24 | 7.50 | 13.87 |
| |
| CPI | | | |
| Consumer Price Index | 1.24% | 2.13% | 1.87% |
3
returned –1.61%. The yield of the 10-year Treasury note closed at 2.74%, up from 1.61% at the end of November 2012.
The broad municipal bond market returned –3.51%. Returns of money market funds and savings accounts continued to be restrained by the Fed’s 0%–0.25% target for short-term interest rates.
International bond markets (as measured by the Barclays Global Aggregate Index ex USD) returned –2.93%.
Despite some jolts, U.S. stocks notched an impressive 12-month gain
U.S. stocks powered to a return of about 32% for the fiscal year, despite encountering a few bumps along the way.
Uncertainty surrounding Federal Reserve policy contributed to market declines in June and August. But stocks bounced back in September when, to the surprise of some investors, the Fed announced it had no immediate plans to scale back its bond purchases. (In mid-December, the Fed ended several months of speculation by announcing that it would begin tapering the purchases in January 2014.) Corporate profit growth, though not robust, was generally solid during the fiscal year.
International stocks returned about 18% in aggregate. While the developed markets of Europe and the Pacific region performed well for the period, gains were modest for emerging-market stocks.
Expense Ratios
Your Fund Compared With Its Peer Group
| | |
| | | Peer Group |
| | Fund | Average |
| Ohio Tax-Exempt Money Market Fund | 0.16% | 0.26% |
| Ohio Long-Term Tax-Exempt Fund | 0.16 | 1.07 |
The fund expense ratios shown are from the prospectus dated March 28, 2013, and represent estimated costs for the current fiscal year. For the fiscal year ended November 30, 2013, the funds’ expense ratios were: for the Ohio Tax-Exempt Money Market Fund, 0.12%; and for the Ohio Long-Term Tax-Exempt Fund, 0.16%. The expense ratio for the Ohio Tax-Exempt Money Market Fund reflects a temporary reduction in operating expenses (described in Note B of the Notes to Financial Statements). Before the reduction, the expense ratio was 0.16%. Peer-group expense ratios are derived from data provided by Lipper, a Thomson Reuters Company, and capture information through year-end 2012.
Peer groups: For the Ohio Tax-Exempt Money Market Fund, Other States Tax-Exempt Money Market Funds; for the Ohio Long-Term Tax-Exempt Fund, Ohio Municipal Debt Funds.
4
The bond market’s downturn, coupled with the upswing in stocks that occurred during the fiscal year, provides an occasion for investors to review their portfolio’s asset allocation. In a powerful stock market rally, a portfolio’s mix of stocks and bonds can drift away from its target allocation, as Fran Kinniry, a principal in our Investment Strategy Group, recently reminded clients in an article on our website. “Buying stocks now may actually run counter to what many prudent investors should be doing,” he noted. “If you have an equity-heavy portfolio, you will most likely need to direct new cash flows to bond mutual funds, or sell stock mutual funds to maintain your target asset allocation.”
A strategy that helped dampen the impact of rising rates
In general, thanks to rising revenues and restrained budgets, state and local governments continued their slow recovery from the financial challenges brought on by the Great Recession. That was the case in Ohio over the fiscal year—even as the pace of economic growth slowed, tax revenues continued to edge higher. And on the spending side of the equation, difficult decisions were made regarding pension reforms, while bond issuance was virtually flat compared to the previous fiscal year.
Total Returns
Ten Years Ended November 30, 2013
| |
| | Average |
| | Annual Return |
| Ohio Tax-Exempt Money Market Fund | 1.34% |
| Spliced Ohio Tax-Exempt Money Market Funds Average | 1.06 |
| For a benchmark description, see the Glossary. | |
| Spliced Ohio Tax-Exempt Money Market Funds Average: Derived from data provided by Lipper, a Thomson Reuters Company. |
| |
| Ohio Long-Term Tax-Exempt Fund | 4.09% |
| Barclays OH Municipal Bond Index | 3.96 |
| Ohio Municipal Debt Funds Average | 3.18 |
| Ohio Municipal Debt Funds Average: Derived from data provided by Lipper, a Thomson Reuters Company. | |
The figures shown represent past performance, which is not a guarantee of future results. (Current performance may be lower or higher than the performance data cited. For performance data current to the most recent month-end, visit our website at vanguard.com/performance.) Note, too, that both investment returns and principal value can fluctuate widely, so an investor’s shares, when sold, could be worth more or less than their original cost.
5
During the period, however, concerns about the direction of U.S. monetary policy together with credit scares for a very limited number of issuers, including Detroit and Puerto Rico, put downward pressure on the overall muni market. The Barclays Ohio Municipal Bond Index reflected this environment, returning –2.71%. Vanguard Ohio Long-Term Tax-Exempt Fund returned less, but was able to exceed its peer-group average by more than a full percentage point owing in part to the advisor’s portfolio positioning, which better prepared the fund for an eventual rise in bond yields and the accompanying decline in prices. For example, the advisor maintained a shorter duration relative to the fund’s benchmark. Duration is a gauge of the sensitivity of bond prices to changes in interest rates; shorter durations (measured in months and years) can lessen the impact of rising rates.
The advisor also continued to favor bonds with higher credit quality. These bonds’ prices tend to stand up better than those of their lower-quality counterparts in periods of market turbulence, and they are generally more easily sold, which provides the fund with liquidity when needed. Relative to its peers, the fund was significantly underweighted in Puerto Rico issues, which performed very poorly.
The advisor also continued to favor bonds with higher credit quality. These bonds’ prices tend to stand up better than those of their lower-quality counterparts in periods of market turbulence, and they are generally more easily sold, which provides the fund with liquidity when needed. At the end of its fiscal year, the fund held no Puerto Rican bonds.
For the Ohio Tax-Exempt Money Market Fund, returns on savings accounts and other short-term investments have been severely limited since 2008 by the Fed’s policy of maintaining its target for short-term interest rates at 0%–0.25%. As a consequence, the fund returned 0.02% for the fiscal year, a meager result that was nevertheless better than the average for peers.
A decade-long perspective on the funds’ performance
Over the ten years ended November 30, Vanguard Ohio Long-Term Tax-Exempt Fund had an average annual return of 4.09%, outpacing its benchmark index. A more important indication of relative success for this actively managed fund, however, is that it outperformed its peer-group average by almost a full percentage point.
Over the same period, Vanguard Ohio Tax-Exempt Money Market Fund returned 1.34% a year on average, ahead of the 1.06% posted by its peer group.
These results highlight the skill of our experienced portfolio managers, traders, and credit analysts. They also reflect the competitive advantage that Vanguard’s low-cost philosophy can create. A lower-cost fund can steer clear of higher-risk assets because it has no need to offset the drain of high expenses.
6
Bob Auwaerter’s retirement marks the end of a remarkable era In mid-September 2008, about two weeks after I succeeded Jack Brennan as Vanguard’s chief executive officer, Lehman Brothers went bankrupt, igniting the nation’s worst financial crisis in 70 years. It was, to put it mildly, an extremely challenging time.
|
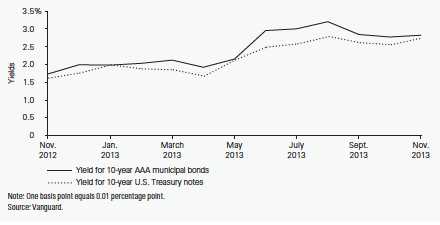
| Muni yields exceed Treasury yields: What does it mean? |
| |
| At times over the 12 months ended November 30, 10-year municipal bonds nationwide yielded |
| substantially more than their Treasury counterparts, even before factoring in munis’ tax-favored |
| status. This reversal of what had been the historical relationship between Treasuries and munis |
| has occurred often in recent years. The turmoil started with the 2008–2009 financial crisis and |
| continued amid dire headlines about state and local finances. |
| |
| Through June, July, and August, a time when investor concerns mounted over Detroit’s |
| bankruptcy filing and the financial health of Puerto Rico, 10-year municipal yields averaged |
| 31 basis points, or about 12%, more than 10-year Treasuries. By the end of November, the |
| gap had closed significantly, but 10-year muni yields were still averaging about 8 basis points, |
| or 3%, more. Over the past decade, however, muni yields have averaged 5% less than their |
| Treasury equivalents. |
| |
| We believe investors shouldn’t be unduly swayed by this turnabout. Will it vanish if they chase |
| it? Or do investors now perceive muni bonds to be riskier? Rather than speculate, we believe |
| investors should carefully evaluate the role of tax-exempt bonds in a diversified portfolio. For |
| any investor, the proportion of muni holdings (if any) should be based on long-term goals, risk |
| tolerance, and tax considerations—not on what may be transient yield trends. |
| |
| 10-year municipal bond yields have topped their Treasury counterparts |
7
Through it all, I was able to depend on Bob Auwaerter’s strong command of the Fixed Income Group, which persevered under these treacherous conditions. Although that was a difficult period for Vanguard and the industry, it was far from the only time I was grateful to have Bob at the helm of our bond group.
Bob, who joined Vanguard in 1981, was an original member of the three-person Fixed Income Group headed by Ian MacKinnon. Over the years, he held various leadership roles in the department, and he eventually succeeded Ian as its head in 2003. He earned a reputation at Vanguard and within the industry as an extremely dedicated, honest, and insightful decision-maker and leader.
The Fixed Income Group that Bob helped start had total assets of about $1.3 billion in seven funds. He tracked his positions in the two funds he managed then on index cards stored in a small metal box. Thirty-two years later, the 120-person group oversees $750 billion, which represents nearly one-third of Vanguard’s assets under management.
On behalf of our clients, I thank Bob for more than three decades of exemplary service and wish him the best in his retirement.
We’re fortunate that Greg Davis will become the head of the Fixed Income Group. Greg currently serves as chief investment officer for the Asia-Pacific region and as a director of Vanguard
Investments Australia. He joined Vanguard in 1999 and has been head of bond indexing and a senior portfolio manager in the Fixed Income Group. Greg is an eminently qualified successor to Bob, with a strong commitment to the Vanguard way of investing. I couldn’t be more confident in his ability to lead the Fixed Income Group and its deep and talented team.
As always, thank you for investing with Vanguard.
Sincerely,

F. William McNabb III
Chairman and Chief Executive Officer
December 19, 2013
8
Advisor’s Report
For the fiscal year ended November 30, 2013, Vanguard Ohio Long-Term Tax-Exempt Fund posted a return of –4.28%, behind its benchmark’s return of –2.71% but ahead of the average return of –5.49% for its peer group. Vanguard Ohio Tax-Exempt Money Market Fund returned 0.02%, marginally more than the 0.00% average for its peers.
The investment environment
Some uncertainty is natural in the financial markets, but during the fiscal year conditions were more unsettled than usual, largely because of fiscal battles in Washington and apprehension over what the Federal Reserve might do next.
The struggles in Washington included a political showdown in December 2012 over scheduled tax increases and spending cuts known as the “fiscal cliff” and, more recently, gridlock over the debt ceiling that led to a partial government shutdown in October. These challenges weighed on gross domestic product (the broadest measure of goods and services produced across the economy), which increased at an annual rate of about 2% during the fiscal year.
Even more disquieting for bond investors was the Fed’s suggesting in May and June that it might soon begin scaling back its $85 billion-per-month bond-buying program. Reasons cited by the Fed included a fall in the national unemployment rate and further signs of recovery in the housing market. After some backpedaling in September, the Fed did decide, just after the close of the funds’ fiscal year, that it would begin a slow tapering of its purchases in January 2014.
Yields of Tax-Exempt Municipal Securities
(AAA-Rated General-Obligation Issues)
| | |
| | November 30, | November 30, |
| Maturity | 2012 | 2013 |
| 2 years | 0.30% | 0.33% |
| 5 years | 0.64 | 1.16 |
| 10 years | 1.47 | 2.65 |
| 30 years | 2.47 | 4.10 |
| Source: Vanguard. | | |
9
The Fed’s policy regarding short-term rates remained unchanged; its target stayed at 0%–0.25%, where it has been since 2008.
With Detroit’s bankruptcy and Puerto Rico’s fiscal woes weighing on market sentiment as well, municipal bond yields—especially those of longer-term securities—climbed significantly during the 12-month period. As you can see in the table on page 9, the yields of very short-term AAA-rated securities remained close to zero, while those of 10-year bonds rose 118 basis points to 2.65% and those of 30-year bonds climbed 163 basis points to 4.10%. Credit spreads also widened as investors grew less willing to take on risk.
As a whole, Ohio municipal bonds returned –2.71%, as measured by our benchmark index, faring slightly better than the broad U.S. municipal market at –3.51%. The pace of economic growth slowed in the Buckeye State during the funds’ fiscal year, owing in part to some weakness in the manufacturing sector. Additional strains included the unemployment rate ticking up and state tax revenues rebounding more slowly than the national average.
However, many municipal bond issuers in Ohio continued to deal with their financial challenges head-on. Officials made tough decisions to reform two statewide pension plans, and more reforms are being carried out at the local-government level. As for spending, municipal bond issuance for the state remained virtually flat compared with the previous year.
Management of the funds
For the fiscal year, the returns of longer-term maturities in particular were hurt by the rise in interest rates. This dynamic gave an advantage to the Ohio Long-Term Tax-Exempt Fund compared with its peer funds, which, on average, held more longer-dated securities. The same positioning, however, put the fund at a disadvantage to its benchmark, which had even fewer longer-term securities.
Another plus for the fund during the fiscal year was the liquidity of its holdings. We were more careful than usual to have an allocation to bonds that can easily be sold without affecting the fund’s core positioning. This approach, which is especially useful during volatile periods, allows us to have “dry powder” available to buy bonds when they are undervalued in the market.
The fund held a small allocation to Puerto Rican bonds, which suffered sharp price declines. (State municipal bond funds often include securities from Puerto Rico, because the income they generate is free from every state’s income tax as well as from the federal tax.) We had less exposure to these bonds than many competing funds did, which proved to
10
be a good call. By the close of the period, the fund had sold virtually all of its Puerto Rican debt.
With the Fed still keeping short-term interest rates exceptionally low, the return for the Ohio Tax-Exempt Money Market Fund was paper-thin. In managing this fund, we adhered to our strategy of investing in high-quality money market securities from issuers closely screened by our own team of credit analysts.
A look ahead
We expect U.S. economic growth to approach 3% in 2014 and the national unemployment rate to keep falling. But the unresolved federal-level fiscal uncertainties of 2013 will continue into the new year, and we wouldn’t be surprised if talk of tax reform, a subject that can include municipal bonds, resurfaces.
The gradual reduction in the Fed’s bond-buying program that will begin in January should allow the Fed to bring the program to a close by the end of 2014. Of course, how the market will react over time to the Fed’s tapering is a big unknown.
As tapering starts, and if economic growth picks up, we expect that interest rates will move modestly higher and lower-credit-quality bonds will outperform. We plan to continue our defensive positioning, in which we have shortened the fund’s averageduration relative to its benchmark, and to maintain higher levels of liquidity so that we can take advantage of attractive opportunities if volatility increases in the municipal market. As usual, our experienced team will continue to seek outperformance through security selection by identifying bonds that are mispriced by the market.
Christopher W. Alwine, CFA, Principal, Head of Municipal Bond Funds
Pamela Wisehaupt Tynan, Principal, Head of Municipal Money Market Funds
Marlin G. Brown, Portfolio Manager
Justin A. Schwartz, CFA, Portfolio Manager Vanguard Fixed Income Group
December 20, 2013
11
Ohio Tax-Exempt Money Market Fund
Fund Profile
As of November 30, 2013
| |
| Financial Attributes | |
| Ticker Symbol | VOHXX |
| Expense Ratio1 | 0.16% |
| 7-Day SEC Yield | 0.01% |
| Average Weighted | |
| Maturity | 39 days |
| |
| Distribution by Credit Quality (% of portfolio) |
| First Tier | 100.0% |
| For information about these ratings, see the Glossary entry for |
| Credit Quality. | |
1 The expense ratio shown is from the prospectus dated March 28, 2013, and represents estimated costs for the current fiscal year. For the fiscal year ended November 30, 2013, the expense ratio was 0.12%, reflecting a temporary reduction in operating expenses (described in Note B of the Notes to Financial Statements). Before this reduction, the expense ratio was 0.16%.
12
Ohio Tax-Exempt Money Market Fund
Performance Summary
Investment returns will fluctuate. All of the returns in this report represent past performance, which is not a guarantee of future results that may be achieved by the fund. (Current performance may be lower or higher than the performance data cited. For performance data current to the most recent month-end, visit our website at vanguard.com/performance.) The returns shown do not reflect taxes that a shareholder would pay on fund distributions. An investment in a money market fund is not insured or guaranteed by the Federal Deposit Insurance Corporation or any other government agency. Although the fund seeks to preserve the value of your investment at $1 per share, it is possible to lose money by investing in the fund. The fund’s 7-day SEC yield reflects its current earnings more closely than do the average annual returns.
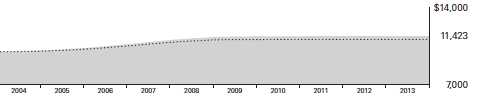
Cumulative Performance: November 30, 2003, Through November 30, 2013
Initial Investment of $10,000
| | | | |
| | | Average Annual Total Returns | |
| | Periods Ended November 30, 2013 | |
| |
| | | | | Final Value |
| | One | Five | Ten | of a $10,000 |
| | Year | Years | Years | Investment |
| |
| Ohio Tax-Exempt Money Market | | | | |
| Fund | 0.02% | 0.17% | 1.34% | $11,423 |
| Spliced Ohio Tax-Exempt Money | | | | |
| •••••••• Market Funds Average | 0.00 | 0.07 | 1.06 | 11,115 |
For a benchmark description, see the Glossary.
Spliced Ohio Tax-Exempt Money Market Funds Average: Derived from data provided by Lipper, a Thomson Reuters Company.
See Financial Highlights for dividend information.
13
| | |
| Ohio Tax-Exempt Money Market Fund | | |
| |
| |
| |
| Fiscal-Year Total Returns (%): November 30, 2003, Through November 30, 2013 | |
| | | Spliced Ohio |
| | | Tax-Exempt |
| | | Money Mkt |
| | | Funds Avg. |
| Fiscal Year | Total Returns | Total Returns |
| 2004 | 1.06% | 0.59% |
| 2005 | 2.21 | 1.73 |
| 2006 | 3.30 | 2.84 |
| 2007 | 3.63 | 3.14 |
| 2008 | 2.40 | 2.05 |
| 2009 | 0.56 | 0.31 |
| 2010 | 0.15 | 0.03 |
| 2011 | 0.09 | 0.00 |
| 2012 | 0.05 | 0.00 |
| 2013 | 0.02 | 0.00 |
| 7-day SEC yield (11/30/2013): 0.01% | | |
| For a benchmark description, see the Glossary. | | |
| Spliced Ohio Tax-Exempt Money Market Funds Average: Derived from data provided by Lipper, a Thomson Reuters Company. | |
Average Annual Total Returns: Periods Ended September 30, 2013
This table presents returns through the latest calendar quarter—rather than through the end of the fiscal period.
Securities and Exchange Commission rules require that we provide this information.
| | | | |
| | Inception | One | Five | Ten |
| | Date | Year | Years | Years |
| Ohio Tax-Exempt Money Market | | | | |
| Fund | 6/18/1990 | 0.02% | 0.25% | 1.35% |
14
Ohio Tax-Exempt Money Market Fund
Financial Statements
Statement of Net Assets
As of November 30, 2013
The fund reports a complete list of its holdings in various monthly and quarterly regulatory filings. The fund publishes its holdings on a monthly basis at vanguard.com and files them with the Securities and Exchange Commission on Form N-MFP. The fund’s Form N-MFP filings become public 60 days after the relevant month-end, and may be viewed at sec.gov or via a link on the “Portfolio Holdings” page on vanguard.com. For the second and fourth fiscal quarters, the lists appear in the fund’s semiannual and annual reports to shareholders. For the first and third fiscal quarters, the fund files the lists with the SEC on Form N-Q. Shareholders can look up the fund’s Forms N-Q on the SEC’s website at sec.gov. Forms N-Q may also be reviewed and copied at the SEC’s Public Reference Room (see the back cover of this report for further information).
| | | | |
| | | | Face | Market |
| | | Maturity | Amount | Value |
| | Coupon | Date | ($000) | ($000) |
| Tax-Exempt Municipal Bonds (102.6%) | | | | |
| Ohio (102.6%) | | | | |
| Akron OH Income Tax Revenue | | | | |
| (Community Learning Centers) | 5.000% | 12/1/13 (Prere.) | 6,300 | 6,300 |
| Akron OH Income Tax Revenue BAN | 1.125% | 3/13/14 | 1,600 | 1,603 |
| Akron OH Income Tax Revenue BAN | 1.000% | 11/12/14 | 3,090 | 3,111 |
| Allen County OH Hospital Facilities Revenue | | | | |
| (Catholic Healthcare Partners) VRDO | 0.040% | 12/2/13 LOC | 960 | 960 |
| Athens County OH Port Authority | | | | |
| Housing Revenue VRDO | 0.050% | 12/6/13 LOC | 5,000 | 5,000 |
| Avon OH BAN | 0.450% | 6/25/14 | 2,610 | 2,610 |
| 1 Blue Ash OH BAN | 1.000% | 12/3/14 | 3,450 | 3,476 |
| Butler County OH BAN | 0.400% | 7/31/14 | 2,000 | 2,000 |
| Cincinnati OH City School District GO | 5.000% | 12/1/13 (Prere.) | 1,625 | 1,625 |
| 2 Cincinnati OH City School District GO TOB VRDO | 0.050% | 12/6/13 | 12,205 | 12,205 |
| 2 Cincinnati OH City School District GO TOB VRDO | 0.060% | 12/6/13 | 5,000 | 5,000 |
| Cincinnati OH GO | 2.000% | 12/1/13 | 1,120 | 1,120 |
| 2 Cleveland OH Water Works Revenue TOB VRDO | 0.050% | 12/6/13 | 9,950 | 9,950 |
| Cleveland OH Water Works Revenue VRDO | 0.060% | 12/6/13 LOC | 7,900 | 7,900 |
| Cleveland-Cuyahoga County OH Port Authority | | | | |
| Revenue (Carnegie/89th Garage & | | | | |
| Service Center LLC Project) VRDO | 0.060% | 12/6/13 LOC | 2,385 | 2,385 |
| Cleveland-Cuyahoga County OH Port Authority | | | | |
| Revenue (Cleveland Museum | | | | |
| of Art Project) VRDO | 0.050% | 12/6/13 | 5,810 | 5,810 |
| 1 Cleveland-Cuyahoga County OH Port Authority | | | | |
| Revenue (Cleveland Museum | | | | |
| of Art Project) VRDO | 0.050% | 12/6/13 | 5,900 | 5,900 |
| Cleveland-Cuyahoga County OH Port Authority | | | | |
| Revenue (Cleveland Museum | | | | |
| of Art Project) VRDO | 0.050% | 12/6/13 | 7,115 | 7,115 |
| Cleveland-Cuyahoga County OH Port Authority | | | | |
| Revenue (Euclid Avenue Housing | | | | |
| Corp. Project) VRDO | 0.060% | 12/6/13 LOC | 2,675 | 2,675 |
| Columbus OH BAN | 2.000% | 9/2/14 | 6,600 | 6,689 |
| Columbus OH GO | 5.000% | 7/1/14 | 1,000 | 1,028 |
| 2 Columbus OH GO TOB VRDO | 0.080% | 12/6/13 | 4,360 | 4,360 |
15
| | | | |
| Ohio Tax-Exempt Money Market Fund | | | | |
| |
| |
| |
| | | | Face | Market |
| | | Maturity | Amount | Value |
| | Coupon | Date | ($000) | ($000) |
| 1 Columbus OH GO VRDO | 0.030% | 12/6/13 | 7,500 | 7,500 |
| Columbus OH Regional Airport Authority | | | | |
| Airport Revenue (Oasbo Expanded | | | | |
| Asset Program) VRDO | 0.060% | 12/6/13 LOC | 3,345 | 3,345 |
| Columbus OH Regional Airport Authority | | | | |
| Airport Revenue (Oasbo Expanded | | | | |
| Asset Program) VRDO | 0.060% | 12/6/13 LOC | 8,180 | 8,180 |
| 2 Columbus OH Sewer Revenue TOB VRDO | 0.050% | 12/6/13 | 2,800 | 2,800 |
| 2 Columbus OH Sewer Revenue TOB VRDO | 0.050% | 12/6/13 | 4,935 | 4,935 |
| Columbus OH Sewer Revenue VRDO | 0.030% | 12/6/13 | 5,465 | 5,465 |
| Cuyahoga County OH Economic Development | | | | |
| Revenue (Cleveland Hearing & Speech) VRDO | 0.060% | 12/6/13 LOC | 4,540 | 4,540 |
| Cuyahoga County OH Housing Revenue VRDO | 0.050% | 12/6/13 LOC | 6,935 | 6,935 |
| Cuyahoga Falls OH BAN | 1.000% | 12/5/13 | 2,400 | 2,400 |
| 1 Cuyahoga Falls OH BAN | 1.000% | 12/4/14 | 1,870 | 1,884 |
| Dayton OH City School District BAN | 1.250% | 10/15/14 | 3,000 | 3,025 |
| Deerfield Township OH BAN | 1.000% | 10/29/14 | 2,495 | 2,511 |
| Euclid OH Income Tax BAN | 1.150% | 6/12/14 | 1,245 | 1,249 |
| 1 Fairfield Township OH Fire Station | | | | |
| Improvement Notes | 1.250% | 6/5/14 | 1,350 | 1,357 |
| Franklin County OH Hospital Facilities Revenue | | | | |
| (Doctors OhioHealth Corp.) VRDO | 0.060% | 12/6/13 LOC | 13,670 | 13,670 |
| Franklin County OH Hospital Facilities Revenue | | | | |
| (OhioHealth Corp.) VRDO | 0.060% | 12/6/13 | 3,400 | 3,400 |
| Franklin County OH Hospital Facilities Revenue | | | | |
| (OhioHealth Corp.) VRDO | 0.060% | 12/6/13 | 4,940 | 4,940 |
| Franklin County OH Hospital Revenue | | | | |
| (Holy Cross Health System) VRDO | 0.040% | 12/6/13 | 1,800 | 1,800 |
| Franklin County OH Hospital Revenue | | | | |
| (Nationwide Children’s Hospital Project) VRDO | 0.050% | 12/6/13 | 3,715 | 3,715 |
| Franklin County OH Hospital Revenue | | | | |
| (Nationwide Children’s Hospital Project) VRDO | 0.050% | 12/6/13 | 6,500 | 6,500 |
| Franklin County OH Hospital Revenue | | | | |
| (Nationwide Hospital) VRDO | 0.030% | 12/6/13 | 9,500 | 9,500 |
| 3 Franklin County OH Revenue | | | | |
| (Trinity Health Credit Group) PUT | 0.120% | 6/27/14 | 5,800 | 5,800 |
| Green OH BAN | 1.000% | 6/17/14 | 910 | 913 |
| 2 Hamilton County OH Economic | | | | |
| Development Revenue TOB VRDO | 0.050% | 12/6/13 LOC | 2,995 | 2,995 |
| Hamilton County OH Health Care Facilities | | | | |
| Revenue (The Children’s Home of Cincinnati) | | | | |
| VRDO | 0.050% | 12/6/13 LOC | 3,165 | 3,165 |
| 2 Hamilton County OH Sewer System Revenue | | | | |
| TOB VRDO | 0.060% | 12/6/13 | 8,500 | 8,500 |
| Hamilton OH BAN | 1.000% | 10/2/14 | 2,400 | 2,408 |
| Huber Heights OH BAN | 1.000% | 11/7/14 | 2,000 | 2,013 |
| Jackson OH Local School District | | | | |
| Stark & Summit Counties GO | 5.000% | 6/1/14 (Prere.) | 1,000 | 1,024 |
| Kent OH BAN | 1.000% | 9/4/14 | 2,565 | 2,578 |
| Lakewood OH BAN | 1.000% | 4/15/14 | 1,610 | 1,614 |
| 2 Lakewood OH City School District GO TOB VRDO | 0.070% | 12/6/13 | 3,825 | 3,825 |
| Lancaster Port Authority Ohio Gas Revenue VRDO | 0.050% | 12/6/13 | 18,300 | 18,300 |
| 2 Lorain County OH Hospital Facilities Revenue | | | | |
| (Catholic Healthcare Partners) TOB VRDO | 0.150% | 12/6/13 | 10,000 | 10,000 |
| 2 Lorain County OH Hospital Facilities Revenue | | | | |
| (Catholic Healthcare Partners) TOB VRDO | 0.230% | 12/6/13 | 5,000 | 5,000 |
16
| | | | |
| Ohio Tax-Exempt Money Market Fund | | | | |
| |
| |
| |
| | | | Face | Market |
| | | Maturity | Amount | Value |
| | Coupon | Date | ($000) | ($000) |
| Lorain County OH Port Authority Educational | | | | |
| Facilities Revenue (St. Ignatius High School | | | | |
| Project) VRDO | 0.070% | 12/6/13 LOC | 1,650 | 1,650 |
| Lucas County OH BAN | 1.000% | 7/16/14 | 3,000 | 3,013 |
| Marysville OH BAN | 1.500% | 5/29/14 | 1,900 | 1,910 |
| Mason OH City School District BAN | 1.500% | 1/30/14 | 3,000 | 3,006 |
| Mason OH City School District GO | 5.000% | 6/1/14 (Prere.) | 1,175 | 1,203 |
| Middletown OH Hospital Facilities Revenue | | | | |
| (Atrium Medical Center) VRDO | 0.090% | 12/6/13 LOC | 5,710 | 5,710 |
| 2 Montgomery County OH Revenue | | | | |
| (Miami Valley Hospital) TOB VRDO | 0.060% | 12/6/13 | 7,500 | 7,500 |
| Montgomery County OH Revenue | | | | |
| (Miami Valley Hospital) VRDO | 0.040% | 12/2/13 | 5,815 | 5,815 |
| Montgomery County OH Revenue | | | | |
| (Miami Valley Hospital) VRDO | 0.050% | 12/2/13 | 500 | 500 |
| New Albany OH BAN | 1.000% | 7/31/14 | 3,800 | 3,818 |
| 2 Northeast OH Regional Sewer District | | | | |
| Revenue (Wastewater Revenue | | | | |
| Improvement) TOB VRDO | 0.050% | 12/6/13 | 6,800 | 6,800 |
| 2 Nuveen Ohio Quality Income Municipal Fund | | | | |
| VRDP VRDO | 0.140% | 12/6/13 LOC | 21,000 | 21,000 |
| Ohio Air Quality Development Authority | | | | |
| Pollution Control Revenue (FirstEnergy | | | | |
| Nuclear Generation Corp. Project) VRDO | 0.060% | 12/2/13 LOC | 2,800 | 2,800 |
| 2 Ohio Air Quality Development Authority Revenue | | | | |
| (Dayton Power & Light Co. Project) TOB VRDO | 0.110% | 12/6/13 (13) | 13,320 | 13,320 |
| Ohio Air Quality Development Authority Revenue | | | | |
| (Dayton Power & Light Co. Project) VRDO | 0.060% | 12/6/13 LOC | 6,500 | 6,500 |
| Ohio Air Quality Development Authority Revenue | | | | |
| (Ohio Valley Electric Corp. Project) VRDO | 0.030% | 12/6/13 LOC | 5,000 | 5,000 |
| Ohio Air Quality Development Authority Revenue | | | | |
| (Ohio Valley Electric Corp. Project) VRDO | 0.040% | 12/6/13 LOC | 10,000 | 10,000 |
| Ohio Air Quality Development Authority Revenue | | | | |
| (Ohio Valley Electric Corp. Project) VRDO | 0.050% | 12/6/13 LOC | 5,000 | 5,000 |
| Ohio Common Schools GO VRDO | 0.030% | 12/6/13 | 1,950 | 1,950 |
| Ohio Common Schools GO VRDO | 0.030% | 12/6/13 | 1,220 | 1,220 |
| Ohio Conservation Projects GO | 5.000% | 3/1/14 (Prere.) | 1,425 | 1,442 |
| Ohio GO | 1.000% | 6/15/14 | 4,385 | 4,404 |
| Ohio GO | 2.000% | 11/1/14 | 620 | 630 |
| Ohio GO VRDO | 0.030% | 12/6/13 | 985 | 985 |
| Ohio GO VRDO | 0.030% | 12/6/13 | 7,045 | 7,045 |
| 2 Ohio Higher Education GO TOB VRDO | 0.050% | 12/6/13 | 16,920 | 16,920 |
| Ohio Higher Educational Facility Commission | | | | |
| Revenue (Case Western Reserve University | | | | |
| Project) CP | 0.150% | 12/4/13 | 7,000 | 7,000 |
| Ohio Higher Educational Facility Commission | | | | |
| Revenue (Case Western Reserve University | | | | |
| Project) VRDO | 0.050% | 12/2/13 LOC | 10,950 | 10,950 |
| Ohio Higher Educational Facility Commission | | | | |
| Revenue (Case Western Reserve University | | | | |
| Project) VRDO | 0.050% | 12/2/13 LOC | 2,700 | 2,700 |
| Ohio Higher Educational Facility Commission | | | | |
| Revenue (Cleveland Clinic Health System | | | | |
| Obligated Group) VRDO | 0.040% | 12/2/13 | 2,400 | 2,400 |
17
| | | | |
| Ohio Tax-Exempt Money Market Fund | | | | |
| |
| |
| |
| | | | Face | Market |
| | | Maturity | Amount | Value |
| | Coupon | Date | ($000) | ($000) |
| Ohio Higher Educational Facility Commission | | | | |
| Revenue (Cleveland Clinic Health System | | | | |
| Obligated Group) VRDO | 0.050% | 12/2/13 | 1,400 | 1,400 |
| Ohio Higher Educational Facility Commission | | | | |
| Revenue (Cleveland Clinic Health System | | | | |
| Obligated Group) VRDO | 0.050% | 12/2/13 | 8,600 | 8,600 |
| Ohio Higher Educational Facility Commission | | | | |
| Revenue (Marietta College Project) VRDO | 0.070% | 12/6/13 LOC | 2,540 | 2,540 |
| Ohio Higher Educational Facility Commission | | | | |
| Revenue (Oberlin College Project) VRDO | 0.050% | 12/6/13 | 1,800 | 1,800 |
| Ohio Higher Educational Facility Commission | | | | |
| Revenue (Ohio Northern University Project) | | | | |
| VRDO | 0.080% | 12/6/13 LOC | 10,000 | 10,000 |
| 2 Ohio Higher Educational Facility Commission | | | | |
| Revenue (University Hospitals Health | | | | |
| System Inc.) TOB VRDO | 0.100% | 12/6/13 (13) | 5,000 | 5,000 |
| 2 Ohio Higher Educational Facility Commission | | | | |
| Revenue (University of Dayton Project) | | | | |
| TOB VRDO | 0.050% | 12/6/13 LOC | 4,225 | 4,225 |
| Ohio Higher Educational Facility Revenue | | | | |
| (Ohio Dominican University) VRDO | 0.070% | 12/6/13 LOC | 8,925 | 8,925 |
| 2 Ohio Hospital Revenue (Cleveland Clinic | | | | |
| Health System Obligated Group) TOB VRDO | 0.060% | 12/2/13 | 3,100 | 3,100 |
| 2 Ohio Hospital Revenue (Cleveland Clinic | | | | |
| Health System Obligated Group) TOB VRDO | 0.060% | 12/2/13 | 2,425 | 2,425 |
| Ohio Housing Finance Agency Residential | | | | |
| Mortgage Revenue VRDO | 0.050% | 12/6/13 | 10,960 | 10,960 |
| Ohio Housing Finance Agency Residential | | | | |
| Mortgage Revenue VRDO | 0.050% | 12/6/13 | 13,000 | 13,000 |
| Ohio Housing Finance Agency Residential | | | | |
| Mortgage Revenue VRDO | 0.070% | 12/6/13 | 4,000 | 4,000 |
| Ohio Housing Finance Agency Residential | | | | |
| Mortgage Revenue VRDO | 0.080% | 12/6/13 | 2,865 | 2,865 |
| Ohio Housing Finance Agency Residential | | | | |
| Mortgage Revenue VRDO | 0.080% | 12/6/13 | 4,800 | 4,800 |
| 1 Ohio Infrastructure Improvement GO VRDO | 0.030% | 12/6/13 | 6,800 | 6,800 |
| Ohio State University General Receipts | | | | |
| Revenue CP | 0.110% | 12/4/13 | 7,790 | 7,790 |
| Ohio State University General Receipts | | | | |
| Revenue CP | 0.110% | 12/10/13 | 8,000 | 8,000 |
| Ohio State University General Receipts | | | | |
| Revenue CP | 0.130% | 1/7/14 | 8,200 | 8,200 |
| Ohio Turnpike Commission Turnpike Revenue | 5.500% | 2/15/14 | 5,155 | 5,211 |
| Ohio Water Development Authority Pollution | | | | |
| Control Revenue (FirstEnergy Nuclear | | | | |
| Generation Corp. Project) VRDO | 0.040% | 12/2/13 LOC | 3,650 | 3,650 |
| Ohio Water Development Authority Pollution | | | | |
| Control Revenue (FirstEnergy Nuclear | | | | |
| Generation Corp. Project) VRDO | 0.050% | 12/6/13 LOC | 7,450 | 7,450 |
| Ohio Water Development Authority Pollution | | | | |
| Control Revenue (Water Quality) | 4.000% | 12/1/13 | 1,000 | 1,000 |
| Ohio Water Development Authority Pollution | | | | |
| Control Revenue (Water Quality) | 5.000% | 12/1/13 | 1,000 | 1,000 |
| Ohio Water Development Authority Revenue | 2.000% | 12/1/13 | 1,500 | 1,500 |
| Ohio Water Development Authority Revenue | 2.000% | 6/1/14 | 1,500 | 1,513 |
18
| | | | | |
| Ohio Tax-Exempt Money Market Fund | | | | |
| |
| |
| |
| | | | | Face | Market |
| | | | Maturity | Amount | Value |
| | | Coupon | Date | ($000) | ($000) |
| | Ohio Water Development Authority Revenue | | | | |
| | (FirstEnergy Nuclear Generation Corp. Project) | | | | |
| | VRDO | 0.050% | 12/2/13 LOC | 6,700 | 6,700 |
| | Olentangy OH Local School District GO | 5.250% | 6/1/14 (Prere.) | 3,055 | 3,132 |
| 2 | Olentangy OH School District GO TOB VRDO | 0.050% | 12/6/13 LOC | 2,840 | 2,840 |
| 2 | South-Western City OH School District GO | | | | |
| | TOB VRDO | 0.050% | 12/6/13 | 8,000 | 8,000 |
| | Stow OH BAN | 1.000% | 5/2/14 | 2,700 | 2,708 |
| | Summit County OH GO | 5.250% | 12/1/13 (Prere.) | 1,820 | 1,820 |
| | Summit County OH GO | 5.250% | 12/1/13 (Prere.) | 1,395 | 1,395 |
| | Toledo OH City School District GO | 5.000% | 12/1/13 (Prere.) | 1,940 | 1,940 |
| | Toledo-Lucas County OH Port Authority | | | | |
| | Airport Development Revenue | | | | |
| | (FlightSafety International Inc.) VRDO | 0.050% | 12/6/13 | 11,450 | 11,450 |
| | University of Cincinnati OH BAN | 1.500% | 5/9/14 | 4,000 | 4,021 |
| | University of Cincinnati Ohio General | | | | |
| | Receipts Revenue | 5.000% | 6/1/14 (Prere.) | 3,695 | 3,783 |
| | Willoughby OH BAN | 1.500% | 7/25/14 | 5,625 | 5,671 |
| | | | | | 618,013 |
| Total Tax-Exempt Municipal Bonds (Cost $618,013) | | | | 618,013 |
| Other Assets and Liabilities (-2.6%) | | | | |
| Other Assets | | | | 10,880 |
| Liabilities | | | | (26,780) |
| | | | | | (15,900) |
| Net Assets (100%) | | | | |
| Applicable to 601,958,401 outstanding $.001 par value shares of | | | |
| beneficial interest (unlimited authorization) | | | | 602,113 |
| Net Asset Value Per Share | | | | $1.00 |
| |
| |
| At November 30, 2013, net assets consisted of: | | | | |
| | | | | | Amount |
| | | | | | ($000) |
| Paid-in Capital | | | | 602,119 |
| Undistributed Net Investment Income | | | | — |
| Accumulated Net Realized Losses | | | | (6) |
| Net Assets | | | | 602,113 |
See Note A in Notes to Financial Statements.
1 Security purchased on a when-issued or delayed-delivery basis for which the fund has not taken delivery as of November 30, 2013.
2 Security exempt from registration under Rule 144A of the Securities Act of 1933. Such securities may be sold in transactions exempt from registration, normally to qualified institutional buyers. At November 30, 2013, the aggregate value of these securities was $160,700,000, representing 26.7% of net assets.
3 Adjustable-rate security.
A key to abbreviations and other references follows the Statement of Net Assets.
See accompanying Notes, which are an integral part of the Financial Statements.
19
Ohio Tax-Exempt Money Market Fund
Key to Abbreviations
ARS—Auction Rate Security.
BAN—Bond Anticipation Note.
COP—Certificate of Participation.
CP—Commercial Paper.
FR—Floating Rate.
GAN—Grant Anticipation Note.
GO—General Obligation Bond.
PUT—Put Option Obligation.
RAN—Revenue Anticipation Note.
TAN—Tax Anticipation Note.
TOB—Tender Option Bond.
TRAN—Tax Revenue Anticipation Note.
VRDO—Variable Rate Demand Obligation.
VRDP—Variable Rate Demand Preferred.
(ETM)—Escrowed to Maturity.
(Prere.)—Prerefunded.
Scheduled principal and interest payments are guaranteed by:
(1) MBIA (Municipal Bond Investors Assurance).
(2) AMBAC (Ambac Assurance Corporation).
(3) FGIC (Financial Guaranty Insurance Company).
(4) AGM (Assured Guaranty Municipal Corporation).
(5) BIGI (Bond Investors Guaranty Insurance).
(6) Connie Lee Inc.
(7) FHA (Federal Housing Authority).
(8) CapMAC (Capital Markets Assurance Corporation).
(9) American Capital Access Financial Guaranty Corporation.
(10) XL Capital Assurance Inc.
(11) CIFG (CDC IXIS Financial Guaranty).
(12) Assured Guaranty Corporation.
(13) Berkshire Hathaway Assurance Corporation.
(14) National Public Finance Guarantee Corporation.
(15) Build America Mutual Assurance Company.
The insurance does not guarantee the market value of the municipal bonds.
LOC—Scheduled principal and interest payments are guaranteed by bank letter of credit.
20
| |
| Ohio Tax-Exempt Money Market Fund | |
| |
| |
| Statement of Operations | |
| |
| | Year Ended |
| | November 30, 2013 |
| | ($000) |
| Investment Income | |
| Income | |
| Interest | 821 |
| Total Income | 821 |
| Expenses | |
| The Vanguard Group—Note B | |
| Investment Advisory Services | 148 |
| Management and Administrative | 603 |
| Marketing and Distribution | 159 |
| Custodian Fees | 13 |
| Auditing Fees | 23 |
| Shareholders’ Reports | 5 |
| Trustees’ Fees and Expenses | 1 |
| Total Expenses | 952 |
| Expense Reduction—Note B | (221) |
| Net Expenses | 731 |
| Net Investment Income | 90 |
| Realized Net Gain (Loss) on Investment Securities Sold | — |
| Net Increase (Decrease) in Net Assets Resulting from Operations | 90 |
See accompanying Notes, which are an integral part of the Financial Statements.
21
| | |
| Ohio Tax-Exempt Money Market Fund | | |
| |
| |
| Statement of Changes in Net Assets | | |
| |
| | Year Ended November 30, |
| | 2013 | 2012 |
| | ($000) | ($000) |
| Increase (Decrease) in Net Assets | | |
| Operations | | |
| Net Investment Income | 90 | 334 |
| Realized Net Gain (Loss) | — | (9) |
| Net Increase (Decrease) in Net Assets Resulting from Operations | 90 | 325 |
| Distributions | | |
| Net Investment Income | (90) | (334) |
| Realized Capital Gain | — | — |
| Total Distributions | (90) | (334) |
| Capital Share Transactions (at $1.00 per share) | | |
| Issued | 358,609 | 350,136 |
| Issued in Lieu of Cash Distributions | 84 | 312 |
| Redeemed | (365,619) | (427,382) |
| Net Increase (Decrease) from Capital Share Transactions | (6,926) | (76,934) |
| Total Increase (Decrease) | (6,926) | (76,943) |
| Net Assets | | |
| Beginning of Period | 609,039 | 685,982 |
| End of Period | 602,113 | 609,039 |
See accompanying Notes, which are an integral part of the Financial Statements.
22
| | | | | |
| Ohio Tax-Exempt Money Market Fund | | | | | |
| |
| |
| Financial Highlights | | | | | |
| |
| |
| For a Share Outstanding | | | Year Ended November 30, |
| Throughout Each Period | 2013 | 2012 | 2011 | 2010 | 2009 |
| Net Asset Value, Beginning of Period | $1.00 | $1.00 | $1.00 | $1.00 | $1.00 |
| Investment Operations | | | | | |
| Net Investment Income | .0002 | .0005 | .001 | .002 | .006 |
| Net Realized and Unrealized Gain (Loss) | | | | | |
| on Investments | — | — | — | — | — |
| Total from Investment Operations | .0002 | .0005 | .001 | .002 | .006 |
| Distributions | | | | | |
| Dividends from Net Investment Income | (.0002) | (.0005) | (.001) | (.002) | (.006) |
| Distributions from Realized Capital Gains | — | — | — | — | — |
| Total Distributions | (.0002) | (.0005) | (.001) | (.002) | (.006) |
| Net Asset Value, End of Period | $1.00 | $1.00 | $1.00 | $1.00 | $1.00 |
| |
| Total Return1 | 0.02% | 0.05% | 0.09% | 0.15% | 0.56% |
| |
| Ratios/Supplemental Data | | | | | |
| Net Assets, End of Period (Millions) | $602 | $609 | $686 | $786 | $947 |
| Ratio of Expenses to Average Net Assets | 0.12%2 | 0.16% | 0.17% | 0.17% | 0.17%3 |
| Ratio of Net Investment Income to | | | | | |
| Average Net Assets | 0.02% | 0.05% | 0.09% | 0.15% | 0.57% |
1 Total returns do not include account service fees that may have applied in the periods shown. Fund prospectuses provide information about any applicable account service fees.
2 The ratio of total expenses to average net assets before an expense reduction was 0.16%. See Note B in Notes to Financial Statements.
3 Includes fees to participate in the Treasury Temporary Guarantee Program for Money Market Funds of 0.04% for 2009.
See accompanying Notes, which are an integral part of the Financial Statements.
23
Ohio Tax-Exempt Money Market Fund
Notes to Financial Statements
Vanguard Ohio Tax-Exempt Money Market Fund is registered under the Investment Company Act of 1940 as an open-end investment company, or mutual fund. The fund invests in debt instruments of municipal issuers whose ability to meet their obligations may be affected by economic and political developments in the state.
A. The following significant accounting policies conform to generally accepted accounting principles for U.S. mutual funds. The fund consistently follows such policies in preparing its financial statements.
1. Security Valuation: Securities are valued at amortized cost, which approximates market value.
2. Federal Income Taxes: The fund intends to continue to qualify as a regulated investment company and distribute all of its income. Management has analyzed the fund’s tax positions taken for all open federal income tax years (November 30, 2010–2013), and has concluded that no provision for federal income tax is required in the fund’s financial statements.
3. Distributions: Distributions from net investment income are declared daily and paid on the first business day of the following month.
4. Other: Interest income is accrued daily. Premiums and discounts on debt securities purchased are amortized and accreted, respectively, to interest income over the lives of the respective securities. Security transactions are accounted for on the date securities are bought or sold. Costs used to determine realized gains (losses) on the sale of investment securities are those of the specific securities sold.
B. The Vanguard Group furnishes at cost investment advisory, corporate management, administrative, marketing, and distribution services. The costs of such services are allocated to the fund under methods approved by the board of trustees. The fund has committed to provide up to 0.40% of its net assets in capital contributions to Vanguard. At November 30, 2013, the fund had contributed capital of $68,000 to Vanguard (included in Other Assets), representing 0.01% of the fund’s net assets and 0.03% of Vanguard’s capitalization. The fund’s trustees and officers are also directors and officers of Vanguard. Vanguard and the board of trustees have agreed to temporarily limit certain net operating expenses in excess of the fund’s daily yield so as to maintain a zero or positive yield for the fund. Vanguard and the board of trustees may terminate the temporary expense limitation at any time. For the year ended November 30, 2013, Vanguard’s expenses were reduced by $221,000 (an effective annual rate of 0.04% of the fund’s average net assets).
C. Various inputs may be used to determine the value of the fund’s investments. These inputs are summarized in three broad levels for financial statement purposes. The inputs or methodologies used to value securities are not necessarily an indication of the risk associated with investing in those securities.
Level 1—Quoted prices in active markets for identical securities.
Level 2—Other significant observable inputs (including quoted prices for similar securities, interest rates, prepayment speeds, credit risk, etc.).
Level 3—Significant unobservable inputs (including the fund’s own assumptions used to determine the fair value of investments).
24
Ohio Tax-Exempt Money Market Fund
At November 30, 2013, 100% of the market value of the fund’s investments was determined using amortized cost, in accordance with rules under the Investment Company Act of 1940. Amortized cost approximates the current fair value of a security, but since the value is not obtained from a quoted price in an active market, securities valued at amortized cost are considered to be valued using Level 2 inputs.
D. Management has determined that no material events or transactions occurred subsequent to November 30, 2013, that would require recognition or disclosure in these financial statements.
25
Ohio Long-Term Tax-Exempt Fund
Fund Profile
As of November 30, 2013
| | | |
| Financial Attributes | | | |
| |
| | | Barclays | |
| | | OH | Barclays |
| | | Muni | Municipal |
| | | Bond | Bond |
| | Fund | Index | Index |
| Number of Bonds | 267 | 1,357 | 46,517 |
| Yield to Maturity | | | |
| (before expenses) | 3.7% | 3.0% | 3.1% |
| Average Coupon | 4.8% | 4.9% | 4.9% |
| Average Duration | 7.7 years | 8.5 years | 8.4 years |
| Average Effective | | | |
| Maturity | 8.4 years | 7.7 years | 7.1 years |
| Ticker Symbol | VOHIX | — | — |
| Expense Ratio1 | 0.16% | — | — |
| 30-Day SEC Yield | 3.50% | — | — |
| Short-Term | | | |
| Reserves | 5.5% | — | — |
| | |
| Volatility Measures | | |
| | Barclays OH | Barclays |
| | Muni Bond | Municipal |
| | Index | Bond Index |
| R-Squared | 0.97 | 0.98 |
| Beta | 1.21 | 1.15 |
These measures show the degree and timing of the fund’s fluctuations compared with the indexes over 36 months.
| |
| Distribution by Effective Maturity | |
| (% of portfolio) | |
| Under 1 Year | 8.3% |
| 1 - 3 Years | 4.5 |
| 3 - 5 Years | 18.6 |
| 5 - 10 Years | 54.0 |
| 10 - 20 Years | 4.9 |
| 20 - 30 Years | 8.7 |
| Over 30 Years | 1.0 |
Distribution by Credit Quality (% of portfolio)
| |
| AAA | 6.9% |
| AA | 56.5 |
| A | 26.2 |
| BBB | 10.3 |
| Not Rated | 0.1 |
For information about these ratings, see the Glossary entry for Credit Quality.
Investment Focus

1 The expense ratio shown is from the prospectus dated March 28, 2013, and represents estimated costs for the current fiscal year. For the fiscal year ended November 30, 2013, the expense ratio was 0.16%.
26
Ohio Long-Term Tax-Exempt Fund
Performance Summary
All of the returns in this report represent past performance, which is not a guarantee of future results that may be achieved by the fund. (Current performance may be lower or higher than the performance data cited. For performance data current to the most recent month-end, visit our website at vanguard.com/performance.) Note, too, that both investment returns and principal value can fluctuate widely, so an investor’s shares, when sold, could be worth more or less than their original cost. The returns shown do not reflect taxes that a shareholder would pay on fund distributions or on the sale of fund shares.
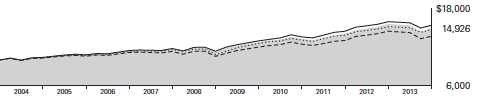
Cumulative Performance: November 30, 2003, Through November 30, 2013
Initial Investment of $10,000
| | | | | |
| | | | Average Annual Total Returns | |
| | | Periods Ended November 30, 2013 | |
| | | | | | Final Value |
| | | One | Five | Ten | of a $10,000 |
| | | Year | Years | Years | Investment |
| | Ohio Long-Term Tax-Exempt Fund | -4.28% | 5.87% | 4.09% | $14,926 |
| •••••••• | Barclays OH Municipal Bond Index | -2.71 | 6.30 | 3.96 | 14,741 |
| |
| – – – – | Barclays Ohio Municipal Municipal Debt Bond Funds Index Average | -3.51 -5.49 | 6.26 5.29 | 4.40 3.18 | 15,385 13,680 |
| Ohio Municipal Debt Funds Average: Derived from data provided by Lipper, a Thomson Reuters Company. | | |
See Financial Highlights for dividend and capital gains information.
27
| | | | |
| Ohio Long-Term Tax-Exempt Fund | | | | |
| |
| |
| |
| Fiscal-Year Total Returns (%): November 30, 2003, Through November 30, 2013 | |
| | | | | Barclays OH |
| | | | | Muni Bond |
| | | | | Index |
| Fiscal Year | Income Returns | Capital Returns | Total Returns | Total Returns |
| 2004 | 4.47% | -0.96% | 3.51% | 3.63% |
| 2005 | 4.36 | -1.16 | 3.20 | 3.56 |
| 2006 | 4.53 | 1.60 | 6.13 | 5.73 |
| 2007 | 4.32 | -1.61 | 2.71 | 2.64 |
| 2008 | 4.13 | -7.74 | -3.61 | -6.73 |
| 2009 | 4.76 | 8.85 | 13.61 | 15.73 |
| 2010 | 4.14 | -0.08 | 4.06 | 4.20 |
| 2011 | 4.20 | 1.61 | 5.81 | 5.84 |
| 2012 | 3.88 | 7.20 | 11.08 | 9.28 |
| 2013 | 3.48 | -7.76 | -4.28 | -2.71 |
Average Annual Total Returns: Periods Ended September 30, 2013
This table presents returns through the latest calendar quarter—rather than through the end of the fiscal period.
Securities and Exchange Commission rules require that we provide this information.
| | | | | | |
| | | | | | | Ten Years |
| | Inception Date | One Year | Five Years | Income | Capital | Total |
| Ohio Long-Term | | | | | | |
| Tax-Exempt Fund | 6/18/1990 | -2.60% | 5.55% | 4.23% | -0.17% | 4.06% |
28
Ohio Long-Term Tax-Exempt Fund
Financial Statements
Statement of Net Assets
As of November 30, 2013
The fund reports a complete list of its holdings in regulatory filings four times in each fiscal year, at the quarter-ends. For the second and fourth fiscal quarters, the lists appear in the fund’s semiannual and annual reports to shareholders. For the first and third fiscal quarters, the fund files the lists with the Securities and Exchange Commission on Form N-Q. Shareholders can look up the fund’s Forms N-Q on the SEC’s website at sec.gov. Forms N-Q may also be reviewed and copied at the SEC’s Public Reference Room (see the back cover of this report for further information).
| | | | |
| | | | Face | Market |
| | | Maturity | Amount | Value |
| | Coupon | Date | ($000) | ($000) |
| Tax-Exempt Municipal Bonds (100.3%) | | | | |
| Ohio (100.0%) | | | | |
| Akron OH Bath & Copley Joint Township | | | | |
| Hospital District Revenue (Children’s Hospital | | | | |
| Medical Center of Akron) | 5.000% | 11/15/32 | 2,000 | 2,018 |
| Akron OH Bath & Copley Joint Township | | | | |
| Hospital District Revenue (Children’s Hospital | | | | |
| Medical Center of Akron) | 5.000% | 11/15/38 | 5,000 | 4,986 |
| Akron OH Bath & Copley Joint Township | | | | |
| Hospital District Revenue (Children’s Hospital | | | | |
| Medical Center of Akron) | 5.000% | 11/15/42 | 2,280 | 2,252 |
| Akron OH Income Tax Revenue | | | | |
| (Community Learning Centers) | 5.000% | 12/1/28 | 4,000 | 4,277 |
| Allen County OH Hospital Facilities Revenue | | | | |
| (Catholic Healthcare Partners) | 5.250% | 9/1/27 | 4,000 | 4,266 |
| Allen County OH Hospital Facilities Revenue | | | | |
| (Catholic Healthcare Partners) | 5.000% | 6/1/38 | 8,000 | 7,911 |
| Allen County OH Hospital Facilities Revenue | | | | |
| (Catholic Healthcare Partners) | 5.000% | 5/1/42 | 5,885 | 5,771 |
| American Municipal Power Ohio Inc. Revenue | | | | |
| (Fremont Energy Center Project) | 5.000% | 2/15/24 | 3,500 | 3,866 |
| American Municipal Power Ohio Inc. Revenue | | | | |
| (Fremont Energy Center Project) | 5.000% | 2/15/31 | 3,000 | 3,108 |
| American Municipal Power Ohio Inc. Revenue | | | | |
| (Fremont Energy Center Project) | 5.000% | 2/15/37 | 8,500 | 8,579 |
| American Municipal Power Ohio Inc. Revenue | | | | |
| (Fremont Energy Center Project) | 5.000% | 2/15/42 | 14,250 | 14,227 |
| American Municipal Power Ohio Inc. Revenue | | | | |
| (Hydroelectric Projects) | 5.000% | 2/15/23 | 4,000 | 4,345 |
| American Municipal Power Ohio Inc. Revenue | | | | |
| (Hydroelectric Projects) | 5.000% | 2/15/24 | 1,215 | 1,308 |
| American Municipal Power Ohio Inc. Revenue | | | | |
| (Prairie State Energy Campus Project) | 5.000% | 2/15/38 | 5,375 | 5,405 |
| American Municipal Power Ohio Inc. Revenue | | | | |
| (Prairie State Energy Campus Project) | 5.750% | 2/15/39 (12) | 4,500 | 4,763 |
| Apollo Career Center Joint Vocational | | | | |
| School District Ohio GO | 5.250% | 12/1/31 | 1,015 | 1,085 |
| Apollo Career Center Joint Vocational | | | | |
| School District Ohio GO | 5.000% | 12/1/38 | 3,000 | 3,088 |
29
| | | | |
| Ohio Long-Term Tax-Exempt Fund | | | | |
| |
| |
| |
| | | | Face | Market |
| | | Maturity | Amount | Value |
| | Coupon | Date | ($000) | ($000) |
| Bowling Green State University Ohio | | | | |
| Student Housing Revenue (CFP I LLC - | | | | |
| State University Project) | 5.750% | 6/1/31 | 2,000 | 2,079 |
| Bowling Green State University Ohio | | | | |
| Student Housing Revenue (CFP I LLC - | | | | |
| State University Project) | 6.000% | 6/1/45 | 2,000 | 2,061 |
| Butler County OH Hospital Facilities Revenue | | | | |
| (Cincinnati Children’s Hospital | | | | |
| Medical Center Project) | 5.000% | 5/15/31 (14) | 5,000 | 4,977 |
| Butler County OH Hospital Facilities Revenue | | | | |
| (Kettering Health Network) | 6.375% | 4/1/36 | 1,350 | 1,488 |
| Butler County OH Hospital Facilities Revenue | | | | |
| (Kettering Health Network) | 5.625% | 4/1/41 | 2,000 | 2,070 |
| Butler County OH Hospital Facilities Revenue | | | | |
| (UC Health) | 5.250% | 11/1/29 | 6,500 | 6,605 |
| Butler County OH Hospital Facilities Revenue | | | | |
| (UC Health) | 5.500% | 11/1/40 | 4,160 | 4,196 |
| Central Ohio Solid Waste Authority GO | 5.000% | 12/1/19 (ETM) | 115 | 138 |
| Central Ohio Solid Waste Authority GO | 5.000% | 12/1/19 | 1,195 | 1,411 |
| Cincinnati OH City School District COP | 5.000% | 12/15/23 (4) | 1,620 | 1,770 |
| Cincinnati OH City School District COP | 5.000% | 12/15/32 (4) | 2,000 | 2,074 |
| Cincinnati OH City School District GO | 5.250% | 6/1/27 | 5,550 | 6,122 |
| Cincinnati OH City School District GO | 5.250% | 12/1/28 (14) | 4,000 | 4,644 |
| Cincinnati OH City School District GO | 5.250% | 12/1/30 (14) | 3,705 | 4,267 |
| Cincinnati OH City School District GO | 5.250% | 12/1/31 (14) | 3,000 | 3,432 |
| Cincinnati OH Economic Development Revenue | | | | |
| (Baldwin 300 Project) | 4.875% | 11/1/38 | 7,370 | 7,384 |
| Cincinnati OH GO | 5.000% | 12/1/24 | 1,090 | 1,222 |
| Cincinnati OH GO | 5.000% | 12/1/26 | 2,605 | 2,872 |
| Cincinnati OH Water System Revenue | 5.000% | 12/1/31 | 1,000 | 1,077 |
| Cincinnati OH Water System Revenue | 5.000% | 12/1/31 | 1,585 | 1,702 |
| Cincinnati OH Water System Revenue | 5.000% | 12/1/32 | 1,000 | 1,071 |
| Cincinnati OH Water System Revenue | 5.000% | 12/1/36 | 3,025 | 3,188 |
| Cincinnati OH Water System Revenue | 5.000% | 12/1/37 | 2,000 | 2,105 |
| Cleveland OH Airport System Revenue | 5.000% | 1/1/28 | 2,530 | 2,579 |
| Cleveland OH Airport System Revenue | 5.000% | 1/1/30 | 1,000 | 996 |
| Cleveland OH Airport System Revenue | 5.000% | 1/1/31 (4) | 7,000 | 7,021 |
| Cleveland OH Income Tax Revenue | 5.000% | 10/1/29 (12) | 7,180 | 7,492 |
| Cleveland OH Municipal School District GO | 5.000% | 12/1/25 | 1,845 | 2,045 |
| Cleveland OH Public Power System Revenue | 5.000% | 11/15/28 (14) | 1,250 | 1,327 |
| Cleveland OH Public Power System Revenue | 0.000% | 11/15/33 (14) | 6,895 | 2,357 |
| Cleveland OH Water Revenue | 5.000% | 1/1/27 | 2,000 | 2,202 |
| Cleveland OH Water Revenue | 5.000% | 1/1/42 | 3,000 | 3,123 |
| Cleveland OH Water Works Revenue | 5.500% | 1/1/21 (14) | 9,635 | 11,389 |
| Cleveland State University Ohio General | | | | |
| Receipts Revenue | 5.000% | 6/1/25 | 2,000 | 2,202 |
| Cleveland State University Ohio General | | | | |
| Receipts Revenue | 5.000% | 6/1/26 | 2,700 | 2,947 |
| Cleveland State University Ohio General | | | | |
| Receipts Revenue | 5.000% | 6/1/27 | 2,000 | 2,155 |
| Cleveland State University Ohio General | | | | |
| Receipts Revenue | 5.000% | 6/1/30 (14) | 3,000 | 3,159 |
| Cleveland State University Ohio General | | | | |
| Receipts Revenue | 5.000% | 6/1/37 | 2,015 | 2,064 |
30
| | | | |
| Ohio Long-Term Tax-Exempt Fund | | | | |
| |
| |
| |
| | | | Face | Market |
| | | Maturity | Amount | Value |
| | Coupon | Date | ($000) | ($000) |
| 1 Cleveland-Cuyahoga County OH Port | | | | |
| Authority Revenue (Cleveland Museum | | | | |
| of Art Project) VRDO | 0.050% | 12/6/13 | 3,000 | 3,000 |
| Columbus OH City School District GO | 4.500% | 12/1/29 | 3,000 | 3,066 |
| Columbus OH City School District School | | | | |
| Facilities Construction & Improvement GO | 5.000% | 12/1/22 | 1,545 | 1,764 |
| Columbus OH GO | 5.000% | 7/1/24 | 1,000 | 1,162 |
| Columbus OH GO | 5.000% | 2/15/25 | 1,800 | 2,077 |
| Columbus OH GO | 5.000% | 7/1/25 | 1,400 | 1,608 |
| Columbus OH GO | 5.000% | 8/15/26 | 2,000 | 2,279 |
| Columbus OH GO | 5.000% | 7/1/27 | 2,000 | 2,225 |
| Columbus OH GO | 5.000% | 7/1/30 | 2,500 | 2,765 |
| Columbus OH GO | 5.000% | 7/1/31 | 1,185 | 1,299 |
| Columbus OH Metropolitan Library | | | | |
| Special Obligation Revenue | 5.000% | 12/1/24 | 1,320 | 1,477 |
| Columbus OH Metropolitan Library | | | | |
| Special Obligation Revenue | 5.000% | 12/1/25 | 1,000 | 1,108 |
| Columbus OH Metropolitan Library | | | | |
| Special Obligation Revenue | 4.000% | 12/1/37 | 3,700 | 3,335 |
| 1 Columbus OH Regional Airport Authority | | | | |
| Airport Revenue (Oasbo Expanded Asset | | | | |
| Program) VRDO | 0.060% | 12/6/13 LOC | 1,895 | 1,895 |
| Columbus OH Sewer Revenue | 5.000% | 6/1/28 | 4,005 | 4,382 |
| Cuyahoga County OH Economic Development | | | | |
| Revenue (Med Mart/Convention Center Project) | 5.000% | 12/1/24 | 4,000 | 4,393 |
| Fairfield County OH Hospital Facilities Revenue | | | | |
| (Fairfield Medical Center) | 5.000% | 6/15/43 | 4,250 | 4,012 |
| Franklin County OH GO | 5.000% | 12/1/31 | 6,885 | 7,377 |
| Franklin County OH Health Care Facilities | | | | |
| Improvement Revenue (Ohio Presbyterian | | | | |
| Retirement Services Project) | 5.625% | 7/1/26 | 2,800 | 2,911 |
| Franklin County OH Health Care Facilities | | | | |
| Improvement Revenue (OPRS Communities) | 6.125% | 7/1/40 | 3,685 | 3,610 |
| Franklin County OH Hospital Facilities Revenue | | | | |
| (OhioHealth Corp.) | 5.000% | 5/15/31 | 5,000 | 5,171 |
| Franklin County OH Hospital Facilities Revenue | | | | |
| (OhioHealth Corp.) | 5.000% | 11/15/36 | 3,640 | 3,678 |
| Franklin County OH Hospital Facilities Revenue | | | | |
| (OhioHealth Corp.) VRDO | 0.060% | 12/6/13 | 4,700 | 4,700 |
| Franklin County OH Hospital Improvement | | | | |
| Revenue (Nationwide Children’s Hospital Project) | 4.750% | 11/1/28 | 1,500 | 1,531 |
| Franklin County OH Hospital Improvement | | | | |
| Revenue (Nationwide Children’s Hospital Project) | 5.000% | 11/1/34 | 1,500 | 1,523 |
| Franklin County OH Hospital Improvement | | | | |
| Revenue (Nationwide Children’s Hospital Project) | 5.000% | 11/1/42 | 7,000 | 6,957 |
| 1 Franklin County OH Hospital Revenue | | | | |
| (Nationwide Children’s Hospital Project) VRDO | 0.050% | 12/6/13 | 5,000 | 5,000 |
| Gallia County OH Local School District GO | 5.000% | 12/1/30 (4) | 5,000 | 5,234 |
| Gallia County OH Local School District GO | 5.000% | 12/1/33 (4) | 3,500 | 3,576 |
| Greene County OH Hospital Facilities Revenue | | | | |
| (Kettering Health Network Obligated | | | | |
| Group Project) | 5.375% | 4/1/34 | 2,500 | 2,535 |
31
| | | | |
| Ohio Long-Term Tax-Exempt Fund | | | | |
| |
| |
| |
| | | | Face | Market |
| | | Maturity | Amount | Value |
| | Coupon | Date | ($000) | ($000) |
| Greene County OH Hospital Facilities Revenue | | | | |
| (Kettering Health Network Obligated | | | | |
| Group Project) | 5.500% | 4/1/39 | 2,500 | 2,550 |
| Greene County OH Sewer System Revenue | 5.000% | 12/1/15 (Prere.) | 4,695 | 5,130 |
| Hamilton County OH Convention Center | | | | |
| Facilities Authority Revenue | 5.250% | 12/1/20 (14) | 1,185 | 1,213 |
| Hamilton County OH Convention Center | | | | |
| Facilities Authority Revenue | 5.250% | 12/1/21 (14) | 1,245 | 1,274 |
| Hamilton County OH Convention Center | | | | |
| Facilities Authority Revenue | 5.250% | 12/1/23 (14) | 1,380 | 1,413 |
| Hamilton County OH Convention Center | | | | |
| Facilities Authority Revenue | 5.250% | 12/1/24 (14) | 185 | 189 |
| Hamilton County OH Economic Development | | | | |
| Revenue (King Highland Community Urban | | | | |
| Redevelopment Corp. - University of Cincinnati | | | | |
| Lessee Project) | 5.250% | 6/1/28 (14) | 7,290 | 7,792 |
| Hamilton County OH Health Care Facilities | | | | |
| Revenue (Christ Hospital Project) | 5.250% | 6/1/32 | 3,000 | 3,027 |
| Hamilton County OH Health Care Facilities | | | | |
| Revenue (Christ Hospital Project) | 5.000% | 6/1/42 | 4,790 | 4,533 |
| Hamilton County OH Health Care Facilities | | | | |
| Revenue (Christ Hospital Project) | 5.500% | 6/1/42 | 3,000 | 3,026 |
| Hamilton County OH Healthcare Revenue | | | | |
| (Life Enriching Communities) | 5.000% | 1/1/32 | 1,750 | 1,685 |
| Hamilton County OH Healthcare Revenue | | | | |
| (Life Enriching Communities) | 5.000% | 1/1/42 | 2,000 | 1,847 |
| Hamilton County OH Healthcare Revenue | | | | |
| (Life Enriching Communities) | 5.000% | 1/1/46 | 2,000 | 1,828 |
| Hamilton County OH Sales Tax Revenue | 5.000% | 12/1/26 (2) | 5,000 | 5,332 |
| Hamilton County OH Sales Tax Revenue | 5.000% | 12/1/32 | 5,000 | 5,116 |
| Hamilton County OH Sales Tax Revenue | 5.000% | 12/1/32 (4) | 9,700 | 10,088 |
| Hamilton County OH Sewer System Revenue | 5.000% | 12/1/31 (14) | 5,300 | 5,666 |
| Hamilton OH City School District GO | 5.000% | 12/1/28 (4) | 5,000 | 5,310 |
| Hilliard OH School District GO | 5.000% | 12/1/15 (Prere.) | 2,895 | 3,163 |
| Huron County OH Hospital Facilities Improvement | | | | |
| Revenue (Fisher-Titus Medical Center) | 5.250% | 12/1/37 | 3,000 | 3,009 |
| JobsOhio Beverage System Statewide | | | | |
| Liquor Profits Revenue | 5.000% | 1/1/38 | 17,250 | 17,501 |
| Kent State University OH Revenue | 5.000% | 5/1/37 | 4,185 | 4,245 |
| Kent State University OH Revenue | 5.000% | 5/1/42 | 1,750 | 1,768 |
| Lorain County OH Community College | | | | |
| District General Revenue | 5.000% | 12/1/41 | 4,520 | 4,631 |
| Lorain County OH Hospital Facilities Revenue | | | | |
| (Catholic Healthcare Partners) | 5.000% | 4/1/33 (4) | 4,000 | 4,052 |
| 2 Lorain County OH Hospital Facilities Revenue | | | | |
| (Catholic Healthcare Partners) TOB VRDO | 0.150% | 12/6/13 | 4,995 | 4,995 |
| Lorain County OH Hospital Facilities Revenue | | | | |
| (Kendal At Oberlin) | 5.000% | 11/15/23 | 1,000 | 1,090 |
| Lorain County OH Hospital Facilities Revenue | | | | |
| (Kendal At Oberlin) | 5.000% | 11/15/30 | 2,500 | 2,539 |
| Lucas County OH Hospital Revenue | | | | |
| (ProMedica Healthcare Obligated Group) | 5.000% | 11/15/26 | 2,000 | 2,127 |
| Lucas County OH Hospital Revenue | | | | |
| (ProMedica Healthcare Obligated Group) | 5.250% | 11/15/27 | 2,000 | 2,139 |
32
| | | | |
| Ohio Long-Term Tax-Exempt Fund | | | | |
| |
| |
| |
| | | | Face | Market |
| | | Maturity | Amount | Value |
| | Coupon | Date | ($000) | ($000) |
| Lucas County OH Hospital Revenue | | | | |
| (ProMedica Healthcare Obligated Group) | 5.250% | 11/15/28 | 4,000 | 4,243 |
| Lucas County OH Hospital Revenue | | | | |
| (ProMedica Healthcare Obligated Group) | 6.500% | 11/15/37 | 2,000 | 2,255 |
| Lucas County OH Hospital Revenue | | | | |
| (ProMedica Healthcare Obligated Group) | 6.000% | 11/15/41 | 2,530 | 2,752 |
| Marysville OH Wastewater Treatment | | | | |
| System Revenue | 5.000% | 12/1/31 (10) | 2,720 | 2,825 |
| Mason OH City School District School | | | | |
| Improvement GO | 5.000% | 6/1/17 (Prere.) | 1,000 | 1,149 |
| Medina OH School District COP | 5.250% | 12/1/37 (12) | 7,210 | 7,585 |
| Miami University of Ohio General | | | | |
| Receipts Revenue | 5.250% | 12/1/13 (Prere.) | 2,000 | 2,001 |
| Miami University of Ohio General | | | | |
| Receipts Revenue | 5.000% | 9/1/31 | 2,000 | 2,114 |
| Miami University of Ohio General | | | | |
| Receipts Revenue | 5.000% | 9/1/36 | 2,000 | 2,078 |
| Middleburg Heights OH Hospital Revenue | | | | |
| (Southwest General) | 5.125% | 8/1/31 | 1,250 | 1,251 |
| Middleburg Heights OH Hospital Revenue | | | | |
| (Southwest General) | 5.250% | 8/1/41 | 1,000 | 994 |
| Middleburg Heights OH Hospital Revenue | | | | |
| (Southwest General) | 5.000% | 8/1/47 | 5,000 | 4,752 |
| Middletown OH City School District GO | 5.000% | 12/1/23 (4) | 5,345 | 5,970 |
| Montgomery County OH Revenue | | | | |
| (Catholic Health Initiatives) | 5.250% | 5/1/29 | 3,000 | 3,091 |
| Montgomery County OH Revenue | | | | |
| (Catholic Health Initiatives) | 5.000% | 5/1/30 | 7,630 | 7,645 |
| Montgomery County OH Revenue | | | | |
| (Miami Valley Hospital) | 5.750% | 11/15/23 | 1,000 | 1,142 |
| Montgomery County OH Revenue | | | | |
| (Miami Valley Hospital) VRDO | 0.040% | 12/2/13 | 7,450 | 7,450 |
| Montgomery County OH Revenue | | | | |
| (Miami Valley Hospital) VRDO | 0.050% | 12/2/13 | 600 | 600 |
| Northeast Ohio Regional Sewer District | | | | |
| Wastewater Revenue | 5.000% | 11/15/32 | 4,685 | 5,017 |
| Northeast Ohio Regional Sewer District | | | | |
| Wastewater Revenue | 5.000% | 11/15/38 | 8,000 | 8,381 |
| Northeast Ohio Regional Sewer District | | | | |
| Wastewater Revenue | 5.000% | 11/15/43 | 5,000 | 5,206 |
| Ohio Air Quality Development Authority | | | | |
| Pollution Control Revenue (FirstEnergy | | | | |
| Generation Corp. Project) | 5.625% | 6/1/18 | 4,500 | 4,909 |
| Ohio Air Quality Development Authority | | | | |
| Pollution Control Revenue (FirstEnergy | | | | |
| Generation Corp. Project) PUT | 5.875% | 6/1/16 | 6,000 | 6,481 |
| Ohio Air Quality Development Authority | | | | |
| Pollution Control Revenue (FirstEnergy | | | | |
| Nuclear Generation Corp. Project) VRDO | 0.060% | 12/2/13 LOC | 600 | 600 |
| Ohio Air Quality Development Authority Revenue | | | | |
| (Columbus Southern Power Co. Project) | 5.800% | 12/1/38 | 2,000 | 2,085 |
| Ohio Air Quality Development Authority Revenue | | | | |
| (Columbus Southern Power Co. Project) PUT | 3.875% | 6/1/14 | 3,000 | 3,041 |
33
| | | | |
| Ohio Long-Term Tax-Exempt Fund | | | | |
| |
| |
| |
| | | | Face | Market |
| | | Maturity | Amount | Value |
| | Coupon | Date | ($000) | ($000) |
| Ohio Air Quality Development Authority Revenue | | | | |
| (FirstEnergy Generation Corp. Project) | 5.700% | 8/1/20 | 6,000 | 6,592 |
| Ohio Air Quality Development Authority Revenue | | | | |
| (Ohio Power Co. Project) PUT | 3.250% | 6/2/14 | 7,000 | 7,073 |
| Ohio Air Quality Development Authority Revenue | | | | |
| (Ohio Valley Electric Corp. Project) | 5.625% | 10/1/19 | 3,000 | 3,268 |
| Ohio Building Authority Revenue | | | | |
| (Administration Building Fund) | 5.000% | 10/1/23 | 2,000 | 2,241 |
| Ohio Capital Facilities Lease | | | | |
| Appropriation Revenue | 5.000% | 10/1/23 | 1,250 | 1,441 |
| Ohio Capital Facilities Lease | | | | |
| Appropriation Revenue | 5.000% | 10/1/24 | 1,000 | 1,139 |
| Ohio Capital Facilities Lease | | | | |
| Appropriation Revenue | 5.000% | 4/1/25 | 2,670 | 2,906 |
| Ohio Capital Facilities Lease | | | | |
| Appropriation Revenue | 5.000% | 4/1/30 | 2,650 | 2,762 |
| Ohio Common Schools GO | 5.000% | 6/15/14 (Prere.) | 8,000 | 8,211 |
| Ohio Common Schools GO | 5.000% | 9/15/21 | 1,920 | 2,283 |
| Ohio Common Schools GO | 5.000% | 3/15/24 | 4,410 | 5,065 |
| Ohio GO | 5.000% | 9/15/22 | 5,000 | 5,944 |
| Ohio GO | 5.000% | 8/1/24 | 2,000 | 2,367 |
| Ohio GO | 5.000% | 8/1/24 | 5,000 | 5,918 |
| Ohio GO | 5.000% | 2/1/30 | 4,000 | 4,347 |
| Ohio GO | 5.000% | 4/1/30 | 1,770 | 1,885 |
| Ohio GO | 5.000% | 2/1/31 | 4,500 | 4,859 |
| Ohio GO | 5.000% | 4/1/31 | 1,230 | 1,303 |
| Ohio Higher Educational Facility | | | | |
| Commission Revenue (Case Western | | | | |
| Reserve University Project) | 5.250% | 12/1/26 (14) | 3,520 | 4,111 |
| Ohio Higher Educational Facility | | | | |
| Commission Revenue (Case Western | | | | |
| Reserve University Project) | 5.000% | 12/1/27 (2) | 2,115 | 2,116 |
| Ohio Higher Educational Facility | | | | |
| Commission Revenue (Case Western | | | | |
| Reserve University Project) VRDO | 0.050% | 12/2/13 LOC | 9,200 | 9,200 |
| Ohio Higher Educational Facility | | | | |
| Commission Revenue (Case Western | | | | |
| Reserve University Project) VRDO | 0.050% | 12/2/13 LOC | 295 | 295 |
| Ohio Higher Educational Facility | | | | |
| Commission Revenue (Cleveland Clinic | | | | |
| Health System Obligated Group) | 5.125% | 1/1/28 | 5,000 | 5,193 |
| Ohio Higher Educational Facility | | | | |
| Commission Revenue (Cleveland Clinic | | | | |
| Health System Obligated Group) | 5.000% | 1/1/29 | 3,500 | 3,725 |
| Ohio Higher Educational Facility | | | | |
| Commission Revenue (Cleveland Clinic | | | | |
| Health System Obligated Group) | 5.250% | 1/1/29 | 5,000 | 5,205 |
| Ohio Higher Educational Facility Commission | | | | |
| Revenue (Cleveland Clinic Health System | | | | |
| Obligated Group) | 5.000% | 1/1/38 | 5,000 | 5,076 |
| Ohio Higher Educational Facility Commission | | | | |
| Revenue (Cleveland Clinic Health System | | | | |
| Obligated Group) | 5.500% | 1/1/43 | 1,460 | 1,501 |
34
| | | | |
| Ohio Long-Term Tax-Exempt Fund | | | | |
| |
| |
| |
| | | | Face | Market |
| | | Maturity | Amount | Value |
| | Coupon | Date | ($000) | ($000) |
| Ohio Higher Educational Facility Commission | | | | |
| Revenue (Denison University Project) | 5.000% | 11/1/26 | 1,815 | 1,971 |
| Ohio Higher Educational Facility Commission | | | | |
| Revenue (Denison University Project) | 5.000% | 11/1/32 | 1,000 | 1,061 |
| Ohio Higher Educational Facility Commission | | | | |
| Revenue (Kenyon College Project) | 5.000% | 7/1/37 | 8,080 | 8,197 |
| Ohio Higher Educational Facility Commission | | | | |
| Revenue (University of Dayton Project) | 5.500% | 12/1/24 | 2,250 | 2,601 |
| Ohio Higher Educational Facility Commission | | | | |
| Revenue (University of Dayton Project) | 5.375% | 12/1/30 | 1,000 | 1,070 |
| Ohio Higher Educational Facility Commission | | | | |
| Revenue (University of Dayton Project) | 5.000% | 12/1/31 | 2,830 | 2,966 |
| Ohio Higher Educational Facility Commission | | | | |
| Revenue (University of Dayton Project) | 5.625% | 12/1/41 | 2,000 | 2,117 |
| Ohio Higher Educational Facility Commission | | | | |
| Revenue (University of Dayton Project) | 5.000% | 12/1/43 | 3,570 | 3,583 |
| Ohio Higher Educational Facility Commission | | | | |
| Revenue (Xavier University Project) | 5.750% | 5/1/28 | 5,000 | 5,360 |
| Ohio Highway Capital Improvements GO | 5.000% | 5/1/24 | 3,000 | 3,455 |
| Ohio Highway Capital Improvements GO | 5.000% | 5/1/25 | 3,000 | 3,417 |
| Ohio Highway Capital Improvements GO | 5.000% | 5/1/26 | 3,000 | 3,379 |
| Ohio Hospital Facilities Revenue | | | | |
| (Cleveland Clinic Health System) | 5.000% | 1/1/22 | 2,250 | 2,557 |
| Ohio Hospital Facilities Revenue | | | | |
| (Cleveland Clinic Health System) | 5.000% | 1/1/25 | 1,000 | 1,101 |
| Ohio Hospital Facilities Revenue | | | | |
| (Cleveland Clinic Health System) | 5.000% | 1/1/32 | 2,500 | 2,604 |
| Ohio Hospital Facilities Revenue | | | | |
| (Summa Health System) | 5.750% | 11/15/35 | 1,500 | 1,555 |
| Ohio Hospital Facilities Revenue | | | | |
| (Summa Health System) | 5.750% | 11/15/40 | 6,650 | 6,878 |
| Ohio Hospital Revenue (Cleveland Clinic | | | | |
| Health System Obligated Group) | 5.500% | 1/1/39 | 6,500 | 7,059 |
| 2 Ohio Hospital Revenue (Cleveland Clinic | | | | |
| Health System Obligated Group) TOB VRDO | 0.060% | 12/2/13 | 9,100 | 9,100 |
| Ohio Hospital Revenue (University Hospitals | | | | |
| Health System Inc.) | 6.750% | 1/15/15 (Prere.) | 5,000 | 5,367 |
| 1 Ohio Hospital Revenue (University Hospitals | | | | |
| Health System Inc.) | 5.000% | 1/15/29 | 2,000 | 2,038 |
| Ohio Hospital Revenue (University Hospitals | | | | |
| Health System Inc.) | 5.000% | 1/15/41 | 7,000 | 6,758 |
| Ohio Hospital Revenue (University Hospitals | | | | |
| Health System Inc.) | 5.250% | 1/15/46 | 10,000 | 9,999 |
| Ohio Housing Finance Agency Residential | | | | |
| Mortgage Revenue | 5.250% | 9/1/28 | 395 | 401 |
| Ohio Housing Finance Agency Residential | | | | |
| Mortgage Revenue | 6.200% | 9/1/33 | 2,315 | 2,426 |
| Ohio Infrastructure Improvement GO | 5.000% | 8/1/21 | 900 | 1,070 |
| Ohio Major New State Infrastructure | | | | |
| Project Revenue | 5.000% | 12/15/24 | 4,000 | 4,520 |
| Ohio State University General Receipts Revenue | 5.000% | 12/1/16 (ETM) | 300 | 340 |
| Ohio State University General Receipts Revenue | 5.000% | 12/1/17 (ETM) | 280 | 326 |
| Ohio State University General Receipts Revenue | 5.000% | 12/1/18 (Prere.) | 160 | 190 |
| Ohio State University General Receipts Revenue | 5.000% | 12/1/18 (Prere.) | 255 | 302 |
35
| | | | |
| Ohio Long-Term Tax-Exempt Fund | | | | |
| |
| |
| |
| | | | Face | Market |
| | | Maturity | Amount | Value |
| | Coupon | Date | ($000) | ($000) |
| Ohio State University General Receipts Revenue | 5.000% | 6/1/25 | 2,130 | 2,432 |
| Ohio State University General Receipts Revenue | 5.000% | 12/1/26 | 2,245 | 2,503 |
| Ohio State University General Receipts Revenue | 5.000% | 12/1/28 | 610 | 651 |
| Ohio State University General Receipts Revenue | 5.000% | 6/1/38 | 12,475 | 13,071 |
| Ohio State University General Receipts Revenue | 5.000% | 12/1/42 | 1,450 | 1,462 |
| Ohio Turnpike Commission Turnpike Revenue | 5.500% | 2/15/24 (14) | 3,000 | 3,617 |
| Ohio Turnpike Commission Turnpike Revenue | 5.000% | 2/15/25 | 4,500 | 4,989 |
| Ohio Turnpike Commission Turnpike Revenue | 5.000% | 2/15/26 | 3,000 | 3,245 |
| Ohio Turnpike Commission Turnpike Revenue | 5.250% | 2/15/27 | 2,500 | 2,914 |
| Ohio Turnpike Commission Turnpike Revenue | 0.000% | 2/15/36 | 5,000 | 1,389 |
| Ohio Turnpike Commission Turnpike Revenue | 0.000% | 2/15/37 | 8,025 | 2,090 |
| Ohio Turnpike Commission Turnpike Revenue | 5.250% | 2/15/39 | 4,000 | 4,178 |
| Ohio Turnpike Commission Turnpike Revenue | 0.000% | 2/15/40 | 1,045 | 228 |
| Ohio Turnpike Commission Turnpike Revenue | 0.000% | 2/15/41 | 2,810 | 576 |
| Ohio University General Receipts Revenue | 5.000% | 12/1/33 | 1,000 | 1,039 |
| Ohio University General Receipts Revenue | 5.000% | 12/1/36 | 2,490 | 2,552 |
| Ohio University General Receipts Revenue | 5.000% | 12/1/39 | 7,250 | 7,350 |
| Ohio Water Development Authority | | | | |
| Fresh Water Revenue | 5.500% | 6/1/23 | 1,225 | 1,503 |
| Ohio Water Development Authority | | | | |
| Fresh Water Revenue | 5.500% | 12/1/23 | 1,115 | 1,374 |
| Ohio Water Development Authority Pollution | | | | |
| Control Revenue (FirstEnergy Nuclear | | | | |
| Generation Corp. Project) VRDO | 0.040% | 12/2/13 LOC | 2,700 | 2,700 |
| Ohio Water Development Authority Water | | | | |
| Pollution Control Loan Fund Revenue | 5.000% | 6/1/14 (Prere.) | 520 | 533 |
| Ohio Water Development Authority Water | | | | |
| Pollution Control Loan Fund Revenue | 5.500% | 6/1/21 | 5,135 | 6,272 |
| Ohio Water Development Authority Water | | | | |
| Pollution Control Loan Fund Revenue | 5.500% | 6/1/22 | 1,505 | 1,844 |
| Ohio Water Development Authority Water | | | | |
| Pollution Control Loan Fund Revenue | 5.500% | 6/1/23 | 2,155 | 2,656 |
| Ohio Water Development Authority Water | | | | |
| Pollution Control Loan Fund Revenue | 5.000% | 12/1/29 | 5,000 | 5,606 |
| Ohio Water Development Authority Water | | | | |
| Pollution Control Loan Fund Revenue | 5.000% | 6/1/30 | 1,000 | 1,105 |
| Olentangy OH Local School District GO | 5.000% | 6/1/16 (Prere.) | 3,765 | 4,190 |
| Olentangy OH Local School District School | | | | |
| Facilities Construction & Improvement GO | 5.250% | 6/1/14 (Prere.) | 1,400 | 1,436 |
| Olentangy OH Local School District School | | | | |
| Facilities Construction & Improvement GO | 5.500% | 6/1/14 (Prere.) | 2,750 | 2,824 |
| Rocky River OH City School District GO | 5.375% | 12/1/17 | 1,350 | 1,466 |
| Ross County OH Hospital Facilities Revenue | | | | |
| (Adena Health System) | 5.750% | 12/1/22 | 1,000 | 1,155 |
| Ross County OH Hospital Facilities Revenue | | | | |
| (Adena Health System) | 5.750% | 12/1/35 | 10,040 | 10,565 |
| Scioto County OH Hospital Facilities Revenue | | | | |
| (Southern Ohio Medical Center) | 5.500% | 2/15/28 | 6,500 | 6,830 |
| Scioto County OH Hospital Facilities Revenue | | | | |
| (Southern Ohio Medical Center) | 5.750% | 2/15/38 | 1,800 | 1,853 |
| South-Western City OH School District GO | 5.000% | 12/1/36 | 1,700 | 1,784 |
| Tallmadge OH City School District GO | 5.000% | 6/1/15 (Prere.) | 1,550 | 1,660 |
| Tallmadge OH City School District GO | 5.000% | 6/1/15 (Prere.) | 1,480 | 1,585 |
| Teays Valley OH Local School District GO | 5.000% | 12/1/27 (14) | 3,040 | 3,215 |
36
| | | | |
| Ohio Long-Term Tax-Exempt Fund | | | | |
| |
| |
| |
| | | | Face | Market |
| | | Maturity | Amount | Value |
| | Coupon | Date | ($000) | ($000) |
| Toledo OH City School District GO | 5.000% | 12/1/22 | 2,015 | 2,319 |
| Toledo OH City School District GO | 5.000% | 12/1/23 | 1,085 | 1,229 |
| Toledo OH Waterworks Revenue | 5.000% | 11/15/38 | 8,500 | 8,752 |
| Tri Valley OH Local School District GO | 5.500% | 12/1/16 (14) | 1,255 | 1,364 |
| Tri Valley OH Local School District GO | 5.500% | 12/1/19 (14) | 1,785 | 2,054 |
| University of Akron Ohio General | | | | |
| Receipts Revenue | 5.000% | 1/1/26 (4) | 6,980 | 7,494 |
| University of Akron Ohio General | | | | |
| Receipts Revenue | 5.000% | 1/1/29 (4) | 2,000 | 2,091 |
| University of Akron Ohio General | | | | |
| Receipts Revenue | 5.000% | 1/1/33 (4) | 2,000 | 2,057 |
| University of Cincinnati Ohio General | | | | |
| Receipts Revenue | 5.000% | 6/1/20 | 1,000 | 1,168 |
| University of Cincinnati Ohio General | | | | |
| Receipts Revenue | 5.000% | 6/1/21 | 1,000 | 1,156 |
| University of Cincinnati Ohio General | | | | |
| Receipts Revenue | 5.000% | 6/1/23 | 3,665 | 4,150 |
| University of Cincinnati Ohio General | | | | |
| Receipts Revenue | 5.000% | 6/1/24 | 1,000 | 1,128 |
| University of Cincinnati Ohio General | | | | |
| Receipts Revenue | 5.000% | 6/1/25 | 500 | 550 |
| University of Cincinnati Ohio General | | | | |
| Receipts Revenue | 5.000% | 6/1/26 | 500 | 547 |
| University of Cincinnati Ohio General | | | | |
| Receipts Revenue | 5.000% | 6/1/27 | 2,000 | 2,177 |
| University of Cincinnati Ohio General | | | | |
| Receipts Revenue | 5.000% | 6/1/28 (14) | 5,000 | 5,303 |
| University of Cincinnati Ohio General | | | | |
| Receipts Revenue | 5.000% | 6/1/29 | 3,385 | 3,609 |
| University of Cincinnati Ohio General | | | | |
| Receipts Revenue | 5.000% | 6/1/30 | 1,890 | 2,000 |
| University of Cincinnati Ohio General | | | | |
| Receipts Revenue | 5.000% | 6/1/31 | 1,000 | 1,053 |
| University of Toledo Ohio General | | | | |
| Receipts Revenue | 5.000% | 6/1/29 | 1,000 | 1,056 |
| Warren County OH Health Care Facilities | | | | |
| Improvement Revenue | | | | |
| (Otterbein Homes Project) | 5.750% | 7/1/33 | 600 | 617 |
| Warren County OH Health Care Facilities | | | | |
| Improvement Revenue | | | | |
| (Otterbein Homes Project) | 5.500% | 7/1/39 | 1,225 | 1,220 |
| Wood County OH Hospital Facilities | | | | |
| Revenue (Wood County Hospital) | 5.000% | 12/1/32 | 715 | 686 |
| Wood County OH Hospital Facilities | | | | |
| Revenue (Wood County Hospital) | 5.000% | 12/1/42 | 2,500 | 2,320 |
| Woodridge OH School District GO | 6.800% | 12/1/14 (2) | 340 | 348 |
| Wright State University Ohio General Revenue | 5.000% | 5/1/26 | 2,030 | 2,180 |
| Wright State University Ohio General Revenue | 5.000% | 5/1/31 | 3,000 | 3,099 |
| Wyoming OH City School District GO | 5.000% | 12/1/49 | 2,000 | 1,997 |
| | | | | 901,773 |
| Guam (0.3%) | | | | |
| 1 Guam Government Waterworks Authority | | | | |
| Water & Waste Water System Revenue | 5.500% | 7/1/43 | 2,250 | 2,183 |
37
| | | | |
| Ohio Long-Term Tax-Exempt Fund | | | | |
| |
| |
| | | | Face | Market |
| | | Maturity | Amount | Value |
| | Coupon | Date | ($000) | ($000) |
| Puerto Rico (0.0%) | | | | |
| Puerto Rico Public Finance Corp. Revenue | 6.000% | 8/1/26 (ETM) | 305 | 376 |
| Total Tax-Exempt Municipal Bonds (Cost $898,782) | | | 904,332 |
| Other Assets and Liabilities (-0.3%) | | | | |
| Other Assets | | | | 15,910 |
| Liabilities | | | | (18,289) |
| | | | | (2,379) |
| Net Assets (100%) | | | | |
| Applicable to 75,624,375 outstanding $.001 par value shares of | | | |
| beneficial interest (unlimited authorization) | | | | 901,953 |
| Net Asset Value Per Share | | | | $11.93 |
| |
| |
| At November 30, 2013, net assets consisted of: | | | | |
| | | | | Amount |
| | | | | ($000) |
| Paid-in Capital | | | | 894,227 |
| Undistributed Net Investment Income | | | | — |
| Accumulated Net Realized Gains | | | | 2,176 |
| Unrealized Appreciation (Depreciation) | | | | 5,550 |
| Net Assets | | | | 901,953 |
See Note A in Notes to Financial Statements.
1 Security purchased on a when-issued or delayed-delivery basis for which the fund has not taken delivery as of November 30, 2013.
2 Security exempt from registration under Rule 144A of the Securities Act of 1933. Such securities may be sold in transactions exempt from registration, normally to qualified institutional buyers. At November 30, 2013, the aggregate value of these securities was $14,095,000, representing 1.6% of net assets.
A key to abbreviations and other references follows the Statement of Net Assets.
See accompanying Notes, which are an integral part of the Financial Statements.
38
Ohio Long-Term Tax-Exempt Fund
Key to Abbreviations
ARS—Auction Rate Security.
BAN—Bond Anticipation Note.
COP—Certificate of Participation.
CP—Commercial Paper.
FR—Floating Rate.
GAN—Grant Anticipation Note.
GO—General Obligation Bond.
PUT—Put Option Obligation.
RAN—Revenue Anticipation Note.
TAN—Tax Anticipation Note.
TOB—Tender Option Bond.
TRAN—Tax Revenue Anticipation Note.
VRDO—Variable Rate Demand Obligation.
VRDP—Variable Rate Demand Preferred.
(ETM)—Escrowed to Maturity.
(Prere.)—Prerefunded.
Scheduled principal and interest payments are guaranteed by:
(1) MBIA (Municipal Bond Investors Assurance).
(2) AMBAC (Ambac Assurance Corporation).
(3) FGIC (Financial Guaranty Insurance Company).
(4) AGM (Assured Guaranty Municipal Corporation).
(5) BIGI (Bond Investors Guaranty Insurance).
(6) Connie Lee Inc.
(7) FHA (Federal Housing Authority).
(8) CapMAC (Capital Markets Assurance Corporation).
(9) American Capital Access Financial Guaranty Corporation.
(10) XL Capital Assurance Inc.
(11) CIFG (CDC IXIS Financial Guaranty).
(12) Assured Guaranty Corporation.
(13) Berkshire Hathaway Assurance Corporation.
(14) National Public Finance Guarantee Corporation.
(15) Build America Mutual Assurance Company.
The insurance does not guarantee the market value of the municipal bonds.
LOC—Scheduled principal and interest payments are guaranteed by bank letter of credit.
39
| |
| Ohio Long-Term Tax-Exempt Fund | |
| |
| |
| Statement of Operations | |
| |
| | Year Ended |
| | November 30, 2013 |
| | ($000) |
| Investment Income | |
| Income | |
| Interest | 37,849 |
| Total Income | 37,849 |
| Expenses | |
| The Vanguard Group—Note B | |
| Investment Advisory Services | 75 |
| Management and Administrative | 1,237 |
| Marketing and Distribution | 205 |
| Custodian Fees | 18 |
| Auditing Fees | 29 |
| Shareholders’ Reports | 11 |
| Trustees’ Fees and Expenses | 1 |
| Total Expenses | 1,576 |
| Net Investment Income | 36,273 |
| Realized Net Gain (Loss) | |
| Investment Securities Sold | 5,614 |
| Futures Contracts | (279) |
| Options on Futures Contracts | (5) |
| Realized Net Gain (Loss) | 5,330 |
| Change in Unrealized Appreciation (Depreciation) | |
| Investment Securities | (88,322) |
| Futures Contracts | 3 |
| Change in Unrealized Appreciation (Depreciation) | (88,319) |
| Net Increase (Decrease) in Net Assets Resulting from Operations | (46,716) |
See accompanying Notes, which are an integral part of the Financial Statements.
40
| | |
| Ohio Long-Term Tax-Exempt Fund | | |
| |
| |
| Statement of Changes in Net Assets | | |
| |
| | Year Ended November 30, |
| | 2013 | 2012 |
| | ($000) | ($000) |
| Increase (Decrease) in Net Assets | | |
| Operations | | |
| Net Investment Income | 36,273 | 34,350 |
| Realized Net Gain (Loss) | 5,330 | 2,870 |
| Change in Unrealized Appreciation (Depreciation) | (88,319) | 63,276 |
| Net Increase (Decrease) in Net Assets Resulting from Operations | (46,716) | 100,496 |
| Distributions | | |
| Net Investment Income | (36,273) | (34,350) |
| Realized Capital Gain | (2,125) | — |
| Total Distributions | (38,398) | (34,350) |
| Capital Share Transactions | | |
| Issued | 140,887 | 185,647 |
| Issued in Lieu of Cash Distributions | 26,379 | 23,190 |
| Redeemed | (235,647) | (94,125) |
| Net Increase (Decrease) from Capital Share Transactions | (68,381) | 114,712 |
| Total Increase (Decrease) | (153,495) | 180,858 |
| Net Assets | | |
| Beginning of Period | 1,055,448 | 874,590 |
| End of Period | 901,953 | 1,055,448 |
See accompanying Notes, which are an integral part of the Financial Statements.
41
| | | | | |
| Ohio Long-Term Tax-Exempt Fund | | | | | |
| |
| |
| Financial Highlights | | | | | |
| |
| |
| For a Share Outstanding | | | Year Ended November 30, |
| Throughout Each Period | 2013 | 2012 | 2011 | 2010 | 2009 |
| Net Asset Value, Beginning of Period | $12.96 | $12.09 | $11.92 | $11.93 | $10.96 |
| Investment Operations | | | | | |
| Net Investment Income | .454 | .449 | .478 | .491 | .498 |
| Net Realized and Unrealized Gain (Loss) | | | | | |
| on Investments | (1.003) | .870 | .191 | (.010) | .970 |
| Total from Investment Operations | (.549) | 1.319 | .669 | .481 | 1.468 |
| Distributions | | | | | |
| Dividends from Net Investment Income | (.454) | (.449) | (.478) | (.491) | (.498) |
| Distributions from Realized Capital Gains | (.027) | — | (.021) | — | — |
| Total Distributions | (.481) | (.449) | (.499) | (.491) | (.498) |
| Net Asset Value, End of Period | $11.93 | $12.96 | $12.09 | $11.92 | $11.93 |
| |
| Total Return1 | -4.28% | 11.08% | 5.81% | 4.06% | 13.61% |
| |
| Ratios/Supplemental Data | | | | | |
| Net Assets, End of Period (Millions) | $902 | $1,055 | $875 | $944 | $931 |
| Ratio of Total Expenses to | | | | | |
| Average Net Assets | 0.16% | 0.16% | 0.17% | 0.17% | 0.17% |
| Ratio of Net Investment Income to | | | | | |
| Average Net Assets | 3.69% | 3.57% | 4.06% | 4.07% | 4.29% |
| Portfolio Turnover Rate | 28% | 15% | 20% | 24% | 16% |
1 Total returns do not include account service fees that may have applied in the periods shown. Fund prospectuses provide information about any applicable account service fees.
See accompanying Notes, which are an integral part of the Financial Statements.
42
Ohio Long-Term Tax-Exempt Fund
Notes to Financial Statements
Vanguard Ohio Long-Term Tax-Exempt Fund is registered under the Investment Company Act of 1940 as an open-end investment company, or mutual fund. The fund invests in debt instruments of municipal issuers whose ability to meet their obligations may be affected by economic and political developments in the state.
A. The following significant accounting policies conform to generally accepted accounting principles for U.S. mutual funds. The fund consistently follows such policies in preparing its financial statements.
1. Security Valuation: Bonds, and temporary cash investments acquired over 60 days to maturity, are valued using the latest bid prices or using valuations based on a matrix system (which considers such factors as security prices, yields, maturities, and ratings), both as furnished by independent pricing services. Other temporary cash investments are valued at amortized cost, which approximates market value. Securities for which market quotations are not readily available, or whose values have been affected by events occurring before the fund’s pricing time but after the close of the securities’ primary markets, are valued by methods deemed by the board of trustees to represent fair value.
2. Futures and Options: The fund may use futures contracts and options on futures contracts to invest in fixed income asset classes with greater efficiency and lower cost than is possible through direct investment, to add value when these instruments are attractively priced, or to adjust sensitivity to changes in interest rates. The primary risks associated with the use of futures contracts are imperfect correlation between changes in market values of bonds held by the fund and the prices of futures contracts, and the possibility of an illiquid market. The primary risk associated with purchasing options is that interest rates move in such a way that the option is out-of-the-money, the position is worthless at expiration, and the fund loses the premium paid. The primary risk associated with writing options is that interest rates move in such a way that the option is in-the-money, the counterparty exercises the option, and the fund loses an amount equal to the market value of the option written less the premium received. Counterparty risk involving futures and exchange-traded options is mitigated because a regulated clearinghouse is the counterparty instead of the clearing broker. To further mitigate counterparty risk, the fund trades futures and options on an exchange, monitors the financial strength of its clearing brokers and clearinghouse, and has entered into clearing agreements with its clearing brokers. The clearinghouse imposes initial margin requirements to secure the fund’s performance and requires daily settlement of variation margin representing changes in the market value of each contract.
Futures contracts are valued at their quoted daily settlement prices. The aggregate notional amounts of the contracts are not recorded in the Statement of Net Assets. Fluctuations in the value of the contracts are recorded in the Statement of Net Assets as an asset (liability) and in the Statement of Operations as unrealized appreciation (depreciation) until the contracts are closed, when they are recorded as realized futures gains (losses).
During the year ended November 30, 2013, the fund’s average investments in long and short futures contracts represented 1% and less than 1% of net assets, respectively, based on quarterly average aggregate settlement values. The fund had no open futures contracts at November 30, 2013.
Options on futures contracts are also valued at their quoted daily settlement prices. The premium paid for a purchased option is recorded as an asset that is subsequently adjusted daily to the current market value of the option purchased. The premium received for a written option is recorded as an
43
Ohio Long-Term Tax-Exempt Fund
asset with an equal liability that is subsequently adjusted daily to the current market value of the option written. Fluctuations in the value of the options are recorded as unrealized appreciation (depreciation) until expired, closed, or exercised, at which time realized gains (losses) are recognized.
During the year ended November 30, 2013, the fund’s average value of options purchased and options written each represented 0% of net assets, based on quarterly average market values. The fund had no open options on futures contracts at November 30, 2013.
3. Federal Income Taxes: The fund intends to continue to qualify as a regulated investment company and distribute all of its income. Management has analyzed the fund’s tax positions taken for all open federal income tax years (November 30, 2010–2013), and has concluded that no provision for federal income tax is required in the fund’s financial statements.
4. Distributions: Distributions from net investment income are declared daily and paid on the first business day of the following month. Annual distributions from realized capital gains, if any, are recorded on the ex-dividend date.
5. Other: Interest income is accrued daily. Premiums and discounts on debt securities purchased are amortized and accreted, respectively, to interest income over the lives of the respective securities. Security transactions are accounted for on the date securities are bought or sold. Costs used to determine realized gains (losses) on the sale of investment securities are those of the specific securities sold.
B. The Vanguard Group furnishes at cost investment advisory, corporate management, administrative, marketing, and distribution services. The costs of such services are allocated to the fund under methods approved by the board of trustees. The fund has committed to provide up to 0.40% of its net assets in capital contributions to Vanguard. At November 30, 2013, the fund had contributed capital of $104,000 to Vanguard (included in Other Assets), representing 0.01% of the fund’s net assets and 0.04% of Vanguard’s capitalization. The fund’s trustees and officers are also directors and officers of Vanguard.
C. Various inputs may be used to determine the value of the fund’s investments. These inputs are summarized in three broad levels for financial statement purposes. The inputs or methodologies used to value securities are not necessarily an indication of the risk associated with investing in those securities.
Level 1—Quoted prices in active markets for identical securities.
Level 2—Other significant observable inputs (including quoted prices for similar securities, interest rates, prepayment speeds, credit risk, etc.).
Level 3—Significant unobservable inputs (including the fund’s own assumptions used to determine the fair value of investments).
At November 30, 2013, 100% of the market value of the fund’s investments was determined based on Level 2 inputs.
44
Ohio Long-Term Tax-Exempt Fund
D. Capital gain distributions are determined on a tax basis and may differ from realized capital gains for financial reporting purposes. Differences may be permanent or temporary. Permanent differences are reclassified among capital accounts in the financial statements to reflect their tax character. Temporary differences arise when gains or losses are recognized in different periods for financial statement and tax purposes. These differences will reverse at some time in the future.
The fund used a tax accounting practice to treat a portion of the price of capital shares redeemed during the year as distributions from realized capital gains. Accordingly, the fund has reclassified $1,130,000 from accumulated net realized gains to paid-in capital.
For tax purposes, at November 30, 2013, the fund had short-term and long-term capital gains of $53,000 and $3,567,000, respectively, available for distribution. Short-term gain distributions are treated as ordinary income dividends for tax purposes.
At November 30, 2013, the cost of investment securities for tax purposes was $900,226,000. Net unrealized appreciation of investment securities for tax purposes was $4,106,000, consisting of unrealized gains of $21,255,000 on securities that had risen in value since their purchase and $17,149,000 in unrealized losses on securities that had fallen in value since their purchase.
E. During the year ended November 30, 2013, the fund purchased $261,897,000 of investment securities and sold $316,706,000 of investment securities, other than temporary cash investments.
F. Capital shares issued and redeemed were:
| | |
| | Year Ended November 30, |
| | 2013 | 2012 |
| | Shares | Shares |
| | (000) | (000) |
| Issued | 11,304 | 14,789 |
| Issued in Lieu of Cash Distributions | 2,145 | 1,841 |
| Redeemed | (19,277) | (7,515) |
| Net Increase (Decrease) in Shares Outstanding | (5,828) | 9,115 |
G. Management has determined that no material events or transactions occurred subsequent to November 30, 2013, that would require recognition or disclosure in these financial statements.
45
Report of Independent Registered Public Accounting Firm
To the Trustees of Vanguard Ohio Tax-Free Funds and the Shareholders of Vanguard Ohio Tax-Exempt Money Market Fund and Vanguard Ohio Long-Term Tax-Exempt Fund:
In our opinion, the accompanying statements of net assets and the related statements of operations and of changes in net assets and the financial highlights present fairly, in all material respects, the financial position of Vanguard Ohio Tax-Exempt Money Market Fund and Vanguard Ohio Long-Term Tax-Exempt Fund (constituting separate portfolios of Vanguard Ohio Tax-Free Funds, hereafter referred to as the “Funds”) at November 30, 2013, the results of each of their operations for the year then ended, the changes in each of their net assets for each of the two years in the period then ended, and the financial highlights for each of the five years in the period then ended, in conformity with accounting principles generally accepted in the United States of America. These financial statements and financial highlights (hereafter referred to as “financial statements”) are the responsibility of the Funds’ management; our responsibility is to express an opinion on these financial statements based on our audits. We conducted our audits of these financial statements in accordance with the standards of the Public Company Accounting Oversight Board (United States). Those standards require that we plan and perform the audit to obtain reasonable assurance about whether the financial statements are free of material misstatement. An audit includes examining, on a test basis, evidence supporting the amounts and disclosures in the financial statements, assessing the accounting principles used and significant estimates made by management, and evaluating the overall financial statement presentation. We believe that our audits, which included confirmation of securities at November 30, 2013 by correspondence with the custodian, provide a reasonable basis for our opinion.
/s/PricewaterhouseCoopers LLP
Philadelphia, Pennsylvania
January 15, 2014
Special 2013 tax information (unaudited) for Vanguard Ohio Tax-Exempt Funds
This information for the fiscal year ended November 30, 2013, is included pursuant to provisions of the Internal Revenue Code.
Each fund designates 100% of its income dividends as exempt-interest dividends.
The Long-Term Tax-Exempt Fund distributed $3,255,000 as capital gain dividends (from net long-term capital gains) to shareholders during the fiscal year.
46
About Your Fund’s Expenses
As a shareholder of the fund, you incur ongoing costs, which include costs for portfolio management, administrative services, and shareholder reports (like this one), among others. Operating expenses, which are deducted from a fund’s gross income, directly reduce the investment return of the fund.
A fund’s expenses are expressed as a percentage of its average net assets. This figure is known as the expense ratio. The following examples are intended to help you understand the ongoing costs (in dollars) of investing in your fund and to compare these costs with those of other mutual funds. The examples are based on an investment of $1,000 made at the beginning of the period shown and held for the entire period.
The accompanying table illustrates your fund’s costs in two ways:
• Based on actual fund return. This section helps you to estimate the actual expenses that you paid over the period. The ”Ending Account Value“ shown is derived from the fund‘s actual return, and the third column shows the dollar amount that would have been paid by an investor who started with $1,000 in the fund. You may use the information here, together with the amount you invested, to estimate the expenses that you paid over the period.
To do so, simply divide your account value by $1,000 (for example, an $8,600 account value divided by $1,000 = 8.6), then multiply the result by the number given for your fund under the heading ”Expenses Paid During Period.“
• Based on hypothetical 5% yearly return. This section is intended to help you compare your fund‘s costs with those of other mutual funds. It assumes that the fund had a yearly return of 5% before expenses, but that the expense ratio is unchanged. In this case—because the return used is not the fund’s actual return—the results do not apply to your investment. The example is useful in making comparisons because the Securities and Exchange Commission requires all mutual funds to calculate expenses based on a 5% return. You can assess your fund’s costs by comparing this hypothetical example with the hypothetical examples that appear in shareholder reports of other funds.
Note that the expenses shown in the table are meant to highlight and help you compare ongoing costs only and do not reflect transaction costs incurred by the fund for buying and selling securities. Further, the expenses do not include any purchase, redemption, or account service fees described in the fund prospectus. If such fees were applied to your account, your costs would be higher. Your fund does not carry a “sales load.”
The calculations assume no shares were bought or sold during the period. Your actual costs may have been higher or lower, depending on the amount of your investment and the timing of any purchases or redemptions.
You can find more information about the fund’s expenses, including annual expense ratios, in the Financial Statements section of this report. For additional information on operating expenses and other shareholder costs, please refer to your fund’s current prospectus.
47
| | | |
| Six Months Ended November 30, 2013 | | | |
| | Beginning | Ending | Expenses |
| | Account Value | Account Value | Paid During |
| | 5/31/2013 | 11/30/2013 | Period |
| Based on Actual Fund Return | | | |
| Ohio Tax-Exempt Money Market Fund | $1,000.00 | $1,000.05 | $0.50 |
| Ohio Long-Term Tax-Exempt Fund | $1,000.00 | $972.22 | $0.79 |
| Based on Hypothetical 5% Yearly Return | | | |
| Ohio Tax-Exempt Money Market Fund | $1,000.00 | $1,024.57 | $0.51 |
| Ohio Long-Term Tax-Exempt Fund | $1,000.00 | $1,024.27 | $0.81 |
The calculations are based on expenses incurred in the most recent six-month period. The funds’ annualized six-month expense ratios for that period are: for the Ohio Tax-Exempt Money Market Fund, 0.10%; and for the Ohio Long-Term Tax-Exempt Fund, 0.16%. (The six-month expense ratio for the Ohio Tax-Exempt Money Market Fund reflects a temporary reduction in operating expenses, described in Note B of the Notes to Financial Statements. Before the reduction, the fund’s annualized six-month expense ratio was 0.16%.) The dollar amounts shown as “Expenses Paid” are equal to the annualized expense ratio multiplied by the average account value over the period, multiplied by the number of days in the most recent six-month period, then divided by the number of days in the most recent 12-month period.
48
Glossary
7-Day SEC Yield and 30-Day SEC Yield. A money market fund’s 7-day SEC yield is calculated by annualizing its income distributions for the previous seven days, as required by the U.S. Securities and Exchange Commission. For other funds, 30-day SEC yield is derived using a formula specified by the commission. Under the formula, data related to the fund’s security holdings in the previous 30 days are used to calculate the fund’s hypothetical net income for that period, which is then annualized and divided by the fund’s estimated average net assets over the calculation period. For the purposes of this calculation, a security’s income is based on its current market yield to maturity (for bonds), its actual income (for asset-backed securities), or its projected dividend yield (for stocks). Because the SEC yield represents hypothetical annualized income, it will differ—at times significantly—from the fund’s actual experience. As a result, the fund’s income distributions may be higher or lower than implied by the SEC yield.
Average Coupon. The average interest rate paid on the fixed income securities held by a fund. It is expressed as a percentage of face value.
Average Duration. An estimate of how much the value of the bonds held by a fund will fluctuate in response to a change in interest rates. To see how the value could change, multiply the average duration by the change in rates. If interest rates rise by 1 percentage point, the value of the bonds in a fund with an average duration of five years would decline by about 5%. If rates decrease by a percentage point, the value would rise by 5%.
Average Effective Maturity. The average length of time until fixed income securities held by a fund reach maturity and are repaid, taking into consideration the possibility that the issuer may call the bond before its maturity date. The figure reflects the proportion of fund assets represented by each security; it also reflects any futures contracts held. In general, the longer the average effective maturity, the more a fund’s share price will fluctuate in response to changes in market interest rates.
Average Weighted Maturity. The average length of time until fixed income securities held by a fund reach maturity and are repaid. The figure reflects the proportion of fund assets represented by each security.
Beta. A measure of the magnitude of a fund’s past share-price fluctuations in relation to the ups and downs of a given market index. The index is assigned a beta of 1.00. Compared with a given index, a fund with a beta of 1.20 typically would have seen its share price rise or fall by 12% when the index rose or fell by 10%. For this report, beta is based on returns over the past 36 months for both the fund and the index. Note that a fund’s beta should be reviewed in conjunction with its R-squared (see definition). The lower the R-squared, the less correlation there is between the fund and the index, and the less reliable beta is as an indicator of volatility.
49
Credit Quality. For Vanguard money market funds, the Distribution by Credit Quality table includes tier ratings for consistency with SEC Rule 2a-7 under the Investment Company Act of 1940, which governs money market funds. A First Tier security is one that is eligible for money market funds and has been rated in the highest short-term rating category for debt obligations by the requisite nationally recognized statistical rating organizations. An unrated security is First Tier if it represents quality comparable to that of a rated security, as determined in accordance with SEC Rule 2a-7. A Second Tier security is one that is eligible for money market funds and is not a First Tier security. For Vanguard tax-exempt bond funds, credit-quality ratings are measured on a scale that generally ranges from AAA (highest) to D (lowest). “Not Rated” is used to classify securities for which a rating is not available. Credit-quality ratings are obtained from Moody’s and S&P, and the higher rating for each issue is used.
Expense Ratio. A fund’s total annual operating expenses expressed as a percentage of the fund’s average net assets. The expense ratio includes management and administrative expenses, but does not include the transaction costs of buying and selling portfolio securities.
Inception Date. The date on which the assets of a fund (or one of its share classes) are first invested in accordance with the fund’s investment objective. For funds with a subscription period, the inception date is the day after that period ends. Investment performance is measured from the inception date.
R-Squared. A measure of how much of a fund’s past returns can be explained by the returns from the market in general, as measured by a given index. If a fund’s total returns were precisely synchronized with an index’s returns, its R-squared would be 1.00. If the fund’s returns bore no relationship to the index’s returns, its R-squared would be 0. For this report, R-squared is based on returns over the past 36 months for both the fund and the index.
Short-Term Reserves. The percentage of a fund invested in highly liquid, short-term securities that can be readily converted to cash.
Yield to Maturity. The rate of return an investor would receive if the fixed income securities held by a fund were held to their maturity dates.
Benchmark Information
Spliced Ohio Tax-Exempt Money Market Funds Average: Ohio Tax-Exempt Money Market Funds Average through August 31, 2013; Other States Tax-Exempt Money Market Funds Average thereafter.
50
This page intentionally left blank.
The People Who Govern Your Fund
The trustees of your mutual fund are there to see that the fund is operated and managed in your best interests since, as a shareholder, you are a part owner of the fund. Your fund’s trustees also serve on the board of directors of The Vanguard Group, Inc., which is owned by the Vanguard funds and provides services to them on an at-cost basis.
A majority of Vanguard’s board members are independent, meaning that they have no affiliation with Vanguard or the funds they oversee, apart from the sizable personal investments they have made as private individuals. The independent board members have distinguished backgrounds in business, academia, and public service. Each of the trustees and executive officers oversees 181 Vanguard funds.
The following table provides information for each trustee and executive officer of the fund. More information about the trustees is in the Statement of Additional Information, which can be obtained, without charge, by contacting Vanguard at 800-662-7447, or online at vanguard.com.
| |
| InterestedTrustee1 | and Delphi Automotive LLP (automotive components); |
| | Senior Advisor at New Mountain Capital; Trustee of |
| F. William McNabb III | The Conference Board. |
| Born 1957. Trustee Since July 2009. Chairman of the | |
| Board. Principal Occupation(s) During the Past Five | Amy Gutmann |
| Years: Chairman of the Board of The Vanguard Group, | Born 1949. Trustee Since June 2006. Principal |
| Inc., and of each of the investment companies served | Occupation(s) During the Past Five Years: President |
| by The Vanguard Group, since January 2010; Director | of the University of Pennsylvania; Christopher H. |
| of The Vanguard Group since 2008; Chief Executive | Browne Distinguished Professor of Political Science |
| Officer and President of The Vanguard Group and of | in the School of Arts and Sciences with secondary |
| each of the investment companies served by The | appointments at the Annenberg School for |
| Vanguard Group since 2008; Director of Vanguard | Communication and the Graduate School of Education |
| Marketing Corporation; Managing Director of The | of the University of Pennsylvania; Member of the |
| Vanguard Group (1995–2008). | National Commission on the Humanities and Social |
| | Sciences; Trustee of Carnegie Corporation of New |
| | York and of the National Constitution Center; Chair |
| IndependentTrustees | of the U.S. Presidential Commission for the Study |
| | of Bioethical Issues. |
| Emerson U. Fullwood | |
| Born 1948. Trustee Since January 2008. Principal | |
| Occupation(s) During the Past Five Years: Executive | JoAnn Heffernan Heisen |
| Chief Staff and Marketing Officer for North America | Born 1950. Trustee Since July 1998. Principal |
| and Corporate Vice President (retired 2008) of Xerox | Occupation(s) During the Past Five Years: Corporate |
| Corporation (document management products and | Vice President and Chief Global Diversity Officer |
| services); Executive in Residence and 2010 | (retired 2008) and Member of the Executive |
| Distinguished Minett Professor at the Rochester | Committee (1997–2008) of Johnson & Johnson |
| Institute of Technology; Director of SPX Corporation | (pharmaceuticals/medical devices/consumer |
| (multi-industry manufacturing), the United Way of | products); Director of Skytop Lodge Corporation |
| Rochester, Amerigroup Corporation (managed health | (hotels), the University Medical Center at Princeton, |
| care), the University of Rochester Medical Center, | the Robert Wood Johnson Foundation, and the Center |
| Monroe Community College Foundation, and North | for Talent Innovation; Member of the Advisory Board |
| Carolina A&T University. | of the Maxwell School of Citizenship and Public Affairs |
| | at Syracuse University. |
| Rajiv L. Gupta | |
| Born 1945. Trustee Since December 2001.2 | F. Joseph Loughrey |
| Principal Occupation(s) During the Past Five Years: | Born 1949. Trustee Since October 2009. Principal |
| Chairman and Chief Executive Officer (retired 2009) | Occupation(s) During the Past Five Years: President |
| and President (2006–2008) of Rohm and Haas Co. | and Chief Operating Officer (retired 2009) of Cummins |
| (chemicals); Director of Tyco International, Ltd. | Inc. (industrial machinery); Chairman of the Board of |
| (diversified manufacturing and services), Hewlett- | Hillenbrand, Inc. (specialized consumer services) and |
| Packard Co. (electronic computer manufacturing), | of Oxfam America; Director of SKF AB (industrial |
| |
| | |
| machinery), Hyster-Yale Materials Handling, Inc. | Executive Officers | |
| (forklift trucks), and the Lumina Foundation for | | |
| Education; Member of the Advisory Council for the | Glenn Booraem | |
| College of Arts and Letters and of the Advisory Board | Born 1967. Controller Since July 2010. Principal |
| to the Kellogg Institute for International Studies, both | Occupation(s) During the Past Five Years: Principal |
| at the University of Notre Dame. | of The Vanguard Group, Inc.; Controller of each of |
| | the investment companies served by The Vanguard |
| Mark Loughridge | Group; Assistant Controller of each of the investment |
| Born 1953. Trustee Since March 2012. Principal | companies served by The Vanguard Group (2001–2010). |
| Occupation(s) During the Past Five Years: Senior Vice | | |
| President and Chief Financial Officer at IBM (information | Thomas J. Higgins | |
| technology services); Fiduciary Member of IBM’s | Born 1957. Chief Financial Officer Since September |
| Retirement Plan Committee. | 2008. Principal Occupation(s) During the Past Five |
| | Years: Principal of The Vanguard Group, Inc.; Chief |
| Scott C. Malpass | Financial Officer of each of the investment companies |
| Born 1962. Trustee Since March 2012. Principal | served by The Vanguard Group; Treasurer of each of |
| Occupation(s) During the Past Five Years: Chief | the investment companies served by The Vanguard |
| Investment Officer and Vice President at the University | Group (1998–2008). | |
| of Notre Dame; Assistant Professor of Finance at the | | |
| Mendoza College of Business at Notre Dame; Member | Kathryn J. Hyatt | |
| of the Notre Dame 403(b) Investment Committee; | Born 1955. Treasurer Since November 2008. Principal |
| Director of TIFF Advisory Services, Inc. (investment | Occupation(s) During the Past Five Years: Principal of |
| advisor); Member of the Investment Advisory | The Vanguard Group, Inc.; Treasurer of each of the |
| Committees of the Financial Industry Regulatory | investment companies served by The Vanguard |
| Authority (FINRA) and of Major League Baseball. | Group; Assistant Treasurer of each of the investment |
| | companies served by The Vanguard Group (1988–2008). |
| André F. Perold | | |
| Born 1952. Trustee Since December 2004. Principal | Heidi Stam | |
| Occupation(s) During the Past Five Years: George | Born 1956. Secretary Since July 2005. Principal |
| Gund Professor of Finance and Banking at the Harvard | Occupation(s) During the Past Five Years: Managing |
| Business School (retired 2011); Chief Investment | Director of The Vanguard Group, Inc.; General Counsel |
| Officer and Managing Partner of HighVista Strategies | of The Vanguard Group; Secretary of The Vanguard |
| LLC (private investment firm); Director of Rand | Group and of each of the investment companies |
| Merchant Bank; Overseer of the Museum of Fine | served by The Vanguard Group; Director and Senior |
| Arts Boston. | Vice President of Vanguard Marketing Corporation. |
| |
| Alfred M. Rankin, Jr. | | |
| | Vanguard Senior ManagementTeam |
| Born 1941. Trustee Since January 1993. Principal | | |
| Occupation(s) During the Past Five Years: Chairman, | Mortimer J. Buckley | Chris D. McIsaac |
| President, and Chief Executive Officer of NACCO | Kathleen C. Gubanich | Michael S. Miller |
| Industries, Inc. (housewares/lignite) and of Hyster-Yale | Paul A. Heller | James M. Norris |
| Materials Handling, Inc. (forklift trucks); Director of | Martha G. King | Glenn W. Reed |
| the National Association of Manufacturers; Chairman | John T. Marcante | |
| of the Board of University Hospitals of Cleveland; | | |
| Advisory Chairman of the Board of The Cleveland | | |
| Museum of Art. | Chairman Emeritus and Senior Advisor |
| | |
| | John J. Brennan | |
| Peter F. Volanakis | Chairman, 1996–2009 | |
| Born 1955. Trustee Since July 2009. Principal | Chief Executive Officer and President, 1996–2008 | |
| Occupation(s) During the Past Five Years: President | | |
| and Chief Operating Officer (retired 2010) of Corning | | |
| Incorporated (communications equipment); Director | Founder | |
| of SPX Corporation (multi-industry manufacturing); | | |
| Overseer of the Amos Tuck School of Business | John C. Bogle | |
| Administration at Dartmouth College; Advisor to the | Chairman and Chief Executive Officer, 1974–1996 |
| Norris Cotton Cancer Center. | | |
1 Mr. McNabb is considered an “interested person,” as defined in the Investment Company Act of 1940, because he is an officer of the Vanguard funds.
2 December 2002 for Vanguard Equity Income Fund, Vanguard Growth Equity Fund, the Vanguard Municipal Bond Funds, and the Vanguard State Tax-Exempt Funds.
|  |
| P.O. Box 2600 |
| Valley Forge, PA 19482-2600 |
Connect with Vanguard® > vanguard.com
| |
| Fund Information > 800-662-7447 | CFA® is a trademark owned by CFA Institute. |
| Direct Investor Account Services > 800-662-2739 | |
| Institutional Investor Services > 800-523-1036 | |
| Text Telephone for People | |
| With Hearing Impairment > 800-749-7273 | |
| |
| This material may be used in conjunction | |
| with the offering of shares of any Vanguard | |
| fund only if preceded or accompanied by | |
| the fund’s current prospectus. | |
| |
| All comparative mutual fund data are from Lipper, a | |
| Thomson Reuters Company, or Morningstar, Inc., unless | |
| otherwise noted. | |
| |
| You can obtain a free copy of Vanguard’s proxy voting | |
| guidelines by visiting vanguard.com/proxyreporting or by | |
| calling Vanguard at 800-662-2739. The guidelines are | |
| also available from the SEC’s website, sec.gov. In | |
| addition, you may obtain a free report on how your fund | |
| voted the proxies for securities it owned during the 12 | |
| months ended June 30. To get the report, visit either | |
| vanguard.com/proxyreporting or sec.gov. | |
| |
| You can review and copy information about your fund at | |
| the SEC’s Public Reference Room in Washington, D.C. To | |
| find out more about this public service, call the SEC at | |
| 202-551-8090. Information about your fund is also | |
| available on the SEC’s website, and you can receive | |
| copies of this information, for a fee, by sending a | |
| request in either of two ways: via e-mail addressed to | |
| publicinfo@sec.gov or via regular mail addressed to the | |
| Public Reference Section, Securities and Exchange | |
| Commission, Washington, DC 20549-1520. | |
| |
| | © 2014 The Vanguard Group, Inc. |
| | All rights reserved. |
| | Vanguard Marketing Corporation, Distributor. |
| |
| | Q960 012014 |
Item 2: Code of Ethics. The Registrant has adopted a code of ethics that applies to the Registrant’s principal executive officer, principal financial officer, principal accounting officer or controller or persons performing similar functions. The Code of Ethics was amended during the reporting period covered by this report to make certain technical, non-material changes.
Item 3: Audit Committee Financial Expert. The following members of the Audit Committee have been determined by the Registrant’s Board of Trustees to be Audit Committee Financial Experts serving on its Audit Committee, and to be independent: Rajiv L. Gupta, Amy Gutmann, JoAnn Heffernan Heisen, F. Joseph Loughrey, Mark Loughridge, Scott C. Malpass, André F. Perold, and Alfred M. Rankin, Jr.
Item 4: Principal Accountant Fees and Services.
(a) Audit Fees.
Audit Fees of the Registrant
Fiscal Year Ended November 30, 2013: $52,000
Fiscal Year Ended November 30, 2012: $51,000
Aggregate Audit Fees of Registered Investment Companies in the Vanguard Group.
Fiscal Year Ended November 30, 2013: $5,714,113
Fiscal Year Ended November 30, 2012: $4,809,780
Includes fees billed in connection with audits of the Registrant and other registered investment companies in the Vanguard complex. Also includes fees billed in connection with audits of The Vanguard Group, Inc. and Vanguard Marketing Corporation for Fiscal Year Ended November 30, 2013.
(b) Audit-Related Fees.
Fiscal Year Ended November 30, 2013: $1,552,950
Fiscal Year Ended November 30, 2012: $1,812,565
Includes fees billed in connection with assurance and related services provided to the Registrant, other registered investment companies in the Vanguard complex, The Vanguard Group, Inc., and Vanguard Marketing Corporation.
(c) Tax Fees.
Fiscal Year Ended November 30, 2013: $110,000
Fiscal Year Ended November 30, 2012: $490,518
Includes fees billed in connection with tax compliance, planning, and advice services provided to the Registrant, other registered investment companies in the Vanguard complex, The Vanguard Group, Inc., and Vanguard Marketing Corporation. Also includes fees billed in connection with certain tax services related to audits of the Registrant and other registered investment companies in the Vanguard complex for Fiscal Year Ended November 30, 2012.
(d) All Other Fees.
Fiscal Year Ended November 30, 2013: $132,000
Fiscal Year Ended November 30, 2012: $16,000
Includes fees billed for services related to tax reported information provided to the Registrant, other registered investment companies in the Vanguard complex, The Vanguard Group, Inc., and Vanguard Marketing Corporation.
(e) (1) Pre-Approval Policies. The policy of the Registrant’s Audit Committee is to consider and, if appropriate, approve before the principal accountant is engaged for such services, all specific audit and non-audit services provided to: the Registrant, other registered investment companies in the Vanguard complex, The Vanguard Group, Inc., and entities controlled by The Vanguard Group, Inc. that provide ongoing services to the Registrant. In making a determination, the Audit Committee considers whether the services are consistent with maintaining the principal accountant’s independence.
In the event of a contingency situation in which the principal accountant is needed to provide services in between scheduled Audit Committee meetings, the Chairman of the Audit Committee would be called on to consider and, if appropriate, pre-approve audit or permitted non-audit services in an amount sufficient to complete services through the next Audit Committee meeting, and to determine if such services would be consistent with maintaining the accountant’s independence. At the next scheduled Audit Committee meeting, services and fees would be presented to the Audit Committee for formal consideration, and, if appropriate, approval by the entire Audit Committee. The Audit Committee would again consider whether such services and fees are consistent with maintaining the principal accountant’s independence.
The Registrant’s Audit Committee is informed at least annually of all audit and non-audit services provided by the principal accountant to the Vanguard complex, whether such services are provided to: the Registrant, other registered investment companies in the Vanguard complex, The Vanguard Group, Inc., or other entities controlled by The Vanguard Group, Inc. that provide ongoing services to the Registrant.
(2) No percentage of the principal accountant’s fees or services were approved pursuant to the waiver provision of paragraph (c)(7)(i)(C) of Rule 2-01 of Regulation S-X.
(f) For the most recent fiscal year, over 50% of the hours worked under the principal accountant’s engagement were not performed by persons other than full-time, permanent employees of the principal accountant.
(g) Aggregate Non-Audit Fees.
Fiscal Year Ended November 30, 2013: $242,000
Fiscal Year Ended November 30, 2012: $506,518
Includes fees billed for non-audit services provided to the Registrant, other registered investment companies in the Vanguard complex, The Vanguard Group, Inc., and Vanguard Marketing Corporation.
(h) For the most recent fiscal year, the Audit Committee has determined that the provision of all non-audit services was consistent with maintaining the principal accountant’s independence.
Item 5: Audit Committee of Listed Registrants.
Not Applicable.
Item 6: Investments.
Not Applicable.
Item 7: Disclosure of Proxy Voting Policies and Procedures for Closed-End Management Investment Companies.
Not Applicable.
Item 8: Portfolio Managers of Closed-End Management Investment Companies.
Not Applicable.
Item 9: Purchase of Equity Securities by Closed-End Management Investment Company and Affiliated Purchasers.
Not Applicable.
Item 10: Submission of Matters to a Vote of Security Holders.
Not Applicable.
Item 11: Controls and Procedures.
(a) Disclosure Controls and Procedures. The Principal Executive and Financial Officers concluded that the Registrant’s Disclosure Controls and Procedures are effective based on their evaluation of the Disclosure Controls and Procedures as of a date within 90 days of the filing date of this report.
(b) Internal Control Over Financial Reporting. There were no significant changes in Registrant’s Internal Control Over Financial Reporting or in other factors that could significantly affect this control subsequent to the date of the evaluation, including any corrective actions with regard to significant deficiencies and material weaknesses.
Item 12: Exhibits.
(a) Code of Ethics.
(b) Certifications.
Pursuant to the requirements of the Securities Exchange Act of 1934 and the Investment Company Act of 1940, the registrant has duly caused this report to be signed on its behalf by the undersigned, thereunto duly authorized.
| |
| | VANGUARD OHIO TAX-FREE FUNDS |
| |
| By: | /s/ F. WILLIAM MCNABB III* |
| | F. WILLIAM MCNABB III |
| | CHIEF EXECUTIVE OFFICER |
| |
| Date: January 21, 2014 |
Pursuant to the requirements of the Securities Exchange Act of 1934 and the Investment Company Act of 1940, this report has been signed below by the following persons on behalf of the registrant and in the capacities and on the dates indicated.
| |
| | VANGUARD OHIO TAX-FREE FUNDS |
| |
| By: | /s/ F. WILLIAM MCNABB III* |
| | F. WILLIAM MCNABB III |
| | CHIEF EXECUTIVE OFFICER |
| |
| Date: January 21, 2014 |
| |
| | VANGUARD OHIO TAX-FREE FUNDS |
| |
| By: | /s/ THOMAS J. HIGGINS* |
| | THOMAS J. HIGGINS |
| | CHIEF FINANCIAL OFFICER |
| |
| Date: January 21, 2014 |
* By: /s/ Heidi Stam
Heidi Stam, pursuant to a Power of Attorney filed on March 27, 2012 see file Number 2-11444, Incorporated by Reference.