UNITED STATES
SECURITIES AND EXCHANGE COMMISSION Washington, D.C. 20549
FORM N-CSR
CERTIFIED SHAREHOLDER REPORT OF
REGISTERED MANAGEMENT INVESTMENT COMPANIES
Investment Company Act file number: 811-06083
Name of Registrant: Vanguard Ohio Tax-Free Funds
Address of Registrant:
P.O. Box 2600
Valley Forge, PA 19482
Name and address of agent for service:
Heidi Stam, Esquire
P.O. Box 876
Valley Forge, PA 19482
Registrant’s telephone number, including area code: (610) 669-1000
Date of fiscal year end: November 30
Date of reporting period: December 1, 2013 – November 30, 2014
Item 1: Reports to Shareholders
Annual Report | November 30, 2014
Vanguard Ohio Tax-Exempt Funds
Vanguard Ohio Tax-Exempt Money Market Fund
Vanguard Ohio Long-Term Tax-Exempt Fund
The mission continues
On May 1, 1975, Vanguard began operations, a fledgling company based on the simple but revolutionary idea that a mutual fund company should be managed solely in the interest of its investors.
Four decades later, that revolutionary spirit continues to animate the enterprise. Vanguard remains on a mission to give investors the best chance of investment success.
As we mark our 40th anniversary, we thank you for entrusting your assets to Vanguard and giving us the opportunity to help you reach your financial goals in the decades to come.
| |
| Contents | |
| Your Fund’s Total Returns. | 1 |
| Chairman’s Letter. | 2 |
| Advisor’s Report. | 8 |
| Ohio Tax-Exempt Money Market Fund. | 11 |
| Ohio Long-Term Tax-Exempt Fund. | 25 |
| About Your Fund’s Expenses. | 47 |
| Glossary. | 49 |
Please note: The opinions expressed in this report are just that—informed opinions. They should not be considered promises or advice.
Also, please keep in mind that the information and opinions cover the period through the date on the front of this report. Of course, the
risks of investing in your fund are spelled out in the prospectus.
See the Glossary for definitions of investment terms used in this report.
About the cover: Since our founding, Vanguard has drawn inspiration from the enterprise and valor demonstrated by British
naval hero Horatio Nelson and his command at the Battle of the Nile in 1798. The photograph displays a replica of a merchant
ship from the same era as Nelson’s flagship, the HMS Vanguard.
Your Fund’s Total Returns
| | | | | |
| Fiscal Year Ended November 30, 2014 | | | | | |
| | | Taxable- | | | |
| | SEC | Equivalent | Income | Capital | Total |
| | Yield | Yield | Returns | Returns | Returns |
| Vanguard Ohio Tax-Exempt Money Market Fund | 0.01% | 0.02% | 0.01% | 0.00% | 0.01% |
| Other States Tax-Exempt Money Market Funds | | | | | |
| Average | | | | | 0.00 |
| Other States Tax-Exempt Money Market Funds Average: Derived from data provided by Lipper, a Thomson Reuters Company. |
| |
| Vanguard Ohio Long-Term Tax-Exempt Fund | 2.33% | 4.35% | 3.89% | 6.30% | 10.19% |
| Barclays OH Municipal Bond Index | | | | | 8.60 |
| Ohio Municipal Debt Funds Average | | | | | 8.41 |
| Ohio Municipal Debt Funds Average: Derived from data provided by Lipper, a Thomson Reuters Company. |
7-day SEC yield for the Ohio Tax-Exempt Money Market Fund; 30-day SEC yield for the Ohio Long-Term Tax-Exempt Fund.
The calculation of taxable-equivalent yield assumes a typical itemized tax return and is based on the maximum federal tax rate of 43.4% and
the maximum income tax rate for the state. Local taxes were not considered. Please see the prospectus for a detailed explanation of the
calculation.
| | | | |
| Your Fund’s Performance at a Glance | | | | |
| November 30, 2013, Through November 30, 2014 | | | | |
| | | | Distributions Per Share |
| | Starting | Ending | | |
| | Share | Share | Income | Capital |
| | Price | Price | Dividends | Gains |
| Vanguard Ohio Tax-Exempt Money Market Fund | $1.00 | $1.00 | $0.000 | $0.000 |
| Vanguard Ohio Long-Term Tax-Exempt Fund | $11.93 | $12.63 | $0.444 | $0.049 |
1

Chairman’s Letter
Dear Shareholder,
After a rough start, the broad U.S. municipal bond market posted 11 consecutive months of gains to finish the fiscal year ended November 30, 2014, with a return of more than 8%.
Demand was strong for lower-rated and longer-dated munis, a trend that helped Vanguard Ohio Long-Term Tax-Exempt Fund return 10.19% for the 12 months. Price appreciation accounted for well over half of the fund’s results, unlike in the previous fiscal year, when price depreciation detracted significantly from returns.
The Long-Term Fund performed much better than its benchmark, which returned 8.60%, and its peer group, whose average return was 8.41%.
The rise in municipal bond prices drove the Long-Term Fund’s 30-day SEC yield down to 2.33% at the end of the period, from 3.50% a year earlier. (Bond prices and yields move in opposite directions.)
With Federal Reserve policy pinning short-term interest rates near zero, Vanguard Ohio Tax-Exempt Money Market Fund, which invests in securities maturing in less than one year, returned 0.01%, compared with the average of 0.00% for peer funds. Its 7-day SEC yield began and finished the fiscal year at 0.01%.
2
Please note: Although the funds are permitted to invest in securities whose income is subject to the alternative minimum tax (AMT), throughout the year the Long-Term Fund owned no securities that would generate income distributions subject to the AMT. The Money Market Fund did hold such securities during the year and on November 30.
In case you hadn’t heard about them, I wanted to mention that the Securities and Exchange Commission (SEC) adopted a number of regulatory changes governing money market funds earlier this year. With these changes, and the significant safeguards it adopted in 2010, the SEC has issued a strong response to those who believe institutional money market funds pose a risk to the financial system.
The vast majority of investors in Vanguard money market funds will not be affected by the new rules. A brief overview of the new rules can be found in the box on page 6.
U.S. taxable bond prices climbed as yields declined even further
Yields in the United States were low at the beginning of the fiscal year, and defied expectations by moving even lower despite the Fed’s winding down its bond-purchasing program from January through October. Falling yields and “safe haven” demand for U.S. Treasury bonds from overseas investors helped the broad U.S. taxable bond market return 5.27% for the 12 months. The yield of the 10-year Treasury note ended November at 2.25%, down from 2.74% a year earlier.
| | | |
| Market Barometer | | | |
| | | Average Annual Total Returns |
| | | Periods Ended November 30, 2014 |
| | One | Three | Five |
| | Year | Years | Years |
| Bonds | | | |
| Barclays U.S. Aggregate Bond Index (Broad taxable | | | |
| market) | 5.27% | 3.00% | 4.10% |
| Barclays Municipal Bond Index (Broad tax-exempt market) | 8.23 | 4.78 | 5.12 |
| Citigroup Three-Month U.S. Treasury Bill Index | 0.04 | 0.04 | 0.06 |
| |
| Stocks | | | |
| Russell 1000 Index (Large-caps) | 16.56% | 21.05% | 16.25% |
| Russell 2000 Index (Small-caps) | 3.99 | 18.36 | 16.69 |
| Russell 3000 Index (Broad U.S. market) | 15.53 | 20.84 | 16.28 |
| FTSE All-World ex US Index (International) | 1.05 | 10.29 | 5.94 |
| |
| CPI | | | |
| Consumer Price Index | 1.32% | 1.44% | 1.77% |
3
International bonds (as measured by the Barclays Global Aggregate Index ex USD) returned –2.53% for U.S. investors, as many foreign currencies weakened against the U.S. dollar during the fiscal year. (International bonds produced a positive return for U.S. investors after currency hedging, which helps mitigate the effects of movements in foreign exchange rates.)
Monetary policy, corporate earnings gave the U.S. stock market a boost
The broad U.S. stock market gained more than 15% for the 12 months. Generally accommodative global monetary actions and strong corporate earnings offset investors’ concerns about geopolitical issues such as economic struggles in Europe and strife in the Middle East.
Here, too, weakness in foreign currencies weighed on international stocks, which returned about 1% in dollar terms. Emerging markets fared better than the developed markets of Europe and the Pacific region.
Both supply and demand worked in Ohio munis’ favor
The municipal bond market was under pressure through much of 2013 as, amid unsettling headlines about distressed issuers such as Puerto Rico and Detroit, it absorbed the fact that the Fed would be beginning to scale back its bond purchases. Other considerations took center stage in the new year, however. These included a domestic economic recovery marked by stops and starts, instability in Eastern Europe and the
| | |
| Expense Ratios | | |
| Your Fund Compared With Its Peer Group | | |
| | | Peer Group |
| | Fund | Average |
| Ohio Tax-Exempt Money Market Fund | 0.16% | 0.20% |
| Ohio Long-Term Tax-Exempt Fund | 0.16 | 1.09 |
The fund expense ratios shown are from the prospectus dated March 27, 2014, and represent estimated costs for the current fiscal year. Forthe fiscal year ended November 30, 2014, the funds’ expense ratios were: for the Ohio Tax-Exempt Money Market Fund, 0.08%; and for theOhio Long-Term Tax-Exempt Fund, 0.16%. The expense ratio for the Ohio Tax-Exempt Money Market Fund reflects a temporary reduction inoperating expenses (described in Note B of the Notes to Financial Statements). Before the reduction, the expense ratio was 0.16%.Peer-group expense ratios are derived from data provided by Lipper, a Thomson Reuters Company, and capture information through year-end2013.Peer groups: For the Ohio Tax-Exempt Money Market Fund, Other States Tax-Exempt Money Market Funds; for the Ohio Long-TermTax-Exempt Fund, Ohio Municipal Debt Funds.4
Middle East, and muni yields that were attractive on their own and relative to those of Treasuries and corporate bonds.
Those factors, along with the positive credit trend for state-issued debt, contributed to a resurgence in demand for Ohio munis in 2014. Among those showing interest were the usual clients for these securities—residents of the Buckeye State in high income tax brackets looking for tax-exempt income—as well as nontraditional buyers, including banks, insurance companies, and hedge funds.
At the same time, supply shrank. Even with the state’s economy expanding, its revenues coming in above budget, and borrowing costs very low, many issuers remained in austerity mode, resulting in a significant year-over-year decline in new issuance in Ohio for the fiscal year just ended.
The Long-Term Fund was well positioned for this environment thanks to the skill of its advisor, Vanguard Fixed Income Group. A strategic overweight to pockets of lower-quality investment-grade bonds and longer maturities relative to the fund’s benchmark proved an advantage.
Another positive was the fund’s holdings in longer-term premium callable bonds, which tend to have higher yields relative to their duration risk.
Security selection also contributed to the fund’s relative performance, as did avoiding Puerto Rico’s beleaguered
| |
| Total Returns | |
| Ten Years Ended November 30, 2014 | |
| | Average |
| | Annual Return |
| Ohio Tax-Exempt Money Market Fund | 1.23% |
| Spliced Ohio Tax-Exempt Money Market Funds Average | 1.00 |
For a benchmark description, see the Glossary.
Spliced Ohio Tax-Exempt Money Market Funds Average: Derived from data provided by Lipper, a Thomson Reuters Company. |
|
| |
| |
| Ohio Long-Term Tax-Exempt Fund | 4.74% |
| Barclays OH Municipal Bond Index | 4.45 |
| Ohio Municipal Debt Funds Average | 3.71 |
| Ohio Municipal Debt Funds Average: Derived from data provided by Lipper, a Thomson Reuters Company. |
The figures shown represent past performance, which is not a guarantee of future results. (Current performance may be
lower or higher than the performance data cited. For performance data current to the most recent month-end, visit our
website at vanguard.com/performance.) Note, too, that both investment returns and principal value can fluctuate widely, so
an investor’s shares, when sold, could be worth more or less than their original cost.
5
muni bonds. Despite their high coupons and the allure of their exemption from federal, state, and local taxes, these securities lagged because of the economic and fiscal challenges facing the commonwealth.
Although this past fiscal year was a very strong one for munis, keep in mind that, given how low yields have fallen, it’s unlikely that munis—especially those with longer-maturities—will produce similar results next year.
For more information about the advisor’s approach and the funds’ positioning during the year, please see the Advisor’s Report that follows this letter.
Strong credit analysis has guided the fund through tough times
At times over the ten years ended November 30, media scares about the creditworthiness of municipal issuers and a few widely publicized municipal bankruptcies rattled the muni market. However, Vanguard’s in-house analysis—always one of the pillars of our investment
|
| New rules on money market funds won’t affect most Vanguard investors |
| |
| New rules governing money market funds garnered significant attention in 2014. But under |
| these rules, approved by the Securities and Exchange Commission (SEC), it will be business as |
| usual for the vast majority of Vanguard clients invested in such funds, including our tax-exempt |
| money market funds. A key point is that money market funds catering to individual investors |
| will be allowed to continue to seek to maintain a stable $1 share price, or net asset value (NAV). |
| |
| The SEC has put in place a new framework that will enable a fund’s board of directors to |
| address a “run on the fund” by imposing redemption fees or even suspending redemptions. |
| The board will be able to take these measures when the fund’s liquidity—the percentage of |
| its assets invested in securities that may be readily traded in the market—falls below a certain |
| predefined level. (Government and Treasury money market funds will be permitted, but not |
| required, to implement these fees and restrictions.) |
| |
| More extensive changes are in store for institutional money market funds, which proved more |
| susceptible to large-scale redemptions during the 2008–09 financial crisis. Most significantly, |
| these funds will have to shift from a fixed share price to a floating NAV. |
| |
| Although some rules must be implemented sooner, the compliance date for the core reforms |
| is in autumn 2016, which gives investors time to find alternatives if they wish. We will no doubt |
| be reporting to you again as we work through the implications of these changes for our clients |
| and our lineup of funds. |
6
process—has helped us sidestep potential problems and identify opportunities among muni bonds. That process is ongoing, even for the bonds already held in our portfolios.
The skill of our credit analysts, along with the competitive advantage of our low costs, has been instrumental in enabling the Money Market Fund and the Long-Term Fund to outpace the average annual return of their peer groups over the last decade by 23 and 103 basis points, respectively. (A basis point is one-hundredth of a percentage point.) The Long-Term Fund outperformed its benchmark index, which, unlike the fund or its peers, has no expenses.
Realistic expectations are key to reaching your long-term goals
Over the last several years, investors have grown accustomed to mostly strong returns from both stocks and bonds. This, of course, has been a welcome development for our clients as they strive to achieve their financial goals. But as any experienced investor knows, markets aren’t always so favorable.
Our recently published economic and market outlook research paper cautions that, over the next decade, returns for a balanced 60% equity/40% bond portfolio are likely to be moderately below long-run historical averages. (For more details, see Vanguard’s Economic and Investment Outlook, available at vanguard.com/ research.)
I point out our modest projections not to be discouraging but to be helpful. Realistic expectations are the foundation of a sound plan to reach your long-term objective, whether it’s establishing a secure retirement, paying for a child’s education, or achieving some other goal.
If you expect too much from the markets, you might not save sufficiently. You might also take on excessive risk in your portfolio in the pursuit of unrealistically high returns
We firmly believe that a better course is to follow Vanguard’s principles for investing success:
• Goals. Create clear, appropriate
investment goals.
• Balance. Develop a suitable asset
allocation using broadly diversified funds.
• Cost. Minimize cost.
• Discipline. Maintain perspective and
long-term discipline.
The beauty of these principles is that, unlike market returns, each one is within your control, and focusing on them can put you on the right path.
As always, thank you for investing with Vanguard.
Sincerely,

F. William McNabb III
Chairman and Chief Executive Officer
December 10, 2014
7
Advisor’s Report
For the fiscal year ended November 30, 2014, Vanguard Ohio Long-Term Tax-Exempt Fund posted a return of 10.19%. That performance was well ahead of the 8.60% return for its benchmark, the Barclays Ohio Municipal Bond Index, and the average return of 8.41% for peer-group funds. Vanguard Ohio Tax-Exempt Money Market Fund returned 0.01%; the average return for its peers was 0.00%.
The investment environment
It was a remarkable year for municipal bonds as a whole. While the macroeconomic environment helped the overall bond market produce solid returns, limited supply and a surge in demand helped municipal bonds perform even better.
The bond market was shaken last year when the Federal Reserve signaled its intention to wind down its unprecedented bond-buying program. Eventually, the Fed was able to reassure investors that the tapering would be gradual, that it would proceed only if the economy showed sufficient underlying strength, and that interest rates were likely to remain low for a considerable period even after the program ended.
The economy provided the signals the central bank was looking for to bring its program to an end. Despite a sharp contraction in the first quarter of 2014 resulting in part from severe winter weather, gross domestic product increased at an annual rate well above 2% over the 12 months ended September 30. The labor
| | |
| Yields of Tax-Exempt Municipal Securities | | |
| (AAA-Rated General-Obligation Issues) | | |
| | November 30, | November 30, |
| Maturity | 2013 | 2014 |
| 2 years | 0.33% | 0.14% |
| 5 years | 1.16 | 0.88 |
| 10 years | 2.65 | 1.98 |
| 30 years | 4.10 | 3.00 |
| Source: Vanguard. |
8
market also improved: The unemployment rate fell to 5.8% for November. Inflation remained well below the Fed’s target of 2%.
Ohio’s economy continued to expand at a slightly faster pace than that of the nation, according to a gauge of current economic conditions for each state that is published monthly by the Federal Reserve Bank of Philadelphia. The bank’s index for Ohio climbed about 5% from November 2013 through October 2014, compared with an increase of about 3% for the nation as a whole. (Each state’s index incorporates data on nonfarm payroll employment, the jobless rate, average hours worked in manufacturing, and inflation-adjusted wage and salary payments.) The state has seen a recovery in auto and machinery manufacturing as well as an upturn in energy exploration.
This benign environment for bonds—moderate economic growth, low inflation, and continuing easy monetary policy—helped revive demand for them. Heightened tensions in Eastern Europe and the Middle East were also a factor: More risk-averse investors turned to bonds as a perceived safe harbor for their assets. Over the period, Treasury yield curve flattened, and securities with longer maturities strongly outperformed those with shorter maturities. Corporate bonds, with their draw of higher yields, also fared well.
Ohio municipal bonds, however, outperformed both Treasuries and corporates over the 12 months. In part, this was because of lack of supply. Even with a balanced state budget and tax revenues running ahead of projections, issuers weren’t ready to take on more debt. While municipal issuance at the national level was down by about 6% for the first ten months of 2014, it dropped by roughly 30% in Ohio.
At the same time, demand for these bonds rebounded. After falling out of favor with investors last year, municipal bonds reached very attractive valuations compared with Treasuries and corporate bonds. Those valuations drew back individual investors looking for tax-free income, as well as many buyers who do not usually buy municipal bonds, including insurance companies, pension funds, and foreign investors.
Management of the funds
The Long-Term Fund’s position in longer- dated bonds proved fruitful. While many investors believed that rates were headed significantly higher and wanted to limit their exposure to the longer end of the yield curve, we believed that rates would remain relatively stable and that holding bonds with maturities of ten years or more would help us maximize yield.
In terms of credit exposure, we saw relative value in lower-rated investment-grade securities, primarily in the A-rated category. The prices of these bonds rose significantly as investors intensified their search for yield.
Other contributors to performance over the period included our security selection and our allocation to premium callable bonds, which benefited from a compression in spreads.
We continued to view Puerto Rico bonds as unattractive; although their yields are high, so is their level of credit risk, because of the territory’s debt load, unbalanced budget, and poor economic prospects.
For the Money Market Fund, the low interest rate environment remained challenging but not unfamiliar: The Fed has kept its target for overnight rates at 0%–0.25% since 2008. We continued to look for opportunities to support returns through risk management and security selection.
A look ahead
The strong performance of municipal bonds has put their valuations at much fuller levels compared with 12 months ago. And with yields having fallen so low, the overall economy continuing to improve, and a rise in interest rates potentially in the offing, we expect these bonds’ returns over the next year to be more or less in line with the coupons they pay out.
Our outlook is for the U.S. economy to grow at a moderate pace in 2015. The Fed is likely to begin raising the federal funds target rate in the second half of the year. Although market volatility will probably pick up as we approach that point, we believe that the next wave of monetary tightening will be slow and that the target rate will eventually end up below its historical average.
For municipal bonds, that’s likely to mean their yields will remain lower than we’ve seen over the past 10 to 15 years.
As we enter the new fiscal year, the Long-Term Fund has a duration shorter than that of its benchmark (because of the prospect of rising interest rates) and allocations favoring longer maturities.
As for Puerto Rico, we are likely to remain on the sidelines until we see sustained economic growth and budget discipline in the territory.
We will continue to make sure that the fund has higher-than-usual levels of liquidity, so that we can take advantage of any pricing dislocations that may arise.
As always, our experienced team of portfolio managers, traders, and credit analysts will seek out opportunities to add to the funds’ performance by identifying bonds that are mispriced by the market.
Christopher W. Alwine, CFA, Principal,
Head of Municipal Bond Funds
Pamela Wisehaupt Tynan, Principal,
Head of Municipal Money Market Funds
Marlin G. Brown, Portfolio Manager
Justin A. Schwartz, CFA, Portfolio Manager
Vanguard Fixed Income Group
December 12, 2014
10
Ohio Tax-Exempt Money Market Fund
Fund Profile
As of November 30, 2014
| |
| Financial Attributes | |
| Ticker Symbol | VOHXX |
| Expense Ratio1 | 0.16% |
| 7-Day SEC Yield | 0.01% |
| Average Weighted | |
| Maturity | 37 days |
| |
| Distribution by Credit Quality (% of portfolio) |
| First Tier | 100.0% |
A First Tier security is one that is eligible for money market fundsand has been rated in the highest short-term rating category fordebt obligations by nationally recognized statistical ratingorganizations. Credit-quality ratings are obtained from Moody's,Fitch, and S&P. For securities rated by all three agencies, wheretwo of them are in agreement and assign the highest ratingcategory, the highest rating applies. If a security is only rated bytwo agencies, and their ratings are in different categories, thelower of the ratings applies. An unrated security is First Tier if itrepresents quality comparable to that of a rated security, asdetermined in accordance with SEC Rule 2a-7. For moreinformation about these ratings, see the Glossary entry for CreditQuality.1 The expense ratio shown is from the prospectus dated March 27, 2014, and represents estimated costs for the current fiscal year. For the
fiscal year ended November 30, 2014, the expense ratio was 0.08%, reflecting a temporary reduction in operating expenses (described in
Note B of the Notes to Financial Statements). Before this reduction, the expense ratio was 0.16%.
11
Ohio Tax-Exempt Money Market Fund
Performance Summary
Investment returns will fluctuate. All of the returns in this report represent past performance, which is not a guarantee of future results that may be achieved by the fund. (Current performance may be lower or higher than the performance data cited. For performance data current to the most recent month-end, visit our website at vanguard.com/performance.) The returns shown do not reflect taxes that a shareholder would pay on fund distributions. An investment in a money market fund is not insured or guaranteed by the Federal Deposit Insurance Corporation or any other government agency. Although the fund seeks to preserve the value of your investment at $1 per share, it is possible to lose money by investing in the fund. The fund’s 7-day SEC yield reflects its current earnings more closely than do the average annual returns.
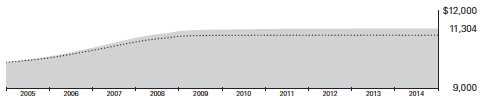
Cumulative Performance: November 30, 2004, Through November 30, 2014
Initial Investment of $10,000
| | | | |
| | | Average Annual Total Returns | |
| | Periods Ended November 30, 2014 | |
| |
| | | | | Final Value |
| | One | Five | Ten | of a $10,000 |
| | Year | Years | Years | Investment |
| |
| Ohio Tax-Exempt Money Market | | | | |
| Fund | 0.01% | 0.06% | 1.23% | $11,304 |
| Spliced Ohio Tax-Exempt Money | | | | |
| •••••••• Market Funds Average | 0.00 | 0.01 | 1.00 | 11,049 |
For a benchmark description, see the Glossary.Spliced Ohio Tax-Exempt Money Market Funds Average: Derived from data provided by Lipper, a Thomson Reuters Company.
See Financial Highlights for dividend information.
12
| | |
| Ohio Tax-Exempt Money Market Fund | | |
| |
| |
| |
| Fiscal-Year Total Returns (%): November 30, 2004, Through November 30, 2014 | |
| | | Spliced Ohio |
| | | Tax-Exempt |
| | | Money Mkt |
| | | Funds Avg. |
| Fiscal Year | Total Returns | Total Returns |
| 2005 | 2.21% | 1.73% |
| 2006 | 3.30 | 2.84 |
| 2007 | 3.63 | 3.14 |
| 2008 | 2.40 | 2.05 |
| 2009 | 0.56 | 0.31 |
| 2010 | 0.15 | 0.03 |
| 2011 | 0.09 | 0.00 |
| 2012 | 0.05 | 0.00 |
| 2013 | 0.02 | 0.00 |
| 2014 | 0.01 | 0.00 |
7-day SEC yield (11/30/2014): 0.01%
For a benchmark description, see the Glossary.
Spliced Ohio Tax-Exempt Money Market Funds Average: Derived from data provided by Lipper, a Thomson Reuters Company. |
|
|
Average Annual Total Returns: Periods Ended September 30, 2014
This table presents returns through the latest calendar quarter—rather than through the end of the fiscal period.
Securities and Exchange Commission rules require that we provide this information.
| | | | |
| | Inception | One | Five | Ten |
| | Date | Year | Years | Years |
| Ohio Tax-Exempt Money Market | | | | |
| Fund | 6/18/1990 | 0.01% | 0.07% | 1.26% |
13
Ohio Tax-Exempt Money Market Fund
Financial Statements
Statement of Net Assets
As of November 30, 2014
The fund reports a complete list of its holdings in various monthly and quarterly regulatory filings. The fund publishes its holdings on a monthly basis at vanguard.com and files them with the Securities and Exchange Commission on Form N-MFP. The fund’s Form N-MFP filings become public 60 days after the relevant month-end, and may be viewed at sec.gov or via a link on the “Portfolio Holdings” page on vanguard.com. For the second and fourth fiscal quarters, the lists appear in the fund’s semiannual and annual reports to shareholders. For the first and third fiscal quarters, the fund files the lists with the SEC on Form N-Q. Shareholders can look up the fund’s Forms N-Q on the SEC’s website at sec.gov. Forms N-Q may also be reviewed and copied at the SEC’s Public Reference Room (see the back cover of this report for further information).
| | | | |
| | | | Face | Market |
| | | Maturity | Amount | Value• |
| | Coupon | Date | ($000) | ($000) |
| Tax-Exempt Municipal Bonds (101.4%) | | | | |
| Ohio (101.4%) | | | | |
| Akron OH Income Tax Revenue | 3.000% | 12/1/14 | 2,465 | 2,465 |
| Akron OH Income Tax Revenue | 2.000% | 12/1/15 | 1,145 | 1,165 |
| Akron OH Income Tax Revenue BAN | 1.150% | 3/12/15 | 3,250 | 3,258 |
| Allen County OH Hospital Facilities Revenue | | | | |
| (Catholic Healthcare Partners) VRDO | 0.050% | 12/1/14 LOC | 1,000 | 1,000 |
| Allen County OH Hospital Facilities Revenue | | | | |
| (Catholic Healthcare Partners) VRDO | 0.060% | 12/1/14 LOC | 800 | 800 |
| Athens County OH Port Authority Housing | | | | |
| Revenue VRDO | 0.040% | 12/5/14 LOC | 4,900 | 4,900 |
| Avon OH BAN | 1.000% | 9/9/15 | 3,000 | 3,017 |
| Berea OH BAN | 0.750% | 3/25/15 | 2,000 | 2,003 |
| Blue Ash OH BAN | 1.000% | 12/3/14 | 3,450 | 3,450 |
| Butler County OH BAN | 0.300% | 7/30/15 | 2,389 | 2,389 |
| 1 Cincinnati OH City School District GO TOB VRDO | 0.040% | 12/5/14 | 12,150 | 12,150 |
| 1 Cincinnati OH City School District GO TOB VRDO | 0.050% | 12/5/14 | 5,000 | 5,000 |
| 1 Cleveland OH Water Works Revenue TOB VRDO | 0.040% | 12/5/14 | 4,335 | 4,335 |
| 1 Cleveland OH Water Works Revenue TOB VRDO | 0.050% | 12/5/14 | 8,665 | 8,665 |
| Cleveland OH Water Works Revenue VRDO | 0.050% | 12/5/14 LOC | 7,900 | 7,900 |
| Cleveland-Cuyahoga County OH Port Authority | | | | |
| Revenue (Carnegie/89th Garage & Service Center | | | | |
| LLC Project) VRDO | 0.040% | 12/5/14 LOC | 6,305 | 6,305 |
| Cleveland-Cuyahoga County OH Port Authority | | | | |
| Revenue (Cleveland Museum of Art Project) | | | | |
| VRDO | 0.040% | 12/5/14 | 3,210 | 3,210 |
| Cleveland-Cuyahoga County OH Port Authority | | | | |
| Revenue (Cleveland Museum of Art Project) | | | | |
| VRDO | 0.040% | 12/5/14 | 4,750 | 4,750 |
| Cleveland-Cuyahoga County OH Port Authority | | | | |
| Revenue (Cleveland Museum of Art Project) | | | | |
| VRDO | 0.040% | 12/5/14 | 4,900 | 4,900 |
| Cleveland-Cuyahoga County OH Port Authority | | | | |
| Revenue (Cleveland Museum of Art Project) | | | | |
| VRDO | 0.040% | 12/5/14 | 3,000 | 3,000 |
14
| | | | |
| Ohio Tax-Exempt Money Market Fund | | | | |
| |
| |
| |
| | | | Face | Market |
| | | Maturity | Amount | Value• |
| | Coupon | Date | ($000) | ($000) |
| Cleveland-Cuyahoga County OH Port Authority | | | | |
| Revenue (Euclid Avenue Housing Corp. Project) | | | | |
| VRDO | 0.040% | 12/5/14 LOC | 2,600 | 2,600 |
| Columbus OH BAN | 1.000% | 8/28/15 | 4,500 | 4,529 |
| Columbus OH GO | 5.000% | 6/1/15 | 5,710 | 5,849 |
| 1 Columbus OH GO TOB VRDO | 0.070% | 12/5/14 | 4,360 | 4,360 |
| Columbus OH GO VRDO | 0.030% | 12/5/14 | 3,135 | 3,135 |
| Columbus OH Regional Airport Authority Airport | | | | |
| Revenue (Oasbo Expanded Asset Program) | | | | |
| VRDO | 0.040% | 12/5/14 LOC | 8,245 | 8,245 |
| Columbus OH Regional Airport Authority Airport | | | | |
| Revenue (Oasbo Expanded Asset Program) | | | | |
| VRDO | 0.040% | 12/5/14 LOC | 3,600 | 3,600 |
| Columbus OH Regional Airport Authority Airport | | | | |
| Revenue (Oasbo Expanded Asset Program) | | | | |
| VRDO | 0.040% | 12/5/14 LOC | 6,570 | 6,570 |
| Columbus OH Regional Airport Authority Revenue | | | | |
| (Pooled Financing Program) VRDO | 0.040% | 12/5/14 LOC | 4,580 | 4,580 |
| 1 Columbus OH Sewer Revenue TOB VRDO | 0.040% | 12/5/14 | 2,800 | 2,800 |
| 1 Columbus OH Sewer Revenue TOB VRDO | 0.040% | 12/5/14 | 4,925 | 4,925 |
| Columbus OH Sewer Revenue VRDO | 0.030% | 12/5/14 | 3,365 | 3,365 |
| 1 Cuyahoga County OH (Convention Hotel Project) | | | | |
| COP TOB VRDO | 0.080% | 12/5/14 | 13,000 | 13,000 |
| Cuyahoga County OH GO | 3.000% | 12/1/14 | 1,640 | 1,640 |
| Cuyahoga County OH Housing Revenue VRDO | 0.040% | 12/5/14 LOC | 6,935 | 6,935 |
| Cuyahoga Falls OH BAN | 1.000% | 12/4/14 | 1,870 | 1,870 |
| 2 Cuyahoga Falls OH BAN | 1.000% | 12/3/15 | 1,550 | 1,562 |
| Deerfield Township OH BAN | 0.300% | 10/28/15 | 2,384 | 2,384 |
| Fairfield Township OH BAN | 1.000% | 6/4/15 | 1,350 | 1,355 |
| Franklin County OH Hospital Facilities Revenue | | | | |
| (Doctors OhioHealth Corp.) VRDO | 0.050% | 12/5/14 LOC | 4,670 | 4,670 |
| 3 Franklin County OH Hospital Facilities Revenue | | | | |
| (OhioHealth Corp.) PUT | 0.070% | 6/3/15 | 6,000 | 6,000 |
| 1 Franklin County OH Hospital Facilities Revenue | | | | |
| (OhioHealth Corp.) TOB VRDO | 0.090% | 12/5/14 | 7,000 | 7,000 |
| Franklin County OH Hospital Facilities Revenue | | | | |
| (OhioHealth Corp.) VRDO | 0.040% | 12/5/14 | 1,900 | 1,900 |
| Franklin County OH Hospital Facilities Revenue | | | | |
| (OhioHealth Corp.) VRDO | 0.040% | 12/5/14 | 2,240 | 2,240 |
| Franklin County OH Hospital Revenue | | | | |
| (Holy Cross Health System) VRDO | 0.020% | 12/5/14 | 1,200 | 1,200 |
| Franklin County OH Hospital Revenue | | | | |
| (Nationwide Children’s Hospital Project) VRDO | 0.040% | 12/5/14 | 14,000 | 14,000 |
| Franklin County OH Hospital Revenue | | | | |
| (Nationwide Hospital) VRDO | 0.030% | 12/5/14 | 9,470 | 9,470 |
| 3 Franklin County OH Revenue | | | | |
| (Trinity Health Credit Group) PUT | 0.110% | 6/26/15 | 5,800 | 5,800 |
| Hamilton County OH Health Care Facilities | | | | |
| Revenue (The Children’s Home of Cincinnati) | | | | |
| VRDO | 0.040% | 12/5/14 LOC | 3,065 | 3,065 |
| 1 Hamilton County OH Hospital Facilities Revenue | | | | |
| (Cincinnati Children’s Hospital Medical Center) | | | | |
| TOB VRDO | 0.050% | 12/5/14 | 5,625 | 5,625 |
| Hamilton County OH Sewer System Revenue | 5.000% | 12/1/15 (Prere.) | 4,000 | 4,192 |
15
| | | | |
| Ohio Tax-Exempt Money Market Fund | | | | |
| |
| |
| |
| | | | Face | Market |
| | | Maturity | Amount | Value• |
| | Coupon | Date | ($000) | ($000) |
| 1 Hamilton County OH Sewer System Revenue | | | | |
| TOB VRDO | 0.050% | 12/5/14 | 8,500 | 8,500 |
| Huber Heights OH BAN | 1.000% | 6/3/15 | 3,000 | 3,011 |
| Huber Heights OH BAN | 1.125% | 6/3/15 | 1,750 | 1,757 |
| Independence OH BAN | 1.000% | 4/15/15 | 1,565 | 1,569 |
| Kent OH BAN | 1.000% | 9/2/15 | 2,355 | 2,367 |
| Lakewood OH BAN | 1.000% | 4/10/15 | 2,850 | 2,858 |
| 1 Lakewood OH City School District GO TOB VRDO | 0.060% | 12/5/14 | 3,825 | 3,825 |
| 1 Lorain County OH Hospital Facilities Revenue | | | | |
| (Catholic Healthcare Partners) TOB VRDO | 0.140% | 12/5/14 | 10,000 | 10,000 |
| Lorain County OH Port Authority Educational | | | | |
| Facilities Revenue (St. Ignatius High School | | | | |
| Project) VRDO | 0.060% | 12/5/14 LOC | 1,030 | 1,030 |
| Lucas County OH BAN | 1.000% | 7/14/15 | 2,482 | 2,495 |
| Marysville OH BAN | 1.250% | 5/28/15 | 1,850 | 1,858 |
| Mason OH City School District BAN | 1.250% | 1/28/15 | 3,000 | 3,005 |
| Middletown OH Hospital Facilities Revenue | | | | |
| (Atrium Medical Center) VRDO | 0.030% | 12/5/14 LOC | 12,625 | 12,625 |
| 1 Montgomery County OH Revenue (Miami Valley | | | | |
| Hospital) TOB VRDO | 0.050% | 12/5/14 | 7,500 | 7,500 |
| Montgomery County OH Revenue (Miami Valley | | | | |
| Hospital) VRDO | 0.030% | 12/1/14 | 10,290 | 10,290 |
| 1 Northeast OH Regional Sewer District Revenue | | | | |
| (Wastewater Revenue Improvement) TOB VRDO | 0.040% | 12/5/14 | 6,800 | 6,800 |
| 1 Nuveen Ohio Quality Income Municipal Fund | | | | |
| VRDP VRDO | 0.130% | 12/5/14 LOC | 21,000 | 21,000 |
| Ohio Air Quality Development Authority Pollution | | | | |
| Control Revenue (FirstEnergy Nuclear | | | | |
| Generation Corp. Project) VRDO | 0.060% | 12/1/14 LOC | 985 | 985 |
| 1 Ohio Air Quality Development Authority Revenue | | | | |
| (Dayton Power & Light Co. Project) TOB VRDO | 0.100% | 12/5/14 (13) | 13,320 | 13,320 |
| Ohio Air Quality Development Authority Revenue | | | | |
| (Dayton Power & Light Co. Project) VRDO | 0.040% | 12/5/14 LOC | 6,500 | 6,500 |
| Ohio Air Quality Development Authority Revenue | | | | |
| (Ohio Valley Electric Corp. Project) VRDO | 0.040% | 12/5/14 LOC | 6,000 | 6,000 |
| Ohio Air Quality Development Authority Revenue | | | | |
| (Ohio Valley Electric Corp. Project) VRDO | 0.040% | 12/5/14 LOC | 10,000 | 10,000 |
| Ohio Air Quality Development Authority Revenue | | | | |
| (Ohio Valley Electric Corp. Project) VRDO | 0.040% | 12/5/14 LOC | 5,000 | 5,000 |
| Ohio Common Schools GO VRDO | 0.040% | 12/5/14 | 1,810 | 1,810 |
| Ohio Common Schools GO VRDO | 0.040% | 12/5/14 | 1,135 | 1,135 |
| 1 Ohio GO TOB VRDO | 0.050% | 12/5/14 | 9,285 | 9,285 |
| Ohio GO VRDO | 0.040% | 12/5/14 | 985 | 985 |
| Ohio GO VRDO | 0.040% | 12/5/14 | 7,990 | 7,990 |
| Ohio GO VRDO | 0.040% | 12/5/14 | 6,800 | 6,800 |
| Ohio Higher Educational Facility Commission | | | | |
| Revenue (Case Western Reserve University | | | | |
| Project) CP | 0.110% | 2/19/15 | 7,000 | 7,000 |
| Ohio Higher Educational Facility Commission | | | | |
| Revenue (Case Western Reserve University | | | | |
| Project) CP | 0.080% | 2/20/15 | 7,000 | 7,000 |
| Ohio Higher Educational Facility Commission | | | | |
| Revenue (Case Western Reserve University | | | | |
| Project) VRDO | 0.050% | 12/1/14 | 2,310 | 2,310 |
16
| | | | |
| Ohio Tax-Exempt Money Market Fund | | | | |
| |
| |
| |
| | | | Face | Market |
| | | Maturity | Amount | Value• |
| | Coupon | Date | ($000) | ($000) |
| Ohio Higher Educational Facility Commission | | | | |
| Revenue (Case Western Reserve University | | | | |
| Project) VRDO | 0.050% | 12/1/14 | 200 | 200 |
| Ohio Higher Educational Facility Commission | | | | |
| Revenue (Case Western Reserve University | | | | |
| Project) VRDO | 0.050% | 12/1/14 | 2,900 | 2,900 |
| Ohio Higher Educational Facility Commission | | | | |
| Revenue (Cleveland Clinic Health System | | | | |
| Obligated Group) VRDO | 0.040% | 12/1/14 | 10,750 | 10,750 |
| Ohio Higher Educational Facility Commission | | | | |
| Revenue (Cleveland Clinic Health System | | | | |
| Obligated Group) VRDO | 0.040% | 12/1/14 | 5,200 | 5,200 |
| Ohio Higher Educational Facility Commission | | | | |
| Revenue (Cleveland Clinic Health System | | | | |
| Obligated Group) VRDO | 0.040% | 12/1/14 | 2,300 | 2,300 |
| Ohio Higher Educational Facility Commission | | | | |
| Revenue (Cleveland Clinic Health System | | | | |
| Obligated Group) VRDO | 0.040% | 12/1/14 | 5,500 | 5,500 |
| Ohio Higher Educational Facility Commission | | | | |
| Revenue (Marietta College Project) VRDO | 0.050% | 12/5/14 LOC | 2,360 | 2,360 |
| 1 Ohio Higher Educational Facility Commission | | | | |
| Revenue (University Hospitals Health | | | | |
| System Inc.) TOB VRDO | 0.090% | 12/5/14 (13) | 5,000 | 5,000 |
| Ohio Housing Finance Agency Residential | | | | |
| Mortgage Revenue VRDO | 0.040% | 12/5/14 | 7,835 | 7,835 |
| Ohio Housing Finance Agency Residential | | | | |
| Mortgage Revenue VRDO | 0.040% | 12/5/14 | 8,500 | 8,500 |
| Ohio Housing Finance Agency Residential | | | | |
| Mortgage Revenue VRDO | 0.050% | 12/5/14 | 2,500 | 2,500 |
| Ohio Housing Finance Agency Residential | | | | |
| Mortgage Revenue VRDO | 0.060% | 12/5/14 | 10,775 | 10,775 |
| Ohio Housing Finance Agency Residential | | | | |
| Mortgage Revenue VRDO | 0.070% | 12/5/14 | 4,320 | 4,320 |
| Ohio Housing Finance Agency Residential | | | | |
| Mortgage Revenue VRDO | 0.070% | 12/5/14 | 2,310 | 2,310 |
| Ohio Infrastructure Improvement GO VRDO | 0.040% | 12/5/14 | 6,635 | 6,635 |
| Ohio State University General Receipts Revenue | 4.125% | 6/1/15 (Prere.) | 8,520 | 8,688 |
| Ohio State University General Receipts Revenue | | | | |
| CP | 0.100% | 12/4/14 | 7,790 | 7,790 |
| Ohio State University General Receipts Revenue | | | | |
| CP | 0.100% | 2/3/15 | 8,000 | 8,000 |
| Ohio State University General Receipts Revenue | | | | |
| CP | 0.100% | 2/5/15 | 8,200 | 8,200 |
| Ohio State University General Receipts Revenue | | | | |
| VRDO | 0.040% | 12/5/14 | 5,000 | 5,000 |
| Ohio Turnpike Commission Turnpike Revenue | 5.500% | 2/15/15 | 4,500 | 4,550 |
| Ohio Water Development Authority Drinking | | | | |
| Water Assistance Fund Revenue | 5.000% | 12/1/15 | 2,000 | 2,096 |
| Olentangy OH Local School District GO | 5.000% | 12/1/14 | 2,720 | 2,720 |
| 1 South-Western City OH School District GO TOB | | | | |
| VRDO | 0.040% | 12/5/14 | 8,275 | 8,275 |
| Toledo-Lucas County OH Port Authority Airport | | | | |
| Development Revenue (FlightSafety | | | | |
| International Inc.) VRDO | 0.040% | 12/5/14 | 11,450 | 11,450 |
17
| | | | |
| Ohio Tax-Exempt Money Market Fund | | | | |
| |
| |
| | | | Face | Market |
| | | Maturity | Amount | Value• |
| | Coupon | Date | ($000) | ($000) |
| University of Cincinnati Ohio General Receipts | | | | |
| Revenue | 4.000% | 6/1/15 | 1,000 | 1,019 |
| | | | | 564,611 |
| Total Tax-Exempt Municipal Bonds (Cost $564,611) | | | 564,611 |
| Other Assets and Liabilities (-1.4%) | | | | |
| Other Assets | | | | 4,365 |
| Liabilities | | | | (12,132) |
| | | | | (7,767) |
| Net Assets (100%) | | | | |
| Applicable to 556,690,025 outstanding $.001 par value shares of | | | |
| beneficial interest (unlimited authorization) | | | | 556,844 |
| Net Asset Value Per Share | | | | $1.00 |
| |
| |
| At November 30, 2014, net assets consisted of: | | | | |
| | | | | Amount |
| | | | | ($000) |
| Paid-in Capital | | | | 556,850 |
| Undistributed Net Investment Income | | | | — |
| Accumulated Net Realized Losses | | | | (6) |
| Net Assets | | | | 556,844 |
• See Note A in Notes to Financial Statements.
1 Security exempt from registration under Rule 144A of the Securities Act of 1933. Such securities may be sold in transactions exempt from
registration, normally to qualified institutional buyers. At November 30, 2014, the aggregate value of these securities was $161,365,000,
representing 29.0% of net assets.
2 Security purchased on a when-issued or delayed-delivery basis for which the fund has not taken delivery as of November 30, 2014.
3 Adjustable-rate security.
A key to abbreviations and other references follows the Statement of Net Assets.
See accompanying Notes, which are an integral part of the Financial Statements.
18
Ohio Tax-Exempt Money Market Fund
Key to Abbreviations
ARS—Auction Rate Security.
BAN—Bond Anticipation Note.
COP—Certificate of Participation.
CP—Commercial Paper.
FR—Floating Rate.
GAN—Grant Anticipation Note.
GO—General Obligation Bond.
PILOT—Payments in Lieu of Taxes.
PUT—Put Option Obligation.
RAN—Revenue Anticipation Note.
TAN—Tax Anticipation Note.
TOB—Tender Option Bond.
TRAN—Tax Revenue Anticipation Note.
VRDO—Variable Rate Demand Obligation.
VRDP—Variable Rate Demand Preferred.
(ETM)—Escrowed to Maturity.
(Prere.)—Prerefunded.
Scheduled principal and interest payments are guaranteed by:
(1) MBIA (Municipal Bond Investors Assurance).
(2) AMBAC (Ambac Assurance Corporation).
(3) FGIC (Financial Guaranty Insurance Company).
(4) AGM (Assured Guaranty Municipal Corporation).
(5) BIGI (Bond Investors Guaranty Insurance).
(6) Connie Lee Inc.
(7) FHA (Federal Housing Authority).
(8) CapMAC (Capital Markets Assurance Corporation).
(9) American Capital Access Financial Guaranty Corporation.
(10) XL Capital Assurance Inc.
(11) CIFG (CDC IXIS Financial Guaranty).
(12) AGC (Assured Guaranty Corporation).
(13) BHAC (Berkshire Hathaway Assurance Corporation).
(14) NPFG (National Public Finance Guarantee Corporation).
(15) BAM (Build America Mutual Assurance Company).
(16) MAC (Municipal Assurance Corporation).
(17) RAA (Radian Asset Assurance Inc.).
The insurance does not guarantee the market value of the municipal bonds.
LOC—Scheduled principal and interest payments are guaranteed by bank letter of credit.
19
Ohio Tax-Exempt Money Market Fund
Statement of Operations
| |
| | Year Ended |
| | November 30, 2014 |
| | ($000) |
| Investment Income | |
| Income | |
| Interest | 550 |
| Total Income | 550 |
| Expenses | |
| The Vanguard Group—Note B | |
| Investment Advisory Services | 115 |
| Management and Administrative | 624 |
| Marketing and Distribution | 146 |
| Custodian Fees | 13 |
| Auditing Fees | 27 |
| Shareholders’ Reports | 6 |
| Total Expenses | 931 |
| Expense Reduction—Note B | (439) |
| Net Expenses | 492 |
| Net Investment Income | 58 |
| Realized Net Gain (Loss) on Investment Securities Sold | — |
| Net Increase (Decrease) in Net Assets Resulting from Operations | 58 |
See accompanying Notes, which are an integral part of the Financial Statements.
20
Ohio Tax-Exempt Money Market Fund
Statement of Changes in Net Assets
| | |
| | Year Ended November 30, |
| | 2014 | 2013 |
| | ($000) | ($000) |
| Increase (Decrease) in Net Assets | | |
| Operations | | |
| Net Investment Income | 58 | 90 |
| Realized Net Gain (Loss) | — | — |
| Net Increase (Decrease) in Net Assets Resulting from Operations | 58 | 90 |
| Distributions | | |
| Net Investment Income | (58) | (90) |
| Realized Capital Gain | — | — |
| Total Distributions | (58) | (90) |
| Capital Share Transactions (at $1.00 per share) | | |
| Issued | 301,581 | 358,609 |
| Issued in Lieu of Cash Distributions | 55 | 84 |
| Redeemed | (346,905) | (365,619) |
| Net Increase (Decrease) from Capital Share Transactions | (45,269) | (6,926) |
| Total Increase (Decrease) | (45,269) | (6,926) |
| Net Assets | | |
| Beginning of Period | 602,113 | 609,039 |
| End of Period | 556,844 | 602,113 |
See accompanying Notes, which are an integral part of the Financial Statements.
21
Ohio Tax-Exempt Money Market Fund
Financial Highlights
| | | | | |
| For a Share Outstanding | Year Ended November 30, |
| Throughout Each Period | 2014 | 2013 | 2012 | 2011 | 2010 |
| Net Asset Value, Beginning of Period | $1.00 | $1.00 | $1.00 | $1.00 | $1.00 |
| Investment Operations | | | | | |
| Net Investment Income | .0001 | .0002 | .0005 | .001 | .002 |
| Net Realized and Unrealized Gain (Loss) | | | | | |
| on Investments | — | — | — | — | — |
| Total from Investment Operations | .0001 | .0002 | .0005 | .001 | .002 |
| Distributions | | | | | |
| Dividends from Net Investment Income | (.0001) | (.0002) | (.0005) | (.001) | (.002) |
| Distributions from Realized Capital Gains | — | — | — | — | — |
| Total Distributions | (.0001) | (.0002) | (.0005) | (.001) | (.002) |
| Net Asset Value, End of Period | $1.00 | $1.00 | $1.00 | $1.00 | $1.00 |
| |
| Total Return1 | 0.01% | 0.02% | 0.05% | 0.09% | 0.15% |
| |
| Ratios/Supplemental Data | | | | | |
| Net Assets, End of Period (Millions) | $557 | $602 | $609 | $686 | $786 |
| Ratio of Total Expenses to Average Net Assets | 0.08%2 | 0.12%2 | 0.16%2 | 0.17% | 0.17% |
| Ratio of Net Investment Income to | | | | | |
| Average Net Assets | 0.01% | 0.02% | 0.05% | 0.09% | 0.15% |
1 Total returns do not include account service fees that may have applied in the periods shown. Fund prospectuses provide information aboutany applicable account service fees.2 The ratio of total expenses to average net assets before an expense reduction was 0.16% for 2014, 0.16% for 2013, and 0.16% for 2012.See Note B in Notes to Financial Statements.See accompanying Notes, which are an integral part of the Financial Statements.
22
Ohio Tax-Exempt Money Market Fund
Notes to Financial Statements
Vanguard Ohio Tax-Exempt Money Market Fund is registered under the Investment Company Act of 1940 as an open-end investment company, or mutual fund. The fund invests in debt instruments of municipal issuers whose ability to meet their obligations may be affected by economic and political developments in the state.
A. The following significant accounting policies conform to generally accepted accounting principles for U.S. investment companies. The fund consistently follows such policies in preparing its financial statements.
1. Security Valuation: Securities are valued as of the close of trading on the New York Stock Exchange (generally 4 p.m., Eastern time) on the valuation date. Securities are valued at amortized cost, which approximates market value.
2. Federal Income Taxes: The fund intends to continue to qualify as a regulated investment company and distribute all of its income. Management has analyzed the fund’s tax positions taken for all open federal income tax years (November 30, 2011–2014), and has concluded that no provision for federal income tax is required in the fund’s financial statements.
3. Distributions: Distributions from net investment income are declared daily and paid on the first business day of the following month.
4. Credit Facility: The fund and certain other funds managed by The Vanguard Group participate in a $2.89 billion committed credit facility provided by a syndicate of lenders pursuant to a credit agreement that may be renewed annually; each fund is individually liable for its borrowings, if any, under the credit facility. Borrowings may be utilized for temporary and emergency purposes, and are subject to the fund’s regulatory and contractual borrowing restrictions. The participating funds are charged administrative fees and an annual commitment fee of 0.06% of the undrawn amount of the facility; these fees are allocated to the funds based on a method approved by the fund’s board of trustees and included in Management and Administrative expenses on the fund’s Statement of Operations. Any borrowings under this facility bear interest at a rate equal to the higher of the federal funds rate or LIBOR reference rate plus an agreed-upon spread.
The fund had no borrowings outstanding at November 30, 2014, or at any time during the period then ended.
5. Other: Interest income is accrued daily. Premiums and discounts on debt securities purchased are amortized and accreted, respectively, to interest income over the lives of the respective securities. Security transactions are accounted for on the date securities are bought or sold. Costs used to determine realized gains (losses) on the sale of investment securities are those of the specific securities sold.
B. The Vanguard Group furnishes at cost investment advisory, corporate management, administrative, marketing, and distribution services. The costs of such services are allocated to the fund based on methods approved by the board of trustees. The fund has committed to invest up to 0.40% of its net assets in Vanguard. At November 30, 2014, the fund had contributed capital of $55,000 to Vanguard (included in Other Assets), representing 0.01% of the fund’s net assets and 0.02% of Vanguard’s capitalization. The fund’s trustees and officers are also directors and officers of Vanguard. Vanguard and the board of trustees have agreed to temporarily limit certain net operating expenses in excess of the fund’s daily yield so as to maintain a zero or positive yield for the fund. Vanguard and the board of trustees may terminate the temporary expense limitation at any time. For the year ended November 30, 2014, Vanguard’s expenses were reduced by $439,000 (an effective annual rate of 0.08% of the fund’s average net assets).
23
Ohio Tax-Exempt Money Market Fund
C. Various inputs may be used to determine the value of the fund’s investments. These inputs are summarized in three broad levels for financial statement purposes. The inputs or methodologies used to value securities are not necessarily an indication of the risk associated with investing in those securities.
Level 1—Quoted prices in active markets for identical securities.
Level 2—Other significant observable inputs (including quoted prices for similar securities, interest rates, prepayment speeds, credit risk, etc.).
Level 3—Significant unobservable inputs (including the fund’s own assumptions used to determine the fair value of investments).
At November 30, 2014, 100% of the market value of the fund’s investments was determined using amortized cost, in accordance with rules under the Investment Company Act of 1940. Amortized cost approximates the current fair value of a security, but since the value is not obtained from a quoted price in an active market, securities valued at amortized cost are considered to be valued using Level 2 inputs.
D. Management has determined that no material events or transactions occurred subsequent to November 30, 2014, that would require recognition or disclosure in these financial statements.
24
Ohio Long-Term Tax-Exempt Fund
Fund Profile
As of November 30, 2014
| | | |
| Financial Attributes | | |
| |
| | | Barclays | |
| | | OH | Barclays |
| | | Muni | Municipal |
| | | Bond | Bond |
| | Fund | Index | Index |
| Number of Bonds | 300 | 1,341 | 46,044 |
| Yield to Maturity | | | |
| (before expenses) | 2.4% | 2.2% | 2.1% |
| Average Coupon | 4.8% | 4.9% | 4.8% |
| Average Duration | 6.2 years | 7.1 years | 6.5 years |
| Average Stated | | | |
| Maturity | 15.5 years 13.0 years | 13.4 years |
| Ticker Symbol | VOHIX | — | — |
| Expense Ratio1 | 0.16% | — | — |
| 30-Day SEC Yield | 2.33% | — | — |
| Short-Term | | | |
| Reserves | 5.0% | — | — |
| | |
| Volatility Measures | | |
| | Barclays OH | Barclays |
| | Muni Bond | Municipal |
| | Index | Bond Index |
| R-Squared | 0.99 | 0.98 |
| Beta | 1.23 | 1.18 |
| These measures show the degree and timing of the fund’s fluctuations compared with the indexes over 36 months. |
|
| |
| Distribution by Stated Maturity | |
| (% of portfolio) | |
| Under 1 Year | 4.8% |
| 1 - 3 Years | 3.1 |
| 3 - 5 Years | 3.4 |
| 5 - 10 Years | 13.6 |
| 10 - 20 Years | 42.7 |
| 20 - 30 Years | 30.5 |
| Over 30 Years | 1.9 |
| |
| Distribution by Credit Quality (% of portfolio) |
| AAA | 8.7% |
| AA | 57.9 |
| A | 27.7 |
| BBB | 5.6 |
| Not Rated | 0.1 |
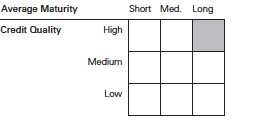
Credit-quality ratings are from Moody's and S&P. The higher ratingfor each issue is shown. "Not Rated" is used to classify securitiesfor which a rating is not available. For more information aboutthese ratings, see the Glossary entry for Credit Quality.Investment Focus
1 The expense ratio shown is from the prospectus dated March 27, 2014, and represents estimated costs for the current fiscal year. For the
fiscal year ended November 30, 2014, the expense ratio was 0.16%.
25
Ohio Long-Term Tax-Exempt Fund
Performance Summary
All of the returns in this report represent past performance, which is not a guarantee of future results that may be achieved by the fund. (Current performance may be lower or higher than the performance data cited. For performance data current to the most recent month-end, visit our website at vanguard.com/performance.) Note, too, that both investment returns and principal value can fluctuate widely, so an investor’s shares, when sold, could be worth more or less than their original cost. The returns shown do not reflect taxes that a shareholder would pay on fund distributions or on the sale of fund shares.
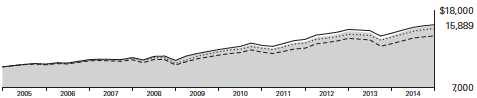
Cumulative Performance: November 30, 2004, Through November 30, 2014
Initial Investment of $10,000
| | | | | |
| | | Average Annual Total Returns | |
| | | Periods Ended November 30, 2014 | |
| | | | | | Final Value |
| | | One | Five | Ten | of a $10,000 |
| | | Year | Years | Years | Investment |
| | Ohio Long-Term Tax-Exempt Fund | 10.19% | 5.22% | 4.74% | $15,889 |
| •••••••• | Barclays OH Municipal Bond Index | 8.60 | 4.95 | 4.45 | 15,448 |
| |
| – – – – | Ohio Municipal Debt Funds Average | 8.41 | 4.30 | 3.71 | 14,398 |
| | Barclays Municipal Bond Index | 8.23 | 5.12 | 4.81 | 15,999 |
| Ohio Municipal Debt Funds Average: Derived from data provided by Lipper, a Thomson Reuters Company. |
See Financial Highlights for dividend and capital gains information.
26
| | | | |
| Ohio Long-Term Tax-Exempt Fund | | | | |
| |
| |
| |
| Fiscal-Year Total Returns (%): November 30, 2004, Through November 30, 2014 | |
| | | | | Barclays OH |
| | | | | Muni Bond |
| | | | | Index |
| Fiscal Year | Income Returns | Capital Returns | Total Returns | Total Returns |
| 2005 | 4.36% | -1.16% | 3.20% | 3.56% |
| 2006 | 4.53 | 1.60 | 6.13 | 5.73 |
| 2007 | 4.32 | -1.61 | 2.71 | 2.64 |
| 2008 | 4.13 | -7.74 | -3.61 | -6.73 |
| 2009 | 4.76 | 8.85 | 13.61 | 15.73 |
| 2010 | 4.14 | -0.08 | 4.06 | 4.20 |
| 2011 | 4.20 | 1.61 | 5.81 | 5.84 |
| 2012 | 3.88 | 7.20 | 11.08 | 9.28 |
| 2013 | 3.48 | -7.76 | -4.28 | -2.71 |
| 2014 | 3.89 | 6.30 | 10.19 | 8.60 |
Average Annual Total Returns: Periods Ended September 30, 2014
This table presents returns through the latest calendar quarter—rather than through the end of the fiscal period.
Securities and Exchange Commission rules require that we provide this information.
| | | | | | |
| | | | Ten Years |
| | Inception Date | One Year | Five Years | Income | Capital | Total |
| Ohio Long-Term | | | | | | |
| Tax-Exempt Fund | 6/18/1990 | 9.75% | 4.70% | 4.18% | 0.40% | 4.58% |
27
Ohio Long-Term Tax-Exempt Fund
Financial Statements
Statement of Net Assets
As of November 30, 2014
The fund reports a complete list of its holdings in regulatory filings four times in each fiscal year, at the quarter-ends. For the second and fourth fiscal quarters, the lists appear in the fund’s semiannual and annual reports to shareholders. For the first and third fiscal quarters, the fund files the lists with the Securities and Exchange Commission on Form N-Q. Shareholders can look up the fund’s Forms N-Q on the SEC’s website at sec.gov. Forms N-Q may also be reviewed and copied at the SEC’s Public Reference Room (see the back cover of this report for further information).
| | | | |
| | | | Face | Market |
| | | Maturity | Amount | Value• |
| | Coupon | Date | ($000) | ($000) |
| Tax-Exempt Municipal Bonds (100.0%) | | | | |
| Ohio (99.2%) | | | | |
| Akron OH Bath & Copley Joint Township Hospital | | | | |
| District Revenue (Children’s Hospital Medical | | | | |
| Center of Akron) | 5.000% | 11/15/24 | 920 | 1,062 |
| Akron OH Bath & Copley Joint Township Hospital | | | | |
| District Revenue (Children’s Hospital Medical | | | | |
| Center of Akron) | 5.000% | 11/15/38 | 5,000 | 5,446 |
| Akron OH Bath & Copley Joint Township Hospital | | | | |
| District Revenue (Children’s Hospital Medical | | | | |
| Center of Akron) | 5.000% | 11/15/42 | 2,780 | 3,012 |
| Akron OH Income Tax Revenue | | | | |
| (Community Learning Centers) | 5.000% | 12/1/28 | 4,000 | 4,622 |
| Akron OH Income Tax Revenue | | | | |
| (Community Learning Centers) | 5.000% | 12/1/33 | 1,500 | 1,700 |
| Allen County OH Hospital Facilities Revenue | | | | |
| (Catholic Healthcare Partners) | 5.250% | 9/1/27 | 4,000 | 4,568 |
| Allen County OH Hospital Facilities Revenue | | | | |
| (Catholic Healthcare Partners) | 5.000% | 5/1/33 | 2,000 | 2,215 |
| Allen County OH Hospital Facilities Revenue | | | | |
| (Catholic Healthcare Partners) | 5.000% | 6/1/38 | 8,000 | 8,764 |
| Allen County OH Hospital Facilities Revenue | | | | |
| (Catholic Healthcare Partners) | 5.000% | 5/1/42 | 5,885 | 6,417 |
| Allen County OH Hospital Facilities Revenue | | | | |
| (Catholic Healthcare Partners) VRDO | 0.060% | 12/1/14 LOC | 4,130 | 4,130 |
| American Municipal Power Ohio Inc. Revenue | | | | |
| (Fremont Energy Center Project) | 5.000% | 2/15/24 | 3,500 | 4,042 |
| American Municipal Power Ohio Inc. Revenue | | | | |
| (Fremont Energy Center Project) | 5.000% | 2/15/31 | 3,000 | 3,325 |
| American Municipal Power Ohio Inc. Revenue | | | | |
| (Fremont Energy Center Project) | 5.000% | 2/15/37 | 8,500 | 9,329 |
| American Municipal Power Ohio Inc. Revenue | | | | |
| (Fremont Energy Center Project) | 5.000% | 2/15/42 | 10,755 | 11,718 |
| American Municipal Power Ohio Inc. Revenue | | | | |
| (Hydroelectric Projects) | 5.000% | 2/15/23 | 4,000 | 4,519 |
| American Municipal Power Ohio Inc. Revenue | | | | |
| (Hydroelectric Projects) | 5.000% | 2/15/24 | 1,215 | 1,365 |
| American Municipal Power Ohio Inc. Revenue | | | | |
| (Prairie State Energy Campus Project) | 5.250% | 2/15/22 | 1,135 | 1,283 |
28
| | | | |
| Ohio Long-Term Tax-Exempt Fund | | | | |
| |
| |
| |
| | | | Face | Market |
| | | Maturity | Amount | Value• |
| | Coupon | Date | ($000) | ($000) |
| American Municipal Power Ohio Inc. Revenue | | | | |
| (Prairie State Energy Campus Project) | 5.250% | 2/15/23 | 2,000 | 2,255 |
| American Municipal Power Ohio Inc. Revenue | | | | |
| (Prairie State Energy Campus Project) | 5.250% | 2/15/27 | 1,000 | 1,118 |
| American Municipal Power Ohio Inc. Revenue | | | | |
| (Prairie State Energy Campus Project) | 5.750% | 2/15/39 (12) | 4,500 | 5,073 |
| Apollo Career Center Joint Vocational School | | | | |
| District Ohio GO | 5.250% | 12/1/31 | 1,015 | 1,169 |
| Apollo Career Center Joint Vocational School | | | | |
| District Ohio GO | 5.000% | 12/1/38 | 4,700 | 5,234 |
| Bowling Green State University Ohio Student | | | | |
| Housing Revenue (CFP I LLC - State University | | | | |
| Project) | 5.750% | 6/1/31 | 2,000 | 2,160 |
| Bowling Green State University Ohio Student | | | | |
| Housing Revenue (CFP I LLC - State University | | | | |
| Project) | 6.000% | 6/1/45 | 2,000 | 2,151 |
| Butler County OH Hospital Facilities Revenue | | | | |
| (Cincinnati Children’s Hospital Medical Center | | | | |
| Project) | 5.000% | 5/15/31 (14) | 4,000 | 4,127 |
| Butler County OH Hospital Facilities Revenue | | | | |
| (Kettering Health Network) | 6.375% | 4/1/36 | 1,350 | 1,581 |
| Butler County OH Hospital Facilities Revenue | | | | |
| (Kettering Health Network) | 5.625% | 4/1/41 | 2,000 | 2,219 |
| Butler County OH Hospital Facilities Revenue | | | | |
| (UC Health) | 5.500% | 11/1/22 | 2,000 | 2,311 |
| Butler County OH Hospital Facilities Revenue | | | | |
| (UC Health) | 5.250% | 11/1/29 | 4,000 | 4,448 |
| Butler County OH Hospital Facilities Revenue | | | | |
| (UC Health) | 5.500% | 11/1/40 | 4,160 | 4,604 |
| Butler County OH Hospital Facilities Revenue | | | | |
| (UC Health) | 5.750% | 11/1/40 | 1,305 | 1,461 |
| Central Ohio Solid Waste Authority GO | 5.000% | 12/1/19 (ETM) | 115 | 136 |
| Central Ohio Solid Waste Authority GO | 5.000% | 12/1/19 | 1,195 | 1,405 |
| Cincinnati OH City School District COP | 5.000% | 12/15/16 (Prere.) | 1,190 | 1,301 |
| Cincinnati OH City School District COP | 5.000% | 12/15/16 (Prere.) | 1,470 | 1,607 |
| Cincinnati OH City School District COP | 5.000% | 12/15/23 (4) | 430 | 465 |
| Cincinnati OH City School District COP | 5.000% | 12/15/32 (4) | 530 | 567 |
| Cincinnati OH City School District GO | 5.250% | 6/1/27 | 5,550 | 6,413 |
| Cincinnati OH City School District GO | 5.250% | 12/1/30 (14) | 4,385 | 5,542 |
| Cincinnati OH City School District GO | 5.250% | 12/1/31 (14) | 3,000 | 3,797 |
| Cincinnati OH GO | 5.000% | 12/1/18 | 1,000 | 1,152 |
| Cincinnati OH GO | 5.000% | 12/1/24 | 1,090 | 1,255 |
| Cincinnati OH GO | 5.000% | 12/1/26 | 2,605 | 2,985 |
| Cincinnati OH Water System Revenue | 5.000% | 12/1/31 | 1,000 | 1,166 |
| Cincinnati OH Water System Revenue | 5.000% | 12/1/31 | 1,585 | 1,848 |
| Cincinnati OH Water System Revenue | 5.000% | 12/1/32 | 1,000 | 1,167 |
| Cincinnati OH Water System Revenue | 5.000% | 12/1/36 | 5,025 | 5,828 |
| Cincinnati OH Water System Revenue | 5.000% | 12/1/37 | 2,000 | 2,296 |
| Cleveland OH Airport System Revenue | 5.000% | 1/1/28 | 2,530 | 2,765 |
| Cleveland OH Airport System Revenue | 5.000% | 1/1/30 | 2,000 | 2,167 |
| Cleveland OH Airport System Revenue | 5.000% | 1/1/31 (4) | 7,000 | 7,422 |
| Cleveland OH Income Tax Revenue | 5.000% | 10/1/29 (12) | 7,180 | 7,881 |
| Cleveland OH Municipal School District GO | 5.000% | 12/1/25 | 1,845 | 2,138 |
| Cleveland OH Public Power System Revenue | 5.000% | 11/15/28 (14) | 1,250 | 1,381 |
29
| | | | |
| Ohio Long-Term Tax-Exempt Fund | | | | |
| |
| |
| |
| | | | Face | Market |
| | | Maturity | Amount | Value• |
| | Coupon | Date | ($000) | ($000) |
| Cleveland OH Public Power System Revenue | 0.000% | 11/15/33 (14) | 6,895 | 3,083 |
| Cleveland OH Water Revenue | 5.000% | 1/1/27 | 2,000 | 2,322 |
| Cleveland OH Water Works Revenue | 5.500% | 1/1/21 (14) | 9,590 | 11,053 |
| Cleveland State University Ohio General Receipts | | | | |
| Revenue | 5.000% | 6/1/25 | 2,000 | 2,313 |
| Cleveland State University Ohio General Receipts | | | | |
| Revenue | 5.000% | 6/1/26 | 2,700 | 3,104 |
| Cleveland State University Ohio General Receipts | | | | |
| Revenue | 5.000% | 6/1/27 | 2,000 | 2,285 |
| Cleveland State University Ohio General Receipts | | | | |
| Revenue | 5.000% | 6/1/30 (14) | 3,000 | 3,236 |
| Cleveland State University Ohio General Receipts | | | | |
| Revenue | 5.000% | 6/1/37 | 2,815 | 3,105 |
| 1 Cleveland-Cuyahoga County OH Port Authority | | | | |
| Revenue (Euclid Avenue Development Corp. | | | | |
| Project) | 5.000% | 8/1/39 | 3,000 | 3,286 |
| Columbus OH City School District GO | 4.500% | 12/1/29 | 3,000 | 3,330 |
| Columbus OH City School District School | | | | |
| Facilities Construction & Improvement GO | 5.000% | 6/1/19 (Prere.) | 1,545 | 1,806 |
| Columbus OH GO | 5.000% | 2/15/21 | 1,905 | 2,288 |
| Columbus OH GO | 5.000% | 2/15/22 | 1,900 | 2,307 |
| Columbus OH GO | 5.000% | 2/15/23 | 1,475 | 1,803 |
| Columbus OH GO | 5.000% | 2/15/24 | 1,475 | 1,818 |
| Columbus OH GO | 5.000% | 7/1/24 | 1,000 | 1,198 |
| Columbus OH GO | 5.000% | 2/15/25 | 1,470 | 1,808 |
| Columbus OH GO | 5.000% | 2/15/25 | 1,800 | 2,152 |
| Columbus OH GO | 5.000% | 7/1/25 | 1,400 | 1,667 |
| Columbus OH GO | 5.000% | 8/15/25 | 3,450 | 4,269 |
| Columbus OH GO | 5.000% | 8/15/26 | 2,000 | 2,395 |
| Columbus OH GO | 5.000% | 7/1/27 | 2,000 | 2,314 |
| Columbus OH GO | 5.000% | 7/1/30 | 2,500 | 2,945 |
| Columbus OH GO | 5.000% | 7/1/31 | 1,185 | 1,391 |
| Columbus OH GO VRDO | 0.030% | 12/5/14 | 1,015 | 1,015 |
| Columbus OH Metropolitan Library Special | | | | |
| Obligation Revenue | 5.000% | 12/1/24 | 1,320 | 1,536 |
| Columbus OH Metropolitan Library Special | | | | |
| Obligation Revenue | 5.000% | 12/1/25 | 1,000 | 1,164 |
| Columbus OH Metropolitan Library Special | | | | |
| Obligation Revenue | 4.000% | 12/1/37 | 2,000 | 2,057 |
| Columbus OH Sewer Revenue | 5.000% | 12/1/17 (Prere.) | 4,005 | 4,523 |
| 1 Columbus OH Sewer Revenue | 5.000% | 6/1/24 | 3,000 | 3,703 |
| 1 Columbus OH Sewer Revenue | 5.000% | 6/1/31 | 1,000 | 1,185 |
| Cuyahoga County OH (Convention Hotel Project) | | | | |
| COP | 5.000% | 12/1/36 | 2,000 | 2,237 |
| Cuyahoga County OH Economic Development | | | | |
| Revenue (Med Mart/Convention Center Project) | 5.000% | 12/1/24 | 4,000 | 4,597 |
| Fairfield County OH Hospital Facilities Revenue | | | | |
| (Fairfield Medical Center) | 5.000% | 6/15/43 | 4,250 | 4,530 |
| Franklin County OH GO | 5.000% | 12/1/31 | 6,885 | 7,566 |
| Franklin County OH Health Care Facilities | | | | |
| Improvement Revenue (Ohio Presbyterian | | | | |
| Retirement Services Project) | 5.625% | 7/1/26 | 2,800 | 3,040 |
| Franklin County OH Health Care Facilities | | | | |
| Improvement Revenue (OPRS Communities) | 6.125% | 7/1/40 | 4,110 | 4,510 |
30
| | | | |
| Ohio Long-Term Tax-Exempt Fund | | | | |
| |
| |
| |
| | | | Face | Market |
| | | Maturity | Amount | Value• |
| | Coupon | Date | ($000) | ($000) |
| Franklin County OH Hospital Facilities Revenue | | | | |
| (Doctors OhioHealth Corp.) VRDO | 0.050% | 12/5/14 LOC | 2,480 | 2,480 |
| Franklin County OH Hospital Facilities Revenue | | | | |
| (OhioHealth Corp.) | 5.000% | 5/15/31 | 5,000 | 5,702 |
| Franklin County OH Hospital Facilities Revenue | | | | |
| (OhioHealth Corp.) | 5.000% | 11/15/36 | 3,640 | 3,996 |
| Franklin County OH Hospital Improvement | | | | |
| Revenue (Nationwide Children’s Hospital Project) | 4.750% | 11/1/28 | 1,500 | 1,652 |
| Franklin County OH Hospital Improvement | | | | |
| Revenue (Nationwide Children’s Hospital Project) | 5.000% | 11/1/34 | 1,500 | 1,639 |
| Franklin County OH Hospital Improvement | | | | |
| Revenue (Nationwide Children’s Hospital Project) | 5.000% | 11/1/42 | 7,000 | 7,605 |
| Franklin County OH Hospital Revenue (Nationwide | | | | |
| Children’s Hospital Project) VRDO | 0.040% | 12/5/14 | 2,000 | 2,000 |
| Greene County OH Hospital Facilities Revenue | | | | |
| (Kettering Health Network Obligated Group | | | | |
| Project) | 5.375% | 4/1/34 | 2,500 | 2,756 |
| Greene County OH Hospital Facilities Revenue | | | | |
| (Kettering Health Network Obligated Group | | | | |
| Project) | 5.500% | 4/1/39 | 2,500 | 2,760 |
| Greene County OH Sewer System Revenue | 5.000% | 12/1/15 (Prere.) | 4,695 | 4,922 |
| Hamilton County OH Convention Center Facilities | | | | |
| Authority Revenue | 5.250% | 12/1/20 (14) | 1,185 | 1,191 |
| Hamilton County OH Convention Center Facilities | | | | |
| Authority Revenue | 5.250% | 12/1/21 (14) | 1,245 | 1,252 |
| Hamilton County OH Convention Center Facilities | | | | |
| Authority Revenue | 5.250% | 12/1/23 (14) | 1,380 | 1,387 |
| Hamilton County OH Convention Center Facilities | | | | |
| Authority Revenue | 5.250% | 12/1/24 (14) | 185 | 186 |
| Hamilton County OH Economic Development | | | | |
| Revenue (King Highland Community Urban | | | | |
| Redevelopment Corp. - University of Cincinnati | | | | |
| Lessee Project) | 5.250% | 6/1/28 (14) | 3,290 | 3,471 |
| Hamilton County OH Economic Development | | | | |
| Revenue (King Highland Community Urban | | | | |
| Redevelopment Corp. - University of Cincinnati | | | | |
| Lessee Project) | 5.000% | 6/1/33 (14) | 4,000 | 4,192 |
| Hamilton County OH Health Care Facilities | | | | |
| Revenue (Christ Hospital Project) | 5.250% | 6/1/32 | 3,150 | 3,533 |
| Hamilton County OH Health Care Facilities | | | | |
| Revenue (Christ Hospital Project) | 5.000% | 6/1/42 | 5,000 | 5,321 |
| Hamilton County OH Health Care Facilities | | | | |
| Revenue (Christ Hospital Project) | 5.500% | 6/1/42 | 3,000 | 3,306 |
| Hamilton County OH Healthcare Revenue | | | | |
| (Life Enriching Communities) | 5.000% | 1/1/32 | 1,750 | 1,861 |
| Hamilton County OH Healthcare Revenue | | | | |
| (Life Enriching Communities) | 5.000% | 1/1/42 | 2,000 | 2,079 |
| Hamilton County OH Healthcare Revenue | | | | |
| (Life Enriching Communities) | 5.000% | 1/1/46 | 2,000 | 2,073 |
| Hamilton County OH Hospital Facilities Revenue | | | | |
| (Cincinnati Children’s Hospital Medical Center) | 5.000% | 5/15/34 | 1,000 | 1,146 |
| Hamilton County OH Hospital Facilities Revenue | | | | |
| (UC Health) | 5.000% | 2/1/30 | 1,360 | 1,539 |
31
| | | | |
| Ohio Long-Term Tax-Exempt Fund | | | | |
| |
| |
| |
| | | | Face | Market |
| | | Maturity | Amount | Value• |
| | Coupon | Date | ($000) | ($000) |
| Hamilton County OH Hospital Facilities Revenue | | | | |
| (UC Health) | 5.000% | 2/1/44 | 2,500 | 2,720 |
| Hamilton County OH Sales Tax Revenue | 5.000% | 12/1/26 (2) | 5,000 | 5,403 |
| Hamilton County OH Sales Tax Revenue | 5.000% | 12/1/32 | 5,000 | 5,604 |
| Hamilton County OH Sales Tax Revenue | 5.000% | 12/1/32 (4) | 9,700 | 10,357 |
| Hamilton County OH Sewer System Revenue | 5.000% | 12/1/16 (Prere.) | 5,300 | 5,788 |
| Hamilton County OH Sewer System Revenue | 5.000% | 12/1/22 | 1,000 | 1,218 |
| Hamilton County OH Sewer System Revenue | 5.000% | 12/1/32 | 1,525 | 1,803 |
| Hamilton OH City School District GO | 5.000% | 12/1/28 (4) | 5,000 | 5,420 |
| Hilliard OH School District GO | 5.000% | 12/1/15 (Prere.) | 2,895 | 3,035 |
| Huron County OH Hospital Facilities Improvement | | | | |
| Revenue (Fisher-Titus Medical Center) | 5.250% | 12/1/37 | 3,000 | 3,165 |
| JobsOhio Beverage System Statewide Liquor | | | | |
| Profits Revenue | 5.000% | 1/1/20 | 2,550 | 2,986 |
| JobsOhio Beverage System Statewide Liquor | | | | |
| Profits Revenue | 5.000% | 1/1/38 | 22,000 | 24,653 |
| Kent State University OH Revenue | 5.000% | 5/1/37 | 4,185 | 4,630 |
| 2 Lancaster OH Port Authority Gas Supply Revenue | | | | |
| PUT | 0.825% | 5/1/38 | 3,000 | 3,028 |
| Lorain County OH Community College District | | | | |
| General Revenue | 5.000% | 12/1/41 | 4,520 | 4,975 |
| Lorain County OH Hospital Facilities Revenue | | | | |
| (Catholic Healthcare Partners) | 5.000% | 4/1/33 (4) | 4,000 | 4,364 |
| 3 Lorain County OH Hospital Facilities Revenue | | | | |
| (Catholic Healthcare Partners) TOB VRDO | 0.140% | 12/5/14 | 4,995 | 4,995 |
| Lorain County OH Hospital Facilities Revenue | | | | |
| (Kendal At Oberlin) | 5.000% | 11/15/23 | 1,000 | 1,134 |
| Lorain County OH Hospital Facilities Revenue | | | | |
| (Kendal At Oberlin) | 5.000% | 11/15/30 | 2,500 | 2,738 |
| Lucas County OH Hospital Revenue (ProMedica | | | | |
| Healthcare Obligated Group) | 5.000% | 11/15/26 | 2,000 | 2,264 |
| Lucas County OH Hospital Revenue (ProMedica | | | | |
| Healthcare Obligated Group) | 5.250% | 11/15/27 | 2,000 | 2,292 |
| Lucas County OH Hospital Revenue (ProMedica | | | | |
| Healthcare Obligated Group) | 5.250% | 11/15/28 | 4,000 | 4,581 |
| Lucas County OH Hospital Revenue (ProMedica | | | | |
| Healthcare Obligated Group) | 6.500% | 11/15/37 | 2,000 | 2,461 |
| Lucas County OH Hospital Revenue (ProMedica | | | | |
| Healthcare Obligated Group) | 6.000% | 11/15/41 | 2,530 | 3,011 |
| Madison OH Local School District GO | 5.250% | 12/1/32 | 695 | 794 |
| Madison OH Local School District GO | 5.250% | 12/1/37 | 3,815 | 4,320 |
| Marysville OH Wastewater Treatment System | | | | |
| Revenue | 5.000% | 12/1/31 (10) | 2,720 | 2,899 |
| Mason OH City School District BAN | 5.250% | 12/1/17 (14) | 2,915 | 3,311 |
| Mason OH City School District School | | | | |
| Improvement GO | 5.000% | 6/1/17 (Prere.) | 1,000 | 1,110 |
| Medina OH School District COP | 5.250% | 12/1/37 (12) | 7,210 | 7,974 |
| Miami University of Ohio General Receipts | | | | |
| Revenue | 5.000% | 9/1/31 | 2,000 | 2,298 |
| Miami University of Ohio General Receipts | | | | |
| Revenue | 5.000% | 9/1/36 | 2,000 | 2,245 |
| Middleburg Heights OH Hospital Revenue | | | | |
| (Southwest General) | 5.125% | 8/1/31 | 1,250 | 1,348 |
32
| | | | |
| Ohio Long-Term Tax-Exempt Fund | | | | |
| |
| |
| |
| | | | Face | Market |
| | | Maturity | Amount | Value• |
| | Coupon | Date | ($000) | ($000) |
| Middleburg Heights OH Hospital Revenue | | | | |
| (Southwest General) | 5.250% | 8/1/41 | 1,000 | 1,078 |
| Middleburg Heights OH Hospital Revenue | | | | |
| (Southwest General) | 5.000% | 8/1/47 | 5,000 | 5,331 |
| Middletown OH City School District GO | 5.000% | 12/1/23 (4) | 5,345 | 5,856 |
| 1 Middletown OH City School District GO | 5.250% | 12/1/40 | 2,000 | 2,234 |
| 1 Middletown OH City School District GO | 5.250% | 12/1/48 | 1,000 | 1,108 |
| Middletown OH Hospital Facilities Revenue | | | | |
| (Atrium Medical Center) VRDO | 0.030% | 12/5/14 LOC | 4,975 | 4,975 |
| Montgomery County OH Revenue | | | | |
| (Catholic Health Initiatives) | 5.250% | 5/1/29 | 3,000 | 3,529 |
| Montgomery County OH Revenue | | | | |
| (Catholic Health Initiatives) | 5.000% | 5/1/30 | 5,000 | 5,014 |
| Montgomery County OH Revenue | | | | |
| (Miami Valley Hospital) | 5.750% | 11/15/23 | 1,000 | 1,193 |
| Montgomery County OH Revenue | | | | |
| (Miami Valley Hospital) VRDO | 0.030% | 12/1/14 | 2,785 | 2,785 |
| Montgomery County OH Revenue | | | | |
| (Miami Valley Hospital) VRDO | 0.030% | 12/1/14 | 9,175 | 9,175 |
| Montgomery County OH Revenue | | | | |
| (Miami Valley Hospital) VRDO | 0.040% | 12/1/14 | 2,600 | 2,600 |
| Northeast Ohio Regional Sewer District | | | | |
| Wastewater Revenue | 5.000% | 11/15/32 | 4,685 | 5,434 |
| Northeast Ohio Regional Sewer District | | | | |
| Wastewater Revenue | 5.000% | 11/15/38 | 9,400 | 10,706 |
| Ohio Air Quality Development Authority Pollution | | | | |
| Control Revenue (FirstEnergy Generation Corp. | | | | |
| Project) | 5.625% | 6/1/18 | 2,500 | 2,778 |
| Ohio Air Quality Development Authority Pollution | | | | |
| Control Revenue (FirstEnergy Generation Corp. | | | | |
| Project) PUT | 5.875% | 6/1/16 | 3,000 | 3,215 |
| Ohio Air Quality Development Authority Revenue | | | | |
| (Columbus Southern Power Co. Project) | 5.800% | 12/1/38 | 2,000 | 2,226 |
| Ohio Air Quality Development Authority Revenue | | | | |
| (Ohio Valley Electric Corp. Project) | 5.625% | 10/1/19 | 3,000 | 3,383 |
| Ohio Building Authority Revenue | | | | |
| (Administration Building Fund) | 5.000% | 10/1/23 | 2,000 | 2,330 |
| Ohio Building Authority Revenue | | | | |
| (Adult Correctional Building) | 5.000% | 10/1/20 | 2,975 | 3,552 |
| Ohio Capital Facilities Lease-Appropriation | | | | |
| Revenue (Administrative Building Fund Projects) | 5.000% | 10/1/23 | 1,250 | 1,495 |
| Ohio Capital Facilities Lease-Appropriation | | | | |
| Revenue (Administrative Building Fund Projects) | 5.000% | 10/1/24 | 1,000 | 1,187 |
| Ohio Capital Facilities Lease-Appropriation | | | | |
| Revenue (Administrative Building Fund Projects) | 5.000% | 4/1/25 | 2,670 | 3,114 |
| Ohio Capital Facilities Lease-Appropriation | | | | |
| Revenue (Administrative Building Fund Projects) | 5.000% | 4/1/30 | 1,650 | 1,899 |
| Ohio Capital Facilities Lease-Appropriation | | | | |
| Revenue (Cultural & Sports Facilities Building | | | | |
| Fund Projects) | 4.000% | 4/1/16 | 2,330 | 2,444 |
| Ohio Common Schools GO | 5.000% | 9/15/19 | 3,000 | 3,530 |
| Ohio Common Schools GO | 5.000% | 9/15/21 | 5,920 | 7,155 |
| Ohio Common Schools GO | 5.000% | 3/15/24 | 4,410 | 5,285 |
| Ohio GO | 5.000% | 9/15/23 | 2,950 | 3,634 |
33
| | | | |
| Ohio Long-Term Tax-Exempt Fund | | | | |
| |
| |
| |
| | | | Face | Market |
| | | Maturity | Amount | Value• |
| | Coupon | Date | ($000) | ($000) |
| Ohio GO | 5.000% | 8/1/24 | 2,000 | 2,485 |
| Ohio GO | 5.000% | 5/1/27 | 5,350 | 6,520 |
| Ohio GO | 5.000% | 2/1/30 | 4,000 | 4,640 |
| Ohio GO | 5.000% | 4/1/30 | 1,770 | 2,000 |
| Ohio GO | 5.000% | 2/1/31 | 4,500 | 5,219 |
| Ohio GO | 5.000% | 4/1/31 | 1,230 | 1,384 |
| Ohio Higher Educational Facility Commission | | | | |
| Revenue (Case Western Reserve University | | | | |
| Project) | 5.250% | 12/1/26 (14) | 3,520 | 4,413 |
| Ohio Higher Educational Facility Commission | | | | |
| Revenue (Case Western Reserve University | | | | |
| Project) VRDO | 0.050% | 12/1/14 | 2,310 | 2,310 |
| Ohio Higher Educational Facility Commission | | | | |
| Revenue (Case Western Reserve University | | | | |
| Project) VRDO | 0.050% | 12/1/14 | 3,795 | 3,795 |
| Ohio Higher Educational Facility Commission | | | | |
| Revenue (Case Western Reserve University | | | | |
| Project) VRDO | 0.050% | 12/1/14 | 1,700 | 1,700 |
| Ohio Higher Educational Facility Commission | | | | |
| Revenue (Cleveland Clinic Health System | | | | |
| Obligated Group) | 5.125% | 1/1/28 | 5,000 | 5,506 |
| Ohio Higher Educational Facility Commission | | | | |
| Revenue (Cleveland Clinic Health System | | | | |
| Obligated Group) | 5.000% | 1/1/29 | 3,500 | 4,014 |
| Ohio Higher Educational Facility Commission | | | | |
| Revenue (Cleveland Clinic Health System | | | | |
| Obligated Group) | 5.250% | 1/1/29 | 5,000 | 5,537 |
| Ohio Higher Educational Facility Commission | | | | |
| Revenue (Cleveland Clinic Health System | | | | |
| Obligated Group) | 5.000% | 1/1/38 | 5,000 | 5,580 |
| Ohio Higher Educational Facility Commission | | | | |
| Revenue (Cleveland Clinic Health System | | | | |
| Obligated Group) | 5.500% | 1/1/43 | 1,460 | 1,606 |
| Ohio Higher Educational Facility Commission | | | | |
| Revenue (Denison University Project) | 5.000% | 11/1/26 | 1,815 | 2,013 |
| Ohio Higher Educational Facility Commission | | | | |
| Revenue (Denison University Project) | 5.000% | 11/1/32 | 1,000 | 1,094 |
| Ohio Higher Educational Facility Commission | | | | |
| Revenue (John Carroll University Project) PUT | 2.250% | 9/1/18 | 3,250 | 3,315 |
| Ohio Higher Educational Facility Commission | | | | |
| Revenue (Kenyon College Project) | 5.000% | 7/1/37 | 9,955 | 11,117 |
| Ohio Higher Educational Facility Commission | | | | |
| Revenue (University of Dayton Project) | 5.500% | 12/1/24 | 2,250 | 2,600 |
| Ohio Higher Educational Facility Commission | | | | |
| Revenue (University of Dayton Project) | 5.000% | 12/1/29 | 2,575 | 2,975 |
| Ohio Higher Educational Facility Commission | | | | |
| Revenue (University of Dayton Project) | 5.375% | 12/1/30 | 1,000 | 1,150 |
| Ohio Higher Educational Facility Commission | | | | |
| Revenue (University of Dayton Project) | 5.000% | 12/1/33 (3) | 4,500 | 4,796 |
| Ohio Higher Educational Facility Commission | | | | |
| Revenue (University of Dayton Project) | 5.625% | 12/1/41 | 2,000 | 2,301 |
| Ohio Higher Educational Facility Commission | | | | |
| Revenue (Xavier University Project) | 5.750% | 5/1/28 | 4,000 | 4,612 |
| Ohio Highway Capital Improvements GO | 5.000% | 5/1/25 | 3,000 | 3,567 |
34
| | | | |
| Ohio Long-Term Tax-Exempt Fund | | | | |
| |
| |
| |
| | | | Face | Market |
| | | Maturity | Amount | Value• |
| | Coupon | Date | ($000) | ($000) |
| Ohio Highway Capital Improvements GO | 5.000% | 5/1/26 | 3,000 | 3,551 |
| Ohio Hospital Facilities Revenue (Cleveland Clinic | | | | |
| Health System) | 5.000% | 1/1/22 | 2,250 | 2,616 |
| Ohio Hospital Facilities Revenue (Cleveland Clinic | | | | |
| Health System) | 5.000% | 1/1/25 | 1,000 | 1,142 |
| Ohio Hospital Facilities Revenue (Cleveland Clinic | | | | |
| Health System) | 5.000% | 1/1/32 | 2,500 | 2,771 |
| Ohio Hospital Facilities Revenue (Summa Health | | | | |
| System) | 5.750% | 11/15/35 | 1,675 | 1,857 |
| Ohio Hospital Facilities Revenue (Summa Health | | | | |
| System) | 5.750% | 11/15/40 | 6,650 | 7,357 |
| Ohio Hospital Revenue (Cleveland Clinic Health | | | | |
| System Obligated Group) | 5.500% | 1/1/39 | 6,600 | 7,420 |
| 3 Ohio Hospital Revenue (Cleveland Clinic Health | | | | |
| System Obligated Group) TOB VRDO | 0.040% | 12/1/14 | 1,700 | 1,700 |
| Ohio Hospital Revenue (University Hospitals | | | | |
| Health System Inc.) | 6.750% | 1/15/15 (Prere.) | 5,000 | 5,043 |
| Ohio Hospital Revenue (University Hospitals | | | | |
| Health System Inc.) | 5.000% | 1/15/28 | 6,560 | 7,439 |
| Ohio Hospital Revenue (University Hospitals | | | | |
| Health System Inc.) | 5.000% | 1/15/29 | 2,000 | 2,257 |
| Ohio Hospital Revenue (University Hospitals | | | | |
| Health System Inc.) | 5.000% | 1/15/41 | 7,000 | 7,497 |
| Ohio Hospital Revenue (University Hospitals | | | | |
| Health System Inc.) | 5.250% | 1/15/46 | 3,000 | 3,129 |
| Ohio Housing Finance Agency Residential | | | | |
| Mortgage Revenue | 5.250% | 9/1/28 | 60 | 60 |
| Ohio Housing Finance Agency Residential | | | | |
| Mortgage Revenue | 6.200% | 9/1/33 | 1,775 | 1,855 |
| Ohio Infrastructure Improvement GO | 5.000% | 8/1/21 | 900 | 1,086 |
| Ohio Major New State Infrastructure Project | | | | |
| Revenue | 5.000% | 12/15/24 | 4,000 | 4,736 |
| Ohio Public Facilities Commission GO | 5.000% | 2/1/22 | 1,460 | 1,765 |
| Ohio Public Facilities Commission GO | 5.000% | 4/1/22 | 2,395 | 2,901 |
| Ohio State University General Receipts Revenue | 5.000% | 12/1/16 (ETM) | 300 | 328 |
| Ohio State University General Receipts Revenue | 5.000% | 12/1/17 | 1,000 | 1,130 |
| Ohio State University General Receipts Revenue | 5.000% | 12/1/17 (ETM) | 280 | 316 |
| Ohio State University General Receipts Revenue | 5.000% | 12/1/18 | 835 | 967 |
| Ohio State University General Receipts Revenue | 5.000% | 12/1/18 (Prere.) | 160 | 185 |
| Ohio State University General Receipts Revenue | 5.000% | 12/1/18 (Prere.) | 255 | 296 |
| Ohio State University General Receipts Revenue | 5.000% | 12/1/19 | 625 | 739 |
| Ohio State University General Receipts Revenue | 5.000% | 6/1/25 | 4,130 | 4,980 |
| Ohio State University General Receipts Revenue | 5.000% | 12/1/26 | 2,245 | 2,554 |
| Ohio State University General Receipts Revenue | 5.000% | 12/1/28 | 610 | 695 |
| Ohio State University General Receipts Revenue | 5.000% | 6/1/38 | 8,000 | 9,059 |
| Ohio State University General Receipts Revenue | 5.000% | 12/1/42 | 1,450 | 1,604 |
| Ohio State University General Receipts Revenue | | | | |
| VRDO | 0.040% | 12/5/14 | 4,700 | 4,700 |
| Ohio Turnpike Commission Turnpike Revenue | 5.500% | 2/15/24 (14) | 3,000 | 3,693 |
| Ohio Turnpike Commission Turnpike Revenue | 5.000% | 2/15/25 | 4,500 | 5,297 |
| Ohio Turnpike Commission Turnpike Revenue | 5.000% | 2/15/26 | 3,000 | 3,472 |
| Ohio Turnpike Commission Turnpike Revenue | 5.250% | 2/15/27 | 2,500 | 3,128 |
| Ohio Turnpike Commission Turnpike Revenue | 0.000% | 2/15/36 | 5,000 | 1,982 |
| Ohio Turnpike Commission Turnpike Revenue | 0.000% | 2/15/37 | 5,000 | 1,889 |
35
| | | | |
| Ohio Long-Term Tax-Exempt Fund | | | | |
| |
| |
| |
| | | | Face | Market |
| | | Maturity | Amount | Value• |
| | Coupon | Date | ($000) | ($000) |
| Ohio Turnpike Commission Turnpike Revenue | 5.250% | 2/15/39 | 4,000 | 4,588 |
| Ohio University General Receipts Revenue | 5.000% | 12/1/33 | 1,000 | 1,132 |
| Ohio University General Receipts Revenue | 5.000% | 12/1/36 | 2,490 | 2,797 |
| Ohio University General Receipts Revenue | 5.000% | 12/1/39 | 2,000 | 2,236 |
| Ohio Water Development Authority Fresh | | | | |
| Water Revenue | 5.500% | 12/1/18 (4) | 645 | 761 |
| Ohio Water Development Authority Fresh | | | | |
| Water Revenue | 5.500% | 12/1/23 | 1,115 | 1,419 |
| Ohio Water Development Authority Water | | | | |
| Pollution Control Loan Fund Revenue | 5.000% | 12/1/19 | 5,490 | 6,500 |
| Ohio Water Development Authority Water | | | | |
| Pollution Control Loan Fund Revenue | 5.500% | 6/1/21 | 5,135 | 6,345 |
| Ohio Water Development Authority Water | | | | |
| Pollution Control Loan Fund Revenue | 5.500% | 6/1/22 | 1,505 | 1,884 |
| Ohio Water Development Authority Water | | | | |
| Pollution Control Loan Fund Revenue | 5.000% | 12/1/29 | 5,000 | 5,782 |
| Ohio Water Development Authority Water | | | | |
| Pollution Control Loan Fund Revenue | 5.000% | 6/1/30 | 1,000 | 1,154 |
| Olentangy OH Local School District GO | 5.000% | 6/1/16 (Prere.) | 3,765 | 4,028 |
| Rocky River OH City School District GO | 5.375% | 12/1/17 | 1,035 | 1,104 |
| Ross County OH Hospital Facilities Revenue | | | | |
| (Adena Health System) | 5.750% | 12/1/22 | 1,000 | 1,156 |
| Ross County OH Hospital Facilities Revenue | | | | |
| (Adena Health System) | 5.750% | 12/1/35 | 10,040 | 11,180 |
| Scioto County OH Hospital Facilities Revenue | | | | |
| (Southern Ohio Medical Center) | 5.500% | 2/15/28 | 4,000 | 4,363 |
| Scioto County OH Hospital Facilities Revenue | | | | |
| (Southern Ohio Medical Center) | 5.750% | 2/15/38 | 1,800 | 1,959 |
| South-Western City OH School District GO | 5.000% | 12/1/36 | 1,700 | 1,909 |
| Streetsboro OH City School District GO | 5.250% | 12/1/44 | 4,000 | 4,564 |
| Tallmadge OH City School District GO | 5.000% | 6/1/15 (Prere.) | 1,550 | 1,588 |
| Tallmadge OH City School District GO | 5.000% | 6/1/15 (Prere.) | 1,480 | 1,516 |
| Teays Valley OH Local School District GO | 5.000% | 12/1/27 (14) | 3,040 | 3,172 |
| Toledo OH City School District GO | 5.000% | 12/1/22 | 2,015 | 2,397 |
| Toledo OH City School District GO | 5.000% | 12/1/23 | 1,085 | 1,275 |
| Toledo OH City School District GO | 5.000% | 12/1/28 | 4,730 | 5,570 |
| Toledo OH Waterworks Revenue | 5.000% | 11/15/38 | 4,000 | 4,521 |
| Toledo-Lucas County OH Port Authority Student | | | | |
| Housing Revenue (CHF-Toledo, LLC - | | | | |
| The University of Toledo Project) | 5.000% | 7/1/34 | 1,000 | 1,057 |
| Toledo-Lucas County OH Port Authority Student | | | | |
| Housing Revenue (CHF-Toledo, LLC - | | | | |
| The University of Toledo Project) | 5.000% | 7/1/39 | 1,000 | 1,046 |
| Tri Valley OH Local School District GO | 5.500% | 12/1/16 (14) | 890 | 933 |
| Tri Valley OH Local School District GO | 5.500% | 12/1/19 (14) | 1,785 | 2,020 |
| University of Akron Ohio General Receipts | | | | |
| Revenue | 5.000% | 1/1/26 (4) | 6,980 | 7,909 |
| University of Akron Ohio General Receipts | | | | |
| Revenue | 5.000% | 1/1/29 (4) | 2,000 | 2,256 |
| University of Akron Ohio General Receipts | | | | |
| Revenue | 5.000% | 1/1/33 (4) | 2,000 | 2,176 |
| University of Akron Ohio General Receipts | | | | |
| Revenue | 5.000% | 1/1/33 | 2,975 | 3,367 |
36
| | | | |
| Ohio Long-Term Tax-Exempt Fund | | | | |
| |
| |
| |
| | | | Face | Market |
| | | Maturity | Amount | Value• |
| | Coupon | Date | ($000) | ($000) |
| University of Cincinnati Ohio General Receipts | | | | |
| Revenue | 5.000% | 6/1/20 | 1,000 | 1,186 |
| University of Cincinnati Ohio General Receipts | | | | |
| Revenue | 5.000% | 6/1/21 | 1,000 | 1,187 |
| University of Cincinnati Ohio General Receipts | | | | |
| Revenue | 5.000% | 6/1/23 | 3,665 | 4,375 |
| University of Cincinnati Ohio General Receipts | | | | |
| Revenue | 5.000% | 6/1/24 | 1,000 | 1,195 |
| University of Cincinnati Ohio General Receipts | | | | |
| Revenue | 5.000% | 6/1/25 | 500 | 582 |
| University of Cincinnati Ohio General Receipts | | | | |
| Revenue | 5.000% | 6/1/26 | 500 | 580 |
| University of Cincinnati Ohio General Receipts | | | | |
| Revenue | 5.000% | 6/1/27 | 2,000 | 2,350 |
| University of Cincinnati Ohio General Receipts | | | | |
| Revenue | 5.000% | 6/1/28 (14) | 5,000 | 5,420 |
| University of Cincinnati Ohio General Receipts | | | | |
| Revenue | 5.000% | 6/1/30 | 1,890 | 2,167 |
| University of Cincinnati Ohio General Receipts | | | | |
| Revenue | 5.000% | 6/1/31 | 1,000 | 1,144 |
| University of Toledo Ohio General Receipts | | | | |
| Revenue | 5.000% | 6/1/29 | 1,000 | 1,109 |
| Warren County OH Health Care Facilities | | | | |
| Improvement Revenue (Otterbein Homes Project) | 5.000% | 7/1/31 | 870 | 974 |
| Warren County OH Health Care Facilities | | | | |
| Improvement Revenue (Otterbein Homes Project) | 5.750% | 7/1/33 | 600 | 697 |
| Warren County OH Health Care Facilities | | | | |
| Improvement Revenue (Otterbein Homes Project) | 5.000% | 7/1/39 | 1,000 | 1,091 |
| Warren County OH Health Care Facilities | | | | |
| Improvement Revenue (Otterbein Homes Project) | 5.500% | 7/1/39 | 1,225 | 1,378 |
| Westlake OH Special Obligation Revenue | | | | |
| (American Greetings/Crocker Park Public | | | | |
| Improvement Project) | 5.000% | 12/1/30 | 1,350 | 1,590 |
| Westlake OH Special Obligation Revenue | | | | |
| (American Greetings/Crocker Park Public | | | | |
| Improvement Project) | 5.000% | 12/1/32 | 1,395 | 1,632 |
| Wood County OH Hospital Facilities Revenue | | | | |
| (Wood County Hospital) | 5.000% | 12/1/32 | 715 | 758 |
| Wood County OH Hospital Facilities Revenue | | | | |
| (Wood County Hospital) | 5.000% | 12/1/42 | 2,500 | 2,588 |
| Woodridge OH School District GO | 6.800% | 12/1/14 (2) | 340 | 340 |
| Wright State University Ohio General Revenue | 5.000% | 5/1/26 | 2,030 | 2,286 |
| Wright State University Ohio General Revenue | 5.000% | 5/1/31 | 3,000 | 3,330 |
| | | | | 957,339 |
| Virgin Islands (0.5%) | | | | |
| Virgin Islands Public Finance Authority Revenue | 5.000% | 10/1/30 | 4,000 | 4,394 |
| |
| Guam (0.3%) | | | | |
| Guam Government Waterworks Authority | | | | |
| Water & Waste Water System Revenue | 5.500% | 7/1/43 | 2,300 | 2,630 |
| |
| Puerto Rico (0.0%) | | | | |
| Puerto Rico Public Finance Corp. Revenue | 6.000% | 8/1/26 (ETM) | 305 | 391 |
| Total Tax-Exempt Municipal Bonds (Cost $909,735) | | | | 964,754 |
37
| |
| Ohio Long-Term Tax-Exempt Fund | |
| |
| |
| | Market |
| | Value• |
| | ($000) |
| Other Assets and Liabilities (0.0%) | |
| Other Assets | 15,889 |
| Liabilities | (15,589) |
| | 300 |
| Net Assets (100%) | |
| Applicable to 76,435,415 outstanding $.001 par value shares of | |
| beneficial interest (unlimited authorization) | 965,054 |
| Net Asset Value Per Share | $12.63 |
| |
| |
| At November 30, 2014, net assets consisted of: | |
| | Amount |
| | ($000) |
| Paid-in Capital | 906,341 |
| Undistributed Net Investment Income | — |
| Accumulated Net Realized Gains | 3,694 |
| Unrealized Appreciation (Depreciation) | 55,019 |
| Net Assets | 965,054 |
• See Note A in Notes to Financial Statements.
1 Security purchased on a when-issued or delayed-delivery basis for which the fund has not taken delivery as of November 30, 2014.
2 Adjustable-rate security.
3 Security exempt from registration under Rule 144A of the Securities Act of 1933. Such securities may be sold in transactions exempt from
registration, normally to qualified institutional buyers. At November 30, 2014, the aggregate value of these securities was $6,695,000,
representing 0.7% of net assets.
A key to abbreviations and other references follows the Statement of Net Assets.
See accompanying Notes, which are an integral part of the Financial Statements.
38
Ohio Long-Term Tax-Exempt Fund
Key to Abbreviations
ARS—Auction Rate Security.
BAN—Bond Anticipation Note.
COP—Certificate of Participation.
CP—Commercial Paper.
FR—Floating Rate.
GAN—Grant Anticipation Note.
GO—General Obligation Bond.
PILOT—Payments in Lieu of Taxes.
PUT—Put Option Obligation.
RAN—Revenue Anticipation Note.
TAN—Tax Anticipation Note.
TOB—Tender Option Bond.
TRAN—Tax Revenue Anticipation Note.
VRDO—Variable Rate Demand Obligation.
VRDP—Variable Rate Demand Preferred.
(ETM)—Escrowed to Maturity.
(Prere.)—Prerefunded.
Scheduled principal and interest payments are guaranteed by:
(1) MBIA (Municipal Bond Investors Assurance).
(2) AMBAC (Ambac Assurance Corporation).
(3) FGIC (Financial Guaranty Insurance Company).
(4) AGM (Assured Guaranty Municipal Corporation).
(5) BIGI (Bond Investors Guaranty Insurance).
(6) Connie Lee Inc.
(7) FHA (Federal Housing Authority).
(8) CapMAC (Capital Markets Assurance Corporation).
(9) American Capital Access Financial Guaranty Corporation.
(10) XL Capital Assurance Inc.
(11) CIFG (CDC IXIS Financial Guaranty).
(12) AGC (Assured Guaranty Corporation).
(13) BHAC (Berkshire Hathaway Assurance Corporation).
(14) NPFG (National Public Finance Guarantee Corporation).
(15) BAM (Build America Mutual Assurance Company).
(16) MAC (Municipal Assurance Corporation).
(17) RAA (Radian Asset Assurance Inc.).
The insurance does not guarantee the market value of the municipal bonds.
LOC—Scheduled principal and interest payments are guaranteed by bank letter of credit.
39
Ohio Long-Term Tax-Exempt Fund
Statement of Operations
| |
| | Year Ended |
| | November 30, 2014 |
| | ($000) |
| Investment Income | |
| Income | |
| Interest | 34,588 |
| Total Income | 34,588 |
| Expenses | |
| The Vanguard Group—Note B | |
| Investment Advisory Services | 90 |
| Management and Administrative | 1,151 |
| Marketing and Distribution | 175 |
| Custodian Fees | 16 |
| Auditing Fees | 33 |
| Shareholders’ Reports | 6 |
| Trustees’ Fees and Expenses | 1 |
| Total Expenses | 1,472 |
| Net Investment Income | 33,116 |
| Realized Net Gain (Loss) | |
| Investment Securities Sold | 6,030 |
| Futures Contracts | (297) |
| Realized Net Gain (Loss) | 5,733 |
| Change in Unrealized Appreciation (Depreciation) of Investment Securities | 49,469 |
| Net Increase (Decrease) in Net Assets Resulting from Operations | 88,318 |
See accompanying Notes, which are an integral part of the Financial Statements.
40
Ohio Long-Term Tax-Exempt Fund
Statement of Changes in Net Assets
| | |
| | Year Ended November 30, |
| | 2014 | 2013 |
| | ($000) | ($000) |
| Increase (Decrease) in Net Assets | | |
| Operations | | |
| Net Investment Income | 33,116 | 36,273 |
| Realized Net Gain (Loss) | 5,733 | 5,330 |
| Change in Unrealized Appreciation (Depreciation) | 49,469 | (88,319) |
| Net Increase (Decrease) in Net Assets Resulting from Operations | 88,318 | (46,716) |
| Distributions | | |
| Net Investment Income | (33,116) | (36,273) |
| Realized Capital Gain1 | (3,623) | (2,125) |
| Total Distributions | (36,739) | (38,398) |
| Capital Share Transactions | | |
| Issued | 114,638 | 140,887 |
| Issued in Lieu of Cash Distributions | 25,605 | 26,379 |
| Redeemed | (128,721) | (235,647) |
| Net Increase (Decrease) from Capital Share Transactions | 11,522 | (68,381) |
| Total Increase (Decrease) | 63,101 | (153,495) |
| Net Assets | | |
| Beginning of Period | 901,953 | 1,055,448 |
| End of Period | 965,054 | 901,953 |
1 Includes fiscal 2014 and 2013 short-term gain distributions totaling $54,000 and $0, respectively. Short-term gain distributions are treatedas ordinary income dividends for tax purposes.See accompanying Notes, which are an integral part of the Financial Statements.
41
Ohio Long-Term Tax-Exempt Fund
Financial Highlights
| | | | | |
| For a Share Outstanding | Year Ended November 30, |
| Throughout Each Period | 2014 | 2013 | 2012 | 2011 | 2010 |
| Net Asset Value, Beginning of Period | $11.93 | $12.96 | $12.09 | $11.92 | $11.93 |
| Investment Operations | | | | | |
| Net Investment Income | .444 | .454 | .449 | .478 | .491 |
| Net Realized and Unrealized Gain (Loss) | | | | | |
| on Investments | .749 | (1.003) | .870 | .191 | (.010) |
| Total from Investment Operations | 1.193 | (.549) | 1.319 | .669 | .481 |
| Distributions | | | | | |
| Dividends from Net Investment Income | (. 444) | (. 454) | (. 449) | (. 478) | (.491) |
| Distributions from Realized Capital Gains | (.049) | (.027) | — | (.021) | — |
| Total Distributions | (.493) | (.481) | (. 449) | (. 499) | (. 491) |
| Net Asset Value, End of Period | $12.63 | $11.93 | $12.96 | $12.09 | $11.92 |
| |
| Total Return1 | 10.19% | -4.28% | 11.08% | 5.81% | 4.06% |
| |
| Ratios/Supplemental Data | | | | | |
| Net Assets, End of Period (Millions) | $965 | $902 | $1,055 | $875 | $944 |
| Ratio of Total Expenses to Average Net Assets | 0.16% | 0.16% | 0.16% | 0.17% | 0.17% |
| Ratio of Net Investment Income to | | | | | |
| Average Net Assets | 3.60% | 3.69% | 3.57% | 4.06% | 4.07% |
| Portfolio Turnover Rate | 23% | 28% | 15% | 20% | 24% |
1 Total returns do not include account service fees that may have applied in the periods shown. Fund prospectuses provide information aboutany applicable account service fees.See accompanying Notes, which are an integral part of the Financial Statements.
42
Ohio Long-Term Tax-Exempt Fund
Notes to Financial Statements
Vanguard Ohio Long-Term Tax-Exempt Fund is registered under the Investment Company Act of 1940 as an open-end investment company, or mutual fund. The fund invests in debt instruments of municipal issuers whose ability to meet their obligations may be affected by economic and political developments in the state.
A. The following significant accounting policies conform to generally accepted accounting principles for U.S. investment companies. The fund consistently follows such policies in preparing its financial statements.
1. Security Valuation: Securities are valued as of the close of trading on the New York Stock Exchange (generally 4 p.m., Eastern time) on the valuation date. Bonds, and temporary cash investments acquired over 60 days to maturity, are valued using the latest bid prices or using valuations based on a matrix system (which considers such factors as security prices, yields, maturities, and ratings), both as furnished by independent pricing services. Other temporary cash investments are valued at amortized cost, which approximates market value. Securities for which market quotations are not readily available, or whose values have been affected by events occurring before the fund’s pricing time but after the close of the securities’ primary markets, are valued by methods deemed by the board of trustees to represent fair value.
2. Futures Contracts: The fund uses futures contracts to invest in fixed income asset classes with greater efficiency and lower cost than is possible through direct investment, to add value when these instruments are attractively priced, or to adjust sensitivity to changes in interest rates. The primary risks associated with the use of futures contracts are imperfect correlation between changes in market values of bonds held by the fund and the prices of futures contracts, and the possibility of an illiquid market. Counterparty risk involving futures is mitigated because a regulated clearinghouse is the counterparty instead of the clearing broker. To further mitigate counterparty risk, the fund trades futures contracts on an exchange, monitors the financial strength of its clearing brokers and clearing-house, and has entered into clearing agreements with its clearing brokers. The clearinghouse imposes initial margin requirements to secure the fund’s performance and requires daily settlement of variation margin representing changes in the market value of each contract.
Futures contracts are valued at their quoted daily settlement prices. The aggregate settlement values of the contracts are not recorded in the Statement of Net Assets. Fluctuations in the value of the contracts are recorded in the Statement of Net Assets as an asset (liability) and in the Statement of Operations as unrealized appreciation (depreciation) until the contracts are closed, when they are recorded as realized futures gains (losses).
During the year ended November 30, 2014, the fund’s average investments in long and short futures contracts each represented less than 1% of net assets, based on the average of aggregate settlement values at each quarter-end during the period. The fund had no open futures contracts at November 30, 2014.
3. Federal Income Taxes: The fund intends to continue to qualify as a regulated investment company and distribute all of its income. Management has analyzed the fund’s tax positions taken for all open federal income tax years (November 30, 2011–2014), and has concluded that no provision for federal income tax is required in the fund’s financial statements.
4. Distributions: Distributions from net investment income are declared daily and paid on the first business day of the following month. Annual distributions from realized capital gains, if any, are recorded on the ex-dividend date.
43
Ohio Long-Term Tax-Exempt Fund
5. Credit Facility: The fund and certain other funds managed by The Vanguard Group participate in a $2.89 billion committed credit facility provided by a syndicate of lenders pursuant to a credit agreement that may be renewed annually; each fund is individually liable for its borrowings, if any, under the credit facility. Borrowings may be utilized for temporary and emergency purposes, and are subject to the fund’s regulatory and contractual borrowing restrictions. The participating funds are charged administrative fees and an annual commitment fee of 0.06% of the undrawn amount of the facility; these fees are allocated to the funds based on a method approved by the fund’s board of trustees and included in Management and Administrative expenses on the fund’s Statement of Operations. Any borrowings under this facility bear interest at a rate equal to the higher of the federal funds rate or LIBOR reference rate plus an agreed-upon spread.
The fund had no borrowings outstanding at November 30, 2014, or at any time during the period then ended.
6. Other: Interest income is accrued daily. Premiums and discounts on debt securities purchased are amortized and accreted, respectively, to interest income over the lives of the respective securities. Security transactions are accounted for on the date securities are bought or sold. Costs used to determine realized gains (losses) on the sale of investment securities are those of the specific securities sold.
B. The Vanguard Group furnishes at cost investment advisory, corporate management, administrative, marketing, and distribution services. The costs of such services are allocated to the fund based on methods approved by the board of trustees. The fund has committed to invest up to 0.40% of its net assets in Vanguard. At November 30, 2014, the fund had contributed capital of $94,000 to Vanguard (included in Other Assets), representing 0.01% of the fund’s net assets and 0.04% of Vanguard’s capitalization. The fund’s trustees and officers are also directors and officers of Vanguard.
C. Various inputs may be used to determine the value of the fund’s investments. These inputs are summarized in three broad levels for financial statement purposes. The inputs or methodologies used to value securities are not necessarily an indication of the risk associated with investing in those securities.
Level 1—Quoted prices in active markets for identical securities.
Level 2—Other significant observable inputs (including quoted prices for similar securities, interest rates, prepayment speeds, credit risk, etc.).
Level 3—Significant unobservable inputs (including the fund’s own assumptions used to determine the fair value of investments).
At November 30, 2014, 100% of the market value of the fund’s investments was determined based on Level 2 inputs.
D. Capital gain distributions are determined on a tax basis and may differ from realized capital gains for financial reporting purposes. Differences may be permanent or temporary. Permanent differences are reclassified among capital accounts in the financial statements to reflect their tax character. Temporary differences arise when gains or losses are recognized in different periods for financial statement and tax purposes. These differences will reverse at some time in the future.
The fund used a tax accounting practice to treat a portion of the price of capital shares redeemed during the year as distributions from realized capital gains. Accordingly, the fund has reclassified $594,000 from accumulated net realized gains to paid-in capital.
44
Ohio Long-Term Tax-Exempt Fund
For tax purposes, at November 30, 2014, the fund had short-term and long-term capital gains of $1,545,000 and $3,476,000, respectively, available for distribution. Short-term gain distributions are treated as ordinary income dividends for tax purposes.
At November 30, 2014, the cost of investment securities for tax purposes was $911,063,000. Net unrealized appreciation of investment securities for tax purposes was $53,691,000, consisting of unrealized gains of $53,994,000 on securities that had risen in value since their purchase and $303,000 in unrealized losses on securities that had fallen in value since their purchase.
E. During the year ended November 30, 2014, the fund purchased $208,395,000 of investment securities and sold $196,959,000 of investment securities, other than temporary cash investments
F. Capital shares issued and redeemed were:
| | |
| | Year Ended November 30, |
| | 2014 | 2013 |
| | Shares | Shares |
| | (000) | (000) |
| Issued | 9,285 | 11,304 |
| Issued in Lieu of Cash Distributions | 2,082 | 2,145 |
| Redeemed | (10,556) | (19,277) |
| Net Increase (Decrease) in Shares Outstanding | 811 | (5,828) |
G. Management has determined that no material events or transactions occurred subsequent to November 30, 2014, that would require recognition or disclosure in these financial statements.
45
Report of Independent Registered Public Accounting Firm
To the Board of Trustees of Vanguard Ohio Tax-Free Funds and the Shareholders of Vanguard Ohio Tax-Exempt Money Market Fund and Vanguard Ohio Long-Term Tax-Exempt Fund:
In our opinion, the accompanying statements of net assets and the related statements of operations and of changes in net assets and the financial highlights present fairly, in all material respects, the financial position of Vanguard Ohio Tax-Exempt Money Market Fund and Vanguard Ohio Long-Term Tax-Exempt Fund (constituting Vanguard Ohio Tax-Free Funds, hereafter referred to as the “Funds”) at November 30, 2014, the results of each of their operations for the year then ended, the changes in each of their net assets for each of the two years in the period then ended, and the financial highlights for each of the five years in the period then ended, in conformity with accounting principles generally accepted in the United States of America. These financial statements and financial highlights (hereafter referred to as “financial statements”) are the responsibility of the Funds’ management. Our responsibility is to express an opinion on these financial statements based on our audits. We conducted our audits of these financial statements in accordance with the standards of the Public Company Accounting Oversight Board (United States). Those standards require that we plan and perform the audit to obtain reasonable assurance about whether the financial statements are free of material misstatement. An audit includes examining, on a test basis, evidence supporting the amounts and disclosures in the financial statements, assessing the accounting principles used and significant estimates made by management, and evaluating the overall financial statement presentation. We believe that our audits, which included confirmation of securities at November 30, 2014 by correspondence with the custodian and the application of alternative auditing procedures where securities purchased had not been received, provide a reasonable basis for our opinion.
/s/PricewaterhouseCoopers LLP
Philadelphia, Pennsylvania
January 13, 2015
Special 2014 tax information (unaudited) for Vanguard Ohio Tax-Exempt Funds
This information for the fiscal year ended November 30, 2014, is included pursuant to provisions of
the Internal Revenue Code.
Each fund designates 100% of its income dividends as exempt-interest dividends.
The Long-Term Tax-Exempt Fund distributed $3,992,000 as capital gain dividends (from net long-term
capital gains) to shareholders during the fiscal year.
For nonresident alien shareholders, 100% of short-term capital gain dividends distributed by the funds
are qualified short-term capital gains.
46
About Your Fund’s Expenses
As a shareholder of the fund, you incur ongoing costs, which include costs for portfolio management, administrative services, and shareholder reports (like this one), among others. Operating expenses, which are deducted from a fund’s gross income, directly reduce the investment return of the fund.
A fund’s expenses are expressed as a percentage of its average net assets. This figure is known as the expense ratio. The following examples are intended to help you understand the ongoing costs (in dollars) of investing in your fund and to compare these costs with those of other mutual funds. The examples are based on an investment of $1,000 made at the beginning of the period shown and held for the entire period.
The accompanying table illustrates your fund’s costs in two ways:
• Based on actual fund return. This section helps you to estimate the actual expenses that you paid over the period. The ”Ending Account Value“ shown is derived from the fund‘s actual return, and the third column shows the dollar amount that would have been paid by an investor who started with $1,000 in the fund. You may use the information here, together with the amount you invested, to estimate the expenses that you paid over the period.
To do so, simply divide your account value by $1,000 (for example, an $8,600 account value divided by $1,000 = 8.6), then multiply the result by the number given for your fund under the heading ”Expenses Paid During Period.“
• Based on hypothetical 5% yearly return. This section is intended to help you compare your fund‘s costs with those of other mutual funds. It assumes that the fund had a yearly return of 5% before expenses, but that the expense ratio is unchanged. In this case—because the return used is not the fund’s actual return—the results do not apply to your investment. The example is useful in making comparisons because the Securities and Exchange Commission requires all mutual funds to calculate expenses based on a 5% return. You can assess your fund’s costs by comparing this hypothetical example with the hypothetical examples that appear in shareholder reports of other funds.
Note that the expenses shown in the table are meant to highlight and help you compare ongoing costs only and do not reflect transaction costs incurred by the fund for buying and selling securities. Further, the expenses do not include any purchase, redemption, or account service fees described in the fund prospectus. If such fees were applied to your account, your costs would be higher. Your fund does not carry a “sales load.”
The calculations assume no shares were bought or sold during the period. Your actual costs may have been higher or lower, depending on the amount of your investment and the timing of any purchases or redemptions.
You can find more information about the fund’s expenses, including annual expense ratios, in the Financial Statements section of this report. For additional information on operating expenses and other shareholder costs, please refer to your fund’s current prospectus.
47
| | | |
| Six Months Ended November 30, 2014 | | | |
| | Beginning | Ending | Expenses |
| | Account Value | Account Value | Paid During |
| | 5/31/2014 | 11/30/2014 | Period |
| Based on Actual Fund Return | | | |
| Ohio Tax-Exempt Money Market Fund | $1,000.00 | $1,000.05 | $0.40 |
| Ohio Long-Term Tax-Exempt Fund | $1,000.00 | $1,029.55 | $0.81 |
| Based on Hypothetical 5% Yearly Return | | | |
| Ohio Tax-Exempt Money Market Fund | $1,000.00 | $1,024.67 | $0.41 |
| Ohio Long-Term Tax-Exempt Fund | $1,000.00 | $1,024.27 | $0.81 |
The calculations are based on expenses incurred in the most recent six-month period. The funds’ annualized six-month expense ratios for thatperiod are: for the Ohio Tax-Exempt Money Market Fund, 0.08%; and for the Ohio Long-Term Tax-Exempt Fund, 0.16%. (The six-monthexpense ratio for the Ohio Tax-Exempt Money Market Fund reflects a temporary reduction in operating expenses, described in Note B of theNotes to Financial Statements. Before the reduction, the fund’s annualized six-month expense ratio was 0.16%.) The dollar amounts shownas “Expenses Paid” are equal to the annualized expense ratio multiplied by the average account value over the period, multiplied by thenumber of days in the most recent six-month period, then divided by the number of days in the most recent 12-month period.48
Glossary
7-Day SEC Yield and 30-Day SEC Yield. A money market fund’s 7-day SEC yield is calculated by annualizing its income distributions for the previous seven days, as required by the U.S. Securities and Exchange Commission. For other funds, 30-day SEC yield is derived using a formula specified by the commission. Under the formula, data related to the fund’s security holdings in the previous 30 days are used to calculate the fund’s hypothetical net income for that period, which is then annualized and divided by the fund’s estimated average net assets over the calculation period. For the purposes of this calculation, a security’s income is based on its current market yield to maturity (for bonds), its actual income (for asset-backed securities), or its projected dividend yield (for stocks). Because the SEC yield represents hypothetical annualized income, it will differ—at times significantly—from the fund’s actual experience. As a result, the fund’s income distributions may be higher or lower than implied by the SEC yield.
Average Coupon. The average interest rate paid on the fixed income securities held by a fund. It is expressed as a percentage of face value.
Average Duration. An estimate of how much the value of the bonds held by a fund will fluctuate in response to a change in interest rates. To see how the value could change, multiply the average duration by the change in rates. If interest rates rise by 1 percentage point, the value of the bonds in a fund with an average duration of five years would decline by about 5%. If rates decrease by a percentage point, the value would rise by 5%.
Average Stated Maturity. The average length of time until fixed income securities held by a fund reach maturity and are repaid using the maturity date of the security. The figure reflects the proportion of fund assets represented by each security; it also reflects any futures contracts held. In general, the longer the average stated maturity, the more a fund’s share price will fluctuate in response to changes in market interest rates.
Average Weighted Maturity. The average length of time until fixed income securities held by a fund reach maturity and are repaid. The figure reflects the proportion of fund assets represented by each security.
Beta. A measure of the magnitude of a fund’s past share-price fluctuations in relation to the ups and downs of a given market index. The index is assigned a beta of 1.00. Compared with a given index, a fund with a beta of 1.20 typically would have seen its share price rise or fall by 12% when the index rose or fell by 10%. For this report, beta is based on returns over the past 36 months for both the fund and the index. Note that a fund’s beta should be reviewed in conjunction with its R-squared (see definition). The lower the R-squared, the less correlation there is between the fund and the index, and the less reliable beta is as an indicator of volatility.
49
Credit Quality. For Vanguard money market funds, the Distribution by Credit Quality table includes tier ratings for consistency with SEC Rule 2a-7 under the Investment Company Act of 1940, which governs money market funds. A First Tier security is one that is eligible for money market funds and has been rated in the highest short-term rating category for debt obligations by the requisite nationally recognized statistical rating organizations. Credit-quality ratings are obtained from Moody’s, Fitch, and S&P. For securities rated by all three agencies, where two of them are in agreement and assign the highest rating category, the highest rating applies. If a security is only rated by two agencies, and their ratings are in different categories, the lower of the ratings applies. An unrated security is First Tier if it represents quality comparable to that of a rated security, as determined in accordance with SEC Rule 2a-7. A Second Tier security is one that is eligible for money market funds and is not a First Tier security. For Vanguard tax-exempt bond funds, credit-quality ratings are measured on a scale that generally ranges from AAA (highest) to D (lowest). “Not Rated” is used to classify securities for which a rating is not available. Credit-quality ratings are obtained from Moody’s and S&P, and the higher rating for each issue is used.
Expense Ratio. A fund’s total annual operating expenses expressed as a percentage of the fund’s average net assets. The expense ratio includes management and administrative expenses, but does not include the transaction costs of buying and selling portfolio securities.
Inception Date. The date on which the assets of a fund (or one of its share classes) are first invested in accordance with the fund’s investment objective. For funds with a subscription period, the inception date is the day after that period ends. Investment performance is measured from the inception date.
R-Squared. A measure of how much of a fund’s past returns can be explained by the returns from the market in general, as measured by a given index. If a fund’s total returns were precisely synchronized with an index’s returns, its R-squared would be 1.00. If the fund’s returns bore no relationship to the index’s returns, its R-squared would be 0. For this report, R-squared is based on returns over the past 36 months for both the fund and the index.
Short-Term Reserves. The percentage of a fund invested in highly liquid, short-term securities that can be readily converted to cash.
Yield to Maturity. The rate of return an investor would receive if the fixed income securities held by a fund were held to their maturity dates.
Benchmark Information
Spliced Ohio Tax-Exempt Money Market Funds Average: Ohio Tax-Exempt Money Market Funds
Average through August 31, 2013; Other States Tax-Exempt Money Market Funds Average
thereafter.
50
This page intentionally left blank.
The People Who Govern Your Fund
The trustees of your mutual fund are there to see that the fund is operated and managed in your best interests since, as a shareholder, you are a part owner of the fund. Your fund’s trustees also serve on the board of directors of The Vanguard Group, Inc., which is owned by the Vanguard funds and provides services to them on an at-cost basis.
A majority of Vanguard’s board members are independent, meaning that they have no affiliation with Vanguard or the funds they oversee, apart from the sizable personal investments they have made as private individuals. The independent board members have distinguished backgrounds in business, academia, and public service. Each of the trustees and executive officers oversees 177 Vanguard funds.
The following table provides information for each trustee and executive officer of the fund. More information about the trustees is in the Statement of Additional Information, which can be obtained, without charge, by contacting Vanguard at 800-662-7447, or online at vanguard.com.
| |
| InterestedTrustee1 | and Delphi Automotive LLP (automotive components); |
| | Senior Advisor at New Mountain Capital. |
| F. William McNabb III | |
| Born 1957. Trustee Since July 2009. Chairman of the | Amy Gutmann |
| Board. Principal Occupation(s) During the Past Five | Born 1949. Trustee Since June 2006. Principal |
| Years: Chairman of the Board of The Vanguard Group, | Occupation(s) During the Past Five Years: President of |
| Inc., and of each of the investment companies served | the University of Pennsylvania; Christopher H. Browne |
| by The Vanguard Group, since January 2010; Director | Distinguished Professor of Political Science, School of |
| of The Vanguard Group since 2008; Chief Executive | Arts and Sciences, and Professor of Communication, |
| Officer and President of The Vanguard Group, and of | Annenberg School for Communication, with secondary |
| each of the investment companies served by The | faculty appointments in the Department of Philosophy, |
| Vanguard Group, since 2008; Director of Vanguard | School of Arts and Sciences, and at the Graduate |
| Marketing Corporation; Managing Director of The | School of Education, University of Pennsylvania; |
| Vanguard Group (1995–2008). | Trustee of the National Constitution Center; Chair |
| | of the Presidential Commission for the Study of |
| | Bioethical Issues. |
| IndependentTrustees | |
| | JoAnn Heffernan Heisen |
| Emerson U. Fullwood | Born 1950. Trustee Since July 1998. Principal |
| Born 1948. Trustee Since January 2008. Principal | Occupation(s) During the Past Five Years: Corporate |
| Occupation(s) During the Past Five Years: Executive | Vice President and Chief Global Diversity Officer |
| Chief Staff and Marketing Officer for North America | (retired 2008) and Member of the Executive |
| and Corporate Vice President (retired 2008) of Xerox | Committee (1997–2008) of Johnson & Johnson |
| Corporation (document management products and | (pharmaceuticals/medical devices/consumer |
| services); Executive in Residence and 2009–2010 | products); Director of Skytop Lodge Corporation |
| Distinguished Minett Professor at the Rochester | (hotels), the University Medical Center at Princeton, |
| Institute of Technology; Director of SPX Corporation | the Robert Wood Johnson Foundation, and the Center |
| (multi-industry manufacturing), the United Way of | for Talent Innovation; Member of the Advisory Board |
| Rochester, Amerigroup Corporation (managed health | of the Maxwell School of Citizenship and Public Affairs |
| care), the University of Rochester Medical Center, | at Syracuse University. |
| Monroe Community College Foundation, and North | |
| Carolina A&T University. | F. Joseph Loughrey |
| | Born 1949. Trustee Since October 2009. Principal |
| Rajiv L. Gupta | Occupation(s) During the Past Five Years: President |
| Born 1945. Trustee Since December 2001.2 | and Chief Operating Officer (retired 2009) of Cummins |
| Principal Occupation(s) During the Past Five Years: | Inc. (industrial machinery); Chairman of the Board |
| Chairman and Chief Executive Officer (retired 2009) | of Hillenbrand, Inc. (specialized consumer services), |
| and President (2006–2008) of Rohm and Haas Co. | and of Oxfam America; Director of SKF AB (industrial |
| (chemicals); Director of Tyco International, Ltd. | machinery), Hyster-Yale Materials Handling, Inc. |
| (diversified manufacturing and services), Hewlett- | (forklift trucks), the Lumina Foundation for Education, |
| Packard Co. (electronic computer manufacturing), | |
| | |
| and the V Foundation for Cancer Research; Member | Executive Officers | |
| of the Advisory Council for the College of Arts and | | |
| Letters and of the Advisory Board to the Kellogg | Glenn Booraem | |
| Institute for International Studies, both at the | Born 1967. Controller Since July 2010. Principal |
| University of Notre Dame. | Occupation(s) During the Past Five Years: Principal |
| | of The Vanguard Group, Inc.; Controller of each of |
| Mark Loughridge | the investment companies served by The Vanguard |
| Born 1953. Trustee Since March 2012. Principal | Group; Assistant Controller of each of the investment |
| Occupation(s) During the Past Five Years: Senior Vice | companies served by The Vanguard Group (2001–2010). |
| President and Chief Financial Officer (retired 2013) | | |
| at IBM (information technology services); Fiduciary | Thomas J. Higgins | |
| Member of IBM’s Retirement Plan Committee (2004– | Born 1957. Chief Financial Officer Since September |
| 2013); Member of the Council on Chicago Booth. | 2008. Principal Occupation(s) During the Past Five |
| | Years: Principal of The Vanguard Group, Inc.; Chief |
| Scott C. Malpass | Financial Officer of each of the investment companies |
| Born 1962. Trustee Since March 2012. Principal | served by The Vanguard Group; Treasurer of each of |
| Occupation(s) During the Past Five Years: Chief | the investment companies served by The Vanguard |
| Investment Officer and Vice President at the University | Group (1998–2008). | |
| of Notre Dame; Assistant Professor of Finance at the | | |
| Mendoza College of Business at Notre Dame; Member | Kathryn J. Hyatt | |
| of the Notre Dame 403(b) Investment Committee; | Born 1955. Treasurer Since November 2008. Principal |
| Board Member of TIFF Advisory Services, Inc. | Occupation(s) During the Past Five Years: Principal of |
| (investment advisor); Member of the Investment | The Vanguard Group, Inc.; Treasurer of each of the |
| Advisory Committees of the Financial Industry | investment companies served by The Vanguard |
| Regulatory Authority (FINRA) and of Major League | Group; Assistant Treasurer of each of the investment |
| Baseball. | companies served by The Vanguard Group (1988–2008). |
| |
| André F. Perold | Heidi Stam | |
| Born 1952. Trustee Since December 2004. Principal | Born 1956. Secretary Since July 2005. Principal |
| Occupation(s) During the Past Five Years: George | Occupation(s) During the Past Five Years: Managing |
| Gund Professor of Finance and Banking, Emeritus | Director of The Vanguard Group, Inc.; General Counsel |
| at the Harvard Business School (retired 2011); | of The Vanguard Group; Secretary of The Vanguard |
| Chief Investment Officer and Managing Partner of | Group and of each of the investment companies |
| HighVista Strategies LLC (private investment firm); | served by The Vanguard Group; Director and Senior |
| Director of Rand Merchant Bank; Overseer of the | Vice President of Vanguard Marketing Corporation. |
| Museum of Fine Arts Boston. | | |
| | Vanguard Senior ManagementTeam |
| Alfred M. Rankin, Jr. | | |
| Born 1941. Trustee Since January 1993. Principal | Mortimer J. Buckley | Chris D. McIsaac |
| Occupation(s) During the Past Five Years: Chairman, | Kathleen C. Gubanich | Michael S. Miller |
| President, and Chief Executive Officer of NACCO | Paul A. Heller | James M. Norris |
| Industries, Inc. (housewares/lignite), and of Hyster- | Martha G. King | Glenn W. Reed |
| Yale Materials Handling, Inc. (forklift trucks); Chairman | John T. Marcante | |
| of the Board of University Hospitals of Cleveland. | | |
| |
| Peter F. Volanakis | Chairman Emeritus and Senior Advisor |
| Born 1955. Trustee Since July 2009. Principal | | |
| Occupation(s) During the Past Five Years: President | John J. Brennan | |
| and Chief Operating Officer (retired 2010) of Corning | Chairman, 1996–2009 | |
| Incorporated (communications equipment); Trustee of | Chief Executive Officer and President, 1996–2008 |
| Colby-Sawyer College; Member of the Advisory Board | | |
| of the Norris Cotton Cancer Center and of the Advisory | Founder | |
| Board of the Parthenon Group (strategy consulting). | | |
| | John C. Bogle | |
| | Chairman and Chief Executive Officer, 1974–1996 |
1 Mr. McNabb is considered an “interested person,” as defined in the Investment Company Act of 1940, because he is an officer of the
Vanguard funds.
2 December 2002 for Vanguard Equity Income Fund, the Vanguard Municipal Bond Funds, and the Vanguard State Tax-Exempt Funds.
| 
|
| | P.O. Box 2600 |
| | Valley Forge, PA 19482-2600 |
| |
| |
| |
| Connect with Vanguard® > vanguard.com | |
| |
| |
| |
| Fund Information > 800-662-7447 | CFA® is a registered trademark owned by CFA Institute. |
| Direct Investor Account Services > 800-662-2739 | |
| Institutional Investor Services > 800-523-1036 | |
| Text Telephone for People | |
| Who Are Deaf or Hard of Hearing> 800-749-7273 | |
| |
| This material may be used in conjunction | |
| with the offering of shares of any Vanguard | |
| fund only if preceded or accompanied by | |
| the fund’s current prospectus. | |
| |
| All comparative mutual fund data are from Lipper, a | |
| Thomson Reuters Company, or Morningstar, Inc., unless | |
| otherwise noted. | |
| |
| You can obtain a free copy of Vanguard’s proxy voting | |
| guidelines by visiting vanguard.com/proxyreporting or by | |
| calling Vanguard at 800-662-2739. The guidelines are | |
| also available from the SEC’s website, sec.gov. In | |
| addition, you may obtain a free report on how your fund | |
| voted the proxies for securities it owned during the 12 | |
| months ended June 30. To get the report, visit either | |
| vanguard.com/proxyreporting or sec.gov. | |
| |
| You can review and copy information about your fund at | |
| the SEC’s Public Reference Room in Washington, D.C. To | |
| find out more about this public service, call the SEC at | |
| 202-551-8090. Information about your fund is also | |
| available on the SEC’s website, and you can receive | |
| copies of this information, for a fee, by sending a | |
| request in either of two ways: via e-mail addressed to | |
| publicinfo@sec.gov or via regular mail addressed to the | |
| Public Reference Section, Securities and Exchange | |
| Commission, Washington, DC 20549-1520. | |
| |
| | © 2015 The Vanguard Group, Inc. |
| | All rights reserved. |
| | Vanguard Marketing Corporation, Distributor. |
| |
| | Q960 012015 |
Item 2: Code of Ethics. The Registrant has adopted a code of ethics that applies to the Registrant’s principal executive officer, principal financial officer, principal accounting officer or controller or persons performing similar functions. The Code of Ethics was amended during the reporting period covered by this report to make certain technical, non-material changes.
Item 3: Audit Committee Financial Expert. The following members of the Audit Committee have been determined by the Registrant’s Board of Trustees to be Audit Committee Financial Experts serving on its Audit Committee, and to be independent: Rajiv L. Gupta, Amy Gutmann, JoAnn Heffernan Heisen, F. Joseph Loughrey, Mark Loughridge, Scott C. Malpass, and André F. Perold.
Item 4: Principal Accountant Fees and Services.
(a) Audit Fees.
Audit Fees of the Registrant
Fiscal Year Ended November 30, 2014: $60,000
Fiscal Year Ended November 30, 2013: $52,000
Aggregate Audit Fees of Registered Investment Companies in the Vanguard Group.
Fiscal Year Ended November 30, 2014: $6,605,127
Fiscal Year Ended November 30, 2013: $5,714,113
Includes fees billed in connection with audits of the Registrant, other registered investment companies in the Vanguard complex, The Vanguard Group, Inc. and Vanguard Marketing Corporation.
(b) Audit-Related Fees.
Fiscal Year Ended November 30, 2014: $2,176,479
Fiscal Year Ended November 30, 2013: $1,552,950
Includes fees billed in connection with assurance and related services provided to the Registrant, other registered investment companies in the Vanguard complex, The Vanguard Group, Inc., and Vanguard Marketing Corporation.
(c) Tax Fees.
Fiscal Year Ended November 30, 2014: $316,869
Fiscal Year Ended November 30, 2013: $110,000
Includes fees billed in connection with tax compliance, planning, and advice services provided to the Registrant, other registered investment companies in the Vanguard complex, The Vanguard Group, Inc., and Vanguard Marketing Corporation.
(d) All Other Fees.
Fiscal Year Ended November 30, 2014: $198,163
Fiscal Year Ended November 30, 2013: $132,000
Includes fees billed for services related to tax reported information provided to the Registrant, other registered investment companies in the Vanguard complex, The Vanguard Group, Inc., and Vanguard Marketing Corporation.
(e) (1) Pre-Approval Policies. The policy of the Registrant’s Audit Committee is to consider and, if appropriate, approve before the principal accountant is engaged for such services, all specific audit and non-audit services provided to: the Registrant, other registered investment companies in the Vanguard complex, The Vanguard Group, Inc., and entities controlled by The Vanguard Group, Inc. that provide ongoing services to the Registrant. In making a determination, the Audit Committee considers whether the services are consistent with maintaining the principal accountant’s independence.
In the event of a contingency situation in which the principal accountant is needed to provide services in between scheduled Audit Committee meetings, the Chairman of the Audit Committee would be called on to consider and, if appropriate, pre-approve audit or permitted non-audit services in an amount sufficient to complete services through the next Audit Committee meeting, and to determine if such services would be consistent with maintaining the accountant’s independence. At the next scheduled Audit Committee meeting, services and fees would be presented to the Audit Committee for formal consideration, and, if appropriate, approval by the entire Audit Committee. The Audit Committee would again consider whether such services and fees are consistent with maintaining the principal accountant’s independence.
The Registrant’s Audit Committee is informed at least annually of all audit and non-audit services provided by the principal accountant to the Vanguard complex, whether such services are provided to: the Registrant, other registered investment companies in the Vanguard complex, The Vanguard Group, Inc., or other entities controlled by The Vanguard Group, Inc. that provide ongoing services to the Registrant.
(2) No percentage of the principal accountant’s fees or services were approved pursuant to the waiver provision of paragraph (c)(7)(i)(C) of Rule 2-01 of Regulation S-X.
(f) For the most recent fiscal year, over 50% of the hours worked under the principal accountant’s engagement were not performed by persons other than full-time, permanent employees of the principal accountant.
(g) Aggregate Non-Audit Fees.
Fiscal Year Ended November 30, 2014: $515,032
Fiscal Year Ended November 30, 2013: $242,000
Includes fees billed for non-audit services provided to the Registrant, other registered investment companies in the Vanguard complex, The Vanguard Group, Inc., and Vanguard Marketing Corporation.
(h) For the most recent fiscal year, the Audit Committee has determined that the provision of all non-audit services was consistent with maintaining the principal accountant’s independence.
Item 5: Audit Committee of Listed Registrants.
Not Applicable.
Item 6: Investments.
Not Applicable.
Item 7: Disclosure of Proxy Voting Policies and Procedures for Closed-End Management Investment Companies.
Not Applicable.
Item 8: Portfolio Managers of Closed-End Management Investment Companies.
Not Applicable.
Item 9: Purchase of Equity Securities by Closed-End Management Investment Company and Affiliated Purchasers.
Not Applicable.
Item 10: Submission of Matters to a Vote of Security Holders.
Not Applicable.
Item 11: Controls and Procedures.
(a) Disclosure Controls and Procedures. The Principal Executive and Financial Officers concluded that the Registrant’s Disclosure Controls and Procedures are effective based on their evaluation of the Disclosure Controls and Procedures as of a date within 90 days of the filing date of this report.
(b) Internal Control Over Financial Reporting. There were no significant changes in Registrant’s Internal Control Over Financial Reporting or in other factors that could significantly affect this control subsequent to the date of the evaluation, including any corrective actions with regard to significant deficiencies and material weaknesses.
Item 12: Exhibits.
(a) Code of Ethics.
(b) Certifications.
Pursuant to the requirements of the Securities Exchange Act of 1934 and the Investment Company Act of 1940, the registrant has duly caused this report to be signed on its behalf by the undersigned, thereunto duly authorized.
| |
| | VANGUARD OHIO TAX-FREE FUNDS |
| |
| |
| BY: | /s/ F. WILLIAM MCNABB III* |
| F. WILLIAM MCNABB III |
| CHIEF EXECUTIVE OFFICER |
| |
| Date: January 21, 2015 |
Pursuant to the requirements of the Securities Exchange Act of 1934 and the Investment Company Act of 1940, this report has been signed below by the following persons on behalf of the registrant and in the capacities and on the dates indicated.
| |
| | VANGUARD OHIO TAX-FREE FUNDS |
| |
| |
| BY: | /s/ F. WILLIAM MCNABB III* |
| F. WILLIAM MCNABB III |
| CHIEF EXECUTIVE OFFICER |
| |
| Date: January 21, 2015 |
| |
| | VANGUARD OHIO TAX-FREE FUNDS |
| |
| |
| BY: | /s/ THOMAS J. HIGGINS* |
| | THOMAS J. HIGGINS |
| CHIEF FINANCIAL OFFICER |
| |
| Date: January 21, 2015 |
* By: /s/ Heidi Stam
Heidi Stam, pursuant to a Power of Attorney filed on April 22, 2014 see file Number 2-17620, Incorporated by Reference.