The
TORRAY
FUND
ANNUAL REPORT
December 31, 2017
The Torray Fund
Suite 750 W
7501 Wisconsin Avenue
Bethesda, Maryland 20814
(301) 493-4600
(855) 753-8174
The Torray Fund
Letter to Shareholders
January 15, 2018
Dear Fellow Shareholders,
The Torray Fund advanced 12.07% in 2017 compared to a gain of 21.83% on the Standard & Poor’s 500 Index, the latter number reflecting particular strength in the shares of growth companies. According to the Wall Street Journal, almost 24% of the S&P 500 return last year can be attributed to just five stocks – Alphabet (parent of Google), Amazon, Apple, Facebook and Microsoft. The Russell 1000 Growth Index returned 30.21% while the Russell 1000 Value Index gained 13.66%. The unusually wide spread on this large group was last seen in the late 1990s. We believe these excessive valuations are unlikely to support reasonable, long-term outcomes and, in some cases, may cause punishing losses.
Much of the current situation sheds light on the significant flow of capital into index funds and an overwhelming number of exchange traded funds. In both cases, the capitalization size of companies determines where the money goes, explaining why prices of the largest, most inflated stocks continue to rise regardless of underlying fundamentals. Such patterns have occasionally surfaced in the past, producing painful results for those playing the game. As we said in our July letter, our objective remains the same – to invest in sound businesses using a value-oriented strategy that focuses on limiting risk while building shareholder wealth over time. Our Fund’s portfolio matches this theme. Today’s shortage of attractive examples explains the Fund’s 11.7% cash reserve which will be used to take advantage of promising opportunities as they arise.
Portfolio activity was modest in the second half of the year. We trimmed three holdings, added to three others, and sold two positions along with one small spin-off. The only new investment was Royal Dutch Shell, a large integrated oil company with a conservative financial structure, modest valuation and a dividend yield in excess of 6%.
After more than eight years of aggressive monetary ease, fiscal deficits and steady economic growth, asset prices, as noted, seem high to us almost across the board – equities, real estate, tangible assets, cryptocurrencies, etc. (As skeptical as we are of equities in general, we find fixed income prices even more out of line.) Investors’ recollections of past stock market booms and busts seem to have faded in the backdrop of surging prices. Our experience of nearly 50 years has consistently shown that a conservative approach to appraising investments is critical to long-term success. In that vein, we are more than comfortable with our Fund’s estimated forward price-earnings ratio of 13.7, but leery of the 18.4 measure carried by the S&P 500.
The Torray Fund
Letter to Shareholders (continued)
January 15, 2018
Those of us who have devoted a lifetime to investment analysis with special emphasis on business fundamentals and the lessons of history have witnessed triumphs and tragedies, booms and busts, and the rise of countless grand theories only to see them toppled by reality. For us there is nothing new in the events of recent years, or in the pronouncements of “experts” along the way. We’ve seen it all, and we’ll see it again. This is the message our letters have conveyed from the start. We hope they have helped.
We are grateful for your support and the opportunity to manage your funds.
| | Sincerely, |
| | |
| |  |
| | Robert E. Torray |
| | |
| | |
| |  |
| | Shawn M. Hendon |
The Torray Fund
PERFORMANCE DATA
As of December 31, 2017 (unaudited)
Average Annual Returns on an Investment in
The Torray Fund vs. the S&P 500 Index
For the periods ended December 31, 2017:
| | | | | | Since |
| | | | | | Inception |
| | 1 Year | 3 Years | 5 Years | 10 Years | 12/31/90 |
| The Torray Fund | 12.07% | 8.11% | 13.46% | 6.47% | 10.16% |
| S&P 500 Index | 21.83% | 11.41% | 15.79% | 8.50% | 10.32% |
Cumulative Returns for the 27 years ended December 31, 2017
| | The Torray Fund | 1,262.11% | |
| | S&P 500 Index | 1,317.93% | |
The Torray Fund
PERFORMANCE DATA (continued)
As of December 31, 2017 (unaudited)
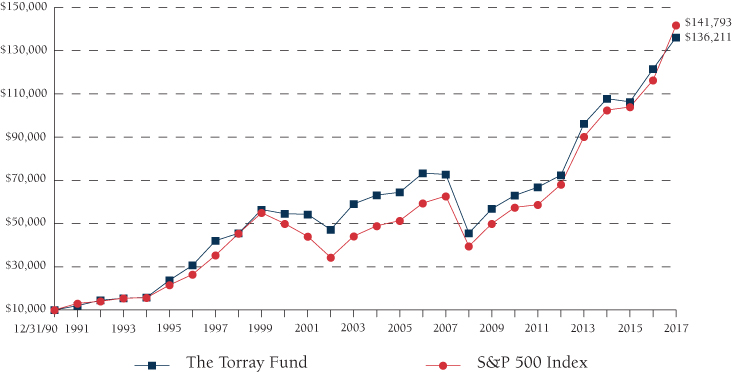
Change in Value of $10,000 Invested
on December 31, 1990 (commencement of operations) to:
| | 12/31/90 | 12/31/95 | 12/31/00 | 12/31/05 | 12/31/10 | 12/31/15 | 12/31/17 |
| The Torray Fund | $10,000 | $23,774 | $54,563 | $64,476 | $63,039 | $106,342 | $136,211 |
| S&P 500 Index | $10,000 | $21,544 | $49,978 | $51,354 | $57,511 | $103,952 | $141,793 |
The returns quoted represent past performance and do not guarantee future results. Investment return and principal value will fluctuate so that shares, when redeemed, may be worth more or less than their original cost. Current performance may be lower or higher. For performance current to the most recent month end, please call (800) 626-9769. The returns shown do not reflect the deduction of taxes a shareholder would pay on the redemption of fund shares and distributions. The Fund’s Gross Expense Ratio is 1.18%. The Fund’s Net Expense Ratio of 1.10%, after fee waiver and expense reimbursement, will contractually remain in effect through April 30, 2018. Returns on both The Torray Fund and the S&P 500 Index assume reinvestment of all dividends and distributions. The S&P 500 Index is an unmanaged index consisting of 500 U.S. large-cap stocks. It is not possible to invest directly in an index. Current and future portfolio holdings are subject to change and risk. Mutual fund investing involves risk, including the possible loss of principal value. At times, the Fund’s portfolio may be more concentrated than that of a more diversified fund, subjecting it to greater fluctuation and risk.
The Torray Fund
FUND PROFILE
As of December 31, 2017 (unaudited)
DIVERSIFICATION (% of net assets)
| Financials | | | 28.4 | % |
| Information Technology | | | 16.0 | % |
| Industrials | | | 12.9 | % |
| Consumer Discretionary | | | 11.9 | % |
| Energy | | | 8.8 | % |
| Health Care | | | 7.5 | % |
| Materials | | | 2.8 | % |
| Short-Term Investments | | | 11.7 | % |
| Other Assets and Liabilities, Net | | | 0.0 | % |
| | | | 100.0 | % |
TOP TEN EQUITY HOLDINGS (% of net assets)
| | 1. | | Bank of America Corp. | | | 5.3 | % |
| | 2. | | American Express Co. | | | 4.4 | % |
| | 3. | | Loews Corp. | | | 4.1 | % |
| | 4. | | Cisco Systems, Inc. | | | 4.0 | % |
| | 5. | | BP plc – ADR | | | 3.9 | % |
| | 6. | | General Motors Co. | | | 3.6 | % |
| | 7. | | Wells Fargo & Co. | | | 3.4 | % |
| | 8. | | Johnson & Johnson | | | 3.4 | % |
| | 9. | | Chubb Ltd. | | | 3.0 | % |
| | 10. | | International Business Machines Corp. | | | 3.0 | % |
| | | | | | | 38.1 | % |
PORTFOLIO CHARACTERISTICS
| Net Assets (millions) | | $448 |
| Number of Holdings | | 31 |
| Portfolio Turnover | | 19.38% |
| P/E Multiple (forward) | | 13.7x |
| Trailing Weighted Average Dividend Yield | | 1.9% |
| Market Capitalization (billion) | Average | $125 |
| | Median | $57 |
The Torray Fund
SCHEDULE OF INVESTMENTS
As of December 31, 2017
| | Shares | | | | Market Value | |
| COMMON STOCKS 88.3% | |
| | | | | | | |
28.4% FINANCIALS† | |
| | | 801,500 | | Bank of America Corp. | | $ | 23,660,280 | |
| | | 200,250 | | American Express Co. | | | 19,886,827 | |
| | | 364,400 | | Loews Corp. | | | 18,230,932 | |
| | | 253,400 | | Wells Fargo & Co. | | | 15,373,778 | |
| | | 92,950 | | Chubb Ltd. | | | 13,582,784 | |
| | | 65,400 | | Berkshire Hathaway, Inc. – Class B* | | | 12,963,588 | |
| | | 156,818 | | Marsh & McLennan Cos., Inc. | | | 12,763,417 | |
| | | 177,700 | | American International Group, Inc. | | | 10,587,366 | |
| | | | | | | | 127,048,972 | |
| | | | | | | | | |
| 16.0% INFORMATION TECHNOLOGY | |
| | | 465,300 | | Cisco Systems, Inc. | | | 17,820,990 | |
| | | 87,650 | | International Business Machines Corp. | | | 13,447,263 | |
| | | 569,400 | | HP, Inc. | | | 11,963,094 | |
| | | 252,700 | | Intel Corp. | | | 11,664,632 | |
| | | 475,900 | | Western Union Co. | | | 9,046,859 | |
| | | 538,700 | | Hewlett Packard Enterprise Co. | | | 7,735,732 | |
| | | | | | | | 71,678,570 | |
| | | | | | | | | |
| 12.9% INDUSTRIALS | |
| | | 166,350 | | Eaton Corp. plc | | | 13,143,313 | |
| | | 746,097 | | General Electric Co. | | | 13,019,393 | |
| | | 587,600 | | KBR, Inc. | | | 11,652,108 | |
| | | 63,600 | | Stanley Black & Decker, Inc. | | | 10,792,284 | |
| | | 45,900 | | General Dynamics Corp. | | | 9,338,355 | |
| | | | | | | | 57,945,453 | |
| | | | | | | | | |
| 11.9% CONSUMER DISCRETIONARY | |
| | | 391,300 | | General Motors Co. | | | 16,039,387 | |
| | | 1,040,150 | | Gannett Co., Inc. | | | 12,055,339 | |
| | | 191,300 | | Tupperware Brands Corp. | | | 11,994,510 | |
| | | 480,300 | | TEGNA, Inc. | | | 6,762,624 | |
| | | 207,700 | | Viacom, Inc. – Class B | | | 6,399,237 | |
| | | | | | | | 53,251,097 | |
See notes to the financial statements.
The Torray Fund
SCHEDULE OF INVESTMENTS (continued)
As of December 31, 2017
| | | Shares | | | | Market Value | |
| 8.8% ENERGY | | | |
| | | | 417,620 | | BP plc – ADR | | $ | 17,552,569 | |
| | | | 190,000 | | Royal Dutch Shell plc – ADR | | | 12,674,900 | |
| | | | 702,900 | | Boardwalk Pipeline Partners LP | | | 9,074,439 | |
| | | | | | | | | 39,301,908 | |
| | | | | | | | | | |
| 7.5% HEALTH CARE | | | | |
| | | | 108,924 | | Johnson & Johnson | | | 15,218,861 | |
| | | | 49,350 | | Becton Dickinson & Co. | | | 10,563,861 | |
| | | | 34,650 | | UnitedHealth Group Inc. | | | 7,638,939 | |
| | | | | | | | | 33,421,661 | |
| | | | | | | | | | |
| 2.8% MATERIALS | | | | |
| | | | 176,200 | | DowDuPont, Inc. | | | 12,548,964 | |
| TOTAL COMMON STOCKS | | | | |
| (cost $266,543,118) | | | 395,196,625 | |
| | | | | | | | | | |
| SHORT-TERM INVESTMENTS 11.7% | |
| | |
| 3.9% MONEY MARKET FUND | |
| | | | | | Fidelity Investments Money Market Funds Government | | | | |
| | | | | | Portfolio, Class I, 1.14%^ | | | 17,461,172 | |
| | | | | | | | | | |
| | | Par | | | | | | |
| | 7.8% U.S. TREASURY OBLIGATION | |
| | | | | | U.S. Treasury Bill, 1.00%, 1/18/2018 | | | 34,982,481 | |
| TOTAL SHORT-TERM INVESTMENTS | |
| (cost $52,443,653) | | | 52,443,653 | |
| TOTAL INVESTMENTS 100.0% | | | | |
| (cost $318,986,771) | | | 447,640,278 | |
| OTHER ASSETS AND LIABILITIES, NET 0.0% | | | 47,891 | |
| TOTAL NET ASSETS 100.0% | | $ | 447,688,169 | |
| † | As of December 31, 2017, the Fund had a significant portion of its assets invested in this sector. See Note 8 in the Notes to the Financial Statements. |
| * | Non-income producing security. |
| ^ | The rate shown is the annualized seven day effective yield as of December 31, 2017. |
| Rate shown is effective yield as of December 31, 2017. |
| ADR – American Depositary Receipt |
See notes to the financial statements.
The Torray Fund
STATEMENT OF ASSETS AND LIABILITIES
As of December 31, 2017
| ASSETS | | | |
| Investments in securities at value | | | |
| (cost $318,986,771) | | $ | 447,640,278 | |
| Receivable for fund shares sold | | | 6,687 | |
| Dividends & interest receivable | | | 543,379 | |
| Prepaid expenses | | | 37,215 | |
| TOTAL ASSETS | | | 448,227,559 | |
| | | | | |
| LIABILITIES | | | | |
| Payable for fund shares redeemed | | | 92,942 | |
| Payable to investment manager | | | 346,313 | |
| Accrued expenses and other liabilities | | | 100,135 | |
| TOTAL LIABILITIES | | | 539,390 | |
| | | | | |
| NET ASSETS | | $ | 447,688,169 | |
| | | | | |
| NET ASSETS CONSIST OF | | | | |
| Shares of beneficial interest ($1 stated value, | | | | |
| 9,026,600 shares outstanding, unlimited shares authorized) | | $ | 9,026,600 | |
| Paid-in capital in excess of par | | | 309,824,047 | |
| Accumulated undistributed net investment income | | | 2,785 | |
| Accumulated undistributed net realized gain on investments | | | 181,230 | |
| Net unrealized appreciation on investments | | | 128,653,507 | |
| | | | | |
| TOTAL NET ASSETS | | $ | 447,688,169 | |
| Net Asset Value, Offering and Redemption Price per Share | | $ | 49.60 | |
See notes to the financial statements.
The Torray Fund
STATEMENT OF OPERATIONS
For the year ended December 31, 2017
| INVESTMENT INCOME | | | |
| Dividend income (net of withholding of $29,903) | | $ | 9,078,346 | |
| Interest income | | | 447,776 | |
| Total investment income | | | 9,526,122 | |
| | | | | |
| EXPENSES | | | | |
| Management fees (See Note 4) | | | 4,358,481 | |
| Fund administration & accounting fees | | | 178,019 | |
| Transfer agent fees & expenses | | | 168,034 | |
| Trustees’ fees | | | 97,997 | |
| Insurance expense | | | 79,377 | |
| Legal fees | | | 61,117 | |
| Federal & state registration fees | | | 34,107 | |
| Audit fees | | | 24,005 | |
| Printing, postage & mailing fees | | | 21,889 | |
| Custody fees | | | 18,759 | |
| Compliance fees | | | 7,999 | |
| Total expenses before waiver | | | 5,049,784 | |
| Less: waiver from investment manager (See Note 4) | | | (372,811 | ) |
| Net expenses | | | 4,676,973 | |
| | | | | |
| NET INVESTMENT INCOME | | | 4,849,149 | |
| | | | | |
| REALIZED AND UNREALIZED GAIN ON INVESTMENTS | | | | |
| Net realized gain on investments | | | 21,917,736 | |
| Net change in unrealized appreciation on investments | | | 22,907,455 | |
| Net realized and unrealized gain on investments | | | 44,825,191 | |
| NET INCREASE IN NET ASSETS RESULTING FROM OPERATIONS | | $ | 49,674,340 | |
See notes to the financial statements.
The Torray Fund
STATEMENTS OF CHANGES IN NET ASSETS
For the years indicated:
| | | Year ended | | | Year ended | |
| | | 12/31/17 | | | 12/31/16 | |
| Increase in Net Assets Resulting from Operations: | | | | | | |
| Net investment income | | $ | 4,849,149 | | | $ | 4,835,302 | |
| Net realized gain on investments | | | 21,917,736 | | | | 34,138,121 | |
| Net change in unrealized | | | | | | | | |
| appreciation on investments | | | 22,907,455 | | | | 15,637,663 | |
| Net increase in net assets | | | | | | | | |
| resulting from operations | | | 49,674,340 | | | | 54,611,086 | |
| | | | | | | | | |
| Distributions to Shareholders from: | | | | | | | | |
| Net investment income | | | | | | | | |
| ($0.576 and $0.560 per share, respectively) | | | (5,063,495 | ) | | | (4,834,497 | ) |
| Net realized gains | | | | | | | | |
| ($3.065 and $3.693 per share, respectively) | | | (26,219,463 | ) | | | (31,035,124 | ) |
| Total distributions to shareholders | | | (31,282,958 | ) | | | (35,869,621 | ) |
| | | | | | | | | |
| Shares of Beneficial Interest: | | | | | | | | |
| Net increase from share transactions (Note 5) | | | 878,375 | | | | 15,899,094 | |
| Total increase in net assets | | | 19,269,757 | | | | 34,640,559 | |
| Net Assets – Beginning of Year | | | 428,418,412 | | | | 393,777,853 | |
| Net Assets – End of Year | | $ | 447,688,169 | | | $ | 428,418,412 | |
| Accumulated Undistributed Net | | | | | | | | |
| Investment Income (Loss) | | $ | 2,785 | | | $ | (352,774 | ) |
See notes to the financial statements.
The Torray Fund
FINANCIAL HIGHLIGHTS
For a Fund share outstanding throughout the year.
PER SHARE DATA
| | | Years ended December 31: | |
| | | 2017 | | | 2016 | | | 2015 | | | 2014 | | | 2013 | |
| Net Asset Value, Beginning of Year | | $ | 47.600 | | | $ | 45.510 | | | $ | 48.110 | | | $ | 43.400 | | | $ | 33.000 | |
| Investment operations: | | | | | | | | | | | | | | | | | | | | |
Net investment income(1) | | | 0.550 | | | | 0.563 | | | | 0.445 | | | | 0.458 | | | | 0.444 | |
| Net realized and unrealized | | | | | | | | | | | | | | | | | | | | |
| gain (loss) on securities | | | 5.091 | | | | 5.780 | | | | (1.088 | ) | | | 4.743 | | | | 10.351 | |
| Total from investment operations | | | 5.641 | | | | 6.343 | | | | (0.643 | ) | | | 5.201 | | | | 10.795 | |
| Less distributions from: | | | | | | | | | | | | | | | | | | | | |
| Net investment income | | | (0.576 | ) | | | (0.560 | ) | | | (0.479 | ) | | | (0.491 | ) | | | (0.395 | ) |
| Net capital gains | | | (3.065 | ) | | | (3.693 | ) | | | (1.478 | ) | | | — | | | | — | |
| Total distributions | | | (3.641 | ) | | | (4.253 | ) | | | (1.957 | ) | | | (0.491 | ) | | | (0.395 | ) |
| Net Asset Value, End of Year | | $ | 49.600 | | | $ | 47.600 | | | $ | 45.510 | | | $ | 48.110 | | | $ | 43.400 | |
TOTAL RETURN(2) | | | 12.07 | % | | | 14.29 | % | | | (1.36 | )% | | | 12.04 | % | | | 32.84 | % |
| | | | | | | | | | | | | | | | | | | | | |
| SUPPLEMENTAL DATA AND RATIOS: | | | | | | | | | | | | | | | | | | | | |
| Net assets, end of year (000’s omitted) | | $ | 447,688 | | | $ | 428,418 | | | $ | 393,778 | | | $ | 423,854 | | | $ | 401,295 | |
| Ratios of expenses to average net assets: | | | | | | | | | | | | | | | | | | | | |
| Before expense waiver | | | 1.16 | % | | | 1.07 | % | | | 1.16 | % | | | 1.15 | % | | | 1.15 | % |
| After expense waiver | | | 1.07 | % | | | 1.07 | % | | | 1.16 | % | | | 1.15 | % | | | 1.15 | % |
| Ratios of net investment income | | | | | | | | | | | | | | | | | | | | |
| to average net assets | | | 1.11 | % | | | 1.19 | % | | | 0.95 | % | | | 1.01 | % | | | 1.15 | % |
| Portfolio turnover rate | | | 19.38 | % | | | 9.46 | % | | | 10.77 | % | | | 15.68 | % | | | 13.63 | % |
(1) | Calculated based on average amount of shares outstanding during the year. |
(2) | Past performance is not predictive of future performance. Returns assume reinvestment of all dividends and distributions. |
See notes to the financial statements.
The Torray Fund
NOTES TO FINANCIAL STATEMENTS
As of December 31, 2017
NOTE 1 — ORGANIZATION
The Torray Fund (“Fund”) is a separate diversified series of The Torray Fund (“Trust”). The Trust is registered under the Investment Company Act of 1940, as amended, as an open-end management investment company. The Trust is organized as a business trust under Massachusetts law. The Fund’s investment objectives are to build investor wealth over extended periods and to minimize shareholder capital gains tax liability by limiting the realization of long- and short-term gains. The Fund seeks to meet its objectives by investing in the common stocks of high quality businesses that are fairly priced and run by sound management. These companies must have solid finances and a long-term record of rising sales, earnings and free cash flow. Investments are held as long as the issuers’ fundamentals remain intact. The Fund invests principally in the common stocks of large capitalization companies (e.g. companies with market capitalization of $8 billion or more). There can be no assurance that the Fund’s investment objectives will be achieved. The Fund is an investment company and accordingly follows the investment companies accounting and reporting guidance of the Financial Accounting Standards Board (“FASB”) Accounting Standards Codification Topic 946 Financial Services – Investment Companies.
NOTE 2 — SIGNIFICANT ACCOUNTING POLICIES
The following is a summary of accounting policies followed by the Fund in the preparation of its financial statements. These policies are in conformity with accounting principles generally accepted in the United States of America (“GAAP”).
Security Valuation – All investments in securities are recorded at their estimated fair value, as described in Note 3.
Federal Income Taxes – The Fund complies with the requirements of subchapter M of the Internal Revenue Code of 1986, as amended, necessary to qualify as a regulated investment company and distributes substantially all net taxable investment income and net realized gains to shareholders in a manner which results in no tax cost to the Fund. Therefore, no federal income tax provision is required. As of and during the year ended December 31, 2017, the Fund did not have any tax positions that did not meet the “more-likely-than-not” threshold of being sustained by the applicable tax authority. As of and during the year ended December 31, 2017, the Fund did not have liabilities for any unrecognized tax benefits. The Fund recognizes interest and penalties, if any, related to unrecognized tax benefits on uncertain tax positions as income tax expense in the Statement of Operations. As of and during the year ended December 31, 2017, the Fund did not incur any interest or penalties. The Fund is not subject to examination by U.S. tax authorities for tax years prior to the period ended December 31, 2014.
Security Transactions and Investment Income – The Fund follows industry practice and records security transactions on the trade date. Realized gains and losses on sales of securities are calculated on the basis of identified cost. Dividend income is recorded on the ex-dividend date and interest income is recorded on an accrual basis. Withholding taxes on foreign dividends have been provided for in accordance with the Fund’s understanding of the applicable country’s tax rules and regulations. Discounts and premiums on securities purchased are amortized over the expected life of the respective securities.
The Torray Fund
NOTES TO FINANCIAL STATEMENTS (continued)
As of December 31, 2017
The Fund distributes all net investment income, if any, quarterly and net realized capital gains, if any, annually. Distributions to shareholders are recorded on the ex-dividend date. The treatment for financial reporting purposes of distributions made to shareholders during the year from net investment income or net realized capital gains may differ from their ultimate treatment for federal income tax purposes. These differences are caused primarily by differences in the timing of the recognition of certain components of income, expense or realized capital gain for federal income tax purposes. Where such differences are permanent in nature, GAAP requires that they be reclassified in the components of the net assets based on their ultimate characterization for federal income tax purposes. Any such reclassifications will have no effect on net assets, results of operations or net asset values per share of the Fund. For the year ended December 31, 2017, the Fund increased net investment income by $569,905, decreased accumulated net realized gain on investments by $569,904, and decreased paid in capital by $1.
Use of Estimates – The preparation of financial statements in conformity with GAAP requires management to make estimates and assumptions that affect the reported amounts of assets and liabilities and disclosure of contingent assets and liabilities at the date of the financial statements and the reported amounts of revenues and expenses during the reporting period. Actual results could differ from those estimates.
NOTE 3 — SECURITIES VALUATION
The Fund has adopted authoritative fair value accounting standards which establish an authoritative definition of fair value and set out a hierarchy for measuring fair value. These standards require additional disclosures about the various inputs and valuation techniques used to develop the measurements of fair value, a discussion of changes in valuation techniques and related inputs during the period and expanded disclosure of valuation levels for major security types. These inputs are summarized in the three broad levels listed below:
| | • | Level 1 – Unadjusted quoted prices in active markets for identical assets or liabilities that the Fund has the ability to access. |
| | | |
| | • | Level 2 – Observable inputs other than quoted prices included in Level 1 that are observable for the asset or liability, either directly or indirectly. These inputs may include quoted prices for the identical instrument on an inactive market, prices for similar instruments, interest rates, prepayment speeds, credit risk, yield curves, default rates and similar data. |
| | | |
| | • | Level 3 – Unobservable inputs for the asset or liability, to the extent relevant observable inputs are not available, representing the Fund’s own assumptions about the assumptions a market participant would use in valuing the asset or liability, and would be based on the best information available. |
Following is a description of the valuation techniques applied to the Fund’s major categories of assets and liabilities measured at fair value on a recurring basis. The Fund’s investments are carried at fair value.
The Torray Fund
NOTES TO FINANCIAL STATEMENTS (continued)
As of December 31, 2017
Equity Securities – Securities that are primarily traded on a national securities exchange are valued at the last sale price on the exchange on which they are primarily traded on the day of valuation or, if there has been no sale on such day, at the mean between the bid and ask prices. Securities traded primarily in the Nasdaq Global Market System for which market quotations are readily available are valued using the Nasdaq Official Closing Price (“NOCP”). If the NOCP is not available, such securities are valued at the last sale price on the day of valuation, or if there has been no sale on such day, at the mean between the bid and ask prices. To the extent these securities are actively traded and valuation adjustments are not applied, they are categorized in Level 1 of the fair value hierarchy. If the market for a particular security is not active, and the mean between bid and ask prices is used, these securities are categorized in Level 2 of the fair value hierarchy.
Short-Term Investments – Investments in money market funds are valued at their net asset value per share. To the extent these securities are actively traded and valuation adjustments are not applied, they are categorized in Level 1 of the fair value hierarchy. Short-term debt securities (maturing in 60 days or less), such as U.S. Treasury Bills, are valued at amortized cost, which approximates market value and are categorized in Level 2 of the fair value hierarchy.
Securities for which market quotations are not readily available, or if the closing price does not represent fair value, are valued following procedures approved by the Board of Trustees. As of December 31, 2017, no Fund portfolio securities were priced using the Trust’s fair value guidelines.
The inputs or methodology used for valuing securities are not an indication of the risk associated with investing in those securities. The following is a summary of the inputs used to value the Fund’s securities as of December 31, 2017:
| | | Level 1 | | | Level 2 | | | Level 3 | | | Total | |
| Common Stocks | | $ | 395,196,625 | | | $ | — | | | $ | — | | | $ | 395,196,625 | |
| Short-Term Investments | | | 17,461,172 | | | | 34,982,481 | | | | — | | | | 52,443,653 | |
| Total Investments in Securities | | $ | 412,657,797 | | | $ | 34,982,481 | | | $ | — | | | $ | 447,640,278 | |
Transfers between levels are recognized at the end of the reporting period. During the year ended December 31, 2017, the Fund recognized no transfers between levels. The Fund did not invest in any Level 3 investments during the year. Refer to the Schedule of Investments for further information on the classification of investments.
The Torray Fund
NOTES TO FINANCIAL STATEMENTS (continued)
As of December 31, 2017
NOTE 4 — MANAGEMENT FEES AND OTHER TRANSACTIONS WITH AFFILIATES
The Trust has an agreement (“Management Contract”) with Torray LLC (the “Manager”) to furnish investment advisory services and to pay for certain operating expenses of the Fund. Pursuant to the Management Contract between the Trust and the Manager, the Manager is entitled to receive, on a monthly basis, an annual management fee equal to 1.00% of the Fund’s average daily net assets. For the year ended December 31, 2017, the Fund incurred management fees of $4,358,481.
The Manager and the Fund have entered into an Operating Expenses Limitation Agreement (the “Agreement”) whereby the Manager has contractually agreed prospectively for the term of Agreement to waive its management fee and reimburse the Fund for its current Operating Expenses so as to limit the Fund’s current Operating Expenses to an annual rate, expressed as a percentage of the Fund’s average annual net assets, to 1.00%. For purposes of the Agreement, the term “Operating Expenses” includes the Manager’s management fee and all other expenses necessary or appropriate for the operation of the Fund, excluding any front-end or contingent deferred loads, taxes, leverage, interest, brokerage commissions, acquired fund fees and expenses, trustee fees and expenses, auditor fees and expenses, legal fees and expenses, insurance costs, registration and filing fees, printing, postage and mailing expenses, expenses incurred in connection with any merger or reorganization, or extraordinary expenses such as litigation. The Agreement will remain in effect until April 30, 2019.
U.S. Bancorp Fund Services, LLC (“USBFS” or the “Administrator”) acts as the Fund’s Administrator, Transfer Agent, and Fund Accountant. U.S. Bank, N.A. (the “Custodian”) serves as the custodian to the Fund. The Custodian is an affiliate of the Administrator. The Administrator performs various administrative and accounting services for the Fund. The Administrator prepares various federal and state regulatory filings, reports and returns for the Fund; prepares reports and materials to be supplied to the Trustees; monitors the activities of the Fund’s custodian; coordinates the payment of the Fund’s expenses and reviews the Fund’s expense accruals. As compensation for its services, the Administrator is entitled to a monthly fee at an annual rate based upon the average daily net assets of the Fund, subject to annual minimums. Fees incurred by the Fund for administration and accounting, transfer agency, custody and compliance support services for the year ended December 31, 2017, are disclosed in the Statement of Operations.
Certain officers and Trustees of the Fund are also officers and/or shareholders of the Manager, and are not paid by the Fund for serving in such capacities.
The Torray Fund
NOTES TO FINANCIAL STATEMENTS (continued)
As of December 31, 2017
NOTE 5 — SHARES OF BENEFICIAL INTEREST TRANSACTIONS
Transactions in shares of beneficial interest were as follows:
| | | Year ended | | | Year ended | |
| | | 12/31/17 | | | 12/31/16 | |
| | | Shares | | | Amount | | | Shares | | | Amount | |
| Shares sold | | | 80,342 | | | $ | 3,963,676 | | | | 160,425 | | | $ | 7,673,295 | |
| Reinvestments of dividends and distributions | | | 609,083 | | | | 29,678,623 | | | | 734,335 | | | | 34,036,692 | |
| Shares redeemed | | | (662,699 | ) | | | (32,763,924 | ) | | | (548,237 | ) | | | (25,810,893 | ) |
| | | | 26,726 | | | $ | 878,375 | | | | 346,523 | | | $ | 15,899,094 | |
As of December 31, 2017, the Trust’s officers, Trustees and affiliated persons and their families directly or indirectly controlled 1,767,681 shares or 19.58% of the Fund.
NOTE 6 — INVESTMENT TRANSACTIONS
Purchases and sales of investment securities, other than short-term investments, for the year ended December 31, 2017, aggregated $74,785,393 and $72,606,946, respectively.
NOTE 7 — TAX MATTERS
Distributions to shareholders are determined in accordance with United States federal income tax regulations, which may differ from GAAP.
The tax character of distributions paid during the years ended December 31, 2017 and 2016 were as follows:
| | | 2017 | | | 2016 | |
| Distributions paid from: | | | | | | |
| Ordinary Income* | | $ | 5,309,631 | | | $ | 4,834,497 | |
| Long-Term Capital Gains | | | 25,973,327 | | | | 31,035,124 | |
| | | $ | 31,282,958 | | | $ | 35,869,621 | |
| * For federal income tax purposes, distributions of short-term capital gains are treated as ordinary income. | | | | | | | | |
| As of December 31, 2017, the components of distributable earnings on a tax basis were as follows: | | | |
| | | | |
| Undistributed ordinary income | | $ | 202 | |
| Unrealized appreciation | | | 128,837,320 | |
| Total accumulated earnings | | $ | 128,837,522 | |
The Torray Fund
NOTES TO FINANCIAL STATEMENTS (continued)
As of December 31, 2017
As of December 31, 2017, the Fund did not have any capital loss carryovers. A regulated investment company may elect for any taxable year to treat any portion of any qualified late year loss as arising on the first day of the next taxable year. Qualified late year losses are certain capital and ordinary losses which occur during the portion of the Fund’s taxable year subsequent to October 31. For the taxable year ended December 31, 2017, the Fund does not plan to defer any late year losses.
The cost basis of investments for federal income tax purposes for the year ended December 31, 2017, was as follows:
| | | 2017 | |
| Gross unrealized appreciation | | $ | 139,055,255 | |
| Gross unrealized depreciation | | | (10,217,935 | ) |
| Net unrealized appreciation | | | 128,837,320 | |
| Cost | | $ | 318,802,958 | |
The difference between book-basis and tax-basis unrealized appreciation is attributable to differences in the treatment of partnerships.
NOTE 8 — SECTOR RISK
As of December 31, 2017, the Fund had a significant portion of its assets invested in the financials sector. The financials sector may be more greatly impacted by the performance of the overall economy, interest rates, competition, and consumer confidence spending.
NOTE 9 — COMMITMENTS AND CONTINGENCIES
The Fund indemnifies its officers and Trustees for certain liabilities that may arise from their performance of their duties to the Fund. Additionally, in the normal course of business, the Fund enters into contracts that contain a variety of representations and warranties which provide general indemnifications. The Fund’s maximum exposure under these arrangements is unknown, as this would involve future claims that may be made against the Fund that have not yet occurred.
NOTE 10 — SUBSEQUENT EVENTS
Management has evaluated the impact of all subsequent events on the Fund through the date these financial statements were issued and has determined that there were no subsequent events requiring recognition or disclosure in the financial statements.
The Torray Fund
REPORT OF INDEPENDENT REGISTERED PUBLIC ACCOUNTING FIRM
To the Board of Trustees and the Shareholders
of The Torray Fund
Opinion on the Financial Statements
We have audited the accompanying statement of assets and liabilities of The Torray Fund (the “Fund”), including the schedule of investments, as of December 31, 2017, and the related statement of operations for the year then ended, the statements of changes in net assets for each of the years in the two-year period then ended and the financial highlights for each of the years in the five-year period then ended, and the related notes (collectively referred to as the “financial statements”). In our opinion, the financial statements present fairly, in all material respects, the financial position of the Fund as of December 31, 2017, and the results of its operations for the year then ended, the changes in its net assets for each of the years in the two-year period then ended and its financial highlights for each of the years in the five-year period then ended, in conformity with accounting principles generally accepted in the United States of America (“GAAP”).
Basis for Opinion
These financial statements are the responsibility of the Fund’s management. Our responsibility is to express an opinion on the Fund’s financial statements based on our audits. We are a public accounting firm registered with the Public Company Accounting Oversight Board (United States) (“PCAOB”) and are required to be independent with respect to the Fund in accordance with the U.S. federal securities law and the applicable rules and regulations of the Securities and Exchange Commission and the PCAOB.
We conducted our audits in accordance with the standards of the PCAOB. Those standards require that we plan and perform the audits to obtain reasonable assurance about whether the financial statements are free of material misstatement, whether due to error or fraud. The Fund is not required to have, nor were we engaged to perform, an audit of its internal control over financial reporting. As part of our audits we are required to obtain an understanding of internal control over financial reporting but not for the purpose of expressing an opinion on the effectiveness of the Fund’s internal control over financial reporting. Accordingly, we express no such opinion.
Our audits included performing procedures to assess the risk of material misstatement of the financial statements, whether due to error or fraud, and performing procedures that respond to those risks. Such procedures include examining, on a test basis, evidence regarding the amounts and disclosures in the financial statements. Our procedures included confirmation of securities owned as of December 31, 2017 by correspondence with the custodian. Our audits also included evaluating the accounting principles used and significant estimates made by management, as well as evaluating the overall presentation of the financial statements. We believe that our audits provide a reasonable basis for our opinion.
| |  |
| | |
| | BBD, LLP |
We have served as the auditor of The Torray Fund since 1997.
Philadelphia, Pennsylvania
February 27, 2018
The Torray Fund
FUND MANAGEMENT
As of December 31, 2017 (unaudited)
The Trust is overseen by a Board of Trustees (the “Board”), who has delegated the day-to-day management to the officers of the Trust. The Board meets regularly to review the Fund’s activities, contractual arrangements, and performance. The Trustees and officers serve until their successors are elected and qualified, or until the Trustee or officer dies, resigns or is removed, or becomes disqualified.
Information pertaining to the Trustees and officers of the Trust is set forth below. The Statement of Additional Information (SAI) includes additional information about the Trustees and is available without charge, upon request, by calling (855) 753-8174.
| | | | No. of | |
| | | | Portfolios in | |
| Name, Age, | Term of Office | | Fund Complex | Other |
| Address* and | and Length of | Principal Occupation(s) | Overseen by | Directorships |
| Position(s) with the Trust | Time Served | During Past Five Years | Trustee | Held |
| INDEPENDENT TRUSTEES |
| Carol T. Crawford (74) | Indefinite Term | Attorney and International | 1 | None |
| Trustee | Since 2006 | Trade Consultant, | | |
| | | McLean, VA | | |
| | | | | |
| Bruce C. Ellis (73) | Indefinite Term | Private Investor, | 1 | None |
| Trustee | Since 1993 | Bethesda, MD | | |
| | | | | |
| Robert P. Moltz (70) | Indefinite Term | Chairman and CEO, Weaver Bros. | 1 | None |
| Trustee | Since 1990 | Insurance Associates, Inc., | | |
| | | Bethesda, MD | | |
| | | | | |
| Wayne H. Shaner (70)** | Indefinite Term | Managing Partner, | 1 | Director, |
| Trustee and Chairman of | Since 1993 | Rockledge Partners, LLC, | | Van Eck Funds |
| the Board | | Investment Advisory Firm, | | New York, NY |
| | | Easton, MD (Jan. 2004-present) | | |
The Torray Fund
FUND MANAGEMENT (continued)
As of December 31, 2017 (unaudited)
| | | | No. of | |
| | | | Portfolios in | |
| Name, Age, | Term of Office | | Fund Complex | Other |
| Address* and | and Length of | Principal Occupation(s) | Overseen by | Directorships |
| Position(s) with the Trust | Time Served | During Past Five Years | Trustee | Held |
| INTERESTED TRUSTEES AND OFFICERS OF THE TRUST |
| William M Lane (67)*** | Indefinite Term | Executive Vice President and | 1 | None |
| Trustee, Treasurer and | Since 1990 | Secretary, Torray LLC, | | |
| Secretary | | Bethesda, MD (Oct. 2005-present) | | |
| | | | | |
| Robert E. Torray (80)*** | Indefinite Term | Chairman, Torray LLC, | N/A | None |
| President | Since 2007 | Bethesda, MD (2005-present) | | |
| | | | | |
| Suzanne E. Kellogg (35) | Indefinite Term | Chief Compliance Officer and | N/A | None |
| Chief Compliance Officer | Since 2017 | Anti-Money Laundering Officer, | | |
| and Anti-Money | | Torray LLC, Bethesda, MD | | |
| Laundering Officer | | (Jul. 2017-present); | | |
| | | Compliance Manager, | | |
| | | FINRA, Washington, DC | | |
| | | (Sep. 2016-Jul. 2017); | | |
| | | Consultant, Torray LLC, Bethesda, | | |
| | | MD (Jun. 2016-Sep. 2016); | | |
| | | Chief Compliance Officer, | | |
| | | TAMRO Capital Partners, | | |
| | | Alexandria, VA (Nov. 2012-Apr. 2016) | | |
| * | All addresses are c/o The Torray Fund, 7501 Wisconsin Avenue, Suite 750W, Bethesda, MD 20814. |
| ** | Mr. Shaner is deemed to be an independent Trustee effective as of January 1, 2011. |
| *** | Mr. Lane and Mr. Torray, by virtue of their employment with Torray LLC, the Trust’s investment adviser, are considered “interested persons” of the Trust, as that term is defined in Section 2(a)(19) of the Investment Company Act of 1940, as amended. |
The Torray Fund
FACTORS CONSIDERED BY THE BOARD OF TRUSTEES IN CONNECTION WITH ITS
APPROVAL OF THE TRUST’S MANAGEMENT AGREEMENT WITH THE MANAGER
(unaudited)
The Torray Fund (“Trust”) has entered into a Management Contract (the “Agreement”) with Torray LLC (“Manager”) pursuant to which the Manager provides investment management services to The Torray Fund, a series of the Trust (“Fund”). In accordance with the Investment Company Act of 1940, the Trust’s Board of Trustees (“Board”), including a majority of the Trustees who are not “interested persons” of the Trust as that term is defined in Section 2(a)(19) of the Investment Company Act of 1940, as amended (“Independent Trustees”) is required, on an annual basis, to consider the continuation of the Agreement with the Manager, and this must take place at an in-person meeting of the Board. The relevant provisions of the Investment Company Act of 1940, as amended (“1940 Act”) specifically provide that it is the duty of the Board to request and evaluate such information as the Board determines is necessary to allow them to properly consider the continuation of the Agreement, and it is the duty of the Manager to furnish the Trustees with such information that is responsive to their request.
At the regular meeting of the Board on September 13, 2017, the Board, including all of the Trustees who are not “interested persons” of the Trust as that term is defined in Section 2(a)(19) of the 1940 Act (“Independent Trustees”), considered and approved the continuation of the Agreement. Prior to the meeting, the Trustees received and considered information from the Manager designed to provide the Trustees with the information necessary to evaluate the terms of the Agreement (“Support Materials”). Before voting to approve the continuation of the Agreement, the Trustees reviewed the Support Materials with counsel to the Fund and the Independent Trustees, as well as a memorandum from such counsel discussing the legal standards applicable to their consideration of the continuation of the Agreement. The Manager also met with the Trustees and provided further information regarding the management services it provides to the Fund under the Agreement (“Management Services”), including but not limited to information regarding its overall investment philosophy with respect to the Fund.
In determining whether to approve the continuation of the Agreement, the Trustees considered all factors they believed relevant to such determination, including the following: (1) the nature, extent, and quality of the services of the Management Services; (2) the investment performance of the Fund; (3) the cost of the Management Services and the profits that the Manager and its affiliate realize from the Manager’s relationship with the Fund; (4) the extent to which the Manager realizes economies of scale as the Fund grows and whether fees for the Management Services reflect these economies for the benefit of the Fund’s investors; (5) management fees paid by the Fund and the net and total expense ratios of the Fund and other similar mutual funds; and (6) any other benefits that the Manager derives from its relationship with the Fund.
Based upon the Manager’s presentation and Support Materials, the Board concluded that the overall arrangements between the Fund and the Manager as set forth in the Agreement are fair and reasonable in light of the services performed, fees paid and such other matters as the Trustees considered relevant in the exercise of their reasonable judgment. In their deliberations, the Trustees did not identify any particular information that was all-important or controlling. The material factors and conclusions that formed the basis of the Trustees’ determination to approve the continuation of the Agreement are summarized below.
The Torray Fund
FACTORS CONSIDERED BY THE BOARD OF TRUSTEES IN CONNECTION WITH ITS
APPROVAL OF THE TRUST’S MANAGEMENT AGREEMENT WITH THE MANAGER
(unaudited) (continued)
Nature, Extent and Quality of Services. With respect to the nature, extent and quality of services that Manager renders, the Trustees considered the scope of services provided under the Agreement, which includes, but are not limited to, the following: (1) investing the Fund’s assets consistent with the Fund’s investment objective, policies and restrictions; (2) making investment decisions and placing all orders for the purchase and sale of portfolio securities and cash instruments; (3) pursuant to its Operating Expense Limitation Agreement with the Trust, paying for the administration, fund accounting, custody, transfer agency and distribution services that are provided to the Fund; (4) monitoring the compliance of the Fund’s investment portfolio with applicable Federal securities laws and regulations and Internal Revenue standards; and (5) providing the interested Trustee, Chief Financial Officer and Chief Compliance Officer (“CCO”) of the Fund, and paying the salaries, fees and expenses of such persons. The Trustees also considered the long-term investment philosophy and the significant industry experience of the Manager’s personnel involved in servicing the Fund, noting their high quality. In addition, the Trustees reviewed the Manager’s brokerage and best-execution procedures and observed that they were reasonable and consistent with standard industry practice. The Trustees also noted that while the Manager is permitted to use soft dollars to acquire proprietary and third-party research, it receives only proprietary research and that such research is provided on an unsolicited basis and is not a motivation for the selection of broker-dealers. Finally, the Trustees discussed the state of the Manager’s compliance program, including the transition of CCO responsibilities from former CCO Janet Gallagher, who was appointed to be the Manager’s Director of Investment Operations, to the new CCO Suzanne Kellogg. They further discussed with Ms. Kellogg the Manager’s increased emphasis on cybersecurity and the new liquidity rules affecting the Fund. The Board also noted the significant resources that the Manager had expended to enhance the compliance program. The Trustees concluded that they were satisfied with the nature, extent and quality of services provided by the Manager pursuant to the Agreement.
Performance of the Fund. The Board next reviewed the Fund’s performance as reported in the Meeting Materials for the period ending July 31, 2017. The Trustees discussed the Manager’s focus on long-term investing and risk management, as well as the fact that the Fund tends to underperform in strong markets and outperform during periods of negative market activity. The Trustees noted the Fund’s positive returns for all the reported time periods as of July 31, 2017, as well as its overall three star Morningstar rating for the same time period. The Trustees further noted that despite the positive returns, the Fund underperformed its benchmark, the S&P 500 Index, for the one, three, five and 10 year periods ended July 31, 2017, and only slightly underperformed the benchmark for the since inception period ended July 31, 2017. The Trustees observed that the Fund’s performance has generally been consistent with its benchmark. After further discussion, the Trustees concluded that they were satisfied with the Fund’s performance.
Cost of Advisory Services and Profitability. The Trustees considered and discussed with the Manager the profitability to the Manager of its relationship with the Fund, the overall profitability of the Manager as of August 31, 2017, and the Manager’s balance sheet as of the same date. The Trustees also discussed with the Manager its business succession planning, insurance coverage, existing new business, and potential new business opportunities. Mr. Lane indicated that the Manager is dedicating significant resources to grow both its mutual fund and separate account businesses, and in that regard has entered into a marketing services agreement with ENDEAVOUR Investment Partners,
The Torray Fund
FACTORS CONSIDERED BY THE BOARD OF TRUSTEES IN CONNECTION WITH ITS
APPROVAL OF THE TRUST’S MANAGEMENT AGREEMENT WITH THE MANAGER
(unaudited) (continued)
LLC, a marketing consultant and strategist, to assist in the marketing of both the mutual funds and separate account businesses across all investment strategies. The Trustees also discussed the growth of the two other mutual funds that the Manager sub-advises which have a different investment strategy and a different portfolio manager than the Fund, as well as another mutual fund that the Manager advises, also with a different investment strategy and a different portfolio manager than the Fund. The Trustees inquired and received responses from the Manager concerning how much each of these endeavors contributed to the Manager’s revenues and expenses relative to the revenues and expenses of the Fund. After further discussion, the Trustees concluded that the Manager’s profitability with respect to the Fund was reasonable, that its assets and revenues were sufficient to provide the services called for by the Agreement, and that the Manager’s assets, coupled with its insurance coverage, were sufficient to cover potential liabilities incurred under the Agreement.
Comparative Fee and Expense Data; Economies of Scale. The Trustees discussed the Fund’s management fee of 1.00% and its current expense ratio of 1.07%. The Trustees noted that the management fee payable to the Manager is in the form of a partial “unified fee,” an arrangement wherein the Manager pays certain expenses of the Fund from its management fee, and that comparative fee data for such arrangements is not readily available from data sources such as Morningstar. They also noted that the Manager has entered into an Operating Expense Limitation Agreement (“OELA”) with the Fund, which remains in effect. The Trustees then discussed that the Manager receives a net management fee of approximately ninety basis points after payment of fees to service providers and other required waivers and reimbursements made pursuant to the OELA. They also considered that because the Fund has no rule 12b-l or shareholder service fees, the Manager pays certain distribution and platform expenses exclusively from its own profits, noting that expense amounted to approximately five basis points. The Trustees then focused their attention on the gross and net expense ratios of comparable funds, noting that the Fund’s expense ratio was slightly higher when compared to those funds within the Morningstar Large Value category, the Fund’s designated Morningstar category. The Trustees discussed economies of scale with the Manager and considered the Manager’s representation that the Fund’s asset level is not high enough to warrant breakpoints in the management fee. The Trustees also noted that the Manager advised 33 separate accounts in a similar investment style to that of the Fund, and that with respect to 32 of these accounts, the Manager charged a significantly lower basis point fee, while the 33rd account (whose purpose is to maintain a composite of this investment style) charged no management fee. The Trustees further noted however, that management of the Fund entails many additional regulatory and compliance responsibilities and higher costs, and therefore would be expected to have a higher fee. After further discussion, the Trustees concluded that the fees paid to the Manager under the Agreement and the Fund’s overall expenses were reasonable, and were not inflated to cover distribution-related expenses.
Other Benefits. The Trustees considered the Manager’s representation that it does not derive any other benefits from its relationship with the Fund and concluded that Manager does not receive any additional financial or other benefits from its relationship with the Fund.
The Torray Fund
PORTFOLIO HOLDINGS, PROXY VOTING AND PROCEDURES
As of December 31, 2017 (unaudited)
The Fund files its complete schedule of portfolio holdings with the Securities and Exchange Commission (the “Commission”) for the first and third quarters of each fiscal year on Form N-Q. The Fund’s Forms N-Q are available on the Commission’s website at http://www.sec.gov. The Fund’s Forms N-Q may be reviewed and copied at the Commission’s Public Reference Room in Washington, D.C. Information on the operation of the Commissions Public Reference Room may be obtained by calling 1-800-SEC-0330.
A description of the policies and procedures that the Fund uses to determine how to vote proxies relating to portfolio securities is available without charge, upon request, by calling 1-855-753-8174.
Information regarding how the Fund voted proxies relating to portfolio securities during the most recent 12-month period ended June 30 is available without charge, upon request, by calling 1-855-753-8174; and on the Commission’s website at http://www.sec.gov.
The Torray Fund
ABOUT YOUR FUND’S EXPENSES
As of December 31, 2017 (unaudited)
We believe it is important for you to understand the impact of costs on your investment. All mutual funds have operating expenses. As a shareholder of the Fund, you incur ongoing costs, including management fees, and other fund expenses. Operating expenses, which are deducted directly from the Fund’s gross income, directly reduce the investment return of the Fund.
A mutual fund’s expenses are expressed as a percentage of its average net assets. This figure is known as the expense ratio. The following examples are intended to help you understand the ongoing costs (in dollars) of investing in the Fund and to compare these costs with the ongoing costs of investing in other mutual funds. The examples below are based on an investment of $1,000 made at the beginning of the period and held for the entire period from July 1, 2017 to December 31, 2017.
The table below illustrates the Fund’s cost in two ways:
Actual Fund Return This section helps you estimate the actual expenses that you paid over the period. The “Ending Account Value” shown is derived from the Fund’s actual return, and the third column shows the operating expenses that would have been paid by an investor who started with $1,000 in the Fund. You may use the information here, together with the amount invested, to estimate the expenses that you paid over the period.
To do so, simply divide your account value by $1,000 (for example, an $8,600 account value divided by $1,000 = 8.6), then multiply the result by the number given for the Fund under the heading “Expenses Paid During Period” below.
Hypothetical 5% Return This section is intended to help you compare your Fund’s costs with those of other mutual funds. It assumes that the Fund had an annual return of 5% before expenses, and that the expense ratio is unchanged. In this case, because the return used is not the Fund’s actual return, the results do not apply to your investment. The example is useful in making comparisons because the Commission requires all mutual funds to calculate expenses based on a 5% return. You can assess the Fund’s costs by comparing this hypothetical example with the hypothetical examples that appear in shareholder reports of other funds.
Note that expenses shown in the table are meant to highlight and help you compare ongoing costs only. The Fund does not charge transactions fees, such as purchase or redemption fees, nor does it carry a “sales load.”
The calculation assumes no shares were bought or sold during the period. Your actual costs may have been higher or lower, depending on the amount of your investment and the timing of any purchases or redemptions.
More information about the Fund’s expenses, including recent annual expense ratios, can be found in this report. For additional information on operating expenses and other shareholder costs, please refer to the Fund’s prospectus.
| | Beginning | Ending | |
| | Account Value | Account Value | Expenses Paid |
| | July 1, 2017 | December 31, 2017 | During Period(1) |
Based on Actual Fund Return(2) | $1,000.00 | $1,076.00 | $5.62 |
| Based on Hypothetical 5% Return (before expenses) | $1,000.00 | $1,019.80 | $5.46 |
(1) | Expenses are equal to the Fund’s annualized expense ratio for the most recent six-month period of 1.07%, multiplied by the average account value over the period, multiplied by 184/365 to reflect the one-half year period. |
(2) | Based on the actual returns for the six-month period ended December 31, 2017 of 7.60%. |
The Torray Fund
TAX INFORMATION
As of December 31, 2017 (unaudited)
We are required to advise you within 60 days of the Fund’s fiscal year end regarding the Federal tax status of certain distributions received by shareholders during such fiscal year. The information below is provided for the Fund’s fiscal year ending December 31, 2017. All designations are based on financial information available as of the date of this annual report and, accordingly are subject to change. For each item it is the intention of the Fund to designate the maximum amount permitted under the Internal Revenue Code and the regulations thereunder.
Qualified Dividend Income/Dividends Received Deduction
For the fiscal year ended December 31, 2017, certain dividends paid by the Fund may be subject to a maximum tax rate of 23.8%, as provided for by the American Taxpayer Relief Act of 2012. The percentage of dividends declared from ordinary income designated as qualified dividend income was 100% for the Fund.
For corporate shareholders, the percent of ordinary income distributions qualifying for the corporate dividends received deduction for the fiscal year ended December 31, 2017, was 100% for the Fund.
The percentage of taxable ordinary income distributions that are designated as short-term capital gain distributions under Internal Revenue Section 871(k)(2)(C) for the Fund was 4.64%.
Dividends and distributions received by retirement plans such as IRA’s, Keogh-type plans and 403(b) plans need not be reported as taxable income. However, many retirement plan trusts may need this information for their annual information reporting.
The Torray Fund
PRIVACY NOTICE
The Fund collects only relevant information about you that the law allows or requires it to have in order to conduct its business and properly service you. The Fund collects financial and personal information about you (“Personal Information”) directly (e.g., information on account applications and other forms, such as your name, address, and social security number, and information provided to access account information or conduct account transactions online, such as password, account number, e-mail address, and alternate telephone number), and indirectly (e.g., information about your transactions with us, such as transaction amounts, account balance and account holdings).
The Fund does not disclose any non-public personal information about its shareholders or former shareholders other than for everyday business purposes such as to process a transaction, service an account, respond to court orders and legal investigations or as otherwise permitted by law. Third parties that may receive this information include companies that provide transfer agency, technology and administrative services to the Fund, as well as the Fund’s investment adviser who is an affiliate of the Fund. If you maintain a retirement/educational custodial account directly with the Fund, we may also disclose your Personal Information to the custodian for that account for shareholder servicing purposes. The Fund limits access to your Personal Information provided to unaffiliated third parties to information necessary to carry out their assigned responsibilities to the Fund. All shareholder records will be disposed of in accordance with applicable law. The Fund maintains physical, electronic and procedural safeguards to protect your Personal Information and requires its third party service providers with access to such information to treat your Personal Information with the same high degree of confidentiality.
In the event that you hold shares of the Fund through a financial intermediary, including, but not limited to, a broker-dealer, credit union, bank or trust company, the privacy policy of your financial intermediary governs how your non-public personal information is shared with unaffiliated third parties.
TRUSTEES
Carol T. Crawford
Bruce C. Ellis
William M Lane
Robert P. Moltz
Wayne H. Shaner
INVESTMENT ADVISOR
Torray LLC
OFFICERS
Robert E. Torray
William M Lane
Nicholas C. Haffenreffer
Shawn M. Hendon
Suzanne E. Kellogg
INDEPENDENT REGISTERED
PUBLIC ACCOUNTING FIRM
BBD, LLP
1835 Market Street, 3rd Floor
Philadelphia, PA 19103
ADMINISTRATOR AND TRANSFER AGENT
U.S. Bancorp Fund Services, LLC
615 E. Michigan Street
Milwaukee, WI 53202
LEGAL COUNSEL
Bernstein Shur
100 Middle Street, 6th Floor
Portland, ME 04104
Distributed by Foreside Funds Distributors LLC
400 Berwyn Park, 899 Cassatt Road
Berwyn, PA 19132
Date of first use, February 2018
This report is not authorized for distribution to prospective investors unless preceded or accompanied by a current prospectus. All indices are unmanaged groupings of stocks that are not available for investment.
