UNITED STATES
SECURITIES AND EXCHANGE COMMISSION
Washington, D.C. 20549
FORM N-CSR
CERTIFIED SHAREHOLDER REPORT OF REGISTERED MANAGEMENT
INVESTMENT COMPANIES
Investment Company Act file number 811-06096
| | | | |
| | The Torray Fund | | |
| (Exact name of registrant as specified in charter) |
|
| 7501 Wisconsin Avenue, Suite 750 West |
| Bethesda, MD 20814-6519 |
| (Address of principal executive offices) (Zip code) |
William M Lane
Torray LLC
7501 Wisconsin Avenue, Suite 750 West
|
| Bethesda, MD 20814-6519 |
| (Name and address of agent for service) |
Registrant’s telephone number, including area code: 301-493-4600
Date of fiscal year end: December 31
Date of reporting period: December 31, 2014
Item 1. Reports to Stockholders.
The Report to Shareholders is attached herewith.
The Torray Fund
Letter to Shareholders
January 16, 2015
Dear Fellow Shareholders,
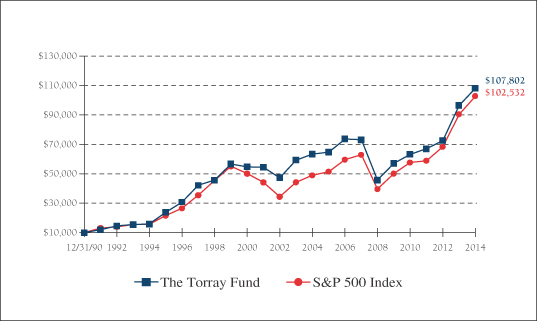
We are pleased to report The Torray Fund returned 12% in 2014; the Standard & Poor’s 500 made 13.7%. The difference is largely due to the cash balance the Fund held throughout the year. After all expenses an original $10,000 investment in our Fund 24 years ago was worth $107,802 at year end; in the Index, $102,532. These results represent compound returns of 10.4% and 10.2%, respectively. By coincidence, the Standard & Poor’s 500 has made 10.5% per year since 1937* — the year I was born — proof, we think, of two things: stocks are great long-term investments, and the market is tough to beat. As far as just how great they are, $10,000 invested back then would have grown to more than $24,000,000 today.
From an investment perspective, the last 15 years have been among the most disappointing on record. The S&P 500 with dividends reinvested returned only 4.2% annually, and The Torray Fund, net of expenses, 4.4%. These numbers are 60% lower than the market’s historic average. In sharp contrast, for the last six years, the S&P made 17.2% and The Torray Fund, after expenses, 15.5%. Without these outsized returns, the 15-year average would have been far lower. If asked, we doubt investors, even many professionals, could recite these numbers. With the passage of time people’s memories fade and important lessons of the past are forgotten. This is one of the reasons investors fall victim time and again to these boom-bust cycles.
Looking ahead, it seems unlikely the market’s performance over the last six years will repeat anytime soon. The far-above-average-outcome reflects a rebound from the extraordinarily low prices and depressed earnings caused by the 2008 crash. Today, GDP, employment, corporate earnings and housing have largely recovered, and price/earnings ratios are about average. At year end, the forward P/E on our Fund was 13.5-to-1; on the market, 15.4-to-1. Some Wall Street strategists using last year’s earnings or an average of earnings over the last decade claim the ratio is too high. Ironically, in the year 2000, when P/E’s hit 33-to-1, strategists were mum on the market’s valuation and investors were all in with both feet. Leaving that aside, it feels to us things are more or less back to normal, if there is such a thing.
This prompts us to underscore the importance of ignoring the stock market’s gyrations and anything the so-called “experts” have to say about it. Over the last decade-and-a-half, those that failed to do so have suffered irretrievable losses. In selling their stocks after the bottom fell out and fleeing, first to cash, then to bonds, they became lenders instead of owners, swapping assets that have historically returned 10% a year for fixed returns that are now the lowest on record. The 3% 30-year U.S. government bond due in 2044 now trades at 115 to return just 2.3% before taxes, a little over half the 4.1% average inflation rate of the last 50 years. Should interest rates rise to historic levels, its price will plunge 46%, from 115 to 62. With the exception of 1929, this is as bad or worse than any stock market crash in 100 years. Despite this reality, market strategists continue to insist bonds are a safe haven and stocks are risky.
| * | Returns prior to the Index’s 1957 inception have been reconstructed by Standard & Poor’s back to 1936. |
| | Source: Factset, S&P. S&P 500 (TR) (1936) |
1
The Torray Fund
Letter to Shareholders (continued)
January 16, 2015
In spite of the many challenges investors faced over the last 15 years, those that held onto the stocks of quality companies are better off than they were at the start. We may be wrong, but our country’s financial system, economy, and the prospects of sound businesses all seem better to us today than they were on balance over the period we’ve discussed. While the valuations of some companies are inflated, there are many like those we own that are fairly valued and well-positioned for what we believe is a bright future. If we’re right, Torray Fund shareholders hopefully will enjoy returns more in line with the Fund’s long-term results.
As always we thank you for your patience and trust in our management, and would be pleased to hear from you if you have any comments or questions.
| | | | | | |
| | | Sincerely, | | | | |
| | | |
| | |  | | | | |
| | | Robert E. Torray | | | | |
| | | 
| | | | |
| | | Fred M. Fialco | | | | |
| | | | | | | |
| | | | | | | |
| | | | | | | |
2
The Torray Fund
PERFORMANCE DATA
As of December 31, 2014 (unaudited)
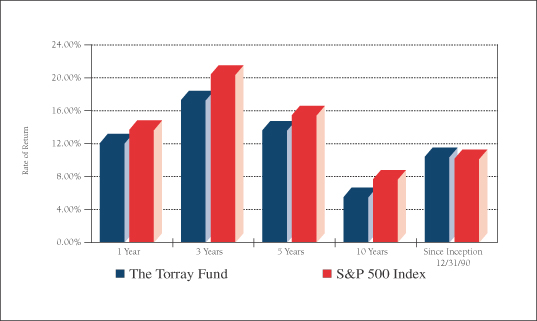
Average Annual Returns on an Investment in
The Torray Fund vs. the S&P 500 Index
For the periods ended December 31, 2014:
| | | | | | | | | | | | | | | | | | | | |
| | | 1 Year
| | | 3 Years
| | | 5 Years
| | | 10 Years
| | | Since
Inception
12/31/90
| |
The Torray Fund | | | 12.04 | % | | | 17.28 | % | | | 13.65 | % | | | 5.49 | % | | | 10.41 | % |
S&P 500 Index | | | 13.69 | % | | | 20.41 | % | | | 15.45 | % | | | 7.67 | % | | | 10.18 | % |
Cumulative Returns for the 24 years ended December 31, 2014
| | | | |
The Torray Fund | | | 978.02 | % |
S&P 500 Index | | | 925.32 | % |
3
The Torray Fund
PERFORMANCE DATA (continued)
As of December 31, 2014 (unaudited)
Change in Value of $10,000 Invested
on December 31, 1990 (commencement of operations) to:
| | | | | | | | | | | | | | | | | | | | | | | | | | | | |
| | | 12/31/90
| | | 12/31/94
| | | 12/31/98
| | | 12/31/02
| | | 12/31/06
| | | 12/31/10
| | | 12/31/14
| |
The Torray Fund | | $ | 10,000 | | | $ | 15,821 | | | $ | 45,576 | | | $ | 47,236 | | | $ | 73,496 | | | $ | 63,039 | | | $ | 107,802 | |
S&P 500 Index | | $ | 10,000 | | | $ | 15,666 | | | $ | 45,438 | | | $ | 34,318 | | | $ | 59,452 | | | $ | 57,501 | | | $ | 102,532 | |
The returns quoted represent past performance and do not guarantee future results. Investment return and principal value will fluctuate so that shares, when redeemed, may be worth more or less than their original cost. Current performance may be lower or higher. For performance current to the most recent month end, please call (800) 626-9769. The returns shown do not reflect the deduction of taxes a shareholder would pay on the redemption of fund shares and distributions. The Fund’s annual operating expense ratio, as stated in the current prospectus, is 1.15%. Returns on both The Torray Fund and the S&P 500 Index assume reinvestment of all dividends and distributions. The S&P 500 Index is an unmanaged index consisting of 500 U.S. large-cap stocks. It is not possible to invest directly in an index. Current and future portfolio holdings are subject to change and risk.
4
The Torray Fund
FUND PROFILE
As of December 31, 2014 (unaudited)
| | | | |
DIVERSIFICATION (% of net assets) | | | | |
| |
Information Technology | | | 20.08% | |
Financials | | | 16.22% | |
Industrials | | | 13.83% | |
Health Care | | | 13.30% | |
Consumer Discretionary | | | 7.38% | |
Energy | | | 6.33% | |
Materials | | | 5.03% | |
Consumer Staples | | | 2.81% | |
Telecommunications | | | 2.66% | |
Short-Term Investments | | | 12.30% | |
Other Assets Less Liabilities | | | 0.06% | |
| | |
|
|
|
| | | | 100.00% | |
| | |
|
|
|
| | | | | | | | |
| TOP TEN EQUITY HOLDINGS (% of net assets) | |
| | |
| | 1. | | | Hewlett-Packard Co. | | | 3.72% | |
| | 2. | | | EMC Corp. | | | 3.56% | |
| | 3. | | | International Business Machines Corp. | | | 3.32% | |
| | 4. | | | Western Union Co. (The) | | | 3.29% | |
| | 5. | | | Wells Fargo & Co. | | | 3.28% | |
| | 6. | | | Boardwalk Pipeline Partners LP | | | 3.26% | |
| | 7. | | | Gannett Co., Inc. | | | 3.19% | |
| | 8. | | | General Electric Co. | | | 3.14% | |
| | 9. | | | Intel Corp. | | | 3.14% | |
| | 10. | | | Loews Corp. | | | 3.12% | |
| | | | | | |
|
|
|
| | | | | | | | 33.02% | |
| | | | | | |
|
|
|
| | | | | | | | |
PORTFOLIO CHARACTERISTICS | |
| | |
Net Assets (million) | | | | | | | $424 | |
Number of Holdings | | | | | | | 32 | |
Portfolio Turnover | | | | | | | 15.68% | |
P/E Multiple (forward) | | | | | | | 13.5x | |
Trailing Weighted Average Dividend Yield | | | | 2.28% | |
Market Capitalization (billion) | | | Average | | | | $83.5 | |
| | | | Median | | | | $45.6 | |
5
The Torray Fund
SCHEDULE OF INVESTMENTS
As of December 31, 2014
| | | | | | | | | | |
| | | Shares
| | | | | Market Value
| |
| COMMON STOCK 87.64% | | | | |
| |
20.08% INFORMATION TECHNOLOGY | | | | |
| | | | 393,400 | | | Hewlett-Packard Co. | | | $15,787,142 | |
| | | | 508,000 | | | EMC Corp. | | | 15,107,920 | |
| | | | 87,650 | | | International Business Machines Corp. | | | 14,062,566 | |
| | | | 777,600 | | | Western Union Co. (The) | | | 13,926,816 | |
| | | | 366,400 | | | Intel Corp. | | | 13,296,656 | |
| | | | 465,300 | | | Cisco Systems, Inc. | | | 12,942,320 | |
| | | | | | | | |
|
|
|
| | | | | | | 85,123,420 | |
| |
16.22% FINANCIALS | | | | |
| | | | 253,400 | | | Wells Fargo & Co. | | | 13,891,388 | |
| | | | 314,300 | | | Loews Corp. | | | 13,206,886 | |
| | | | 121,200 | | | Chubb Corp. | | | 12,540,564 | |
| | | | 118,550 | | | American Express Co. | | | 11,029,892 | |
| | | | 183,618 | | | Marsh & McLennan Cos., Inc. | | | 10,510,294 | |
| | | | 424,000 | | | Bank of America Corp. | | | 7,585,360 | |
| | | | | | | | |
|
|
|
| | | | | | | 68,764,384 | |
| |
13.83% INDUSTRIALS | | | | |
| | | | 527,097 | | | General Electric Co. | | | 13,319,741 | |
| | | | 123,400 | | | Stanley Black & Decker, Inc. | | | 11,856,272 | |
| | | | 166,350 | | | Eaton Corp. PLC | | | 11,305,146 | |
| | | | 82,100 | | | General Dynamics Corp. | | | 11,298,602 | |
| | | | 268,900 | | | Republic Services, Inc. | | | 10,823,225 | |
| | | | | | | | |
|
|
|
| | | | | | | 58,602,986 | |
| |
13.30% HEALTH CARE | | | | |
| | | | 92,150 | | | Becton Dickinson & Co. | | | 12,823,594 | |
| | | | 173,800 | | | Baxter International Inc. | | | 12,737,802 | |
| | | | 108,924 | | | Johnson & Johnson | | | 11,390,183 | |
| | | | 99,200 | | | UnitedHealth Group Inc. | | | 10,028,128 | |
| | | | 74,600 | | | Anthem Inc. | | | 9,374,982 | |
| | | | | | | | |
|
|
|
| | | | | | | 56,354,689 | |
See notes to the financial statements.
6
The Torray Fund
SCHEDULE OF INVESTMENTS (continued)
As of December 31, 2014
| | | | | | | | | | |
| | | Shares
| | | | | Market Value
| |
| |
7.38% CONSUMER DISCRETIONARY | | | | |
| | | | 424,100 | | | Gannett Co., Inc. | | | $ 13,541,513 | |
| | | | 119,700 | | | DIRECTV * | | | 10,377,990 | |
| | | | 116,800 | | | Tupperware Brands Corp. | | | 7,358,400 | |
| | | | | | | | |
|
|
|
| | | | | | | 31,277,903 | |
| |
6.33% ENERGY | | | | |
| | | | 776,700 | | | Boardwalk Pipeline Partners LP | | | 13,801,959 | |
| | | | 345,350 | | | Chesapeake Energy Corp. | | | 6,758,500 | |
| | | | 164,120 | | | BP PLC, ADR | | | 6,256,254 | |
| | | | | | | | |
|
|
|
| | | | | | | 26,816,713 | |
| |
5.03% MATERIALS | | | | |
| | | | 234,700 | | | Dow Chemical Co. (The) | | | 10,704,667 | |
| | | | 143,900 | | | E.I. du Pont de Nemours & Co. | | | 10,639,966 | |
| | | | | | | | |
|
|
|
| | | | | | | 21,344,633 | |
| |
2.81% CONSUMER STAPLES | | | | |
| | | | 299,900 | | | Sysco Corp. | | | 11,903,031 | |
| |
2.66% TELECOMMUNICATIONS | | | | |
| | | | 335,900 | | | AT&T Inc. | | | 11,282,881 | |
| | | | | | | | |
|
|
|
| TOTAL COMMON STOCK 87.64% | | | 371,470,640 | |
(cost $252,136,647) | | | | |
| | |
| | | Principal Amount ($)
| | | | |
| SHORT-TERM INVESTMENTS 12.30% | | | | |
| | | | 52,133,807 | | | BNY Mellon Cash Reserve, 0.01%(1) | | | 52,133,807 | |
(cost $52,133,807) | | | | |
| | | | | | | | |
|
|
|
| TOTAL INVESTMENTS 99.94% | | | 423,604,447 | |
(cost $304,270,454) | | | | |
| OTHER ASSETS LESS LIABILITIES 0.06% | | | 249,916 | |
| | | | | | | | |
|
|
|
| NET ASSETS 100.00% | | | $423,854,363 | |
| | | | | | | | |
|
|
|
| * | Non-income producing securities |
| (1) | Represents current yield at December 31, 2014 |
ADR — American Depositary Receipt
See notes to the financial statements.
7
The Torray Fund
STATEMENT OF ASSETS AND LIABILITIES
As of December 31, 2014
| | | | |
ASSETS | |
Investments in securities at value
(cost $304,270,454) | | $ | 423,604,447 | |
Interest and dividends receivable | | | 830,132 | |
Receivable for fund shares sold | | | 15,088 | |
Prepaid expenses | | | 56,031 | |
| | |
|
|
|
TOTAL ASSETS | | | 424,505,698 | |
| | |
|
|
|
| |
LIABILITIES | | | | |
Payable to advisor | | | 359,690 | |
Payable for fund shares redeemed | | | 216,159 | |
Accrued expenses | | | 75,486 | |
| | |
|
|
|
TOTAL LIABILITIES | | | 651,335 | |
| | |
|
|
|
| |
NET ASSETS | | $ | 423,854,363 | |
| | |
|
|
|
Shares of beneficial interest ($1 stated value,
8,810,887 shares outstanding, unlimited shares authorized) | | $ | 8,810,887 | |
Paid-in-capital in excess of par | | | 300,925,055 | |
Undistributed net investment income | | | 280,549 | |
Accumulated net realized loss on investments | | | (5,496,121 | ) |
Net unrealized appreciation of investments | | | 119,333,993 | |
| | |
|
|
|
| |
TOTAL NET ASSETS | | $ | 423,854,363 | |
| | |
|
|
|
Net Asset Value, Offering and Redemption Price per Share | | $ | 48.11 | |
| | |
|
|
|
See notes to the financial statements.
8
The Torray Fund
STATEMENT OF OPERATIONS
For the year ended December 31, 2014
| | | | |
INVESTMENT INCOME | |
Dividend income | | $ | 8,821,680 | |
Interest income | | | 4,144 | |
| | |
|
|
|
Total investment income | | | 8,825,824 | |
| | |
|
|
|
| |
EXPENSES | | | | |
Management fees | | | 4,092,250 | |
Transfer agent fees & expenses | | | 276,563 | |
Trustees’ fees | | | 85,750 | |
Insurance expense | | | 80,905 | |
Printing, postage & mailing | | | 47,035 | |
Legal fees | | | 45,469 | |
Audit fees | | | 25,500 | |
Registration & filing fees | | | 25,387 | |
Custodian fees | | | 21,359 | |
| | |
|
|
|
Total expenses | | | 4,700,218 | |
| | |
|
|
|
NET INVESTMENT INCOME | | | 4,125,606 | |
| | |
|
|
|
REALIZED AND UNREALIZED GAIN ON INVESTMENTS | | | | |
Net realized gain on investments | | | 28,873,105 | |
Net change in unrealized appreciation (depreciation) on investments | | | 13,615,010 | |
| | |
|
|
|
Net realized and unrealized gain on investments | | | 42,488,115 | |
| | |
|
|
|
NET INCREASE IN NET ASSETS RESULTING FROM OPERATIONS | | $ | 46,613,721 | |
| | |
|
|
|
See notes to the financial statements.
9
The Torray Fund
STATEMENTS OF CHANGES IN NET ASSETS
For the years indicated:
| | | | | | | | |
| | | Year ended
12/31/14
| | | Year ended
12/31/13
| |
Increase in Net Assets Resulting from Operations: | | | | | | | | |
Net investment income | | $ | 4,125,606 | | | $ | 4,240,200 | |
Net realized gain on investments | | | 28,873,105 | | | | 36,286,728 | |
Net change in unrealized appreciation
(depreciation) on investments | | | 13,615,010 | | | | 63,203,357 | |
| | |
|
|
| |
|
|
|
Net increase in net assets resulting from operations | | | 46,613,721 | | | | 103,730,285 | |
| | |
|
|
| |
|
|
|
Distributions to Shareholders from: | | | | | | | | |
Net investment income
($0.491 and $0.395 per share, respectively) | | | (4,406,226 | ) | | | (3,750,469 | ) |
| | |
|
|
| |
|
|
|
Total distributions | | | (4,406,226 | ) | | | (3,750,469 | ) |
| | |
|
|
| |
|
|
|
Shares of Beneficial Interest | | | | | | | | |
Net decrease from share transactions (Note 2) | | | (19,648,204 | ) | | | (30,193,238 | ) |
| | |
|
|
| |
|
|
|
Total increase in net assets | | | 22,559,291 | | | | 69,786,578 | |
| | |
Net Assets — Beginning of Year | | | 401,295,072 | | | | 331,508,494 | |
| | |
|
|
| |
|
|
|
Net Assets — End of Year | | $ | 423,854,363 | | | $ | 401,295,072 | |
| | |
|
|
| |
|
|
|
Undistributed Net Investment Income | | $ | 280,549 | | | $ | 561,169 | |
| | |
|
|
| |
|
|
|
See notes to the financial statements.
10
The Torray Fund
FINANCIAL HIGHLIGHTS
For a share outstanding throughout each year presented:
PER SHARE DATA
| | | | | | | | | | | | | | | | | | | | |
| | | Years ended December 31:
| |
| | | 2014
| | | 2013
| | | 2012
| | | 2011
| | | 2010
| |
Net Asset Value, Beginning of Year | | $ | 43.400 | | | $ | 33.000 | | | $ | 30.870 | | | $ | 29.430 | | | $ | 26.760 | |
| | |
|
|
| |
|
|
| |
|
|
| |
|
|
| |
|
|
|
Income from investment operations | | | | | | | | | | | | | | | | | | | | |
Net investment income(1) | | | 0.458 | | | | 0.444 | | | | 0.440 | | | | 0.328 | | | | 0.230 | |
Net gains on securities (both realized and unrealized) | | | 4.743 | | | | 10.351 | | | | 2.139 | | | | 1.438 | | | | 2.673 | |
| | |
|
|
| |
|
|
| |
|
|
| |
|
|
| |
|
|
|
Total from investment operations | | | 5.201 | | | | 10.795 | | | | 2.579 | | | | 1.766 | | | | 2.903 | |
| | |
|
|
| |
|
|
| |
|
|
| |
|
|
| |
|
|
|
Less: distributions | | | | | | | | | | | | | | | | | | | | |
Dividends (from net investment income) | | | (0.491 | ) | | | (0.395 | ) | | | (0.449 | ) | | | (0.326 | ) | | | (0.233 | ) |
| | |
|
|
| |
|
|
| |
|
|
| |
|
|
| |
|
|
|
Total distributions | | | (0.491 | ) | | | (0.395 | ) | | | (0.449 | ) | | | (0.326 | ) | | | (0.233 | ) |
| | |
|
|
| |
|
|
| |
|
|
| |
|
|
| |
|
|
|
Net Asset Value, End of Year | | $ | 48.110 | | | $ | 43.400 | | | $ | 33.000 | | | $ | 30.870 | | | $ | 29.430 | |
| | |
|
|
| |
|
|
| |
|
|
| |
|
|
| |
|
|
|
TOTAL RETURN(2) | | | 12.04 | % | | | 32.84 | % | | | 8.38 | % | | | 6.01 | % | | | 10.90 | % |
RATIOS/SUPPLEMENTAL DATA | | | | | | | | | | | | | | | | | | | | |
Net assets, end of year (000’s omitted) | | $ | 423,854 | | | $ | 401,295 | | | $ | 331,508 | | | $ | 344,468 | | | $ | 362,409 | |
Ratios of expenses to average net assets | | | 1.15 | % | | | 1.15 | % | | | 1.17 | % | | | 1.17 | % | | | 1.17 | % |
Ratios of net investment income to average net assets | | | 1.01 | % | | | 1.15 | % | | | 1.35 | % | | | 1.07 | % | | | 0.84 | % |
Portfolio turnover rate | | | 15.68 | % | | | 13.63 | % | | | 16.55 | % | | | 12.85 | % | | | 14.42 | % |
| (1) | Calculated based on the average amount of shares outstanding during the year |
| (2) | Past performance is not predictive of future performance. Returns assume reinvestment of all dividends and distributions. |
See notes to the financial statements.
11
The Torray Fund
NOTES TO FINANCIAL STATEMENTS
As of December 31, 2014
NOTE 1 — SUMMARY OF SIGNIFICANT ACCOUNTING POLICIES
The Torray Fund (“Fund”) is a separate diversified series of The Torray Fund (“Trust”). The Trust is registered under the Investment Company Act of 1940, as amended, as an open-end management investment company. The Trust is organized as a business trust under Massachusetts law. The Fund’s investment objectives are to build investor wealth over extended periods and to minimize shareholder capital gains tax liability by limiting the realization of long- and short-term gains. The Fund seeks to meet its objectives by investing in the common stocks of high quality businesses that are fairly priced and run by sound management. These companies must have solid finances and a long-term record of rising sales, earnings and free cash flow. Investments are held as long as the issuers’ fundamentals remain intact. The Fund invests principally in the common stocks of large capitalization companies (e.g. companies with market capitalization of $8 billion or more). There can be no assurance that the Fund’s investment objectives will be achieved.
The following is a summary of accounting policies followed by the Fund in the preparation of its financial statements. These policies are in conformity with accounting principles generally accepted in the United States of America.
Securities Valuation Portfolio securities for which market quotations are readily available are valued at market value, which is determined by using the last reported sale price, or, if no sales are reported—and in the case of certain securities traded over-the-counter — the last reported bid price. For NASDAQ traded securities, market value may also be determined on the basis of the NASDAQ Official Closing Price instead of the last reported sales price. In cases where quotes are not readily available, such as with respect to restricted securities, private placements or other types of illiquid securities, or when Torray LLC (the “Advisor”) does not believe the quotations reflect market value, the securities will be valued using fair value guidelines approved by the Trust’s Board of Trustees (the “Board” or “Trustees”). As of December 31, 2014, no Fund portfolio securities were priced using the Trust’s fair value guidelines. Short-term obligations having remaining maturities of 60 days or less are valued at amortized cost, which approximates market value.
Fair Value Measurements Various inputs are used in determining the fair value of investments which are as follows:
| | • | | Level 1 — quoted prices in active markets for identical securities |
| | • | | Level 2 — significant observable inputs (including quoted prices for similar securities, interest rates, prepayment speeds, credit risk, etc.) |
| | • | | Level 3 — significant unobservable inputs (including the Fund’s own assumptions in determining the fair value of investments) |
The inputs or methodology used for valuing securities are not necessarily an indication of the risk associated with investing in those securities.
12
The Torray Fund
NOTES TO FINANCIAL STATEMENTS (continued)
As of December 31, 2014
The summary of inputs used to value the Fund’s investments as of December 31, 2014 is as follows:
| | | | |
Valuation Inputs
| | | |
Level 1 — Quoted Prices * | | $ | 423,604,447 | |
Level 2 — Other Significant Observable Inputs | | | — | |
Level 3 — Significant Unobservable Inputs | | | — | |
| | |
|
|
|
Total Market Value of Investments | | $ | 423,604,447 | |
| | |
|
|
|
| | * | Security types and industry classifications as defined in the Schedule of Investments. |
The Fund had no Level 3 investments during the year and had no transfers between Level 1, Level 2 and Level 3 investments during the year ended 12/31/14.
Securities Transactions and Investment Income Securities transactions are recorded on a trade date basis. Realized gains and losses from securities transactions are recorded on the specific identification basis. Dividend income and distributions to shareholders are recorded on the ex-dividend date. Interest income, including amortization of discount on short-term investments, and expenses are recorded on the accrual basis.
Federal Income Taxes The Fund intends to continue to comply with the requirements of the Internal Revenue Code applicable to regulated investment companies and to distribute all of its taxable income, including any net realized gain on investments to its shareholders. Therefore, no federal income tax provision is required.
As of and during the year ended December 31, 2014, the funds did not have any liabilities for any uncertain tax positions. Management has analyzed the Fund’s tax positions taken on federal income tax returns for all open tax years (current and prior three tax years), and has concluded that no provision for federal income tax is required in the Fund’s financial statements. The Fund’s federal and state income and federal excise tax returns for tax years for which the applicable statutes of limitations have not expired are subject to examination by the Internal Revenue Service and state departments of revenue.
Net Asset Value The net asset value per share of the Fund is determined daily as of the close of trading on the New York Stock Exchange by dividing the value of the Fund’s net assets by the number of shares outstanding.
Use of Estimates In preparing financial statements in accordance with accounting principles generally accepted in the United States of America, management is required to make estimates and assumptions that affect the reported amounts of assets and liabilities and the disclosure of contingent assets and liabilities at the date of the financial statements, and the reported amounts of increases and decreases in net assets from operations during the reporting period. Actual results could differ from those estimates.
13
The Torray Fund
NOTES TO FINANCIAL STATEMENTS (continued)
As of December 31, 2014
NOTE 2 — SHARES OF BENEFICIAL INTEREST TRANSACTIONS
Transactions in shares of beneficial interest were as follows:
| | | | | | | | | | | | | | | | |
| | | Year ended
12/31/14
| | | Year ended
12/31/13
| |
| | | Shares
| | | Amount
| | | Shares
| | | Amount
| |
Shares issued | | | 75,580 | | | $ | 3,423,260 | | | | 99,911 | | | $ | 3,863,597 | |
Reinvestments of dividends and distributions | | | 90,348 | | | | 4,137,023 | | | | 89,567 | | | | 3,521,931 | |
Shares redeemed | | | (600,805 | ) | | | (27,208,487 | ) | | | (988,735 | ) | | | (37,578,766 | ) |
| | |
|
|
| |
|
|
| |
|
|
| |
|
|
|
| | | | (434,877 | ) | | $ | (19,648,204 | ) | | | (799,257 | ) | | $ | (30,193,238 | ) |
| | |
|
|
| |
|
|
| |
|
|
| |
|
|
|
As of December 31, 2014, the Trust’s officers, Trustees and affiliated persons and their families directly or indirectly controlled 1,569,204 shares or 17.81% of the Fund.
NOTE 3 — INVESTMENT TRANSACTIONS
Purchases and sales of investment securities, other than short-term investments, for the year ended December 31, 2014, aggregated $57,596,161 and $72,520,037, respectively.
NOTE 4 — MANAGEMENT FEES
Pursuant to the Management Contract, the Advisor provides investment advisory and administrative services to the Fund. The Fund pays the Advisor a management fee, computed daily and payable monthly at the annual rate of 1.00% of the Fund’s average daily net assets. For the year ended December 31, 2014, the Fund incurred management fees of $4,092,250.
Excluding the management fee, other expenses incurred by the Fund during the year ended December 31, 2014, totaled $607,968. These expenses include all costs associated with the Fund’s operations including transfer agent fees, independent trustees’ fees ($14,000 per annum, $2,000 for each Board meeting attended per Trustee, and an additional $10,000 annual retainer for the Chairman of the Board), dues, fees and expenses of registering and qualifying the Fund and its shares for distribution, charges of the custodian, auditing and legal expenses, insurance premiums, supplies, postage, expenses of issue or redemption of shares, reports to shareholders and Trustees, expenses of printing and mailing prospectuses, proxy statements and proxies to existing shareholders, and other miscellaneous expenses.
Certain officers and Trustees of the Fund are also officers and/or shareholders of the Advisor, and are not paid by the Fund for serving in such capacities.
14
The Torray Fund
NOTES TO FINANCIAL STATEMENTS (continued)
As of December 31, 2014
NOTE 5 — TAX MATTERS
Distributions to shareholders are determined in accordance with United States federal income tax regulations, which may differ from accounting principles generally accepted in the United States of America.
The tax character of distributions paid during the years ended December 31, 2014 and 2013 were as follows:
| | | | | | | | |
| | | 2014
| | | 2013
| |
Distributions paid from: | | | | | | | | |
Ordinary income | | $ | 4,406,226 | | | $ | 3,750,469 | |
| | |
|
|
| |
|
|
|
| | | $ | 4,406,226 | | | $ | 3,750,469 | |
| | |
|
|
| |
|
|
|
As of December 31, 2014, the components of distributable earnings on a tax basis were as follows:
| | | | | | |
| Capital loss carry forward | | $ | (5,496,121 | ) | | |
| Undistributed net investment income | | | 280,549 | | | |
| Net unrealized appreciation | | | 119,333,993 | | | |
| | |
|
|
| | |
| | | $ | 114,118,421 | | | |
| | |
|
|
| | |
At December 31, 2014, the Fund had net capital loss carry forward for federal income tax purposes of $5,496,121 which is available to reduce future required distributions of net capital gains to shareholders through 2017.
For the year ended December 31, 2014, the Fund utilized capital loss carry forwards of $28,873,104.
Under current tax law, capital losses realized after October 31 of a fund’s fiscal year may be deferred and treated as occurring on the first business day of the following fiscal year for tax purposes. At December 31, 2014, the Fund had deferred no post-October capital losses.
The following information is based upon the federal tax basis of investment securities as of December 31, 2014:
| | | | | | |
Gross unrealized appreciation | | $ | 121,313,573 | | | |
Gross unrealized depreciation | | | (1,979,580 | ) | | |
| | |
|
|
| | |
Net unrealized appreciation | | $ | 119,333,993 | | | |
| | |
|
|
| | |
Cost | | $ | 304,270,454 | | | |
| | |
|
|
| | |
15
The Torray Fund
NOTES TO FINANCIAL STATEMENTS (continued)
As of December 31, 2014
NOTE 6 — COMMITMENTS AND CONTINGENCIES
The Fund indemnifies its officers and Trustees for certain liabilities that may arise from their performance of their duties to the Fund. Additionally, in the normal course of business, the Fund enters into contracts that contain a variety of representations and warranties which provide general indemnifications. The Fund’s maximum exposure under these arrangements is unknown, as this would involve future claims that may be made against the Fund that have not yet occurred.
NOTE 7 — SUBSEQUENT EVENTS
Management has evaluated the impact of all subsequent events on the Fund through the date these financial statements were issued and has determined that there were no subsequent events requiring recognition or disclosure in the financial statements.
16
The Torray Fund
REPORT OF INDEPENDENT REGISTERED PUBLIC ACCOUNTING FIRM
To the Board of Trustees of The Torray Fund
and the Shareholders of The Torray Fund
We have audited the accompanying statement of assets and liabilities of The Torray Fund (the “Fund”), a series of shares of beneficial interest in The Torray Fund, including the schedule of investments, as of December 31, 2014, and the related statement of operations for the year then ended, the statements of changes in net assets for each of the years in the two-year period then ended and the financial highlights for each of the years in the five-year period then ended. These financial statements and financial highlights are the responsibility of the Fund’s management. Our responsibility is to express an opinion on these financial statements and financial highlights based on our audits.
We conducted our audits in accordance with the standards of the Public Company Accounting Oversight Board (United States). Those standards require that we plan and perform the audits to obtain reasonable assurance about whether the financial statements and financial highlights are free of material misstatement. An audit includes examining, on a test basis, evidence supporting the amounts and disclosures in the financial statements. Our procedures included confirmation of securities owned as of December 31, 2014 by correspondence with the custodian. An audit also includes assessing the accounting principles used and significant estimates made by management, as well as evaluating the overall financial statement presentation. We believe that our audits provide a reasonable basis for our opinion.
In our opinion, the financial statements and financial highlights referred to above present fairly, in all material respects, the financial position of The Torray Fund as of December 31, 2014, the results of its operations for the year then ended, the changes in its net assets for each of the years in the two-year period then ended and its financial highlights for each of the years in the five-year period then ended, in conformity with accounting principles generally accepted in the United States of America.

BBD, LLP
Philadelphia, Pennsylvania
February 24, 2015
17
The Torray Fund
FUND MANAGEMENT
As of December 31, 2014 (unaudited)
The Trust is overseen by a Board of Trustees (the “Board”), who has delegated the day-to-day management to the officers of the Trust. The Board meets regularly to review the Fund’s activities, contractual arrangements, and performance. The Trustees and officers serve until their successors are elected and qualified, or until the Trustee or officer dies, resigns or is removed, or becomes disqualified.
Information pertaining to the Trustees and officers of the Trust is set forth below. The Statement of Additional Information (SAI) includes additional information about the Trustees and is available without charge, upon request, by calling (855) 753-8174.
| | | | | | | | | | |
Name, Age, Address* and Position(s) with the Trust | | Term of Office
and Length of
Time Served | | Principal Occupation(s)
During Past Five Years | | No. of Portfolios in
Fund Complex
Overseen by
Trustee | | | Other Directorships Held |
| INDEPENDENT TRUSTEES |
Carol T. Crawford (71) Trustee | | Indefinite Term Since 2006 | | Attorney and International Trade Consultant,
McLean, VA | | | 1 | | | None |
Bruce C. Ellis (70) Trustee | | Indefinite Term Since 1993 | | Private Investor,
Bethesda, MD | | | 1 | | | None |
Robert P. Moltz (67) Trustee | | Indefinite Term Since 1990 | | Chairman and CEO,
Weaver Bros. Insurance Associates, Inc.,
Bethesda, MD | | | 1 | | | None |
Wayne H. Shaner (67)** Trustee and Chairman of the Board | | Indefinite Term Since 1993 | | Managing Partner,
Rockledge Partners, LLC,
Investment Advisory Firm,
Easton, MD (Jan. 2004-present);
Vice President,
Torray LLC,
Bethesda, MD (Jan. 2008-June 2008) | | | 1 | | | Director,
Van Eck Funds
New York, NY |
18
The Torray Fund
FUND MANAGEMENT (continued)
As of December 31, 2014 (unaudited)
| | | | | | | | | | |
Name, Age, Address* and Position(s) with the Trust | | Term of Office
and Length of
Time Served | | Principal Occupation(s)
During the Past Five Years | | No. of Portfolios in
Fund Complex
Overseen by
Trustee | | | Other
Directorships Held |
| INTERESTED TRUSTEES AND OFFICERS OF THE TRUST |
William M Lane (64)*** Trustee, Treasurer and Secretary | | Indefinite Term Since 1990 | | Executive Vice President and Secretary, Torray LLC, Bethesda, MD (Oct. 2005-present); Chief Compliance Officer, Torray LLC, Bethesda, MD (Oct. 2005-Mar. 2011); Vice President, Secretary, Treasurer and Chief Compliance Officer, Robert E. Torray & Co. Inc., Bethesda, MD (Jul. 1984-Oct. 2005) | | | 1 | | | None |
Robert E. Torray (77) President | | Indefinite Term Since 2007 | | Chairman, Torray LLC, Bethesda, MD (2005-present); President, Torray LLC, Bethesda, MD (2007-present); President, Robert E. Torray & Co. Inc., Bethesda, MD (May 1972-Oct. 2005) | | | N/A | | | None |
Barbara C. Warder (57) Chief Compliance Officer and Anti-Money Laundering Officer | | Indefinite Term Since 2011 | | Chief Compliance Officer and Anti-Money Laundering Officer, Torray LLC, Bethesda, MD (Mar. 2011-present); Chief Operating Officer and Chief Compliance Officer, Resolute Capital Management, Washington, DC (Mar. 1998-June 2010) | | | N/A | | | None |
| * | All addresses are c/o The Torray Fund, 7501 Wisconsin Avenue, Suite 750W, Bethesda, MD 20814-6519. |
| ** | Mr. Shaner is deemed to be an independent Trustee effective as of January 1, 2011. |
| *** | Mr. Lane, by virtue of his employment with Torray LLC, the Trust’s investment adviser, is considered an “interested person” of the Trust, as that term is defined in Section 2(a)(19) of the Investment Company Act of 1940, as amended. |
19
The Torray Fund
FACTORS CONSIDERED BY THE BOARD OF TRUSTEES IN CONNECTION WITH THEIR APPROVAL OF THE TRUST’S MANAGEMENT AGREEMENT WITH THE ADVISOR (unaudited)
The Torray Fund (“Trust”) has entered into a Management Contract (the “Agreement”) with Torray LLC (“Advisor”) pursuant to which the Advisor provides investment management services to The Torray Fund, a series of the Trust (“Fund”). In accordance with the Investment Company Act of 1940, the Trust’s Board of Trustees (“Board”), including a majority of the Trustees who are not “interested persons” of the Trust as that term is defined in Section 2(a)(19) of the Investment Company Act of 1940, as amended (“Independent Trustees”) is required, on an annual basis, to consider the continuation of the Agreement with the Advisor, and this must take place at an in-person meeting of the Board. The relevant provisions of the Investment Company Act of 1940, as amended (“1940 Act”) specifically provide that it is the duty of the Board to request and evaluate such information as the Board determines is necessary to allow them to properly consider the continuation of the Agreement, and it is the duty of the Advisor to furnish the Trustees with such information that is responsive to their request.
At the regular meeting of the Board on September 25, 2014, the Board, including all of the Trustees who are not “interested persons” of the Trust as that term is defined in Section 2(a)(19) of the 1940 Act (“Independent Trustees”), considered and approved the continuation of the Agreement. Prior to the meeting, the Trustees received and considered information from the Advisor designed to provide the Trustees with the information necessary to evaluate the terms of the Agreement (“Support Materials”). Before voting to approve the continuation of the Agreement, the Trustees reviewed the Support Materials with counsel to the Independent Trustees and a memorandum from such counsel discussing the legal standards applicable to their consideration of the continuation of the Agreement. The Advisor also met with the Trustees and provided further information regarding the management services it provides to the Fund under the Agreement (“Management Services”), including but not limited to information regarding its overall investment philosophy with respect to the Fund.
In determining whether to approve the continuation of the Agreement, the Trustees considered all factors they believed relevant to such determination, including the following: (1) the nature, extent, and quality of the services of the Management Services; (2) the investment performance of the Fund; (3) the cost of the Management Services and the profits that the Advisor and its affiliate realize from the Advisor’s relationship with the Fund; (4) the extent to which the Advisor realizes economies of scale as the Fund grows and whether fees for the Management Services reflect these economies for the benefit of the Fund’s investors; (5) management fees paid by the Fund and the net and total expense ratios of the Fund and other similar mutual funds; and (6) any other benefits that the Advisor derives from its relationship with the Fund.
Based upon the Advisor’s presentation and Support Materials, the Board concluded that the overall arrangements between the Fund and the Advisor as set forth in the Agreement are fair and reasonable in light of the services performed, fees paid and such other matters as the Trustees considered relevant in the exercise of their reasonable judgment. In their deliberations, the Trustees did not identify any particular information that was all-important or controlling. The material factors and conclusions that formed the basis of the Trustees’ determination to approve the continuation of the Agreement are summarized below.
20
The Torray Fund
FACTORS CONSIDERED BY THE BOARD OF TRUSTEES IN CONNECTION WITH THEIR APPROVAL OF THE TRUST’S MANAGEMENT AGREEMENT WITH THE ADVISOR (unaudited) (continued)
Nature, Extent and Quality of Services. With respect to the nature, extent and quality of services that Manager renders, the Trustees considered the scope of services provided under the Agreement, which includes, but are not limited to, the following: (1) investing the Fund’s assets consistent with the Fund’s investment objective, policies and restrictions; (2) making investment decisions and placing all orders for the purchase and sale of portfolio securities and cash instruments; (3) paying for the administration and fund accounting services that BNY Mellon provides and the distribution services Foreside provides to the Fund; (4) monitoring the compliance of the Fund’s investment portfolio with applicable Federal securities laws and regulations and Internal Revenue standards; and (5) providing the interested Trustee, Chief Financial Officer and Chief Compliance Officer of the Fund and paying the salaries, fees and expenses of such persons. The Trustees also considered the long-term investment philosophy and the significant industry experience of the Advisor’s personnel involved in servicing the Fund, noting their high quality. In addition, the Trustees reviewed the Advisor’s brokerage and best-execution procedures and observed that they were reasonable and consistent with standard industry practice. The Trustees also noted that while the Advisor is permitted to use soft dollars to acquire proprietary and third-party research, it receives only proprietary research and that such research is provided on an unsolicited basis and is not the motivation for the selection of broker-dealers. Finally, the Trustees discussed the state of the Advisor’s compliance program and acknowledged that a recent independent risk assessment of the program did not identify any material concerns. The Trustees concluded that they were satisfied with the nature, extent and quality of services provided by the Advisor pursuant to the Agreement.
Performance of the Fund. The Board reviewed the Fund’s performance as reported in the Support Materials for various periods ending as of June 30, 2014, July 31, 2014 and August 31, 2014. The Trustees discussed the Advisor’s focus on long-term investing and risk management, the fact that the Fund tends to underperform in strong markets and outperform during periods of negative market activity as a result, and the fact that the Advisor does not provide management services to any other fee paying accounts with similar investment objectives, policies and restrictions. The Trustees also noted the Fund’s positive performance for all reported time periods, its overall three star Morningstar rating as of August 2014 and Lipper’s high ranking of the Fund for preservation of capital. After further discussion, the Trustees concluded that they were satisfied with the Fund’s performance.
Cost of Advisory Services and Profitability. The Trustees considered and discussed with the Advisor the income and expenses of the Advisor as of September 30, 2014 and the Advisor’s balance sheet as of the same date. The Trustees also discussed with the Advisor its business succession planning, insurance coverage, potential new business opportunities, and the recent distribution success and significant asset growth of the Transamerica Concentrated Growth Fund, a mutual fund subadvised by one of the Advisor’s portfolio managers. The Trustees concluded that the Advisor’s profitability was reasonable, that its assets were sufficient to provide the services called for by the Agreement, and that the Advisor’s assets, coupled with its insurance coverage, were sufficient to cover potential liabilities incurred under the Agreement.
Comparative Fee and Expense Data; Economies of Scale. The Trustees discussed the Fund’s management fee of 1.00% and its current expense ratio of 1.15%. The Trustees noted that the management fee payable to the Advisor is in the form of a “unified fee,” a relatively uncommon arrangement wherein the Advisor is required to pay
21
The Torray Fund
FACTORS CONSIDERED BY THE BOARD OF TRUSTEES IN CONNECTION WITH THEIR APPROVAL OF THE TRUST’S MANAGEMENT AGREEMENT WITH THE ADVISOR (unaudited) (continued)
certain expenses of the Fund from its management fee (“Specified Expenses”), and that comparative fee data for such arrangements is not readily available from data sources such as Morningstar and Lipper. The Trustees then discussed that the Advisor receives a net management fee of approximately 93 basis points after payment of Specified Expenses. The Trustees then focused on the gross and net expense ratios of comparable funds noting that the Fund’s expense ratio is comparable to those funds with net assets of less than $500 million within the Morningstar Large Blend category, the Fund’s designated Morningstar category. They also note that because the Fund has no rule 12b-1 or shareholder fees, the Advisor pays certain distribution and platform expenses exclusively from its own profits. The Trustees discussed economies of scale with the Advisor and considered the Advisor’s representation that the Fund’s asset level is not high enough to warrant breakpoints in the management fee. The Trustees also noted that the Advisor does not service any other fee paying accounts with similar investment objectives, policies and restrictions. After further discussion, the Trustees concluded that the fees paid to the Advisor under the Agreement and the Fund’s overall expenses were reasonable.
Other Benefits. The Trustees considered the Advisor’s representation that it does not derive any other benefits from its relationship with the Fund and concluded that Advisor does not receive any additional financial or other benefits from its relationship with the Fund.
22
The Torray Fund
PORTFOLIO HOLDINGS, PROXY VOTING AND PROCEDURES
As of December 31, 2014 (unaudited)
The Fund files its complete schedule of portfolio holdings with the Securities and Exchange Commission (the “Commission”) for the first and third quarters of each fiscal year on Form N-Q. The Fund’s Forms N-Q are available on the Commission’s website at http://www.sec.gov. The Fund’s Forms N-Q may be reviewed and copied at the Commission’s Public Reference Room in Washington, D.C. Information on the operation of the Commission’s Public Reference Room may be obtained by calling 1-800-SEC-0330.
A description of the policies and procedures that the Fund uses to determine how to vote proxies relating to portfolio securities is available without charge, upon request, by calling 1-855-753-8174; and on the Commission’s website at http://www.sec.gov.
Information regarding how the Fund voted proxies relating to portfolio securities during the most recent 12-month period ended June 30 is available without charge, upon request, by calling 1-855-753-8174; and on the Commission’s website at http://www.sec.gov.
23
The Torray Fund
ABOUT YOUR FUND’S EXPENSES
As of December 31, 2014 (unaudited)
We believe it is important for you to understand the impact of costs on your investment. All mutual funds have operating expenses. As a shareholder of the Fund, you incur ongoing costs, including management fees, and other fund expenses. Operating expenses, which are deducted directly from the Fund’s gross income, directly reduce the investment return of the Fund.
A mutual fund’s expenses are expressed as a percentage of its average net assets. This figure is known as the expense ratio. The following examples are intended to help you understand the ongoing costs (in dollars) of investing in the Fund and to compare these costs with the ongoing costs of investing in other mutual funds. The examples below are based on an investment of $1,000 made at the beginning of the period and held for the entire period from July 1, 2014 to December 31, 2014.
The table on the next page illustrates the Fund’s cost in two ways:
Actual Fund Return This section helps you estimate the actual expenses that you paid over the period. The “Ending Account Value” shown is derived from the Fund’s actual return, and the third column shows the operating expenses that would have been paid by an investor who started with $1,000 in the Fund. You may use the information here, together with the amount invested, to estimate the expenses that you paid over the period.
To do so, simply divide your account value by $1,000 (for example, an $8,600 account value divided by $1,000 = 8.6), then multiply the result by the number given for the Fund under the heading “Expenses Paid During Period” on the next page.
Hypothetical 5% Return This section is intended to help you compare your Fund’s costs with those of other mutual funds. It assumes that the Fund had an annual return of 5% before expenses, and that the expense ratio is unchanged. In this case, because the return used is not the Fund’s actual return, the results do not apply to your investment. The example is useful in making comparisons because the Commission requires all mutual funds to calculate expenses based on a 5% return. You can assess the Fund’s costs by comparing this hypothetical example with the hypothetical examples that appear in shareholder reports of other funds.
Note that expenses shown in the table are meant to highlight and help you compare ongoing costs only. The Fund does not charge transactions fees, such as purchase or redemption fees, nor does it carry a “sales load.”
The calculation assumes no shares were bought or sold during the period. Your actual costs may have been higher or lower, depending on the amount of your investment and the timing of any purchases or redemptions.
24
The Torray Fund
ABOUT YOUR FUND’S EXPENSES (continued)
As of December 31, 2014 (unaudited)
More information about the Fund’s expenses, including recent annual expense ratios, can be found in this report. For additional information on operating expenses and other shareholder costs, please refer to the Fund’s prospectus.
| | | | | | | | | | | | |
| | | Beginning
Account Value
July 1, 2014
| | | Ending
Account Value
December 31, 2014
| | | Expenses Paid
During Period *
| |
Based on Actual Fund Return | | $ | 1,000.00 | | | $ | 1,043.90 | | | $ | 5.92 | |
Based on Hypothetical 5% Return
(before expenses) | | $ | 1,000.00 | | | $ | 1,019.41 | | | $ | 5.85 | |
| * | Expenses are equal to the Fund’s annualized expense ratio of 1.15% for the period, multiplied by the average account value over the period, multiplied by 184/365 (to reflect the one-half-year period). |
25
The Torray Fund
TAX INFORMATION
As of December 31, 2014 (unaudited)
We are required to advise you within 60 days of the Fund’s fiscal year end regarding the Federal tax status of certain distributions received by shareholders during such fiscal year. The information below is provided for the Fund’s fiscal year ending December 31, 2014. All designations are based on financial information available as of the date of this annual report and, accordingly are subject to change. For each item it is the intention of the Fund to designate the maximum amount permitted under the Internal Revenue Code and the regulations thereunder.
Qualified Interest Income
For the year ended December 31, 2014, 0.05% of the ordinary distributions paid (net investment income plus short-term capital gain) represent the amount of Qualifying Interest Income as created by The American Jobs Creation Act of 2004.
Qualified Dividend Income
For the year ended December 31, 2014, 100% of the distributions paid by the Fund from ordinary income qualifies for a reduced tax rate pursuant to The Jobs and Growth Tax Relief Reconciliation Act of 2003.
Dividends Received Deduction
For the year ended December 31, 2014, 100% of the ordinary income distribution qualifies for the dividends received deduction available to corporations.
Dividends and distributions received by retirement plans such as IRA’s, Keogh-type plans and 403(b) plans need not be reported as taxable income. However, many retirement plan trusts may need this information for their annual information reporting.
26
TRUSTEES
Carol T. Crawford
Bruce C. Ellis
William M Lane
Robert P. Moltz
Wayne H. Shaner
INVESTMENT ADVISOR
Torray LLC
OFFICERS
Robert E. Torray
William M Lane
Fred M. Fialco
Nicholas C. Haffenreffer
Barbara C. Warder
INDEPENDENT REGISTERED
PUBLIC ACCOUNTING FIRM
BBD, LLP
1835 Market Street, 26th Floor
Philadelphia, PA 19103
TRANSFER AGENT
BNY Mellon Investment Servicing (US) Inc.
4400 Computer Drive
Westborough, MA 01581-1722
LEGAL COUNSEL
Bernstein Shur
100 Middle Street, 6th Floor
Portland, ME 04104
Distributed by Foreside Funds Distributors LLC
400 Berwyn Park, 899 Cassatt Road,
Berwyn, PA 19132
Date of first use, February 2015
This report is not authorized for distribution to prospective
investors unless preceded or accompanied by a current
prospectus. All indices are unmanaged groupings of stocks
that are not available for investment.
The
TORRAY
FUND
ANNUAL REPORT
December 31, 2014
The Torray Fund
Suite 750 W
7501 Wisconsin Avenue
Bethesda, Maryland 20814-6519
(301) 493-4600
(855) 753-8174
Item 2. Code of Ethics.
| | (a) | | The registrant, as of the end of the period covered by this report, has adopted a code of ethics that applies to the registrant’s principal executive officer, principal financial officer, principal accounting officer or controller, or persons performing similar functions, regardless of whether these individuals are employed by the registrant or a third party. |
| | (c) | | There have been no amendments, during the period covered by this report, to a provision of the code of ethics that applies to the registrant’s principal executive officer, principal financial officer, principal accounting officer or controller, or persons performing similar functions, regardless of whether these individuals are employed by the registrant or a third party, and that relates to any element of the code of ethics description. |
| | (d) | | The registrant has not granted any waivers, including an implicit waiver, from a provision of the code of ethics that applies to the registrant’s principal executive officer, principal financial officer, principal accounting officer or controller, or persons performing similar functions, regardless of whether these individuals are employed by the registrant or a third party, that relates to one or more of the items set forth in paragraph (b) of this item’s instructions. |
Item 3. Audit Committee Financial Expert.
The Registrant’s Board of Directors has not designated an audit committee financial expert. The Registrant has determined that it will retain the services of an independent third party to assist it if circumstances arise that require specific investment company auditing expertise.
Item 4. Principal Accountant Fees and Services.
Audit Fees
| | (a) | | The aggregate fees billed for each of the last two fiscal years for professional services rendered by the principal accountant for the audit of the registrant’s annual financial statements or services that are normally provided by the accountant in connection with statutory and regulatory filings or engagements for those fiscal years are $30,000 for 2013 and $22,000 for 2014. |
Audit-Related Fees
| | (b) | | The aggregate fees billed in each of the last two fiscal years for assurance and related services by the principal accountant that are reasonably related to the performance of the audit of the registrant’s financial statements and are not reported under paragraph (a) of this Item are $0 for 2013 and $0 for 2014. |
Tax Fees
| | (c) | | The aggregate fees billed in each of the last two fiscal years for professional services rendered by the principal accountant for tax compliance, tax advice, and tax planning are $2,000 for 2013 and $2,000 for 2014. Tax fees represent tax compliance services provided in connection with the review of the Registrant’s tax returns. |
All Other Fees
| | (d) | | The aggregate fees billed in each of the last two fiscal years for products and services provided by the principal accountant, other than the services reported in paragraphs (a) through (c) of this Item are $0 for 2013 and $0 for 2014. |
| (e)(1) | | Disclose the audit committee’s pre-approval policies and procedures described in paragraph (c)(7) of Rule 2-01 of Regulation S-X. |
Audit Committee Pre-Approval Policy. All services to be performed for the Registrant by BBD, LLP must be pre-approved by the audit committee. All services performed during 2014 and 2013 were pre-approved by the committee.
| (e)(2) | | The percentage of services described in each of paragraphs (b) through (d) of this Item that were approved by the audit committee pursuant to paragraph (c)(7)(i)(C) of Rule 2-01 of Regulation S-X are as follows: |
(b) N/A
(c) 100%
(d) N/A
| | (f) | | The percentage of hours expended on the principal accountant’s engagement to audit the registrant’s financial statements for the most recent fiscal year that were attributed to work performed by persons other than the principal accountant’s full-time, permanent employees was 0%. |
| | (g) | | The aggregate non-audit fees billed by the registrant’s accountant for services rendered to the registrant, and rendered to the registrant’s investment adviser (not including any sub-adviser whose role is primarily portfolio management and is subcontracted with or overseen by another investment adviser), and any entity controlling, controlled by, or under common control with the adviser that provides ongoing services to the registrant for each of the last two fiscal years of the registrant was $0 for 2013 and $0 for 2014. |
| | (h) | | The registrant’s audit committee of the board of directors has considered whether the provision of non-audit services that were rendered to the registrant’s investment adviser (not including any sub-adviser whose role is primarily portfolio management and is subcontracted with or overseen by another investment adviser), and any entity controlling, controlled by, or under common control with the investment adviser that provides ongoing services to the registrant that were not pre-approved pursuant to paragraph (c)(7)(ii) of Rule 2-01 of Regulation S-X is compatible with maintaining the principal accountant’s independence. |
Item 5. Audit Committee of Listed Registrants.
Not applicable
Item 6. Investments.
| (a) | | Schedule of Investments in securities of unaffiliated issuers as of the close of the reporting period is included as part of the report to shareholders filed under Item 1 of this form. |
| Item 7. | Disclosure of Proxy Voting Policies and Procedures for Closed-End Management Investment Companies. |
Not applicable.
Item 8. Portfolio Managers of Closed-End Management Investment Companies.
Not applicable.
| Item 9. | Purchases of Equity Securities by Closed-End Management Investment Company and Affiliated Purchasers. |
Not applicable.
Item 10. Submission of Matters to a Vote of Security Holders.
There have been no material changes to the procedures by which the shareholders may recommend nominees to the registrant’s board of directors, where those changes were implemented after the registrant last provided disclosure in response to the requirements of Item 407(c)(2)(iv) of Regulation S-K (17 CFR 229.407) (as required by Item 22(b)(15) of Schedule 14A (17 CFR 240.14a-101)), or this Item.
Item 11. Controls and Procedures.
| | (a) | | The registrant’s principal executive and principal financial officers, or persons performing similar functions, have concluded that the registrant’s disclosure controls and procedures (as defined in Rule 30a-3(c) under the Investment Company Act of 1940, as amended (the “1940 Act”) (17 CFR 270.30a-3(c))) are effective, as of a date within 90 days of the filing date of the report that includes the disclosure required by this paragraph, based on their evaluation of these controls and procedures required by Rule 30a-3(b) under the 1940 Act (17 CFR 270.30a-3(b)) and Rules 13a-15(b) or 15d-15(b) under the Securities Exchange Act of 1934, as amended (17 CFR 240.13a-15(b) or 240.15d-15(b)). |
| | (b) | | There were no changes in the registrant’s internal control over financial reporting (as defined in Rule 30a-3(d) under the 1940 Act (17 CFR 270.30a-3(d)) that occurred during the registrant’s second fiscal quarter of the period covered by this report that has materially affected, or is reasonably likely to materially affect, the registrant’s internal control over financial reporting. |
Item 12. Exhibits.
| | (a)(1) | | Code of ethics, or any amendment thereto, that is the subject of disclosure required by Item 2 is attached hereto. |
| | (a)(2) | | Certifications pursuant to Rule 30a-2(a) under the 1940 Act and Section 302 of the Sarbanes-Oxley Act of 2002 are attached hereto. |
| | (b) | | Certifications pursuant to Rule 30a-2(b) under the 1940 Act and Section 906 of the Sarbanes-Oxley Act of 2002 are attached hereto. |
(12.other) Not applicable.
SIGNATURES
Pursuant to the requirements of the Securities Exchange Act of 1934 and the Investment Company Act of 1940, the registrant has duly caused this report to be signed on its behalf by the undersigned, thereunto duly authorized.
| | |
| (Registrant) | | The Torray Fund |
| | |
| By (Signature and Title)* | | /s/ Robert E. Torray |
| | Robert E. Torray, President (principal executive officer) |
Pursuant to the requirements of the Securities Exchange Act of 1934 and the Investment Company Act of 1940, this report has been signed below by the following persons on behalf of the registrant and in the capacities and on the dates indicated.
| | |
| By (Signature and Title)* | | /s/ Robert E. Torray |
| | Robert E. Torray, President (principal executive officer) |
| | |
| By (Signature and Title)* | | /s/ William M Lane |
| | William M Lane, Treasurer (principal financial officer) |
* Print the name and title of each signing officer under his or her signature.