UNITED STATES
SECURITIES AND EXCHANGE COMMISSION
Washington, D.C. 20549
FORM N-CSR
CERTIFIED SHAREHOLDER REPORT OF REGISTERED MANAGEMENT
INVESTMENT COMPANIES
Investment Company Act file number 811-06096
|
| The Torray Fund |
| (Exact name of registrant as specified in charter) |
|
| 7501 Wisconsin Avenue, Suite 750 West |
| Bethesda, MD 20814-6519 |
| (Address of principal executive offices) (Zip code) |
William M Lane
Torray LLC
7501 Wisconsin Avenue, Suite 750 West
|
| Bethesda, MD 20814-6519 |
| (Name and address of agent for service) |
Registrant’s telephone number, including area code: 301-493-4600
Date of fiscal year end: December 31
Date of reporting period: December 31, 2012
| Item 1. | Reports to Stockholders. |
The Report to Shareholders is attached herewith.
The Torray Fund
Letter to Shareholders
January 23, 2013
Dear Fellow Shareholders,
The Torray Fund returned 8.4% in 2012, compared to 16% for the S&P 500 Index. Given the market environment, we are pleased with our results and remain highly confident about the Fund’s long-term prospects.
Last year’s market was driven by factors that had little to do with investing. Business fundamentals were almost irrelevant. What mattered most was which stocks and industry groups were expected to go up next. Traders using high-speed computers controlled most of the action and, as the year progressed, they became increasingly emboldened, causing volatile price swings on ever-more-speculative stocks. Nine out of the 10 S&P 500 industry sectors both led and lagged the market at one point or another even though the long-term fundamentals of the companies in them could not possibly have changed in such a short time. The effect of it all was to further alarm already disillusioned investors, driving them to flee in large numbers. Meanwhile, according to Morningstar, actively managed domestic mutual funds recorded portfolio turnover averaging 81%. Our turnover was 17%.
U.S. equity funds had trouble keeping pace with all this. At least 65% of the funds in the various categories trailed their benchmark indices. Eighty percent in the large capitalization value fund group, which includes The Torray Fund, lagged that index. We do not focus on these ratings. It’s simply not possible to outrun the market every year, no matter the approach. Our mission is to avoid the risk of permanent loss and earn a reasonable return measured over decades, not months or years. The approach has worked out well. The Torray Company just completed its 40th year. Over that span, its equity composite earned 11.8% compounded, turning $1 into $87.41. Comparable numbers for the S&P 500 Index were 9.7%, and $40.77. This is in spite of the fact that during those 40 years we only outperformed the market annually 22 times. During one long stretch, we trailed it seven out of eight years (1984-1991) and on another, eight of 10 (2003-2012). Had we changed our approach during these periods, there’s no doubt in our minds the outcome would have been nowhere near as good.
These results underscore the importance of both knowing what you’re doing and exercising patience. Most people, as we’ve often said, through no fault of their own, have a problem with this. When stocks are going up, they become increasingly excited and invest ever-larger sums, often on margin. When the cycle reverses, they bail out. We know we’ve made this case time and again, but it can’t be overemphasized. It’s impossible to make money doing this, and almost impossible not to lose. If a downturn is severe, as in 2008 and early 2009, stocks inevitably end up drastically undervalued. This is exactly the point at which investors should hold on and even buy more if they have the resources. Unfortunately, few can bring themselves to do it, and no wonder.
1
The Torray Fund
Letter to Shareholders (continued)
January 23, 2013
The mood by then is highly negative, and the so-called experts are yelling about how risky the market is. But, the “market” has nothing to do with risk. It only sets the prices at which shares can be bought or sold, and those prices are a reflection of public sentiment which often bears no relation to reality. The real risk lies in the economic fundamentals of companies. This is why business analysis is so critical to the investment process. We have tried our best in these shareholder letters to highlight this issue and also to place all the background noise in perspective. With that in mind and at the risk of making your eyes glaze over, we want to review the last four years and what we had to say about them along the way.
Our 2008 annual letter reported a disastrous 37% loss for the Fund, about the same as the S&P 500 Index. Broader measures of the market did even worse. Virtually everything went down and even those closest to the inner workings of the financial system didn’t see it coming. Recently released Federal Reserve Board minutes for 2007 reveal that board members believed the problems in housing and banking were isolated and unlikely to seriously damage the U.S. economy, which in the end is exactly what they did. Even when warning signals started flashing red during the summer of ’07, the minutes indicate officials thought the troubles would be moderate and short-lived. Treasury Secretary Timothy Geithner, then president of the New York Federal Reserve Bank, in an emergency telephone call on August 10, said that most of Wall Street was still doing fine. “We have no indication that the major, more diversified institutions are facing any funding pressure. In fact, some of them report what we classically see in a context like this, which is that money is flowing to them.” If these insiders didn’t know, how would anyone else?
In any event, the numbing aftermath marked the close of a miserable decade for investors and seems to have dominated their thinking ever since. By contrast, in spite of our loss and the gloomy backdrop, the Fund’s ‘08 letter expressed confidence in America’s future and underscored the idea that the issues paralyzing investors were already on the table in plain sight and priced into the market. Stocks might go lower, we said, but long term they were seriously undervalued. As for what to do next, our answer was, “stay the course.” This was four years ago, when the headlines painted the darkest of pictures. Near the bottom, TV’s most outspoken market guru virtually screamed into the camera that stocks were headed a lot lower and investors should sell everything.
Our upbeat 2009 letter referenced the ‘08 advice but noted an error in timing: during January and February, stocks collapsed another 25%, extending their loss since late 2007 to 60%. The news then proceeded to get worse, but the market brushed it all off, and by mid-year had rallied to a small gain. Our July letter expressed “room for more optimism than at any time since the financial crisis began.” This view had nothing to do with the six-month rally, but, rather, was based on the large discount to value on quality companies of the type we owned. As always, we added that this was a long-term opinion, not a forecast of where stocks were headed over the next few months or quarters.
2
The Torray Fund
Letter to Shareholders (continued)
January 23, 2013
We should have predicted a market boom. Between March 9 and year’s end, in one of the biggest advances on record, stocks soared 65%. Unfortunately, we noted, this came too late for investors that were scared out on the way down. In any event, our Fund closed the year up 25%, just a shade below the S&P 500 Index. Those who sold near the bottom — and there were a lot of them — now had to more than double their money to get even. Given that most had reinvested in money market funds, CDs and bonds, this seemed highly unlikely.
In 2010, our Fund made 11%, the Index, 15%. We explained that the difference could be traced to large gains on a handful of stocks in the S&P 500. Just 10 of them — 2% of the total — produced 25% of its return, equal to the spread between our results and those of the Index. Later, in closing, we repeated the opinion we’d expressed in letters dating back to the crash: stocks were a long-term bargain, and we thought investors should buy them: “The point of investing now is to take advantage of America’s future prosperity at a discount, not to buy a ticket on a short-term market rally.”
The following year, we made 6%, the Index, 2%. It was a scary period marked by high volatility; daily price swings sometimes measured 2% or 3%, and monthly fluctuations in the broad market ranged between a 7% loss and an 11% gain. We do not recall ever seeing instability of this magnitude in the past. Trading on the New York Stock Exchange reached 1.1 trillion shares, 2.6 times all of the shares outstanding. We reported the collective value of this paper shuffling approached $32 trillion, twice the size of our country’s economy. News of all this dominated the headlines, further undermining the public’s confidence. We ignored it and instead expressed our optimism once again, saying that we thought the worst was over and that large quality companies offered some of the best opportunities we’d seen in our company’s 39-year history.
Investors that bailed out during these years apparently still have most of their money where it’s been all along — bank accounts, money market and bond funds. In our opinion none of these choices has a chance of doing well in the long run. In fact, it seems unlikely they will match America’s 75-year, 4% average inflation rate, especially after taxes. By contrast, despite everything, our Fund has earned 12.3% annually over the last four years, and we believe it is well positioned for reasonable returns going forward. In saying that, we’re thinking that equities over the long term will perform more or less in line with their historic average — about nine or 10% including dividends.
We are encouraged by improving economic fundamentals, both in America and many other countries as well. The World Bank’s recently released periodic update of its economic forecast is cautiously reassuring on the international outlook, citing among other things a dramatic easing of financial conditions around the globe. Here at home, there are a number of signs suggesting a recovery is underway. U.S.
3
The Torray Fund
Letter to Shareholders (continued)
January 23, 2013
household debt has fallen to its lowest level in 29 years. By a broader measure that includes things like auto lease payments and apartment rents, individuals’ overhead has dropped to 15.7% of disposable income, the lowest it’s been since early 1984. In addition, the housing industry is recovering. Construction activity has reached its highest level since 2008, and home prices in most areas are on the rise. (The latter is good news because the net worth of the average homeowner reportedly dropped 40% due to the collapse in home prices.) Unemployment is still a big problem but should gradually trend down if the economy continues on its current course. These signs appear to have increased investor confidence in U.S. stocks. During December, domestic equity mutual funds experienced their first significant net inflows in a long time, and the trend appears to be continuing as we write. It is ironic but typical that this shift in sentiment took four years and a doubling of the stock market to play out.
In summary, investors are out of the market, sitting on a pile of cash and equivalents making very little. Stocks are a bargain, and the economy is recovering. This suggests to us that we’ve entered a more favorable investment environment than we’ve seen in years. However, we must say again that this is not a forecast. It may prove wrong for a while, but eventually we think it will be right.
On behalf of our management team, Board of Directors and staff, we extend our appreciation for your investment and best wishes for the coming year.
| | | | | | |
| | | Sincerely, | | | | |
| | | |
| | |  | | | | |
| | | Robert E. Torray | | | | |
| | | 
| | | | |
| | | Fred M. Fialco | | | | |
| | | | | | | |
| | | | | | | |
| | | | | | | |
4
The Torray Fund
PERFORMANCE DATA
As of December 31, 2012 (unaudited)
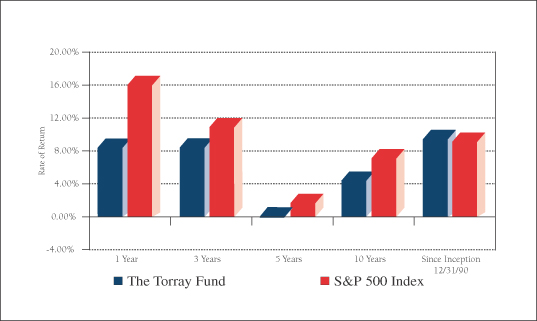
Average Annual Returns on an Investment in
The Torray Fund vs. the S&P 500 Index
For the periods ended December 31, 2012:
| | | | | | | | | | | | | | | | | | | | |
| | | 1 Year
| | | 3 Years
| | | 5 Years
| | | 10 Years
| | | Since
Inception
12/31/90
| |
The Torray Fund | | | 8.38 | % | | | 8.41 | % | | | -0.09 | % | | | 4.37 | % | | | 9.42 | % |
S&P 500 Index | | | 16.00 | % | | | 10.87 | % | | | 1.66 | % | | | 7.10 | % | | | 9.11 | % |
Cumulative Returns for the 22 years ended December 31, 2012
| | | | |
The Torray Fund | | | 624.28 | % |
S&P 500 Index | | | 581.08 | % |
5
The Torray Fund
PERFORMANCE DATA (continued)
As of December 31, 2012 (unaudited)
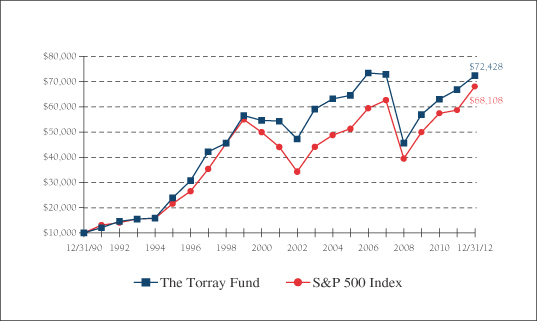
Change in Value of $10,000 Invested
on December 31, 1990 (commencement of operations) to:
| | | | | | | | | | | | | | | | | | | | | | | | | | | | |
| | | 12/31/94
| | | 12/31/97
| | | 12/31/00
| | | 12/31/03
| | | 12/31/06
| | | 12/31/09
| | | 12/31/12
| |
The Torray Fund | | $ | 15,821 | | | $ | 42,122 | | | $ | 54,609 | | | $ | 59,135 | | | $ | 73,496 | | | $ | 56,903 | | | $ | 72,428 | |
S&P 500 Index | | $ | 15,666 | | | $ | 35,339 | | | $ | 49,993 | | | $ | 44,156 | | | $ | 59,452 | | | $ | 49,974 | | | $ | 68,108 | |
The returns quoted represent past performance and do not guarantee future results. Investment return and principal value will fluctuate so that shares, when redeemed, may be worth more or less than their original cost. Current performance may be lower or higher. For performance current to the most recent monthend, please call (800) 626-9769. The returns shown do not reflect the deduction of taxes a shareholder would pay on the redemption of fund shares and distributions. The Fund’s annual operating expense ratio, as stated in the current prospectus, is 1.17%. Returns on both The Torray Fund and the S&P 500 Index assume reinvestment of all dividends and distributions. The S&P 500 Index is an unmanaged index consisting of 500 U.S. large-cap stocks. It is not possible to invest directly in an index. Current and future portfolio holdings are subject to change and risk.
6
The Torray Fund
FUND PROFILE
As of December 31, 2012 (unaudited)
| | | | |
DIVERSIFICATION (% of net assets) | | | | |
| |
Information Technology | | | 19.66% | |
Industrials | | | 18.30% | |
Financials | | | 17.84% | |
Health Care | | | 14.32% | |
Consumer Staples | | | 9.86% | |
Consumer Discretionary | | | 6.76% | |
Materials | | | 2.73% | |
Energy | | | 2.13% | |
Telecommunications | | | 2.13% | |
Short-Term Investments | | | 6.51% | |
Liabilities Less Other Assets | | | (0.24)% | |
| | |
|
|
|
| | | | 100.00% | |
| | |
|
|
|
| | | | | | | | |
| TOP TEN EQUITY HOLDINGS (% of net assets) | |
| | |
| | 1. | | | Wells Fargo & Co. | | | 3.92% | |
| | 2. | | | International Business Machines Corp. | | | 3.84% | |
| | 3. | | | General Electric Co. | | | 3.73% | |
| | 4. | | | Marsh & McLennan Cos., Inc. | | | 3.73% | |
| | 5. | | | Sysco Corp. | | | 3.68% | |
| | 6. | | | Chubb Corp. | | | 3.67% | |
| | 7. | | | Tupperware Brands Corp. | | | 3.62% | |
| | 8. | | | Eaton Corp. PLC | | | 3.60% | |
| | 9. | | | Baxter International Inc. | | | 3.49% | |
| | 10. | | | Johnson & Johnson | | | 3.45% | |
| | | | | | |
|
|
|
| | | | | | | | 36.73% | |
| | | | | | |
|
|
|
| | | | |
|
PORTFOLIO CHARACTERISTICS |
| | | | | | | | |
| | |
Net Assets (million) | | | | | | | $332 | |
Number of Holdings | | | | | | | 31 | |
Portfolio Turnover | | | | | | | 16.55% | |
P/E Multiple (forward) | | | | | | | 12.3x | |
Trailing Weighted Average Dividend Yield | | | | 2.72% | |
Market Capitalization (billion) | | | Average | | | | $67.0 | |
| | | | Median | | | | $28.2 | |
7
The Torray Fund
SCHEDULE OF INVESTMENTS
As of December 31, 2012
| | | | | | | | | | |
| | | Shares
| | | | | Market Value
| |
| COMMON STOCK 93.73% | | | | |
| |
19.66% INFORMATION TECHNOLOGY | | | | |
| | | | 66,400 | | | International Business Machines Corp. | | $ | 12,718,920 | |
| | | | 790,100 | | | Western Union Co. (The) | | | 10,753,261 | |
| | | | 542,900 | | | Cisco Systems, Inc. | | | 10,667,985 | |
| | | | 400,000 | | | EMC Corp. * | | | 10,120,000 | |
| | | | 424,600 | | | Intel Corp. | | | 8,759,498 | |
| | | | 131,300 | | | Automatic Data Processing, Inc. | | | 7,485,413 | |
| | | | 327,400 | | | Hewlett-Packard Co. | | | 4,665,450 | |
| | | | | | | | |
|
|
|
| | | | | | | | | | 65,170,527 | |
| |
18.30% INDUSTRIALS | | | | |
| | | | 588,897 | | | General Electric Co. | | | 12,360,948 | |
| | | | 220,300 | | | Eaton Corp. PLC | | | 11,940,260 | |
| | | | 263,146 | | | Cintas Corp. | | | 10,762,671 | |
| | | | 134,700 | | | General Dynamics Corp. | | | 9,330,669 | |
| | | | 100,000 | | | 3M Co. | | | 9,285,000 | |
| | | | 237,600 | | | Republic Services, Inc. | | | 6,968,808 | |
| | | | | | | | |
|
|
|
| | | | | | | | | | 60,648,356 | |
| |
17.84% FINANCIALS | | | | |
| | | | 380,500 | | | Wells Fargo & Co. | | | 13,005,490 | |
| | | | 358,518 | | | Marsh & McLennan Cos., Inc. | | | 12,358,116 | |
| | | | 161,400 | | | Chubb Corp. | | | 12,156,648 | |
| | | | 278,000 | | | Loews Corp. | | | 11,328,500 | |
| | | | 179,300 | | | American Express Co. | | | 10,306,164 | |
| | | | | | | | |
|
|
|
| | | | | | | | | | 59,154,918 | |
| |
14.32% HEALTH CARE | | | | |
| | | | 173,800 | | | Baxter International Inc. | | | 11,585,508 | |
| | | | 163,224 | | | Johnson & Johnson | | | 11,442,002 | |
| | | | 133,700 | | | Becton Dickinson & Co. | | | 10,454,003 | |
| | | | 146,900 | | | UnitedHealth Group Inc. | | | 7,967,856 | |
| | | | 99,100 | | | WellPoint, Inc. | | | 6,037,172 | |
| | | | | | | | |
|
|
|
| | | | | | | | | | 47,486,541 | |
8
The Torray Fund
SCHEDULE OF INVESTMENTS (continued)
As of December 31, 2012
| | | | | | | | | | |
| | | Shares
| | | | | Market Value
| |
| |
9.86% CONSUMER STAPLES | | | | |
| | | | 385,600 | | | Sysco Corp. | | $ | 12,208,096 | |
| | | | 294,400 | | | Walgreen Co. | | | 10,895,744 | |
| | | | 141,300 | | | Procter & Gamble Co. (The) | | | 9,592,857 | |
| | | | | | | | |
|
|
|
| | | | | | | | | | 32,696,697 | |
| |
6.76% CONSUMER DISCRETIONARY | | | | |
| | | | 187,400 | | | Tupperware Brands Corp. | | | 12,012,340 | |
| | | | 577,300 | | | Gannett Co., Inc. | | | 10,397,173 | |
| | | | | | | | |
|
|
|
| | | | | | | | | | 22,409,513 | |
| |
2.73% MATERIALS | | | | |
| | | | 200,900 | | | E.I. du Pont de Nemours & Co. | | | 9,034,473 | |
| |
2.13% ENERGY | | | | |
| | | | 425,500 | | | Chesapeake Energy Corp. | | | 7,071,810 | |
| |
2.13% TELECOMMUNICATIONS | | | | |
| | | | 209,400 | | | AT&T Inc. | | | 7,058,874 | |
| | | | | | | | |
|
|
|
| TOTAL COMMON STOCK 93.73% | | | 310,731,709 | |
(cost $268,216,083) | | | | |
| | | |
| | | Principal Amount ($) | | | | | | |
| |
| SHORT-TERM INVESTMENTS 6.51% | | | | |
| | | | 21,568,094 | | | BNY Mellon Cash Reserve, 0.05%(1) | | | 21,568,094 | |
(cost $21,568,094) | | | | |
| | | | | | | | |
|
|
|
| TOTAL INVESTMENTS 100.24% | | | 332,299,803 | |
(cost $289,784,177) | | | | |
| LIABILITIES LESS OTHER ASSETS (0.24%) | | | (791,309 | ) |
| | | | | | | | |
|
|
|
| NET ASSETS 100.00% | | $ | 331,508,494 | |
| | | | | | | | |
|
|
|
| * | Non-income producing securities. |
| (1) | Represents current yield at December 31, 2012. |
See notes to the financial statements.
9
The Torray Fund
STATEMENT OF ASSETS AND LIABILITIES
As of December 31, 2012
| | | | |
ASSETS | | | | |
Investments in securities at value
(cost $289,784,177) | | $ | 332,299,803 | |
Interest and dividends receivable | | | 527,903 | |
Receivable for fund shares sold | | | 42,943 | |
Prepaid expenses | | | 30,740 | |
| | |
|
|
|
TOTAL ASSETS | | | 332,901,389 | |
| | |
|
|
|
| |
LIABILITIES | | | | |
Payable for fund shares redeemed | | | 979,343 | |
Payable to advisor | | | 282,443 | |
Accrued expenses | | | 131,109 | |
| | |
|
|
|
TOTAL LIABILITIES | | | 1,392,895 | |
| | |
|
|
|
| |
NET ASSETS | | $ | 331,508,494 | |
| | |
|
|
|
Shares of beneficial interest ($1 stated value,
10,045,021 shares outstanding, unlimited shares authorized) | | $ | 10,045,021 | |
Paid-in-capital in excess of par | | | 349,532,363 | |
Undistributed net investment income | | | 71,438 | |
Accumulated net realized loss on investments | | | (70,655,954 | ) |
Net unrealized appreciation of investments | | | 42,515,626 | |
| | |
|
|
|
| |
TOTAL NET ASSETS | | $ | 331,508,494 | |
| | |
|
|
|
Net Asset Value, Offering and Redemption Price per Share | | $ | 33.00 | |
| | |
|
|
|
See notes to the financial statements.
10
The Torray Fund
STATEMENT OF OPERATIONS
For the year ended December 31, 2012
| | | | |
INVESTMENT INCOME | | | | |
Dividend income | | $ | 8,716,066 | |
Interest income | | | 10,749 | |
| | |
|
|
|
Total investment income | | | 8,726,815 | |
| | |
|
|
|
| |
EXPENSES | | | | |
Management fees | | | 3,457,186 | |
Transfer agent fees & expenses | | | 312,475 | |
Legal fees | | | 64,101 | |
Printing, postage & mailing | | | 56,043 | |
Insurance expense | | | 44,781 | |
Audit fees | | | 33,500 | |
Trustees’ fees | | | 32,667 | |
Registration & filing fees | | | 24,030 | |
Custodian fees | | | 17,819 | |
| | |
|
|
|
Total expenses | | | 4,042,602 | |
| | |
|
|
|
NET INVESTMENT INCOME | | | 4,684,213 | |
| | |
|
|
|
REALIZED AND UNREALIZED GAIN ON INVESTMENTS | | | | |
Net realized gain on investments | | | 15,149,234 | |
Net change in unrealized appreciation (depreciation) on investments | | | 8,071,001 | |
| | |
|
|
|
Net realized and unrealized gain on investments | | | 23,220,235 | |
| | |
|
|
|
NET INCREASE IN NET ASSETS RESULTING FROM OPERATIONS | | $ | 27,904,448 | |
| | |
|
|
|
See notes to the financial statements.
11
The Torray Fund
STATEMENTS OF CHANGES IN NET ASSETS
For the years indicated:
| | | | | | | | |
| | | Year ended
12/31/12
| | | Year ended
12/31/11
| |
Increase in Net Assets Resulting from Operations: | | | | | | | | |
Net investment income | | $ | 4,684,213 | | | $ | 3,816,185 | |
Net realized gain on investments | | | 15,149,234 | | | | 4,042,409 | |
Net change in unrealized appreciation (depreciation) on investments | | | 8,071,001 | | | | 13,422,919 | |
| | |
|
|
| |
|
|
|
Net increase in net assets resulting from operations | | | 27,904,448 | | | | 21,281,513 | |
| | |
|
|
| |
|
|
|
| | |
Distributions to Shareholders from: | | | | | | | | |
Net investment income ($0.449 and
$0.326 per share, respectively) | | | (4,689,438 | ) | | | (3,748,354 | ) |
| | |
|
|
| |
|
|
|
Total distributions | | | (4,689,438 | ) | | | (3,748,354 | ) |
| | |
|
|
| |
|
|
|
| | |
Shares of Beneficial Interest | | | | | | | | |
Net decrease from share transactions | | | (36,174,031 | ) | | | (35,474,157 | ) |
| | |
|
|
| |
|
|
|
Total decrease | | | (12,959,021 | ) | | | (17,940,998 | ) |
| | |
Net Assets — Beginning of Year | | | 344,467,515 | | | | 362,408,513 | |
| | |
|
|
| |
|
|
|
Net Assets — End of Year | | $ | 331,508,494 | | | $ | 344,467,515 | |
| | |
|
|
| |
|
|
|
Undistributed Net Investment Income | | $ | 71,438 | | | $ | 76,663 | |
| | |
|
|
| |
|
|
|
See notes to the financial statements.
12
The Torray Fund
FINANCIAL HIGHLIGHTS
For a share outstanding throughout each year presented:
PER SHARE DATA
| | | | | | | | | | | | | | | | | | | | |
| | | Years ended December 31:
| |
| | | 2012
| | | 2011
| | | 2010
| | | 2009
| | | 2008
| |
Net Asset Value, Beginning of Year | | $ | 30.870 | | | $ | 29.430 | | | $ | 26.760 | | | $ | 21.640 | | | $ | 36.440 | |
| | |
|
|
| |
|
|
| |
|
|
| |
|
|
| |
|
|
|
Income/(loss) from investment operations | | | | | | | | | | | | | | | | | | | | |
Net investment income (1) | | | 0.440 | | | | 0.328 | | | | 0.230 | | | | 0.200 | | | | 0.243 | |
Net gains (losses) on securities (both realized and
unrealized) | | | 2.139 | | | | 1.438 | | | | 2.673 | | | | 5.124 | | | | (13.464 | ) |
| | |
|
|
| |
|
|
| |
|
|
| |
|
|
| |
|
|
|
Total from investment operations | | | 2.579 | | | | 1.766 | | | | 2.903 | | | | 5.324 | | | | (13.221 | ) |
| | |
|
|
| |
|
|
| |
|
|
| |
|
|
| |
|
|
|
Less: distributions | | | | | | | | | | | | | | | | | | | | |
Dividends (from net investment income) | | | (0.449 | ) | | | (0.326 | ) | | | (0.233 | ) | | | (0.204 | ) | | | (0.303 | ) |
Distributions (from capital gains) | | | — | | | | — | | | | — | | | | — | | | | (1.242 | ) |
Distributions (from return of capital) | | | — | | | | — | | | | — | | | | — | | | | (0.034 | ) |
| | |
|
|
| |
|
|
| |
|
|
| |
|
|
| |
|
|
|
Total distributions | | | (0.449 | ) | | | (0.326 | ) | | | (0.233 | ) | | | (0.204 | ) | | | (1.579 | ) |
| | |
|
|
| |
|
|
| |
|
|
| |
|
|
| |
|
|
|
Net Asset Value, End of Year | | $ | 33.000 | | | $ | 30.870 | | | $ | 29.430 | | | $ | 26.760 | | | $ | 21.640 | |
| | |
|
|
| |
|
|
| |
|
|
| |
|
|
| |
|
|
|
TOTAL RETURN (2) | | | 8.38 | % | | | 6.01 | % | | | 10.90 | % | | | 24.80 | % | | | (37.39 | %) |
RATIOS/SUPPLEMENTAL DATA | | | | | | | | | | | | | | | | | | | | |
Net assets, end of year (000’s omitted) | | $ | 331,508 | | | $ | 344,468 | | | $ | 362,409 | | | $ | 363,014 | | | $ | 353,445 | |
Ratios of expenses to average net assets | | | 1.17 | % | | | 1.17 | % | | | 1.17 | % | | | 1.21 | % | | | 1.13 | % |
Ratios of net investment income to average net assets | | | 1.35 | % | | | 1.07 | % | | | 0.84 | % | | | 0.89 | % | | | 0.80 | % |
Portfolio turnover rate | | | 16.55 | % | | | 12.85 | % | | | 14.42 | % | | | 15.87 | % | | | 28.13 | % |
| (1) | Calculated based on the average amount of shares outstanding during the year. |
| (2) | Past performance is not predictive of future performance. |
See notes to the financial statements.
13
The Torray Fund
NOTES TO FINANCIAL STATEMENTS
As of December 31, 2012
NOTE 1 — SUMMARY OF SIGNIFICANT ACCOUNTING POLICIES
The Torray Fund (“Fund”) is a separate series of The Torray Fund (“Trust”). The Trust is registered under the Investment Company Act of 1940, as amended, as a diversified, open-end management investment company. The Trust is organized as a business trust under Massachusetts law. The Fund’s investment objectives are to build investor wealth over extended periods and to minimize shareholder capital gains tax liability by limiting the realization of long and short-term gains. The Fund seeks to meet its objectives by investing its assets in high quality companies that have a record of increasing sales and earnings, and to hold them as long as their fundamentals remain intact. There can be no assurance that the Fund’s investment objectives will be achieved.
The following is a summary of accounting policies followed by the Fund in the preparation of its financial statements. These policies are in conformity with accounting principles generally accepted in the United States of America.
Securities Valuation Portfolio securities for which market quotations are readily available are valued at market value, which is determined by using the last reported sale price, or, if no sales are reported, the last reported bid price. For NASDAQ traded securities, market value is determined on the basis of the NASDAQ Official Closing Price instead of the last reported sales price. Other assets and securities for which no quotations are readily available or for which Torray LLC (the “Advisor”) believes do not reflect market value are valued at fair value as determined in good faith by the Advisor under the supervision of the Board of Trustees (the “Board” or “Trustees”) in accordance with the Fund’s Valuation Procedures. Short-term obligations having remaining maturities of 60 days or less are valued at amortized cost, which approximates market value.
Fair Value Measurements Various inputs are used in determining the fair value of investments which are as follows:
| | • | | Level 1 — quoted prices in active markets for identical securities |
| | • | | Level 2 — significant observable inputs (including quoted prices for similar securities, interest rates, prepayment speeds, credit risk, etc.) |
| | • | | Level 3 — significant unobservable inputs (including the Fund’s own assumptions in determining the fair value of investments) |
The inputs or methodology used for valuing securities are not necessarily an indication of the risk associated with investing in those securities.
14
The Torray Fund
NOTES TO FINANCIAL STATEMENTS (continued)
As of December 31, 2012
The summary of inputs used to value the Fund’s investments as of December 31, 2012 is as follows:
| | | | |
Valuation Inputs | | | | |
| |
Level 1 — Quoted Prices * | | $ | 332,299,803 | |
Level 2 — Other Significant Observable Inputs | | | — | |
Level 3 — Significant Unobservable Inputs | | | — | |
| | |
|
|
|
Total Market Value of Investments | | $ | 332,299,803 | |
| | |
|
|
|
| | * | Security types and industry classifications as defined in the Schedule of Investments. |
The Fund had no transfers between Level 1 and Level 2 investments during the reporting period.
Securities Transactions and Investment Income Securities transactions are recorded on a trade date basis. Realized gains and losses from securities transactions are recorded on the specific identification basis. Dividend income and distributions to shareholders are recorded on the ex-dividend date. Interest income, including amortization of discount on short-term investments, and expenses are recorded on the accrual basis.
Federal Income Taxes The Fund intends to continue to comply with the requirements of the Internal Revenue Code applicable to regulated investment companies and to distribute all of its taxable income, including any net realized gain on investments to its shareholders. Therefore, no federal income tax provision is required.
Management has analyzed the Fund’s tax positions taken on federal income tax returns for all open tax years (current and prior three tax years), and has concluded that no provision for federal income tax is required in the Fund’s financial statements. The Fund’s federal and state income and federal excise tax returns for tax years for which the applicable statutes of limitations have not expired are subject to examination by the Internal Revenue Service and state departments of revenue.
Net Asset Value The net asset value per share of the Fund is determined daily as of the close of trading on the New York Stock Exchange by dividing the value of the Fund’s net assets by the number of shares outstanding.
Use of Estimates In preparing financial statements in accordance with accounting principles generally accepted in the United States of America, management is required to make estimates and assumptions that affect the reported amounts of assets and liabilities and the disclosure of contingent assets and liabilities at the date of the financial statements, and the reported amounts of increases and decreases in net assets from operations during the reporting period. Actual results could differ from those estimates.
15
The Torray Fund
NOTES TO FINANCIAL STATEMENTS (continued)
As of December 31, 2012
NOTE 2 — SHARES OF BENEFICIAL INTEREST TRANSACTIONS
Transactions in shares of beneficial interest were as follows:
| | | | | | | | | | | | | | | | |
| | | Year ended
12/31/12
| | | Year ended
12/31/11
| |
| | | Shares
| | | Amount
| | | Shares
| | | Amount
| |
Shares issued | | | 138,694 | | | $ | 4,570,038 | | | | 252,060 | | | $ | 7,781,617 | |
Reinvestments of dividends and distributions | | | 133,983 | | | | 4,382,730 | | | | 115,133 | | | | 3,515,340 | |
Shares redeemed | | | (1,384,521 | ) | | | (45,126,799 | ) | | | (1,523,525 | ) | | | (46,771,114 | ) |
| | |
|
|
| |
|
|
| |
|
|
| |
|
|
|
| | | | (1,111,844 | ) | | $ | (36,174,031 | ) | | | (1,156,332 | ) | | $ | (35,474,157 | ) |
| | |
|
|
| |
|
|
| |
|
|
| |
|
|
|
As of December 31, 2012, the Trust’s officers, Trustees and affiliated persons and their families directly or indirectly controlled 1,575,500 shares or 15.68% of the Fund.
NOTE 3 — INVESTMENT TRANSACTIONS
Purchases and sales of investment securities, other than short-term investments, for the year ended December 31, 2012, aggregated $53,361,186 and $77,972,511, respectively.
NOTE 4 — MANAGEMENT FEES
Pursuant to the Management Contract, the Advisor provides investment advisory and administrative services to the Fund. The Fund pays the Advisor a management fee, computed daily and payable monthly at the annual rate of 1.00% of the Fund’s average daily net assets. For the year ended December 31, 2012, the Fund incurred management fees of $3,457,186.
Excluding the management fee, other expenses incurred by the Fund during the year ended December 31, 2012, totaled $585,416. These expenses include all costs associated with the Fund’s operations including transfer agent fees, independent trustees’ fees ($14,000 per annum and $2,000 for each Board meeting attended per Trustee), dues, fees and expenses of registering and qualifying the Fund and its shares for distribution, charges of the custodian, auditing and legal expenses, insurance premiums, supplies, postage, expenses of issue or redemption of shares, reports to shareholders and Trustees, expenses of printing and mailing prospectuses, proxy statements and proxies to existing shareholders, and other miscellaneous expenses.
Certain officers and Trustees of the Fund are also officers and/or shareholders of the Advisor, and are not paid by the Fund for serving in such capacities.
16
The Torray Fund
NOTES TO FINANCIAL STATEMENTS (continued)
As of December 31, 2012
NOTE 5 — TAX MATTERS
Distributions to shareholders are determined in accordance with United States federal income tax regulations, which may differ from accounting principles generally accepted in the United States of America.
The tax character of distributions paid during the years ended December 31, 2012 and 2011 were as follows:
| | | | | | | | |
| | | 2012
| | | 2011
| |
Distributions paid from: | | | | | | | | |
Ordinary income | | $ | 4,689,438 | | | $ | 3,748,354 | |
| | |
|
|
| |
|
|
|
| | | $ | 4,689,438 | | | $ | 3,748,354 | |
| | |
|
|
| |
|
|
|
As of December 31, 2012, the components of distributable earnings on a tax basis were as follows:
| | | | | | |
Capital loss carry forward | | $ | (70,638,491 | ) | | |
Deferred post October losses | | | (17,463 | ) | | |
Undistributed net investment income | | | 71,438 | | | |
Unrealized appreciation | | | 42,515,626 | | | |
| | |
|
|
| | |
| | | $ | (28,068,890 | ) | | |
| | |
|
|
| | |
At December 31, 2012, the Fund had net capital loss carry forward for federal income tax purposes of $70,638,491 which is available to reduce future required distributions of net capital gains to shareholders through 2017.
For the year ended December 31, 2012, the Fund utilized capital loss carry forwards of $15,166,197.
Under current tax law, capital losses realized after October 31 of a fund’s fiscal year may be deferred and treated as occurring on the first business day of the following fiscal year for tax purposes. The Fund had deferred post October capital losses of $17,463, which will be treated as arising on the first business day of the fiscal year ending December 31, 2014.
The following information is based upon the federal tax basis of investment securities as of December 31, 2012:
| | | | | | |
Gross unrealized appreciation | | $ | 61,155,415 | | | |
Gross unrealized depreciation | | | (18,639,789 | ) | | |
| | |
|
|
| | |
Net unrealized appreciation | | $ | 42,515,626 | | | |
| | |
|
|
| | |
Cost | | $ | 289,784,177 | | | |
| | |
|
|
| | |
17
The Torray Fund
NOTES TO FINANCIAL STATEMENTS (continued)
As of December 31, 2012
NOTE 6 — COMMITMENTS AND CONTINGENCIES
The Fund indemnifies its officers and Trustees for certain liabilities that may arise from their performance of their duties to the Fund. Additionally, in the normal course of business, the Fund enters into contracts that contain a variety of representations and warranties which provide general indemnifications. The Fund’s maximum exposure under these arrangements is unknown, as this would involve future claims that may be made against the Fund that have not yet occurred.
NOTE 7 — SUBSEQUENT EVENTS
Management has evaluated the impact of all subsequent events on the Fund through the date these financial statements were issued and has determined that there were no subsequent events requiring recognition or disclosure in the financial statements.
NOTE 8 — NEW ACCOUNTING PRONOUNCEMENTS
In December 2011, the Financial Accounting Standards Board (“FASB”) issued Accounting Standards Update (“ASU”) No. 2011-11, Disclosures about Offsetting Assets and Liabilities (“ASU 2011-11”). The amendments in ASU 2011-11 require an entity to disclose information about offsetting and related arrangements to enable users of its financial statements to understand the effect of those arrangements on its financial position. ASU 2011-11 is effective for annual reporting periods beginning on or after January 1, 2013, and interim periods within those annual periods. The guidance requires retrospective application for all comparative periods presented. Management is currently evaluating the impact ASU 2011-11 will have on the Fund’s financial statement disclosures.
18
The Torray Fund
REPORT OF INDEPENDENT REGISTERED PUBLIC ACCOUNTING FIRM
To the Shareholders of The Torray Fund
and the Board of Trustees of The Torray Fund
We have audited the accompanying statement of assets and liabilities of The Torray Fund, a series of shares of beneficial interest in The Torray Fund (the “Fund”), including the schedule of investments, as of December 31, 2012, and the related statement of operations for the year then ended, the statements of changes in net assets for each of the years in the two-year period then ended, and the financial highlights for each of the years in the five-year period then ended. These financial statements and financial highlights are the responsibility of the Fund’s management. Our responsibility is to express an opinion on these financial statements and financial highlights based on our audits.
We conducted our audits in accordance with the standards of the Public Company Accounting Oversight Board (United States). Those standards require that we plan and perform the audits to obtain reasonable assurance about whether the financial statements and financial highlights are free of material misstatement. An audit includes examining, on a test basis, evidence supporting the amounts and disclosures in the financial statements. Our procedures included confirmation of securities owned as of December 31, 2012 by correspondence with the custodian. An audit also includes assessing the accounting principles used and significant estimates made by management, as well as evaluating the overall financial statement presentation. We believe that our audits provide a reasonable basis for our opinion.
In our opinion, the financial statements and financial highlights referred to above present fairly, in all material respects, the financial position of The Torray Fund as of December 31, 2012, the results of its operations for the year then ended, the changes in its net assets for each of the years in the two-year period then ended, and its financial highlights for each of the years in the five-year period then ended, in conformity with accounting principles generally accepted in the United States of America.

BBD, LLP
Philadelphia, Pennsylvania
February 22, 2013
19
The Torray Fund
FUND MANAGEMENT
As of December 31, 2012 (unaudited)
The Trust is overseen by a Board of Trustees (the “Board”), who has delegated the day-to-day management to the officers of the Trust. The Board meets regularly to review the Fund’s activities, contractual arrangements, and performance. The trustees and officers serve until their successors are elected and qualified, or until the trustee or officer dies, resigns or is removed, or becomes disqualified.
Information pertaining to the Trustees and Officers of The Trust is set forth below. The Statement of Additional Information (SAI) includes additional information about the Trustees and is available without charge, upon request, by calling (800) 443-3036.
| | | | | | | | |
Name, Age, Address* and Position(s) with the Trust | | Term of Office
and Length of
Time Served | | Principal Occupation(s)
During Past Five Years | | No. of Portfolios in
Fund Complex
Overseen by
Trustee | | Other Directorships Held |
| INDEPENDENT TRUSTEES |
Carol T. Crawford (69) Trustee | | Indefinite Term since 2006 | | Attorney and International Trade Consultant,
McLean, VA | | 2 | | Director,
Smithfield Foods, Inc.
Smithfield, VA |
Bruce C. Ellis (68) Trustee | | Indefinite Term since 1993 | | Private Investor,
Bethesda, MD | | 2 | | None |
Robert P. Moltz (65) Trustee | | Indefinite Term since 1990 | | Chairman and CEO,
Weaver Bros. Insurance Associates, Inc.
Bethesda, MD | | 2 | | None |
Wayne H. Shaner (65)** Trustee and Chairman of the Board | | Indefinite Term since 1993 | | Managing Partner,
Rockledge Partners, LLC,
Investment Advisory Firm,
Easton, MD (Jan. 2004-present);
Vice President,
Torray LLC,
Bethesda, MD (Jan. 2008-June 2008) | | 2 | | Director,
Van Eck Funds
New York, NY |
20
The Torray Fund
FUND MANAGEMENT (continued)
As of December 31, 2012 (unaudited)
| | | | | | | | |
Name, Age, Address* and Position(s) with the Trust | | Term of Office
and Length of
Time Served | | Principal Occupation(s)
During Past Five Years | | No. of Portfolios in
Fund Complex
Overseen by
Trustee | | Other Directorships Held |
| INTERESTED TRUSTEES AND OFFICERS OF THE TRUST |
William M Lane (62)*** Trustee, Treasurer and Secretary | | Indefinite Term Since 1990 | | Executive Vice President and Secretary, Torray LLC, Bethesda, MD (Oct. 2005-Present); Chief Compliance Officer, Torray LLC, Bethesda, MD (Oct. 2005-Mar. 2011); Vice President, Secretary, Treasurer and Chief Compliance Officer, Robert E. Torray & Co. Inc., Bethesda, MD (Jul.1984-Oct. 2005) | | 2 | | None |
Robert E. Torray (75) President | | Indefinite Term since 2007 | | Chairman, Torray LLC, Bethesda, MD (2005-present) President, Torray LLC, Bethesda, MD (2007-present) President, Robert E. Torray & Co. Inc., Bethesda, MD (May 1972-Oct. 2005). | | N/A | | None |
Barbara C. Warder (55) Chief Compliance Officer and Anti-Money Laundering Officer | | Indefinite Term since 2011 | | Chief Compliance Officer and Anti-Money Laundering Officer, Torray LLC, Bethesda, MD (Mar. 2011-present); Chief Operating Officer and Chief Compliance Officer, Resolute Capital Management, Washington, DC (Mar. 1998-June 2010). | | N/A | | None |
| * | All addresses are c/o The Torray Fund, 7501 Wisconsin Avenue, Suite 750W, Bethesda, MD 20814-6519. |
| ** | Mr. Shaner is deemed to be an independent Trustee effective as of January 1, 2011. |
| *** | Mr. Lane, by virtue of his employment with Torray LLC, the Trust’s investment adviser, is considered an “interested person” of the Trust, as that term is defined in Section 2(a)(19) of the Investment Company Act of 1940, as amended. |
21
The Torray Fund
FACTORS CONSIDERED BY THE BOARD OF TRUSTEES IN CONNECTION WITH THEIR APPROVAL OF THE CONTINUATION OF THE FUND’S INVESTMENT MANAGEMENT AGREEMENT WITH THE MANAGER (unaudited)
The Fund has entered into an Investment Management Agreement (the “Agreement”) with Torray LLC (the “Manager”) pursuant to which the Manager provides investment management services to the Fund. In accordance with the Investment Company Act of 1940, the Board of Trustees of the Fund is required, on an annual basis, to consider the continuation of the Agreement with the Manager, and this must take place at an in-person meeting of the Board. The relevant provisions of the Investment Company Act of 1940 specifically provide that it is the duty of the Board to request and evaluate such information as the Board determines is necessary to allow them to properly consider the continuation of the Agreement, and it is the duty of the Manager to furnish the Trustees with such information that is responsive to their request. Set forth below is a discussion of the various factors that the Board of Trustees considered in deciding to approve the continuation of the Agreement with the Manager.
In determining whether to approve the continuation of the Agreement, the Board of Trustees requested, and the Manager provided, information and data relevant to the Board’s consideration. This included materials that provided the Board with information regarding the investment performance of the Fund and information regarding the fees and expenses of the Fund as compared to other similar mutual funds. As part of its deliberations, the Board also considered and relied upon the information about the Fund and the Manager that had been provided to them throughout the year in connection with their regular Board meetings at which they engage in the ongoing oversight of the Fund and its operations.
The Board met at an in-person meeting on September 25, 2012 in order to consider the proposed continuation of the Agreement. Among the factors the Board considered was the performance results of the Fund achieved by the Manager relative to the performance of the Fund’s benchmark index, the S&P 500 Index, as well as the Fund’s performance relative to other mutual funds with similar investment objectives on both a long-term basis and over shorter time periods. In particular, the Board took note of the favorable long-term performance achieved by the Manager and they considered the Manager’s particular focus on long-term investment performance. The Board took into consideration the fact that the Manager seeks to achieve investment results for the Fund with less risk than other similar funds, and that the Manager has maintained a low portfolio turnover rate for the Fund which is beneficial to shareholders of the Fund because this results in lower brokerage costs. They noted the range of investment advisory and management services provided by the Manager and the level and quality of these services, and in particular, they noted the quality of the personnel providing these services, taking into consideration their finding that the personnel providing these services, and the services provided, were of a very high caliber and quality.
The Board also compared the total annual operating expenses of the Fund to the total annual operating expenses of other funds of similar size, noting that the average annual expense ratio for the Fund over the past year compared favorably with industry averages for total annual operating expenses of funds of similar size. They also took note of the fact that the Fund is not subject to any sales loads, sales commissions or other similar fees, including Rule 12b-1 distribution fees, and they considered the fact that the Manager had informed the Board that it did not intend to propose the introduction of such types of fees for the Fund. The Board also reviewed financial information concerning the Manager, noting its financial soundness as demonstrated by the financial information provided and the level of
22
The Torray Fund
FACTORS CONSIDERED BY THE BOARD OF TRUSTEES IN CONNECTION WITH THEIR APPROVAL OF THE CONTINUATION OF THE FUND’S INVESTMENT MANAGEMENT AGREEMENT WITH THE MANAGER (unaudited) (continued)
profitability relating to its services for the Fund, noting that these were reasonable and consistent with industry standards. The Board was also provided with information regarding the fees that the Manager charges other clients for investment advisory services and they noted that the fees were comparable based on the relevant circumstances of the types of accounts involved.
In addition, the Board reviewed with the Manager information regarding its brokerage practices, including soft dollar matters, and noted that the Manager did not have in place any formal soft dollar arrangements, and the Board also reviewed the Manager’s best execution procedures, which the Board noted were reasonable and consistent with standard industry practice.
Based on their review, the Trustees concluded that the investment management services provided under the Agreement were reasonably worth the full amount of the fee and that the terms of the Agreement were fair and reasonable. In reaching their conclusion with respect to their approval of the continuation of the Agreement, the Trustees did not identify any one single factor as being controlling, rather, the Board took note of a combination of factors that influenced their decision making process. The Board did, however, identify the overall favorable investment performance of the Fund on a long-term basis, the commitment of the Manager to the successful operation of the Fund, and the level of expenses of the Fund, as being important elements of their consideration. Based upon their review and consideration of these factors and other matters deemed relevant by the Board in reaching an informed business judgment, a majority of the Board of Trustees, including a majority of the Independent Trustees, concluded that the terms of the Agreement were fair and reasonable and the Board voted to approve the continuation of the Agreement with the Manager.
23
The Torray Fund
PORTFOLIO HOLDINGS, PROXY VOTING AND PROCEDURES
As of December 31, 2012 (unaudited)
The Fund files its complete schedule of portfolio holdings with the Securities and Exchange Commission (the “Commission”) for the first and third quarters of each fiscal year on Form N-Q. The Fund’s Forms N-Q are available on the Commission’s website at http://www.sec.gov. The Fund’s Forms N-Q may be reviewed and copied at the Commission’s Public Reference Room in Washington, D.C. Information on the operation of the Commission’s Public Reference Room may be obtained by calling 1-800-SEC-0330.
A description of the policies and procedures that the Fund uses to determine how to vote proxies relating to portfolio securities is available without charge, upon request, by calling 1-800-443-3036; and on the Commission’s website at http://www.sec.gov.
Information regarding how the Fund voted proxies relating to portfolio securities is available without charge, upon request, by calling 1-800-443-3036; and on the Commission’s website at http://www.sec.gov.
24
The Torray Fund
ABOUT YOUR FUND’S EXPENSES
As of December 31, 2012 (unaudited)
We believe it is important for you to understand the impact of costs on your investment. All mutual funds have operating expenses. As a shareholder of the Fund, you incur ongoing costs, including management fees, and other fund expenses. Operating expenses, which are deducted directly from the Fund’s gross income, directly reduce the investment return of the Fund.
A mutual fund’s expenses are expressed as a percentage of its average net assets. This figure is known as the expense ratio. The following examples are intended to help you understand the ongoing costs (in dollars) of investing in the Fund and to compare these costs with the ongoing costs of investing in other mutual funds. The examples below are based on an investment of $1,000 made at the beginning of the period shown and held for the entire period.
The table on the next page illustrates the Fund’s cost in two ways:
Actual Fund Return This section helps you estimate the actual expenses that you paid over the period. The “Ending Account Value” shown is derived from the Fund’s actual return, and the third column shows the operating expenses that would have been paid by an investor who started with $1,000 in the Fund. You may use the information here, together with the amount invested, to estimate the expenses that you paid over the period.
To do so, simply divide your account value by $1,000 (for example, an $8,600 account value divided by $1,000 = 8.6), then multiply the result by the number given for the Fund under the heading “Expenses Paid During Period” on the next page.
Hypothetical 5% Return This section is intended to help you compare your Fund’s costs with those of other mutual funds. It assumes that the Fund had an annual return of 5% before expenses, and that the expense ratio is unchanged. In this case, because the return used is not the Fund’s actual return, the results do not apply to your investment. The example is useful in making comparisons because the Commission requires all mutual funds to calculate expenses based on a 5% return. You can assess the Fund’s costs by comparing this hypothetical example with the hypothetical examples that appear in shareholder reports of other funds.
Note that expenses shown in the table are meant to highlight and help you compare ongoing costs only. The Fund does not charge transactions fees, such as purchase or redemption fees, nor does it carry a “sales load.”
The calculation assumes no shares were bought or sold during the period. Your actual costs may have been higher or lower, depending on the amount of your investment and the timing of any purchases or redemptions.
25
The Torray Fund
ABOUT YOUR FUND’S EXPENSES (continued)
As of December 31, 2012 (unaudited)
More information about the Fund’s expenses, including recent annual expense ratios, can be found in this report. For additional information on operating expenses and other shareholder costs, please refer to the Fund’s prospectus.
| | | | | | | | | | | | |
| | | Beginning
Account Value
July 1, 2012
| | | Ending
Account Value
December 31, 2012
| | | Expenses Paid
During Period *
| |
Based on Actual Fund Return | | $ | 1,000.00 | | | $ | 1,033.90 | | | $ | 5.93 | |
Based on Hypothetical 5% Return
(before expenses) | | $ | 1,000.00 | | | $ | 1,019.30 | | | $ | 5.89 | |
| * | Expenses are equal to the Fund’s annualized expense ratio of 1.16% for the period, multiplied by the average account value over the period, multiplied by 184/366 (to reflect the one-half year period). |
26
The Torray Fund
TAX INFORMATION
As of December 31, 2012 (unaudited)
We are required to advise you within 60 days of the Fund’s fiscal year-end regarding the federal tax status of certain distributions received by shareholders during such fiscal year. The information below is provided for the Fund’s fiscal year ending December 31, 2012. All designations are based on financial information available as of the date of this annual report and, accordingly are subject to change. For each item it is the intention of the Fund to designate the maximum amount permitted under the Internal Revenue Code and the regulations thereunder.
Qualified Interest Income
For the year ended December 31, 2012, 0.12% of the ordinary distributions paid (net investment income plus short-term capital gain) represent the amount of Qualifying Interest Income as created by The American Jobs Creation Act of 2004.
Qualified Dividend Income
For the year ended December 31, 2012, 100% of the distributions paid by the Fund from ordinary income qualifies for a reduced tax rate pursuant to The Jobs and Growth Tax Relief Reconciliation Act of 2003.
Dividends Received Deduction
For the year ended December 31, 2012, 100% of the ordinary income distribution qualifies for the dividends received deduction available to corporations.
Dividends and distributions received by retirement plans such as IRA’s, Keogh-type plans and 403(b) plans need not be reported as taxable income. However, many retirement plan trusts may need this information for their annual information reporting.
27
TRUSTEES
Carol T. Crawford
Bruce C. Ellis
William M Lane
Robert P. Moltz
Wayne H. Shaner
INVESTMENT ADVISOR
Torray LLC
OFFICERS
Robert E. Torray
William M Lane
Fred M. Fialco
Nicholas C. Haffenreffer
Barbara C. Warder
INDEPENDENT REGISTERED
PUBLIC ACCOUNTING FIRM
BBD, LLP
1835 Market Street, 26th Floor
Philadelphia, PA 19103
TRANSFER AGENT
BNY Mellon Investment Servicing (US) Inc.
4400 Computer Drive
Westborough, MA 01581-1722
LEGAL COUNSEL
Dechert LLP
1900 K Street, N.W.
Washington, DC 20006
Distributed by Foreside Funds Distributors LLC
400 Berwyn Park, 899 Cassatt Road,
Berwyn, PA 19132
Date of first use, February 2013
This report is not authorized for distribution to prospective
investors unless preceded or accompanied by a current
prospectus. All indices are unmanaged groupings of stocks
that are not available for investment.
The
TORRAY
FUND
ANNUAL REPORT
December 31, 2012
The Torray Fund
Suite 750 W
7501 Wisconsin Avenue
Bethesda, Maryland 20814-6519
(301) 493-4600
(800) 443-3036
The Torray Resolute Fund
Letter to Shareholders
January 30, 2013
Dear Fellow Shareholders,
The year 2012 was a great period for The Torray Resolute Fund. Beneath the exaggerated headlines of China’s economic slowdown, dire predictions associated with the European debt crisis, a hard-fought U.S. presidential race and the dysfunctional theatrics of the fiscal cliff debate, the domestic economy gradually improved, the unemployment rate declined and the housing market firmed; less bad was good enough. Investors, with real capital on the line, painted a brighter picture than hyperbolic journalists, ambitious politicians and self-assured strategists. The final result was a fourth consecutive year of gains following the crisis lows of 2009. What worked in 2012 was a focus on improving fundamentals rather than chasing the rapid sector and asset class rotations that characterized the period. In the final quarter of the year, the Fund gained 3.3% versus a decline of 1.3% in the Russell 1000 Growth Index and a decline of 0.4% for the S&P 500. For the full year, the Fund gained 20.3% versus 15.3% for the Russell and 16.0% for the S&P.
Top portfolio contributors for the quarter included industrial manufacturer Precision Castparts (PCP) with a gain of 16% and consumer products direct seller Tupperware Brands (TUP) with a gain of 20%. Precision Castparts benefitted from continuing strong demand trends in aerospace and the acquisition of a key supplier, Titanium Metals. Weakness in established markets at Tupperware was offset by strong sales in its emerging markets, which account for almost two-thirds of sales. Neither of these companies is immune to the headwinds that challenge global economic growth expansion, but both benefit from distinct secular trends differentiating them from competitors.
The top detractor for the period was Apple (AAPL). Apple’s 20% decline for the quarter, 35% from the September high, demonstrates two things: how rapid the rate of change can be in the technology sector, particularly in the consumer space, and how fickle investor sentiment is. With a maturing of the handset market, the company’s largest source of profits, and a pause in its rate of innovation, some have begun to doubt that Apple is an exception to the rule that excess profits are eventually arbitraged away by competition. This doubt caused them to conclude the company should be valued like other commodity device manufacturers. We continue to believe Apple is a compelling investment. While we don’t expect this period of transition from hyper growth to moderate growth will be a smooth one, we view the company as more than a commodity hardware vendor; we expect the brand will continue to garner premium pricing power and its uniquely integrated platform will serve to retain customers and create new opportunities. Ultimately, Apple may not be an exception to the rule, but we continue to believe its prospects for growth remain attractive.
1
The Torray Resolute Fund
Letter to Shareholders (continued)
January 30, 2013
Over the course of the quarter, we sold two long-term, successful holdings, global snack and beverage company PepsiCo (PEP) and Danish insulin provider Novo Nordisk (NVO). We also purchased shares of Swiss-based pharmaceutical and diagnostics company Roche Holdings (RHHBY). Satisfactory returns at PepsiCo have been increasingly hard to come by as it faces challenges on two fronts: an extended reorganization and an increasing preference on the part of the consumer for healthier snacks. This, coupled with a valuation we consider more reflective of an unencumbered consumer products company, led us to sell the stock. Valuation was also a key part of our decision to sell Novo Nordisk. While the company has maintained a dominant position in the sales of insulin, an important therapy for the global pandemic of diabetes, we believe the marginal benefit of its next generation drugs don’t justify a multiple twice that of its peer group and the broader market. Our investment thesis on Roche Holdings is based on the complimentary attributes of a leading oncology franchise and diagnostics business. While each is attractive in its own right, the combination supports efficient research, development and utilization addressing large unmet medical needs.
Despite the low growth environment that characterized 2012 and our expectations for more of the same in the new year, favorable portfolio returns reflect the strong underlying results of our investments, both in terms of financial characteristics and the innovation of new, valuable products and services. As the perception of risks in the market declined and valuations expanded, stock prices increased. Looking to 2013, we continue our focus on innovation and growth.
Finally, we would like to introduce a new member of our team. Hugh P. Tawney has joined our firm as Director, Client Service and Development. Prior to joining Torray, Hugh was an analyst at Graystone Consulting, a division of Morgan Stanley. We hope you have the opportunity to meet or speak with him. In our efforts to serve our clients and expand the business, he is a welcome addition.
As ever, we appreciate your interest and trust.
| | | | | | |
| | | Respectfully, | | | | |
| | | |
| | |  | | | | |
| | | Nicholas C. Haffenreffer | | | | |
2
The Torray Resolute Fund
PERFORMANCE DATA
As of December 31, 2012 (unaudited)
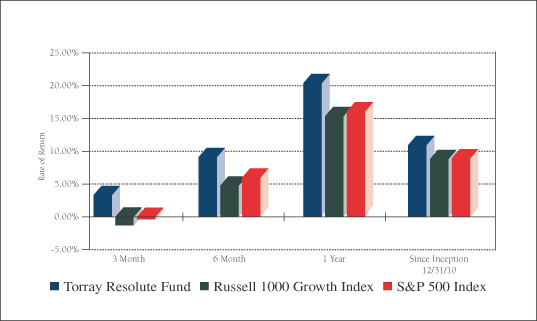
Average Annual Returns on an Investment in
The Torray Resolute Fund vs.
the Russell 1000 Growth Index and the S&P 500 Index
For the periods ended December 31, 2012:
| | | | | | | | | | | | | | | | |
| | | 3 Month
| | | 6 Month
| | | 1 Year
| | | Since
Inception
12/31/10
| |
The Torray Resolute Fund | | | 3.30 | % | | | 9.08 | % | | | 20.28 | % | | | 10.89 | % |
Russell 1000 Growth Index | | | –1.32 | % | | | 4.71 | % | | | 15.26 | % | | | 8.77 | % |
S&P 500 Index | | | –0.38 | % | | | 5.95 | % | | | 16.00 | % | | | 8.84 | % |
Cumulative Returns for the 2 years ended December 31, 2012
| | | | |
The Torray Resolute Fund | | | 22.97 | % |
Russell 1000 Growth Index | | | 18.26 | % |
S&P 500 Index | | | 18.42 | % |
3
The Torray Resolute Fund
PERFORMANCE DATA (continued)
As of December 31, 2012 (unaudited)
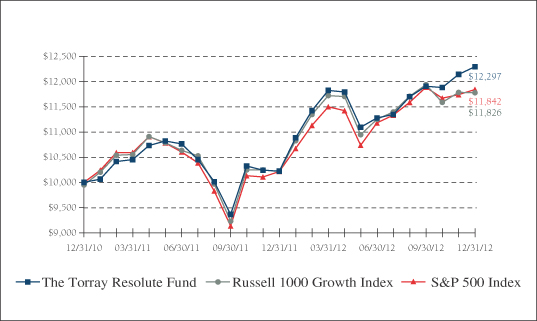
Change in Value of $10,000 Invested
on December 31, 2010 (commencement of operations) to:
| | | | | | | | | | | | | | | | | | | | |
| | | 12/31/10
| | | 06/30/11
| | | 12/31/11
| | | 06/30/12
| | | 12/31/12
| |
The Torray Resolute Fund | | $ | 10,000 | | | $ | 10,760 | | | $ | 10,223 | | | $ | 11,274 | | | $ | 12,297 | |
Russell 1000 Growth Index | | $ | 10,000 | | | $ | 10,683 | | | $ | 10,264 | | | $ | 11,299 | | | $ | 11,826 | |
S&P 500 Index | | $ | 10,000 | | | $ | 10,603 | | | $ | 10,211 | | | $ | 11,180 | | | $ | 11,842 | |
The returns quoted represent past performance and do not guarantee future results. Investment return and principal value will fluctuate so that shares, when redeemed, may be worth more or less than their original cost. Current performance may be lower or higher. For performance current to the most recent monthend, please call (800) 626-9769. The returns shown do not reflect the deduction of taxes a shareholder would pay on the redemption of fund shares and distributions. The Fund’s gross annual operating expense ratio as stated in the Fund’s current prospectus was 5.90% before fee waivers and expense reimbursements by the Adviser. The Fund’s net annual operating expense ratio after such fee waivers and expense reimbursements was 1.25%. The Adviser has contractually agreed to waive fees and/or reimburse expenses of the Fund in order to limit the total annual operating expenses of the Fund to 1.25% of the Fund’s average daily net assets through May 1, 2014. Total returns shown above include fee waivers and expense reimbursements. These total returns would have been lower had there been no waivers and reimbursements by the Adviser during the periods shown. Returns on The Torray Resolute Fund, the Russell 1000 Growth Index, the Fund’s primary benchmark index, and the S&P 500 Index assume reinvestment of all dividends and distributions. The Russell 1000 Growth Index is an unmanaged index consisting of 571 U.S. large-cap growth stocks, and the S&P 500 Index is an unmanaged index consisting of 500 large-cap stocks. It is not possible to invest directly in an index. Current and future portfolio holdings are subject to change and risk.
4
The Torray Resolute Fund
FUND PROFILE
As of December 31, 2012 (unaudited)
| | | | |
DIVERSIFICATION (% of net assets) | | | | |
| |
Information Technology | | | 29.69% | |
Health Care | | | 14.70% | |
Industrials | | | 13.27% | |
Energy | | | 10.29% | |
Consumer Discretionary | | | 8.42% | |
Financials | | | 7.94% | |
Materials | | | 5.35% | |
Consumer Staples | | | 3.40% | |
Short-Term Investments | | | 3.86% | |
Other Assets Less Liabilities | | | 3.08% | |
| | |
|
|
|
| | | | 100.00% | |
| | |
|
|
|
| | | | | | | | |
| TOP TEN EQUITY HOLDINGS (% of net assets) | |
| | |
| | 1. | | | Apple Inc. | | | 4.57% | |
| | 2. | | | American Tower Corp., REIT | | | 4.42% | |
| | 3. | | | EOG Resources, Inc. | | | 3.93% | |
| | 4. | | | Danaher Corp. | | | 3.92% | |
| | 5. | | | Enbridge, Inc. | | | 3.92% | |
| | 6. | | | QUALCOMM, Inc. | | | 3.61% | |
| | 7. | | | Franklin Resources, Inc. | | | 3.51% | |
| | 8. | | | Precision Castparts Corp. | | | 3.45% | |
| | 9. | | | Visa, Inc., Class A | | | 3.44% | |
| | 10. | | | Baxter International Inc. | | | 3.43% | |
| | | | | | |
|
|
|
| | | | | | | | 38.20% | |
| | | | | | |
|
|
|
| | | | | | | | |
|
PORTFOLIO CHARACTERISTICS | |
| | |
Net Assets (million) | | | | | | | $10 | |
Number of Holdings | | | | | | | 29 | |
Portfolio Turnover | | | | | | | 21.76% | |
P/E Multiple (forward) | | | | | | | 16.4x | |
Trailing Weighted Average Dividend Yield | | | | 1.31% | |
Market Capitalization (billion) | | | Average | | | | $67.4 | |
| | | | Median | | | | $32.8 | |
5
The Torray Resolute Fund
SCHEDULE OF INVESTMENTS
As of December 31, 2012
| | | | | | | | | | |
| | | Shares
| | | | | Market Value
| |
| COMMON STOCK 93.06% | | | | |
| |
29.69% INFORMATION TECHNOLOGY | | | | |
| | | | 885 | | | Apple Inc. | | $ | 471,732 | |
| | | | 6,000 | | | QUALCOMM, Inc. | | | 372,120 | |
| | | | 2,345 | | | Visa, Inc., Class A | | | 355,455 | |
| | | | 5,311 | | | Accenture PLC, Class A | | | 353,181 | |
| | | | 8,270 | | | MICROS Systems, Inc.* | | | 350,979 | |
| | | | 4,441 | | | Fiserv Inc.* | | | 350,972 | |
| | | | 4,702 | | | Amphenol Corp., Class A | | | 304,219 | |
| | | | 9,053 | | | Oracle Corp. | | | 301,646 | |
| | | | 5,399 | | | Adobe Systems, Inc.* | | | 203,434 | |
| | | | | | | | |
|
|
|
| | | | | | | | | | 3,063,738 | |
14.70% HEALTH CARE | | | | |
| | | | 5,318 | | | Baxter International Inc. | | | 354,498 | |
| | | | 7,366 | | | Vertex Pharmaceuticals Inc.* | | | 308,930 | |
| | | | 4,131 | | | Gilead Sciences, Inc.* | | | 303,422 | |
| | | | 5,920 | | | Roche Holding AG ADR | | | 298,960 | |
| | | | 3,579 | | | Varian Medical Systems, Inc.* | | | 251,389 | |
| | | | | | | | |
|
|
|
| | | | | | | | | | 1,517,199 | |
| |
13.27% INDUSTRIALS | | | | |
| | | | 7,246 | | | Danaher Corp. | | | 405,051 | |
| | | | 1,878 | | | Precision Castparts Corp. | | | 355,731 | |
| | | | 4,315 | | | United Technologies Corp. | | | 353,873 | |
| | | | 2,356 | | | Cummins Inc. | | | 255,273 | |
| | | | | | | | |
|
|
|
| | | | | | | | | | 1,369,928 | |
10.29% ENERGY | | | | |
| | | | 3,361 | | | EOG Resources, Inc. | | | 405,975 | |
| | | | 9,345 | | | Enbridge, Inc. | | | 404,825 | |
| | | | 2,302 | | | Core Laboratories N.V. | | | 251,632 | |
| | | | | | | | |
|
|
|
| | | | | | | | | | 1,062,432 | |
6
The Torray Resolute Fund
SCHEDULE OF INVESTMENTS (continued)
As of December 31, 2012
| | | | | | | | | | |
| | | Shares
| | | | | Market Value
| |
| |
8.42% CONSUMER DISCRETIONARY | | | | |
| | | | 4,771 | | | Tupperware Brands Corp. | | $ | 305,821 | |
| | | | 5,865 | | | Nike, Inc., Class B | | | 302,634 | |
| | | | 4,688 | | | Coach, Inc. | | | 260,231 | |
| | | | | | | | |
|
|
|
| | | | | | | | | | 868,686 | |
| |
7.94% FINANCIALS | | | | |
| | | | 5,907 | | | American Tower Corp. REIT | | | 456,434 | |
| | | | 2,885 | | | Franklin Resources, Inc. | | | 362,645 | |
| | | | | | | | |
|
|
|
| | | | | | | | | | 819,079 | |
| |
5.35% MATERIALS | | | | |
| | | | 2,772 | | | Praxair, Inc. | | | 303,395 | |
| | | | 3,332 | | | Compass Minerals International, Inc. | | | 248,934 | |
| | | | | | | | |
|
|
|
| | | | | | | | | | 552,329 | |
| |
3.40% CONSUMER STAPLES | | | | |
| | | | 3,354 | | | Colgate-Palmolive Co. | | | 350,627 | |
| | | | | | | | |
|
|
|
| TOTAL COMMON STOCK 93.06% | | | 9,604,018 | |
(cost $9,004,662) | | | | |
| | | |
| | | Principal Amount ($) | | | | | | |
| |
| SHORT-TERM INVESTMENTS 3.86% | | | | |
| | | | 398,735 | | | BNY Mellon Cash Reserve, 0.05%(1) | | | 398,735 | |
(cost $398,735) | | | | |
| | | | | | | | |
|
|
|
| |
| TOTAL INVESTMENTS 96.92% | | | 10,002,753 | |
(cost $9,403,397) | | | | |
| OTHER ASSETS LESS LIABILITIES 3.08% | | | 317,579 | |
| | | | | | | | |
|
|
|
| NET ASSETS 100.00% | | $ | 10,320,332 | |
| | | | | | | | |
|
|
|
| * | Non-income producing securities. |
| (1) | Represents current yield at December 31, 2012. |
| ADR | – American Depositary Receipt |
| REIT | – Real Estate Investment Trust |
See notes to the financial statements.
7
The Torray Resolute Fund
STATEMENT OF ASSETS AND LIABILITIES
As of December 31, 2012
| | | | |
ASSETS | | | | |
Investments in securities at value
(cost $9,403,397) | | $ | 10,002,753 | |
Receivable for fund shares sold | | | 4,100,000 | |
Receivable from advisor | | | 8,670 | |
Interest and dividends receivable | | | 1,442 | |
Prepaid expenses | | | 16,357 | |
| | |
|
|
|
TOTAL ASSETS | | | 14,129,222 | |
| | |
|
|
|
| |
LIABILITIES | | | | |
Payable for securities purchased | | | 3,788,780 | |
Payable to advisor | | | 3,610 | |
Accrued expenses | | | 16,500 | |
| | |
|
|
|
TOTAL LIABILITIES | | | 3,808,890 | |
| | |
|
|
|
| |
NET ASSETS | | $ | 10,320,332 | |
| | |
|
|
|
Paid-in-capital (843,114 shares outstanding, unlimited shares authorized) | | $ | 9,689,366 | |
Accumulated net realized gain on investments | | | 31,610 | |
Net unrealized appreciation of investments | | | 599,356 | |
| | |
|
|
|
| |
TOTAL NET ASSETS | | $ | 10,320,332 | |
| | |
|
|
|
Net Asset Value, Offering and Redemption Price per Share | | $ | 12.24 | |
| | |
|
|
|
See notes to the financial statements.
8
The Torray Resolute Fund
STATEMENT OF OPERATIONS
For the year ended December 31, 2012
| | | | |
INVESTMENT INCOME | | | | |
Dividend income | | $ | 46,913 | |
Interest income | | | 56 | |
Foreign tax withheld | | | (883 | ) |
| | |
|
|
|
Total investment income | | | 46,086 | |
| | |
|
|
|
| |
EXPENSES | | | | |
Management fees | | | 34,766 | |
Trustees’ fees | | | 32,667 | |
Transfer agent fees & expenses | | | 17,546 | |
Registration & filing fees | | | 13,488 | |
Insurance expense | | | 12,080 | |
Audit fees | | | 12,000 | |
Custodian fees | | | 4,447 | |
Legal fees | | | 755 | |
Printing, postage & mailing | | | 109 | |
| | |
|
|
|
Total expenses | | | 127,858 | |
Fees waived and expenses reimbursed by Advisor | | | (84,400 | ) |
| | |
|
|
|
Net expenses | | | 43,458 | |
| | |
|
|
|
NET INVESTMENT INCOME | | | 2,628 | |
| | |
|
|
|
REALIZED AND UNREALIZED GAIN ON INVESTMENTS | | | | |
Net realized gain on investments | | | 61,007 | |
Net change in unrealized appreciation (depreciation) on investments | | | 607,782 | |
| | |
|
|
|
Net realized and unrealized gain on investments | | | 668,789 | |
| | |
|
|
|
NET INCREASE IN NET ASSETS RESULTING FROM OPERATIONS | | $ | 671,417 | |
| | |
|
|
|
See notes to the financial statements.
9
The Torray Resolute Fund
STATEMENTS OF CHANGES IN NET ASSETS
For the years indicated:
| | | | | | | | |
| | | Year ended
12/31/12
| | | Year ended
12/31/11
| |
Increase (Decrease) in Net Assets Resulting from Operations: | | | | | | | | |
Net investment income | | $ | 2,628 | | | $ | 424 | |
Net realized gain (loss) on investments | | | 61,007 | | | | (5,094 | ) |
Net change in unrealized appreciation (depreciation) on investments | | | 607,782 | | | | (8,426 | ) |
| | |
|
|
| |
|
|
|
Net increase (decrease) in net assets resulting from operations | | | 671,417 | | | | (13,096 | ) |
| | |
|
|
| |
|
|
|
Distributions to Shareholders from: | | | | | | | | |
Net investment income ($0.006 and
$0.002 per share, respectively) | | | (2,880 | ) | | | (422 | ) |
Net realized gains ($0.047 and
$0.002 per share, respectively) | | | (23,593 | ) | | | (460 | ) |
| | |
|
|
| |
|
|
|
Total distributions | | | (26,473 | ) | | | (882 | ) |
| | |
|
|
| |
|
|
|
| | |
Shares of Beneficial Interest | | | | | | | | |
Net increase from share transactions | | | 6,874,773 | | | | 2,714,593 | |
| | |
|
|
| |
|
|
|
Total increase | | | 7,519,717 | | | | 2,700,615 | |
| | |
Net Assets — Beginning of Year | | | 2,800,615 | | | | 100,000 | |
| | |
|
|
| |
|
|
|
Net Assets — End of Year | | $ | 10,320,332 | | | $ | 2,800,615 | |
| | |
|
|
| |
|
|
|
Undistributed Net Investment Income | | $ | — | | | $ | 1 | |
| | |
|
|
| |
|
|
|
See notes to the financial statements.
10
The Torray Resolute Fund
FINANCIAL HIGHLIGHTS
For a share outstanding throughout each period presented:
PER SHARE DATA
| | | | | | | | | | | | |
| | | Years ended
December 31:
| | | Period ended
December 31:
| |
| | | 2012
| | | 2011
| | | 2010(3)
| |
Net Asset Value, Beginning of Period | | $ | 10.220 | | | $ | 10.000 | | | $ | 10.000 | |
| | |
|
|
| |
|
|
| |
|
|
|
Income from investment operations | | | | | | | | | | | | |
Net investment income | | | 0.009 | (2)(5) | | | 0.003 | (2) | | | 0.000 | |
Net gains on securities (both realized and unrealized) | | | 2.064 | | | | 0.221 | (4) | | | 0.000 | |
| | |
|
|
| |
|
|
| |
|
|
|
Total from investment operations | | | 2.073 | | | | 0.224 | | | | 0.000 | |
| | |
|
|
| |
|
|
| |
|
|
|
Less: distributions | | | | | | | | | | | | |
Dividends (from net investment income) | | | (0.006 | ) | | | (0.002 | ) | | | 0.000 | |
Distributions (from capital gains) | | | (0.047 | ) | | | (0.002 | ) | | | — | |
| | |
|
|
| |
|
|
| |
|
|
|
Total distributions | | | (0.053 | ) | | | (0.004 | ) | | | 0.000 | |
| | |
|
|
| |
|
|
| |
|
|
|
Net Asset Value, End of Period | | $ | 12.240 | | | $ | 10.220 | | | $ | 10.000 | |
| | |
|
|
| |
|
|
| |
|
|
|
TOTAL RETURN (1) | | | 20.28 | % | | | 2.23 | % | | | 0.00 | % |
RATIOS/SUPPLEMENTAL DATA | | | | | | | | | | | | |
Net assets, end of period (000’s omitted) | | $ | 10,320 | | | $ | 2,801 | | | $ | 100 | |
Ratios of expenses to average net assets before expense reimbursement | | | 3.68 | % | | | 5.90 | % | | | 0.00 | % |
Ratios of expenses to average net assets after expense reimbursement | | | 1.25 | % | | | 1.25 | % | | | 0.00 | % |
Ratios of net investment income to average net assets | | | 0.08 | %(5) | | | 0.03 | % | | | 0.00 | % |
Portfolio turnover rate | | | 21.76 | % | | | 22.35 | % | | | 0.00 | % |
| (1) | Past performance is not predictive of future performance. |
| (2) | Calculated based on the average amount of shares outstanding during the year. |
| (3) | Commencement of operations on 12/31/10. |
| (4) | The amount of net gains on securities (both realized and unrealized) per share does not accord with the amounts reported in the Statement of Changes due to the timing of purchases and redemptions of Fund shares and fluctuating market values during the period. |
| (5) | For the year ended December 31, 2012, investment income per share reflects a special dividend which amounted to $0.01 per share. Excluding the special dividend, the ratio of net investment income to average net assets would have been (0.01)%. |
See notes to the financial statements.
11
The Torray Resolute Fund
NOTES TO FINANCIAL STATEMENTS
As of December 31, 2012
NOTE 1 — SUMMARY OF SIGNIFICANT ACCOUNTING POLICIES
The Torray Resolute Fund (“Fund”) is a separate series of The Torray Fund (“Trust”). The Trust is registered under the Investment Company Act of 1940, as amended, as a diversified, open-end management investment company. The Trust is organized as a business trust under Massachusetts law. The Fund’s investment objective is to seek to achieve long-term growth of capital. The Fund seeks to meet its objective by investing its assets in a concentrated portfolio of predominantly large capitalization companies with proven records of increasing earnings on a consistent and sustainable basis. There can be no assurance that the Fund’s investment objective will be achieved.
The following is a summary of accounting policies followed by the Fund in the preparation of its financial statements. These policies are in conformity with accounting principles generally accepted in the United States of America.
Securities Valuation Portfolio securities for which market quotations are readily available are valued at market value, which is determined by using the last reported sale price, or, if no sales are reported, the last reported bid price. For NASDAQ traded securities, market value is determined on the basis of the NASDAQ Official Closing Price instead of the last reported sales price. Other assets and securities for which no quotations are readily available or for which Torray LLC (the “Advisor”) believes do not reflect market value are valued at fair value as determined in good faith by the Advisor under the supervision of the Board of Trustees (the “Board” or “Trustees”) in accordance with the Fund’s Valuation Procedures. Short-term obligations having remaining maturities of 60 days or less are valued at amortized cost, which approximates market value.
Fair Value Measurements Various inputs are used in determining the fair value of investments which are as follows:
| | • | | Level 1 — quoted prices in active markets for identical securities |
| | • | | Level 2 — significant observable inputs (including quoted prices for similar securities, interest rates, prepayment speeds, credit risk, etc.) |
| | • | | Level 3 — significant unobservable inputs (including the Fund’s own assumptions in determining the fair value of investments) |
The inputs or methodology used for valuing securities are not necessarily an indication of the risk associated with investing in those securities.
12
The Torray Resolute Fund
NOTES TO FINANCIAL STATEMENTS (continued)
As of December 31, 2012
The summary of inputs used to value the Fund’s investments as of December 31, 2012 is as follows:
| | | | |
Valuation Inputs
| | | |
Level 1 — Quoted Prices * | | $ | 10,002,753 | |
Level 2 — Other Significant Observable Inputs | | | — | |
Level 3 — Significant Unobservable Inputs | | | — | |
| | |
|
|
|
Total Market Value of Investments | | $ | 10,002,753 | |
| | |
|
|
|
| | * | Security types and industry classifications as defined in the Schedule of Investments. |
The Fund had no transfers between Level 1 and Level 2 investments during the reporting period.
Securities Transactions and Investment Income Securities transactions are recorded on a trade date basis. Realized gains and losses from securities transactions are recorded on the specific identification basis. Dividend income and distributions to shareholders are recorded on the ex-dividend date. Interest income, including amortization of discount on short-term investments, and expenses are recorded on the accrual basis. Premium and discount are amortized using the effective yield to maturity method.
Federal Income Taxes The Fund intends to continue to comply with the requirements of the Internal Revenue Code applicable to regulated investment companies and to distribute all of its taxable income, including any net realized gain on investments to its shareholders. Therefore, no federal income tax provision is required.
Management has analyzed the Fund’s tax positions taken on federal income tax returns for all open tax years (current and prior tax year), and has concluded that no provision for federal income tax is required in the Fund’s financial statements. The Fund’s federal and state income and federal excise tax returns for tax years for which the applicable statutes of limitations have not expired are subject to examination by the Internal Revenue Service and state departments of revenue.
Net Asset Value The net asset value per share of the Fund is determined daily as of the close of trading on the New York Stock Exchange by dividing the value of the Fund’s net assets by the number of shares outstanding.
Use of Estimates In preparing financial statements in accordance with accounting principles generally accepted in the United States of America, management is required to make estimates and assumptions that affect the reported amounts of assets and liabilities and the disclosure of contingent assets and liabilities at the date of the financial statements, and the reported amounts of increases and decreases in net assets from operations during the reporting period. Actual results could differ from those estimates.
13
The Torray Resolute Fund
NOTES TO FINANCIAL STATEMENTS (continued)
As of December 31, 2012
NOTE 2 — SHARES OF BENEFICIAL INTEREST TRANSACTIONS
Transactions in shares of beneficial interest were as follows:
| | | | | | | | | | | | | | | | |
| | | Year ended
12/31/12
| | | Year ended
12/31/11
| |
| | | Shares
| | | Amount
| | | Shares
| | | Amount
| |
Shares issued | | | 611,391 | | | $ | 7,365,038 | | | | 301,712 | | | $ | 3,091,907 | |
Reinvestments of dividends and distributions | | | 1,979 | | | | 24,168 | | | | 86 | | | | 882 | |
Shares redeemed | | | (44,281 | ) | | | (514,433 | ) | | | (37,773 | ) | | | (378,196 | ) |
| | |
|
|
| |
|
|
| |
|
|
| |
|
|
|
| | | | 569,089 | | | $ | 6,874,773 | | | | 264,025 | | | $ | 2,714,593 | |
| | |
|
|
| |
|
|
| |
|
|
| |
|
|
|
As of December 31, 2012, the Trust’s officers, Trustees and affiliated persons and their families directly or indirectly controlled 628,974 shares or 74.60% of the Fund.
NOTE 3 — INVESTMENT TRANSACTIONS
Purchases and sales of investment securities, other than short-term investments, for the year ended December 31, 2012, aggregated $6,979,010 and $823,552, respectively.
NOTE 4 — MANAGEMENT FEES
Pursuant to the Management Contract, the Advisor provides investment advisory and administrative services to the Fund. The Fund pays the Advisor a management fee, computed daily and payable monthly at the annual rate of 1.00% of the Fund’s average daily net assets. For the year ended December 31, 2012, the Fund incurred management fees of $34,766.
Excluding the management fee, other expenses incurred by the Fund during the year ended December 31, 2012, totaled $93,092. During the year ended December 31, 2012, the Advisor waived fees and reimbursed expenses in the amount of $84,400 to maintain the Fund’s expense ratio at 1.25%. These expenses include all costs associated with the Fund’s operations including transfer agent fees, independent trustees’ fees ($14,000 per annum and $2,000 for each Board meeting attended per Trustee), dues, fees and expenses of registering and qualifying the Fund and its shares for distribution, charges of the custodian, auditing and legal expenses, insurance premiums, supplies, postage, expenses of issue or redemption of shares, reports to shareholders and Trustees, expenses of printing and mailing prospectuses, proxy statements and proxies to existing shareholders, and other miscellaneous expenses.
Certain officers and Trustees of the Fund are also officers and/or shareholders of the Advisor, and are not paid by the Fund for serving in such capacities.
14
The Torray Resolute Fund
NOTES TO FINANCIAL STATEMENTS (continued)
As of December 31, 2012
NOTE 5 — TAX MATTERS
Distributions to shareholders are determined in accordance with United States federal income tax regulations, which may differ from accounting principles generally accepted in the United States of America.
The tax character of distributions paid during the years ended December 31, 2012 and 2011 were as follows:
| | | | | | | | |
| | | 2012
| | | 2011
| |
Distributions paid from: | | | | | | | | |
Ordinary income | | $ | 2,628 | | | $ | 882 | |
Long-term capital gain | | | 23,845 | | | | — | |
| | |
|
|
| |
|
|
|
| | | $ | 26,473 | | | $ | 882 | |
| | |
|
|
| |
|
|
|
As of December 31, 2012, the components of distributable earnings on a tax basis were as follows:
| | | | | | |
Undistributed long-term capital gains | | $ | 34,333 | | | |
Unrealized appreciation | | | 596,633 | | | |
| | |
|
|
| | |
| | | $ | 630,966 | | | |
| | |
|
|
| | |
Permanent book/tax differences are reclassified among the Fund’s components of capital on a tax basis. As of December 31, 2012, the Fund reclassified $251 to increase undistributed net investment income and decrease accumulated net realized gain on investments in order to reflect permanent book/tax differences related to short-term capital gain distributions.
At December 31, 2012, the Fund had no capital loss carry forward for federal income tax purposes.
The following information is based upon the federal tax basis of investment securities as of December 31, 2012:
| | | | | | |
Gross unrealized appreciation | | $ | 618,350 | | | |
Gross unrealized depreciation | | | (21,717 | ) | | |
| | |
|
|
| | |
Net unrealized appreciation | | $ | 596,633 | | | |
| | |
|
|
| | |
Cost | | $ | 9,406,120 | | | |
| | |
|
|
| | |
15
The Torray Resolute Fund
NOTES TO FINANCIAL STATEMENTS (continued)
As of December 31, 2012
NOTE 6 — COMMITMENTS AND CONTINGENCIES
The Fund indemnifies its officers and Trustees for certain liabilities that may arise from their performance of their duties to the Fund. Additionally, in the normal course of business, the Fund enters into contracts that contain a variety of representations and warranties which provide general indemnifications. The Fund’s maximum exposure under these arrangements is unknown, as this would involve future claims that may be made against the Fund that have not yet occurred.
NOTE 7 — SUBSEQUENT EVENTS
Management has evaluated the impact of all subsequent events on the Fund through the date these financial statements were issued and has determined that there were no subsequent events requiring recognition or disclosure in the financial statements.
NOTE 8 — NEW ACCOUNTING PRONOUNCEMENTS
In December 2011, the Financial Accounting Standards Board (“FASB”) issued Accounting Standards Update (“ASU”) No. 2011-11, Disclosures about Offsetting Assets and Liabilities (“ASU 2011-11”). The amendments in ASU 2011-11 require an entity to disclose information about offsetting and related arrangements to enable users of its financial statements to understand the effect of those arrangements on its financial position. ASU 2011-11 is effective for annual reporting periods beginning on or after January 1, 2013, and interim periods within those annual periods. The guidance requires retrospective application for all comparative periods presented. Management is currently evaluating the impact ASU 2011-11 will have on the Fund’s financial statement disclosures.
16
The Torray Resolute Fund
REPORT OF INDEPENDENT REGISTERED PUBLIC ACCOUNTING FIRM
To the Shareholders of The Torray Resolute Fund
and the Board of Trustees of The Torray Fund
We have audited the accompanying statement of assets and liabilities of The Torray Resolute Fund, a series of shares of beneficial interest in The Torray Fund (the “Fund”), including the schedule of investments, as of December 31, 2012, and the related statement of operations for the year then ended, the statements of changes in net assets for each of the years in the two-year period then ended, and the financial highlights for each of the years in the two-year period then ended and for the one day in the period ended December 31, 2010. These financial statements and financial highlights are the responsibility of the Fund’s management. Our responsibility is to express an opinion on these financial statements and financial highlights based on our audits.
We conducted our audits in accordance with the standards of the Public Company Accounting Oversight Board (United States). Those standards require that we plan and perform the audits to obtain reasonable assurance about whether the financial statements and financial highlights are free of material misstatement. An audit includes examining, on a test basis, evidence supporting the amounts and disclosures in the financial statements. Our procedures included confirmation of securities owned as of December 31, 2012 by correspondence with the custodian and broker. An audit also includes assessing the accounting principles used and significant estimates made by management, as well as evaluating the overall financial statement presentation. We believe that our audits provide a reasonable basis for our opinion.
In our opinion, the financial statements and financial highlights referred to above present fairly, in all material respects, the financial position of The Torray Resolute Fund as of December 31, 2012, the results of its operations for the year then ended, the changes in its net assets for each of the years in the two-year period then ended, and its financial highlights for each of the years in the two-year period then ended and for the one day in the period ended December 31, 2010, in conformity with accounting principles generally accepted in the United States of America.

BBD, LLP
Philadelphia, Pennsylvania
February 22, 2013
17
The Torray Resolute Fund
FUND MANAGEMENT
As of December 31, 2012 (unaudited)
The Trust is overseen by a Board of Trustees (the “Board”), who has delegated the day-to-day management to the officers of the Trust. The Board meets regularly to review the Fund’s activities, contractual arrangements, and performance. The trustees and officers serve until their successors are elected and qualified, or until the trustee or officer dies, resigns or is removed, or becomes disqualified.
Information pertaining to the Trustees and Officers of The Trust is set forth below. The Statement of Additional Information (SAI) includes additional information about the Trustees and is available without charge, upon request, by calling (800) 443-3036.
| | | | | | | | |
Name, Age,
Address* and
Position(s)
with the Trust | | Term of Office
and Length of
Time Served | | Principal Occupation(s) During Past Five Years | | No. of
Portfolios in
Fund Complex
Overseen by
Trustee | | Other Directorships Held |
| INDEPENDENT TRUSTEES |
Carol T. Crawford (69) Trustee | | Indefinite Term since 2006 | | Attorney and International Trade Consultant, McLean, VA | | 2 | | Director, Smithfield Foods, Inc. Smithfield, VA |
Bruce C. Ellis (68) Trustee | | Indefinite Term since 1993 | | Private Investor, Bethesda, MD | | 2 | | None |
Robert P. Moltz (65) Trustee | | Indefinite Term since 1990 | | Chairman and CEO,
Weaver Bros. Insurance Associates, Inc. Bethesda, MD | | 2 | | None |
Wayne H. Shaner (65)** Trustee and Chairman of the Board | | Indefinite Term since 1993 | | Managing Partner,
Rockledge Partners, LLC,
Investment Advisory Firm,
Easton, MD (Jan. 2004-present);
Vice President,
Torray LLC, Bethesda, MD (Jan. 2008-June 2008) | | 2 | | Director,
Van Eck Funds New York, NY |
18
The Torray Resolute Fund
FUND MANAGEMENT (continued)
As of December 31, 2012 (unaudited)
| | | | | | | | |
Name, Age,
Address* and Position(s) with the Trust | | Term of Office
and Length of
Time Served | | Principal Occupation(s) During Past Five Years | | No. of
Portfolios in
Fund Complex
Overseen by
Trustee | | Other Directorships Held |
| INTERESTED TRUSTEES AND OFFICERS OF THE TRUST |
William M Lane (62)*** Trustee, Treasurer and Secretary | | Indefinite Term
Since 1990 | | Executive Vice President and Secretary, Torray LLC, Bethesda, MD (Oct. 2005-Present); Chief Compliance Officer, Torray LLC, Bethesda, MD (Oct. 2005-Mar. 2011); Vice President, Secretary, Treasurer and Chief Compliance Officer, Robert E. Torray & Co. Inc., Bethesda, MD (Jul.1984-Oct. 2005) | | 2 | | None |
Robert E. Torray (75) President | | Indefinite Term
since 2007 | | Chairman, Torray LLC, Bethesda, MD (2005-present) President, Torray LLC, Bethesda, MD (2007-present) President, Robert E. Torray & Co. Inc., Bethesda, MD (May 1972-Oct. 2005). | | N/A | | None |
Barbara C. Warder (55) Chief Compliance Officer and Anti-Money Laundering Officer | | Indefinite Term since 2011 | | Chief Compliance Officer and Anti-Money Laundering Officer, Torray LLC, Bethesda, MD (Mar. 2011-present); Chief Operating Officer and Chief Compliance Officer, Resolute Capital Management, Washington, DC (Mar. 1998-June 2010). | | N/A | | None |
| * | All addresses are c/o The Torray Fund, 7501 Wisconsin Avenue, Suite 750W, Bethesda, MD 20814-6519. |
| ** | Mr. Shaner is deemed to be an independent Trustee effective as of January 1, 2011. |
| *** | Mr. Lane, by virtue of his employment with Torray LLC, the Trust’s investment adviser, is considered an “interested person” of the Trust, as that term is defined in Section 2(a)(19) of the Investment Company Act of 1940, as amended. |
19
The Torray Resolute Fund
FACTORS CONSIDERED BY THE BOARD OF TRUSTEES IN CONNECTION WITH THEIR APPROVAL OF THE FUND’S INVESTMENT MANAGEMENT AGREEMENT WITH THE MANAGER (unaudited)
The Fund has entered into an Investment Management Agreement (the “Agreement”) with Torray LLC (the “Manager”) pursuant to which the Manager provides investment management services to the Fund. In accordance with the Investment Company Act of 1940, the Board of Trustees of the Fund is required, on an annual basis, to consider the continuation of the Agreement with the Manager, and this must take place at an in-person meeting of the Board. The relevant provisions of the Investment Company Act of 1940 specifically provide that it is the duty of the Board to request and evaluate such information as the Board determines is necessary to allow them to properly consider the continuation of the Agreement, and it is the duty of the Manager to furnish the Trustees with such information that is responsive to their request. Set forth below is a discussion of the various factors that the Board of Trustees considered in deciding to approve the continuation of the Agreement with the Manager.
In determining whether to approve the continuation of the Agreement, the Board of Trustees requested, and the Manager provided, information and data relevant to the Board’s consideration. This included materials that provided the Board with information regarding the investment performance of the Fund and information regarding the fees and expenses of the Fund as compared to other similar mutual funds. As part of its deliberations, the Board also considered and relied upon the information about the Fund and the Manager that had been provided to them throughout the year in connection with their regular Board meetings at which they engage in the ongoing oversight of the Fund and its operations.
The Board met at an in-person meeting on September 25, 2012, in order to consider the proposed continuation of the Agreement. Among the factors the Board considered was the performance results of the Fund achieved by the Manager for the past year and since the commencement of operations of the Fund. The members of the Board took into consideration the performance of the Fund as compared to the Fund’s primary benchmark index, the Russell 1000 Growth Index, as well as the performance of the Fund as compared to the Standard & Poor’s 500 Stock Index. They noted the range of investment advisory and management services that are provided by the Manager and the level and quality of these services, and in particular, they noted the quality of the personnel providing these services, taking into consideration their finding that the personnel providing these services, and the services provided, were of a very high caliber and quality.
The Board also compared the expenses of the Fund to the expenses of other similar types of funds, and the Board took into consideration the Manager’s willingness to maintain a contractual Expense Limitation Agreement with respect to the Fund in order to limit the total operating expenses of the Fund. They also took note of the fact that the Fund is not subject to any sales loads, sales commissions or other similar fees, including Rule 12b-1 distribution fees, and they considered the fact that the Manager had informed the Board that it did not intend to propose the introduction of such types of fees for the Fund. The Board took into consideration the Manager’s agreement to continue to contractually limit the total annual operating expenses of the Fund for its current fiscal year. The Board also reviewed financial information concerning the Manager, noting its financial soundness as demonstrated by the financial information provided and the extent to which the Manager has waived fees and reimbursed expenses of the Fund in connection with its management and operation of the Fund since the Fund’s inception. The Board was also
20
The Torray Resolute Fund
FACTORS CONSIDERED BY THE BOARD OF TRUSTEES IN CONNECTION WITH THEIR APPROVAL OF THE FUND’S INVESTMENT MANAGEMENT AGREEMENT WITH THE MANAGER (unaudited) (continued)
provided with information regarding the fees that the Manager charges other clients for similar investment advisory services and they noted that the fees were comparable based on the relevant circumstances of the types of accounts involved.
In addition, the Board reviewed with the Manager information regarding its brokerage practices, including its soft dollar practices, and noted that the Manager did not have in place any formal soft dollar arrangements, and the Board also reviewed the Manager’s best execution procedures, which the Board noted were reasonable and consistent with standard industry practice.
Based on their review, the Trustees concluded that the investment management services provided under the Agreement were reasonably worth the full amount of the fee and that the terms of the Agreement were fair and reasonable. In reaching their conclusion with respect to their approval of the continuation of the Agreement, the Trustees did not identify any one single factor as being controlling, rather, the Board took note of a combination of factors that influenced their decision making process. The Board did, however, identify the overall favorable investment performance of the Fund since its commencement of operations, the commitment of the Manager to the successful operation of the Fund, the net level of expenses of the Fund following the imposition of the Manager’s contractual expense limitations, and the Manager’s agreement to continue to contractually limit the Fund’s total operating expenses, as being important elements of their consideration. Based upon their review and consideration of these factors and other matters deemed relevant by the Board in reaching an informed business judgment, a majority of the Board of Trustees, including a majority of the Independent Trustees, concluded that the terms of the Agreement were fair and reasonable and the Board voted to approve the continuation of the Agreement with the Manager.
21
The Torray Resolute Fund
PORTFOLIO HOLDINGS, PROXY VOTING AND PROCEDURES
As of December 31, 2012 (unaudited)
The Fund files its complete schedule of portfolio holdings with the Securities and Exchange Commission (the “Commission”) for the first and third quarters of each fiscal year on Form N-Q. The Fund’s Forms N-Q are available on the Commission’s website at http://www.sec.gov. The Fund’s Forms N-Q may be reviewed and copied at the Commission’s Public Reference Room in Washington, D.C. Information on the operation of the Commission’s Public Reference Room may be obtained by calling 1-800-SEC-0330.
A description of the policies and procedures that the Fund uses to determine how to vote proxies relating to portfolio securities is available without charge, upon request, by calling 1-800-443-3036; and on the Commission’s website at http://www.sec.gov.
Information regarding how the Fund voted proxies relating to portfolio securities is available without charge, upon request, by calling 1-800-443-3036; and on the Commission’s website at http://www.sec.gov.
22
The Torray Resolute Fund
ABOUT YOUR FUND’S EXPENSES
As of December 31, 2012 (unaudited)
We believe it is important for you to understand the impact of costs on your investment. All mutual funds have operating expenses. As a shareholder of the Fund, you incur ongoing costs, including management fees, and other fund expenses. Operating expenses, which are deducted directly from the Fund’s gross income, directly reduce the investment return of the Fund.
A mutual fund’s expenses are expressed as a percentage of its average net assets. This figure is known as the expense ratio. The following examples are intended to help you understand the ongoing costs (in dollars) of investing in the Fund and to compare these costs with the ongoing costs of investing in other mutual funds. The examples below are based on an investment of $1,000 made at the beginning of the period shown and held for the entire period.
The table on the next page illustrates the Fund’s cost in two ways:
Actual Fund Return This section helps you estimate the actual expenses that you paid over the period. The “Ending Account Value” shown is derived from the Fund’s actual return, and the third column shows the operating expenses that would have been paid by an investor who started with $1,000 in the Fund. You may use the information here, together with the amount invested, to estimate the expenses that you paid over the period.
To do so, simply divide your account value by $1,000 (for example, an $8,600 account value divided by $1,000 = 8.6), then multiply the result by the number given for the Fund under the heading “Expenses Paid During Period” on the next page.
Hypothetical 5% Return This section is intended to help you compare your Fund’s costs with those of other mutual funds. It assumes that the Fund had an annual return of 5% before expenses, and that the expense ratio is unchanged. In this case, because the return used is not the Fund’s actual return, the results do not apply to your investment. The example is useful in making comparisons because the Commission requires all mutual funds to calculate expenses based on a 5% return. You can assess the Fund’s costs by comparing this hypothetical example with the hypothetical examples that appear in shareholder reports of other funds.
Note that expenses shown in the table are meant to highlight and help you compare ongoing costs only. The Fund does not charge transactions fees, such as purchase or redemption fees, nor does it carry a “sales load.”
The calculation assumes no shares were bought or sold during the period. Your actual costs may have been higher or lower, depending on the amount of your investment and the timing of any purchases or redemptions.
23
The Torray Resolute Fund
ABOUT YOUR FUND’S EXPENSES (continued)
As of December 31, 2012 (unaudited)
More information about the Fund’s expenses, including recent annual expense ratios, can be found in this report. For additional information on operating expenses and other shareholder costs, please refer to the Fund’s prospectus.
| | | | | | | | | | | | |
| | | Beginning
Account Value
July 1, 2012
| | | Ending
Account Value
December 31, 2012
| | | Expenses Paid
During Period *
| |
Based on Actual Fund Return | | $ | 1,000.00 | | | $ | 1,090.80 | | | $ | 6.62 | |
Based on Hypothetical 5% Return
(before expenses) | | $ | 1,000.00 | | | $ | 1,018.80 | | | $ | 6.39 | |
| * | Expenses are equal to the Fund’s annualized expense ratio of 1.26% for the period, multiplied by the average account value over the period, multiplied by 184/366 (to reflect the one-half year period). |
24
The Torray Resolute Fund
TAX INFORMATION
As of December 31, 2012 (unaudited)
We are required to advise you within 60 days of the Fund’s fiscal year-end regarding the federal tax status of certain distributions received by shareholders during such fiscal year. The information below is provided for the Fund’s fiscal year ending December 31, 2012. All designations are based on financial information available as of the date of this annual report and, accordingly are subject to change. For each item it is the intention of the Fund to designate the maximum amount permitted under the Internal Revenue Code and the regulations thereunder.
Qualified Interest Income
For the year ended December 31, 2012, 0.11% of the ordinary distributions paid (net investment income plus short-term capital gain) represent the amount of Qualifying Interest Income as created by The American Jobs Creation Act of 2004.
Qualified Dividend Income
For the year ended December 31, 2012, 100% of the distributions paid by the Fund from ordinary income qualifies for a reduced tax rate pursuant to The Jobs and Growth Tax Relief Reconciliation Act of 2003.
Dividends Received Deduction
For the year ended December 31, 2012, 100% of the ordinary income distribution qualifies for the dividends received deduction available to corporations.
Long-Term Capital Gain Dividends
The Fund designates $23,845 as long-term capital gain distributions pursuant to section 852(b)(3) of the Internal Revenue Code for the year ended December 31, 2012.
Dividends and distributions received by retirement plans such as IRA’s, Keogh-type plans and 403(b) plans need not be reported as taxable income. However, many retirement plan trusts may need this information for their annual information reporting.
25
TRUSTEES
Carol T. Crawford
Bruce C. Ellis
William M Lane
Robert P. Moltz
Wayne H. Shaner
INVESTMENT ADVISOR
Torray LLC
OFFICERS
Robert E. Torray
William M Lane
Fred M. Fialco
Nicholas C. Haffenreffer
Barbara C. Warder
INDEPENDENT REGISTERED PUBLIC ACCOUNTING FIRM
BBD, LLP
1835 Market Street, 26th Floor
Philadelphia, PA 19103
TRANSFER AGENT
BNY Mellon Investment Servicing (US) Inc.
4400 Computer Drive
Westborough, MA 01581-1722
LEGAL COUNSEL
Dechert LLP
1900 K Street, N.W.
Washington, DC 20006
Distributed by Foreside Funds Distributors LLC
400 Berwyn Park, 899 Cassatt Road,
Berwyn, PA 19132
Date of first use, February 2013
This report is not authorized for distribution to prospective
investors unless preceded or accompanied by a current
prospectus. All indices are unmanaged groupings of stocks
that are not available for investment.
The
TORRAY
RESOLUTE
FUND
ANNUAL REPORT
December 31, 2012
The Torray Resolute Fund
Suite 750 W
7501 Wisconsin Avenue
Bethesda, Maryland 20814-6519
(301) 493-4600
(800) 443-3036
| | (a) | | The registrant, as of the end of the period covered by this report, has adopted a code of ethics that applies to the registrant’s principal executive officer, principal financial officer, principal accounting officer or controller, or persons performing similar functions, regardless of whether these individuals are employed by the registrant or a third party. |
| | (c) | | There have been no amendments, during the period covered by this report, to a provision of the code of ethics that applies to the registrant’s principal executive officer, principal financial officer, principal accounting officer or controller, or persons performing similar functions, regardless of whether these individuals are employed by the registrant or a third party, and that relates to any element of the code of ethics description. |
| | (d) | | The registrant has not granted any waivers, including an implicit waiver, from a provision of the code of ethics that applies to the registrant’s principal executive officer, principal financial officer, principal accounting officer or controller, or persons performing similar functions, regardless of whether these individuals are employed by the registrant or a third party, that relates to one or more of the items set forth in paragraph (b) of this item’s instructions. |
| Item 3. | Audit Committee Financial Expert. |
The Registrant’s Board of Directors has not designated an audit committee financial expert. The Registrant has determined that it will retain the services of an independent third party to assist it if circumstances arise that require specific investment company auditing expertise.
| Item 4. | Principal Accountant Fees and Services. |
Audit Fees
| | (a) | | The aggregate fees billed for each of the last two fiscal years for professional services rendered by the principal accountant for the audit of the registrant’s annual financial statements or services that are normally provided by the accountant in connection with statutory and regulatory filings or engagements for those fiscal years are $42,000 for 2012 and $60,000 for 2011. |
Audit-Related Fees
| | (b) | | The aggregate fees billed in each of the last two fiscal years for assurance and related services by the principal accountant that are reasonably related to the performance of the audit of the registrant’s financial statements and are not reported under paragraph (a) of this Item are $0 for 2012 and $0 for 2011. |
Tax Fees
| | (c) | | The aggregate fees billed in each of the last two fiscal years for professional services rendered by the principal accountant for tax compliance, tax advice, and tax planning are $4,000 for 2012 and $6,000 for 2011. Tax fees represent tax compliance services provided in connection with the review of the Registrant’s tax returns. |
All Other Fees
| | (d) | | The aggregate fees billed in each of the last two fiscal years for products and services provided by the principal accountant, other than the services reported in paragraphs (a) through (c) of this Item are $0 for 2012 and $0 for 2011. |
| | (e)(1) | | Disclose the audit committee’s pre-approval policies and procedures described in paragraph (c)(7) of Rule 2-01 of Regulation S-X. |
Audit Committee Pre-Approval Policy. All services to be performed for the Registrant by BBD, LLP must be pre-approved by the audit committee. All services performed during 2012 and 2011 were pre-approved by the committee.
| | (e)(2) | | The percentage of services described in each of paragraphs (b) through (d) of this Item that were approved by the audit committee pursuant to paragraph (c)(7)(i)(C) of Rule 2-01 of Regulation S-X are as follows: |
| | (f) | | The percentage of hours expended on the principal accountant’s engagement to audit the registrant’s financial statements for the most recent fiscal year that were attributed to work performed by persons other than the principal accountant’s full-time, permanent employees was 0%. |
| | (g) | | The aggregate non-audit fees billed by the registrant’s accountant for services rendered to the registrant, and rendered to the registrant’s investment adviser (not including any sub-adviser whose role is primarily portfolio management and is subcontracted with or overseen by another investment adviser), and any entity controlling, controlled by, or under common control with the adviser that provides ongoing services to the registrant for each of the last two fiscal years of the registrant was $0 for 2012 and $0 for 2011. |
| | (h) | | The registrant’s audit committee of the board of directors has considered whether the provision of non-audit services that were rendered to the registrant’s investment adviser (not including any sub-adviser whose role is primarily portfolio management and is subcontracted with or overseen by another investment adviser), and any entity controlling, controlled by, or under common control with the investment adviser that provides ongoing services to the registrant that were not pre-approved pursuant to paragraph (c)(7)(ii) of Rule 2-01 of Regulation S-X is compatible with maintaining the principal accountant’s independence. |
| Item 5. | Audit Committee of Listed Registrants. |
Not applicable.
| (a) | | Schedule of Investments in securities of unaffiliated issuers as of the close of the reporting period is included as part of the report to shareholders filed under Item 1 of this form. |
| Item 7. | Disclosure of Proxy Voting Policies and Procedures for Closed-End Management Investment Companies. |
Not applicable.
| Item 8. | Portfolio Managers of Closed-End Management Investment Companies. |
Not applicable.
| Item 9. | Purchases of Equity Securities by Closed-End Management Investment Company and Affiliated Purchasers. |
Not applicable.
| Item 10. | Submission of Matters to a Vote of Security Holders. |
There have been no material changes to the procedures by which the shareholders may recommend nominees to the registrant’s board of directors, where those changes were implemented after the registrant last provided disclosure in response to the requirements of Item 407(c)(2)(iv) of Regulation S-K (17 CFR 229.407) (as required by Item 22(b)(15) of Schedule 14A (17 CFR 240.14a-101)), or this Item.
| Item 11. | Controls and Procedures. |
| | (a) | | The registrant’s principal executive and principal financial officers, or persons performing similar functions, have concluded that the registrant’s disclosure controls and procedures (as defined in Rule 30a-3(c) under the Investment Company Act of 1940, as amended (the “1940 Act”) (17 CFR 270.30a-3(c))) are effective, as of a date within 90 days of the filing date of the report that includes the disclosure required by this paragraph, based on their evaluation of these controls and procedures required by Rule 30a-3(b) under the 1940 Act (17 CFR 270.30a-3(b)) and Rules 13a-15(b) or 15d-15(b) under the Securities Exchange Act of 1934, as amended (17 CFR 240.13a-15(b) or 240.15d-15(b)). |
| | (b) | | There were no changes in the registrant’s internal control over financial reporting (as defined in Rule 30a-3(d) under the 1940 Act (17 CFR 270.30a-3(d)) that occurred during the registrant’s second fiscal quarter of the period covered by this report that has materially affected, or is reasonably likely to materially affect, the registrant’s internal control over financial reporting. |
| | (a)(1) | | Code of ethics, or any amendment thereto, that is the subject of disclosure required by Item 2 is attached hereto. |
| | (a)(2) | | Certifications pursuant to Rule 30a-2(a) under the 1940 Act and Section 302 of the Sarbanes-Oxley Act of 2002 are attached hereto. |
| | (b) | | Certifications pursuant to Rule 30a-2(b) under the 1940 Act and Section 906 of the Sarbanes-Oxley Act of 2002 are attached hereto. |
SIGNATURES
Pursuant to the requirements of the Securities Exchange Act of 1934 and the Investment Company Act of 1940, the registrant has duly caused this report to be signed on its behalf by the undersigned, thereunto duly authorized.
| | |
| (Registrant) | | The Torray Fund |
| | |
| By (Signature and Title)* | | /s/ Robert E. Torray |
| | Robert E. Torray, President (principal executive officer) |
Pursuant to the requirements of the Securities Exchange Act of 1934 and the Investment Company Act of 1940, this report has been signed below by the following persons on behalf of the registrant and in the capacities and on the dates indicated.
| | |
| By (Signature and Title)* | | /s/ Robert E. Torray |
| | Robert E. Torray, President (principal executive officer) |
| | |
| By (Signature and Title)* | | /s/ William M Lane |
| | William M Lane, Treasurer (principal financial officer) |
* Print the name and title of each signing officer under his or her signature.