UNITED STATES
SECURITIES AND EXCHANGE COMMISSION
Washington, D.C. 20549
FORM N-CSR
CERTIFIED SHAREHOLDER REPORT OF REGISTERED
MANAGEMENT INVESTMENT COMPANIES
Investment Company Act file number 811-06096
(Exact name of registrant as specified in charter)
|
7501 Wisconsin Avenue, Suite 1100 Bethesda, MD 20814-6523 |
(Address of principal executive offices) (Zip code)
|
William M Lane Torray LLC 7501 Wisconsin Avenue, Suite 1100 Bethesda, MD 20814-6523 |
(Name and address of agent for service)
Registrant’s telephone number, including area code: 301-493-4600
Date of fiscal year end: December 31
Date of reporting period: December 31, 2010
| Item 1. | Reports to Stockholders. |
The Report to Shareholders is attached herewith.
The Torray Fund
Letter to Shareholders
February 1, 2011
Dear Fellow Shareholders,
The Torray Fund gained 10.9% last year compared to a 15.1% advance for the Standard & Poor’s 500 Index. The difference is due to a late autumn surge in both commodities and a small percentage of stocks in the major indexes. Up to that point, the market had been flat to down for 2010. (As of August 26, it had lost 4.9% and our Fund, 2.9%.)
The year-end rally was triggered the very next day by Federal Reserve Board Chairman Ben Bernanke’s Jackson Hole, Wyoming, speech hinting the Fed might initiate a second round of quantitative easing. The object, he said, would be to encourage investments in “risk assets” – particularly stocks and commodities. If successful, it was hoped the resulting wealth effect would spur economic growth and employment. Although the plan was not adopted until November, the market took off in short order. From late August through year end, the S&P jumped 21%, the NASDAQ 26%, and commodity indices 26%. While the rally has buoyed investor spirits, its impact on the economy remains unclear. Equally uncertain is the potential fallout from trillion dollar budget deficits and their potential to trigger speculative bubbles.
A recent analysis of the S&P, NASDAQ 100 and Dow Jones Industrial Average illustrates just how narrow last year’s list of winners was. Only 10% of the stocks in each index represented the lion’s share of their appreciation – 60% for the S&P; 73% for the NASDAQ and 48% for the Dow. Without them, the indices’ returns, including dividends, would have been in the 6% - 8% range. Even more telling, the top 10 S&P stocks – 2% of the total – produced 25% of its return, about equal to the difference between our Fund’s performance and that of the Index. In another sign of the market’s heavy concentration in a few names, Apple, Inc. accounted for 45% of the NASDAQ 100’s gain.
Finally, our relative result was impacted by outsized returns on high multiple tech stocks and small company stocks. The former soared 97%, compared to a gain of only one percent for moderate growth technology stocks like those in our Fund. (The price/earnings ratios were 36 and 12, respectively.) We think the stocks we own are a real bargain and the high P/E group is risky. Small company shares outperformed big ones by nearly 100%. The country’s top 50 stocks rose only 7%. We own 12 of them, accounting for 37% of our Fund. The largest is General Electric, followed by International Business Machines, Procter and Gamble, Johnson & Johnson, Wells Fargo, AT&T, Intel, Cisco Systems, Abbott Laboratories, 3M Company, Kraft Foods and American Express. These outstanding businesses sell at conservative valuations; their earnings, dividends and free cash flow have been rising, and long-term prospects remain excellent. The same goes for the rest of our holdings.
There is no telling how long the speculative over-concentration of money in so few stocks will continue, but it won’t be forever, nor will high multiple and small company stocks keep going up 50% - 100% a year. In our 38-year history, we’ve witnessed dramatic price trends like this before, the most recent being the tech/telecom bubble of the late 1990s and the housing/sub-prime mortgage boom a few years later. These and all of the others imploded, leaving their participants a lot poorer.
1
The Torray Fund
Letter to Shareholders (continued)
February 1, 2011
Our 2010 semi-annual letter expressed concerns about flash trading and other computer-controlled strategies that have been roiling markets, driving up volatility and frightening investors away. If anything, the situation in that regard seems to have gotten worse. On the other hand, economic and business fundamentals are improving, corporate balance sheets are probably the strongest on record, and stocks, measured by historic standards, are undervalued. This is especially true relative to bonds and other readily available alternatives. Ironically, individuals and institutions continue to avoid them. A number of big pension funds have reported sharp reductions in their equity holdings, some of them from as much as 70% of assets a few years ago, when the market was a lot more expensive, to 30% now.
While this makes no sense to us, it is understandable considering the market’s miserable showing over the last 10 years. People are scared; many have less money today than they did a decade ago, and the picture is worse when inflation is taken into account. Beyond that, paper thin money market rates have caused investors to seek alternatives in their search for yield and capital preservation. As usual, Wall Street has responded enthusiastically by creating increasingly speculative new outlets for the public’s money. Media business shows, with their endless market predictions, earnings forecasts and focus on short-term trading strategies have only added to investor confusion. This emphasis on knowing the unknowable undermines any value these programs might otherwise add.
Exchange-traded funds (ETFs) have become one of the most widely embraced Wall Street promotions. There are now nearly 1,000 such funds holding around $1 trillion in assets. These include U.S. and international stock, fixed income, commodities and currency portfolios, to mention only a few. Many can be sold short, and some can be leveraged 3-to-1, greatly magnifying their downside risk. In addition, new ETFs are constantly being created to meet popular demand for portfolios concentrated on narrow market sectors, often the speculative favorites of the day. Essentially these funds are little more than an inexpensive rapid-fire vehicle investors are using to chase a rising price. When trends reverse, they typically flee, illustrating once again just how short-term-minded people are these days.
“Absolute-return” funds are another relatively new Wall Street innovation. In simplest terms, these funds hold stocks their managers think are going up, and sell short those they expect to fall, while at the same time holding smaller positions in short-term investments for liquidity purposes. Proponents contend this combination of long, short and cash equivalent holdings will make money no matter what the market does. Implicit in that claim is that the managers can predict the direction of individual stock prices. We doubt even the marketers believe this. Anyone who could do it would simply buy winners in advance and ignore everything else. In our opinion this strategy has no chance of outrunning the long-term returns generated by sound, growing companies.
Finally, we mention gold and silver, which are on a lot of people’s minds these days. This comes as no surprise given that the prices of these metals have soared five and six-fold, respectively, over the last ten years. Adjusted for inflation, however, gold has lost nearly half its value from its peak 30 years ago. Silver’s record is even worse. It hit $49 three decades ago, driven by the Texas oil billionaire Hunt brothers’ scheme to corner the market. When the plot unraveled, silver collapsed to $5; ten years later it was $3.50. Nearly 20 years after that (2004) it was $5 again; today it’s $29. After inflation, the current price of silver would have to more than quadruple to $130 an ounce to match its 1980 high. Predictably, the promoters hawking these metals on TV avoid this history like the plague.
2
The Torray Fund
Letter to Shareholders (continued)
February 1, 2011
The inimitable Ben Stein talked with Warren Buffett about gold last October. The interview appeared on CNN Money.com under the headline “Warren Buffet: Forget Gold, Buy Stocks.” When Stein asked, “What about gold; is this a classic bubble or what?” Buffet answered: “Look, you could take all the gold that’s ever been mined and it would fill a cube 67 feet in each direction. For what that’s worth at current gold prices, you could buy all – not some – all of the farmland in the United States. Plus you could buy 10 Exxon Mobils,” (the world’s largest corporation) “plus have $1 trillion of walking around money. Or you could have a big cube of metal. Which would you take? Which is going to produce more value?” Stein then asked what a typical middle class person in the US should buy to prepare for retirement. Without hesitation, Buffet replied, “Equities.”
It may be a few years before our economy’s pace accelerates to a level that meaningfully stimulates employment and restores confidence, but by then stocks will already have advanced to reflect the fact. Unfortunately, human nature is such that most people need convincing assurances as to when that will happen before they act. Obviously no one knows. What we do know is that investors will come back in droves after the clouds have parted and prices are a lot higher.
Jason Zweig, in his January 22, 2011, Wall Street Journal column, “The Intelligent Investor,” made this point in spades. It was titled “Will Small Investors Ever Warm Up to Stocks Again?” Zweig recounts that in early 1948 - nearly two decades after the crash of 1929 – the Federal Reserve surveyed 3,500 investors nationwide about their attitude toward stocks. Only 5% were willing to invest in them, while 62% were opposed. Asked why, 26% said stocks were “not safe” or “a gamble.” Only 4% believed stocks offered a “satisfactory” return. Ironically, this was after stocks had doubled over the preceding five years, showing that the great crash still hadn’t been forgotten. We will add here that in the 10 years following the 1948 survey, stocks returned 16.4% compounded annually, and 14.6% for 20 years. (It was not until the mid-1950s ushered in one of the biggest bull markets in history that individuals returned to stocks with enthusiasm. By then, as Zweig notes, they were roughly twice as expensive as they had been when individual investors told the Federal Reserve they were “a gamble.”)
This letter, our 40th, marks the 20th anniversary of The Torray Fund’s founding. Over the first 10 years, it earned 18.5% compounded, the S&P 500 Index, 17.4%. These numbers are nearly double long-term equity market averages. During the last decade, our results fell to 1.5% compounded, compared to 1.4% for the market. Yet, despite the ups and downs, an original investment in our Fund earned 9.6% compounded annually, multiplying capital 6.3 times; numbers for the Index were 9.1% and 5.8 times.
As noted earlier, a recovery, though slow, is underway. Stocks are a bargain, and we think investors should buy them. This is a long-term view, not a prediction of where prices will be in six months or a year. They might be lower for all we know. The point of investing now is to take advantage of America’s future prosperity at a discount, not to buy a ticket for a short-term ride on a stock market rally.
3
The Torray Fund
Letter to Shareholders (continued)
February 1, 2011
We thank you, once again, for your continued trust in our management.
| | | | | | |
| | | Sincerely, | | | | |
| | | |
| | |  | | | | |
| | | Robert E. Torray | | | | |
| | | 
| | | | |
| | | Fred M. Fialco | | | | |
| | | 
| | | | |
| | | Shawn M. Hendon | | | | |
| | | | | | | |
4
The Torray Fund
PERFORMANCE DATA
As of December 31, 2010
Average Annual Returns on an Investment in
The Torray Fund vs. the S&P 500 Index
For the periods ended December 31, 2010:
| | | | | | | | | | | | | | | | | | | | |
| | | 1 Year
| | | 3 Years
| | | 5 Years
| | | 10 Years
| | | Since
Inception
12/31/90
| |
The Torray Fund | | | 10.90 | % | | | -4.66 | % | | | -0.45 | % | | | 1.45 | % | | | 9.64 | % |
S&P 500 Index | | | 15.06 | % | | | -2.86 | % | | | 2.29 | % | | | 1.41 | % | | | 9.14 | % |
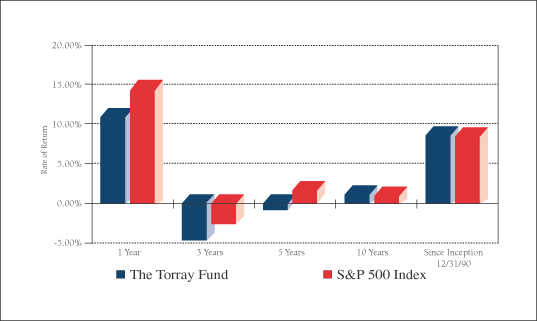
Cumulative Returns for the 20 years ended December 31, 2010
| | | | |
The Torray Fund | | | 530.39 | % |
S&P 500 Index | | | 475.01 | % |
5
The Torray Fund
PERFORMANCE DATA (continued)
As of December 31, 2010
Change in Value of $10,000 Invested
on December 31, 1990 (commencement of operations) to:
| | | | | | | | | | | | | | | | | | | | | | | | | | | | |
| | | 12/31/92
| | | 12/31/95
| | | 12/31/98
| | | 12/31/01
| | | 12/31/04
| | | 12/31/07
| | | 12/31/10
| |
The Torray Fund | | $ | 14,523 | | | $ | 23,796 | | | $ | 45,576 | | | $ | 54,325 | | | $ | 63,227 | | | $ | 72,908 | | | $ | 63,039 | |
S&P 500 Index | | $ | 14,047 | | | $ | 21,547 | | | $ | 45,438 | | | $ | 44,054 | | | $ | 48,811 | | | $ | 62,716 | | | $ | 57,501 | |
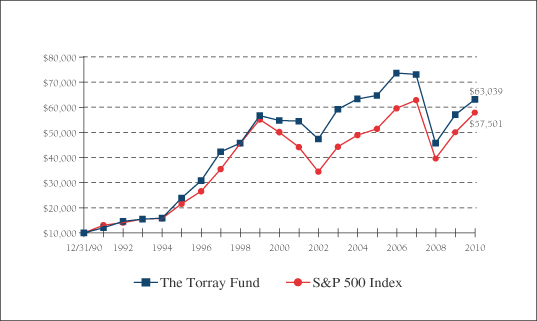
The returns quoted represent past performance and do not guarantee future results. Investment return and principal value will fluctuate so that shares, when redeemed, may be worth more or less than their original cost. Current performance may be lower or higher. For performance current to the most recent month-end, please call (800) 626-9769. The returns shown do not reflect the deduction of taxes a shareholder would pay on the redemption of fund shares and distributions. The Torray Fund’s gross annual operating expense ratio, as stated in the current prospectus, is 1.21%. Returns on both The Torray Fund and the S&P 500 Index assume reinvestment of all dividends and distributions. The S&P 500 Index is an unmanaged index consisting of 500 U.S. large-cap stocks.
6
The Torray Fund
FUND PROFILE
As of December 31, 2010 (unaudited)
| | | | |
DIVERSIFICATION (% of net assets) | | | | |
| |
Information Technology | | | 23.03% | |
Health Care | | | 17.89% | |
Financials | | | 16.87% | |
Industrials | | | 11.99% | |
Consumer Staples | | | 10.72% | |
Consumer Discretionary | | | 4.98% | |
Materials | | | 3.55% | |
Telecommunications | | | 3.48% | |
Short-Term Investments | | | 7.58% | |
Liabilities Less Other Assets | | | (0.09)% | |
| | |
|
|
|
| | | | 100.00% | |
| | |
|
|
|
| | | | | | | | |
| TOP TEN EQUITY HOLDINGS (% of net assets) | |
| | 1. | | | Loews Corp. | | | 4.08% | |
| | 2. | | | Marsh & McLennan Cos., Inc. | | | 3.86% | |
| | 3. | | | Western Union Co. (The) | | | 3.80% | |
| | 4. | | | EMC Corp. | | | 3.70% | |
| | 5. | | | Kraft Foods Inc., Class A | | | 3.68% | |
| | 6. | | | UnitedHealth Group Inc. | | | 3.63% | |
| | 7. | | | International Business Machines Corp. | | | 3.62% | |
| | 8. | | | E.I. du Pont de Nemours & Co. | | | 3.55% | |
| | 9. | | | AT&T Inc. | | | 3.48% | |
| | 10. | | | Cintas Corp. | | | 3.47% | |
| | | | | | |
|
|
|
| | | | | | | | 36.87% | |
| | | | | | |
|
|
|
PORTFOLIO CHARACTERISTICS
| | | | | | | | |
Net Assets (million) | | | | | | $ | 362 | |
Number of Holdings | | | | | | | 30 | |
Portfolio Turnover | | | | | | | 14.42 | % |
P/E Multiple (forward) | | | | | | | 12.7x | |
Portfolio Yield | | | | | | | 2.30 | % |
Market Capitalization (billion) | | | Average | | | $ | 65.4 | |
| | | | Median | | | $ | 40.2 | |
7
The Torray Fund
SCHEDULE OF INVESTMENTS
As of December 31, 2010
| | | | | | | | | | | | |
| | | | Shares
| | | | | Market Value
| |
| | COMMON STOCK 92.51% | | | | |
| |
| 23.03% INFORMATION TECHNOLOGY | | | | |
| | | | | | 742,300 | | | Western Union Co. (The) | | $ | 13,784,511 | |
| | | | | | 585,600 | | | EMC Corp.* | | | 13,410,240 | |
| | | | | | 89,300 | | | International Business Machines Corp. | | | 13,105,668 | |
| | | | | | 539,600 | | | Intel Corp. | | | 11,347,788 | |
| | | | | | 796,875 | | | Applied Materials, Inc. | | | 11,196,094 | |
| | | | | | 226,500 | | | Automatic Data Processing, Inc. | | | 10,482,420 | |
| | | | | | 501,800 | | | Cisco Systems, Inc.* | | | 10,151,414 | |
| | | | | | | | | | |
|
|
|
| | | | | | | | | | | | 83,478,135 | |
| |
| 17.89% HEALTH CARE | | | | |
| | | | | | 364,200 | | | UnitedHealth Group Inc. | | | 13,151,262 | |
| | | | | | 191,724 | | | Johnson & Johnson | | | 11,858,129 | |
| | | | | | 133,700 | | | Becton Dickinson & Co. | | | 11,300,324 | |
| | | | | | 188,400 | | | WellPoint, Inc.* | | | 10,712,424 | |
| | | | | | 203,800 | | | Abbott Laboratories | | | 9,764,058 | |
| | | | | | 158,700 | | | Baxter International Inc. | | | 8,033,394 | |
| | | | | | | | | | |
|
|
|
| | | | | | | | | | | | 64,819,591 | |
| |
| 16.87% FINANCIALS | | | | |
| | | | | | 380,400 | | | Loews Corp. | | | 14,801,364 | |
| | | | | | 511,218 | | | Marsh & McLennan Cos., Inc. | | | 13,976,700 | |
| | | | | | 380,500 | | | Wells Fargo & Co. | | | 11,791,695 | |
| | | | | | 187,200 | | | Chubb Corp. | | | 11,164,608 | |
| | | | | | 219,300 | | | American Express Co. | | | 9,412,356 | |
| | | | | | | | | | |
|
|
|
| | | | | | | | | | | | 61,146,723 | |
| |
| 11.99% INDUSTRIALS | | | | |
| | | | | | 449,946 | | | Cintas Corp. | | | 12,580,490 | |
| | | | | | 603,797 | | | General Electric Co. | | | 11,043,447 | |
| | | | | | 118,900 | | | 3M Co. | | | 10,261,070 | |
| | | | | | 134,700 | | | General Dynamics Corp. | | | 9,558,312 | |
| | | | | | | | | | |
|
|
|
| | | | | | | | | | | | 43,443,319 | |
8
The Torray Fund
SCHEDULE OF INVESTMENTS (continued)
As of December 31, 2010
| | | | | | | | | | | | |
| | | | Shares
| | | | | Market Value
| |
| |
| 10.72% CONSUMER STAPLES | | | | |
| | | | | | 423,300 | | | Kraft Foods Inc., Class A | | $ | 13,338,183 | |
| | | | | | 114,400 | | | Colgate-Palmolive Co. | | | 9,194,328 | |
| | | | | | 141,300 | | | Procter & Gamble Co. (The) | | | 9,089,829 | |
| | | | | | 246,400 | | | Sysco Corp. | | | 7,244,160 | |
| | | | | | | | | | |
|
|
|
| | | | | | | | | | | | 38,866,500 | |
| |
| 4.98% CONSUMER DISCRETIONARY | | | | |
| | | | | | 332,100 | | | McGraw-Hill Cos. Inc. (The) | | | 12,091,761 | |
| | | | | | 394,200 | | | Gannett Co., Inc. | | | 5,948,478 | |
| | | | | | | | | | |
|
|
|
| | | | | | | | | | | | 18,040,239 | |
| |
| 3.55% MATERIALS | | | | |
| | | | | | 258,100 | | | E.I. du Pont de Nemours & Co. | | | 12,874,028 | |
| |
| 3.48% TELECOMMUNICATIONS | | | | |
| | | | | | 429,300 | | | AT&T Inc. | | | 12,612,834 | |
| | | | | | | | | | |
|
|
|
| | TOTAL COMMON STOCK 92.51% | | | 335,281,369 | |
| (cost $314,259,663) | | | | | | | |
| | | |
| | | | Principal Amount ($)
| | | | | | |
| | SHORT-TERM INVESTMENTS 7.58% | | | | |
| | | | | | 27,450,995 | | | PNC Bank Money Market Account, 0.05%(1) | | | 27,450,995 | |
| (cost $27,450,995) | | | | | | | |
| | | | | | | | | | |
|
|
|
| | TOTAL INVESTMENTS 100.09% | | | 362,732,364 | |
| (cost $341,710,658) | | | | |
| | LIABILITIES LESS OTHER ASSETS (0.09%) | | | (323,851 | ) |
| | | | | | | | | | |
|
|
|
| | NET ASSETS 100.00% | | $ | 362,408,513 | |
| | | | | | | | | | |
|
|
|
| * | Non-income producing securities. |
| (1) | Represents current yield at December 31, 2010. |
See notes to the financial statements.
9
The Torray Fund
STATEMENT OF ASSETS AND LIABILITIES
As of December 31, 2010
| | | | |
ASSETS | | | | |
Investments in securities at value (cost $341,710,658) | | $ | 362,732,364 | |
Interest and dividends receivable | | | 424,359 | |
Receivable for fund shares sold | | | 502,778 | |
Prepaid expenses | | | 38,857 | |
| | |
|
|
|
TOTAL ASSETS | | | 363,698,358 | |
| | |
|
|
|
| |
LIABILITIES | | | | |
Payable for fund shares redeemed | | | 810,559 | |
Payable to advisor | | | 307,912 | |
Payable for legal fees | | | 77,089 | |
Accrued expenses | | | 94,285 | |
| | |
|
|
|
TOTAL LIABILITIES | | | 1,289,845 | |
| | |
|
|
|
| |
NET ASSETS | | $ | 362,408,513 | |
| | |
|
|
|
Shares of beneficial interest ($1 stated value, 12,313,197 shares outstanding, unlimited shares authorized) | | $ | 12,313,197 | |
Paid-in-capital in excess of par | | | 418,912,375 | |
Undistributed net investment income | | | 8,832 | |
Accumulated net realized loss on investments | | | (89,847,597 | ) |
Net unrealized appreciation of investments | | | 21,021,706 | |
| | |
|
|
|
| |
TOTAL NET ASSETS | | $ | 362,408,513 | |
| | |
|
|
|
Net Asset Value, Offering and Redemption Price per Share | | $ | 29.43 | |
| | |
|
|
|
See notes to the financial statements.
10
The Torray Fund
STATEMENT OF OPERATIONS
For the year ended December 31, 2010
| | | | |
INVESTMENT INCOME | | | | |
Dividend income | | $ | 7,141,770 | |
Interest income | | | 18,301 | |
| | |
|
|
|
Total investment income | | | 7,160,071 | |
| | |
|
|
|
| |
EXPENSES | | | | |
Management fees | | | 3,566,008 | |
Transfer agent fees & expenses | | | 326,859 | |
Legal fees | | | 64,099 | |
Insurance expense | | | 60,551 | |
Trustees' fees | | | 48,000 | |
Printing, postage & mailing | | | 46,425 | |
Audit fees | | | 28,000 | |
Registration & filing fees | | | 23,684 | |
Custodian fees | | | 17,050 | |
| | |
|
|
|
Total expenses | | | 4,180,676 | |
| | |
|
|
|
NET INVESTMENT INCOME | | | 2,979,395 | |
| | |
|
|
|
REALIZED AND UNREALIZED GAIN
ON INVESTMENTS | | | | |
Net realized gain on investments | | | 4,801,831 | |
Net change in unrealized appreciation (depreciation) on investments | | | 29,046,530 | |
| | |
|
|
|
Net realized and unrealized gain on investments | | | 33,848,361 | |
| | |
|
|
|
NET INCREASE IN NET ASSETS FROM OPERATIONS | | $ | 36,827,756 | |
| | |
|
|
|
See notes to the financial statements.
11
The Torray Fund
STATEMENTS OF CHANGES IN NET ASSETS
For the years indicated:
| | | | | | | | |
| | | Year ended
12/31/10
| | | Year ended
12/31/09
| |
Increase in Net Assets from Operations: | | | | | | | | |
Net investment income | | $ | 2,979,395 | | | $ | 2,980,550 | |
Net realized gain (loss) on investments | | | 4,801,831 | | | | (43,082,102 | ) |
Net change in unrealized appreciation (depreciation) on investments | | | 29,046,530 | | | | 113,618,716 | |
| | |
|
|
| |
|
|
|
Net increase in net assets from operations | | | 36,827,756 | | | | 73,517,164 | |
| | |
|
|
| |
|
|
|
| | |
Distributions to Shareholders from: | | | | | | | | |
Net investment income ($0.233 and $0.204 per share, respectively) | | | (2,970,563 | ) | | | (2,980,744 | ) |
| | |
|
|
| |
|
|
|
Total distributions | | | (2,970,563 | ) | | | (2,980,744 | ) |
| | |
|
|
| |
|
|
|
| | |
Shares of Beneficial Interest | | | | | | | | |
Decrease from share transactions | | | (34,462,230 | ) | | | (60,967,912 | ) |
| | |
|
|
| |
|
|
|
Total increase (decrease) | | | (605,037 | ) | | | 9,568,508 | |
Net Assets — Beginning of Year | | | 363,013,550 | | | | 353,445,042 | |
| | |
|
|
| |
|
|
|
Net Assets — End of Year | | $ | 362,408,513 | | | $ | 363,013,550 | |
| | |
|
|
| |
|
|
|
Undistributed Net Investment Income | | $ | 8,832 | | | $ | — | |
| | |
|
|
| |
|
|
|
See notes to the financial statements.
12
The Torray Fund
FINANCIAL HIGHLIGHTS
For a share outstanding throughout each year presented:
PER SHARE DATA
| | | | | | | | | | | | | | | | | | | | |
| | | Years ended December 31:
| |
| | | 2010
| | | 2009
| | | 2008
| | | 2007
| | | 2006
| |
Net Asset Value, Beginning of Year | | $ | 26.760 | | | $ | 21.640 | | | $ | 36.440 | | | $ | 41.570 | | | $ | 39.020 | |
| | |
|
|
| |
|
|
| |
|
|
| |
|
|
| |
|
|
|
Income/(loss) from investment operations | | | | | | | | | | | | | | | | | | | | |
Net investment income | | | 0.230 | (2) | | | 0.200 | (2) | | | 0.243 | (2) | | | 0.152 | | | | 0.073 | |
Net gains (losses) on securities (both realized and unrealized) | | | 2.673 | | | | 5.124 | | | | (13.464 | ) | | | (0.443 | ) | | | 5.176 | |
| | |
|
|
| |
|
|
| |
|
|
| |
|
|
| |
|
|
|
Total from investment operations | | | 2.903 | | | | 5.324 | | | | (13.221 | ) | | | (0.291 | ) | | | 5.249 | |
| | |
|
|
| |
|
|
| |
|
|
| |
|
|
| |
|
|
|
Less: distributions | | | | | | | | | | | | | | | | | | | | |
Dividends (from net investment income) | | | (0.233 | ) | | | (0.204 | ) | | | (0.303 | ) | | | (0.121 | ) | | | (0.087 | ) |
Distributions (from capital gains) | | | — | | | | — | | | | (1.242 | ) | | | (4.718 | ) | | | (2.612 | ) |
Distributions (from return of capital) | | | — | | | | — | | | | (0.034 | ) | | | — | | | | — | |
| | |
|
|
| |
|
|
| |
|
|
| |
|
|
| |
|
|
|
Total distributions | | | (0.233 | ) | | | (0.204 | ) | | | (1.579 | ) | | | (4.839 | ) | | | (2.699 | ) |
| | |
|
|
| |
|
|
| |
|
|
| |
|
|
| |
|
|
|
Net Asset Value, End of Year | | $ | 29.430 | | | $ | 26.760 | | | $ | 21.640 | | | $ | 36.440 | | | $ | 41.570 | |
| | |
|
|
| |
|
|
| |
|
|
| |
|
|
| |
|
|
|
TOTAL RETURN(1) | | | 10.90 | % | | | 24.80 | % | | | (37.39 | %) | | | (0.80 | %) | | | 13.74 | % |
RATIOS/SUPPLEMENTAL DATA | | | | | | | | | | | | | | | | | | | | |
Net assets, end of year (000's omitted) | | $ | 362,409 | | | $ | 363,014 | | | $ | 353,445 | | | $ | 1,000,344 | | | $ | 1,198,919 | |
Ratios of expenses to average net assets | | | 1.17 | % | | | 1.21 | % | | | 1.13 | % | | | 1.09 | % | | | 1.10 | % |
Ratios of net investment income to average net assets | | | 0.84 | % | | | 0.89 | % | | | 0.80 | % | | | 0.36 | % | | | 0.18 | % |
Portfolio turnover rate | | | 14.42 | % | | | 15.87 | % | | | 28.13 | % | | | 50.47 | % | | | 21.92 | % |
| (1) | Past performance is not predictive of future performance. |
| (2) | Calculated based on the average amount of shares outstanding during the year. |
See notes to the financial statements.
13
The Torray Fund
NOTES TO FINANCIAL STATEMENTS
As of December 31, 2010
NOTE 1 — SUMMARY OF SIGNIFICANT ACCOUNTING POLICIES
The Torray Fund (“Fund”) is a separate series of The Torray Fund (“Trust”). The Trust is registered under the Investment Company Act of 1940, as amended, as a no-load, diversified, open-end management investment company. The Trust was organized as a business trust under Massachusetts law. The Fund’s primary investment objective is to provide long-term total return. The Fund seeks to meet its objective by investing its assets in a diversified portfolio of common stocks. In order to accomplish these goals, the Fund intends to hold stocks for the long term, as opposed to actively buying and selling. There can be no assurances that the Fund’s investment objectives will be achieved.
The following is a summary of accounting policies followed by the Fund in the preparation of its financial statements. These policies are in conformity with accounting principles generally accepted in the United States of America.
Securities Valuation Portfolio securities for which market quotations are readily available are valued at market value, which is determined by using the last reported sale price, or, if no sales are reported, the last reported bid price. For NASDAQ traded securities, market value is determined on the basis of the NASDAQ official closing price instead of the last reported sales price. Other assets and securities for which no quotations are readily available or for which Torray LLC (the “Advisor”) believes do not reflect market value are valued at fair value as determined in good faith by the Advisor under the supervision of the Board of Trustees (the “Board” or “Trustees”) in accordance with the Fund’s Valuation Procedures. Short-term obligations having remaining maturities of 60 days or less are valued at amortized cost, which approximates market value.
Fair Value Measurements Various inputs are used in determining the fair value of investments which are as follows:
| | • | Level 1 — quoted prices in active markets for identical securities |
| | • | Level 2 — significant observable inputs (including quoted prices for similar securities, interest rates, prepayment speeds, credit risk, etc.) |
| | • | Level 3 — significant unobservable inputs (including the Fund’s own assumptions in determining the fair value of investments) |
The inputs or methodology used for valuing securities are not necessarily an indication of the risk associated with investing in those securities.
14
The Torray Fund
NOTES TO FINANCIAL STATEMENTS (continued)
As of December 31, 2010
The summary of inputs used to value the Fund’s investments as of December 31, 2010 is as follows:
| | | | |
Valuation Inputs | | | | |
Level 1—Quoted Prices* | | $ | 362,732,364 | |
Level 2—Other Significant Observable Inputs | | | — | |
Level 3—Significant Unobservable Inputs | | | — | |
| | |
|
|
|
Total Market Value of Investments | | $ | 362,732,364 | |
| | |
|
|
|
| | * | Security types and industry classifications as defined in the Schedule of Investments. |
The Fund did not have significant transfers between Level 1 and Level 2 investments during the period.
Securities Transactions and Investment Income Securities transactions are recorded on a trade date basis. Realized gains and losses from securities transactions are recorded on the specific identification basis. Dividend income and distributions to shareholders are recorded on the ex-dividend date. Interest income, including amortization of discount on short-term investments, and expenses are recorded on the accrual basis. Premium and discount are amortized using the effective yield to maturity method.
Federal Income Taxes The Fund intends to continue to comply with the requirements of the Internal Revenue Code applicable to regulated investment companies and to distribute all of its taxable income, including any net realized gain on investments to its shareholders. Therefore, no Federal income tax provision is required.
Management has analyzed the Fund’s tax positions taken on Federal income tax returns for all open tax years (current and prior three tax years), and has concluded that no provision for Federal income tax is required in the Fund’s financial statements. The Fund’s Federal and state income and Federal excise tax returns for tax years for which the applicable statutes of limitations have not expired are subject to examination by the Internal Revenue Service and state departments of revenue.
Net Asset Value The net asset value per share of the Fund is determined daily as of the close of trading on the New York Stock Exchange by dividing the value of the Fund’s net assets by the number of shares outstanding.
Interest Expense When cash balances are overdrawn in the Fund’s custody account, the Fund is charged an overdraft fee equal to 1.25% above the Federal Funds Rate. The Trust has entered into a line of credit facility with PNC Bank. Under the terms of the line of credit, the separate series of the Trust (including the Fund) may borrow up to $20,000,000 on a short-term basis with interest accruing at the Federal Funds Rate plus 0.75%. As of December 31, 2010, the Fund had no outstanding borrowings under this line of credit facility.
Use of Estimates In preparing financial statements in accordance with accounting principles generally accepted in the United States of America, management is required to make estimates and assumptions that affect the
15
The Torray Fund
NOTES TO FINANCIAL STATEMENTS (continued)
As of December 31, 2010
reported amounts of assets and liabilities and the disclosure of contingent assets and liabilities at the date of the financial statements, and the reported amounts of increases and decreases in net assets from operations during the reporting period. Actual results could differ from those estimates.
NOTE 2 — SHARES OF BENEFICIAL INTEREST TRANSACTIONS
Transactions in shares of beneficial interest were as follows:
| | | | | | | | | | | | | | | | |
| | | Year ended
12/31/10
| | | Year ended
12/31/09
| |
| | | Shares
| | | Amount
| | | Shares
| | | Amount
| |
Shares issued | | | 409,087 | | | $ | 11,455,255 | | | | 149,751 | | | $ | 3,200,077 | |
Reinvestments of dividends and distributions | | | 99,617 | | | | 2,797,454 | | | | 127,284 | | | | 2,811,759 | |
Shares redeemed | | | (1,759,347 | ) | | | (48,714,939 | ) | | | (3,044,625 | ) | | | (66,979,748 | ) |
| | |
|
|
| |
|
|
| |
|
|
| |
|
|
|
| | | | (1,250,643 | ) | | $ | (34,462,230 | ) | | | (2,767,590 | ) | | $ | (60,967,912 | ) |
| | |
|
|
| |
|
|
| |
|
|
| |
|
|
|
As of December 31, 2010, the Trust’s officers, Trustees and affiliated persons and their families directly or indirectly controlled 1,390,108 shares or 11.29% of the Fund.
NOTE 3 — INVESTMENT TRANSACTIONS
Purchases and sales of investment securities, other than short-term investments, for the year ended December 31, 2010, aggregated $45,722,650 and $57,991,247, respectively.
NOTE 4 — MANAGEMENT FEES
Pursuant to the Management Contract, the Advisor provides investment advisory and administrative services to the Fund. The Fund pays the Advisor a management fee, computed daily and payable monthly at the annual rate of 1.00% of the Fund’s average daily net assets. For the year ended December 31, 2010, the Fund incurred management fees of $3,566,008.
Excluding the management fee, other expenses incurred by the Fund during the year ended December 31, 2010, totaled $614,668. These expenses include all costs associated with the Fund’s operations including transfer agent fees, independent trustees’ fees ($14,000 per annum and $2,000 for each Board meeting attended per Trustee), dues, fees and expenses of registering and qualifying the Fund and its shares for distribution, charges of the custodian, auditing and legal expenses, insurance premiums, supplies, postage, expenses of issue or redemption of shares, reports to shareholders and Trustees, expenses of printing and mailing prospectuses, proxy statements and proxies to existing shareholders, and other miscellaneous expenses.
16
The Torray Fund
NOTES TO FINANCIAL STATEMENTS (continued)
As of December 31, 2010
Certain Officers and Trustees of the Fund are also officers and/or shareholders of the Advisor.
NOTE 5 — TAX MATTERS
Distributions to shareholders are determined in accordance with United States Federal income tax regulations, which may differ from accounting principles generally accepted in the United States of America.
The tax character of distributions paid during the years ended December 31, 2010 and 2009 was as follows:
| | | | | | | | |
| | | 2010
| | | 2009
| |
Distributions paid from: | | | | | | | | |
Ordinary income | | $ | 2,970,563 | | | $ | 2,980,744 | |
| | |
|
|
| |
|
|
|
| | | $ | 2,970,563 | | | $ | 2,980,744 | |
| | |
|
|
| |
|
|
|
As of December 31, 2010, the components of distributable earnings on a tax basis were as follows:
| | | | | | | | |
Capital loss carry forward | | $ | (89,847,597 | ) | | | | |
Undistributed net investment income | | | 8,832 | | | | | |
Unrealized appreciation | | | 21,021,706 | | | | | |
| | |
|
|
| | | | |
| | | $ | (68,817,059 | ) | | | | |
| | |
|
|
| | | | |
At December 31, 2010, the Fund had net capital loss carry forward for federal income tax purposes of $89,847,597 which are available to reduce future required distributions of net capital gains to shareholders through 2017.
For the year ended December 31, 2010, The Fund utilized capital loss carry forwards of $1,694,524.
17
The Torray Fund
NOTES TO FINANCIAL STATEMENTS (continued)
As of December 31, 2010
The following information is based upon the federal tax basis of investment securities as of December 31, 2010:
| | | | | | | | |
Gross unrealized appreciation | | $ | 46,136,933 | | | | | |
Gross unrealized depreciation | | | (25,115,227 | ) | | | | |
| | |
|
|
| | | | |
Net unrealized appreciation | | $ | 21,021,706 | | �� | | | |
| | |
|
|
| | | | |
Cost | | $ | 341,710,658 | | | | | |
| | |
|
|
| | | | |
NOTE 6 — COMMITMENTS AND CONTINGENCIES
The Fund indemnifies its Officers and Trustees for certain liabilities that may arise from their performance of their duties to the Fund. Additionally, in the normal course of business, the Fund enters into contracts that contain a variety of representations and warranties which provide general indemnifications. The Fund’s maximum exposure under these arrangements is unknown, as this would involve future claims that may be made against the Fund that have not yet occurred.
NOTE 7 — SUBSEQUENT EVENTS
Management has evaluated the impact of all subsequent events on the Fund through the date these financial statements were issued and has determined that there were no subsequent events requiring recognition or disclosure in the financial statements.
NOTE 8 — RECENT ACCOUNTING PRONOUNCEMENTS
In January 2010, the Financial Accounting Standards Board (“FASB”) issued Accounting Standards Update (“ASU”) No. 2010-06 “Improving Disclosures about Fair value measurements.” ASU No. 2010-06 amends FASB Accounting Standards Codification Topic 820, Fair value measurements and Disclosures, to require additional disclosure regarding fair value measurements. Effective for fiscal years beginning after December 15, 2010 and for interim periods within those fiscal years, entities will need to disclose information about purchases, sales, issuances and settlements of Level 3 securities on a gross basis rather than as a net number as currently required.
18
The Torray Fund
REPORT OF INDEPENDENT REGISTERED PUBLIC ACCOUNTING FIRM
To the Board of Trustees of The Torray Fund
and the Shareholders of The Torray Fund
We have audited the accompanying statement of assets and liabilities of The Torray Fund, a series of shares of beneficial interest in The Torray Fund, including the schedule of investments, as of December 31, 2010, and the related statement of operations for the year then ended, the statements of changes in net assets for each of the years in the two-year period then ended, and the financial highlights for each of the years in the five-year period then ended. These financial statements and financial highlights are the responsibility of the Fund’s management. Our responsibility is to express an opinion on these financial statements and financial highlights based on our audits.
We conducted our audits in accordance with the standards of the Public Company Accounting Oversight Board (United States). Those standards require that we plan and perform the audits to obtain reasonable assurance about whether the financial statements and financial highlights are free of material misstatement. An audit includes examining, on a test basis, evidence supporting the amounts and disclosures in the financial statements. Our procedures included confirmation of securities owned as of December 31, 2010 by correspondence with the custodian. An audit also includes assessing the accounting principles used and significant estimates made by management, as well as evaluating the overall financial statement presentation. We believe that our audits provide a reasonable basis for our opinion.
In our opinion, the financial statements and financial highlights referred to above present fairly, in all material respects, the financial position of The Torray Fund as of December 31, 2010, the results of its operations for the year then ended, the changes in its net assets for each of the years in the two-year period then ended, and its financial highlights for each of the years in the five-year period then ended, in conformity with accounting principles generally accepted in the United States of America.

BBD, LLP
Philadelphia, Pennsylvania
February 18, 2011
19
The Torray Fund
FUND MANAGEMENT
As of December 31, 2010 (unaudited)
The Trust is overseen by a Board of Trustees (the "Board"), which has delegated the day-to-day management to the officers of the Trust. The Board meets regularly to review the Fund's activities, contractual arrangements, and per- formance. The trustees and officers serve until their successors are elected and qualified, or until the trustee or officer dies, resigns or is removed, or becomes disqualified.
Information pertaining to the Trustees and Officers of the Trust is set forth below. The Statement of Additional Information (“SAI”) includes additional information about the Trustees and is available without charge, upon request, by calling (800) 443-3036.
| | | | | | | | | | |
Name, Birthdate,
Address* and
Position(s) with the Trust | | Term of Office
and Length of
Time Served | | Principal Occupation(s) During Past 5 Years | | No. of
Portfolios in
Fund Complex
Overseen by
Trustee | | | Other Directorships Held |
| INDEPENDENT TRUSTEES |
Carol T. Crawford 02/25/43 Trustee | | Indefinite Term Since 2006 | | Attorney and International Trade Consultant McLean, VA | | | 3 | | | Director, Smithfield Foods, Inc., Smithfield, VA |
Bruce C. Ellis 07/20/44 Trustee | | Indefinite Term Since 1993 | | Private Investor, Bethesda, MD | | | 3 | | | None |
Robert P. Moltz 10/03/47 Trustee | | Indefinite Term Since 1990 | | President, CEO, Weaver Bros Insurance Associates, Inc., Bethesda, MD | | | 3 | | | None |
Wayne H. Shaner** 08/23/47 Trustee and Chairman of the Board | | Indefinite Term Since 1993 | | Managing Partner, Rockledge Partners, LLC, Investment Advisory Firm, Easton, MD (Jan. 2004-Present); Vice President, Torray LLC, Bethesda, MD (Jan. 2008-Jun. 2008) | | | 3 | | | Director, Van Eck Funds, New York, NY |
20
The Torray Fund
FUND MANAGEMENT (continued)
As of December 31, 2010 (unaudited)
| | | | | | | | | | |
Name, Birthdate,
Address* and
Position(s) with the Trust | | Term of Office
and Length of
Time Served | | Principal Occupation(s) During Past 5 Years | | No. of
Portfolios in
Fund Complex
Overseen by
Trustee | | | Other Directorships Held |
| INTERESTED TRUSTEE AND OFFICERS OF THE TRUST |
William M Lane*** 05/21/50 Trustee, Treasurer, Secretary, Chief Compliance Officer and Anti-Money Laundering Officer | | Indefinite Term Since 1990 | | Vice President, Secretary and Chief Compliance Officer, Torray LLC, Bethesda, MD (Oct. 2005-Present); Vice President, Secretary, Treasurer and Chief Compliance Officer, Robert E. Torray & Co. Inc., Bethesda, MD (Jul. 1984-Oct. 2005); Vice President, Secretary and Chief Compliance Officer, The Torray Corporation, Bethesda, MD (Jan. 1990-Oct. 2005); Vice President, Secretary, Treasurer and Chief Compliance Officer, TEL Corporation, Bethesda, MD (Jun. 2005-Oct. 2005).*** | | | 3 | | | None |
Robert E. Torray 04/10/37 President | | Indefinite Term Since 2007 | | Chairman, Torray LLC, Bethesda, MD (2005- Present); President, Torray LLC, Bethesda, MD (2007-Present); President, Robert E. Torray & Co. Inc., Bethesda, MD (May 1972- Oct. 2005); President, The Torray Corporation, Bethesda, MD (Jan. 1990-Oct. 2005); Chairman, TEL Corporation, Bethesda, MD (Jun. 2005-Oct. 2005).**** | | | N/A | | | None |
| * | | All addresses are c/o The Torray Fund, 7501 Wisconsin Avenue, Suite 1100, Bethesda, MD 20814-6523. |
| ** | | Mr. Shaner is deemed to be an independent Trustee effective as of January 1, 2011. |
| *** | | Mr. Lane, by virtue of his employment with Torray LLC, the Trust’s investment adviser, is considered an “interested person” of the Trust, as that term is defined in Section 2(a)(19) of the Investment Company Act of 1940, as amended. |
| **** | | Robert E. Torray & Co. Inc., The Torray Corporation and TEL Corporation have all been succeeded to by Torray LLC. |
21
The Torray Fund
FACTORS CONSIDERED BY THE BOARD OF TRUSTEES IN CONNECTION WITH THEIR APPROVAL OF THE CONTINUATION OF THE FUND’S INVESTMENT MANAGEMENT AGREEMENT WITH THE MANAGER (unaudited)
The Fund has entered into an Investment Management Agreement (the “Agreement”) with Torray LLC (the “Manager”) pursuant to which the Manager provides investment management services to the Fund. In accordance with the Investment Company Act of 1940, the Board of Trustees of the Fund is required, on an annual basis, to consider the continuation of the Agreement with the Manager, and this must take place at an in-person meeting of the Board. The relevant provisions of the Investment Company Act of 1940 specifically provide that it is the duty of the Board to request and evaluate such information as the Board determines is necessary to allow them to properly consider the continuation of the Agreement, and it is the duty of the Manager to furnish the trustees with such information that is responsive to their request. Set forth below is a discussion of the various factors that the Board of Trustees considered in deciding to approve the continuation of the Agreement with the Manager.
In determining whether to approve the continuation of the Agreement, the Board of Trustees requested, and the Manager provided, information and data relevant to the Board’s consideration. This included materials that provided the Board with information regarding the investment performance of the Fund and information regarding the fees and expenses of the Fund as compared to other similar mutual funds. As part of its deliberations, the Board also considered and relied upon the information about the Fund that had been provided to them throughout the year in connection with their regular Board meetings at which they engage in the ongoing oversight of the Fund and its operations.
The Board met at an in-person meeting on October 6, 2010 in order to consider the proposed continuation of the Agreement. Among the factors the Board considered was the overall performance of the Fund achieved by the Manager relative to the performance of the Fund’s benchmark index, the S&P 500 Index, as well as the Fund’s performance relative to other mutual funds with similar investment objectives on both a long-term basis and over shorter time periods. In particular, the Board took note of the favorable performance achieved by the Manager and they considered the Manager’s particular focus on long-term investment performance. The Board took into consideration the fact that the Manager seeks to achieve investment results for the Fund with less risk than other similar funds, and that the Manager has maintained a low portfolio turnover rate for the Fund which is beneficial to shareholders of the Fund because this results in lower brokerage costs which helps to reduce the operating costs of the Fund. They noted the range of investment advisory and management services provided by the Manager and the level and quality of these services, and in particular, they noted the quality of the personnel providing these services, taking into consideration their finding that the personnel providing these services, and the services provided, were of a very high caliber and quality. The Board also considered the portfolio manager arrangements
22
The Torray Fund
FACTORS CONSIDERED BY THE BOARD OF TRUSTEES IN CONNECTION WITH THEIR APPROVAL OF THE CONTINUATION OF THE FUND’S INVESTMENT MANAGEMENT AGREEMENT WITH THE MANAGER (unaudited) (continued)
for the Fund, noting that the Manager has undertaken appropriate measures to provide for the continued management of the Fund by a team of portfolio managers with extensive portfolio management experience.
The Board also compared the total annual operating expenses of the Fund to the total annual operating expenses of other funds of similar size, noting that the average annual expense ratio for the Fund over the past year compared favorably with industry averages for total annual operating expenses. They also took note of the fact that the Fund is not subject to any sales loads, sales commissions or other similar fees, including Rule 12b-1 distribution fees, which helps to keep the overall expense to shareholders of investing in the Fund lower than the expenses associated with investing in many comparable funds, and they considered the fact that the Manager had informed the Board that it did not intend to propose the introduction of such types of fees for the Fund. The Board also reviewed financial information concerning the Manager, noting its financial soundness as demonstrated by the financial information provided and the level of profitability relating to its services for the Fund, noting that these were reasonable and consistent with industry standards. The Board was also provided with information regarding the fees that the Manager charges other clients for investment advisory services and they noted that the fees were comparable based on the relevant circumstances of the types of accounts involved. The Board reviewed with the Manager the allocation of the portfolio management team’s time between managing the investments of the Fund and managing other accounts.
In addition, the Board reviewed with the Manager information regarding its brokerage practices, including soft dollar matters, and noted that the Manager did not have in place any formal soft dollar arrangements, and the Board also reviewed the Manager’s best execution procedures, which the Board noted were reasonable and consistent with standard industry practice.
Based on their review, the trustees concluded that the investment management services provided under the Agreement were reasonably worth the full amount of the fee and that the terms of the Agreement were fair and reasonable. In reaching their conclusion with respect to their approval of the continuation of the Agreement, the trustees did not identify any one single factor as being controlling, rather, the Board took note of a combination of factors that influenced their decision making process. The Board did, however, identify the overall favorable investment performance of the Fund, the commitment of the Manager to the successful operation of the Fund, and the level of expenses of the Fund, as being important elements of their consideration. Based upon their review and consideration of these factors and other matters deemed relevant by the Board in reaching an informed business judgment, a majority of the Board of Trustees, including a majority of the Independent Trustees, concluded that the terms of the Agreement were fair and reasonable and the Board voted to approve the continuation of the Agreement with the Manager.
23
The Torray Fund
PORTFOLIO HOLDINGS, PROXY VOTING AND PROCEDURES
As of December 31, 2010 (unaudited)
The Fund files its complete schedule of portfolio holdings with the Securities and Exchange Commission (the "Commission") for the first and third quarters of each fiscal year on Form N-Q. The Fund's Forms N-Q are available on the Commission's website at http://www.sec.gov. The Fund's Forms N-Q may be reviewed and copied at the Commission's Public Reference Room in Washington, D.C. Information on the operation of the Commission's Public Reference Room may be obtained by calling 1-800-SEC-0330.
A description of the policies and procedures that the Fund uses to determine how to vote proxies relating to portfolio securities is available without charge, upon request, by calling 1-800-443-3036; and on the Commission's website at http://www.sec.gov.
Information regarding how the Fund voted proxies relating to portfolio securities is available without charge, upon request, by calling 1-800-443-3036; and on the Commission's website at http://www.sec.gov.
24
The Torray Fund
ABOUT YOUR FUND'S EXPENSES
As of December 31, 2010 (unaudited)
We believe it is important for you to understand the impact of costs on your investment. All mutual funds have operating expenses. As a shareholder of the Fund, you incur ongoing costs, including management fees, and other Fund expenses. Operating expenses, which are deducted directly from the Fund's gross income, directly reduce the investment return of the Fund.
A mutual fund's expenses are expressed as a percentage of its average net assets. This figure is known as the expense ratio. The following examples are intended to help you understand the ongoing costs (in dollars) of investing in the Fund and to compare these costs with the ongoing costs of investing in other mutual funds. The examples below are based on an investment of $1,000 made at the beginning of the period shown and held for the entire period.
The table on the next page illustrates the Fund's cost in two ways:
Actual Fund Return — This section helps you estimate the actual expenses that you paid over the period. The "Ending Account Value" shown is derived from the Fund's actual return, and the third column shows the operating expenses that would have been paid by an investor who started with $1,000 in the Fund. You may use the information here, together with the amount invested, to estimate the expenses that you paid over the period.
To do so, simply divide your account value by $1,000 (for example, an $8,600 account value divided by $1,000 = 8.6), then multiply the result by the number given for the Fund under the heading "Expenses Paid During Period" on the next page.
Hypothetical 5% Return — This section is intended to help you compare your Fund's costs with those of other mutual funds. It assumes that the Fund had an annual return of 5% before expenses, and that the expense ratio is unchanged. In this case, because the return used is not the Fund's actual return, the results do not apply to your investment. The example is useful in making comparisons because the Commission requires all mutual funds to calculate expenses based on a 5% return. You can assess the Fund's costs by comparing this hypothetical example with the hypothetical examples that appear in shareholder reports of other funds.
Note that expenses shown in the table are meant to highlight and help you compare ongoing costs only. The Fund does not charge transactions fees, such as purchase or redemption fees, nor does it carry a "sales load."
The calculation assumes no shares were bought or sold during the period. Your actual costs may have been higher or lower, depending on the amount of your investment and the timing of any purchases or redemptions.
25
The Torray Fund
ABOUT YOUR FUND'S EXPENSES (continued)
As of December 31, 2010 (unaudited)
More information about the Fund's expenses, including recent annual expense ratios, can be found in this report. For additional information on operating expenses and other shareholder costs, please refer to the Fund's prospectus.
| | | | | | | | | | | | |
| | | Beginning
Account Value
July 1, 2010
| | | Ending
Account Value
December 31, 2010
| | | Expenses Paid
During Period*
| |
Based on Actual Fund Return | | $ | 1,000.00 | | | $ | 1,157.30 | | | $ | 6.31 | |
Based on Hypothetical 5% Return
(before expenses) | | $ | 1,000.00 | | | $ | 1,019.36 | | | $ | 5.90 | |
| * | Expenses are equal to the Fund's annualized expense ratio of 1.17% for the period, multiplied by the average account value over the period, multiplied by 184/365 (to reflect the one-half year period). |
26
The Torray Fund
TAX INFORMATION
As of December 31, 2010 (unaudited)
We are required to advise you within 60 days of the Fund's fiscal year-end regarding the Federal tax status of certain distributions received by shareholders during such fiscal year. The information below is provided for the Fund's fiscal year ending December 31, 2010. All designations are based on financial information available as of the date of this annual report and, accordingly, are subject to change. For each item it is the intention of the Fund to designate the maximum amount permitted under the Internal Revenue Code and the regulations thereunder.
Qualified Interest Income
For the year ended December 31, 2010, 0.26% of the ordinary distributions paid (net investment income plus short-term capital gain) represent the amount of Qualifying Interest Income as created by The American Jobs Creation Act of 2004.
Qualified Dividend Income
For the year ended December 31, 2010, 100% of the distributions paid by the Fund from ordinary income qualifies for a reduced tax rate pursuant to The Jobs and Growth Tax Relief Reconciliation Act of 2003.
Dividends Received Deduction
For the year ended December 31, 2010, 100% of the ordinary income distribution qualifies for the dividends received deduction available to corporations.
Dividends and distributions received by retirement plans such as IRA's, Keogh-type plans and 403(b) plans need not be reported as taxable income. However, many retirement plan trusts may need this information for their annual information reporting.
27
TRUSTEES
Carol Crawford
Bruce C. Ellis
William M Lane
Robert P. Moltz
Wayne H. Shaner
INVESTMENT ADVISOR
Torray LLC
OFFICERS
Robert E. Torray
William M Lane
Fred M. Fialco
Shawn M. Hendon
Nicholas C. Haffenreffer
INDEPENDENT REGISTERED PUBLIC
ACCOUNTING FIRM
BBD, LLP
1835 Market Street 26th Floor
Philadelphia, PA 19103
TRANSFER AGENT
BNY Mellon Investment Servicing (US) Inc.
101 Sabin Street
Pawtucket, RI 02860-1427
LEGAL COUNSEL
Dechert LLP
1775 I Street, N.W.
Washington, DC 20006
Distributed by BNY Mellon Distributors Inc.
760 Moore Road, King of Prussia, PA 19406-1212
Date of first use, February 2011
This report is not authorized for distribution to prospective
investors unless preceded or accompanied by a current
prospectus. All indices are unmanaged groupings of stocks
that are not available for investment.
The
TORRAY
FUND
ANNUAL REPORT
December 31, 2010
The Torray Fund
Suite 1100
7501 Wisconsin Avenue
Bethesda, Maryland 20814-6523
(301) 493-4600
(800) 443-3036
The Torray Institutional Fund
Letter to Shareholders
February 1, 2011
Dear Fellow Shareholders,
The Torray Institutional Fund gained 11.4% last year compared to a 15.1% advance for the Standard & Poor’s 500 Index. The difference is due to a late autumn surge in both commodities and a small percentage of stocks in the major indexes. Up to that point, the market had been flat to down for 2010. (As of August 26, it was off 4.9%, our Fund, 2.7%.)
The year-end rally was triggered the very next day by Federal Reserve Board Chairman Ben Bernanke’s Jackson Hole, Wyoming, speech hinting the Fed might initiate a second round of quantitative easing. The object, he said, would be to encourage investments in “risk assets” – particularly stocks and commodities. If successful, it was hoped the resulting wealth effect would spur economic growth and employment. Although the plan was not adopted until November, the market took off in short order. From late August through year end, the S&P jumped 21%, the NASDAQ 26%, and commodity indices 26%. While the rally has buoyed investor spirits, its impact on the economy remains unclear. Equally uncertain is the potential fallout from trillion dollar budget deficits and their potential to trigger speculative bubbles.
A recent analysis of the S&P, NASDAQ 100 and Dow Jones Industrial Average illustrates just how narrow last year’s list of winners was. Only 10% of the stocks in each index represented the lion’s share of their appreciation – 60% for the S&P; 73% for the NASDAQ and 48% for the Dow. Without them, the indices’ returns, including dividends, would have been in the 6%—8% range. Even more telling, the top 10 S&P stocks – 2% of the total – produced 25% of its return, about equal to the difference between our Fund’s performance and that of the Index. In another sign of the market’s heavy concentration in a few names, Apple, Inc. accounted for 45% of the NASDAQ 100’s gain.
Finally, our relative result was impacted by outsized returns on high multiple tech stocks and small company stocks. The former soared 97%, compared to a gain of only one percent for moderate growth technology stocks like those in our Fund. (The price/earnings ratios were 36 and 12, respectively.) We think the stocks we own are a real bargain and the high P/E group is risky. Small company shares outperformed big ones by nearly 100%. The country’s top 50 stocks rose only 7%. We own 12 of them, accounting for 37% of our Fund. The largest is General Electric, followed by International Business Machines, Procter and Gamble, Johnson & Johnson, Wells Fargo, AT&T, Intel, Cisco Systems, Abbott Laboratories, 3M Company, Kraft Foods and American Express. These outstanding businesses sell at conservative valuations; their earnings, dividends and free cash flow have been rising, and long-term prospects remain excellent. The same goes for the rest of our holdings.
There is no telling how long the speculative over-concentration of money in so few stocks will continue, but it won’t be forever, nor will high multiple and small company stocks keep going up 50%—100% a year. In our 38-year history, we’ve witnessed dramatic price trends like this before, the most recent being the tech/telecom bubble of the late 1990s and the housing/sub-prime mortgage boom a few years later. These and all of the others imploded, leaving their participants a lot poorer.
1
The Torray Institutional Fund
Letter to Shareholders (continued)
February 1, 2011
Our 2010 semi-annual letter expressed concerns about flash trading and other computer-controlled strategies that have been roiling markets, driving up volatility and frightening investors away. If anything, the situation in that regard seems to have gotten worse. On the other hand, economic and business fundamentals are improving, corporate balance sheets are probably the strongest on record, and stocks, measured by historic standards, are undervalued. This is especially true relative to bonds and other readily available alternatives. Ironically, individuals and institutions continue to avoid them. A number of big pension funds have reported sharp reductions in their equity holdings, some of them from as much as 70% of assets a few years ago, when the market was a lot more expensive, to 30% now.
While this makes no sense to us, it is understandable considering the market’s miserable showing over the last 10 years. People are scared; many have less money today than they did a decade ago, and the picture is worse when inflation is taken into account. Beyond that, paper thin money market rates have caused investors to seek alternatives in their search for yield and capital preservation. As usual, Wall Street has responded enthusiastically by creating increasingly speculative new outlets for the public’s money. Media business shows, with their endless market predictions, earnings forecasts and focus on short-term trading strategies have only added to investor confusion. This emphasis on knowing the unknowable undermines any value these programs might otherwise add.
Exchange-traded funds (ETFs) have become one of the most widely embraced Wall Street promotions. There are now nearly 1,000 such funds holding around $1 trillion in assets. These include U.S. and international stock, fixed income, commodities and currency portfolios, to mention only a few. Many can be sold short, and some can be leveraged 3-to-1, greatly magnifying their downside risk. In addition, new ETFs are constantly being created to meet popular demand for portfolios concentrated on narrow market sectors, often the speculative favorites of the day. Essentially these funds are little more than an inexpensive rapid-fire vehicle investors are using to chase a rising price. When trends reverse, they typically flee, illustrating once again just how short-term-minded people are these days.
“Absolute-return” funds are another relatively new Wall Street innovation. In simplest terms, these funds hold stocks their managers think are going up, and sell short those they expect to fall, while at the same time holding smaller positions in short-term investments for liquidity purposes. Proponents contend this combination of long, short and cash equivalent holdings will make money no matter what the market does. Implicit in that claim is that the managers can predict the direction of individual stock prices. We doubt even the marketers believe this. Anyone who could do it would simply buy winners in advance and ignore everything else. In our opinion this strategy has no chance of outrunning the long-term returns generated by sound, growing companies.
Finally, we mention gold and silver, which are on a lot of people’s minds these days. This comes as no surprise given that the prices of these metals have soared five and six-fold, respectively, over the last ten years. Adjusted for inflation, however, gold has lost nearly half its value from its peak 30 years ago. Silver’s record is even worse. It hit $49 three decades ago, driven by the Texas oil billionaire Hunt brothers’ scheme to corner the market. When the plot unraveled, silver collapsed to $5; ten years later it was $3.50. Nearly 20 years after that (2004) it was $5 again; today it’s $29. After inflation, the current price of silver would have to more than quadruple to $130 an ounce to match its 1980 high. Predictably, the promoters hawking these metals on TV avoid this history like the plague.
2
The Torray Institutional Fund
Letter to Shareholders (continued)
February 1, 2011
The inimitable Ben Stein talked with Warren Buffett about gold last October. The interview appeared on CNN Money.com under the headline “Warren Buffet: Forget Gold, Buy Stocks.” When Stein asked, “What about gold; is this a classic bubble or what?” Buffet answered: “Look, you could take all the gold that’s ever been mined and it would fill a cube 67 feet in each direction. For what that’s worth at current gold prices, you could buy all – not some – all of the farmland in the United States. Plus you could buy 10 Exxon Mobils,” (the world’s largest corporation) “plus have $1 trillion of walking around money. Or you could have a big cube of metal. Which would you take? Which is going to produce more value?” Stein then asked what a typical middle class person in the US should buy to prepare for retirement. Without hesitation, Buffet replied, “Equities.”
It may be a few years before our economy’s pace accelerates to a level that meaningfully stimulates employment and restores confidence, but by then stocks will already have advanced to reflect the fact. Unfortunately, human nature is such that most people need convincing assurances as to when that will happen before they act. Obviously no one knows. What we do know is that investors will come back in droves after the clouds have parted and prices are a lot higher.
Jason Zweig, in his January 22, 2011, Wall Street Journal column, “The Intelligent Investor,” made this point in spades. It was titled “Will Small Investors Ever Warm Up to Stocks Again?” Zweig recounts that in early 1948—nearly two decades after the crash of 1929 – the Federal Reserve surveyed 3,500 investors nationwide about their attitude toward stocks. Only 5% were willing to invest in them, while 62% were opposed. Asked why, 26% said stocks were “not safe” or “a gamble.” Only 4% believed stocks offered a “satisfactory” return. Ironically, this was after stocks had doubled over the preceding five years, showing that the great crash still hadn’t been forgotten. We will add here that in the 10 years following the 1948 survey, stocks returned 16.4% compounded annually, and 14.6% for 20 years. (It was not until the mid-1950s ushered in one of the biggest bull markets in history that individuals returned to stocks with enthusiasm. By then, as Zweig notes, they were roughly twice as expensive as they had been when individual investors told the Federal Reserve they were “a gamble.”)
This letter marks the 9 1/2-year anniversary of our Institutional Fund’s founding. Unfortunately, from an investment perspective, the period proved to be one of the worst on record. The Fund made only 2.15% compounded annually, and the S&P 500 Index, 2.23%. These numbers are a small fraction of the 11% average annual return equities have provided over the last 70 years. Although no one can foresee the future, the sharp contrast between these records suggests to us that a gradual reversion to the mean is a reasonable expectation. As noted earlier, a recovery, though slow, is underway. Stocks are a bargain, and we think investors should buy them. This is a long-term view, not a prediction of where prices will be in six months or a year. They might be lower for all we know. The point of investing now is to take advantage of America’s future prosperity at a discount, not to buy a ticket for a short-term ride on a stock market rally.
3
The Torray Institutional Fund
Letter to Shareholders (continued)
February 1, 2011
We thank you, once again, for your continued trust in our management.
| | | | | | |
| | | Sincerely, | | | | |
| | |  | | | | |
| | | Robert E. Torray | | | | |
| | | 
| | | | |
| | | Fred M. Fialco | | | | |
| | | 
| | | | |
| | | Shawn M. Hendon | | | | |
| | | | | | | |
4
The Torray Institutional Fund
PERFORMANCE DATA
As of December 31, 2010
Average Annual Returns on an Investment in
The Torray Institutional Fund vs. the S&P 500 Index
For the periods ended December 31, 2010:
| | | | | | | | | | | | | | | | |
| | | 1 Year
| | | 3 Years
| | | 5 Years
| | | Since
Inception
06/30/01
| |
The Torray Institutional Fund | | | 11.39 | % | | | -2.98 | % | | | -0.26 | % | | | 2.15 | % |
S&P 500 Index | | | 15.06 | % | | | -2.86 | % | | | 2.29 | % | | | 2.23 | % |
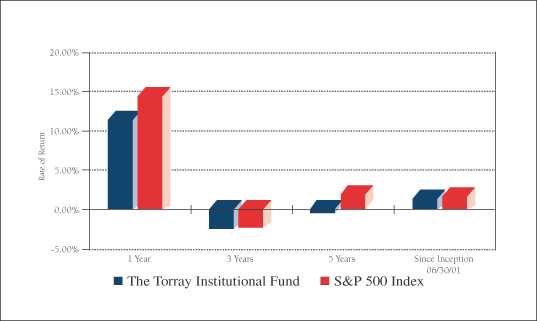
Cumulative Returns for the 9 1/2 years ended December 31, 2010
| | | | |
The Torray Institutional Fund | | | 22.41 | % |
S&P 500 Index | | | 23.32 | % |
5
The Torray Institutional Fund
PERFORMANCE DATA (continued)
As of December 31, 2010
Change in Value of $5,000,000 Invested
on June 30, 2001 (commencement of operations) to:
| | | | | | | | | | | | | | | | | | | | |
| | | 12/31/02
| | | 12/31/04
| | | 12/31/06
| | | 12/31/08
| | | 12/31/10
| |
The Torray Institutional Fund | | $ | 4,537,000 | | | $ | 6,123,000 | | | $ | 6,908,000 | | | $ | 4,272,000 | | | $ | 6,120,500 | |
S&P 500 Index | | $ | 3,682,500 | | | $ | 5,255,500 | | | $ | 6,373,000 | | | $ | 4,237,380 | | | $ | 6,166,150 | |
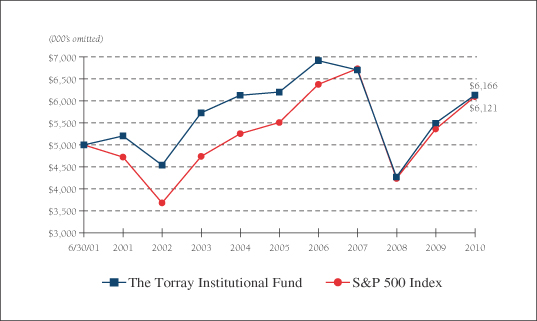
The returns quoted represent past performance and do not guarantee future results. Investment return and principal value will fluctuate so that shares, when redeemed, may be worth more or less than their original cost. Current performance may be lower or higher. For performance current to the most recent month-end, please call (800) 626-9769. The returns shown do not reflect the deduction of taxes a shareholder would pay on the redemption of fund shares and distributions. The Torray Institutional Fund’s gross annual operating expense ratio, as stated in the current prospectus, is 0.85%. Returns on both The Torray Institutional Fund and the S&P 500 Index assume reinvestment of all dividends and distributions. The S&P 500 Index is an unmanaged index consisting of 500 U.S. large-cap stocks.
6
The Torray Institutional Fund
FUND PROFILE
As of December 31, 2010 (unaudited)
| | | | |
DIVERSIFICATION (% of net assets) | | | | |
| |
Information Technology | | | 21.24% | |
Health Care | | | 17.23% | |
Financials | | | 15.93% | |
Industrials | | | 11.46% | |
Consumer Staples | | | 10.43% | |
Consumer Discretionary | | | 4.85% | |
Materials | | | 3.50% | |
Telecommunications | | | 3.28% | |
Short-Term Investments | | | 12.46% | |
Liabilities Less Other Assets | | | (0.38)% | |
| | |
|
|
|
| | �� | | 100.00% | |
| | |
|
|
|
| | | | | | |
| TOP TEN EQUITY HOLDINGS (% of net assets) |
| | 1. | | | Loews Corp. | | 3.86% |
| | 2. | | | Marsh & McLennan Cos., Inc. | | 3.65% |
| | 3. | | | Western Union Co. (The) | | 3.59% |
| | 4. | | | Kraft Foods Inc., Class A | | 3.55% |
| | 5. | | | EMC Corp. | | 3.51% |
| | 6. | | | E.I. du Pont de Nemours & Co. | | 3.50% |
| | 7. | | | International Business Machines Corp. | | 3.48% |
| | 8. | | | UnitedHealth Group Inc. | | 3.43% |
| | 9. | | | Cintas Corp. | | 3.39% |
| | 10. | | | McGraw-Hill Cos. Inc. (The) | | 3.30% |
| | | | | | |
|
| | | | | | | 35.26% |
| | | | | | |
|
PORTFOLIO CHARACTERISTICS
| | | | | | | | |
Net Assets (million) | | | | | | $ | 21 | |
Number of Holdings | | | | | | | 30 | |
Portfolio Turnover | | | | | | | 15.40 | % |
P/E Multiple (forward) | | | | | | | 12.7x | |
Portfolio Yield | | | | | | | 2.30 | % |
Market Capitalization (billion) | | | Average | | | $ | 65.4 | |
| | | | Median | | | $ | 40.2 | |
7
The Torray Institutional Fund
SCHEDULE OF INVESTMENTS
As of December 31, 2010
| | | | | | | | | | | | |
| | | | Shares
| | | | | Market Value
| |
| | COMMON STOCK 87.92% | | | | |
| |
| 21.24% INFORMATION TECHNOLOGY | | | | |
| | | | | | 41,600 | | | Western Union Co. (The) | | $ | 772,512 | |
| | | | | | 32,942 | | | EMC Corp.* | | | 754,372 | |
| | | | | | 5,100 | | | International Business Machines Corp. | | | 748,476 | |
| | | | | | 29,500 | | | Cisco Systems, Inc.* | | | 596,785 | |
| | | | | | 27,956 | | | Intel Corp. | | | 587,915 | |
| | | | | | 12,616 | | | Automatic Data Processing, Inc. | | | 583,868 | |
| | | | | | 37,193 | | | Applied Materials, Inc. | | | 522,562 | |
| | | | | | | | | | |
|
|
|
| | | | | | | | | | | | 4,566,490 | |
| |
| 17.23% HEALTH CARE | | | | |
| | | | | | 20,400 | | | UnitedHealth Group Inc. | | | 736,644 | |
| | | | | | 11,264 | | | Johnson & Johnson | | | 696,678 | |
| | | | | | 7,900 | | | Becton Dickinson & Co. | | | 667,708 | |
| | | | | | 10,500 | | | WellPoint, Inc.* | | | 597,030 | |
| | | | | | 11,600 | | | Abbott Laboratories | | | 555,756 | |
| | | | | | 8,900 | | | Baxter International Inc. | | | 450,518 | |
| | | | | | | | | | |
|
|
|
| | | | | | | | | | | | 3,704,334 | |
| |
| 15.93% FINANCIALS | | | | |
| | | | | | 21,300 | | | Loews Corp. | | | 828,783 | |
| | | | | | 28,717 | | | Marsh & McLennan Cos., Inc. | | | 785,123 | |
| | | | | | 21,300 | | | Wells Fargo & Co. | | | 660,087 | |
| | | | | | 10,500 | | | Chubb Corp. | | | 626,220 | |
| | | | | | 12,223 | | | American Express Co. | | | 524,611 | |
| | | | | | | | | | |
|
|
|
| | | | | | | | | | | | 3,424,824 | |
| |
| 11.46% INDUSTRIALS | | | | |
| | | | | | 26,092 | | | Cintas Corp. | | | 729,532 | |
| | | | | | 35,419 | | | General Electric Co. | | | 647,814 | |
| | | | | | 6,500 | | | 3M Co. | | | 560,950 | |
| | | | | | 7,400 | | | General Dynamics Corp. | | | 525,104 | |
| | | | | | | | | | |
|
|
|
| | | | | | | | | | | | 2,463,400 | |
8
The Torray Institutional Fund
SCHEDULE OF INVESTMENTS (continued)
As of December 31, 2010
| | | | | | | | | | | | |
| | | | Shares
| | | | | Market Value
| |
| |
| 10.43% CONSUMER STAPLES | | | | |
| | | | | | 24,200 | | | Kraft Foods Inc., Class A | | $ | 762,542 | |
| | | | | | 6,600 | | | Colgate-Palmolive Co. | | | 530,442 | |
| | | | | | 8,200 | | | Procter & Gamble Co. (The) | | | 527,506 | |
| | | | | | 14,300 | | | Sysco Corp. | | | 420,420 | |
| | | | | | | | | | |
|
|
|
| | | | | | | | | | | | 2,240,910 | |
| |
| 4.85% CONSUMER DISCRETIONARY | | | | |
| | | | | | 19,500 | | | McGraw-Hill Cos. Inc. (The) | | | 709,995 | |
| | | | | | 22,000 | | | Gannett Co., Inc. | | | 331,980 | |
| | | | | | | | | | |
|
|
|
| | | | | | | | | | | | 1,041,975 | |
| |
| 3.50% MATERIALS | | | | |
| | | | | | 15,100 | | | E.I. du Pont de Nemours & Co. | | | 753,188 | |
| |
| 3.28% TELECOMMUNICATIONS | | | | |
| | | | | | 24,000 | | | AT&T Inc. | | | 705,120 | |
| | | | | | | | | | |
|
|
|
| | TOTAL COMMON STOCK 87.92% | | | 18,900,241 | |
| (cost $18,083,066) | | | | |
| | | |
| | | | Principal Amount ($) | | | | | | |
| |
| | SHORT-TERM INVESTMENTS 12.46% | | | | |
| | | | | | 2,679,070 | | | PNC Bank Money Market Account, 0.05%(1) | | | 2,679,070 | |
| (cost $2,679,070) | | | | |
| | | | | | | | | | |
|
|
|
| | TOTAL INVESTMENTS 100.38% | | | 21,579,311 | |
| (cost $20,762,136) | | | | |
| | LIABILITIES LESS OTHER ASSETS (0.38%) | | | (80,850 | ) |
| | | | | | | | | | |
|
|
|
| | NET ASSETS 100.00% | | $ | 21,498,461 | |
| | | | | | | | | | |
|
|
|
| * | Non-income producing securities. |
| (1) | Represents current yield at December 31, 2010. |
See notes to the financial statements.
9
The Torray Institutional Fund
STATEMENT OF ASSETS AND LIABILITIES
As of December 31, 2010
| | | | |
ASSETS | | | | |
Investments in securities at value
(cost $20,762,136) | | $ | 21,579,311 | |
Interest and dividends receivable | | | 24,159 | |
| | |
|
|
|
TOTAL ASSETS | | | 21,603,470 | |
| | |
|
|
|
| |
LIABILITIES | | | | |
Payable for fund shares redeemed | | | 50,107 | |
Payable to advisor | | | 54,902 | |
| | |
|
|
|
TOTAL LIABILITIES | | | 105,009 | |
| | |
|
|
|
| |
NET ASSETS | | $ | 21,498,461 | |
| | |
|
|
|
Shares of beneficial interest ($1 stated value, 310,493 shares outstanding, unlimited shares authorized) | | $ | 310,493 | |
Paid-in-capital in excess of par | | | 24,680,889 | |
Undistributed net investment income | | | 632 | |
Accumulated net realized loss on investments | | | (4,310,728 | ) |
Net unrealized appreciation of investments | | | 817,175 | |
| | |
|
|
|
| |
TOTAL NET ASSETS | | $ | 21,498,461 | |
| | |
|
|
|
Net Asset Value, Offering and Redemption Price per Share | | $ | 69.24 | |
| | |
|
|
|
See notes to the financial statements.
10
The Torray Institutional Fund
STATEMENT OF OPERATIONS
For the year ended December 31, 2010
| | | | |
INVESTMENT INCOME | | | | |
Dividend income | | $ | 379,292 | |
Interest income | | | 1,651 | |
| | |
|
|
|
Total investment income | | | 380,943 | |
| | |
|
|
|
| |
EXPENSES | | | | |
Management fees | | | 172,947 | |
| | |
|
|
|
Total expenses | | | 172,947 | |
| | |
|
|
|
NET INVESTMENT INCOME | | | 207,996 | |
| | |
|
|
|
REALIZED AND UNREALIZED GAIN ON INVESTMENTS | | | | |
Net realized gain on investments | | | 163,976 | |
Net change in unrealized appreciation (depreciation) on investments | | | 1,861,864 | |
| | |
|
|
|
Net realized and unrealized gain on investments | | | 2,025,840 | |
| | |
|
|
|
NET INCREASE IN NET ASSETS FROM OPERATIONS | | $ | 2,233,836 | |
| | |
|
|
|
See notes to the financial statements.
11
The Torray Institutional Fund
STATEMENTS OF CHANGES IN NET ASSETS
For the years indicated:
| | | | | | | | |
| | | Year ended
12/31/10
| | | Year ended
12/31/09
| |
Increase in Net Assets from Operations: | | | | | | | | |
Net investment income | | $ | 207,996 | | | $ | 203,148 | |
Net realized gain (loss) on investments | | | 163,976 | | | | (1,097,450 | ) |
Net change in unrealized appreciation (depreciation)
on investments | | | 1,861,864 | | | | 5,382,730 | |
| | |
|
|
| |
|
|
|
Net increase in net assets from operations | | | 2,233,836 | | | | 4,488,428 | |
| | |
|
|
| |
|
|
|
Distributions to Shareholders from: | | | | | | | | |
Net investment income ($0.662 and $0.609
per share, respectively) | | | (207,364 | ) | | | (203,153 | ) |
| | |
|
|
| |
|
|
|
Total distributions | | | (207,364 | ) | | | (203,153 | ) |
| | |
|
|
| |
|
|
|
Shares of Beneficial Interest | | | | | | | | |
Decrease from share transactions | | | (851,312 | ) | | | (1,655,402 | ) |
| | |
|
|
| |
|
|
|
Total increase | | | 1,175,160 | | | | 2,629,873 | |
Net Assets — Beginning of Year | | | 20,323,301 | | | | 17,693,428 | |
| | |
|
|
| |
|
|
|
Net Assets — End of Year | | $ | 21,498,461 | | | $ | 20,323,301 | |
| | |
|
|
| |
|
|
|
Undistributed Net Investment Income | | $ | 632 | | | | — | |
| | |
|
|
| |
|
|
|
See notes to the financial statements.
12
The Torray Institutional Fund
FINANCIAL HIGHLIGHTS
For a share outstanding throughout each year presented:
PER SHARE DATA
| | | | | | | | | | | | | | | | | | | | |
| | | Years ended December 31:
| |
| | | 2010
| | | 2009
| | | 2008
| | | 2007
| | | 2006
| |
Net Asset Value, Beginning of Year | | $ | 62.790 | | | $ | 49.400 | | | $ | 80.800 | | | $ | 108.640 | | | $ | 111.920 | |
| | |
|
|
| |
|
|
| |
|
|
| |
|
|
| |
|
|
|
Income/(loss) from investment operations: | | | | | | | | | | | | | | | | | | | | |
Net investment income | | | 0.660 | (2) | | | 0.605 | (2) | | | 0.687 | (2) | | | 0.896 | | | | 0.720 | |
Net gains (losses) on securities (both realized and unrealized) | | | 6.452 | | | | 13.394 | | | | (29.336 | ) | | | (4.074 | ) | | | 11.587 | |
| | |
|
|
| |
|
|
| |
|
|
| |
|
|
| |
|
|
|
Total from investment operations | | | 7.112 | | | | 13.999 | | | | (28.649 | ) | | | (3.178 | ) | | | 12.307 | |
| | |
|
|
| |
|
|
| |
|
|
| |
|
|
| |
|
|
|
Less: distributions | | | | | | | | | | | | | | | | | | | | |
Dividends (from net investment income) | | | (0.662 | ) | | | (0.609 | ) | | | (0.770 | ) | | | (0.716 | ) | | | (0.790 | ) |
Distributions (from capital gains) | | | — | | | | — | | | | (1.889 | ) | | | (23.946 | ) | | | (14.797 | ) |
Distributions (from return of capital) | | | — | | | | — | | | | (0.092 | ) | | | — | | | | — | |
| | |
|
|
| |
|
|
| |
|
|
| |
|
|
| |
|
|
|
Total distributions | | | (0.662 | ) | | | (0.609 | ) | | | (2.751 | ) | | | (24.662 | ) | | | (15.587 | ) |
| | |
|
|
| |
|
|
| |
|
|
| |
|
|
| |
|
|
|
Net Asset Value, End of Year | | $ | 69.240 | | | $ | 62.790 | | | $ | 49.400 | | | $ | 80.800 | | | $ | 108.640 | |
| | |
|
|
| |
|
|
| |
|
|
| |
|
|
| |
|
|
|
TOTAL RETURN (1) | | | 11.39 | % | | | 28.61 | % | | | (36.24 | %) | | | (3.01 | %) | | | 11.40 | % |
RATIOS/SUPPLEMENTAL DATA | | | | | | | | | | | | | | | | | | | | |
Net assets, end of year (000’s omitted) | | $ | 21,498 | | | $ | 20,323 | | | $ | 17,693 | | | $ | 46,689 | | | $ | 205,851 | |
Ratios of expenses to average net assets | | | 0.85 | % | | | 0.85 | % | | | 0.85 | % | | | 0.85 | % | | | 0.85 | % |
Ratios of net investment income to average net assets | | | 1.02 | % | | | 1.16 | % | | | 1.00 | % | | | 0.66 | % | | | 0.60 | % |
Portfolio turnover rate | | | 15.40 | % | | | 18.60 | % | | | 32.00 | % | | | 44.32 | % | | | 24.26 | % |
| (1) | Past performance is not predictive of future performance. |
| (2) | Calculated based on the average amount of shares outstanding during the year. |
See notes to the financial statements.
13
The Torray Institutional Fund
NOTES TO FINANCIAL STATEMENTS
As of December 31, 2010
NOTE 1 — SUMMARY OF SIGNIFICANT ACCOUNTING POLICIES
The Torray Institutional Fund (“Fund”) is a separate series of The Torray Fund (“Trust”). The Trust is registered under the Investment Company Act of 1940, as amended, as a no-load, diversified, open-end management investment company. The Trust was organized as a business trust under Massachusetts law and the Fund commenced operations on June 30, 2001. The Fund’s primary investment objective is to provide long-term total return. The Fund seeks to meet its objective by investing its assets in a diversified portfolio of common stocks. In order to accomplish these goals, the Fund intends to hold stocks for the long term, as opposed to actively buying and selling. There can be no assurances that the Fund’s investment objectives will be achieved.
The following is a summary of accounting policies followed by the Fund in the preparation of its financial statements. These policies are in conformity with accounting principles generally accepted in the United States of America.
Securities Valuation Portfolio securities for which market quotations are readily available are valued at market value, which is determined by using the last reported sale price, or, if no sales are reported, the last reported bid price. For NASDAQ traded securities, market value is determined on the basis of the NASDAQ official closing price instead of the last reported sales price. Other assets and securities for which no quotations are readily available or for which Torray LLC (the “Advisor”) believes do not reflect market value are valued at fair value as determined in good faith by the Advisor under the supervision of the Board of Trustees (the “Board” or “Trustees”) in accordance with the Fund’s Valuation Procedures. Short-term obligations having remaining maturities of 60 days or less are valued at amortized cost, which approximates market value.
Fair Value Measurements Various inputs are used in determining the fair value of investments which are as follows:
| | • | | Level 1 — quoted prices in active markets for identical securities |
| | • | | Level 2 — significant observable inputs (including quoted prices for similar securities, interest rates, prepayment speeds, credit risk, etc.) |
| | • | | Level 3 — significant unobservable inputs (including the Fund’s own assumptions in determining the fair value of investments) |
The inputs or methodology used for valuing securities are not necessarily an indication of the risk associated with investing in those securities.
14
The Torray Institutional Fund
NOTES TO FINANCIAL STATEMENTS (continued)
As of December 31, 2010
The summary of inputs used to value the Fund’s investments as of December 31, 2010 is as follows:
| | | | |
Valuation Inputs
| | | |
Level 1 — Quoted Prices * | | $ | 21,579,311 | |
Level 2 — Other Significant Observable Inputs | | | — | |
Level 3 — Significant Unobservable Inputs | | | — | |
| | |
|
|
|
Total Market Value of Investments | | $ | 21,579,311 | |
| | |
|
|
|
| * | Security types and industry classifications as defined in the Schedule of Investments. |
The Fund did not have significant transfers between Level 1 and Level 2 investments during the reporting period.
Securities Transactions and Investment Income Securities transactions are recorded on a trade date basis. Realized gains and losses from securities transactions are recorded on the specific identification basis. Dividend income and distributions to shareholders are recorded on the ex-dividend date. Interest income, including amortization of discount on short-term investments, and expenses are recorded on the accrual basis. Premium and discount are amortized using the effective yield to maturity method.
Federal Income Taxes The Fund intends to continue to comply with the requirements of the Internal Revenue Code applicable to regulated investment companies and to distribute all of its taxable income, including any net realized gain on investments to its shareholders. Therefore, no Federal income tax provision is required.
Management has analyzed the Fund’s tax positions taken on Federal income tax returns for all open tax years (current and prior three tax years), and has concluded that no provision for Federal income tax is required in the Fund’s financial statements. The Fund’s Federal and state income and Federal excise tax returns for tax years for which the applicable statutes of limitations have not expired are subject to examination by the Internal Revenue Service and state departments of revenue.
Net Asset Value The net asset value per share of the Fund is determined daily as of the close of trading on the New York Stock Exchange by dividing the value of the Fund’s net assets by the number of shares outstanding.
Interest Expense When cash balances are overdrawn in the Fund’s custody account, the Fund is charged an overdraft fee equal to 1.25% above the Federal Funds Rate. Such overdraft fees are paid by the Advisor under the comprehensive management fee arrangement described in Note 4. The Trust has entered into a line of credit facility with PNC Bank. Under the terms of the line of credit, the separate series of the Trust (including the Fund) may borrow up to $20,000,000 on a short-term basis with interest accruing at the Federal Funds Rate plus 0.75%. Any interest expense on the line of credit is paid by the Advisor under the comprehensive management fee arrangement described in Note 4. As of December 31, 2010, the Fund had no outstanding borrowings under this line of credit facility.
15
The Torray Institutional Fund
NOTES TO FINANCIAL STATEMENTS (continued)
As of December 31, 2010
Use of Estimates In preparing financial statements in accordance with accounting principles generally accepted in the United States of America, management is required to make estimates and assumptions that affect the reported amounts of assets and liabilities and the disclosure of contingent assets and liabilities at the date of the financial statements, and the reported amounts of increases and decreases in net assets from operations during the reporting period. Actual results could differ from those estimates.
NOTE 2 — SHARES OF BENEFICIAL INTEREST TRANSACTIONS
Transactions in shares of beneficial interest were as follows:
| | | | | | | | | | | | | | | | |
| | | Year ended
12/31/10
| | | Year ended
12/31/09
| |
| | | Shares
| | | Amount
| | | Shares
| | | Amount
| |
Shares issued | | | 2,530 | | | $ | 162,829 | | | | 10,727 | | | $ | 562,111 | |
Reinvestments of dividends and distributions | | | 3,149 | | | | 207,271 | | | | 3,952 | | | | 202,799 | |
Shares redeemed | | | (18,876 | ) | | | (1,221,412 | ) | | | (49,132 | ) | | | (2,420,312 | ) |
| | |
|
|
| |
|
|
| |
|
|
| |
|
|
|
| | | | (13,197 | ) | | $ | (851,312 | ) | | | (34,453 | ) | | $ | (1,655,402 | ) |
| | |
|
|
| |
|
|
| |
|
|
| |
|
|
|
As of December 31, 2010, the Trust’s officers, Trustees and affiliated persons and their families directly or indirectly controlled 211,643 shares or 68.16% of the Fund.
NOTE 3 — INVESTMENT TRANSACTIONS
Purchases and sales of investment securities, other than short-term investments, for the year ended December 31, 2010, aggregated $3,665,830 and $2,612,236, respectively.
NOTE 4 — MANAGEMENT FEES
Pursuant to the Management Contract, the Advisor provides investment advisory and administrative services to the Fund. The Fund pays the Advisor a management fee, computed daily and payable monthly at the annual rate of 0.85% of the Fund’s average daily net assets. For the year ended December 31, 2010, the Fund paid comprehensive management fees of $172,947. The Fund pays the Advisor a single comprehensive management fee which covers all operating expenses of the Fund including the investment advisory and administrative services provided by the Advisor as well as all miscellaneous costs incurred in connection with the ongoing operation of the Fund including transfer agency, custody, professional, and registration fees.
Certain Officers and Trustees of the Fund are also officers and/or shareholders of the Advisor.
16
The Torray Institutional Fund
NOTES TO FINANCIAL STATEMENTS (continued)
As of December 31, 2010
NOTE 5 — TAX MATTERS
Distributions to shareholders are determined in accordance with United States Federal income tax regulations, which may differ from accounting principles generally accepted in the United States of America.
The tax character of distributions paid during the years ended December 31, 2010 and 2009 was as follows:
| | | | | | | | |
| | | 2010
| | | 2009
| |
Distributions paid from: | | | | | | | | |
Ordinary income | | $ | 207,364 | | | $ | 203,153 | |
| | |
|
|
| |
|
|
|
| | | $ | 207,364 | | | $ | 203,153 | |
| | |
|
|
| |
|
|
|
As of December 31, 2010, the components of distributable earnings on a tax basis were as follows:
| | | | |
Undistributed net investment income | | $ | 632 | |
Capital loss carry forward | | | (4,019,474 | ) |
Unrealized appreciation | | | 525,921 | |
| | |
|
|
|
| | | $ | (3,492,921 | ) |
| | |
|
|
|
The difference between the capital loss carry forward on a tax basis and accumulated realized loss on investments reported in the Statement of Assets and Liabilities is due to realized losses on certain wash sales that are deferred for Federal income tax purposes. The difference between net unrealized appreciation for tax purposes and net unrealized appreciation on investments reported in the Statement of Assets and Liabilities is due to the same wash sale losses.
At December 31, 2010 the Fund had net capital loss carry forward for federal income tax purposes of $339,016, $3,679,435 and $1,023, which are available to reduce future required distributions of net capital gains to shareholders through 2016, 2017 and 2018, respectively.
17
The Torray Institutional Fund
NOTES TO FINANCIAL STATEMENTS (continued)
As of December 31, 2010
The following information is based upon the federal tax basis of investment securities as of December 31, 2010:
| | | | |
Gross unrealized appreciation | | $ | 2,047,350 | |
Gross unrealized depreciation | | | (1,521,429 | ) |
| | |
|
|
|
Net unrealized appreciation | | $ | 525,921 | |
| | |
|
|
|
Cost | | $ | 21,053,390 | |
| | |
|
|
|
NOTE 6 — COMMITMENTS AND CONTINGENCIES
The Fund indemnifies its Officers and Trustees for certain liabilities that may arise from their performance of their duties to the Fund. Additionally, in the normal course of business, the Fund enters into contracts that contain a variety of representations and warranties, which provide general indemnifications. The Fund’s maximum exposure under these arrangements is unknown, as this would involve future claims that may be made against the Fund that have not yet occurred.
NOTE 7 — SUBSEQUENT EVENTS
Management has evaluated the impact of all subsequent events on the Fund through the date these financial statements were issued and has determined that there were no subsequent events requiring recognition or disclosure in the financial statements.
NOTE 8 — RECENT ACCOUNTING PRONOUNCEMENTS
In January 2010, the Financial Accounting Standards Board (“FASB”) issued Accounting Standards Update (“ASU”) No. 2010-06 “Improving Disclosures about Fair value measurements.” ASU No. 2010-06 amends FASB Accounting Standards Codification Topic 820, Fair value measurements and Disclosures, to require additional disclosure regarding fair value measurements. Effective for fiscal years beginning after December 15, 2010 and for interim periods within those fiscal years, entities will need to disclose information about purchases, sales, issuances and settlements of Level 3 securities on a gross basis rather than as a net number as currently required.
18
The Torray Institutional Fund
REPORT OF INDEPENDENT REGISTERED PUBLIC ACCOUNTING FIRM
To the Board of Trustees of The Torray Fund
and the Shareholders of The Torray Institutional Fund
We have audited the accompanying statement of assets and liabilities of The Torray Institutional Fund, a series of shares of beneficial interest in The Torray Fund, including the schedule of investments, as of December 31, 2010, and the related statement of operations for the year then ended, the statements of changes in net assets for each of the years in the two-year period then ended, and the financial highlights for each of the years in the five-year period then ended. These financial statements and financial highlights are the responsibility of the Fund’s management. Our responsibility is to express an opinion on these financial statements and financial highlights based on our audits.
We conducted our audits in accordance with the standards of the Public Company Accounting Oversight Board (United States). Those standards require that we plan and perform the audits to obtain reasonable assurance about whether the financial statements and financial highlights are free of material misstatement. An audit includes examining, on a test basis, evidence supporting the amounts and disclosures in the financial statements. Our procedures included confirmation of securities owned as of December 31, 2010 by correspondence with the custodian. An audit also includes assessing the accounting principles used and significant estimates made by management, as well as evaluating the overall financial statement presentation. We believe that our audits provide a reasonable basis for our opinion.
In our opinion, the financial statements and financial highlights referred to above present fairly, in all material respects, the financial position of The Torray Institutional Fund as of December 31, 2010, the results of its operations for the year then ended, the changes in its net assets for each of the years in the two-year period then ended, and its financial highlights for each of the years in the five-year period then ended, in conformity with accounting principles generally accepted in the United States of America.

BBD, LLP
Philadelphia, Pennsylvania
February 18, 2011
19
The Torray Institutional Fund
FUND MANAGEMENT
As of December 31, 2010 (unaudited)
The Trust is overseen by a Board of Trustees (the "Board"), which has delegated the day-to-day management to the officers of the Trust. The Board meets regularly to review the Fund's activities, contractual arrangements, and per- formance. The trustees and officers serve until their successors are elected and qualified, or until the trustee or officer dies, resigns or is removed, or becomes disqualified.
Information pertaining to the Trustees and Officers of the Trust is set forth below. The Statement of Additional Information (“SAI”) includes additional information about the Trustees and is available without charge, upon request, by calling (800) 443-3036.
| | | | | | | | | | |
Name, Birthdate,
Address* and
Position(s) with the Trust | | Term of Office
and Length of
Time Served | | Principal Occupation(s) During Past 5 Years | | No. of
Portfolios in
Fund Complex
Overseen by
Trustee | | | Other Directorships Held |
| INDEPENDENT TRUSTEES |
Carol T. Crawford 02/25/43 Trustee | | Indefinite Term Since 2006 | | Attorney and International Trade Consultant McLean, VA | | | 3 | | | Director, Smithfield Foods, Inc., Smithfield, VA |
Bruce C. Ellis 07/20/44 Trustee | | Indefinite Term Since 1993 | | Private Investor, Bethesda, MD | | | 3 | | | None |
Robert P. Moltz 10/03/47 Trustee | | Indefinite Term Since 1990 | | President, CEO, Weaver Bros Insurance Associates, Inc., Bethesda, MD | | | 3 | | | None |
Wayne H. Shaner** 08/23/47 Trustee and Chairman of the Board | | Indefinite Term Since 1993 | | Managing Partner, Rockledge Partners, LLC, Investment Advisory Firm, Easton, MD (Jan. 2004-Present); Vice President, Torray LLC, Bethesda, MD (Jan. 2008-Jun. 2008) | | | 3 | | | Director, Van Eck Funds, New York, NY |
20
The Torray Institutional Fund
FUND MANAGEMENT (continued)
As of December 31, 2010 (unaudited)
| | | | | | | | | | |
Name, Birthdate,
Address* and
Position(s) with the Trust | | Term of Office
and Length of
Time Served | | Principal Occupation(s) During Past 5 Years | | No. of
Portfolios in
Fund Complex
Overseen by
Trustee | | | Other Directorships Held |
| INTERESTED TRUSTEE AND OFFICERS OF THE TRUST |
William M Lane*** 05/21/50 Trustee, Treasurer, Secretary, Chief Compliance Officer and Anti-Money Laundering Officer | | Indefinite Term Since 1990 | | Vice President, Secretary and Chief Compliance Officer, Torray LLC, Bethesda, MD (Oct. 2005-Present); Vice President, Secretary, Treasurer and Chief Compliance Officer, Robert E. Torray & Co. Inc., Bethesda, MD (Jul. 1984-Oct. 2005); Vice President, Secretary and Chief Compliance Officer, The Torray Corporation, Bethesda, MD (Jan. 1990-Oct. 2005); Vice President, Secretary, Treasurer and Chief Compliance Officer, TEL Corporation, Bethesda, MD (Jun. 2005-Oct. 2005).*** | | | 3 | | | None |
Robert E. Torray 04/10/37 President | | Indefinite Term Since 2007 | | Chairman, Torray LLC, Bethesda, MD (2005-Present); President, Torray LLC, Bethesda, MD (2007-Present); President, Robert E. Torray & Co. Inc., Bethesda, MD (May 1972-Oct. 2005); President, The Torray Corporation, Bethesda, MD (Jan. 1990-Oct. 2005); Chairman, TEL Corporation, Bethesda, MD (Jun. 2005-Oct. 2005).**** | | | N/A | | | None |
| * | All addresses are c/o The Torray Fund, 7501 Wisconsin Avenue, Suite 1100, Bethesda, MD 20814-6523. |
| ** | Mr. Shaner is deemed to be an independent Trustee effective as of January 1, 2011. |
| *** | Mr. Lane, by virtue of his employment with Torray LLC, the Trust’s investment adviser, is considered an “interested person” of the Trust, as that term is defined in Section 2(a)(19) of the Investment Company Act of 1940, as amended. |
| **** | Robert E. Torray & Co. Inc., The Torray Corporation and TEL Corporation have all been succeeded to by Torray LLC. |
21
The Torray Institutional Fund
FACTORS CONSIDERED BY THE BOARD OF TRUSTEES IN CONNECTION WITH THEIR APPROVAL OF THE FUND’S INVESTMENT MANAGEMENT AGREEMENT WITH THE MANAGER (unaudited)
The Fund has entered into an Investment Management Agreement (the “Agreement”) with Torray LLC (the “Manager”) pursuant to which the Manager provides investment management services to the Fund. In accordance with the Investment Company Act of 1940, the Board of Trustees of the Fund is required, on an annual basis, to consider the continuation of the Agreement with the Manager, and this must take place at an in-person meeting of the Board. The relevant provisions of the Investment Company Act of 1940 specifically provide that it is the duty of the Board to request and evaluate such information as the Board determines is necessary to allow them to properly consider the continuation of the Agreement, and it is the duty of the Manager to furnish the trustees with such information that is responsive to their request. Set forth below is a discussion of the various factors that the Board of Trustees considered in deciding to approve the continuation of the Agreement with the Manager.
In determining whether to approve the continuation of the Agreement, the Board of Trustees requested, and the Manager provided, information and data relevant to the Board’s consideration. This included materials that provided the Board with information regarding the investment performance of the Fund and information regarding the fees and expenses of the Fund as compared to other similar mutual funds. As part of its deliberations, the Board also considered and relied upon the information about the Fund that had been provided to them throughout the year in connection with their regular Board meetings at which they engage in the ongoing oversight of the Fund and its operations.
The Board met at an in-person meeting on October 6, 2010 in order to consider the proposed continuation of the Agreement. Among the factors the Board considered was the overall performance of the Fund achieved by the Manager relative to the performance of the Fund’s benchmark index, the S&P 500 Index, as well as the Fund’s performance relative to other mutual funds with similar investment objectives. The Board took into consideration the fact that the Manager seeks to achieve investment results for the Fund with less risk than other similar funds, and that the Manager has maintained a low portfolio turnover rate for the Fund. They noted the range of investment advisory and management services provided by the Manager and the level and quality of these services, and in particular, they noted the quality of the personnel providing these services, taking into consideration their finding that the personnel providing these services, and the services provided, were of a very high caliber and quality. The Board also considered the portfolio manager arrangements for the Fund, noting that the Manager has undertaken appropriate measures to provide for the continued management of the Fund by a team of portfolio managers with extensive portfolio management experience.
22
The Torray Institutional Fund
FACTORS CONSIDERED BY THE BOARD OF TRUSTEES IN CONNECTION WITH THEIR APPROVAL OF THE FUND’S INVESTMENT MANAGEMENT AGREEMENT WITH THE MANAGER (unaudited) (continued)
The Board also compared the total annual operating expenses of the Fund to the total annual operating expenses of other funds of similar size, noting that the expenses for the Fund compared favorably with industry averages for total annual operating expenses. They also took note of the fact that the Fund is not subject to any sales loads, sales commissions or other similar fees, including Rule 12b-1 distribution fees, and they considered the fact that the Manager had informed the Board that it did not intend to propose the introduction of such types of fees for the Fund. In connection with their review of these matters, the trustees took note of the fact that the Fund was established principally as an investment vehicle for use by larger institutional types of investors and that the Fund’s fee structure, which is an all-inclusive fee structure, is reflective of fees generally charged in the institutional fund marketplace. The Board also reviewed financial information concerning the Manager, noting its financial soundness as demonstrated by the financial information provided and the level of profitability relating to its services for the Fund, noting that these were reasonable and consistent with industry standards. The Board was also provided with information regarding the fees that the Manager charges other clients for investment advisory services and they noted that the fees were comparable based on the relevant circumstances of the types of accounts involved. The Board reviewed with the Manager the allocation of the portfolio management team’s time between managing the investments of the Fund and managing other accounts.
In addition, the Board reviewed with the Manager information regarding its brokerage practices, including soft dollar matters, and noted that the Manager did not have in place any formal soft dollar arrangements, and the Board also reviewed the Manager’s best execution procedures, which the Board noted were reasonable and consistent with standard industry practice.
Based on their review, the trustees concluded that the investment management services provided under the Agreement were reasonably worth the full amount of the fee and that the terms of the Agreement were fair and reasonable. In reaching their conclusion with respect to their approval of the continuation of the Agreement, the trustees did not identify any one single factor as being controlling, rather, the Board took note of a combination of factors that influenced their decision making process. The Board did, however, identify the overall favorable investment performance of the Fund, the commitment of the Manager to the successful operation of the Fund, and the level of expenses of the Fund, as being important elements of their consideration. Based upon their review and consideration of these factors and other matters deemed relevant by the Board in reaching an informed business judgment, a majority of the Board of Trustees, including a majority of the Independent Trustees, concluded that the terms of the Agreement were fair and reasonable and the Board voted to approve the continuation of the Agreement with the Manager.
23
The Torray Institutional Fund
PORTFOLIO HOLDINGS, PROXY VOTING AND PROCEDURES
As of December 31, 2010 (unaudited)
The Fund files its complete schedule of portfolio holdings with the Securities and Exchange Commission (the "Commission") for the first and third quarters of each fiscal year on Form N-Q. The Fund's Forms N-Q are available on the Commission's website at http://www.sec.gov. The Fund's Forms N-Q may be reviewed and copied at the Commission's Public Reference Room in Washington, D.C. Information on the operation of the Commission's Public Reference Room may be obtained by calling 1-800-SEC-0330.
A description of the policies and procedures that the Fund uses to determine how to vote proxies relating to portfolio securities is available without charge, upon request, by calling 1-800-443-3036; and on the Commission's website at http://www.sec.gov.
Information regarding how the Fund voted proxies relating to portfolio securities is available without charge, upon request, by calling 1-800-443-3036; and on the Commission's website at http://www.sec.gov.
24
The Torray Institutional Fund
ABOUT YOUR FUND'S EXPENSES
As of December 31, 2010 (unaudited)
We believe it is important for you to understand the impact of costs on your investment. All mutual funds have operating expenses. As a shareholder of the Fund, you incur ongoing costs, including management fees, and other Fund expenses. Operating expenses, which are deducted directly from the Fund's gross income, directly reduce the investment return of the Fund.
A mutual fund's expenses are expressed as a percentage of its average net assets. This figure is known as the expense ratio. The following examples are intended to help you understand the ongoing costs (in dollars) of investing in the Fund and to compare these costs with the ongoing costs of investing in other mutual funds. The examples below are based on an investment of $1,000 made at the beginning of the period shown and held for the entire period.
The table on the next page illustrates the Fund's cost in two ways:
Actual Fund Return — This section helps you estimate the actual expenses that you paid over the period. The "Ending Account Value" shown is derived from the Fund's actual return, and the third column shows the operating expenses that would have been paid by an investor who started with $1,000 in the Fund. You may use the information here, together with the amount invested, to estimate the expenses that you paid over the period.
To do so, simply divide your account value by $1,000 (for example, an $8,600 account value divided by $1,000 = 8.6), then multiply the result by the number given for the Fund under the heading "Expenses Paid During Period” on the next page.
Hypothetical 5% Return — This section is intended to help you compare your Fund's costs with those of other mutual funds. It assumes that the Fund had an annual return of 5% before expenses, and that the expense ratio is unchanged. In this case, because the return used is not the Fund's actual return, the results do not apply to your investment. The example is useful in making comparisons because the Commission requires all mutual funds to calculate expenses based on a 5% return. You can assess the Fund's costs by comparing this hypothetical example with the hypothetical examples that appear in shareholder reports of other funds.
Note that expenses shown in the table are meant to highlight and help you compare ongoing costs only. The Fund does not charge transaction fees, such as purchase or redemption fees, nor does it carry a "sales load."
The calculation assumes no shares were bought or sold during the period. Your actual costs may have been higher or lower, depending on the amount of your investment and the timing of any purchases or redemptions.
25
The Torray Institutional Fund
ABOUT YOUR FUND'S EXPENSES (continued)
As of December 31, 2010 (unaudited)
More information about the Fund's expenses, including recent annual expense ratios, can be found in this report. For additional information on operating expenses and other shareholder costs, please refer to the Fund's prospectus.
| | | | | | | | | | | | |
| | | Beginning
Account Value
July 1, 2010
| | | Ending
Account Value
December 31, 2010
| | | Expenses Paid
During Period*
| |
Based on Actual Fund Return | | $ | 1,000.00 | | | $ | 1,159.40 | | | $ | 4.63 | |
Based on Hypothetical 5% Return | | $ | 1,000.00 | | | $ | 1,020.92 | | | $ | 4.33 | |
(before expenses) | | | | | | | | | | | | |
| * | Expenses are equal to the Fund's annualized expense ratio of 0.85% for the period, multiplied by the average account value over the period, multiplied by 184/365 (to reflect the one-half year period). |
26
The Torray Institutional Fund
TAX INFORMATION
As of December 31, 2010 (unaudited)
We are required to advise you within 60 days of the Fund's fiscal year-end regarding the Federal tax status of certain distributions received by shareholders during such fiscal year. The information below is provided for the Fund's fiscal year ending December 31, 2010. All designations are based on financial information available as of the date of this annual report and, accordingly, are subject to change. For each item it is the intention of the Fund to designate the maximum amount permitted under the Internal Revenue Code and the regulations thereunder.
Qualified Interest Income
For the year ended December 31, 2010, 0.43% of the ordinary distributions paid (net investment income plus short-term capital gain) represent the amount of Qualifying Interest Income as created by The American Jobs Creation Act of 2004.
Qualified Dividend Income
For the year ended December 31, 2010, 100% of the distributions paid by the Fund from ordinary income qualifies for a reduced tax rate pursuant to The Jobs and Growth Tax Relief Reconciliation Act of 2003.
Dividends Received Deduction
For the year ended December 31, 2010, 100% of the ordinary income distribution qualifies for the dividends received deduction available to corporations.
Dividends and distributions received by retirement plans such as IRA's, Keogh-type plans and 403(b) plans need not be reported as taxable income. However, many retirement plan trusts may need this information for their annual information reporting.
27
TRUSTEES
Carol Crawford
Bruce C. Ellis
William M Lane
Robert P. Moltz
Wayne H. Shaner
INVESTMENT ADVISOR
Torray LLC
OFFICERS
Robert E. Torray
William M Lane
Fred M. Fialco
Shawn M. Hendon
Nicholas C. Haffenreffer
INDEPENDENT REGISTERED
PUBLIC ACCOUNTING FIRM
BBD, LLP
1835 Market Street 26th Floor
Philadelphia, PA 19103
TRANSFER AGENT
BNY Mellon Investment Servicing (US) Inc.
101 Sabin Street
Pawtucket, RI 02860-1427
LEGAL COUNSEL
Dechert LLP
1775 I Street, N.W.
Washington, DC 20006
Distributed by BNY Mellon Distributors Inc.
760 Moore Road, King of Prussia, PA 19406-1212
Date of first use, February 2011
This report is not authorized for distribution to prospective
investors unless preceded or accompanied by a current
prospectus. All indices are unmanaged groupings of stocks
that are not available for investment.
The
TORRAY
INSTITUTIONAL
FUND
ANNUAL REPORT
December 31, 2010
The Torray Institutional Fund
Suite 1100
7501 Wisconsin Avenue
Bethesda, Maryland 20814-6523
(301) 493-4600
(800) 443-3036
The Torray Resolute Fund
STATEMENT OF ASSETS AND LIABILITIES
As of December 31, 2010
| | | | |
ASSETS | | | | |
Receivable for fund shares sold | | $ | 100,000 | |
| | | | |
TOTAL ASSETS | | | 100,000 | |
| | | | |
NET ASSETS | | $ | 100,000 | |
| | | | |
Paid-in-capital (10,000 shares outstanding, unlimited shares authorized) | | $ | 100,000 | |
| | | | |
TOTAL NET ASSETS | | $ | 100,000 | |
| | | | |
Net Asset Value, Offering and Redemption Price per Share | | $ | 10.00 | |
| | | | |
See notes to the financial statements.
1
The Torray Resolute Fund
STATEMENTS OF CHANGES IN NET ASSETS
For the periods indicated:
| | | | |
| | | Period
ended
12/31/10 (1) | |
Shares of Beneficial Interest | | | | |
Increase (Decrease) from share transactions | | $ | 100,000 | |
| | | | |
| |
Total increase (decrease) | | | 100,000 | |
| |
Net Assets - Beginning of Period | | | — | |
| | | | |
| |
Net Assets - End of Period | | $ | 100,000 | |
| | | | |
| (1) | Commencement of operations on 12/31/10. |
See notes to the financial statements.
2
The Torray Resolute Fund
NOTES TO FINANCIAL STATEMENTS
As of December 31, 2010
NOTE 1 - SUMMARY OF SIGNIFICANT ACCOUNTING POLICIES
The Torray Resolute Fund (“Fund”) is a separate series of The Torray Fund (“Trust”). The Fund commenced operations on December 31, 2010. The Trust is registered under the Investment Company Act of 1940, as amended, as a no-load, diversified, open-end management investment company. The Trust was organized as a business trust under Massachusetts law. The Fund’s primary investment objective is to seek to achieve long-term growth of capital. The Fund seeks to meet its objective by investing its assets in a diversified portfolio of common stocks. In order to accomplish these goals, the Fund intends to hold stocks for the long term, as opposed to actively buying and selling. There can be no assurances that the Fund’s investment objectives will be achieved.
The following is a summary of accounting policies followed by the Fund in the preparation of its financial statements. These policies are in conformity with accounting principles generally accepted in the United States of America.
Securities Valuation Portfolio securities for which market quotations are readily available are valued at market value, which is determined by using the last reported sale price, or, if no sales are reported, the last reported bid price. For NASDAQ traded securities, market value is determined on the basis of the NASDAQ Official Closing Price instead of the last reported sales price. Other assets and securities for which no quotations are readily available or for which Torray LLC (the “Advisor”) believes do not reflect market value are valued at fair value as determined in good faith by the Advisor under the supervision of the Board of Trustees (the “Board” or “Trustees”) in accordance with the Fund’s Valuation Procedures. Short-term obligations having remaining maturities of 60 days or less are valued at amortized cost, which approximates market value.
Securities Transactions and Investment Income Securities transactions are recorded on a trade date basis. Realized gains and losses from securities transactions are recorded on the specific identification basis. Dividend income and distributions to shareholders are recorded on the ex-dividend date. Interest income, including amortization of discount on short-term investments, and expenses are recorded on the accrual basis. Premium and discount are amortized using the effective yield to maturity method.
Federal Income Taxes The Fund intends to continue to comply with the requirements of the Internal Revenue Code applicable to regulated investment companies and to distribute all of its taxable income, including any net realized gain on investments to its shareholders. Therefore, no Federal income tax provision is required.
Management has analyzed the Fund’s tax positions to be taken on the Federal income tax return for the current year, and has concluded that no provision for Federal income tax is required in the Fund’s financial statements. The Fund’s Federal and state income and Federal excise tax returns for tax years for which the applicable statutes of limitations have not expired are subject to examination by the Internal Revenue Service and state departments of revenue.
Net Asset Value The net asset value per share of the Fund is determined daily as of the close of trading on the New York Stock Exchange by dividing the value of the Fund’s net assets by the number of shares outstanding.
Interest Expense When cash balances are overdrawn in the Fund’s custody account, the Fund is charged an overdraft fee equal to 1.25% above the Federal Funds Rate. The Trust has entered into a line of credit facility with PNC Bank. Under the terms of the line of credit, the separate series of the Trust (including the Fund) may borrow up to $20,000,000 on a short-term basis with interest accruing at the Federal Funds Rate plus 0.75%. As of December 31, 2010, the Fund had no outstanding borrowings under this line of credit facility.
Use of Estimates In preparing financial statements in accordance with accounting principles generally accepted in the United States of America, management is required to make estimates and assumptions that affect the
3
The Torray Resolute Fund
NOTES TO FINANCIAL STATEMENTS (continued)
As of December 31, 2010
reported amounts of assets and liabilities and the disclosure of contingent assets and liabilities at the date of the financial statements, and the reported amounts of increases and decreases in net assets from operations during the reporting period. Actual results could differ from those estimates.
NOTE 2 - SHARES OF BENEFICIAL INTEREST TRANSACTIONS
Transactions in shares of beneficial interest were as follows:
| | | | | | | | |
| | | Period ended
12/31/10 | |
| | | Shares | | | Amount | |
Shares issued | | | 10,000 | | | $ | 100,000 | |
Reinvestments of dividends and distributions | | | — | | | | — | |
Shares redeemed | | | — | | | | — | |
| | | | | | | | |
| | | 10,000 | | | $ | 100,000 | |
| | | | | | | | |
NOTE 3 - MANAGEMENT FEES
Pursuant to the Management Contract, the Advisor provides investment advisory and administrative services to the Fund. The Fund pays the Advisor a management fee, computed daily and payable monthly at the annual rate of 1.00% of the Fund’s average daily net assets. For the period ended December 31, 2010, the Fund incurred management fees of $0.
There were no expenses incurred by the Fund during the period ended December 31, 2010. Typical costs associated with the Fund’s operations including transfer agent fees, independent trustees’ fees ($14,000 per annum and $2,000 for each Board meeting attended per Trustee), dues, fees and expenses of registering and qualifying the Fund and its shares for distribution, charges of custodian, auditing and legal expenses, insurance premiums, supplies, postage, expenses of issue or redemption of shares, reports to shareholders and Trustees, expenses of printing and mailing prospectuses, proxy statements and proxies to existing shareholders, and other miscellaneous expenses.
Certain officers and Trustees of the Fund are also officers and/or shareholders of the Advisor.
NOTE 5 - TAX MATTERS
Distributions to shareholders are determined in accordance with United States Federal income tax regulations, which may differ from accounting principles generally accepted in the United States of America.
NOTE 6 - COMMITMENTS AND CONTINGENCIES
The Fund indemnifies its officers and Trustees for certain liabilities that may arise from their performance of their duties to the Fund. Additionally, in the normal course of business, the Fund enters into contracts that contain a variety of representations and warranties which provide general indemnifications. The Fund’s maximum exposure under these arrangements is unknown, as this would involve future claims that may be made against the Fund that have not yet occurred.
4
The Torray Resolute Fund
NOTES TO FINANCIAL STATEMENTS (continued)
As of December 31, 2010
NOTE 7 - SUBSEQUENT EVENTS
Management has evaluated the impact of all subsequent events on the Fund and has determined that there were no subsequent events requiring recognition or disclosure in the financial statements.
5
The Torray Resolute Fund
REPORT OF INDEPENDENT REGISTERED PUBLIC ACCOUNTING FIRM
To the Board of Trustees of The Torray Fund
and the Shareholder of The Torray Resolute Fund
We have audited the accompanying statement of assets and liabilities of The Torray Resolute Fund (“the Fund”), a series of shares of beneficial interest of The Torray Fund, as of December 31, 2010, and the related statement of changes in net assets for the period ended December 31, 2010. These financial statements are the responsibility of the Fund’s management. Our responsibility is to express an opinion on these financial statements based on our audit.
We conducted our audit in accordance with the standards of the Public Company Accounting Oversight Board (United States). Those standards require that we plan and perform the audit to obtain reasonable assurance about whether the financial statements are free of material misstatement. An audit includes examining, on a test basis, evidence supporting the amounts and disclosures in the financial statements. An audit also includes assessing the accounting principles used and significant estimates made by management, as well as evaluating the overall financial statement presentation. We believe that our audit provides a reasonable basis for our opinion.
In our opinion, the financial statements referred to above present fairly, in all material respects, the financial position of The Torray Resolute Fund as of December 31, 2010, and the changes in its net assets for the period then ended in conformity with accounting principles generally accepted in the United States of America.

BBD, LLP
Philadelphia, Pennsylvania
February 18, 2011
6
The Torray Resolute Fund
FUND MANAGEMENT
As of December 31, 2010 (unaudited)
The Trust is overseen by a Board of Trustees (the "Board"), which has delegated the day-to-day management to the officers of the Trust. The Board meets regularly to review the Fund's activities, contractual arrangements, and performance. The trustees and officers serve until their successors are elected and qualified, or until the trustee or officer dies, resigns or is removed, or becomes disqualified.
Information pertaining to the Trustees and Officers of the Trust is set forth below. The Statement of Additional Information (“SAI”) includes additional information about the Trustees and is available without charge, upon request, by calling (800) 443-3036.
| | | | | | | | | | |
Name, Birthdate,
Address* and
Position(s) with the Trust | | Term of Office
and Length of
Time Served | | Principal Occupation(s) During Past 5 Years | | No. of
Portfolios in
Fund Complex
Overseen by
Trustee | | | Other Directorships Held |
| INDEPENDENT TRUSTEES |
Carol T. Crawford 02/25/43 Trustee | | Indefinite Term Since 2006 | | Attorney and International Trade Consultant McLean, VA | | | 3 | | | Director, Smithfield Foods, Inc., Smithfield, VA |
Bruce C. Ellis 07/20/44 Trustee | | Indefinite Term Since 1993 | | Private Investor, Bethesda, MD | | | 3 | | | None |
Robert P. Moltz 10/03/47 Trustee | | Indefinite Term Since 1990 | | President, CEO, Weaver Bros Insurance Associates, Inc., Bethesda, MD | | | 3 | | | None |
Wayne H. Shaner** 08/23/47 Trustee and Chairman of the Board | | Indefinite Term Since 1993 | | Managing Partner, Rockledge Partners, LLC, Investment Advisory Firm, Easton, MD (Jan. 2004-Present); Vice President, Torray LLC, Bethesda, MD (Jan. 2008-Jun. 2008) | | | 3 | | | Director, Van Eck Funds, New York, NY |
7
The Torray Resolute Fund
FUND MANAGEMENT (continued)
As of December 31, 2010 (unaudited)
| | | | | | | | | | |
Name, Birthdate,
Address* and
Position(s) with the Trust | | Term of Office
and Length of
Time Served | | Principal Occupation(s) During Past 5 Years | | No. of
Portfolios in
Fund Complex
Overseen by
Trustee | | | Other Directorships Held |
| INTERESTED TRUSTEE AND OFFICERS OF THE TRUST |
William M Lane*** 05/21/50 Trustee, Treasurer, Secretary, Chief Compliance Officer and Anti-Money Laundering Officer | | Indefinite Term Since 1990 | | Vice President, Secretary and Chief Compliance Officer, Torray LLC, Bethesda, MD (Oct. 2005-Present); Vice President, Secretary, Treasurer and Chief Compliance Officer, Robert E. Torray & Co. Inc., Bethesda, MD (Jul. 1984-Oct. 2005); Vice President, Secretary and Chief Compliance Officer, The Torray Corporation, Bethesda, MD (Jan. 1990-Oct. 2005); Vice President, Secretary, Treasurer and Chief Compliance Officer, TEL Corporation, Bethesda, MD (Jun. 2005-Oct. 2005).*** | | | 3 | | | None |
Robert E. Torray 04/10/37 President | | Indefinite Term Since 2007 | | Chairman, Torray LLC, Bethesda, MD (2005- Present); President, Torray LLC, Bethesda, MD (2007-Present); President, Robert E. Torray & Co. Inc., Bethesda, MD (May 1972- Oct. 2005); President, The Torray Corporation, Bethesda, MD (Jan. 1990-Oct. 2005); Chairman, TEL Corporation, Bethesda, MD (Jun. 2005-Oct. 2005).**** | | | N/A | | | None |
| * | | All addresses are c/o The Torray Fund, 7501 Wisconsin Avenue, Suite 1100, Bethesda, MD 20814-6523. |
| ** | | Mr. Shaner is deemed to be an independent Trustee effective as of January 1, 2011. |
| *** | | Mr. Lane, by virtue of his employment with Torray LLC, the Trust’s investment adviser, is considered an “interested person” of the Trust, as that term is defined in Section 2(a)(19) of the Investment Company Act of 1940, as amended. |
| **** | | Robert E. Torray & Co. Inc., The Torray Corporation and TEL Corporation have all been succeeded to by Torray LLC. |
8
The Torray Resolute Fund
FACTORS CONSIDERED BY THE BOARD OF TRUSTEES IN CONNECTION WITH THEIR APPROVAL OF THE ADOPTION OF THE FUND’S INVESTMENT MANAGEMENT AGREEMENT WITH THE MANAGER (unaudited)
The Fund has entered into an Investment Management Agreement (the “Agreement”) with Torray LLC (the “Manager”) pursuant to which the Manager has agreed to provide investment management services to the Fund. In accordance with the Investment Company Act of 1940, the Board of Trustees of the Fund is required to initially approve the adoption of the Agreement with the Manager, and this must take place at an in-person meeting of the Board. The relevant provisions of the Investment Company Act of 1940 specifically provide that it is the duty of the Board to request and evaluate such information as the Board determines is necessary to allow them to properly consider the adoption of the Agreement, and it is the duty of the Manager to furnish the trustees with such information that is responsive to their request. Set forth below is a discussion of the various factors that the Board of Trustees considered in deciding to approve the adoption of the Agreement with the Manager.
In determining whether to approve the adoption of the Agreement, the Board of Trustees requested, and the Manager provided, information and data relevant to the Board’s consideration. This included materials that provided the Board with information regarding the investment performance of certain investment management accounts that are substantially similar to the Fund that have been managed by the portfolio manager of the Fund and information regarding the estimated fees and expenses of the Fund. As part of its deliberations, the Board also considered and relied upon the information about the Manager that had been provided to them throughout the year in connection with their regular Board meetings at which they engage in the ongoing oversight of each of the Funds advised and managed by the Manager and their operations.
The Board initially met at an in-person meeting on October 6, 2010, during which they considered various matters with respect to the proposed establishment and organization of the Fund. The Board then met again at an in-person meeting on December 8, 2010, in order to consider the proposed adoption of the Agreement. Among the factors the Board considered was the performance results of a composite of investment management accounts managed by the Fund’s portfolio manager over a ten-year period, which accounts have substantially similar investment objectives, policies and strategies as the Fund (the “Composite”). The members of the Board took into consideration the favorable performance of the Composite as compared to the Fund’s primary benchmark index, the Russell 1000 Growth Index, as well as the favorable performance of the Composite as compared to the Standard & Poor’s 500 Stock Index, over various time periods. They noted the range of investment advisory and management services that are to be provided by the Manager and the level and quality of these services that have been provided to the other Funds in the Trust, and in particular, they noted the quality of the personnel providing these services, taking into consideration their finding that the personnel providing these services, and the services provided, were of a very high caliber and quality.
The Board also compared the estimated expenses of the Fund to the expenses of other similar types of funds, noting that the estimated average expense ratio for the Fund for its initial year of operations compared favorably with industry averages. They also took note of the fact that the Fund will not be subject to any sales loads, sales commissions or other similar fees, including Rule 12b-1 distribution fees, which helps to keep the overall expense to shareholders of investing in the Fund lower than the expenses associated with investing in many comparable funds, and they considered the fact that the Manager had informed the Board that it did not intend to propose the introduction of such types of fees for the Fund.
9
The Board took into consideration the Manager’s agreement to voluntary limit the total operating expenses of the Fund during its initial year of investment operations. The Board also reviewed financial information concerning the Manager, noting its financial soundness as demonstrated by the financial information provided. The Board was also provided with information regarding the fees that the Manager charges other clients for similar investment advisory services and they noted that the fees were comparable based on the relevant circumstances of the types of accounts involved. The Board reviewed with the Manager the expected allocation of the portfolio manager’s time between managing the investments of the Fund and managing other accounts.
In addition, the Board reviewed with the Manager information regarding its brokerage practices, including its soft dollar practices, and noted that the Manager did not have in place any formal soft dollar arrangements, and the Board also reviewed the Manager’s best execution procedures, which the Board noted were reasonable and consistent with standard industry practice.
Based on their review, the trustees concluded that the investment management services to be provided under the Agreement were reasonably worth the full amount of the fee and that the terms of the Agreement were fair and reasonable. In reaching their conclusion with respect to their approval of the adoption of the Agreement, the trustees did not identify any one single factor as being controlling, rather, the Board took note of a combination of factors that influenced their decision making process. The Board did, however, identify the overall favorable long-term investment performance of the private accounts managed by the Fund’s portfolio manager as represented by the Composite, the commitment of the Manager to the successful operation of the Fund, the estimated level of expenses of the Fund and the Manager’s voluntary agreement to limit the Fund’s total operating expenses during its initial year of investment operations, as being important elements of their consideration. Based upon their review and consideration of these factors and other matters deemed relevant by the Board in reaching an informed business judgment, a majority of the Board of Trustees, including a majority of the Independent Trustees, concluded that the terms of the Agreement were fair and reasonable and the Board voted to approve the adoption of the Agreement with the Manager.
10
The Torray Resolute Fund
PORTFOLIO HOLDINGS, PROXY VOTING AND PROCEDURES
As of December 31, 2010 (unaudited)
The Fund files its complete schedule of portfolio holdings with the Securities and Exchange Commission (the “Commission”) for the first and third quarters of each fiscal year on Form N-Q. The Fund’s Forms N-Q are available on the Commission’s website at http://www.sec.gov. The Fund’s Forms N-Q may be reviewed and copied at the Commission’s Public Reference Room in Washington, D.C. Information on the operation of the Commission’s Public Reference Room may be obtained by calling 1-800-SEC-0330.
A description of the policies and procedures that the Fund uses to determine how to vote proxies relating to portfolio securities is available without charge, upon request, by calling 1-800-443-3036; and on the Commission’s website at http://www.sec.gov.
Information regarding how the Fund voted proxies relating to portfolio securities is available without charge, upon request, by calling 1-800-443-3036; and on the Commission’s website at http://www.sec.gov.
11
TRUSTEES
Carol Crawford
Bruce C. Ellis
William M Lane
Robert P. Moltz
Wayne H. Shaner
INVESTMENT ADVISOR
Torray LLC
OFFICERS
Robert E. Torray
William M Lane
Fred M. Fialco
Shawn M. Hendon
Nicholas C. Haffenreffer
INDEPENDENT REGISTERED
PUBLIC ACCOUNTING FIRM
BBD, LLP
1835 Market Street 26th Floor
Philadelphia, PA 19103
TRANSFER AGENT
��
BNY Mellon Investment Servicing (US) Inc.
101 Sabin Street
Pawtucket, RI 02860-1427
LEGAL COUNSEL
Dechert LLP
1775 I Street, N.W.
Washington, DC 20006
Distributed by BNY Mellon Distributors, Inc.
760 Moore Road, King of Prussia, PA 19406-1212
Date of first use, February 2011
This report is not authorized for distribution to prospective investors unless preceded or accompanied by a current prospectus. All indices are unmanaged groupings of stocks that are not available for investment.
Item 2. Code of Ethics.
| | (a) | The registrant, as of the end of the period covered by this report, has adopted a code of ethics that applies to the registrant’s principal executive officer, principal financial officer, principal accounting officer or controller, or persons performing similar functions, regardless of whether these individuals are employed by the registrant or a third party. |
| | (c) | There have been no amendments, during the period covered by this report, to a provision of the code of ethics that applies to the registrant’s principal executive officer, principal financial officer, principal accounting officer or controller, or persons performing similar functions, regardless of whether these individuals are employed by the registrant or a third party, and that relates to any element of the code of ethics description. |
| | (d) | The registrant has not granted any waivers, including an implicit waiver, from a provision of the code of ethics that applies to the registrant’s principal executive officer, principal financial officer, principal accounting officer or controller, or persons performing similar functions, regardless of whether these individuals are employed by the registrant or a third party, that relates to one or more of the items set forth in paragraph (b) of this item’s instructions. |
Item 3. Audit Committee Financial Expert.
The Registrant’s Board of Directors has not designated an audit committee financial expert. The Registrant has determined that it will retain the services of an independent third party to assist it if circumstances arise that require specific investment company auditing expertise.
Item 4. Principal Accountant Fees and Services.
Audit Fees
| | (a) | The aggregate fees billed for each of the last two fiscal years for professional services rendered by the principal accountant for the audit of the registrant’s annual financial statements or services that are normally provided by the accountant in connection with statutory and regulatory filings or engagements for those fiscal years are $53,500 for 2010 and $51,000 for 2009. |
Audit-Related Fees
| | (b) | The aggregate fees billed in each of the last two fiscal years for assurance and related services by the principal accountant that are reasonably related to the performance of the audit of the registrant’s financial statements and are not reported under paragraph (a) of this Item are $0 for 2010 and $0 for 2009. |
Tax Fees
| | (c) | The aggregate fees billed in each of the last two fiscal years for professional services rendered by the principal accountant for tax compliance, tax advice, and tax planning are $4,000 for 2010 and $4,000 for 2009. Tax fees represent tax compliance services provided in connection with the review of the Registrant’s tax returns. |
All Other Fees
| | (d) | The aggregate fees billed in each of the last two fiscal years for products and services provided by the principal accountant, other than the services reported in paragraphs (a) through (c) of this Item are $0 for 2010 and $0 for 2009. |
| | |
(e)(1) | | Disclose the audit committee’s pre-approval policies and procedures described in paragraph (c)(7) of Rule 2-01 of Regulation S-X. |
| | Audit Committee Pre-Approval Policy. All services to be performed for the Registrant by BBD, LLP must be pre-approved by the audit committee. All services performed during 2010 and 2009 were pre-approved by the committee. |
| (e)(2) | | The percentage of services described in each of paragraphs (b) through (d) of this Item that were approved by the audit committee pursuant to paragraph (c)(7)(i)(C) of Rule 2-01 of Regulation S-X are as follows: |
(b) 0%
(c) 100%
(d) 0%
| | (f) | The percentage of hours expended on the principal accountant’s engagement to audit the registrant’s financial statements for the most recent fiscal year that were attributed to work performed by persons other than the principal accountant’s full-time, permanent employees was 0%. |
| | (g) | The aggregate non-audit fees billed by the registrant’s accountant for services rendered to the registrant, and rendered to the registrant’s investment adviser (not including any sub-adviser whose role is primarily portfolio management and is subcontracted with or overseen by another investment adviser), and any entity controlling, controlled by, or under common control with the adviser that provides ongoing services to the registrant for each of the last two fiscal years of the registrant was $0 for 2010 and $0 for 2009. |
| | (h) | The registrant’s audit committee of the board of directors has considered whether the provision of non-audit services that were rendered to the registrant’s investment adviser (not including any sub-adviser whose role is primarily portfolio management and is subcontracted with or overseen by another investment adviser), and any entity controlling, controlled by, or under common control with the investment adviser that provides ongoing services to the registrant that were not pre-approved pursuant to paragraph (c)(7)(ii) of Rule 2-01 of Regulation S-X is compatible with maintaining the principal accountant’s independence. |
Item 5. Audit Committee of Listed registrants.
Not applicable.
Item 6. Investments.
| (a) | Schedule of Investments in securities of unaffiliated issuers as of the close of the reporting period is included as part of the report to shareholders filed under Item 1 of this form. |
| | |
| Item 7. | | Disclosure of Proxy Voting Policies and Procedures for Closed-End Management Investment Companies. |
Not applicable.
Item 8. Portfolio Managers of Closed-End Management Investment Companies.
Not applicable.
| | |
| Item 9. | | Purchases of Equity Securities by Closed-End Management Investment Company and Affiliated Purchasers. |
Not applicable.
Item 10. Submission of Matters to a Vote of Security Holders.
There have been no material changes to the procedures by which the shareholders may recommend nominees to the registrant’s board of directors, where those changes were implemented after the registrant last provided disclosure in response to the requirements of Item 407(c)(2)(iv) of Regulation S-K (17 CFR 229.407) (as required by Item 22(b)(15) of Schedule 14A (17 CFR 240.14a-101)), or this Item.
Item 11. Controls and Procedures.
| | (a) | The registrant’s principal executive and principal financial officers, or persons performing similar functions, have concluded that the registrant’s disclosure controls and procedures (as defined in Rule 30a-3(c) under the Investment Company Act of 1940, as amended (the “1940 Act”) (17 CFR 270.30a-3(c))) are effective, as of a date within 90 days of the filing date of the report that includes the disclosure required by this paragraph, based on their evaluation of these controls and procedures required by Rule 30a-3(b) under the 1940 Act (17 CFR 270.30a-3(b)) and Rules 13a-15(b) or 15d-15(b) under the Securities Exchange Act of 1934, as amended (17 CFR 240.13a-15(b) or 240.15d-15(b)). |
| | (b) | There were no changes in the registrant’s internal control over financial reporting (as defined in Rule 30a-3(d) under the 1940 Act (17 CFR 270.30a-3(d)) that occurred during the registrant’s second fiscal quarter of the period covered by this report that has materially affected, or is reasonably likely to materially affect, the registrant’s internal control over financial reporting. |
Item 12. Exhibits.
| | |
| (a)(1) | | Code of ethics, or any amendment thereto, that is the subject of disclosure required by Item 2 is attached hereto. |
| |
| (a)(2) | | Certifications pursuant to Rule 30a-2(a) under the 1940 Act and Section 302 of the Sarbanes-Oxley Act of 2002 are attached hereto. |
| |
| (a)(3) | | Not applicable. |
| |
| (b) | | Certifications pursuant to Rule 30a-2(b) under the 1940 Act and Section 906 of the Sarbanes- Oxley Act of 2002 are attached hereto. |
SIGNATURES
Pursuant to the requirements of the Securities Exchange Act of 1934 and the Investment Company Act of 1940, the registrant has duly caused this report to be signed on its behalf by the undersigned, thereunto duly authorized.
| | | | |
| (registrant) | | | | The Torray Fund |
| | | | |
| | |
| By (Signature and Title)* | | | | /s/ Robert E. Torray |
| | | | Robert E. Torray, President |
| | | | (principal executive officer) |
Pursuant to the requirements of the Securities Exchange Act of 1934 and the Investment Company Act of 1940, this report has been signed below by the following persons on behalf of the registrant and in the capacities and on the dates indicated.
| | |
| By (Signature and Title)* | | /s/ Robert E. Torray |
| | Robert E. Torray, President |
| | (principal executive officer) |
| | |
| By (Signature and Title)* | | /s/ William M Lane |
| | William M Lane, Treasurer |
| | (principal financial officer) |
| * | Print the name and title of each signing officer under his or her signature. |