UNITED STATES
SECURITIES AND EXCHANGE COMMISSION
Washington, D.C. 20549
FORM N-CSR
CERTIFIED SHAREHOLDER REPORT OF REGISTERED MANAGEMENT INVESTMENT COMPANIES
Investment Company Act file number 811-06096
The Torray Fund
(Exact name of registrant as specified in charter)
7501 Wisconsin Avenue, Suite 1100
Bethesda, MD 20814-6523
(Address of principal executive offices) (Zip code)
William M Lane
Torray LLC
7501 Wisconsin Avenue, Suite 1100
Bethesda, MD 20814-6523
(Name and address of agent for service)
Registrant’s telephone number, including area code: 301-493-4600
Date of fiscal year end: December 31
Date of reporting period: December 31, 2008
Item 1. Reports to Stockholders.
The Report to Shareholders is attached herewith.
The Torray Fund
Letter to Shareholders
January 15, 2009
Dear Fellow Shareholders,
We are deeply disappointed to report that The Torray Fund depreciated 37.4% last year, about the same as the Standard and Poor’s 500 Index (-37.0%). This is the first time in our Firm’s 36-year history we have lost anywhere near as much as the market during a severe downturn. The tangled web of toxic financial products, bursting of the housing bubble, hedge fund implosions and margin calls combined to destroy values across the board. In addition, mutual funds, ours included, which had been large net buyers of stocks for many decades, faced massive redemptions, suddenly becoming forced sellers just when buyers became scarce. There was simply nowhere to hide.
While the performance of the S&P 500 and Dow was bad enough, broader measures of the market paint an even grimmer picture: the Value Line 1600 and Wilshire 5000 stock indexes lost 49% and 39%, respectively. Overseas exchanges also experienced big setbacks. The Dow Jones Global Index, excluding the U.S., sank 46%. China, India and Russia were off 65%, 52% and 72%. Some European markets registered similar declines; commodity prices also buckled, most notably oil, which dropped 70% from its high. These numbing results mark the close of a miserable decade for investors — the S&P 500, including dividends, lost 1.4% annually over the period, and we only broke even. While the media continues to draw parallels to the 1930s, the last ten years were worse. Between 1929 and 1938, the market lost 0.89% per year, and from 1930 to 1939, it slipped only 0.05% annually.
Compounding the pain from these losses is a market environment characterized by low volumes and high volatility which has attracted speculators but scared off long-term investors. Sources at the New York Stock Exchange have told us there are an estimated several million day-traders gambling with their 401(k) plans — some, unfortunately, unemployed. These trading accounts can be leveraged four-to-one ($100,000 of equity supports a $400,000 portfolio) provided the positions are liquidated by the end of each day. You may have noticed the market’s recent gyrations and heavy volume between 3:40 and its 4:00 close. It is during this period that many large blocks of stock and most of the outstanding day-trading margin debt are cleared, a phenomenon that occasionally has caused volume to as much as double in 20 minutes. (The orders are entered into the Exchange’s electronic system, nicknamed “the dark hole,” where they are matched by computers.) This activity has triggered wild swings in the Dow Jones and S&P 500 indices, heightening investors’ anxiety and adding to suspicions the market is being manipulated. The failure of banks and prominent Wall Street firms, the collapse of AIG, Fannie Mae, Freddie Mac and more, not to mention shocking revelations of at least five new Ponzi schemes, have played an even greater role in compromising the public’s trust in our financial system and the integrity of corporate managements.
But, we will not dwell on this further. The damage is done and, in our opinion, largely reflected in stock prices, particularly those of quality companies of the type held in our portfolio. While they may go lower, from a long-term perspective, valuations are attractive. Earnings returns and, in many cases, dividend yields, are well above rates on money market funds and U.S. government bonds of all maturities. (Short-term Treasuries yield zero, and the 30-year bond paying 4 1/2% trades at 131% of par for a current return of 3.4% and a yield if held to maturity of only 2.9%.)
1
The Torray Fund
Letter to Shareholders (continued)
January 15, 2009
Also worth noting is the Federal Reserve’s measure of assets available for immediate spending — i.e. cash or equivalents — jumped 86% to $8.9 trillion in the first 11 months of last year. That is enough to buy 75% of all domestic stocks. By contrast, at the market’s peak in early 2000, the same Fed measure totaled $5 trillion, or 20% of the market’s total value, suggesting that investors are more fearful of losses at today’s low prices than they were when the market was twice as high. If history is a guide, when the current financial distress passes and the economy recovers, investors will quickly change their minds and pile back into stocks, causing them to rally sharply. This classic “buy high — sell low — buy high” syndrome has afflicted investors since the earliest days of exchanges.
Another thing to keep in mind is that most of the cash on hand yields virtually nothing after inflation, and less than nothing after taxes. It seems highly unlikely investors will pursue this no-return option indefinitely. That is especially true if inflation heats up in the years ahead. Today’s all-time-low yields reflect the Federal Reserve’s concerns about deflation. Yet, at the height of the energy and materials mania around the middle of last year, its focus was just the opposite, which shows how fast things can change in such an unsettled environment.
While the Fed’s posture seems appropriate at this point, looking further down the road one has to wonder about the impact projected massive budget deficits will have on the bond market. Eventually, the current crisis will pass and all of the new money our government is pumping into the economy will surely make itself felt. We well remember the inflationary surge of the late 1970s and early ‘80s (peaking at 13.5% in 1980) which prompted the Federal Reserve under Chairman Paul Volcker to sharply raise rates. (The prime rate soared above 21% and the yield on the 30-year Treasury bond hit 15.2%.) Although it’s hard to conceive of such a move today, should history someday repeat, the U.S. government 4 1/2’s of 2038 would plunge from 1310 to 300 — a loss of 77%. Even if the current yield rose from 3.4% to 5.7% — its average since 1926 — its price would fall 520 points to 790. The intermediate and long-term Treasury market strikes us as a bond version of the housing and dot.com bubbles.
Having said all of this, as students of history, we remain eternally optimistic about America’s future. Over time, it has never paid to bet against it. Counting this year’s decline, stocks across the board are probably down 50%, with many having lost far more. Leaving aside the housing downturn, $10 trillion has disappeared, and few have been spared. We are all in the same boat. The question is what to do now? Our answer is to stay the course. Values, as earlier noted, are compelling, and the government’s massive rescue program should kick in relatively soon. While opinions differ widely on the likely impact, it seems improbable the package could produce a worse outcome than doing nothing.
Finally, we draw your attention to investor sentiment. It’s the most negative we’ve ever encountered. This stands in stark contrast to the unbridled optimism and high stock prices of the late 1990s and the euphoria over energy and materials between 2003 and 2007. Each of these episodes ended badly. The simple fact is that when investors have already departed and prices are low, risk is low as well, and vice-versa. After four down years between 1929 and 1932, the market rallied 54% in ‘33, eased 1.4% in ‘34, advanced 48% in ‘35 and another 34% in ‘36. This record is
2
The Torray Fund
Letter to Shareholders (continued)
January 15, 2009
at odds with the common perception that stocks were obliterated during the 1930s. As we pointed out before, they lost ground, but slightly less than our market did during the last decade.
In closing, we want to express again our profound disappointment over the loss you have suffered. As so many have observed, this has been a once-in-a-lifetime setback. We believe it is not an exaggeration to say once-in-a- century. Despite the present gloom, a few years from now we think the U.S. and world economies will have recovered, and stocks will be higher by enough to make the wait worthwhile.
We thank you for your investment and assure you we are devoted, as ever, to your best interests.
| | | | | | |
| | | Sincerely, | | | | |
| | | |
| | |  | | | | |
| | | Robert E. Torray | | | | |
| | | 
| | | | |
| | | Fred M. Fialco | | | | |
| | | 
| | | | |
| | | Shawn M. Hendon | | | | |
| | | | | | | |
3
The Torray Fund
PERFORMANCE DATA
As of December 31, 2008 (unaudited)
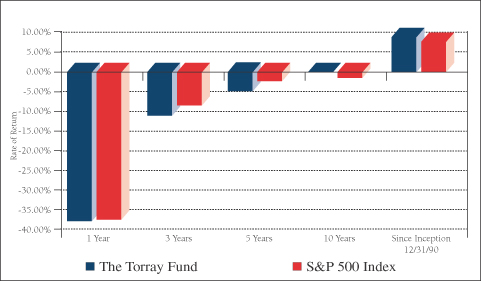
Average Annual Returns on an Investment in
The Torray Fund vs. the S&P 500 Index
For the periods ended December 31, 2008:
| | | | | | | | | | | | | | | |
| | | 1 Year
| | | 3 Years
| | | 5 Years
| | | 10 Years
| | | Since
Inception
12/31/90
| |
The Torray Fund | | (37.39 | %) | | (10.94 | %) | | (5.07 | %) | | 0.01 | % | | 8.79 | % |
S&P 500 Index | | (37.00 | %) | | (8.36 | %) | | (2.19 | %) | | (1.38 | %) | | 7.93 | % |
Cumulative Returns for the 18 years ended December 31, 2008
| | | |
The Torray Fund | | 355.97 | % |
S&P 500 Index | | 295.22 | % |
4
The Torray Fund
PERFORMANCE DATA (continued)
As of December 31, 2008 (unaudited)
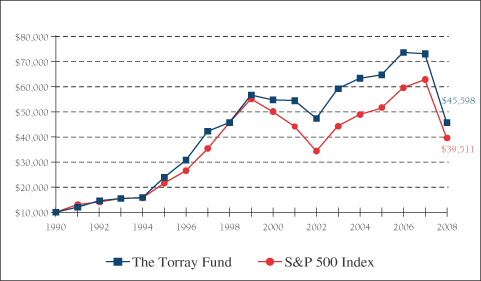
Change in Value of $10,000 Invested
on December 31, 1990 (commencement of operations) to:
| | | | | | | | | | | | | | | | | | |
| | | 12/31/93
| | 12/31/96
| | 12/31/99
| | 12/31/02
| | 12/31/05
| | 12/31/08
|
The Torray Fund | | $ | 15,448 | | $ | 30,719 | | $ | 56,519 | | $ | 47,236 | | $ | 64,542 | | $ | 45,598 |
S&P 500 Index | | $ | 15,465 | | $ | 26,499 | | $ | 54,998 | | $ | 34,318 | | $ | 51,319 | | $ | 39,511 |
The returns quoted represent past performance and do not guarantee future results. Investment return and principal value will fluctuate so that shares, when redeemed, may be worth more or less than their original cost. Current performance may be lower or higher. Returns current to the most recent month-end are available at www.torray.com. The returns shown do not reflect the deduction of taxes a shareholder would pay on the redemption of fund shares and distributions. The Fund’s gross annual operating expense ratio, as stated in the current prospectus dated May 1, 2008, is 1.09%. Returns on both The Torray Fund and the S&P 500 Index assume reinvestment of all dividends and distributions. The S&P 500 Index is an unmanaged index consisting of 500 U.S. large-cap stocks.
5
The Torray Fund
FUND PROFILE
As of December 31, 2008 (unaudited)
| | |
DIVERSIFICATION (% of net assets) | | |
| |
Information Technology | | 19.31% |
Industrials | | 18.23% |
Health Care | | 14.42% |
Financials | | 13.41% |
Consumer Discretionary | | 11.88% |
Consumer Staples | | 7.07% |
Energy | | 3.28% |
Telecommunications | | 2.86% |
Materials | | 2.42% |
Short-Term Investments | | 7.39% |
Liabilities Less Other Assets | | (0.27) |
| | |
|
| | | 100.00% |
| | |
|
| | | | |
| TOP TEN EQUITY HOLDINGS (% of net assets) |
| 1. | | Marsh & McLennan Cos., Inc. | | 4.3% |
| 2. | | Walt Disney Co. (The) | | 4.1% |
| 3. | | Johnson & Johnson | | 4.0% |
| 4. | | Automatic Data Processing, Inc. | | 3.9% |
| 5. | | O’Reilly Automotive, Inc. | | 3.8% |
| 6. | | Cintas Corp. | | 3.8% |
| 7. | | UnitedHealth Group, Inc. | | 3.7% |
| 8. | | WellPoint, Inc. | | 3.6% |
| 9. | | 3M Co. | | 3.6% |
| 10. | | Procter & Gamble Co. (The) | | 3.6% |
| | | | |
|
| | | | | 38.4% |
| | | | |
|
| | | | | |
PORTFOLIO CHARACTERISTICS | | | |
| | |
Net Assets (million) | | | | $ | 353 |
Number of Holdings | | | | | 33 |
Portfolio Turnover | | | | | 28.13% |
P/E Multiple (forward) | | | | | 11.0x |
Portfolio Yield | | | | | 2.75% |
Market Capitalization | | Average | | $ | 47.2 B |
| | | Median | | $ | 21.4 B |
6
The Torray Fund
SCHEDULE OF INVESTMENTS
As of December 31, 2008
| | | | | | | |
| | | Shares
| | | | Market Value
|
| COMMON STOCK 92.88% | | | |
| |
| 19.31% INFORMATION TECHNOLOGY | | | |
| | | 354,900 | | Automatic Data Processing, Inc. | | $ | 13,961,766 |
| | | 767,400 | | Cisco Systems, Inc.* | | | 12,508,620 |
| | | 148,600 | | International Business Machines Corp. | | | 12,506,176 |
| | | 1,163,020 | | EMC Corp.* | | | 12,176,819 |
| | | 616,700 | | Intel Corp. | | | 9,040,822 |
| | | 796,875 | | Applied Materials, Inc. | | | 8,072,344 |
| | | | | | |
|
|
| | | | | | | | 68,266,547 |
| |
| 18.23% INDUSTRIALS | | | |
| | | 573,646 | | Cintas Corp. | | | 13,325,797 |
| | | 223,300 | | 3M Co. | | | 12,848,682 |
| | | 308,800 | | Illinois Tool Works, Inc. | | | 10,823,440 |
| | | 490,097 | | General Electric Co. | | | 7,939,571 |
| | | 121,700 | | Danaher Corp. | | | 6,889,437 |
| | | 385,737 | | Owens Corning, Inc.* | | | 6,673,250 |
| | | 119,000 | | Eaton Corp. | | | 5,915,490 |
| | | | | | |
|
|
| | | | | | | | 64,415,667 |
| |
| 14.42% HEALTH CARE | | | |
| | | 237,624 | | Johnson & Johnson | | | 14,217,044 |
| | | 488,400 | | UnitedHealth Group, Inc. | | | 12,991,440 |
| | | 306,000 | | WellPoint, Inc.* | | | 12,891,780 |
| | | 203,800 | | Abbott Laboratories | | | 10,876,806 |
| | | | | | |
|
|
| | | | | | | | 50,977,070 |
| |
| 13.41% FINANCIALS | | | |
| | | 624,418 | | Marsh & McLennan Cos., Inc. | | | 15,154,625 |
| | | 2,375,200 | | LaBranche & Co., Inc.* | | | 11,377,208 |
| | | 326,900 | | Loews Corp. | | | 9,234,925 |
| | | 361,100 | | Bank of America Corp. | | | 5,084,288 |
| | | 183,500 | | American Express Co. | | | 3,403,925 |
| | | 469,600 | | Citigroup, Inc. | | | 3,151,016 |
| | | | | | |
|
|
| | | | | | | | 47,405,987 |
See notes to the financial statements.
7
The Torray Fund
SCHEDULE OF INVESTMENTS (continued)
As of December 31, 2008
| | | | | | | | | |
| | | Shares
| | | | Market Value
| |
| |
| 11.88% CONSUMER DISCRETIONARY | | | | |
| | | | 634,500 | | Walt Disney Co. (The) | | $ | 14,396,805 | |
| | | | 435,120 | | O'Reilly Automotive, Inc.* | | | 13,375,589 | |
| | | | 446,500 | | McGraw-Hill Cos., Inc. (The) | | | 10,354,335 | |
| | | | 481,700 | | Gannett Co., Inc. | | | 3,853,600 | |
| | | | | | | |
|
|
|
| | | | | | | | | 41,980,329 | |
| |
| 7.07% CONSUMER STAPLES | | | | |
| | | | 204,300 | | Procter & Gamble Co. (The) | | | 12,629,826 | |
| | | | 459,700 | | Kraft Foods, Inc., Class A | | | 12,342,945 | |
| | | | | | | |
|
|
|
| | | | | | | | | 24,972,771 | |
| |
| 3.28% ENERGY | | | | |
| | | | 2,578,031 | | USEC, Inc.* | | | 11,575,359 | |
| |
| 2.86% TELECOMMUNICATIONS | | | | |
| | | | 355,000 | | AT&T, Inc. | | | 10,117,500 | |
| |
| 2.42% MATERIALS | | | | |
| | | | 193,700 | | E.I. du Pont de Nemours & Co. | | | 4,900,610 | |
| | | | 242,100 | | Dow Chemical Co. (The) | | | 3,653,289 | |
| | | | | | | |
|
|
|
| | | | | | | | | 8,553,899 | |
| | | | | | | |
|
|
|
| TOTAL COMMON STOCK 92.88% | | | 328,265,129 | |
| (cost $449,908,669) | | | | |
| | | |
| | | Principal Amount | | | | | |
| SHORT-TERM INVESTMENTS 7.39% | | | | |
| | | $ | 26,121,925 | | PNC Bank Money Market Account, 0.05%(1) | | | 26,121,925 | |
| (cost $26,121,925) | | | | |
| | | | | | | |
|
|
|
| TOTAL INVESTMENTS 100.27% | | | 354,387,054 | |
| (cost $476,030,594) | | | | |
| |
| LIABILITIES LESS OTHER ASSETS (0.27%) | | | (942,012 | ) |
| | | | | | | |
|
|
|
| NET ASSETS 100.00% | | $ | 353,445,042 | |
| | | | | | | |
|
|
|
| * | Non-income producing securities. |
(1) | Represents current yield at December 31, 2008. |
See notes to the financial statements.
8
The Torray Fund
STATEMENT OF ASSETS AND LIABILITIES
As of December 31, 2008
| | | | |
ASSETS | | | | |
Investments in securities at value
(cost $476,030,594) | | $ | 354,387,054 | |
Interest and dividends receivable | | | 1,040,676 | |
Receivable for fund shares sold | | | 36,103 | |
Prepaid expenses | | | 50,587 | |
| | |
|
|
|
TOTAL ASSETS | | | 355,514,420 | |
| | |
|
|
|
| |
LIABILITIES | | | | |
Payable for fund shares redeemed | | | 1,613,789 | |
Payable to advisor | | | 298,995 | |
Accrued expenses | | | 148,344 | |
Payable to trustees | | | 8,250 | |
| | |
|
|
|
TOTAL LIABILITIES | | | 2,069,378 | |
| | |
|
|
|
| |
NET ASSETS | | $ | 353,445,042 | |
| | |
|
|
|
Shares of beneficial interest ($1 stated value,
16,331,430 shares outstanding, unlimited shares authorized) | | $ | 16,331,430 | |
Paid-in-capital in excess of par | | | 510,315,504 | |
Accumulated net realized loss on investments | | | (51,558,352 | ) |
Net unrealized depreciation of investments | | | (121,643,540 | ) |
| | |
|
|
|
| |
TOTAL NET ASSETS | | $ | 353,445,042 | |
| | |
|
|
|
Net asset value, offering and redemption price per share | | $ | 21.64 | |
| | |
|
|
|
See notes to the financial statements.
9
The Torray Fund
STATEMENT OF OPERATIONS
For the year ended December 31, 2008
| | | | |
INVESTMENT INCOME | | | | |
Dividend income | | $ | 11,998,879 | |
Interest income | | | 858,300 | |
| | |
|
|
|
Total income | | | 12,857,179 | |
| | |
|
|
|
| |
EXPENSES | | | | |
Management fees | | | 6,676,450 | |
Transfer agent fees & expenses | | | 548,278 | |
Legal fees | | | 84,636 | |
Custodian fees | | | 68,417 | |
Trustees' fees | | | 48,478 | |
Audit fees | | | 39,000 | |
Printing, postage & mailing | | | 35,358 | |
Registration & filing fees | | | 23,228 | |
Insurance expense | | | 19,159 | |
Interest expense | | | 4,508 | |
| | |
|
|
|
Total expenses | | | 7,547,512 | |
| | |
|
|
|
NET INVESTMENT INCOME | | | 5,309,667 | |
| | |
|
|
|
REALIZED AND UNREALIZED GAIN/(LOSS)
ON INVESTMENTS | | | | |
Net realized loss on investments | | | (51,918,837 | ) |
Realized gain distributions | | | 360,485 | |
Net change in unrealized appreciation (depreciation) on investments | | | (233,567,470 | ) |
| | |
|
|
|
Net realized and unrealized loss on investments | | | (285,125,822 | ) |
| | |
|
|
|
NET DECREASE IN NET ASSETS FROM OPERATIONS | | $ | (279,816,155 | ) |
| | |
|
|
|
See notes to the financial statements.
10
The Torray Fund
STATEMENT OF CHANGES IN NET ASSETS
For the years indicated:
| | | | | | | | |
| | | Year ended
12/31/2008
| | | Year ended
12/31/2007
| |
Decrease in Net Assets from Operations: | | | | | | | | |
Net investment income | | $ | 5,309,667 | | | $ | 4,127,509 | |
Net realized gain (loss) on investments | | | (51,558,352 | ) | | | 161,043,999 | |
Net change in unrealized appreciation (depreciation) on investments | | | (233,567,470 | ) | | | (167,246,623 | ) |
| | |
|
|
| |
|
|
|
Net decrease in net assets from operations | | | (279,816,155 | ) | | | (2,075,115 | ) |
| | |
|
|
| |
|
|
|
Distributions to Shareholders from: | | | | | | | | |
Net investment income ($0.303 and $0.121 per share, respectively) | | | (6,343,588 | ) | | | (3,263,557 | ) |
Net realized gains ($1.242 and $4.718 per share, respectively) | | | (29,816,455 | ) | | | (119,990,286 | ) |
Return of capital ($0.034 and $0.000 per share respectively) | | | (706,904 | ) | | | — | |
| | |
|
|
| |
|
|
|
Total distributions | | | (36,866,947 | ) | | | (123,253,843 | ) |
| | |
|
|
| |
|
|
|
| | |
Shares of Beneficial Interest | | | | | | | | |
Decrease from share transactions | | | (330,215,602 | ) | | | (73,246,614 | ) |
| | |
|
|
| |
|
|
|
Total decrease | | | (646,898,704 | ) | | | (198,575,572 | ) |
| | |
Net Assets — Beginning of Year | | | 1,000,343,746 | | | | 1,198,919,318 | |
| | |
|
|
| |
|
|
|
Net Assets — End of Year | | $ | 353,445,042 | | | $ | 1,000,343,746 | |
| | |
|
|
| |
|
|
|
Undistributed Net Investment Income | | $ | — | | | $ | 1,037,704 | |
| | |
|
|
| |
|
|
|
See notes to the financial statements.
11
The Torray Fund
FINANCIAL HIGHLIGHTS
For a share outstanding throughout each year presented:
PER SHARE DATA
| | | | | | | | | | | | | | | | | | | | |
| | | Years ended December 31:
| |
| | | 2008
| | | 2007
| | | 2006
| | | 2005
| | | 2004
| |
Net Asset Value, Beginning of Year | | $ | 36.440 | | | $ | 41.570 | | | $ | 39.020 | | | $ | 41.080 | | | $ | 39.980 | |
| | |
|
|
| |
|
|
| |
|
|
| |
|
|
| |
|
|
|
Income/(loss) from investment operations | | | | | | | | | | | | | | | | | | | | |
Net investment income | | | 0.243 | (2) | | | 0.152 | | | | 0.073 | | | | 0.133 | | | | 0.165 | |
Net gains (losses) on securities (both realized and unrealized) | | | (13.464 | ) | | | (0.443 | ) | | | 5.176 | | | | 0.653 | | | | 2.523 | |
| | |
|
|
| |
|
|
| |
|
|
| |
|
|
| |
|
|
|
Total from investment operations | | | (13.221 | ) | | | (0.291 | ) | | | 5.249 | | | | 0.786 | | | | 2.688 | |
| | |
|
|
| |
|
|
| |
|
|
| |
|
|
| |
|
|
|
Less: distributions | | | | | | | | | | | | | | | | | | | | |
Dividends (from net investment income) | | | (0.303 | ) | | | (0.121 | ) | | | (0.087 | ) | | | (0.133 | ) | | | (0.165 | ) |
Distributions (from capital gains) | | | (1.242 | ) | | | (4.718 | ) | | | (2.612 | ) | | | (2.713 | ) | | | (1.423 | ) |
Distributions (from return of capital) | | | (0.034 | ) | | | — | | | | — | | | | — | | | | — | |
| | |
|
|
| |
|
|
| |
|
|
| |
|
|
| |
|
|
|
Total distributions | | | (1.579 | ) | | | (4.839 | ) | | | (2.699 | ) | | | (2.846 | ) | | | (1.588 | ) |
| | |
|
|
| |
|
|
| |
|
|
| |
|
|
| |
|
|
|
Net Asset Value, End of Year | | $ | 21.640 | | | $ | 36.440 | | | $ | 41.570 | | | $ | 39.020 | | | $ | 41.080 | |
| | |
|
|
| |
|
|
| |
|
|
| |
|
|
| |
|
|
|
TOTAL RETURN(1) | | | (37.39 | %) | | | (0.80 | %) | | | 13.74 | % | | | 2.08 | % | | | 6.90 | % |
RATIOS/SUPPLEMENTAL DATA | | | | | | | | | | | | | | | | | | | | |
Net assets, end of year (000’s omitted) | | $ | 353,445 | | | $ | 1,000,344 | | | $ | 1,198,919 | | | $ | 1,329,951 | | | $ | 1,734,500 | |
Ratios of expenses to average net assets | | | 1.13 | % | | | 1.09 | % | | | 1.10 | % | | | 1.07 | % | | | 1.08 | % |
Ratios of net investment income to average net assets | | | 0.80 | % | | | 0.36 | % | | | 0.18 | % | | | 0.34 | % | | | 0.41 | % |
Portfolio turnover rate | | | 28.13 | % | | | 50.47 | % | | | 21.92 | % | | | 33.16 | % | | | 27.12 | % |
(1) | Past performance is not predictive of future performance. |
(2) | Calculated based on the average amount of shares outstanding during the year. |
See notes to the financial statements.
12
The Torray Fund
NOTES TO FINANCIAL STATEMENTS
As of December 31, 2008
NOTE 1 — SUMMARY OF SIGNIFICANT ACCOUNTING POLICIES
The Torray Fund (“Fund”) is a separate series of The Torray Fund (“Trust”). The Trust is registered under the Investment Company Act of 1940 as a no-load, diversified, open-end management investment company. The Trust was organized as a business trust under Massachusetts law. The Fund’s primary investment objective is to provide long-term total return. The Fund seeks to meet its objective by investing its assets in a diversified portfolio of common stocks. In order to accomplish these goals, the Fund intends to hold stocks for the long term, as opposed to actively buying and selling. There can be no assurances that the Fund’s investment objectives will be achieved.
The following is a summary of accounting policies followed by the Fund in the preparation of its financial statements. These policies are in conformity with accounting principles generally accepted in the United States of America.
Securities Valuation Portfolio securities for which market quotations are readily available are valued at market value, which is determined by using the last reported sale price, or, if no sales are reported, the last reported bid price. For NASDAQ traded securities, market value is determined on the basis of the NASDAQ official closing price instead of the last reported sales price. Other assets and securities for which no quotations are readily available or for which Torray LLC (the “Advisor”) believes do not reflect market value are valued at fair value as determined in good faith by the Advisor under the supervision of the Board of Trustees in accordance with the Fund’s Valuation Procedures. Short-term obligations having remaining maturities of 60 days or less are valued at amortized cost, which approximates market value.
Adoption of Statement of Financial Accounting Standards No. 157 “Fair Value Measurements” (“FAS 157”) In September 2006, the Financial Accounting Standards Board issued FAS 157 effective for fiscal years beginning after November 15, 2007. This standard clarifies the definition of fair value for financial reporting, establishes a framework for measuring fair value and requires additional disclosures about the use of fair value measurements. The Fund has adopted FAS 157 as of January 1, 2008. The three levels of the fair value hierarchy under FAS 157 are described below:
| | • | | Level 1—quoted prices in active markets for identical securities |
| | • | | Level 2—other significant observable inputs (including quoted prices for similar securities, interest rates, prepayment speeds, credit risk, etc.) |
| | • | | Level 3—significant unobservable inputs (including the Fund’s own assumptions in determining the fair value of investments) |
The inputs or methodology used for valuing securities are not necessarily an indication of the risk associated with investing in those securities.
13
The Torray Fund
NOTES TO FINANCIAL STATEMENTS (continued)
As of December 31, 2008
The summary of inputs used to value the Fund’s net assets as of December 31, 2008 is as follows:
| | | |
Valuation Inputs | | | |
Level 1—Quoted Prices | | $ | 354,387,054 |
Level 2—Other Significant Observable Inputs | | | — |
Level 3—Significant Unobservable Inputs | | | — |
| | |
|
|
Total Market Value of Investments | | $ | 354,387,054 |
| | |
|
|
Securities Transactions and Investment Income Securities transactions are recorded on a trade date basis. Realized gains and losses from securities transactions are recorded on the specific identification basis. Dividend income and distributions to shareholders are recorded on the ex-dividend date. Interest income, including amortization of discount on short-term investments, and expenses are recorded on the accrual basis. Premium and discount are amortized using the effective yield to maturity method.
Federal Income Taxes The Fund intends to continue to comply with the requirements of the Internal Revenue Code applicable to regulated investment companies and to distribute all of its taxable income, including any net realized gain on investments to its shareholders. Therefore, no Federal income or excise tax provision is required.
The Fund adopted the provisions of FASB Interpretation No. 48 (“FIN48”), Accounting for Uncertainty in Income Taxes, on June 29, 2007. The implementation of FIN48 resulted in no material liability for unrecognized tax benefits and no material change to the beginning net asset value of the Fund. As of and during the year ended December 31, 2008, the Fund did not have a liability for any unrecognized tax benefits. The Fund recognizes interest and penalties, if any, related to unrecognized tax benefits as income tax expense in the Statement of Operations. During the year, the Fund did not incur any interest or penalties. The Fund’s taxable years 2005 to 2008 remain subject to examination by the Internal Revenue Service.
Net Asset Value The net asset value per share of the Fund is determined daily as of the close of trading on the New York Stock Exchange by dividing the value of the Fund’s net assets by the number of shares outstanding.
Interest Expense When cash balances are overdrawn in the Fund’s custody account, the Fund is charged an overdraft fee equal to 1.25% above the Federal Funds Rate. In addition, the Trust has entered into a line of credit facility with PNC Bank. Under the terms of the line of credit, the separate series of the Trust (including the Fund) may borrow up to $20,000,000 on a short-term basis with interest accruing at the Federal Funds Rate plus 0.75%. This amount of $4,508 is included in “interest expense” in the Statement of Operations. For the year ended December 31, 2008, the average amount of credit utilized was $163,934 at an average rate of 2.75%. As of December 31, 2008, the Fund had no outstanding borrowings under this line of credit facility.
14
The Torray Fund
NOTES TO FINANCIAL STATEMENTS (continued)
As of December 31, 2008
Use of Estimates In preparing financial statements in accordance with accounting principles generally accepted in the United States of America, management is required to make estimates and assumptions that affect the reported amounts of assets and liabilities and the disclosure of contingent assets and liabilities at the date of the financial statements, and the reported amounts of increases and decreases in net assets from operations during the reporting period. Actual results could differ from those estimates.
NOTE 2 — SHARES OF BENEFICIAL INTEREST TRANSACTIONS
Transactions in shares of beneficial interest were as follows:
| | | | | | | | | | | | | | |
| | | Year ended
12/31/2008
| | | Year ended
12/31/2007
| |
| | | Shares
| | | Amount
| | | Shares
| | | Amount
| |
Shares issued | | 1,640,783 | | | $ | 53,535,920 | | | 2,839,192 | | | $ | 115,735,240 | |
Reinvestments of dividends and distributions | | 1,204,731 | | | | 35,559,707 | | | 3,222,408 | | | | 119,041,292 | |
Shares redeemed | | (13,963,362 | ) | | | (419,311,229 | ) | | (7,456,654 | ) | | | (308,023,146 | ) |
| | |
|
| |
|
|
| |
|
| |
|
|
|
| | | (11,117,848 | ) | | $ | (330,215,602 | ) | | (1,395,054 | ) | | $ | (73,246,614 | ) |
| | |
|
| |
|
|
| |
|
| |
|
|
|
Officers, Trustees and affiliated persons of The Torray Fund and their families directly or indirectly control 1,284,100 shares or 7.86% of the Fund.
NOTE 3 — INVESTMENT TRANSACTIONS
Purchases and sales of investment securities, other than short-term investments, for the year ended December 31, 2008, aggregated $174,162,433 and $489,758,451, respectively.
NOTE 4 — MANAGEMENT FEES
Pursuant to the Management Contract, Torray LLC provides investment advisory and administrative services to the Fund. The Fund pays Torray LLC a management fee, computed daily and payable monthly at the annual rate of 1.00% of the Fund’s average daily net assets. For the year ended December 31, 2008, The Torray Fund incurred management fees of $6,676,450.
Excluding the management fee, other expenses incurred by the Fund during the year ended December 31, 2008, totaled $871,062. These expenses include all costs associated with the Fund’s operations including transfer agent fees, independent trustees’ fees ($14,000 per annum and $2,000 for each Board meeting attended per trustee), dues, fees and expenses of registering and qualifying the Fund and its shares for distribution, charges of custodian, auditing and legal expenses, insurance premiums, supplies, postage, expenses of issue or redemption of shares, reports to shareholders and trustees, expenses of printing and mailing prospectuses, proxy statements and proxies to existing shareholders, and other miscellaneous expenses.
15
The Torray Fund
NOTES TO FINANCIAL STATEMENTS (continued)
As of December 31, 2008
Certain officers and trustees of the Fund are also officers and/or shareholders of Torray LLC.
NOTE 5 — TAX MATTERS
Distributions to shareholders are determined in accordance with Federal income tax regulations, which may differ from accounting principles generally accepted in the United States of America.
The tax character of distributions paid during the years ended December 31, 2008 and 2007 were as follows:
| | | | | | |
| | | 2008
| | 2007
|
Distributions paid from: | | | | | | |
Ordinary income | | $ | 6,347,372 | | $ | 7,706,855 |
Long-term capital gain | | | 29,812,671 | | | 115,546,988 |
Non-taxable return of capital | | | 706,904 | | | — |
| | |
|
| |
|
|
| | | $ | 36,866,947 | | $ | 123,253,843 |
| | |
|
| |
|
|
As of December 31, 2008, the components of distributable earnings on a tax basis were as follows:
| | | | |
Capital loss carry forward | | $ | (687,498 | ) |
Deferred post-October losses | | | (50,870,854 | ) |
Unrealized depreciation | | | (121,643,540 | ) |
| | |
|
|
|
| | | $ | (173,201,892 | ) |
| | |
|
|
|
The primary difference between book basis and tax basis distributions is differing book and tax treatment of short-term capital gains.
Permanent book/tax differences are reclassified among the Fund’s components of capital in order to reflect such components of capital on a tax basis. As of December 31, 2008, the Fund reclassified $3,783 to decrease accumulated net investment income and decrease accumulated net realized loss on investments in order to reflect permanent book/tax differences related to short term capital gain distributions.
At December 31, 2008, the Torray Fund had net capital loss carry forwards for federal income tax purposes of $687,498, which are available to reduce future required distributions of net capital gains to shareholders through 2016.
16
The Torray Fund
NOTES TO FINANCIAL STATEMENTS (continued)
As of December 31, 2008
The following information is based upon the federal tax basis of investment securities as of December 31, 2008:
| | | | |
Gross unrealized appreciation | | $ | 23,819,480 | |
Gross unrealized depreciation | | | (145,463,020 | ) |
| | |
|
|
|
Net unrealized depreciation | | $ | (121,643,540 | ) |
| | |
|
|
|
Cost | | $ | 476,030,594 | |
| | |
|
|
|
NOTE 6 — COMMITMENTS AND CONTINGENCIES
The Fund indemnifies its officers and trustees for certain liabilities that may arise from their performance of their duties to the Fund. Additionally, in the normal course of business, the Fund enters into contracts that contain a variety of representations and warranties which provide general indemnifications. The Fund’s maximum exposure under these arrangements is unknown, as this would involve future claims that may be made against the Fund that have not yet occurred.
17
The Torray Fund
REPORT OF INDEPENDENT REGISTERED PUBLIC ACCOUNTING FIRM
To the Board of Trustees of The Torray Fund
and Shareholders of The Torray Fund
We have audited the accompanying statement of assets and liabilities, including the schedule of investments, of The Torray Fund, a series of shares of beneficial interest of The Torray Fund, as of December 31, 2008, and the related statement of operations for the year then ended, the statements of changes in net assets for each of the years in the two-year period then ended and the financial highlights for each of the years in the five-year period then ended. These financial statements and financial highlights are the responsibility of the Fund’s management. Our responsibility is to express an opinion on these financial statements and financial highlights based on our audits.
We conducted our audits in accordance with the standards of the Public Company Accounting Oversight Board (United States). Those standards require that we plan and perform the audits to obtain reasonable assurance about whether the financial statements and financial highlights are free of material misstatement. An audit includes examining, on a test basis, evidence supporting the amounts and disclosures in the financial statements. Our procedures included confirmation of securities owned as of December 31, 2008 by correspondence with the custodian. An audit also includes assessing the accounting principles used and significant estimates made by management, as well as evaluating the overall financial statement presentation. We believe that our audits provide a reasonable basis for our opinion.
In our opinion, the financial statements and financial highlights referred to above present fairly, in all material respects, the financial position of The Torray Fund as of December 31, 2008, the results of its operations for the year then ended, the changes in its net assets for each of the years in the two-year period then ended, and its financial highlights for each of the years in the five-year period then ended in conformity with accounting principles generally accepted in the United States of America.

BRIGGS, BUNTING & DOUGHERTY, LLP
Philadelphia, Pennsylvania
February 18, 2009
18
The Torray Fund
FUND MANAGEMENT
As of December 31, 2008 (unaudited)
The Trust is overseen by a Board of Trustees (the “Board”), who has delegated the day-to-day management to the officers of the Trust. The Board meets regularly to review the Fund’s activities, contractual arrangements, and performance. The trustees and officers serve until their successors are elected and qualified, or until the trustee or officer dies, resigns or is removed, or becomes disqualified.
Information pertaining to the Trustees and Officers of The Trust is set forth below. The Statement of Additional Information (SAI) includes additional information about the Trustees and is available without charge, upon request, by calling (800) 443-3036.
| | | | | | | | |
Name, Birthdate,
Address* and
Positions with the
Trust | | Term of Office
and Length of
Time Served | | Principal Occupation(s) During Past Five Years | | Portfolios
Overseen
by Trustee | | Other Directorships Held |
| INDEPENDENT TRUSTEES |
Carol T. Crawford DOB: 2/25/43 Trustee | | Indefinite Term since 2006 | | Attorney, Private Practice, McLean, VA | | 2 | | Director, Smithfield Foods, Inc. Smithfield, VA |
Bruce C. Ellis DOB: 7/20/44 Trustee | | Indefinite Term since 1993 | | Private Investor, Bethesda, MD | | 2 | | None |
Robert P. Moltz DOB: 10/3/47 Trustee | | Indefinite Term since 1990 | | President and CEO, Weaver Bros Insurance Associates, Inc., Bethesda, MD | | 2 | | None |
| INTERESTED TRUSTEES AND OFFICERS OF THE TRUST |
William M Lane** DOB: 5/21/50 Trustee, Treasurer, Secretary, Chief Compliance Officer and Anti-Money Laudering Officer | | Indefinite Term Since1990 | | Vice President, Secretary and Chief Compliance Officer, Torray LLC, Bethesda, MD (Oct. 2005-Present); Vice President, Secretary, Treasurer and Chief Compliance Officer, Robert E. Torray & Co. Inc. (Jul. 1984-Oct. 2005); Vice President, Secretary and Chief Compliance Officer, The Torray Corporation (Jan. 1990-Oct. 2005); Vice President, Secretary, Treasurer and Chief Compliance Officer, TEL Corporation (Jun. 2005-Oct. 2005).*** | | 2 | | None |
Wayne H. Shaner** DOB: 8/23/47 Trustee and Chairman of the Board | | Indefinite Term since 1993 | | Managing Partner, Rockledge Partners, LLC Investment Advisory Firm, Bethesda, MD (Jan. 2004- present); Vice President of Torray LLC, Bethesda, MD (Jan. 2008-June 2008); Prior to January 1, 2004, Managing Director, Lockheed Martin Investment Management Company, Bethesda, MD | | 2 | | Director, Van Eck Funds New York, NY |
19
The Torray Fund
FUND MANAGEMENT (continued)
As of December 31, 2008 (unaudited)
| | | | | | | | |
Name, Birthdate,
Address* and
Positions with the
Trust | | Term of Office
and Length of
Time Served | | Principal Occupation(s) During Past Five Years | | Portfolios
Overseen
by Trustee | | Other Directorships Held |
| INTERESTED TRUSTEES AND OFFICERS OF THE TRUST |
Robert E. Torray DOB: 4/10/37 President | | Indefinite Term since 2007 | | Chairman and President, Torray LLC, Bethesda, MD (Oct. 2005-Present); President, Robert E. Torray & Co. Inc. (May 1972-Oct. 2005); President, The Torray Corporation (Jan. 1990-Oct. 2005); Chairman, TEL Corporation (Jun. 2005-Oct. 2005).*** | | N/A | | None |
| * | All addresses are c/o The Torray Fund, 7501 Wisconsin Avenue, Suite 1100, Bethesda, MD 20814-6523 |
| ** | Mr. Lane by virtue of employment with Torray LLC, the Trust's investment adviser, is considered an "interested person" of the Trust, as that term is defined in Section 2(a)(19) of the Investment Company Act of 1940, as amended. Mr. Shaner by virtue of prior employment with Torray LLC, is considered an "interested person" of the Trust. |
| *** | Robert E. Torray & Co., The Torray Corporation and TEL Corporation have all been succeeded to by Torray LLC. |
20
The Torray Fund
FACTORS CONSIDERED BY THE BOARD OF TRUSTEES IN CONNECTION WITH THEIR APPROVAL OF THE CONTINUATION OF THE FUND’S INVESTMENT MANAGEMENT AGREEMENT WITH THE MANAGERS (unaudited)
The Fund has entered into an Investment Management Agreement (the “Agreement”) with Torray LLC (the “Manager”) pursuant to which the Manager provides investment management services to the Fund. In accordance with the Investment Company Act of 1940, the Board of Trustees of the Fund is required, on an annual basis, to consider the continuation of the Agreement with the Manager, and this must take place at an in-person meeting of the Board. The relevant provisions of the Investment Company Act of 1940 specifically provide that it is the duty of the Board to request and evaluate such information as the Board determines is necessary to allow them to properly consider the continuation of the Agreement, and it is the duty of the Manager to furnish the trustees with such information that is responsive to their request. Set forth below is a discussion of the various factors that the Board of Trustees considered in deciding to approve the continuation of the Agreement with the Manager.
In determining whether to approve the continuation of the Agreement, the Board of Trustees requested, and the Manager provided, information and data relevant to the Board’s consideration. This included materials that provided the Board with information regarding the investment performance of the Fund and information regarding the fees and expenses of the Fund as compared to other similar mutual funds. As part of its deliberations, the Board also considered and relied upon the information about the Fund that had been provided to them throughout the year in connection with their regular Board meetings at which they engage in the ongoing oversight of the Fund and its operations.
The Board met at an in-person meeting on October 1, 2008 in order to consider the proposed continuation of the Agreement. Among the factors the Board considered was the overall performance of the Fund achieved by the Manager relative to the performance of other mutual funds with similar investment objectives on both a long-term basis and over shorter time periods. In particular, the Board took note of the favorable performance achieved by the Manager over longer time periods (five years and longer) and they considered the Manager’s particular focus on long-term investment performance. In reviewing the shorter term performance of the Fund, the trustees took note of the fact that the short-term performance (for periods of less than five years) was generally lower than that of the benchmark index and of other funds with similar investment objectives, and the trustees discussed with the Manager the likely reasons for this, noting that the Manager maintains a particular focus on long-term investment results and as a result, short-term results can, and will, trail comparable averages from time to time. The Board took into consideration the fact that the Manager seeks to achieve investment results for the Fund with less risk than other similar funds, and that the Manager has maintained a low portfolio turnover rate for the Fund which is beneficial to shareholders of the Fund because this results in lower brokerage costs which helps to reduce the operating costs of the Fund. They noted the range of investment advisory and management services provided by the Manager and the level and quality of these services, and in particular, they noted the quality of the personnel providing these services, taking into consideration their finding that the personnel providing these services, and the services provided, were of a very high caliber and quality. The Board also considered the portfolio manager arrangements for the Fund, noting that the Manager had undertaken appropriate measures to provide for the continued management of the Fund by a team of portfolio managers with extensive portfolio management experience.
21
The Torray Fund
FACTORS CONSIDERED BY THE BOARD OF TRUSTEES IN CONNECTION WITH THEIR APPROVAL OF THE CONTINUATION OF THE FUND’S INVESTMENT MANAGEMENT AGREEMENT WITH THE MANAGERS (unaudited) (continued)
The Board also compared expenses of the Fund to the expenses of other funds of similar size, noting that the average expense ration for the Fund over the past year compared favorably with industry averages. They also took note of the fact that the Fund is not subject to any sales loads, sales commissions or other similar fees, including Rule 12b-1 distribution fees, which helps to keep the overall expense to shareholders of investing in the Fund lower than the expenses associated with investing in many comparable funds, and they considered the fact that the Manager had informed the Board that it did not intend to propose the introduction of such types of fees for the Fund. The Board further considered the overall decline in the level of assets in the Fund over the past year, and they reviewed with the Manager possible actions that the Manager might take in order to respond to the changes in the level of the operating expense of the Fund which may result from the decline in assets. The Board also reviewed financial information concerning the Manager, noting its financial soundness as demonstrated by the financial information provided and the level of profitability relating to its services for the Fund, noting that these were reasonable and consistent with industry standards. The Board was also provided with information regarding the fees that the Manager charges other clients for investment advisory services and they noted that the fees were comparable based on the relevant circumstances of the types of accounts involved. The Board reviewed with the Manager the allocation of the portfolio management team’s time between managing the investments of the Fund and managing other accounts. The Board also engaged in a review of the compensation arrangements for the portfolio managers of the Fund.
In addition, the Board reviewed with the Manager information regarding its brokerage practices, including soft dollar matters, and noted that the Manager did not have in place any formal soft dollar arrangements, and the Board also reviewed the Manager’s best execution procedures, which the Board noted were reasonable and consistent with standard industry practice.
Based on their review, the trustees concluded that the investment management services provided under the Agreement were reasonably worth the full amount of the fee and that the terms of the Agreement were fair and reasonable. In reaching their conclusion with respect to their approval of the continuation of the Agreement, the trustees did not identify any one single factor as being controlling, rather, the Board took note of a combination of factors that influenced their decision making process. The Board did, however, identify the overall favorable long-term investment performance of the Fund, the commitment of the Manager to the successful operation of the Fund, and the level of expenses of the Fund, as being important elements of their consideration. Based upon their review and consideration of these factors and other matters deemed relevant by the Board in reaching an informed business judgment, a majority of the Board of Trustees, including a majority of the Independent Trustees, concluded that the terms of the Agreement were fair and reasonable and the Board voted to approve the continuation of the Agreement with the Manager.
22
The Torray Fund
PORTFOLIO HOLDINGS, PROXY VOTING AND PROCEDURES
As of December 31, 2008 (unaudited)
The Fund files its complete schedule of portfolio holdings with the Securities and Exchange Commission (the "Commission") for the first and third quarters of each fiscal year on Form N-Q. The Fund's Forms N-Q are available on the Commission's website at http://www.sec.gov. The Fund's Form N-Q may be reviewed and copied at the Commission's Public Reference Room in Washington, D.C. Information on the operation of the Commission's Public Reference Room may be obtained by calling 1-800-SEC-0330.
A description of the policies and procedures that the Fund uses to determine how to vote proxies relating to portfolio securities is available without charge, upon request, by calling 1-800-443-3036; and on the Commission's website at http://www.sec.gov.
Information regarding how the Fund voted proxies relating to portfolio securities is available without charge, upon request, by calling 1-800-443-3036; and on the Commission's website at http://www.sec.gov.
23
The Torray Fund
ABOUT YOUR FUND’S EXPENSES
As of December 31, 2008 (unaudited)
We believe it is important for you to understand the impact of costs on your investment. All mutual funds have operating expenses. As a shareholder of the Fund, you incur ongoing costs, including management fees, and other fund expenses. Operating expenses, which are deducted directly from the Fund’s gross income, directly reduce the investment return of the Fund.
A fund’s expenses are expressed as a percentage of its average net assets. This figure is known as the expense ratio. The following examples are intended to help you understand the ongoing costs (in dollars) of investing in the Fund and to compare these costs with the ongoing costs of investing in other mutual funds. The examples below are based on an investment of $1,000 made at the beginning of the period shown and held for the entire period.
The table on the next page illustrates the Fund’s cost in two ways:
Actual Fund Return This section helps you estimate the actual expenses that you paid over the period. The “Ending Account Value” shown is derived from the Fund’s actual return, and the third column shows the operating expenses that would have been paid by an investor who started with $1,000 in the Fund. You may use the information here, together with the amount invested, to estimate the expenses that you paid over the period.
To do so, simply divide your account value by $1,000 (for example, an $8,600 account value divided by $1,000 = 8.6), then multiply the result by the number given for the Fund under the heading “Expenses Paid During Period” on the next page.
Hypothetical 5% Return This section is intended to help you compare your Fund’s costs with those of other mutual funds. It assumes that the Fund had an annual return of 5% before expenses, and that the expense ratio is unchanged. In this case, because the return used is not the Fund’s actual return, the results do not apply to your investment. The example is useful in making comparisons because the Securities and Exchange Commission requires all mutual funds to calculate expenses based on a 5% return. You can assess the Fund’s costs by comparing this hypothetical example with the hypothetical examples that appear in shareholder reports of other funds.
Note that expenses shown in the table are meant to highlight and help you compare ongoing costs only. The Fund does not charge transactions fees, such as purchase or redemption fees, nor does it carry a “sales load.”
The calculation assumes no shares were bought or sold during the period. Your actual costs may have been higher or lower, depending on the amount of your investment and the timing of any purchases or redemptions.
24
The Torray Fund
ABOUT YOUR FUND’S EXPENSES (continued)
As of December 31, 2008 (unaudited)
More information about the Fund’s expenses, including recent annual expense ratios, can be found in this report. For additional information on operating expenses and other shareholder costs, please refer to the Fund’s prospectus.
| | | | | | | | | |
| | | Beginning
Account Value
July 1, 2008
| | Ending
Account Value
December 31, 2008
| | Expenses Paid
During Period *
|
Based on Actual Fund Return | | $ | 1,000.00 | | $ | 735.90 | | $ | 5.02 |
Based on Hypothetical 5% Return
(before expenses) | | $ | 1,000.00 | | $ | 1,019.36 | | $ | 5.84 |
| * | Expenses are equal to the Fund’s annualized expense ratio of 1.15% for the period, multiplied by the average account value over the period, multiplied by 184/366 (to reflect the one-half year period). |
25
The Torray Fund
TAX INFORMATION
As of December 31, 2008 (unaudited)
We are required to advise you within 60 days of the Fund’s fiscal year-end regarding the Federal tax status of certain distributions received by shareholders during such fiscal year. The information below is provided for the Fund’s fiscal year ending December 31, 2008.
Qualified Interest Income
For the year ended December 31, 2008, 10.89% of the ordinary distributions paid (net investment income plus short-term capital gain) represent the amount of Qualifying Interest Income as created by The American Jobs Creation Act of 2004.
Qualified Dividend Income
For the year ended December 31, 2008, 100% of the distributions paid by the Fund from ordinary income qualifies for a reduced tax rate pursuant to The Jobs and Growth Tax Relief Reconciliation Act of 2003.
Dividends Received Deduction
For the year ended December 31, 2008, 100% of the ordinary income distribution qualifies for the dividends received deduction available to corporations.
Long-Term Capital Gain Dividends
The Fund designates $29,812,671 as long-term capital gain distributions pursuant to section 852(b)(3) of the Internal Revenue Code for the year ended December 31, 2008.
Dividends and distributions received by retirement plans such as IRA’s, Keogh-type plans and 403(b) plans need not be reported as taxable income. However, many retirement plan trusts may need this information for their annual information reporting.
26
TRUSTEES
Carol Crawford
Bruce C. Ellis
William M Lane
Robert P. Moltz
Wayne H. Shaner
INVESTMENT ADVISOR
Torray LLC
OFFICERS
Robert E. Torray
William M Lane
Fred M. Fialco
Shawn M. Hendon
INDEPENDENT REGISTERED PUBLIC
ACCOUNTING FIRM
Briggs, Bunting & Dougherty, LLP
1835 Market Street 26th Floor
Philadelphia, PA 19103
TRANSFER AGENT
PNC Global Investment Servicing (U.S.) Inc.
101 Sabin Street
Pawtucket, RI 02860-1427
LEGAL COUNSEL
Dechert LLP
1775 I Street, N.W.
Washington, DC 20006
Distributed by PFPC Distributors, Inc.
760 Moore Road. King of Prussia, PA 19406-1212
Date of first use, February 2009
This report is not authorized for distribution to prospective
investors unless preceded or accompanied by a current
prospectus. All indices are unmanaged groupings of stocks
that are not available for investment.
The
TORRAY
FUND
ANNUAL REPORT
December 31, 2008
The Torray Fund
Suite 1100
7501 Wisconsin Avenue
Bethesda, Maryland 20814-6523
(301) 493-4600
(800) 443-3036
The Torray Institutional Fund
Letter to Shareholders
January 15, 2009
Dear Fellow Shareholders,
We are deeply disappointed to report that The Torray Institutional Fund depreciated 36.2% last year, about the same as the Standard & Poor’s 500 Index (-37.0%). This is the first time in our Firm’s 36-year history we have lost anywhere near as much as the market during a severe downturn. The tangled web of toxic financial products, bursting of the housing bubble, hedge fund implosions and margin calls combined to destroy values across the board. In addition, mutual funds, ours included, which had been large net buyers of stocks for many decades, faced massive redemptions, suddenly becoming forced sellers just when buyers became scarce. There was simply nowhere to hide.
While the performance of the S&P 500 and Dow was bad enough, broader measures of the market paint an even grimmer picture: the Value Line 1600 and Wilshire 5000 stock indexes lost 49% and 39%, respectively. Overseas exchanges also experienced big setbacks. The Dow Jones Global Index, excluding the U.S., sank 46%. China, India and Russia were off 65%, 52% and 72%. Some European markets registered similar declines; commodity prices also buckled, most notably oil, which dropped 70% from its high. These numbing results mark the close of a miserable decade for investors — the S&P 500, including dividends, lost 1.4% annually over the period, and we only broke even. While the media continues to draw parallels to the 1930s, the last ten years were worse. Between 1929 and 1938, the market lost 0.89% per year, and from 1930 to 1939, it slipped only 0.05% annually.
Compounding the pain from these losses is a market environment characterized by low volumes and high volatility which has attracted speculators but scared off long-term investors. Sources at the New York Stock Exchange have told us there are an estimated several million day-traders gambling with their 401(k) plans — some, unfortunately, unemployed. These trading accounts can be leveraged four-to-one ($100,000 of equity supports a $400,000 portfolio) provided the positions are liquidated by the end of each day. You may have noticed the market’s recent gyrations and heavy volume between 3:40 and its 4:00 close. It is during this period that many large blocks of stock and most of the outstanding day-trading margin debt are cleared, a phenomenon that occasionally has caused volume to as much as double in 20 minutes. (The orders are entered into the Exchange’s electronic system, nicknamed “the dark hole,” where they are matched by computers.) This activity has triggered wild swings in the Dow Jones and S&P 500 indices, heightening investors’ anxiety and adding to suspicions the market is being manipulated. The failure of banks and prominent Wall Street firms, the collapse of AIG, Fannie Mae, Freddie Mac and more, not to mention shocking revelations of at least five new Ponzi schemes, have played an even greater role in compromising the public’s trust in our financial system and the integrity of corporate managements.
But, we will not dwell on this further. The damage is done and, in our opinion, largely reflected in stock prices, particularly those of quality companies of the type held in our portfolio. While they may go lower, from a long-term perspective, valuations are attractive. Earnings returns and, in many cases, dividend yields, are well above rates on money market funds and U.S. government bonds of all maturities. (Short-term Treasuries yield zero, and the 30-year bond paying 4 1/2% trades at 131% of par for a current return of 3.4% and a yield if held to maturity of only 2.9%.)
1
The Torray Institutional Fund
Letter to Shareholders (continued)
January 15, 2009
Also worth noting is the Federal Reserve’s measure of assets available for immediate spending — i.e. cash or equivalents — jumped 86% to $8.9 trillion in the first 11 months of last year. That is enough to buy 75% of all domestic stocks. By contrast, at the market’s peak in early 2000, the same Fed measure totaled $5 trillion, or 20% of the market’s total value, suggesting that investors are more fearful of losses at today’s low prices than they were when the market was twice as high. If history is a guide, when the current financial distress passes and the economy recovers, investors will quickly change their minds and pile back into stocks, causing them to rally sharply. This classic “buy high — sell low — buy high” syndrome has afflicted investors since the earliest days of exchanges.
Another thing to keep in mind is that most of the cash on hand yields virtually nothing after inflation, and less than nothing after taxes. It seems highly unlikely investors will pursue this no-return option indefinitely. That is especially true if inflation heats up in the years ahead. Today’s all-time-low yields reflect the Federal Reserve’s concerns about deflation. Yet, at the height of the energy and materials mania around the middle of last year, its focus was just the opposite, which shows how fast things can change in such an unsettled environment.
While the Fed’s posture seems appropriate at this point, looking further down the road one has to wonder about the impact projected massive budget deficits will have on the bond market. Eventually, the current crisis will pass and all of the new money our government is pumping into the economy will surely make itself felt. We well remember the inflationary surge of the late 1970s and early ‘80s (peaking at 13.5% in 1980) which prompted the Federal Reserve under Chairman Paul Volcker to sharply raise rates. (The prime rate soared above 21% and the yield on the 30-year Treasury bond hit 15.2%.) Although it’s hard to conceive of such a move today, should history someday repeat, the U.S. government 4 1/2’s of 2038 would plunge from 1310 to 300 — a loss of 77%. Even if the current yield rose from 3.4% to 5.7% — its average since 1926 — its price would fall 520 points to 790. The intermediate and long-term Treasury market strikes us as a bond version of the housing and dot.com bubbles.
Having said all of this, as students of history, we remain eternally optimistic about America’s future. Over time, it has never paid to bet against it. Counting this year’s decline, stocks across the board are probably down 50%, with many having lost far more. Leaving aside the housing downturn, $10 trillion has disappeared, and few have been spared. We are all in the same boat. The question is what to do now? Our answer is to stay the course. Values, as earlier noted, are compelling, and the government’s massive rescue program should kick in relatively soon. While opinions differ widely on the likely impact, it seems improbable the package could produce a worse outcome than doing nothing.
Finally, we draw your attention to investor sentiment. It’s the most negative we’ve ever encountered. This stands in stark contrast to the unbridled optimism and high stock prices of the late 1990s and the euphoria over energy and materials between 2003 and 2007. Each of these episodes ended badly. The simple fact is that when investors have already departed and prices are low, risk is low as well, and vice-versa. After four down years between 1929 and 1932, the market rallied 54% in ‘33, eased 1.4% in ‘34, advanced 48% in ‘35 and another 34% in ‘36. This record is
2
The Torray Institutional Fund
Letter to Shareholders (continued)
January 15, 2009
at odds with the common perception that stocks were obliterated during the 1930s. As we pointed out before, they lost ground, but slightly less than our market did during the last decade.
In closing, we want to express again our profound disappointment over the loss you have suffered. As so many have observed, this has been a once-in-a-lifetime setback. We believe it is not an exaggeration to say once-in-a-century. Despite the present gloom, a few years from now we think the U.S. and world economies will have recovered, and stocks will be higher by enough to make the wait worthwhile.
We thank you for your investment and assure you we are devoted, as ever, to your best interests.
| | | | | | |
| | | Sincerely, | | | | |
| | |  | | | | |
| | | Robert E. Torray | | | | |
| | | 
| | | | |
| | | Fred M. Fialco | | | | |
| | | 
| | | | |
| | | Shawn M. Hendon | | | | |
| | | | | | | |
3
The Torray Institutional Fund
PERFORMANCE DATA
As of December 31, 2008 (unaudited)
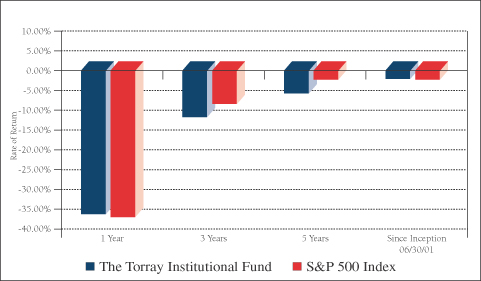
Average Annual Returns on an Investment in
The Torray Institutional Fund vs. the S&P 500 Index
For the periods ended December 31, 2008:
| | | | | | | | | | | | |
| | | 1 Year
| | | 3 Years
| | | 5 Years
| | | Since
Inception
06/30/01
| |
The Torray Institutional Fund | | (36.24% | ) | | (11.68% | ) | | (5.68% | ) | | (2.07% | ) |
S&P 500 Index | | (37.00% | ) | | (8.36% | ) | | (2.19% | ) | | (2.18% | ) |
Cumulative Returns for the 7½ years ended December 31, 2008
| | | |
The Torray Institutional Fund | | (14.56 | %) |
S&P 500 Index | | (15.25 | %) |
4
The Torray Institutional Fund
PERFORMANCE DATA (continued)
As of December 31, 2008 (unaudited)
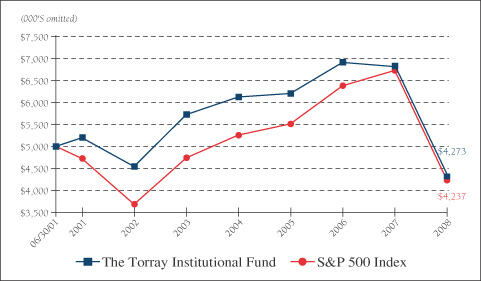
Change in Value of $5,000,000 Invested
on June 30, 2001 (commencement of operations) to:
| | | | | | | | | | | | |
| | | 12/31/02
| | 12/31/04
| | 12/31/06
| | 12/31/08
|
The Torray Institutional Fund | | $ | 4,537,500 | | $ | 6,123,000 | | $ | 6,908,000 | | $ | 4,273,000 |
S&P 500 Index | | $ | 3,682,500 | | $ | 5,255,500 | | $ | 6,373,000 | | $ | 4,237,380 |
The returns quoted represent past performance and do not guarantee future results. Investment return and principal value will fluctuate so that shares, when redeemed, may be worth more or less than their original cost. Current performance may be lower or higher. Returns current to the most recent month-end are available at www.torray.com. The returns shown do not reflect the deduction of taxes a shareholder would pay on the redemption of fund shares and distributions. The Fund's gross annual operating expense ratio, as stated in the current prospectus, is 0.85%. Returns on both The Torray Institutional Fund and the S&P 500 Index assume reinvestment of all dividends and distributions. The S&P 500 Index is an unmanaged index consisting of 500 U.S. large-cap stocks.
5
The Torray Institutional Fund
FUND PROFILE
As of December 31, 2008 (unaudited)
| | |
DIVERSIFICATION (% of net assets) | | |
| |
Information Technology | | 18.19% |
Industrials | | 17.19% |
Health Care | | 14.01% |
Financials | | 12.88% |
Consumer Discretionary | | 10.57% |
Consumer Staples | | 7.02% |
Energy | | 3.08% |
Telecommunications | | 2.79% |
Materials | | 2.37% |
Short-Term Investments | | 11.95% |
Liabilities Less Other Assets | | (0.05)% |
| | |
|
| | | 100.00% |
| | |
|
| | | | |
| TOP TEN EQUITY HOLDINGS (% of net assets) |
| 1. | | Marsh & McLennan Cos., Inc. | | 4.2% |
| 2. | | Johnson & Johnson | | 4.0% |
| 3. | | Automatic Data Processing, Inc. | | 3.9% |
| 4. | | Walt Disney Co. (The) | | 3.7% |
| 5. | | Procter & Gamble Co. (The) | | 3.6% |
| 6. | | Cintas Corp. | | 3.5% |
| 7. | | WellPoint, Inc. | | 3.5% |
| 8. | | UnitedHealth Group, Inc. | | 3.5% |
| 9. | | Kraft Foods, Inc., Class A | | 3.5% |
| 10. | | 3M Co. | | 3.4% |
| | | | |
|
| | | | | 36.8% |
| | | | |
|
| | | | | |
|
PORTFOLIO CHARACTERISTICS |
| | |
Net Assets (million) | | | | | $18 |
Number of Holdings | | | | | 33 |
Portfolio Turnover | | | | | 32.00% |
P/E Multiple (forward) | | | | | 11.1x |
Portfolio Yield | | | | | 2.74% |
Market Capitalization | | Average | | $ | 47.2 B |
| | | Median | | $ | 21.4 B |
6
The Torray Institutional Fund
SCHEDULE OF INVESTMENTS
As of December 31, 2008
| | | | | | | |
| | | Shares
| | | | Market Value
|
| COMMON STOCK 88.10% | | | |
| |
| 18.19% INFORMATION TECHNOLOGY | | | |
| | | 17,516 | | Automatic Data Processing, Inc. | | $ | 689,079 |
| | | 7,200 | | International Business Machines Corp. | | | 605,952 |
| | | 54,442 | | EMC Corp.* | | | 570,008 |
| | | 34,300 | | Cisco Systems, Inc.* | | | 559,090 |
| | | 28,456 | | Intel Corp. | | | 417,165 |
| | | 37,193 | | Applied Materials, Inc. | | | 376,765 |
| | | | | | |
|
|
| | | | | | | | 3,218,059 |
| 17.19% INDUSTRIALS | | | |
| | | 26,792 | | Cintas Corp. | | | 622,378 |
| | | 10,600 | | 3M Co. | | | 609,924 |
| | | 14,000 | | Illinois Tool Works, Inc. | | | 490,700 |
| | | 24,119 | | General Electric Co. | | | 390,728 |
| | | 5,900 | | Danaher Corp. | | | 333,999 |
| | | 17,918 | | Owens Corning, Inc.* | | | 309,981 |
| | | 5,700 | | Eaton Corp. | | | 283,347 |
| | | | | | |
|
|
| | | | | | | | 3,041,057 |
| 14.01% HEALTH CARE | | | |
| | | 11,864 | | Johnson & Johnson | | | 709,823 |
| | | 14,600 | | WellPoint, Inc.* | | | 615,098 |
| | | 23,100 | | UnitedHealth Group, Inc. | | | 614,460 |
| | | 10,100 | | Abbott Laboratories | | | 539,037 |
| | | | | | |
|
|
| | | | | | 2,478,418 |
| 12.88% FINANCIALS | | | |
| | | 30,817 | | Marsh & McLennan Cos., Inc. | | | 747,929 |
| | | 118,000 | | LaBranche & Co., Inc.* | | | 565,220 |
| | | 15,300 | | Loews Corp. | | | 432,225 |
| | | 16,700 | | Bank of America Corp. | | | 235,136 |
| | | 8,523 | | American Express Co. | | | 158,102 |
| | | 21,000 | | Citigroup, Inc. | | | 140,910 |
| | | | | | |
|
|
| | | | | | | | 2,279,522 |
See notes to the financial statements.
7
The Torray Institutional Fund
SCHEDULE OF INVESTMENTS (continued)
As of December 31, 2008
| | | | | | | | |
| | | Shares
| | | | Market Value
| |
| 10.57% CONSUMER DISCRETIONARY | | | | |
| | | 28,810 | | Walt Disney Co. (The) | | $ | 653,699 | |
| | | 18,725 | | O'Reilly Automotive, Inc.* | | | 575,606 | |
| | | 21,200 | | McGraw-Hill Cos., Inc. (The) | | | 491,628 | |
| | | 18,600 | | Gannett Co., Inc. | | | 148,800 | |
| | | | | | |
|
|
|
| | | | | | | | 1,869,733 | |
| 7.02% CONSUMER STAPLES | | | | |
| | | 10,200 | | Procter & Gamble Co. (The) | | | 630,564 | |
| | | 22,800 | | Kraft Foods, Inc., Class A | | | 612,180 | |
| | | | | | |
|
|
|
| | | | | | | | 1,242,744 | |
| 3.08% ENERGY | | | | |
| | | 121,293 | | USEC, Inc.* | | | 544,606 | |
| |
| 2.79% TELECOMMUNICATIONS | | | | |
| | | 17,300 | | AT&T, Inc. | | | 493,050 | |
| |
| 2.37% MATERIALS | | | | |
| | | 9,500 | | E.I. du Pont de Nemours & Co. | | | 240,350 | |
| | | 11,900 | | Dow Chemical Co. (The) | | | 179,571 | |
| | | | | | |
|
|
|
| | | | | | | | 419,921 | |
| | | | | | |
|
|
|
| TOTAL COMMON STOCK 88.10% | | | 15,587,110 | |
| (cost $22,014,529) | | | | |
| | | |
| | | Principal Amount | | | | | |
| |
| SHORT-TERM INVESTMENTS 11.95% | | | | |
| | | $2,114,962 | | PNC Bank Money Market Account, 0.05% (1) | | | 2,114,962 | |
| (cost $2,114,962) | | | | |
| | | | | | |
|
|
|
| TOTAL INVESTMENTS 100.05% | | | 17,702,072 | |
| (cost $24,129,491) | | | | |
| LIABILITIES LESS OTHER ASSETS (0.05%) | | | (8,644 | ) |
| | | | | | |
|
|
|
| NET ASSETS 100.00% | | $ | 17,693,428 | |
| | | | | | |
|
|
|
| * | Non-income producing securities |
(1) | Represents current yield at December 31, 2008 |
See notes to the financial statements.
8
The Torray Institutional Fund
STATEMENT OF ASSETS AND LIABILITIES
As of December 31, 2008
| | | | |
ASSETS | | | | |
Investments in securities at value
(cost $24,129,491) | | $ | 17,702,072 | |
Interest and dividends receivable | | | 47,847 | |
Receivable for fund shares sold | | | 1,906 | |
| | |
|
|
|
TOTAL ASSETS | | | 17,751,825 | |
| | |
|
|
|
| |
LIABILITIES | | | | |
Payable for fund shares redeemed | | | 57,596 | |
Payable to advisor | | | 801 | |
| | |
|
|
|
TOTAL LIABILITIES | | | 58,397 | |
| | |
|
|
|
| |
NET ASSETS | | $ | 17,693,428 | |
| | |
|
|
|
| | | | | |
Shares of beneficial interest ($1 stated value,
358,143 shares outstanding, unlimited shares authorized) | | $ | 358,143 | |
Paid-in-capital in excess of par | | | 27,139,510 | |
Accumulated net realized loss on investments | | | (3,376,806 | ) |
Net unrealized depreciation of investments | | | (6,427,419 | ) |
| | |
|
|
|
| |
TOTAL NET ASSETS | | $ | 17,693,428 | |
| | |
|
|
|
Net asset value, offering and redemption price per share | | $ | 49.40 | |
| | |
|
|
|
See notes to the financial statements.
9
The Torray Institutional Fund
STATEMENT OF OPERATIONS
For the year ended December 31, 2008
| | | | |
INVESTMENT INCOME | | | | |
Dividend income | | $ | 550,250 | |
Interest income | | | 48,380 | |
| | |
|
|
|
Total income | | | 598,630 | |
| | |
|
|
|
| |
EXPENSES | | | | |
Management fees | | | 274,328 | |
| | |
|
|
|
Total expenses | | | 274,328 | |
| | |
|
|
|
NET INVESTMENT INCOME | | | 324,302 | |
| | |
|
|
|
REALIZED AND UNREALIZED GAIN/(LOSS) ON INVESTMENTS | | | | |
Net realized loss on investments | | | (2,892,333 | ) |
Realized gain distributions | | | 18,021 | |
Net change in unrealized appreciation (depreciation) on investments | | | (10,021,539 | ) |
| | |
|
|
|
Net realized and unrealized loss on investments | | | (12,895,851 | ) |
| | |
|
|
|
NET DECREASE IN NET ASSETS FROM OPERATIONS | | $ | (12,571,549 | ) |
| | |
|
|
|
See notes to the financial statements.
10
The Torray Institutional Fund
STATEMENTS OF CHANGES IN NET ASSETS
For the years indicated:
| | | | | | | | |
| | | Year ended
12/31/08
| | | Year ended
12/31/07
| |
Decrease in Net Assets from Operations: | | | | | | | | |
Net investment income | | $ | 324,302 | | | $ | 1,023,599 | |
Net realized gain (loss) on investments | | | (2,874,312 | ) | | | 30,615,499 | |
Net change in unrealized appreciation (depreciation) on investments | | | (10,021,539 | ) | | | (32,380,205 | ) |
| | |
|
|
| |
|
|
|
Net decrease in net assets from operations | | | (12,571,549 | ) | | | (741,107 | ) |
| | |
|
|
| |
|
|
|
Distributions to Shareholders from: | | | | | | | | |
Net investment income ($0.770 and
$0.716 per share, respectively) | | | (325,807 | ) | | | (919,415 | ) |
Net realized gains ($1.889 and $23.946 per
share, respectively) | | | (806,861 | ) | | | (19,038,918 | ) |
Return of capital ($0.092 and $0.000 per share, respectively) | | | (39,970 | ) | | | — | |
| | |
|
|
| |
|
|
|
Total distributions | | | (1,172,638 | ) | | | (19,958,333 | ) |
| | |
|
|
| |
|
|
|
| | |
Shares of Beneficial Interest | | | | | | | | |
Decrease from share transactions | | | (15,250,909 | ) | | | (138,463,291 | ) |
| | |
|
|
| |
|
|
|
Total decrease | | | (28,995,096 | ) | | | (159,162,731 | ) |
| | |
Net Assets — Beginning of Year | | | 46,688,524 | | | | 205,851,255 | |
| | |
|
|
| |
|
|
|
Net Assets — End of Year | | $ | 17,693,428 | | | $ | 46,688,524 | |
| | |
|
|
| |
|
|
|
Undistributed Net Investment Income | | $ | — | | | $ | 1,824 | |
| | |
|
|
| |
|
|
|
See notes to the financial statements.
11
The Torray Institutional Fund
FINANCIAL HIGHLIGHTS
For a share outstanding throughout each year presented:
PER SHARE DATA
| | | | | | | | | | | | | | | | | | | | |
| | | Years ended December 31:
| |
| | | 2008
| | | 2007
| | | 2006
| | | 2005
| | | 2004
| |
Net Asset Value, Beginning of Year | | $ | 80.800 | | | $ | 108.640 | | | $ | 111.920 | | | $ | 116.290 | | | $ | 110.520 | |
| | |
|
|
| |
|
|
| |
|
|
| |
|
|
| |
|
|
|
Income/(loss) from investment operations: | | | | | | | | | | | | | | | | | | | | |
Net investment income | | | 0.687 | (3) | | | 0.896 | | | | 0.720 | | | | 0.616 | | | | 0.588 | |
Net gains (losses) on securities (both realized and unrealized) | | | (29.336 | ) | | | (4.074 | ) | | | 11.587 | | | | 0.748 | (2) | | | 7.025 | |
| | |
|
|
| |
|
|
| |
|
|
| |
|
|
| |
|
|
|
Total from investment operations | | | (28.649 | ) | | | (3.178 | ) | | | 12.307 | | | | 1.364 | | | | 7.613 | |
| | |
|
|
| |
|
|
| |
|
|
| |
|
|
| |
|
|
|
Less: distributions | | | | | | | | | | | | | | | | | | | | |
Dividends (from net investment income) | | | (0.770 | ) | | | (0.716 | ) | | | (0.790 | ) | | | (0.616 | ) | | | (0.588 | ) |
Distributions (from capital gains) | | | (1.889 | ) | | | (23.946 | ) | | | (14.797 | ) | | | (5.118 | ) | | | (1.255 | ) |
Distributions (from return of capital) | | | (0.092 | ) | | | — | | | | — | | | | — | | | | — | |
| | |
|
|
| |
|
|
| |
|
|
| |
|
|
| |
|
|
|
Total distributions | | | (2.751 | ) | | | (24.662 | ) | | | (15.587 | ) | | | (5.734 | ) | | | (1.843 | ) |
| | |
|
|
| |
|
|
| |
|
|
| |
|
|
| |
|
|
|
Net Asset Value, End of Year | | $ | 49.400 | | | $ | 80.800 | | | $ | 108.640 | | | $ | 111.920 | | | $ | 116.290 | |
| | |
|
|
| |
|
|
| |
|
|
| |
|
|
| |
|
|
|
TOTAL RETURN (1) | | | (36.24 | %) | | | (3.01 | %) | | | 11.40 | % | | | 1.28 | % | | | 6.96 | % |
RATIOS/SUPPLEMENTAL DATA | | | | | | | | | | | | | | | | | | | | |
Net assets, end of year (000’s omitted) | | $ | 17,693 | | | $ | 46,689 | | | $ | 205,851 | | | $ | 400,665 | | | $ | 1,012,566 | |
Ratios of expenses to average net assets | | | 0.85 | % | | | 0.85 | % | | | 0.85 | % | | | 0.85 | % | | | 0.85 | % |
Ratios of net investment income to average net
assets | | | 1.00 | % | | | 0.66 | % | | | 0.60 | % | | | 0.59 | % | | | 0.56 | % |
Portfolio turnover rate | | | 32.00 | % | | | 44.32 | % | | | 24.26 | % | | | 53.66 | % | | | 16.12 | % |
(1) | Past performance is not predictive of future performance. |
(2) | The amount shown for the year ended December 31, 2005 for a share outstanding throughout the year does not accord with the aggregate net losses on investments reported in the statement of operations for the year because of the timing of sales and repurchases of Fund shares in rela- tion to fluctuating market value of the investments of the Fund. |
(3) | Calculated based on the average amount of shares outstanding during the year. |
See notes to the financial statements.
12
The Torray Institutional Fund
NOTES TO FINANCIAL STATEMENTS
As of December 31, 2008
NOTE 1 — SUMMARY OF SIGNIFICANT ACCOUNTING POLICIES
The Torray Institutional Fund (“Fund”) is a separate series of The Torray Fund (“Trust”). The Trust is registered under the Investment Company Act of 1940 as a no-load, diversified, open-end management investment company. The Trust was organized as a business trust under Massachusetts law and the Fund commenced operations on June 30, 2001. The Fund’s primary investment objective is to provide long-term total return. The Fund seeks to meet its objective by investing its assets in a diversified portfolio of common stocks. In order to accomplish these goals, the Fund intends to hold stocks for the long term, as opposed to actively buying and selling. There can be no assurances that the Fund’s investment objectives will be achieved.
The following is a summary of accounting policies followed by the Fund in the preparation of its financial statements. These policies are in conformity with accounting principles generally accepted in the United States of America.
Securities Valuation Portfolio securities for which market quotations are readily available are valued at market value, which is determined by using the last reported sale price, or, if no sales are reported, the last reported bid price. For NASDAQ traded securities, market value is determined on the basis of the NASDAQ official closing price instead of the last reported sales price. Other assets and securities for which no quotations are readily available or for which Torray LLC (the “Advisor”) believes do not reflect market value are valued at fair value as determined in good faith by the Advisor under the supervision of the Board of Trustees in accordance with the Fund’s Valuation Procedures. Short-term obligations having remaining maturities of 60 days or less are valued at amortized cost, which approximates market value.
Adoption of Statement of Financial Accounting Standards No. 157 “Fair Value Measurements” (“FAS 157”) In September 2006, the Financial Accounting Standards Board issued FAS 157 effective for fiscal years beginning after November 15, 2007. This standard clarifies the definition of fair value for financial reporting, establishes a framework for measuring fair value and requires additional disclosures about the use of fair value measurements. The Fund has adopted FAS 157 as of January 1, 2008. The three levels of the fair value hierarchy under FAS 157 are described below:
| | • | | Level 1 — quoted prices in active markets for identical securities |
| | • | | Level 2 — other significant observable inputs (including quoted prices for similar securities, interest rates, prepayment speeds, credit risk, etc.) |
| | • | | Level 3 — significant unobservable inputs (including the Fund’s own assumptions in determining the fair value of investments) |
The inputs or methodology used for valuing securities are not necessarily an indication of the risk associated with investing in those securities.
13
The Torray Institutional Fund
NOTES TO FINANCIAL STATEMENTS (continued)
As of December 31, 2008
The summary of inputs used to value the Fund’s net assets as of December 31, 2008 is as follows:
| | | |
Valuation Inputs | | | |
Level 1 — Quoted Prices | | $ | 17,702,072 |
Level 2 — Other Significant Observable Inputs | | | — |
Level 3 — Significant Unobservable Inputs | | | — |
| | |
|
|
Total Market Value of Investments | | $ | 17,702,072 |
| | |
|
|
Securities Transactions and Investment Income Securities transactions are recorded on a trade date basis. Realized gains and losses from securities transactions are recorded on the specific identification basis. Dividend income and distributions to shareholders are recorded on the ex-dividend date. Interest income, including amortization of discount on short-term investments, and expenses are recorded on the accrual basis. Premium and discount are amortized using the effective yield to maturity method.
Federal Income Taxes The Fund intends to continue to comply with the requirements of the Internal Revenue Code applicable to regulated investment companies and to distribute all of its taxable income, including any net realized gain on investments to its shareholders. Therefore, no Federal income or excise tax provision is required.
The Fund adopted the provisions of FASB Interpretation No. 48 (“FIN48”), Accounting for Uncertainty in Income Taxes, on June 29, 2007. The implementation of FIN48 resulted in no material liability for unrecognized tax benefits and no material change to the beginning net asset value of the Fund. As of and during the year ended December 31, 2008, the Fund did not have a liability for any unrecognized tax benefits. The Fund recognizes interest and penalties, if any, related to unrecognized tax benefits as income tax expense in the Statement of Operations. During the year, the Fund did not incur any interest or penalties. The Fund’s taxable years 2005 to 2008 remain subject to examination by the Internal Revenue Service.
Net Asset Value The net asset value per share of the Fund is determined daily as of the close of trading on the New York Stock Exchange by dividing the value of the Fund’s net assets by the number of shares outstanding.
Interest Expense When cash balances are overdrawn in the Fund’s custody account, the Fund is charged an overdraft fee equal to 1.25% above the Federal Funds Rate. Such overdraft fees are paid by the Advisor under the comprehensive management fee arrangement described in Note 4. In addition, the Trust has entered into a line of credit facility with PNC Bank. Under the terms of the line of credit, the separate series of the Trust (including the Fund) may borrow up to $20,000,000 on a short-term basis with interest accruing at the Federal Funds Rate plus 0.75%. Any interest expense on the line of credit is paid by the Advisor under the comprehensive management fee arrangement described in Note 4. As of December 31, 2008, the Fund had no outstanding borrowings under this line of credit facility.
14
The Torray Institutional Fund
NOTES TO FINANCIAL STATEMENTS (continued)
As of December 31, 2008
Use of Estimates In preparing financial statements in accordance with accounting principles generally accepted in the United States of America, management is required to make estimates and assumptions that affect the reported amounts of assets and liabilities and the disclosure of contingent assets and liabilities at the date of the financial statements, and the reported amounts of increases and decreases in net assets from operations during the reporting period. Actual results could differ from those estimates.
NOTE 2 — SHARES OF BENEFICIAL INTEREST TRANSACTIONS
Transactions in shares of beneficial interest were as follows:
| | | | | | | | | | | | | | |
| | | Year ended
12/31/2008
| | | Year ended
12/31/2007
| |
| | | Shares
| | | Amount
| | | Shares
| | | Amount
| |
Shares issued | | 28,742 | | | $ | 2,018,803 | | | 69,035 | | | $ | 7,712,634 | |
Reinvestments of dividends and distributions | | 17,899 | | | | 1,169,772 | | | 242,642 | | | | 19,904,789 | |
Shares redeemed | | (266,338 | ) | | | (18,439,484 | ) | | (1,628,646 | ) | | | (166,080,714 | ) |
| | |
|
| |
|
|
| |
|
| |
|
|
|
| | | (219,697 | ) | | $ | (15,250,909 | ) | | (1,316,969 | ) | | $ | (138,463,291 | ) |
| | |
|
| |
|
|
| |
|
| |
|
|
|
Officers, Trustees and affiliated persons of The Torray Institutional Fund and their families directly or indirectly control 206,429 shares or 57.64% of the Fund.
NOTE 3 — INVESTMENT TRANSACTIONS
Purchases and sales of investment securities, other than short-term investments, for the year ended December 31, 2008, aggregated $9,395,253 and $26,006,037, respectively.
NOTE 4 — MANAGEMENT FEES
Pursuant to the Management Contract, Torray LLC provides investment advisory and administrative services to the Fund. The Fund pays Torray LLC a management fee, computed daily and payable monthly at the annual rate of 0.85% of the Fund’s average daily net assets. For the year ended December 31, 2008, The Torray Institutional Fund incurred comprehensive management fees of $274,328. The Fund pays the manager a single comprehensive management fee which covers all operating expenses of the Fund including the investment advisory and administrative services provided by the manager as well as all miscellaneous costs incurred in connection with the ongoing operation of the Fund including transfer agency, custody, professional, and registration fees.
Certain officers and trustees of the Fund are also officers and/or shareholders of Torray LLC.
15
The Torray Institutional Fund
NOTES TO FINANCIAL STATEMENTS (continued)
As of December 31, 2008
NOTE 5 — TAX MATTERS
Distributions to shareholders are determined in accordance with Federal income tax regulations, which may differ from accounting principles generally accepted in the United States of America.
The tax character of distributions paid during the years ended December 31, 2008 and 2007 were as follows:
| | | | | | |
| | | 2008
| | 2007
|
Distributions paid from: | | | | | | |
Ordinary income | | $ | 1,132,668 | | $ | 2,747,638 |
Long-term capital gain | | | — | | | 17,210,695 |
Non-taxable return of capital | | | 39,970 | | | — |
| | |
|
| |
|
|
| | | $ | 1,172,638 | | $ | 19,958,333 |
| | |
|
| |
|
|
As of December 31, 2008, the components of distributable earnings on a tax basis were as follows:
| | | | | | |
Capital loss carryforward | | $ | (342,098 | ) | | |
Deferred post-October losses | | | (2,666,279 | ) | | |
Unrealized depreciation | | | (6,795,848 | ) | | |
| | |
|
|
| | |
| | | $ | (9,804,225 | ) | | |
| | |
|
|
| |
|
The primary difference between book basis and tax basis distributions is differing book and tax treatment of short-term capital gains.
The difference between the sum of the capital loss carryforward and deferred post-October losses on a tax basis and accumulated realized loss on investments reported in the Statement of Assets and Liabilities is due to realized losses on certain wash sales that are deferred for federal income tax purposes. The difference between net unrealized depreciation for tax purposes and net unrealized depreciation on investments reported in the Statement of Assets and Liabilities is due to the same wash sale losses.
Permanent book/tax differences are reclassified among the Fund’s components of capital in order to reflect such components of capital on a tax basis. As of December 31, 2008, the Fund reclassified $319 to decrease accumulated net investment income and decrease accumulated net realized loss on investments in order to reflect permanent book/tax differences related to short term capital gain distributions.
At December 31, 2008, the Torray Institutional Fund had net capital loss carryforwards for federal income tax purposes of $342,098, which are available to reduce future required distributions of net capital gains to shareholders through 2016.
16
The Torray Institutional Fund
NOTES TO FINANCIAL STATEMENTS (continued)
As of December 31, 2008
The following information is based upon the federal tax basis of investment securities as of December 31, 2008:
| | | | | | |
Gross unrealized appreciation | | $ | 437,203 | | | |
Gross unrealized depreciation | | | (7,233,051 | ) | | |
| | |
|
|
| | |
Net unrealized depreciation | | $ | (6,795,848 | ) | | |
| | |
|
|
| | |
Cost | | $ | 24,497,920 | | | |
| | |
|
|
| | |
NOTE 6 — COMMITMENTS AND CONTINGENCIES
The Fund indemnifies its officers and trustees for certain liabilities that may arise from their performance of their duties to the Fund. Additionally, in the normal course of business, the Fund enters into contracts that contain a variety of representations and warranties, which provide general indemnifications. The Fund’s maximum exposure under these arrangements is unknown, as this would involve future claims that may be made against the Fund that have not yet occurred.
17
The Torray Institutional Fund
REPORT OF INDEPENDENT REGISTERED PUBLIC ACCOUNTING FIRM
To the Board of Trustees of The Torray Fund
and Shareholders of The Torray Institutional Fund
We have audited the accompanying statement of assets and liabilities, including the schedule of investments, of The Torray Institutional Fund, a series of shares of beneficial interest of The Torray Fund, as of December 31, 2008, and the related statement of operations for the year then ended, the statements of changes in net assets for each of the years in the two-year period then ended and the financial highlights for each of the years in the five-year period then ended. These financial statements and financial highlights are the responsibility of the Fund’s management. Our responsibility is to express an opinion on these financial statements and financial highlights based on our audits.
We conducted our audits in accordance with the standards of the Public Company Accounting Oversight Board (United States). Those standards require that we plan and perform the audits to obtain reasonable assurance about whether the financial statements and financial highlights are free of material misstatement. An audit includes examining, on a test basis, evidence supporting the amounts and disclosures in the financial statements. Our procedures included confirmation of securities owned as of December 31, 2008 by correspondence with the custodian. An audit also includes assessing the accounting principles used and significant estimates made by management, as well as evaluating the overall financial statement presentation. We believe that our audits provide a reasonable basis for our opinion.
In our opinion, the financial statements and financial highlights referred to above present fairly, in all material respects, the financial position of The Torray Institutional Fund as of December 31, 2008, the results of its operations for the year then ended, the changes in its net assets for each of the years in the two-year period then ended, and its financial highlights for each of the years in the five-year period then ended in conformity with accounting principles generally accepted in the United States of America.

BRIGGS, BUNTING & DOUGHERTY, LLP
Philadelphia, Pennsylvania
February 18, 2009
18
The Torray Institutional Fund
FUND MANAGEMENT
As of December 31, 2008 (unaudited)
The Trust is overseen by a Board of Trustees (the “Board”), who has delegated the day-to-day management to the officers of the Trust. The Board meets regularly to review the Fund’s activities, contractual arrangements, and performance. The trustees and officers serve until their successors are elected and qualified, or until the trustee or officer dies, resigns or is removed, or becomes disqualified.
Information pertaining to the Trustees and Officers of The Trust is set forth below. The Statement of Additional Information (SAI) includes additional information about the Trustees and is available without charge, upon request, by calling (800) 443-3036.
| | | | | | | | |
Name, Birth Date,
Address* and
Positions
with the Trust | | Term of Office
and Length of
Time Served | | Principal Occupation(s) During Past Five Years | | Portfolios
Overseen
by Trustee | | Other Directorships Held
|
| INDEPENDENT TRUSTEES |
Carol T. Crawford DOB: 2/25/43 Trustee | | Indefinite Term since 2006 | | Attorney, Private Practice, McLean, VA | | 2 | | Director, Smithfield Foods, Inc. Smithfield, VA |
Bruce C. Ellis DOB: 7/20/44 Trustee | | Indefinite Term since 1993 | | Private Investor, Bethesda, MD | | 2 | | None |
Robert P. Moltz DOB: 10/3/47 Trustee | | Indefinite Term since 1990 | | President and CEO, Weaver Bros Insurance Associates, Inc., Bethesda, MD | | 2 | | None |
| INTERESTED TRUSTEES AND OFFICERS OF THE TRUST |
William M Lane** DOB: 5/21/50 Trustee, Treasurer, Secretary, Chief Compliance Officer and Anti-Money Laundering Officer | | Indefinite Term Since 1990 | | Vice President, Secretary and Chief Compliance Officer, Torray LLC, Bethesda, MD (Oct. 2005-Present); Vice President, Secretary, Treasurer and Chief Compliance Officer, Robert E. Torray & Co. Inc. (Jul. 1984-Oct. 2005); Vice President, Secretary and Chief Compliance Officer, The Torray Corporation (Jan. 1990-Oct. 2005); Vice President, Secretary, Treasurer and Chief Compliance Officer, TEL Corporation (Jun. 2005-Oct. 2005).*** | | 2 | | None |
Wayne H. Shaner** DOB: 8/23/47 Trustee and Chairman of the Board | | Indefinite Term since 1993 | | Managing Partner, Rockledge Partners, LLC Investment Advisory Firm, Bethesda, MD (Jan. 2004- present); Vice President of Torray LLC, Bethesda, MD (Jan. 2008-June 2008); Prior to January 1, 2004, Managing Director, Lockheed Martin Investment Management Company, Bethesda, MD | | 2 | | Director, Van Eck Funds New York, NY |
19
The Torray Institutional Fund
FUND MANAGEMENT (continued)
As of December 31, 2008 (unaudited)
| | | | | | | | |
Name, Birth Date,
Address* and
Positions
with the Trust | | Term of Office
and Length of
Time Served | | Principal Occupation(s) During Past Five Years | | Portfolios
Overseen
by Trustee | | Other Directorships Held
|
| INTERESTED TRUSTEES AND OFFICERS OF THE TRUST |
Robert E. Torray DOB: 4/10/37 President | | Indefinite Term since 2007 | | Chairman and President, Torray LLC, Bethesda, MD (Oct. 2005-Present); President, Robert E. Torray & Co. Inc. (May 1972-Oct. 2005); President, The Torray Corporation (Jan. 1990 Oct. 2005); Chairman, TEL Corporation (Jun. 2005-Oct. 2005).*** | | N/A | | None |
| * | All addresses are c/o The Torray Fund, 7501 Wisconsin Avenue, Suite 1100, Bethesda, MD 20814-6523 |
| ** | Mr. Lane by virtue of employment with Torray LLC, the Trust's investment adviser, is considered an "interested person" of the Trust, as that term is defined in Section 2(a)(19) of the Investment Company Act of 1940, as amended. Mr. Shaner by virtue of prior employment with Torray LLC, is considered an "interested person" of the Trust. |
| *** | Robert E. Torray & Co., The Torray Corporation and TEL Corporation have all been succeeded to by Torray LLC. |
20
The Torray Institutional Fund
FACTORS CONSIDERED BY THE BOARD OF TRUSTEES IN CONNECTION WITH THEIR APPROVAL OF THE FUND’S INVESTMENT MANAGEMENT AGREEMENT WITH THE MANAGER (unaudited)
The Fund has entered into an Investment Management Agreement (the “Agreement”) with Torray LLC (the “Manager”) pursuant to which the Manager provides investment management services to the Fund. In accordance with the Investment Company Act of 1940, the Board of Trustees of the Fund is required, on an annual basis, to consider the continuation of the Agreement with the Manager, and this must take place at an in-person meeting of the Board. The relevant provisions of the Investment Company Act of 1940 specifically provide that it is the duty of the Board to request and evaluate such information as the Board determines is necessary to allow them to properly consider the continuation of the Agreement, and it is the duty of the Manager to furnish the trustees with such information that is responsive to their request. Set forth below is a discussion of the various factors that the Board of Trustees considered in deciding to approve the continuation of the Agreement with the Manager.
In determining whether to approve the continuation of the Agreement, the Board of Trustees requested, and the Manager provided, information and data relevant to the Board’s consideration. This included materials that provided the Board with information regarding the investment performance of the Fund and information regarding the fees and expenses of the Fund as compared to other similar mutual funds. As part of its deliberations, the Board also considered and relied upon the information about the Fund that had been provided to them throughout the year in connection with their regular Board meetings at which they engage in the ongoing oversight of the Fund and its operations.
The Board met at an in-person meeting on October 1, 2008 in order to consider the proposed continuation of the Agreement. Among the factors the Board considered was the overall performance of the Fund achieved by the Manager relative to the performance of other mutual funds with similar investment objectives since the inception of the Fund on June 30, 2001. In reviewing the shorter term performance of the Fund, the trustees took note of the fact that the short-term performance (for periods of less than five years) was generally lower than that of the benchmark index and of other funds with similar investment objectives, and the trustees discussed with the Manager the likely reasons for this, noting that the Manager maintains a particular focus on long-term investment results and as a result, short-term results can, and will, trail comparable averages from time to time. The Board took into consideration the fact that the Manager seeks to achieve investment results for the Fund with less risk than other similar funds, and that the Manager has maintained a low portfolio turnover rate for the Fund which is beneficial to shareholders of the Fund because this results in lower brokerage costs which helps to reduce the operating costs of the Fund. They noted the range of investment advisory and management services provided by the Manager and the level and quality of these services, and in particular, they noted the quality of the personnel providing these services, taking into consideration their finding that the personnel providing these services, and the services provided, were of a very high caliber and quality. The Board also considered the portfolio manager arrangements for the Fund, noting that the Manager had undertaken appropriate measures to provide for the continued management of the Fund by a team of portfolio managers with extensive portfolio management experience.
The Board also compared expenses of the Fund to the expenses of other funds of similar size, noting that the expenses for the Fund compared favorably with industry averages. They also took note of the fact that the Fund is not
21
The Torray Institutional Fund
FACTORS CONSIDERED BY THE BOARD OF TRUSTEES IN CONNECTION WITH THEIR APPROVAL OF THE FUND’S INVESTMENT MANAGEMENT AGREEMENT WITH THE MANAGER (unaudited) (continued)
subject to any sales loads, sales commissions or other similar fees, including Rule 12b-1 distribution fees, and they considered the fact that the Manager had informed the Board that it did not intend to propose the introduction of such types of fees for the Fund. In connection with their review of these matters, the trustees took note of the fact that the Fund was established principally as an investment vehicle for use by larger institutional types of investors and that the Fund’s fee structure, which is an all-inclusive fee structure, is reflective of fees generally charged in the institutional fund marketplace. The Board further took note of the overall decline in the level of assets in the Fund over the past year, and they reviewed with representatives of the Manager possible actions that might be taken in order to address the asset size of the Fund, and the representatives of the Manager indicated their continuing interest in operating the Fund at its present asset level. The Board also reviewed financial information concerning the Manager, noting its financial soundness as demonstrated by the financial information provided and the level of profitability relating to its services for the Fund, noting that these were reasonable and consistent with industry standards. The Board was also provided with information regarding the fees that the Manager charges other clients for investment advisory services and they noted that the fees were comparable based on the relevant circumstances of the types of accounts involved. The Board reviewed with the Manager the allocation of the portfolio management team’s time between managing the investments of the Fund and managing other accounts. The Board also engaged in a review of the compensation arrangements for the portfolio managers of the Fund.
In addition, the Board reviewed with the Manager information regarding its brokerage practices, including soft dollar matters, and noted that the Manager did not have in place any formal soft dollar arrangements, and the Board also reviewed the Manager’s best execution procedures, which the Board noted were reasonable and consistent with standard industry practice.
Based on their review, the trustees concluded that the investment management services provided under the Agreement were reasonably worth the full amount of the fee and that the terms of the Agreement were fair and reasonable. In reaching their conclusion with respect to their approval of the continuation of the Agreement, the trustees did not identify any one single factor as being controlling, rather, the Board took note of a combination of factors that influenced their decision making process. The Board did, however, identify the overall favorable investment performance of the Fund since its inception, the commitment of the Manager to the successful operation of the Fund, and the level of expenses of the Fund, as being important elements of their consideration Based upon their review and consideration of these factors and other matters deemed relevant by the Board in reaching an informed business judgment, a majority of the Board of Trustees, including a majority of the Independent Trustees, concluded that the terms of the Agreement were fair and reasonable and the Board voted to approve the continuation of the Agreement with the Manager.
22
The Torray Institutional Fund
PORTFOLIO HOLDINGS, PROXY VOTING AND PROCEDURES
As of December 31, 2008 (unaudited)
The Fund files its complete schedule of portfolio holdings with the Securities and Exchange Commission (the “Commission”) for the first and third quarters of each fiscal year on Form N-Q. The Fund’s Forms N-Q are available on the Commission’s website at http://www.sec.gov. The Fund’s Form N-Q may be reviewed and copied at the Commission’s Public Reference Room in Washington, D.C. Information on the operation of the Commission's Public Reference Room may be obtained by calling 1-800-SEC-0330.
A description of the policies and procedures that the Fund uses to determine how to vote proxies relating to portfolio securities is available without charge, upon request, by calling 1-800-443-3036; and on the Commission’s website at http://www.sec.gov.
Information regarding how the Fund voted proxies relating to portfolio securities is available without charge, upon request, by calling 1-800-443-3036; and on the Commission’s website at http://www.sec.gov.
23
The Torray Institutional Fund
ABOUT YOUR FUND'S EXPENSES
As of December 31, 2008 (unaudited)
We believe it is important for you to understand the impact of costs on your investment. All mutual funds have operating expenses. As a shareholder of the Fund, you incur ongoing costs, including management fees. Operating expenses, which are deducted directly from the Fund’s gross income, directly reduce the investment return of the Fund.
A fund’s expenses are expressed as a percentage of its average net assets. This figure is known as the expense ratio. The following examples are intended to help you understand the ongoing costs (in dollars) of investing in the Fund and to compare these costs with the ongoing costs of investing in other mutual funds. The examples below are based on an investment of $1,000 made at the beginning of the period shown and held for the entire period.
The table on the next page illustrates the Fund’s cost in two ways:
Actual Fund Return This section helps you estimate the actual expenses that you paid over the period. The “Ending Account Value” shown is derived from the Fund’s actual return, and the third column shows the operating expenses that would have been paid by an investor who started with $1,000 in the Fund. You may use the in-formation here, together with the amount invested, to estimate the expenses that you paid over the period.
To do so, simply divide your account value by $1,000 (for example, an $8,600 account value divided by $1,000 = 8.6), then multiply the result by the number given for the Fund under the heading “Expenses Paid During Period” on the next page.
Hypothetical 5% Return This section is intended to help you compare your Fund’s costs with those of other mutual funds. It assumes that the Fund had an annual return of 5% before expenses, and that the expense ratio is unchanged. In this case, because the return used is not the Fund’s actual return, the results do not apply to your investment. The example is useful in making comparisons because the Securities and Exchange Commission requires all mutual funds to calculate expenses based on a 5% return. You can assess the Fund’s costs by comparing this hypothetical example with the hypothetical examples that appear in shareholder reports of other funds.
Note that expenses shown in the table are meant to highlight and help you compare ongoing costs only. The Fund does not charge transactions fees, such as purchase or redemption fees, nor does it carry a “sales load.”
The calculation assumes no shares were bought or sold during the period. Your actual costs may have been higher or lower, depending on the amount of your investment and the timing of any purchases or redemptions.
More information about the Fund’s expenses, including recent annual expense ratios, can be found in this report. For additional information on operating expenses and other shareholder costs, please refer to the Fund’s prospectus.
24
The Torray Institutional Fund
ABOUT YOUR FUND'S EXPENSES (continued)
As of December 31, 2008 (unaudited)
| | | | | | | | | |
| | | Beginning
Account Value
July 1, 2008
| | Ending
Account Value
December 31, 2008
| | Expenses Paid
During Period*
|
Based on Actual Fund Return | | $ | 1,000.00 | | $ | 748.60 | | $ | 3.74 |
Based on Hypothetical 5% Return
(before expenses) | | $ | 1,000.00 | | $ | 1,020.86 | | $ | 4.32 |
| * | Expenses are equal to the Fund’s annualized expense ratio of 0.85% for the period, multiplied by the average account value over the period, multiplied by 184/366 (to reflect the one-half year period). |
25
The Torray Institutional Fund
TAX INFORMATION
As of December 31, 2008 (unaudited)
We are required to advise you within 60 days of the Fund's fiscal year-end regarding the Federal tax status of certain distributions received by shareholders during such fiscal year. The information below is provided for the Fund's fiscal year ending December 31, 2008.
Qualified Interest Income
For the year ended December 31, 2008, 8.24% of the ordinary distributions paid (net investment income plus short-term capital gain) represent the amount of Qualifying Interest Income as created by The American Jobs Creation Act of 2004.
Qualified Dividend Income
For the year ended December 31, 2008, 63.16% of the distributions paid by the Fund from ordinary income qualifies for a reduced tax rate pursuant to The Jobs and Growth Tax Relief Reconciliation Act of 2003.
Dividends Received Deduction
For the year ended December 31, 2008, 59.86% of the ordinary income distribution qualifies for the dividends received deduction available to corporations.
Qualifying Short-Term Capital Gain
For the year ended December 31, 2008, 100% of the ordinary distributions paid (net investment income plus short-term capital gain) represent the amount of Qualifying Short-Term Capital Gain as created by The American Jobs Creation Act of 2004.
Dividends and distributions received by retirement plans such as IRA's, Keogh-type plans and 403(b) plans need not be reported as taxable income. However, many retirement plan trusts may need this information for their annual information reporting.
26
TRUSTEES
Carol Crawford
Bruce C. Ellis
William M Lane
Robert P. Moltz
Wayne H. Shaner
INVESTMENT ADVISOR
Torray LLC
OFFICERS
Robert E. Torray
William M Lane
Fred M. Fialco
Shawn M. Hendon
INDEPENDENT REGISTERED PUBLIC
ACCOUNTING FIRM
Briggs, Bunting & Dougherty, LLP
1835 Market Street, 26th Floor
Philadelphia, PA 19103
TRANSFER AGENT
PNC Global Investment Servicing (U.S.) Inc.
101 Sabin Street
Pawtucket, RI 02860-1427
LEGAL COUNSEL
Dechert LLP
1775 I Street, N.W.
Washington, DC 20006
Distributed by PFPC Distributors, Inc.
760 Moore Road, King of Prussia, PA 19406-1212
Date of first use, February 2009
This report is not authorized for distribution to prospective
investors unless preceded or accompanied by a current
prospectus. All indices are unmanaged groupings of stocks
that are not available for investment.
The
TORRAY
INSTITUTIONAL
FUND
ANNUAL REPORT
December 31, 2008
The Torray Institutional Fund
Suite 1100
7501 Wisconsin Avenue
Bethesda, Maryland 20814-6523
(301) 493-4600
(800) 443-3036
| | (a) | The registrant, as of the end of the period covered by this report, has adopted a code of ethics that applies to the registrant’s principal executive officer, principal financial officer, principal accounting officer or controller, or persons performing similar functions, regardless of whether these individuals are employed by the registrant or a third party. |
| | (c) | There have been no amendments, during the period covered by this report, to a provision of the code of ethics that applies to the registrant’s principal executive officer, principal financial officer, principal accounting officer or controller, or persons performing similar functions, regardless of whether these individuals are employed by the registrant or a third party, and that relates to any element of the code of ethics description. |
| | (d) | The registrant has not granted any waivers, including an implicit waiver, from a provision of the code of ethics that applies to the registrant’s principal executive officer, principal financial officer, principal accounting officer or controller, or persons performing similar functions, regardless of whether these individuals are employed by the registrant or a third party, that relates to one or more of the items set forth in paragraph (b) of this item’s instructions. |
| Item 3. | Audit Committee Financial Expert. |
The Registrant’s Board of Directors has not designated an audit committee financial expert. The Registrant has determined that it will retain the services of an independent third party to assist it if circumstances arise that require specific investment company auditing expertise.
| Item 4. | Principal Accountant Fees and Services. |
Audit Fees
| | (a) | The aggregate fees billed for each of the last two fiscal years for professional services rendered by the principal accountant for the audit of the registrant’s annual financial statements or services that are normally provided by the accountant in connection with statutory and regulatory filings or engagements for those fiscal years are $56,000 for 2008 and $56,000 for 2007. |
Audit-Related Fees
| | (b) | The aggregate fees billed in each of the last two fiscal years for assurance and related services by the principal accountant that are reasonably related to the performance of the audit of the registrant’s financial statements and are not reported under paragraph (a) of this Item are $0 for 2008 and $0 for 2007. |
Tax Fees
| | (c) | The aggregate fees billed in each of the last two fiscal years for professional services rendered by the principal accountant for tax compliance, tax advice, and tax planning are $4,000 for 2008 and $4,000 for 2007. Tax fees represent tax compliance services provided in connection with the review of the Registrant’s tax returns. |
All Other Fees
| | (d) | The aggregate fees billed in each of the last two fiscal years for products and services provided by the principal accountant, other than the services reported in paragraphs (a) through (c) of this Item are $0 for 2008 and $0 for 2007. |
| | (e)(1) | Disclose the audit committee’s pre-approval policies and procedures described in paragraph (c)(7) of Rule 2-01 of Regulation S-X. |
Audit Committee Pre-Approval Policy. All services to be performed for the Registrant by Briggs Bunting & Dougherty, LLP must be pre-approved by the audit committee. All services performed during 2008 and 2007 were pre-approved by the committee.
| | (e)(2) | The percentage of services described in each of paragraphs (b) through (d) of this Item that were approved by the audit committee pursuant to paragraph (c)(7)(i)(C) of Rule 2-01 of Regulation S-X are as follows: |
| | (f) | The percentage of hours expended on the principal accountant’s engagement to audit the registrant’s financial statements for the most recent fiscal year that were attributed to work performed by persons other than the principal accountant’s full-time, permanent employees was 0%. |
| | (g) | The aggregate non-audit fees billed by the registrant’s accountant for services rendered to the registrant, and rendered to the registrant’s investment adviser (not including any sub-adviser whose role is primarily portfolio management and is subcontracted with or overseen by another investment adviser), and any entity controlling, controlled by, or under common control with the adviser that provides ongoing services to the registrant for each of the last two fiscal years of the registrant was $15,000 for 2008 and $14,300 for 2007. |
| | (h) | The registrant’s audit committee of the board of directors has considered whether the provision of non-audit services that were rendered to the registrant’s investment adviser (not including any sub-adviser whose role is primarily portfolio management and is subcontracted with or overseen by another investment adviser), and any entity controlling, controlled by, or under common control with the investment adviser that provides ongoing services to the registrant that were not pre-approved pursuant to paragraph (c)(7)(ii) of Rule 2-01 of Regulation S-X is compatible with maintaining the principal accountant’s independence. |
| Item 5. | Audit Committee of Listed registrants. |
Not applicable.
| | (a) | Schedule of Investments in securities of unaffiliated issuers as of the close of the reporting period is included as part of the report to shareholders filed under Item 1 of this form. |
| Item 7. | Disclosure of Proxy Voting Policies and Procedures for Closed-End Management Investment Companies. |
Not applicable.
| Item 8. | Portfolio Managers of Closed-End Management Investment Companies. |
Not applicable.
| Item 9. | Purchases of Equity Securities by Closed-End Management Investment Company and Affiliated Purchasers. |
Not applicable.
| Item 10. | Submission of Matters to a Vote of Security Holders. |
There have been no material changes to the procedures by which the shareholders may recommend nominees to the registrant’s board of directors, where those changes were implemented after the registrant last provided disclosure in response to the requirements of Item 407(c)(2)(iv) of Regulation S-K (17 CFR 229.407) (as required by Item 22(b)(15) of Schedule 14A (17 CFR 240.14a-101)), or this Item.
| Item 11. | Controls and Procedures. |
| | (a) | The registrant’s principal executive and principal financial officers, or persons performing similar functions, have concluded that the registrant’s disclosure controls and procedures (as defined in Rule 30a-3(c) under the Investment Company Act of 1940, as amended (the “1940 Act”) (17 CFR 270.30a-3(c))) are effective, as of a date within 90 days of the filing date of the report that includes the disclosure required by this paragraph, based on their evaluation of these controls and procedures required by Rule 30a-3(b) under the 1940 Act (17 CFR 270.30a-3(b)) and Rules 13a-15(b) or 15d-15(b) under the Securities Exchange Act of 1934, as amended (17 CFR 240.13a-15(b) or 240.15d-15(b)). |
| | (b) | There were no changes in the registrant’s internal control over financial reporting (as defined in Rule 30a-3(d) under the 1940 Act (17 CFR 270.30a-3(d)) that occurred during the registrant’s second fiscal quarter of the period covered by this report that has materially affected, or is reasonably likely to materially affect, the registrant’s internal control over financial reporting. |
| | (a)(1) | Code of ethics, or any amendment thereto, that is the subject of disclosure required by Item 2 is incorporated by reference to Exhibit (a)(1) of the Registrant’s Form N-CSR filed on March 9, 2006 (Accession No. 0001193125-06-049180). |
| | (a)(2) | Certifications pursuant to Rule 30a-2(a) under the 1940 Act and Section 302 of the Sarbanes-Oxley Act of 2002 are attached hereto. |
| | (b) | Certifications pursuant to Rule 30a-2(b) under the 1940 Act and Section 906 of the Sarbanes- Oxley Act of 2002 are attached hereto. |
SIGNATURES
Pursuant to the requirements of the Securities Exchange Act of 1934 and the Investment Company Act of 1940, the registrant has duly caused this report to be signed on its behalf by the undersigned, thereunto duly authorized.
(registrant) The Torray Fund
By (Signature and Title)* /s/ Robert E. Torray
Robert E. Torray, President
(principal executive officer)
Date 3/9/09
Pursuant to the requirements of the Securities Exchange Act of 1934 and the Investment Company Act of 1940, this report has been signed below by the following persons on behalf of the registrant and in the capacities and on the dates indicated.
By (Signature and Title)* /s/ Robert E. Torray
Robert E. Torray, President
(principal executive officer)
Date 3/9/09
By (Signature and Title)* /s/ William M Lane
William M Lane, Treasurer
(principal financial officer)
Date 3/9/09
| * | Print the name and title of each signing officer under his or her signature. |