UNITED STATES
SECURITIES AND EXCHANGE COMMISSION
Washington, D.C. 20549
FORM N-CSR
CERTIFIED SHAREHOLDER REPORT OF REGISTERED MANAGEMENT
INVESTMENT COMPANIES
Investment Company Act file number 811-06096
The Torray Fund
(Exact name of registrant as specified in charter)
7501 Wisconsin Avenue, Suite 1100
Bethesda, MD 20814-6523
(Address of principal executive offices) (Zip code)
William M Lane
Torray LLC
7501 Wisconsin Avenue, Suite 1100
Bethesda, MD 20814-6523
(Name and address of agent for service)
Registrant’s telephone number, including area code: 301-493-4600
Date of fiscal year end: December 31
Date of reporting period: December 31, 2007
Item 1. Reports to Stockholders.
The Report to Shareholders is attached herewith.
The Torray Fund
Letter to Shareholders
February 4, 2008
Dear Fellow Shareholders,
The Torray Fund depreciated 0.8% during 2007, compared to a gain of 5.5% for the Standard & Poor’s 500 Index. Commodities — particularly energy — along with materials and utilities, all absent from the portfolio, continued to make the difference. We have often reexamined our thinking on these sectors, but always reach the same conclusion. Four decades of experience tell us that, over time, the course we’re on is safer and more certain to succeed.
The market’s performance over the last eight years has been one of the worst on record. It seems hard to believe, but on a price basis, the S&P 500 Index lost 0.1% annually. Including dividends, it made only 1.7% per year, 14% cumulatively. After trading costs, taxes, fees and mutual fund switching, the average investor probably fared even worse. Eight years is a very long time to wait for such an outcome. Even though comparable returns for our Fund were twice the market’s, 3.2% and 29%, respectively, they were still only a fraction of what we’ve come to expect. The truth is it’s hard to make money when stocks go sideways for such a long period. Nevertheless, we’re optimistic. The future looks good to us, and equities are by far the best way to take advantage of it.
As we write, cataclysmic losses on sub-prime mortgages, collateralized debt obligations, credit default swaps, derivatives and bond insurance have cast a dark shadow over our markets. We expressed deep skepticism about these complex financial constructs in our June 2007 semi-annual letter, but nothing at the time remotely suggested what was to come. It seems that prominent bank executives, some of whom have since been fired, had no clue of the risks either, or perhaps, given the enormous though illusory profits at stake, they simply chose to ignore them. While there is no minimizing the debacle, the main victims, at least so far, have been the very institutions that caused it — large commercial and investment banks, mortgage companies, and so on. In the ultimate irony, it would appear Wall Street’s rocket scientists designed a heat-seeking missile that hit themselves. The good news is, regardless of how things turn out, history confirms that shareholders in large, quality companies will continue to prosper as the economy and earnings grow in the decades to come.
Although this is easy to say, it is also easily forgotten when markets turn down. Following our Company’s inception in 1972, a period preceded by a wild speculation in the day’s most popular stocks, prices collapsed nearly 50% on the heels of the Arab oil embargo which drove crude up five-fold, wrecking the world’s cost structure. During the crash of ‘87, the Dow fell 36% top to bottom in less than two months, equivalent to 4300 points today. Most of the loss, a staggering 31%, occurred in the last four days alone. One can just imagine the response if the same thing happened today. At the time, we thought the New York Stock Exchange, in an effort to forestall the panic, surely would close for a while — it didn’t. (For more on this market disaster, see Tim Metz’s gripping Black Monday, William Morrow and Co., 1988.) Fifteen years later, 9/11 accelerated the unwinding of the tech/telecom/dot.com mania. When it was over, the S&P and NASDAQ had suffered losses of 50% and 80%, respectively.
Investors’ response to each of these jarring downturns was to sell the shares they had eagerly bought at much higher prices earlier on. This proved a big mistake as subsequent recoveries and the long-term picture confirm.
1
The Torray Fund
Letter to Shareholders (continued)
February 4, 2008
Underscoring the point, studies show that after compounding, 90% of the return on stocks is generated on just 1 1/2 percent of the days the exchanges are open. Translated, the odds are 66 1/2-to-1 against those that trade in and out of the market based on the direction it’s headed.
In spite of the turmoil, stocks, over the last 36 years, have returned 10.9% compounded annually, and our institutional management company, 13.3%. (The Torray Fund, since its inception 17 years ago, made 12.4% per year, compared to 11.4% for the market.) It is noteworthy that our interim results since 1972 were often at odds with the long-term average; in five years, we lost money — though always less than the market, which sustained eight years of losses. This record goes a long way to discredit today’s fixation on short-term performance.
The market’s story over the last five years is essentially that stocks going up kept going up, and those that weren’t, didn’t. The winners were largely those recording unsustainably high rates of earnings growth off long-depressed cyclical lows. The lure of these situations deflected attention from some of the best companies in the world — businesses that were also growing, just not nearly as fast. We own a number of them. Investors’ lack of interest muted our performance — earnings grew 13%, the Fund, 9%. This reduced its price/earnings ratio to 14.2 times 2008 estimated earnings. By comparison, the market’s P/E ratio over the last 25 years averaged 20.7— nearly 50% higher; it was 17.6 for 50 years, and 15.9 since 1926, a period encompassing the Great Depression and World War II. At the very least, this suggests The Torray Fund’s stocks are attractively valued. Moreover, their combined earnings return (earnings divided by price) is now better than 7%, double the yield on 10-year government bonds which provide no growth or protection against inflation. This is far too wide a risk premium for a high quality portfolio.
In addition, we believe our prospects have been enhanced by a number of shifts we made in the Fund’s investments during the second half of 2007. These moves were prompted by rising market volatility and the aforementioned investor obsession with price momentum, which, in turn, caused significant changes in the relative valuations of many stocks. Twelve new companies were added, and eight existing holdings were increased. The purchases were funded by eliminating 17 positions and paring back 10 others. This raised our industrial, consumer discretionary and information technology weightings and reduced those of health care, financials and telecom services. In each case we felt the long-range outlook for the replacements was superior to those of the sales. These companies are well-positioned to weather economic storms and should also benefit from exposure to expanding international markets, new product development, reinvestment in core operations and acquisition possibilities. An unavoidable fallout from this activity was that portfolio turnover reached 50%, a level recorded only once in the Fund’s 17-year history. Going forward, the rate should decline to the 20-30% range we’ve typically experienced. By comparison, the fund industry average exceeds 100%, testimony to the wildly speculative era we live in.
I would now like to tell you about changes in the management structure of our Company. On November 1, 2007, Doug Eby left The Torray Companies to pursue his interest in hedge funds. I am pleased to announce that the principals of Rockledge Partners, LLC, Wayne H. Shaner, the chairman of The Torray Funds, and his partner Shawn M. Hendon, along with their staff, joined us at the start of the New Year. Wayne and Shawn each have
2
The Torray Fund
Letter to Shareholders (continued)
February 4, 2008
30 years of experience in the business, and I have known them well throughout that period. Their commitment to the values and approach our Company has endorsed for nearly four decades adds immeasurably to the strength of the Torray organization.
Special thanks go to Fred M. Fialco, our talented research and investment executive, who has been with us for 11 years, and my partner Bill Lane for his diligent and astute management of The Torray Companies over more than 25 years. Our entire staff deserves the highest marks for a job well done and their unyielding dedication to your interests. They are a joy to work with. On this 17th anniversary of The Torray Fund, I would also like to praise Robin Lichterman, my executive assistant for the last 23 years. Among many other things, she has tirelessly, cheerfully, and skillfully played a major role in the writing of these letters — now totaling 34. They would not have been the same without her.
We thank you once again for your investment in our Fund.
| | | | | | |
Sincerely, | | | | |
| | |  | | | | |
| | | Robert E. Torray President | | | | |
3
The Torray Fund
PERFORMANCE DATA
As of December 31, 2007
Average Annual Returns on an Investment in
The Torray Fund vs. the S&P 500 Index
For the periods ended December 31, 2007:
| | | | | | | | | | | | | | | |
| | | 1 Year
| | | 3 Years
| | | 5 Years
| | | 10 Years
| | | Since
Inception
12/31/90
| |
The Torray Fund | | -0.80 | % | | 4.82 | % | | 9.04 | % | | 5.63 | % | | 12.39 | % |
S&P 500 Index | | 5.49 | % | | 8.62 | % | | 12.83 | % | | 5.90 | % | | 11.40 | % |

Cumulative Returns for the 17 years ended December 31, 2007
| | | |
The Torray Fund | | 629.08 | % |
S&P 500 Index | | 527.19 | % |
4
The Torray Fund
PERFORMANCE DATA (continued)
As of December 31, 2007
Change in Value of $10,000 Invested
on December 31, 1990 (commencement of operations) to:
| | | | | | | | | | | | | | | | | | |
| | | 12/31/92
| | 12/31/95
| | 12/31/98
| | 12/31/01
| | 12/31/04
| | 12/31/07
|
The Torray Fund | | $ | 14,523 | | $ | 23,796 | | $ | 45,576 | | $ | 54,325 | | $ | 63,227 | | $ | 72,908 |
S&P 500 Index | | $ | 14,047 | | $ | 21,547 | | $ | 45,438 | | $ | 44,054 | | $ | 48,811 | | $ | 62,719 |
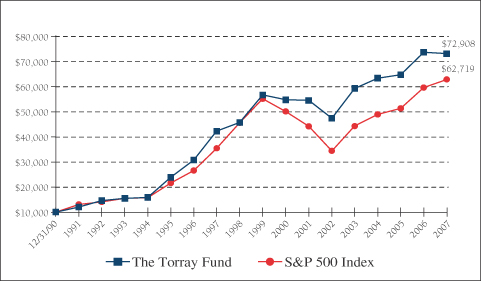
The returns quoted represent past performance and do not guarantee future results. Investment return and principal value will fluctuate so that shares, when redeemed, may be worth more or less than their original cost. Current performance may be lower or higher. Returns current to the most recent month-end are available at www.torray.com. The returns shown do not reflect the deduction of taxes a shareholder would pay on the redemption of fund shares and distributions. The Fund’s gross annual operating expense ratio, as stated in the current prospectus, is 1.10%. Returns on both The Torray Fund and the S&P 500 Index assume reinvestment of all dividends and distributions. The S&P 500 Index is an unmanaged index consisting of 500 U.S. large-cap stocks.
5
The Torray Fund
FUND PROFILE
As of December 31, 2007 (unaudited)
| | |
DIVERSIFICATION (% of net assets) | | |
| |
Financials | | 22.77% |
Industrials | | 20.27 |
Information Technology | | 16.78 |
Health Care | | 15.16 |
Consumer Discretionary | | 10.87 |
Materials | | 4.29 |
Consumer Staples | | 2.84 |
Short-Term Investments | | 9.01 |
Other Liabilities Less Assets | | (1.99) |
| | |
|
| | | 100.00% |
| | |
| TOP TEN EQUITY HOLDINGS |
| |
| 1. | | Berkshire Hathaway, Inc., Class B |
| 2. | | W.R. Grace & Co. |
| 3. | | General Electric Co. |
| 4. | | Johnson & Johnson |
| 5. | | UnitedHealth Group, Inc. |
| 6. | | WellPoint, Inc. |
| 7. | | EMC Corp. |
| 8. | | USG Corp. |
| 9. | | Marsh & McLennan Cos., Inc. |
| 10. | | Procter & Gamble Co. (The) |
| | | | |
PORTFOLIO CHARACTERISTICS | | |
| | |
Net Assets (million) | | | | $1,000 |
Number of Holdings | | | | 39 |
Portfolio Turnover | | | | 50.47% |
P/E Multiple (forward) | | | | 15.4x |
Portfolio Yield | | | | 1.40% |
Market Capitalization | | Average | | 68.7 B |
| | | Median | | 37.3 B |
6
The Torray Fund
SCHEDULE OF INVESTMENTS
As of December 31, 2007
| | | | | | | |
| | | Shares
| | | | Market Value
|
| COMMON STOCK 92.98% | | | |
| |
| 22.77% FINANCIALS | | | |
| | | 13,601 | | Berkshire Hathaway, Inc., Class B * | | $ | 64,414,336 |
| | | 1,093,600 | | Marsh & McLennan Cos., Inc. | | | 28,947,592 |
| | | 445,909 | | Aflac, Inc. | | | 27,927,281 |
| | | 425,700 | | American International Group, Inc. | | | 24,818,310 |
| | | 42,447 | | Markel Corp. * | | | 20,845,722 |
| | | 439,900 | | Bank of America Corp. | | | 18,150,274 |
| | | 572,000 | | Citigroup, Inc. | | | 16,839,680 |
| | | 2,830,200 | | LaBranche & Co., Inc. * | | | 14,264,208 |
| | | 223,500 | | American Express Co. | | | 11,626,470 |
| | | | | | |
|
|
| | | | | | | | 227,833,873 |
| |
| 20.27% INDUSTRIALS | | | |
| | | 1,085,000 | | General Electric Co. | | | 40,220,950 |
| | | 830,101 | | USG Corp. * | | | 29,709,315 |
| | | 779,800 | | Cintas Corp. | | | 26,216,876 |
| | | 230,900 | | Danaher Corp. | | | 20,259,166 |
| | | 376,200 | | Illinois Tool Works, Inc. | | | 20,141,748 |
| | | 225,100 | | General Dynamics Corp. | | | 20,031,649 |
| | | 253,850 | | United Technologies Corp. | | | 19,429,679 |
| | | 747,200 | | Owens Corning, Inc. * | | | 15,108,384 |
| | | 205,600 | | Emerson Electric Co. | | | 11,649,296 |
| | | | | | |
|
|
| | | | | | | | 202,767,063 |
| |
| 16.78% INFORMATION TECHNOLOGY | | | |
| | | 1,762,400 | | EMC Corp. * | | | 32,657,272 |
| | | 1,234,984 | | Electronic Data Systems Corp. | | | 25,601,218 |
| | | 934,800 | | Cisco Systems, Inc. * | | | 25,305,036 |
| | | 506,200 | | Automatic Data Processing, Inc. | | | 22,541,086 |
| | | 205,100 | | International Business Machines Corp. | | | 22,171,310 |
| | | 751,300 | | Intel Corp. | | | 20,029,658 |
| | | 1,102,800 | | Applied Materials, Inc. | | | 19,585,728 |
| | | | | | |
|
|
| | | | | | | | 167,891,308 |
See notes to the financial statements.
7
The Torray Fund
SCHEDULE OF INVESTMENTS (continued)
As of December 31, 2007
| | | | | | | | |
| | | Shares
| | | | Market Value
| |
| |
| 15.16% HEALTH CARE | | | | |
| | | 561,500 | | Johnson & Johnson | | $ | 37,452,050 | |
| | | 628,800 | | UnitedHealth Group, Inc. | | | 36,596,160 | |
| | | 400,200 | | WellPoint, Inc. * | | | 35,109,546 | |
| | | 467,500 | | Eli Lilly & Co. | | | 24,959,825 | |
| | | 312,000 | | Abbott Laboratories | | | 17,518,800 | |
| | | | | | |
|
|
|
| | | | | | | | 151,636,381 | |
| |
| 10.87% CONSUMER DISCRETIONARY | | | | |
| | | 840,400 | | O’Reilly Automotive, Inc. * | | | 27,254,172 | |
| | | 772,900 | | Walt Disney Co. (The) | | | 24,949,212 | |
| | | 543,900 | | McGraw-Hill Cos., Inc. (The) | | | 23,828,259 | |
| | | 1,013,700 | | CarMax, Inc. * | | | 20,020,575 | |
| | | 220,700 | | Gannett Co., Inc. | | | 8,607,300 | |
| | | 324,524 | | McClatchy Co. (The), Class A | | | 4,063,040 | |
| | | | | | |
|
|
|
| | | | | | | | 108,722,558 | |
| |
| 4.29% MATERIALS | | | | |
| | | 1,639,900 | | W.R. Grace & Co. * | | | 42,932,582 | |
| |
| 2.84% CONSUMER STAPLES | | | | |
| | | 386,500 | | Procter & Gamble Co. (The) | | | 28,376,830 | |
| | | | | | |
|
|
|
| TOTAL COMMON STOCK 92.98% | | | 930,160,595 | |
| (cost $818,236,665) | | | | |
| SHORT-TERM INVESTMENTS 9.01% | | | | |
| | | 90,119,854 | | PNC Bank Money Market Account, 3.51% | | | 90,119,854 | |
| | | | | | |
|
|
|
| (cost $90,119,854) | | | | |
| TOTAL INVESTMENTS 101.99% | | | 1,020,280,449 | |
| (cost $908,356,519) | | | | |
| OTHER LIABILITIES LESS ASSETS (1.99%) | | | (19,936,703 | ) |
| | | | | | |
|
|
|
| NET ASSETS 100.00% | | $ | 1,000,343,746 | |
| | | | | | |
|
|
|
| * | Non-income producing securities |
See notes to the financial statements.
8
The Torray Fund
STATEMENT OF ASSETS AND LIABILITIES
As of December 31, 2007
| | | |
ASSETS | | | |
Investments in securities at value
(cost $908,356,519) | | $ | 1,020,280,449 |
Receivable for fund shares sold | | | 20,841,314 |
Receivable for investments sold | | | 8,009,082 |
Interest and dividends receivable | | | 1,250,996 |
Prepaid expenses | | | 29,500 |
| | |
|
|
TOTAL ASSETS | | | 1,050,411,341 |
| | |
|
|
| |
LIABILITIES | | | |
Payable for securities purchased | | | 39,936,514 |
Payable for fund shares redeemed | | | 8,990,075 |
Payable to advisor | | | 953,016 |
Accrued expenses | | | 179,740 |
Payable to trustees | | | 8,250 |
| | |
|
|
TOTAL LIABILITIES | | | 50,067,595 |
| | |
|
|
| |
NET ASSETS | | $ | 1,000,343,746 |
| | |
|
|
Shares of beneficial interest ($1 stated value,
27,449,278 shares outstanding, unlimited shares authorized) | | $ | 27,449,278 |
Paid-in-capital in excess of par | | | 830,120,162 |
Accumulated undistributed net investment income | | | 1,037,704 |
Accumulated net realized gain on investments | | | 29,812,672 |
Net unrealized appreciation of investments | | | 111,923,930 |
| | |
|
|
| |
TOTAL NET ASSETS | | $ | 1,000,343,746 |
| | |
|
|
Net asset value, offering and redemption price per share | | $ | 36.44 |
| | |
|
|
See notes to the financial statements.
9
The Torray Fund
STATEMENT OF OPERATIONS
For the year ended December 31, 2007
| | | | |
INVESTMENT INCOME | | | | |
Dividend income (net of foreign taxes withheld of $138,618) | | $ | 12,948,585 | |
Interest income | | | 3,625,753 | |
| | |
|
|
|
Total income | | | 16,574,338 | |
| | |
|
|
|
| |
EXPENSES | | | | |
Management fees | | | 11,465,956 | |
Transfer agent fees & expenses | | | 522,091 | |
Legal fees | | | 134,264 | |
Custodian fees | | | 81,986 | |
Printing, postage & mailing | | | 67,409 | |
Trustees’ fees | | | 57,655 | |
Interest expense | | | 42,334 | |
Audit fees | | | 35,994 | |
Insurance expense | | | 26,859 | |
Registration & filing fees | | | 12,281 | |
| | |
|
|
|
Total expenses | | | 12,446,829 | |
| | |
|
|
|
NET INVESTMENT INCOME | | | 4,127,509 | |
| | |
|
|
|
REALIZED AND UNREALIZED GAIN (LOSS)
ON INVESTMENTS | | | | |
Net realized gain on investments | | | 161,043,999 | |
Net change in unrealized appreciation (depreciation) on investments | | | (167,246,623 | ) |
| | |
|
|
|
Net realized and unrealized loss on investments | | | (6,202,624 | ) |
| | |
|
|
|
NET DECREASE IN NET ASSETS FROM OPERATIONS | | $ | (2,075,115 | ) |
| | |
|
|
|
See notes to the financial statements.
10
The Torray Fund
STATEMENTS OF CHANGES IN NET ASSETS
For the years indicated:
| | | | | | | | |
| | | Year ended
12/31/07
| | | Year ended
12/31/06
| |
Increase (Decrease) in Net Assets from Operations: | | | | | | | | |
Net investment income | | $ | 4,127,509 | | | $ | 2,233,733 | |
Net realized gain on investments | | | 161,043,999 | | | | 77,850,871 | |
Capital gain distributions from investment companies | | | — | | | | 537,718 | |
Net change in unrealized appreciation
(depreciation) on investments | | | (167,246,623 | ) | | | 75,047,861 | |
| | |
|
|
| |
|
|
|
Net increase (decrease) in net assets from operations | | | (2,075,115 | ) | | | 155,670,183 | |
| | |
|
|
| |
|
|
|
| | |
Distributions to Shareholders from: | | | | | | | | |
Net investment income ($0.121 and
$0.087 per share, respectively) | | | (3,263,557 | ) | | | (2,633,260 | ) |
Net realized gains ($4.718 and $2.612 per
share, respectively) | | | (119,990,286 | ) | | | (73,114,435 | ) |
| | |
|
|
| |
|
|
|
Total distributions | | | (123,253,843 | ) | | | (75,747,695 | ) |
| | |
|
|
| |
|
|
|
| | |
Shares of Beneficial Interest | | | | | | | | |
Decrease from share transactions | | | (73,246,614 | ) | | | (210,953,920 | ) |
| | |
|
|
| |
|
|
|
Total decrease | | | (198,575,572 | ) | | | (131,031,432 | ) |
| | |
Net Assets — Beginning of Year | | | 1,198,919,318 | | | | 1,329,950,750 | |
| | |
|
|
| |
|
|
|
Net Assets — End of Year | | $ | 1,000,343,746 | | | $ | 1,198,919,318 | |
| | |
|
|
| |
|
|
|
Accumulated Undistributed Net Investment Income
(Distributions in Excess of Net Investment Income) | | $ | 1,037,704 | | | $ | (399,527 | ) |
| | |
|
|
| |
|
|
|
See notes to the financial statements.
11
The Torray Fund
FINANCIAL HIGHLIGHTS
For a share outstanding throughout each year presented:
PER SHARE DATA
| | | | | | | | | | | | | | | | | | | | |
| | | Years ended December 31:
| |
| | | 2007
| | | 2006
| | | 2005
| | | 2004
| | | 2003
| |
Net Asset Value, Beginning of Year | | $ | 41.570 | | | $ | 39.020 | | | $ | 41.080 | | | $ | 39.980 | | | $ | 32.240 | |
| | |
|
|
| |
|
|
| |
|
|
| |
|
|
| |
|
|
|
Income from investment operations | | | | | | | | | | | | | | | | | | | | |
Net investment income | | | 0.152 | | | | 0.073 | | | | 0.133 | | | | 0.165 | | | | 0.220 | |
Net gains (losses) on securities (both realized and unrealized) | | | (0.443 | ) | | | 5.176 | | | | 0.653 | | | | 2.523 | | | | 7.864 | |
| | |
|
|
| |
|
|
| |
|
|
| |
|
|
| |
|
|
|
Total from investment operations | | | (0.291 | ) | | | 5.249 | | | | 0.786 | | | | 2.688 | | | | 8.084 | |
| | |
|
|
| |
|
|
| |
|
|
| |
|
|
| |
|
|
|
Less: distributions | | | | | | | | | | | | | | | | | | | | |
Dividends (from net investment income) | | | (0.121 | ) | | | (0.087 | ) | | | (0.133 | ) | | | (0.165 | ) | | | (0.220 | ) |
Distributions (from capital gains) | | | (4.718 | ) | | | (2.612 | ) | | | (2.713 | ) | | | (1.423 | ) | | | (0.124 | ) |
| | |
|
|
| |
|
|
| |
|
|
| |
|
|
| |
|
|
|
Total distributions | | | (4.839 | ) | | | (2.699 | ) | | | (2.846 | ) | | | (1.588 | ) | | | (0.344 | ) |
| | |
|
|
| |
|
|
| |
|
|
| |
|
|
| |
|
|
|
Net Asset Value, End of Year | | $ | 36.440 | | | $ | 41.570 | | | $ | 39.020 | | | $ | 41.080 | | | $ | 39.980 | |
| | |
|
|
| |
|
|
| |
|
|
| |
|
|
| |
|
|
|
TOTAL RETURN (1) | | | (0.80 | %) | | | 13.74 | % | | | 2.08 | % | | | 6.90 | % | | | 25.19 | % |
RATIOS/SUPPLEMENTAL DATA | | | | | | | | | | | | | | | | | | | | |
Net assets, end of year (000’s omitted) | | $ | 1,000,344 | | | $ | 1,198,919 | | | $ | 1,329,951 | | | $ | 1,734,500 | | | $ | 1,655,279 | |
Ratios of expenses to average net assets | | | 1.09 | % | | | 1.10 | % | | | 1.07 | % | | | 1.08 | % | | | 1.11 | % |
Ratios of net investment income to average net assets | | | 0.36 | % | | | 0.18 | % | | | 0.34 | % | | | 0.41 | % | | | 0.62 | % |
Portfolio turnover rate | | | 50.47 | % | | | 21.92 | % | | | 33.16 | % | | | 27.12 | % | | | 37.11 | % |
(1) | Past performance is not predictive of future performance. |
See notes to the financial statements.
12
The Torray Fund
NOTES TO FINANCIAL STATEMENTS
As of December 31, 2007
NOTE 1 — SUMMARY OF SIGNIFICANT ACCOUNTING POLICIES
The Torray Fund (“Fund”) is a separate series of The Torray Fund (“Trust”). The Trust is registered under the Investment Company Act of 1940 as a no-load, diversified, open-end management investment company. The Trust was organized as a business trust under Massachusetts law. The Fund’s primary investment objective is to provide long-term total return. The Fund seeks to meet its objective by investing its assets in a diversified portfolio of common stocks. In order to accomplish these goals, the Fund intends to hold stocks for the long term, as opposed to actively buying and selling. There can be no assurances that the Fund’s investment objectives will be achieved.
The following is a summary of accounting policies followed by the Fund in the preparation of its financial statements. These policies are in conformity with accounting principles generally accepted in the United States of America.
Securities Valuation Portfolio securities for which market quotations are readily available are valued at market value, which is determined by using the last reported sale price, or, if no sales are reported, the last reported bid price. For NASDAQ traded securities, market value is determined on the basis of the NASDAQ official closing price instead of the last reported sales price. Other assets and securities for which no quotations are readily available or for which Torray LLC (the “Advisor”) believes do not reflect market value are valued at fair value as determined in good faith by the Advisor under the supervision of the Board of Trustees in accordance with the Fund’s Valuation Procedures. Short-term obligations having remaining maturities of 60 days or less are valued at amortized cost, which approximates market value.
Securities Transactions and Investment Income Securities transactions are recorded on a trade date basis. Realized gains and losses from securities transactions are recorded on the specific identification basis. Dividend income and distributions to shareholders are recorded on the ex-dividend date. Interest income, including amortization of discount on short-term investments, and expenses are recorded on the accrual basis. Premium and discount are amortized using the effective yield to maturity method.
Federal Income Taxes The Fund intends to continue to comply with the requirements of the Internal Revenue Code applicable to regulated investment companies and to distribute all of its taxable income, including any net realized gain on investments to its shareholders. Therefore, no Federal income tax provision is required.
On July 13, 2006, the Financial Accounting Standards Board (“FASB”) released FASB Interpretation No. 48 “Accounting for Uncertainty in Income Taxes” (“FIN 48”). FIN 48 provides guidance for how uncertain tax positions should be recognized, measured, presented and disclosed in the financial statements. FIN 48 requires the evaluation of tax positions taken or expected to be taken in the course of preparing the Fund’s tax return to determine whether the tax positions are “more-likely-than-not” of being sustained by the applicable tax authority. Tax positions not deemed to meet the more-likely-than-not threshold would be recorded as a tax benefit or expense in the year of determination. Adoption of FIN 48 is required for fiscal years beginning after December 15, 2006 and is to be applied
13
The Torray Fund
NOTES TO FINANCIAL STATEMENTS (continued)
As of December 31, 2007
to all open tax years as of the effective date. The Fund’s federal and state income and federal excise tax returns for tax years for which the applicable statutes of limitations have not expired are subject to examination by the Internal Revenue Service and state departments of revenue. Management has implemented FIN 48 and has determined that there is no impact to the financial statements.
Net Asset Value The net asset value per share of the Fund is determined daily as of the close of trading on the New York Stock Exchange by dividing the value of the Fund’s net assets by the number of shares outstanding.
Interest Expense When cash balances are overdrawn in the Fund’s custody account, the Fund is charged an overdraft fee equal to 1.25% above the Federal Funds Rate. This amount of $32,507 is included in “interest expense” in the Statement of Operations. For the year ended December 31, 2007, the average amount of overdrafts were $1,677,801 and the average rate charged was 6.49%. In addition, in December 2006, the Trust entered into a line of credit facility with PNC Bank. Under the terms of the line of credit, the separate series of the Trust (including the Fund) may borrow up to $20,000,000 on a short-term basis with interest accruing at the Federal Funds Rate plus 0.75%. This amount of $9,827 is also included in “interest expense” in the Statement of Operations. For the year ended December 31, 2007, the average amount of credit utilized was $1,750,031 at an average rate of 6.09%. As of December 31, 2007, the Fund had no outstanding borrowings under this line of credit facility.
Use of Estimates In preparing financial statements in accordance with accounting principles generally accepted in the United States of America, management is required to make estimates and assumptions that affect the reported amounts of assets and liabilities and the disclosure of contingent assets and liabilities at the date of the financial statements, and the reported amounts of increases and decreases in net assets from operations during the reporting period. Actual results could differ from those estimates.
Recent Accounting Pronouncements In September 2006, the FASB issued Statement on Financial Accounting Standards No. 157, Fair Value Measurements (“SFAS No. 157”). This standard establishes a single authoritative definition of fair value, sets out a framework for measuring fair value and requires additional disclosures about fair value measurements. SFAS No. 157 applies to fair value measurements already required or permitted by existing standards. SFAS No. 157 is effective for financial statements issued for fiscal years beginning after November 15, 2007 and interim periods within those fiscal years. The changes to current generally accepted accounting principles from the application of this SFAS No. 157 relate to the definition of fair value, the methods used to measure fair value, and the expanded disclosures about fair value measurements. As of December 31, 2007, the Fund does not believe the adoption of SFAS No. 157 will impact the financial statement amounts, however, additional disclosures may be required about the inputs used to develop the measurements and the effect of certain of the measurements on changes in net assets for the period.
14
The Torray Fund
NOTES TO FINANCIAL STATEMENTS (continued)
As of December 31, 2007
NOTE 2 — SHARES OF BENEFICIAL INTEREST TRANSACTIONS
Transactions in shares of beneficial interest were as follows:
| | | | | | | | | | | | | | |
| | | Year ended
12/31/07
| | | Year ended
12/31/06
| |
| | | Shares
| | | Amount
| | | Shares
| | | Amount
| |
Shares issued | | 2,839,192 | | | $ | 115,735,240 | | | 1,876,465 | | | $ | 75,722,613 | |
Reinvestments of dividends and distributions | | 3,222,408 | | | | 119,041,292 | | | 1,806,759 | | | | 72,571,132 | |
Shares redeemed | | (7,456,654 | ) | | | (308,023,146 | ) | | (8,920,428 | ) | | | (359,247,665 | ) |
| | |
|
| |
|
|
| |
|
| |
|
|
|
| | | (1,395,054 | ) | | $ | (73,246,614 | ) | | (5,237,204 | ) | | $ | (210,953,920 | ) |
| | |
|
| |
|
|
| |
|
| |
|
|
|
Officers, trustees and affiliated persons of The Torray Fund and their families directly or indirectly control 2,981,354 shares or 10.86% of the Fund.
NOTE 3 — INVESTMENT TRANSACTIONS
Purchases and sales of investment securities, other than short-term investments, for the year ended December 31, 2007, aggregated $554,721,881 and $814,685,530, respectively.
NOTE 4 — MANAGEMENT FEES
Pursuant to the Management Contract, Torray LLC provides investment advisory and administrative services to the Fund. The Fund pays Torray LLC a management fee, computed daily and payable monthly at the annual rate of one percent of the Fund’s average daily net assets. For the year ended December 31, 2007, The Torray Fund paid management fees of $11,465,956.
Excluding the management fee, other expenses incurred by the Fund during the year ended December 31, 2007, totaled $980,873. These expenses include all costs associated with the Fund’s operations including transfer agent fees, independent trustees’ fees ($14,000 per annum and $2,000 for each Board meeting attended per trustee), interest expense, taxes, dues, fees and expenses of registering and qualifying the Fund and its shares for distribution, charges of custodian, auditing and legal expenses, insurance premiums, supplies, postage, expenses of issue or redemption of shares, reports to shareholders and trustees, expenses of printing and mailing prospectuses, proxy statements and proxies to existing shareholders, and other miscellaneous expenses.
Certain officers and trustees of the Fund are also officers and/or shareholders of Torray LLC.
15
The Torray Fund
NOTES TO FINANCIAL STATEMENTS (continued)
As of December 31, 2007
NOTE 5 — TAX MATTERS
Distributions to shareholders are determined in accordance with Federal income tax regulations, which may differ from accounting principles generally accepted in the United States of America.
The tax character of distributions paid during the years ended December 31, 2007 and 2006 were as follows:
| | | | | | | |
| | | 2007
| | | 2006
|
Distributions paid from: | | | | | | | |
Ordinary income | | $ | 7,706,855 | | | $ | 2,633,260 |
Long-term capital gain | | | 115,546,988 | | | | 73,114,435 |
| | |
|
|
| |
|
|
| | | $ | 123,253,843 | | | $ | 75,747,695 |
| | |
|
|
| |
|
|
|
As of December 31, 2007, the components of distributable earnings on a tax basis were as follows: |
| | |
Undistributed ordinary income | | $ | 1,037,704 | | | | |
Undistributed long-term gain | | | 29,812,672 | | | | |
Unrealized appreciation | | | 111,923,930 | | | | |
| | |
|
|
| | | |
| | | $ | 142,774,306 | | | | |
| | |
|
|
| | | |
|
The following information is based upon the Federal income tax basis of investment securities as of December 31, 2007: |
| | |
Gross unrealized appreciation | | $ | 175,506,770 | | | | |
Gross unrealized depreciation | | | (63,582,840 | ) | | | |
| | |
|
|
| | | |
Net unrealized appreciation | | $ | 111,923,930 | | | | |
| | |
|
|
| | | |
Federal income tax basis | | $ | 908,356,519 | | | | |
| | |
|
|
| | | |
The primary difference between book basis and tax basis distributions is differing book and tax treatment of short-term capital gains.
16
The Torray Fund
NOTES TO FINANCIAL STATEMENTS (continued)
As of December 31, 2007
NOTE 6 — RECLASSIFICATIONS
Accounting principals generally accepted in the United States require that certain components of net assets be reclassified between financial and tax reporting. These reclassifications have no effect on net assets or net asset value per share. For the year ended December 31, 2007, permanent differences in book and tax accounting have been reclassified as follows:
| | | | |
Increase accumulated undistributed net investment income | | $ | 573,279 | |
Decrease accumulated net realized gain on investments | | | (13,384,825 | ) |
Increase paid-in-capital in excess of par | | | 12,811,546 | |
NOTE 7 — COMMITMENTS AND CONTINGENCIES
The Fund indemnifies its officers and trustees for certain liabilities that may arise from their performance of their duties to the Fund. Additionally, in the normal course of business, the Fund enters into contracts that contain a variety of representations and warranties which provide general indemnifications. The Fund’s maximum exposure under these arrangements is unknown, as this would involve future claims that may be made against the Fund that have not yet occurred.
17
The Torray Fund
REPORT OF INDEPENDENT REGISTERED PUBLIC ACCOUNTING FIRM
To the Board of Trustees of The Torray Fund
and Shareholders of The Torray Fund
We have audited the accompanying statement of assets and liabilities, including the schedule of investments, of The Torray Fund, a series of shares of beneficial interest of The Torray Fund, as of December 31, 2007, and the related statement of operations for the year then ended, the statements of changes in net assets for each of the years in the two-year period then ended and the financial highlights for each of the years in the five-year period then ended. These financial statements and financial highlights are the responsibility of the Fund’s management. Our responsibility is to express an opinion on these financial statements and financial highlights based on our audits.
We conducted our audits in accordance with the standards of the Public Company Accounting Oversight Board (United States). Those standards require that we plan and perform the audit to obtain reasonable assurance about whether the financial statements and financial highlights are free of material misstatement. An audit includes examining, on a test basis, evidence supporting the amounts and disclosures in the financial statements. Our procedures included confirmation of securities owned as of December 31, 2007 by correspondence with the custodian and brokers or by other appropriate audit procedures where replies from brokers were not received. An audit also includes assessing the accounting principles used and significant estimates made by management, as well as evaluating the overall financial statement presentation. We believe that our audits provide a reasonable basis for our opinion.
In our opinion, the financial statements and financial highlights referred to above present fairly, in all material respects, the financial position of The Torray Fund as of December 31, 2007, the results of its operations for the year then ended, the changes in its net assets for each of the years in the two-year period then ended, and the financial highlights for each of the years in the five-year period then ended in conformity with accounting principles generally accepted in the United States of America.

BRIGGS, BUNTING & DOUGHERTY, LLP
Philadelphia, Pennsylvania
February 25, 2008
18
The Torray Fund
FUND MANAGEMENT
As of December 31, 2007 (unaudited)
The Trust is overseen by a Board of Trustees (the “Board”), who has delegated the day-to-day management to the officers of the Trust. The Board meets regularly to review the Fund’s activities, contractual arrangements, and performance. The trustees and officers serve until their successors are elected and qualified, or until the trustee or officer dies, resigns or is removed, or becomes disqualified.
Information regarding the trustees and officers of the Trust is provided below. “Fund Complex” includes both series of the Trust, The Torray Fund and The Torray Institutional Fund. The Statement of Additional Information (“SAI”) includes additional information about the trustees and is available without charge, upon request, by calling (800) 443-3036.
| | | | | | | | |
Name, Birth Date,
Address* and
Positions
with the Trust | | Term of Office
and Length of
Time Served | | Principal Occupation During the Past Five Years | | Number of
Portfolios in
Fund Complex
Overseen by
Trustee | | Other Directorships Held |
| INDEPENDENT TRUSTEES |
Carol T. Crawford DOB: 2/25/43 Trustee | | Indefinite Term since 2006 | | Attorney, Private Practice. McLean, VA | | 2 | | Director, Smithfield Foods, Inc., Smithfield, VA |
Bruce C. Ellis DOB: 7/20/44 Trustee | | Indefinite Term since 1993 | | Private Investor, Bethesda, MD | | 2 | | N/A |
Robert P. Moltz DOB: 10/3/47 Trustee | | Indefinite Term since 1990 | | President and CEO, Weaver Bros. Insurance Associates, Inc., Bethesda, MD | | 2 | | N/A |
19
The Torray Fund
FUND MANAGEMENT (continued)
As of December 31, 2007 (unaudited)
| | | | | | | | |
Name, Birth Date,
Address* and
Positions
with the Trust | | Term of Office
and Length of
Time Served | | Principal Occupation During the Past Five Years | | Number of
Portfolios in
Fund Complex
Overseen by
Trustee | | Other Directorships Held |
| INTERESTED TRUSTEES AND OFFICERS OF THE TRUST |
William M Lane** DOB: 5/21/50 Trustee, Treasurer, Secretary, Chief Compliance Officer and Anti-Money Laundering Officer | | Indefinite Term since 1990 | | Vice President, Secretary and Chief Compliance Officer, Torray LLC, Bethesda, MD (Oct. 2005-Present); Vice President, Secretary, Treasurer and Chief Compliance Officer, Robert E. Torray & Co. Inc. (Jul. 1984-Oct. 2005); Vice President, Secretary and Chief Compliance Officer, The Torray Corporation (Jan. 1990-Oct. 2005); Vice President, Secretary, Treasurer and Chief Compliance Officer, TEL Corporation (Jun. 2005-Oct. 2005).*** | | 2 | | N/A |
Wayne H. Shaner** DOB: 8/23/47 Trustee and Chairman of the Board | | Indefinite Term since 1993 | | Vice President of Torray LLC, Bethesda, MD, Managing Partner, Rockledge Partners, LLC, Investment Advisory Firm, Bethesda, MD; Prior to January 1, 2004, Managing Director, Lockheed Martin Investment Management Company, Bethesda, MD | | 2 | | Director, Van Eck Funds New York, NY |
Robert E. Torray DOB: 4/10/37 President | | Indefinite Term since 2007 | | Chairman and President, Torray LLC, Bethesda, MD (Oct. 2005-Present); President, Robert E. Torray & Co. Inc. (May 1972-Oct. 2005); President, The Torray Corporation (Jan. 1990-Oct. 2005); Chairman, TEL Corporation (Jun. 2005-Oct. 2005).*** | | N/A | | Director, La Branche & Co Inc. New York, NY |
| * | All addresses are c/o The Torray Fund, 7501 Wisconsin Avenue, Suite 1100, Bethesda, MD 20814-6523 |
| ** | Mr. Lane and Mr. Shaner, by virtue of their employment with Torray LLC, the Trust’s investment adviser, are each considered an “interested person” of the Trust, as that term is defined in Section 2(a)(19) of the Investment Company Act of 1940, as amended. |
| *** | Robert E. Torray & Co. Inc., The Torray Corporation and TEL Corporation have all been succeeded to by Torray LLC. |
20
The Torray Fund
FACTORS CONSIDERED BY THE BOARD OF TRUSTEES IN CONNECTION WITH THEIR APPROVAL OF THE CONTINUATION OF THE FUND’S INVESTMENT MANAGEMENT AGREEMENT WITH THE MANAGERS (unaudited)
The Fund has entered into an Investment Management Agreement (the “Agreement”) with Torray LLC (the “Manager”) pursuant to which the Manager provides investment management services to the Fund. In accordance with the Investment Company Act of 1940, the Board of Trustees of the Fund is required, on an annual basis, to consider the continuation of the Agreement with the Manager, and this must take place at an in-person meeting of the Board. The relevant provisions of the Investment Company Act of 1940 specifically provide that it is the duty of the Board to request and evaluate such information as the Board determines is necessary to allow them to properly consider the continuation of the Agreement, and it is the duty of the Manager to furnish the trustees with such information that is responsive to their request. Set forth below is a discussion of the various factors that the Board of Trustees considered in deciding to approve the continuation of the Agreement with the Manager.
In determining whether to approve the continuation of the Agreement, the Board of Trustees requested, and the Manager provided, information and data relevant to the Board’s consideration. This included materials that provided the Board with information regarding the investment performance of the Fund and information regarding the fees and expenses of the Fund as compared to other similar mutual funds. As part of its deliberations, the Board also considered and relied upon the information about the Fund that had been provided to them throughout the year in connection with their regular Board meetings at which they engage in the ongoing oversight of the Fund and its operations.
The Board met at an in-person meeting on October 24, 2007 in order to consider the proposed continuation of the Agreement. Among the factors the Board considered was the overall performance of the Fund achieved by the Manager relative to the performance of other mutual funds with similar investment objectives on both a long-term basis and over shorter time periods. In particular, the Board took note of the favorable performance achieved by the Manager over longer time periods (five years and longer) and they considered the Manager’s particular focus on long-term investment performance. In reviewing the shorter term performance of the Fund, the trustees took note of the fact that the short-term performance (for periods of less than five years) was generally lower than that of the benchmark index and of other funds with similar investment objectives, and the trustees discussed with the Manager the likely reasons for this, noting that the Manager maintains a particular focus on long-term investment results and as a result, short-term results can, and will, trail comparable averages from time to time. The Board took into consideration the fact that the Manager seeks to achieve investment results for the Fund with less risk than other similar funds, and that the Manager has maintained a low portfolio turnover rate for the Fund which is beneficial to shareholders of the Fund because this results in lower brokerage costs which helps to reduce the operating costs of the Fund. They noted the range of investment advisory and management services provided by the Manager and the level and quality of these services, and in particular, they noted the quality of the personnel providing these services, taking into consideration their finding that the personnel providing these services, and the services provided, were of a very high caliber and quality. The Board also considered the portfolio manager arrangements for the Fund, noting that the Manager had undertaken appropriate measures to provide for the continued management of the Fund by a team of portfolio managers with extensive portfolio management experience.
21
The Torray Fund
FACTORS CONSIDERED BY THE BOARD OF TRUSTEES IN CONNECTION WITH THEIR APPROVAL OF THE CONTINUATION OF THE FUND’S INVESTMENT MANAGEMENT AGREEMENT WITH THE MANAGERS (unaudited) (continued)
The Board also compared expenses of the Fund to the expenses of other funds of similar size, noting that the expenses for the Fund compared favorably with industry averages. They also took note of the fact that the Fund is not subject to any sales loads, sales commissions or other similar fees, including Rule 12b-1 distribution fees, which helps to keep the overall expense to shareholders of investing in the Fund lower than the expenses associated with investing in many comparable funds, and they considered the fact that the Manager had informed the Board that it did not intend to propose the introduction of such types of fees for the Fund. The Board also reviewed financial information concerning the Manager, noting its financial soundness as demonstrated by the financial information provided and the level of profitability relating to its services for the Fund, noting that these were reasonable and consistent with industry standards. The Board was also provided with information regarding the fees that the Manager charges other clients for investment advisory services and they noted that the fees were comparable based on the relevant circumstances of the types of accounts involved. The Board reviewed with the Manager the allocation of the portfolio management team’s time between managing the investments of the Fund and managing other accounts. The Board also engaged in a review of the compensation arrangements for the portfolio managers of the Fund.
In addition, the Board reviewed with the Manager information regarding its brokerage practices, including soft dollar matters, and noted that the Manager did not have in place any formal soft dollar arrangements, and the Board also reviewed the Manager’s best execution procedures, which the Board noted were reasonable and consistent with standard industry practice.
Based on their review, the trustees concluded that the investment management services provided under the Agreement were reasonably worth the full amount of the fee and that the terms of the Agreement were fair and reasonable. In reaching their conclusion with respect to their approval of the continuation of the Agreement, the trustees did not identify any one single factor as being controlling, rather, the Board took note of a combination of factors that influenced their decision making process. The Board did, however, identify the overall favorable long-term investment performance of the Fund, the commitment of the Manager to the successful operation of the Fund, and the level of expenses of the Fund, as being important elements of their consideration. Based upon their review and consideration of these factors and other matters deemed relevant by the Board in reaching an informed business judgment, a majority of the Board of Trustees, including a majority of the Independent Trustees, concluded that the terms of the Agreement were fair and reasonable and the Board voted to approve the continuation of the Agreement with the Manager.
22
The Torray Fund
PORTFOLIO HOLDINGS, PROXY VOTING AND PROCEDURES
As of December 31, 2007 (unaudited)
The Fund files its complete schedule of portfolio holdings with the Securities and Exchange Commission (the “Commission”) for the first and third quarters of each fiscal year on Form N-Q. The Fund’s Forms N-Q are available on the Commission’s website at http://www.sec.gov. The Fund’s Form N-Q may be reviewed and copied at the Commission’s Public Reference Room in Washington, D.C. Information on the operation of the Commission’s Public Reference Room may be obtained by calling 1-800-SEC-0330.
A description of the policies and procedures that the Fund uses to determine how to vote proxies relating to portfolio securities is available without charge, upon request, by calling 1-800-443-3036; and on the Commission’s website at http://www.sec.gov.
Information regarding how the Fund voted proxies relating to portfolio securities is available without charge, upon request, by calling 1-800-443-3036; and on the Commission’s website at http://www.sec.gov.
23
The Torray Fund
ABOUT YOUR FUND’S EXPENSES
As of December 31, 2007 (unaudited)
We believe it is important for you to understand the impact of costs on your investment. All mutual funds have operating expenses. As a shareholder of the Fund, you incur ongoing costs, including management fees, and other fund expenses. Operating expenses, which are deducted directly from the Fund’s gross income, directly reduce the investment return of the Fund.
A fund’s expenses are expressed as a percentage of its average net assets. This figure is known as the expense ratio. The following examples are intended to help you understand the ongoing costs (in dollars) of investing in the Fund and to compare these costs with the ongoing costs of investing in other mutual funds. The examples below are based on an investment of $1,000 made at the beginning of the period shown and held for the entire period.
The table on the next page illustrates the Fund’s cost in two ways:
Actual Fund Return — This section helps you estimate the actual expenses that you paid over the period. The “Ending Account Value” shown is derived from the Fund’s actual return, and the third column shows the operating expenses that would have been paid by an investor who started with $1,000 in the Fund. You may use the information here, together with the amount invested, to estimate the expenses that you paid over the period.
To do so, simply divide your account value by $1,000 (for example, an $8,600 account value divided by $1,000 = 8.6), then multiply the result by the number given for the Fund under the heading “Expenses Paid During Period” on the next page.
Hypothetical 5% Return — This section is intended to help you compare your Fund’s costs with those of other mutual funds. It assumes that the Fund had an annual return of 5% before expenses, and that the expense ratio is unchanged. In this case, because the return used is not the Fund’s actual return, the results do not apply to your investment. The example is useful in making comparisons because the Securities and Exchange Commission requires all mutual funds to calculate expenses based on a 5% return. You can assess the Fund’s costs by comparing this hypothetical example with the hypothetical examples that appear in shareholder reports of other funds.
Note that expenses shown in the table are meant to highlight and help you compare ongoing costs only. The Fund does not charge transactions fees, such as purchase or redemption fees, nor does it carry a “sales load.”
The calculation assumes no shares were bought or sold during the period. Your actual costs may have been higher or lower, depending on the amount of your investment and the timing of any purchases or redemptions.
24
The Torray Fund
ABOUT YOUR FUND’S EXPENSES (continued)
As of December 31, 2007 (unaudited)
More information about the Fund’s expenses, including recent annual expense ratios, can be found in this report. For additional information on operating expenses and other shareholder costs, please refer to the Fund’s prospectus.
| | | | | | | | | |
| | | Beginning
Account Value
July 1, 2007
| | Ending
Account Value
December 31, 2007
| | Expenses Paid
During Period *
|
Based on Actual Fund Return | | $ | 1,000.00 | | $ | 936.70 | | $ | 5.20 |
Based on Hypothetical 5% Return
(before expenses) | | $ | 1,000.00 | | $ | 1,019.97 | | $ | 5.43 |
| * | Expenses are equal to the Fund’s annualized expense ratio of 1.06% for the period, multiplied by the average account value over the period, multiplied by 185/365 (to reflect the one-half year period). |
25
The Torray Fund
TAX INFORMATION
As of December 31, 2007 (unaudited)
We are required to advise you within 60 days of the Fund’s fiscal year-end regarding the Federal tax status of certain distributions received by shareholders during such fiscal year. The information below is provided for the Fund’s fiscal year ending December 31, 2007.
Qualified Interest Income
For the fiscal year ended December 31, 2007, 34.15% of the ordinary distributions paid (net investment income plus short-term capital gain) represent the amount of Qualifying Interest Income as created by The American Jobs Creation Act of 2004.
Qualified Dividend Income
For the fiscal year ended December 31, 2007, 99.71% of the distributions paid by the Fund from ordinary income qualifies for a reduced tax rate pursuant to The Jobs and Growth Tax Relief Reconciliation Act of 2003.
Dividends Received Deduction
For the fiscal year ended December 31, 2007, 100% of the ordinary income distribution qualifies for the dividends received deduction available to corporations.
Qualifying Short-Term Capital Gain
For the fiscal year ended December 31, 2007, 57.65% of the ordinary distributions paid (net investment income plus short-term capital gain) represent the amount of Qualifying Short-Term Capital Gain as created by The American Jobs Creation Act of 2004.
Long-Term Capital Gain Dividends
The Fund designates $127,892,159, including $12,345,171 of equalization debits, as long-term capital gain distributions pursuant to section 852(b)(3) of the Internal Revenue Code for the fiscal year ended December 31, 2007.
Dividends and distributions received by retirement plans such as IRA’s, Keogh-type plans and 403(b) plans need not be reported as taxable income. However, many retirement plan trusts may need this information for their annual information reporting.
26
TRUSTEES
Carol Crawford
Bruce C. Ellis
William M Lane
Robert P. Moltz
Wayne H. Shaner
INVESTMENT ADVISOR
Torray LLC
OFFICERS
Robert E. Torray
William M Lane
Fred M. Fialco
Wayne H. Shaner
Shawn M. Hendon
INDEPENDENT REGISTERED PUBLIC ACCOUNTING FIRM
Briggs, Bunting & Dougherty, LLP
Two Penn Center Plaza, Suite 820
Philadelphia, PA 19102-1732
TRANSFER AGENT
PFPC Inc.
101 Sabin Street
Pawtucket, RI 02860-1427
LEGAL COUNSEL
Dechert LLP
1775 I Street, N.W.
Washington, DC 20006
Distributed by PFPC Distributors, Inc.
760 Moore Road, King of Prussia, PA 19406-1212
Date of first use, February 2008
This report is not authorized for distribution to prospective investors unless preceded or accompanied by a current prospectus. All indices are unmanaged groupings of stocks that are not available for investment.
The
TORRAY
FUND
ANNUAL REPORT
December 31, 2007
The Torray Fund
Suite 1100
7501 Wisconsin Avenue
Bethesda, Maryland 20814-6523
(301) 493-4600
(800) 443-3036
The Torray Institutional Fund
Letter to Shareholders
February 4, 2008
Dear Fellow Shareholders,
The Torray Institutional Fund depreciated 3.0% during 2007, compared to a gain of 5.5% for the Standard & Poor’s 500 Index. Commodities — particularly energy — along with materials and utilities, all absent from the portfolio, continued to make a big difference. Our thinking on these sectors has been reexamined many times, but we always reach the same conclusion. Four decades of experience tell us that, over time, the course we’re on is safer and more certain to succeed. Results were also adversely affected by substantial withdrawals, as reflected in the Fund’s sharply reduced assets. This unfortunate aspect of the mutual fund business is beyond our control. We remain optimistic as evidenced by the fact your management and directors now own 36% of the Fund’s shares outstanding.
The market’s performance over the last eight years has been one of the worst on record. It seems hard to believe, but on a price basis, the S&P 500 Index lost 0.1% annually. Even including dividends, it made only 1.7% per year, 14% cumulatively. After trading costs, taxes, fees and mutual fund switching, the average investor probably fared worse. Eight years is a very long time to wait for such an outcome. The truth is it’s hard to make money when stocks go sideways for such a long period. Nevertheless, the future looks good to us, and equities are by far the best way to take advantage of it.
As we write, cataclysmic losses on sub-prime mortgages, collateralized debt obligations, credit default swaps, derivatives and bond insurance have cast a dark shadow over our markets. We expressed deep skepticism about these complex financial constructs in our June 2007 semi-annual letter, but nothing at the time remotely suggested what was to come. It seems that prominent bank executives, some of whom have since been fired, had no clue of the risks either, or perhaps, given the enormous though illusory profits at stake, they simply chose to ignore them. While there is no minimizing the debacle, the main victims, at least so far, have been the very institutions that caused it — large commercial and investment banks, mortgage companies, and so on. In the ultimate irony, it would appear Wall Street’s rocket scientists designed a heat-seeking missile that hit themselves. The good news is, regardless of how things turn out, history confirms that shareholders in large, quality companies will continue to prosper as the economy and earnings grow in the decades to come.
Although this is easy to say, it is also easily forgotten when markets turn down. Following our Company’s inception in 1972, a period preceded by a wild speculation in the day’s most popular stocks, prices collapsed nearly 50% on the heels of the Arab oil embargo which drove crude up five-fold, wrecking the world’s cost structure. During the crash of ‘87, the Dow fell 36% top to bottom in less than two months, equivalent to 4300 points today. Most of the loss, a staggering 31%, occurred in the last four days alone. One can just imagine the response if the same thing happened today. At the time, we thought the New York Stock Exchange, in an effort to forestall the panic, surely would close for a while — it didn’t. (For more on this market disaster, see Tim Metz’s gripping Black Monday, William Morrow and Co., 1988.) Fifteen years later, 9/11 accelerated the unwinding of the tech/telecom/dot.com mania. When it was over, the S&P and NASDAQ had suffered losses of 50% and 80%, respectively.
1
The Torray Institutional Fund
Letter to Shareholders (continued)
February 4, 2008
Investors’ response to each of these jarring downturns was to sell the shares they had eagerly bought at much higher prices earlier on. This proved a big mistake as subsequent recoveries and the long-term picture confirm. Underscoring the point, studies show that after compounding, 90% of the return on stocks is generated on just 1 1/2 percent of the days the exchanges are open. Translated, the odds are 66 1/2-to-1 against those that trade in and out of the market based on the direction it’s headed.
In spite of the turmoil, stocks, over the last 36 years, have returned 10.9% compounded annually, and our institutional management company, 13.3%. It is noteworthy that our interim results since 1972 were often at odds with the long-term average; in five years, we lost money — though always less than the market, which sustained eight years of losses. This record goes a long way to discredit today’s fixation on short-term performance.
The market’s story over the last five years is essentially that stocks going up kept going up, and those that weren’t, didn’t. The winners were largely those recording unsustainably high rates of earnings growth off long-depressed cyclical lows. The lure of these situations deflected attention from some of the best companies in the world — businesses that were also growing, just not nearly as fast. We own a number of them. Investors’ lack of interest muted our performance — earnings grew 13%, the Fund, 9%. This reduced its price/earnings ratio to 14.2 times 2008 estimated earnings. By comparison, the market’s P/E ratio over the last 25 years averaged 20.7 — nearly 50% higher; it was 17.6 for 50 years, and 15.9 since 1926, a period encompassing the Great Depression and World War II. At the very least, this suggests The Torray Institutional Fund’s stocks are attractively valued. Moreover, their combined earnings return (earnings divided by price) is now better than 7%, double the yield on 10-year government bonds which provide no growth or protection against inflation. This is far too wide a risk premium for a high quality portfolio.
In addition, we believe our prospects have been enhanced by alterations we made to the Fund’s investments during the second half of 2007. These moves were prompted by rising market volatility and the aforementioned investor obsession with price momentum, which, in turn, caused significant changes in the relative valuations of many stocks. Thirteen new companies were added, and certain existing holdings were increased. The purchases were funded by eliminating 18 positions and paring back others. This raised our industrial and information technology weightings and reduced those of health care, financials and telecom services. In each case we felt the long-range outlook for the replacements was superior to those of the sales. These companies are well-positioned to weather economic storms and should also benefit from exposure to expanding international markets, new product development, reinvestment in core operations and acquisition possibilities. An unavoidable fallout from this activity was that portfolio turnover reached 44%. Going forward, the rate should decline to the 20-30% range we’ve typically experienced. By comparison, the fund industry average exceeds 100%, testimony to the wildly speculative era we live in.
I would now like to tell you about changes in the management structure of our Company. On November 1, 2007, Doug Eby left The Torray Companies to pursue his interest in hedge funds. I am pleased to announce that the principals of Rockledge Partners, LLC, Wayne H. Shaner, the chairman of The Torray Funds, and his part-
2
The Torray Institutional Fund
Letter to Shareholders (continued)
February 4, 2008
ner Shawn M. Hendon, along with their staff, joined us at the start of the New Year. Wayne and Shawn each have 30 years of experience in the business, and I have known them well throughout that period. Their commitment to the values and approach our Company has endorsed for nearly four decades adds immeasurably to the strength of the Torray organization.
Special thanks go to Fred M. Fialco, our talented research and investment executive, who has been with us for 11 years, and my partner Bill Lane for his diligent and astute management of The Torray Companies over more than 25 years. Our entire staff deserves the highest marks for a job well done and their unyielding dedication to your interests. They are a joy to work with. On this 17th anniversary of The Torray Fund, I would also like to praise Robin Lichterman, my executive assistant for the last 23 years. Among many other things, she has tirelessly, cheerfully, and skillfully played a major role in the writing of these letters — now totaling 34. They would not have been the same without her.
We thank you once again for your investment in our Fund.
|
| Sincerely, |
|
 |
Robert E. Torray President |
3
The Torray Institutional Fund
PERFORMANCE DATA
As of December 31, 2007
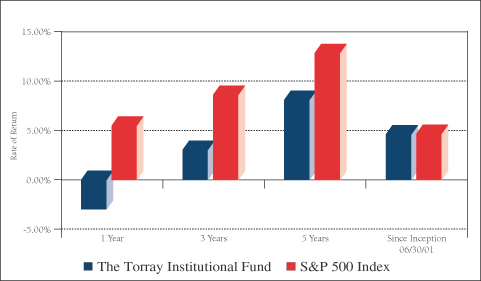
Average Annual Returns on an Investment in
The Torray Institutional Fund vs. the S&P 500 Index
For the periods ended December 31, 2007:
| | | | | | | | |
| | | 1 Year
| | 3 Years
| | 5 Years
| | Since
Inception
06/30/01
|
The Torray Institutional Fund | | (3.01)% | | 3.05% | | 8.11% | | 4.60% |
S&P 500 Index | | 5.49% | | 8.62% | | 12.83% | | 4.66% |
Cumulative Returns for the 6 1/2 years ended December 31, 2007
| | | |
The Torray Institutional Fund | | 34.02 | % |
S&P 500 Index | | 34.52 | % |
4
The Torray Institutional Fund
PERFORMANCE DATA (continued)
As of December 31, 2007
Change in Value of $5,000,000 Invested
on June 30, 2001 (commencement of operations) to:
| | | | | | | | | | | | | | | |
| | | 06/30/01
| | 12/31/01
| | 12/31/03
| | 12/31/05
| | 12/31/07
|
The Torray Institutional Fund | | $ | 5,000,000 | | $ | 5,199,000 | | $ | 5,724,500 | | $ | 6,201,000 | | $ | 6,701,000 |
S&P 500 Index | | $ | 5,000,000 | | $ | 4,723,000 | | $ | 4,739,000 | | $ | 5,507,000 | | $ | 6,726,000 |

The returns quoted represent past performance and do not guarantee future results. Investment return and principal value will fluctuate so that shares, when redeemed, may be worth more or less than their original cost. Current performance may be lower or higher. Returns current to the most recent month-end are available at www.torray.com. The returns shown do not reflect the deduction of taxes a shareholder would pay on the redemption of fund shares and distributions. The Fund’s gross annual operating expense ratio, as stated in the current prospectus, is 0.85%. Returns on both The Torray Institutional Fund and the S&P 500 Index assume reinvestment of all dividends and distributions. The S&P 500 Index is an unmanaged index consisting of 500 U.S. large-cap stocks.
5
The Torray Institutional Fund
FUND PROFILE
As of December 31, 2007 (unaudited)
| | | |
DIVERSIFICATION (% of net assets) | | | |
| |
Financials | | 22.21 | % |
Industrials | | 21.40 | |
Information Technology | | 17.81 | |
Health Care | | 16.08 | |
Consumer Discretionary | | 11.60 | |
Materials | | 4.56 | |
Consumer Staples | | 3.02 | |
Short-Term Investments | | 8.43 | |
Other Liabilities Less Assets | | (5.11 | ) |
| | |
|
|
| | | 100.00 | % |
| | |
| TOP TEN EQUITY HOLDINGS |
| |
| 1. | | Berkshire Hathaway, Inc., Class B |
| 2. | | W.R. Grace & Co. |
| 3. | | General Electric Co. |
| 4. | | Johnson & Johnson |
| 5. | | UnitedHealth Group, Inc. |
| 6. | | WellPoint, Inc. |
| 7. | | EMC Corp. |
| 8. | | Marsh & McLennan Cos., Inc. |
| 9. | | USG Corp. |
| 10. | | Procter & Gamble Co. (The) |
| | | | |
PORTFOLIO CHARACTERISTICS | | |
| | |
Net Assets (million) | | | | $47 |
Number of Holdings | | | | 38 |
Portfolio Turnover | | | | 44.32% |
P/E Multiple (forward) | | | | 15.7x |
Portfolio Yield | | | | 1.30% |
Market Capitalization | | Average | | 66.6 B |
| | | Median | | 35.8 B |
6
The Torray Institutional Fund
SCHEDULE OF INVESTMENTS
As of December 31, 2007
| | | | | | | |
| | | Shares
| | | | Market Value
|
| COMMON STOCK 96.68% | | | |
| |
| 22.21% FINANCIALS | | | |
| | | 631 | | Berkshire Hathaway, Inc., Class B * | | $ | 2,988,416 |
| | | 54,238 | | Marsh & McLennan Cos., Inc. | | | 1,435,680 |
| | | 22,100 | | Aflac, Inc. | | | 1,384,123 |
| | | 21,100 | | American International Group, Inc. | | | 1,230,130 |
| | | 2,100 | | Markel Corp. * | | | 1,031,310 |
| | | 21,800 | | Bank of America Corp. | | | 899,468 |
| | | 163,000 | | LaBranche & Co., Inc. * | | | 821,520 |
| | | 11,123 | | American Express Co. | | | 578,618 |
| | | | | | |
|
|
| | | | | | | | 10,369,265 |
| |
| 21.40% INDUSTRIALS | | | |
| | | 54,900 | | General Electric Co. | | | 2,035,143 |
| | | 39,958 | | USG Corp. * | | | 1,430,097 |
| | | 38,800 | | Cintas Corp. | | | 1,304,456 |
| | | 11,200 | | Danaher Corp. | | | 982,688 |
| | | 18,300 | | Illinois Tool Works, Inc. | | | 979,782 |
| | | 10,911 | | General Dynamics Corp. | | | 970,970 |
| | | 12,541 | | United Technologies Corp. | | | 959,888 |
| | | 37,000 | | Owens Corning, Inc. * | | | 748,140 |
| | | 10,246 | | Emerson Electric Co. | | | 580,538 |
| | | | | | |
|
|
| | | | | | | | 9,991,702 |
| |
| 17.81% INFORMATION TECHNOLOGY | | | |
| | | 87,400 | | EMC Corp. * | | | 1,619,522 |
| | | 63,216 | | Electronic Data Systems Corp. | | | 1,310,468 |
| | | 44,700 | | Cisco Systems, Inc. * | | | 1,210,029 |
| | | 25,016 | | Automatic Data Processing, Inc. | | | 1,113,963 |
| | | 10,200 | | International Business Machines Corp. | | | 1,102,620 |
| | | 37,056 | | Intel Corp. | | | 987,913 |
| | | 54,700 | | Applied Materials, Inc. | | | 971,472 |
| | | | | | |
|
|
| | | | | | | | 8,315,987 |
See notes to the financial statements.
7
The Torray Institutional Fund
SCHEDULE OF INVESTMENTS (continued)
As of December 31, 2007
| | | | | | | | |
| | | Shares
| | | | Market Value
| |
| |
| 16.08% HEALTH CARE | | | | |
| | | 27,800 | | Johnson & Johnson | | $ | 1,854,260 | |
| | | 31,200 | | UnitedHealth Group, Inc. | | | 1,815,840 | |
| | | 19,800 | | WellPoint, Inc. * | | | 1,737,054 | |
| | | 23,100 | | Eli Lilly & Co. | | | 1,233,309 | |
| | | 15,400 | | Abbott Laboratories | | | 864,710 | |
| | | | | | |
|
|
|
| | | | | | | | 7,505,173 | |
| |
| 11.60% CONSUMER DISCRETIONARY | | | | |
| | | 41,700 | | O’Reilly Automotive, Inc. * | | | 1,352,331 | |
| | | 27,700 | | McGraw-Hill Cos., Inc. (The) | | | 1,213,537 | |
| | | 37,510 | | Walt Disney Co. (The) | | | 1,210,823 | |
| | | 50,300 | | CarMax, Inc. * | | | 993,425 | |
| | | 11,000 | | Gannett Co., Inc. | | | 429,000 | |
| | | 17,391 | | McClatchy Co. (The), Class A | | | 217,735 | |
| | | | | | |
|
|
|
| | | | | | | | 5,416,851 | |
| |
| 4.56% MATERIALS | | | | |
| | | 81,395 | | W.R. Grace & Co. * | | | 2,130,921 | |
| |
| 3.02% CONSUMER STAPLES | | | | |
| | | 19,200 | | Procter & Gamble Co. (The) | | | 1,409,664 | |
| | | | | | |
|
|
|
| TOTAL COMMON STOCK 96.68% | | | 45,139,563 | |
| (cost $41,545,443) | | | | |
| SHORT-TERM INVESTMENTS 8.43% | | | | |
| | | 3,935,542 | | PNC Bank Money Market Account, 3.51% | | | 3,935,542 | |
| (cost $3,935,542) | | | | |
| | | | | | |
|
|
|
| TOTAL INVESTMENTS 105.11% | | | 49,075,105 | |
| (cost $45,480,985) | | | | |
| OTHER LIABILITIES LESS ASSETS (5.11%) | | | (2,386,581 | ) |
| | | | | | |
|
|
|
| NET ASSETS 100.00% | | $ | 46,688,524 | |
| | | | | | |
|
|
|
| * | Non-income producing securities |
See notes to the financial statements.
8
The Torray Institutional Fund
STATEMENT OF ASSETS AND LIABILITIES
As of December 31, 2007
| | | |
ASSETS | | | |
Investments in securities at value
(cost $45,480,985) | | $ | 49,075,105 |
Interest and dividends receivable | | | 66,957 |
Receivable for fund shares sold | | | 1,636 |
| | |
|
|
TOTAL ASSETS | | | 49,143,698 |
| | |
|
|
| |
LIABILITIES | | | |
Payable for securities purchased | | | 1,847,547 |
Payable for fund shares redeemed | | | 556,270 |
Payable to advisor | | | 51,357 |
| | |
|
|
TOTAL LIABILITIES | | | 2,455,174 |
| | |
|
|
| |
NET ASSETS | | $ | 46,688,524 |
| | |
|
|
Shares of beneficial interest ($1 stated value,
577,840 shares outstanding, unlimited shares authorized) | | $ | 577,840 |
Paid-in-capital in excess of par | | | 42,210,692 |
Accumulated undistributed net investment income | | | 1,824 |
Accumulated net realized gain on investments | | | 304,048 |
Net unrealized appreciation of investments | | | 3,594,120 |
| | |
|
|
| |
TOTAL NET ASSETS | | $ | 46,688,524 |
| | |
|
|
Net asset value, offering and redemption price per share | | $ | 80.80 |
| | |
|
|
See notes to the financial statements.
9
The Torray Institutional Fund
STATEMENT OF OPERATIONS
For the year ended December 31, 2007
| | | | |
INVESTMENT INCOME | | | | |
Dividend income (net of foreign taxes withheld of $19,347) | | $ | 1,837,049 | |
Interest income | | | 496,353 | |
| | |
|
|
|
Total income | | | 2,333,402 | |
| | |
|
|
|
| |
EXPENSES | | | | |
Management fees | | | 1,309,803 | |
| | |
|
|
|
Total expenses | | | 1,309,803 | |
| | |
|
|
|
NET INVESTMENT INCOME | | | 1,023,599 | |
| | |
|
|
|
REALIZED AND UNREALIZED GAIN (LOSS)
ON INVESTMENTS | | | | |
Net realized gain on investments | | | 30,615,499 | |
Net change in unrealized appreciation (depreciation) on investments | | | (32,380,205 | ) |
| | |
|
|
|
Net realized and unrealized loss on investments | | | (1,764,706 | ) |
| | |
|
|
|
NET DECREASE IN NET ASSETS FROM OPERATIONS | | $ | (741,107 | ) |
| | |
|
|
|
See notes to the financial statements.
10
The Torray Institutional Fund
STATEMENTS OF CHANGES IN NET ASSETS
For the years indicated:
| | | | | | | | |
| | | Year ended
12/31/07
| | | Year ended
12/31/06
| |
Increase (Decrease) in Net Assets from Operations: | | | | | | | | |
Net investment income | | $ | 1,023,599 | | | $ | 1,572,577 | |
Net realized gain on investments | | | 30,615,499 | | | | 34,297,242 | |
Capital gain distributions from investment companies | | | — | | | | 190,765 | |
Net change in unrealized appreciation
(depreciation) on investments | | | (32,380,205 | ) | | | (6,888,801 | ) |
| | |
|
|
| |
|
|
|
Net increase (decrease) in net assets from operations | | | (741,107 | ) | | | 29,171,783 | |
| | |
|
|
| |
|
|
|
| | |
Distributions to Shareholders from: | | | | | | | | |
Net investment income ($0.716 and
$0.790 per share, respectively) | | | (919,415 | ) | | | (1,705,784 | ) |
Net realized gains ($23.946 and $14.797 per
share, respectively) | | | (19,038,918 | ) | | | (25,771,863 | ) |
| | |
|
|
| |
|
|
|
Total distributions | | | (19,958,333 | ) | | | (27,477,647 | ) |
| | |
|
|
| |
|
|
|
| | |
Shares of Beneficial Interest | | | | | | | | |
Decrease from share transactions | | | (138,463,291 | ) | | | (196,507,859 | ) |
| | |
|
|
| |
|
|
|
Total decrease | | | (159,162,731 | ) | | | (194,813,723 | ) |
| | |
Net Assets — Beginning of Year | | | 205,851,255 | | | | 400,664,978 | |
| | |
|
|
| |
|
|
|
Net Assets — End of Year | | $ | 46,688,524 | | | $ | 205,851,255 | |
| | |
|
|
| |
|
|
|
Accumulated Undistributed Net Investment Income | | $ | 1,824 | | | | — | |
| | |
|
|
| |
|
|
|
See notes to the financial statements.
11
The Torray Institutional Fund
FINANCIAL HIGHLIGHTS
For a share outstanding throughout each year presented:
PER SHARE DATA
| | | | | | | | | | | | | | | | | | | | |
| | | Years ended December 31:
| |
| | | 2007
| | | 2006
| | | 2005
| | | 2004
| | | 2003
| |
Net Asset Value, Beginning of Year | | $ | 108.640 | | | $ | 111.920 | | | $ | 116.290 | | | $ | 110.520 | | | $ | 89.490 | |
| | |
|
|
| |
|
|
| |
|
|
| |
|
|
| |
|
|
|
Income from investment operations: | | | | | | | | | | | | | | | | | | | | |
Net investment income | | | 0.896 | | | | 0.720 | | | | 0.616 | | | | 0.588 | | | | 0.671 | |
Net gains (losses) on securities (both realized and unrealized) | | | (4.074 | ) | | | 11.587 | | | | 0.748 | (2) | | | 7.025 | | | | 22.586 | |
| | |
|
|
| |
|
|
| |
|
|
| |
|
|
| |
|
|
|
Total from investment operations | | | (3.178 | ) | | | 12.307 | | | | 1.364 | | | | 7.613 | | | | 23.257 | |
| | |
|
|
| |
|
|
| |
|
|
| |
|
|
| |
|
|
|
Less: distributions | | | | | | | | | | | | | | | | | | | | |
Dividends (from net investment income) | | | (0.716 | ) | | | (0.790 | ) | | | (0.616 | ) | | | (0.588 | ) | | | (0.671 | ) |
Distributions (from capital gains) | | | (23.946 | ) | | | (14.797 | ) | | | (5.118 | ) | | | (1.255 | ) | | | (1.556 | ) |
| | |
|
|
| |
|
|
| |
|
|
| |
|
|
| |
|
|
|
Total distributions | | | (24.662 | ) | | | (15.587 | ) | | | (5.734 | ) | | | (1.843 | ) | | | (2.227 | ) |
| | |
|
|
| |
|
|
| |
|
|
| |
|
|
| |
|
|
|
Net Asset Value, End of Year | | $ | 80.800 | | | $ | 108.640 | | | $ | 111.920 | | | $ | 116.290 | | | $ | 110.520 | |
| | |
|
|
| |
|
|
| |
|
|
| |
|
|
| |
|
|
|
TOTAL RETURN(1) | | | (3.01 | %) | | | 11.40 | % | | | 1.28 | % | | | 6.96 | % | | | 26.16 | % |
RATIOS/SUPPLEMENTAL DATA | | | | | | | | | | | | | | | | | | | | |
Net assets, end of year (000’s omitted) | | $ | 46,689 | | | $ | 205,851 | | | $ | 400,665 | | | $ | 1,012,566 | | | $ | 598,183 | |
Ratios of expenses to average net assets | | | 0.85 | % | | | 0.85 | % | | | 0.85 | % | | | 0.85 | % | | | 0.85 | % |
Ratios of net investment income to average net assets | | | 0.66 | % | | | 0.60 | % | | | 0.59 | % | | | 0.56 | % | | | 0.80 | % |
Portfolio turnover rate | | | 44.32 | % | | | 24.26 | % | | | 53.66 | % | | | 16.12 | % | | | 22.20 | % |
(1) | Past performance is not predictive of future performance. |
(2) | The amount shown for the year ended December 31, 2005 for a share outstanding throughout the year does not accord with the aggregate net losses on investments reported in the statement of operations for the year because of the timing of sales and repurchases of Fund shares in relation to fluctuating market value of the investments of the Fund. |
See notes to the financial statements.
12
The Torray Institutional Fund
NOTES TO FINANCIAL STATEMENTS
As of December 31, 2007
NOTE 1 — SUMMARY OF SIGNIFICANT ACCOUNTING POLICIES
The Torray Institutional Fund (“Fund”) is a separate series of The Torray Fund (“Trust”). The Trust is registered under the Investment Company Act of 1940 as a no-load, diversified, open-end management investment company. The Trust was organized as a business trust under Massachusetts law and the Fund commenced operations on June 30, 2001. The Fund’s primary investment objective is to provide long-term total return. The Fund seeks to meet its objective by investing its assets in a diversified portfolio of common stocks. In order to accomplish these goals, the Fund intends to hold stocks for the long term, as opposed to actively buying and selling. There can be no assurances that the Fund’s investment objectives will be achieved.
The following is a summary of accounting policies followed by the Fund in the preparation of its financial statements. These policies are in conformity with accounting principles generally accepted in the United States of America.
Securities Valuation Portfolio securities for which market quotations are readily available are valued at market value, which is determined by using the last reported sale price, or, if no sales are reported, the last reported bid price. For NASDAQ traded securities, market value is determined on the basis of the NASDAQ official closing price instead of the last reported sales price. Other assets and securities for which no quotations are readily available or for which Torray LLC (the “Advisor”) believes do not reflect market value are valued at fair value as determined in good faith by the Advisor under the supervision of the Board of Trustees in accordance with the Fund’s Valuation Procedures. Short-term obligations having remaining maturities of 60 days or less are valued at amortized cost, which approximates market value.
Securities Transactions and Investment Income Securities transactions are recorded on a trade date basis. Realized gains and losses from securities transactions are recorded on the specific identification basis. Dividend income and distributions to shareholders are recorded on the ex-dividend date. Interest income, including amortization of discount on short-term investments, and expenses are recorded on the accrual basis. Premium and discount are amortized using the effective yield to maturity method.
Federal Income Taxes The Fund intends to continue to comply with the requirements of the Internal Revenue Code applicable to regulated investment companies and to distribute all of its taxable income, including any net realized gain on investments to its shareholders. Therefore, no Federal income tax provision is required.
On July 13, 2006, the Financial Accounting Standards Board (“FASB”) released FASB Interpretation No.48 “Accounting for Uncertainty in Income Taxes” (“FIN 48”). FIN 48 provides guidance for how uncertain tax positions should be recognized, measured, presented and disclosed in the financial statements. FIN 48 requires the evaluation of tax positions taken or expected to be taken in the course of preparing the Fund’s tax return to determine whether the tax positions are “more-likely-than-not” of being sustained by the applicable tax authority. Tax positions not deemed to meet the more-likely-than-not threshold would be recorded as a tax benefit or expense in the year of
13
The Torray Institutional Fund
NOTES TO FINANCIAL STATEMENTS (continued)
As of December 31, 2007
determination. Adoption of FIN 48 is required for fiscal years beginning after December 15, 2006 and is to be applied to all open tax years as of the effective date. The Fund’s federal and state income and federal excise tax returns for tax years for which the applicable statutes of limitations have not expired are subject to examination by the Internal Revenue Service and state departments of revenue. Management has implemented FIN 48 and has determined that there is no impact to the financial statements.
Net Asset Value The net asset value per share of the Fund is determined daily as of the close of trading on the New York Stock Exchange by dividing the value of the Fund’s net assets by the number of shares outstanding.
Interest Expense When cash balances are overdrawn in the Fund’s custody account, the Fund is charged an overdraft fee equal to 1.25% above the Federal Funds Rate. Such overdraft fees are paid by the Advisor under the comprehensive management fee arrangement described in Note 4. In addition, in December 2006, the Trust entered into a line of credit facility with PNC Bank. Under the terms of the line of credit, the separate series of the Trust (including the Fund) may borrow up to $20,000,000 on a short-term basis with interest accruing at the Federal Funds Rate plus 0.75%. Any interest expense on the line of credit is paid by the Advisor under the comprehensive management fee arrangement described in Note 4. As of December 31, 2007, the Fund had no outstanding borrowings under this line of credit facility.
Use of Estimates In preparing financial statements in accordance with accounting principles generally accepted in the United States of America, management is required to make estimates and assumptions that affect the reported amounts of assets and liabilities and the disclosure of contingent assets and liabilities at the date of the financial statements, and the reported amounts of increases and decreases in net assets from operations during the reporting period. Actual results could differ from those estimates.
Recent Accounting Pronouncements In September 2006, the FASB issued Statement on Financial Accounting Standards No. 157, Fair Value Measurements (“SFAS No. 157”). This standard establishes a single authoritative definition of fair value, sets out a framework for measuring fair value and requires additional disclosures about fair value measurements. SFAS No. 157 applies to fair value measurements already required or permitted by existing standards. SFAS No. 157 is effective for financial statements issued for fiscal years beginning after November 15, 2007 and interim periods within those fiscal years. The changes to current generally accepted accounting principles from the application of this SFAS No. 157 relate to the definition of fair value, the methods used to measure fair value, and the expanded disclosures about fair value measurements. As of December 31, 2007, the Fund does not believe the adoption of SFAS No. 157 will impact the financial statement amounts, however, additional disclosures may be required about the inputs used to develop the measurements and the effect of certain of the measurements on changes in net assets for the period.
14
The Torray Institutional Fund
NOTES TO FINANCIAL STATEMENTS (continued)
As of December 31, 2007
NOTE 2 — SHARES OF BENEFICIAL INTEREST TRANSACTIONS
Transactions in shares of beneficial interest were as follows:
| | | | | | | | | | | | | | |
| | | Year ended
12/31/07
| | | Year ended
12/31/06
| |
| | | Shares
| | | Amount
| | | Shares
| | | Amount
| |
Shares issued | | 69,035 | | | $ | 7,712,634 | | | 226,670 | | | $ | 26,081,904 | |
Reinvestments of dividends and distributions | | 242,642 | | | | 19,904,789 | | | 246,122 | | | | 26,157,121 | |
Shares redeemed | | (1,628,646 | ) | | | (166,080,714 | ) | | (2,158,056 | ) | | | (248,746,884 | ) |
| | |
|
| |
|
|
| |
|
| |
|
|
|
| | | (1,316,969 | ) | | $ | (138,463,291 | ) | | (1,685,264 | ) | | $ | (196,507,859 | ) |
| | |
|
| |
|
|
| |
|
| |
|
|
|
Officers, trustees and affiliated persons of The Torray Institutional Fund and their families directly or indirectly control 206,792 shares or 35.79% of the Fund.
NOTE 3 — INVESTMENT TRANSACTIONS
Purchases and sales of investment securities, other than short-term investments, for the year ended December 31, 2007, aggregated $65,897,020 and $223,698,875, respectively.
NOTE 4 — MANAGEMENT FEES
Pursuant to the Management Contract, Torray LLC provides investment advisory and administrative services to the Fund. The Fund pays Torray LLC a management fee, computed daily and payable monthly at the annual rate of 0.85% of the Fund’s average daily net assets. For the year ended December 31, 2007, The Torray Institutional Fund paid comprehensive management fees of $1,309,803. The Fund pays the manager a single comprehensive management fee which covers all operating expenses of the Fund including the investment advisory and administrative services provided by the manager as well as all miscellaneous costs incurred in connection with the ongoing operation of the Fund including transfer agency, custody, professional, and registration fees.
Certain officers and trustees of the Fund are also officers and/or shareholders of Torray LLC.
NOTE 5 — TAX MATTERS
Distributions to shareholders are determined in accordance with Federal income tax regulations, which may differ from accounting principles generally accepted in the United States of America.
15
The Torray Institutional Fund
NOTES TO FINANCIAL STATEMENTS (continued)
As of December 31, 2007
The tax character of distributions paid during the years ended December 31, 2007 and 2006 were as follows:
| | | | | | |
| | | 2007
| | 2006
|
Distributions paid from: | | | | | | |
Ordinary income | | $ | 2,747,638 | | $ | 1,572,577 |
Long-term capital gain | | | 17,210,695 | | | 25,905,070 |
| | |
|
| |
|
|
| | | $ | 19,958,333 | | $ | 27,477,647 |
| | |
|
| |
|
|
As of December 31, 2007, the components of distributable earnings on a tax basis were as follows:
| | | |
Undistributed ordinary income | | $ | 808,366 |
Unrealized appreciation | | | 3,091,626 |
| | |
|
|
| | | $ | 3,899,992 |
| | |
|
|
The following information is based upon the Federal income tax basis of investment securities as of December 31, 2007:
| | | | |
Gross unrealized appreciation | | $ | 5,726,756 | |
Gross unrealized depreciation | | | (2,635,130 | ) |
| | |
|
|
|
Net unrealized appreciation | | $ | 3,091,626 | |
| | |
|
|
|
Federal income tax basis | | $ | 45,983,479 | |
| | |
|
|
|
The primary differences between book basis and tax basis distributions and distributable earnings are due to the tax deferral of losses on wash sales and differing book and tax treatment of short-term capital gains.
NOTE 6 — RECLASSIFICATIONS
Accounting principals generally accepted in the United States require that certain components of net assets be reclassified between financial and tax reporting. These reclassifications have no effect on net assets or net asset value per share. For the year ended December 31, 2007, permanent differences in book and tax accounting have been reclassified as follows:
| | | | |
Decrease accumulated net realized gain/loss on investments | | $ | (10,130,615 | ) |
Increase paid-in-capital in excess of par | | | 10,232,975 | |
Decrease accumulated undistributed net investment income | | | (102,360 | ) |
16
The Torray Institutional Fund
NOTES TO FINANCIAL STATEMENTS (continued)
As of December 31, 2007
NOTE 7 — COMMITMENTS AND CONTINGENCIES
The Fund indemnifies its officers and trustees for certain liabilities that may arise from their performance of their duties to the Fund. Additionally, in the normal course of business, the Fund enters into contracts that contain a variety of representations and warranties, which provide general indemnifications. The Fund’s maximum exposure under these arrangements is unknown, as this would involve future claims that may be made against the Fund that have not yet occurred.
17
The Torray Institutional Fund
REPORT OF INDEPENDENT REGISTERED PUBLIC ACCOUNTING FIRM
To the Board of Trustees of The Torray Fund
and Shareholders of The Torray Institutional Fund
We have audited the accompanying statement of assets and liabilities, including the schedule of investments, of The Torray Institutional Fund, a series of shares of beneficial interest of The Torray Fund, as of December 31, 2007, and the related statement of operations for the year then ended, the statements of changes in net assets for each of the years in the two-year period then ended and the financial highlights for each of the years in the five-year period then ended. These financial statements and financial highlights are the responsibility of the Fund’s management. Our responsibility is to express an opinion on these financial statements and financial highlights based on our audits.
We conducted our audits in accordance with the standards of the Public Company Accounting Oversight Board (United States). Those standards require that we plan and perform the audit to obtain reasonable assurance about whether the financial statements and financial highlights are free of material misstatement. An audit includes examining, on a test basis, evidence supporting the amounts and disclosures in the financial statements. Our procedures included confirmation of securities owned as of December 31, 2007 by correspondence with the custodian and brokers or by other appropriate audit procedures where replies from brokers were not received. An audit also includes assessing the accounting principles used and significant estimates made by management, as well as evaluating the overall financial statement presentation. We believe that our audits provide a reasonable basis for our opinion.
In our opinion, the financial statements and financial highlights referred to above present fairly, in all material respects, the financial position of The Torray Institutional Fund as of December 31, 2007, the results of its operations for the year then ended, the changes in its net assets for each of the years in the two-year period then ended, and the financial highlights for each of the years in the five-year period then ended in conformity with accounting principles generally accepted in the United States of America.

BRIGGS, BUNTING & DOUGHERTY, LLP
Philadelphia, Pennsylvania
February 25, 2008
18
The Torray Institutional Fund
FUND MANAGEMENT
As of December 31, 2007 (unaudited)
The Trust is overseen by a Board of Trustees (the “Board”), who has delegated the day-to-day management to the officers of the Trust. The Board meets regularly to review the Fund’s activities, contractual arrangements, and performance. The trustees and officers serve until their successors are elected and qualified, or until the trustee or officer dies, resigns or is removed, or becomes disqualified.
Information regarding the trustees and officers of the Trust is provided below. “Fund Complex” includes both series of the Trust, The Torray Fund and The Torray Institutional Fund. The Statement of Additional Information (“SAI”) includes additional information about the trustees and is available without charge, upon request, by calling (800) 443-3036.
| | | | | | | | |
Name, Birth Date,
Address* and
Positions
with the Trust | | Term of Office
and Length of
Time Served | | Principal Occupation
During the Past Five Years | | Number of
Portfolios in
Fund Complex
Overseen by
Trustee | | Other
Directorships Held |
| INDEPENDENT TRUSTEES |
Carol T. Crawford DOB: 2/25/43 Trustee | | Indefinite Term since 2006 | | Attorney, Private Practice. McLean, VA | | 2 | | Director, Smithfield Foods, Inc., Smithfield, VA |
Bruce C. Ellis DOB: 7/20/44 Trustee | | Indefinite Term since 1993 | | Private Investor, Bethesda, MD | | 2 | | N/A |
Robert P. Moltz DOB: 10/3/47 Trustee | | Indefinite Term since 1990 | | President and CEO, Weaver Bros. Insurance Associates, Inc., Bethesda, MD | | 2 | | N/A |
19
The Torray Institutional Fund
FUND MANAGEMENT (continued)
As of December 31, 2007 (unaudited)
| | | | | | | | |
Name, Birth Date,
Address* and
Positions
with the Trust | | Term of Office
and Length of
Time Served | | Principal Occupation
During the Past Five Years | | Number of
Portfolios in
Fund Complex
Overseen by
Trustee | | Other
Directorships Held |
| INTERESTED TRUSTEES AND OFFICERS OF THE TRUST |
William M Lane** DOB: 5/21/50 Trustee, Treasurer, Secretary, Chief Compliance Officer and Anti-Money Laundering Officer | | Indefinite Term since 1990 | | Vice President, Secretary and Chief Compliance Officer, Torray LLC, Bethesda, MD (Oct. 2005-Present); Vice President, Secretary, Treasurer and Chief Compliance Officer, Robert E. Torray & Co. Inc. (Jul. 1984-Oct. 2005); Vice President, Secretary and Chief Compliance Officer, The Torray Corporation (Jan. 1990-Oct. 2005); Vice President, Secretary, Treasurer and Chief Compliance Officer, TEL Corporation (Jun. 2005-Oct. 2005).*** | | 2 | | N/A |
Wayne H. Shaner** DOB: 8/23/47 Trustee and Chairman of the Board | | Indefinite Term since 1993 | | Vice President of Torray LLC, Bethesda, MD, Managing Partner, Rockledge Partners, LLC, Investment Advisory Firm, Bethesda, MD; Prior to January 1, 2004, Managing Director, Lockheed Martin Investment Management Company, Bethesda, MD | | 2 | | Director, Van Eck Funds New York, NY |
Robert E. Torray DOB: 4/10/37 President | | Indefinite Term since 2007 | | Chairman and President, Torray LLC, Bethesda, MD (Oct. 2005-Present); President, Robert E. Torray & Co. Inc. (May 1972-Oct 2005); President, The Torray Corporation (Jan. 1990-Oct. 2005); Chairman, TEL Corporation (Jun. 2005-Oct. 2005).*** | | N/A | | Director, LaBranche & Co Inc. New York, NY |
| * | All addresses are c/o The Torray Institutional Fund, 7501 Wisconsin Avenue, Suite 1100, Bethesda, MD 20814-6523. |
| ** | Mr. Lane and Mr. Shaner, by virtue of their employment with Torray LLC, the Trust’s investment adviser, are each considered an “interested person” of the Trust, as that term is defined in Section 2(a)(19) of the Investment Company Act of 1940, as amended. |
| *** | Robert E. Torray & Co. Inc., The Torray Corporation and TEL Corporation have all been succeeded to by Torray LLC. |
20
The Torray Institutional Fund
FACTORS CONSIDERED BY THE BOARD OF TRUSTEES IN CONNECTION WITH THEIR APPROVAL OF THE FUND’S INVESTMENT MANAGEMENT AGREEMENT WITH THE MANAGER (unaudited)
The Fund has entered into an Investment Management Agreement (the “Agreement”) with Torray LLC (the “Manager”) pursuant to which the Manager provides investment management services to the Fund. In accordance with the Investment Company Act of 1940, the Board of Trustees of the Fund is required, on an annual basis, to consider the continuation of the Agreement with the Manager, and this must take place at an in-person meeting of the Board. The relevant provisions of the Investment Company Act of 1940 specifically provide that it is the duty of the Board to request and evaluate such information as the Board determines is necessary to allow them to properly consider the continuation of the Agreement, and it is the duty of the Manager to furnish the trustees with such information that is responsive to their request. Set forth below is a discussion of the various factors that the Board of Trustees considered in deciding to approve the continuation of the Agreement with the Manager.
In determining whether to approve the continuation of the Agreement, the Board of Trustees requested, and the Manager provided, information and data relevant to the Board’s consideration. This included materials that provided the Board with information regarding the investment performance of the Fund and information regarding the fees and expenses of the Fund as compared to other similar mutual funds. As part of its deliberations, the Board also considered and relied upon the information about the Fund that had been provided to them throughout the year in connection with their regular Board meetings at which they engage in the ongoing oversight of the Fund and its operations.
The Board met at an in-person meeting on October 24, 2007 in order to consider the proposed continuation of the Agreement. Among the factors the Board considered was the overall performance of the Fund achieved by the Manager relative to the performance of other mutual funds with similar investment objectives since the inception of the Fund on June 30, 2001. In reviewing the shorter term performance of the Fund, the trustees took note of the fact that the short-term performance (for periods of less than five years) was generally lower than that of the benchmark index and of other funds with similar investment objectives, and the trustees discussed with the Manager the likely reasons for this, noting that the Manager maintains a particular focus on long-term investment results and as a result, short-term results can, and will, trail comparable averages from time to time. The Board took into consideration the fact that the Manager seeks to achieve investment results for the Fund with less risk than other similar funds, and that the Manager has maintained a low portfolio turnover rate for the Fund which is beneficial to shareholders of the Fund because this results in lower brokerage costs which helps to reduce the operating costs of the Fund. They noted the range of investment advisory and management services provided by the Manager and the level and quality of these services, and in particular, they noted the quality of the personnel providing these services, taking into consideration their finding that the personnel providing these services, and the services provided, were of a very high caliber and quality. The Board also considered the portfolio manager arrangements for the Fund, noting that the Manager had undertaken appropriate measures to provide for the continued management of the Fund by a team of portfolio managers with extensive portfolio management experience.
The Board also compared expenses of the Fund to the expenses of other funds of similar size, noting that the expenses for the Fund compared favorably with industry averages. They also took note of the fact that the Fund is not subject to any sales loads, sales commissions or other similar fees, including Rule 12b-1 distribution fees, and they
21
The Torray Institutional Fund
FACTORS CONSIDERED BY THE BOARD OF TRUSTEES IN CONNECTION WITH THEIR APPROVAL OF THE FUND’S INVESTMENT MANAGEMENT AGREEMENT WITH THE MANAGER (unaudited) (continued)
considered the fact that the Manager had informed the Board that it did not intend to propose the introduction of such types of fees for the Fund. In connection with their review of these matters, the trustees took note of the fact that the Fund was established principally as an investment vehicle for use by larger institutional types of investors and that the Fund’s fee structure, which is an all-inclusive fee structure, is reflective of fees generally charged in the institutional fund marketplace. The Board also reviewed financial information concerning the Manager, noting its financial soundness as demonstrated by the financial information provided and the level of profitability relating to its services for the Fund, noting that these were reasonable and consistent with industry standards. The Board was also provided with information regarding the fees that the Manager charges other clients for investment advisory services and they noted that the fees were comparable based on the relevant circumstances of the types of accounts involved. The Board reviewed with the Manager the allocation of the portfolio management team’s time between managing the investments of the Fund and managing other accounts. The Board also engaged in a review of the compensation arrangements for the portfolio managers of the Fund.
In addition, the Board reviewed with the Manager information regarding its brokerage practices, including soft dollar matters, and noted that the Manager did not have in place any formal soft dollar arrangements, and the Board also reviewed the Manager’s best execution procedures, which the Board noted were reasonable and consistent with standard industry practice.
Based on their review, the trustees concluded that the investment management services provided under the Agreement were reasonably worth the full amount of the fee and that the terms of the Agreement were fair and reasonable. In reaching their conclusion with respect to their approval of the continuation of the Agreement, the trustees did not identify any one single factor as being controlling, rather, the Board took note of a combination of factors that influenced their decision making process. The Board did, however, identify the overall favorable investment performance of the Fund since its inception, the commitment of the Manager to the successful operation of the Fund, and the level of expenses of the Fund, as being important elements of their consideration. Based upon their review and consideration of these factors and other matters deemed relevant by the Board in reaching an informed business judgment, a majority of the Board of Trustees, including a majority of the Independent Trustees, concluded that the terms of the Agreement were fair and reasonable and the Board voted to approve the continuation of the Agreement with the Manager.
22
The Torray Institutional Fund
PORTFOLIO HOLDINGS, PROXY VOTING AND PROCEDURES
As of December 31, 2007 (unaudited)
The Fund files its complete schedule of portfolio holdings with the Securities and Exchange Commission (the “Commission”) for the first and third quarters of each fiscal year on Form N-Q. The Fund’s Forms N-Q are available on the Commission’s website at http://www.sec.gov. The Fund’s Form N-Q may be reviewed and copied at the Commission’s Public Reference Room in Washington, D.C. Information on the operation of the Commission’s Public Reference Room may be obtained by calling 1-800-SEC-0330.
A description of the policies and procedures that the Fund uses to determine how to vote proxies relating to portfolio securities is available without charge, upon request, by calling 1-800-443-3036; and on the Commission’s website at http://www.sec.gov.
Information regarding how the Fund voted proxies relating to portfolio securities is available without charge, upon request, by calling 1-800-443-3036; and on the Commission’s website at http://www.sec.gov.
23
The Torray Institutional Fund
ABOUT YOUR FUND’S EXPENSES
As of December 31, 2007 (unaudited)
We believe it is important for you to understand the impact of costs on your investment. All mutual funds have operating expenses. As a shareholder of the Fund, you incur ongoing costs, including management fees, and other fund expenses. Operating expenses, which are deducted directly from the Fund’s gross income, directly reduce the investment return of the Fund.
A fund’s expenses are expressed as a percentage of its average net assets. This figure is known as the expense ratio. The following examples are intended to help you understand the ongoing costs (in dollars) of investing in the Fund and to compare these costs with the ongoing costs of investing in other mutual funds. The examples below are based on an investment of $1,000 made at the beginning of the period shown and held for the entire period.
The table on the next page illustrates the Fund’s cost in two ways:
Actual Fund Return — This section helps you estimate the actual expenses that you paid over the period. The “Ending Account Value” shown is derived from the Fund’s actual return, and the third column shows the operating expenses that would have been paid by an investor who started with $1,000 in the Fund. You may use the information here, together with the amount invested, to estimate the expenses that you paid over the period.
To do so, simply divide your account value by $1,000 (for example, an $8,600 account value divided by $1,000 = 8.6), then multiply the result by the number given for the Fund under the heading “Expenses Paid During Period” on the next page.
Hypothetical 5% Return — This section is intended to help you compare your Fund’s costs with those of other mutual funds. It assumes that the Fund had an annual return of 5% before expenses, and that the expense ratio is unchanged. In this case, because the return used is not the Fund’s actual return, the results do not apply to your investment. The example is useful in making comparisons because the Securities and Exchange Commission requires all mutual funds to calculate expenses based on a 5% return. You can assess the Fund’s costs by comparing this hypothetical example with the hypothetical examples that appear in shareholder reports of other funds.
Note that expenses shown in the table are meant to highlight and help you compare ongoing costs only. The Fund does not charge transactions fees, such as purchase or redemption fees, nor does it carry a “sales load.”
The calculation assumes no shares were bought or sold during the period. Your actual costs may have been higher or lower, depending on the amount of your investment and the timing of any purchases or redemptions.
24
The Torray Institutional Fund
ABOUT YOUR FUND’S EXPENSES (continued)
As of December 31, 2007 (unaudited)
More information about the Fund’s expenses, including recent annual expense ratios, can be found in this report. For additional information on operating expenses and other shareholder costs, please refer to the Fund’s prospectus.
| | | | | | | | | |
| | | Beginning
Account Value
July 1, 2007
| | Ending
Account Value
December 31, 2007
| | Expenses Paid
During Period*
|
Based on Actual Fund Return | | $ | 1,000.00 | | $ | 916.30 | | $ | 4.13 |
Based on Hypothetical 5% Return
(before expenses) | | $ | 1,000.00 | | $ | 1,021.03 | | $ | 4.35 |
| * | Expenses are equal to the Fund’s annualized expense ratio of 0.85% for the period, multiplied by the average account value over the period, multiplied by 185/365 (to reflect the one-half year period). |
25
The Torray Institutional Fund
TAX INFORMATION
As of December 31, 2007 (unaudited)
We are required to advise you within 60 days of the Fund’s fiscal year-end regarding the Federal tax status of certain distributions received by shareholders during such fiscal year. The information below is provided for the Fund’s fiscal year ending December 31, 2007.
Qualified Interest Income
For the fiscal year ended December 31, 2007, 36.50% of the ordinary distributions paid (net investment income plus short-term capital gain) represent the amount of Qualifying Interest Income as created by The American Jobs Creation Act of 2004.
Qualified Dividend Income
For the fiscal year ended December 31, 2007, 46.56% of the distributions paid by the Fund from ordinary income qualifies for a reduced tax rate pursuant to The Jobs and Growth Tax Relief Reconciliation Act of 2003.
Dividends Received Deduction
For the fiscal year ended December 31, 2007, 43.75% of the ordinary income distribution qualifies for the dividends received deduction available to corporations.
Qualifying Short-Term Capital Gain
For the fiscal year ended December 31, 2007, 66.54% of the ordinary distributions paid (net investment income plus short-term capital gain) represent the amount of Qualifying Short-Term Capital Gain as created by The American Jobs Creation Act of 2004.
Long-Term Capital Gain Dividends
The Fund designates $27,341,310, including $10,130,615 of equalization debits, as long-term capital gain distributions pursuant to section 852(b)(3) of the Internal Revenue Code for the fiscal year ended December 31, 2007.
Dividends and distributions received by retirement plans such as IRA’s, Keogh-type plans and 403(b) plans need not be reported as taxable income. However, many retirement plan trusts may need this information for their annual information reporting.
26
TRUSTEES
Carol Crawford
Bruce C. Ellis
William M Lane
Robert P. Moltz
Wayne H. Shaner
INVESTMENT ADVISOR
Torray LLC
OFFICERS
Robert E. Torray
William M Lane
Fred M. Fialco
Wayne H. Shaner
Shawn M. Hendon
INDEPENDENT REGISTERED PUBLIC ACCOUNTING FIRM
Briggs, Bunting & Dougherty, LLP
Two Penn Center Plaza, Suite 820
Philadelphia, PA 19102-1732
TRANSFER AGENT
PFPC Inc.
101 Sabin Street
Pawtucket, RI 02860-1427
LEGAL COUNSEL
Dechert LLP
1775 I Street, N.W.
Washington, DC 20006
Distributed by PFPC Distributors, Inc.
760 Moore Road, King of Prussia, PA 19406-1212
Date of first use, February 2008
This report is not authorized for distribution to prospective
investors unless preceded or accompanied by a current
prospectus. All indices are unmanaged groupings of stocks
that are not available for investment.
The
TORRAY
INSTITUTIONAL
FUND
ANNUAL REPORT
December 31, 2007
The Torray Institutional Fund
Suite 1100
7501 Wisconsin Avenue
Bethesda, Maryland 20814-6523
(301) 493-4600
(800) 443-3036
| | (a) | The registrant, as of the end of the period covered by this report, has adopted a code of ethics that applies to the registrant’s principal executive officer, principal financial officer, principal accounting officer or controller, or persons performing similar functions, regardless of whether these individuals are employed by the registrant or a third party. |
| | (b) | There have been no amendments, during the period covered by this report, to a provision of the code of ethics that applies to the registrant’s principal executive officer, principal financial officer, principal accounting officer or controller, or persons performing similar functions, regardless of whether these individuals are employed by the registrant or a third party, and that relates to any element of the code of ethics description. |
| | (c) | The registrant has not granted any waivers, including an implicit waiver, from a provision of the code of ethics that applies to the registrant’s principal executive officer, principal financial officer, principal accounting officer or controller, or persons performing similar functions, regardless of whether these individuals are employed by the registrant or a third party, that relates to one or more of the items set forth in paragraph (b) of this item’s instructions. |
| Item 3. | Audit Committee Financial Expert. |
The Registrant’s Board of Directors has not designated an audit committee financial expert. The Registrant has determined that it will retain the services of an independent third party to assist it if circumstances arise that require specific investment company auditing expertise.
| Item 4. | Principal Accountant Fees and Services. |
Audit Fees
| | (a) | The aggregate fees billed for each of the last two fiscal years for professional services rendered by the principal accountant for the audit of the registrant’s annual financial statements or services that are normally provided by the accountant in connection with statutory and regulatory filings or engagements for those fiscal years are $56,000 for 2007 and $54,000 for 2006. |
Audit-Related Fees
| | (b) | The aggregate fees billed in each of the last two fiscal years for assurance and related services by the principal accountant that are reasonably related to the performance of the audit of the registrant’s financial statements and are not reported under paragraph (a) of this Item are $0 for both 2007 and 2006. |
Tax Fees
| | (c) | The aggregate fees billed in each of the last two fiscal years for professional services rendered by the principal accountant for tax compliance, tax advice, and tax planning are $4,000 for 2007 and $3,000 for 2006. Tax fees represent tax compliance services provided in connection with the review of the Registrant’s tax returns. |
All Other Fees
| | (d) | The aggregate fees billed in each of the last two fiscal years for products and services provided by the principal accountant, other than the services reported in paragraphs (a) through (c) of this Item are $0 for both 2007 and 2006. |
| | (e)(1) | Disclose the audit committee’s pre-approval policies and procedures described in paragraph (c)(7) of Rule 2-01 of Regulation S-X. |
Audit Committee Pre-Approval Policy. All services to be performed for the Registrant by Briggs Bunting & Dougherty, LLP must be pre-approved by the audit committee. All services performed during 2007 and 2006 were pre-approved by the committee.
| | (e)(2) | The percentage of services described in each of paragraphs (b) through (d) of this Item that were approved by the audit committee pursuant to paragraph (c)(7)(i)(C) of Rule 2-01 of Regulation S-X are as follows: |
| | (f) | The percentage of hours expended on the principal accountant’s engagement to audit the registrant’s financial statements for the most recent fiscal year that were attributed to work performed by persons other than the principal accountant’s full-time, permanent employees was zero per cent (0%). |
| | (g) | The aggregate non-audit fees billed by the registrant’s accountant for services rendered to the registrant, and rendered to the registrant’s investment adviser (not including any sub-adviser whose role is primarily portfolio management and is subcontracted with or overseen by another investment adviser), and any entity controlling, controlled by, or under common control with the adviser that provides ongoing services to the registrant for each of the last two fiscal years of the registrant was $14,300 for 2007 and $18,300 for 2006. |
| | (h) | The registrant’s audit committee of the board of directors has considered whether the provision of non-audit services that were rendered to the registrant’s investment adviser (not including any sub-adviser whose role is primarily portfolio management and is subcontracted with or overseen by another investment adviser), and any entity controlling, controlled by, or under common control with the investment adviser that provides ongoing services to the registrant that were not pre-approved pursuant to paragraph (c)(7)(ii) of Rule 2-01 of Regulation S-X is compatible with maintaining the principal accountant’s independence. |
| Item 5. | Audit Committee of Listed registrants. |
Not applicable.
| Item 6. | Schedule of Investments. |
Schedule of Investments in securities of unaffiliated issuers as of the close of the reporting period is included as part of the report to shareholders filed under Item 1 of this form.
| Item 7. | Disclosure of Proxy Voting Policies and Procedures for Closed-End Management Investment Companies. |
Not applicable.
| Item 8. | Portfolio Managers of Closed-End Management Investment Companies. |
Not applicable.
| Item 9. | Purchases of Equity Securities by Closed-End Management Investment Company and Affiliated Purchasers. |
Not applicable.
| Item 10. | Submission of Matters to a Vote of Security Holders. |
There have been no material changes to the procedures by which the shareholders may recommend nominees to the registrant’s board of directors, where those changes were implemented after the registrant last provided disclosure in response to the requirements of Item 407(c)(2)(iv) of Regulation S-K (17 CFR 229.407) (as required by Item 22(b)(15) of Schedule 14A (17 CFR 240.14a-101)), or this Item.
| Item 11. | Controls and Procedures. |
| | (a) | The registrant’s principal executive and principal financial officers, or persons performing similar functions, have concluded that the registrant’s disclosure controls and procedures (as defined in Rule 30a-3(c) under the Investment Company Act of 1940, as amended (the “1940 Act”) (17 CFR 270.30a-3(c))) are effective, as of a date within 90 days of the filing date of the report that includes the disclosure required by this paragraph, based on their evaluation of these controls and procedures required by Rule 30a-3(b) under the 1940 Act (17 CFR 270.30a-3(b)) and Rules 13a-15(b) or 15d-15(b) under the Securities Exchange Act of 1934, as amended (17 CFR 240.13a-15(b) or 240.15d-15(b)). |
| | (b) | There were no changes in the registrant’s internal control over financial reporting (as defined in Rule 30a-3(d) under the 1940 Act (17 CFR 270.30a-3(d)) that occurred during the registrant’s second fiscal quarter of the period covered by this report that has materially affected, or is reasonably likely to materially affect, the registrant’s internal control over financial reporting. |
| | |
| (a)(1) | | Code of ethics, or any amendment thereto, that is the subject of disclosure required by Item 2 is incorporated by reference to Exhibit (a)(1) of the Registrant’s Form N-CSR filed on March 9, 2006 (Accession No. 0001193125-06-049180). |
| |
| (a)(2) | | Certifications pursuant to Rule 30a-2(a) under the 1940 Act and Section 302 of the Sarbanes-Oxley Act of 2002 are attached hereto. |
| |
| (a)(3) | | Not applicable. |
| |
| (b) | | Certifications pursuant to Rule 30a-2(b) under the 1940 Act and Section 906 of the Sarbanes-Oxley Act of 2002 are attached hereto. |
SIGNATURES
Pursuant to the requirements of the Securities Exchange Act of 1934 and the Investment Company Act of 1940, the registrant has duly caused this report to be signed on its behalf by the undersigned, thereunto duly authorized.
| | |
| (registrant) The Torray Fund |
| |
| By (Signature and Title)* | | /s/ Robert E. Torray |
| | Robert E. Torray, President (principal executive officer) |
Date March 7, 2008
Pursuant to the requirements of the Securities Exchange Act of 1934 and the Investment Company Act of 1940, this report has been signed below by the following persons on behalf of the registrant and in the capacities and on the dates indicated.
| | |
| |
| By (Signature and Title)* | | /s/ Robert E. Torray |
| | Robert E. Torray, President (principal executive officer) |
Date March 7, 2008
| | |
| |
| By (Signature and Title)* | | /s/ William M Lane |
| | William M Lane, Treasurer (principal financial officer) |
Date March 7, 2008
| * | Print the name and title of each signing officer under his or her signature. |