UNITED STATES
SECURITIES AND EXCHANGE COMMISSION
Washington, D.C. 20549
FORM N-CSR
CERTIFIED SHAREHOLDER REPORT OF REGISTERED
MANAGEMENT INVESTMENT COMPANIES
Investment Company Act file number 811-06096
The Torray Fund
(Exact name of registrant as specified in charter)
| | |
7501 Wisconsin Avenue Suite 1100 Bethesda, | | MD 20814-6523 |
|
| (Address of principal executive offices) | | (Zip code) |
William M Lane
The Torray Corporation
7501 Wisconsin Avenue Suite 1100
Bethesda, MD 20814-6523
(Name and address of agent for service)
registrant’s telephone number, including area code: 301-493-4600
Date of fiscal year end: December 31
Date of reporting period: December 31, 2004
Form N-CSR is to be used by management investment companies to file reports with the Commission not later than 10 days after the transmission to stockholders of any report that is required to be transmitted to stockholders under Rule 30e-1 under the Investment Company Act of 1940 (17 CFR 270.30e-1). The Commission may use the information provided on Form N-CSR in its regulatory, disclosure review, inspection, and policymaking roles.
A registrant is required to disclose the information specified by Form N-CSR, and the Commission will make this information public. A registrant is not required to respond to the collection of information contained in Form N-CSR unless the Form displays a currently valid Office of Management and Budget (“OMB”) control number. Please direct comments concerning the accuracy of the information collection burden estimate and any suggestions for reducing the burden to Secretary, Securities and Exchange Commission, 450 Fifth Street, NW, Washington, DC 20549-0609. The OMB has reviewed this collection of information under the clearance requirements of 44 U.S.C. § 3507.
Item 1. Reports to Stockholders.
The Report to Shareholders is attached herewith.
The Torray Fund
Letter to Shareholders
February 10, 2005
Dear Fellow Shareholders,
The Torray Fund gained 6.9% during 2004, compared to 10.9% for the Standard & Poor’s 500 Index. This was not the result we were looking for, especially considering the fund industry average earned 11.9%, beating the market for the first time in more than 10 years. However, our long-term record, which we’ll discuss later, continues to outpace both the Index and the vast majority of funds. While we are disappointed not to have done better for you last year, our policy of investing in high quality businesses that generate rising earnings and free cash flow temporarily was out of vogue. Although we believe our approach is the soundest way to succeed over the long term, in the short run, anything can happen and, in 2004, it did.
Strength in the economy, surging oil prices, unusually strong world demand for commodities, and a dramatic recovery in a number of depressed industries were the key elements in the market’s advance. These factors combined to cause extraordinary gains in the stocks of companies in economically sensitive sectors like oil, metals, mining, fertilizer, transportation (except airlines), home building and others. Utilities were bid up by investors looking for income. Overall, there were so many winners, throwing darts at the stock page might have produced a higher return than we did. Nevertheless, having watched these cycles for more than four decades, we are convinced that our philosophy is the best one, and we’re sticking with it.
We will explain why. As a general rule — and this is an observation, not a criticism — the companies to which we have just referred, though important to the economy and their employees, do not have records or prospects that meet our investment criteria. Most are cyclical — meaning their sales and earnings rise and fall with the economy. They are also capital intensive and, in many cases, subject to brutal competition. As a result, profit margins and returns on equity tend to be modest, and growth prospects mediocre. Excluding periods of robust demand for their products and services — the recent experience — they produce limited and, in some instances, no free cash flow. That term refers to money left over after all costs of operating and maintaining the business have been met. It may be used for dividends, share repurchases, acquisitions, debt reduction, and so on. If there is none, the value of the enterprise cannot increase, and the stock will merely move up and down, reflecting fluctuations in underlying fundamentals and investor preferences.
Torray Fund companies are different. As a group they have generated rising earnings and tremendous free cash flow - the only factors that produce long-term appreciation in stocks. Man - -
1
The Torray Fund
Letter to Shareholders
February 10, 2005
agements are sound, balance sheets strong, capital requirements minimal, and the franchises have sustainable competitive advantages.
But, last year, markets were not focused on these aspects. Instead, as noted, attention centered on sectors more closely tied to the economy’s cyclical recovery. If investors, knowing all the facts, were given a choice between owning the companies in our Fund and those described above — the only hitch being they couldn’t sell for 20 years — we think most would select the former. Benjamin Graham, the father of security analysis, observed more than half a century ago that in the short run the market is a voting machine, but in the long run it’s a weighing machine. We believe your investment in The Torray Fund will weigh enough in the future to meet your financial goals.
Some, we know, will say “forget all that, just buy something, anything that will go up.” We sympathize. But, the urge to do this is exactly what gets people into trouble. Besides, we would not know which stocks to choose. It’s always a good idea when you’re tempted to go down this road to ask yourself — and be honest — have I or has anyone I know made money — net of losses and taxes — trying to pick near-term winners? In conclusion on these points, we reaffirm our confidence in the Fund’s portfolio and determination to ride it out pretty much as is.
We believe the record supports our persistence. Since its inception 14 years ago, The Torray Fund has earned 14.1% compounded annually, versus 12.0% for the S&P 500. By coincidence, our affiliate Robert E. Torray & Co., a manager of large institutional portfolios, has produced the same annualized return for 32 years, turning $1 into $68. The market, measured by the S&P 500, grew $1 into $29. Over the past decade, the comparison is even more favorable: 14.9% for the Fund, 12.1% for the Index.
At the risk of overkill, we will also mention that our record looks good when compared to mutual fund industry averages. Over the last 10 years, (14 year numbers are not published), The Torray Fund ranks in the top 8% of all domestic stock funds, and the top 3% of those considered to be similar in style and objective. After taxes, it stands among the top 3% and 1%, respectively.
These numbers highlight the importance of maintaining a long-term perspective. However, we realize that during periods like this, it’s only natural for people to become impatient and start switching things around. But, as detailed in our 2003 mid-year report, studies have shown this tendency has substantially slashed returns. As we have said in the past, we think it makes sense
2
The Torray Fund
Letter to Shareholders
February 10, 2005
to stick with a few funds that have competent, experienced management and a good track record, and then be resigned to the fact there will always be others — though not many — performing better. We accept that. Our goal is to provide you with a safe investment that will earn more, net of expenses, than you are likely to make on your own or in an index fund — not every month, every quarter, every year, but over your lifetime. We also endeavor to communicate in plain language what we’re doing and why; and to put important issues in perspective to help you evaluate the crushing oversupply of investment products and the endless, often confusing, barrage of advice from experts.
Beyond that, we want you to know that every officer and employee of The Torray Companies is an investor in the Fund, as are all of our Trustees. Many of us buy more shares each month, regardless of the price or our personal views of the economic and market outlook. We do so, believing that over time the values building in the companies we hold eventually will be reflected in higher share prices. Anyone that owns funds ranking in the top 10% of industry averages over a long period should do exceedingly well.
Thank you once again for entrusting your savings to us. The protection and growth of your investment is our top priority.
| | |
| Sincerely, | | |
| |
 | |  |
| Robert E. Torray | | Douglas C. Eby |
3
The Torray Fund
PERFORMANCE DATA
As of December 31, 2004
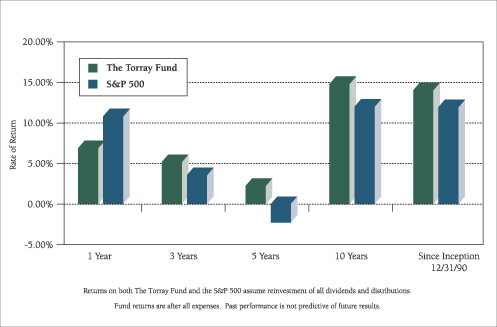
Total Rates of Return on an Investment in The Torray Fund vs. the S&P 500
For the periods ended December 31, 2004:
| | | | | | | | | | |
| | | 1 Year
| | 3 Years
| | 5 Years
| | 10 Years
| | Since
Inception 12/31/90
|
The Torray Fund | | 6.90% | | 5.18% | | 2.26% | | 14.86% | | 14.08% |
S&P 500 | | 10.87% | | 3.58% | | -2.30% | | 12.07% | | 11.99% |
Cumulative Returns for the 14 years ended December 31, 2004
| | | |
The Torray Fund | | 532.27 | % |
S&P 500 | | 388.71 | % |
4
The Torray Fund
PERFORMANCE DATA
As of December 31, 2004
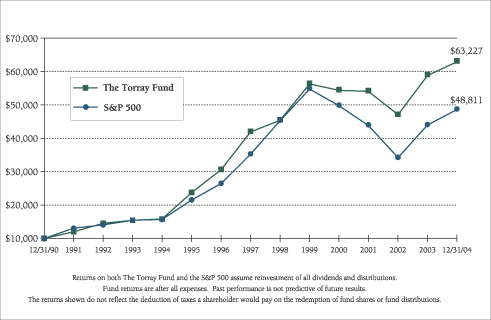
Change in Value of $10,000 Invested on December 31, 1990 (commencement of operations) to:
| | | | | | | | | | | | | | | | | | | | | |
| | | 12/31/92
| | 12/31/94
| | 12/31/96
| | 12/31/98
| | 12/31/00
| | 12/31/02
| | 12/31/04
|
The Torray Fund | | $ | 14,523 | | $ | 15,821 | | $ | 30,719 | | $ | 45,576 | | $ | 54,609 | | $ | 47,236 | | $ | 63,227 |
S&P 500 | | $ | 14,047 | | $ | 15,666 | | $ | 26,499 | | $ | 45,438 | | $ | 49,993 | | $ | 34,318 | | $ | 48,811 |
5
The Torray Fund
FUND PROFILE (unaudited)
As of December 31, 2004
| | |
DIVERSIFICATION (% of net assets) | | |
| |
Diversified Financial Services | | 24.38% |
Media & Entertainment | | 12.05% |
Diversified Manufacturing | | 11.37% |
Data Processing & Management | | 8.36% |
Aerospace & Defense | | 7.86% |
Pharmaceuticals | | 7.06% |
Health Care Services | | 5.58% |
Communications Services | | 4.25% |
Beverages | | 4.21% |
Diversified Medical Products | | 3.94% |
Diversified Telecommunication Services | | 2.57% |
Specialty Retail | | 2.22% |
Real Estate | | 1.76% |
Banking | | 1.67% |
Electronic Equipment | | 1.21% |
Computer Systems & Integration | | 0.72% |
Utilities | | 0.57% |
Energy | | 0.09% |
Other assets less liabilities | | 0.13% |
| | |
|
| | | 100.00% |
| | |
| TOP TEN HOLDINGS |
| |
| 1. | | Amgen Inc. |
| 2. | | Franklin Resources, Inc. |
| 3. | | Cardinal Health, Inc. |
| 4. | | Illinois Tool Works Inc. |
| 5. | | First Data Corporation |
| 6. | | AMBAC Financial Group, Inc. |
| 7. | | Univision Communications Inc. |
| 8. | | Anheuser-Busch Cos., Inc. |
| 9. | | Markel Corporation |
| 10. | | Automatic Data Processing, Inc. |
| | | | |
PORTFOLIO CHARACTERISTICS | | |
| | |
Net Assets (million) | | | | $1,735 |
Number of Stocks | | | | 40 |
Portfolio Turnover | | | | 27.12% |
P/E Multiple (forward) | | | | 17.7x |
Portfolio Yield | | | | 1.40% |
Market Capitalization | | Average | | 55.6 B |
| | | Median | | 25.0 B |
6
The Torray Fund
SCHEDULE OF INVESTMENTS
As of December 31, 2004
| | | | | | | |
| | | Shares
| | | | Market Value
|
| | | | | | | | |
| COMMON STOCK 99.87% | | | |
| |
| 24.38% DIVERSIFIED FINANCIAL SERVICES | | | |
| | | 1,426,600 | | Franklin Resources, Inc. | | $ | 99,362,690 |
| | | 899,000 | | AMBAC Financial Group, Inc. | | | 73,834,870 |
| | | 199,005 | | Markel Corporation * | | | 72,437,820 |
| | | 1,434,962 | | JPMorgan Chase & Co. | | | 55,977,868 |
| | | 1,581,400 | | Allied Capital Corporation | | | 40,863,376 |
| | | 207,900 | | Fairfax Financial Holdings Limited | | | 35,031,150 |
| | | 411,700 | | American International Group, Inc. | | | 27,036,339 |
| | | 192,000 | | American Express Company | | | 10,823,040 |
| | | 829,200 | | LaBranche & Co. Inc. * | | | 7,429,632 |
| | | | | | |
|
|
| | | | | | | | 422,796,785 |
| |
| 12.05% MEDIA & ENTERTAINMENT | | | |
| | | 2,496,000 | | Univision Communications Inc. * | | | 73,057,920 |
| | | 2,178,900 | | The Walt Disney Company | | | 60,573,420 |
| | | 875,700 | | Tribune Company | | | 36,901,998 |
| | | 794,300 | | Clear Channel Communications, Inc. | | | 26,601,107 |
| | | 145,000 | | Gannett Co., Inc. | | | 11,846,500 |
| | | | | | |
|
|
| | | | | | | | 208,980,945 |
| |
| 11.37% DIVERSIFIED MANUFACTURING | | | |
| | | 862,000 | | Illinois Tool Works Inc. | | | 79,890,160 |
| | | 1,322,300 | | General Electric Company | | | 48,263,950 |
| | | 598,100 | | Emerson Electric Co. | | | 41,926,810 |
| | | 472,400 | | Danaher Corporation | | | 27,120,484 |
| | | | | | |
|
|
| | | | | | | | 197,201,404 |
| |
| 8.36% DATA PROCESSING & MANAGEMENT | | | |
| | | 1,836,700 | | First Data Corporation | | | 78,133,218 |
| | | 1,509,600 | | Automatic Data Processing, Inc. | | | 66,950,760 |
| | | | | | |
|
|
| | | | | | | | 145,083,978 |
7
The Torray Fund
SCHEDULE OF INVESTMENTS (continued)
As of December 31, 2004
| | | | | | | |
| | | Shares
| | | | Market Value
|
| | | | | | | | |
| |
| 7.86% AEROSPACE & DEFENSE | | | |
| | | 533,100 | | United Technologies Corporation | | $ | 55,095,885 |
| | | 1,287,400 | | Honeywell International Inc. | | | 45,586,834 |
| | | 341,100 | | General Dynamics Corporation | | | 35,679,060 |
| | | | | | |
|
|
| | | | | | | | 136,361,779 |
| |
| 7.06% PHARMACEUTICALS | | | |
| | | 1,626,300 | | Amgen Inc. * | | | 104,327,145 |
| | | 673,000 | | Pfizer Inc. | | | 18,096,970 |
| | | | | | |
|
|
| | | | | | | | 122,424,115 |
| |
| 5.58% HEALTH CARE SERVICES | | | |
| | | 1,665,200 | | Cardinal Health, Inc. | | | 96,831,380 |
| |
| 4.25% COMMUNICATIONS SERVICES | | | |
| | | 2,975,360 | | The DIRECTV Group, Inc. * | | | 49,807,526 |
| | | 722,400 | | EchoStar Communications Corporation | | | 24,012,576 |
| | | | | | |
|
|
| | | | | | | | 73,820,102 |
| |
| 4.21% BEVERAGES | | | |
| | | 1,439,000 | | Anheuser-Busch Cos., Inc. | | | 73,000,470 |
| |
| 3.94% DIVERSIFIED MEDICAL PRODUCTS | | | |
| | | 1,032,100 | | Abbott Laboratories | | | 48,147,465 |
| | | 317,300 | | Johnson & Johnson | | | 20,123,166 |
| | | | | | |
|
|
| | | | | | | | 68,270,631 |
| |
| 2.57% DIVERSIFIED TELECOMMUNICATION SERVICES | | | |
| | | 1,726,700 | | SBC Communications Inc. | | | 44,497,059 |
| |
| 2.22% SPECIALTY RETAIL | | | |
| | | 854,300 | | O’Reilly Automotive, Inc. * | | | 38,486,215 |
| |
| 1.76% REAL ESTATE | | | |
| | | 922,500 | | CarrAmerica Realty Corporation | | | 30,442,500 |
8
The Torray Fund
SCHEDULE OF INVESTMENTS (continued)
As of December 31, 2004
| | | | | | | |
| | | Shares
| | | | Market Value
|
| | | | | | | | |
| |
| 1.67% BANKING | | | |
| | | 616,800 | | Bank of America Corporation | | $ | 28,983,432 |
| |
| 1.21% ELECTRONIC EQUIPMENT | | | |
| | | 873,200 | | Agilent Technologies, Inc. * | | | 21,044,120 |
| |
| 0.72% COMPUTER SYSTEMS & INTEGRATION | | | |
| | | 596,400 | | Hewlett-Packard Company | | | 12,506,508 |
| |
| 0.57% UTILITIES | | | |
| | | 941,600 | | Sierra Pacific Resources * | | | 9,886,800 |
| |
| 0.09% ENERGY | | | |
| | | 75,000 | | Pengrowth Energy Trust “A” | | | 1,561,500 |
| |
| 0.00% COMMUNICATIONS EQUIPMENT | | | |
| | | 10,255 | | Lucent Technologies Warrants | | | 16,203 |
| | | | | | |
|
|
| TOTAL COMMON STOCK 99.87% | | | 1,732,195,926 |
| (cost $1,437,003,834) | | | |
| SHORT-TERM INVESTMENTS .06% | | | |
| (cost $1,028,819) | | PNC Bank Money Market Account, 1.83% | | | 1,028,819 |
| | | | | | |
|
|
| TOTAL PORTFOLIO SECURITIES 99.93% | | | 1,733,224,745 |
| (amortized cost $1,438,032,653) | | | |
| OTHER ASSETS LESS LIABILITIES 0.07% | | | 1,275,669 |
| | | | | | |
|
|
| NET ASSETS 100.00% | | $ | 1,734,500,414 |
| | | | | | |
|
|
| * | | Non-income producing securities |
See notes to the financial statements.
9
The Torray Fund
STATEMENT OF ASSETS AND LIABILITIES
As of December 31, 2004
| | | |
ASSETS | | | |
Investments in securities at value
(amortized cost $1,438,032,653) | | $ | 1,733,224,745 |
Receivable for investments sold | | | 2,576,880 |
Interest and dividends receivable | | | 1,855,564 |
Receivable for fund shares sold | | | 539,602 |
Prepaid insurance and other | | | 32,744 |
| | |
|
|
TOTAL ASSETS | | | 1,738,229,535 |
| | |
|
|
| |
LIABILITIES | | | |
Payable for fund shares redeemed | | | 1,872,656 |
Payable to advisor | | | 1,464,029 |
Accrued expenses | | | 392,436 |
| | |
|
|
TOTAL LIABILITIES | | | 3,729,121 |
| | |
|
|
| |
NET ASSETS | | $ | 1,734,500,414 |
| | |
|
|
Shares of beneficial interest ($1 stated value,
42,219,644 shares outstanding, unlimited
shares authorized) | | $ | 42,219,644 |
Paid-in-capital in excess of par | | | 1,388,477,869 |
Accumulated net realized gain on investments | | | 8,610,809 |
Net unrealized appreciation of investments | | | 295,192,092 |
| | |
|
|
| |
TOTAL NET ASSETS | | $ | 1,734,500,414 |
| | |
|
|
Per Share | | $ | 41.08 |
| | |
|
|
See notes to the financial statements.
10
The Torray Fund
STATEMENT OF OPERATIONS
For the year ended December 31, 2004
| | | |
INVESTMENT INCOME | | | |
Dividend income | | $ | 25,099,986 |
Interest income | | | 28,262 |
| | |
|
|
Total income | | | 25,128,248 |
| | |
|
|
| |
EXPENSES | | | |
Management fees | | | 16,893,454 |
Transfer agent fees & expenses | | | 825,503 |
Printing, postage & mailing | | | 85,596 |
Custodian fees | | | 107,233 |
Trustees’ fees | | | 98,257 |
Insurance | | | 59,422 |
Registration & filing fees | | | 48,804 |
Legal fees | | | 78,313 |
Audit fees | | | 35,753 |
| | |
|
|
Total expenses | | | 18,232,335 |
| | |
|
|
NET INVESTMENT INCOME | | | 6,895,913 |
| | |
|
|
REALIZED AND UNREALIZED GAIN
ON INVESTMENTS | | | |
Net realized gain on investments | | | 48,800,088 |
Capital gain distributions from investment companies | | | 1,389,124 |
Net change in unrealized appreciation on investments | | | 55,913,967 |
| | |
|
|
Net realized and unrealized gain on investments | | | 106,103,179 |
| | |
|
|
NET INCREASE IN NET ASSETS FROM OPERATIONS | | $ | 112,999,092 |
| | |
|
|
See notes to the financial statements.
11
The Torray Fund
STATEMENTS OF CHANGES IN NET ASSETS
For the years indicated:
| | | | | | | | |
| | | Year ended
12/31/04
| | | Year ended
12/31/03
| |
Increase in Net Assets from Operations: | | | | | | | | |
Net investment income | | $ | 6,895,913 | | | $ | 9,116,828 | |
Net realized gain on investments | | | 48,800,088 | | | | 18,020,686 | |
Capital gain distributions from investment companies | | | 1,389,124 | | | | — | |
Net change in unrealized appreciation on investments | | | 55,913,967 | | | | 306,757,734 | |
| | |
|
|
| |
|
|
|
Net increase in net assets from operations | | | 112,999,092 | | | | 333,895,248 | |
| | |
|
|
| |
|
|
|
| | |
Distributions to Shareholders from: | | | | | | | | |
Net investment income ($0.165 and
$0.220 per share, respectively) | | | (6,932,648 | ) | | | (9,080,093 | ) |
Net realized gains ($1.423 and $0.124 per
share, respectively) | | | (59,599,089 | ) | | | (5,103,734 | ) |
| | |
|
|
| |
|
|
|
Total distributions | | | (66,531,737 | ) | | | (14,183,827 | ) |
| | |
|
|
| |
|
|
|
| | |
Shares of Beneficial Interest | | | | | | | | |
Increase (decrease) from share transactions | | | 32,754,527 | | | | (31,968,568 | ) |
| | |
|
|
| |
|
|
|
Total increase | | | 79,221,882 | | | | 287,742,853 | |
| | |
Net Assets — Beginning of period | | | 1,655,278,532 | | | | 1,367,535,679 | |
| | |
|
|
| |
|
|
|
Net Assets — End of period | | $ | 1,734,500,414 | | | $ | 1,655,278,532 | |
| | |
|
|
| |
|
|
|
Accumulated net investment income | | $ | — | | | $ | 36,735 | |
| | |
|
|
| |
|
|
|
See notes to the financial statements.
12
The Torray Fund
FINANCIAL HIGHLIGHTS
For a share outstanding throughout each year:
PER SHARE DATA
| | | | | | | | | | | | | | | | | | | | |
| | | Years ended December 31:
| |
| | | 2004
| | | 2003
| | | 2002
| | | 2001
| | | 2000
| |
Net Asset Value,
Beginning of Period | | $ | 39.980 | | | $ | 32.240 | | | $ | 37.530 | | | $ | 39.790 | | | $ | 44.310 | |
| | |
|
|
| |
|
|
| |
|
|
| |
|
|
| |
|
|
|
Income from investment operations | | | | | | | | | | | | | | | | | | | | |
Net investment income | | | 0.165 | | | | 0.220 | | | | 0.205 | | | | 0.172 | | | | 0.265 | |
Net gains (losses) on securities (both realized and unrealized) | | | 2.523 | | | | 7.864 | | | | (5.083 | ) | | | (0.489 | ) | | | (1.730 | ) |
| | |
|
|
| |
|
|
| |
|
|
| |
|
|
| |
|
|
|
Total from investment operations | | | 2.688 | | | | 8.084 | | | | (4.878 | ) | | | (0.317 | ) | | | (1.465 | ) |
| | |
|
|
| |
|
|
| |
|
|
| |
|
|
| |
|
|
|
Less: distributions | | | | | | | | | | | | | | | | | | | | |
Dividends (from net investment income) | | | (0.165 | ) | | | (0.220 | ) | | | (0.205 | ) | | | (0.184 | ) | | | (0.253 | ) |
Distributions (from capital gains) | | | (1.423 | ) | | | (0.124 | ) | | | (0.207 | ) | | | (1.759 | ) | | | (2.802 | ) |
| | |
|
|
| |
|
|
| |
|
|
| |
|
|
| |
|
|
|
Total distributions | | | (1.588 | ) | | | (0.344 | ) | | | (0.412 | ) | | | (1.943 | ) | | | (3.055 | ) |
| | |
|
|
| |
|
|
| |
|
|
| |
|
|
| |
|
|
|
Net Asset Value,
End of Period | | $ | 41.080 | | | $ | 39.980 | | | $ | 32.240 | | | $ | 37.530 | | | $ | 39.790 | |
| | |
|
|
| |
|
|
| |
|
|
| |
|
|
| |
|
|
|
TOTAL RETURN(1) | | | 6.90 | % | | | 25.19 | % | | | (13.05 | %) | | | (0.52 | %) | | | (3.38 | %) |
RATIOS/SUPPLEMENTAL DATA | | | | | | | | | | | | | | | | | | | | |
Net assets, end of period (000’s omitted) | | $ | 1,734,500 | | | $ | 1,655,279 | | | $ | 1,367,536 | | | $ | 1,638,814 | | | $ | 1,820,972 | |
Ratios of expenses to average net assets | | | 1.08 | % | | | 1.11 | % | | | 1.07 | % | | | 1.07 | % | | | 1.06 | % |
Ratios of net income to average net assets | | | 0.41 | % | | | 0.62 | % | | | 0.58 | % | | | 0.45 | % | | | 0.64 | % |
Portfolio turnover rate | | | 27.12 | % | | | 37.11 | % | | | 22.52 | % | | | 37.56 | % | | | 45.44 | % |
| (1) | | Past performance is not predictive of future performance. |
See notes to the financial statements.
13
The Torray Fund
NOTES TO FINANCIAL STATEMENTS
As of December 31, 2004
NOTE 1 — SUMMARY OF SIGNIFICANT ACCOUNTING POLICIES
The Torray Fund (“Fund”) is a separate series of The Torray Fund (“Trust”). The Trust is registered under the Investment Company Act of 1940 as a no-load, diversified, open-end management investment company. The Trust was organized as a business trust under Massachusetts law. The Fund’s primary investment objective is to provide long-term total return. The Fund seeks to meet its objective by investing its assets in a diversified portfolio of common stocks. In order to accomplish these goals, the Fund intends to hold stocks for the long term, as opposed to actively buying and selling. There can be no assurances that the Fund’s investment objectives will be achieved.
The following is a summary of accounting policies followed by the Fund in the preparation of its financial statements. These policies are in conformity with accounting principles generally accepted in the United States of America.
Securities Valuation Portfolio securities for which market quotations are readily available are valued at market value, which is determined by using the last reported sale price, or, if no sales are reported, the last reported bid price. For NASDAQ traded securities, market value is determined on the basis of the NASDAQ official closing price (the “NOCP”) instead of the last reported sales price. Other assets and securities for which no quotations are readily available or for which The Torray Corporation (the “Advisor”) believes do not reflect market value are valued at fair value as determined in good faith by the Advisor under the supervision of the Board of Trustees. Short-term obligations having remaining maturities of 60 days or less are valued at amortized cost, which approximates market value.
Securities Transactions and Investment Income Securities transactions are recorded on a trade date basis. Realized gains and losses from securities transactions are recorded on the specific identification basis. Dividend income and distributions to shareholders are recorded on the ex-dividend date. Interest income, including amortization of discount on short-term investments, and expenses are recorded on the accrual basis.
Federal Income Taxes The Fund intends to continue to comply with the requirements of the Internal Revenue Code applicable to regulated investment companies and to distribute all of its taxable income, including any net realized gain on investments to its shareholders. Therefore, no Federal income tax provision is required.
Net Asset Value The net asset value per share of the Fund is determined daily as of the close of trading on the New York Stock Exchange by dividing the value of the Fund’s net assets by the number of shares outstanding.
Use of Estimates In preparing financial statements in accordance with accounting principles generally accepted in the United States of America, management is required to make estimates and assumptions that affect the reported amounts of assets and liabilities and the disclosure of contingent assets and liabilities at the date of the financial statements, and the reported amounts of increases and decreases in net assets from operations during the reporting period. Actual results could differ from those estimates.
14
The Torray Fund
NOTES TO FINANCIAL STATEMENTS (continued)
As of December 31, 2004
NOTE 2 — SHARES OF BENEFICIAL INTEREST TRANSACTIONS
Transactions in shares of beneficial interest were as follows:
| | | | | | | | | | | | | | |
| | | Year ended 12/31/04
| | | Year ended 12/31/03
| |
| | | Shares
| | | Amount
| | | Shares
| | | Amount
| |
Shares issued | | 6,330,626 | | | $ | 254,788,909 | | | 6,185,253 | | | $ | 219,046,893 | |
Reinvestments of dividends and distributions | | 1,586,647 | | | | 63,147,856 | | | 367,157 | | | | 13,313,016 | |
Shares redeemed | | (7,099,087 | ) | | | (285,182,238 | ) | | (7,567,966 | ) | | | (264,328,477 | ) |
| | |
|
| |
|
|
| |
|
| |
|
|
|
| | | 818,186 | | | $ | 32,754,527 | | | (1,015,556 | ) | | $ | (31,968,568 | ) |
| | |
|
| |
|
|
| |
|
| |
|
|
|
Officers, Trustees and affiliated persons of The Torray Fund and their families directly or indirectly control 1,893,136 shares or 4.48% of the Fund.
NOTE 3 — INVESTMENT TRANSACTIONS
Purchases and sales of investment securities, other than short-term investments, for the year ended December 31, 2004, aggregated $457,022,698 and $481,037,986, respectively.
NOTE 4 — MANAGEMENT FEES
Pursuant to the Management Contract, The Torray Corporation provides investment advisory and administrative services to the Fund. The Fund pays The Torray Corporation a management fee, computed daily and payable monthly at the annual rate of one percent of the Fund’s average daily net assets. For the year ended December 31, 2004, The Torray Fund paid management fees of $16,893,454.
Excluding the management fee, other expenses incurred by the Fund during the year ended December 31, 2004, totaled $1,338,881. These expenses include all costs associated with the Fund’s operations including transfer agent fees, Independent Trustees’ fees ($10,000 per annum and $1,000 for each Board meeting attended), taxes, dues, fees and expenses of registering and qualifying the Fund and its shares for distribution, charges of custodian, auditing and legal expenses, insurance premiums, supplies, postage, expenses of issue or redemption of shares, re- ports to shareholders and Trustees, expenses of printing and mailing prospectuses, proxy statements and proxies to existing shareholders, and other miscellaneous expenses.
Certain officers and Trustees of the Fund are also officers and/or shareholders of The Torray Corporation.
15
The Torray Fund
NOTES TO FINANCIAL STATEMENTS (continued)
As of December 31, 2004
NOTE 5 — TAX MATTERS
Distributions to shareholders are determined in accordance with federal income tax regulations which may differ from accounting principles generally accepted in the United States of America.
The tax character of distributions paid during 2004 and 2003 were as follows:
| | | | | | |
| | | 2004
| | 2003
|
Distributions paid from: | | | | | | |
Ordinary income | | $ | 13,670,506 | | $ | 14,183,827 |
Long-term capital gain | | | 52,861,231 | | | — |
| | |
|
| |
|
|
| | | $ | 66,531,737 | | $ | 14,183,827 |
| | |
|
| |
|
|
As of December 31, 2004, the components of distributable earnings on a tax basis were as follows:
| | | | | |
Undistributed long-term gain | | $ | 9,555,581 | | |
Unrealized appreciation | | | 294,247,320 | | |
| | |
|
| | |
| | | $ | 303,802,901 | | |
| | |
|
| | |
The following information is based upon the federal income tax basis of investment securities as of December 31, 2004:
| | | | | | |
Gross unrealized appreciation | | $ | 330,408,895 | | | |
Gross unrealized depreciation | | | (36,161,575 | ) | | |
| | |
|
|
| | |
Net unrealized appreciation | | $ | 294,247,320 | | | |
| | |
|
|
| | |
Federal income tax basis | | $ | 1,438,977,425 | | | |
| | |
|
|
| | |
The primary difference between book basis and tax basis distributions and distributable earnings is different book and tax treatment of short-term capital gains and the tax deferral of losses on wash sales.
NOTE 6 — COMMITMENTS AND CONTINGENCIES
The Fund indemnifies its officers and trustees for certain liabilities that may arise from their performance of their duties to the Fund. Additionally, in the normal course of business, the Fund enters into contracts that contain a variety of representations and warranties and which provide general indemnifications. The Fund’s maximum exposure under these arrangements is unknown, as this would involve future claims that may be made against the Fund that have not yet occurred.
16
The Torray Fund
REPORT OF INDEPENDENT REGISTERED PUBLIC ACCOUNTING FIRM
As of December 31, 2004
To the Shareholders and Board of Trustees
The Torray Fund
Bethesda, Maryland
We have audited the statement of assets and liabilities of The Torray Fund, a series of shares of beneficial interest of The Torray Fund, including the schedule of investments, as of December 31, 2004, and the related statement of operations for the year then ended, the statements of changes in net assets for each of the two years then ended and the financial highlights for each of the five years then ended. These financial statements and financial highlights are the responsibility of the Fund’s management. Our responsibility is to express an opinion on these financial statements and financial highlights based on our audit.
We conducted our audits in accordance with the standards of the Public Company Accounting Oversight Board (United States). Those standards require that we plan and perform the audit to obtain reasonable assurance about whether the financial statements and financial highlights are free of material misstatement. An audit includes examining, on a test basis, evidence supporting the amounts and disclosures in the financial statements. Our procedures included confirmation of securities owned as of December 31, 2004 by correspondence with the custodian. An audit also includes assessing the accounting principles used and significant estimates made by management, as well as evaluating the overall financial statement presentation. We believe that our audit provides a reasonable basis for our opinion.
In our opinion, the financial statements and financial highlights referred to above present fairly, in all material respects, the financial position of The Torray Fund as of December 31, 2004, the results of its operations for the year then ended, the changes in its net assets for each of the two years then ended, and the financial highlights for each of the five years then ended in conformity with accounting principles generally accepted in the United States of America.

BRIGGS, BUNTING & DOUGHERTY, LLP
Philadelphia, Pennsylvania
January 20, 2005
17
The Torray Fund
FUND MANAGEMENT (unaudited)
As of December 31, 2004
Information pertaining to the Trustees and Officers of The Trust is set forth below. The Statement of Additional
Information (SAI) includes additional information about the Trustees and is available without charge, upon request, by calling (800) 443-3036.
| | | | | | | | |
Name, Birthdate,
Address* and
Positions
with the Trust | | Term of Office
and Length of
Time Served | | Principal Occupation(s)
During Past 5 Years | | Portfolios
Overseen
by Trustee | | Other Trusteeships/
Directorships Held
by Trustee |
DISINTERESTED TRUSTEES |
Bruce C. Ellis
07/20/44
Trustee | | Indefinite Term Since Jun 1993 | | Private Investor
Bethesda, Maryland | | 2 | | |
Robert P. Moltz
10/03/47
Trustee | | Indefinite Term Since Nov 1990 | | President, CEO
Weaver Bros Insurance Assoc.
Bethesda, Maryland | | 2 | | |
Roy A. Schotland
03/18/33
Trustee | | Indefinite Term Since Nov 1990 | | Professor of Law
Georgetown University Law Center
Washington, D.C. | | 2 | | Director
Custodial Trust Co.,
a Bear Stearns subsidiary |
Wayne H. Shaner
08/23/47
Trustee | | Indefinite Term Since Jun 1993 | | Managing Partner Rockledge Partners, L.L.C.
Bethesda, Maryland Managing Director (through 1/2/04) Lockheed Martin Investment Management Co. Bethesda, Maryland | | 2 | | |
Dr. Charlene Nunley
09/26/50
Trustee | | Indefinite Term Since May 2002 | | President
Montgomery College
Rockville, Maryland | | 2 | | |
Dr. Carl MacCartee
01/09/41
Trustee | | Indefinite Term Since May 2002 | | Medical Doctor
MacCartee, Haas, Grossman, Connell & Shaffer P.A. Chevy Chase, Maryland | | 2 | | |
Dr. Patricia Kavanagh
11/01/49 Trustee | | Indefinite Term Since May 2002 | | Medical Doctor, Resident Neurological Institute at Columbia Presbyterian New York, New York | | 2 | | |
INTERESTED TRUSTEES |
William M Lane 05/21/50 President, Secretary, Trustee | | Indefinite Term Since Nov 1990 | | President and Trustee, The Torray Fund
Vice President, Robert E. Torray & Co. Inc.
Vice President, The Torray Corporation Bethesda, Maryland | | 2 | | |
Douglas C. Eby 07/28/59 Vice President, Treasurer, Trustee | | Indefinite Term Since May 2002 | | President, Robert E. Torray & Co. Inc.
Vice President and Treasurer
The Torray Corporation
Bethesda, Maryland | | 2 | | Director
Markel Corporation
Richmond, Virginia |
Robert E. Torray 04/10/37 Trustee | | Indefinite Term Since May 2002 | | Chairman, Robert E. Torray & Co. Inc.
President, The Torray Corporation
Bethesda, Maryland | | 2 | | Director
CarrAmerica Realty
Washington, D.C. |
| * | | All addresses are c/o The Torray Fund, 7501 Wisconsin Avenue, Suite 1100, Bethesda, MD 20814-6523 |
18
The Torray Fund
PORTFOLIO HOLDINGS, PROXY VOTING AND PROCEDURES (unaudited)
As of December 31, 2004
The Fund files its complete schedule of portfolio holdings with the Securities and Exchange Commission (the “Commission”) for the first and third quarters of each fiscal year on Form N-Q. The Fund’s Forms N-Q are available on the Commission’s website at http://www.sec.gov. The Fund’s Form N-Q may be reviewed and copied at the Commission’s Public Reference Room in Washington, D.C. Information on the operation of the Commission’s Public Reference Room may be obtained by calling 1-800-SEC-0330.
A description of the policies and procedures that the Fund uses to determine how to vote proxies relating to portfolio securities is available without charge, upon request, by calling 1-800-443-3036; and on the Commission’s website at http://www.sec.gov.
Information regarding how the Fund voted proxies relating to portfolio securities is available without charge, upon request, by calling 1-800-443-3036; and on the Commission’s website at http://www.sec.gov.
19
The Torray Fund
ABOUT YOUR FUND’S EXPENSES (unaudited)
As of December 31, 2004
We believe it is important for you to understand the impact of costs on your investment. All mutual funds have operating expenses. As a shareholder of the Fund, you incur ongoing costs, including management fees, and other fund expenses. Operating expenses, which are deducted directly from the Fund’s gross income, directly reduce the investment return of the Fund.
A fund’s expenses are expressed as a percentage of its average net assets. This figure is known as the expense ratio. The following examples are intended to help you understand the ongoing costs (in dollars) of investing in the Fund and to compare these costs with the ongoing costs of investing in other mutual funds. The examples below are based on an investment of $1,000 made at the beginning of the period shown and held for the entire period.
The table on the next page illustrates the Fund’s cost in two ways:
Actual Fund Return This section helps you estimate the actual expenses that you paid over the period. The “Ending Account Value” shown is derived from the Fund’s actual return, and the third column shows the operating expenses that would have been paid by an investor who started with $1,000 in the Fund. You may use the information here, together with the amount invested, to estimate the expenses that you paid over the period. To do so, simply divide your account value by $1,000 (for example, an $8,600 account value divided by $1,000 = 8.6), then multiply the result by the number given for the Fund under the heading “Expenses Paid During Period” on the next page.
Hypothetical 5% return This section is intended to help you compare your Fund’s costs with those of other mutual funds. It assumes that the Fund had an annual return of 5% before expenses, and that the expense ratio is unchanged. In this case, because the return used is not the Fund’s actual return, the results do not apply to your investment. The example is useful in making comparisons because the Securities and Exchange Commission requires all mutual funds to calculate expenses based on a 5% return. You can assess the Fund’s costs by comparing this hypothetical example with the hypothetical examples that appear in shareholder reports of other funds.
Note that expenses shown in the table are meant to highlight and help you compare ongoing costs only. The Fund does not charge transactions fees, such as purchase or redemption fees, nor does it carry a “sales load.”
The calculation assumes no shares were bought or sold during the period. Your actual costs may have been higher or lower, depending on the amount of your investment and the timing of any purchases or redemptions.
20
The Torray Fund
ABOUT YOUR FUND’S EXPENSES (unaudited)
As of December 31, 2004
More information about the Fund’s expenses, including recent annual expense ratios, can be found in this report. For additional information on operating expenses and other shareholder costs, please refer to the Fund’s prospectus.
| | | | | | | | | |
| | | Beginning
Account Value
June 30, 2004
| | Ending
Account Value
December 31, 2004
| | Expenses Paid
During Period
|
Based on Actual Fund Return | | $ | 1,000.00 | | $ | 1,043.36 | | $ | 5.50 |
Based on Hypothetical 5% Return
(before expenses) | | $ | 1,000.00 | | $ | 1,019.76 | | $ | 5.43 |
21
The Torray Fund
TAX INFORMATION (unaudited)
As of December 31, 2004
We are required to advise you within 60 days of the Fund’s fiscal year-end regarding the federal tax status of certain distributions received by shareholders during such fiscal year. The information below is provided for the Fund’s fiscal year ending December 31, 2004.
During the fiscal year, the Fund paid a long-term capital gain distribution of $13,670,506.
Individual shareholders are eligible for reduced tax rates on qualified dividend income. For purposes of computing this exclusion, all of the dividends paid by the Fund from ordinary income earned during the fiscal year are considered qualified dividend income.
Corporate shareholders may exclude up to 70% of qualifying dividends. For the purposes of computing this exclusion, all of the dividends paid by the Fund from ordinary income earned during the fiscal year represent qualifying dividends.
Dividends and distributions received by retirement plans such as IRA’s, Keogh-type plans and 403(b) plans need not be reported as taxable income. However, many retirement plan trusts may need this information for their annual information reporting.
22
TRUSTEES
Douglas C. Eby
Bruce C. Ellis
Patricia Kavanagh
William M Lane
Carl C. MacCartee, Jr.
Robert P. Moltz
Charlene R. Nunley
Roy A. Schotland
Wayne H. Shaner
Robert E. Torray
INVESTMENT ADVISOR
The Torray Corporation
OFFICERS
Robert E. Torray, President
Douglas C. Eby, Vice President
William M Lane, Vice President
INDEPENDENT REGISTERED PUBLIC
ACCOUNTING FIRM
Briggs, Bunting & Dougherty, LLP
Two Penn Center Plaza, Suite 820
Philadelphia, PA 19102-1732
TRANSFER AGENT
PFPC Inc.
760 Moore Road
King of Prussia, PA 19406-1212
LEGAL COUNSEL
Dechert
1775 Eye Street, N.W.
Washington, D.C. 20006
This report is not authorized for distribution to prospective investors unless preceded or accompanied by a current prospectus.
The
TORRAY
FUND
ANNUAL REPORT
December 31, 2004
The Torray Fund
Suite 1100
7501 Wisconsin Avenue
Bethesda, Maryland 20814-6523
(301) 493-4600
(800) 443-3036
The Torray Institutional Fund
Letter to Shareholders
February 10, 2005
Dear Fellow Shareholders,
The Torray Institutional Fund gained 7% during 2004, bringing its return since inception three and a half years ago to 6% compounded annually. By comparison, the Standard & Poor’s 500 Index returned 10.9% and 1.4%, respectively. While we are disappointed not to have done better for you last year, our policy of investing in high quality businesses that generate rising earnings and free cash flow was temporarily out of vogue. Although we believe our approach is the soundest way to succeed over the long term, in the short run, anything can happen and, in 2004, it did.
Strength in the economy, surging oil prices, unusually strong world demand for commodities, and a dramatic recovery in a number of depressed industries were the key elements in the market’s advance. These factors combined to cause extraordinary gains in the stocks of companies in economically sensitive sectors like oil, metals, mining, fertilizer, transportation (except airlines), home building and others. Utilities were bid up by investors looking for income. Overall, there were so many winners, throwing darts at the stock page might have produced a higher return than we did. Nevertheless, having watched these cycles for more than four decades, we are convinced that our philosophy is the best one, and we’re sticking with it.
We will explain why. As a general rule — and this is an observation, not a criticism — the companies to which we have just referred, though important to the economy and their employees, do not have records or prospects that meet our investment criteria. Most are cyclical — meaning their sales and earnings rise and fall with the economy. They are also capital intensive and, in many cases, subject to brutal competition. As a result, profit margins and returns on equity tend to be modest, and growth prospects mediocre. Excluding periods of robust demand for their products and services — the recent experience — they produce limited and, in some instances, no free cash flow. That term refers to money left over after all costs of operating and maintaining the business have been met. It may be used for dividends, share repurchases, acquisitions, debt reduction, and so on. If there is none, the value of the enterprise cannot increase, and the stock will merely move up and down, reflecting fluctuations in underlying fundamentals and investor preferences.
Torray Institutional Fund companies are different. As a group they have generated rising earnings and tremendous free cash flow — the only factors that produce long-term appreciation in stocks. Managements are sound, balance sheets strong, capital requirements minimal, and the franchises have sustainable competitive advantages.
1
The Torray Institutional Fund
Letter to Shareholders
February 10, 2005
But, last year, markets were not focused on these aspects. Instead, as noted, attention centered on sectors more closely tied to the economy’s cyclical recovery. If investors, knowing all the facts, were given a choice between owning the companies in our Fund and those described above — the only hitch being they couldn’t sell for 20 years — we think most would select the former. Benjamin Graham, the father of security analysis, observed more than half a century ago that in the short run the market is a voting machine, but in the long run it’s a weighing machine. We believe your investment in The Torray Institutional Fund will weigh enough in the future to meet your financial goals.
Some, we know, will say “forget all that, just buy something, anything that will go up.” We sympathize. But, the urge to do this is exactly what gets people into trouble. Besides, we would not know which stocks to choose. It’s always a good idea when you’re tempted to go down this road to ask yourself — and be honest —have I or has anyone I know made money — net of losses and taxes — trying to pick near-term winners? In conclusion on these points, we reaffirm our confidence in the Fund’s portfolio and determination to ride it out pretty much as is.
We believe the record supports our persistence. The Torray Fund, which we started 14 years ago, has earned 14.1% compounded annually, versus 12.0% for the S&P 500 and, by coincidence, our affiliate Robert E. Torray & Co., a manager of large institutional portfolios, has produced the same annualized return for 32 years, turning $1 into $68. The market, measured by the S&P 500, grew $1 into $29. Over the past decade, the comparison is even more favorable: 14.9% for The Torray Fund, 12.1% for the Index.
At the risk of overkill, we will also mention that our record looks good when compared to mutual fund industry averages. Over the last 10 years, (14 year numbers are not published), The Torray Fund ranks in the top 8% of all domestic stock funds, and the top 3% of those considered to be similar in style and objective. After taxes, it stands among the top 3% and 1%, respectively.
These numbers highlight the importance of maintaining a long-term perspective. However, we realize that during periods like this, it’s only natural for people to become impatient and start switching things around. But, as detailed in our 2003 mid-year report, studies have shown this tendency has substantially slashed returns. As we have said in the past, we think it makes
2
The Torray Institutional Fund
Letter to Shareholders
February 10, 2005
sense to stick with a few funds that have competent, experienced management and a good track record, and then be resigned to the fact there will always be others — though not many — performing better. We accept that. Our goal is to provide you with a safe investment that will earn more, net of expenses, than you are likely to make on your own or in an index fund — not every month, every quarter, every year, but over your lifetime. We also endeavor to communicate in plain language what we’re doing and why; and to put important issues in perspective to help you evaluate the crushing oversupply of investment products and the endless, often confusing, barrage of advice from experts.
Thank you once again for entrusting your savings to us. The protection and growth of your investment is our top priority.
| | | | |
| Sincerely, | | | | |
| | |
 | | | |  |
| Robert E. Torray | | | | Douglas C. Eby |
3
The Torray Institutional Fund
PERFORMANCE DATA
As of December 31, 2004
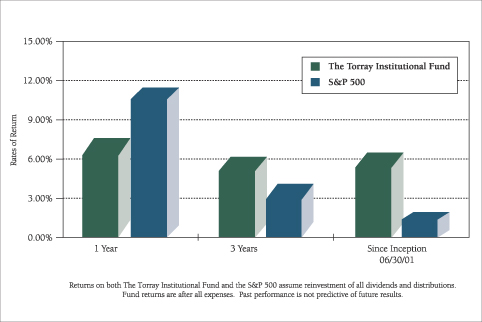
Total Rates of Return on an Investment in The Torray Institutional Fund vs. the S&P 500
For the periods ended December 31, 2004:
| | | | | | |
| | | 1 Year
| | 3 Years
| | Since
Inception
06/30/01
|
The Torray Institutional Fund | | 6.96% | | 5.60% | | 5.96% |
S&P 500 | | 10.87% | | 3.58% | | 1.43% |
Cumulative Returns for the 3.5 years ended December 31, 2004
| | | |
Torray Institutional Fund | | 22.46 | % |
S&P 500 | | 5.11 | % |
4
The Torray Institutional Fund
PERFORMANCE DATA
As of December 31, 2004
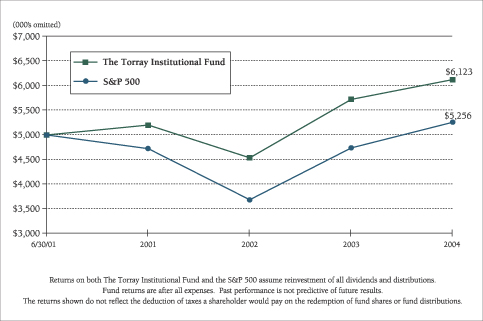
Change in Value of $5,000,000 Invested on June 30, 2001 (commencement of operations) to:
| | | | | | | | | | | | | | | |
| | | 06/30/01
| | 12/31/01
| | 12/31/02
| | 12/31/03
| | 12/31/04
|
The Torray Institutional Fund | | $ | 5,000,000 | | $ | 5,199,000 | | $ | 4,537,500 | | $ | 5,724,500 | | $ | 6,123,000 |
S&P 500 | | $ | 5,000,000 | | $ | 4,723,000 | | $ | 3,682,500 | | $ | 4,739,000 | | $ | 5,255,500 |
5
The Torray Institutional Fund
FUND PROFILE (unaudited)
As of December 31, 2004
DIVERSIFICATION (% of net assets)
| | |
Diversified Financial Services | | 23.80% |
Media & Entertainment | | 14.21% |
Diversified Manufacturing | | 10.19% |
Data Processing & Management | | 7.67% |
Pharmaceuticals | | 7.42% |
Aerospace & Defense | | 7.32% |
Health Care Services | | 5.27% |
Communications Services | | 5.06% |
Diversified Medical Products | | 4.97% |
Beverages | | 3.93% |
Diversified Telecommunication Services | | 2.57% |
Specialty Retail | | 2.31% |
Electronic Equipment | | 1.80% |
Banking | | 0.98% |
Utilities | | 0.68% |
Real Estate | | 0.60% |
Computer Systems & Integration | | 0.57% |
Energy | | 0.15% |
Other Assets Less Liabilities | | 0.50% |
| | |
|
| | | 100.00% |
TOP TEN HOLDINGS
| | |
| 1. | | Amgen Inc. |
| 2. | | Cardinal Health, Inc. |
| 3. | | Franklin Resources, Inc. |
| 4. | | Univision Communications Inc. |
| 5. | | The Walt Disney Company |
| 6. | | First Data Corporation |
| 7. | | AMBAC Financial Group, Inc. |
| 8. | | Anheuser-Busch Cos., Inc. |
| 9. | | Illinois Tool Works Inc. |
| 10. | | The DIRECTV Group, Inc. |
PORTFOLIO CHARACTERISTICS
| | | | |
Net Assets (million) | | | | $1,013 |
Number of Stocks | | | | 39 |
Portfolio Turnover | | | | 16.12% |
P/E Multiple (forward) | | | | 17.8x |
Portfolio Yield | | | | 1.30% |
Market Capitalization | | Average | | 55.6 B |
| | | Median | | 25.0 B |
6
The Torray Institutional Fund
SCHEDULE OF INVESTMENTS
As of December 31, 2004
| | | | | | | |
| | | Shares
| | | | Market Value
|
| COMMON STOCK 99.50 % |
|
| 23.80% DIVERSIFIED FINANCIAL SERVICES |
| | | 701,900 | | Franklin Resources, Inc. | | $ | 48,887,335 |
| | | 518,700 | | AMBAC Financial Group, Inc. | | | 42,600,831 |
| | | 85,500 | | Markel Corporation * | | | 31,122,000 |
| | | 676,412 | | JPMorgan Chase & Co. | | | 26,386,832 |
| | | 385,900 | | American International Group, Inc. | | | 25,342,053 |
| | | 961,300 | | Allied Capital Corporation | | | 24,839,992 |
| | | 136,000 | | Fairfax Financial Holdings Limited | | | 22,916,000 |
| | | 1,446,800 | | LaBranche & Co. Inc. * | | | 12,963,328 |
| | | 104,500 | | American Express Company | | | 5,890,665 |
| | | | | | |
|
|
| | | | | | | | 240,949,036 |
|
| 14.21% MEDIA & ENTERTAINMENT |
| | | 1,619,900 | | Univision Communications Inc. * | | | 47,414,473 |
| | | 1,643,700 | | The Walt Disney Company | | | 45,694,860 |
| | | 512,200 | | Tribune Company | | | 21,584,108 |
| | | 545,300 | | Clear Channel Communications, Inc. | | | 18,262,097 |
| | | 134,300 | | Gannett Co., Inc. | | | 10,972,310 |
| | | | | | |
|
|
| | | | | | | | 143,927,848 |
|
| 10.19% DIVERSIFIED MANUFACTURING |
| | | 402,700 | | Illinois Tool Works Inc. | | | 37,322,236 |
| | | 715,600 | | General Electric Company | | | 26,119,400 |
| | | 345,500 | | Emerson Electric Co. | | | 24,219,550 |
| | | 270,300 | | Danaher Corporation | | | 15,517,923 |
| | | | | | |
|
|
| | | | | | | | 103,179,109 |
|
| 7.67% DATA PROCESSING & MANAGEMENT |
| | | 1,022,500 | | First Data Corporation | | | 43,497,150 |
| | | 769,300 | | Automatic Data Processing, Inc. | | | 34,118,455 |
| | | | | | |
|
|
| | | | | | | | 77,615,605 |
7
The Torray Institutional Fund
SCHEDULE OF INVESTMENTS (continued)
As of December 31, 2004
| | | | | | | |
| | | Shares
| | | | Market Value
|
|
| 7.42% PHARMACEUTICALS |
| | | 931,800 | | Amgen Inc. * | | $ | 59,774,970 |
| | | 570,800 | | Pfizer Inc. | | | 15,348,812 |
| | | | | | |
|
|
| | | | | | | | 75,123,782 |
| |
| 7.32% AEROSPACE & DEFENSE | | | |
| | | 314,200 | | General Dynamics Corporation | | | 32,865,320 |
| | | 220,400 | | United Technologies Corporation | | | 22,778,340 |
| | | 523,200 | | Honeywell International Inc. | | | 18,526,512 |
| | | | | | |
|
|
| | | | | | | | 74,170,172 |
| |
| 5.27% HEALTH CARE SERVICES | | | |
| | | 918,400 | | Cardinal Health, Inc. | | | 53,404,960 |
| |
| 5.06% COMMUNICATIONS SERVICES | | | |
| | | 2,148,544 | | The DIRECTV Group, Inc. * | | | 35,966,627 |
| | | 460,700 | | EchoStar Communications Corporation | | | 15,313,668 |
| | | | | | |
|
|
| | | | | | | | 51,280,295 |
| |
| 4.97% DIVERSIFIED MEDICAL PRODUCTS | | | |
| | | 593,100 | | Abbott Laboratories | | | 27,668,115 |
| | | 356,900 | | Johnson & Johnson | | | 22,634,598 |
| | | | | | |
|
|
| | | | | | | | 50,302,713 |
| |
| 3.93% BEVERAGES | | | |
| | | 783,700 | | Anheuser-Busch Cos., Inc. | | | 39,757,101 |
| |
| 2.57% DIVERSIFIED TELECOMMUNICATION SERVICES | | | |
| | | 1,010,400 | | SBC Communications Inc. | | | 26,038,008 |
| |
| 2.31% SPECIALTY RETAIL | | | |
| | | 518,200 | | O’Reilly Automotive, Inc. * | | | 23,344,910 |
| |
| 1.80% ELECTRONIC EQUIPMENT | | | |
| | | 756,800 | | Agilent Technologies, Inc. * | | | 18,238,880 |
| |
| 0.98% BANKING | | | |
| | | 212,000 | | Bank of America Corporation | | | 9,961,880 |
8
The Torray Institutional Fund
SCHEDULE OF INVESTMENTS (continued)
As of December 31, 2004
| | | | | | | | |
| | | Shares
| | | | Market Value
| |
| |
| 0.68% UTILITIES | | | | |
| | | 655,400 | | Sierra Pacific Resources * | | $ | 6,881,700 | |
| |
| 0.60% REAL ESTATE | | | | |
| | | 184,000 | | CarrAmerica Realty Corporation | | | 6,072,000 | |
| |
| 0.57% COMPUTER SYSTEMS & INTEGRATION | | | | |
| | | 272,400 | | Hewlett-Packard Company | | | 5,712,228 | |
| |
| 0.15% ENERGY | | | | |
| | | 75,000 | | Pengrowth Energy Trust “A” | | | 1,561,500 | |
| | | | | | |
|
|
|
| TOTAL COMMON STOCK 99.50% | | | | |
| (cost $895,164,112) | | | | | 1,007,521,727 | |
| SHORT-TERM INVESTMENTS 1.25% | | | | |
| (cost $12,666,312) | | PNC Bank Money Market Account, 1.83% | | | 12,666,312 | |
| | | | | | |
|
|
|
| TOTAL PORTFOLIO SECURITIES 100.75% | | | | |
| (amortized cost $907,830,424) | | | 1,020,188,039 | |
| LIABILITIES LESS OTHER ASSETS (.75)% | | | (7,621,930 | ) |
| | | | | | |
|
|
|
| NET ASSETS 100.00% | | $ | 1,012,566,109 | |
| | |
|
|
|
| * | | Non-income producing securities |
See notes to the financial statements.
9
The Torray Institutional Fund
STATEMENT OF ASSETS AND LIABILITIES
As of December 31, 2004
| | | |
ASSETS | | | |
Investments in securities at value
(amortized cost $907,830,424) | | $ | 1,020,188,039 |
Receivable for fund shares sold | | | 4,313,524 |
Interest and dividends receivable | | | 1,120,535 |
| | |
|
|
TOTAL ASSETS | | | 1,025,622,098 |
| | |
|
|
| |
LIABILITIES | | | |
Payable for investments purchased | | | 11,738,155 |
Payable to Advisor | | | 708,830 |
Payable for fund shares redeemed | | | 609,004 |
| | |
|
|
TOTAL LIABILITIES | | | 13,055,989 |
| | |
|
|
| |
NET ASSETS | | $ | 1,012,566,109 |
| | |
|
|
Shares of beneficial interest ($1 stated value,
8,707,312 shares outstanding, unlimited
shares authorized) | | $ | 8,707,312 |
Paid-in-capital in excess of par | | | 889,042,205 |
Accumulated net realized gain | | | 2,458,977 |
Net unrealized appreciation of investments | | | 112,357,615 |
| | |
|
|
| |
TOTAL NET ASSETS | | $ | 1,012,566,109 |
| | |
|
|
Per Share | | $ | 116.29 |
| | |
|
|
See notes to the financial statements.
10
The Torray Institutional Fund
STATEMENT OF OPERATIONS
For the year ended December 31, 2004
| | | |
INVESTMENT INCOME | | | |
Dividend income | | $ | 10,896,446 |
Interest income | | | 61,276 |
| | |
|
|
Total income | | | 10,957,722 |
| | |
|
|
| |
EXPENSES | | | |
Management fees | | | 6,600,243 |
| | |
|
|
Total expenses | | | 6,600,243 |
| | |
|
|
NET INVESTMENT INCOME | | | 4,357,479 |
| | |
|
|
REALIZED AND UNREALIZED GAIN
ON INVESTMENTS | | | |
Net realized gain on investments | | | 9,075,617 |
Capital gain distributions from investment companies | | | 809,540 |
Net change in unrealized appreciation on investments | | | 46,162,153 |
| | |
|
|
Net realized and unrealized gain on investments | | | 56,047,310 |
| | |
|
|
NET INCREASE IN NET ASSETS FROM OPERATIONS | | $ | 60,404,789 |
| | |
|
|
See notes to the financial statements.
11
The Torray Institutional Fund
STATEMENTS OF CHANGES IN NET ASSETS
For the years indicated:
| | | | | | | | |
| | | Year ended
12/31/04
| | | Year ended
12/31/03
| |
Increase in Net Assets from Operations: | | | | | | | | |
Net investment income | | $ | 4,357,479 | | | $ | 2,810,909 | |
Net realized gain on investments | | | 9,075,617 | | | | 10,210,025 | |
Capital gain distributions from investment companies | | | 809,540 | | | | | |
Net change in unrealized appreciation on investments | | | 46,162,153 | | | | 73,157,304 | |
| | |
|
|
| |
|
|
|
Net increase in net assets from operations | | | 60,404,789 | | | | 86,178,238 | |
| | |
|
|
| |
|
|
|
| | |
Distributions to Shareholders from: | | | | | | | | |
Net investment income ($0.588 and $0.671 per share, respectively) | | | (4,367,472 | ) | | | (2,801,257 | ) |
Net realized gains ($1.255 and $1.556 per share, respectively) | | | (9,678,951 | ) | | | (7,779,240 | ) |
| | |
|
|
| |
|
|
|
Total distributions | | | (14,046,423 | ) | | | (10,580,497 | ) |
| | |
|
|
| |
|
|
|
| | |
Shares of Beneficial Interest | | | | | | | | |
Increase from share transactions | | | 368,025,136 | | | | 384,869,414 | |
| | |
|
|
| |
|
|
|
Total increase | | | 414,383,502 | | | | 460,467,155 | |
| | |
Net Assets — Beginning of period | | | 598,182,607 | | | | 137,715,452 | |
| | |
|
|
| |
|
|
|
Net Assets — End of period | | $ | 1,012,566,109 | | | $ | 598,182,607 | |
| | |
|
|
| |
|
|
|
Accumulated net investment income | | $ | — | | | $ | 9,652 | |
| | |
|
|
| |
|
|
|
See notes to the financial statements.
12
The Torray Institutional Fund
FINANCIAL HIGHLIGHTS
For a share outstanding throughout each period:
PER SHARE DATA
| | | | | | | | | | | | |
| | | Years ended December 31:
| | | Period
ended
12/31/01(1)
| |
| | | 2004
| | | 2003
| | | 2002
| | |
Net Asset Value,
Beginning of Period | | $110.520 | | | $89.490 | | | $103.300 | | | $100.000 | |
| | |
|
| |
|
| |
|
| |
|
|
Income from investment operations: | | | | | | | | | | | | |
Net investment income | | 0.588 | | | 0.671 | | | 0.679 | | | 0.359 | |
Net gains (losses) on securities (both realized and unrealized) | | 7.025 | | | 22.586 | | | (13.810 | ) | | 3.555 | |
| | |
|
| |
|
| |
|
| |
|
|
Total from investment operations | | 7.613 | | | 23.257 | | | (13.131 | ) | | 3.914 | |
| | |
|
| |
|
| |
|
| |
|
|
Less: distributions | | | | | | | | | | | | |
Dividends (from net investment income) | | (0.588 | ) | | (0.671 | ) | | (0.679 | ) | | (0.359 | ) |
Distributions (from capital gains) | | (1.255 | ) | | (1.556 | ) | | 0.000 | | | (0.255 | ) |
| | |
|
| |
|
| |
|
| |
|
|
Total distributions | | (1.843 | ) | | (2.227 | ) | | (0.679 | ) | | (0.614 | ) |
| | |
|
| |
|
| |
|
| |
|
|
Net Asset Value,
End of Period | | $116.290 | | | $110.520 | | | $89.490 | | | $103.300 | |
| | |
|
| |
|
| |
|
| |
|
|
TOTAL RETURN(2) | | 6.96 | % | | 26.16 | % | | (12.73 | %) | | 3.99 | % ** |
RATIOS/SUPPLEMENTAL DATA | | | | | | | | | | | | |
Net assets, end of period (000’s omitted) | | $1,012,566 | | | $598,183 | | | $137,715 | | | $50,684 | |
Ratios of expenses to average net assets | | 0.85 | % | | 0.85 | % | | 0.85 | % | | 0.85 | % * |
Ratios of net income to average net assets | | 0.56 | % | | 0.80 | % | | 0.85 | % | | 0.76 | % * |
Portfolio turnover rate | | 16.12 | % | | 22.20 | % | | 6.87 | % | | 8.84 | % * |
| (1) | | The Torray Institutional Fund commenced operations on June 30, 2001. |
| (2) | | Past performance is not predictive of future performance. |
See notes to the financial statements.
13
The Torray Institutional Fund
NOTES TO FINANCIAL STATEMENTS
As of December 31, 2004
NOTE 1 — SUMMARY OF SIGNIFICANT ACCOUNTING POLICIES
The Torray Institutional Fund (“Fund”) is a separate series of The Torray Fund (“Trust”). The Trust is registered under the Investment Company Act of 1940 as a no-load, diversified, open-end management investment company. The Trust was organized as a business trust under Massachusetts law and commenced operations on June 30, 2001. The Fund’s primary investment objective is to provide long-term total return. The Fund seeks to meet its objective by investing its assets in a diversified portfolio of common stocks. In order to accomplish these goals, the Fund intends to hold stocks for the long term, as opposed to actively buying and selling. There can be no assurances that the Fund’s investment objectives will be achieved.
The following is a summary of accounting policies followed by the Fund in the preparation of its financial statements. These policies are in conformity with accounting principles generally accepted in the United States of America.
Securities Valuation Portfolio securities for which market quotations are readily available are valued at market value, which is determined by using the last reported sale price, or, if no sales are reported, the last reported bid price. For NASDAQ traded securities, market value is determined on the basis of the NASDAQ official closing price (the “NOCP”) instead of the last reported sales price. Other assets and securities for which no quotations are readily available or for which The Torray Corporation (the “Advisor”) believes do not reflect market value are valued at fair value as determined in good faith by the Advisor under the supervision of the Board of Trustees. Short-term obligations having remaining maturities of 60 days or less are valued at amortized cost, which approximates market value.
Securities Transactions and Investment Income Securities transactions are recorded on a trade date basis. Realized gains and losses from securities transactions are recorded on the specific identification basis. Dividend income and distributions to shareholders are recorded on the ex-dividend date. Interest income, including amortization of discount on short-term investments, and expenses are recorded on the accrual basis.
Federal Income Taxes The Fund intends to continue to comply with the requirements of the Internal Revenue Code applicable to regulated investment companies and to distribute all of its taxable income, including any net realized gain on investments to its shareholders. Therefore, no Federal income tax provision is required.
Net Asset Value The net asset value per share of the Fund is determined daily as of the close of trading on the New York Stock Exchange by dividing the value of the Fund’s net assets by the number of shares outstanding.
Use of Estimates In preparing financial statements in accordance with accounting principles generally accepted in the United States of America, management is required to make estimates and assumptions that affect the reported amounts of assets and liabilities and the disclosure of contingent assets and liabilities at the date of the financial statements, and the reported amounts of increases and decreases in net assets from operations during the reporting period. Actual results could differ from those estimates.
14
The Torray Institutional Fund
NOTES TO FINANCIAL STATEMENTS (continued)
As of December 31, 2004
NOTE 2 — SHARES OF BENEFICIAL INTEREST TRANSACTIONS
Transactions in shares of beneficial interest were as follows:
| | | | | | | | | | | | | | |
| | | Year ended 12/31/04
| | | Year ended 12/31/03
| |
| | | Shares
| | | Amount
| | | Shares
| | | Amount
| |
Shares issued | | 3,988,230 | | | $ | 445,562,922 | | | 4,110,543 | | | $ | 408,604,899 | |
Reinvestments of dividends and distributions | | 117,934 | | | | 13,242,686 | | | 92,982 | | | | 9,722,685 | |
Shares redeemed | | (811,222 | ) | | | (90,780,472 | ) | | (330,094 | ) | | | (33,458,170 | ) |
| | |
|
| |
|
|
| |
|
| |
|
|
|
| | | 3,294,942 | | | $ | 368,025,136 | | | 3,873,431 | | | $ | 384,869,414 | |
| | |
|
| |
|
|
| |
|
| |
|
|
|
Officers, Trustees and affiliated persons of The Torray Institutional Fund and their families directly or indirectly control 137,410 shares or 1.58% of the Fund.
NOTE 3 — INVESTMENT TRANSACTIONS
Purchases and sales of investment securities, other than short-term investments, for the year ended December 31, 2004, aggregated $481,147,456 and $124,054,089, respectively.
NOTE 4 — MANAGEMENT FEES
Pursuant to the Management Contract, The Torray Corporation provides investment advisory and administrative services to the Fund. The Fund pays The Torray Corporation a management fee, computed daily and payable monthly at the annual rate of 0.85% of the Fund’s average daily net assets. For the year ended December 31, 2004, The Torray Institutional Fund paid comprehensive management fees of $6,600,243. The Fund pays the manager a single comprehensive management fee which covers all operating expenses of the Fund including the investment advisory and administrative services provided by the manager as well as all miscellaneous costs incurred in connection with the ongoing operation of the Fund including transfer agency, custody, professional and registration fees.
Certain officers and Trustees of the Fund are also officers and/or shareholders of The Torray Corporation.
NOTE 5 — TAX MATTERS
Distributions to shareholders are determined in accordance with federal income tax regulations which may differ from accounting principles generally accepted in the United States of America.
15
The Torray Institutional Fund
NOTES TO FINANCIAL STATEMENTS (continued)
As of December 31, 2004
The tax character of distributions paid during 2004 and 2003 were as follows:
| | | | | | |
| | | 2004
| | 2003
|
Distributions paid from: | | | | | | |
Ordinary income | | $ | 7,577,381 | | $ | 7,511,124 |
Long-term capital gain | | | 6,469,042 | | | 3,069,373 |
| | |
|
| |
|
|
| | | $ | 14,046,423 | | $ | 10,580,497 |
| | |
|
| |
|
|
As of December 31, 2004, the components of distributable earnings on a tax basis were as follows:
| | | |
Undistributed long-term gain | | $ | 2,458,977 |
Unrealized appreciation | | | 112,357,615 |
| | |
|
|
| | | $ | 114,816,592 |
| | |
|
|
The following information is based upon the federal income tax basis of investment securities as of
December 31, 2004:
| | | | |
Gross unrealized appreciation | | $ | 132,552,963 | |
Gross unrealized depreciation | | | (20,195,348 | ) |
| | |
|
|
|
Net unrealized appreciation | | $ | 112,357,615 | |
| | |
|
|
|
Federal income tax basis | | $ | 907,830,424 | |
| | |
|
|
|
The primary difference between book basis and tax basis distributions is different book and tax treatment of short-term capital gains.
NOTE 6 — COMMITMENTS AND CONTINGENCIES
The Fund indemnifies its officers and Trustees for certain liabilities that may arise from their performance of their duties to the Fund. Additionally, in the normal course of business, the Fund enters into contracts that contain a variety of representations and warranties which provide general indemnifications. The Fund’s maximum exposure under these arrangements is unknown, as this would involve future claims that may be made against the Fund that have not yet occurred.
16
The Torray Institutional Fund
REPORT OF INDEPENDENT REGISTERED PUBLIC ACCOUNTING FIRM
As of December 31, 2004
To the Shareholders and Board of Trustees
The Torray Institutional Fund
Bethesda, Maryland
We have audited the statement of assets and liabilities of The Torray Institutional Fund, a series of shares of beneficial interest of The Torray Fund, including the schedule of investments, as of December 31, 2004, and the related statement of operations for the year then ended, the statements of changes in net assets for each of the two years then ended and the financial highlights for each of the years or period in the four-year period then ended. These financial statements and financial highlights are the responsibility of the Fund’s management. Our responsibility is to express an opinion on these financial statements and financial highlights based on our audit.
We conducted our audits in accordance with the standards of the Public Company Accounting Oversight Board (United States). Those standards require that we plan and perform the audit to obtain reasonable assurance about whether the financial statements and financial highlights are free of material misstatement. An audit includes examining, on a test basis, evidence supporting the amounts and disclosures in the financial statements. Our procedures included confirmation of securities owned as of December 31, 2004 by correspondence with the custodian and brokers. An audit also includes assessing the accounting principles used and significant estimates made by management, as well as evaluating the overall financial statement presentation. We believe that our audit provides a reasonable basis for our opinion.
In our opinion, the financial statements and financial highlights referred to above present fairly, in all material respects, the financial position of The Torray Institutional Fund as of December 31, 2004, the results of its operations for the year then ended, the changes in its net assets for each of the two years then ended, and the financial highlights for each of the years or period in the four-year period then ended in conformity with accounting principles generally accepted in the United States of America.

BRIGGS, BUNTING & DOUGHERTY, LLP
Philadelphia, Pennsylvania
January 20, 2005
17
The Torray Institutional Fund
FUND MANAGEMENT (unaudited)
As of December 31, 2004
Information pertaining to the Trustees and officers of The Trust is set forth below. The Statement of Additional Information (SAI) includes additional information about the Trustees and is available without charge, upon request, by calling (800) 443-3036.
| | | | | | | | |
Name, Birth Date,
Address* and
Positions
with the Trust | | Term of Office
and Length of
Time Served | | Principal Occupation(s)
During Past 5 Years | | Portfolios
Overseen
by Trustee | | Other Trusteeships/
Directorships Held by
Trustee |
| | | | | DISINTERESTED TRUSTEES | | | | |
Bruce C. Ellis 07/20/44 Trustee | | Indefinite Term Since Jun 1993 | | Private Investor
Bethesda, Maryland | | 2 | | |
Robert P. Moltz 10/03/47 Trustee | | Indefinite Term Since Nov 1990 | | President, CEO
Weaver Bros Insurance Assoc.
Bethesda, Maryland | | 2 | | |
Roy A. Schotland 03/18/33 Trustee | | Indefinite Term Since Nov 1990 | | Professor of Law
Georgetown University Law Center
Washington, D.C. | | 2 | | Director Custodial Trust Co., a Bear Stearns subsidiary |
Wayne H. Shaner 08/23/47 Trustee | | Indefinite Term Since Jun 1993 | | Managing Partner, Rockledge Partners, L.L.C. Bethesda, Maryland Managing Director (through 1/2/04) Lockheed Martin Investment Management Co. Bethesda, Maryland | | 2 | | |
Dr. Charlene Nunley 09/26/50 Trustee | | Indefinite Term Since May 2002 | | President
Montgomery College
Rockville, Maryland | | 2 | | |
Dr. Carl MacCartee 01/09/41 Trustee | | Indefinite Term Since May 2002 | | Medical Doctor
MacCartee, Haas, Grossman, Connell & Shaffer P.A.
Chevy Chase, Maryland | | 2 | | |
Dr. Patricia Kavanagh 11/01/49 Trustee | | Indefinite Term Since May 2002 | | Medical Doctor, Resident
Neurological Institute at Columbia Presbyterian
New York, New York | | 2 | | |
| | | | | INTERESTED TRUSTEES | | | | |
William M. Lane 05/21/50 President, Secretary, Trustee | | Indefinite Term Since Nov 1990 | | President and Trustee, The Torray Fund
Vice President, Robert E. Torray & Co. Inc.
Vice President, The Torray Corporation Bethesda, Maryland | | 2 | | |
Douglas C. Eby 07/28/59 Vice President, Treasurer, Trustee | | Indefinite Term Since May 2002 | | President, Robert E. Torray & Co. Inc.
Vice President and Treasurer The Torray Corporation
Bethesda, Maryland | | 2 | | Director Markel Corporation Richmond, Virginia |
Robert E. Torray 04/10/37 Trustee | | Indefinite Term Since May 2002 | | Chairman, Robert E. Torray & Co. Inc.
President, The Torray Corporation
Bethesda, Maryland | | 2 | | Director CarrAmerica Realty Washington, D.C. |
| * | | All addresses are c/o The Torray Institutional Fund, 7501 Wisconsin Avenue, Suite 1100, Bethesda, MD 20814-6523 |
18
The Torray Institutional Fund
PORTFOLIO HOLDINGS, PROXY VOTING AND PROCEDURES (unaudited)
As of December 31, 2004
The Fund files its complete schedule of portfolio holdings with the Securities and Exchange Commission (the “Commission”) for the first and third quarters of each fiscal year on Form N-Q. The Fund’s Forms N-Q are available on the Commission’s website at http://www.sec.gov. The Fund’s Form N-Q may be reviewed and copied at the Commission’s Public Reference Room in Washington, D.C. Information on the operation of the Commission’s Public Reference Room may be obtained by calling 1-800-SEC-0330.
A description of the policies and procedures that the Fund uses to determine how to vote proxies relating to portfolio securities is available without charge, upon request, by calling 1-800-443-3036, and on the Commission’s website at http://www.sec.gov.
Information regarding how the Fund voted proxies relating to portfolio securities is available without charge, upon request, by calling 1-800-443-3036, and on the Commission’s website at http://www.sec.gov.
19
The Torray Institutional Fund
ABOUT YOUR FUND’S EXPENSES (unaudited)
As of December 31, 2004
We believe it is important for you to understand the impact of costs on your investment. All mutual funds have operating expenses. As a shareholder of the Fund, you incur ongoing costs, including management fees, and other fund expenses. Operating expenses, which are deducted directly from the Fund’s gross income, directly reduce the investment return of the Fund.
A fund’s expenses are expressed as a percentage of its average net assets. This figure is known as the expense ratio. The following examples are intended to help you understand the ongoing costs (in dollars) of investing in the Fund and to compare these costs with the ongoing costs of investing in other mutual funds. The examples below are based on an investment of $1,000 made at the beginning of the period shown and held for the entire period.
The table on the next page illustrates the Fund’s cost in two ways:
Actual Fund Return This section helps you estimate the actual expenses that you paid over the period. The “Ending Account Value” shown is derived from the Fund’s actual return, and the third column shows the operating expenses that would have been paid by an investor who started with $1,000 in the Fund. You may use the information here, together with the amount invested, to estimate the expenses that you paid over the period. To do so, simply divide your account value by $1,000 (for example, an $8,600 account value divided by $1,000 = 8.6), then multiply the result by the number given for the Fund under the heading “Expenses Paid During Period” on the next page.
Hypothetical 5% Return This section is intended to help you compare your Fund’s costs with those of other mutual funds. It assumes that the Fund had an annual return of 5% before expenses, and that the expense ratio is unchanged. In this case, because the return used is not the Fund’s actual return, the results do not apply to your investment. The example is useful in making comparisons because the Securities and Exchange Commission requires all mutual funds to calculate expenses based on a 5% return. You can assess the Fund’s costs by comparing this hypothetical example with the hypothetical examples that appear in shareholder reports of other funds.
Note that expenses shown in the table are meant to highlight and help you compare ongoing costs only. The Fund does not charge transactions fees, such as purchase or redemption fees, nor does it carry a “sales load.”
The calculation assumes no shares were bought or sold during the period. Your actual costs may have been higher or lower, depending on the amount of your investment and the timing of any purchases or redemptions.
20
The Torray Institutional Fund
ABOUT YOUR FUND’S EXPENSES (unaudited)
As of December 31, 2004
More information about the Fund’s expenses, including recent annual expense ratios, can be found in this report. For additional information on operating expenses and other shareholder costs, please refer to the Fund’s prospectus.
| | | | | | | | | |
| | | Beginning
Account Value
June 30, 2004
| | Ending
Account Value December 31, 2004
| | Expenses Paid
During Period
|
Based on Actual Fund Return | | $ | 1,000.00 | | $ | 1,043.91 | | $ | 4.37 |
Based on Hypothetical 5% Return
(before expenses) | | $ | 1,000.00 | | $ | 1,020.86 | | $ | 4.32 |
21
The Torray Institutional Fund
TAX INFORMATION (unaudited)
As of December 31, 2004
We are required to advise you within 60 days of the Fund’s fiscal year-end regarding the federal tax status of certain distributions received by shareholders during such fiscal year. The information below is provided for the Fund’s fiscal year ending December 31, 2004.
During the fiscal year, the Fund paid a long-term capital gain distribution of $6,469,042.
Individual shareholders are eligible for reduced tax rates on qualified dividend income. For purposes of computing this exclusion, all of the dividends paid by the Fund from ordinary income earned during the fiscal year are considered qualified dividend income.
Corporate shareholders may exclude up to 70% of qualifying dividends. For the purposes of computing this exclusion, all of the dividends paid by the Fund from ordinary income earned during the fiscal year represent qualifying dividends.
Dividends and distributions received by retirement plans such as IRA’s, Keogh-type plans and 403(b) plans need not be reported as taxable income. However, many retirement plan trusts may need this information for their annual information reporting.
22
TRUSTEES
Douglas C. Eby
Bruce C. Ellis
Patricia Kavanagh
William M Lane
Carl C. MacCartee, Jr.
Robert P. Moltz
Charlene R. Nunley
Roy A. Schotland
Wayne H. Shaner
Robert E. Torray
INVESTMENT ADVISOR
The Torray Corporation
OFFICERS
Robert E. Torray, President
Douglas C. Eby, Vice President
William M Lane, Vice President
INDEPENDENT REGISTERED PUBLIC ACCOUNTING FIRM
Briggs, Bunting & Dougherty, LLP
Two Penn Center Plaza, Suite 820
Philadelphia, PA 19102-1732
TRANSFER AGENT
PFPC Inc.
760 Moore Road
King of Prussia, PA 19406-1212
LEGAL COUNSEL
Dechert
1775 Eye Street, N.W.
Washington, DC 20006
This report is not authorized for distribution to prospective investors unless preceded or accompanied by a current prospectus.
The
TORRAY
INSTITUTIONAL
FUND
ANNUAL REPORT
December 31, 2004
The Torray Institutional Fund
Suite 1100
7501 Wisconsin Avenue
Bethesda, Maryland 20814-6523
(301) 493-4600
(800) 443-3036
Item 2. Code of Ethics.
| | (a) | The registrant, as of the end of the period covered by this report, has adopted a code of ethics that applies to the registrant’s principal executive officer, principal financial officer, principal accounting officer or controller, or persons performing similar functions, regardless of whether these individuals are employed by the registrant or a third party. |
| | (c) | There have been no amendments, during the period covered by this report, to a provision of the code of ethics that applies to the registrant’s principal executive officer, principal financial officer, principal accounting officer or controller, or persons performing similar functions, regardless of whether these individuals are employed by the registrant or a third party, and that relates to any element of the code of ethics description. |
| | (d) | The registrant has not granted any waivers, including an implicit waiver, from a provision of the code of ethics that applies to the registrant’s principal executive officer, principal financial officer, principal accounting officer or controller, or persons performing similar functions, regardless of whether these individuals are employed by the registrant or a third party, that relates to one or more of the items set forth in paragraph (b) of this item’s instructions. |
Item 3. Audit Committee Financial Expert.
The Registrant’s Board of Directors has not designated an audit committee financial expert. The Registrant has determined that it will retain the services of an independent third party to assist it if circumstances arise that require specific investment company auditing expertise.
Item 4. Principal Accountant Fees and Services.
Audit Fees
| | (a) | The aggregate fees billed for each of the last two fiscal years for professional services rendered by the principal accountant for the audit of the registrant’s annual financial statements or services that are normally provided by the accountant in connection with statutory and regulatory filings or engagements for those fiscal years are $54,000 in 2004 and $51,000 in 2003 . |
Audit-Related Fees
| | |
(b) | | The aggregate fees billed in each of the last two fiscal years for assurance and related services by the principal accountant that are reasonably related to the performance of the audit of the registrant’s financial statements and are not reported under paragraph (a) of this Item are none. |
Tax Fees
| | |
(c) | | The aggregate fees billed in each of the last two fiscal years for professional services rendered by the principal accountant for tax compliance, tax advice, and tax planning are $3,000 in 2004 and $3,000 in 2003. |
Tax Fees represent tax compliance services provided in connection with the preparation of the Registrant’s federal income tax and excise tax returns.
All Other Fees
| | |
| (d) | | The aggregate fees billed in each of the last two fiscal years for products and services provided by the principal accountant, other than the services reported in paragraphs (a) through (c) of this Item are none. |
| |
(e)(1) | | Disclose the audit committee’s pre-approval policies and procedures described in paragraph (c)(7) of Rule 2-01 of Regulation S-X. |
Audit Committee Pre-Approval Policy. All services to be performed for the Registrant by BriggsBunting & Dougherty, LLP must be pre-approved by the audit committee. All services performed during 2004 and 2003 were pre-approved by the committee.
| | |
(e)(2) | | The percentage of services described in each of paragraphs (b) through (d) of this Item that were approved by the audit committee pursuant to paragraph (c)(7)(i)(C) of Rule 2-01 of Regulation S-X are as follows: |
(b) N/A
(c) 100%
(d) N/A
| | |
| (f) | | The percentage of hours expended on the principal accountant’s engagement to audit the registrant’s financial statements for the most recent fiscal year that were attributed to work performed by persons other than the principal accountant’s full-time, permanent employees was less than fifty percent. |
| |
| (g) | | The aggregate non-audit fees billed by the registrant’s accountant for services rendered to the registrant, and rendered to the registrant’s investment adviser (not including any sub-adviser whose role is primarily portfolio management and is subcontracted with or overseen by another investment adviser), and any entity controlling, controlled by, or under common control with the adviser that provides ongoing services to the registrant for each of the last two fiscal years of the registrant was $11,500 in 2004 and $11,000 in 2003. |
| | (h) | The registrant’s audit committee of the board of directors has considered whether the provision of non-audit services that were rendered to the registrant’s investment adviser (not including any sub-adviser whose role is primarily portfolio management and is subcontracted with or overseen by another investment adviser), and any entity controlling, controlled by, or under common control with the investment adviser that provides ongoing services to the registrant that were not pre-approved pursuant to paragraph (c)(7)(ii) of Rule 2-01 of Regulation S-X is compatible with maintaining the principal accountant’s independence. |
Item 5. Audit Committee of Listed registrants.
Not applicable.
Item 6. Schedule of Investments
Schedule of Investments in securities of unaffiliated issuers as of the close of the reporting period is included as part of the report to shareholders filed under Item 1 of this form.
Item 7. Disclosure of Proxy Voting Policies and Procedures for Closed-End Management Investment Companies.
Not applicable.
Item 8. Portfolio Managers of Closed-End Management Investment Companies.
Not applicable.
Item 9. Purchases of Equity Securities by Closed-End Management Investment Company and Affiliated Purchasers.
Not applicable.
Item 10. Submission of Matters to a Vote of Security Holders.
Not applicable.
Item 11. Controls and Procedures.
| | (a) | The registrant’s principal executive and principal financial officers, or persons performing similar functions, have concluded that the registrant’s disclosure controls and procedures (as defined in Rule 30a-3(c) under the Investment Company Act of 1940, as amended (the “1940 Act”) (17 CFR 270.30a-3(c))) are effective, as of a date within 90 days of the filing date of the report that includes the disclosure required by this paragraph, based on their evaluation of these controls and procedures required by Rule 30a-3(b) under the 1940 Act (17 CFR 270.30a-3(b)) and Rules 13a-15(b) or 15d-15(b) under the Securities Exchange Act of 1934, as amended (17 CFR 240.13a-15(b) or 240.15d-15(b)) |
| | (b) | There were no changes in the registrant’s internal control over financial reporting (as defined in Rule 30a-3(d) under the 1940 Act (17 CFR 270.30a-3(d)) that occurred during the registrant’s second fiscal quarter of the period covered by this report that has materially affected, or is reasonably likely to materially affect, the registrant’s internal control over financial reporting. |
Item 12. Exhibits.
| | |
(a)(1) | | Code of ethics, or any amendment thereto, that is the subject of disclosure required by Item 2 is attached hereto. |
| |
(a)(2) | | Certifications pursuant to Rule 30a-2(a) under the 1940 Act and Section 302 of the Sarbanes-Oxley Act of 2002 are attached hereto. |
| |
(a)(3) | | Not applicable. |
| |
(b) | | Certifications pursuant to Rule 30a-2(b) under the 1940 Act and Section 906 of the Sarbanes-Oxley Act of 2002 are attached hereto. |
SIGNATURES
Pursuant to the requirements of the Securities Exchange Act of 1934 and the Investment Company Act of 1940, the registrant has duly caused this report to be signed on its behalf by the undersigned, thereunto duly authorized.
| | |
(registrant) | | The Torray Fund |
| |
By (Signature and Title)* | | /s/ William M. Lane
|
| | | William M Lane, President & Secretary (principal executive officer) |
| |
Date | | March 1, 2005 |
|
| Pursuant to the requirements of the Securities Exchange Act of 1934 and the Investment Company Act of 1940, this report has been signed below by the following persons on behalf of the registrant and in the capacities and on the dates indicated. |
| |
By (Signature and Title)* | | /s/ William M. Lane
|
| | | William M Lane, President & Secretary (principal executive officer) |
| |
Date | | March 1, 2005 |
| |
By (Signature and Title)* | | /s/ Douglas C. Eby
|
| | | Douglas C. Eby, Vice President & Treasurer (principal financial officer) |
| |
Date | | March 1, 2005 |
| * | Print the name and title of each signing officer under his or her signature. |