UNITED STATES
SECURITIES AND EXCHANGE COMMISSION
Washington, D.C. 20549
FORM N-CSR
CERTIFIED SHAREHOLDER REPORT OF REGISTERED MANAGEMENT
INVESTMENT COMPANIES
Investment Company Act file number 811-06096
The Torray Fund
(Exact name of registrant as specified in charter)
7501 Wisconsin Avenue, Suite 1100
Bethesda, MD 20814-6523
(Address of principal executive offices) (Zip code)
William M Lane
The Torray Corporation
7501 Wisconsin Avenue, Suite 1100
Bethesda, MD 20814-6523
(Name and address of agent for service)
Registrant’s telephone number, including area code: 301-493-4600
Date of fiscal year end: December 31, 2003
Date of reporting period: December 31, 2003
Form N-CSR is to be used by management investment companies to file reports with the Commission not later than 10 days after the transmission to stockholders of any report that is required to be transmitted to stockholders under Rule 30e-1 under the Investment Company Act of 1940 (17 CFR 270.30e-1). The Commission may use the information provided on Form N-CSR in its regulatory, disclosure review, inspection, and policymaking roles.
A registrant is required to disclose the information specified by Form N-CSR, and the Commission will make this information public. A registrant is not required to respond to the collection of information contained in Form N-CSR unless the Form displays a currently valid Office of Management and Budget (“OMB”) control number. Please direct comments concerning the accuracy of the information collection burden estimate and any suggestions for reducing the burden to Secretary, Securities and Exchange Commission, 450 Fifth Street, NW, Washington, DC 20549-0609. The OMB has reviewed this collection of information under the clearance requirements of 44 U.S.C. § 3507.
Item 1. Reports to Stockholders.
The Annual Report to Shareholders is attached herewith.
The Torray Fund
Letter to Shareholders
February 10, 2004
Dear Fellow Shareholders:
We are pleased to report that The Torray Fund gained 25.2% in 2003, bringing its return since inception 13 years ago to 14.6% compounded annually. Comparable results for the S&P 500 Index were 28.7% and 12.1%, respectively. Generally speaking, the market’s biggest gainers last year were stocks that lost the most during the downturn. We don’t own any of them and therefore feel fortunate to have done so well. More importantly, over the last 10 years, The Torray Fund outperformed 96% of the 2,336 equity funds with 10-year track records by a margin of 5.1 percentage points annually (14.4% vs. 9.3%).1 A $10,000 investment in our Fund appreciated to $38,300, while in the fund group average it became $24,200. Over the last 13 years, $10,000 in the Fund grew to $59,100 compared to $44,200 in the S&P 500 Index (Morningstar does not report 13-year fund industry averages).
When we wrote to you at this time a year ago, the stock market had been sinking for 35 months, its longest running decline in six decades, and the loss was the greatest in nearly three-quarters of a century. From top to bottom, the S&P 500 surrendered half of its value, and the NASDAQ, 80%. It was the worst of times, and the average investor probably thought it would only get worse. But, as so often happens, the market fooled us all, unexpectedly reversing course only two months later. From its March 11, 2003 low, the S&P 500 rose 39% to close the year at 1112. While this was welcome news, it came too late for the millions of investors that needlessly panicked and sold as prices collapsed. We were optimistic throughout the slump, time and again encouraging you to ignore the market’s gyrations and the advice of “experts” that if you do this, that or the other thing your luck will change. Torray Fund shareholder records show that most of you heeded our advice, which gives us a deep sense of satisfaction.
As prices touched bottom during the fall of 2002, and again in early spring of 2003, there were predictions investors would desert the market for a generation. We didn’t believe it. Over the long term, stocks are by far the best investment available to the general public. When fears subside, investors always come back to them, though usually in a cautious mode. This time, however, things are different. A major speculation is underway in poor quality, low priced stocks, technology issues selling at astounding P.E. ratios, a host of companies that have no earnings and the shares of businesses emerging from bankruptcy. Put another way, the stocks of companies doing the worst are going up the most. It’s as though the market collapse never happened.
| 1 | | Morningstar data 12/31/03 |
1
The Torray Fund
Letter to Shareholders
February 10, 2004
We drew your attention to a similar pattern in our 1998 annual report. A little more than a year later, the market’s diciest sectors took a nosedive. Then, in the spring of 2001, the economy fell into recession, driving stocks down across the board. In the current instance, a repeat of the first part of this scenario seems likely, but not the second. Although we are very optimistic about our long-term prospects, the market’s 40% advance, along with its speculative overtone, gives us pause. As stocks were tumbling, we tried to reassure you by pointing out that the lower markets go, the less risky they become. Now we ask you to remember the opposite is also true. Having said this, we are

Copyright, 2004, Tribune Media Services. Reprinted with permission.
not concerned about The Torray Fund. It is always a good time to invest in reasonably priced, quality stocks like those in our portfolio. The Fund’s valuation is the most reasonable it has been in nearly four years, and promising opportunities have surfaced. All in all, our prospects look bright.
A number of you have called or written to ask about the fund scandals. We want you to know that our company has not engaged in any of the practices under investigation by the SEC and various State Attorneys General. When the story first broke, we were as surprised as anyone. Most of the earlier cases involved fund companies granting preferential treatment to large investors or fund executives trading for their own benefit in ways not open to the public. As a result, individual shareholders in these situations have experienced a slight dilution of their returns. More recently, an SEC probe found that many brokerage firms have routinely accepted cash or other forms of payment in exchange for steering investors to particular funds, some of them apparently costlier or lower performing.
2
The Torray Fund
Letter to Shareholders
February 10, 2004
In response, the Commission is taking steps to improve fund governance and close legal loopholes that some industry executives have exploited. It also intends to require a more thorough disclosure of fees and expenses, and that brokers tell clients about any payments or other incentives they receive to recommend certain funds over others. There have been calls as well for portfolio managers to reveal their holdings in the funds they oversee. We are in favor of these initiatives. However, we are against a proposal mandating that independent trustees hold 75% of board seats, including that of chairman. If adopted, one of us or our partner Bill Lane would have to resign. Our view is the board needs the advice and direction of those most knowledgeable about business, investment, finance and the fund industry. With all due respect, we believe your management team most closely fits that profile.
The notion that investors must be protected from their own fiduciaries is a sad commentary on the times. While the misdeeds so far revealed are to be harshly condemned, we feel the reaction has been disproportionate to both the number of people implicated and the amount of money involved. And, when you think about it, how could independent directors have detected the shenanigans in the first place? They meet a few times a year, and most of the representations they rely on are prepared by management. The fact is ethics cannot be imposed by government. If those at the top are bent on deception, directors and shareholders are often the last to know. Adding layers of oversight will not change that. The best approach to dealing with violations of the public trust is to substantially stiffen financial penalties and criminalize the most egregious behavior.
Having pretty well worked over the scandals, fund critics have now shifted their focus to the industry’s cost structure. The New York State Attorney General has branded fund fees “grossly out of control,” and announced his determination to bring them down. But, we ask, by how much. The rationale for management fees is that professionals can outperform the market. Historic data does not support that premise. The average return of the 2,336 funds in business for the last 10 years trailed the S&P 500 Index by 1.8 percentage points annually,2 an amount approximating their disclosed expenses plus brokerage commissions paid on portfolio transactions. Three-quarters of the funds did worse than the Index, and tinkering with their expense ratios would not have changed the outcome. Counting all types, there are now over 9,000 mutual funds holding $7 trillion in assets. Taken together, they are the market and therefore can match its performance only if they incur no expenses at all. The point is, even if costs are
| 2 | | Morningstar data 12/31/03 |
3
The Torray Fund
Letter to Shareholders
February 10, 2004
reduced, the great majority of funds will still fail to earn market returns. On the other hand, many will do better, as 25% did over the last 10 years. A lot of good funds are out there; investors just need more help finding them. If you are looking, keep in mind the mutual fund business is just that — a business. Fund companies, banks and brokers are not social service organizations. So, it pays to do your homework and think for yourself. The more you know, the better off you’ll be.
In establishing our management fee 13 years ago, we took into consideration the fact that the institutional clients of our affiliate Robert E. Torray & Co. had significantly outperformed the market for 18 years — a record that now extends to 31 years. One dollar invested with us at the end of 1972 has grown to $63, while in the S&P 500 Index it has become $26. At the Fund’s inception, we were confident we could do as well in the future as we had in the past, and, if so, felt investors would consider a 1% fee reasonable, especially if other expenses — legal, accounting and so on — were kept to a bare minimum. Our expanding shareholder base appears to support that belief.
Looking back, we are pleased to report that The Torray Fund’s expense ratio has been consistently lower than the industry average, and its returns, far higher. We also want to underscore that the Fund imposes no sales charges, redemption fees or 12b-1 fees, and it makes no payments in soft dollars or any other form to brokerage firms except for negotiated commissions on portfolio transactions. Right from the start we felt our investors should pay for results, not costly marketing campaigns that, despite claims to the contrary, have failed to benefit investors in the slightest.
Here is a breakdown of annual expenses charged to Torray Fund shareholders using a $10,000 minimum account as an example: management fee (1%), $100; combined other costs, excluding brokerage commissions, $8; commissions, not required to be disclosed under current regulations, about $12. From our perspective, $120 or 1.2% (the industry average is 50% higher) seems fair when viewed in the context of a 14.6% annual appreciation that has turned a $10,000 investment into $59,100 in 13 years. Your Fund’s Board of Trustees will consider these, as well as many other factors, when it meets in September to vote on renewing our management contract.
4
The Torray Fund
Letter to Shareholders
February 10, 2004
In closing, we thank you again for the confidence you have placed in us. Your financial success is our number one priority.
| | | | |
| Sincerely, | | | | |
| | |
 | | | |  |
| Robert E. Torray | | | | Douglas C. Eby |
5
The Torray Fund
PERFORMANCE DATA
As of December 31, 2003
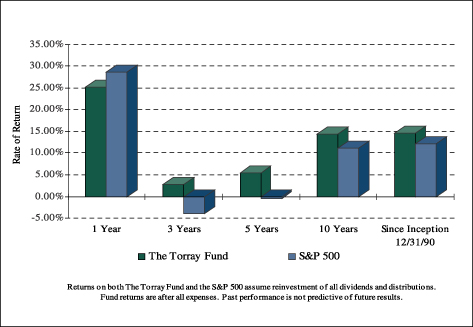
Total Rates of Return on an Investment in The Torray Fund vs. the S&P 500
For the periods ended December 31, 2003:
| | | | | | | | | | |
| | | 1 Year
| | 3 Years
| | 5 Years
| | 10 Years
| | Since
Inception
12/31/90
|
The Torray Fund | | 25.19% | | 2.69% | | 5.35% | | 14.37% | | 14.64% |
S&P 500 | | 28.67% | | -4.05% | | -0.57% | | 11.06% | | 12.09% |
Cumulative Returns for the 13 years ended December 31, 2003
| | |
The Torray Fund | | 491.50% |
S&P 500 | | 342.59% |
6
The Torray Fund
PERFORMANCE DATA
As of December 31, 2003
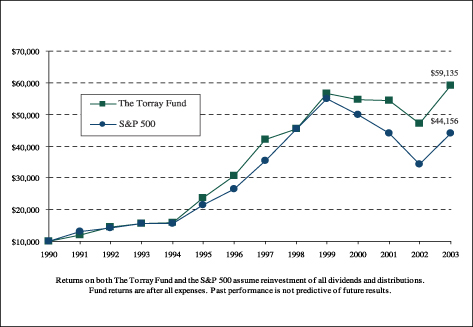
Change in Value of $10,000 Invested on December 31, 1990 (commencement of operations) to:
| | | | | | | | | | | | | | | | | | | | | |
| | | 12/31/91
| | 12/31/93
| | 12/31/95
| | 12/31/97
| | 12/31/99
| | 12/31/01
| | 12/31/03
|
The Torray Fund | | $ | 11,999 | | $ | 15,448 | | $ | 23,796 | | $ | 42,122 | | $ | 56,519 | | $ | 54,325 | | $ | 59,135 |
S&P 500 | | $ | 13,048 | | $ | 15,465 | | $ | 21,547 | | $ | 35,339 | | $ | 54,998 | | $ | 44,054 | | $ | 44,156 |
7
The Torray Fund
SCHEDULE OF INVESTMENTS
As of December 31, 2003
| | | | | | | |
| | | Shares
| | | | Market Value
|
| COMMON STOCK 99.80 % | | | |
| |
| 20.33% DIVERSIFIED FINANCIAL SERVICES | | | |
| | | 1,023,400 | | AMBAC Financial Group, Inc. | | $ | 71,013,726 |
| | | 1,169,000 | | Franklin Resources, Inc. | | | 60,858,140 |
| | | 216,905 | | Markel Corporation * | | | 54,987,587 |
| | | 1,445,550 | | J.P. Morgan Chase & Co. | | | 53,095,052 |
| | | 533,000 | | American International Group, Inc. | | | 35,327,240 |
| | | 1,234,600 | | Allied Capital Corporation | | | 34,420,648 |
| | | 372,000 | | American Express Company | | | 17,941,560 |
| | | 754,200 | | LaBranche & Co., Inc. | | | 8,801,514 |
| | | | | | |
|
|
| | | | | | | | 336,445,467 |
| |
| 10.24% MEDIA & ENTERTAINMENT | | | |
| | | 1,481,600 | | Clear Channel Communications, Inc. | | | 69,383,328 |
| | | 875,700 | | Tribune Company | | | 45,186,120 |
| | | 1,584,600 | | The Walt Disney Company | | | 36,968,718 |
| | | 201,000 | | Gannett Co., Inc. | | | 17,921,160 |
| | | | | | |
|
|
| | | | | | | | 169,459,326 |
| |
| 9.42% PHARMACEUTICALS | | | |
| | | 1,241,500 | | Amgen, Inc. * | | | 76,724,700 |
| | | 736,500 | | Merck & Co., Inc. | | | 34,026,300 |
| | | 673,000 | | Pfizer, Inc. | | | 23,777,090 |
| | | 505,300 | | Wyeth | | | 21,449,985 |
| | | | | | |
|
|
| | | | | | | | 155,978,075 |
| |
| 8.37% DATA PROCESSING & MANAGEMENT | | | |
| | | 1,762,900 | | Automatic Data Processing, Inc. | | | 69,828,469 |
| | | 1,672,200 | | First Data Corporation | | | 68,710,698 |
| | | | | | |
|
|
| | | | | | | | 138,539,167 |
8
The Torray Fund
SCHEDULE OF INVESTMENTS (continued)
As of December 31, 2003
| | | | | | | |
| | | Shares
| | | | Market Value
|
| |
| 6.82% DIVERSIFIED MEDICAL PRODUCTS | | | |
| | | 1,212,200 | | Abbott Laboratories | | $ | 56,488,520 |
| | | 868,400 | | Boston Scientific Corporation * | | | 31,922,384 |
| | | 474,400 | | Johnson & Johnson | | | 24,507,504 |
| | | | | | |
|
|
| | | | | | | | 112,918,408 |
| |
| 6.51% BANKING | | | |
| | | 1,271,600 | | Charter One Financial, Inc. | | | 43,933,780 |
| | | 726,600 | | Bank One Corporation | | | 33,125,694 |
| | | 382,000 | | Bank of America Corporation | | | 30,724,260 |
| | | | | | |
|
|
| | | | | | | | 107,783,734 |
| |
| 6.36% DIVERSIFIED MANUFACTURING | | | |
| | | 1,673,800 | | Honeywell International Inc. | | | 55,955,134 |
| | | 520,600 | | United Technologies Corporation | | | 49,337,262 |
| | | | | | |
|
|
| | | | | | | | 105,292,396 |
| |
| 5.83% INDUSTRIAL MACHINERY | | | |
| | | 1,149,100 | | Illinois Tool Works, Inc. | | | 96,420,981 |
| |
| 5.09% CONSUMER PRODUCTS | | | |
| | | 916,500 | | Kimberly-Clark Corporation | | | 54,155,985 |
| | | 300,900 | | The Procter & Gamble Company | | | 30,053,892 |
| | | | | | |
|
|
| | | | | | | | 84,209,877 |
| |
| 4.35% BEVERAGES | | | |
| | | 1,365,900 | | Anheuser-Busch Cos., Inc. | | | 71,955,612 |
| |
| 3.80% HEALTH CARE SERVICES | | | |
| | | 1,029,800 | | Cardinal Health, Inc. | | | 62,982,568 |
| |
| 3.35% COMMUNICATIONS SERVICES | | | |
| | | 1,865,161 | | Hughes Electronics Corporation * | | | 30,868,412 |
| | | 722,400 | | EchoStar Communications Corporation * | | | 24,561,600 |
| | | | | | |
|
|
| | | | | | | | 55,430,012 |
9
The Torray Fund
SCHEDULE OF INVESTMENTS (continued)
As of December 31, 2003
| | | | | | | |
| | | Shares
| | | | Market Value
|
| |
| 2.83% COMPUTER SYSTEMS & INTEGRATION | | | |
| | | 358,500 | | IBM Corporation | | $ | 33,225,780 |
| | | 596,400 | | Hewlett-Packard Company | | | 13,699,308 |
| | | | | | |
|
|
| | | | | | | | 46,925,088 |
| |
| 2.50% DIVERSIFIED TELECOMMUNICATION SERVICES | | | |
| | | 1,588,300 | | SBC Communications, Inc. | | | 41,406,981 |
| |
| 2.34% ELECTRICAL EQUIPMENT | | | |
| | | 598,100 | | Emerson Electric Company | | | 38,726,975 |
| |
| 1.66% REAL ESTATE | | | |
| | | 922,500 | | CarrAmerica Realty Corporation | | | 27,472,050 |
| | | | | | |
|
|
| TOTAL COMMON STOCK 99.80% | | $ | 1,651,946,717 |
| (cost $1,412,668,592) | | | |
| SHORT-TERM INVESTMENTS 0.12% | | | |
| (cost $2,025,218) | | PNC Bank Money Market Account, 0.53% | | | 2,025,218 |
| | | | | | |
|
|
| TOTAL PORTFOLIO SECURITIES 99.92% | | | 1,653,971,935 |
| (amortized cost $1,414,693,810) | | | |
| OTHER ASSETS LESS LIABILITIES 0.08% | | | 1,306,597 |
| | | | | | |
|
|
| NET ASSETS 100.00% | | $ | 1,655,278,532 |
| | | | | | |
|
|
| | |
| TOP 10 HOLDINGS | | |
1. Illinois Tool Works, Inc. | | 6. Clear Channel Communications, Inc. |
2. Amgen, Inc. * | | 7. First Data Corporation |
3. Anheuser-Busch Cos., Inc. | | 8. Cardinal Health, Inc. |
4. AMBAC Financial Group, Inc. | | 9. Franklin Resources, Inc. |
5. Automatic Data Processing, Inc. | | 10. Abbott Laboratories |
*non-income producing securities
See notes to the financial statements.
10
The Torray Fund
STATEMENT OF ASSETS AND LIABILITIES
As of December 31, 2003
| | | |
| |
ASSETS | | | |
| |
Investments in securities at value
(amortized cost $1,414,693,810) | | $ | 1,653,971,935 |
| |
Receivable for investments sold | | | 6,151,575 |
| |
Interest and dividends receivable | | | 2,122,770 |
| |
Receivable for fund shares sold | | | 1,834,669 |
| |
Prepaid insurance | | | 18,942 |
| | |
|
|
| |
TOTAL ASSETS | | | 1,664,099,891 |
| | |
|
|
| |
LIABILITIES | | | |
| |
Payable for investments purchased | | | 5,372,216 |
| |
Payable for fund shares redeemed | | | 1,564,768 |
| |
Payable to advisor | | | 1,369,099 |
| |
Accrued expenses | | | 515,276 |
| | |
|
|
| |
TOTAL LIABILITIES | | | 8,821,359 |
| | |
|
|
| |
NET ASSETS | | $ | 1,655,278,532 |
| | |
|
|
| |
Shares of beneficial interest ($1 stated value,
41,401,458 shares outstanding,
unlimited shares authorized) | | $ | 41,401,458 |
| |
Paid-in-capital in excess of par | | | 1,356,541,528 |
| |
Accumulated net investment income | | | 36,735 |
| |
Accumulated net realized gain | | | 18,020,686 |
| |
Net unrealized appreciation of investments | | | 239,278,125 |
| | |
|
|
| |
TOTAL NET ASSETS | | $ | 1,655,278,532 |
| | |
|
|
| |
Per Share | | $ | 39.98 |
| | |
|
|
See notes to the financial statements.
11
The Torray Fund
STATEMENT OF OPERATIONS
For the year ended December 31, 2003
| | | |
| |
INVESTMENT INCOME | | | |
| |
Dividend income | | $ | 25,346,734 |
| |
Interest income | | | 27,155 |
| | |
|
|
| |
Total income | | | 25,373,889 |
| | |
|
|
| |
EXPENSES | | | |
| |
Management fees | | | 14,702,558 |
| |
Transfer agent fees & expenses | | | 891,088 |
| |
Printing, postage & mailing | | | 267,149 |
| |
Custodian fees | | | 99,743 |
| |
Trustees’ fees | | | 82,038 |
| |
Insurance | | | 62,755 |
| |
Registration & filing fees | | | 55,216 |
| |
Legal fees | | | 53,138 |
| |
Audit fees | | | 43,376 |
| | |
|
|
| |
Total expenses | | | 16,257,061 |
| | |
|
|
| |
NET INVESTMENT INCOME | | | 9,116,828 |
| | |
|
|
| |
REALIZED AND UNREALIZED GAIN
ON INVESTMENTS | | | |
| |
Net realized gain on investments | | | 18,020,686 |
| |
Net change in unrealized appreciation on investments | | | 306,757,734 |
| | |
|
|
| |
Net realized and unrealized gain on investments | | | 324,778,420 |
| | |
|
|
| |
NET INCREASE IN NET ASSETS FROM OPERATIONS | | $ | 333,895,248 |
| | |
|
|
See notes to the financial statements.
12
The Torray Fund
STATEMENT OF CHANGES IN NET ASSETS
For the periods indicated:
| | | | | | | | |
| | | Year ended
12/31/03
| | | Year ended
12/31/02
| |
| | |
Increase (Decrease) in Net Assets from Operations: | | | | | | | | |
| | |
Net investment income | | $ | 9,116,828 | | | $ | 8,817,821 | |
| | |
Net realized gain on investments | | | 18,020,686 | | | | 5,103,863 | |
| | |
Net change in unrealized appreciation
(depreciation) on investments | | | 306,757,734 | | | | (228,677,856 | ) |
| | |
|
|
| |
|
|
|
| | |
Net increase (decrease) in net assets from operations | | | 333,895,248 | | | | (214,756,172 | ) |
| | |
|
|
| |
|
|
|
| | |
Distributions to Shareholders from: | | | | | | | | |
| | |
Net investment income ($0.220 and
$0.205 per share, respectively) | | | (9,080,093 | ) | | | (8,817,821 | ) |
| | |
Net realized gains ($0.124 and $0.207 per
share, respectively) | | | (5,103,734 | ) | | | (8,974,996 | ) |
| | |
|
|
| |
|
|
|
| | |
Total distributions | | | (14,183,827 | ) | | | (17,792,817 | ) |
| | |
|
|
| |
|
|
|
| | |
Shares of Beneficial Interest | | | | | | | | |
| | |
Decrease from share transactions | | | (31,968,568 | ) | | | (38,729,489 | ) |
| | |
|
|
| |
|
|
|
| | |
Total increase (decrease) | | | 287,742,853 | | | | (271,278,478 | ) |
| | |
Net Assets — Beginning of period | | | 1,367,535,679 | | | | 1,638,814,157 | |
| | |
|
|
| |
|
|
|
| | |
Net Assets — End of period | | $ | 1,655,278,532 | | | $ | 1,367,535,679 | |
| | |
|
|
| |
|
|
|
| | |
Accumulated net investment income | | $ | 36,735 | | | $ | — | |
| | |
|
|
| |
|
|
|
See notes to the financial statements.
13
The Torray Fund
FINANCIAL HIGHLIGHTS
For a share outstanding:
PER SHARE DATA
| | | | | | | | | | | | | | | | | | | | |
| | | Years ended December 31:
| |
| | | 2003
| | | 2002
| | | 2001
| | | 2000
| | | 1999
| |
| | | | | |
Net Asset Value,
Beginning of Period | | $ | 32.240 | | | $ | 37.530 | | | $ | 39.790 | | | $ | 44.310 | | | $ | 36.480 | |
| | |
|
|
| |
|
|
| |
|
|
| |
|
|
| |
|
|
|
| | | | | |
Income from investment operations | | | | | | | | | | | | | | | | | | | | |
| | | | | |
Net investment income | | | 0.220 | | | | 0.205 | | | | 0.172 | | | | 0.265 | | | | 0.073 | |
| | | | | |
Net gains (losses) on securities (both
realized and unrealized) | | | 7.864 | | | | (5.083 | ) | | | (0.489 | ) | | | (1.730 | ) | | | 8.616 | |
| | |
|
|
| |
|
|
| |
|
|
| |
|
|
| |
|
|
|
| | | | | |
Total from investment operations | | | 8.084 | | | | (4.878 | ) | | | (0.317 | ) | | | (1.465 | ) | | | 8.689 | |
| | |
|
|
| |
|
|
| |
|
|
| |
|
|
| |
|
|
|
| | | | | |
Less: distributions | | | | | | | | | | | | | | | | | | | | |
| | | | | |
Dividends (from net investment income) | | | (0.220 | ) | | | (0.205 | ) | | | (0.184 | ) | | | (0.253 | ) | | | (0.073 | ) |
| | | | | |
Distributions (from capital gains) | | | (0.124 | ) | | | (0.207 | ) | | | (1.759 | ) | | | (2.802 | ) | | | (0.786 | ) |
| | |
|
|
| |
|
|
| |
|
|
| |
|
|
| |
|
|
|
| | | | | |
Total distributions | | | (0.344 | ) | | | (0.412 | ) | | | (1.943 | ) | | | (3.055 | ) | | | (0.859 | ) |
| | |
|
|
| |
|
|
| |
|
|
| |
|
|
| |
|
|
|
| | | | | |
Net Asset Value,
End of Period | | $ | 39.980 | | | $ | 32.240 | | | $ | 37.530 | | | $ | 39.790 | | | $ | 44.310 | |
| | |
|
|
| |
|
|
| |
|
|
| |
|
|
| |
|
|
|
| | | | | |
TOTAL RETURN(1) | | | 25.19 | % | | | (13.05 | %) | | | (0.52 | %) | | | (3.38 | %) | | | 24.01 | % |
| | | | | |
RATIOS/SUPPLEMENTAL DATA | | | | | | | | | | | | | | | | | | | | |
| | | | | |
Net assets, end of period
(000’s omitted) | | $ | 1,655,279 | | | $ | 1,367,536 | | | $ | 1,638,814 | | | $ | 1,820,972 | | | $ | 1,895,538 | |
| | | | | |
Ratios of expenses to average net assets | | | 1.11 | % | | | 1.07 | % | | | 1.07 | % | | | 1.06 | % | | | 1.07 | % |
| | | | | |
Ratios of net income to average net assets | | | 0.62 | % | | | 0.58 | % | | | 0.45 | % | | | 0.64 | % | | | 0.18 | % |
| | | | | |
Portfolio turnover rate | | | 37.11 | % | | | 22.52 | % | | | 37.56 | % | | | 45.44 | % | | | 32.55 | % |
| (1) | | Past performance is not predictive of future performance. |
See notes to the financial statements.
14
The Torray Fund
NOTES TO FINANCIAL STATEMENTS
As of December 31, 2003
NOTE 1 — SUMMARY OF SIGNIFICANT ACCOUNTING POLICIES
The Torray Fund (“Fund”) is registered under the Investment Company Act of 1940 as a no-load, diversified, open-end management investment company. The Fund was organized as a business trust under Massachusetts law. The Fund’s primary investment objective is to provide long-term total return. The Fund seeks to meet its objective by investing its assets in a diversified portfolio of common stocks. In order to accomplish these goals, the Fund intends to hold stocks for the long term, as opposed to actively buying and selling. There can be no assurances that the Fund’s investment objectives will be achieved.
The following is a summary of accounting policies followed by the Fund in the preparation of its financial statements. These policies are in conformity with accounting principles generally accepted in the United States of America.
Securities Valuation Portfolio securities for which market quotations are readily available are valued at market value, which is determined by using the last reported sale price, or, if no sales are reported, the last reported bid price. For NASDAQ traded securities, market value may also be determined on the basis of the NASDAQ official closing price (the “NOCP”) instead of the last reported sales price. Short-term obligations having remaining maturities of 60 days or less are valued at amortized cost, which approximates market value.
Securities Transactions and Investment Income Securities transactions are recorded on a trade date basis. Realized gains and losses from securities transactions are recorded on the specific identification basis. Dividend income and distributions to shareholders are recorded on the ex-dividend date. Interest income, including amortization of discount on short-term investments, is recorded on the accrual basis.
Federal Income Taxes The Fund intends to continue to comply with the requirements of the Internal Revenue Code applicable to regulated investment companies and to distribute all of its taxable income, including any net realized gain on investments to its shareholders. Therefore, no Federal income tax provision is required. Cost of securities for tax purposes is substantially the same as for financial reporting purposes.
Net Asset Value Net asset value per share is determined daily as of the close of trading on the New York Stock Exchange by dividing the value of the Fund’s net assets by the number of shares outstanding.
Use of Estimates In preparing financial statements in accordance with accounting principles generally accepted in the United States of America, management is required to make estimates and assumptions that affect the reported amounts of assets and liabilities and the disclosure of contingent assets and liabilities at the date of the financial statements, and the reported amounts of increases and decreases in net assets from operations during the reporting period. Actual results could differ from those estimates.
15
The Torray Fund
NOTES TO FINANCIAL STATEMENTS (continued)
As of December 31, 2003
NOTE 2 — SHARES OF BENEFICIAL INTEREST TRANSACTIONS
Transactions in shares of beneficial interest were as follows:
| | | | | | | | | | | | | | |
| | | Year ended
12/31/03
| | | Year ended
12/31/02
| |
| | | Shares
| | | Amount
| | | Shares
| | | Amount
| |
Shares issued | | 6,185,253 | | | $ | 219,046,893 | | | 7,976,490 | | | $ | 284,739,641 | |
Reinvestments of dividends and distributions | | 367,157 | | | | 13,313,016 | | | 501,011 | | | | 16,935,699 | |
Shares redeemed | | (7,567,966 | ) | | | (264,328,477 | ) | | (9,726,760 | ) | | | (340,404,829 | ) |
| | |
|
| |
|
|
| |
|
| |
|
|
|
| | | (1,015,556 | ) | | $ | (31,968,568 | ) | | (1,249,259 | ) | | $ | (38,729,489 | ) |
| | |
|
| |
|
|
| |
|
| |
|
|
|
Officers, Trustees and affiliated persons of The Torray Fund and their families directly or indirectly control 1,717,411 shares or 4.15% of the Fund.
NOTE 3 — INVESTMENT TRANSACTIONS
Purchases and sales of investment securities, other than short-term investments, for the year ended December 31, 2003, aggregated $541,090,966 and $574,701,625, respectively.
NOTE 4 — MANAGEMENT FEES
Pursuant to the Management Contract, The Torray Corporation provides investment advisory and administrative services to the Fund. The Fund pays The Torray Corporation a management fee, computed daily and payable monthly at the annual rate of one percent of the Fund's average daily net assets. For the year ended December 31, 2003, The Torray Fund paid management fees of $14,702,558.
Excluding the management fee, other expenses incurred by the Fund during the year ended December 31, 2003, totaled $1,554,503. These expenses include all costs associated with the Fund’s operations including transfer agent fees, Independent Trustees’ fees ($10,000 per annum and $1,000 for each Board meeting attended), taxes, dues, fees and expenses of registering and qualifying the Fund and its shares for distribution, charges of custodian, auditing and legal expenses, insurance premiums, supplies, postage, expenses of issue or redemption of shares, reports to shareholders and Trustees, expenses of printing and mailing prospectuses, proxy statements and proxies to existing shareholders, and other miscellaneous expenses.
Certain officers and Trustees of the Fund are also officers and/or shareholders of The Torray Corporation.
16
The Torray Fund
NOTES TO FINANCIAL STATEMENTS (continued)
As of December 31, 2003
NOTE 5 — TAX MATTERS
Distributions to shareholders are determined in accordance with federal income tax regulations which may differ from accounting principles generally accepted in the United States of America.
The tax character of distributions paid during 2003 and 2002 were as follows:
| | | | | | |
| | | 2003
| | 2002
|
Distributions paid from: | | | | | | |
Ordinary income | | $ | 14,183,827 | | $ | 8,817,821 |
Long-term capital gain | | | — | | | 8,974,996 |
| | |
|
| |
|
|
| | | $ | 14,183,827 | | $ | 17,792,817 |
| | |
|
| |
|
|
As of December 31, 2003, the components of distributable earnings on a tax basis were as follows:
| | | | | |
Undistributed ordinary income | | $ | 2,092,171 | | |
Undistributed long-term gain | | | 16,910,022 | | |
Unrealized appreciation | | | 238,333,353 | | |
| | |
|
| | |
| | | $ | 257,335,546 | | |
| | |
|
| | |
The difference between book basis and tax basis distributable earnings is due primarily to different book and tax treatment of short-term capital gains.
The following information is based upon the federal income tax basis of investment securities as of December 31, 2003:
| | | | | | |
Gross unrealized appreciation | | $ | 260,052,676 | | | |
Gross unrealized depreciation | | | (21,719,323 | ) | | |
| | |
|
|
| | |
Net unrealized appreciation | | $ | 238,333,353 | | | |
| | |
|
|
| | |
Federal income tax basis | | $ | 1,415,638,582 | | | |
| | |
|
|
| | |
17
The Torray Fund
INDEPENDENT AUDITORS’ REPORT
As of December 31, 2003
To the Shareholders and Board of Trustees of
The Torray Fund
Bethesda, Maryland
We have audited the accompanying statement of assets and liabilities of The Torray Fund, including the schedule of investments, as of December 31, 2003, and the related statement of operations for the year then ended, the statement of changes in net assets for each of the two years in the period then ended, and the financial highlights for each of the five years in the period then ended. These financial statements and financial highlights are the responsibility of the Fund’s management. Our responsibility is to express an opinion on these financial statements and financial highlights based on our audits.
We conducted our audit in accordance with auditing standards generally accepted in the United States of America. Those standards require that we plan and perform the audit to obtain reasonable assurance about whether the financial statements and financial highlights are free of material misstatement. An audit includes examining, on a test basis, evidence supporting the amounts and disclosures in the financial statements. Our procedures included confirmation of securities owned as of December 31, 2003, by correspondence with the custodian and brokers. An audit also includes assessing the accounting principles used and significant estimates made by management, as well as evaluating the overall financial statement presentation. We believe our audit provides a reasonable basis for our opinion.
In our opinion, the financial statements and financial highlights referred to above present fairly, in all material respects, the financial position of The Torray Fund, as of December 31, 2003, the results of its operations for the year then ended, the changes in its net assets for each of the two years in the period then ended, and its financial highlights for the each of the five years in the period then ended, in conformity with accounting principles generally accepted in the United States of America.

BRIGGS, BUNTING & DOUGHERTY, LLP
Philadelphia, Pennsylvania
January 26, 2004
18
The Torray Fund
FUND MANAGEMENT (unaudited)
As of December 31, 2003
Information pertaining to the Trustees and Officers of The Trust is set forth below. The Statement of Additional Information (SAI) includes additional information about the Trustees and is available without charge, upon request, by calling (800) 443-3036.
| | | | | | | | |
Name, Birth Date,
Address* and
Positions
with the Trust | | Term of Office
and Length of
Time Served | | Principal Occupation(s) During Past 5 Years | | Portfolios
Overseen
by Trustee | | Other Trusteeships/
Directorships Held
by Trustee |
|
DISINTERESTED TRUSTEES |
| | | | |
Bruce C. Ellis 07/20/1944 Trustee | | Indefinite Term Since Jun 1993 | | Private Investor Bethesda, Maryland | | 2 | | |
| | | | |
Robert P. Moltz 10/03/1947 Trustee | | Indefinite Term Since Nov 1990 | | President, CEO
Weaver Bros. Insurance Assoc. Bethesda, Maryland | | 2 | | |
| | | | |
Roy A. Schotland 03/18/1933 Trustee | | Indefinite Term Since Nov 1990 | | Professor of Law
Georgetown University Law Center Washington, D.C. | | 2 | | Director,
Custodial Trust Co.,
a Bear Stearns subsidiary |
| | | | |
Wayne H. Shaner 08/23/1947 Trustee | | Indefinite Term Since Jun 1993 | | Managing Director
Lockheed Martin Investment Management Co. Managing Partner, Rockledge Partners, L.L.C. Bethesda, Maryland | | 2 | | |
| | | | |
Dr. Charlene Nunley 09/26/1950 Trustee | | Indefinite Term Since May 2002 | | President
Montgomery College Rockville, Maryland | | 2 | | |
| | | | |
Dr. Carl MacCartee 01/09/1941 Trustee | | Indefinite Term Since May 2002 | | Medical Doctor
MacCartee, Haas, Grossman, Connell & Shaffer P.A. Chevy Chase, Maryland | | 2 | | |
| | | | |
Dr. Patricia Kavanagh 11/01/1949 Trustee | | Indefinite Term Since May 2002 | | Medical Doctor, Resident
Neurological Institute at Columbia Presbyterian New York, New York | | 2 | | |
|
INTERESTED TRUSTEES |
| | | | |
William M Lane 05/21/1950 President, Secretary, Trustee | | Indefinite Term Since Nov 1990 | | President, The Torray Fund Vice President, Robert E. Torray & Co. Inc. Vice President, The Torray Corporation Bethesda, Maryland | | 2 | | |
| | | | |
Douglas C. Eby 07/28/1959 Vice President, Treasurer Trustee | | Indefinite Term Since May 2002 | | President, Robert E. Torray & Co. Inc. Vice President and Treasurer The Torray Corporation Bethesda, Maryland | | 2 | | Director,
Markel Corporation
Richmond, Virginia |
| | | | |
Robert E. Torray 04/10/1937 Trustee | | Indefinite Term Since May 2002 | | Chairman, Robert E. Torray & Co. Inc.
President, The Torray Corporation
Bethesda, Maryland | | 2 | | Director,
CarrAmerica Realty
Washington, D.C. |
| * | | All addresses are c/o The Torray Fund, 7501 Wisconsin Avenue, Suite 1100, Bethesda, MD 20814-6523 |
19
TRUSTEES
Douglas C. Eby
Bruce C. Ellis
Patricia Kavanagh
William M Lane
Carl C. MacCartee, Jr.
Robert P. Moltz
Charlene R. Nunley
Roy A. Schotland
Wayne H. Shaner
Robert E. Torray
INVESTMENT ADVISOR
The Torray Corporation
OFFICERS
Robert E. Torray, President
Douglas C. Eby, Vice President
William M Lane, Vice President
AUDITORS
Briggs, Bunting & Dougherty, LLP
Two Penn Center Plaza, Suite 820
Philadelphia, PA 19102-1732
TRANSFER AGENT
PFPC Inc.
760 Moore Road
King of Prussia, PA 19406-1212
LEGAL COUNSEL
Dechert
1775 Eye Street, N.W.
Washington, D.C. 20006
This report is not authorized for distribution to
prospective investors unless preceded or accompanied by a current prospectus.
The
TORRAY
FUND
ANNUAL REPORT
December 31, 2003
The Torray Fund
Suite 1100
7501 Wisconsin Avenue
Bethesda, Maryland 20814-6523
(301) 493-4600
(800) 443-3036
The Torray Institutional Fund
Letter to Shareholders
February 10, 2004
Dear Fellow Shareholders:
We are pleased to report that The Torray Institutional Fund gained 26.2% in 2003, bringing its return since inception 2½ years ago to 5.6% compounded annually. Comparable results for the S&P 500 Index were 28.7% and -2.2%, respectively. Generally speaking, the market’s biggest gainers last year were stocks that lost the most during the downturn. We don’t own any of them and therefore feel fortunate to have done so well. Because your Fund has been open for only a relatively short time, we will reference the much longer record of The Torray Fund, which is managed on an identical basis. According to Morningstar, over the last decade it outperformed 96% of the 2,336 equity funds with 10-year track records by a margin of 5.1 percentage points annually (14.4% vs. 9.3%).
When we wrote to you at this time a year ago, the stock market had been sinking for 35 months, its longest running decline in six decades, and the loss was the greatest in nearly three-quarters of a century. From top to bottom, the S&P 500 surrendered half of its value, and the NASDAQ, 80%. It was the worst of times, and the average investor probably thought it would only get worse. But, as so often happens, the market fooled us all, unexpectedly reversing course only two months later. From its March 11, 2003 low, the S&P 500 rose 39% to close the year at 1112. While this was welcome news, it came too late for the millions of investors that needlessly panicked and sold as prices collapsed. We were optimistic throughout the slump, time and again encouraging you to ignore the market’s gyrations and the advice of “experts” that if you do this, that or the other thing your luck will change. Shareholder records show that most of you heeded our advice, which gives us a deep sense of satisfaction.
As prices touched bottom during the fall of 2002, and again in early spring of 2003, there were predictions investors would desert the market for a generation. We didn’t believe it. Over the long term, stocks are by far the best investment available to the general public. When fears subside, investors always come back to them, though usually in a cautious mode. This time, however, things are different. A major speculation is underway in poor quality, low priced stocks, technology issues selling at astounding P.E. ratios, a host of companies that have no earnings and the shares of businesses emerging from bankruptcy. Put another way, the stocks of companies doing the worst are going up the most. It’s as though the market collapse never happened.
We drew attention to a similar pattern in our 1998 Torray Fund annual report. A little more than a year later, the market’s diciest sectors took a nosedive. Then, in the spring of 2001, the
1
The Torray Institutional Fund
Letter to Shareholders
February 10, 2004
economy fell into recession, driving stocks down across the board. In the current instance, a repeat of the first part of this scenario seems likely, but not the second. Although we are very optimistic about our long-term prospects, the market’s 40% advance, along with its speculative overtone, gives us pause. As stocks were tumbling, we tried to reassure you by pointing out that the lower markets go, the less risky they become. Now we ask you to remember the opposite is also true. Having said this, we are not concerned about The Torray Institutional Fund. It is always a good time to invest in reasonably priced, quality stocks like those in our portfolio. The Fund’s valuation is reasonable, and promising opportunities have surfaced. All in all, our prospects look bright.
A number of you have called or written to ask about the fund scandals. We want you

Copyright, 2004, Tribune Media Services. Reprinted with permission.
to know that our company has not engaged in any of the practices under investigation by the SEC and various State Attorneys General. When the story first broke, we were as surprised as anyone. Most of the earlier cases involved fund companies granting preferential treatment to large investors or fund executives trading for their own benefit in ways not open to the public. As a result, individual shareholders in these situations have experienced a slight dilution of their returns. More recently, an SEC probe found that many brokerage firms have routinely accepted cash or other forms of payment in exchange for steering investors to particular funds, some of them apparently costlier or lower performing.
In response, the Commission is taking steps to improve fund governance and close legal loopholes that some industry executives have exploited. It also intends to require a more thorough disclosure of fees and expenses, and that brokers tell clients about any payments or other incentives they receive to recommend certain funds over others. There have been calls as well for portfolio managers to reveal their holdings in the funds they oversee. We favor these initiatives.
2
The Torray Institutional Fund
Letter to Shareholders
February 10, 2004
However, we are against a proposal mandating that independent trustees hold 75% of board seats, including that of chairman. If adopted, one of us or our partner Bill Lane would have to resign. Our view is the board needs the advice and direction of those most knowledgeable about business, investment, finance and the fund industry. With all due respect, we believe your management team most closely fits that profile.
The notion that investors must be protected from their own fiduciaries is a sad commentary on the times. While the misdeeds so far revealed are to be harshly condemned, we feel the reaction has been disproportionate to both the number of people caught and the amount of money involved. And, when you think about it, how could independent directors have detected the shenanigans in the first place? They meet a few times a year, and most of the representations they rely on are prepared by management. The fact is ethics cannot be imposed by government. If those at the top are bent on deception, directors and shareholders are often the last to know. Adding layers of oversight will not change that. The best approach to dealing with violations of the public trust is to substantially stiffen financial penalties and criminalize the most egregious behavior.
Having pretty well worked over the scandals, fund critics have now shifted their focus to the industry’s cost structure. The New York State Attorney General has branded fund fees “grossly out of control,” and announced his determination to bring them down. But, we ask, by how much. The rationale for management fees is that professionals can outperform the market. Historic data does not support that premise. The average return of the 2,336 funds in business for the last 10 years trailed the S&P 500 Index by 1.8 percentage points annually,1 an amount approximating their disclosed expenses plus brokerage commissions paid on portfolio transactions. Three-quarters of the funds did worse than the Index, and tinkering with their expense ratios would not have changed the outcome. Counting all types, there are now over 9,000 mutual funds holding $7 trillion in assets. Taken together, they are the market and thus can match its performance only if they incur no expenses at all. The point is, even if costs are reduced, the great majority of funds will still fail to earn market returns. On the other hand, many will do better, as 25% did over the last 10 years. A lot of good funds are out there; investors just need more help finding them. If you are looking, keep in mind the mutual fund business is just that — a business. Fund companies, banks and brokers are not social service organizations. So, it pays to do your homework and think for yourself. The more you know, the better off you’ll be.
| 1 | | Morningstar data 12/31/03 |
3
The Torray Institutional Fund
Letter to Shareholders
February 10, 2004
In establishing our management fee 2½ years ago, we took into account the performance of The Torray Fund, noted earlier, as well as the fact that the institutional clients of our affiliate Robert E. Torray & Co. had significantly outperformed the market for 28½ years. One dollar invested with us at the end of 1972 has grown to $63, while in the S&P 500 Index it has become $26. At the time, we were confident we could to do as well in the future as we had in the past, and, if so, an all-inclusive fee of .85% was fair and reasonable. Brokerage commissions, which under current regulations are not disclosed, have been adding about 0.12% to expenses annually, bringing total costs to just under 1% of assets. While this is substantially lower than expense ratios in the retail fund market, it is probably typical for institutional funds, where rates are held down by the competition to gain assets from corporate 401(k) plans, endowments, foundations, and so on. Your Fund’s Board of Trustees will consider these as well as many other factors when it meets in September to vote on renewing our management contract.
In closing, we thank you again for the confidence you have placed in us. Your financial success is our number one priority.
| | | | |
| Sincerely, | | | | |
| | |
 | | | |  |
| Robert E. Torray | | | | Douglas C. Eby |
4
The Torray Institutional Fund
SCHEDULE OF INVESTMENTS
As of December 31, 2003
| | | | | | | |
| | | Shares
| | | | Market Value
|
| COMMON STOCK 99.51% | | | |
| |
| 19.55% DIVERSIFIED FINANCIAL SERVICES | | | |
| | | 396,000 | | AMBAC Financial Group, Inc. | | $ | 27,478,440 |
| | | 399,500 | | Franklin Resources, Inc. | | | 20,797,970 |
| | | 471,900 | | J.P. Morgan Chase & Co. | | | 17,332,887 |
| | | 64,300 | | Markel Corporation * | | | 16,300,693 |
| | | 502,000 | | Allied Capital Corporation | | | 13,995,760 |
| | | 197,900 | | American International Group, Inc. | | | 13,116,812 |
| | | 104,500 | | American Express Company | | | 5,040,035 |
| | | 245,800 | | LaBranche & Co., Inc. | | | 2,868,486 |
| | | | | | |
|
|
| | | | | | | | 116,931,083 |
| |
| 10.61% MEDIA & ENTERTAINMENT | | | |
| | | 545,300 | | Clear Channel Communications, Inc. | | | 25,536,399 |
| | | 303,800 | | Tribune Company | | | 15,676,080 |
| | | 534,300 | | The Walt Disney Company | | | 12,465,219 |
| | | 110,000 | | Gannett Co., Inc. | | | 9,807,600 |
| | | | | | |
|
|
| | | | | | | | 63,485,298 |
| |
| 10.26% PHARMACEUTICALS | | | |
| | | 518,300 | | Amgen, Inc. * | | | 32,030,940 |
| | | 237,700 | | Merck & Co., Inc. | | | 10,981,740 |
| | | 284,300 | | Pfizer, Inc. | | | 10,044,319 |
| | | 195,600 | | Wyeth | | | 8,303,220 |
| | | | | | |
|
|
| | | | | | | | 61,360,219 |
| |
| 9.09% DATA PROCESSING & MANAGEMENT | | | |
| | | 749,300 | | Automatic Data Processing, Inc. | | | 29,679,773 |
| | | 601,000 | | First Data Corporation | | | 24,695,090 |
| | | | | | |
|
|
| | | | | | | | 54,374,863 |
| |
| 6.94% DIVERSIFIED MEDICAL PRODUCTS | | | |
| | | 420,400 | | Abbott Laboratories | | | 19,590,640 |
| | | 338,700 | | Boston Scientific Corporation * | | | 12,450,612 |
| | | 183,200 | | Johnson & Johnson | | | 9,464,112 |
| | | | | | |
|
|
| | | | | | | | 41,505,364 |
5
The Torray Institutional Fund
SCHEDULE OF INVESTMENTS (continued)
As of December 31, 2003
| | | | | | | |
| | | Shares
| | | | Market Value
|
| |
| 6.24% BANKING | | | |
| | | 441,200 | | Charter One Financial, Inc. | | $ | 15,243,460 |
| | | 254,100 | | Bank One Corporation | | | 11,584,419 |
| | | 130,600 | | Bank of America Corporation | | | 10,504,158 |
| | | | | | |
|
|
| | | | | | | | 37,332,037 |
| |
| 6.11% DIVERSIFIED MANUFACTURING | | | |
| | | 580,700 | | Honeywell International Inc. | | | 19,412,801 |
| | | 180,700 | | United Technologies Corporation | | | 17,124,939 |
| | | | | | |
|
|
| | | | | | | | 36,537,740 |
| |
| 5.18% INDUSTRIAL MACHINERY | | | |
| | | 369,400 | | Illinois Tool Works, Inc. | | | 30,996,354 |
| |
| 5.07% CONSUMER PRODUCTS | | | |
| | | 324,500 | | Kimberly-Clark Corporation | | | 19,174,705 |
| | | 111,700 | | The Procter & Gamble Company | | | 11,156,596 |
| | | | | | |
|
|
| | | | | | | | 30,331,301 |
| |
| 4.55% BEVERAGES | | | |
| | | 517,100 | | Anheuser-Busch Cos., Inc. | | | 27,240,828 |
| |
| 3.82% COMMUNICATIONS SERVICES | | | |
| | | 763,945 | | Hughes Electronics Corporation * | | | 12,643,283 |
| | | 300,700 | | EchoStar Communications Corporation * | | | 10,223,800 |
| | | | | | |
|
|
| | | | | | | | 22,867,083 |
| |
| 3.76% HEALTH CARE SERVICES | | | |
| | | 367,500 | | Cardinal Health, Inc. | | | 22,476,300 |
| |
| 2.72% COMPUTER SYSTEMS & INTEGRATION | | | |
| | | 124,600 | | IBM Corporation | | | 11,547,928 |
| | | 203,800 | | Hewlett-Packard Company | | | 4,681,286 |
| | | | | | |
|
|
| | | | | | | | 16,229,214 |
| |
| 2.49% DIVERSIFIED TELECOMMUNICATION SERVICES | | | |
| | | 581,400 | | SBC Communications, Inc. | | | 14,896,398 |
6
The Torray Institutional Fund
SCHEDULE OF INVESTMENTS (continued)
As of December 31, 2003
| | | | | | | | |
| | | Shares
| | | | Market Value
| |
| |
| 2.21% ELECTRICAL EQUIPMENT | | | | |
| | | 204,400 | | Emerson Electric Company | | $ | 13,234,900 | |
| |
| 0.92% REAL ESTATE | | | | |
| | | 184,000 | | CarrAmerica Realty Corporation | | | 5,479,520 | |
| | | | | | |
|
|
|
| TOTAL COMMON STOCK 99.52% | | | 595,278,502 | |
| (cost $529,083,040) | | | | | | |
| SHORT-TERM INVESTMENTS 0.49% | | | | |
| (cost $2,944,810) | | PNC Bank Money Market Account, 0.53% | | | 2,944,810 | |
| | | | | | |
|
|
|
| TOTAL PORTFOLIO SECURITIES 100.01% | | | 598,223,312 | |
| (amortized cost $532,027,850) | | | | |
| OTHER ASSETS LESS LIABILITIES (0.01)% | | | (40,705 | ) |
| | | | | | |
|
|
|
| NET ASSETS 100.00% | | $ | 598,182,607 | |
| | | | | | |
|
|
|
TOP 10 HOLDINGS
| | |
1. Amgen, Inc. * | | 6. Clear Channel Communications, Inc. |
2. Illinois Tool Works, Inc. | | 7. First Data Corporation |
3. Automatic Data Processing, Inc. | | 8. Cardinal Health, Inc. |
4. AMBAC Financial Group, Inc. | | 9. Franklin Resources, Inc. |
5. Anheuser-Busch Cos., Inc. | | 10. Abbott Laboratories |
*non-income producing securities
See notes to the financial statements.
7
The Torray Institutional Fund
STATEMENT OF ASSETS AND LIABILITIES
As of December 31, 2003
| | | |
| |
ASSETS | | | |
| |
Investments in securities at value
(cost $532,027,850) | | $ | 598,223,312 |
| |
Receivable for investments sold | | | 2,519,583 |
| |
Receivable for fund shares sold | | | 2,081,383 |
| |
Interest and dividends receivable | | | 711,282 |
| | |
|
|
| |
TOTAL ASSETS | | | 603,535,560 |
| | |
|
|
| |
LIABILITIES | | | |
| |
Payable for investments purchased | | | 4,587,891 |
| |
Payable to Advisor | | | 412,175 |
| |
Payable for fund shares redeemed | | | 352,887 |
| | |
|
|
| |
TOTAL LIABILITIES | | | 5,352,953 |
| | |
|
|
| |
NET ASSETS | | $ | 598,182,607 |
| | |
|
|
| |
Shares of beneficial interest ($1 stated value,
5,412,370 shares outstanding, unlimited
shares authorized) | | $ | 5,412,370 |
| |
Paid-in-capital in excess of par | | | 524,312,011 |
| |
Accumulated net investment income | | | 9,652 |
| |
Accumulated net realized gain | | | 2,253,112 |
| |
Net unrealized appreciation of investments | | | 66,195,462 |
| | |
|
|
| |
NET ASSETS | | $ | 598,182,607 |
| | |
|
|
| |
Per Share | | $ | 110.52 |
| | |
|
|
See notes to the financial statements.
8
The Torray Institutional Fund
STATEMENT OF OPERATIONS
For the year ended December 31, 2003
| | | |
| |
INVESTMENT INCOME | | | |
| |
Dividend income | | $ | 5,754,929 |
| |
Interest income | | | 35,669 |
| | |
|
|
| |
Total income | | | 5,790,598 |
| | |
|
|
| |
EXPENSES | | | |
| |
Management fees | | | 2,979,689 |
| | |
|
|
| |
Total expenses | | | 2,979,689 |
| | |
|
|
| |
NET INVESTMENT INCOME | | | 2,810,909 |
| | |
|
|
| |
REALIZED AND UNREALIZED GAIN
ON INVESTMENTS | | | |
| |
Net realized gain on investments | | | 10,210,025 |
| |
Net change in unrealized appreciation on investments | | | 73,157,304 |
| | |
|
|
| |
Net realized and unrealized gain on investments | | | 83,367,329 |
| | |
|
|
| |
NET INCREASE IN NET ASSETS FROM OPERATIONS | | $ | 86,178,238 |
| | |
|
|
See notes to the financial statements.
9
The Torray Institutional Fund
STATEMENT OF CHANGES IN NET ASSETS
For the periods indicated:
| | | | | | | | |
| | | Year ended
12/31/03
| | | Year ended
12/31/02
| |
| | |
Increase (Decrease) in Net Assets from Operations: | | | | | | | | |
| | |
Net investment income | | $ | 2,810,909 | | | $ | 709,289 | |
| | |
Net realized gain on investments | | | 10,210,025 | | | | 61,893 | |
| | |
Net change in unrealized appreciation
(depreciation) on investments | | | 73,157,304 | | | | (9,777,300 | ) |
| | |
|
|
| |
|
|
|
| | |
Net increase (decrease) in net assets from operations | | | 86,178,238 | | | | (9,006,118 | ) |
| | |
|
|
| |
|
|
|
| | |
Distributions to Shareholders from: | | | | | | | | |
| | |
Net investment income ($0.671 and
$0.679 per share, respectively) | | | (2,801,257 | ) | | | (709,190 | ) |
| | |
Net realized gains ($1.556 and $0 per
share, respectively) | | | (7,779,240 | ) | | | 0 | |
| | |
|
|
| |
|
|
|
| | |
Total distributions | | | (10,580,497 | ) | | | (709,190 | ) |
| | |
|
|
| |
|
|
|
| | |
Shares of Beneficial Interest: | | | | | | | | |
| | |
Increase from share transactions | | | 384,869,414 | | | | 96,746,538 | |
| | |
|
|
| |
|
|
|
| | |
Total increase | | | 460,467,155 | | | | 87,031,230 | |
| | |
Net assets — beginning of period | | | 137,715,452 | | | | 50,684,222 | |
| | |
|
|
| |
|
|
|
| | |
Net assets — end of period | | $ | 598,182,607 | | | $ | 137,715,452 | |
| | |
|
|
| |
|
|
|
| | |
Accumulated net investment income | | $ | 9,652 | | | $ | 0 | |
| | |
|
|
| |
|
|
|
See notes to the financial statements.
10
The Torray Institutional Fund
FINANCIAL HIGHLIGHTS
For a share outstanding:
PER SHARE DATA
| | | | | | | | | | | | |
| | | Years ended December 31:
| | | Period ended 12/31/01(1)
| |
| | | 2003
| | | 2002
| | |
| | | |
Net Asset Value,
Beginning of Period | | $ | 89.490 | | | $ | 103.300 | | | $ | 100.000 | |
| | |
|
|
| |
|
|
| |
|
|
|
| | | |
Income from investment operations: | | | | | | | | | | | | |
| | | |
Net investment income | | | 0.671 | | | | 0.679 | | | | 0.359 | |
| | | |
Net gains on securities (both realized and unrealized) | | | 22.586 | | | | (13.810 | ) | | | 3.555 | |
| | |
|
|
| |
|
|
| |
|
|
|
| | | |
Total from investment operations | | | 23.257 | | | | (13.131 | ) | | | 3.914 | |
| | |
|
|
| |
|
|
| |
|
|
|
| | | |
Less: Distributions | | | | | | | | | | | | |
| | | |
Dividends (from net investment income) | | | (0.671 | ) | | | (0.679 | ) | | | (0.359 | ) |
| | | |
Distributions (from capital gains) | | | (1.556 | ) | | | 0.000 | | | | (0.255 | ) |
| | |
|
|
| |
|
|
| |
|
|
|
| | | |
Total distributions | | | (2.227 | ) | | | (0.679 | ) | | | (0.614 | ) |
| | |
|
|
| |
|
|
| |
|
|
|
| | | |
Net Asset Value,
End of Period | | $ | 110.520 | | | $ | 89.490 | | | $ | 103.300 | |
| | |
|
|
| |
|
|
| |
|
|
|
| | | |
TOTAL RETURN(2) | | | 26.16 | % | | | (12.73 | %) | | | 3.99 | % |
| | | |
RATIOS/SUPPLEMENTAL DATA | | | | | | | | | | | | |
| | | |
Net assets, end of period
(000’s omitted) | | $ | 598,183 | | | $ | 137,715 | | | $ | 50,684 | |
| | | |
Ratios of expenses to average net assets | | | 0.85 | % | | | 0.85 | % | | | 0.85 | %* |
| | | |
Ratios of net income to average net assets | | | 0.80 | % | | | 0.85 | % | | | 0.76 | %* |
| | | |
Portfolio turnover rate | | | 22.20 | % | | | 6.87 | % | | | 8.84 | %* |
| (1) | | The Torray Institutional Fund commenced operations on June 30, 2001. |
| (2) | | Past performance is not predictive of future performance. |
See notes to the financial statements.
11
The Torray Institutional Fund
NOTES TO FINANCIAL STATEMENTS
As of December 31, 2003
NOTE 1 — SUMMARY OF SIGNIFICANT ACCOUNTING POLICIES
The Torray Institutional Fund (“Fund”) is registered under the Investment Company Act of 1940 as a no-load, diversified, open-end management investment company. The Fund was organized as a business trust under Massachusetts law and commenced operations on June 30, 2001. The Fund’s primary investment objective is to provide long-term total return. The Fund seeks to meet its objective by investing its assets in a diversified portfolio of common stocks. In order to accomplish these goals, the Fund intends to hold stocks for the long term, as opposed to actively buying and selling. There can be no assurances that the Fund’s investment objectives will be achieved.
The following is a summary of accounting policies followed by the Fund in the preparation of its financial statements. These policies are in conformity with accounting principles generally accepted in the United States of America.
Securities Valuation Portfolio securities for which market quotations are readily available are valued at market value, which is determined by using the last reported sale price or, if no sales are reported, the last reported bid price. For NASDAQ traded securities, market value may also be determined on the basis of the NASDAQ official closing price (the “NOCP”) instead of the last reported sales price. Short-term obligations having remaining maturities of 60 days or less are valued at amortized cost, which approximates market value.
Securities Transactions and Investment Income Securities transactions are recorded on a trade date basis. Realized gains and losses from securities transactions are determined by using the identified cost method. Dividend income and distributions to shareholders are recorded on the ex-dividend date. Interest income, including amortization of discount on short-term investments, is recorded on the accrual basis.
Federal Income Taxes The Fund intends to continue to comply with the requirements of the Internal Revenue Code applicable to regulated investment companies and to distribute all of its taxable income, including any net realized gain on investments to its shareholders. Therefore, no Federal income tax provision is required. Cost of securities for tax purposes is substantially the same as for financial reporting purposes.
Net Asset Value Net asset value per share of the Fund is determined daily as of the close of trading on the New York Stock Exchange by dividing the value of the Fund’s net assets by the number of shares outstanding.
Use of Estimates In preparing financial statements in accordance with accounting principles generally accepted in the United States of America, management is required to make estimates and assumptions that affect the reported amounts of assets and liabilities and the disclosure of contingent assets and liabilities at the date of the financial statements, and the reported amounts of increases and decreases in net assets from operations during the reporting period. Actual results could differ from those estimates.
12
The Torray Institutional Fund
NOTES TO FINANCIAL STATEMENTS (continued)
As of December 31, 2003
NOTE 2 — SHARES OF BENEFICIAL INTEREST TRANSACTIONS
Transactions in shares of beneficial interest were as follows:
| | | | | | | | | | | | | | |
| | | Year ended 12/31/03
| | | Year ended 12/31/02
| |
| | | Shares
| | | Amount
| | | Shares
| | | Amount
| |
Shares issued | | 4,110,543 | | | $ | 408,604,899 | | | 1,201,693 | | | $ | 110,574,522 | |
Reinvestments of dividends and distributions | | 92,982 | | | | 9,722,685 | | | 6,063 | | | | 549,695 | |
Shares redeemed | | (330,094 | ) | | | (33,458,170 | ) | | (159,463 | ) | | | (14,377,679 | ) |
| | |
|
| |
|
|
| |
|
| |
|
|
|
| | | 3,873,431 | | | $ | 384,869,414 | | | 1,048,293 | | | $ | 96,746,538 | |
| | |
|
| |
|
|
| |
|
| |
|
|
|
Officers, Trustees and affiliated persons of The Torray Institutional Fund and their families directly or indirectly control 133,634 shares or 2.47% of the Fund.
NOTE 3 — INVESTMENT TRANSACTIONS
Purchases and sales of investment securities, other than short-term investments, for the year ended December 31, 2003, aggregated $462,714,513 and $76,300,157, respectively.
NOTE 4 — MANAGEMENT FEES
Pursuant to the Management Contract, The Torray Corporation provides investment advisory and administrative services to the Fund. The Fund pays the Torray Corporation a management fee, computed daily and payable monthly at the annual rate of 0.85% of the Fund’s average daily net assets. For the year ended December 31, 2003, The Torray Institutional Fund paid comprehensive management fees of $2,979,689. The Funds pays the manager a single comprehensive management fee which covers all operating expenses of the Fund including the investment advisory and administrative services provided by the manager as well as all miscellaneous costs incurred in connection with the ongoing operation of the Fund including transfer agency, custody, professional, and registration fees.
Certain officers and Trustees of the Fund are also officers and/or shareholders of The Torray Corporation.
13
The Torray Institutional Fund
NOTES TO FINANCIAL STATEMENTS (continued)
As of December 31, 2003
NOTE 5 — TAX MATTERS
Distributions to shareholders are determined in accordance with federal income tax regulations which may differ from accounting principles generally accepted in the United States of America.
The tax character of distributions paid during 2003 and 2002 were as follows:
| | | | | | |
| | | 2003
| | 2002
|
Distributions paid from: | | | | | | |
Ordinary income | | $ | 7,511,124 | | $ | 709,190 |
Long-term capital gain | | | 3,069,373 | | | — |
| | |
|
| |
|
|
| | | $ | 10,580,497 | | $ | 709,190 |
| | |
|
| |
|
|
As of December 31, 2003, the components of distributable earnings on a tax basis were as follows:
| | | | | |
Undistributed ordinary income | | $ | 1,841,651 | | |
Undistributed long-term gain | | | 517,083 | | |
Unrealized appreciation | | | 66,099,492 | | |
| | |
|
| | |
| | | $ | 68,458,226 | | |
| | |
|
| | |
The difference between book basis and tax basis distributable earnings is due primarily to different book and tax treatment of short-term capital gains.
The following information is based upon the federal income tax basis of investment securities as of December 31, 2003:
| | | | | | |
Gross unrealized appreciation | | $ | 68,400,200 | | | |
Gross unrealized depreciation | | | (2,300,708 | ) | | |
| | |
|
|
| | |
Net unrealized appreciation | | $ | 66,099,492 | | | |
| | |
|
|
| | |
Federal income tax basis | | $ | 532,123,820 | | | |
| | |
|
|
| | |
14
The Torray Institutional Fund
INDEPENDENT AUDITORS’ REPORT
As of December 31, 2003
To the Shareholders and Board of Trustees of
The Torray Institutional Fund
Bethesda, Maryland
We have audited the accompanying statement of assets and liabilities of The Torray Institutional Fund, including the schedule of investments, as of December 31, 2003, and the related statement of operations for the year then ended, the statement of changes in net assets for each of the two years in the period then ended and the financial highlights for each of the two years in the period then ended and from June 30, 2001 (commencement of operations) to December 31, 2001. These financial statements and financial highlights are the responsibility of the Fund’s management. Our responsibility is to express an opinion on these financial statements and financial highlights based on our audits.
We conducted our audit in accordance with auditing standards generally accepted in the United States of America. Those standards require that we plan and perform the audit to obtain reasonable assurance about whether the financial statements and financial highlights are free of material misstatement. An audit includes examining, on a test basis, evidence supporting the amounts and disclosures in the financial statements. Our procedures included confirmation of securities owned as of December 31, 2003, by correspondence with the custodian and brokers. An audit also includes assessing the accounting principles used and significant estimates made by management, as well as evaluating the overall financial statement presentation. We believe our audit provides a reasonable basis for our opinion.
In our opinion, the financial statements and financial highlights referred to above present fairly, in all material respects, the financial position of The Torray Institutional Fund, as of December 31, 2003, the results of its operations for the year then ended, the changes in its net assets for each of the two years in the period then ended and the financial highlights for each of the two years in the period then ended and from June 30, 2001 (commencement of operations) to December 31, 2001, in conformity with accounting principles generally accepted in the United States of America.

BRIGGS, BUNTING & DOUGHERTY, LLP
Philadelphia, Pennsylvania
January 26, 2004
15
The Torray Institutional Fund
FUND MANAGEMENT (unaudited)
As of December 31, 2003
Information pertaining to the Trustees and Officers of The Trust is set forth below. The Statement of Additional Information (SAI) includes additional information about the Trustees and is available without charge, upon request, by calling (800) 443-3036.
| | | | | | | | |
Name, Birth Date,
Address* and
Positions
with the Trust | | Term of Office
and Length of
Time Served | | Principal Occupation(s) During Past 5 Years | | Portfolios
Overseen
by Trustee | | Other Trusteeships/
Directorships Held
by Trustee |
|
DISINTERESTED TRUSTEES |
| | | | |
Bruce C. Ellis 07/20/1944 Trustee | | Indefinite Term Since Jun 1993 | | Private Investor Bethesda, Maryland | | 2 | | |
| | | | |
Robert P. Moltz 10/03/1947 Trustee | | Indefinite Term Since Nov 1990 | | President, CEO
Weaver Bros. Insurance Assoc. Bethesda, Maryland | | 2 | | |
| | | | |
Roy A. Schotland 03/18/1933 Trustee | | Indefinite Term Since Nov 1990 | | Professor of Law
Georgetown University Law Center Washington, D.C. | | 2 | | Director
Custodial Trust Co.,
a Bear Stearns subsidiary |
| | | | |
Wayne H. Shaner 08/23/1947 Trustee | | Indefinite Term Since Jun 1993 | | Managing Director
Lockheed Martin Investment Management Co. Managing Partner, Rockledge Partners, L.L.C. Bethesda, Maryland | | 2 | | |
| | | | |
Dr. Charlene Nunley 09/26/1950 Trustee | | Indefinite Term Since May 2002 | | President
Montgomery College Rockville, Maryland | | 2 | | |
| | | | |
Dr. Carl MacCartee 01/09/1941 Trustee | | Indefinite Term Since May 2002 | | Medical Doctor
MacCartee, Haas, Grossman, Connell & Shaffer P.A. Chevy Chase, Maryland | | 2 | | |
| | | | |
Dr. Patricia Kavanagh 11/01/1949 Trustee | | Indefinite Term Since May 2002 | | Medical Doctor, Resident
Neurological Institute at Columbia Presbyterian New York, New York | | 2 | | |
|
INTERESTED TRUSTEES |
| | | | |
William M Lane 05/21/1950 President, Secretary, Trustee | | Indefinite Term Since Nov 1990 | | President, The Torray Fund Vice President, Robert E. Torray & Co. Inc. Vice President, The Torray Corporation Bethesda, Maryland | | 2 | | |
| | | | |
Douglas C. Eby 07/28/1959 Vice President, Treasurer Trustee | | Indefinite Term Since May 2002 | | President, Robert E. Torray & Co. Inc. Vice President and Treasurer The Torray Corporation Bethesda, Maryland | | 2 | | Director
Markel Corporation
Richmond, Virginia |
| | | | |
Robert E. Torray 04/10/1937 Trustee | | Indefinite Term Since May 2002 | | Chairman, Robert E. Torray & Co. Inc.
President, The Torray Corporation
Bethesda, Maryland | | 2 | | Director
CarrAmerica Realty
Washington, D.C. |
| * | | All addresses are c/o The Torray Institutional Fund, 7501 Wisconsin Avenue, Suite 1100, Bethesda, MD 20814-6523 |
16
TRUSTEES
Douglas C. Eby
Bruce C. Ellis
Patricia Kavanagh
William M Lane
Carl C. MacCartee, Jr.
Robert P. Moltz
Charlene R. Nunley
Roy A. Schotland
Wayne H. Shaner
Robert E. Torray
INVESTMENT ADVISOR
The Torray Corporation
OFFICERS
Robert E. Torray, President
Douglas C. Eby, Vice President
William M Lane, Vice President
AUDITORS
Briggs, Bunting & Dougherty, LLP
Two Penn Center Plaza, Suite 820
Philadelphia, PA 19102-1732
TRANSFER AGENT
PFPC Inc.
760 Moore Road
King of Prussia, PA 19406-1212
LEGAL COUNSEL
Dechert
1775 Eye Street, N.W.
Washington, D.C. 20006
This report is not authorized for distribution to prospective investors unless preceded or accompanied by a current prospectus.
The
TORRAY
INSTITUTIONAL
FUND
ANNUAL REPORT
December 31, 2003
The Torray Institutional Fund
Suite 1100
7501 Wisconsin Avenue
Bethesda, Maryland 20814-6523
(301) 493-4600
(800) 443-3036
Item 2. Code of Ethics.
| | (a) | The registrant, as of the end of the period covered by this report, has adopted a code of ethics that applies to the registrant’s principal executive officer, principal financial officer, principal accounting officer or controller, or persons performing similar functions, regardless of whether these individuals are employed by the registrant or a third party. |
| | (b) | There have been no amendments, during the period covered by this report, to a provision of the code of ethics that applies to the registrant’s principal executive officer, principal financial officer, principal accounting officer or controller, or persons performing similar functions, regardless of whether these individuals are employed by the registrant or a third party, and that relates to any element of the code of ethics description. |
| | (c) | The registrant has not granted any waivers, including an implicit waiver, from a provision of the code of ethics that applies to the registrant’s principal executive officer, principal financial officer, principal accounting officer or controller, or persons performing similar functions, regardless of whether these individuals are employed by the registrant or a third party, that relates to one or more of the items set forth in paragraph (b) of this item’s instructions. |
Item 3. Audit Committee Financial Expert.
The Registrants’ Board of Directors has not designated an audit committee financial expert. The Registrant has determined that it will retain the services of an independent third party to assist it if circumstances arise that require specific investment company auditing expertise.
Item 4. Principal Accountant Fees and Services.
| | (a) | AUDIT FEES: The aggregate fees billed for each of the last two fiscal years for professional services rendered by the principal accountant for the audit of the registrant’s annual financial statements or services that are normally provided by the accountant in connection with statutory and regulatory filings or engagements for those fiscal years are $51,000 in 2003 and $51,000 in 2002. |
| | (b) | AUDIT-RELATED FEES: The aggregate fees billed in each of the last two fiscal years for assurance and related services by the principal accountant that are reasonably related to the performance of the audit of the registrant’s financial statements and are not reported under paragraph (a) of this Item are NONE. |
| | (c) | TAX FEES: The aggregate fees billed in each of the last two fiscal years for professional services rendered by the principal accountant for tax compliance, tax advice, and tax planning are $3,000 in 2003 and $3,000 in 2002. |
| | | Tax Fees represent tax compliance services provided in connection with the preparation of the Registrant’s federal income tax and excise tax returns. |
| | (d) | ALL OTHER FEES: The aggregate fees billed in each of the last two fiscal years for products and services provided by the principal accountant, other than the services reported in paragraphs (a) through (c) of this Item are NONE. |
| | (e)(1) | Disclose the audit committee’s pre-approval policies and procedures described in paragraph (c)(7) of Rule 2-01 of Regulation S-X. |
| | | Audit Committee Pre-Approval Policy. All services to be performed for the Registrant by Briggs Bunting & Dougherty, LLP must be pre-approved by the audit committee. All services performed during 2003 and 2002 were pre-approved by the committee. |
| | (e)(2) | The percentage of services described in each of paragraphs (b) through (d) of this Item that were approved by the audit committee pursuant to paragraph (c)(7)(i)(C) of Rule 2-01 of Regulation S-X are as follows: |
(b) N/A
(c) 100%
(d) N/A
| | (f) | The percentage of hours expended on the principal accountant’s engagement to audit the registrant’s financial statements for the most recent fiscal year that were attributed to work performed by persons other than the principal accountant’s full-time, permanent employees was NONE. |
| | (g) | The aggregate non-audit fees billed by the registrant’s accountant for services rendered to the registrant, and rendered to the registrant’s investment adviser (not including any sub-adviser whose role is primarily portfolio management and is subcontracted with or overseen by another investment adviser), and any entity controlling, controlled by, or under common control with the adviser that provides ongoing services to the registrant for each of the last two fiscal years of the registrant was $ 24,000 in 2003 and $23,000 in 2002. |
| | (h) | The registrant’s audit committee of the board of directors has considered whether the provision of non-audit services that were rendered to the registrant’s investment adviser (not including any sub-adviser whose role is primarily portfolio management and is subcontracted with or overseen |
| | | by another investment adviser), and any entity controlling, controlled by, or under common control with the investment adviser that provides ongoing services to the registrant that were not pre-approved pursuant to paragraph (c)(7)(ii) of Rule 2-01 of Regulation S-X is compatible with maintaining the principal accountant’s independence. |
Item 5. Audit Committee of Listed registrants.
Not applicable.
Item 6. [Reserved]
Item 7. Disclosure of Proxy Voting Policies and Procedures for Closed-End Management Investment Companies.
Not applicable.
Item 8. Purchases of Equity Securities by Closed-End Management Investment Company and Affiliated Purchasers.
Not applicable.
Item 9. Submission of Matters to a Vote of Security Holders.
Not applicable.
Item 10. Controls and Procedures.
| | (a) | The registrant’s principal executive and principal financial officers, or persons performing similar functions, have concluded that the registrant’s disclosure controls and procedures (as defined in Rule 30a-3(c) under the Investment Company Act of 1940, as amended (the “1940 Act”) (17 CFR 270.30a-3(c))) are effective, as of a date within 90 days of the filing date of the report that includes the disclosure required by this paragraph, based on their evaluation of these controls and procedures required by Rule 30a-3(b) under the 1940 Act (17 CFR 270.30a-3(b)) and Rules 13a-15(b) or 15d-15(b) under the Securities Exchange Act of 1934, as amended (17 CFR 240.13a-15(b) or 240.15d-15(b)). |
| | (b) | There were no changes in the registrant’s internal control over financial reporting (as defined in Rule 30a-3(d) under the 1940 Act (17 CFR 270.30a-3(d)) that occurred during the registrant’s last fiscal half-year (the registrant’s second fiscal half-year in the case of an annual report) that has materially affected, or is reasonably likely to materially affect, the registrant’s internal control over financial reporting. |
Item 11. Exhibits.
| | (a)(1) | Code of ethics, or any amendment thereto, that is the subject of disclosure required by Item 2 is attached hereto. |
| | (a)(2) | Certifications pursuant to Section 302 of the Sarbanes-Oxley Act of 2002 are attached hereto. |
| | (b) | Certifications pursuant to Section 906 of the Sarbanes-Oxley Act of 2002 are attached hereto. |
SIGNATURES
Pursuant to the requirements of the Securities Exchange Act of 1934 and the Investment Company Act of 1940, the registrant has duly caused this report to be signed on its behalf by the undersigned, thereunto duly authorized.
| | |
(registrant) | | The Torray Fund |
| |
By (Signature and Title)* | | /s/ William M Lane
|
| | | William M Lane, President & Secretary |
Date March 7, 2004
Pursuant to the requirements of the Securities Exchange Act of 1934 and the Investment Company Act of 1940, this report has been signed below by the following persons on behalf of the registrant and in the capacities and on the dates indicated.
| | |
By (Signature and Title)* | | /s/ William M Lane
|
| | | William M Lane, President & Secretary |
Date March 7, 2004
| | |
By (Signature and Title)* | | /s/ Douglas C. Eby
|
| | | Douglas C. Eby, Vice President & Treasurer |
Date March 7, 2004
| * | Print the name and title of each signing officer under his or her signature. |