UNITED STATES
SECURITIES AND EXCHANGE COMMISSION
Washington, D.C. 20549
FORM N-CSR
CERTIFIED SHAREHOLDER REPORT OF REGISTERED MANAGEMENT INVESTMENT COMPANIES
Investment Company Act file number 811-06096
The Torray Fund
(Exact name of registrant as specified in charter)
7501 Wisconsin Avenue, Suite 1100
Bethesda, MD 20814-6523
(Address of principal executive offices) (Zip code)
William M. Lane
The Torray Corporation
7501 Wisconsin Avenue, Suite 1100
Bethesda, MD 20814-6523
(Name and address of agent for service)
Registrant’s telephone number, including area code: 301-493-4600
Date of fiscal year end: December 31, 2003
Date of reporting period: June 30, 2003
Form N-CSR is to be used by management investment companies to file reports with the Commission not later than 10 days after the transmission to stockholders of any report that is required to be transmitted to stockholders under Rule 30e-1 under the Investment Company Act of 1940 (17 CFR 270.30e-1). The Commission may use the information provided on Form N-CSR in its regulatory, disclosure review, inspection, and policymaking roles.
A registrant is required to disclose the information specified by Form N-CSR, and the Commission will make this information public. A registrant is not required to respond to the collection of information contained in Form N-CSR unless the Form displays a currently valid Office of Management and Budget (“OMB”) control number. Please direct comments concerning the accuracy of the information collection burden estimate and any suggestions for reducing the burden to Secretary, Securities and Exchange Commission, 450 Fifth Street, NW, Washington, DC 20549-0609. The OMB has reviewed this collection of information under the clearance requirements of 44 U.S.C. § 3507.
Item 1. Reports to Stockholders.
The Torray Fund
Letter to Shareholders
August 4, 2003
Dear Fellow Shareholders:
The Torray Fund appreciated 12.4% during the first half of 2003, bringing its return since inception 12 1/2 years ago to 14.3% compounded annually. By comparison, the Standard & Poor’s 500 Index returned 11.8% and 11.3%, respectively. Our long-term record continues to outpace mutual fund industry averages by a wide margin, an outcome that confirms the merits of a buy and hold approach centered on superior businesses bought at fair prices. We are also pleased to let you know that The Lipper Organization, for the second year in a row, has ranked The Torray Fund #1 among all large capitalization value-oriented funds for the preceding 10 years.
When we wrote to you at this time a year ago, things were bleak. The market was down 50%, and investors were very discouraged. Our shareholder letter, dated July 22, 2002, said that despite current circumstances we were optimistic (this letter is carried on our website at www.torray.com). We expressed confidence about long-range prospects for the economy and stock prices, but uncertainty as to the timing of a rebound. The ensuing market recovery came as a complete surprise. On July 24, stocks rallied 5.7% and five days after that, another 5.4%. On three days over the next six weeks, they rose 4.0%, 4.0% and 4.7%, respectively, for a total gain of 26.3%. Yet, at the close of this year’s first half, 236 trading days after the advance began, the S&P 500 was ahead 24.3%. Absent those five big up-days last year, the market, on a compound basis, lost 1.6% for the period. So, despite a rise that would take almost a half-century to match at today’s money market fund rates, the odds of making anything trading in and out over this time frame were 50 to 1 against you. In two earlier letters we proved the same point with data covering five and 10-year spans.
Yet, many people keep trying, along the way equating the ups and downs of their investments to making or losing money. This is a false perception. In the short run, which we view as anything less than 5 years, the market is driven mainly by fads and emotions. Unfortunately, investors and financial service companies have proven highly vulnerable to these compromising inputs. Thus, when nonsensical themes captivate Wall Street, money pours into them, setting the stage for an inevitable reversal. The collapse of the technology sector and dot.coms a few years ago is a prime example.
1
The Torray Fund
Letter to Shareholders
August 4, 2003
Surprisingly, a new speculation has recently surfaced: the shares of 200 companies that lost money last year have doubled and according to Birinyi Associates, the NASDAQ 100 Index is trading at 240 times last year’s earnings, suggesting investors are once again fixated on price momentum and picking stocks based on guesses about what others might pick rather than business performance. These foolish strategies should be avoided.
In that connection, it is helpful to keep in mind that stocks cannot outperform businesses for long . Investors forgot this during the late 90’s. At the time, corporate earnings were growing 6% annually but stocks were going up 28%. There was no way it could last. In the end many were burned far worse than market statistics suggest. That’s because the largest sums of money entered the game near the top. When prices collapsed, everyone ran for the exits, sealing the fate of the late-arriving players. By contrast, those that were invested in a diversified list of successful companies when the advance began in 1995 are now in great shape 8 1/2 years later. The Torray Fund, for instance, made 15.3% a year over that period and the S&P 500, 11.1%.
This underscores the fact that the market’s gyrations only punish investors that behave irrationally. A new study by Dalbar Inc. confirms the point. It estimates that between 1984 and 2002 mutual fund shareholders made less than 3% annually, even though funds averaged 9.3% and the S&P 500 made 12.2%. Dalbar ascribes most of the disparity to investors’ penchant for piling in as prices rise and bailing out when they fall. Fund switching, fees, expenses and taxes explain the rest. Investors clearly need to address these issues. But, more important by far, they should restrict their investments to funds that buy and hold companies with proven track records. As we have often said, business performance drives stock prices, not the other way around.

Reprinted with permisssion. All rights reserved.
2
The Torray Fund
Letter to Shareholders
August 4, 2003
It is also key to recognize that success doesn’t depend on beating the market every year. In fact, attempts to do so are bound to produce the opposite result. The Torray Fund’s long-term return has handily outrun the market; yet, in three out of the last 12 1/2 years — 1991, ‘93 and ‘98 — we trailed the S&P 500 Index by 10.5, 3.7 and 20.4 percentage points, respectively. The record of our affiliate, Robert E. Torray & Co. Inc., a manager of large institutional accounts, is similar: returns lagged the market for 10 out of the 30.6 years since its incorporation — on three occasions by 18-22 percentage points each. Although such large disparities would seem to doom the outcome, we earned 14.2% compounded annually compared to 10.9% for the S&P 500, a cumulative gain of 5,642% versus 2,235%. Clearly, you don’t have to outperform every year to be a winner.
Having said this, the reality is that mutual fund track records have no bearing on how most shareholders fare. For one thing, investors move around a lot — the average holding period has fallen to 30 months, down from 15 years several decades ago. This renders a fund’s record on either side of that brief window irrelevant. Another factor is that shareholders increase their investment as prices rise — particularly when it comes to buying funds that have turned in eye-popping recent performance. As ever-larger sums flow into these situations, the weighted cost basis for shareholders as a group goes up. Then, if the market falls, investors suffer a net loss even though the fund’s historic returns may have been excellent. This happens all the time.
We’ve experienced it at The Torray Fund: only the original investors — and there weren’t many — have earned 14.3% on their money. Likewise, a very small percentage of today’s shareholders were with us from 1995 on and realized a 15.3% annual return. But, as the Fund’s shares advanced 50%, 29%, 37% and 24% in 1995, ‘96, ‘97 and ‘99, tens of thousands of new investors came in at successively higher prices, substantially increasing the cost profile for shareholders as a group. When the market bottomed this spring, most had a loss.
Now, this is no one’s fault, nor is it a reason to be discouraged. Results generated in the early years of an investment are almost always a function of timing. Those that purchased The Torray Fund a few years ago suffered a temporary depreciation of, say, 25%, while investors that came in this March had the opposite experience — their shares are up 25%. Yet, each group bought essentially the same portfolio managed by the same team that has been in place for over 12 1/2 years. And, it cannot be said one was smarter than the other, for there was no more reason
3
The Torray Fund
Letter to Shareholders
August 4, 2003
to think our stock would drop in the earlier period than to believe it would rally this spring. In the end, it shouldn’t matter anyway. If shareholders remain with us long enough, their returns will eventually converge. That is our hope. It’s the caliber of the investment and persistence of the investor that count, not the entry price.
In closing, we want to reaffirm our confidence in the economy and stock market. Even if current uncertainties persist for a few more years, investors in solid companies like those held in The Torray Fund should still enjoy a low-risk, reasonable return. On behalf of your trustees, management and the staff of The Torray Corporation, we extend our best wishes and appreciation for the confidence you have placed in us.
| Sincerely, | | | | |
| | |
 | | | |  |
| Robert E. Torray | | | | Douglas C. Eby |
4
The Torray Fund
PERFORMANCE DATA
As of June 30, 2003 (unaudited)
Total Rates of Return on an Investment in The Torray Fund vs. the S&P 500
For the periods ended June 30, 2003:
| | | 1 Year
| | | 3 Years
| | | 5 Years
| | | 10 Years
| | | Since
Inception
12/31/90
| |
The Torray Fund | | 5.94 | % | | 0.53 | % | | 2.14 | % | | 13.66 | % | | 14.29 | % |
S&P 500 | | 0.25 | % | | -11.19 | % | | -1.61 | % | | 10.04 | % | | 11.35 | % |
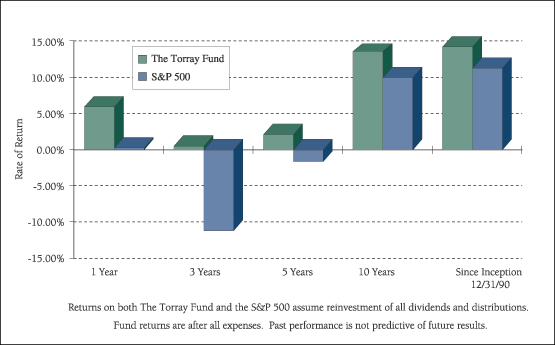
Cumulative Returns for the 12½ years ended June 30, 2003
The Torray Fund | | 430.87% |
S&P 500 | | 283.17% |
5
The Torray Fund
PERFORMANCE DATA
As of June 30, 2003 (unaudited)
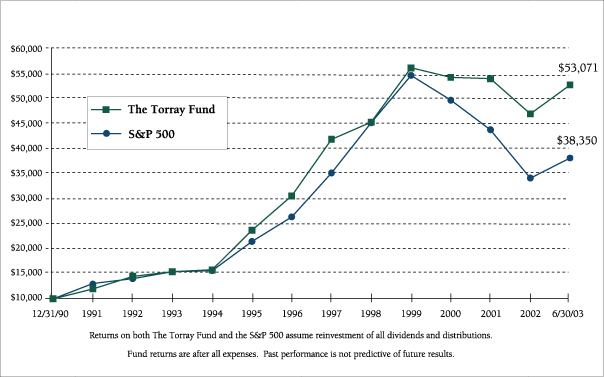
Change in Value of $10,000 Invested on December 31, 1990 (commencement of operations) to:
| | | 12/31/90
| | 12/31/92
| | 12/31/94
| | 12/31/96
| | 12/31/98
| | 12/31/00
| | 12/31/02
| | 06/30/03
|
The Torray Fund | | $ | 10,000 | | $ | 14,523 | | $ | 15,821 | | $ | 30,719 | | $ | 45,576 | | $ | 54,609 | | $ | 47,236 | | $ | 53,071 |
S&P 500 | | $ | 10,000 | | $ | 14,047 | | $ | 15,666 | | $ | 26,499 | | $ | 45,438 | | $ | 49,993 | | $ | 34,318 | | $ | 38,350 |
6
The Torray Fund
SCHEDULE OF INVESTMENTS
As of June 30, 2003 (unaudited)
| | | Shares
| | | | Market Value
|
| COMMON STOCK 99.85% | | | |
| |
21.62% DIVERSIFIED FINANCIAL SERVICES | | | |
| | | 1,914,950 | | J.P. Morgan Chase & Co. | | $ | 65,452,991 |
| | | 247,305 | | Markel Corporation * | | | 63,310,080 |
| | | 909,800 | | AMBAC Financial Group, Inc. | | | 60,274,250 |
| | | 1,256,500 | | Franklin Resources, Inc. | | | 49,091,455 |
| | | 686,300 | | American International Group, Inc. | | | 37,870,034 |
| | | 543,000 | | American Express Company | | | 22,702,830 |
| | | 508,157 | | Citigroup, Inc. | | | 21,749,119 |
| | | | | | |
|
|
| | | | | | | | 320,450,759 |
| |
13.38% PHARMACEUTICALS | | | |
| | | 1,156,700 | | Amgen Inc. * | | | 76,851,148 |
| | | 845,500 | | Merck & Co., Inc. | | | 51,195,025 |
| | | 901,400 | | Pfizer Inc. | | | 30,782,810 |
| | | 505,300 | | Wyeth | | | 23,016,415 |
| | | 607,800 | | Bristol-Myers Squibb Company | | | 16,501,770 |
| | | | | | |
|
|
| | | | | | | | 198,347,168 |
| |
10.17% MEDIA & ENTERTAINMENT | | | |
| | | 1,456,300 | | Clear Channel Communications, Inc. * | | | 61,732,557 |
| | | 875,700 | | Tribune Company | | | 42,296,310 |
| | | 1,584,600 | | The Walt Disney Company | | | 31,295,850 |
| | | 201,000 | | Gannett Co., Inc. | | | 15,438,810 |
| | | | | | |
|
|
| | | | | | | | 150,763,527 |
| |
8.62% DIVERSIFIED MEDICAL PRODUCTS | | | |
| | | 1,438,200 | | Abbott Laboratories | | | 62,935,632 |
| | | 534,200 | | Boston Scientific Corporation * | | | 32,639,620 |
| | | 621,900 | | Johnson & Johnson | | | 32,152,230 |
| | | | | | |
|
|
| | | | | | | | 127,727,482 |
| |
8.49% BANKING | | | |
| | | 1,206,800 | | Bank One Corporation | | | 44,868,824 |
| | | 523,000 | | Bank of America Corporation | | | 41,332,690 |
| | | 1,271,600 | | Charter One Financial, Inc. | | | 39,648,488 |
| | | | | | |
|
|
| | | | | | | | 125,850,002 |
7
The Torray Fund
SCHEDULE OF INVESTMENTS
As of June 30, 2003 (unaudited)
| | | Shares
| | | | Market Value
|
| |
7.02% DIVERSIFIED MANUFACTURING | | | |
| | | 835,800 | | United Technologies Corporation | | $ | 59,199,714 |
| | | 1,673,800 | | Honeywell International Inc. | | | 44,941,530 |
| | | | | | |
|
|
| | | | | | | | 104,141,244 |
| |
6.76% CONSUMER PRODUCTS | | | |
| | | 1,197,600 | | Kimberly-Clark Corporation | | | 62,442,864 |
| | | 423,900 | | The Procter & Gamble Company | | | 37,803,402 |
| | | | | | |
|
|
| | | | | | | | 100,246,266 |
| |
5.10% INDUSTRIAL MACHINERY | | | |
| | | 1,149,100 | | Illinois Tool Works Inc. | | | 75,668,235 |
| |
3.96% DATA PROCESSING & MANAGEMENT | | | |
| | | 1,733,100 | | Automatic Data Processing, Inc. | | | 58,682,766 |
| |
3.60% COMPUTER SYSTEMS & INTEGRATION | | | |
| | | 443,000 | | IBM Corporation | | | 36,547,500 |
| | | 790,000 | | Hewlett-Packard Company | | | 16,827,000 |
| | | | | | |
|
|
| | | | | | | | 53,374,500 |
| |
2.73% COMMUNICATIONS SERVICES | | | |
| | | 722,400 | | EchoStar Communications Corporation * | | | 25,009,488 |
| | | 1,207,000 | | Hughes Electronics Corporation * | | | 15,461,670 |
| | | | | | |
|
|
| | | | | | | | 40,471,158 |
| |
2.37% REAL ESTATE | | | |
| | | 1,261,000 | | CarrAmerica Realty Corporation | | | 35,068,410 |
| |
2.06% ELECTRICAL EQUIPMENT | | | |
| | | 598,100 | | Emerson Electric Co. | | | 30,562,910 |
| |
1.91% COMPUTER PERIPHERALS | | | |
| | | 1,758,700 | | EMC Corporation * | | | 18,413,589 |
| | | 2,151,500 | | Sun Microsystems, Inc. * | | | 9,896,900 |
| | | | | | |
|
|
| | | | | | | | 28,310,489 |
8
The Torray Fund
SCHEDULE OF INVESTMENTS
As of June 30, 2003 (unaudited)
| | | Shares
| | | | Market Value
| |
| |
1.35% SOFTWARE | | | | |
| | | 1,671,100 | | Oracle Corporation * | | $ | 20,086,622 | |
| |
0.71% SEMICONDUCTOR EQUIPMENT & PRODUCTS | | | | |
| | | 502,700 | | Intel Corporation | | | 10,448,117 | |
| | | | | | |
|
|
|
| TOTAL COMMON STOCK 99.85% | | | 1,480,199,655 | |
(cost $1,349,819,774) | | | | |
| SHORT-TERM INVESTMENTS 0.38% | | | | |
(cost $5,580,474) | | PNC Bank Money Market Account, 0.58% | | | 5,580,474 | |
| | | | | | |
|
|
|
| TOTAL PORTFOLIO SECURITIES 100.23% | | | 1,485,780,129 | |
(amortized cost $1,355,400,248) | | | | |
| OTHER ASSETS LESS LIABILITIES (0.23%) | | | (3,316,269 | ) |
| | | | | | |
|
|
|
| NET ASSETS 100.00% | | $ | 1,482,463,860 | |
| | | | | | |
|
|
|
TOP 10 HOLDINGS
1. Amgen Inc. * | | 6. Kimberly-Clark Corporation |
2. Illinois Tool Works Inc. | | 7. Clear Channel Communications, Inc. * |
3. J.P. Morgan Chase & Co. | | 8. AMBAC Financial Group, Inc. |
4. Markel Corporation * | | 9. United Technologies Corporation |
5. Abbott Laboratories | | 10. Automatic Data Processing, Inc. |
*non-income producing securities
See notes to the financial statements.
9
The Torray Fund
STATEMENT OF ASSETS AND LIABILITIES
As of June 30, 2003 (unaudited)
| |
ASSETS | | | | |
| |
Investments in securities at value
(amortized cost $1,355,400,248) | | $ | 1,485,780,129 | |
| |
Receivable for investments sold | | | 5,951,218 | |
| |
Interest and dividends receivable | | | 1,683,699 | |
| |
Subscriptions receivable | | | 631,005 | |
| |
Prepaid insurance | | | 48,530 | |
| | |
|
|
|
| |
TOTAL ASSETS | | | 1,494,094,581 | |
| | |
|
|
|
| |
LIABILITIES | | | | |
| |
Payable for investments purchased | | | 8,947,136 | |
| |
Redemptions payable | | | 1,170,115 | |
| |
Payable to advisor | | | 1,231,466 | |
| |
Accrued expenses | | | 282,004 | |
| | |
|
|
|
| |
TOTAL LIABILITIES | | | 11,630,721 | |
| | |
|
|
|
| |
NET ASSETS | | $ | 1,482,463,860 | |
| | |
|
|
|
| |
Shares of beneficial interest ($1 stated value,
41,181,711 shares outstanding, unlimited
shares authorized) | | $ | 41,181,711 | |
| |
Paid-in-capital in excess of par | | | 1,348,761,260 | |
| |
Accumulated net investment income | | | 136,843 | |
| |
Accumulated net realized loss | | | (37,995,835 | ) |
| |
Net unrealized appreciation of investments | | | 130,379,881 | |
| | |
|
|
|
| |
TOTAL NET ASSETS | | $ | 1,482,463,860 | |
| | |
|
|
|
| |
Per Share | | $ | 36.00 | |
| | |
|
|
|
See notes to the financial statements.
10
The Torray Fund
STATEMENT OF OPERATIONS
For the six months ended June 30, 2003 (unaudited)
| |
INVESTMENT INCOME | | | | |
| |
Dividend income | | $ | 11,544,010 | |
| |
Interest income | | | 14,965 | |
| | |
|
|
|
| |
Total income | | | 11,558,975 | |
| | |
|
|
|
| |
EXPENSES | | | | |
| |
Management fees | | | 6,898,053 | |
| |
Transfer agent fees & expenses | | | 302,700 | |
| |
Printing, postage & mailing | | | 110,088 | |
| |
Custodian fees | | | 52,564 | |
| |
Registration & filing fees | | | 27,380 | |
| |
Legal fees | | | 38,618 | |
| |
Trustees’ fees | | | 48,597 | |
| |
Insurance | | | 32,867 | |
| |
Audit fees | | | 13,885 | |
| | |
|
|
|
| |
Total expenses | | | 7,524,752 | |
| | |
|
|
|
| |
NET INVESTMENT INCOME | | | 4,034,223 | |
| | |
|
|
|
| |
REALIZED AND UNREALIZED GAIN (LOSS)
ON INVESTMENTS | | | | |
| |
Net realized loss on investments | | | (37,995,835 | ) |
| |
Net change in unrealized appreciation on investments | | | 197,859,490 | |
| | |
|
|
|
| |
Net realized and unrealized gain on investments | | | 159,863,655 | |
| | |
|
|
|
| |
NET INCREASE IN NET ASSETS FROM OPERATIONS | | $ | 163,897,878 | |
| | |
|
|
|
See notes to the financial statements.
11
The Torray Fund
STATEMENTS OF CHANGES IN NET ASSETS
For the periods indicated:
| | | Six months ended
06/30/03
(unaudited)
| | | Year ended
12/31/02
| |
| | |
Increase (Decrease) in Net Assets from Operations: | | | | | | | | |
| | |
Net investment income | | $ | 4,034,223 | | | $ | 8,817,821 | |
| | |
Net realized gain (loss) on investments | | | (37,995,835 | ) | | | 5,103,863 | |
| | |
Net change in unrealized appreciation
(depreciation) on investments | | | 197,859,490 | | | | (228,677,856 | ) |
| | |
|
|
| |
|
|
|
| | |
Net increase (decrease) in net assets from operations | | | 163,897,878 | | | | (214,756,172 | ) |
| | |
|
|
| |
|
|
|
| | |
Distributions to Shareholders from: | | | | | | | | |
| | |
Net investment income ($0.094 and
$0.205 per share, respectively) | | | (3,897,381 | ) | | | (8,817,821 | ) |
| | |
Net realized gains ($0.124 and $0.207 per
share, respectively) | | | (5,103,733 | ) | | | (8,974,996 | ) |
| | |
|
|
| |
|
|
|
| | |
Total distributions | | | (9,001,114 | ) | | | (17,792,817 | ) |
| | |
|
|
| |
|
|
|
| | |
Shares of Beneficial Interest | | | | | | | | |
| | |
Decrease from share transactions | | | (39,968,583 | ) | | | (38,729,489 | ) |
| | |
|
|
| |
|
|
|
| | |
Total increase (decrease) | | | 114,928,181 | | | | (271,278,478 | ) |
| | |
Net Assets — Beginning of period | | | 1,367,535,679 | | | | 1,638,814,157 | |
| | |
|
|
| |
|
|
|
| | |
Net Assets — End of period | | $ | 1,482,463,860 | | | $ | 1,367,535,679 | |
| | |
|
|
| |
|
|
|
See notes to the financial statements.
12
The Torray Fund
FINANCIAL HIGHLIGHTS
For a share outstanding:
PER SHARE DATA
| | | Six months
ended
06/30/03
(unaudited)
| | | Years ended December 31:
| |
| | | | 2002
| | | 2001
| | | 2000
| | | 1999
| | | 1998
| |
| | | | | | |
Net Asset Value,
Beginning of Period | | $ | 32.240 | | | $ | 37.530 | | | $ | 39.790 | | | $ | 44.310 | | | $ | 36.480 | | | $ | 33.850 | |
| | |
|
|
| |
|
|
| |
|
|
| |
|
|
| |
|
|
| |
|
|
|
| | | | | | |
Income from investment operations | | | | | | | | | | | | | | | | | | | | | | | | |
| | | | | | |
Net investment income | | | 0.096 | | | | 0.205 | | | | 0.172 | | | | 0.265 | | | | 0.073 | | | | 0.139 | |
| | | | | | |
Net gains (losses) on securities (both realized and unrealized) | | | 3.882 | | | | (5.083 | ) | | | (0.489 | ) | | | (1.730 | ) | | | 8.616 | | | | 2.630 | |
| | |
|
|
| |
|
|
| |
|
|
| |
|
|
| |
|
|
| |
|
|
|
| | | | | | |
Total from investment operations | | | 3.978 | | | | (4.878 | ) | | | (0.317 | ) | | | (1.465 | ) | | | 8.689 | | | | 2.769 | |
| | |
|
|
| |
|
|
| |
|
|
| |
|
|
| |
|
|
| |
|
|
|
| | | | | | |
Less: distributions | | | | | | | | | | | | | | | | | | | | | | | | |
| | | | | | |
Dividends (from net investment income) | | | (0.094 | ) | | | (0.205 | ) | | | (0.184 | ) | | | (0.253 | ) | | | (0.073 | ) | | | (0.139 | ) |
| | | | | | |
Distributions (from capital gains) | | | (0.124 | ) | | | (0.207 | ) | | | (1.759 | ) | | | (2.802 | ) | | | (0.786 | ) | | | 0.000 | |
| | |
|
|
| |
|
|
| |
|
|
| |
|
|
| |
|
|
| |
|
|
|
| | | | | | |
Total distributions | | | (0.218 | ) | | | (0.412 | ) | | | (1.943 | ) | | | (3.055 | ) | | | (0.859 | ) | | | (0.139 | ) |
| | |
|
|
| |
|
|
| |
|
|
| |
|
|
| |
|
|
| |
|
|
|
| | | | | | |
Net Asset Value,
End of Period | | $ | 36.000 | | | $ | 32.240 | | | $ | 37.530 | | | $ | 39.790 | | | $ | 44.310 | | | $ | 36.480 | |
| | |
|
|
| |
|
|
| |
|
|
| |
|
|
| |
|
|
| |
|
|
|
| | | | | | |
TOTAL RETURN(1) | | | 12.35 | % | | | (13.05 | %) | | | (0.52 | %) | | | (3.38 | %) | | | 24.01 | % | | | 8.20 | % |
| | | | | | |
RATIOS/SUPPLEMENTAL DATA | | | | | | | | | | | | | | | | | | | | | | | | |
| | | | | | |
Net assets, end of period (000’s omitted) | | $ | 1,482,464 | | | $ | 1,367,536 | | | $ | 1,638,814 | | | $ | 1,820,972 | | | $ | 1,895,538 | | | $ | 1,458,854 | |
| | | | | | |
Ratios of expenses to average net assets | | | 1.09 | %* | | | 1.07 | % | | | 1.07 | % | | | 1.06 | % | | | 1.07 | % | | | 1.09 | % |
| | | | | | |
Ratios of net income to average net assets | | | 0.58 | %* | | | 0.58 | % | | | 0.45 | % | | | 0.64 | % | | | 0.18 | % | | | 0.42 | % |
| | | | | | |
Portfolio turnover rate | | | 16.04 | % | | | 22.52 | % | | | 37.56 | % | | | 45.44 | % | | | 32.55 | % | | | 25.96 | % |
| (1) | | Past performance is not predictive of future performance. |
See notes to the financial statements.
13
The Torray Fund
NOTES TO FINANCIAL STATEMENTS
As of June 30, 2003 (unaudited)
NOTE 1 — SUMMARY OF SIGNIFICANT ACCOUNTING POLICIES
The Torray Fund (“Fund”) is registered under the Investment Company Act of 1940 as a no-load, diversified, open-end management investment company. The Fund’s primary investment objective is to provide long-term total return. The Fund seeks to meet its objective by investing its assets in a diversified portfolio of common stocks. In order to accomplish these goals, the Fund intends to hold stocks for the long term, as opposed to actively buying and selling. There can be no assurances that the Fund’s investment objectives will be achieved. The Fund was organized as a business trust under Massachusetts law. The Torray Corporation serves as administrator and investment advisor to the Fund.
The following is a summary of accounting policies followed by the Fund in the preparation of its financial statements.
Securities Valuation Short-term obligations having remaining maturities of 60 days or less are valued at amortized cost, which approximates market value. Portfolio securities for which market quotations are readily available are valued at market value, which is determined by using the last reported sale price, or, if no sales are reported, the last reported bid price. For NASDAQ traded securities, market value may also be determined on the basis of the NASDAQ official closing price (the “NOCP”) instead of the last reported sales price.
Securities Transactions and Investment Income Securities transactions are recorded on a trade date basis. Realized gains and losses from securities transactions are recorded on the specific identification basis. Dividend income is recorded on the ex-dividend date and interest income, including amortization of discount on short-term investments, is recorded on the accrual basis.
Federal Income Taxes The Fund intends to continue to comply with the requirements of the Internal Revenue Code applicable to regulated investment companies and to distribute all of its taxable income, including any net realized gain on investments to its shareholders. Therefore, no Federal income tax provision is required. Cost of securities for tax purposes is substantially the same as for financial reporting purposes.
Net Asset Value The net asset value per share of the Fund is determined once on each day that the New York Stock Exchange is open, as of the close of the Exchange.
Use of Estimates In preparing financial statements in accordance with U.S. generally accepted accounting principles, management is required to make estimates and assumptions that affect the reported amounts of assets and liabilities and the disclosure of contingent assets and liabilities at the date of the financial statements, and revenues and expenses during the reporting period. Actual results could differ from those estimates.
14
The Torray Fund
NOTES TO FINANCIAL STATEMENTS
As of June 30, 2003 (unaudited)
NOTE 2 — SHARES OF BENEFICIAL INTEREST TRANSACTIONS
Transactions in shares of beneficial interest were as follows:
| | | Six months ended 06/30/03
| | | Year ended 12/31/02
| |
| | | Shares
| | | Amount
| | | Shares
| | | Amount
| |
Shares issued | | 2,926,906 | | | $ | 97,216,219 | | | 7,976,490 | | | $ | 284,739,641 | |
Reinvestments of dividends and distributions | | 239,722 | | | | 8,467,620 | | | 501,011 | | | | 16,935,699 | |
Shares redeemed | | (4,401,931 | ) | | | (145,652,422 | ) | | (9,726,760 | ) | | | (340,404,829 | ) |
| | |
|
| |
|
|
| |
|
| |
|
|
|
| | | (1,235,303 | ) | | $ | (39,968,583 | ) | | (1,249,259 | ) | | $ | (38,729,489 | ) |
| | |
|
| |
|
|
| |
|
| |
|
|
|
Officers, Trustees and affiliated persons of The Torray Fund and their families directly or indirectly control 1,692,820 shares or 4.11% of the Fund.
NOTE 3 — PORTFOLIO SECURITIES
Purchases and sales of investment securities, other than short-term investments, for the six months ended June 30, 2003, aggregated $221,089,054 and $261,532,011, respectively. Net unrealized appreciation of investments at June 30, 2003, includes aggregate unrealized gains of $204,291,491 and unrealized losses of $73,911,610.
NOTE 4 — MANAGEMENT CONTRACT
Pursuant to the Management Contract, The Torray Corporation provides investment advisory and portfolio management services to the Fund. The Fund pays The Torray Corporation a management fee, computed daily and payable monthly at the annual rate of one percent of the Fund’s average daily net assets. During the six months ended June 30, 2003, The Torray Fund paid management fees of $6,898,053 (1% of average net assets).
Excluding the management fee, other expenses incurred by the Fund during the six months ended June 30, 2003, totaled $626,699. These expenses include all costs associated with the Fund’s operations including transfer agent fees, Independent Trustees’ fees ($10,000 per annum and $1,000 for each Board meeting attended), taxes, dues, fees and expenses of registering and qualifying the Fund and its shares for distribution, charges of custodian, auditing and legal expenses, insurance premiums, supplies, postage, expenses of issue or redemption of shares, reports to shareholders and Trustees, expenses of printing and mailing prospectuses, proxy statements and proxies to existing shareholders, and other miscellaneous expenses.
Certain officers and Trustees of the Fund are also officers and/or shareholders of The Torray Corporation.
15
TRUSTEES
Douglas C. Eby
Bruce C. Ellis
Patricia Kavanagh
William M Lane
Carl C. MacCartee, Jr.
Robert P. Moltz
Charlene R. Nunley
Roy A. Schotland
Wayne H. Shaner
Robert E. Torray
INVESTMENT ADVISOR
The Torray Corporation
OFFICERS
Robert E. Torray, President
Douglas C. Eby, Vice President
William M Lane, Vice President
AUDITORS
Briggs, Bunting & Dougherty, LLP
Two Penn Center Plaza, Suite 820
Philadelphia, PA 19102-1732
TRANSFER AGENT
PFPC Inc.
760 Moore Road
King of Prussia, PA 19406-1212
LEGAL COUNSEL
Dechert
1775 Eye Street, N.W.
Washington, D.C. 20006
This report is not authorized for distribution to prospective investors unless preceded or accompanied by a current prospectus.
The
TORRAY
FUND
SEMI-ANNUAL REPORT
June 30, 2003
The Torray Fund
Suite 1100
7501 Wisconsin Avenue
Bethesda, Maryland 20814-6523
(301) 493-4600
(800) 443-3036
The Torray Institutional Fund
Letter to Shareholders
August 4, 2003
Dear Fellow Shareholders:
The Torray Institutional Fund appreciated 12.9% during the first half of 2003, compared to 11.8% for the Standard & Poor’s 500 Index. Its cumulative return since inception two years ago was 2.4%, while the Index lost 17.8%.
Recognizing that your Fund has been open only two years, we have incorporated into this letter the records of The Torray Fund and our affiliate, Robert E. Torray & Co. Inc., a manager of large pension accounts, other corporate assets and endowments. These entities employ the same philosophy and approach as the Institutional Fund, and we believe their histories provide relevant perspectives on your investment.
When we wrote to you at this time a year ago, things were bleak. The market was down 50%, and investors were very discouraged. Our shareholder letter, dated July 22, 2002, said that despite current circumstances we were optimistic (this letter is carried on our website at www.torray.com). We expressed confidence about long-range prospects for the economy and stock prices, but uncertainty as to the timing of a rebound. The ensuing market recovery came as a complete surprise. On July 24, stocks rallied 5.7% and five days after that, another 5.4%. On three days over the next six weeks, they rose 4.0%, 4.0% and 4.7%, respectively, for a total gain of 26.3%. Yet, at the close of this year’s first half, 236 trading days after the advance began, the S&P 500 was ahead 24.3%. Absent those five big up-days last year, the market, on a compound basis, lost 1.6% for the period. So, despite a rise that would take almost a half-century to match at today’s money market fund rates, the odds of making anything trading in and out over this time frame were 50 to 1 against you.
Yet, many people keep trying, along the way equating the ups and downs of their investments to making or losing money. This is a false perception. In the short run, which we view as anything less than 5 years, the market is driven mainly by fads and emotions. Unfortunately, investors and financial service companies have proven highly vulnerable to these compromising inputs. Thus, when nonsensical themes captivate Wall Street, money pours into them, setting the stage for an inevitable reversal. The collapse of the technology sector and dot.coms a few years ago is a prime example.
Surprisingly, a new speculation has recently surfaced: the shares of 200 companies that lost money last year have doubled and according to Birinyi Associates, the NASDAQ 100 Index is trading at 240 times last year’s earnings, suggesting investors are once again fixated on price
1
The Torray Institutional Fund
Letter to Shareholders
August 4, 2003
momentum and picking stocks based on guesses about what others might pick rather than business performance. These foolish strategies should be avoided.
In that connection, it is helpful to keep in mind that stocks cannot outperform businesses for long. Investors forgot this during the late 90’s. At the time, corporate earnings were growing 6% annually but stocks were going up 28%. There was no way it could last. In the end many were burned far worse than market statistics suggest. That’s because the largest sums of money entered the game near the top. When prices collapsed, everyone ran for the exits, sealing the fate of the late-arriving players. By contrast, those that were invested in a diversified list of successful companies when the advance began in 1995 are now in great shape 8 1/2 years later. For instance, our companion Torray Fund, after which the Institutional Fund is modeled, made 15.3% a year over that period and the S&P 500, 11.1%.
This underscores the fact that the market’s gyrations only punish investors that behave irrationally. A new study by Dalbar Inc. confirms the point. It estimates that between 1984 and 2002 mutual fund shareholders made less than 3% annually, even though funds averaged 9.3% and the S&P 500 made 12.2%. Dalbar ascribes most of the disparity to investors’ penchant for piling in as prices rise and bailing out when they fall. Fund switching, fees, expenses and taxes explain the rest. Investors clearly need to address these issues. But, more important by far, they should restrict their investments to funds that buy and hold companies with proven track records. As we have often said, business performance drives stock prices, not the other way around.
It is also key to recognize that success doesn’t depend on beating the market every year. In fact, attempts to do so are bound to produce the opposite result. The Torray Fund’s long-term
Reprinted with permisssion. All rights reserved.
2
The Torray Institutional Fund
Letter to Shareholders
August 4, 2003
return has handily outrun the market; yet, in three out of the last 12 1/2 years — 1991, ‘93 and ‘98 — it trailed the S&P 500 Index by 10.5, 3.7 and 20.4 percentage points, respectively. The record of our affiliate, Robert E. Torray & Co. Inc., is similar: returns lagged the market for 10 out of the 30.6 years since its incorporation — on three occasions by 18-22 percentage points each. Although these large disparities would seem to doom the outcome, we earned 14.2% compounded annually compared to 10.9% for the S&P 500, a cumulative gain of 5,642% versus 2,235%. Clearly, you don’t have to outperform every year to be a winner.
Having said this, the reality is that mutual fund track records have no bearing on how most shareholders fare. For one thing, investors move around a lot — the average holding period has fallen to 30 months, down from 15 years several decades ago. This renders a fund’s record on either side of that brief window irrelevant. Another factor is that shareholders increase their investment as prices rise — particularly when it comes to buying funds that have turned in eye-popping recent performance. As ever-larger sums flow into these situations, the weighted cost basis for shareholders as a group goes up. Then, if the market falls, investors suffer a net loss even though the fund’s historic returns may have been excellent. It happens all the time.
We’ve experienced this at The Torray Fund: only the original investors — and there weren’t many — have earned 14.3% on their money. Likewise, a very small percentage of today’s shareholders were with us from 1995 on and realized a 15.3% annual return. But, as the Fund’s shares advanced 50%, 29%, 37% and 24% in 1995, ‘96, ‘97 and ‘99, tens of thousands of new investors came in at successively higher prices, substantially increasing the cost profile for shareholders as a group. When the market bottomed this spring, most had a loss.
Now, this is no one’s fault, nor is it a reason to be discouraged. Results generated in the early years of an investment are almost always a function of timing. For example, those that purchased The Torray Fund a few years ago suffered a temporary depreciation of, say, 25%, while investors that came in this March had the opposite experience — their shares are up 25%. Yet, each group bought essentially the same portfolio managed by the same team that has been in place for over 12 1/2 years. And, it cannot be said one was smarter than the other, for there was no more reason to think the Fund’s stock would drop during the earlier period than to believe it would rally this spring. In the end, it shouldn’t matter anyway. If shareholders remain with us long enough, their returns will eventually converge. That is our hope. It’s the caliber of the investment and persistence of the investor that count, not the entry price.
3
The Torray Institutional Fund
Letter to Shareholders
August 4, 2003
In closing, we want to reaffirm our confidence in the economy and stock market. Even if current uncertainties persist for a few more years, investors in solid companies like those held in The Torray Institutional Fund should still enjoy a low-risk, reasonable return. On behalf of your trustees, management and the staff of The Torray Corporation, we extend our best wishes and appreciation for the confidence you have placed in us.
| Sincerely, | | |
 | |  |
| Robert E. Torray | | Douglas C. Eby |
4
The Torray Institutional Fund
SCHEDULE OF INVESTMENTS
As of June 30, 2003 (unaudited)
| | | Shares
| | | | Market Value
|
| COMMON STOCK 99.54% | | | |
| |
22.25% DIVERSIFIED FINANCIAL SERVICES | | | |
| | | 574,700 | | J.P. Morgan Chase & Co. | | $ | 19,643,246 |
| | | 66,900 | | Markel Corporation * | | | 17,126,400 |
| | | 248,900 | | AMBAC Financial Group, Inc. | | | 16,489,625 |
| | | 372,100 | | Franklin Resources, Inc. | | | 14,537,947 |
| | | 197,900 | | American International Group, Inc. | | | 10,920,122 |
| | | 126,700 | | Citigroup, Inc. | | | 5,422,760 |
| | | 126,600 | | American Express Company | | | 5,293,146 |
| | | | | | |
|
|
| | | | | | | | 89,433,246 |
| |
13.48% PHARMACEUTICALS | | | |
| | | 313,100 | | Amgen Inc. * | | | 20,802,364 |
| | | 221,000 | | Merck & Co., Inc. | | | 13,381,550 |
| | | 245,300 | | Pfizer Inc. | | | 8,376,995 |
| | | 216,300 | | Bristol-Myers Squibb Company | | | 5,872,545 |
| | | 126,000 | | Wyeth | | | 5,739,300 |
| | | | | | |
|
|
| | | | | | | | 54,172,754 |
| |
10.48% MEDIA & ENTERTAINMENT | | | |
| | | 393,800 | | Clear Channel Communications, Inc. * | | | 16,693,182 |
| | | 233,700 | | Tribune Company | | | 11,287,710 |
| | | 534,300 | | The Walt Disney Company | | | 10,552,425 |
| | | 47,000 | | Gannett Co., Inc. | | | 3,610,070 |
| | | | | | |
|
|
| | | | | | | | 42,143,387 |
| |
8.75% DIVERSIFIED MEDICAL PRODUCTS | | | |
| | | 389,600 | | Abbott Laboratories | | | 17,048,896 |
| | | 183,800 | | Johnson & Johnson | | | 9,502,460 |
| | | 141,200 | | Boston Scientific Corporation * | | | 8,627,320 |
| | | | | | |
|
|
| | | | | | | | 35,178,676 |
| |
7.80% BANKING | | | |
| | | 306,300 | | Bank One Corporation | | | 11,388,234 |
| | | 345,600 | | Charter One Financial, Inc. | | | 10,775,808 |
| | | 116,500 | | Bank of America Corporation | | | 9,206,995 |
| | | | | | |
|
|
| | | | | | | | 31,371,037 |
5
The Torray Institutional Fund
SCHEDULE OF INVESTMENTS
As of June 30, 2003 (unaudited)
| | | Shares
| | | | Market Value
|
| |
7.00% DIVERSIFIED MANUFACTURING | | | |
| | | 226,400 | | United Technologies Corporation | | $ | 16,035,912 |
| | | 450,900 | | Honeywell International Inc. | | | 12,106,665 |
| | | | | | |
|
|
| | | | | | | | 28,142,577 |
| |
6.64% CONSUMER PRODUCTS | | | |
| | | 324,500 | | Kimberly-Clark Corporation | | | 16,919,430 |
| | | 109,800 | | The Procter & Gamble Company | | | 9,791,964 |
| | | | | | |
|
|
| | | | | | | | 26,711,394 |
| |
5.09% INDUSTRIAL MACHINERY | | | |
| | | 311,000 | | Illinois Tool Works Inc. | | | 20,479,350 |
| |
4.27% DATA PROCESSING & MANAGEMENT | | | |
| | | 506,700 | | Automatic Data Processing, Inc. | | | 17,156,862 |
| |
3.32% COMPUTER SYSTEMS & INTEGRATION | | | |
| | | 113,900 | | IBM Corporation | | | 9,396,750 |
| | | 184,900 | | Hewlett-Packard Company | | | 3,938,370 |
| | | | | | |
|
|
| | | | | | | | 13,335,120 |
| |
2.94% COMMUNICATIONS SERVICES | | | |
| | | 180,200 | | EchoStar Communications Corporation * | | | 6,238,524 |
| | | 434,000 | | Hughes Electronics Corporation * | | | 5,559,540 |
| | | | | | |
|
|
| | | | | | | | 11,798,064 |
| |
2.39% ELECTRICAL EQUIPMENT | | | |
| | | 187,700 | | Emerson Electric Co. | | | 9,591,470 |
| |
1.76% COMPUTERS & PERIPHERALS | | | |
| | | 795,500 | | Sun Microsystems, Inc. * | | | 3,659,300 |
| | | 325,100 | | EMC Corporation * | | | 3,403,797 |
| | | | | | |
|
|
| | | | | | | | 7,063,097 |
| |
1.27% REAL ESTATE | | | |
| | | 184,000 | | CarrAmerica Realty Corporation | | | 5,117,040 |
6
The Torray Institutional Fund
SCHEDULE OF INVESTMENTS
As of June 30, 2003 (unaudited)
| | | Shares
| | | | Market Value
| |
| |
1.25% SOFTWARE | | | | |
| | | 416,800 | | Oracle Corporation * | | $ | 5,009,936 | |
| |
0.85% SEMICONDUCTOR EQUIPMENT & PRODUCTS | | | | |
| | | 165,100 | | Intel Corporation | | | 3,431,438 | |
| | | | | | |
|
|
|
| TOTAL COMMON STOCK 99.54% | | | 400,135,448 | |
(cost $380,852,339) | | | | | | |
| SHORT-TERM INVESTMENTS 3.39% | | | | |
(cost $13,609,490) | | PNC Bank Money Market Account, 0.58% | | | 13,609,490 | |
| | | | | | |
|
|
|
| TOTAL PORTFOLIO SECURITIES 102.93% | | | 413,744,938 | |
(cost $394,461,829) | | | | |
| OTHER ASSETS LESS LIABILITIES (2.93)% | | | (11,775,346 | ) |
| | | | | | |
|
|
|
| NET ASSETS 100.00% | | $ | 401,969,592 | |
| | | | | | |
|
|
|
TOP 10 HOLDINGS
1. Amgen Inc. * | | 6. Abbott Laboratories |
2. Illinois Tool Works Inc. | | 7. Kimberly-Clark Corporation |
3. J.P. Morgan Chase & Co. | | 8. Clear Channel Communications, Inc. * |
4. Automatic Data Processing, Inc. | | 9. AMBAC Financial Group, Inc. |
5. Markel Corporation * | | 10. United Technologies Corporation |
*non-income producing securities
See notes to the financial statements.
7
The Torray Institutional Fund
STATEMENT OF ASSETS AND LIABILITIES
As of June 30, 2003 (unaudited)
| |
ASSETS | | | |
| |
Investments in securities at value
(cost $394,461,829) | | $ | 413,744,938 |
| |
Interest and dividends receivable | | | 424,420 |
| | |
|
|
| |
TOTAL ASSETS | | | 414,169,358 |
| | |
|
|
| |
LIABILITIES | | | |
| |
Payable for investments purchased | | | 11,924,366 |
| |
Payable to advisor | | | 275,400 |
| | |
|
|
| |
TOTAL LIABILITIES | | | 12,199,766 |
| | |
|
|
| |
NET ASSETS | | $ | 401,969,592 |
| | |
|
|
| |
Shares of beneficial interest ($1 stated value,
3,989,812 shares outstanding, unlimited
shares authorized) | | $ | 3,989,812 |
| |
Paid-in-capital in excess of par | | | 377,014,837 |
| |
Accumulated net investment income | | | 53,165 |
| |
Accumulated net realized gain | | | 1,628,669 |
| |
Net unrealized appreciation of investments | | | 19,283,109 |
| | |
|
|
| |
TOTAL NET ASSETS | | $ | 401,969,592 |
| | |
|
|
| |
Per Share | | $ | 100.75 |
| | |
|
|
See notes to the financial statements.
8
The Torray Institutional Fund
STATEMENT OF OPERATIONS
For the six months ended June 30, 2003 (unaudited)
| |
INVESTMENT INCOME | | | |
| |
Dividend income | | $ | 1,617,107 |
| |
Interest income | | | 21,918 |
| | |
|
|
| |
Total income | | | 1,639,025 |
| | |
|
|
| |
EXPENSES | | | |
| |
Management fees | | | 892,729 |
| | |
|
|
| |
Total expenses | | | 892,729 |
| | |
|
|
| |
NET INVESTMENT INCOME | | | 746,296 |
| | |
|
|
| |
REALIZED AND UNREALIZED GAIN
ON INVESTMENTS | | | |
| |
Net realized gain on investments | | | 1,806,343 |
| |
Net change in unrealized appreciation on investments | | | 26,244,951 |
| | |
|
|
| |
Net realized and unrealized gain on investments | | | 28,051,294 |
| | |
|
|
| |
NET INCREASE IN NET ASSETS FROM OPERATIONS | | $ | 28,797,590 |
| | |
|
|
See notes to the financial statements.
9
The Torray Institutional Fund
STATEMENT OF CHANGES IN NET ASSETS
For the periods indicated:
| | | Six months ended
06/30/03
(unaudited)
| | | Year ended
12/31/02
| |
| | |
Increase (Decrease) in Net Assets from Operations: | | | | | | | | |
| | |
Net investment income | | $ | 746,296 | | | $ | 709,289 | |
| | |
Net realized gain on investments | | | 1,806,343 | | | | 61,893 | |
| | |
Net change in unrealized appreciation (depreciation) on investments | | | 26,244,951 | | | | (9,777,300 | ) |
| | |
|
|
| |
|
|
|
| | |
Net increase (decrease) in net assets from operations | | | 28,797,590 | | | | (9,006,118 | ) |
| | |
|
|
| |
|
|
|
| | |
Distributions to Shareholders from: | | | | | | | | |
| | |
Net investment income ($0.252 and $0.679 per share, respectively) | | | (693,131 | ) | | | (709,190 | ) |
| | |
Net realized gains ($0 and $0 per share, respectively) | | | — | | | | — | |
| | |
|
|
| |
|
|
|
| | |
Total distributions | | | (693,131 | ) | | | (709,190 | ) |
| | |
|
|
| |
|
|
|
| | |
Shares of Beneficial Interest: | | | | | | | | |
| | |
Increase from share transactions | | | 236,149,681 | | | | 96,746,538 | |
| | |
|
|
| |
|
|
|
| | |
Total increase | | | 264,254,140 | | | | 87,031,230 | |
| | |
Net Assets — Beginning of period | | | 137,715,452 | | | | 50,684,222 | |
| | |
|
|
| |
|
|
|
| | |
Net Assets — End of period | | $ | 401,969,592 | | | $ | 137,715,452 | |
| | |
|
|
| |
|
|
|
See notes to the financial statements.
10
The Torray Institutional Fund
FINANCIAL HIGHLIGHTS
For a share outstanding:
PER SHARE DATA
| | | Six months
ended
06/30/03
(unaudited)
| | | Year
ended
12/31/02
| | | Period
ended
12/31/01(1)
| |
| | | |
Net Asset Value,
Beginning of Period | | $ | 89.490 | | | $ | 103.300 | | | $ | 100.000 | |
| | |
|
|
| |
|
|
| |
|
|
|
| | | |
Income from investment operations: | | | | | | | | | | | | |
| | | |
Net investment income | | | 0.332 | | | | 0.679 | | | | 0.359 | |
| | | |
Net gains (losses) on securities (both realized and unrealized) | | | 11.180 | | | | (13.810 | ) | | | 3.555 | |
| | |
|
|
| |
|
|
| |
|
|
|
| | | |
Total from investment operations | | | 11.512 | | | | (13.131 | ) | | | 3.914 | |
| | |
|
|
| |
|
|
| |
|
|
|
| | | |
Less: Distributions | | | | | | | | | | | | |
| | | |
Dividends (from net investment income) | | | (0.252 | ) | | | (0.679 | ) | | | (0.359 | ) |
| | | |
Distributions (from capital gains) | | | 0.000 | | | | 0.000 | | | | (0.255 | ) |
| | |
|
|
| |
|
|
| |
|
|
|
| | | |
Total distributions | | | (0.252 | ) | | | (0.679 | ) | | | (0.614 | ) |
| | |
|
|
| |
|
|
| |
|
|
|
| | | |
Net Asset Value,
End of Period | | $ | 100.75 | | | $ | 89.49 | | | $ | 103.30 | |
| | |
|
|
| |
|
|
| |
|
|
|
| | | |
TOTAL RETURN(2) | | | 12.88 | % | | | (12.73 | %) | | | 3.99 | % |
| | | |
RATIOS/SUPPLEMENTAL DATA | | | | | | | | | | | | |
| | | |
Net assets, end of period (000’s omitted) | | $ | 401,970 | | | $ | 137,715 | | | $ | 50,684 | |
| | | |
Ratios of expenses to average net assets | | | 0.85 | %* | | | 0.85 | % | | | 0.85 | %* |
| | | |
Ratios of net income to average net assets | | | 0.71 | %* | | | 0.85 | % | | | 0.76 | %* |
| | | |
Portfolio turnover rate | | | 6.78 | % | | | 6.87 | % | | | 8.84 | %* |
| (1) | | The Torray Institutional Fund commenced operation on June 30, 2001. |
| (2) | | Past performance is not predictive of future performance. |
See notes to the financial statements.
11
The Torray Institutional Fund
NOTES TO FINANCIAL STATEMENTS
As of June 30, 2003 (unaudited)
NOTE 1 — SUMMARY OF SIGNIFICANT ACCOUNTING POLICIES
The Torray Institutional Fund (“Fund”) is registered under the Investment Company Act of 1940 as a no-load, diversified, open-end management investment company. The Fund was SEC organized on June 29, 2001 and commenced operations on June 30, 2001. The Fund’s primary investment objective is to provide long-term total return. The Fund seeks to meet its objective by investing its assets in a diversified portfolio of common stocks. In order to accomplish these goals, the Fund intends to hold stocks for the long term, as opposed to actively buying and selling. There can be no assurances that the Fund’s investment objectives will be achieved. The Fund was organized as a business trust under Massachusetts law. The Torray Corporation serves as administrator and investment advisor to the Fund.
The following is a summary of accounting policies followed by the Fund in the preparation of its financial statements.
Securities Valuation Short-term obligations having remaining maturities of 60 days or less are valued at amortized cost, which approximates market value. Portfolio securities for which market quotations are readily available are valued at market value, which is determined by using the last reported sale price, or, if no sales are reported, the last reported bid price. For NASDAQ traded securities, market value may also be determined on the basis of the NASDAQ official closing price (the “NOCP”) instead of the last reported sales price.
Securities Transactions and Investment Income Securities transactions are recorded on a trade date basis. Realized gains and losses from securities transactions are determined by using the identified cost method. Dividend income is recorded on the ex-dividend date and interest income, including amortization of discount on short-term investments, is recorded on the accrual basis.
Federal Income Taxes The Fund intends to continue to comply with the requirements of the Internal Revenue Code applicable to regulated investment companies and to distribute all of its taxable income, including any net realized gain on investments to its shareholders. Therefore, no Federal income tax provision is required. Cost of securities for tax purposes is substantially the same as for financial reporting purposes.
Net Asset Value The net asset value per share of the Fund is determined once on each day that the New York Stock Exchange is open, as of the close of the Exchange.
Use of Estimates In preparing financial statements in accordance with accounting principles generally accepted in the United States of America, management is required to make estimates and assumptions that affect the reported amounts of assets and liabilities and the disclosure of contingent assets and liabilities at the date of the financial statements, and revenues and expenses during the reporting period. Actual results could differ from those estimates.
12
The Torray Institutional Fund
NOTES TO FINANCIAL STATEMENTS
As of June 30, 2003 (unaudited)
NOTE 2 — SHARES OF BENEFICIAL INTEREST TRANSACTIONS
Transactions in shares of beneficial interest were as follows:
| | | Six months ended
06/30/03
| | | Year ended
12/31/02
| |
| | | Shares
| | | Amount
| | | Shares
| | | Amount
| |
Shares issued | | 2,559,383 | | | $ | 246,574,306 | | | 1,201,693 | | | $ | 110,574,522 | |
Reinvestments of dividends and distributions | | 6,129 | | | | 595,897 | | | 6,063 | | | | 549,695 | |
Shares redeemed | | (114,639 | ) | | | (11,020,522 | ) | | (159,463 | ) | | | (14,377,679 | ) |
| | |
|
| |
|
|
| |
|
| |
|
|
|
| | | 2,450,873 | | | $ | 236,149,681 | | | 1,048,293 | | | $ | 96,746,538 | |
| | |
|
| |
|
|
| |
|
| |
|
|
|
Officers, Trustees and affiliated persons of The Torray Institutional Fund and their families directly or indirectly control 178,715 shares or 4.48% of the Fund.
NOTE 3 — PORTFOLIO SECURITIES
Purchases and sales of investment securities, other than short-term investments, for the six months ended June 30, 2003, aggregated $261,105,282 and $14,546,847, respectively. Net unrealized depreciation of investments at June 30, 2003, includes aggregate unrealized gains of $24,885,883 and unrealized losses of $5,602,774.
NOTE 4 — MANAGEMENT CONTRACT
Pursuant to the Management Contract, The Torray Corporation provides investment advisory and portfolio management services to the Fund. The Fund pays The Torray Corporation a management fee, computed daily and payable monthly at the annual rate of 0.85% of the Fund’s average daily net assets. During the six months ended June 30, 2003, The Torray Institutional Fund paid comprehensive management fees of $892,729 (0.85% of average daily net assets). The Fund pays the manager a single comprehensive management fee which covers all operating expenses of the Fund including the investment advisory and management services provided by the manager as well as all miscellaneous costs incurred in connection with the ongoing operation of the Fund including transfer agency, custody, professional, and registration fees.
Certain officers and Trustees of the Fund are also officers and/or shareholders of The Torray Corporation.
13
TRUSTEES
Douglas C. Eby
Bruce C. Ellis
Patricia Kavanagh
William M Lane
Carl C. MacCartee, Jr.
Robert P. Moltz
Charlene R. Nunley
Roy A. Schotland
Wayne H. Shaner
Robert E. Torray
INVESTMENT ADVISOR
The Torray Corporation
OFFICERS
Robert E. Torray, President
Douglas C. Eby, Vice President
William M Lane, Vice President
AUDITORS
Briggs, Bunting & Dougherty, LLP
Two Penn Center Plaza, Suite 820
Philadelphia, PA 19102-1732
TRANSFER AGENT
PFPC Inc.
760 Moore Road
King of Prussia, PA 19406-1212
LEGAL COUNSEL
Dechert
1775 Eye Street, N.W.
Washington, D.C. 20006
This report is not authorized for distribution to prospective investors unless preceded or accompanied by a current prospectus.
The
TORRAY
INSTITUTIONAL
FUND
SEMI-ANNUAL REPORT
June 30, 2003
The Torray Institutional Fund
Suite 1100
7501 Wisconsin Avenue
Bethesda, Maryland 20814-6523
(301) 493-4600
(800) 443-3036
Item 2. Code of Ethics.
Not applicable.
Item 3. Audit Committee Financial Expert.
Not applicable.
Item 4. Principal Accountant Fees and Services.
Not applicable.
Item 5. Audit Committee of Listed Registrants.
Not applicable.
Item 6. [Reserved]
Item 7. Disclosure of Proxy Voting Policies and Procedures for Closed-End Management Investment Companies.
Not applicable.
Item 8. [Reserved]
Item 9. Controls and Procedures.
| (a) | | The registrant’s principal executive and principal financial officers, or persons performing similar functions, have concluded that the registrant’s disclosure controls and procedures (as defined in Rule 30a-3(c) under the Investment Company Act of 1940, as amended (the “1940 Act”) (17 CFR 270.30a-3(c))) are effective, as of a date within 90 days of the filing date of the report that includes the disclosure required by this paragraph, based on their evaluation of these controls and procedures required by Rule 30a-3(b) under the 1940 Act (17 CFR 270.30a-3(b)) and Rules 13a-15(b) or 15d-15(b) under the Exchange Act (17 CFR 240.13a-15(b) or 240.15d-15(b)). |
| (b) | | There were no changes in the registrant’s internal control over financial reporting (as defined in Rule 30a-3(d) under the 1940 Act (17 CFR 270.30a-3(d)) that occurred during the registrant’s last fiscal half-year (the registrant’s second fiscal half-year in the case of an annual report) that has materially affected, or is reasonably likely to materially affect, the registrant’s internal control over financial reporting. |
Item 10. Exhibits.
| |
| (a | )(1) | | Not applicable. |
| |
| (a | )(2) | | Certifications pursuant to Section 302 of the Sarbanes-Oxley Act of 2002 are attached hereto. |
| |
| (b | ) | | Certifications pursuant to Section 906 of the Sarbanes-Oxley Act of 2002 are attached hereto. |
SIGNATURES
Pursuant to the requirements of the Securities Exchange Act of 1934 and the Investment Company Act of 1940, the registrant has duly caused this report to be signed on its behalf by the undersigned, thereunto duly authorized.
| (registrant) THE TORRAY FUND |
| |
By (Signature and Title)*: | | /s/ WILLIAM M. LANE
|
| | | | | William M. Lane President & Secretary |
| |
Date | | 8/22/03 |
Pursuant to the requirements of the Securities Exchange Act of 1934 and the Investment Company Act of 1940, this report has been signed below by the following persons on behalf of the registrant and in the capacities and on the dates indicated.
| |
By (Signature and Title)*: | | /s/ WILLIAM M. LANE
|
| | | | | William M. Lane President & Secretary |
| |
Date | | 8/22/03 |
| |
By (Signature and Title)*: | | /s/ DOUGLAS C. EBY
|
| | | | | Douglas C. Eby Vice President & Treasurer |
| |
Date | | 8/22/03 |
| * | | Print the name and title of each signing officer under his or her signature. |