UNITED STATES
SECURITIES AND EXCHANGE COMMISSION
Washington, D.C. 20549
FORM N-CSR
CERTIFIED SHAREHOLDER REPORT OF REGISTERED MANAGEMENT
INVESTMENT COMPANIES
Investment Company Act file number 811-06096
The Torray Fund
(Exact name of registrant as specified in charter)
7501 Wisconsin Avenue, Suite 1100
Bethesda, MD 20814-6523
(Address of principal executive offices) (Zip code)
William M Lane
Torray LLC
7501 Wisconsin Avenue, Suite 1100
Bethesda, MD 20814-6523
(Name and address of agent for service)
Registrant’s telephone number, including area code: 301-493-4600
Date of fiscal year end: December 31
Date of reporting period: December 31, 2011
Item 1. Reports to Stockholders.
The Report to Shareholders is attached herewith.
The Torray Fund
Letter to Shareholders
January 26, 2012
Dear Fellow Shareholders,
The Torray Fund gained 6.0% in 2011, compared to 2.1% for the Standard & Poor’s 500 Index. Since inception 21 years ago, it has returned 9.5% annually, turning $1 into $6.68. Comparable figures for the Index were 8.8% and $5.87. Given the performance of our economy and stock market over the last decade, we are pleased with the way things have turned out.
Last year started off well, with stocks advancing about 9% through the end of April. But then fears about the soaring Federal debt and a double-dip recession escalated, and the Middle East erupted in turmoil. In August, Standard & Poors cut the U.S.’s credit rating from AAA to AA, and doubts about the solvency of euro zone countries and banks sent stocks into a freefall. The sell off was marked by high volatility and increased volume, with daily price swings sometimes measuring two or three percentage points. Monthly gyrations ranged between a loss of 7% and a gain of 11%. Just when things looked the worst, stocks rallied 11% in October and limped along to close the year up 2.1%. Through it all, our Fund, with its quality investments and low 12.9% turnover, was hardly affected.
According to the New York Stock Exchange, an astonishing average of 4.4 billion NYSE-listed shares changed hands on the 252 trading days last year; annual volume was about 1.1 trillion shares, 2.6 times the 415 billion outstanding. As startling as these numbers are, they’re 10% lower than those of the preceding year. The collective value of all this paper shuffling amounted to approximately $32 trillion, a number twice the size of our country’s entire economy. Yet, in the end, nothing of value was created. In fact, after fees, commissions and taxes on trading gains — if any — investors as a group probably lost money. Only Wall Street and the tax collector came out ahead.
On the mutual fund front, turnover in domestic stock funds once again surpassed 100%, and shareholders continued to withdraw money — in this case $85 billion, extending the string of annual withdrawals back to 2007, for a total of $328 billion. By contrast, bond funds took in about twice that much in just the last three years, including $116 billion in 2011. Ironically, over a decade ago, when valuations on stocks were twice as high, investors largely ignored bonds and loaded up on stocks and stock funds.
Finally, reflecting the widely held view that emerging markets’ growth prospects are superior to those in the U.S., $34 billion shifted into international funds. While the potential of these markets may or may not be as advertised, last year was a bad time to try and find out. Brazil, China, Hong Kong, Japan and Singapore suffered losses of 12%, 18%, 15%, 19% and 17%, respectively. Germany, the European Union’s strongest country, lost 15%. Fortunately, we have avoided these venues and instead invested in U.S. companies that transact business in them. Many of our holdings generate 30% to 40%, and a few, 50%, of their revenues overseas. Our strategy is based on the belief that the long-standing records, superior finances, reliance on U.S. accounting standards and capable managements of these solid businesses outweigh the lure of less certain opportunities that are difficult to analyze from afar.
The stark reality of all this money jumping in and out of markets around the world, not to mention the popularity of exchange-traded funds, commodities and hedge funds, highlights today’s total disconnect between market
1
The Torray Fund
Letter to Shareholders (continued)
January 26, 2012
activity and business fundamentals. While most companies did well last year, investors were just too frightened by what stocks were doing to notice. The earnings of companies in The Torray Fund grew almost 9%, and 26 out of 31 increased dividends. Combined, earnings growth plus dividend yield exceeded 11%. We think this is a better measure of the improvement in the Fund’s fundamental value than its closing share price, which is only a snapshot of what investors think our stocks are worth on a given day.
While we may be wrong, it appears to us the worst of the economic crisis has passed and that large, high quality companies trading at today’s conservative valuations offer some of the best opportunities we’ve seen in our Company’s 40-year history. If earnings and dividends gradually rise in line with current projections, we believe share prices will eventually follow suit, providing reasonable returns that should outpace readily available alternatives.
We thank you for your investment and continued confidence in our management.
| | | | | | |
| | | Sincerely, | | | | |
| | | |
| | |  | | | | |
| | | Robert E. Torray | | | | |
| | | 
| | | | |
| | | Fred M. Fialco | | | | |
| | | 
| | | | |
| | | Shawn M. Hendon | | | | |
| | | | | | | |
2
The Torray Fund
PERFORMANCE DATA
As of December 31, 2011 (unaudited)
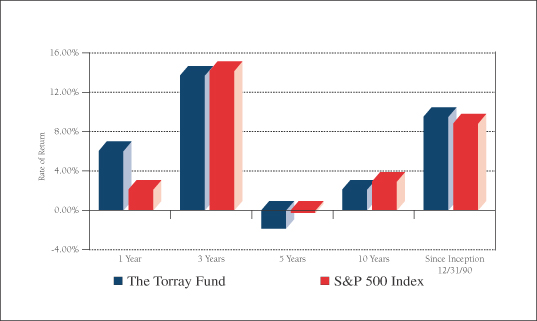
Average Annual Returns on an Investment in
The Torray Fund vs. the S&P 500 Index
For the periods ended December 31, 2011:
| | | | | | | | | | | | | | | | | | | | |
| | | 1 Year
| | | 3 Years
| | | 5 Years
| | | 10 Years
| | | Since
Inception
12/31/90
| |
The Torray Fund | | | 6.01 | % | | | 13.63 | % | | | -1.84 | % | | | 2.10 | % | | | 9.47 | % |
S&P 500 Index | | | 2.11 | % | | | 14.11 | % | | | -0.25 | % | | | 2.92 | % | | | 8.80 | % |
Cumulative Returns for the 21 years ended December 31, 2011
| | | | |
The Torray Fund | | | 568.32 | % |
S&P 500 Index | | | 487.14 | % |
3
The Torray Fund
PERFORMANCE DATA (continued)
As of December 31, 2011 (unaudited)
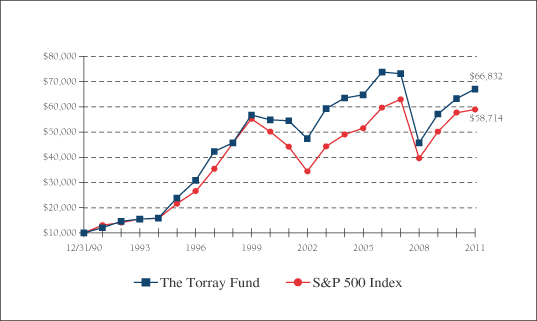
Change in Value of $10,000 Invested
on December 31, 1990 (commencement of operations) to:
| | | | | | | | | | | | | | | | | | | | | | | | | | | | |
| | | 12/31/93
| | | 12/31/96
| | | 12/31/99
| | | 12/31/02
| | | 12/31/05
| | | 12/31/08
| | | 12/31/11
| |
The Torray Fund | | $ | 15,448 | | | $ | 30,719 | | | $ | 56,519 | | | $ | 47,236 | | | $ | 64,542 | | | $ | 45,598 | | | $ | 66,832 | |
S&P 500 Index | | $ | 15,465 | | | $ | 26,499 | | | $ | 54,998 | | | $ | 34,318 | | | $ | 51,319 | | | $ | 39,511 | | | $ | 58,714 | |
The returns quoted represent past performance and do not guarantee future results. Investment return and principal value will fluctuate so that shares, when redeemed, may be worth more or less than their original cost. Current performance may be lower or higher. For perfomance current to the most recent month-end, please call (800) 626-9769. The returns shown do not reflect the deduction of taxes a shareholder would pay on the redemption of fund shares and distributions. The Fund’s annual operating expense ratio, as stated in the current prospectus, is 1.17%. Returns on both The Torray Fund and the S&P 500 Index assume reinvestment of all dividends and distributions. The S&P 500 Index is an unmanaged index consisting of 500 U.S. large-cap stocks. It is not possible to invest directly in an index. Current and future portfolio holdings are subject to change and risk.
4
The Torray Fund
FUND PROFILE
As of December 31, 2011 (unaudited)
| | | | |
DIVERSIFICATION (% of net assets) | | | | |
| |
Information Technology | | | 21.23% | |
Financials | | | 16.78% | |
Health Care | | | 16.68% | |
Industrials | | | 12.91% | |
Consumer Staples | | | 12.66% | |
Consumer Discretionary | | | 4.61% | |
Telecommunications | | | 3.07% | |
Materials | | | 2.67% | |
Short-Term Investments | | | 9.41% | |
Liabilities Less Other Assets | | | (0.02)% | |
| | |
|
|
|
| | | | 100.00% | |
| | |
|
|
|
| | | | | | | | |
| TOP TEN EQUITY HOLDINGS (% of net assets) | |
| | |
| | 1. | | | Chubb Corp. | | | 3.76% | |
| | 2. | | | Cintas Corp. | | | 3.76% | |
| | 3. | | | Kraft Foods Inc., Class A | | | 3.76% | |
| | 4. | | | General Electric Co. | | | 3.73% | |
| | 5. | | | Loews Corp. | | | 3.68% | |
| | 6. | | | Johnson & Johnson | | | 3.65% | |
| | 7. | | | Automatic Data Processing, Inc. | | | 3.55% | |
| | 8. | | | International Business Machines Corp. | | | 3.54% | |
| | 9. | | | Western Union Co. (The) | | | 3.35% | |
| | 10. | | | Abbott Laboratories | | | 3.33% | |
| | | | | | |
|
|
|
| | | | | | | | 36.11% | |
| | | | | | |
|
|
|
| | | | | | | | |
PORTFOLIO CHARACTERISTICS | | | | | |
| | |
Net Assets (million) | | | | | | | $344 | |
Number of Holdings | | | | | | | 31 | |
Portfolio Turnover | | | | | | | 12.85% | |
P/E Multiple (forward) | | | | | | | 11.8x | |
Weighted Average Dividend Yield | | | | | | | 2.40% | |
Market Capitalization (billion) | | | Average | | | | $67.1 | |
| | | | Median | | | | $44.3 | |
5
The Torray Fund
SCHEDULE OF INVESTMENTS
As of December 31, 2011
| | | | | | | | | | |
| | | Shares
| | | | | Market Value
| |
| COMMON STOCK 90.61% | | | | |
| |
21.23% INFORMATION TECHNOLOGY | | | | |
| | | | 226,500 | | | Automatic Data Processing, Inc. | | $ | 12,233,265 | |
| | | | 66,400 | | | International Business Machines Corp. | | | 12,209,632 | |
| | | | 632,100 | | | Western Union Co. (The) | | | 11,542,146 | |
| | | | 424,600 | | | Intel Corp. | | | 10,296,550 | |
| | | | 542,900 | | | Cisco Systems, Inc. | | | 9,815,632 | |
| | | | 400,000 | | | EMC Corp. * | | | 8,616,000 | |
| | | | 327,400 | | | Hewlett-Packard Co. | | | 8,433,824 | |
| | | | | | | | |
|
|
|
| | | | | | | | | | 73,147,049 | |
| |
16.78% FINANCIALS | | | | |
| | | | 187,200 | | | Chubb Corp. | | | 12,957,984 | |
| | | | 336,400 | | | Loews Corp. | | | 12,665,460 | |
| | | | 358,518 | | | Marsh & McLennan Cos., Inc. | | | 11,336,339 | |
| | | | 380,500 | | | Wells Fargo & Co. | | | 10,486,580 | |
| | | | 219,300 | | | American Express Co. | | | 10,344,381 | |
| | | | | | | | |
|
|
|
| | | | | | | | | | 57,790,744 | |
| |
16.68% HEALTH CARE | | | | |
| | | | 191,724 | | | Johnson & Johnson | | | 12,573,260 | |
| | | | 203,800 | | | Abbott Laboratories | | | 11,459,674 | |
| | | | 133,700 | | | Becton Dickinson & Co. | | | 9,990,064 | |
| | | | 190,700 | | | Baxter International Inc. | | | 9,435,836 | |
| | | | 146,900 | | | UnitedHealth Group Inc. | | | 7,444,892 | |
| | | | 99,100 | | | WellPoint, Inc. | | | 6,565,375 | |
| | | | | | | | |
|
|
|
| | | | | | | | | | 57,469,101 | |
| |
12.91% INDUSTRIALS | | | | |
| | | | 371,946 | | | Cintas Corp. | | | 12,947,440 | |
| | | | 717,797 | | | General Electric Co. | | | 12,855,745 | |
| | | | 118,900 | | | 3M Co. | | | 9,717,697 | |
| | | | 134,700 | | | General Dynamics Corp. | | | 8,945,427 | |
| | | | | | | | |
|
|
|
| | | | | | | | | | 44,466,309 | |
6
The Torray Fund
SCHEDULE OF INVESTMENTS (continued)
As of December 31, 2011
| | | | | | | | | | |
| | | Shares
| | | | | Market Value
| |
| |
12.66% CONSUMER STAPLES | | | | |
| | | | 346,400 | | | Kraft Foods Inc., Class A | | $ | 12,941,504 | |
| | | | 141,300 | | | Procter & Gamble Co. (The) | | | 9,426,123 | |
| | | | 314,400 | | | Sysco Corp. | | | 9,221,352 | |
| | | | 89,500 | | | Colgate-Palmolive Co. | | | 8,268,905 | |
| | | | 113,200 | | | Walgreen Co. | | | 3,742,392 | |
| | | | | | | | |
|
|
|
| | | | | | | | | | 43,600,276 | |
| |
4.61% CONSUMER DISCRETIONARY | | | | |
| | | | 149,900 | | | Tupperware Brands Corp. | | | 8,389,903 | |
| | | | 559,600 | | | Gannett Co., Inc. | | | 7,481,852 | |
| | | | | | | | |
|
|
|
| | | | | | | | | | 15,871,755 | |
| |
3.07% TELECOMMUNICATIONS | | | | |
| | | | 350,000 | | | AT&T Inc. | | | 10,584,000 | |
| |
2.67% MATERIALS | | | | |
| | | | 200,900 | | | E.I. du Pont de Nemours & Co. | | | 9,197,202 | |
| | | | | | | | |
|
|
|
| TOTAL COMMON STOCK 90.61% | | | 312,126,436 | |
(cost $277,681,811) | | | | | | | |
| | | |
| | | Principal Amount ($) | | | | | | |
| |
| SHORT-TERM INVESTMENTS 9.41% | | | | |
| | | | 32,420,873 | | | BNY Mellon Cash Reserve, 0.05%(1) | | | 32,420,873 | |
(cost $32,420,873) | | | | |
| | | | | | | | |
|
|
|
| TOTAL INVESTMENTS 100.02% | | | 344,547,309 | |
(cost $310,102,684) | | | | |
| LIABILITIES LESS OTHER ASSETS (0.02%) | | | (79,794 | ) |
| | | | | | | | |
|
|
|
| NET ASSETS 100.00% | | $ | 344,467,515 | |
| | | | | | | | |
|
|
|
| * | Non-income producing securities. |
| (1) | Represents current yield at December 31, 2011. |
See notes to the financial statements.
7
The Torray Fund
STATEMENT OF ASSETS AND LIABILITIES
As of December 31, 2011
| | | | |
ASSETS | | | | |
Investments in securities at value
(cost $310,102,684) | | $ | 344,547,309 | |
Interest and dividends receivable | | | 578,203 | |
Receivable for fund shares sold | | | 131 | |
Prepaid expenses | | | 35,058 | |
| | |
|
|
|
TOTAL ASSETS | | | 345,160,701 | |
| | |
|
|
|
| |
LIABILITIES | | | | |
Payable to Advisor | | | 290,851 | |
Payable for fund shares redeemed | | | 262,274 | |
Payable for transfer agent fees & expenses | | | 42,763 | |
Accrued expenses | | | 97,298 | |
| | |
|
|
|
TOTAL LIABILITIES | | | 693,186 | |
| | |
|
|
|
| |
NET ASSETS | | $ | 344,467,515 | |
| | |
|
|
|
Shares of beneficial interest ($1 stated value,
11,156,865 shares outstanding, unlimited shares authorized) | | $ | 11,156,865 | |
Paid-in-capital in excess of par | | | 384,594,550 | |
Undistributed net investment income | | | 76,663 | |
Accumulated net realized loss on investments | | | (85,805,188 | ) |
Net unrealized appreciation of investments | | | 34,444,625 | |
| | |
|
|
|
| |
TOTAL NET ASSETS | | $ | 344,467,515 | |
| | |
|
|
|
Net Asset Value, Offering and Redemption Price per Share | | $ | 30.87 | |
| | |
|
|
|
See notes to the financial statements.
8
The Torray Fund
STATEMENT OF OPERATIONS
For the year ended December 31, 2011
| | | | |
INVESTMENT INCOME | | | | |
Dividend income | | $ | 7,977,874 | |
Interest income | | | 12,888 | |
| | |
|
|
|
Total investment income | | | 7,990,762 | |
| | |
|
|
|
| |
EXPENSES | | | | |
Management fees | | | 3,560,358 | |
Transfer agent fees & expenses | | | 302,785 | |
Printing, postage & mailing | | | 82,921 | |
Legal fees | | | 73,778 | |
Insurance expense | | | 47,546 | |
Audit fees | | | 33,500 | |
Trustees’ fees | | | 31,090 | |
Registration & filing fees | | | 24,030 | |
Custodian fees | | | 18,569 | |
| | |
|
|
|
Total expenses | | | 4,174,577 | |
| | |
|
|
|
NET INVESTMENT INCOME | | | 3,816,185 | |
| | |
|
|
|
REALIZED AND UNREALIZED GAIN
ON INVESTMENTS | | | | |
Net realized gain on investments | | | 4,042,409 | |
Net change in unrealized appreciation (depreciation) on investments | | | 13,422,919 | |
| | |
|
|
|
Net realized and unrealized gain on investments | | | 17,465,328 | |
| | |
|
|
|
NET INCREASE IN NET ASSETS RESULTING FROM OPERATIONS | | $ | 21,281,513 | |
| | |
|
|
|
See notes to the financial statements.
9
The Torray Fund
STATEMENTS OF CHANGES IN NET ASSETS
For the years indicated:
| | | | | | | | |
| | | Year ended
12/31/11
| | | Year ended
12/31/10
| |
Increase in Net Assets Resulting from Operations: | | | | | | | | |
Net investment income | | $ | 3,816,185 | | | $ | 2,979,395 | |
Net realized gain on investments | | | 4,042,409 | | | | 4,801,831 | |
Net change in unrealized appreciation
(depreciation) on investments | | | 13,422,919 | | | | 29,046,530 | |
| | |
|
|
| |
|
|
|
Net increase in net assets from operations | | | 21,281,513 | | | | 36,827,756 | |
| | |
|
|
| |
|
|
|
| | |
Distributions to Shareholders from: | | | | | | | | |
Net investment income ($0.326 and
$0.233 per share, respectively) | | | (3,748,354 | ) | | | (2,970,563 | ) |
| | |
|
|
| |
|
|
|
Total distributions | | | (3,748,354 | ) | | | (2,970,563 | ) |
| | |
|
|
| |
|
|
|
| | |
Shares of Beneficial Interest | | | | | | | | |
Decrease from share transactions | | | (35,474,157 | ) | | | (34,462,230 | ) |
| | |
|
|
| |
|
|
|
Total decrease | | | (17,940,998 | ) | | | (605,037 | ) |
| | |
Net Assets — Beginning of Year | | | 362,408,513 | | | | 363,013,550 | |
| | |
|
|
| |
|
|
|
Net Assets — End of Year | | $ | 344,467,515 | | | $ | 362,408,513 | |
| | |
|
|
| |
|
|
|
Undistributed Net Investment Income | | $ | 76,663 | | | $ | 8,832 | |
| | |
|
|
| |
|
|
|
See notes to the financial statements.
10
The Torray Fund
FINANCIAL HIGHLIGHTS
For a share outstanding throughout each year presented:
PER SHARE DATA
| | | | | | | | | | | | | | | | | | | | |
| | | Years ended December 31:
| |
| | | 2011
| | | 2010
| | | 2009
| | | 2008
| | | 2007
| |
Net Asset Value, Beginning of Year | | $ | 29.430 | | | $ | 26.760 | | | $ | 21.640 | | | $ | 36.440 | | | $ | 41.570 | |
| | |
|
|
| |
|
|
| |
|
|
| |
|
|
| |
|
|
|
Income/(loss) from investment operations | | | | | | | | | | | | | | | | | | | | |
Net investment income | | | 0.328 | (2) | | | 0.230 | (2) | | | 0.200 | (2) | | | 0.243 | (2) | | | 0.152 | |
Net gains (losses) on securities (both realized and unrealized) | | | 1.438 | | | | 2.673 | | | | 5.124 | | | | (13.464 | ) | | | (0.443 | ) |
| | |
|
|
| |
|
|
| |
|
|
| |
|
|
| |
|
|
|
Total from investment operations | | | 1.766 | | | | 2.903 | | | | 5.324 | | | | (13.221 | ) | | | (0.291 | ) |
| | |
|
|
| |
|
|
| |
|
|
| |
|
|
| |
|
|
|
Less: distributions | | | | | | | | | | | | | | | | | | | | |
Dividends (from net investment income) | | | (0.326 | ) | | | (0.233 | ) | | | (0.204 | ) | | | (0.303 | ) | | | (0.121 | ) |
Distributions (from capital gains) | | | — | | | | — | | | | — | | | | (1.242 | ) | | | (4.718 | ) |
Distributions (from return of capital) | | | — | | | | — | | | | — | | | | (0.034 | ) | | | — | |
| | |
|
|
| |
|
|
| |
|
|
| |
|
|
| |
|
|
|
Total distributions | | | (0.326 | ) | | | (0.233 | ) | | | (0.204 | ) | | | (1.579 | ) | | | (4.839 | ) |
| | |
|
|
| |
|
|
| |
|
|
| |
|
|
| |
|
|
|
Net Asset Value, End of Year | | $ | 30.870 | | | $ | 29.430 | | | $ | 26.760 | | | $ | 21.640 | | | $ | 36.440 | |
| | |
|
|
| |
|
|
| |
|
|
| |
|
|
| |
|
|
|
TOTAL RETURN (1) | | | 6.01 | % | | | 10.90 | % | | | 24.80 | % | | | (37.39 | %) | | | (0.80 | %) |
RATIOS/SUPPLEMENTAL DATA | | | | | | | | | | | | | | | | | | | | |
Net assets, end of year (000’s omitted) | | $ | 344,468 | | | $ | 362,409 | | | $ | 363,014 | | | $ | 353,445 | | | $ | 1,000,344 | |
Ratios of expenses to average net assets | | | 1.17 | % | | | 1.17 | % | | | 1.21 | % | | | 1.13 | % | | | 1.09 | % |
Ratios of net investment income to average net assets | | | 1.07 | % | | | 0.84 | % | | | 0.89 | % | | | 0.80 | % | | | 0.36 | % |
Portfolio turnover rate | | | 12.85 | % | | | 14.42 | % | | | 15.87 | % | | | 28.13 | % | | | 50.47 | % |
| (1) | Past performance is not predictive of future performance. |
| (2) | Calculated based on the average amount of shares outstanding during the year. |
See notes to the financial statements.
11
The Torray Fund
NOTES TO FINANCIAL STATEMENTS
As of December 31, 2011
NOTE 1 — SUMMARY OF SIGNIFICANT ACCOUNTING POLICIES
The Torray Fund (“Fund”) is a separate series of The Torray Fund (“Trust”). The Trust is registered under the Investment Company Act of 1940, as amended, as a no-load, diversified, open-end management investment company. The Trust was organized as a business trust under Massachusetts law. The Fund’s primary investment objective is to provide long-term total return. The Fund seeks to meet its objective by investing its assets in a diversified portfolio of common stocks. In order to accomplish these goals, the Fund intends to hold stocks for the long term, as opposed to actively buying and selling. There can be no assurances that the Fund’s investment objectives will be achieved.
The following is a summary of accounting policies followed by the Fund in the preparation of its financial statements. These policies are in conformity with accounting principles generally accepted in the United States of America.
Securities Valuation Portfolio securities for which market quotations are readily available are valued at market value, which is determined by using the last reported sale price, or, if no sales are reported, the last reported bid price. For NASDAQ traded securities, market value is determined on the basis of the NASDAQ Official Closing Price instead of the last reported sales price. Other assets and securities for which no quotations are readily available or for which Torray LLC (the “Advisor”) believes do not reflect market value are valued at fair value as determined in good faith by the Advisor under the supervision of the Board of Trustees (the “Board” or “Trustees”) in accordance with the Fund’s Valuation Procedures. Short-term obligations having remaining maturities of 60 days or less are valued at amortized cost, which approximates market value.
Fair Value Measurements Various inputs are used in determining the fair value of investments which are as follows:
| | • | | Level 1 — quoted prices in active markets for identical securities |
| | • | | Level 2 — significant observable inputs (including quoted prices for similar securities, interest rates, prepayment speeds, credit risk, etc.) |
| | • | | Level 3 — significant unobservable inputs (including the Fund’s own assumptions in determining the fair value of investments) |
The inputs or methodologies used for valuing securities are not necessarily an indication of the risk associated with investing in those securities.
12
The Torray Fund
NOTES TO FINANCIAL STATEMENTS (continued)
As of December 31, 2011
The summary of inputs used to value the Fund’s investments as of December 31, 2011 is as follows:
| | | | |
Valuation Inputs | | | | |
| |
Level 1 — Quoted Prices* | | $ | 344,547,309 | |
Level 2 — Other Significant Observable Inputs | | | — | |
Level 3 — Significant Unobservable Inputs | | | — | |
| | |
|
|
|
Total Market Value of Investments | | $ | 344,547,309 | |
| | |
|
|
|
| | * | Security types and industry classifications as defined in the Schedule of Investments. |
The Fund did not have significant transfers between Level 1 and Level 2 investments during the year.
In May 2011, the Financial Accounting Standards Board issued Accounting Standards Update (“ASU”) No. 2011-04 “Amendments to Achieve Common Fair Value Measurement and Disclosure Requirements in U.S. GAAP and International Financial Reporting Standards (“IFRS”)”. ASU 2011-04 includes common requirements for measurement of and disclosure about fair value between U.S. GAAP and IFRS. ASU 2011-04 will require reporting entities to disclose the following information for fair value measurements categorized within Level 3 of the fair value hierarchy: quantitative information about the unobservable inputs used in the fair value measurement, the valuation processes used by the reporting entity and a narrative description of the sensitivity of the fair value measurement to changes in unobservable inputs and the interrelationships between those unobservable inputs. In addition, ASU 2011-04 will require reporting entities to make disclosures about amounts and reasons for all transfers in and out of Level 1 and Level 2 fair value measurements. The new and revised disclosures are effective for interim and annual reporting periods beginning after December 15, 2011. At this time, the Fund does not have any Level 3 securities in its portfolio. To the extent the Fund’s portfolio was ever to be invested in such Level 3 securities, management will evaluate the implications of ASU No. 2011-04 and its impact on the financial statements.
Securities Transactions and Investment Income Securities transactions are recorded on a trade date basis. Realized gains and losses from securities transactions are recorded on the specific identification basis. Dividend income and distributions to shareholders are recorded on the ex-dividend date. Interest income, including amortization of discount on short-term investments, and expenses are recorded on the accrual basis. Premium and discount are amortized using the effective yield to maturity method.
Federal Income Taxes The Fund intends to continue to comply with the requirements of the Internal Revenue Code applicable to regulated investment companies and to distribute all of its taxable income, including any net realized gain on investments to its shareholders. Therefore, no Federal income tax provision is required.
Management has analyzed the Fund’s tax positions taken on Federal income tax returns for all open tax years (current and prior three tax years), and has concluded that no provision for Federal income tax is required in the
13
The Torray Fund
NOTES TO FINANCIAL STATEMENTS (continued)
As of December 31, 2011
Fund’s financial statements. The Fund’s Federal and state income and Federal excise tax returns for tax years for which the applicable statutes of limitations have not expired are subject to examination by the Internal Revenue Service and state departments of revenue.
Net Asset Value The net asset value per share of the Fund is determined daily as of the close of trading on the New York Stock Exchange by dividing the value of the Fund’s net assets by the number of shares outstanding.
Interest Expense When cash balances are overdrawn in the Fund’s custody account, the Fund is charged an overdraft fee equal to 1.25% above the Federal Funds Rate.
Use of Estimates In preparing financial statements in accordance with accounting principles generally accepted in the United States of America, management is required to make estimates and assumptions that affect the reported amounts of assets and liabilities and the disclosure of contingent assets and liabilities at the date of the financial statements, and the reported amounts of increases and decreases in net assets from operations during the reporting period. Actual results could differ from those estimates.
NOTE 2 — SHARES OF BENEFICIAL INTEREST TRANSACTIONS
Transactions in shares of beneficial interest were as follows:
| | | | | | | | | | | | | | | | |
| | | Year ended
12/31/11
| | | Year ended
12/31/10
| |
| | | Shares
| | | Amount
| | | Shares
| | | Amount
| |
Shares issued | | | 252,060 | | | $ | 7,781,617 | | | | 409,087 | | | $ | 11,455,255 | |
Reinvestments of dividends and distributions | | | 115,133 | | | | 3,515,340 | | | | 99,617 | | | | 2,797,454 | |
Shares redeemed | | | (1,523,525 | ) | | | (46,771,114 | ) | | | (1,759,347 | ) | | | (48,714,939 | ) |
| | |
|
|
| |
|
|
| |
|
|
| |
|
|
|
| | | | (1,156,332 | ) | | $ | (35,474,157 | ) | | | (1,250,643 | ) | | $ | (34,462,230 | ) |
| | |
|
|
| |
|
|
| |
|
|
| |
|
|
|
As of December 31, 2011, the Trust’s officers, Trustees and affiliated persons and their families directly or indirectly controlled 1,514,484 shares or 13.57% of the Fund.
NOTE 3 — INVESTMENT TRANSACTIONS
Purchases and sales of investment securities, other than short-term investments, for the year ended December 31, 2011, aggregated $42,758,030 and $83,300,217, respectively.
14
The Torray Fund
NOTES TO FINANCIAL STATEMENTS (continued)
As of December 31, 2011
NOTE 4 — MANAGEMENT FEES
Pursuant to the Management Contract, the Advisor provides investment advisory and administrative services to the Fund. The Fund pays the Advisor a management fee, computed daily and payable monthly at the annual rate of 1.00% of the Fund’s average daily net assets. For the year ended December 31, 2011, the Fund incurred management fees of $3,560,358.
Excluding the management fee, other expenses incurred by the Fund during the year ended December 31, 2011, totaled $614,219. These expenses include all costs associated with the Fund’s operations including transfer agent fees, independent trustees’ fees ($14,000 per annum and $2,000 for each Board meeting attended per Trustee), dues, fees and expenses of registering and qualifying the Fund and its shares for distribution, charges of the custodian, auditing and legal expenses, insurance premiums, supplies, postage, expenses of issue or redemption of shares, reports to shareholders and Trustees, expenses of printing and mailing prospectuses, proxy statements and proxies to existing shareholders, and other miscellaneous expenses.
Certain officers and Trustees of the Fund are also officers and/or shareholders of the Advisor.
NOTE 5 — TAX MATTERS
Distributions to shareholders are determined in accordance with United States Federal income tax regulations, which may differ from accounting principles generally accepted in the United States of America.
The tax character of distributions paid during the years ended December 31, 2011 and 2010 were as follows:
| | | | | | | | |
| | | 2011
| | | 2010
| |
Distributions paid from: | | | | | | | | |
Ordinary income | | $ | 3,748,354 | | | $ | 2,970,563 | |
| | |
|
|
| |
|
|
|
| | | $ | 3,748,354 | | | $ | 2,970,563 | |
| | |
|
|
| |
|
|
|
As of December 31, 2011, the components of distributable earnings on a tax basis were as follows:
| | | | | | |
Capital loss carry forward | | $ | (85,805,188 | ) | | |
Undistributed net investment income | | | 76,663 | | | |
Unrealized appreciation | | | 34,444,625 | | | |
| | |
|
|
| | |
| | | $ | (51,283,900 | ) | | |
| | |
|
|
| | |
15
The Torray Fund
NOTES TO FINANCIAL STATEMENTS (continued)
As of December 31, 2011
At December 31, 2011, the Fund had net capital loss carry forward for federal income tax purposes of $85,805,188 which is available to reduce future required distributions of net capital gains to shareholders through 2017.
For the year ended December 31, 2011, the Fund utilized capital loss carry forwards of $4,042,409.
The following information is based upon the federal tax basis of investment securities as of December 31, 2011:
| | | | |
Gross unrealized appreciation | | $ | 55,644,113 | |
Gross unrealized depreciation | | | (21,199,488 | ) |
| | |
|
|
|
Net unrealized appreciation | | $ | 34,444,625 | |
| | |
|
|
|
Cost | | $ | 310,102,684 | |
| | |
|
|
|
NOTE 6 — COMMITMENTS AND CONTINGENCIES
The Fund indemnifies its officers and Trustees for certain liabilities that may arise from their performance of their duties to the Fund. Additionally, in the normal course of business, the Fund enters into contracts that contain a variety of representations and warranties which provide general indemnifications. The Fund’s maximum exposure under these arrangements is unknown, as this would involve future claims that may be made against the Fund that have not yet occurred.
NOTE 7 — SUBSEQUENT EVENTS
Management has evaluated the impact of all subsequent events on the Fund through the date these financial statements were issued and has determined that there were no subsequent events requiring recognition or disclosure in the financial statements except as follows:
The Bank of New York Mellon Corporation (“BNY Mellon”) recently announced that it has agreed to sell BNY Mellon Distributors LLC and its four subsidiaries (“Distributor”) to Foreside Distributors, a subsidiary of Foreside Financial Group (the “Transaction”). Subject to any necessary approvals, the Transaction is anticipated to close in the first half of 2012. Upon the closing of the Transaction, Distributor will become an indirect, wholly owned subsidiary of Foreside Financial Group, and it is anticipated will be named Foreside Funds Distributors LLC.
16
The Torray Fund
REPORT OF INDEPENDENT REGISTERED PUBLIC ACCOUNTING FIRM
To the Board of Trustees of The Torray Fund
and the Shareholders of The Torray Fund
We have audited the accompanying statement of assets and liabilities of The Torray Fund, a series of shares of beneficial interest in The Torray Fund (the “Fund”), including the schedule of investments, as of December 31, 2011, and the related statement of operations for the year then ended, the statements of changes in net assets for each of the years in the two-year period then ended, and the financial highlights for each of the years in the five-year period then ended. These financial statements and financial highlights are the responsibility of the Fund’s management. Our responsibility is to express an opinion on these financial statements and financial highlights based on our audits.
We conducted our audits in accordance with the standards of the Public Company Accounting Oversight Board (United States). Those standards require that we plan and perform the audits to obtain reasonable assurance about whether the financial statements and financial highlights are free of material misstatement. An audit includes examining, on a test basis, evidence supporting the amounts and disclosures in the financial statements. Our procedures included confirmation of securities owned as of December 31, 2011 by correspondence with the custodian. An audit also includes assessing the accounting principles used and significant estimates made by management, as well as evaluating the overall financial statement presentation. We believe that our audits provide a reasonable basis for our opinion.
In our opinion, the financial statements and financial highlights referred to above present fairly, in all material respects, the financial position of The Torray Fund as of December 31, 2011, the results of its operations for the year then ended, the changes in its net assets for each of the years in the two-year period then ended, and its financial highlights for each of the years in the five-year period then ended, in conformity with accounting principles generally accepted in the United States of America.

BBD, LLP
Philadelphia, Pennsylvania
February 22, 2012
17
The Torray Fund
FUND MANAGEMENT
As of December 31, 2011 (unaudited)
The Trust is overseen by a Board of Trustees (the "Board"), which has delegated the day-to-day management to the officers of the Trust. The Board meets regularly to review the Fund's activities, contractual arrangements, and per- formance. The trustees and officers serve until their successors are elected and qualified, or until the trustee or officer dies, resigns or is removed, or becomes disqualified.
Information pertaining to the Trustees and Officers of the Trust is set forth below. The Statement of Additional Information (“SAI”) includes additional information about the Trustees and is available without charge, upon request, by calling (800) 443-3036.
| | | | | | | | | | |
Name, Age, Address* and Position(s) with the Trust | | Term of Office
and Length of
Time Served | | Principal Occupation(s) During Past 5 Years | | No. of
Portfolios in
Fund Complex
Overseen by
Trustee | | | Other Directorships Held |
| INDEPENDENT TRUSTEES |
Carol T. Crawford (69) Trustee | | Indefinite Term Since 2006 | | Attorney and International Trade Consultant, McLean, VA | | | 3 | | | Director, Smithfield Foods, Inc., Smithfield, VA |
Bruce C. Ellis (67) Trustee | | Indefinite Term Since 1993 | | Private Investor, Bethesda, MD | | | 3 | | | None |
Robert P. Moltz (64) Trustee | | Indefinite Term Since 1990 | | President, CEO, Weaver Bros Insurance Associates, Inc., Bethesda, MD | | | 3 | | | None |
Wayne H. Shaner (64)** Trustee and Chairman of the Board | | Indefinite Term Since 1993 | | Managing Partner, Rockledge Partners, LLC, Investment Advisory Firm, Easton, MD (Jan. 2004-Present); Vice President, Torray LLC, Bethesda, MD (Jan. 2008-Jun. 2008) | | | 3 | | | Director, Van Eck Funds, New York, NY |
18
The Torray Fund
FUND MANAGEMENT (continued)
As of December 31, 2011 (unaudited)
| | | | | | | | | | |
Name, Age, Address* and Position(s) with the Trust | | Term of Office
and Length of
Time Served | | Principal Occupation(s) During Past 5 Years | | No. of
Portfolios in
Fund Complex
Overseen by
Trustee | | | Other Directorships Held |
| INTERESTED TRUSTEE AND OFFICERS OF THE TRUST |
William M Lane (61)*** Trustee, Treasurer and Secretary | | Indefinite Term Since 1990 | | Executive Vice President and Secretary, Torray LLC, Bethesda, MD (Oct. 2005-Present); Chief Compliance Officer (Oct. 2005-Mar. 2011); Vice President, Secretary, Treasurer and Chief Compliance Officer, Robert E. Torray & Co. Inc., Bethesda, MD (Jul. 1984-Oct. 2005).*** | | | 3 | | | None |
Robert E. Torray (74) President | | Indefinite Term Since 2007 | | Chairman, Torray LLC, Bethesda, MD (2005-Present); President, Torray LLC, Bethesda, MD (2007-Present); President, Robert E. Torray & Co. Inc., Bethesda, MD (May 1972-Oct. 2005). | | | N/A | | | None |
Barbara Warder, (54) Chief Compliance Officer and Anti-Money Laundering Officer | | Indefinite Term Since 2011 | | Chief Compliance Officer and Anti- Money Laundering Officer, Torray LLC, Bethesda, MD (Mar. 2011-Present); Chief Operating Officer and Chief Compliance Officer, Resolute Capital Management, Washington, DC (Mar. 1998-Jun. 2010). | | | N/A | | | None |
| * | All addresses are c/o The Torray Fund, 7501 Wisconsin Avenue, Suite 750 W, Bethesda, MD 20814-6519. |
| ** | Mr. Shaner is deemed to be an independent Trustee effective as of January 1, 2011. |
| *** | Mr. Lane, by virtue of his employment with Torray LLC, the Trust’s investment adviser, is considered an “interested person” of the Trust, as that term is defined in Section 2(a)(19) of the Investment Company Act of 1940, as amended. |
19
The Torray Fund
FACTORS CONSIDERED BY THE BOARD OF TRUSTEES IN CONNECTION WITH THEIR APPROVAL OF THE CONTINUATION OF THE FUND’S INVESTMENT MANAGEMENT AGREEMENT WITH THE MANAGER (unaudited)
The Fund has entered into an Investment Management Agreement (the “Agreement”) with Torray LLC (the “Manager”) pursuant to which the Manager provides investment management services to the Fund. In accordance with the Investment Company Act of 1940, the Board of Trustees of the Fund is required, on an annual basis, to consider the continuation of the Agreement with the Manager, and this must take place at an in-person meeting of the Board. The relevant provisions of the Investment Company Act of 1940 specifically provide that it is the duty of the Board to request and evaluate such information as the Board determines is necessary to allow them to properly consider the continuation of the Agreement, and it is the duty of the Manager to furnish the Trustees with such information that is responsive to their request. Set forth below is a discussion of the various factors that the Board of Trustees considered in deciding to approve the continuation of the Agreement with the Manager.
In determining whether to approve the continuation of the Agreement, the Board of Trustees requested, and the Manager provided, information and data relevant to the Board’s consideration. This included materials that provided the Board with information regarding the investment performance of the Fund and information regarding the fees and expenses of the Fund as compared to other similar mutual funds. As part of its deliberations, the Board also considered and relied upon the information about the Fund that had been provided to them throughout the year in connection with their regular Board meetings at which they engage in the ongoing oversight of the Fund and its operations.
The Board met at an in-person meeting on September 13, 2011 in order to consider the proposed continuation of the Agreement. Among the factors the Board considered was the overall performance of the Fund achieved by the Manager relative to the performance of the Fund’s benchmark index, the S&P 500 Index, as well as the Fund’s performance relative to other mutual funds with similar investment objectives on both a long-term basis and over shorter time periods. In particular, the Board took note of the favorable performance achieved by the Manager and they considered the Manager’s particular focus on long-term investment performance. The Board took into consideration the fact that the Manager seeks to achieve investment results for the Fund with less risk than other similar funds, and that the Manager has maintained a low portfolio turnover rate for the Fund which is beneficial to shareholders of the Fund because this results in lower brokerage costs which helps to reduce the operating costs of the Fund. They noted the range of investment advisory and management services provided by the Manager and the level and quality of these services, and in particular, they noted the quality of the personnel providing these services, taking into consideration their finding that the personnel providing these services, and the services provided, were of a very high caliber and quality. The Board also considered the portfolio manager arrangements for the Fund, noting that the Manager has undertaken appropriate measures to provide for the continued management of the Fund by a team of portfolio managers with extensive portfolio management experience.
The Board also compared the total annual operating expenses of the Fund to the total annual operating expenses of other funds of similar size, noting that the average annual expense ratio for the Fund over the past year compared favorably with industry averages for total annual operating expenses. They also took note of the fact that the Fund is not subject to any sales loads, sales commissions or other similar fees, including Rule 12b-1 distribution fees, which
20
The Torray Fund
FACTORS CONSIDERED BY THE BOARD OF TRUSTEES IN CONNECTION WITH THEIR APPROVAL OF THE CONTINUATION OF THE FUND’S INVESTMENT MANAGEMENT AGREEMENT WITH THE MANAGER (unaudited) (continued)
helps to keep the overall expense to shareholders of investing in the Fund lower than the expenses associated with investing in many comparable funds, and they considered the fact that the Manager had informed the Board that it did not intend to propose the introduction of such types of fees for the Fund. The Board also reviewed financial information concerning the Manager, noting its financial soundness as demonstrated by the financial information provided and the level of profitability relating to its services for the Fund, noting that these were reasonable and consistent with industry standards. The Board was also provided with information regarding the fees that the Manager charges other clients for investment advisory services and they noted that the fees were comparable based on the relevant circumstances of the types of accounts involved.
In addition, the Board reviewed with the Manager information regarding its brokerage practices, including soft dollar matters, and noted that the Manager did not have in place any formal soft dollar arrangements, and the Board also reviewed the Manager’s best execution procedures, which the Board noted were reasonable and consistent with standard industry practice.
Based on their review, the Trustees concluded that the investment management services provided under the Agreement were reasonably worth the full amount of the fee and that the terms of the Agreement were fair and reasonable. In reaching their conclusion with respect to their approval of the continuation of the Agreement, the Trustees did not identify any one single factor as being controlling, rather, the Board took note of a combination of factors that influenced their decision making process. The Board did, however, identify the overall favorable investment performance of the Fund, the commitment of the Manager to the successful operation of the Fund, and the level of expenses of the Fund, as being important elements of their consideration. Based upon their review and consideration of these factors and other matters deemed relevant by the Board in reaching an informed business judgment, a majority of the Board of Trustees, including a majority of the Independent Trustees, concluded that the terms of the Agreement were fair and reasonable and the Board voted to approve the continuation of the Agreement with the Manager.
21
The Torray Fund
PORTFOLIO HOLDINGS, PROXY VOTING AND PROCEDURES
As of December 31, 2011 (unaudited)
The Fund files its complete schedule of portfolio holdings with the Securities and Exchange Commission (the “Commission”) for the first and third quarters of each fiscal year on Form N-Q. The Fund’s Forms N-Q are available on the Commission’s website at http://www.sec.gov. The Fund’s Forms N-Q may be reviewed and copied at the Commission’s Public Reference Room in Washington, D.C. Information on the operation of the Commission’s Public Reference Room may be obtained by calling 1-800-SEC-0330.
A description of the policies and procedures that the Fund uses to determine how to vote proxies relating to portfolio securities is available without charge, upon request, by calling 1-800-443-3036; and on the Commission’s website at http://www.sec.gov.
Information regarding how the Fund voted proxies relating to portfolio securities is available without charge, upon request, by calling 1-800-443-3036; and on the Commission’s website at http://www.sec.gov.
22
The Torray Fund
ABOUT YOUR FUND’S EXPENSES
As of December 31, 2011 (unaudited)
We believe it is important for you to understand the impact of costs on your investment. All mutual funds have operating expenses. As a shareholder of the Fund, you incur ongoing costs, including management fees, and other fund expenses. Operating expenses, which are deducted directly from the Fund’s gross income, directly reduce the investment return of the Fund.
A mutual fund’s expenses are expressed as a percentage of its average net assets. This figure is known as the expense ratio. The following examples are intended to help you understand the ongoing costs (in dollars) of investing in the Fund and to compare these costs with the ongoing costs of investing in other mutual funds. The examples below are based on an investment of $1,000 made at the beginning of the period shown and held for the entire period.
The table on the next page illustrates the Fund’s cost in two ways:
Actual Fund Return This section helps you estimate the actual expenses that you paid over the period. The “Ending Account Value” shown is derived from the Fund’s actual return, and the third column shows the operating expenses that would have been paid by an investor who started with $1,000 in the Fund. You may use the information here, together with the amount invested, to estimate the expenses that you paid over the period.
To do so, simply divide your account value by $1,000 (for example, an $8,600 account value divided by $1,000 = 8.6), then multiply the result by the number given for the Fund under the heading “Expenses Paid During Period” on the next page.
Hypothetical 5% Return This section is intended to help you compare your Fund’s costs with those of other mutual funds. It assumes that the Fund had an annual return of 5% before expenses, and that the expense ratio is unchanged. In this case, because the return used is not the Fund’s actual return, the results do not apply to your investment. The example is useful in making comparisons because the Commission requires all mutual funds to calculate expenses based on a 5% return. You can assess the Fund’s costs by comparing this hypothetical example with the hypothetical examples that appear in shareholder reports of other funds.
Note that expenses shown in the table are meant to highlight and help you compare ongoing costs only. The Fund does not charge transactions fees, such as purchase or redemption fees, nor does it carry a “sales load.”
The calculation assumes no shares were bought or sold during the period. Your actual costs may have been higher or lower, depending on the amount of your investment and the timing of any purchases or redemptions.
23
The Torray Fund
ABOUT YOUR FUND’S EXPENSES (continued)
As of December 31, 2011 (unaudited)
More information about the Fund’s expenses, including recent annual expense ratios, can be found in this report. For additional information on operating expenses and other shareholder costs, please refer to the Fund’s prospectus.
| | | | | | | | | | | | |
| | | Beginning
Account Value
July 1, 2011
| | | Ending
Account Value
December 31, 2011
| | | Expenses Paid
During Period *
| |
Based on Actual Fund Return | | $ | 1,000.00 | | | $ | 964.70 | | | $ | 5.89 | |
Based on Hypothetical 5% Return
(before expenses) | | $ | 1,000.00 | | | $ | 1,019.21 | | | $ | 6.06 | |
| * | Expenses are equal to the Fund’s annualized expense ratio of 1.19% for the period, multiplied by the average account value over the period, multiplied by 184/365 (to reflect the one-half year period). |
24
The Torray Fund
TAX INFORMATION
As of December 31, 2011 (unaudited)
We are required to advise you within 60 days of the Fund’s fiscal year-end regarding the Federal tax status of certain distributions received by shareholders during such fiscal year. The information below is provided for the Fund’s fiscal year ending December 31, 2011. All designations are based on financial information available as of the date of this annual report and, accordingly are subject to change. For each item it is the intention of the Fund to designate the maximum amount permitted under the Internal Revenue Code and the regulations thereunder.
Qualified Interest Income
For the year ended December 31, 2011, 0.16% of the ordinary distributions paid (net investment income plus short-term capital gain) represent the amount of Qualifying Interest Income as created by The American Jobs Creation Act of 2004.
Qualified Dividend Income
For the year ended December 31, 2011, 100% of the distributions paid by the Fund from ordinary income qualifies for a reduced tax rate pursuant to The Jobs and Growth Tax Relief Reconciliation Act of 2003.
Dividends Received Deduction
For the year ended December 31, 2011, 100% of the ordinary income distribution qualifies for the dividends received deduction available to corporations.
Dividends and distributions received by retirement plans such as IRA’s, Keogh-type plans and 403(b) plans need not be reported as taxable income. However, many retirement plan trusts may need this information for their annual information reporting.
25
TRUSTEES
Carol Crawford
Bruce C. Ellis
William M Lane
Robert P. Moltz
Wayne H. Shaner
INVESTMENT ADVISOR
Torray LLC
OFFICERS
Robert E. Torray
William M Lane
Fred M. Fialco
Shawn M. Hendon
Nicholas C. Haffenreffer
Barbara C. Warder
INDEPENDENT REGISTERED PUBLIC
ACCOUNTING FIRM
BBD, LLP
1835 Market Street, 26th Floor
Philadelphia, PA 19103
TRANSFER AGENT
BNY Mellon Investment Servicing (US) Inc.
4400 Computer Drive
Westborough, MA 01581-1722
LEGAL COUNSEL
Dechert LLP
1775 I Street, N.W.
Washington, DC 20006
Distributed by BNY Mellon Distributors LLC
760 Moore Road, King of Prussia, PA 19406-1212
Date of first use, February 2012
This report is not authorized for distribution to prospective
investors unless preceded or accompanied by a current
prospectus. All indices are unmanaged groupings of stocks
that are not available for investment.
The
TORRAY
FUND
ANNUAL REPORT
December 31, 2011
The Torray Fund
Suite 750 W
7501 Wisconsin Avenue
Bethesda, Maryland 20814-6519
(301) 493-4600
(800) 443-3036
The Torray Institutional Fund
Letter to Shareholders
January 26, 2012
Dear Fellow Shareholders:
The Torray Institutional Fund gained 6.0% in 2011, compared to 2.1% for the Standard & Poor’s 500 Index. Since inception 10 1/2 years ago, it has returned 2.5% annually, versus 2.2% for the Index. As these disappointing numbers demonstrate, our economy and stock market presented almost insurmountable challenges for equity investors over the past decade.
Last year started off well, with stocks advancing about 9% through the end of April. But then fears about the soaring Federal debt and a double-dip recession escalated, and the Middle East erupted in turmoil. In August, Standard & Poors cut the U.S.’s credit rating from AAA to AA, and doubts about the solvency of euro zone countries and banks sent stocks into a freefall. The sell off was marked by high volatility and increased volume, with daily price swings sometimes measuring two or three percentage points. Monthly gyrations ranged between a loss of 7% and a gain of 11%. Just when things looked the worst, stocks rallied 11% in October and limped along to close the year up 2.1%. Through it all, our Fund, with its quality investments and low 17% turnover, was hardly affected.
According to the New York Stock Exchange, an astonishing average of 4.4 billion NYSE-listed shares changed hands on the 252 trading days last year; annual volume was about 1.1 trillion shares, 2.6 times the 415 billion outstanding. As startling as these numbers are, they’re 10% lower than those of the preceding year. The collective value of all this paper shuffling amounted to approximately $32 trillion, a number twice the size of our country’s entire economy. Yet, in the end, nothing of value was created. In fact, after fees, commissions and taxes on trading gains — if any — investors as a group probably lost money. Only Wall Street and the tax collector came out ahead.
On the mutual fund front, turnover in domestic stock funds once again surpassed 100%, and shareholders continued to withdraw money — in this case $85 billion, extending the string of annual withdrawals back to 2007, for a total of $328 billion. By contrast, bond funds took in about twice that much in just the last three years, including $116 billion in 2011. Ironically, over a decade ago, when valuations on stocks were twice as high, investors largely ignored bonds and loaded up on stocks and stock funds.
Finally, reflecting the widely held view that emerging markets’ growth prospects are superior to those in the U.S., $34 billion shifted into international funds. While the potential of these markets may or may not be as advertised, last year was a bad time to try and find out. Brazil, China, Hong Kong, Japan and Singapore suffered losses of 12%, 18%, 15%, 19% and 17%, respectively. Germany, the European Union’s strongest country, lost 15%. Fortunately, we have avoided these venues and instead invested in U.S. companies that transact business in them. Many of our holdings generate 30% to 40%, and a few, 50%, of their revenues overseas. Our strategy is based on the belief that the long-standing records, superior finances, reliance on U.S. accounting standards and capable managements of these solid businesses outweigh the lure of less certain opportunities that are difficult to analyze from afar.
The stark reality of all this money jumping in and out of markets around the world, not to mention the popularity of exchange-traded funds, commodities and hedge funds, highlights today’s total disconnect between market
1
The Torray Institutional Fund
Letter to Shareholders (continued)
January 26, 2012
activity and business fundamentals. While most companies did well last year, investors were just too frightened by what stocks were doing to notice. The earnings of companies in The Torray Institutional Fund grew almost 9%, and 26 out of 31 increased dividends. Combined, earnings growth plus dividend yield exceeded 11%. We think this is a better measure of the improvement in the Fund’s fundamental value than its closing share price, which is only a snapshot of what investors think our stocks are worth on a given day.
While we may be wrong, it appears to us the worst of the economic crisis has passed and that large, high quality companies trading at today’s conservative valuations offer some of the best opportunities we’ve seen in our Company’s 40-year history. If earnings and dividends gradually rise in line with current projections, we believe share prices will eventually follow suit, providing reasonable returns that should outpace readily available alternatives.
We thank you for your investment and continued confidence in our management.
| | | | | | |
| | | Sincerely, | | | | |
| | |  | | | | |
| | | Robert E. Torray | | | | |
| | | 
| | | | |
| | | Fred M. Fialco | | | | |
| | | 
| | | | |
| | | Shawn M. Hendon | | | | |
| | | | | | | |
2
The Torray Institutional Fund
PERFORMANCE DATA
As of December 31, 2011 (unaudited)
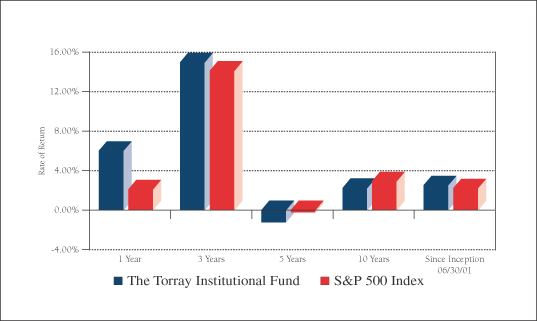
Average Annual Returns on an Investment in
The Torray Institutional Fund vs. the S&P 500 Index
For the periods ended December 31, 2011:
| | | | | | | | | | | | | | | | | | | | |
| | | 1 Year
| | | 3 Years
| | | 5 Years
| | | 10 Years
| | | Since
Inception
06/30/01
| |
The Torray Institutional Fund | | | 6.03 | % | | | 14.95 | % | | | -1.24 | % | | | 2.24 | % | | | 2.51 | % |
S&P 500 Index | | | 2.11 | % | | | 14.11 | % | | | -0.25 | % | | | 2.92 | % | | | 2.22 | % |
Cumulative Returns for the 10 1/2 years ended December 31, 2011
| | | | |
The Torray Institutional Fund | | | 29.79 | % |
S&P 500 Index | | | 25.92 | % |
3
The Torray Institutional Fund
PERFORMANCE DATA (continued)
As of December 31, 2011 (unaudited)
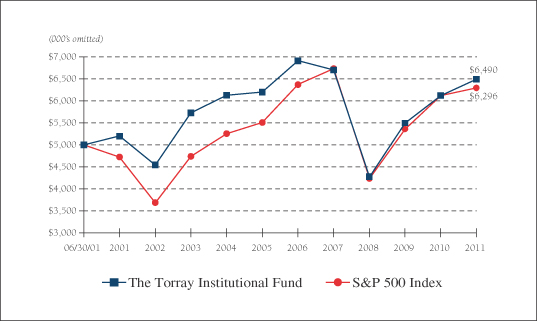
Change in Value of $5,000,000 Invested
on June 30, 2001 (commencement of operations) to:
| | | | | | | | | | | | | | | | | | | | |
| | | 12/31/03
| | | 12/31/05
| | | 12/31/07
| | | 12/31/09
| | | 12/31/11
| |
The Torray Institutional Fund | | $ | 5,725,000 | | | $ | 6,201,000 | | | $ | 6,701,000 | | | $ | 5,495,000 | | | $ | 6,489,500 | |
S&P 500 Index | | $ | 4,739,000 | | | $ | 5,507,000 | | | $ | 6,726,000 | | | $ | 5,358,000 | | | $ | 6,296,000 | |
The returns quoted represent past performance and do not guarantee future results. Investment return and principal value will fluctuate so that shares, when redeemed, may be worth more or less than their original cost. Current performance may be lower or higher. For perfomance current to the most recent month-end, please call (800) 626-9769. The returns shown do not reflect the deduction of taxes a shareholder would pay on the redemption of fund shares and distributions. The Fund’s annual operating expense ratio, as stated in the current prospectus, is 0.85%. Returns on both The Torray Institutional Fund and the S&P 500 Index assume reinvestment of all dividends and distributions. The S&P 500 Index is an unmanaged index consisting of 500 U.S. large-cap stocks. It is not possible to invest directly in an index. Current and future portfolio holdings are subject to change and risk.
4
The Torray Institutional Fund
FUND PROFILE
As of December 31, 2011 (unaudited)
| | | | |
DIVERSIFICATION (% of net assets) | |
| |
Information Technology | | | 20.52% | |
Financials | | | 15.72% | |
Health Care | | | 15.33% | |
Industrials | | | 12.37% | |
Consumer Staples | | | 12.02% | |
Consumer Discretionary | | | 4.40% | |
Telecommunications | | | 3.05% | |
Materials | | | 2.56% | |
Short-Term Investments | | | 13.98% | |
Other Assets Less Liabilities | | | 0.05% | |
| | |
|
|
|
| | | | 100.00% | |
| | |
|
|
|
| | | | | | | | |
| TOP TEN EQUITY HOLDINGS (% of net assets) | |
| | |
| | 1. | | | General Electric Co. | | | 3.70% | |
| | 2. | | | Kraft Foods Inc., Class A | | | 3.68% | |
| | 3. | | | Cintas Corp. | | | 3.67% | |
| | 4. | | | International Business Machines Corp. | | | 3.51% | |
| | 5. | | | Chubb Corp. | | | 3.47% | |
| | 6. | | | Loews Corp. | | | 3.37% | |
| | 7. | | | Automatic Data Processing, Inc. | | | 3.29% | |
| | 8. | | | Johnson & Johnson | | | 3.28% | |
| | 9. | | | Marsh & McLennan Cos., Inc. | | | 3.26% | |
| | 10. | | | Western Union Co. (The) | | | 3.08% | |
| | | | | | |
|
|
|
| | | | | | | | 34.31% | |
| | | | | | |
|
|
|
| | | | | | | | |
PORTFOLIO CHARACTERISTICS | |
| | |
Net Assets (million) | | | | | | | $23 | |
Number of Holdings | | | | | | | 31 | |
Portfolio Turnover | | | | | | | 16.98% | |
P/E Multiple (forward) | | | | | | | 11.8x | |
Weighted Average Dividend Yield | | | | | | | 2.40% | |
Market Capitalization (billion) | | | Average | | | | $67.1 | |
| | | | Median | | | | $44.3 | |
5
The Torray Institutional Fund
SCHEDULE OF INVESTMENTS
As of December 31, 2011
| | | | | | | | | | |
| | | Shares
| | | | | Market Value
| |
| COMMON STOCK 85.97% | | | | |
| |
20.52% INFORMATION TECHNOLOGY | | | | |
| | | | 4,300 | | | International Business Machines Corp. | | $ | 790,684 | |
| | | | 13,716 | | | Automatic Data Processing, Inc. | | | 740,801 | |
| | | | 38,000 | | | Western Union Co. (The) | | | 693,880 | |
| | | | 27,956 | | | Intel Corp. | | | 677,933 | |
| | | | 35,200 | | | Cisco Systems, Inc. | | | 636,416 | |
| | | | 21,200 | | | Hewlett-Packard Co. | | | 546,112 | |
| | | | 25,042 | | | EMC Corp. * | | | 539,405 | |
| | | | | | | | |
|
|
|
| | | | | | | | | | 4,625,231 | |
| |
15.72% FINANCIALS | | | | |
| | | | 11,300 | | | Chubb Corp. | | | 782,186 | |
| | | | 20,200 | | | Loews Corp. | | | 760,530 | |
| | | | 23,217 | | | Marsh & McLennan Cos., Inc. | | | 734,122 | |
| | | | 23,000 | | | Wells Fargo & Co. | | | 633,880 | |
| | | | 13,423 | | | American Express Co. | | | 633,163 | |
| | | | | | | | |
|
|
|
| | | | | | | | | | 3,543,881 | |
| |
15.33% HEALTH CARE | | | | |
| | | | 11,264 | | | Johnson & Johnson | | | 738,693 | |
| | | | 11,600 | | | Abbott Laboratories | | | 652,268 | |
| | | | 7,900 | | | Becton Dickinson & Co. | | | 590,288 | |
| | | | 11,500 | | | Baxter International Inc. | | | 569,020 | |
| | | | 9,500 | | | UnitedHealth Group Inc. | | | 481,460 | |
| | | | 6,400 | | | WellPoint, Inc. | | | 424,000 | |
| | | | | | | | |
|
|
|
| | | | | | | | | | 3,455,729 | |
| |
12.37% INDUSTRIALS | | | | |
| | | | 46,519 | | | General Electric Co. | | | 833,155 | |
| | | | 23,792 | | | Cintas Corp. | | | 828,199 | |
| | | | 7,200 | | | 3M Co. | | | 588,456 | |
| | | | 8,100 | | | General Dynamics Corp. | | | 537,921 | |
| | | | | | | | |
|
|
|
| | | | | | | | | | 2,787,731 | |
6
The Torray Institutional Fund
SCHEDULE OF INVESTMENTS (continued)
As of December 31, 2011
| | | | | | | | | | |
| | | Shares
| | | | | Market Value
| |
| |
12.02% CONSUMER STAPLES | | | | |
| | | | 22,200 | | | Kraft Foods Inc., Class A | | $ | 829,392 | |
| | | | 18,900 | | | Sysco Corp. | | | 554,337 | |
| | | | 8,200 | | | Procter & Gamble Co. (The) | | | 547,022 | |
| | | | 5,800 | | | Colgate-Palmolive Co. | | | 535,862 | |
| | | | 7,300 | | | Walgreen Co. | | | 241,338 | |
| | | | | | | | |
|
|
|
| | | | | | | | | | 2,707,951 | |
| |
4.40% CONSUMER DISCRETIONARY | | | | |
| | | | 9,700 | | | Tupperware Brands Corp. | | | 542,909 | |
| | | | 33,600 | | | Gannett Co., Inc. | | | 449,232 | |
| | | | | | | | |
|
|
|
| | | | | | | | | | 992,141 | |
| |
3.05% TELECOMMUNICATIONS | | | | |
| | | | 22,700 | | | AT&T Inc. | | | 686,448 | |
| |
2.56% MATERIALS | | | | |
| | | | 12,600 | | | E.I. du Pont de Nemours & Co. | | | 576,828 | |
| | | | | | | | |
|
|
|
| TOTAL COMMON STOCK 85.97% | | | 19,375,940 | |
(cost $17,555,392) | | | | | | | |
| | | |
| | | Principal Amount ($) | | | | | | |
| |
| SHORT-TERM INVESTMENTS 13.98% | | | | |
| | | | 3,150,571 | | | BNY Mellon Cash Reserve, 0.05%(1) | | | 3,150,571 | |
| | | | | | | | |
|
|
|
(cost $3,150,571) | | | | | | | |
| |
| TOTAL INVESTMENTS 99.95% | | | 22,526,511 | |
(cost $20,705,963) | | | | | | | |
| OTHER ASSETS LESS LIABILITIES 0.05% | | | 11,063 | |
| | | | | | | | |
|
|
|
| NET ASSETS 100.00% | | $ | 22,537,574 | |
| | | | | | | | |
|
|
|
| * | Non-income producing securities. |
| (1) | Represents current yield at December 31, 2011. |
See notes to the financial statements.
7
The Torray Institutional Fund
STATEMENT OF ASSETS AND LIABILITIES
As of December 31, 2011
| | | | |
ASSETS | | | | |
Investments in securities at value
(cost $20,705,963) | | $ | 22,526,511 | |
Interest and dividends receivable | | | 36,207 | |
| | |
|
|
|
TOTAL ASSETS | | | 22,562,718 | |
| | |
|
|
|
| |
LIABILITIES | | | | |
Payable to Advisor | | | 24,949 | |
Payable for fund shares redeemed | | | 195 | |
| | |
|
|
|
TOTAL LIABILITIES | | | 25,144 | |
| | |
|
|
|
| |
NET ASSETS | | $ | 22,537,574 | |
| | |
|
|
|
Shares of beneficial interest ($1 stated value,
310,804, shares outstanding, unlimited shares authorized) | | $ | 310,804 | |
Paid-in-capital in excess of par | | | 24,728,139 | |
Undistributed net investment income | | | 13,897 | |
Accumulated net realized loss on investments | | | (4,335,814 | ) |
Net unrealized appreciation of investments | | | 1,820,548 | |
| | |
|
|
|
| |
TOTAL NET ASSETS | | $ | 22,537,574 | |
| | |
|
|
|
Net Asset Value, Offering and Redemption Price per Share | | $ | 72.51 | |
| | |
|
|
|
See notes to the financial statements.
8
The Torray Institutional Fund
STATEMENT OF OPERATIONS
For the year ended December 31, 2011
| | | | |
INVESTMENT INCOME | | | | |
Dividend income | | $ | 481,349 | |
Interest income | | | 1,312 | |
| | |
|
|
|
Total investment income | | | 482,661 | |
| | |
|
|
|
| |
EXPENSES | | | | |
Management fees | | | 191,095 | |
| | |
|
|
|
Total expenses | | | 191,095 | |
| | |
|
|
|
NET INVESTMENT INCOME | | | 291,566 | |
| | |
|
|
|
REALIZED AND UNREALIZED GAIN (LOSS)
ON INVESTMENTS | | | | |
Net realized loss on investments | | | (25,086 | ) |
Net change in unrealized appreciation (depreciation) on investments | | | 1,003,373 | |
| | |
|
|
|
Net realized and unrealized gain on investments | | | 978,287 | |
| | |
|
|
|
NET INCREASE IN NET ASSETS RESULTING FROM OPERATIONS | | $ | 1,269,853 | |
| | |
|
|
|
See notes to the financial statements.
9
The Torray Institutional Fund
STATEMENTS OF CHANGES IN NET ASSETS
For the years indicated:
| | | | | | | | |
| | | Year ended
12/31/11
| | | Year ended
12/31/10
| |
Increase in Net Assets Resulting from Operations: | | | | | | | | |
Net investment income | | $ | 291,566 | | | $ | 207,996 | |
Net realized gain (loss) on investments | | | (25,086 | ) | | | 163,976 | |
Net change in unrealized appreciation
(depreciation) on investments | | | 1,003,373 | | | | 1,861,864 | |
| | |
|
|
| |
|
|
|
Net increase in net assets from operations | | | 1,269,853 | | | | 2,233,836 | |
| | |
|
|
| |
|
|
|
Distributions to Shareholders from: | | | | | | | | |
Net investment income ($0.888 and
$0.662 per share, respectively) | | | (278,301 | ) | | | (207,364 | ) |
| | |
|
|
| |
|
|
|
Total distributions | | | (278,301 | ) | | | (207,364 | ) |
| | |
|
|
| |
|
|
|
| | |
Shares of Beneficial Interest | | | | | | | | |
Increase (Decrease) from share transactions | | | 47,561 | | | | (851,312 | ) |
| | |
|
|
| |
|
|
|
Total increase | | | 1,039,113 | | | | 1,175,160 | |
| | |
Net Assets — Beginning of Year | | | 21,498,461 | | | | 20,323,301 | |
| | |
|
|
| |
|
|
|
Net Assets — End of Year | | $ | 22,537,574 | | | $ | 21,498,461 | |
| | |
|
|
| |
|
|
|
Undistributed Net Investment Income | | $ | 13,897 | | | $ | 632 | |
| | |
|
|
| |
|
|
|
See notes to the financial statements.
10
The Torray Institutional Fund
FINANCIAL HIGHLIGHTS
For a share outstanding throughout each year presented:
PER SHARE DATA
| | | | | | | | | | | | | | | | | | | | |
| | | Years ended December 31:
| |
| | | 2011
| | | 2010
| | | 2009
| | | 2008
| | | 2007
| |
Net Asset Value, Beginning of Year | | $ | 69.240 | | | $ | 62.790 | | | $ | 49.400 | | | $ | 80.800 | | | $ | 108.640 | |
| | |
|
|
| |
|
|
| |
|
|
| |
|
|
| |
|
|
|
Income/(loss) from investment operations: | | | | | | | | | | | | | | | | | | | | |
Net investment income | | | 0.932 | (2) | | | 0.660 | (2) | | | 0.605 | (2) | | | 0.687 | (2) | | | 0.896 | |
Net gains (losses) on securities (both realized and
unrealized) | | | 3.226 | | | | 6.452 | | | | 13.394 | | | | (29.336 | ) | | | (4.074 | ) |
| | |
|
|
| |
|
|
| |
|
|
| |
|
|
| |
|
|
|
Total from investment operations | | | 4.158 | | | | 7.112 | | | | 13.999 | | | | (28.649 | ) | | | (3.178 | ) |
| | |
|
|
| |
|
|
| |
|
|
| |
|
|
| |
|
|
|
Less: distributions | | | | | | | | | | | | | | | | | | | | |
Dividends (from net investment income) | | | (0.888 | ) | | | (0.662 | ) | | | (0.609 | ) | | | (0.770 | ) | | | (0.716 | ) |
Distributions (from capital gains) | | | — | | | | — | | | | — | | | | (1.889 | ) | | | (23.946 | ) |
Distributions (from return of capital) | | | — | | | | — | | | | — | | | | (0.092 | ) | | | — | |
| | |
|
|
| |
|
|
| |
|
|
| |
|
|
| |
|
|
|
Total distributions | | | (0.888 | ) | | | (0.662 | ) | | | (0.609 | ) | | | (2.751 | ) | | | (24.662 | ) |
| | |
|
|
| |
|
|
| |
|
|
| |
|
|
| |
|
|
|
Net Asset Value, End of Year | | $ | 72.510 | | | $ | 69.240 | | | $ | 62.790 | | | $ | 49.400 | | | $ | 80.800 | |
| | |
|
|
| |
|
|
| |
|
|
| |
|
|
| |
|
|
|
TOTAL RETURN(1) | | | 6.03 | % | | | 11.39 | % | | | 28.61 | % | | | (36.24 | %) | | | (3.01 | %) |
RATIOS/SUPPLEMENTAL DATA | | | | | | | | | | | | | | | | | | | | |
Net assets, end of year (000’s omitted) | | $ | 22,538 | | | $ | 21,498 | | | $ | 20,323 | | | $ | 17,693 | | | $ | 46,689 | |
Ratios of expenses to average net assets | | | 0.85 | % | | | 0.85 | % | | | 0.85 | % | | | 0.85 | % | | | 0.85 | % |
Ratios of net investment income to average net assets | | | 1.30 | % | | | 1.02 | % | | | 1.16 | % | | | 1.00 | % | | | 0.66 | % |
Portfolio turnover rate | | | 16.98 | % | | | 15.40 | % | | | 18.60 | % | | | 32.00 | % | | | 44.32 | % |
| (1) | Past performance is not predictive of future performance. |
| (2) | Calculated based on the average amount of shares outstanding during the year. |
See notes to the financial statements.
11
The Torray Institutional Fund
NOTES TO FINANCIAL STATEMENTS
As of December 31, 2011
NOTE 1 — SUMMARY OF SIGNIFICANT ACCOUNTING POLICIES
The Torray Institutional Fund (“Fund”) is a separate series of The Torray Fund (“Trust”). The Trust is registered under the Investment Company Act of 1940, as amended, as a no-load, diversified, open-end management investment company. The Trust was organized as a business trust under Massachusetts law and the Fund commenced operations on June 30, 2001. The Fund’s primary investment objective is to provide long-term total return. The Fund seeks to meet its objective by investing its assets in a diversified portfolio of common stocks. In order to accomplish these goals, the Fund intends to hold stocks for the long term, as opposed to actively buying and selling. There can be no assurances that the Fund’s investment objectives will be achieved.
The following is a summary of accounting policies followed by the Fund in the preparation of its financial statements. These policies are in conformity with accounting principles generally accepted in the United States of America.
Securities Valuation Portfolio securities for which market quotations are readily available are valued at market value, which is determined by using the last reported sale price, or, if no sales are reported, the last reported bid price. For NASDAQ traded securities, market value is determined on the basis of the NASDAQ official closing price instead of the last reported sales price. Other assets and securities for which no quotations are readily available or for which Torray LLC (the “Advisor”) believes do not reflect market value are valued at fair value as determined in good faith by the Advisor under the supervision of the Board of Trustees (the “Board” or “Trustees”) in accordance with the Fund’s Valuation Procedures. Short-term obligations having remaining maturities of 60 days or less are valued at amortized cost, which approximates market value.
Fair Value Measurements Various inputs are used in determining the fair value of investments which are as follows:
| | • | | Level 1 — quoted prices in active markets for identical securities |
| | • | | Level 2 — significant observable inputs (including quoted prices for similar securities, interest rates, prepayment speeds, credit risk, etc.) |
| | • | | Level 3 — significant unobservable inputs (including the Fund’s own assumptions in determining the fair value of investments) |
The inputs or methodologies used for valuing securities are not necessarily an indication of the risk associated with investing in those securities.
12
The Torray Institutional Fund
NOTES TO FINANCIAL STATEMENTS (continued)
As of December 31, 2011
The summary of inputs used to value the Fund’s investments as of December 31, 2011 is as follows:
| | | | | | |
Valuation Inputs | | | | | | |
Level 1 — Quoted Prices * | | $ | 22,526,511 | | | |
Level 2 — Other Significant Observable Inputs | | | — | | | |
Level 3 — Significant Unobservable Inputs | | | — | | | |
| | |
|
|
| | |
Total Market Value of Investments | | $ | 22,526,511 | | | |
| | |
|
|
| | |
| | * | Security types and industry classifications as defined in the Schedule of Investments. |
The Fund did not have significant transfers between Level 1 and Level 2 investments during the reporting period.
In May 2011, the Financial Accounting Standards Board issued Accounting Standards Update (“ASU”) No. 2011-04 “Amendments to Achieve Common Fair Value Measurement and Disclosure Requirements in U.S. GAAP and International Financial Reporting Standards (“IFRS”)”. ASU 2011-04 includes common requirements for measurement of and disclosure about fair value between U.S. GAAP and IFRS. ASU 2011-04 will require reporting entities to disclose the following information for fair value measurements categorized within Level 3 of the fair value hierarchy: quantitative information about the unobservable inputs used in the fair value measurement, the valuation processes used by the reporting entity and a narrative description of the sensitivity of the fair value measurement to changes in unobservable inputs and the interrelationships between those unobservable inputs. In addition, ASU 2011-04 will require reporting entities to make disclosures about amounts and reasons for all transfers in and out of Level 1 and Level 2 fair value measurements. The new and revised disclosures are effective for interim and annual reporting periods beginning after December 15, 2011. At this time, the Fund does not have any Level 3 securities in its portfolio. To the extent the Fund’s portfolio were ever to be invested in such Level 3 securities, management will evaluate the implications of ASU No. 2011-04 and its impact on the financial statements.
Securities Transactions and Investment Income Securities transactions are recorded on a trade date basis. Realized gains and losses from securities transactions are recorded on the specific identification basis. Dividend income and distributions to shareholders are recorded on the ex-dividend date. Interest income, including amortization of discount on short-term investments, and expenses are recorded on the accrual basis. Premium and discount are amortized using the effective yield to maturity method.
Federal Income Taxes The Fund intends to continue to comply with the requirements of the Internal Revenue Code applicable to regulated investment companies and to distribute all of its taxable income, including any net realized gain on investments to its shareholders. Therefore, no Federal income tax provision is required.
13
The Torray Institutional Fund
NOTES TO FINANCIAL STATEMENTS (continued)
As of December 31, 2011
Management has analyzed the Fund’s tax positions taken on Federal income tax returns for all open tax years (current and prior three tax years), and has concluded that no provision for Federal income tax is required in the Fund’s financial statements. The Fund’s Federal and state income and Federal excise tax returns for tax years for which the applicable statutes of limitations have not expired are subject to examination by the Internal Revenue Service and state departments of revenue.
Net Asset Value The net asset value per share of the Fund is determined daily as of the close of trading on the New York Stock Exchange by dividing the value of the Fund’s net assets by the number of shares outstanding.
Interest Expense When cash balances are overdrawn in the Fund’s custody account, the Fund is charged an overdraft fee equal to 1.25% above the Federal Funds Rate. Such overdraft fees are paid by the Advisor under the comprehensive management fee arrangement described in Note 4.
Use of Estimates In preparing financial statements in accordance with accounting principles generally accepted in the United States of America, management is required to make estimates and assumptions that affect the reported amounts of assets and liabilities and the disclosure of contingent assets and liabilities at the date of the financial statements, and the reported amounts of increases and decreases in net assets from operations during the reporting period. Actual results could differ from those estimates.
NOTE 2 — SHARES OF BENEFICIAL INTEREST TRANSACTIONS
Transactions in shares of beneficial interest were as follows:
| | | | | | | | | | | | | | | | |
| | | Year ended
12/31/11
| | | Year ended
12/31/10
| |
| | | Shares
| | | Amount
| | | Shares
| | | Amount
| |
Shares issued | | | 12,920 | | | $ | 941,960 | | | | 2,530 | | | $ | 162,829 | |
Reinvestments of dividends and distributions | | | 3,868 | | | | 276,882 | | | | 3,149 | | | | 207,271 | |
Shares redeemed | | | (16,477 | ) | | | (1,171,281 | ) | | | (18,876 | ) | | | (1,221,412 | ) |
| | |
|
|
| |
|
|
| |
|
|
| |
|
|
|
| | | | 311 | | | $ | 47,561 | | | | (13,197 | ) | | $ | (851,312 | ) |
| | |
|
|
| |
|
|
| |
|
|
| |
|
|
|
As of December 31, 2011, the Trust’s officers, Trustees and affiliated persons and their families directly or indirectly controlled 214,026 shares or 68.86% of the Fund.
NOTE 3 — INVESTMENT TRANSACTIONS
Purchases and sales of investment securities, other than short-term investments, for the year ended December 31, 2011, aggregated $3,399,580 and $3,901,030, respectively.
14
The Torray Institutional Fund
NOTES TO FINANCIAL STATEMENTS (continued)
As of December 31, 2011
NOTE 4 — MANAGEMENT FEES
Pursuant to the Management Contract, the Advisor provides investment advisory and administrative services to the Fund. The Fund pays the Advisor a management fee, computed daily and payable monthly at the annual rate of 0.85% of the Fund’s average daily net assets. For the year ended December 31, 2011, the Fund paid comprehensive management fees of $191,095. The Fund pays the Advisor a single comprehensive management fee which covers all operating expenses of the Fund including the investment advisory and administrative services provided by the Advisor as well as all miscellaneous costs incurred in connection with the ongoing operation of the Fund including transfer agency, custody, professional, and registration fees.
Certain officers and Trustees of the Fund are also officers and/or shareholders of the Advisor.
NOTE 5 — TAX MATTERS
Distributions to shareholders are determined in accordance with United States Federal income tax regulations, which may differ from accounting principles generally accepted in the United States of America.
The tax character of distributions paid during the years ended December 31, 2011 and 2010 were as follows:
| | | | | | | | |
| | | 2011
| | | 2010
| |
Distributions paid from: | | | | | | | | |
Ordinary income | | $ | 278,301 | | | $ | 207,364 | |
| | |
|
|
| |
|
|
|
| | | $ | 278,301 | | | $ | 207,364 | |
| | |
|
|
| |
|
|
|
As of December 31, 2011, the components of distributable earnings on a tax basis were as follows:
| | | | | | |
Undistributed net investment income | | $ | 13,897 | | | |
Capital loss carry forward | | | (4,042,611 | ) | | |
Deferred post-October losses | | | (105,172 | ) | | |
Unrealized appreciation | | | 1,632,517 | | | |
| | |
|
|
| | |
| | | $ | (2,501,369 | ) | | |
| | |
|
|
| | |
The difference between the capital loss carry forward and deferred post-October losses on a tax basis and accumulated realized loss on investments reported in the Statement of Assets and Liabilities is due to realized losses on certain wash sales that are deferred for Federal income tax purposes. The difference between net unrealized appreciation for tax purposes and net unrealized appreciation on investments reported in the Statement of Assets and Liabilities is due to the same wash sale losses.
15
The Torray Institutional Fund
NOTES TO FINANCIAL STATEMENTS (continued)
As of December 31, 2011
At December 31, 2011 the Fund had net capital loss carry forward for federal income tax purposes of $339,016, $3,679,435 and $1,023, which are available to reduce future required distributions of net capital gains to shareholders through 2016, 2017 and 2018, respectively.
As of December 31, 2011, the Fund had a short-term capital loss carry forward of $14,410 and a long-term capital loss carry forward of $8,727 available to offset future realized capital gains in accordance with the Regulated Investment Company Modernization Act of 2010. These capital loss carry forwards are not subject to expiration and must first be utilized to offset future realized gains of the same character and must be utilized prior to the utilization of the loss carryforwards subject to expiration that are described in the previous paragraph.
The following information is based upon the federal tax basis of investment securities as of December 31, 2011:
| | | | |
Gross unrealized appreciation | | $ | 2,833,142 | |
Gross unrealized depreciation | | | (1,200,625 | ) |
| | |
|
|
|
Net unrealized appreciation | | $ | 1,632,517 | |
| | |
|
|
|
Cost | | $ | 20,893,995 | |
| | |
|
|
|
NOTE 6 — COMMITMENTS AND CONTINGENCIES
The Fund indemnifies its officers and Trustees for certain liabilities that may arise from their performance of their duties to the Fund. Additionally, in the normal course of business, the Fund enters into contracts that contain a variety of representations and warranties, which provide general indemnifications. The Fund’s maximum exposure under these arrangements is unknown, as this would involve future claims that may be made against the Fund that have not yet occurred.
NOTE 7 — SUBSEQUENT EVENTS
Management has evaluated the impact of all subsequent events on the Fund through the date these financial statements were issued and has determined that there were no subsequent events requiring recognition or disclosure in the financial statements except as follows:
The Bank of New York Mellon Corporation (“BNY Mellon”) recently announced that it has agreed to sell BNY Mellon Distributors LLC and its four subsidiaries (“Distributor”) to Foreside Distributors, a subsidiary of Foreside Financial Group (the “Transaction”). Subject to any necessary approvals, the Transaction is anticipated to close in the first half of 2012. Upon the closing of the Transaction, Distributor will become an indirect, wholly owned subsidiary of Foreside Financial Group, and it is anticipated will be named Foreside Funds Distributors LLC.
16
The Torray Institutional Fund
REPORT OF INDEPENDENT REGISTERED PUBLIC ACCOUNTING FIRM
To the Board of Trustees of The Torray Fund
and the Shareholders of The Torray Institutional Fund
We have audited the accompanying statement of assets and liabilities of The Torray Institutional Fund, a series of shares of beneficial interest in The Torray Fund (the “Fund”), including the schedule of investments, as of December 31, 2011, and the related statement of operations for the year then ended, the statements of changes in net assets for each of the years in the two-year period then ended, and the financial highlights for each of the years in the five-year period then ended. These financial statements and financial highlights are the responsibility of the Fund’s management. Our responsibility is to express an opinion on these financial statements and financial highlights based on our audits.
We conducted our audits in accordance with the standards of the Public Company Accounting Oversight Board (United States). Those standards require that we plan and perform the audits to obtain reasonable assurance about whether the financial statements and financial highlights are free of material misstatement. An audit includes examining, on a test basis, evidence supporting the amounts and disclosures in the financial statements. Our procedures included confirmation of securities owned as of December 31, 2011 by correspondence with the custodian. An audit also includes assessing the accounting principles used and significant estimates made by management, as well as evaluating the overall financial statement presentation. We believe that our audits provide a reasonable basis for our opinion.
In our opinion, the financial statements and financial highlights referred to above present fairly, in all material respects, the financial position of The Torray Institutional Fund as of December 31, 2011, the results of its operations for the year then ended, the changes in its net assets for each of the years in the two-year period then ended, and its financial highlights for each of the years in the five-year period then ended, in conformity with accounting principles generally accepted in the United States of America.

BBD, LLP
Philadelphia, Pennsylvania
February 22, 2012
17
The Torray Institutional Fund
FUND MANAGEMENT
As of December 31, 2011 (unaudited)
The Trust is overseen by a Board of Trustees (the "Board"), which has delegated the day-to-day management to the officers of the Trust. The Board meets regularly to review the Fund's activities, contractual arrangements, and per- formance. The trustees and officers serve until their successors are elected and qualified, or until the trustee or officer dies, resigns or is removed, or becomes disqualified.
Information pertaining to the Trustees and Officers of the Trust is set forth below. The Statement of Additional Information (“SAI”) includes additional information about the Trustees and is available without charge, upon request, by calling (800) 443-3036.
| | | | | | | | | | |
Name, Age, Address* and Position(s) with the Trust | | Term of Office
and Length of
Time Served | | Principal Occupation(s) During Past 5 Years | | No. of
Portfolios in
Fund Complex
Overseen by
Trustee | | | Other Directorships Held |
| INDEPENDENT TRUSTEES |
Carol T. Crawford (69) Trustee | | Indefinite Term Since 2006 | | Attorney and International Trade Consultant, McLean, VA | | | 3 | | | Director, Smithfield Foods, Inc., Smithfield, VA |
Bruce C. Ellis (67) Trustee | | Indefinite Term Since 1993 | | Private Investor, Bethesda, MD | | | 3 | | | None |
Robert P. Moltz (64) Trustee | | Indefinite Term Since 1990 | | President, CEO, Weaver Bros Insurance Associates, Inc., Bethesda, MD | | | 3 | | | None |
Wayne H. Shaner (64)** Trustee and Chairman of the Board | | Indefinite Term Since 1993 | | Managing Partner, Rockledge Partners, LLC, Investment Advisory Firm, Easton, MD (Jan. 2004-Present); Vice President, Torray LLC, Bethesda, MD (Jan. 2008-Jun. 2008) | | | 3 | | | Director, Van Eck Funds, New York, NY |
18
The Torray Institutional Fund
FUND MANAGEMENT (continued)
As of December 31, 2011 (unaudited)
| | | | | | | | | | |
Name, Age, Address* and Position(s) with the Trust | | Term of Office
and Length of
Time Served | | Principal Occupation(s) During Past 5 Years | | No. of
Portfolios in
Fund Complex
Overseen by
Trustee | | | Other Directorships Held |
| INTERESTED TRUSTEE AND OFFICERS OF THE TRUST |
William M Lane (61)*** Trustee, Treasurer and Secretary | | Indefinite Term Since 1990 | | Executive Vice President and Secretary, Torray LLC, Bethesda, MD (Oct. 2005-Present); Chief Compliance Officer (Oct. 2005-Mar. 2011); Vice President, Secretary, Treasurer and Chief Compliance Officer, Robert E. Torray & Co. Inc., Bethesda, MD (Jul. 1984-Oct. 2005).*** | | | 3 | | | None |
Robert E. Torray (74) President | | Indefinite Term Since 2007 | | Chairman, Torray LLC, Bethesda, MD (2005-Present); President, Torray LLC, Bethesda, MD (2007-Present); President, Robert E. Torray & Co. Inc., Bethesda, MD (May 1972-Oct. 2005). | | | N/A | | | None |
Barbara Warder, (54) Chief Compliance Officer and Anti-Money Laundering Officer | | Indefinite Term Since 2011 | | Chief Compliance Officer and Anti- Money Laundering Officer, Torray LLC, Bethesda, MD (Mar. 2011-Present); Chief Operating Officer and Chief Compliance Officer, Resolute Capital Management, Washington, DC (Mar. 1998-Jun. 2010). | | | N/A | | | None |
| * | All addresses are c/o The Torray Fund, 7501 Wisconsin Avenue, Suite 750 W, Bethesda, MD 20814-6519. |
| ** | Mr. Shaner is deemed to be an independent Trustee effective as of January 1, 2011. |
| *** | Mr. Lane, by virtue of his employment with Torray LLC, the Trust’s investment adviser, is considered an “interested person” of the Trust, as that term is defined in Section 2(a)(19) of the Investment Company Act of 1940, as amended. |
19
The Torray Institutional Fund
FACTORS CONSIDERED BY THE BOARD OF TRUSTEES IN CONNECTION WITH THEIR APPROVAL OF THE FUND’S INVESTMENT MANAGEMENT AGREEMENT WITH THE MANAGER (unaudited)
The Fund has entered into an Investment Management Agreement (the “Agreement”) with Torray LLC (the “Manager”) pursuant to which the Manager provides investment management services to the Fund. In accordance with the Investment Company Act of 1940, the Board of Trustees of the Fund is required, on an annual basis, to consider the continuation of the Agreement with the Manager, and this must take place at an in-person meeting of the Board. The relevant provisions of the Investment Company Act of 1940 specifically provide that it is the duty of the Board to request and evaluate such information as the Board determines is necessary to allow them to properly consider the continuation of the Agreement, and it is the duty of the Manager to furnish the Trustees with such information that is responsive to their request. Set forth below is a discussion of the various factors that the Board of Trustees considered in deciding to approve the continuation of the Agreement with the Manager.
In determining whether to approve the continuation of the Agreement, the Board of Trustees requested, and the Manager provided, information and data relevant to the Board’s consideration. This included materials that provided the Board with information regarding the investment performance of the Fund and information regarding the fees and expenses of the Fund as compared to other similar mutual funds. As part of its deliberations, the Board also considered and relied upon the information about the Fund that had been provided to them throughout the year in connection with their regular Board meetings at which they engage in the ongoing oversight of the Fund and its operations.
The Board met at an in-person meeting on September 13, 2011 in order to consider the proposed continuation of the Agreement. Among the factors the Board considered was the overall performance of the Fund achieved by the Manager relative to the performance of the Fund’s benchmark index, the S&P 500 Index, as well as the Fund’s performance relative to other mutual funds with similar investment objectives. The Board took into consideration the fact that the Manager seeks to achieve investment results for the Fund with less risk than other similar funds, and that the Manager has maintained a low portfolio turnover rate for the Fund. They noted the range of investment advisory and management services provided by the Manager and the level and quality of these services, and in particular, they noted the quality of the personnel providing these services, taking into consideration their finding that the personnel providing these services, and the services provided, were of a very high caliber and quality. The Board also considered the portfolio manager arrangements for the Fund, noting that the Manager has undertaken appropriate measures to provide for the continued management of the Fund by a team of portfolio managers with extensive portfolio management experience.
The Board also compared the total annual operating expenses of the Fund to the total annual operating expenses of other funds of similar size, noting that the expenses for the Fund compared favorably with industry averages for total annual operating expenses. They also took note of the fact that the Fund is not subject to any sales loads, sales commissions or other similar fees, including Rule 12b-1 distribution fees, and they considered the fact that the Manager had informed the Board that it did not intend to propose the introduction of such types of fees for the Fund. In connection with their review of these matters, the Trustees took note of the fact that the Fund was established principally as an investment vehicle for use by larger institutional types of investors and that the Fund’s fee structure,
20
The Torray Institutional Fund
FACTORS CONSIDERED BY THE BOARD OF TRUSTEES IN CONNECTION WITH THEIR APPROVAL OF THE FUND’S INVESTMENT MANAGEMENT AGREEMENT WITH THE MANAGER (unaudited) (continued)
which is an all-inclusive fee structure, is reflective of fees generally charged in the institutional fund marketplace. The Board also reviewed financial information concerning the Manager, noting its financial soundness as demonstrated by the financial information provided and the level of profitability relating to its services for the Fund, noting that these were reasonable and consistent with industry standards. The Board was also provided with information regarding the fees that the Manager charges other clients for investment advisory services and they noted that the fees were comparable based on the relevant circumstances of the types of accounts involved.
In addition, the Board reviewed with the Manager information regarding its brokerage practices, including soft dollar matters, and noted that the Manager did not have in place any formal soft dollar arrangements, and the Board also reviewed the Manager’s best execution procedures, which the Board noted were reasonable and consistent with standard industry practice.
Based on their review, the Trustees concluded that the investment management services provided under the Agreement were reasonably worth the full amount of the fee and that the terms of the Agreement were fair and reasonable. In reaching their conclusion with respect to their approval of the continuation of the Agreement, the Trustees did not identify any one single factor as being controlling, rather, the Board took note of a combination of factors that influenced their decision making process. The Board did, however, identify the overall favorable investment performance of the Fund, the commitment of the Manager to the successful operation of the Fund, and the level of expenses of the Fund, as being important elements of their consideration. Based upon their review and consideration of these factors and other matters deemed relevant by the Board in reaching an informed business judgment, a majority of the Board of Trustees, including a majority of the Independent Trustees, concluded that the terms of the Agreement were fair and reasonable and the Board voted to approve the continuation of the Agreement with the Manager.
21
The Torray Institutional Fund
PORTFOLIO HOLDINGS, PROXY VOTING AND PROCEDURES
As of December 31, 2011 (unaudited)
The Fund files its complete schedule of portfolio holdings with the Securities and Exchange Commission (the “Commission”) for the first and third quarters of each fiscal year on Form N-Q. The Fund’s Forms N-Q are available on the Commission’s website at http://www.sec.gov. The Fund’s Forms N-Q may be reviewed and copied at the Commission’s Public Reference Room in Washington, D.C. Information on the operation of the Commission’s Public Reference Room may be obtained by calling 1-800-SEC-0330.
A description of the policies and procedures that the Fund uses to determine how to vote proxies relating to portfolio securities is available without charge, upon request, by calling 1-800-443-3036; and on the Commission’s website at http://www.sec.gov.
Information regarding how the Fund voted proxies relating to portfolio securities is available without charge, upon request, by calling 1-800-443-3036; and on the Commission’s website at http://www.sec.gov.
22
The Torray Institutional Fund
ABOUT YOUR FUND’S EXPENSES
As of December 31, 2011 (unaudited)
We believe it is important for you to understand the impact of costs on your investment. All mutual funds have operating expenses. As a shareholder of the Fund, you incur ongoing costs, including management fees, and other fund expenses. Operating expenses, which are deducted directly from the Fund’s gross income, directly reduce the investment return of the Fund.
A mutual fund’s expenses are expressed as a percentage of its average net assets. This figure is known as the expense ratio. The following examples are intended to help you understand the ongoing costs (in dollars) of investing in the Fund and to compare these costs with the ongoing costs of investing in other mutual funds. The examples below are based on an investment of $1,000 made at the beginning of the period shown and held for the entire period.
The table on the next page illustrates the Fund’s cost in two ways:
Actual Fund Return This section helps you estimate the actual expenses that you paid over the period. The “Ending Account Value” shown is derived from the Fund’s actual return, and the third column shows the operating expenses that would have been paid by an investor who started with $1,000 in the Fund. You may use the information here, together with the amount invested, to estimate the expenses that you paid over the period.
To do so, simply divide your account value by $1,000 (for example, an $8,600 account value divided by $1,000 = 8.6), then multiply the result by the number given for the Fund under the heading “Expenses Paid During Period” on the next page.
Hypothetical 5% Return This section is intended to help you compare your Fund’s costs with those of other mutual funds. It assumes that the Fund had an annual return of 5% before expenses, and that the expense ratio is unchanged. In this case, because the return used is not the Fund’s actual return, the results do not apply to your investment. The example is useful in making comparisons because the Commission requires all mutual funds to calculate expenses based on a 5% return. You can assess the Fund’s costs by comparing this hypothetical example with the hypothetical examples that appear in shareholder reports of other funds.
Note that expenses shown in the table are meant to highlight and help you compare ongoing costs only. The Fund does not charge transactions fees, such as purchase or redemption fees, nor does it carry a “sales load.”
The calculation assumes no shares were bought or sold during the period. Your actual costs may have been higher or lower, depending on the amount of your investment and the timing of any purchases or redemptions.
23
The Torray Institutional Fund
ABOUT YOUR FUND’S EXPENSES (continued)
As of December 31, 2011 (unaudited)
More information about the Fund’s expenses, including recent annual expense ratios, can be found in this report. For additional information on operating expenses and other shareholder costs, please refer to the Fund’s prospectus.
| | | | | | | | | | | | |
| | | Beginning
Account Value
July 1, 2011
| | | Ending
Account Value
December 31, 2011
| | | Expenses Paid
During Period *
| |
Based on Actual Fund Return | | $ | 1,000.00 | | | $ | 968.20 | | | $ | 4.22 | |
Based on Hypothetical 5% Return
(before expenses) | | $ | 1,000.00 | | | $ | 1,020.92 | | | $ | 4.33 | |
| * | Expenses are equal to the Fund’s annualized expense ratio of .85% for the period, multiplied by the average account value over the period, multiplied by 184/365 (to reflect the one-half year period). |
24
The Torray Institutional Fund
TAX INFORMATION
As of December 31, 2011 (unaudited)
We are required to advise you within 60 days of the Fund’s fiscal year-end regarding the Federal tax status of certain distributions received by shareholders during such fiscal year. The information below is provided for the Fund’s fiscal year ending December 31, 2011. All designations are based on financial information available as of the date of this annual report and, accordingly are subject to change. For each item it is the intention of the Fund to designate the maximum amount permitted under the Internal Revenue Code and the regulations thereunder.
Qualified Interest Income
For the year ended December 31, 2011, 0.27% of the ordinary distributions paid (net investment income plus short-term capital gain) represent the amount of Qualifying Interest Income as created by The American Jobs Creation Act of 2004.
Qualified Dividend Income
For the year ended December 31, 2011, 100% of the distributions paid by the Fund from ordinary income qualifies for a reduced tax rate pursuant to The Jobs and Growth Tax Relief Reconciliation Act of 2003.
Dividends Received Deduction
For the year ended December 31, 2011, 100% of the ordinary income distribution qualifies for the dividends received deduction available to corporations.
Dividends and distributions received by retirement plans such as IRA’s, Keogh-type plans and 403(b) plans need not be reported as taxable income. However, many retirement plan trusts may need this information for their annual information reporting.
25
TRUSTEES
Carol Crawford
Bruce C. Ellis
William M Lane
Robert P. Moltz
Wayne H. Shaner
INVESTMENT ADVISOR
Torray LLC
OFFICERS
Robert E. Torray
William M Lane
Fred M. Fialco
Shawn M. Hendon
Nicholas C. Haffenreffer
Barbara C. Warder
INDEPENDENT REGISTERED
PUBLIC ACCOUNTING FIRM
BBD, LLP
1835 Market Street, 26th Floor
Philadelphia, PA 19103
TRANSFER AGENT
BNY Mellon Investment Servicing (US) Inc.
4400 Computer Drive
Westborough, MA 01581-1722
LEGAL COUNSEL
Dechert LLP
1775 I Street, N.W.
Washington, DC 20006
Distributed by BNY Mellon Distributors LLC
760 Moore Road, King of Prussia, PA 19406-1212
Date of first use, February 2012
This report is not authorized for distribution to prospective
investors unless preceded or accompanied by a current
prospectus. All indices are unmanaged groupings of stocks
that are not available for investment.
The
TORRAY
INSTITUTIONAL
FUND
ANNUAL REPORT
December 31, 2011
The Torray Institutional Fund
Suite 750 W
7501 Wisconsin Avenue
Bethesda, Maryland 20814-6519
(301) 493-4600
(800) 443-3036
The Torray Resolute Fund
Letter to Shareholders
January 30, 2012
Dear Fellow Shareholders,
The year 2011 was a roller coaster ride, producing an exhausting series of twists, turns, ups and downs that ultimately ended at the same point it began. With 35 days of 2% or greater price changes, the year goes into the books as one of the most volatile periods for equities. Headlines of financial stress, political chaos and natural disasters played out against a dynamic background of a recovering U.S. economy and poor investor sentiment. In spite of this, the fourth quarter produced positive equity returns with the Torray Resolute Fund gaining 9.2% versus the benchmark Russell 1000 Growth Index’s rise of 10.6% and the S&P 500’s gain of 11.8%. Full-year advances were more modest with the Fund gaining 2.2%, the Russell 2.6% and the S&P 2.1%.
Volatility took its toll on investor psychology and created a challenging environment for managers to add value. According to a study published by Merrill Lynch, the average growth manager trailed the benchmark Russell 1000 Growth Index by 4.5 percentage points and just 11% beat the benchmark for the year. We believe our strategy of focusing on companies with sustainable growth was effective in this difficult environment. This was especially true in volatile sectors such as energy and materials, where our holdings added significant value to the portfolio’s performance.
For the fourth quarter, our top contributors included EOG Resources (EOG), Varian Medical Systems (VAR) and Visa (V). The largest detractors were Baxter International (BAX), Oracle (ORCL) and Compass Minerals (CMP). Generally speaking, defensive stocks underperformed cyclical issues as the domestic economy produced encouraging signs of stability and recovery. However, over the course of the full year the opposite was true: defensive stocks strongly outperformed cyclicals. This flux was a key reason why 2011 was such a difficult year for active management.
During the quarter, we purchased shares of Precision Castparts (PCP), a manufacturer of complex metal components serving the aerospace and power generation industries. With $7 billion in sales and a market capitalization of $25 billion, the company enjoys dominant market share and best-in-class operating metrics, due in part to the specialized nature of its products, high customer switching costs and long-term supply contracts that pass raw material costs along to customers.
Despite the fact that the company serves cyclical end markets, PCP has produced a record of consistent growth, particularly since GE alum Mark Donegan was appointed CEO in 2002. In the nine years since he took the helm, revenues have increased at a compound annual rate of 10%, operating margins expanded from 18% to 27% and earnings have grown at an average rate of 20%. As the aerospace market enters a strong secular growth phase and the industrial gas turbine business stabilizes, PCP is well-positioned to continue its record of steady growth and profitability.
Shares of Global Payments (GPN) were sold during the quarter due to our outlook for a weaker pricing environment for payment processors and the company’s increasing reliance on Independent Sales Organizations, a
1
The Torray Resolute Fund
Letter to Shareholders (continued)
January 30, 2012
distribution channel that is less profitable than direct sales. We expect this dynamic will continue, limiting the company’s operating leverage and ability to sustain satisfactory earnings growth.
There is little value in market predictions, but decisions are informed by certain assumptions. Over the course of the past year, our analysis and strategy has been effective, leading us to opportunistically transition away from a defensive posture that was more appropriate for the financial crisis and period that followed. The extreme market volatility of this period created opportunities to invest in superior companies that will thrive over time. Long-term structural challenges remain. European economies are at a crisis point that is likely to generate collateral damage, but the passage of time may help limit this. There is something to the phrase, “Better the devil you know than the devil you don’t.”
The consensus outlook is for a sluggish U.S. economy, a mild recession across the European Union and continued market volatility. There is nothing magic about the turn of the calendar, but 2012 could just as easily produce the opposite: quiet markets, improving fundamentals, a decoupling of international economies, declining correlations and improving investor sentiment. As we look to the New Year, this is where we see opportunity.
As ever, we appreciate your interest and trust.
| | | | | | |
| | | Respectfully, | | | | |
| | | |
| | |  | | | | |
| | | Nicholas C. Haffenreffer | | | | |
2
The Torray Resolute Fund
PERFORMANCE DATA
As of December 31, 2011 (unaudited)
Average Annual Returns on an Investment in
The Torray Resolute Fund vs.
the Russell 1000 Growth Index and the S&P 500 Index
For the periods ended December 31, 2011:
| | | | | | | | | | | | |
| | | 3 Month
| | | 6 Month
| | | Since Inception
12/31/10 (1 Year)
| |
The Torray Resolute Fund | | | 9.22 | % | | | -4.99 | % | | | 2.23 | % |
Russell 1000 Growth Index | | | 10.61 | % | | | -3.92 | % | | | 2.64 | % |
S&P 500 Index | | | 11.82 | % | | | -4.77 | % | | | 2.11 | % |
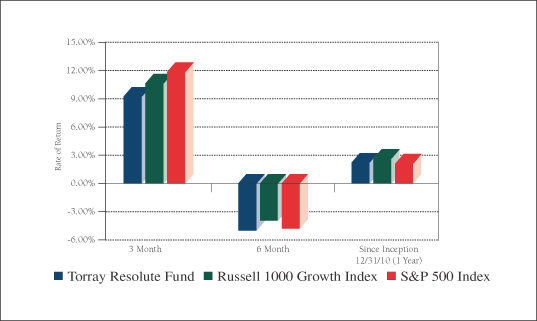
Cumulative Returns for the Year ended December 31, 2011
| | | | |
The Torray Resolute Fund | | | 2.23 | % |
Russell 1000 Growth Index | | | 2.64 | % |
S&P 500 Index | | | 2.11 | % |
3
The Torray Resolute Fund
PERFORMANCE DATA (continued)
As of December 31, 2011 (unaudited)
Change in Value of $10,000 Invested
on December 31, 2010 (commencement of operations) to:
| | | | | | | | | | | | | | | | | | | | | | | | |
| | | 02/28/11
| | | 04/30/11
| | | 06/30/11
| | | 08/31/11
| | | 10/31/11
| | | 12/31/11
| |
The Torray Resolute Fund | | $ | 10,410 | | | $ | 10,730 | | | $ | 10,760 | | | $ | 10,010 | | | $ | 10,320 | | | $ | 10,223 | |
Russell 1000 Growth Index | | $ | 10,590 | | | $ | 10,958 | | | $ | 10,683 | | | $ | 10,018 | | | $ | 10,298 | | | $ | 10,264 | |
S&P 500 Index | | $ | 10,588 | | | $ | 10,906 | | | $ | 10,603 | | | $ | 9,823 | | | $ | 10,130 | | | $ | 10,211 | |
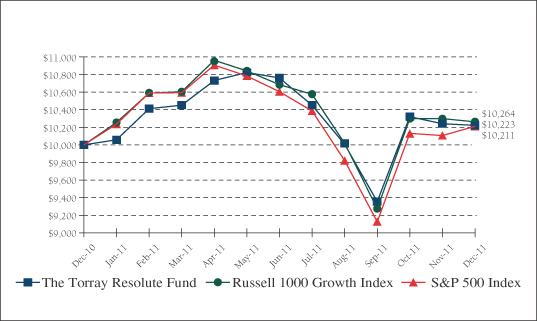
The returns quoted represent past performance and do not guarantee future results. Investment return and principal value will fluctuate so that shares, when redeemed, may be worth more or less than their original cost. Current performance may be lower or higher. For performance current to the most recent monthend, please call (800) 626-9769. The returns shown do not reflect the deduction of taxes a shareholder would pay on the redemption of fund shares and distributions. The Fund’s gross annual operating expense ratio, as stated in the current prospectus, is estimated to be 1.22%. The Fund’s actual gross annual operating expense ratio for the fiscal year ended December 31, 2011 was 5.90% before voluntary fee waivers and expense reimbursements by the Adviser and the Fund’s net annual operating expense ratio after such voluntary expense waivers and reimbursements was 1.25%. Returns on The Torray Resolute Fund, the Russell 1000 Growth Index and the S&P 500 Index assume reinvestment of all dividends and distributions. The Russell 1000 Growth Index is an unmanaged index consisting of 588 U.S. large-cap growth stocks, and the S&P 500 Index is an unmanaged index consisting of 500 large-cap stocks. It is not possible to invest directly in an index. Current and future portfolio holdings are subject to change and risk.
4
The Torray Resolute Fund
FUND PROFILE
As of December 31, 2011 (unaudited)
| | | | |
DIVERSIFICATION (% of net assets) | | | | |
| |
Information Technology | | | 30.44% | |
Health Care | | | 16.56% | |
Industrials | | | 12.56% | |
Energy | | | 10.08% | |
Consumer Staples | | | 7.45% | |
Financials | | | 5.84% | |
Consumer Discretionary | | | 5.77% | |
Materials | | | 5.77% | |
Telecommunications | | | 4.79% | |
Short-Term Investments | | | 1.08% | |
Liabilities Less Other Assets | | | (0.34)% | |
| | |
|
|
|
| | | | 100.00% | |
| | |
|
|
|
| | | | | | |
| TOP TEN EQUITY HOLDINGS (% of net assets) |
| | |
| | 1. | | | Visa, Inc., Class A | | 4.92% |
| | 2. | | | American Tower Corp., Class A | | 4.79% |
| | 3. | | | Enbridge, Inc. | | 4.39% |
| | 4. | | | Apple Inc. | | 4.29% |
| | 5. | | | Danaher Corp. | | 3.98% |
| | 6. | | | Gilead Sciences, Inc. | | 3.83% |
| | 7. | | | PepsiCo, Inc. | | 3.73% |
| | 8. | | | Colgate-Palmolive Co. | | 3.72% |
| | 9. | | | EOG Resources, Inc. | | 3.61% |
| | 10. | | | United Technologies Corp. | | 3.47% |
| | | | | | |
|
| | | | | | | 40.73% |
| | | | | | |
|
| | | | | | | | |
PORTFOLIO CHARACTERISTICS | |
| | |
Net Assets (million) | | | | | | | $3 | |
Number of Holdings | | | | | | | 30 | |
Portfolio Turnover | | | | | | | 22.35% | |
P/E Multiple (forward) | | | | | | | 14.7x | |
Weighted Average Dividend Yield | | | | | | | 1.27% | |
Market Capitalization (billion) | | | Average | | | | $57.3 | |
| | | | Median | | | | $28.7 | |
5
The Torray Resolute Fund
SCHEDULE OF INVESTMENTS
As of December 31, 2011
| | | | | | | | | | |
| | | Shares
| | | | | Market Value
| |
| COMMON STOCK 99.26% | | | | |
30.44% INFORMATION TECHNOLOGY | | | | |
| | | | 1,356 | | | Visa, Inc., Class A | | $ | 137,675 | |
| | | | 297 | | | Apple Inc.* | | | 120,285 | |
| | | | 3,749 | | | Oracle Corp. | | | 96,162 | |
| | | | 2,036 | | | Amphenol Corp., Class A | | | 92,414 | |
| | | | 1,504 | | | Fiserv Inc.* | | | 88,345 | |
| | | | 1,881 | | | MICROS Systems, Inc.* | | | 87,617 | |
| | | | 2,876 | | | Adobe Systems, Inc.* | | | 81,305 | |
| | | | 1,496 | | | Accenture PLC, Class A | | | 79,632 | |
| | | | 1,905 | | | NetApp, Inc.* | | | 69,094 | |
| | | | | | | | |
|
|
|
| | | | | | | | | | 852,529 | |
16.56% HEALTH CARE | | | | |
| | | | 2,621 | | | Gilead Sciences, Inc.* | | | 107,278 | |
| | | | 1,354 | | | Varian Medical Systems, Inc.* | | | 90,894 | |
| | | | 1,368 | | | Johnson & Johnson | | | 89,713 | |
| | | | 771 | | | Novo-Nordisk A/S, ADR | | | 88,866 | |
| | | | 1,758 | | | Baxter International Inc. | | | 86,986 | |
| | | | | | | | |
|
|
|
| | | | | | | | | | 463,737 | |
12.56% INDUSTRIALS | | | | |
| | | | 2,369 | | | Danaher Corp. | | | 111,438 | |
| | | | 1,331 | | | United Technologies Corp. | | | 97,283 | |
| | | | 435 | | | Precision Castparts Corp. | | | 71,684 | |
| | | | 809 | | | Cummins Inc. | | | 71,208 | |
| | | | | | | | |
|
|
|
| | | | | | | | | | 351,613 | |
10.08% ENERGY | | | | |
| | | | 3,283 | | | Enbridge, Inc. | | | 122,817 | |
| | | | 1,027 | | | EOG Resources, Inc. | | | 101,170 | |
| | | | 512 | | | Core Laboratories N.V. | | | 58,342 | |
| | | | | | | | |
|
|
|
| | | | | | | | | | 282,329 | |
7.45% CONSUMER STAPLES | | | | |
| | | | 1,573 | | | PepsiCo, Inc. | | | 104,369 | |
| | | | 1,128 | | | Colgate-Palmolive Co. | | | 104,216 | |
| | | | | | | | |
|
|
|
| | | | | | | | | | 208,585 | |
6
The Torray Resolute Fund
SCHEDULE OF INVESTMENTS (continued)
As of December 31, 2011
| | | | | | | | | | |
| | | Shares
| | | | | Market Value
| |
| |
5.84% FINANCIALS | | | | |
| | | | 904 | | | Franklin Resources, Inc. | | $ | 86,838 | |
| | | | 2,309 | | | JPMorgan Chase & Co. | | | 76,774 | |
| | | | | | | | |
|
|
|
| | | | | | | | | | 163,612 | |
| |
5.77% CONSUMER DISCRETIONARY | | | | |
| | | | 912 | | | Nike, Inc., Class B | | | 87,889 | |
| | | | 1,318 | | | Tupperware Brands Corp. | | | 73,768 | |
| | | | | | | | |
|
|
|
| | | | | | | | | | 161,657 | |
| |
5.77% MATERIALS | | | | |
| | | | 849 | | | Praxair, Inc. | | | 90,758 | |
| | | | 1,027 | | | Compass Minerals International, Inc. | | | 70,709 | |
| | | | | | | | |
|
|
|
| | | | | | | | | | 161,467 | |
| |
4.79% TELECOMMUNICATIONS | | | | |
| | | | 2,237 | | | American Tower Corp., Class A | | | 134,242 | |
| | | | | | | | |
|
|
|
| TOTAL COMMON STOCK 99.26% | | | 2,779,771 | |
(cost $2,788,197) | | | | |
| | | |
| | | Principal Amount ($) | | | | | | |
| |
| SHORT-TERM INVESTMENTS 1.08% | | | | |
| | | | 30,243 | | | BNY Mellon Cash Reserve, 0.05%(1) | | | 30,243 | |
| | | | | | | | | | | |
(cost $30,243) | | | | |
| | | | | | | | |
|
|
|
| |
| TOTAL INVESTMENTS 100.34% | | | 2,810,014 | |
(cost $2,818,440) | | | | |
| LIABILITIES LESS OTHER ASSETS (0.34%) | | | (9,399 | ) |
| | | | | | | | |
|
|
|
| NET ASSETS 100.00% | | $ | 2,800,615 | |
| | | | | | | | |
|
|
|
| * | Non-income producing securities. |
| (1) | Represents current yield at December 31, 2011. |
| ADR | — American Depositary Receipt |
See notes to the financial statements.
7
The Torray Resolute Fund
STATEMENT OF ASSETS AND LIABILITIES
As of December 31, 2011
| | | | |
ASSETS | | | | |
Investments in securities at value | | | | |
(cost $2,818,440) | | $ | 2,810,014 | |
Interest and dividends receivable | | | 2,055 | |
Prepaid expenses | | | 10,267 | |
| | |
|
|
|
TOTAL ASSETS | | | 2,822,336 | |
| | |
|
|
|
| |
LIABILITIES | | | | |
Payable for audit fees | | | 14,000 | |
Payable to Advisor | | | 5,346 | |
Payable for transfer agent fees & expenses | | | 1,317 | |
Accrued expenses | | | 1,058 | |
| | |
|
|
|
TOTAL LIABILITIES | | | 21,721 | |
| | |
|
|
|
| |
NET ASSETS | | $ | 2,800,615 | |
| | |
|
|
|
Paid-in-capital (274,025 shares outstanding, unlimited shares authorized) | | $ | 2,814,593 | |
Undistributed net investment income | | | 1 | |
Accumulated net realized loss on investments | | | (5,553 | ) |
Net unrealized depreciation of investments | | | (8,426 | ) |
| | |
|
|
|
| |
TOTAL NET ASSETS | | $ | 2,800,615 | |
| | |
|
|
|
Net Asset Value, Offering and Redemption Price per Share | | $ | 10.22 | |
| | |
|
|
|
See notes to the financial statements.
8
The Torray Resolute Fund
STATEMENT OF OPERATIONS
For the year ended December 31, 2011
| | | | |
INVESTMENT INCOME | | | | |
Dividend income | | $ | 21,720 | |
Interest income | | | 104 | |
Foreign tax withheld | | | (536 | ) |
| | |
|
|
|
Total investment income | | | 21,288 | |
| | |
|
|
|
| |
EXPENSES | | | | |
Trustees’ fees | | | 32,666 | |
Management fees | | | 16,691 | |
Transfer agent fees & expenses | | | 15,766 | |
Audit fees | | | 14,000 | |
Insurance expense | | | 8,306 | |
Custodian fees | | | 5,939 | |
Registration & filing fees | | | 5,024 | |
Printing, postage & mailing | | | 306 | |
Legal fees | | | 207 | |
| | |
|
|
|
Total expenses | | | 98,905 | |
Fees waived and expenses reimbursed by Adviser | | | (78,041 | ) |
| | |
|
|
|
Net expenses | | | 20,864 | |
| | |
|
|
|
NET INVESTMENT INCOME | | | 424 | |
| | |
|
|
|
REALIZED AND UNREALIZED GAIN (LOSS)
ON INVESTMENTS | | | | |
Net realized loss on investments | | | (5,094 | ) |
Net change in unrealized appreciation (depreciation) on investments | | | (8,426 | ) |
| | |
|
|
|
Net realized and unrealized loss on investments | | | (13,520 | ) |
| | |
|
|
|
NET DECREASE IN NET ASSETS RESULTING FROM OPERATIONS | | $ | (13,096 | ) |
| | |
|
|
|
See notes to the financial statements.
9
The Torray Resolute Fund
STATEMENTS OF CHANGES IN NET ASSETS
For the periods indicated:
| | | | | | | | |
| | | Year ended
12/31/11
| | | Period ended
12/31/10(1)
| |
Increase (Decrease) in Net Assets Resulting from Operations: | | | | | | | | |
Net investment income | | $ | 424 | | | $ | — | |
Net realized loss on investments | | | (5,094 | ) | | | — | |
Net change in unrealized appreciation
(depreciation) on investments | | | (8,426 | ) | | | — | |
| | |
|
|
| |
|
|
|
Net increase in net assets from operations | | | (13,096 | ) | | | — | |
| | |
|
|
| |
|
|
|
| | |
Distributions to Shareholders from: | | | | | | | | |
Net investment income ($0.002 and
$0.000 per share, respectively) | | | (422 | ) | | | — | |
Net realized gains ($0.002 and $0.000 per
share, respectively) | | | (460 | ) | | | — | |
| | |
|
|
| |
|
|
|
Total distributions | | | (882 | ) | | | — | |
| | |
|
|
| |
|
|
|
| | |
Shares of Beneficial Interest | | | | | | | | |
Increase from share transactions | | | 2,714,593 | | | | 100,000 | |
| | |
|
|
| |
|
|
|
Total increase | | | 2,700,615 | | | | 100,000 | |
| | |
Net Assets — Beginning of Period | | | 100,000 | | | | — | |
| | |
|
|
| |
|
|
|
| | |
Net Assets — End of Period | | $ | 2,800,615 | | | $ | 100,000 | |
| | |
|
|
| |
|
|
|
Undistributed Net Investment Income | | $ | 1 | | | $ | — | |
| | |
|
|
| |
|
|
|
| (1) | Commencement of operations on 12/31/10. |
See notes to the financial statements.
10
The Torray Resolute Fund
FINANCIAL HIGHLIGHTS
For a share outstanding throughout each period presented:
PER SHARE DATA
| | | | | | | | |
| | | Year ended
12/31/11
| | | Period ended
12/31/10(3)
| |
Net Asset Value, Beginning of Period | | $ | 10.000 | | | $ | 10.000 | |
| | |
|
|
| |
|
|
|
Income from investment operations | | | | | | | | |
Net investment income | | | 0.003 | (2) | | | 0.000 | |
Net gains on securities (both realized and unrealized) | | | 0.221 | (4) | | | 0.000 | |
| | |
|
|
| |
|
|
|
Total from investment operations | | | 0.224 | | | | 0.000 | |
| | |
|
|
| |
|
|
|
Less: distributions | | | | | | | | |
Dividends (from net investment income) | | | (0.002 | ) | | | 0.000 | |
Distributions (from capital gains) | | | (0.002 | ) | | | — | |
| | |
|
|
| |
|
|
|
Total distributions | | | (0.004 | ) | | | 0.000 | |
| | |
|
|
| |
|
|
|
Net Asset Value, End of Period | | $ | 10.220 | | | $ | 10.000 | |
| | |
|
|
| |
|
|
|
TOTAL RETURN(1) | | | 2.23 | % | | | 0.00 | % |
RATIOS/SUPPLEMENTAL DATA | | | | | | | | |
Net assets, end of period (000’s omitted) | | $ | 2,801 | | | $ | 100 | |
Ratios of expenses to average net assets before expense reimbursement | | | 5.90 | % | | | 0.00 | % |
Ratios of expenses to average net assets after expense reimbursement | | | 1.25 | % | | | 0.00 | % |
Ratios of net investment income to average net assets | | | 0.03 | % | | | 0.00 | % |
Portfolio turnover rate | | | 22.35 | % | | | 0.00 | % |
| (1) | Past performance is not predictive of future performance. |
| (2) | Calculated based on the average amount of shares outstanding during the period. |
| (3) | Commencement of operations on 12/31/10. |
| (4) | The amount of net gains on securities (both realized and unrealized) per share does not accord with the amounts reported in the Statement of Operations due to the timing of purchases and redemptions of Fund shares and fluctuating market values during the period. |
See notes to the financial statements.
11
The Torray Resolute Fund
NOTES TO FINANCIAL STATEMENTS
As of December 31, 2011
NOTE 1 — SUMMARY OF SIGNIFICANT ACCOUNTING POLICIES
The Torray Resolute Fund (“Fund”) is a separate series of The Torray Fund (“Trust”). The Trust is registered under the Investment Company Act of 1940, as amended, as a no-load, diversified, open-end management investment company. The Trust was organized as a business trust under Massachusetts law. The Fund’s primary investment objective is to seek to achieve long-term growth of capital. The Fund seeks to meet its objective by investing its assets in a diversified portfolio of common stocks. In order to accomplish these goals, the Fund intends to hold stocks for the long term, as opposed to actively buying and selling. There can be no assurances that the Fund’s investment objectives will be achieved.
The following is a summary of accounting policies followed by the Fund in the preparation of its financial statements. These policies are in conformity with accounting principles generally accepted in the United States of America.
Securities Valuation Portfolio securities for which market quotations are readily available are valued at market value, which is determined by using the last reported sale price, or, if no sales are reported, the last reported bid price. For NASDAQ traded securities, market value is determined on the basis of the NASDAQ Official Closing Price instead of the last reported sales price. Other assets and securities for which no quotations are readily available or for which Torray LLC (the “Advisor”) believes do not reflect market value are valued at fair value as determined in good faith by the Advisor under the supervision of the Board of Trustees (the “Board” or “Trustees”) in accordance with the Fund’s Valuation Procedures. Short-term obligations having remaining maturities of 60 days or less are valued at amortized cost, which approximates market value.
Fair Value Measurements Various inputs are used in determining the fair value of investments which are as follows:
| | • | | Level 1 — quoted prices in active markets for identical securities |
| | • | | Level 2 — significant observable inputs (including quoted prices for similar securities, interest rates, prepayment speeds, credit risk, etc.) |
| | • | | Level 3 — significant unobservable inputs (including the Fund’s own assumptions in determining the fair value of investments) |
The inputs or methodologies used for valuing securities are not necessarily an indication of the risk associated with investing in those securities.
12
The Torray Resolute Fund
NOTES TO FINANCIAL STATEMENTS (continued)
As of December 31, 2011
The summary of inputs used to value the Fund’s investments as of December 31, 2011 is as follows:
| | | | |
Valuation Inputs
| | | |
Level 1 — Quoted Prices * | | $ | 2,810,014 | |
Level 2 — Other Significant Observable Inputs | | | — | |
Level 3 — Significant Unobservable Inputs | | | — | |
| | |
|
|
|
Total Market Value of Investments | | $ | 2,810,014 | |
| | |
|
|
|
| | * | Security types and industry classifications as defined in the Schedule of Investments. |
The Fund did not have significant transfers between Level 1 and Level 2 investments during the reporting period.
In May 2011, the Financial Accounting Standards Board issued Accounting Standards Update (“ASU”) No. 2011-04 “Amendments to Achieve Common Fair Value Measurement and Disclosure Requirements in U.S. GAAP and International Financial Reporting Standards (“IFRS”)”. ASU 2011-04 includes common requirements for measurement of and disclosure about fair value between U.S. GAAP and IFRS. ASU 2011-04 will require reporting entities to disclose the following information for fair value measurements categorized within Level 3 of the fair value hierarchy: quantitative information about the unobservable inputs used in the fair value measurement, the valuation processes used by the reporting entity and a narrative description of the sensitivity of the fair value measurement to changes in unobservable inputs and the interrelationships between those unobservable inputs. In addition, ASU 2011-04 will require reporting entities to make disclosures about amounts and reasons for all transfers in and out of Level 1 and Level 2 fair value measurements. The new and revised disclosures are effective for interim and annual reporting periods beginning after December 15, 2011. At this time, the Fund does not have any Level 3 securities in its portfolio. To the extent the Fund’s portfolio were ever to be invested in such Level 3 securities, management will evaluate the implications of ASU No. 2011-04 and its impact on the financial statements.
Securities Transactions and Investment Income Securities transactions are recorded on a trade date basis. Realized gains and losses from securities transactions are recorded on the specific identification basis. Dividend income and distributions to shareholders are recorded on the ex-dividend date. Interest income, including amortization of discount on short-term investments, and expenses are recorded on the accrual basis. Premium and discount are amortized using the effective yield to maturity method.
Federal Income Taxes The Fund intends to continue to comply with the requirements of the Internal Revenue Code applicable to regulated investment companies and to distribute all of its taxable income, including any net realized gain on investments to its shareholders. Therefore, no Federal income tax provision is required.
Management has analyzed the Fund’s tax positions taken on Federal income tax returns for the current year, and has concluded that no provision for Federal income tax is required in the Fund’s financial statements. The Fund’s
13
The Torray Resolute Fund
NOTES TO FINANCIAL STATEMENTS (continued)
As of December 31, 2011
Federal and state income and Federal excise tax returns for tax years for which the applicable statutes of limitations have not expired are subject to examination by the Internal Revenue Service and state departments of revenue.
Net Asset Value The net asset value per share of the Fund is determined daily as of the close of trading on the New York Stock Exchange by dividing the value of the Fund’s net assets by the number of shares outstanding.
Interest Expense When cash balances are overdrawn in the Fund’s custody account, the Fund is charged an overdraft fee equal to 1.25% above the Federal Funds Rate.
Use of Estimates In preparing financial statements in accordance with accounting principles generally accepted in the United States of America, management is required to make estimates and assumptions that affect the reported amounts of assets and liabilities and the disclosure of contingent assets and liabilities at the date of the financial statements, and the reported amounts of increases and decreases in net assets from operations during the reporting period. Actual results could differ from those estimates.
NOTE 2 — SHARES OF BENEFICIAL INTEREST TRANSACTIONS
Transactions in shares of beneficial interest were as follows:
| | | | | | | | | | | | | | | | |
| | | Year ended
12/31/11
| | | Period ended
12/31/10
| |
| | | Shares
| | | Amount
| | | Shares
| | | Amount
| |
Shares issued | | | 301,712 | | | $ | 3,091,907 | | | | 10,000 | | | $ | 100,000 | |
Reinvestments of dividends and distributions | | | 86 | | | | 882 | | | | — | | | | — | |
Shares redeemed | | | (37,773 | ) | | | (378,196 | ) | | | — | | | | — | |
| | |
|
|
| |
|
|
| |
|
|
| |
|
|
|
| | | | 264,025 | | | $ | 2,714,593 | | | | 10,000 | | | $ | 100,000 | |
| | |
|
|
| |
|
|
| |
|
|
| |
|
|
|
As of December 31, 2011, the Trust’s officers, Trustees and affiliated persons and their families directly or indirectly controlled 90,580 shares or 33.06% of the Fund.
NOTE 3 — INVESTMENT TRANSACTIONS
Purchases and sales of investment securities, other than short-term investments, for the year ended December 31, 2011, aggregated $3,181,934 and $388,643, respectively.
14
The Torray Resolute Fund
NOTES TO FINANCIAL STATEMENTS (continued)
As of December 31, 2011
NOTE 4 — MANAGEMENT FEES
Pursuant to the Management Contract, the Advisor provides investment advisory and administrative services to the Fund. The Fund pays the Advisor a management fee, computed daily and payable monthly at the annual rate of 1.00% of the Fund’s average daily net assets. For the year ended December 31, 2011, the Fund incurred management fees of $16,691.
Excluding the management fee, other expenses incurred by the Fund during the year ended December 31, 2011, totaled $82,214. During the year ended December 31, 2011, the Adviser voluntarily waived fees and reimbursed expenses in the amount of $78,041 to maintain the Fund’s expense ratio at 1.25%. These expenses include all costs associated with the Fund’s operations including transfer agent fees, independent trustees’ fees ($14,000 per annum and $2,000 for each Board meeting attended per Trustee), dues, fees and expenses of registering and qualifying the Fund and its shares for distribution, charges of the custodian, auditing and legal expenses, insurance premiums, supplies, postage, expenses of issue or redemption of shares, reports to shareholders and Trustees, expenses of printing and mailing prospectuses, proxy statements and proxies to existing shareholders, and other miscellaneous expenses.
Certain officers and Trustees of the Fund are also officers and/or shareholders of the Advisor.
NOTE 5 — TAX MATTERS
Distributions to shareholders are determined in accordance with United States Federal income tax regulations, which may differ from accounting principles generally accepted in the United States of America.
The tax character of distributions paid during the year ended December 31, 2011 was as follows:
| | | | |
| | | 2011
| |
Distributions paid from: | | | | |
Ordinary income | | $ | 882 | |
| | |
|
|
|
| | | $ | 882 | |
| | |
|
|
|
As of December 31, 2011, the components of distributable earnings on a tax basis were as follows:
| | | | |
Undistributed net investment income | | $ | 1 | |
Deferred post October losses | | | (3,587 | ) |
Unrealized depreciation | | | (10,392 | ) |
| | |
|
|
|
| | | $ | (13,978 | ) |
| | |
|
|
|
15
The Torray Resolute Fund
NOTES TO FINANCIAL STATEMENTS (continued)
As of December 31, 2011
Permanent book/tax differences are reclassified among the Fund’s components of capital on a tax basis. As of December 31, 2011, the Fund reclassified $1 to decrease undistributed net investment income and decrease accumulated net realized loss on investments in order to reflect permanent book/tax differences related to short-term capital gain distributions.
At December 31, 2011, the Fund had no capital loss carry forward for federal income tax purposes.
The following information is based upon the federal tax basis of investment securities as of December 31, 2011:
| | | | |
Gross unrealized appreciation | | $ | 128,930 | |
Gross unrealized depreciation | | | (139,322 | ) |
| | |
|
|
|
Net unrealized depreciation | | $ | (10,392 | ) |
| | |
|
|
|
Cost | | $ | 2,820,406 | |
| | |
|
|
|
NOTE 6 — COMMITMENTS AND CONTINGENCIES
The Fund indemnifies its officers and Trustees for certain liabilities that may arise from their performance of their duties to the Fund. Additionally, in the normal course of business, the Fund enters into contracts that contain a variety of representations and warranties which provide general indemnifications. The Fund’s maximum exposure under these arrangements is unknown, as this would involve future claims that may be made against the Fund that have not yet occurred.
NOTE 7 — SUBSEQUENT EVENTS
Management has evaluated the impact of all subsequent events on the Fund through the date these financial statements were issued and has determined that there were no subsequent events requiring recognition or disclosure in the financial statements except as follows:
The Bank of New York Mellon Corporation (“BNY Mellon”) recently announced that it has agreed to sell BNY Mellon Distributors LLC and its four subsidiaries (“Distributor”) to Foreside Distributors, a subsidiary of Foreside Financial Group (the “Transaction”). Subject to any necessary approvals, the Transaction is anticipated to close in the first half of 2012. Upon the closing of the Transaction, Distributor will become an indirect, wholly owned subsidiary of Foreside Financial Group, and it is anticipated will be named Foreside Funds Distributors LLC.
16
The Torray Resolute Fund
REPORT OF INDEPENDENT REGISTERED PUBLIC ACCOUNTING FIRM
To the Board of Trustees of The Torray Fund
and the Shareholders of The Torray Resolute Fund
We have audited the accompanying statement of assets and liabilities of The Torray Resolute Fund, a series of shares of beneficial interest in The Torray Fund (the “Fund”), including the schedule of investments, as of December 31, 2011, the related statement of operations for the year then ended, and the statements of changes in net assets and financial highlights for the year then ended and for the one day in the period ended December 31, 2010. These financial statements and financial highlights are the responsibility of the Fund’s management. Our responsibility is to express an opinion on these financial statements and financial highlights based on our audits.
We conducted our audits in accordance with the standards of the Public Company Accounting Oversight Board (United States). Those standards require that we plan and perform the audits to obtain reasonable assurance about whether the financial statements and financial highlights are free of material misstatement. An audit includes examining, on a test basis, evidence supporting the amounts and disclosures in the financial statements. Our procedures included confirmation of securities owned as of December 31, 2011 by correspondence with the custodian. An audit also includes assessing the accounting principles used and significant estimates made by management, as well as evaluating the overall financial statement presentation. We believe that our audits provide a reasonable basis for our opinion.
In our opinion, the financial statements and financial highlights referred to above present fairly, in all material respects, the financial position of The Torray Resolute Fund as of December 31, 2011, the results of its operations for the year then ended, and the changes in its net assets and its financial highlights for the year then ended and for the one day in the period ended December 31, 2010, in conformity with accounting principles generally accepted in the United States of America.

BBD, LLP
Philadelphia, Pennsylvania
February 22, 2012
17
The Torray Resolute Fund
FUND MANAGEMENT
As of December 31, 2011 (unaudited)
The Trust is overseen by a Board of Trustees (the "Board"), which has delegated the day-to-day management to the officers of the Trust. The Board meets regularly to review the Fund's activities, contractual arrangements, and per- formance. The trustees and officers serve until their successors are elected and qualified, or until the trustee or officer dies, resigns or is removed, or becomes disqualified.
Information pertaining to the Trustees and Officers of the Trust is set forth below. The Statement of Additional Information (“SAI”) includes additional information about the Trustees and is available without charge, upon request, by calling (800) 443-3036.
| | | | | | | | | | |
Name, Age, Address* and Position(s) with the Trust | | Term of Office
and Length of
Time Served | | Principal Occupation(s) During Past 5 Years | | No. of
Portfolios in
Fund Complex
Overseen by
Trustee | | | Other Directorships Held |
| INDEPENDENT TRUSTEES |
Carol T. Crawford (69) Trustee | | Indefinite Term Since 2006 | | Attorney and International Trade Consultant, McLean, VA | | | 3 | | | Director, Smithfield Foods, Inc., Smithfield, VA |
Bruce C. Ellis (67) Trustee | | Indefinite Term Since 1993 | | Private Investor, Bethesda, MD | | | 3 | | | None |
Robert P. Moltz (64) Trustee | | Indefinite Term Since 1990 | | President, CEO, Weaver Bros Insurance Associates, Inc., Bethesda, MD | | | 3 | | | None |
Wayne H. Shaner (64)** Trustee and Chairman of the Board | | Indefinite Term Since 1993 | | Managing Partner, Rockledge Partners, LLC, Investment Advisory Firm, Easton, MD (Jan. 2004-Present); Vice President, Torray LLC, Bethesda, MD (Jan. 2008-Jun. 2008) | | | 3 | | | Director, Van Eck Funds, New York, NY |
18
The Torray Resolute Fund
FUND MANAGEMENT (continued)
As of December 31, 2011 (unaudited)
| | | | | | | | | | |
Name, Age, Address* and Position(s) with the Trust | | Term of Office
and Length of
Time Served | | Principal Occupation(s) During Past 5 Years | | No. of
Portfolios in
Fund Complex
Overseen by
Trustee | | | Other Directorships Held |
| INTERESTED TRUSTEE AND OFFICERS OF THE TRUST |
William M Lane (61)*** Trustee, Treasurer and Secretary | | Indefinite Term Since 1990 | | Executive Vice President and Secretary, Torray LLC, Bethesda, MD (Oct. 2005-Present); Chief Compliance Officer (Oct. 2005-Mar. 2011); Vice President, Secretary, Treasurer and Chief Compliance Officer, Robert E. Torray & Co. Inc., Bethesda, MD (Jul. 1984-Oct. 2005).*** | | | 3 | | | None |
Robert E. Torray (74) President | | Indefinite Term Since 2007 | | Chairman, Torray LLC, Bethesda, MD (2005-Present); President, Torray LLC, Bethesda, MD (2007-Present); President, Robert E. Torray & Co. Inc., Bethesda, MD (May 1972-Oct. 2005). | | | N/A | | | None |
Barbara Warder, (54) Chief Compliance Officer and Anti-Money Laundering Officer | | Indefinite Term Since 2011 | | Chief Compliance Officer and Anti- Money Laundering Officer, Torray LLC, Bethesda, MD (Mar. 2011-Present); Chief Operating Officer and Chief Compliance Officer, Resolute Capital Management, Washington, DC (Mar. 1998-Jun. 2010). | | | N/A | | | None |
| * | All addresses are c/o The Torray Fund, 7501 Wisconsin Avenue, Suite 750 W, Bethesda, MD 20814-6519. |
| ** | Mr. Shaner is deemed to be an independent Trustee effective as of January 1, 2011. |
| *** | Mr. Lane, by virtue of his employment with Torray LLC, the Trust’s investment adviser, is considered an “interested person” of the Trust, as that term is defined in Section 2(a)(19) of the Investment Company Act of 1940, as amended. |
19
The Torray Resolute Fund
FACTORS CONSIDERED BY THE BOARD OF TRUSTEES IN CONNECTION WITH THEIR APPROVAL OF THE FUND’S INVESTMENT MANAGEMENT AGREEMENT WITH THE MANAGER (unaudited)
The Fund has entered into an Investment Management Agreement (the “Agreement”) with Torray LLC (the “Manager”) pursuant to which the Manager provides investment management services to the Fund. In accordance with the Investment Company Act of 1940, the Board of Trustees of the Fund is required, on an annual basis, to consider the continuation of the Agreement with the Manager, and this must take place at an in-person meeting of the Board. The relevant provisions of the Investment Company Act of 1940 specifically provide that it is the duty of the Board to request and evaluate such information as the Board determines is necessary to allow them to properly consider the continuation of the Agreement, and it is the duty of the Manager to furnish the Trustees with such information that is responsive to their request. Set forth below is a discussion of the various factors that the Board of Trustees considered in deciding to approve the continuation of the Agreement with the Manager.
In determining whether to approve the continuation of the Agreement, the Board of Trustees requested, and the Manager provided, information and data relevant to the Board’s consideration. This included materials that provided the Board with information regarding the investment performance of the Fund during its initial period of investment operations as well as information regarding certain investment management accounts that are substantially similar to the Fund that have been managed by the portfolio manager of the Fund. The Board was also provided with information regarding the fees and expenses of the Fund. As part of its deliberations, the Board also considered and relied upon the information about the Manager that had been provided to them throughout the year in connection with their regular Board meetings at which they engage in the ongoing oversight of the Fund and its operations.
The Board met at an in-person meeting on September 13, 2011, in order to consider the proposed continuation of the Agreement. Among the factors the Board considered was the performance results of the Fund during its initial period of investment operations as well as the performance results represented by a composite of investment management accounts managed by the Fund’s portfolio manager for over ten years, which accounts have substantially similar investment objectives, policies and strategies as the Fund (the “Composite”). The members of the Board took into consideration the favorable performance of the Fund and of the Composite as compared to the Fund’s primary benchmark index, the Russell 1000 Growth Index, as well as the favorable performance of the Fund and the Composite as compared to the Standard & Poor’s 500 Stock Index, over various time periods. They noted the range of investment advisory and management services that are provided by the Manager and the level and quality of these services, and in particular, they noted the quality of the personnel providing these services, taking into consideration their finding that the personnel providing these services, and the services provided, were of a very high caliber and quality.
The Board also compared the expenses of the Fund to the expenses of other similar types of funds, noting that the expense ratio for the Fund for its initial period of operations compared favorably with industry averages after the imposition of voluntary expense waivers implemented by the Manager in order to limit the total operating expenses of the Fund. They also took note of the fact that the Fund is not subject to any sales loads, sales commissions or other similar fees, including Rule 12b-1 distribution fees, which helps to keep the overall expense to shareholders of investing in the Fund lower than the expenses associated with investing in many comparable funds, and they considered
20
The Torray Resolute Fund
FACTORS CONSIDERED BY THE BOARD OF TRUSTEES IN CONNECTION WITH THEIR APPROVAL OF THE FUND’S INVESTMENT MANAGEMENT AGREEMENT WITH THE MANAGER (unaudited) (continued)
the fact that the Manager had informed the Board that it did not intend to propose the introduction of such types of fees for the Fund. The Board took into consideration the Manager’s agreement to continue to voluntarily limit the total annual operating expenses of the Fund for its current fiscal year. The Board also reviewed financial information concerning the Manager, noting its financial soundness as demonstrated by the financial information provided. The Board was also provided with information regarding the fees that the Manager charges other clients for similar investment advisory services and they noted that the fees were comparable based on the relevant circumstances of the types of accounts involved.
In addition, the Board reviewed with the Manager information regarding its brokerage practices, including its soft dollar practices, and noted that the Manager did not have in place any formal soft dollar arrangements, and the Board also reviewed the Manager’s best execution procedures, which the Board noted were reasonable and consistent with standard industry practice.
Based on their review, the Trustees concluded that the investment management services provided under the Agreement were reasonably worth the full amount of the fee and that the terms of the Agreement were fair and reasonable. In reaching their conclusion with respect to their approval of the continuation of the Agreement, the Trustees did not identify any one single factor as being controlling, rather, the Board took note of a combination of factors that influenced their decision making process. The Board did, however, identify the overall favorable long-term investment performance of the private accounts managed by the Fund’s portfolio manager as represented by the Composite, the investment performance of the Fund during its initial period of operations, the commitment of the Manager to the successful operation of the Fund, the level of expenses of the Fund following the imposition of the Manager’s expense limitations, and the Manager’s voluntary agreement to continue to limit the Fund’s total operating expenses, as being important elements of their consideration. Based upon their review and consideration of these factors and other matters deemed relevant by the Board in reaching an informed business judgment, a majority of the Board of Trustees, including a majority of the Independent Trustees, concluded that the terms of the Agreement were fair and reasonable and the Board voted to approve the continuation of the Agreement with the Manager.
21
The Torray Resolute Fund
PORTFOLIO HOLDINGS, PROXY VOTING AND PROCEDURES
As of December 31, 2011 (unaudited)
��
The Fund files its complete schedule of portfolio holdings with the Securities and Exchange Commission (the “Commission”) for the first and third quarters of each fiscal year on Form N-Q. The Fund’s Forms N-Q are available on the Commission’s website at http://www.sec.gov. The Fund’s Forms N-Q may be reviewed and copied at the Commission’s Public Reference Room in Washington, D.C. Information on the operation of the Commission’s Public Reference Room may be obtained by calling 1-800-SEC-0330.
A description of the policies and procedures that the Fund uses to determine how to vote proxies relating to portfolio securities is available without charge, upon request, by calling 1-800-443-3036; and on the Commission’s website at http://www.sec.gov.
Information regarding how the Fund voted proxies relating to portfolio securities is available without charge, upon request, by calling 1-800-443-3036; and on the Commission’s website at http://www.sec.gov.
22
The Torray Resolute Fund
ABOUT YOUR FUND’S EXPENSES
As of December 31, 2011 (unaudited)
We believe it is important for you to understand the impact of costs on your investment. All mutual funds have operating expenses. As a shareholder of the Fund, you incur ongoing costs, including management fees, and other fund expenses. Operating expenses, which are deducted directly from the Fund’s gross income, directly reduce the investment return of the Fund.
A mutual fund’s expenses are expressed as a percentage of its average net assets. This figure is known as the expense ratio. The following examples are intended to help you understand the ongoing costs (in dollars) of investing in the Fund and to compare these costs with the ongoing costs of investing in other mutual funds. The examples below are based on an investment of $1,000 made at the beginning of the period shown and held for the entire period.
The table on the next page illustrates the Fund’s cost in two ways:
Actual Fund Return This section helps you estimate the actual expenses that you paid over the period. The “Ending Account Value” shown is derived from the Fund’s actual return, and the third column shows the operating expenses that would have been paid by an investor who started with $1,000 in the Fund. You may use the information here, together with the amount invested, to estimate the expenses that you paid over the period.
To do so, simply divide your account value by $1,000 (for example, an $8,600 account value divided by $1,000 = 8.6), then multiply the result by the number given for the Fund under the heading “Expenses Paid During Period” on the next page.
Hypothetical 5% Return This section is intended to help you compare your Fund’s costs with those of other mutual funds. It assumes that the Fund had an annual return of 5% before expenses, and that the expense ratio is unchanged. In this case, because the return used is not the Fund’s actual return, the results do not apply to your investment. The example is useful in making comparisons because the Commission requires all mutual funds to calculate expenses based on a 5% return. You can assess the Fund’s costs by comparing this hypothetical example with the hypothetical examples that appear in shareholder reports of other funds.
Note that expenses shown in the table are meant to highlight and help you compare ongoing costs only. The Fund does not charge transactions fees, such as purchase or redemption fees, nor does it carry a “sales load.”
The calculation assumes no shares were bought or sold during the period. Your actual costs may have been higher or lower, depending on the amount of your investment and the timing of any purchases or redemptions.
23
The Torray Resolute Fund
ABOUT YOUR FUND’S EXPENSES (continued)
As of December 31, 2011 (unaudited)
More information about the Fund’s expenses, including recent annual expense ratios, can be found in this report. For additional information on operating expenses and other shareholder costs, please refer to the Fund’s prospectus.
| | | | | | | | | | | | |
| | | Beginning
Account Value
July 1, 2011
| | | Ending
Account Value
December 31, 2011
| | | Expenses Paid
During Period*
| |
Based on Actual Fund Return | | $ | 1,000.00 | | | $ | 950.10 | | | $ | 6.14 | |
Based on Hypothetical 5% Return
(before expenses) | | $ | 1,000.00 | | | $ | 1,018.90 | | | $ | 6.36 | |
| * | Expenses are equal to the Fund’s annualized expense ratio of 1.25% for the period, multiplied by the average account value over the period, multiplied by 184/365 (to reflect the one-half year period). |
24
The Torray Resolute Fund
TAX INFORMATION
As of December 31, 2011 (unaudited)
We are required to advise you within 60 days of the Fund’s fiscal year-end regarding the Federal tax status of certain distributions received by shareholders during such fiscal year. The information below is provided for the Fund’s fiscal year ending December 31, 2011. All designations are based on financial information available as of the date of this annual report and, accordingly are subject to change. For each item it is the intention of the Fund to designate the maximum amount permitted under the Internal Revenue Code and the regulations thereunder.
Qualified Interest Income
For the year ended December 31, 2011, 0.95% of the ordinary distributions paid (net investment income plus short-term capital gain) represent the amount of Qualifying Interest Income as created by The American Jobs Creation Act of 2004.
Qualified Dividend Income
For the year ended December 31, 2011, 100% of the distributions paid by the Fund from ordinary income qualifies for a reduced tax rate pursuant to The Jobs and Growth Tax Relief Reconciliation Act of 2003.
Dividends Received Deduction
For the year ended December 31, 2011, 100% of the ordinary income distribution qualifies for the dividends received deduction available to corporations.
Qualifying Short-Term Capital Gain
For the year ended December 31, 2011, 100% of the ordinary distributions paid (net investment income plus short-term capital gain) represent the amount of Qualifying Short-Term Capital Gain as created by The American Jobs Creation Act of 2004.
Dividends and distributions received by retirement plans such as IRA’s, Keogh-type plans and 403(b) plans need not be reported as taxable income. However, many retirement plan trusts may need this information for their annual information reporting.
25
TRUSTEES
Carol Crawford
Bruce C. Ellis
William M Lane
Robert P. Moltz
Wayne H. Shaner
INVESTMENT ADVISOR
Torray LLC
OFFICERS
Robert E. Torray
William M Lane
Fred M. Fialco
Shawn M. Hendon
Nicholas C. Haffenreffer
Barbara C. Warder
INDEPENDENT REGISTERED PUBLIC ACCOUNTING FIRM
BBD, LLP
1835 Market Street, 26th Floor
Philadelphia, PA 19103
TRANSFER AGENT
BNY Mellon Investment Servicing (U.S.) Inc.
4400 Computer Drive
Westborough, MA 01581-1722
LEGAL COUNSEL
Dechert LLP
1775 I Street, N.W.
Washington, DC 20006
Distributed by BNY Mellon Distributors LLC
760 Moore Road, King of Prussia, PA 19406-1212
Date of first use, February 2012
This report is not authorized for distribution to prospective
investors unless preceded or accompanied by a current
prospectus. All indices are unmanaged groupings of stocks
that are not available for investment.
The
TORRAY
RESOLUTE
FUND
ANNUAL REPORT
December 31, 2011
The Torray Resolute Fund
Suite 750 W
7501 Wisconsin Avenue
Bethesda, Maryland 20814-6519
(301) 493-4600
(800) 443-3036
Item 2. Code of Ethics.
| | (a) | The registrant, as of the end of the period covered by this report, has adopted a code of ethics that applies to the registrant’s principal executive officer, principal financial officer, principal accounting officer or controller, or persons performing similar functions, regardless of whether these individuals are employed by the registrant or a third party. |
| | (c) | There have been no amendments, during the period covered by this report, to a provision of the code of ethics that applies to the registrant’s principal executive officer, principal financial officer, principal accounting officer or controller, or persons performing similar functions, regardless of whether these individuals are employed by the registrant or a third party, and that relates to any element of the code of ethics description. |
| | (d) | The registrant has not granted any waivers, including an implicit waiver, from a provision of the code of ethics that applies to the registrant’s principal executive officer, principal financial officer, principal accounting officer or controller, or persons performing similar functions, regardless of whether these individuals are employed by the registrant or a third party, that relates to one or more of the items set forth in paragraph (b) of this item’s instructions. |
Item 3. Audit Committee Financial Expert.
The Registrant’s Board of Directors has not designated an audit committee financial expert. The Registrant has determined that it will retain the services of an independent third party to assist it if circumstances arise that require specific investment company auditing expertise.
Item 4. Principal Accountant Fees and Services.
Audit Fees
| | (a) | The aggregate fees billed for each of the last two fiscal years for professional services rendered by the principal accountant for the audit of the registrant’s annual financial statements or services that are normally provided by the accountant in connection with statutory and regulatory filings or engagements for those fiscal years are $60,000 for 2011 and $53,500 for 2010. |
Audit-Related Fees
| | (b) | The aggregate fees billed in each of the last two fiscal years for assurance and related services by the principal accountant that are reasonably related to the performance of the audit of the registrant’s financial statements and are not reported under paragraph (a) of this Item are $0 for 2011 and $0 for 2010. |
Tax Fees
| | (c) | The aggregate fees billed in each of the last two fiscal years for professional services rendered by the principal accountant for tax compliance, tax advice, and tax planning are $6,000 for 2011 and $4,000 for 2010. Tax fees represent tax compliance services provided in connection with the review of the Registrant’s tax returns. |
All Other Fees
| | (d) | The aggregate fees billed in each of the last two fiscal years for products and services provided by the principal accountant, other than the services reported in paragraphs (a) through (c) of this Item are $0 for 2011 and $0 for 2010. |
| | (e)(1) | Disclose the audit committee’s pre-approval policies and procedures described in paragraph (c)(7) of Rule 2-01 of Regulation S-X. |
Audit Committee Pre-Approval Policy. All services to be performed for the Registrant by BBD, LLP must be pre-approved by the audit committee. All services performed during 2011 and 2010 were pre-approved by the committee.
| | (e)(2) | The percentage of services described in each of paragraphs (b) through (d) of this Item that were approved by the audit committee pursuant to paragraph (c)(7)(i)(C) of Rule 2-01 of Regulation S-X are as follows: |
(b) 0%
(c) 100%
(d) 0%
| | (f) | The percentage of hours expended on the principal accountant’s engagement to audit the registrant’s financial statements for the most recent fiscal year that were attributed to work performed by persons other than the principal accountant’s full-time, permanent employees was 0%. |
| | (g) | The aggregate non-audit fees billed by the registrant’s accountant for services rendered to the registrant, and rendered to the registrant’s investment adviser (not including any sub-adviser whose role is primarily portfolio management and is subcontracted with or overseen by another investment adviser), and any entity controlling, controlled by, or under common control with the adviser that provides ongoing services to the registrant for each of the last two fiscal years of the registrant was $0 for 2011 and $0 for 2010. |
| | (h) | The registrant’s audit committee of the board of directors has considered whether the provision of non-audit services that were rendered to the registrant’s investment adviser (not including any sub-adviser whose role is primarily portfolio management and is subcontracted with or overseen by another investment adviser), and any entity controlling, controlled by, or under common control with the investment adviser that provides ongoing services to the registrant that were not pre-approved pursuant to paragraph (c)(7)(ii) of Rule 2-01 of Regulation S-X is compatible with maintaining the principal accountant’s independence. |
Item 5. Audit Committee of Listed registrants.
Not applicable.
Item 6. Investments.
| (a) | Schedule of Investments in securities of unaffiliated issuers as of the close of the reporting period is included as part of the report to shareholders filed under Item 1 of this form. |
Item 7. Disclosure of Proxy Voting Policies and Procedures for Closed-End Management Investment Companies.
Not applicable.
Item 8. Portfolio Managers of Closed-End Management Investment Companies.
Not applicable.
Item 9. Purchases of Equity Securities by Closed-End Management Investment Company and Affiliated Purchasers.
Not applicable.
Item 10. Submission of Matters to a Vote of Security Holders.
There have been no material changes to the procedures by which the shareholders may recommend nominees to the registrant’s board of directors, where those changes were implemented after the registrant last provided disclosure in response to the requirements of Item 407(c)(2)(iv) of Regulation S-K (17 CFR 229.407) (as required by Item 22(b)(15) of Schedule 14A (17 CFR 240.14a-101)), or this Item.
Item 11. Controls and Procedures.
| | (a) | The registrant’s principal executive and principal financial officers, or persons performing similar functions, have concluded that the registrant’s disclosure controls and procedures (as defined in Rule 30a-3(c) under the Investment Company Act of 1940, as amended (the “1940 Act”) (17 CFR 270.30a-3(c))) are effective, as of a date within 90 days of the filing date of the report that includes the disclosure required by this paragraph, based on their evaluation of these controls and procedures required by Rule 30a-3(b) under the 1940 Act (17 CFR 270.30a-3(b)) and Rules 13a-15(b) or 15d-15(b) under the Securities Exchange Act of 1934, as amended (17 CFR 240.13a-15(b) or 240.15d-15(b)). |
| | (b) | There were no changes in the registrant’s internal control over financial reporting (as defined in Rule 30a-3(d) under the 1940 Act (17 CFR 270.30a-3(d)) that occurred during the registrant’s second fiscal quarter of the period covered by this report that has materially affected, or is reasonably likely to materially affect, the registrant’s internal control over financial reporting. |
Item 12. Exhibits.
| | (a)(1) | Code of ethics, or any amendment thereto, that is the subject of disclosure required by Item 2 is attached hereto. |
| | (a)(2) | Certifications pursuant to Rule 30a-2(a) under the 1940 Act and Section 302 of the Sarbanes-Oxley Act of 2002 are attached hereto. |
| | (b) | Certifications pursuant to Rule 30a-2(b) under the 1940 Act and Section 906 of the Sarbanes- Oxley Act of 2002 are attached hereto. |
SIGNATURES
Pursuant to the requirements of the Securities Exchange Act of 1934 and the Investment Company Act of 1940, the registrant has duly caused this report to be signed on its behalf by the undersigned, thereunto duly authorized.
| | |
| (registrant) The Torray Fund |
| |
| By (Signature and Title)* | | /s/ Robert E. Torray |
| | Robert E. Torray, President |
| | (principal executive officer) |
Date 3/5/12
Pursuant to the requirements of the Securities Exchange Act of 1934 and the Investment Company Act of 1940, this report has been signed below by the following persons on behalf of the registrant and in the capacities and on the dates indicated.
| | |
| |
| By (Signature and Title)* | | /s/ Robert E. Torray |
| | Robert E. Torray, President |
| | (principal executive officer) |
Date 3/5/12
| | |
| |
| By (Signature and Title)* | | /s/ William M Lane |
| | William M Lane, Treasurer |
| | (principal financial officer) |
Date 3/5/12
| * | Print the name and title of each signing officer under his or her signature. |