UNITED STATES
SECURITIES AND EXCHANGE COMMISSION
Washington, D.C. 20549
FORM N-CSR
CERTIFIED SHAREHOLDER REPORT OF REGISTERED
MANAGEMENT INVESTMENT COMPANIES
Investment Company Act file number: 811-06110
Western Asset Funds, Inc.
Name of Fund:
385 East Colorado Boulevard
Pasadena, CA 91101
Address of Principal Executive Offices:
Richard M. Wachterman, Esq.
Legg Mason Wood Walker, Incorporated
100 Light Street
Baltimore, MD 21202
Name and address of agent for service:
Registrant’s telephone number, including area code: (410) 539-0000
Date of fiscal year end: March 31, 2005
Date of reporting period: September 30, 2004
Item 1 – Report to Shareholders
Western Asset Funds, Inc.
Western Asset Limited Duration Bond Portfolio
Western Asset Intermediate Bond Portfolio
Western Asset Intermediate Plus Bond Portfolio
Western Asset Core Bond Portfolio
Western Asset Core Plus Bond Portfolio
Western Asset Inflation Indexed Plus Bond Portfolio
Western Asset High Yield Portfolio
Western Asset Non-U.S. Opportunity Bond Portfolio
Semi-Annual Report to Shareholders
September 30, 2004
Semi-Annual Report to Shareholders
EXPENSE EXAMPLES
As a shareholder of any of the Funds, you incur ongoing costs, including management fees, service (12b-1) fees on Financial Intermediary Class shares, and other Fund expenses. These examples are intended to help you understand your ongoing costs (in dollars) of investing in a Fund and to compare these costs with the ongoing costs of investing in other mutual funds. The examples are based on an investment of $1,000 invested on April 1, 2004, and held through September 30, 2004.
Actual Expenses
The first line for each Fund in the accompanying table provides information about actual account values and actual expenses. You may use the information in this line, together with the amount you invested, to estimate the expenses that you paid over the period. Simply divide your account value by $1,000 (for example, an $8,600 account divided by $1,000 = 8.6), then multiply the result by the number in the first line under the heading entitled “Expenses Paid During Period” to estimate the expenses you paid on your account during this period.
Hypothetical Example for Comparison Purposes
The second line for each Fund in the accompanying table provides information about hypothetical account values and hypothetical expenses based on each Fund’s actual expense ratios and an assumed rate of return of 5% per year before expenses, which is not the actual return of any of the Funds. The hypothetical account values and expenses may not be used to estimate the actual ending account balance or expenses you paid for the period. You may use this information to compare the ongoing costs of investing in a Fund and other funds. To do so, compare this 5% hypothetical example with the 5% hypothetical examples that appear in the shareholder reports of the other funds.
| | | | | | | | | | | |
| | | Beginning
Account Value
4/1/04 | | Ending
Account Value
9/30/04 | | Expenses PaidA
During the Period
4/1/04 to 9/30/04 | | Annualized
Expense Ratio |
Limited Duration Bond Portfolio Institutional Class: | | | | | | | | | | | |
Actual | | $ | 1,000.00 | | $ | 1,002.60 | | $ | 2.01 | | 0.40% |
Hypothetical (5% return before expenses) | | | 1,000.00 | | | 1,023.06 | | | 2.03 | | |
Intermediate Bond Portfolio
Institutional Class: | | | | | | | | | | | |
Actual | | | 1,000.00 | | | 1,011.20 | | | 2.27 | | 0.45% |
Hypothetical (5% return before expenses) | | | 1,000.00 | | | 1,022.81 | | | 2.28 | | |
Intermediate Plus Bond Portfolio Institutional Class: | | | | | | | | | | | |
Actual | | | 1,000.00 | | | 1,012.40 | | | 2.22 | | 0.45% |
Hypothetical (5% return before expenses) | | | 1,000.00 | | | 1,022.31 | | | 2.23 | | |
Core Bond Portfolio
Institutional Class: | | | | | | | | | | | |
Actual | | | 1,000.00 | | | 1,012.80 | | | 2.32 | | 0.46% |
Hypothetical (5% return before expenses) | | | 1,000.00 | | | 1,022.76 | | | 2.33 | | |
Financial Intermediary Class: | | | | | | | | | | | |
Actual | | | 1,000.00 | | | 1,012.40 | | | 3.68 | | 0.73% |
Hypothetical (5% return before expenses) | | | 1,000.00 | | | 1,021.41 | | | 3.70 | | |
| A | These calculations are based on expenses incurred in the most recent fiscal half-year. The dollar amounts shown as “Expenses Paid” are equal to the annualized expense ratio multiplied by the average value over the period, multiplied by the number of days in the most recent fiscal half-year (183), and divided by 365. |
1
Semi-Annual Report to Shareholders
EXPENSE EXAMPLE—Continued
| | | | | | | | | | | |
| | | Beginning
Account Value
4/1/04 | | Ending
Account Value
9/30/04 | | Expenses PaidA
During the Period
4/1/04 to 9/30/04 | | Annualized
Expense Ratio |
Core Plus Bond Portfolio
Institutional Class: | | | | | | | | | | | |
Actual | | $ | 1,000.00 | | $ | 1,021.50 | | $ | 2.28 | | 0.45% |
Hypothetical (5% return before expenses) | | | 1,000.00 | | | 1,022.81 | | | 2.28 | | |
Financial Intermediary Class: | | | | | | | | | | | |
Actual | | | 1,000.00 | | | 1,020.30 | | | 3.55 | | 0.70% |
Hypothetical (5% return before expenses) | | | 1,000.00 | | | 1,021.56 | | | 3.55 | | |
Inflation Indexed Plus Bond Portfolio Institutional Class: | | | | | | | | | | | |
Actual | | | 1,000.00 | | | 1,007.20 | | | 1.26 | | 0.25% |
Hypothetical (5% return before expenses) | | | 1,000.00 | | | 1,023.82 | | | 1.27 | | |
High Yield Portfolio
Institutional Class: | | | | | | | | | | | |
Actual | | | 1,000.00 | | | 1,047.00 | | | 3.28 | | 0.64% |
Hypothetical (5% return before expenses) | | | 1,000.00 | | | 1,021.86 | | | 3.24 | | |
Non-U.S. Opportunity Bond Portfolio Institutional Class: | | | | | | | | | | | |
Actual | | | 1,000.00 | | | 1,016.20 | | | 2.78 | | 0.55% |
Hypothetical (5% return before expenses) | | | 1,000.00 | | | 1,022.31 | | | 2.79 | | |
| A | These calculations are based on expenses incurred in the most recent fiscal half-year. The dollar amounts shown as “Expenses Paid” are equal to the annualized expense ratio multiplied by the average value over the period, multiplied by the number of days in the most recent fiscal half-year (183), and divided by 365. |
2
Semi-Annual Report to Shareholders
PORTFOLIO COMPOSITION
The following tables show the portfolio composition (as a percentage of the portfolio) for each of the Funds:
| | | | | | | | | | | | | | | | | | | | | | | | |
| Debt RatingsA | | Limited
Duration | | | Intermediate | | | Intermediate
Plus | | | Core | | | Core
Plus | | | Inflation
Indexed Plus | | | High
Yield | | | Non-U.S. | |
AAA | | 73.55 | % | | 55.51 | % | | 55.45 | % | | 78.22 | % | | 77.60 | % | | 96.49 | % | | — | | | 74.15 | % |
AA | | 2.04 | % | | 3.23 | % | | 2.47 | % | | 0.53 | % | | 0.42 | % | | — | | | — | | | 13.59 | % |
A | | 8.68 | % | | 14.81 | % | | 14.49 | % | | 3.91 | % | | 3.17 | % | | 0.73 | % | | 0.25 | % | | 0.82 | % |
BBB | | 15.19 | % | | 22.92 | % | | 22.82 | % | | 12.74 | % | | 9.45 | % | | — | | | 2.81 | % | | — | |
BB | | 0.47 | % | | 1.87 | % | | 2.67 | % | | 1.74 | % | | 3.52 | % | | — | | | 26.85 | % | | — | |
B | | — | | | 0.37 | % | | 1.55 | % | | 0.90 | % | | 3.55 | % | | — | | | 53.77 | % | | — | |
Below B | | — | | | — | | | 0.27 | % | | 0.38 | % | | 0.26 | % | | — | | | 15.02 | % | | — | |
Not Rated | | 0.07 | % | | 1.29 | % | | 0.28 | % | | 1.58 | % | | 2.03 | % | | 2.78 | % | | 1.30 | % | | 11.44 | % |
| | |
|
| |
|
| |
|
| |
|
| |
|
| |
|
| |
|
| |
|
|
| | | 100.00 | % | | 100.00 | % | | 100.00 | % | | 100.00 | % | | 100.00 | % | | 100.00 | % | | 100.00 | % | | 100.00 | % |
| | |
|
| |
|
| |
|
| |
|
| |
|
| |
|
| |
|
| |
|
|
| | | | | | | | |
Maturity
Schedule | | Limited
Duration | | | Intermediate | | | Intermediate
Plus | | | Core | | | Core
Plus | | | Inflation
Indexed Plus | | | High
Yield | | | Non-U.S. | |
Less Than 1 Year | | 25.30 | % | | 9.06 | % | | 14.63 | % | | 32.53 | % | | 35.20 | % | | 0.41 | % | | 0.57 | % | | 13.22 | % |
1 to 3 Years | | 20.05 | % | | 17.49 | % | | 25.08 | % | | 10.48 | % | | 8.17 | % | | 6.49 | % | | 4.25 | % | | 22.31 | % |
3 to 5 Years | | 20.82 | % | | 29.97 | % | | 25.30 | % | | 13.64 | % | | 15.05 | % | | 12.77 | % | | 10.69 | % | | 6.69 | % |
5 to 10 Years | | 8.66 | % | | 25.45 | % | | 28.61 | % | | 9.74 | % | | 11.85 | % | | 47.76 | % | | 77.16 | % | | 36.02 | % |
10 to 20 Years | | 2.78 | % | | 3.99 | % | | 0.81 | % | | 6.10 | % | | 2.73 | % | | — | | | 5.01 | % | | 4.32 | % |
20 to 30 Years | | 15.97 | % | | 13.47 | % | | 5.57 | % | | 17.77 | % | | 15.00 | % | | 31.02 | % | | 2.05 | % | | 16.95 | % |
More Than 30 Years | | 6.42 | % | | 0.57 | % | | — | | | 9.74 | % | | 12.00 | % | | 1.55 | % | | 0.27 | % | | 0.49 | % |
| | |
|
| |
|
| |
|
| |
|
| |
|
| |
|
| |
|
| |
|
|
| | | 100.00 | % | | 100.00 | % | | 100.00 | % | | 100.00 | % | | 100.00 | % | | 100.00 | % | | 100.00 | % | | 100.00 | % |
| | |
|
| |
|
| |
|
| |
|
| |
|
| |
|
| |
|
| |
|
|
| A | Source: Standard & Poor's. |
3
Semi-Annual Report to Shareholders
PERFORMANCE INFORMATION
The following graphs and tables compare each Fund’s total returns against that of an appropriate broad-based securities market index. The lines illustrate the cumulative total return of an initial $1,000,000 investment for the periods indicated. The line for each Fund represents the total return after deducting all Fund investment management and other administrative expenses and the transaction costs of buying and selling securities. The line representing the securities market index does not include any transaction costs associated with buying and selling securities in the index or other investment management or administrative expenses.
Due to the limited operating history of the Western Asset Limited Duration Bond Portfolio and the Western Asset Intermediate Plus Bond Portfolio, performance graphs are not presented. The Funds, which began operations on October 1, 2003, and April 1, 2004, respectively, had total returns of 1.97% and 1.24%, respectively, for the period ended September 30, 2004.
Total return measures investment performance in terms of appreciation or depreciation in net asset value per share, plus dividends and any capital gain distributions. It assumes that dividends and distributions were reinvested at the time they were paid. Returns do not reflect the deduction of taxes that a shareholder would pay on Fund distributions or the redemption of Fund shares. Average annual returns tend to smooth out variations in a fund’s return, so that they differ from actual year-to-year results.
The performance data quoted represents past performance and does not guarantee future results. The performance stated may have been due to extraordinary market conditions, which may not be duplicated in the future. Current performance may be lower or higher than the performance data quoted. To obtain the most recent month-end performance information, please visit www.westernassetfunds.com. The investment return and principal value of the Funds will fluctuate so that an investor’s shares, when redeemed, may be worth more or less than the original cost. Calculations assume reinvestment of dividends and capital gain distributions. Performance would have been lower if fees had not been waived in various periods.
4
Semi-Annual Report to Shareholders
Western Asset Intermediate Bond Portfolio
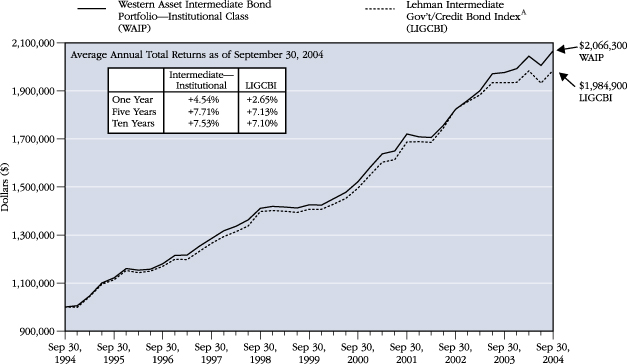
The graph and table do not reflect the deduction of taxes that a shareholder
would pay on Fund distributions or the redemption of Fund shares.
Past performance does not predict future performance.
| A | A total return index consisting of investment grade corporate debt issues as well as debt issues of U.S. government agencies and the U.S. Treasury. The debt issues all maintain maturities within a range of 1 to 10 years. It is not possible to invest in an index. |
5
Semi-Annual Report to Shareholders
| B | A market value-weighted index that tracks the daily price, coupon, pay-downs, and total return performance of fixed rate, publicly placed, dollar-denominated, and nonconvertible investment grade debt issues with at least $100 million par amount outstanding and with at least one year to final maturity. It is not possible to invest in an index. |
PERFORMANCE INFORMATION—Continued
Western Asset Core Bond Portfolio
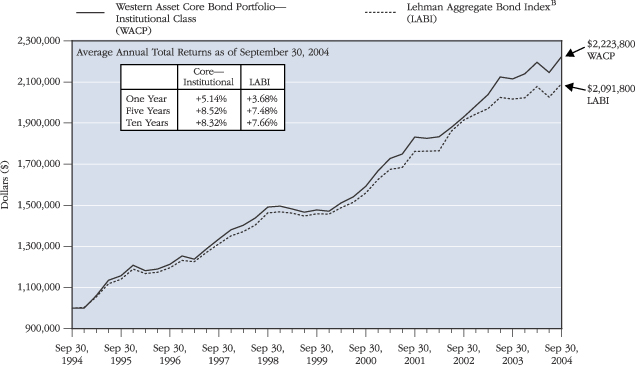
The graph and table do not reflect the deduction of taxes that a shareholder
would pay on Fund distributions or the redemption of Fund shares.
Past performance does not predict future performance.
6
Semi-Annual Report to Shareholders
Western Asset Core Bond Portfolio—Continued
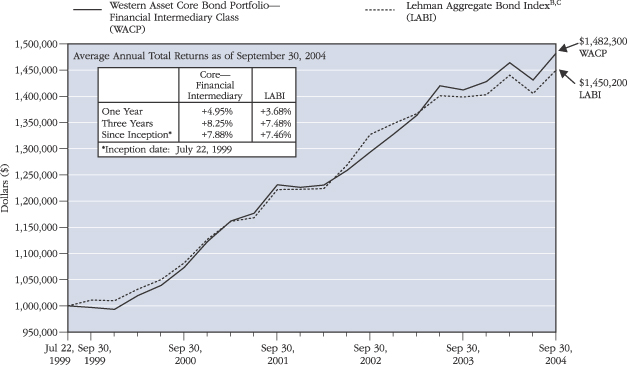
The graph and table do not reflect the deduction of taxes that a shareholder
would pay on Fund distributions or the redemption of Fund shares.
Past performance does not predict future performance.
| C | The Fund’s Financial Intermediary Class inception date is July 22, 1999. Index returns are for periods beginning July 31, 1999. |
7
Semi-Annual Report to Shareholders
PERFORMANCE INFORMATION—Continued
Western Asset Core Plus Bond Portfolio
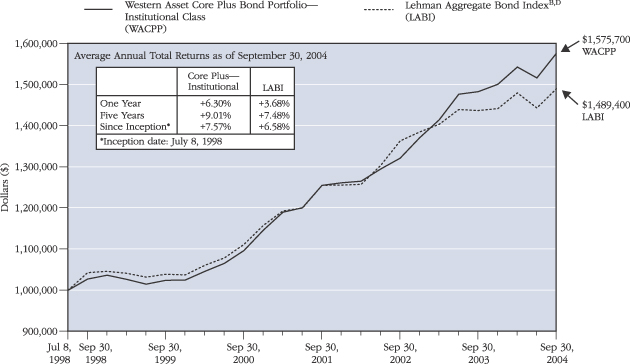
The graph and table do not reflect the deduction of taxes that a shareholder
would pay on Fund distributions or the redemption of Fund shares.
Past performance does not predict future performance.
| D | The Fund’s Institutional Class inception date is July 8, 1998. Index returns are for periods beginning June 30, 1998. |
8
Semi-Annual Report to Shareholders
Western Asset Core Plus Bond Portfolio—Continued
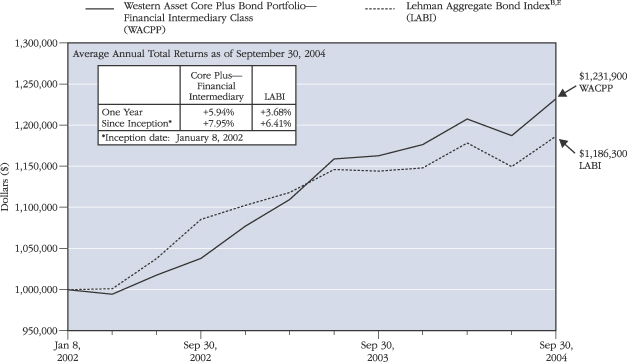
The graph and table do not reflect the deduction of taxes that a shareholder
would pay on Fund distributions or the redemption of Fund shares.
Past performance does not predict future performance.
| E | The Fund’s Financial Intermediary Class inception date is January 8, 2002. Index returns are for periods beginning December 31, 2001. |
9
Semi-Annual Report to Shareholders
| F | An unmanaged index that measures the performance of intermediate (1 to 10 year) U.S. Treasury inflation-protected securities. It is not possible to invest in an index. |
| G | The Fund’s Institutional Class inception date is March 1, 2001. Index returns are for periods beginning February 28, 2001. |
PERFORMANCE INFORMATION—Continued
Western Asset Inflation Indexed Plus Bond Portfolio
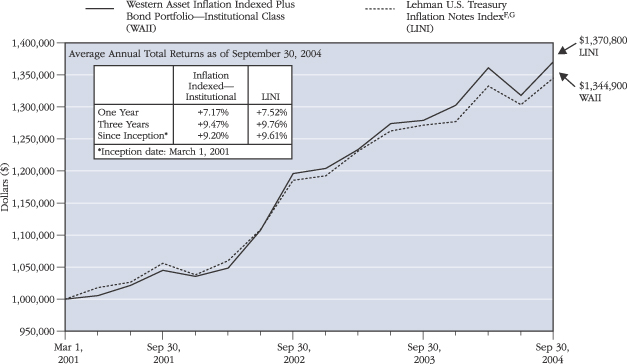
The graph and table do not reflect the deduction of taxes that a shareholder
would pay on Fund distributions or the redemption of Fund shares.
Past performance does not predict future performance.
10
Semi-Annual Report to Shareholders
Western Asset High Yield Portfolio
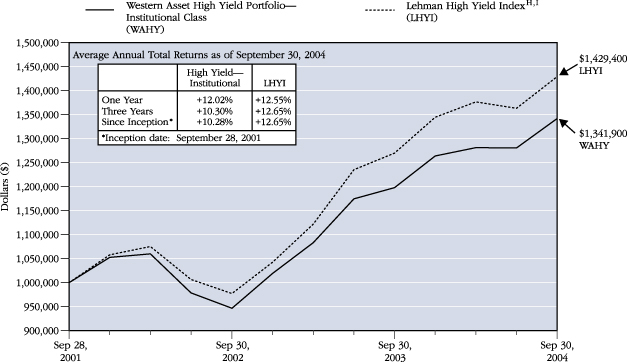
The graph and table do not reflect the deduction of taxes that a shareholder
would pay on Fund distributions or the redemption of Fund shares.
Past performance does not predict future performance.
| H | A market value-weighted index that tracks the daily price-only, coupon, and total return performance of non-investment grade, fixed rate, publicly placed, dollar-denominated, and non-convertible debt registered with the U.S. Securities and Exchange Commission. It is not possible to invest in an index. |
| I | The Fund’s Institutional Class inception date is September 28, 2001. Index returns are for periods beginning September 30, 2001. |
11
Semi-Annual Report to Shareholders
| J | An index encompassing an all-inclusive universe of institutionally traded bonds, including all fixed rate bonds with remaining maturities of one year or longer and with amounts outstanding of at least the equivalent of $25 million USD. This Index excludes the U.S. and is currency-hedged as a means of achieving low-risk interest rate diversification. It is not possible to invest in an index. |
| K | The Fund’s Institutional Class inception date is July 15, 1998. Index returns are for periods beginning July 31, 1998. |
PERFORMANCE INFORMATION—Continued
Western Asset Non-U.S. Opportunity Bond Portfolio

The graph and table do not reflect the deduction of taxes that a shareholder
would pay on Fund distributions or the redemption of Fund shares.
Past performance does not predict future performance.
12
Semi-Annual Report to Shareholders
PORTFOLIO OF INVESTMENTS
September 30, 2004 (Unaudited)
(Amounts in Thousands)
Western Asset Limited Duration Bond Portfolio
| | | | | | | | | | | | | |
| | | % OF
NET ASSETS | | RATE | | MATURITY
DATE | | PAR/
SHARES | | VALUE | |
Long-Term Securities | | 87.1% | | | | | | | | | | | |
| | | | | |
Corporate Bonds and Notes | | 21.2% | | | | | | | | | | | |
| | | | | |
Aerospace/Defense | | 0.2% | | | | | | | | | | | |
Northrop Grumman Corporation | | | | 4.079% | | 11/16/06 | | $ | 70 | | $ | 71 | |
| | | | | | | | | | | |
|
|
|
| | | | | |
Banking and Finance | | 2.0% | | | | | | | | | | | |
Ford Motor Credit Company | | | | 2.790% | | 9/28/07 | | | 390 | | | 389 | A |
General Motors Acceptance Corporation | | | | 4.150% | | 2/7/05 | | | 60 | | | 61 | |
General Motors Acceptance Corporation | | | | 5.250% | | 5/16/05 | | | 70 | | | 71 | |
General Motors Acceptance Corporation | | | | 7.500% | | 7/15/05 | | | 110 | | | 114 | |
Household Finance Corporation | | | | 6.500% | | 1/24/06 | | | 120 | | | 126 | |
John Deere Capital Corporation | | | | 3.900% | | 1/15/08 | | | 120 | | | 122 | |
| | | | | | | | | | | |
|
|
|
| | | | | | | | | | | | | 883 | |
| | | | | | | | | | | |
|
|
|
Banks | | 0.8% | | | | | | | | | | | |
Bank of America Corporation | | | | 1.913% | | 10/22/04 | | | 70 | | | 70 | A |
FleetBoston Financial Corporation | | | | 4.875% | | 12/1/06 | | | 140 | | | 145 | |
Wachovia Corporation | | | | 6.800% | | 6/1/05 | | | 120 | | | 124 | |
| | | | | | | | | | | |
|
|
|
| | | | | | | | | | | | | 339 | |
| | | | | | | | | | | |
|
|
|
Cable | | 0.5% | | | | | | | | | | | |
Tele-Communications, Inc. | | | | 7.250% | | 8/1/05 | | | 200 | | | 210 | |
| | | | | | | | | | | |
|
|
|
| | | | | |
Chemicals | | 0.3% | | | | | | | | | | | |
The Dow Chemical Company | | | | 7.000% | | 8/15/05 | | | 140 | | | 145 | |
| | | | | | | | | | | |
|
|
|
| | | | | |
Computer Services and Systems | | 0.2% | | | | | | | | | | | |
Electronic Data Systems Corporation | | | | 7.125% | | 10/15/09 | | | 90 | | | 97 | |
| | | | | | | | | | | |
|
|
|
| | | | | |
Consumer Products | | 0.3% | | | | | | | | | | | |
The Procter & Gamble Company | | | | 4.750% | | 6/15/07 | | | 120 | | | 125 | |
| | | | | | | | | | | |
|
|
|
| | | | | |
Diversified Financial Services | | 0.8% | | | | | | | | | | | |
Citigroup Inc. | | | | 3.625% | | 2/9/09 | | | 115 | | | 115 | |
U.S. Bancorp | | | | 3.125% | | 3/15/08 | | | 130 | | | 128 | |
Wells Fargo & Company | | | | 1.900% | | 3/3/06 | | | 100 | | | 100 | A |
| | | | | | | | | | | |
|
|
|
| | | | | | | | | | | | | 343 | |
| | | | | | | | | | | |
|
|
|
Drug and Grocery Store Chains | | 0.1% | | | | | | | | | | | |
Safeway Inc. | | | | 2.164% | | 11/1/05 | | | 30 | | | 30 | A |
| | | | | | | | | | | |
|
|
|
13
Semi-Annual Report to Shareholders
| | | | | | | | | | | | | |
| | | % OF
NET ASSETS | | RATE | | MATURITY
DATE | | PAR/
SHARES | | VALUE | |
Corporate Bonds and Notes—Continued | | | | | | | | | | | | | |
| | | | | |
Electric | | 2.4% | | | | | | | | | | | |
American Electric Power Company, Inc. | | | | 6.125% | | 5/15/06 | | $ | 160 | | $ | 168 | |
DTE Energy Company | | | | 2.740% | | 6/1/07 | | | 215 | | | 215 | A |
FirstEnergy Corp. | | | | 5.500% | | 11/15/06 | | | 400 | | | 416 | |
Southern California Edison Company | | | | 1.890% | | 1/13/06 | | | 60 | | | 60 | A |
Virginia Electric and Power Company | | | | 5.750% | | 3/31/06 | | | 150 | | | 156 | |
| | | | | | | | | | | |
|
|
|
| | | | | | | | | | | | | 1,015 | |
| | | | | | | | | | | |
|
|
|
Energy | | 1.0% | | | | | | | | | | | |
Pacific Gas and Electric Company | | | | 3.600% | | 3/1/09 | | | 90 | | | 89 | |
Progress Energy, Inc. | | | | 6.750% | | 3/1/06 | | | 150 | | | 158 | |
Sempra Energy | | | | 2.210% | | 5/21/08 | | | 90 | | | 90 | A |
TXU Energy Co. | | | | 2.380% | | 1/17/06 | | | 100 | | | 100 | A,B |
| | | | | | | | | | | |
|
|
|
| | | | | | | | | | | | | 437 | |
| | | | | | | | | | | |
|
|
|
Environmental Services | | 0.4% | | | | | | | | | | | |
Waste Management, Inc. | | | | 7.000% | | 10/15/06 | | | 175 | | | 188 | |
| | | | | | | | | | | |
|
|
|
| | | | | |
Food, Beverage and Tobacco | | 1.3% | | | | | | | | | | | |
Altria Group, Inc. | | | | 7.000% | | 7/15/05 | | | 140 | | | 143 | |
Altria Group, Inc. | | | | 5.625% | | 11/4/08 | | | 95 | | | 97 | |
Kellogg Company | | | | 6.000% | | 4/1/06 | | | 130 | | | 136 | |
Kraft Foods Inc. | | | | 5.625% | | 11/1/11 | | | 40 | | | 42 | |
Sara Lee Corporation | | | | 1.950% | | 6/15/06 | | | 160 | | | 158 | |
| | | | | | | | | | | |
|
|
|
| | | | | | | | | | | | | 576 | |
| | | | | | | | | | | |
|
|
|
Investment Banking/Brokerage | | 2.3% | | | | | | | | | | | |
J.P. Morgan Chase & Co. | | | | 2.000% | | 5/20/05 | | | 100 | | | 100 | A |
J.P. Morgan Chase & Co. | | | | 2.160% | | 10/2/09 | | | 160 | | | 160 | A |
Lehman Brothers Holdings Inc. | | | | 1.750% | | 4/20/07 | | | 180 | | | 180 | A |
Merrill Lynch & Co., Inc. | | | | 7.375% | | 5/15/06 | | | 140 | | | 151 | |
The Bear Stearns Companies Inc. | | | | 2.130% | | 9/9/09 | | | 200 | | | 200 | A |
The Goldman Sachs Group, Inc. | | | | 2.100% | | 2/25/05 | | | 110 | | | 110 | A |
The Goldman Sachs Group, Inc. | | | | 1.980% | | 7/23/09 | | | 100 | | | 100 | A |
| | | | | | | | | | | |
|
|
|
| | | | | | | | | | | | | 1,001 | |
| | | | | | | | | | | |
|
|
|
Media | | 1.9% | | | | | | | | | | | |
America Online Inc. | | | | 0.000% | | 12/6/19 | | | 295 | | | 188 | C,D |
Clear Channel Communications, Inc. | | | | 3.125% | | 2/1/07 | | | 80 | | | 79 | |
Liberty Media Corporation | | | | 3.380% | | 9/17/06 | | | 160 | | | 162 | A |
News America Incorporated | | | | 6.625% | | 1/9/08 | | | 140 | | | 152 | |
Viacom Inc. | | | | 5.625% | | 5/1/07 | | | 220 | | | 233 | |
| | | | | | | | | | | |
|
|
|
| | | | | | | | | | | | | 814 | |
| | | | | | | | | | | |
|
|
|
14
PORTFOLIO OF INVESTMENTS—Continued
Western Asset Limited Duration Bond Portfolio—Continued
Semi-Annual Report to Shareholders
| | | | | | | | | | | | | |
| | | % OF
NET ASSETS | | RATE | | MATURITY
DATE | | PAR/
SHARES | | VALUE | |
Corporate Bonds and Notes—Continued | | | | | | | | | | | | | |
| | | | | |
Medical Care Facilities | | 0.1% | | | | | | | | | | | |
HCA Inc. | | | | 6.910% | | 6/15/05 | | $ | 30 | | $ | 31 | |
| | | | | | | | | | | |
|
|
|
| | | | | |
Oil and Gas | | 2.0% | | | | | | | | | | | |
Amerada Hess Corporation | | | | 7.375% | | 10/1/09 | | | 120 | | | 135 | |
Apache Corporation | | | | 6.250% | | 4/15/12 | | | 90 | | | 101 | |
Devon Energy Corporation | | | | 2.750% | | 8/1/06 | | | 150 | | | 149 | |
Occidental Petroleum Corporation | | | | 7.650% | | 2/15/06 | | | 110 | | | 117 | |
Pemex Project Funding Master Trust | | | | 8.500% | | 2/15/08 | | �� | 50 | | | 56 | |
Pemex Project Funding Master Trust | | | | 3.180% | | 6/15/10 | | | 190 | | | 192 | A,B |
Tosco Corporation | | | | 7.625% | | 5/15/06 | | | 115 | | | 123 | |
| | | | | | | | | | | |
|
|
|
| | | | | | | | | | | | | 873 | |
| | | | | | | | | | | |
|
|
|
Paper and Forest Products | | 0.4% | | | | | | | | | | | |
MeadWestvaco Corporation | | | | 8.400% | | 6/1/07 | | | 130 | | | 145 | |
Weyerhaeuser Company | | | | 5.500% | | 3/15/05 | | | 45 | | | 45 | |
| | | | | | | | | | | |
|
|
|
| | | | | | | | | | | | | 190 | |
| | | | | | | | | | | |
|
|
|
Pharmaceuticals | | 0.3% | | | | | | | | | | | |
Bristol-Myers Squibb Company | | | | 4.750% | | 10/1/06 | | | 120 | | | 124 | |
| | | | | | | | | | | |
|
|
|
| | | | | |
Retail | | 0.4% | | | | | | | | | | | |
Target Corporation | | | | 5.400% | | 10/1/08 | | | 150 | | | 159 | |
| | | | | | | | | | | |
|
|
|
| | | | | |
Special Purpose | | 2.2% | | | | | | | | | | | |
American Honda Finance Corporation | | | | 3.850% | | 11/6/08 | | | 34 | | | 34 | B |
ChevronTexaco Capital Company | | | | 3.500% | | 9/17/07 | | | 120 | | | 121 | |
DaimlerChrysler NA Holding Corporation | | | | 2.343% | | 9/10/07 | | | 340 | | | 341 | A |
Sprint Capital Corporation | | | | 7.900% | | 3/15/05 | | | 240 | | | 246 | |
Sprint Capital Corporation | | | | 4.780% | | 8/17/06 | | | 40 | | | 41 | |
Toyota Motor Credit Corporation | | | | 1.751% | | 2/15/05 | | | 125 | | | 125 | A |
Verizon Wireless Capital LLC | | | | 1.810% | | 5/23/05 | | | 50 | | | 50 | A,B |
| | | | | | | | | | | |
|
|
|
| | | | | | | | | | | | | 958 | |
| | | | | | | | | | | |
|
|
|
Telecommunications | | 0.3% | | | | | | | | | | | |
BellSouth Corporation | | | | 4.200% | | 9/15/09 | | | 110 | | | 110 | |
| | | | | | | | | | | |
|
|
|
| | | | | |
Telecommunications (Cellular/Wireless) | | 0.6% | | | | | | | | | | | |
AT&T Wireless Services Inc. | | | | 7.350% | | 3/1/06 | | | 160 | | | 170 | |
Motorola, Inc. | | | | 4.608% | | 11/16/07 | | | 80 | | | 82 | |
| | | | | | | | | | | |
|
|
|
| | | | | | | | | | | | | 252 | |
| | | | | | | | | | | |
|
|
|
15
Semi-Annual Report to Shareholders
| | | | | | | | | | | | | |
| | | % OF
NET ASSETS | | RATE | | MATURITY
DATE | | PAR/
SHARES | | VALUE | |
Corporate Bonds and Notes—Continued | | | | | | | | | | | | | |
| | | | | |
Telecommunications Equipment | | 0.4% | | | | | | | | | | | |
New York Telephone | | | | 6.000% | | 4/15/08 | | $ | 160 | | $ | 170 | |
| | | | | | | | | | | |
|
|
|
Total Corporate Bonds and Notes
(Identified Cost—$9,137) | | | | | | | | | | | | 9,141 | |
Asset-Backed Securities | | 24.2% | | | | | | | | | | | |
| | | | | |
Fixed Rate Securities | | 5.0% | | | | | | | | | | | |
ACE Security Corp. 2003-MH1 | | | | 2.200% | | 8/15/30 | | | 183 | | | 181 | B |
Aesop Funding II LLC 1998-1 | | | | 6.140% | | 5/20/06 | | | 250 | | | 254 | B |
Capital One Auto Finance Trust 2001-B A4 | | | | 4.880% | | 9/15/08 | | | 250 | | | 256 | |
Capital One Auto Finance Trust 2002-B | | | | 2.710% | | 10/16/06 | | | 159 | | | 160 | |
Hyundai Auto Receivables Trust 2002-A | | | | 2.800% | | 2/15/07 | | | 175 | | | 175 | B |
Onyx Acceptance Owner Trust 2002-D | | | | 3.100% | | 7/15/09 | | | 138 | | | 139 | |
Structured Asset Securities Corporation 2004-SC1 A | | | | 8.809% | | 12/25/29 | | | 284 | | | 302 | B |
UCFC Home Equity Loan 1998-D | | | | 6.905% | | 4/15/30 | | | 140 | | | 145 | |
UPFC Auto Receivables Trust 2004-A | | | | 3.270% | | 9/15/10 | | | 500 | | | 500 | |
Vanderbilt Mortgage Finance 2001-C | | | | 4.235% | | 8/7/14 | | | 42 | | | 42 | |
| | | | | | | | | | | |
|
|
|
| | | | | | | | | | | | | 2,154 | |
| | | | | | | | | | | |
|
|
|
Indexed SecuritiesA | | 19.2% | | | | | | | | | | | |
AmeriCredit Automobile Loan Trust 2003-BX | | | | 1.920% | | 1/6/10 | | | 30 | | | 30 | |
AmeriCredit Automobile Receivables Trust 2003-AM | | | | 1.956% | | 10/6/06 | | | 44 | | | 44 | |
AQ Finance Nim Trust 2003-N13 | | | | 2.070% | | 12/25/08 | | | 126 | | | 126 | B |
Bayview Financial Acquisition Trust 2004-C A1 | | | | 2.035% | | 5/28/44 | | | 414 | | | 415 | |
Capital Auto Receivables Asset Trust 2003-1 | | | | 1.810% | | 6/15/05 | | | 67 | | | 67 | |
Centex Home Equity 2002-D | | | | 2.280% | | 12/25/32 | | | 112 | | | 112 | |
Chase Credit Card Master Trust 2002-2 | | | | 2.660% | | 7/16/07 | | | 100 | | | 100 | |
Chase Funding Mortgage Loan Asset-Backed Certificates 2002-4 | | | | 2.210% | | 10/25/32 | | | 118 | | | 118 | |
Chase USA Master Trust 2000-1 | | | | 2.320% | | 8/17/09 | | | 200 | | | 199 | |
Chesapeake Funding LLC 2003-1 | | | | 1.946% | | 8/7/08 | | | 300 | | | 300 | |
Citibank Credit Card Issuance Trust 2000-C2 | | | | 2.250% | | 10/15/07 | | | 90 | | | 90 | |
Citibank Credit Card Issuance Trust 2002-C3 | | | | 3.020% | | 12/15/09 | | | 160 | | | 164 | |
Countrywide Asset-Backed Certificates 2000-4 | | | | 2.080% | | 12/25/31 | | | 125 | | | 125 | |
Countrywide Asset-Backed Certificates 2001-4 | | | | 2.180% | | 4/25/32 | | | 59 | | | 60 | |
Countrywide Asset-Backed Certificates 2002-3 | | | | 2.210% | | 5/25/32 | | | 79 | | | 79 | |
Countrywide Asset-Backed Certificates 2002-C | | | | 2.000% | | 5/15/28 | | | 94 | | | 94 | |
Countrywide Home Equity Loan Trust 2002-G | | | | 2.130% | | 12/15/28 | | | 957 | | | 959 | |
Countrywide Home Equity Loan Trust 2004-J | | | | 2.160% | | 3/25/32 | | | 800 | | | 800 | |
Countrywide Home Equity Loan Trust 2004-O | | | | 2.160% | | 2/15/34 | | | 390 | | | 390 | |
DSLA Mortgage Loan Trust 2004-ARI | | | | 2.070% | | 9/19/44 | | | 560 | | | 560 | |
16
PORTFOLIO OF INVESTMENTS—Continued
Western Asset Limited Duration Bond Portfolio—Continued
Semi-Annual Report to Shareholders
| | | | | | | | | | | | | |
| | | % OF
NET ASSETS | | RATE | | MATURITY
DATE | | PAR/
SHARES | | VALUE | |
Asset-Backed Securities—Continued | | | | | | | | | | | | | |
| | | | | |
Indexed Securities—Continued | | | | | | | | | | | | | |
EQCC Trust 2002-1 | | | | 2.140% | | 11/25/31 | | $ | 111 | | $ | 111 | |
First North American National Bank 2003-A | | | | 2.240% | | 5/16/11 | | | 220 | | | 221 | |
Irwin Home Equity Trust 2003-A | | | | 2.340% | | 10/25/27 | | | 90 | | | 90 | |
Metris Master Trust 2002-3A | | | | 2.111% | | 5/20/09 | | | 490 | | | 489 | |
Navistar Financial 2003-B Owner Trust | | | | 1.960% | | 4/15/08 | | | 200 | | | 200 | |
New Century Home Equity Loan Trust 2001-NC1 | | | | 2.101% | | 6/20/31 | | | 71 | | | 71 | |
Providian Gateway Master Trust 2002-B | | | | 2.460% | | 6/15/09 | | | 500 | | | 501 | B |
Rental Car Finance Corporation 2003-1A | | | | 2.240% | | 5/25/08 | | | 500 | | | 503 | B |
Rental Car Finance Corporation 2004-1A | | | | 2.040% | | 6/25/09 | | | 500 | | | 501 | B |
Residential Asset Securities Corporation 1999-KS1 | | | | 2.115% | | 3/25/29 | | | 148 | | | 148 | |
Structured Asset Securities Corporation 2002-BC1 A1 | | | | 2.340% | | 8/25/32 | | | 83 | | | 83 | |
Superior Wholesale Inventory Financing
Trust 2004-A10 | | | | 1.879% | | 9/15/11 | | | 500 | | | 499 | |
| | | | | | | | | | | |
|
|
|
| | | | | | | | | | | | | 8,249 | |
| | | | | | | | | | | |
|
|
|
Total Asset-Backed Securities
(Identified Cost—$10,417) | | | | | | | | | | | | 10,403 | |
Mortgage-Backed Securities | | 12.6% | | | | | | | | | | | |
| | | | | |
Fixed Rate Securities | | 1.6% | | | | | | | | | | | |
Asset Securitization Corporation 1996-D2 | | | | 6.920% | | 2/14/29 | | | 135 | | | 141 | |
Bank of America Mortgage Securities 2003-D | | | | 4.569% | | 5/25/33 | | | 314 | | | 314 | E |
Countrywide Alternative Loan Trust 2004-J1 | | | | 6.000% | | 2/25/34 | | | 126 | | | 128 | |
Residential Asset Mortgage Products, Inc. 2004-SL2 | | | | 8.500% | | 10/25/31 | | | 87 | | | 92 | |
| | | | | | | | | | | |
|
|
|
| | | | | | | | | | | | | 675 | |
| | | | | | | | | | | |
|
|
|
Indexed SecuritiesA | | 11.0% | | | | | | | | | | | |
Bear Stearns Commercial Mortgage Securities Incorporated 2004-ESA A1 | | | | 1.978% | | 5/14/16 | | | 250 | | | 250 | B |
Crusade Global Trust 2003-2 | | | | 2.100% | | 9/18/34 | | | 159 | | | 159 | |
Granite Mortgages PLC 2003-1 | | | | 1.820% | | 1/20/20 | | | 339 | | | 339 | |
Holmes Financing plc Series 6 | | | | 1.770% | | 4/15/08 | | | 300 | | | 300 | |
Impac CMB Trust 2002-8 | | | | 2.300% | | 3/25/33 | | | 121 | | | 121 | |
Impac CMB Trust 2003-12 | | | | 2.220% | | 12/25/33 | | | 416 | | | 416 | |
Impac Secured Assets Corp. 2004-3 | | | | 2.040% | | 11/25/34 | | | 496 | | | 495 | |
J.P. Morgan Chase Commercial Mortgage Securities Corp. 2003-FL2A | | | | 2.010% | | 11/15/16 | | | 177 | | | 177 | B |
Mall America Capital Company LLC 2000-1 | | | | 2.050% | | 3/12/10 | | | 250 | | | 250 | B |
Medallion Trust 2000-2G | | | | 2.110% | | 12/18/31 | | | 163 | | | 163 | |
Medallion Trust 2003-1G | | | | 2.100% | | 12/21/33 | | | 146 | | | 146 | |
Merrill Lynch Mortgage Investor, Inc. 2004-SL1 | | | | 2.100% | | 4/25/35 | | | 205 | | | 205 | |
17
Semi-Annual Report to Shareholders
PORTFOLIO OF INVESTMENTS—Continued
Western Asset Limited Duration Bond Portfolio—Continued
| | | | | | | | | | | | | |
| | | % OF
NET ASSETS | | RATE | | MATURITY
DATE | | PAR/
SHARES | | VALUE | |
Mortgage-Backed Securities—Continued | | | | | | | | | | | | | |
| | | | | |
Indexed Securities—Continued | | | | | | | | | | | | | |
MLCC Mortgage Investors, Inc. 2003-H | | | | 2.865% | | 1/25/29 | | $ | 145 | | $ | 153 | |
Morgan Stanley Dean Witter Capital I Trust 2001-XLF | | | | 2.236% | | 10/7/13 | | | 103 | | | 103 | B |
Residential Asset Mortgage Products, Inc. 2002-RS6 | | | | 2.290% | | 11/25/32 | | | 163 | | | 164 | |
Sequoia Mortgage Trust 2003-2 A2 | | | | 1.620% | | 6/20/33 | | | 184 | | | 184 | |
Sequoia Mortgage Trust 2003-8 A1 | | | | 2.131% | | 1/20/34 | | | 446 | | | 446 | |
Torrens Trust 2000-1GA | | | | 2.020% | | 7/15/31 | | | 75 | | | 75 | B |
Washington Mutual 2004-AR8 | | | | 2.260% | | 6/25/44 | | | 590 | | | 590 | |
| | | | | | | | | | | |
|
|
|
| | | | | | | | | | | | | 4,736 | |
| | | | | | | | | | | |
|
|
|
Total Mortgage-Backed Securities
(Identified Cost—$5,419) | | | | | | | | | | | | 5,411 | |
U.S. Government and Agency Obligations | | 22.9% | | | | | | | | | | | |
| | | | | |
Fixed Rate Securities | | 17.2% | | | | | | | | | | | |
Fannie Mae | | | | 3.125% | | 7/15/06 | | | 860 | | | 866 | |
Fannie Mae | | | | 3.250% | | 2/15/09 | | | 440 | | | 434 | |
Fannie Mae | | | | 2.800% | | 3/1/19 | | | 260 | | | 259 | |
Federal Home Loan Bank | | | | 2.500% | | 3/30/06 | | | 870 | | | 869 | |
Federal Home Loan Bank | | | | 2.625% | | 10/16/06 | | | 450 | | | 448 | |
Freddie Mac | | | | 3.625% | | 11/14/08 | | | 430 | | | 432 | |
Freddie Mac | | | | 5.750% | | 3/15/09 | | | 400 | | | 434 | |
United States Treasury Notes | | | | 1.625% | | 9/30/05 | | | 2,600 | | | 2,586 | |
United States Treasury Notes | | | | 3.375% | | 9/15/09 | | | 1,060 | | | 1,060 | |
| | | | | | | | | | | |
|
|
|
| | | | | | | | | | | | | 7,388 | |
| | | | | | | | | | | |
|
|
|
| | | | | |
Indexed SecuritiesF | | 5.7% | | | | | | | | | | | |
United States Treasury Inflation-Protected Security | | | | 3.625% | | 1/15/08 | | | 1,114 | | | 1,221 | |
United States Treasury Inflation-Protected Security | | | | 3.000% | | 7/15/12 | | | 748 | | | 828 | |
United States Treasury Inflation-Protected Security | | | | 3.875% | | 4/15/29 | | | 311 | | | 413 | |
| | | | | | | | | | | |
|
|
|
| | | | | | | | | | | | | 2,462 | |
| | | | | | | | | | | |
|
|
|
Total U.S. Government and Agency Obligations
(Identified Cost—$9,818) | | | | | | | | | | | | 9,850 | |
U.S. Government Agency Mortgage-Backed Securities | | 2.0% | | | | | | | | | | | |
| | | | | |
Fixed Rate Securities | | 2.0% | | | | | | | | | | | |
Fannie Mae | | | | 5.500% | | 10/1/34 | | | 700 | | | 709 | G |
Government National Mortgage Association | | | | 5.000% | | 10/1/34 | | | 130 | | | 129 | G |
| | | | | | | | | | | |
|
|
|
Total U.S. Government Agency Mortgage-Backed
Securities (Identified Cost—$838) | | | | | | | | | | | | 838 | |
18
Semi-Annual Report to Shareholders
| | | | | | | | | | | | | |
| | | % OF
NET ASSETS | | RATE | | MATURITY
DATE | | PAR/
SHARES | | VALUE | |
Yankee BondsH | | 4.2% | | | | | | | | | | | |
| | | | | |
Banks | | 0.2% | | | | | | | | | | | |
The Korea Development Bank | | | | 4.750% | | 7/20/09 | | $ | 70 | | $ | 72 | |
| | | | | | | | | | | |
|
|
|
| | | | | |
Foreign Governments | | 0.6% | | | | | | | | | | | |
Republic of Chile | | | | 2.062% | | 1/28/08 | | | 40 | | | 40 | A |
Russian Federation | | | | 8.250% | | 3/31/10 | | | 60 | | | 65 | |
Russian Federation | | | | 8.250% | | 3/31/10 | | | 130 | | | 142 | B |
| | | | | | | | | | | |
|
|
|
| | | | | | | | | | | | | 247 | |
| | | | | | | | | | | |
|
|
|
Manufacturing (Diversified) | | 0.7% | | | | | | | | | | | |
Tyco International Group SA | | | | 4.436% | | 6/15/07 | | | 300 | | | 306 | B |
| | | | | | | | | | | |
|
|
|
| | | | | |
Retail | | 0.3% | | | | | | | | | | | |
Wal-Mart Stores Canada, Inc. | | | | 5.580% | | 5/1/06 | | | 140 | | | 146 | B |
| | | | | | | | | | | |
|
|
|
| | | | | |
Special Purpose | | 1.0% | | | | | | | | | | | |
BP Capital Markets Plc | | | | 2.750% | | 12/29/06 | | | 140 | | | 139 | |
Deutsche Telekom International Finance BV | | | | 8.250% | | 6/15/05 | | | 200 | | | 208 | |
Diageo Capital Plc | | | | 3.375% | | 3/20/08 | | | 100 | | | 100 | |
| | | | | | | | | | | |
|
|
|
| | | | | | | | | | | | | 447 | |
| | | | | | | | | | | |
|
|
|
Telecommunications | | 1.4% | | | | | | | | | | | |
British Telecommunications plc | | | | 7.875% | | 12/15/05 | | | 110 | | | 116 | |
Telecom Italia Capital | | | | 4.000% | | 1/15/10 | | | 220 | | | 218 | B |
Telefonos de Mexico SA de CV (Telmex) | | | | 8.250% | | 1/26/06 | | | 250 | | | 267 | |
| | | | | | | | | | | |
|
|
|
| | | | | | | | | | | | | 601 | |
| | | | | | | | | | | |
|
|
|
Total Yankee Bonds (Identified Cost—$1,815) | | | | | | | | | | | | 1,819 | |
| | | | | | | | | | | |
|
|
|
Total Long-Term Securities (Identified Cost—$37,444) | | | | | | | | | | | | 37,462 | |
19
Semi-Annual Report to Shareholders
PORTFOLIO OF INVESTMENTS—Continued
Western Asset Limited Duration Bond Portfolio—Continued
| | | | | | | | | | | | | |
| | | % OF
NET ASSETS | | RATE | | MATURITY
DATE | | PAR/
SHARES | | VALUE | |
Short-Term Securities | | 15.2% | | | | | | | | | | | |
| | | | | |
U.S. Government and Agency Obligations | | 0.1% | | | | | | | | | | | |
Fannie Mae | | | | 0.000% | | 4/1/05 | | $ | 30 | | $ | 30 | C,I |
| | | | | | | | | | | |
|
|
|
| | | | | |
Repurchase Agreements | | 15.1% | | | | | | | | | | | |
Goldman, Sachs & Company
1.85%, dated 9/30/04, to be repurchased at $6,525 on 10/1/04 (Collateral: $6,185 Fannie Mae notes, 5.5%, due 3/15/11, value $6,671) | | | | | | | | | 6,525 | | | 6,525 | |
| | | | | | | | | | | |
|
|
|
Total Short-Term Securities (Identified Cost—$6,555) | | | | | | | | | | | | 6,555 | |
Total Investments (Identified Cost—$43,999) | | 102.3% | | | | | | | | | | 44,017 | |
Other Assets Less Liabilities | | (2.3)% | | | | | | | | | | (971 | ) |
| | | | | | | | | | | |
|
|
|
| | | | | |
Net Assets | | 100.0% | | | | | | | | | $ | 43,046 | |
| | | | | | | | | | | |
|
|
|
| | | | | | | | |
| | | EXPIRATION | | ACTUAL
CONTRACTS | | APPRECIATION/
(DEPRECIATION) | |
Futures Contracts PurchasedJ | | | | | | | | |
U.S. Treasury Note Futures | | December 2004 | | 45 | | $ | (4 | ) |
| | | | | | |
|
|
|
Futures Contracts WrittenI | | | | | | | | |
U.S. Treasury Note Futures | | December 2004 | | 17 | | $ | 4 | |
| | | | | | |
|
|
|
| | | | | | | | | |
| A | Indexed security – The rates of interest earned on these securities are tied to the London Interbank Offered Rate (“LIBOR”), the Consumer Price Index (“CPI”), or the one-year Treasury Bill rate. The coupon rates are the rates as of September 30, 2004. |
| B | Rule 144a Security – A security purchased pursuant to Rule 144a under the Securities Act of 1933 which may not be resold subject to that rule except to qualified institutional buyers. These securities represent 10.65% of net assets. |
| C | Zero coupon bond – A bond with no periodic interest payments which is sold at such a discount as to produce a current yield to maturity. |
| D | Convertible security – Security may be converted into the issuer’s common stock. |
| E | Stepped coupon security – A security with a predetermined schedule of interest or dividend rate changes, at which time it begins to accrue interest or pay dividends. |
| F | Treasury Inflation-Protected Security – Treasury security whose principal value is adjusted daily in accordance with changes to the Consumer Price Index for All Urban Consumers. Interest is calculated on the basis of the current adjusted principal value. |
| G | When-issued security – Security purchased on a delayed delivery basis. Final settlement amount and maturity date have not yet been announced. |
| H | Yankee Bond – A dollar-denominated bond issued in the U.S. by foreign entities. |
| I | All or a portion of this security is collateral to cover futures contracts. |
| J | Futures are described in more detail in the notes to financial statements. |
See notes to financial statements.
20
Semi-Annual Report to Shareholders
PORTFOLIO OF INVESTMENTS
September 30, 2004 (Unaudited)
(Amounts in Thousands)
Western Asset Intermediate Bond Portfolio
| | | | | | | | | | | | | |
| | | % OF
NET ASSETS | | RATE | | MATURITY
DATE | | PAR | | VALUE | |
Long-Term Securities | | 91.4% | | | | | | | | | | | |
| | | | | |
Corporate Bonds and Notes | | 37.9% | | | | | | | | | | | |
| | | | | |
Aerospace/Defense | | 1.0% | | | | | | | | | | | |
Northrop Grumman Corporation | | | | 4.079% | | 11/16/06 | | $ | 1,270 | | $ | 1,290 | |
Raytheon Company | | | | 6.750% | | 8/15/07 | | | 1,510 | | | 1,652 | |
Systems 2001 Asset Trust | | | | 6.664% | | 9/15/13 | | | 1,709 | | | 1,898 | A |
United Technologies Corporation | | | | 6.350% | | 3/1/11 | | | 1,280 | | | 1,421 | B |
| | | | | | | | | | | |
|
|
|
| | | | | | | | | | | | | 6,261 | |
| | | | | | | | | | | |
|
|
|
Banking and Finance | | 3.9% | | | | | | | | | | | |
Boeing Capital Corporation | | | | 6.350% | | 11/15/07 | | | 1,530 | | | 1,656 | B |
Countrywide Home Loans, Inc. | | | | 2.875% | | 2/15/07 | | | 1,250 | | | 1,236 | |
Ford Motor Credit Company | | | | 2.790% | | 9/28/07 | | | 11,730 | | | 11,716 | C |
General Motors Acceptance Corporation | | | | 2.595% | | 5/18/06 | | | 1,500 | | | 1,504 | B,C |
General Motors Acceptance Corporation | | | | 2.510% | | 1/16/07 | | | 1,950 | | | 1,953 | C |
General Motors Acceptance Corporation | | | | 6.125% | | 8/28/07 | | | 805 | | | 848 | B |
General Motors Acceptance Corporation | | | | 3.080% | | 9/23/08 | | | 4,270 | | | 4,268 | C |
| | | | | | | | | | | |
|
|
|
| | | | | | | | | | | | | 23,181 | |
| | | | | | | | | | | |
|
|
|
Banks | | 1.3% | | | | | | | | | | | |
Bank of America Corporation | | | | 5.250% | | 2/1/07 | | | 1,100 | | | 1,153 | |
Bank of America Corporation | | | | 2.260% | | 9/15/14 | | | 2,170 | | | 2,166 | C |
BankBoston NA | | | | 6.375% | | 3/25/08 | | | 1,270 | | | 1,384 | |
U.S. Bank NA | | | | 2.870% | | 2/1/07 | | | 1,410 | | | 1,401 | |
Wachovia Corporation | | | | 3.625% | | 2/17/09 | | | 1,900 | | | 1,885 | |
| | | | | | | | | | | |
|
|
|
| | | | | | | | | | | | | 7,989 | |
| | | | | | | | | | | |
|
|
|
Cable | | 0.9% | | | | | | | | | | | |
Comcast Corporation | | | | 6.500% | | 1/15/15 | | | 530 | | | 572 | |
Continental Cablevision, Inc. | | | | 8.875% | | 9/15/05 | | | 3,096 | | | 3,267 | |
Cox Communications, Inc. | | | | 3.875% | | 10/1/08 | | | 1,110 | | | 1,070 | B |
Cox Communications, Inc. | | | | 4.625% | | 6/1/13 | | | 210 | | | 194 | |
TCI Communications, Inc. | | | | 8.000% | | 8/1/05 | | | 220 | | | 232 | |
| | | | | | | | | | | |
|
|
|
| | | | | | | | | | | | | 5,335 | |
| | | | | | | | | | | |
|
|
|
Chemicals | | 0.2% | | | | | | | | | | | |
E.I. du Pont de Nemours and Company | | | | 4.125% | | 4/30/10 | | | 1,270 | | | 1,281 | |
| | | | | | | | | | | |
|
|
|
| | | | | |
Computer Services and Systems | | 0.4% | | | | | | | | | | | |
Electronic Data Systems Corporation | | | | 7.125% | | 10/15/09 | | | 2,360 | | | 2,535 | B |
| | | | | | | | | | | |
|
|
|
21
Semi-Annual Report to Shareholders
| | | | | | | | | | | | | |
| | | % OF
NET ASSETS | | RATE | | MATURITY
DATE | | PAR | | VALUE | |
Corporate Bonds and Notes—Continued | | | | | | | | | | | | | |
| | | | | |
Diversified Financial Services | | 2.2% | | | | | | | | | | | |
CIT Group Inc. | | | | 1.940% | | 5/18/07 | | $ | 150 | | $ | 150 | C |
CIT Group Inc. | | | | 4.000% | | 5/8/08 | | | 1,410 | | | 1,424 | |
CIT Group Inc. | | | | 3.375% | | 4/1/09 | | | 150 | | | 146 | |
Citigroup Inc. | | | | 1.880% | | 6/4/07 | | | 1,220 | | | 1,219 | C |
Citigroup Inc. | | | | 5.625% | | 8/27/12 | | | 2,470 | | | 2,640 | |
General Electric Capital Corporation | | | | 1.762% | | 7/28/08 | | | 2,650 | | | 2,646 | C |
General Electric Capital Corporation | | | | 2.148% | | 9/15/14 | | | 1,530 | | | 1,527 | |
U.S. Bancorp | | | | 3.125% | | 3/15/08 | | | 1,500 | | | 1,477 | |
Wells Fargo & Company | | | | 1.980% | | 9/15/09 | | | 1,570 | | | 1,568 | C |
Wells Fargo & Company | | | | 5.000% | | 11/15/14 | | | 350 | | | 355 | |
| | | | | | | | | | | |
|
|
|
| | | | | | | | | | | | | 13,152 | |
| | | | | | | | | | | |
|
|
|
Drug and Grocery Store Chains | | 0.3% | | | | | | | | | | | |
Safeway Inc. | | | | 2.164% | | 11/1/05 | | | 740 | | | 741C | |
The Kroger Co. | | | | 6.200% | | 6/15/12 | | | 1,090 | | | 1,184 | |
| | | | | | | | | | | |
|
|
|
| | | | | | | | | | | | | 1,925 | |
| | | | | | | | | | | |
|
|
|
Electric | | 3.0% | | | | | | | | | | | |
American Electric Power Company, Inc. | | | | 6.125% | | 5/15/06 | | | 1,830 | | | 1,918 | B |
Carolina Power & Light Company | | | | 5.950% | | 3/1/09 | | | 1,175 | | | 1,258 | |
Commonwealth Edison Company | | | | 6.150% | | 3/15/12 | | | 325 | | | 362 | |
Dominion Resources, Inc. | | | | 5.700% | | 9/17/12 | | | 2,220 | | | 2,334 | |
DTE Energy Company | | | | 2.740% | | 6/1/07 | | | 1,480 | | | 1,480 | C |
FirstEnergy Corp. | | | | 6.450% | | 11/15/11 | | | 2,420 | | | 2,640 | |
General Electric Company | | | | 5.000% | | 2/1/13 | | | 3,110 | | | 3,198 | |
Niagara Mohawk Power Corporation | | | | 7.750% | | 10/1/08 | | | 2,150 | | | 2,447 | |
The Cleveland Electric Illuminating Company | | | | 5.650% | | 12/15/13 | | | 2,115 | | | 2,189 | |
| | | | | | | | | | | |
|
|
|
| | | | | | | | | | | | | 17,826 | |
| | | | | | | | | | | |
|
|
|
Energy | | 2.5% | | | | | | | | | | | |
Duke Energy Corporation | | | | 6.250% | | 1/15/12 | | | 1,330 | | | 1,448 | |
Exelon Corporation | | | | 6.750% | | 5/1/11 | | | 2,200 | | | 2,456 | |
MidAmerican Energy Holdings Company | | | | 5.875% | | 10/1/12 | | | 1,020 | | | 1,077 | |
Pacific Gas and Electric Company | | | | 3.600% | | 3/1/09 | | | 2,850 | | | 2,817 | B |
Progress Energy, Inc. | | | | 5.850% | | 10/30/08 | | | 1,250 | | | 1,330 | B |
Progress Energy, Inc. | | | | 7.100% | | 3/1/11 | | | 1,650 | | | 1,863 | B |
Sempra Energy | | | | 2.210% | | 5/21/08 | | | 1,930 | | | 1,928 | C |
TXU Energy Co. | | | | 2.380% | | 1/17/06 | | | 1,900 | | | 1,905 | A,C |
| | | | | | | | | | | |
|
|
|
| | | | | | | | | | | | | 14,824 | |
| | | | | | | | | | | |
|
|
|
22
PORTFOLIO OF INVESTMENTS—Continued
Western Asset Intermediate Bond Portfolio—Continued
Semi-Annual Report to Shareholders
| | | | | | | | | | | | | |
| | | % OF
NET ASSETS | | RATE | | MATURITY
DATE | | PAR | | VALUE | |
Corporate Bonds and Notes—Continued | | | | | | | | | | | | | |
| | | | | |
Environmental Services | | 0.6% | | | | | | | | | | | |
Waste Management, Inc. | | | | 7.000% | | 10/15/06 | | $ | 2,900 | | $ | 3,110 | |
Waste Management, Inc. | | | | 7.375% | | 8/1/10 | | | 200 | | | 231 | |
| | | | | | | | | | | |
|
|
|
| | | | | | | | | | | | | 3,341 | |
| | | | | | | | | | | |
|
|
|
Food, Beverage and Tobacco | | 2.7% | | | | | | | | | | | |
Altria Group, Inc. | | | | 7.000% | | 7/15/05 | | | 2,000 | | | 2,049 | |
Altria Group, Inc. | | | | 6.375% | | 2/1/06 | | | 460 | | | 475 | |
Altria Group, Inc. | | | | 5.625% | | 11/4/08 | | | 1,970 | | | 2,012 | B |
Kraft Foods Inc. | | | | 4.000% | | 10/1/08 | | | 3,740 | | | 3,763 | B |
Kraft Foods Inc. | | | | 5.625% | | 11/1/11 | | | 900 | | | 951 | |
Pepsi Bottling Holdings Inc. | | | | 5.625% | | 2/17/09 | | | 2,441 | | | 2,628 | A |
Philip Morris Companies, Inc. | | | | 7.125% | | 10/1/04 | | | 730 | | | 730 | |
Philip Morris Companies, Inc. | | | | 6.950% | | 6/1/06 | | | 1,390 | | | 1,458 | B |
Sara Lee Corporation | | | | 2.750% | | 6/15/08 | | | 2,050 | | | 2,006 | |
| | | | | | | | | | | |
|
|
|
| | | | | | | | | | | | | 16,072 | |
| | | | | | | | | | | |
|
|
|
Gas and Pipeline Utilities | | 0.4% | | | | | | | | | | | |
The Williams Companies, Inc. | | | | 8.125% | | 3/15/12 | | | 1,900 | | | 2,190 | B |
| | | | | | | | | | | |
|
|
|
| | | | | |
Insurance | | 0.5% | | | | | | | | | | | |
ACE INA Holdings Inc. | | | | 8.300% | | 8/15/06 | | | 1,610 | | | 1,757 | |
Loews Corporation | | | | 3.125% | | 9/15/07 | | | 1,240 | | | 1,214 | D |
| | | | | | | | | | | |
|
|
|
| | | | | | | | | | | | | 2,971 | |
| | | | | | | | | | | |
|
|
|
Investment Banking/Brokerage | | 4.6% | | | | | | | | | | | |
Credit Suisse First Boston USA | | | | 6.125% | | 11/15/11 | | | 2,220 | | | 2,419 | |
J.P. Morgan & Co. Incorporated | | | | 4.560% | | 2/15/12 | | | 2,190 | | | 2,365 | C |
J.P. Morgan Chase & Co. | | | | 2.160% | | 10/2/09 | | | 6,080 | | | 6,079 | C |
J.P. Morgan Chase Capital XIII | | | | 2.880% | | 9/30/34 | | | 1,500 | | | 1,485 | C |
Lehman Brothers Holdings Inc. | | | | 7.000% | | 2/1/08 | | | 495 | | | 546 | |
Lehman Brothers Holdings Inc. | | | | 3.500% | | 8/7/08 | | | 1,550 | | | 1,538 | B |
Merrill Lynch & Co., Inc. | | | | 4.125% | | 1/15/09 | | | 3,130 | | | 3,155 | |
Morgan Stanley | | | | 3.625% | | 4/1/08 | | | 250 | | | 251 | |
Salomon Smith Barney Holdings Inc. | | | | 6.250% | | 1/15/05 | | | 2,150 | | | 2,176 | |
The Bear Stearns Companies Inc. | | | | 2.875% | | 7/2/08 | | | 1,380 | | | 1,340 | |
The Bear Stearns Companies Inc. | | | | 5.700% | | 11/15/14 | | | 500 | | | 526 | |
The Goldman Sachs Group, Inc. | | | | 1.980% | | 7/23/09 | | | 1,880 | | | 1,882 | C |
The Goldman Sachs Group, Inc. | | | | 2.570% | | 9/29/14 | | | 3,980 | | | 3,980 | B,C |
| | | | | | | | | | | |
|
|
|
| | | | | | | | | | | | | 27,742 | |
| | | | | | | | | | | |
|
|
|
23
Semi-Annual Report to Shareholders
| | | | | | | | | | | | | |
| | | % OF
NET ASSETS | | RATE | | MATURITY
DATE | | PAR | | VALUE | |
Corporate Bonds and Notes—Continued | | | | | | | | | | | | | |
| | | | | |
Investment Management | | 0.5% | | | | | | | | | | | |
Dryden Investor Trust | | | | 7.157% | | 7/23/08 | | $ | 2,584 | | $ | 2,766 | |
| | | | | | | | | | | |
|
|
|
| | | | | |
Media | | 1.5% | | | | | | | | | | | |
America Online Inc. | | | | 0.000% | | 12/6/19 | | | 2,240 | | | 1,428 | D,E |
AOL Time Warner Inc. | | | | 6.875% | | 5/1/12 | | | 1,740 | | | 1,941 | |
Cox Enterprises, Inc. | | | | 8.000% | | 2/15/07 | | | 1,150 | | | 1,234A | |
Liberty Media Corporation | | | | 3.380% | | 9/17/06 | | | 1,365 | | | 1,380 | C |
Turner Broadcasting System, Inc. | | | | 8.375% | | 7/1/13 | | | 1,830 | | | 2,207 | |
Viacom Inc. | | | | 5.625% | | 8/15/12 | | | 730 | | | 765 | B |
| | | | | | | | | | | |
|
|
|
| | | | | | | | | | | | | 8,955 | |
| | | | | | | | | | | |
|
|
|
Medical Care Facilities | | 0.6% | | | | | | | | | | | |
HCA Inc. | | | | 8.750% | | 9/1/10 | | | 3,075 | | | 3,604 | |
| | | | | | | | | | | |
|
|
|
| | | | | |
Oil and Gas | | 3.4% | | | | | | | | | | | |
Amerada Hess Corporation | | | | 7.375% | | 10/1/09 | | | 2,440 | | | 2,742 | B |
Anadarko Petroleum Corporation | | | | 3.250% | | 5/1/08 | | | 1,720 | | | 1,700 | |
Apache Corporation | | | | 6.250% | | 4/15/12 | | | 2,280 | | | 2,555 | B |
ConocoPhillips | | | | 4.750% | | 10/15/12 | | | 1,620 | | | 1,643 | |
Panhandle Eastern Pipe Line Company | | | | 4.800% | | 8/15/08 | | | 315 | | | 323 | |
Pemex Project Funding Master Trust | | | | 8.500% | | 2/15/08 | | | 1,000 | | | 1,124 | |
Pemex Project Funding Master Trust | | | | 3.180% | | 6/15/10 | | | 5,080 | | | 5,133 | A,C |
Sonat Inc. | | | | 7.625% | | 7/15/11 | | | 4,880 | | | 4,807 | |
XTO Energy, Inc. | | | | 7.500% | | 4/15/12 | | | 560 | | | 658 | |
| | | | | | | | | | | |
|
|
|
| | | | | | | | | | | | | 20,685 | |
| | | | | | | | | | | |
|
|
|
Paper and Forest Products | | 0.8% | | | | | | | | | | | |
MeadWestvaco Corporation | | | | 6.850% | | 4/1/12 | | | 2,063 | | | 2,298 | |
Willamette Industries, Inc. | | | | 7.125% | | 7/22/13 | | | 2,270 | | | 2,569 | |
| | | | | | | | | | | |
|
|
|
| | | | | | | | | | | | | 4,867 | |
| | | | | | | | | | | |
|
|
|
Pharmaceuticals | | 0.2% | | | | | | | | | | | |
Bristol-Myers Squibb Company | | | | 5.750% | | 10/1/11 | | | 1,200 | | | 1,287 | B |
| | | | | | | | | | | |
|
|
|
| | | | | |
Retail | | 0.5% | | | | | | | | | | | |
Target Corporation | | | | 5.875% | | 3/1/12 | | | 1,320 | | | 1,437 | |
Wal-Mart Stores, Inc. | | | | 3.375% | | 10/1/08 | | | 600 | | | 596 | B |
Wal-Mart Stores, Inc. | | | | 4.125% | | 2/15/11 | | | 850 | | | 851 | |
| | | | | | | | | | | |
|
|
|
| | | | | | | | | | | | | 2,884 | |
| | | | | | | | | | | |
|
|
|
24
PORTFOLIO OF INVESTMENTS—Continued
Western Asset Intermediate Bond Portfolio—Continued
Semi-Annual Report to Shareholders
| | | | | | | | | | | | | |
| | | % OF
NET ASSETS | | RATE | | MATURITY
DATE | | PAR | | VALUE | |
Corporate Bonds and Notes—Continued | | | | | | | | | | | | | |
| | | | | |
Special Purpose | | 3.4% | | | | | | | | | | | |
DaimlerChrysler NA Holding Corporation | | | | 2.343% | | 9/10/07 | | $ | 4,710 | | $ | 4,715 | C |
DaimlerChrysler NA Holding Corporation | | | | 7.300% | | 1/15/12 | | | 2,170 | | | 2,465 | |
Devon Financing Corporation ULC | | | | 6.875% | | 9/30/11 | | | 2,500 | | | 2,821 | |
Sprint Capital Corporation | | | | 4.780% | | 8/17/06 | | | 1,970 | | | 2,025 | |
Sprint Capital Corporation | | | | 8.375% | | 3/15/12 | | | 4,540 | | | 5,499 | B |
Verizon Global Funding Corp. | | | | 7.250% | | 12/1/10 | | | 2,500 | | | 2,882 | |
| | | | | | | | | | | |
|
|
|
| | | | | | | | | | | | | 20,407 | |
| | | | | | | | | | | |
|
|
|
Telecommunications | | 0.7% | | | | | | | | | | | |
BellSouth Corporation | | | | 4.200% | | 9/15/09 | | | 2,300 | | | 2,313 | |
Pacific Bell | | | | 6.125% | | 2/15/08 | | | 1,800 | | | 1,939 | B |
| | | | | | | | | | | |
|
|
|
| | | | | | | | | | | | | 4,252 | |
| | | | | | | | | | | |
|
|
|
Telecommunications (Cellular/Wireless) | | 0.8% | | | | | | | | | | | |
AT&T Wireless Services Inc. | | | | 7.350% | | 3/1/06 | | | 500 | | | 531 | |
AT&T Wireless Services Inc. | | | | 8.125% | | 5/1/12 | | | 2,304 | | | 2,784 | |
Motorola, Inc. | | | | 4.608% | | 11/16/07 | | | 1,570 | | | 1,613 | |
| | | | | | | | | | | |
|
|
|
| | | | | | | | | | | | | 4,928 | |
| | | | | | | | | | | |
|
|
|
Transportation | | 1.0% | | | | | | | | | | | |
Continental Airlines, Inc. | | | | 6.545% | | 2/2/19 | | | 1,349 | | | 1,302 | |
Delta Air Lines, Inc. | | | | 6.619% | | 3/18/11 | | | 561 | | | 510 | |
Delta Air Lines, Inc. | | | | 6.718% | | 7/2/24 | | | 2,556 | | | 2,627 | |
U.S. Airways | | | | 6.850% | | 7/30/19 | | | 1,371 | | | 1,253 | |
Union Pacific Corporation | | | | 7.250% | | 11/1/08 | | | 250 | | | 280 | |
| | | | | | | | | | | |
|
|
|
| | | | | | | | | | | | | 5,972 | |
| | | | | | | | | | | |
|
|
|
Total Corporate Bonds and Notes
(Identified Cost—$222,977) | | | | | | | | | | | | 227,232 | |
Asset-Backed Securities | | 9.2% | | | | | | | | | | | |
| | | | | |
Fixed Rate Securities | | 2.0% | | | | | | | | | | | |
ABFS Mortgage Loan Trust 2002-3 | | | | 4.263% | | 9/15/33 | | | 3,189 | | | 3,226 | F |
Conseco Finance Securitizations Corp. 2000-4 | | | | 8.310% | | 5/1/32 | | | 800 | | | 689 | |
Ford Credit Auto Owner Trust 2002-B | | | | 4.140% | | 12/15/05 | | | 1,135 | | | 1,139 | |
Green Tree Financial Corporation 1994-6 | | | | 8.900% | | 1/15/20 | | | 3,800 | | | 4,113 | |
Mego Mortgage Home Loan Trust 1996-2 | | | | 7.275% | | 8/25/17 | | | 59 | | | 59 | |
UCFC Home Equity Loan 1998-D | | | | 6.905% | | 4/15/30 | | | 790 | | | 817 | |
WFS Financial Owner Trust 2002-2 | | | | 3.810% | | 2/20/07 | | | 1,982 | | | 1,990 | |
| | | | | | | | | | | |
|
|
|
| | | | | | | | | | | | | 12,033 | |
| | | | | | | | | | | |
|
|
|
25
Semi-Annual Report to Shareholders
| | | | | | | | | | | | | |
| | | % OF
NET ASSETS | | RATE | | MATURITY
DATE | | PAR | | VALUE | |
Asset-Backed Securities—Continued | | | | | | | | | | | | | |
| | | | | |
Indexed SecuritiesC | | 6.9% | | | | | | | | | | | |
AFC Home Equity Loan Trust 2003-3 | | | | 2.190% | | 10/25/30 | | $ | 2,957 | | $ | 2,945 | A |
AmeriCredit Automobile Receivables Trust 2003-BX | | | | 1.876% | | 11/6/06 | | | 1,273 | | | 1,273 | |
Amresco Residential Securities Mortgage Loan Trust 1998-2 | | | | 2.390% | | 6/25/28 | | | 522 | | | 521 | |
Asset Backed Securities Corp. Home Equity Loan Trust 2002-HE2 | | | | 2.060% | | 8/15/32 | | | 909 | | | 909 | |
Capital One Auto Finance Trust 2003-A | | | | 1.920% | | 10/15/07 | | | 5,500 | | | 5,505 | |
CNH Equipment Trust 2003-A | | | | 1.940% | | 7/16/07 | | | 5,500 | | | 5,501 | |
Countrywide Asset-Backed Certificates 2002-BC1 | | | | 2.170% | | 4/25/32 | | | 2,376 | | | 2,379 | |
Household Home Equity Loan Trust 2002-3 | | | | 2.261% | | 7/20/32 | | | 2,370 | | | 2,373 | |
IndyMac Home Equity Loan Asset-Backed Trust 2001-A | | | | 2.100% | | 3/25/31 | | | 1,695 | | | 1,693 | |
MMCA Automobile Trust 2002-1 | | | | 2.040% | | 1/15/10 | | | 942 | | | 941 | |
Morgan Stanley ABS Capital I 2003-NC8 A2 | | | | 2.200% | | 9/25/33 | | | 3,341 | | | 3,350 | |
MSDWCC HELOC Trust 2003-1 | | | | 2.110% | | 11/25/15 | | | 3,879 | | | 3,880 | |
Paragon Hotel Finance Company 2003-CTF | | | | 3.260% | | 11/15/13 | | | 100 | | | 101 | A |
Residential Asset Securities Corporation 2003-KS1 | | | | 2.210% | | 1/25/33 | | | 3,888 | | | 3,896 | |
Saxon Asset Securities Trust 2003-3 | | | | 1.980% | | 12/25/33 | | | 553 | | | 553 | |
Sovereign Dealer Floor Plan Master LLC 2000-1A | | | | 2.010% | | 10/15/07 | | | 5,500 | | | 5,508 | A |
| | | | | | | | | | | |
|
|
|
| | | | | | | | | | | | | 41,328 | |
| | | | | | | | | | | |
|
|
|
Stripped Securities | | 0.3% | | | | | | | | | | | |
ACA CDS 2002-1, Ltd. | | | | 5.484% | | 7/15/08 | | | 7,600 | | | 646 | G1 |
Oakwood Mortgage Investors Inc. 2001-C | | | | 6.000% | | 5/15/08 | | | 5,320 | | | 800 | G1 |
| | | | | | | | | | | |
|
|
|
| | | | | | | | | | | | | 1,446 | |
| | | | | | | | | | | |
|
|
|
Total Asset-Backed Securities
(Identified Cost—$54,972) | | | | | | | | | | | | 54,807 | |
Mortgage-Backed Securities | | 5.9% | | | | | | | | | | | |
| | | | | |
Fixed Rate Securities | | 1.6% | | | | | | | | | | | |
Asset Securitization Corporation 1996-D2 | | | | 6.920% | | 2/14/29 | | | 842 | | | 879 | |
GMAC Commercial Mortgage Securities Inc. 1998-C1 | | | | 6.700% | | 5/15/30 | | | 1,000 | | | 1,091 | |
GMAC Commercial Mortgage Securities Inc. 1998-C2 | | | | 6.150% | | 5/15/35 | | | 1,079 | | | 1,096 | |
Merrill Lynch Mortgage Investors, Inc. 1998-C1 | | | | 6.310% | | 11/15/26 | | | 590 | | | 607 | |
Morgan Stanley Capital I 1995-GAL1 | | | | 7.950% | | 8/15/27 | | | 2,650 | | | 2,738 | A |
Nomura Asset Securities Corporation 1996-MD5 | | | | 7.120% | | 4/13/39 | | | 1,500 | | | 1,589 | |
Ocwen Residential MBS Corporation 1998-R1 | | | | 7.000% | | 10/25/40 | | | 649 | | | 662 | A,F |
Wells Fargo Mortgage Backed Securities Trust 2002-18 | | | | 5.500% | | 12/25/32 | | | 648 | | | 655 | |
| | | | | | | | | | | |
|
|
|
| | | | | | | | | | | | | 9,317 | |
| | | | | | | | | | | |
|
|
|
26
PORTFOLIO OF INVESTMENTS—Continued
Western Asset Intermediate Bond Portfolio—Continued
Semi-Annual Report to Shareholders
| | | | | | | | | | | | |
| | | % OF
NET ASSETS | | RATE | | MATURITY
DATE | | PAR | | VALUE |
Mortgage-Backed Securities—Continued | | | | | | | | | | | | |
| | | | | |
Indexed SecuritiesC | | 4.3% | | | | | | | | | | |
Commerce 2002-Fl7 | | | | 2.110% | | 11/15/14 | | $ | 3,093 | | $ | 3,093A |
Countrywide Home Loans 2004-20 | | | | 3.626% | | 9/25/34 | | | 3,558 | | | 3,664 |
Countrywide Home Loans 2003-49 | | | | 3.697% | | 12/19/33 | | | 1,000 | | | 988 |
Credit Suisse First Boston Mortgage Securities Corp.
2003-TFLA1 | | | | 2.030% | | 4/15/13 | | | 5,420 | | | 5,421A |
Impac CMB Trust 2001-3 | | | | 2.210% | | 10/25/31 | | | 1,700 | | | 1,701 |
Impac CMB Trust 2002-5 | | | | 2.210% | | 7/25/32 | | | 1,995 | | | 1,999 |
Impac CMB Trust 2003-12 | | | | 2.220% | | 12/25/33 | | | 4,828 | | | 4,826 |
Wells Fargo Mortgage Backed Securities Trust 2004-S | | | | 3.542% | | 9/25/34 | | | 4,350 | | | 4,258 |
| | | | | | | | | | | |
|
|
| | | | | | | | | | | | | 25,950 |
| | | | | | | | | | | |
|
|
Stripped Securities | | N.M. | | | | | | | | | | |
FFCA Secured Lending Corporation 1997-1 | | | | 0.434% | | 2/18/22 | | | 1,449 | | | 17A,G1 |
| | | | | | | | | | | |
|
|
Total Mortgage-Backed Securities
(Identified Cost—$35,698) | | | | | | | | | | | | 35,284 |
U.S. Government and Agency Obligations | | 31.2% | | | | | | | | | | |
| | | | | |
Fixed Rate Securities | | 29.2% | | | | | | | | | | |
Fannie Mae | | | | 5.500% | | 5/2/06 | | | 3,900 | | | 4,072 |
Fannie Mae | | | | 6.250% | | 2/1/11 | | | 2,900 | | | 3,202B |
Fannie Mae | | | | 6.125% | | 3/15/12 | | | 3,160 | | | 3,521 |
Fannie Mae | | | | 4.375% | | 3/15/13 | | | 3,540 | | | 3,520B |
Federal Home Loan Bank | | | | 2.625% | | 10/16/06 | | | 6,000 | | | 5,973B |
Freddie Mac | | | | 3.625% | | 11/14/08 | | | 6,320 | | | 6,347B |
Freddie Mac | | | | 5.800% | | 3/30/09 | | | 600 | | | 655 |
Freddie Mac | | | | 3.000% | | 4/15/09 | | | 4,410 | | | 4,295B |
Freddie Mac | | | | 4.500% | | 1/15/13 | | | 2,450 | | | 2,461B |
Overseas Private Investment Corporation | | | | 7.740% | | 8/15/07 | | | 3,000 | | | 3,253 |
Tennessee Valley Authority | | | | 5.625% | | 1/18/11 | | | 460 | | | 499 |
United States Treasury Bonds | | | | 2.375% | | 1/15/25 | | | 18,881 | | | 19,670 |
United States Treasury Notes | | | | 1.500% | | 3/31/06 | | | 9,410 | | | 9,287B |
United States Treasury Notes | | | | 2.750% | | 6/30/06 | | | 8,820 | | | 8,856B |
United States Treasury Notes | | | | 2.375% | | 8/15/06 | | | 30 | | | 30B |
United States Treasury Notes | | | | 2.250% | | 2/15/07 | | | 2,370 | | | 2,345B |
United States Treasury Notes | | | | 3.125% | | 5/15/07 | | | 3,860 | | | 3,893B |
United States Treasury Notes | | | | 4.375% | | 5/15/07 | | | 980 | | | 1,019B |
United States Treasury Notes | | | | 6.625% | | 5/15/07 | | | 2,290 | | | 2,511B |
United States Treasury Notes | | | | 2.750% | | 8/15/07 | | | 520 | | | 519B |
United States Treasury Notes | | | | 3.000% | | 2/15/08 | | | 680 | | | 680B |
United States Treasury Notes | | | | 2.625% | | 5/15/08 | | | 26,610 | | | 26,220B |
27
Semi-Annual Report to Shareholders
PORTFOLIO OF INVESTMENTS—Continued
Western Asset Intermediate Bond Portfolio—Continued
| | | | | | | | | | | | |
| | | % OF
NET ASSETS | | RATE | | MATURITY
DATE | | PAR | | VALUE |
U.S. Government and Agency
Obligations—Continued | | | | | | | | | | | | |
| | | | | |
Fixed Rate Securities—Continued | | | | | | | | | | | | |
United States Treasury Notes | | | | 4.000% | | 6/15/09 | | $ | 47,210 | | $ | 48,586B |
United States Treasury Notes | | | | 3.500% | | 8/15/09 | | | 7,990 | | | 8,038B |
United States Treasury Notes | | | | 3.375% | | 9/15/09 | | | 60 | | | 60 |
United States Treasury Notes | | | | 4.000% | | 11/15/12 | | | 1,205 | | | 1,211B |
United States Treasury Notes | | | | 4.250% | | 8/15/14 | | | 4,305 | | | 4,350B |
| | | | | | | | | | | |
|
|
| | | | | | | | | | | | | 175,073 |
| | | | | | | | | | | |
|
|
Indexed SecuritiesH | | 1.3% | | | | | | | | | | |
United States Treasury Inflation-Protected Security | | | | 3.000% | | 7/15/12 | | | 1,485 | | | 1,645B |
United States Treasury Inflation-Protected Security | | | | 1.875% | | 7/15/13 | | | 722 | | | 734B |
United States Treasury Inflation-Protected Security | | | | 2.000% | | 7/15/14 | | | 322 | | | 329B |
United States Treasury Inflation-Protected Security | | | | 3.625% | | 4/15/28 | | | 3,783 | | | 4,799 |
| | | | | | | | | | | |
|
|
| | | | | | | | | | | | | 7,507 |
| | | | | | | | | | | |
|
|
Stripped Securities | | 0.7% | | | | | | | | | | |
United States Treasury Bonds | | | | 0.000% | | 2/15/23 | | | 7,080 | | | 2,752B,G2 |
United States Treasury Notes | | | | 0.000% | | 5/15/30 | | | 6,490 | | | 1,729B,G2 |
| | | | | | | | | | | |
|
|
| | | | | | | | | | | | | 4,481 |
| | | | | | | | | | | |
|
|
Total U.S. Government and Agency Obligations (Identified Cost—$184,047) | | | | | | | | | | | | 187,061 |
U.S. Government Agency Mortgage-
Backed Securities | | 0.5% | | | | | | | | | | |
| | | | | |
Fixed Rate Securities | | 0.5% | | | | | | | | | | |
Fannie Mae | | | | 7.250% | | 1/15/10 | | | 200 | | | 232 |
Fannie Mae | | | | 5.125% | | 1/2/14 | | | 1,300 | | | 1,324B |
Fannie Mae | | | | 6.500% | | 6/1/14 | | | 508 | | | 538 |
Fannie Mae | | | | 8.000% | | 9/1/15 | | | 136 | | | 145 |
Fannie Mae | | | | 9.500% | | 4/1/21 | | | 88 | | | 100 |
Freddie Mac | | | | 8.500% | | 7/1/06 | | | 1 | | | 1 |
Freddie Mac | | | | 6.500% | | 6/1/13 to 11/1/15 | | | 135 | | | 143 |
Freddie Mac | | | | 7.500% | | 4/1/17 | | | 7 | | | 8 |
Freddie Mac | | | | 9.300% | | 4/15/19 | | | 132 | | | 132 |
Freddie Mac | | | | 6.000% | | 12/15/28 | | | 504 | | | 506 |
28
Semi-Annual Report to Shareholders
| | | | | | | | | | | | |
| | | % OF
NET ASSETS | | RATE | | MATURITY
DATE | | PAR | | VALUE |
U.S. Government Agency Mortgage-Backed Securities—Continued | | | | | | | | | | | | |
| | | | | |
Fixed Rate Securities—Continued | | | | | | | | | | | | |
Government National Mortgage Association | | | | 9.500% | | 9/15/05 | | $ | 13 | | $ | 14 |
Government National Mortgage Association | | | | 9.000% | | 6/15/06 | | | 37 | | | 38 |
| | | | | | | | | | | |
|
|
| | | | | | | | | | | | | 3,181 |
| | | | | | | | | | | |
|
|
Stripped Securities | | N.M. | | | | | | | | | | |
Fannie Mae | | | | 0.000% | | 5/25/22 | | | 22 | | | 19G2 |
Freddie Mac | | | | 10.000% | | 3/1/21 | | | 18 | | | 4G1 |
| | | | | | | | | | | |
|
|
| | | | | | | | | | | | | 23 |
| | | | | | | | | | | |
|
|
Variable Rate SecuritiesI | | N.M. | | | | | | | | | | |
Fannie Mae | | | | 3.191% | | 3/1/18 | | | 50 | | | 51 |
Freddie Mac | | | | 3.612% | | 1/1/19 | | | 19 | | | 19 |
| | | | | | | | | | | |
|
|
| | | | | | | | | | | | | 70 |
| | | | | | | | | | | |
|
|
Total U.S. Government Agency Mortgage-
Backed Securities (Identified Cost—$3,252) | | | | | | | | | | | | 3,274 |
Yankee BondsJ | | 6.5% | | | | | | | | | | |
| | | | | |
Banking and Finance | | 0.3% | | | | | | | | | | |
HBOS Treasury Services plc | | | | 4.000% | | 9/15/09 | | | 1,530 | | | 1,534A |
| | | | | | | | | | | |
|
|
| | | | | |
Banks | | 1.6% | | | | | | | | | | |
HSBC Holdings plc | | | | 7.500% | | 7/15/09 | | | 5,700 | | | 6,564 |
The Korea Development Bank | | | | 4.250% | | 11/13/07 | | | 60 | | | 61 |
The Korea Development Bank | | | | 5.750% | | 9/10/13 | | | 2,770 | | | 2,920 |
| | | | | | | | | | | |
|
|
| | | | | | | | | | | | | 9,545 |
| | | | | | | | | | | |
|
|
Diversified Financial Services | | 0.5% | | | | | | | | | | |
Pemex Finance LTD. | | | | 7.800% | | 2/15/13 | | | 2,400 | | | 2,830 |
| | | | | | | | | | | |
|
|
| | | | | |
Electric | | 0.3% | | | | | | | | | | |
SP PowerAssets Limited | | | | 5.000% | | 10/22/13 | | | 1,965 | | | 1,991A |
| | | | | | | | | | | |
|
|
| | | | | |
Foreign Governments | | 0.9% | | | | | | | | | | |
Russian Federation | | | | 5.000% | | 3/31/30 | | | 4,640 | | | 4,463 |
United Mexican States | | | | 8.375% | | 1/14/11 | | | 850 | | | 997 |
| | | | | | | | | | | |
|
|
| | | | | | | | | | | | | 5,460 |
| | | | | | | | | | | |
|
|
Insurance | | 0.1% | | | | | | | | | | |
XL Capital plc | | | | 6.500% | | 1/15/12 | | | 700 | | | 768 |
| | | | | | | | | | | |
|
|
29
Semi-Annual Report to Shareholders
| | | | | | | | | | | | | |
| | | % OF
NET ASSETS | | RATE | | MATURITY
DATE | | PAR | | | VALUE |
Yankee Bonds—Continued | | | | | | | | | | | | | |
| | | | | |
Manufacturing (Diversified) | | 1.1% | | | | | | | | | | | |
Tyco International Group SA | | | | 5.875% | | 11/1/04 | | $ | 1,000 | | | $ | 1,003 |
Tyco International Group SA | | | | 6.375% | | 6/15/05 | | | 1,000 | | | | 1,026 |
Tyco International Group SA | | | | 4.436% | | 6/15/07 | | | 3,350 | | | | 3,423A |
Tyco International Group SA | | | | 6.375% | | 10/15/11 | | | 180 | | | | 199 |
Tyco International Group SA | | | | 6.000% | | 11/15/13 | | | 1,020 | | | | 1,101 |
| | | | | | | | | | | | |
|
|
| | | | | | | | | | | | | | 6,752 |
| | | | | | | | | | | | |
|
|
Special Purpose | | 0.8% | | | | | | | | | | | |
Deutsche Telekom International Finance BV | | | | 8.500% | | 6/15/10 | | | 1,300 | | | | 1,558 |
Diageo Capital Plc | | | | 3.375% | | 3/20/08 | | | 2,090 | | | | 2,082 |
Petrozuata Finance, Inc. | | | | 8.220% | | 4/1/17 | | | 1,090 | | | | 1,074A |
| | | | | | | | | | | | |
|
|
| | | | | | | | | | | | | | 4,714 |
| | | | | | | | | | | | |
|
|
Telecommunications | | 0.9% | | | | | | | | | | | |
Koninklijke KPN NV | | | | 8.000% | | 10/1/10 | | | 1,600 | | | | 1,903 |
Telecom Italia Capital | | | | 4.000% | | 1/15/10 | | | 3,550 | | | | 3,523A |
| | | | | | | | | | | | |
|
|
| | | | | | | | | | | | | | 5,426 |
| | | | | | | | | | | | |
|
|
Total Yankee Bonds (Identified Cost—$37,816) | | | | | | | | | | | | | 39,020 |
Preferred Stocks | | 0.2% | | | | | | | | | | | |
Home Ownership Funding Corporation | | | | 13.331% | | | | | 6 | shs | | | 247A,F |
Home Ownership Funding Corporation II | | | | 13.338% | | | | | 18 | | | | 740A,F |
| | | | | | | | | | | | |
|
|
Total Preferred Stocks (Identified Cost—$1,942) | | | | | | | | | | | | | 987 |
| | | | | | | | | | | | |
|
|
Total Long-Term Securities (Identified Cost—$540,704) | | | | | | | | | | | 547,665 |
Investment of Proceeds From Securities Lending | | 25.1% | | | | | | | | | | | |
State Street Navigator Securities Lending Prime Portfolio | | | | | | | | | 150,568 | | | | 150,568 |
| | | | | | | | | | | | |
|
|
Total Investment of Proceeds From Securities Lending (Identified Cost—$150,568) | | | | | | | | | | | | | 150,568 |
Short-Term Securities | | 7.2% | | | | | | | | | | | |
| | | | | |
U.S. Government and Agency Obligations | | 0.1% | | | | | | | | | | | |
Fannie Mae | | | | 0.000% | | 4/1/05 | | $ | 470 | | | | 465E,K |
| | | | | | | | | | | | |
|
|
| | | | | |
Options PurchasedL | | N.M. | | | | | | | | | | | |
Eurodollar Futures Call, January 2005,
Strike Price $98 | | | | | | | | | 40M | | | | 0.4 |
| | | | | | | | | | | | |
|
|
30
PORTFOLIO OF INVESTMENTS—Continued
Western Asset Intermediate Bond Portfolio—Continued
Semi-Annual Report to Shareholders
| | | | | | | | | | | | | |
| | | % OF
NET ASSETS | | RATE | | MATURITY
DATE | | PAR | | VALUE | |
Short-Term Securities—Continued | | | | | | | | | | | | | |
| | | | | |
Repurchase Agreements | | 7.1% | | | | | | | | | | | |
Deutsche Bank AG
1.85%, dated 9/30/04, to be repurchased at
$21,478 on 10/1/04 (Collateral: $21,512 Fannie Mae notes, 4.61%, due 10/10/13, value $22,379) | | | | | | | | $ | 21,477 | | $ | 21,477 | |
Goldman, Sachs & Company
1.85%, dated 9/30/04, to be repurchased at $21,001 on 10/1/04 (Collateral: $21,235 Fannie Mae notes, 3.125%, due 5/4/07, value $21,690) | | | | | | | | | 21,000 | | | 21,000 | |
| | | | | | | | | | | |
|
|
|
| | | | | | | | | | | | | 42,477 | |
| | | | | | | | | | | |
|
|
|
Total Short-Term Securities (Identified Cost—$42,958) | | | | | | | | | | | | 42,942 | |
Total Investments (Identified Cost—$734,230) | | 123.7% | | | | | | | | | | 741,175 | |
Obligation to Return Collateral for Securities Loaned | | (25.1)% | | | | | | | | | | (150,568 | ) |
Other Assets Less Liabilities | | 1.4% | | | | | | | | | | 8,351 | |
| | | | | | | | | | | |
|
|
|
| | | | | |
Net Assets | | 100.0% | | | | | | | | | $ | 598,958 | |
| | | | | | | | | | | |
|
|
|
31
Semi-Annual Report to Shareholders
PORTFOLIO OF INVESTMENTS—Continued
Western Asset Intermediate Bond Portfolio—Continued
| | | | | | | | |
| | | EXPIRATION | | ACTUAL
CONTRACTS | | APPRECIATION/
(DEPRECIATION) | |
Futures Contracts PurchasedL | | | | | | | | |
Eurodollar Futures | | December 2004 | | 19 | | $ | 22 | |
Eurodollar Futures | | March 2005 | | 238 | | | 300 | |
U.S. Treasury Note Futures | | December 2004 | | 16 | | | 5 | |
| | | | | | |
|
|
|
| | | | | | | $ | 327 | |
| | | | | | |
|
|
|
Futures Contracts WrittenL | | | | | | | | |
U.S. Treasury Note Futures | | December 2004 | | 153 | | $ | (49 | ) |
| | | | | | |
|
|
|
Options WrittenL | | | | | | | | |
U.S. Treasury Note Futures Put, Strike Price $102.00 | | March 2004 | | 104 | | $ | 65 | |
| | | | | | |
|
|
|
| | | | | | | | | |
| A | Rule 144a Security – A security purchased pursuant to Rule 144a under the Securities Act of 1933 which may not be resold subject to that rule except to qualified institutional buyers. These securities represent 7.65% of net assets. |
| B | All or a portion of this security is on loan. See Note 4 to the financial statements. |
| C | Indexed security – The rates of interest earned on these securities are tied to the London Interbank Offered Rate (“LIBOR”), the Consumer Price Index (“CPI”), or the one-year Treasury Bill rate. The coupon rates are the rates as of September 30, 2004. |
| D | Convertible bond – Security may be converted into the issuer’s common stock. |
| E | Zero coupon bond – A bond with no periodic interest payments which is sold at such a discount as to produce a current yield to maturity. |
| F | Stepped coupon security – A security with a predetermined schedule of interest or dividend rate changes, at which time it begins to accrue interest or pay dividends. |
| G | Stripped security – Security with interest-only or principal-only payment streams, denoted by a 1 or 2, respectively. For interest-only securities, the amount shown as principal is the notional balance used to calculate the amount of interest due. |
| H | Treasury Inflation-Protected Security – Treasury security whose principal value is adjusted daily in accordance with changes to the Consumer Price Index for All Urban Consumers. Interest is calculated on the basis of the current adjusted principal value. |
| I | The coupon rates shown on variable rate securities are the rates at September 30, 2004. These rates vary with the weighted average coupon of the underlying loans. |
| J | Yankee Bond – A dollar-denominated bond issued in the U.S. by foreign entities. |
| K | All or a portion of this security is collateral to cover futures and option contracts. |
| L | Options and futures are described in more detail in the notes to financial statements. |
| M | Represents actual number of contracts. |
See notes to financial statements.
32
Semi-Annual Report to Shareholders
PORTFOLIO OF INVESTMENTS
September 30, 2004 (Unaudited)
(Amounts in Thousands)
Western Asset Intermediate Plus Bond Portfolio
| | | | | | | | | | | | | |
| | | % OF
NET ASSETS | | RATE | | MATURITY
DATE | | PAR/
SHARES | | VALUE | |
Long-Term Securities | | 89.4% | | | | | | | | | | | |
| | | | | |
Corporate Bonds and Notes | | 38.9% | | | | | | | | | | | |
| | | | | |
Aerospace/Defense | | 0.5% | | | | | | | | | | | |
Northrop Grumman Corporation | | | | 4.079% | | 11/16/06 | | $ | 20 | | $ | 20 | |
Raytheon Company | | | | 6.750% | | 8/15/07 | | | 40 | | | 44 | |
| | | | | | | | | | | |
|
|
|
| | | | | | | | | | | | | 64 | |
| | | | | | | | | | | |
|
|
|
Banking and Finance | | 4.0% | | | | | | | | | | | |
Boeing Capital Corporation | | | | 5.750% | | 2/15/07 | | | 50 | | | 53 | |
Countrywide Home Loans, Inc. | | | | 2.875% | | 2/15/07 | | | 60 | | | 59 | |
Ford Motor Credit Company | | | | 2.790% | | 9/28/07 | | | 210 | | | 210 | A |
General Motors Acceptance Corporation | | | | 2.510% | | 1/16/07 | | | 50 | | | 50 | A |
General Motors Acceptance Corporation | | | | 3.080% | | 9/23/08 | | | 120 | | | 120 | A |
John Deere Capital Corporation | | | | 3.900% | | 1/15/08 | | | 50 | | | 51 | |
| | | | | | | | | | | |
|
|
|
| | | | | | | | | | | | | 543 | |
| | | | | | | | | | | |
|
|
|
Banks | | 1.2% | | | | | | | | | | | |
Bank of America Corporation | | | | 2.260% | | 9/15/14 | | | 70 | | | 70 | A |
U.S. Bank NA | | | | 2.870% | | 2/1/07 | | | 50 | | | 50 | |
Wachovia Corporation | | | | 3.625% | | 2/17/09 | | | 50 | | | 49 | |
| | | | | | | | | | | |
|
|
|
| | | | | | | | | | | | | 169 | |
| | | | | | | | | | | |
|
|
|
Cable | | 0.7% | | | | | | | | | | | |
Comcast Cable Communications, Inc. | | | | 6.375% | | 1/30/06 | | | 70 | | | 73 | |
Cox Communications, Inc. | | | | 3.875% | | 10/1/08 | | | 20 | | | 19 | |
| | | | | | | | | | | |
|
|
|
| | | | | | | | | | | | | 92 | |
| | | | | | | | | | | |
|
|
|
Chemicals | | 0.5% | | | | | | | | | | | |
E.I. du Pont de Nemours and Company | | | | 4.125% | | 4/30/10 | | | 30 | | | 30 | |
The Dow Chemical Company | | | | 5.750% | | 12/15/08 | | | 40 | | | 43 | |
| | | | | | | | | | | |
|
|
|
| | | | | | | | | | | | | 73 | |
| | | | | | | | | | | |
|
|
|
Computer Services and Systems | | 0.4% | | | | | | | | | | | |
Electronic Data Systems Corporation | | | | 7.125% | | 10/15/09 | | | 50 | | | 54 | |
| | | | | | | | | | | |
|
|
|
| | | | | |
Diversified Financial Services | | 3.2% | | | | | | | | | | | |
CIT Group Inc. | | | | 4.000% | | 5/8/08 | | | 50 | | | 51 | |
Citigroup Inc. | | | | 1.880% | | 6/4/07 | | | 100 | | | 100 | A |
Citigroup Inc. | | | | 5.625% | | 8/27/12 | | | 50 | | | 53 | |
General Electric Capital Corporation | | | | 1.762% | | 7/28/08 | | | 20 | | | 20 | A |
General Electric Capital Corporation | | | | 2.148% | | 9/15/14 | | | 150 | | | 150 | A |
Wells Fargo & Company | | | | 1.980% | | 9/15/09 | | | 60 | | | 60 | A |
Wells Fargo & Company | | | | 5.000% | | 11/15/14 | | | 10 | | | 10 | |
| | | | | | | | | | | |
|
|
|
| | | | | | | | | | | | | 444 | |
| | | | | | | | | | | |
|
|
|
33
Semi-Annual Report to Shareholders
| | | | | | | | | | | | | |
| | | % OF
NET ASSETS | | RATE | | MATURITY
DATE | | PAR/
SHARES | | VALUE | |
Corporate Bonds and Notes—Continued | | | | | | | | | | | | | |
| | | | | |
Electric | | 3.5% | | | | | | | | | | | |
American Electric Power Company, Inc. | | | | 6.125% | | 5/15/06 | | $ | 50 | | $ | 52 | |
Dominion Resources, Inc. | | | | 5.700% | | 9/17/12 | | | 50 | | | 53 | |
DTE Energy Company | | | | 2.740% | | 6/1/07 | | | 30 | | | 30 | A |
FirstEnergy Corp. | | | | 5.500% | | 11/15/06 | | | 50 | | | 52 | |
FirstEnergy Corp. | | | | 6.450% | | 11/15/11 | | | 50 | | | 55 | |
General Electric Company | | | | 5.000% | | 2/1/13 | | | 50 | | | 51 | |
GPU, Inc. | | | | 7.700% | | 12/1/05 | | | 30 | | | 32 | |
Niagara Mohawk Power Corporation | | | | 7.750% | | 10/1/08 | | | 50 | | | 57 | |
The AES Corporation | | | | 9.500% | | 6/1/09 | | | 50 | | | 56 | |
The Cleveland Electric Illuminating Company | | | | 5.650% | | 12/15/13 | | | 40 | | | 41 | |
| | | | | | | | | | | |
|
|
|
| | | | | | | | | | | | | 479 | |
| | | | | | | | | | | |
|
|
|
Energy | | 2.5% | | | | | | | | | | | |
Exelon Corporation | | | | 6.750% | | 5/1/11 | | | 60 | | | 67 | |
Pacific Gas and Electric Company | | | | 3.600% | | 3/1/09 | | | 50 | | | 50 | |
Progress Energy, Inc. | | | | 7.100% | | 3/1/11 | | | 70 | | | 79 | |
Sempra Energy | | | | 2.210% | | 5/21/08 | | | 40 | | | 40 | A |
TXU Energy Co. | | | | 2.380% | | 1/17/06 | | | 100 | | | 100 | A,B |
| | | | | | | | | | | |
|
|
|
| | | | | | | | | | | | | 336 | |
| | | | | | | | | | | |
|
|
|
Environmental Services | | 0.6% | | | | | | | | | | | |
Waste Management, Inc. | | | | 6.375% | | 11/15/12 | | | 70 | | | 77 | |
| | | | | | | | | | | |
|
|
|
| | | | | |
Food, Beverage and Tobacco | | 3.7% | | | | | | | | | | | |
Altria Group, Inc. | | | | 7.000% | | 7/15/05 | | | 90 | | | 92 | |
Altria Group, Inc. | | | | 5.625% | | 11/4/08 | | | 150 | | | 153 | |
General Mills, Inc. | | | | 5.125% | | 2/15/07 | | | 40 | | | 41 | |
Kraft Foods Inc. | | | | 4.000% | | 10/1/08 | | | 90 | | | 91 | |
Kraft Foods Inc. | | | | 5.625% | | 11/1/11 | | | 20 | | | 21 | |
Pepsi Bottling Holdings Inc. | | | | 5.625% | | 2/17/09 | | | 50 | | | 54 | B |
Sara Lee Corporation | | | | 2.750% | | 6/15/08 | | | 50 | | | 49 | |
| | | | | | | | | | | |
|
|
|
| | | | | | | | | | | | | 501 | |
| | | | | | | | | | | |
|
|
|
Insurance | | 0.5% | | | | | | | | | | | |
ACE INA Holdings Inc | | | | 8.300% | | 8/15/06 | | | 60 | | | 66 | |
| | | | | | | | | | | |
|
|
|
| | | | | |
Investment Banking/Brokerage | | 4.8% | | | | | | | | | | | |
Credit Suisse First Boston USA | | | | 6.125% | | 11/15/11 | | | 50 | | | 54 | |
J.P. Morgan Chase & Co. | | | | 2.160% | | 10/2/09 | | | 130 | | | 130 | A |
J.P. Morgan Chase Capital XIII | | | | 2.880% | | 9/30/34 | | | 30 | | | 30 | A |
Lehman Brothers Holdings Inc. | | | | 3.500% | | 8/7/08 | | | 50 | | | 50 | |
34
PORTFOLIO OF INVESTMENTS—Continued
Western Asset Intermediate Plus Bond Portfolio—Continued
Semi-Annual Report to Shareholders
| | | | | | | | | | | | | |
| | | % OF
NET ASSETS | | RATE | | MATURITY
DATE | | PAR/
SHARES | | VALUE | |
Corporate Bonds and Notes—Continued | | | | | | | | | | | | | |
| | | | | |
Investment Banking/Brokerage—Continued | | | | | | | | | | | | | |
Merrill Lynch & Co., Inc. | | | | 4.125% | | 1/15/09 | | $ | 70 | | $ | 70 | |
Morgan Stanley | | | | 5.800% | | 4/1/07 | | | 100 | | | 106 | |
The Bear Stearns Companies Inc. | | | | 2.875% | | 7/2/08 | | | 50 | | | 49 | |
The Goldman Sachs Group, Inc. | | | | 1.980% | | 7/23/09 | | | 60 | | | 60 | A |
The Goldman Sachs Group, Inc. | | | | 2.570% | | 9/29/14 | | | 100 | | | 100 | A |
| | | | | | | | | | | |
|
|
|
| | | | | | | | | | | | | 649 | |
| | | | | | | | | | | |
|
|
|
Media | | 2.1% | | | | | | | | | | | |
AOL Time Warner Inc. | | | | 6.150% | | 5/1/07 | | | 50 | | | 53 | |
AOL Time Warner Inc. | | | | 6.875% | | 5/1/12 | | | 20 | | | 22 | |
Cox Enterprises, Inc. | | | | 4.375% | | 5/1/08 | | | 40 | | | 39 | B |
Liberty Media Corporation | | | | 3.380% | | 9/17/06 | | | 80 | | | 81 | A |
Turner Broadcasting System, Inc. | | | | 8.375% | | 7/1/13 | | | 30 | | | 36 | |
Viacom Inc. | | | | 5.625% | | 5/1/07 | | | 50 | | | 53 | |
| | | | | | | | | | | |
|
|
|
| | | | | | | | | | | | | 284 | |
| | | | | | | | | | | |
|
|
|
Medical Care Facilities | | 0.4% | | | | | | | | | | | |
HCA Inc. | | | | 8.750% | | 9/1/10 | | | 50 | | | 59 | |
| | | | | | | | | | | |
|
|
|
| | | | | |
Oil and Gas | | 2.3% | | | | | | | | | | | |
Amerada Hess Corporation | | | | 7.375% | | 10/1/09 | | | 43 | | | 48 | |
Anadarko Petroleum Corporation | | | | 3.250% | | 5/1/08 | | | 30 | | | 30 | |
Apache Corporation | | | | 6.250% | | 4/15/12 | | | 50 | | | 56 | |
ConocoPhillips | | | | 4.750% | | 10/15/12 | | | 50 | | | 51 | |
Occidental Petroleum Corporation | | | | 7.650% | | 2/15/06 | | | 30 | | | 32 | |
Texas Eastern Transmission Corporation | | | | 5.250% | | 7/15/07 | | | 50 | | | 52 | |
XTO Energy, Inc. | | | | 7.500% | | 4/15/12 | | | 40 | | | 47 | |
| | | | | | | | | | | |
|
|
|
| | | | | | | | | | | | | 316 | |
| | | | | | | | | | | |
|
|
|
Paper and Forest Products | | 0.8% | | | | | | | | | | | |
MeadWestvaco Corporation | | | | 6.850% | | 4/1/12 | | | 50 | | | 56 | |
Weyerhaeuser Company | | | | 6.750% | | 3/15/12 | | | 50 | | | 56 | |
| | | | | | | | | | | |
|
|
|
| | | | | | | | | | | | | 112 | |
| | | | | | | | | | | |
|
|
|
Pharmaceuticals | | 0.3% | | | | | | | | | | | |
Bristol-Myers Squibb Company | | | | 4.750% | | 10/1/06 | | | 40 | | | 41 | |
| | | | | | | | | | | |
|
|
|
| | | | | |
Real Estate | | 0.4% | | | | | | | | | | | |
EOP Operating Limited Partnership | | | | 6.750% | | 2/15/12 | | | 50 | | | 55 | |
| | | | | | | | | | | |
|
|
|
35
Semi-Annual Report to Shareholders
| | | | | | | | | | | | | |
| | | % OF
NET ASSETS | | RATE | | MATURITY
DATE | | PAR/
SHARES | | VALUE | |
Corporate Bonds and Notes—Continued | | | | | | | | | | | | | |
| | | | | |
Retail | | 0.4% | | | | | | | | | | | |
Target Corporation | | | | 5.400% | | 10/1/08 | | $ | 50 | | $ | 53 | |
| | | | | | | | | | | |
|
|
|
| | | | | |
Special Purpose | | 4.1% | | | | | | | | | | | |
DaimlerChrysler NA Holding Corporation | | | | 2.343% | | 9/10/07 | | | 70 | | | 70 | A |
DaimlerChrysler NA Holding Corporation | | | | 7.300% | | 1/15/12 | | | 90 | | | 102 | |
Devon Financing Corporation ULC | | | | 6.875% | | 9/30/11 | | | 60 | | | 68 | |
National Rural Utilities Cooperative Finance Corporation | | | | 6.000% | | 5/15/06 | | | 50 | | | 53 | |
Sprint Capital Corporation | | | | 4.780% | | 8/17/06 | | | 50 | | | 51 | C |
Sprint Capital Corporation | | | | 8.375% | | 3/15/12 | | | 70 | | | 85 | |
The Williams Companies, Inc. Credit-Linked Certificates | | | | 4.944% | | 5/1/09 | | | 55 | | | 57 | A,B |
Verizon Global Funding Corp. | | | | 6.875% | | 6/15/12 | | | 60 | | | 68 | |
| | | | | | | | | | | |
|
|
|
| | | | | | | | | | | | | 554 | |
| | | | | | | | | | | |
|
|
|
Telecommunications | | 1.1% | | | | | | | | | | | |
BellSouth Corporation | | | | 4.200% | | 9/15/09 | | | 30 | | | 30 | |
GTE Hawaiian Telephone Company, Inc. | | | | 7.000% | | 2/1/06 | | | 16 | | | 17 | |
GTE Hawaiian Telephone Company, Inc. | | | | 7.375% | | 9/1/06 | | | 10 | | | 10 | |
Pacific Bell | | | | 6.125% | | 2/15/08 | | | 50 | | | 54 | |
Qwest Communications International Inc. | | | | 5.211% | | 2/15/09 | | | 40 | | | 38 | A,B |
| | | | | | | | | | | |
|
|
|
| | | | | | | | | | | | | 149 | |
| | | | | | | | | | | |
|
|
|
Telecommunications (Cellular/Wireless) | | 0.9% | | | | | | | | | | | |
AT&T Wireless Services Inc. | | | | 7.500% | | 5/1/07 | | | 30 | | | 33 | |
AT&T Wireless Services Inc. | | | | 8.125% | | 5/1/12 | | | 50 | | | 60 | |
Motorola, Inc. | | | | 4.608% | | 11/16/07 | | | 30 | | | 31 | |
| | | | | | | | | | | |
|
|
|
| | | | | | | | | | | | | 124 | |
| | | | | | | | | | | |
|
|
|
Total Corporate Bonds and Notes
(Identified Cost—$5,286) | | | | | | | | | | | | 5,294 | |
Asset-Backed Securities | | 5.4% | | | | | | | | | | | |
| | | | | |
Fixed Rate Securities | | 2.9% | | | | | | | | | | | |
AmeriCredit Automobile Recreation Trust 2002-B | | | | 3.780% | | 2/12/07 | | | 70 | | | 70 | |
Capital Auto Receivables Asset Trust 2002-1 | | | | 4.160% | | 7/16/07 | | | 122 | | | 123 | |
Nissan Auto Receivables Owner Trust 2002-B | | | | 4.600% | | 9/17/07 | | | 200 | | | 203 | |
| | | | | | | | | | | |
|
|
|
| | | | | | | | | | | | | 396 | |
| | | | | | | | | | | |
|
|
|
Indexed SecuritiesA | | 2.5% | | | | | | | | | | | |
Chase Credit Card Master Trust 2001-5 | | | | 2.760% | | 2/15/07 | | | 30 | | | 30 | B |
Metris Master Trust 2004-1 | | | | 2.091% | | 4/20/11 | | | 100 | | | 100 | |
36
PORTFOLIO OF INVESTMENTS—Continued
Western Asset Intermediate Plus Bond Portfolio—Continued
Semi-Annual Report to Shareholders
| | | | | | | | | | | | |
| | | % OF
NET ASSETS | | RATE | | MATURITY
DATE | | PAR/
SHARES | | VALUE |
Asset-Backed Securities—Continued | | | | | | | | | | | | |
| | | | | |
Indexed Securities—Continued | | | | | | | | | | | | |
Morgan Stanley ABS Capital I 2003-NC8 A2 | | | | 2.200% | | 9/25/33 | | $ | 115 | | $ | 115 |
Residential Asset Securities Corporation 2002-KS7 | | | | 2.210% | | 11/25/32 | | | 93 | | | 93 |
| | | | | | | | | | | |
|
|
| | | | | | | | | | | | | 338 |
| | | | | | | | | | | |
|
|
Total Asset-Backed Securities
(Identified Cost—$738) | | | | | | | | | | | | 734 |
Mortgage-Backed Securities | | 1.8% | | | | | | | | | | |
| | | | | |
Fixed Rate Securities | | 0.5% | | | | | | | | | | |
Washington Mutual Mortgage Securities Corporation 2004-RA1 | | | | 7.000% | | 3/25/34 | | | 65 | | | 67 |
| | | | | | | | | | | |
|
|
Indexed SecuritiesA | | 1.3% | | | | | | | | | | |
Countrywide Home Loans 2004-20 | | | | 3.626% | | 9/25/34 | | | 69 | | | 71 |
Merrill Lynch Mortgage Investors, Inc. 2004-B | | | | 2.899% | | 6/25/29 | | | 96 | | | 99 |
| | | | | | | | | | | |
|
|
| | | | | | | | | | | | | 170 |
| | | | | | | | | | | |
|
|
Total Mortgage-Backed Securities
(Identified Cost—$238) | | | | | | | | | | | | 237 |
U.S. Government and Agency Obligations | | 28.2% | | | | | | | | | | |
| | | | | |
Fixed Rate Securities | | 23.2% | | | | | | | | | | |
Fannie Mae | | | | 6.250% | | 2/1/11 | | | 30 | | | 33 |
Federal Home Loan Bank | | | | 2.625% | | 10/16/06 | | | 100 | | | 99 |
Tennessee Valley Authority | | | | 5.625% | | 1/18/11 | | | 10 | | | 11 |
United States Treasury Bonds | | | | 2.375% | | 1/15/25 | | | 60 | | | 63 |
United States Treasury Notes | | | | 2.250% | | 2/15/07 | | | 475 | | | 470 |
United States Treasury Notes | | | | 2.750% | | 8/15/07 | | | 700 | | | 698 |
United States Treasury Notes | | | | 3.375% | | 9/15/09 | | | 1,070 | | | 1,070 |
United States Treasury Notes | | | | 6.500% | | 2/15/10 | | | 40 | | | 46 |
United States Treasury Notes | | | | 4.750% | | 5/15/14 | | | 247 | | | 260 |
United States Treasury Notes | | | | 4.250% | | 8/15/14 | | | 400 | | | 404 |
| | | | | | | | | | | |
|
|
| | | | | | | | | | | | | 3,154 |
| | | | | | | | | | | |
|
|
Indexed SecuritiesD | | 5.0% | | | | | | | | | | |
United States Treasury Inflation-Protected Security | | | | 2.000% | | 1/15/14 | | | 666 | | | 682 |
| | | | | | | | | | | |
|
|
Total U.S. Government and Agency Obligations
(Identified Cost—$3,848) | | | | | | | | | | | | 3,836 |
U.S. Government Agency Mortgage-Backed Securities | | 0.4% | | | | | | | | | | |
| | | | | |
Fixed Rate Securities | | 0.4% | | | | | | | | | | |
Freddie Mac | | | | 5.000% | | 10/15/32 | | | 60 | | | 60 |
| | | | | | | | | | | |
|
|
Total U.S. Government Agency Mortgage-Backed Securities (Identified Cost—$60) | | | | | | | | | | | | 60 |
37
Semi-Annual Report to Shareholders
PORTFOLIO OF INVESTMENTS—Continued
Western Asset Intermediate Plus Bond Portfolio—Continued
| | | | | | | | | | | | | |
| | | % OF
NET ASSETS | | RATE | | MATURITY
DATE | | PAR/
SHARES | | VALUE | |
Yankee BondsE | | 9.1% | | | | | | | | | | | |
| | | | | |
Banks | | 1.6% | | | | | | | | | | | |
HSBC Holdings plc | | | | 7.500% | | 7/15/09 | | $ | 100 | | $ | 115 | |
KFW Kreditanstalt fuer Wiederaufbau | | | | 3.375% | | 1/23/08 | | | 70 | | | 70 | |
The Korea Development Bank | | | | 4.250% | | 11/13/07 | | | 30 | | | 31 | |
| | | | | | | | | | | |
|
|
|
| | | | | | | | | | | | | 216 | |
| | | | | | | | | | | |
|
|
|
Foreign Governments | | 3.6% | | | | | | | | | | | |
Federative Republic of Brazil | | | | 14.500% | | 10/15/09 | | | 40 | | | 52 | |
Federative Republic of Brazil | | | | 10.125% | | 5/15/27 | | | 50 | | | 53 | |
Republic of Bulgaria | | | | 8.250% | | 1/15/15 | | | 25 | | | 31 | B |
Republic of Bulgaria | | | | 8.250% | | 1/15/15 | | | 30 | | | 37 | |
Republic of Colombia | | | | 11.750% | | 2/25/20 | | | 15 | | | 18 | |
Republic of Panama | | | | 10.750% | | 5/15/20 | | | 15 | | | 18 | |
Russian Federation | | | | 5.000% | | 3/31/30 | | | 140 | | | 135 | C |
United Mexican States | | | | 8.375% | | 1/14/11 | | | 130 | | | 152 | |
| | | | | | | | | | | |
|
|
|
| | | | | | | | | | | | | 496 | |
| | | | | | | | | | | |
|
|
|
Manufacturing (Diversified) | | 0.8% | | | | | | | | | | | |
Tyco International Group SA | | | | 4.436% | | 6/15/07 | | | 50 | | | 51 | B |
Tyco International Group SA | | | | 6.000% | | 11/15/13 | | | 50 | | | 54 | |
| | | | | | | | | | | |
|
|
|
| | | | | | | | | | | | | 105 | |
| | | | | | | | | | | |
|
|
|
Special Purpose | | 0.8% | | | | | | | | | | | |
Deutsche Telekom International Finance BV | | | | 8.250% | | 6/15/05 | | | 50 | | | 52 | |
Diageo Capital Plc | | | | 3.375% | | 3/20/08 | | | 50 | | | 50 | |
| | | | | | | | | | | |
|
|
|
| | | | | | | | | | | | | 102 | |
| | | | | | | | | | | |
|
|
|
Telecommunications | | 2.0% | | | | | | | | | | | |
British Telecommunications plc | | | | 7.625% | | 12/15/05 | | | 50 | | | 53 | |
France Telecom SA | | | | 7.950% | | 3/1/06 | | | 40 | | | 43 | |
Telecom Italia Capital | | | | 4.000% | | 1/15/10 | | | 80 | | | 79 | B |
Telefonos de Mexico SA de CV | | | | 4.500% | | 11/19/08 | | | 100 | | | 100 | |
| | | | | | | | | | | |
|
|
|
| | | | | | | | | | | | | 275 | |
| | | | | | | | | | | |
|
|
|
Telecommunications (Cellular/Wireless) | | 0.3% | | | | | | | | | | | |
Vodafone Group Plc | | | | 3.950% | | 1/30/08 | | | 40 | | | 41 | |
| | | | | | | | | | | |
|
|
|
Total Yankee Bonds (Identified Cost—$1,220) | | | | | | | | | | | | 1,235 | |
38
Semi-Annual Report to Shareholders
| | | | | | | | | | | | | |
| | | % OF
NET ASSETS | | RATE | | MATURITY
DATE | | PAR/ SHARES | | VALUE | |
Foreign Government Obligations | | 5.6% | | | | | | | | | | | |
| | | | | |
Fixed Rate Securities | | 5.6% | | | | | | | | | | | |
Federal Republic of Germany | | | | 3.250% | | 4/17/09 | | | 450F | | $ | 560 | |
Federal Republic of Germany | | | | 4.250% | | 1/4/14 | | | 160F | | | 203 | |
| | | | | | | | | | | |
|
|
|
Total Foreign Government Obligations
(Identified Cost—$727) | | | | | | | | | | | | 763 | |
| | | | | | | | | | | |
|
|
|
Total Long-Term Securities (Identified Cost—$12,117) | | | | | | | | | | | | 12,159 | |
Short-Term Securities | | 14.1% | | | | | | | | | | | |
| | | | | |
U.S. Government and Agency Obligations | | N.M. | | | | | | | | | | | |
Fannie Mae | | | | 0.000% | | 4/1/05 | | $ | 10 | | | 10 | G,H |
| | | | | | | | | | | |
|
|
|
| | | | | |
Repurchase Agreements | | 14.1% | | | | | | | | | | | |
Lehman Brothers, Inc.
1.86%, dated 9/30/04, to be repurchased
at $1,917 on 10/1/04 (Collateral: $1,905
Federal Home Loan Bank bonds,
6%, due 4/30/19, value $2,003) | | | | | | | | | 1,917 | | | 1,917 | |
| | | | | | | | | | | |
|
|
|
Total Short-Term Securities (Identified Cost—$1,927) | | | | | | | | | | | | 1,927 | |
Total Investments (Identified Cost—$14,044) | | 103.5% | | | | | | | | | | 14,086 | |
Other Assets Less Liabilities | | (3.5)% | | | | | | | | | | (481 | ) |
| | | | | | | | | | | |
|
|
|
| | | | | |
Net Assets | | 100.0% | | | | | | | | | $ | 13,605 | |
| | | | | | | | | | | |
|
|
|
39
Semi-Annual Report to Shareholders
PORTFOLIO OF INVESTMENTS—Continued
Western Asset Intermediate Plus Bond Portfolio—Continued
| | | | | | | | |
| | | EXPIRATION | | ACTUAL
CONTRACTS | | APPRECIATION/
(DEPRECIATION) | |
Futures Contracts PurchasedI | | | | | | | | |
Eurodollar Futures | | March 2005 | | 2 | | $ | 3 | |
U.S. Treasury Note Futures | | December 2004 | | 1 | | | 1 | |
| | | | | | |
|
|
|
| | | | | | | $ | 4 | |
| | | | | | |
|
|
|
Futures Contracts WrittenI | | | | | | | | |
U.S. Treasury Note Futures | | December 2004 | | 2 | | $ | (0.1 | ) |
| | | | | | |
|
|
|
Options WrittenI | | | | | | | | |
U.S. Treasury Note Futures Put, Strike Price $102.00 | | March 2004 | | 2 | | $ | 1 | |
| | | | | | |
|
|
|
| | | | | | | | | |
| A | Indexed security – The rates of interest earned on these securities are tied to the London Interbank Offered Rate (“LIBOR”), the Consumer Price Index (“CPI”), or the one-year Treasury Bill rate. The coupon rates are the rates as of September 30, 2004. |
| B | Rule 144a Security – A security purchased pursuant to Rule 144a under the Securities Act of 1933 which may not be resold subject to that rule except to qualified institutional buyers. These securities represent 3.52% of net assets. |
| C | Stepped coupon security – A security with a predetermined schedule of interest or dividend rate changes, at which time it begins to accrue interest or pay dividends. |
| D | Treasury Inflation-Protected Security – Treasury security whose principal value is adjusted daily in accordance with changes to the Consumer Price Index for All Urban Consumers. Interest is calculated on the basis of the current adjusted principal value. |
| E | Yankee Bond – A dollar-denominated bond issued in the U.S. by foreign entities. |
| F | Denominated in euro currency. |
| G | Zero coupon bond – A bond with no periodic interest payments which is sold at such a discount as to produce a current yield to maturity. |
| H | All or a portion of this security is collateral to cover futures and option contracts. |
| I | Options and futures are described in more detail in the notes to financial statements. |
See notes to financial statements.
40
Semi-Annual Report to Shareholders
PORTFOLIO OF INVESTMENTS
September 30, 2004 (Unaudited)
(Amounts in Thousands)
Western Asset Core Bond Portfolio
| | | | | | | | | | | | | |
| | | % OF
NET ASSETS | | RATE | | MATURITY
DATE | | PAR/
SHARES | | VALUE | |
Long-Term Securities | | 74.0% | | | | | | | | | | | |
| | | | | |
Corporate Bonds and Notes | | 17.3% | | | | | | | | | | | |
| | | | | |
Aerospace/Defense | | 0.3% | | | | | | | | | | | |
Lockheed Martin Corporation | | | | 7.650% | | 5/1/16 | | $ | 225 | | $ | 273 | |
Northrop Grumman Corporation | | | | 4.079% | | 11/16/06 | | | 2,600 | | | 2,641 | |
Raytheon Company | | | | 6.000% | | 12/15/10 | | | 125 | | | 137 | |
Raytheon Company | | | | 5.500% | | 11/15/12 | | | 65 | | | 68 | A |
Raytheon Company | | | | 5.375% | | 4/1/13 | | | 705 | | | 733 | |
Systems 2001 Asset Trust | | | | 6.664% | | 9/15/13 | | | 3,146 | | | 3,495 | B |
| | | | | | | | | | | |
|
|
|
| | | | | | | | | | | | | 7,347 | |
| | | | | | | | | | | |
|
|
|
Banking and Finance | | 3.2% | | | | | | | | | | | |
Boeing Capital Corporation | | | | 7.375% | | 9/27/10 | | | 3,240 | | | 3,764 | |
Ford Motor Credit Company | | | | 6.875% | | 2/1/06 | | | 11,410 | | | 11,940 | |
Ford Motor Credit Company | | | | 7.375% | | 10/28/09 | | | 20,525 | | | 22,482 | |
Ford Motor Credit Company | | | | 7.875% | | 6/15/10 | | | 7,450 | | | 8,309 | |
Ford Motor Credit Company | | | | 7.375% | | 2/1/11 | | | 1,825 | | | 1,985 | |
Ford Motor Credit Company | | | | 7.250% | | 10/25/11 | | | 360 | | | 389 | A |
General Motors Acceptance Corporation | | | | 6.125% | | 9/15/06 | | | 8,090 | | | 8,458 | |
General Motors Acceptance Corporation | | | | 6.125% | | 2/1/07 | | | 4,800 | | | 5,043 | |
General Motors Acceptance Corporation | | | | 7.250% | | 3/2/11 | | | 2,220 | | | 2,370 | |
General Motors Acceptance Corporation | | | | 0.000% | | 6/15/15 | | | 13,910 | | | 6,961 | C |
Household Finance Corporation | | | | 7.875% | | 3/1/07 | | | 2,800 | | | 3,099 | |
Household Finance Corporation | | | | 8.000% | | 7/15/10 | | | 690 | | | 816 | |
Household Finance Corporation | | | | 7.000% | | 5/15/12 | | | 700 | | | 801 | |
Household Finance Corporation | | | | 6.375% | | 11/27/12 | | | 440 | | | 487 | |
SB Treasury Company LLC | | | | 9.400% | | 12/29/49 | | | 2,930 | | | 3,448 | B |
SLM Corporation | | | | 4.120% | | 4/1/09 | | | 7,620 | | | 7,649 | D |
| | | | | | | | | | | |
|
|
|
| | | | | | | | | | | | | 88,001 | |
| | | | | | | | | | | |
|
|
|
Banks | | 0.5% | | | | | | | | | | | |
Bank of America Corporation | | | | 5.250% | | 2/1/07 | | | 3,200 | | | 3,354 | |
Bank of America Corporation | | | | 7.400% | | 1/15/11 | | | 1,500 | | | 1,748 | A |
Bank One Corporation | | | | 7.875% | | 8/1/10 | | | 4,500 | | | 5,311 | |
Bank One Corporation | | | | 5.900% | | 11/15/11 | | | 2,000 | | | 2,141 | |
Firstar Bank NA | | | | 7.125% | | 12/1/09 | | | 450 | | | 517 | |
Wells Fargo Bank NA, San Francisco | | | | 6.450% | | 2/1/11 | | | 510 | | | 572 | |
| | | | | | | | | | | |
|
|
|
| | | | | | | | | | | | | 13,643 | |
| | | | | | | | | | | |
|
|
|
41
Semi-Annual Report to Shareholders
PORTFOLIO OF INVESTMENTS—Continued
Western Asset Core Bond Portfolio—Continued
| | | | | | | | | | | | | |
| | | % OF
NET ASSETS | | RATE | | MATURITY
DATE | | PAR/
SHARES | | VALUE | |
Corporate Bonds and Notes—Continued | | | | | | | | | | | | | |
| | | | | |
Cable | | 0.4% | | | | | | | | | | | |
Comcast Cable Communications, Inc. | | | | 6.375% | | 1/30/06 | | $ | 2,790 | | $ | 2,905 | |
Comcast Corporation | | | | 6.500% | | 1/15/15 | | | 1,800 | | | 1,944 | |
Comcast Corporation | | | | 7.050% | | 3/15/33 | | | 3,130 | | | 3,434 | |
Continental Cablevision, Inc. | | | | 9.000% | | 9/1/08 | | | 2,200 | | | 2,579 | |
Cox Communications, Inc. | | | | 7.875% | | 8/15/09 | | | 640 | | | 714 | |
Cox Communications, Inc. | | | | 7.125% | | 10/1/12 | | | 10 | | | 11 | |
Cox Communications, Inc. | | | | 4.625% | | 6/1/13 | | | 10 | | | 9 | |
Cox Communications, Inc. | | | | 5.500% | | 10/1/15 | | | 230 | | | 219 | |
| | | | | | | | | | | |
|
|
|
| | | | | | | | | | | | | 11,815 | |
| | | | | | | | | | | |
|
|
|
Computer Services and Systems | | 0.2% | | | | | | | | | | | |
Electronic Data Systems Corporation | | | | 7.125% | | 10/15/09 | | | 4,255 | | | 4,570 | A |
| | | | | | | | | | | |
|
|
|
| | | | | |
Diversified Financial Services | | 0.1% | | | | | | | | | | | |
U.S. Bancorp | | | | 3.125% | | 3/15/08 | | | 1,300 | | | 1,280 | |
Wells Fargo & Company | | | | 5.000% | | 11/15/14 | | | 180 | | | 182 | |
| | | | | | | | | | | |
|
|
|
| | | | | | | | | | | | | 1,462 | |
| | | | | | | | | | | |
|
|
|
Electric | | 0.7% | | | | | | | | | | | |
Dominion Resources, Inc. | | | | 4.125% | | 2/15/08 | | | 950 | | | 962 | |
Dominion Resources, Inc. | | | | 5.125% | | 12/15/09 | | | 50 | | | 52 | A |
Dominion Resources, Inc. | | | | 5.700% | | 9/17/12 | | | 2,350 | | | 2,471 | A |
FirstEnergy Corp. | | | | 5.500% | | 11/15/06 | | | 6,290 | | | 6,547 | |
FirstEnergy Corp. | | | | 6.450% | | 11/15/11 | | | 340 | | | 371 | |
FirstEnergy Corp. | | | | 7.375% | | 11/15/31 | | | 6,650 | | | 7,469 | |
The Cleveland Electric Illuminating Company | | | | 5.650% | | 12/15/13 | | | 280 | | | 290 | |
The Detroit Edison Company | | | | 6.125% | | 10/1/10 | | | 920 | | | 1,009 | |
| | | | | | | | | | | |
|
|
|
| | | | | | | | | | | | | 19,171 | |
| | | | | | | | | | | |
|
|
|
Energy | | 0.7% | | | | | | | | | | | |
Duke Energy Corporation | | | | 5.625% | | 11/30/12 | | | 1,880 | | | 1,971 | A |
Pacific Gas and Electric Company | | | | 6.050% | | 3/1/34 | | | 3,090 | | | 3,145 | |
Progress Energy, Inc. | | | | 7.100% | | 3/1/11 | | | 3,170 | | | 3,579 | |
TXU Corp. | | | | 6.375% | | 6/15/06 | | | 8,380 | | | 8,810 | |
TXU Energy Co. | | | | 2.380% | | 1/17/06 | | | 1,640 | | | 1,644 | B,D |
| | | | | | | | | | | |
|
|
|
| | | | | | | | | | | | | 19,149 | |
| | | | | | | | | | | |
|
|
|
Environmental Services | | 0.5% | | | | | | | | | | | |
Waste Management, Inc. | | | | 7.000% | | 10/1/04 | | | 290 | | | 290 | |
Waste Management, Inc. | | | | 7.125% | | 10/1/07 | | | 1,330 | | | 1,467 | |
Waste Management, Inc. | | | | 6.875% | | 5/15/09 | | | 2,000 | | | 2,234 | |
42
Semi-Annual Report to Shareholders
| | | | | | | | | | | | | |
| | | % OF
NET ASSETS | | RATE | | MATURITY
DATE | | PAR/
SHARES | | VALUE | |
Corporate Bonds and Notes—Continued | | | | | | | | | | | | | |
| | | | | |
Environmental Services—Continued | | | | | | | | | | | | | |
Waste Management, Inc. | | | | 6.375% | | 11/15/12 | | $ | 2,530 | | $ | 2,797 | |
Waste Management, Inc. | | | | 7.125% | | 12/15/17 | | | 6,000 | | | 6,893 | |
Waste Management, Inc. | | | | 7.375% | | 5/15/29 | | | 1,220 | | | 1,401 | |
| | | | | | | | | | | |
|
|
|
| | | | | | | | | | | | | 15,082 | |
| | | | | | | | | | | |
|
|
|
Food, Beverage and Tobacco | | 0.6% | | | | | | | | | | | |
Altria Group, Inc. | | | | 7.000% | | 11/4/13 | | | 4,655 | | | 4,857 | |
Altria Group, Inc. | | | | 7.750% | | 1/15/27 | | | 2,500 | | | 2,641 | |
Nabisco Incorporated | | | | 6.375% | | 2/1/05 | | | 4,250 | | | 4,294 | |
R.J. Reynolds Tobacco Holdings, Inc. | | | | 7.875% | | 5/15/09 | | | 3,240 | | | 3,353 | |
| | | | | | | | | | | |
|
|
|
| | | | | | | | | | | | | 15,145 | |
| | | | | | | | | | | |
|
|
|
Gas and Pipeline Utilities | | 1.2% | | | | | | | | | | | |
Dynegy Holdings Inc. | | | | 8.750% | | 2/15/12 | | | 11,260 | | | 11,710 | A |
Southern Natural Gas Company | | | | 8.000% | | 3/1/32 | | | 7,390 | | | 7,630 | |
Tennessee Gas Pipeline Company | | | | 8.375% | | 6/15/32 | | | 1,110 | | | 1,188 | |
The Williams Companies, Inc. | | | | 8.125% | | 3/15/12 | | | 3,730 | | | 4,299 | A |
The Williams Companies, Inc. | | | | 7.500% | | 1/15/31 | | | 5,000 | | | 5,025 | A |
The Williams Companies, Inc. | | | | 8.750% | | 3/15/32 | | | 3,240 | | | 3,621 | |
| | | | | | | | | | | |
|
|
|
| | | | | | | | | | | | | 33,473 | |
| | | | | | | | | | | |
|
|
|
Health Care | | 0.4% | | | | | | | | | | | |
Tenet Healthcare Corporation | | | | 6.375% | | 12/1/11 | | | 2,500 | | | 2,244 | |
Tenet Healthcare Corporation | | | | 7.375% | | 2/1/13 | | | 9,462 | | | 8,894 | A |
| | | | | | | | | | | |
|
|
|
| | | | | | | | | | | | | 11,138 | |
| | | | | | | | | | | |
|
|
|
Insurance | | 0.1% | | | | | | | | | | | |
Loews Corporation | | | | 7.000% | | 10/15/23 | | | 3,000 | | | 3,045 | |
| | | | | | | | | | | |
|
|
|
| | | | | |
Investment Banking/Brokerage | | 0.8% | | | | | | | | | | | |
Credit Suisse First Boston USA | | | | 4.625% | | 1/15/08 | | | 1,650 | | | 1,704 | |
J.P. Morgan & Co. Incorporated | | | | 4.560% | | 2/15/12 | | | 2,000 | | | 2,160 | D |
J.P. Morgan Chase & Co. | | | | 5.750% | | 1/2/13 | | | 3,270 | | | 3,482 | A |
Lehman Brothers Holdings Inc. | | | | 1.750% | | 4/20/07 | | | 5,470 | | | 5,470 | D |
Merrill Lynch & Co., Inc. | | | | 3.375% | | 9/14/07 | | | 2,120 | | | 2,119 | |
Morgan Stanley | | | | 5.300% | | 3/1/13 | | | 3,380 | | | 3,464 | |
The Goldman Sachs Group, Inc. | | | | 4.750% | | 7/15/13 | | | 4,370 | | | 4,288 | A |
| | | | | | | | | | | |
|
|
|
| | | | | | | | | | | | | 22,687 | |
| | | | | | | | | | | |
|
|
|
Investment Management | | 0.4% | | | | | | | | | | | |
Dryden Investor Trust | | | | 7.157% | | 7/23/08 | | | 10,697 | | | 11,453 | |
| | | | | | | | | | | |
|
|
|
43
Semi-Annual Report to Shareholders
| | | | | | | | | | | | | |
| | | % OF
NET ASSETS | | RATE | | MATURITY
DATE | | PAR/
SHARES | | VALUE | |
Corporate Bonds and Notes—Continued | | | | | | | | | | | | | |
| | | | | |
Media | | 2.0% | | | | | | | | | | | |
AOL Time Warner Inc. | | | | 6.875% | | 5/1/12 | | $ | 8,270 | | $ | 9,227 | |
AOL Time Warner Inc. | | | | 7.625% | | 4/15/31 | | | 1,350 | | | 1,554 | |
AOL Time Warner Inc. | | | | 7.700% | | 5/1/32 | | | 13,960 | | | 16,232 | |
Liberty Media Corporation | | | | 3.380% | | 9/17/06 | | | 24,060 | | | 24,318 | A,D |
Liberty Media Corporation | | | | 3.750% | | 2/15/30 | | | 290 | | | 192 | E |
Time Warner Inc. | | | | 6.950% | | 1/15/28 | | | 2,500 | | | 2,668 | |
Viacom Inc. | | | | 5.625% | | 8/15/12 | | | 1,240 | | | 1,300 | A |
| | | | | | | | | | | |
|
|
|
| | | | | | | | | | | | | 55,491 | |
| | | | | | | | | | | |
|
|
|
Medical Care Facilities | | 0.8% | | | | | | | | | | | |
HCA Inc. | | | | 5.750% | | 3/15/14 | | | 21,360 | | | 21,175 | |
| | | | | | | | | | | |
|
|
|
| | | | | |
Oil and Gas | | 1.1% | | | | | | | | | | | |
Apache Corporation | | | | 6.250% | | 4/15/12 | | | 1,170 | | | 1,311 | |
Conoco Inc. | | | | 6.950% | | 4/15/29 | | | 8,320 | | | 9,600 | |
ConocoPhillips | | | | 4.750% | | 10/15/12 | | | 2,170 | | | 2,200 | |
Devon Energy Corporation | | | | 7.950% | | 4/15/32 | | | 3,605 | | | 4,472 | A |
El Paso Corporation | | | | 0.000% | | 2/28/21 | | | 4,950 | | | 2,524 | C,E |
El Paso Corporation | | | | 7.800% | | 8/1/31 | | | 140 | | | 123 | |
El Paso Natural Gas Company | | | | 8.375% | | 6/15/32 | | | 3,610 | | | 3,809 | |
Sonat Inc. | | | | 7.625% | | 7/15/11 | | | 5,000 | | | 4,925 | A |
XTO Energy, Inc. | | | | 7.500% | | 4/15/12 | | | 2,090 | | | 2,455 | |
| | | | | | | | | | | |
|
|
|
| | | | | | | | | | | | | 31,419 | |
| | | | | | | | | | | |
|
|
|
Paper and Forest Products | | N.M. | | | | | | | | | | | |
International Paper Company | | | | 5.500% | | 1/15/14 | | | 675 | | | 691 | |
| | | | | | | | | | | |
|
|
|
| | | | | |
Pharmaceuticals | | 0.2% | | | | | | | | | | | |
Bristol-Myers Squibb Company | | | | 5.750% | | 10/1/11 | | | 3,790 | | | 4,064 | |
Merck & Co., Inc. | | | | 6.750% | | 9/19/05 | | | 1,000 | | | 1,042 | |
| | | | | | | | | | | |
|
|
|
| | | | | | | | | | | | | 5,106 | |
| | | | | | | | | | | |
|
|
|
Photo Equipment and Supplies | | 0.5% | | | | | | | | | | | |
Eastman Kodak Company | | | | 3.625% | | 5/15/08 | | | 13,000 | | | 12,733 | |
Eastman Kodak Company | | | | 7.250% | | 11/15/13 | | | 710 | | | 783 | A |
| | | | | | | | | | | |
|
|
|
| | | | | | | | | | | | | 13,516 | |
| | | | | | | | | | | |
|
|
|
Real Estate | | N.M. | | | | | | | | | | | |
Socgen Real Estate Co. LLC | | | | 7.640% | | 12/29/49 | | | 260 | | | 289 | B |
| | | | | | | | | | | |
|
|
|
44
PORTFOLIO OF INVESTMENTS—Continued
Western Asset Core Bond Portfolio—Continued
Semi-Annual Report to Shareholders
| | | | | | | | | | | | | |
| | | % OF
NET ASSETS | | RATE | | MATURITY
DATE | | PAR/
SHARES | | VALUE | |
Corporate Bonds and Notes—Continued | | | | | | | | | | | | | |
| | | | | |
Retail | | 0.2% | | | | | | | | | | | |
Target Corporation | | | | 4.000% | | 6/15/13 | | $ | 4,445 | | $ | 4,251 | A |
Wal-Mart Stores, Inc. | | | | 5.450% | | 8/1/06 | | | 150 | | | 157 | |
Wal-Mart Stores, Inc. | | | | 4.125% | | 2/15/11 | | | 2,210 | | | 2,213 | |
| | | | | | | | | | | |
|
|
|
| | | | | | | | | | | | | 6,621 | |
| | | | | | | | | | | |
|
|
|
Special Purpose | | 1.8% | | | | | | | | | | | |
Anadarko Finance Company | | | | 6.750% | | 5/1/11 | | | 1,590 | | | 1,801 | A |
DaimlerChrysler NA Holding Corporation | | | | 4.050% | | 6/4/08 | | | 3,490 | | | 3,521 | A |
Devon Financing Corporation ULC | | | | 6.875% | | 9/30/11 | | | 1,330 | | | 1,501 | |
Patrons’ Legacy 2003 IV | | | | 5.775% | | 1/23/17 | | | 5,100 | | | 5,182 | B |
Sprint Capital Corporation | | | | 6.000% | | 1/15/07 | | | 22,760 | | | 24,092 | |
Sprint Capital Corporation | | | | 8.375% | | 3/15/12 | | | 5,445 | | | 6,594 | |
Texaco Capital Inc. | | | | 5.500% | | 1/15/09 | | | 1,000 | | | 1,070 | |
Unilever Capital Corporation | | | | 7.125% | | 11/1/10 | | | 1,730 | | | 2,003 | |
Verizon Global Funding Corp. | | | | 7.250% | | 12/1/10 | | | 1,720 | | | 1,983 | |
Verizon Global Funding Corp. | | | | 6.875% | | 6/15/12 | | | 1,290 | | | 1,462 | A |
Verizon Global Funding Corp. | | | | 7.375% | | 9/1/12 | | | 1,275 | | | 1,489 | A |
| | | | | | | | | | | |
|
|
|
| | | | | | | | | | | | | 50,698 | |
| | | | | | | | | | | |
|
|
|
Telecommunications | | N.M. | | | | | | | | | | | |
GTE Hawaiian Telephone Company, Inc. | | | | 7.375% | | 9/1/06 | | | 700 | | | 729 | |
| | | | | | | | | | | |
|
|
|
| | | | | |
Transportation | | 0.6% | | | | | | | | | | | |
Continental Airlines, Inc. | | | | 6.545% | | 2/2/19 | | | 1,012 | | | 976 | |
Delta Air Lines, Inc. | | | | 6.619% | | 3/18/11 | | | 499 | | | 454 | |
Delta Air Lines, Inc. | | | | 7.111% | | 9/18/11 | | | 500 | | | 449 | A |
Delta Air Lines, Inc. | | | | 6.718% | | 1/2/23 | | | 4,526 | | | 4,652 | |
Southwest Airlines Co. | | | | 5.496% | | 11/1/06 | | | 9,000 | | | 9,306 | |
United Airlines, Inc. | | | | 7.783% | | 1/1/14 | | | 2,539 | | | 2,085 | |
| | | | | | | | | | | |
|
|
|
| | | | | | | | | | | | | 17,922 | |
| | | | | | | | | | | |
|
|
|
Total Corporate Bonds and Notes
(Identified Cost—$461,701) | | | | | | | | | | | | 480,838 | |
Asset-Backed Securities | | 3.5% | | | | | | | | | | | |
| | | | | |
Fixed Rate Securities | | 0.8% | | | | | | | | | | | |
Advanta Mortgage Loan Trust 1999-3 | | | | 7.590% | | 6/25/14 | | | 405 | | | 429 | |
Conseco Finance Securitizations Corp. 2000-5 | | | | 7.960% | | 2/1/32 | | | 4,700 | | | 4,232 | |
Equity One ABS, Inc. 2003-3 | | | | 4.995% | | 12/25/33 | | | 8,200 | | | 8,246 | |
Green Tree Financial Corporation 1996-5 | | | | 8.100% | | 7/15/27 | | | 1,072 | | | 268 | |
45
Semi-Annual Report to Shareholders
PORTFOLIO OF INVESTMENTS—Continued
Western Asset Core Bond Portfolio—Continued
| | | | | | | | | | | | | |
| | | % OF
NET ASSETS | | RATE | | MATURITY
DATE | | PAR/
SHARES | | VALUE | |
Asset-Backed Securities—Continued | | | | | | | | | | | | | |
| | | | | |
Fixed Rate Securities—Continued | | | | | | | | | | | | | |
Green Tree Home Improvement Loan Trust 1997-D | | | | 7.450% | | 9/15/28 | | $ | 1,700 | | $ | 1,703 | |
Irwin Home Equity Loan Trust 2001-1 | | | | 7.100% | | 9/25/31 | | | 6,537 | | | 6,697 | G |
| | | | | | | | | | | |
|
|
|
| | | | | | | | | | | | | 21,575 | |
| | | | | | | | | | | |
|
|
|
Indexed SecuritiesD | | 2.7% | | | | | | | | | | | |
ACE Securities Corp. Home Equity Loan Trust, 2001-AQ1 | | | | 2.100% | | 4/25/31 | | | 69 | | | 69 | |
Aesop Funding II LLC 2003-4A | | | | 2.041% | | 8/20/07 | | | 13,900 | | | 13,907 | B |
Amortizing Residential Collateral Trust 2002-BC1M | | | | 2.120% | | 1/1/32 | | | 735 | | | 735 | |
Argent NIM Trust 2003-N1 | | | | 2.110% | | 8/25/08 | | | 1,803 | | | 1,803 | B |
Asset Backed Funding Certificates 2002-SB1 | | | | 2.270% | | 12/25/30 | | | 3,422 | | | 3,432 | |
Bayview Financial Aquisition Trust 2001-DA | | | | 2.220% | | 11/25/31 | | | 2,345 | | | 2,346 | B |
Bayview Financial Aquisition Trust 2002-CA | | | | 2.170% | | 5/25/32 | | | 2,969 | | | 2,965 | B |
CDC Mortgage Capital Trust 2002-HE1 | | | | 2.150% | | 1/25/33 | | | 2,716 | | | 2,719 | |
Centex Home Equity 2000-C | | | | 2.080% | | 10/25/30 | | | 194 | | | 194 | |
Centex Home Equity 2002-D | | | | 2.280% | | 12/25/32 | | | 2,843 | | | 2,849 | |
Chase Funding Mortgage Loan Asset-Backed Certificates 2000-2 | | | | 2.120% | | 5/25/30 | | | 56 | | | 56 | |
CIT Group Home Equity Loan Trust 2002-1 | | | | 2.130% | | 3/25/33 | | | 2,593 | | | 2,594 | |
Countrywide Asset-Backed Certificates 2001-BC2 | | | | 2.090% | | 7/25/31 | | | 253 | | | 254 | |
Countrywide Asset-Backed Certificates 2003-BC3 | | | | 2.150% | | 9/25/33 | | | 11,779 | | | 11,793 | |
Fleet Home Equity Loan Trust 2003-1 | | | | 2.061% | | 1/20/33 | | | 8,620 | | | 8,620 | |
Household Home Equity Loan Trust 2002-4A | | | | 2.361% | | 10/20/32 | | | 1,976 | | | 1,980 | |
Long Beach Mortgage Loan Trust 2000-1 | | | | 2.080% | | 1/21/31 | | | 769 | | | 771 | |
New Century Home Equity Loan Trust 2001-NC1 | | | | 2.101% | | 6/20/31 | | | 2,212 | | | 2,213 | |
Option One Mortgage Securities Corp. NIM Trust 2003-1 | | | | 2.230% | | 1/26/10 | | | 707 | | | 707 | B |
Provident Bank Home Equity Loan Trust 1999-3 | | | | 2.230% | | 1/25/31 | | | 2,357 | | | 2,358 | |
Residential Asset Mortgage Products, Inc. 2000-RS3 | | | | 2.130% | | 9/25/30 | | | 78 | | | 78 | |
Residential Asset Mortgage Products, Inc. 2003-RS2 | | | | 2.180% | | 3/25/33 | | | 1,683 | | | 1,686 | |
Residential Asset Securities Corporation 2001-KS2 | | | | 2.070% | | 6/25/31 | | | 1,617 | | | 1,620 | |
Residential Asset Securities Corporation 2001-KS3 | | | | 2.070% | | 9/25/31 | | | 743 | | | 743 | |
Structured Asset Investment Loan Trust 2003-BC5 | | | | 1.960% | | 6/25/33 | | | 263 | | | 263 | |
William Street Funding Corporation 2003-1 | | | | 1.950% | | 4/23/06 | | | 7,400 | | | 7,408 | B |
| | | | | | | | | | | |
|
|
|
| | | | | | | | | | | | | 74,163 | |
| | | | | | | | | | | |
|
|
|
46
Semi-Annual Report to Shareholders
| | | | | | | | | | | | | |
| | | % OF
NET ASSETS | | RATE | | MATURITY
DATE | | PAR/
SHARES | | VALUE | |
Asset-Backed Securities—Continued | | | | | | | | | | | | | |
| | | | | |
Stripped Securities | | N.M. | | | | | | | | | | | |
Bayview Financial Acquisition Trust 2002-FA | | | | 7.000% | | 6/25/05 | | $ | 178 | | $ | 5 | B,G1 |
Diversified REIT Trust 1999-1A | | | | 0.535% | | 3/18/11 | | | 98,304 | | | 1,843 | G1 |
| | | | | | | | | | | |
|
|
|
| | | | | | | | | | | | | 1,848 | |
| | | | | | | | | | | |
|
|
|
Total Asset-Backed Securities
(Identified Cost—$95,687) | | | | | | | | | | | | 97,586 | |
Mortgage-Backed Securities | | 6.3% | | | | | | | | | | | |
| | | | | |
Fixed Rate Securities | | 4.2% | | | | | | | | | | | |
Asset Securitization Corporation 1996-D2 | | | | 6.920% | | 2/14/29 | | | 5,464 | | | 5,702 | |
Criimi Mae Commercial Mortgage Trust 1998-C1 | | | | 7.000% | | 6/2/33 | | | 7,838 | | | 8,387 | B |
Deutsche Mortgage and Asset Receiving Corporation 1998-C1 | | | | 6.538% | | 6/15/31 | | | 13,085 | | | 14,106 | |
Merrill Lynch Mortgage Investors, Inc. 1996-C2 | | | | 6.960% | | 11/21/28 | | | 734 | | | 775 | |
Nomura Asset Securities Corporation 1996-MD5 | | | | 7.120% | | 4/13/39 | | | 5,500 | | | 5,825 | |
Nomura Asset Securities Corporation 1996-MD5A | | | | 7.070% | | 4/13/39 | | | 1,012 | | | 1,046 | |
Residential Asset Securitization Trust 2003-A14 | | | | 4.750% | | 2/25/19 | | | 80,302 | | | 80,167 | |
Washington Mutual 2002-S8 | | | | 5.750% | | 1/25/33 | | | 1,590 | | | 1,592 | |
| | | | | | | | | | | |
|
|
|
| | | | | | | | | | | | | 117,600 | |
| | | | | | | | | | | |
|
|
|
Indexed SecuritiesD | | 2.0% | | | | | | | | | | | |
Chevy Chase Mortgage Funding Corporation
2003-2A | | | | 2.220% | | 5/25/34 | | | 12,154 | | | 12,173 | B |
Credit Suisse First Boston Mortgage 2003-NP6 | | | | 2.740% | | 8/25/32 | | | 767 | | | 767 | B |
Credit-Based Asset Servicing and Securitization 2001-CB2 | | | | 2.130% | | 8/25/33 | | | 2,150 | | | 2,153 | |
Granite Mortgages PLC 2003-1 | | | | 1.820% | | 1/20/20 | | | 7,550 | | | 7,552 | |
Impac Mortgage Trust 2003-7 A | | | | 2.160% | | 8/25/33 | | | 6,990 | | | 7,001 | |
Medallion Trust 2000-1G | | | | 1.820% | | 7/12/31 | | | 299 | | | 300 | |
Medallion Trust 2000-2G | | | | 2.110% | | 12/18/31 | | | 2,116 | | | 2,117 | |
Medallion Trust 2003-1G | | | | 2.100% | | 12/21/33 | | | 5,127 | | | 5,132 | |
MLCC Mortgage Investors, Inc. 2003-B | | | | 2.180% | | 4/25/28 | | | 12,226 | | | 12,268 | |
Morgan Stanley Capital I 2003 XLF A-1 | | | | 1.940% | | 7/15/17 | | | 5,977 | | | 5,977 | B |
| | | | | | | | | | | |
|
|
|
| | | | | | | | | | | | | 55,440 | |
| | | | | | | | | | | |
|
|
|
Stripped Securities | | 0.1% | | | | | | | | | | | |
FFCA Secured Lending Corporation 1999-1A | | | | 1.680% | | 9/18/25 | | | 11,846 | | | 524 | B,G1 |
LB-UBS Commercial Mortgage Trust 2001-C3 | | | | 1.208% | | 6/15/36 | | | 19,420 | | | 992 | B,G1 |
Structured Mortgage Asset Residential Trust 1991-8 | | | | 0.070% | | 1/25/23 | | | 993 | | | 1 | G1 |
| | | | | | | | | | | |
|
|
|
| | | | | | | | | | | | | 1,517 | |
| | | | | | | | | | | |
|
|
|
Total Mortgage-Backed Securities
(Identified Cost—$174,191) | | | | | | | | | | | | 174,557 | |
47
Semi-Annual Report to Shareholders
| | | | | | | | | | | | | |
| | | % OF
NET ASSETS | | RATE | | MATURITY
DATE | | PAR/
SHARES | | VALUE | |
U.S. Government and Agency Obligations | | 24.5% | | | | | | | | | | | |
| | | | | |
Fixed Rate Securities | | 14.9% | | | | | | | | | | | |
Freddie Mac | | | | 7.250% | | 2/15/07 | | $ | 100 | | $ | 110 | |
Tennessee Valley Authority | | | | 6.750% | | 11/1/25 | | | 2,560 | | | 3,031 | |
Tennessee Valley Authority | | | | 7.125% | | 5/1/30 | | | 2,450 | | | 3,032 | A |
United States Treasury Bonds | | | | 7.500% | | 11/15/16 | | | 1,490 | | | 1,915 | A |
United States Treasury Bonds | | | | 8.000% | | 11/15/21 | | | 13,860 | | | 19,051 | A |
United States Treasury Bonds | | | | 7.250% | | 8/15/22 | | | 13,010 | | | 16,751 | A |
United States Treasury Bonds | | | | 6.250% | | 8/15/23 | | | 1,980 | | | 2,312 | A |
United States Treasury Bonds | | | | 2.375% | | 1/15/25 | | | 5,788 | | | 6,030 | A |
United States Treasury Bonds | | | | 5.250% | | 11/15/28 | | | 7,760 | | | 8,071 | A |
United States Treasury Bonds | | | | 5.375% | | 2/15/31 | | | 11,640 | | | 12,469 | A |
United States Treasury Notes | | | | 1.250% | | 5/31/05 | | | 480 | | | 477 | A |
United States Treasury Notes | | | | 1.500% | | 7/31/05 | | | 5,430 | | | 5,402 | A |
United States Treasury Notes | | | | 1.500% | | 3/31/06 | | | 3,940 | | | 3,889 | A |
United States Treasury Notes | | | | 2.750% | | 6/30/06 | | | 10,360 | | | 10,403 | A |
United States Treasury Notes | | | | 2.250% | | 2/15/07 | | | 6,480 | | | 6,411 | A |
United States Treasury Notes | | | | 3.125% | | 5/15/07 | | | 8,480 | | | 8,552 | A |
United States Treasury Notes | | | | 2.750% | | 8/15/07 | | | 2,530 | | | 2,523 | A |
United States Treasury Notes | | | | 3.250% | | 8/15/08 | | | 12,000 | | | 12,057 | A |
United States Treasury Notes | | | | 3.125% | | 10/15/08 | | | 12,680 | | | 12,661 | A |
United States Treasury Notes | | | | 3.375% | | 11/15/08 | | | 3,330 | | | 3,353 | A |
United States Treasury Notes | | | | 3.000% | | 2/15/09 | | | 7,070 | | | 6,999 | A |
United States Treasury Notes | | | | 2.625% | | 3/15/09 | | | 10,510 | | | 10,231 | A |
United States Treasury Notes | | | | 4.000% | | 6/15/09 | | | 72,160 | | | 74,263 | A |
United States Treasury Notes | | | | 3.625% | | 7/15/09 | | | 41,010 | | | 41,507 | A |
United States Treasury Notes | | | | 3.500% | | 8/15/09 | | | 99,230 | | | 99,831 | A |
United States Treasury Notes | | | | 3.375% | | 9/15/09 | | | 12,390 | | | 12,392 | A |
United States Treasury Notes | | | | 4.250% | | 11/15/13 | | | 17,090 | | | 17,310 | A |
United States Treasury Notes | | | | 4.250% | | 8/15/14 | | | 13,215 | | | 13,353 | A |
| | | | | | | | | | | |
|
|
|
| | | | | | | | | | | | | 414,386 | |
| | | | | | | | | | | |
|
|
|
Indexed SecuritiesH | | 9.6% | | | | | | | | | | | |
United States Treasury Inflation-Protected Security | | | | 3.375% | | 1/15/07 | | | 104,427 | | | 111,569 | A |
United States Treasury Inflation-Protected Security | | | | 3.875% | | 1/15/09 | | | 20,974 | | | 23,611 | A |
United States Treasury Inflation-Protected Security | | | | 4.250% | | 1/15/10 | | | 73,245 | | | 85,006 | A |
United States Treasury Inflation-Protected Security | | | | 3.375% | | 1/15/12 | | | 7,467 | | | 8,461 | A |
United States Treasury Inflation-Protected Security | | | | 1.875% | | 7/15/13 | | | 14,263 | | | 14,505 | A |
United States Treasury Inflation-Protected Security | | | | 2.000% | | 1/15/14 | | | 4,541 | | | 4,650 | A |
United States Treasury Inflation-Protected Security | | | | 3.625% | | 4/15/28 | | | 13,901 | | | 17,638 | A |
48
PORTFOLIO OF INVESTMENTS—Continued
Western Asset Core Bond Portfolio—Continued
Semi-Annual Report to Shareholders
| | | | | | | | | | | | | |
| | | % OF
NET ASSETS | | RATE | | MATURITY DATE | | PAR/
SHARES | | VALUE | |
U.S. Government and Agency Obligations—Continued | | | | | | | | | | | | | |
| | | | | |
Indexed Securities—Continued | | | | | | | | | | | | | |
United States Treasury
Inflation-Protected Security | | | | 3.875% | | 4/15/29 | | $ | 841 | | $ | 1,116 | |
| | | | | | | | | | | |
|
|
|
| | | | | | | | | | | | | 266,556 | |
| | | | | | | | | | | |
|
|
|
Stripped Securities | | N.M. | | | | | | | | | | | |
United States Treasury Bonds | | | | 0.000% | | 8/15/27 | | | 1,630 | | | 496 | A,G2 |
| | | | | | | | | | | |
|
|
|
Total U.S. Government and Agency Obligations
(Identified Cost—$675,020) | | | | | | | | | | 681,438 | |
U.S. Government Agency
Mortgage-Backed Securities | | 17.2% | | | | | | | | | | | |
| | | | | |
Fixed Rate Securities | | 17.2% | | | | | | | | | | | |
Fannie Mae | | | | 7.000% | | 9/1/07 to 2/1/33 | | | 19,599 | | | 20,795 | |
Fannie Mae | | | | 8.000% | | 5/1/15 | | | 78 | | | 84 | |
Fannie Mae | | | | 6.000% | | 11/1/16 to 2/1/32 | | | 4,244 | | | 4,435 | |
Fannie Mae | | | | 5.500% | | 4/1/18 | | | 2,558 | | | 2,650 | |
Fannie Mae | | | | 4.500% | | 7/1/18 | | | 6,074 | | | 6,071 | |
Fannie Mae | | | | 7.500% | | 6/1/25 to 7/1/29 | | | 1,537 | | | 1,651 | |
Fannie Mae | | | | 6.500% | | 7/1/28 to 5/1/32 | | | 10,380 | | | 10,905 | |
Freddie Mac | | | | 7.500% | | 4/1/06 | | | 2 | | | 2 | |
Freddie Mac | | | | 9.750% | | 7/1/08 | | | 41 | | | 44 | |
Freddie Mac | | | | 5.500% | | 12/1/13 to 6/1/33 | | | 12,163 | | | 12,376 | |
Freddie Mac | | | | 9.300% | | 4/15/19 | | | 254 | | | 255 | |
Freddie Mac | | | | 6.000% | | 10/1/19 | | | 1,700 | | | 1,780 | I |
Freddie Mac | | | | 7.000% | | 4/1/24 to 5/1/32 | | | 7,451 | | | 7,915 | |
Freddie Mac | | | | 6.000% | | 2/1/29 to 5/1/29 | | | 309 | | | 320 | |
Freddie Mac | | | | 6.500% | | 6/1/32 | | | 172 | | | 181 | |
Freddie Mac | | | | 5.000% | | 6/1/33 to 8/1/33 | | | 55,006 | | | 54,641 | |
Government National Mortgage
Association | | | | 10.000% | | 11/15/09 | | | 1 | | | 1 | |
Government National Mortgage
Association | | | | 8.000% | | 10/15/16 to 7/15/17 | | | 364 | | | 401 | |
Government National Mortgage
Association | | | | 7.500% | | 10/15/22 to 8/15/32 | | | 866 | | | 934 | |
Government National Mortgage
Association | | | | 7.000% | | 6/15/23 to 5/15/32 | | | 945 | | | 1,008 | |
Government National Mortgage
Association | | | | 6.500% | | 10/15/23 to 3/15/33 | | | 49,971 | | | 52,793 | |
49
Semi-Annual Report to Shareholders
| | | | | | | | | | | | | |
| | | % OF
NET ASSETS | | RATE | | MATURITY DATE | | PAR/
SHARES | | VALUE | |
U.S. Government Agency Mortgage-
Backed Securities—Continued | | | | | | | | | | | | | |
| | | | | |
Fixed Rate Securities—Continued | | | | | | | | | | | | | |
Government National Mortgage
Association | | | | 6.000% | | 11/15/28 to 5/15/33 | | $ | 22,486 | | $ | 23,348 | |
Government National Mortgage
Association | | | | 5.500% | | 1/15/33 | | | 410 | | | 418 | |
Government National Mortgage
Association | | | | 5.000% | | 10/1/34 | | | 46,865 | | | 46,601 | I |
Government National Mortgage
Association | | | | 5.500% | | 10/1/34 | | | 108,800 | | | 110,636 | I |
Government National Mortgage
Association | | | | 6.000% | | 10/1/34 | | | 113,890 | | | 118,019 | J |
| | | | | | | | | | | |
|
|
|
| | | | | | | | | | | | | 478,264 | |
| | | | | | | | | | | |
|
|
|
Stripped Securities | | N.M. | | | | | | | | | | | |
Fannie Mae | | | | 9.500% | | 2/1/17 | | | 26 | | | 5 | G1 |
Fannie Mae | | | | 1,009.250% | | 8/25/21 | | | 1 | | | 20 | G1 |
Fannie Mae | | | | 0.000% | | 5/25/22 | | | 261 | | | 236 | G2 |
Financing Corporation | | | | 0.000% | | 4/5/19 | | | 1,150 | | | 536 | G2 |
Freddie Mac | | | | 10.000% | | 3/1/21 | | | 199 | | | 43 | G1 |
Freddie Mac | | | | 0.000% | | 7/15/22 | | | 31 | | | 31 | G2 |
| | | | | | | | | | | |
|
|
|
| | | | | | | | | | | | | 871 | |
| | | | | | | | | | | |
|
|
|
Total U.S. Government Agency
Mortgage-Backed Securities (Identified Cost—$478,149) | | | | | | | | 479,135 | |
Yankee BondsJ | | 5.0% | | | | | | | | | | | |
| | | | | |
Banks | | 0.1% | | | | | | | | | | | |
Royal Bank of Scotland Group plc | | | | 8.817% | | 3/31/49 | | | 870 | | | 897 | |
The Korea Development Bank | | | | 4.250% | | 11/13/07 | | | 1,545 | | | 1,573 | |
| | | | | | | | | | | |
|
|
|
| | | | | | | | | | | | | 2,470 | |
| | | | | | | | | | | |
|
|
|
Cable | | 0.2% | | | | | | | | | | | |
Rogers Cable Inc. | | | | 5.500% | | 3/15/14 | | | 4,340 | | | 3,993 | A |
| | | | | | | | | | | |
|
|
|
| | | | | |
Electric | | N.M. | | | | | | | | | | | |
Hydro-Quebec | | | | 6.300% | | 5/11/11 | | | 570 | | | 639 | A |
| | | | | | | | | | | |
|
|
|
| | | | | |
Energy | | N.M. | | | | | | | | | | | |
Korea Electric Power Corporation | | | | 8.250% | | 3/15/05 | | | 1,050 | | | 1,077 | |
| | | | | | | | | | | |
|
|
|
50
PORTFOLIO OF INVESTMENTS—Continued
Western Asset Core Bond Portfolio—Continued
Semi-Annual Report to Shareholders
| | | | | | | | | | | | | |
| | | % OF
NET ASSETS | | RATE | | MATURITY
DATE | | PAR/
SHARES | | VALUE | |
Yankee BondsK—Continued | | | | | | | | | | | | | |
| | | | | |
Foreign Governments | | 2.1% | | | | | | | | | | | |
Quebec Province | | | | 5.500% | | 4/11/06 | | $ | 200 | | $ | 209 | |
Russian Federation | | | | 5.000% | | 3/31/30 | | | 27,610 | | | 26,558 | F |
United Mexican States | | | | 8.375% | | 1/14/11 | | | 4,590 | | | 5,382 | |
United Mexican States | | | | 7.500% | | 4/8/33 | | | 25,127 | | | 26,408 | |
| | | | | | | | | | | |
|
|
|
| | | | | | | | | | | | | 58,557 | |
| | | | | | | | | | | |
|
|
|
Insurance | | 0.1% | | | | | | | | | | | |
Atlas Reinsurance PLC | | | | 3.953% | | 1/7/05 | | | 250 | | | 251 | B,D |
Korea Deposit Insurance Corp. | | | | 2.500% | | 12/11/05 | | | 2,400 | | | 2,655 | E |
| | | | | | | | | | | |
|
|
|
| | | | | | | | | | | | | 2,906 | |
| | | | | | | | | | | |
|
|
|
Manufacturing (Diversified) | | 1.8% | | | | | | | | | | | |
Tyco International Group SA | | | | 5.875% | | 11/1/04 | | | 900 | | | 902 | |
Tyco International Group SA | | | | 6.375% | | 2/15/06 | | | 16,600 | | | 17,354 | |
Tyco International Group SA | | | | 5.800% | | 8/1/06 | | | 10,250 | | | 10,734 | |
Tyco International Group SA | | | | 6.750% | | 2/15/11 | | | 430 | | | 484 | |
Tyco International Group SA | | | | 6.375% | | 10/15/11 | | | 1,230 | | | 1,360 | |
Tyco International Group SA | | | | 7.000% | | 6/15/28 | | | 3,070 | | | 3,464 | |
Tyco International Group SA | | | | 6.875% | | 1/15/29 | | | 14,780 | | | 16,563 | A |
| | | | | | | | | | | |
|
|
|
| | | | | | | | | | | | | 50,861 | |
| | | | | | | | | | | |
|
|
|
Oil and Gas | | 0.1% | | | | | | | | | | | |
YPF Sociedad Anonima | | | | 7.750% | | 8/27/07 | | | 3,250 | | | 3,486 | |
| | | | | | | | | | | |
|
|
|
| | | | | |
Special Purpose | | 0.4% | | | | | | | | | | | |
Conoco Funding Company | | | | 7.250% | | 10/15/31 | | | 350 | | | 419 | |
CVRD Finance LTD. | | | | 2.250% | | 10/15/07 | | | 2,282 | | | 2,273 | B,D |
HSBC Capital Funding LP | | | | 4.610% | | 12/29/49 | | | 1,630 | | | 1,566 | B |
Petronas Capital Ltd. | | | | 7.875% | | 5/22/22 | | | 1,340 | | | 1,604 | B |
Petrozuata Finance, Inc. | | | | 8.220% | | 4/1/17 | | | 3,950 | | | 3,891 | B |
| | | | | | | | | | | |
|
|
|
| | | | | | | | | | | | | 9,753 | |
| | | | | | | | | | | |
|
|
|
Telecommunications | | 0.2% | | | | | | | | | | | |
British Telecommunications plc | | | | 8.375% | | 12/15/10 | | | 1,755 | | | 2,116 | |
Telecom Italia S.p.A. | | | | 5.250% | | 11/15/13 | | | 965 | | | 983 | B |
Telecom Italia S.p.A. | | | | 4.950% | | 9/30/14 | | | 2,570 | | | 2,539 | B |
| | | | | | | | | | | |
|
|
|
| | | | | | | | | | | | | 5,638 | |
| | | | | | | | | | | |
|
|
|
Total Yankee Bonds (Identified Cost—$131,890) | | | | | | | | | | | | 139,380 | |
51
Semi-Annual Report to Shareholders
PORTFOLIO OF INVESTMENTS—Continued
Western Asset Core Bond Portfolio—Continued
| | | | | | | | | | | | | | |
| | | % OF
NET ASSETS | | RATE | | MATURITY
DATE | | PAR/
SHARES | | | VALUE | |
Preferred Stocks | | 0.2% | | | | | | | | | | | | |
Home Ownership Funding Corporation | | | | 13.331% | | | | | 56 | shs | | $ | 2,292 | B,F |
Home Ownership Funding Corporation II | | | | 13.338% | | | | | 50 | | | | 2,057 | B,F |
| | | | | | | | | | | | |
|
|
|
Total Preferred Stocks (Identified Cost—$9,045) | | | | | | | | | | | | | 4,349 | |
| | | | | | | | | | | | |
|
|
|
Total Long-Term Securities (Identified Cost—$2,025,683) | | | | | | | | | | | 2,057,283 | |
Investment of Proceeds From Securities Lending | | 24.2% | | | | | | | | | | | | |
State Street Navigator Securities Lending Prime Portfolio | | | | | | | | | 673,075 | | | | 673,075 | |
| | | | | | | | | | | | |
|
|
|
Total Investment of Proceeds From Securities Lending (Identified Cost—$673,075) | | | | | | | | | | | | | 673,075 | |
Short-Term Securities | | 35.2% | | | | | | | | | | | | |
| | | | | |
Corporate Bonds and Notes | | 0.3% | | | | | | | | | | | | |
Altria Group, Inc. | | | | 2.362% | | 10/22/04 | | $ | 6,600 | | | | 6,600 | D |
| | | | | | | | | | | | |
|
|
|
| | | | | |
U.S. Government and Agency Obligations | | 11.3% | | | | | | | | | | | | |
Fannie Mae | | | | 0.000% | | 11/10/04 | | | 27,760 | | | | 27,706 | C |
Fannie Mae | | | | 0.000% | | 11/12/04 | | | 27,760 | | | | 27,703 | C |
Fannie Mae | | | | 0.000% | | 11/17/04 | | | 27,760 | | | | 27,695 | C |
Fannie Mae | | | | 0.000% | | 11/24/04 | | | 27,760 | | | | 27,685 | C |
Fannie Mae | | | | 0.000% | | 11/29/04 | | | 27,760 | | | | 27,678 | C |
Fannie Mae | | | | 0.000% | | 11/30/04 | | | 27,760 | | | | 27,676 | C |
Fannie Mae | | | | 0.000% | | 4/1/05 | | | 10,090 | | | | 9,988 | C,L |
Federal Home Loan Bank | | | | 0.000% | | 10/22/04 | | | 27,760 | | | | 27,732 | C |
Federal Home Loan Bank | | | | 0.000% | | 10/27/04 | | | 27,760 | | | | 27,725 | C |
Freddie Mac | | | | 0.000% | | 10/26/04 | | | 27,760 | | | | 27,726 | C |
Freddie Mac | | | | 0.000% | | 11/7/04 | | | 27,760 | | | | 27,668 | C |
Freddie Mac | | | | 0.000% | | 11/30/04 | | | 27,760 | | | | 27,678 | C |
| | | | | | | | | | | | |
|
|
|
| | | | | | | | | | | | | | 314,660 | |
| | | | | | | | | | | | |
|
|
|
Options PurchasedL | | N.M. | | | | | | | | | | | | |
Eurodollar Futures Call,
January 2005, Strike Price $96.50 | | | | | | | | | 67 | M | | | 66 | |
Eurodollar Futures Put,
April 2005, Strike Price $97.50 | | | | | | | | | 188 | M | | | 89 | |
Eurodollar Futures Put,
April 2005, Strike Price $97.75 | | | | | | | | | 847 | M | | | 746 | |
| | | | | | | | | | | | |
|
|
|
| | | | | | | | | | | | | | 901 | |
| | | | | | | | | | | | |
|
|
|
52
Semi-Annual Report to Shareholders
| | | | | | | | | | | | | |
| | | % OF
NET ASSETS | | RATE | | MATURITY
DATE | | PAR/
SHARES | | VALUE | |
Short-Term Securities—Continued | | | | | | | | | | | | | |
| | | | | |
Repurchase Agreements | | 23.6% | | | | | | | | | | | |
Deutsche Bank AG
1.85%, dated 9/30/04, to be repurchased at $363,050 on 10/1/04 (Collateral: $118,596 Fannie Mae notes, 4.61%, due 10/10/13, value $123,380; $250,000 Federal Home Loan Bank bonds, 2.50%, due 4/11/06, value $249,619) | | | | | | | | $ | 363,031 | | $ | 363,031 | |
Goldman, Sachs & Company
1.85%, dated 9/30/04, to be repurchased at $292,320 on 10/1/04 (Collateral: $299,280 Federal Home Loan Bank bonds, 2.375%,
due 4/5/06, value $298,177) | | | | | | | | | 292,305 | | | 292,305 | |
| | | | | | | | | | | |
|
|
|
| | | | | | | | | | | | | 655,336 | |
| | | | | | | | | | | |
|
|
|
Total Short-Term Securities (Identified Cost—$977,308) | | | | | | | | | | | | 977,497 | |
Total Investments (Identified Cost—$3,676,066) | | 133.4% | | | | | | | | | | 3,707,855 | |
Obligation to Return Collateral for Securities Loaned | | (24.2)% | | | | | | | | | | (673,075 | ) |
Other Assets Less Liabilities | | (9.2)% | | | | | | | | | | (255,127 | ) |
| | | | | | | | | | | |
|
|
|
| | | | | |
Net Assets | | 100.0% | | | | | | | | | $ | 2,779,653 | |
| | | | | | | | | | | |
|
|
|
| | | | | | | | |
| | | EXPIRATION | | ACTUAL
CONTRACTS | | APPRECIATION/
(DEPRECIATION) | |
Futures Contracts PurchasedL | | | | | | | | |
Eurodollar Futures | | March 2005 | | 311 | | $ | (2 | ) |
Eurodollar Futures | | September 2005 | | 1,170 | | | (98 | ) |
U.S. Treasury Note Futures | | December 2004 | | 1,781 | | | (746 | ) |
U.S. Treasury Note Futures | | December 2004 | | 1,293 | | | (134 | ) |
U.S. Treasury Note Futures | | December 2004 | | 1,696 | | | (786 | ) |
| | | | | | |
|
|
|
| | | | | | | $ | (1,766 | ) |
| | | | | | |
|
|
|
Options WrittenL | | | | | | | | |
Eurodollar Futures Call, Strike Price $96.75 | | October 2004 | | 82 | | $ | (40 | ) |
Eurodollar Futures Put, Strike Price $96.50 | | January 2005 | | 63 | | | (3 | ) |
Goldman Sachs Swaption Call, Strike Price $4.935 | | January 2005 | | 30,300,000 | | | 428 | |
U.S. Treasury Note Futures Call, Strike Price $112.00 | | December 2004 | | 844 | | | (457 | ) |
U.S. Treasury Note Futures Call, Strike Price $113.00 | | December 2004 | | 800 | | | (183 | ) |
U.S. Treasury Note Futures Call, Strike Price $114.00 | | December 2004 | | 741 | | | 57 | |
53
Semi-Annual Report to Shareholders
PORTFOLIO OF INVESTMENTS—Continued
Western Asset Core Bond Portfolio—Continued
| | | | | | | | |
| | | EXPIRATION | | ACTUAL
CONTRACTS | | APPRECIATION/
(DEPRECIATION) | |
Options WrittenL—Continued | | | | | | | | |
U.S. Treasury Note Futures Call, Strike Price $114.00 | | March 2005 | | 315 | | $ | 14 | |
U.S. Treasury Note Futures Call, Strike Price $116.00 | | March 2005 | | 251 | | | 67 | |
U.S. Treasury Note Futures Put, Strike Price $110.50 | | November 2004 | | 6 | | | (1 | ) |
U.S. Treasury Note Futures Put, Strike Price $106.00 | | December 2004 | | 561 | | | 391 | |
U.S. Treasury Note Futures Put, Strike Price $108.00 | | December 2004 | | 122 | | | 53 | |
U.S. Treasury Note Futures Put, Strike Price $109.00 | | December 2004 | | 579 | | | 298 | |
U.S. Treasury Note Futures Put, Strike Price $109.00 | | December 2004 | | 124 | | | 42 | |
U.S. Treasury Bond Futures Put, Strike Price $109.00 | | December 2004 | | 867 | | | 52 | |
U.S. Treasury Note Futures Put, Strike Price $110.00 | | December 2004 | | 220 | | | (22 | ) |
U.S. Treasury Note Futures Put, Strike Price $112.00 | | December 2004 | | 356 | | | (90 | ) |
U.S. Treasury Note Futures Put, Strike Price $102.00 | | March 2005 | | 184 | | | 99 | |
U.S. Treasury Note Futures Put, Strike Price $109.00 | | March 2005 | | 379 | | | (58 | ) |
| | | | | | |
|
|
|
| | | | | | | $ | 647 | |
| | | | | | |
|
|
|
| | | | | | | | | |
| A | All or a portion of this security is on loan. See Note 4 to the financial statements. |
| B | Rule 144a Security – A security purchased pursuant to Rule 144a under the Securities Act of 1933 which may not be resold subject to that rule except to qualified institutional buyers. These securities represent 7.14% of net assets. |
| C | Zero coupon bond – A bond with no periodic interest payments which is sold at such a discount as to produce a current yield to maturity. |
| D | Indexed security – The rates of interest earned on these securities are tied to the London Interbank Offered Rate (“LIBOR”), the Consumer Price Index (“CPI”), or the one-year Treasury Bill rate. The coupon rates are the rates as of September 30, 2004. |
| E | Convertible security – Security may be converted into the issuer’s common stock. |
| F | Stepped coupon security – A security with a predetermined schedule of interest or dividend rate changes, at which time it begins to accrue interest or pay dividends. |
| G | Stripped security – Security with interest-only or principal-only payment streams, denoted by a 1 or 2, respectively. For interest-only securities, the amount shown as principal is the notional balance used to calculate the amount of interest due. |
| H | Treasury Inflation-Protected Security – Treasury security whose principal value is adjusted daily in accordance with changes to the Consumer Price Index for All Urban Consumers. Interest is calculated on the basis of the current adjusted principal value. |
| I | When-issued security – Security purchased on a delayed delivery basis. Final settlement amount and maturity date have not yet been announced. |
| J | Yankee Bond – A dollar-denominated bond issued in the U.S. by foreign entities. |
| K | All or a portion of this security is collateral to cover futures and options contracts. |
| L | Options and futures are described in more detail in the notes to financial statements. |
| M | Represents actual number of contracts. |
See notes to financial statements.
54
Semi-Annual Report to Shareholders
PORTFOLIO OF INVESTMENTS
September 30, 2004 (Unaudited)
(Amounts in Thousands)
Western Asset Core Plus Bond Portfolio
| | | | | | | | | | | | | |
| | | % OF
NET ASSETS | | RATE | | MATURITY
DATE | | PAR/
SHARES | | VALUE | |
Long-Term Securities | | 73.0% | | | | | | | | | | | |
| | | | | |
Corporate Bonds and Notes | | 15.1% | | | | | | | | | | | |
| | | | | |
Aerospace/Defense | | 0.3% | | | | | | | | | | | |
L-3 Communications Corp. | | | | 7.625% | | 6/15/12 | | $ | 912 | | $ | 1,003 | A |
Lockheed Martin Corporation | | | | 7.650% | | 5/1/16 | | | 1,575 | | | 1,912 | |
Lockheed Martin Corporation | | | | 8.500% | | 12/1/29 | | | 20 | | | 26 | A |
Northrop Grumman Corporation | | | | 4.079% | | 11/16/06 | | | 3,580 | | | 3,637 | |
Raytheon Company | | | | 6.750% | | 8/15/07 | | | 25 | | | 27 | |
Raytheon Company | | | | 6.000% | | 12/15/10 | | | 160 | | | 175 | |
Raytheon Company | | | | 5.500% | | 11/15/12 | | | 75 | | | 79 | A |
Raytheon Company | | | | 5.375% | | 4/1/13 | | | 875 | | | 910 | |
Systems 2001 Asset Trust | | | | 6.664% | | 9/15/13 | | | 3,034 | | | 3,371 | B |
| | | | | | | | | | | |
|
|
|
| | | | | | | | | | | | | 11,140 | |
| | | | | | | | | | | |
|
|
|
Auto and Automotive Parts | | N.M. | | | | | | | | | | | |
Cummins Inc. | | | | 7.125% | | 3/1/28 | | | 545 | | | 545 | |
| | | | | | | | | | | |
|
|
|
| | | | | |
Banking and Finance | | 1.9% | | | | | | | | | | | |
Boeing Capital Corporation | | | | 5.800% | | 1/15/13 | | | 2,030 | | | 2,178 | |
Ford Motor Credit Company | | | | 6.875% | | 2/1/06 | | | 800 | | | 837 | A |
Ford Motor Credit Company | | | | 7.375% | | 10/28/09 | | | 26,330 | | | 28,840 | |
Ford Motor Credit Company | | | | 7.875% | | 6/15/10 | | | 4,200 | | | 4,685 | |
Ford Motor Credit Company | | | | 7.375% | | 2/1/11 | | | 7,985 | | | 8,684 | |
Ford Motor Credit Company | | | | 7.250% | | 10/25/11 | | | 5,760 | | | 6,233 | |
Ford Motor Credit Company | | | | 7.000% | | 10/1/13 | | | 70 | | | 74 | A |
General Motors Acceptance Corporation | | | | 6.750% | | 1/15/06 | | | 3,730 | | | 3,891 | |
General Motors Acceptance Corporation | | | | 6.125% | | 9/15/06 | | | 10 | | | 10 | |
General Motors Acceptance Corporation | | | | 4.375% | | 12/10/07 | | | 20 | | | 20 | |
General Motors Acceptance Corporation | | | | 7.750% | | 1/19/10 | | | 110 | | | 121 | |
General Motors Acceptance Corporation | | | | 7.250% | | 3/2/11 | | | 1,400 | | | 1,495 | A |
Household Finance Corporation | | | | 7.200% | | 7/15/06 | | | 3,750 | | | 4,019 | |
Household Finance Corporation | | | | 6.400% | | 6/17/08 | | | 20 | | | 22 | A |
Household Finance Corporation | | | | 6.500% | | 11/15/08 | | | 40 | | | 44 | |
Household Finance Corporation | | | | 8.000% | | 7/15/10 | | | 70 | | | 83 | |
Household Finance Corporation | | | | 6.375% | | 8/1/10 | | | 1,000 | | | 1,099 | |
Household Finance Corporation | | | | 7.000% | | 5/15/12 | | | 160 | | | 183 | |
Household Finance Corporation | | | | 6.375% | | 11/27/12 | | | 520 | | | 576 | |
John Deere Capital Corporation | | | | 7.000% | | 3/15/12 | | | 80 | | | 92 | |
SB Treasury Company LLC | | | | 9.400% | | 12/29/49 | | | 360 | | | 424 | B |
SLM Corporation | | | | 4.120% | | 4/1/09 | | | 10,680 | | | 10,720 | C |
Toyota Motor Credit Corporation | | | | 2.800% | | 1/18/06 | | | 150 | | | 150 | |
| | | | | | | | | | | |
|
|
|
| | | | | | | | | | | | | 74,480 | |
| | | | | | | | | | | |
|
|
|
55
Semi-Annual Report to Shareholders
| | | | | | | | | | | | | |
| | | % OF
NET ASSETS | | RATE | | MATURITY
DATE | | PAR/
SHARES | | VALUE | |
Corporate Bonds and Notes—Continued | | | | | | | | | | | | | |
| | | | | |
Banks | | 0.3% | | | | | | | | | | | |
Bank of America Corporation | | | | 5.250% | | 2/1/07 | | $ | 400 | | $ | 419 | |
Bank of America Corporation | | | | 7.400% | | 1/15/11 | | | 3,090 | | | 3,601 | |
Bank One Corporation | | | | 4.125% | | 9/1/07 | | | 2,780 | | | 2,841 | |
Bank One Corporation | | | | 6.000% | | 8/1/08 | | | 150 | | | 162 | |
Bank One Corporation | | | | 5.900% | | 11/15/11 | | | 2,000 | | | 2,141 | |
Firstar Bank NA | | | | 7.125% | | 12/1/09 | | | 350 | | | 402 | |
Wells Fargo Bank NA, San Francisco | | | | 6.450% | | 2/1/11 | | | 1,600 | | | 1,794 | |
| | | | | | | | | | | |
|
|
|
| | | | | | | | | | | | | 11,360 | |
| | | | | | | | | | | |
|
|
|
Cable | | 0.5% | | | | | | | | | | | |
Comcast Cable Communications, Inc. | | | | 6.375% | | 1/30/06 | | | 3,550 | | | 3,697 | |
Comcast Cable Communications, Inc. | | | | 6.750% | | 1/30/11 | | | 680 | | | 754 | |
Comcast Corporation | | | | 6.500% | | 1/15/15 | | | 1,970 | | | 2,128 | |
Comcast Corporation | | | | 7.050% | | 3/15/33 | | | 6,530 | | | 7,163 | |
Continental Cablevision, Inc. | | | | 9.000% | | 9/1/08 | | | 1,060 | | | 1,243 | |
Cox Communications, Inc. | | | | 7.125% | | 10/1/12 | | | 1,750 | | | 1,899 | |
Cox Communications, Inc. | | | | 4.625% | | 6/1/13 | | | 710 | | | 654 | |
CSC Holdings Inc. | | | | 7.625% | | 4/1/11 | | | 280 | | | 295 | |
CSC Holdings Inc. | | | | 6.750% | | 4/15/12 | | | 500 | | | 501 | B |
CSC Holdings Inc. | | | | 7.875% | | 2/15/18 | | | 260 | | | 269 | |
| | | | | | | | | | | |
|
|
|
| | | | | | | | | | | | | 18,603 | |
| | | | | | | | | | | |
|
|
|
Casino Resorts | | 0.1% | | | | | | | | | | | |
MGM MIRAGE | | | | 9.750% | | 6/1/07 | | | 795 | | | 883 | |
MGM MIRAGE | | | | 8.500% | | 9/15/10 | | | 289 | | | 328 | A |
MGM MIRAGE | | | | 6.750% | | 9/1/12 | | | 1,190 | | | 1,232 | B |
Park Place Entertainment Corporation | | | | 8.125% | | 5/15/11 | | | 1,065 | | | 1,230 | A |
Station Casinos, Inc. | | | | 6.000% | | 4/1/12 | | | 1,420 | | | 1,456 | A |
| | | | | | | | | | | |
|
|
|
| | | | | | | | | | | | | 5,129 | |
| | | | | | | | | | | |
|
|
|
Chemicals | | 0.1% | | | | | | | | | | | |
FMC Corporation | | | | 10.250% | | 11/1/09 | | | 295 | | | 344 | |
IMC Global Inc. | | | | 10.875% | | 6/1/08 | | | 615 | | | 745 | |
IMC Global Inc. | | | | 11.250% | | 6/1/11 | | | 132 | | | 156 | |
IMC Global Inc. | | | | 10.875% | | 8/1/13 | | | 460 | | | 581 | A |
MacDermid, Incorporated | | | | 9.125% | | 7/15/11 | | | 1,067 | | | 1,190 | |
Millennium America Inc. | | | | 7.000% | | 11/15/06 | | | 880 | | | 913 | |
Westlake Chemical Corporation | | | | 8.750% | | 7/15/11 | | | 232 | | | 261 | |
| | | | | | | | | | | |
|
|
|
| | | | | | | | | | | | | 4,190 | |
| | | | | | | | | | | |
|
|
|
56
PORTFOLIO OF INVESTMENTS—Continued
Western Asset Core Plus Bond Portfolio—Continued
Semi-Annual Report to Shareholders
| | | | | | | | | | | | | |
| | | % OF
NET ASSETS | | RATE | | MATURITY
DATE | | PAR/
SHARES | | VALUE | |
Corporate Bonds and Notes—Continued | | | | | | | | | | | | | |
| | | | | |
Computer Services and Systems | | 0.2% | | | | | | | | | | | |
Electronic Data Systems Corporation | | | | 7.125% | | 10/15/09 | | $ | 8,255 | | $ | 8,867 | A |
International Business Machines Corporation | | | | 4.750% | | 11/29/12 | | | 40 | | | 41 | |
| | | | | | | | | | | |
|
|
|
| | | | | | | | | | | | | 8,908 | |
| | | | | | | | | | | |
|
|
|
Containers and Packaging | | N.M. | | | | | | | | | | | |
Ball Corporation | | | | 6.875% | | 12/15/12 | | | 1,109 | | | 1,181 | |
| | | | | | | | | | | |
|
|
|
| | | | | |
Diversified Financial Services | | 0.6% | | | | | | | | | | | |
CIT Group Inc. | | | | 6.500% | | 2/7/06 | | | 40 | | | 42 | |
CIT Group Inc. | | | | 5.750% | | 9/25/07 | | | 80 | | | 85 | |
Citigroup Inc. | | | | 5.000% | | 3/6/07 | | | 500 | | | 522 | |
Citigroup Inc. | | | | 4.250% | | 7/29/09 | | | 2,850 | | | 2,898 | |
Citigroup Inc. | | | | 6.000% | | 2/21/12 | | | 150 | | | 165 | |
General Electric Capital Corporation | | | | 5.450% | | 1/15/13 | | | 11,915 | | | 12,623 | A |
IBJ Preferred Capital Corp. LLC | | | | 8.790% | | 12/29/49 | | | 3,380 | | | 3,864 | B |
Philip Morris Capital Corporation | | | | 7.500% | | 7/16/09 | | | 190 | | | 200 | |
U.S. Bancorp | | | | 3.125% | | 3/15/08 | | | 1,610 | | | 1,585 | A |
Wells Fargo & Company | | | | 1.960% | | 6/12/06 | | | 50 | | | 50 | A,C |
Wells Fargo & Company | | | | 5.000% | | 11/15/14 | | | 1,150 | | | 1,168 | A |
| | | | | | | | | | | |
|
|
|
| | | | | | | | | | | | | 23,202 | |
| | | | | | | | | | | |
|
|
|
Diversified Services | | N.M. | | | | | | | | | | | |
SPX Corporation | | | | 7.500% | | 1/1/13 | | | 954 | | | 970 | A |
| | | | | | | | | | | |
|
|
|
| | | | | |
Electric | | 1.6% | | | | | | | | | | | |
Dominion Resources, Inc. | | | | 4.125% | | 2/15/08 | | | 460 | | | 466 | |
Dominion Resources, Inc. | | | | 5.125% | | 12/15/09 | | | 1,260 | | | 1,305 | |
Dominion Resources, Inc. | | | | 5.700% | | 9/17/12 | | | 3,810 | | | 4,006 | |
FirstEnergy Corp. | | | | 5.500% | | 11/15/06 | | | 6,840 | | | 7,120 | |
FirstEnergy Corp. | | | | 6.450% | | 11/15/11 | | | 1,640 | | | 1,789 | A |
FirstEnergy Corp. | | | | 7.375% | | 11/15/31 | | | 11,345 | | | 12,741 | |
General Electric Company | | | | 5.000% | | 2/1/13 | | | 920 | | | 946 | |
Nevada Power Company | | | | 6.500% | | 4/15/12 | | | 1,060 | | | 1,095 | B |
Niagara Mohawk Power Corporation | | | | 7.750% | | 10/1/08 | | | 500 | | | 569 | |
Oncor Electric Delivery Company | | | | 6.375% | | 1/15/15 | | | 685 | | | 756 | A |
Orion Power Holdings, Inc. | | | | 12.000% | | 5/1/10 | | | 1,047 | | | 1,309 | |
The AES Corporation | | | | 10.000% | | 7/15/05 | | | 476 | | | 484 | B |
The AES Corporation | | | | 9.500% | | 6/1/09 | | | 2,736 | | | 3,058 | |
The AES Corporation | | | | 9.375% | | 9/15/10 | | | 2,494 | | | 2,809 | |
The AES Corporation | | | | 8.750% | | 5/15/13 | | | 15,838 | | | 17,857 | B |
57
Semi-Annual Report to Shareholders
| | | | | | | | | | | | | |
| | | % OF
NET ASSETS | | RATE | | MATURITY
DATE | | PAR/
SHARES | | VALUE | |
Corporate Bonds and Notes—Continued | | | | | | | | | | | | | |
| | | | | |
Electric—Continued | | | | | | | | | | | | | |
The AES Corporation | | | | 9.000% | | 5/15/15 | | $ | 4,700 | | $ | 5,299 | B |
The Cleveland Electric Illuminating Company | | | | 5.650% | | 12/15/13 | | | 1,495 | | | 1,547 | |
The Detroit Edison Company | | | | 5.200% | | 10/15/12 | | | 10 | | | 10 | |
| | | | | | | | | | | |
|
|
|
| | | | | | | | | | | | | 63,166 | |
| | | | | | | | | | | |
|
|
|
Energy | | 0.8% | | | | | | | | | | | |
Calpine Corporation | | | | 7.625% | | 4/15/06 | | | 490 | | | 453 | |
Calpine Corporation | | | | 7.750% | | 4/15/09 | | | 38 | | | 24 | |
Calpine Corporation | | | | 8.625% | | 8/15/10 | | | 180 | | | 117 | |
Calpine Corporation | | | | 8.500% | | 2/15/11 | | | 8,429 | | | 5,395 | |
Calpine Corporation | | | | 8.750% | | 7/15/13 | | | 3,430 | | | 2,590 | B |
Calpine Generating Co. LLC | | | | 11.500% | | 4/1/11 | | | 960 | | | 840 | B |
Duke Energy Corporation | | | | 5.625% | | 11/30/12 | | | 2,010 | | | 2,107 | |
MidAmerican Energy Holdings Company | | | | 5.875% | | 10/1/12 | | | 30 | | | 32 | |
Pacific Gas and Electric Company | | | | 6.050% | | 3/1/34 | | | 4,300 | | | 4,376 | |
Peabody Energy Corporation | | | | 5.875% | | 4/15/16 | | | 880 | | | 869 | A |
Peabody Energy Corporation | | | | 6.875% | | 3/15/13 | | | 860 | | | 929 | A |
PG&E Corporation | | | | 6.875% | | 7/15/08 | | | 1,910 | | | 2,068 | |
Progress Energy, Inc. | | | | 7.100% | | 3/1/11 | | | 110 | | | 124 | A |
TXU Corp. | | | | 6.375% | | 6/15/06 | | | 9,795 | | | 10,298 | |
TXU Energy Co. | | | | 2.380% | | 1/17/06 | | | 2,570 | | | 2,576 | B,C |
TXU Energy Co. | | | | 7.000% | | 3/15/13 | | | 10 | | | 11 | |
| | | | | | | | | | | |
|
|
|
| | | | | | | | | | | | | 32,809 | |
| | | | | | | | | | | |
|
|
|
Environmental Services | | 0.7% | | | | | | | | | | | |
Allied Waste North America Incorporated | | | | 8.875% | | 4/1/08 | | | 882 | | | 957 | |
Allied Waste North America Incorporated | | | | 8.500% | | 12/1/08 | | | 375 | | | 407 | |
Safety-Kleen Corp. | | | | 9.250% | | 5/15/09 | | | 85 | | | 5 | D |
Waste Management, Inc. | | | | 7.000% | | 10/1/04 | | | 120 | | | 120 | |
Waste Management, Inc. | | | | 7.000% | | 10/15/06 | | | 2,545 | | | 2,729 | |
Waste Management, Inc. | | | | 7.125% | | 10/1/07 | | | 1,060 | | | 1,169 | |
Waste Management, Inc. | | | | 6.875% | | 5/15/09 | | | 8,000 | | | 8,934 | |
Waste Management, Inc. | | | | 7.375% | | 8/1/10 | | | 6,055 | | | 6,989 | |
Waste Management, Inc. | | | | 7.125% | | 12/15/17 | | | 500 | | | 575 | |
Waste Management, Inc. | | | | 7.000% | | 7/15/28 | | | 3,010 | | | 3,331 | |
Waste Management, Inc. | | | | 7.375% | | 5/15/29 | | | 80 | | | 92 | |
Waste Management, Inc. | | | | 7.750% | | 5/15/32 | | | 750 | | | 910 | |
| | | | | | | | | | | |
|
|
|
| | | | | | | | | | | | | 26,218 | |
| | | | | | | | | | | |
|
|
|
Food, Beverage and Tobacco | | 0.5% | | | | | | | | | | | |
Altria Group, Inc. | | | | 7.000% | | 11/4/13 | | | 5,985 | | | 6,245 | |
Altria Group, Inc. | | | | 7.750% | | 1/15/27 | | | 5,000 | | | 5,281 | |
58
PORTFOLIO OF INVESTMENTS—Continued
Western Asset Core Plus Bond Portfolio—Continued
Semi-Annual Report to Shareholders
| | | | | | | | | | | | | |
| | | % OF
NET ASSETS | | RATE | | MATURITY
DATE | | PAR/
SHARES | | VALUE | |
Corporate Bonds and Notes—Continued | | | | | | | | | | | | | |
| | | | | |
Food, Beverage and Tobacco—Continued | | | | | | | | | | | | | |
Constellation Brands, Inc. | | | | 8.000% | | 2/15/08 | | $ | 502 | | $ | 553 | |
Constellation Brands, Inc. | | | | 8.125% | | 1/15/12 | | | 130 | | | 142 | |
Nabisco Incorporated | | | | 7.550% | | 6/15/15 | | | 3,570 | | | 4,271 | |
R.J. Reynolds Tobacco Holdings, Inc. | | | | 7.750% | | 5/15/06 | | | 1,080 | | | 1,123 | A |
R.J. Reynolds Tobacco Holdings, Inc. | | | | 6.500% | | 6/1/07 | | | 590 | | | 599 | A |
R.J. Reynolds Tobacco Holdings, Inc. | | | | 7.875% | | 5/15/09 | | | 730 | | | 756 | A |
Sara Lee Corporation | | | | 6.250% | | 9/15/11 | | | 30 | | | 33 | |
Sara Lee Corporation | | | | 3.875% | | 6/15/13 | | | 20 | | | 19 | |
Smithfield Foods, Inc. | | | | 8.000% | | 10/15/09 | | | 471 | | | 519 | A |
Smithfield Foods, Inc. | | | | 7.000% | | 8/1/11 | | | 370 | | | 387 | B |
| | | | | | | | | | | |
|
|
|
| | | | | | | | | | | | | 19,928 | |
| | | | | | | | | | | |
|
|
|
Gaming | | N.M. | | | | | | | | | | | |
Mohegan Tribal Gaming Authority | | | | 6.375% | | 7/15/09 | | | 88 | | | 91 | |
Mohegan Tribal Gaming Authority | | | | 8.000% | | 4/1/12 | | | 245 | | | 271 | |
| | | | | | | | | | | |
|
|
|
| | | | | | | | | | | | | 362 | |
| | | | | | | | | | | |
|
|
|
Gas and Pipeline Utilities | | 1.0% | | | | | | | | | | | |
Dynegy Holdings Inc. | | | | 8.750% | | 2/15/12 | | | 5,890 | | | 6,126 | |
Southern Natural Gas Company | | | | 8.875% | | 3/15/10 | | | 1,220 | | | 1,372 | A |
Southern Natural Gas Company | | | | 8.000% | | 3/1/32 | | | 11,940 | | | 12,328 | |
The Williams Companies, Inc. | | | | 7.500% | | 1/15/31 | | | 4,113 | | | 4,133 | |
The Williams Companies, Inc. | | | | 7.750% | | 6/15/31 | | | 530 | | | 538 | |
The Williams Companies, Inc. | | | | 8.750% | | 3/15/32 | | | 15,130 | | | 16,908 | |
| | | | | | | | | | | |
|
|
|
| | | | | | | | | | | | | 41,405 | |
| | | | | | | | | | | |
|
|
|
Health Care | | 0.9% | | | | | | | | | | | |
Tenet Healthcare Corporation | | | | 6.375% | | 12/1/11 | | | 2,500 | | | 2,244 | A |
Tenet Healthcare Corporation | | | | 7.375% | | 2/1/13 | | | 15,939 | | | 14,983 | A |
Tenet Healthcare Corporation | | | | 9.875% | | 7/1/14 | | | 16,720 | | | 17,472 | A,B |
| | | | | | | | | | | |
|
|
|
| | | | | | | | | | | | | 34,699 | |
| | | | | | | | | | | |
|
|
|
Homebuilding | | N.M. | | | | | | | | | | | |
Beazer Homes USA, Inc. | | | | 8.375% | | 4/15/12 | | | 210 | | | 232 | |
Lennar Corporation | | | | 9.950% | | 5/1/10 | | | 286 | | | 311 | |
| | | | | | | | | | | |
|
|
|
| | | | | | | | | | | | | 543 | |
| | | | | | | | | | | |
|
|
|
Insurance | | 0.4% | | | | | | | | | | | |
Loews Corporation | | | | 3.125% | | 9/15/07 | | | 12,000 | | | 11,745 | E |
Loews Corporation | | | | 8.875% | | 4/15/11 | | | 90 | | | 107 | |
Loews Corporation | | | | 7.000% | | 10/15/23 | | | 3,300 | | | 3,350 | |
| | | | | | | | | | | |
|
|
|
| | | | | | | | | | | | | 15,202 | |
| | | | | | | | | | | |
|
|
|
59
Semi-Annual Report to Shareholders
| | | | | | | | | | | | | |
| | | % OF
NET ASSETS | | RATE | | MATURITY
DATE | | PAR/
SHARES | | VALUE | |
Corporate Bonds and Notes—Continued | | | | | | | | | | | | | |
| | | | | |
Investment Banking/Brokerage | | 0.6% | | | | | | | | | | | |
Credit Suisse First Boston USA | | | | 4.625% | | 1/15/08 | | $ | 2,730 | | $ | 2,820 | |
Credit Suisse First Boston USA | | | | 7.125% | | 7/15/32 | | | 60 | | | 71 | |
J.P. Morgan Capital Trust II | | | | 7.950% | | 2/1/27 | | | 20 | | | 22 | |
J.P. Morgan Chase & Co. | | | | 5.250% | | 5/30/07 | | | 30 | | | 31 | A |
J.P. Morgan Chase & Co. | | | | 6.000% | | 2/15/09 | | | 10 | | | 11 | |
J.P. Morgan Chase & Co. | | | | 4.500% | | 11/15/10 | | | 140 | | | 142 | A |
J.P. Morgan Chase & Co. | | | | 5.750% | | 1/2/13 | | | 4,430 | | | 4,717 | A |
Lehman Brothers Holdings Inc. | | | | 4.000% | | 1/22/08 | | | 1,740 | | | 1,767 | |
Lehman Brothers Holdings Inc. | | | | 7.000% | | 2/1/08 | | | 160 | | | 177 | |
Merrill Lynch & Co., Inc. | | | | 3.375% | | 9/14/07 | | | 3,130 | | | 3,128 | |
Morgan Stanley | | | | 3.625% | | 4/1/08 | | | 90 | | | 90 | |
Morgan Stanley | | | | 5.300% | | 3/1/13 | | | 4,090 | | | 4,192 | |
The Goldman Sachs Group, Inc. | | | | 6.600% | | 1/15/12 | | | 2,810 | | | 3,138 | |
The Goldman Sachs Group, Inc. | | | | 4.750% | | 7/15/13 | | | 1,420 | | | 1,393 | |
| | | | | | | | | | | |
|
|
|
| | | | | | | | | | | | | 21,699 | |
| | | | | | | | | | | |
|
|
|
Investment Management | | N.M. | | | | | | | | | | | |
Dryden Investor Trust | | | | 7.157% | | 7/23/08 | | | 1,433 | | | 1,534 | B |
| | | | | | | | | | | |
|
|
|
| | | | | |
Lodging/Hotels | | N.M. | | | | | | | | | | | |
Host Marriott Corporation | | | | 7.875% | | 8/1/08 | | | 187 | | | 192 | |
ITT Corporation | | | | 6.750% | | 11/15/05 | | | 80 | | | 83 | |
Starwood Hotels & Resorts Worldwide, Inc. | | | | 7.375% | | 5/1/07 | | | 890 | | | 959 | |
| | | | | | | | | | | |
|
|
|
| | | | | | | | | | | | | 1,234 | |
| | | | | | | | | | | |
|
|
|
Machinery | | N.M. | | | | | | | | | | | |
AGCO Corporation | | | | 9.500% | | 5/1/08 | | | 179 | | | 194 | |
Grant Prideco, Inc. | | | | 9.000% | | 12/15/09 | | | 147 | | | 164 | |
Terex Corporation | | | | 10.375% | | 4/1/11 | | | 185 | | | 209 | A |
| | | | | | | | | | | |
|
|
|
| | | | | | | | | | | | | 567 | |
| | | | | | | | | | | |
|
|
|
Manufacturing (Diversified) | | N.M. | | | | | | | | | | | |
Procter & Gamble Company | | | | 8.500% | | 8/10/09 | | | 90 | | | 108 | |
The Gillette Company | | | | 2.500% | | 6/1/08 | | | 160 | | | 156 | |
| | | | | | | | | | | |
|
|
|
| | | | | | | | | | | | | 264 | |
| | | | | | | | | | | |
|
|
|
Media | | 1.1% | | | | | | | | | | | |
AOL Time Warner Inc. | | | | 6.875% | | 5/1/12 | | | 5,850 | | | 6,527 | |
AOL Time Warner Inc. | | | | 7.625% | | 4/15/31 | | | 440 | | | 506 | |
AOL Time Warner Inc. | | | | 7.700% | | 5/1/32 | | | 15,480 | | | 18,000 | |
EchoStar DBS Corporation | | | | 4.850% | | 10/1/08 | | | 833 | | | 864 | C |
EchoStar DBS Corporation | | | | 6.625% | | 10/1/14 | | | 690 | | | 686 | B |
Lamar Media Corporation | | | | 7.250% | | 1/1/13 | | | 989 | | | 1,063 | A |
60
PORTFOLIO OF INVESTMENTS—Continued
Western Asset Core Plus Bond Portfolio—Continued
Semi-Annual Report to Shareholders
| | | | | | | | | | | | | |
| | | % OF
NET ASSETS | | RATE | | MATURITY
DATE | | PAR/
SHARES | | VALUE | |
Corporate Bonds and Notes—Continued | | | | | | | | | | | | | |
| | | | | |
Media—Continued | | | | | | | | | | | | | |
Liberty Media Corporation | | | | 3.380% | | 9/17/06 | | $ | 12,260 | | $ | 12,391 | C |
Liberty Media Corporation | | | | 5.700% | | 5/15/13 | | | 565 | | | 558 | |
Liberty Media Corporation | | | | 3.750% | | 2/15/30 | | | 170 | | | 113 | E |
News America Incorporated | | | | 6.750% | | 1/9/38 | | | 200 | | | 223 | |
Viacom Inc. | | | | 5.625% | | 8/15/12 | | | 1,710 | | | 1,793 | A |
| | | | | | | | | | | |
|
|
|
| | | | | | | | | | | | | 42,724 | |
| | | | | | | | | | | |
|
|
|
Medical Care Facilities | | 0.2% | | | | | | | | | | | |
HCA Inc. | | | | 6.910% | | 6/15/05 | | | 353 | | | 361 | |
HCA Inc. | | | | 7.125% | | 6/1/06 | | | 540 | | | 570 | |
HCA Inc. | | | | 7.250% | | 5/20/08 | | | 314 | | | 339 | |
HCA Inc. | | | | 8.750% | | 9/1/10 | | | 256 | | | 300 | |
HCA Inc. | | | | 6.300% | | 10/1/12 | | | 3 | | | 3 | |
HCA Inc. | | | | 5.750% | | 3/15/14 | | | 5,880 | | | 5,829 | |
Health Care REIT, Inc. | | | | 8.000% | | 9/12/12 | | | 128 | | | 148 | |
Manor Care, Inc. | | | | 7.500% | | 6/15/06 | | | 527 | | | 564 | |
Manor Care, Inc. | | | | 8.000% | | 3/1/08 | | | 58 | | | 66 | |
| | | | | | | | | | | |
|
|
|
| | | | | | | | | | | | | 8,180 | |
| | | | | | | | | | | |
|
|
|
Medical Products | | N.M. | | | | | | | | | | | |
Fresenius Medical Care Capital Trust II | | | | 7.875% | | 2/1/08 | | | 719 | | | 785 | F |
Fresenius Medical Care Capital Trust IV | | | | 7.875% | | 6/15/11 | | | 681 | | | 756 | |
| | | | | | | | | | | |
|
|
|
| | | | | | | | | | | | | 1,541 | |
| | | | | | | | | | | |
|
|
|
Oil and Gas | | 1.0% | | | | | | | | | | | |
Amerada Hess Corporation | | | | 7.300% | | 8/15/31 | | | 6,870 | | | 7,489 | |
Amerigas Partners LP | | | | 8.875% | | 5/20/11 | | | 30 | | | 33 | |
Apache Corporation | | | | 6.250% | | 4/15/12 | | | 1,265 | | | 1,418 | |
Chesapeake Energy Corporation | | | | 9.000% | | 8/15/12 | | | 517 | | | 591 | |
Chesapeake Energy Corporation | | | | 7.500% | | 9/15/13 | | | 670 | | | 733 | |
Conoco Inc. | | | | 6.950% | | 4/15/29 | | | 2,155 | | | 2,486 | |
ConocoPhillips | | | | 8.750% | | 5/25/10 | | | 3,100 | | | 3,814 | A |
ConocoPhillips | | | | 4.750% | | 10/15/12 | | | 3,180 | | | 3,225 | |
ConocoPhillips | | | | 5.900% | | 10/15/32 | | | 10 | | | 10 | |
Devon Energy Corporation | | | | 7.950% | | 4/15/32 | | | 4,085 | | | 5,068 | |
El Paso Corporation | | | | 0.000% | | 2/28/21 | | | 3,150 | | | 1,607 | E,G |
El Paso Natural Gas Company | | | | 8.375% | | 6/15/32 | | | 1,310 | | | 1,382 | |
Pacific Energy Partners | | | | 7.125% | | 6/15/14 | | | 730 | | | 790 | B |
Pemex Project Funding Master Trust | | | | 8.500% | | 2/15/08 | | | 110 | | | 124 | |
Plains Exploration & Production Company | | | | 7.125% | | 6/15/14 | | | 1,010 | | | 1,083 | B |
Pride International, Inc. | | | | 7.375% | | 7/15/14 | | | 1,440 | | | 1,598 | B |
Seariver Maritime Inc. | | | | 0.000% | | 9/1/12 | | | 70 | | | 49 | G |
61
Semi-Annual Report to Shareholders
| | | | | | | | | | | | | |
| | | % OF
NET ASSETS | | RATE | | MATURITY
DATE | | PAR/
SHARES | | VALUE | |
Corporate Bonds and Notes—Continued | | | | | | | | | | | | | |
| | | | | |
Oil and Gas—Continued | | | | | | | | | | | | | |
Sonat Inc. | | | | 7.625% | | 7/15/11 | | $ | 3,000 | | $ | 2,955 | |
Vintage Petroleum, Inc. | | | | 7.875% | | 5/15/11 | | | 340 | | | 364 | A |
Vintage Petroleum, Inc. | | | | 8.250% | | 5/1/12 | | | 661 | | | 735 | A |
XTO Energy, Inc. | | | | 7.500% | | 4/15/12 | | | 1,221 | | | 1,435 | |
XTO Energy, Inc. | | | | 6.250% | | 4/15/13 | | | 1,787 | | | 1,957 | A |
| | | | | | | | | | | |
|
|
|
| | | | | | | | | | | | | 38,946 | |
| | | | | | | | | | | |
|
|
|
Paper and Forest Products | | 0.1% | | | | | | | | | | | |
Georgia-Pacific Corp. | | | | 7.500% | | 5/15/06 | | | 200 | | | 211 | |
Georgia-Pacific Corp. | | | | 8.875% | | 2/1/10 | | | 245 | | | 287 | |
Georgia-Pacific Corp. | | | | 8.125% | | 5/15/11 | | | 9 | | | 10 | |
Georgia-Pacific Corp. | | | | 9.500% | | 12/1/11 | | | 588 | | | 728 | A |
Georgia-Pacific Corp. | | | | 9.375% | | 2/1/13 | | | 12 | | | 14 | |
Georgia-Pacific Corp. | | | | 7.700% | | 6/15/15 | | | 176 | | | 201 | |
International Paper Company | | | | 5.500% | | 1/15/14 | | | 1,205 | | | 1,234 | |
MeadWestvaco Corporation | | | | 6.850% | | 4/1/12 | | | 2,235 | | | 2,490 | |
| | | | | | | | | | | |
|
|
|
| | | | | | | | | | | | | 5,175 | |
| | | | | | | | | | | |
|
|
|
Pharmaceuticals | | 0.3% | | | | | | | | | | | |
AmerisourceBergen Corporation | | | | 8.125% | | 9/1/08 | | | 946 | | | 1,050 | |
Bristol-Myers Squibb Company | | | | 5.750% | | 10/1/11 | | | 8,840 | | | 9,480 | |
Omnicare, Inc. | | | | 8.125% | | 3/15/11 | | | 709 | | | 771 | A |
| | | | | | | | | | | |
|
|
|
| | | | | | | | | | | | | 11,301 | |
| | | | | | | | | | | |
|
|
|
Photo Equipment and Supplies | | N.M. | | | | | | | | | | | |
Eastman Kodak Company | | | | 7.250% | | 11/15/13 | | | 755 | | | 832 | |
| | | | | | | | | | | |
|
|
|
| | | | | |
Real Estate | | N.M. | | | | | | | | | | | |
La Quinta Properties, Inc. | | | | 7.000% | | 8/15/12 | | | 350 | | | 369 | B |
Ventas Realty, Limited Partnership | | | | 8.750% | | 5/1/09 | | | 770 | | | 859 | |
Ventas Realty, Limited Partnership | | | | 9.000% | | 5/1/12 | | | 180 | | | 205 | |
| | | | | | | | | | | |
|
|
|
| | | | | | | | | | | | | 1,433 | |
| | | | | | | | | | | |
|
|
|
Retail | | 0.2% | | | | | | | | | | | |
Target Corporation | | | | 5.875% | | 3/1/12 | | | 80 | | | 87 | |
Target Corporation | | | | 4.000% | | 6/15/13 | | | 5,340 | | | 5,106 | A |
Wal-Mart Stores, Inc. | | | | 4.125% | | 2/15/11 | | | 3,160 | | | 3,165 | |
| | | | | | | | | | | |
|
|
|
| | | | | | | | | | | | | 8,358 | |
| | | | | | | | | | | |
|
|
|
Special Purpose | | 1.2% | | | | | | | | | | | |
Air 2 US Series A | | | | 8.027% | | 10/1/19 | | | 190 | | | 159 | B |
Anadarko Finance Company | | | | 6.750% | | 5/1/11 | | | 240 | | | 272 | |
ChevronTexaco Capital Company | | | | 3.500% | | 9/17/07 | | | 20 | | | 20 | |
62
PORTFOLIO OF INVESTMENTS—Continued
Western Asset Core Plus Bond Portfolio—Continued
Semi-Annual Report to Shareholders
| | | | | | | | | | | | | |
| | | % OF
NET ASSETS | | RATE | | MATURITY
DATE | | PAR/
SHARES | | VALUE | |
Corporate Bonds and Notes—Continued | | | | | | | | | | | | | |
| | | | | |
Special Purpose—Continued | | | | | | | | | | | | | |
DaimlerChrysler NA Holding Corporation | | | | 7.400% | | 1/20/05 | | $ | 190 | | $ | 193 | |
DaimlerChrysler NA Holding Corporation | | | | 4.050% | | 6/4/08 | | | 1,750 | | | 1,766 | |
DaimlerChrysler NA Holding Corporation | | | | 7.300% | | 1/15/12 | | | 3,315 | | | 3,765 | |
DaimlerChrysler NA Holding Corporation | | | | 6.500% | | 11/15/13 | | | 1,290 | | | 1,400 | |
Devon Financing Corporation ULC | | | | 6.875% | | 9/30/11 | | | 2,220 | | | 2,505 | |
Entercom Capital Inc. | | | | 7.625% | | 3/1/14 | | | 565 | | | 607 | |
Patrons’ Legacy 2003 IV | | | | 5.775% | | 1/23/17 | | | 6,600 | | | 6,706 | B |
Sprint Capital Corporation | | | | 4.780% | | 8/17/06 | | | 4,725 | | | 4,858 | |
Sprint Capital Corporation | | | | 6.000% | | 1/15/07 | | | 9,220 | | | 9,759 | |
Sprint Capital Corporation | | | | 6.125% | | 11/15/08 | | | 130 | | | 140 | |
Sprint Capital Corporation | | | | 8.375% | | 3/15/12 | | | 3,295 | | | 3,991 | A |
TCI Communications Financing III | | | | 9.650% | | 3/31/27 | | | 1,480 | | | 1,733 | |
Texaco Capital Inc. | | | | 5.500% | | 1/15/09 | | | 1,600 | | | 1,711 | |
Unilever Capital Corporation | | | | 7.125% | | 11/1/10 | | | 1,450 | | | 1,679 | |
Verizon Global Funding Corp. | | | | 6.875% | | 6/15/12 | | | 2,130 | | | 2,414 | A |
Verizon Global Funding Corp. | | | | 7.375% | | 9/1/12 | | | 2,645 | | | 3,089 | A |
| | | | | | | | | | | |
|
|
|
| | | | | | | | | | | | | 46,767 | |
| | | | | | | | | | | |
|
|
|
Telecommunications | | 0.2% | | | | | | | | | | | |
Cincinnati Bell Inc. | | | | 7.250% | | 7/15/13 | | | 1,450 | | | 1,396 | |
PanAmSat Corporation | | | | 6.375% | | 1/15/08 | | | 346 | | | 351 | |
Qwest Communications International Inc. | | | | 5.211% | | 2/15/09 | | | 1,745 | | | 1,662 | B,C |
Qwest Corporation | | | | 5.625% | | 11/15/08 | | | 3,860 | | | 3,783 | A |
Qwest Corporation | | | | 9.125% | | 3/15/12 | | | 1,260 | | | 1,386 | B |
| | | | | | | | | | | |
|
|
|
| | | | | | | | | | | | | 8,578 | |
| | | | | | | | | | | |
|
|
|
Telecommunications (Cellular/Wireless) | | 0.1% | | | | | | | | | | | |
AT&T Wireless Services Inc. | | | | 7.350% | | 3/1/06 | | | 3,000 | | | 3,186 | |
Nextel Communications, Inc. | | | | 7.375% | | 8/1/15 | | | 1,140 | | | 1,225 | A |
| | | | | | | | | | | |
|
|
|
| | | | | | | | | | | | | 4,411 | |
| | | | | | | | | | | |
|
|
|
Transportation | | 0.2% | | | | | | | | | | | |
Continental Airlines, Inc. | | | | 6.545% | | 2/2/19 | | | 1,265 | | | 1,220 | |
Delta Air Lines, Inc. | | | | 6.619% | | 3/18/11 | | | 1,996 | | | 1,816 | |
Delta Air Lines, Inc. | | | | 6.417% | | 7/2/12 | | | 40 | | | 41 | |
Delta Air Lines, Inc. | | | | 6.718% | | 1/2/23 | | | 2,583 | | | 2,654 | |
Kansas City Southern Railway | | | | 9.500% | | 10/1/08 | | | 558 | | | 611 | |
Norfolk Southern Corporation | | | | 6.200% | | 4/15/09 | | | 20 | | | 22 | |
| | | | | | | | | | | |
|
|
|
| | | | | | | | | | | | | 6,364 | |
| | | | | | | | | | | |
|
|
|
Total Corporate Bonds and Notes
(Identified Cost—$574,045) | | | | | | | | | | | | 603,948 | |
63
Semi-Annual Report to Shareholders
| | | | | | | | | | | | | |
| | | % OF
NET ASSETS | | RATE | | MATURITY
DATE | | PAR/
SHARES | | VALUE | |
Asset-Backed Securities | | 3.5% | | | | | | | | | | | |
| | | | | |
Fixed Rate Securities | | 0.6% | | | | | | | | | | | |
Bay View Auto Trust 2003-LJ1 | | | | 3.440% | | 4/25/12 | | $ | 300 | | $ | 300 | |
Conseco Finance Securitizations Corp. 2000-4 | | | | 8.310% | | 5/1/32 | | | 2,200 | | | 1,894 | |
Conseco Finance Securitizations Corp. 2000-6 | | | | 6.770% | | 9/1/32 | | | 2,397 | | | 2,454 | |
Contimortgage Home Equity Loan Trust 1997-4 | | | | 7.330% | | 10/15/28 | | | 1,434 | | | 1,147 | |
Green Tree Financial Corporation 1992-2 | | | | 9.150% | | 1/15/18 | | | 481 | | | 434 | |
Green Tree Financial Corporation 1993-2 | | | | 8.000% | | 7/15/18 | | | 1,300 | | | 1,231 | |
Green Tree Financial Corporation 1996-5 | | | | 8.100% | | 7/15/27 | | | 6,135 | | | 1,534 | |
Green Tree Home Improvement Loan Trust
1996-A | | | | 7.400% | | 2/15/26 | | | 998 | | | 958 | |
Green Tree Home Improvement Loan Trust
1997-D | | | | 7.450% | | 9/15/28 | | | 1,500 | | | 1,503 | |
Lehman ABS Manufactured Housing Contract
2001-B A3 | | | | 4.350% | | 5/15/14 | | | 4,355 | | | 4,341 | |
Lehman ABS Manufactured Housing Contract
2001-B A6 | | | | 6.467% | | 8/15/28 | | | 4,270 | | | 4,518 | |
Pegasus Aviation Lease Securitization 2000-1 | | | | 8.370% | | 3/25/30 | | | 2,500 | | | 1,593 | B |
UCFC Home Equity Loan Trust 1998-C | | | | 5.935% | | 1/15/30 | | | 57 | | | 58 | |
Vanderbilt Mortgage Finance 1996-A | | | | 8.150% | | 4/7/26 | | | 477 | | | 481 | |
Vanderbilt Mortgage Finance 1997-B | | | | 8.155% | | 10/7/26 | | | 250 | | | 251 | |
Vanderbilt Mortgage Finance 1997-C | | | | 7.830% | | 8/7/27 | | | 500 | | | 520 | |
| | | | | | | | | | | |
|
|
|
| | | | | | | | | | | | | 23,217 | |
| | | | | | | | | | | |
|
|
|
Indexed SecuritiesC | | 2.8% | | | | | | | | | | | |
Advanta Revolving Home Equity Loan Trust
2000-A | | | | 2.090% | | 8/25/24 | | | 1,172 | | | 1,173 | |
AFC Home Equity Loan Trust 2002-2 | | | | 2.140% | | 6/25/30 | | | 1,782 | | | 1,782 | |
AmeriCredit Automobile Receivables Trust
2003-BX | | | | 1.876% | | 11/6/06 | | | 50 | | | 50 | |
Argent NIM Trust 2003-N1 | | | | 2.110% | | 8/25/08 | | | 4,165 | | | 4,166 | B |
Asset Backed Funding Certificates 2002-WF1 | | | | 2.130% | | 12/25/32 | | | 681 | | | 682 | |
Asset Backed Securities Corp. Home Equity Loan Trust 2001 HE3 | | | | 2.030% | | 11/15/31 | | | 1,068 | | | 1,069 | |
Bayview Financial Aquisition Trust 2001-DA | | | | 2.220% | | 11/25/31 | | | 343 | | | 343 | B |
Capital Auto Receivables Asset Trust 2003-1 | | | | 1.810% | | 6/15/05 | | | 19 | | | 19 | |
CDC Mortgage Capital Trust 2002-HE1 | | | | 2.150% | | 1/25/33 | | | 2,589 | | | 2,592 | |
CDC Mortgage Capital Trust 2003-HE1 | | | | 2.170% | | 8/25/33 | | | 1,132 | | | 1,133 | |
Centex Home Equity 2000-C | | | | 2.080% | | 10/25/30 | | | 417 | | | 417 | |
Centex Home Equity 2002-D | | | | 2.280% | | 12/25/32 | | | 2,932 | | | 2,938 | |
Chase Funding Mortgage Loan Asset-Backed Certificates 2000-2 | | | | 2.120% | | 5/25/30 | | | 5 | | | 5 | |
64
PORTFOLIO OF INVESTMENTS—Continued
Western Asset Core Plus Bond Portfolio—Continued
Semi-Annual Report to Shareholders
| | | | | | | | | | | | | |
| | | % OF
NET ASSETS | | RATE | | MATURITY
DATE | | PAR/
SHARES | | VALUE | |
Asset-Backed Securities—Continued | | | | | | | | | | | | | |
| | | | | |
Indexed Securities—Continued | | | | | | | | | | | | | |
Chase USA Master Trust 2000-2 A | | | | 1.930% | | 4/15/09 | | $ | 110 | | $ | 110 | |
Citibank Credit Card Issuance Trust 2002-C1 | | | | 2.700% | | 2/9/09 | | | 2,040 | | | 2,067 | |
Conseco Finance 2000-C | | | | 2.130% | | 12/15/29 | | | 138 | | | 138 | |
Countrywide Asset-Backed Certificates 2001-BC2 | | | | 2.090% | | 7/25/31 | | | 243 | | | 243 | |
Countrywide Asset-Backed Certificates 2002-BC1 | | | | 2.170% | | 4/25/32 | | | 824 | | | 826 | |
Countrywide Asset-Backed Certificates 2003-1 | | | | 2.180% | | 6/25/33 | | | 4,754 | | | 4,759 | |
Countrywide Asset-Backed Certificates 2003-BC3 | | | | 2.150% | | 9/25/33 | | | 16,062 | | | 16,080 | |
Countrywide Home Equity Loan Trust 2002-F | | | | 2.110% | | 11/15/28 | | | 3,474 | | | 3,506 | |
DaimlerChrysler Master Owner Trust 2002-A | | | | 1.820% | | 5/15/07 | | | 60 | | | 60 | |
Fannie Mae Grantor Trust 2002-T15 | | | | 2.040% | | 11/26/32 | | | 5,247 | | | 5,228 | |
Fleet Home Equity Loan Trust 2003-1 | | | | 2.061% | | 1/20/33 | | | 14,424 | | | 14,423 | |
Ford Credit Auto Owner Trust 2003-A | | | | 1.810% | | 8/15/05 | | | 13 | | | 13 | |
Household Home Equity Loan Trust 2001-1 | | | | 2.101% | | 1/20/31 | | | 37 | | | 37 | |
Household Home Equity Loan Trust 2002-3 | | | | 2.261% | | 7/20/32 | | | 410 | | | 411 | |
Irwin Home Equity Loan Trust 2003-1 | | | | 2.340% | | 2/25/28 | | | 48 | | | 48 | |
Korea Asset Funding Ltd. 2000-1A | | | | 3.941% | | 2/10/09 | | | 237 | | | 236 | B |
Option One Mortgage Loan Trust 2000-2 | | | | 2.130% | | 6/25/30 | | | 213 | | | 213 | |
Option One Mortgage Loan Trust 2003-1 | | | | 2.260% | | 2/25/33 | | | 101 | | | 102 | |
Option One Mortgage Securities Corp. NIM Trust 2003-1 | | | | 2.230% | | 1/26/10 | | | 23 | | | 23 | B |
Pass-Through Amortizing Credit Card Trust
2002-1A | | | | 2.538% | | 6/18/12 | | | 42 | | | 42 | B |
Provident Bank Home Equity Loan Trust 2000-2 | | | | 2.110% | | 8/25/31 | | | 985 | | | 985 | |
Providian Gateway Master Trust 2002-B | | | | 2.460% | | 6/15/09 | | | 14,970 | | | 15,004 | B |
Residential Asset Mortgage Products, Inc.
2003-RS4 | | | | 2.170% | | 5/25/33 | | | 9,363 | | | 9,373 | |
Residential Funding Mortgage Secs II 2003-HS3 | | | | 2.130% | | 8/25/33 | | | 168 | | | 168 | |
Salomon Brothers Mortgage Securities VII
2002-CIT1 | | | | 2.140% | | 3/25/32 | | | 3,794 | | | 3,795 | |
Southern Pacific Secured Assets Corporation
1998-2 | | | | 2.010% | | 7/25/29 | | | 73 | | | 73 | |
Vanderbilt Mortgage Finance 1999-D | | | | 4.946% | | 1/7/30 | | | 4,100 | | | 4,133 | |
Wachovia Asset Securitization, Inc. 2002-HE1 | | | | 2.210% | | 9/27/32 | | | 3,832 | | | 3,856 | |
Wachovia Asset Securitization, Inc. 2002-HE2 | | | | 2.270% | | 12/25/32 | | | 366 | | | 367 | |
Wachovia Asset Securitization, Inc. 2003-HE1 | | | | 2.130% | | 3/25/33 | | | 136 | | | 136 | |
William Street Funding Corporation 2003-1 | | | | 1.950% | | 4/23/06 | | | 10,100 | | | 10,111 | B |
| | | | | | | | | | | |
|
|
|
| | | | | | | | | | | | | 112,935 | |
| | | | | | | | | | | |
|
|
|
| | | | | |
Stripped Securities | | 0.1% | | | | | | | | | | | |
Diversified REIT Trust 2001-1 | | | | 0.772% | | 3/8/10 | | | 16,000 | | | 445 | B,H1 |
Oakwood Mortgage Investors Inc. 2001-E | | | | 6.000% | | 11/15/09 | | | 7,399 | | | 1,353 | H1 |
| | | | | | | | | | | |
|
|
|
| | | | | | | | | | | | | 1,798 | |
| | | | | | | | | | | |
|
|
|
Total Asset-Backed Securities
(Identified Cost—$137,177) | | | | | | | | | | | | 137,950 | |
65
Semi-Annual Report to Shareholders
| | | | | | | | | | | | | |
| | | % OF
NET ASSETS | | RATE | | MATURITY
DATE | | PAR/
SHARES | | VALUE | |
Mortgage-Backed Securities | | 2.2% | | | | | | | | | | | |
| | | | | |
Fixed Rate Securities | | 1.1% | | | | | | | | | | | |
Asset Securitization Corporation 1996-D2 | | | | 6.920% | | 2/14/29 | | $ | 7,278 | | $ | 7,597 | |
Banc of America Funding Corporation 2003-1 | | | | 6.000% | | 5/20/33 | | | 1,370 | | | 1,386 | |
Blackrock Capital Finance L.P. 1997-R3 | | | | 7.220% | | 11/25/28 | | | 144 | | | 146 | B |
Commercial Capital Access One, Inc. 2I | | | | 12.000% | | 11/15/27 | | | 3,085 | | | 1,604 | |
Commercial Mortgage Asset Trust 1999-C2 | | | | 7.546% | | 11/17/32 | | | 330 | | | 378 | |
Criimi Mae Commercial Mortgage Trust 1998-C1 | | | | 7.000% | | 6/2/33 | | | 680 | | | 728 | B |
Enterprise Mortgage Acceptance Company
1998-1 | | | | 6.110% | | 1/15/25 | | | 439 | | | 435 | B |
FFCA Secured Lending Corporation 1999-1A | | | | 6.370% | | 9/18/25 | | | 135 | | | 135 | B |
GMAC Commercial Mortgage Securities Inc.
1998-C1 | | | | 6.700% | | 5/15/30 | | | 10,800 | | | 11,781 | |
GMAC Commercial Mortgage Securities Inc.
1999-C2 | | | | 6.945% | | 9/15/33 | | | 340 | | | 380 | |
GS Mortgage Securities Corporation II 1998-C1 | | | | 6.620% | | 10/18/30 | | | 5,500 | | | 6,020 | |
J.P. Morgan Commercial Mortgage Finance Corporation 1999-C8 | | | | 7.400% | | 7/15/31 | | | 2,000 | | | 2,261 | |
Nomura Asset Securities Corporation 1996-MD5 | | | | 7.120% | | 4/13/39 | | | 2,000 | | | 2,118 | |
Residential Asset Securitization Trust 2003-A14 | | | | 4.750% | | 2/25/19 | | | 4,645 | | | 4,637 | |
Structured Asset Securities Corporation 1996-CFL | | | | 7.750% | | 2/25/28 | | | 4,531 | | | 4,894 | |
| | | | | | | | | | | |
|
|
|
| | | | | | | | | | | | | 44,500 | |
| | | | | | | | | | | |
|
|
|
Indexed SecuritiesC | | 1.1% | | | | | | | | | | | |
Chase Commercial Mortgage Securities Corporation 2000-FL1A | | | | 2.030% | | 12/12/13 | | | 3,385 | | | 3,380 | B |
Credit Suisse First Boston Mortgage Securities Corp. 2003-TFLA1 | | | | 2.030% | | 4/15/13 | | | 1,350 | | | 1,350 | B |
Government National Mortgage Association
2001-36 | | | | 2.211% | | 8/20/31 | | | 9 | | | 9 | |
Impac CMB Trust 2002-1 | | | | 2.160% | | 3/25/32 | | | 2,499 | | | 2,503 | |
Impac CMB Trust 2002-5 | | | | 2.210% | | 7/25/32 | | | 1,527 | | | 1,530 | |
Impac CMB Trust 2003-4 1A1 | | | | 2.160% | | 10/25/33 | | | 2,428 | | | 2,432 | |
Impac CMB Trust 2003-5 A1 | | | | 2.170% | | 8/25/33 | | | 2,558 | | | 2,561 | |
Impac Mortgage Trust 2003-7 A | | | | 2.160% | | 8/25/33 | | | 7,154 | | | 7,164 | |
J.P. Morgan Chase Commercial Mortgage Security 2003-FL1A | | | | 2.028% | | 2/17/15 | | | 20 | | | 20 | B |
Medallion Trust 2000-2G | | | | 2.110% | | 12/18/31 | | | 732 | | | 733 | |
MLCC Mortgage Investors, Inc. 2003-B | | | | 2.180% | | 4/25/28 | | | 16,958 | | | 17,017 | |
Morgan Stanley Capital I 2003 XLF A-1 | | | | 1.940% | | 7/15/17 | | | 6,140 | | | 6,140 | B |
Sequoia Mortgage Trust 4 | | | | 2.188% | | 11/22/24 | | | 41 | | | 40 | |
Westpac Securitisation Trust 1999-1G | | | | 1.930% | | 5/19/30 | | | 149 | | | 149 | |
| | | | | | | | | | | |
|
|
|
| | | | | | | | | | | | | 45,028 | |
| | | | | | | | | | | |
|
|
|
66
PORTFOLIO OF INVESTMENTS—Continued
Western Asset Core Plus Bond Portfolio—Continued
Semi-Annual Report to Shareholders
| | | | | | | | | | | | | |
| | | % OF
NET ASSETS | | RATE | | MATURITY
DATE | | PAR/
SHARES | | VALUE | |
Mortgage-Backed Securities—Continued | | | | | | | | | | | | | |
| | | | | |
Stripped Securities | | N.M. | | | | | | | | | | | |
FFCA Secured Lending Corporation 1999-1A | | | | 1.680% | | 9/18/25 | | $ | 722 | | $ | 32 | B,H1 |
GMAC Commercial Mortgage Securities Inc.
1999-CTL1 | | | | 0.893% | | 12/15/16 | | | 1,888 | | | 28 | B,H1 |
LB-UBS Commercial Mortgage Trust 2001-C3 | | | | 1.208% | | 6/15/36 | | | 5,438 | | | 278 | B,H1 |
| | | | | | | | | | | |
|
|
|
| | | | | | | | | | | | | 338 | |
| | | | | | | | | | | |
|
|
|
Total Mortgage-Backed Securities
(Identified Cost—$89,224) | | | | | | | | | | | | 89,866 | |
U.S. Government and Agency Obligations | | 23.6% | | | | | | | | | | | |
| | | | | |
Fixed Rate Securities | | 12.4% | | | | | | | | | | | |
Fannie Mae | | | | 4.625% | | 10/15/14 | | | 20 | | | 20 | A |
Freddie Mac | | | | 4.875% | | 11/15/06 | | | 100 | | | 104 | |
Freddie Mac | | | | 3.500% | | 11/15/07 | | | 100 | | | 101 | |
Freddie Mac | | | | 5.875% | | 11/15/07 | | | 750 | | | 808 | |
Tennessee Valley Authority | | | | 6.250% | | 12/15/17 | | | 40 | | | 45 | |
Tennessee Valley Authority | | | | 6.750% | | 11/1/25 | | | 1,670 | | | 1,977 | |
Tennessee Valley Authority | | | | 7.125% | | 5/1/30 | | | 840 | | | 1,039 | A |
United States Treasury Bonds | | | | 6.250% | | 8/15/23 | | | 520 | | | 607 | A |
United States Treasury Bonds | | | | 2.375% | | 1/15/25 | | | 14,781 | | | 15,399 | A |
United States Treasury Bonds | | | | 6.750% | | 8/15/26 | | | 1,600 | | | 1,987 | A |
United States Treasury Bonds | | | | 5.250% | | 2/15/29 | | | 5,920 | | | 6,163 | A |
United States Treasury Bonds | | | | 5.375% | | 2/15/31 | | | 140 | | | 150 | A |
United States Treasury Notes | | | | 1.625% | | 1/31/05 | | | 360 | | | 360 | A |
United States Treasury Notes | | | | 1.500% | | 7/31/05 | | | 7,590 | | | 7,551 | A |
United States Treasury Notes | | | | 1.500% | | 3/31/06 | | | 5,370 | | | 5,300 | A |
United States Treasury Notes | | | | 2.750% | | 6/30/06 | | | 15,090 | | | 15,153 | A |
United States Treasury Notes | | | | 2.250% | | 2/15/07 | | | 8,820 | | | 8,726 | A |
United States Treasury Notes | | | | 3.125% | | 5/15/07 | | | 12,070 | | | 12,172 | A |
United States Treasury Notes | | | | 2.750% | | 8/15/07 | | | 2,920 | | | 2,912 | A |
United States Treasury Notes | | | | 6.125% | | 8/15/07 | | | 60 | | | 65 | A |
United States Treasury Notes | | | | 3.000% | | 11/15/07 | | | 60 | | | 60 | A |
United States Treasury Notes | | | | 3.250% | | 8/15/08 | | | 1,310 | | | 1,316 | A |
United States Treasury Notes | | | | 3.375% | | 11/15/08 | | | 9,900 | | | 9,970 | A |
United States Treasury Notes | | | | 3.000% | | 2/15/09 | | | 28,970 | | | 28,679 | A |
United States Treasury Notes | | | | 2.625% | | 3/15/09 | | | 6,940 | | | 6,756 | A |
United States Treasury Notes | | | | 4.000% | | 6/15/09 | | | 104,955 | | | 108,014 | A |
United States Treasury Notes | | | | 3.625% | | 7/15/09 | | | 155,085 | | | 156,963 | A |
United States Treasury Notes | | | | 3.500% | | 8/15/09 | | | 25,380 | | | 25,534 | A |
United States Treasury Notes | | | | 3.375% | | 9/15/09 | | | 17,790 | | | 17,793 | A |
United States Treasury Notes | | | | 4.250% | | 8/15/13 | | | 140 | | | 142 | A |
67
Semi-Annual Report to Shareholders
| | | | | | | | | | | | | |
| | | % OF
NET ASSETS | | RATE | | MATURITY
DATE | | PAR/
SHARES | | VALUE | |
U.S. Government and Agency
Obligations—Continued | | | | | | | | | | | | | |
| | | | | |
Fixed Rate Securities—Continued | | | | | | | | | | | | | |
United States Treasury Notes | | | | 4.250% | | 11/15/13 | | $ | 41,500 | | $ | 42,035 | A |
United States Treasury Notes | | | | 4.250% | | 8/15/14 | | | 19,410 | | | 19,613 | A |
| | | | | | | | | | | |
|
|
|
| | | | | | | | | | | | | 497,514 | |
| | | | | | | | | | | |
|
|
|
Indexed Securities | | 10.7% | | | | | | | | | | | |
Fannie Mae | | | | 1.755% | | 1/28/05 | | | 49,120 | | | 49,117 | C |
United States Treasury Inflation-Protected Security | | | | 3.375% | | 1/15/07 | | | 175,021 | | | 186,992 | A,I |
United States Treasury Inflation-Protected Security | | | | 3.875% | | 1/15/09 | | | 31,103 | | | 35,013 | A,I |
United States Treasury Inflation-Protected Security | | | | 4.250% | | 1/15/10 | | | 20,816 | | | 24,159 | A,I |
United States Treasury Inflation-Protected Security | | | | 3.375% | | 1/15/12 | | | 11,542 | | | 13,078 | A,I |
United States Treasury Inflation-Protected Security | | | | 1.875% | | 7/15/13 | | | 19,966 | | | 20,305 | A,I |
United States Treasury Inflation-Protected Security | | | | 2.000% | | 1/15/14 | | | 8,826 | | | 9,037 | A,I |
United States Treasury Inflation-Protected Security | | | | 2.000% | | 7/15/14 | | | 15,042 | | | 15,376 | A,I |
United States Treasury Inflation-Protected Security | | | | 3.625% | | 4/15/28 | | | 25,916 | | | 32,883 | A,I |
United States Treasury Inflation-Protected Security | | | | 3.875% | | 4/15/29 | | | 30,164 | | | 40,010 | A,I |
| | | | | | | | | | | |
|
|
|
| | | | | | | | | | | | | 425,970 | |
| | | | | | | | | | | |
|
|
|
Stripped Securities | | 0.5% | | | | | | | | | | | |
United States Treasury Bonds | | | | 0.000% | | 11/15/21 | | | 45,460 | | | 19,002 | A,H2 |
United States Treasury Bonds | | | | 0.000% | | 2/15/23 | | | 1,420 | | | 552 | A,H2 |
United States Treasury Bonds | | | | 0.000% | | 8/15/27 | | | 1,520 | | | 462 | H2 |
| | | | | | | | | | | |
|
|
|
| | | | | | | | | | | | | 20,016 | |
| | | | | | | | | | | |
|
|
|
Total U.S. Government and Agency Obligations
(Identified Cost—$926,870) | | | | | | | | | | | | 943,500 | |
U.S. Government Agency Mortgage-
Backed Securities | | 17.0% | | | | | | | | | | | |
| | | | | |
Fixed Rate Securities | | 17.0% | | | | | | | | | | | |
Fannie Mae | | | | 6.500% | | 5/1/14 to 6/1/32 | | | 8,614 | | | 9,069 | |
Fannie Mae | | | | 6.000% | | 5/1/16 to 7/1/32 | | | 5,600 | | | 5,833 | |
Fannie Mae | | | | 5.500% | | 1/1/17 to 4/1/18 | | | 12,010 | | | 12,437 | |
Fannie Mae | | | | 9.500% | | 11/1/21 | | | 3 | | | 3 | |
Fannie Mae | | | | 7.000% | | 8/1/29 to 7/1/32 | | | 11,475 | | | 12,181 | |
Fannie Mae | | | | 7.500% | | 11/1/29 | | | 57 | | | 61 | |
Fannie Mae | | | | 6.000% | | 10/1/34 | | | 7,400 | | | 7,652 | J |
Fannie Mae | | | | 7.000% | | 10/1/34 | | | 500 | | | 530 | J |
Freddie Mac | | | | 5.500% | | 12/1/13 | | | 179 | | | 186 | |
Freddie Mac | | | | 7.000% | | 10/1/16 to 4/1/32 | | | 3,982 | | | 4,227 | |
Freddie Mac | | | | 6.500% | | 7/1/29 | | | 872 | | | 916 | |
Freddie Mac | | | | 5.500% | | 10/1/34 | | | 27,200 | | | 27,565 | J |
Freddie Mac | | | | 6.000% | | 10/1/34 | | | 12,200 | | | 12,776 | J |
68
PORTFOLIO OF INVESTMENTS—Continued
Western Asset Core Plus Bond Portfolio—Continued
Semi-Annual Report to Shareholders
| | | | | | | | | | | | | |
| | | % OF
NET ASSETS | | RATE | | MATURITY
DATE | | PAR/
SHARES | | VALUE | |
U.S. Government Agency Mortgage-
Backed Securities—Continued | | | | | | | | | | | | | |
| | | | | |
Fixed Rate Securities—Continued | | | | | | | | | | | | | |
Government National Mortgage Association | | | | 9.500% | | 1/15/06 | | $ | 24 | | $ | 25 | |
Government National Mortgage Association | | | | 7.500% | | 3/15/23 to 9/15/31 | | | 601 | | | 648 | |
Government National Mortgage Association | | | | 7.000% | | 7/15/23 to 7/15/31 | | | 2,116 | | | 2,258 | |
Government National Mortgage Association | | | | 6.500% | | 4/15/28 to 4/15/33 | | | 48,490 | | | 51,222 | |
Government National Mortgage Association | | | | 6.000% | | 1/15/29 to 7/15/33 | | | 58,162 | | | 60,393 | |
Government National Mortgage Association | | | | 8.000% | | 12/15/30 to 1/15/31 | | | 75 | | | 83 | |
Government National Mortgage Association | | | | 5.500% | | 7/15/33 | | | 11,232 | | | 11,450 | |
Government National Mortgage Association | | | | 5.000% | | 10/1/34 | | | 144,300 | | | 143,488 | J |
Government National Mortgage Association | | | | 5.500% | | 10/1/34 | | | 88,200 | | | 89,689 | J |
Government National Mortgage Association | | | | 6.000% | | 10/1/34 | | | 219,290 | | | 227,239 | J |
| | | | | | | | | | | |
|
|
|
| | | | | | | | | | | | | 679,931 | |
| | | | | | | | | | | |
|
|
|
Stripped Securities | | N.M. | | | | | | | | | | | |
Financing Corporation | | | | 0.000% | | 11/30/17 | | | 1,250 | | | 639 | H2 |
Financing Corporation | | | | 0.000% | | 4/5/19 | | | 320 | | | 149 | H2 |
| | | | | | | | | | | |
|
|
|
| | | | | | | | | | | | | 788 | |
| | | | | | | | | | | |
|
|
|
Total U.S. Government Agency Mortgage-Backed Securities (Identified Cost—$680,050) | | | | | | | | | | 680,719 | |
Yankee BondsK | | 7.8% | | | | | | | | | | | |
| | | | | |
Banks | | N.M. | | | | | | | | | | | |
KFW Kreditanstalt fuer Wiederaufbau | | | | 2.375% | | 9/25/06 | | | 240 | | | 239 | A |
KFW Kreditanstalt fuer Wiederaufbau | | | | 3.375% | | 1/23/08 | | | 100 | | | 101 | A |
Royal Bank of Scotland Group plc | | | | 8.817% | | 3/31/49 | | | 230 | | | 237 | |
The Korea Development Bank | | | | 4.250% | | 11/13/07 | | | 200 | | | 204 | |
The Korea Development Bank | | | | 5.500% | | 11/13/12 | | | 60 | | | 62 | A |
| | | | | | | | | | | |
|
|
|
| | | | | | | | | | | | | 843 | |
| | | | | | | | | | | |
|
|
|
| | | | | |
Cable | | N.M. | | | | | | | | | | | |
Rogers Cable Inc. | | | | 7.875% | | 5/1/12 | | | 687 | | | 747 | |
| | | | | | | | | | | |
|
|
|
| | | | | |
Chemicals | | N.M. | | | | | | | | | | | |
Rhodia SA | | | | 10.250% | | 6/1/10 | | | 450 | | | 466 | |
| | | | | | | | | | | |
|
|
|
| | | | | |
Containers and Packaging | | 0.1% | | | | | | | | | | | |
Cascades Inc. | | | | 7.250% | | 2/15/13 | | | 1,416 | | | 1,483 | |
Norampac Inc. | | | | 6.750% | | 6/1/13 | | | 572 | | | 597 | |
| | | | | | | | | | | |
|
|
|
| | | | | | | | | | | | | 2,080 | |
| | | | | | | | | | | |
|
|
|
69
Semi-Annual Report to Shareholders
| | | | | | | | | | | | | |
| | | % OF
NET ASSETS | | RATE | | MATURITY
DATE | | PAR/
SHARES | | VALUE | |
Yankee Bonds—Continued | | | | | | | | | | | | | |
Diversified Financial Services | | N.M. | | | | | | | | | | | |
Pemex Finance LTD. | | | | 9.030% | | 2/15/11 | | $ | 10 | | $ | 12 | |
| | | | | | | | | | | |
|
|
|
| | | | | |
Electric | | 0.1% | | | | | | | | | | | |
Hydro-Quebec | | | | 6.300% | | 5/11/11 | | | 1,720 | | | 1,927 | A |
| | | | | | | | | | | |
|
|
|
| | | | | |
Foreign Governments | | 5.0% | | | | | | | | | | | |
Federative Republic of Brazil | | | | 14.500% | | 10/15/09 | | | 14,720 | | | 18,989 | |
Federative Republic of Brazil | | | | 12.000% | | 4/15/10 | | | 3,240 | | | 3,860 | |
Federative Republic of Brazil | | | | 2.125% | | 4/15/12 | | | 5,816 | | | 5,388 | C |
Federative Republic of Brazil | | | | 8.000% | | 4/15/14 | | | 18,166 | | | 17,963 | A |
Federative Republic of Brazil | | | | 11.000% | | 8/17/40 | | | 4,036 | | | 4,524 | |
Province of British Columbia | | | | 4.300% | | 5/30/13 | | | 180 | | | 182 | |
Province of Ontario | | | | 3.500% | | 9/17/07 | | | 110 | | | 111 | |
Republic of Bulgaria | | | | 8.250% | | 1/15/15 | | | 6,820 | | | 8,406 | B |
Republic of Bulgaria | | | | 8.250% | | 1/15/15 | | | 6,090 | | | 7,520 | |
Republic of Colombia | | | | 10.500% | | 7/9/10 | | | 2,230 | | | 2,570 | |
Republic of Colombia | | | | 11.750% | | 2/25/20 | | | 3,185 | | | 3,894 | |
Republic of Panama | | | | 9.625% | | 2/8/11 | | | 2,733 | | | 3,136 | |
Republic of Panama | | | | 9.375% | | 7/23/12 | | | 660 | | | 747 | |
Republic of Panama | | | | 10.750% | | 5/15/20 | | | 1,527 | | | 1,832 | |
Republic of Panama | | | | 9.375% | | 1/16/23 | | | 930 | | | 1,014 | |
Republic of Peru | | | | 5.000% | | 3/7/17 | | | 6,325 | | | 5,819 | B,L |
Republic of Peru | | | | 5.000% | | 3/7/17 | | | 44 | | | 40 | B,L |
Republic of Peru | | | | 8.750% | | 11/21/33 | | | 3,670 | | | 3,642 | A |
Republic of Poland | | | | 6.000% | | 5/24/09 | | | 69,200 | | | 18,843 | |
Russian Federation | | | | 8.250% | | 3/31/10 | | | 510 | | | 555 | |
Russian Federation | | | | 5.000% | | 3/31/30 | | | 38,760 | | | 37,283 | L |
United Mexican States | | | | 8.375% | | 1/14/11 | | | 8,050 | | | 9,439 | |
United Mexican States | | | | 11.500% | | 5/15/26 | | | 29,240 | | | 44,006 | A |
| | | | | | | | | | | |
|
|
|
| | | | | | | | | | | | | 199,763 | |
| | | | | | | | | | | |
|
|
|
| | | | | |
Insurance | | 0.1% | | | | | | | | | | | |
Atlas Reinsurance PLC | | | | 3.953% | | 1/7/05 | | | 250 | | | 251 | B,C |
Korea Deposit Insurance Corp. | | | | 2.500% | | 12/11/05 | | | 2,500 | | | 2,766 | B,E |
Oil Insurance Ltd | | | | 5.150% | | 8/15/33 | | | 35 | | | 36 | |
Residential Reinsurance LTD | | | | 6.690% | | 6/1/05 | | | 850 | | | 825 | B,C |
| | | | | | | | | | | |
|
|
|
| | | | | | | | | | | | | 3,878 | |
| | | | | | | | | | | |
|
|
|
Manufacturing (Diversified) | | 1.5% | | | | | | | | | | | |
Tyco International Group SA | | | | 6.375% | | 2/15/06 | | | 10,250 | | | 10,716 | |
Tyco International Group SA | | | | 5.800% | | 8/1/06 | | | 10,250 | | | 10,733 | A |
Tyco International Group SA | | | | 6.125% | | 11/1/08 | | | 100 | | | 108 | |
70
PORTFOLIO OF INVESTMENTS—Continued
Western Asset Core Plus Bond Portfolio—Continued
Semi-Annual Report to Shareholders
| | | | | | | | | | | | | |
| | | % OF
NET ASSETS | | RATE | | MATURITY
DATE | | PAR/
SHARES | | VALUE | |
Yankee Bonds—Continued | | | | | | | | | | | | | |
| | | | | |
Manufacturing (Diversified)—Continued | | | | | | | | | | | | | |
Tyco International Group SA | | | | 6.750% | | 2/15/11 | | $ | 460 | | $ | 517 | |
Tyco International Group SA | | | | 6.375% | | 10/15/11 | | | 5,580 | | | 6,171 | A |
Tyco International Group SA | | | | 7.000% | | 6/15/28 | | | 145 | | | 164 | |
Tyco International Group SA | | | | 6.875% | | 1/15/29 | | | 28,820 | | | 32,298 | A |
| | | | | | | | | | | |
|
|
|
| | | | | | | | | | | | | 60,707 | |
| | | | | | | | | | | |
|
|
|
Media | | N.M. | | | | | | | | | | | |
Shaw Communications Inc. | | | | 8.250% | | 4/11/10 | | | 27 | | | 30 | |
Shaw Communications Inc. | | | | 7.250% | | 4/6/11 | | | 630 | | | 685 | A |
Shaw Communications Inc. | | | | 7.200% | | 12/15/11 | | | 395 | | | 430 | A |
| | | | | | | | | | | |
|
|
|
| | | | | | | | | | | | | 1,145 | |
| | | | | | | | | | | |
|
|
|
Oil and Gas | | 0.1% | | | | | | | | | | | |
Gazprom | | | | 9.625% | | 3/1/13 | | | 330 | | | 367 | |
Western Oil Sands Inc. | | | | 8.375% | | 5/1/12 | | | 1,198 | | | 1,381 | A |
YPF Sociedad Anonima | | | | 7.750% | | 8/27/07 | | | 1,000 | | | 1,072 | A |
| | | | | | | | | | | |
|
|
|
| | | | | | | | | | | | | 2,820 | |
| | | | | | | | | | | |
|
|
|
Paper and Forest Products | | N.M. | | | | | | | | | | | |
Abitibi-Consolidated Inc. | | | | 8.550% | | 8/1/10 | | | 919 | | | 986 | |
| | | | | | | | | | | |
|
|
|
| | | | | |
Publishing | | N.M. | | | | | | | | | | | |
Sun Media Corporation | | | | 7.625% | | 2/15/13 | | | 565 | | | 605 | |
| | | | | | | | | | | |
|
|
|
| | | | | |
Services | | N.M. | | | | | | | | | | | |
Compagnie Generale de Geophysique S.A. | | | | 10.625% | | 11/15/07 | | | 636 | | | 674 | |
| | | | | | | | | | | |
|
|
|
| | | | | |
Special Purpose | | 0.7% | | | | | | | | | | | |
Arcel Finance | | | | 5.984% | | 2/1/09 | | | 8,929 | | | 9,339 | B |
Aries Vermogensverwaltungs | | | | 9.600% | | 10/25/14 | | | 5,250 | | | 5,893 | B |
Conoco Funding Company | | | | 7.250% | | 10/15/31 | | | 810 | | | 971 | |
Eircom Funding | | | | 8.250% | | 8/15/13 | | | 900 | | | 985 | A |
Gaz Capital S.A. | | | | 8.625% | | 4/28/34 | | | 1,000 | | | 1,062 | B |
General Motors Nova Scotia Finance Company | | | | 6.850% | | 10/15/08 | | | 1,550 | | | 1,644 | |
HSBC Capital Funding LP | | | | 4.610% | | 12/29/49 | | | 2,090 | | | 2,008 | A,B |
Petrozuata Finance, Inc. | | | | 8.220% | | 4/1/17 | | | 5,220 | | | 5,142 | B |
| | | | | | | | | | | |
|
|
|
| | | | | | | | | | | | | 27,044 | |
| | | | | | | | | | | |
|
|
|
Telecommunications | | 0.2% | | | | | | | | | | | |
British Telecommunications plc | | | | 8.375% | | 12/15/10 | | | 1,145 | | | 1,381 | |
INTELSAT | | | | 6.500% | | 11/1/13 | | | 1,208 | | | 990 | |
Telecom Italia S.p.A. | | | | 5.250% | | 11/15/13 | | | 1,260 | | | 1,284 | A,B |
Telecom Italia S.p.A. | | | | 4.950% | | 9/30/14 | | | 3,730 | | | 3,684 | B |
| | | | | | | | | | | |
|
|
|
| | | | | | | | | | | | | 7,339 | |
| | | | | | | | | | | |
|
|
|
71
Semi-Annual Report to Shareholders
PORTFOLIO OF INVESTMENTS—Continued
Western Asset Core Plus Bond Portfolio—Continued
| | | | | | | | | | | | | | |
| | | % OF
NET ASSETS | | RATE | | MATURITY
DATE | | PAR/
SHARES | | | VALUE | |
Yankee Bonds—Continued | | | | | | | | | | | | | | |
Telecommunications (Cellular/Wireless) | | N.M. | | | | | | | | | | | | |
Rogers Wireless Communications Inc. | | | | 6.375% | | 3/1/14 | | $ | 900 | | | $ | 828 | A |
| | | | | | | | | | | | |
|
|
|
| | | | | |
Transportation | | N.M. | | | | | | | | | | | | |
Teekay Shipping Corporation | | | | 8.875% | | 7/15/11 | | | 1,219 | | | | 1,379 | |
| | | | | | | | | | | | |
|
|
|
Total Yankee Bonds (Identified Cost—$283,224) | | | | | | | | | | | | | 313,243 | |
Foreign Government Obligations | | 3.8% | | | | | | | | | | | | |
| | | | | |
Fixed Rate Securities | | 3.8% | | | | | | | | | | | | |
Federal Republic of Germany | | | | 3.750% | | 1/4/09 | | | 57,340 | M | | | 72,849 | |
Federal Republic of Germany | | | | 5.000% | | 1/4/12 | | | 17,775 | M | | | 23,871 | |
Federal Republic of Germany | | | | 5.500% | | 1/4/31 | | | 11,240 | M | | | 15,801 | |
Government of Canada | | | | 5.250% | | 6/1/12 | | | 45,000 | N | | | 37,493 | |
| | | | | | | | | | | | |
|
|
|
Total Foreign Government Obligations
(Identified Cost $129,159) | | | | | | | | | | | | | 150,014 | |
Foreign Corporate Bonds | | N.M | | | | | | | | | | | | |
| | | | | |
Banking and Finance | | N.M. | | | | | | | | | | | | |
Stadshypotek AB | | | | 6.000% | | 3/18/09 | | | 9,000 | O | | | 1,337 | |
| | | | | | | | | | | | |
|
|
|
Total Foreign Corporate Bonds
(Identified Cost—$1,276) | | | | | | | | | | | | | 1,337 | |
Preferred Stocks | | N.M | | | | | | | | | | | | |
Home Ownership Funding Corporation | | | | 13.331% | | | | | 15 | shs | | | 617 | B,L |
Home Ownership Funding Corporation II | | | | 13.338% | | | | | 13 | | | | 534 | B,L |
| | | | | | | | | | | | |
|
|
|
Total Preferred Stocks (Identified Cost—$1,794) | | | | | | | | | | | | | 1,151 | |
Options PurchasedP | | N.M | | | | | | | | | | | | |
BellSouth Telecommunications Inc.
Call, July 2006, Strike Price $97.72 | | | | | | | | | 500 | Q | | | 15 | |
International Business Machines Corporation
Call, July 2006, Strike Price $99.90 | | | | | | | | | 500 | Q | | | 40 | |
| | | | | | | | | | | | |
|
|
|
Total Options Purchased (Identified Cost—$18) | | | | | | | | | | | | | 55 | |
| | | | | | | | | | | | |
|
|
|
Total Long-Term Securities (Identified Cost—$2,822,837) | | | | | | | | | | | | | 2,921,783 | |
Investment of Proceeds From Securities Lending | | 23.6% | | | | | | | | | | | | |
State Street Navigator Securities Lending Prime
Portfolio | | | | | | | | | 943,250 | shs | | | 943,250 | |
| | | | | | | | | | | | |
|
|
|
Total Investment of Proceeds From Securities
Lending (Identified Cost—$943,250) | | | | | | | | | | | | | 943,250 | |
72
Semi-Annual Report to Shareholders
| | | | | | | | | | | | | | |
| | | % OF
NET ASSETS | | RATE | | MATURITY
DATE | | PAR/
SHARES | | | VALUE | |
Short-Term Securities | | 37.3% | | | | | | | | | | | | |
| | | | | |
Corporate Bonds and Notes | | 0.4% | | | | | | | | | | | | |
Altria Group, Inc. | | | | 2.362% | | 10/22/04 | | $ | 7,780 | | | $ | 7,780 | C |
Hertz Corporation | | | | 2.140% | | 3/24/05 | | | 8,160 | | | | 8,160 | |
| | | | | | | | | | | | |
|
|
|
| | | | | | | | | | | | | | 15,940 | |
| | | | | | | | | | | | |
|
|
|
U.S. Government and Agency Obligations | | 11.3% | | | | | | | | | | | | |
Fannie Mae | | | | 0.000% | | 11/10/04 | | | 39,840 | | | | 39,762 | G |
Fannie Mae | | | | 0.000% | | 11/12/04 | | | 39,840 | | | | 39,758 | G |
Fannie Mae | | | | 0.000% | | 11/17/04 | | | 39,840 | | | | 39,747 | G |
Fannie Mae | | | | 0.000% | | 11/24/04 | | | 39,840 | | | | 39,732 | G |
Fannie Mae | | | | 0.000% | | 11/29/04 | | | 39,840 | | | | 39,722 | G |
Fannie Mae | | | | 0.000% | | 4/1/05 | | | 15,535 | | | | 15,380 | C,R |
Fannie Mae | | | | 0.000% | | 11/30/04 | | | 39,840 | | | | 39,720 | G |
Federal Home Loan Bank | | | | 0.000% | | 10/22/04 | | | 39,840 | | | | 39,800 | G |
Federal Home Loan Bank | | | | 0.000% | | 10/27/04 | | | 39,840 | | | | 39,790 | G |
Freddie Mac | | | | 0.000% | | 10/26/04 | | | 39,840 | | | | 39,792 | G |
Freddie Mac | | | | 0.000% | | 11/30/04 | | | 39,840 | | | | 39,722 | G |
Freddie Mac | | | | 0.000% | | 11/7/04 | | | 39,840 | | | | 39,707 | G |
| | | | | | | | | | | | |
|
|
|
| | | | | | | | | | | | | | 452,632 | |
| | | | | | | | | | | | |
|
|
|
Options PurchasedP | | 0.3% | | | | | | | | | | | | |
Eurodollar Futures Call, January 2005, Strike Price $96.50 | | | | | | | | | 94 | Q | | | 93 | |
Eurodollar Futures Put, April 2005, Strike Price $97.50 | | | | | | | | | 258 | Q | | | 123 | |
Eurodollar Futures Put, April 2005, Strike Price $97.75 | | | | | | | | | 1,226 | Q | | | 1,080 | |
JPY Call / USD Put, December 2004, Strike Price $115.00 | | | | | | | | | 320,000 | Q | | | 1,603 | |
LIBOR Futures Call, December 2004, Strike Price EUR 94.25 | | | | | | | | | 1,447 | Q | | | 2,556 | |
LIBOR Futures Call, September 2005, Strike Price EUR 93.25 | | | | | | | | | 1,410 | Q | | | 5,508 | |
| | | | | | | | | | | | |
|
|
|
| | | | | | | | | | | | | | 10,963 | |
| | | | | | | | | | | | |
|
|
|
Repurchase Agreements | | 25.3% | | | | | | | | | | | | |
Goldman, Sachs & Company
1.85%, dated 9/30/04, to be repurchased at $410,021 on 10/1/04 (Collateral: $419,785 Federal Home Loan Bank bonds, 2.375%, due 4/5/06, value $418,239) | | | | | | | | | 410,000 | | | | 410,000 | |
73
Semi-Annual Report to Shareholders
PORTFOLIO OF INVESTMENTS—Continued
Western Asset Core Plus Bond Portfolio—Continued
| | | | | | | | | |
| | | % OF
NET ASSETS | | PAR/
SHARES | | VALUE | |
Short-Term Securities—Continued | | | | | | | | | |
| | | |
Repurchase Agreements—Continued | | | | | | | | | |
Merrill Lynch Government Securities, Inc.
1.86%, dated 9/30/04, to be repurchased at $605,741 on 10/1/04 (Collateral: $200,000 Fannie Mae variable rate notes, 1.726%, due 1/9/06, value $200,079; $50,000 Fannie Mae notes, 8.50%, due 5/26/05, value $51,495; $69,780 Federal Home Loan Bank bonds, 3.70% to 6%, due 7/28/09 to 4/30/19, value $70,989; $50,000 Freddie Mac notes, 5.55%, due 9/12/17, value $50,076; $570,105 Resolution Funding Corp. principal-only securities, due 1/15/07 to 4/15/30, value $247,676.) | | | | $ | 605,710 | | $ | 605,710 | |
| | | | | | | |
|
|
|
| | | | | | | | | 1,015,710 | |
| | | | | | | |
|
|
|
Total Short-Term Securities (Identified Cost—$1,493,327) | | | | | | | | 1,495,245 | |
Total Investments (Identified Cost—$5,259,414) | | 133.9% | | | | | | 5,360,278 | |
Obligation to Return Collateral for Securities Loaned | | (23.6)% | | | | | | (943,250 | ) |
Other Assets Less Liabilities | | (10.3)% | | | | | | (412,856 | ) |
| | | | | | | |
|
|
|
| | | |
Net Assets | | 100.0% | | | | | $ | 4,004,172 | |
| | | | | | | |
|
|
|
| | | | | | | | |
| | | EXPIRATION | | ACTUAL
CONTRACTS | | APPRECIATION/
(DEPRECIATION) | |
Futures Contracts PurchasedP | | | | | | | | |
Australian Dollar Futures | | December 2004 | | 100 | | $ | 373 | |
Canadian Dollar Futures | | December 2004 | | 300 | | | 490 | |
Euribor Futures | | October 2004 | | 218 | | | 405 | |
Euribor Futures | | December 2004 | | 512 | | | 1,124 | |
Euribor Futures | | June 2005 | | 888 | | | 2,048 | |
Euro Currency Futures | | December 2004 | | 526 | | | 2,366 | |
Eurodollar Futures | | October 2004 | | 1,634 | | | (261 | ) |
German Government Bond Futures | | December 2004 | | 3,637 | | | 1,494 | |
German Government Bond Futures | | December 2004 | | 550 | | | 673 | |
Japanese Yen Futures | | December 2004 | | 725 | | | (540 | ) |
LIBOR Futures | | October 2004 | | 1,620 | | | 554 | |
U.S. Treasury Bond Futures | | December 2004 | | 100 | | | 193 | |
U.S. Treasury Bond Futures | | December 2004 | | 157 | | | (186 | ) |
U.S. Treasury Note Futures | | December 2004 | | 1,687 | | | (1,312 | ) |
| | | | | | |
|
|
|
| | | | | | | $ | 7,421 | |
| | | | | | |
|
|
|
Futures Contracts WrittenP | | | | | | | | |
Eurodollar Futures | | March 2005 | | 704 | | $ | 224 | |
U.S. Treasury Note Futures | | December 2004 | | 1,871 | | | 189 | |
| | | | | | |
|
|
|
| | | | | | | $ | 413 | |
| | | | | | |
|
|
|
74
Semi-Annual Report to Shareholders
| | | | | | | | |
| | | EXPIRATION | | ACTUAL
CONTRACTS | | APPRECIATION/
(DEPRECIATION) | |
Options WrittenP | | | | | | | | |
Eurodollar Futures Call, Strike Price $96.75 | | October 2005 | | 104 | | $ | (51 | ) |
Eurodollar Futures Put, Strike Price $96.50 | | January 2005 | | 92 | | | (5 | ) |
Goldman Sachs Swaption Call, Strike Price $98.00 | | January 2005 | | 39,300,000 | | | 553 | |
Merrill Lynch Swaption Call, Strike Price $100.00 | | October 2005 | | 45,400,000 | | | 253 | |
U.S. Treasury Bond Futures Put, Strike Price $109.00 | | December 2004 | | 967 | | | 111 | |
U.S. Treasury Note Futures Call, Strike Price $112.00 | | December 2004 | | 1,171 | | | (635 | ) |
U.S. Treasury Note Futures Call, Strike Price $113.00 | | December 2004 | | 1,119 | | | (255 | ) |
U.S. Treasury Note Futures Call, Strike Price $114.00 | | December 2004 | | 1,073 | | | 82 | |
U.S. Treasury Note Futures Call, Strike Price $114.00 | | March 2005 | | 447 | | | 20 | |
U.S. Treasury Note Futures Call, Strike Price $116.00 | | March 2005 | | 361 | | | 97 | |
U.S. Treasury Note Futures Put, Strike Price $110.50 | | November 2004 | | 22 | | | (3 | ) |
U.S. Treasury Note Futures Put, Strike Price $106.00 | | December 2004 | | 783 | | | 546 | |
U.S. Treasury Note Futures Put, Strike Price $108.00 | | December 2004 | | 168 | | | 70 | |
U.S. Treasury Note Futures Put, Strike Price $109.00 | | December 2004 | | 178 | | | 60 | |
U.S. Treasury Note Futures Put, Strike Price $109.00 | | December 2004 | | 834 | | | 426 | |
U.S. Treasury Note Futures Put, Strike Price $110.00 | | December 2004 | | 731 | | | (80 | ) |
U.S. Treasury Note Futures Put, Strike Price $112.00 | | December 2004 | | 512 | | | (130 | ) |
U.S. Treasury Note Futures Put, Strike Price $102.00 | | March 2005 | | 259 | | | 139 | |
U.S. Treasury Note Futures Put, Strike Price $109.00 | | March 2005 | | 544 | | | (83 | ) |
| | | | | | |
|
|
|
| | | | | | | $ | 1,115 | |
| | | | | | |
|
|
|
| | | | | | | | | |
| A | All or a portion of this security is on loan. See Note 4 to the financial statements. |
| B | Rule 144a Security – A security purchased pursuant to Rule 144a under the Securities Act of 1933 which may not be resold subject to that rule except to qualified institutional buyers. These securities represent 4.15% of net assets. |
| C | Indexed security – The rates of interest earned on these securities are tied to the London Interbank Offered Rate (“LIBOR”), the Consumer Price Index (“CPI”), or the one-year Treasury Bill rate. The coupon rates are the rates as of September 30, 2004. |
| D | Bond is in default at September 30, 2004. |
| E | Convertible security – Security may be converted into the issuer’s common stock. |
| F | Unit - A security which consists of a bond and warrants to purchase the common stock of the issuer. |
| G | Zero coupon bond – A bond with no periodic interest payments which is sold at such a discount as to produce a current yield to maturity. |
| H | Stripped security – Security with interest-only or principal-only payment streams, denoted by a 1 or 2, respectively. For interest-only securities, the amount shown as principal is the notional balance used to calculate the amount of interest due. |
| I | Treasury Inflation-Protected Security – Treasury security whose principal value is adjusted daily in accordance with changes to the Consumer Price Index for All Urban Consumers. Interest is calculated on the basis of the current adjusted principal value. |
| J | When-issued security – Security purchased on a delayed delivery basis. Final settlement amount and maturity date have not yet been announced. |
| K | Yankee Bond – A dollar-denominated bond issued in the U.S. by foreign entities. |
| L | Stepped coupon security – A security with a predetermined schedule of interest or dividend rate changes, at which time it begins to accrue interest or pay dividends. |
| M | Denominated in euro currency. |
| N | Denominated in Canadian dollars. |
| O | Denominated in Swedish krona. |
| P | Options and futures are described in more detail in the notes to financial statements. |
| Q | Represents actual number of contracts. |
| R | All or a portion of this security is collateral to cover futures and option contracts. |
See notes to financial statements.
75
Semi-Annual Report to Shareholders
PORTFOLIO OF INVESTMENTS
September 30, 2004 (Unaudited)
(Amounts in Thousands)
Western Asset Inflation Indexed Plus Bond Portfolio
| | | | | | | | | | | | | |
| | | % OF
NET ASSETS | | RATE | | MATURITY
DATE | | PAR/
SHARES | | VALUE | |
Long-Term Securities | | 100.3% | | | | | | | | | | | |
| | | | | |
Corporate Bonds and Notes | | 0.7% | | | | | | | | | | | |
| | | | | |
Investment Banking/Brokerage | | 0.7% | | | | | | | | | | | |
J.P. Morgan & Co. Incorporated | | | | 4.560% | | 2/15/12 | | $ | 2,690 | | $ | 2,905 | A |
| | | | | | | | | | | |
|
|
|
Total Corporate Bonds and Notes
(Identified Cost—$2,628) | | | | | | | | | | | | 2,905 | |
Asset-Backed Securities | | 3.0% | | | | | | | | | | | |
| | | | | |
Indexed SecuritiesA | | 3.0% | | | | | | | | | | | |
ACE Securities Corp. Home Equity Loan
Trust 2003-HS1 | | | | 2.210% | | 6/25/33 | | | 1,823 | | | 1,827 | |
Ameriquest Mortgage Securities, Inc. 2002-5 | | | | 2.310% | | 2/25/33 | | | 1,263 | | | 1,265 | |
Ameriquest Mortgage Securities, Inc. 2002-AR3 | | | | 2.210% | | 10/25/33 | | | 595 | | | 597 | |
Bear Stearns Asset Backed Securities, Inc.
2003-ABF1 | | | | 2.210% | | 1/25/34 | | | 1,664 | | | 1,666 | |
Chase Funding Mortgage Loan Asset-Backed Certificates 2002-4 | | | | 2.210% | | 10/25/32 | | | 1,053 | | | 1,057 | |
Countrywide Asset-Backed Certificates 2002-1 | | | | 2.120% | | 8/25/32 | | | 171 | | | 171 | |
EMC Mortgage Loan Trust ABS Security 2002-B | | | | 2.390% | | 11/25/41 | | | 2,480 | | | 2,487 | B |
EQCC Trust 2002-1 | | | | 2.140% | | 11/25/31 | | | 673 | | | 674 | |
Home Equity Mortgage Trust 2003-5 | | | | 2.260% | | 1/15/34 | | | 1,186 | | | 1,189 | |
Structured Asset Investment Loan Trust 2003-BC7 | | | | 1.970% | | 7/25/33 | | | 246 | | | 246 | |
Structured Asset Investment Loan Trust 2003-BC8 | | | | 1.980% | | 8/25/10 | | | 789 | | | 789 | |
| | | | | | | | | | | |
|
|
|
Total Asset-Backed Securities
(Identified Cost—$11,950) | | | | | | | | | | | | 11,968 | |
Mortgage-Backed Securities | | 2.2% | | | | | | | | | | | |
| | | | | |
Indexed SecuritiesA | | 2.2% | | | | | | | | | | | |
Credit Suisse First Boston Mortgage Securities Corp. 2003-TFLA1 | | | | 2.030% | | 4/15/13 | | | 500 | | | 500 | B |
Crusade Global Trust 2003-2 | | | | 2.100% | | 9/18/34 | | | 2,188 | | | 2,185 | C |
CS First Boston Mortgage Securities Corp.
2001-28 | | | | 2.490% | | 11/25/31 | | | 1,758 | | | 1,764 | |
GSRPM Mortgage Loan Trust Series 2003-2 | | | | 2.540% | | 6/25/33 | | | 2,146 | | | 2,153 | |
Merrill Lynch Mortgage Investors, Inc. 2003-F | | | | 2.904% | | 10/25/28 | | | 1,427 | | | 1,452 | |
Residential Asset Mortgage Products, Inc.
2003-RS2 | | | | 2.180% | | 3/25/33 | | | 597 | | | 598 | |
| | | | | | | | | | | |
|
|
|
Total Mortgage-Backed Securities
(Identified Cost—$8,663) | | | | | | | | | | | | 8,652 | |
76
Semi-Annual Report to Shareholders
| | | | | | | | | | | | | | |
| | | % OF
NET ASSETS | | RATE | | MATURITY
DATE | | PAR/
SHARES | | | VALUE | |
U.S. Government and Agency Obligations | | 90.6% | | | | | | | | | | | | |
| | | | | |
Fixed Rate Securities | | 3.4% | | | | | | | | | | | | |
Tennessee Valley Authority | | | | 3.375% | | 1/15/07 | | $ | 7,651 | | | $ | 8,143 | |
United States Treasury Bonds | | | | 2.375% | | 1/15/25 | | | 5,074 | | | | 5,286 | |
| | | | | | | | | | | | |
|
|
|
| | | | | | | | | | | | | | 13,429 | |
| | | | | | | | | | | | |
|
|
|
Indexed SecuritiesD | | 87.2% | | | | | | | | | | | | |
United States Treasury Inflation-Protected Security | | | | 3.375% | | 1/15/07 | | | 16,522 | | | | 17,652 | |
United States Treasury Inflation-Protected Security | | | | 3.625% | | 1/15/08 | | | 19,163 | | | | 21,016 | |
United States Treasury Inflation-Protected Security | | | | 3.875% | | 1/15/09 | | | 26,380 | | | | 29,697 | |
United States Treasury Inflation-Protected Security | | | | 4.250% | | 1/15/10 | | | 26,355 | | | | 30,587 | |
United States Treasury Inflation-Protected Security | | | | 3.500% | | 1/15/11 | | | 31,625 | | | | 35,795 | |
United States Treasury Inflation-Protected Security | | | | 3.375% | | 1/15/12 | | | 15,873 | | | | 17,985 | |
United States Treasury Inflation-Protected Security | | | | 3.000% | | 7/15/12 | | | 25,736 | | | | 28,498 | |
United States Treasury Inflation-Protected Security | | | | 1.875% | | 7/15/13 | | | 24,462 | | | | 24,878 | E |
United States Treasury Inflation-Protected Security | | | | 2.000% | | 1/15/14 | | | 29,205 | | | | 29,904 | |
United States Treasury Inflation-Protected Security | | | | 2.000% | | 7/15/14 | | | 9,044 | | | | 9,244 | E |
United States Treasury Inflation-Protected Security | | | | 3.625% | | 4/15/28 | | | 33,247 | | | | 42,185 | |
United States Treasury Inflation-Protected Security | | | | 3.875% | | 4/15/29 | | | 42,538 | | | | 56,423 | |
| | | | | | | | | | | | |
|
|
|
| | | | | | | | | | | | | | 343,864 | |
| | | | | | | | | | | | |
|
|
|
Total U.S. Government and Agency Obligations (Identified Cost—$343,198) | | | | | | | | | | | | | 357,293 | |
Foreign Government Obligations | | 3.8% | | | | | | | | | | | | |
| | | | | |
Fixed Rate Securities | | 2.2% | | | | | | | | | | | | |
French Republic | | | | 1.600% | | 7/25/11 | | | 1,325 | F | | | 1,660 | |
| | | | | | | | | | | | |
|
|
|
| | | | | |
Indexed SecuritiesD | | 1.6% | | | | | | | | | | | | |
Canadian Real Return Bond | | | | 3.000% | | 12/1/36 | | | 4,039 | G | | | 3,665 | |
French Republic | | | | 2.500% | | 7/25/13 | | | 5,281 | F | | | 6,973 | |
Kingdom of Sweden | | | | 3.500% | | 12/1/28 | | | 13,580 | H | | | 2,457 | |
| | | | | | | | | | | | |
|
|
|
| | | | | | | | | | | | | | 13,095 | |
| | | | | | | | | | | | |
|
|
|
Total Foreign Government Obligations
(Identified Cost—$13,764) | | | | | | | | | | | | | 14,755 | |
| | | | | | | | | | | | |
|
|
|
Total Long-Term Securities (Identified Cost—$380,203) | | | | | | | | | | | 395,573 | |
77
Semi-Annual Report to Shareholders
| | | | | | | | | | | | | | |
| | | % OF
NET ASSETS | | RATE | | MATURITY
DATE | | PAR/
SHARES | | | VALUE | |
Investment of Proceeds From Securities Lending | | 2.7% | | | | | | | | | | | | |
State Street Navigator Securities Lending Prime Portfolio | | | | | | | | | 10,497 | shs | | $ | 10,497 | |
| | | | | | | | | | | | |
|
|
|
Total Investment of Proceeds From Securities Lending (Identified Cost—$10,497) | | | | | | | | | | | | | 10,497 | |
Short-Term Securities | | 0.4% | | | | | | | | | | | | |
| | | | | |
U.S. Government and Agency Obligations | | N.M. | | | | | | | | | | | | |
Fannie Mae | | | | 0.000% | | 4/1/05 | | $ | 60 | | | | 60 | I,,J |
| | | | | | | | | | | | |
|
|
|
| | | | | |
Repurchase Agreements | | 0.4% | | | | | | | | | | | | |
Deutsche Bank AG
1.85%, dated 9/30/04, to be repurchased
at $802 on 10/1/04 (Collateral: $820
Federal Home Loan Bank bonds,
2.5%, due 4/11/06, value $818) | | | | | | | | | 802 | | | | 802 | |
Goldman, Sachs & Company
1.85%, dated 9/30/04, to be repurchased
at $770 on 10/1/04 (Collateral: $790 Fannie Mae notes, 1.875%, due 9/15/05, value $788) | | | | | | | | | 770 | | | | 770 | |
| | | | | | | | | | | | |
|
|
|
| | | | | | | | | | | | | | 1,572 | |
| | | | | | | | | | | | |
|
|
|
Total Short-Term Securities (Identified Cost—$1,631) | | | | | | | | | | | | | 1,632 | |
Total Investments (Identified Cost—$392,331) | | 103.4% | | | | | | | | | | | 407,702 | |
Obligation to Return Collateral for Securities Loaned | | (2.7)% | | | | | | | | | | | (10,497 | ) |
Other Assets Less Liabilities | | (0.7)% | | | | | | | | | | | (2,914 | ) |
| | | | | | | | | | | | |
|
|
|
| | | | | |
Net Assets | | 100.0% | | | | | | | | | | $ | 394,291 | |
| | | | | | | | | | | | |
|
|
|
78
PORTFOLIO OF INVESTMENTS—Continued
Western Asset Inflation Indexed Plus Bond Portfolio—Continued
Semi-Annual Report to Shareholders
| | | | | | | | |
| | | EXPIRATION | | ACTUAL
CONTRACTS | | APPRECIATION/
(DEPRECIATION) | |
Futures Contracts PurchasedK | | | | | | | | |
Eurodollar Futures | | March 2005 | | 76 | | $ | (31 | ) |
| | | | | | |
|
|
|
Futures Contracts WrittenK | | | | | | | | |
U.S. Treasury Bond Futures | | December 2004 | | 8 | | $ | 1 | |
| | | | | | |
|
|
|
Options WrittenK | | | | | | | | |
J.P. Morgan Swaption Call, Strike Price $100.00 | | October 2004 | | 4,800,000 | | $ | 27 | |
| | | | | | |
|
|
|
| | | | | | | | | |
| A | Indexed security – The rates of interest earned on these securities are tied to the London Interbank Offered Rate (“LIBOR”), the Consumer Price Index (“CPI”), or the one-year Treasury Bill rate. The coupon rates are the rates as of September 30, 2004. |
| B | Rule 144a Security – A security purchased pursuant to Rule 144a under the Securities Act of 1933 which may not be resold subject to that rule except to qualified institutional buyers. These securities represent 0.76% of net assets. |
| C | Yankee Bond – A dollar-denominated bond issued in the U.S. by foreign entities. |
| D | Treasury Inflation-Protected Security – Treasury security whose principal value is adjusted daily in accordance with changes to the Consumer Price Index for All Urban Consumers. Interest is calculated on the basis of the current adjusted principal value. |
| E | All or a portion of this security is on loan. See Note 4 to the financial statements. |
| F | Denominated in euro currency. |
| G | Denominated in Canadian dollar. |
| H | Denominated in Swedish krona. |
| I | Zero coupon bond – A bond with no periodic interest payments which is sold at such a discount as to produce a current yield to maturity. |
| J | Collateral to cover futures and options contracts. |
| K | Options and futures are described in more detail in the notes to financial statements. |
See notes to financial statements.
79
Semi-Annual Report to Shareholders
PORTFOLIO OF INVESTMENTS
September 30, 2004 (Unaudited)
(Amounts in Thousands)
Western Asset High Yield Portfolio
| | | | | | | | | | | | | |
| | | % OF
NET ASSETS | | RATE | | MATURITY
DATE | | PAR/
SHARES | | VALUE | |
Long-Term Securities | | 97.2% | | | | | | | | | | | |
| | | | | |
Corporate Bonds and Notes | | 89.8% | | | | | | | | | | | |
| | | | | |
Advertising | | 0.7% | | | | | | | | | | | |
Vertis Inc. | | | | 10.875% | | 6/15/09 | | $ | 2,422 | | $ | 2,604 | |
| | | | | | | | | | | |
|
|
|
| | | | | |
Aerospace/Defense | | 1.5% | | | | | | | | | | | |
Armor Holdings, Inc. | | | | 8.250% | | 8/15/13 | | | 2,510 | | | 2,767 | |
Esterline Technologies Corporation | | | | 7.750% | | 6/15/13 | | | 1,605 | | | 1,717 | |
Hexcel Corporation | | | | 9.875% | | 10/1/08 | | | 736 | | | 824 | |
Hexcel Corporation | | | | 9.750% | | 1/15/09 | | | 290 | | | 305 | |
| | | | | | | | | | | |
|
|
|
| | | | | | | | | | | | | 5,613 | |
| | | | | | | | | | | |
|
|
|
Animal Hospitals | | 0.2% | | | | | | | | | | | |
Vicar Operating, Inc. | | | | 9.875% | | 12/1/09 | | | 580 | | | 641 | |
| | | | | | | | | | | |
|
|
|
| | | | | |
Apparel | | 1.1% | | | | | | | | | | | |
Oxford Industries, Inc. | | | | 8.875% | | 6/1/11 | | | 1,484 | | | 1,610 | A |
Russell Corporation | | | | 9.250% | | 5/1/10 | | | 1,666 | | | 1,807 | |
The William Carter Company | | | | 10.875% | | 8/15/11 | | | 585 | | | 657 | |
| | | | | | | | | | | |
|
|
|
| | | | | | | | | | | | | 4,074 | |
| | | | | | | | | | | |
|
|
|
Auto and Automotive Parts | | 1.5% | | | | | | | | | | | |
Keystone Automotive Operations Inc. | | | | 9.750% | | 11/1/13 | | | 2,520 | | | 2,709 | |
TRW Automotive | | | | 9.375% | | 2/15/13 | | | 1,899 | | | 2,170 | |
TRW Automotive | | | | 11.000% | | 2/15/13 | | | 417 | | | 496 | |
| | | | | | | | | | | |
|
|
|
| | | | | | | | | | | | | 5,375 | |
| | | | | | | | | | | |
|
|
|
Automotive Retailer | | 0.8% | | | | | | | | | | | |
Asbury Automotive Group Inc. | | | | 9.000% | | 6/15/12 | | | 2,827 | | | 2,983 | |
| | | | | | | | | | | |
|
|
|
| | | | | |
Building Materials | | 3.7% | | | | | | | | | | | |
American Standard, Inc. | | | | 7.375% | | 2/1/08 | | | 31 | | | 34 | |
Associated Materials Incorporated | | | | 11.250% | | 3/1/14 | | | 3,440 | | | 2,503 | A,B |
Atrium Companies, Inc. | | | | 10.500% | | 5/1/09 | | | 3,318 | | | 3,484 | |
Interface, Inc. | | | | 7.300% | | 4/1/08 | | | 411 | | | 413 | |
Interface, Inc. | | | | 10.375% | | 2/1/10 | | | 2,897 | | | 3,288 | |
Nortek Holdings, Inc. | | | | 8.500% | | 9/1/14 | | | 3,570 | | | 3,739 | A |
| | | | | | | | | | | |
|
|
|
| | | | | | | | | | | | | 13,461 | |
| | | | | | | | | | | |
|
|
|
80
Semi-Annual Report to Shareholders
| | | | | | | | | | | | | |
| | | % OF
NET ASSETS | | RATE | | MATURITY
DATE | | PAR/
SHARES | | VALUE | |
Corporate Bonds and Notes—Continued | | | | | | | | | | | | | |
| | | | | |
Cable | | 3.4% | | | | | | | | | | | |
Charter Communications Holdings, LLC | | | | 9.625% | | 11/15/09 | | $ | 2,220 | | $ | 1,748 | |
Charter Communications Holdings, LLC | | | | 10.250% | | 9/15/10 | | | 4,459 | | | 4,554 | |
CSC Holdings Inc. | | | | 7.625% | | 4/1/11 | | | 2,450 | | | 2,582 | |
CSC Holdings Inc. | | | | 7.875% | | 2/15/18 | | | 720 | | | 743 | |
CSC Holdings Inc. | | | | 7.625% | | 7/15/18 | | | 1,138 | | | 1,161 | |
LodgeNet Entertainment Corporation | | | | 9.500% | | 6/15/13 | | | 1,662 | | | 1,811 | |
| | | | | | | | | | | |
|
|
|
| | | | | | | | | | | | | 12,599 | |
| | | | | | | | | | | |
|
|
|
Casino Resorts | | 2.9% | | | | | | | | | | | |
Inn of The Mountain Gods Resort and Casino | | | | 12.000% | | 11/15/10 | | | 2,840 | | | 3,252 | |
Mandalay Resort Group | | | | 9.375% | | 2/15/10 | | | 200 | | | 230 | |
MGM MIRAGE | | | | 8.500% | | 9/15/10 | | | 1,340 | | | 1,522 | |
Mirage Resorts, Incorporated | | | | 7.250% | | 10/15/06 | | | 328 | | | 348 | |
Premier Entertainment Biloxi Llc | | | | 10.750% | | 2/1/12 | | | 1,284 | | | 1,355 | |
River Rock Entertainment | | | | 9.750% | | 11/1/11 | | | 1,750 | | | 1,842 | |
Station Casinos, Inc. | | | | 6.000% | | 4/1/12 | | | 1,360 | | | 1,394 | |
Station Casinos, Inc. | | | | 6.875% | | 3/1/16 | | | 360 | | | 370 | |
Wynn Las Vegas LLC | | | | 12.000% | | 11/1/10 | | | 411 | | | 514 | |
| | | | | | | | | | | |
|
|
|
| | | | | | | | | | | | | 10,827 | |
| | | | | | | | | | | |
|
|
|
Chemicals | | 4.5% | | | | | | | | | | | |
FMC Corporation | | | | 10.250% | | 11/1/09 | | | 1,896 | | | 2,213 | |
Georgia Gulf Corporation | | | | 7.625% | | 11/15/05 | | | 17 | | | 18 | |
Huntsman International LLC | | | | 10.125% | | 7/1/09 | | | 2,262 | | | 2,375 | |
Lyondell Chemical Company | | | | 9.625% | | 5/1/07 | | | 3,537 | | | 3,851 | |
MacDermid, Incorporated | | | | 9.125% | | 7/15/11 | | | 1,991 | | | 2,220 | |
Millennium America Inc. | | | | 7.000% | | 11/15/06 | | | 121 | | | 125 | |
Millennium America Inc. | | | | 9.250% | | 6/15/08 | | | 1,968 | | | 2,170 | |
Nalco Co. | | | | 7.750% | | 11/15/11 | | | 1,060 | | | 1,124 | |
Nalco Co. | | | | 8.875% | | 11/15/13 | | | 1,000 | | | 1,075 | |
Westlake Chemical Corporation | | | | 8.750% | | 7/15/11 | | | 1,202 | | | 1,349 | |
| | | | | | | | | | | |
|
|
|
| | | | | | | | | | | | | 16,520 | |
| | | | | | | | | | | |
|
|
|
Coal | | 0.8% | | | | | | | | | | | |
Alpha Natural Resources LLC | | | | 10.000% | | 6/1/12 | | | 2,560 | | | 2,822 | A |
| | | | | | | | | | | |
|
|
|
| | | | | |
Containers and Packaging | | 3.1% | | | | | | | | | | | |
Graham Packaging Company Lp | | | | 9.875% | | 10/15/14 | | | 1,620 | | | 1,659 | A |
Graphic Packaging International Corp. | | | | 9.500% | | 8/15/13 | | | 1,840 | | | 2,102 | |
Owens Brockway Glass Containers | | | | 8.750% | | 11/15/12 | | | 2,330 | | | 2,586 | |
Owens-Illinois, Inc. | | | | 7.500% | | 5/15/10 | | | 730 | | | 746 | |
81
Semi-Annual Report to Shareholders
| | | | | | | | | | | | | |
| | | % OF
NET ASSETS | | RATE | | MATURITY
DATE | | PAR/
SHARES | | VALUE | |
Corporate Bonds and Notes—Continued | | | | | | | | | | | | | |
| | | | | |
Containers and Packaging—Continued | | | | | | | | | | | | | |
Smurfit-Stone Container Corporation | | | | 8.250% | | 10/1/12 | | $ | 1,380 | | $ | 1,522 | |
Solo Cup Company | | | | 8.500% | | 2/15/14 | | | 2,880 | | | 2,837 | |
| | | | | | | | | | | |
|
|
|
| | | | | | | | | | | | | 11,452 | |
| | | | | | | | | | | |
|
|
|
Diversified Services | | 0.8% | | | | | | | | | | | |
SPX Corporation | | | | 7.500% | | 1/1/13 | | | 3,020 | | | 3,069 | |
| | | | | | | | | | | |
|
|
|
Electric | | 3.1% | | | | | | | | | | | |
Midwest Generation Llc | | | | 8.750% | | 5/1/34 | | | 1,840 | | | 2,006 | |
Nevada Power Company | | | | 6.500% | | 4/15/12 | | | 1,700 | | | 1,755 | A |
Orion Power Holdings, Inc. | | | | 12.000% | | 5/1/10 | | | 2,383 | | | 2,979 | |
The AES Corporation | | | | 10.000% | | 7/15/05 | | | 148 | | | 150 | A |
The AES Corporation | | | | 8.750% | | 5/15/13 | | | 150 | | | 169 | A |
The AES Corporation | | | | 9.000% | | 5/15/15 | | | 3,905 | | | 4,403 | A |
| | | | | | | | | | | |
|
|
|
| | | | | | | | | | | | | 11,462 | |
| | | | | | | | | | | |
|
|
|
Electronics | | 1.0% | | | | | | | | | | | |
BRL Universal Equipment 2001 A., L.P. | | | | 8.875% | | 2/15/08 | | | 1,010 | | | 1,076 | |
Rayovac Corporation | | | | 8.500% | | 10/1/13 | | | 1,180 | | | 1,280 | |
Viasystems Inc. | | | | 10.500% | | 1/15/11 | | | 1,540 | | | 1,463 | |
| | | | | | | | | | | |
|
|
|
| | | | | | | | | | | | | 3,819 | |
| | | | | | | | | | | |
|
|
|
Energy | | 3.0% | | | | | | | | | | | |
Calpine Corporation | | | | 7.625% | | 4/15/06 | | | 2,090 | | | 1,933 | |
Calpine Corporation | | | | 8.625% | | 8/15/10 | | | 592 | | | 385 | |
Calpine Corporation | | | | 9.875% | | 12/1/11 | | | 930 | | | 730 | A |
Calpine Corporation | | | | 8.750% | | 7/15/13 | | | 2,050 | | | 1,548 | A |
Calpine Generating Co. LLC | | | | 11.500% | | 4/1/11 | | | 1,780 | | | 1,557 | A |
Calpine Generating Co. LLC | | | | 10.250% | | 4/1/11 | | | 1,220 | | | 1,098 | A,C |
Midwest Generation LLC | | | | 8.560% | | 1/2/16 | | | 1,260 | | | 1,323 | |
NRG Energy, Inc. | | | | 8.000% | | 12/15/13 | | | 2,442 | | | 2,616 | A |
| | | | | | | | | | | |
|
|
|
| | | | | | | | | | | | | 11,190 | |
| | | | | | | | | | | |
|
|
|
Entertainment | | 1.2% | | | | | | | | | | | |
Cinemark, Inc. | | | | 0.000% | | 3/15/14 | | | 2,710 | | | 1,863 | D |
Loews Cineplex Entertainment Corporation | | | | 9.000% | | 8/1/14 | | | 1,160 | | | 1,198 | A |
Six Flags, Inc. | | | | 9.750% | | 4/15/13 | | | 1,445 | | | 1,365 | |
| | | | | | | | | | | |
|
|
|
| | | | | | | | | | | | | 4,426 | |
| | | | | | | | | | | |
|
|
|
82
PORTFOLIO OF INVESTMENTS—Continued
Western Asset High Yield Portfolio—Continued
Semi-Annual Report to Shareholders
| | | | | | | | | | | | | |
| | | % OF
NET ASSETS | | RATE | | MATURITY
DATE | | PAR/
SHARES | | VALUE | |
Corporate Bonds and Notes—Continued | | | | | | | | | | | | | |
| | | | | |
Environmental Services | | 1.4% | | | | | | | | | | | |
Allied Waste North America Incorporated | | | | 8.875% | | 4/1/08 | | $ | 951 | | $ | 1,032 | |
Allied Waste North America Incorporated | | | | 8.500% | | 12/1/08 | | | 1,125 | | | 1,220 | |
Capital Environment Resource, Inc. | | | | 9.500% | | 4/15/14 | | | 3,030 | | | 2,879 | A |
Safety-Kleen Corp. | | | | 9.250% | | 5/15/09 | | | 1,418 | | | 78 | E |
| | | | | | | | | | | |
|
|
|
| | | | | | | | | | | | | 5,209 | |
| | | | | | | | | | | |
|
|
|
Food, Beverage and Tobacco | | 0.9% | | | | | | | | | | | |
Cott Beverages Incorporated | | | | 8.000% | | 12/15/11 | | | 1,296 | | | 1,416 | |
Domino’s, Inc. | | | | 8.250% | | 7/1/11 | | | 1,778 | | | 1,925 | |
| | | | | | | | | | | |
|
|
|
| | | | | | | | | | | | | 3,341 | |
| | | | | | | | | | | |
|
|
|
Gaming | | 1.5% | | | | | | | | | | | |
Argosy Gaming Company | | | | 9.000% | | 9/1/11 | | | 1,408 | | | 1,581 | |
Isle of Capri Casinos, Inc. | | | | 9.000% | | 3/15/12 | | | 1,030 | | | 1,143 | |
Mohegan Tribal Gaming Authority | | | | 8.000% | | 4/1/12 | | | 1,000 | | | 1,105 | |
Pinnacle Entertainment, Inc. | | | | 9.250% | | 2/15/07 | | | 1,597 | | | 1,637 | |
| | | | | | | | | | | |
|
|
|
| | | | | | | | | | | | | 5,466 | |
| | | | | | | | | | | |
|
|
|
Gas and Pipeline Utilities | | 3.7% | | | | | | | | | | | |
ANR Pipeline, Inc. | | | | 8.875% | | 3/15/10 | | | 243 | | | 273 | |
ANR Pipeline, Inc. | | | | 9.625% | | 11/1/21 | | | 1,604 | | | 1,909 | |
Colorado Interstate Gas Company | | | | 10.000% | | 6/15/05 | | | 400 | | | 420 | |
Dynegy Holdings Inc. | | | | 10.125% | | 7/15/13 | | | 3,995 | | | 4,594 | A |
GulfTerra Energy Partners, L.P. | | | | 10.625% | | 12/1/12 | | | 331 | | | 416 | |
Northwest Pipelines Corporation | | | | 8.125% | | 3/1/10 | | | 851 | | | 954 | |
Sonat Inc. | | | | 6.875% | | 6/1/05 | | | 430 | | | 435 | |
Southern Natural Gas Company | | | | 8.875% | | 3/15/10 | | | 1,775 | | | 1,997 | |
The Williams Companies, Inc. | | | | 8.750% | | 3/15/32 | | | 1,554 | | | 1,737 | |
Transcontinental Gas Pipeline Corporation | | | | 8.875% | | 7/15/12 | | | 698 | | | 849 | |
| | | | | | | | | | | |
|
|
|
| | | | | | | | | | | | | 13,584 | |
| | | | | | | | | | | |
|
|
|
Health Care | | 2.1% | | | | | | | | | | | |
Ardent Health Services | | | | 10.000% | | 8/15/13 | | | 2,350 | | | 2,374 | |
Equinox Holdings Inc | | | | 9.000% | | 12/15/09 | | | 1,620 | | | 1,669 | |
Tenet Healthcare Corporation | | | | 9.875% | | 7/1/14 | | | 3,519 | | | 3,677 | A |
| | | | | | | | | | | |
|
|
|
| | | | | | | | | | | | | 7,720 | |
| | | | | | | | | | | |
|
|
|
Homebuilding | | 0.6% | | | | | | | | | | | |
Beazer Homes USA, Inc. | | | | 8.625% | | 5/15/11 | | | 500 | | | 552 | |
D.R. Horton Inc. | | | | 8.500% | | 4/15/12 | | | 470 | | | 531 | |
Schuler Homes, Inc. | | | | 9.375% | | 7/15/09 | | | 418 | | | 458 | |
Schuler Homes, Inc. | | | | 10.500% | | 7/15/11 | | | 430 | | | 494 | |
| | | | | | | | | | | |
|
|
|
| | | | | | | | | | | | | 2,035 | |
| | | | | | | | | | | |
|
|
|
83
Semi-Annual Report to Shareholders
| | | | | | | | | | | | | |
| | | % OF
NET ASSETS | | RATE | | MATURITY
DATE | | PAR/
SHARES | | VALUE | |
Corporate Bonds and Notes—Continued | | | | | | | | | | | | | |
| | | | | |
Investment Banking/Brokerage | | 0.5% | | | | | | | | | | | |
Refco Finance Inc | | | | 9.000% | | 8/1/12 | | $ | 1,740 | | $ | 1,857 | A |
| | | | | | | | | | | |
|
|
|
| | | | | |
Lodging/Hotels | | 1.2% | | | | | | | | | | | |
Host Marriott Corporation | | | | 9.250% | | 10/1/07 | | | 135 | | | 151 | |
Host Marriott LP | | | | 9.500% | | 1/15/07 | | | 2,190 | | | 2,425 | |
La Quinta Inns, Inc. | | | | 7.000% | | 8/15/07 | | | 375 | | | 396 | |
La Quinta Inns, Inc. | | | | 8.875% | | 3/15/11 | | | 1,130 | | | 1,266 | |
| | | | | | | | | | | |
|
|
|
| | | | | | | | | | | | | 4,238 | |
| | | | | | | | | | | |
|
|
|
Machinery | | 2.1% | | | | | | | | | | | |
Case New Holland Incorporated | | | | 9.250% | | 8/1/11 | | | 1,600 | | | 1,792 | A |
Case New Holland Incorporated | | | | 9.250% | | 8/1/11 | | | 1,640 | | | 1,837 | A |
Grant Prideco, Inc. | | | | 9.000% | | 12/15/09 | | | 922 | | | 1,030 | |
Hanover Compressor Company | | | | 8.625% | | 12/15/10 | | | 687 | | | 746 | |
Joy Global Inc. | | | | 8.750% | | 3/15/12 | | | 1,340 | | | 1,514 | |
Terex Corporation | | | | 9.250% | | 7/15/11 | | | 750 | | | 840 | |
| | | | | | | | | | | |
|
|
|
| | | | | | | | | | | | | 7,759 | |
| | | | | | | | | | | |
|
|
|
Manufacturing (Diversified) | | 3.1% | | | | | | | | | | | |
Ames True Temper | | | | 10.000% | | 7/15/12 | | | 1,720 | | | 1,756 | A |
Jacuzzi Brands Incorporated | | | | 9.625% | | 7/1/10 | | | 3,351 | | | 3,703 | |
Koppers Inc. | | | | 9.875% | | 10/15/13 | | | 2,300 | | | 2,541 | |
MMI Products, Inc. | | | | 11.250% | | 4/15/07 | | | 1,780 | | | 1,798 | |
Samsonite Corporation | | | | 8.875% | | 6/1/11 | | | 1,660 | | | 1,735 | A |
| | | | | | | | | | | |
|
|
|
| | | | | | | | | | | | | 11,533 | |
| | | | | | | | | | | |
|
|
|
Media | | 2.6% | | | | | | | | | | | |
EchoStar DBS Corporation | | | | 4.850% | | 10/1/08 | | | 1,880 | | | 1,951 | C |
EchoStar DBS Corporation | | | | 6.625% | | 10/1/14 | | | 1,870 | | | 1,858 | A |
Lamar Media Corporation | | | | 7.250% | | 1/1/13 | | | 1,560 | | | 1,677 | |
Paxson Communications Corporation | | | | 10.750% | | 7/15/08 | | | 320 | | | 322 | |
Paxson Communications Corporation | | | | 0.000% | | 1/15/09 | | | 237 | | | 203 | D |
PRIMEDIA Inc. | | | | 7.086% | | 5/15/10 | | | 900 | | | 904 | A |
Sinclair Broadcast Group, Inc. | | | | 8.750% | | 12/15/11 | | | 730 | | | 792 | |
Warner Music Group | | | | 7.375% | | 4/15/14 | | | 1,800 | | | 1,863 | A |
| | | | | | | | | | | |
|
|
|
| | | | | | | | | | | | | 9,570 | |
| | | | | | | | | | | |
|
|
|
Medical Care Facilities | | 1.2% | | | | | | | | | | | |
Extendicare Health Services, Inc. | | | | 9.500% | | 7/1/10 | | | 981 | | | 1,101 | |
HCA Inc. | | | | 8.750% | | 9/1/10 | | | 1,330 | | | 1,559 | |
HCA Inc. | | | | 7.875% | | 2/1/11 | | | 546 | | | 618 | |
HCA Inc. | | | | 9.000% | | 12/15/14 | | | 818 | | | 996 | |
| | | | | | | | | | | |
|
|
|
| | | | | | | | | | | | | 4,274 | |
| | | | | | | | | | | |
|
|
|
84
PORTFOLIO OF INVESTMENTS—Continued
Western Asset High Yield Portfolio—Continued
Semi-Annual Report to Shareholders
| | | | | | | | | | | | | |
| | | % OF
NET ASSETS | | RATE | | MATURITY
DATE | | PAR/
SHARES | | VALUE | |
Corporate Bonds and Notes—Continued | | | | | | | | | | | | | |
| | | | | |
Medical Products | | 0.5% | | | | | | | | | | | |
Fresenius Medical Care Capital Trust II | | | | 7.875% | | 2/1/08 | | $ | 1,667 | | $ | 1,821 | F |
| | | | | | | | | | | |
|
|
|
| | | | | |
Medical Supplies and Services | | 0.2% | | | | | | | | | | | |
AmeriPath Inc. | | | | 10.500% | | 4/1/13 | | | 796 | | | 812 | |
| | | | | | | | | | | |
|
|
|
| | | | | |
Metals | | 0.5% | | | | | | | | | | | |
Century Aluminum Company | | | | 7.500% | | 8/15/14 | | | 1,680 | | | 1,768 | A |
| | | | | | | | | | | |
|
|
|
| | | | | |
Oil and Gas | | 7.3% | | | | | | | | | | | |
Amerigas Partners LP | | | | 8.875% | | 5/20/11 | | | 602 | | | 664 | |
Belden Blake Corporation | | | | 8.750% | | 7/15/12 | | | 2,000 | | | 2,130 | A |
Chesapeake Energy Corporation | | | | 8.375% | | 11/1/08 | | | 614 | | | 669 | |
Chesapeake Energy Corporation | | | | 9.000% | | 8/15/12 | | | 1,346 | | | 1,538 | |
El Paso CGP Co. | | | | 7.750% | | 6/15/10 | | | 2,068 | | | 2,068 | |
El Paso Corporation | | | | 6.950% | | 12/15/07 | | | 465 | | | 467 | |
El Paso Corporation | | | | 7.875% | | 6/15/12 | | | 1,270 | | | 1,261 | |
El Paso Corporation | | | | 7.800% | | 8/1/31 | | | 1,020 | | | 895 | |
El Paso Corporation | | | | 7.750% | | 1/15/32 | | | 1,050 | | | 916 | |
El Paso Energy Partners | | | | 8.500% | | 6/1/11 | | | 143 | | | 161 | |
El Paso Production Holding Company | | | | 7.750% | | 6/1/13 | | | 590 | | | 591 | |
Evergreen Resources, Inc. | | | | 5.875% | | 3/15/12 | | | 695 | | | 716 | |
Ferrellgas Partners, L.P. | | | | 8.750% | | 6/15/12 | | | 80 | | | 88 | |
Ferrellgas, L.P. | | | | 6.750% | | 5/1/14 | | | 1,070 | | | 1,091 | |
KCS Energy, Inc. | | | | 7.125% | | 4/1/12 | | | 1,150 | | | 1,202 | |
Pacific Energy Partners | | | | 7.125% | | 6/15/14 | | | 870 | | | 942 | A |
Parker Drilling Company | | | | 10.125% | | 11/15/09 | | | 511 | | | 542 | |
Parker Drilling Company | | | | 6.540% | | 9/1/10 | | | 1,630 | | | 1,634 | A,C |
Plains Exploration & Production Company | | | | 7.125% | | 6/15/14 | | | 1,340 | | | 1,437 | A |
Pride International, Inc. | | | | 7.375% | | 7/15/14 | | | 1,610 | | | 1,787 | A |
SESI, LLC | | | | 8.875% | | 5/15/11 | | | 1,375 | | | 1,502 | |
Suburban Propane Partners LP | | | | 6.875% | | 12/15/13 | | | 1,720 | | | 1,772 | |
Vintage Petroleum, Inc. | | | | 7.875% | | 5/15/11 | | | 522 | | | 559 | |
Vintage Petroleum, Inc. | | | | 8.250% | | 5/1/12 | | | 1,860 | | | 2,069 | |
| | | | | | | | | | | |
|
|
|
| | | | | | | | | | | | | 26,701 | |
| | | | | | | | | | | |
|
|
|
Paper and Forest Products | | 1.8% | | | | | | | | | | | |
Georgia-Pacific Corp | | | | 9.500% | | 12/1/11 | | | 1,803 | | | 2,231 | |
Georgia-Pacific Corp. | | | | 9.375% | | 2/1/13 | | | 3,117 | | | 3,670 | |
Georgia-Pacific Corp. | | | | 7.700% | | 6/15/15 | | | 46 | | | 53 | |
85
Semi-Annual Report to Shareholders
PORTFOLIO OF INVESTMENTS—Continued
Western Asset High Yield Portfolio—Continued
| | | | | | | | | | | | | |
| | | % OF
NET ASSETS | | RATE | | MATURITY
DATE | | PAR/
SHARES | | VALUE | |
Corporate Bonds and Notes—Continued | | | | | | | | | | | | | |
| | | | | |
Paper and Forest Products—Continued | | | | | | | | | | | | | |
Georgia-Pacific Corp. | | | | 7.750% | | 11/15/29 | | $ | 67 | | $ | 72 | |
Georgia-Pacific Corp. | | | | 8.875% | | 5/15/31 | | | 540 | | | 655 | |
| | | | | | | | | | | |
|
|
|
| | | | | | | | | | | | | 6,681 | |
| | | | | | | | | | | |
|
|
|
Pharmaceuticals | | 0.4% | | | | | | | | | | | |
Leiner Health Products Inc. | | | | 11.000% | | 6/1/12 | | | 1,320 | | | 1,403 | A |
| | | | | | | | | | | |
|
|
|
| | | | | |
Publishing | | 0.4% | | | | | | | | | | | |
Dex Media East LLC | | | | 12.125% | | 11/15/12 | | | 1,167 | | | 1,453 | |
| | | | | | | | | | | |
|
|
|
| | | | | |
Real Estate | | 0.6% | | | | | | | | | | | |
Forest City Enterprises, Inc. | | | | 7.625% | | 6/1/15 | | | 255 | | | 268 | |
Ventas Realty, Limited Partnership | | | | 8.750% | | 5/1/09 | | | 1,156 | | | 1,289 | |
Ventas Realty, Limited Partnership | | | | 9.000% | | 5/1/12 | | | 412 | | | 469 | |
| | | | | | | | | | | |
|
|
|
| | | | | | | | | | | | | 2,026 | |
| | | | | | | | | | | |
|
|
|
Rental and Lease Services (Commercial) | | 0.7% | | | | | | | | | | | |
NationsRent Inc. | | | | 9.500% | | 10/15/10 | | | 2,430 | | | 2,637 | |
| | | | | | | | | | | |
|
|
|
| | | | | |
Retail | | 1.8% | | | | | | | | | | | |
American Achievement Corp. | | | | 8.250% | | 4/1/12 | | | 630 | | | 662 | A |
Hollywood Entertainment Corporation | | | | 9.625% | | 3/15/11 | | | 349 | | | 373 | |
Norcraft Companies | | | | 9.000% | | 11/1/11 | | | 2,570 | | | 2,801 | A |
Stater Bros. Holdings Inc. | | | | 5.380% | | 6/15/10 | | | 1,040 | | | 1,056 | A,C |
Toys “R” Us, Inc. | | | | 7.875% | | 4/15/13 | | | 1,690 | | | 1,686 | |
| | | | | | | | | | | |
|
|
|
| | | | | | | | | | | | | 6,578 | |
| | | | | | | | | | | |
|
|
|
Special Purpose | | 7.5% | | | | | | | | | | | |
Alamosa Incorporated | | | | 11.000% | | 7/31/10 | | | 1,673 | | | 1,895 | |
Dennys Holdings, Inc. | | | | 10.000% | | 10/1/12 | | | 1,750 | | | 1,757 | A |
H & E Equipment Services LLC | | | | 11.125% | | 6/15/12 | | | 1,910 | | | 1,967 | |
Huntsman Advanced Materials LLC | | | | 11.000% | | 7/15/10 | | | 340 | | | 394 | A |
Jostens IH Corporation | | | | 7.625% | | 10/1/12 | | | 2,680 | | | 2,693 | |
Midland Funding II | | | | 11.750% | | 7/23/05 | | | 423 | | | 448 | |
Milacron Escrow Corporation | | | | 11.500% | | 5/15/11 | | | 2,104 | | | 2,230 | A |
Norcraft Holdings LP | | | | 0.000% | | 9/1/12 | | | 1,150 | | | 834 | A,D |
Qwest Capital Funding, Inc. | | | | 7.000% | | 8/3/09 | | | 936 | | | 857 | |
Rainbow National Services Llc | | | | 8.750% | | 9/1/12 | | | 930 | | | 965 | A |
Rainbow National Services Llc | | | | 10.375% | | 9/1/14 | | | 1,720 | | | 1,802 | A |
Sensus Metering Systems Inc. | | | | 8.625% | | 12/15/13 | | | 2,599 | | | 2,651 | |
86
Semi-Annual Report to Shareholders
| | | | | | | | | | | | | |
| | | % OF
NET ASSETS | | RATE | | MATURITY
DATE | | PAR/
SHARES | | VALUE | |
Corporate Bonds and Notes—Continued | | | | | | | | | | | | | |
| | | | | |
Special Purpose—Continued | | | | | | | | | | | | | |
The Williams Companies, Inc. Credit-Linked Certificates | | | | 6.750% | | 4/15/09 | | $ | 1,590 | | $ | 1,658 | A |
Transdigm Funding Corp. | | | | 8.375% | | 7/15/11 | | | 1,480 | | | 1,584 | |
UCAR Finance Inc. | | | | 10.250% | | 2/15/12 | | | 2,251 | | | 2,577 | |
UGS Corporation | | | | 10.000% | | 6/1/12 | | | 1,460 | | | 1,591 | A |
WII Components, Inc. | | | | 10.000% | | 2/15/12 | | | 1,730 | | | 1,678 | |
| | | | | | | | | | | |
|
|
|
| | | | | | | | | | | | | 27,581 | |
| | | | | | | | | | | |
|
|
|
Steel Producers | | 1.0% | | | | | | | | | | | |
AK Steel Corporation | | | | 7.750% | | 6/15/12 | | | 1,010 | | | 987 | |
Ispat Inland Ulc | | | | 9.750% | | 4/1/14 | | | 2,380 | | | 2,624 | |
| | | | | | | | | | | |
|
|
|
| | | | | | | | | | | | | 3,611 | |
| | | | | | | | | | | |
|
|
|
Steel Products | | 0.3% | | | | | | | | | | | |
Allegheny Technologies, Inc. | | | | 8.375% | | 12/15/11 | | | 1,160 | | | 1,235 | |
| | | | | | | | | | | |
|
|
|
| | | | | |
Storage Facilities | | 0.6% | | | | | | | | | | | |
Mobile Mini, Inc. | | | | 9.500% | | 7/1/13 | | | 1,937 | | | 2,150 | |
| | | | | | | | | | | |
|
|
|
| | | | | |
Telecommunications | | 6.2% | | | | | | | | | | | |
AT&T Corp. | | | | 8.050% | | 11/15/11 | | | 1,260 | | | 1,410 | |
AT&T Corp. | | | | 8.750% | | 11/15/31 | | | 1,210 | | | 1,319 | |
Cincinnati Bell Inc. | | | | 7.250% | | 7/15/13 | | | 657 | | | 632 | |
Cincinnati Bell Inc. | | | | 8.375% | | 1/15/14 | | | 3,295 | | | 3,007 | |
Crown Castle International Corp. | | | | 9.375% | | 8/1/11 | | | 1,490 | | | 1,713 | |
Crown Castle International Corp. | | | | 10.750% | | 8/1/11 | | | 370 | | | 412 | |
GTE Hawaiian Telephone Company, Inc. | | | | 7.000% | | 2/1/06 | | | 520 | | | 536 | |
GTE Hawaiian Telephone Company, Inc. | | | | 7.375% | | 9/1/06 | | | 390 | | | 406 | |
Insight Midwest, L.P. | | | | 10.500% | | 11/1/10 | | | 1,040 | | | 1,139 | |
MCI Inc. | | | | 5.908% | | 5/1/07 | | | 274 | | | 272 | |
MCI Inc. | | | | 6.688% | | 5/1/09 | | | 1,974 | | | 1,903 | |
MCI Inc. | | | | 7.735% | | 5/1/14 | | | 235 | | | 223 | |
Qwest Communications International Inc. | | | | 7.250% | | 2/15/11 | | | 1,820 | | | 1,724 | A |
Qwest Corporation | | | | 7.875% | | 9/1/11 | | | 2,730 | | | 2,832 | A |
Qwest Services Corporation | | | | 14.000% | | 12/15/10 | | | 4,540 | | | 5,300 | A |
| | | | | | | | | | | |
|
|
|
| | | | | | | | | | | | | 22,828 | |
| | | | | | | | | | | |
|
|
|
Telecommunications (Cellular/Wireless) | | 2.7% | | | | | | | | | | | |
Centennial Communications Corporation | | | | 8.625% | | 2/1/14 | | | 2,220 | | | 2,117 | A |
Nextel Communications, Inc. | | | | 5.250% | | 1/15/10 | | | 843 | | | 840 | G |
87
Semi-Annual Report to Shareholders
PORTFOLIO OF INVESTMENTS—Continued
Western Asset High Yield Portfolio—Continued
| | | | | | | | | | | | | |
| | | % OF
NET ASSETS | | RATE | | MATURITY
DATE | | PAR/
SHARES | | VALUE | |
Corporate Bonds and Notes—Continued | | | | | | | | | | | | | |
| | | | | |
Telecommunications (Cellular/Wireless)—Continued | | | | | | | | | | | | | |
Nextel Communications, Inc. | | | | 7.375% | | 8/1/15 | | $ | 2,285 | | $ | 2,456 | |
Rural Cellular Corporation | | | | 8.250% | | 3/15/12 | | | 1,380 | | | 1,404 | A |
SBA Communications Corporation | | | | 0.000% | | 12/15/11 | | | 2,210 | | | 1,790 | D |
US Unwired Inc. | | | | 10.000% | | 6/15/12 | | | 1,320 | | | 1,370 | |
| | | | | | | | | | | |
|
|
|
| | | | | | | | | | | | | 9,977 | |
| | | | | | | | | | | |
|
|
|
Transportation | | 2.4% | | | | | | | | | | | |
Continental Airlines, Inc. | | | | 7.373% | | 6/15/17 | | | 794 | | | 623 | |
Gulfmark Offshore, Inc. | | | | 7.750% | | 7/15/14 | | | 1,890 | | | 1,914 | A |
Horizon Lines, LLC | | | | 9.000% | | 11/1/12 | | | 1,340 | | | 1,414 | A |
Kansas City Southern Railway | | | | 9.500% | | 10/1/08 | | | 3,339 | | | 3,656 | |
OMI Corporation | | | | 7.625% | | 12/1/13 | | | 1,319 | | | 1,353 | |
| | | | | | | | | | | |
|
|
|
| | | | | | | | | | | | | 8,960 | |
| | | | | | | | | | | |
|
|
|
Water Utilities | | 0.7% | | | | | | | | | | | |
National Waterworks, Inc. | | | | 10.500% | | 12/1/12 | | | 2,130 | | | 2,418 | |
| | | | | | | | | | | |
|
|
|
Total Corporate Bonds and Notes
(Identified Cost—$319,533) | | | | | | | | | | | | 330,163 | |
Yankee BondsH | | 6.9% | | | | | | | | | | | |
| | | | | |
Building Materials | | 0.2% | | | | | | | | | | | |
North American Energy Partners | | | | 8.750% | | 12/1/11 | | | 710 | | | 692 | A |
| | | | | | | | | | | |
|
|
|
| | | | | |
Chemicals | | 1.4% | | | | | | | | | | | |
Rhodia SA | | | | 10.250% | | 6/1/10 | | | 2,360 | | | 2,442 | |
Rhodia SA | | | | 8.875% | | 6/1/11 | | | 3,093 | | | 2,691 | |
| | | | | | | | | | | |
|
|
|
| | | | | | | | | | | | | 5,133 | |
| | | | | | | | | | | |
|
|
|
Foreign Governments | | 0.3% | | | | | | | | | | | |
Federative Republic of Brazil | | | | 14.500% | | 10/15/09 | | | 800 | | | 1,032 | |
| | | | | | | | | | | |
|
|
|
| | | | | |
Manufacturing (Diversified) | | 0.1% | | | | | | | | | | | |
Tyco International Group SA | | | | 6.375% | | 10/15/11 | | | 325 | | | 359 | |
| | | | | | | | | | | |
|
|
|
| | | | | |
Media | | 0.8% | | | | | | | | | | | |
Kabel Deutschland GmbH | | | | 10.625% | | 7/1/14 | | | 2,685 | | | 2,927 | A |
| | | | | | | | | | | |
|
|
|
| | | | | |
Oil and Gas | | 0.7% | | | | | | | | | | | |
Western Oil Sands Inc. | | | | 8.375% | | 5/1/12 | | | 2,335 | | | 2,691 | |
| | | | | | | | | | | |
|
|
|
88
Semi-Annual Report to Shareholders
| | | | | | | | | | | | | | |
| | | % OF
NET ASSETS | | RATE | | MATURITY
DATE | | PAR/
SHARES | | | VALUE | |
Yankee Bonds—Continued | | | | | | | | | | | | | | |
| | | | | |
Paper and Forest Products | | 1.0% | | | | | | | | | | | | |
Abitibi Consolidated Inc. | | | | 5.380% | | 6/15/11 | | $ | 1,560 | | | $ | 1,576 | C |
Abitibi-Consolidated Inc. | | | | 8.550% | | 8/1/10 | | | 1,090 | | | | 1,169 | |
Smurfit Capital Funding PLC | | | | 6.750% | | 11/20/05 | | | 1,000 | | | | 1,030 | |
| | | | | | | | | | | | |
|
|
|
| | | | | | | | | | | | | | 3,775 | |
| | | | | | | | | | | | |
|
|
|
Services | | 0.4% | | | | | | | | | | | | |
Compagnie Generale de Geophysique S.A. | | | | 10.625% | | 11/15/07 | | | 1,454 | | | | 1,540 | |
| | | | | | | | | | | | |
|
|
|
| | | | | |
Special Purpose | | 0.4% | | | | | | | | | | | | |
Calpine Canada Energy Finance | | | | 8.500% | | 5/1/08 | | | 569 | | | | 393 | |
Gemstone Investors Limited | | | | 7.710% | | 10/31/04 | | | 420 | | | | 420 | A |
Yell Finance BV | | | | 10.750% | | 8/1/11 | | | 371 | | | | 430 | |
| | | | | | | | | | | | |
|
|
|
| | | | | | | | | | | | | | 1,243 | |
| | | | | | | | | | | | |
|
|
|
Telecommunications | | 0.9% | | | | | | | | | | | | |
Inmarsat Finance PLC | | | | 7.625% | | 6/30/12 | | | 2,320 | | | | 2,303 | A |
Nortel Networks Ltd. | | | | 6.125% | | 2/15/06 | | | 950 | | | | 969 | |
| | | | | | | | | | | | |
|
|
|
| | | | | | | | | | | | | | 3,272 | |
| | | | | | | | | | | | |
|
|
|
Telecommunications (Cellular/Wireless) | | 0.4% | | | | | | | | | | | | |
Rogers Wireless Communications Inc. | | | | 9.625% | | 5/1/11 | | | 1,416 | | | | 1,579 | |
| | | | | | | | | | | | |
|
|
|
| | | | | |
Transportation | | 0.3% | | | | | | | | | | | | |
Teekay Shipping Corporation | | | | 8.875% | | 7/15/11 | | | 1,195 | | | | 1,352 | |
| | | | | | | | | | | | |
|
|
|
Total Yankee Bonds (Identified Cost—$24,898) | | | | | | | | | | | | | 25,595 | |
Common Stocks | | 0.1% | | | | | | | | | | | | |
| | | | | |
Engineering and Construction | | 0.1% | | | | | | | | | | | | |
Washington Group International, Inc. | | | | | | | | | 8 | shs | | | 277 | I |
| | | | | | | | | | | | |
|
|
|
Total Common Stocks (Identified Cost—$51) | | | | | | | | | | | | | 277 | |
Preferred Stocks | | 0.3% | | | | | | | | | | | | |
| | | | | |
Industrial Conglomerates | | N.M. | | | | | | | | | | | | |
High Voltage Engineering Corporation | | | | | | | | | 0.2 | | | | 2 | J |
| | | | | | | | | | | | |
|
|
|
Media | | 0.2% | | | | | | | | | | | | |
Paxson Communications Corporation | | | | | | | | | 0.1 | | | | 750 | J |
| | | | | | | | | | | | |
|
|
|
Telecommunications (Cellular/Wireless) | | 0.1% | | | | | | | | | | | | |
Rural Cellular Corporation | | | | | | | | | 3 | | | | 268 | J |
| | | | | | | | | | | | |
|
|
|
Total Preferred Stocks (Identified Cost—$1,312) | | | | | | | | | | | | | 1,020 | |
89
Semi-Annual Report to Shareholders
| | | | | | | | | |
| | | % OF
NET ASSETS | | PAR/
SHARES | | | VALUE | |
Warrants | | 0.1% | | | | | | | |
American Tower Corporation | | | | 1 | wts | | $ | 139 | A,I |
Horizon PCS, Inc. | | | | 1 | | | | 0 | A,I |
Next Generation Network, Inc. | | | | 3 | | | | 0 | I |
Washington Group International, Series A | | | | 5 | | | | 42 | I |
Washington Group International, Series B | | | | 6 | | | | 33 | I |
Washington Group International, Series C | | | | 3 | | | | 17 | I |
| | | | | | | |
|
|
|
Total Warrants (Identified Cost—$75) | | | | | | | | 231 | |
| | | | | | | |
|
|
|
Total Long-Term Securities (Identified Cost—$345,869) | | | | | | | | 357,286 | |
Total Investments (Identified Cost—$345,869) | | 97.2% | | | | | | 357,286 | |
Other Assets Less Liabilities | | 2.8% | | | | | | 10,107 | |
| | | | | | | |
|
|
|
| | | |
Net Assets | | 100.0% | | | | | | $367,393 | |
| | | | | | | |
|
|
|
| | | | | | | | | | |
| A | Rule 144a Security – A security purchased pursuant to Rule 144a under the Securities Act of 1933 which may not be resold subject to that rule except to qualified institutional buyers. These securities represent 27.85% of net assets. |
| B | Zero coupon bond – A bond with no periodic interest payments which is sold at such a discount as to produce a current yield to maturity. |
| C | Indexed security – The rates of interest earned on these securities are tied to the London Interbank Offered Rate (“LIBOR”), the Consumer Price Index (“CPI”), or the one-year Treasury Bill rate. The coupon rates are the rates as of September 30, 2004. |
| D | Stepped coupon security – A security with a predetermined schedule of interest or dividend rate changes, at which time it begins to accrue interest or pay dividends. |
| E | Bond is in default at September 30, 2004. |
| F | Unit – A security which consists of a bond and warrants to purchase the common stock of the issuer. |
| G | Convertible bond – Bond may be converted into the issuer’s common stock. |
| H | Yankee Bond – A dollar-denominated bond issued in the U.S. by foreign entities. |
| J | Pay-in-Kind (“PIK”) security – A bond in which interest or dividends during the initial few years is paid in additional PIK securities rather than in cash. |
See notes to financial statements.
90
PORTFOLIO OF INVESTMENTS—Continued
Western Asset High Yield Portfolio—Continued
Semi-Annual Report to Shareholders
PORTFOLIO OF INVESTMENTS
September 30, 2004 (Unaudited)
(Amounts in Thousands)
Western Asset Non-U.S. Opportunity Bond Portfolio
| | | | | | | | | | | |
| | | % OF
NET ASSETS | | RATE | | MATURITY
DATE | | PARA | | VALUE |
Long-Term Securities | | 85.0% | | | | | | | | | |
| | | | | |
British Sterling | | 2.3% | | | | | | | | | |
| | | | | |
Corporate Bonds and Notes | | 0.7% | | | | | | | | | |
Halifax plc | | | | 6.375% | | 4/3/08 | | 200 | | $ | 375 |
Landesbank Hessen-Thueringen Girozentrale | | | | 5.375% | | 3/7/12 | | 200 | | | 363 |
| | | | | | | | | | |
|
|
| | | | | | | | | | | | 738 |
| | | | | | | | | | |
|
|
Government Obligations | | 1.6% | | | | | | | | | |
United Kingdom Treasury Stock | | | | 5.000% | | 3/7/12 | | 840 | | | 1,540 |
| | | | | | | | | | |
|
|
Total British Sterling | | | | | | | | | | | 2,278 |
Danish Krone | | 5.2% | | | | | | | | | |
| | | | | |
Corporate Bonds and Notes | | 0.5% | | | | | | | | | |
Realkredit Danmark A/S | | | | 5.000% | | 10/1/35 | | 2,849 | | | 469 |
| | | | | | | | | | |
|
|
| | | | | |
Government Obligations | | 4.7% | | | | | | | | | |
Kingdom of Denmark | | | | 5.000% | | 11/15/13 | | 26,000 | | | 4,633 |
| | | | | | | | | | |
|
|
Total Danish Krone | | | | | | | | | | | 5,102 |
Euro | | 67.6% | | | | | | | | | |
| | | | | |
Corporate Bonds and Notes | | 9.2% | | | | | | | | | |
Bank Nederlandse Gemeenten NV | | | | 5.625% | | 10/25/10 | | 1,850 | | | 2,550 |
Bank of Scotland | | | | 5.125% | | 12/5/13 | | 545 | | | 721 |
Caisse de Refinancement L’ Habitat | | | | 4.200% | | 4/25/11 | | 2,000 | | | 2,545 |
CAM International | | | | 5.750% | | 4/3/12 | | 400 | | | 528 |
Kreditanstalt fuer Wiederaufbau | | | | 5.250% | | 1/4/10 | | 1,800 | | | 2,439 |
ING Verzekeringen NV | | | | 6.250% | | 6/21/21 | | 190 | | | 263 |
| | | | | | | | | | |
|
|
| | | | | | | | | | | | 9,046 |
| | | | | | | | | | |
|
|
U.S. Government and Agency Obligations | | 1.2% | | | | | | | | | |
Freddie Mac | | | | 5.750% | | 9/15/10 | | 900 | | | 1,240 |
| | | | | | | | | | |
|
|
| | | | | |
Government Obligations | | 57.2% | | | | | | | | | |
Federal Republic of Germany | | | | 5.000% | | 2/17/06 | | 9,500 | | | 12,210 |
Federal Republic of Germany | | | | 4.250% | | 1/4/14 | | 4,400 | | | 5,594 |
Federal Republic of Germany | | | | 5.500% | | 1/4/31 | | 3,350 | | | 4,710 |
Finland Republic | | | | 5.375% | | 7/4/13 | | 3,250 | | | 4,471 |
French Republic | | | | 5.750% | | 10/25/32 | | 2,600 | | | 3,782 |
Hellenic Republic | | | | 6.500% | | 10/22/19 | | 2,600 | | | 3,914 |
Kingdom of Spain | | | | 5.750% | | 7/30/32 | | 2,600 | | | 3,771 |
Kingdom of the Netherlands | | | | 5.500% | | 1/15/28 | | 2,950 | | | 4,123 |
91
Semi-Annual Report to Shareholders
| | | | | | | | | | | | | |
| | | % OF
NET ASSETS | | RATE | | MATURITY
DATE | | PARA | | VALUE | |
Euro—Continued | | | | | | | | | | | | | |
| | | | | |
Government Obligations—Continued | | | | | | | | | | | | | |
Republic of Austria | | | | 3.800% | | 10/20/13 | | | 3,650 | | $ | 4,481 | B |
Republic of Italy | | | | 2.750% | | 2/1/06 | | | 7,510 | | | 9,366 | |
| | | | | | | | | | | |
|
|
|
| | | | | | | | | | | | | 56,422 | |
| | | | | | | | | | | |
|
|
|
Total Euro | | | | | | | | | | | | 66,708 | |
Swedish Krona | | 9.9% | | | | | | | | | | | |
| | | | | |
Corporate Bonds and Notes | | 6.1% | | | | | | | | | | | |
AB Spintab | | | | 6.000% | | 4/20/09 | | | 18,000 | | | 2,676 | |
Stadshypotek AB | | | | 6.000% | | 3/18/09 | | | 23,000 | | | 3,418 | |
| | | | | | | | | | | |
|
|
|
| | | | | | | | | | | | | 6,094 | |
| | | | | | | | | | | |
|
|
|
Government Obligations | | 3.8% | | | | | | | | | | | |
Kingdom of Sweden | | | | 5.500% | | 10/8/12 | | | 25,000 | | | 3,731 | |
| | | | | | | | | | | |
|
|
|
Total Swedish Krona | | | | | | | | | | | | 9,825 | |
| | | | | | | | | | | |
|
|
|
Total Long-Term Securities (Identified Cost—$72,408) | | | | | | | | | | | | 83,913 | |
Short-Term Securities | | 13.0% | | | | | | | | | | | |
| | | | | |
Repurchase Agreements | | 13.0% | | | | | | | | | | | |
Deutsch Bank AG
1.85%, dated 9/30/04, to be repurchased at $7,100 on 10/1/04 (Collateral: $7,112 Fannie Mae notes, 4.61%, due 10/10/13, value $7,398) | | | | | | | | $ | 7,100 | | | 7,100 | |
Nomura Securities Co. Ltd.
1.89%, dated 9/30/04, to be repurchased at $5,683 on 10/1/04 (Collateral: $5,815 Federal Home Loan Bank bonds, 2.379%, due 7/16/18, value $5,806) | | | | | | | | | 5,683 | | | 5,683 | |
| | | | | | | | | | | |
|
|
|
Total Short-Term Securities (Identified Cost—$12,783) | | | | | | | | | | | | 12,783 | |
Total Investments (Identified Cost—$85,191) | | 98.0% | | | | | | | | | | 96,696 | |
Other Assets Less Liabilities | | 2.0% | | | | | | | | | | 2,014 | |
| | | | | | | | | | | |
|
|
|
| | | | | |
Net Assets | | 100.0% | | | | | | | | | $ | 98,710 | |
| | | | | | | | | | | |
|
|
|
| | | | | | | | | | | | | | |
| A | Securities are grouped by the currencies in which they were issued, and the par amounts are also in the issuance currency of the security. |
| B | Rule 144a Security – A security purchased pursuant to Rule 144a under the Securities Act of 1933 which may not be resold subject to that rule except to qualified institutional buyers. This security represents 4.53% of net assets. |
See notes to financial statements.
92
PORTFOLIO OF INVESTMENTS—Continued
Western Asset Non-U.S. Opportunity Bond Portfolio—Continued
Semi-Annual Report to Shareholders
STATEMENTS OF ASSETS AND LIABILITIES
September 30, 2004 (Unaudited)
(Amounts in Thousands)
Western Asset Limited Duration Bond Portfolio
| | | | | | | |
Assets: | | | | | | | |
Investment securities at market value (identified cost—$37,444) | | $ | 37,462 | | | | |
Short-term securities at value (identified cost—$6,555) | | | 6,555 | | | | |
| | |
|
|
| | | |
Total investments | | | | | | $ | 44,017 |
Cash | | | | | | | 1 |
Receivable for: | | | | | | | |
Securities sold | | | | | | | 352 |
Interest income | | | | | | | 176 |
| | | | | | |
|
|
| | | | | | | | 44,546 |
| | |
Liabilities: | | | | | | | |
Payable for: | | | | | | | |
Securities purchased | | | 1,474 | | | | |
Income distribution | | | 3 | | | | |
Futures variation margin | | | 1 | | | | |
Due to manager | | | 4 | | | | |
Accrued expenses | | | 18 | | | | |
| | |
|
|
| | | |
| | | | | | | | 1,500 |
| | | | | | |
|
|
Net Assets | | | | | | $ | 43,046 |
| | | | | | |
|
|
| | |
Net assets consist of: | | | | | | | |
Accumulated paid-in-capital applicable to: | | | | | | | |
4,305 Institutional Class shares outstanding | | $ | 42,984 | | | | |
Under/(Over) distributed net investment income | | | (9 | ) | | | |
Accumulated net realized gain/(loss) on investments, options and futures | | | 53 | | | | |
Unrealized appreciation/(depreciation) of investments, options and futures | | | 18 | | | | |
| | |
|
|
| | | |
| | |
Net Assets | | | | | | $ | 43,046 |
| | | | | | |
|
|
| | |
Net Asset Value Per Share: | | | | | | | |
Institutional Class | | | | | | | $10.00 |
| | | | | | |
|
|
| | | | | | | | |
See notes to financial statements.
93
Semi-Annual Report to Shareholders
STATEMENTS OF ASSETS AND LIABILITIES—Continued
Western Asset Intermediate Bond Portfolio
| | | | | | |
Assets: | | | | | | |
Investment securities at market value (identified cost—$691,272) | | $ | 698,233 | | | |
Short-term securities at value (identified cost—$42,958) | | | 42,942 | | | |
| | |
|
| | | |
Total investments | | | | | $ | 741,175 |
Cash | | | | | | 116 |
Swap contracts | | | | | | 28 |
Receivable for: | | | | | | |
Securities sold | | | | | | 14,877 |
Fund shares sold | | | | | | 1,561 |
Dividend and interest income | | | | | | 5,567 |
Futures variation margin | | | | | | 24 |
| | | | | |
|
|
| | | | | | | 763,348 |
| | |
Liabilities: | | | | | | |
Obligation to return collateral for securities loaned | | | 150,568 | | | |
Options written (proceeds—$71) | | | 6 | | | |
Payable for: | | | | | | |
Securities purchased | | | 13,444 | | | |
Fund shares repurchased | | | 4 | | | |
Income distribution | | | 67 | | | |
Due to manager | | | 195 | | | |
Accrued expenses | | | 106 | | | |
| | |
|
| | | |
| | | | | | | 164,390 |
| | | | | |
|
|
| | |
Net Assets | | | | | $ | 598,958 |
| | | | | |
|
|
| | |
Net assets consist of: | | | | | | |
Accumulated paid-in-capital applicable to: | | | | | | |
56,274 Institutional Class shares outstanding | | $ | 589,691 | | | |
Under/(Over) distributed net investment income | | | 43 | | | |
Accumulated net realized gain/(loss) on investments, options, futures and swaps | | | 1,908 | | | |
Unrealized appreciation/(depreciation) of investments, options, futures and swaps | | | 7,316 | | | |
| | |
|
| | | |
| | |
Net Assets | | | | | $ | 598,958 |
| | | | | |
|
|
| | |
Net Asset Value Per Share: | | | | | | |
Institutional Class | | | | | | $10.64 |
| | | | | |
|
|
| | | | | | | |
See notes to financial statements.
94
Semi-Annual Report to Shareholders
Western Asset Intermediate Plus Bond Portfolio
| | | | | | | |
Assets: | | | | | | | |
Investment securities at market value (identified cost—$12,117) | | $ | 12,159 | | | | |
Short-term securities at value (identified cost—$1,927) | | | 1,927 | | | | |
| | |
|
|
| | | |
Total investments | | | | | | $ | 14,086 |
Cash | | | | | | | 35 |
Swap contracts | | | | | | | 5 |
Receivable for: | | | | | | | |
Securities sold | | | | | | | 5,315 |
Interest income | | | | | | | 116 |
| | | | | | |
|
|
| | | | | | | | 19,557 |
| | |
Liabilities: | | | | | | | |
Options written (proceeds—$1) | | | —A | | | | |
Payable for securities purchased | | | 5,893 | | | | |
Depreciation of forward contracts | | | 19 | | | | |
Accrued expenses | | | 40 | | | | |
| | |
|
|
| | | |
| | | | | | | | 5,952 |
| | | | | | |
|
|
| | |
Net Assets | | | | | | $ | 13,605 |
| | | | | | |
|
|
| | |
Net assets consist of: | | | | | | | |
Accumulated paid-in-capital applicable to: | | | | | | | |
1,366 Institutional Class shares outstanding | | $ | 13,714 | | | | |
Under/(Over) distributed net investment income | | | (6 | ) | | | |
Accumulated net realized gain/(loss) on investments, options, futures, swaps and foreign currency transactions | | | (132 | ) | | | |
Unrealized appreciation/(depreciation) of investments, options, futures, swaps and foreign currency translations | | | 29 | | | | |
| | |
|
|
| | | |
| | |
Net Assets | | | | | | $ | 13,605 |
| | | | | | |
|
|
| | |
Net Asset Value Per Share: | | | | | | | |
Institutional Class | | | | | | | $9.96 |
| | | | | | |
|
|
| | | | | | | | |
See notes to financial statements.
95
Semi-Annual Report to Shareholders
STATEMENTS OF ASSETS AND LIABILITIES—Continued
Western Asset Core Bond Portfolio
| | | | | | | |
Assets: | | | | | | | |
Investment securities at market value (identified cost—$2,698,758) | | $ | 2,730,358 | | | | |
Short-term securities at value (identified cost—$977,308) | | | 977,497 | | | | |
| | |
|
|
| | | |
Total investments | | | | | | $ | 3,707,855 |
Swap contracts | | | | | | | 1,346 |
Receivable for: | | | | | | | |
Securities sold | | | | | | | 30,928 |
Fund shares sold | | | | | | | 9,880 |
Dividend and interest income | | | | | | | 17,210 |
| | | | | | |
|
|
| | | | | | | | 3,767,219 |
| | |
Liabilities: | | | | | | | |
Obligation to return collateral for securities loaned | | | 673,075 | | | | |
Options written (proceeds—$5,077) | | | 4,430 | | | | |
Payable for: | | | | | | | |
Securities purchased | | | 305,758 | | | | |
Fund shares repurchased | | | 1,109 | | | | |
Income distribution | | | 524 | | | | |
Interest expense | | | 714 | | | | |
Futures variation margin | | | 550 | | | | |
Due to manager and distributor | | | 956 | | | | |
Accrued expenses | | | 450 | | | | |
| | |
|
|
| | | |
| | | | | | | | 987,566 |
| | | | | | |
|
|
| | |
Net Assets | | | | | | $ | 2,779,653 |
| | | | | | |
|
|
| | |
Net assets consist of: | | | | | | | |
Accumulated paid-in-capital applicable to: | | | | | | | |
228,665 Institutional Class shares outstanding | | $ | 2,582,736 | | | | |
13,356 Financial Intermediary Class shares outstanding | | | 152,204 | | | | |
Under/(Over) distributed net investment income | | | (1,917 | ) | | | |
Accumulated net realized gain/(loss) on investments, options, futures and swaps | | | 14,180 | | | | |
Unrealized appreciation/(depreciation) of investments, options, futures and swaps | | | 32,450 | | | | |
| | |
|
|
| | | |
| | |
Net Assets | | | | | | $ | 2,779,653 |
| | | | | | |
|
|
| | |
Net Asset Value Per Share: | | | | | | | |
Institutional Class | | | | | | | $11.49 |
| | | | | | |
|
|
Financial Intermediary Class | | | | | | | $11.49 |
| | | | | | |
|
|
| | | | | | | | |
See notes to financial statements.
96
Semi-Annual Report to Shareholders
Western Asset Core Plus Bond Portfolio
| | | | | | | |
Assets: | | | | | | | |
Investment securities at market value (identified cost—$3,716,969) | | $ | 3,815,916 | | | | |
Short-term securities at value (identified cost—$1,542,445) | | | 1,544,362 | | | | |
| | |
|
|
| | | |
Total investments | | | | | | $ | 5,360,278 |
Cash and foreign currencies | | | | | | | 83,417 |
Swap contracts | | | | | | | 3,561 |
Receivable for: | | | | | | | |
Securities sold | | | | | | | 562 |
Fund shares sold | | | | | | | 21,775 |
Dividend and interest income | | | | | | | 29,666 |
Futures variation margin | | | | | | | 2,127 |
| | | | | | |
|
|
| | | | | | | | 5,501,386 |
| | |
Liabilities: | | | | | | | |
Obligation to return collateral for securities loaned | | | 943,250 | | | | |
Options written (proceeds—$7,504) | | | 6,389 | | | | |
Payable for: | | | | | | | |
Securities purchased | | | 533,531 | | | | |
Fund shares repurchased | | | 5,054 | | | | |
Interest expense | | | 1,045 | | | | |
Income distribution | | | 1,520 | | | | |
Due to manager and distributor | | | 1,284 | | | | |
Depreciation of forward contracts | | | 4,585 | | | | |
Accrued expenses | | | 556 | | | | |
| | |
|
|
| | | |
| | | | | | | | 1,497,214 |
| | | | | | |
|
|
| | |
Net Assets | | | | | | $ | 4,004,172 |
| | | | | | |
|
|
| | |
Net assets consist of: | | | | | | | |
Accumulated paid-in-capital applicable to: | | | | | | | |
370,059 Institutional Class shares outstanding | | $ | 3,800,870 | | | | |
7,695 Financial Intermediary Class shares outstanding | | | 81,283 | | | | |
Under/(Over) distributed net investment income | | | (19,067 | ) | | | |
Accumulated net realized gain/(loss) on investments, options, futures, swaps and foreign currency transactions | | | 29,949 | | | | |
Unrealized appreciation/(depreciation) of investments, options, futures, swaps and foreign currency translations | | | 111,137 | | | | |
| | |
|
|
| | | |
| | |
Net Assets | | | | | | $ | 4,004,172 |
| | | | | | |
|
|
| | |
Net Asset Value Per Share: | | | | | | | |
Institutional Class | | | | | | | $10.60 |
| | | | | | |
|
|
Financial Intermediary Class | | | | | | | $10.60 |
| | | | | | |
|
|
| | | | | | | | |
See notes to financial statements.
97
Semi-Annual Report to Shareholders
STATEMENTS OF ASSETS AND LIABILITIES—Continued
Western Asset Inflation Indexed Plus Bond Portfolio
| | | | | | | |
Assets: | | | | | | | |
Investment securities at market value (identified cost—$390,700) | | $ | 406,070 | | | | |
Short-term securities at value (identified cost—$1,631) | | | 1,632 | | | | |
| | |
|
|
| | | |
Total investments | | | | | | $ | 407,702 |
Cash | | | | | | | 646 |
Receivable for: | | | | | | | |
Fund shares sold | | | | | | | 400 |
Interest income | | | | | | | 2,945 |
Futures variation margin | | | | | | | 3 |
| | | | | | |
|
|
| | | | | | | | 411,696 |
| | |
Liabilities: | | | | | | | |
Obligation to return collateral for securities loaned | | | 10,497 | | | | |
Options written (proceeds—$31) | | | 4 | | | | |
Payable for: | | | | | | | |
Securities purchased | | | 6,537 | | | | |
Fund shares repurchased | | | 4 | | | | |
Income distribution | | | 13 | | | | |
Due to manager | | | 63 | | | | |
Depreciation of forward contracts | | | 220 | | | | |
Accrued expenses | | | 67 | | | | |
| | |
|
|
| | | |
| | | | | | | | 17,405 |
| | | | | | |
|
|
| | |
Net Assets | | | | | | $ | 394,291 |
| | | | | | |
|
|
| | |
Net assets consist of: | | | | | | | |
Accumulated paid-in-capital applicable to:
37,135 Institutional Class shares outstanding | | $ | 384,154 | | | | |
Under/(Over) distributed net investment income | | | (8 | ) | | | |
Accumulated net realized gain/(loss) on investments, options, futures, swaps
and foreign currency transactions | | | (5,014 | ) | | | |
Unrealized appreciation/(depreciation) of investments, options, futures, swaps
and foreign currency translations | | | 15,159 | | | | |
| | |
|
|
| | | |
| | |
Net Assets | | | | | | $ | 394,291 |
| | | | | | |
|
|
| | |
Net Asset Value Per Share: | | | | | | | |
Institutional Class | | | | | | | $10.62 |
| | | | | | |
|
|
| | | | | | | | |
See notes to financial statements.
98
Semi-Annual Report to Shareholders
Western Asset High Yield Portfolio
| | | | | | | |
Assets: | | | | | | | |
Investment securities at market value (identified cost—$345,869) | | | | | | $ | 357,286 |
Cash | | | | | | | 475 |
Receivable for: | | | | | | | |
Securities sold | | | | | | | 16,215 |
Dividend and interest income | | | | | | | 8,299 |
| | | | | | |
|
|
| | | | | | | | 382,275 |
| | |
Liabilities: | | | | | | | |
Payable for securities purchased | | $ | 14,614 | | | | |
Due to manager | | | 173 | | | | |
Accrued expenses | | | 95 | | | | |
| | |
|
|
| | | |
| | | | | | | | 14,882 |
| | | | | | |
|
|
| | |
Net Assets | | | | | | $ | 367,393 |
| | | | | | |
|
|
| | |
Net assets consist of: | | | | | | | |
Accumulated paid-in-capital applicable to: | | | | | | | |
34,964 Institutional Class shares outstanding | | $ | 352,909 | | | | |
Under/(Over) distributed net investment income | | | 5,704 | | | | |
Accumulated net realized gain/(loss) on investments | | | (2,637 | ) | | | |
Unrealized appreciation/(depreciation) of investments | | | 11,417 | | | | |
| | |
|
|
| | | |
| | |
Net Assets | | | | | | $ | 367,393 |
| | | | | | |
|
|
| | |
Net Asset Value Per Share: | | | | | | | |
Institutional Class | | | | | | | $10.51 |
| | | | | | |
|
|
| | | | | | | | |
See notes to financial statements.
99
Semi-Annual Report to Shareholders
STATEMENTS OF ASSETS AND LIABILITIES—Continued
Western Asset Non U.S. Opportunity Bond Portfolio
| | | | | | | |
Assets: | | | | | | | |
Investment securities at market value (identified cost—$72,408) | | $ | 83,913 | | | | |
Short-term securities at value (identified cost—$12,783) | | | 12,783 | | | | |
| | |
|
|
| | | |
Total investments | | | | | | $ | 96,696 |
Cash and foreign currencies | | | | | | | 923 |
Receivable for: | | | | | | | |
Securities sold | | | | | | | 2 |
Dividend and interest income | | | | | | | 2,435 |
| | | | | | |
|
|
| | | | | | | | 100,056 |
| | |
Liabilities: | | | | | | | |
Due to manager | | | 68 | | | | |
Depreciation of forward contracts | | | 1,253 | | | | |
Accrued expenses | | | 25 | | | | |
| | |
|
|
| | | |
| | | | | | | | 1,346 |
| | | | | | |
|
|
| | |
Net Assets | | | | | | $ | 98,710 |
| | | | | | |
|
|
| | |
Net assets consist of: | | | | | | | |
Accumulated paid-in-capital applicable to: | | | | | | | |
9,508 Institutional Class shares outstanding | | $ | 96,840 | | | | |
Under/(Over) distributed net investment income | | | (11,850 | ) | | | |
Accumulated net realized gain/(loss) on investments, options, futures
and foreign currency transactions | | | 3,402 | | | | |
Unrealized appreciation/(depreciation) of investments, options, futures
and foreign currency translations | | | 10,318 | | | | |
| | |
|
|
| | | |
| | |
Net Assets | | | | | | $ | 98,710 |
| | | | | | |
|
|
| | |
Net Asset Value Per Share: | | | | | | | |
Institutional Class | | | | | | | $10.38 |
| | | | | | |
|
|
| | | | | | | | |
See notes to financial statements.
100
[This Page Intentionally Left Blank]
101
Semi-Annual Report to Shareholders
STATEMENT OF OPERATIONS
(Amounts in Thousands) (Unaudited)
| | | | | | | | | | | | |
| | | SIX MONTHS ENDED SEPTEMBER 30, 2004
| |
| | | WESTERN
ASSET
LIMITED
DURATION
BOND
PORTFOLIO | | | WESTERN
ASSET
INTERMEDIATE
BOND
PORTFOLIO | | | WESTERN
ASSET
INTERMEDIATE
PLUS BOND
PORTFOLIO | |
Investment Income: | | | | | | | | | | | | |
Interest | | $ | 434 | | | $ | 11,824 | | | $ | 196 | |
Dividends | | | — | | | | 160 | | | | — | |
| | |
|
|
| |
|
|
| |
|
|
|
Total income | | | 434 | | | | 11,984 | | | | 196 | |
| | |
|
|
| |
|
|
| |
|
|
|
Expenses: | | | | | | | | | | | | |
Advisory fee | | | 57 | | | | 1,166 | | | | 21 | |
Distribution and service fees: | | | | | | | | | | | | |
Financial Intermediary Class | | | N/A | | | | N/A | | | | N/A | |
Audit and legal fees | | | 16 | | | | 37 | | | | 28 | |
Custodian fees | | | 36 | | | | 71 | | | | 21 | |
Directors’ fees and expenses | | | 1 | | | | 26 | | | | 1 | |
Registration fees | | | 3 | | | | 12 | | | | 2 | |
Reports to shareholders | | | — | | | | 8 | | | | 2 | |
Transfer agent and shareholder servicing expense: | | | | | | | | | | | | |
Institutional Class | | | 6 | | | | 17 | | | | 8 | |
Financial Intermediary Class | | | N/A | | | | N/A | | | | N/A | |
Other expenses | | | 1 | | | | 10 | | | | 1 | |
| | |
|
|
| |
|
|
| |
|
|
|
| | | | 120 | | | | 1,347 | | | | 84 | |
Less: Fees waived | | | (54 | ) | | | (34 | ) | | | (59 | ) |
Compensating balance credits | | | — | | | | (1 | ) | | | (1 | ) |
| | |
|
|
| |
|
|
| |
|
|
|
Total expenses, net of waivers and compensating balance credits | | | 66 | | | | 1,312 | | | | 24 | |
| | |
|
|
| |
|
|
| |
|
|
|
Net Investment Income | | | 368 | | | | 10,672 | | | | 172 | |
| | |
|
|
| |
|
|
| |
|
|
|
Net Realized and Unrealized Gain/(Loss) on Investments: | | | | | | | | | | | | |
Realized gain/(loss) on: | | | | | | | | | | | | |
Investments | | | 57 | | | | 644 | | | | (151 | ) |
Options | | | 2 | | | | 1,338 | | | | 2 | |
Futures | | | — | | | | 147 | | | | 29 | |
Foreign currency transactions | | | N/A | | | | N/A | | | | (15 | ) |
Swaps | | | — | | | | 50 | | | | 3 | |
| | |
|
|
| |
|
|
| |
|
|
|
| | | | 59 | | | | 2,179 | | | | (132 | ) |
| | |
|
|
| |
|
|
| |
|
|
|
Change in unrealized gain/(loss) on: | | | | | | | | | | | | |
Investments | | | (232 | ) | | | (6,284 | ) | | | 28 | |
Assets and liabilities denominated in foreign currency | | | N/A | | | | N/A | | | | 1 | |
| | |
|
|
| |
|
|
| |
|
|
|
| | | | (232 | ) | | | (6,284 | ) | | | 29 | |
| | |
|
|
| |
|
|
| |
|
|
|
Net Realized and Unrealized Gain/(Loss) on Investments | | | (173 | ) | | | (4,105 | ) | | | (103 | ) |
| | |
|
|
| |
|
|
| |
|
|
|
Change in Net Assets Resulting From Operations | | $ | 195 | | | $ | 6,567 | | | $ | 69 | |
| | |
|
|
| |
|
|
| |
|
|
|
| | | | | | | | | | | | | |
N/A—Not applicable.
See notes to financial statements.
102
Semi-Annual Report to Shareholders
| | | | | | | | | | | | | | | | | | |
SIX MONTHS ENDED SEPTEMBER 30, 2004
| |
WESTERN
ASSET
CORE
BOND
PORTFOLIO | | | WESTERN
ASSET
CORE
PLUS BOND
PORTFOLIO | | | WESTERN
ASSET
INFLATION
INDEXED
PLUS BOND
PORTFOLIO | | | WESTERN
ASSET
HIGH YIELD
PORTFOLIO | | | WESTERN
ASSET
NON-U.S.
OPPORTUNITY
BOND
PORTFOLIO | |
| | | | | | | | | | | | | | | | | | | |
| $ | 48,004 | | | $ | 66,675 | | | $ | 9,361 | | | $ | 12,330 | | | $ | 1,751 | |
| | 705 | | | | 187 | | | | — | | | | 60 | | | | — | |
|
|
| |
|
|
| |
|
|
| |
|
|
| |
|
|
|
| | 48,709 | | | | 66,862 | | | | 9,361 | | | | 12,390 | | | | 1,751 | |
|
|
| |
|
|
| |
|
|
| |
|
|
| |
|
|
|
| | | | | | | | | | | | | | | | | | | |
| | 5,103 | | | | 7,143 | | | | 356 | | | | 893 | | | | 217 | |
| | | | | | | | | | | | | | | | | | | |
| | 160 | | | | 19 | | | | N/A | | | | N/A | | | | N/A | |
| | 60 | | | | 95 | | | | 29 | | | | 29 | | | | 17 | |
| | 229 | | | | 408 | | | | 53 | | | | 55 | | | | 58 | |
| | 81 | | | | 107 | | | | 16 | | | | 9 | | | | 4 | |
| | 94 | | | | 101 | | | | 9 | | | | 27 | | | | 5 | |
| | 22 | | | | 15 | | | | 3 | | | | 3 | | | | 2 | |
| | | | | | | | | | | | | | | | | | | |
| | 13 | | | | 56 | | | | 11 | | | | 9 | | | | 7 | |
| | 49 | | | | — | | | | N/A | | | | N/A | | | | N/A | |
| | 46 | | | | 68 | | | | 6 | | | | 6 | | | | 2 | |
|
|
| |
|
|
| |
|
|
| |
|
|
| |
|
|
|
| | 5,857 | | | | 8,012 | | | | 483 | | | | 1,031 | | | | 312 | |
| | — | | | | (153 | ) | | | (37 | ) | | | — | | | | (46 | ) |
| | (3 | ) | | | (15 | ) | | | (1 | ) | | | (6 | ) | | | (1 | ) |
|
|
| |
|
|
| |
|
|
| |
|
|
| |
|
|
|
| | 5,854 | | | | 7,844 | | | | 445 | | | | 1,025 | | | | 265 | |
|
|
| |
|
|
| |
|
|
| |
|
|
| |
|
|
|
| | 42,855 | | | | 59,018 | | | | 8,916 | | | | 11,365 | | | | 1,486 | |
|
|
| |
|
|
| |
|
|
| |
|
|
| |
|
|
|
| | | | | | | | | | | | | | | | | | | |
| | | | | | | | | | | | | | | | | | | |
| | 8,621 | | | | 15,115 | | | | (3,533 | ) | | | 1,547 | | | | 201 | |
| | (2,226 | ) | | | 6,212 | | | | 66 | | | | — | | | | (554 | ) |
| | 3,484 | | | | 8 | | | | (446 | ) | | | — | | | | 795 | |
| | N/A | | | | 3,960 | | | | (22 | ) | | | — | | | | 2,959 | |
| | 7,763 | | | | 11,109 | | | | 4 | | | | — | | | | — | |
|
|
| |
|
|
| |
|
|
| |
|
|
| |
|
|
|
| | 17,642 | | | | 36,404 | | | | (3,931 | ) | | | 1,547 | | | | 3,401 | |
|
|
| |
|
|
| |
|
|
| |
|
|
| |
|
|
|
| | | | | | | | | | | | | | | | | | | |
| | (19,221 | ) | | | (6,472 | ) | | | (1,713 | ) | | | 4,166 | | | | (972 | ) |
| | N/A | | | | (2,346 | ) | | | 4 | | | | — | | | | (2,214 | ) |
|
|
| |
|
|
| |
|
|
| |
|
|
| |
|
|
|
| | (19,221 | ) | | | (8,818 | ) | | | (1,709 | ) | | | 4,166 | | | | (3,186 | ) |
|
|
| |
|
|
| |
|
|
| |
|
|
| |
|
|
|
| | (1,579 | ) | | | 27,586 | | | | (5,640 | ) | | | 5,713 | | | | 215 | |
|
|
| |
|
|
| |
|
|
| |
|
|
| |
|
|
|
| $ | 41,276 | | | $ | 86,604 | | | $ | 3,276 | | | $ | 17,078 | | | $ | 1,701 | |
|
|
| |
|
|
| |
|
|
| |
|
|
| |
|
|
|
| | | | | | | | | | | | | | | | | | | |
103
Semi-Annual Report to Shareholders
STATEMENT OF CHANGES IN NET ASSETS
(Amounts in Thousands) (Unaudited)
| | | | | | | | | | | | | | | | | | | | |
| | | WESTERN ASSET
LIMITED DURATION
BOND PORTFOLIO
| | | WESTERN ASSET
INTERMEDIATE BOND
PORTFOLIO
| | | WESTERN ASSET
INTERMEDIATE PLUS
BOND PORTFOLIO
| |
| | | SIX MONTHS
ENDED
9/30/04 | | | PERIOD
ENDED
3/31/04A | | | SIX MONTHS
ENDED
9/30/04 | | | YEAR
ENDED
3/31/04 | | | PERIOD
ENDED
9/30/04B | |
| Change in Net Assets: | | | | | | | | | | | | | | | |
Net investment income | | $ | 368 | | | $ | 206 | | | $ | 10,672 | | | $ | 22,550 | | | $ | 172 | |
| | | | | |
Net realized gain/(loss) on investments, options, futures, swaps and foreign currency transactions | | | 59 | | | | (6 | ) | | | 2,179 | | | | 16,937 | | | | (132 | ) |
| | | | | |
Change in unrealized appreciation/ (depreciation) of investments, options, futures, swaps and assets and liabilities denominated in foreign currencies | | | (232 | ) | | | 250 | | | | (6,284 | ) | | | 2,068 | | | | 29 | |
| | |
|
|
| |
|
|
| |
|
|
| |
|
|
| |
|
|
|
Change in net assets resulting from operations | | | 195 | | | | 450 | | | | 6,567 | | | | 41,555 | | | | 69 | |
| | | | | |
Distributions to Shareholders: | | | | | | | | | | | | | | | | | | | | |
From net investment income: | | | | | | | | | | | | | | | | | | | | |
Institutional Class | | | (377 | ) | | | (206 | ) | | | (10,711 | ) | | | (22,411 | ) | | | (178 | ) |
Financial Intermediary Class | | | N/A | | | | N/A | | | | N/A | | | | N/A | | | | N/A | |
| | | | | |
From net realized gain on investments: | | | | | | | | | | | | | | | | | | | | |
Institutional Class | | | — | | | | — | | | | (15,309 | ) | | | (13,489 | ) | | | — | |
Financial Intermediary Class | | | N/A | | | | N/A | | | | N/A | | | | N/A | | | | N/A | |
| | | | | |
Change in net assets from: | | | | | | | | | | | | | | | | | | | | |
Fund share transactions: | | | | | | | | | | | | | | | | | | | | |
Institutional Class | | | 17,046 | | | | 25,938 | | | | 31,182 | | | | 41,700 | | | | 13,714 | |
Financial Intermediary Class | | | N/A | | | | N/A | | | | N/A | | | | N/A | | | | N/A | |
| | |
|
|
| |
|
|
| |
|
|
| |
|
|
| |
|
|
|
Change in net assets | | | 16,864 | | | | 26,182 | | | | 11,729 | | | | 47,355 | | | | 13,605 | |
| | | | | |
Net Assets: | | | | | | | | | | | | | | | | | | | | |
Beginning of period | | | 26,182 | | | | — | | | | 587,229 | | | | 539,874 | | | | — | |
| | |
|
|
| |
|
|
| |
|
|
| |
|
|
| |
|
|
|
| | | | | |
End of period | | $ | 43,046 | | | $ | 26,182 | | | $ | 598,958 | | | $ | 587,229 | | | $ | 13,605 | |
| | |
|
|
| |
|
|
| |
|
|
| |
|
|
| |
|
|
|
| | | | | |
Under/(Over) distributed net investment income | | $ | (9 | ) | | $ | — | | | $ | 43 | | | $ | 82 | | | $ | (6 | ) |
| | |
|
|
| |
|
|
| |
|
|
| |
|
|
| |
|
|
|
| | | | | | | | | | | | | | | | | | | | | |
| A | For the period October 1, 2003 (commencement of operations) to March 31, 2004. |
| B | For the period April 1, 2004 (commencement of operations) to September 30, 2004 |
N/A—Not applicable.
See notes to financial statements.
104
Semi-Annual Report to Shareholders
| | | | | | | | | | | | | | | | | | | | | | | | | | | | | | | | | | | | | | |
WESTERN ASSET
CORE BOND
PORTFOLIO
| | | WESTERN ASSET
CORE PLUS BOND
PORTFOLIO
| | | WESTERN ASSET
INFLATION INDEXED
PLUS BOND PORTFOLIO
| | | WESTERN ASSET
HIGH YIELD
PORTFOLIO
| | | WESTERN ASSET
NON-U.S. OPPORTUNITY
BOND PORTFOLIO
| |
SIX MONTHS
ENDED
9/30/04 | | | YEAR
ENDED
3/31/04 | | | SIX MONTHS
ENDED
9/30/04 | | | YEAR
ENDED
3/31/04 | | | SIX MONTHS
ENDED
9/30/04 | | | YEAR
ENDED
3/31/04 | | | SIX MONTHS
ENDED
9/30/04 | | | YEAR
ENDED
3/31/04 | | | SIX MONTHS
ENDED
9/30/04 | | | YEAR
ENDED
3/31/04 | |
| | | | | | | | | | | | | | | | | | | | | | | | | | | | | |
| $ | 42,855 | | | $ | 65,432 | | | $ | 59,018 | | | $ | 87,230 | | | $ | 8,916 | | | $ | 11,494 | | | $ | 11,365 | | | $ | 12,730 | | | $ | 1,486 | | | $ | 2,498 | |
| | | | | | | | | |
| | 17,642 | | | | 55,766 | | | | 36,404 | | | | 61,576 | | | | (3,931 | ) | | | 23,127 | | | | 1,547 | | | | 6,041 | | | | 3,401 | | | | (2,553 | ) |
| | | | | | | | | |
| | (19,221 | ) | | | 18,124 | | | | (8,818 | ) | | | 67,117 | | | | (1,709 | ) | | | (2,556 | ) | | | 4,166 | | | | 7,912 | | | | (3,186 | ) | | | 5,428 | |
|
|
| |
|
|
| |
|
|
| |
|
|
| |
|
|
| |
|
|
| |
|
|
| |
|
|
| |
|
|
| |
|
|
|
| | 41,276 | | | | 139,322 | | | | 86,604 | | | | 215,923 | | | | 3,276 | | | | 32,065 | | | | 17,078 | | | | 26,683 | | | | 1,701 | | | | 5,373 | |
| | | | | | | | | |
| | | | | | | | | | | | | | | | | | | | | | | | | | | | | | | | | | | | | | | |
| | | | | | | | | | | | | | | | | | | | | �� | | | | | | | | | | | | | | | | | | |
| | (42,065 | ) | | | (65,545 | ) | | | (61,865 | ) | | | (95,872 | ) | | | (8,988 | ) | | | (11,494 | ) | | | (8,269 | ) | | | (15,028 | ) | | | (2,732 | ) | | | (5,476 | ) |
| | (2,140 | ) | | | (3,395 | ) | | | (227 | ) | | | (107 | ) | | | N/A | | | | N/A | | | | N/A | | | | N/A | | | | N/A | | | | N/A | |
| | | | | | | | | |
| | | | | | | | | | | | | | | | | | | | | | | | | | | | | | | | | | | | | | | |
| | (49,163 | ) | | | (23,668 | ) | | | (44,219 | ) | | | (43,348 | ) | | | (12,719 | ) | | | (12,824 | ) | | | — | | | | — | | | | (136 | ) | | | (1,794 | ) |
| | (2,570 | ) | | | (1,371 | ) | | | (111 | ) | | | (45 | ) | | | N/A | | | | N/A | | | | N/A | | | | N/A | | | | N/A | | | | N/A | |
| | | | | | | | | |
| | | | | | | | | | | | | | | | | | | | | | | | | | | | | | | | | | | | | | | |
| | | | | | | | | | | | | | | | | | | | | | | | | | | | | | | | | | | | | | | |
| | 491,116 | | | | 743,572 | | | | 655,961 | | | | 1,343,566 | | | | 66,343 | | | | 48,326 | | | | 169,126 | | | | 27,866 | | | | 2,850 | | | | 39,898 | |
| | 34,373 | | | | 40,360 | | | | 74,339 | | | | 6,585 | | | | N/A | | | | N/A | | | | N/A | | | | N/A | | | | N/A | | | | N/A | |
|
|
| |
|
|
| |
|
|
| |
|
|
| |
|
|
| |
|
|
| |
|
|
| |
|
|
| |
|
|
| |
|
|
|
| | 470,827 | | | | 829,275 | | | | 710,482 | | | | 1,426,702 | | | | 47,912 | | | | 56,073 | | | | 177,935 | | | | 39,521 | | | | 1,683 | | | | 38,001 | |
| | | | | | | | | |
| | | | | | | | | | | | | | | | | | | | | | | | | | | | | | | | | | | | | | | |
| | 2,308,826 | | | | 1,479,551 | | | | 3,293,690 | | | | 1,866,988 | | | | 346,379 | | | | 290,306 | | | | 189,458 | | | | 149,937 | | | | 97,027 | | | | 59,026 | |
|
|
| |
|
|
| |
|
|
| |
|
|
| |
|
|
| |
|
|
| |
|
|
| |
|
|
| |
|
|
| |
|
|
|
| | | | | | | | | |
| $ | 2,779,653 | | | $ | 2,308,826 | | | $ | 4,004,172 | | | $ | 3,293,690 | | | $ | 394,291 | | | $ | 346,379 | | | $ | 367,393 | | | $ | 189,458 | | | $ | 98,710 | | | $ | 97,027 | |
|
|
| |
|
|
| |
|
|
| |
|
|
| |
|
|
| |
|
|
| |
|
|
| |
|
|
| |
|
|
| |
|
|
|
| | | | | | | | | |
| $ | (1,916 | ) | | $ | (566 | ) | | $ | (19,066 | ) | | $ | (15,992 | ) | | $ | (8 | ) | | $ | 64 | | | $ | 5,704 | | | $ | 2,608 | | | $ | (11,850 | ) | | $ | (10,604 | ) |
|
|
| |
|
|
| |
|
|
| |
|
|
| |
|
|
| |
|
|
| |
|
|
| |
|
|
| |
|
|
| |
|
|
|
| | | | | | | | | | | | | | | | | | | | | | | | | | | | | | | | | | | | | | | |
105
Semi-Annual Report to Shareholders
FINANCIAL HIGHLIGHTS
Contained below is per share operating performance data for a share of common stock outstanding throughout each period shown, total investment return, ratios to average net assets and other supplemental data. This information has been derived from information in the financial statements.
| | | | | | | | | | | | | | |
| | | | | INVESTMENT OPERATIONS
|
| | NET ASSET
VALUE,
BEGINNING
OF PERIOD | | NET
INVESTMENT
INCOME | | | NET REALIZED
AND UNREALIZED
GAIN/(LOSS) ON
INVESTMENTS,
OPTIONS, FUTURES,
SWAPS, AND
FOREIGN CURRENCY
TRANSACTIONS | | | TOTAL
FROM
INVESTMENT
OPERATIONS |
| Western Asset Limited Duration Bond Portfolio | | | | | | | | | | |
—Institutional Class | | | | | | | | | | | | | | |
Six Months Ended September 30, 2004A | | $ | 10.09 | | $ | .12 | B | | $ | (.09 | ) | | $ | .03 |
Period Ended March 31, 2004E | | | 10.00 | | | .08 | B | | | .09 | | | | .17 |
| | | | |
Western Asset Intermediate Bond Portfolio | | | | | | | | | | | | | | |
—Institutional Class | | | | | | | | | | | | | | |
Six Months Ended September 30, 2004A | | $ | 11.01 | | $ | .19 | F | | $ | (.09 | ) | | $ | .10 |
Years Ended March 31, | | | | | | | | | | | | | | |
2004 | | | 10.92 | | | .44 | F | | | .36 | | | | .80 |
2003 | | | 10.39 | | | .53 | | | | .62 | | | | 1.15 |
2002 | | | 10.65 | | | .57 | F | | | (.13 | ) | | | .44 |
2001 | | | 10.09 | | | .68 | F | | | .56 | | | | 1.24 |
2000 | | | 10.62 | | | .63 | F | | | (.38 | ) | | | .25 |
—Financial Intermediary Class | | | | | | | | | | | | | | |
Period Ended November 30, 1999G | | $ | 10.61 | | $ | .41 | H | | $ | (.33 | ) | | $ | .08 |
| | | | |
Western Asset Intermediate Plus Bond Portfolio | | | | | | | | | | | | | | |
—Institutional Class | | | | | | | | | | | | | | |
Period Ended September 30, 2004A,I | | $ | 10.00 | | $ | .16 | J | | $ | (.04 | ) | | $ | .12 |
| | | | |
Western Asset Core Bond Portfolio | | | | | | | | | | | | | | |
—Institutional Class | | | | | | | | | | | | | | |
Six Months Ended September 30, 2004A | | $ | 11.81 | | $ | .21 | | | $ | (.06 | ) | | $ | .15 |
Years Ended March 31, | | | | | | | | | | | | | | |
2004 | | | 11.57 | | | .41 | | | | .45 | | | | .86 |
2003 | | | 11.01 | | | .55 | | | | .65 | | | | 1.20 |
2002 | | | 11.09 | | | .62 | K | | | .05 | | | | .67 |
2001 | | | 10.39 | | | .73 | K | | | .70 | | | | 1.43 |
2000 | | | 11.01 | | | .67 | K | | | (.46 | ) | | | .21 |
—Financial Intermediary Class | | | | | | | | | | | | | | |
Six Months Ended September 30, 2004A | | $ | 11.81 | | $ | .20 | | | $ | (.07 | ) | | $ | .13 |
Years Ended March 31, | | | | | | | | | | | | | | |
2004 | | | 11.57 | | | .40 | L | | | .43 | | | | .83 |
2003 | | | 11.02 | | | .53 | | | | .63 | | | | 1.16 |
2002 | | | 11.10 | | | .59 | L | | | .06 | | | | .65 |
2001 | | | 10.40 | | | .70 | L | | | .70 | | | | 1.40 |
2000M | | | 10.69 | | | .45 | L | | | (.25 | ) | | | .20 |
| | | | | | | | | | | | | | | |
106
Semi-Annual Report to Shareholders
| | | | | | | | | | | | | | | | | | | | | | | | | | | | |
DISTRIBUTIONS
| | | | | RATIOS/SUPPLEMENTAL DATA
|
FROM
NET
INVESTMENT
INCOME | | | FROM
NET
REALIZED
GAIN ON
INVESTMENTS | | | TOTAL
DISTRIBUTIONS | | | NET ASSET
VALUE,
END OF
PERIOD | | TOTAL
RETURN | | | EXPENSES
TO
AVERAGE
NET
ASSETS | | | NET
INVESTMENT
INCOME
TO
AVERAGE
NET ASSETS | | | PORTFOLIO
TURNOVER
RATE | | | NET
ASSETS,
END OF
PERIOD
(IN
THOUSANDS) |
| | | | | | | | | | | | | | | | | | | | | | | | |
| | | | | | | | | | | | | | | | | | | | | | | | | | | | | |
| $ | (.12 | ) | | $ | — | | | $ | (.12 | ) | | $ | 10.00 | | .26 | %C | | .40 | %B,D | | 2.2 | %B,D | | 150.4 | %C | | $ | 43,046 |
| | (.08 | ) | | | — | | | | (.08 | ) | | | 10.09 | | 1.69 | %C | | .40 | %B,D | | 1.6 | %B,D | | 125.5 | %C | | | 26,182 |
| | | | | | | | |
| | | | | | | | | | | | | | | | | | | | | | | | | | | | | |
| | | | | | | | | | | | | | | | | | | | | | | | | | | | | |
| $ | (.19 | ) | | $ | (.28 | ) | | $ | (.47 | ) | | $ | 10.64 | | 1.12 | %C | | .45 | %D,F | | 3.7 | %D,F | | 102.5 | %C | | $ | 598,958 |
| | | | | | | | | | | | | | | | | | | | | | | | | | | | | |
| | (.44 | ) | | | (.27 | ) | | | (.71 | ) | | | 11.01 | | 7.58 | % | | .45 | %F | | 4.0 | %F | | 255.1 | % | | $ | 587,229 |
| | (.53 | ) | | | (.09 | ) | | | (.62 | ) | | | 10.92 | | 11.37 | % | | .45 | % | | 5.0 | % | | 238.5 | % | | | 539,874 |
| | (.57 | ) | | | (.13 | ) | | | (.70 | ) | | | 10.39 | | 4.20 | % | | .45 | %F | | 5.3 | %F | | 274.8 | % | | | 628,196 |
| | (.68 | ) | | | — | | | | (.68 | ) | | | 10.65 | | 12.79 | % | | .45 | %F | | 6.6 | %F | | 328.4 | % | | | 457,822 |
| | (.78 | ) | | | — | | | | (.78 | ) | | | 10.09 | | 2.49 | % | | .45 | %F | | 6.3 | %F | | 440.8 | % | | | 376,056 |
| | | | | | | | | | | | | | | | | | | | | | | | | | | | | |
| $ | (.43 | ) | | $ | — | | | $ | (.43 | ) | | $ | 10.26 | | .81 | %C | | .70 | %D,H | | 5.9 | %D,H | | 440.8 | % | | $ | — |
| | | | | | | | |
| | | | | | | | | | | | | | | | | | | | | | | | | | | | | |
| | | | | | | | | | | | | | | | | | | | | | | | | | | | | |
| $ | (.16 | ) | | $ | — | | | $ | (.16 | ) | | $ | 9.96 | | 1.24 | %C | | .45 | %D,J | | 3.3 | %D,J | | 385.1 | %C | | $ | 13,605 |
| | | | | | | | |
| | | | | | | | | | | | | | | | | | | | | | | | | | | | | |
| | | | | | | | | | | | | | | | | | | | | | | | | | | | | |
| $ | (.21 | ) | | $ | (.26 | ) | | $ | (.47 | ) | | $ | 11.49 | | 1.28 | %C | | .46 | %D | | 3.5 | %D | | 179.3 | %C | | $ | 2,626,228 |
| | | | | | | | | | | | | | | | | | | | | | | | | | | | | |
| | (.44 | ) | | | (.18 | ) | | | (.62 | ) | | | 11.81 | | 7.64 | % | | .49 | % | | 3.5 | % | | 464.6 | % | | | 2,187,219 |
| | (.55 | ) | | | (.09 | ) | | | (.64 | ) | | | 11.57 | | 11.19 | % | | .49 | % | | 4.9 | % | | 438.6 | % | | | 1,400,431 |
| | (.62 | ) | | | (.13 | ) | | | (.75 | ) | | | 11.01 | | 6.14 | % | | .50 | %K | | 5.6 | %K | | 595.2 | % | | | 971,544 |
| | (.73 | ) | | | — | | | | (.73 | ) | | | 11.09 | | 14.37 | % | | .50 | %K | | 6.8 | %K | | 387.2 | % | | | 826,459 |
| | (.80 | ) | | | (.03 | ) | | | (.83 | ) | | | 10.39 | | 1.99 | % | | .50 | %K | | 6.3 | %K | | 260.4 | % | | | 649,038 |
| | | | | | | | | | | | | | | | | | | | | | | | | | | | | |
| $ | (.19 | ) | | $ | (.26 | ) | | $ | (.45 | ) | | $ | 11.49 | | 1.24 | %C | | .73 | %D | | 3.2 | %D | | 179.3 | %C | | $ | 153,425 |
| | | | | | | | | | | | | | | | | | | | | | | | | | | | | |
| | (.41 | ) | | | (.18 | ) | | | (.59 | ) | | | 11.81 | | 7.36 | % | | .75 | %L | | 3.2 | %L | | 464.6 | % | | | 121,607 |
| | (.52 | ) | | | (.09 | ) | | | (.61 | ) | | | 11.57 | | 10.80 | % | | .75 | % | | 4.1 | % | | 438.6 | % | | | 79,120 |
| | (.60 | ) | | | (.13 | ) | | | (.73 | ) | | | 11.02 | | 5.88 | % | | .75 | %L | | 5.3 | %L | | 595.2 | % | | | 1,885 |
| | (.70 | ) | | | — | | | | (.70 | ) | | | 11.10 | | 13.96 | % | | .75 | %L | | 6.6 | %L | | 387.2 | % | | | 1,883 |
| | (.49 | ) | | | — | | | | (.49 | ) | | | 10.40 | | 1.97 | %C | | .75 | %D,L | | 6.2 | %D,L | | 260.4 | % | | | 1,456 |
| | | | | | | | | | | | | | | | | | | | | | | | | | | | | |
107
Semi-Annual Report to Shareholders
FINANCIAL HIGHLIGHTS—Continued
| | | | | | | | | | | | | | | |
| | | | | INVESTMENT OPERATIONS
| |
| | NET ASSET
VALUE,
BEGINNING
OF PERIOD | | NET
INVESTMENT
INCOME | | | NET REALIZED
AND UNREALIZED
GAIN/(LOSS) ON
INVESTMENTS,
OPTIONS, FUTURES,
SWAPS, AND
FOREIGN CURRENCY
TRANSACTIONS | | | TOTAL
FROM
INVESTMENT
OPERATIONS | |
| Western Asset Core Plus Bond Portfolio | | | | | | | | | | | |
—Institutional Class | | | | | | | | | | | | | | | |
Six Months Ended September 30, 2004A | | $ | 10.71 | | $ | .19 | N | | $ | .03 | | | $ | .22 | |
Years Ended March 31, | | | | | | | | | | | | | | | |
2004 | | | 10.40 | | | .37 | N | | | .55 | | | | .92 | |
2003 | | | 9.88 | | | .51 | N | | | .62 | | | | 1.13 | |
2002 | | | 10.07 | | | .56 | N,O | | | .06 | O | | | .62 | |
2001 | | | 9.48 | | | .66 | N | | | .59 | | | | 1.25 | |
2000 | | | 9.97 | | | .55 | N | | | (.37 | ) | | | .18 | |
—Financial Intermediary Class | | | | | | | | | | | | | | | |
Six Months Ended September 30, 2004A | | $ | 10.71 | | $ | .19 | P | | $ | .01 | | | $ | .20 | |
Years Ended March 31, | | | | | | | | | | | | | | | |
2004 | | | 10.40 | | | .36 | P | | | .54 | | | | .90 | |
2003 | | | 9.87 | | | .48 | P | | | .63 | | | | 1.11 | |
2002Q | | | 10.04 | | | .11 | O,P | | | (.17 | )O | | | (.06 | ) |
| | | | |
Western Asset Inflation Indexed Plus Bond Portfolio | | | | | | | | | | | | | | | |
—Institutional Class | | | | | | | | | | | | | | | |
Six Months Ended September 30, 2004A | | $ | 11.24 | | $ | .27 | R | | $ | (.22 | ) | | $ | .05 | |
Years Ended March 31, | | | | | | | | | | | | | | | |
2004 | | | 10.96 | | | .37 | R | | | .71 | | | | 1.08 | |
2003 | | | 9.92 | | | .51 | R | | | 1.19 | | | | 1.70 | |
2002 | | | 9.98 | | | .41 | R | | | .01 | | | | .42 | |
2001S | | | 10.00 | | | .08 | R | | | (.02 | ) | | | .06 | |
| | | | |
Western Asset High Yield Portfolio | | | | | | | | | | | | | | | |
—Institutional Class | | | | | | | | | | | | | | | |
Six Months Ended September 30, 2004A | | $ | 10.28 | | $ | .26 | T | | $ | .21 | | | $ | .47 | |
Years Ended March 31, | | | | | | | | | | | | | | | |
2004 | | | 9.56 | | | .78 | T | | | .89 | | | | 1.67 | |
2003 | | | 10.36 | | | .96 | T | | | (.82 | ) | | | .14 | |
2002U | | | 10.00 | | | .53 | T | | | .07 | | | | .60 | |
| | | | | | | | | | | | | | | | |
108
Semi-Annual Report to Shareholders
| | | | | | | | | | | | | | | | | | | | | | | | | | | | |
DISTRIBUTIONS
| | | | | RATIOS/SUPPLEMENTAL DATA
|
FROM
NET
INVESTMENT
INCOME | | | FROM
NET
REALIZED
GAIN ON
INVESTMENTS | | | TOTAL
DISTRIBUTIONS | | | NET ASSET
VALUE,
END OF
PERIOD | | TOTAL
RETURN | | | EXPENSES
TO
AVERAGE
NET
ASSETS | | | NET
INVESTMENT
INCOME
TO
AVERAGE
NET ASSETS | | | PORTFOLIO
TURNOVER
RATE | | | NET
ASSETS,
END OF
PERIOD
(IN
THOUSANDS) |
| | | | | | | | | | | | | | | | | | | | | | | | |
| | | | | | | | | | | | | | | | | | | | | | | | | | | | | |
| $ | (.19 | ) | | $ | (.14 | ) | | $ | (.33 | ) | | $ | 10.60 | | 2.15 | %C | | .45 | %D,N | | 3.4 | %D,N | | 280.3 | %C | | $ | 3,922,584 |
| | | | | | | | | | | | | | | | | | | | | | | | | | | | | |
| | (.41 | ) | | | (.20 | ) | | | (.61 | ) | | | 10.71 | | 9.12 | % | | .45 | %N | | 3.6 | %N | | 463.8 | % | | | 3,286,650 |
| | (.51 | ) | | | (.10 | ) | | | (.61 | ) | | | 10.40 | | 11.78 | % | | .45 | %N | | 5.0 | %N | | 422.6 | % | | | 1,866,619 |
| | (.54 | ) | | | (.27 | ) | | | (.81 | ) | | | 9.88 | | 6.34 | % | | .45 | %N | | 5.3 | %N | | 590.7 | % | | | 991,673 |
| | (.66 | ) | | | — | | | | (.66 | ) | | | 10.07 | | 13.73 | % | | .46 | %N | | 6.8 | %N | | 432.8 | % | | | 444,451 |
| | (.67 | ) | | | — | | | | (.67 | ) | | | 9.48 | | 1.95 | % | | .50 | %N | | 6.2 | %N | | 315.9 | % | | | 215,184 |
| | | | | | | | | | | | | | | | | | | | | | | | | | | | | |
| $ | (.17 | ) | | $ | (.14 | ) | | $ | (.31 | ) | | $ | 10.60 | | 2.03 | %C | | .70 | %D,P | | 2.2 | %D,P | | 280.3 | %C | | $ | 81,588 |
| | | | | | | | | | | | | | | | | | | | | | | | | | | | | |
| | (.39 | ) | | | (.20 | ) | | | (.59 | ) | | | 10.71 | | 8.82 | % | | .70 | %P | | 3.2 | %P | | 463.8 | % | | | 7,040 |
| | (.48 | ) | | | (.10 | ) | | | (.58 | ) | | | 10.40 | | 11.57 | % | | .70 | %P | | 4.8 | %P | | 422.6 | % | | | 369 |
| | (.11 | ) | | | — | | | | (.11 | ) | | | 9.87 | | (.57 | )%C | | .70 | %D,P | | 5.3 | %D,P | | 590.7 | % | | | 235 |
| | | | | | | | |
| | | | | | | | | | | | | | | | | | | | | | | | | | | | | |
| | | | | | | | | | | | | | | | | | | | | | | | | | | | | |
| $ | (.27 | ) | | $ | (.40 | ) | | $ | (.67 | ) | | $ | 10.62 | | .72 | %C | | .25 | %D,R | | 5.0 | %D,R | | 185.9 | %C | | $ | 394,291 |
| | | | | | | | | | | | | | | | | | | | | | | | | | | | | |
| | (.37 | ) | | | (.43 | ) | | | (.80 | ) | | | 11.24 | | 10.33 | % | | .25 | %R | | 3.4 | %R | | 281.8 | % | | | 346,379 |
| | (.51 | ) | | | (.15 | ) | | | (.66 | ) | | | 10.96 | | 17.62 | % | | .25 | %R | | 4.8 | %R | | 75.4 | % | | | 290,306 |
| | (.41 | ) | | | (.07 | ) | | | (.48 | ) | | | 9.92 | | 4.28 | % | | .25 | %R | | 5.0 | %R | | 79.5 | % | | | 210,635 |
| | (.08 | ) | | | — | | | | (.08 | ) | | | 9.98 | | .55 | %C | | .25 | %D,R | | 8.9 | %D,R | | — | | | | 11,978 |
| | | | | | | | |
| | | | | | | | | | | | | | | | | | | | | | | | | | | | | |
| | | | | | | | | | | | | | | | | | | | | | | | | | | | | |
| $ | (.24 | ) | | $ | — | | | $ | (.24 | ) | | $ | 10.51 | | 4.70 | %C | | .64 | %D | | 7.0 | %D | | 55.5 | %C | | $ | 367,393 |
| | | | | | | | | | | | | | | | | | | | | | | | | | | | | |
| | (.95 | ) | | | — | | | | (.95 | ) | | | 10.28 | | 18.27 | % | | .58 | %T | | 7.9 | %T | | 116.0 | % | | | 189,458 |
| | (.94 | ) | | | — | | | | (.94 | ) | | | 9.56 | | 2.22 | % | | .55 | %T | | 10.2 | %T | | 110.1 | % | | | 149,937 |
| | (.24 | ) | | | — | | | | (.24 | ) | | | 10.36 | | 6.02 | %C | | .55 | %D,T | | 10.4 | %D,T | | 51.8 | %C | | | 152,729 |
| | | | | | | | | | | | | | | | | | | | | | | | | | | | | |
109
Semi-Annual Report to Shareholders
FINANCIAL HIGHLIGHTS—Continued
| | | | | | | | | | | | | | |
| | | | | INVESTMENT OPERATIONS
|
| | NET ASSET
VALUE,
BEGINNING
OF PERIOD | | NET
INVESTMENT
INCOME | | | NET REALIZED
AND UNREALIZED
GAIN/(LOSS) ON
INVESTMENTS,
OPTIONS, FUTURES,
SWAPS, AND
FOREIGN CURRENCY
TRANSACTIONS | | | TOTAL
FROM
INVESTMENT
OPERATIONS |
| Western Asset Non-U.S. Opportunity Bond Portfolio | | | | | | | | | | |
—Institutional Class | | | | | | | | | | | | | | |
Six Months Ended September 30, 2004A | | $ | 10.52 | | $ | .20 | V | | $ | (.04 | ) | | $ | .16 |
Years Ended March 31, | | | | | | | | | | | | | | |
2004 | | | 10.91 | | | .97 | V | | | (.01 | ) | | | .96 |
2003 | | | 9.25 | | | .25 | V | | | 1.52 | | | | 1.77 |
2002 | | | 9.25 | | | — | O,V | | | .46 | O | | | .46 |
2001 | | | 9.59 | | | .59 | V | | | (.05 | ) | | | .54 |
| | | | | | | | | | | | | | | |
| B | Net of advisory fees waived by the adviser pursuant to a voluntary expense limitation of 0.40%. If no fees had been waived by the adviser, the annualized ratio of expenses to average net assets would have been as follows: for the six months ended September 30, 2004, 0.73%; and for the period October 1, 2003 (commencement of operations) to March 31, 2004, 0.68%. |
| E | For the period October 1, 2003 (commencement of operations) to March 31, 2004. |
| F | Net of advisory fees waived by the adviser pursuant to a voluntary expense limitation of 0.45%. If no fees had been waived by the adviser, the ratio of expenses to average net assets would have been: for the six months ended September 30, 2004, 0.46%; and for the years ended March 31,2004, 0.47%; 2002, 0.47%; 2001, 0.47%; and 2000, 0.48%. |
| G | Liquidation of Financial Intermediary Class shares. |
| H | Net of advisory fees waived by the adviser pursuant to a voluntary expense limitation of 0.70%. If no fees had been waived by the adviser, the annualized ratio of expenses to average net assets would have been as follows: for the period ending November 30, 1999 (liquidation of Financial Intermediary Class shares), 0.74%. |
| I | For the period April 1, 2004 (commencement of operations) to September 30, 2004. |
| J | Net of advisory fees waived by the adviser pursuant to a voluntary expense limitation of 0.45%. If no fees had been waived by the adviser, the ratio of expenses to average net assets would have been as follows: for the period ended September 30, 2004, 1.57%. |
| K | Net of advisory fees waived by the adviser pursuant to a voluntary expense limitation of 0.50%. If no fees had been waived by the adviser, the ratio of expenses to average net assets would have been as follows: for the years ended March 31, 2002, 0.52%; 2001, 0.53%; and 2000, 0.51%. |
| L | Net of advisory fees waived by the adviser pursuant to a voluntary expense limitation of 0.75%. If no fees had been waived by the adviser, the ratio of expenses to average net assets would have been as follows: for the years ended March 31, 2004, 0.76% ; 2002, 0.77%; and 2001, 0.78%. For the period July 22, 1999 (commencement of operations) to March 31, 2000, the annualized ratio of expenses to average net assets would have been 0.76%. |
| M | For the period July 22, 1999 (commencement of operations) to March 31, 2000. |
| N | Net of advisory fees waived by the adviser pursuant to a voluntary expense limitation of 0.50% to June 30, 2000, and 0.45% thereafter. If no fees had been waived by the adviser, the ratio of expenses to average net assets would have been as follows: for the six months ended September 30, 2004, 0.46%; and for the years ended March 31, 2004, 0.48%; 2003, 0.50%; 2002, 0.54%; 2001, 0.57%; and 2000, 0.65%. |
110
Semi-Annual Report to Shareholders
| | | | | | | | | | | | | | | | | | | | | | | | | | | | |
DISTRIBUTIONS
| | | | | RATIOS/SUPPLEMENTAL DATA
|
FROM
NET
INVESTMENT
INCOME | | | FROM
NET
REALIZED
GAIN ON
INVESTMENTS | | | TOTAL
DISTRIBUTIONS | | | NET ASSET
VALUE,
END OF
PERIOD | | TOTAL
RETURN | | | EXPENSES
TO
AVERAGE
NET
ASSETS | | | NET
INVESTMENT
INCOME
TO
AVERAGE
NET ASSETS | | | PORTFOLIO
TURNOVER
RATE | | | NET
ASSETS,
END OF
PERIOD
(IN
THOUSANDS) |
| | | | | | | | | | | | | | | | | | | | | | | | |
| | | | | | | | | | | | | | | | | | | | | | | | | | | | | |
| $ | (.29 | ) | | $ | (.01 | ) | | $ | (.30 | ) | | $ | 10.38 | | 1.62 | %C | | .55 | %D,V | | 3.1 | %D,V | | 6.9 | %C | | $ | 98,710 |
| | | | | | | | | | | | | | | | | | | | | | | | | | | | | |
| | (1.01 | ) | | | (.34 | ) | | | (1.35 | ) | | | 10.52 | | 9.06 | % | | .55 | %V | | 4.0 | %V | | 42.8 | % | | | 97,027 |
| | (.11 | ) | | | — | | | | (.11 | ) | | | 10.91 | | 19.26 | % | | .55 | %V | | 4.4 | %V | | 187.5 | % | | | 59,026 |
| | (.46 | ) | | | — | | | | (.46 | ) | | | 9.25 | | 5.21 | % | | .55 | %V | | 4.5 | %V | | 307.6 | % | | | 47,487 |
| | (.88 | ) | | | — | | | | (.88 | ) | | | 9.25 | | 6.31 | % | | .55 | %V | | 5.6 | %V | | 263.4 | % | | | 93,385 |
| | | | | | | | | | | | | | | | | | | | | | | | | | | | | |
| O | The amount presented is calculated pursuant to a methodology prescribed by the Securities and Exchange Commission for a share outstanding throughout the period. This amount is inconsistent with the Fund’s aggregate gains and losses because of the timing of sales and redemptions of Fund shares in relation to fluctuating market values for the investment portfolio. |
| P | Net of advisory fees waived by the adviser pursuant to a voluntary expense limitation of 0.70%. If no fees had been waived by the adviser, the ratio of expenses to average net assets would have been as follows: for the six months ended September 30, 2004, 0.71%; and for the years ended March 31, 2004, 0.73% and 2003, 0.75%. For the period January 8, 2002 (commencement of operations) to March 31, 2002, the annualized ratio of expenses to average net assets would have been 0.75%. |
| Q | For the period January 8, 2002 (commencement of operations) to March 31, 2002. |
| R | Net of advisory fees waived by the adviser pursuant to a voluntary expense limitation of 0.25%. If no fees had been waived by the adviser, the ratio of expenses to average net assets would have been as follows: for the six months ended September 30, 2004, 0.27%; and for the years ended March 31, 2004, 0.27%; 2003, 0.27%; and 2002, 0.67%. For the period March 1, 2001 (commencement of operations) to March 31, 2001, the annualized ratio of expenses to average net assets would have been 2.03%. |
| S | For the period March 1, 2001 (commencement of operations) to March 31, 2001. |
| T | Net of advisory fees waived by the adviser pursuant to a voluntary expense limitation of 0.55% to December 31, 2003, and 0.65% thereafter. If no fees had been waived by the adviser, the ratio of expenses to average net assets would have been as follows: for the years ended March 31, 2004, 0.67% and 2003, 0.67%. For the period September 28, 2001 (commencement of operations) to March 31, 2002, the annualized ratio of expenses to average net assets would have been 0.75%. |
| U | For the period September 28, 2001 (commencement of operations) to March 31, 2002. |
| V | Net of advisory fees waived by the adviser pursuant to a voluntary expense limitation of 0.55%. If no fees had been waived by the adviser, the ratio of expenses to average net assets would have been as follows: for the six months ended September 30, 2004, 0.67%; and for the years ended March 31, 2004, 0.80%; 2003, 0.82%; 2002, 0.82%; 2001, 0.85; and 2000, 0.83%. |
See notes to financial statements.
111
Semi-Annual Report to Shareholders
NOTES TO FINANCIAL STATEMENTS
(Amounts in Thousands) (Unaudited)
1. Significant Accounting Policies:
Western Asset Funds, Inc. (“Corporation”), consisting of Western Asset Limited Duration Bond Portfolio (“Limited Duration”), Western Asset Intermediate Bond Portfolio (“Intermediate”), Western Asset Intermediate Plus Bond Portfolio (“Intermediate Plus”), Western Asset Core Bond Portfolio (“Core”), Western Asset Core Plus Bond Portfolio (“Core Plus”), Western Asset Inflation Indexed Plus Bond Portfolio (“Inflation Indexed”), Western Asset High Yield Portfolio (“High Yield”), and Western Asset Non-U.S. Opportunity Bond Portfolio (“Non-U.S.”) (individually a “Fund,” collectively the “Funds”), is registered under the Investment Company Act of 1940, as amended (“1940 Act”), as a diversified, open-end management investment company with the exception of Non-U.S., which is non-diversified.
Each Fund offers two classes of shares: Institutional Class and Financial Intermediary Class. Shares in the Financial Intermediary Class bear a distribution fee. The Financial Intermediary Class shares of Limited Duration, Intermediate Plus, Inflation Indexed, High Yield, and Non-U.S. are not active. All outstanding Financial Intermediary Class shares of Intermediate were redeemed on November 30, 1999. The income and expenses of each of the Funds are allocated proportionately to the two classes of shares based on daily net assets, except for Rule 12b-1 distribution fees, which are charged only on the Financial Intermediary Class shares, and transfer agent and shareholder servicing expenses, which are determined separately for each class.
Preparation of the financial statements in accordance with accounting principles generally accepted in the United States of America requires management to make estimates and assumptions that affect the reported amounts and disclosures in the financial statements. Actual results could differ from these estimates. The following is a summary of significant accounting policies followed by the funds in the preparation of their financial statements:
Security Valuation
Securities owned by the Funds for which market quotations are readily available are valued at current market value. Securities for which market quotations are not readily available are fair valued by the Board of Directors or the Funds’ Valuation Committee pursuant to procedures adopted by the Board. In determining fair value, the Board of Directors or the Funds’ Valuation Committee consider all relevant qualitative and quantitative factors available. These factors are subject to change over time and are reviewed periodically. The values assigned to fair value investments are based on available information and do not necessarily represent amounts that might ultimately be realized, since such amounts depend on future developments inherent in long-term investments. Further, because of the inherent uncertainty of valuation, those estimated values may differ significantly from the values that would have been used had a ready market of the investments existed, and the differences could be material.
With respect to Intermediate Plus, Core Plus, Inflation Indexed, High Yield and Non-U.S., where a security is traded on more than one market, which may include foreign markets, the securities are generally valued on the market considered by the Funds’ adviser to be the primary market. The Funds will value their foreign securities in U.S. dollars on the basis of the then-prevailing exchange rates.
Security Transactions
Security transactions are recorded on the trade date. Realized gains and losses from security transactions are reported on an identified cost basis for both financial reporting and federal income tax purposes.
For the six months ended September 30, 2004, investment transactions (excluding short-term investments) were:
| | | | | | | | | | | | |
| | | Purchases
| | Proceeds From Sales
|
| | | U.S. Gov’t
Securities
| | Other
| | U.S. Gov’t
Securities
| | Other
|
Limited Duration | | $ | 43,345 | | $ | 14,170 | | $ | 37,802 | | $ | 6,383 |
Intermediate | | | 374,836 | | | 197,735 | | | 413,801 | | | 147,073 |
Intermediate Plus | | | 40,844 | | | 11,169 | | | 36,921 | | | 2,950 |
Core | | | 3,913,951 | | | 145,517 | | | 4,281,579 | | | 178,067 |
Core Plus | | | 6,527,704 | | | 2,211,749 | | | 6,770,447 | | | 2,192,357 |
Inflation Indexed | | | 719,391 | | | 2,309 | | | 680,037 | | | 21,087 |
High Yield | | | — | | | 361,803 | | | — | | | 164,465 |
Non-U.S. | | | — | | | 5,837 | | | — | | | 5,646 |
112
Semi-Annual Report to Shareholders
Foreign Currency Translation
Assets and liabilities initially expressed in non-U.S. currencies are translated into U.S. dollars using currency exchange rates determined prior to the close of the Exchange, usually 2:00 p.m. Eastern time. Purchases and sales of securities and income and expenses are translated into U.S. dollars at the prevailing market rates on the dates of such transactions. The effects of changes in non-U.S. currency exchange rates on investment securities and other assets and liabilities are included with the net realized and unrealized gain or loss on investment securities.
Repurchase Agreements
The Funds may engage in repurchase agreement transactions. Under the terms of a typical repurchase agreement, a fund takes possession of an underlying debt obligation subject to an obligation of the seller to repurchase, and a fund to resell, the obligation at an agreed-upon price and time, thereby determining the yield during a fund’s holding period. This arrangement results in a fixed rate of return that is not subject to market fluctuations during the fund’s holding period. The value of the collateral is at all times at least equal to the total amount of the repurchase obligation, including interest. In the event of counterparty default, a fund has the right to use the collateral to satisfy the terms of the repurchase agreement. However, there could be potential loss to the fund in the event the fund is delayed or prevented from exercising its right to dispose of the collateral securities, including the risk of a possible decline in the value of the collateral securities during the period in which the fund seeks to assert its rights. The Funds’ investment advisers review the value of the collateral and the creditworthiness of those banks and dealers with which the Funds enter into repurchase agreements to evaluate potential risks.
Options, Futures and Swap Agreements
The current market value of a traded option is the last sale price or, in the absence of a sale, the mean between the closing bid and asked price. Futures contracts are valued daily at the settlement price established by the board of trade or exchange on which they are traded. Futures contracts are marked-to-market on a daily basis. As a contract’s value fluctuates, payments known as variation margin are made or received by a Fund each day, depending on the daily fluctuation in the value of the contract. The daily changes in contract value are recorded as unrealized gains or losses, and the Fund recognizes a gain or loss when the contract is closed. Swap agreements are priced daily based upon quotations from brokers and the change, if any, is recorded as unrealized appreciation or depreciation.
Investment Income and Distributions to Shareholders
Dividend income and distributions to shareholders are allocated at the class level and are recorded on the ex-dividend date. Dividends from net investment income are declared daily and paid monthly for each Fund except High Yield and Non-U.S., which declare and pay dividends quarterly. Net capital gains distributions, which are calculated at the Fund level, are declared and paid annually in June. An additional distribution may be made in November to the extent necessary in order to comply with federal excise tax requirements. Distributions are determined in accordance with federal income tax regulations, which may differ from those determined in accordance with accounting principles generally accepted in the United States of America; accordingly, periodic reclassifications are made within the Funds’ capital accounts to reflect income and gains available for distribution under federal income tax regulations. Interest income and expenses are recorded on the accrual basis. Bond discounts and premiums are amortized and included in interest income for financial reporting and federal income tax purposes.
2. Federal Income Taxes:
No provision for federal income or excise taxes is required since each Fund intends to continue to qualify as a regulated investment company and distribute substantially all of its taxable income and capital gains to its shareholders. Because federal income tax regulations differ from accounting principles generally accepted in the United States of America, income and capital gains distributions determined in accordance with tax regulations may differ from net investment income and realized gains recognized for financial reporting purposes. Accordingly, the character of the distributions and composition of net assets for tax purposes differ from those reflected in the accompanying financial statements. The amount and character of tax-basis distributions and composition of net assets are finalized at fiscal year-end; accordingly, tax-basis balances have not been determined as of September 30, 2004.
The Funds intend to retain realized capital gains that may be offset against available capital loss carryforwards for federal income tax purposes. As of March 31, 2004, Limited Duration and High Yield had capital loss carryforwards of $6 (expiring in 2012) and $4,078 (expiring in 2011), respectively. There were no capital loss carryforwards for any of the other Funds.
113
Semi-Annual Report to Shareholders
NOTES TO FINANCIAL STATEMENTS—Continued
3. Financial Instruments:
Forward Currency Exchange Contracts
As part of their investment programs, the Funds may utilize forward currency exchange contracts. The nature and risks of these financial instruments and the reasons for using them are set forth more fully in the Corporation’s prospectus and statement of additional information.
Forward foreign currency contracts are marked-to-market daily using forward foreign currency exchange rates supplied by an independent pricing service. The change in a contract’s market value is recorded by the Funds as an unrealized gain or loss. When the contract is closed or delivery is taken, the Funds record a realized gain or loss equal to the difference between the value of the contract at the time it was opened and the value at the time it was closed.
The use of forward foreign currency exchange contracts does not eliminate fluctuations in the underlying prices of the Funds’ securities, but it does establish a rate of exchange that can be achieved in the future. These forward foreign currency contracts involve market risk in excess of amounts reflected in the financial statements. Although forward foreign currency contracts used for hedging purposes limit the risk of loss due to a decline in the value of the hedged currency, they also limit any potential gain that might result should the value of the currency increase. In addition, the Funds could be exposed to risks if the counterparties to the contracts are unable to meet the terms of their contracts.
At September 30, 2004 open forward currency exchange contracts were as follows:
Intermediate Plus
| | | | | | | | | | | | |
Settlement Date
| | Contract to
| | Unrealized Gain/(Loss)
| |
| | ReceiveA
| | DeliverA
| |
| 11/10/04 | | USD | | 746 | | EUR | | 615 | | $ | (19 | ) |
| | | | | | | | | | |
|
|
|
| | | | | | | | | | | $ | (19 | ) |
| | | | | | | | | | |
|
|
|
Core Plus
| | | | | | | | | | | | |
Settlement Date
| | Contract to
| | Unrealized Gain/(Loss)
| |
| | ReceiveA
| | DeliverA
| |
| 11/10/04 | | USD | | 38,659 | | CAD | | 51,481 | | $ | (2,146 | ) |
| 11/10/04 | | USD | | 111,909 | | EUR | | 92,018 | | | (2,439 | ) |
| | | | | | | | | | |
|
|
|
| | | | | | | | | | | $ | (4,585 | ) |
| | | | | | | | | | |
|
|
|
Inflation Indexed
| | | | | | | | | | | | |
Settlement Date
| | Contract to
| | Unrealized Gain/(Loss)
| |
| | ReceiveA
| | DeliverA
| |
| 11/10/04 | | USD | | 3,400 | | CAD | | 4,425 | | $ | (108 | ) |
| 11/10/04 | | USD | | 3,551 | | EUR | | 2,923 | | | (82 | ) |
| 11/10/04 | | USD | | 757 | | SEK | | 5,739 | | | (30 | ) |
| | | | | | | | | | |
|
|
|
| | | | | | | | | | | $ | (220 | ) |
| | | | | | | | | | |
|
|
|
Non-U.S.
| | | | | | | | | | | | |
Settlement Date
| | Contract to
| | Unrealized Gain/(Loss)
| |
| | ReceiveA
| | DeliverA
| |
| 11/10/04 | | CAD | | 10,545 | | USD | | 7,912 | | $ | 447 | |
| 11/10/04 | | USD | | 1,592 | | DKK | | 9,740 | | | (35 | ) |
| 11/10/04 | | EUR | | 2,891 | | NOK | | 24,541 | | | 83 | |
| 11/10/04 | | EUR | | 6,488 | | USD | | 7,874 | | | 188 | |
| 11/10/04 | | USD | | 65,386 | | EUR | | 53,855 | | | (1,538 | ) |
| 11/10/04 | | NOK | | 20,438 | | EUR | | 2,411 | | | (98 | ) |
| 11/10/04 | | NOK | | 14,792 | | USD | | 2,118 | | | 83 | |
| 11/10/04 | | NOK | | 20,438 | | EUR | | 2,411 | | | 144 | |
| 11/10/04 | | EUR | | 2,891 | | NOK | | 24,541 | | | (143 | ) |
| 11/10/04 | | USD | | 1,866 | | NOK | | 13,030 | | | (73 | ) |
| 11/10/04 | | GBP | | 550 | | USD | | 1,003 | | | (10 | ) |
| 11/10/04 | | USD | | 3,345 | | GBP | | 1,833 | | | 35 | |
| 11/10/04 | | USD | | 9,094 | | SEK | | 68,733 | | | (336 | ) |
| | | | | | | | | | |
|
|
|
| | | | | | | | | | | $ | (1,253 | ) |
| | | | | | | | | | |
|
|
|
114
Semi-Annual Report to Shareholders
Options and Futures
As part of their investment programs, the Funds may utilize options and futures. Options may be written (sold) or purchased by the Funds. When a Fund purchases a put or call option, the premium paid is recorded as an investment and its value is marked-to-market daily. When a Fund writes a put or call option, an amount equal to the premium received by the Fund is recorded as a liability and its value is marked-to-market daily.
When options, whether written or purchased, expire, are exercised or are closed (by entering into a closing purchase or sale transaction), the Fund realizes a gain or loss as described in the chart below:
| | |
| Purchased option: | | Impact on the Fund: |
| The option expires | | Realize a loss in the amount of the cost of the option. |
| The option is closed through a closing sale transaction | | Realize a gain or loss depending on whether the proceeds from the closing sale transaction are greater or less than the cost of the option. |
| The Fund exercises a call option | | The cost of the security purchased through the exercise of the option will be increased by the premium originally paid to purchase the option. |
| The Fund exercises a put option | | Realize a gain or loss from the sale of the underlying security. The proceeds of that sale will be reduced by the premium originally paid to purchase the put option. |
| |
| Written option: | | Impact on the Fund: |
| The option expires | | Realize a gain equal to the amount of the premium received. |
| The option is closed through a closing purchase transaction | | Realize a gain or loss without regard to any unrealized gain or loss on the underlying security and eliminate the option liability. The Fund will realize a loss in this transaction if the cost of the closing purchase exceeds the premium received when the option was written. |
| A written call option is exercised by the option purchaser | | Realize a gain or loss from the sale of the underlying security. The proceeds of that sale will be increased by the premium originally received when the option was written. |
| A written put option is exercised by the option purchaser | | The amount of the premium originally received will reduce the cost of the security that the Fund purchased when the option was exercised. |
The risk associated with purchasing options is limited to the premium originally paid. Options written by a Fund involve, to varying degrees, risk of loss in excess of the option value reflected in the statement of net assets. The risk in writing a covered call option is that a Fund may forgo the opportunity of profit if the market price of the underlying security increases and the option is exercised. The risk in writing a put option is that a Fund may incur a loss if the market price of the underlying security decreases and the option is exercised. In addition, there is the risk a Fund may not be able to enter into a closing transaction because of an illiquid secondary market or, for over-the-counter options, because of the counterparty’s inability or unwillingness to perform. The nature and risks of these financial instruments and the reasons for using them are set forth more fully in the Corporation’s prospectus and statement of additional information.
| A | Definitions of currency abbreviations: |
CAD—Canadian dollar
DKK—Danish krona
EUR—Euro
GBP—British pound
NOK—Norwegian krone
SEK—Swedish Krona
USD—United States dollar
115
Semi-Annual Report to Shareholders
NOTES TO FINANCIAL STATEMENTS—Continued
Activity in written call and put options during the six months ended September 30, 2004, was as follows:
| | | | | | | | | | | | | | |
| | | Calls
| | | Puts
| |
| Intermediate | | Actual
Contracts
| | | Premiums
| | | Actual
Contracts
| | | Premiums
| |
Options outstanding at March 31, 2004 | | 752 | | | $ | 991 | | | 13,400,557 | | | $ | 736 | |
Options written | | 634 | | | | 821 | | | 548 | | | | 460 | |
Options closed | | (1,386 | ) | | | (1,812 | ) | | (13,401,001 | ) | | | (1,125 | ) |
Options expired | | — | | | | — | | | | | | | | |
Options exercised | | — | | | | — | | | | | | | | |
| | |
|
| |
|
|
| |
|
| |
|
|
|
Options outstanding at September 30, 2004 | | — | | | $ | — | | | 104 | | | $ | 71 | |
| | |
|
| |
|
|
| |
|
| |
|
|
|
| | | | | | | | | | | | | | |
| | | Calls
| | | Puts
| |
| Intermediate Plus | | Actual
Contracts
| | | Premiums
| | | Actual
Contracts
| | | Premiums
| |
Options outstanding at March 31, 2004 | | — | | | $ | — | | | — | | | $ | — | |
Options written | | 2 | | | | 1 | | | 4 | | | | 2 | |
Options closed | | (2 | ) | | | (1 | ) | | (2 | ) | | | (1 | ) |
Options expired | | — | | | | — | | | — | | | | — | |
Options exercised | | — | | | | — | | | — | | | | — | |
| | |
|
| |
|
|
| |
|
| |
|
|
|
Options outstanding at September 30, 2004 | | — | | | $ | — | | | 2 | | | $ | 1 | |
| | |
|
| |
|
|
| |
|
| |
|
|
|
| | | | | | | | | | | | | | |
| | | Calls
| | | Puts
| |
| Core | | Actual
Contracts
| | | Premiums
| | | Actual
Contracts
| | | Premiums
| |
Options outstanding at March 31, 2004 | | 30,302,820 | | | $ | 2,962 | | | 92,706,826 | | | $ | 6,470 | |
Options written | | 11,030 | | | | 8,535 | | | 147,597,101 | | | | 5,062 | |
Options closed | | (5,956 | ) | | | (4,934 | ) | | (147,596,866 | ) | | | (6,356 | ) |
Options expired | | (3,281 | ) | | | (2,910 | ) | | (92,702,422 | ) | | | (2,293 | ) |
Options exercised | | (1,580 | ) | | | (784 | ) | | (1,178 | ) | | | (675 | ) |
| | |
|
| |
|
|
| |
|
| |
|
|
|
Options outstanding at September 30, 2004 | | 30,303,033 | | | $ | 2,869 | | | 3,461 | | | $ | 2,208 | |
| | |
|
| |
|
|
| |
|
| |
|
|
|
| | | | | | | | | | | | | | |
| | | Calls
| | | Puts
| |
| Core Plus | | Actual
Contracts
| | | Premiums
| | | Actual
Contracts
| | | Premiums
| |
Options outstanding at March 31, 2004 | | 39,303,534 | | | $ | 3,803 | | | 129,705,061 | | | $ | 5,517 | |
Options written | | 45,416,385 | | | | 13,055 | | | 214,960,296 | | | | 7,293 | |
Options closed | | (9,100 | ) | | | (7,605 | ) | | (214,955,018 | ) | | | (5,124 | ) |
Options expired | | (4,411 | ) | | | (3,906 | ) | | (129,703,224 | ) | | | (3,113 | ) |
Options exercised | | (2,133 | ) | | | (1,063 | ) | | (2,025 | ) | | | (1,353 | ) |
| | |
|
| |
|
|
| |
|
| |
|
|
|
Options outstanding at September 30, 2004 | | 84,704,275 | | | $ | 4,284 | | | 5,090 | | | $ | 3,220 | |
| | |
|
| |
|
|
| |
|
| |
|
|
|
| | | | | | | | | | | | | | |
| | |
| | | Calls
| | | Puts
| |
| Inflation Indexed | | Actual
Contracts
| | | Premiums
| | | Actual
Contracts
| | | Premiums
| |
Options outstanding at March 31, 2004 | | 4,600,283
4,800,033
(4,600,188
(95
(33 |
)
)
) | | $ | 305 | | | 25,600,387 | | | $ | 403 | |
Options written | | | | 53 | | | 110 | | | | 80 | |
Options closed | | | | (218 | ) | | (403 | ) | | | (185 | ) |
Options expired | | | | (87 | ) | | (25,600,000 | ) | | | (266 | ) |
Options exercised | | | | (22 | ) | | (94 | ) | | | (32 | ) |
| | |
|
| |
|
|
| |
|
| |
|
|
|
Options outstanding at September 30, 2004 | | 4,800,000 | | | $ | 31 | | | — | | | $ | — | |
| | |
|
| |
|
|
| |
|
| |
|
|
|
116
Semi-Annual Report to Shareholders
Upon entering into a futures contract, the Funds are required to deposit with the broker cash or cash equivalents in an amount equal to a certain percentage of the contract amount. This is known as the “initial margin.” Subsequent payments (“variation margin”) are made or received by the Fund each day, depending on the daily fluctuation in the value of the contract. For Non-U.S. and foreign denominated futures held in Intermediate Plus, Core Plus and Inflation Indexed, payment is not sent daily, but is recorded as a net payable or receivable by the Fund to or from the futures broker, which holds cash collateral from the Fund. The daily changes in contract value are recorded as unrealized gains or losses, and each Fund recognizes a realized gain or loss when the contract is closed. Futures contracts are valued daily at the settlement price established by the board of trade or exchange on which they are traded.
The Funds enter into futures contracts for various reasons, including in connection with their interest rate management strategy. Futures contracts involve, to varying degrees, risk of loss in excess of the amounts reflected in the financial statements. The change in value of the futures contracts primarily corresponds with the value of the underlying instruments, which may not correlate with changes in interest rates, if applicable. In addition, there is a risk that a Fund may not be able to enter into a closing transaction because of an illiquid secondary market. The nature and risks of these financial instruments and other reasons for using them are set forth more fully in the Corporation’s prospectus and statement of additional information.
The open futures positions and related appreciation or depreciation at September 30, 2004 are listed at the end of each Fund’s portfolio of investments.
Swap Agreements
The use of swaps involves risks that are different from those associated with ordinary portfolio securities transactions. Swap agreements may be considered to be illiquid. Although a Fund will not enter into any swap agreement unless the adviser believes that the other party to the transaction is creditworthy, a Fund does bear the risk of loss of the amount expected to be received under a swap agreement in the event of the default or bankruptcy of the agreement counterparty. The nature and risks of these financial instruments and the reasons for using them are set forth more fully in the Corporation’s prospectus and statement of additional information.
The Funds may invest in different types of swap agreements. Currently, the Funds hold credit default and interest rate swap contracts (denoted in the table below by a superscript 1 or 2, respectively). Credit default swap contracts represent the exchange of commitments to provide a level of credit protection for a commitment to receive interest at a fixed rate based on the potential risk of default of the relevant underlying issuer. The relevant underlying issuer for credit default swap contracts is listed in a parenthetical reference following the agreement counterparty. Interest rate swap contracts involve the exchange of commitments to pay and receive interest based on a notional principal amount.
117
Semi-Annual Report to Shareholders
NOTES TO FINANCIAL STATEMENTS—Continued
The following is a summary of open swap contracts outstanding at September 30, 2004.
| | | | | | | | | | | | |
Intermediate: | | | | | | | | | | | | |
Agreement With:
| | Termination Date
| | The Fund Agrees to Pay
| | The Fund Will Receive
| | Contract Notional Amount
| | Unrealized
Appreciation/
(Depreciation)
|
Lehman Brothers (Dynergy Holdings, 8.75%, due 2/15/12)1 | | April 23, 2007 | | Specified amount
upon credit
event noticeB | | 3.00%
Quarterly | | $ | 2,200 | | $ | (56) |
| | | | | |
J.P. Morgan Chase
& Co., Inc (Telecom Italia SPA, 6.25%, due 2/1/12)1 | | March 20, 2009 | | Specified amount
upon credit
event noticeB | | 1.00%
Quarterly | | | 3,010 | | | 67 |
| | | | | |
J.P. Morgan Chase
& Co., Inc (Fannie Mae, 6.25%, due 2/15/11)1 | | September 24, 2009 | | Specified amount
upon credit
event noticeB | | 0.55%
Quarterly | | | 5,180 | | | 17 |
| | | | | | | | | | | |
|
|
| | | | | | | | | | | | $ | 28 |
| | | | | | | | | | | |
|
|
| | | | | |
Intermediate Plus: | | | | | | | | | | | | |
Agreement With:
| | Termination Date
| | The Fund Agrees to Pay
| | The Fund Will Receive
| | Contract Notional Amount
| | Unrealized
Appreciation/
(Depreciation)
|
The Goldman Sachs Group, Inc. (iBoxx IG Hi-Vol2)1 | | September 20, 2009 | | Specified amount
upon credit
event noticeC | | 4.30%
Quarterly | | $ | 250 | | | N.M. |
| | | | | |
J.P. Morgan Chase & Co., Inc (Fannie Mae,
6.25%, due 2/15/11)1 | | September 24, 2009 | | Specified amount
upon credit
event noticeC | | 0.55%
Quarterly | | | 90 | | | N.M. |
| | | | | | | | | | | |
|
|
| | | | | | | | | | | | | N.M. |
| | | | | | | | | | | |
|
|
| | | | | |
Core: | | | | | | | | | | | | |
Agreement With:
| | Termination Date
| | The Fund Agrees to Pay
| | The Fund Will Receive
| | Contract Notional Amount
| | Unrealized
Appreciation/
(Depreciation)
|
Deutsche Bank (Dynegy Holdings, 8.75%, due 2/15/12)1 | | May 1, 2007 | | Specified amount
upon credit
event noticeB | | 5.25%
Quarterly | | $ | 3,340 | | $ | 117 |
| | | | | |
Credit Suisse First
Boston USA2 | | September 14, 2007 | | 3.228%
Semi-annually | | 3-month
LIBORD | | | 132,510 | | | 159 |
| | | | | |
Credit Suisse First
Boston USA2 | | September 14, 2007 | | 3.206%
Semi-annually | | 3-month
LIBORD | | | 132,510 | | | 241 |
| | | | | |
The Goldman Sachs
Group, Inc.2 | | September 14, 2007 | | 3-month
LIBORD | | 3.215%
Semi-annually | | | 26,500 | | | (41) |
| B | Upon bankruptcy or failure to make a scheduled interest payment, the Fund will pay $1,000; upon default, the Fund will pay $10,000. |
| C | Upon bankruptcy or failure to make a scheduled interest payment, the Fund will pay $1,000. |
| D | London Interbank Offered Rate. |
| E | Upon bankruptcy or failure to make a scheduled interest payment, the Fund will receive $1,000. |
118
Semi-Annual Report to Shareholders
| | | | | | | | | | | | |
Agreement With:
| | Termination Date
| | The Fund Agrees to Pay
| | The Fund Will Receive
| | Contract Notional Amount
| | Unrealized
Appreciation/
(Depreciation)
|
Credit Suisse First
Boston USA2 | | September 21, 2007 | | 3.222%
Semi-annually | | 3-month
LIBORD | | $ | 58,700 | | $ | 91 |
| | | | | |
Credit Suisse First
Boston USA2 | | September 21, 2007 | | 3.237%
Semi-annually | | 3-month
LIBORD | | | 88,000 | | | 99 |
| | | | | |
The Goldman Sachs
Group, Inc.2 | | September 22, 2007 | | 3.1985%
Semi-annually | | 3-month
LIBORD | | | 96,800 | | | 233 |
| | | | | |
Deutsche Bank AG
(iBoxx IG TMT)1 | | March 20, 2009 | | 0.60%
Quarterly | | Specified amount
upon credit
event noticeE | | | 7,400 | | | 43 |
| | | | | |
Deutsche Bank AG
(iBoxx 30 Hi-Vol)1 | | March 20, 2009 | | 1.25%
Quarterly | | Specified amount
upon credit
event noticeE | | | 7,400 | | | 23 |
| | | | | |
Deutsche Bank AG
(iBoxx IG Hi-Vol)1 | | March 20, 2009 | | Specified amount
upon credit
event noticeC | | 1.25%
Quarterly | | | 9,740 | | | 35 |
| | | | | |
Merrill Lynch & Co., Inc. (Pacific Gas & Electric,
4.80%, due 3/1/14)1 | | June 20, 2009 | | Specified amount
upon credit
event noticeC | | 0.42%
Quarterly | | | 2,100 | | | (3) |
| | | | | |
Deutsche Bank AG
(iBoxx IG Hi-Vol2)1 | | September 20, 2009 | | 1.15%
Quarterly | | Specified amount
upon credit
event noticeE | | | 25,000 | | | 160 |
| | | | | |
Credit Suisse First
Boston USA
(iBoxx IG Hi-Vol2)1 | | September 20, 2009 | | Specified amount
upon credit
event noticeC | | 1.15%
Quarterly | | | 7,510 | | | 36 |
| | | | | |
Deutsche Bank AG
(iBoxx IG Hi-Vol2)1 | | September 20, 2009 | | Specified amount
upon credit
event noticeC | | 1.15%
Quarterly | | | 25,000 | | | (40) |
| | | | | |
The Goldman Sachs
Group, Inc. (iBoxx IG Hi-Vol2)1 | | September 20, 2009 | | Specified amount
upon credit
event noticeC | | 1.15%
Quarterly | | | 4,310 | | | 29 |
| | | | | |
Deutsche Bank AG
(iBoxx IG Hi-Vol2)1 | | September 20, 2009 | | Specified amount
upon credit
event noticeC | | 1.15%
Quarterly | | | 4,160 | | | (23) |
| | | | | |
Deutsche Bank AG2 | | September 24, 2014 | | 4.432%
Semi-annually | | 3-month
LIBORD | | | 63,300 | | | 628 |
| | | | | |
Credit Suisse First
Boston USA
(iBoxx IG Hi-Vol2)1 | | September 20, 2009 | | Specified amount
upon credit
event noticeC | | 1.15%
Quarterly | | | 25,000 | | | (3) |
| | | | | |
Deutsche Bank AG
(iBoxx IG Hi-Vol2)1 | | September 20, 2009 | | Specified amount
upon credit
event noticeC | | 1.15%
Quarterly | | | 16,100 | | | 76 |
119
Semi-Annual Report to Shareholders
NOTES TO FINANCIAL STATEMENTS—Continued
| | | | | | | | | | | | |
Agreement With:
| | Termination Date
| | The Fund Agrees to Pay
| | The Fund Will Receive
| | Contract Notional Amount
| | Unrealized
Appreciation/
(Depreciation)
|
J.P. Morgan Chase & Co. (iBoxx IG Hi-Vol2)1 | | September 20, 2009 | | Specified amount
upon credit
event noticeC | | 1.15%
Quarterly | | $ | 26,000 | | $ | 24 |
| | | | | |
Credit Suisse First
Boston USA
(iBoxx IG Hi-Vol2)1 | | September 20, 2009 | | Specified amount
upon credit
event noticeC | | 1.15%
Quarterly | | | 12,500 | | | 43 |
| | | | | |
Deutsche Bank AG
(iBoxx IG Hi-Vol2)1 | | September 20, 2014 | | Specified amount
upon credit
event noticeC | | 1.30%
Quarterly | | | 8,320 | | | (100) |
| | | | | |
Deutsche Bank AG
(iBoxx IG2)1 | | September 20, 2014 | | 0.80%
Quarterly | | Specified amount
upon credit
event noticeE | | | 7,400 | | | (47) |
| | | | | | | | | | | |
|
|
| | | | | | | | | | | | $ | 1,780 |
| | | | | | | | | | | |
|
|
| | | | | |
Core Plus: | | | | | | | | | | | | |
Agreement With:
| | Termination Date
| | The Fund Agrees to Pay
| | The Fund Will Receive
| | Contract Notional Amount
| | Unrealized
Appreciation/
(Depreciation)
|
Deutsche Bank AG (Dynergy Holdings,
8.75%, due 2/15/12)1 | | April 23, 2007 | | Specified amount
upon credit
event noticeC | | 2.95%
Quarterly | | $ | 2,250 | | $ | (63) |
| | | | | |
Deutsche Bank AG (Dynergy Holdings,
8.75%, due 2/15/12)1 | | May 1, 2007 | | Specified amount
upon credit
event noticeC | | 5.25%
Quarterly | | | 3,460 | | | 121 |
| | | | | |
Credit Suisse First
Boston USA2 | | September 14, 2007 | | 3.206%
Semi-annually | | 3-month
LIBORD | | | 186,350 | | | 338 |
| | | | | |
Credit Suisse First
Boston USA2 | | September 14, 2007 | | 3.228%
Semi-annually | | 3-month
LIBORD | | | 186,350 | | | 224 |
| | | | | |
The Goldman Sachs
Group, Inc.2 | | September 14, 2007 | | 3-month
LIBORD | | 3.215%
Semi-annually | | | 37,270 | | | (58) |
| | | | | |
Credit Suisse First
Boston USA2 | | September 21, 2007 | | 3.24%
Semi-annually | | 3-month
LIBORD | | | 92,500 | | | 104 |
| | | | | |
Credit Suisse First
Boston USA2 | | September 21, 2007 | | 3.22%
Semi-annually | | 3-month
LIBORD | | | 61,700 | | | 96 |
| | | | | |
The Goldman Sachs
Group, Inc.2 | | September 22, 2007 | | 3.1985%
Semi-annually | | 3-month
LIBORD | | | 138,700 | | | 333 |
| | | | | |
Credit Suisse First
Boston USA
(iBoxx IG Hi-Vol)1 | | March 20, 2009 | | Specified amount
upon credit
event noticeC | | 1.25%
Quarterly | | | 50,000 | | | 220 |
| | | | | |
Deutsche Bank AG
(iBoxx IG TMT)1 | | March 20, 2009 | | 0.60%
Quarterly | | Specified amount
upon credit
event noticeE | | | 6,450 | | | 37 |
| | | | | |
Deutsche Bank AG
(iBoxx 30 Hi-Vol)1 | | March 20, 2009 | | 1.25%
Quarterly | | Specified amount
upon credit
event noticeE | | | 9,500 | | | 30 |
120
Semi-Annual Report to Shareholders
| | | | | | | | | | | | |
Agreement With:
| | Termination Date
| | The Fund Agrees to Pay
| | The Fund Will Receive
| | Contract Notional Amount
| | Unrealized
Appreciation/
(Depreciation)
|
Deutsche Bank AG
(iBoxx IG TMT)1 | | March 20, 2009 | | 0.60%
Quarterly | | Specified amount
upon credit
event noticeE | | $ | 9,500 | | $ | 55 |
| | | | | |
Deutsche Bank AG
(iBoxx 100 HY)1 | | March 20, 2009 | | 4.25%
Quarterly | | Specified amount
upon credit
event noticeE | | | 1,900 | | | 4 |
| | | | | |
Deutsche Bank AG
(iBoxx 100 HY)1 | | March 20, 2009 | | Specified amount
upon credit
event noticeC | | 4.25%
Quarterly | | | 10,000 | | | (31) |
| | | | | |
Deutsche Bank AG
(iBoxx 100 IG)1 | | March 20, 2009 | | 4.25%
Quarterly | | Specified amount
upon credit
event noticeE | | | 3,710 | | | 216 |
| | | | | |
Deutsche Bank AG
(iBoxx HY B)1 | | March 20, 2009 | | Specified amount
upon credit
event noticeC | | 5.00%
Quarterly | | | 5,000 | | | (28) |
| | | | | |
Deutsche Bank AG
(iBoxx HY B)1 | | March 20, 2009 | | Specified amount
upon credit
event noticeC | | 5.00%
Quarterly | | | 10,000 | | | (94) |
| | | | | |
Deutsche Bank AG
(iBoxx IG Hi-Vol)1 | | March 20, 2009 | | Specified amount
upon credit
event noticeC | | 1.25%
Quarterly | | | 13,760 | | | 50 |
| | | | | |
Lehman Brothers
(iBoxx IG TMT)1 | | March 20, 2009 | | 0.60%
Quarterly | | Specified amount
upon credit
event noticeD | | | 9,000 | | | 62 |
| | | | | |
Merrill Lynch & Co., Inc. (Pacific Gas & Electric, 4.80%, due 3/1/14)1 | | June 20, 2009 | | Specified amount
upon credit
event noticeC | | 0.42%
Quarterly | | | 2,980 | | | (4) |
| | | | | |
Credit Suisse First
Boston USA
(iBoxx HY 2 B)1 | | September 20, 2009 | | Specified amount
upon credit
event noticeC | | 4.30%
Quarterly | | | 5,000 | | | 152 |
| | | | | |
Credit Suisse First
Boston USA
(iBoxx IG Hi-Vol2)1 | | September 20, 2009 | | 1.15%
Quarterly | | Specified amount
upon credit
event noticeD | | | 25,000 | | | 160 |
| | | | | |
Credit Suisse First
Boston USA
(iBoxx IG Hi-Vol2)1 | | September 20, 2009 | | Specified amount
upon credit
event noticeC | | 1.15%
Quarterly | | | 17,490 | | | 85 |
| | | | | |
Credit Suisse First
Boston USA
(iBoxx IG Hi-Vol2)1 | | September 20, 2009 | | Specified amount
upon credit
event noticeC | | 1.15%
Quarterly | | | 12,500 | | | 42 |
| | | | | |
Deutsche Bank AG
(iBoxx IG 2)1 | | September 20, 2009 | | Specified amount
upon credit
event noticeC | | 4.30%
Quarterly | | | 15,000 | | | 267 |
| | | | | |
Deutsche Bank AG
(iBoxx IG Hi-Vol2)1 | | September 20, 2009 | | Specified amount
upon credit
event noticeC | | 1.15%
Quarterly | | | 5,830 | | | (33) |
121
Semi-Annual Report to Shareholders
NOTES TO FINANCIAL STATEMENTS—Continued
| | | | | | | | | | | | |
Agreement With:
| | Termination Date
| | The Fund Agrees to Pay
| | The Fund Will Receive
| | Contract Notional Amount
| | Unrealized
Appreciation/
(Depreciation)
|
Deutsche Bank AG (iBoxx HY 2)1 | | September 20, 2009 | | Specified amount
upon credit
event noticeC | | 4.30%
Quarterly | | $ | 2,620 | | $ | 153 |
| | | | | |
Deutsche Bank AG
(iBoxx HY 2 B)1 | | September 20, 2009 | | Specified amount
upon credit
event noticeC | | 4.80%
Quarterly | | | 2,620 | | | 121 |
| | | | | |
Deutsche Bank AG
(iBoxx IG Hi-Vol2)1 | | September 20, 2009 | | Specified amount
upon credit
event noticeC | | 1.15%
Quarterly | | | 37,580 | | | 178 |
| | | | | |
Deutsche Bank AG
(iBoxx HY 2)1 | | September 20, 2009 | | Specified amount
upon credit
event noticeC | | 4.30%
Quarterly | | | 3,260 | | | 131 |
| | | | | |
The Goldman Sachs
Group, Inc. (iBoxx IG Hi-Vol 2)1 | | September 20, 2009 | | Specified amount
upon credit
event noticeC | | 1.15%
Quarterly | | | 6,160 | | | 42 |
| | | | | |
The Goldman Sachs
Group, Inc.2 | | September 24, 2009 | | 3.7135%
Semi-annually | | 3-month
LIBORD | | | 100,000 | | | 389 |
| | | | | |
Credit Suisse First
Boston USA
(iBoxx HY 3 B)1 | | December 20, 2009 | | Specified amount
upon credit
event noticeC | | 4.00%
Quarterly | | | 3,150 | | | 80 |
| | | | | |
Credit Suisse First
Boston USA
(iBoxx HY 3 B)1 | | December 20, 2009 | | Specified amount
upon credit
event noticeC | | 4.00%
Quarterly | | | 3,150 | | | 80 |
| | | | | |
The Goldman Sachs
Group, Inc.
(iBoxx HY 3 B)1 | | December 20, 2009 | | Specified amount
upon credit
event noticeC | | 4.00%
Quarterly | | | 3,000 | | | 79 |
| | | | | |
The Goldman Sachs
Group, Inc.
(iBoxx HY 3)1 | | December 20, 2009 | | Specified amount
upon credit
event noticeC | | 3.75%
Quarterly | | | 3,000 | | | 63 |
| | | | | |
The Goldman Sachs
Group, Inc.
(iBoxx HY 3 B)1 | | December 20, 2009 | | Specified amount
upon credit
event noticeC | | 4.00%
Quarterly | | | 2,980 | | | 29 |
| | | | | |
Deutsche Bank AG
(iBoxx IG 2)1 | | September 20, 2014 | | 0.80%
Quarterly | | Specified amount
upon credit
event noticeE | | | 24,500 | | | (155) |
| | | | | |
Deutsche Bank AG
(iBoxx IG Hi-Vol 2)1 | | September 20, 2014 | | Specified amount
upon credit
event noticeC | | 1.30%
Quarterly | | | 11,560 | | | (139) |
| | | | | |
Deutsche Bank AG2 | | September 24, 2014 | | 4.4318%
Semi-annually | | 3-month
LIBORD | | | 89,700 | | | 890 |
| | | | | | | | | | | |
|
|
| | | | | | | | | | | | $ | 4,226 |
| | | | | | | | | | | |
|
|
122
Semi-Annual Report to Shareholders
4. Securities Loaned:
Each Fund may lend its securities to approved brokers to earn additional income and will receive cash and U.S. government securities as collateral against the loans. Cash collateral received is invested in a money market pooled account by each Fund’s lending agent. Collateral is maintained over the life of the loan in an amount not less than 100% of the value of the loaned securities.
At September 30, 2004, the market value of securities on loan to broker-dealers was $147,542 for Intermediate, $659,669 for Core, $924,315 for Core Plus, and $10,283 for Inflation Indexed. Cash collateral received was $150,568 for Intermediate, $673,075 for Core, $943,250 for Core Plus, and $10,497 for Inflation Indexed.
5. Transactions With Affiliates:
Each Fund has a management agreement with Legg Mason Fund Adviser, Inc. (“LMFA”). Western Asset Management Company (“Western Asset”) is the investment adviser to Limited Duration, Intermediate, Intermediate Plus, Core, Core Plus, Inflation Indexed, and High Yield. Western Asset Management Company Limited (“WAML”) is the investment adviser to Non-U.S. and shares advisory responsibilities with Western Asset for Intermediate Plus, Core Plus and Inflation Indexed. Pursuant to their respective agreements, LMFA provides the Funds with management and administrative services for which each Fund pays a fee, computed daily and payable monthly, at annual rates of each Fund’s average daily net assets. LMFA, Western Asset and WAML have voluntarily agreed to waive their fees and reimburse the Funds to the extent each Fund’s expenses (exclusive of taxes, interest, brokerage and extraordinary expenses) exceed during any month certain annual rates of each Fund’s average daily net assets. Western Asset and WAML have also agreed to waive their advisory fees (which are paid by LMFA, and not the Funds) in corresponding amounts. The following chart shows annual rates of management fees, expense limits, management fees waived, and management fees payable for each Fund:
| | | | | | | | | | | | | | |
Fund
| | Asset
Breakpoint
| | Management Fee
| | | Expense Limitation
| | | Management Fees Waived
| | Management Fees Payable
|
Limited Duration | | All asset levels | | 0.350 | % | | 0.40 | % | | $ | 54 | | $ | 4 |
| | | | | |
Intermediate | | All asset levels | | 0.400 | % | | 0.45 | % | | | 34 | | | 195 |
| | | | | |
Intermediate Plus | | All asset levels | | 0.400 | % | | 0.45 | % | | | 21 | | | — |
| | | | | |
Core | | | | | | | | | | | | | | |
Institutional Class | | Up to $500 million | | 0.450 | % | | 0.50 | % | | | — | | | 874 |
| | | Next $500 million | | 0.425 | % | | | | | | | | | |
| | | In excess of $1 billion | | 0.400 | % | | | | | | | | | |
| | | | | |
Financial Intermediary Class | | Up to $500 million | | 0.450 | % | | 0.75 | % | | | — | | | 51 |
| | | Next $500 million | | 0.425 | % | | | | | | | | | |
| | | In excess of $1 billion | | 0.400 | % | | | | | | | | | |
| | | | | |
Core Plus | | | | | | | | | | | | | | |
Institutional Class | | Up to $500 million | | 0.450 | % | | 0.45 | % | | | 152 | | | 1,260 |
| | | Next $500 million | | 0.425 | % | | | | | | | | | |
| | | In excess of $1 billion | | 0.400 | % | | | | | | | | | |
| | | | | |
Financial Intermediary Class | | Up to $500 million | | 0.450 | % | | 0.70 | % | | | 1 | | | 15 |
| | | Next $500 million | | 0.425 | % | | | | | | | | | |
| | | In excess of $1 billion | | 0.400 | % | | | | | | | | | |
| | | | | |
Inflation Indexed | | All asset levels | | 0.200 | % | | 0.25 | % | | | 37 | | | 63 |
| | | | | |
High Yield | | All asset levels | | 0.550 | % | | 0.65 | % | | | — | | | 173 |
| | | | | |
Non-U.S. | | All asset levels | | 0.450 | % | | 0.55 | % | | | 46 | | | 68 |
123
Semi-Annual Report to Shareholders
NOTES TO FINANCIAL STATEMENTS—Continued
Legg Mason Wood Walker, Incorporated (“LMWW”), a member of the New York Stock Exchange, serves as distributor of the Funds’ shares. LMWW receives from each Fund an annual distribution fee of 0.25% of the average daily net assets of the Financial Intermediary Class of each Fund, computed daily and payable monthly. At September 30, 2004, $31 was due to LMWW from Core and $9 from Core Plus.
LMFA, Western Asset, WAML and LMWW are wholly owned subsidiaries of Legg Mason, Inc.
6. Fund Share Transactions:
At September 30, 2004, there were 13.1 billion shares of common stock of the Corporation authorized at $.001 par value. Transactions in Fund shares were as follows:
| | | | | | | | | | | | | | | | | | | | | | |
| | | Sold
| | Reinvestment
of Dividends
| | Repurchased
| | | Net Change
|
| | | Shares
| | Amount
| | Shares
| | Amount
| | Shares
| | | Amount
| | | Shares
| | Amount
|
Limited Duration | | | | | | | | | | | | | | | | | | | | | | |
—Institutional Class | | | | | | | | | | | | | | | | | | | | | | |
Six Months Ended Sept. 30, 2004 | | 1,816 | | $ | 18,100 | | 37 | | $ | 375 | | (143 | ) | | $ | (1,429 | ) | | 1,710 | | $ | 17,046 |
Period Ended Mar. 31, 2004F | | 3,108 | | | 31,078 | | 17 | | | 171 | | (530 | ) | | | (5,311 | ) | | 2,595 | | | 25,938 |
| | | | | | | | |
Intermediate | | | | | | | | | | | | | | | | | | | | | | |
—Institutional Class | | | | | | | | | | | | | | | | | | | | | | |
Six Months Ended Sept. 30, 2004 | | 5,087 | | $ | 53,879 | | 2,417 | | $ | 25,229 | | (4,561 | ) | | $ | (47,926 | ) | | 2,943 | | $ | 31,182 |
Year Ended Mar. 31, 2004 | | 15,529 | | | 168,930 | | 3,173 | | | 34,520 | | (14,808 | ) | | | (161,750 | ) | | 3,894 | | | 41,700 |
| | | | | | | | |
Intermediate Plus | | | | | | | | | | | | | | | | | | | | | | |
—Institutional Class | | | | | | | | | | | | | | | | | | | | | | |
Period Ended Sept. 30, 2004G | | 1,644 | | $ | 16,419 | | 18 | | $ | 178 | | (296 | ) | | $ | (2,883 | ) | | 1,366 | | $ | 13,714 |
| | | | | | | | |
Core | | | | | | | | | | | | | | | | | | | | | | |
—Institutional Class | | | | | | | | | | | | | | | | | | | | | | |
Six Months Ended Sept. 30, 2004 | | 53,482 | | $ | 606,951 | | 7,604 | | $ | 85,074 | | (17,697 | ) | | $ | (200,909 | ) | | 43,389 | | $ | 491,116 |
Year Ended Mar. 31, 2004 | | 102,574 | | | 1,186,661 | | 7,133 | | | 82,880 | | (45,456 | ) | | | (525,969 | ) | | 64,251 | | | 743,572 |
| | | | | | | | |
—Financial Intermediary Class | | | | | | | | | | | | | | | | | | | | | | |
Six Months Ended Sept. 30, 2004 | | 4,829 | | $ | 54,673 | | 421 | | $ | 4,711 | | (2,193 | ) | | $ | (25,011 | ) | | 3,057 | | $ | 34,373 |
Year Ended Mar. 31, 2004 | | 6,137 | | | 71,299 | | 410 | | | 4,766 | | (3,084 | ) | | | (35,705 | ) | | 3,463 | | | 40,360 |
| | | | | | | | |
Core Plus | | | | | | | | | | | | | | | | | | | | | | |
—Institutional Class | | | | | | | | | | | | | | | | | | | | | | |
Six Months Ended Sept. 30, 2004 | | 84,710 | | $ | 882,256 | | 8,813 | | $ | 90,883 | | (30,432 | ) | | $ | (317,178 | ) | | 63,091 | | $ | 655,961 |
Year Ended Mar. 31, 2004 | | 149,832 | | | 1,577,617 | | 11,320 | | | 118,968 | | (33,656 | ) | | | (353,019 | ) | | 127,496 | | | 1,343,566 |
| | | | | | | | |
—Financial Intermediary Class | | | | | | | | | | | | | | | | | | | | | | |
Six Months Ended Sept. 30, 2004 | | 7,163 | | $ | 75,651 | | 33 | | $ | 338 | | (158 | ) | | $ | (1,650 | ) | | 7,038 | | $ | 74,339 |
Year Ended Mar. 31, 2004 | | 669 | | | 7,091 | | 14 | | | 153 | | (62 | ) | | | (659 | ) | | 621 | | | 6,585 |
| | | | | | | | |
Inflation Indexed | | | | | | | | | | | | | | | | | | | | | | |
—Institutional Class | | | | | | | | | | | | | | | | | | | | | | |
Six Months Ended Sept. 30, 2004 | | 4,416 | | $ | 46,602 | | 1,983 | | $ | 20,543 | | (74 | ) | | $ | (802 | ) | | 6,325 | | $ | 66,343 |
Year Ended Mar. 31, 2004 | | 8,298 | | | 91,034 | | 2,059 | | | 22,404 | | (6,028 | ) | | | (65,112 | ) | | 4,329 | | | 48,326 |
| | | | | | | | |
High Yield | | | | | | | | | | | | | | | | | | | | | | |
—Institutional Class | | | | | | | | | | | | | | | | | | | | | | |
Six Months Ended Sept. 30, 2004 | | 17,042 | | $ | 174,512 | | 821 | | $ | 8,269 | | (1,323 | ) | | $ | (13,655 | ) | | 16,540 | | $ | 169,126 |
Year Ended Mar. 31, 2004 | | 17,347 | | | 178,219 | | 1,518 | | | 15,029 | | (16,128 | ) | | | (165,382 | ) | | 2,737 | | | 27,866 |
| | | | | | | | |
Non-U.S. | | | | | | | | | | | | | | | | | | | | | | |
—Institutional Class | | | | | | | | | | | | | | | | | | | | | | |
Six Months Ended Sept. 30, 2004 | | 1 | | $ | 5 | | 285 | | $ | 2,868 | | (3 | ) | | $ | (23 | ) | | 283 | | $ | 2,850 |
Year Ended Mar. 31, 2004 | | 3,740 | | | 39,475 | | 704 | | | 7,271 | | (630 | ) | | | (6,848 | ) | | 3,814 | | | 39,898 |
| | | | | | | | | | | | | | | | | | | | | | | |
| F | For the period from October 1, 2003 (commencement of operations) to March 31, 2004. |
| G | For the period from April 1, 2004 (commencement of operations) to September 30, 2004 |
124
Western Asset Funds, Inc.
Investment Manager
Legg Mason Fund Adviser, Inc.
P.O. Box 17635
Baltimore, Maryland 21297-1635
Investment Advisers
Western Asset Management Company
385 East Colorado Boulevard
Pasadena, California 91101
Western Asset Management Company Limited
155 Bishopgate
London, England EC2M3XG
Transfer and Shareholder Servicing Agent
Boston Financial Data Services
66 Brooks Drive
Braintree, Massachusetts 02184
Custodian
State Street Bank & Trust Company
P.O Box 1031
Boston, Massachusetts 02103
Counsel
Ropes & Gray LLP
45 Rockefeller Plaza
New York, New York 10111
Independent Registered Public Accounting Firm
PricewaterhouseCoopers LLP
250 West Pratt Street
Baltimore, Maryland 21201
Information about the policies and procedures that the Funds use to determine how to vote proxies relating to each Fund’s portfolio securities is contained in the Statement of Additional Information, available upon request without charge by calling 1-888-425-6432 or on the Securities and Exchange Commission (“SEC”) website (http://www.sec.gov). Information regarding how the Funds voted proxies relating to portfolio securities during the most recent twelve-month period ended June 30 is also available on the SEC’s website or without charge through www.westernassetfunds.com.
The Funds will file a complete schedule of portfolio holdings with the SEC for the third quarter of the current fiscal year and the first and third quarters of each fiscal year thereafter on Form N-Q. The Funds’ Form N-Q will be available on the SEC’s website or viewed and copied at the SEC’s Public Reference Room in Washington DC when available. Information about the operation of the Public Reference Room may be obtained by calling 1-800-SEC-0330.
Monthly portfolio holdings are available upon request
by calling 1-888-425-6432.
This report is not to be distributed unless preceded or accompanied by a prospectus.
Legg Mason Wood Walker, Inc., Distributor
Item 2 – Code of Ethics
Not applicable for semi-annual reports.
Item 3 – Audit Committee Financial Expert
Not applicable for semi-annual reports.
Item 4 – Principal Accountant Fees and Services
Not applicable for semi-annual reports.
Item 5 – Audit Committee of Listed Registrants
Not applicable.
| Item | 6 – Schedule of Investments |
The schedule of investments in securities of unaffiliated issuers as of the close of the reporting period is included as part of the semi-annual report to shareholders filed under Item 1 hereto.
Item 7 – Disclosure of Proxy Voting Policies and Procedures for Closed-End Management Investment Companies
Not applicable.
Item 8 – Purchases of Equity Securities by Closed-End Management Investment Companies and Affiliated Purchasers
Not applicable.
Item 9 – Submission of Matters to a Vote of Security Holders
There have been no material changes to the procedures by which shareholders may recommend nominees to the Registrant’s Board of Directors that have been implemented since the Registrant last provided disclosure in response to the requirements of this Item 9.
Item 10 – Controls and Procedures
| | (a) | The registrant’s principal executive and principal financial officers have concluded, based on their evaluation of the Registrant’s disclosure controls and procedures as of a date within 90 days of the filing date of this report, that the Registrant’s disclosure controls and procedures are reasonably designed to |
| | | ensure that information required to be disclosed by the Registrant on Form N-CSR is recorded, processed, summarized and reported within the required time periods in the Securities and Exchange Commission’s rule and forms and that information required to be disclosed by the Registrant in the reports that it files or submits on Form N-CSR is accumulated and communicated to the Registrant’s management, including its principal executive and principal financial officers, as appropriate to allow timely decisions regarding required disclosure. |
| | (b) | There were no changes in the Registrant’s internal control over financial reporting during the registrant’s last fiscal half-year that have materially affected, or are reasonably likely to materially affect, the Registrant’s internal control over financial reporting. |
Item 11 – Exhibits
| | |
(a) | | File the exhibits listed below as part of this Form. |
| |
(a)(1) | | Not applicable for semi-annual reports. |
| |
(a)(2) | | Certifications pursuant to Rule 30a-2(a) under the Investment Company Act of 1940 are attached hereto. |
| |
(a)(3) | | Not applicable. |
| |
(b) | | Certifications pursuant to Rule 30a-2(b) under the Investment Company Act of 1940 are attached hereto. |
SIGNATURES
Pursuant to the requirements of the Securities Exchange Act of 1934 and the Investment Company Act of 1940, the registrant has duly caused this report to be signed on its behalf by the undersigned, thereunto duly authorized.
Western Asset Funds, Inc.
| | |
| By: | | /s/ James W. Hirschmann
|
| | | James W. Hirschmann |
| | | President |
| | | Western Asset Funds, Inc. |
Date: 11/29/04
Pursuant to the requirements of the Securities Exchange Act of 1934 and the Investment Company Act of 1940, this report has been signed below by the following persons on behalf of the registrant and in the capacities and on the dates indicated.
| | |
| By: | | /s/ James W. Hirschmann
|
| | | James W. Hirschmann |
| | | President |
| | | Western Asset Funds, Inc. |
Date: 11/29/04
| | |
| By: | | /s/ Marie K. Karpinski
|
| | | Marie K. Karpinski |
| | | Treasurer and Principal Financial and Accounting Officer |
| | | Western Asset Funds, Inc. |
Date: 11/29/04