UNITED STATES
SECURITIES AND EXCHANGE COMMISSION
Washington, D.C. 20549
FORM N-CSR
CERTIFIED SHAREHOLDER REPORT OF REGISTERED
MANAGEMENT INVESTMENT COMPANIES
| | |
Investment Company Act file number: | | 811-06110 |
| |
Name of Registrant: | | Western Asset Funds, Inc. |
| |
Address of Principal Executive Offices: | | 385 East Colorado Boulevard, Pasadena, CA 91101 |
| |
Registrant’s telephone number, including area code: | | (626) 844-9400 |
| |
Name and address of agent for service: | | Richard M. Wachterman, Esq. Legg Mason Wood Walker, Incorporated 100 Light Street Baltimore, MD 21202 |
| |
Date of fiscal year end: | | March 31, 2007 |
| |
Date of reporting period: | | September 30, 2006 |
Item 1. Report to Shareholders.
Page 2 of 5
Western Asset Funds, Inc.
Western Asset Limited Duration Bond Portfolio
Western Asset Intermediate Bond Portfolio
Western Asset Intermediate Plus Bond Portfolio
Western Asset Core Bond Portfolio
Western Asset Core Plus Bond Portfolio
Western Asset Inflation Indexed Plus Bond Portfolio
Western Asset High Yield Portfolio
Western Asset Non-U.S. Opportunity Bond Portfolio
Western Asset Absolute Return Portfolio
Semi-Annual Report to Shareholders
September 30, 2006
Semi-Annual Report to Shareholders
Expense Example
Western Asset Limited Duration Bond Portfolio
As a shareholder of the Fund, you incur ongoing costs, including management fees and other Fund expenses. These examples are intended to help you understand your ongoing costs (in dollars) of investing in the Fund and to compare these costs with the ongoing costs of investing in other mutual funds. The example is based on an investment of $1,000 invested on April 1, 2006 and held through September 30, 2006.
Actual Expenses
The first line in the table below provides information about actual account values and actual expenses for the Fund. You may use the information in this line, together with the amount you invested, to estimate the expenses that you paid over the period. Simply divide your account value by $1,000 (for example, an $8,600 account value divided by $1,000 = 8.6), then multiply the result by the number in the first line under the heading entitled “Expenses Paid During the Period” to estimate the expenses you paid on your account during this period.
Hypothetical Example for Comparison Purposes
The second line in the table below provides information about hypothetical account values and hypothetical expenses based on the Fund’s actual expense ratio and an assumed rate of return of 5% per year before expenses, which is not the Fund’s actual return. The hypothetical account values and expenses may not be used to estimate the actual ending account balance or expenses you paid for the period. You may use this information to compare the ongoing costs of investing in the Fund and other funds. To do so, compare this 5% hypothetical example with the 5% hypothetical examples that appear in the shareholder reports of other funds.
| | | | | | | | | |
| | | Beginning
Account Value
4/1/06 | | Ending
Account Value
9/30/06 | | Expenses PaidA
During the Period
4/1/06 to 9/30/06 |
Institutional Class: | | | | | | | | | |
Actual | | $ | 1,000.00 | | $ | 1,028.10 | | $ | 2.03 |
Hypothetical (5% return before expenses) | | | 1,000.00 | | | 1,023.06 | | | 2.03 |
| A | | These calculations are based on expenses incurred in the most recent fiscal half-year. The dollar amounts shown as “Expenses Paid” are equal to the annualized expense ratio of 0.40% multiplied by the average value over the period, multiplied by the number of days in the most recent fiscal half-year (183), and divided by 365. |
1
Semi-Annual Report to Shareholders
Performance Information
Western Asset Limited Duration Bond Portfolio
The graph compares the Fund’s total returns against that of an appropriate broad-based securities market index. The line illustrates the cumulative total return of an initial $1,000,000 investment for the periods indicated. The line for the Fund represents the total return after deducting all Fund investment management and other administrative expenses and the transaction costs of buying and selling securities. The line representing the securities market index does not include any transaction costs associated with buying and selling securities in the index or other investment management or administrative expenses.
Total return measures investment performance in terms of appreciation or depreciation in the Fund’s net asset value per share, plus dividends and any capital gain distributions. It assumes that dividends and distributions were reinvested at the time they were paid. Returns (and the graph and table found below) do not reflect the deduction of taxes that a shareholder would pay on Fund distributions or the redemption of Fund shares. Average annual returns tend to smooth out variations in a fund’s return, so that they differ from actual year-to-year results.
Bonds are subject to a variety of risks, including interest rate, credit and inflation risk.
Growth of a $1,000,000 Investment—Institutional Class
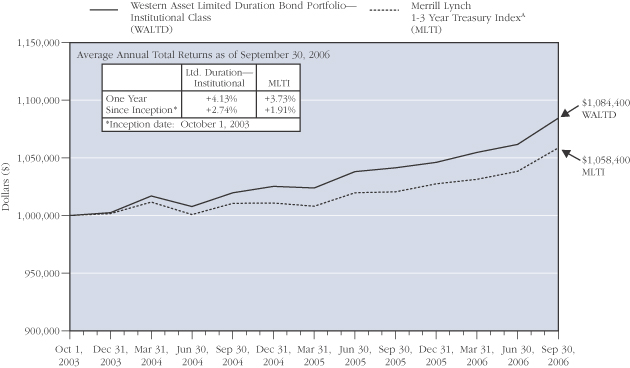
The performance data quoted represents past performance and does not guarantee future results. The performance stated may have been due to extraordinary market conditions, which may not be duplicated in the future. Current performance may be lower or higher than the performance data quoted. To obtain the most recent month-end performance information, please visit www.westernassetfunds.com. The investment return and principal value of the Fund will fluctuate so that an investor’s shares, when redeemed, may be worth more or less than the original cost. Calculations assume reinvestment of dividends and capital gain distributions. Performance would have been lower if fees had not been waived in various periods.
| A | | Index returns are for periods beginning September 30, 2003. |
2
Semi-Annual Report to Shareholders
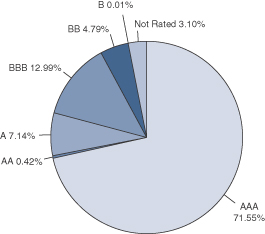
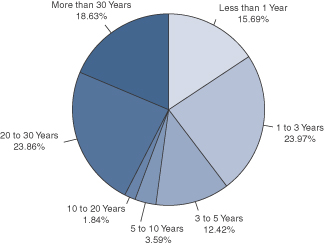
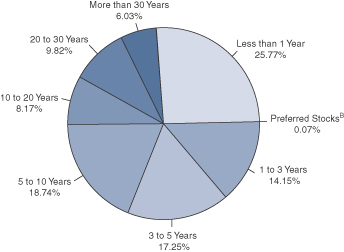
Portfolio Composition (as of September 30, 2006)
Standard & Poor’s Debt RatingsB
(as a percentage of the portfolio)
Maturity Schedule (as a percentage of the portfolio)
| B | | Source: Standard & Poor's. |
The Fund is actively managed. As a result, the composition of the portfolio holdings and sectors are subject to change at any time.
3
Semi-Annual Report to Shareholders
Portfolio of Investments
Western Asset Limited Duration Bond Portfolio
September 30, 2006 (Unaudited)
(Amounts in Thousands)
| | | | | | | | | | | | | |
| | | % OF
NET ASSETS | | RATE | | MATURITY
DATE | | PAR | | VALUE | |
| | | | | | | | | | | | | |
Long-Term Securities | | 101.0% | | | | | | | | | | | |
| | | | | |
Corporate Bonds and Notes | | 21.9% | | | | | | | | | | | |
| | | | | |
Auto Parts and Equipment | | 0.1% | | | | | | | | | | | |
Johnson Controls, Inc. | | | | 5.737% | | 1/17/08 | | $ | 90 | | $ | 90 | A |
| | | | | | | | | | | | | |
| | | | | |
Banking and Finance | | 5.7% | | | | | | | | | | | |
Caterpillar Financial Services | | | | 3.450% | | 1/15/09 | | | 200 | | | 193 | |
Countrywide Financial Corporation | | | | 5.609% | | 3/24/09 | | | 280 | | | 280 | A |
Ford Motor Credit Company | | | | 6.194% | | 9/28/07 | | | 450 | | | 446 | A |
Ford Motor Credit Company | | | | 6.625% | | 6/16/08 | | | 1,510 | | | 1,487 | |
General Motors Acceptance Corporation | | | | 6.539% | | 9/23/08 | | | 1,340 | | | 1,331 | A |
HSBC Finance Corporation | | | | 5.696% | | 5/10/10 | | | 310 | | | 312 | A |
Residential Capital Corporation | | | | 6.742% | | 6/29/07 | | | 130 | | | 131 | A |
Residential Capital Corporation | | | | 6.693% | | 11/21/08 | | | 300 | | | 303 | A |
Wachovia Capital Trust III | | | | 5.800% | | 3/15/42 | | | 670 | | | 672 | B |
| | | | | | | | | | | | | |
| | | | | | | | | | | | 5,155 | |
| | | | | | | | | | | | | |
Cable | | 0.6% | | | | | | | | | | | |
Comcast Cable Communications, Inc. | | | | 6.875% | | 6/15/09 | | | 400 | | | 416 | |
Comcast MO of Delaware Inc. | | | | 9.000% | | 9/1/08 | | | 100 | | | 106 | |
| | | | | | | | | | | | | |
| | | | | | | | | | | | 522 | |
| | | | | | | | | | | | | |
Casino Resorts | | 0.3% | | | | | | | | | | | |
Caesars Entertainment, Inc. | | | | 7.500% | | 9/1/09 | | | 130 | | | 136 | |
Harrah’s Operating Company, Inc. | | | | 6.099% | | 2/8/08 | | | 120 | | | 120 | A,C |
| | | | | | | | | | | | | |
| | | | | | | | | | | | 256 | |
| | | | | | | | | | | | | |
Chemicals | | 0.2% | | | | | | | | | | | |
The Dow Chemical Company | | | | 5.970% | | 1/15/09 | | | 200 | | | 203 | |
| | | | | | | | | | | | | |
| | | | | |
Computer Services and Systems | | 0.3% | | | | | | | | | | | |
Electronic Data Systems Corporation | | | | 7.125% | | 10/15/09 | | | 290 | | | 303 | |
| | | | | | | | | | | | | |
| | | | | |
Diversified Financial Services | | 1.3% | | | | | | | | | | | |
Citigroup Inc. | | | | 5.000% | | 9/15/14 | | | 200 | | | 195 | |
iStar Financial Inc. | | | | 5.730% | | 9/15/09 | | | 300 | | | 300 | A,C |
iStar Financial Inc. | | | | 5.650% | | 9/15/11 | | | 640 | | | 640 | |
| | | | | | | | | | | | | |
| | | | | | | | | | | | 1,135 | |
| | | | | | | | | | | | | |
Electric | | 1.3% | | | | | | | | | | | |
American Electric Power Company, Inc. | | | | 4.709% | | 8/16/07 | | | 40 | | | 40 | B |
Appalachian Power Company | | | | 3.600% | | 5/15/08 | | | 300 | | | 292 | |
4
Semi-Annual Report to Shareholders
| | | | | | | | | | | | | |
| | | % OF
NET ASSETS | | RATE | | MATURITY
DATE | | PAR | | VALUE | |
| | | | | | | | | | | | | |
Corporate Bonds and Notes—Continued | | | | | | | | | | | | | |
| | | | | |
Electric—Continued | | | | | | | | | | | | | |
Commonwealth Edison Company | | | | 3.700% | | 2/1/08 | | $ | 180 | | $ | 176 | |
Dominion Resources, Inc. | | | | 4.125% | | 2/15/08 | | | 100 | | | 98 | |
FirstEnergy Corp. | | | | 6.450% | | 11/15/11 | | | 430 | | | 449 | |
Niagara Mohawk Power Corporation | | | | 7.750% | | 10/1/08 | | | 100 | | | 104 | |
| | | | | | | | | | | | | |
| | | | | | | | | | | | 1,159 | |
| | | | | | | | | | | | | |
Energy | | 1.3% | | | | | | | | | | | |
CenterPoint Energy, Inc. | | | | 5.875% | | 6/1/08 | | | 150 | | | 151 | |
Duke Energy Corporation | | | | 3.750% | | 3/5/08 | | | 200 | | | 196 | |
Pacific Gas and Electric Co. | | | | 3.600% | | 3/1/09 | | | 190 | | | 183 | |
Progress Energy, Inc. | | | | 5.850% | | 10/30/08 | | | 200 | | | 202 | |
Sempra Energy | | | | 5.863% | | 5/21/08 | | | 90 | | | 90 | A |
TXU Corp. | | | | 4.800% | | 11/15/09 | | | 400 | | | 390 | |
| | | | | | | | | | | | | |
| | | | | | | | | | | | 1,212 | |
| | | | | | | | | | | | | |
Environmental Services | | 0.5% | | | | | | | | | | | |
Waste Management, Inc. | | | | 7.375% | | 8/1/10 | | | 390 | | | 418 | |
| | | | | | | | | | | | | |
| | | | | |
Food, Beverage and Tobacco | | 0.5% | | | | | | | | | | | |
Altria Group, Inc. | | | | 7.650% | | 7/1/08 | | | 30 | | | 31 | |
Altria Group, Inc. | | | | 5.625% | | 11/4/08 | | | 410 | | | 413 | |
| | | | | | | | | | | | | |
| | | | | | | | | | | | 444 | |
| | | | | | | | | | | | | |
Investment Banking/Brokerage | | 1.2% | | | | | | | | | | | |
Lehman Brothers Holdings E-Capital Trust I | | | | 6.173% | | 8/19/65 | | | 310 | | | 312 | A |
Merrill Lynch & Co., Inc. | | | | 5.700% | | 2/5/10 | | | 300 | | | 301 | A |
Morgan Stanley | | | | 5.625% | | 1/9/12 | | | 280 | | | 284 | |
The Bear Stearns Companies Inc. | | | | 5.715% | | 1/31/11 | | | 160 | | | 160 | A |
| | | | | | | | | | | | | |
| | | | | | | | | | | | 1,057 | |
| | | | | | | | | | | | | |
Media | | 1.0% | | | | | | | | | | | |
Clear Channel Communications, Inc. | | | | 6.625% | | 6/15/08 | | | 60 | | | 61 | |
Clear Channel Communications, Inc. | | | | 4.250% | | 5/15/09 | | | 550 | | | 531 | |
Liberty Media Corporation | | | | 7.875% | | 7/15/09 | | | 300 | | | 314 | |
| | | | | | | | | | | | | |
| | | | | | | | | | | | 906 | |
| | | | | | | | | | | | | |
Oil and Gas | | 2.4% | | | | | | | | | | | |
Hess Corporation | | | | 6.650% | | 8/15/11 | | | 720 | | | 756 | |
Kinder Morgan Energy Partners, L.P. | | | | 6.750% | | 3/15/11 | | | 130 | | | 135 | |
Ocean Energy Inc. | | | | 4.375% | | 10/1/07 | | | 100 | | | 99 | |
Pemex Project Funding Master Trust | | | | 6.125% | | 8/15/08 | | | 292 | | | 294 | A,C |
5
Semi-Annual Report to Shareholders
Portfolio of Investments—Continued
Western Asset Limited Duration Bond Portfolio—Continued
| | | | | | | | | | | | | |
| | | % OF
NET ASSETS | | RATE | | MATURITY
DATE | | PAR | | VALUE | |
| | | | | | | | | | | | | |
Corporate Bonds and Notes—Continued | | | | | | | | | | | | | |
| | | | | |
Oil and Gas—Continued | | | | | | | | | | | | | |
Pemex Project Funding Master Trust | | | | 6.690% | | 6/15/10 | | $ | 140 | | $ | 143 | A,C |
Pemex Project Funding Master Trust | | | | 5.991% | | 12/3/12 | | | 543 | | | 541 | |
XTO Energy, Inc. | | | | 5.650% | | 4/1/16 | | | 180 | | | 179 | |
| | | | | | | | | | | | | |
| | | | | | | | | | | | 2,147 | |
| | | | | | | | | | | | | |
Paper and Forest Products | | 0.5% | | | | | | | | | | | |
International Paper Company | | | | 3.800% | | 4/1/08 | | | 390 | | | 381 | |
Weyerhaeuser Company | | | | 5.950% | | 11/1/08 | | | 40 | | | 41 | |
| | | | | | | | | | | | | |
| | | | | | | | | | | | 422 | |
| | | | | | | | | | | | | |
Pharmaceuticals | | 0.2% | | | | | | | | | | | |
Bristol-Myers Squibb Company | | | | 4.000% | | 8/15/08 | | | 140 | | | 137 | |
| | | | | | | | | | | | | |
| | | | | |
Photo Equipment and Supplies | | N.M. | | | | | | | | | | | |
Eastman Kodak Company | | | | 7.250% | | 11/15/13 | | | 10 | | | 10 | |
| | | | | | | | | | | | | |
| | | | | |
Special Purpose | | 3.7% | | | | | | | | | | | |
DaimlerChrysler North America Holding Corporation | | | | 5.875% | | 3/15/11 | | | 990 | | | 991 | |
Devon Financing Corp. ULC | | | | 6.875% | | 9/30/11 | | | 520 | | | 554 | |
ILFC E-Capital Trust I | | | | 5.900% | | 12/21/65 | | | 300 | | | 302 | B,C |
International Lease Finance Corporation | | | | 5.000% | | 4/15/10 | | | 440 | | | 434 | |
National Rural Utilities Cooperative Finance Corporation | | | | 3.875% | | 2/15/08 | | | 100 | | | 98 | |
Sprint Capital Corporation | | | | 6.125% | | 11/15/08 | | | 680 | | | 690 | |
Verizon Global Funding Corp. | | | | 7.250% | | 12/1/10 | | | 270 | | | 290 | |
| | | | | | | | | | | | | |
| | | | | | | | | | | | 3,359 | |
| | | | | | | | | | | | | |
Telecommunications | | 0.4% | | | | | | | | | | | |
AT&T Inc. | | | | 4.125% | | 9/15/09 | | | 100 | | | 97 | |
AT&T Inc. | | | | 5.300% | | 11/15/10 | | | 280 | | | 279 | |
| | | | | | | | | | | | | |
| | | | | | | | | | | | 376 | |
| | | | | | | | | | | | | |
Telecommunications (Cellular/Wireless) | | 0.3% | | | | | | | | | | | |
Motorola, Inc. | | | | 4.608% | | 11/16/07 | | | 100 | | | 99 | |
New Cingular Wireless Services Inc. | | | | 8.125% | | 5/1/12 | | | 130 | | | 146 | |
| | | | | | | | | | | | | |
| | | | | | | | | | | | 245 | |
| | | | | | | | | | | | | |
Telecommunications Equipment | | 0.1% | | | | | | | | | | | |
New York Telephone Co. | | | | 6.000% | | 4/15/08 | | | 100 | | | 101 | |
| | | | | | | | | | | | | |
Total Corporate Bonds and Notes
(Identified Cost—$19,628) | | | | | | | | | | | | 19,657 | |
6
Semi-Annual Report to Shareholders
| | | | | | | | | | | | | |
| | | % OF
NET ASSETS | | RATE | | MATURITY
DATE | | PAR | | VALUE | |
| | | | | | | | | | | | | |
Asset-Backed Securities | | 7.5% | | | | | | | | | | | |
| | | | | |
Fixed Rate Securities | | 1.9% | | | | | | | | | | | |
AmeriCredit Automobile Receivables Trust 2003-BX | | | | 2.720% | | 1/6/10 | | $ | 213 | | $ | 211 | |
MBNA Practice Solutions Owners Trust 2005-2 | | | | 4.100% | | 5/15/09 | | | 400 | | | 396 | C |
Prestige Auto Receivables Trust 2005-1A | | | | 4.370% | | 6/15/12 | | | 200 | | | 197 | C |
Prestige Auto Receivables Trust 2006-1A | | | | 5.120% | | 2/15/10 | | | 448 | | | 447 | C |
UCFC Home Equity Loan 1998-D | | | | 6.905% | | 4/15/30 | | | 83 | | | 82 | |
UPFC Auto Receivables Trust 2004-A | | | | 3.270% | | 9/15/10 | | | 343 | | | 339 | |
| | | | | | | | | | | | | |
| | | | | | | | | | | | 1,672 | |
| | | | | | | | | | | | | |
Indexed SecuritiesA | | 5.6% | | | | | | | | | | | |
Aesop Funding II LLC 2004-2A | | | | 5.550% | | 4/20/10 | | | 500 | | | 501 | C |
AmeriCredit Automobile Loan Trust 2003-BX | | | | 5.800% | | 1/6/10 | | | 16 | | | 16 | |
AQ Finance Nim Trust 2003-N13 | | | | 5.560% | | 12/25/08 | | | 20 | | | 20 | C,D |
Bayview Financial Acquisition Trust 2004-C | | | | 5.744% | | 5/28/44 | | | 174 | | | 175 | |
Bear Stearns Asset-Backed Securities, Inc. 2005-AQ2 | | | | 5.600% | | 9/25/35 | | | 500 | | | 500 | |
Bear Stearns Asset-Backed Securities Trust 2006-SD2 | | | | 5.530% | | 6/25/36 | | | 613 | | | 614 | |
Chase Funding Mortgage Loan Asset-Backed Certificates 2002-4 | | | | 5.700% | | 10/25/32 | | | 27 | | | 26 | |
Citibank Credit Card Issuance Trust 2002-C3 | | | | 6.530% | | 12/15/09 | | | 160 | | | 162 | |
Countrywide Asset-Backed Certificates 2002-3 | | | | 5.700% | | 5/25/32 | | | 7 | | | 7 | |
Countrywide Home Equity Loan Trust 2002-C | | | | 5.570% | | 5/15/28 | | | 32 | | | 32 | |
Countrywide Home Equity Loan Trust 2004-J | | | | 5.620% | | 12/15/33 | | | 82 | | | 82 | |
Countrywide Home Equity Loan Trust 2004-O | | | | 5.610% | | 2/15/34 | | | 122 | | | 122 | |
EQCC Trust 2002-1 | | | | 5.630% | | 11/25/31 | | | 19 | | | 19 | |
First Franklin Mortgage Loan Asset-Backed Certificate 2004-FF10 | | | | 5.730% | | 12/25/32 | | | 259 | | | 260 | |
GSAA Home Equity Trust 2004-9 | | | | 5.710% | | 9/25/34 | | | 22 | | | 22 | |
Morgan Stanley Mortgage Loan Trust 2006-12XS | | | | 5.444% | | 10/25/36 | | | 900 | | | 900 | |
Navistar Financial Corp. Owner Trust 2003-B | | | | 5.530% | | 4/15/08 | | | 51 | | | 51 | |
Origen Manufactured Housing 2006-A | | | | 5.474% | | 11/15/18 | | | 488 | | | 488 | |
Rental Car Finance Corp. 2004-1A | | | | 5.530% | | 6/25/09 | | | 500 | | | 501 | C |
Residential Asset Mortgage Products, Inc. 2002-RS6 | | | | 5.780% | | 11/25/32 | | | 29 | | | 29 | |
Superior Wholesale Inventory Financing Trust 2004-A10 | | | | 5.430% | | 9/15/11 | | | 500 | | | 501 | |
| | | | | | | | | | | | | |
| | | | | | | | | | | | 5,028 | |
| | | | | | | | | | | | | |
Total Asset-Backed Securities
(Identified Cost—$6,716) | | | | | | | | | | | | 6,700 | |
Mortgage-Backed Securities | | 22.0% | | | | | | | | | | | |
| | | | | |
Fixed Rate Securities | | 1.5% | | | | | | | | | | | |
Asset Securitization Corporation 1996-D2 | | | | 6.920% | | 2/14/29 | | | 9 | | | 9 | |
Countrywide Alternative Loan Trust 2004-J1 | | | | 6.000% | | 2/25/34 | | | 46 | | | 46 | |
7
Semi-Annual Report to Shareholders
Portfolio of Investments—Continued
Western Asset Limited Duration Bond Portfolio—Continued
| | | | | | | | | | | | | |
| | | % OF
NET ASSETS | | RATE | | MATURITY
DATE | | PAR | | VALUE | |
| | | | | | | | | | | | | |
Mortgage-Backed Securities—Continued | | | | | | | | | | | | | |
| | | | | |
Fixed Rate Securities—Continued | | | | | | | | | | | | | |
Residential Asset Mortgage Products, Inc. 2004-SL1 | | | | 7.000% | | 11/25/31 | | $ | 556 | | $ | 564 | |
Residential Asset Mortgage Products, Inc. 2004-SL2 | | | | 8.500% | | 10/25/31 | | | 38 | | | 40 | |
Residential Asset Mortgage Products, Inc. 2005-SL1 | | | | 8.000% | | 5/25/32 | | | 700 | | | 729 | |
| | | | | | | | | | | | | |
| | | | | | | | | | | | 1,388 | |
| | | | | | | | | | | | | |
Indexed SecuritiesA | | 18.1% | | | | | | | | | | | |
American Home Mortgage Investment Trust 2005-SD1 | | | | 5.780% | | 9/25/35 | | | 667 | | | 669 | C |
Banc of America Mortgage Securities 2003-D | | | | 4.569% | | 5/25/33 | | | 179 | | | 177 | |
Banc of America Mortgage Securities 2005-F | | | | 5.021% | | 7/25/35 | | | 867 | | | 858 | |
Bear Stearns Arm Trust 2004-10 | | | | 4.517% | | 1/25/35 | | | 703 | | | 698 | |
CBA Commercial Small Balance Commercial Trust 2005-1A | | | | 5.650% | | 8/25/35 | | | 582 | | | 583 | C |
Citigroup Mortgage Loan Trust, Inc. 2005-5 | | | | 5.480% | | 8/25/35 | | | 327 | | | 328 | |
Countrywide Alternative Loan Trust 2005-38 | | | | 5.680% | | 9/25/35 | | | 552 | | | 554 | |
Countrywide Alternative Loan Trust 2005-51 | | | | 5.630% | | 11/20/35 | | | 643 | | | 646 | |
Countrywide Asset-backed Certificates 2005-IM1 | | | | 5.610% | | 11/25/35 | | | 990 | | | 991 | |
Countrywide Home Loans 2005-R3 | | | | 5.730% | | 9/25/35 | | | 713 | | | 717 | C |
Credit Suisse/Morgan Stanley Commercial Mortgage Trust 2006-HC1A | | | | 5.520% | | 5/15/23 | | | 600 | | | 600 | C |
Crusade Global Trust 2003-2 | | | | 5.580% | | 9/18/34 | | | 77 | | | 77 | D |
Granite Mortgages PLC 2003-1 | | | | 5.690% | | 1/20/20 | | | 128 | | | 128 | D |
GSMPS Mortgage Loan Trust 2005-RP3 | | | | 5.680% | | 9/25/35 | | | 546 | | | 547 | |
Harborview Mortgage Loan Trust 2006-7 | | | | 5.530% | | 10/19/37 | | | 907 | | | 907 | |
J.P. Morgan Mortgage Trust 2003-A1 | | | | 4.359% | | 10/25/33 | | | 278 | | | 271 | |
Luminent Mortgage Trust 2006-2 | | | | 5.530% | | 2/25/46 | | | 862 | | | 861 | |
MASTR Adjustable Rate Mortgages Trust 2004-13 | | | | 3.786% | | 11/21/34 | | | 350 | | | 338 | |
MASTR Specialized Loan Trust 2006-2 | | | | 5.584% | | 2/25/36 | | | 618 | | | 618 | C |
Medallion Trust 2000-2G | | | | 5.590% | | 12/18/31 | | | 86 | | | 86 | D |
Medallion Trust 2003-1G | | | | 5.580% | | 12/21/33 | | | 78 | | | 78 | D |
MLCC Mortgage Investors, Inc. 2003-H | | | | 6.706% | | 1/25/29 | | | 49 | | | 50 | |
Provident Funding Mortgage Loan Trust 2005-1 | | | | 4.159% | | 5/25/35 | | | 278 | | | 275 | |
Sequoia Mortgage Trust 2003-2 | | | | 5.560% | | 6/20/33 | | | 56 | | | 56 | |
Structured Adjustable Rate Mortgage Loan Trust 2005-16XS | | | | 5.670% | | 8/25/35 | | | 418 | | | 419 | |
Structured Adjustable Rate Mortgage Loan Trust 2005-19XS | | | | 5.630% | | 9/25/35 | | | 443 | | | 444 | |
Structured Asset Mortgage Investments, Inc. 2006-AR6 | | | | 5.586% | | 7/25/36 | | | 893 | | | 893 | |
Thornburg Mortgage Securities Trust 2005-3 | | | | 5.570% | | 10/25/35 | | | 711 | | | 710 | |
Wachovia Mortgage Loan Trust, LLC 2005-A | | | | 4.783% | | 8/20/35 | | | 354 | | | 349 | |
8
Semi-Annual Report to Shareholders
| | | | | | | | | | | | | |
| | | % OF
NET ASSETS | | RATE | | MATURITY
DATE | | PAR | | VALUE | |
| | | | | | | | | | | | | |
Mortgage-Backed Securities—Continued | | | | | | | | | | | | | |
| | | | | |
Indexed Securities—Continued | | | | | | | | | | | | | |
WaMu Mortgage Pass-Through Certificates 2003-AR10 | | | | 4.062% | | 10/25/33 | | $ | 200 | | $ | 197 | |
WaMu Mortgage Pass-Through Certificates 2005-AR15 | | | | 5.610% | | 11/25/45 | | | 890 | | | 894 | |
WaMu Mortgage Pass-Through Certificates 2005-AR19 | | | | 5.740% | | 12/25/45 | | | 500 | | | 502 | |
WaMu Mortgage Pass-Through Certificates 2006-AR11 | | | | 5.590% | | 9/25/46 | | | 698 | | | 698 | |
| | | | | | | | | | | | | |
| | | | | | | | | | | | 16,219 | |
| | | | | | | | | | | | | |
Variable Rate SecuritiesE | | 2.4% | | | | | | | | | | | |
Banc of America Funding Corporation 2004-B | | | | 4.177% | | 12/20/34 | | | 150 | | | 150 | |
Banc of America Funding Corporation 2005-F | | | | 5.257% | | 9/20/35 | | | 250 | | | 251 | |
Countrywide Alternative Loan Trust 2004-33 1A1 | | | | 5.003% | | 12/25/34 | | | 95 | | | 95 | |
Countrywide Alternative Loan Trust 2004-33 2A1 | | | | 4.948% | | 12/25/34 | | | 45 | | | 45 | |
Countrywide Alternative Loan Trust 2005-14 | | | | 3.300% | | 5/25/35 | | | 141 | | | 138 | |
IndyMac INDX Mortgage Loan Trust 2004-AR15 | | | | 5.074% | | 2/25/35 | | | 618 | | | 615 | |
Prime Mortgage Trust 2005-2 | | | | 7.448% | | 10/25/32 | | | 202 | | | 207 | |
Residential Funding Mortgage Securities I 2005-SA3 | | | | 4.920% | | 8/25/35 | | | 544 | | | 543 | |
Structured Asset Securities Corporation 2004-SC1 | | | | 9.902% | | 12/25/29 | | | 118 | | | 127 | C |
| | | | | | | | | | | | | |
| | | | | | | | | | | | 2,171 | |
| | | | | | | | | | | | | |
Total Mortgage-Backed Securities
(Identified Cost—$19,806) | | | | | | | | | | | | 19,778 | |
U.S. Government and Agency Obligations | | 19.5% | | | | | | | | | | | |
| | | | | |
Fixed Rate Securities | | 17.8% | | | | | | | | | | | |
Fannie Mae | | | | 5.000% | | 9/15/08 | | | 150 | | | 150 | |
Freddie Mac | | | | 3.800% | | 12/27/06 | | | 1,820 | | | 1,813 | |
Freddie Mac | | | | 3.625% | | 11/14/08 | | | 375 | | | 365 | |
United States Treasury Notes | | | | 3.500% | | 5/31/07 | | | 760 | | | 753 | |
United States Treasury Notes | | | | 3.625% | | 6/30/07 | | | 1,730 | | | 1,713 | |
United States Treasury Notes | | | | 4.375% | | 1/31/08 | | | 9,220 | | | 9,165 | |
United States Treasury Notes | | | | 5.000% | | 7/31/08 | | | 2,000 | | | 2,009 | |
| | | | | | | | | | | | | |
| | | | | | | | | | | | 15,968 | |
| | | | | | | | | | | | | |
Treasury Inflation-Protected SecuritiesF | | 1.7% | | | | | | | | | | | |
United States Treasury Inflation-Protected Security | | | | 3.000% | | 7/15/12 | | | 849 | | | 881 | |
United States Treasury Inflation-Protected Security | | | | 2.375% | | 1/15/25 | | | 658 | | | 669 | |
| | | | | | | | | | | | | |
| | | | | | | | | | | | 1,550 | |
| | | | | | | | | | | | | |
Total U.S. Government and Agency Obligations
(Identified Cost—$17,621) | | | | | | | | | | | | 17,518 | |
9
Semi-Annual Report to Shareholders
Portfolio of Investments—Continued
Western Asset Limited Duration Bond Portfolio—Continued
| | | | | | | | | | | | | |
| | | % OF
NET ASSETS | | RATE | | MATURITY
DATE | | PAR | | VALUE | |
| | | | | | | | | | | | | |
U.S. Government Agency Mortgage-Backed Securities | | 22.4% | | | | | | | | | | | |
| | | | | |
Fixed Rate Securities | | 14.2% | | | | | | | | | | | |
Fannie Mae | | | | 5.000% | | 12/1/36 | | $ | 5,650 | | $ | 5,429 | G |
Fannie Mae | | | | 5.500% | | 12/1/36 | | | 2,200 | | | 2,167 | G |
Fannie Mae | | | | 6.000% | | 12/1/36 | | | 3,450 | | | 3,465 | G |
Freddie Mac | | | | 5.000% | | 12/1/36 | | | 100 | | | 96 | G |
Government National Mortgage Association | | | | 5.000% | | 8/15/33 | | | 84 | | | 82 | |
Government National Mortgage Association | | | | 5.500% | | 12/1/36 | | | 1,500 | | | 1,490 | G |
Government National Mortgage Association | | | | 5.000% | | 12/1/36 | | | 30 | | | 29 | G |
| | | | | | | | | | | | | |
| | | | | | | | | | | | 12,758 | |
| | | | | | | | | | | | | |
Indexed SecuritiesA | | 8.2% | | | | | | | | | | | |
Fannie Mae | | | | 4.215% | | 12/1/34 | | | 150 | | | 146 | |
Fannie Mae | | | | 4.253% | | 12/1/34 | | | 147 | | | 144 | |
Fannie Mae | | | | 4.329% | | 1/1/35 | | | 163 | | | 159 | |
Fannie Mae | | | | 4.860% | | 1/1/35 | | | 291 | | | 287 | |
Fannie Mae | | | | 4.792% | | 2/1/35 | | | 667 | | | 661 | |
Fannie Mae | | | | 4.541% | | 3/1/35 | | | 334 | | | 329 | |
Fannie Mae | | | | 5.113% | | 3/1/35 | | | 552 | | | 548 | |
Fannie Mae | | | | 4.725% | | 7/1/35 | | | 4,648 | | | 4,596 | |
Freddie Mac | | | | 4.354% | | 12/1/34 | | | 73 | | | 72 | |
Freddie Mac | | | | 4.081% | | 1/1/35 | | | 50 | | | 48 | |
Freddie Mac | | | | 4.099% | | 1/1/35 | | | 89 | | | 86 | |
Freddie Mac | | | | 4.512% | | 1/1/35 | | | 243 | | | 239 | |
| | | | | | | | | | | | | |
| | | | | | | | | | | | 7,315 | |
| | | | | | | | | | | | | |
Total U.S. Government Agency Mortgage-Backed Securities (Identified Cost—$20,158) | | | | | | | | | | | | 20,073 | |
Yankee BondsD | | 7.7% | | | | | | | | | | | |
| | | | | |
Banking and Finance | | 1.5% | | | | | | | | | | | |
AIFUL CORPORATION | | | | 5.000% | | 8/10/10 | | | 370 | | | 360 | C |
Islandsbanki hf | | | | 5.519% | | 2/22/08 | | | 10 | | | 10 | A,C |
Kaupthing Bank hf | | | | 6.190% | | 4/12/11 | | | 300 | | | 300 | A,C |
Kaupthing Bank hf | | | | 5.750% | | 10/4/11 | | | 290 | | | 289 | C |
Landsbanki Islands hf (The National Bank of Iceland) | | | | 6.100% | | 8/25/11 | | | 210 | | | 212 | C |
MUFG Capital Finance 1 Limited | | | | 6.346% | | 7/25/49 | | | 140 | | | 141 | B |
| | | | | | | | | | | | | |
| | | | | | | | | | | | 1,312 | |
| | | | | | | | | | | | | |
Beverages | | 0.5% | | | | | | | | | | | |
SABMiller Plc | | | | 5.671% | | 7/1/09 | | | 480 | | | 480 | A,C |
| | | | | | | | | | | | | |
10
Semi-Annual Report to Shareholders
| | | | | | | | | | | | | |
| | | % OF
NET ASSETS | | RATE | | MATURITY
DATE | | PAR | | VALUE | |
| | | | | | | | | | | | | |
Yankee Bonds—Continued | | | | | | | | | | | | | |
| | | | | |
Foreign Governments | | 0.8% | | | | | | | | | | | |
Russian Federation | | | | 3.000% | | 5/14/08 | | $ | 330 | | $ | 317 | |
Russian Federation | | | | 8.250% | | 3/31/10 | | | 36 | | | 37 | |
Russian Federation | | | | 8.250% | | 3/31/10 | | | 329 | | | 346 | C |
| | | | | | | | | | | | | |
| | | | | | | | | | | | 700 | |
| | | | | | | | | | | | | |
Health Care | | 0.2% | | | | | | | | | | | |
Baxter Finco B.V. | | | | 4.750% | | 10/15/10 | | | 150 | | | 147 | |
| | | | | | | | | | | | | |
| | | | | |
Special Purpose | | 2.3% | | | | | | | | | | | |
Anadarko Finance Company | | | | 6.750% | | 5/1/11 | | | 790 | | | 830 | |
Diageo Capital Plc | | | | 3.375% | | 3/20/08 | | | 280 | | | 273 | |
TNK-BP Finance SA | | | | 6.875% | | 7/18/11 | | | 470 | | | 481 | C |
Tyco International Group SA | | | | 6.375% | | 10/15/11 | | | 480 | | | 503 | |
| | | | | | | | | | | | | |
| | | | | | | | | | | | 2,087 | |
| | | | | | | | | | | | | |
Telecommunications | | 2.2% | | | | | | | | | | | |
British Telecommunications plc | | | | 8.375% | | 12/15/10 | | | 500 | | | 561 | |
Deutsche Telekom International Finance BV | | | | 8.000% | | 6/15/10 | | | 300 | | | 327 | |
France Telecom SA | | | | 7.750% | | 3/1/11 | | | 240 | | | 263 | |
Koninklijke (Royal) KPN NV | | | | 8.000% | | 10/1/10 | | | 420 | | | 454 | |
Telecom Italia Capital | | | | 5.969% | | 2/1/11 | | | 100 | | | 99 | A |
Telefonica Emisiones, S.A.U. | | | | 5.690% | | 6/19/09 | | | 300 | | | 300 | A |
| | | | | | | | | | | | | |
| | | | | | | | | | | | 2,004 | |
| | | | | | | | | | | | | |
Telecommunications (Cellular/Wireless) | | 0.2% | | | | | | | | | | | |
Vodafone Group Plc | | | | 3.950% | | 1/30/08 | | | 170 | | | 167 | |
| | | | | | | | | | | | | |
Total Yankee Bonds (Identified Cost—$6,879) | | | | | | | | | | | | 6,897 | |
| | | | | | | | | | | | | |
Total Long-Term Securities (Identified Cost—$90,808) | | | | | | | | | | | | 90,623 | |
Short-Term Securities | | 12.9% | | | | | | | | | | | |
| | | | | |
U.S. Government and Agency Obligations | | 0.1% | | | | | | | | | | | |
Fannie Mae | | | | 0.000% | | 6/25/07 | | | 124 | | | 119H,I | |
| | | | | | | | | | | | | |
| | | | | |
Options PurchasedJ | | N.M. | | | | | | | | | | | |
U.S. Treasury Note Futures Call, November 2006, Strike Price $102.03 | | | | | | | | | 400,000K | | | 3 | |
| | | | | | | | | | | | | |
11
Semi-Annual Report to Shareholders
Portfolio of Investments—Continued
Western Asset Limited Duration Bond Portfolio—Continued
| | | | | | | | | |
| | | % OF
NET ASSETS | | PAR | | VALUE | |
| | | | | | | | | |
Short-Term Securities—Continued | | | | | | | | | |
| | | |
Repurchase Agreements | | 12.8% | | | | | | | |
Goldman Sachs Group, Inc.
5.3%, dated 9/29/06, to be repurchased at $11,465
on 10/2/06 (Collateral: $11,190 Tennessee Valley | | | | | | | | | |
Authority notes, 5.375%, due 4/1/56, value $11,694) | | | | $ | 11,460 | | $ | 11,460 | |
| | | | | | | | | |
Total Short-Term Securities (Identified Cost—$11,583) | | | | | | | | 11,582 | |
Total Investments (Identified Cost—$102,391) | | 113.9% | | | | | | 102,205 | |
Other Assets Less Liabilities | | (13.9)% | | | | | | (12,488 | ) |
| | | | | | | | | |
| | | |
Net Assets | | 100.0% | | | | | $ | 89,717 | |
| | | | | | | | | |
| | | | | | | | |
| | | EXPIRATION | | ACTUAL
CONTRACTS | | APPRECIATION/
(DEPRECIATION) | |
Futures Contracts PurchasedJ | | | | | | | | |
U.S. Treasury Note Futures | | December 2006 | | 245 | | $ | 100 | |
| | | | | | | | |
Futures Contracts WrittenJ | | | | | | | | |
U.S. Treasury Note Futures | | December 2006 | | 2 | | $ | (0.1 | ) |
U.S. Treasury Note Futures | | December 2006 | | 3 | | | (0.2 | ) |
U.S. Treasury Note Futures | | December 2006 | | 112 | | | (119 | ) |
U.S. Treasury Note Futures | | December 2006 | | 120 | | | (83 | ) |
| | | | | | | | |
| | | | | | $ | (202 | ) |
| | | | | | | | |
Options WrittenJ | | | | | | | | |
Fannie Mae Futures Call, Strike Price $100.3984 | | November 2006 | | 1,100,000 | | | — L | |
U.S. Treasury Note Futures Call, Strike Price $110.00 | | March 2007 | | 38 | | | 10 | |
U.S. Treasury Note Futures Put, Strike Price $106.00 | | March 2007 | | 58 | | | (6 | ) |
| | | | | | | | |
| | | | | | $ | 4 | |
| | | | | | | | |
| | | | | | | | | |
| A | | Indexed Security – The rates of interest earned on these securities are tied to the London Interbank Offered Rate (“LIBOR”), the one-year U.S. Treasury Bill Rate, or the Cost of Funds Index (“COFI”) rate. The coupon rates are the rates as of September 30, 2006. |
| B | | Stepped Coupon Security – A security with a predetermined schedule of interest or dividend rate changes. |
| C | | Rule 144a Security – A security purchased pursuant to Rule 144a under the Securities Act of 1933 which may not be resold subject to that rule except to qualified institutional buyers. These securities, which the Fund’s investment adviser has determined to be liquid, represent 10.0% of net assets. |
| D | | Yankee Bond – A dollar denominated bond issued in the U.S. by foreign entities. |
| E | | The coupon rates shown on variable rate securities are the rates at September 30, 2006. These rates vary with the weighted average coupon of the underlying loans. |
| F | | Treasury Inflation-Protected Security – A security whose principal value is adjusted daily in accordance with changes to the Consumer Price Index for All Urban Consumers. Interest is calculated on the basis of the current adjusted principal value. |
| G | | When-issued Security – A security purchased on a delayed delivery basis. Final settlement amount and maturity date have not yet been announced. |
| H | | All or a portion of this security is pledged as collateral to cover futures contracts. |
| I | | Zero Coupon Bond – A bond with no periodic interest payments which is sold at such a discount as to produce a current yield to maturity. |
| J | | Options and futures are described in more detail in the notes to financial statements. |
| K | | Par represents actual number of contracts. |
N.M.—Not meaningful.
See note to financial statements.
12
Semi-Annual Report to Shareholders
Statement of Assets and Liabilities
Western Asset Limited Duration Bond Portfolio
September 30, 2006 (Unaudited)
(Amounts in Thousands)
| | | | | | | |
Assets: | | | | | | | |
Investment securities at market value (Identified Cost—$90,808) | | | | | $ | 90,623 | |
Short-term securities at value (Identified Cost—$11,583) | | | | | | 11,582 | |
Swap contracts at value | | | | | | 6 | |
Receivable for securities sold | | | | | | 3,467 | |
Futures variation margin receivable | | | | | | 6 | |
Interest receivable | | | | | | 609 | |
Due from manager | | | | | | 10 | |
Other assets | | | | | | 1 | |
| | | | | | | |
Total assets | | | | | | 106,304 | |
| | |
Liabilities: | | | | | | | |
Payable for securities purchased | | $ | 49 | | | | |
Payable for fund shares repurchased | | | 16,446 | | | | |
Options written (Proceeds—$50) | | | 46 | | | | |
Accrued expenses | | | 46 | | | | |
| | | | | | | |
Total liabilities | | | | | | 16,587 | |
| | | | | | | |
| | |
Net Assets | | | | | $ | 89,717 | |
| | | | | | | |
| | |
Net assets consist of: | | | | | | | |
Accumulated paid-in-capital applicable to: | | | | | | | |
9,117 Institutional Class shares outstanding | | | | | $ | 90,662 | |
Undistributed net investment income | | | | | | 6 | |
Accumulated net realized loss on investments, options, futures, and swaps | | | | | | (670 | ) |
Unrealized appreciation/(depreciation) of investments, options, futures, and swaps | | | | | | (281 | ) |
| | | | | | | |
| | |
Net Assets | | | | | $ | 89,717 | |
| | | | | | | |
| | |
Net Asset Value Per Share: | | | | | | | |
Institutional Class | | | | | | $9.84 | |
| | | | | | | | |
See notes to financial statements.
13
Semi-Annual Report to Shareholders
Statement of Operations
Western Asset Limited Duration Bond Portfolio
For the Six Months Ended September 30, 2006 (Unaudited)
(Amounts in Thousands)
| | | | | | | | |
Investment Income: | | | | | | | | |
Interest | | | | | | $ | 1,920 | |
Expenses: | | | | | | | | |
Advisory fee | | $ | 131 | | | | | |
Audit and legal fees | | | 35 | �� | | | | |
Custodian fees | | | 29 | | | | | |
Directors’ fees and expenses | | | 1 | | | | | |
Proxy expense | | | — A | | | | | |
Registration fees | | | 8 | | | | | |
Reports to shareholders | | | 7 | | | | | |
Transfer agent and shareholder servicing expense | | | 4 | | | | | |
Other expenses | | | 7 | | | | | |
| | | | | | | | |
| | | 222 | | | | | |
Less: Fees waived | | | (72 | ) | | | | |
Compensating balance creditsB | | | — | A | | | | |
| | | | | | | | |
Total expenses, net of waivers and compensating balance credits | | | | | | | 150 | |
| | | | | | | | |
Net Investment Income | | | | | | | 1,770 | |
Net Realized and Unrealized Gain/(Loss) on Investments: | | | | | | | | |
Realized loss on: | | | | | | | | |
Investments | | | (15 | ) | | | | |
Futures | | | (131 | ) | | | | |
Swaps | | | (1 | ) | | | | |
| | | | | | | | |
| | | | | | | (147 | ) |
Change in unrealized appreciation/(depreciation) of investments, options, futures, and swaps | | | | | | | 479 | |
| | | | | | | | |
Net Realized and Unrealized Gain on Investments | | | | | | | 332 | |
| | | | | | | | | |
Change in Net Assets Resulting From Operations | | | | | | $ | 2,102 | |
| | | | | | | | | |
| B | | See note 1, compensating balance credits, in the notes to financial statements. |
N/A—Not applicable.
See notes to financial statements.
14
Semi-Annual Report to Shareholders
Statement of Changes in Net Assets
Western Asset Limited Duration Bond Portfolio
(Amounts in Thousands)
| | | | | | | | |
| | | FOR THE
SIX MONTHS ENDED
SEPTEMBER 30, 2006 | | | FOR THE
YEAR ENDED
MARCH 31, 2006 | |
| Change in Net Assets: | | (Unaudited) | | | | |
Net investment income | | $ | 1,770 | | | $ | 2,658 | |
| | |
Net realized loss on investments, options, futures, and swaps | | | (147 | ) | | | (449 | ) |
| | |
Change in unrealized appreciation/(depreciation) of investments, options, futures, and swaps | | | 479 | | | | (458 | ) |
| | | | | | | | |
Change in net assets resulting from operations | | | 2,102 | | | | 1,751 | |
| | |
Distributions to Shareholders from net investment income | | | (1,771 | ) | | | (2,696 | ) |
| | |
Change in net assets from Fund share transactions | | | 15,243 | | | | 37,662 | |
| | | | | | | | |
Change in net assets | | | 15,574 | | | | 36,717 | |
| | |
Net Assets: | | | | | | | | |
Beginning of period | | | 74,143 | | | | 37,426 | |
| | | | | | | | |
| | |
End of period | | $ | 89,717 | | | $ | 74,143 | |
| | | | | | | | |
| | |
Undistributed net investment income | | $ | 6 | | | $ | 7 | |
| | | | | | | | |
| | | | | | | | | |
See notes to financial statements.
15
Semi-Annual Report to Shareholders
Financial Highlights
Western Asset Limited Duration Bond Portfolio
Contained below is per share operating performance data for a share of common stock outstanding throughout each period shown, total investment return, ratios to average net assets and other supplemental data. This information has been derived from information in the financial statements.
Institutional Class:
| | | | | | | | | | | | | | | | |
| | | SIX MONTHS
ENDED
SEPTEMBER 30, 2006 | | | YEARS ENDED MARCH 31, | |
| | | 2006 | | | 2005 | | | 2004A | |
| | | (Unaudited) | | | | | | | | | | |
Net asset value, beginning of period | | $ | 9.80 | | | $ | 9.89 | | | $ | 10.09 | | | $ | 10.00 | |
| | | | | | | | | | | | | | | | |
Investment operations: | | | | | | | | | | | | | | | | |
Net investment income | | | .23 | | | | .38 | | | | .24 | | | | .08 | |
Net realized and unrealized gain/(loss) on investments, options, futures, and swaps | | | .04 | | | | (.09 | ) | | | (.17 | ) | | | .09 | |
| | | | | | | | | | | | | | | | |
Total from investment operations | | | .27 | | | | .29 | | | | .07 | | | | .17 | |
| | | | | | | | | | | | | | | | |
Distributions paid from: | | | | | | | | | | | | | | | | |
Net investment income | | | (.23 | ) | | | (.38 | ) | | | (.25 | ) | | | (.08 | ) |
Net realized gain on investments | | | — | | | | — | | | | (.02 | ) | | | — | |
| | | | | | | | | | | | | | | | |
Total distributions | | | (.23 | ) | | | (.38 | ) | | | (.27 | ) | | | (.08 | ) |
| | | | | | | | | | | | | | | | |
Net asset value, end of period | | $ | 9.84 | | | $ | 9.80 | | | $ | 9.89 | | | $ | 10.09 | |
| | | | | | | | | | | | | | | | |
Total return | | | 2.81 | %B | | | 3.01 | % | | | .69 | % | | | 1.69 | %B |
| | | | |
Ratios to Average Net Assets:C | | | | | | | | | | | | | | | | |
Total expenses | | | .59 | %D | | | .68 | % | | | .73 | % | | | .68 | %D |
Expenses net of waivers, if any | | | .40 | %D | | | .40 | % | | | .40 | % | | | .40 | %D |
Expenses net of all reductions | | | .40 | %D | | | .40 | % | | | .40 | % | | | .40 | %D |
Net investment income | | | 4.7 | %D | | | 3.9 | % | | | 2.4 | % | | | 1.6 | %D |
| | | | |
Supplemental Data: | | | | | | | | | | | | | | | | |
Portfolio turnover rate | | | 127.8 | %B | | | 244.7 | % | | | 231.5 | % | | | 125.5 | % |
Net assets at end of period (in thousands) | | $ | 89,717 | | | $ | 74,143 | | | $ | 37,426 | | | $ | 26,182 | |
| | | | | | | | | | | | | | | | | |
| A | | For the period October 1, 2003 (commencement of operations) to March 31, 2004. |
| C | | Total expenses reflects operating expenses prior to any voluntary expense waivers and/or compensating balance credits. Expenses net of waivers reflects total expenses before compensating balance credits but net of any voluntary expense waivers. Expenses net of all reductions reflects expenses less any compensating balance credits and/or voluntary expense waivers. |
See notes to financial statements.
16
Semi-Annual Report to Shareholders
Expense Example
Western Asset Intermediate Bond Portfolio
As a shareholder of the Fund, you incur ongoing costs, including management fees, and other Fund expenses. These examples are intended to help you understand your ongoing costs (in dollars) of investing in the Fund and to compare these costs with the ongoing costs of investing in other mutual funds. The example is based on an investment of $1,000 invested on April 1, 2006, and held through September 30, 2006.
Actual Expenses
The first line in the table below provides information about actual account values and actual expenses for the Fund. You may use the information in this line, together with the amount you invested, to estimate the expenses that you paid over the period. Simply divide your account value by $1,000 (for example, an $8,600 account value divided by $1,000 = 8.6), then multiply the result by the number in the first line under the heading entitled “Expenses Paid During the Period” to estimate the expenses you paid on your account during this period.
Hypothetical Example for Comparison Purposes
The second line in the table below provides information about hypothetical account values and hypothetical expenses based on the Fund’s actual expense ratio and an assumed rate of return of 5% per year before expenses, which is not the Fund’s actual return. The hypothetical account values and expenses may not be used to estimate the actual ending account balance or expenses you paid for the period. You may use this information to compare the ongoing costs of investing in the Fund and other funds. To do so, compare this 5% hypothetical example with the 5% hypothetical examples that appear in the shareholder reports of other funds.
| | | | | | | | | |
| | | Beginning
Account Value
4/1/06 | | Ending
Account Value
9/30/06 | | Expenses PaidA
During the Period
4/1/06 to 9/30/06 |
Institutional Class: | | | | | | | | | |
Actual | | $ | 1,000.00 | | $ | 1,037.60 | | $ | 2.30 |
Hypothetical (5% return before expenses) | | | 1,000.00 | | | 1,022.81 | | | 2.28 |
| A | | These calculations are based on expenses incurred in the most recent fiscal half-year. The dollar amounts shown as “Expenses Paid” are equal to the annualized expense ratio of 0.45% multiplied by the average value over the period, multiplied by the number of days in the most recent fiscal half-year (183), and divided by 365. |
17
Semi-Annual Report to Shareholders
Performance Information
Western Asset Intermediate Bond Portfolio
The graph compares the Fund’s total returns against that of an appropriate broad-based securities market index. The line illustrates the cumulative total return of an initial $1,000,000 investment for the periods indicated. The line for the Fund represents the total return after deducting all Fund investment management and other administrative expenses and the transaction costs of buying and selling securities. The line representing the securities market index does not include any transaction costs associated with buying and selling securities in the index or other investment management or administrative expenses.
Total return measures investment performance in terms of appreciation or depreciation in the Fund’s net asset value per share, plus dividends and any capital gain distributions. It assumes that dividends and distributions were reinvested at the time they were paid. Returns (and the graph and table found below) do not reflect the deduction of taxes that a shareholder would pay on Fund distributions or the redemption of Fund shares. Average annual returns tend to smooth out variations in a fund’s return, so that they differ from actual year-to-year results.
Bonds are subject to a variety of risks, including interest rate, credit, and inflation risk.
Growth of a $1,000,000 Investment—Institutional Class
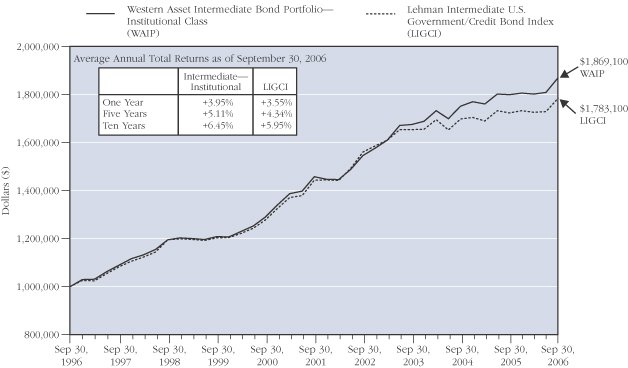
The performance data quoted represents past performance and does not guarantee future results. The performance stated may have been due to extraordinary market conditions, which may not be duplicated in the future. Current performance may be lower or higher than the performance data quoted. To obtain the most recent month-end performance information, please visit www.westernassetfunds.com. The investment return and principal value of the Fund will fluctuate so that an investor’s shares, when redeemed, may be worth more or less than the original cost. Calculations assume reinvestment of dividends and capital gain distributions. Performance would have been lower if fees had not been waived in various periods.
18
Semi-Annual Report to Shareholders
Portfolio Composition (as of September 30, 2006)
Standard & Poor’s Debt RatingsA
(as a percentage of the portfolio)

Maturity Schedule
(as a percentage of the portfolio)
| A | | Source: Standard & Poor's. |
| B | | Preferred Stocks do not have a defined maturity date. |
The Fund is actively managed. As a result, the composition of the portfolio holdings and sectors are subject to change at any time.
19
Semi-Annual Report to Shareholders
Portfolio of Investments
Western Asset Intermediate Bond Portfolio
September 30, 2006 (Unaudited)
(Amounts in Thousands)
| | | | | | | | | | | | | |
| | | % OF
NET ASSETS | | RATE | | MATURITY
DATE | | PAR | | VALUE | |
| | | | | | | | | | | | | |
Long-Term Securities | | 84.8% | | | | | | | | | | | |
| | | | | |
Corporate Bonds and Notes | | 35.0% | | | | | | | | | | | |
| | | | | |
Aerospace/Defense | | 0.2% | | | | | | | | | | | |
United Technologies Corporation | | | | 6.350% | | 3/1/11 | | $ | 1,037 | | $ | 1,083 | |
| | | | | | | | | | | | | |
| | | | | |
Automotive | | 0.7% | | | | | | | | | | | |
Ford Motor Company | | | | 7.450% | | 7/16/31 | | | 1,159 | | | 896 | A |
General Motors Corporation | | | | 8.375% | | 7/15/33 | | | 3,598 | | | 3,112 | A |
| | | | | | | | | | | | | |
| | | | | | | | | | | | 4,008 | |
| | | | | | | | | | | | | |
Banking and Finance | | 7.5% | | | | | | | | | | | |
Ford Motor Credit Company | | | | 6.194% | | 9/28/07 | | | 7,730 | | | 7,659 | B |
Ford Motor Credit Company | | | | 8.466% | | 11/2/07 | | | 251 | | | 253 | B |
Ford Motor Credit Company | | | | 6.625% | | 6/16/08 | | | 9,148 | | | 9,010 | |
General Motors Acceptance Corporation | | | | 6.125% | | 8/28/07 | | | 3,792 | | | 3,787 | A |
General Motors Acceptance Corporation | | | | 6.539% | | 9/23/08 | | | 995 | | | 989 | B |
General Motors Acceptance Corporation | | | | 6.750% | | 12/1/14 | | | 1,556 | | | 1,519 | A |
General Motors Acceptance Corporation | | | | 5.046% | | 9/19/35 | | | 1,721 | | | 1,707 | B |
HSBC Finance Corporation | | | | 5.696% | | 5/10/10 | | | 1,272 | | | 1,278 | B |
Nissan Motor Acceptance Corporation | | | | 5.625% | | 3/14/11 | | | 2,196 | | | 2,205 | C |
Residential Capital Corporation | | | | 6.742% | | 6/29/07 | | | 3,962 | | | 3,984 | B |
Residential Capital Corporation | | | | 6.000% | | 2/22/11 | | | 2,836 | | | 2,832 | A |
Wachovia Capital Trust III | | | | 5.800% | | 3/15/42 | | | 6,788 | | | 6,807 | D |
Washington Mutual, Inc. | | | | 4.200% | | 1/15/10 | | | 2,423 | | | 2,346 | |
| | | | | | | | | | | | | |
| | | | | | | | | | | | 44,376 | |
| | | | | | | | | | | | | |
Cable | | 0.8% | | | | | | | | | | | |
Comcast Cable Communications, Inc. | | | | 6.750% | | 1/30/11 | | | 4,303 | | | 4,521 | A |
| | | | | | | | | | | | | |
| | | | | |
Casino Resorts | | 0.5% | | | | | | | | | | | |
Caesars Entertainment, Inc. | | | | 7.500% | | 9/1/09 | | | 802 | | | 838 | A |
Harrah’s Operating Company, Inc. | | | | 5.500% | | 7/1/10 | | | 754 | | | 743 | |
Harrah’s Operating Company, Inc. | | | | 5.625% | | 6/1/15 | | | 1,378 | | | 1,281 | |
| | | | | | | | | | | | | |
| | | | | | | | | | | | 2,862 | |
| | | | | | | | | | | | | |
Chemicals | | 0.4% | | | | | | | | | | | |
The Dow Chemical Company | | | | 5.750% | | 12/15/08 | | | 616 | | | 623 | |
The Dow Chemical Company | | | | 5.970% | | 1/15/09 | | | 713 | | | 724 | |
The Dow Chemical Company | | | | 6.000% | | 10/1/12 | | | 810 | | | 837 | |
| | | | | | | | | | | | | |
| | | | | | | | | | | | 2,184 | |
| | | | | | | | | | | | | |
20
Semi-Annual Report to Shareholders
| | | | | | | | | | | | | |
| | | % OF
NET ASSETS | | RATE | | MATURITY
DATE | | PAR | | VALUE | |
| | | | | | | | | | | | | |
Corporate Bonds and Notes—Continued | | | | | | | | | | | | | |
| | | | | |
Computer Services and Systems | | 0.5% | | | | | | | | | | | |
Electronic Data Systems Corporation | | | | 7.125% | | 10/15/09 | | $ | 2,625 | | $ | 2,746 | |
| | | | | | | | | | | | | |
| | | | | |
Diversified Financial Services | | 0.3% | | | | | | | | | | | |
ZFS Finance USA Trust II | | | | 6.450% | | 12/15/65 | | | 2,060 | | | 2,037 | C,D |
| | | | | | | | | | | | | |
| | | | | |
Drug and Grocery Store Chains | | 0.3% | | | | | | | | | | | |
Safeway Inc. | | | | 6.500% | | 3/1/11 | | | 690 | | | 712 | |
The Kroger Co. | | | | 6.200% | | 6/15/12 | | | 883 | | | 905 | |
| | | | | | | | | | | | | |
| | | | | | | | | | | | 1,617 | |
| | | | | | | | | | | | | |
Electric | | 1.3% | | | | | | | | | | | |
Appalachian Power Company | | | | 3.600% | | 5/15/08 | | | 1,094 | | | 1,064 | |
Commonwealth Edison Company | | | | 6.150% | | 3/15/12 | | | 263 | | | 270 | |
Dominion Resources, Inc. | | | | 5.700% | | 9/17/12 | | | 1,596 | | | 1,606 | A |
FirstEnergy Corp. | | | | 6.450% | | 11/15/11 | | | 2,877 | | | 3,001 | A |
Niagara Mohawk Power Corporation | | | | 7.750% | | 10/1/08 | | | 1,742 | | | 1,818 | |
| | | | | | | | | | | | | |
| | | | | | | | | | | | 7,759 | |
| | | | | | | | | | | | | |
Energy | | 2.6% | | | | | | | | | | | |
Alabama Power Company | | | | 5.590% | | 8/25/09 | | | 1,134 | | | 1,138 | B |
CenterPoint Energy Inc. | | | | 5.875% | | 6/1/08 | | | 1,325 | | | 1,331 | |
Duke Energy Corporation | | | | 6.250% | | 1/15/12 | | | 1,078 | | | 1,122 | A |
| | | | | | | | | | | | | |
Duke Energy Corporation | | | | 5.625% | | 11/30/12 | | | 729 | | | 739 | |
Exelon Corporation | | | | 6.750% | | 5/1/11 | | | 2,269 | | | 2,384 | |
MidAmerican Energy Holdings Company | | | | 5.875% | | 10/1/12 | | | 827 | | | 842 | |
Pacific Gas and Electric Company | | | | 3.600% | | 3/1/09 | | | 2,309 | | | 2,226 | |
Progress Energy, Inc. | | | | 5.850% | | 10/30/08 | | | 1,013 | | | 1,023 | |
Progress Energy, Inc. | | | | 7.100% | | 3/1/11 | | | 1,337 | | | 1,433 | A |
TXU Corp. | | | | 4.800% | | 11/15/09 | | | 570 | | | 556 | |
TXU Corp. | | | | 5.550% | | 11/15/14 | | | 2,480 | | | 2,343 | A |
| | | | | | | | | | | | | |
| | | | | | | | | | | | 15,137 | |
| | | | | | | | | | | | | |
Environmental Services | | 0.9% | | | | | | | | | | | |
Waste Management, Inc. | | | | 6.875% | | 5/15/09 | | | 2,285 | | | 2,374 | |
Waste Management, Inc. | | | | 7.375% | | 8/1/10 | | | 3,055 | | | 3,275 | |
| | | | | | | | | | | | | |
| | | | | | | | | | | | 5,649 | |
| | | | | | | | | | | | | |
Food, Beverage and Tobacco | | 1.0% | | | | | | | | | | | |
Altria Group, Inc. | | | | 7.000% | | 11/4/13 | | | 170 | | | 185 | |
Kraft Foods Inc. | | | | 5.625% | | 11/1/11 | | | 1,932 | | | 1,952 | |
Pepsi Bottling Holdings Inc. | | | | 5.625% | | 2/17/09 | | | 1,978 | | | 2,000 | C |
21
Semi-Annual Report to Shareholders
Portfolio of Investments—Continued
Western Asset Intermediate Bond Portfolio—Continued
| | | | | | | | | | | | | |
| | | % OF
NET ASSETS | | RATE | | MATURITY
DATE | | PAR | | VALUE | |
| | | | | | | | | | | | | |
Corporate Bonds and Notes—Continued | | | | | | | | | | | | | |
| | | | | |
Food, Beverage and Tobacco—Continued | | | | | | | | | | | | | |
Sara Lee Corporation | | | | 2.750% | | 6/15/08 | | $ | 1,661 | | $ | 1,589 | |
Sara Lee Corporation | | | | 6.250% | | 9/15/11 | | | 543 | | | 556 | |
| | | | | | | | | | | | | |
| | | | | | | | | | | | 6,282 | |
| | | | | | | | | | | | | |
Gas and Pipeline Utilities | | 0.7% | | | | | | | | | | | |
Kinder Morgan Energy Partners, L.P. | | | | 7.500% | | 11/1/10 | | | 1,321 | | | 1,411 | A |
Kinder Morgan Energy Partners, L.P. | | | | 6.750% | | 3/15/11 | | | 1,337 | | | 1,393 | |
The Williams Companies, Inc. | | | | 8.125% | | 3/15/12 | | | 1,540 | | | 1,644 | |
| | | | | | | | | | | | | |
| | | | | | | | | | | | 4,448 | |
| | | | | | | | | | | | | |
Investment Banking/Brokerage | | 2.9% | | | | | | | | | | | |
JPMorgan Chase & Co. | | | | 5.125% | | 9/15/14 | | | 1,329 | | | 1,303 | |
JPMorgan Chase Capital XIII | | | | 6.317% | | 9/30/34 | | | 122 | | | 122 | B |
Lehman Brothers Holdings E-Capital Trust I | | | | 6.173% | | 8/19/65 | | | 3,206 | | | 3,224 | B |
Merrill Lynch & Co. Inc. | | | | 5.700% | | 2/5/10 | | | 2,334 | | | 2,343 | B |
Morgan Stanley | | | | 5.050% | | 1/21/11 | | | 1,544 | | | 1,530 | |
Morgan Stanley | | | | 5.625% | | 1/9/12 | | | 1,940 | | | 1,965 | |
The Bear Stearns Companies Inc. | | | | 4.550% | | 6/23/10 | | | 1,118 | | | 1,093 | A |
The Goldman Sachs Group, Inc. | | | | 5.664% | | 6/28/10 | | | 5,494 | | | 5,522 | B |
| | | | | | | | | | | | | |
| | | | | | | | | | | | 17,102 | |
| | | | | | | | | | | | | |
Investment Management | | 0.2% | | | | | | | | | | | |
Dryden Investor Trust | | | | 7.157% | | 7/23/08 | | | 1,260 | | | 1,280 | |
| | | | | | | | | | | | | |
| | | | | |
Media | | 2.0% | | | | | | | | | | | |
Clear Channel Communications, Inc. | | | | 4.250% | | 5/15/09 | | | 3,347 | | | 3,235 | |
Liberty Media Corporation | | | | 7.875% | | 7/15/09 | | | 2,820 | | | 2,952 | |
News America Incorporated | | | | 5.300% | | 12/15/14 | | | 2,344 | | | 2,298 | |
Time Warner Inc. | | | | 6.875% | | 5/1/12 | | | 1,288 | | | 1,362 | |
Turner Broadcasting System, Inc. | | | | 8.375% | | 7/1/13 | | | 1,483 | | | 1,667 | |
Viacom Inc. | | | | 5.750% | | 4/30/11 | | | 420 | | | 419 | C |
| | | | | | | | | | | | | |
| | | | | | | | | | | | 11,933 | |
| | | | | | | | | | | | | |
Medical Care Facilities | | 0.1% | | | | | | | | | | | |
HCA, Inc. | | | | 8.750% | | 9/1/10 | | | 822 | | | 830 | |
| | | | | | | | | | | | | |
| | | | | |
Oil and Gas | | 4.5% | | | | | | | | | | | |
Amerada Hess Corporation | | | | 6.650% | | 8/15/11 | | | 4,528 | | | 4,751 | |
Anadarko Petroleum Corporation | | | | 5.950% | | 9/15/16 | | | 4,110 | | | 4,159 | |
Apache Corporation | | | | 6.250% | | 4/15/12 | | | 1,870 | | | 1,951 | |
Occidental Petroleum Corporation | | | | 6.750% | | 1/15/12 | | | 1,000 | | | 1,069 | A |
22
Semi-Annual Report to Shareholders
| | | | | | | | | | | | | |
| | | % OF
NET ASSETS | | RATE | | MATURITY
DATE | | PAR | | VALUE | |
| | | | | | | | | | | | | |
Corporate Bonds and Notes—Continued | | | | | | | | | | | | | |
| | | | | |
Oil and Gas—Continued | | | | | | | | | | | | | |
Pemex Project Funding Master Trust | | | | 6.125% | | 8/15/08 | | $ | 319 | | $ | 321 | |
Pemex Project Funding Master Trust | | | | 6.690% | | 6/15/10 | | | 4,603 | | | 4,704 | B,C |
Pemex Project Funding Master Trust | | | | 5.991% | | 12/3/12 | | | 1,075 | | | 1,072 | B,C |
Pemex Project Funding Master Trust | | | | 7.375% | | 12/15/14 | | | 178 | | | 193 | |
Sonat Inc. | | | | 7.625% | | 7/15/11 | | | 3,954 | | | 4,053 | |
XTO Energy, Inc. | | | | 7.500% | | 4/15/12 | | | 859 | | | 936 | |
XTO Energy, Inc. | | | | 6.250% | | 4/15/13 | | | 1,645 | | | 1,697 | A |
XTO Energy, Inc. | | | | 5.650% | | 4/1/16 | | | 1,612 | | | 1,599 | |
| | | | | | | | | | | | | |
| | | | | | | | | | | | 26,505 | |
| | | | | | | | | | | | | |
Paper and Forest Products | | 0.8% | | | | | | | | | | | |
International Paper Company | | | | 3.800% | | 4/1/08 | | | 1,872 | | | 1,830 | |
International Paper Company | | | | 6.750% | | 9/1/11 | | | 810 | | | 860 | |
Willamette Industries, Inc. | | | | 7.125% | | 7/22/13 | | | 1,839 | | | 1,988 | |
| | | | | | | | | | | | | |
| | | | | | | | | | | | 4,678 | |
| | | | | | | | | | | | | |
Pharmaceuticals | | 0.3% | | | | | | | | | | | |
Bristol-Myers Squibb Company | | | | 5.750% | | 10/1/11 | | | 1,900 | | | 1,937 | |
| | | | | | | | | | | | | |
| | | | | |
Special Purpose | | 4.5% | | | | | | | | | | | |
DaimlerChrysler NA Holding Corporation | | | | 6.500% | | 11/15/13 | | | 6,790 | | | 6,963 | |
Devon Financing Corporation ULC | | | | 6.875% | | 9/30/11 | | | 2,577 | | | 2,742 | |
International Lease Finance Corp. E-Capital Trust I | | | | 5.900% | | 12/21/65 | | | 2,561 | | | 2,580 | A,C,D |
International Lease Finance Corporation | | | | 5.000% | | 4/15/10 | | | 4,262 | | | 4,203 | |
National Rural Utilities | | | | 3.875% | | 2/15/08 | | | 940 | | | 923 | |
National Rural Utilities | | | | 5.750% | | 12/1/08 | | | 559 | | | 565 | |
Sprint Capital Corporation | | | | 8.375% | | 3/15/12 | | | 4,019 | | | 4,504 | |
Verizon Global Funding Corp. | | | | 7.250% | | 12/1/10 | | | 4,051 | | | 4,345 | |
| | | | | | | | | | | | | |
| | | | | | | | | | | | 26,825 | |
| | | | | | | | | | | | | |
Telecommunications | | 1.0% | | | | | | | | | | | |
AT&T Inc. | | | | 4.125% | | 9/15/09 | | | 1,929 | | | 1,868 | |
AT&T Inc. | | | | 5.300% | | 11/15/10 | | | 2,706 | | | 2,698 | A |
Embarq Corporation | | | | 6.738% | | 6/1/13 | | | 1,296 | | | 1,334 | |
| | | | | | | | | | | | | |
| | | | | | | | | | | | 5,900 | |
| | | | | | | | | | | | | |
Telecommunications (Cellular/Wireless) | | 0.5% | | | | | | | | | | | |
New Cingular Wireless Services Inc. | | | | 8.125% | | 5/1/12 | | | 2,774 | | | 3,122 | |
| | | | | | | | | | | | | |
| | | | | |
Transportation | | 0.5% | | | | | | | | | | | |
Continental Airlines, Inc. | | | | 6.545% | | 8/2/20 | | | 1,036 | | | 1,054 | |
Delta Air Lines, Inc. | | | | 6.619% | | 9/18/12 | | | 316 | | | 316 | |
U.S. Airways | | | | 6.850% | | 1/30/18 | | | 1,528 | | | 1,547 | |
| | | | | | | | | | | | | |
| | | | | | | | | | | | 2,917 | |
| | | | | | | | | | | | | |
Total Corporate Bonds and Notes
(Identified Cost—$208,292) | | | | | | | | | | | | 207,738 | |
23
Semi-Annual Report to Shareholders
Portfolio of Investments—Continued
Western Asset Intermediate Bond Portfolio—Continued
| | | | | | | | | | | | | |
| | | % OF
NET ASSETS | | RATE | | MATURITY
DATE | | PAR | | VALUE | |
| | | | | | | | | | | | | |
Asset-Backed Securities | | 1.2% | | | | | | | | | | | |
| | | | | |
Fixed Rate Securities | | 0.5% | | | | | | | | | | | |
ABFS Mortgage Loan Trust 2002-3 | | | | 4.263% | | 9/15/33 | | $ | 359 | | $ | 355D | |
Conseco Finance Securitizations Corp. 2000-4 | | | | 8.310% | | 5/1/32 | | | 648 | | | 543 | |
Green Tree Financial Corporation 1994-6 | | | | 8.900% | | 1/15/20 | | | 1,820 | | | 1,855 | |
Mego Mortgage Home Loan Trust 1996-2 | | | | 7.275% | | 8/25/17 | | | 10 | | | 10 | |
UCFC Home Equity Loan 1998-D | | | | 6.905% | | 4/15/30 | | | 377 | | | 376 | |
| | | | | | | | | | | | | |
| | | | | | | | | | | | 3,139 | |
| | | | | | | | | | | | | |
Indexed SecuritiesB | | 0.6% | | | | | | | | | | | |
AFC Home Equity Loan Trust 2003-3 | | | | 5.680% | | 10/25/30 | | | 1,000 | | | 1,002 | C |
AMRESCO Residential Securites Mortgage Loan Trust 1998-2 | | | | 6.155% | | 6/25/28 | | | 164 | | | 164 | |
Countrywide Asset-Backed Certificates 2002-BC1 | | | | 5.990% | | 4/25/32 | | | 574 | | | 574 | |
IndyMac Home Equity Loan Asset-Backed Trust 2001-A | | | | 5.590% | | 3/25/31 | | | 467 | | | 471 | |
MSDWCC HELOC Trust 2003-1 | | | | 5.600% | | 11/25/15 | | | 1,149 | | | 1,149 | |
Residential Asset Securities Corporation 2003-KS1 | | | | 5.700% | | 1/25/33 | | | 401 | | | 401 | |
| | | | | | | | | | | | | |
| | | | | | | | | | | | 3,761 | |
| | | | | | | | | | | | | |
Stripped Securities | | 0.1% | | | | | | | | | | | |
ACA CDS 2002-1, Ltd. | | | | 2.742% | | 7/15/08 | | | 6,158 | | | 154 | E1 |
Oakwood Mortgage Investors Inc. 2001-C | | | | 6.000% | | 5/15/08 | | | 3,079 | | | 250 | E1 |
| | | | | | | | | | | | | |
| | | | | | | | | | | | 404 | |
| | | | | | | | | | | | | |
Total Asset-Backed Securities
(Identified Cost—$7,537) | | | | | | | | | | | | 7,304 | |
Mortgage-Backed Securities | | 5.7% | | | | | | | | | | | |
| | | | | |
Fixed Rate Securities | | 1.6% | | | | | | | | | | | |
Asset Securitization Corporation 1996-D2 | | | | 6.920% | | 2/14/29 | | | 44 | | | 44 | |
Fannie Mae Grantor Trust 2002-T3 | | | | 5.763% | | 12/25/11 | | | 3,103 | | | 3,211 | |
GMAC Commercial Mortgage Securities Inc. 1998-C1 | | | | 6.700% | | 5/15/30 | | | 563 | | | 572 | |
Virginia Housing Development Authority Commonwealth Mortgage Bonds Pass-Through Certificates 2006 | | | | 6.000% | | 6/25/34 | | | 5,724 | | | 5,725 | |
| | | | | | | | | | | | | |
| | | | | | | | | | | | 9,552 | |
| | | | | | | | | | | | | |
Indexed SecuritiesB | | 1.8% | | | | | | | | | | | |
Countrywide Home Loans 2003-49 | | | | 3.697% | | 12/19/33 | | | 810 | | | 793 | |
Impac CMB Trust 2003-12 | | | | 6.090% | | 12/25/33 | | | 793 | | | 794 | |
MASTR Adjustable Rate Mortgages Trust 2004-13 | | | | 3.786% | | 11/21/34 | | | 5,915 | | | 5,715 | |
Wells Fargo Mortgage-Backed Securities Trust 2004-S | | | | 3.539% | | 9/25/34 | | | 3,525 | | | 3,415 | |
| | | | | | | | | | | | | |
| | | | | | | | | | | | 10,717 | |
| | | | | | | | | | | | | |
24
Semi-Annual Report to Shareholders
| | | | | | | | | | | | | |
| | | % OF
NET ASSETS | | RATE | | MATURITY
DATE | | PAR | | VALUE | |
| | | | | | | | | | | | | |
Mortgage-Backed Securities—Continued | | | | | | | | | | | | | |
| | | | | |
Variable Rate SecuritiesF | | 2.3% | | | | | | | | | | | |
Banc of America Funding Corporation 2005-B | | | | 5.109% | | 4/20/35 | | $ | 2,387 | | $ | 2,371 | |
Bear Stearns ALT-A Trust 2005-2 | | | | 4.745% | | 4/25/35 | | | 2,023 | | | 1,995 | |
Citigroup Mortgage Loan Trust, Inc. 2005-8 1A1A | | | | 5.320% | | 10/25/35 | | | 2,007 | | | 1,997 | |
Countrywide Home Loans 2004-20 | | | | 6.882% | | 9/25/34 | | | 1,363 | | | 1,388 | |
Merrill Lynch Mortgage Investors, Inc. 2005-A2 | | | | 4.488% | | 2/25/35 | | | 1,755 | | | 1,724 | |
MLCC Mortgage Investors, Inc. 2005-1 2A1 | | | | 4.965% | | 4/25/35 | | | 923 | | | 915 | |
MLCC Mortgage Investors, Inc. 2005-1 2A2 | | | | 4.965% | | 4/25/35 | | | 2,873 | | | 2,849 | |
WaMu Mortgage Pass-Through Certificates 2004-AR11 | | | | 4.569% | | 10/25/34 | | | 409 | | | 402 | |
| | | | | | | | | | | | | |
| | | | | | | | | | | | 13,641 | |
| | | | | | | | | | | | | |
Total Mortgage-Backed Securities
(Identified Cost—$34,163) | | | | | | | | | | | | 33,910 | |
U.S. Government and Agency Obligations | | 20.2% | | | | | | | | | | | |
| | | | | |
Fixed Rate Securities | | 17.9% | | | | | | | | | | | |
Fannie Mae | | | | 5.000% | | 9/15/08 | | | 2,080 | | | 2,081 | |
Fannie Mae | | | | 7.250% | | 1/15/10 | | | 162 | | | 173 | |
Fannie Mae | | | | 4.375% | | 3/15/13 | | | 2,868 | | | 2,777 | |
Fannie Mae | | | | 4.625% | | 5/1/13 | | | 235 | | | 228 | |
Fannie Mae | | | | 4.625% | | 10/15/13 | | | 5,600 | | | 5,490 | |
Fannie Mae | | | | 5.125% | | 1/2/14 | | | 1,053 | | | 1,050 | |
Farmer Mac | | | | 4.250% | | 7/29/08 | | | 1,005 | | | 991 | |
Federal Farm Credit Bank | | | | 4.875% | | 4/4/12 | | | 2,561 | | | 2,552 | |
Federal Home Loan Bank | | | | 5.800% | | 3/30/09 | | | 485 | | | 492 | |
Federal Home Loan Bank | | | | 5.500% | | 7/15/36 | | | 180 | | | 189 | |
Freddie Mac | | | | 5.125% | | 4/18/08 | | | 1,993 | | | 1,997 | |
Freddie Mac | | | | 4.750% | | 1/18/11 | | | 5,899 | | | 5,863 | |
Tennessee Valley Authority | | | | 5.625% | | 1/18/11 | | | 373 | | | 383 | |
Tennessee Valley Authority | | | | 6.790% | | 5/23/12 | | | 2,747 | | | 2,994 | |
United States Treasury Bonds | | | | 6.125% | | 11/15/27 | | | 1,475 | | | 1,725 | A |
United States Treasury Bonds | | | | 6.250% | | 5/15/30 | | | 186 | | | 224 | A |
United States Treasury Bonds | | | | 4.500% | | 2/15/36 | | | 194 | | | 186 | A |
United States Treasury Notes | | | | 2.250% | | 2/15/07 | | | 1,920 | | | 1,900 | A |
United States Treasury Notes | | | | 4.375% | | 5/15/07 | | | 794 | | | 791 | A |
United States Treasury Notes | | | | 6.625% | | 5/15/07 | | | 1,856 | | | 1,874 | A |
United States Treasury Notes | | | | 2.750% | | 8/15/07 | | | 421 | | | 413 | |
United States Treasury Notes | | | | 4.375% | | 1/31/08 | | | 81 | | | 81 | A |
United States Treasury Notes | | | | 3.750% | | 5/15/08 | | | 19,642 | | | 19,336 | A |
United States Treasury Notes | | | | 5.000% | | 7/31/08 | | | 8,400 | | | 8,439 | |
United States Treasury Notes | | | | 3.875% | | 5/15/09 | | | 3,946 | | | 3,873 | A |
United States Treasury Notes | | | | 4.000% | | 6/15/09 | | | 4,246 | | | 4,180 | |
25
Semi-Annual Report to Shareholders
Portfolio of Investments—Continued
Western Asset Intermediate Bond Portfolio—Continued
| | | | | | | | | | | | | |
| | | % OF
NET ASSETS | | RATE | | MATURITY
DATE | | PAR | | VALUE | |
| | | | | | | | | | | | | |
U.S. Government and Agency
Obligations—Continued | | | | | | | | | | | |
| | | | | |
Fixed Rate Securities—Continued | | | | | | | | | | | | | |
United States Treasury Notes | | | | 3.875% | | 9/15/10 | | $ | 5,956 | | $ | 5,804 | A |
United States Treasury Notes | | | | 4.500% | | 2/28/11 | | | 2,901 | | | 2,890 | A |
United States Treasury Notes | | | | 4.750% | | 3/31/11 | | | 1,118 | | | 1,125 | A |
United States Treasury Notes | | | | 4.875% | | 4/30/11 | | | 450 | | | 455 | A |
United States Treasury Notes | | | | 4.625% | | 8/31/11 | | | 1,500 | | | 1,502 | A |
United States Treasury Notes | | | | 4.250% | | 8/15/13 | | | 15,740 | | | 15,408 | A |
United States Treasury Notes | | | | 4.250% | | 8/15/15 | | | 426 | | | 414 | A |
United States Treasury Notes | | | | 4.875% | | 8/15/16 | | | 7,900 | | | 8,049 | A |
| | | | | | | | | | | | | |
| | | | | | | | | | | | 105,929 | |
| | | | | | | | | | | | | |
Stripped Securities | | 0.7% | | | | | | | | | | | |
United States Treasury Bonds | | | | 0.000% | | 11/15/24 | | | 9,318 | | | 3,869 | A,E2 |
| | | | | | | | | | | | | |
| | | | | |
Treasury Inflation-Protected SecuritiesG | | 1.6% | | | | | | | | | | | |
United States Treasury Inflation-Protected Security | | | | 3.000% | | 7/15/12 | | | 18 | | | 19 | A |
United States Treasury Inflation-Protected Security | | | | 1.875% | | 7/15/13 | | | 341 | | | 332 | A |
United States Treasury Inflation-Protected Security | | | | 2.000% | | 1/15/14 | | | 3,099 | | | 3,040 | A |
United States Treasury Inflation-Protected Security | | | | 2.000% | | 7/15/14 | | | 158 | | | 155 | A |
United States Treasury Inflation-Protected Security | | | | 1.875% | | 7/15/15 | | | 1,238 | | | 1,198 | A |
United States Treasury Inflation-Protected Security | | | | 2.000% | | 1/15/16 | | | 2,600 | | | 2,540 | A |
United States Treasury Inflation-Protected Security | | | | 2.375% | | 1/15/25 | | | 1,483 | | | 1,507 | A |
United States Treasury Inflation-Protected Security | | | | 2.000% | | 1/15/26 | | | 944 | | | 906 | A |
| | | | | | | | | | | | | |
| | | | | | | | | | | | 9,697 | |
| | | | | | | | | | | | | |
Total U.S. Government and Agency Obligations
(Identified Cost—$119,914) | | | | | | | | | | | | 119,495 | |
U.S. Government Agency Mortgage-Backed Securities | | 13.7% | | | | | | | | | | | |
| | | | | |
Fixed Rate Securities | | 11.0% | | | | | | | | | | | |
Fannie Mae | | | | 6.500% | | 6/1/14 | | | 110 | | | 113 | |
Fannie Mae | | | | 8.000% | | 9/1/15 | | | 55 | | | 57 | |
Fannie Mae | | | | 6.000% | | 12/1/16 | | | 40,757 | | | 41,368 | |
Fannie Mae | | | | 9.500% | | 4/15/21 | | | 42 | | | 46 | |
Fannie Mae | | | | 6.000% | | 10/1/36 | | | 16,108 | | | 16,182 | |
Fannie Mae | | | | 6.000% | | 12/1/36 | | | 50 | | | 50 | H |
Fannie Mae | | | | 5.000% | | 12/1/36 | | | 50 | | | 48 | H |
Fannie Mae | | | | 5.500% | | 12/1/36 | | | 386 | | | 380 | H |
Freddie Mac | | | | 4.375% | | 11/16/07 | | | 4,100 | | | 4,067 | |
Freddie Mac | | | | 4.500% | | 1/15/13 | | | 1,985 | | | 1,937 | |
Freddie Mac | | | | 6.500% | | 6/1/13 to 11/1/15 | | | 63 | | | 65 | |
Freddie Mac | | | | 7.500% | | 4/1/17 | | | 4 | | | 4 | |
26
Semi-Annual Report to Shareholders
| | | | | | | | | | | | | |
| | | % OF
NET ASSETS | | RATE | | MATURITY
DATE | | PAR | | VALUE | |
| | | | | | | | | | | | | |
U.S. Government Agency Mortgage-
Backed Securities—Continued | | | | | | | | | |
| | | | | |
Fixed Rate Securities—Continued | | | | | | | | | | | | | |
Freddie Mac | | | | 9.300% | | 4/15/19 | | $ | 65 | | $ | 69 | |
Freddie Mac | | | | 5.000% | | 12/1/36 | | | 891 | | | 857 | H |
| | | | | | | | | | | | | |
| | | | | | | | | | | | 65,243 | |
| | | | | | | | | | | | | |
Stripped Securities | | N.M. | | | | | | | | | | | |
Fannie Mae | | | | 0.000% | | 5/25/22 | | | 9 | | | 8 | E2 |
Freddie Mac | | | | 10.000% | | 3/1/21 | | | 8 | | | 2 | E1 |
| | | | | | | | | | | | | |
| | | | | | | | | | | | 10 | |
| | | | | | | | | | | | | |
Variable Rate SecuritiesF | | 2.7% | | | | | | | | | | | |
Fannie Mae | | | | 4.736% | | 3/1/18 | | | 28 | | | 28 | |
Fannie Mae | | | | 4.316% | | 11/1/34 | | | 721 | | | 706 | |
Fannie Mae | | | | 4.215% | | 12/1/34 | | | 916 | | | 891 | |
Fannie Mae | | | | 4.860% | | 1/1/35 | | | 4,087 | | | 4,029 | |
Fannie Mae | | | | 3.776% | | 3/1/35 | | | 1,720 | | | 1,668 | |
Fannie Mae | | | | 4.768% | | 4/1/35 | | | 1,053 | | | 1,040 | |
Freddie Mac | | | | 5.136% | | 1/1/19 | | | 9 | | | 9 | |
Freddie Mac | | | | 4.354% | | 12/1/34 | | | 356 | | | 349 | |
Freddie Mac | | | | 4.460% | | 12/1/34 | | | 1,747 | | | 1,717 | |
Freddie Mac | | | | 4.081% | | 1/1/35 | | | 341 | | | 331 | |
Freddie Mac | | | | 4.099% | | 1/1/35 | | | 611 | | | 593 | |
Freddie Mac | | | | 4.608% | | 7/1/35 | | | 4,927 | | | 4,887 | |
| | | | | | | | | | | | | |
| | | | | | | | | | | | 16,248 | |
| | | | | | | | | | | | | |
Total U.S. Government Agency Mortgage-Backed Securities
(Identified Cost—$81,845) | | | | | | | | | | | | 81,501 | |
Yankee BondsI | | 8.9% | | | | | | | | | | | |
| | | | | |
Aerospace/Defense | | 0.2% | | | | | | | | | | | |
Systems 2001 Asset Trust | | | | 6.664% | | 9/15/13 | | | 1,237 | | | 1,302 | C |
| | | | | | | | | | | | | |
| | | | | |
Banking and Finance | | 1.7% | | | | | | | | | | | |
AIFUL CORPORATION | | | | 5.000% | | 8/10/10 | | | 3,371 | | | 3,278 | C |
HBOS Treasury Services plc | | | | 4.000% | | 9/15/09 | | | 1,240 | | | 1,200 | C |
HSBC Holdings plc | | | | 7.500% | | 7/15/09 | | | 3,808 | | | 4,041 | A |
MUFG Capital Finance 1 Limited | | | | 6.346% | | 7/25/49 | | | 1,612 | | | 1,625 | D |
| | | | | | | | | | | | | |
| | | | | | | | | | | | 10,144 | |
| | | | | | | | | | | | | |
| | | | | |
Banks | | 2.1% | | | | | | | | | | | |
Banco Santiago SA | | | | 5.740% | | 12/9/09 | | | 235 | | | 236 | B,C |
Glitnir Banki hf | | | | 6.330% | | 7/28/11 | | | 120 | | | 120 | B,C |
Islandsbanki hf | | | | 5.519% | | 2/22/08 | | | 80 | | | 80 | B,C |
Kaupthing Bank hf | | | | 5.750% | | 10/4/11 | | | 4,090 | | | 4,071 | C |
27
Semi-Annual Report to Shareholders
Portfolio of Investments—Continued
Western Asset Intermediate Bond Portfolio—Continued
| | | | | | | | | | | | | | |
| | | % OF
NET ASSETS | | RATE | | MATURITY
DATE | | PAR | | | VALUE | |
| | | | | | | | | | | | | | |
Yankee Bonds—Continued | | | | | | | | | | | | | | |
| | | | | |
Banks—Continued | | | | | | | | | | | | | | |
Landsbanki Islands hf (The National Bank of Iceland) | | | | 6.100% | | 8/25/11 | | $ | 2,210 | | | $ | 2,233 | C |
Royal Bank of Scotland Group plc | | | | 9.118% | | 3/31/49 | | | 2,431 | | | | 2,713 | |
Shinsei Fin Cayman Ltd | | | | 6.418% | | 1/29/49 | | | 2,755 | | | | 2,736 | C,D |
| | | | | | | | | | | | | | |
| | | | | | | | | | | | | 12,189 | |
| | | | | | | | | | | | | | |
Electric | | 0.3% | | | | | | | | | | | | |
SP PowerAssets Limited | | | | 5.000% | | 10/22/13 | | | 1,592 | | | | 1,558C | |
| | | | | | | | | | | | | | |
Foreign Governments | | 0.8% | | | | | | | | | | | | |
Russian Federation | | | | 5.000% | | 3/31/30 | | | 4,384 | | | | 4,893 | |
| | | | | | | | | | | | | | |
Manufacturing (Diversified) | | 0.4% | | | | | | | | | | | | |
Tyco International Group SA | | | | 6.000% | | 11/15/13 | | | 2,358 | | | | 2,440 | |
| | | | | | | | | | | | | | |
| | | | | |
Special Purpose | | 0.9% | | | | | | | | | | | | |
Deutsche Telekom International Finance BV | | | | 8.000% | | 6/15/10 | | | 1,612 | | | | 1,758 | |
Petrozuata Finance, Inc. | | | | 8.220% | | 4/1/17 | | | 883 | | | | 861 | C |
TNK-BP Finance S.A. | | | | 6.875% | | 7/18/11 | | | 2,783 | | | | 2,848 | C |
| | | | | | | | | | | | | | |
| | | | | | | | | | | | | 5,467 | |
| | | | | | | | | | | | | | |
Telecommunications | | 2.4% | | | | | | | | | | | | |
British Telecommunications plc | | | | 8.375% | | 12/15/10 | | | 3,817 | | | | 4,278 | |
France Telecom SA | | | | 7.750% | | 3/1/11 | | | 2,358 | | | | 2,583 | |
Koninklijke (Royal) KPN NV | | | | 8.000% | | 10/1/10 | | | 4,007 | | | | 4,329 | |
Telecom Italia Capital | | | | 5.969% | | 2/1/11 | | | 2,779 | | | | 2,756 | B |
| | | | | | | | | | | | | | |
| | | | | | | | | | | | | 13,946 | |
| | | | | | | | | | | | | | |
Utilities | | 0.1% | | | | | | | | | | | | |
United Utilities plc | | | | 6.450% | | 4/1/08 | | | 778 | | | | 788 | |
| | | | | | | | | | | | | | |
Total Yankee Bonds (Identified Cost—$51,835) | | | | | | | | | | | | | 52,727 | |
Preferred Stocks | | 0.1% | | | | | | | | | | | | |
Home Ownership Funding Corporation | | | | 13.331% | | | | | 1 | shs | | | 108 | C,D |
Home Ownership Funding Corporation II | | | | 13.338% | | | | | 2 | | | | 324 | C,D |
| | | | | | | | | | | | | | |
Total Preferred Stocks (Identified Cost—$1,942) | | | | | | | | | | | | | 432 | |
| | | | | | | | | | | | | | |
Total Long-Term Securities
(Identified Cost—$505,528) | | | | | | | | | | | | | 503,107 | |
28
Semi-Annual Report to Shareholders
| | | | | | | | | | | | | | |
| | | % OF
NET ASSETS | | RATE | | MATURITY
DATE | | PAR | | | VALUE | |
Investment of Collateral From Securities Lending | | 15.2% | | | | | | | | | | | | |
State Street Navigator Securities Lending Prime
Portfolio | | | | | | | | | 90,372 | shs | | $ | 90,372 | |
| | | | | | | | | | | | | | |
Total Investment of Collateral From Securities
Lending (Identified Cost—$90,372) | | | | | | | | | | | | | 90,372 | |
Short-Term Securities | | 24.8% | | | | | | | | | | | | |
| | | | | |
U.S. Government and Agency Obligations | | 0.9% | | | | | | | | | | | | |
Fannie Mae | | | | 0.000% | | 6/25/07 | | $ | 5,737 | | | | 5,526 | J,K |
| | | | | | | | | | | | | | |
| | | | | |
Repurchase Agreements | | 23.9% | | | | | | | | | | | | |
Goldman Sachs Group, Inc.
5.3%, dated 9/29/06, to be repurchased at $141,694 on 10/2/06 (Collateral: $45,270 Freddie Mac notes, 6.625%, due 9/15/09, value $47,477; $100,000 Federal Home Loan Bank note, 2.75%, due 3/14/08, value $97,000) | | | | | | | | | 141,631 | | | | 141,631 | |
| | | | | | | | | | | | | | |
Total Short-Term Securities
(Identified Cost—$147,157) | | | | | | | | | | | | | 147,157 | |
Total Investments (Identified Cost—$743,057) | | 124.8% | | | | | | | | | | | 740,636 | |
Obligation to Return Collateral for Securities Loaned | | (15.2)% | | | | | | | | | | | (90,372 | ) |
Other Assets Less Liabilities | | (9.6)% | | | | | | | | | | | (57,101 | ) |
| | | | | | | | | | | | | | |
| | | | | |
Net Assets | | 100.0% | | | | | | | | | | $ | 593,163 | |
| | | | | | | | | | | | | | |
29
Semi-Annual Report to Shareholders
Portfolio of Investments—Continued
Western Asset Intermediate Bond Portfolio—Continued
| | | | | | | | |
| | | EXPIRATION | | ACTUAL
CONTRACTS | | APPRECIATION/
(DEPRECIATION) | |
Futures Contracts PurchasedL | | | | | | | | |
Eurodollar Futures | | June 2007 | | 55 | | $ | 27 | |
U.S. Treasury Note Futures | | December 2006 | | 890 | | | 630 | |
U.S. Treasury Note Futures | | December 2006 | | 264 | | | 114 | |
| | | | | | | | |
| | | | | | $ | 771 | |
| | | | | | | | |
Futures Contracts WrittenL | | | | | | | | |
U.S. Treasury Bond Futures | | December 2006 | | 62 | | $ | (98 | ) |
U.S. Treasury Note Futures | | December 2006 | | 72 | | | 5 | |
| | | | | | | | |
| | | | | | $ | (93 | ) |
| | | | | | | | |
Options WrittenL | | | | | | | | |
U.S. Treasury Note Futures Call, Strike Price $110.00 | | March 2007 | | 66 | | $ | 7 | |
U.S. Treasury Note Futures Call, Strike Price $111.00 | | March 2007 | | 83 | | | 8 | |
U.S. Treasury Note Futures Put, Strike Price $106.00 | | March 2007 | | 81 | | | (5 | ) |
| | | | | | | | |
| | | | | | $ | 10 | |
| | | | | | | | |
| | | | | | | | | |
| A | | All or a portion of these securities is on loan. |
| B | | Indexed security – The rates of interest earned on these securities are tied to the London Interbank Offered Rate (“LIBOR”), the Consumer Price Index (“CPI”), or the one-year Treasury Bill rate. The coupon rates are the rates as of September 30, 2006. |
| C | | Rule 144a – A security purchased pursuant to Rule 144a under the Securities Act of 1933 which may not be resold subject to that rule except to qualified institutional buyers. These securities, which the Fund’s investment adviser has determined to be liquid, represent 6.2% of net assets. |
| D | | Stepped coupon security – A security with a predetermined schedule of interest or dividend rate changes, at which time it begins to accrue interest or pay dividends. |
| E | | Stripped security – Security with interest-only or principal-only payments streams, denoted by a 1 or 2, respectively. For interest-only securities, the amount shown as principal is the notional balance used to calculate the amount of interest due. |
| F | | The coupon rates shown on variable rate securities are the rates at September 30, 2006. These rates vary with the weighted average coupon of the underlying loans. |
| G | | Treasury Inflation-Protected Security – Treasury security whose principal value is adjusted daily in accordance with changes to the Consumer Price Index for All Urban Consumers. Interest is calculated on the basis of the current adjusted principal value. |
| H | | When-issued security – Security purchased on a delayed basis. Final settlement amount and maturity date have not yet been announced. |
| I | | Yankee Bond – A dollar-denominated bond issued in the U.S. by foreign entities. |
| J | | Zero coupon bond – A bond with no periodic interest payments which is sold at such a discount as to produce a current yield to maturity. |
| K | | All or a portion of this security is pledged as collateral to cover futures and option contracts. |
| L | | Options and futures are described in more detail in the notes to financial statements. |
N.M.—Not meaningful.
See notes to financial statements.
30
Semi-Annual Report to Shareholders
Statement of Assets and Liabilities
Western Asset Intermediate Bond Portfolio
September 30, 2006 (Unaudited)
(Amounts in Thousands)
| | | | | | | |
Assets: | | | | | | | |
Investment securities at market value (Identified Cost—$595,900)A | | | | | $ | 593,479 | |
Short-term securities at value (Identified Cost—$147,157) | | | | | | 147,157 | |
Swap contracts at value | | | | | | 130 | |
Cash | | | | | | 745 | |
Receivable for securities sold | | | | | | 43,832 | |
Receivable for fund shares sold | | | | | | 326 | |
Interest and dividends receivable | | | | | | 5,499 | |
| | | | | | | |
Total assets | | | | | | 791,168 | |
| | |
Liabilities: | | | | | | | |
Payable for securities purchased | | $ | 106,487 | | | | |
Payable for fund shares repurchased | | | 457 | | | | |
Accrued management fee | | | 163 | | | | |
Income distribution payable | | | 256 | | | | |
Interest expense payable | | | 4 | | | | |
Obligation to return collateral for securities loaned | | | 90,372 | | | | |
Options written (Proceeds—$100) | | | 90 | | | | |
Futures variation margin | | | 62 | | | | |
Accrued expenses | | | 114 | | | | |
| | | | | | | |
Total liabilities | | | | | | 198,005 | |
| | | | | | | |
| | |
Net Assets | | | | | $ | 593,163 | |
| | | | | | | |
| | |
Net assets consist of: | | | | | | | |
Accumulated paid-in-capital applicable to: | | | | | | | |
57,367 Institutional Class shares outstanding | | | | | $ | 606,510 | |
Undistributed net investment income | | | | | | 144 | |
Accumulated net realized loss on investments, options, futures and swaps | | | | | | (11,941 | ) |
Unrealized appreciation/(depreciation) of investments, options, futures and swaps | | | | | | (1,550 | ) |
| | | | | | | |
| | |
Net Assets | | | | | $ | 593,163 | |
| | | | | | | |
| | |
Net Asset Value Per Share: | | | | | | | |
Institutional Class | | | | | | $10.34 | |
| | | | | | | | |
| A | | The market value of securities on loan is $90,318. |
See notes to financial statements.
31
Semi-Annual Report to Shareholders
Statement of Operations
Western Asset Intermediate Bond Portfolio
For the Six Months Ended September 30, 2006 (Unaudited)
(Amounts in Thousands)
| | | | | | | | |
Investment Income: | | | | | | | | |
Interest | | $ | 17,517 | | | | | |
Dividends | | | 80 | | | | | |
| | | | | | | | |
Total income | | | | | | $ | 17,597 | |
Expenses: | | | | | | | | |
Advisory fee | | | 1,335 | | | | | |
Audit and legal fees | | | 56 | | | | | |
Custodian fees | | | 90 | | | | | |
Directors’ fees and expenses | | | 21 | | | | | |
Proxy expense | | | 4 | | | | | |
Registration fees | | | 16 | | | | | |
Reports to shareholders | | | 9 | | | | | |
Transfer agent and shareholder servicing expense | | | 10 | | | | | |
Other expenses | | | 28 | | | | | |
| | | | | | | | |
| | | 1,569 | | | | | |
Less: Fees waived | | | (65 | ) | | | | |
Compensating balance creditsA | | | (2 | ) | | | | |
| | | | | | | | |
Total expenses, net of waivers and compensating balance credits | | | | | | | 1,502 | |
| | | | | | | | |
Net Investment Income | | | | | | | 16,095 | |
Net Realized and Unrealized Gain/(Loss) on Investments: | | | | | | | | |
Realized gain/(loss) on: | | | | | | | | |
Investments | | | (6,266 | ) | | | | |
Options | | | (92 | ) | | | | |
Futures | | | (94 | ) | | | | |
Swaps | | | 314 | | | | | |
| | | | | | | | |
| | | | | | | (6,138 | ) |
Change in unrealized appreciation/(depreciation) of investments, options, futures and swaps | | | | | | | 13,600 | |
| | | | | | | | |
Net Realized and Unrealized Gain/(Loss) on Investments | | | | | | | 7,462 | |
| | | | | | | | | |
Change in Net Assets Resulting From Operations | | | | | | $ | 23,557 | |
| | | | | | | | | |
| A | | See note 1, compensating balance credits, in the notes to financial statements. |
See notes to financial statements.
32
Semi-Annual Report to Shareholders
Statement of Changes in Net Assets
Western Asset Intermediate Bond Portfolio
(Amounts in Thousands)
| | | | | | | | |
| | | FOR THE
SIX MONTHS ENDED
SEPTEMBER 30, 2006 | | | FOR THE
YEAR ENDED
MARCH 31, 2006 | |
| Change in Net Assets: | | (Unaudited) | | | | |
Net investment income | | $ | 16,095 | | | $ | 30,272 | |
| | |
Net realized loss on investments, options, futures, swaps | | | (6,138 | ) | | | (5,633 | ) |
| | |
Change in unrealized appreciation/(depreciation) of investments, options, futures and swaps | | | 13,600 | | | | (9,284 | ) |
| | | | | | | | |
Change in net assets resulting from operations | | | 23,557 | | | | 15,355 | |
| | |
Distributions to Shareholders from: | | | | | | | | |
Net investment income | | | (16,193 | ) | | | (30,414 | ) |
Net realized gain on investments | | | — | | | | (6,582 | ) |
| | |
Change in net assets from Fund share transactions | | | (153,693 | ) | | | 100,653 | |
| | | | | | | | |
Change in net assets | | | (146,329 | ) | | | 79,012 | |
| | |
Net Assets: | | | | | | | | |
Beginning of period | | | 739,492 | | | | 660,480 | |
| | | | | | | | |
| | |
End of period | | $ | 593,163 | | | $ | 739,492 | |
| | | | | | | | |
| | |
Undistributed net investment income | | $ | 144 | | | $ | 242 | |
| | | | | | | | |
| | | | | | | | | |
See notes to financial statements.
33
Semi-Annual Report to Shareholders
Financial Highlights
Western Asset Intermediate Bond Portfolio
Contained below is per share operating performance data for a share of common stock outstanding throughout each period shown, total investment return, ratios to average net assets and other supplemental data. This information has been derived from information in the financial statements.
Institutional Class:
| | | | | | | | | | | | | | | | | | | | | | | | |
| | | SIX MONTHS
ENDED
SEPTEMBER 30, 2006 | | | FOR THE YEARS ENDED MARCH 31, | |
| | | | 2006 | | | 2005 | | | 2004 | | | 2003 | | | 2002 | |
| | | (Unaudited) | | | | | | | | | | | | | | | | |
Net asset value, beginning of period | | $ | 10.21 | | | $ | 10.51 | | | $ | 11.01 | | | $ | 10.92 | | | $ | 10.39 | | | $ | 10.65 | |
| | | | | | | | | | | | | | | | | | | | | | | | |
Investment operations: | | | | | | | | | | | | | | | | | | | | | | | | |
Net investment income | | | .25 | | | | .44 | | | | .38 | | | | .44 | | | | .53 | | | | .57 | |
Net realized and unrealized gain/(loss) on investments, options, futures and swaps | | | .13 | | | | (.20 | ) | | | (.22 | ) | | | .36 | | | | .62 | | | | (.13 | ) |
| | | | | | | | | | | | | | | | | | | | | | | | |
Total from investment operations | | | .38 | | | | .24 | | | | .16 | | | | .80 | | | | 1.15 | | | | .44 | |
| | | | | | | | | | | | | | | | | | | | | | | | |
Distributions paid from: | | | | | | | | | | | | | | | | | | | | | | | | |
Net investment income | | | (.25 | ) | | | (.44 | ) | | | (.38 | ) | | | (.44 | ) | | | (.53 | ) | | | (.57 | ) |
Net realized gain on investments | | | — | | | | (.10 | ) | | | (.28 | ) | | | (.27 | ) | | | (.09 | ) | | | (.13 | ) |
| | | | | | | | | | | | | | | | | | | | | | | | |
Total distributions | | | (.25 | ) | | | (.54 | ) | | | (.66 | ) | | | (.71 | ) | | | (.62 | ) | | | (.70 | ) |
| | | | | | | | | | | | | | | | | | | | | | | | |
Net asset value, end of period | | $ | 10.34 | | | $ | 10.21 | | | $ | 10.51 | | | $ | 11.01 | | | $ | 10.92 | | | $ | 10.39 | |
| | | | | | | | | | | | | | | | | | | | | | | | |
Total return | | | 3.76 | %A | | | 2.37 | % | | | 1.66 | % | | | 7.58 | % | | | 11.37 | % | | | 4.20 | % |
| | | | | | |
Ratios to Average Net Assets:B | | | | | | | | | | | | | | | | | | | | | | | | |
Total expenses | | | .47 | %C | | | .47 | % | | | .46 | % | | | .47 | % | | | .45 | % | | | .47 | % |
Expenses net of waivers, if any | | | .45 | %C | | | .45 | % | | | .45 | % | | | .45 | % | | | .45 | % | | | .45 | % |
Expenses net of all reductions | | | .45 | %C | | | .45 | % | | | .45 | % | | | .45 | % | | | .45 | % | | | .45 | % |
Net investment income | | | 4.8 | %C | | | 4.3 | % | | | 3.6 | % | | | 4.0 | % | | | 5.0 | % | | | 5.3 | % |
| | | | | | |
Supplemental Data: | | | | | | | | | | | | | | | | | | | | | | | | |
Portfolio turnover rate | | | 177.7 | %A | | | 266.1 | % | | | 215.7 | % | | | 255.1 | % | | | 238.5 | % | | | 274.8 | % |
Net assets at end of period (in thousands) | | $ | 593,163 | | | $ | 739,492 | | | $ | 660,480 | | | $ | 587,229 | | | $ | 539,874 | | | $ | 628,196 | |
| | | | | | | | | | | | | | | | | | | | | | | | | |
| B | | Total expenses reflects operating expenses prior to any voluntary expense waivers and/or compensating balance credits. Expenses net of waivers reflects total expenses before compensating balance credits but net of any voluntary expense waivers. Expenses net of all reductions reflects expenses less any compensating balance credits and/or voluntary expense waivers. |
See notes to financial statements.
34
Semi-Annual Report to Shareholders
Expense Example
Western Asset Intermediate Plus Bond Portfolio
As a shareholder of the Fund, you incur ongoing costs, including management fees, and other Fund expenses. These examples are intended to help you understand your ongoing costs (in dollars) of investing in the Fund and to compare these costs with the ongoing costs of investing in other mutual funds. The example is based on an investment of $1,000 invested on April 1, 2006, and held through September 30, 2006.
Actual Expenses
The first line in the table below provides information about actual account values and actual expenses for the Fund. You may use the information in this line, together with the amount you invested, to estimate the expenses that you paid over the period. Simply divide your account value by $1,000 (for example, an $8,600 account value divided by $1,000 = 8.6), then multiply the result by the number in the first line under the heading entitled “Expenses Paid During the Period” to estimate the expenses you paid on your account during this period.
Hypothetical Example for Comparison Purposes
The second line in the table below provides information about hypothetical account values and hypothetical expenses based on the Fund’s actual expense ratio and an assumed rate of return of 5% per year before expenses, which is not the Fund’s actual return. The hypothetical account values and expenses may not be used to estimate the actual ending account balance or expenses you paid for the period. You may use this information to compare the ongoing costs of investing in the Fund and other funds. To do so, compare this 5% hypothetical example with the 5% hypothetical examples that appear in the shareholder reports of other funds.
| | | | | | | | | |
| | | Beginning
Account Value
4/1/06 | | Ending
Account Value
9/30/06 | | Expenses PaidA
During the Period
4/1/06 to 9/30/06 |
Institutional Class: | | | | | | | | | |
Actual | | $ | 1,000.00 | | $ | 1,038.40 | | $ | 2.30 |
Hypothetical (5% return before expenses) | | | 1,000.00 | | | 1,022.81 | | | 2.28 |
| A | | These calculations are based on expenses incurred in the most recent fiscal half-year. The dollar amounts shown as “Expenses Paid” are equal to the annualized expense ratio of 0.45% multiplied by the average value over the period, multiplied by the number of days in the most recent fiscal half-year (183), and divided by 365. |
35
Semi-Annual Report to Shareholders
Performance Information
Western Asset Intermediate Plus Bond Portfolio
The graph compares the Fund’s total returns against that of an appropriate broad-based securities market index. The line illustrates the cumulative total return of an initial $1,000,000 investment for the periods indicated. The line for the Fund represents the total return after deducting all Fund investment management and other administrative expenses and the transaction costs of buying and selling securities. The line representing the securities market index does not include any transaction costs associated with buying and selling securities in the index or other investment management or administrative expenses.
Total return measures investment performance in terms of appreciation or depreciation in the Fund’s net asset value per share, plus dividends and any capital gain distributions. It assumes that dividends and distributions were reinvested at the time they were paid. Returns (and the graph and table found below) do not reflect the deduction of taxes that a shareholder would pay on Fund distributions or the redemption of Fund shares. Average annual returns tend to smooth out variations in a fund’s return, so that they differ from actual year-to-year results.
Bonds are subject to a variety of risks, including interest rate, credit, and inflation risk. Non-U.S. investment are subject to currency fluctuations, social, economic and political risk.
Growth of a $1,000,000 Investment—Institutional Class

The performance data quoted represents past performance and does not guarantee future results. The performance stated may have been due to extraordinary market conditions, which may not be duplicated in the future. Current performance may be lower or higher than the performance data quoted. To obtain the most recent month-end performance information, please visit www.westernassetfunds.com. The investment return and principal value of the Fund will fluctuate so that an investor’s shares, when redeemed, may be worth more or less than the original cost. Calculations assume reinvestment of dividends and capital gain distributions. Performance would have been lower if fees had not been waived in various periods.
| A | | Index returns are for periods beginning March 31, 2004. |
36
Semi-Annual Report to Shareholders
Portfolio Composition (as of September 30, 2006)
Standard & Poor’s Debt RatingsB (as a percentage of the portfolio)

Maturity Schedule (as a percentage of the portfolio)
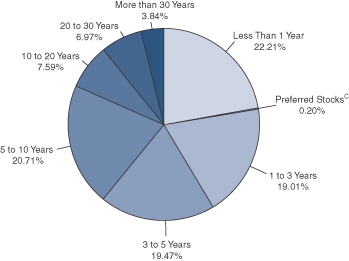
| B | | Source: Standard & Poor's. |
| C | | Preferred Stocks do not have a defined maturity date. |
The Fund is actively managed. As a result, the composition of the portfolio holdings and sectors are subject to change at any time.
37
Semi-Annual Report to Shareholders
Portfolio of Investments
Western Asset Intermediate Plus Bond Portfolio
September 30, 2006 (Unaudited)
(Amounts in Thousands)
| | | | | | | | | | | | | |
| | | % OF
NET ASSETS | | RATE | | MATURITY
DATE | | PAR | | VALUE | |
| | | | | | | | | | | | | |
Long-Term Securities | | 83.8% | | | | | | | | | | | |
| | | | | |
Corporate Bonds and Notes | | 36.0% | | | | | | | | | | | |
| | | | | |
Automotive | | 0.2% | | | | | | | | | | | |
Ford Motor Company | | | | 7.450% | | 7/16/31 | | $ | 110 | | $ | 85 | |
General Motors Corporation | | | | 8.375% | | 7/15/33 | | | 120 | | | 104 | |
| | | | | | | | | | | | | |
| | | | | | | | | | | | 189 | |
| | | | | | | | | | | | | |
Banking and Finance | | 8.0% | | | | | | | | | | | |
Caterpillar Financial Services Corporation | | | | 3.450% | | 1/15/09 | | | 120 | | | 116 | |
Ford Motor Credit Company | | | | 6.625% | | 6/16/08 | | | 850 | | | 837 | |
Ford Motor Credit Company | | | | 9.957% | | 4/15/12 | | | 1,000 | | | 1,046 | A |
General Motors Acceptance Corporation | | | | 6.407% | | 1/16/07 | | | 700 | | | 699 | A |
General Motors Acceptance Corporation | | | | 6.125% | | 8/28/07 | | | 370 | | | 369 | |
General Motors Acceptance Corporation | | | | 6.539% | | 9/23/08 | | | 850 | | | 845 | A |
General Motors Acceptance Corporation | | | | 6.750% | | 12/1/14 | | | 40 | | | 39 | |
General Motors Acceptance Corporation | | | | 5.046% | | 9/19/35 | | | 174 | | | 173 | A |
HSBC Finance Corporation | | | | 5.696% | | 5/10/10 | | | 454 | | | 456 | A |
John Deere Capital Corporation | | | | 5.100% | | 1/15/13 | | | 200 | | | 198 | |
Nissan Motor Acceptance Corporation | | | | 5.625% | | 3/14/11 | | | 320 | | | 321 | B |
Residential Capital Corporation | | | | 6.742% | | 6/29/07 | | | 100 | | | 100 | A |
Residential Capital Corporation | | | | 6.000% | | 2/22/11 | | | 300 | | | 300 | |
Wachovia Capital Trust III | | | | 5.800% | | 3/15/42 | | | 970 | | | 973 | C |
Washington Mutual, Inc. | | | | 4.200% | | 1/15/10 | | | 290 | | | 281 | |
| | | | | | | | | | | | | |
| | | | | | | | | | | | 6,753 | |
| | | | | | | | | | | | | |
Cable | | 0.6% | | | | | | | | | | | |
Comcast Cable Communications, Inc. | | | | 6.750% | | 1/30/11 | | | 510 | | | 536 | |
| | | | | | | | | | | | | |
| | | | | |
Casino Resorts | | 0.5% | | | | | | | | | | | |
Caesars Entertainment, Inc. | | | | 7.500% | | 9/1/09 | | | 90 | | | 94 | |
Harrah’s Operating Company, Inc. | | | | 5.500% | | 7/1/10 | | | 200 | | | 197 | |
Harrah’s Operating Company, Inc. | | | | 5.625% | | 6/1/15 | | | 130 | | | 121 | |
| | | | | | | | | | | | | |
| | | | | | | | | | | | 412 | |
| | | | | | | | | | | | | |
Chemicals | | 0.6% | | | | | | | | | | | |
The Dow Chemical Company | | | | 5.750% | | 12/15/08 | | | 100 | | | 101 | |
The Dow Chemical Company | | | | 5.970% | | 1/15/09 | | | 70 | | | 71 | |
The Dow Chemical Company | | | | 6.000% | | 10/1/12 | | | 300 | | | 310 | |
| | | | | | | | | | | | | |
| | | | | | | | | | | | 482 | |
| | | | | | | | | | | | | |
38
Semi-Annual Report to Shareholders
| | | | | | | | | | | | | |
| | | % OF
NET ASSETS | | RATE | | MATURITY
DATE | | PAR | | VALUE | |
| | | | | | | | | | | | | |
Corporate Bonds and Notes—Continued | | | | | | | | | | | | | |
| | | | | |
Computer Services and Systems | | 0.5% | | | | | | | | | | | |
Electronic Data Systems Corporation | | | | 7.125% | | 10/15/09 | | $ | 330 | | $ | 345 | |
International Business Machines Corporation | | | | 4.750% | | 11/29/12 | | | 100 | | | 98 | |
| | | | | | | | | | | | | |
| | | | | | | | | | | | 443 | |
| | | | | | | | | | | | | |
Diversified Financial Services | | 0.6% | | | | | | | | | | | |
ZFS Finance (USA) Trust II | | | | 6.450% | | 12/15/65 | | | 240 | | | 237B,C | |
American Express Company | | | | 6.800% | | 9/1/66 | | | 250 | | | 264 | C |
| | | | | | | | | | | | | |
| | | | | | | | | | | | 501 | |
| | | | | | | | | | | | | |
Drug and Grocery Store Chains | | 0.1% | | | | | | | | | | | |
Safeway Inc. | | | | 6.500% | | 3/1/11 | | | 100 | | | 103 | |
| | | | | | | | | | | | | |
| | | | | |
Electric | | 1.8% | | | | | | | | | | | |
Alabama Power Company | | | | 5.590% | | 8/25/09 | | | 120 | | | 120 | A |
Appalachian Power Company | | | | 3.600% | | 5/15/08 | | | 277 | | | 270 | |
Dominion Resources, Inc. | | | | 5.700% | | 9/17/12 | | | 380 | | | 382 | |
FirstEnergy Corp. | | | | 6.450% | | 11/15/11 | | | 500 | | | 522 | |
Niagara Mohawk Power Corporation | | | | 7.750% | | 10/1/08 | | | 50 | | | 52 | |
The AES Corporation | | | | 9.500% | | 6/1/09 | | | 150 | | | 160 | |
| | | | | | | | | | | | | |
| | | | | | | | | | | | 1,506 | |
| | | | | | | | | | | | | |
Energy | | 2.4% | | | | | | | | | | | |
CenterPoint Energy, Inc. | | | | 5.875% | | 6/1/08 | | | 120 | | | 121 | |
Duke Energy Corporation | | | | 6.250% | | 1/15/12 | | | 200 | | | 208 | |
Duke Energy Corporation | | | | 5.625% | | 11/30/12 | | | 160 | | | 162 | |
Exelon Corporation | | | | 6.750% | | 5/1/11 | | | 300 | | | 315 | |
Pacific Gas and Electric Company | | | | 3.600% | | 3/1/09 | | | 320 | | | 309 | |
Progress Energy, Inc. | | | | 5.850% | | 10/30/08 | | | 100 | | | 101 | |
Progress Energy, Inc. | | | | 7.100% | | 3/1/11 | | | 370 | | | 396 | |
TXU Corp. | | | | 4.800% | | 11/15/09 | | | 170 | | | 166 | |
TXU Corp. | | | | 5.550% | | 11/15/14 | | | 280 | | | 264 | |
| | | | | | | | | | | | | |
| | | | | | | | | | | | 2,042 | |
| | | | | | | | | | | | | |
Environmental Services | | 0.9% | | | | | | | | | | | |
Waste Management, Inc. | | | | 6.875% | | 5/15/09 | | | 250 | | | 260 | |
Waste Management, Inc. | | | | 7.375% | | 8/1/10 | | | 460 | | | 493 | |
| | | | | | | | | | | | | |
| | | | | | | | | | | | 753 | |
| | | | | | | | | | | | | |
Food, Beverage and Tobacco | | 1.9% | | | | | | | | | | | |
Altria Group, Inc. | | | | 5.625% | | 11/4/08 | | | 170 | | | 171 | |
Altria Group, Inc. | | | | 7.000% | | 11/4/13 | | | 480 | | | 524 | |
39
Semi-Annual Report to Shareholders
Portfolio of Investments—Continued
Western Asset Intermediate Plus Bond Portfolio—Continued
| | | | | | | | | | | | | |
| | | % OF
NET ASSETS | | RATE | | MATURITY
DATE | | PAR | | VALUE | |
| | | | | | | | | | | | | |
Corporate Bonds and Notes—Continued | | | | | | | | | | | | | |
| | | | | |
Food, Beverage and Tobacco—Continued | | | | | | | | | | | | | |
Kraft Foods Inc. | | | | 5.625% | | 11/1/11 | | $ | 340 | | $ | 343 | |
Pepsi Bottling Holdings Inc. | | | | 5.625% | | 2/17/09 | | | 320 | | | 324 | B |
Sara Lee Corporation | | | | 2.750% | | 6/15/08 | | | 150 | | | 143 | |
Sara Lee Corporation | | | | 6.250% | | 9/15/11 | | | 60 | | | 62 | |
| | | | | | | | | | | | | |
| | | | | | | | | | | | 1,567 | |
| | | | | | | | | | | | | |
Gas and Pipeline Utilities | | 1.1% | | | | | | | | | | | |
ANR Pipeline, Inc. | | | | 8.875% | | 3/15/10 | | | 65 | | | 68 | |
Kinder Morgan Energy Partners, L.P. | | | | 7.500% | | 11/1/10 | | | 290 | | | 310 | |
Kinder Morgan Energy Partners, L.P. | | | | 6.750% | | 3/15/11 | | | 80 | | | 83 | |
Southern Natural Gas Company | | | | 8.875% | | 3/15/10 | | | 85 | | | 89 | |
The Williams Companies, Inc. | | | | 6.375% | | 10/1/10 | | | 60 | | | 60 | B |
The Williams Companies, Inc. | | | | 7.508% | | 10/1/10 | | | 280 | | | 285 | A,B |
| | | | | | | | | | | | | |
| | | | | | | | | | | | 895 | |
| | | | | | | | | | | | | |
Investment Banking/Brokerage | | 2.0% | | | | | | | | | | | |
JPMorgan Chase & Co. | | | | 5.125% | | 9/15/14 | | | 210 | | | 206 | |
JPMorgan Chase Capital XIII | | | | 6.317% | | 9/30/34 | | | 20 | | | 20 | A |
Lehman Brothers Holdings E-Capital Trust I | | | | 6.173% | | 8/19/65 | | | 430 | | | 432 | A |
Lehman Brothers Holdings Inc. | | | | 4.500% | | 7/26/10 | | | 140 | | | 136 | |
Merrill Lynch & Co., Inc. | | | | 5.700% | | 2/5/10 | | | 160 | | | 161 | A |
Morgan Stanley | | | | 5.050% | | 1/21/11 | | | 180 | | | 179 | |
Morgan Stanley | | | | 5.625% | | 1/9/12 | | | 330 | | | 334 | |
The Bear Stearns Companies Inc. | | | | 4.550% | | 6/23/10 | | | 250 | | | 244 | |
| | | | | | | | | | | | | |
| | | | | | | | | | | | 1,712 | |
| | | | | | | | | | | | | |
Media | | 2.0% | | | | | | | | | | | |
Clear Channel Communications, Inc. | | | | 4.250% | | 5/15/09 | | | 480 | | | 464 | |
Liberty Media Corporation | | | | 7.875% | | 7/15/09 | | | 440 | | | 461 | |
News America Incorporated | | | | 5.300% | | 12/15/14 | | | 400 | | | 392 | |
Time Warner Inc. | | | | 6.875% | | 5/1/12 | | | 200 | | | 211 | |
Turner Broadcasting System, Inc. | | | | 8.375% | | 7/1/13 | | | 130 | | | 146 | |
Viacom Inc. | | | | 5.750% | | 4/30/11 | | | 60 | | | 60 | B |
| | | | | | | | | | | | | |
| | | | | | | | | | | | 1,734 | |
| | | | | | | | | | | | | |
Medical Care Facilities | | 0.3% | | | | | | | | | | | |
HCA, Inc. | | | | 8.750% | | 9/1/10 | | | 50 | | | 50 | |
HCA, Inc. | | | | 6.250% | | 2/15/13 | | | 130 | | | 109 | |
HCA, Inc. | | | | 6.750% | | 7/15/13 | | | 70 | | | 59 | |
| | | | | | | | | | | | | |
| | | | | | | | | | | | 218 | |
| | | | | | | | | | | | | |
40
Semi-Annual Report to Shareholders
| | | | | | | | | | | | | |
| | | % OF
NET ASSETS | | RATE | | MATURITY
DATE | | PAR | | VALUE | |
| | | | | | | | | | | | | |
Corporate Bonds and Notes—Continued | | | | | | | | | | | | | |
| | | | | |
Medical Products | | 0.4% | | | | | | | | | | | |
Bristol-Myers Squibb Company | | | | 5.750% | | 10/1/11 | | $ | 310 | | $ | 316 | |
| | | | | | | | | | | | | |
| | | | | |
Oil and Gas | | 4.9% | | | | | | | | | | | |
Amerada Hess Corporation | | | | 6.650% | | 8/15/11 | | | 690 | | | 724 | |
Apache Corporation | | | | 6.250% | | 4/15/12 | | | 100 | | | 104 | |
ConocoPhillips | | | | 4.750% | | 10/15/12 | | | 500 | | | 490 | |
El Paso Corporation | | | | 6.950% | | 12/15/07 | | | 300 | | | 303 | |
Kerr-McGee Corporation | | | | 6.625% | | 10/15/07 | | | 60 | | | 61 | |
Kerr-McGee Corporation | | | | 6.875% | | 9/15/11 | | | 650 | | | 688 | |
Occidental Petroleum Corporation | | | | 6.750% | | 1/15/12 | | | 200 | | | 214 | |
Pemex Project Funding Master Trust | | | | 6.125% | | 8/15/08 | | | 322 | | | 324 | |
Pemex Project Funding Master Trust | | | | 5.991% | | 12/3/12 | | | 220 | | | 220 | A,B |
Pemex Project Funding Master Trust | | | | 7.375% | | 12/15/14 | | | 230 | | | 248 | |
XTO Energy, Inc. | | | | 7.500% | | 4/15/12 | | | 100 | | | 109 | |
XTO Energy, Inc. | | | | 6.250% | | 4/15/13 | | | 190 | | | 196 | |
XTO Energy, Inc. | | | | 5.650% | | 4/1/16 | | | 460 | | | 456 | |
| | | | | | | | | | | | | |
| | | | | | | | | | | | 4,137 | |
| | | | | | | | | | | | | |
Paper and Forest Products | | 0.7% | | | | | | | | | | | |
International Paper Company | | | | 3.800% | | 4/1/08 | | | 230 | | | 225 | |
International Paper Company | | | | 6.750% | | 9/1/11 | | | 50 | | | 53 | |
Weyerhaeuser Company | | | | 6.750% | | 3/15/12 | | | 330 | | | 345 | |
| | | | | | | | | | | | | |
| | | | | | | | | | | | 623 | |
| | | | | | | | | | | | | |
Photo Equipment and Supplies | | N.M. | | | | | | | | | | | |
Eastman Kodak Company | | | | 3.625% | | 5/15/08 | | | 10 | | | 10 | |
| | | | | | | | | | | | | |
| | | | | |
Special Purpose | | 4.7% | | | | | | | | | | | |
DaimlerChrysler NA Holding Corporation | | | | 6.500% | | 11/15/13 | | | 970 | | | 995 | |
Devon Financing Corporation ULC | | | | 6.875% | | 9/30/11 | | | 450 | | | 479 | |
International Lease Finance Corp. E-Capital Trust I | | | | 5.900% | | 12/21/65 | | | 470 | | | 473 | B,C |
International Lease Finance Corporation | | | | 5.000% | | 4/15/10 | | | 510 | | | 503 | |
National Rural Utilities Cooperative Finance Corporation | | | | 3.875% | | 2/15/08 | | | 100 | | | 98 | |
Sprint Capital Corporation | | | | 8.375% | | 3/15/12 | | | 570 | | | 639 | |
The Williams Companies, Inc. Credit-Linked Certificates | | | | 6.750% | | 4/15/09 | | | 170 | | | 171 | B |
The Williams Companies, Inc. Credit-Linked Certificates | | | | 8.739% | | 5/1/09 | | | 255 | | | 267 | A,B |
Verizon Global Funding Corp. | | | | 7.250% | | 12/1/10 | | | 350 | | | 375 | |
| | | | | | | | | | | | | |
| | | | | | | | | | | | 4,000 | |
| | | | | | | | | | | | | |
41
Semi-Annual Report to Shareholders
Portfolio of Investments—Continued
Western Asset Intermediate Plus Bond Portfolio—Continued
| | | | | | | | | | | | | |
| | | % OF
NET ASSETS | | RATE | | MATURITY
DATE | | PAR | | VALUE | |
| | | | | | | | | | | | | |
Corporate Bonds and Notes—Continued | | | | | | | | | | | | | |
| | | | | |
Telecommunications | | 1.3% | | | | | | | | | | | |
AT&T Inc. | | | | 4.125% | | 9/15/09 | | $ | 190 | | $ | 184 | |
AT&T Inc. | | | | 5.300% | | 11/15/10 | | | 380 | | | 379 | |
AT&T Inc. | | | | 6.250% | | 3/15/11 | | | 100 | | | 103 | |
Embarq Corporation | | | | 6.738% | | 6/1/13 | | | 200 | | | 206 | |
Qwest Communications International Incorporated | | | | 8.905% | | 2/15/09 | | | 200 | | | 204 | A |
| | | | | | | | | | | | | |
| | | | | | | | | | | | 1,076 | |
| | | | | | | | | | | | | |
Telecommunications (Cellular/Wireless) | | 0.5% | | | | | | | | | | | |
New Cingular Wireless Services Inc. | | | | 8.125% | | 5/1/12 | | | 400 | | | 450 | |
| | | | | | | | | | | | | |
Total Corporate Bonds and Notes
(Identified Cost—$30,448) | | | | | | | | | | | | 30,458 | |
Asset-Backed Securities | | 0.2% | | | | | | | | | | | |
| | | | | |
Indexed SecuritiesA | | 0.2% | | | | | | | | | | | |
Metris Master Trust 2004-1 | | | | 5.610% | | 4/20/11 | | | 100 | | | 100 | |
Residential Asset Securities Corporation 2002-KS7 | | | | 5.700% | | 11/25/32 | | | 18 | | | 19 | |
| | | | | | | | | | | | | |
| | | | | | | | | | | | 119 | |
| | | | | | | | | | | | | |
Total Asset-Backed Securities
(Identified Cost—$119) | | | | | | | | | | | | 119 | |
Mortgage-Backed Securities | | 3.3% | | | | | | | | | | | |
| | | | | |
Fixed Rate Securities | | N.M. | | | | | | | | | | | |
Washington Mutual MSC Mortgage Pass-Through Certificates, Series 2004-RA1 | | | | 7.000% | | 3/25/34 | | | 27 | | | 27 | |
| | | | | | | | | | | | | |
| | | | | |
Indexed SecuritiesA | | 0.6% | | | | | | | | | | | |
MASTR Adjustable Rate Mortgages Trust 2004-13 | | | | 3.786% | | 11/21/34 | | | 450 | | | 435 | |
Merrill Lynch Mortgage Investors, Inc. 2004-B | | | | 6.660% | | 5/25/29 | | | 31 | | | 31 | |
| | | | | | | | | | | | | |
| | | | | | | | | | | | 466 | |
| | | | | | | | | | | | | |
Variable Rate SecuritiesD | | 2.7% | | | | | | | | | | | |
Banc of America Funding Corporation 2005-B | | | | 5.109% | | 4/20/35 | | | 194 | | | 193 | |
Bear Stearns ALT-A Trust 2005-2 | | | | 4.745% | | 4/25/35 | | | 153 | | | 151 | |
Countrywide Home Loans 2004-20 | | | | 6.882% | | 9/25/34 | | | 33 | | | 33 | |
J.P. Morgan Mortgage Trust 2004-A3 | | | | 4.304% | | 7/25/34 | | | 634 | | | 627 | |
MLCC Mortgage Investors, Inc. 2005-1 2A1 | | | | 4.965% | | 4/25/35 | | | 68 | | | 67 | |
MLCC Mortgage Investors, Inc. 2005-1 2A2 | | | | 4.965% | | 4/25/35 | | | 221 | | | 219 | |
Structured Adjustable Rate Mortgage Loan Trust 2004-6 3A2 | | | | 4.725% | | 6/25/34 | | | 208 | | | 206 | |
42
Semi-Annual Report to Shareholders
| | | | | | | | | | | | | |
| | | % OF
NET ASSETS | | RATE | | MATURITY
DATE | | PAR | | VALUE | |
| | | | | | | | | | | | | |
Mortgage-Backed Securities—Continued | | | | | | | | | | | | | |
| | | | | |
Variable Rate Securities—Continued | | | | | | | | | | | | | |
WaMu Mortgage Pass-Through Certificates 2005-AR12 | | | | 4.839% | | 10/25/35 | | $ | 518 | | $ | 514 | |
WaMu Mortgage Pass-Through Certificates 2005-AR4 | | | | 4.674% | | 4/25/35 | | | 300 | | | 293 | |
| | | | | | | | | | | | | |
| | | | | | | | | | | | 2,303 | |
| | | | | | | | | | | | | |
Total Mortgage-Backed Securities
(Identified Cost—$2,813) | | | | | | | | | | | | 2,796 | |
U.S. Government and Agency Obligations | | 26.1% | | | | | | | | | | | |
| | | | | |
Fixed Rate Securities | | 24.4% | | | | | | | | | | | |
Fannie Mae | | | | 5.000% | | 9/15/08 | | | 300 | | | 300 | |
Fannie Mae | | | | 4.625% | | 10/15/13 | | | 430 | | | 422 | |
Farmer Mac | | | | 4.250% | | 7/29/08 | | | 80 | | | 79 | |
Federal Home Loan Bank | | | | 5.125% | | 6/13/08 | | | 140 | | | 140 | |
Federal Home Loan Bank | | | | 5.375% | | 5/18/16 | | | 600 | | | 618 | |
Federal Home Loan Bank | | | | 5.500% | | 7/15/36 | | | 20 | | | 21 | |
Freddie Mac | | | | 4.750% | | 1/18/11 | | | 710 | | | 706 | |
Tennessee Valley Authority | | | | 5.625% | | 1/18/11 | | | 10 | | | 10 | |
Tennessee Valley Authority | | | | 6.790% | | 5/23/12 | | | 210 | | | 229 | |
United States Treasury Bonds | | | | 6.125% | | 11/15/27 | | | 110 | | | 128 | |
United States Treasury Bonds | | | | 4.500% | | 2/15/36 | | | 54 | | | 52 | |
United States Treasury Notes | | | | 3.000% | | 11/15/07 | | | 3,600 | | | 3,527 | |
United States Treasury Notes | | | | 4.375% | | 1/31/08 | | | 120 | | | 119 | |
United States Treasury Notes | | | | 3.750% | | 5/15/08 | | | 3,940 | | | 3,879 | |
United States Treasury Notes | | | | 5.000% | | 7/31/08 | | | 700 | | | 703 | |
United States Treasury Notes | | | | 3.375% | | 9/15/09 | | | 770 | | | 744 | |
United States Treasury Notes | | | | 3.375% | | 10/15/09 | | | 10 | | | 10 | |
United States Treasury Notes | | | | 6.500% | | 2/15/10 | | | 40 | | | 42 | |
United States Treasury Notes | | | | 3.875% | | 9/15/10 | | | 2,650 | | | 2,582 | |
United States Treasury Notes | | | | 4.250% | | 10/15/10 | | | 1,080 | | | 1,067 | |
United States Treasury Notes | | | | 4.500% | | 2/28/11 | | | 340 | | | 339 | |
United States Treasury Notes | | | | 4.750% | | 3/31/11 | | | 80 | | | 80 | |
United States Treasury Notes | | | | 4.250% | | 8/15/13 | | | 1,630 | | | 1,596 | |
United States Treasury Notes | | | | 4.250% | | 11/15/14 | | | 10 | | | 10 | |
United States Treasury Notes | | | | 4.250% | | 8/15/15 | | | 130 | | | 126 | |
United States Treasury Notes | | | | 2.000% | | 1/15/16 | | | 328 | | | 320 | |
United States Treasury Notes | | | | 4.500% | | 2/15/16 | | | 410 | | | 406 | |
United States Treasury Notes | | | | 4.875% | | 8/15/16 | | | 2,380 | | | 2,425 | |
| | | | | | | | | | | | | |
| | | | | | | | | | | | 20,680 | |
| | | | | | | | | | | | | |
Stripped Securities | | 0.6% | | | | | | | | | | | |
United States Treasury Bonds | | | | 0.000% | | 11/15/24 | | | 1,270 | | | 527 | E2 |
| | | | | | | | | | | | | |
43
Semi-Annual Report to Shareholders
Portfolio of Investments—Continued
Western Asset Intermediate Plus Bond Portfolio—Continued
| | | | | | | | | | | | | |
| | | % OF
NET ASSETS | | RATE | | MATURITY
DATE | | PAR | | VALUE | |
| | | | | | | | | | | | | |
U.S. Government and Agency Obligations—Continued | | | | | | | | | | | | | |
| | | | | |
Treasury Inflation-Protected SecuritiesF | | 1.1% | | | | | | | | | | | |
United States Treasury Inflation-Protected Security | | | | 2.000% | | 1/15/14 | | $ | 628 | | $ | 616 | |
United States Treasury Inflation-Protected Security | | | | 2.000% | | 7/15/14 | | | 11 | | | 10 | |
United States Treasury Inflation-Protected Security | | | | 1.875% | | 7/15/15 | | | 94 | | | 91 | |
United States Treasury Inflation-Protected Security | | | | 2.375% | | 1/15/25 | | | 76 | | | 77 | |
United States Treasury Inflation-Protected Security | | | | 2.000% | | 1/15/26 | | | 103 | | | 98 | |
| | | | | | | | | | | | | |
| | | | | | | | | | | | 892 | |
| | | | | | | | | | | | | |
Total U.S. Government and Agency Obligations
(Identified Cost—$22,130) | | | | | | | | | | | | 22,099 | |
U.S. Government Agency Mortgage-Backed Securities | | 9.2% | | | | | | | | | | | |
| | | | | |
Fixed Rate Securities | | 7.8% | | | | | | | | | | | |
Fannie Mae | | | | 5.000% | | 12/1/36 | | | 600 | | | 577 | G |
Fannie Mae | | | | 6.000% | | 12/1/16 | | | 5,480 | | | 5,562 | G |
Freddie Mac | | | | 4.375% | | 11/16/07 | | | 370 | | | 367 | |
Freddie Mac | | | | 5.000% | | 12/1/36 | | | 100 | | | 96 | G |
| | | | | | | | | | | | | |
| | | | | | | | | | | | 6,602 | |
| | | | | | | | | | | | | |
Variable Rate SecuritiesD | | 1.4% | | | | | | | | | | | |
Fannie Mae | | | | 5.229% | | 9/1/35 | | | 388 | | | 385 | |
Fannie Mae | | | | 4.240% | | 12/1/34 | | | 750 | | | 731 | |
Freddie Mac | | | | 4.082% | | 1/1/35 | | | 25 | | | 24 | |
Freddie Mac | | | | 4.098% | | 1/1/35 | | | 44 | | | 43 | |
| | | | | | | | | | | | | |
| | | | | | | | | | | | 1,183 | |
| | | | | | | | | | | | | |
Total U.S. Government Agency Mortgage-Backed Securities (Identified Cost—$7,797) | | | | | | | | | | | | 7,785 | |
Yankee BondsH | | 7.9% | | | | | | | | | | | |
| | | | | |
Banking and Finance | | 1.0% | | | | | | | | | | | |
AIFUL CORPORATION | | | | 5.000% | | 8/10/10 | | | 390 | | | 379 | B |
HSBC Holdings plc | | | | 7.500% | | 7/15/09 | | | 120 | | | 128 | |
MUFG Capital Finance 1 Limited | | | | 6.346% | | 7/25/49 | | | 150 | | | 151 | C |
Royal Bank of Scotland Group plc | | | | 9.118% | | 3/31/49 | | | 180 | | | 201 | |
| | | | | | | | | | | | | |
| | | | | | | | | | | | 859 | |
| | | | | | | | | | | | | |
Banks | | 1.8% | | | | | | | | | | | |
Banco Santiago SA | | | | 5.740% | | 12/9/09 | | | 200 | | | 201 | A,B |
Islandsbanki hf | | | | 5.519% | | 2/22/08 | | | 10 | | | 10 | A,B |
Kaupthing Bank hf | | | | 5.750% | | 10/4/11 | | | 150 | | | 150 | B |
Kaupthing Bank hf | | | | 6.125% | | 10/4/16 | | | 430 | | | 429 | B |
44
Semi-Annual Report to Shareholders
| | | | | | | | | | | | | |
| | | % OF
NET ASSETS | | RATE | | MATURITY
DATE | | PAR | | VALUE | |
| | | | | | | | | | | | | |
Yankee Bonds—Continued | | | | | | | | | | | | | |
Banks—Continued | | | | | | | | | | | | | |
Landsbanki Islands hf (The National Bank of Iceland) | | | | 6.100% | | 8/25/11 | | $ | 330 | | $ | 333 | B |
Shinsei Fin Cayman Ltd | | | | 6.418% | | 1/29/49 | | | 420 | | | 417 | B,C |
| | | | | | | | | | | | | |
| | | | | | | | | | | | 1,540 | |
Foreign Governments | | 1.3% | | | | | | | | | | | |
Federative Republic of Brazil | | | | 8.875% | | 4/15/24 | | | 20 | | | 24 | |
Federative Republic of Brazil | | | | 10.125% | | 5/15/27 | | | 22 | | | 29 | |
Federative Republic of Brazil | | | | 11.000% | | 8/17/40 | | | 144 | | | 188 | |
Republic of Bulgaria | | | | 8.250% | | 1/15/15 | | | 6 | | | 7 | |
Republic of Colombia | | | | 11.750% | | 2/25/20 | | | 17 | | | 24 | |
Republic of Colombia | | | | 7.375% | | 9/18/37 | | | 100 | | | 101 | |
Republic of Panama | | | | 7.125% | | 1/29/26 | | | 55 | | | 57 | |
Republic of Panama | | | | 9.375% | | 4/1/29 | | | 20 | | | 26 | |
Russian Federation | | | | 5.000% | | 3/31/30 | | | 340 | | | 380 | C |
Russian Federation | | | | 5.000% | | 3/31/30 | | | 210 | | | 234 | B,C |
United Mexican States | | | | 8.300% | | 8/15/31 | | | 10 | | | 12 | |
| | | | | | | | | | | | | |
| | | | | | | | | | | | 1,082 | |
| | | | | | | | | | | | | |
Manufacturing (Diversified) | | 0.6% | | | | | | | | | | | |
Tyco International Group SA | | | | 6.000% | | 11/15/13 | | | 460 | | | 476 | |
| | | | | | | | | | | | | |
| | | | | |
Special Purpose | | 1.0% | | | | | | | | | | | |
Deutsche Telekom International Finance BV | | | | 8.000% | | 6/15/10 | | | 440 | | | 480 | |
TNK-BP Finance S.A. | | | | 6.875% | | 7/18/11 | | | 380 | | | 389 | B |
| | | | | | | | | | | | | |
| | | | | | | | | | | | 869 | |
| | | | | | | | | | | | | |
Telecommunications | | 2.0% | | | | | | | | | | | |
British Telecommunications plc | | | | 8.375% | | 12/15/10 | | | 350 | | | 392 | |
France Telecom SA | | | | 7.750% | | 3/1/11 | | | 400 | | | 438 | |
Koninklijke (Royal) KPN NV | | | | 8.000% | | 10/1/10 | | | 490 | | | 530 | |
Telecom Italia Capital | | | | 5.969% | | 2/1/11 | | | 370 | | | 367 | A |
| | | | | | | | | | | | | |
| | | | | | | | | | | | 1,727 | |
| | | | | | | | | | | | | |
| | | | | |
Utilities | | 0.2% | | | | | | | | | | | |
United Utilities plc | | | | 6.450% | | 4/1/08 | | | 170 | | | 172 | |
| | | | | | | | | | | | | |
Total Yankee Bonds (Identified Cost—$6,647) | | | | | | | | | | | | 6,725 | |
Foreign Government Obligations | | 0.8% | | | | | | | | | | | |
Canadian Real Return Bond | | | | 4.000% | | 12/1/31 | | | 192I | | | 254F | |
Bundesrepublik Deutschland | | | | 3.750% | | 1/4/15 | | | 310J | | | 396 | |
| | | | | | | | | | | | | |
Total Foreign Government Obligations
(Identified Cost—$605) | | | | | | | | | | | | 650 | |
45
Semi-Annual Report to Shareholders
Portfolio of Investments—Continued
Western Asset Intermediate Plus Bond Portfolio—Continued
| | | | | | | | | | | | | | |
| | | % OF
NET ASSETS | | RATE | | MATURITY
DATE | | PAR/
SHARES | | | VALUE | |
| | | | | | | | | | | | | | |
Foreign Corporate Bonds | | 0.1% | | | | | | | | | | | | |
General Motors Corporation | | | | 8.375% | | 7/5/33 | | $ | 50J | | | $ | 56 | |
| | | | | | | | | | | | | | |
Total Foreign Corporate Bonds
(Identified Cost—$65) | | | | | | | | | | | | | 56 | |
Preferred Stocks | | 0.2% | | | | | | | | | | | | |
General Motors Corporation | | | | 4.500% | | | | | 7 | shs | | | 178 | |
| | | | | | | | | | | | | | |
Total Preferred Stocks (Identified Cost—$168) | | | | | | | | | | | | | 178 | |
| | | | | | | | | | | | | | |
Total Long-Term Securities
(Identified Cost—$70,792) | | | | | | | | | | | | | 70,866 | |
Short-Term Securities | | 22.1% | | | | | | | | | | | | |
| | | | | |
U.S. Government and Agency Obligations | | 0.2% | | | | | | | | | | | | |
Fannie Mae | | | | 0.000% | | 6/25/07 | | $ | 210 | | | | 202 | K,L |
| | | | | | | | | | | | | | |
| | | | | |
Repurchase Agreements | | 21.9% | | | | | | | | | | | | |
Goldman Sachs Group, Inc.
5.3%, dated 9/29/06, to be repurchased at $18,531 on 10/2/06 (Collateral: $18,570 Federal Home Loan Bank note, 5.875%, due 2/14/08, value $18,895) | | | | | | | | | 18,523 | | | | 18,523 | |
| | | | | | | | | | | | | | |
Total Short-Term Securities (Identified Cost—$18,725) | | | | | | | | | | | | | 18,725 | |
Total Investments (Identified Cost—$89,517) | | 105.9% | | | | | | | | | | | 89,591 | |
Other Assets Less Liabilities | | (5.9)% | | | | | | | | | | | (4,975 | ) |
| | | | | | | | | | | | | | |
| | | | | |
Net Assets | | 100.0% | | | | | | | | | | $ | 84,616 | |
| | | | | | | | | | | | | | |
46
Semi-Annual Report to Shareholders
| | | | | | | | |
| | | EXPIRATION | | ACTUAL
CONTRACTS | | APPRECIATION/
(DEPRECIATION) | |
Futures Contracts PurchasedM | | | | | | | | |
Eurodollar Futures | | June 2007 | | 8 | | $ | 4 | |
U.S. Treasury Note Futures | | December 2006 | | 145 | | | 92 | |
U.S. Treasury Note Futures | | December 2006 | | 40 | | | 17 | |
| | | | | | | | |
| | | | | | $ | 113 | |
| | | | | | | | |
Futures Contracts WrittenM | | | | | | | | |
U.S. Treasury Bond Futures | | December 2006 | | 9 | | $ | (14 | ) |
U.S. Treasury Note Futures | | December 2006 | | 25 | | | (15 | ) |
| | | | | | | | |
| | | �� | | | $ | (29 | ) |
| | | | | | | | |
Options WrittenM | | | | | | | | |
U.S. Treasury Note Futures Call, Strike Price $110.00 | | March 2007 | | 9 | | $ | 1 | |
U.S. Treasury Note Futures Call, Strike Price $111.00 | | March 2007 | | 12 | | | 1 | |
U.S. Treasury Note Futures Put, Strike Price $106.00 | | March 2007 | | 12 | | | (1 | ) |
| | | | | | | | |
| | | | | | $ | 1 | |
| | | | | | | | |
| | | | | | | | | |
| A | | Indexed security – The rates of interest earned on these securities are tied to the London Interbank Offered Rate (“LIBOR”), the Consumer Price Index (“CPI”), or the one-year Treasury Bill rate. The coupon rates are the rates as of September 30, 2006. |
| B | | Rule 144a – A security purchased pursuant to Rule 144a under the Securities Act of 1933 which may not be resold subject to that rule except to qualified institutional buyers. These securities, which the fund’s investment adviser has determined to be liquid, represent 5.9% of net assets. |
| C | | Stepped coupon security – A security with a predetermined schedule of interest or dividend rate changes, at which time it begins to accrue interest or pay dividends. |
| D | | The coupon rates shown on variable rate securities are the rates at September 30, 2006. These rates vary with the weighted average coupon of the underlying loans. |
| E | | Stripped security – Security with interest-only or principal-only payment streams, denoted by a 1 or 2, respectively. For interest-only securities, the amount shown as principal is the notional balance used to calculate the amount of interest due. |
| F | | Inflation-Protected Security – A security whose principal value is adjusted daily or monthly in accordance with changes to the relevant country’s Consumer Price Index for All Urban Consumers or its equivalent used as an inflation proxy. Interest is calculated on the basis of the current adjusted principal value. |
| G | | When-issued security – Security purchased on a delayed basis. Final settlement amount and maturity date have not yet been announced. |
| H | | Yankee Bond – A dollar-denominated bond issued in the U.S. by foreign entities. |
| I | | Denominated in Canadian dollars. |
| K | | Zero coupon bond – A bond with no periodic interest payments which is sold at such a discount as to produce a current yield to maturity. |
| L | | All or a portion of this security is collateral to cover futures and option contracts. |
| M | | Options and futures are described in more detail in the notes to financial statements. |
N.M.—Not Meaningful.
See notes to financial statements.
47
Semi-Annual Report to Shareholders
Statement of Assets and Liabilities
Western Asset Intermediate Plus Bond Portfolio
September 30, 2006 (Unaudited)
(Amounts in Thousands)
| | | | | | | |
Assets: | | | | | | | |
Investment securities at market value (Identified Cost—$70,792) | | | | | $ | 70,866 | |
Short-term securities at value (Identified Cost—$18,725) | | | | | | 18,725 | |
Swap contracts at value | | | | | | 44 | |
Cash and foreign currencies | | | | | | 1,604 | |
Receivable for securities sold | | | | | | 6,544 | |
Interest receivable | | | | | | 812 | |
| | | | | | | |
Total assets | | | | | | 98,595 | |
| | |
Liabilities: | | | | | | | |
Payable for securities purchased | | $ | 13,399 | | | | |
Payable for fund shares repurchased | | | 400 | | | | |
Accrued management fee | | | 14 | | | | |
Income distribution payable | | | 52 | | | | |
Options written (Proceeds—$14) | | | 13 | | | | |
Futures variation margin payable | | | 9 | | | | |
Unrealized depreciation of foreign forward currency contracts | | | 24 | | | | |
Accrued expenses | | | 68 | | | | |
| | | | | | | |
Total liabilities | | | | | | 13,979 | |
| | | | | | | |
| | |
Net Assets | | | | | $ | 84,616 | |
| | | | | | | |
| | |
Net assets consist of: | | | | | | | |
Accumulated paid-in-capital applicable to: | | | | | | | |
8,563 Institutional Class shares outstanding | | | | | $ | 84,936 | |
Overdistributions of net investment income | | | | | | (36 | ) |
Accumulated net realized loss on investments, options, futures, swaps and foreign currency transactions | | | | | | (452 | ) |
Unrealized appreciation/(depreciation) of investments, options, futures, swaps and foreign currency translations | | | | | | 168 | |
| | | | | | | |
| | |
Net Assets | | | | | $ | 84,616 | |
| | | | | | | |
| | |
Net Asset Value Per Share: | | | | | | | |
Institutional Class | | | | | | $9.88 | |
| | | | | | | | |
See notes to financial statements.
48
Semi-Annual Report to Shareholders
Statement of Operations
Western Asset Intermediate Plus Bond Portfolio
For the Six Months Ended September 30, 2006 (Unaudited)
(Amounts in Thousands)
| | | | | | | | |
Investment Income: | | | | | | | | |
Interest | | $ | 2,171 | | | | | |
Dividends | | | 4 | | | | | |
| | | | | | | | |
Total income | | | | | | $ | 2,175 | |
Expenses: | | | | | | | | |
Advisory fee | | | 169 | | | | | |
Audit and legal fees | | | 46 | | | | | |
Custodian fees | | | 32 | | | | | |
Directors’ fees and expenses | | | 2 | | | | | |
Proxy expense | | | — | A | | | | |
Registration fees | | | 1 | | | | | |
Reports to shareholders | | | 8 | | | | | |
Transfer agent and shareholder servicing expense | | | 7 | | | | | |
Other expenses | | | 8 | | | | | |
| | | | | | | | |
| | | 273 | | | | | |
Less: Fees waived | | | (81 | ) | | | | |
Compensating balance creditsB | | | (1 | ) | | | | |
| | | | | | | | |
Total expenses, net of waivers and compensating balance credits | | | | | | | 191 | |
| | | | | | | | |
Net Investment Income | | | | | | | 1,984 | |
| | | | | | | | |
Net Realized and Unrealized Gain/(Loss) on Investments: | | | | | | | | |
Realized gain/(loss) on: | | | | | | | | |
Investments | | | (321 | ) | | | | |
Options | | | (5 | ) | | | | |
Futures | | | 33 | | | | | |
Foreign currency transactions | | | 18 | | | | | |
Swaps | | | 37 | | | | | |
| | | | | | | | |
| | | | | | | (238 | ) |
| | | | | | | | |
Change in unrealized appreciation/(depreciation) of: | | | | | | | | |
Investments, options, futures, foreign currency translations and swaps | | | 1,427 | | | | | |
Assets and liabilities denominated in foreign currency | | | (— | )A | | | | |
| | | | | | | | |
| | | | | | | 1,427 | |
| | | | | | | | |
Net Realized and Unrealized Gain/(Loss) on Investments | | | | | | | 1,189 | |
| | | | | | | | | |
Change in Net Assets Resulting From Operations | | | | | | $ | 3,173 | |
| | | | | | | | | |
| B | | See note 1, compensating balance credits, in the notes to financial statements. |
See notes to financial statements.
49
Semi-Annual Report to Shareholders
Statement of Changes in Net Assets
Western Asset Intermediate Plus Bond Portfolio
(Amounts in Thousands)
| | | | | | | | |
| | | FOR THE
SIX MONTHS ENDED
SEPTEMBER 30,
2006 | | | FOR THE
YEAR ENDED
MARCH 31,
2006 | |
| Change in Net Assets: | | (Unaudited) | | | | |
Net investment income | | $ | 1,984 | | | $ | 2,314 | |
| | |
Net realized loss on investments, options, futures, foreign currency transactions and swaps | | | (238 | ) | | | (29 | ) |
| | |
Change in unrealized appreciation/(depreciation) of investments, options, futures, foreign currency translations, swaps and assets and liabilities denominated in foreign currencies | | | 1,427 | | | | (813 | ) |
| | | | | | | | |
Change in net assets resulting from operations | | | 3,173 | | | | 1,472 | |
| | |
Distributions to Shareholders from net investment income | | | (1,984 | ) | | | (2,415 | ) |
| | |
Change in net assets from Fund share transactions | | | 13,519 | | | | 30,214 | |
| | | | | | | | |
Change in net assets | | | 14,708 | | | | 29,271 | |
| | |
Net Assets: | | | | | | | | |
Beginning of period | | | 69,908 | | | | 40,637 | |
| | | | | | | | |
| | |
End of period | | $ | 84,616 | | | $ | 69,908 | |
| | | | | | | | |
| | |
Overdistributions of net investment income | | $ | (36 | ) | | $ | (36 | ) |
| | | | | | | | |
| | | | | | | | | |
See notes to financial statements.
50
Semi-Annual Report to Shareholders
Financial Highlights
Western Asset Intermediate Plus Bond Portfolio
Contained below is per share operating performance data for a share of common stock outstanding throughout each period shown, total investment return, ratios to average net assets and other supplemental data. This information has been derived from information in the financial statements.
Institutional Class:
| | | | | | | | | | | | |
| | | SIX MONTHS
ENDED
SEPTEMBER 30,
2006 | | | YEARS ENDED
MARCH 31, | |
| | | 2006 | | | 2005 | |
| | | (Unaudited) | | | | | | | |
Net asset value, beginning of period | | $ | 9.74 | | | $ | 9.86 | | | $ | 10.00 | |
| | | | | | | | | | | | |
Investment operations: | | | | | | | | | | | | |
Net investment income | | | .23 | | | | .40 | | | | .32 | |
Net realized and unrealized gain/(loss) on investments, options, futures, swaps, and foreign currency transactions | | | .14 | | | | (.11 | ) | | | (.14 | ) |
| | | | | | | | | | | | |
Total from investment operations | | | .37 | | | | .29 | | | | .18 | |
| | | | | | | | | | | | |
Distributions paid from net investment income | | | (.23 | ) | | | (.41 | ) | | | (.32 | ) |
| | | | | | | | | | | | |
Total distributions | | | (.23 | ) | | | (.41 | ) | | | (.32 | ) |
| | | | | | | | | | | | |
Net asset value, end of period | | $ | 9.88 | | | $ | 9.74 | | | $ | 9.86 | |
| | | | | | | | | | | | |
Total return | | | 3.84 | %A | | | 2.99 | % | | | 1.81 | %A |
| | | |
Ratios to Average Net Assets:B | | | | | | | | | | | | |
Total expenses | | | .64 | %C | | | .76 | % | | | 1.22 | %C |
Expenses net of waivers, if any | | | .45 | %C | | | .45 | % | | | .45 | %C |
Expenses net of all reductions | | | .45 | %C | | | .45 | % | | | .45 | %C |
Net investment income | | | 4.7 | %C | | | 4.1 | % | | | 3.1 | %C |
| | | |
Supplemental Data: | | | | | | | | | | | | |
Portfolio turnover rate | | | 195.1 | %A | | | 368.6 | % | | | 463.5 | %A |
Net assets at end of period (in thousands) | | $ | 84,616 | | | $ | 69,908 | | | $ | 40,637 | |
| | | | | | | | | | | | | |
| B | | Total expenses reflects operating expenses prior to any voluntary expense waivers and/or compensating balance credits. Expenses net of waivers reflects total expenses before compensating balance credits but net of any voluntary expense waivers. Expenses net of all reductions reflects expenses less any compensating balance credits and/or voluntary expense waivers. |
See notes to financial statements.
51
Semi-Annual Report to Shareholders
Expense Example
Western Asset Core Bond Portfolio
As a shareholder of the Fund, you incur ongoing costs, including management fees, service (12b-1) fees on Financial Intermediary Class shares, and other Fund expenses. These examples are intended to help you understand your ongoing costs (in dollars) of investing in the Fund and to compare these costs with the ongoing costs of investing in other mutual funds. Each example is based on an investment of $1,000 invested on April 1, 2006 and held through September 30, 2006.
Actual Expenses
The first line in the table below provides information about actual account values and actual expenses for the Fund. You may use the information in this line, together with the amount you invested, to estimate the expenses that you paid over the period. Simply divide your account value by $1,000 (for example, an $8,600 account value divided by $1,000 = 8.6), then multiply the result by the number in the first line under the heading entitled “Expenses Paid During the Period” to estimate the expenses you paid on your account during this period.
Hypothetical Example for Comparison Purposes
The second line for each class in the table below provides information about hypothetical account values and hypothetical expenses based on the Fund’s actual expense ratios and an assumed rate of return of 5% per year before expenses, which is not the Fund’s actual return. The hypothetical account values and expenses may not be used to estimate the actual ending account balance or expenses you paid for the period. You may use this information to compare the ongoing costs of investing in the Fund and other funds. To do so, compare this 5% hypothetical example with the 5% hypothetical examples for the relevant classes that appear in the shareholder reports of other funds.
| | | | | | | | | |
| | | Beginning
Account Value
4/1/06 | | Ending
Account Value
9/30/06 | | Expenses PaidA
During the Period
4/1/06 to 9/30/06 |
Institutional Class: | | | | | | | | | |
Actual | | $ | 1,000.00 | | $ | 1,044.60 | | $ | 2.35 |
Hypothetical (5% return before expenses) | | | 1,000.00 | | | 1,022.77 | | | 2.32 |
Financial Intermediary Class: | | | | | | | | | |
Actual | | $ | 1,000.00 | | $ | 1,043.30 | | $ | 3.69 |
Hypothetical (5% return before expenses) | | | 1,000.00 | | | 1,021.46 | | | 3.65 |
| A | | These calculations are based on expenses incurred in the most recent fiscal half-year. The dollar amounts shown as “Expenses Paid” are equal to the annualized expense ratios of 0.46% and 0.72% for the Institutional Class and Financial Intermediary Class, respectively, multiplied by the average values over the period, multiplied by the number of days in the most recent fiscal half-year (183), and divided by 365. |
52
Semi-Annual Report to Shareholders
Performance Information
Western Asset Core Bond Portfolio
The graphs compare the Fund’s total returns to that of an appropriate broad-based securities market index. The graphs illustrate the cumulative total return of an initial $1,000,000 investment in the Institutional Class and Financial Intermediary Class of the Fund, for the periods indicated. The lines for the Fund represent the total return after deducting all Fund investment management and other administrative expenses and the transaction costs of buying and selling securities. The line representing the securities market index does not include any transaction costs associated with buying and selling securities in the index or other investment management or administrative expenses.
Total return measures investment performance in terms of appreciation or depreciation in the Fund’s net asset value per share, plus dividends and any capital gain distributions. It assumes that dividends and distributions were reinvested at the time they were paid. Returns (and the graphs and tables found below) do not reflect the deduction of taxes that a shareholder would pay on Fund distributions or the redemption of Fund shares. Average annual returns tend to smooth out variations in a fund’s return, so that they differ from actual year-to-year results.
Bonds are subject to a variety of risks, including interest rate, credit and inflation risk.
Growth of a $1,000,000 Investment—Institutional Class
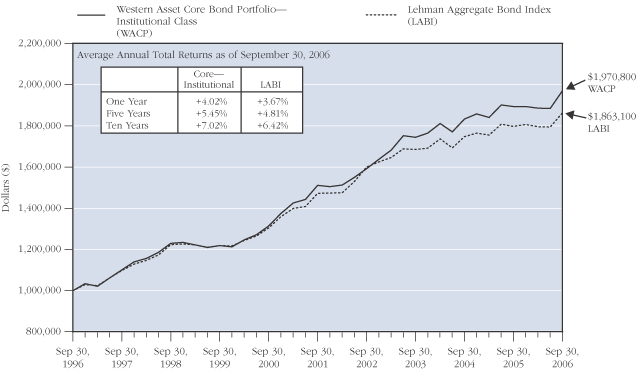
The performance data quoted represents past performance and does not guarantee future results. The performance stated may have been due to extraordinary market conditions, which may not be duplicated in the future. Current performance may be lower or higher than the performance data quoted. To obtain the most recent month-end performance information, please visit www.westernassetfunds.com. The investment return and principal value of the Fund will fluctuate so that an investor’s shares, when redeemed, may be worth more or less than the original cost. Calculations assume reinvestment of dividends and capital gain distributions. Performance would have been lower if fees had not been waived in various periods.
53
Semi-Annual Report to Shareholders
Growth of a $1,000,000 Investment—Financial Intermediary Class
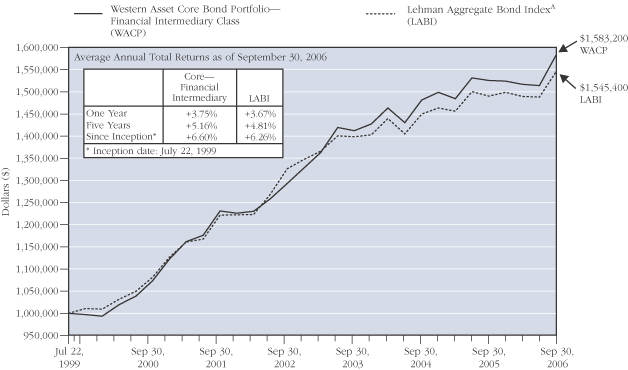
The performance data quoted represents past performance and does not guarantee future results. The performance stated may have been due to extraordinary market conditions, which may not be duplicated in the future. Current performance may be lower or higher than the performance data quoted. To obtain the most recent month-end performance information, please visit www.westernassetfunds.com. The investment return and principal value of the Fund will fluctuate so that an investor’s shares, when redeemed, may be worth more or less than the original cost. Calculations assume reinvestment of dividends and capital gain distributions. Performance would have been lower if fees had not been waived in various periods.
| A | | Index returns are for periods beginning July 31, 1999. |
54
Performance Information—Continued
Semi-Annual Report to Shareholders
Portfolio Composition (as of September 30, 2006)
Standard & Poor’s Debt RatingsB (as a percentage of the portfolio)
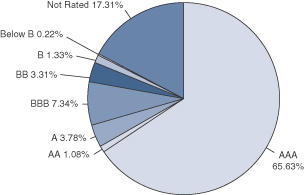
Maturity Schedule (as a percentage of the portfolio)
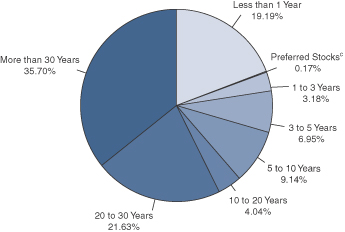
| B | | Source: Standard & Poor's. |
| C | | Preferred Stocks do not have a defined maturity date. |
The Fund is actively managed. As a result, the composition of the portfolio holdings and sectors are subject to change at any time.
55
Semi-Annual Report to Shareholders
Portfolio of Investments
Western Asset Core Bond Portfolio
September 30, 2006 (Unaudited)
(Amounts in Thousands)
| | | | | | | | | | | | |
| | | % OF
NET ASSETS | | RATE | | MATURITY
DATE | | PAR | | VALUE | |
| | | | | | | | | | | | |
Long-Term Securities | | 112.2% | | | | | | | | | | |
| | | | | |
Corporate Bonds and Notes | | 18.4% | | | | | | | | | | |
| | | | | |
Aerospace/Defense | | 0.1% | | | | | | | | | | |
Lockheed Martin Corporation | | | | 7.650% | | 5/1/16 | | $ 135 | | $ | 157 | |
Northrop Grumman Corporation | | | | 4.079% | | 11/16/06 | | 2,600 | | | 2,596 | |
Raytheon Company | | | | 6.000% | | 12/15/10 | | 32 | | | 33 | |
Raytheon Company | | | | 5.500% | | 11/15/12 | | 65 | | | 65 | |
United Technologies Corporation | | | | 5.400% | | 5/1/35 | | 1,460 | | | 1,416 | A |
| | | | | | | | | | | | |
| | | | | | | | | | | 4,267 | |
| | | | | | | | | | | | |
Automotive | | 0.4% | | | | | | | | | | |
Ford Motor Company | | | | 7.450% | | 7/16/31 | | 15,410 | | | 11,904 | A |
General Motors Corporation | | | | 8.375% | | 7/15/33 | | 7,850 | | | 6,790 | A |
| | | | | | | | | | | | |
| | | | | | | | | | | 18,694 | |
| | | | | | | | | | | | |
Banking and Finance | | 3.3% | | | | | | | | | | |
Boeing Capital Corporation | | | | 7.375% | | 9/27/10 | | 3,240 | | | 3,493 | |
Ford Motor Credit Company | | | | 6.625% | | 6/16/08 | | 8,900 | | | 8,765 | |
Ford Motor Credit Company | | | | 7.375% | | 10/28/09 | | 50,175 | | | 48,760 | |
Ford Motor Credit Company | | | | 7.875% | | 6/15/10 | | 6,310 | | | 6,145 | |
Ford Motor Credit Company | | | | 7.375% | | 2/1/11 | | 6,435 | | | 6,177 | |
Ford Motor Credit Company | | | | 7.250% | | 10/25/11 | | 5,910 | | | 5,574 | |
General Motors Acceptance Corporation | | | | 6.125% | | 8/28/07 | | 8,620 | | | 8,608 | A |
General Motors Acceptance Corporation | | | | 5.625% | | 5/15/09 | | 9,550 | | | 9,313 | A |
General Motors Acceptance Corporation | | | | 7.750% | | 1/19/10 | | 5,355 | | | 5,487 | |
General Motors Acceptance Corporation | | | | 7.250% | | 3/2/11 | | 820 | | | 824 | |
GMAC LLC | | | | 0.000% | | 6/15/15 | | 13,910 | | | 7,431 | B |
HSBC Finance Corporation | | | | 5.440% | | 2/28/07 | | 30,000 | | | 30,013 | C |
HSBC Finance Corporation | | | | 7.875% | | 3/1/07 | | 2,800 | | | 2,828 | |
HSBC Finance Corporation | | | | 8.000% | | 7/15/10 | | 690 | | | 754 | |
HSBC Finance Corporation | | | | 7.000% | | 5/15/12 | | 700 | | | 757 | A |
HSBC Finance Corporation | | | | 6.375% | | 11/27/12 | | 440 | | | 461 | A |
PHH Corporation | | | | 7.125% | | 3/1/13 | | 4,700 | | | 4,831 | |
Residential Capital Corporation | | | | 6.125% | | 11/21/08 | | 8,180 | | | 8,212 | |
SB Treasury Company LLC | | | | 9.400% | | 12/29/49 | | 2,930 | | | 3,114 | D,E |
SLM Corporation | | | | 5.440% | | 4/1/09 | | 8,960 | | | 8,606 | C |
Wachovia Capital Trust III | | | | 5.800% | | 3/15/42 | | 6,130 | | | 6,147 | E |
| | | | | | | | | | | | |
| | | | | | | | | | | 176,300 | |
| | | | | | | | | | | | |
Banks | | 0.8% | | | | | | | | | | |
Bank of America Corporation | | | | 7.400% | | 1/15/11 | | 2,000 | | | 2,164 | |
Bank One Corporation | | | | 7.875% | | 8/1/10 | | 4,500 | | | 4,906 | |
56
Semi-Annual Report to Shareholders
| | | | | | | | | | | | | |
| | | % OF
NET ASSETS | | RATE | | MATURITY
DATE | | PAR | | VALUE | |
| | | | | | | | | | | | | |
Corporate Bonds and Notes—Continued | | | | | | | | | | | | | |
| | | | | |
Banks—Continued | | | | | | | | | | | | | |
Bank One Corporation | | | | 5.900% | | 11/15/11 | | $ | 2,000 | | $ | 2,051 | |
Firstar Bank NA | | | | 7.125% | | 12/1/09 | | | 450 | | | 475 | |
Countrywide Bank NA | | | | 5.360% | | 8/16/07 | | | 35,000 | | | 35,017 | C |
| | | | | | | | | | | | | |
| | | | | | | | | | | | 44,613 | |
| | | | | | | | | | | | | |
Cable | | 0.3% | | | | | | | | | | | |
Comcast Corporation | | | | 6.500% | | 1/15/15 | | | 1,200 | | | 1,253 | A |
Comcast Corporation | | | | 6.500% | | 1/15/17 | | | 600 | | | 626 | |
Comcast Corporation | | | | 7.050% | | 3/15/33 | | | 3,130 | | | 3,352 | A |
Comcast MO of Delaware Inc. | | | | 9.000% | | 9/1/08 | | | 2,200 | | | 2,344 | |
Cox Communications, Inc. | | | | 7.875% | | 8/15/09 | | | 9,640 | | | 10,222 | |
| | | | | | | | | | | | | |
| | | | | | | | | | | | 17,797 | |
| | | | | | | | | | | | | |
Casino Resorts | | 0.1% | | | | | | | | | | | |
Harrah’s Operating Company, Inc | | | | 6.500% | | 6/1/16 | | | 7,680 | | | 7,529 | |
| | | | | | | | | | | | | |
| | | | | |
Computer Services and Systems | | 0.2% | | | | | | | | | | | |
Electronic Data Systems Corporation | | | | 7.125% | | 10/15/09 | | | 7,685 | | | 8,038 | A |
| | | | | | | | | | | | | |
| | | | | |
Diversified Financial Services | | 0.9% | | | | | | | | | | | |
Marsh & McLennan Companies, Inc. | | | | 5.150% | | 9/15/10 | | | 38,220 | | | 37,656 | A |
U.S. Bancorp | | | | 3.125% | | 3/15/08 | | | 10,300 | | | 10,003 | |
Wells Fargo & Company | | | | 5.000% | | 11/15/14 | | | 690 | | | 673 | A |
| | | | | | | | | | | | | |
| | | | | | | | | | | | 48,332 | |
| | | | | | | | | | | | | |
Electric | | 0.8% | | | | | | | | | | | |
Dominion Resources, Inc. | | | | 4.125% | | 2/15/08 | | | 10,850 | | | 10,677 | |
Dominion Resources, Inc. | | | | 5.125% | | 12/15/09 | | | 50 | | | 50 | |
Dominion Resources, Inc. | | | | 4.750% | | 12/15/10 | | | 570 | | | 556 | |
Dominion Resources, Inc. | | | | 5.700% | | 9/17/12 | | | 2,050 | | | 2,062 | A |
Exelon Corporation | | | | 5.625% | | 6/15/35 | | | 4,840 | | | 4,570 | A |
FirstEnergy Corp. | | | | 5.500% | | 11/15/06 | | | 9,174 | | | 9,173 | |
FirstEnergy Corp. | | | | 6.450% | | 11/15/11 | | | 340 | | | 355 | A |
FirstEnergy Corp. | | | | 7.375% | | 11/15/31 | | | 10,850 | | | 12,544 | A |
The Cleveland Electric Illuminating Company | | | | 5.650% | | 12/15/13 | | | 280 | | | 280 | |
The Detroit Edison Company | | | | 6.125% | | 10/1/10 | | | 920 | | | 946 | |
| | | | | | | | | | | | | |
| | | | | | | | | | | | 41,213 | |
| | | | | | | | | | | | | |
Energy | | 0.9% | | | | | | | | | | | |
Duke Energy Corporation | | | | 6.250% | | 1/15/12 | | | 20 | | | 21 | A |
Pacific Gas and Electric Company | | | | 6.050% | | 3/1/34 | | | 940 | | | 945 | A |
Progress Energy, Inc. | | | | 7.100% | | 3/1/11 | | | 3,170 | | | 3,398 | A |
57
Semi-Annual Report to Shareholders
Portfolio of Investments—Continued
Western Asset Core Bond Portfolio—Continued
| | | | | | | | | | | | | |
| | | % OF
NET ASSETS | | RATE | | MATURITY
DATE | | PAR | | VALUE | |
| | | | | | | | | | | | | |
Corporate Bonds and Notes—Continued | | | | | | | | | | | | | |
| | | | | |
Energy—Continued | | | | | | | | | | | | | |
TXU Corp. | | | | 4.800% | | 11/15/09 | | $ | 9,000 | | $ | 8,772 | A |
TXU Corp. | | | | 6.550% | | 11/15/34 | | | 11,020 | | | 10,380 | A |
TXU Energy Co. | | | | 7.000% | | 3/15/13 | | | 25,800 | | | 27,087 | |
| | | | | | | | | | | | | |
| | | | | | | | | | | | 50,603 | |
| | | | | | | | | | | | | |
Environmental Services | | 0.4% | | | | | | | | | | | |
Waste Management, Inc. | | | | 7.125% | | 10/1/07 | | | 10,330 | | | 10,464 | |
Waste Management, Inc. | | | | 6.875% | | 5/15/09 | | | 2,000 | | | 2,078 | |
Waste Management, Inc. | | | | 6.375% | | 11/15/12 | | | 2,530 | | | 2,643 | |
Waste Management, Inc. | | | | 7.125% | | 12/15/17 | | | 6,000 | | | 6,653 | |
Waste Management, Inc. | | | | 7.375% | | 5/15/29 | | | 1,220 | | | 1,396 | A |
| | | | | | | | | | | | | |
| | | | | | | | | | | | 23,234 | |
| | | | | | | | | | | | | |
Food, Beverage and Tobacco | | 0.3% | | | | | | | | | | | |
Altria Group, Inc. | | | | 7.000% | | 11/4/13 | | | 3,815 | | | 4,160 | |
Altria Group, Inc. | | | | 7.750% | | 1/15/27 | | | 2,500 | | | 3,027 | |
Sara Lee Corporation | | | | 6.250% | | 9/15/11 | | | 10,600 | | | 10,858 | |
| | | | | | | | | | | | | |
| | | | | | | | | | | | 18,045 | |
| | | | | | | | | | | | | |
Gas and Pipeline Utilities | | 0.7% | | | | | | | | | | | |
Dynegy Holdings Inc. | | | | 8.750% | | 2/15/12 | | | 11,010 | | | 11,409 | |
Kinder Morgan Energy Partners, L.P. | | | | 7.125% | | 3/15/12 | | | 4,650 | | | 4,929 | |
Southern Natural Gas Company | | | | 8.000% | | 3/1/32 | | | 7,390 | | | 8,171 | |
Tennessee Gas Pipeline Company | | | | 8.375% | | 6/15/32 | | | 1,110 | | | 1,274 | A |
The Williams Companies, Inc. | | | | 8.125% | | 3/15/12 | | | 3,730 | | | 3,982 | |
The Williams Companies, Inc. | | | | 7.500% | | 1/15/31 | | | 5,000 | | | 4,937 | A |
The Williams Companies, Inc. | | | | 8.750% | | 3/15/32 | | | 3,240 | | | 3,548 | |
| | | | | | | | | | | | | |
| | | | | | | | | | | | 38,250 | |
| | | | | | | | | | | | | |
Health Care | | 0.2% | | | | | | | | | | | |
Tenet Healthcare Corporation | | | | 6.375% | | 12/1/11 | | | 2,500 | | | 2,197 | A |
Tenet Healthcare Corporation | | | | 7.375% | | 2/1/13 | | | 9,462 | | | 8,527 | A |
| | | | | | | | | | | | | |
| | | | | | | | | | | | 10,724 | |
| | | | | | | | | | | | | |
Homebuilding | | 0.3% | | | | | | | | | | | |
Centex Corporation | | | | 5.450% | | 8/15/12 | | | 5,500 | | | 5,370 | A |
D.R. Horton, Inc. | | | | 6.875% | | 5/1/13 | | | 3,100 | | | 3,166 | |
Lennar Corporation | | | | 5.950% | | 10/17/11 | | | 3,700 | | | 3,700 | D |
Pulte Homes, Inc. | | | | 5.250% | | 1/15/14 | | | 4,000 | | | 3,788 | |
| | | | | | | | | | | | | |
| | | | | | | | | | | | 16,024 | |
| | | | | | | | | | | | | |
58
Semi-Annual Report to Shareholders
| | | | | | | | | | | | | |
| | | % OF
NET ASSETS | | RATE | | MATURITY
DATE | | PAR | | VALUE | |
| | | | | | | | | | | | | |
Corporate Bonds and Notes—Continued | | | | | | | | | | | | | |
| | | | | |
Investment Banking/Brokerage | | 1.3% | | | | | | | | | | | |
J.P. Morgan & Co. Incorporated | | | | 9.604% | | 2/15/12 | | $ | 2,000 | | $ | 2,077 | E |
JPMorgan Chase & Co. | | | | 5.750% | | 1/2/13 | | | 3,770 | | | 3,855 | |
Lehman Brothers Holdings Inc. | | | | 5.620% | | 4/20/07 | | | 5,470 | | | 5,476 | C |
Merrill Lynch & Co., Inc. | | | | 3.375% | | 9/14/07 | | | 11,120 | | | 10,926 | |
Merrill Lynch & Co., Inc. | | | | 5.490% | | 6/16/08 | | | 31,040 | | | 31,088 | C |
Morgan Stanley | | | | 5.623% | | 1/18/08 | | | 8,000 | | | 8,014 | C |
Morgan Stanley | | | | 4.750% | | 4/1/14 | | | 3,070 | | | 2,919 | A |
The Goldman Sachs Group, Inc. | | | | 4.750% | | 7/15/13 | | | 4,370 | | | 4,197 | |
| | | | | | | | | | | | | |
| | | | | | | | | | | | 68,552 | |
| | | | | | | | | | | | | |
Investment Management | | 0.1% | | | | | | | | | | | |
Dryden Investor Trust | | | | 7.157% | | 7/23/08 | | | 6,491 | | | 6,599 | |
| | | | | | | | | | | | | |
| | | | | |
Lodging/Hotels | | 0.1% | | | | | | | | | | | |
Starwood Hotels & Resorts Worldwide, Inc. | | | | 7.875% | | 5/1/12 | | | 6,100 | | | 6,405 | |
| | | | | | | | | | | | | |
| | | | | |
Media | | 1.0% | | | | | | | | | | | |
Clear Channel Communications, Inc. | | | | 4.625% | | 1/15/08 | | | 1,430 | | | 1,412 | A |
Clear Channel Communications, Inc. | | | | 4.250% | | 5/15/09 | | | 2,130 | | | 2,058 | |
Clear Channel Communications, Inc. | | | | 6.250% | | 3/15/11 | | | 5,580 | | | 5,597 | |
Clear Channel Communications, Inc. | | | | 5.500% | | 9/15/14 | | | 790 | | | 734 | |
Liberty Media Corporation | | | | 7.875% | | 7/15/09 | | | 9,000 | | | 9,422 | |
Liberty Media Corporation | | | | 3.750% | | 2/15/30 | | | 290 | | | 181 | A,F |
News America, Inc. | | | | 6.200% | | 12/15/34 | | | 605 | | | 578 | A |
Time Warner Inc. | | | | 6.875% | | 5/1/12 | | | 8,270 | | | 8,745 | A |
Time Warner Inc. | | | | 6.950% | | 1/15/28 | | | 2,000 | | | 2,061 | A |
Time Warner Inc. | | | | 7.625% | | 4/15/31 | | | 1,350 | | | 1,491 | |
Time Warner Inc. | | | | 7.700% | | 5/1/32 | | | 8,565 | | | 9,565 | A |
Viacom Inc. | | | | 5.750% | | 4/30/11 | | | 9,730 | | | 9,711 | D |
Viacom Inc. | | | | 5.625% | | 8/15/12 | | | 970 | | | 959 | A |
| | | | | | | | | | | | | |
| | | | | | | | | | | | 52,514 | |
| | | | | | | | | | | | | |
Medical Care Facilities | | 0.6% | | | | | | | | | | | |
HCA, Inc. | | | | 5.750% | | 3/15/14 | | | 40,360 | | | 31,683 | |
| | | | | | | | | | | | | |
| | | | | |
Oil and Gas | | 2.1% | | | | | | | | | | | |
Hess Corporation | | | | 7.875% | | 10/1/29 | | | 1,710 | | | 2,021 | |
Hess Corporation | | | | 7.300% | | 8/15/31 | | | 10,825 | | | 12,189 | |
Anadarko Petroleum Corporation | | | | 5.790% | | 9/15/09 | | | 12,340 | | | 12,355 | C |
Anadarko Petroleum Corporation | | | | 6.450% | | 9/15/36 | | | 10,670 | | | 10,899 | |
59
Semi-Annual Report to Shareholders
Portfolio of Investments—Continued
Western Asset Core Bond Portfolio—Continued
| | | | | | | | | | | | | |
| | | % OF
NET ASSETS | | RATE | | MATURITY
DATE | | PAR | | VALUE | |
| | | | | | | | | | | | | |
Corporate Bonds and Notes—Continued | | | | | | | | | | | | | |
| | | | | |
Oil and Gas—Continued | | | | | | | | | | | | | |
Apache Corporation | | | | 6.250% | | 4/15/12 | | $ | 1,190 | | $ | 1,241 | |
Conoco Inc. | | | | 6.950% | | 4/15/29 | | | 9,950 | | | 11,475 | A |
ConocoPhillips | | | | 4.750% | | 10/15/12 | | | 770 | | | 754 | |
Devon Energy Corporation | | | | 7.950% | | 4/15/32 | | | 4,145 | | | 5,118 | |
El Paso Corporation | | | | 7.800% | | 8/1/31 | | | 110 | | | 113 | A |
El Paso Natural Gas Company | | | | 8.375% | | 6/15/32 | | | 3,610 | | | 4,133 | |
Kerr-McGee Corporation | | | | 6.875% | | 9/15/11 | | | 17,000 | | | 18,008 | |
Kinder Morgan Energy Partners, L.P. | | | | 5.000% | | 12/15/13 | | | 3,180 | | | 3,020 | |
Pemex Project Funding Master Trust | | | | 6.625% | | 6/15/35 | | | 12,805 | | | 12,581 | D |
Sonat Inc. | | | | 7.625% | | 7/15/11 | | | 5,000 | | | 5,125 | |
XTO Energy, Inc. | | | | 7.500% | | 4/15/12 | | | 10,379 | | | 11,316 | |
XTO Energy, Inc. | | | | 6.250% | | 4/15/13 | | | 980 | | | 1,011 | |
| | | | | | | | | | | | | |
| | | | | | | | | | | | 111,359 | |
| | | | | | | | | | | | | |
Paper and Forest Products | | 0.1% | | | | | | | | | | | |
Weyerhaeuser Company | | | | 6.750% | | 3/15/12 | | | 3,445 | | | 3,600 | |
| | | | | | | | | | | | | |
| | | | | |
Pharmaceuticals | | 0.1% | | | | | | | | | | | |
AmerisourceBergen Corporation | | | | 5.875% | | 9/15/15 | | | 3,050 | | | 2,990 | |
Bristol-Myers Squibb Company | | | | 5.750% | | 10/1/11 | | | 830 | | | 846 | |
| | | | | | | | | | | | | |
| | | | | | | | | | | | 3,836 | |
| | | | | | | | | | | | | |
Photo Equipment and Supplies | | 1.0% | | | | | | | | | | | |
Eastman Kodak Company | | | | 3.625% | | 5/15/08 | | | 17,500 | | | 16,799 | A |
Eastman Kodak Company | | | | 7.250% | | 11/15/13 | | | 34,680 | | | 33,865 | A |
| | | | | | | | | | | | | |
| | | | | | | | | | | | 50,664 | |
| | | | | | | | | | | | | |
Real Estate Management and Development | | N.M. | | | | | | | | | | | |
Socgen Real Estate Co. LLC | | | | 7.640% | | 12/29/49 | | | 260 | | | 266 | D,E |
| | | | | | | | | | | | | |
| | | | | |
Rental and Lease Services | | 0.1% | | | | | | | | | | | |
International Lease Finance Corporation | | | | 5.750% | | 6/15/11 | | | 7,300 | | | 7,435 | A |
| | | | | | | | | | | | | |
| | | | | |
Retail | | 0.1% | | | | | | | | | | | |
Target Corporation | | | | 4.000% | | 6/15/13 | | | 4,445 | | | 4,129 | A |
| | | | | | | | | | | | | |
| | | | | |
Special Purpose | | 1.7% | | | | | | | | | | | |
ASIF Global Financing XIX | | | | 4.900% | | 1/17/13 | | | 1,210 | | | 1,183 | D |
DaimlerChrysler North America Holding Corporation | | | | 4.050% | | 6/4/08 | | | 1,530 | | | 1,494 | |
60
Semi-Annual Report to Shareholders
| | | | | | | | | | | | | |
| | | % OF
NET ASSETS | | RATE | | MATURITY
DATE | | PAR | | VALUE | |
| | | | | | | | | | | | | |
Corporate Bonds and Notes—Continued | | | | | | | | | | | | | |
| | | | | |
Special Purpose—Continued | | | | | | | | | | | | | |
DaimlerChrysler North America Holding Corporation | | | | 7.200% | | 9/1/09 | | $ | 1,240 | | $ | 1,292 | |
DaimlerChrysler North America Holding Corporation | | | | 5.875% | | 3/15/11 | | | 700 | | | 701 | A |
ILFC E-Capital Trust I | | | | 5.900% | | 12/21/65 | | | 4,420 | | | 4,452 | A,D,E |
ILFC E-Capital Trust II | | | | 6.250% | | 12/21/65 | | | 800 | | | 800 | D,E |
Patrons’ Legacy 2003 IV | | | | 5.775% | | 1/23/17 | | | 5,800 | | | 5,819 | D |
Rabobank Capital Funding Trust II | | | | 5.260% | | 12/31/49 | | | 470 | | | 460 | D,E |
Rabobank Capital Funding Trust III | | | | 5.254% | | 12/29/49 | | | 3,030 | | | 2,925 | D,E |
Reynolds American Inc. | | | | 7.875% | | 5/15/09 | | | 3,240 | | | 3,383 | D |
Sigma Finance Inc. | | | | 8.500% | | 8/11/16 | | | 17,200 | | | 17,200 | D,E |
Sprint Capital Corporation | | | | 6.000% | | 1/15/07 | | | 31,760 | | | 31,794 | |
Sprint Capital Corporation | | | | 8.375% | | 3/15/12 | | | 7,935 | | | 8,893 | |
Texaco Capital Inc. | | | | 5.500% | | 1/15/09 | | | 1,000 | | | 1,012 | A |
Toll Brothers Finance Corp. | | | | 5.950% | | 9/15/13 | | | 7,300 | | | 6,984 | |
Unilever Capital Corporation | | | | 7.125% | | 11/1/10 | | | 1,730 | | | 1,848 | |
Verizon Global Funding Corp. | | | | 7.250% | | 12/1/10 | | | 2,220 | | | 2,381 | |
Verizon Global Funding Corp. | | | | 7.375% | | 9/1/12 | | | 5 | | | 6 | |
| | | | | | | | | | | | | |
| | | | | | | | | | | | 92,627 | |
| | | | | | | | | | | | | |
Telecommunications | | 0.1% | | | | | | | | | | | |
AT&T Inc. | | | | 5.100% | | 9/15/14 | | | 4,960 | | | 4,792 | |
BellSouth Corporation | | | | 4.750% | | 11/15/12 | | | 440 | | | 420 | A |
| | | | | | | | | | | | | |
| | | | | | | | | | | | 5,212 | |
| | | | | | | | | | | | | |
Transportation | | 0.3% | | | | | | | | | | | |
Continental Airlines, Inc. | | | | 6.900% | | 1/2/18 | | | 465 | | | 478 | |
Continental Airlines, Inc. | | | | 6.545% | | 8/2/20 | | | 2,799 | | | 2,847 | |
Delta Air Lines, Inc. | | | | 7.111% | | 9/18/11 | | | 500 | | | 501 | |
Southwest Airlines Co. | | | | 5.496% | | 11/1/06 | | | 9,700 | | | 9,705 | |
| | | | | | | | | | | | | |
| | | | | | | | | | | | 13,531 | |
| | | | | | | | | | | | | |
Total Corporate Bonds and Notes
(Identified Cost—$990,681) | | | | | | | | | | | | 982,075 | |
Asset-Backed Securities | | 3.5% | | | | | | | | | | | |
| | | | | |
Fixed Rate Securities | | 0.2% | | | | | | | | | | | |
Advanta Mortgage Loan Trust 1999-3 | | | | 7.590% | | 6/25/14 | | | 162 | | | 162 | |
Conseco Finance Securitizations Corp. 2000-5 | | | | 7.960% | | 2/1/32 | | | 4,700 | | | 4,280 | |
Equity One ABS, Inc. 2003-3 | | | | 4.995% | | 12/25/33 | | | 4,069 | | | 4,027 | |
Green Tree Financial Corporation 1996-5 | �� | | | 8.100% | | 7/15/27 | | | 694 | | | 145 | |
| | | | | | | | | | | | | |
| | | | | | | | | | | | 8,614 | |
| | | | | | | | | | | | | |
61
Semi-Annual Report to Shareholders
Portfolio of Investments—Continued
Western Asset Core Bond Portfolio—Continued
| | | | | | | | | | | | | |
| | | % OF
NET ASSETS | | RATE | | MATURITY
DATE | | PAR | | VALUE | |
| | | | | | | | | | | | | |
Asset-Backed Securities—Continued | | | | | | | | | | | | | |
| | | | | |
Indexed SecuritiesC | | 3.3% | | | | | | | | | | | |
Amortizing Residential Collateral Trust 2002-BC1M | | | | 5.610% | | 1/1/32 | | $ | 252 | | $ | 252 | |
Asset-Backed Funding Certificates 2002-SB1 | | | | 5.760% | | 4/25/18 | | | 2,108 | | | 2,112 | |
Brazos Higher Education Authority, Inc. 2005-1 | | | | 5.419% | | 9/26/16 | | | 15,738 | | | 15,719 | |
CDC Mortgage Capital Trust 2002-HE1 | | | | 5.640% | | 1/25/33 | | | 837 | | | 837 | |
CIT Group Home Equity Loan Trust 2002-1 | | | | 5.620% | | 3/25/33 | | | 706 | | | 708 | |
Countrywide Asset-Backed Certificates 2003-BC3 | | | | 5.640% | | 9/25/33 | | | 467 | | | 468 | |
Countrywide Asset-Backed Certificates 2005-AB1 | | | | 5.430% | | 5/25/35 | | | 6 | | | 6 | |
Countrywide Home Equity Loan Trust 2005-H | | | | 5.570% | | 12/15/35 | | | 337 | | | 337 | |
Credit-Based Asset Servicing and Securitization 2001-CB2 | | | | 5.620% | | 8/25/33 | | | 187 | | | 187 | |
Fleet Home Equity Loan Trust 2003-1 | | | | 5.580% | | 1/20/33 | | | 3,973 | | | 3,978 | |
GMAC Mortgage Corporation Loan Trust 2004-HE4 | | | | 5.604% | | 3/25/35 | | | 30,419 | | | 30,441 | |
GSAMP Trust 2006-S4 | | | | 5.414% | | 5/25/36 | | | 7,219 | | | 7,219 | |
Lehman XS Trust 2005-5N | | | | 5.630% | | 11/25/35 | | | 17,226 | | | 17,273 | |
Lehman XS Trust 2006-2N | | | | 5.590% | | 2/25/46 | | | 25,053 | | | 25,101 | |
Lehman XS Trust 2006-GP4 | | | | 5.400% | | 8/25/46 | | | 5,132 | | | 5,135 | |
Long Beach Mortgage Loan Trust 2000-1 | | | | 5.840% | | 1/21/31 | | | 303 | | | 304 | |
MSDWCC Heloc Trust 2005-1 | | | | 5.520% | | 7/25/17 | | | 2,365 | | | 2,366 | |
New Century Home Equity Loan Trust 2005-B | | | | 5.450% | | 10/25/35 | | | 1,881 | | | 1,882 | |
Provident Bank Home Equity Loan Trust 1999-3 | | | | 5.720% | | 1/25/31 | | | 1,026 | | | 1,026 | |
Residential Asset Mortgage Products, Inc. 2003-RS2 | | | | 5.670% | | 3/25/33 | | | 296 | | | 296 | |
Residential Asset Securities Corporation 2001-KS2 | | | | 5.790% | | 6/25/31 | | | 536 | | | 536 | |
Residential Asset Securities Corporation 2001-KS3 | | | | 5.790% | | 9/25/31 | | | 196 | | | 197 | |
SLM Student Loan Trust 2006-5 | | | | 5.429% | | 7/25/17 | | | 49,600 | | | 49,533 | |
Structured Asset Investment Loan Trust 2005-3 | | | | 5.460% | | 4/25/35 | | | 12,325 | | | 12,329 | |
| | | | | | | | | | | | | |
| | | | | | | | | | | | 178,242 | |
| | | | | | | | | | | | | |
Stripped Securities | | N.M. | | | | | | | | | | | |
Diversified REIT Trust 1999-1A | | | | 0.596% | | 3/18/11 | | | 92,093 | | | 1,065 | G1 |
| | | | | | | | | | | | | |
Total Asset-Backed Securities
(Identified Cost—$188,763) | | | | | | | | | | | | 187,921 | |
62
Semi-Annual Report to Shareholders
| | | | | | | | | | | | | |
| | | % OF
NET ASSETS | | RATE | | MATURITY
DATE | | PAR | | VALUE | |
| | | | | | | | | | | | | |
Mortgage-Backed Securities | | 20.2% | | | | | | | | | | | |
| | | | | |
Fixed Rate Securities | | 2.8% | | | | | | | | | | | |
Asset Securitization Corporation 1996-D2 | | | | 6.920% | | 2/14/29 | | $ | 354 | | $ | 354 | |
Criimi Mae Commercial Mortgage Trust 1998-C1 | | | | 7.000% | | 6/2/33 | | | 5,159 | | | 5,186 | D |
CS First Boston Mortgage Securities Corp. 1998-C1 A1B | | | | 6.480% | | 5/17/40 | | | 450 | | | 458 | |
Deutsche Mortgage and Asset Receiving Corporation 1998-C1 | | | | 6.538% | | 6/15/31 | | | 6,780 | | | 6,851 | |
GS Mortgage Securities Corporation II 2005-GG4 | | | | 4.680% | | 7/10/39 | | | 12,900 | | | 12,526 | |
J.P. Morgan Chase Commercial Mortgage Pass-Through Certificates 2005-CIBC12 | | | | 4.895% | | 9/12/37 | | | 1,610 | | | 1,560 | |
J.P. Morgan Commercial Mortgage Finance Corporation 1999-C8 A2 | | | | 7.400% | | 7/15/31 | | | 456 | | | 475 | |
LB-UBS Commercial Mortgage Trust 2005-C3 A5 | | | | 4.739% | | 7/15/30 | | | 13,356 | | | 12,814 | |
LB-UBS Commercial Mortgage Trust 2005-C3 AAB | | | | 4.664% | | 7/15/30 | | | 15,000 | | | 14,555 | |
LB-UBS Commercial Mortgage Trust 2005-C5 | | | | 4.954% | | 9/15/30 | | | 10,800 | | | 10,516 | |
MASTR Reperforming Loan Trust 2005-1 | | | | 7.000% | | 8/25/34 | | | 11,548 | | | 11,868 | D |
MASTR Specialized Loan Trust 2005-1 | | | | 6.500% | | 8/25/34 | | | 1,388 | | | 1,412 | D |
Morgan Stanley Capital I 2005-HQ6 | | | | 4.989% | | 8/13/42 | | | 13,450 | | | 13,120 | |
Residential Asset Mortgage Products, Inc. 2005-SL2 | | | | 7.500% | | 3/25/32 | | | 5,313 | | | 5,436 | |
Residential Asset Securitization Trust 2003-A14 | | | | 4.750% | | 2/25/19 | | | 56,170 | | | 54,274 | |
| | | | | | | | | | | | | |
| | | | | | | | | | | | 151,405 | |
| | | | | | | | | | | | | |
Indexed SecuritiesC | | 15.3% | | | | | | | | | | | |
American Home Mortgage Assets 2006-4 | | | | 5.540% | | 10/25/46 | | | 1,200 | | | 1,200 | |
Banc of America Funding Corporation 2005-E | | | | 5.314% | | 6/20/35 | | | 22,534 | | | 22,604 | |
Chevy Chase Mortgage Funding Corporation 2003-2A | | | | 5.710% | | 5/25/34 | | | 2,689 | | | 2,691 | D |
Countrywide Alternative Loan Trust 2005-14 | | | | 5.540% | | 5/25/35 | | | 14,059 | | | 14,069 | |
Countrywide Alternative Loan Trust 2005-17 1A1 | | | | 5.590% | | 7/25/35 | | | 17,797 | | | 17,843 | |
Countrywide Alternative Loan Trust 2005-17 2A1 | | | | 5.570% | | 7/25/35 | | | 31,807 | | | 31,876 | |
Countrywide Alternative Loan Trust 2005-38 | | | | 5.680% | | 9/25/35 | | | 621 | | | 624 | |
Countrywide Alternative Loan Trust 2005-56 | | | | 5.620% | | 11/25/35 | | | 1,975 | | | 1,981 | |
Countrywide Alternative Loan Trust 2005-59 | | | | 5.656% | | 11/20/35 | | | 4,027 | | | 4,040 | |
Countrywide Alternative Loan Trust 2006-0A7 | | | | 5.595% | | 6/25/46 | | | 23,222 | | | 23,241 | |
Countrywide Asset-Backed Certificates 2005-3 | | | | 5.620% | | 4/25/35 | | | 18,848 | | | 18,913 | |
Countrywide Home Loans 2005-9 1A1 | | | | 5.630% | | 5/25/35 | | | 19,910 | | | 19,995 | |
Countrywide Home Loans 2005-9 2A1 | | | | 5.550% | | 5/25/35 | | | 10,913 | | | 10,937 | |
DSLA Mortgage Loan Trust 2005-AR6 | | | | 5.620% | | 10/19/45 | | | 4,211 | | | 4,227 | |
Granite Mortgages PLC 2003-1 | | | | 5.690% | | 1/20/20 | | | 2,851 | | | 2,853 | H |
Greenpoint Mortgage Funding Trust 2005-AR1 | | | | 5.550% | | 6/25/45 | | | 15,032 | | | 15,084 | |
Greenpoint Mortgage Funding Trust 2005-AR4 | | | | 5.590% | | 10/25/45 | | | 4,889 | | | 4,900 | |
Greenpoint Mortgage Funding Trust 2006-AR4 | | | | 5.430% | | 9/25/46 | | | 53,368 | | | 53,368 | |
63
Semi-Annual Report to Shareholders
Portfolio of Investments—Continued
Western Asset Core Bond Portfolio—Continued
| | | | | | | | | | | | | |
| | | % OF
NET ASSETS | | RATE | | MATURITY
DATE | | PAR | | VALUE | |
| | | | | | | | | | | | | |
Mortgage-Backed Securities—Continued | | | | | | | | | | | | | |
| | | | | |
Indexed Securities—Continued | | | | | | | | | | | | | |
Greenpoint Mortgage Funding Trust 2006-AR5 | | | | 5.410% | | 10/25/46 | | $ | 52,900 | | $ | 52,905 | |
GSMPS Mortgage Loan Trust 2005-RP2 | | | | 5.680% | | 3/25/35 | | | 21,530 | | | 21,612 | D |
Harborview Mortgage Loan Trust 2005-7 | | | | 5.734% | | 6/19/45 | | | 26,792 | | | 26,924 | |
Impac CMB Trust 2003-7 | | | | 5.964% | | 8/25/33 | | | 1,032 | | | 1,033 | |
Impac Secured Assets Corp. 2005-2 | | | | 5.650% | | 3/25/36 | | | 2,139 | | | 2,143 | |
Medallion Trust 2000-1G | | | | 5.730% | | 7/12/31 | | | 160 | | | 160 | H |
Medallion Trust 2000-2G | | | | 5.590% | | 12/18/31 | | | 1,119 | | | 1,121 | H |
Medallion Trust 2003-1G | | | | 5.580% | | 12/21/33 | | | 2,739 | | | 2,747 | H |
MLCC Mortgage Investors, Inc. 2003-B | | | | 5.670% | | 4/25/28 | | | 4,301 | | | 4,322 | |
Structured Adjustable Rate Mortgage Loan Trust 2005-19XS | | | | 5.650% | | 10/25/35 | | | 3,333 | | | 3,348 | |
Structured Asset Mortgage Investments, Inc. 2006-AR6 | | | | 5.586% | | 7/25/36 | | | 26,704 | | | 26,688 | |
Structured Asset Mortgage Investments, Inc. 2006-AR7 | | | | 5.540% | | 8/25/36 | | | 47,133 | | | 47,135 | |
Thornburg Mortgage Securities Trust 2005-2 A1 | | | | 5.550% | | 7/25/45 | | | 11,024 | | | 11,008 | |
Thornburg Mortgage Securities Trust 2005-2 A2 | | | | 5.560% | | 7/25/45 | | | 17,255 | | | 17,266 | |
Thornburg Mortgage Securities Trust 2006-1 | | | | 5.500% | | 1/25/36 | | | 65,984 | | | 65,869 | |
Thornburg Mortgage Securities Trust 2006-3 | | | | 5.435% | | 6/25/36 | | | 4,974 | | | 4,964 | |
WaMu Mortgage Pass-Through Certificates 2005-AR6 | | | | 5.560% | | 4/25/45 | | | 18,184 | | | 18,225 | |
WaMu Mortgage Pass-Through Certificates 2005-AR8 | | | | 5.600% | | 7/25/45 | | | 23,573 | | | 23,649 | |
WaMu Mortgage Pass-Through Certificates 2005-AR11 | | | | 5.650% | | 8/25/45 | | | 53,984 | | | 54,110 | |
WaMu Mortgage Pass Through Certificates 2005-AR13 A1A1 | | | | 5.620% | | 10/25/45 | | | 30,781 | | | 30,978 | |
WaMu Mortgage Pass-Through Certificates 2005-AR13 B10 | | | | 6.176% | | 10/25/45 | | | 4,182 | | | 3,665 | D |
WaMu Mortgage Pass-Through Certificates 2005-AR17 | | | | 5.620% | | 12/25/45 | | | 17,586 | | | 17,658 | |
WaMu Mortgage Pass-Through Certificates 2005-AR19 A1A1 | | | | 5.600% | | 12/25/45 | | | 41,665 | | | 41,800 | |
WaMu Mortgage Pass-Through Certificates 2005-AR19 A1A2 | | | | 5.620% | | 12/25/45 | | | 40,428 | | | 40,581 | |
Zuni Mortgage Loan Trust 2006-0A1 | | | | 5.615% | | 8/25/36 | | | 45,669 | | | 45,607 | |
| | | | | | | | | | | | | |
| | | | | | | | | | | | 815,964 | |
| | | | | | | | | | | | | |
Stripped Securities | | N.M. | | | | | | | | | | | |
FFCA Secured Lending Corporation 1999-1A | | | | 1.447% | | 9/18/25 | | | 6,537 | | | 345 | D,G1 |
LB-UBS Commercial Mortgage Trust 2001-C3 | | | | 1.189% | | 6/15/36 | | | 16,661 | | | 629 | D,G1 |
Structured Mortgage Asset Residential Trust 1991-8 | | | | 0.014% | | 1/25/23 | | | 615 | | | — | G1,I |
| | | | | | | | | | | | | |
| | | | | | | | | | | | 974 | |
| | | | | | | | | | | | | |
Variable Rate SecuritiesJ | | 2.1% | | | | | | | | | | | |
Banc of America Commercial Mortgage Inc. 2005-5 | | | | 5.115% | | 10/10/45 | | | 6,440 | | | 6,334 | |
Banc of America Commercial Mortgage Inc. 2006-3 | | | | 5.889% | | 7/10/44 | | | 24,090 | | | 25,037 | |
GE Capital Commercial Mortgage Corporation 2005-C4 | | | | 5.511% | | 11/10/45 | | | 6,650 | | | 6,673 | |
Greenwich Capital Commercial Funding Corp. 2006-GG7 | | | | 6.110% | | 7/10/38 | | | 22,370 | | | 23,421 | |
IndyMac INDX Mortgage Loan Trust 2005-AR15 | | | | 5.099% | | 9/25/35 | | | 8,686 | | | 8,431 | |
J.P. Morgan Chase Commercial Mortgage Pass-Through Certificates 2005-CB13 | | | | 5.472% | | 1/12/43 | | | 7,500 | | | 7,499 | |
64
Semi-Annual Report to Shareholders
| | | | | | | | | | | | | |
| | | % OF
NET ASSETS | | RATE | | MATURITY
DATE | | PAR | | VALUE | |
| | | | | | | | | | | | | |
Mortgage-Backed Securities—Continued | | | | | | | | | | | | | |
| | | | | |
Variable Rate Securities—Continued | | | | | | | | | | | | | |
MASTR Adjustable Rate Mortgages Trust 2004-15 | | | | 4.612% | | 12/25/34 | | $ | 1,603 | | $ | 1,592 | |
Merrill Lynch Mortgage Trust 2005-CKI1 | | | | 5.417% | | 11/12/37 | | | 23,750 | | | 23,688 | |
Morgan Stanley Mortgage Loan Trust 2005-3AR | | | | 5.224% | | 7/25/35 | | | 5,872 | | | 5,883 | |
Wachovia Bank Commercial Mortgage Trust 2005-C20 | | | | 5.118% | | 7/15/42 | | | 4,000 | | | 3,930 | |
| | | | | | | | | | | | | |
| | | | | | | | | | | | 112,488 | |
| | | | | | | | | | | | | |
Total Mortgage-Backed Securities
(Identified Cost—$1,083,650) | | | | | | | | | | | | 1,080,831 | |
U.S. Government and Agency Obligations | | 15.6% | | | | | | | | | | | |
| | | | | |
Fixed Rate Securities | | 11.2% | | | | | | | | | | | |
Fannie Mae | | | | 4.875% | | 4/15/09 | | | 430 | | | 430 | |
Fannie Mae | | | | 6.625% | | 9/15/09 | | | 9,800 | | | 10,256 | |
Fannie Mae | | | | 5.200% | | 11/8/10 | | | 10,910 | | | 10,866 | |
Fannie Mae | | | | 5.625% | | 5/19/11 | | | 19,640 | | | 19,902 | |
Fannie Mae | | | | 4.610% | | 10/10/13 | | | 30,420 | | | 29,320 | |
Fannie Mae | | | | 6.419% | | 11/1/35 | | | 8,018 | | | 8,211 | |
Federal Home Loan Bank | | | | 7.250% | | 2/15/07 | | | 100 | | | 101 | |
Freddie Mac | | | | 4.625% | | 2/21/08 | | | 7,540 | | | 7,499 | |
Freddie Mac | | | | 4.125% | | 10/18/10 | | | 2,490 | | | 2,420 | |
Freddie Mac | | | | 4.750% | | 1/18/11 | | | 6,560 | | | 6,520 | |
Freddie Mac | | | | 5.250% | | 2/24/11 | | | 21,300 | | | 21,349 | |
Freddie Mac | | | | 5.125% | | 4/18/11 | | | 9,560 | | | 9,642 | |
Freddie Mac | | | | 4.650% | | 10/10/13 | | | 34,390 | | | 33,200 | |
Freddie Mac | | | | 5.300% | | 5/12/20 | | | 10,660 | | | 10,286 | |
Tennessee Valley Authority | | | | 6.750% | | 11/1/25 | | | 2,560 | | | 3,051 | |
Tennessee Valley Authority | | | | 7.125% | | 5/1/30 | | | 2,450 | | | 3,100 | |
United States Treasury Bonds | | | | 7.500% | | 11/15/16 | | | 1,490 | | | 1,825 | A |
United States Treasury Bonds | | | | 4.500% | | 2/15/36 | | | 148,943 | | | 142,718 | A |
United States Treasury Notes | | | | 3.750% | | 5/15/08 | | | 2,840 | | | 2,796 | A |
United States Treasury Notes | | | | 4.375% | | 11/15/08 | | | 5,590 | | | 5,555 | A |
United States Treasury Notes | | | | 4.500% | | 2/15/09 | | | 14,780 | | | 14,727 | A |
United States Treasury Notes | | | | 3.500% | | 8/15/09 | | | 4,700 | | | 4,561 | A |
United States Treasury Notes | | | | 3.375% | | 10/15/09 | | | 750 | | | 724 | A |
United States Treasury Notes | | | | 3.500% | | 12/15/09 | | | 18,492 | | | 17,890 | A |
United States Treasury Notes | | | | 3.625% | | 1/15/10 | | | 39,670 | | | 38,494 | A |
United States Treasury Notes | | | | 3.500% | | 2/15/10 | | | 12,250 | | | 11,829 | A |
United States Treasury Notes | | | | 4.125% | | 8/15/10 | | | 4,660 | | | 4,583 | A |
United States Treasury Notes | | | | 3.875% | | 9/15/10 | | | 22,690 | | | 22,109 | A |
United States Treasury Notes | | | | 4.250% | | 10/15/10 | | | 2,530 | | | 2,499 | A |
65
Semi-Annual Report to Shareholders
Portfolio of Investments—Continued
Western Asset Core Bond Portfolio—Continued
| | | | | | | | | | | | | |
| | | % OF
NET ASSETS | | RATE | | MATURITY
DATE | | PAR | | VALUE | |
| | | | | | | | | | | | | |
U.S. Government and Agency Obligations—Continued | | | | | | | | | | | | | |
| | | | | |
Fixed Rate Securities—Continued | | | | | | | | | | | | | |
United States Treasury Notes | | | | 4.500% | | 11/15/10 | | $ | 2,320 | | $ | 2,312 | A |
United States Treasury Notes | | | | 4.875% | | 7/31/11 | | | 13,970 | | | 14,132 | A |
United States Treasury Notes | | | | 5.125% | | 5/15/16 | | | 131,530 | | | 136,442 | A |
United States Treasury Notes | | | | 4.875% | | 8/15/16 | | | 40 | | | 41 | A |
| | | | | | | | | | | | | |
| | | | | | | | | | | | 599,390 | |
| | | | | | | | | | | | | |
Treasury Inflation-Protected SecuritiesK | | 4.4% | | | | | | | | | | | |
United States Treasury Inflation-Protected Security | | | | 0.875% | | 4/15/10 | | | 17,948 | | | 17,008A | |
United States Treasury Inflation-Protected Security | | | | 2.375% | | 4/15/11 | | | 41,622 | | | 41,666A | |
United States Treasury Inflation-Protected Security | | | | 3.375% | | 1/15/12 | | | 8,022 | | | 8,443 | A |
United States Treasury Inflation-Protected Security | | | | 1.875% | | 7/15/13 | | | 12,464 | | | 12,141 | A |
United States Treasury Inflation-Protected Security | | | | 2.000% | | 1/15/14 | | | 650 | | | 637 | A |
United States Treasury Inflation-Protected Security | | | | 2.000% | | 7/15/14 | | | 32 | | | 32 | A |
United States Treasury Inflation-Protected Security | | | | 1.875% | | 7/15/15 | | | 25,180 | | | 24,382 | A |
United States Treasury Inflation-Protected Security | | | | 2.000% | | 1/15/16 | | | 30,161 | | | 29,469 | A |
United States Treasury Inflation-Protected Security | | | | 2.375% | | 1/15/25 | | | 53,132 | | | 53,988 | A |
United States Treasury Inflation-Protected Security | | | | 2.000% | | 1/15/26 | | | 28,788 | | | 27,609 | A |
United States Treasury Inflation-Protected Security | | | | 3.625% | | 4/15/28 | | | 12,656 | | | 15,684 | A |
| | | | | | | | | | | | | |
| | | | | | | | | | | | 231,059 | |
| | | | | | | | | | | | | |
Total U.S. Government and Agency Obligations (Identified Cost—$817,984) | | | | | | | | | | | | 830,449 | |
U.S. Government Agency Mortgage-Backed Securities | | 48.2% | | | | | | | | | | | |
| | | | | |
Fixed Rate Securities | | 46.2% | | | | | | | | | | | |
Fannie Mae | | | | 7.000% | | 9/1/07 to 2/1/33 | | | 10,957 | | | 11,280 | |
Fannie Mae | | | | 8.000% | | 5/1/15 | | | 31 | | | 33 | |
Fannie Mae | | | | 5.500% | | 4/1/18 to 10/1/35 | | | 59,109 | | | 58,383 | |
66
Semi-Annual Report to Shareholders
| | | | | | | | | | | | | |
| | | % OF
NET ASSETS | | RATE | | MATURITY
DATE | | PAR | | VALUE | |
| | | | | | | | | | | | | |
U.S. Government Agency Mortgage-Backed Securities—Continued | | | | | | | | | | | | | |
| | | | | |
Fixed Rate Securities—Continued | | | | | | | | | | | | | |
Fannie Mae | | | | 4.500% | | 7/1/18 to 9/1/35 | | $ | 13,351 | | $ | 12,626 | |
Fannie Mae | | | | 4.000% | | 8/1/20 to 9/1/20 | | | 5,981 | | | 5,647 | |
Fannie Mae | | | | 5.000% | | 8/1/20 to 1/1/36 | | | 151,065 | | | 145,646 | |
Fannie Mae | | | | 5.500% | | 7/1/34 | | | 873 | | | 862 | |
Fannie Mae | | | | 7.500% | | 6/1/25 to 7/1/29 | | | 645 | | | 671 | |
Fannie Mae | | | | 6.000% | | 1/1/26 to 10/1/35 | | | 26,995 | | | 27,149 | |
Fannie Mae | | | | 6.500% | | 7/1/28 to 7/1/35 | | | 21,028 | | | 21,485 | |
Fannie Mae | | | | 6.000% | | 12/1/16 | | | 1,670 | | | 1,695 | L |
Fannie Mae | | | | 5.000% | | 12/1/36 | | | 149,000 | | | 143,133 | L |
Fannie Mae | | | | 5.000% | | 12/1/36 | | | 655,550 | | | 629,943 | L |
Fannie Mae | | | | 5.500% | | 12/1/36 | | | 544,800 | | | 536,628 | L |
Fannie Mae | | | | 6.000% | | 12/1/36 | | | 532,250 | | | 534,578 | L |
Fannie Mae | | | | 6.500% | | 12/1/36 | | | 90,850 | | | 92,497 | L |
Freddie Mac | | | | 9.750% | | 7/1/08 | | | 10 | | | 10 | |
Freddie Mac | | | | 6.000% | | 3/1/09 to 10/1/35 | | | 4,101 | | | 4,133 | |
Freddie Mac | | | | 5.500% | | 12/1/13 to 8/1/35 | | | 37,181 | | | 36,716 | |
Freddie Mac | | | | 9.300% | | 4/15/19 | | | 155 | | | 163 | |
Freddie Mac | | | | 5.000% | | 9/1/20 to 8/1/33 | | | 63,098 | | | 61,260 | |
Freddie Mac | | | | 7.000% | | 4/1/24 to 5/1/32 | | | 3,412 | | | 3,514 | |
Freddie Mac | | | | 6.500% | | 6/1/32 | | | 64 | | | 66 | |
Freddie Mac | | | | 5.625% | | 11/23/35 | | | 12,290 | | | 12,016 | |
Government National Mortgage Association | | | | 10.000% | | 11/15/09 | | | 0.2 | | | 0.2 | |
Government National Mortgage Association | | | | 8.000% | | 10/15/16 to 7/15/17 | | | 158 | | | 166 | |
Government National Mortgage Association | | | | 7.500% | | 10/15/22 to 8/15/32 | | | 348 | | | 363 | |
Government National Mortgage Association | | | | 7.000% | | 6/15/23 to 5/15/32 | | | 433 | | | 445 | |
Government National Mortgage Association | | | | 6.500% | | 10/15/23 to 3/15/33 | | | 20,671 | | | 21,233 | |
Government National Mortgage Association | | | | 6.000% | | 3/15/26 to 8/15/35 | | | 37,103 | | | 37,600 | |
Government National Mortgage Association | | | | 5.500% | | 1/15/33 | | | 271 | | | 269 | |
Government National Mortgage Association | | | | 5.000% | | 6/15/35 to 9/15/35 | | | 69,591 | | | 67,627 | |
| | | | | | | | | | | | | |
| | | | | | | | | | | | 2,467,837 | |
| | | | | | | | | | | | | |
67
Semi-Annual Report to Shareholders
Portfolio of Investments—Continued
Western Asset Core Bond Portfolio—Continued
| | | | | | | | | | | | | | |
| | | % OF
NET ASSETS | | RATE | | MATURITY
DATE | | PAR | | | VALUE | |
| | | | | | | | | | | | | | |
U.S. Government Agency Mortgage-Backed Securities—Continued | | | | | | | | | | | | | | |
Variable Rate SecuritiesJ | | 2.0% | | | | | | | | | | | | |
Fannie Mae | | | | 4.767% | | 6/1/35 | | $ | 14,828 | | | $ | 14,681 | |
Fannie Mae | | | | 4.357% | | 8/1/35 | | | 1,446 | | | | 1,427 | |
Fannie Mae | | | | 4.610% | | 9/1/35 | | | 7,961 | | | | 7,898 | |
Fannie Mae | | | | 4.681% | | 9/1/35 | | | 3,285 | | | | 3,261 | |
Fannie Mae | | | | 4.568% | | 10/1/35 | | | 2,809 | | | | 2,789 | |
Fannie Mae | | | | 4.659% | | 10/1/35 | | | 3,267 | | | | 3,251 | |
Fannie Mae | | | | 4.741% | | 10/1/35 | | | 5,153 | | | | 5,112 | |
Fannie Mae | | | | 4.816% | | 10/1/35 | | | 3,096 | | | | 3,076 | |
Fannie Mae | | | | 6.416% | | 10/1/35 | | | 22,859 | | | | 23,409 | |
Fannie Mae | | | | 6.418% | | 11/1/35 | | | 17,230 | | | | 17,644 | |
Fannie Mae | | | | 6.419% | | 11/1/35 | | | 7,783 | | | | 7,970 | |
Fannie Mae | | | | 6.421% | | 11/1/35 | | | 8,957 | | | | 9,173 | |
Freddie Mac | | | | 4.879% | | 10/1/35 | | | 5,385 | | | | 5,351 | |
| | | | | | | | | | | | | | |
| | | | | | | | | | | | | 105,042 | |
| | | | | | | | | | | | | | |
Stripped Securities | | N.M. | | | | | | | | | | | | |
Fannie Mae | | | | 9.500% | | 2/1/17 | | | 16 | | | | 4 | G1 |
Fannie Mae | | | | 0.000% | | 2/25/20 | | | — | I | | | 0.2 | G2 |
Fannie Mae | | | | 1009.300% | | 8/25/21 | | | 1 | | | | 15G1 | |
Fannie Mae | | | | 0.000% | | 5/25/22 | | | 133 | | | | 114 | G2 |
Financing Corporation | | | | 0.000% | | 4/5/19 | | | 1,150 | | | | 611 | G2 |
Freddie Mac | | | | 10.000% | | 3/1/21 | | | 104 | | | | 26 | G1 |
Freddie Mac | | | | 0.000% | | 7/15/22 | | | 17 | | | | 15 | G2 |
| | | | | | | | | | | | | | |
| | | | | | | | | | | | | 785 | |
| | | | | | | | | | | | | | |
Total U.S. Government Agency Mortgage-Backed Securities
(Identified Cost—$2,576,193) | | | | | | | | | | | | | 2,573,664 | |
Yankee BondsH | | 6.1% | | | | | | | | | | | | |
| | | | | |
Aerospace/Defense | | 0.1% | | | | | | | | | | | | |
Systems 2001 Asset Trust | | | | 6.664% | | 9/15/13 | | | 3,149 | | | | 3,312 | D |
| | | | | | | | | | | | | | |
| | | | | |
Banking and Finance | | 0.4% | | | | | | | | | | | | |
AIFUL CORPORATION | | | | 5.000% | | 8/10/10 | | | 4,030 | | | | 3,919 | D |
Eksportfinans ASA | | | | 5.500% | | 5/25/16 | | | 10,700 | | | | 11,036 | |
MUFG Capital Finance 1 Limited | | | | 6.346% | | 7/25/49 | | | 4,660 | | | | 4,698 | E |
| | | | | | | | | | | | | | |
| | | | | | | | | | | | | 19,653 | |
| | | | | | | | | | | | | | |
Banks | | 1.9% | | | | | | | | | | | | |
Glitnir Banki hf | | | | 6.330% | | 7/28/11 | | | 6,080 | | | | 6,206 | D |
Glitnir Banki hf | | | | 6.693% | | 6/15/16 | | | 11,830 | | | | 12,097 | D,E |
68
Semi-Annual Report to Shareholders
| | | | | | | | | | | | | |
| | | % OF
NET ASSETS | | RATE | | MATURITY
DATE | | PAR | | VALUE | |
| | | | | | | | | | | | | |
Yankee BondsH—Continued | | | | | | | | | | | | | |
| | | | | |
Banks—Continued | | | | | | | | | | | | | |
Kaupthing Bank hf | | | | 6.190% | | 4/12/11 | | $ | 17,140 | | $ | 17,143 | D |
Kaupthing Bank hf | | | | 5.750% | | 10/4/11 | | | 2,080 | | | 2,070 | C,D |
Kaupthing Bank hf | | | | 7.125% | | 5/19/16 | | | 30,520 | | | 32,082 | A,D |
Landsbanki Islands hf (The National Bank of Iceland) | | | | 6.100% | | 8/25/11 | | | 17,170 | | | 17,350 | D |
Shinsei Finance Cayman Ltd. | | | | 6.418% | | 1/29/49 | | | 9,980 | | | 9,912 | D,E |
The Korea Development Bank | | | | 4.250% | | 11/13/07 | | | 6,045 | | | 5,972 | |
| | | | | | | | | | | | | |
| | | | | | | | | | | | 102,832 | |
| | | | | | | | | | | | | |
Cable | | 0.1% | | | | | | | | | | | |
Rogers Cable Inc. | | | | 5.500% | | 3/15/14 | | | 4,340 | | | 4,080 | |
| | | | | | | | | | | | | |
| | | | | |
Electric | | N.M. | | | | | | | | | | | |
Hydro-Quebec | | | | 6.300% | | 5/11/11 | | | 570 | | | 597 | |
| | | | | | | | | | | | | |
| | | | | |
Foreign Governments | | 1.6% | | | | | | | | | | | |
Russian Federation | | | | 5.000% | | 3/31/30 | | | 49,315 | | | 55,040 | E |
United Mexican States | | | | 5.625% | | 1/15/17 | | | 160 | | | 158 | A |
United Mexican States | | | | 8.300% | | 8/15/31 | | | 5,070 | | | 6,323 | A |
United Mexican States | | | | 7.500% | | 4/8/33 | | | 19,890 | | | 22,943 | |
| | | | | | | | | | | | | |
| | | | | | | | | | | | 84,464 | |
| | | | | | | | | | | | | |
Manufacturing (Diversified) | | 0.8% | | | | | | | | | | | |
Tyco International Group SA | | | | 6.750% | | 2/15/11 | | | 430 | | | 454 | |
Tyco International Group SA | | | | 6.375% | | 10/15/11 | | | 1,230 | | | 1,289 | |
Tyco International Group SA | | | | 6.000% | | 11/15/13 | | | 2,300 | | | 2,380 | |
Tyco International Group SA | | | | 7.000% | | 6/15/28 | | | 3,700 | | | 4,209 | |
Tyco International Group SA | | | | 6.875% | | 1/15/29 | | | 29,900 | | | 33,286 | |
| | | | | | | | | | | | | |
| | | | | | | | | | | | 41,618 | |
| | | | | | | | | | | | | |
Mining | | N.M. | | | | | | | | | | | |
Corporacion Nacional del Cobre—Codelco | | | | 4.750% | | 10/15/14 | | | 1,750 | | | 1,651 | D |
| | | | | | | | | | | | | |
| | | | | |
Oil and Gas | | 0.2% | | | | | | | | | | | |
Petrobras International Finance Company (PIFCO) | | | | 6.125% | | 10/6/16 | | | 7,490 | | | 7,458 | |
YPF Sociedad Anonima | | | | 7.750% | | 8/27/07 | | | 3,250 | | | 3,299 | |
| | | | | | | | | | | | | |
| | | | | | | | | | | | 10,757 | |
| | | | | | | | | | | | | |
69
Semi-Annual Report to Shareholders
Portfolio of Investments—Continued
Western Asset Core Bond Portfolio—Continued
| | | | | | | | | | | | | | |
| | | % OF
NET ASSETS | | RATE | | MATURITY
DATE | | PAR | | | VALUE | |
| | | | | | | | | | | | | | |
Yankee BondsH—Continued | | | | | | | | | | | | | | |
Special Purpose | | 0.6% | | | | | | | | | | | | |
Conoco Funding Company | | | | 6.350% | | 10/15/11 | | $ | 400 | | | $ | 421 | A |
Conoco Funding Company | | | | 7.250% | | 10/15/31 | | | 350 | | | | 417 | |
CVRD Finance Ltd. | | | | 6.157% | | 10/15/07 | | | 2,548 | | | | 2,579 | C,D |
HSBC Capital Funding LP | | | | 4.610% | | 12/29/49 | | | 1,630 | | | | 1,511 | D,E |
Petronas Capital Ltd. | | | | 7.875% | | 5/22/22 | | | 1,340 | | | | 1,616 | D |
Petrozuata Finance, Inc. | | | | 8.220% | | 4/1/17 | | | 3,950 | | | | 3,851 | D |
Resona Preferred Global Securities (Cayman) Ltd. | | | | 7.191% | | 12/29/49 | | | 13,670 | | | | 14,149 | D,E |
TNK-BP Finance SA | | | | 7.500% | | 7/18/16 | | | 9,940 | | | | 10,385 | D |
| | | | | | | | | | | | | | |
| | | | | | | | | | | | | 34,929 | |
| | | | | | | | | | | | | | |
Telecommunications | | 0.4% | | | | | | | | | | | | |
British Telecommunications plc | | | | 8.375% | | 12/15/10 | | | 1,755 | | | | 1,967 | |
Deutsche Telekom International Finance B.V. | | | | 5.750% | | 3/23/16 | | | 5,370 | | | | 5,254 | A |
Koninklijke (Royal) KPN NV | | | | 8.000% | | 10/1/10 | | | 8,240 | | | | 8,902 | |
Telecom Italia Capital S.p.A. | | | | 5.250% | | 11/15/13 | | | 965 | | | | 914 | |
Telecom Italia Capital S.p.A. | | | | 4.950% | | 9/30/14 | | | 2,570 | | | | 2,360 | |
Telecom Italia Capital S.p.A. | | | | 5.250% | | 10/1/15 | | | 2,060 | | | | 1,909 | |
| | | | | | | | | | | | | | |
| | | | | | | | | | | | | 21,306 | |
| | | | | | | | | | | | | | |
Total Yankee Bonds (Identified Cost—$308,565) | | | | | | | | | | | | | 325,199 | |
Preferred Stocks | | 0.2% | | | | | | | | | | | | |
Fannie Mae | | | | 5.375% | | | | | — I | shs | | | 4,236 | F |
General Motors Corporation | | | | 5.250% | | | | | 293 | | | | 5,889 | F |
Home Ownership Funding Corporation | | | | 13.331% | | | | | 6 | | | | 1,003 | D,E |
Home Ownership Funding Corporation II | | | | 13.338% | | | | | 5 | | | | 900 | D,E |
| | | | | | | | | | | | | | |
Total Preferred Stocks
(Identified Cost—$18,532) | | | | | | | | | | | | | 12,028 | |
| | | | | | | | | | | | | | |
Total Long-Term Securities
(Identified Cost—$5,984,368) | | | | | | | | | | | | | 5,992,167 | |
Investment of Collateral From Securities Lending | | 12.6% | | | | | | | | | | | | |
State Street Navigator Securities Lending
Prime Portfolio | | | | | | | | | 673,701 | shs | | | 673,701 | |
| | | | | | | | | | | | | | |
Total Investment of Collateral From Securities Lending
(Identified Cost — $673,701) | | | | | | | | | | | | | 673,701 | |
Short-Term Securities — 23.2% | | 23.2% | | | | | | | | | | | | |
| | | | | |
Corporate Bonds and Notes | | 3.1% | | | | | | | | | | | | |
BankAmerica Corporation | | | | 0.000% | | 10/11/06 | | | 50,000 | | | | 49,925B | |
Barclays Bank Plc | | | | 5.480% | | 10/20/06 | | | 40,000 | | | | 40,001 | |
Tribune Company | | | | 0.000% | | 2/1/07 | | | 18,200 | | | | 17,837B | |
70
Semi-Annual Report to Shareholders
| | | | | | | | | | | | | | |
| | | % OF
NET ASSETS | | RATE | | MATURITY
DATE | | PAR | | | VALUE | |
| | | | | | | | | | | | | | |
Short-Term Securities—Continued | | | | | | | | | | | | | | |
| | | | | |
Corporate Bonds and Notes—Continued | | | | | | | | | | | | | | |
Washington Mutual Bank | | | | 5.420% | | 10/30/06 | | $ | 30,000 | | | $ | 30,000 | |
Washington Mutual Bank | | | | 5.390% | | 11/20/06 | | | 30,800 | | | | 30,800 | |
| | | | | | | | | | | | | | |
| | | | | | | | | | | | | 168,563 | |
| | | | | | | | | | | | | | |
| | | | | |
U.S. Government and Agency Obligations | | 17.7% | | | | | | | | | | | | |
Fannie Mae | | | | 0.000% | | 6/25/07 | | | 20,655 | | | | 19,894 | A,B,M |
Federal Home Loan Bank | | | | 0.000% | | 10/2/06 | | | 925,000 | | | | 924,878 | B |
| | | | | | | | | | | | | | |
| | | | | | | | | | | | | 944,772 | |
| | | | | | | | | | | | | | |
| | | | | |
Foreign Government Obligations | | 0.1% | | | | | | | | | | | | |
Government of Canada | | | | 0.000% | | 12/15/06 | | | 5,640 | | | | 5,580B | |
| | | | | | | | | | | | | | |
| | | | | |
Options PurchasedN | | 0.4% | | | | | | | | | | | | |
Eurodollar Futures Call, January 2007,
Strike Price $94.50 | | | | | | | | | 2,305 | O | | | 980 | |
Eurodollar Futures Call, January 2007,
Strike Price $94.00 | | | | | | | | | 911 | O | | | 1,514 | |
Eurodollar Futures Call, January 2007,
Strike Price $94.625 | | | | | | | | | 2,587 | O | | | 420 | |
Eurodollar Futures Call, March 2007,
Strike Price $94.75 | | | | | | | | | 525 | O | | | 246 | |
Eurodollar Futures Put, April 2007, Strike Price $93.00 | | | | | | | | | 218 | O | | | 1 | |
Goldman Sachs Futures Call, December 2006,
Strike Price $4.848 | | | | | | | | | 260,550,000 | O | | | 432 | |
Goldman Sachs Futures Call, January 2007,
Strike Price $5.6575 | | | | | | | | | 71,900,000 | O | | | 1,890 | |
Goldman Sachs Futures Call, October 2006,
Strike Price $5.55 | | | | | | | | | 229,100,000 | O | | | 1,929 | |
Goldman Sachs Futures Call, October 2006,
Strike Price $5.58 | | | | | | | | | 223,508,000 | O | | | 2,007 | |
U.S. Treasury Bond Futures Call, December 2006, Strike Price $110.00 | | | | | | | | | 615 | O | | | 1,586 | |
U.S. Treasury Bond Futures Call, December 2006, Strike Price $111.00 | | | | | | | | | 802 | O | | | 1,391 | |
U.S. Treasury Bond Futures Call, December 2006, Strike Price $113.00 | | | | | | | | | 90 | O | | | 71 | |
U.S. Treasury Note Futures Call, December 2006, Strike Price $100.00 | | | | | | | | | 554 | O | | | 3,056 | |
U.S. Treasury Note Futures Call, December 2006, Strike Price $102.00 | | | | | | | | | 913 | O | | | 3,210 | |
| | | | | | | | | | | | | | |
| | | | | | | | | | | | | 18,733 | |
| | | | | | | | | | | | | | |
71
Semi-Annual Report to Shareholders
Portfolio of Investments—Continued
Western Asset Core Bond Portfolio—Continued
| | | | | | | | | |
| | | % OF
NET ASSETS | | PAR | | VALUE | |
| | | | | | | | | |
Short-Term Securities—Continued | | | | | | | | | |
| | | |
Repurchase Agreements | | 1.9% | | | | | | | |
Goldman Sachs Group, Inc.
5.3%, dated 9/29/06, to be repurchased at $41,695 on 10/02/06 (Collateral: $40,680 Tennessee Valley Authority notes, 5.375%, due 4/1/56, value $42,511) | | | | $ | 41,677 | | $ | 41,677 | |
Lehman Brothers, Inc.
5.25%, dated 9/29/06, to be repurchased at $58,983 on 10/2/06 (Collateral: $187,220 Resolution Funding Corporation principal-only securities,
due 1/15/30, value $60,137) | | | | | 58,957 | | | 58,957 | |
| | | | | | | | | |
| | | | | | | | 100,634 | |
| | | | | | | | | |
Total Short-Term Securities (Identified Cost—$1,236,233) | | | | | | | | 1,238,282 | |
Total Investments (Identified Cost—$7,894,302) | | 148.0% | | | | | | 7,904,150 | |
Other Assets Less Liabilities | | (35.4)% | | | | | | (1,889,734 | ) |
Obligation to Return Collateral for Securities Loaned | | (12.6)% | | | | | | (673,701 | ) |
| | | | | | | | | |
| | | |
Net Assets | | 100.0% | | | | | $ | 5,340,715 | |
| | | | | | | | | |
| | | | | | | | |
| | | EXPIRATION | | ACTUAL
CONTRACTS | | APPRECIATION/
(DEPRECIATION) | |
Futures Contracts PurchasedN | | | | | | | | |
Eurodollar Futures | | December 2006 | | 732 | | $ | 84 | |
Eurodollar Futures | | December 2006 | | 125 | | | (4 | ) |
Eurodollar Futures | | March 2008 | | 341 | | | 280 | |
U.S. Treasury Note Futures | | March 2008 | | 1,505 | | | 63 | |
| | | | | | | | |
| | | | | | $ | 423 | |
| | | | | | | | |
Futures Contracts WrittenN | | | | | | | | |
Eurodollar Futures | | September 2007 | | 311 | | $ | (99 | ) |
Eurodollar Futures | | September 2008 | | 186 | | | (63 | ) |
U.S. Treasury Bond Futures | | December 2006 | | 316 | | | 180 | |
U.S. Treasury Note Futures | | December 2006 | | 4,075 | | | (1,033 | ) |
| | | | | | | | |
| | | | | | $ | (1,015 | ) |
| | | | | | | | |
Options WrittenN | | | | | | | | |
Eurodollar Futures Call, Strike Price $94.75 | | December 2006 | | 344 | | $ | 22 | |
Eurodollar Futures Call, Strike Price $95.125 | | March 2007 | | 175 | | | 6 | |
Eurodollar Futures Call, Strike Price $95.25 | | December 2006 | | 384 | | | (43 | ) |
Eurodollar Futures Call, Strike Price $95.50 | | December 2006 | | 516 | | | 30 | |
Eurodollar Futures Put, Strike Price $94.50 | | December 2006 | | 173 | | | 27 | |
Eurodollar Futures Put, Strike Price $94.625 | | March 2007 | | 625 | | | (5 | ) |
Eurodollar Futures Put, Strike Price $95.00 | | December 2006 | | 358 | | | (4 | ) |
Goldman Sachs Swaption Call, Strike Price $4.946 | | December 2006 | | 121,155,750 | | | 2,150 | |
Goldman Sachs Swaption Call, Strike Price $5.67 | | October 2006 | | 55,877,000 | | | (1,592 | ) |
72
Semi-Annual Report to Shareholders
| | | | | | | | |
| | | EXPIRATION | | ACTUAL
CONTRACTS | | APPRECIATION/
(DEPRECIATION) | |
Options Written—Continued | | | | | | | | |
Goldman Sachs Swaption Call, Strike Price $5.69 | | October 2006 | | 55,877,000 | | $ | (1,642 | ) |
U.S. Treasury Bond Futures Call, Strike Price $112.00 | | November 2006 | | 1,817 | | | (723 | ) |
U.S. Treasury Bond Futures Call, Strike Price $114.00 | | November 2006 | | 590 | | | 121 | |
U.S. Treasury Bond Futures Call, Strike Price $115.00 | | February 2007 | | 330 | | | 112 | |
U.S. Treasury Bond Futures Put, Strike Price $100.00 | | November 2006 | | 861 | | | 353 | |
U.S. Treasury Bond Futures Put, Strike Price $103.00 | | November 2006 | | 444 | | | 191 | |
U.S. Treasury Bond Futures Put, Strike Price $107.00 | | November 2006 | | 97 | | | 43 | |
U.S. Treasury Bond Futures Put, Strike Price $108.00 | | November 2006 | | 829 | | | 265 | |
U.S. Treasury Bond Futures Put, Strike Price $109.00 | | November 2006 | | 997 | | | 478 | |
U.S. Treasury Bond Futures Put, Strike Price $109.00 | | February 2007 | | 781 | | | (27 | ) |
U.S. Treasury Bond Futures Put, Strike Price $111.00 | | November 2006 | | 90 | | | 0 | |
U.S. Treasury Note Futures Call, Strike Price $104.50 | | November 2006 | | 753 | | | (594 | ) |
U.S. Treasury Note Futures Call, Strike Price $107.00 | | November 2006 | | 1,582 | | | (1,630 | ) |
U.S. Treasury Note Futures Call, Strike Price $108.00 | | November 2006 | | 1,842 | | | (348 | ) |
U.S. Treasury Note Futures Call, Strike Price $109.00 | | November 2006 | | 1,740 | | | 27 | |
U.S. Treasury Note Futures Call, Strike Price $109.00 | | February 2007 | | 978 | | | (208 | ) |
U.S. Treasury Note Futures Call, Strike Price $110.00 | | February 2007 | | 3,025 | | | (32 | ) |
U.S. Treasury Note Futures Put, Strike Price $104.00 | | November 2006 | | 258 | | | 85 | |
U.S. Treasury Note Futures Put, Strike Price $104.00 | | February 2007 | | 1,434 | | | 224 | |
U.S. Treasury Note Futures Put, Strike Price $105.00 | | November 2006 | | 458 | | | 84 | |
U.S. Treasury Note Futures Put, Strike Price $106.00 | | February 2007 | | 1,518 | | | (77 | ) |
U.S. Treasury Note Futures Put, Strike Price $107.00 | | February 2007 | | 265 | | | (22 | ) |
| | | | | | | | |
| | | | | | $ | (2,729 | ) |
| | | | | | | | |
| A | | All or a portion of this security is on loan. See note 4 to the notes to financial statements. |
| B | | Zero Coupon Bond – A bond with no periodic interest payments which is sold at such a discount as to produce a current yield to maturity. |
| C | | Indexed Security – The rates of interest earned on these securities are tied to the London Interbank Offered Rate (“LIBOR”), the Consumer Price Index (“CPI”), or the Cost of Funds Index (“COFI”) rate. The coupon rate is the rate as of September 30, 2006. |
| D | | Rule 144a Security – A security purchased pursuant to Rule 144a under the Securities Act of 1933 which may not be resold subject to that rule except to qualified institutional buyers. These securities, which the Fund’s investment adviser has determined to be liquid, represent 4.8% of net assets. |
| E | | Stepped Coupon Security – A security with a predetermined schedule of interest or dividend rate changes, at which time it begins to accrue interest or pay dividends. |
| F | | Convertible Security – The security may be converted into the issuer’s common stock. |
| G | | Securities with interest-only or principal-only payment streams, denoted by a 1 or 2, respectively. For interest-only securities, the amount shown as principal is the notional balance used to calculate the amount of interest due. |
| H | | Yankee Bond – A dollar denominated bond issued in the U.S. by foreign entities. |
| J | | The coupon rates shown on variable rate securities are the rates at September 30, 2006. These rates vary with the weighted average coupon of the underlying loans. |
| K | | Treasury Inflation-Protected Security – A security whose principal value is adjusted daily in accordance with changes to the Consumer Price Index for All Urban Consumers. Interest is calculated on the basis of the current adjusted principal value. |
| L | | When-issued Security – A security purchased on a delayed delivery basis. Final settlement amount and maturity date have not yet been announced. |
| M | | All or a portion of this security is collateral to cover futures and options contracts. |
| N | | Options and futures are described in more detail in the notes to financial statements. |
| O | | Par represents actual number of contracts. |
See notes to financial statements.
73
Semi-Annual Report to Shareholders
Statement of Assets and Liabilities
Western Asset Core Bond Portfolio
September 30, 2006 (Unaudited)
(Amounts in Thousands)
| | | | | | | |
Assets: | | | | | | | |
Investment securities at market value (Identified Cost—$6,658,069)A | | | | | $ | 6,665,868 | |
Short-term securities at value (Identified Cost—$1,236,233) | | | | | | 1,238,282 | |
Swap contracts at value | | | | | | 15,341 | |
Cash | | | | | | 3,301 | |
Receivable for securities sold | | | | | | 199,592 | |
Receivable for fund shares sold | | | | | | 9,141 | |
Interest receivable | | | | | | 48,650 | |
Futures variation margin receivable | | | | | | 684 | |
Other assets | | | | | | 1 | |
| | | | | | | |
Total assets | | | | | | 8,180,860 | |
| | |
Liabilities: | | | | | | | |
Payable for securities purchased | | $ | 2,135,870 | | | | |
Payable for fund shares repurchased | | | 2,880 | | | | |
Accrued management fee | | | 1,772 | | | | |
Accrued distribution fee | | | 203 | | | | |
Income distribution payable | | | 1,323 | | | | |
Interest expense payable | | | 7,555 | | | | |
Obligation to return collateral for securities loaned | | | 673,701 | | | | |
Options written (Proceeds—$13,947) | | | 16,676 | | | | |
Accrued expenses | | | 165 | | | | |
| | | | | | | |
Total liabilities | | | | | | 2,840,145 | |
| | | | | | | |
| | |
Net Assets | | | | | $ | 5,340,715 | |
| | | | | | | |
| | |
Net assets consist of: | | | | | | | |
Accumulated paid-in-capital applicable to: | | | | | | | |
385,181 Institutional Class shares outstanding | | | | | $ | 4,361,026 | |
89,129 Financial Intermediary Class shares outstanding | | | | | | 991,593 | |
Undistributed net investment income | | | | | | 4,031 | |
Accumulated net realized loss on investments, options, futures, and swaps | | | | | | (40,013 | ) |
Unrealized appreciation/(depreciation) of investments, options, futures, and swaps | | | | | | 24,078 | |
| | | | | | | |
| | |
Net Assets | | | | | $ | 5,340,715 | |
| | | | | | | |
| | |
Net Asset Value Per Share: | | | | | | | |
Institutional Class | | | | | | $11.26 | |
Financial Intermediary Class | | | | | | $11.26 | |
| | | | | | | | |
| A | | Market value of securities on loan is $670,902. |
See notes to financial statements.
74
Semi-Annual Report to Shareholders
Statement of Operations
Western Asset Core Bond Portfolio
For the Six Months Ended September 30, 2006 (Unaudited)
(Amounts in Thousands)
| | | | | | | | |
Investment Income: | | | | | | | | |
Interest | | $ | 134,890 | | | | | |
Dividends | | | 712 | | | | | |
| | | | | | | | |
Total income | | | | | | $ | 135,602 | |
Expenses: | | | | | | | | |
Advisory fee | | | 10,146 | | | | | |
Distribution and service fees: | | | | | | | | |
Financial Intermediary Class | | | 902 | | | | | |
Audit and legal fees | | | 113 | | | | | |
Custodian fees | | | 456 | | | | | |
Directors’ fees and expenses | | | 86 | | | | | |
Proxy expense | | | 218 | | | | | |
Registration fees | | | 91 | | | | | |
Reports to shareholders | | | 394 | | | | | |
Transfer agent and shareholder servicing expense: | | | | | | | | |
Institutional Class | | | 17 | | | | | |
Financial Intermediary Class | | | 9 | | | | | |
Other expenses | | | 46 | | | | | |
| | | | | | | | |
| | | 12,478 | | | | | |
Less: Compensating balance creditsA | | | (3 | ) | | | | |
| | | | | | | | |
Total expenses net of compensating balance credits | | | | | | | 12,475 | |
| | | | | | | | |
Net Investment Income | | | | | | | 123,127 | |
Net Realized and Unrealized Gain/(Loss) on Investments: | | | | | | | | |
Realized gain/(loss) on: | | | | | | | | |
Investments | | | (7,126 | ) | | | | |
Options | | | 1,695 | | | | | |
Futures | | | (11,900 | ) | | | | |
Swaps | | | 13,424 | | | | | |
| | | | | | | | |
| | | | | | | (3,907 | ) |
Change in unrealized appreciation/(depreciation) of investments, options, futures and swaps | | | | | | | 107,180 | |
| | | | | | | | |
Net Realized and Unrealized Gain on Investments | | | | | | | 103,273 | |
| | | | | | | | | |
Change in Net Assets Resulting From Operations | | | | | | $ | 226,400 | |
| | | | | | | | | |
| A | | See note 1, compensating balance credits, in the notes to financial statements. |
See notes to financial statements.
75
Semi-Annual Report to Shareholders
Statement of Changes in Net Assets
Western Asset Core Bond Portfolio
(Amounts in Thousands)
| | | | | | | | |
| | | FOR THE
SIX MONTHS ENDED
SEPTEMBER 30,
2006 | | | FOR THE
YEAR ENDED
MARCH 31,
2006 | |
| Change in Net Assets: | | (Unaudited) | | | | |
Net investment income | | $ | 123,127 | | | $ | 178,397 | |
| | |
Net realized loss on investments, options, futures, and swaps | | | (3,907 | ) | | | (27,239 | ) |
| | |
Change in unrealized appreciation/(depreciation) of investments, options, futures, and swaps | | | 107,180 | | | | (66,457 | ) |
| | | | | | | | |
Change in net assets resulting from operations | | | 226,400 | | | | 84,701 | |
| | |
Distributions to Shareholders from: | | | | | | | | |
Net investment income: | | | | | | | | |
Institutional Class | | | (105,726 | ) | | | (173,004 | ) |
Financial Intermediary Class | | | (17,058 | ) | | | (13,718 | ) |
| | |
Net realized gain on investments: | | | | | | | | |
Institutional Class | | | — | | | | (1,163 | ) |
Financial Intermediary Class | | | — | | | | (95 | ) |
| | |
Change in net assets from Fund share transactions: | | | | | | | | |
Institutional Class | | | 13,731 | | | | 1,060,406 | |
Financial Intermediary Class | | | 619,301 | | | | 103,640 | |
| | | | | | | | |
Change in net assets | | | 736,648 | | | | 1,060,767 | |
| | |
Net Assets: | | | | | | | | |
Beginning of period | | | 4,604,067 | | | | 3,543,300 | |
| | | | | | | | |
| | |
End of period | | $ | 5,340,715 | | | $ | 4,604,067 | |
| | | | | | | | |
| | |
Undistributed net investment income | | $ | 4,031 | | | $ | 3,688 | |
| | | | | | | | |
| | | | | | | | | |
See notes to financial statements.
76
Semi-Annual Report to Shareholders
Financial Highlights
Western Asset Core Bond Portfolio
Contained below is per share operating performance data for a share of common stock outstanding throughout each year shown, total investment return, ratios to average net assets and other supplemental data. This information has been derived from information in the financial statements.
Institutional Class:
| | | | | | | | | | | | | | | | | | | | | | | | |
| | | SIX MONTHS
ENDED
SEPTEMBER 30, 2006 | | | YEARS ENDED MARCH 31, | |
| | | | 2006 | | | 2005 | | | 2004 | | | 2003 | | | 2002 | |
| | | (Unaudited) | | | | | | | | | | | | | | | | |
Net asset value, beginning of period | | $ | 11.05 | | | $ | 11.29 | | | $ | 11.81 | | | $ | 11.57 | | | $ | 11.01 | | | $ | 11.09 | |
| | | | | | | | | | | | | | | | | | | | | | | | |
Investment operations: | | | | | | | | | | | | | | | | | | | | | | | | |
Net investment income | | | .28 | | | | .49 | | | | .39 | | | | .41 | | | | .55 | | | | .62 | |
Net realized and unrealized gain/(loss) on investments, options, futures, and swaps | | | .20 | | | | (.22 | ) | | | (.21 | ) | | | .45 | | | | .65 | | | | .05 | |
| | | | | | | | | | | | | | | | | | | | | | | | |
Total from investment operations | | | .48 | | | | .27 | | | | .18 | | | | .86 | | | | 1.20 | | | | .67 | |
| | | | | | | | | | | | | | | | | | | | | | | | |
Distributions paid from: | | | | | | | | | | | | | | | | | | | | | | | | |
Net investment income | | | (.27 | ) | | | (.51 | ) | | | (.39 | ) | | | (.44 | ) | | | (.55 | ) | | | (.62 | ) |
Net realized gain on investments | | | — | | | | — A | | | | (.31 | ) | | | (.18 | ) | | | (.09 | ) | | | (.13 | ) |
| | | | | | | | | | | | | | | | | | | | | | | | |
Total distributions | | | (.27 | ) | | | (.51 | ) | | | (.70 | ) | | | (.62 | ) | | | (.64 | ) | | | (.75 | ) |
| | | | | | | | | | | | | | | | | | | | | | | | |
Net asset value, end of period | | $ | 11.26 | | | $ | 11.05 | | | $ | 11.29 | | | $ | 11.81 | | | $ | 11.57 | | | $ | 11.01 | |
| | | | | | | | | | | | | | | | | | | | | | | | |
Total return | | | 4.46 | %B | | | 2.46 | % | | | 1.68 | % | | | 7.64 | % | | | 11.19 | % | | | 6.14 | % |
| | | | | | |
Ratios to Average Net Assets:C | | | | | | | | | | | | | | | | | | | | | | | | |
Total expenses | | | .46 | %D | | | .45 | % | | | .46 | % | | | .49 | % | | | .49 | % | | | .52 | % |
Expenses net of waivers, if any | | | .46 | %D | | | .45 | % | | | .46 | % | | | .49 | % | | | .49 | % | | | .50 | % |
Expenses net of all reductions | | | .46 | %D | | | .45 | % | | | .46 | % | | | .49 | % | | | .49 | % | | | .50 | % |
Net investment income | | | 5.0 | %D | | | 4.3 | % | | | 3.4 | % | | | 3.5 | % | | | 4.9 | % | | | 5.6 | % |
| | | | | | |
Supplemental Data: | | | | | | | | | | | | | | | | | | | | | | | | |
Portfolio turnover rate | | | 247.7 | %B | | | 540.4 | % | | | 407.2 | % | | | 464.6 | % | | | 438.6 | % | | | 595.2 | % |
Net assets at end of period (in thousands) | | $ | 4,337,064 | | | $ | 4,243,248 | | | $ | 3,277,782 | | | $ | 2,187,219 | | | $ | 1,400,431 | | | $ | 971,544 | |
| | | | | | | | | | | | | | | | | | | | | | | | | |
| A | | Amounts less than $.01. |
| C | | Total expenses reflects operating expenses prior to any voluntary expense waivers and/or compensating balance credits. Expenses net of waivers reflects total expenses before compensating balance credits but net of any voluntary expense waivers. Expenses net of all reductions reflects expenses less any compensating balance credits and/or voluntary expense waivers. |
See notes to financial statements.
77
Semi-Annual Report to Shareholders
Financial Intermediary Class:
| | | | | | | | | | | | | | | | | | | | | | | | |
| | | SIX MONTHS
ENDED
SEPTEMBER 30,
2006 | | | YEARS ENDED MARCH 31, | |
| | | | 2006 | | | 2005 | | | 2004 | | | 2003 | | | 2002 | |
| | | (Unaudited) | | | | | | | | | | | | | | | | |
Net asset value, beginning of period | | $ | 11.05 | | | $ | 11.29 | | | $ | 11.81 | | | $ | 11.57 | | | $ | 11.02 | | | $ | 11.10 | |
| | | | | | | | | | | | | | | | | | | | | | | | |
Investment operations: | | | | | | | | | | | | | | | | | | | | | | | | |
Net investment income | | | .25 | | | | .47 | | | | .38 | | | | .40 | | | | .53 | | | | .59 | |
Net realized and unrealized gain/(loss) on investments, options, futures, and swaps | | | .22 | | | | (.22 | ) | | | (.23 | ) | | | .43 | | | | .63 | | | | .06 | |
| | | | | | | | | | | | | | | | | | | | | | | | |
Total from investment operations | | | .47 | | | | .25 | | | | .15 | | | | .83 | | | | 1.16 | | | | .65 | |
| | | | | | | | | | | | | | | | | | | | | | | | |
Distributions paid from: | | | | | | | | | | | | | | | | | | | | | | | | |
Net investment income | | | (.26 | ) | | | (.49 | ) | | | (.36 | ) | | | (.41 | ) | | | (.52 | ) | | | (.60 | ) |
Net realized gain on investments | | | — | | | | — A | | | | (.31 | ) | | | (.18 | ) | | | (.09 | ) | | | (.13 | ) |
| | | | | | | | | | | | | | | | | | | | | | | | |
Total distributions | | | (.26 | ) | | | (.49 | ) | | | (.67 | ) | | | (.59 | ) | | | (.61 | ) | | | (.73 | ) |
| | | | | | | | | | | | | | | | | | | | | | | | |
Net asset value, end of period | | $ | 11.26 | | | $ | 11.05 | | | $ | 11.29 | | | $ | 11.81 | | | $ | 11.57 | | | $ | 11.02 | |
| | | | | | | | | | | | | | | | | | | | | | | | |
Total return | | | 4.33 | %B | | | 2.19 | % | | | 1.42 | % | | | 7.36 | % | | | 10.80 | % | | | 5.88 | % |
| | | | | | |
Ratios to Average Net Assets:C | | | | | | | | | | | | | | | | | | | | | | | | |
Total expenses | | | .72 | %D | | | .70 | % | | | .72 | % | | | .76 | % | | | .75 | % | | | .77 | % |
Expenses net of waivers, if any | | | .72 | %D | | | .70 | % | | | .72 | % | | | .75 | % | | | .75 | % | | | .75 | % |
Expenses net of all reductions | | | .72 | %D | | | .70 | % | | | .72 | % | | | .75 | % | | | .75 | % | | | .75 | % |
Net investment income | | | 4.7 | %D | | | 4.1 | % | | | 4.2 | % | | | 3.3 | % | | | 4.1 | % | | | 5.3 | % |
| | | | | | |
Supplemental Data: | | | | | | | | | | | | | | | | | | | | | | | | |
Portfolio turnover rate | | | 247.7 | %B | | | 540.4 | % | | | 407.2 | % | | | 464.6 | % | | | 438.6 | % | | | 595.2 | % |
Net assets at end of period (in thousands) | | $ | 1,003,651 | | | $ | 360,819 | | | $ | 265,518 | | | $ | 121,607 | | | $ | 79,120 | | | $ | 1,885 | |
| | | | | | | | | | | | | | | | | | | | | | | | | |
See notes to financial statements.
78
Semi-Annual Report to Shareholders
Expense Example
Western Asset Core Plus Bond Portfolio
As a shareholder of the Fund, you incur ongoing costs, including management fees, service (12b-1) fees on Financial Intermediary Class shares, and other Fund expenses. These examples are intended to help you understand your ongoing costs (in dollars) of investing in the Fund and to compare these costs with the ongoing costs of investing in other mutual funds. Each example is based on an investment of $1,000 invested on April 1, 2006, and held through September 30, 2006.
Actual Expenses
The first line for each class in the table below provides information about actual account values and actual expenses for each class. You may use the information in this line, together with the amount you invested, to estimate the expenses that you paid over the period. Simply divide your account value by $1,000 (for example, an $8,600 account value divided by $1,000 = 8.6), then multiply the result by the number in the first line under the heading entitled “Expenses Paid During the Period” to estimate the expenses you paid on your account during this period.
Hypothetical Example for Comparison Purposes
The second line for each class in the table below provides information about hypothetical account values and hypothetical expenses based on the relevant class’s actual expense ratio and an assumed rate of return of 5% per year before expenses, which is not the class’s actual return. The hypothetical account values and expenses may not be used to estimate the actual ending account balance or expenses you paid for the period. You may use this information to compare the ongoing costs of investing in the Fund and other funds. To do so, compare this 5% hypothetical example with the 5% hypothetical examples for the relevant class that appear in the shareholder reports of other funds.
| | | | | | | | | |
| | | Beginning
Account Value
4/1/06 | | Ending
Account Value
9/30/06 | | Expenses PaidA
During the Period
4/1/06 to 9/30/06 |
Institutional Class: | | | | | | | | | |
Actual | | $ | 1,000.00 | | $ | 1,049.10 | | $ | 2.26 |
Hypothetical (5% return before expenses) | | | 1,000.00 | | | 1,022.86 | | | 2.23 |
Financial Intermediary Class: | | | | | | | | | |
Actual | | | 1,000.00 | | $ | 1,047.80 | | $ | 3.54 |
Hypothetical (5% return before expenses) | | | 1,000.00 | | | 1,021.61 | | | 3.50 |
| A | | These calculations are based on expenses incurred in the most recent fiscal half-year. The dollar amounts shown as “Expenses Paid” are equal to the annualized expense ratios of 0.44% and 0.69% for the Institutional Class and Financial Intermediary Class, respectively, multiplied by the average values over the period, multiplied by the number of days in the most recent fiscal half-year (183), and divided by 365. |
79
Semi-Annual Report to Shareholders
Performance Information
Western Asset Core Plus Bond Portfolio
The graphs compare the Fund’s total returns to that of an appropriate broad-based securities market index. The graphs illustrate the cumulative total return of an initial $1,000,000 investment in the Institutional Class and Financial Intermediary Class of the Fund, for the periods indicated. The lines for the Fund represent the total return after deducting all Fund investment management and other administrative expenses and the transaction costs of buying and selling securities. The line representing the securities market index does not include any transaction costs associated with buying and selling securities in the index or other investment management or administrative expenses.
Total return measures investment performance in terms of appreciation or depreciation in the Fund’s net asset value per share, plus dividends and any capital gain distributions. It assumes that dividends and distributions were reinvested at the time they were paid. Returns (and the graphs and tables found below) do not reflect the deduction of taxes that a shareholder would pay on Fund distributions or the redemption of Fund shares. Average annual returns tend to smooth out variations in a fund’s return, so that they differ from actual year-to-year results.
Bonds are subject to a variety of risks, including interest rate, credit and inflation risk. Non-U.S. investment are subject to currency fluctuations, social, economical and political risk.
Growth of a $1,000,000 Investment—Institutional Class
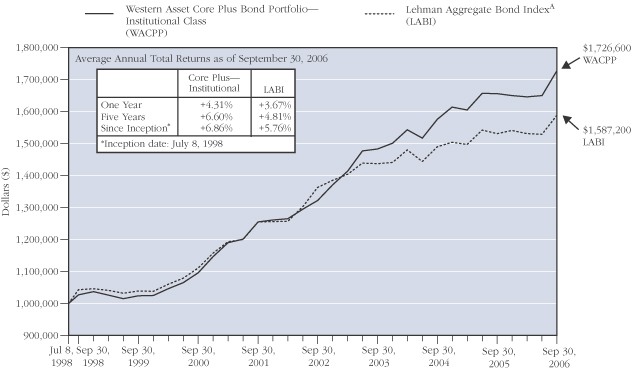
The performance data quoted represents past performance and does not guarantee future results. The performance stated may have been due to extraordinary market conditions, which may not be duplicated in the future. Current performance may be lower or higher than the performance data quoted. To obtain the most recent month-end performance information, please visit www.westernassetfunds.com. The investment return and principal value of the Fund will fluctuate so that an investor’s shares, when redeemed, may be worth more or less than the original cost. Calculations assume reinvestment of dividends and capital gain distributions. Performance would have been lower if fees had not been waived in various periods.
| A | | Since-inception index returns are for periods beginning June 30, 1998. |
80
Semi-Annual Report to Shareholders
Growth of a $1,000,000 Investment—Financial Intermediary Class
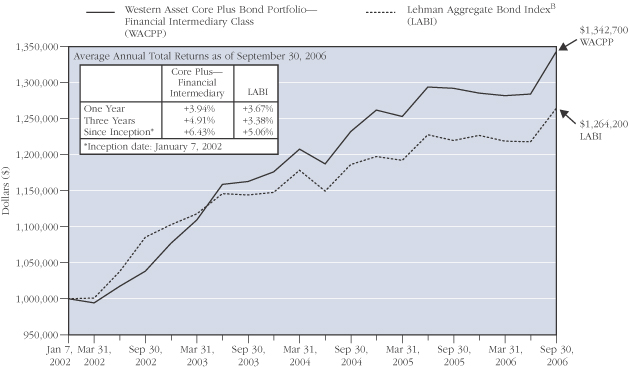
The performance data quoted represents past performance and does not guarantee future results. The performance stated may have been due to extraordinary market conditions, which may not be duplicated in the future. Current performance may be lower or higher than the performance data quoted. To obtain the most recent month-end performance information, please visit www.westernassetfunds.com. The investment return and principal value of the Fund will fluctuate so that an investor’s shares, when redeemed, may be worth more or less than the original cost. Calculations assume reinvestment of dividends and capital gain distributions. Performance would have been lower if fees had not been waived in various periods.
| B | | Since-inception index returns are for periods beginning December 31, 2001. |
81
Semi-Annual Report to Shareholders
Performance Information—Continued
Portfolio Composition (as of September 30, 2006)
Standard & Poor’s Debt RatingsC (as a percentage of the portfolio)
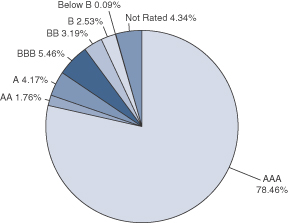
Maturity Schedule (as a percentage of the portfolio)
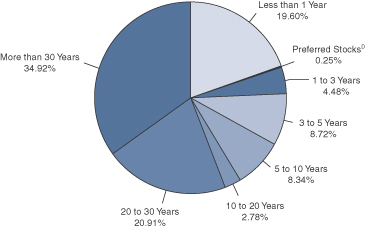
| C | | Source: Standard & Poor's. |
| D | | Preferred Stocks do not have a defined maturity date. |
The Fund is actively managed. As a result, the composition of the portfolio holdings and sectors are subject to change at any time.
82
Semi-Annual Report to Shareholders
Portfolio of Investments
Western Asset Core Plus Bond Portfolio
September 30, 2006 (Unaudited)
(Amounts in Thousands)
| | | | | | | | | | | | | |
| | | % OF
NET ASSETS | | RATE | | MATURITY
DATE | | PAR | | VALUE | |
| | | | | | | | | | | | | |
Long-Term Securities | | 112.9% | | | | | | | | | | | |
| | | | | |
Corporate Bonds and Notes | | 18.4% | | | | | | | | | | | |
| | | | | |
Aerospace/Defense | | 0.1% | | | | | | | | | | | |
L-3 Communications Corp. | | | | 7.625% | | 6/15/12 | | $ | 852 | | $ | 877 | |
Lockheed Martin Corporation | | | | 7.650% | | 5/1/16 | | | 945 | | | 1,098 | |
Lockheed Martin Corporation | | | | 6.150% | | 9/1/36 | | | 380 | | | 398 | A |
Northrop Grumman Corporation | | | | 4.079% | | 11/16/06 | | | 3,580 | | | 3,574 | |
Raytheon Company | | | | 6.000% | | 12/15/10 | | | 41 | | | 42 | |
Raytheon Company | | | | 5.500% | | 11/15/12 | | | 75 | | | 76 | |
| | | | | | | | | | | | | |
| | | | | | | | | | | | 6,065 | |
| | | | | | | | | | | | | |
Apparel | | N.M. | | | | | | | | | | | |
Oxford Industries, Inc. | | | | 8.875% | | 6/1/11 | | | 800 | | | 816 | |
| | | | | | | | | | | | | |
| | | | | |
Auto Trucks and Parts | | N.M. | | | | | | | | | | | |
Visteon Corporation | | | | 8.250% | | 8/1/10 | | | 2,050 | | | 1,999 | B |
| | | | | | | | | | | | | |
| | | | | |
Automotive | | 0.7% | | | | | | | | | | | |
Ford Motor Company | | | | 7.450% | | 7/16/31 | | | 42,400 | | | 32,754 | B |
General Motors Corporation | | | | 8.250% | | 7/15/23 | | | 8,000 | | | 6,930 | |
General Motors Corporation | | | | 8.375% | | 7/15/33 | | | 33,195 | | | 28,714 | B |
| | | | | | | | | | | | | |
| | | | | | | | | | | | 68,398 | |
| | | | | | | | | | | | | |
Banking and Finance | | 4.2% | | | | | | | | | | | |
American Honda Finance Corporation | | | | 5.482% | | 5/12/08 | | | 28,000 | | | 28,041 | A,C |
Boeing Capital Corporation | | | | 5.800% | | 1/15/13 | | | 2,030 | | | 2,095 | |
Countrywide Financial Corporation | | | | 5.548% | | 11/3/06 | | | 15,000 | | | 15,001 | C |
Countrywide Financial Corporation | | | | 5.448% | | 6/27/07 | | | 16,400 | | | 16,401 | C |
Countrywide Home Loans, Inc. | | | | 5.560% | | 2/27/08 | | | 25,000 | | | 25,020C | |
Ford Motor Credit Company | | | | 7.375% | | 10/28/09 | | | 57,540 | | | 55,918 | |
Ford Motor Credit Company | | | | 7.875% | | 6/15/10 | | | 3,560 | | | 3,467 | |
Ford Motor Credit Company | | | | 7.375% | | 2/1/11 | | | 19,135 | | | 18,366 | |
Ford Motor Credit Company | | | | 10.640% | | 6/15/11 | | | 5,684 | | | 5,939 | A,C |
Ford Motor Credit Company | | | | 7.250% | | 10/25/11 | | | 14,030 | | | 13,231 | |
General Motors Acceptance Corporation | | | | 6.311% | | 11/30/07 | | | 4,570 | | | 4,519 | |
General Motors Acceptance Corporation | | | | 8.000% | | 11/1/31 | | | 14,000 | | | 14,638 | |
HSBC Finance Corporation | | | | 5.440% | | 2/28/07 | | | 45,000 | | | 45,020 | C |
HSBC Finance Corporation | | | | 5.486% | | 5/10/07 | | | 18,100 | | | 18,109 | C |
HSBC Finance Corporation | | | | 6.400% | | 6/17/08 | | | 20 | | | 20 | |
HSBC Finance Corporation | | | | 6.500% | | 11/15/08 | | | 40 | | | 41 | |
HSBC Finance Corporation | | | | 8.000% | | 7/15/10 | | | 70 | | | 77 | |
HSBC Finance Corporation | | | | 6.375% | | 8/1/10 | | | 1,000 | | | 1,040 | |
83
Semi-Annual Report to Shareholders
Portfolio of Investments—Continued
Western Asset Core Plus Bond Portfolio—Continued
| | | | | | | | | | | | | |
| | | % OF
NET ASSETS | | RATE | | MATURITY
DATE | | PAR | | VALUE | |
| | | | | | | | | | | | | |
Corporate Bonds and Notes—Continued | | | | | | | | | | | | | |
| | | | | |
Banking and Finance—Continued | | | | | | | | | | | | | |
HSBC Finance Corporation | | | | 7.000% | | 5/15/12 | | $ | 160 | | $ | 173 | |
HSBC Finance Corporation | | | | 6.375% | | 11/27/12 | | | 520 | | | 546 | |
SB Treasury Company LLC | | | | 9.400% | | 12/29/49 | | | 360 | | | 383 | A,D |
Sigma Finance Inc | | | | 8.500% | | 8/11/16 | | | 29,650 | | | 29,650 | A,D |
SLM Corporation | | | | 5.440% | | 4/1/09 | | | 11,220 | | | 10,777 | C |
SLM Corporation | | | | 5.330% | | 4/11/12 | | | 40,000 | | | 40,010 | A,C |
Toyota Motor Credit Corporation | | | | 5.255% | | 4/19/07 | | | 32,000 | | | 32,001 | C |
Wachovia Capital Trust III | | | | 5.800% | | 3/15/42 | | | 9,420 | | | 9,446 | D |
| | | | | | | | | | | | | |
| | | | | | | | | | | | 389,929 | |
| | | | | | | | | | | | | |
Banks | | 0.7% | | | | | | | | | | | |
Bank of America Corporation | | | | 7.400% | | 1/15/11 | | | 3,090 | | | 3,344 | |
Bank One Corporation | | | | 4.125% | | 9/1/07 | | | 2,780 | | | 2,744 | |
Bank One Corporation | | | | 7.875% | | 8/1/10 | | | 150 | | | 163 | |
Bank One Corporation | | | | 5.900% | | 11/15/11 | | | 2,000 | | | 2,051 | |
Firstar Bank NA | | | | 7.125% | | 12/1/09 | | | 350 | | | 370 | |
U.S. Bank | | | | 5.265% | | 2/8/08 | | | 27,200 | | | 27,184 | C |
Wachovia Bank NA | | | | 5.425% | | 5/22/07 | | | 31,000 | | | 31,003 | C |
| | | | | | | | | | | | | |
| | | | | | | | | | | | 66,859 | |
| | | | | | | | | | | | | |
Cable | | 0.3% | | | | | | | | | | | |
Comcast Cable Communications, Inc. | | | | 6.750% | | 1/30/11 | | | 680 | | | 714 | |
Comcast Corporation | | | | 6.500% | | 1/15/15 | | | 1,130 | | | 1,180 | |
Comcast Corporation | | | | 6.500% | | 1/15/17 | | | 560 | | | 584 | |
Comcast Corporation | | | | 7.050% | | 3/15/33 | | | 7,470 | | | 7,999 | |
Comcast MO of Delaware Inc. | | | | 9.000% | | 9/1/08 | | | 1,060 | | | 1,130 | |
Cox Communications, Inc. | | | | 7.875% | | 8/15/09 | | | 7,680 | | | 8,144 | |
CSC Holdings Inc. | | | | 7.250% | | 4/15/12 | | | 500 | | | 498 | A |
CSC Holdings Inc. | | | | 7.875% | | 2/15/18 | | | 260 | | | 270 | |
CSC Holdings Inc. | | | | 7.625% | | 7/15/18 | | | 568 | | | 581 | |
DirecTV Holdings LLC | | | | 8.375% | | 3/15/13 | | | 2,450 | | | 2,539 | |
EchoStar DBS Corporation | | | | 6.625% | | 10/1/14 | | | 805 | | | 766 | |
| | | | | | | | | | | | | |
| | | | | | | | | | | | 24,405 | |
| | | | | | | | | | | | | |
Casino Resorts | | 0.2% | | | | | | | | | | | |
Caesars Entertainment Inc. | | | | 8.125% | | 5/15/11 | | | 733 | | | 773 | |
Harrah’s Operating Company, Inc. | | | | 6.500% | | 6/1/16 | | | 13,400 | | | 13,136 | |
Inn of The Mountain Gods Resort and Casino | | | | 12.000% | | 11/15/10 | | | 1,070 | | | 1,121 | |
Mandalay Resort Group | | | | 9.500% | | 8/1/08 | | | 80 | | | 85 | |
MGM MIRAGE | | | | 6.750% | | 9/1/12 | | | 815 | | | 804 | |
84
Semi-Annual Report to Shareholders
| | | | | | | | | | | | | |
| | | % OF
NET ASSETS | | RATE | | MATURITY
DATE | | PAR | | VALUE | |
| | | | | | | | | | | | | |
Corporate Bonds and Notes—Continued | | | | | | | | | | | | | |
| | | | | |
Casino Resorts—Continued | | | | | | | | | | | | | |
MGM MIRAGE | | | | 6.625% | | 7/15/15 | | $ | 2,240 | | $ | 2,150 | |
Premier Entertainment Biloxi LLC | | | | 10.750% | | 2/1/12 | | | 810 | | | 824 | |
Station Casinos, Inc. | | | | 7.750% | | 8/15/16 | | | 3,345 | | | 3,471 | |
| | | | | | | | | | | | | |
| | | | | | | | | | | | 22,364 | |
| | | | | | | | | | | | | |
Chemicals | | 0.1% | | | | | | | | | | | |
Georgia Gulf Corporation | | | | 9.500% | | 10/15/14 | | | 1,100 | | | 1,096 | A |
IMC Global Inc. | | | | 11.250% | | 6/1/11 | | | 132 | | | 139 | |
IMC Global Inc. | | | | 10.875% | | 8/1/13 | | | 460 | | | 513 | |
Lyondell Chemical Company | | | | 8.000% | | 9/15/14 | | | 1,175 | | | 1,190 | |
Lyondell Chemical Company | | | | 8.250% | | 9/15/16 | | | 670 | | | 680 | |
MacDermid, Incorporated | | | | 9.125% | | 7/15/11 | | | 1,067 | | | 1,112 | |
Westlake Chemical Corporation | | | | 6.625% | | 1/15/16 | | | 1,255 | | | 1,192 | |
| | | | | | | | | | | | | |
| | | | | | | | | | | | 5,922 | |
| | | | | | | | | | | | | |
Computer Services and Systems | | 0.5% | | | | | | | | | | | |
Electronic Data Systems Corporation | | | | 7.125% | | 10/15/09 | | | 19,905 | | | 20,819 | |
International Business Machines Corporation | | | | 5.364% | | 6/28/07 | | | 25,500 | | | 25,513 | C |
International Business Machines Corporation | | | | 4.750% | | 11/29/12 | | | 40 | | | 39 | |
SunGard Data Systems Inc. | | | | 9.125% | | 8/15/13 | | | 1,640 | | | 1,698 | |
| | | | | | | | | | | | | |
| | | | | | | | | | | | 48,069 | |
| | | | | | | | | | | | | |
Containers and Packaging | | N.M. | | | | | | | | | | | |
Horizon Lines, LLC | | | | 9.000% | | 11/1/12 | | | 855 | | | 881 | |
| | | | | | | | | | | | | |
| | | | | |
Diversified Financial Services | | 0.8% | | | | | | | | | | | |
Aig-Fp Matched Funding | | | | 5.320% | | 12/17/07 | | | 32,700 | | | 32,700 | A,C |
American General Finance Corporation (AGFC) | | | | 5.498% | | 6/27/08 | | | 18,300 | | | 18,339 | C |
CIT Group Inc. | | | | 5.750% | | 9/25/07 | | | 80 | | | 80 | |
Citigroup Inc. | | | | 5.000% | | 3/6/07 | | | 500 | | | 499 | B |
Citigroup Inc. | | | | 5.100% | | 9/29/11 | | | 2,790 | | | 2,782 | |
Citigroup Inc. | | | | 5.000% | | 9/15/14 | | | 150 | | | 146 | |
General Electric Capital Corporation | | | | 5.450% | | 1/15/13 | | | 225 | | | 228 | |
Mizuho Preferred Capital Corp. LLC | | | | 8.790% | | 12/29/49 | | | 3,380 | | | 3,560 | A,D |
PHH Corporation | | | | 7.125% | | 3/1/13 | | | 8,100 | | | 8,326 | |
U.S. Bancorp | | | | 3.125% | | 3/15/08 | | | 8,290 | | | 8,051 | |
Wells Fargo & Company | | | | 5.000% | | 11/15/14 | | | 2,750 | | | 2,684 | |
| | | | | | | | | | | | | |
| | | | | | | | | | | | 77,395 | |
| | | | | | | | | | | | | |
85
Semi-Annual Report to Shareholders
Portfolio of Investments—Continued
Western Asset Core Plus Bond Portfolio—Continued
| | | | | | | | | | | | | |
| | | % OF
NET ASSETS | | RATE | | MATURITY
DATE | | PAR | | VALUE | |
| | | | | | | | | | | | | |
Corporate Bonds and Notes—Continued | | | | | | | | | | | | | |
| | | | | |
Electric | | 1.5% | | | | | | | | | | | |
Dominion Resources, Inc. | | | | 4.125% | | 2/15/08 | | $ | 2,000 | | $ | 1,968 | |
Dominion Resources, Inc. | | | | 5.125% | | 12/15/09 | | | 1,260 | | | 1,252 | |
Dominion Resources, Inc. | | | | 4.750% | | 12/15/10 | | | 1,010 | | | 985 | |
Dominion Resources, Inc. | | | | 5.700% | | 9/17/12 | | | 3,335 | | | 3,355 | B |
FirstEnergy Corp. | | | | 5.500% | | 11/15/06 | | | 9,348 | | | 9,347 | |
FirstEnergy Corp. | | | | 6.450% | | 11/15/11 | | | 2,500 | | | 2,608 | |
FirstEnergy Corp. | | | | 7.375% | | 11/15/31 | | | 17,150 | | | 19,828 | |
General Electric Company | | | | 5.000% | | 2/1/13 | | | 8,205 | | | 8,112 | |
Niagara Mohawk Power Corporation | | | | 7.750% | | 10/1/08 | | | 500 | | | 522 | |
The AES Corporation | | | | 8.750% | | 5/15/13 | | | 18,838 | | | 20,204 | A |
The AES Corporation | | | | 7.750% | | 3/1/14 | | | 63,005 | | | 65,525 | |
The AES Corporation | | | | 9.000% | | 5/15/15 | | | 7,700 | | | 8,297 | A |
The Cleveland Electric Illuminating Company | | | | 5.650% | | 12/15/13 | | | 1,495 | | | 1,495 | |
The Detroit Edison Company | | | | 5.200% | | 10/15/12 | | | 10 | | | 10 | |
TXU Electric Delivery Company | | | | 6.375% | | 1/15/15 | | | 125 | | | 129 | |
| | | | | | | | | | | | | |
| | | | | | | | | | | | 143,637 | |
| | | | | | | | | | | | | |
Energy | | 0.4% | | | | | | | | | | | |
Duke Energy Corporation | | | | 6.250% | | 1/15/12 | | | 50 | | | 52 | |
Exelon Corporation | | | | 5.625% | | 6/15/35 | | | 7,510 | | | 7,091 | |
MidAmerican Energy Holdings Company | | | | 5.875% | | 10/1/12 | | | 30 | | | 31 | |
Pacific Gas and Electric Company | | | | 6.050% | | 3/1/34 | | | 4,480 | | | 4,506 | |
Peabody Energy Corporation | | | | 6.875% | | 3/15/13 | | | 860 | | | 847 | |
Peabody Energy Corporation | | | | 5.875% | | 4/15/16 | | | 880 | | | 807 | |
Progress Energy, Inc. | | | | 7.100% | | 3/1/11 | | | 110 | | | 118 | |
TXU Corp. | | | | 4.800% | | 11/15/09 | | | 7,760 | | | 7,563 | |
TXU Corp. | | | | 5.550% | | 11/15/14 | | | 560 | | | 529 | |
TXU Corp. | | | | 6.550% | | 11/15/34 | | | 14,425 | | | 13,587 | |
TXU Energy Co. | | | | 7.000% | | 3/15/13 | | | 10 | | | 10 | |
| | | | | | | | | | | | | |
| | | | | | | | | | | | 35,141 | |
| | | | | | | | | | | | | |
Environmental Services | | 0.4% | | | | | | | | | | | |
Waste Management, Inc. | | | | 7.000% | | 10/15/06 | | | 5,330 | | | 5,332 | |
Waste Management, Inc. | | | | 7.125% | | 10/1/07 | | | 10,940 | | | 11,082 | |
Waste Management, Inc. | | | | 6.500% | | 11/15/08 | | | 4,340 | | | 4,444 | |
Waste Management, Inc. | | | | 6.875% | | 5/15/09 | | | 8,000 | | | 8,312 | |
Waste Management, Inc. | | | | 7.375% | | 8/1/10 | | | 6,055 | | | 6,490 | |
Waste Management, Inc. | | | | 7.125% | | 12/15/17 | | | 500 | | | 554 | |
Waste Management, Inc. | | | | 7.000% | | 7/15/28 | | | 3,010 | | | 3,295 | |
Waste Management, Inc. | | | | 7.375% | | 5/15/29 | | | 80 | | | 92 | |
Waste Management, Inc. | | | | 7.750% | | 5/15/32 | | | 1,290 | | | 1,547 | |
| | | | | | | | | | | | | |
| | | | | | | | | | | | 41,148 | |
| | | | | | | | | | | | | |
86
Semi-Annual Report to Shareholders
| | | | | | | | | | | | | |
| | | % OF
NET ASSETS | | RATE | | MATURITY
DATE | | PAR | | VALUE | |
| | | | | | | | | | | | | |
Corporate Bonds and Notes—Continued | | | | | | | | | | | | | |
| | | | | |
Food, Beverage and Tobacco | | 0.5% | | | | | | | | | | | |
Altria Group, Inc. | | | | 7.000% | | 11/4/13 | | $ | 5,525 | | $ | 6,024 | |
Altria Group, Inc. | | | | 7.750% | | 1/15/27 | | | 5,000 | | | 6,054 | |
Reynolds American Inc. | | | | 7.875% | | 5/15/09 | | | 730 | | | 762 | A |
Sara Lee Corporation | | | | 6.250% | | 9/15/11 | | | 18,680 | | | 19,135 | |
Sara Lee Corporation | | | | 3.875% | | 6/15/13 | | | 20 | | | 18 | |
SUPERVALU INC. | | | | 7.875% | | 8/1/09 | | | 10,770 | | | 11,163 | |
| | | | | | | | | | | | | |
| | | | | | | | | | | | 43,156 | |
| | | | | | | | | | | | | |
Funeral Parlors and Cemeteries | | N.M. | | | | | | | | | | | |
Service Corporation International | | | | 7.375% | | 10/1/14 | | | 155 | | | 156 | A |
Service Corporation International | | | | 8.000% | | 6/15/17 | | | 1,510 | | | 1,446 | A |
Service Corporation International | | | | 7.625% | | 10/1/18 | | | 235 | | | 236 | A |
| | | | | | | | | | | | | |
| | | | | | | | | | | | 1,838 | |
| | | | | | | | | | | | | |
Gaming | | N.M. | | | | | | | | | | | |
Mohegan Tribal Gaming Authority | | | | 8.000% | | 4/1/12 | | | 245 | | | 253 | |
River Rock Entertainment Authority | | | | 9.750% | | 11/1/11 | | | 220 | | | 234 | |
| | | | | | | | | | | | | |
| | | | | | | | | | | | 487 | |
| | | | | | | | | | | | | |
Gas and Pipeline Utilities | | 0.4% | | | | | | | | | | | |
Dynegy Holdings Inc. | | | | 8.750% | | 2/15/12 | | | 3,280 | | | 3,399 | |
Kinder Morgan Energy Partners, L.P. | | | | 7.125% | | 3/15/12 | | | 7,565 | | | 8,020 | |
Kinder Morgan Energy Partners, L.P. | | | | 5.000% | | 12/15/13 | | | 1,804 | | | 1,713 | |
Southern Natural Gas Company | | | | 8.000% | | 3/1/32 | | | 8,940 | | | 9,884 | |
The Williams Companies, Inc. | | | | 7.750% | | 6/15/31 | | | 530 | | | 530 | B |
The Williams Companies, Inc. | | | | 8.750% | | 3/15/32 | | | 10,130 | | | 11,093 | |
| | | | | | | | | | | | | |
| | | | | | | | | | | | 34,639 | |
| | | | | | | | | | | | | |
Health Care | | 0.5% | | | | | | | | | | | |
Tenet Healthcare Corporation | | | | 6.375% | | 12/1/11 | | | 2,500 | | | 2,197 | B |
Tenet Healthcare Corporation | | | | 7.375% | | 2/1/13 | | | 6,222 | | | 5,607 | B |
Tenet Healthcare Corporation | | | | 9.875% | | 7/1/14 | | | 27,435 | | | 27,332 | B |
Tenet Healthcare Corporation | | | | 9.250% | | 2/1/15 | | | 12,430 | | | 11,964 | |
| | | | | | | | | | | | | |
| | | | | | | | | | | | 47,100 | |
| | | | | | | | | | | | | |
Homebuilding | | 0.3% | | | | | | | | | | | |
Beazer Homes USA, Inc. | | | | 8.375% | | 4/15/12 | | | 210 | | | 209 | |
Centex Corporation | | | | 5.450% | | 8/15/12 | | | 9,500 | | | 9,275 | |
D. R. Horton, Inc. | | | | 6.875% | | 5/1/13 | | | 5,400 | | | 5,516 | |
Lennar Corporation | | | | 5.950% | | 10/17/11 | | | 6,300 | | | 6,300 | A |
Pulte Homes, Inc. | | | | 5.250% | | 1/15/14 | | | 7,000 | | | 6,629 | |
| | | | | | | | | | | | | |
| | | �� | | | | | | | | | 27,929 | |
| | | | | | | | | | | | | |
87
Semi-Annual Report to Shareholders
Portfolio of Investments—Continued
Western Asset Core Plus Bond Portfolio—Continued
| | | | | | | | | | | | | |
| | | % OF
NET ASSETS | | RATE | | MATURITY
DATE | | PAR | | VALUE | |
| | | | | | | | | | | | | |
Corporate Bonds and Notes—Continued | | | | | | | | | | | | | |
| | | | | |
Insurance | | N.M. | | | | | | | | | | | |
Loews Corporation | | | | 8.875% | | 4/15/11 | | $ | 90 | | $ | 101 | |
| | | | | | | | | | | | | |
| | | | | |
Investment Banking/Brokerage | | 1.4% | | | | | | | | | | | |
E*TRADE Financial Corporation | | | | 7.375% | | 9/15/13 | | | 590 | | | 603 | |
J.P. Morgan Capital Trust II | | | | 7.950% | | 2/1/27 | | | 20 | | | 21 | |
J.P. Morgan Chase & Co. | | | | 5.750% | | 1/2/13 | | | 4,430 | | | 4,530 | |
JPMorgan Chase & Co. | | | | 6.750% | | 2/1/11 | | | 10 | | | 11 | |
JPMorgan Chase & Co. | | | | 5.600% | | 6/1/11 | | | 140 | | | 142 | |
Lehman Brothers Holdings Inc. | | | | 5.370% | | 6/26/07 | | | 28,000 | | | 28,003 | C |
Lehman Brothers Holdings Inc. | | | | 4.000% | | 1/22/08 | | | 6,840 | | | 6,731 | |
Lehman Brothers Holdings Inc. | | | | 7.000% | | 2/1/08 | | | 160 | | | 163 | |
Merrill Lynch & Co., Inc. | | | | 5.365% | | 5/29/07 | | | 16,700 | | | 16,701 | C |
Merrill Lynch & Co., Inc. | | | | 3.375% | | 9/14/07 | | | 3,130 | | | 3,075 | |
Merrill Lynch & Co., Inc. | | | | 3.125% | | 7/15/08 | | | 3,115 | | | 3,004 | |
Merrill Lynch & Co., Inc. | | | | 5.489% | | 8/22/08 | | | 42,800 | | | 42,838 | C |
Merrill Lynch & Co., Inc. | | | | 6.375% | | 10/15/08 | | | 2,670 | | | 2,727 | |
Morgan Stanley | | | | 5.550% | | 11/24/06 | | | 1,600 | | | 1,601 | C |
Morgan Stanley | | | | 5.623% | | 1/18/08 | | | 12,000 | | | 12,020 | C |
Morgan Stanley | | | | 3.625% | | 4/1/08 | | | 90 | | | 88 | |
Morgan Stanley | | | | 4.750% | | 4/1/14 | | | 3,700 | | | 3,519 | |
The Goldman Sachs Group, Inc. | | | | 6.600% | | 1/15/12 | | | 2,810 | | | 2,965 | |
The Goldman Sachs Group, Inc. | | | | 4.750% | | 7/15/13 | | | 1,420 | | | 1,364 | |
| | | | | | | | | | | | | |
| | | | | | | | | | | | 130,106 | |
| | | | | | | | | | | | | |
Investment Management | | N.M. | | | | | | | | | | | |
Dryden Investor Trust | | | | 7.157% | | 7/23/08 | | | 1,454 | | | 1,478 | |
| | | | | | | | | | | | | |
| | | | | |
Lodging/Hotels | | 0.1% | | | | | | | | | | | |
Host Marriott LP | | | | 6.750% | | 6/1/16 | | | 2,055 | | | 2,027 | |
Starwood Hotels & Resorts Worldwide, Inc. | | | | 7.375% | | 5/1/07 | | | 890 | | | 895 | |
Starwood Hotels & Resorts Worldwide, Inc. | | | | 7.875% | | 5/1/12 | | | 10,700 | | | 11,235 | |
| | | | | | | | | | | | | |
| | | | | | | | | | | | 14,157 | |
| | | | | | | | | | | | | |
Machinery | | N.M. | | | | | | | | | | | |
Terex Corporation | | | | 7.375% | | 1/15/14 | | | 1,734 | | | 1,743 | |
| | | | | | | | | | | | | |
| | | | | |
Manufacturing (Diversified) | | N.M. | | | | | | | | | | | |
American Achievement Corp. | | | | 8.250% | | 4/1/12 | | | 250 | | | 253 | |
Jacuzzi Brands Incorporated | | | | 9.625% | | 7/1/10 | | | 200 | | | 212 | |
88
Semi-Annual Report to Shareholders
| | | | | | | | | | | | | |
| | | % OF
NET ASSETS | | RATE | | MATURITY
DATE | | PAR | | VALUE | |
| | | | | | | | | | | | | |
Corporate Bonds and Notes—Continued | | | | | | | | | | | | | |
| | | | | |
Manufacturing (Diversified)—Continued | | | | | | | | | | | | | |
Procter & Gamble Company | | | | 8.500% | | 8/10/09 | | $ | 90 | | $ | 98 | |
The Gillette Company | | | | 2.500% | | 6/1/08 | | | 160 | | | 153 | |
| | | | | | | | | | | | | |
| | | | | | | | | | | | 716 | |
| | | | | | | | | | | | | |
Media | | 0.7% | | | | | | | | | | | |
Clear Channel Communications, Inc. | | | | 4.625% | | 1/15/08 | | | 165 | | | 163 | |
Clear Channel Communications, Inc. | | | | 4.250% | | 5/15/09 | | | 2,760 | | | 2,667 | |
Clear Channel Communications, Inc. | | | | 6.250% | | 3/15/11 | | | 5,450 | | | 5,467 | |
Clear Channel Communications, Inc. | | | | 5.500% | | 9/15/14 | | | 8,050 | | | 7,479 | |
Lamar Media Corporation | | | | 7.250% | | 1/1/13 | | | 1,459 | | | 1,468 | |
Lamar Media Corporation | | | | 6.625% | | 8/15/15 | | | 1,990 | | | 1,908 | A |
Liberty Media Corporation | | | | 5.700% | | 5/15/13 | | | 535 | | | 505 | B |
Liberty Media Corporation | | | | 3.750% | | 2/15/30 | | | 170 | | | 106 | E |
News America, Inc. | | | | 6.200% | | 12/15/34 | | | 1,300 | | | 1,242 | |
News America, Inc. | | | | 6.750% | | 1/9/38 | | | 200 | | | 207 | |
Readers Digest Association, Inc. | | | | 6.500% | | 3/1/11 | | | 460 | | | 437 | |
Sinclair Broadcast Group, Inc. | | | | 8.000% | | 3/15/12 | | | 360 | | | 365 | |
Time Warner Inc. | | | | 6.875% | | 5/1/12 | | | 5,850 | | | 6,186 | |
Time Warner Inc. | | | | 7.625% | | 4/15/31 | | | 440 | | | 486 | |
Time Warner Inc. | | | | 7.700% | | 5/1/32 | | | 15,350 | | | 17,142 | |
Viacom Inc. | | | | 5.750% | | 4/30/11 | | | 17,794 | | | 17,758 | A |
Viacom Inc. | | | | 5.625% | | 8/15/12 | | | 1,350 | | | 1,335 | |
| | | | | | | | | | | | | |
| | | | | | | | | | | | 64,921 | |
| | | | | | | | | | | | | |
Medical Care Facilities | | 0.2% | | | | | | | | | | | |
DaVita, Inc. | | | | 7.250% | | 3/15/15 | | | 1,270 | | | 1,248 | B |
HCA, Inc. | | | | 8.750% | | 9/1/10 | | | 256 | | | 259 | |
HCA, Inc. | | | | 6.300% | | 10/1/12 | | | 593 | | | 502 | |
HCA, Inc. | | | | 5.750% | | 3/15/14 | | | 150 | | | 118 | |
HCA, Inc. | | | | 6.500% | | 2/15/16 | | | 4,328 | | | 3,462 | B |
HCA, Inc. | | | | 7.690% | | 6/15/25 | | | 723 | | | 564 | |
HCA, Inc. | | | | 7.500% | | 11/6/33 | | | 14,640 | | | 11,419 | |
Health Care REIT, Inc. | | | | 8.000% | | 9/12/12 | | | 128 | | | 141 | |
| | | | | | | | | | | | | |
| | | | | | | | | | | | 17,713 | |
| | | | | | | | | | | | | |
Medical Products | | N.M. | | | | | | | | | | | |
Fresenius Medical Care Capital Trust II | | | | 7.875% | | 2/1/08 | | | 938 | | | 954 | F |
Fresenius Medical Care Capital Trust IV | | | | 7.875% | | 6/15/11 | | | 681 | | | 699 | |
| | | | | | | | | | | | | |
| | | | | | | | | | | | 1,653 | |
| | | | | | | | | | | | | |
89
Semi-Annual Report to Shareholders
Portfolio of Investments—Continued
Western Asset Core Plus Bond Portfolio—Continued
| | | | | | | | | | | | | |
| | | % OF
NET ASSETS | | RATE | | MATURITY
DATE | | PAR | | VALUE | |
| | | | | | | | | | | | | |
Corporate Bonds and Notes—Continued | | | | | | | | | | | | | |
| | | | | |
Oil and Gas | | 1.7% | | | | | | | | | | | |
Amerigas Partners, L.P. | | | | 7.250% | | 5/20/15 | | $ | 990 | | $ | 986 | |
Anadarko Petroleum Corporation | | | | 5.790% | | 9/15/09 | | | 21,500 | | | 21,526 | C |
Anadarko Petroleum Corporation | | | | 6.450% | | 9/15/36 | | | 35,090 | | | 35,842 | |
Apache Corporation | | | | 6.250% | | 4/15/12 | | | 1,280 | | | 1,335 | |
Chesapeake Energy Corporation | | | | 6.375% | | 6/15/15 | | | 195 | | | 186 | |
Chesapeake Energy Corporation | | | | 6.250% | | 1/15/18 | | | 1,970 | | | 1,827 | |
Conoco Inc. | | | | 6.950% | | 4/15/29 | | | 10,193 | | | 11,755 | |
ConocoPhillips | | | | 8.750% | | 5/25/10 | | | 3,100 | | | 3,462 | |
ConocoPhillips | | | | 4.750% | | 10/15/12 | | | 1,130 | | | 1,107 | |
ConocoPhillips | | | | 5.900% | | 10/15/32 | | | 10 | | | 10 | B |
Devon Energy Corporation | | | | 7.950% | | 4/15/32 | | | 5,615 | | | 6,934 | |
El Paso Corporation | | | | 7.800% | | 8/1/31 | | | 8,230 | | | 8,436 | B |
El Paso Corporation | | | | 7.750% | | 1/15/32 | | | 9,560 | | | 9,799 | B |
El Paso Natural Gas Company | | | | 8.375% | | 6/15/32 | | | 1,310 | | | 1,500 | |
Hess Corporation | | | | 7.875% | | 10/1/29 | | | 2,280 | | | 2,695 | |
Hess Corporation | | | | 7.300% | | 8/15/31 | | | 14,515 | | | 16,344 | |
Kerr-McGee Corporation | | | | 6.875% | | 9/15/11 | | | 800 | | | 847 | |
Kerr-McGee Corporation | | | | 7.875% | | 9/15/31 | | | 8,000 | | | 9,671 | |
Pacific Energy Partners | | | | 7.125% | | 6/15/14 | | | 630 | | | 643 | |
Pemex Project Funding Master Trust | | | | 5.991% | | 12/3/12 | | | 117 | | | 117 | A,C |
Pemex Project Funding Master Trust | | | | 6.625% | | 6/15/35 | | | 16,845 | | | 16,550 | A |
Plains Exploration & Production Company | | | | 7.125% | | 6/15/14 | | | 1,010 | | | 1,055 | B |
Pogo Producing Company | | | | 6.875% | | 10/1/17 | | | 850 | | | 811 | |
Pride International, Inc. | | | | 7.375% | | 7/15/14 | | | 1,440 | | | 1,483 | |
Seariver Maritime Inc. | | | | 0.000% | | 9/1/12 | | | 70 | | | 53 | G |
Suburban Propane Partners LP | | | | 6.875% | | 12/15/13 | | | 1,990 | | | 1,920 | |
Vintage Petroleum, Inc. | | | | 8.250% | | 5/1/12 | | | 661 | | | 698 | |
XTO Energy, Inc. | | | | 7.500% | | 4/15/12 | | | 691 | | | 753 | |
XTO Energy, Inc. | | | | 6.250% | | 4/15/13 | | | 2,317 | | | 2,390 | |
| | | | | | | | | | | | | |
| | | | | | | | | | | | 160,735 | |
| | | | | | | | | | | | | |
Paper and Forest Products | | 0.1% | | | | | | | | | | | |
Georgia-Pacific Corp. | | | | 8.125% | | 5/15/11 | | | 9 | | | 9 | |
Georgia-Pacific Corp. | | | | 7.700% | | 6/15/15 | | | 176 | | | 175 | |
Weyerhaeuser Company | | | | 6.750% | | 3/15/12 | | | 5,775 | | | 6,036 | |
| | | | | | | | | | | | | |
| | | | | | | | | | | | 6,220 | |
| | | | | | | | | | | | | |
90
Semi-Annual Report to Shareholders
| | | | | | | | | | | | | |
| | | % OF
NET ASSETS | | RATE | | MATURITY
DATE | | PAR | | VALUE | |
| | | | | | | | | | | | | |
Corporate Bonds and Notes—Continued | | | | | | | | | | | | | |
| | | | | |
Pharmaceuticals | | 0.2% | | | | | | | | | | | |
AmerisourceBergen Corporation | | | | 5.875% | | 9/15/15 | | $ | 7,070 | | $ | 6,931 | |
Bristol-Myers Squibb Company | | | | 5.750% | | 10/1/11 | | | 8,840 | | | 9,005 | |
Omnicare, Inc. | | | | 6.875% | | 12/15/15 | | | 709 | | | 689 | |
| | | | | | | | | | | | | |
| | | | | | | | | | | | 16,625 | |
| | | | | | | | | | | | | |
Photo Equipment and Supplies | | 0.4% | | | | | | | | | | | |
Eastman Kodak Company | | | | 3.625% | | 5/15/08 | | | 1,430 | | | 1,373 | B |
Eastman Kodak Company | | | | 7.250% | | 11/15/13 | | | 21,284 | | | 20,783 | |
Eastman Kodak Company | | | | 3.375% | | 10/15/33 | | | 12,820 | | | 12,532 | B |
| | | | | | | | | | | | | |
| | | | | | | | | | | | 34,688 | |
| | | | | | | | | | | | | |
Printing and Copying Services | | N.M. | | | | | | | | | | | |
Xerox Corporation | | | | 6.750% | | 2/1/17 | | | 1,630 | | | 1,654 | |
| | | | | | | | | | | | | |
| | | | | |
Real Estate Management and Development | | N.M. | | | | | | | | | | | |
Forest City Enterprises, Inc. | | | | 7.625% | | 6/1/15 | | | 360 | | | 367 | |
Forest City Enterprises, Inc. | | | | 6.500% | | 2/1/17 | | | 597 | | | 561 | |
Ventas, Inc. | | | | 8.750% | | 5/1/09 | | | 770 | | | 819 | |
Ventas, Inc. | | | | 6.750% | | 6/1/10 | | | 800 | | | 814 | |
Ventas, Inc. | | | | 9.000% | | 5/1/12 | | | 440 | | | 491 | |
Ventas, Inc. | | | | 6.625% | | 10/15/14 | | | 50 | | | 50 | |
Ventas, Inc. | | | | 7.125% | | 6/1/15 | | | 800 | | | 823 | |
| | | | | | | | | | | | | |
| | | | | | | | | | | | 3,925 | |
| | | | | | | | | | | | | |
Rental and Lease Services | | 0.2% | | | | | | | | | | | |
Hertz Corporation | | | | 8.875% | | 1/1/14 | | | 1,435 | | | 1,503 | A |
International Lease Finance Corporation | | | | 5.750% | | 6/15/11 | | | 12,700 | | | 12,935 | |
| | | | | | | | | | | | | |
| | | | | | | | | | | | 14,438 | |
| | | | | | | | | | | | | |
Retail | | 0.1% | | | | | | | | | | | |
J.C. Penney Company, Inc. | | | | 7.400% | | 4/1/37 | | | 690 | | | 747 | B |
Target Corporation | | | | 4.000% | | 6/15/13 | | | 5,340 | | | 4,961 | B |
Wal-Mart Stores, Inc. | | | | 4.125% | | 2/15/11 | | | 3,160 | | | 3,042 | B |
| | | | | | | | | | | | | |
| | | | | | | | | | | | 8,750 | |
| | | | | | | | | | | | | |
Special Purpose | | 1.3% | | | | | | | | | | | |
AAC Group Holding Corp. | | | | 0.000% | | 10/1/12 | | | 770 | | | 639 | D |
Air 2 US Series A | | | | 8.027% | | 10/1/19 | | | 7,870 | | | 7,910 | A |
ASIF Global Financing XIX | | | | 4.900% | | 1/17/13 | | | 2,180 | | | 2,130 | A |
DaimlerChrysler North America Holding Corporation | | | | 4.050% | | 6/4/08 | | | 610 | | | 596 | |
91
Semi-Annual Report to Shareholders
Portfolio of Investments—Continued
Western Asset Core Plus Bond Portfolio—Continued
| | | | | | | | | | | | | |
| | | % OF
NET ASSETS | | RATE | | MATURITY
DATE | | PAR | | VALUE | |
| | | | | | | | | | | | | |
Corporate Bonds and Notes—Continued | | | | | | | | | | | | | |
| | | | | |
Special Purpose—Continued | | | | | | | | | | | | | |
DaimlerChrysler North America Holding Corporation | | | | 7.200% | | 9/1/09 | | $ | 620 | | $ | 646 | |
DaimlerChrysler North America Holding Corporation | | | | 5.875% | | 3/15/11 | | | 500 | | | 501 | |
DaimlerChrysler North America Holding Corporation | | | | 7.300% | | 1/15/12 | | | 3,315 | | | 3,523 | |
DaimlerChrysler North America Holding Corporation | | | | 6.500% | | 11/15/13 | | | 1,290 | | | 1,323 | |
Di Finance Corporation | | | | 9.500% | | 2/15/13 | | | 1,004 | | | 1,039 | |
El Paso Performance Linked Trust | | | | 7.750% | | 7/15/11 | | | 26,120 | | | 26,838 | A |
Entercom Capital Inc. | | | | 7.625% | | 3/1/14 | | | 795 | | | 776 | |
Hexion U.S. Finance Corp./ Hexion Nova Scotia Finance, ULC | | | | 9.000% | | 7/15/14 | | | 790 | | | 806 | |
ILFC E-Capital Trust I | | | | 5.900% | | 12/21/65 | | | 7,880 | | | 7,938 | A,D |
ILFC E-Capital Trust II | | | | 6.250% | | 12/21/65 | | | 1,800 | | | 1,800A,D | |
John Deere Capital Corporation | | | | 7.000% | | 3/15/12 | | | 80 | | | 86 | |
Patrons’ Legacy 2003 IV | | | | 5.775% | | 1/23/17 | | | 7,900 | | | 7,925 | A |
Philip Morris Capital Corporation | | | | 7.500% | | 7/16/09 | | | 190 | | | 198 | |
Rabobank Capital Funding Trust II | | | | 5.260% | | 12/31/49 | | | 590 | | | 577 | A,D |
Rabobank Capital Funding Trust III | | | | 5.254% | | 12/29/49 | | | 4,140 | | | 3,996 | A,D |
Sprint Capital Corporation | | | | 6.000% | | 1/15/07 | | | 16,370 | | | 16,388 | |
Sprint Capital Corporation | | | | 6.125% | | 11/15/08 | | | 130 | | | 132 | |
Sprint Capital Corporation | | | | 8.375% | | 3/15/12 | | | 13,945 | | | 15,629 | |
TCI Communications Financing III | | | | 9.650% | | 3/31/27 | | | 1,480 | | | 1,572 | |
Texaco Capital Inc. | | | | 5.500% | | 1/15/09 | | | 1,600 | | | 1,619 | |
Toll Brothers Finance Corp | | | | 5.950% | | 9/15/13 | | | 12,700 | | | 12,151 | |
UGS Corporation | | | | 10.000% | | 6/1/12 | | | 400 | | | 432 | |
Unilever Capital Corporation | | | | 7.125% | | 11/1/10 | | | 1,450 | | | 1,549 | |
Verizon Global Funding Corp. | | | | 7.375% | | 9/1/12 | | | 5 | | | 6 | |
| | | | | | | | | | | | | |
| | | | | | | | | | | | 118,725 | |
| | | | | | | | | | | | | |
Telecommunications | | 0.2% | | | | | | | | | | | |
AT&T Inc. | | | | 5.100% | | 9/15/14 | | | 8,630 | | | 8,338 | |
BellSouth Corporation | | | | 4.750% | | 11/15/12 | | | 640 | | | 611 | |
Cincinnati Bell Inc | | | | 7.000% | | 2/15/15 | | | 2,257 | | | 2,212 | |
Citizens Communications Company | | | | 9.250% | | 5/15/11 | | | 530 | | | 584 | |
Qwest Corporation | | | | 7.500% | | 10/1/14 | | | 4,140 | | | 4,275 | A |
Windstream Corporation | | | | 8.625% | | 8/1/16 | | | 875 | | | 936 | A |
| | | | | | | | | | | | | |
| | | | | | | | | | | | 16,956 | |
| | | | | | | | | | | | | |
92
Semi-Annual Report to Shareholders
| | | | | | | | | | | | | |
| | | % OF
NET ASSETS | | RATE | | MATURITY
DATE | | PAR | | VALUE | |
| | | | | | | | | | | | | |
Corporate Bonds and Notes—Continued | | | | | | | | | | | | | |
| | | | | |
Telecommunications (Cellular/Wireless) | | N.M. | | | | | | | | | | | |
Nextel Communications, Inc. | | | | 5.950% | | 3/15/14 | | $ | 493 | | $ | 482 | |
Nextel Communications, Inc. | | | | 7.375% | | 8/1/15 | | | 1,980 | | | 2,043 | |
| | | | | | | | | | | | | |
| | | | | | | | | | | | 2,525 | |
| | | | | | | | | | | | | |
Transportation | | 0.2% | | | | | | | | | | | |
Continental Airlines, Inc. | | | | 6.545% | | 8/2/20 | | | 8,191 | | | 8,332 | |
Delta Air Lines, Inc. | | | | 6.619% | | 9/18/12 | | | 1,386 | | | 1,385 | |
Norfolk Southern Corporation | | | | 6.200% | | 4/15/09 | | | 20 | | | 21 | |
Northwest Airlines Inc. | | | | 5.960% | | 2/6/15 | | | 1,725 | | | 1,673 | |
United Air Lines, Inc. | | | | 6.602% | | 3/1/15 | | | 7,888 | | | 7,908 | |
| | | | | | | | | | | | | |
| | | | | | | | | | | | 19,319 | |
| | | | | | | | | | | | | |
Total Corporate Bonds and Notes
(Identified Cost—$1,724,168) | | | | | | | | | | | | 1,725,325 | |
Asset-Backed Securities | | 1.6% | | | | | | | | | | | |
| | | | | |
Fixed Rate Securities | | 0.2% | | | | | | | | | | | |
Bay View Auto Trust 2003-LJ1 | | | | 3.440% | | 4/25/12 | | | 189 | | | 184 | |
Conseco Finance Securitizations Corp. 2000-4 | | | | 8.310% | | 5/1/32 | | | 2,200 | | | 1,844 | |
Contimortgage Home Equity Loan Trust 1997-4 | | | | 7.330% | | 10/15/28 | | | 1,319 | | | 1,069 | |
Green Tree Financial Corporation 1992-2 | | | | 9.150% | | 1/15/18 | | | 267 | | | 231 | |
Green Tree Financial Corporation 1993-2 | | | | 8.000% | | 7/15/18 | | | 769 | | | 751 | |
Green Tree Financial Corporation 1996-5 | | | | 8.100% | | 7/15/27 | | | 3,973 | | | 830 | |
Green Tree Home Improvement Loan Trust 1996-A | | | | 7.400% | | 2/15/26 | | | 463 | | | 415 | |
Lehman ABS Manufactured Housing Contract 2001-B A3 | | | | 4.350% | | 5/15/14 | | | 3,956 | | | 3,783 | |
Lehman ABS Manufactured Housing Contract 2001-B A6 | | | | 6.467% | | 8/15/28 | | | 2,974 | | | 3,035 | |
Pegasus Aviation Lease Securitization 2000-1 | | | | 8.370% | | 3/25/30 | | | 2,500 | | | 1,575 | A |
Residential Asset Mortgage Products, Inc. 2004-SL4 | | | | 7.500% | | 7/25/32 | | | 2,294 | | | 2,336 | |
UCFC Home Equity Loan Trust 1998-C | | | | 5.935% | | 1/15/30 | | | 21 | | | 20 | |
Vanderbilt Mortgage Finance 1996-A | | | | 8.150% | | 5/7/26 | | | 457 | | | 461 | |
Vanderbilt Mortgage Finance 1997-B | | | | 8.155% | | 10/7/26 | | | 231 | | | 238 | |
Vanderbilt Mortgage Finance 1997-C | | | | 7.830% | | 8/7/27 | | | 500 | | | 517 | |
| | | | | | | | | | | | | |
| | | | | | | | | | | | 17,289 | |
| | | | | | | | | | | | | |
93
Semi-Annual Report to Shareholders
Portfolio of Investments—Continued
Western Asset Core Plus Bond Portfolio—Continued
| | | | | | | | | | | | | |
| | | % OF
NET ASSETS | | RATE | | MATURITY
DATE | | PAR | | VALUE | |
| | | | | | | | | | | | | |
Asset-Backed Securities—Continued | | | | | | | | | | | | | |
| | | | | |
Indexed SecuritiesC | | 1.2% | | | | | | | | | | | |
AFC Home Equity Loan Trust 2002-2 | | | | 5.624% | | 6/25/30 | | $ | 626 | | $ | 628 | |
Asset Backed Securities Corporation Home Equity Loan Trust 2001 HE3 | | | | 5.870% | | 11/15/31 | | | 470 | | | 471 | |
Bayview Financial Acquisition Trust 2003-G | | | | 5.924% | | 1/28/39 | | | 3,300 | | | 3,300 | |
Bear Stearns Asset Backed Securities Series 2005-CL1 | | | | 5.830% | | 9/25/34 | | | 14,997 | | | 15,026 | |
Bear Stearns Asset Backed Securities, Inc. 2005-AQ2 | | | | 5.490% | | 9/25/35 | | | 10,431 | | | 10,433 | |
CDC Mortgage Capital Trust 2002-HE1 | | | | 5.640% | | 1/25/33 | | | 798 | | | 798 | |
Citibank Credit Card Issuance Trust 2002-C1 | | | | 6.470% | | 2/9/09 | | | 2,040 | | | 2,046 | |
Countrywide Asset-Backed Certificates 2002-BC1 | | | | 5.990% | | 4/25/32 | | | 250 | | | 250 | |
Countrywide Asset-Backed Certificates 2003-1 | | | | 5.670% | | 6/25/33 | | | 470 | | | 471 | |
Countrywide Asset-Backed Certificates 2003-BC3 | | | | 5.640% | | 9/25/33 | | | 637 | | | 638 | |
Countrywide Home Equity Loan Trust 2002-F | | | | 5.680% | | 11/15/28 | | | 1,089 | | | 1,095 | |
Countrywide Home Equity Loan Trust 2006-RES | | | | 5.590% | | 7/25/36 | | | 1,263 | | | 1,270 | A |
Credit Suisse First Boston Mortgage Securities Corp. 2005-AGE1 | | | | 5.470% | | 2/25/32 | | | 12,751 | | | 12,754 | |
Fannie Mae Grantor Trust 2002-T15 | | | | 5.530% | | 11/26/32 | | | 1,563 | | | 1,563 | |
Fleet Home Equity Loan Trust 2003-1 | | | | 5.580% | | 1/20/33 | | | 6,648 | | | 6,657 | |
Greenpoint Mortgage Funding Trust 2005-HE1 | | | | 5.730% | | 9/25/34 | | | 1,200 | | | 1,204 | |
IndyMac Home Equity Loan Asset-Backed Trust 2001-A | | | | 5.590% | | 3/25/31 | | | 138 | | | 139 | |
Option One Mortgage Loan Trust 2003-1 | | | | 5.750% | | 2/25/33 | | | 17 | | | 17 | |
Popular ABA Morgage Pass-Through Trust 2005-A | | | | 5.430% | | 6/25/35 | | | 2,012 | | | 2,012 | |
Provident Bank Home Equity Loan Trust 2000-2 | | | | 5.600% | | 8/25/31 | | | 443 | | | 444 | |
Renaissance Home Equity Loan Trust 2005-1 | | | | 5.660% | | 5/25/35 | | | 3,000 | | | 3,016 | |
Residential Asset Mortgage Products, Inc. 2003-RS4 | | | | 5.660% | | 5/25/33 | | | 1,783 | | | 1,805 | |
Residential Funding Mortgage Secs II 2003-HS3 | | | | 5.620% | | 8/25/33 | | | 52 | | | 52 | |
Salomon Brothers Mortgage Securities VII 2002-CIT1 | | | | 5.630% | | 3/25/32 | | | 1,226 | | | 1,230 | |
Southern Pacific Secured Assets Corporation 1998-2 | | | | 5.670% | | 7/25/29 | | | 35 | | | 35 | |
Truman Capital Mortgage Loan Trust 2006-1 | | | | 5.660% | | 3/25/36 | | | 39,233 | | | 39,233 | A |
Vanderbilt Mortgage Finance 1999-D | | | | 8.580% | | 1/7/30 | | | 4,100 | | | 4,384 | |
Wachovia Asset Securitization, Inc. 2002-HE1 | | | | 5.700% | | 9/27/32 | | | 1,601 | | | 1,604 | |
Wachovia Asset Securitization, Inc. 2002-HE2 | | | | 5.760% | | 12/25/32 | | | 116 | | | 116 | |
Wachovia Asset Securitization, Inc. 2003-HE1 | | | | 5.620% | | 3/25/33 | | | 52 | | | 52 | |
| | | | | | | | | | | | | |
| | | | | | | | | | | | 112,743 | |
| | | | | | | | | | | | | |
94
Semi-Annual Report to Shareholders
| | | | | | | | | | | | | |
| | | % OF
NET ASSETS | | RATE | | MATURITY
DATE | | PAR | | VALUE | |
| | | | | | | | | | | | | |
Asset-Backed Securities—Continued | | | | | | | | | | | | | |
| | | | | |
Stripped Securities | | N.M. | | | | | | | | | | | |
Diversified REIT Trust 2001-1 | | | | 0.772% | | 3/8/10 | | $ | 12,258 | | $ | 238 | A,H1 |
Oakwood Mortgage Investors Inc. 2001-E | | | | 6.000% | | 11/15/09 | | | 5,398 | | | 729 | A,H1 |
| | | | | | | | | | | | | |
| | | | | | | | | | | | 967 | |
| | | | | | | | | | | | | |
Variable Rate SecuritiesI | | 0.2% | | | | | | | | | | | |
Countrywide Asset-Backed Certificates 2004-15 | | | | 4.614% | | 12/25/32 | | | 11,882 | | | 11,687 | |
Origen Manufactured Housing Contract Trust Series 2005-B | | | | 5.910% | | 1/15/37 | | | 4,797 | | | 4,768 | |
Origen Manufactured Housing Contract Trust Series 2005-B | | | | 5.990% | | 1/15/37 | | | 1,500 | | | 1,486 | |
Origen Manufactured Housing Contract Trust Series 2005-B | | | | 6.480% | | 1/15/37 | | | 2,100 | | | 2,111 | |
| | | | | | | | | | | | | |
| | | | | | | | | | | | 20,052 | |
| | | | | | | | | | | | | |
Total Asset-Backed Securities
(Identified Cost—$151,640) | | | | | | | | | | | | 151,051 | |
Mortgage-Backed Securities | | 16.1% | | | | | | | | | | | |
| | | | | |
Fixed Rate Securities | | 1.2% | | | | | | | | | | | |
Asset Securitization Corporation 1996-D2 | | | | 6.920% | | 2/14/29 | | | 550 | | | 551 | |
Banc of America Funding Corporation 2003-1 | | | | 6.000% | | 5/20/33 | | | 635 | | | 634 | |
Bank One Issuance Trust 2003-C1 C1 | | | | 4.540% | | 9/15/10 | | | 470 | | | 465 | |
Blackrock Capital Finance L.P. 1997-R3 | | | | 7.220% | | 11/25/28 | | | 31 | | | 31 | A |
Commercial Mortgage Pass-Through Certificates, Series 2001-J1A A2 | | | | 6.457% | | 2/16/34 | | | 193 | | | 200 | A |
Criimi Mae Commercial Mortgage Trust 1998-C1 | | | | 7.000% | | 6/2/33 | | | 376 | | | 378 | A |
CS First Boston Mortgage Securities Corp. 1998-C1 A1B | | | | 6.480% | | 5/17/40 | | | 180 | | | 183 | |
GMAC Commercial Mortgage Securities Inc. 1998-C1 | | | | 6.700% | | 5/15/30 | | | 7,508 | | | 7,626 | |
GMAC Commercial Mortgage Securities Inc. 1999-C2 | | | | 6.945% | | 9/15/33 | | | 339 | | | 351 | |
GS Mortgage Securities Corporation II 1998-C1 | | | | 6.620% | | 10/18/30 | | | 4,611 | | | 4,690 | |
GS Mortgage Securities Corporation II 2005-GG4 | | | | 4.680% | | 7/10/39 | | | 18,650 | | | 18,109 | |
J.P. Morgan Chase Commercial Mortgage Securities Corp., 2006-CB15 | | | | 5.814% | | 6/12/43 | | | 2,370 | | | 2,451 | |
J.P. Morgan Chase Commercial Mortgage Securities Corp., Series 2005-CIBC12 | | | | 4.895% | | 9/12/37 | | | 3,000 | | | 2,906 | |
J.P. Morgan Commercial Mortgage Finance Corporation 1999-C8 | | | | 7.400% | | 7/15/31 | | | 1,822 | | | 1,900 | |
95
Semi-Annual Report to Shareholders
Portfolio of Investments—Continued
Western Asset Core Plus Bond Portfolio—Continued
| | | | | | | | | | | | | |
| | | % OF
NET ASSETS | | RATE | | MATURITY
DATE | | PAR | | VALUE | |
| | | | | | | | | | | | | |
Mortgage-Backed Securities—Continued | | | | | | | | | | | | | |
| | | | | |
Fixed Rate Securities—Continued | | | | | | | | | | | | | |
LB-UBS Commercial Mortgage Trust
2000-C3 A2 | | | | 7.950% | | 5/15/25 | | $ | 100 | | $ | 108 | |
LB-UBS Commercial Mortgage Trust
2005-C3 A5 | | | | 4.739% | | 7/15/30 | | | 8,640 | | | 8,289 | |
LB-UBS Commercial Mortgage Trust
2005-C3 AAB | | | | 4.664% | | 7/15/30 | | | 4,100 | | | 3,978 | |
MASTR Reperforming Loan Trust 2005-1 | | | | 6.000% | | 8/25/34 | | | 6,970 | | | 6,991 | A |
MASTR Reperforming Loan Trust 2005-1 | | | | 7.000% | | 8/25/34 | | | 10,177 | | | 10,459 | A |
Morgan Stanley Capital I 2005-HQ6 | | | | 4.989% | | 8/13/42 | | | 21,070 | | | 20,554 | |
Residential Asset Mortgage Products, Inc. 2004-SL2 A4 | | | | 8.500% | | 10/25/31 | | | 344 | | | 359 | |
Residential Asset Mortgage Products, Inc. 2005-SL2 | | | | 7.500% | | 3/25/32 | | | 16,603 | | | 16,987 | |
Residential Asset Securitization Trust 2003-A14 | | | | 4.750% | | 2/25/19 | | | 3,249 | | | 3,139 | |
Structured Asset Securities Corporation 1996-CFL | | | | 7.750% | | 2/25/28 | | | 264 | | | 264 | A |
WEF Issuer LLC Series 2006-A | | | | 5.190% | | 12/15/14 | | | 1,215 | | | 1,211 | A |
| | | | | | | | | | | | | |
| | | | | | | | | | | | 112,814 | |
| | | | | | | | | | | | | |
Indexed SecuritiesC | | 13.7% | | | | | | | | | | | |
American Home Mortgage Assets Trust 2006-3 | | | | 5.330% | | 7/25/36 | | | 32,237 | | | 32,237 | |
American Home Mortgage Investment Trust 2005-4 | | | | 5.620% | | 11/25/45 | | | 28,497 | | | 28,622 | |
Citigroup Mortgage Loan Trust 2005-HE2 | | | | 5.730% | | 5/25/35 | | | 20,759 | | | 20,804 | A |
Citigroup Mortgage Loan Trust, Inc. | | | | 5.480% | | 8/25/35 | | | 327 | | | 328 | |
Countrywide Alternative Loan Trust | | | | 5.680% | | 9/25/35 | | | 34,255 | | | 34,413 | |
Countrywide Alternative Loan Trust
2005-44 1A1 | | | | 5.660% | | 10/25/35 | | | 47,489 | | | 47,593 | |
Countrywide Alternative Loan Trust
2005-44 2A1 | | | | 5.640% | | 10/25/35 | | | 26,626 | | | 26,632 | |
Countrywide Alternative Loan Trust
2005-56 3A1 | | | | 5.620% | | 11/25/35 | | | 33,102 | | | 33,204 | |
Countrywide Alternative Loan Trust
2005-56 4A1 | | | | 5.640% | | 11/25/35 | | | 11,808 | | | 11,843 | |
Countrywide Alternative Loan Trust 2005-H 2A | | | | 5.570% | | 12/25/35 | | | 4,015 | | | 4,021 | |
Countrywide Alternative Loan Trust 2005-J12 | | | | 5.600% | | 11/25/35 | | | 1,593 | | | 1,596 | |
Countrywide Alternative Loan Trust 2006-0A17 | | | | 5.525% | | 10/25/36 | | | 79,000 | | | 79,014 | |
Countrywide Home Loans 2005-9 1A1 | | | | 5.630% | | 5/25/35 | | | 16,769 | | | 16,841 | |
DSLA Mortgage Loan Trust 2006-AR1 1A1A | | | | 5.483% | | 4/19/36 | | | 2,774 | | | 2,774 | |
DSLA Mortgage Loan Trust 2006-AR1 1A1B | | | | 5.483% | | 4/19/36 | | | 2,774 | | | 2,774 | |
96
Semi-Annual Report to Shareholders
| | | | | | | | | | | | | |
| | | % OF
NET ASSETS | | RATE | | MATURITY
DATE | | PAR | | VALUE | |
| | | | | | | | | | | | | |
Mortgage-Backed Securities—Continued | | | | | | | | | | | | | |
| | | | | |
Indexed Securities—Continued | | | | | | | | | | | | | |
GMACM Home Equity Loan Trust 2004-HE4 | | | | 5.604% | | 3/25/35 | | $ | 54,612 | | $ | 54,651 | |
Government National Mortgage Association 2001-36 | | | | 5.730% | | 8/20/31 | | | 3 | | | 3 | |
Greenpoint Mortgage Funding Trust 2006-AR3 | | | | 5.560% | | 9/25/35 | | | 2,675 | | | 2,680 | |
GSMPS Mortgage Loan Trust 2005-RP2 | | | | 5.680% | | 3/25/35 | | | 28,682 | | | 28,791 | A |
GSMPS Mortgage Loan Trust 2005-RP3 | | | | 5.680% | | 9/25/35 | | | 43,830 | | | 43,891 | |
Harborview Mortgage Loan Trust 2005-3 | | | | 5.570% | | 6/19/35 | | | 33,081 | | | 33,163 | |
Harborview Mortgage Loan Trust 2005-7 | | | | 5.734% | | 6/19/45 | | | 12,986 | | | 13,050 | |
Impac CMB Trust 2003-4 1A1 | | | | 5.650% | | 10/25/33 | | | 409 | | | 410 | |
Impac CMB Trust 2003-5 A1 | | | | 5.660% | | 8/25/33 | | | 520 | | | 520 | |
Impac CMB Trust 2003-7 | | | | 5.964% | | 8/25/33 | | | 1,057 | | | 1,057 | |
Lehman XS Trust 2005-5N | | | | 5.630% | | 11/25/35 | | | 42,347 | | | 42,462 | |
Lehman XS Trust 2006-GP2 | | | | 5.400% | | 6/25/46 | | | 1,016 | | | 1,016 | |
Medallion Trust 2000-2G | | | | 5.590% | | 12/18/31 | | | 387 | | | 388 | F |
MLCC Mortgage Investors, Inc. 2003-B | | | | 5.670% | | 4/25/28 | | | 5,965 | | | 5,995 | |
MSDWCC Heloc Trust 2005-1 | | | | 5.520% | | 7/25/17 | | | 3,318 | | | 3,321 | |
Nomura Asset Acceptance Corporation
Series 2005-AP3 | | | | 5.460% | | 8/25/35 | | | 14,168 | | | 14,173 | |
Residential Accredit Loans, Inc. | | | | 5.730% | | 10/25/45 | | | 4,185 | | | 4,198 | |
Sequoia Mortgage Trust 4 | | | | 5.690% | | 11/22/24 | | | 21 | | | 21 | |
Structured Asset Mortgage Investments II Trust 2006-AR7 | | | | 5.540% | | 8/25/36 | | | 50,569 | | | 50,571 | |
Thornburg Mortgage Secs Trust | | | | 5.500% | | 1/25/36 | | | 101,632 | | | 101,458 | |
Thornburg Mortgage Securities Trust 2005-4 | | | | 5.530% | | 12/25/35 | | | 81,860 | | | 81,755 | |
WaMu Mortgage Pass-Through Certificates
2005-AR06 | | | | 5.560% | | 4/25/45 | | | 25,929 | | | 25,987 | |
WaMu Mortgage Pass-Through Certificates
2005-AR08 | | | | 5.600% | | 7/25/45 | | | 14,819 | | | 14,867 | |
WaMu Mortgage Pass-Through Certificates 2005-AR11 | | | | 5.650% | | 8/25/45 | | | 73,526 | | | 73,698 | |
WaMu Mortgage Pass-Through Certificates 2005-AR13 A1A1 | | | | 5.620% | | 10/25/45 | | | 39,201 | | | 39,452 | |
WaMu Mortgage Pass-Through Certificates 2005-AR13 B10 | | | | 6.176% | | 10/25/45 | | | 6,264 | | | 5,488 | A |
WaMu Mortgage Pass-Through Certificates 2005-AR15 A1A1 | | | | 5.590% | | 11/25/45 | | | 37,292 | | | 37,418 | |
WaMu Mortgage Pass-Through Certificates
2005-AR15 A1A2 | | | | 5.610% | | 11/25/45 | | | 57,940 | | | 58,168 | |
97
Semi-Annual Report to Shareholders
Portfolio of Investments—Continued
Western Asset Core Plus Bond Portfolio—Continued
| | | | | | | | | | | | | |
| | | % OF
NET ASSETS | | RATE | | MATURITY
DATE | | PAR | | VALUE | |
| | | | | | | | | | | | | |
Mortgage-Backed Securities—Continued | | | | | | | | | | | | | |
| | | | | |
Indexed Securities—Continued | | | | | | | | | | | | | |
WaMu Mortgage Pass-Through Certificates 2005-AR17 A1A2 | | | | 5.620% | | 12/25/45 | | $ | 27,852 | | $ | 27,966 | |
WaMu Mortgage Pass-Through Certificates 2005-AR19 A1A1 | | | | 5.600% | | 12/25/45 | | | 59,444 | | | 59,637 | |
WaMu Mortgage Pass-Through Certificates 2005-AR19 A1A2 | | | | 5.620% | | 12/25/45 | | | 65,706 | | | 65,954 | |
Zuni Mortgage Loan Trust 2006-0A1 | | | | 5.615% | | 8/25/36 | | | 51,813 | | | 51,743 | |
| | | | | | | | | | | | | |
| | | | | | | | | | | | 1,286,648 | |
| | | | | | | | | | | | | |
Stripped Securities | | N.M. | | | | | | | | | | | |
Commercial Capital Access One, Inc. 2 | | | | 12.000% | | 11/15/27 | | | 2,408 | | | 992 | H1 |
FFCA Secured Lending Corporation 1999-1A | | | | 1.447% | | 9/18/25 | | | 399 | | | 21 | A,H1 |
GMAC Commercial Mortgage Securities Inc. 1999-CTL1 | | | | 0.794% | | 12/15/16 | | | 961 | | | 5 | A,H1 |
LB-UBS Commercial Mortgage Trust 2001-C3 | | | | 1.189% | | 6/15/36 | | | 8,830 | | | 333 | A,H1 |
| | | | | | | | | | | | | |
| | | | | | | | | | | | 1,351 | |
| | | | | | | | | | | | | |
Variable Rate SecuritiesI | | 1.2% | | | | | | | | | | | |
Banc of America Commercial Mortgage Inc. 2005-5 | | | | 5.115% | | 10/10/45 | | | 7,630 | | | 7,505 | |
Commercial Mortgage Asset Trust 1999-C2 | | | | 7.546% | | 11/17/32 | | | 330 | | | 347 | |
GE Capital Commercial Mortgage Corporation | | | | 5.511% | | 11/10/45 | | | 15,020 | | | 15,072 | |
Harborview Mortgage Loan Trust 2006-2 | | | | 5.449% | | 2/25/36 | | | 9,010 | | | 8,997 | |
IndyMac INDX Mortgage Loan Trust 2004-AR15 | | | | 5.074% | | 2/25/35 | | | 1,325 | | | 1,318 | |
IndyMac INDX Mortgage Loan Trust 2005-AR13 | | | | 4.477% | | 8/25/35 | | | 1,193 | | | 1,182 | |
IndyMac Indx Mortgage Loan Trust 2005-AR15 | | | | 5.099% | | 9/25/35 | | | 12,826 | | | 12,449 | |
J.P. Morgan Chase Commercial Mortgage Securities Corp., Series 2005-CIBC13 | | | | 5.472% | | 1/12/43 | | | 11,800 | | | 11,799 | |
Merrill Lynch Mortgage Investors, Inc.
Series 2005-SD1 A2 | | | | 5.666% | | 5/25/46 | | | 3,500 | | | 3,499 | |
Merrill Lynch Mortgage Trust 2005-CKI1 | | | | 5.417% | | 11/12/37 | | | 17,280 | | | 17,235 | |
Merrill Lynch Mortgage Trust 2005-MCP1 | | | | 4.747% | | 6/12/43 | | | 15,240 | | | 14,617 | |
Morgan Stanley Mortgage Loan Trust 2005-3AR | | | | 5.224% | | 7/25/35 | | | 12,834 | | | 12,858 | |
Prime Mortgage Trust 2005-2 2A1 | | | | 7.448% | | 10/25/32 | | | 1,008 | | | 1,036 | |
Thornburg Mortgage Securities Trust 2004-1 | | | | 2.807% | | 3/25/44 | | | 970 | | | 955 | |
| | | | | | | | | | | | | |
| | | | | | | | | | | | 108,869 | |
| | | | | | | | | | | | | |
Total Mortgage-Backed Securities
(Identified Cost—$1,511,474) | | | | | | | | | | | | 1,509,682 | |
98
Semi-Annual Report to Shareholders
| | | | | | | | | | | | |
| | | % OF
NET ASSETS | | RATE | | MATURITY
DATE | | PAR | | VALUE |
| | | | | | | | | | | | |
Loan Participations and AssignmentsC | | 0.3% | | | | | | | | | | |
| | | | | |
Containers and Packaging | | | | | | | | | | | | |
Graham Packing Company, L.P., Term Loan, Tranche B | | | | 7.625% | | 4/7/12 | | $ | 424 | | $ | 425 |
Graham Packing Company, L.P., Term Loan, Tranche B | | | | 7.750% | | 4/7/12 | | | 472 | | | 473 |
Graham Packing Company, L.P., Term Loan, Tranche B | | | | 7.875% | | 4/7/12 | | | 600 | | | 601 |
| | | | | | | | | | | | |
| | | | | | | | | | | | 1,499 |
| | | | | | | | | | | | |
| | | | | |
Environmental Services | | | | | | | | | | | | |
Allied Waste North America, Inc., Credit Linked Deposit, Tranche A | | | | 7.270% | | 1/15/12 | | | 554 | | | 551 |
Allied Waste North America, Inc., Term Loan | | | | 7.170% | | 1/15/12 | | | 695 | | | 692 |
Allied Waste North America, Inc., Term Loan | | | | 7.210% | | 1/15/12 | | | 237 | | | 236 |
Allied Waste North America, Inc., Term Loan | | | | 7.270% | | 1/15/12 | | | 508 | | | 507 |
| | | | | | | | | | | | |
| | | | | | | | | | | | 1,986 |
| | | | | | | | | | | | |
Cable | | | | | | | | | | | | |
Charter Communications Operating, LLC, Term Loan | | | | 8.125% | | 4/28/13 | | | 2,000 | | | 2,008 |
CSC Holdings Inc., Incremental Term Loan | | | | 7.110% | | 3/30/13 | | | 425 | | | 423 |
CSC Holdings Inc., Incremental Term Loan | | | | 7.218% | | 3/30/13 | | | 287 | | | 285 |
CSC Holdings Inc., Incremental Term Loan | | | | 7.258% | | 3/30/13 | | | 286 | | | 285 |
Insight Midwest Holdings, LLC, Term Loan, Tranche C | | | | 7.438% | | 1/5/07 | | | 1,995 | | | 2,000 |
| | | | | | | | | | | | |
| | | | | | | | | | | | 5,001 |
| | | | | | | | | | | | |
Chemicals | | | | | | | | | | | | |
Celanese, AG, Dollar Term Loan | | | | 7.367% | | 4/11/11 | | | 997 | | | 1,000 |
| | | | | | | | | | | | |
| | | | | |
Computer Services and Systems | | | | | | | | | | | | |
Sungard Data Systems, Inc., Term Loan,
Tranche B | | | | 7.999% | | 8/15/12 | | | 2,000 | | | 2,013 |
| | | | | | | | | | | | |
| | | | | |
Drug Stores | | | | | | | | | | | | |
Jean Coutu Group, Inc., Term Loan, Tranche B | | | | 8.000% | | 7/30/11 | | | 997 | | | 998 |
| | | | | | | | | | | | |
| | | | | |
Energy | | | | | | | | | | | | |
NRG Energy, Inc, Term Loan | | | | 7.367% | | 2/1/13 | | | 1,500 | | | 1,506 |
| | | | | | | | | | | | |
99
Semi-Annual Report to Shareholders
Portfolio of Investments—Continued
Western Asset Core Plus Bond Portfolio—Continued
| | | | | | | | | | | | |
| | | % OF
NET ASSETS | | RATE | | MATURITY
DATE | | PAR | | VALUE |
| | | | | | | | | | | | |
Loan Participations and Assignments—Continued | | | | | | | | | | |
| | | | | |
Entertainment | | | | | | | | | | | | |
Carmike Cinemas, Inc., Delayed Draw Term Loan | | | | 8.640% | | 5/19/12 | | $ | 841 | | $ | 847 |
Cedar Fair, LP, Term Loan, Tranche B | | | | 7.867% | | 6/13/12 | | | 997 | | | 1,002 |
Metro-Goldwyn-Mayer Studios, Inc., Term Loan, Tranche B | | | | 8.749% | | 4/6/11 | | | 1,500 | | | 1,483 |
| | | | | | | | | | | | |
| | | | | | | | | | | | 3,332 |
| | | | | | | | | | | | |
| | | | | |
Medical Care Facilities | | | | | | | | | | | | |
Davita, Inc., Term Loan, Tranche B | | | | 7.370% | | 10/5/12 | | | 339 | | | 340 |
Davita, Inc., Term Loan, Tranche B | | | | 7.400% | | 10/5/12 | | | 170 | | | 170 |
Davita, Inc., Term Loan, Tranche B | | | | 7.510% | | 10/5/12 | | | 1,110 | | | 1,113 |
Davita, Inc., Term Loan, Tranche B | | | | 7.690% | | 10/5/12 | | | 277 | | | 278 |
Healthsouth Corporation, Term Loan, Tranche B | | | | 8.580% | | 6/15/10 | | | 998 | | | 1,001 |
Iasis Healthcare Corporation, Term Loan, Tranche B | | | | 7.617% | | 6/22/11 | | | 8 | | | 7 |
Iasis Healthcare Corporation, Term Loan, Tranche B | | | | 7.730% | | 6/22/11 | | | 990 | | | 994 |
| | | | | | | | | | | | |
| | | | | | | | | | | | 3,903 |
| | | | | | | | | | | | |
Paper and Forest Products | | | | | | | | | | | | |
Georgia Pacific Corporation, First Lien Term Loan | | | | 7.367% | | 12/23/13 | | | 186 | | | 187 |
Georgia Pacific Corporation, First Lien Term Loan | | | | 7.390% | | 12/23/13 | | | 766 | | | 767 |
Georgia Pacific Corporation, First Lien Term Loan | | | | 7.485% | | 12/23/13 | | | 48 | | | 48 |
Georgia Pacific Corporation, Second Lien Term Loan | | | | 8.390% | | 12/23/13 | | | 1,000 | | | 1,009 |
| | | | | | | | | | | | |
| | | | | | | | | | | | 2,011 |
| | | | | | | | | | | | |
Restaurants | | | | | | | | | | | | |
Denny’s Corporation, Term Loan, Tranche B | | | | 8.576% | | 8/15/11 | | | 135 | | | 136 |
Denny’s Corporation, Term Loan, Tranche B | | | | 8.617% | | 8/15/11 | | | 339 | | | 339 |
Denny’s Corporation, Term Loan, Tranche B | | | | 8.750% | | 8/15/11 | | | 156 | | | 156 |
Denny’s Corporation, Term Loan, Tranche B | | | | 10.000% | | 8/15/11 | | | 9 | | | 9 |
| | | | | | | | | | | | |
| | | | | | | | | | | | 640 |
| | | | | | | | | | | | |
100
Semi-Annual Report to Shareholders
| | | | | | | | | | | | | |
| | | % OF
NET ASSETS | | RATE | | MATURITY
DATE | | PAR | | VALUE | |
| | | | | | | | | | | | | |
Loan Participations and Assignments—Continued | | | | | | | | | | | |
| | | | | |
Semiconductor Equipment and Production | | | | | | | | | | | | | |
Sensata Technologies, Term Loan, Tranche B | | | | 7.117% | | 4/27/13 | | $ | 16 | | $ | 16 | |
Sensata Technologies, Term Loan, Tranche B | | | | 7.240% | | 4/27/13 | | | 1,480 | | | 1,469 | |
| | | | | | | | | | | | | |
| | | | | | | | | | | | 1,485 | |
| | | | | | | | | | | | | |
| | | | | |
Special Purpose | | | | | | | | | | | | | |
CCM Merger, Inc., Term Loan, Tranche B | | | | 7.367% | | 7/21/12 | | | 725 | | | 723 | |
CCM Merger, Inc., Term Loan, Tranche B | | | | 7.390% | | 7/21/12 | | | 78 | | | 77 | |
CCM Merger, Inc., Term Loan, Tranche B | | | | 7.400% | | 7/21/12 | | | 194 | | | 193 | |
Nielsen Finance, LLC, Term Loan, Tranche B | | | | 8.190% | | 8/8/13 | | | 2,000 | | | 1,993 | |
Vanguard Health Holding Company II, Replacement Term Loan | | | | 7.868% | | 5/18/11 | | | 1,995 | | | 1,994 | |
| | | | | | | | | | | | | |
| | | | | | | | | | | | 4,980 | |
| | | | | | | | | | | | | |
Telecommunications | | | | | | | | | | | | | |
Panamsat Corporation, Term Loan, Tranche A | | | | 7.633% | | 7/3/12 | | | 2,000 | | | 1,997 | |
| | | | | | | | | | | | | |
Total Loan Participations and Assignments
(Identified Cost—$32,375) | | | | | | | | | | | | 32,351 | |
U.S. Government and Agency Obligations | | 20.6% | | | | | | | | | | | |
| | | | | |
Fixed Rate Securities | | 15.3% | | | | | | | | | | | |
Fannie Mae | | | | 3.125% | | 12/15/07 | | | 35,000 | | | 34,210 | |
Fannie Mae | | | | 6.625% | | 9/15/09 | | | 16,140 | | | 16,891 | |
Fannie Mae | | | | 5.200% | | 11/8/10 | | | 17,470 | | | 17,400 | |
Fannie Mae | | | | 5.625% | | 5/19/11 | | | 31,580 | | | 32,001 | |
Fannie Mae | | | | 4.610% | | 10/10/13 | | | 40,690 | | | 39,218 | |
Federal Home Loan Bank | | | | 4.875% | | 11/15/06 | | | 100 | | | 100 | |
Federal Home Loan Bank | | | | 3.500% | | 11/15/07 | | | 100 | | | 98 | |
Federal Home Loan Bank | | | | 5.875% | | 11/15/07 | | | 750 | | | 756 | |
Freddie Mac | | | | 4.625% | | 2/21/08 | | | 11,930 | | | 11,866 | |
Freddie Mac | | | | 5.250% | | 2/24/11 | | | 34,230 | | | 34,308 | |
Freddie Mac | | | | 5.125% | | 4/18/11 | | | 14,440 | | | 14,564 | |
Freddie Mac | | | | 5.300% | | 5/12/20 | | | 75,000 | | | 72,366 | |
Tennessee Valley Authority | | | | 6.250% | | 12/15/17 | | | 40 | | | 44 | |
Tennessee Valley Authority | | | | 6.750% | | 11/1/25 | | | 1,670 | | | 1,991 | |
Tennessee Valley Authority | | | | 7.125% | | 5/1/30 | | | 840 | | | 1,063 | |
United States Treasury Bonds | | | | 4.500% | | 2/15/36 | | | 384,797 | | | 368,714 | B |
United States Treasury Notes | | | | 3.000% | | 12/31/06 | | | 11,784 | | | 11,724 | B |
United States Treasury Notes | | | | 3.750% | | 5/15/08 | | | 25,460 | | | 25,063 | B |
United States Treasury Notes | | | | 5.000% | | 7/31/08 | | | 5,835 | | | 5,862 | B |
United States Treasury Notes | | | | 4.375% | | 11/15/08 | | | 66,590 | | | 66,176 | B |
101
Semi-Annual Report to Shareholders
Portfolio of Investments—Continued
Western Asset Core Plus Bond Portfolio—Continued
| | | | | | | | | | | | | |
| | | % OF
NET ASSETS | | RATE | | MATURITY
DATE | | PAR | | VALUE | |
| | | | | | | | | | | | | |
U.S. Government and Agency Obligations—Continued | | | | | | | | | | | | | |
| | | | | |
Fixed Rate Securities—Continued | | | | | | | | | | | | | |
United States Treasury Notes | | | | 4.500% | | 2/15/09 | | $ | 13,500 | | $ | 13,452 | B |
United States Treasury Notes | | | | 3.500% | | 8/15/09 | | | 36,100 | | | 35,031 | B |
United States Treasury Notes | | | | 3.375% | | 10/15/09 | | | 5,910 | | | 5,704 | B |
United States Treasury Notes | | | | 3.500% | | 12/15/09 | | | 177,095 | | | 171,326 | B |
United States Treasury Notes | | | | 3.625% | | 1/15/10 | | | 11,280 | | | 10,946 | B |
United States Treasury Notes | | | | 3.500% | | 2/15/10 | | | 20 | | | 19 | |
United States Treasury Notes | | | | 4.000% | | 4/15/10 | | | 10 | | | 10 | B |
United States Treasury Notes | | | | 3.875% | | 9/15/10 | | | 24,700 | | | 24,068 | B |
United States Treasury Notes | | | | 4.250% | | 10/15/10 | | | 17,340 | | | 17,125 | B |
United States Treasury Notes | | | | 4.500% | | 11/15/10 | | | 238,680 | | | 237,859 | B |
United States Treasury Notes | | | | 4.250% | | 1/15/11 | | | 13,130 | | | 12,951 | B |
United States Treasury Notes | | | | 4.875% | | 7/31/11 | | | 5,840 | | | 5,908 | B |
United States Treasury Notes | | | | 4.250% | | 8/15/13 | | | 140 | | | 137 | B |
United States Treasury Notes | | | | 5.125% | | 5/15/16 | | | 114,560 | | | 118,838 | B |
United States Treasury Notes | | | | 4.875% | | 8/15/16 | | | 29,950 | | | 30,516 | B |
| | | | | | | | | | | | | |
| | | | | | | | | | | | 1,438,305 | |
| | | | | | | | | | | | | |
Treasury Inflation-Protected SecuritiesJ | | 5.1% | | | | | | | | | | | |
United States Treasury Inflation-Protected Security | | | | 3.625% | | 1/15/08 | | | 50,758 | | | 51,165 | B |
United States Treasury Inflation-Protected Security | | | | 0.875% | | 4/15/10 | | | 31,395 | | | 29,751 | B |
United States Treasury Inflation-Protected Security | | | | 2.375% | | 4/15/11 | | | 72,460 | | | 72,536 | B |
United States Treasury Inflation-Protected Security | | | | 4.625% | | 8/31/11 | | | 2,900 | | | 2,903 | B |
United States Treasury Inflation-Protected Security | | | | 3.375% | | 1/15/12 | | | 12,399 | | | 13,051 | B |
United States Treasury Inflation-Protected Security | | | | 1.875% | | 7/15/13 | | | 17,438 | | | 16,987 | B |
United States Treasury Inflation-Protected Security | | | | 2.000% | | 1/15/14 | | | 1,255 | | | 1,231 | B |
United States Treasury Inflation-Protected Security | | | | 2.000% | | 7/15/14 | | | 43 | | | 42 | B |
United States Treasury Inflation-Protected Security | | | | 1.875% | | 7/15/15 | | | 38,853 | | | 37,620 | B |
United States Treasury Inflation-Protected Security | | | | 2.000% | | 1/15/16 | | | 49,076 | | | 47,949 | B |
United States Treasury Inflation-Protected Security | | | | 2.375% | | 1/15/25 | | | 114,696 | | | 116,542 | B |
102
Semi-Annual Report to Shareholders
| | | | | | | | | | | | | |
| | | % OF
NET ASSETS | | RATE | | MATURITY DATE | | PAR | | VALUE | |
| | | | | | | | | | | | | |
U.S. Government and Agency
Obligations—Continued | | | | | | | | | |
| | | | |
Treasury Inflation-Protected
Securities—Continued | | | | | | | | | | | |
United States Treasury Inflation-Protected Security | | | | 2.000% | | 1/15/26 | | $ | 47,128 | | $ | 45,199 | B |
United States Treasury Inflation-Protected Security | | | | 3.625% | | 4/15/28 | | | 23,614 | | | 29,264 | B |
United States Treasury Inflation-Protected Security | | | | 3.875% | | 4/15/29 | | | 9,395 | | | 12,139 | B |
| | | | | | | | | | | | | |
| | | | | | | | | | | | 476,379 | |
| | | | | | | | | | | | | |
Stripped Securities | | 0.2% | | | | | | | | | | | |
United States Treasury Bonds | | | | 0.000% | | 11/15/21 | | | 37,190 | | | 17,861 | B,H2 |
| | | | | | | | | | | | | |
Total U.S. Government and Agency Obligations (Identified Cost—$1,911,026) | | | | | | | | | | | | 1,932,545 | |
U.S. Government Agency Mortgage-Backed Securities | | 48.8% | | | | | | | | | | | |
| | | | | |
Fixed Rate Securities | | 47.4% | | | | | | | | | | | |
Fannie Mae | | | | 6.500% | | 5/1/14 to 7/1/35 | | | 22,598 | | | 23,059 | |
Fannie Mae | | | | 6.000% | | 12/1/16 | | | 1,030 | | | 1,045 | |
Fannie Mae | | | | 5.500% | | 1/1/17 to 10/1/35 | | | 48,591 | | | 48,058 | |
Fannie Mae | | | | 9.500% | | 11/1/21 | | | 2 | | | 2 | |
Fannie Mae | | | | 6.000% | | 3/1/28 to 1/1/36 | | | 32,684 | | | 32,849 | |
Fannie Mae | | | | 7.000% | | 8/1/29 to 7/1/32 | | | 5,348 | | | 5,505 | |
Fannie Mae | | | | 7.500% | | 11/1/29 | | | 27 | | | 28 | |
Fannie Mae | | | | 5.000% | | 6/1/35 to 10/1/36 | | | 210,138 | | | 202,051 | |
Fannie Mae | | | | 6.414% | | 10/1/35 to 11/1/35 | | | 49,967 | | | 51,169 | |
Fannie Mae | | | | 4.500% | | 12/1/36 | | | 26,400 | | | 24,659 | K |
Fannie Mae | | | | 5.000% | | 12/1/36 | | | 1,775,300 | | | 1,705,941 | K |
Fannie Mae | | | | 5.500% | | 12/1/36 | | | 617,300 | | | 608,041 | K |
Fannie Mae | | | | 6.000% | | 12/1/36 | | | 1,227,305 | | | 1,232,674K | |
Fannie Mae | | | | 6.500% | | 12/1/36 | | | 15,000 | | | 15,272 | K |
Freddie Mac | | | | 6.000% | | 6/1/08 to 9/1/19 | | | 9,765 | | | 9,889 | |
Freddie Mac | | | | 4.125% | | 10/18/10 | | | 28,720 | | | 27,911 | |
Freddie Mac | | | | 4.750% | | 1/18/11 | | | 9,890 | | | 9,830 | |
Freddie Mac | | | | 4.650% | | 10/10/13 | | | 47,200 | | | 45,566 | |
Freddie Mac | | | | 5.500% | | 12/1/13 to 5/1/35 | | | 14,792 | | | 14,619 | |
Freddie Mac | | | | 7.000% | | 10/1/16 to 4/1/32 | | | 1,782 | | | 1,835 | |
Freddie Mac | | | | 6.500% | | 7/1/29 | | | 451 | | | 462 | |
Freddie Mac | | | | 5.625% | | 11/23/35 | | | 19,270 | | | 18,840 | |
103
Semi-Annual Report to Shareholders
Portfolio of Investments—Continued
Western Asset Core Plus Bond Portfolio—Continued
| | | | | | | | | | | | | |
| | | % OF
NET ASSETS | | RATE | | MATURITY DATE | | PAR | | VALUE | |
| | | | | | | | | | | | | |
U.S. Government Agency Mortgage-Backed Securities—Continued | | | | | | | | | | | | | |
| | | | | |
Fixed Rate Securities—Continued | | | | | | | | | | | | | |
Freddie Mac | | | | 5.000% | | 12/1/36 | | $ | 35,000 | | $ | 33,655 | K |
Freddie Mac | | | | 6.000% | | 12/1/36 | | | 4,000 | | | 4,020 | K |
Government National Mortgage Association | | | | 7.500% | | 3/15/23 to 9/15/31 | | | 277 | | | 289 | |
Government National Mortgage Association | | | | 7.000% | | 7/15/23 to 7/15/31 | | | 893 | | | 922 | |
Government National Mortgage Association | | | | 6.500% | | 4/15/28 to 4/15/33 | | | 20,015 | | | 20,558 | |
Government National Mortgage Association | | | | 6.000% | | 1/15/29 to 11/15/35 | | | 100,496 | | | 101,837 | |
Government National Mortgage Association | | | | 8.000% | | 12/15/30 to 1/15/31 | | | 36 | | | 39 | |
Government National Mortgage Association | | | | 5.000% | | 7/15/33 to 11/15/35 | | | 87,599 | | | 85,075 | |
Government National Mortgage Association | | | | 5.500% | | 7/15/33 to 6/15/35 | | | 26,148 | | | 25,995 | |
Government National Mortgage Association | | | | 5.000% | | 12/1/36 | | | 49,760 | | | 48,329 | K |
Government National Mortgage Association | | | | 6.000% | | 12/1/36 | | | 5,700 | | | 5,768 | K |
Government National Mortgage Association | | | | 6.500% | | 12/1/36 | | | 45,800 | | | 46,959 | K |
| | | | | | | | | | | | | |
| | | | | | | | | | | | 4,452,751 | |
| | | | | | | | | | | | | |
Stripped Securities | | N.M. | | | | | | | | | | | |
Financing Corporation | | | | 0.000% | | 11/30/17 | | | 1,250 | | | 716H2 | |
Financing Corporation | | | | 0.000% | | 4/5/19 | | | 320 | | | 170H2 | |
| | | | | | | | | | | | | |
| | | | | | | | | | | | 886 | |
| | | | | | | | | | | | | |
| | | | | |
Variable Rate SecuritiesI | | 1.4% | | | | | | | | | | | |
Fannie Mae | | | | 4.767% | | 6/1/35 | | | 21,757 | | | 21,541 | |
Fannie Mae | | | | 4.357% | | 8/1/35 | | | 2,181 | | | 2,151 | |
Fannie Mae | | | | 4.610% | | 9/1/35 | | | 12,122 | | | 12,025 | |
Fannie Mae | | | | 4.681% | | 9/1/35 | | | 4,951 | | | 4,914 | |
Fannie Mae | | | | 4.568% | | 10/1/35 | | | 4,208 | | | 4,179 | |
Fannie Mae | | | | 4.659% | | 10/1/35 | | | 4,865 | | | 4,841 | |
Fannie Mae | | | | 4.741% | | 10/1/35 | | | 7,734 | | | 7,672 | |
104
Semi-Annual Report to Shareholders
| | | | | | | | | | | | | |
| | | % OF
NET ASSETS | | RATE | | MATURITY
DATE | | PAR | | VALUE | |
| | | | | | | | | | | | | |
U.S. Government Agency Mortgage-Backed Securities—Continued | | | | | | | | | | | | | |
| | | | | |
Variable Rate SecuritiesI—Continued | | | | | | | | | | | | | |
Fannie Mae | | | | 4.816% | | 10/1/35 | | $ | 4,653 | | $ | 4,623 | |
Fannie Mae | | | | 6.416% | | 10/1/35 | | | 51,146 | | | 52,377 | |
Fannie Mae | | | | 6.418% | | 10/1/35 | | | 7,477 | | | 7,657 | |
Freddie Mac | | | | 4.879% | | 10/1/35 | | | 7,975 | | | 7,925 | |
| | | | | | | | | | | | | |
| | | | | | | | | | | | 129,905 | |
| | | | | | | | | | | | | |
Total U.S. Government Agency Mortgage-
Backed Securities
(Identified Cost—$4,580,633) | | | | | | | | | | | | 4,583,542 | |
Yankee BondsL | | 6.0% | | | | | | | | | | | |
| | | | | |
Aerospace/Defense | | N.M. | | | | | | | | | | | |
Systems 2001 Asset Trust | | | | 6.664% | | 9/15/13 | | | 2,678 | | | 2,817 | A |
| | | | | | | | | | | | | |
| | | | | |
Banks | | 1.9% | | | | | | | | | | | |
Glitnir Banki hf | | | | 6.330% | | 7/28/11 | | | 9,940 | | | 10,145 | A |
Glitnir Banki hf | | | | 6.693% | | 6/15/16 | | | 19,500 | | | 19,941 | A,D |
Kaupthing Bank hf | | | | 6.190% | | 4/12/11 | | | 27,710 | | | 27,714 | A,C |
Kaupthing Bank hf | | | | 5.750% | | 10/4/11 | | | 3,700 | | | 3,683 | A |
Kaupthing Bank hf | | | | 7.125% | | 5/19/16 | | | 6,060 | | | 6,370 | A |
Landsbanki Islands hf (The National Bank of Iceland) | | | | 6.100% | | 8/25/11 | | | 28,390 | | | 28,687 | A |
MUFG Capital Finance 1 Limited | | | | 6.346% | | 7/25/49 | | | 7,400 | | | 7,460 | D |
Nordea Bank AB | | | | 5.310% | | 4/8/11 | | | 52,000 | | | 52,001 | A,C |
Shinsei Fin Cayman Ltd | | | | 6.418% | | 1/29/49 | | | 17,115 | | | 16,998 | A,D |
The Korea Development Bank | | | | 4.250% | | 11/13/07 | | | 200 | | | 198 | |
The Korea Development Bank | | | | 5.500% | | 11/13/12 | | | 60 | | | 60 | |
| | | | | | | | | | | | | |
| | | | | | | | | | | | 173,257 | |
| | | | | | | | | | | | | |
Cable | | N.M. | | | | | | | | | | | |
Kabel Deutschland GmbH | | | | 10.625% | | 7/1/14 | | | 680 | | | 729 | A |
Rogers Cable Inc. | | | | 7.875% | | 5/1/12 | | | 687 | | | 733 | |
Rogers Cable Inc. | | | | 5.500% | | 3/15/14 | | | 860 | | | 809 | |
Rogers Cable Inc. | | | | 6.750% | | 3/15/15 | | | 130 | | | 131 | |
| | | | | | | | | | | | | |
| | | | | | | | | | | | 2,402 | |
| | | | | | | | | | | | | |
Diversified Financial Services | | 0.1% | | | | | | | | | | | |
AIFUL CORPORATION | | | | 5.000% | | 8/10/10 | | | 11,440 | | | 11,124 | A |
Pemex Finance LTD. | | | | 9.030% | | 2/15/11 | | | 9 | | | 9 | |
| | | | | | | | | | | | | |
| | | | | | | | | | | | 11,133 | |
| | | | | | | | | | | | | |
Electric | | N.M. | | | | | | | | | | | |
Hydro-Quebec | | | | 6.300% | | 5/11/11 | | | 1,720 | | | 1,801 | |
| | | | | | | | | | | | | |
105
Semi-Annual Report to Shareholders
Portfolio of Investments—Continued
Western Asset Core Plus Bond Portfolio—Continued
| | | | | | | | | | | | | |
| | | % OF
NET ASSETS | | RATE | | MATURITY
DATE | | PAR | | VALUE | |
| | | | | | | | | | | | | |
Yankee Bonds—Continued | | | | | | | | | | | | | |
| | | | | |
Foreign Governments | | 2.1% | | | | | | | | | | | |
Federal Republic of Germany | | | | 3.750% | | 1/4/15 | | $ | 18,440 | | $ | 23,525 | |
Federative Republic of Brazil | | | | 8.875% | | 4/15/24 | | | 950 | | | 1,143 | |
Federative Republic of Brazil | | | | 10.125% | | 5/15/27 | | | 3,755 | | | 5,039 | B |
Federative Republic of Brazil | | | | 11.000% | | 8/17/40 | | | 19,673 | | | 25,624 | B |
Province of British Columbia | | | | 4.300% | | 5/30/13 | | | 180 | | | 173 | |
Province of Ontario | | | | 3.500% | | 9/17/07 | | | 110 | | | 108 | |
Republic of Bulgaria | | | | 8.250% | | 1/15/15 | | | 1,230 | | | 1,448 | |
Republic of Colombia | | | | 11.750% | | 2/25/20 | | | 781 | | | 1,093 | |
Republic of Colombia | | | | 7.375% | | 9/18/37 | | | 1,610 | | | 1,630 | B |
Republic of Panama | | | | 7.125% | | 1/29/26 | | | 4,390 | | | 4,598 | B |
Republic of Panama | | | | 8.875% | | 9/30/27 | | | 690 | | | 854 | |
Republic of Panama | | | | 9.375% | | 4/1/29 | | | 354 | | | 457 | |
Republic of Panama | | | | 6.700% | | 1/26/36 | | | 1,139 | | | 1,128 | |
Russian Federation | | | | 5.000% | | 3/31/30 | | | 66,420 | | | 74,131 | D |
United Mexican States | | | | 5.625% | | 1/15/17 | | | 374 | | | 370 | |
United Mexican States | | | | 11.500% | | 5/15/26 | | | 9,330 | | | 14,774 | |
United Mexican States | | | | 8.300% | | 8/15/31 | | | 6,950 | | | 8,667 | |
United Mexican States | | | | 7.500% | | 4/8/33 | | | 28,211 | | | 32,541 | |
| | | | | | | | | | | | | |
| | | | | | | | | | | | 197,303 | |
| | | | | | | | | | | | | |
Insurance | | 0.1% | | | | | | | | | | | |
Foundation Re Ltd | | | | 9.526% | | 11/24/08 | | | 6,650 | | | 6,306 | A,C |
| | | | | | | | | | | | | |
| | | | | |
Manufacturing (Diversified) | | 0.6% | | | | | | | | | | | |
Tyco International Group SA | | | | 6.125% | | 11/1/08 | | | 100 | | | 101 | |
Tyco International Group SA | | | | 6.750% | | 2/15/11 | | | 460 | | | 486 | |
Tyco International Group SA | | | | 6.375% | | 10/15/11 | | | 5,580 | | | 5,850 | |
Tyco International Group SA | | | | 7.000% | | 6/15/28 | | | 1,035 | | | 1,177 | |
Tyco International Group SA | | | | 6.875% | | 1/15/29 | | | 40,530 | | | 45,120 | |
| | | | | | | | | | | | | |
| | | | | | | | | | | | 52,734 | |
| | | | | | | | | | | | | |
Media | | N.M. | | | | | | | | | | | |
Quebecor Media Inc. | | | | 7.750% | | 3/15/16 | | | 550 | | | 551 | |
Shaw Communications Inc. | | | | 7.250% | | 4/6/11 | | | 630 | | | 644 | |
Shaw Communications Inc. | | | | 7.200% | | 12/15/11 | | | 395 | | | 405 | |
| | | | | | | | | | | | | |
| | | | | | | | | | | | 1,600 | |
| | | | | | | | | | | | | |
Mining | | N.M. | | | | | | | | | | | |
Corporacion Nacional del Cobre—Codelco | | | | 4.750% | | 10/15/14 | | | 2,590 | | | 2,444 | A |
| | | | | | | | | | | | | |
106
Semi-Annual Report to Shareholders
| | | | | | | | | | | | | |
| | | % OF
NET ASSETS | | RATE | | MATURITY
DATE | | PAR | | VALUE | |
| | | | | | | | | | | | | |
Yankee Bonds—Continued | | | | | | | | | | | | | |
| | | | | |
Oil and Gas | | 0.3% | | | | | | | | | | | |
Anadarko Finance Co | | | | 7.500% | | 5/1/31 | | $ | 11,880 | | $ | 13,584 | |
Petrobras International Finance Company | | | | 6.125% | | 10/6/16 | | | 13,300 | | | 13,242 | |
YPF Sociedad Anonima | | | | 7.750% | | 8/27/07 | | | 1,000 | | | 1,015 | B |
| | | | | | | | | | | | | |
| | | | | | | | | | | | 27,841 | |
| | | | | | | | | | | | | |
Publishing | | N.M. | | | | | | | | | | | |
Sun Media Corporation | | | | 7.625% | | 2/15/13 | | | 565 | | | 571 | |
| | | | | | | | | | | | | |
| | | | | |
Special Purpose | | 0.4% | | | | | | | | | | | |
Cascadia Ltd | | | | 8.515% | | 6/13/08 | | | 1,700 | | | 1,676 | A,C |
ChevronTexaco Capital Company | | | | 3.500% | | 9/17/07 | | | 20 | | | 20 | |
Conoco Funding Company | | | | 6.350% | | 10/15/11 | | | 590 | | | 621 | |
Conoco Funding Company | | | | 7.250% | | 10/15/31 | | | 810 | | | 966 | |
European Investment Bank | | | | 4.000% | | 3/3/10 | | | 100 | | | 97 | |
General Motors Nova Scotia Finance Company | | | | 6.850% | | 10/15/08 | | | 1,550 | | | 1,507 | B |
HSBC Capital Funding LP | | | | 4.610% | | 12/29/49 | | | 2,090 | | | 1,937 | A,D |
Resona Preferred Global Securities Limited | | | | 7.191% | | 12/29/49 | | | 10,630 | | | 11,002 | A,D |
TNK-BP Finance S.A. | | | | 7.500% | | 7/18/16 | | | 16,450 | | | 17,186 | A |
| | | | | | | | | | | | | |
| | | | | | | | | | | | 35,012 | |
| | | | | | | | | | | | | |
Telecommunications | | 0.5% | | | | | | | | | | | |
British Telecommunications plc | | | | 8.375% | | 12/15/10 | | | 2,315 | | | 2,594 | |
Deutsche Telekom International Finance BV | | | | 5.750% | | 3/23/16 | | | 18,520 | | | 18,120 | |
Intelsat (Bermuda), Ltd. | | | | 9.250% | | 6/15/16 | | | 1,095 | | | 1,151 | A |
Koninklijke (Royal) KPN NV | | | | 8.000% | | 10/1/10 | | | 13,130 | | | 14,186 | |
Telecom Italia Capital S.p.A | | | | 4.950% | | 9/30/14 | | | 3,730 | | | 3,426 | |
Telecom Italia Capital S.p.A | | | | 5.250% | | 10/1/15 | | | 2,950 | | | 2,733 | |
Telecom Italia Capital S.p.A. | | | | 5.250% | | 11/15/13 | | | 1,260 | | | 1,193 | |
| | | | | | | | | | | | | |
| | | | | | | | | | | | 43,403 | |
| | | | | | | | | | | | | |
Telecommunications (Cellular/Wireless) | | N.M. | | | | | | | | | | | |
Rogers Wireless Communications Inc. | | | | 6.375% | | 3/1/14 | | | 1,850 | | | 1,843 | |
| | | | | | | | | | | | | |
| | | | | |
Transportation | | N.M. | | | | | | | | | | | |
OMI Corporation | | | | 7.625% | | 12/1/13 | | | 1,450 | | | 1,465 | |
Teekay Shipping Corporation | | | | 8.875% | | 7/15/11 | | | 1,729 | | | 1,824 | |
| | | | | | | | | | | | | |
| | | | | | | | | | | | 3,289 | |
| | | | | | | | | | | | | |
Total Yankee Bonds (Identified Cost—$539,235) | | | | | | | | | | | | 563,756 | |
107
Semi-Annual Report to Shareholders
Portfolio of Investments—Continued
Western Asset Core Plus Bond Portfolio—Continued
| | | | | | | | | | | | | |
| | | % OF
NET ASSETS | | RATE | | MATURITY
DATE | | PAR/
SHARES | | | VALUE | |
| | | | | | | | | | | | | |
Foreign Government Obligations | | 0.6% | | | | | | | | | | | |
Canadian Real Return Bond | | | | 4.000% | | 12/1/31 | | | 11,628 | M | | 15,356J | |
Government of Canada | | | | 5.250% | | 6/1/12 | | | 45,000 | M | | 42,967 | |
| | | | | | | | | | | | | |
| | | | | | | | | | | | 58,323 | |
| | | | | | | | | | | | | |
Total Foreign Government Obligations
(Identified Cost—$48,095) | | | | | | | | | | | | 58,323 | |
Foreign Corporate Bonds | | 0.1% | | | | | | | | | | | |
General Motors Corporation | | | | 8.375% | | 7/5/33 | | | 9,520 | N | | 10,714 | |
| | | | | | | | | | | | | |
Total Foreign Corporate Bonds
(Identified Cost—$12,361) | | | | | | | | | | | | 10,714 | |
Preferred Stocks | | 0.4% | | | | | | | | | | | |
Fannie Mae | | | | 5.375% | | | | | 0.029 | shs | | 2,792 | E |
Ford Motor Company | | | | 7.500% | | | | | 16 | | | 302 | |
General Motors Corporation | | | | 7.500% | | | | | 260 | | | 4,921 | |
General Motors Corporation | | | | 5.250% | | | | | 646 | | | 12,998 | E |
General Motors Corporation | | | | 7.250% | | | | | 128 | | | 2,402 | |
General Motors Corporation | | | | 7.250% | | | | | 56 | | | 1,041 | |
General Motors Corporation | | | | 7.250% | | | | | 45 | | | 837 | |
General Motors Corporation | | | | 7.375% | | | | | 328 | | | 6,140 | |
Home Ownership Funding Corporation | | | | 13.331% | | | | | 2 | | | 270 | A,D |
Home Ownership Funding Corporation II | | | | 13.338% | | | | | 1 | | | 234 | A,D |
| | | | | | | | | | | | | |
| | | | | | | | | | | | 31,937 | |
| | | | | | | | | | | | | |
Total Preferred Stocks (Identified Cost—$28,453) | | | | | | | | | | | | 31,937 | |
Options PurchasedO | | N.M. | | | | | | | | | | | |
| | | | | |
BellSouth Telecommunications Inc. Call, December 2095, Strike Price $97.72 | | | | | | | | | 500 | P | | 21 | |
International Business Machines Corporation Call, December 2096, Strike Price $99.90 | | | | | | | | | 500 | P | | 81 | |
| | | | | | | | | | | | | |
Total Options Purchased (Identified Cost—$18) | | | | | | | | | | | | 102 | |
| | | | | | | | | | | | | |
Total Long-Term Securities
(Identified Cost—$10,539,478) | | | | | | | | | | | | 10,599,328 | |
Investment of Collateral From Securities Lending | | 18.1% | | | | | | | | | | | |
State Street Navigator Securities Lending Prime Portfolio | | | | | | | | | 1,703,026 | shs | | 1,703,026 | |
| | | | | | | | | | | | | |
Total Investment of Collateral From Securities Lending (Identified Cost — $1,703,026) | | | | | | | | | | | | 1,703,026 | |
Short-Term Securities | | 23.7% | | | | | | | | | | | |
| | | | | |
Corporate Bonds and Notes | | 4.1% | | | | | | | | | | | |
Bankamerica Corporation | | | | 5.533% | | 10/11/06 | | $ | 80,000 | | | 79,880 | |
Barclays Banl Plc | | | | 5.480% | | 10/20/06 | | | 60,000 | | | 60,002 | |
108
Semi-Annual Report to Shareholders
| | | | | | | | | | | | | | |
| | | % OF
NET ASSETS | | RATE | | MATURITY
DATE | | PAR | | | VALUE | |
Short-Term Securities—Continued | | | | | | | | | | | | | | |
| | | | | |
Corporate Bonds and Notes—Continued | | | | | | | | | | | | | | |
Barclays U.S. Funding Corporation | | | | 5.434% | | 10/10/06 | | $ | 19,400 | | | $ | 19,374 | |
Royal Bank Scotland Plc New York | | | | 5.270% | | 9/14/07 | | | 50,000 | | | | 49,981 | |
State Street Bank & Trust Company | | | | 5.300% | | 10/10/06 | | | 50,000 | | | | 50,000 | Q |
Tribune Company | | | | 6.100% | | 2/1/07 | | | 29,450 | | | | 28,863 | |
Washington Mutual Bank Fa | | | | 5.420% | | 10/30/06 | | | 50,000 | | | | 50,000 | |
Washington Mutual Bank Fa | | | | 5.390% | | 11/20/06 | | | 49,600 | | | | 49,600 | |
| | | | | | | | | | | | | | |
| | | | | | | | | | | | | 387,700 | |
| | | | | | | | | | | | | | |
U.S. Government and Agency Obligations | | 17.9% | | | | | | | | | | | | |
Fannie Mae | | | | 0.000% | | 6/25/07 | | | 29,300 | | | | 28,217 | G,R |
Federal Home Loan Bank | | | | 0.000% | | 10/2/06 | | | 650,000 | | | | 649,914 | G |
Freddie Mac | | | | 0.000% | | 10/2/06 | | | 1,000,000 | | | | 999,868 | G |
| | | | | | | | | | | | | | |
| | | | | | | | | | | | | 1,677,999 | |
| | | | | | | | | | | | | | |
Yankee BondsL | | 0.1% | | | | | | | | | | | | |
Government Of Canada | | | | 5.214% | | 12/15/06 | | | 10,370 | | | | 10,260 | |
| | | | | | | | | | | | | | |
| | | | | | | | | | | | | | |
| | | | | |
Options PurchasedO | | 0.3% | | | | | | | | | | | | |
Eurodollar Futures Call, December 2006, Strike Price $1.28 | | | | | | | | | 3,125 | P | | | 33 | |
Eurodollar Futures Call, January 2007,
Strike Price $94.00 | | | | | | | | | 3,608 | P | | | 2,399 | |
Eurodollar Futures Call, January 2007,
Strike Price $94.50 | | | | | | | | | 7,208 | P | | | 1,225 | |
Eurodollar Futures Call, January 2007,
Strike Price $94.625 | | | | | | | | | 9,978 | P | | | 649 | |
Eurodollar Futures Call, March 2007,
Strike Price $94.75 | | | | | | | | | 2,173 | P | | | 407 | |
Eurodollar Futures Put, April 2007,
Strike Price $93.00 | | | | | | | | | 878 | P | | | 2 | |
Goldman Sachs Swaption Futures Call,
October 2006, Strike Price $5.55 | | | | | | | | | 364,010,000 | P | | | 3,065 | |
Goldman Sachs Swaption Futures Call,
October 2006, Strike Price $5.58 | | | | | | | | | 355,124,000 | P | | | 3,189 | |
Goldman Sachs Swaption Futures Call, December 2006, Strike Price $4.848 | | | | | | | | | 403,660,000 | P | | | 669 | |
Japanese Yen Futures Call, January 2007,
Strike Price $88.00 | | | | | | | | | 313 | P | | | 106 | |
Goldman Sachs Swaption Futures Call,
February 2007, Strike Price $4.97 | | | | | | | | | 292,700,000 | P | | | 249 | |
Goldman Sachs Swaption Futures Call,
February 2007, Strike Price $5.03 | | | | | | | | | 292,700,000 | P | | | 323 | |
109
Semi-Annual Report to Shareholders
Portfolio of Investments—Continued
Western Asset Core Plus Bond Portfolio—Continued
| | | | | | | | | | |
| | | % OF
NET ASSETS | | PAR/
SHARES | | | VALUE | |
Short-Term Securities—Continued | | | | | | | | | | |
| | | |
Options Purchased—Continued | | | | | | | | | | |
Goldman Sachs Swaption Futures Call, January 2007,
Strike Price $5.6575 | | | | | 113,900,000 | P | | $ | 2,994 | |
U.S. Treasury Bond Futures Call, December 2006,
Strike Price $110.00 | | | | | 985 | P | | | 2,540 | |
U.S. Treasury Bond Futures Call, December 2006,
Strike Price $111.00 | | | | | 1,395 | P | | | 2,420 | |
U.S. Treasury Bond Futures Call, December 2006,
Strike Price $113.00 | | | | | 154 | P | | | 121 | |
U.S. Treasury Note Futures Call, November 2006,
Strike Price $102.031 | | | | | 18,800 | P | | | 142 | |
U.S. Treasury Note Futures Call, December 2006,
Strike Price $100.00 | | | | | 883 | P | | | 4,870 | |
U.S. Treasury Note Futures Call, December 2006,
Strike Price $102.00 | | | | | 764 | P | | | 2,686 | |
| | | | | | | | | | |
| | | | | | | | | 28,089 | |
| | | | | | | | | | |
| | | |
Repurchase Agreements | | 1.3% | | | | | | | | |
Goldman Sachs Group, Inc.
5.3%, dated 9/29/06, to be repurchased at $123,578 on 10/2/06 (Collateral: $124,910 Freddie Mac notes, 5.25%, due 10/19/15, value $126,003) | | | | $ | 123,523 | | | | 123,523 | |
| | | | | | | | | | |
Total Short-Term Securities (Identified Cost—$2,225,224) | | | | | | | | | 2,227,571 | |
Total Investments (Identified Cost—$14,467,728) | | 154.7% | | | | | | | 14,529,925 | |
Obligation to Return Collateral for Securities Loaned | | (18.1)% | | | | | | | (1,703,026 | ) |
Other Assets Less Liabilities | | (36.6)% | | | | | | | (3,436,374 | ) |
| | | | | | | | | | |
| | | |
Net Assets | | 100.0% | | | | | | $ | 9,390,525 | |
| | | | | | | | | | |
| | | |
| | | EXPIRATION | | ACTUAL
CONTRACTS | | | APPRECIATION/
(DEPRECIATION) | |
Futures Contracts PurchasedO | | | | | | | | | | |
Australian Treasury Bond Futures | | December 2006 | | | 100 | | | $ | 84 | |
Canadian Government Bond Futures | | December 2006 | | | 461 | | | | 670 | |
Euro Currency Futures | | December 2006 | | | 537 | | | | (197 | ) |
Eurodollar Futures | | December 2006 | | | 1,369 | | | | 170 | |
Eurodollar Futures | | March 2007 | | | 221 | | | | (7 | ) |
Eurodollar Futures | | March 2008 | | | 564 | | | | 458 | |
LIBOR Futures | | March 2007 | | | 1,000 | | | | 119 | |
Japanese Yen Futures | | December 2006 | | | 3,719 | | | | (2,704 | ) |
Swiss Franc Futures | | December 2006 | | | 50 | | | | (70 | ) |
U.S. Treasury Note Futures | | December 2006 | | | 1,645 | | | | 23 | |
| | | | | | | | | | |
| | | | | | | | $ | (1,454 | ) |
| | | | | | | | | | |
110
Semi-Annual Report to Shareholders
| | | | | | | | |
| | | |
| | | EXPIRATION | | ACTUAL
CONTRACTS | | APPRECIATION/
(DEPRECIATION) | |
Futures Contracts WrittenO | | | | | | | | |
Australian Dollar Futures | | December 2006 | | 50 | | $ | 104 | |
British Pound Futures | | December 2006 | | 50 | | | 45 | |
Bundesobligation Futures | | December 2006 | | 936 | | | (862 | ) |
Canadian Dollar Futures | | December 2006 | | 515 | | | 258 | |
Eurodollar Futures | | September 2007 | | 538 | | | (171 | ) |
Eurodollar Futures | | September 2008 | | 310 | | | (104 | ) |
U.S. Treasury Bond Futures | | December 2006 | | 2,866 | | | (1,817 | ) |
U.S. Treasury Note Futures | | December 2006 | | 4,704 | | | 845 | |
| | | | | | | | |
| | | | | | $ | (1,702 | ) |
| | | | | | | | |
Options WrittenO | | | | | | | | |
Euro Currency Futures Call, Strike Price $1.32 | | December 2006 | | 275 | | $ | 318 | |
Euro Currency Futures Call, Strike Price $1.35 | | December 2006 | | 10 | | | 8 | |
Euro Currency Futures Put, Strike Price $1.24 | | December 2006 | | 150 | | | 105 | |
Euro Currency Futures Put, Strike Price $1.25 | | December 2006 | | 125 | | | 28 | |
Eurodollar Futures Call, Strike Price $94.75 | | December 2006 | | 606 | | | 39 | |
Eurodollar Futures Call, Strike Price $95.25 | | December 2006 | | 632 | | | (70 | ) |
Eurodollar Futures Call, Strike Price $95.50 | | December 2006 | | 910 | | | 52 | |
Eurodollar Futures Call, Strike Price $95.125 | | March 2007 | | 293 | | | 9 | |
Eurodollar Futures Put, Strike Price $94.50 | | December 2006 | | 283 | | | 45 | |
Eurodollar Futures Put, Strike Price $95.00 | | December 2006 | | 622 | | | (7 | ) |
Eurodollar Futures Put, Strike Price $94.625 | | March 2007 | | 1,104 | | | (10 | ) |
Fannie Mae Futures Call, Strike Price $100.3984 | | November 2006 | | 48,900,000 | | | (2 | ) |
Goldman Sachs Swaption Futures Call,
Strike Price $4.946 | | December 2006 | | 187,701,900 | | | 3,331 | |
Goldman Sachs Swaption Futures Call,
Strike Price $5.67 | | October 2006 | | 88,781,000 | | | (2,529 | ) |
| | | |
Goldman Sachs Swaption Futures Call,
Strike Price $5.69 | | October 2006 | | 88,781,000 | | | (2,609 | ) |
Goldman Sachs Swaption Futures Call,
Strike Price $5.005 | | February 2007 | | 64,700,000 | | | 497 | |
Goldman Sachs Swaption Futures Call,
Strike Price $5.045 | | February 2007 | | 64,700,000 | | | 436 | |
Japanese Yen Futures Call, Strike Price $90.00 | | December 2006 | | 175 | | | 178 | |
Japanese Yen Futures Put, Strike Price $85.00 | | December 2006 | | 70 | | | (32 | ) |
Japanese Yen Futures Put, Strike Price $84.00 | | December 2006 | | 25 | | | 2 | |
U.S. Treasury Bond Futures Call, Strike Price $109.00 | | November 2006 | | 19 | | | (45 | ) |
U.S. Treasury Bond Futures Call, Strike Price $112.00 | | November 2006 | | 2,897 | | | (1,171 | ) |
U.S. Treasury Bond Futures Call, Strike Price $114.00 | | November 2006 | | 1,024 | | | 210 | |
U.S. Treasury Bond Futures Call, Strike Price $115.00 | | February 2007 | | 575 | | | 195 | |
111
Semi-Annual Report to Shareholders
Portfolio of Investments—Continued
Western Asset Core Plus Bond Portfolio—Continued
| | | | | | | | |
| | | |
| | | EXPIRATION | | ACTUAL
CONTRACTS | | APPRECIATION/
(DEPRECIATION) | |
Options Written—Continued | | | | | | | | |
U.S. Treasury Note Futures Call, Strike Price $104.50 | | November 2006 | | 1,207 | | $ | (950 | ) |
U.S. Treasury Note Futures Call, Strike Price $107.00 | | November 2006 | | 2,521 | | | (2,594 | ) |
U.S. Treasury Note Futures Call, Strike Price $108.00 | | November 2006 | | 2,995 | | | (566 | ) |
U.S. Treasury Note Futures Call, Strike Price $109.00 | | November 2006 | | 2,876 | | | 52 | |
U.S. Treasury Note Futures Call, Strike Price $109.00 | | February 2007 | | 1,649 | | | (350 | ) |
U.S. Treasury Note Futures Call, Strike Price $110.00 | | February 2007 | | 4,525 | | | 86 | |
U.S. Treasury Bond Futures Put, Strike Price $100.00 | | November 2006 | | 1,376 | | | 565 | |
U.S. Treasury Bond Futures Put, Strike Price $103.00 | | November 2006 | | 713 | | | 306 | |
U.S. Treasury Bond Futures Put, Strike Price $107.00 | | November 2006 | | 165 | | | 74 | |
U.S. Treasury Bond Futures Put, Strike Price $108.00 | | November 2006 | | 1,332 | | | 431 | |
U.S. Treasury Bond Futures Put, Strike Price $109.00 | | November 2006 | | 1,595 | | | 773 | |
U.S. Treasury Bond Futures Put, Strike Price $111.00 | | November 2006 | | 166 | | | — | |
U.S. Treasury Bond Futures Put, Strike Price $109.00 | | February 2007 | | 1,345 | | | (46 | ) |
U.S. Treasury Note Futures Put, Strike Price $104.00 | | November 2006 | | 419 | | | 138 | |
U.S. Treasury Note Futures Put, Strike Price $105.00 | | November 2006 | | 743 | | | 136 | |
U.S. Treasury Note Futures Put, Strike Price $104.00 | | February 2007 | | 1,758 | | | 243 | |
U.S. Treasury Note Futures Put, Strike Price $106.00 | | February 2007 | | 2,650 | | | (134 | ) |
U.S. Treasury Note Futures Put, Strike Price $107.00 | | February 2007 | | 468 | | | (39 | ) |
| | | | | | | | |
| | | | | | $ | (2,897 | ) |
| | | | | | | | |
| | | | | | | | | |
| A | | Rule 144a Security – A security purchased pursuant to Rule 144a under the Securities Act of 1933 which may not be resold subject to that rule except to qualified institutional buyers. These securities, which the Fund’s investment adviser has determined to be liquid, represent 6.6% of net assets. |
| B | | All or a portion of this security is on loan. See note 4 to the notes to financial statements. |
| C | | Indexed Security – The rates of interest earned on this security are tied to the London Interbank Offered Rate (“LIBOR”), the Consumer Price Index (“CPI”), or the Cost of Funds Index (“COFI”). The coupon rate is the rate as of September 30, 2006. |
| D | | Stepped Coupon Security – A security with a predetermined schedule of interest or dividend rate changes. |
| E | | Convertible Security – The security may be converted into issuer’s common or preferred stock. |
| F | | Unit – A security which consists of a bond and warrants to purchase to stock of the issuer. |
| G | | Zero Coupon Bond – A bond with no periodic interest payments which is sold at such a discount as to produce a current yield to maturity. |
| H | | Securities with interest-only or principal-only payment streams, denoted by a 1 or 2, respectively. For interest-only securities, the amount shown as principal is the notional balance used to calculate the amount of interest due. |
| I | | The coupon rates shown on variable rate securities are the rates at September 30, 2006. These rates vary with the weighted average coupon of the underlying loans. |
| J | | Inflation Protected Security – A security whose principal value is adjusted daily or monthly in accordance with changes to the relevant country’s Consumer Price Index or its equivalent used as an inflation proxy. Interest is calculated on the basis of the current adjusted principal value. |
| K | | When-issued Security – A security purchased on a delayed delivery basis. Final settlement amount and maturity date have not yet been announced. |
| L | | Yankee Bond – A dollar denominated bond issued in the U.S. by foreign entities. |
| M | | Denominated in Canadian dollars. |
| N | | Denominated in Euro currency. |
| O | | Options and futures are described in more detail in the notes to financial statements. |
| P | | Par represents actual number of contracts. |
| Q | | All or a portion of this security is pledged as collateral for credit default swap agreements. |
| R | | All or a portion of this security is pledged as collateral to cover futures and options contracts. |
N.M.—Not meaningful.
See notes to financial statements.
112
Semi-Annual Report to Shareholders
Statement of Assets and Liabilities
Western Asset Core Plus Bond Portfolio
September 30, 2006 (Unaudited)
(Amounts in Thousands)
| | | | | | | |
Assets: | | | | | | | |
Investment securities at market value (Identified Cost—$12,242,504)A | | | | | $ | 12,302,354 | |
Short-term securities at value (Identified Cost—$2,225,224) | | | | | | 2,227,571 | |
Swap contracts at value | | | | | | 34,340 | |
Cash and foreign currencies | | | | | | 188,791 | |
Receivable for securities sold | | | | | | 229,047 | |
Receivable for fund shares sold | | | | | | 82,780 | |
Interest receivable | | | | | | 86,237 | |
Other assets | | | | | | 1,755 | |
| | | | | | | |
Total assets | | | | | | 15,152,875 | |
| | |
Liabilities: | | | | | | | |
Payable for securities purchased | | $ | 3,963,252 | | | | |
Payable for fund shares repurchased | | | 39,536 | | | | |
Accrued management fee | | | 3,007 | | | | |
Accrued distribution fee | | | 113 | | | | |
Income distribution payable | | | 6,323 | | | | |
Interest expense payable | | | 15,225 | | | | |
Obligation to return collateral for securities loaned | | | 1,703,026 | | | | |
Options written (Proceeds—$25,376) | | | 28,273 | | | | |
Futures variation margin | | | 479 | | | | |
Unrealized depreciation of foreign forward currency contracts | | | 2,479 | | | | |
Accrued expenses | | | 637 | | | | |
| | | | | | | |
Total liabilities | | | | | | 5,762,350 | |
| | | | | | | |
| | |
Net Assets | | | | | $ | 9,390,525 | |
| | | | | | | |
| | |
Net assets consist of: | | | | | | | |
Accumulated paid-in-capital applicable to: | | | | | | | |
842,029 Institutional Class shares outstanding | | | | | $ | 8,739,231 | |
53,794 Financial Intermediary Class shares outstanding | | | | | | 565,914 | |
Undistributed net investment income | | | | | | 7,124 | |
Accumulated net realized loss on investments, options, futures, swaps and foreign currency transactions | | | | | | (15,743 | ) |
Unrealized appreciation/(depreciation) of investments, options, futures, swaps and foreign currency translations | | | | | | 93,999 | |
| | | | | | | |
| | |
Net Assets | | | | | $ | 9,390,525 | |
| | | | | | | |
| | |
Net Asset Value Per Share: | | | | | | | |
Institutional Class | | | | | | $10.48 | |
Financial Intermediary Class | | | | | | $10.49 | |
| | | | | | | | |
| A | | Market value of securities on loan is $1,700,048. |
See notes to financial statements.
113
Semi-Annual Report to Shareholders
Statement of Operations
Western Asset Core Plus Bond Portfolio
For the Six Months Ended September 30, 2006 (Unaudited)
(Amounts in Thousands)
| | | | | | | |
Investment Income: | | | | | | | |
Interest | | $ | 216,584 | | | | |
Dividends | | | 1,474 | | | | |
| | | | | | | |
Total income | | | | | | $ | 218,058 |
Expenses: | | | | | | | |
Advisory fee | | | 16,293 | | | | |
Distribution and service fees: | | | | | | | |
Financial Intermediary Class | | | 652 | | | | |
Audit and legal fees | | | 156 | | | | |
Custodian fees | | | 682 | | | | |
Directors’ fees and expenses | | | 180 | | | | |
Proxy expense | | | 85 | | | | |
Registration fees | | | 76 | | | | |
Reports to shareholders | | | 191 | | | | |
Transfer agent and shareholder servicing expense: | | | | | | | |
Institutional Class | | | 17 | | | | |
Financial Intermediary Class | | | 3 | | | | |
Other expenses | | | 56 | | | | |
| | | | | | | |
| | | 18,391 | | | | |
Less: Compensating balance creditsA | | | (17 | ) | | | |
| | | | | | | |
Total expenses, net of compensating balance credits | | | | | | | 18,374 |
| | | | | | | |
Net Investment Income | | | | | | | 199,684 |
Net Realized and Unrealized Gain/(Loss) on Investments: | | | | | | | |
Realized gain/(loss) on: | | | | | | | |
Investments | | | (933 | ) | | | |
Options | | | 7,589 | | | | |
Futures | | | (13,472 | ) | | | |
Swaps | | | 21,735 | | | | |
Assets and liabilities denominated in foreign currency | | | 1,245 | | | | |
| | | | | | | |
| | | | | | | 16,164 |
Change in unrealized appreciation/(depreciation) of: | | | | | | | |
Investments, options, futures, and swaps | | | 187,043 | | | | |
Assets and liabilities denominated in foreign currency | | | 15 | | | | |
| | | | | | | |
| | | | | | | 187,058 |
| | | | | | | |
Net Realized and Unrealized Gain/(Loss) on Investments | | | | | | | 203,222 |
| | | | | | | | |
Change in Net Assets Resulting From Operations | | | | | | $ | 402,906 |
| | | | | | | | |
| A | | See note 1, compensating balance credits, in the notes to financial statements. |
See notes to financial statements.
114
Semi-Annual Report to Shareholders
Statement of Changes in Net Assets
Western Asset Core Plus Bond Portfolio
(Amounts in Thousands)
| | | | | | | | |
| | | FOR THE
SIX MONTHS ENDED
SEPTEMBER 30, 2006 | | | FOR THE
YEAR ENDED
MARCH 31, 2006 | |
| Change in Net Assets: | | (Unaudited) | | | | |
Net investment income | | $ | 199,684 | | | $ | 256,356 | |
| | |
Net realized gain/(loss) on investments, options, futures, assets and liabilities denominated in foreign currency and swaps transactions | | | 16,164 | | | | (11,235 | ) |
| | |
Change in unrealized appreciation/(depreciation) of investments, options, futures, swaps and assets and liabilities denominated in foreign currencies | | | 187,058 | | | | (129,734 | ) |
| | | | | | | | |
Change in net assets resulting from operations | | | 402,906 | | | | 115,387 | |
| | |
Distributions to Shareholders from: | | | | | | | | |
Net investment income: | | | | | | | | |
Institutional Class | | | (187,455 | ) | | | (282,055 | ) |
Financial Intermediary Class | | | (12,301 | ) | | | (15,483 | ) |
| | |
Net realized gain on investments: | | | | | | | | |
Institutional Class | | | — | | | | (14,478 | ) |
Financial Intermediary Class | | | — | | | | (622 | ) |
| | |
Change in net assets from Fund share transactions: | | | | | | | | |
Institutional Class | | | 1,739,356 | | | | 2,515,953 | |
Financial Intermediary Class | | | 47,987 | | | | 325,191 | |
| | | | | | | | |
Change in net assets | | | 1,990,493 | | | | 2,643,893 | |
| | |
Net Assets: | | | | | | | | |
Beginning of period | | | 7,400,032 | | | | 4,756,139 | |
| | | | | | | | |
| | |
End of period | | $ | 9,390,525 | | | $ | 7,400,032 | |
| | | | | | | | |
| | |
Undistributed net investment income | | $ | 7,124 | | | $ | 7,196 | |
| | | | | | | | |
| | | | | | | | | |
See notes to financial statements.
115
Semi-Annual Report to Shareholders
Financial Highlights
Western Asset Core Plus Bond Portfolio
Contained below is per share operating performance data for a share of common stock outstanding throughout each period shown, total investment return, ratios to average net assets and other supplemental data. This information has been derived from information in the financial statements.
Institutional Class:
| | | | | | | | | | | | | | | | | | | | | | | | |
| | | SIX MONTHS
ENDED
SEPTEMBER 30, 2006 | | | FOR THE YEARS ENDED MARCH 31, | |
| | | 2006 | | | 2005 | | | 2004 | | | 2003 | | | 2002 | |
| | | (Unaudited) | | | | | | | | | | | | | | | | |
Net asset value, beginning of period | | $ | 10.24 | | | $ | 10.52 | | | $ | 10.71 | | | $ | 10.40 | | | $ | 9.88 | | | $ | 10.07 | |
| | | | | | | | | | | | | | | | | | | | | | | | |
Investment operations: | | | | | | | | | | | | | | | | | | | | | | | | |
Net investment income | | | .25 | | | | .45 | A | | | .37 | | | | .37 | | | | .51 | | | | .56 | A |
Net realized and unrealized gain/(loss) on investments, options, futures, swaps, and foreign currency transactions | | | .25 | | | | (.18 | )A | | | .04 | | | | .55 | | | | .62 | | | | .06 | A |
| | | | | | | | | | | | | | | | | | | | | | | | |
Total from investment operations | | | .50 | | | | .27 | | | | .41 | | | | .92 | | | | 1.13 | | | | .62 | |
| | | | | | | | | | | | | | | | | | | | | | | | |
Distributions paid from: | | | | | | | | | | | | | | | | | | | | | | | | |
Net investment income | | | (.26 | ) | | | (.52 | ) | | | (.35 | ) | | | (.41 | ) | | | (.51 | ) | | | (.54 | ) |
Net realized gain on investments | | | — | | | | (.03 | ) | | | (.25 | ) | | | (.20 | ) | | | (.10 | ) | | | (.27 | ) |
| | | | | | | | | | | | | | | | | | | | | | | | |
Total distributions | | | (.26 | ) | | | (.55 | ) | | | (.60 | ) | | | (.61 | ) | | | (.61 | ) | | | (.81 | ) |
| | | | | | | | | | | | | | | | | | | | | | | | |
Net asset value, end of period | | $ | 10.48 | | | $ | 10.24 | | | $ | 10.52 | | | $ | 10.71 | | | $ | 10.40 | | | $ | 9.88 | |
| | | | | | | | | | | | | | | | | | | | | | | | |
Total return | | | 4.91 | %B | | | 2.57 | % | | | 4.01 | % | | | 9.12 | % | | | 11.78 | % | | | 6.34 | % |
| | | | | | |
Ratios to Average Net Assets:C | | | | | | | | | | | | | | | | | | | | | | | | |
Total expenses | | | .44 | %D | | | .45 | % | | | .45 | % | | | .48 | % | | | .50 | % | | | .54 | % |
Expenses net of waivers, if any | | | .44 | %D | | | .45 | % | | | .45 | % | | | .45 | % | | | .45 | % | | | .45 | % |
Expenses net of all reductions | | | .44 | %D | | | .45 | % | | | .45 | % | | | .45 | % | | | .45 | % | | | .45 | % |
Net investment income | | | 5.0 | %D | | | 4.3 | % | | | 3.3 | % | | | 3.6 | % | | | 5.0 | % | | | 5.3 | % |
| | | | | | |
Supplemental Data: | | | | | | | | | | | | | | | | | | | | | | | | |
Portfolio turnover rate | | | 261.5 | %B | | | 549.4 | % | | | 586.1 | % | | | 463.8 | % | | | 422.6 | % | | | 590.7 | % |
Net assets at end of period (in thousands) | | $ | 8,826,459 | | | $ | 6,896,815 | | | $ | 4,565,054 | | | $ | 3,286,650 | | | $ | 1,866,619 | | | $ | 991,673 | |
| | | | | | | | | | | | | | | | | | | | | | | | | |
| A | | The amount presented is calculated pursuant to a methodology prescribed by the Securities and Exchange Commission for a share outstanding throughout the period. This amount is inconsistent with the Fund’s aggregate gains and losses because of the timing of sales and redemptions of Fund shares in relation to fluctuating market values for the investment portfolio. |
| C | | Total expenses reflects operating expenses prior to any voluntary expense waivers and/or compensating balance credits. Expenses net of waivers reflects total expenses before compensating balance credits but net of any voluntary expense waivers. Expenses net of all reductions reflects expenses less any compensating balance credits and/or voluntary expense waivers. |
See notes to financial statements.
116
Semi-Annual Report to Shareholders
Financial Intermediary Class:
| | | | | | | | | | | | | | | | | | | | | | | | |
| | | SIX MONTHS
ENDED
SEPTEMBER 30, 2006 | | | FOR THE YEARS ENDED MARCH 31, | |
| | | | 2006 | | | 2005 | | | 2004 | | | 2003 | | | 2002E | |
| | | (Unaudited) | | | | | | | | | | | | | | | | |
Net asset value, beginning of period | | $ | 10.24 | | | $ | 10.52 | | | $ | 10.71 | | | $ | 10.40 | | | $ | 9.87 | | | $ | 10.04 | |
| | | | | | | | | | | | | | | | | | | | | | | | |
Investment operations: | | | | | | | | | | | | | | | | | | | | | | | | |
Net investment income | | | .23 | | | | .42 | A | | | .35 | | | | .36 | | | | .48 | | | | .11 | A |
Net realized and unrealized gain/(loss) on investments, options, futures, swaps, and foreign currency transactions | | | .26 | | | | (.18 | )A | | | .04 | | | | .54 | | | | .63 | | | | (.17 | )A |
| | | | | | | | | | | | | | | | | | | | | | | | |
Total from investment operations | | | .49 | | | | .24 | | | | .39 | | | | .90 | | | | 1.11 | | | | (.06 | ) |
| | | | | | | | | | | | | | | | | | | | | | | | |
Distributions paid from: | | | | | | | | | | | | | | | | | | | | | | | | |
Net investment income | | | (.24 | ) | | | (.49 | ) | | | (.33 | ) | | | (.39 | ) | | | (.48 | ) | | | (.11 | ) |
Net realized gain on investments | | | — | | | | (.03 | ) | | | (.25 | ) | | | (.20 | ) | | | (.10 | ) | | | — | |
| | | | | | | | | | | | | | | | | | | | | | | | |
Total distributions | | | (.24 | ) | | | (.52 | ) | | | (.58 | ) | | | (.59 | ) | | | (.58 | ) | | | (.11 | ) |
| | | | | | | | | | | | | | | | | | | | | | | | |
Net asset value, end of period | | $ | 10.49 | | | $ | 10.24 | | | $ | 10.52 | | | $ | 10.71 | | | $ | 10.40 | | | $ | 9.87 | |
| | | | | | | | | | | | | | | | | | | | | | | | |
Total return | | | 4.78 | %B | | | 2.32 | % | | | 3.77 | % | | | 8.82 | % | | | 11.57 | % | | | (.57 | )%B |
| | | | | | |
Ratios to Average Net Assets:C | | | | | | | | | | | | | | | | | | | | | | | | |
Total expenses | | | .69 | %D | | | .70 | % | | | .70 | % | | | .73 | % | | | .75 | % | | | .75 | %D |
Expenses net of waivers, if any | | | .69 | %D | | | .70 | % | | | .70 | % | | | .70 | % | | | .70 | % | | | .70 | %D |
Expenses net of all reductions | | | .69 | %D | | | .70 | % | | | .70 | % | | | .70 | % | | | .70 | % | | | .70 | %D |
Net investment income | | | 4.7 | %D | | | 4.0 | % | | | 2.9 | % | | | 3.2 | % | | | 4.8 | % | | | 5.3 | %D |
| | | | | | |
Supplemental Data: | | | | | | | | | | | | | | | | | | | | | | | | |
Portfolio turnover rate | | | 261.5 | %B | | | 549.4 | % | | | 586.1 | % | | | 463.8 | % | | | 422.6 | % | | | 590.7 | %B |
Net assets at end of period (in thousands) | | $ | 564,066 | | | $ | 503,217 | | | $ | 191,085 | | | $ | 7,040 | | | $ | 369 | | | $ | 235 | |
| | | | | | | | | | | | | | | | | | | | | | | | | |
| E | | For the period January 8, 2002 (commencement of operations) to March 31, 2002. |
See notes to financial statements.
117
Semi-Annual Report to Shareholders
Expense Example
Western Asset Inflation Indexed Plus Bond Portfolio
As a shareholder of the Fund, you incur ongoing costs, including management fees, and other Fund expenses. These examples are intended to help you understand your ongoing costs (in dollars) of investing in the Fund and to compare these costs with the ongoing costs of investing in other mutual funds. The example is based on an investment of $1,000 invested on April 1, 2006, and held through September 30, 2006.
Actual Expenses
The first line in the table below provides information about actual account values and actual expenses for the Fund. You may use the information in this line, together with the amount you invested, to estimate the expenses that you paid over the period. Simply divide your account value by $1,000 (for example, an $8,600 account value divided by $1,000 = 8.6), then multiply the result by the number in the first line under the heading entitled “Expenses Paid During the Period” to estimate the expenses you paid on your account during this period.
Hypothetical Example for Comparison Purposes
The second line in the table below provides information about hypothetical account values and hypothetical expenses based on the Fund’s actual expense ratio and an assumed rate of return of 5% per year before expenses, which is not the Fund’s actual return. The hypothetical account values and expenses may not be used to estimate the actual ending account balance or expenses you paid for the period. You may use this information to compare the ongoing costs of investing in the Fund and other funds. To do so, compare this 5% hypothetical example with the 5% hypothetical examples that appear in the shareholder reports of other funds.
| | | | | | | | | |
| | | Beginning
Account Value
4/1/06 | | Ending
Account Value
9/30/06 | | Expenses PaidA
During the Period
4/1/06 to 9/30/06 |
Institutional Class: | | | | | | | | | |
Actual | | $ | 1,000.00 | | $ | 1,043.60 | | $ | 1.28 |
Hypothetical (5% return before expenses) | | | 1,000.00 | | | 1,023.82 | | | 1.27 |
| A | | These calculations are based on expenses incurred in the most recent fiscal half-year. The dollar amounts shown as “Expenses Paid” are equal to the annualized expense ratio of 0.25% multiplied by the average value over the period, multiplied by the number of days in the most recent fiscal half-year (183), and divided by 365 . |
118
Semi-Annual Report to Shareholders
Performance Information
Western Asset Inflation Indexed Plus Bond Portfolio
The graph compares the Fund’s total returns against that of an appropriate broad-based securities market index. The line illustrates the cumulative total return of an initial $1,000,000 investment for the periods indicated. The line for the Fund represents the total return after deducting all Fund investment management and other administrative expenses and the transaction costs of buying and selling securities. The line representing the securities market index does not include any transaction costs associated with buying and selling securities in the index or other investment management or administrative expenses.
Total return measures investment performance in terms of appreciation or depreciation in the Fund’s net asset value per share, plus dividends and any capital gain distributions. It assumes that dividends and distributions were reinvested at the time they were paid. Returns (and the graph and table found below) do not reflect the deduction of taxes that a shareholder would pay on Fund distributions or the redemption of Fund shares. Average annual returns tend to smooth out variations in a fund’s return, so that they differ from actual year-to-year results.
Bonds are subject to a variety of risks, including interest rate, credit and inflation risk.
Growth of a $1,000,000 Investment—Institutional Class
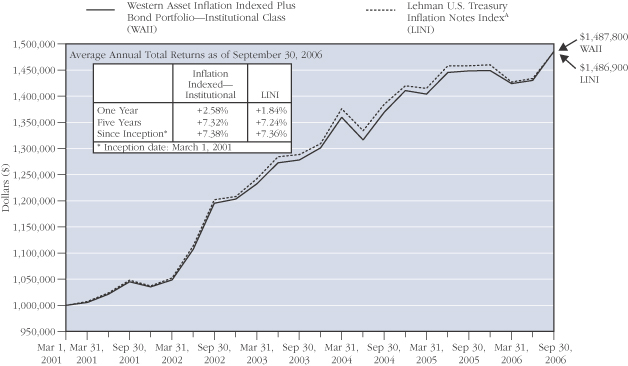
The performance data quoted represents past performance and does not guarantee future results. The performance stated may have been due to extraordinary market conditions, which may not be duplicated in the future. Current performance may be lower or higher than the performance data quoted. To obtain the most recent month-end performance information, please visit www.westernassetfunds.com. The investment return and principal value of the Fund will fluctuate so that an investor’s shares, when redeemed, may be worth more or less than the original cost. Calculations assume reinvestment of dividends and capital gain distributions. Performance would have been lower if fees had not been waived in various periods.
| A | | Since-inception index returns are for periods beginning February 28, 2001. |
119
Semi-Annual Report to Shareholders
Performance Information—Continued
Portfolio Composition (as of September 30, 2006)
Standard & Poor��s Debt RatingsB (as a percentage of the portfolio)
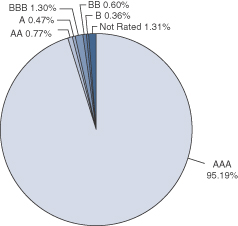
Maturity Schedule (as a percentage of the portfolio)
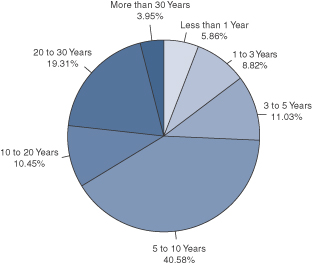
| B | | Source: Standard & Poor's. |
The Fund is actively managed. As a result, the composition of the portfolio holdings and sectors are subject to change at any time.
120
Semi-Annual Report to Shareholders
Portfolio of Investments
Western Asset Inflation Indexed Plus Bond Portfolio
September 30, 2006 (Unaudited)
(Amounts in Thousands)
| | | | | | | | | | | | | |
| | | % OF
NET ASSETS | | RATE | | MATURITY
DATE | | PAR | | VALUE | |
| | | | | | | | | | | | | |
Long-Term Securities | | 98.4% | | | | | | | | | | | |
| | | | | |
Corporate Bonds and Notes | | 1.6% | | | | | | | | | | | |
| | | | | |
Gas and Pipeline Utilities | | 0.3% | | | | | | | | | | | |
The Williams Companies, Inc. | | | | 8.750% | | 3/15/32 | | $ | 1,900 | | $ | 2,080 | |
| | | | | | | | | | | | | |
| | | | | |
Investment Banking/Brokerage | | 0.5% | | | | | | | | | | | |
J.P. Morgan & Co. Incorporated | | | | 9.604% | | 2/15/12 | | | 2,690 | | | 2,794 | A |
| | | | | | | | | | | | | |
| | | | | |
Special Purpose | | 0.8% | | | | | | | | | | | |
Allstate Life Global Funding Trust | | | | 5.170% | | 4/2/07 | | | 4,600 | | | 4,565 | A |
| | | | | | | | | | | | | |
Total Corporate Bonds and Notes
(Identified Cost—$9,508) | | | | | | | | | | | | 9,439 | |
Asset-Backed Securities | | 0.2% | | | | | | | | | | | |
| | | | | |
Indexed SecuritiesA | | 0.2% | | | | | | | | | | | |
Bear Stearns Asset Backed Securities, Inc. 2003-ABF1 | | 5.700% | | 1/25/34 | | | 181 | | | 182 | |
Chase Funding Mortgage Loan Asset-Backed Certificates 2002-4 | | | | 5.700% | | 10/25/32 | | | 237 | | | 238 | |
Countrywide Asset-Backed Certificates 2002-1 | | | | 5.890% | | 8/25/32 | | | 67 | | | 67 | |
EMC Mortgage Loan Trust ABS Security 2002-B | | | | 5.880% | | 11/25/41 | | | 746 | | | 749 | B |
EQCC Trust 2002-1 | | | | 5.630% | | 11/25/31 | | | 115 | | | 115 | |
Residential Asset Mortgage Products, Inc. 2003-RS2 | | | | 5.670% | | 3/25/33 | | | 105 | | | 105 | |
| | | | | | | | | | | | | |
Total Asset-Backed Securities
(Identified Cost—$1,452) | | | | | | | | | | | | 1,456 | |
Mortgage-Backed Securities | | 0.4% | | | | | | | | | | | |
| | | | | |
Indexed SecuritiesA | | 0.4% | | | | | | | | | | | |
Crusade Global Trust 2003-2 | | | | 5.580% | | 9/18/34 | | | 1,058 | | | 1,060 | C |
CS First Boston Mortgage Securities Corp. 2001-28 | | | | 5.980% | | 11/25/31 | | | 713 | | | 719 | |
GSRPM Mortgage Loan Trust 2003-2 | | | | 6.030% | | 6/25/33 | | | 350 | | | 352 | |
| | | | | | | | | | | | | |
Total Mortgage-Backed Securities
(Identified Cost—$2,123) | | | | | | | | | | | | 2,131 | |
U.S. Government and Agency Obligations | | 89.6% | | | | | | | | | | | |
| | | | | |
Indexed SecuritiesD | | 89.6% | | | | | | | | | | | |
Tennessee Valley Authority | | | | 3.375% | | 1/15/07 | | | 8,220 | | | 8,178 | |
United States Treasury Inflation-Protected Security | | | | 3.625% | | 1/15/08 | | | 35,260 | | | 35,542 | |
United States Treasury Inflation-Protected Security | | | | 3.875% | | 1/15/09 | | | 16,440 | | | 16,912 | |
United States Treasury Inflation-Protected Security | | | | 4.250% | | 1/15/10 | | | 13,582 | | | 14,365 | |
United States Treasury Inflation-Protected Security | | | | 0.875% | | 4/15/10 | | | 14,317 | | | 13,567E | |
121
Semi-Annual Report to Shareholders
Portfolio of Investments—Continued
Western Asset Inflation Indexed Plus Bond Portfolio—Continued
| | | | | | | | | | | | | |
| | | % OF
NET ASSETS | | RATE | | MATURITY
DATE | | PAR | | VALUE | |
| | | | | | | | | | | | | |
U.S. Government and Agency
Obligations—Continued | | | | | | | | | | | | | |
| | | | | |
Indexed Securities—Continued | | | | | | | | | | | | | |
United States Treasury Inflation-Protected Security | | | | 3.500% | | 1/15/11 | | $ | 24,043 | | $ | 25,183 | |
United States Treasury Inflation-Protected Security | | | | 2.375% | | 4/15/11 | | | 12,445 | | | 12,459 | |
United States Treasury Inflation-Protected Security | | | | 3.375% | | 1/15/12 | | | 19,114 | | | 20,119 | |
United States Treasury Inflation-Protected Security | | | | 3.000% | | 7/15/12 | | | 41,126 | | | 42,670 | |
United States Treasury Inflation-Protected Security | | | | 1.875% | | 7/15/13 | | | 28,417 | | | 27,681 | |
United States Treasury Inflation-Protected Security | | | | 2.000% | | 1/15/14 | | | 43,587 | | | 42,754 | |
United States Treasury Inflation-Protected Security | | | | 2.000% | | 7/15/14 | | | 21,460 | | | 21,033 | |
United States Treasury Inflation-Protected Security | | | | 1.625% | | 1/15/15 | | | 25,650 | | | 24,398 | |
United States Treasury Inflation-Protected Security | | | | 1.875% | | 7/15/15 | | | 23,295 | | | 22,556 | |
United States Treasury Inflation-Protected Security | | | | 2.000% | | 1/15/16 | | | 17,797 | | | 17,389 | |
United States Treasury Inflation-Protected Security | | | | 2.500% | | 7/15/16 | | | 14,680 | | | 14,974 | |
United States Treasury Inflation-Protected Security | | | | 2.375% | | 1/15/25 | | | 22,324 | | | 22,683 | |
United States Treasury Inflation-Protected Security | | | | 2.000% | | 1/15/26 | | | 39,860 | | | 38,228 | |
United States Treasury Inflation-Protected Security | | | | 3.625% | | 4/15/28 | | | 37,730 | | | 46,757 | |
United States Treasury Inflation-Protected Security | | | | 3.875% | | 4/15/29 | | | 41,638 | | | 53,801 | |
| | | | | | | | | | | | | |
Total U.S. Government and Agency Obligations (Identified Cost—$525,365) | | | | | | | | | | | | 521,249 | |
U.S. Government Agency Mortgage-Backed Securities | | 3.4% | | | | | | | | | | | |
| | | | | |
Fixed Rate Securities | | 3.4% | | | | | | | | | | | |
Fannie Mae | | | | 5.000% | | 12/1/36 | | | 16,440 | | | 15,796 | F |
Fannie Mae | | | | 6.000% | | 12/1/36 | | | 3,900 | | | 3,917 | F |
| | | | | | | | | | | | | |
Total U.S. Government Agency Mortgage-Backed Securities (Identified Cost—$19,644) | | | | | | | | | | | | 19,713 | |
Yankee BondsC | | 2.5% | | | | | | | | | | | |
| | | | | |
Banks | | 0.9% | | | | | | | | | | | |
Glitnir Banki hf | | | | 6.693% | | 6/15/16 | | | 1,760 | | | 1,800 | A,B |
Kaupthing Bank hf | | | | 7.125% | | 5/19/16 | | | 2,940 | | | 3,090 | B |
| | | | | | | | | | | | | |
| | | | | | | | | | | | 4,890 | |
| | | | | | | | | | | | | |
| | | | | |
Foreign Governments | | 1.6% | | | | | | | | | | | |
Federative Republic of Brazil | | | | 8.875% | | 4/15/24 | | | 180 | | | 217 | |
Federative Republic of Brazil | | | | 10.125% | | 5/15/27 | | | 310 | | | 416 | |
Federative Republic of Brazil | | | | 11.000% | | 8/17/40 | | | 1,151 | | | 1,499 | |
Republic of Colombia | | | | 11.750% | | 2/25/20 | | | 200 | | | 280 | |
Republic of Colombia | | | | 7.375% | | 9/18/37 | | | 410 | | | 415 | |
Republic of Panama | | | | 7.125% | | 1/29/26 | | | 697 | | | 730 | G |
122
Semi-Annual Report to Shareholders
| | | | | | | | | | | | | | |
| | | % OF
NET ASSETS | | RATE | | MATURITY
DATE | | PAR | | | VALUE | |
| | | | | | | | | | | | | | |
Yankee Bonds—Continued | | | | | | | | | | | | | | |
| | | | | |
Foreign Governments—Continued | | | | | | | | | | | | | | |
Russian Federation | | | | 5.000% | | 3/31/30 | | $ | 4,620 | | | $ | 5,157 | H |
United Mexican States | | | | 7.500% | | 4/8/33 | | | 706 | | | | 814 | |
| | | | | | | | | | | | | | |
| | | | | | | | | | | | | 9,528 | |
| | | | | | | | | | | | | | |
Total Yankee Bonds (Identified Cost—$13,707) | | | | | | | | | | | | | 14,418 | |
Foreign Government Obligations | | 0.7% | | | | | | | | | | | | |
Canadian Real Return Bond | | | | 3.000% | | 12/1/36 | | | 942I | | | | 1,105 | D |
Kingdom of Sweden Inflation-Protected Notes | | | | 3.500% | | 12/1/28 | | | 14,480J | | | | 2,917 | D |
| | | | | | | | | | | | | | |
Total Foreign Government Obligations
(Identified Cost—$3,579) | | | | | | | | | | | | | 4,022 | |
| | | | | | | | | | | | | | |
Total Long-Term Securities (Identified Cost—$575,378) | | | | | | | | | | | | | 572,428 | |
Investment of Collateral From Securities Lending | | 0.1% | | | | | | | | | | | | |
State Street Navigator Securities Lending Prime Portfolio | | | | | | | | | 653 | shs | | | 653 | |
| | | | | | | | | | | | | | |
Total Investment of Collateral From Securities Lending (Identified Cost—$653) | | | | | | | | | | | | | 653 | |
Short-Term Securities | | 3.8% | | | | | | | | | | | | |
| | | | | |
U.S. Government and Agency Obligations | | 1.2% | | | | | | | | | | | | |
Fannie Mae | | | | 0.000% | | 6/25/07 | | $ | 7,300 | | | | 7,031 | E,K |
| | | | | | | | | | | | | | |
| | | | | |
Options PurchasedL | | N.M. | | | | | | | | | | | | |
U.S. Treasury Note Futures Put, November 2006, Strike Price $107.00 | | | | | | | | | 125M | | | | 16 | |
| | | | | | | | | | | | | | |
| | | | | |
Repurchase Agreements | | 2.6% | | | | | | | | | | | | |
Lehman Brothers, Inc.
5.25%, dated 9/29/06, to be repurchased at $15,067 on 10/2/06 (Collateral: $14,915 Fannie Mae notes, 6.27%, due 7/18/16, value $15,361) | | | | | | | | | 15,060 | | | | 15,060 | |
| | | | | | | | | | | | | | |
Total Short-Term Securities (Identified Cost—$22,129) | | | | | | | | | | | | | 22,107 | |
Total Investments (Identified Cost—$598,160) | | 102.3% | | | | | | | | | | $ | 595,188 | |
Obligation to Return Collateral for Securities Loaned | | (0.1)% | | | | | | | | | | | (653 | ) |
Other Assets Less Liabilities | | (2.2)% | | | | | | | | | | | (12,587 | ) |
| | | | | | | | | | | | | | |
| | | | | |
Net Assets | | 100.0% | | | | | | | | | | $ | 581,948 | |
| | | | | | | | | | | | | | |
123
Semi-Annual Report to Shareholders
Portfolio of Investments—Continued
Western Asset Inflation Indexed Plus Bond Portfolio—Continued
| | | | | | | |
| | | EXPIRATION | | ACTUAL
CONTRACTS | | APPRECIATION/
(DEPRECIATION) |
Futures Contracts PurchasedL | | | | | | | |
U.S. Treasury Note Futures Call | | December 2006 | | 66 | | $ | 73 |
| | | | | | | |
| | | | | | | | |
| A | | Indexed security – The rates of interest earned on these securities are tied to the London Interbank Offered Rate (“LIBOR”), the Consumer Price Index (“CPI”), or the one-year Treasury Bill rate. The coupon rates are the rates as of September 30, 2006. |
| B | | Rule 144a Security – A security purchased pursuant to Rule 144a under the Securities Act of 1933 which may not be resold subject to that rule except to qualified institutional buyers. These securities, which the Fund’s investment adviser has determined to be liquid, represent 1.0% of net assets. |
| C | | Yankee Bond – A dollar-denominated bond issued in the U.S. by foreign entities. |
| D | | Inflation-Protected Security – A security whose principal value is adjusted daily or monthly in accordance with changes to the relevant’s country’s Consumer Price Index or its equivalent used as an inflation proxy. Interest is calculated on the basis of the current adjusted principal value. |
| E | | All or a portion of this security is pledged as collateral to cover futures and options contracts. |
| F | | When-issued security – Security purchased on a delayed basis. Final settlement amount and maturity date have not yet been announced. |
| G | | A portion of this security is on loan. |
| H | | Stepped coupon security – A security with a predetermined schedule of interest or dividend rate changes, at which time it begins to accrue interest or pay dividends. |
| I | | Denominated in Canadian dollars. |
| J | | Denominated in Swedish krona. |
| K | | Zero coupon bond – A bond with no periodic interest payments which is sold at such a discount as to produce a current yield to maturity. |
| L | | Options and futures are described in more detail in the notes to financial statements. |
| M | | Par represents actual number of contracts. |
N.M.—Not meaningful.
See notes to financial statements.
124
Semi-Annual Report to Shareholders
Statement of Assets and Liabilities
Western Asset Inflation Indexed Plus Bond Portfolio
September 30, 2006 (Unaudited)
(Amounts in Thousands)
| | | | | | | |
Assets: | | | | | | | |
Investment securities at market value (Identified Cost—$576,031)A | | | | | $ | 573,081 | |
Short-term securities at value (Identified Cost—$22,129) | | | | | | 22,107 | |
Swap contracts at value | | | | | | 1,642 | |
Cash and foreign currencies | | | | | | 973 | |
Receivable for securities sold | | | | | | 5,787 | |
Receivable for fund shares sold | | | | | | 520 | |
Interest receivable | | | | | | 4,221 | |
| | | | | | | |
Total assets | | | | | | 608,331 | |
| | |
Liabilities: | | | | | | | |
Payable for securities purchased | | $ | 25,379 | | | | |
Payable for fund shares repurchased | | | 29 | | | | |
Accrued management fee | | | 37 | | | | |
Income distribution payable | | | 150 | | | | |
Obligation to return collateral for securities loaned | | | 653 | | | | |
Futures variation margin payable | | | 6 | | | | |
Unrealized depreciation of foreign forward currency contracts | | | 40 | | | | |
Accrued expenses | | | 89 | | | | |
| | | | | | | |
Total liabilities | | | | | | 26,383 | |
| | | | | | | |
| | |
Net Assets | | | | | $ | 581,948 | |
| | | | | | | |
| | |
Net assets consist of: | | | | | | | |
Accumulated paid-in-capital applicable to: | | | | | | | |
56,243 Institutional Class shares outstanding | | | | | $ | 584,739 | |
Overdistribution of net investment income | | | | | | (84 | ) |
Accumulated net realized loss on investments, options, futures, swaps and foreign currency transactions | | | | | | (1,595 | ) |
Unrealized appreciation/(depreciation) of investments, options, futures, swaps and foreign currency translations | | | | | | (1,112 | ) |
| | | | | | | |
| | |
Net Assets | | | | | $ | 581,948 | |
| | | | | | | |
| | |
Net Asset Value Per Share: | | | | | | | |
Institutional Class | | | | | | $10.35 | |
| | | | | | | | |
| A | | The market value of securities on loan is $639. |
See notes to financial statements.
125
Semi-Annual Report to Shareholders
Statement of Operations
Western Asset Inflation Indexed Plus Bond Portfolio
For the Six Months Ended September 30, 2006 (Unaudited)
(Amounts in Thousands)
| | | | | | | | |
Investment Income: | | | | | | | | |
Interest | | | | | | $ | 18,894 | |
Expenses: | | | | | | | | |
Advisory fee | | $ | 554 | | | | | |
Audit and legal fees | | | 47 | | | | | |
Custodian fees | | | 71 | | | | | |
Directors’ fees and expenses | | | 21 | | | | | |
Proxy expense | | | 4 | | | | | |
Registration fees | | | 3 | | | | | |
Reports to shareholders | | | 24 | | | | | |
Transfer agent and shareholder servicing expense: | | | 58 | | | | | |
Other expenses | | | 21 | | | | | |
| | | | | | | | |
| | | 803 | | | | | |
Less: Fees waived | | | (109 | ) | | | | |
Compensating balance creditsA | | | (2 | ) | | | | |
| | | | | | | | |
Total expenses, net of waivers and compensating balance credits | | | | | | | 692 | |
| | | | | | | | |
Net Investment Income | | | | | | | 18,202 | |
Net Realized and Unrealized Gain/(Loss) on Investments: | | | | | | | | |
Realized gain/(loss) on: | | | | | | | | |
Investments | | | (1,426 | ) | | | | |
Options | | | 181 | | | | | |
Futures | | | (974 | ) | | | | |
Foreign currency transactions | | | (145 | ) | | | | |
Swaps | | | 1,266 | | | | | |
| | | | | | | | |
| | | | | | | (1,098 | ) |
Change in unrealized gain/(loss) on: | | | | | | | | |
Investments, options, futures, foreign currency translations, and swaps | | | 6,834 | | | | | |
Assets and liabilities denominated in foreign currency | | | 1 | | | | | |
| | | | | | | | |
| | | | | | | 6,835 | |
| | | | | | | | |
Net Realized and Unrealized Loss on Investments | | | | | | | 5,737 | |
| | | | | | | | | |
Change in Net Assets Resulting From Operations | | | | | | $ | 23,939 | |
| | | | | | | | | |
| A | | See note 1, compensating balance credits, in the notes to financial statements |
See notes to financial statements.
126
Semi-Annual Report to Shareholders
Statement of Changes in Net Assets
Western Asset Inflation Indexed Plus Bond Portfolio
(Amounts in Thousands)
| | | | | | | | |
| | | FOR THE
SIX MONTHS ENDED
SEPTEMBER 30, 2006 | | | FOR THE
YEAR ENDED
MARCH 31, 2006 | |
| Change in Net Assets: | | (Unaudited) | | | | |
Net investment income | | $ | 18,202 | | | $ | 23,665 | |
| | |
Net realized gain/(loss) on investments, options, futures, foreign currency transactions and swaps | | | (1,098 | ) | | | 3,571 | |
| | |
Change in unrealized appreciation/(depreciation) of investments, options, futures, foreign currency translations, swaps and assets and liabilities denominated in foreign currencies | | | 6,835 | | | | (22,027 | ) |
| | | | | | | | |
Change in net assets resulting from operations | | | 23,939 | | | | 5,209 | |
| | |
Distributions to Shareholders from: | | | | | | | | |
Net investment income | | | (18,196 | ) | | | (24,662 | ) |
Net realized gain on investments | | | — | | | | (3,825 | ) |
| | |
Change in net assets from Fund share transactions | | | 33,673 | | | | 104,064 | |
| | | | | | | | |
Change in net assets | | | 39,416 | | | | 80,786 | |
| | |
Net Assets: | | | | | | | | |
Beginning of period | | | 542,532 | | | | 461,746 | |
| | | | | | | | |
| | |
End of period | | $ | 581,948 | | | $ | 542,532 | |
| | | | | | | | |
| | |
Overdistributions of net investment income | | $ | (84 | ) | | $ | (90 | ) |
| | | | | | | | |
| | | | | | | | | |
See notes to financial statements.
127
Semi-Annual Report to Shareholders
Financial Highlights
Western Asset Inflation Indexed Plus Bond Portfolio
Contained below is per share operating performance data for a share of common stock outstanding throughout each period shown, total investment return, ratios to average net assets and other supplemental data. This information has been derived from information in the financial statements.
Institutional Class:
| | | | | | | | | | | | | | | | | | | | | | | | |
| | | SIX MONTHS
ENDED
SEPTEMBER 30, 2006 | | | FOR THE YEARS ENDED MARCH 31, | |
| | | | 2006 | | | 2005 | | | 2004 | | | 2003 | | | 2002 | |
| | | (Unaudited) | | | | | | | | | | | | | | | | |
Net asset value, beginning of period | | $ | 10.25 | | | $ | 10.74 | | | $ | 11.24 | | | $ | 10.96 | | | $ | 9.92 | | | $ | 9.98 | |
| | | | | | | | | | | | | | | | | | | | | | | | |
Investment operations: | | | | | | | | | | | | | | | | | | | | | | | | |
Net investment income | | | .34 | | | | .54 | | | | .42 | | | | .37 | | | | .51 | | | | .41 | |
Net realized and unrealized gain/(loss) on investments, options, futures, foreign currency transactions and swaps | | | .10 | | | | (.38 | ) | | | (.10 | ) | | | .71 | | | | 1.19 | | | | .01 | |
| | | | | | | | | | | | | | | | | | | | | | | | |
Total from investment operations | | | .44 | | | | .16 | | | | .32 | | | | 1.08 | | | | 1.70 | | | | .42 | |
| | | | | | | | | | | | | | | | | | | | | | | | |
Distributions paid from: | | | | | | | | | | | | | | | | | | | | | | | | |
Net investment income | | | (.34 | ) | | | (.56 | ) | | | (.42 | ) | | | (.37 | ) | | | (.51 | ) | | | (.41 | ) |
Net realized gain on investments | | | — | | | | (.09 | ) | | | (.40 | ) | | | (.43 | ) | | | (.15 | ) | | | (.07 | ) |
| | | | | | | | | | | | | | | | | | | | | | | | |
Total distributions | | | (.34 | ) | | | (.65 | ) | | | (.82 | ) | | | (.80 | ) | | | (.66 | ) | | | (.48 | ) |
| | | | | | | | | | | | | | | | | | | | | | | | |
Net asset value, end of period | | $ | 10.35 | | | $ | 10.25 | | | $ | 10.74 | | | $ | 11.24 | | | $ | 10.96 | | | $ | 9.92 | |
| | | | | | | | | | | | | | | | | | | | | | | | |
Total return | | | 4.36 | %A | | | 1.44 | % | | | 3.27 | % | | | 10.33 | % | | | 17.62 | % | | | 4.28 | % |
| | | | | | |
Ratios to Average Net Assets:B | | | | | | | | | | | | | | | | | | | | | | | | |
Total expenses | | | .29 | %C | | | .27 | % | | | .27 | % | | | .27 | % | | | .27 | % | | | .67 | % |
Expenses net of waivers, if any | | | .25 | %C | | | .25 | % | | | .25 | % | | | .25 | % | | | .25 | % | | | .25 | % |
Expenses net of all reductions | | | .25 | %C | | | .25 | % | | | .25 | % | | | .25 | % | | | .25 | % | | | .25 | % |
Net investment income | | | 6.6 | %C | | | 5.0 | % | | | 3.8 | % | | | 3.4 | % | | | 4.8 | % | | | 5.0 | % |
| | | | | | |
Supplemental Data: | | | | | | | | | | | | | | | | | | | | | | | | |
Portfolio turnover rate | | | 49.1 | %A | | | 177.1 | % | | | 255.5 | % | | | 281.8 | % | | | 75.4 | % | | | 79.5 | % |
Net assets at end of period (in thousands) | | $ | 581,948 | | | $ | 542,532 | | | $ | 461,746 | | | $ | 346,379 | | | $ | 290,306 | | | $ | 210,635 | |
| | | | | | | | | | | | | | | | | | | | | | | | | |
| B | | Total expenses reflects operating expenses prior to any voluntary expense waivers and/or compensating balance credits. Expenses net of waivers reflects total expenses before compensating balance credits but net of any voluntary expense waivers. Expenses net of all reductions reflects expenses less any compensating balance credits and/or voluntary expense waivers. |
See notes to financial statements.
128
Semi-Annual Report to Shareholders
Expense Example
Western Asset High Yield Portfolio
As a shareholder of the Fund, you incur ongoing costs, including management fees and other Fund expenses. These examples are intended to help you understand your ongoing costs (in dollars) of investing in the Fund and to compare these costs with the ongoing costs of investing in other mutual funds. The example is based on an investment of $1,000 invested on April 1, 2006, and held through September 30, 2006.
Actual Expenses
The first line in the table below provides information about actual account values and actual expenses for the Fund. You may use the information in this line, together with the amount you invested, to estimate the expenses that you paid over the period. Simply divide your account value by $1,000 (for example, an $8,600 account value divided by $1,000 = 8.6), then multiply the result by the number in the first line under the heading entitled “Expenses Paid During the Period” to estimate the expenses you paid on your account during this period.
Hypothetical Example for Comparison Purposes
The second line in the table below provides information about hypothetical account values and hypothetical expenses based on the Fund’s actual expense ratios and an assumed rate of return of 5% per year before expenses, which is not the Fund’s actual return. The hypothetical account values and expenses may not be used to estimate the actual ending account balance or expenses you paid for the period. You may use this information to compare the ongoing costs of investing in the Fund and other funds. To do so, compare this 5% hypothetical example with the 5% hypothetical examples that appear in the shareholder reports of other funds.
| | | | | | | | | |
| | | Beginning
Account Value
4/1/06 | | Ending
Account Value
9/30/06 | | Expenses PaidA
During the Period
4/1/06 to 9/30/06 |
Institutional Class: | | | | | | | | | |
Actual | | $ | 1,000.00 | | $ | 1,041.60 | | $ | 3.12 |
Hypothetical (5% return before expenses) | | | 1,000.00 | | | 1,022.01 | | | 3.09 |
| A | | These calculations are based on expenses incurred in the most recent fiscal half-year. The dollar amounts shown as “Expenses Paid” are equal to the annualized expense ratio of 0.61% multiplied by the average value over the period, multiplied by the number of days in the most recent fiscal half-year (183), and divided by 365. |
129
Semi-Annual Report to Shareholders
Performance Information
Western Asset High Yield Portfolio
The graph compares the Fund’s total returns against that of two broad-based securities market indices. Effective September 1, 2005, the Fund changed its comparative index from the Lehman High Yield Index to the Lehman High Yield Index 2% Issuer Constrained (“High Yield Constrained Index”). As a result of significant changes to the Lehman High Yield composition and Lehman index methodology rules, the adviser has determined that the High Yield Constrained Index is more representative of the overall high yield market and therefore more accurately reflects the types of securities in which the Fund invests. The lines illustrate the cumulative total return of an initial $1,000,000 investment for the periods indicated. The line for the Fund represents the total return after deducting all Fund investment management and other administrative expenses and the transaction costs of buying and selling securities. The lines representing the securities market indices do not include any transaction costs associated with buying and selling securities in the indices or other investment management or administrative expenses.
Total return measures investment performance in terms of appreciation or depreciation in the Fund’s net asset value per share, plus dividends and any capital gain distributions. It assumes that dividends and distributions were reinvested at the time they were paid. Returns (and the graph and table found below) do not reflect the deduction of taxes that a shareholder would pay on Fund distributions or the redemption of Fund shares. Average annual returns tend to smooth out variations in a fund’s return, so that they differ from actual year-to-year results.
Bonds are subject to a variety of risks, including interest rate, credit and inflation risk. High Yield securities are subject to greater fluctuations in value and greater risk of loss of income and principal due to default by the issuer than are higher rated bonds.
Growth of a $1,000,000 Investment—Institutional Class
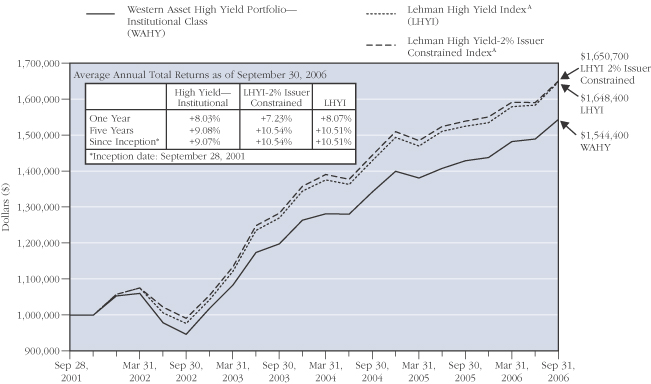
The performance data quoted represents past performance and does not guarantee future results. The performance stated may have been due to extraordinary market conditions, which may not be duplicated in the future. Current performance may be lower or higher than the performance data quoted. To obtain the most recent month-end performance information, please visit www.westernassetfunds.com. The investment return and principal value of the Fund will fluctuate so that an investor’s shares, when redeemed, may be worth more or less than the original cost. Calculations assume reinvestment of dividends and capital gain distributions. Performance would have been lower if fees had not been waived in various periods.
| A | | Index returns are for periods beginning September 30, 2001. |
130
Semi-Annual Report to Shareholders
Portfolio Composition (as of September 30, 2006)
Standard & Poor’s Debt RatingsB (as a percentage of the portfolio)
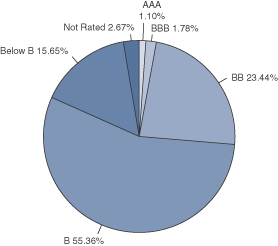
Maturity Schedule (as a percentage of the portfolio)
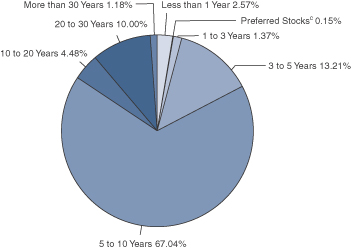
| B | | Source: Standard & Poor's. |
| C | | Preferred Stocks do not have a defined maturity date. |
The Fund is actively managed. As a result, the composition of the portfolio holdings and sectors are subject to change at any time.
131
Semi-Annual Report to Shareholders
Portfolio of Investments
Western Asset High Yield Portfolio
September 30, 2006 (Unaudited)
(Amounts in Thousands)
| | | | | | | | | | | | | |
| | | % OF
NET ASSETS | | RATE | | MATURITY
DATE | | PAR | | VALUE | |
| | | | | | | | | | | | | |
Long-Term Securities | | 96.7% | | | | | | | | | | | |
| | | | | |
Corporate Bonds and Notes | | 85.4% | | | | | | | | | | | |
| | | | | |
Advertising | | 1.0% | | | | | | | | | | | |
Affinion Group, Inc. | | | | 10.125% | | 10/15/13 | | $ | 3,020 | | $ | 3,171 | |
R.H. Donnelley Corp. | | | | 6.875% | | 1/15/13 | | | 1,395 | | | 1,273 | |
R.H. Donnelley Corp. | | | | 6.875% | | 1/15/13 | | | 2,520 | | | 2,299 | |
| | | | | | | | | | | | | |
| | | | | | | | | | | | 6,743 | |
| | | | | | | | | | | | | |
Aerospace/Defense | | 1.6% | | | | | | | | | | | |
Alliant Techsystems Inc. | | | | 6.750% | | 4/1/16 | | | 1,680 | | | 1,655 | |
DRS Technologies, Inc. | | | | 6.625% | | 2/1/16 | | | 1,565 | | | 1,538 | |
DRS Technologies, Inc. | | | | 7.625% | | 2/1/18 | | | 1,500 | | | 1,522 | |
Standard Aero Holdings Inc. | | | | 8.250% | | 9/1/14 | | | 4,240 | | | 4,092 | |
TransDigm Inc. | | | | 7.750% | | 7/15/14 | | | 1,750 | | | 1,763 | A |
| | | | | | | | | | | | | |
| | | | | | | | | | | | 10,570 | |
| | | | | | | | | | | | | |
Apparel | | 0.7% | | | | | | | | | | | |
Levi Strauss & Co. | | | | 9.750% | | 1/15/15 | | | 1,860 | | | 1,930 | |
Levi Strauss & Co. | | | | 8.875% | | 4/1/16 | | | 1,200 | | | 1,194 | |
Oxford Industries, Inc. | | | | 8.875% | | 6/1/11 | | | 1,504 | | | 1,534 | |
| | | | | | | | | | | | | |
| | | | | | | | | | | | 4,658 | |
| | | | | | | | | | | | | |
Auto and Automotive Parts | | 1.6% | | | | | | | | | | | |
Commercial Vehicle Group, Inc. | | | | 8.000% | | 7/1/13 | | | 2,170 | | | 2,078 | |
Keystone Automotive Operations Inc. | | | | 9.750% | | 11/1/13 | | | 3,400 | | | 3,196 | |
TRW Automotive | | | | 9.375% | | 2/15/13 | | | 990 | | | 1,054 | |
Visteon Corporation | | | | 8.250% | | 8/1/10 | | | 1,907 | | | 1,859 | |
Visteon Corporation | | | | 7.000% | | 3/10/14 | | | 2,640 | | | 2,363 | |
| | | | | | | | | | | | | |
| | | | | | | | | | | | 10,550 | |
| | | | | | | | | | | | | |
Automotive | | 1.4% | | | | | | | | | | | |
Ford Motor Company | | | | 8.875% | | 1/15/22 | | | 640 | | | 551 | |
Ford Motor Company | | | | 7.450% | | 7/16/31 | | | 4,575 | | | 3,534 | |
General Motors Corporation | | | | 7.200% | | 1/15/11 | | | 1,600 | | | 1,474 | |
General Motors Corporation | | | | 8.375% | | 7/15/33 | | | 4,200 | | | 3,633 | |
| | | | | | | | | | | | | |
| | | | | | | | | | | | 9,192 | |
| | | | | | | | | | | | | |
Automotive Retailer | | 0.5% | | | | | | | | | | | |
Asbury Automotive Group Inc. | | | | 9.000% | | 6/15/12 | | | 2,832 | | | 2,899 | |
| | | | | | | | | | | | | |
| | | | | |
Banking and Finance | | 3.8% | | | | | | | | | | | |
ACE Cash Express, Inc. | | | | 10.250% | | 10/1/14 | | | 651 | | | 659 | A |
Ford Motor Credit Company | | | | 8.625% | | 11/1/10 | | | 1,310 | | | 1,305 | |
132
Semi-Annual Report to Shareholders
| | | | | | | | | | | | | |
| | | % OF
NET ASSETS | | RATE | | MATURITY
DATE | | PAR | | VALUE | |
| | | | | | | | | | | | | |
Corporate Bonds and Notes—Continued | | | | | | | | | | | | | |
| | | | | |
Banking and Finance—Continued | | | | | | | | | | | | | |
Ford Motor Credit Company | | | | 7.375% | | 2/1/11 | | $ | 3,370 | | $ | 3,235 | |
Ford Motor Credit Company | | | | 9.875% | | 8/10/11 | | | 2,800 | | | 2,897 | |
General Motors Acceptance Corporation | | | | 6.875% | | 8/28/12 | | | 1,500 | | | 1,485 | |
General Motors Acceptance Corporation | | | | 8.000% | | 11/1/31 | | | 14,015 | | | 14,654 | |
| | | | | | | | | | | | | |
| | | | | | | | | | | | 24,235 | |
| | | | | | | | | | | | | |
Building Materials | | 2.7% | | | | | | | | | | | |
Associated Materials Incorporated | | | | 0.000% | | 3/1/14 | | | 6,500 | | | 3,575 | B |
Interface, Inc. | | | | 7.300% | | 4/1/08 | | | 411 | | | 415 | |
Interface, Inc. | | | | 10.375% | | 2/1/10 | | | 3,182 | | | 3,469 | |
K Hovnanian Enterprises Inc. | | | | 6.250% | | 1/15/16 | | | 3,250 | | | 2,860 | |
K Hovnanian Enterprises Inc. | | | | 7.500% | | 5/15/16 | | | 1,400 | | | 1,307 | |
Nortek, Inc. | | | | 8.500% | | 9/1/14 | | | 3,145 | | | 2,972 | |
NTK Holdings, Inc. | | | | 10.750% | | 3/1/14 | | | 4,055 | | | 2,798 | |
| | | | | | | | | | | | | |
| | | | | | | | | | | | 17,396 | |
| | | | | | | | | | | | | |
Cable | | 4.1% | | | | | | | | | | | |
CCH I Holdings, LLC | | | | 11.000% | | 10/1/15 | | | 3,500 | | | 3,185 | |
CCH I Holdings, LLC | | | | 11.000% | | 10/1/15 | | | 152 | | | 137 | A |
CCH II Holdings, LLC | | | | 10.250% | | 10/1/13 | | | 2,892 | | | 2,942 | A |
Charter Communications Holdings, LLC | | | | 10.250% | | 9/15/10 | | | 3,050 | | | 3,111 | |
Charter Communications Holdings, LLC | | | | 11.750% | | 5/15/14 | | | 2,500 | | | 1,781 | |
CSC Holdings Inc. | | | | 7.625% | | 4/1/11 | | | 820 | | | 841 | |
CSC Holdings Inc. | | | �� | 7.250% | | 4/15/12 | | | 3,785 | | | 3,771 | A |
CSC Holdings Inc. | | | | 7.875% | | 2/15/18 | | | 150 | | | 156 | |
EchoStar DBS Corporation | | | | 7.000% | | 10/1/13 | | | 3,440 | | | 3,363 | A |
EchoStar DBS Corporation | | | | 6.625% | | 10/1/14 | | | 3,030 | | | 2,882 | |
EchoStar DBS Corporation | | | | 7.125% | | 2/1/16 | | | 920 | | | 889 | A |
LodgeNet Entertainment Corporation | | | | 9.500% | | 6/15/13 | | | 2,852 | | | 3,052 | |
| | | | | | | | | | | | | |
| | | | | | | | | | | | 26,110 | |
| | | | | | | | | | | | | |
Casino Resorts | | 3.8% | | | | | | | | | | | |
Boyd Gaming Corporation | | | | 8.750% | | 4/15/12 | | | 862 | | | 905 | |
Boyd Gaming Corporation | | | | 6.750% | | 4/15/14 | | | 480 | | | 469 | |
Inn of The Mountain Gods Resort and Casino | | | | 12.000% | | 11/15/10 | | | 5,370 | | | 5,625 | |
Isle of Capri Casinos, Inc. | | | | 7.000% | | 3/1/14 | | | 665 | | | 632 | |
Mandalay Resort Group | | | | 9.375% | | 2/15/10 | | | 58 | | | 62 | |
MGM MIRAGE | | | | 8.375% | | 2/1/11 | | | 1,750 | | | 1,824 | |
Pinnacle Entertainment, Inc. | | | | 8.250% | | 3/15/12 | | | 2,760 | | | 2,795 | |
Premier Entertainment Biloxi LLC | | | | 10.750% | | 2/1/12 | | | 5,000 | | | 5,087 | |
Station Casinos, Inc. | | | | 7.750% | | 8/15/16 | | | 2,015 | | | 2,091 | |
133
Semi-Annual Report to Shareholders
Portfolio of Investments—Continued
Western Asset High Yield Portfolio—Continued
| | | | | | | | | | | | | |
| | | % OF
NET ASSETS | | RATE | | MATURITY
DATE | | PAR | | VALUE | |
| | | | | | | | | | | | | |
Corporate Bonds and Notes—Continued | | | | | | | | | | | | | |
| | | | | |
Casino Resorts—Continued | | | | | | | | | | | | | |
Station Casinos, Inc. | | | | 6.625% | | 3/15/18 | | $ | 1,410 | | $ | 1,272 | |
Turning Stone Casino Resort Enterprise | | | | 9.125% | | 9/15/14 | | | 965 | | | 975 | A |
Wynn Las Vegas, LLC | | | | 6.625% | | 12/1/14 | | | 3,000 | | | 2,910 | |
| | | | | | | | | | | | | |
| | | | | | | | | | | | 24,647 | |
| | | | | | | | | | | | | |
Chemicals | | 1.3% | | | | | | | | | | | |
Chemtura Corporation | | | | 6.875% | | 6/1/16 | | | 70 | | | 69 | |
Georgia Gulf Corporation | | | | 9.500% | | 10/15/14 | | | 3,500 | | | 3,487 | A |
Lyondell Chemical Company | | | | 10.500% | | 6/1/13 | | | 1,445 | | | 1,589 | |
Lyondell Chemical Company | | | | 8.000% | | 9/15/14 | | | 875 | | | 886 | |
Lyondell Chemical Company | | | | 8.250% | | 9/15/16 | | | 720 | | | 731 | |
Westlake Chemical Corporation | | | | 6.625% | | 1/15/16 | | | 1,377 | | | 1,308 | |
| | | | | | | | | | | | | |
| | | | | | | | | | | | 8,070 | |
| | | | | | | | | | | | | |
Coal | | 0.8% | | | | | | | | | | | |
Alpha Natural Resources LLC | | | | 10.000% | | 6/1/12 | | | 2,965 | | | 3,187 | |
International Coal Group, Inc. | | | | 10.250% | | 7/15/14 | | | 2,365 | | | 2,247 | A |
| | | | | | | | | | | | | |
| | | | | | | | | | | | 5,434 | |
| | | | | | | | | | | | | |
Computer Services and Systems | | 1.2% | | | | | | | | | | | |
Activant Solutions, Inc. | | | | 9.500% | | 5/1/16 | | | 1,385 | | | 1,281 | A |
SunGard Data Systems Inc. | | | | 9.125% | | 8/15/13 | | | 120 | | | 124 | |
SunGard Data Systems Inc. | | | | 10.250% | | 8/15/15 | | | 5,805 | | | 5,979 | |
UGS Capital Corporation II | | | | 10.380% | | 6/1/11 | | | 465 | | | 472 | A,C |
| | | | | | | | | | | | | |
| | | | | | | | | | | | 7,856 | |
| | | | | | | | | | | | | |
Containers and Packaging | | 1.9% | | | | | | | | | | | |
Berry Plastics Holding Corp | | | | 8.875% | | 9/15/14 | | | 1,420 | | | 1,427 | A |
Graham Packaging Company Inc. | | | | 9.875% | | 10/15/14 | | | 3,106 | | | 3,052 | |
Graphic Packaging International Corp. | | | | 8.500% | | 8/15/11 | | | 450 | | | 460 | |
Graphic Packaging International Corp. | | | | 9.500% | | 8/15/13 | | | 2,610 | | | 2,669 | |
Owens Brockway Glass Containers | | | | 8.750% | | 11/15/12 | | | 1,790 | | | 1,888 | |
Plastipak Holdings Inc. | | | | 8.500% | | 12/15/15 | | | 2,810 | | | 2,838 | A |
| | | | | | | | | | | | | |
| | | | | | | | | | | | 12,334 | |
| | | | | | | | | | | | | |
Drug and Grocery Store Chains | | 0.7% | | | | | | | | | | | |
Delhaize America, Inc. | | | | 8.125% | | 4/15/11 | | | 1,208 | | | 1,297 | |
Delhaize America, Inc. | | | | 9.000% | | 4/15/31 | | | 2,580 | | | 3,022 | |
| | | | | | | | | | | | | |
| | | | | | | | | | | | 4,319 | |
| | | | | | | | | | | | | |
134
Semi-Annual Report to Shareholders
| | | | | | | | | | | | | |
| | | % OF
NET ASSETS | | RATE | | MATURITY
DATE | | PAR | | VALUE | |
| | | | | | | | | | | | | |
Corporate Bonds and Notes—Continued | | | | | | | | | | | | | |
| | | | | |
Educational Services | | 0.2% | | | | | | | | | | | |
Education Management LLC | | | | 8.750% | | 6/1/14 | | $ | 1,480 | | $ | 1,495 | A |
| | | | | | | | | | | | | |
| | | | | |
Electric | | 2.1% | | | | | | | | | | | |
Mirant Americas Generation, LLC | | | | 8.300% | | 5/1/11 | | | 1,620 | | | 1,622 | |
Mirant North America LLC | | | | 7.375% | | 12/31/13 | | | 2,070 | | | 2,073 | |
Mission Energy Holding Company | | | | 13.500% | | 7/15/08 | | | 1,200 | | | 1,340 | |
Orion Power Holdings, Inc. | | | | 12.000% | | 5/1/10 | | | 1,555 | | | 1,761 | |
The AES Corporation | | | | 8.875% | | 2/15/11 | | | 40 | | | 43 | |
The AES Corporation | | | | 8.750% | | 5/15/13 | | | 1,849 | | | 1,983 | A |
The AES Corporation | | | | 7.750% | | 3/1/14 | | | 2,790 | | | 2,901 | |
The AES Corporation | | | | 9.000% | | 5/15/15 | | | 1,535 | | | 1,654 | A |
| | | | | | | | | | | | | |
| | | | | | | | | | | | 13,377 | |
| | | | | | | | | | | | | |
Electronics | | 1.2% | | | | | | | | | | | |
Amkor Technology, Inc. | | | | 2.500% | | 5/15/11 | | | 1,660 | | | 1,386D | |
L-3 Communications Corporation | | | | 7.625% | | 6/15/12 | | | 550 | | | 567 | |
L-3 Communications Corporation | | | | 6.375% | | 10/15/15 | | | 3,800 | | | 3,695 | |
Rayovac Corporation | | | | 8.500% | | 10/1/13 | | | 1,680 | | | 1,453 | |
Spectrum Brands Inc. | | | | 7.375% | | 2/1/15 | | | 410 | | | 328 | |
| | | | | | | | | | | | | |
| | | | | | | | | | | | 7,429 | |
| | | | | | | | | | | | | |
Energy | | 2.7% | | | | | | | | | | | |
Edison Mission Energy | | | | 7.500% | | 6/15/13 | | | 345 | | | 348 | A |
Edison Mission Energy | | | | 7.750% | | 6/15/16 | | | 1,960 | | | 1,985 | A |
Elwood Energy LLC | | | | 8.159% | | 7/5/26 | | | 2,833 | | | 2,982 | |
Midwest Generation LLC | | | | 8.560% | | 1/2/16 | | | 1,983 | | | 2,107 | |
NRG Energy, Inc. | | | | 7.250% | | 2/1/14 | | | 190 | | | 189 | |
NRG Energy, Inc. | | | | 7.375% | | 2/1/16 | | | 7,430 | | | 7,383 | |
Sierra Pacific Resources | | | | 6.750% | | 8/15/17 | | | 2,360 | | | 2,361 | |
| | | | | | | | | | | | | |
| | | | | | | | | | | | 17,355 | |
| | | | | | | | | | | | | |
Entertainment | | 0.5% | | | | | | | | | | | |
Blockbuster Inc. | | | | 9.000% | | 9/1/12 | | | 1,590 | | | 1,459 | |
Cinemark USA, Inc. | | | | 0.000% | | 3/15/14 | | | 145 | | | 116 | B |
Warner Music Group | | | | 7.375% | | 4/15/14 | | | 1,755 | | | 1,711 | |
| | | | | | | | | | | | | |
| | | | | | | | | | | | 3,286 | |
| | | | | | | | | | | | | |
Environmental Services | | 0.2% | | | | | | | | | | | |
Allied Waste North America Incorporated | | | | 8.500% | | 12/1/08 | | | 1,185 | | | 1,241 | |
| | | | | | | | | | | | | |
135
Semi-Annual Report to Shareholders
Portfolio of Investments—Continued
Western Asset High Yield Portfolio—Continued
| | | | | | | | | | | | | |
| | | % OF
NET ASSETS | | RATE | | MATURITY
DATE | | PAR | | VALUE | |
| | | | | | | | | | | | | |
Corporate Bonds and Notes—Continued | | | | | | | | | | | | | |
| | | | | |
Food, Beverage and Tobacco | | 1.6% | | | | | | | | | | | |
Alliance One International, Inc. | | | | 11.000% | | 5/15/12 | | $ | 530 | | $ | 541 | |
Constellation Brands, Inc. | | | | 7.250% | | 9/1/16 | | | 2,810 | | | 2,842 | |
Dole Food Company, Inc. | | | | 7.250% | | 6/15/10 | | | 2,960 | | | 2,745 | |
Domino’s, Inc. | | | | 8.250% | | 7/1/11 | | | 2,424 | | | 2,545 | |
Stater Bros. Holdings Inc. | | | | 8.890% | | 6/15/10 | | | 1,420 | | | 1,434 | E |
| | | | | | | | | | | | | |
| | | | | | | | | | | | 10,107 | |
| | | | | | | | | | | | | |
Funeral Parlors and Cemeteries | | 0.2% | | | | | | | | | | | |
Service Corporation International | | | | 7.375% | | 10/1/14 | | | 410 | | | 413 | A |
Service Corporation International | | | | 8.000% | | 6/15/17 | | | 515 | | | 493 | A |
Service Corporation International | | | | 7.625% | | 10/1/18 | | | 615 | | | 619 | A |
| | | | | | | | | | | | | |
| | | | | | | | | | | | 1,525 | |
| | | | | | | | | | | | | |
Gaming | | 1.3% | | | | | | | | | | | |
CCM Merger Incorporated | | | | 8.000% | | 8/1/13 | | | 1,585 | | | 1,522 | A |
Isle of Capri Casinos, Inc. | | | | 9.000% | | 3/15/12 | | | 195 | | | 203 | |
Penn National Gaming, Inc. | | | | 6.750% | | 3/1/15 | | | 2,600 | | | 2,532 | |
River Rock Entertainment Authority | | | | 9.750% | | 11/1/11 | | | 4,008 | | | 4,258 | |
| | | | | | | | | | | | | |
| | | | | | | | | | | | 8,515 | |
| | | | | | | | | | | | | |
Gas and Pipeline Utilities | | 2.2% | | | | | | | | | | | |
ANR Pipeline, Inc. | | | | 9.625% | | 11/1/21 | | | 1,604 | | | 1,976 | |
Southern Natural Gas Company | | | | 8.000% | | 3/1/32 | | | 1,590 | | | 1,758 | |
The Williams Companies, Inc. | | | | 7.500% | | 1/15/31 | | | 1,350 | | | 1,333 | |
The Williams Companies, Inc. | | | | 8.750% | | 3/15/32 | | | 7,259 | | | 7,949 | |
Transcontinental Gas Pipeline Corporation | | | | 8.875% | | 7/15/12 | | | 1,060 | | | 1,172 | |
| | | | | | | | | | | | | |
| | | | | | | | | | | | 14,188 | |
| | | | | | | | | | | | | |
Health Care | | 1.3% | | | | | | | | | | | |
Tenet Healthcare Corporation | | | | 9.875% | | 7/1/14 | | | 6,725 | | | 6,700 | |
Tenet Healthcare Corporation | | | | 9.250% | | 2/1/15 | | | 1,830 | | | 1,761 | |
| | | | | | | | | | | | | |
| | | | | | | | | | | | 8,461 | |
| | | | | | | | | | | | | |
Homebuilding | | 0.5% | | | | | | | | | | | |
Beazer Homes USA, Inc. | | | | 8.625% | | 5/15/11 | | | 720 | | | 726 | |
Beazer Homes USA, Inc. | | | | 8.375% | | 4/15/12 | | | 580 | | | 577 | |
Beazer Homes USA, Inc. | | | | 6.875% | | 7/15/15 | | | 770 | | | 697 | |
Beazer Homes USA, Inc. | | | | 8.125% | | 6/15/16 | | | 1,415 | | | 1,376 | |
| | | | | | | | | | | | | |
| | | | | | | | | | | | 3,376 | |
| | | | | | | | | | | | | |
Insurance | | 0.6% | | | | | | | | | | | |
Crum & Forster Holdings Corp | | | | 10.375% | | 6/15/13 | | | 3,745 | | | 3,839 | |
| | | | | | | | | | | | | |
136
Semi-Annual Report to Shareholders
| | | | | | | | | | | | | |
| | | % OF
NET ASSETS | | RATE | | MATURITY
DATE | | PAR | | VALUE | |
| | | | | | | | | | | | | |
Corporate Bonds and Notes—Continued | | | | | | | | | | | | | |
| | | | | |
Investment Banking/Brokerage | | 0.5% | | | | | | | | | | | |
E*Trade Financial Corporation | | | | 7.375% | | 9/15/13 | | $ | 1,290 | | $ | 1,319 | |
E*Trade Financial Corporation | | | | 7.875% | | 12/1/15 | | | 1,547 | | | 1,628 | |
| | | | | | | | | | | | | |
| | | | | | | | | | | | 2,947 | |
| | | | | | | | | | | | | |
Lodging/Hotels | | 0.2% | | | | | | | | | | | |
Host Marriott LP | | | | 6.750% | | 6/1/16 | | | 1,500 | | | 1,479 | |
| | | | | | | | | | | | | |
| | | | | |
Machinery | | 0.4% | | | | | | | | | | | |
Terex Corporation | | | | 7.375% | | 1/15/14 | | | 2,855 | | | 2,869 | |
| | | | | | | | | | | | | |
| | | | | |
Manufacturing (Diversified) | | 1.2% | | | | | | | | | | | |
American Achievement Corp. | | | | 8.250% | | 4/1/12 | | | 930 | | | 939 | |
Jacuzzi Brands Incorporated | | | | 9.625% | | 7/1/10 | | | 4,156 | | | 4,405 | |
Koppers Inc. | | | | 9.875% | | 10/15/13 | | | 750 | | | 812 | |
Mueller Group Inc. | | | | 10.000% | | 5/1/12 | | | 1,295 | | | 1,407 | |
| | | | | | | | | | | | | |
| | | | | | | | | | | | 7,563 | |
| | | | | | | | | | | | | |
Media | | 3.4% | | | | | | | | | | | |
AMC Entertainment Inc. | | | | 11.000% | | 2/1/16 | | | 3,900 | | | 4,251 | |
Barrington Brodcasting Group LLC | | | | 10.500% | | 8/15/14 | | | 560 | | | 546 | A |
Clear Channel Communications, Inc. | | | | 5.500% | | 12/15/16 | | | 3,100 | | | 2,793 | |
CMP Susquehanna Corp. | | | | 9.875% | | 5/15/14 | | | 555 | | | 522 | A |
Hughes Network Systems LLC | | | | 9.500% | | 4/15/14 | | | 1,475 | | | 1,519 | A |
ION Media Networks, Inc. | | | | 8.757% | | 1/15/12 | | | 1,760 | | | 1,773 | A,E |
Lamar Media Corp. | | | | 6.625% | | 8/15/15 | | | 1,295 | | | 1,242 | |
LIN Television Corporation | | | | 6.500% | | 5/15/13 | | | 1,040 | | | 970 | |
LIN Television Corporation | | | | 6.500% | | 5/15/13 | | | 670 | | | 625 | |
PRIMEDIA Inc. | | | | 8.875% | | 5/15/11 | | | 4,135 | | | 4,042 | |
Sinclair Broadcast Group, Inc. | | | | 8.000% | | 3/15/12 | | | 1,395 | | | 1,414 | |
XM Satellite Radio Inc. | | | | 9.989% | | 5/1/13 | | | 625 | | | 594 | A |
XM Satellite Radio Inc. | | | | 9.750% | | 5/1/14 | | | 1,475 | | | 1,416 | A |
| | | | | | | | | | | | | |
| | | | | | | | | | | | 21,707 | |
| | | | | | | | | | | | | |
Medical Care Facilities | | 1.5% | | | | | | | | | | | |
DaVita, Inc. | | | | 7.250% | | 3/15/15 | | | 4,000 | | | 3,930 | |
HCA Inc. | | | | 6.300% | | 10/1/12 | | | 890 | | | 753 | |
HCA, Inc. | | | | 9.000% | | 12/15/14 | | | 56 | | | 53 | |
HCA, Inc. | | | | 6.500% | | 2/15/16 | | | 890 | | | 712 | |
HCA, Inc. | | | | 7.690% | | 6/15/25 | | | 1,850 | | | 1,444 | |
HCA, Inc. | | | | 7.500% | | 11/15/95 | | | 4,210 | | | 3,003 | |
| | | | | | | | | | | | | |
| | | | | | | | | | | | 9,895 | |
| | | | | | | | | | | | | |
137
Semi-Annual Report to Shareholders
Portfolio of Investments—Continued
Western Asset High Yield Portfolio—Continued
| | | | | | | | | | | | | |
| | | % OF
NET ASSETS | | RATE | | MATURITY
DATE | | PAR | | VALUE | |
| | | | | | | | | | | | | |
Corporate Bonds and Notes—Continued | | | | | | | | | | | | | |
| | | | | |
Medical Products | | 0.3% | | | | | | | | | | | |
Fresenius Medical Care Capital Trust II | | | | 7.875% | | 2/1/08 | | $ | 1,767 | | $ | 1,798 | F |
Fresenius Medical Care Capital Trust IV | | | | 7.875% | | 6/15/11 | | | 150 | | | 154 | |
| | | | | | | | | | | | | |
| | | | | | | | | | | | 1,952 | |
| | | | | | | | | | | | | |
Metals | | 0.6% | | | | | | | | | | | |
Metals USA, Inc. | | | | 11.125% | | 12/1/15 | | | 3,475 | | | 3,805 | |
| | | | | | | | | | | | | |
| | | | | |
Oil and Gas | | 9.1% | | | | | | | | | | | |
AmeriGas Partners, L.P. | | | | 7.250% | | 5/20/15 | | | 860 | | | 857 | |
Belden & Blake Corporation | | | | 8.750% | | 7/15/12 | | | 7,470 | | | 7,675 | |
Chesapeake Energy Corporation | | | | 6.375% | | 6/15/15 | | | 1,990 | | | 1,901 | |
Chesapeake Energy Corporation | | | | 6.625% | | 1/15/16 | | | 65 | | | 63 | |
Chesapeake Energy Corporation | | | | 6.875% | | 1/15/16 | | | 420 | | | 410 | |
Chesapeake Energy Corporation | | | | 6.500% | | 8/15/17 | | | 2,960 | | | 2,775 | |
Chesapeake Energy Corporation | | | | 6.250% | | 1/15/18 | | | 1,760 | | | 1,632 | |
Colorado Interstate Gas Company | | | | 6.800% | | 11/15/15 | | | 1,340 | | | 1,350 | |
El Paso Corporation | | | | 7.750% | | 6/15/10 | | | 1,568 | | | 1,623 | |
El Paso Corporation | | | | 8.050% | | 10/15/30 | | | 4,040 | | | 4,202 | |
El Paso Corporation | | | | 7.800% | | 8/1/31 | | | 4,570 | | | 4,684 | |
El Paso Natural Gas Company | | | | 8.375% | | 6/15/32 | | | 1,600 | | | 1,832 | |
Encore Acquisition Company | | | | 6.250% | | 4/15/14 | | | 310 | | | 290 | |
Encore Acquisition Company | | | | 6.000% | | 7/15/15 | | | 1,030 | | | 943 | |
Encore Acquisition Company | | | | 7.250% | | 12/1/17 | | | 1,030 | | | 991 | |
Exco Resources, Inc. | | | | 7.250% | | 1/15/11 | | | 2,878 | | | 2,813 | |
Mariner Energy Inc. | | | | 7.500% | | 4/15/13 | | | 1,070 | | | 1,022 | A |
Pacific Energy Partners | | | | 7.125% | | 6/15/14 | | | 510 | | | 520 | |
Parker Drilling Company | | | | 9.625% | | 10/1/13 | | | 2,578 | | | 2,810 | |
Petrohawk Energy Corporation | | | | 9.125% | | 7/15/13 | | | 1,480 | | | 1,487 | A |
Plains Exploration & Production Company | | | | 7.125% | | 6/15/14 | | | 1,340 | | | 1,400 | |
Pogo Producing Company | | | | 7.875% | | 5/1/13 | | | 120 | | | 122 | A |
Pogo Producing Company | | | | 6.875% | | 10/1/17 | | | 2,995 | | | 2,857 | |
Pride International, Inc. | | | | 7.375% | | 7/15/14 | | | 1,890 | | | 1,947 | |
SemGroup, L.P. | | | | 8.750% | | 11/15/15 | | | 2,890 | | | 2,915 | A |
SESI, L.L.C. | | | | 6.875% | | 6/1/14 | | | 120 | | | 119 | A |
Stone Energy Corporation | | | | 8.250% | | 12/15/11 | | | 315 | | | 319 | |
Stone Energy Corporation | | | | 6.750% | | 12/15/14 | | | 1,550 | | | 1,550 | |
Suburban Propane Partners LP | | | | 6.875% | | 12/15/13 | | | 5,860 | | | 5,655 | |
Whiting Petroleum Corporation | | | | 7.000% | | 2/1/14 | | | 2,120 | | | 2,067 | |
| | | | | | | | | | | | | |
| | | | | | | | | | | | 58,831 | |
| | | | | | | | | | | | | |
138
Semi-Annual Report to Shareholders
| | | | | | | | | | | | | |
| | | % OF
NET ASSETS | | RATE | | MATURITY
DATE | | PAR | | VALUE | |
| | | | | | | | | | | | | |
Corporate Bonds and Notes—Continued | | | | | | | | | | | | | |
| | | | | |
Paper and Forest Products | | 1.6% | | | | | | | | | | | |
Appleton Papers Inc. | | | | 9.750% | | 6/15/14 | | $ | 3,635 | | $ | 3,590 | |
Georgia-Pacific Corp. | | | | 7.700% | | 6/15/15 | | | 770 | | | 766 | |
Glatfelter | | | | 7.125% | | 5/1/16 | | | 580 | | | 565 | A |
NewPage Corporation | | | | 12.000% | | 5/1/13 | | | 3,305 | | | 3,421 | |
Verso Paper Holdings LLC | | | | 9.125% | | 8/1/14 | | | 750 | | | 755 | A |
Verso Paper Holdings LLC | | | | 11.375% | | 8/1/16 | | | 1,255 | | | 1,245 | A |
| | | | | | | | | | | | | |
| | | | | | | | | | | | 10,342 | |
| | | | | | | | | | | | | |
Personal Products | | 0.3% | | | | | | | | | | | |
Playtex Products, Inc. | | | | 8.000% | | 3/1/11 | | | 1,525 | | | 1,582 | |
| | | | | | | | | | | | | |
| | | | | |
Pet Products | | 0.2% | | | | | | | | | | | |
Nutro Products Inc. | | | | 9.230% | | 10/15/13 | | | 315 | | | 324 | A,E |
Nutro Products Inc. | | | | 10.750% | | 4/15/14 | | | 940 | | | 1,006 | A |
| | | | | | | | | | | | | |
| | | | | | | | | | | | 1,330 | |
| | | | | | | | | | | | | |
Pharmaceuticals | | 0.5% | | | | | | | | | | | |
Leiner Health Products Inc. | | | | 11.000% | | 6/1/12 | | | 3,305 | | | 3,198 | |
Omnicare, Inc. | | | | 6.875% | | 12/15/15 | | | 300 | | | 291 | |
| | | | | | | | | | | | | |
| | | | | | | | | | | | 3,489 | |
| | | | | | | | | | | | | |
Printing and Copying Services | | 0.5% | | | | | | | | | | | |
Xerox Corporation | | | | 6.400% | | 3/15/16 | | | 2,180 | | | 2,169 | |
Xerox Corporation | | | | 6.750% | | 2/1/17 | | | 830 | | | 843 | |
| | | | | | | | | | | | | |
| | | | | | | | | | | | 3,012 | |
| | | | | | | | | | | | | |
Publishing | | 0.3% | | | | | | | | | | | |
Houghton Mifflin Company | | | | 0.000% | | 10/15/13 | | | 2,215 | | | 1,933 | B |
| | | | | | | | | | | | | |
| | | | | |
Real Estate Management and Development | | 1.0% | | | | | | | | | | | |
Forest City Enterprises, Inc. | | | | 7.625% | | 6/1/15 | | | 255 | | | 260 | |
Forest City Enterprises, Inc. | | | | 6.500% | | 2/1/17 | | | 2,010 | | | 1,890 | |
K. Hovnanian Enterprises, Inc. | | | | 8.625% | | 1/15/17 | | | 250 | | | 248 | |
Kimball Hill, Inc. | | | | 10.500% | | 12/15/12 | | | 1,535 | | | 1,385 | |
Ventas, Inc. | | | | 8.750% | | 5/1/09 | | | 1,616 | | | 1,719 | |
Ventas, Inc. | | | | 9.000% | | 5/1/12 | | | 762 | | | 849 | |
Ventas, Inc. | | | | 6.625% | | 10/15/14 | | | 290 | | | 291 | |
| | | | | | | | | | | | | |
| | | | | | | | | | | | 6,642 | |
| | | | | | | | | | | | | |
Rental and Lease Services | | 2.3% | | | | | | | | | | | |
Ashtead Capital, Inc. | | | | 9.000% | | 8/15/16 | | | 1,142 | | | 1,188 | A |
Avis Budget Car Rental LLC | | | | 7.625% | | 5/15/14 | | | 400 | | | 388 | A |
139
Semi-Annual Report to Shareholders
Portfolio of Investments—Continued
Western Asset High Yield Portfolio—Continued
| | | | | | | | | | | | | |
| | | % OF
NET ASSETS | | RATE | | MATURITY
DATE | | PAR | | VALUE | |
| | | | | | | | | | | | | |
Corporate Bonds and Notes—Continued | | | | | | | | | | | | | |
| | | | | |
Rental and Lease Services—Continued | | | | | | | | | | | | | |
H&E Equipment Services, Inc. | | | | 8.375% | | 7/15/16 | | $ | 3,100 | | $ | 3,178 | A |
Hertz Corporation | | | | 8.875% | | 1/1/14 | | | 1,860 | | | 1,948 | A |
Hertz Corporation | | | | 10.500% | | 1/1/16 | | | 5,070 | | | 5,577 | A |
Penhall International Corp. | | | | 12.000% | | 8/1/14 | | | 2,630 | | | 2,755 | A |
| | | | | | | | | | | | | |
| | | | | | | | | | | | 15,034 | |
| | | | | | | | | | | | | |
Retail | | 2.5% | | | | | | | | | | | |
American Greetings Corporation | | | | 7.375% | | 6/1/16 | | | 235 | | | 238 | |
Brookstone Company, Inc. | | | | 12.000% | | 10/15/12 | | | 2,030 | | | 1,847 | |
El Pollo Loco, Inc. | | | | 11.750% | | 11/15/13 | | | 2,401 | | | 2,665 | A |
FTD, Inc. | | | | 7.750% | | 2/15/14 | | | 1,525 | | | 1,502 | |
J.C. Penney Company, Inc. | | | | 6.875% | | 10/15/15 | | | 1,055 | | | 1,115 | |
Norcraft Companies | | | | 9.000% | | 11/1/11 | | | 3,755 | | | 3,807 | |
Simmons Company | | | | 10.000% | | 12/15/14 | | | 855 | | | 609 | B |
The Neiman Marcus Group, Inc. | | | | 9.000% | | 10/15/15 | | | 3,450 | | | 3,666 | |
The Neiman Marcus Group, Inc. | | | | 10.375% | | 10/15/15 | | | 650 | | | 702 | |
| | | | | | | | | | | | | |
| | | | | | | | | | | | 16,151 | |
| | | | | | | | | | | | | |
Special Purpose | | 7.0% | | | | | | | | | | | |
AAC Group Holding Corp. | | | | 10.250% | | 10/1/12 | | | 4,510 | | | 3,743 | B |
Allied Security Holdings LLC | | | | 11.375% | | 7/15/11 | | | 425 | | | 425 | |
Denny’s Holdings, Inc. | | | | 10.000% | | 10/1/12 | | | 1,240 | | | 1,283 | |
Di Finance Corporation | | | | 9.500% | | 2/15/13 | | | 4,490 | | | 4,647 | |
DIRECTV Finance Co., Inc. | | | | 6.375% | | 6/15/15 | | | 2,060 | | | 1,936 | |
Enterprise Products Operating L.P. | | | | 8.375% | | 8/1/66 | | | 1,460 | | | 1,537 | B |
Ford Motor Credit Company | | | | 7.000% | | 10/1/13 | | | 3,000 | | | 2,784 | |
H-Lines Finance Holding Corp. | | | | 11.000% | | 4/1/13 | | | 1,671 | | | 1,470 | B |
Hexion U. S. Finance Corporation | | | | 9.000% | | 7/15/14 | | | 2,852 | | | 2,909 | |
Milacron Escrow Corporation | | | | 11.500% | | 5/15/11 | | | 5,464 | | | 5,191 | |
Mueller Holdings (N.A.), Inc. | | | | 14.750% | | 4/15/14 | | | 1,411 | | | 1,242 | B |
Norcraft Holdings LP | | | | 0.000% | | 9/1/12 | | | 295 | | | 239 | B |
Rainbow National Services LLC | | | | 8.750% | | 9/1/12 | | | 1,373 | | | 1,469 | A |
Rainbow National Services LLC | | | | 10.375% | | 9/1/14 | | | 2,060 | | | 2,328 | A |
Reynolds American Inc. | | | | 6.500% | | 7/15/10 | | | 1,330 | | | 1,342 | A |
UCAR Finance Inc. | | | | 10.250% | | 2/15/12 | | | 1,636 | | | 1,718 | |
UGS Corporation | | | | 10.000% | | 6/1/12 | | | 2,935 | | | 3,170 | |
Vanguard Health Holding Company I, LLC | | | | 11.250% | | 10/1/15 | | | 366 | | | 264 | B |
Vanguard Health Holding Company II, LLC | | | | 9.000% | | 10/1/14 | | | 6,359 | | | 6,168 | |
Visant Holding Corp. | | | | 8.750% | | 12/1/13 | | | 1,230 | | | 1,238 | A |
| | | | | | | | | | | | | |
| | | | | | | | | | | | 45,103 | |
| | | | | | | | | | | | | |
140
Semi-Annual Report to Shareholders
| | | | | | | | | | | | | |
| | | % OF
NET ASSETS | | RATE | | MATURITY
DATE | | PAR | | VALUE | |
| | | | | | | | | | | | | |
Corporate Bonds and Notes—Continued | | | | | | | | | | | | | |
| | | | | |
Steel Products | | 1.8% | | | | | | | | | | | |
Chaparral Steel Company | | | | 10.000% | | 7/15/13 | | $ | 3,120 | | $ | 3,479 | |
CitiSteel USA, Inc. | | | | 12.949% | | 9/1/10 | | | 2,920 | | | 3,015 | E |
CitiSteel USA, Inc. | | | | 15.000% | | 10/1/10 | | | 600 | | | 643 | A,C |
International Steel Group, Inc. | | | | 6.500% | | 4/15/14 | | | 1,405 | | | 1,388 | |
RathGibson Inc. | | | | 11.250% | | 2/15/14 | | | 2,695 | | | 2,776 | A |
| | | | | | | | | | | | | |
| | | | | | | | | | | | 11,301 | |
| | | | | | | | | | | | | |
Telecommunications | | 4.3% | | | | | | | | | | | |
Cincinnati Bell Inc. | | | | 7.000% | | 2/15/15 | | | 2,102 | | | 2,060 | |
Cincinnati Bell Inc. | | | | 6.300% | | 12/1/28 | | | 2,725 | | | 2,357 | |
Citizens Communications Company | | | | 9.000% | | 8/15/31 | | | 2,600 | | | 2,789 | |
Hawaiian Telcom Communications, Inc. | | | | 12.500% | | 5/1/15 | | | 5,970 | | | 6,268 | |
Qwest Communications International Inc. | | | | 8.905% | | 2/15/09 | | | 720 | | | 733 | E |
Qwest Communications International Inc. | | | | 7.250% | | 2/15/11 | | | 2,652 | | | 2,652 | |
Qwest Communications International Inc. | | | | 7.500% | | 2/15/14 | | | 3,102 | | | 3,110 | |
Qwest Corporation | | | | 7.875% | | 9/1/11 | | | 2,180 | | | 2,289 | |
Qwest Corporation | | | | 7.500% | | 10/1/14 | | | 1,780 | | | 1,838 | A |
Windstream Corp. | | | | 8.625% | | 8/1/16 | | | 3,515 | | | 3,761 | A |
| | | | | | | | | | | | | |
| | | | | | | | | | | | 27,857 | |
| | | | | | | | | | | | | |
Telecommunications (Cellular/Wireless) | | 0.9% | | | | | | | | | | | |
Rural Cellular Corporation | | | | 9.875% | | 2/1/10 | | | 3,965 | | | 4,134 | |
Ubiquitel Operating Company | | | | 9.875% | | 3/1/11 | | | 1,250 | | | 1,356 | |
| | | | | | | | | | | | | |
| | | | | | | | | | | | 5,490 | |
| | | | | | | | | | | | | |
Transportation | | 3.3% | | | | | | | | | | | |
American Airlines, Inc. | | | | 7.800% | | 10/1/06 | | | 4,940 | | | 4,940 | |
American Commercial Lines LLC | | | | 9.500% | | 2/15/15 | | | 1,161 | | | 1,266 | |
Continental Airlines, Inc. | | | | 7.568% | | 12/1/06 | | | 3,474 | | | 3,474 | |
Gulfmark Offshore, Inc. | | | | 7.750% | | 7/15/14 | | | 2,250 | | | 2,261 | |
Horizon Lines, LLC | | | | 9.000% | | 11/1/12 | | | 2,656 | | | 2,736 | |
Kansas City Southern Railway | | | | 7.500% | | 6/15/09 | | | 1,400 | | | 1,400 | |
United Air Lines, Inc. | | | | 7.032% | | 10/1/10 | | | 1,537 | | | 1,554 | |
United Air Lines, Inc. | | | | 7.186% | | 10/1/12 | | | 4,040 | | | 4,091 | |
| | | | | | | | | | | | | |
| | | | | | | | | | | | 21,722 | |
| | | | | | | | | | | | | |
Total Corporate Bonds and Notes
(Identified Cost—$550,751) | | | | | | | | | | | | 551,243 | |
141
Semi-Annual Report to Shareholders
Portfolio of Investments—Continued
Western Asset High Yield Portfolio—Continued
| | | | | | | | | | | | | |
| | | % OF
NET ASSETS | | RATE | | MATURITY
DATE | | PAR | | VALUE | |
| | | | | | | | | | | | | |
Mortgage-Backed Securities | | 0.1% | | | | | | | | | | | |
| | | | | |
Fixed Rate Securities | | 0.1% | | | | | | | | | | | |
Blackrock Capital Finance L.P. 1996-R1 | | | | 9.537% | | 9/25/26 | | $ | 955 | | $ | 573 | |
Ocwen Residential Mortgage Corporation 1998-R1 | | | | 7.000% | | 10/25/40 | | | 298 | | | 28 | |
| | | | | | | | | | | | | |
Total Mortgage-Backed Securities
(Identified Cost—$849) | | | | | | | | | | | | 601 | |
Yankee BondsG | | 10.9% | | | | | | | | | | | |
| | | | | |
Cable | | 0.9% | | | | | | | | | | | |
Rogers Cable Inc. | | | | 5.500% | | 3/15/14 | | | 1,650 | | | 1,551 | |
Rogers Cable Inc. | | | | 6.750% | | 3/15/15 | | | 4,540 | | | 4,585 | |
| | | | | | | | | | | | | |
| | | | | | | | | | | | 6,136 | |
| | | | | | | | | | | | | |
Chemicals | | 1.0% | | | | | | | | | | | |
Montell Finl Co Bv | | | | 8.100% | | 3/15/27 | | | 4,600 | | | 4,255 | A |
Nell Af SARL | | | | 8.375% | | 8/15/15 | | | 2,330 | | | 2,313 | A |
| | | | | | | | | | | | | |
| | | | | | | | | | | | 6,568 | |
| | | | | | | | | | | | | |
Electric | | 0.2% | | | | | | | | | | | |
AES China Generating Co., Ltd. | | | | 8.250% | | 6/26/10 | | | 1,580 | | | 1,552 | |
| | | | | | | | | | | | | |
| | | | | |
Foreign Governments | | 1.6% | | | | | | | | | | | |
Federative Republic of Brazil | | | | 8.000% | | 1/15/18 | | | 240 | | | 264 | |
Federative Republic of Brazil | | | | 11.000% | | 8/17/40 | | | 2,220 | | | 2,891 | |
Republic of Panama | | | | 9.375% | | 4/1/29 | | | 610 | | | 787 | |
Russian Federation | | | | 5.000% | | 3/31/30 | | | 5,640 | | | 6,296B | |
| | | | | | | | | | | | | |
| | | | | | | | | | | | 10,238 | |
| | | | | | | | | | | | | |
Media | | 1.2% | | | | | | | | | | | |
Kabel Deutschland GmbH | | | | 10.625% | | 7/1/14 | | | 3,855 | | | 4,134 | A |
Quebecor Media Inc. | | | | 7.750% | | 3/15/16 | | | 3,650 | | | 3,655 | |
| | | | | | | | | | | | | |
| | | | | | | | | | | | 7,789 | |
| | | | | | | | | | | | | |
Oil and Gas | | 0.7% | | | | | | | | | | | |
Utilicorp Canada Finance Corp | | | | 7.750% | | 6/15/11 | | | 1,330 | | | 1,397 | |
Western Oil Sands Inc. | | | | 8.375% | | 5/1/12 | | | 3,285 | | | 3,523 | |
| | | | | | | | | | | | | |
| | | | | | | | | | | | 4,920 | |
| | | | | | | | | | | | | |
Paper and Forest Products | | 0.5% | | | | | | | | | | | |
Domtar Inc. | | | | 7.875% | | 10/15/11 | | | 1,030 | | | 1,025 | |
Domtar Inc. | | | | 5.375% | | 12/1/13 | | | 2,350 | | | 2,009 | |
| | | | | | | | | | | | | |
| | | | | | | | | | | | 3,034 | |
| | | | | | | | | | | | | |
Pharmaceuticals | | 0.2% | | | | | | | | | | | |
Angiotech Pharmaceuticals, Inc. | | | | 7.750% | | 4/1/14 | | | 1,310 | | | 1,245 | A |
| | | | | | | | | | | | | |
142
Semi-Annual Report to Shareholders
| | | | | | | | | | | | | | |
| | | % OF
NET ASSETS | | RATE | | MATURITY
DATE | | PAR/
SHARES | | | VALUE | |
| | | | | | | | | | | | | | |
Yankee Bonds—Continued | | | | | | | | | | | | | | |
| | | | | |
Printing and Copying Services | | 0.2% | | | | | | | | | | | | |
Quebecor World Capital Corp. | | | | 8.750% | | 3/15/16 | | $ | 1,120 | | | $ | 1,078 | A |
| | | | | | | | | | | | | | |
| | | | | |
Semiconductor Equipment and Production | | 0.2% | | | | | | | | | | | | |
Magnachip Semiconductor S.A. | | | | 8.000% | | 12/15/14 | | | 2,460 | | | | 1,494 | |
| | | | | | | | | | | | | | |
| | | | | |
Services | | 0.3% | | | | | | | | | | | | |
Compagnie Generale de Geophysique SA (CGG) | | | | 7.500% | | 5/15/15 | | | 1,870 | | | | 1,851 | |
| | | | | | | | | | | | | | |
| | | | | |
Special Purpose | | 0.1% | | | | | | | | | | | | |
MDP Acquisitions PLC | | | | 9.625% | | 10/1/12 | | | 475 | | | | 501 | |
| | | | | | | | | | | | | | |
| | | | | |
Telecommunications | | 2.6% | | | | | | | | | | | | |
Intelsat Bermuda Ltd. | | | | 9.250% | | 6/15/16 | | | 2,385 | | | | 2,507 | A |
Intelsat Bermuda Ltd. | | | | 11.250% | | 6/15/16 | | | 4,320 | | | | 4,590 | A |
Intelsat, Ltd. | | | | 7.625% | | 4/15/12 | | | 3,570 | | | | 3,124 | |
Nordic Telephone Company Holding ApS | | | | 8.875% | | 5/1/16 | | | 1,370 | | | | 1,440 | A |
NTL Cable PLC | | | | 9.125% | | 8/15/16 | | | 1,695 | | | | 1,750 | |
Wind Acquisition Finance SA | | | | 10.750% | | 12/1/15 | | | 2,605 | | | | 2,875 | A |
| | | | | | | | | | | | | | |
| | | | | | | | | | | | | 16,286 | |
| | | | | | | | | | | | | | |
Telecommunications (Cellular/Wireless) | | 0.2% | | | | | | | | | | | | |
Rogers Wireless Communications Inc. | | | | 8.000% | | 12/15/12 | | | 60 | | | | 64 | |
Rogers Wireless Inc. | | | | 7.250% | | 12/15/12 | | | 1,060 | | | | 1,109 | |
| | | | | | | | | | | | | | |
| | | | | | | | | | | | | 1,173 | |
| | | | | | | | | | | | | | |
Transportation | | 1.0% | | | | | | | | | | | | |
Grupo Transportacion Ferroviaria Mexicana, S.A de C.V. (TFM) | | | | 9.375% | | 5/1/12 | | | 1,930 | | | | 2,046 | |
OMI Corporation | | | | 7.625% | | 12/1/13 | | | 2,779 | | | | 2,806 | |
Teekay Shipping Corporation | | | | 8.875% | | 7/15/11 | | | 1,362 | | | | 1,437 | |
| | | | | | | | | | | | | | |
| | | | | | | | | | | | | 6,289 | |
| | | | | | | | | | | | | | |
Total Yankee Bonds (Identified Cost—$70,534) | | | | | | | | | | | | | 70,154 | |
Common Stocks | | N.M. | | | | | | | | | | | | |
Washington Group International, Inc. | | | | | | | | | 0.3 | shs | | | 19 | |
| | | | | | | | | | | | | | |
Total Common Stocks (Identified Cost—$0) | | | | | | | | | | | | | 19 | |
143
Semi-Annual Report to Shareholders
Portfolio of Investments—Continued
Western Asset High Yield Portfolio—Continued
| | | | | | | | | | |
| | | % OF
NET ASSETS | | PAR/
SHARES | | | VALUE | |
| | | | | | | | | | |
Preferred Stocks | | 0.3% | | | | | | | | |
Chespeake Energy Corporation | | | | | 4 | shs | | $ | 939D | |
ION Media Networks, Inc. | | | | | 0.2 | | | | 1,469 | C,D |
| | | | | | | | | | |
Total Preferred Stocks (Identified Cost—$2,271) | | | | | | | | | 2,408 | |
Warrants | | N.M. | | | | | | | | |
Next Generation Network, Inc. | | | | | 3 | wts | | | — | H,I |
| | | | | | | | | | |
Total Warrants (Identified Cost—$—H) | | | | | | | | | | |
Total Long-Term Securities (Identified Cost—$624,405) | | | | | | | | | 624,425 | |
Short-Term Securities | | 1.0% | | | | | | | | |
| | | |
Repurchase Agreements | | 1.0% | | | | | | | | |
Goldman Sachs Group, Inc.
5.3%, dated 9/29/06, to be repurchased at $6,347 on 10/2/06 (Collateral: $5,840 Tennessee Valley Authority bonds, 6.79%, due 5/23/12, value $6,475) | | | | $ | 6,344 | | | | 6,344 | |
| | | | | | | | | | |
Total Short-Term Securities (Identified Cost—$6,344) | | | | | | | | | 6,344 | |
Total Investments (Identified Cost—$630,749) | | 97.7% | | | | | | | $630,769 | |
Other Assets Less Liabilities | | 2.3% | | | | | | | 14,499 | |
| | | | | | | | | | |
| | | |
Net Assets | | 100.0% | | | | | | | $645,268 | |
| | | | | | | | | | |
| | | | | | | | | | | |
| A | | Rule 144a Security – A security purchased pursuant to Rule 144a under the Securities Act of 1933 which may not be resold subject to that rule except to qualified institutional buyers. These securities, which the Fund’s investment adviser has determined to be liquid, represent 17.1% of net assets. |
| B | | Stepped Coupon Security – A security with a predetermined schedule of interest or dividend rate changes. |
| C | | Pay-in-kind (“PIK”) Security – A bond or stock in which interest or dividends during the initial few years is paid in additional PIK securities rather than in cash. |
| D | | Convertible Security – The security may be convertd into the issuer’s common stock. |
| E | | Indexed Security – The rates of interest earned on these securities are tied to the London Interbank Offered Rate (“LIBOR”). The coupon rates are the rates as of September 30, 2006. |
| F | | Unit – A security which consists of a bond and warrants to purchase the common stock of the issuer. |
| G | | Yankee Bond – A dollar denominated bond issued in the U.S. by foreign entities. |
See notes to financial statements.
144
Semi-Annual Report to Shareholders
Statement of Assets and Liabilities
Western Asset High Yield Portfolio
September 30, 2006 (Unaudited)
(Amounts in Thousands)
| | | | | | | |
Assets: | | | | | | | |
Investment securities at market value (Identified Cost—$624,405) | | | | | $ | 624,425 | |
Short-term securities at value (Identified Cost—$6,344) | | | | | | 6,344 | |
Receivable for securities sold | | | | | | 4,396 | |
Receivable for fund shares sold | | | | | | 7,350 | |
Interest receivable | | | | | | 14,089 | |
| | | | | | | |
Total assets | | | | | | 656,604 | |
| | |
Liabilities: | | | | | | | |
Payable for securities purchased | | $ | 10,965 | | | | |
Accrued management fee | | | 286 | | | | |
Accrued expenses | | | 85 | | | | |
| | | | | | | |
Total liabilities | | | | | | 11,336 | |
| | | | | | | |
| | |
Net Assets | | | | | $ | 645,268 | |
| | | | | | | |
| | |
Net assets consist of: | | | | | | | |
Accumulated paid-in-capital applicable to: | | | | | | | |
62,449 Institutional Class shares outstanding | | | | | $ | 635,343 | |
Undistributed net investment income | | | | | | 10,746 | |
Accumulated net realized loss on investments and swaps | | | | | | (841 | ) |
Unrealized appreciation/(depreciation) of investments | | | | | | 20 | |
| | | | | | | |
| | |
Net Assets | | | | | $ | 645,268 | |
| | | | | | | |
| | |
Net Asset Value Per Share: | | | | | | | |
Institutional Class | | | | | | $10.33 | |
See notes to financial statements.
145
Semi-Annual Report to Shareholders
Statement of Operations
Western Asset High Yield Portfolio
For the Six Months Ended September 30, 2006 (Unaudited)
(Amounts in Thousands)
| | | | | | | | |
Investment Income: | | | | | | | | |
Interest | | $ | 26,293 | | | | | |
Dividends | | | 115 | | | | | |
| | | | | | | | |
Total income | | | | | | $ | 26,408 | |
Expenses: | | | | | | | | |
Advisory fee | | | 1,701 | | | | | |
Audit and legal fees | | | 55 | | | | | |
Custodian fees | | | 73 | | | | | |
Directors’ fees and expenses | | | 21 | | | | | |
Proxy expense | | | 1 | | | | | |
Registration fees | | | 10 | | | | | |
Reports to shareholders | | | 10 | | | | | |
Transfer agent and shareholder servicing expense | | | 7 | | | | | |
Other expenses | | | 18 | | | | | |
| | | | | | | | |
| | | 1,896 | | | | | |
Less: Compensating balance creditsA | | | (1 | ) | | | | |
| | | | | | | | |
Total expenses and compensating balance credits | | | | | | | 1,895 | |
| | | | | | | | |
Net Investment Income | | | | | | | 24,513 | |
Net Realized and Unrealized Gain/(Loss) on Investments: | | | | | | | | |
Realized gain/(loss) on: | | | | | | | | |
Investments | | | (524 | ) | | | | |
Swaps | | | 32 | | | | | |
| | | | | | | | |
| | | | | | | (492 | ) |
Change in unrealized appreciation/(depreciation) of investments | | | | | | | 1,316 | |
| | | | | | | | |
Net Realized and Unrealized Gain on Investments | | | | | | | 824 | |
| | | | | | | | | |
Change in Net Assets Resulting From Operations | | | | | | $ | 25,337 | |
| | | | | | | | | |
| A | | See note 1, compensating balance credits, in the notes to financial statements |
See notes to financial statements.
146
Semi-Annual Report to Shareholders
Statement of Changes in Net Assets
Western Asset High Yield Portfolio
(Amounts in Thousands)
| | | | | | | | |
| | | FOR THE
SIX MONTHS ENDED
SEPTEMBER 30, 2006 | | | FOR THE
YEAR ENDED
MARCH 31, 2006 | |
| Change in Net Assets: | | (Unaudited) | | | | |
Net investment income | | $ | 24,513 | | | $ | 36,822 | |
| | |
Net realized gain/(loss) on investments and swaps | | | (492 | ) | | | 38 | |
| | |
Change in unrealized appreciation/(depreciation) of investments | | | 1,316 | | | | (2,759 | ) |
| | | | | | | | |
Change in net assets resulting from operations | | | 25,337 | | | | 34,101 | |
| | |
Distributions to Shareholders from: | | | | | | | | |
Net investment income | | | (25,445 | ) | | | (32,038 | ) |
Net realized gain on investments | | | (131 | ) | | | (5,384 | ) |
| | |
Change in net assets from Fund share transactions | | | 48,589 | | | | 185,822 | |
| | | | | | | | |
Change in net assets | | | 48,350 | | | | 182,501 | |
| | |
Net Assets: | | | | | | | | |
Beginning of period | | | 596,918 | | | | 414,417 | |
| | | | | | | | |
| | |
End of period | | $ | 645,268 | | | $ | 596,918 | |
| | | | | | | | |
| | |
Undistributed net investment income | | $ | 10,746 | | | $ | 11,678 | |
| | | | | | | | |
| | | | | | | | | |
See notes to financial statements.
147
Semi-Annual Report to Shareholders
Financial Highlights
Western Asset High Yield Portfolio
Contained below is per share operating performance data for a share of common stock outstanding throughout each year shown, total investment return, ratios to average net assets and other supplemental data. This information has been derived from information in the financial statements.
Institutional Class:
| | | | | | | | | | | | | | | | | | | | | | | | |
| | | SIX MONTHS
ENDED
SEPTEMBER 30,
2006 | | | YEARS ENDED MARCH 31, | |
| | | 2006 | | | 2005 | | | 2004 | | | 2003 | | | 2002A | |
| | | (Unaudited) | | | | | | | | | | | | | | | | |
Net asset value, beginning of period | | $ | 10.34 | | | $ | 10.49 | | | $ | 10.28 | | | $ | 9.56 | | | $ | 10.36 | | | $ | 10.00 | |
| | | | | | | | | | | | | | | | | | | | | | | | |
Investment operations: | | | | | | | | | | | | | | | | | | | | | | | | |
Net investment income | | | .39 | | | | .76 | | | | .61 | | | | .78 | | | | .96 | | | | .53 | |
Net realized and unrealized gain/(loss) on investments and swaps | | | .02 | | | | (.05 | ) | | | .17 | | | | .89 | | | | (.82 | ) | | | .07 | |
| | | | | | | | | | | | | | | | | | | | | | | | |
Total from investment operations | | | .41 | | | | .71 | | | | .78 | | | | 1.67 | | | | .14 | | | | .60 | |
| | | | | | | | | | | | | | | | | | | | | | | | |
Distributions paid from: | | | | | | | | | | | | | | | | | | | | | | | | |
Net investment income | | | (.42 | ) | | | (.73 | ) | | | (.57 | ) | | | (.95 | ) | | | (.94 | ) | | | (.24 | ) |
Net realized gain on investments | | | — B | | | | (.13 | ) | | | — | | | | — | | | | — | | | | — | |
| | | | | | | | | | | | | | | | | | | | | | | | |
Total distributions | | | (.42 | ) | | | (.86 | ) | | | (.57 | ) | | | (.95 | ) | | | (.94 | ) | | | (.24 | ) |
| | | | | | | | | | | | | | | | | | | | | | | | |
Net asset value, end of period | | $ | 10.33 | | | $ | 10.34 | | | $ | 10.49 | | | $ | 10.28 | | | $ | 9.56 | | | $ | 10.36 | |
| | | | | | | | | | | | | | | | | | | | | | | | |
Total return | | | 4.16 | %C | | | 7.30 | % | | | 7.81 | % | | | 18.27 | % | | | 2.22 | % | | | 6.02 | %C |
| | | | | | |
Ratios to Average Net Assets:D | | | | | | | | | | | | | | | | | | | | | | | | |
Total expenses | | | .61 | %E | | | .62 | % | | | .62 | % | | | .67 | % | | | .67 | % | | | .75 | %E |
Expenses net of waivers, if any | | | .61 | %E | | | .62 | % | | | .62 | % | | | .58 | % | | | .55 | % | | | .55 | %E |
Expenses net of all reductions | | | .61 | %E | | | .62 | % | | | .62 | % | | | .58 | % | | | .55 | % | | | .55 | %E |
Net investment income | | | 7.9 | %E | | | 7.8 | % | | | 7.0 | % | | | 7.9 | % | | | 10.2 | % | | | 10.4 | %E |
| | | | | | |
Supplemental Data: | | | | | | | | | | | | | | | | | | | | | | | | |
Portfolio turnover rate | | | 35.7 | %C | | | 147.2 | % | | | 121.0 | % | | | 116.0 | % | | | 110.1 | % | | | 51.8 | %C |
Net assets at end of period (in thousands) | | $ | 645,268 | | | $ | 596,918 | | | $ | 414,417 | | | $ | 189,458 | | | $ | 149,937 | | | $ | 152,729 | |
| | | | | | | | | | | | | | | | | | | | | | | | | |
| A | | For the period September 28, 2001 (commencement of operations) to March 31, 2002. |
| B | | Amounts less than $.01. |
| D | | Total expenses reflects operating expenses prior to any voluntary expense waivers and/or compensating balance credits. Expenses net of waivers reflects total expenses before compensating balance credits but net of any voluntary expense waivers. Expenses net of all reductions reflects expenses less any compensating balance credits and/or voluntary expense waivers. |
See notes to financial statements.
148
Semi-Annual Report to Shareholders
Expense Example
Western Asset Non-U.S. Opportunity Bond Portfolio
As a shareholder of the Fund, you incur ongoing costs, including management fees and other Fund expenses. These examples are intended to help you understand your ongoing costs (in dollars) of investing in the Fund and to compare these costs with the ongoing costs of investing in other mutual funds. The example is based on an investment of $1,000 invested on April 1, 2006, and held through September 30, 2006.
Actual Expenses
The first line in the table below provides information about actual account values and actual expenses for the Fund. You may use the information in this line, together with the amount you invested, to estimate the expenses that you paid over the period. Simply divide your account value by $1,000 (for example, an $8,600 account value divided by $1,000 = 8.6), then multiply the result by the number in the first line under the heading entitled “Expenses Paid During the Period” to estimate the expenses you paid on your account during this period.
Hypothetical Example for Comparison Purposes
The second line in the table below provides information about hypothetical account values and hypothetical expenses based on the Fund’s actual expense ratio and an assumed rate of return of 5% per year before expenses, which is not the Fund’s actual return. The hypothetical account values and expenses may not be used to estimate the actual ending account balance or expenses you paid for the period. You may use this information to compare the ongoing costs of investing in the Fund and other funds. To do so, compare this 5% hypothetical example with the 5% hypothetical examples that appear in the shareholder reports of other funds.
| | | | | | | | | |
| | | Beginning
Account Value
4/1/06 | | Ending
Account Value
9/30/06 | | Expenses PaidA
During the Period
4/1/06 to 9/30/06 |
Institutional Class: | | | | | | | | | |
Actual | | $ | 1,000.00 | | $ | 1,027.20 | | $ | 2.80 |
Hypothetical (5% return before expenses) | | | 1,000.00 | | | 1,022.31 | | | 2.79 |
| A | | These calculations are based on expenses incurred in the most recent fiscal half-year. The dollar amounts shown as “Expenses Paid” are equal to the annualized expense ratio of 0.55% multiplied by the average value over the period, multiplied by the number of days in the most recent fiscal half-year (183), and divided by 365. |
149
Semi-Annual Report to Shareholders
Performance Information
Western Asset Non-U.S. Opportunity Bond Portfolio
The graph compares the Fund’s total returns against that of an appropriate broad-based securities market index. The line illustrates the cumulative total return of an initial $1,000,000 investment for the periods indicated. The line for the Fund represents the total return after deducting all Fund investment management and other administrative expenses and the transaction costs of buying and selling securities. The line representing the securities market index does not include any transaction costs associated with buying and selling securities in the index or other investment management or administrative expenses.
Total return measures investment performance in terms of appreciation or depreciation in a Fund’s net asset value per share, plus dividends and any capital gain distributions. It assumes that dividends and distributions were reinvested at the time they were paid. Returns (and the graph and table found below) do not reflect the deduction of taxes that a shareholder would pay on Fund distributions or the redemption of Fund shares. Average annual returns tend to smooth out variations in a fund’s return, so that they differ from actual year-to-year results.
Bonds are subject to a variety of risks, including interest rate, credit and inflation risk. Non U.S. investments are subject to currency fluctuations, social, economic and political risk.
Growth of a $1,000,000 Investment—Institutional Class
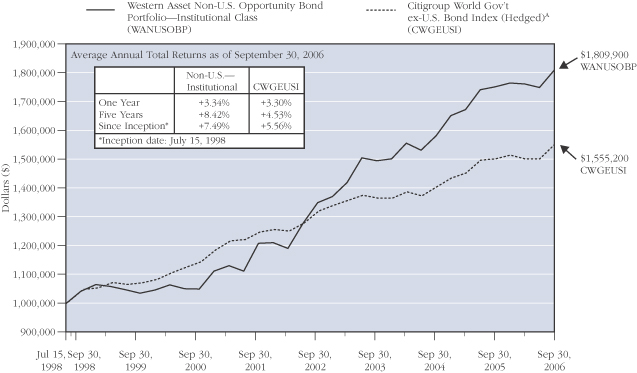
The performance data quoted represents past performance and does not guarantee future results. The performance stated may have been due to extraordinary market conditions, which may not be duplicated in the future. Current performance may be lower or higher than the performance data quoted. To obtain the most recent month-end performance information, please visit www.westernassetfunds.com. The investment return and principal value of the Fund will fluctuate so that an investor’s shares, when redeemed, may be worth more or less than the original cost. Calculations assume reinvestment of dividends and capital gain distributions. Performance would have been lower if fees had not been waived in various periods.
| A | | Index returns are for periods beginning July 31, 1998. |
150
Semi-Annual Report to Shareholders
Portfolio Composition (as of September 30, 2006)
Standard & Poor’s Debt RatingsB (as a percentage of the portfolio)
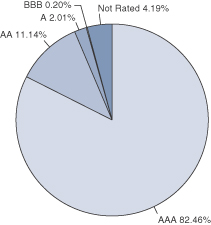
Maturity Schedule (as a percentage of the portfolio)
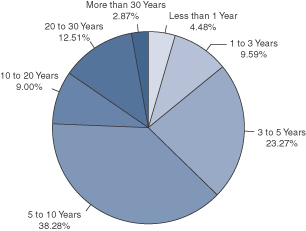
| B | | Source: Standard & Poor's. |
��
The Fund is actively managed. As a result, the composition of the portfolio holdings and sectors are subject to change at any time.
151
Semi-Annual Report to Shareholders
Portfolio of Investments
Western Asset Non-U.S. Opportunity Bond Portfolio
September 30, 2006 (Unaudited)
(Amounts in Thousands)
| | | | | | | | | | | | |
| | | % OF
NET ASSETS | | RATE | | MATURITY
DATE | | PARA | | VALUE | |
| | | | | | | | | | | | |
Long-Term Securities | | 89.9% | | | | | | | | | | |
| | | | | |
Australian Dollar | | 10.7% | | | | | | | | | | |
| | | | | |
Government Obligations | | 10.7% | | | | | | | | | | |
Queensland Treasury Corp | | | | 6.000% | | 6/14/11 | | 18,330 | | $ | 13,752 | B |
British Sterling | | 11.3% | | | | | | | | | | |
| | | | | |
Corporate Bonds and Notes | | 8.1% | | | | | | | | | | |
| | | | | |
Banking and Finance | | 3.5% | | | | | | | | | | |
European Investment Bank | | | | 4.250% | | 12/7/10 | | 2,280 | | | 4,147 | |
Landesbank Hessen-Thueringen Girozentrale | | | | 5.375% | | 3/7/12 | | 200 | | | 380 | |
| | | | | | | | | | | | |
| | | | | | | | | | | 4,527 | |
| | | | | | | | | | | | |
| | | | | |
Diversified Financial Services | | 4.6% | | | | | | | | | | |
Irish Nationwide Building Society | | | | 5.875% | | 12/15/08 | | 200 | | | 378 | |
Network Rail MTN Finance PLC | | | | 4.875% | | 3/6/09 | | 3,000 | | | 5,591 | |
| | | | | | | | | | | | |
| | | | | | | | | | | 5,969 | |
| | | | | | | | | | | | |
| | | | | |
Government Obligations | | 3.2% | | | | | | | | | | |
United Kingdom of Great Britain and Northern Ireland | | | | 8.000% | | 6/7/21 | | 960 | | | 2,474 | |
United Kingdom Treasury Bond | | | | 4.750% | | 9/7/15 | | 870 | | | 1,653 | |
| | | | | | | | | | | | |
| | | | | | | | | | | 4,127 | |
| | | | | | | | | | | | |
Total British Sterling | | | | | | | | | | | 14,623 | |
Canadian Dollar | | 15.3% | | | | | | | | | | |
| | | | | |
Government Obligations | | 15.3% | | | | | | | | | | |
Canadian Real Return Bond | | | | 4.500% | | 6/1/15 | | 20,038 | | | 18,619 | B |
Canadian Real Return Bond | | | | 4.000% | | 12/1/31 | | 840 | | | 1,109 | B |
| | | | | | | | | | | | |
Total Canadian Dollar | | | | | | | | | | | 19,728 | |
Danish Krone | | 6.9% | | | | | | | | | | |
| | | | | |
Corporate Bonds and Notes | | 4.4% | | | | | | | | | | |
Nordea Kredit Realkreditaktieselskab | | | | 4.000% | | 10/1/35 | | 13,412 | | | 2,137 | |
Nykredit Realkredit AS | | | | 4.000% | | 10/1/38 | | 7,143 | | | 1,106 | |
Realkredit Danmark AS | | | | 4.000% | | 10/1/38 | | 15,070 | | | 2,373 | |
| | | | | | | | | | | | |
| | | | | | | | | | | 5,616 | |
| | | | | | | | | | | | |
| | | | | |
Government Obligations | | 2.5% | | | | | | | | | | |
Kingdom of Denmark | | | | 5.000% | | 11/15/13 | | 17,460 | | | 3,220 | |
| | | | | | | | | | | | |
Total Danish Krone | | | | | | | | | | | 8,836 | |
152
Semi-Annual Report to Shareholders
| | | | | | | | | | | | |
| | | % OF
NET ASSETS | | RATE | | MATURITY
DATE | | PARA | | VALUE | |
| | | | | | | | | | | | |
Euro | | 29.1% | | | | | | | | | | |
| | | | | |
Corporate Bonds and Notes | | 6.7% | | | | | | | | | | |
| | | | | |
Banking and Finance | | 0.1% | | | | | | | | | | |
BAWAG P.S.K. | | | | 4.350% | | 5/28/13 | | 67 | | $ | 85 | |
| | | | | | | | | | | | |
| | | | | |
Banks | | 2.1% | | | | | | | | | | |
Bank Nederlandse Gemeenten NV | | | | 5.625% | | 10/25/10 | | 1,850 | | | 2,514 | |
Resona Bank, Limited | | | | 4.125% | | 9/27/12 | | 200 | | | 246 | C |
| | | | | | | | | | | | |
| | | | | | | | | | | 2,760 | |
| | | | | | | | | | | | |
| | | | | |
Diversified Financial Services | | 1.9% | | | | | | | | | | |
Kreditanstalt fuer Wiederaufbau | | | | 5.250% | | 1/4/10 | | 1,800 | | | 2,396 | |
| | | | | | | | | | | | |
| | | | | |
Investment Banking/Brokerage | | 2.6% | | | | | | | | | | |
Caisse de Refinancement L’ Habitat | | | | 4.200% | | 4/25/11 | | 2,000 | | | 2,588 | |
Morgan Stanley | | | | 3.404% | | 7/20/12 | | 600 | | | 761 | D |
| | | | | | | | | | | | |
| | | | | | | | | | | 3,349 | |
| | | | | | | | | | | | |
| | | | | |
U.S. Government and Agency Obligations | | 0.9% | | | | | | | | | | |
Freddie Mac | | | | 5.750% | | 9/15/10 | | 900 | | | 1,224 | |
| | | | | | | | | | | | |
| | | | | |
Government Obligations | | 21.5% | | | | | | | | | | |
Federal Republic of Germany | | | | 4.125% | | 7/4/08 | | 2,020 | | | 2,585 | |
Federal Republic of Germany | | | | 3.500% | | 10/10/08 | | 2,430 | | | 3,081 | |
Federal Republic of Germany | | | | 3.500% | | 4/8/11 | | 1,270 | | | 1,603 | |
Federal Republic of Germany | | | | 3.750% | | 1/4/15 | | 3,864 | | | 4,930 | |
Federal Republic of Germany | | | | 4.750% | | 7/4/34 | | 3,390 | | | 4,903 | |
Kingdom of Spain | | | | 5.750% | | 7/30/32 | | 1,970 | | | 3,214 | |
Kingdom of the Netherlands | | | | 5.500% | | 1/15/28 | | 1,270 | | | 1,975 | |
Republic of France | | | | 5.000% | | 10/25/16 | | 2,530 | | | 3,552 | B |
Republic of France | | | | 4.750% | | 4/25/35 | | 1,270 | | | 1,833 | B |
| | | | | | | | | | | | |
| | | | | | | | | | | 27,676 | |
| | | | | | | | | | | | |
Total Euro | | | | | | | | | | | 37,490 | |
Japanese Yen | | 10.2% | | | | | | | | | | |
| | | | | |
Corporate Bonds and Notes | | 6.4% | | | | | | | | | | |
Development Bank of Japan | | | | 1.600% | | 6/20/14 | | 620,000 | | | 5,309 | |
Japan Finance Corporation for Municipal Enterprises | | | | 1.350% | | 11/26/13 | | 349,000 | | | 2,935 | |
| | | | | | | | | | | | |
| | | | | | | | | | | 8,244 | |
| | | | | | | | | | | | |
| | | | | |
Government Obligations | | 3.8% | | | | | | | | | | |
Japan Development Bank | | | | 1.050% | | 6/20/23 | | 319,000 | | | 2,327 | |
Japan Development Bank | | | | 2.300% | | 3/19/26 | | 300,000 | | | 2,562 | |
| | | | | | | | | | | | |
| | | | | | | | | | | 4,889 | |
| | | | | | | | | | | | |
Total Japanese Yen | | | | | | | | | | | 13,133 | |
153
Semi-Annual Report to Shareholders
Portfolio of Investments—Continued
Western Asset Non-U.S. Opportunity Bond Portfolio—Continued
| | | | | | | | | | | | |
| | | % OF
NET ASSETS | | RATE | | MATURITY
DATE | | PARA | | VALUE |
Norwegian Krone | | 2.4% | | | | | | | | | | |
| | | | | |
Government Obligations | | 2.4% | | | | | | | | | | |
Kingdom of Norway | | | | 6.500% | | 5/15/13 | | | 10,000 | | $ | 1,750 |
Kingdom of Norway | | | | 5.000% | | 5/15/15 | | | 8,280 | | | 1,356 |
| | | | | | | | | | | | |
Total Norwegian Krone | | | | | | | | | | | | 3,106 |
Polish Zloty | | 3.2% | | | | | | | | | | |
| | | | | |
Government Obligations | | 3.2% | | | | | | | | | | |
Republic of Poland | | | | 5.000% | | 10/24/13 | | | 5,410 | | | 1,683 |
Republic of Poland | | | | 6.250% | | 10/24/15 | | | 7,204 | | | 2,423 |
| | | | | | | | | | | | |
Total Polish Zloty | | | | | | | | | | | | 4,106 |
South African Rand | | 0.8% | | | | | | | | | | |
| | | | | |
Government Obligations | | 0.8% | | | | | | | | | | |
Republic of South Africa | | | | 8.750% | | 12/21/14 | | | 8,460 | | | 1,096 |
| | | | | | | | | | | | |
Total Long-Term Securities
(Identified Cost—$110,122) | | | | | | | | | | | | 115,870 |
Short-Term Securities | | 4.2% | | | | | | | | | | |
| | | | | |
Repurchase Agreements | | 4.2% | | | | | | | | | | |
Lehman Brothers, Inc.
5.25%, dated 9/29/06, to be repurchased at $5,439 on 10/2/06 (Collateral: $5,400 Freddie Mac notes, 6.4%, due 5/2/16, value $5,546) | | | | | | | | $ | 5,437 | | | 5,437 |
| | | | | | | | | | | | |
Total Short-Term Securities (Identified Cost—$5,437) | | | | | | | | | | | | 5,437 |
Total Investments (Identified Cost—$115,559) | | 94.1% | | | | | | | | | $ | 121,307 |
Other Assets Less Liabilities | | 5.9% | | | | | | | | | | 7,668 |
| | | | | | | | | | | | |
| | | | | |
Net Assets | | 100.0% | | | | | | | | | $ | 128,975 |
| | | | | | | | | | | | |
154
Semi-Annual Report to Shareholders
| | | | | | | | |
| | | EXPIRATION | | ACTUAL
CONTRACTS | | APPRECIATION/
(DEPRECIATION) | |
Futures Contracts PurchasedE | | | | | | | | |
Bundesobligation Futures | | December 2006 | | 127 | | $ | 67 | |
LIBOR Futures | | September 2007 | | 109 | | | 16 | |
| | | | | | | | |
| | | | | | $ | 83 | |
| | | | | | | | |
Futures Contracts WrittenE | | | | | | | | |
Australian Dollar Futures | | December 2006 | | 197 | | $ | (165 | ) |
Bundesobligation Futures | | December 2006 | | 133 | | | 7 | |
Bundesobligation Futures | | December 2006 | | 230 | | | 13 | |
U.K. Treasury Bond Futures | | December 2006 | | 44 | | | (12 | ) |
| | | | | | | | |
| | | | | | $ | (157 | ) |
| | | | | | | | |
| | | | | | | | | |
| A | | Securities are grouped by the currencies in which they were issued, and the par amounts are also in the issuance currency of the security. |
| B | | Inflation-Protected Security – A security whose principal value is adjusted daily or monthly in accordance with changes to the relevant country’s Consumer Price Index or its equivalent used as an inflation proxy. Interest is calculated on the basis of the current adjusted principal value. |
| C | | Stepped Coupon Security – A security with a predetermined schedule of interest or dividend rate changes. |
| D | | Indexed Security – The rates of interest earned on these securities is tied to the Euro Interbank Offered Rate (“EURIBOR”). The coupon rates are the rates as of September 30, 2006. |
| E | | Futures are described in more detail in the notes to financial statements. |
See notes to financial statements.
155
Semi-Annual Report to Shareholders
Statement of Assets and Liabilities
Western Asset Non-U.S. Opportunity Bond Portfolio
September 30, 2006 (Unaudited)
(Amounts in Thousands)
| | | | | | | |
Assets: | | | | | | | |
Investment securities at market value (Identified Cost—$110,122) | | | | | $ | 115,870 | |
Short-term securities at value (Identified Cost—$5,437) | | | | | | 5,437 | |
Cash and foreign currencies | | | | | | 3,125 | |
Receivable for securities sold | | | | | | 29 | |
Receivable for fund shares sold | | | | | | 1,898 | |
Interest receivable | | | | | | 2,349 | |
Unrealized appreciation of forward foreign currency contracts | | | | | | 453 | |
| | | | | | | |
Total assets | | | | | | 129,161 | |
| | |
Liabilities: | | | | | | | |
Payable for fund shares repurchased | | $ | 17 | | | | |
Accrued management fee | | | 31 | | | | |
Futures variation margin payable | | | 74 | | | | |
Accrued expenses | | | 64 | | | | |
| | | | | | | |
Total liabilities | | | | | | 186 | |
| | | | | | | |
| | |
Net Assets | | | | | $ | 128,975 | |
| | | | | | | |
| | |
Net assets consist of: | | | | | | | |
Accumulated paid-in-capital applicable to: | | | | | | | |
13,374 Institutional Class shares outstanding | | | | | $ | 124,867 | |
Overdistributions of net investment income | | | | | | (616 | ) |
Accumulated net realized loss on investments, futures and foreign currency transactions | | | | | | (1,395 | ) |
Unrealized appreciation/(depreciation) of investments, futures and foreign currency translations | | | | | | 6,119 | |
| | | | | | | |
| | |
Net Assets | | | | | $ | 128,975 | |
| | | | | | | |
| | |
Net Asset Value Per Share: | | | | | | | |
Institutional Class | | | | | | $9.64 | |
| | | | | | | | |
See notes to financial statements.
156
Semi-Annual Report to Shareholders
Statement of Operations
Western Asset Non-U.S. Opportunity Bond Portfolio
For the Six Months Ended September 30, 2006 (Unaudited)
(Amounts in Thousands)
| | | | | | | | |
Investment Income: | | | | | | | | |
Interest | | | | | | $ | 2,364 | |
Expenses: | | | | | | | | |
Advisory fee | | $ | 243 | | | | | |
Audit and legal fees | | | 39 | | | | | |
Custodian fees | | | 56 | | | | | |
Directors’ fees and expenses | | | 3 | | | | | |
Proxy expense | | | — A | | | | | |
Registration fees | | | 7 | | | | | |
Reports to shareholders | | | 5 | | | | | |
Transfer agent and shareholder servicing expense | | | 9 | | | | | |
Other expenses | | | 13 | | | | | |
| | | | | | | | |
| | | 375 | | | | | |
Less: Fees waived | | | (77 | ) | | | | |
Compensating balance creditsB | | | (1 | ) | | | | |
| | | | | | | | |
Total expenses, net of waivers and compensating balance credits | | | | | | | 297 | |
| | | | | | | | |
Net Investment Income | | | | | | | 2,067 | |
Net Realized and Unrealized Gain/(Loss) on Investments: | | | | | | | | |
Realized gain/(loss) on: | | | | | | | | |
Investments | | | (705 | ) | | | | |
Futures | | | 164 | | | | | |
Foreign currency transactions | | | (854 | ) | | | | |
| | | | | | | | |
| | | | | | | (1,395 | ) |
Change in unrealized appreciation/(depreciation) of: | | | | | | | | |
Investments | | | 3,749 | | | | | |
Forward foreign currency exchange contracts | | | (1,061 | ) | | | | |
Assets and liabilities denominated in foreign currencies | | | (7 | ) | | | | |
| | | | | | | | |
| | | | | | | 2,681 | |
| | | | | | | | |
Net Realized and Unrealized Gain on Investments | | | | | | | 1,286 | |
| | | | | | | | | |
Change in Net Assets Resulting From Operations | | | | | | $ | 3,353 | |
| | | | | | | | | |
| B | | See note 1, compensating balance credits, in the notes to financial statements |
See notes to financial statements.
157
Semi-Annual Report to Shareholders
Statement of Changes in Net Assets
Western Asset Non-U.S. Opportunity Bond Portfolio
(Amounts in Thousands)
| | | | | | | | |
| | | FOR THE
SIX MONTHS ENDED
SEPTEMBER 30, 2006 | | | FOR THE
YEAR ENDED
MARCH 31, 2006 | |
| Change in Net Assets: | | (Unaudited) | | | | |
Net investment income | | $ | 2,067 | | | $ | 2,667 | |
| | |
Net realized gain/(loss) on investments, options, futures, swaps and foreign currency transactions | | | (1,395 | ) | | | 11,263 | |
| | |
Change in unrealized appreciation/(depreciation) of investments, options, futures, swaps and assets and liabilities denominated in foreign currencies | | | 2,681 | | | | (9,560 | ) |
| | | | | | | | |
Change in net assets resulting from operations | | | 3,353 | | | | 4,370 | |
| | |
Distributions to Shareholders from: | | | | | | | | |
Net investment income | | | (2,138 | ) | | | (7,829 | ) |
Net realized gain on investments | | | — | | | | (5,345 | ) |
| | |
Change in net assets from Fund share transactions | | | 37,339 | | | | 10,055 | |
| | | | | | | | |
Change in net assets | | | 38,554 | | | | 1,251 | |
| | |
Net Assets: | | | | | | | | |
Beginning of period | | | 90,421 | | | | 89,170 | |
| | | | | | | | |
| | |
End of period | | $ | 128,975 | | | $ | 90,421 | |
| | | | | | | | |
| | |
Overdistributions of net investment income | | $ | (616 | ) | | $ | (545 | ) |
| | | | | | | | |
| | | | | | | | | |
See notes to financial statements.
158
Semi-Annual Report to Shareholders
Financial Highlights
Western Asset Non-U.S. Opportunity Bond Portfolio
Contained below is per share operating performance data for a share of common stock outstanding throughout each year shown, total investment return, ratios to average net assets and other supplemental data. This information has been derived from information in the financial statements.
Institutional Class:
| | | | | | | | | | | | | | | | | | | | | | | | |
| | | SIX MONTHS
ENDED
SEPTEMBER 30,
2006 | | | YEARS ENDED MARCH 31, | |
| | | 2006 | | | 2005 | | | 2004 | | | 2003 | | | 2002 | |
| | | (Unaudited) | | | | | | | | | | | | | | | | |
Net asset value, beginning of period | | $ | 9.59 | | | $ | 10.98 | | | $ | 10.52 | | | $ | 10.91 | | | $ | 9.25 | | | $ | 9.25 | |
| | | | | | | | | | | | | | | | | | | | | | | | |
Investment operations: | | | | | | | | | | | | | | | | | | | | | | | | |
Net investment income | | | .18A | | | | .64 | | | | .19 | | | | .97 | | | | .25 | | | | — | A |
Net realized and unrealized gain/(loss) on investments, options, futures, swaps, and foreign currency transactions | | | .07A | | | | (.07 | ) | | | .57 | | | | (.01 | ) | | | 1.52 | | | | .46 | A |
| | | | | | | | | | | | | | | | | | | | | | | | |
Total from investment operations | | | .25 | | | | .57 | | | | .76 | | | | .96 | | | | 1.77 | | | | .46 | |
| | | | | | | | | | | | | | | | | | | | | | | | |
Distributions paid from: | | | | | | | | | | | | | | | | | | | | | | | | |
Net investment income | | | (.20 | ) | | | (1.16 | ) | | | (.29 | ) | | | (1.01 | ) | | | (.11 | ) | | | (.46 | ) |
Net realized gain on investments | | | — | | | | (.80 | ) | | | (.01 | ) | | | (.34 | ) | | | — | | | | — | |
| | | | | | | | | | | | | | | | | | | | | | | | |
Total distributions | | | (.20 | ) | | | (1.96 | ) | | | (.30 | ) | | | (1.35 | ) | | | (.11 | ) | | | (.46 | ) |
| | | | | | | | | | | | | | | | | | | | | | | | |
Net asset value, end of period | | $ | 9.64 | | | $ | 9.59 | | | $ | 10.98 | | | $ | 10.52 | | | $ | 10.91 | | | $ | 9.25 | |
| | | | | | | | | | | | | | | | | | | | | | | | |
Total return | | | 2.72 | %B | | | 5.33 | % | | | 7.60 | % | | | 9.06 | % | | | 19.26 | % | | | 5.21 | % |
| | | | | | |
Ratios to Average Net Assets:C | | | | | | | | | | | | | | | | | | | | | | | | |
Total expenses | | | .69 | %D | | | .74 | % | | | .68 | % | | | .80 | % | | | .82 | % | | | .82 | % |
Expenses net of waivers, if any | | | .55 | %D | | | .55 | % | | | .55 | % | | | .55 | % | | | .55 | % | | | .55 | % |
Expenses net of all reductions | | | .55 | %D | | | .55 | % | | | .55 | % | | | .55 | % | | | .55 | % | | | .55 | % |
Net investment income | | | 3.8 | %D | | | 3.3 | % | | | 3.2 | % | | | 4.0 | % | | | 4.4 | % | | | 4.5 | % |
| | | | | | |
Supplemental Data: | | | | | | | | | | | | | | | | | | | | | | | | |
Portfolio turnover rate | | | 83.1 | %B | | | 140.1 | % | | | 40.8 | % | | | 42.8 | % | | | 187.5 | % | | | 307.6 | % |
Net assets at end of period (in thousands) | | $ | 128,975 | | | $ | 90,421 | | | $ | 89,170 | | | $ | 97,027 | | | $ | 59,026 | | | $ | 47,487 | |
| | | | | | | | | | | | | | | | | | | | | | | | | |
| A | | The amount presented is calculated pursuant to a methodology prescribed by the Securities and Exchange Commission for a share outstanding throughout the period. This amount is inconsistent with the Fund’s aggregate gains and losses because of the timing of sales and redemptions of Fund shares in relation to fluctuating market values for the investment portfolio. |
| C | | Total expenses reflects operating expenses prior to any voluntary expense waivers and/or compensating balance credits. Expenses net of waivers reflects total expenses before compensating balance credits but net of any voluntary expense waivers. Expenses net of all reductions reflects expenses less any compensating balance credits and/or voluntary expense waivers. |
See notes to financial statements.
159
Semi-Annual Report to Shareholders
Expense Example
Western Asset Absolute Return Portfolio
As a shareholder of the Fund, you incur ongoing costs, including management fees and other Fund expenses. These examples are intended to help you understand your ongoing costs (in dollars) of investing in the Fund and to compare these costs with the ongoing costs of investing in other mutual funds.
Actual Expenses
The first table below provides information about actual account values and actual expenses for the Fund. You may use the information in this table, together with the amount you invested, to estimate the expenses that you paid over the period. Simply divide your account value by $1,000 (for example, an $8,600 account value divided by $1,000 = 8.6), then multiply the result by the number under the heading entitled “Expenses Paid During the Period” to estimate the expenses you paid on your account during this period. The actual expense example is based on an investment of $1,000 invested on the inception dateA and held through September 30, 2006.
Hypothetical Example for Comparison Purposes
The second table below provides information about hypothetical account values and hypothetical expenses based on the Fund’s actual expense ratio and an assumed rate of return of 5% per year before expenses, which is not the Fund’s actual return. The hypothetical account values and expenses may not be used to estimate the actual ending account balance or expenses you paid for the period. You may use this information to compare the ongoing costs of investing in the Fund and other funds. To do so, compare this 5% hypothetical example with the 5% hypothetical examples that appear in the shareholder reports of other funds. The hypothetical example is based on an investment of $1,000 invested on April 1, 2006, and held through September 30, 2006.
| | | | | | | | | |
| | | Beginning
Account Value
Since InceptionA | | Ending
Account Value
9/30/06 | | Expenses PaidB
During the Period
Since Inception to
9/30/06 |
Institutional Class | | | | | | | | | |
Actual | | $ | 1,000.00 | | $ | 1,029.90 | | $ | 1.94 |
Financial Intermediary Class | | | | | | | | | |
Actual | | | 1,000.00 | | | 1,006.00 | | | 0.72 |
| | | |
| | | Beginning
Account Value
4/1/06 | | Ending
Account Value
9/30/06 | | Expenses PaidC
During the Period
4/1/06 to 9/30/06 |
Institutional Class | | | | | | | | | |
Hypothetical (5% return before expenses) | | $ | 1,000.00 | | $ | 1,021.06 | | $ | 4.05 |
Financial Intermediary Class | | | | | | | | | |
Hypothetical (5% return before expenses) | | | 1,000.00 | | | 1,019.80 | | | 5.32 |
| A | | The inception date of the Institutional Class is July 6, 2006. The inception date of the Financial Intermediary Class is September 6, 2006. |
| B | | These calculations are based on expenses incurred since the inception date. The dollar amounts shown as “Expenses Paid” are equal to the annualized expense ratios of ..0.80% and 1.05% for Institutional Class and Financial Intermediary Class, respectively, multiplied by the average values over the period, multiplied by the number of days in the most recent fiscal period (87 days) and (26 days) for Institutional Class and Financial Intermediary Class, respectively, and divided by 365. |
| C | | These calculations are based on expenses incurred since the inception date. The dollar amounts shown as “Expenses Paid” are equal to the annualized expense rations of 0.80% and 1.05% for Institutional Class and Financial Intermediary Class, respectively, multiplied by the average values over the period, multiplied by the number of days in the most recent fiscal half-year (183), and divided by 365. |
160
Semi-Annual Report to Shareholders
Performance Information
Western Asset Absolute Return Portfolio
Portfolio Composition (as of September 30, 2006)
Standard & Poor’s Debt RatingsA
(as a percentage of the portfolio)
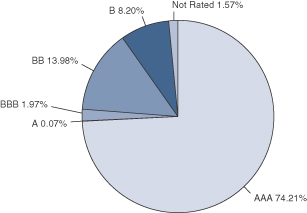
Maturity Schedule (as a percentage of the portfolio)

Bonds are subject to a variety of risks, including interest rate, credit and inflation risk.
| A | | Source: Standard & Poor's. |
The Fund is actively managed. As a result, the composition of the portfolio holdings and sectors are subject to change at any time.
161
Semi-Annual Report to Shareholders
Portfolio of Investments
Western Asset Absolute Return Portfolio
September 30, 2006 (Unaudited)
(Amounts in Thousands)
| | | | | | | | | | | | |
| | | % OF
NET ASSETS | | RATE | | MATURITY
DATE | | PAR | | VALUE |
Long-Term Securities | | 76.3% | | | | | | | | | | |
| | | | | |
Corporate Bonds and Notes | | 16.4% | | | | | | | | | | |
| | | | | |
Banking and Finance | | 6.9% | | | | | | | | | | |
Ford Motor Credit Company | | | | 7.375% | | 10/28/09 | | $ | 560 | | $ | 544 |
Ford Motor Credit Company | | | | 9.750% | | 9/15/10 | | | 1,500 | | | 1,549A |
GMAC LLC | | | | 5.850% | | 1/14/09 | | | 1,375 | | | 1,348 |
GMAC LLC | | | | 8.000% | | 11/1/31 | | | 1,750 | | | 1,830 |
GMAC LLC | | | | 4.375% | | 12/10/07 | | | 425 | | | 415 |
PHH Corporation | | | | 7.125% | | 3/1/13 | | | 100 | | | 103 |
| | | | | | | | | | | | |
| | | | | | | | | | | | 5,789 |
| | | | | | | | | | | | |
Cable | | 0.3% | | | | | | | | | | |
EchoStar DBS Corporation | | | | 7.125% | | 2/1/16 | | | 300 | | | 290A |
| | | | | | | | | | | | |
| | | | | |
Casino Resorts | | 0.5% | | | | | | | | | | |
Harrah’s Operating Company, Inc | | | | 6.500% | | 6/1/16 | | | 120 | | | 118 |
MGM MIRAGE | | | | 6.625% | | 7/15/15 | | | 300 | | | 288 |
| | | | | | | | | | | | |
| | | | | | | | | | | | 406 |
| | | | | | | | | | | | |
Electric | | 2.1% | | | | | | | | | | |
The AES Corporation | | | | 7.750% | | 3/1/14 | | | 1,700 | | | 1,768 |
| | | | | | | | | | | | |
| | | | | |
Food, Beverage and Tobacco | | 0.6% | | | | | | | | | | |
Sara Lee Corporation | | | | 6.250% | | 9/15/11 | | | 150 | | | 154 |
SUPERVALU INC. | | | | 7.875% | | 8/1/09 | | | 300 | | | 311 |
| | | | | | | | | | | | |
| | | | | | | | | | | | 465 |
| | | | | | | | | | | | |
Homebuilding | | 0.5% | | | | | | | | | | |
Centex Corporation | | | | 5.125% | | 10/1/13 | | | 350 | | | 332 |
D.R. Horton, Inc. | | | | 6.875% | | 5/1/13 | | | 100 | | | 102 |
| | | | | | | | | | | | |
| | | | | | | | | | | | 434 |
| | | | | | | | | | | | |
| | | | | |
Health Care | | 0.7% | | | | | | | | | | |
Tenet Healthcare Corporation | | | | 6.375% | | 12/1/11 | | | 670 | | | 589 |
| | | | | | | | | | | | |
| | | | | |
Lodging/Hotels | | 0.1% | | | | | | | | | | |
Starwood Hotels & Resorts Worldwide, Inc. | | | | 7.875% | | 5/1/12 | | | 100 | | | 105 |
| | | | | | | | | | | | |
162
Semi-Annual Report to Shareholders
| | | | | | | | | | | | | |
| | | % OF
NET ASSETS | | RATE | | MATURITY
DATE | | PAR | | VALUE | |
Corporate Bonds and Notes—Continued | | | | | | | | | | | | | |
| | | | | |
Medical Care Facilities | | 0.9% | | | | | | | | | | | |
DaVita, Inc. | | | | 7.250% | | 3/15/15 | | $ | 300 | | $ | 295 | |
HCA, Inc. | | | | 6.300% | | 10/1/12 | | | 4 | | | 3 | |
HCA, Inc. | | | | 6.500% | | 2/15/16 | | | 588 | | | 470 | |
| | | | | | | | | | | | | |
| | | | | | | | | | | | 768 | |
| | | | | | | | | | | | | |
| | | | | |
Oil and Gas | | 1.3% | | | | | | | | | | | |
Anadarko Petroleum Corporation | | | | 5.790% | | 9/15/09 | | | 170 | | | 170 | B |
Anadarko Petroleum Corporation | | | | 6.450% | | 9/15/36 | | | 190 | | | 194 | |
Chesapeake Energy Corporation | | | | 6.375% | | 6/15/15 | | | 300 | | | 286 | |
Suburban Propane Partners, L.P. | | | | 6.875% | | 12/15/13 | | | 500 | | | 482 | |
| | | | | | | | | | | | | |
| | | | | | | | | | | | 1,132 | |
| | | | | | | | | | | | | |
| | | | | |
Pharmaceuticals | | 0.1% | | | | | | | | | | | |
AmerisourceBergen Corporation | | | | 5.875% | | 9/15/15 | | | 50 | | | 49 | |
| | | | | | | | | | | | | |
| | | | | |
Photo Equipment and Supplies | | 0.2% | | | | | | | | | | | |
Eastman Kodak Company | | | | 7.250% | | 11/15/13 | | | 200 | | | 195 | |
| | | | | | | | | | | | | |
| | | | | |
Special Purpose | | 1.0% | | | | | | | | | | | |
AIR 2 US | | | | 8.027% | | 10/1/19 | | | 174 | | | 175A | |
El Paso Performance-Link | | | | 7.750% | | 7/15/11 | | | 140 | | | 144A | |
Sigma Finance Inc. | | | | 8.500% | | 8/11/16 | | | 500 | | | 500A,C | |
| | | | | | | | | | | | | |
| | | | | | | | | | | | 819 | |
| | | | | | | | | | | | | |
Telecommunications | | 0.4% | | | | | | | | | | | |
Qwest Corporation | | | | 7.500% | | 10/1/14 | | | 300 | | | 310A | |
| | | | | | | | | | | | | |
| | | | | |
Transportation | | 0.8% | | | | | | | | | | | |
Continental Airlines, Inc. | | | | 6.820% | | 5/1/18 | | | 67 | | | 68 | |
Continental Airlines, Inc. | | | | 6.703% | | 6/15/21 | | | 75 | | | 75 | |
US Airways Pass Through Trust | | | | 6.850% | | 1/30/18 | | | 221 | | | 224 | |
United Air Lines, Inc. | | | | 7.032% | | 10/1/10 | | | 298 | | | 301 | |
| | | | | | | | | | | | | |
| | | | | | | | | | | | 668 | |
| | | | | | | | | | | | | |
Total Corporate Bonds and Notes
(Identified Cost—$13,624) | | | | | | | | | | | | 13,787 | |
163
Semi-Annual Report to Shareholders
Portfolio of Investments—Continued
Western Asset Absolute Return Portfolio—Continued
| | | | | | | | | | | | |
| | | % OF
NET ASSETS | | RATE | | MATURITY
DATE | | PAR | | VALUE |
Asset-Backed Securities | | 0.5% | | | | | | | | | | |
| | | | | |
Fixed Rate Securities | | 0.5% | | | | | | | | | | |
ABSC Manufactured Housing Contract 2004-CN1 | | | | 8.400% | | 12/2/30 | | $ | 170 | | $ | 152A |
Pegasus Aviation Lease Securitization II 2000-1 | | | | 8.370% | | 3/25/30 | | | 390 | | | 246A |
| | | | | | | | | | | | |
Total Asset-Backed Securities
(Identified Cost—$399) | | | | | | | | | | | | 398 |
Mortgage-Backed Securities | | 0.7% | | | | | | | | | | |
| | | | | |
Indexed SecuritiesB | | 0.1% | | | | | | | | | | |
Merit Securities Corporation 11PA | | | | 6.828% | | 9/28/32 | | | 103 | | | 88A |
| | | | | | | | | | | | |
| | | | | |
Variable Rate SecuritiesD | | 0.6% | | | | | | | | | | |
Morgan Stanley Mortgage Loan Trust 2004-6AR | | | | 4.073% | | 8/25/34 | | | 485 | | | 481 |
| | | | | | | | | | | | |
Total Mortgage-Backed Securities
(Identified Cost—$573) | | | | | | | | | | | | 569 |
U.S. Government and Agency Obligations | | 9.8% | | | | | | | | | | |
| | | | | |
Fixed Rate Securities | | 8.4% | | | | | | | | | | |
United States Treasury Notes | | | | 5.125% | | 6/30/08 | | | 6,400 | | | 6,441 |
United States Treasury Notes | | | | 4.875% | | 8/15/16 | | | 570 | | | 581 |
| | | | | | | | | | | | |
| | | | | | | | | | | | 7,022 |
| | | | | | | | | | | | |
Treasury Inflation-Protected SecuritiesE | | 1.4% | | | | | | | | | | |
United States Treasury Inflation-Protected Security | | | | 0.875% | | 4/15/10 | | | 564 | | | 534 |
United States Treasury Inflation-Protected Security | | | | 2.000% | | 1/15/16 | | | 718 | | | 701 |
| | | | | | | | | | | | |
| | | | | | | | | | | | 1,235 |
| | | | | | | | | | | | |
Total U.S. Government and Agency Obligations (Identified Cost—$8,188) | | | | | | | | | | | | 8,257 |
U.S. Government Agency Mortgage-Backed Securities | | 35.2% | | | | | | | | | | |
| | | | | |
Fixed Rate Securities | | 18.2% | | | | | | | | | | |
Fannie Mae | | | | 5.000% | | 12/1/36 | | | 5,700 | | | 5,477F |
Fannie Mae | | | | 6.000% | | 12/1/36 | | | 9,800 | | | 9,843F |
| | | | | | | | | | | | |
| | | | | | | | | | | | 15,320 |
| | | | | | | | | | | | |
Variable Rate SecuritiesD | | 17.0% | | | | | | | | | | |
Freddie Mac | | | | 5.598% | | 1/1/36 | | | 4,548 | | | 4,555 |
Freddie Mac | | | | 5.714% | | 7/1/36 | | | 9,642 | | | 9,687 |
| | | | | | | | | | | | |
| | | | | | | | | | | | 14,242 |
| | | | | | | | | | | | |
Total U.S. Government Agency Mortgage-Backed Securities (Identified Cost—$29,361) | | | | | | | | | | | | 29,562 |
164
Semi-Annual Report to Shareholders
| | | | | | | | | | | | | |
| | | % OF
NET ASSETS | | RATE | | MATURITY
DATE | | PAR | | VALUE | |
Yankee BondsG | | 2.6% | | | | | | | | | | | |
| | | | | |
Banks | | 1.0% | | | | | | | | | | | |
Glitnir Banki hf | | | | 6.693% | | 6/15/16 | | $ | 310 | | $ | 317A,C | |
Kaupthing Bank hf | | | | 7.125% | | 5/19/16 | | | 240 | | | 252A | |
Landsbanki Islands hf (The National Bank of Iceland) | | | | 6.100% | | 8/25/11 | | | 190 | | | 192A | |
UBS AG Jersey | | | | 3.398% | | 3/23/07 | | | 100 | | | 102H | |
| | | | | | | | | | | | | |
| | | | | | | | | | | | 863 | |
| | | | | | | | | | | | | |
Foreign Governments | | 1.4% | | | | | | | | | | | |
Federative Republic of Brazil | | | | 11.000% | | 8/17/40 | | | 300 | | | 391 | |
Federative Republic of Brazil | | | | 8.000% | | 1/15/18 | | | 320 | | | 352 | |
Republic of Panama | | | | 9.375% | | 4/1/29 | | | 198 | | | 256 | |
United Mexican States | | | | 7.500% | | 4/8/33 | | | 110 | | | 127 | |
| | | | | | | | | | | | | |
| | | | | | | | | | | | 1,126 | |
| | | | | | | | | | | | | |
| | | | | |
Special Purpose | | 0.2% | | | | | | | | | | | |
TNK-BP Finance SA | | | | 7.500% | | 7/18/16 | | | 200 | | | 209A | |
| | | | | | | | | | | | | |
Total Yankee Bonds
(Identified Cost—$2,134) | | | | | | | | | | | | 2,198 | |
Foreign Corporate Bonds and Notes | | 0.2% | | | | | | | | | | | |
Gazprom | | | | 6.950% | | 8/6/09 | | | 5,470I | | | 206 | |
| | | | | | | | | | | | | |
Total Foreign Corporate Bonds and Notes
(Identified Cost—$206) | | | | | | | | | | | | | |
Foreign Government Obligations | | 0.2% | | | | | | | | | | | |
Republic of Argentina | | | | 2.000% | | 1/3/10 | | | 334J | | | 206 | C,D |
Total Foreign Government Obligations
(Identified Cost—$212) | | | | | | | | | | | | | |
Loan Participations and AssignmentsB | | 10.7% | | | | | | | | | | | |
| | | | | |
Cable | | 2.4% | | | | | | | | | | | |
CableVision, Incremental Term Loan | | | | 7.110% | | 3/30/13 | | | 425 | | | 423 | |
CableVision, Incremental Term Loan | | | | 7.258% | | 3/30/13 | | | 286 | | | 285 | |
CableVision, Incremental Term Loan | | | | 7.218% | | 3/30/13 | | | 286 | | | 285 | |
Charter Communications Operating, LLC, Term Loan | | | | 8.125% | | 4/28/13 | | | 1,000 | | | 1,004 | |
| | | | | | | | | | | | | |
| | | | | | | | | | | | 1,997 | |
| | | | | | | | | | | | | |
Chemicals | | 1.2% | | | | | | | | | | | |
Georgia Gulf Corporation, Term Loan | | | | 7.320% | | 9/18/13 | | | 1,001 | | | 1,002 | |
| | | | | | | | | | | | | |
165
Semi-Annual Report to Shareholders
Portfolio of Investments—Continued
Western Asset Absolute Return Portfolio—Continued
| | | | | | | | | | | | |
| | | % OF
NET ASSETS | | RATE | | MATURITY
DATE | | PAR | | VALUE |
Loan Participations and Assignments—Continued | | | | | | | | | | | | |
Computer Services and Systems | | 1.2% | | | | | | | | | | |
SunGard Data Systems Inc., Term Loan, Tranche B | | | | 7.999% | | 8/15/12 | | $ | 1,000 | | $ | 1,006 |
| | | | | | | | | | | | |
| | | | | |
Entertainment | | 1.2% | | | | | | | | | | |
Cedar Fair, LP, Term Loan, Tranche B | | | | 7.867% | | 6/13/12 | | | 1,000 | | | 1,005 |
| | | | | | | | | | | | |
| | | | | |
Environmental Services | | 1.2% | | | | | | | | | | |
Allied Waste North America, Inc., Credit Linked Deposit, Tranche A | | | | 7.270% | | 1/15/12 | | | 277 | | | 276 |
Allied Waste North America, Inc., Term Loan | | | | 7.170% | | 1/15/12 | | | 347 | | | 346 |
Allied Waste North America, Inc., Term Loan | | | | 7.210% | | 1/15/12 | | | 119 | | | 118 |
Allied Waste North America, Inc., Term Loan | | | | 7.270% | | 1/15/12 | | | 254 | | | 253 |
| | | | | | | | | | | | |
| | | | | | | | | | | | 993 |
| | | | | | | | | | | | |
| | | | | |
Medical Care Facilities | | 1.1% | | | | | | | | | | |
DaVita, Inc., Term Loan, Tranche B | | | | 7.370% | | 10/5/12 | | | 169 | | | 170 |
DaVita, Inc., Term Loan, Tranche B | | | | 7.400% | | 10/5/12 | | | 85 | | | 85 |
DaVita, Inc., Term Loan, Tranche B | | | | 7.510% | | 10/5/12 | | | 553 | | | 556 |
DaVita, Inc., Term Loan, Tranche B | | | | 7.690% | | 10/5/12 | | | 139 | | | 139 |
| | | | | | | | | | | | |
| | | | | | | | | | | | 950 |
| | | | | | | | | | | | |
Paper and Forest Products | | 1.2% | | | | | | | | | | |
Georgia-Pacific Corporation, First Lien Term Loan | | | | 7.367% | | 12/23/13 | | | 187 | | | 187 |
Georgia-Pacific Corporation, First Lien Term Loan | | | | 7.390% | | 12/23/13 | | | 766 | | | 767 |
Georgia-Pacific Corporation, First Lien Term Loan | | | | 7.485% | | 12/23/13 | | | 48 | | | 48 |
| | | | | | | | | | | | |
| | | | | | | | | | | | 1,002 |
| | | | | | | | | | | | |
Semiconductor Equipment and Production | | 1.2% | | | | | | | | | | |
Sensata Technologies, Term Loan, Tranche B | | | | 7.240% | | 4/27/13 | | | 987 | | | 980 |
Sensata Technologies, Term Loan, Tranche B | | | | 7.117% | | 4/27/13 | | | 11 | | | 10 |
| | | | | | | | | | | | |
| | | | | | | | | | | | 990 |
| | | | | | | | | | | | |
Total Loan Participations and Assignments
(Identified Cost—$8,957) | | | | | | | | | | | | 8,945 |
| | | | | | | | | | | | |
Total Long-Term Securities
(Identified Cost—$63,654) | | | | | | | | | | | | 64,128 |
166
Semi-Annual Report to Shareholders
| | | | | | | | | | | | | | |
| | | % OF
NET ASSETS | | RATE | | MATURITY
DATE | | PAR | | | VALUE | |
Short-Term Securities | | 41.7% | | | | | | | | | | | | |
| | | | | |
Corporate Bonds and Notes | | 0.3% | | | | | | | | | | | | |
Tribune Company | | | | 0.000% | | 2/1/07 | | $ | 250 | | | $ | 244K | |
| | | | | | | | | | | | | | |
| | | | | |
U.S. Government and Agency Obligations | | 0.2% | | | | | | | | | | | | |
Fannie Mae | | | | 0.000% | | 6/25/07 | | | 160 | | | | 154K,L | |
| | | | | | | | | | | | | | |
| | | | | |
Options PurchasedM | | 0.1% | | | | | | | | | | | | |
U.S. Treasury Note Futures Put, December 2006, Strike Price $106.00 | | | | | | | | | 18 | N | | | 2 | |
U.S. Treasury Bond Futures Call, December 2006, Strike Price $112.00 | | | | | | | | | 63 | N | | | 67 | |
| | | | | | | | | | | | | | |
| | | | | | | | | | | | | 69 | |
| | | | | | | | | | | | | | |
Repurchase Agreements | | 41.1% | | | | | | | | | | | | |
Merrill Lynch
5.27%, dated 9/29/06, to be repurchased at $34,552 on 10/2/06 (Collateral: $60,425 Resolution Funding Corporation principal-only securities, due 4/15/30, value $19,185; $15,845 Fannie Mae notes, 4.5%, due 10/15/08, value $16,043) | | | | | | | | $ | 34,537 | | | | 34,537 | |
| | | | | | | | | | | | | | |
Total Short-Term Securities
(Identified Cost—$34,997) | | | | | | | | | | | | | 35,004 | |
Total Investments (Identified Cost—$98,651) | | 118.0% | | | | | | | | | | | 99,132 | |
Other Assets Less Liabilities | | (18.0)% | | | | | | | | | | | (15,097 | ) |
| | | | | | | | | | | | | | |
| | | | | |
Net Assets | | 100.0% | | | | | | | | | | $ | 84,035 | |
| | | | | | | | | | | | | | |
167
Semi-Annual Report to Shareholders
Portfolio of Investments—Continued
Western Asset Absolute Return Portfolio—Continued
| | | | | | | | |
| | | EXPIRATION | | ACTUAL
CONTRACTS | | APPRECIATION/
(DEPRECIATION) | |
Futures Contracts PurchasedM | | | | | | | | |
Eurodollar Futures | | December 2006 | | 7 | | $ | 2 | |
Eurodollar Futures | | March 2007 | | 4 | | | 3 | |
Eurodollar Futures | | June 2007 | �� | 5 | | | — | O |
Eurodollar Futures | | September 2007 | | 75 | | | 105 | |
LIBOR Futures | | June 2007 | | 46 | | | 1 | |
U.S. Treasury Note Futures | | December 2006 | | 122 | | | 91 | |
| | | | | | | | |
| | | | | | $ | 202 | |
| | | | | | | | |
Futures Contracts WrittenM | | | | | | | | |
Eurodollar Futures | | March 2007 | | 4 | | $ | (5 | ) |
U.S. Treasury Bond Futures | | December 2006 | | 13 | | | (3 | ) |
U.S. Treasury Note Futures | | December 2006 | | 12 | | | (4 | ) |
U.S. Treasury Note Futures | | December 2006 | | 7 | | | 3 | |
| | | | | | | | |
| | | | | | $ | (9 | ) |
| | | | | | | | |
Options WrittenM | | | | | | | | |
U.S. Treasury Note Futures Call, Strike Price $106.00 | | December 2006 | | 7 | | $ | (10 | ) |
| | | | | | | | |
| | | | | | | | | |
| A | | Rule 144a Security – A security purchased pursuant to Rule 144a under the Securities Act of 1933 which may not be resold subject to that rule except to qualified institutional buyers. These securities, which the Fund's investment adviser has determined to be liquid, represent 5.3% of net assets. |
| B | | Indexed Security – The rates of interest earned on these securities are tied to the London Interbank Offered Rate ("LIBOR"). The coupon rates are the rates as of September 30, 2006. |
| C | | Stepped Coupon Security – A security with a predetermined schedule of interest or dividend rate changes. |
| D | | The coupon rates shown on variable rate securities are the rates at September 30, 2006. These rates vary with the weighted average coupon of the underlying loans. |
| E | | Treasury Inflation-Protected Security – A security whose principal value is adjusted daily in accordance with changes to the Consumer Price Index for All Urban Consumers. Interest is calculated on the basis of the current adjusted principal value. |
| F | | When-issued Security – A security purchased on a delayed delivery basis. Final settlement amount and maturity date have not yet been announced. |
| G | | Yankee Bond – A dollar denominated bond issued in the U.S. by foreign entities. |
| H | | Unit – A security which consists of a bond and warrants to purchase the stock of the issuer. |
| I | | Denominated in Russian Rubles. |
| J | | Denominated in Argentine Pesos. |
| K | | Zero Coupon Bond – A bond with no periodic interest payments which is sold at such a discount as to produce a current yield to maturity. |
| L | | All or a portion of this security is pledged as collateral to cover futures and options contracts. |
| M | | Options and futures are described in more detail in the notes to financial statements. |
| N | | Par represents actual number of contracts. |
See notes to financial statements.
168
Semi-Annual Report to Shareholders
Statement of Assets and Liabilities
Western Asset Absolute Return Portfolio
September 30, 2006 (Unaudited)
(Amounts in Thousands)
| | | | | | |
Assets: | | | | | | |
Investment securities at market value (Identified Cost—$63,654) | | | | | $ | 64,128 |
Short-term securities at value (Identified Cost—$34,997) | | | | | | 35,004 |
Cash and foreign currencies | | | | | | 69 |
Receivable for securities sold | | | | | | 3,885 |
Receivable for fund shares sold | | | | | | 22 |
Interest and dividends receivable | | | | | | 563 |
Unrealized appreciation of forward foreign currency contracts | | | | | | 34 |
| | | | | | |
Total assets | | | | | | 103,705 |
| | | | | | |
| | |
Liabilities: | | | | | | |
Payable for securities purchased | | $ | 19,591 | | | |
Accrued management fee | | | 25 | | | |
Accrued distribution fee | | | — A | | | |
Income distribution payable | | | 4 | | | |
Options written (Proceeds—$5) | | | 15 | | | |
Swap contracts at value | | | 1 | | | |
Futures variation margin payable | | | 8 | | | |
Accrued expenses | | | 26 | | | |
| | | | | | |
Total liabilities | | | | | | 19,670 |
| | | | | | |
| | |
Net Assets | | | | | $ | 84,035 |
| | | | | | |
| | |
Net assets consist of: | | | | | | |
Accumulated paid-in-capital applicable to: | | | | | | |
8,237 Institutional Class shares outstanding | | | | | $ | 82,946 |
2 Financial Intermediary Class shares outstanding | | | | | | 17 |
Undistributed net investment income | | | | | | 1 |
Accumulated net realized gain on investments, options, futures, swaps and foreign currency transactions | | | | | | 374 |
Unrealized appreciation/(depreciation) of investments, options, futures, swaps, and foreign currency translations | | | | | | 697 |
| | | | | | |
| | |
Net Assets | | | | | $ | 84,035 |
| | | | | | |
| | |
Net Asset Value Per Share: | | | | | | |
Institutional Class | | | | | | $10.20 |
Financial Intermediary Class | | | | | | $10.20 |
| | | | | | | |
See notes to financial statements.
169
Semi-Annual Report to Shareholders
Statement of Operations
Western Asset Absolute Return Portfolio
For the Period Ended September 30, 2006A (Unaudited)
(Amounts in Thousands)
| | | | | | | |
Investment Income: | | | | | | | |
Interest | | | | | | $ | 704 |
Expenses: | | | | | | | |
Advisory fee | | $ | 99 | | | | |
Audit and legal fees | | | 23 | | | | |
Custodian fees | | | 27 | | | | |
Directors’ fees and expenses | | | 7 | | | | |
Organization expense | | | 4 | | | | |
Registration fees | | | 16 | | | | |
Reports to shareholders | | | 4 | | | | |
Transfer agent and shareholder servicing expense: | | | | | | | |
Institutional Class | | | 3 | | | | |
Financial Intermediary Class | | | 0 | | | | |
Other expenses | | | 11 | | | | |
| | | | | | | |
| | | 194 | | | | |
Less: Fees waived | | | (74 | ) | | | |
Compensating balance creditsB | | | (14 | ) | | | |
| | | | | | | |
Total expenses, net of waivers and compensating balance credits | | | | | | | 106 |
| | | | | | | |
Net Investment Income | | | | | | | 598 |
Net Realized and Unrealized Gain/(Loss) on Investments: | | | | | | | |
Realized gain on: | | | | | | | |
Investments | | | 182 | | | | |
Options | | | 3 | | | | |
Futures | | | 189 | | | | |
| | | | | | | |
| | | | | | | 374 |
Change in unrealized appreciation/(depreciation) of: | | | | | | | |
Investments, options, futures, swaps, and foreign currency translations | | | 663 | | | | |
Forward foreign currency exchange contracts | | | 34 | | | | |
Assets and liabilities denominated in foreign currencies | | | —C | | | | |
| | | | | | | |
| | | | | | | 697 |
| | | | | | | |
Net Realized and Unrealized Gain on Investments | | | | | | | 1,071 |
| | | | | | | | |
Change in Net Assets Resulting From Operations | | | | | | $ | 1,669 |
| | | | | | | | |
| A | | For the period July 6, 2006 (commencement of operations) to September 30, 2006. |
| B | | See note 1, compensating balance credits, in the notes to financial statements. |
See notes to financial statements.
170
Semi-Annual Report to Shareholders
Statement of Changes in Net Assets
Western Asset Absolute Return Portfolio
(Amounts in Thousands)
| | | | |
| | | FOR THE
PERIOD ENDED SEPTEMBER 30, 2006A | |
| | | (Unaudited) | |
| Change in Net Assets: | | | |
Net investment income | | $ | 598 | |
| |
Net realized gain on investments, options, futures, swaps and foreign currency transactions | | | 374 | |
| |
Change in unrealized appreciation/(depreciation) of investments, options, futures, swaps and assets and liabilities denominated in foreign currencies | | | 697 | |
| | | | |
Change in net assets resulting from operations | | | 1,669 | |
| |
Distributions to Shareholders from: | | | | |
Net investment income: | | | | |
Institutional Class | | | (597 | ) |
Financial Intermediary Class | | | — | B |
| |
Change in net assets from Fund share transactions: | | | | |
Institutional Class | | | 82,946 | |
Financial Intermediary Class | | | 17 | |
| | | | |
Change in net assets | | | 84,035 | |
| |
Net Assets: | | | | |
Beginning of period | | | 0 | |
| | | | |
| |
End of period | | $ | 84,035 | |
| | | | |
| |
Undistributed net investment income | | $ | 1 | |
| | | | |
| | | | | |
| A | | For the period July 6, 2006 (commencement of operations) to September 30, 2006. |
See notes to financial statements.
171
Semi-Annual Report to Shareholders
Financial Highlights
Western Asset Absolute Return Portfolio
Contained below is per share operating performance data for a share of common stock outstanding throughout the period shown, total investment return, ratios to average net assets and other supplemental data. This information has been derived from information in the financial statements.
Institutional Class:
| | | | |
| | | PERIOD ENDED
SEPTEMBER 30, 2006A | |
| | | (Unaudited) | |
Net asset value, beginning of period | | $ | 10.00 | |
| | | | |
Investment operations: | | | | |
Net investment income | | | .10 | |
Net realized and unrealized gain on investments, options, futures, swaps, and foreign currency transactions | | | .20 | |
| | | | |
Total from investment operations | | | .30 | |
| | | | |
Distributions paid from net investment income: | | | (.10 | ) |
| | | | |
Total distributions | | | (.10 | ) |
| | | | |
Net asset value, end of period | | $ | 10.20 | |
| | | | |
Total return | | | 2.99 | %B |
| |
Ratios To Average Net Assets:C | | | | |
Total expenses | | | 1.46 | %D |
Expenses net of waivers, if any | | | .90 | %D |
Expenses net of all reductions | | | .80 | %D |
Net investment income | | | 4.5 | %D |
| |
Supplemental Data: | | | | |
Portfolio turnover rate | | | 64.2 | %B |
Net assets at end of period (in thousands) | | $ | 84,018 | |
| | | | | |
| A | | For the period July 6, 2006 (commencement of operations) to September 30, 2006. |
| C | | Total expenses reflects operating expenses prior to any voluntary expense waivers and/or compensating balance credits. Expenses net of waivers reflects total expenses before compensating balance credits but net of any voluntary expense waivers. Expenses net of all reductions reflects expenses less any compensating balance credits and/or voluntary expense waivers. |
See notes to financial statements.
172
Semi-Annual Report to Shareholders
Financial Intermediary Class:
| | | | |
| | | PERIOD ENDED
SEPTEMBER 30, 2006E | |
| | | (Unaudited) | |
Net asset value, beginning of period | | $ | 10.17 | |
| | | | |
Investment operations: | | | | |
Net investment income | | | .03 | |
Net realized and unrealized gain/(loss) of investments, options, futures, swaps, and foreign currency transactions | | | .03 | |
| | | | |
Total from investment operations | | | .06 | |
| | | | |
Distributions paid from: | | | | |
Net investment income | | | (.03 | ) |
| | | | |
Total distributions | | | (.03 | ) |
| | | | |
Net asset value, end of period | | $ | 10.20 | |
| | | | |
Total return | | | .60 | %B |
| |
Ratios To Average Net Assets:C | | | | |
Total expenses | | | 1.85 | %D |
Expenses net of waivers, if any | | | 1.29 | %D |
Expenses net of all reductions | | | 1.05 | %D |
Net investment income | | | 4.8 | %D |
| |
Supplemental Data: | | | | |
Portfolio turnover rate | | | 64.2 | %B |
Net assets at end of period (in thousands) | | $ | 17 | |
| | | | | |
| E | | For the period September 6, 2006 (commencement of operations) to September 30, 2006. |
See notes to financial statements.
173
Semi-Annual Report to Shareholders
Notes to Financial Statements
(Amounts in Thousands) (Unaudited)
1. Significant Accounting Policies:
Western Asset Funds, Inc. (“Corporation”), consisting of Western Asset Limited Duration Bond Portfolio (“Limited Duration”), Western Asset Intermediate Bond Portfolio (“Intermediate”), Western Asset Intermediate Plus Bond Portfolio (“Intermediate Plus”), Western Asset Core Bond Portfolio (“Core”), Western Asset Core Plus Bond Portfolio (“Core Plus”), Western Asset Inflation Indexed Plus Bond Portfolio (“Inflation Indexed”), Western Asset High Yield Portfolio (“High Yield”), Western Asset Non-U.S. Opportunity Bond Portfolio (“Non-U.S.”), and Western Asset Absolute Return Portfolio (“Absolute Return”) (individually a “Fund,” collectively the “Funds”), is registered under the Investment Company Act of 1940, as amended (“1940 Act”), as a diversified, open-end management investment company with the exception of Non-U.S., which is non-diversified.
Each Fund offers two classes of shares: Institutional Class and Financial Intermediary Class. Shares in the Financial Intermediary Class bear a distribution fee. The Financial Intermediary Class shares of Limited Duration, Intermediate, Intermediate Plus, Inflation Indexed, High Yield, and Non-U.S. have not commenced operations. The income and expenses of each of the Funds are allocated proportionately to the two classes of shares based on daily net assets, except for Rule 12b-1 distribution fees, which are charged only on the Financial Intermediary Class shares, and transfer agent and shareholder servicing expenses, which are determined separately for each class.
Preparation of the financial statements in accordance with accounting principles generally accepted in the United States of America requires management to make estimates and assumptions that affect the reported amounts and disclosures in the financial statements. Actual results could differ from these estimates. The following is a summary of significant accounting policies followed by the Funds in the preparation of their financial statements:
Security Valuation
Securities owned by the Funds for which market quotations are readily available are valued at current market value. Securities for which market quotations are not readily available are fair valued pursuant to procedures approved by and under the general oversight of the Board of Directors. In determining fair value, all relevant qualitative and quantitative factors available are considered. These factors are subject to change over time and are reviewed periodically. The values assigned to fair value investments are based on available information and do not necessarily represent amounts that might ultimately be realized, since such amounts depend on future developments inherent in long-term investments. Further, because of the inherent uncertainty of valuation, those estimated values may differ significantly from the values that would have been used had a ready market of the investments existed, and the differences could be material.
With respect to Intermediate Plus, Core Plus, Inflation Indexed, High Yield, Non-U.S., and Absolute Return, where a security is traded on more than one market, which may include foreign markets, the securities are generally valued on the market considered by the Funds’ adviser to be the primary market. The Funds will value their foreign securities in U.S. dollars on the basis of the then-prevailing exchange rates.
Security Transactions
Security transactions are accounted for as of the trade date. Realized gains and losses from security transactions are reported on an identified cost basis for both financial reporting and federal income tax purposes.
For the six months ended September 30, 2006 investment transactions (excluding short-term investments) were:
| | | | | | | | | | | | |
| | | Purchases | | Proceeds From Sales |
| | | U.S. Gov’t
Securities | | Other | | U.S. Gov’t
Securities | | Other |
Limited Duration | | $ | 93,663 | | $ | 25,788 | | $ | 87,250 | | $ | 15,548 |
Intermediate | | | 723,271 | | | 297,935 | | | 850,644 | | | 372,761 |
Intermediate Plus | | | 93,886 | | | 42,813 | | | 103,292 | | | 36,356 |
Core | | | 11,487,028 | | | 1,720,325 | | | 11,083,508 | | | 2,183,559 |
Core Plus | | | 20,884,306 | | | 4,402,170 | | | 19,717,949 | | | 3,229,412 |
Inflation Indexed | | | 239,793 | | | 36,118 | | | 230,761 | | | 40,867 |
High Yield | | | — | | | 257,222 | | | — | | | 211,674 |
Non-U.S. | | | — | | | 115,561 | | | — | | | 78,741 |
Absolute Return | | | 66,200 | | | 28,666 | | | 28,844 | | | 2,464 |
174
Semi-Annual Report to Shareholders
Forward Commitments
The Funds may enter into commitments to purchase securities on a “forward commitment” basis, including purchases on a “when-issued” basis or a “to be announced” basis. When such transactions are negotiated, certain terms may be fixed at the time the commitment is made, but delivery and payment for the securities takes place at a later date. During the period between a commitment and settlement, no payment is made by the purchaser for the securities purchased and, thus, no interest accrues to the purchaser from the transaction. In a “to be announced” transaction, a Fund commits to purchase securities for which all specific information is not yet known at the time of the trade, particularly the exact face amount in forward commitment mortgage-backed securities transactions. Depending on market conditions, a Fund’s forward commitment purchases could cause its net asset value to be more volatile.
A Fund may sell the securities subject to a forward commitment purchase, which may result in a gain or loss. When a Fund purchases securities on a forward commitment basis, it assumes the risks of ownership, including the risk of price fluctuation, at the time of purchase, not at the time of receipt. Purchases of forward commitment securities also involve a risk of loss if the seller fails to deliver after the value of the securities has risen.
Each Fund may also enter into a forward commitment to sell securities it owns and will generally do so only with the intention of actually delivering the securities. In a forward sale, a Fund does not participate in gains or losses on the security occurring after the commitment date. Forward commitments to sell securities also involve a risk of loss if the seller fails to take delivery after the value of the securities has declined.
Foreign Currency Translation
Assets and liabilities initially expressed in non-U.S. currencies are translated into U.S. dollars using currency exchange rates determined prior to the close of trading on the New York Stock Exchange, usually at 2:00 p.m. Eastern time. Purchases and sales of securities and income and expenses are translated into U.S. dollars at the prevailing market rates on the dates of such transactions. The effects of changes in non-U.S. currency exchange rates on investment securities and other assets and liabilities are included with the net realized and unrealized gain or loss on foreign currency transactions.
Repurchase Agreements
The Funds may engage in repurchase agreement transactions. Under the terms of a typical repurchase agreement, a fund takes possession of an underlying debt obligation subject to an obligation of the seller to repurchase, and a fund to resell, the obligation at an agreed-upon price and time, thereby determining the yield during a fund’s holding period. This arrangement results in a fixed rate of return that is not subject to market fluctuations during the fund’s holding period. The value of the collateral is at all times at least equal to the total amount of the repurchase obligation, including interest. In the event of counterparty default, a fund has the right to use the collateral to satisfy the terms of the repurchase agreement. However, there could be potential loss to the fund in the event the fund is delayed or prevented from exercising its right to dispose of the collateral securities, including the risk of a possible decline in the value of the collateral securities during the period in which the fund seeks to assert its rights. The Funds’ investment advisers review the value of the collateral and the creditworthiness of those banks and dealers with which the Funds enter into repurchase agreements to evaluate potential risks.
Options, Futures and Swap Agreements
The current market value of a traded option is the last sale price or, in the absence of a sale, the mean between the closing bid and asked price. Futures contracts are valued daily at the settlement price established by the board of trade or exchange on which they are traded. Futures contracts are marked-to-market on a daily basis. As a contract’s value fluctuates, payments known as variation margin are made or received by a Fund each day, depending on the daily fluctuation in the value of the contract. The daily changes in contract value are recorded as unrealized gains or losses, and the Fund recognizes a gain or loss when the contract is closed. Swap agreements are priced daily based upon valuations furnished by an independent pricing service or quotations provided by brokers and the change, if any, is recorded as unrealized appreciation or depreciation.
Investment Income and Distributions to Shareholders
Investment income and distributions to shareholders are allocated at the class level and are recorded on the ex-dividend date. Dividends from net investment income are declared daily and paid monthly for each Fund except High Yield and Non-U.S., which
175
Semi-Annual Report to Shareholders
Notes to Financial Statements—Continued
declare and pay dividends quarterly. Net capital gain distributions, which are calculated at the Fund level, are declared and paid annually in May. An additional distribution may be made in November to the extent necessary in order to comply with federal excise tax requirements. Distributions are determined in accordance with federal income tax regulations, which may differ from those determined in accordance with accounting principles generally accepted in the United States of America; accordingly, periodic reclassifications are made within the Funds’ capital accounts to reflect income and gains available for distribution under federal income tax regulations. Interest income and expenses are recorded on the accrual basis. Bond discounts and premiums are amortized and included in interest income for financial reporting and federal income tax purposes.
Compensating Balance Credits
The Funds have an arrangement with their custodian bank, whereby a portion of the custodian’s fee is paid indirectly by credits earned on the Funds’ cash on deposit with the bank. This deposit arrangement is an alternative to purchasing overnight investments.
Redemption-In-Kind
In consideration of the best interests of non-redeeming shareholders, the Corporation reserves the right to pay any redemption price in whole or in part by a distribution in-kind of readily marketable securities held by a Fund in lieu of cash. For financial reporting purposes, the Fund recognizes a gain on in-kind redemptions to the extent the value of the distributed securities on the date of redemption exceeds the cost of those securities; the Fund recognizes a loss if cost exceeds value. Gains and losses realized on redemption-in-kind transactions are not recognized for tax purposes, and are reclassified from undistributed realized gain/(loss) to paid-in-capital. During the period ended September 30, 2006, Western Asset Intermediate Bond Portfolio realized $1,834 of net loss on $132,323 redemption-in-kind transactions.
Other
In the normal course of business, each Fund enters into contracts that provide general indemnifications. Each Fund’s maximum exposure under these arrangements is dependent upon claims that may be made against the Fund in the future and, therefore, cannot be estimated; however, based on experience, the risk of material loss from such claims is considered remote.
2. Federal Income Taxes:
No provision for federal income or excise taxes is required since each Fund intends to qualify as a regulated investment company and distribute substantially all of its taxable income and capital gains to its shareholders. Because federal income tax regulations differ from accounting principles generally accepted in the United States of America, income and capital gain distributions determined in accordance with tax regulations may differ from net investment income and realized gains recognized for financial reporting purposes. Accordingly, the character of distributions and composition of net assets for tax purposes may differ from those reflected in the accompanying financial statements. The amount and character of tax-basis distributions and composition of net assets are finalized at fiscal-year end; accordingly, tax-basis balances have not been determined as of September 30, 2006.
The Funds intend to retain realized capital gains that may be offset against available capital loss carryforwards for federal income tax purposes.
At March 31, 2006, the Funds listed below had capital loss carryforwards as follows:
| | | | | | | | | | | | | | | |
Expiration Date | | Limited Duration | | Intermediate | | Intermediate
Plus | | Core | | Core Plus |
2013 | | | $— | | $ | — | | $ | 113 | | $ | — | | $ | — |
2014 | | | 235 | | | 3,777 | | | 92 | | | 22,155 | | | 13,040 |
3. Financial Instruments:
Forward Currency Exchange Contracts
As part of their investment programs, the Funds may utilize forward currency exchange contracts. The nature and risks of these financial instruments and the reasons for using them are set forth more fully in the Corporation’s prospectus and statement of additional information.
176
Semi-Annual Report to Shareholders
Forward foreign currency contracts are marked-to-market daily using forward foreign currency exchange rates supplied by an independent pricing service. The change in a contract’s market value is recorded by the Funds as an unrealized gain or loss. When the contract is closed or delivery is taken, the Funds record a realized gain or loss equal to the difference between the value of the contract at the time it was opened and the value at the time it was closed.
The use of forward foreign currency exchange contracts does not eliminate fluctuations in the underlying prices of the Funds’ securities, but it does establish a rate of exchange that can be achieved in the future. These forward foreign currency exchange contracts involve market risk in excess of amounts reflected in the financial statements. Although forward foreign currency exchange contracts used for hedging purposes limit the risk of loss due to a decline in the value of the hedged currency, they also limit any potential gain that might result should the value of the currency increase. In addition, the Funds could be exposed to risks if the counterparties to the contracts are unable to meet the terms of their contracts.
At September 30, 2006, open forward foreign currency exchange contracts were as follows:
Intermediate Plus
| | | | | | | | | | | | |
Settlement
Date | | Contract to | | Unrealized
Gain/(Loss) | |
| | ReceiveA | | DeliverA | |
| 11/7/06 | | CAD | | 1,010 | | USD | | 908 | | $ | (4 | ) |
| 11/7/06 | | JPY | | 104,502 | | CAD | | 1,010 | | | (15 | ) |
| 11/7/06 | | USD | | 205 | | AUD | | 272 | | | 2 | |
| 11/7/06 | | USD | | 439 | | CAD | | 498 | | | (8 | ) |
| 11/7/06 | | USD | | 1,466 | | EUR | | 1,153 | | | 1 | |
| | | | | | | | | | | | |
| | | | | | | | | | $ | (24 | ) |
| | | | | | | | | | | | |
Core Plus
| | | | | | | | | | | | |
Settlement
Date | | Contract to | | Unrealized
Gain/(Loss) | |
| | ReceiveA | | DeliverA | |
| 11/7/06 | | CAD | | 66,710 | | USD | | 59,993 | | $ | (238 | ) |
| 11/7/06 | | EUR | | 28,857 | | USD | | 36,715 | | | (19 | ) |
| 11/7/06 | | JPY | | 13,848,996 | | CAD | | 133,420 | | | (784 | ) |
| 11/7/06 | | JPY | | 3,680,000 | | USD | | 31,982 | | | (642 | ) |
| 11/7/06 | | USD | | 23,861 | | AUD | | 31,627 | | | 280 | |
| 11/7/06 | | USD | | 63,766 | | CAD | | 72,410 | | | (1,095 | ) |
| 11/7/06 | | USD | | 108,820 | | EUR | | 85,559 | | | 19 | |
| | | | | | | | | | | | |
| | | | | | | | | | $ | (2,479 | ) |
| | | | | | | | | | | | |
Inflation Indexed
| | | | | | | | | | | | |
Settlement
Date | | Contract to | | Unrealized
Gain/(Loss) | |
| | ReceiveA | | DeliverA | |
| 11/7/06 | | CAD | | 6,462 | | USD | | 5,685 | | $ | 103 | |
| 11/7/06 | | EUR | | 2,834 | | USD | | 3,609 | | | (5 | ) |
| 11/7/06 | | JPY | | 1,328,527 | | CAD | | 12,740 | | | (49 | ) |
| 11/7/06 | | JPY | | 646,770 | | USD | | 5,618 | | | (111 | ) |
| 11/7/06 | | USD | | 7,076 | | CAD | | 7,896 | | | 3 | |
| 11/7/06 | | USD | | 3,961 | | EUR | | 3,112 | | | 4 | |
| 11/7/06 | | USD | | 3,163 | | SEK | | 22,981 | | | 15 | |
| | | | | | | | | | | | |
| | | | | | | | | | $ | (40 | ) |
| | | | | | | | | | | | |
177
Semi-Annual Report to Shareholders
Notes to Financial Statements—Continued
Non-U.S.
| | | | | | | | | | | | |
Settlement
Date | | Contract to | | Unrealized
Gain/(Loss) | |
| | ReceiveA | | DeliverA | |
| 11/7/06 | | AUD | | 15,927 | | USD | | 11,974 | | $ | (99 | ) |
| 11/7/06 | | EUR | | 406 | | PLN | | 1,580 | | | 5 | |
| 11/7/06 | | EUR | | 14,589 | | USD | | 18,682 | | | (130 | ) |
| 11/7/06 | | EUR | | 894 | | ZAR | | 7,998 | | | 56 | |
| 11/7/06 | | GBP | | 3,020 | | USD | | 5,603 | | | 53 | |
| 11/7/06 | | JPY | | 128,319 | | USD | | 1,116 | | | (23 | ) |
| 11/7/06 | | NOK | | 2,238 | | USD | | 358 | | | (14 | ) |
| 11/7/06 | | USD | | 26,347 | | AUD | | 34,831 | | | 376 | |
| 11/7/06 | | USD | | 19,304 | | CAD | | 21,770 | | | (197 | ) |
| 11/7/06 | | USD | | 9,034 | | DKK | | 52,960 | | | 3 | |
| 11/7/06 | | USD | | 58,685 | | EUR | | 46,112 | | | 47 | |
| 11/7/06 | | USD | | 20,549 | | GBP | | 11,082 | | | (204 | ) |
| 11/7/06 | | USD | | 14,245 | | JPY | | 1,636,326 | | | 310 | |
| 11/7/06 | | USD | | 3,593 | | NOK | | 22,439 | | | 143 | |
| 11/7/06 | | USD | | 4,114 | | PLN | | 12,678 | | | 59 | |
| 11/7/06 | | USD | | 707 | | ZAR | | 4,984 | | | 68 | |
| | | | | | | | | | | | |
| | | | | | | | | | $ | 453 | |
| | | | | | | | | | | | |
Absolute Return
| | | | | | | | | | | |
Settlement Date | | Contract to | | Unrealized Gain/(Loss) |
| | ReceiveA | | DeliverA | |
| 11/7/06 | | CAD | | 950 | | USD | | 854 | | | 3 |
| 11/7/06 | | EUR | | 1,387 | | USD | | 1,780 | | | 17 |
| 11/7/06 | | JPY | | 98,294 | | CAD | | 950 | | | 13 |
| 11/7/06 | | JPY | | 98,294 | | USD | | 950 | | | 1 |
| | | | | | | | | | | |
| | | | | | | | | | $ | 34 |
| | | | | | | | | | | |
| A | | Definitions of currency abbreviations: |
AUD—Australian dollar
CAD—Canadian dollar
DKK—Danish krona
EUR—Euro
GBP—British pound
JPY—Japanese yen
NOK—Norwegian krone
PLN—Polish zloty
SEK—Swedish krona
USD—United States dollar
ZAR—South African rand
Loan Participations and Assignments
Core Plus and Absolute Return may invest in loans arranged through private negotiation between one or more financial institutions. The Funds’ investment in any such loan may be in the form of a participation in or an assignment of the loan. In connection with purchasing participations, the Funds generally will have no right to enforce compliance by the borrower with the terms of the loan agreement relating to the loan, nor any rights of set-off against the borrower and the Funds may not benefit directly from any collateral supporting the loan in which it has purchased the participation.
The Funds will assume the credit risk of both the borrower and the lender that is selling the participation. In the event of the insolvency of the lender selling the participation, the Funds may be treated as a general creditor of the lender and may not benefit from any set-off between the lender and the borrower.
178
Semi-Annual Report to Shareholders
Options and Futures
As part of their investment programs, the Funds may utilize options and futures. Options may be written (sold) or purchased by the Funds. When a Fund purchases a put or call option, the premium paid is recorded as an investment and its value is marked-to-market daily. When a Fund writes a put or call option, an amount equal to the premium received by the Fund is recorded as a liability and its value is marked-to-market daily.
When options, whether written or purchased, expire, are exercised or are closed (by entering into a closing purchase or sale transaction), the Fund realizes a gain or loss as described in the chart below:
| | |
| Purchased option: | | Impact on the Fund: |
| The option expires | | Realize a loss in the amount of the cost of the option. |
| The option is closed through a closing sale transaction | | Realize a gain or loss depending on whether the proceeds from the closing sale transaction are greater or less than the cost of the option. |
| The Fund exercises a call option | | The cost of the security purchased through the exercise of the option will be increased by the premium originally paid to purchase the call option. |
| The Fund exercises a put option | | Realize a gain or loss from the sale of the underlying security. The proceeds of that sale will be reduced by the premium originally paid to purchase the put option. |
| Written option: | | Impact on the Fund: |
| The option expires | | Realize a gain equal to the amount of the premium received. |
| The option is closed through a closing purchase transaction | | Realize a gain or loss without regard to any unrealized gain or loss on the underlying security and eliminate the option liability. The Fund will realize a loss in this transaction if the cost of the closing purchase exceeds the premium received when the option was written. |
| A written call option is exercised by the option purchaser | | Realize a gain or loss from the sale of the underlying security. The proceeds of that sale will be increased by the premium originally received when the option was written. |
| A written put option is exercised by the option purchaser | | The amount of the premium originally received will reduce the cost of the security that the Fund purchased when the option was exercised. |
The risk associated with purchasing options is limited to the premium originally paid. Options written by a Fund involve, to varying degrees, risk of loss in excess of the option value reflected in the statement of assets and liabilities. The risk in writing a covered call option is that a Fund may forgo the opportunity of profit if the market price of the underlying security increases and the option is exercised. The risk in writing a put option is that a Fund may incur a loss if the market price of the underlying security decreases and the option is exercised. In addition, there is the risk a Fund may not be able to enter into a closing transaction because of an illiquid secondary market or, for over-the-counter options, because of the counterparty’s inability or unwillingness to perform. The nature and risks of these financial instruments and the reasons for using them are set forth more fully in the Corporation’s prospectus and statement of additional information.
Activity in written call and put options during the six months ended September 30, 2006, was as follows:
| | | | | | | | | | |
| | | Calls | | Puts |
| Limited Duration | | Actual
Contracts | | Premiums | | Actual
Contracts | | Premiums |
Options outstanding at March 31, 2006 | | — | | $ | — | | — | | $ | — |
Options written | | 1,100,038 | | | 30 | | 58 | | | 20 |
Options closed | | — | | | — | | — | | | — |
Options expired | | — | | | — | | — | | | — |
Options exercised | | — | | | — | | | | | |
| | | | | | | | | | |
Options outstanding at September 30, 2006 | | 1,100,038 | | $ | 30 | | 58 | | $ | 20 |
| | | | | | | | | | |
179
Semi-Annual Report to Shareholders
Notes to Financial Statements—Continued
| | | | | | | | | | | | | | |
| | Calls | | | Puts | |
| Intermediate | | Actual
Contracts | | | Premiums | | | Actual
Contracts | | | Premiums | |
Options outstanding at March 31, 2006 | | 4,900,522 | | | $ | 175 | | | 497 | | | $ | 126 | |
Options written | | 973 | | | | 268 | | | 838 | | | | 220 | |
Options closed | | (4,901,343 | ) | | | (372 | ) | | (1,254 | ) | | | (316 | ) |
Options expired | | (3 | ) | | | (1 | ) | | — | | | | — | |
Options exercised | | — | | | | — | | | — | | | | — | |
| | | | | | | | | | | | | | |
Options outstanding at September 30, 2006 | | 149 | | | $ | 70 | | | 81 | | | $ | 30 | |
| | | | | | | | | | | | | | |
| | |
| | | Calls | | | Puts | |
| Intermediate Plus | | Actual
Contracts | | | Premiums | | | Actual
Contracts | | | Premiums | |
Options outstanding at March 31, 2006 | | 900,051 | | | $ | 23 | | | 48 | | | $ | 12 | |
Options written | | 143 | | | | 39 | | | 132 | | | | 35 | |
Options closed | | (900,173 | ) | | | (52 | ) | | (168 | ) | | | (43 | ) |
Options expired | | — | | | | — | | | — | | | | — | |
Options exercised | | — | | | | — | | | — | | | | — | |
| | | | | | | | | | | | | | |
Options outstanding at September 30, 2006 | | 21 | | | $ | 10 | | | 12 | | | $ | 4 | |
| | | | | | | | | | | | | | |
| | |
| | | Calls | | | Puts | |
| Core | | Actual
Contracts | | | Premiums | | | Actual
Contracts | | | Premiums | |
Options outstanding at March 31, 2006 | | 188,419,897 | | | $ | 9,930 | | | 1,476 | | | $ | 996 | |
Options written | | 111,786,537 | | | | 15,882 | | | 12,226 | | | | 5,346 | |
Options closed | | (10,606 | ) | | | (6,249 | ) | | (1,589 | ) | | | (1,358 | ) |
Options expired | | (67,268,987 | ) | | | (8,223 | ) | | (1,578 | ) | | | (783 | ) |
Options exercised | | (3,015 | ) | | | (1,011 | ) | | (1,347 | ) | | | (583 | ) |
| | | | | | | | | | | | | | |
Options outstanding at September 30, 2006 | | 232,923,826 | | | $ | 10,329 | | | 9,188 | | | $ | 3,618 | |
| | | | | | | | | | | | | | |
| | |
| | | Calls | | | Puts | |
| Core Plus | | Actual
Contracts | | | Premiums | | | Actual
Contracts | | | Premiums | |
Options outstanding at March 31, 2006 | | 420,324,249 | | | $ | 17,644 | | | 2,434 | | | $ | 1,737 | |
Options written | | 226,515,798 | | | | 29,405 | | | 23,224 | | | | 11,923 | |
Options closed | | (18,306 | ) | | | (11,230 | ) | | (3,125 | ) | | | (2,526 | ) |
Options expired | | (103,229,630 | ) | | | (14,790 | ) | | (4,136 | ) | | | (3,210 | ) |
Options exercised | | (5,022 | ) | | | (1,842 | ) | | (3,288 | ) | | | (1,735 | ) |
| | | | | | | | | | | | | | |
Options outstanding at September 30, 2006 | | 543,587,089 | | | $ | 19,187 | | | 15,109 | | | $ | 6,189 | |
| | | | | | | | | | | | | | |
| | |
| | | Calls | | | Puts | |
| Inflation Indexed | | Actual
Contracts | | | Premiums | | | Actual
Contracts | | | Premiums | |
Options outstanding at March 31, 2006 | | 162 | | | $ | 57 | | | — | | | $ | — | |
Options written | | 676 | | | | 288 | | | 894 | | | | 14 | |
Options closed | | (290 | ) | | | (153 | ) | | — | | | | — | |
Options expired | | (306 | ) | | | (113 | ) | | (894 | ) | | | (14 | ) |
Options exercised | | (242 | ) | | | (79 | ) | | — | | | | — | |
| | | | | | | | | | | | | | |
Options outstanding at September 30, 2006 | | — | | | $ | — | | | — | | | $ | — | |
| | | | | | | | | | | | | | |
Upon entering into a futures contract, the Funds are required to deposit with the broker cash or cash equivalents in an amount equal to a certain percentage of the contract amount. This is known as the “initial margin.” Subsequent payments (“variation margin”) are made or received by the Fund each day, depending on the daily fluctuation in the value of the contract. For Non-U.S. and foreign denominated futures held in Intermediate Plus, Core Plus, Inflation Indexed, and Absolute Return, payment is not sent daily, but is recorded as a net payable or receivable by the Fund to or from the futures broker, which holds cash collateral from the Fund. The daily changes in contract value are recorded as unrealized gains or losses, and each Fund recognizes a realized gain or loss when the contract is closed. Futures contracts are valued daily at the settlement price established by the board of trade or exchange on which they are traded.
180
Semi-Annual Report to Shareholders
The Funds enter into futures contracts for various reasons, including in connection with their interest rate management strategy. Futures contracts involve, to varying degrees, risk of loss in excess of the amounts reflected in the financial statements. The change in value of the futures contracts primarily corresponds with the value of the underlying instruments, which may not correlate with changes in interest rates, if applicable. In addition, there is a risk that a Fund may not be able to enter into a closing transaction because of an illiquid secondary market. The nature and risks of these financial instruments and other reasons for using them are set forth more fully in the Corporation’s prospectus and statement of additional information.
The open futures positions and related appreciation or depreciation at September 30, 2006, are listed at the end of each Fund’s portfolio of investments.
Swap Agreements
The Funds may invest in swaps for the purpose of managing their exposure to interest rate, credit or market risk or for other purposes. The use of swaps involves risks that are different from those associated with ordinary portfolio transactions.
Total return swaps are agreements to exchange the return generated by one instrument for the return generated by another instrument, for example, the agreement to pay interest in exchange for a market-linked return based on a notional amount. To the extent the total return of the index exceeds the offsetting interest obligation, the Funds will receive a payment from the counterparty. To the extent it is less, the Funds will make a payment to the counterparty. Periodic payments received or made by the Funds are recorded in the accompanying statements of operations as realized gains or losses, respectively.
Credit default swaps (denoted in the table below and on the following pages by a superscript 1) involve the exchange of a fixed rate premium for protection against the loss in value of an underlying debt instrument in the event of a defined credit event (such as payment default or bankruptcy). Under the terms of the swap, one party acts as a “guarantor,” receiving a periodic payment that is a fixed percentage applied to a notional principal amount. In return, the party agrees to purchase the notional amount of the underlying instrument, at par, if a credit event occurs during the term of the swap. The Funds may enter into credit default swaps in which a Fund or its counterparty act as guarantors. By acting as the guarantor of a swap, a Fund assumes the market and credit risk of the underlying instrument, including liquidity and loss of value. Interest rate swap contracts (denoted in the table below and on the following pages by a superscript 2) involve the exchange of commitments to pay and receive interest based on a notional principal amount.
Swaps are marked-to-market daily and changes in value are recorded as unrealized appreciation/(depreciation). Gains or losses are realized upon termination of the swap agreement. Periodic payments and premiums received or made by a Fund are recorded in the accompanying statements of operations as realized gains or losses, respectively. Collateral, in the form of cash or securities, may be required to be held in segregated accounts with the Funds’ custodian in compliance with swap contracts. Risks may exceed amounts recognized on the statements of assets and liabilities. These risks include changes in the returns of the underlying instruments, failure of the counterparties to perform under the contracts’ terms, and the possible lack of liquidity with respect to the swap agreements.
| | | | | | | | | | | | | |
| Western Asset Limited Duration Bond Portfolio | |
Agreement With: | | Termination Date | | The Fund Agrees to Pay | | The Fund Will Receive | | Contract
Notional Amount | | Unrealized
Appreciation/
(Depreciation) | |
| | | | | | | | | | | | | |
Barclays Capital, Inc.
(iBoxx IG Hi-Vol7)1 | | December 20, 2011 | | 0.750%
Quarterly | | Specified amount upon credit event noticeB | | $ | 300 | | $ | 0.2 | |
| | | | | |
Deutsche Bank AG
(RSHB Capital,
7.175%, due 5/16/13)1 | | July 20, 2007 | | Specified amount upon credit event noticeC | | 0.870%
Quarterly | | | 200 | | | 1 | |
| | | | | |
Lehman Brothers Holdings Inc. (iBoxx IG Hi-Vol7)1 | | December 20, 2011 | | 0.750%
Quarterly | | Specified amount upon credit event noticeB | | | 1,000 | | | 1 | |
| | | | | |
The Goldman Sachs Group, Inc. (iBoxx IG Hi-Vol6)1 | | June 20, 2011 | | 0.750%
Quarterly | | Specified amount upon credit event noticeB | | | 400 | | | (0.2 | ) |
| | | | | | | | | | | | | |
| | | | | | | | $ | 1,900 | | $ | 2 | |
| | | | | | | | | | | | | |
181
Semi-Annual Report to Shareholders
Notes to Financial Statements—Continued
| | | | | | | | | | | | | |
| Western Asset Intermediate Bond Portfolio | |
Agreement With: | | Termination Date | | The Fund
Agrees to Pay | | The Fund
Will Receive | | Contract
Notional Amount | | Unrealized
Appreciation/
(Depreciation) | |
| | | | | | | | | | | | | |
Barclays Capital, Inc.
(iBoxx IG Hi-Vol7)1 | | December 20, 2011 | | 0.750%
Quarterly | | Specified amount upon credit event noticeB | | $ | 2,200 | | $ | 1 | |
| | | | | |
Barclays Capital, Inc.
(iBoxx IG Hi-Vol7)1 | | December 20, 2011 | | 0.750%
Quarterly | | Specified amount upon credit event noticeB | | | 4,600 | | | 3 | |
| | | | | |
Barclays Capital, Inc.
(iBoxx IG Hi-Vol7)1 | | December 20, 2011 | | 0.750%
Quarterly | | Specified amount upon credit event noticeB | | | 4,500 | | | 3 | |
| | | | | |
Deutsche Bank AG
(RSHB Capital,
7.175%, due 5/16/13)1 | | July 20, 2007 | | Specified amount upon credit event noticeC | | 0.870%
Quarterly | | | 1,296 | | | 6 | |
| | | | | |
Deutsche Bank AG
(RSHB Capital,
7.175%, due 5/16/13)1 | | July 20, 2007 | | Specified amount upon credit event noticeC | | 0.900%
Quarterly | | | 405 | | | 2 | |
| | | | | |
Deutsche Bank AG
(Freddie Mac,
5.00%, due 7/15/14)1 | | March 20, 2015 | | Specified amount upon credit event noticeC | | 0.290%
Quarterly | | | 1,945 | | | 25 | |
| | | | | |
Lehman Brothers Holdings Inc. (Dynegy Holdings,
8.75%, due 2/15/12)1 | | April 23, 2007 | | Specified amount upon credit event noticeC | | 3.000%
Quarterly | | | 1,783 | | | 47 | |
| | | | | |
The Goldman Sachs Group, Inc.
(iBoxx IG Hi-Vol6)1 | | June 20, 2011 | | 0.750%
Quarterly | | Specified amount upon credit event noticeB | | | 4,500 | | | (2 | ) |
| | | | | |
The Goldman Sachs Group, Inc.
(iBoxx IG Hi-Vol4)1 | | June 20, 2012 | | Specified amount upon credit event noticeD | | 1.000%
Quarterly | | | 7,811 | | | 99 | |
| | | | | | | | | | | | | |
| | | | | | | | $ | 29,040 | | $ | 184 | |
| | | | | | | | | | | | | |
| | | | | | | | | | | | |
|
| Western Asset Intermediate Plus Bond Portfolio |
Agreement With: | | Termination Date | | The Fund
Agrees to Pay | | The Fund
Will Receive | | Contract
Notional Amount | | Unrealized
Appreciation/
(Depreciation) |
| | | | | | | | | | | | |
Barclays Capital, Inc.
(iBoxx IG Hi-Vol7)1 | | December 20, 2011 | | 0.750%
Quarterly | | Specified amount upon credit event noticeB | | $ | 300 | | $ | 0.2 |
| | | | | |
Barclays Capital, Inc.
(iBoxx IG Hi-Vol7)1 | | December 20, 2011 | | 0.750%
Quarterly | | Specified amount upon credit event noticeB | | | 700 | | | 0.4 |
| | | | | |
Barclays Capital, Inc.
(iBoxx IG Hi-Vol7)1 | | December 20, 2011 | | 0.750%
Quarterly | | Specified amount upon credit event noticeB | | | 600 | | | 0.4 |
182
Semi-Annual Report to Shareholders
| | | | | | | | | | | | | |
| Western Asset Intermediate Plus Bond Portfolio—Continued | |
Agreement With: | | Termination Date | | The Fund
Agrees to Pay | | The Fund
Will Receive | | Contract
Notional Amount | | Unrealized
Appreciation/
(Depreciation) | |
| | | | | | | | | | | | | |
Deutsche Bank AG
(RSHB Capital,
7.175%, due 5/16/13)1 | | July 20, 2007 | | Specified amount upon credit event noticeC | | 0.870%
Quarterly | | $ | 200 | | $ | 1 | |
| | | | | |
Deutsche Bank AG
(RSHB Capital,
7.175%, due 5/16/13)1 | | July 20, 2007 | | Specified amount upon credit event noticeC | | 0.900%
Quarterly | | | 100 | | | 1 | |
| | | | | |
JP Morgan Chase & Co. (Countrywide Home Loans, 5.625%, due 7/15/09)1 | | June 20, 2010 | | Specified amount upon credit event noticeC | | 0.580%
Quarterly | | | 200 | | | 2 | |
| | | | | |
Merrill Lynch & Co., Inc.
(iBoxx HY3)1 | | December 20, 2009 | | Specified amount upon credit event noticeD | | 3.750%
Quarterly | | | 388 | | | 13 | |
| | | | | |
The Goldman Sachs Group, Inc. (iBoxx HY2)1 | | September 20, 2009 | | Specified amount upon credit event noticeD | | 4.300%
Quarterly | | | 240 | | | 10 | |
| | | | | |
The Goldman Sachs Group, Inc. (iBoxx IG Hi-Vol6)1 | | June 20, 2011 | | 0.750%
Quarterly | | Specified amount upon credit event noticeB | | | 600 | | | (0.3 | ) |
| | | | | | | | | | | | | |
| | | | | | | | $ | 3,328 | | $ | 27 | |
| | | | | | | | | | | | | |
| | | | | | | | | | | | | |
| | |
| Western Asset Core Bond Portfolio | | | | | |
Agreement With: | | Termination Date | | The Fund
Agrees to Pay | | The Fund
Will Receive | | Contract
Notional Amount | | Unrealized
Appreciation/
(Depreciation) | |
| | | | | | | | | | | | | |
Banc of America Securities LLC (Centex Corporation,
5.45%, due 8/15/12)1 | | September 20, 2012 | | 0.680%
Monthly | | Specified amount upon credit event noticeB | | $ | 5,500 | | $ | 11 | |
| | | | | |
Banc of America Securities LLC (D.R. Horton,
6.875%, due 5/1/13)1 | | June 20, 2013 | | 1.250%
Monthly | | Specified amount upon credit event noticeB | | | 3,100 | | | (1 | ) |
| | | | | |
Banc of America Securities LLC (Harrah’s Operating Co., 5.375%, due 12/15/13)1 | | June 20, 2013 | | 1.250%
Monthly | | Specified amount upon credit event noticeB | | | 7,680 | | | 162 | |
| | | | | |
Banc of America Securities LLC (Lehnnar Corporation,
5.95%, due 10/17/11)1 | | September 20, 2011 | | 0.670%
Monthly | | Specified amount upon credit event noticeB | | | 3,700 | | | 9 | |
| | | | | |
Banc of America Securities LLC (PHH Corporate Note, 7.125%, due 3/1/13)1 | | March 20, 2013 | | 1.050%
Monthly | | Specified amount upon credit event noticeB | | | 5,010 | | | (20 | ) |
| | | | | |
Banc of America Securities LLC (Toll Brothers,
5.95%, due 9/15/13)1 | | September 20, 2013 | | 1.430%
Monthly | | Specified amount upon credit event noticeB | | | 7,300 | | | (72 | ) |
183
Semi-Annual Report to Shareholders
Notes to Financial Statements—Continued
| | | | | | | | | | | | | |
| Western Asset Core Bond Portfolio—Continued | | | | | |
Agreement With: | | Termination Date | | The Fund
Agrees to Pay | | The Fund
Will Receive | | Contract
Notional Amount | | Unrealized
Appreciation/
(Depreciation) | |
| | | | | | | | | | | | | |
Banc of America Securities LLC (iBoxx IG Hi-Vol7)1 | | December 20, 2011 | | 0.750%
Quarterly | | Specified amount upon credit event noticeB | | $ | 46,400 | | $ | 25 | |
| | | | | |
Banc of America Securities LLC2 | | October 17, 2011 | | 5.293%
Semi-annually | | 3-month LIBORF | | | 3,700 | | | (34 | ) |
| | | | | |
Banc of America Securities LLC2 | | August 15, 2012 | | 5.291%
Semi-annually | | 3-month LIBORF | | | 5,500 | | | (53 | ) |
| | | | | |
Banc of America Securities LLC2 | | September 15, 2013 | | 5.290%
Semi-annually | | 3-month LIBORF | | | 7,300 | | | (72 | ) |
| | | | | |
Banc of America Securities LLC2 | | June 1, 2016 | | 5.110%
Semi-annually | | 3-month LIBORF | | | 3,100 | | | (0 | ) |
| | | | | |
Banc of America Securities LLC2 | | June 1, 2016 | | 5.263%
Semi-annually | | 3-month LIBORF | | | 7,680 | | | (57 | ) |
| | | | | |
Bear Stearns, Inc.
(Ford Motor Credit Company,
7.00%, due 10/1/13)1 | | June 20, 2010 | | Specified amount upon credit event noticeC | | 4.830%
Quarterly | | | 12,500 | | | 545 | |
| | | | | |
Credit Suisse First Boston USA (AAMES Mortgage Investment Trust 2005-1 M8 1-Month LIBORF + 160 bpG, due 6/25/35)1 | | April 25, 2035 | | 1.280%
Monthly | | Specified amount upon credit event noticeB | | | 784 | | | (0.4 | ) |
| | | | | |
Credit Suisse First Boston USA (AAMES Mortgage Investment Trust 2005-1 M9 1-Month LIBORF + 250 bpG, due 6/25/35)1 | | April 25, 2035 | | 2.050%
Monthly | | Specified amount upon credit event noticeB | | | 784 | | | 3 | |
| | | | | |
Credit Suisse First Boston USA (ACE Securities Corp. 2005-HE1 M8 1-Month LIBORF + 138 bpG, due 2/25/35)1 | | February 25, 2035 | | 1.310%
Monthly | | Specified amount upon credit event noticeB | | | 784 | | | 1 | |
| | | | | |
Credit Suisse First Boston USA (ACE Securities Corp. 2005-HE1 M9 1-Month LIBORF + 220 bpG, due 2/25/35)1 | | February 25, 2035 | | 2.060%
Monthly | | Specified amount upon credit event noticeB | | | 784 | | | 5 | |
| | | | | |
Credit Suisse First Boston USA (Aegis Asset-Backed Securities Trust 2004-4 B2 1-Month LIBORF + 190 bpG, due 10/25/34)1 | | October 25, 2034 | | 1.370%
Monthly | | Specified amount upon credit event noticeB | | | 1,046 | | | 2 | |
184
Semi-Annual Report to Shareholders
| | | | | | | | | | | | | |
| Western Asset Core Bond Portfolio—Continued | | | | | |
Agreement With: | | Termination Date | | The Fund
Agrees to Pay | | The Fund
Will Receive | | Contract
Notional Amount | | Unrealized
Appreciation/
(Depreciation) | |
| | | | | | | | | | | | | |
Credit Suisse First Boston USA (Aegis Asset-Backed Securities Trust 2005 B2 1-Month LIBORF + 130 bpG, due 3/25/35)1 | | March 25, 2035 | | 1.310%
Quarterly | | Specified amount upon credit event noticeB | | $ | 784 | | $ | 3 | |
| | | | | |
Credit Suisse First Boston USA (Aegis Asset-Backed Securities Trust 2005 B3 1-Month LIBORF + 200 bpG, due 3/25/35)1 | | March 25, 2035 | | 2.180%
Quarterly | | Specified amount upon credit event noticeB | | | 784 | | | 6 | |
| | | | | |
Credit Suisse First Boston USA (AmerisourceBergen Corp., 8.125%, due 9/1/8)1 | | September 20, 2015 | | 0.900%
Monthly | | Specified amount upon credit event noticeB | | | 3,050 | | | (4 | ) |
| | | | | |
Credit Suisse First Boston USA (Argent Securities Inc. 2004-W4 M3 1-Month LIBORF + 300 bpG, due 3/25/34)1 | | March 25, 2034 | | 2.200%
Monthly | | Specified amount upon credit event noticeB | | | 1,046 | | | 6 | |
| | | | | |
Credit Suisse First Boston USA (Argent Securities Inc, 2004-W11 M9 1-Month LIBORF + 225 bpG, due 11/25/34)1 | | November 25, 2034 | | 1.330%
Monthly | | Specified amount upon credit event noticeB | | | 784 | | | 5 | |
| | | | | |
Credit Suisse First Boston USA (Argent Securities Inc, 2004-W11 M10 1-Month LIBORF + 350 bpG, due 11/25/34)1 | | November 25, 2034 | | 2.150%
Monthly | | Specified amount upon credit event noticeB | | | 784 | | | 8 | |
| | | | | |
Credit Suisse First Boston USA (ConocoPhillips,
4.75%, due 10/15/12)1 | | September 20, 2012 | | Specified amount upon credit event noticeD | | 0.270% Quarterly | | | 1,000 | | | (1 | ) |
| | | | | |
Credit Suisse First Boston USA (Eastman Kodak Company, 7.25%, due 11/15/13)1 | | March 20, 2010 | | Specified amount upon credit event noticeD | | 1.400% Quarterly | | | 6,500 | | | (72 | ) |
| | | | | |
Credit Suisse First Boston USA (Finance America Mortgage Loan Trust 2004-3 M8 1-Month LIBORF + 180 bpG, due 11/25/34)1 | | November 25, 2034 | | 1.310%
Monthly | | Specified amount upon credit event noticeB | | | 784 | | | (1 | ) |
| | | | | |
Credit Suisse First Boston USA (Finance America Mortgage Loan Trust 2004-3 M9 1-Month LIBORF + 315 bpG, due 11/25/34)1 | | November 25, 2034 | | 2.180%
Monthly | | Specified amount upon credit event noticeB | | | 784 | | | 2 | |
185
Semi-Annual Report to Shareholders
Notes to Financial Statements—Continued
| | | | | | | | | | | | | |
| Western Asset Core Bond Portfolio—Continued | | | | | |
Agreement With: | | Termination Date | | The Fund
Agrees to Pay | | The Fund
Will Receive | | Contract
Notional Amount | | Unrealized
Appreciation/
(Depreciation) | |
| | | | | | | | | | | | | |
Credit Suisse First Boston USA (Fremont Home Loan Trust 2005-A 1-Month LIBORF + 135 bpG, due 1/25/35)1 | | January 25, 2035 | | 1.310%
Monthly | | Specified amount upon credit event noticeB | | $ | 784 | | $ | (1 | ) |
| | | | | |
Credit Suisse First Boston USA (Fremont Home Loan Trust 2005-A 1-Month LIBORF + 100 bpG, due 1/25/35)1 | | January 25, 2035 | | 2.080%
Monthly | | Specified amount upon credit event noticeB | | | 784 | | | 3 | |
| | | | | |
Credit Suisse First Boston USA (IndyMac Home Equity Loan Asset-Backed Trust 2004-C M8 1-Month LIBORF + 190 bpG, due 3/25/35)1 | | March 25, 2035 | | 1.280%
Monthly | | Specified amount upon credit event noticeB | | | 784 | | | (0.4 | ) |
| | | | | |
Credit Suisse First Boston USA (IndyMac Home Equity Loan Asset-Backed Trust 2004-C M9 1-Month LIBORF + 325 bpG, due 3/25/35)1 | | March 25, 2035 | | 2.050%
Monthly | | Specified amount upon credit event noticeB | | | 784 | | | 4 | |
| | | | | |
Credit Suisse First Boston USA (Long Beach Mortgage Loan Trust 2004-1 M9 1-Month LIBORF + 350 bpG, due 2/25/34)1 | | February 25, 2034 | | 2.150%
Monthly | | Specified amount upon credit event noticeB | | | 1,046 | | | 5 | |
| | | | | |
Credit Suisse First Boston USA (Long Beach Mortgage Loan Trust 2005-1 M8 1-Month LIBORF + 170 bpG, due 2/25/35)1 | | February 25, 2035 | | 1.310%
Monthly | | Specified amount upon credit event noticeB | | | 784 | | | 5 | |
| | | | | |
Credit Suisse First Boston USA (Long Beach Mortgage Loan Trust 2005-1 M9 1-Month LIBORF + 275 bpG, due 2/25/35)1 | | February 25, 2035 | | 2.080%
Monthly | | Specified amount upon credit event noticeB | | | 784 | | | 9 | |
| | | | | |
Credit Suisse First Boston USA (MASTR Asset-Backed Securities Trust 2005-NC1 M8 1-Month LIBORF + 153 bpG, due 12/25/34)1 | | December 25, 2034 | | 1.310%
Monthly | | Specified amount upon credit event noticeB | | | 784 | | | 6 | |
| | | | | |
Credit Suisse First Boston USA (MASTR Asset-Backed Securities Trust 2005-NC1 M9 1-Month LIBORF + 240 bpG, due 12/25/34)1 | | December 25, 2034 | | 2.080%
Monthly | | Specified amount upon credit event noticeB | | | 784 | | | 10 | |
186
Semi-Annual Report to Shareholders
| | | | | | | | | | | | | |
| Western Asset Core Bond Portfolio—Continued | | | | | |
Agreement With: | | Termination Date | | The Fund
Agrees to Pay | | The Fund
Will Receive | | Contract
Notional Amount | | Unrealized
Appreciation/
(Depreciation) | |
| | | | | | | | | | | | | |
Credit Suisse First Boston USA (Merrill Lynch Mortgage Investors, Inc 2004-WMC4 B3 1-Month LIBORF + 375 bpG, due 4/25/35)1 | | April 25, 2035 | | 2.150%
Monthly | | Specified amount upon credit event noticeB | | $ | 1,046 | | $ | 3 | |
| | | | | |
Credit Suisse First Boston USA (Merrill Lynch Mortgage Investors, Inc 2005-WMC1 B2 1-Month LIBORF + 135 bpG, due 9/25/35)1 | | September 25, 2035 | | 1.280%
Monthly | | Specified amount upon credit event noticeB | | | 784 | | | 3 | |
| | | | | |
Credit Suisse First Boston USA (Merrill Lynch Mortgage Investors, Inc 2005-WMC1 B3 1-Month LIBORF + 225 bpG, due 9/25/35)1 | | September 25, 2035 | | 2.050%
Monthly | | Specified amount upon credit event noticeB | | | 784 | | | 6 | |
| | | | | |
Credit Suisse First Boston USA (Merrill Lynch Mortgage Investors, Inc 2005-NC1 B2 1-Month LIBORF + 130 bpG, due 10/25/35)1 | | October 25, 2035 | | 1.280%
Monthly | | Specified amount upon credit event noticeB | | | 784 | | | 2 | |
| | | | | |
Credit Suisse First Boston USA (Merrill Lynch Mortgage Investors, Inc 2005-NC1 B3 1-Month LIBORF + 205 bpG, due 10/25/35)1 | | October 25, 2035 | | 2.050%
Monthly | | Specified amount upon credit event noticeB | | | 784 | | | 7 | |
| | | | | |
Credit Suisse First Boston USA (Morgan Stanley ABS Capital I 2005-WMC1 B2 1-Month LIBORF + 130 bpG, due 1/25/35)1 | | January 25, 2035 | | 1.310%
Monthly | | Specified amount upon credit event noticeB | | | 784 | | | (1 | ) |
| | | | | |
Credit Suisse First Boston USA (Morgan Stanley ABS Capital I 2005-WMC1 B3 1-Month LIBORF + 215 bpG, due 1/25/35)1 | | January 25, 2035 | | 2.180%
Monthly | | Specified amount upon credit event noticeB | | | 784 | | | 2 | |
| | | | | |
Credit Suisse First Boston USA (New Century Home Equity Loan Trust 2004-2 M9 1-Month LIBORF + 325 bpG, due 8/25/34)1 | | August 25, 2034 | | 2.150%
Monthly | | Specified amount upon credit event noticeB | | | 1,046 | | | 4 | |
187
Semi-Annual Report to Shareholders
Notes to Financial Statements—Continued
| | | | | | | | | | | | | |
| Western Asset Core Bond Portfolio—Continued | | | | | |
Agreement With: | | Termination Date | | The Fund
Agrees to Pay | | The Fund
Will Receive | | Contract
Notional Amount | | Unrealized
Appreciation/
(Depreciation) | |
| | | | | | | | | | | | | |
Credit Suisse First Boston USA (New Century Home Equity Loan Trust 2005-1 M8 1-Month LIBORF + 140 bpG, due 3/25/35)1 | | March 25, 2035 | | 1.310%
Monthly | | Specified amount upon credit event noticeB | | $ | 784 | | $ | 2 | |
| | | | | |
Credit Suisse First Boston USA (New Century Home Equity Loan Trust 2005-1 M9 1-Month LIBORF + 205 bpG, due 3/25/35)1 | | March 25, 2035 | | 2.180%
Monthly | | Specified amount upon credit event noticeB | | | 784 | | | 5 | |
| | | | | |
Credit Suisse First Boston USA (Novastar Home Equity Loan 2005-1 B2 1-Month LIBORF + 135 bpG, due 6/25/35)1 | | June 25, 2035 | | 1.280%
Monthly | | Specified amount upon credit event noticeB | | | 784 | | | (0.4 | ) |
| | | | | |
Credit Suisse First Boston USA (Novastar Home Equity Loan 2005-4 B3 1-Month LIBORF + 195 bpG, due 6/25/35)1 | | June 25, 2035 | | 2.050%
Monthly | | Specified amount upon credit event noticeB | | | 784 | | | 4 | |
| | | | | |
Credit Suisse First Boston USA (Park Place Securities Inc. 2005-WCH1 M8 1-Month LIBORF + 155 bpG, due 1/25/36)1 | | January 25, 2036 | | 1.360%
Monthly | | Specified amount upon credit event noticeB | | | 784 | | | 10 | |
| | | | | |
Credit Suisse First Boston USA (Park Place Securities Inc. 2005-WCH1 M9 1-Month LIBORF + 250 bpG, due 1/25/36)1 | | January 25, 2036 | | 2.180%
Monthly | | Specified amount upon credit event noticeB | | | 784 | | | 14 | |
| | | | | |
Credit Suisse First Boston USA (People’s Choice Home Loan Securities Trust 2004-1 M6 1-Month LIBORF + 230 bpG, due 6/25/34)1 | | June 25, 2034 | | 1.370%
Quarterly | | Specified amount upon credit event noticeB | | | 1,046 | | | 1 | |
| | | | | |
Credit Suisse First Boston USA (People’s Choice Home Loan Securities Trust 2005-1 1-Month LIBORF + 165 bpG, due 1/25/35)1 | | January 25, 2035 | | 1.258%
Monthly | | Specified amount upon credit event noticeB | | | 784 | | | 3 | |
| | | | | |
Credit Suisse First Boston USA (People’s Choice Home Loan Securities Trust 2005-1 B3 1-Month LIBORF + 260 bpG, due 1/25/35)1 | | January 25, 2035 | | 2.050%
Monthly | | Specified amount upon credit event noticeB | | | 784 | | | 9 | |
188
Semi-Annual Report to Shareholders
| | | | | | | | | | | | | |
| Western Asset Core Bond Portfolio—Continued | | | | | |
Agreement With: | | Termination Date | | The Fund
Agrees to Pay | | The Fund
Will Receive | | Contract
Notional Amount | | Unrealized
Appreciation/
(Depreciation) | |
| | | | | | | | | | | | | |
Credit Suisse First Boston USA (Pulte Homes Inc., 7.875%, due 8/1/11)1 | | September 20, 2013 | | 0.870%
Monthly | | Specified amount upon credit event noticeB | | $ | 4,000 | | $ | 2 | |
| | | | | |
Credit Suisse First Boston USA (Starwood Hotels, 7.875%, due 5/1/12)1 | | December 20, 2011 | | 1.370%
Monthly | | Specified amount upon credit event noticeB | | | 6,400 | | | (35 | ) |
| | | | | |
Credit Suisse First Boston USA (iBoxx IG Hi-Vol2)1 | | September 20, 2009 | | 1.150%
Quarterly | | Specified amount upon credit event noticeB | | | 24,167 | | | (249 | ) |
| | | | | |
Credit Suisse First Boston USA2 | | May 1, 2012 | | 5.085%
Semi-annually | | 3-month LIBORF | | | 6,100 | | | 2 | |
| | | | | |
Credit Suisse First Boston USA2 | | January 15, 2014 | | 5.328%
Semi-annually | | 3-month LIBORF | | | 3,700 | | | (45 | ) |
| | | | | |
Credit Suisse First Boston USA2 | | September 15, 2015 | | 5.160%
Semi-annually | | 3-month LIBORF | | | 3,050 | | | (1 | ) |
| | | | | |
Deutsche Bank AG
(Dynegy Holdings, 8.75%, due 2/15/12)1 | | May 1, 2007 | | Specified amount upon credit event noticeC | | 5.250%
Quarterly | | | 3,340 | | | 134 | |
| | | | | |
Deutsche Bank AG
(Eastman Kodak Company, 7.25%, due 11/15/13)1 | | March 20, 2010 | | Specified amount upon credit event noticeC | | 1.250%
Quarterly | | | 1,100 | | | (17 | ) |
| | | | | |
Deutsche Bank AG
(Eastman Kodak Company,
7.25%, due 11/15/13)1 | | March 20, 2015 | | Specified amount upon credit event noticeC | | 1.670%
Quarterly | | | 1,300 | | | (104 | ) |
| | | | | |
Deutsche Bank AG
(Fannie Mae,
6.00%, due 5/15/11)1 | | December 20, 2009 | | Specified amount upon credit event noticeC | | 0.215%
Quarterly | | | 11,700 | | | 61 | |
| | | | | |
Deutsche Bank AG
(Ford Motor Credit Company,
7.00%, due 10/1/13)1 | | December 20, 2010 | | Specified amount upon credit event noticeC | | 5.050%
Quarterly | | | 17,100 | | | 904 | |
| | | | | |
Deutsche Bank AG
(Ford Motor Credit Company,
7.45%, due 7/16/31)1 | | March 20, 2015 | | Specified amount upon credit event noticeC | | 2.930%
Quarterly | | | 1,700 | | | (307 | ) |
| | | | | |
Deutsche Bank AG
(Freddie Mac,
5.00%, due 7/15/14)1 | | March 20, 2015 | | Specified amount upon credit event noticeC | | 0.290%
Quarterly | | | 15,600 | | | 202 | |
| | | | | |
Deutsche Bank AG
(General Motors Acceptance Corporation,
6.875%, due 8/28/12)1 | | March 20, 2007 | | Specified amount upon credit event noticeC | | 2.280%
Quarterly | | | 5,000 | | | 31 | |
189
Semi-Annual Report to Shareholders
Notes to Financial Statements—Continued
| | | | | | | | | | | | | |
| Western Asset Core Bond Portfolio—Continued | | | | | |
Agreement With: | | Termination Date | | The Fund
Agrees to Pay | | The Fund
Will Receive | | Contract
Notional Amount | | Unrealized
Appreciation/
(Depreciation) | |
| | | | | | | | | | | | | |
Deutsche Bank AG
(General Motors Acceptance Corporation,
8.375%, due 7/15/33)1 | | March 20, 2015 | | Specified amount upon credit event noticeD | | 3.510%
Quarterly | | $ | 1,700 | | $ | (177 | ) |
| | | | | |
Deutsche Bank AG
(Sara Lee Corporation, 6.125%, due 11/1/32)1 | | September 20, 2011 | | 0.420%
Quarterly | | Specified amount upon credit event noticeB | | | 5,100 | | | 8 | |
| | | | | |
Deutsche Bank AG
(iBoxx IG TMT)1 | | March 20, 2009 | | 0.600%
Quarterly | | Specified amount upon credit event noticeB | | | 7,400 | | | (61 | ) |
| | | | | |
Deutsche Bank AG
(iBoxx 30 Hi-Vol)1 | | March 20, 2009 | | 1.250%
Quarterly | | Specified amount upon credit event noticeB | | | 7,153 | | | (14 | ) |
| | | | | |
Deutsche Bank AG
(iBoxx IG Hi-Vol)1 | | March 20, 2009 | | Specified amount upon credit event noticeD | | 1.250%
Quarterly | | | 9,415 | | | 83 | |
| | | | | |
Deutsche Bank AG
(iBoxx IG Hi-Vol2)1 | | September 20, 2014 | | Specified amount upon credit event noticeD | | 1.300%
Quarterly | | | 8,043 | | | 76 | |
| | | | | |
Deutsche Bank AG2 | | October 5, 2008 | | 3-month LIBORF | | 4.655%
Semi-annually | | | 115,540 | | | (1,008 | ) |
| | | | | |
Deutsche Bank AG2 | | June 17, 2010 | | 3-month LIBORF | | 4.313%
Semi-annually | | | 31,430 | | | (786 | ) |
| | | | | |
Deutsche Bank AG2 | | October 11, 2010 | | 3-month LIBORF | | 4.708%
Semi-annually | | | 206,791 | | | (2,649 | ) |
| | | | | |
Deutsche Bank AG2 | | July 13, 2011 | | 3-month LIBORF | | 5.628%
Semi-annually | | | 83,870 | | | 1,944 | |
| | | | | |
Deutsche Bank AG2 | | September 15, 2011 | | 5.186%
Semi-annually | | 3-month LIBORF | | | 5,100 | | | (23 | ) |
| | | | | |
Deutsche Bank AG2 | | July 21, 2016 | | 3-month LIBORF | | 5.693%
Semi-annually | | | 77,910 | | | 3,561 | |
| | | | | |
JP Morgan Chase & Co. (General Motors Acceptance Corporation,
7.125%, due 7/15/13)1 | | September 20, 2010 | | Specified amount upon credit event noticeC | | 6.000%
Quarterly | | | 10,500 | | | 311 | |
| | | | | |
JP Morgan Chase & Co. (International Lease Finance Corporation,
5.75%, due 6/15/11)1 | | June 20, 2011 | | 0.160%
Quarterly | | Specified amount upon credit event noticeB | | | 7,300 | | | (20 | ) |
190
Semi-Annual Report to Shareholders
| | | | | | | | | | | | | |
| Western Asset Core Bond Portfolio—Continued | | | | | |
Agreement With: | | Termination Date | | The Fund
Agrees to Pay | | The Fund
Will Receive | | Contract
Notional Amount | | Unrealized
Appreciation/
(Depreciation) | |
| | | | | | | | | | | | | |
JP Morgan Chase & Co.2 | | June 15, 2011 | | 5.242%
Semi-annually | | 3-month LIBORF | | $ | 7,300 | | $ | (51 | ) |
| | | | | |
JP Morgan Chase & Co.2 | | September 7, 2016 | | 5.322%
Semi-annually | | 3-month LIBORF | | | 35,900 | | | (393 | ) |
| | | | | |
Lehman Brothers Holdings Inc. (General Motors Acceptance Corporation,
6.875%, due 8/28/12)1 | | May 1, 2007 | | Specified amount upon credit event noticeC | | 5.250%
Quarterly | | | 10,000 | | | 606 | |
| | | | | |
Lehman Brothers Holdings Inc. (Sara Lee Corporation, 6.125%, due 11/01/32)1 | | September 20, 2011 | | 0.440% Quarterly | | Specified amount upon credit event noticeB | | | 5,500 | | | 4 | |
| | | | | |
Lehman Brothers Holdings Inc. (Viacom Inc.,
6.25%, due 4/30/16)1 | | March 20, 2011 | | 0.570% Quarterly | | Specified amount upon credit event noticeB | | | 3,580 | | | 0 | |
| | | | | |
Lehman Brothers Holdings Inc. (iBoxx IG Hi-Vol2)1 | | September 20, 2009 | | 1.150% Quarterly | | Specified amount upon credit event noticeB | | | 8,507 | | | (46 | ) |
| | | | | |
Lehman Brothers Holdings Inc. (iBoxx IG Hi-Vol3)1 | | March 20, 2010 | | 1.050% Quarterly | | Specified amount upon credit event noticeB | | | 773 | | | (5 | ) |
| | | | | |
Lehman Brothers Holdings Inc.2 | | October 7, 2007 | | 3-month LIBORF | | 4.601%
Semi-annually | | | 630 | | | (4 | ) |
| | | | | |
Lehman Brothers Holdings Inc.2 | | April 30, 2011 | | 5.070%
Semi-annually | | 3-month LIBORF | | | 3,580 | | | 0 | |
| | | | | |
Lehman Brothers Holdings Inc.2 | | September 15, 2011 | | 5.193%
Semi-annually | | 3-month LIBORF | | | 5,500 | | | (27 | ) |
| | | | | |
Merrill Lynch & Co., Inc.
(Pacific Gas & Electric Co., 4.80%, due 3/1/14)1 | | June 20, 2009 | | Specified amount upon credit event noticeD | | 0.420%
Quarterly | | | 2,100 | | | 14 | |
| | | | | |
Morgan Stanley & Co., Inc. (Marsh & McLennan Inc., 5.375%, due 7/15/14)1 | | September 20, 2010 | | 0.350%
Quarterly | | Specified amount upon credit event noticeC | | | 37,000 | | | 246 | |
| | | | | |
RBS Greenwich
(DSLA Mortgage Loan Trust 2005-AR5 1-Month LIBORF + 175 bpG, due 8/19/45)1 | | August 19, 2045 | | 4.500%
Monthly | | Specified amount upon credit event noticeB | | | 1,298 | | | 24 | |
| | | | | |
RBS Greenwich
(Ford Motor Credit Company, 7.00%, due 10/1/13)1 | | December 20, 2010 | | Specified amount upon credit event noticeC | | 4.260%
Quarterly | | | 25,000 | | | 670 | |
191
Semi-Annual Report to Shareholders
Notes to Financial Statements—Continued
| | | | | | | | | | | | |
| Western Asset Core Bond Portfolio—Continued | | | | |
Agreement With: | | Termination Date | | The Fund
Agrees to Pay | | The Fund
Will Receive | | Contract
Notional Amount | | Unrealized
Appreciation/
(Depreciation) |
| | | | | | | | | | | | |
RBS Greenwich
(General Motors Acceptance Corporation,
6.875%, due 8/12/12)1 | | June 20, 2010 | | Specified amount upon credit event noticeC | | 4.530%
Quarterly | | $ | 15,000 | | $ | 1,362 |
| | | | | |
RBS Greenwich
(General Motors Acceptance Corporation,
6.875%, due 8/28/12)1 | | June 20, 2010 | | Specified amount upon credit event noticeC | | 4.680%
Quarterly | | | 25,000 | | | 2,388 |
| | | | | |
RBS Greenwich
(General Motors Acceptance Corporation,
6.875%, due 8/28/12)1 | | September 20, 2010 | | Specified amount upon credit event noticeC | | 5.750%
Quarterly | | | 7,500 | | | 1,014 |
| | | | | |
RBS Greenwich
(General Motors Acceptance Corporation,
7.125%, due 7/15/13)1 | | June 20, 2010 | | Specified amount upon credit event noticeC | | 6.800%
Quarterly | | | 5,900 | | | 328 |
| | | | | |
RBS Greenwich
(General Motors Acceptance Corporation,
7.125%, due 7/15/13)1 | | June 20, 2010 | | Specified amount upon credit event noticeC | | 7.100%
Quarterly | | | 5,800 | | | 374 |
| | | | | |
RBS Greenwich
(General Motors Acceptance Corporation,
7.125%, due 7/15/13)1 | | September 20, 2010 | | Specified amount upon credit event noticeC | | 7.700%
Quarterly | | | 12,500 | | | 1,032 |
| | | | | |
RBS Greenwich
(General Motors Acceptance Corporation,
7.125%, due 7/15/13)1 | | June 20, 2010 | | Specified amount upon credit event noticeC | | 8.400%
Quarterly | | | 12,500 | | | 1,289 |
| | | | | |
RBS Greenwich
(Harborview Mortgage Loan Trust 2005-12 1-Month LIBORF + 175 bpG, due 10/19/35)1 | | October 19, 2035 | | 2.500%
Monthly | | Specified amount upon credit event noticeB | | | 1,299 | | | 29 |
| | | | | |
RBS Greenwich
(IndyMac Index Mortgage Loan Trust 2005-AR18 1-Month LIBORF + 125 bpG, due 10/25/36)1 | | October 25, 2036 | | 2.700%
Monthly | | Specified amount upon credit event noticeB | | | 1,391 | | | 36 |
| | | | | |
RBS Greenwich
(Time Warner Inc.,
6.875%, due 5/1/12)1 | | September 20, 2010 | | Specified amount upon credit event noticeC | | 0.470%
Quarterly | | | 5,000 | | | 27 |
| | | | | |
RBS Greenwich
(Time Warner Inc.,
6.875%, due 5/1/12)1 | | December 20, 2010 | | Specified amount upon credit event noticeC | | 0.500%
Quarterly | | | 12,500 | | | 76 |
192
Semi-Annual Report to Shareholders
| | | | | | | | | | | | | |
| Western Asset Core Bond Portfolio—Continued | | | | | |
Agreement With: | | Termination Date | | The Fund
Agrees to Pay | | The Fund
Will Receive | | Contract
Notional Amount | | Unrealized
Appreciation/
(Depreciation) | |
| | | | | | | | | | | | | |
RBS Greenwich
(Washington Mutual 2005-AR11 1-Month LIBORF + 120 bpG, due 8/25/45)1 | | August 25, 2045 | | 2.550%
Monthly | | Specified amount upon credit event noticeB | | $ | 569 | | $ | 10 | |
| | | | | |
RBS Greenwich
(iBoxx IG Hi-Vol3)1 | | March 20, 2010 | | 1.050%
Quarterly | | Specified amount upon credit event noticeB | | | 17,303 | | | 273 | |
| | | | | |
The Goldman Sachs Group, Inc. (Eastman Kodak Company, 7.25%, due 11/15/13)1 | | March 20, 2015 | | Specified amount upon credit event noticeC | | 1.670%
Quarterly | | | 1,400 | | | (112 | ) |
| | | | | |
The Goldman Sachs Group, Inc. (Ford Motor Credit Company, 7.00%, due 10/1/13)1 | | June 20, 2010 | | Specified amount upon credit event noticeC | | 4.750%
Quarterly | | | 1,900 | | | 78 | |
| | | | | |
The Goldman Sachs Group, Inc. (General Motors Acceptance Corporation,
6.875%, due 8/28/12)1 | | June 20, 2010 | | Specified amount upon credit event noticeC | | 6.000%
Quarterly | | | 5,000 | | | 686 | |
| | | | | |
The Goldman Sachs Group, Inc. (General Motors Acceptance Corporation,
7.125%, due 7/15/13 )1 | | June 20, 2010 | | Specified amount upon credit event noticeC | | 8.950%
Quarterly | | | 5,000 | | | 597 | |
| | | | | |
The Goldman Sachs Group, Inc. (General Motors Acceptance Corporation,
8.375%, due 7/15/33)1 | | September 20, 2010 | | Specified amount upon credit event noticeC | | 6.000%
Quarterly | | | 18,500 | | | 549 | |
| | | | | |
The Goldman Sachs Group, Inc. (iBoxx IG Fin 3)1 | | March 20, 2010 | | Specified amount upon credit event noticeD | | 0.500%
Quarterly | | | 5,200 | | | 25 | |
| | | | | |
The Goldman Sachs Group, Inc. (iBoxx IG Fin 3)1 | | March 20, 2015 | | Specified amount upon credit event noticeD | | 0.700%
Quarterly | | | 5,300 | | | 90 | |
| | | | | |
The Goldman Sachs Group, Inc. (iBoxx IG Hi-Vol3)1 | | March 20, 2010 | | Specified amount upon credit event noticeD | | 1.050%
Quarterly | | | 48,333 | | | 663 | |
| | | | | |
The Goldman Sachs Group, Inc. (iBoxx IG Hi-Vol3)1 | | March 20, 2010 | | Specified amount upon credit event noticeD | | 1.050%
Quarterly | | | 16,433 | | | 298 | |
| | | | | |
The Goldman Sachs Group, Inc. (iBoxx IG Hi-Vol3)1 | | March 20, 2010 | | Specified amount upon credit event noticeD | | 1.050%
Quarterly | | | 32,093 | | | 1,003 | |
193
Semi-Annual Report to Shareholders
Notes to Financial Statements—Continued
| | | | | | | | | | | | | |
| Western Asset Core Bond Portfolio—Continued | | | | | |
Agreement With: | | Termination Date | | The Fund
Agrees to Pay | | The Fund
Will Receive | | Contract
Notional Amount | | Unrealized
Appreciation/
(Depreciation) | |
| | | | | | | | | | | | | |
The Goldman Sachs Group, Inc. (iBoxx IG Hi-Vol4)1 | | June 20, 2010 | | Specified amount upon credit
event noticeD | | 0.400%
Quarterly | | $ | 17,600 | | $ | 282 | |
| | | | | |
The Goldman Sachs Group, Inc. (iBoxx IG Hi-Vol4)1 | | June 20, 2010 | | Specified amount upon credit
event noticeD | | 0.400%
Quarterly | | | 45,500 | | | 804 | |
| | | | | |
The Goldman Sachs Group, Inc. (iBoxx IG Hi-Vol5)1 | | December 20, 2010 | | 0.850%
Quarterly | | Specified amount upon credit
event noticeB | | | 30,100 | | | 76 | |
| | | | | |
The Goldman Sachs Group, Inc. (iBoxx IG Hi-Vol6)1 | | June 20, 2011 | | 0.750%
Quarterly | | Specified amount upon credit
event noticeB | | | 14,600 | | | (15 | ) |
| | | | | |
The Goldman Sachs Group, Inc. (iBoxx IG Hi-Vol6)1 | | June 20, 2011 | | 0.750%
Quarterly | | Specified amount upon credit
event noticeB | | | 15,400 | | | 12 | |
| | | | | |
The Goldman Sachs Group, Inc.2 | | September 14, 2007 | | 3-month LIBORF | | 3.215%
Semi-annually | | | 26,500 | | | (520 | ) |
| | | | | |
The Goldman Sachs Group, Inc.2 | | March 10, 2009 | | 3-month LIBORF | | 4.360%
Semi-annually | | | 54,100 | | | (493 | ) |
| | | | | |
The Goldman Sachs Group, Inc.2 | | July 7, 2011 | | 3-month LIBORF | | 5.713%
Semi-annually | | | 71,600 | | | 1,909 | |
| | | | | | | | | | | | | |
| | | | | | | | $ | 1,525,382 | | $ | 17,552 | |
| | | | | | | | | | | | | |
| | | | | | | | | | | | | |
|
| Western Asset Core Plus Bond Portfolio | |
Agreement With: | | Termination Date | | The Fund Agrees to Pay | | The Fund Will Receive | | Contract
Notional Amount | | Unrealized
Appreciation/
(Depreciation) | |
| | | | | | | | | | | | | |
Banc of America Securities LLC
(Centex Corporation,
5.45%, due 8/15/12)1 | | September 20, 2012 | | 0.680%
Monthly | | Specified amount upon credit event noticeB | | $ | 9,500 | | $ | 19 | |
| | | | | |
Banc of America Securities LLC
(D.R. Horton,
6.875%, due 5/1/13)1 | | June 20, 2013 | | 1.250%
Monthly | | Specified amount upon credit event noticeB | | | 5,400 | | | (2 | ) |
| | | | | |
Banc of America Securities LLC
(Harrah’s Operating Co.,
5.375%, due 12/15/13)1 | | June 20, 2013 | | 1.250%
Monthly | | Specified amount upon credit event noticeB | | | 13,400 | | | 283 | |
| | | | | |
Banc of America Securities LLC
(Lehnnar Corporation,
5.95%, due 10/17/11)1 | | September 20, 2011 | | 0.670%
Monthly | | Specified amount upon credit event noticeB | | | 6,300 | | | 16 | |
| | | | | |
Banc of America Securities LLC
(PHH Corporate Note,
7.125%, due 3/1/13)1 | | March 20, 2013 | | 1.050%
Monthly | | Specified amount upon credit event noticeB | | | 8,640 | | | (34 | ) |
194
Semi-Annual Report to Shareholders
| | | | | | | | | | | | | |
| Western Asset Core Plus Bond Portfolio—Continued | |
Agreement With: | | Termination Date | | The Fund Agrees to Pay | | The Fund Will Receive | | Contract
Notional Amount | | Unrealized
Appreciation/
(Depreciation) | |
| | | | | | | | | | | | | |
Banc of America Securities LLC
(Toll Brothers,
5.95%, due 9/15/13)1 | | September 20, 2013 | | 1.430%
Monthly | | Specified amount upon credit event noticeB | | $ | 12,700 | | $ | (126 | ) |
| | | | | |
Banc of America Securities LLC
(iBoxx IG Hi-Vol7)1 | | December 20, 2011 | | 0.750%
Quarterly | | Specified amount upon credit event noticeB | | | 75,600 | | | 40 | |
| | | | | |
Banc of America Securities LLC2 | | October 17, 2011 | | 5.293%
Semi-annually | | 3-month LIBORF | | | 6,300 | | | (59 | ) |
| | | | | |
Banc of America Securities LLC2 | | August 15, 2012 | | 5.291%
Semi-annually | | 3-month LIBORF | | | 9,500 | | | (92 | ) |
| | | | | |
Banc of America Securities LLC2 | | September 15, 2013 | | 5.290%
Semi-annually | | 3-month LIBORF | | | 12,700 | | | (125 | ) |
| | | | | |
Banc of America Securities LLC2 | | June 1, 2016 | | 5.110%
Semi-annually | | 3-month LIBORF | | | 5,400 | | | (0.1 | ) |
| | | | | |
Banc of America Securities LLC2 | | June 1, 2016 | | 5.263%
Semi-annually | | 3-month LIBORF | | | 13,400 | | | (100 | ) |
| | | | | |
Bear Stearns, Inc.
(Ford Motor Credit Company,
7.00%, due 10/1/13)1 | | June 20, 2010 | | Specified amount upon credit event noticeC | | 4.830%
Quarterly | | | 12,500 | | | 545 | |
| | | | | |
Bear Stearns, Inc.
(GIE PSA Tresorerie,
5.875%, due 9/27/11)1 | | March 20, 2011 | | 0.320%
Quarterly | | Specified amount upon credit event noticeB | | | 2,620 | | | (13 | ) |
| | | | | |
Bear Stearns, Inc.
(GIE PSA Tresorerie,
5.875%, due 9/27/11)1 | | March 20, 2011 | | 0.320%
Quarterly | | Specified amount upon credit event noticeB | | | 3,470 | | | (5 | ) |
| | | | | |
Bear Stearns, Inc.
(Renault S.A.,
4.625%, due 5/28/10)1 | | March 20, 2011 | | 0.350%
Quarterly | | Specified amount upon credit event noticeB | | | 790 | | | 1 | |
| | | | | |
Bear Stearns, Inc.
(Renault S.A.,
4.625%, due 5/28/10)1 | | March 20, 2011 | | 0.360%
Quarterly | | Specified amount upon credit event noticeB | | | 2,620 | | | 2 | |
| | | | | |
Bear Stearns, Inc.
(Renault S.A.,
4.625%, due 5/28/10)1 | | March 20, 2011 | | 0.360%
Quarterly | | Specified amount upon credit event noticeB | | | 2,620 | | | 2 | |
| | | | | |
Bear Stearns, Inc.
(Volkswagen International Finance NV,
4.875%, due 5/22/13)1 | | March 20, 2011 | | 0.330%
Quarterly | | Specified amount upon credit event noticeB | | | 790 | | | (3 | ) |
195
Semi-Annual Report to Shareholders
Notes to Financial Statements—Continued
| | | | | | | | | | | | | |
| Western Asset Core Plus Bond Portfolio—Continued | |
Agreement With: | | Termination Date | | The Fund Agrees to Pay | | The Fund Will Receive | | Contract
Notional Amount | | Unrealized
Appreciation/
(Depreciation) | |
| | | | | | | | | | | | | |
Bear Stearns, Inc.
(Volkswagen International Finance NV,
4.875%, due 5/22/13)1 | | March 20, 2011 | | 0.335%
Quarterly | | Specified amount upon credit event noticeB | | $ | 2,620 | | $ | (9 | ) |
| | | | | |
Bear Stearns, Inc.
(Volkswagen International Finance NV,
4.875%, due 5/22/13)1 | | March 20, 2011 | | 0.340% Quarterly | | Specified amount upon credit event noticeB | | | 2,620 | | | (10 | ) |
| | | | | |
Bear Stearns, Inc.
(iBoxx HY 3)1 | | December 20, 2010 | | 3.950%
Quarterly | | Specified amount upon credit event noticeB | | | 8,439 | | | 116 | |
| | | | | |
Bear Stearns, Inc.
(iBoxx HY 6B)1 | | June 20, 2011 | | 3.000%
Quarterly | | Specified amount upon credit event noticeB | | | 17,000 | | | 206 | |
| | | | | |
Bear Stearns, Inc.
(iBoxx HY 6B)1 | | June 20, 2011 | | Specified amount upon credit event noticeD | | 3.000%
Quarterly | | | 25,000 | | | 131 | |
| | | | | |
Bear Stearns, Inc.
(iBoxx HY 7B)1 | | December 20, 2011 | | Specified amount upon credit event noticeD | | 3.000%
Quarterly | | | 20,000 | | | (38 | ) |
| | | | | |
Credit Suisse First Boston USA
(AAMES Mortgage Investment Trust 2005-1 M8 1-Month LIBORF + 160 bpG, due 6/25/35)1 | | April 25, 2035 | | 1.280%
Monthly | | Specified amount upon credit event noticeB | | | 1,122 | | | (1 | ) |
| | | | | |
Credit Suisse First Boston USA
(AAMES Mortgage Investment Trust 2005-1 M9 1-Month LIBORF + 250 bpG, due 6/25/35)1 | | April 25, 2035 | | 2.050%
Monthly | | Specified amount upon credit event noticeB | | | 1,122 | | | 4 | |
| | | | | |
Credit Suisse First Boston USA
(ACE Securities Corp. 2005-HE1 M8 1-Month LIBORF + 138 bpG, due 2/25/35)1 | | February 25, 2035 | | 1.310%
Monthly | | Specified amount upon credit event noticeB | | | 1,122 | | | 1 | |
| | | | | |
Credit Suisse First Boston USA
(ACE Securities Corp. 2005-HE1 M9 1-Month LIBORF + 220 bpG, due 2/25/35)1 | | February 25, 2035 | | 2.060%
Monthly | | Specified amount upon credit event noticeB | | | 1,122 | | | 8 | |
| | | | | |
Credit Suisse First Boston USA
(Aegis Asset-Backed Securities Trust 2004-4 B2 1-Month LIBORF + 190 bpG, due 10/25/34)1 | | October 25, 2034 | | 1.370%
Monthly | | Specified amount upon credit event noticeB | | | 1,494 | | | 2 | |
196
Semi-Annual Report to Shareholders
| | | | | | | | | | | | | |
| Western Asset Core Plus Bond Portfolio—Continued | |
Agreement With: | | Termination Date | | The Fund Agrees to Pay | | The Fund Will Receive | | Contract
Notional Amount | | Unrealized
Appreciation/
(Depreciation) | |
| | | | | | | | | | | | | |
Credit Suisse First Boston USA
(Aegis Asset-Backed Securities Trust 2005 B2 1-Month LIBORF + 130 bpG, due 3/25/35)1 | | March 25, 2035 | | 1.310%
Quarterly | | Specified amount upon credit event noticeB | | $ | 1,122 | | $ | 4 | |
| | | | | |
Credit Suisse First Boston USA
(Aegis Asset-Backed Securities Trust 2005 B3 1-Month LIBORF + 200 bpG, due 3/25/35)1 | | March 25, 2035 | | 2.180%
Quarterly | | Specified amount upon credit event noticeB | | | 1,122 | | | 8 | |
| | | | | |
Credit Suisse First Boston USA
(AmerisourceBergen Corp.,
8.125%, due 9/1/8)1 | | September 20, 2015 | | 0.900%
Monthly | | Specified amount upon credit event noticeB | | | 5,350 | | | (8 | ) |
| | | | | |
Credit Suisse First Boston USA
(Argent Securities Inc. 2004-W4 M3 1-Month LIBORF + 300 bpG, due 3/25/34)1 | | March 25, 2034 | | 2.200%
Monthly | | Specified amount upon credit event noticeB | | | 1,494 | | | 9 | |
| | | | | |
Credit Suisse First Boston USA
(Argent Securities Inc. 2004-W11 M9 1-Month LIBORF + 225 bpG, due 11/25/34)1 | | November 25, 2034 | | 1.330%
Monthly | | Specified amount upon credit event noticeB | | | 1,122 | | | 7 | |
| | | | | |
Credit Suisse First Boston USA
(Argent Securities Inc. 2004-W11 M10 1-Month LIBORF + 350 bpG, due 11/25/34)1 | | November 25, 2034 | | 2.150%
Monthly | | Specified amount upon credit event noticeB | | | 1,122 | | | 11 | |
| | | | | |
Credit Suisse First Boston USA
(ConocoPhillips,
4.75%, due 10/15/12)1 | | September 20, 2012 | | Specified amount upon credit event noticeD | | 0.270%
Quarterly | | | 1,460 | | | (1 | ) |
| | | | | |
Credit Suisse First Boston USA
(Eastman Kodak Company,
7.25%, due 11/15/13)1 | | March 20, 2010 | | Specified amount upon credit event noticeD | | 1.400%
Quarterly | | | 9,000 | | | (99 | ) |
| | | | | |
Credit Suisse First Boston USA
(Eastman Kodak Company,
7.25%, due 11/15/13)1 | | September 20, 2010 | | Specified amount upon credit event noticeD | | 2.320%
Quarterly | | | 2,400 | | | 29 | |
| | | | | |
Credit Suisse First Boston USA
(Finance America Mortgage Loan Trust 2004-3 M8 1-Month LIBORF + 180 bpG, due 11/25/34)1 | | November 25, 2034 | | 1.310%
Monthly | | Specified amount upon credit event noticeB | | | 1,122 | | | (1 | ) |
197
Semi-Annual Report to Shareholders
Notes to Financial Statements—Continued
| | | | | | | | | | | | | |
| Western Asset Core Plus Bond Portfolio—Continued | |
Agreement With: | | Termination Date | | The Fund Agrees to Pay | | The Fund Will Receive | | Contract
Notional Amount | | Unrealized
Appreciation/
(Depreciation) | |
| | | | | | | | | | | | | |
Credit Suisse First Boston USA
(Finance America Mortgage Loan Trust 2004-3 M9 1-Month LIBORF + 315 bpG, due 11/25/34)1 | | November 25, 2034 | | 2.180%
Monthly | | Specified amount upon credit event noticeB | | $ | 1,122 | | $ | 3 | |
| | | | | |
Credit Suisse First Boston USA
(Fremont Home Loan Trust 2005-A M8 1-Month LIBORF + 135 bpG, due 1/25/35)1 | | January 25, 2035 | | 1.310%
Monthly | | Specified amount upon credit event noticeB | | | 1,122 | | | (1 | ) |
| | | | | |
Credit Suisse First Boston USA
(Fremont Home Loan Trust 2005-A 1-Month LIBORF + 100 bpG, due 1/25/35)1 | | January 25, 2035 | | 2.080%
Monthly | | Specified amount upon credit event noticeB | | | 1,122 | | | 5 | |
| | | | | |
Credit Suisse First Boston USA
(IndyMac Home Equity Loan Asset-Backed Trust 2004-C M8 1-Month LIBORF + 190 bpG, due 3/25/35)1 | | March 25, 2035 | | 1.280%
Monthly | | Specified amount upon credit event noticeB | | | 1,122 | | | (1 | ) |
| | | | | |
Credit Suisse First Boston USA
(IndyMac Home Equity Loan Asset-Backed Trust 2004-C M9 1-Month LIBORF + 325 bpG, due 3/25/35)1 | | March 25, 2035 | | 2.050%
Monthly | | Specified amount upon credit event noticeB | | | 1,122 | | | 6 | |
| | | | | |
Credit Suisse First Boston USA
(Long Beach Mortgage Loan Trust 2004-1 M9 1-Month LIBORF + 350 bpG, due 2/25/34)1 | | February 25, 2034 | | 2.150%
Monthly | | Specified amount upon credit event noticeB | | | 1,494 | | | 7 | |
| | | | | |
Credit Suisse First Boston USA
(Long Beach Mortgage Loan Trust 2005-1 M8 1-Month LIBORF + 170 bpG, due 2/25/35)1 | | February 25, 2035 | | 1.310% Monthly | | Specified amount upon credit event noticeB | | | 1,122 | | | 7 | |
| | | | | |
Credit Suisse First Boston USA
(Long Beach Mortgage Loan Trust 2005-1 M9 1-Month LIBORF + 275 bpG, due 2/25/35)1 | | February 25, 2035 | | 2.080%
Monthly | | Specified amount upon credit event noticeB | | | 1,122 | | | 13 | |
| | | | | |
Credit Suisse First Boston USA
(MASTR Asset-Backed Securities Trust 2005-NC1 M8 1-Month LIBORF + 153 bpG, due 12/25/34)1 | | December 25, 2034 | | 1.310%
Monthly | | Specified amount upon credit event noticeB | | | 1,122 | | | 8 | |
198
Semi-Annual Report to Shareholders
| | | | | | | | | | | | | |
| Western Asset Core Plus Bond Portfolio—Continued | |
Agreement With: | | Termination Date | | The Fund Agrees to Pay | | The Fund Will Receive | | Contract
Notional Amount | | Unrealized
Appreciation/
(Depreciation) | |
| | | | | | | | | | | | | |
Credit Suisse First Boston USA
(MASTR Asset-Backed Securities Trust 2005-NC1 M9 1-Month LIBORF + 240 bpG, due 12/25/34)1 | | December 25, 2034 | | 2.080%
Monthly | | Specified amount upon credit event noticeB | | $ | 1,122 | | $ | 15 | |
| | | | | |
Credit Suisse First Boston USA
(Merrill Lynch Mortgage Investors, Inc 2004-WMC4 B3 1-Month LIBORF + 375 bpG, due 4/25/35)1 | | April 25, 2035 | | 2.150%
Monthly | | Specified amount upon credit event noticeB | | | 1,494 | | | 4 | |
| | | | | |
Credit Suisse First Boston USA
(Merrill Lynch Mortgage Investors, Inc 2005-NC1 B2 1-Month LIBORF + 130 bpG, due 10/25/35)1 | | October 25, 2035 | | 1.280%
Monthly | | Specified amount upon credit event noticeB | | | 1,122 | | | 3 | |
| | | | | |
Credit Suisse First Boston USA
(Merrill Lynch Mortgage Investors, Inc 2005-NC1 B3 1-Month LIBORF + 205 bpG, due 10/25/35)1 | | October 25, 2035 | | 2.050%
Monthly | | Specified amount upon credit event noticeB | | | 1,122 | | | 10 | |
| | | | | |
Credit Suisse First Boston USA
(Merrill Lynch Mortgage Investors, Inc 2005-WMC1 B2 1-Month LIBORF + 135 bpG, due 9/25/35)1 | | September 25, 2035 | | 1.280%
Monthly | | Specified amount upon credit event noticeB | | | 1,122 | | | 4 | |
| | | | | |
Credit Suisse First Boston USA
(Merrill Lynch Mortgage Investors, Inc 2005-WMC1 B3 1-Month LIBORF + 225 bpG, due 9/25/35)1 | | September 25, 2035 | | 2.050% Monthly | | Specified amount upon credit event noticeB | | | 1,122 | | | 9 | |
| | | | | |
Credit Suisse First Boston USA
(Morgan Stanley ABS Capital I 2005-WMC1 B2 1-Month LIBORF + 130 bpG, due 1/25/35)1 | | January 25, 2035 | | 1.310%
Monthly | | Specified amount upon credit event noticeB | | | 1,122 | | | (1 | ) |
| | | | | |
Credit Suisse First Boston USA
(Morgan Stanley ABS Capital I 2005-WMC1 B3 1-Month LIBORF + 215 bpG, due 1/25/35)1 | | January 25, 2035 | | 2.180%
Monthly | | Specified amount upon credit event noticeB | | | 1,122 | | | 2 | |
| | | | | |
Credit Suisse First Boston USA
(New Century Home Equity Loan Trust 2004-2 M9 1-Month LIBORF + 325 bpG, due 8/25/34)1 | | August 25, 2034 | | 2.150%
Monthly | | Specified amount upon credit event noticeB | | | 1,494 | | | 6 | |
199
Semi-Annual Report to Shareholders
Notes to Financial Statements—Continued
| | | | | | | | | | | | | |
| Western Asset Core Plus Bond Portfolio—Continued | |
Agreement With: | | Termination Date | | The Fund Agrees to Pay | | The Fund Will Receive | | Contract
Notional Amount | | Unrealized
Appreciation/
(Depreciation) | |
| | | | | | | | | | | | | |
Credit Suisse First Boston USA
(New Century Home Equity Loan Trust 2005-1 M8 1-Month LIBORF + 140 bpG, due 3/25/35)1 | | March 25, 2035 | | 1.310%
Monthly | | Specified amount upon credit event noticeB | | $ | 1,122 | | $ | 3 | |
| | | | | |
Credit Suisse First Boston USA
(New Century Home Equity Loan Trust 2005-1 M9 1-Month LIBORF + 205 bpG, due 3/25/35)1 | | March 25, 2035 | | 2.180%
Monthly | | Specified amount upon credit event noticeB | | | 1,122 | | | 7 | |
| | | | | |
Credit Suisse First Boston USA
(Novastar Home Equity Loan 2005-1 B2 1-Month LIBORF + 135 bpG, due 6/25/35)1 | | June 25, 2035 | | 1.280%
Monthly | | Specified amount upon credit event noticeB | | | 1,122 | | | (1 | ) |
| | | | | |
Credit Suisse First Boston USA
(Novastar Home Equity Loan 2005-4 B3 1-Month LIBORF + 195 bpG, due 6/25/35)1 | | June 25, 2035 | | 2.050%
Monthly | | Specified amount upon credit event noticeB | | | 1,122 | | | 5 | |
| | | | | |
Credit Suisse First Boston USA
(Park Place Securities Inc. 2005-WCH1 M8 1-Month LIBORF + 155 bpG, due 1/25/36)1 | | January 25, 2036 | | 1.360%
Monthly | | Specified amount upon credit event noticeB | | | 1,122 | | | 14 | |
| | | | | |
Credit Suisse First Boston USA
(Park Place Securities Inc. 2005-WCH1 M9 1-Month LIBORF + 250 bpG, due 1/25/36)1 | | January 25, 2036 | | 2.180%
Monthly | | Specified amount upon credit event noticeB | | | 1,122 | | | 20 | |
| | | | | |
Credit Suisse First Boston USA
(People’s Choice Home Loan Securities Trust 2004-1 M6 1-Month LIBORF + 230 bpG, due 6/25/34)1 | | June 25, 2034 | | 1.370%
Quarterly | | Specified amount upon credit event noticeB | | | 1,494 | | | 1 | |
| | | | | |
Credit Suisse First Boston USA
(People’s Choice Home Loan Securities Trust 2005-1 1-Month LIBORF + 165 bpG, due 1/25/35)1 | | January 25, 2035 | | 1.258%
Monthly | | Specified amount upon credit event noticeB | | | 1,122 | | | 5 | |
| | | | | |
Credit Suisse First Boston USA
(People’s Choice Home Loan Securities Trust 2005-1 B3 1-Month LIBORF + 260 bpG, due 1/25/35)1 | | January 25, 2035 | | 2.050%
Monthly | | Specified amount upon credit event noticeB | | | 1,122 | | | 13 | |
200
Semi-Annual Report to Shareholders
| | | | | | | | | | | | | |
| Western Asset Core Plus Bond Portfolio—Continued | |
Agreement With: | | Termination Date | | The Fund Agrees to Pay | | The Fund Will Receive | | Contract
Notional Amount | | Unrealized
Appreciation/
(Depreciation) | |
| | | | | | | | | | | | | |
Credit Suisse First Boston USA
(Pulte Homes Inc.,
7.875%, due 8/1/11)1 | | September 20, 2013 | | 0.870%
Monthly | | Specified amount upon credit event noticeB | | $ | 7,000 | | $ | 4 | |
| | | | | |
Credit Suisse First Boston USA
(Starwood Hotels,
7.875%, due 5/1/12)1 | | December 20, 2011 | | 1.370%
Monthly | | Specified amount upon credit event noticeB | | | 11,250 | | | (61 | ) |
| | | | | |
Credit Suisse First Boston USA
(iBoxx IG Hi-Vol)1 | | March 20, 2009 | | Specified amount upon credit event noticeD | | 1.250%
Quarterly | | | 48,333 | | | 463 | |
| | | | | |
Credit Suisse First Boston USA
(iBoxx IG Hi-Vol2)1 | | September 20, 2009 | | 1.150%
Quarterly | | Specified amount upon credit event noticeB | | | 24,167 | | | (249 | ) |
| | | | | |
Credit Suisse First Boston USA
(iBoxx HY 3)1 | | December 20, 2009 | | Specified amount upon credit event noticeD | | 4.000%
Quarterly | | | 3,078 | | | 209 | |
| | | | | |
Credit Suisse First Boston USA
(iBoxx HY 3)1 | | December 20, 2009 | | Specified amount upon credit event noticeD | | 4.000%
Quarterly | | | 3,078 | | | 209 | |
| | | | | |
Credit Suisse First Boston USA
(iBoxx HY 3)1 | | December 20, 2009 | | Specified amount upon credit event noticeD | | 4.000%
Quarterly | | | 15,539 | | | 513 | |
| | | | | |
Credit Suisse First Boston USA
(iBoxx HY 3)1 | | December 20, 2009 | | Specified amount upon credit event noticeD | | 4.000%
Quarterly | | | 11,532 | | | 294 | |
| | | | | |
Credit Suisse First Boston USA2 | | May 1, 2012 | | 5.085%
Semi-annually | | 3-month LIBORF | | | 10,700 | | | 4 | |
| | | | | |
Credit Suisse First Boston USA2 | | January 15, 2014 | | 5.328%
Semi-annually | | 3-month LIBORF | | | 6,300 | | | (77 | ) |
| | | | | |
Credit Suisse First Boston USA2 | | September 15, 2015 | | 5.160%
Semi-annually | | 3-month LIBORF | | | 5,350 | | | (3 | ) |
| | | | | |
Deutsche Bank AG
(Dynegy Holdings,
8.75%, due 2/15/12)1 | | April 23, 2007 | | Specified amount upon credit event noticeC | | 2.950%
Quarterly | | | 2,250 | | | 58 | |
| | | | | |
Deutsche Bank AG
(Dynegy Holdings,
8.75%, due 2/15/12)1 | | May 1, 2007 | | Specified amount upon credit event noticeC | | 5.250%
Quarterly | | | 3,460 | | | 139 | |
| | | | | |
Deutsche Bank AG
(Eastman Kodak Company,
7.25%, due 11/15/13)1 | | March 20, 2010 | | Specified amount upon credit event noticeC | | 1.250%
Quarterly | | | 1,600 | | | (25 | ) |
201
Semi-Annual Report to Shareholders
Notes to Financial Statements—Continued
| | | | | | | | | | | | | |
| Western Asset Core Plus Bond Portfolio—Continued | |
Agreement With: | | Termination Date | | The Fund Agrees to Pay | | The Fund Will Receive | | Contract
Notional Amount | | Unrealized
Appreciation/
(Depreciation) | |
| | | | | | | | | | | | | |
Deutsche Bank AG
(Eastman Kodak Company,
7.25%, due 11/15/13)1 | | March 20, 2015 | | Specified amount upon credit event noticeC | | 1.670%
Quarterly | | $ | 1,900 | | $ | (152 | ) |
| | | | | |
Deutsche Bank AG
(Eastman Kodak Company,
7.25%, due 11/15/13)1 | | September 20, 2010 | | Specified amount upon credit event noticeC | | 2.300%
Quarterly | | | 3,020 | | | 34 | |
| | | | | |
Deutsche Bank AG
(Eastman Kodak Company,
7.25%, due 11/15/13)1 | | September 20, 2010 | | Specified amount upon credit event noticeC | | 2.300%
Quarterly | | | 5,430 | | | 61 | |
| | | | | |
Deutsche Bank AG
(Eastman Kodak Company,
7.25%, due 11/15/13)1 | | September 20, 2010 | | Specified amount upon credit event noticeC | | 2.320%
Quarterly | | | 3,200 | | | 38 | |
| | | | | |
Deutsche Bank AG
(Fannie Mae,
6%, due 5/15/11)1 | | December 20, 2009 | | Specified amount upon credit event noticeC | | 0.215%
Quarterly | | | 17,000 | | | 89 | |
| | | | | |
Deutsche Bank AG
(Ford Motor Credit Company,
7.00%, due 10/1/13)1 | | December 20, 2010 | | Specified amount upon credit event noticeC | | 5.050%
Quarterly | | | 25,400 | | | 1,343 | |
| | | | | |
Deutsche Bank AG
(Ford Motor Credit Company,
7.45%, due 7/16/31)1 | | March 20, 2015 | | Specified amount upon credit event noticeC | | 2.930%
Quarterly | | | 2,600 | | | (469 | ) |
| | | | | |
Deutsche Bank AG
(Freddie Mac,
5.00%, due 7/15/14)1 | | March 20, 2015 | | Specified amount upon credit event noticeC | | 0.290%
Quarterly | | | 25,100 | | | 326 | |
| | | | | |
Deutsche Bank AG
(General Motors Acceptance Corporation,
6.875%, due 8/12/12)1 | | March 20, 2010 | | Specified amount upon credit event noticeC | | 2.280%
Quarterly | | | 5,500 | | | 34 | |
| | | | | |
Deutsche Bank AG
(General Motors Acceptance Corporation,
8.375%, due 7/15/33)1 | | March 20, 2015 | | Specified amount upon credit event noticeD | | 3.510%
Quarterly | | | 2,600 | | | (271 | ) |
| | | | | |
Deutsche Bank AG
(GIE PSA Tresorerie,
5.875%, due 9/27/11)1 | | March 20, 2011 | | 0.325%
Quarterly | | Specified amount upon credit event noticeE | | | 2,540 | | | (13 | ) |
| | | | | |
Deutsche Bank AG
(GIE PSA Tresorerie,
5.875%, due 9/27/11)1 | | March 20, 2011 | | 0.325%
Quarterly | | Specified amount upon credit event noticeE | | | 2,540 | | | (4 | ) |
| | | | | |
Deutsche Bank AG
(GIE PSA Tresorerie,
5.875%, due 9/27/11)1 | | March 20, 2011 | | 0.340%
Quarterly | | Specified amount upon credit event noticeE | | | 2,540 | | | (6 | ) |
202
Semi-Annual Report to Shareholders
| | | | | | | | | | | | | |
| Western Asset Core Plus Bond Portfolio—Continued | |
Agreement With: | | Termination Date | | The Fund Agrees to Pay | | The Fund Will Receive | | Contract
Notional Amount | | Unrealized
Appreciation/
(Depreciation) | |
| | | | | | | | | | | | | |
Deutsche Bank AG
(Renault S.A.,
4.625%, due 5/28/10)1 | | March 20, 2011 | | 0.360%
Quarterly | | Specified amount upon credit event noticeE | | $ | 2,540 | | $ | 2 | |
| | | | | |
Deutsche Bank AG
(Renault S.A.,
4.625%, due 5/28/10)1 | | March 20, 2011 | | 0.380%
Quarterly | | Specified amount upon credit event noticeE | | | 2,540 | | | (0.1 | ) |
| | | | | |
Deutsche Bank AG
(Sara Lee Corporation,
6.125%, due 11/1/32)1 | | September 20, 2011 | | 0.420%
Quarterly | | Specified amount upon credit event noticeB | | | 8,900 | | | 14 | |
| | | | | |
Deutsche Bank AG
(Supervalu Inc.,
7.5%, due 5/15/12)1 | | September 20, 2009 | | 1.200%
Quarterly | | Specified amount upon credit event noticeE | | | 11,310 | | | (21 | ) |
| | | | | |
Deutsche Bank AG
(Volkswagen International Finance NV,
4.875%, due 5/22/13)1 | | March 20, 2011 | | 0.340%
Quarterly | | Specified amount upon credit event noticeE | | | 2,540 | | | (10 | ) |
| | | | | |
Deutsche Bank AG
(Volkswagen International Finance NV,
4.875%, due 5/22/13)1 | | March 20, 2011 | | 0.370%
Quarterly | | Specified amount upon credit event noticeE | | | 2,540 | | | (10 | ) |
| | | | | |
Deutsche Bank AG
(iBoxx 100 HY)1 | | March 20, 2009 | | Specified amount upon credit event noticeD | | 4.250%
Quarterly | | | 9,500 | | | 512 | |
| | | | | |
Deutsche Bank AG
(iBoxx IG Hi-Vol)1 | | March 20, 2009 | | Specified amount upon credit event noticeD | | 1.250%
Quarterly | | | 13,301 | | | 117 | |
| | | | | |
Deutsche Bank AG
(iBoxx IG Hi-Vol2)1 | | September 20, 2014 | | Specified amount upon credit event noticeD | | 1.300%
Quarterly | | | 11,175 | | | 106 | |
| | | | | |
Deutsche Bank AG
(iBoxx IG TMT)1 | | March 20, 2009 | | 0.600%
Quarterly | | Specified amount upon credit event noticeB | | | 6,450 | | | (54 | ) |
| | | | | |
Deutsche Bank AG
(iBoxx IG TMT)1 | | March 20, 2009 | | 0.600%
Quarterly | | Specified amount upon credit event noticeB | | | 9,500 | | | (79 | ) |
| | | | | |
Deutsche Bank AG
(iBoxx IG TMT)1 | | March 20, 2009 | | 1.250%
Quarterly | | Specified amount upon credit event noticeB | | | 9,183 | | | (18 | ) |
| | | | | |
Deutsche Bank AG
(iBoxx HY 2)1 | | September 20, 2009 | | Specified amount upon credit event noticeD | | 4.800%
Quarterly | | | 2,559 | | | 224 | |
203
Semi-Annual Report to Shareholders
Notes to Financial Statements—Continued
| | | | | | | | | | | | | |
| Western Asset Core Plus Bond Portfolio—Continued | |
Agreement With: | | Termination Date | | The Fund Agrees to Pay | | The Fund Will Receive | | Contract
Notional Amount | | Unrealized
Appreciation/
(Depreciation) | |
| | | | | | | | | | | | | |
Deutsche Bank AG
(iBoxx HY B)1 | | March 20, 2009 | | Specified amount upon credit event noticeD | | 5.000%
Quarterly | | $ | 4,768 | | $ | 259 | |
| | | | | |
Deutsche Bank AG
(iBoxx HY B)1 | | March 20, 2009 | | Specified amount upon credit event noticeD | | 5.000%
Quarterly | | | 9,535 | | | 483 | |
| | | | | |
Deutsche Bank AG2 | | January 10, 2008 | | 3-month LIBORF | | 3.754%
Semi-annually | | | 143,500 | | | (2,624 | ) |
| | | | | |
Deutsche Bank AG2 | | October 5, 2008 | | 3-month LIBORF | | 4.655%
Semi-annually | | | 194,330 | | | (1,695 | ) |
| | | | | |
Deutsche Bank AG2 | | August 1, 2009 | | 4.985%
Semi-annually | | 3-month LIBORF | | | 10,770 | | | 22 | |
| | | | | |
Deutsche Bank AG2 | | June 17, 2010 | | 3-month LIBORF | | 4.313%
Semi-annually | | | 41,570 | | | (1,039 | ) |
| | | | | |
Deutsche Bank AG2 | | October 11, 2010 | | 3-month LIBORF | | 4.708%
Semi-annually | | | 299,650 | | | (3,838 | ) |
| | | | | |
Deutsche Bank AG2 | | July 13, 2011 | | 3-month LIBORF | | 5.628%
Semi-annually | | | 133,350 | | | 3,090 | |
| | | | | |
Deutsche Bank AG2 | | September 15, 2011 | | 5.186%
Semi-annually | | 3-month LIBORF | | | 8,900 | | | (40 | ) |
| | | | | |
Deutsche Bank AG2 | | July 21, 2016 | | 3-month LIBORF | | 5.693%
Semi-annually | | | 124,720 | | | 5,701 | |
| | | | | |
JP Morgan Chase & Co.
(General Motors Acceptance Corporation,
7.125%, due 7/15/13)1 | | September 20, 2010 | | Specified amount upon credit event noticeC | | 6.000%
Quarterly | | | 14,300 | | | 424 | |
| | | | | |
JP Morgan Chase & Co.
(International Lease Finance Corporation,
5.75%, due 6/15/11)1 | | June 20, 2011 | | 0.160% Quarterly | | Specified amount upon credit event noticeC | | | 12,700 | | | (34 | ) |
| | | | | |
JP Morgan Chase & Co.2 | | June 15, 2011 | | 5.242%
Semi-annually | | 3-month LIBORF | | | 12,700 | | | (89 | ) |
| | | | | |
JP Morgan Chase & Co.2 | | September 7, 2016 | | 5.322%
Semi-annually | | 3-month LIBORF | | | 59,000 | | | (647 | ) |
| | | | | |
Lehman Brothers Holdings Inc.
(General Motors Acceptance Corporation,
6.875%, due 8/12/12)1 | | March 20, 2010 | | Specified amount upon credit event noticeC | | 3.650%
Quarterly | | | 25,000 | | | 1,514 | |
204
Semi-Annual Report to Shareholders
| | | | | | | | | | | | | |
| Western Asset Core Plus Bond Portfolio—Continued | |
Agreement With: | | Termination Date | | The Fund Agrees to Pay | | The Fund Will Receive | | Contract
Notional Amount | | Unrealized
Appreciation/
(Depreciation) | |
| | | | | | | | | | | | | |
Lehman Brothers Holdings Inc.
(Sara Lee Corporation,
6.125%, due 11/01/32)1 | | September 20, 2011 | | 0.440%
Quarterly | | Specified amount upon credit event noticeC | | $ | 9,750 | | $ | 7 | |
| | | | | |
Lehman Brothers Holdings Inc.
(Viacom Inc.,
6.25%, due 4/30/16)1 | | March 20, 2011 | | 0.570%
Quarterly | | Specified amount upon credit event noticeC | | | 6,270 | | | 0 | |
| | | | | |
Lehman Brothers Holdings Inc.
(iBoxx IG Hi-Vol2)1 | | September 20, 2009 | | 1.150%
Quarterly | | Specified amount upon credit event noticeB | | | 1,450 | | | (9 | ) |
| | | | | |
Lehman Brothers Holdings Inc.
(iBoxx IG Hi-Vol2)1 | | September 20, 2009 | | 1.150%
Quarterly | | Specified amount upon credit event noticeB | | | 12,180 | | | (65 | ) |
| | | | | |
Lehman Brothers Holdings Inc.
(iBoxx HY 3)1 | | December 20, 2009 | | Specified amount upon credit event noticeD | | 4.000%
Quarterly | | | 3,225 | | | 131 | |
| | | | | |
Lehman Brothers Holdings Inc.
(iBoxx HY 3)1 | | December 20, 2009 | | Specified amount upon credit event noticeD | | 4.000%
Quarterly | | | 3,323 | | | 56 | |
| | | | | |
Lehman Brothers Holdings Inc.
(iBoxx HY 3)1 | | December 20, 2009 | | Specified amount upon credit event noticeD | | 4.000%
Quarterly | | | 3,323 | | | 56 | |
| | | | | |
Lehman Brothers Holdings Inc.
(iBoxx HY 3)1 | | December 20, 2010 | | 3.950%
Quarterly | | Specified amount upon credit event noticeB | | | 9,021 | | | 124 | |
| | | | | |
Lehman Brothers Holdings Inc.
(iBoxx HY 6)1 | | June 20, 2011 | | 3.450%
Quarterly | | Specified amount upon credit event noticeB | | | 8,000 | | | 67 | |
| | | | | |
Lehman Brothers Holdings Inc.*
(iBoxx IG TMT)1 | | March 20, 2009 | | 0.600%
Quarterly | | Specified amount upon credit event noticeB | | | 9,000 | | | (107 | ) |
| | | | | |
Lehman Brothers Holdings Inc.2 | | October 7, 2007 | | 3-month LIBORF | | 4.601%
Semi-annually | | | 80,020 | | | (562 | ) |
| | | | | |
Lehman Brothers Holdings Inc.2 | | April 30, 2011 | | 5.070%
Semi-annually | | 3-month LIBORF | | | 6,270 | | | 0 | |
| | | | | |
Lehman Brothers Holdings Inc.2 | | September 15, 2011 | | 5.193%
Semi-annually | | 3-month LIBORF | | | 9,750 | | | (47 | ) |
| | | | | |
Merrill Lynch & Co., Inc.
(Eastman Kodak Company,
7.25%, due 11/15/13)1 | | September 20, 2010 | | Specified amount upon credit event noticeC | | 2.300%
Quarterly | | | 1,610 | | | 18 | |
205
Semi-Annual Report to Shareholders
Notes to Financial Statements—Continued
| | | | | | | | | | | | |
| Western Asset Core Plus Bond Portfolio—Continued |
Agreement With: | | Termination Date | | The Fund Agrees to Pay | | The Fund Will Receive | | Contract
Notional Amount | | Unrealized
Appreciation/
(Depreciation) |
| | | | | | | | | | | | |
Merrill Lynch & Co., Inc.
(Pacific Gas & Electric Co.,
4.80%, due 3/1/14)1 | | June 20, 2009 | | Specified amount upon credit event noticeD | | 0.420%
Quarterly | | $ | 2,980 | | $ | 20 |
| | | | | |
Morgan Stanley & Co., Inc.
(Eastman Kodak Company,
7.25%, due 11/15/13)1 | | March 20, 2011 | | Specified amount upon credit event noticeC | | 2.700%
Quarterly | | | 5,000 | | | 99 |
| | | | | |
RBS Greenwich
(DSLA Mortgage Loan Trust 2005-AR5 1-Month LIBORF
+ 175 bpG, due 8/19/45)1 | | August 19, 2045 | | 4.500%
Monthly | | Specified amount upon credit event noticeB | | | 2,098 | | | 39 |
| | | | | |
RBS Greenwich
(Eastman Kodak,
7.250%, due 11/15/13)1 | | December 20, 2010 | | Specified amount upon credit event noticeC | | 3.200%
Quarterly | | | 19,300 | | | 800 |
| | | | | |
RBS Greenwich
(Ford Motor Credit Company,
7.00%, due 10/1/13)1 | | September 20, 2011 | | Specified amount upon credit event noticeC | | 3.750%
Quarterly | | | 8,900 | | | 132 |
| | | | | |
RBS Greenwich
(Ford Motor Credit Company,
7.45%, due 7/16/31)1 | | September 20, 2011 | | Specified amount upon credit event noticeC | | 6.750%
Quarterly | | | 18,400 | | | 2,411 |
| | | | | |
RBS Greenwich
(General Motors Acceptance Corporation,
6.875%, due 8/28/12)1 | | September 20, 2010 | | Specified amount upon credit event noticeC | | 5.750%
Quarterly | | | 7,500 | | | 1,014 |
| | | | | |
RBS Greenwich
(General Motors Acceptance Corporation,
7.125%, due 7/15/13)1 | | June 20, 2010 | | Specified amount upon credit event noticeC | | 6.800%
Quarterly | | | 7,500 | | | 417 |
| | | | | |
RBS Greenwich
(General Motors Acceptance Corporation,
7.125%, due 7/15/13)1 | | June 20, 2010 | | Specified amount upon credit event noticeC | | 7.100%
Quarterly | | | 8,000 | | | 516 |
| | | | | |
RBS Greenwich
(General Motors Acceptance Corporation,
7.125%, due 7/15/13)1 | | September 20, 2010 | | Specified amount upon credit event noticeC | | 7.700%
Quarterly | | | 12,500 | | | 1,032 |
| | | | | |
RBS Greenwich
(General Motors Acceptance Corporation,
7.125%, due 7/15/13)1 | | June 20, 2010 | | Specified amount upon credit event noticeC | | 8.400%
Quarterly | | | 12,500 | | | 1,289 |
206
Semi-Annual Report to Shareholders
| | | | | | | | | | | | |
| Western Asset Core Plus Bond Portfolio—Continued |
Agreement With: | | Termination Date | | The Fund Agrees to Pay | | The Fund Will Receive | | Contract
Notional Amount | | Unrealized
Appreciation/
(Depreciation) |
| | | | | | | | | | | | |
RBS Greenwich
(General Motors Acceptance Corporation,
7.125%, due 7/15/13)1 | | September 20, 2010 | | Specified amount upon credit event noticeC | | 6.100%
Quarterly | | $ | 8,000 | | $ | 262 |
| | | | | |
RBS Greenwich
(General Motors Acceptance Corporation,
7.125%, due 7/15/13)1 | | September 20, 2010 | | Specified amount upon credit event noticeC | | 6.630%
Quarterly | | | 19,600 | | | 965 |
| | | | | |
RBS Greenwich
(General Motors Acceptance Corporation,
7.125%, due 7/15/13)1 | | September 20, 2010 | | Specified amount upon credit event noticeC | | 6.900%
Quarterly | | | 10,000 | | | 577 |
| | | | | |
RBS Greenwich
(General Motors Acceptance Corporation,
7.125%, due 7/15/13)1 | | September 20, 2010 | | Specified amount upon credit event noticeC | | 7.200%
Quarterly | | | 7,820 | | | 524 |
| | | | | |
RBS Greenwich
(General Motors Acceptance Corporation,
7.125%, due 7/15/13)1 | | December 20, 2010 | | Specified amount upon credit event noticeC | | 8.950%
Quarterly | | | 19,300 | | | 2,380 |
| | | | | |
RBS Greenwich
(General Motors Acceptance Corporation,
7.125%, due 7/15/13)1 | | June 20, 2016 | | Specified amount upon credit event noticeC | | 5.000%
Quarterly | | | 7,200 | | | 1,154 |
| | | | | |
RBS Greenwich
(Harborview Mortgage Loan Trust 2005-12 1-Month LIBORF + 175 bpG, due 10/19/35)1 | | October 19, 2035 | | 2.500%
Monthly | | Specified amount upon credit event noticeB | | | 1,999 | | | 45 |
| | | | | |
RBS Greenwich
(IndyMac Index Mortgage Loan Trust 2005-AR18 1-Month LIBORF + 125 bpG, due 10/25/36)1 | | October 25, 2036 | | 2.700%
Monthly | | Specified amount upon credit event noticeB | | | 1,887 | | | 49 |
| | | | | |
RBS Greenwich
(Tenet Healthcare Corporation,
6.375%, due 12/1/11)1 | | September 20, 2010 | | Specified amount upon credit event noticeC | | 3.550%
Quarterly | | | 1,600 | | | 1 |
| | | | | |
RBS Greenwich
(Tenet Healthcare Corporation,
6.375%, due 12/1/11)1 | | September 20, 2010 | | Specified amount upon credit event noticeC | | 3.550%
Quarterly | | | 3,900 | | | 3 |
207
Semi-Annual Report to Shareholders
Notes to Financial Statements—Continued
| | | | | | | | | | | | | |
| Western Asset Core Plus Bond Portfolio—Continued | |
Agreement With: | | Termination Date | | The Fund Agrees to Pay | | The Fund Will Receive | | Contract
Notional Amount | | Unrealized
Appreciation/
(Depreciation) | |
| | | | | | | | | | | | | |
RBS Greenwich
(Tenet Healthcare Corporation,
6.375%, due 12/1/11)1 | | September 20, 2010 | | Specified amount upon credit event noticeC | | 3.500%
Quarterly | | $ | 3,920 | | $ | (4 | ) |
| | | | | |
RBS Greenwich
(Tenet Healthcare Corporation,
6.375%, due 12/1/11)1 | | September 20, 2010 | | Specified amount upon credit event noticeC | | 3.670%
Quarterly | | | 5,000 | | | 24 | |
| | | | | |
RBS Greenwich
(Tenet Healthcare Corporation,
6.375%, due 12/1/11)1 | | December 20, 2010 | | Specified amount upon credit event noticeC | | 3.870%
Quarterly | | | 7,700 | | | 47 | |
| | | | | |
RBS Greenwich
(Time Warner Inc.,
6.875%, due 5/1/12)1 | | September 20, 2010 | | Specified amount upon credit event noticeC | | 0.470%
Quarterly | | | 5,000 | | | 27 | |
| | | | | |
RBS Greenwich
(Time Warner Inc.,
6.875%, due 5/1/12)1 | | December 20, 2010 | | Specified amount upon credit event noticeC | | 0.500%
Quarterly | | | 12,500 | | | 76 | |
| | | | | |
RBS Greenwich
(Washington Mutual 2005-AR11 1-Month LIBORF + 120 bpG, due 8/25/45)1 | | August 25, 2045 | | 2.550%
Monthly | | Specified amount upon credit event noticeB | | | 829 | | | 14 | |
| | | | | |
RBS Greenwich
(iBoxx CDX)1 | | December 20, 2010 | | Specified amount upon credit event noticeD | | 2.000%
Quarterly | | | 13,114 | | | 579 | |
| | | | | |
RBS Greenwich
(iBoxx CDX)1 | | December 20, 2010 | | Specified amount upon credit event noticeD | | 2.000%
Quarterly | | | 15,154 | | | 409 | |
| | | | | |
RBS Greenwich
(iBoxx CDX)1 | | June 20, 2011 | | Specified amount upon credit event noticeD | | 3.450%
Quarterly | | | 11,000 | | | 11 | |
| | | | | |
The Goldman Sachs Group, Inc.
(Eastman Kodak Company,
7.25%, due 11/15/13)1 | | March 20, 2015 | | Specified amount upon credit event noticeC | | 1.670%
Quarterly | | | 1,900 | | | (152 | ) |
| | | | | |
The Goldman Sachs Group, Inc.
(Eastman Kodak Company,
7.25%, due 11/15/13)1 | | September 20, 2011 | | Specified amount upon credit event noticeC | | 2.920%
Quarterly | | | 7,300 | | | 163 | |
| | | | | |
The Goldman Sachs Group, Inc.
(Ford Motor Credit Company,
7.00%, due 10/1/13)1 | | September 20, 2011 | | Specified amount upon credit event noticeC | | 3.800%
Quarterly | | | 9,200 | | | 52 | |
208
Semi-Annual Report to Shareholders
| | | | | | | | | | | | |
| Western Asset Core Plus Bond Portfolio—Continued |
Agreement With: | | Termination Date | | The Fund Agrees to Pay | | The Fund Will Receive | | Contract
Notional Amount | | Unrealized
Appreciation/
(Depreciation) |
| | | | | | | | | | | | |
The Goldman Sachs Group, Inc.
(Ford Motor Credit Company,
7.00%, due 10/1/13)1 | | June 20, 2010 | | Specified amount upon credit event noticeC | | 4.750%
Quarterly | | $ | 2,500 | | $ | 103 |
| | | | | |
The Goldman Sachs Group, Inc.
(Ford Motor Credit Company,
7.45%, due 7/16/31)1 | | September 20, 2011 | | Specified amount upon credit event noticeC | | 6.800%
Quarterly | | | 10,000 | | | 1,145 |
| | | | | |
The Goldman Sachs Group, Inc.
(Ford Motor Credit Company,
7.45%, due 7/16/31)1 | | September 20, 2011 | | Specified amount upon credit event noticeC | | 6.800%
Quarterly | | | 8,400 | | | 962 |
| | | | | |
The Goldman Sachs Group, Inc.
(General Motors Acceptance Corporation,
6.875%, due 8/28/12)1 | | September 20, 2007 | | Specified amount upon credit event noticeC | | 4.900%
Quarterly | | | 10,000 | | | 351 |
| | | | | |
The Goldman Sachs Group, Inc.
(General Motors Acceptance Corporation,
6.875%, due 8/28/12)1 | | June 20, 2010 | | Specified amount upon credit event noticeC | | 5.750%
Quarterly | | | 10,000 | | | 1,293 |
| | | | | |
The Goldman Sachs Group, Inc.
(General Motors Acceptance Corporation,
6.875%, due 8/28/12)1 | | June 20, 2010 | | Specified amount upon credit event noticeC | | 5.950%
Quarterly | | | 500 | | | 68 |
| | | | | |
The Goldman Sachs Group, Inc.
(General Motors Acceptance Corporation,
6.875%, due 8/28/12)1 | | June 20, 2010 | | Specified amount upon credit event noticeC | | 6.000%
Quarterly | | | 5,000 | | | 686 |
| | | | | |
The Goldman Sachs Group, Inc.
(General Motors Acceptance Corporation,
7.125%, due 7/15/13)1 | | June 20, 2010 | | Specified amount upon credit event noticeC | | 8.950%
Quarterly | | | 5,000 | | | 597 |
| | | | | |
The Goldman Sachs Group, Inc.
(General Motors Acceptance Corporation,
8.375%, due 7/15/33)1 | | September 20, 2010 | | Specified amount upon credit event noticeC | | 6.000%
Quarterly | | | 25,100 | | | 744 |
| | | | | |
The Goldman Sachs Group, Inc.
(General Motors Acceptance Corporation,
8.375%, due 7/15/33)1 | | December 20, 2010 | | Specified amount upon credit event noticeC | | 7.000%
Quarterly | | | 42,500 | | | 2,554 |
| | | | | |
The Goldman Sachs Group, Inc.
(iBoxx IG FIN 3)1 | | March 20, 2010 | | Specified amount upon credit event noticeD | | 0.500%
Quarterly | | | 7,500 | | | 37 |
209
Semi-Annual Report to Shareholders
Notes to Financial Statements—Continued
| | | | | | | | | | | | | |
| Western Asset Core Plus Bond Portfolio—Continued | |
Agreement With: | | Termination Date | | The Fund Agrees to Pay | | The Fund Will Receive | | Contract
Notional Amount | | Unrealized
Appreciation/
(Depreciation) | |
| | | | | | | | | | | | | |
The Goldman Sachs Group, Inc.
(iBoxx IG FIN 3)1 | | March 20, 2015 | | Specified amount upon credit event noticeD | | 0.700%
Quarterly | | $ | 7,600 | | $ | 129 | |
| | | | | |
The Goldman Sachs Group, Inc.
(iBoxx IG Hi-Vol3)1 | | March 20, 2010 | | Specified amount upon credit event noticeD | | 1.050%
Quarterly | | | 21,847 | | | 396 | |
| | | | | |
The Goldman Sachs Group, Inc.
(iBoxx IG Hi-Vol3)1 | | March 20, 2010 | | Specified amount upon credit event noticeD | | 1.050%
Quarterly | | | 42,823 | | | 1,339 | |
| | | | | |
The Goldman Sachs Group, Inc.
(iBoxx IG Hi-Vol4)1 | | June 20, 2010 | | Specified amount upon credit event noticeD | | 0.400%
Quarterly | | | 23,300 | | | 373 | |
| | | | | |
The Goldman Sachs Group, Inc.
(iBoxx IG Hi-Vol4)1 | | June 20, 2010 | | Specified amount upon credit event noticeD | | 0.400%
Quarterly | | | 61,600 | | | 1,089 | |
| | | | | |
The Goldman Sachs Group, Inc.
(iBoxx IG Hi-Vol5)1 | | December 20, 2010 | | 0.850%
Quarterly | | Specified amount upon credit event noticeB | | | 48,200 | | | 121 | |
| | | | | |
The Goldman Sachs Group, Inc.
(iBoxx IG Hi-Vol6)1 | | June 20, 2011 | | 0.750%
Quarterly | | Specified amount upon credit event noticeB | | | 23,600 | | | (25 | ) |
| | | | | |
The Goldman Sachs Group, Inc.
(iBoxx IG Hi-Vol6)1 | | June 20, 2011 | | 0.750%
Quarterly | | Specified amount upon credit event noticeB | | | 58,500 | | | 47 | |
| | | | | |
The Goldman Sachs Group, Inc.
(iBoxx IG Hi-Vol7)1 | | December 20, 2011 | | 0.750%
Quarterly | | Specified amount upon credit event noticeB | | | 34,200 | | | 15 | |
| | | | | |
The Goldman Sachs Group, Inc.
(iBoxx HY 3)1 | | December 20, 2009 | | Specified amount upon credit event noticeD | | 4.000%
Quarterly | | | 2,912 | | | 153 | |
| | | | | |
The Goldman Sachs Group, Inc.
(iBoxx HY 3)1 | | December 20, 2009 | | Specified amount upon credit event noticeD | | 4.000%
Quarterly | | | 977 | | | 41 | |
| | | | | |
The Goldman Sachs Group, Inc.
(iBoxx HY 3)1 | | December 20, 2009 | | 4.000% Quarterly | | Specified amount upon credit event noticeB | | | 5,922 | | | 158 | |
| | | | | |
The Goldman Sachs Group, Inc.
(iBoxx HY 4)1 | | June 20, 2010 | | Specified amount upon credit event noticeD | | 3.400%
Quarterly | | | 2,200 | | | 156 | |
210
Semi-Annual Report to Shareholders
| | | | | | | | | | | | | |
| Western Asset Core Plus Bond Portfolio—Continued | |
Agreement With: | | Termination Date | | The Fund Agrees to Pay | | The Fund Will Receive | | Contract
Notional Amount | | Unrealized
Appreciation/
(Depreciation) | |
| | | | | | | | | | | | | |
The Goldman Sachs Group, Inc.
(iBoxx HY 5)1 | | December 20, 2010 | | Specified amount upon credit event noticeD | | 2.000%
Quarterly | | $ | 8,160 | | $ | 215 | |
| | | | | |
The Goldman Sachs Group, Inc.
(iBoxx HY 5)1 | | December 20, 2010 | | Specified amount upon credit event noticeD | | 2.000%
Quarterly | | | 9,714 | | | 427 | |
| | | | | |
The Goldman Sachs Group, Inc.
(iBoxx HY 5)1 | | December 20, 2010 | | 3.950%
Quarterly | | Specified amount upon credit event noticeB | | | 8,342 | | | 114 | |
| | | | | |
The Goldman Sachs Group, Inc.
(iBoxx HY 6)1 | | June 20, 2011 | | 3.450%
Quarterly | | Specified amount upon credit event noticeB | | | 8,700 | | | 116 | |
| | | | | |
The Goldman Sachs Group, Inc.
(iBoxx HY 6)1 | | June 20, 2011 | | 3.450%
Quarterly | | Specified amount upon credit event noticeB | | | 7,800 | | | 65 | |
| | | | | |
The Goldman Sachs Group, Inc.
(iBoxx HY 6)1 | | June 20, 2011 | | 3.450%
Quarterly | | Specified amount upon credit event noticeB | | | 7,400 | | | 62 | |
| | | | | |
The Goldman Sachs Group, Inc.
(iBoxx HY 6B)1 | | June 20, 2011 | | 3.000%
Quarterly | | Specified amount upon credit event noticeB | | | 4,800 | | | 97 | |
| | | | | |
The Goldman Sachs Group, Inc.
(iBoxx HY 6B)1 | | June 20, 2011 | | 3.000%
Quarterly | | Specified amount upon credit event noticeB | | | 18,200 | | | 129 | |
| | | | | |
The Goldman Sachs Group, Inc.
(iBoxx HY 6B)1 | | June 20, 2011 | | 3.000%
Quarterly | | Specified amount upon credit event noticeB | | | 18,200 | | | 175 | |
| | | | | |
The Goldman Sachs Group, Inc.
(iBoxx HY 6B)1 | | June 20, 2011 | | Specified amount upon credit event noticeD | | 3.000%
Quarterly | | | 15,000 | | | 78 | |
| | | | | |
The Goldman Sachs Group, Inc.2 | | September 14, 2007 | | 3-month LIBORF | | 3.215%
Semi-annually | | | 37,270 | | | (731 | ) |
| | | | | |
The Goldman Sachs Group, Inc.2 | | March 10, 2009 | | 3-month LIBORF | | 4.360%
Semi-annually | | | 74,400 | | | (678 | ) |
| | | | | |
The Goldman Sachs Group, Inc.2 | | September 24, 2009 | | 3.714%
Semi-annually | | 3-month LIBORF | | | 100,000 | | | 3,692 | |
| | | | | |
The Goldman Sachs Group, Inc.2 | | July 7, 2011 | | 3-month LIBORF | | 5.713%
Semi-annually | | | 113,400 | | | 3,023 | |
| | | | | | | | | | | | | |
| | | | | | | | $ | 3,116,205 | | $ | 39,602 | |
| | | | | | | | | | | | | |
211
Semi-Annual Report to Shareholders
Notes to Financial Statements—Continued
| | | | | | | | | | | | | |
| Western Asset Inflation Indexed Plus Bond Portfolio | |
Agreement With: | | Termination Date | | The Fund Agrees to Pay | | The Fund Will Receive | | Contract
Notional Amount | | Unrealized
Appreciation/
(Depreciation) | |
| | | | | | | | | | | | | |
Deutsche Bank AG
(iBoxx IG Hi-Vol6)1 | | June 20, 2011 | | Specified amount upon credit event noticeD | | 0.750%
Quarterly | | $ | 28,400 | | $ | 89 | |
| | | | | |
Deutsche Bank AG
(iBoxx HY4)1 | | June 20, 2010 | | Specified amount upon credit event noticeD | | 3.600%
Quarterly | | | 9,600 | | | 429 | |
| | | | | |
J.P. Morgan Chase & Co.
(Ford Motor Credit Company,
7.00%, due 8/15/12)1 | | June 20, 2010 | | Specified amount upon credit event noticeC | | 2.900%
Quarterly | | | 5,000 | | | (73 | ) |
| | | | | |
Merrill Lynch & Co., Inc.
(El Paso Corporation,
7%, due 5/15/11)1 | | June 20, 2010 | | Specified amount upon credit event noticeD | | 3.625%
Quarterly | | | 2,500 | | | 184 | |
| | | | | |
Merrill Lynch & Co., Inc.
(Ford Motor Credit Company,
7.375%, due 10/28/09)1 | | June 20, 2010 | | Specified amount upon credit event noticeC | | 5.500%
Quarterly | | | 2,500 | | | 159 | |
| | | | | |
Merrill Lynch & Co., Inc.
(General Motors Acceptance Corporation,
7.75%, due 1/19/10)1 | | March 20, 2007 | | Specified amount upon credit event noticeC | | 3.550%
Quarterly | | | 5,000 | | | 288 | |
| | | | | |
The Goldman Sachs Group, Inc.
(Eastman Kodak Corporation,
7.25%, due 11/15/13)1 | | March 20, 2011 | | Specified amount upon credit event noticeC | | 2.570%
Quarterly | | | 4,800 | | | 71 | |
| | | | | |
The Goldman Sachs Group, Inc.
(General Motors Acceptance Corporation,
6.875%, due 8/28/12)1 | | June 20, 2010 | | Specified amount upon credit event noticeC | | 4.500% Quarterly | | | 7,500 | | | 674 | |
| | | | | | | | | | | | | |
| | | | | | | | $ | 65,300 | | $ | 1,821 | |
| | | | | | | | | | | | | |
| | | | | | | | | | | | | |
|
| Western Asset Absolute Return Portfolio | |
Agreement With: | | Termination Date | | The Fund Agrees to Pay | | The Fund Will Receive | | Contract
Notional Amount | | Unrealized
Appreciation/
(Depreciation) | |
| | | | | | | | | | | | | |
Banc of America
(D.R. Horton Inc.,
6.875%, due 5/01/13)1 | | June 20, 2013 | | 1.250%
Quarterly | | Specified amount upon credit event noticeB | | $ | 100 | | $ | (0 | ) |
| | | | | |
Banc of America
(Harrahs Operating Co.,
5.375%, due 12/15/13)1 | | June 20, 2016 | | 1.258%
Quarterly | | Specified amount upon credit event noticeB | | | 120 | | | 2 | |
| | | | | |
Banc of America
(PHH Corp.,
7.125%, due 3/01/13)1 | | March 20, 2013 | | 1.050%
Quarterly | | Specified amount upon credit event noticeB | | | 110 | | | (0.4 | ) |
212
Semi-Annual Report to Shareholders
| | | | | | | | | | | | | |
| Western Asset Absolute Return Portfolio—Continued | |
Agreement With: | | Termination Date | | The Fund Agrees to Pay | | The Fund Will Receive | | Contract
Notional Amount | | Unrealized
Appreciation/
(Depreciation) | |
| | | | | | | | | | | | | |
Banc of America Securities LLC2 | | May 1, 2013 | | 5.110%
Semi-annually | | 3-month LIBORF | | $ | 100 | | $ | (0 | ) |
| | | | | |
Banc of America Securities LLC2 | | June 1, 2016 | | 5.263%
Semi-annually | | 3-month LIBORF | | | 120 | | | (1 | ) |
| | | | | |
Credit Suisse First Boston USA
(Amerisource Bergen Corp.,
8.125%, due 9/01/08)1 | | September 20, 2015 | | 0.900%
Quarterly | | Specified amount upon credit event noticeB | | | 50 | | | (0.1 | ) |
| | | | | |
Credit Suisse First Boston USA
(Centex Corp.,
5.25%, due 6/15/15)1 | | September 20, 2013 | | 0.780%
Quarterly | | Specified amount upon credit event noticeB | | | 350 | | | 1 | |
| | | | | |
Credit Suisse First Boston USA
(Starwood Hotels Resorts,
7.875%, due 8/25/34)1 | | December 20, 2011 | | 1.370%
Quarterly | | Specified amount upon credit event noticeB | | | 100 | | | (1 | ) |
| | | | | |
Credit Suisse First Boston USA2 | | May 1, 2012 | | 5.085%
Semi-annually | | 3-month LIBORF | | | 100 | | | 0 | |
| | | | | |
Credit Suisse First Boston USA2 | | October 1, 2013 | | 5.204%
Semi-annually | | 3-month LIBORF | | | 300 | | | (1 | ) |
| | | | | |
Credit Suisse First Boston USA2 | | September 15, 2015 | | 5.160%
Semi-annually | | 3-month LIBORF | | | 50 | | | (0 | ) |
| | | | | |
Deutsche Bank AG
(Supervalu Inc.,
7.5%, due 5/15/12)1 | | September 20, 2009 | | 1.200%
Quarterly | | Specified amount upon credit event noticeE | | | 330 | | | (1 | ) |
| | | | | |
Deutsche Bank AG2 | | August 1, 2009 | | 4.985%
Semi-annually | | 3-month LIBORF | | | 300 | | | 1 | |
| | | | | |
Lehman Brothers Holdings Inc.
(Sara Lee Corp.,
6.125%, due 11/01/32)1 | | December 20, 2011 | | 1.370%
Quarterly | | Specified amount upon credit event noticeB | | | 150 | | | 0.1 | |
| | | | | |
Lehman Brothers | | September 15, 2011 | | 5.193%
Semi-annually | | 3-month LIBORF | | | 150 | | | (1 | ) |
| | | | | | | | | | | | | |
| | | | | | | | $ | 2,430 | | $ | (1 | ) |
| | | | | | | | | | | | | |
| B | | Upon bankruptcy or failure to make a scheduled interest payment, the Fund will receive $1,000. |
| C | | Upon bankruptcy or failure to make a scheduled interest payment, the Fund will pay $1,000; upon default, the Fund will pay $10,000. |
| D | | Upon bankruptcy or failure to make a scheduled interest payment, the Fund will pay $1,000. |
| E | | Upon bankruptcy or failure to make a scheduled interest payment, the Fund will receive $1,000; upon default, the Fund will receive $10,000. |
| F | | As of September 30, 2006, the one- and three-month London Interbank Offered Rates were 5.32% and 5.37%, respectively. |
4. Securities Loaned:
Each Fund may lend its securities to approved brokers to earn additional income and will receive cash and U.S. government securities as collateral against the loans. Cash collateral received is invested in a money market pooled account by each Fund’s lending agent. Collateral is maintained over the life of the loan in an amount not less than 100% of the value of the loaned securities. At September 30, 2006, collateral for securities on loan by Core and Core Plus consisted of $673,701 and $1,703,026, in money market pooled accounts and investments in U.S. government securities, which were valued at $10,865 and $31,644, respectively.
213
Semi-Annual Report to Shareholders
Notes to Financial Statements—Continued
5. Transactions With Affiliates:
Each Fund has an investment management agreement with Legg Mason Fund Adviser, Inc. (“LMFA”). Western Asset Management Company (“Western Asset”) is the investment adviser to Limited Duration, Intermediate, Intermediate Plus, Core, Core Plus, Inflation Indexed, High Yield, and Absolute Return. Western Asset Management Company Limited (“WAML”) is the investment adviser to Non-U.S. and shares advisory responsibilities with Western Asset for Intermediate Plus, Core Plus, Inflation Indexed, and Absolute Return. Pursuant to their respective agreements, LMFA provides the Funds with management and administrative services for which each Fund pays a fee, computed daily and payable monthly, at annual rates of each Fund’s average daily net assets. LMFA, Western Asset and WAML have voluntarily agreed to waive their fees and reimburse the Funds to the extent each Fund’s expenses (exclusive of taxes, interest, brokerage and extraordinary expenses) exceed during any month certain annual rates of each Fund’s average daily net assets. Western Asset and WAML have also agreed to waive their advisory fees (which are paid by LMFA, and not the Funds) in corresponding amounts. Any amounts waived or reimbursed in a particular fiscal year will be subject to repayment by a Fund to LMFA, Western Asset and WAML, to the extent that from time to time during the next three fiscal years the repayment will not cause a Fund’s expenses to exceed the limit set forth by LMFA, Western Asset and WAML. The following chart shows annual rates of management fees, expense limits, management fees waived and potential fees which may be recaptured for each Fund.
| | | | | | | | | | | | | | | | | | |
| | | Asset
Breakpoint
for Management
Fee | | Management
Fee | | | Asset
Breakpoint
for Expense
Limitation | | Expense
Limitation | | | Six Months
Ended
September 30,
2006 | | | Maximum
Amount
Subject to
Recapture | |
Fund | | | | | | Management
Fees (Waived)/
Recaptured | | |
Limited Duration | | All asset levels | | 0.350 | % | | All asset levels | | 0.40 | % | | $ | (72 | ) | | $ | (375 | ) |
| | | | | | |
Intermediate | | All asset levels | | 0.400 | % | | All asset levels | | 0.45 | % | | | (65 | ) | | | (246 | ) |
| | | | | | |
Intermediate Plus | | All asset levels | | 0.400 | % | | All asset levels | | 0.45 | % | | | (81 | ) | | | (384 | ) |
| | | | | | |
Core | | | | | | | | | | | | | | | | | | |
Institutional Class | | Up to $500 million | | 0.450 | % | | All asset levels | | 0.50 | % | | | — | | | | — | |
| | Next $500 million | | 0.425 | % | | All asset levels | | | | | | | | | | | |
| | In excess of $1 billion | | 0.400 | % | | All asset levels | | | | | | | | | | | |
| | | | | | |
Financial Intermediary Class | | Up to $500 million | | 0.450 | % | | All asset levels | | 0.75 | % | | | — | | | | — | |
| | Next $500 million | | 0.425 | % | | All asset levels | | | | | | | | | | | |
| | In excess of $1 billion | | 0.400 | % | | All asset levels | | | | | | | | | | | |
| | | | | | |
Core Plus | | | | | | | | | | | | | | | | | | |
Institutional Class | | Up to $500 million | | 0.450 | % | | All asset levels | | 0.45 | % | | | — | | | | — | |
| | Next $500 million | | 0.425 | % | | All asset levels | | | | | | | | | | | |
| | In excess of $1 billion | | 0.400 | % | | All asset levels | | | | | | | | | | | |
| | | | | | |
Financial Intermediary Class | | Up to $500 million | | 0.450 | % | | All asset levels | | 0.70 | % | | | — | | | | — | |
| | Next $500 million | | 0.425 | % | | All asset levels | | | | | | | | | | | |
| | In excess of $1 billion | | 0.400 | % | | All asset levels | | | | | | | | | | | |
| | | | | | |
Inflation Indexed | | All asset levels | | 0.200 | % | | All asset levels | | 0.25 | % | | | (109 | ) | | | (287 | ) |
| | | | | | |
High Yield | | All asset levels | | 0.550 | % | | All asset levels | | 0.65 | % | | | — | | | | — | |
| | | | | | |
Non-U.S. | | All asset levels | | 0.450 | % | | All asset levels | | 0.55 | % | | | (77 | ) | | | (356 | ) |
| | | | | | |
Absolute Return | | | | | | | | | | | | | | | | | | |
Institutional Class | | All asset levels | | 0.750 | % | | Up to $300,000 In excess of $300,000 | | 0.80
1.10 | %
% | | | (74 | ) | | | (74 | ) |
| | | | | | |
Financial Intermediary Class | | All asset levels | | 0.750 | % | | Up to $300,000 In excess of $300,000 | | 1.05
1.35 | %
% | | | — | | | | — | |
214
Semi-Annual Report to Shareholders
Legg Mason Investor Services, LLC (“LMIS”) serves as distributor of the Funds’ shares. LMIS receives from each Fund an annual distribution fee of 0.25% of the average daily net assets of the Financial Intermediary Class of each Fund, computed daily and payable monthly.
LMFA, Western Asset, WAML and LMIS are wholly owned subsidiaries of Legg Mason, Inc.
6. Fund Share Transactions:
At September 30, 2006, there were 13.1 billion shares of common stock of the Corporation authorized at $.001 par value. Transactions in Fund shares were as follows:
| | | | | | | | | | | | | | | | | | | | | | | | |
| | | Sold | | Reinvestment
of Dividends | | Repurchased | | | Net Change | |
| | | Shares | | Amount | | Shares | | Amount | | Shares | | | Amount | | | Shares | | | Amount | |
Limited Duration | | | | | | | | | | | | | | | | | | | | | | | | |
—Institutional Class | | | | | | | | | | | | | | | | | | | | | | | | |
Six Months Ended September 30, 2006 | | 2,373 | | $ | 23,273 | | 181 | | $ | 1,770 | | (1,003 | ) | | $ | (9,800 | ) | | 1,551 | | | $ | 15,243 | |
Year Ended Mar. 31, 2006 | | 8,501 | | $ | 84,143 | | 270 | | $ | 2,657 | | (4,989 | ) | | $ | (49,138 | ) | | 3,782 | | | $ | 37,662 | |
| | | | | | | | |
Intermediate | | | | | | | | | | | | | | | | | | | | | | | | |
—Institutional Class | | | | | | | | | | | | | | | | | | | | | | | | |
Six Months Ended September 30, 2006 | | 7,715 | | $ | 78,607 | | 1,371 | | $ | 13,994 | | (24,175 | ) | | $ | (246,294 | ) | | (15,089 | ) | | $ | (153,693 | ) |
Year Ended Mar. 31, 2006 | | 21,900 | | $ | 228,223 | | 3,348 | | $ | 34,866 | | (15,656 | ) | | $ | (162,436 | ) | | 9,592 | | | | 100,653 | |
| | | | | | | | |
Intermediate Plus | | | | | | | | | | | | | | | | | | | | | | | | |
—Institutional Class | | | | | | | | | | | | | | | | | | | | | | | | |
Six Months Ended September 30, 2006 | | 1,732 | | $ | 16,867 | | 172 | | $ | 1,673 | | (518 | ) | | $ | (5,021 | ) | | 1,386 | | | $ | 13,519 | |
Year Ended Mar. 31, 2006 | | 3,608 | | $ | 35,668 | | 194 | | $ | 1,917 | | (748 | ) | | $ | (7,371 | ) | | 3,054 | | | $ | 30,214 | |
| | | | | | | | |
Core | | | | | | | | | | | | | | | | | | | | | | | | |
—Institutional Class | | | | | | | | | | | | | | | | | | | | | | | | |
Six Months Ended September 30, 2006 | | 38,525 | | $ | 424,255 | | 8,863 | | $ | 97,914 | | (46,262 | ) | | $ | (508,438 | ) | | 1,126 | | | $ | 13,731 | |
Year Ended Mar. 31, 2006 | | 130,793 | | $ | 1,480,041 | | 14,372 | | $ | 162,380 | | (51,441 | ) | | $ | (582,015 | ) | | 93,724 | | | $ | 1,060,406 | |
—Financial Intermediary Class | | | | | | | | | | | | | | | | | | | | | | | | |
Six Months Ended September 30, 2006 | | 64,140 | | $ | 704,088 | | 1,535 | | $ | 17,011 | | (9,200 | ) | | $ | (101,798 | ) | | 56,475 | | | $ | 619,301 | |
Year Ended Mar. 31, 2006 | | 15,127 | | $ | 171,088 | | 1,215 | | $ | 13,731 | | (7,204 | ) | | $ | (81,179 | ) | | 9,138 | | | $ | 103,640 | |
| | | | | | | | |
Core Plus | | | | | | | | | | | | | | | | | | | | | | | | |
—Institutional Class | | | | | | | | | | | | | | | | | | | | | | | | |
Six Months Ended September 30, 2006 | | 228,773 | | $ | 2,354,983 | | 15,773 | | $ | 162,216 | | (76,034 | ) | | $ | (777,843 | ) | | 168,512 | | | $ | 1,739,356 | |
Year Ended Mar. 31, 2006 | | 296,675 | | $ | 3,113,891 | | 25,658 | | $ | 268,904 | | (82,917 | ) | | $ | (866,842 | ) | | 239,416 | | | $ | 2,515,953 | |
| | | | | | | | |
—Financial Intermediary Class | | | | | | | | | | | | | | | | | | | | | | | | |
Six Months Ended September 30, 2006 | | 13,490 | | $ | 138,258 | | 1,187 | | $ | 12,199 | | (10,005 | ) | | $ | (102,470 | ) | | 4,672 | | | $ | 47,987 | |
Year Ended Mar. 31, 2006 | | 36,104 | | $ | 378,970 | | 1,537 | | $ | 16,071 | | (6,683 | ) | | $ | (69,850 | ) | | 30,958 | | | $ | 325,191 | |
| | | | | | | | |
Inflation Indexed | | | | | | | | | | | | | | | | | | | | | | | | |
—Institutional Class | | | | | | | | | | | | | | | | | | | | | | | | |
Six Months Ended September 30, 2006 | | 3,277 | | $ | 33,460 | | 1,670 | | $ | 17,047 | | (1,653 | ) | | $ | (16,834 | ) | | 3,294 | | | $ | 33,673 | |
Year Ended Mar. 31, 2006 | | 8,808 | | $ | 91,926 | | 2,501 | | $ | 26,549 | | (1,335 | ) | | $ | (14,411 | ) | | 9,974 | | | $ | 104,064 | |
215
Semi-Annual Report to Shareholders
Notes to Financial Statements—Continued
| | | | | | | | | | | | | | | | | | | | | | |
| | | Sold | | Reinvestment
of Dividends | | Repurchased | | | Net Change |
| | | Shares | | Amount | | Shares | | Amount | | Shares | | | Amount | | | Shares | | Amount |
| | | | | | | | |
High Yield | | | | | | | | | | | | | | | | | | | | | | |
—Institutional Class | | | | | | | | | | | | | | | | | | | | | | |
Six Months Ended September 30, 2006 | | 3,292 | | $ | 34,108 | | 2,530 | | $ | 25,576 | | (1,084 | ) | | $ | (11,095 | ) | | 4,738 | | $ | 48,589 |
Year Ended Mar. 31, 2006 | | 22,272 | | $ | 227,228 | | 3,705 | | $ | 37,311 | | (7,754 | ) | | $ | (78,717 | ) | | 18,223 | | $ | 185,822 |
| | | | | | | | |
Non-U.S. | | | | | | | | | | | | | | | | | | | | | | |
—Institutional Class | | | | | | | | | | | | | | | | | | | | | | |
Six Months Ended September 30, 2006 | | 4,353 | | $ | 41,216 | | 193 | | $ | 1,792 | | (599 | ) | | $ | (5,669 | ) | | 3,947 | | $ | 37,339 |
Year Ended Mar. 31, 2006 | | 2,472 | | $ | 24,939 | | 1,316 | | $ | 12,870 | | (2,480 | ) | | $ | (27,754 | ) | | 1,308 | | $ | 10,055 |
| | | | | | | | |
Absolute Return | | | | | | | | | | | | | | | | | | | | | | |
—Institutional Class | | | | | | | | | | | | | | | | | | | | | | |
Period Ended September 30, 2006A | | 8,400 | | $ | 84,610 | | 58 | | $ | 586 | | (221 | ) | | $ | (2,250 | ) | | 8,237 | | $ | 82,946 |
| | | | | | | | |
—Financial Intermediary Class | | | | | | | | | | | | | | | | | | | | | | |
Period Ended September 30, 2006B | | 2 | | $ | 17 | | — | | $ | — | | — | | | $ | — | | | 2 | | $ | 17 |
| | | | | | | | | | | | | | | | | | | | | | | |
| A | | For the period July 6, 2006 (commencement of operations) to September 30, 2006. |
| B | | For the period September 6, 2006 (commencement of operations) to September 30, 2006. |
7. Recent Accounting Pronouncements
During June 2006, the Financial Accounting Standards Board (“FASB”) issued FASB Interpretation 48 (“FIN 48” or the “Interpretation”), Accounting for Uncertainty in Income Taxes—an interpretation of FASB statement 109. FIN 48 supplements FASB Statement 109, Accounting for Income Taxes and prescribes a comprehensive model for how a fund should recognize, measure, present, and disclose in its financial statements uncertain tax positions that the fund has taken or expects to take on a tax return. FIN 48 requires that the tax effects of a position be recognized only if it is “more likely than not” to be sustained based solely on its technical merits. Management must be able to conclude that the tax law, regulations, case law, and other objective information regarding the technical merits sufficiently support the position’s sustainability with a likelihood of more than 50 percent. FIN 48 is effective for fiscal periods beginning after December 15, 2006. At adoption, the financial statements must be adjusted to reflect only those tax positions that are more likely than not to be sustained as of the adoption date.
On September 20, 2006, the FASB released Statement of Financial Accounting Standards No. 157 “Fair Value Measurements” (“FAS 157”). FAS 157 establishes an authoritative definition of fair value, sets out a framework for measuring fair value, and requires additional disclosures about fair-value measurements. The application of FAS 157 is required for fiscal years beginning after November 15, 2007 and interim periods within those fiscal years.
At this time, the Funds’ manager is evaluating the implications of FIN 48 and FAS 157, and their impact on the financial statements has not yet been determined.
216
Semi-Annual Report to Shareholders
Board Consideration of the Management and Advisory Agreements with respect to the
Absolute Return Portfolio
The Board of Directors, including a majority of the Independent Directors, considered and approved the Investment Management Agreement between Western Asset Funds, Inc. (the “Corporation”) and Legg Mason Fund Adviser, Inc. (“LMFA”), the Investment Advisory Agreement between LMFA and Western Asset Management Company (“Western Asset”) and the Investment Advisory Agreement between LMFA and Western Asset Management Company Limited (“WAML”) (collectively, the “Agreements”) with respect to the Western Asset Absolute Return Portfolio (the “Fund”) at an in-person meeting held on May 9, 2006.
In arriving at their decision to approve the Agreements, the Directors met with representatives of Western Asset and WAML (together, the “Advisers”), including relevant investment advisory personnel as well as representatives of LMFA, and reviewed information prepared by LMFA and the Advisers and materials provided by counsel to the Independent Directors. Additionally, the Directors noted that they were familiar with LMFA and the Advisers in their capacity as Directors with respect to the other funds of the Corporation.
As part of their review, the Directors examined the Advisers’ ability to provide high quality investment management services to the Fund. The Directors considered the investment philosophy and research and decision-making processes of each Adviser; the experience of its key advisory personnel responsible for management of the Fund; the ability of the Advisers to attract and retain capable research and advisory personnel; the capability and integrity of the Advisers’ senior management and staff; and the level of skill required to manage the Fund. In addition, the Directors reviewed the expected nature, cost, scope and quality of LMFA and the Advisers’ services under the Agreements, including with respect to regulatory compliance and compliance with the investment policies of the Fund, as well as the provision of such services by LMFA and the Advisers to other funds of the Corporation. The Directors also considered conditions that might affect LMFA or an Adviser’s ability to provide high quality services to the Fund in the future under the Agreements, including LMFA and each Adviser’s business reputation, financial condition and operational stability. Based on the foregoing, the Directors concluded that the Advisers’ investment process, research capabilities and philosophy were well suited to the Fund given the Fund’s investment objectives and policies, and that LMFA and each of the Advisers would be able to meet any reasonably foreseeable obligations under the Agreements.
Because the Fund had not yet commenced operations at the time of consideration of the Agreements, it had no past investment performance to be reviewed by the Directors. The Directors did, however, review information regarding the performance of client accounts overseen by Western Asset and WAML with investment strategies similar to those of the Fund.
The Directors also considered the management fees and total expenses payable by the Fund under the Agreements. They reviewed information concerning management fees paid to investment advisers of similarly-managed funds, as well as fees paid by the Advisers’ other clients, including separate accounts managed by the Advisers with investment strategies similar to those of the Fund. The Directors observed that the management fee to be paid by the Fund was generally comparable to the average of its respective peer group. The Directors noted that the management fee to be paid by the Fund would be generally higher than the fees paid by clients of the Advisers for accounts with similar investment strategies, but that the administrative and operational responsibilities for the Advisers with respect to the Fund would also be relatively higher. In light of these differences, the Directors concluded that the differences in management fees were reasonable.
The Directors did not consider historical information about the profitability of the Fund to LMFA and the Advisers since the Fund had not yet commenced operations. However, the Directors noted that they were familiar with LMFA and the Advisers’ profitability with respect to the other funds of the Corporation. The Directors further evaluated the potential benefits of the advisory relationship to LMFA and the Advisers, including, among others, the direct and indirect benefits that LMFA and each Adviser may receive from its relationship with the Fund, including any so-called “fallout benefits” to LMFA or the Advisers, such as reputational value derived from serving as investment manager or adviser, and the affiliations between LMFA, the Advisers and certain service providers for the Fund.
Finally, the Directors considered the extent to which economies of scale might be realized by LMFA and the Advisers as the assets of the Fund grow. They further concluded that, if the Fund’s assets were to grow to a level at which LMFA and the Advisers potentially may realize economies of scale from any future growth in the Fund, the Directors would discuss with LMFA and the Advisers whether it would be appropriate to implement fee breakpoints to capture a portion of any economies of scale for the benefit of the Fund’s shareholders.
217
Semi-Annual Report to Shareholders
Board Consideration of the Management and Advisory Agreements with respect to the
Absolute Return Portfolio—Continued
In their deliberations with respect to these matters, the Independent Directors were advised by their independent counsel, who are independent of LMFA and the Advisers within the meaning of the Securities and Exchange Commission rules regarding the independence of counsel. The Independent Directors weighed the foregoing matters in light of the advice given to them by their independent counsel as to the law applicable to the review of investment advisory contracts. In arriving at a decision, the Directors, including the Independent Directors, did not identify any single matter as all-important or controlling, and the foregoing summary does not detail all the matters considered. The Directors judged the terms and conditions of the Agreements, including the investment advisory fees, in light of all of the surrounding circumstances.
Based upon their review, the Directors, including all of the Independent Directors, determined, in the exercise of their business judgment, that they were satisfied with the expected quality of investment advisory services to be provided by each Adviser; that the fees to be paid to the Advisers and LMFA under the Agreements were fair and reasonable, given the scope and expected quality of the services to be rendered by the Advisers and LMFA; and that approval of the Agreements was in the best interest of the Corporation and its shareholders.
218
Semi-Annual Report to Shareholders
Stockholder Meeting Results (amounts not in thousands)
An Annual Meeting of the Stockholders of Western Asset Funds, Inc. was held on May 9, 2006 for the purpose of electing a Board of Directors, approving a change to the classification of the investment objective of each of Intermediate and Core, approving the elimination of Core’s fundamental investment restriction with respect to pledging assets, approving an amendment to Core’s fundamental investment restriction with respect to investments in commodities and approving the elimination of Core’s fundamental investment restriction with respect to margin transactions. Because a quorum was not present with respect to any of the proposals, the meeting was adjourned until June 9, 2006.
A continuation of the Annual Meeting of the Stockholders of Western Asset Funds, Inc. was held on June 9, 2006. Although a quorum was present with respect to each proposal, sufficient votes in favor of each proposal other than the election of directors had not been received, and the meeting was adjourned with until July 14, 2006 with respect to each proposal other than the election of directors. The following actions were taken were taken at the June 9, 2006 meeting:
| | | | |
| | | For | | Withheld |
Election of Directors: | | | | |
Ronald J. Arnault | | 438,540,473 | | 7,636,185 |
John E. Bryson | | 392,064,857 | | 54,111,801 |
Anita L. DeFrantz | | 437,176,664 | | 8,999,994 |
Michael Even* | | 438,730,118 | | 7,446,540 |
Ronald L. Olson | | 438,641,905 | | 7,534,753 |
William E.B. Siart | | 438,614,806 | | 7,561,852 |
Louis A. Simpson | | 436,461,555 | | 9,715,103 |
Jaynie Miller Studenmund | | 436,767,479 | | 9,409,179 |
| * | | Michael Even resigned effective with his election to the Board. |
At the continuation of the Annual Meeting of the Stockholders of Western Asset Funds, Inc. held on July 14, 2006 the following actions were taken:
The change to the classification of the investment objectives of each of Intermediate and Core were not approved:
| | | | | | |
| | | Shares Voted
In Favor | | Shares Voted
Against | | Abstained |
Intermediate Bond Portfolio | | 27,950,635 | | 13,397,149 | | 6,572,220 |
Core Bond Portfolio | | 130,875,457 | | 55,389,522 | | 21,457,701 |
The elimination/amendment to certain of Core’s fundamental investment restrictions were each approved:
| | | | | | |
| | | Shares Voted
In Favor | | Shares Voted
Against | | Abstained |
Eliminate investment restriction with respect to pledging assets | | 181,326,162 | | 20,002,177 | | 6,394,341 |
Approve amendment to investment restriction with respect to investments in commodities | | 164,158,079 | | 37,223,252 | | 6,341,349 |
Eliminate fundamental investment restriction with respect to margin transactions | | 161,287,083 | | 40,035,013 | | 6,400,584 |
219
Semi-Annual Report to Shareholders
Privacy Policy
We are committed to keeping nonpublic personal information about you secure and confidential. This notice is intended to help you understand how we fulfill this commitment.
From time to time, we may collect a variety of personal information about you, including:
| | • | | Information we receive from you on applications and forms, via the telephone, and through our websites; |
| | • | | Information about your transactions with us, our affiliates, or others (such as your purchases, sales, or account balances); and |
| | • | | Information we receive from consumer reporting agencies. |
We do not disclose your nonpublic personal information, except as permitted by applicable law or regulation. For example, we may share this information with others in order to process your transactions. We may also provide this information to companies that perform services on our behalf, such as printing and mailing, or to other financial institutions with whom we have joint marketing agreements. We will require these companies to protect the confidentiality of this information and to use it only to perform the services for which we hired them.
With respect to our internal security procedures, we maintain physical, electronic, and procedural safeguards to protect your nonpublic personal information, and we restrict access to this information.
If you decide at some point either to close your account(s) or become an inactive customer, we will continue to adhere to our privacy policies and practices with respect to your nonpublic personal information.
This notice is being provided on behalf of:
Western Asset Funds, Inc.
Western Asset Funds, Inc.
The Board of Directors
William E. B. Siart, Chairman
Ronald J. Arnault
John E. Bryson
Anita L. DeFrantz
R. Jay Gerken
Ronald L. Olson
Louis A. Simpson
Jaynie Miller Studenmund
Officers
James W. Hirschmann, President
D. Daniel Fleet, Vice President
Gavin L. James, Vice President
S. Kenneth Leech, Vice President
Stephen A. Walsh, Vice President
Susanne D. Wilson, Vice President
Marie K. Karpinski, Principal Financial and Accounting Officer
Erin K. Morris, Treasurer
Amy M. Olmert, Chief Compliance Officer
Lisa G. Mrozek, Secretary
Investment Manager
Legg Mason Fund Adviser, Inc.
P.O. Box 17635
Baltimore, Maryland 21297-1635
Investment Advisers
Western Asset Management Company
385 East Colorado Boulevard
Pasadena, California 91101
Western Asset Management Company Limited
10 Exchange Square
London, England EC2A2EN
Transfer and Shareholder Servicing Agent
Boston Financial Data Services
66 Brooks Drive
Braintree, Massachusetts 02184
Custodian
State Street Bank & Trust Company
P.O Box 1031
Boston, Massachusetts 02103
Counsel
Ropes & Gray LLP
45 Rockefeller Plaza
New York, New York 10111
Independent Registered Public Accounting Firm
PricewaterhouseCoopers LLP
250 West Pratt Street
Baltimore, Maryland 21201
Information about the policies and procedures that each Fund uses to determine how to vote proxies relating to each Fund’s portfolio securities is contained in the Statement of Additional Information, available upon request without charge by calling 1-888-425-6432 or on the Securities and Exchange Commission’s (“SEC”) website (http://www.sec.gov). Information regarding how the Funds voted proxies relating to portfolio securities during the most recent twelve-month period ended June 30 is also available on the SEC’s website or without charge through www.westernassetfunds.com.
Each Fund files a complete schedule of portfolio holdings with the SEC for the first and third quarters of each fiscal year on Form N-Q. Each Fund’s Form N-Q is available on the Securities and Exchange Commission’s (“SEC”) website (http://www.sec.gov) and may be viewed and copied at the SEC’s Public Reference Room in Washington, D.C. Information about the operation of the Public Reference Room may be obtained by calling 1-800-SEC-0330. Quarterly portfolio holdings are also available upon request by calling 1-888-425-6432 or at www.lminstitutionalfunds.com/fund_information/fund_literature/gbl_literature/proxy_report.asp.
You should consider a fund’s investment objectives, risks, charges, and expenses carefully before investing. For a prospectus, which contains this and other information on any Fund, call 1-888-425-6432 or visit www.westernassetfunds.com. Please read the prospectus carefully before investing.
This report is not to be distributed unless preceded or accompanied by a free prospectus.
Legg Mason Investor Services, LLC, Distributor
Item 2. Code of Ethics.
Not applicable for semi-annual reports.
Item 3. Audit Committee Financial Expert.
Not applicable for semi-annual reports.
Item 4. Principal Accountant Fees and Services.
Not applicable for semi-annual reports.
Item 5. Audit Committee of Listed Registrants.
Not applicable.
Item 6. Schedule of Investments
The schedule of investments in securities of unaffiliated issuers as of the close of the reporting period is included as part of the semi-annual report to shareholders filed under Item 1 hereto.
Page 3 of 5
Item 7. Disclosure of Proxy Voting Policies and Procedures for Closed-End Management Investment Companies.
Not applicable.
Item 8. Portfolio Managers of Closed-End Management Investment Companies.
Not applicable.
Item 9. Purchases of Equity Securities by Closed-End Management Investment Companies and Affiliated Purchasers.
Not applicable.
Item 10. Submission of Matters to a Vote of Security Holders.
There have been no material changes to the procedures by which shareholders may recommend nominees to the Registrant’s Board of Directors that have been implemented since the Registrant last provided disclosure in response to the requirements of this Item 10.
Item 11. Controls and Procedures.
(a) The Registrant’s principal executive and principal financial officers have concluded, based on their evaluation of the Registrant’s disclosure controls and procedures as of a date within 90 days of the filing date of this report, that the Registrant’s disclosure controls and procedures are reasonably designed to ensure that information required to be disclosed by the Registrant on Form N-CSR is recorded, processed, summarized and reported within the required time periods in the Securities and Exchange Commission’s rules and forms and that information required to be disclosed by the Registrant in the reports that it files or submits on Form N-CSR is accumulated and communicated to the Registrant’s management, including its principal executive and principal financial officers, as appropriate to allow timely decisions regarding required disclosure.
(b) There were no changes in the Registrant’s internal control over financial reporting during the Registrant’s second fiscal quarter of the period covered by this report that have materially affected, or are reasonably likely to materially affect, the Registrant’s internal control over financial reporting.
Item 12. Exhibits.
(a) (1) Not applicable for semi-annual reports.
(a) (2) Certifications pursuant to Rule 30a-2(a) under the Investment Company Act of 1940 – filed as an exhibit hereto.
(a) (3) Not applicable.
(b) Certifications pursuant to Rule 30a-2(b) under the Investment Company Act of 1940 – filed as an exhibit hereto.
Page 4 of 5
SIGNATURES
Pursuant to the requirements of the Securities Exchange Act of 1934 and the Investment Company Act of 1940, the Registrant has duly caused this report to be signed on its behalf by the undersigned, thereunto duly authorized.
| | |
Western Asset Funds, Inc. |
| |
By: | | /s/ James W. Hirschmann |
James W. Hirschmann |
President |
Western Asset Funds, Inc. |
| |
Date: | | November 27, 2006 |
Pursuant to the requirements of the Securities Exchange Act of 1934 and the Investment Company Act of 1940, this report has been signed below by the following persons on behalf of the Registrant and in the capacities and on the dates indicated.
| | |
By: | | /s/ James W. Hirschmann |
James W. Hirschmann |
President |
Western Asset Funds, Inc. |
| |
Date: | | November 27, 2006 |
| | |
By: | | /s/ Marie K. Karpinski |
Marie K. Karpinski |
Principal Financial and Accounting Officer |
Western Asset Funds, Inc. |
| |
Date: | | November 20, 2006 |
Page 5 of 5