UNITED STATES
SECURITIES AND EXCHANGE COMMISSION
Washington, D.C. 20549
FORM N-CSR
CERTIFIED SHAREHOLDER REPORT OF REGISTERED
MANAGEMENT INVESTMENT COMPANIES
Investment Company Act file number: 811-06110
Name of Registrant: Western Asset Funds, Inc.
Address of Principal Executive Offices: 385 East Colorado Boulevard, Pasadena, CA 91101
Registrant's telephone number, including area code: (410) 539-0000
Name and address of agent for service:
Richard M. Wachterman, Esq.
Legg Mason Wood Walker, Incorporated
100 Light Street
Baltimore, MD 21202
Date of fiscal year end: March 31, 2008
Date of reporting period: September 30, 2007
Item 1. Report to Shareholders.
Western Asset Funds, Inc.
Western Asset Absolute Return Portfolio
Western Asset Core Bond Portfolio
Western Asset Core Plus Bond Portfolio
Western Asset High Yield Portfolio
Western Asset Inflation Indexed Plus Bond Portfolio
Western Asset Intermediate Bond Portfolio
Western Asset Intermediate Plus Bond Portfolio
Western Asset Limited Duration Bond Portfolio
Western Asset Non-U.S. Opportunity Bond Portfolio
Semi-Annual Report to Shareholders
September 30, 2007
Semi-Annual Report to Shareholders
Expense Example
Western Asset Absolute Return Portfolio
As a shareholder of the Fund, you incur ongoing costs, including management fees, distribution (12b-1) fees on Financial Intermediary Class shares, and other Fund expenses. These examples are intended to help you understand your ongoing costs (in dollars) of investing in the Fund and to compare these costs with the ongoing costs of investing in other mutual funds. Each example is based on an investment of $1,000 invested on April 1, 2007 and held through September 30, 2007.
Actual Expense
The first line for each class in the table below provides information about actual account values and actual expenses for each class. You may use the information in this line, together with the amount you invested, to estimate the expenses that you paid over the period. Simply divide your account value by $1,000 (for example, an $8,600 account value divided by $1,000 = 8.6), then multiply the result by the number in the first line under the heading entitled “Expenses Paid During the Period” to estimate the expenses you paid on your account during this period.
Hypothetical Examples for Comparison Purposes
The second line for each class in the table below provides information about hypothetical account values and hypothetical expenses based on the relevant class’s actual expense ratio and an assumed rate of return of 5% per year before expenses, which is not the class’s actual return. The hypothetical account values and expenses may not be used to estimate the actual ending account balance or expenses you paid for the period. You may use this information to compare the ongoing costs of investing in the Fund and other funds. To do so, compare this 5% hypothetical example with the 5% hypothetical examples for the relevant classes that appear in the shareholder reports of other funds.
| | | | | | | | | |
| | | Beginning
Account Value
4/1/07 | | Ending
Account Value
9/30/07 | | Expenses PaidA
During the Period
4/1/07 to 9/30/07 |
Institutional Class: | | | | | | | | | |
Actual | | $ | 1,000.00 | | $ | 1,016.30 | | $ | 4.80 |
Hypothetical (5% return before expenses) | | | 1,000.00 | | | 1,020.31 | | | 4.81 |
Financial Intermediary Class: | | | | | | | | | |
Actual | | $ | 1,000.00 | | $ | 1,015.00 | | $ | 6.06 |
Hypothetical (5% return before expenses) | | | 1,000.00 | | | 1,019.05 | | | 6.07 |
A | | These calculations are based on expenses incurred in the most recent fiscal half-year. The dollar amounts shown as “Expenses Paid During the Period” are equal to the annualized expense ratios of 0.95% and 1.20% for the Institutional Class and Financial Intermediary Class, respectively, multiplied by the average values over the period, multiplied by the number of days in the most recent fiscal half-year (183), and divided by 365. |
1
Semi-Annual Report to Shareholders
Performance Information
Western Asset Absolute Return Portfolio
The graphs compare the Fund’s total returns to that of two broad-based securities market indices. The graphs illustrate the cumulative total return of an initial $1,000,000 investment in each of the Institutional Class and Financial Intermediary Class of the Fund, for the periods indicated. The lines for the Fund represent the total return after deducting all Fund investment management and other administrative expenses and the transaction costs of buying and selling securities. The lines representing the securities market indexes do not include any transaction costs associated with buying and selling securities in the indexes or other investment management or administrative expenses.
Total return measures investment performance in terms of appreciation or depreciation in the Fund’s net asset value per share, plus dividends and any capital gain distributions. It assumes that dividends and distributions were reinvested at the time they were paid. Returns (and the graphs and tables found below) do not reflect the deduction of taxes that a shareholder would pay on Fund distributions or the redemption of Fund shares. Average annual returns tend to smooth out variations in a fund’s return, so that they differ from actual year-to-year results.
Bonds are subject to a variety of risks, including interest rate, credit and inflation risk. Non-U.S. investments are subject to currency fluctuations, social, economical and political risk.
Growth of a $1,000,000 Investment—Institutional Class
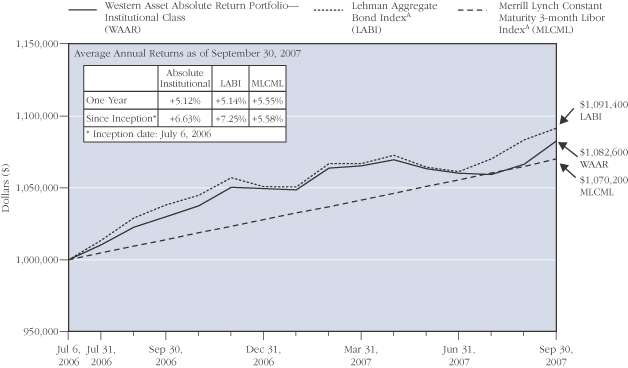
The performance data quoted represents past performance and does not guarantee future results. The performance stated may have been due to extraordinary market conditions, which may not be duplicated in the future. Current performance may be lower or higher than the performance data quoted. To obtain the most recent month-end performance information, please visit www.westernassetfunds.com. The investment return and principal value of the Fund will fluctuate so that an investor’s shares, when redeemed, may be worth more or less than the original cost. Calculations assume reinvestment of dividends and capital gain distributions. Performance would have been lower if fees had not been waived in various periods.
A | | Index returns are for periods beginning June 30, 2006. |
2
Semi-Annual Report to Shareholders
Growth of a $1,000,000 Investment—Financial Intermediary Class
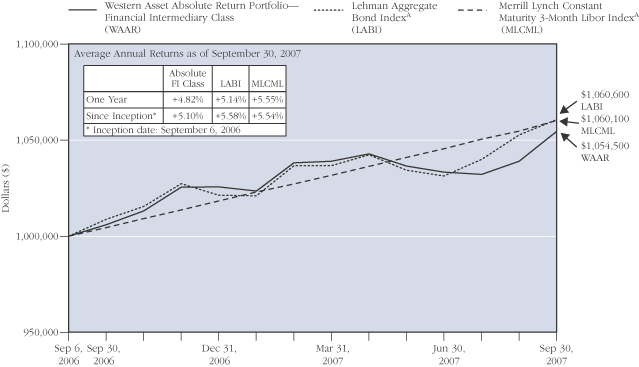
The performance data quoted represents past performance and does not guarantee future results. The performance stated may have been due to extraordinary market conditions, which may not be duplicated in the future. Current performance may be lower or higher than the performance data quoted. To obtain the most recent month-end performance information, please visit www.westernassetfunds.com. The investment return and principal value of the Fund will fluctuate so that an investor’s shares, when redeemed, may be worth more or less than the original cost. Calculations assume reinvestment of dividends and capital gain distributions. Performance would have been lower if fees had not been waived in various periods.
A | | Index returns are for periods beginning August 31, 2006. |
3
Semi-Annual Report to Shareholders
Performance Information—Continued
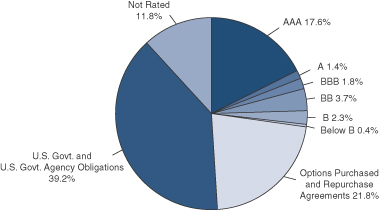
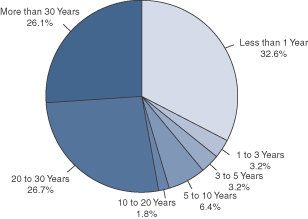
Portfolio Composition (as of September 30, 2007)
Standard & Poor’s Debt RatingsA
(as a percentage of the portfolio)
Maturity Schedule (as a percentage of the portfolio)
A | | Source: Standard & Poor's. |
The Fund is actively managed. As a result, the composition of the portfolio holdings and sectors are subject to change at any time.
4
Semi-Annual Report to Shareholders
Portfolio of Investments
Western Asset Absolute Return Portfolio
September 30, 2007 (Unaudited)
(Amounts in Thousands)
| | | | | | | | | | | | | |
| | | % OF
NET ASSETS | | RATE | | MATURITY
DATE | | PAR/
SHARES† | | VALUE | |
| | | | | | | | | | | | | |
| | | | | | | | | | | | | |
Long-Term Securities | | 95.7% | | | | | | | | | | | |
| | | | | |
Corporate Bonds and Notes | | 10.5% | | | | | | | | | | | |
| | | | | |
Airlines | | 0.1% | | | | | | | | | | | |
Continental Airlines Inc. | | | | 6.820% | | 5/1/18 | | $ | 64 | | $ | 63 | |
Continental Airlines Inc. | | | | 6.703% | | 6/15/21 | | | 69 | | | 69 | |
United Air Lines Inc. | | | | 7.032% | | 10/1/10 | | | 192 | | | 193 | |
United Air Lines Inc. | | | | 7.186% | | 10/1/12 | | | 120 | | | 121 | |
US Airways Pass-Through Trust | | | | 6.850% | | 1/30/18 | | | 315 | | | 310 | |
| | | | | | | | | | | | | |
| | | | | | | | | | | | 756 | |
| | | | | | | | | | | | | |
Auto Components | | 0.1% | | | | | | | | | | | |
Visteon Corp. | | | | 8.250% | | 8/1/10 | | | 500 | | | 440 | |
| | | | | | | | | | | | | |
| | | | | |
Automobiles | | N.M. | | | | | | | | | | | |
Ford Motor Co. | | | | 4.250% | | 12/15/36 | | | 80 | | | 94 | A |
| | | | | | | | | | | | | |
| | | | | |
Building Products | | N.M. | | | | | | | | | | | |
Associated Materials Inc. | | | | 0.000% | | 3/1/14 | | | 155 | | | 98 | B |
Masco Corp. | | | | 7.125% | | 8/15/13 | | | 50 | | | 52 | |
| | | | | | | | | | | | | |
| | | | | | | | | | | | 150 | |
| | | | | | | | | | | | | |
Capital Markets | | 0.5% | | | | | | | | | | | |
Lehman Brothers Holdings Capital Trust VII | | | | 5.857% | | 11/29/49 | | | 40 | | | 38 | B |
Lehman Brothers Holdings Inc. | | | | 6.200% | | 9/26/14 | | | 320 | | | 321 | |
The Bear Stearns Cos. Inc. | | | | 6.950% | | 8/10/12 | | | 2,330 | | | 2,430 | |
| | | | | | | | | | | | | |
| | | | | | | | | | | | 2,789 | |
| | | | | | | | | | | | | |
Commercial Banks | | 0.2% | | | | | | | | | | | |
HSBC Bank PLC | | | | 7.000% | | 11/1/11 | | | 294 | | | 294 | |
HSBC Bank USA | | | | 7.000% | | 11/1/11 | | | 265 | | | 265 | C |
HSBC Bank USA | | | | 7.000% | | 11/1/11 | | | 255 | | | 256 | C |
| | | | | | | | | | | | | |
| | | | | | | | | | | | 815 | |
| | | | | | | | | | | | | |
Commercial Services and Supplies | | 0.1% | | | | | | | | | | | |
Allied Security Escrow Corp. | | | | 11.375% | | 7/15/11 | | | 250 | | | 250 | |
PHH Corp. | | | | 7.125% | | 3/1/13 | | | 110 | | | 116 | |
| | | | | | | | | | | | | |
| | | | | | | | | | | | 366 | |
| | | | | | | | | | | | | |
Consumer Finance | | 3.9% | | | | | | | | | | | |
Ford Motor Credit Co. | | | | 7.375% | | 10/28/09 | | | 4,360 | | | 4,275 | |
Ford Motor Credit Co. | | | | 9.750% | | 9/15/10 | | | 2,000 | | | 2,040 | |
Ford Motor Credit Co. | | | | 9.875% | | 8/10/11 | | | 3,700 | | | 3,748 | |
5
Semi-Annual Report to Shareholders
Portfolio of Investments—Continued
Western Asset Absolute Return Portfolio—Continued
| | | | | | | | | | | | | |
| | | % OF
NET ASSETS | | RATE | | MATURITY
DATE | | PAR/
SHARES† | | VALUE | |
| | | | | | | | | | | | | |
Corporate Bonds and Notes—Continued | | | | | | | | | | | | | |
| | | | | |
Consumer Finance—Continued | | | | | | | | | | | | | |
GMAC LLC | | | | 4.375% | | 12/10/07 | | $ | 915 | | $ | 910 | |
GMAC LLC | | | | 5.850% | | 1/14/09 | | | 1,320 | | | 1,292 | |
GMAC LLC | | | | 6.875% | | 9/15/11 | | | 2,700 | | | 2,569 | |
GMAC LLC | | | | 6.000% | | 12/15/11 | | | 1,600 | | | 1,477 | |
GMAC LLC | | | | 6.625% | | 5/15/12 | | | 1,500 | | | 1,400 | |
GMAC LLC | | | | 8.000% | | 11/1/31 | | | 2,930 | | | 2,875 | |
| | | | | | | | | | | | | |
| | | | | | | | | | | | 20,586 | |
| | | | | | | | | | | | | |
Containers and Packaging | | N.M. | | | | | | | | | | | |
Graham Packaging Co. Inc. | | | | 9.875% | | 10/15/14 | | | 100 | | | 99 | |
Graphic Packaging International Corp. | | | | 9.500% | | 8/15/13 | | | 150 | | | 154 | |
| | | | | | | | | | | | | |
| | | | | | | | | | | | 253 | |
| | | | | | | | | | | | | |
Diversified Financial Services | | 0.6% | | | | | | | | | | | |
Air 2 US | | | | 8.027% | | 10/1/19 | | | 961 | | | 975 | C |
East Lane Re Ltd. | | | | 11.356% | | 5/6/11 | | | 300 | | | 300 | C,D |
El Paso Performance-Linked | | | | 7.750% | | 7/15/11 | | | 340 | | | 349 | C |
Glen Meadow Pass-Through Certificates | | | | 6.505% | | 2/12/67 | | | 100 | | | 96 | B,C |
Sigma Finance Inc. | | | | 8.500% | | 8/11/16 | | | 500 | | | 482 | C,E |
Vanguard Health Holding Co. II LLC | | | | 9.000% | | 10/1/14 | | | 250 | | | 243 | |
ZFS Finance USA Trust II | | | | 6.450% | | 12/15/65 | | | 500 | | | 483 | B,C |
| | | | | | | | | | | | | |
| | | | | | | | | | | | 2,928 | |
| | | | | | | | | | | | | |
Diversified Telecommunication Services | | 0.1% | | | | | | | | | | | |
Level 3 Financing Inc. | | | | 9.250% | | 11/1/14 | | | 500 | | | 492 | |
Qwest Corp. | | | | 7.500% | | 10/1/14 | | | 190 | | | 198 | |
| | | | | | | | | | | | | |
| | | | | | | | | | | | 690 | |
| | | | | | | | | | | | | |
Electric Utilities | | 0.1% | | | | | | | | | | | |
Edison Mission Energy | | | | 7.000% | | 5/15/17 | | | 190 | | | 187 | C |
Edison Mission Energy | | | | 7.200% | | 5/15/19 | | | 250 | | | 246 | C |
Edison Mission Energy | | | | 7.625% | | 5/15/27 | | | 90 | | | 87 | C |
| | | | | | | | | | | | | |
| | | | | | | | | | | | 520 | |
| | | | | | | | | | | | | |
Food and Staples Retailing | | 0.1% | | | | | | | | | | | |
CVS Corp. | | | | 9.350% | | 1/10/23 | | | 500 | | | 569 | C |
CVS Corp. | | | | 5.298% | | 1/11/27 | | | 35 | | | 33 | C |
CVS Lease Pass-Through Trust | | | | 5.880% | | 1/10/28 | | | 45 | | | 43 | C |
CVS Lease Pass-Through Trust | | | | 6.036% | | 12/10/28 | | | 121 | | | 118 | C |
| | | | | | | | | | | | | |
| | | | | | | | | | | | 763 | |
| | | | | | | | | | | | | |
6
Semi-Annual Report to Shareholders
| | | | | | | | | | | | | |
| | | % OF
NET ASSETS | | RATE | | MATURITY
DATE | | PAR/
SHARES† | | VALUE | |
| | | | | | | | | | | | | |
Corporate Bonds and Notes—Continued | | | | | | | | | | | | | |
| | | | | |
Food Products | | 0.1% | | | | | | | | | | | |
H.J. Heinz Co. | | | | 6.428% | | 12/1/08 | | $ | 100 | | $ | 102 | C |
Sara Lee Corp. | | | | 6.250% | | 9/15/11 | | | 150 | | | 155 | |
| | | | | | | | | | | | | |
| | | | | | | | | | | | 257 | |
| | | | | | | | | | | | | |
Gas Utilities | | 0.1% | | | | | | | | | | | |
Suburban Propane Partners LP | | | | 6.875% | | 12/15/13 | | | 500 | | | 487 | |
| | | | | | | | | | | | | |
| | | | | |
Health Care Equipment and Supplies | | N.M. | | | | | | | | | | | |
Advanced Medical Optics Inc. | | | | 7.500% | | 5/1/17 | | | 250 | | | 230 | |
| | | | | | | | | | | | | |
| | | | | |
Health Care Providers and Services | | 0.7% | | | | | | | | | | | |
AmerisourceBergen Corp. | | | | 5.875% | | 9/15/15 | | | 50 | | | 49 | |
Cardinal Health Inc. | | | | 5.800% | | 10/15/16 | | | 60 | | | 59 | C |
DaVita Inc. | | | | 6.625% | | 3/15/13 | | | 500 | | | 496 | |
HCA Inc. | | | | 9.125% | | 11/15/14 | | | 10 | | | 11 | C |
HCA Inc. | | | | 6.500% | | 2/15/16 | | | 893 | | | 759 | |
HCA Inc. | | | | 9.250% | | 11/15/16 | | | 910 | | | 967 | C |
HCA Inc. | | | | 9.625% | | 11/15/16 | | | 599 | | | 639 | C,F |
Tenet Healthcare Corp. | | | | 6.375% | | 12/1/11 | | | 670 | | | 586 | |
Tenet Healthcare Corp. | | | | 9.875% | | 7/1/14 | | | 29 | | | 27 | |
| | | | | | | | | | | | | |
| | | | | | | | | | | | 3,593 | |
| | | | | | | | | | | | | |
Hotels, Restaurants and Leisure | | 0.3% | | | | | | | | | | | |
Buffets Inc. | | | | 12.500% | | 11/1/14 | | | 250 | | | 175 | |
Inn of the Mountain Gods Resort and Casino | | | | 12.000% | | 11/15/10 | | | 200 | | | 211 | |
Las Vegas Sands LLC | | | | 6.950% | | 12/31/07 | | | 800 | | | 778 | |
MGM MIRAGE | | | | 6.625% | | 7/15/15 | | | 140 | | | 133 | |
Starwood Hotels and Resorts Worldwide Inc. | | | | 7.875% | | 5/1/12 | | | 50 | | | 53 | |
| | | | | | | | | | | | | |
| | | | | | | | | | | | 1,350 | |
| | | | | | | | | | | | | |
Independent Power Producers and Energy Traders | | 0.4% | | | | | | | | | | | |
NRG Energy Inc. | | | | 7.375% | | 2/1/16 | | | 250 | | | 251 | |
The AES Corp. | | | | 7.750% | | 3/1/14 | | | 1,800 | | | 1,827 | |
| | | | | | | | | | | | | |
| | | | | | | | | | | | 2,078 | |
| | | | | | | | | | | | | |
Insurance | | N.M. | | | | | | | | | | | |
The Travelers Cos. Inc. | | | | 6.250% | | 3/15/37 | | | 80 | | | 77 | B |
| | | | | | | | | | | | | |
| | | | | |
IT Services | | 0.1% | | | | | | | | | | | |
SunGard Data Systems Inc. | | | | 10.250% | | 8/15/15 | | | 250 | | | 261 | |
| | | | | | | | | | | | | |
7
Semi-Annual Report to Shareholders
Portfolio of Investments—Continued
Western Asset Absolute Return Portfolio—Continued
| | | | | | | | | | | | | | |
| | | % OF
NET ASSETS | | RATE | | MATURITY
DATE | | PAR/
SHARES† | | | VALUE | |
| | | | | | | | | | | | | | |
Corporate Bonds and Notes—Continued | | | | | | | | | | | | | | |
| | | | | |
Leisure Equipment and Products | | 0.4% | | | | | | | | | | | | |
Eastman Kodak Co. | | | | 7.250% | | 11/15/13 | | $ | 1,870 | | | $ | 1,856 | |
| | | | | | | | | | | | | | |
| | | | | |
Media | | 0.1% | | | | | | | | | | | | |
EchoStar DBS Corp. | | | | 7.125% | | 2/1/16 | | | 300 | | | | 308 | |
Gannett Co. Inc. | | | | 6.375% | | 4/1/12 | | | 40 | | | | 41 | |
Idearc Inc. | | | | 8.000% | | 11/15/16 | | | 250 | | | | 250 | |
Viacom Inc. | | | | 5.750% | | 4/30/11 | | | 100 | | | | 101 | |
| | | | | | | | | | | | | | |
| | | | | | | | | | | | | 700 | |
| | | | | | | | | | | | | | |
Metals and Mining | | 0.1% | | | | | | | | | | | | |
Freeport-McMoRan Copper & Gold Inc. | | | | 8.375% | | 4/1/17 | | | 500 | | | | 546 | |
| | | | | | | | | | | | | | |
| | | | | |
Oil, Gas and Consumable Fuels | | 0.8% | | | | | | | | | | | | |
Anadarko Petroleum Corp. | | | | 6.094% | | 9/15/09 | | | 170 | | | | 169 | D |
Anadarko Petroleum Corp. | | | | 5.950% | | 9/15/16 | | | 540 | | | | 535 | |
Chesapeake Energy Corp. | | | | 6.375% | | 6/15/15 | | | 400 | | | | 392 | |
El Paso Corp. | | | | 7.000% | | 6/15/17 | | | 2,640 | | | | 2,681 | |
Gazprom | | | | 6.950% | | 8/6/09 | | | 5,470 | RUB | | | 221 | |
Gazprom | | | | 6.790% | | 10/29/09 | | | 620 | RUB | | | 25 | |
Gazprom | | | | 7.000% | | 10/27/11 | | | 210 | RUB | | | 9 | |
SemGroup LP | | | | 8.750% | | 11/15/15 | | | 85 | | | | 83 | C |
| | | | | | | | | | | | | | |
| | | | | | | | | | | | | 4,115 | |
| | | | | | | | | | | | | | |
Pharmaceuticals | | N.M. | | | | | | | | | | | | |
Leiner Health Products Inc. | | | | 11.000% | | 6/1/12 | | | 250 | | | | 210 | |
| | | | | | | | | | | | | | |
| | | | | |
Real Estate Investment Trusts | | 0.1% | | | | | | | | | | | | |
Health Care Property Investors Inc. | | | | 6.450% | | 6/25/12 | | | 60 | | | | 62 | |
iStar Financial Inc. | | | | 5.850% | | 3/15/17 | | | 770 | | | | 681 | |
| | | | | | | | | | | | | | |
| | | | | | | | | | | | | 743 | |
| | | | | | | | | | | | | | |
Real Estate Management and Development | | 0.1% | | | | | | | | | | | | |
Realogy Corp. | | | | 12.375% | | 4/15/15 | | | 755 | | | | 570 | C |
| | | | | | | | | | | | | | |
| | | | | |
Road and Rail | | 0.1% | | | | | | | | | | | | |
Hertz Corp. | | | | 8.875% | | 1/1/14 | | | 200 | | | | 206 | |
Saint Acquisition Corp. | | | | 12.500% | | 5/15/17 | | | 120 | | | | 80 | C |
| | | | | | | | | | | | | | |
| | | | | | | | | | | | | 286 | |
| | | | | | | | | | | | | | |
8
Semi-Annual Report to Shareholders
| | | | | | | | | | | | | |
| | | % OF
NET ASSETS | | RATE | | MATURITY
DATE | | PAR/
SHARES† | | VALUE | |
| | | | | | | | | | | | | |
Corporate Bonds and Notes—Continued | | | | | | | | | | | | | |
| | | | | |
Textiles, Apparel and Luxury Goods | | 0.1% | | | | | | | | | | | |
Levi Strauss and Co. | | | | 9.750% | | 1/15/15 | | $ | 150 | | $ | 157 | |
Oxford Industries Inc. | | | | 8.875% | | 6/1/11 | | | 200 | | | 202 | |
| | | | | | | | | | | | | |
| | | | | | | | | | | | 359 | |
| | | | | | | | | | | | | |
Thrifts and Mortgage Finance | | 1.2% | | | | | | | | | | | |
Countrywide Financial Corp. | | | | 5.585% | | 2/28/08 | | | 2,000 | | | 1,980 | D |
Countrywide Financial Corp. | | | | 5.600% | | 4/30/08 | | | 2,200 | | | 2,162 | D |
Countrywide Financial Corp. | | | | 5.756% | | 6/18/08 | | | 300 | | | 294 | D |
Countrywide Home Loans Inc. | | | | 5.665% | | 2/27/08 | | | 300 | | | 297 | D |
Residential Capital LLC | | | | 6.460% | | 4/17/09 | | | 90 | | | 77 | D |
Residential Capital LLC | | | | 7.595% | | 5/22/09 | | | 250 | | | 212 | G |
Residential Capital LLC | | | | 6.000% | | 2/22/11 | | | 1,480 | | | 1,206 | |
| | | | | | | | | | | | | |
| | | | | | | | | | | | 6,228 | |
| | | | | | | | | | | | | |
Wireless Telecommunication Services | | N.M. | | | | | | | | | | | |
Rural Cellular Corp. | | | | 8.621% | | 6/1/13 | | | 20 | | | 21 | C,D |
| | | | | | | | | | | | | |
Total Corporate Bonds and Notes
(Cost—$56,314) | | | | | | | | | | | | 55,117 | |
Asset-Backed Securities | | 6.4% | | | | | | | | | | | |
| | | | | |
Fixed Rate Securities | | 0.3% | | | | | | | | | | | |
ABSC Manufactured Housing Contract 2004-CN1 | | | | 8.400% | | 12/2/30 | | | 170 | | | 153 | C |
Bombardier Capital Mortgage Securitization Corp. 2000-A A3 | | | | 7.830% | | 6/15/30 | | | 947 | | | 677 | |
Centex Home Equity 2003-B AF4 | | | | 3.235% | | 2/25/32 | | | 143 | | | 139 | |
Oakwood Mortgage Investors Inc. 1999-D A1 | | | | 7.840% | | 11/15/29 | | | 335 | | | 313 | |
Pegasus Aviation Lease Securitization 2000-1 A2 | | | | 8.370% | | 3/25/30 | | | 390 | | | 234 | C |
| | | | | | | | | | | | | |
| | | | | | | | | | | | 1,516 | |
| | | | | | | | | | | | | |
Indexed SecuritiesD | | 5.9% | | | | | | | | | | | |
ACE Securities Corp. 2006-GP1 A | | | | 5.261% | | 2/25/31 | | | 931 | | | 917 | |
Asset Backed Securities Corp. Home Equity Loan Trust 2007-HE1 A4 | | | | 5.271% | | 12/25/36 | | | 1,470 | | | 1,422 | |
Bear Stearns Asset-Backed Securities Trust 2006-SD2 | | | | 5.331% | | 6/25/36 | | | 1,059 | | | 1,044 | |
Carrington Mortgage Loan Trust 2006-NC4 A2 | | | | 5.231% | | 10/25/36 | | | 1,450 | | | 1,425 | |
Citigroup Mortgage Loan Trust Inc. 2006-SHL1 A1 | | | | 5.331% | | 11/25/45 | | | 266 | | | 262 | C |
Countrywide Home Equity Loan Trust 2006-B 2A | | | | 5.923% | | 5/15/36 | | | 651 | | | 641 | |
Countrywide Home Equity Loan Trust 2006-D 2A | | | | 5.953% | | 5/15/36 | | | 1,187 | | | 1,159 | |
Fremont Home Loan Trust 2006-B 2A2 | | | | 5.231% | | 8/25/36 | | | 3,000 | | | 2,972 | |
GMAC Mortgage Corp. Loan Trust 2006-HE4 A1 | | | | 5.201% | | 12/25/36 | | | 2,600 | | | 2,566 | |
GSAMP Trust 2006-SEA1 A | | | | 5.431% | | 5/25/36 | | | 565 | | | 520 | C |
9
Semi-Annual Report to Shareholders
Portfolio of Investments—Continued
Western Asset Absolute Return Portfolio—Continued
| | | | | | | | | | | | | |
| | | % OF
NET ASSETS | | RATE | | MATURITY
DATE | | PAR/
SHARES† | | VALUE | |
| | | | | | | | | | | | | |
Asset-Backed Securities—Continued | | | | | | | | | | | | | |
| | | | | |
Indexed Securities—Continued | | | | | | | | | | | | | |
GSRPM Mortgage Loan Trust 2006-2 A2 | | | | 5.431% | | 9/25/36 | | $ | 769 | | $ | 731 | C |
HSI Asset Securitization Corp. Trust 2007-NC1 A3 | | | | 5.311% | | 4/25/37 | | | 2,740 | | | 2,588 | |
IXIS Real Estate Capital Trust 2005-HE4 A3 | | | | 5.471% | | 2/25/36 | | | 1,300 | | | 1,237 | |
Lehman XS Trust 2006-16N A4B | | | | 5.371% | | 11/25/46 | | | 857 | | | 836 | |
Lehman XS Trust 2006-2N 1A1 | | | | 5.391% | | 2/25/46 | | | 534 | | | 521 | |
Lehman XS Trust 2006-GP3 2A2 | | | | 5.351% | | 6/25/46 | | | 870 | | | 854 | |
Lehman XS Trust 2007-2N 3A1 | | | | 5.221% | | 2/25/37 | | | 3,399 | | | 3,372 | |
MASTR Asset Backed Securities Trust 2006-FRE1 A2 | | | | 5.251% | | 12/25/35 | | | 1,300 | | | 1,289 | |
MASTR Second Lien Trust 2005-1 A | | | | 5.401% | | 9/25/35 | | | 999 | | | 994 | |
MASTR Specialized Loan Trust 2006-3 A | | | | 5.391% | | 6/25/46 | | | 659 | | | 646 | C |
Morgan Stanley Home Equity Loans 2007-1 A3 | | | | 5.271% | | 12/25/36 | | | 2,720 | | | 2,622 | |
Morgan Stanley Mortgage Loan Trust 2006-12XS | | | | 5.251% | | 10/25/36 | | | 744 | | | 744 | |
Option One Mortgage Loan Trust 2005-1 A4 | | | | 5.531% | | 2/25/35 | | | 1,070 | | | 1,033 | |
RAAC 2006-RP4 A | | | | 5.421% | | 1/25/46 | | | 1,001 | | | 979 | C |
| | | | | | | | | | | | | |
| | | | | | | | | | | | 31,374 | |
| | | | | | | | | | | | | |
Stripped Securities | | 0.1% | | | | | | | | | | | |
First Franklin Mortgage Loan Asset-Backed Certificates 2006-FF5 2A5 | | | | 0.000% | | 4/25/36 | | | 400 | | | 319 | H2 |
| | | | | | | | | | | | | |
| | | | | |
Variable Rate Securities | | 0.1% | | | | | | | | | | | |
GSAMP Trust 2006-S3 A1 | | | | 6.085% | | 5/25/36 | | | 518 | | | 374 | B |
| | | | | | | | | | | | | |
Total Asset-Backed Securities
(Cost—$33,955) | | | | | | | | | | | | 33,583 | |
Mortgage-Backed Securities | | 15.1% | | | | | | | | | | | |
| | | | | |
Fixed Rate Securities | | 0.3% | | | | | | | | | | | |
Banc of America Funding Corp. 2006-8T2 A2 | | | | 5.791% | | 10/25/36 | | | 834 | | | 833 | |
BlackRock Capital Finance LP 1997-R1 | | | | 7.750% | | 3/25/37 | | | 354 | | | 142 | C |
Indymac Manufactured Housing Contract A2-2 | | | | 6.170% | | 12/25/11 | | | 749 | | | 723 | |
| | | | | | | | | | | | | |
| | | | | | | | | | | | 1,698 | |
| | | | | | | | | | | | | |
Indexed SecuritiesD | | 11.8% | | | | | | | | | | | |
American Home Mortgage Assets 2006-6 A1A | | | | 5.321% | | 12/25/46 | | | 720 | | | 706 | |
American Home Mortgage Investment Trust 2005-4 5A | | | | 5.350% | | 11/25/45 | | | 983 | | | 972 | |
Banc of America Mortgage Securities 2003-F 1A1 | | | | 7.149% | | 7/25/33 | | | 48 | | | 48 | |
Banc of America Mortgage Securities 2003-I 2A5 | | | | 4.150% | | 10/25/33 | | | 1,616 | | | 1,594 | |
Banc of America Mortgage Securities 2004-A 1A1 | | | | 6.084% | | 2/25/34 | | | 162 | | | 164 | |
Banc of America Mortgage Securities 2004-E 2A3 | | | | 4.110% | | 6/25/34 | | | 961 | | | 952 | |
Bear Stearns Adjustable Rate Mortgage Trust
2005-12 23A1 | | | | 5.734% | | 2/25/36 | | | 3,519 | | | 3,527 | |
10
Semi-Annual Report to Shareholders
| | | | | | | | | | | | | |
| | | % OF
NET ASSETS | | RATE | | MATURITY
DATE | | PAR/
SHARES† | | VALUE | |
| | | | | | | | | | | | | |
Mortgage-Backed Securities—Continued | | | | | | | | | | | | | |
| | | | | |
Indexed Securities—Continued | | | | | | | | | | | | | |
Bear Stearns Alt-A Trust 2004-10 1A1 | | | | 5.471% | | 9/25/34 | | $ | 270 | | $ | 270 | |
Bear Stearns Alt-A Trust 2004-11 1A2 | | | | 5.551% | | 11/25/34 | | | 189 | | | 189 | |
Bear Stearns Alt-A Trust 2005-2 1A1 | | | | 5.381% | | 3/25/35 | | | 89 | | | 89 | |
Bear Stearns Mortgage Funding Trust 2006-AR5 1A1 | | | | 5.291% | | 12/25/46 | | | 1,266 | | | 1,242 | |
Citigroup Mortgage Loan Trust Inc. 2005-9 1A1 | | | | 5.391% | | 11/25/35 | | | 777 | | | 765 | |
Countrywide Alternative Loan Trust 2005-24 4A1 | | | | 5.726% | | 7/20/35 | | | 944 | | | 925 | |
Countrywide Alternative Loan Trust 2005-51 2A1 | | | | 5.796% | | 11/20/35 | | | 565 | | | 549 | |
Countrywide Alternative Loan Trust 2005-59 1A1 | | | | 5.868% | | 11/20/35 | | | 721 | | | 706 | |
Countrywide Alternative Loan Trust 2005-76 3A1 | | | | 5.391% | | 1/25/46 | | | 642 | | | 625 | |
Countrywide Alternative Loan Trust 2006-OA1 1A1 | | | | 5.706% | | 3/20/46 | | | 362 | | | 352 | |
Countrywide Alternative Loan Trust 2006-OA10 4A3 | | | | 5.401% | | 8/25/46 | | | 2,518 | | | 2,451 | |
Countrywide Alternative Loan Trust 2006-OA8 1A2 | | | | 5.361% | | 7/25/46 | | | 764 | | | 743 | |
Countrywide Alternative Loan Trust 2006-OA9 1A1 | | | | 5.696% | | 7/20/46 | | | 1,358 | | | 1,327 | |
Countrywide Home Loans 2001-HYB1 1A1 | | | | 6.926% | | 6/19/31 | | | 53 | | | 52 | |
Countrywide Home Loans 2003-60 1A1 | | | | 4.731% | | 2/25/34 | | | 983 | | | 965 | |
Countrywide Home Loans 2003-HYB1 1A1 | | | | 3.691% | | 5/19/33 | | | 133 | | | 133 | |
Countrywide Home Loans 2006-3 1A2 | | | | 5.461% | | 3/25/36 | | | 679 | | | 669 | |
Deutsche Mortgage Securities Inc. 2004-4 7AR2 | | | | 5.581% | | 6/25/34 | | | 551 | | | 547 | |
First Horizon Alternative Mortgage Securities
2005-AA12 1A1 | | | | 5.923% | | 2/25/36 | | | 701 | | | 709 | |
Greenpoint Mortgage Funding Trust 2006-AR3 3A1 | | | | 5.361% | | 4/25/36 | | | 965 | | | 947 | |
GSR Mortgage Loan Trust 2006-0A1 2A2 | | | | 5.391% | | 8/25/46 | | | 741 | | | 720 | |
Harborview Mortgage Loan Trust 2006-13 A | | | | 5.683% | | 11/19/46 | | | 903 | | | 893 | |
Harborview Mortgage Loan Trust 2006-14 2A1A | | | | 5.653% | | 3/19/38 | | | 1,395 | | | 1,360 | |
Impac CMB Trust 2004-5 1A1 | | | | 5.491% | | 10/25/34 | | | 358 | | | 358 | |
Impac CMB Trust 2004-6 1A2 | | | | 5.521% | | 10/25/34 | | | 553 | | | 547 | |
Impac CMB Trust 2005-7 A1 | | | | 5.391% | | 10/25/35 | | | 712 | | | 708 | |
Impac Secured Assets Corp. 2004-3 1A4 | | | | 5.531% | | 11/25/34 | | | 30 | | | 31 | |
Impac Secured Assets Corp. 2005-2 | | | | 5.451% | | 3/25/36 | | | 605 | | | 593 | |
IXIS Real Estate Capital Trust 2006-HE2 A1 | | | | 5.191% | | 8/25/36 | | | 1,077 | | | 1,075 | |
Lehman XS Trust 2006-GP2 1A1A | | | | 5.201% | | 6/25/46 | | | 482 | | | 479 | |
Merit Securities Corp. 11PA B2 | | | | 7.005% | | 9/28/32 | | | 63 | | | 58 | C |
Merrill Lynch Mortgage Investors Trust 2004-A3 4A3 | | | | 5.029% | | 5/25/34 | | | 1,505 | | | 1,445 | |
Residential Accredit Loans Inc. 2007-Q01 A1 | | | | 5.281% | | 2/25/37 | | | 3,726 | | | 3,546 | |
Structured Adjustable Rate Mortgage Loan Trust 2004-7 A1 | | | | 5.401% | | 6/25/34 | | | 28 | | | 28 | |
Structured Adjustable Rate Mortgage Loan Trust 2005-19XS | | | | 5.451% | | 10/25/35 | | | 2,208 | | | 2,152 | |
Structured Asset Mortgage Investments Inc. 2003-AR2 A1 | | | | 5.873% | | 12/19/33 | | | 149 | | | 148 | |
11
Semi-Annual Report to Shareholders
Portfolio of Investments—Continued
Western Asset Absolute Return Portfolio—Continued
| | | | | | | | | | | | | |
| | | % OF
NET ASSETS | | RATE | | MATURITY
DATE | | PAR/
SHARES† | | VALUE | |
| | | | | | | | | | | | | |
Mortgage-Backed Securities—Continued | | | | | | | | | | | | | |
| | | | | |
Indexed Securities—Continued | | | | | | | | | | | | | |
Structured Asset Mortgage Investments Inc. 2006-AR6 | | | | 5.321% | | 7/25/36 | | $ | 2,466 | | $ | 2,396 | |
Structured Asset Mortgage Investments Inc. 2007-AR4 A1 | | | | 5.700% | | 9/25/47 | | | 2,430 | | | 2,401 | |
Structured Asset Securities Corp. 2002-08A 7A1 | | | | 6.846% | | 5/25/32 | | | 192 | | | 191 | |
Structured Asset Securities Corp. 2002-11A 1A1 | | | | 6.925% | | 6/25/32 | | | 46 | | | 46 | |
Structured Asset Securities Corp. 2002-16A 1A1 | | | | 7.689% | | 8/25/32 | | | 365 | | | 364 | |
Structured Asset Securities Corp. 2002-18A 1A1 | | | | 7.710% | | 9/25/32 | | | 34 | | | 34 | |
Structured Asset Securities Corp. 2004-NP1 A | | | | 5.531% | | 9/25/33 | | | 342 | | | 336 | C |
Thornburg Mortgage Securities Trust 2004-1 I2A | | | | 5.581% | | 3/25/44 | | | 68 | | | 68 | |
Thornburg Mortgage Securities Trust 2005-3 A1 | | | | 5.361% | | 10/25/45 | | | 206 | | | 205 | |
Thornburg Mortgage Securities Trust 2005-3 A4 | | | | 5.401% | | 10/25/45 | | | 751 | | | 748 | |
Thornburg Mortgage Securities Trust 2006-1 | | | | 5.301% | | 1/25/46 | | | 966 | | | 961 | |
WaMu Mortgage Pass-Through Certificates 2006-AR11 3A1A | | | | 5.903% | | 9/25/46 | | | 3,385 | | | 3,307 | |
WaMu Mortgage Pass-Through Certificates 2006-AR2 A1A | | | | 5.923% | | 4/25/46 | | | 5,296 | | | 5,206 | |
WaMu Mortgage Pass-Through Certificates 2006-AR3 A1A | | | | 5.953% | | 5/25/46 | | | 4,195 | | | 4,101 | |
WaMu Mortgage Pass-Through Certificates 2006-AR4 DA | | | | 5.953% | | 6/25/46 | | | 2,205 | | | 2,148 | |
WaMu Mortgage Pass-Through Certificates 2006-AR6 2A | | | | 5.943% | | 8/25/46 | | | 2,990 | | | 2,915 | |
| | | | | | | | | | | | | |
| | | | | | | | | | | | 61,786 | |
| | | | | | | | | | | | | |
Variable Rate SecuritiesE | | 3.0% | | | | | | | | | | | |
Adjustable Rate Mortgage Trust 2004-1 4A1 | | | | 5.551% | | 1/25/35 | | | 5,331 | | | 5,235 | |
Bear Stearns Adjustable Rate Mortgage Trust
2004-12 1A1 | | | | 4.175% | | 2/25/35 | | | 358 | | | 355 | |
Bear Stearns Alt-A Trust 2003-5 2A1 | | | | 4.898% | | 12/25/33 | | | 955 | | | 947 | |
BlackRock Capital Finance LP 1996-R1 | | | | 9.555% | | 9/25/26 | | | 458 | | | 284 | |
Morgan Stanley Mortgage Loan Trust 2004-6AR | | | | 6.133% | | 8/25/34 | | | 174 | | | 174 | |
Morgan Stanley Mortgage Loan Trust 2006-3AR 2A3 | | | | 5.700% | | 3/25/36 | | | 757 | | | 768 | |
Sequoia Mortgage Trust 2007-4 4A1 | | | | 6.046% | | 7/20/47 | | | 1,900 | | | 1,869 | |
Structured Adjustable Rate Mortgage Loan Trust 2004-17 A1 | | | | 6.098% | | 11/25/34 | | | 90 | | | 92 | |
Structured Adjustable Rate Mortgage Loan Trust 2004-4 3A2 | | | | 4.590% | | 9/25/37 | | | 1,354 | | | 1,342 | |
Thornburg Mortgage Securities Trust 2007-4 2A1 | | | | 6.240% | | 11/25/17 | | | 2,067 | | | 2,074 | |
12
Semi-Annual Report to Shareholders
| | | | | | | | | | | | |
| | | % OF
NET ASSETS | | RATE | | MATURITY
DATE | | PAR/
SHARES† | | VALUE |
| | | | | | | | | | | | |
Mortgage-Backed Securities—Continued | | | | | | | | | | | | |
| | | | | |
Variable Rate Securities—Continued | | | | | | | | | | | | |
Thornburg Mortgage Securities Trust 2007-4 3A1 | | | | 6.228% | | 9/25/37 | | $ | 1,889 | | $ | 1,872 |
Wells Fargo Mortgage-Backed Securities Trust 2005-AR9 4A1 | | | | 4.305% | | 5/25/35 | | | 845 | | | 837 |
| | | | | | | | | | | | |
| | | | | | | | | | | | 15,849 |
| | | | | | | | | | | | |
Total Mortgage-Backed Securities
(Cost—$79,954) | | | | | | | | | | | | 79,333 |
Loan Participations and AssignmentsD | | 9.7% | | | | | | | | | | |
| | | | | |
Aerospace and Defense | | 0.4% | | | | | | | | | | |
Dubai Aerospace Enterprise, Bridge Loan | | | | 9.110% | | 1/31/08 | | | 1,000 | | | 990 |
TransDigm Inc., Term Loan, Tranche B | | | | 7.200% | | 12/27/07 | | | 1,000 | | | 978 |
| | | | | | | | | | | | |
| | | | | | | | | | | | 1,968 |
| | | | | | | | | | | | |
Airlines | | 0.2% | | | | | | | | | | |
Delta Air Lines Inc., Second Lien Term Loan | | | | 8.610% | | 10/30/07 | | | 1,000 | | | 967 |
| | | | | | | | | | | | |
| | | | | |
Auto Components | | 0.2% | | | | | | | | | | |
Allison Transmission Inc., Term Loan, Tranche B | | | | 8.480% to 8.570% | | 12/10/07 | | | 1,000 | | | 967 |
| | | | | | | | | | | | |
| | | | | |
Automobiles | | 0.2% | | | | | | | | | | |
Chrysler Financial Services NA LLC, First Lien Term Loan | | | | 9.360% | | 11/8/07 | | | 1,000 | | | 997 |
| | | | | | | | | | | | |
| | | | | |
Chemicals | | 0.1% | | | | | | | | | | |
Georgia Gulf Corp., Term Loan | | | | 8.298% | | 10/9/07 | | | 621 | | | 606 |
| | | | | | | | | | | | |
| | | | | |
Commercial Services and Supplies | | 0.6% | | | | | | | | | | |
Allied Waste North America Inc., Credit Linked Deposit, Tranche A | | | | 6.820% | | 10/1/07 | | | 277 | | | 273 |
Allied Waste North America Inc., Term Loan | | | | 6.630% to 6.890% | | 2/18/08 | | | 509 | | | 502 |
Aramark Corp., Letter of Credit | | | | 7.198% | | 12/31/07 | | | 148 | | | 145 |
Aramark Corp., Term Loan, Tranche B | | | | 7.198% | | 12/31/07 | | | 2,106 | | | 2,067 |
| | | | | | | | | | | | |
| | | | | | | | | | | | 2,987 |
| | | | | | | | | | | | |
Communications Equipment | | 0.4% | | | | | | | | | | |
Panamsat Corp., Term Loan, Tranche B | | | | 7.360% | | 10/2/07 | | | 1,995 | | | 1,968 |
| | | | | | | | | | | | |
13
Semi-Annual Report to Shareholders
Portfolio of Investments—Continued
Western Asset Absolute Return Portfolio—Continued
| | | | | | | | | | | | |
| | | % OF
NET ASSETS | | RATE | | MATURITY
DATE | | PAR/
SHARES† | | VALUE |
| | | | | | | | | | | | |
Loan Participations and
Assignments—Continued | | | | | | | | | | | | |
| | | | | |
Computers and Peripherals | | 0.3% | | | | | | | | | | |
CCG, Term Loan, Tranche B | | | | 7.360% | | 11/1/07 | | $ | 895 | | $ | 869 |
SunGard Data Systems Inc., Term Loan, Tranche B | | | | 7.356% | | 11/8/07 | | | 992 | | | 974 |
| | | | | | | | | | | | |
| | | | | | | | | | | | 1,843 |
| | | | | | | | | | | | |
Containers and Packaging | | 0.3% | | | | | | | | | | |
Amscan Holdings Inc., Term Loan, Tranche B | | | | 7.345% to 9.000% | | 12/31/07 | | | 998 | | | 950 |
Graham Packaging Co. LP, Term Loan, Tranche B | | | | 7.500% to 8.000% | | 3/4/08 | | | 998 | | | 981 |
| | | | | | | | | | | | |
| | | | | | | | | | | | 1,931 |
| | | | | | | | | | | | |
Distributors | | 0.2% | | | | | | | | | | |
Keystone Automotive Industries Inc., Term Loan, Tranche B | | | | 8.820% to 10.250% | | 12/31/07 | | | 998 | | | 918 |
| | | | | | | | | | | | |
| | | | | |
Diversified Consumer Services | | 0.2% | | | | | | | | | | |
Thomson Medical Education, First Lien Term Loan | | | | 7.950% | | 12/31/07 | | | 1,000 | | | 995 |
| | | | | | | | | | | | |
| | | | | |
Health Care Providers and Services | | 1.2% | | | | | | | | | | |
Community Health Systems Inc., Term Loan, Tranche B | | | | 7.760% | | 11/30/07 | | | 2,345 | | | 2,301 |
Davita Inc., Term Loan, Tranche B1 | | | | 6.700% to 7.010% | | 12/31/07 | | | 1,000 | | | 980 |
HCA Inc., Term Loan, Tranche B | | | | 7.448% | | 12/31/07 | | | 995 | | | 974 |
IASIS Healthcare Corp., Term Loan | | | | 7.360% | | 10/26/07 | | | 1,000 | | | 951 |
Sheridan Healthcare Inc., Term Loan, Tranche B | | | | 7.860% | | 10/16/07 | | | 1,000 | | | 930 |
| | | | | | | | | | | | |
| | | | | | | | | | | | 6,136 |
| | | | | | | | | | | | |
Hotels, Restaurants and Leisure | | 0.3% | | | | | | | | | | |
Quiznos LLC, First Lien Term Loan | | | | 7.450% to 7.610% | | 12/28/07 | | | 992 | | | 962 |
Wimar Opco LLC, Term Loan, Tranche B | | | | 7.448% | | 12/31/07 | | | 977 | | | 944 |
| | | | | | | | | | | | |
| | | | | | | | | | | | 1,906 |
| | | | | | | | | | | | |
Independent Power Producers and Energy Traders | | 0.3% | | | | | | | | | | |
NRG Energy Inc., Term Loan | | | | 7.110% | | 10/1/07 | | | 1,500 | | | 1,470 |
| | | | | | | | | | | | |
14
Semi-Annual Report to Shareholders
| | | | | | | | | | | | |
| | | % OF
NET ASSETS | | RATE | | MATURITY
DATE | | PAR/
SHARES† | | VALUE |
| | | | | | | | | | | | |
Loan Participations and
Assignments—Continued | | | | | | | | | | | | |
| | | | | |
IT Services | | 0.6% | | | | | | | | | | |
First Data Corp., Term Loan, Tranche B1 | | | | 7.960% | | 12/24/07 | | $ | 3,370 | | $ | 3,232 |
| | | | | | | | | | | | |
| | | | | |
Machinery | | 0.4% | | | | | | | | | | |
Nacco Materials Handling Group, Term Loan | | | | 7.350% to 7.665% | | 11/15/07 | | | 995 | | | 958 |
Oshkosh Truck Corp., Term Loan, Tranche B | | | | 7.450% | | 12/6/07 | | | 995 | | | 979 |
| | | | | | | | | | | | |
| | | | | | | | | | | | 1,937 |
| | | | | | | | | | | | |
Media | | 2.2% | | | | | | | | | | |
Cedar Fair LP, Term Loan, Tranche B | | | | 7.129% | | 10/31/07 | | | 990 | | | 968 |
Charter Communications Operating LLC, Term Loan | | | | 7.360% | | 10/30/07 | | | 1,000 | | | 964 |
Citadel Communication Group, Term Loan, Tranche B | | | | 6.755% to 6.825% | | 12/31/07 | | | 1,000 | | | 951 |
CSC Holdings Inc., Incremental Term Loan | | | | 7.569% | | 10/9/07 | | | 990 | | | 975 |
Discovery Communications Inc., Term Loan, Tranche B | | | | 7.198% | | 12/31/07 | | | 1,000 | | | 980 |
Idearc Inc., Term Loan, Tranche B | | | | 7.200% | | 12/31/07 | | | 995 | | | 979 |
Insight Midwest Holdings LLC, Term Loan, Tranche B | | | | 7.110% to 7.360% | | 10/5/07 | | | 1,000 | | | 979 |
Lodgenet Entertainment Corp., Term Loan, Tranche B | | | | 7.360% | | 12/31/07 | | | 1,000 | | | 975 |
Nielsen Finance LLC, Term Loan, Tranche B | | | | 7.360% | | 11/9/07 | | | 990 | | | 961 |
Tribune Co., Tranche B | | | | 8.360% | | 10/5/07 | | | 1,000 | | | 907 |
Univision Communications, Term Loan, Tranche B | | | | 7.610% | | 10/31/07 | | | 940 | | | 893 |
UPC Broadband Holding, Term Loan, Tranche N | | | | 7.130% | | 1/2/08 | | | 1,000 | | | 956 |
| | | | | | | | | | | | |
| | | | | | | | | | | | 11,488 |
| | | | | | | | | | | | |
Metals and Mining | | 0.2% | | | | | | | | | | |
Noranda Aluminum Acquisition Corp., Term Loan | | | | 7.510% | | 11/19/07 | | | 1,000 | | | 970 |
| | | | | | | | | | | | |
| | | | | |
Multiline Retail | | 0.4% | | | | | | | | | | |
Dollar General Corp., Term Loan,
Tranche B | | | | 8.108% | | 10/31/07 | | | 1,000 | | | 949 |
Neiman Marcus Group Inc., Term Loan | | | | 7.448% | | 12/6/07 | | | 1,000 | | | 983 |
| | | | | | | | | | | | |
| | | | | | | | | | | | 1,932 |
| | | | | | | | | | | | |
15
Semi-Annual Report to Shareholders
Portfolio of Investments—Continued
Western Asset Absolute Return Portfolio—Continued
| | | | | | | | | | | | |
| | | % OF
NET ASSETS | | RATE | | MATURITY
DATE | | PAR/
SHARES† | | VALUE |
| | | | | | | | | | | | |
Loan Participations and
Assignments—Continued | | | | | | | | | | | | |
| | | | | |
Oil, Gas and Consumable Fuels | | 0.2% | | | | | | | | | | |
Alpha Natural Resources, Term Loan, Tranche B | | | | 7.110% | | 10/1/07 | | $ | 995 | | $ | 978 |
| | | | | | | | | | | | |
| | | | | |
Paper and Forest Products | | 0.2% | | | | | | | | | | |
Georgia-Pacific Corp., First Lien Term Loan | | | | 6.948% to 7.474% | | 12/31/07 | | | 990 | | | 968 |
| | | | | | | | | | | | |
| | | | | |
Road and Rail | | 0.1% | | | | | | | | | | |
Swift Transportation, Term Loan | | | | 8.375% | | 11/1/07 | | | 884 | | | 800 |
| | | | | | | | | | | | |
| | | | | |
Semiconductors and Semiconductor Equipment | | 0.3% | | | | | | | | | | |
Freescale Semiconductor, Term Loan, Tranche B | | | | 7.330% | | 12/3/07 | | | 993 | | | 947 |
Sensata Technologies, Term Loan, Tranche B | | | | 7.090% to 7.110% | | 10/29/07 | | | 990 | | | 948 |
| | | | | | | | | | | | |
| | | | | | | | | | | | 1,895 |
| | | | | | | | | | | | |
Specialty Retail | | 0.2% | | | | | | | | | | |
Michaels Stores Inc., Term Loan B | | | | 7.625% to 8.125% | | 1/31/08 | | | 997 | | | 966 |
| | | | | | | | | | | | |
Total Loan Participations and Assignments
(Cost—$51,819) | | | | | | | | | | | | 50,825 |
U.S. Government and Agency Obligations | | 6.2% | | | | | | | | | | |
| | | | | |
Fixed Rate Securities | | 3.1% | | | | | | | | | | |
Federal Home Loan Bank | | | | 5.500% | | 5/21/09 | | | 6,900 | | | 6,904 |
United States Treasury Notes | | | | 3.625% | | 7/15/09 | | | 2,960 | | | 2,943 |
United States Treasury Notes | | | | 4.750% | | 8/15/17 | | | 6,110 | | | 6,192 |
| | | | | | | | | | | | |
| | | | | | | | | | | | 16,039 |
| | | | | | | | | | | | |
Treasury Inflation-Protected SecuritiesI | | 3.1% | | | | | | | | | | |
United States Treasury Inflation-Protected Security | | | | 0.875% | | 4/15/10 | | | 1,083 | | | 1,047 |
United States Treasury Inflation-Protected Security | | | | 2.375% | | 4/15/11 | | | 861 | | | 866 |
United States Treasury Inflation-Protected Security | | | | 2.000% | | 1/15/16 | | | 3,568 | | | 3,488 |
United States Treasury Inflation-Protected Security | | | | 2.500% | | 7/15/16 | | | 4,074 | | | 4,150 |
16
Semi-Annual Report to Shareholders
| | | | | | | | | | | | | |
| | | % OF
NET ASSETS | | RATE | | MATURITY
DATE | | PAR/
SHARES† | | VALUE | |
| | | | | | | | | | | | | |
U.S. Government and Agency Obligations—Continued | | | | | | | | | | | | | |
| | | | | |
Treasury Inflation-Protected Securities—Continued | | | | | | | | | | | | | |
United States Treasury Inflation-Protected Security | | | | 2.375% | | 1/15/17 | | $ | 4,318 | | $ | 4,349 | |
United States Treasury Inflation-Protected Security | | | | 2.375% | | 1/15/27 | | | 2,572 | | | 2,603 | |
| | | | | | | | | | | | | |
| | | | | | | | | | | | 16,503 | |
| | | | | | | | | | | | | |
Total U.S. Government and Agency Obligations
(Cost—$31,943) | | | | | | | | | | | | 32,542 | |
U.S. Government Agency Mortgage-Backed Securities | | 42.6% | | | | | | | | | | | |
| | | | | |
Fixed Rate Securities | | 24.7% | | | | | | | | | | | |
Fannie Mae | | | | 5.000% | | 12/1/37 | | | 80,320 | | | 76,595 | J |
Fannie Mae | | | | 5.500% | | 12/1/37 | | | 42,300 | | | 41,412 | J |
Fannie Mae | | | | 6.000% | | 12/1/37 | | | 11,600 | | | 11,613 | J |
| | | | | | | | | | | | | |
| | | | | | | | | | | | 129,620 | |
| | | | | | | | | | | | | |
Indexed SecuritiesD | | 17.9% | | | | | | | | | | | |
Fannie Mae | | | | 5.878% | | 3/1/36 | | | 5,395 | | | 5,445 | |
Fannie Mae | | | | 5.861% | | 6/1/36 | | | 1,801 | | | 1,810 | |
Fannie Mae | | | | 5.807% | | 9/1/36 | | | 23,635 | | | 23,888 | |
Fannie Mae | | | | 5.585% | | 12/1/36 | | | 1,399 | | | 1,406 | |
Fannie Mae | | | | 6.454% | | 1/1/37 | | | 5,139 | | | 5,228 | |
Fannie Mae | | | | 5.726% | | 4/1/37 | | | 5,647 | | | 5,698 | |
Fannie Mae | | | | 5.896% | | 4/1/37 | | | 3,658 | | | 3,685 | |
Fannie Mae | | | | 6.238% | | 4/1/37 | | | 4,457 | | | 4,514 | |
Freddie Mac | | | | 5.524% | | 1/1/36 | | | 3,004 | | | 3,023 | |
Freddie Mac | | | | 5.990% | | 6/1/36 | | | 1,863 | | | 1,894 | |
Freddie Mac | | | | 5.726% | | 7/1/36 | | | 8,710 | | | 8,780 | |
Freddie Mac | | | | 6.157% | | 12/1/36 | | | 5,124 | | | 5,219 | |
Freddie Mac | | | | 5.603% | | 1/1/37 | | | 1,100 | | | 1,106 | |
Freddie Mac | | | | 5.889% | | 2/1/37 | | | 1,083 | | | 1,091 | |
Freddie Mac | | | | 5.818% | | 5/1/37 | | | 1,127 | | | 1,137 | |
Freddie Mac | | | | 5.895% | | 5/1/37 | | | 3,379 | | | 3,413 | |
Freddie Mac | | | | 6.057% | | 5/1/37 | | | 8,774 | | | 8,912 | |
Freddie Mac | | | | 5.796% | | 6/1/37 | | | 570 | | | 575 | |
Freddie Mac | | | | 6.225% | | 9/1/37 | | | 6,970 | | | 7,004 | |
| | | | | | | | | | | | | |
| | | | | | | | | | | | 93,828 | |
| | | | | | | | | | | | | |
Total U.S. Government Agency Mortgage-Backed Securities (Cost—$222,809) | | | | | | | | | | | | 223,448 | |
17
Semi-Annual Report to Shareholders
Portfolio of Investments—Continued
Western Asset Absolute Return Portfolio—Continued
| | | | | | | | | | | | | |
| | | % OF
NET ASSETS | | RATE | | MATURITY
DATE | | PAR/
SHARES† | | VALUE | |
| | | | | | | | | | | | | |
Yankee BondsK | | 3.5% | | | | | | | | | | | |
| | | | | |
Commercial Banks | | 2.5% | | | | | | | | | | | |
Barclays Capital | | | | 5.456% | | 3/20/08 | | $ | 700 | | $ | 685 | C,D |
Glitnir Banki Hf | | | | 6.375% | | 9/25/12 | | | 680 | | | 682 | C |
Glitnir Banki Hf | | | | 6.693% | | 6/15/16 | | | 1,810 | | | 1,850 | B,C |
Glitnir Banki Hf | | | | 7.451% | | 9/14/49 | | | 100 | | | 99 | B,C |
HBOS Capital Funding LP | | | | 6.071% | | 6/30/49 | | | 230 | | | 221 | B,C |
HSBK Europe BV | | | | 7.250% | | 5/3/17 | | | 1,480 | | | 1,335 | C |
ICICI Bank Ltd. | | | | 6.375% | | 4/30/22 | | | 1,422 | | | 1,330 | B,C |
ICICI Bank Ltd. | | | | 6.375% | | 4/30/22 | | | 160 | | | 150 | B,C |
Kaupthing Bank Hf | | | | 7.125% | | 5/19/16 | | | 240 | | | 242 | C |
Landsbanki Islands Hf | | | | 6.100% | | 8/25/11 | | | 2,190 | | | 2,219 | C |
Shinsei Finance Cayman Ltd. | | | | 6.418% | | 1/29/49 | | | 300 | | | 278 | B,C |
TuranAlem Finance BV | | | | 8.250% | | 1/22/37 | | | 1,330 | | | 1,124 | C |
TuranAlem Finance BV | | | | 8.250% | | 1/22/37 | | | 500 | | | 436 | C |
VTB Capital SA for Vneshtorgbank | | | | 5.956% | | 8/1/08 | | | 2,651 | | | 2,624 | C,D |
| | | | | | | | | | | | | |
| | | | | | | | | | | | 13,275 | |
| | | �� | | | | | | | | | | |
Diversified Financial Services | | 0.4% | | | | | | | | | | | |
TNK-BP Finance SA | | | | 7.500% | | 7/18/16 | | | 781 | | | 779 | C |
TNK-BP Finance SA | | | | 7.500% | | 7/18/16 | | | 550 | | | 546 | C |
TNK-BP Finance SA | | | | 6.625% | | 3/20/17 | | | 200 | | | 186 | C |
TNK-BP Finance SA | | | | 6.625% | | 3/20/17 | | | 342 | | | 320 | C |
| | | | | | | | | | | | | |
| | | | | | | | | | | | 1,831 | |
| | | | | | | | | | | | | |
Diversified Telecommunication Services | | 0.1% | | | | | | | | | | | |
Intelsat Bermuda Ltd. | | | | 9.250% | | 6/15/16 | | | 250 | | | 259 | |
| | | | | | | | | | | | | |
| | | | | |
Energy Equipment and Services | | N.M. | | | | | | | | | | | |
Compagnie Generale de Geophysique-Veritas | | | | 7.750% | | 5/15/17 | | | 250 | | | 258 | |
| | | | | | | | | | | | | |
| | | | | |
Foreign Governments | | 0.2% | | | | | | | | | | | |
Federative Republic of Brazil | | | | 8.000% | | 1/15/18 | | | 520 | | | 580 | |
Federative Republic of Brazil | | | | 11.000% | | 8/17/40 | | | 206 | | | 276 | |
Republic of Panama | | | | 9.375% | | 4/1/29 | | | 141 | | | 189 | |
| | | | | | | | | | | | | |
| | | | | | | | | | | | 1,045 | |
| | | | | | | | | | | | | |
Metals and Mining | | 0.3% | | | | | | | | | | | |
Vale Overseas Ltd. | | | | 8.250% | | 1/17/34 | | | 60 | | | 71 | |
Vale Overseas Ltd. | | | | 6.875% | | 11/21/36 | | | 1,546 | | | 1,593 | |
| | | | | | | | | | | | | |
| | | | | | | | | | | | 1,664 | |
| | | | | | | | | | | | | |
18
Semi-Annual Report to Shareholders
| | | | | | | | | | | | | | |
| | | % OF
NET ASSETS | | RATE | | MATURITY
DATE | | PAR/
SHARES† | | | VALUE | |
| | | | | | | | | | | | | | |
Yankee Bonds—Continued | | | | | | | | | | | | | | |
| | | | | |
Wireless Telecommunication Services | | N.M. | | | | | | | | | | | | |
Vodafone Group PLC | | | | 5.000% | | 9/15/15 | | $ | 100 | | | $ | 94 | |
| | | | | | | | | | | | | | |
Total Yankee Bonds (Cost—$19,020) | | | | | | | | | | | | | 18,426 | |
Foreign Government Obligations | | 1.7% | | | | | | | | | | | | |
Commonwealth of Australia | | | | 4.000% | | 8/20/20 | | | 1,730 | AUD | | | 2,335 | L |
Federative Republic of Brazil | | | | 10.000% | | 1/1/10 | | | — | M BRL | | | 1 | |
Federative Republic of Brazil | | | | 10.000% | | 7/1/10 | | | 2 | BRL | | | 962 | |
Federative Republic of Brazil | | | | 6.000% | | 5/15/15 | | | 1 | BRL | | | 508 | L |
Federative Republic of Brazil | | | | 6.000% | | 5/15/45 | | | 1 | BRL | | | 526 | L |
Kingdom of Sweden Inflation-Protected Notes | | | | 3.500% | | 12/1/28 | | | 15,000 | SEK | | | 3,335 | L |
Republic of Argentina | | | | 2.000% | | 1/3/10 | | | 1,089 | ARS | | | 443 | L |
United Kingdom Treasury Gilt | | | | 1.250% | | 11/22/55 | | | 363 | GBP | | | 858 | L |
| | | | | | | | | | | | | | |
Total Foreign Government Obligations
(Cost—$8,556) | | | | | | | | | | | | | 8,968 | |
Preferred Stocks | | N.M. | | | | | | | | | | | | |
Fannie Mae | | | | 7.000% | | | | | 2 | Shs | | | 99 | D |
| | | | | | | | | | | | | | |
Total Preferred Stocks (Cost—$101) | | | | | | | | | | | | | 99 | |
| | | | | | | | | | | | | | |
Total Long-Term Securities (Cost—$504,471) | | | | | | | | | | | | | 502,341 | |
Short-Term Securities | | 29.3% | | | | | | | | | | | | |
| | | | | |
U.S. Government and Agency Obligations | | 0.1% | | | | | | | | | | | | |
Fannie Mae | | | | 0.000% | | 3/17/08 | | $ | 725 | | | | 710 | N,O |
| | | | | | | | | | | | | | |
| | | | | |
Corporate Bonds and Notes | | 1.0% | | | | | | | | | | | | |
Banc of America Corp. | | | | 5.130% | | 10/2/07 | | | 5,000 | | | | 4,999 | |
| | | | | | | | | | | | | | |
| | | | | |
Foreign Government Obligations | | 0.9% | | | | | | | | | | | | |
Bank Negara Malaysia Monetary Notes | | | | 0.000% | | 11/1/07 | | | 620 | MYR | | | 182 | N |
Bank Negara Malaysia Monetary Notes | | | | 0.000% | | 12/6/07 | | | 163 | MYR | | | 48 | N |
Bank Negara Malaysia Monetary Notes | | | | 0.000% | | 1/17/08 | | | 2,933 | MYR | | | 846 | N |
Egypt Treasury Bills | | | | 0.000% | | 10/30/07 | | | 550 | EGP | | | 98 | N |
Egypt Treasury Bills | | | | 0.000% | | 10/30/07 | | | 3,925 | EGP | | | 698 | N |
Egypt Treasury Bills | | | | 0.000% | | 11/6/07 | | | 275 | EGP | | | 49 | N |
19
Semi-Annual Report to Shareholders
Portfolio of Investments—Continued
Western Asset Absolute Return Portfolio—Continued
| | | | | | | | | | | | | | |
| | | % OF
NET ASSETS | | RATE | | MATURITY
DATE | | PAR/
SHARES† | | | VALUE | |
| | | | | | | | | | | | | | |
Short-Term Securities—Continued | | | | | | | | | | | | | | |
| | | | | |
Foreign Government Obligations—Continued | | | | | | | | | | | | | | |
Egypt Treasury Bills | | | | 0.000% | | 11/20/07 | | | 675 | EGP | | $ | 119 | N |
Egypt Treasury Bills | | | | 0.000% | | 1/15/08 | | | 13,500 | EGP | | | 2,365 | N |
Egypt Treasury Bills | | | | 0.000% | | 2/18/08 | | | 850 | EGP | | | 148 | N |
Egypt Treasury Bills | | | | 0.000% | | 3/25/08 | | | 850 | EGP | | | 147 | N |
Egypt Treasury Bills | | | | 0.000% | | 4/1/08 | | | 425 | EGP | | | 73 | N |
| | | | | | | | | | | | | | |
| | | | | | | | | | | | | 4,773 | |
| | | | | | | | | | | | | | |
Options PurchasedP | | 1.1% | | | | | | | | | | | | |
Eurodollar Futures Call, March 2008, Strike Price $94.00 | | | | | | | | | 1,198 | Q | | | 4,433 | |
Eurodollar Futures Call, March 2008, Strike Price $94.25 | | | | | | | | | 100 | Q | | | 307 | |
Eurodollar Futures Put, June 2008, Strike Price $93.75 | | | | | | | | | 202 | Q | | | 1 | |
Eurodollar Futures Put, June 2008, Strike Price $94.00 | | | | | | | | | 205 | Q | | | 1 | |
LIBOR Call, March 2008, Strike Price $93.50 | | | | | | | | | 419 | Q | | | 921 | |
| | | | | | | | | | | | | | |
| | | | | | | | | | | | | 5,663 | |
| | | | | | | | | | | | | | |
Repurchase Agreement | | 26.2% | | | | | | | | | | | | |
Lehman Brothers Inc.
4.75%, dated 9/28/07, to be repurchased at $137,171 on 10/1/07 (Collateral: $79,797 Fannie Mae notes, 6.63%, due 9/15/09, value $83,283, $100,000 Federal Home Loan Bank notes, zero-coupon bond, due 7/29/19, value $50,490, $6,035 Federal Home Loan Bank notes, 4.5%, due 6/22/10, value $6,086) | | | | | | | | $ | 137,117 | | | | 137,117 | |
| | | | | | | | | | | | | | |
Total Short-Term Securities (Cost—$151,411) | | | | | | | | | | | | | 153,262 | |
Total Investments (Cost—$655,587)R | | 125.0% | | | | | | | | | | | 655,603 | |
Other Assets Less Liabilities | | (25.0)% | | | | | | | | | | | (131,064 | ) |
| | | | | | | | | | | | | | |
| | | | | |
Net Assets | | 100.0% | | | | | | | | | | $ | 524,539 | |
| | | | | | | | | | | | | | |
| | | | | | | | |
| | | EXPIRATION | | ACTUAL
CONTRACTS | | APPRECIATION/
(DEPRECIATION) | |
Futures Contracts PurchasedP | | | | | | | | |
Bundesobligations Futures | | December 2007 | | 5 | | $ | (3 | ) |
Eurodollar Futures | | December 2007 | | 157 | | | 112 | |
Eurodollar Futures | | March 2008 | | 121 | | | (14 | ) |
LIBOR Futures | | March 2008 | | 70 | | | 57 | |
U.S. Treasury Bond Futures | | December 2007 | | 114 | | | 20 | |
U.S. Treasury Note Futures | | December 2007 | | 602 | | | 357 | |
| | | | | | | | |
| | | | | | $ | 529 | |
| | | | | | | | |
20
Semi-Annual Report to Shareholders
| | | | | | | | |
| | | EXPIRATION | | ACTUAL
CONTRACTS | | APPRECIATION/
(DEPRECIATION) | |
Futures Contracts WrittenP | | | | | | | | |
Eurodollar Futures | | September 2008 | | 27 | | $ | (47 | ) |
Eurodollar Futures | | December 2008 | | 7 | | | (5 | ) |
Eurodollar Futures | | June 2009 | | 57 | | | (39 | ) |
U.S. Treasury Note Futures | | December 2007 | | 714 | | | 197 | |
| | | | | | | | |
| | | | | | $ | 106 | |
| | | | | | | | |
Options WrittenP | | | | | | | | |
Eurodollar Futures Call, Strike Price $95.50 | | March 2008 | | 43 | | $ | 1 | |
Eurodollar Futures Call, Strike Price $96.00 | | March 2008 | | 209 | | | 62 | |
Eurodollar Futures Put, Strike Price $95.25 | | March 2008 | | 210 | | | 30 | |
Eurodollar Futures Put, Strike Price $95.50 | | March 2008 | | 43 | | | 1 | |
U.S. Treasury Note Futures Call, Strike Price $112.00 | | November 2007 | | 86 | | | 47 | |
U.S. Treasury Note Futures Put, Strike Price $105.00 | | November 2007 | | 20 | | | 13 | |
U.S. Treasury Note Futures Put, Strike Price $107.00 | | February 2008 | | 66 | | | 8 | |
| | | | | | | | |
| | | | | | $ | 162 | |
| | | | | | | | |
| | | | | | | | | |
N.M.—Not Meaningful.
A | | Convertible Security – Security may be converted into the issuer’s common stock. |
B | | Stepped Coupon Security – A security with a predetermined schedule of interest or dividend rate changes at which time it begins to accrue interest or pay dividends according to the predetermined schedule. |
C | | Rule 144a Security – A security purchased pursuant to Rule 144a under the Securities Act of 1933 which may not be resold subject to that rule except to qualified institutional buyers. These securities, which the Fund’s investment adviser has determined to be liquid, represent 4.99% of net assets. |
D | | Indexed Security – The rates of interest earned on these securities are tied to the London Interbank Offered Rate (“LIBOR”), the Euro Interbank Offered Rate (“EURIBOR”) Index, the Consumer Price Index (“CPI”), the one-year Treasury Bill Rate or the ten-year Japanese Government Bond Rate. The coupon rates are the rates as of September 30, 2007. |
E | | The coupon rates shown on variable rate securities are the rates at September 30, 2007. These rates vary with the weighted average coupon of the underlying loans. |
F | | Pay-in-Kind (“PIK”) security – A security in which interest or dividends during the initial few years is paid in additional PIK securities rather than in cash. |
G | | Credit Linked Security – The rates of interest earned on these securities are tied to the credit rating assigned by Standard & Poor’s Rating Service and/or Moody’s Investors Services. |
H | | Stripped Security – Security with interest-only or principal-only payment streams, denoted by a 1 or 2, respectively. For interest-only securities, the amount shown as principal is the notional balance used to calculate the amount of interest due. |
I | | Treasury Inflation-Protected Security – Treasury security whose principal value is adjusted daily in accordance with changes to the Consumer Price Index for All Urban Consumers. Interest is calculated on the basis of the current adjusted principal value. |
J | | When-issued Security – Security purchased on a delayed delivery basis. Final settlement amount and maturity date have not yet been announced. |
K | | Yankee Bond – A dollar-denominated bond issued in the U.S. by foreign entities. |
L | | Inflation-Protected Security – Security whose principal value is adjusted daily or monthly in accordance with changes to the relevant country’s Consumer Price Index or its equivalent used as an inflation proxy. Interest is calculated on the basis of the current adjusted principal value. |
M | | Amount represents less than $0.05. |
N | | Zero coupon bond – A bond with no periodic interest payments which is sold at such a discount as to produce a current yield to maturity. |
O | | All or a portion of this security is collateral to cover futures and options contracts written. |
P | | Options and futures are described in more detail in the notes to financial statements. |
Q | | Par represents actual number of contracts. |
21
Semi-Annual Report to Shareholders
Portfolio of Investments—Continued
Western Asset Absolute Return Portfolio—Continued
R | | Aggregate cost for federal income tax purposes is substantially the same as book cost. At September 30, 2007, the aggregate gross unrealized appreciation and depreciation of investments for federal income tax purposes were substantially as follows: |
| | | | |
| Gross unrealized appreciation | | $ | 5,357 | |
| Gross unrealized depreciation | | | (5,341 | ) |
| | | | |
| Net unrealized appreciation/(depreciation) | | $ | 16 | |
| | | | |
† | | Securities are denominated in U.S. Dollars, unless otherwise noted. |
ARS—Argentine Peso
AUD—Australian Dollar
BRL—Brazilian Real
EGP—Egyptian Pound
GBP—British Pound
MYR—Malaysian Ringgit
RUB—Russian Ruble
SEK—Swedish Krona
See notes to financial statements.
22
Semi-Annual Report to Shareholders
Statement of Assets and Liabilities
Western Asset Absolute Return Portfolio
September 30, 2007 (Unaudited)
(Amounts in Thousands)
| | | | | | | | |
Assets: | | | | | | | | |
Investment securities at market value (Cost—$504,471) | | | | | | $ | 502,341 | |
Short-term securities at value (Cost—$151,411) | | | | | | | 153,262 | |
Cash | | | | | | | 894 | |
Foreign currency at value (Cost—$346) | | | | | | | 350 | |
Receivable for securities sold | | | | | | | 79,188 | |
Receivable for fund shares sold | | | | | | | 127 | |
Interest receivable | | | | | | | 3,608 | |
Futures variation margin receivable | | | | | | | 96 | |
Unrealized appreciation of forward foreign currency contracts | | | | | | | 521 | |
| | | | | | | | |
Total assets | | | | | | | 740,387 | |
| | | | | | | | |
| | |
Liabilities: | | | | | | | | |
Swap contracts at value | | $ | 390 | | | | | |
Payable for securities purchased | | | 214,373 | | | | | |
Payable for fund shares repurchased | | | 59 | | | | | |
Accrued management fee | | | 315 | | | | | |
Accrued distribution fees | | | — | A | | | | |
Income distribution payable | | | 119 | | | | | |
Options written (Proceeds—$438) | | | 276 | | | | | |
Unrealized depreciation of forward foreign currency contracts | | | 62 | | | | | |
Amounts payable on swaps | | | 13 | | | | | |
Accrued expenses | | | 241 | | | | | |
| | | | | | | | |
Total liabilities | | | | | | | 215,848 | |
| | | | | | | | |
| | |
Net Assets | | | | | | $ | 524,539 | |
| | | | | | | | |
| | |
Net assets consist of: | | | | | | | | |
Accumulated paid-in-capital | | | | | | $ | 525,992 | |
Undistributed net investment income | | | | | | | 90 | |
Accumulated net realized loss on investments, options, futures, swaps and foreign currency transactions | | | | | | | (2,386 | ) |
Unrealized appreciation of investments, options, futures, swaps and foreign currency translations | | | | | | | 843 | |
| | | | | | | | |
| | |
Net Assets | | | | | | $ | 524,539 | |
| | | | | | | | |
| | |
Net Asset Value Per Share: | | | | | | | | |
Institutional Class (52,008 shares outstanding) | | | | | | | $10.09 | |
Financial Intermediary Class (2 shares outstanding) | | | | | | | $10.09 | |
| | | | | | | | | |
See notes to financial statements.
23
Semi-Annual Report to Shareholders
Statement of Operations
Western Asset Absolute Return Portfolio
For the Six Months Ended September 30, 2007 (Unaudited)
(Amounts in Thousands)
| | | | | | | | |
Investment Income: | | | | | | | | |
Interest | | $ | 12,659 | | | | | |
Dividends | | | 2 | | | | | |
| | | | | | | | |
Total income | | | | | | $ | 12,661 | |
Expenses: | | | | | | | | |
Management fees | | | 1,632 | | | | | |
Distribution fees: | | | | | | | | |
Financial Intermediary Class | | | — | A | | | | |
Audit and legal fees | | | 88 | | | | | |
Custodian fees | | | 46 | | | | | |
Directors’ fees and expenses | | | 12 | | | | | |
Registration fees | | | 68 | | | | | |
Reports to shareholders | | | 15 | | | | | |
Transfer agent and shareholder servicing expense: | | | | | | | | |
Institutional Class | | | 8 | | | | | |
Financial Intermediary Class | | | — | A | | | | |
Other expenses | | | 22 | | | | | |
| | | | | | | | |
| | | 1,891 | | | | | |
Less: Expenses reimbursed by adviser | | | — | A | | | | |
Compensating balance credits | | | (16 | ) | | | | |
Fees recaptured | | | 190 | | | | | |
| | | | | | | | |
Net expenses | | | | | | | 2,065 | |
| | | | | | | | |
Net Investment Income | | | | | | | 10,596 | |
Net Realized and Unrealized Gain/(Loss) on Investments: | | | | | | | | |
Net realized gain/(loss) on: | | | | | | | | |
Investments | | | 484 | | | | | |
Options | | | (1,104 | ) | | | | |
Futures | | | (1,396 | ) | | | | |
Swaps | | | 465 | | | | | |
Foreign currency transactions | | | (324 | ) | | | | |
| | | | | | | | |
| | | | | | | (1,875 | ) |
Change in unrealized appreciation/depreciation of: | | | | | | | | |
Investments, options, futures, swaps and foreign currency translations | | | (335 | ) | | | | |
Assets and liabilities denominated in foreign currency | | | (41 | ) | | | | |
| | | | | | | | |
| | | | | | | (376 | ) |
| | | | | | | | |
Net Realized and Unrealized Loss on Investments | | | | | | | (2,251 | ) |
| | | | | | | | | |
Change in Net Assets Resulting From Operations | | | | | | $ | 8,345 | |
| | | | | | | | | |
See notes to financial statements.
24
Semi-Annual Report to Shareholders
Statement of Changes in Net Assets
Western Asset Absolute Return Portfolio
(Amounts in Thousands)
| | | | | | | | |
| | | FOR THE
SIX MONTHS ENDED
SEPTEMBER 30, 2007 | | | FOR THE
PERIOD ENDED
MARCH 31, 2007A | |
| Change in Net Assets: | | (Unaudited) | | | | |
Net investment income | | $ | 10,596 | | | $ | 5,736 | |
| | |
Net realized gain/(loss) | | | (1,875 | ) | | | 2,151 | |
| | |
Change in unrealized appreciation/depreciation | | | (376 | ) | | | 1,219 | |
| | | | | | | | |
Change in net assets resulting from operations | | | 8,345 | | | | 9,106 | |
| | |
Distributions to shareholders from: | | | | | | | | |
Net investment income: | | | | | | | | |
Institutional Class | | | (10,585 | ) | | | (5,734 | ) |
Financial Intermediary Class | | | — | B | | | — | B |
| | |
Net realized gain on investments: | | | | | | | | |
Institutional Class | | | (1,802 | ) | | | (783 | ) |
Financial Intermediary Class | | | — | B | | | — | B |
| | |
Change in net assets from fund share transactions: | | | | | | | | |
Institutional Class | | | 157,325 | | | | 368,650 | |
Financial Intermediary Class | | | — | B | | | 17 | |
| | | | | | | | |
Change in net assets | | | 153,283 | | | | 371,256 | |
| | |
Net Assets: | | | | | | | | |
Beginning of period | | | 371,256 | | | | — | |
| | | | | | | | |
| | |
End of period | | $ | 524,539 | | | $ | 371,256 | |
| | | | | | | | |
| | |
Under distributions of net investment income | | $ | 90 | | | $ | 79 | |
| | | | | | | | |
| | | | | | | | | |
A | | For the period July 6, 2006 (commencement of operations) to March 31, 2007. |
See notes to financial statements.
25
Semi-Annual Report to Shareholders
Financial Highlights
Western Asset Absolute Return Portfolio
For a share of each class of capital stock outstanding:
Institutional Class:
| | | | | | | | |
| | | SIX MONTHS
ENDED
SEPTEMBER 30,
2007 | | | PERIOD ENDED
MARCH 31, 2007A | |
| | | (Unaudited) | | | | |
Net asset value, beginning of period | | $ | 10.23 | | | $ | 10.00 | |
| | | | | | | | |
Investment operations: | | | | | | | | |
Net investment income | | | .25 | B | | | .36 | B |
Net realized and unrealized gain | | | (.10 | ) | | | .29 | |
| | | | | | | | |
Total from investment operations | | | .15 | | | | .65 | |
| | | | | | | | |
Distributions from: | | | | | | | | |
Net investment income | | | (.24 | ) | | | (.35 | ) |
Net realized gain on investments | | | (.05 | ) | | | (.07 | ) |
| | | | | | | | |
Total distributions | | | (.29 | ) | | | (.42 | ) |
| | | | | | | | |
Net asset value, end of period | | $ | 10.09 | | | $ | 10.23 | |
| | | | | | | | |
Total return | | | 1.63 | %C | | | 6.63 | %C |
| | |
Ratios to Average Net Assets:D | | | | | | | | |
Total expenses | | | .87 | %E | | | 1.09 | %E |
Expenses net of waivers, if any | | | .96 | %E | | | .93 | %E |
Expenses net of all reductions | | | .95 | %E | | | .89 | %E |
Net investment income | | | 4.87 | %E | | | 4.90 | %E |
| | |
Supplemental Data: | | | | | | | | |
Portfolio turnover rate | | | 196.3 | %C | | | 182.2 | %C |
Net assets, end of period (in thousands) | | $ | 524,521 | | | $ | 371,239 | |
| | | | | | | | | |
A | | For the period July 6, 2006 (commencement of operations) to March 31, 2007. |
B | | Computed using average daily shares outstanding. |
D | | Total expenses reflects operating expenses prior to any voluntary expense (waivers)/reimbursements and/or compensating balance credits. Expenses net of waivers reflects total expenses before compensating balance credits but net of any voluntary expense waivers. Expenses net of all reductions reflects expenses less any compensating balance credits and/or voluntary expense waivers. |
See notes to financial statements.
26
Semi-Annual Report to Shareholders
Financial Highlights
Western Asset Absolute Return Portfolio
For a share of each class of capital stock outstanding:
Financial Intermediary Class:
| | | | | | | | |
| | | SIX MONTHS
ENDED
SEPTEMBER 30,
2007 | | | PERIOD
ENDED
MARCH 31, 2007F | |
| | | (Unaudited) | | | | |
Net asset value, beginning of period | | $ | 10.23 | | | $ | 10.17 | |
| | | | | | | | |
Investment operations: | | | | | | | | |
Net investment income | | | .23 | B | | | .27 | B |
Net realized and unrealized gain/(loss) | | | (.09 | ) | | | .13 | |
| | | | | | | | |
Total from investment operations | | | .14 | | | | .40 | |
| | | | | | | | |
Distributions from: | | | | | | | | |
Net investment income | | | (.23 | ) | | | (.27 | ) |
Net realized gain on investments | | | (.05 | ) | | | (.07 | ) |
| | | | | | | | |
Total distributions | | | (.28 | ) | | | (.34 | ) |
| | | | | | | | |
Net asset value, end of period | | $ | 10.09 | | | $ | 10.23 | |
| | | | | | | | |
Total return | | | 1.50 | %C | | | 3.99 | %C |
| | |
Ratios to Average Net Assets:D | | | | | | | | |
Total expenses | | | 1.36 | %E | | | 85.97 | %E |
Expenses net of waivers, if any | | | 1.21 | %E | | | 1.18 | %E |
Expenses net of all reductions | | | 1.20 | %E | | | 1.16 | %E |
Net investment income | | | 4.62 | %E | | | 4.60 | %E |
| | |
Supplemental Data: | | | | | | | | |
Portfolio turnover rate | | | 196.3 | %C | | | 182.2 | %C |
Net assets, end of period (in thousands) | | $ | 18 | | | $ | 17 | |
| | | | | | | | | |
B | | Computed using average daily shares outstanding. |
D | | Total expenses reflects operating expenses prior to any voluntary expense waivers and/or compensating balance credits. Expenses net of waivers reflects total expenses before compensating balance credits but net of any voluntary expense waivers. Expenses net of all reductions reflects expenses less any compensating balance credits and/or voluntary expense waivers. |
F | | For the period September 6, 2006 (commencement of operations) to March 31, 2007. |
See notes to financial statements.
27
Semi-Annual Report to Shareholders
Expense Example
Western Asset Core Bond Portfolio
As a shareholder of the Fund, you incur ongoing costs, including management fees, distribution (12b-1) fees on Financial Intermediary Class shares, and other Fund expenses. These examples are intended to help you understand your ongoing costs (in dollars) of investing in the Fund and to compare these costs with the ongoing costs of investing in other mutual funds. Each example is based on an investment of $1,000 invested on April 1, 2007 and held through September 30, 2007.
Actual Expenses
The first line for each class in the table below provides information about actual account values and actual expenses for the Fund. You may use the information in this line, together with the amount you invested, to estimate the expenses that you paid over the period. Simply divide your account value by $1,000 (for example, an $8,600 account value divided by $1,000 = 8.6), then multiply the result by the number in the first line under the heading entitled “Expenses Paid During the Period” to estimate the expenses you paid on your account during this period.
Hypothetical Examples for Comparison Purposes
The second line for each class in the table below provides information about hypothetical account values and hypothetical expenses based on the relevant class’s actual expense ratio and an assumed rate of return of 5% per year before expenses, which is not the class’s actual return. The hypothetical account values and expenses may not be used to estimate the actual ending account balance or expenses you paid for the period. You may use this information to compare the ongoing costs of investing in the Fund and other funds. To do so, compare this 5% hypothetical example with the 5% hypothetical examples for the relevant classes that appear in the shareholder reports of other funds.
| | | | | | | | | |
| | | Beginning
Account Value
4/1/07 | | Ending
Account Value
9/30/07 | | Expenses PaidA
During the Period
4/1/07 to 9/30/07 |
Institutional Class | | | | | | | | | |
Actual | | $ | 1,000.00 | | $ | 1,004.00 | | $ | 2.21 |
Hypothetical (5% return before expenses) | | | 1,000.00 | | | 1,022.86 | | | 2.23 |
Financial Intermediary Class | | | | | | | | | |
Actual | | $ | 1,000.00 | | $ | 1,002.80 | | $ | 3.46 |
Hypothetical (5% return before expenses) | | | 1,000.00 | | | 1,021.61 | | | 3.50 |
A | | These calculations are based on expenses incurred in the most recent fiscal half-year. The dollar amounts shown as “Expenses Paid During the Period” are equal to the annualized expense ratios of 0.44% and 0.69% for the Institutional Class and Financial Intermediary Class, respectively, multiplied by the average values over the period, multiplied by the number of days in the most recent fiscal half-year (183), and divided by 365. |
28
Semi-Annual Report to Shareholders
Performance Information
Western Asset Core Bond Portfolio
The graphs compare the Fund’s total returns to that of an appropriate broad-based securities market index. The graphs illustrate the cumulative total return of an initial $1,000,000 investment in the Institutional Class and Financial Intermediary Class of the Fund, for the periods indicated. The lines for the Fund represent the total return after deducting all Fund investment management and other administrative expenses and the transaction costs of buying and selling securities. The line representing the securities market index does not include any transaction costs associated with buying and selling securities in the index or other investment management or administrative expenses.
Total return measures investment performance in terms of appreciation or depreciation in the Fund’s net asset value per share, plus dividends and any capital gain distributions. It assumes that dividends and distributions were reinvested at the time they were paid. Returns (and the graphs and tables found below) do not reflect the deduction of taxes that a shareholder would pay on Fund distributions or the redemption of Fund shares. Average annual returns tend to smooth out variations in a fund’s return, so that they differ from actual year-to-year results.
Bonds are subject to a variety of risks, including interest rate, credit and inflation risk. Non-U.S. investments are subject to currency fluctuations, social, economical and political risk.
Growth of a $1,000,000 Investment—Institutional Class
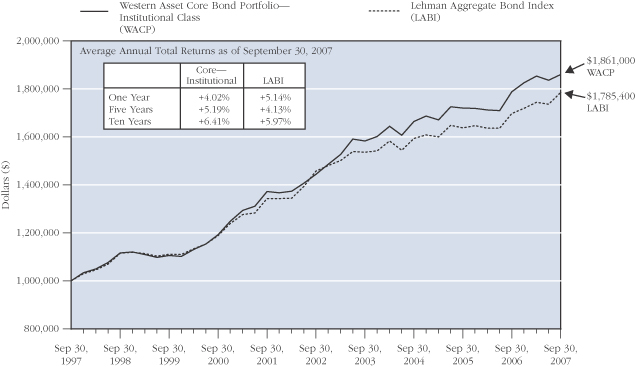
The performance data quoted represents past performance and does not guarantee future results. The performance stated may have been due to extraordinary market conditions, which may not be duplicated in the future. Current performance may be lower or higher than the performance data quoted. To obtain the most recent month-end performance information, please visit www.westernassetfunds.com. The investment return and principal value of the Fund will fluctuate so that an investor’s shares, when redeemed, may be worth more or less than the original cost. Calculations assume reinvestment of dividends and capital gain distributions. Performance would have been lower if fees had not been waived in various periods.
29
Semi-Annual Report to Shareholders
Performance Information—Continued
Growth of a $1,000,000 Investment—Financial Intermediary Class
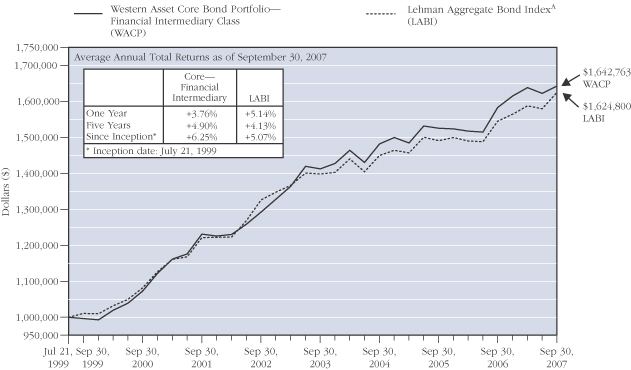
The performance data quoted represents past performance and does not guarantee future results. The performance stated may have been due to extraordinary market conditions, which may not be duplicated in the future. Current performance may be lower or higher than the performance data quoted. To obtain the most recent month-end performance information, please visit www.westernassetfunds.com. The investment return and principal value of the Fund will fluctuate so that an investor’s shares, when redeemed, may be worth more or less than the original cost. Calculations assume reinvestment of dividends and capital gain distributions. Performance would have been lower if fees had not been waived in various periods.
A | | Index returns are for periods beginning July 31, 1999. |
30
Semi-Annual Report to Shareholders
Portfolio Composition (as of September 30, 2007)
Standard & Poor’s Debt RatingsB (as a percentage of the portfolio)
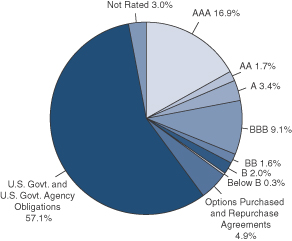
Maturity Schedule (as a percentage of the portfolio)
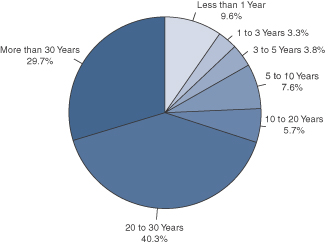
B | | Source: Standard & Poor's. |
The Fund is actively managed. As a result, the composition of the portfolio holdings and sectors are subject to change at any time.
31
Semi-Annual Report to Shareholders
Portfolio of Investments
Western Asset Core Bond Portfolio
September 30, 2007 (Unaudited)
(Amounts in Thousands)
| | | | | | | | | | | | | |
| | | % OF
NET ASSETS | | RATE | | MATURITY
DATE | | PAR/
SHARES | | VALUE | |
| | | | | | | | | | | | | |
| | | | | | | | | | | | | |
Long-Term Securities | | 118.7% | | | | | | | | | | | |
| | | | | |
Corporate Bonds and Notes | | 17.7% | | | | | | | | | | | |
| | | | | |
Aerospace and Defense | | N.M. | | | | | | | | | | | |
United Technologies Corp. | | | | 5.400% | | 5/1/35 | | $ | 1,460 | | $ | 1,367 | |
| | | | | | | | | | | | | |
| | | | | |
Airlines | | 0.7% | | | | | | | | | | | |
Continental Airlines Inc. | | | | 6.900% | | 1/2/18 | | | 440 | | | 450 | |
Continental Airlines Inc. | | | | 6.545% | | 2/2/19 | | | 2,702 | | | 2,719 | |
Delta Air Lines Inc. | | | | 7.379% | | 5/18/10 | | | 5,565 | | | 5,621 | |
Delta Air Lines Inc. | | | | 7.570% | | 11/18/10 | | | 12,026 | | | 12,334 | |
Delta Air Lines Inc. | | | | 7.111% | | 9/18/11 | | | 15,600 | | | 15,814 | |
Southwest Airlines Co. | | | | 5.125% | | 3/1/17 | | | 2,640 | | | 2,433 | A |
US Airways Pass-Through Trust | | | | 6.850% | | 1/30/18 | | | 9,575 | | | 9,431 | |
| | | | | | | | | | | | | |
| | | | | | | | | | | | 48,802 | |
| | | | | | | | | | | | | |
Automobiles | | 0.2% | | | | | | | | | | | |
DaimlerChrysler NA Holding Corp. | | | | 4.050% | | 6/4/08 | | | 1,530 | | | 1,513 | |
DaimlerChrysler NA Holding Corp. | | | | 7.200% | | 9/1/09 | | | 1,240 | | | 1,285 | |
DaimlerChrysler NA Holding Corp. | | | | 5.875% | | 3/15/11 | | | 700 | | | 710 | |
Ford Motor Co. | | | | 7.450% | | 7/16/31 | | | 13,410 | | | 10,527 | A |
| | | | | | | | | | | | | |
| | | | | | | | | | | | 14,035 | |
| | | | | | | | | | | | | |
Building Products | | 0.1% | | | | | | | | | | | |
Masco Corp. | | | | 7.125% | | 8/15/13 | | | 3,320 | | | 3,481 | |
Masco Corp. | | | | 6.125% | | 10/3/16 | | | 4,120 | | | 4,021 | |
| | | | | | | | | | | | | |
| | | | | | | | | | | | 7,502 | |
| | | | | | | | | | | | | |
Capital Markets | | 2.7% | | | | | | | | | | | |
Lehman Brothers Holdings Capital Trust VII | | | | 5.857% | | 11/29/49 | | | 520 | | | 495 | B |
Lehman Brothers Holdings Inc. | | | | 5.260% | | 4/2/08 | | | 50,000 | | | 49,803 | A,C |
Lehman Brothers Holdings Inc. | | | | 6.200% | | 9/26/14 | | | 4,370 | | | 4,387 | |
Lehman Brothers Holdings Inc. | | | | 7.394% | | 9/15/22 | | | 42,560 | | | 43,615 | C |
Merrill Lynch and Co. Inc. | | | | 5.794% | | 6/16/08 | | | 31,040 | | | 31,028 | C |
Merrill Lynch and Co. Inc. | | | | 6.110% | | 1/29/37 | | | 3,510 | | | 3,304 | |
Morgan Stanley | | | | 5.485% | | 1/18/08 | | | 8,000 | | | 7,993 | C |
Morgan Stanley | | | | 4.750% | | 4/1/14 | | | 3,070 | | | 2,884 | |
Morgan Stanley | | | | 5.810% | | 10/18/16 | | | 4,040 | | | 3,865 | C |
The Bear Stearns Cos. Inc. | | | | 5.550% | | 1/22/17 | | | 7,855 | | | 7,415 | A |
The Bear Stearns Cos. Inc. | | | | 6.400% | | 10/2/17 | | | 26,540 | | | 26,422 | |
The Goldman Sachs Group Inc. | | | | 5.625% | | 1/15/17 | | | 9,935 | | | 9,639 | |
| | | | | | | | | | | | | |
| | | | | | | | | | | | 190,850 | |
| | | | | | | | | | | | | |
32
Semi-Annual Report to Shareholders
| | | | | | | | | | | | | |
| | | % OF
NET ASSETS | | RATE | | MATURITY
DATE | | PAR/
SHARES | | VALUE | |
| | | | | | | | | | | | | |
Corporate Bonds and Notes—Continued | | | | | | | | | | | | | |
| | | | | |
Commercial Banks | | 0.7% | | | | | | | | | | | |
Bank One Corp. | | | | 7.875% | | 8/1/10 | | $ | 4,500 | | $ | 4,815 | |
Bank One Corp. | | | | 5.900% | | 11/15/11 | | | 2,000 | | | 2,036 | |
HBOS Treasury Services PLC | | | | 5.250% | | 2/21/17 | | | 2,500 | | | 2,487 | D |
Rabobank Capital Funding Trust II | | | | 5.260% | | 12/31/49 | | | 470 | | | 445 | B,D |
Rabobank Capital Funding Trust III | | | | 5.254% | | 12/31/49 | | | 3,030 | | | 2,788 | B,D |
SunTrust Capital VIII | | | | 6.100% | | 12/15/36 | | | 14,970 | | | 13,580 | B |
Wachovia Capital Trust III | | | | 5.800% | | 3/15/49 | | | 6,130 | | | 6,089 | B |
Wachovia Corp. | | | | 5.750% | | 6/15/17 | | | 16,100 | | | 16,161 | A |
Wells Fargo Capital X | | | | 5.950% | | 12/15/36 | | | 1,890 | | | 1,734 | |
| | | | | | | | | | | | | |
| | | | | | | | | | | | 50,135 | |
| | | | | | | | | | | | | |
Commercial Services and Supplies | | 0.4% | | | | | | | | | | | |
PHH Corp. | | | | 7.125% | | 3/1/13 | | | 5,010 | | | 5,284 | |
Waste Management Inc. | | | | 7.125% | | 10/1/07 | | | 10,330 | | | 10,330 | |
Waste Management Inc. | | | | 6.875% | | 5/15/09 | | | 2,000 | | | 2,067 | |
Waste Management Inc. | | | | 6.375% | | 11/15/12 | | | 2,530 | | | 2,625 | |
Waste Management Inc. | | | | 5.000% | | 3/15/14 | | | 3,440 | | | 3,294 | |
Waste Management Inc. | | | | 7.125% | | 12/15/17 | | | 6,000 | | | 6,331 | |
| | | | | | | | | | | | | |
| | | | | | | | | | | | 29,931 | |
| | | | | | | | | | | | | |
Communications Equipment | | 0.1% | | | | | | | | | | | |
Motorola Inc. | | | | 8.000% | | 11/1/11 | | | 5,600 | | | 6,112 | |
| | | | | | | | | | | | | |
| | | | | |
Consumer Finance | | 2.0% | | | | | | | | | | | |
American Express Co. | | | | 6.800% | | 9/1/66 | | | 3,920 | | | 4,017 | B |
Capital One Financial Corp. | | | | 6.150% | | 9/1/16 | | | 3,170 | | | 3,092 | |
Ford Motor Credit Co. | | | | 6.625% | | 6/16/08 | | | 8,900 | | | 8,833 | |
Ford Motor Credit Co. | | | | 7.375% | | 10/28/09 | | | 50,175 | | | 49,200 | |
Ford Motor Credit Co. | | | | 7.875% | | 6/15/10 | | | 6,310 | | | 6,168 | |
Ford Motor Credit Co. | | | | 7.375% | | 2/1/11 | | | 6,435 | | | 6,166 | |
Ford Motor Credit Co. | | | | 7.250% | | 10/25/11 | | | 5,910 | | | 5,538 | |
GMAC LLC | | | | 5.625% | | 5/15/09 | | | 9,550 | | | 9,297 | |
GMAC LLC | | | | 7.750% | | 1/19/10 | | | 5,355 | | | 5,312 | |
GMAC LLC | | | | 7.250% | | 3/2/11 | | | 820 | | | 795 | |
GMAC LLC | | | | 0.000% | | 6/15/15 | | | 220 | | | 115 | E |
SLM Corp. | | | | 3.820% | | 4/1/09 | | | 8,960 | | | 8,242 | F |
SLM Corp. | | | | 5.625% | | 8/1/33 | | | 42,895 | | | 33,020 | A |
| | | | | | | | | | | | | |
| | | | | | | | | | | | 139,795 | |
| | | | | | | | | | | | | |
33
Semi-Annual Report to Shareholders
Portfolio of Investments—Continued
Western Asset Core Bond Portfolio—Continued
| | | | | | | | | | | | | |
| | | % OF
NET ASSETS | | RATE | | MATURITY
DATE | | PAR/
SHARES | | VALUE | |
| | | | | | | | | | | | | |
Corporate Bonds and Notes—Continued | | | | | | | | | | | | | |
| | | | | |
Diversified Financial Services | | 1.2% | | | | | | | | | | | |
Air 2 US | | | | 8.027% | | 10/1/19 | | $ | 11,859 | | $ | 12,037 | D |
Bank of America Corp. | | | | 5.420% | | 3/15/17 | | | 2,000 | | | 1,945 | |
Dryden Investor Trust | | | | 7.157% | | 7/23/08 | | | 4,368 | | | 4,403 | |
Glen Meadow Pass-Through Certificates | | | | 6.505% | | 2/12/67 | | | 12,080 | | | 11,611 | B,D |
HSBC Finance Corp. | | | | 8.000% | | 7/15/10 | | | 690 | | | 741 | |
HSBC Finance Corp. | | | | 7.000% | | 5/15/12 | | | 700 | | | 736 | |
HSBC Finance Corp. | | | | 6.375% | | 11/27/12 | | | 440 | | | 455 | |
ILFC E-Capital Trust II | | | | 6.250% | | 12/21/65 | | | 4,160 | | | 4,010 | A,B,D |
J.P. Morgan and Co. Inc. | | | | 7.214% | | 2/15/12 | | | 2,000 | | | 2,064 | F |
JPMorgan Chase and Co. | | | | 5.750% | | 1/2/13 | | | 3,770 | | | 3,823 | |
SB Treasury Co. LLC | | | | 9.400% | | 12/29/49 | | | 2,930 | | | 2,997 | B,D |
Sigma Finance Inc. | | | | 8.500% | | 8/11/16 | | | 17,200 | | | 16,590 | D,G |
Sigma Finance Inc. | | | | 8.000% | | 6/22/17 | | | 19,210 | | | 18,089 | D,G |
Unilever Capital Corp. | | | | 7.125% | | 11/1/10 | | | 1,730 | | | 1,838 | |
| | | | | | | | | | | | | |
| | | | | | | | | | | | 81,339 | |
| | | | | | | | | | | | | |
Diversified Telecommunication Services | | 0.2% | | | | | | | | | | | |
AT&T Inc. | | | | 5.100% | | 9/15/14 | | | 4,960 | | | 4,800 | |
BellSouth Corp. | | | | 4.750% | | 11/15/12 | | | 440 | | | 428 | A |
BellSouth Corp. | | | | 5.200% | | 9/15/14 | | | 4,270 | | | 4,156 | |
CenturyTel Inc. | | | | 6.000% | | 4/1/17 | | | 4,120 | | | 4,082 | |
Verizon Global Funding Corp. | | | | 7.250% | | 12/1/10 | | | 2,220 | | | 2,358 | |
Verizon Global Funding Corp. | | | | 7.375% | | 9/1/12 | | | 5 | | | 6 | |
| | | | | | | | | | | | | |
| | | | | | | | | | | | 15,830 | |
| | | | | | | | | | | | | |
Electric Utilities | | 0.7% | | | | | | | | | | | |
Exelon Corp. | | | | 5.625% | | 6/15/35 | | | 345 | | | 309 | |
FirstEnergy Corp. | | | | 6.450% | | 11/15/11 | | | 290 | | | 300 | |
FirstEnergy Corp. | | | | 7.375% | | 11/15/31 | | | 9,330 | | | 10,210 | |
Pacific Gas and Electric Co. | | | | 6.050% | | 3/1/34 | | | 940 | | | 923 | |
Pacific Gas and Electric Co. | | | | 5.800% | | 3/1/37 | | | 7,330 | | | 6,928 | |
Progress Energy Inc. | | | | 7.100% | | 3/1/11 | | | 1,488 | | | 1,565 | |
The Cleveland Electric Illuminating Co. | | | | 5.700% | | 4/1/17 | | | 630 | | | 613 | |
The Detroit Edison Co. | | | | 6.125% | | 10/1/10 | | | 920 | | | 950 | |
TXU Energy Co. | | | | 7.000% | | 3/15/13 | | | 25,800 | | | 28,332 | |
| | | | | | | | | | | | | |
| | | | | | | | | | | | 50,130 | |
| | | | | | | | | | | | | |
Food and Staples Retailing | | 0.7% | | | | | | | | | | | |
CVS Lease Pass-Through Trust | | | | 6.036% | | 12/10/28 | | | 36,022 | | | 34,989 | D |
Wal-Mart Stores Inc. | | | | 5.800% | | 2/15/18 | | | 16,920 | | | 17,037 | |
| | | | | | | | | | | | | |
| | | | | | | | | | | | 52,026 | |
| | | | | | | | | | | | | |
34
Semi-Annual Report to Shareholders
| | | | | | | | | | | | | |
| | | % OF
NET ASSETS | | RATE | | MATURITY
DATE | | PAR/
SHARES | | VALUE | |
| | | | | | | | | | | | | |
Corporate Bonds and Notes—Continued | | | | | | | | | | | | | |
| | | | | |
Food Products | | 0.2% | | | | | | | | | | | |
General Mills Inc. | | | | 5.700% | | 2/15/17 | | $ | 3,580 | | $ | 3,521 | |
H.J. Heinz Co. | | | | 6.428% | | 12/1/08 | | | 6,650 | | | 6,756 | D |
Sara Lee Corp. | | | | 6.250% | | 9/15/11 | | | 5,500 | | | 5,681 | |
| | | | | | | | | | | | | |
| | | | | | | | | | | | 15,958 | |
| | | | | | | | | | | | | |
Gas Utilities | | 0.1% | | | | | | | | | | | |
Southern Natural Gas Co. | | | | 8.000% | | 3/1/32 | | | 7,390 | | | 8,354 | |
| | | | | | | | | | | | | |
| | | | | |
Health Care Equipment and Supplies | | N.M. | | | | | | | | | | | |
Mallinckrodt Inc. | | | | 6.500% | | 11/15/07 | | | 1,210 | | | 1,211 | |
| | | | | | | | | | | | | |
| | | | | |
Health Care Providers and Services | | 0.9% | | | | | | | | | | | |
AmerisourceBergen Corp. | | | | 5.625% | | 9/15/12 | | | 3,520 | | | 3,491 | |
AmerisourceBergen Corp. | | | | 5.875% | | 9/15/15 | | | 3,050 | | | 2,983 | |
Cardinal Health Inc. | | | | 6.300% | | 10/15/16 | | | 3,530 | | | 3,475 | D |
Cardinal Health Inc. | | | | 5.850% | | 12/15/17 | | | 12,985 | | | 12,807 | |
HCA Inc. | | | | 5.750% | | 3/15/14 | | | 35,430 | | | 29,717 | |
Tenet Healthcare Corp. | | | | 6.375% | | 12/1/11 | | | 2,500 | | | 2,188 | A |
Tenet Healthcare Corp. | | | | 7.375% | | 2/1/13 | | | 6,584 | | | 5,580 | |
| | | | | | | | | | | | | |
| | | | | | | | | | | | 60,241 | |
| | | | | | | | | | | | | |
Hotels, Restaurants and Leisure | | 0.1% | | | | | | | | | | | |
Marriott International Inc. | | | | 5.810% | | 11/10/15 | | | 4,400 | | | 4,355 | A |
Starwood Hotels and Resorts Worldwide Inc. | | | | 7.875% | | 5/1/12 | | | 3,050 | | | 3,255 | |
| | | | | | | | | | | | | |
| | | | | | | | | | | | 7,610 | |
| | | | | | | | | | | | | |
Household Durables | | N.M. | | | | | | | | | | | |
Pulte Homes Inc. | | | | 8.125% | | 3/1/11 | | | 2,110 | | | 2,037 | A |
| | | | | | | | | | | | | |
| | | | | |
Independent Power Producers and Energy Traders | | 0.3% | | | | | | | | | | | |
TXU Corp. | | | | 4.800% | | 11/15/09 | | | 9,000 | | | 9,079 | |
TXU Corp. | | | | 6.500% | | 11/15/24 | | | 1,090 | | | 873 | |
TXU Corp. | | | | 6.550% | | 11/15/34 | | | 9,930 | | | 7,788 | A |
| | | | | | | | | | | | | |
| | | | | | | | | | | | 17,740 | |
| | | | | | | | | | | | | |
Insurance | | 1.4% | | | | | | | | | | | |
American International Group Inc. | | | | 6.250% | | 3/15/37 | | | 12,690 | | | 11,947 | |
ASIF Global Financing XIX | | | | 4.900% | | 1/17/13 | | | 1,210 | | | 1,169 | D |
Marsh and McLennan Cos. Inc. | | | | 5.150% | | 9/15/10 | | | 3,070 | | | 3,059 | |
35
Semi-Annual Report to Shareholders
Portfolio of Investments—Continued
Western Asset Core Bond Portfolio—Continued
| | | | | | | | | | | | | |
| | | % OF
NET ASSETS | | RATE | | MATURITY
DATE | | PAR/
SHARES | | VALUE | |
| | | | | | | | | | | | | |
Corporate Bonds and Notes—Continued | | | | | | | | | | | | | |
| | | | | |
Insurance—Continued | | | | | | | | | | | | | |
MetLife Inc. | | | | 6.400% | | 12/15/36 | | $ | 46,240 | | $ | 43,967 | |
The Travelers Cos. Inc. | | | | 6.250% | | 3/15/37 | | | 36,940 | | | 35,716 | B |
| | | | | | | | | | | | | |
| | | | | | | | | | | | 95,858 | |
| | | | | | | | | | | | | |
IT Services | | 0.1% | | | | | | | | | | | |
Electronic Data Systems Corp. | | | | 7.125% | | 10/15/09 | | | 7,685 | | | 7,824 | |
| | | | | | | | | | | | | |
| | | | | |
Leisure Equipment and Products | | 0.7% | | | | | | | | | | | |
Eastman Kodak Co. | | | | 3.625% | | 5/15/08 | | | 17,500 | | | 16,975 | |
Eastman Kodak Co. | | | | 7.250% | | 11/15/13 | | | 34,680 | | | 34,420 | |
| | | | | | | | | | | | | |
| | | | | | | | | | | | 51,395 | |
| | | | | | | | | | | | | |
Media | | 0.9% | | | | | | | | | | | |
CBS Corp. | | | | 7.625% | | 1/15/16 | | | 2,750 | | | 2,958 | |
Clear Channel Communications Inc. | | | | 4.625% | | 1/15/08 | | | 1,430 | | | 1,420 | |
Clear Channel Communications Inc. | | | | 4.250% | | 5/15/09 | | | 2,130 | | | 2,030 | |
Clear Channel Communications Inc. | | | | 6.250% | | 3/15/11 | | | 5,580 | | | 5,115 | |
Clear Channel Communications Inc. | | | | 5.500% | | 9/15/14 | | | 790 | | | 620 | |
Comcast Corp. | | | | 6.500% | | 1/15/15 | | | 1,200 | | | 1,240 | |
Comcast Corp. | | | | 6.500% | | 1/15/17 | | | 600 | | | 619 | |
Comcast Corp. | | | | 7.050% | | 3/15/33 | | | 3,130 | | | 3,299 | |
Comcast MO of Delaware Inc. | | | | 9.000% | | 9/1/08 | | | 2,200 | | | 2,270 | |
Cox Communications Inc. | | | | 7.875% | | 8/15/09 | | | 9,640 | | | 10,081 | |
Liberty Media LLC | | | | 7.875% | | 7/15/09 | | | 9,000 | | | 9,263 | |
Liberty Media LLC | | | | 3.750% | | 2/15/30 | | | 290 | | | 168 | H |
News America Inc. | | | | 6.200% | | 12/15/34 | | | 105 | | | 99 | |
Time Warner Inc. | | | | 6.875% | | 5/1/12 | | | 8,270 | | | 8,678 | |
Time Warner Inc. | | | | 6.950% | | 1/15/28 | | | 2,000 | | | 2,046 | |
Time Warner Inc. | | | | 7.625% | | 4/15/31 | | | 350 | | | 381 | |
Viacom Inc. | | | | 5.750% | | 4/30/11 | | | 8,580 | | | 8,663 | |
Viacom Inc. | | | | 6.250% | | 4/30/16 | | | 3,400 | | | 3,409 | |
| | | | | | | | | | | | | |
| | | | | | | | | | | | 62,359 | |
| | | | | | | | | | | | | |
Multi-Utilities | | 0.2% | | | | | | | | | | | |
Dominion Resources Inc. | | | | 4.125% | | 2/15/08 | | | 10,850 | | | 10,791 | |
Dominion Resources Inc. | | | | 5.125% | | 12/15/09 | | | 50 | | | 50 | |
Dominion Resources Inc. | | | | 4.750% | | 12/15/10 | | | 570 | | | 562 | |
Dominion Resources Inc. | | | | 5.700% | | 9/17/12 | | | 2,050 | | | 2,057 | |
| | | | | | | | | | | | | |
| | | | | | | | | | | | 13,460 | |
| | | | | | | | | | | | | |
36
Semi-Annual Report to Shareholders
| | | | | | | | | | | | | |
| | | % OF
NET ASSETS | | RATE | | MATURITY
DATE | | PAR/
SHARES | | VALUE | |
| | | | | | | | | | | | | |
Corporate Bonds and Notes—Continued | | | | | | | | | | | | | |
| | | | | |
Multiline Retail | | 0.1% | | | | | | | | | | | |
Target Corp. | | | | 4.000% | | 6/15/13 | | $ | 4,445 | | $ | 4,110 | A |
| | | | | | | | | | | | | |
| | | | | |
Oil, Gas and Consumable Fuels | | 1.7% | | | | | | | | | | | |
Anadarko Petroleum Corp. | | | | 6.094% | | 9/15/09 | | | 12,340 | | | 12,269 | C |
Anadarko Petroleum Corp. | | | | 6.450% | | 9/15/36 | | | 10,010 | | | 9,855 | |
Conoco Inc. | | | | 6.950% | | 4/15/29 | | | 2,780 | | | 3,058 | |
El Paso Natural Gas Co. | | | | 8.375% | | 6/15/32 | | | 3,610 | | | 4,242 | |
Hess Corp. | | | | 7.875% | | 10/1/29 | | | 2,940 | | | 3,379 | |
Hess Corp. | | | | 7.300% | | 8/15/31 | | | 9,595 | | | 10,518 | |
Kerr-McGee Corp. | | | | 6.875% | | 9/15/11 | | | 17,000 | | | 17,875 | |
Kerr-McGee Corp. | | | | 6.950% | | 7/1/24 | | | 650 | | | 674 | |
Kinder Morgan Energy Partners LP | | | | 7.125% | | 3/15/12 | | | 4,650 | | | 4,903 | |
Kinder Morgan Energy Partners LP | | | | 5.000% | | 12/15/13 | | | 3,180 | | | 3,034 | |
Kinder Morgan Energy Partners LP | | | | 6.000% | | 2/1/17 | | | 1,670 | | | 1,651 | |
Pemex Project Funding Master Trust | | | | 6.625% | | 6/15/35 | | | 16,155 | | | 16,647 | |
Sonat Inc. | | | | 7.625% | | 7/15/11 | | | 5,000 | | | 5,175 | |
Tennessee Gas Pipeline Co. | | | | 8.375% | | 6/15/32 | | | 1,110 | | | 1,305 | |
Texaco Capital Inc. | | | | 5.500% | | 1/15/09 | | | 1,000 | | | 1,006 | A |
The Williams Cos. Inc. | | | | 8.125% | | 3/15/12 | | | 3,730 | | | 4,019 | A |
The Williams Cos. Inc. | | | | 7.500% | | 1/15/31 | | | 2,035 | | | 2,111 | |
The Williams Cos. Inc. | | | | 8.750% | | 3/15/32 | | | 3,240 | | | 3,730 | |
XTO Energy Inc. | | | | 7.500% | | 4/15/12 | | | 10,379 | | | 11,215 | |
| | | | | | | | | | | | | |
| | | | | | | | | | | | 116,666 | |
| | | | | | | | | | | | | |
Paper and Forest Products | | N.M. | | | | | | | | | | | |
Weyerhaeuser Co. | | | | 6.750% | | 3/15/12 | | | 2,775 | | | 2,881 | |
| | | | | | | | | | | | | |
| | | | | |
Pharmaceuticals | | 0.1% | | | | | | | | | | | |
Wyeth | | | | 5.950% | | 4/1/37 | | | 9,750 | | | 9,409 | |
| | | | | | | | | | | | | |
| | | | | |
Real Estate Investment Trusts | | 0.1% | | | | | | | | | | | |
Health Care Property Investors Inc. | | | | 6.450% | | 6/25/12 | | | 3,550 | | | 3,647 | |
| | | | | | | | | | | | | |
| | | | | |
Real Estate Management and Development | | N.M. | | | | | | | | | | | |
Socgen Real Estate Co. LLC | | | | 7.640% | | 12/29/49 | | | 260 | | | 260 | B,D |
| | | | | | | | | | | | | |
| | | | | |
Specialty Retail | | 0.3% | | | | | | | | | | | |
Autozone Inc. | | | | 6.950% | | 6/15/16 | | | 5,620 | | | 5,965 | |
Home Depot Inc. | | | | 4.625% | | 8/15/10 | | | 1,380 | | | 1,345 | |
37
Semi-Annual Report to Shareholders
Portfolio of Investments—Continued
Western Asset Core Bond Portfolio—Continued
| | | | | | | | | | | | | |
| | | % OF
NET ASSETS | | RATE | | MATURITY
DATE | | PAR/
SHARES | | VALUE | |
| | | | | | | | | | | | | |
Corporate Bonds and Notes—Continued | | | | | | | | | | | | | |
| | | | | |
Specialty Retail—Continued | | | | | | | | | | | | | |
Home Depot Inc. | | | | 5.250% | | 12/16/13 | | $ | 2,740 | | $ | 2,630 | |
Home Depot Inc. | | | | 5.400% | | 3/1/16 | | | 4,250 | | | 3,982 | |
Limited Brands Inc. | | | | 6.125% | | 12/1/12 | | | 9,420 | | | 9,484 | |
| | | | | | | | | | | | | |
| | | | | | | | | | | | 23,406 | |
| | | | | | | | | | | | | |
Thrifts and Mortgage Finance | | 0.6% | | | | | | | | | | | |
Countrywide Financial Corp. | | | | 6.250% | | 5/15/16 | | | 14,400 | | | 13,031 | A |
Residential Capital LLC | | | | 7.125% | | 11/21/08 | | | 8,180 | | | 7,321 | A |
Residential Capital LLC | | | | 8.460% | | 4/17/09 | | | 1,280 | | | 1,088 | C |
Residential Capital LLC | | | | 7.595% | | 5/22/09 | | | 3,550 | | | 3,018 | C,F |
Residential Capital LLC | | | | 7.000% | | 2/22/11 | | | 15,310 | | | 12,478 | |
Residential Capital LLC | | | | 7.500% | | 6/1/12 | | | 5,150 | | | 4,171 | |
| | | | | | | | | | | | | |
| | | | | | | | | | | | 41,107 | |
| | | | | | | | | | | | | |
Tobacco | | 0.1% | | | | | | | | | | | |
Altria Group Inc. | | | | 7.000% | | 11/4/13 | | | 1,115 | | | 1,212 | |
Altria Group Inc. | | | | 7.750% | | 1/15/27 | | | 2,500 | | | 3,071 | |
Reynolds American Inc. | | | | 7.875% | | 5/15/09 | | | 3,240 | | | 3,365 | |
| | | | | | | | | | | | | |
| | | | | | | | | | | | 7,648 | |
| | | | | | | | | | | | | |
Wireless Telecommunication Services | | 0.1% | | | | | | | | | | | |
Sprint Capital Corp. | | | | 8.375% | | 3/15/12 | | | 7,935 | | | 8,737 | |
Sprint Capital Corp. | | | | 6.900% | | 5/1/19 | | | 230 | | | 231 | |
Sprint Capital Corp. | | | | 8.750% | | 3/15/32 | | | 1,330 | | | 1,525 | |
| | | | | | | | | | | | | |
| | | | | | | | | | | | 10,493 | |
| | | | | | | | | | | | | |
Total Corporate Bonds and Notes
(Cost—$1,279,032) | | | | | | | | | | | | 1,251,528 | |
Asset-Backed Securities | | 5.3% | | | | | | | | | | | |
| | | | | |
Fixed Rate Securities | | 0.5% | | | | | | | | | | | |
Conseco Finance Securitizations Corp. 2000-5 | | | | 7.960% | | 2/1/32 | | | 4,700 | | | 4,177 | |
Drive Auto Receivables Trust 2006-2 A3 | | | | 5.330% | | 4/15/14 | | | 25,360 | | | 25,456 | D |
Equity One ABS Inc. 2003-3 | | | | 4.995% | | 12/25/33 | | | 4,037 | | | 3,838 | |
Green Tree Financial Corp. 1996-5 | | | | 8.100% | | 7/15/26 | | | 571 | | | 137 | |
Patrons’ Legacy 2003-IV | | | | 5.775% | | 12/23/63 | | | 5,800 | | | 5,798 | D |
| | | | | | | | | | | | | |
| | | | | | | | | | | | 39,406 | |
| | | | | | | | | | | | | |
Indexed SecuritiesC | | 4.8% | | | | | | | | | | | |
Asset-Backed Funding Certificates 2002-SB1 | | | | 5.561% | | 12/25/30 | | | 1,554 | | | 1,542 | |
Bear Stearns Asset Backed Securities Trust 2007-HE6 1A1 | | | | 6.381% | | 8/25/37 | | | 12,319 | | | 12,392 | |
38
Semi-Annual Report to Shareholders
| | | | | | | | | | | | | |
| | | % OF
NET ASSETS | | RATE | | MATURITY
DATE | | PAR/
SHARES | | VALUE | |
| | | | | | | | | | | | | |
Asset-Backed Securities—Continued | | | | | | | | | | | | | |
| | | | | |
Indexed Securities—Continued | | | | | | | | | | | | | |
Brazos Higher Education Authority Inc. 2005-1 | | | | 5.390% | | 9/26/16 | | $ | 11,137 | | $ | 11,043 | |
CDC Mortgage Capital Trust 2002-HE1 | | | | 5.441% | | 1/25/33 | | | 561 | | | 549 | |
CIT Group Home Equity Loan Trust 2002-1 | | | | 5.421% | | 3/25/33 | | | 411 | | | 405 | |
Countrywide Asset-Backed Certificates 2003-BC3 | | | | 5.751% | | 9/25/33 | | | 467 | | | 463 | |
Countrywide Home Equity Loan Trust 2005-H 2A | | | | 5.331% | | 12/15/35 | | | 192 | | | 189 | |
Fleet Home Equity Loan Trust 2003-1 | | | | 5.788% | | 1/20/33 | | | 2,699 | | | 2,658 | |
GMAC Mortgage Corp. Loan Trust 2004-VF1 A1 | | | | 5.881% | | 2/25/31 | | | 64,200 | | | 61,877 | D |
GMAC Mortgage Corp. Loan Trust 2005-HE3 A1VN | | | | 5.765% | | 2/25/36 | | | 48,410 | | | 47,442 | |
GSAMP Trust 2006-S4 | | | | 5.221% | | 5/25/36 | | | 2,899 | | | 2,767 | |
Lehman XS Trust 2005-5N | | | | 5.431% | | 11/25/35 | | | 9,686 | | | 9,494 | |
Lehman XS Trust 2006-2N 1A1 | | | | 5.391% | | 2/25/46 | | | 16,808 | | | 16,424 | |
Lehman XS Trust 2006-GP4 | | | | 5.201% | | 8/25/46 | | | 3,302 | | | 3,267 | |
Long Beach Mortgage Loan Trust 2000-1 | | | | 5.669% | | 1/21/31 | | | 249 | | | 245 | |
Merrill Lynch Mortgage Investors Trust 2007-SD1 A1 | | | | 5.581% | | 2/25/47 | | | 62,305 | | | 61,471 | |
MSDWCC Heloc Trust 2005-1 | | | | 5.321% | | 7/25/17 | | | 1,390 | | | 1,365 | |
Provident Bank Home Equity Loan Trust 1999-3 | | | | 5.521% | | 1/25/31 | | | 782 | | | 769 | |
Residential Asset Mortgage Products Inc. 2003-RS2 | | | | 5.471% | | 3/25/33 | | | 159 | | | 156 | |
Residential Asset Securities Corp. 2001-KS2 | | | | 5.591% | | 6/25/31 | | | 319 | | | 315 | |
Residential Asset Securities Corp. 2001-KS3 AII | | | | 5.591% | | 9/25/31 | | | 109 | | | 107 | |
SACO I Trust 2005-10 1A | | | | 5.391% | | 6/25/36 | | | 2,464 | | | 2,355 | |
SACO I Trust 2005-8 A1 | | | | 5.411% | | 11/25/20 | | | 1,978 | | | 1,927 | |
SACO I Trust 2006-1 A | | | | 5.301% | | 9/25/35 | | | 2,194 | | | 2,133 | |
Securitized Asset Backed Receivables LLC Trust 2007-BR2 A2 | | | | 5.361% | | 2/25/37 | | | 59,820 | | | 58,786 | |
SLM Student Loan Trust 2006-5 | | | | 5.350% | | 7/25/17 | | | 37,792 | | | 37,760 | |
| | | | | | | | | | | | | |
| | | | | | | | | | | | 337,901 | |
| | | | | | | | | | | | | |
Total Asset-Backed Securities
(Cost—$383,150) | | | | | | | | | | | | 377,307 | |
39
Semi-Annual Report to Shareholders
Portfolio of Investments—Continued
Western Asset Core Bond Portfolio—Continued
| | | | | | | | | | | | | |
| | | % OF
NET ASSETS | | RATE | | MATURITY
DATE | | PAR/
SHARES | | VALUE | |
| | | | | | | | | | | | | |
Mortgage-Backed Securities | | 18.1% | | | | | | | | | | | |
| | | | | |
Fixed Rate Securities | | 6.0% | | | | | | | | | | | |
Banc of America Commercial Mortgage Inc. 2005-5 A4 | | | | 5.115% | | 10/10/45 | | $ | 10,120 | | $ | 9,893 | |
Banc of America Commercial Mortgage Inc. 2006-3 A4 | | | | 5.889% | | 7/10/44 | | | 24,090 | | | 24,682 | |
Citicorp Mortgage Securities Inc. 2003-7 A1 | | | | 4.750% | | 8/25/18 | | | 8,112 | | | 7,964 | |
Countrywide Alternative Loan Trust 2003-20CB 1A1 | | | | 5.500% | | 10/25/33 | | | 10,999 | | | 10,710 | |
Credit Suisse Mortgage Capital Certificates 2006-C5 A3 | | | | 5.311% | | 12/15/39 | | | 14,800 | | | 14,525 | |
Criimi Mae Commercial Mortgage Trust 1998-C1 | | | | 7.000% | | 6/2/33 | | | 2,069 | | | 2,087 | D |
CS First Boston Mortgage Securities Corp. 1998-C1 A1B | | | | 6.480% | | 5/17/40 | | | 385 | | | 387 | |
Deutsche Mortgage and Asset Receiving Corp. 1998-C1 | | | | 6.538% | | 6/15/31 | | | 332 | | | 331 | |
GE Capital Commercial Mortgage Corp. 2007-C1 A4 | | | | 5.543% | | 12/10/49 | | | 1,330 | | | 1,322 | |
GMAC Commercial Mortgage Securities Inc 2006-C1 A4 | | | | 5.238% | | 11/10/45 | | | 3,800 | | | 3,735 | |
GS Mortgage Securities Corp. II 2005-GG4 | | | | 4.680% | | 7/10/39 | | | 12,900 | | | 12,550 | |
GSR Mortgage Loan Trust 2005-4F 1A1 | | | | 4.500% | | 4/25/20 | | | 8,298 | | | 8,033 | |
JP Morgan Chase Commercial Mortgage Pass-Through Certificates 2005-CIBC12 | | | | 4.895% | | 9/12/37 | | | 1,610 | | | 1,550 | |
JP Morgan Chase Commercial Mortgage Securities Corp. 2007-LDPX A3 | | | | 5.420% | | 1/15/49 | | | 56,130 | | | 55,306 | |
JP Morgan Commercial Mortgage Finance Corp. 1999-C8 A2 | | | | 7.400% | | 7/15/31 | | | 4,151 | | | 4,257 | |
LB-UBS Commercial Mortgage Trust 2005-C3 A5 | | | | 4.739% | | 7/15/30 | | | 13,356 | | | 12,745 | |
LB-UBS Commercial Mortgage Trust 2005-C3 AAB | | | | 4.664% | | 7/15/30 | | | 15,000 | | | 14,575 | |
LB-UBS Commercial Mortgage Trust 2005-C5 | | | | 4.954% | | 9/15/30 | | | 12,680 | | | 12,261 | |
MASTR Reperforming Loan Trust 2005-1 | | | | 6.500% | | 8/25/34 | | | 1,136 | | | 1,166 | D |
MASTR Reperforming Loan Trust 2005-1 1A3 | | | | 7.000% | | 8/25/34 | | | 9,456 | | | 9,873 | D |
Merrill Lynch/Countrywide Commercial Mortgage 2007-6 A4 | | | | 5.485% | | 3/12/51 | | | 18,540 | | | 18,331 | |
Merrill Lynch/Countrywide Commercial Mortgage Trust 2007-5 A4 | | | | 5.378% | | 8/12/48 | | | 1,030 | | | 1,012 | |
40
Semi-Annual Report to Shareholders
| | | | | | | | | | | | | |
| | | % OF
NET ASSETS | | RATE | | MATURITY
DATE | | PAR/
SHARES | | VALUE | |
| | | | | | | | | | | | | |
Mortgage-Backed Securities—Continued | | | | | | | | | | | | | |
| | | | | |
Fixed Rate Securities—Continued | | | | | | | | | | | | | |
Morgan Stanley Capital I 2005-HQ6 | | | | 4.989% | | 8/13/42 | | $ | 13,450 | | $ | 13,031 | |
Morgan Stanley Capital I 2006-IQ12 A4 | | | | 5.332% | | 12/15/43 | | | 8,700 | | | 8,556 | |
Prime Mortgage Trust 2006-DR1 1A1 | | | | 5.500% | | 5/25/35 | | | 29,893 | | | 29,571 | D |
Prime Mortgage Trust 2006-DR1 1A2 | | | | 6.000% | | 5/25/35 | | | 13,496 | | | 13,550 | D |
Prime Mortgage Trust 2006-DR1 2A2 | | | | 6.000% | | 5/25/35 | | | 49,222 | | | 48,653 | D |
Residential Asset Mortgage Products Inc. 2005-SL2 | | | | 7.500% | | 2/25/32 | | | 3,791 | | | 3,764 | |
Residential Asset Securitization Trust 2003-A14 | | | | 4.750% | | 2/25/19 | | | 47,384 | | | 45,711 | |
Structured Asset Securities Corp. 2003-29 1A1 | | | | 4.750% | | 9/25/18 | | | 27,289 | | | 26,360 | |
WaMu Mortgage Pass-Through Certificates 2003-S7 A1 | | | | 4.500% | | 8/25/18 | | | 5,142 | | | 4,906 | |
| | | | | | | | | | | | | |
| | | | | | | | | | | | 421,397 | |
| | | | | | | | | | | | | |
Indexed SecuritiesC | | 10.1% | | | | | | | | | | | |
American Home Mortgage Assets 2006-4 | | | | 5.341% | | 10/25/46 | | | 1,021 | | | 989 | |
American Home Mortgage Investment Trust 2006-2 1A1 | | | | 5.211% | | 6/25/46 | | | 3,310 | | | 3,291 | |
Amortizing Residential Collateral Trust 2002-BC1M | | | | 5.411% | | 1/1/32 | | | 180 | | | 171 | |
Banc of America Funding Corp. 2005-E | | | | 5.723% | | 6/20/35 | | | 14,095 | | | 14,053 | |
Bear Stearns Adjustable Rate Mortgage Trust 2004-9 24A1 | �� | | | 5.472% | | 11/25/34 | | | 21,083 | | | 20,500 | |
Bear Stearns Mortgage Funding Trust 2007-AR5 1A1A | | | | 5.301% | | 6/25/37 | | | 9,601 | | | 9,356 | |
Bear Stearns Structured Products Inc. 2007-R11 A1A | | | | 6.103% | | 9/27/37 | | | 7,300 | | | 7,188 | D |
Citigroup Mortgage Loan Trust Inc. 2005-HE2 | | | | 5.531% | | 5/25/35 | | | 3,644 | | | 3,502 | D |
Countrywide Alternative Loan Trust 2005-14 | | | | 5.341% | | 5/25/35 | | | 8,360 | | | 8,305 | |
Countrywide Alternative Loan Trust 2005-17 1A1 | | | | 5.391% | | 7/25/35 | | | 10,119 | | | 9,924 | |
Countrywide Alternative Loan Trust 2005-17 2A1 | | | | 5.371% | | 7/25/35 | | | 20,726 | | | 20,563 | |
Countrywide Alternative Loan Trust 2005-38 A3 | | | | 5.481% | | 9/25/35 | | | 6,503 | | | 6,396 | |
Countrywide Alternative Loan Trust 2005-56 3A1 | | | | 5.421% | | 11/25/35 | | | 972 | | | 952 | |
Countrywide Alternative Loan Trust 2005-59 1A1 | | | | 5.868% | | 11/20/35 | | | 2,645 | | | 2,588 | |
Countrywide Alternative Loan Trust 2006-0A7 | | | | 5.341% | | 6/25/46 | | | 12,758 | | | 12,576 | |
Countrywide Home Loans 2005-03 1A2 | | | | 5.421% | | 4/25/35 | | | 11,841 | | | 11,602 | |
41
Semi-Annual Report to Shareholders
Portfolio of Investments—Continued
Western Asset Core Bond Portfolio—Continued
| | | | | | | | | | | | | |
| | | % OF
NET ASSETS | | RATE | | MATURITY
DATE | | PAR/
SHARES | | VALUE | |
| | | | | | | | | | | | | |
Mortgage-Backed Securities—Continued | | | | | | | | | | | | | |
| | | | | |
Indexed SecuritiesC—Continued | | | | | | | | | | | | | |
Countrywide Home Loans 2005-09 1A1 | | | | 5.431% | | 5/25/35 | | $ | 11,848 | | $ | 11,550 | |
Countrywide Home Loans 2005-09 2A1 | | | | 5.351% | | 5/25/35 | | | 5,593 | | | 5,575 | |
Downey Savings and Loan Association Mortgage Loan Trust 2005-AR6 | | | | 5.793% | | 10/19/45 | | | 2,849 | | | 2,784 | |
GMAC Mortgage Corp. Loan Trust 2004-AR2 3A | | | | 4.376% | | 8/19/34 | | | 41,902 | | | 41,528 | |
Granite Mortgages PLC 2003-1 | | | | 5.550% | | 1/20/20 | | | 1,105 | | | 1,098 | D,I |
Greenpoint Mortgage Funding Trust 2005-AR1 | | | | 5.351% | | 6/25/45 | | | 9,441 | | | 9,256 | |
Greenpoint Mortgage Funding Trust 2005-AR4 | | | | 5.391% | | 10/25/45 | | | 2,137 | | | 2,112 | |
Greenpoint Mortgage Funding Trust 2006-AR4 | | | | 5.231% | | 9/25/46 | | | 38,250 | | | 37,902 | |
Greenpoint Mortgage Funding Trust 2006-AR5 | | | | 5.211% | | 10/25/46 | | | 41,625 | | | 41,408 | |
GSMPS Mortgage Loan Trust 2005-RP2 | | | | 5.481% | | 3/25/35 | | | 17,180 | | | 17,013 | D |
Harborview Mortgage Loan Trust 2005-7 | | | | 6.133% | | 6/19/45 | | | 17,306 | | | 16,838 | |
Harborview Mortgage Loan Trust 2006-14 2A1A | | | | 5.171% | | 3/19/38 | | | 837 | | | 816 | |
Harborview Mortgage Loan Trust 2006-9 2A1A | | | | 5.208% | | 11/19/36 | | | 1,041 | | | 1,020 | |
Impac Secured Assets Corp. 2005-2 | | | | 5.451% | | 3/25/36 | | | 1,512 | | | 1,483 | |
IndyMac Inda Mortgage Loan Trust 2007-AR7 1A1 | | | | 6.287% | | 11/25/37 | | | 9,360 | | | 9,355 | |
IXIS Real Estate Capital Trust 2006-HE2 A1 | | | | 5.191% | | 8/25/36 | | | 1,077 | | | 1,075 | |
MASTR Adjustable Rate Mortgages Trust 2007-3 22A2 | | | | 5.341% | | 5/25/47 | | | 34,908 | | | 34,180 | |
Medallion Trust 2000-2G | | | | 5.846% | | 12/18/31 | | | 830 | | | 825 | I |
Medallion Trust 2003-1G | | | | 5.428% | | 12/21/33 | | | 2,068 | | | 2,056 | I |
MLCC Mortgage Investors Inc. 2003-B | | | | 5.471% | | 4/25/28 | | | 2,517 | | | 2,445 | |
Structured Adjustable Rate Mortgage Loan Trust 2005-19XS | | | | 5.451% | | 10/25/35 | | | 1,865 | | | 1,818 | |
Structured Asset Mortgage Investments Inc. 2006-AR6 | | | | 5.321% | | 7/25/36 | | | 18,880 | | | 18,346 | |
Structured Asset Mortgage Investments Inc. 2006-AR7 A1A | | | | 5.341% | | 8/25/36 | | | 39,181 | | | 38,567 | |
Thornburg Mortgage Securities Trust 2005-2 A1 | | | | 5.351% | | 7/25/45 | | | 8,349 | | | 8,372 | |
Thornburg Mortgage Securities Trust 2005-2 A2 | | | | 5.361% | | 7/25/45 | | | 15,111 | | | 15,090 | |
Thornburg Mortgage Securities Trust 2006-1 | | | | 5.301% | | 1/25/36 | | | 56,628 | | | 56,344 | |
Thornburg Mortgage Securities Trust 2006-3 | | | | 5.236% | | 5/25/46 | | | 4,265 | | | 4,238 | |
WaMu Alternative Mortgage Pass-Through Certificates 2007-OA4 A1A | | | | 5.743% | | 4/25/47 | | | 53,689 | | | 52,045 | |
42
Semi-Annual Report to Shareholders
| | | | | | | | | | | | | |
| | | % OF
NET ASSETS | | RATE | | MATURITY
DATE | | PAR/
SHARES | | VALUE | |
| | | | | | | | | | | | | |
Mortgage-Backed Securities—Continued | | | | | | | | | | | | | |
| | | | | |
Indexed SecuritiesC—Continued | | | | | | | | | | | | | |
WaMu Mortgage Pass-Through Certificates, Series 2005-AR06 2A1A | | | | 5.361% | | 4/25/45 | | $ | 9,692 | | $ | 9,503 | |
WaMu Mortgage Pass-Through Certificates, Series 2005-AR08 1A1A | | | | 5.401% | | 7/25/45 | | | 11,330 | | | 11,011 | |
WaMu Mortgage Pass-Through Certificates, Series 2005-AR11 | | | | 5.451% | | 8/25/45 | | | 28,063 | | | 27,485 | |
WaMu Mortgage Pass-Through Certificates, Series 2005-AR13 A1A1 | | | | 5.421% | | 10/25/45 | | | 16,936 | | | 16,559 | |
WaMu Mortgage Pass-Through Certificates, Series 2005-AR13 B10 | | | | 6.705% | | 10/25/45 | | | 4,034 | | | 3,126 | D |
WaMu Mortgage Pass-Through Certificates, Series 2005-AR17 A1A2 | | | | 5.421% | | 12/25/45 | | | 10,399 | | | 10,176 | |
WaMu Mortgage Pass-Through Certificates, Series 2005-AR19 A1A1 | | | | 5.401% | | 12/25/45 | | | 21,336 | | | 21,026 | |
WaMu Mortgage Pass-Through Certificates, Series 2005-AR19 A1A2 | | | | 5.421% | | 12/25/45 | | | 20,702 | | | 20,307 | |
Zuni Mortgage Loan Trust 2006-OA1 | | | | 5.261% | | 8/25/36 | | | 24,563 | | | 24,375 | |
| | | | | | | | | | | | | |
| | | | | | | | | | | | 710,663 | |
| | | | | | | | | | | | | |
Stripped Securities | | 0.1% | | | | | | | | | | | |
Diversified REIT Trust 1999-1A | | | | 0.617% | | 3/18/11 | | | 71,358 | | | 780 | J1 |
FFCA Secured Lending Corp. 1999-1A | | | | 1.427% | | 9/18/25 | | | 5,611 | | | 233 | D,J1 |
GE Capital Commercial Mortgage Corp. 2005-C4 | | | | 5.333% | | 11/10/45 | | | 6,980 | | | 6,954 | J1 |
LB-UBS Commercial Mortgage Trust 2001-C3 X | | | | 0.941% | | 6/15/36 | | | 16,298 | | | 489 | D,J1 |
Structured Mortgage Asset Residential Trust 1991-8 | | | | 0.014% | | 1/25/23 | | | 598 | | | — | J1,K |
| | | | | | | | | | | | | |
| | | | | | | | | | | | 8,456 | |
| | | | | | | | | | | | | |
Variable Rate SecuritiesG | | 1.9% | | | | | | | | | | | |
Citigroup Mortgage Loan Trust Inc. 2005-5 3A2A | | | | 5.621% | | 9/25/35 | | | 4,203 | | | 4,223 | |
Credit Suisse Mortgage Capital Certificates 2006-C1 A4 | | | | 5.609% | | 2/15/39 | | | 5,080 | | | 5,095 | |
Greenwich Capital Commercial Funding Corp. 2006-GG7 | | | | 6.111% | | 7/10/38 | | | 22,370 | | | 23,063 | |
IndyMac INDX Mortgage Loan Trust 2005-AR15 | | | | 5.099% | | 9/25/35 | | | 7,285 | | | 7,170 | |
JP Morgan Chase Commercial Mortgage Securities Corp. 2005-CB13 | | | | 5.472% | | 1/12/43 | | | 7,600 | | | 7,545 | |
43
Semi-Annual Report to Shareholders
Portfolio of Investments—Continued
Western Asset Core Bond Portfolio—Continued
| | | | | | | | | | | | | |
| | | % OF
NET ASSETS | | RATE | | MATURITY
DATE | | PAR/
SHARES | | VALUE | |
| | | | | | | | | | | | | |
Mortgage-Backed Securities—Continued | | | | | | | | | | | | | |
| | | | | |
Variable Rate Securities—Continued | | | | | | | | | | | | | |
MASTR Adjustable Rate Mortgages Trust 2004-15 | | | | 5.247% | | 12/25/34 | | $ | 383 | | $ | 388 | |
Merrill Lynch Mortgage Trust 2005-CIP1 A4 | | | | 5.047% | | 7/12/38 | | | 1,100 | | | 1,070 | |
Merrill Lynch Mortgage Trust 2005-CKI1 | | | | 5.417% | | 11/12/37 | | | 23,750 | | | 23,519 | |
Morgan Stanley Mortgage Loan Trust 2005-3AR | | | | 5.197% | | 7/25/35 | | | 4,511 | | | 4,580 | |
Thornburg Mortgage Securities Trust 2007-4 2A1 | | | | 6.240% | | 9/25/37 | | | 27,907 | | | 27,994 | |
Thornburg Mortgage Securities Trust 2007-4 3A1 | | | | 6.228% | | 9/25/37 | | | 25,487 | | | 25,252 | |
Wachovia Bank Commercial Mortgage Trust 2005-C20 | | | | 5.118% | | 7/15/42 | | | 4,000 | | | 3,911 | |
| | | | | | | | | | | | | |
| | | | | | | | | | | | 133,810 | |
| | | | | | | | | | | | | |
Total Mortgage-Backed Securities
(Cost—$1,288,461) | | | | | | | | | | | | 1,274,326 | |
U.S. Government and Agency Obligations | | 10.4% | | | | | | | | | | | |
| | | | | |
Fixed Rate Securities | | 5.7% | | | | | | | | | | | |
Fannie Mae | | | | 2.880% | | 10/22/07 | | | 54,000 | | | 53,933 | |
Fannie Mae | | | | 5.200% | | 11/8/10 | | | 10,910 | | | 10,918 | |
Fannie Mae | | | | 5.625% | | 5/19/11 | | | 19,640 | | | 20,014 | |
Fannie Mae | | | | 4.610% | | 10/10/13 | | | 30,420 | | | 29,798 | |
Fannie Mae | | | | 6.000% | | 4/18/36 | | | 9,300 | | | 9,520 | |
Federal Home Loan Bank | | | | 3.875% | | 8/22/08 | | | 5,460 | | | 5,423 | A |
Federal Home Loan Bank | | | | 5.400% | | 1/2/09 | | | 11,470 | | | 11,470 | |
Federal Home Loan Bank | | | | 5.400% | | 1/16/09 | | | 18,870 | | | 18,877 | |
Freddie Mac | | | | 5.250% | | 2/24/11 | | | 9,960 | | | 10,063 | |
Freddie Mac | | | | 5.625% | | 3/15/11 | | | 2,210 | | | 2,292 | A |
Freddie Mac | | | | 5.125% | | 4/18/11 | | | 9,560 | | | 9,763 | A |
Freddie Mac | | | | 4.650% | | 10/10/13 | | | 34,390 | | | 33,723 | A |
Freddie Mac | | | | 5.450% | | 11/21/13 | | | 11,340 | | | 11,415 | |
Freddie Mac | | | | 5.300% | | 5/12/20 | | | 53,095 | | | 51,935 | A |
Freddie Mac | | | | 5.625% | | 11/23/35 | | | 12,290 | | | 12,065 | |
Tennessee Valley Authority | | | | 7.125% | | 5/1/30 | | | 2,450 | | | 3,032 | |
United States Treasury Bonds | | | | 7.500% | | 11/15/16 | | | 1,490 | | | 1,810 | A |
United States Treasury Bonds | | | | 5.375% | | 2/15/31 | | | 10,000 | | | 10,705 | A |
United States Treasury Bonds | | | | 4.750% | | 2/15/37 | | | 7,552 | | | 7,448 | A |
United States Treasury Bonds | | | | 5.000% | | 5/15/37 | | | 8,470 | | | 8,688 | A |
United States Treasury Notes | | | | 3.750% | | 5/15/08 | | | 2,840 | | | 2,833 | A |
United States Treasury Notes | | | | 3.625% | | 7/15/09 | | | 29,610 | | | 29,441 | A |
44
Semi-Annual Report to Shareholders
| | | | | | | | | | | | | |
| | | % OF
NET ASSETS | | RATE | | MATURITY
DATE | | PAR/
SHARES | | VALUE | |
| | | | | | | | | | | | | |
U.S. Government and Agency Obligations—Continued | | | | | | | | | | | | | |
| | | | | |
Fixed Rate Securities—Continued | | | | | | | | | | | | | |
United States Treasury Notes | | | | 6.000% | | 8/15/09 | | $ | 4,260 | | $ | 4,415 | A |
United States Treasury Notes | | | | 4.625% | | 11/15/09 | | | 31,610 | | | 32,020 | A |
United States Treasury Notes | | | | 3.500% | | 2/15/10 | | | 4,150 | | | 4,103 | A |
United States Treasury Notes | | | | 3.875% | | 9/15/10 | | | 251 | | | 250 | |
United States Treasury Notes | | | | 4.500% | | 11/15/10 | | | 2,320 | | | 2,352 | A |
United States Treasury Notes | | | | 4.625% | | 10/31/11 | | | 3,270 | | | 3,328 | A |
United States Treasury Notes | | | | 4.500% | | 3/31/12 | | | 30 | | | 30 | A |
United States Treasury Notes | | | | 4.875% | | 6/30/12 | | | 120 | | | 123 | A |
United States Treasury Notes | | | | 4.625% | | 7/31/12 | | | 2,260 | | | 2,299 | A |
| | | | | | | | | | | | | |
| | | | | | | | | | | | 404,086 | |
| | | | | | | | | | | | | |
Stripped Securities | | 0.1% | | | | | | | | | | | |
United States Treasury Bonds | | | | 0.000% | | 5/15/30 | | | 9,190 | | | 3,054 | A,J2 |
| | | | | | | | | | | | | |
| | | | | |
Treasury Inflation-Protected SecuritiesL | | 4.6% | | | | | | | | | | | |
United States Treasury Inflation-
Protected Security | | | | 3.875% | | 1/15/09 | | | 2,502 | | | 2,553 | A |
United States Treasury Inflation-
Protected Security | | | | 1.875% | | 7/15/13 | | | 6,068 | | | 5,971 | A |
United States Treasury Inflation-
Protected Security | | | | 2.000% | | 1/15/14 | | | 665 | | | 656 | A |
United States Treasury Inflation-
Protected Security | | | | 1.875% | | 7/15/15 | | | 35,457 | | | 34,518 | A |
United States Treasury Inflation-
Protected Security | | | | 2.000% | | 1/15/16 | | | 26,174 | | | 25,585 | A |
United States Treasury Inflation-
Protected Security | | | | 2.375% | | 1/15/17 | | | 20,276 | | | 20,422 | A |
United States Treasury Inflation-
Protected Security | | | | 2.375% | | 1/15/25 | | | 42,700 | | | 43,077 | A |
United States Treasury Inflation-
Protected Security | | | | 2.000% | | 1/15/26 | | | 70,872 | | | 67,683 | A |
United States Treasury Inflation-
Protected Security | | | | 2.375% | | 1/15/27 | | | 83,209 | | | 84,223 | A |
United States Treasury Inflation-
Protected Security | | | | 3.625% | | 4/15/28 | | | 12,956 | | | 15,782 | A |
United States Treasury Inflation-
Protected Security | | | | 3.875% | | 4/15/29 | | | 16,244 | | | 20,628 | A |
United States Treasury Inflation-
Protected Security | | | | 3.375% | | 4/15/32 | | | 5,328 | | | 6,507 | A |
| | | | | | | | | | | | | |
| | | | | | | | | | | | 327,605 | |
| | | | | | | | | | | | | |
Total U.S. Government and Agency Obligations (Cost — $720,875) | | | | | | | | | | | | 734,745 | |
45
Semi-Annual Report to Shareholders
Portfolio of Investments—Continued
Western Asset Core Bond Portfolio—Continued
| | | | | | | | | | | | | | |
| | | % OF
NET ASSETS | | RATE | | MATURITY DATE | | PAR/
SHARES | | | VALUE | |
| | | | | | | | | | | | | | |
U.S. Government Agency Mortgage-Backed Securities | | 60.0% | | | | | | | | | | | | |
| | | | | |
Fixed Rate Securities | | 56.5% | | | | | | | | | | | | |
Fannie Mae | | | | 7.000% | | 12/1/07 to 2/1/33 | | $ | 8,872 | | | $ | 9,233 | |
Fannie Mae | | | | 7.000% | | 12/1/09 | | | — | M | | | — | K |
Fannie Mae | | | | 7.000% | | 11/1/12 | | | — | M | | | — | K |
Fannie Mae | | | | 8.000% | | 5/1/15 | | | 29 | | | | 30 | |
Fannie Mae | | | | 5.500% | | 4/1/18 to 3/1/37 | | | 347,399 | | | | 340,279 | |
Fannie Mae | | | | 4.500% | | 7/1/18 to 9/1/35 | | | 12,011 | | | | 11,292 | |
Fannie Mae | | | | 4.000% | | 8/1/20 to 9/1/20 | | | 5,277 | | | | 4,959 | |
Fannie Mae | | | | 5.000% | | 8/1/20 to 8/1/37 | | | 322,589 | | | | 309,969 | |
Fannie Mae | | | | 5.500% | | 12/1/22 | | | 11,300 | | | | 11,272 | N |
Fannie Mae | | | | 6.000% | | 12/1/22 to 12/1/37 | | | 541,570 | | | | 541,864 | N |
Fannie Mae | | | | 7.500% | | 6/1/25 to 5/1/28 | | | 533 | | | | 561 | |
Fannie Mae | | | | 6.000% | | 1/1/26 to 9/1/37 | | | 848,185 | | | | 849,582 | |
Fannie Mae | | | | 7.500% | | 7/1/26 | | | — | M | | | — | K |
Fannie Mae | | | | 6.500% | | 7/1/28 to 7/1/35 | | | 9,196 | | | | 9,404 | |
Fannie Mae | | | | 5.000% | | 12/1/37 | | | 1,091,300 | | | | 1,040,719 | N |
Fannie Mae | | | | 6.500% | | 12/1/37 | | | 185,170 | | | | 188,518 | N |
Freddie Mac | | | | 9.750% | | 7/1/08 | | | 4 | | | | 4 | |
Freddie Mac | | | | 6.000% | | 3/1/09 | | | — | M | | | — | K |
Freddie Mac | | | | 6.000% | | 3/1/09 to 5/1/29 | | | 1,004 | | | | 1,019 | |
Freddie Mac | | | | 5.500% | | 12/1/13 to 8/1/35 | | | 33,376 | | | | 32,740 | |
Freddie Mac | | | | 9.300% | | 4/15/19 | | | 125 | | | | 133 | |
Freddie Mac | | | | 5.000% | | 9/1/20 to 11/1/36 | | | 431,075 | | | | 412,342 | |
Freddie Mac | | | | 7.000% | | 4/1/24 to 5/1/32 | | | 2,819 | | | | 2,931 | |
Freddie Mac | | | | 6.500% | | 6/1/32 | | | 46 | | | | 47 | |
Government National Mortgage Association | | | | 10.000% | | 11/15/09 | | | — | M | | | — | K |
Government National Mortgage Association | | | | 8.000% | | 10/15/16 to
7/15/17 | | | 132 | | | | 138 | |
Government National Mortgage Association | | | | 7.500% | | 10/15/22 to
8/15/32 | | | 286 | | | | 298 | |
Government National Mortgage Association | | | | 7.000% | | 6/15/23 to 5/15/32 | | | 324 | | | | 338 | |
Government National Mortgage Association | | | | 6.500% | | 10/15/23 to
3/15/33 | | | 16,319 | | | | 16,721 | |
Government National Mortgage Association | | | | 6.000% | | 3/15/26 to 8/15/35 | | | 30,724 | | | | 30,971 | |
Government National Mortgage Association | | | | 5.500% | | 1/15/33 | | | 220 | | | | 217 | |
46
Semi-Annual Report to Shareholders
| | | | | | | | | | | | | | |
| | | % OF
NET ASSETS | | RATE | | MATURITY DATE | | PAR/
SHARES | | | VALUE | |
| | | | | | | | | | | | | | |
U.S. Government Agency Mortgage-Backed Securities—Continued | | | | | | | | | | | | | | |
| | | | | |
Fixed Rate Securities—Continued | | | | | | | | | | | | | | |
Government National Mortgage Association | | | | 5.000% | | 6/15/35 to 9/15/35 | | $ | 62,175 | | | $ | 60,194 | |
Government National Mortgage Association | | | | 6.500% | | 12/1/37 | | | 105,700 | | | | 107,961 | N |
| | | | | | | | | | | | | | |
| | | | | | | | | | | | | 3,983,736 | |
| | | | | | | | | | | | | | |
Indexed SecuritiesC | | 3.5% | | | | | | | | | | | | |
Fannie Mae | | | | 4.795% | | 6/1/35 | | | 11,180 | | | | 11,214 | |
Fannie Mae | | | | 4.333% | | 8/1/35 | | | 1,171 | | | | 1,165 | |
Fannie Mae | | | | 4.615% | | 9/1/35 | | | 6,623 | | | | 6,607 | |
Fannie Mae | | | | 4.698% | | 9/1/35 | | | 2,637 | | | | 2,631 | |
Fannie Mae | | | | 4.578% | | 10/1/35 | | | 2,270 | | | | 2,262 | |
Fannie Mae | | | | 4.704% | | 10/1/35 | | | 3,377 | | | | 3,366 | |
Fannie Mae | | | | 4.718% | | 10/1/35 | | | 2,170 | | | | 2,168 | |
Fannie Mae | | | | 4.826% | | 10/1/35 | | | 2,085 | | | | 2,105 | |
Fannie Mae | | | | 7.029% | | 10/1/35 | | | 16,850 | | | | 17,325 | |
Fannie Mae | | | | 7.002% | | 11/1/35 | | | 6,469 | | | | 6,691 | |
Fannie Mae | | | | 7.004% | | 11/1/35 | | | 6,489 | | | | 6,711 | |
Fannie Mae | | | | 7.009% | | 11/1/35 | | | 5,864 | | | | 6,065 | |
Fannie Mae | | | | 7.021% | | 11/1/35 | | | 5,708 | | | | 5,870 | |
Fannie Mae | | | | 7.034% | | 11/1/35 | | | 6,343 | | | | 6,522 | |
Fannie Mae | | | | 5.515% | | 2/1/37 | | | 62,559 | | | | 62,704 | |
Fannie Mae | | | | 5.638% | | 4/1/37 | | | 14,156 | | | | 14,263 | |
Freddie Mac | | | | 4.829% | | 10/1/35 | | | 3,926 | | | | 3,943 | |
Freddie Mac | | | | 5.896% | | 2/1/37 | | | 63,554 | | | | 64,253 | |
Freddie Mac | | | | 5.830% | | 8/1/37 | | | 21,627 | | | | 21,810 | |
| | | | | | | | | | | | | | |
| | | | | | | | | | | | | 247,675 | |
| | | | | | | | | | | | | | |
Stripped Securities | | N.M. | | | | | | | | | | | | |
Fannie Mae | | | | 9.500% | | 2/1/17 | | | 13 | | | | 3 | J1 |
Fannie Mae | | | | 1,009.500% | | 2/25/20 | | | — | M | | | — | J1,K |
Fannie Mae | | | | 1,009.250% | | 8/25/21 | | | — | M | | | 1 | J1 |
Fannie Mae | | | | 0.000% | | 5/25/22 | | | 105 | | | | 93 | E,J2 |
Financing Corp. | | | | 0.000% | | 4/5/19 | | | 1,150 | | | | 641 | E,J2 |
Freddie Mac | | | | 10.000% | | 3/1/21 | | | 78 | | | | 20 | J1 |
Freddie Mac | | | | 0.000% | | 7/15/22 | | | 13 | | | | 11 | E,J2 |
| | | | | | | | | | | | | | |
| | | | | | | | | | | | | 769 | |
| | | | | | | | | | | | | | |
Total U.S. Government Agency Mortgage-Backed Securities (Cost—$4,235,787) | | | | | | | | | | | | | 4,232,180 | |
47
Semi-Annual Report to Shareholders
Portfolio of Investments—Continued
Western Asset Core Bond Portfolio—Continued
| | | | | | | | | | | | | |
| | | % OF
NET ASSETS | | RATE | | MATURITY
DATE | | PAR/
SHARES | | VALUE | |
| | | | | | | | | | | | | |
Yankee BondsI | | 7.0% | | | | | | | | | | | |
| | | | | |
Aerospace and Defense | | N.M. | | | | | | | | | | | |
Systems 2001 Asset Trust | | | | 6.664% | | 9/15/13 | | $ | 2,856 | | $ | 3,011 | D |
| | | | | | | | | | | | | |
| | | | | |
Commercial Banks | | 3.1% | | | | | | | | | | | |
Eksportfinans ASA | | | | 5.500% | | 5/25/16 | | | 10,700 | | | 10,974 | |
Glitnir Banki Hf | | | | 6.330% | | 7/28/11 | | | 6,080 | | | 6,185 | D |
Glitnir Banki Hf | | | | 6.375% | | 9/25/12 | | | 8,920 | | | 8,941 | D |
Glitnir Banki Hf | | | | 6.693% | | 6/15/16 | | | 11,830 | | | 12,090 | B,D |
Glitnir Banki Hf | | | | 7.451% | | 9/14/49 | | | 1,600 | | | 1,576 | B,D |
HBOS Capital Funding LP | | | | 6.071% | | 6/30/49 | | | 3,105 | | | 2,987 | B,D |
HBOS Treasury Services PLC | | | | 3.500% | | 11/30/07 | | | 48,500 | | | 48,431 | D |
HSBC Capital Funding LP | | | | 4.610% | | 6/27/49 | | | 1,630 | | | 1,531 | B,D |
Kaupthing Bank Hf | | | | 6.050% | | 4/12/11 | | | 17,140 | | | 17,002 | C,D |
Kaupthing Bank Hf | | | | 5.750% | | 10/4/11 | | | 2,960 | | | 2,922 | D |
Kaupthing Bank Hf | | | | 7.125% | | 5/19/16 | | | 30,520 | | | 30,802 | D |
Korea Development Bank | | | | 4.250% | | 11/13/07 | | | 6,045 | | | 6,039 | A |
Landsbanki Islands Hf | | | | 6.100% | | 8/25/11 | | | 17,170 | | | 17,395 | D |
Resona Preferred Global Securities | | | | 7.191% | | 12/29/49 | | | 13,670 | | | 13,718 | B,D |
Royal Bank of Scotland Group PLC | | | | 7.640% | | 3/19/49 | | | 3,700 | | | 3,700 | B |
Royal Bank of Scotland Group PLC | | | | 6.990% | | 10/29/49 | | | 5,720 | | | 5,827 | B,D |
RSHB Capital SA | | | | 6.299% | | 5/15/17 | | | 15,740 | | | 14,818 | D |
Shinsei Finance Cayman Ltd. | | | | 6.418% | | 1/29/49 | | | 11,080 | | | 10,274 | D,G |
| | | | | | | | | | | | | |
| | | | | | | | | | | | 215,212 | |
| | | | | | | | | | | | | |
Diversified Financial Services | | 0.5% | | | | | | | | | | | |
Aiful Corp. | | | | 5.000% | | 8/10/10 | | | 4,030 | | | 3,896 | D |
CVRD Finance Ltd. | | | | 6.010% | | 10/15/07 | | | 529 | | | 529 | C,D |
MUFG Capital Finance 1 Ltd. | | | | 6.346% | | 7/29/49 | | | 4,660 | | | 4,429 | B |
SMFG Preferred Capital | | | | 6.078% | | 1/29/49 | | | 13,800 | | | 12,761 | B,D |
TNK-BP Finance SA | | | | 7.500% | | 7/18/16 | | | 726 | | | 724 | D |
TNK-BP Finance SA | | | | 7.500% | | 7/18/16 | | | 9,940 | | | 9,871 | D |
TNK-BP Finance SA | | | | 6.625% | | 3/20/17 | | | 4,830 | | | 4,498 | D |
TNK-BP Finance SA | | | | 6.625% | | 3/20/17 | | | 318 | | | 298 | A,D |
| | | | | | | | | | | | | |
| | | | | | | | | | | | 37,006 | |
| | | | | | | | | | | | | |
Diversified Telecommunication Services | | 0.3% | | | | | | | | | | | |
British Telecommunications PLC | | | | 8.625% | | 12/15/10 | | | 1,755 | | | 1,932 | F |
Deutsche Telekom International Finance BV | | | | 5.750% | | 3/23/16 | | | 5,370 | | | 5,307 | A |
Koninklijke (Royal) KPN NV | | | | 8.000% | | 10/1/10 | | | 8,240 | | | 8,863 | |
Telecom Italia Capital SpA | | | | 5.250% | | 11/15/13 | | | 965 | | | 936 | |
48
Semi-Annual Report to Shareholders
| | | | | | | | | | | | | |
| | | % OF
NET ASSETS | | RATE | | MATURITY
DATE | | PAR/
SHARES | | VALUE | |
| | | | | | | | | | | | | |
Yankee Bonds—Continued | | | | | | | | | | | | | |
| | | | | |
Diversified Telecommunication
Services—Continued | | | | | | | | | | | | | |
Telecom Italia Capital SpA | | | | 4.950% | | 9/30/14 | | $ | 2,570 | | $ | 2,429 | |
Telecom Italia Capital SpA | | | | 5.250% | | 10/1/15 | | | 2,060 | | | 1,956 | |
| | | | | | | | | | | | | |
| | | | | | | | | | | | 21,423 | |
| | | | | | | | | | | | | |
Electric Utilities | | N.M. | | | | | | | | | | | |
Hydro-Quebec | | | | 6.300% | | 5/11/11 | | | 570 | | | 598 | |
| | | | | | | | | | | | | |
| | | | | |
Foreign Governments | | 0.7% | | | | | | | | | | | |
Russian Federation | | | | 7.500% | | 3/31/30 | | | 18,617 | | | 20,999 | D |
United Mexican States | | | | 5.625% | | 1/15/17 | | | 160 | | | 160 | A |
United Mexican States | | | | 7.500% | | 4/8/33 | | | 302 | | | 358 | A |
United Mexican States | | | | 6.750% | | 9/27/34 | | | 26,862 | | | 29,212 | A |
| | | | | | | | | | | | | |
| | | | | | | | | | | | 50,729 | |
| | | | | | | | | | | | | |
Gas Utilities | | 0.2% | | | | | | | | | | | |
Intergas Finance BV | | | | 6.375% | | 5/14/17 | | | 13,221 | | | 12,768 | D |
| | | | | | | | | | | | | |
| | | | | |
Industrial Conglomerates | | 1.0% | | | | | | | | | | | |
Tyco International Group SA | | | | 6.125% | | 11/1/08 | | | 820 | | | 829 | |
Tyco International Group SA | | | | 6.125% | | 1/15/09 | | | 330 | | | 335 | |
Tyco International Group SA | | | | 6.750% | | 2/15/11 | | | 26,549 | | | 27,985 | |
Tyco International Group SA | | | | 6.375% | | 10/15/11 | | | 6,560 | | | 6,712 | |
Tyco International Group SA | | | | 6.000% | | 11/15/13 | | | 2,950 | | | 2,978 | |
Tyco International Group SA | | | | 7.000% | | 6/15/28 | | | 3,380 | | | 3,676 | |
Tyco International Group SA | | | | 6.875% | | 1/15/29 | | | 24,710 | | | 24,803 | |
| | | | | | | | | | | | | |
| | | | | | | | | | | | 67,318 | |
| | | | | | | | | | | | | |
Insurance | | 0.2% | | | | | | | | | | | |
Merna Reinsurance Ltd. | | | | 7.110% | | 7/7/10 | | | 13,500 | | | 13,481 | C,D |
| | | | | | | | | | | | | |
| | | | | |
Metals and Mining | | 0.3% | | | | | | | | | | | |
Corporacion Nacional del Cobre—Codelco | | | | 4.750% | | 10/15/14 | | | 1,750 | | | 1,672 | D |
Vale Overseas Ltd. | | | | 8.250% | | 1/17/34 | | | 330 | | | 391 | |
Vale Overseas Ltd. | | | | 6.875% | | 11/21/36 | | | 20,252 | | | 20,865 | |
| | | | | | | | | | | | | |
| | | | | | | | | | | | 22,928 | |
| | | | | | | | | | | | | |
Oil, Gas and Consumable Fuels | | 0.6% | | | | | | | | | | | |
Anadarko Finance Co. | | | | 7.500% | | 5/1/31 | | | 730 | | | 795 | |
Conoco Funding Co. | | | | 6.350% | | 10/15/11 | | | 400 | | | 417 | |
Conoco Funding Co. | | | | 7.250% | | 10/15/31 | | | 350 | | | 395 | |
Gazprom | | | | 6.212% | | 11/22/16 | | | 15,410 | | | 15,274 | D |
Gazprom | | | | 6.510% | | 3/7/22 | | | 12,230 | | | 12,107 | D |
49
Semi-Annual Report to Shareholders
Portfolio of Investments—Continued
Western Asset Core Bond Portfolio—Continued
| | | | | | | | | | | | | | |
| | | % OF
NET ASSETS | | RATE | | MATURITY
DATE | | PAR/
SHARES | | | VALUE | |
| | | | | | | | | | | | | | |
Yankee Bonds—Continued | | | | | | | | | | | | | | |
| | | | | |
Oil, Gas and Consumable Fuels—Continued | | | | | | | | | | | | | | |
Petrobras International Finance Co. | | | | 6.125% | | 10/6/16 | | $ | 10,020 | | | $ | 10,097 | |
Petrozuata Finance Inc. | | | | 8.220% | | 4/1/17 | | | 3,950 | | | | 3,940 | D |
| | | | | | | | | | | | | | |
| | | | | | | | | | | | | 43,025 | |
| | | | | | | | | | | | | | |
Wireless Telecommunication Services | | 0.1% | | | | | | | | | | | | |
Vodafone Group PLC | | | | 5.000% | | 9/15/15 | | | 6,040 | | | | 5,699 | |
| | | | | | | | | | | | | | |
Total Yankee Bonds (Cost—$494,288) | | | | | | | | | | | | | 493,198 | |
Preferred Stocks | | 0.2% | | | | | | | | | | | | |
Fannie Mae | | | | 5.375% | | | | | — | M | | | 4,303 | H |
Fannie Mae | | | | 7.000% | | | | | 27 | | | | 1,386 | C,H |
General Motors Corp. | | | | 5.250% | | | | | 293 | | | | 6,232 | H |
Home Ownership Funding Corp. | | | | 1.000% | | | | | 6 | | | | 834 | D |
Home Ownership Funding Corp. II | | | | 1.000% | | | | | 5 | | | | 748 | D |
| | | | | | | | | | | | | | |
Total Preferred Stocks (Cost—$19,947) | | | | | | | | | | | | | 13,503 | |
| | | | | | | | | | | | | | |
Total Long-Term Securities (Cost—$8,421,540) | | | | | | | | | | | | | 8,376,787 | |
Investment of Collateral From Securities Lending | | 7.2% | | | | | | | | | | | | |
State Street Navigator Securities Lending Prime Portfolio | | | | | | | | | 511,124 | shs | | | 511,124 | |
| | | | | | | | | | | | | | |
Total Investment of Collateral From Securities Lending (Cost—$511,124) | | | | | | | | | | | | | 511,124 | |
Short-Term Securities | | 8.5% | | | | | | | | | | | | |
| | | | | |
U.S. Government and Agency Obligations | | 2.2% | | | | | | | | | | | | |
Fannie Mae | | | | 0.000% | | 3/17/08 | | $ | 129,660 | | | | 127,010 | E,O |
Fannie Mae | | | | 0.000% | | 3/31/08 | | | 3,600 | | | | 3,509 | E,O |
United States Treasury Bill | | | | 0.000% | | 1/24/08 | | | 23,000 | | | | 22,725 | A,E |
| | | | | |
Options PurchasedP | | 0.2% | | | | | | | | | | | | |
Eurodollar Futures Call, December 2007,
Strike Price $94.00 | | | | | | | | | 1,573 | Q | | | 4,542 | |
Eurodollar Futures Call, December 2007,
Strike Price $94.50 | | | | | | | | | 1,500 | Q | | | 2,625 | |
Eurodollar Futures Put, December 2007,
Strike Price $93.625 | | | | | | | | | 1,660 | Q | | | 10 | |
Eurodollar Futures Put, December 2007,
Strike Price $93.75 | | | | | | | | | 1,424 | Q | | | 151 | |
Eurodollar Futures Put, December 2007,
Strike Price $94.00 | | | | | | | | | 1,997 | Q | | | 13 | |
50
Semi-Annual Report to Shareholders
| | | | | | | | | | |
| | | % OF
NET ASSETS | | PAR/ SHARES | | | VALUE | |
| | | | | | | | | | |
Short-Term Securities—Continued | | | | | | | | | | |
| | | |
Options Purchased—Continued | | | | | | | | | | |
Eurodollar Futures Put, December 2007,
Strike Price $94.125 | | | | | 2,493 | Q | | $ | 16 | |
Eurodollar Futures Put, March 2008,
Strike Price $93.25 | | | | | 1,669 | Q | | | 10 | |
Eurodollar Futures Put, March 2008,
Strike Price $93.75 | | | | | 1,822 | Q | | | 11 | |
J.P. Morgan Swaption Call, January 2008,
Strike Price $5.1577 | | | | | 30,590,000 | Q | | | 544 | |
Goldman Sachs Swaption Call, November 2007,
Strike Price $5.2725 | | | | | 70,900,000 | Q | | | 1,412 | |
Greenwich Swaption Call, September 2009,
Strike Price $4.50 | | | | | 197,300,000 | Q | | | 787 | |
U.S. Treasury Bond Futures Call,
November 2007, Strike Price $113.00 | | | | | 354 | Q | | | 255 | |
U.S. Treasury Note Futures Put,
November 2007, Strike Price $108.00 | | | | | 32 | Q | | | 14 | |
| | | | | | | | | | |
| | | | | | | | | 10,390 | |
| | | | | | | | | | |
Repurchase Agreements | | 6.1% | | | | | | | | |
Lehman Brothers Inc.
4.75%, dated 9/28/07, to be repurchased at $231,643 on 10/1/07 (Collateral: $718,435 Resolution Funding Corporation principal-only securities, due 1/15/30, value $236,186. | | | | $ | 231,551 | | | | 231,551 | |
Merrill Lynch Government Securities Inc.
4.75%, dated 9/28/07, to be repurchased at $200,079 on 10/1/07 (Collateral: $180,943 Fannie Mae discount notes, zero-coupon bond, due 10/31/07, value $180,264, $24,408 Fannie Mae discount notes, Zero-coupon bond, 5/16/08, value $23,057) | | | | | 200,000 | | | | 200,000 | |
| | | | | | | | | | |
| | | | | | | | | 431,551 | |
| | | | | | | | | | |
Total Short-Term Securities (Cost—$592,019) | | | | | | | | | 595,185 | |
Total Investments (Cost—$9,524,683)R | | 134.4% | | | | | | | 9,483,096 | |
Obligation to Return Collateral for Securities Loaned | | (7.2)% | | | | | | | (511,124 | ) |
Other Assets Less Liabilities | | (27.2)% | | | | | | | (1,915,857 | ) |
| | | | | | | | | | |
| | | |
Net Assets | | 100.0% | | | | | | $ | 7,056,115 | |
| | | | | | | | | | |
51
Semi-Annual Report to Shareholders
Portfolio of Investments—Continued
Western Asset Core Bond Portfolio—Continued
| | | | | | | | |
| | | EXPIRATION | |
ACTUAL
CONTRACTS | |
APPRECIATION/
(DEPRECIATION) | |
Futures Contracts PurchasedP | | | | | | | | |
Eurodollar Futures | | December 2007 | | 8,458 | | $ | 2,481 | |
Eurodollar Futures | | March 2008 | | 3,251 | | | 3,353 | |
Eurodollar Futures | | September 2008 | | 10 | | | 8 | |
| | | | | | | | |
| | | | | | $ | 5,842 | |
| | | | | | | | |
Futures Contracts WrittenP | | | | | | | | |
U.S. Treasury Bond Futures | | December 2007 | | 1,203 | | $ | 934 | |
U.S. Treasury Note Futures | | December 2007 | | 15,481 | | | (3,126 | ) |
U.S. Treasury Note Futures | | December 2007 | | 107 | | | (126 | ) |
U.S. Treasury Note Futures | | December 2007 | | 456 | | | 353 | |
| | | | | | | | |
| | | | | | $ | (1,965 | ) |
| | | | | | | | |
Options WrittenP | | | | | | | | |
Eurodollar Futures Call, Strike Price $95.00 | | April 2008 | | 1,081 | | $ | (1,245 | ) |
Eurodollar Futures Call, Strike Price $95.125 | | January 2008 | | 1,010 | | | 27 | |
Eurodollar Futures Call, Strike Price $95.50 | | December 2007 | | 1,178 | | | 240 | |
Eurodollar Futures Call, Strike Price $95.125 | | December 2007 | | 622 | | | (38 | ) |
Eurodollar Futures Call, Strike Price $95.50 | | March 2008 | | 1,364 | | | 44 | |
Eurodollar Futures Put, Strike Price $95.00 | | December 2007 | | 2,806 | | | 254 | |
Greenwich Swaption Call, Strike Price $4.95 | | September 2009 | | 43,844,000 | | | 91 | |
U.S. Treasury Bond Futures Call, Strike Price $112.00 | | November 2007 | | 304 | | | (87 | ) |
U.S. Treasury Bond Futures Put, Strike Price $106.00 | | November 2007 | | 198 | | | 107 | |
U.S. Treasury Bond Futures Put, Strike Price $108.00 | | November 2007 | | 779 | | | (55 | ) |
U.S. Treasury Bond Futures Put, Strike Price $109.00 | | December 2007 | | 4,085 | | | (694 | ) |
U.S. Treasury Bond Futures Put, Strike Price $109.00 | | March 2008 | | 382 | | | (34 | ) |
U.S. Treasury Bond Futures Put, Strike Price $111.00 | | December 2007 | | 921 | | | (347 | ) |
U.S. Treasury Note Futures Call, Strike Price $107.00 | | November 2007 | | 2,097 | | | (4,465 | ) |
U.S. Treasury Note Futures Call, Strike Price $108.00 | | December 2007 | | 443 | | | (596 | ) |
U.S. Treasury Note Futures Call, Strike Price $109.00 | | December 2007 | | 97 | | | (57 | ) |
U.S. Treasury Note Futures Call, Strike Price $110.00 | | November 2007 | | 502 | | | 36 | |
U.S. Treasury Note Futures Call, Strike Price $110.00 | | December 2007 | | 1,934 | | | 152 | |
U.S. Treasury Note Futures Call, Strike Price $111.00 | | December 2007 | | 1,156 | | | 13 | |
U.S. Treasury Note Futures Put, Strike Price $102.00 | | December 2007 | | 450 | | | 244 | |
U.S. Treasury Note Futures Put, Strike Price $103.00 | | December 2007 | | 1,199 | | | 535 | |
U.S. Treasury Note Futures Put, Strike Price $104.00 | | December 2007 | | 534 | | | 178 | |
U.S. Treasury Note Futures Put, Strike Price $105.00 | | December 2007 | | 281 | | | 139 | |
U.S. Treasury Note Futures Put, Strike Price $106.00 | | November 2007 | | 188 | | | 12 | |
U.S. Treasury Note Futures Put, Strike Price $106.00 | | December 2007 | | 673 | | | 72 | |
U.S. Treasury Note Futures Put, Strike Price $107.00 | | December 2007 | | 833 | | | 84 | |
U.S. Treasury Note Futures Put, Strike Price $107.00 | | December 2007 | | 194 | | | (20 | ) |
52
Semi-Annual Report to Shareholders
| | | | | | | | |
| | | EXPIRATION | | ACTUAL
CONTRACTS | | APPRECIATION/
(DEPRECIATION) | |
Options Written—Continued | | | | | | | | |
U.S. Treasury Note Futures Put, Strike Price $107.00 | | March 2008 | | 525 | | $ | 60 | |
U.S. Treasury Note Futures Put, Strike Price $108.00 | | March 2008 | | 1,062 | | | 29 | |
U.S. Treasury Note Futures Put, Strike Price $109.00 | | December 2007 | | 2,712 | | | 287 | |
| | | | | | | | |
| | | | | | $ | (5,034 | ) |
| | | | | | | | |
| | | | | | | | | |
N.M.—Not Meaningful.
A | | All or a portion of this security is on loan. |
B | | Stepped Coupon Security – A security with a predetermined schedule of interest or dividend rate changes at which time it begins to accrue interest or pay dividends according to the predetermined schedule. |
C | | Indexed Security – The rates of interest earned on these securities are tied to the London Interbank Offered Rate (“LIBOR”), the Consumer Price Index (“CPI”) or the one-year Treasury Bill Rate. The coupon rates are the rates as of September 30, 2007. |
D | | Rule 144a Security – A security purchased pursuant to Rule 144a under the Securities Act of 1933 which may not be resold subject to that rule except to qualified institutional buyers. These securities, which the Fund’s investment adviser has determined to be liquid, represent 9.36% of net assets. |
E | | Zero coupon bond – A bond with no periodic interest payments which is sold at such a discount as to produce a current yield to maturity. |
F | | Credit Linked Security – The rates of interest earned on these securities are tied to the credit rating assigned by Standard & Poor’s Rating Service and/or Moody’s Investors Services. |
G | | The coupon rates shown on variable rate securities are the rates at September 30, 2007. These rates vary with the weighted average coupon of the underlying loans. |
H | | Convertible Security – Security may be converted into the issuer’s common stock. |
I | | Yankee Bond – A dollar-denominated bond issued in the U.S. by foreign entities. |
J | | Stripped Security – Security with interest-only or principal-only payment streams, denoted by a 1 or 2, respectively. For interest-only securities, the amount shown as principal is the notional balance used to calculate the amount of interest due. |
L | | Treasury Inflation-Protected Security – Treasury security whose principal value is adjusted daily in accordance with changes to the Consumer Price Index for All Urban Consumers. Interest is calculated on the basis of the current adjusted principal value. |
M | | Amount represents less than $0.05. |
N | | When-issued Security – Security purchased on a delayed delivery basis. Final settlement amount and maturity date have not yet been announced. |
O | | All or a portion of this security is collateral to cover futures and options contracts written. |
P | | Options and futures are described in more detail in the notes to financial statements. |
Q | | Par represents actual number of contracts. |
R | | Aggregate cost for federal income tax purposes is substantially the same as book cost. At September 30, 2007, the aggregate gross unrealized appreciation and depreciation of investments for federal income tax purposes were substantially as follows: |
| | | | |
| Gross unrealized appreciation | | $ | 51,490 | |
| Gross unrealized depreciation | | | (93,078 | ) |
| | | | |
| Net unrealized appreciation/(depreciation) | | $ | (41,588 | ) |
| | | | |
See notes to financial statements.
53
Semi-Annual Report to Shareholders
Statement of Assets and Liabilities
Western Asset Core Bond Portfolio
September 30, 2007 (Unaudited)
(Amounts in Thousands)
| | | | | | | |
Assets: | | | | | | | |
Investment securities at market value (Cost—$8,932,664) | | | | | $ | 8,887,911 | A |
Short-term securities at value (Cost—$592,019) | | | | | | 595,185 | |
Receivable for securities sold | | | | | | 1,690,117 | |
Receivable for fund shares sold | | | | | | 16,055 | |
Interest receivable | | | | | | 87,434 | |
Futures variation margin receivable | | | | | | 78 | |
Other assets | | | | | | 801 | |
| | | | | | | |
Total assets | | | | | | 11,277,581 | |
| | | | | | | |
| | |
Liabilities: | | | | | | | |
Obligation to return collateral for securities loaned | | $ | 511,124 | | | | |
Payable for securities purchased | | | 3,612,598 | | | | |
Payable for fund shares repurchased | | | 2,943 | | | | |
Accrued management fee | | | 2,310 | | | | |
Accrued distribution fee | | | 318 | | | | |
Income distribution payable | | | 2,547 | | | | |
Swap contracts at value | | | 41,582 | | | | |
Amounts payable on swaps | | | 25,840 | | | | |
Options written (Proceeds—$15,852) | | | 20,886 | | | | |
Accrued expenses | | | 1,318 | | | | |
| | | | | | | |
Total liabilities | | | | | | 4,221,466 | |
| | | | | | | |
| | |
Net Assets | | | | | $ | 7,056,115 | |
| | | | | | | |
| | |
Net assets consist of: | | | | | | | |
Accumulated paid-in-capital | | | | | $ | 7,190,319 | |
Undistributed net investment income | | | | | | 4,449 | |
Accumulated net realized loss on investments, options, futures and swaps | | | | | | (91,968 | ) |
Net unrealized depreciation on investments, options, futures and swaps | | | | | | (46,685 | ) |
| | | | | | | |
| | |
Net Assets | | | | | $ | 7,056,115 | |
| | | | | | | |
| | |
Net Asset Value Per Share: | | | | | | | |
Institutional Class (494,621 shares outstanding) | | | | | | $11.07 | |
Financial Intermediary Class (142,886 shares outstanding) | | | | | | $11.07 | |
| | | | | | | | |
A | | The market value of securities on loan is $571,476. |
See notes to financial statements
54
Semi-Annual Report to Shareholders
Statement of Operations
Western Asset Core Bond Portfolio
For the Six Months Ended September 30, 2007 (Unaudited)
(Amounts in Thousands)
| | | | | | | | |
Investment Income: | | | | | | | | |
Interest | | $ | 190,612 | | | | | |
Dividends | | | 542 | | | | | |
Income from securities lending | | | 602 | | | | | |
| | | | | | | | |
Total income | | | | | | $ | 191,756 | |
Expenses: | | | | | | | | |
Management fees | | | 13,527 | | | | | |
Distribution fee: | | | | | | | | |
Financial Intermediary Class | | | 1,849 | | | | | |
Audit and legal fees | | | 90 | | | | | |
Custodian fees | | | 306 | | | | | |
Directors’ fees and expenses | | | 98 | | | | | |
Registration fees | | | 53 | | | | | |
Reports to shareholders | | | 482 | | | | | |
Transfer agent and shareholder servicing expense: | | | | | | | | |
Institutional Class | | | 24 | | | | | |
Financial Intermediary Class | | | 12 | | | | | |
Other expenses | | | 50 | | | | | |
| | | | | | | | |
Net expenses | | | | | | | 16,491 | |
| | | | | | | | |
Net Investment Income | | | | | | | 175,265 | |
Net Realized and Unrealized Gain/(Loss) on Investments: | | | | | | | | |
Net realized gain/(loss) on: | | | | | | | | |
Investments | | | (41,819 | ) | | | | |
Options | | | (7,087 | ) | | | | |
Futures | | | (63,438 | ) | | | | |
Swaps | | | 26,668 | | | | | |
| | | | | | | | |
| | | | | | | (85,676 | ) |
Change in unrealized appreciation/depreciation of investments, options, futures and swaps | | | | | | | (58,936 | ) |
| | | | | | | | |
Net Realized and Unrealized Loss on Investments | | | | | | | (144,612 | ) |
| | | | | | | | | |
Change in Net Assets Resulting From Operations | | | | | | $ | 30,653 | |
| | | | | | | | | |
See notes to financial statements.
55
Semi-Annual Report to Shareholders
Statement of Changes in Net Assets
Western Asset Core Bond Portfolio
(Amounts in Thousands)
| | | | | | | | |
| | | FOR THE
SIX MONTHS ENDED
SEPTEMBER 30, 2007 | | | FOR THE
YEAR ENDED
MARCH 31, 2007 | |
| Change in Net Assets: | | (Unaudited) | | | | |
Net investment income | | $ | 175,265 | | | $ | 259,136 | |
| | |
Net realized gain/(loss) | | | (85,676 | ) | | | 69,503 | |
| | |
Change in unrealized appreciation/depreciation | | | (58,936 | ) | | | 95,353 | |
| | | | | | | | |
Change in net assets resulting from operations | | | 30,653 | | | | 423,992 | |
| | |
Distributions to shareholders from: | | | | | | | | |
Net investment income: | | | | | | | | |
Institutional Class | | | (137,336 | ) | | | (224,496 | ) |
Financial Intermediary Class | | | (37,269 | ) | | | (45,595 | ) |
| | |
Net realized gain on investments: | | | | | | | | |
Institutional Class | | | (22,348 | ) | | | — | |
Financial Intermediary Class | | | (6,285 | ) | | | — | |
| | |
Change in net assets from fund share transactions: | | | | | | | | |
Institutional Class | | | 633,934 | | | | 611,643 | |
Financial Intermediary Class | | | 216,993 | | | | 1,008,162 | |
| | | | | | | | |
Change in net assets | | | 678,342 | | | | 1,773,706 | |
| | |
Net Assets: | | | | | | | | |
Beginning of period | | | 6,377,773 | | | | 4,604,067 | |
| | | | | | | | |
| | |
End of period | | $ | 7,056,115 | | | $ | 6,377,773 | |
| | | | | | | | |
| | |
Under distributions of net investment income | | $ | 4,449 | | | $ | 3,789 | |
| | | | | | | | |
| | | | | | | | | |
See notes to financial statements.
56
Semi-Annual Report to Shareholders
Financial Highlights
Western Asset Core Bond Portfolio
For a share of each class of capital stock outstanding:
Institutional Class:
| | | | | | | | | | | | | | | | | | | | | | | | |
| | | SIX MONTHS
ENDED
SEPTEMBER 30,
2007 | | | YEARS ENDED MARCH 31, | |
| | | | 2007 | | | 2006 | | | 2005 | | | 2004 | | | 2003 | |
| | | (Unaudited) | | | | | | | | | | | | | | | | |
Net asset value, beginning of period | | $ | 11.37 | | | $ | 11.05 | | | $ | 11.29 | | | $ | 11.81 | | | $ | 11.57 | | | $ | 11.01 | |
| | | | | | | | | | | | | | | | | | | | | | | | |
Investment operations: | | | | | | | | | | | | | | | | | | | | | | | | |
Net investment income | | | .29 | A | | | .55 | A | | | .49 | | | | .39 | | | | .41 | | | | .55 | |
Net realized and unrealized gain/(loss) | | | (.25 | ) | | | .34 | | | | (.22 | ) | | | (.21 | ) | | | .45 | | | | .65 | |
| | | | | | | | | | | | | | | | | | | | | | | | |
Total from investment operations | | | .04 | | | | .89 | | | | .27 | | | | .18 | | | | .86 | | | | 1.20 | |
| | | | | | | | | | | | | | | | | | | | | | | | |
Distributions from: | | | | | | | | | | | | | | | | | | | | | | | | |
Net investment income | | | (.29 | ) | | | (.57 | ) | | | (.51 | ) | | | (.39 | ) | | | (.44 | ) | | | (.55 | ) |
Net realized gain on investments | | | (.05 | ) | | | — | B | | | — | B | | | (.31 | ) | | | (.18 | ) | | | (.09 | ) |
| | | | | | | | | | | | | | | | | | | | | | | | |
Total distributions | | | (.34 | ) | | | (.57 | ) | | | (.51 | ) | | | (.70 | ) | | | (.62 | ) | | | (.64 | ) |
| | | | | | | | | | | | | | | | | | | | | | | | |
Net asset value, end of period | | $ | 11.07 | | | $ | 11.37 | | | $ | 11.05 | | | $ | 11.29 | | | $ | 11.81 | | | $ | 11.57 | |
| | | | | | | | | | | | | | | | | | | | | | | | |
Total return | | | .40 | %C | | | 8.23 | % | | | 2.46 | % | | | 1.68 | % | | | 7.64 | % | | | 11.19 | % |
| | | | | | |
Ratios to Average Net Assets:D | | | | | | | | | | | | | | | | | | | | | | | | |
Total expenses | | | .44 | %E | | | .47 | % | | | .45 | % | | | .46 | % | | | .49 | % | | | .49 | % |
Expenses net of waivers, if any | | | .44 | %E | | | .47 | % | | | .45 | % | | | .46 | % | | | .49 | % | | | .49 | % |
Expenses net of all reductions | | | .44 | %E | | | .47 | % | | | .45 | % | | | .46 | % | | | .49 | % | | | .49 | % |
Net investment income | | | 5.3 | %E | | | 4.9 | % | | | 4.3 | % | | | 3.4 | % | | | 3.5 | % | | | 4.9 | % |
| | | | | | |
Supplemental Data: | | | | | | | | | | | | | | | | | | | | | | | | |
Portfolio turnover rate | | | 258.9 | %C | | | 431.7 | % | | | 540.4 | % | | | 407.2 | % | | | 464.6 | % | | | 438.6 | % |
Net assets, end of period (in thousands) | | $ | 5,474,530 | | | $ | 4,975,052 | | | $ | 4,243,248 | | | $ | 3,277,782 | | | $ | 2,187,219 | | | $ | 1,400,431 | |
| | | | | | | | | | | | | | | | | | | | | | | | | |
A | | Computed using average daily shares outstanding. |
B | | Amount less than $.01 per share. |
D | | Total expenses reflects operating expenses prior to any voluntary expense waivers and/or compensating balance credits. Expenses net of waivers reflects total expenses before compensating balance credits but net of any voluntary expense waivers. Expenses net of all reductions reflects expenses less any compensating balance credits and/or voluntary expense waivers. |
See notes to financial statements
57
Semi-Annual Report to Shareholders
Financial Highlights
Western Asset Core Bond Portfolio
For a share of each class of capital stock outstanding:
Financial Intermediary Class:
| | | | | | | | | | | | | | | | | | | | | | | | |
| | | SIX MONTHS ENDED
SEPTEMBER 30,
2007 | | | YEARS ENDED MARCH 31, | |
| | | | 2007 | | | 2006 | | | 2005 | | | 2004 | | | 2003 | |
| | | (Unaudited) | | | | | | | | | | | | | | | | |
Net asset value, beginning of period | | $ | 11.37 | | | $ | 11.05 | | | $ | 11.29 | | | $ | 11.81 | | | $ | 11.57 | | | $ | 11.02 | |
| | | | | | | | | | | | | | | | | | | | | | | | |
Investment operations: | | | | | | | | | | | | | | | | | | | | | | | | |
Net investment income | | | .28 | A | | | .51 | A | | | .47 | | | | .38 | | | | .40 | | | | .53 | |
Net realized and unrealized gain/(loss) | | | (.25 | ) | | | .35 | | | | (.22 | ) | | | (.23 | ) | | | .43 | | | | .63 | |
| | | | | | | | | | | | | | | | | | | | | | | | |
Total from investment operations | | | .03 | | | | .86 | | | | .25 | | | | .15 | | | | .83 | | | | 1.16 | |
| | | | | | | | | | | | | | | | | | | | | | | | |
Distributions from: | | | | | | | | | | | | | | | | | | | | | | | | |
Net investment income | | | (.28 | ) | | | (.54 | ) | | | (.49 | ) | | | (.36 | ) | | | (.41 | ) | | | (.52 | ) |
Net realized gain on investments | | | (.05 | ) | | | — | | | | — | B | | | (.31 | ) | | | (.18 | ) | | | (.09 | ) |
| | | | | | | | | | | | | | | | | | | | | | | | |
Total distributions | | | (.33 | ) | | | (.54 | ) | | | (.49 | ) | | | (.67 | ) | | | (.59 | ) | | | (.61 | ) |
| | | | | | | | | | | | | | | | | | | | | | | | |
Net asset value, end of period | | $ | 11.07 | | | $ | 11.37 | | | $ | 11.05 | | | $ | 11.29 | | | $ | 11.81 | | | $ | 11.57 | |
| | | | | | | | | | | | | | | | | | | | | | | | |
Total return | | | .28 | %C | | | 7.95 | % | | | 2.19 | % | | | 1.42 | % | | | 7.36 | % | | | 10.80 | % |
| | | | | | |
Ratios to Average Net Assets:D | | | | | | | | | | | | | | | | | | | | | | | | |
Total expenses | | | .69 | %E | | | .72 | % | | | .70 | % | | | .72 | % | | | .76 | % | | | .75 | % |
Expenses net of waivers, if any | | | .69 | %E | | | .72 | % | | | .70 | % | | | .72 | % | | | .75 | % | | | .75 | % |
Expenses net of all reductions | | | .69 | %E | | | .72 | % | | | .70 | % | | | .72 | % | | | .75 | % | | | .75 | % |
Net investment income | | | 5.1 | %E | | | 4.6 | % | | | 4.1 | % | | | 4.2 | % | | | 3.3 | % | | | 4.1 | % |
| | | | | | |
Supplemental Data: | | | | | | | | | | | | | | | | | | | | | | | | |
Portfolio turnover rate | | | 258.9 | %C | | | 431.7 | % | | | 540.4 | % | | | 407.2 | % | | | 464.6 | % | | | 438.6 | % |
Net assets, end of period (in thousands) | | $ | 1,581,585 | | | $ | 1,402,721 | | | $ | 360,819 | | | $ | 265,518 | | | $ | 121,607 | | | $ | 79,120 | |
| | | | | | | | | | | | | | | | | | | | | | | | | |
See notes to financial statements.
58
Semi-Annual Report to Shareholders
Expense Example
Western Asset Core Plus Bond Portfolio
As a shareholder of the Fund, you incur ongoing costs, including management fees, distribution (12b-1) fees on Financial Intermediary Class shares, and other Fund expenses. These examples are intended to help you understand your ongoing costs (in dollars) of investing in the Fund and to compare these costs with the ongoing costs of investing in other mutual funds. Each example is based on an investment of $1,000 invested on April 1, 2007, and held through September 30, 2007.
Actual Expenses
The first line for each class in the table below provides information about actual account values and actual expenses for each class. You may use the information in this line, together with the amount you invested, to estimate the expenses that you paid over the period. Simply divide your account value by $1,000 (for example, an $8,600 account value divided by $1,000 = 8.6), then multiply the result by the number in the first line under the heading entitled “Expenses Paid During the Period” to estimate the expenses you paid on your account during this period.
Hypothetical Example for Comparison Purposes
The second line for each class in the table below provides information about hypothetical account values and hypothetical expenses based on the relevant class’s actual expense ratio and an assumed rate of return of 5% per year before expenses, which is not the class’s actual return. The hypothetical account values and expenses may not be used to estimate the actual ending account balance or expenses you paid for the period. You may use this information to compare the ongoing costs of investing in the Fund and other funds. To do so, compare this 5% hypothetical example with the 5% hypothetical examples that appear in the shareholder reports of other funds.
| | | | | | | | | |
| | | Beginning
Account Value
4/1/07 | | Ending
Account Value
9/30/07 | | Expenses PaidA
During the Period
4/1/07 to 9/30/07 |
Institutional Class: | | | | | | | | | |
Actual | | $ | 1,000.00 | | $ | 1,005.50 | | $ | 2.16 |
Hypothetical (5% return before expenses) | | | 1,000.00 | | | 1,022.91 | | | 2.18 |
Financial Intermediary Class: | | | | | | | | | |
Actual | | $ | 1,000.00 | | $ | 1,005.20 | | $ | 3.42 |
Hypothetical (5% return before expenses) | | | 1,000.00 | | | 1,021.66 | | | 3.45 |
A | | These calculations are based on expenses incurred in the most recent fiscal half-year. The dollar amounts shown as “Expenses Paid During the Period” are equal to the annualized expense ratios of 0.43% and 0.68% for the Institutional Class and Financial Intermediary Class, respectively, multiplied by the average values over the period, multiplied by the number of days in the most recent fiscal half-year (183), and divided by 365. |
59
Semi-Annual Report to Shareholders
Performance Information
Western Asset Core Plus Bond Portfolio
The graphs compare the Fund’s total returns to that of an appropriate broad-based securities market index. The graphs illustrate the cumulative total return of an initial $1,000,000 investment in the Institutional Class and Financial Intermediary Class of the Fund, for the periods indicated. The lines for the Fund represent the total return after deducting all Fund investment management and other administrative expenses and the transaction costs of buying and selling securities. The line representing the securities market index does not include any transaction costs associated with buying and selling securities in the index or other investment management or administrative expenses.
Total return measures investment performance in terms of appreciation or depreciation in the Fund’s net asset value per share, plus dividends and any capital gain distributions. It assumes that dividends and distributions were reinvested at the time they were paid. Returns (and the graphs and tables found below) do not reflect the deduction of taxes that a shareholder would pay on Fund distributions or the redemption of Fund shares. Average annual returns tend to smooth out variations in a fund’s return, so that they differ from actual year-to-year results.
Bonds are subject to a variety of risks, including interest rate, credit and inflation risk. Non-U.S. investment are subject to currency fluctuations, social, economical and political risk.
Growth of a $1,000,000 Investment—Institutional Class

The performance data quoted represents past performance and does not guarantee future results. The performance stated may have been due to extraordinary market conditions, which may not be duplicated in the future. Current performance may be lower or higher than the performance data quoted. To obtain the most recent month-end performance information, please visit www.westernassetfunds.com. The investment return and principal value of the Fund will fluctuate so that an investor’s shares, when redeemed, may be worth more or less than the original cost. Calculations assume reinvestment of dividends and capital gain distributions. Performance would have been lower if fees had not been waived in various periods.
A | | Since-inception index returns are for periods beginning June 30, 1998. |
60
Semi-Annual Report to Shareholders
Growth of a $1,000,000 Investment—Financial Intermediary Class
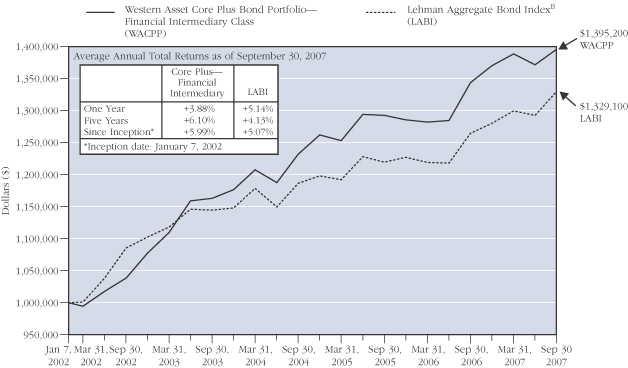
The performance data quoted represents past performance and does not guarantee future results. The performance stated may have been due to extraordinary market conditions, which may not be duplicated in the future. Current performance may be lower or higher than the performance data quoted. To obtain the most recent month-end performance information, please visit www.westernassetfunds.com. The investment return and principal value of the Fund will fluctuate so that an investor’s shares, when redeemed, may be worth more or less than the original cost. Calculations assume reinvestment of dividends and capital gain distributions. Performance would have been lower if fees had not been waived in various periods.
B | | Since-inception index returns are for periods beginning December 31, 2001. |
61
Semi-Annual Report to Shareholders
Performance Information—Continued
Portfolio Composition (as of September 30, 2007)
Standard & Poor’s Debt Ratingsc (as a percentage of the portfolio)
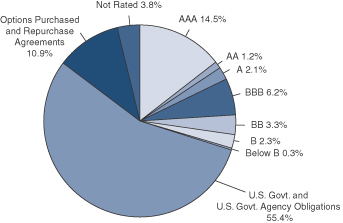
Maturity Schedule (as a percentage of the portfolio)
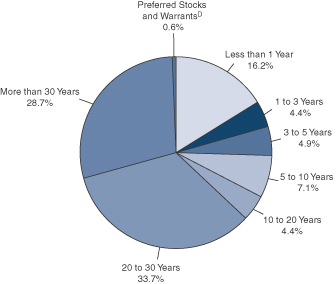
C | | Source: Standard & Poor’s. |
D | | Preferred Stocks do not have a defined maturity date. |
The Fund is actively managed. As a result, the composition of the portfolio holdings and sectors are subject to change at any time.
62
Semi-Annual Report to Shareholders
Portfolio of Investments
Western Asset Core Plus Bond Portfolio
September 30, 2007 (Unaudited)
(Amounts in Thousands)
| | | | | | | | | | | | | | |
| | | % OF
NET ASSETS | | RATE | | MATURITY
DATE | | PAR/
SHARES† | | | VALUE | |
| | | | | | | | | | | | | | |
Long-Term Securities | | 113.5% | | | | | | | | | | | | |
| | | | | |
Corporate Bonds and Notes | | 14.7% | | | | | | | | | | | | |
| | | | | |
Aerospace and Defense | | N.M. | | | | | | | | | | | | |
DRS Technologies Inc. | | | | 6.625% | | 2/1/16 | | $ | 10 | | | $ | 10 | |
L-3 Communications Corp. | | | | 7.625% | | 6/15/12 | | | 852 | | | | 871 | |
| | | | | | | | | | | | | | |
| | | | | | | | | | | | | 881 | |
| | | | | | | | | | | | | | |
Airlines | | 0.4% | | | | | | | | | | | | |
Continental Airlines Inc. | | | | 6.545% | | 8/2/20 | | | 7,906 | | | | 7,956 | |
Continental Airlines Inc. | | | | 5.983% | | 4/19/22 | | | 8,300 | | | | 8,042 | |
Delta Air Lines Inc. | | | | 7.570% | | 5/18/12 | | | 11,375 | | | | 11,667 | |
Northwest Airlines Inc. | | | | 5.836% | | 2/6/15 | | | 1,238 | | | | 1,158 | A |
Southwest Airlines Co. | | | | 5.125% | | 3/1/17 | | | 5,320 | | | | 4,902 | |
United Air Lines Inc. | | | | 7.032% | | 4/1/12 | | | 575 | | | | 578 | |
United Air Lines Inc. | | | | 7.186% | | 10/1/12 | | | 13,372 | | | | 13,489 | |
United Air Lines Inc. | | | | 6.602% | | 3/1/15 | | | 5,766 | | | | 5,780 | |
| | | | | | | | | | | | | | |
| | | | | | | | | | | | | 53,572 | |
| | | | | | | | | | | | | | |
Auto Components | | N.M. | | | | | | | | | | | | |
Visteon Corp. | | | | 8.250% | | 8/1/10 | | | 2,050 | | | | 1,804 | B |
| | | | | | | | | | | | | | |
| | | | | |
Automobiles | | 0.6% | | | | | | | | | | | | |
DaimlerChrysler NA Holding Corp. | | | | 4.050% | | 6/4/08 | | | 610 | | | | 603 | |
DaimlerChrysler NA Holding Corp. | | | | 7.200% | | 9/1/09 | | | 620 | | | | 642 | |
DaimlerChrysler NA Holding Corp. | | | | 5.875% | | 3/15/11 | | | 500 | | | | 507 | |
DaimlerChrysler NA Holding Corp. | | | | 7.300% | | 1/15/12 | | | 3,315 | | | | 3,536 | |
DaimlerChrysler NA Holding Corp. | | | | 6.500% | | 11/15/13 | | | 1,390 | | | | 1,441 | |
Ford Motor Co. | | | | 7.450% | | 7/16/31 | | | 30,335 | | | | 23,813 | B |
Ford Motor Co. | | | | 4.250% | | 12/15/36 | | | 175 | | | | 205 | C |
General Motors Corp. | | | | 8.250% | | 7/15/23 | | | 8,240 | | | | 7,210 | |
General Motors Corp. | | | | 8.375% | | 7/5/33 | | | 9,520 | EUR | | | 11,813 | |
General Motors Corp. | | | | 8.375% | | 7/15/33 | | | 35,270 | | | | 30,905 | B |
| | | | | | | | | | | | | | |
| | | | | | | | | | | | | 80,675 | |
| | | | | | | | | | | | | | |
Building Products | | 0.1% | | | | | | | | | | | | |
Masco Corp. | | | | 7.125% | | 8/15/13 | | | 5,830 | | | | 6,113 | |
Masco Corp. | | | | 6.125% | | 10/3/16 | | | 8,270 | | | | 8,072 | |
| | | | | | | | | | | | | | |
| | | | | | | | | | | | | 14,185 | |
| | | | | | | | | | | | | | |
Capital Markets | | 0.7% | | | | | | | | | | | | |
E*TRADE Financial Corp. | | | | 7.375% | | 9/15/13 | | | 590 | | | | 552 | |
Goldman Sachs Group LP | | | | 4.500% | | 6/15/10 | | | 1,450 | | | | 1,429 | |
63
Semi-Annual Report to Shareholders
Portfolio of Investments—Continued
Western Asset Core Plus Bond Portfolio—Continued
| | | | | | | | | | | | | |
| | | % OF
NET ASSETS | | RATE | | MATURITY
DATE | | PAR/
SHARES† | | VALUE | |
| | | | | | | | | | | | | |
Corporate Bonds and Notes—Continued | | | | | | | | | | | | | |
| | | | | |
Capital Markets—Continued | | | | | | | | | | | | | |
Lehman Brothers Holdings Capital Trust VII | | | | 5.857% | | 11/29/49 | | $ | 3,940 | | $ | 3,754 | D |
Lehman Brothers Holdings Inc. | | | | 5.250% | | 2/6/12 | | | 1,690 | | | 1,655 | |
Lehman Brothers Holdings Inc. | | | | 6.200% | | 9/26/14 | | | 8,690 | | | 8,724 | |
Merrill Lynch and Co. Inc. | | | | 3.125% | | 7/15/08 | | | 3,115 | | | 3,049 | |
Merrill Lynch and Co. Inc. | | | | 5.585% | | 8/22/08 | | | 42,800 | | | 42,739 | A |
Merrill Lynch and Co. Inc. | | | | 6.375% | | 10/15/08 | | | 2,670 | | | 2,693 | |
Morgan Stanley | | | | 5.485% | | 1/18/08 | | | 12,000 | | | 11,990 | A |
Morgan Stanley | | | | 3.625% | | 4/1/08 | | | 120 | | | 119 | |
Morgan Stanley | | | | 5.625% | | 1/9/12 | | | 110 | | | 111 | |
Morgan Stanley | | | | 4.750% | | 4/1/14 | | | 8,460 | | | 7,947 | |
Morgan Stanley | | | | 5.810% | | 10/18/16 | | | 7,290 | | | 6,974 | A |
The Bear Stearns Cos. Inc. | | | | 5.550% | | 1/22/17 | | | 60 | | | 56 | B |
The Goldman Sachs Group Inc. | | | | 6.600% | | 1/15/12 | | | 2,810 | | | 2,945 | |
The Goldman Sachs Group Inc. | | | | 5.625% | | 1/15/17 | | | 1,420 | | | 1,378 | |
| | | | | | | | | | | | | |
| | | | | | | | | | | | 96,115 | |
| | | | | | | | | | | | | |
Chemicals | | N.M. | | | | | | | | | | | |
Georgia Gulf Corp. | | | | 9.500% | | 10/15/14 | | | 1,550 | | | 1,418 | B |
Lyondell Chemical Co. | | | | 8.000% | | 9/15/14 | | | 1,175 | | | 1,293 | |
Lyondell Chemical Co. | | | | 8.250% | | 9/15/16 | | | 670 | | | 755 | |
Westlake Chemical Corp. | | | | 6.625% | | 1/15/16 | | | 1,265 | | | 1,202 | |
| | | | | | | | | | | | | |
| | | | | | | | | | | | 4,668 | |
| | | | | | | | | | | | | |
Commercial Banks | | 0.2% | | | | | | | | | | | |
Bank One Corp. | | | | 7.875% | | 8/1/10 | | | 150 | | | 161 | |
Bank One Corp. | | | | 5.900% | | 11/15/11 | | | 2,000 | | | 2,036 | |
HBOS Treasury Services PLC | | | | 5.250% | | 2/21/17 | | | 4,570 | | | 4,546 | E |
HSBC Bank PLC | | | | 7.000% | | 11/1/11 | | | 2,629 | | | 2,630 | F |
HSBC Bank USA | | | | 7.000% | | 11/1/11 | | | 2,212 | | | 2,213 | E,G |
HSBC Bank USA | | | | 7.000% | | 11/1/11 | | | 2,129 | | | 2,130 | E,G |
Rabobank Capital Funding Trust II | | | | 5.260% | | 12/31/49 | | | 590 | | | 558 | D,E |
Rabobank Capital Funding Trust III | | | | 5.254% | | 12/29/49 | | | 4,140 | | | 3,810 | D,E |
SunTrust Capital VIII | | | | 6.100% | | 12/15/36 | | | 2,660 | | | 2,413 | D |
Wachovia Capital Trust III | | | | 5.800% | | 3/15/42 | | | 9,480 | | | 9,416 | D |
Wachovia Corp. | | | | 5.250% | | 8/1/14 | | | 210 | | | 206 | |
Wells Fargo and Co. | | | | 5.000% | | 11/15/14 | | | 130 | | | 125 | |
Wells Fargo Capital X | | | | 5.950% | | 12/15/36 | | | 6,895 | | | 6,327 | D |
| | | | | | | | | | | | | |
| | | | | | | | | | | | 36,571 | |
| | | | | | | | | | | | | |
64
Semi-Annual Report to Shareholders
| | | | | | | | | | | | | |
| | | % OF
NET ASSETS | | RATE | | MATURITY
DATE | | PAR/
SHARES† | | VALUE | |
| | | | | | | | | | | | | |
Corporate Bonds and Notes—Continued | | | | | | | | | | | | | |
| | | | | |
Commercial Services and Supplies | | 0.3% | | | | | | | | | | | |
PHH Corp. | | | | 7.125% | | 3/1/13 | | $ | 8,640 | | $ | 9,112 | |
Waste Management Inc. | | | | 7.125% | | 10/1/07 | | | 10,940 | | | 10,940 | |
Waste Management Inc. | | | | 6.500% | | 11/15/08 | | | 4,340 | | | 4,396 | |
Waste Management Inc. | | | | 6.875% | | 5/15/09 | | | 8,000 | | | 8,269 | |
Waste Management Inc. | | | | 7.375% | | 8/1/10 | | | 6,055 | | | 6,409 | |
Waste Management Inc. | | | | 6.375% | | 11/15/12 | | | 1,770 | | | 1,837 | |
Waste Management Inc. | | | | 5.000% | | 3/15/14 | | | 6,938 | | | 6,644 | |
Waste Management Inc. | | | | 7.125% | | 12/15/17 | | | 500 | | | 527 | |
Waste Management Inc. | | | | 7.750% | | 5/15/32 | | | 90 | | | 101 | |
| | | | | | | | | | | | | |
| | | | | | | | | | | | 48,235 | |
| | | | | | | | | | | | | |
Communications Equipment | | 0.1% | | | | | | | | | | | |
Motorola Inc. | | | | 8.000% | | 11/1/11 | | | 10,850 | | | 11,842 | |
| | | | | | | | | | | | | |
| | | | | |
Computers and Peripherals | | N.M. | | | | | | | | | | | |
International Business Machines Corp. | | | | 4.750% | | 11/29/12 | | | 40 | | | 39 | |
| | | | | | | | | | | | | |
| | | | | |
Consumer Finance | | 2.2% | | | | | | | | | | | |
American Express Co. | | | | 6.800% | | 9/1/66 | | | 8,385 | | | 8,593 | D |
Ford Motor Credit Co. | | | | 5.800% | | 1/12/09 | | | 4,180 | | | 4,037 | |
Ford Motor Credit Co. | | | | 7.875% | | 6/15/10 | | | 3,560 | | | 3,480 | |
Ford Motor Credit Co. | | | | 10.944% | | 6/15/11 | | | 5,724 | | | 5,840 | A |
Ford Motor Credit Co. | | | | 7.800% | | 6/1/12 | | | 19,090 | | | 18,160 | |
Ford Motor Credit Co. | | | | 8.000% | | 12/15/16 | | | 22,000 | | | 20,581 | |
GMAC LLC | | | | 5.125% | | 5/9/08 | | | 345 | | | 342 | B |
GMAC LLC | | | | 6.625% | | 5/15/12 | | | 280 | | | 261 | |
GMAC LLC | | | | 8.000% | | 11/1/31 | | | 156,550 | | | 153,588 | B |
HSBC Finance Corp. | | | | 4.625% | | 1/15/08 | | | 220 | | | 220 | |
SLM Corp. | | | | 5.806% | | 5/12/08 | | | 40,000 | | | 39,649 | A,E |
SLM Corp. | | | | 3.820% | | 4/1/09 | | | 11,220 | | | 10,321 | A |
SLM Corp. | | | | 5.000% | | 10/1/13 | | | 17,665 | | | 15,425 | |
SLM Corp. | | | | 5.375% | | 5/15/14 | | | 25,005 | | | 21,822 | |
SLM Corp. | | | | 5.050% | | 11/14/14 | | | 4,690 | | | 3,978 | |
SLM Corp. | | | | 5.000% | | 4/15/15 | | | 740 | | | 621 | |
SLM Corp. | | | | 5.625% | | 8/1/33 | | | 4,160 | | | 3,202 | |
| | | | | | | | | | | | | |
| | | | | | | | | | | | 310,120 | |
| | | | | | | | | | | | | |
Diversified Consumer Services | | N.M. | | | | | | | | | | | |
Service Corp. International | | | | 6.750% | | 4/1/16 | | | 1,530 | | | 1,482 | |
Service Corp. International | | | | 7.625% | | 10/1/18 | | | 400 | | | 415 | |
Service Corp. International | | | | 7.500% | | 4/1/27 | | | 5,385 | | | 5,035 | |
| | | | | | | | | | | | | |
| | | | | | | | | | | | 6,932 | |
| | | | | | | | | | | | | |
65
Semi-Annual Report to Shareholders
Portfolio of Investments—Continued
Western Asset Core Plus Bond Portfolio—Continued
| | | | | | | | | | | | | | |
| | | % OF
NET ASSETS | | RATE | | MATURITY
DATE | | PAR/
SHARES† | | | VALUE | |
| | | | | | | | | | | | | | |
Corporate Bonds and Notes—Continued | | | | | | | | | | | | | | |
| | | | | |
Diversified Financial Services | | 2.3% | | | | | | | | | | | | |
AAC Group Holding Corp. | | | | 0.000% | | 10/1/12 | | $ | 770 | | | $ | 685 | B,D |
AIG-Fp Matched Funding | | | | 5.743% | | 12/17/07 | | | 32,700 | | | | 32,695 | A,E |
Air 2 US | | | | 8.027% | | 10/1/19 | | | 14,643 | | | | 14,863 | E |
American General Finance Corp. | | | | 5.330% | | 6/27/08 | | | 18,300 | | | | 18,291 | A |
American Honda Finance Corp. | | | | 5.580% | | 5/12/08 | | | 28,000 | | | | 28,009 | A,E |
Banca Italease SpA | | | | 4.460% | | 2/2/10 | | | 49,100 | EUR | | | 65,939 | A |
Bank of America Corp. | | | | 5.131% | | 7/25/08 | | | 75,000 | | | | 74,921 | A |
Bank of America Corp. | | | | 5.420% | | 3/15/17 | | | 7,030 | | | | 6,835 | |
Citigroup Inc. | | | | 5.000% | | 9/15/14 | | | 150 | | | | 145 | |
DI Finance LLC | | | | 9.500% | | 2/15/13 | | | 1,004 | | | | 1,039 | |
Dryden Investor Trust | | | | 7.157% | | 7/23/08 | | | 752 | | | | 758 | |
General Electric Capital Corp. | | | | 5.450% | | 1/15/13 | | | 1,155 | | | | 1,166 | |
HSBC Finance Corp. | | | | 6.400% | | 6/17/08 | | | 20 | | | | 20 | |
HSBC Finance Corp. | | | | 6.500% | | 11/15/08 | | | 40 | | | | 41 | |
HSBC Finance Corp. | | | | 8.000% | | 7/15/10 | | | 70 | | | | 75 | |
HSBC Finance Corp. | | | | 6.375% | | 8/1/10 | | | 1,000 | | | | 1,035 | B |
HSBC Finance Corp. | | | | 7.000% | | 5/15/12 | | | 160 | | | | 168 | |
HSBC Finance Corp. | | | | 6.375% | | 11/27/12 | | | 520 | | | | 538 | |
ILFC E-Capital Trust II | | | | 6.250% | | 12/21/65 | | | 7,220 | | | | 6,959 | D,E |
JPMorgan Chase and Co. | | | | 5.750% | | 1/2/13 | | | 4,430 | | | | 4,493 | |
JPMorgan Chase and Co. | | | | 5.125% | | 9/15/14 | | | 200 | | | | 195 | |
JPMorgan Chase and Co. | | | | 5.150% | | 10/1/15 | | | 110 | | | | 105 | |
Mizuho Preferred Capital Co. LLC | | | | 8.790% | | 12/29/49 | | | 3,380 | | | | 3,443 | D,E |
SB Treasury Co. LLC | | | | 9.400% | | 12/29/49 | | | 360 | | | | 368 | D,E |
Sigma Finance Inc. | | | | 8.500% | | 8/11/16 | | | 29,650 | | | | 28,598 | D,E |
Sigma Finance Inc. | | | | 8.000% | | 6/22/17 | | | 37,320 | | | | 35,143 | D,E |
Unilever Capital Corp. | | | | 7.125% | | 11/1/10 | | | 1,450 | | | | 1,540 | |
| | | | | | | | | | | | | | |
| | | | | | | | | | | | | 328,067 | |
| | | | | | | | | | | | | | |
Diversified Telecommunication Services | | 0.4% | | | | | | | | | | | | |
AT&T Inc. | | | | 5.100% | | 9/15/14 | | | 8,640 | | | | 8,361 | |
BellSouth Corp. | | | | 4.750% | | 11/15/12 | | | 640 | | | | 622 | B |
BellSouth Corp. | | | | 5.200% | | 9/15/14 | | | 8,250 | | | | 8,030 | |
CenturyTel Inc. | | | | 6.000% | | 4/1/17 | | | 8,270 | | | | 8,194 | |
Cincinnati Bell Inc. | | | | 7.000% | | 2/15/15 | | | 983 | | | | 949 | |
Citizens Communications Co. | | | | 9.250% | | 5/15/11 | | | 530 | | | | 575 | |
Citizens Communications Co. | | | | 7.875% | | 1/15/27 | | | 4,590 | | | | 4,475 | |
Intelsat Corp. | | | | 9.000% | | 6/15/16 | | | 1,690 | | | | 1,741 | |
Level 3 Financing Inc. | | | | 9.250% | | 11/1/14 | | | 4,695 | | | | 4,625 | |
Qwest Communications International Inc. | | | | 9.058% | | 2/15/09 | | | 20 | | | | 20 | A |
66
Semi-Annual Report to Shareholders
| | | | | | | | | | | | | |
| | | % OF
NET ASSETS | | RATE | | MATURITY
DATE | | PAR/
SHARES† | | VALUE | |
| | | | | | | | | | | | | |
Corporate Bonds and Notes—Continued | | | | | | | | | | | | | |
| | | | | |
Diversified Telecommunication Services—Continued | | | | | | | | | | | | | |
Qwest Communications International Inc. | | | | 7.500% | | 2/15/14 | | $ | 3,174 | | $ | 3,214 | |
Qwest Corp. | | | | 7.500% | | 10/1/14 | | | 2,680 | | | 2,787 | |
Qwest Corp. | | | | 6.875% | | 9/15/33 | | | 5,600 | | | 5,236 | |
Verizon Global Funding Corp. | | | | 7.375% | | 9/1/12 | | | 45 | | | 49 | |
Verizon New York Inc. | | | | 6.875% | | 4/1/12 | | | 3,942 | | | 4,152 | |
Windstream Corp. | | | | 8.625% | | 8/1/16 | | | 7,115 | | | 7,586 | |
| | | | | | | | | | | | | |
| | | | | | | | | | | | 60,616 | |
| | | | | | | | | | | | | |
Electric Utilities | | 0.3% | | | | | | | | | | | |
Duke Energy Corp. | | | | 5.625% | | 11/30/12 | | | 790 | | | 801 | |
Exelon Corp. | | | | 5.625% | | 6/15/35 | | | 255 | | | 228 | |
FirstEnergy Corp. | | | | 6.450% | | 11/15/11 | | | 3,000 | | | 3,101 | |
FirstEnergy Corp. | | | | 7.375% | | 11/15/31 | | | 16,640 | | | 18,210 | |
Niagara Mohawk Power Corp. | | | | 7.750% | | 10/1/08 | | | 500 | | | 510 | |
Pacific Gas and Electric Co. | | | | 6.050% | | 3/1/34 | | | 4,990 | | | 4,900 | |
Pacific Gas and Electric Co. | | | | 5.800% | | 3/1/37 | | | 11,750 | | | 11,105 | |
Progress Energy Inc. | | | | 7.100% | | 3/1/11 | | | 52 | | | 55 | |
The Cleveland Electric Illuminating Co. | | | | 5.700% | | 4/1/17 | | | 1,080 | | | 1,051 | |
The Detroit Edison Co. | | | | 5.200% | | 10/15/12 | | | 10 | | | 10 | |
TXU Energy Co. | | | | 7.000% | | 3/15/13 | | | 10 | | | 11 | |
| | | | | | | | | | | | | |
| | | | | | | | | | | | 39,982 | |
| | | | | | | | | | | | | |
Energy Equipment and Services | | 0.1% | | | | | | | | | | | |
Complete Production Services Inc. | | | | 8.000% | | 12/15/16 | | | 5,355 | | | 5,295 | |
Pacific Energy Partners | | | | 7.125% | | 6/15/14 | | | 630 | | | 646 | |
Pride International Inc. | | | | 7.375% | | 7/15/14 | | | 1,440 | | | 1,476 | |
| | | | | | | | | | | | | |
| | | | | | | | | | | | 7,417 | |
| | | | | | | | | | | | | |
Food and Staples Retailing | | 0.2% | | | | | | | | | | | |
CVS Corp. | | | | 5.298% | | 1/11/27 | | | 618 | | | 593 | E |
CVS Lease Pass-Through Trust | | | | 5.880% | | 1/10/28 | | | 5,859 | | | 5,581 | E |
CVS Lease Pass-Through Trust | | | | 6.036% | | 12/10/28 | | | 20,135 | | | 19,557 | E |
| | | | | | | | | | | | | |
| | | | | | | | | | | | 25,731 | |
| | | | | | | | | | | | | |
Food Products | | 0.2% | | | | | | | | | | | |
General Mills Inc. | | | | 5.700% | | 2/15/17 | | | 7,210 | | | 7,092 | |
H.J. Heinz Co. | | | | 6.428% | | 12/1/08 | | | 11,660 | | | 11,844 | E |
Sara Lee Corp. | | | | 6.250% | | 9/15/11 | | | 9,750 | | | 10,071 | |
| | | | | | | | | | | | | |
| | | | | | | | | | | | 29,007 | |
| | | | | | | | | | | | | |
67
Semi-Annual Report to Shareholders
Portfolio of Investments—Continued
Western Asset Core Plus Bond Portfolio—Continued
| | | | | | | | | | | | | |
| | | % OF
NET ASSETS | | RATE | | MATURITY
DATE | | PAR/
SHARES† | | VALUE | |
| | | | | | | | | | | | | |
Corporate Bonds and Notes—Continued | | | | | | | | | | | | | |
| | | | | |
Gas Utilities | | 0.1% | | | | | | | | | | | |
AmeriGas Partners LP | | | | 7.250% | | 5/20/15 | | $ | 990 | | $ | 975 | |
Southern Natural Gas Co. | | | | 5.900% | | 4/1/17 | | | 20 | | | 20 | E |
Southern Natural Gas Co. | | | | 8.000% | | 3/1/32 | | | 9,410 | | | 10,637 | |
Suburban Propane Partners LP | | | | 6.875% | | 12/15/13 | | | 2,000 | | | 1,950 | |
| | | | | | | | | | | | | |
| | | | | | | | | | | | 13,582 | |
| | | | | | | | | | | | | |
Health Care Equipment and Supplies | | N.M. | | | | | | | | | | | |
Fresenius Medical Care Capital Trust II | | | | 7.875% | | 2/1/08 | | | 938 | | | 940 | |
Fresenius Medical Care Capital Trust IV | | | | 7.875% | | 6/15/11 | | | 681 | | | 707 | |
Mallinckrodt Inc. | | | | 6.500% | | 11/15/07 | | | 2,345 | | | 2,347 | |
| | | | | | | | | | | | | |
| | | | | | | | | | | | 3,994 | |
| | | | | | | | | | | | | |
Health Care Providers and Services | | 0.6% | | | | | | | | | | | |
AmerisourceBergen Corp. | | | | 5.625% | | 9/15/12 | | | 6,330 | | | 6,278 | |
AmerisourceBergen Corp. | | | | 5.875% | | 9/15/15 | | | 7,070 | | | 6,915 | |
Cardinal Health Inc. | | | | 6.300% | | 10/15/16 | | | 6,260 | | | 6,163 | E |
Community Health Systems Inc. | | | | 8.875% | | 7/15/15 | | | 7,910 | | | 8,128 | E |
DaVita Inc. | | | | 6.625% | | 3/15/13 | | | 4,435 | | | 4,402 | |
HCA Inc. | | | | 8.750% | | 9/1/10 | | | 256 | | | 259 | |
HCA Inc. | | | | 6.250% | | 2/15/13 | | | 1,243 | | | 1,100 | |
HCA Inc. | | | | 5.750% | | 3/15/14 | | | 86 | | | 72 | |
HCA Inc. | | | | 9.125% | | 11/15/14 | | | 1,280 | | | 1,350 | E |
HCA Inc. | | | | 6.500% | | 2/15/16 | | | 379 | | | 322 | |
HCA Inc. | | | | 9.250% | | 11/15/16 | | | 10,500 | | | 11,156 | E |
HCA Inc. | | | | 9.625% | | 11/15/16 | | | 2,059 | | | 2,198 | E,H |
HCA Inc. | | | | 7.690% | | 6/15/25 | | | 723 | | | 594 | |
HCA Inc. | | | | 7.500% | | 11/6/33 | | | 14,640 | | | 11,785 | |
Tenet Healthcare Corp. | | | | 6.375% | | 12/1/11 | | | 2,500 | | | 2,188 | B |
Tenet Healthcare Corp. | | | | 7.375% | | 2/1/13 | | | 6,222 | | | 5,273 | |
Tenet Healthcare Corp. | | | | 9.875% | | 7/1/14 | | | 2,668 | | | 2,441 | B |
Tenet Healthcare Corp. | | | | 9.250% | | 2/1/15 | | | 12,430 | | | 10,969 | B |
| | | | | | | | | | | | | |
| | | | | | | | | | | | 81,593 | |
| | | | | | | | | | | | | |
Hotels, Restaurants and Leisure | | 0.2% | | | | | | | | | | | |
Boyd Gaming Corp. | | | | 6.750% | | 4/15/14 | | | 10 | | | 10 | |
Boyd Gaming Corp. | | | | 7.125% | | 2/1/16 | | | 20 | | | 19 | |
Caesars Entertainment Inc. | | | | 8.125% | | 5/15/11 | | | 733 | | | 748 | |
Inn of the Mountain Gods Resort and Casino | | | | 12.000% | | 11/15/10 | | | 1,070 | | | 1,129 | B |
Mandalay Resort Group | | | | 9.500% | | 8/1/08 | | | 80 | | | 82 | |
Marriott International Inc. | | | | 5.810% | | 11/10/15 | | | 7,950 | | | 7,869 | B |
MGM MIRAGE | | | | 6.750% | | 9/1/12 | | | 435 | | | 428 | |
68
Semi-Annual Report to Shareholders
| | | | | | | | | | | | | |
| | | % OF
NET ASSETS | | RATE | | MATURITY
DATE | | PAR/
SHARES† | | VALUE | |
| | | | | | | | | | | | | |
Corporate Bonds and Notes—Continued | | | | | | | | | | | | | |
| | | | | |
Hotels, Restaurants and Leisure—Continued | | | | | | | | | | | | | |
MGM MIRAGE | | | | 6.625% | | 7/15/15 | | $ | 380 | | $ | 361 | |
MGM MIRAGE | | | | 7.500% | | 6/1/16 | | | 4,000 | | | 3,975 | |
MGM MIRAGE | | | | 7.625% | | 1/15/17 | | | 4,670 | | | 4,623 | |
Mohegan Tribal Gaming Authority | | | | 8.000% | | 4/1/12 | | | 245 | | | 250 | |
River Rock Entertainment Authority | | | | 9.750% | | 11/1/11 | | | 220 | | | 227 | |
Starwood Hotels and Resorts Worldwide Inc. | | | | 7.875% | | 5/1/12 | | | 5,350 | | | 5,709 | |
Station Casinos Inc. | | | | 7.750% | | 8/15/16 | | | 7,660 | | | 7,583 | |
| | | | | | | | | | | | | |
| | | | | | | | | | | | 33,013 | |
| | | | | | | | | | | | | |
Household Durables | | N.M. | | | | | | | | | | | |
Pulte Homes Inc. | | | | 8.125% | | 3/1/11 | | | 4,110 | | | 3,967 | |
| | | | | | | | | | | | | |
| | | | | |
Household Products | | N.M. | | | | | | | | | | | |
American Achievement Corp. | | | | 8.250% | | 4/1/12 | | | 250 | | | 249 | |
Procter and Gamble Co. | | | | 8.500% | | 8/10/09 | | | 90 | | | 96 | |
| | | | | | | | | | | | | |
| | | | | | | | | | | | 345 | |
| | | | | | | | | | | | | |
Independent Power Producers and Energy Traders | | 0.8% | | | | | | | | | | | |
Dynegy Holdings Inc. | | | | 7.750% | | 6/1/19 | | | 6,530 | | | 6,245 | E |
NRG Energy Inc. | | | | 7.250% | | 2/1/14 | | | 3,130 | | | 3,138 | |
NRG Energy Inc. | | | | 7.375% | | 2/1/16 | | | 6,791 | | | 6,808 | |
NRG Energy Inc. | | | | 7.375% | | 1/15/17 | | | 595 | | | 595 | |
The AES Corp. | | | | 8.750% | | 5/15/13 | | | 18,838 | | | 19,709 | E |
The AES Corp. | | | | 7.750% | | 3/1/14 | | | 33,375 | | | 33,876 | |
The AES Corp. | | | | 9.000% | | 5/15/15 | | | 7,700 | | | 8,085 | E |
TXU Corp. | | | | 5.550% | | 11/15/14 | | | 1,560 | | | 1,258 | |
TXU Corp. | | | | 6.500% | | 11/15/24 | | | 2,850 | | | 2,284 | |
TXU Corp. | | | | 6.550% | | 11/15/34 | | | 33,925 | | | 26,606 | B |
| | | | | | | | | | | | | |
| | | | | | | | | | | | 108,604 | |
| | | | | | | | | | | | | |
Industrial Conglomerates | | N.M. | | | | | | | | | | | |
General Electric Co. | | | | 5.000% | | 2/1/13 | | | 7,055 | | | 6,993 | |
| | | | | | | | | | | | | |
| | | | | |
Insurance | | 0.1% | | | | | | | | | | | |
ASIF Global Financing XIX | | | | 4.900% | | 1/17/13 | | | 2,180 | | | 2,106 | E |
Marsh and McLennan Cos. Inc. | | | | 5.150% | | 9/15/10 | | | 5,990 | | | 5,969 | |
MetLife Inc. | | | | 6.400% | | 12/15/66 | | | 120 | | | 114 | D |
The Travelers Cos. Inc. | | | | 6.250% | | 3/15/67 | | | 100 | | | 97 | D |
| | | | | | | | | | | | | |
| | | | | | | | | | | | 8,286 | |
| | | | | | | | | | | | | |
69
Semi-Annual Report to Shareholders
Portfolio of Investments—Continued
Western Asset Core Plus Bond Portfolio—Continued
| | | | | | | | | | | | | |
| | | % OF
NET ASSETS | | RATE | | MATURITY
DATE | | PAR/
SHARES† | | VALUE | |
| | | | | | | | | | | | | |
Corporate Bonds and Notes—Continued | | | | | | | | | | | | | |
| | | | | |
Internet and Catalog Retail | | 0.2% | | | | | | | | | | | |
Amazon.com Inc. | | | | 4.750% | | 2/1/09 | | $ | 19,320 | | $ | 23,788 | C |
| | | | | | | | | | | | | |
| | | | | |
IT Services | | 0.2% | | | | | | | | | | | |
Electronic Data Systems Corp. | | | | 7.125% | | 10/15/09 | | | 21,645 | | | 22,037 | |
SunGard Data Systems Inc. | | | | 9.125% | | 8/15/13 | | | 1,650 | | | 1,716 | |
| | | | | | | | | | | | | |
| | | | | | | | | | | | 23,753 | |
| | | | | | | | | | | | | |
Leisure Equipment and Products | | 0.2% | | | | | | | | | | | |
Eastman Kodak Co. | | | | 7.250% | | 11/15/13 | | | 21,264 | | | 21,105 | |
Eastman Kodak Co. | | | | 3.375% | | 10/15/33 | | | 13,820 | | | 14,666 | C |
| | | | | | | | | | | | | |
| | | | | | | | | | | | 35,771 | |
| | | | | | | | | | | | | |
Media | | 0.8% | | | | | | | | | | | |
CBS Corp. | | | | 7.625% | | 1/15/16 | | | 5,500 | | | 5,916 | |
Clear Channel Communications Inc. | | | | 4.625% | | 1/15/08 | | | 165 | | | 164 | |
Clear Channel Communications Inc. | | | | 4.250% | | 5/15/09 | | | 2,760 | | | 2,631 | |
Clear Channel Communications Inc. | | | | 6.250% | | 3/15/11 | | | 6,600 | | | 6,050 | |
Clear Channel Communications Inc. | | | | 5.500% | | 9/15/14 | | | 8,120 | | | 6,376 | |
Comcast Cable Communications Inc. | | | | 6.750% | | 1/30/11 | | | 210 | | | 218 | |
Comcast Cable Communications Inc. | | | | 8.875% | | 5/1/17 | | | 40 | | | 47 | |
Comcast Corp. | | | | 6.500% | | 1/15/15 | | | 3,760 | | | 3,885 | |
Comcast Corp. | | | | 6.500% | | 1/15/17 | | | 560 | | | 578 | |
Comcast Corp. | | | | 5.875% | | 2/15/18 | | | 10 | | | 10 | |
Comcast Corp. | | | | 7.050% | | 3/15/33 | | | 7,470 | | | 7,874 | |
Comcast MO of Delaware Inc. | | | | 9.000% | | 9/1/08 | | | 1,060 | | | 1,094 | |
Cox Communications Inc. | | | | 7.875% | | 8/15/09 | | | 7,680 | | | 8,032 | B |
CSC Holdings Inc. | | | | 6.750% | | 4/15/12 | | | 500 | | | 481 | |
CSC Holdings Inc. | | | | 7.875% | | 2/15/18 | | | 260 | | | 252 | |
CSC Holdings Inc. | | | | 7.625% | | 7/15/18 | | | 568 | | | 542 | B |
DirecTV Holdings LLC | | | | 8.375% | | 3/15/13 | | | 2,531 | | | 2,629 | |
EchoStar DBS Corp. | | | | 7.000% | | 10/1/13 | | | 6,340 | | | 6,483 | |
EchoStar DBS Corp. | | | | 6.625% | | 10/1/14 | | | 1,185 | | | 1,191 | |
EchoStar DBS Corp. | | | | 7.125% | | 2/1/16 | | | 20 | | | 21 | |
Gannett Co. Inc. | | | | 6.375% | | 4/1/12 | | | 4,560 | | | 4,686 | B |
Idearc Inc. | | | | 8.000% | | 11/15/16 | | | 8,250 | | | 8,229 | |
Lamar Media Corp. | | | | 7.250% | | 1/1/13 | | | 1,459 | | | 1,466 | |
Lamar Media Corp. | | | | 6.625% | | 8/15/15 | | | 2,010 | | | 1,940 | |
Liberty Media LLC | | | | 5.700% | | 5/15/13 | | | 535 | | | 500 | |
Liberty Media LLC | | | | 3.750% | | 2/15/30 | | | 170 | | | 99 | C |
News America Inc. | | | | 6.200% | | 12/15/34 | | | 240 | | | 226 | |
70
Semi-Annual Report to Shareholders
| | | | | | | | | | | | | |
| | | % OF
NET ASSETS | | RATE | | MATURITY
DATE | | PAR/
SHARES† | | VALUE | |
| | | | | | | | | | | | | |
Corporate Bonds and Notes—Continued | | | | | | | | | | | | | |
| | | | | |
Media—Continued | | | | | | | | | | | | | |
News America Inc. | | | | 6.750% | | 1/9/38 | | $ | 200 | | $ | 209 | |
Time Warner Entertainment Co. LP | | | | 8.375% | | 7/15/33 | | | 20 | | | 23 | |
Time Warner Inc. | | | | 6.875% | | 5/1/12 | | | 5,950 | | | 6,243 | |
Time Warner Inc. | | | | 7.625% | | 4/15/31 | | | 440 | | | 479 | |
Time Warner Inc. | | | | 7.700% | | 5/1/32 | | | 5,554 | | | 6,098 | |
Univision Communications Inc. | | | | 9.750% | | 3/15/15 | | | 2,100 | | | 2,047 | B,E,H |
Viacom Inc. | | | | 5.750% | | 4/30/11 | | | 14,870 | | | 15,014 | |
Viacom Inc. | | | | 6.250% | | 4/30/16 | | | 6,600 | | | 6,617 | |
| | | | | | | | | | | | | |
| | | | | | | | | | | | 108,350 | |
| | | | | | | | | | | | | |
Metals and Mining | | 0.1% | | | | | | | | | | | |
Freeport-McMoRan Copper & Gold Inc. | | | | 8.375% | | 4/1/17 | | | 10,140 | | | 11,078 | |
Steel Dynamics Inc. | | | | 6.750% | | 4/1/15 | | | 5,890 | | | 5,684 | E |
| | | | | | | | | | | | | |
| | | | | | | | | | | | 16,762 | |
| | | | | | | | | | | | | |
Multi-Utilities | | 0.1% | | | | | | | | | | | |
Dominion Resources Inc. | | | | 4.125% | | 2/15/08 | | | 2,000 | | | 1,989 | |
Dominion Resources Inc. | | | | 5.125% | | 12/15/09 | | | 1,260 | | | 1,256 | |
Dominion Resources Inc. | | | | 4.750% | | 12/15/10 | | | 1,010 | | | 996 | |
Dominion Resources Inc. | | | | 5.700% | | 9/17/12 | | | 5,135 | | | 5,153 | |
| | | | | | | | | | | | | |
| | | | | | | | | | | | 9,394 | |
| | | | | | | | | | | | | |
Multiline Retail | | N.M. | | | | | | | | | | | |
J.C. Penney Co. Inc. | | | | 7.400% | | 4/1/37 | | | 690 | | | 728 | B |
Target Corp. | | | | 4.000% | | 6/15/13 | | | 5,340 | | | 4,937 | B |
| | | | | | | | | | | | | |
| | | | | | | | | | | | 5,665 | |
| | | | | | | | | | | | | |
Office Electronics | | N.M. | | | | | | | | | | | |
Xerox Corp. | | | | 6.750% | | 2/1/17 | | | 1,180 | | | 1,208 | |
| | | | | | | | | | | | | |
| | | | | |
Oil, Gas and Consumable Fuels | | 1.8% | | | | | | | | | | | |
Anadarko Petroleum Corp. | | | | 6.094% | | 9/15/09 | | | 21,500 | | | 21,376 | A |
Anadarko Petroleum Corp. | | | | 6.450% | | 9/15/36 | | | 33,540 | | | 33,020 | |
Chesapeake Energy Corp. | | | | 6.375% | | 6/15/15 | | | 1,205 | | | 1,183 | |
Chesapeake Energy Corp. | | | | 6.250% | | 1/15/18 | | | 1,970 | | | 1,901 | |
Conoco Inc. | | | | 6.950% | | 4/15/29 | | | 83 | | | 91 | |
ConocoPhillips | | | | 8.750% | | 5/25/10 | | | 3,100 | | | 3,378 | |
ConocoPhillips | | | | 5.900% | | 10/15/32 | | | 10 | | | 10 | |
El Paso Corp. | | | | 7.000% | | 6/15/17 | | | 69,240 | | | 70,305 | |
El Paso Corp. | | | | 7.800% | | 8/1/31 | | | 4,277 | | | 4,342 | |
El Paso Corp. | | | | 7.750% | | 1/15/32 | | | 5,074 | | | 5,152 | B |
71
Semi-Annual Report to Shareholders
Portfolio of Investments—Continued
Western Asset Core Plus Bond Portfolio—Continued
| | | | | | | | | | | | | | |
| | | % OF
NET ASSETS | | RATE | | MATURITY
DATE | | PAR/
SHARES† | | | VALUE | |
| | | | | | | | | | | | | | |
Corporate Bonds and Notes—Continued | | | | | | | | | | | | | | |
| | | | | |
Oil, Gas and Consumable Fuels—Continued | | | | | | | | | | | | | | |
El Paso Natural Gas Co. | | | | 8.375% | | 6/15/32 | | $ | 2,520 | | | $ | 2,962 | |
Gazprom | | | | 6.950% | | 8/6/09 | | | 546,352 | RUB | | | 22,059 | |
Gazprom | | | | 6.790% | | 10/29/09 | | | 71,970 | RUB | | | 2,933 | |
Gazprom | | | | 7.000% | | 10/27/11 | | | 23,990 | RUB | | | 987 | |
Hess Corp. | | | | 7.875% | | 10/1/29 | | | 4,020 | | | | 4,621 | |
Hess Corp. | | | | 7.300% | | 8/15/31 | | | 14,505 | | | | 15,901 | |
Kerr-McGee Corp. | | | | 6.875% | | 9/15/11 | | | 800 | | | | 841 | |
Kerr-McGee Corp. | | | | 6.950% | | 7/1/24 | | | 2,560 | | | | 2,652 | |
Kerr-McGee Corp. | | | | 7.875% | | 9/15/31 | | | 10,555 | | | | 12,205 | |
Kinder Morgan Energy Partners LP | | | | 6.300% | | 2/1/09 | | | 10 | | | | 10 | |
Kinder Morgan Energy Partners LP | | | | 6.750% | | 3/15/11 | | | 60 | | | | 63 | |
Kinder Morgan Energy Partners LP | | | | 7.125% | | 3/15/12 | | | 7,565 | | | | 7,977 | |
Kinder Morgan Energy Partners LP | | | | 5.000% | | 12/15/13 | | | 1,804 | | | | 1,721 | |
Kinder Morgan Energy Partners LP | | | | 6.000% | | 2/1/17 | | | 8,430 | | | | 8,335 | |
Peabody Energy Corp. | | | | 6.875% | | 3/15/13 | | | 1,085 | | | | 1,096 | |
Peabody Energy Corp. | | | | 5.875% | | 4/15/16 | | | 880 | | | | 863 | |
Pemex Project Funding Master Trust | | | | 6.994% | | 6/15/10 | | | 13 | | | | 13 | A,E |
Pemex Project Funding Master Trust | | | | 6.180% | | 12/3/12 | | | 104 | | | | 104 | A,E |
Pemex Project Funding Master Trust | | | | 6.625% | | 6/15/35 | | | 18,085 | | | | 18,636 | |
Pogo Producing Co. | | | | 6.875% | | 10/1/17 | | | 4,760 | | | | 4,784 | |
Seariver Maritime Inc. | | | | 0.000% | | 9/1/12 | | | 70 | | | | 55 | I |
Texaco Capital Inc. | | | | 5.500% | | 1/15/09 | | | 1,600 | | | | 1,610 | |
The Williams Cos. Inc. | | | | 7.500% | | 1/15/31 | | | 110 | | | | 114 | |
The Williams Cos. Inc. | | | | 7.750% | | 6/15/31 | | | 530 | | | | 557 | B |
XTO Energy Inc. | | | | 7.500% | | 4/15/12 | | | 971 | | | | 1,049 | |
| | | | | | | | | | | | | | |
| | | | | | | | | | | | | 252,906 | |
| | | | | | | | | | | | | | |
Paper and Forest Products | | 0.1% | | | | | | | | | | | | |
Georgia-Pacific Corp. | | | | 8.125% | | 5/15/11 | | | 9 | | | | 9 | |
Weyerhaeuser Co. | | | | 6.750% | | 3/15/12 | | | 7,090 | | | | 7,361 | |
| | | | | | | | | | | | | | |
| | | | | | | | | | | | | 7,370 | |
| | | | | | | | | | | | | | |
Personal Products | | N.M. | | | | | | | | | | | | |
The Gillette Co. | | | | 2.500% | | 6/1/08 | | | 160 | | | | 157 | |
| | | | | | | | | | | | | | |
| | | | | |
Pharmaceuticals | | 0.1% | | | | | | | | | | | | |
Wyeth | | | | 5.950% | | 4/1/37 | | | 19,765 | | | | 19,074 | |
| | | | | | | | | | | | | | |
| | | | | |
Real Estate Investment Trusts | | 0.1% | | | | | | | | | | | | |
Health Care Property Investors Inc. | | | | 6.450% | | 6/25/12 | | | 6,240 | | | | 6,410 | |
Host Marriott LP | | | | 6.750% | | 6/1/16 | | | 2,065 | | | | 2,044 | |
72
Semi-Annual Report to Shareholders
| | | | | | | | | | | | | |
| | | % OF
NET ASSETS | | RATE | | MATURITY
DATE | | PAR/
SHARES† | | VALUE | |
| | | | | | | | | | | | | |
Corporate Bonds and Notes—Continued | | | | | | | | | | | | | |
| | | | | |
Real Estate Investment Trusts—Continued | | | | | | | | | | | | | |
Ventas Inc. | | | | 8.750% | | 5/1/09 | | $ | 770 | | $ | 795 | |
Ventas Inc. | | | | 6.750% | | 6/1/10 | | | 800 | | | 810 | |
Ventas Inc. | | | | 9.000% | | 5/1/12 | | | 440 | | | 479 | |
Ventas Inc. | | | | 6.750% | | 4/1/17 | | | 850 | | | 848 | |
| | | | | | | | | | | | | |
| | | | | | | | | | | | 11,386 | |
| | | | | | | | | | | | | |
Real Estate Management and Development | | N.M. | | | | | | | | | | | |
Forest City Enterprises Inc. | | | | 7.625% | | 6/1/15 | | | 360 | | | 339 | |
Forest City Enterprises Inc. | | | | 6.500% | | 2/1/17 | | | 597 | | | 533 | |
| | | | | | | | | | | | | |
| | | | | | | | | | | | 872 | |
| | | | | | | | | | | | | |
Road and Rail | | N.M. | | | | | | | | | | | |
Hertz Corp. | | | | 8.875% | | 1/1/14 | | | 3,285 | | | 3,384 | |
Hertz Corp. | | | | 10.500% | | 1/1/16 | | | 1,780 | | | 1,922 | |
Norfolk Southern Corp. | | | | 6.200% | | 4/15/09 | | | 20 | | | 20 | B |
| | | | | | | | | | | | | |
| | | | | | | | | | | | 5,326 | |
| | | | | | | | | | | | | |
Semiconductors and Semiconductor Equipment | | N.M. | | | | | | | | | | | |
Freescale Semiconductor Inc. | | | | 8.875% | | 12/15/14 | | | 10 | | | 10 | |
| | | | | | | | | | | | | |
| | | | | |
Specialty Retail | | 0.3% | | | | | | | | | | | |
Autozone Inc. | | | | 6.950% | | 6/15/16 | | | 10,890 | | | 11,559 | |
Home Depot Inc. | | | | 4.625% | | 8/15/10 | | | 2,720 | | | 2,652 | |
Home Depot Inc. | | | | 5.250% | | 12/16/13 | | | 5,510 | | | 5,289 | |
Home Depot Inc. | | | | 5.400% | | 3/1/16 | | | 8,230 | | | 7,711 | |
Limited Brands Inc. | | | | 6.125% | | 12/1/12 | | | 16,900 | | | 17,014 | |
| | | | | | | | | | | | | |
| | | | | | | | | | | | 44,225 | |
| | | | | | | | | | | | | |
Textiles, Apparel and Luxury Goods | | N.M. | | | | | | | | | | | |
Oxford Industries Inc. | | | | 8.875% | | 6/1/11 | | | 800 | | | 808 | |
| | | | | | | | | | | | | |
| | | | | |
Thrifts and Mortgage Finance | | 0.5% | | | | | | | | | | | |
Countrywide Financial Corp. | | | | 5.600% | | 4/30/08 | | | 25,000 | | | 24,564 | A |
Countrywide Financial Corp. | | | | 5.756% | | 6/18/08 | | | 30 | | | 29 | A |
Countrywide Financial Corp. | | | | 5.500% | | 1/5/09 | | | 30 | | | 28 | A |
Countrywide Home Loans Inc. | | | | 5.665% | | 2/27/08 | | | 25,070 | | | 24,819 | A |
Residential Capital LLC | | | | 7.460% | | 4/17/09 | | | 2,650 | | | 2,253 | A |
Residential Capital LLC | | | | 7.595% | | 5/22/09 | | | 7,170 | | | 6,095 | A,F |
Residential Capital LLC | | | | 7.000% | | 2/22/11 | | | 9,495 | | | 7,738 | F |
Residential Capital LLC | | | | 7.500% | | 6/1/12 | | | 3,040 | | | 2,462 | F |
| | | | | | | | | | | | | |
| | | | | | | | | | | | 67,988 | |
| | | | | | | | | | | | | |
73
Semi-Annual Report to Shareholders
Portfolio of Investments—Continued
Western Asset Core Plus Bond Portfolio—Continued
| | | | | | | | | | | | | |
| | | % OF
NET ASSETS | | RATE | | MATURITY
DATE | | PAR/
SHARES† | | VALUE | |
| | | | | | | | | | | | | |
Corporate Bonds and Notes—Continued | | | | | | | | | | | | | |
| | | | | |
Tobacco | | 0.1% | | | | | | | | | | | |
Altria Group Inc. | | | | 7.000% | | 11/4/13 | | $ | 2,430 | | $ | 2,641 | |
Altria Group Inc. | | | | 7.750% | | 1/15/27 | | | 5,000 | | | 6,143 | |
Philip Morris Capital Corp. | | | | 7.500% | | 7/16/09 | | | 190 | | | 197 | |
Reynolds American Inc. | | | | 7.875% | | 5/15/09 | | | 730 | | | 758 | B |
Reynolds American Inc. | | | | 6.750% | | 6/15/17 | | | 8,430 | | | 8,622 | |
| | | | | | | | | | | | | |
| | | | | | | | | | | | 18,361 | |
| | | | | | | | | | | | | |
Wireless Telecommunication Services | | 0.2% | | | | | | | | | | | |
Nextel Communications Inc. | | | | 6.875% | | 10/31/13 | | | 60 | | | 60 | |
Nextel Communications Inc. | | | | 5.950% | | 3/15/14 | | | 493 | | | 471 | |
Nextel Communications Inc. | | | | 7.375% | | 8/1/15 | | | 1,980 | | | 2,012 | |
Sprint Capital Corp. | | | | 6.125% | | 11/15/08 | | | 130 | | | 131 | |
Sprint Capital Corp. | | | | 8.375% | | 3/15/12 | | | 17,025 | | | 18,745 | |
Sprint Capital Corp. | | | | 6.900% | | 5/1/19 | | | 720 | | | 723 | |
Sprint Capital Corp. | | | | 8.750% | | 3/15/32 | | | 4,055 | | | 4,650 | |
| | | | | | | | | | | | | |
| | | | | | | | | | | | 26,792 | |
| | | | | | | | | | | | | |
Total Corporate Bonds and Notes
(Cost—$2,131,489) | | | | | | | | | | | | 2,096,802 | |
Asset-Backed Securities | | 5.7% | | | | | | | | | | | |
| | | | | |
Fixed Rate Securities | | 0.4% | | | | | | | | | | | |
Bank One Issuance Trust 2003-C1 | | | | 4.540% | | 9/15/10 | | | 470 | | | 469 | |
Bay View Auto Trust 2003-LJ1 | | | | 3.440% | | 4/25/12 | | | 94 | | | 93 | |
Citibank Credit Card Issuance Trust 2003-A3 A3 | | | | 3.100% | | 3/10/10 | | | 330 | | | 327 | |
Conseco Finance Securitizations Corp. 2000-4 | | | | 8.310% | | 5/1/32 | | | 2,180 | | | 1,847 | |
Contimortgage Home Equity Trust 1997-4 B1F | | | | 7.330% | | 10/15/28 | | | 1,240 | | | 859 | |
Green Tree Financial Corp. 1992-2 B | | | | 9.150% | | 1/15/18 | | | 191 | | | 155 | |
Green Tree Financial Corp. 1993-2 | | | | 8.000% | | 7/15/18 | | | 567 | | | 544 | |
Green Tree Financial Corp. 1996-5 | | | | 8.100% | | 7/15/27 | | | 3,268 | | | 781 | |
Green Tree Home Improvement Loan Trust 1996-A | | | | 7.400% | | 2/15/26 | | | 334 | | | 281 | |
Lehman ABS Manufactured Housing Contract 2001-B A3 | | | | 4.350% | | 5/15/14 | | | 3,305 | | | 3,126 | |
Lehman ABS Manufactured Housing Contract 2001-B A6 | | | | 6.467% | | 8/15/28 | | | 2,485 | | | 2,561 | |
Merrill Lynch Mortgage Investors Inc. 2005-SD1 A2 | | | | 5.666% | | 5/25/46 | | | 1,985 | | | 1,968 | |
Origen Manufactured Housing Contract Trust 2005-B | | | | 5.910% | | 1/15/37 | | | 4,797 | | | 4,751 | |
74
Semi-Annual Report to Shareholders
| | | | | | | | | | | | | |
| | | % OF
NET ASSETS | | RATE | | MATURITY
DATE | | PAR/
SHARES† | | VALUE | |
| | | | | | | | | | | | | |
Asset-Backed Securities—Continued | | | | | | | | | | | | | |
| | | | | |
Fixed Rate Securities—Continued | | | | | | | | | | | | | |
Origen Manufactured Housing Contract Trust 2005-B | | | | 5.990% | | 1/15/37 | | $ | 1,500 | | $ | 1,492 | |
Origen Manufactured Housing Contract Trust 2005-B | | | | 6.480% | | 1/15/37 | | | 2,100 | | | 2,113 | |
Patrons’ Legacy 2003-IV | | | | 5.775% | | 12/23/63 | | | 7,900 | | | 7,897 | E |
Pegasus Aviation Lease Securitization 2000-1 A2 | | | | 8.370% | | 3/25/30 | | | 2,500 | | | 1,501 | E |
Terwin Mortgage Trust 2006-10SL A1 | | | | 4.750% | | 10/25/37 | | | 31,374 | | | 30,542 | |
UCFC Home Equity Loan 1998-C | | | | 5.935% | | 1/15/30 | | | 10 | | | 10 | |
Vanderbilt Mortgage Finance 1997-B 1B2 | | | | 8.155% | | 10/7/26 | | | 187 | | | 191 | |
Vanderbilt Mortgage Finance 1997-C | | | | 7.830% | | 8/8/27 | | | 431 | | | 442 | |
WEF Issuer LLC 2006-A | | | | 5.190% | | 12/15/14 | | | 802 | | | 799 | E |
| | | | | | | | | | | | | |
| | | | | | | | | | | | 62,749 | |
| | | | | | | | | | | | | |
Indexed SecuritiesA | | 5.2% | | | | | | | | | | | |
Ace Securities Corp. Home Equity Loan Trust 2006-SL3 | | | | 5.231% | | 6/25/36 | | | 229 | | | 221 | |
AFC Home Equity Loan Trust 2002-2 | | | | 5.431% | | 6/25/30 | | | 535 | | | 520 | |
Asset Backed Securities Corp. Home Equity Loan Trust 2001-HE3 | | | | 6.293% | | 11/15/31 | | | 301 | | | 296 | |
Bear Stearns Asset Backed Securities Inc. 2005-AQ2 | | | | 5.291% | | 9/25/35 | | | 773 | | | 773 | |
Bear Stearns Asset Backed Securities Inc. 2005-CL1 | | | | 5.631% | | 9/25/34 | | | 11,278 | | | 11,048 | |
Bear Stearns Asset Backed Securities Inc. 2006-1 A | | | | 5.411% | | 2/25/36 | | | 3,116 | | | 3,042 | |
Bear Stearns Second Lien Trust 2007-SV1A A3 | | | | 5.381% | | 12/25/36 | | | 3,693 | | | 3,537 | E |
CDC Mortgage Capital Trust 2002-HE1 | | | | 5.441% | | 1/25/33 | | | 535 | | | 524 | |
Countrywide Asset-Backed Certificates 2002-BC1 | | | | 5.791% | | 4/25/32 | | | 178 | | | 173 | |
Countrywide Asset-Backed Certificates 2003-1 | | | | 5.471% | | 6/25/33 | | | 414 | | | 408 | |
Countrywide Asset-Backed Certificates 2003-BC3 | | | | 5.751% | | 9/25/33 | | | 637 | | | 631 | |
Countrywide Asset-Backed Certificates 2006-SD4 A1 | | | | 5.471% | | 12/25/36 | | | 281 | | | 257 | E |
Countrywide Home Equity Loan Trust 2002-F | | | | 6.103% | | 11/15/28 | | | 713 | | | 699 | |
Countrywide Home Equity Loan Trust 2005-H 2A | | | | 5.993% | | 12/15/35 | | | 2,286 | | | 2,255 | |
Countrywide Home Equity Loan Trust 2006-RES | | | | 6.013% | | 6/15/29 | | | 777 | | | 777 | E |
Credit-Based Asset Servicing and Securitization 2007-RP1 A | | | | 5.441% | | 5/25/46 | | | 42,707 | | | 42,716 | E |
75
Semi-Annual Report to Shareholders
Portfolio of Investments—Continued
Western Asset Core Plus Bond Portfolio—Continued
| | | | | | | | | | | | | |
| | | % OF
NET ASSETS | | RATE | | MATURITY
DATE | | PAR/
SHARES† | | VALUE | |
| | | | | | | | | | | | | |
Asset-Backed Securities—Continued | | | | | | | | | | | | | |
| | | | | |
Indexed Securities—Continued | | | | | | | | | | | | | |
CS First Boston Mortgage Securities Corp. 2005-AGE1 | | | | 5.271% | | 2/25/32 | | $ | 2,354 | | $ | 2,352 | |
EMC Mortgage Loan Trust 2002-B A1 | | | | 5.781% | | 2/25/41 | | | 657 | | | 655 | E |
Fairbanks Capital Mortgage Loan Trust 1999-1 A | | | | 5.731% | | 5/25/28 | | | 1,056 | | | 1,052 | E |
Fleet Home Equity Loan Trust 2003-1 | | | | 5.788% | | 1/20/33 | | | 4,516 | | | 4,448 | |
GMAC Mortgage Corp. Loan Trust 2004-HE3 A2VN | | | | 5.745% | | 10/25/34 | | | 97,859 | | | 97,783 | |
GMAC Mortgage Corp. Loan Trust 2004-VF1 A1 | | | | 5.881% | | 2/25/31 | | | 6,867 | | | 6,619 | E |
GMAC Mortgage Corp. Loan Trust 2005-HE3 A1VN | | | | 5.765% | | 2/25/36 | | | 87,218 | | | 85,474 | |
GMAC Mortgage Corp. Loan Trust 2006-HE1 A | | | | 5.341% | | 11/25/36 | | | 1,505 | | | 1,481 | |
Greenpoint Mortgage Funding Trust 2005-HE1 | | | | 5.531% | | 9/25/34 | | | 2,200 | | | 2,046 | |
GSRPM Mortgage Loan Trust 2004-1 A1 | | | | 5.611% | | 9/25/42 | | | 3,650 | | | 3,639 | E |
Indymac Home Equity Loan Asset-Backed Trust 2001-A | | | | 5.391% | | 3/25/31 | | | 87 | | | 83 | |
Lehman XS Trust 2005-5N | | | | 5.431% | | 11/25/35 | | | 23,810 | | | 23,338 | |
Lehman XS Trust 2005-5N 3A1A | | | | 5.431% | | 11/25/35 | | | 6,281 | | | 6,131 | |
Lehman XS Trust 2006-2N 1A1 | | | | 5.391% | | 2/25/46 | | | 285 | | | 278 | |
Lehman XS Trust 2006-4N A2A | | | | 5.351% | | 4/25/46 | | | 7,261 | | | 7,098 | |
Lehman XS Trust 2007-8H A1 | | | | 5.261% | | 6/25/37 | | | 107,154 | | | 106,599 | |
Merrill Lynch Mortgage Investors Trust 2007-SD1 A1 | | | | 5.581% | | 2/25/37 | | | 120,758 | | | 119,140 | |
MSDWCC Heloc Trust 2005-1 | | | | 5.321% | | 7/25/17 | | | 1,951 | | | 1,915 | |
Option One Mortgage Loan Trust 2003-1 | | | | 5.551% | | 2/25/33 | | | 17 | | | 17 | |
Provident Bank Home Equity Loan Trust 2000-2 | | | | 5.401% | | 8/25/31 | | | 313 | | | 305 | |
RAAC 2006-RP3 A | | | | 5.401% | | 5/25/36 | | | 62 | | | 61 | E |
RAAC 2006-RP4 A | | | | 5.421% | | 1/25/46 | | | 39,751 | | | 38,886 | E |
Renaissance Home Equity Loan Trust 2005-1 | | | | 5.461% | | 5/25/35 | | | 3,000 | | | 2,944 | |
Residential Asset Mortgage Products Inc. 2003-RS4 | | | | 5.791% | | 5/25/33 | | | 1,084 | | | 1,041 | |
Residential Funding Mortgage Securities II 2003-HS3 | | | | 5.421% | | 8/25/33 | | | 33 | | | 32 | |
Residential Funding Securities Corp. 2002-RP2 A1 | | | | 5.881% | | 10/25/32 | | | 5,499 | | | 5,424 | E |
SACO I Trust 2006-3 A3 | | | | 5.361% | | 4/25/36 | | | 4,588 | | | 3,937 | |
SACO I Trust 2006-6 A | | | | 5.261% | | 6/25/36 | | | 252 | | | 224 | |
76
Semi-Annual Report to Shareholders
| | | | | | | | | | | | | |
| | | % OF
NET ASSETS | | RATE | | MATURITY
DATE | | PAR/
SHARES† | | VALUE | |
| | | | | | | | | | | | | |
Asset-Backed Securities—Continued | | | | | | | | | | | | | |
| | | | | |
Indexed Securities—Continued | | | | | | | | | | | | | |
Salomon Brothers Mortgage Securities VII 2002-CIT1 | | | | 5.431% | | 3/25/32 | | $ | 685 | | $ | 680 | |
Securitized Asset Backed Receivables LLC 2007-BR3 A2B | | | | 5.351% | | 4/25/37 | | | 70,887 | | | 68,912 | |
Securitized Asset Backed Receivables LLC Trust 2007-BR2 A2 | | | | 5.361% | | 2/25/37 | | | 43,984 | | | 43,224 | |
SLM Student Loan Trust 2006-10 A2 | | | | 5.370% | | 10/25/17 | | | 380 | | | 380 | |
Southern Pacific Secured Asset Corp. 1998-2 | | | | 5.471% | | 7/25/29 | | | 24 | | | 23 | |
Structured Asset Securities Corp. 2006-ARS1 A1 | | | | 5.241% | | 2/25/36 | | | 276 | | | 188 | E |
Truman Capital Mortgage Loan Trust 2006-1 | | | | 5.391% | | 3/25/36 | | | 30,318 | | | 27,286 | E |
Vanderbilt Mortgage Finance 1999-D | | | | 9.069% | | 1/7/30 | | | 4,100 | | | 4,330 | |
Wachovia Asset Securitization Inc. 2002-HE1 | | | | 5.501% | | 9/27/32 | | | 1,005 | | | 996 | |
Wachovia Asset Securitization Inc. 2002-HE2 | | | | 5.561% | | 12/25/32 | | | 56 | | | 56 | |
Wachovia Asset Securitization Inc. 2003-HE1 | | | | 5.421% | | 3/25/33 | | | 25 | | | 25 | |
| | | | | | | | | | | | | |
| | | | | | | | | | | | 736,979 | |
| | | | | | | | | | | | | |
Stripped Securities | | N.M. | | | | | | | | | | | |
Oakwood Mortgage Investors Inc. 2001-E | | | | 6.000% | | 11/15/09 | | | 4,847 | | | 492 | J1 |
| | | | | | | | | | | | | |
| | | | | |
Variable Rate SecuritiesG | | 0.1% | | | | | | | | | | | |
Countrywide Asset-Backed Certificates 2004-15 | | | | 4.614% | | 12/25/32 | | | 11,882 | | | 11,699 | |
Irwin Home Equity Corp. 2005-1 2A2 | | | | 4.720% | | 6/25/35 | | | 4,759 | | | 4,721 | |
| | | | | | | | | | | | | |
| | | | | | | | | | | | 16,420 | |
| | | | | | | | | | | | | |
Total Asset-Backed Securities
(Cost—$831,037) | | | | | | | | | | | | 816,640 | |
Mortgage-Backed Securities | | 13.6% | | | | | | | | | | | |
| | | | | |
Fixed Rate Securities | | 2.4% | | | | | | | | | | | |
Banc of America Commercial Mortgage Inc. 2005-5 A4 | | | | 5.115% | | 10/10/45 | | | 7,630 | | | 7,459 | |
Banc of America Commercial Mortgage Inc. 2006-1 A4 | | | | 5.372% | | 9/10/45 | | | 310 | | | 307 | |
Banc of America Funding Corp. 2003-1 | | | | 6.000% | | 5/20/33 | | | 495 | | | 486 | |
Banc of America Funding Corp. 2006-8T2 A2 | | | | 5.791% | | 10/25/36 | | | 226 | | | 226 | |
BlackRock Capital Finance LP 1997-R3 | | | | 7.220% | | 11/25/28 | | | 6 | | | 6 | E |
Commercial Capital Access One Inc. 2I | | | | 12.000% | | 11/15/27 | | | 2,117 | | | 720 | |
Commercial Mortgage Pass-Through Certificates 2001-J1A A2 | | | | 6.457% | | 2/16/34 | | | 370 | | | 384 | E |
77
Semi-Annual Report to Shareholders
Portfolio of Investments—Continued
Western Asset Core Plus Bond Portfolio—Continued
| | | | | | | | | | | | | |
| | | % OF
NET ASSETS | | RATE | | MATURITY
DATE | | PAR/
SHARES† | | VALUE | |
| | | | | | | | | | | | | |
Mortgage-Backed Securities—Continued | | | | | | | | | | | | | |
| | | | | |
Fixed Rate Securities—Continued | | | | | | | | | | | | | |
Countrywide Alternative Loan Trust 2003-20CB 1A1 | | | | 5.500% | | 10/25/33 | | $ | 24,346 | | $ | 23,707 | |
Criimi Mae Commercial Mortgage Trust 1998-C1 | | | | 7.000% | | 6/2/33 | | | 151 | | | 152 | E |
CS First Boston Mortgage Securities Corp. 1998-C1 A1B | | | | 6.480% | | 5/17/40 | | | 2,312 | | | 2,324 | |
GE Capital Commercial Mortgage Corp. 2007-C1 A4 | | | | 5.543% | | 12/10/49 | | | 31,620 | | | 31,421 | |
GMAC Commercial Mortgage Securities Inc. 1998-C1 A2 | | | | 6.700% | | 5/15/30 | | | 3,944 | | | 3,950 | |
GMAC Commercial Mortgage Securities Inc. 1999-C2 | | | | 6.945% | | 9/15/33 | | | 325 | | | 333 | |
GS Mortgage Securities Corp. II 1998-C1 | | | | 6.620% | | 10/18/30 | | | 3,780 | | | 3,799 | |
GS Mortgage Securities Corp. II 2005-GG4 | | | | 4.680% | | 7/10/39 | | | 18,650 | | | 18,144 | |
JP Morgan Chase Commercial Mortgage Pass-Through Certificates 2005-CIBC12 | | | | 4.895% | | 9/12/37 | | | 3,000 | | | 2,888 | |
JP Morgan Chase Commercial Mortgage Securities Corp. 2006-CB15 | | | | 5.814% | | 6/12/43 | | | 2,370 | | | 2,416 | |
JP Morgan Chase Commercial Mortgage Securities Corp. 2007-LDPX A3 | | | | 5.420% | | 1/15/49 | | | 33,610 | | | 33,116 | |
JP Morgan Commercial Mortgage Finance Corp. 1999-C8 A2 | | | | 7.400% | | 7/15/31 | | | 1,661 | | | 1,703 | |
LB-UBS Commercial Mortgage Trust 2000-C3 A2 | | | | 7.950% | | 5/15/25 | | | 99 | | | 105 | |
LB-UBS Commercial Mortgage Trust 2005-C3 A5 | | | | 4.739% | | 7/15/30 | | | 8,640 | | | 8,245 | |
LB-UBS Commercial Mortgage Trust 2005-C3 AAB | | | | 4.664% | | 7/15/30 | | | 4,100 | | | 3,984 | |
MASTR Reperforming Loan Trust 2005-1 1A1 | | | | 6.000% | | 8/25/34 | | | 5,489 | | | 5,478 | E |
MASTR Reperforming Loan Trust 2005-1 1A3 | | | | 7.000% | | 8/25/34 | | | 8,333 | | | 8,701 | E |
Merrill Lynch/Countrywide Commercial Mortgage 2007-6 A4 | | | | 5.485% | | 3/12/51 | | | 22,150 | | | 21,900 | |
Morgan Stanley Capital I 2005-HQ6 | | | | 4.989% | | 8/13/42 | | | 21,070 | | | 20,414 | |
Morgan Stanley Capital I 2007-IQ14 A4 | | | | 5.692% | | 4/15/49 | | | 36,175 | | | 36,239 | |
Prime Mortgage Trust 2006-DR1 2A2 | | | | 6.000% | | 11/25/36 | | | 83,786 | | | 82,817 | E |
Residential Asset Mortgage Products Inc. 2004-SL2 | | | | 8.500% | | 10/25/31 | | | 269 | | | 281 | |
Residential Asset Mortgage Products Inc. 2004-SL4 | | | | 7.500% | | 7/25/32 | | | 1,940 | | | 1,982 | |
78
Semi-Annual Report to Shareholders
| | | | | | | | | | | | | |
| | | % OF
NET ASSETS | | RATE | | MATURITY
DATE | | PAR/
SHARES† | | VALUE | |
| | | | | | | | | | | | | |
Mortgage-Backed Securities—Continued | | | | | | | | | | | | | |
| | | | | |
Fixed Rate Securities—Continued | | | | | | | | | | | | | |
Residential Asset Mortgage Products Inc. 2005-SL2 | | | | 7.500% | | 3/25/32 | | $ | 11,846 | | $ | 11,761 | |
Residential Asset Securitization Trust 2003-A14 | | | | 4.750% | | 2/25/19 | | | 2,741 | | | 2,644 | |
| | | | | | | | | | | | | |
| | | | | | | | | | | | 338,092 | |
| | | | | | | | | | | | | |
Indexed SecuritiesA | | 8.7% | | | | | | | | | | | |
American Home Mortgage Assets Trust 2006-3 | | | | 5.321% | | 7/25/46 | | | 20,857 | | | 20,387 | |
American Home Mortgage Investment Trust 2005-4 | | | | 5.421% | | 11/25/45 | | | 17,851 | | | 17,320 | |
Bayview Commercial Asset Trust 2006-2A A1 | | | | 5.361% | | 7/25/36 | | | 2,104 | | | 2,069 | E |
Bayview Commercial Asset Trust 2006-SP1 A1 | | | | 5.401% | | 4/25/36 | | | 2,894 | | | 2,869 | E |
Bear Stearns Mortgage Funding Trust 2006-AR5 1A1 | | | | 5.291% | | 12/25/36 | | | 370 | | | 363 | |
Bear Stearns Second Lien Trust 2007-SV1A A1 | | | | 5.351% | | 12/25/36 | | | 13,002 | | | 11,703 | E |
Bear Stearns Structured Products Inc. 2007-R10 A1 | | | | 5.853% | | 9/26/37 | | | 46,450 | | | 46,229 | E |
Bear Stearns Structured Products Inc. 2007-R11 A1A | | | | 6.398% | | 9/27/37 | | | 141,000 | | | 138,831 | E |
Citigroup Mortgage Loan Trust Inc. 2005-5 | | | | 5.433% | | 8/25/35 | | | 257 | | | 260 | |
Citigroup Mortgage Loan Trust Inc. 2005-HE2 | | | | 5.531% | | 7/25/35 | | | 13,123 | | | 12,614 | E |
Countrywide Alternative Loan Trust 2004-J9 3A4 | | | | 5.710% | | 10/25/34 | | | 197 | | | 197 | |
Countrywide Alternative Loan Trust 2005-38 A3 | | | | 5.481% | | 9/25/35 | | | 19,696 | | | 19,371 | |
Countrywide Alternative Loan Trust 2005-44 1A1 | | | | 5.461% | | 10/25/35 | | | 23,716 | | | 23,385 | |
Countrywide Alternative Loan Trust 2005-44 2A1 | | | | 5.441% | | 10/25/35 | | | 13,770 | | | 13,659 | |
Countrywide Alternative Loan Trust 2005-56 3A1 | | | | 5.421% | | 11/25/35 | | | 16,296 | | | 15,951 | |
Countrywide Alternative Loan Trust 2005-56 4A1 | | | | 5.441% | | 11/25/35 | | | 7,320 | | | 7,085 | |
Countrywide Alternative Loan Trust 2005-59 1A1 | | | | 5.868% | | 11/20/35 | | | 7,032 | | | 6,882 | |
Countrywide Alternative Loan Trust 2005-72 A1 | | | | 5.401% | | 1/25/36 | | | 5,635 | | | 5,512 | |
Countrywide Alternative Loan Trust 2005-J12 | | | | 5.401% | | 8/25/35 | | | 1,015 | | | 1,013 | |
Countrywide Alternative Loan Trust 2006-0A2 A5 | | | | 5.726% | | 5/20/46 | | | 8,278 | | | 8,090 | |
79
Semi-Annual Report to Shareholders
Portfolio of Investments—Continued
Western Asset Core Plus Bond Portfolio—Continued
| | | | | | | | | | | | | |
| | | % OF
NET ASSETS | | RATE | | MATURITY
DATE | | PAR/
SHARES† | | VALUE | |
| | | | | | | | | | | | | |
Mortgage-Backed Securities—Continued | | | | | | | | | | | | | |
| | | | | |
Indexed Securities—Continued | | | | | | | | | | | | | |
Countrywide Alternative Loan Trust 2006-OA1 2A1 | | | | 5.706% | | 3/20/46 | | $ | 339 | | $ | 331 | |
Countrywide Alternative Loan Trust 2006-OA17 | | | | 5.691% | | 12/20/46 | | | 76,473 | | | 75,027 | |
Countrywide Alternative Loan Trust 2006-OA18 A2 | | | | 5.371% | | 12/25/46 | | | 379 | | | 365 | |
Countrywide Alternative Loan Trust 2006-OC2 2A3 | | | | 5.421% | | 2/25/36 | | | 9,400 | | | 9,149 | |
Countrywide Home Loans 2005-09 1A1 | | | | 5.431% | | 5/25/35 | | | 9,979 | | | 9,728 | |
Countrywide Home Loans 2005-R3 | | | | 5.531% | | 9/25/35 | | | 7,248 | | | 7,080 | E |
Countrywide Home Loans 2006-OA5 1A1 | | | | 5.331% | | 4/25/46 | | | 5,967 | | | 5,831 | |
DSLA Mortgage Loan Trust 2006-AR1 1A1A | | | | 5.903% | | 3/19/46 | | | 1,747 | | | 1,714 | |
DSLA Mortgage Loan Trust 2006-AR1 1A1B | | | | 5.903% | | 3/19/47 | | | 1,747 | | | 1,714 | |
GMAC Mortgage Corp. Loan Trust 2005-AR6 2A1 | | | | 5.199% | | 11/19/35 | | | 335 | | | 333 | |
Greenpoint Mortgage Funding Trust 2006-AR3 3A1 | | | | 5.361% | | 4/25/36 | | | 7,469 | | | 7,330 | |
Greenpoint Mortgage Funding Trust 2007-AR2 1A1 | | | | 5.261% | | 4/25/47 | | | 77,978 | | | 77,045 | |
GSMPS Mortgage Loan Trust 2005-RP2 | | | | 5.481% | | 3/25/35 | | | 22,886 | | | 22,664 | E |
GSMPS Mortgage Loan Trust 2005-RP3 | | | | 5.481% | | 9/25/35 | | | 35,584 | | | 35,634 | E |
Harborview Mortgage Loan Trust 2005-3 | | | | 5.743% | | 6/19/35 | | | 18,792 | | | 18,388 | |
Harborview Mortgage Loan Trust 2005-7 | | | | 6.133% | | 6/19/45 | | | 8,388 | | | 8,161 | |
Harborview Mortgage Loan Trust 2006-13 A | | | | 5.683% | | 11/19/46 | | | 197 | | | 195 | |
Harborview Mortgage Loan Trust 2006-7 | | | | 5.703% | | 10/19/37 | | | 4,046 | | | 3,983 | |
Harborview Mortgage Loan Trust 2007-4 2A1 | | | | 5.723% | | 7/19/47 | | | 37,602 | | | 36,537 | |
Impac CMB Trust 2003-4 1A1 | | | | 5.771% | | 10/25/33 | | | 235 | | | 233 | |
IndyMac Inda Mortgage Loan Trust 2007-AR7 1A1 | | | | 6.287% | | 11/25/37 | | | 18,190 | | | 18,180 | |
IndyMac Index Mortgage Loan Trust 2004-AR2 2A1 | | | | 5.441% | | 6/25/34 | | | 74 | | | 72 | |
IndyMac Index Mortgage Loan Trust 2006-AR15 A1 | | | | 5.251% | | 7/25/36 | | | 334 | | | 328 | |
La Hipotecaria SA 2007-1GA A | | | | 5.750% | | 12/23/36 | | | 379 | | | 377 | E |
Lehman XS Trust 2006-GP2 1A1A | | | | 5.201% | | 6/25/46 | | | 1,126 | | | 1,116 | |
Luminent Mortgage Trust 2006-7 2A1 | | | | 5.301% | | 12/25/36 | | | 5,499 | | | 5,336 | |
MASTR Adjustable Rate Mortgages Trust 2004-13 | | | | 3.786% | | 11/21/34 | | | 1,830 | | | 1,789 | |
MASTR Reperforming Loan Trust 2005-2 1A1F | | | | 5.481% | | 5/25/35 | | | 6,611 | | | 6,542 | E |
Medallion Trust 2000-2G | | | | 5.846% | | 12/18/31 | | | 287 | | | 285 | |
80
Semi-Annual Report to Shareholders
| | | | | | | | | | | | | |
| | | % OF
NET ASSETS | | RATE | | MATURITY
DATE | | PAR/
SHARES† | | VALUE | |
| | | | | | | | | | | | | |
Mortgage-Backed Securities—Continued | | | | | | | | | | | | | |
| | | | | |
Indexed Securities—Continued | | | | | | | | | | | | | |
MLCC Mortgage Investors Inc. 2003-B | | | | 5.471% | | 4/25/28 | | $ | 3,491 | | $ | 3,391 | |
Residential Accredit Loans Inc. 2005-QO3 A1 | | | | 5.531% | | 10/24/45 | | | 2,776 | | | 2,722 | |
Residential Accredit Loans Inc. 2006-QO10 A1 | | | | 5.291% | | 1/25/37 | | | 359 | | | 349 | |
Residential Accredit Loans Inc. 2006-QO5 3A1 | | | | 5.201% | | 5/25/46 | | | 30 | | | 30 | |
Residential Accredit Loans Inc. 2006-QO8 1A1A | | | | 5.221% | | 10/25/46 | | | 3,049 | | | 3,029 | |
Residential Accredit Loans Inc. 2007-QO4 A1A | | | | 5.321% | | 5/25/47 | | | 15,089 | | | 14,723 | |
Sequoia Mortgage Trust A4 | | | | 5.496% | | 11/22/24 | | | 14 | | | 14 | |
Structured Asset Mortgage Investments Inc. 2006-AR3 11A1 | | | | 5.341% | | 4/25/36 | | | 6,698 | | | 6,596 | |
Structured Asset Mortgage Investments Inc. 2006-AR7 A1A | | | | 5.341% | | 8/25/36 | | | 42,868 | | | 42,196 | |
Thornburg Mortgage Securities Trust 2005-4 A4 | | | | 5.331% | | 12/25/35 | | | 75,095 | | | 74,793 | |
Thornburg Mortgage Securities Trust 2006-1 | | | | 5.301% | | 1/25/36 | | | 121,157 | | | 120,550 | |
Thornburg Mortgage Securities Trust 2006-1 A2 | | | | 5.281% | | 1/25/36 | | | 7,462 | | | 7,423 | |
WaMu Mortgage Pass-Through Certificates, 2005-AR06 2A1A | | | | 5.361% | | 4/25/45 | | | 13,821 | | | 13,550 | |
WaMu Mortgage Pass-Through Certificates, 2005-AR08 1A1A | | | | 5.401% | | 7/25/45 | | | 12,983 | | | 12,617 | |
WaMu Mortgage Pass-Through Certificates, 2005-AR1 A1A | | | | 5.451% | | 1/25/45 | | | 3,201 | | | 3,150 | |
WaMu Mortgage Pass-Through Certificates, 2005-AR11 | | | | 5.451% | | 8/25/45 | | | 38,222 | | | 37,435 | |
WaMu Mortgage Pass-Through Certificates, 2005-AR13 A1A1 | | | | 5.421% | | 10/25/45 | | | 21,650 | | | 21,168 | |
WaMu Mortgage Pass-Through Certificates, 2005-AR13 B10 | | | | 6.705% | | 10/25/45 | | | 6,409 | | | 4,967 | E |
WaMu Mortgage Pass-Through Certificates, 2005-AR15 A1A1 | | | | 5.391% | | 11/25/45 | | | 21,081 | | | 20,739 | |
WaMu Mortgage Pass-Through Certificates, 2005-AR15 A1A2 | | | | 5.411% | | 11/25/45 | | | 33,156 | | | 32,392 | |
WaMu Mortgage Pass-Through Certificates, 2005-AR17 A1A2 | | | | 5.421% | | 12/25/45 | | | 20,839 | | | 20,391 | |
WaMu Mortgage Pass-Through Certificates, 2005-AR19 A1A1 | | | | 5.401% | | 12/25/45 | | | 30,440 | | | 29,998 | |
WaMu Mortgage Pass-Through Certificates, 2005-AR19 A1A2 | | | | 5.421% | | 12/25/45 | | | 33,646 | | | 33,004 | |
WaMu Mortgage Pass-Through Certificates, 2007-OA5 A1A | | | | 5.823% | | 5/25/47 | | | 1,592 | | | 1,549 | |
Zuni Mortgage Loan Trust 2006-OA1 | | | | 5.261% | | 8/25/36 | | | 32,272 | | | 32,025 | |
| | | | | | | | | | | | | |
| | | | | | | | | | | | 1,248,058 | |
| | | | | | | | | | | | | |
81
Semi-Annual Report to Shareholders
Portfolio of Investments—Continued
Western Asset Core Plus Bond Portfolio—Continued
| | | | | | | | | | | | | |
| | | % OF
NET ASSETS | | RATE | | MATURITY
DATE | | PAR/
SHARES† | | VALUE | |
| | | | | | | | | | | | | |
Mortgage-Backed Securities—Continued | | | | | | | | | | | | | |
| | | | | |
Stripped Securities | | 0.1% | | | | | | | | | | | |
Diversified REIT Trust 2001-1A | | | | 0.755% | | 3/8/10 | | $ | 10,587 | | $ | 188 | E,J1 |
FFCA Secured Lending Corp. 1999-1A | | | | 1.427% | | 9/18/25 | | | 342 | | | 14 | E,J1 |
GE Capital Commercial Mortgage Corp. 2005-C4 | | | | 5.512% | | 11/10/45 | | | 15,020 | | | 14,964 | J1 |
GMAC Commercial Mortgage Securities Inc. 1999-CTL1 | | | | 0.461% | | 12/15/16 | | | 479 | | | 1 | E,J1 |
LB-UBS Commercial Mortgage Trust 2001-C3 X | | | | 1.164% | | 6/15/36 | | | 8,638 | | | 259 | E,J1 |
| | | | | | | | | | | | | |
| | | | | | | | | | | | 15,426 | |
| | | | | | | | | | | | | |
Variable Rate SecuritiesG | | 2.4% | | | | | | | | | | | |
Banc of America Commercial Mortgage Inc. 2006-2 A4 | | | | 5.930% | | 5/10/45 | | | 28,805 | | | 29,359 | |
Banc of America Funding Corp. 2005-F 2A1 | | | | 5.207% | | 9/20/35 | | | 25,101 | | | 25,038 | |
Commercial Mortgage Asset Trust 1999-C2 | | | | 7.546% | | 11/17/32 | | | 319 | | | 329 | |
Countrywide Home Loan Mortgage Pass Through Trust 2006-HYB1 2A1 | | | | 5.339% | | 3/20/36 | | | 262 | | | 261 | |
Credit Suisse Mortgage Capital Certificates 2006-C1 A4 | | | | 5.609% | | 2/15/39 | | | 310 | | | 311 | |
GSR Mortgage Loan Trust 2005-AR7 1A1 | | | | 5.124% | | 11/25/35 | | | 3,892 | | | 3,946 | |
Harborview Mortgage Loan Trust 2006-2 | | | | 5.430% | | 2/25/36 | | | 7,291 | | | 7,255 | |
IndyMac INDX Mortgage Loan Trust 2004-AR15 | | | | 5.035% | | 2/25/35 | | | 802 | | | 798 | |
IndyMac INDX Mortgage Loan Trust 2005-AR1 1A1 | | | | 5.326% | | 3/25/35 | | | 150 | | | 150 | |
IndyMac INDX Mortgage Loan Trust 2005-AR13 | | | | 4.417% | | 8/25/35 | | | 911 | | | 911 | |
IndyMac INDX Mortgage Loan Trust 2005-AR15 | | | | 5.099% | | 9/25/35 | | | 10,757 | | | 10,588 | |
JP Morgan Chase Commercial Mortgage Securities Corp. 2005-CB13 | | | | 5.472% | | 1/12/43 | | | 11,800 | | | 11,715 | |
JP Morgan Chase Commercial Mortgage Securities Corp. 2006-LDP9 HS | | | | 5.941% | | 5/15/47 | | | 5,000 | | | 4,117 | E |
MASTR Adjustable Rate Mortgages Trust 2004-4 3A1 | | | | 4.172% | | 5/25/34 | | | 3,040 | | | 2,995 | |
MASTR Adjustable Rate Mortgages Trust 2006-2 3A1 | | | | 4.844% | | 1/25/36 | | | 191 | | | 188 | |
Merrill Lynch Mortgage Investors Trust 2006-A1 1A1 | | | | 5.854% | | 3/25/36 | | | 39,573 | | | 39,845 | |
Merrill Lynch Mortgage Trust 2005-CKI1 | | | | 5.417% | | 11/12/37 | | | 18,740 | | | 18,558 | |
Merrill Lynch Mortgage Trust 2005-MCP1 | | | | 4.747% | | 6/12/43 | | | 15,240 | | | 14,528 | |
82
Semi-Annual Report to Shareholders
| | | | | | | | | | | | |
| | | % OF
NET ASSETS | | RATE | | MATURITY
DATE | | PAR/
SHARES† | | VALUE |
| | | | | | | | | | | | |
Mortgage-Backed Securities—Continued | | | | | | | | | | |
| | | | | |
Variable Rate Securities—Continued | | | | | | | | | | | | |
Merrill Lynch Mortgage Trust 2006-C1 A4 | | | | 5.843% | | 5/12/39 | | $ | 130 | | $ | 132 |
Merrill Lynch/Countrywide Commercial Mortgage Trust 2007-7 A4 | | | | 5.810% | | 6/12/50 | | | 5,150 | | | 5,201 |
Morgan Stanley Mortgage Loan Trust 2005-3AR | | | | 5.197% | | 7/25/35 | | | 9,859 | | | 10,010 |
Prime Mortgage Trust 2005-2 | | | | 7.408% | | 10/25/32 | | | 821 | | | 844 |
Structured Adjustable Rate Mortgage Loan Trust 2004-16 5A2 | | | | 5.070% | | 11/25/34 | | | 42,888 | | | 41,984 |
Thornburg Mortgage Securities Trust 2004-1 | | | | 6.302% | | 3/25/44 | | | 118 | | | 119 |
Thornburg Mortgage Securities Trust 2007-4 2A1 | | | | 6.240% | | 9/25/37 | | | 56,129 | | | 56,304 |
Thornburg Mortgage Securities Trust 2007-4 3A1 | | | | 6.228% | | 9/25/37 | | | 51,126 | | | 50,654 |
WaMu Mortgage Pass-Through Certificates 2005-AR14 1A1 | | | | 5.058% | | 12/25/35 | | | 322 | | | 319 |
WaMu Mortgage Pass-Through Certificates 2007-HY4 4A1 | | | | 5.503% | | 9/25/36 | | | 149 | | | 148 |
| | | | | | | | | | | | |
| | | | | | | | | | | | 336,607 |
| | | | | | | | | | | | |
Total Mortgage-Backed Securities
(Cost—$1,960,115) | | | | | | | | | | | | 1,938,183 |
Loan Participations and AssignmentsA | | 0.5% | | | | | | | | | | |
| | | | | |
Auto Components | | N.M. | | | | | | | | | | |
Allison Transmission Inc., Term Loan, Tranche B | | | | 8.480% to 8.570% | | 12/10/07 | | | 1,000 | | | 968 |
| | | | | | | | | | | | |
| | | | | |
Commercial Services and Supplies | | N.M. | | | | | | | | | | |
Allied Waste North America Inc., Credit Linked Deposit, Tranche A | | | | 6.820% | | 10/1/07 | | | 554 | | | 546 |
Allied Waste North America Inc., Term Loan | | | | 6.630% to 6.890% | | 2/18/08 | | | 1,019 | | | 1,004 |
| | | | | | | | | | | | |
| | | | | | | | | | | | 1,550 |
| | | | | | | | | | | | |
Communications Equipment | | N.M. | | | | | | | | | | |
Panamsat Corp., Term Loan, Tranche A | | | | 7.360% | | 10/2/07 | | | 1,850 | | | 1,821 |
| | | | | | | | | | | | |
83
Semi-Annual Report to Shareholders
Portfolio of Investments—Continued
Western Asset Core Plus Bond Portfolio—Continued
| | | | | | | | | | | | |
| | | % OF
NET ASSETS | | RATE | | MATURITY
DATE | | PAR/
SHARES† | | VALUE |
| | | | | | | | | | | | |
Loan Participations and Assignments—Continued | | | | | | | | | | | | |
| | | | | |
Computers and Peripherals | | N.M. | | | | | | | | | | |
SunGard Data Systems Inc., Term Loan, Tranche B | | | | 7.356% | | 11/8/07 | | $ | 1,980 | | $ | 1,943 |
| | | | | | | | | | | | |
| | | | | |
Containers and Packaging | | N.M. | | | | | | | | | | |
Amscan Holdings Inc., Term Loan, Tranche B | | | | 7.345% to 9.000% | | 12/31/07 | | | 998 | | | 950 |
| | | | | | | | | | | | |
| | | | | |
Diversified Consumer Services | | N.M. | | | | | | | | | | |
Thomson Medical Education, First Lien Term Loan | | | | 7.950% | | 12/31/07 | | | 1,000 | | | 995 |
| | | | | | | | | | | | |
| | | | | |
Diversified Financial Services | | N.M. | | | | | | | | | | |
CCM Merger Inc., Term Loan, Tranche B | | | | 7.198% to 7.720% | | 12/28/07 | | | 990 | | | 959 |
| | | | | | | | | | | | |
| | | | | |
Health Care Providers and Services | | 0.1% | | | | | | | | | | |
Davita Inc., Term Loan, Tranche B1 | | | | 6.700% to 7.010% | | 12/31/07 | | | 2,000 | | | 1,959 |
Healthsouth Corp., Term Loan, Tranche B | | | | 7.630% to 7.860% | | 10/29/07 | | | 563 | | | 546 |
Sheridan Healthcare Inc., Term Loan, Tranche B | | | | 7.860% | | 10/16/07 | | | 1,000 | | | 930 |
Vanguard Health Holding Co. II, Replacement Term Loan | | | | 7.448% | | 12/31/07 | | | 1,980 | | | 1,916 |
| | | | | | | | | | | | |
| | | | | | | | | | | | 5,351 |
| | | | | | | | | | | | |
Hotels, Restaurants and Leisure | | N.M. | | | | | | | | | | |
Metro-Goldwyn-Mayer Studios Inc., Term Loan, Tranche B | | | | 8.448% | | 12/31/07 | | | 1,485 | | | 1,419 |
| | | | | | | | | | | | |
| | | | | |
IT Services | | 0.3% | | | | | | | | | | |
First Data Corp., Term Loan, Tranche B1 | | | | 7.960% | | 12/24/07 | | | 39,810 | | | 38,218 |
| | | | | | | | | | | | |
| | | | | |
Media | | 0.1% | | | | | | | | | | |
Carmike Cinemas Inc., Delayed Draw Term Loan | | | | 7.750% to 8.980% | | 12/31/07 | | | 835 | | | 826 |
Cedar Fair LP, Term Loan, Tranche B | | | | 7.129% | | 10/31/07 | | | 990 | | | 968 |
84
Semi-Annual Report to Shareholders
| | | | | | | | | | | | | |
| | | % OF
NET ASSETS | | RATE | | MATURITY
DATE | | PAR/
SHARES† | | VALUE | |
| | | | | | | | | | | | | |
Loan Participations and Assignments—Continued | | | | | | | | | | | | | |
| | | | | |
Media—Continued | | | | | | | | | | | | | |
Charter Communications Operating LLC, Term Loan | | | | 7.360% | | 10/30/07 | | $ | 2,000 | | $ | 1,929 | |
Citadel Communication Group, Term Loan, Tranche B | | | | 6.755% to 6.825% | | 12/31/07 | | | 1,000 | | | 952 | |
CSC Holdings Inc., Incremental Term Loan | | | | 7.569% | | 10/9/07 | | | 990 | | | 975 | |
Idearc Inc., Term Loan, Tranche B | | | | 7.200% | | 12/31/07 | | | 995 | | | 979 | |
Nielsen Finance LLC, Term Loan, Tranche B | | | | 7.360% | | 11/9/07 | | | 1,985 | | | 1,926 | |
Tribune Co., Tranche B | | | | 8.360% | | 10/5/07 | | | 1,000 | | | 907 | |
Univision Communications, Term Loan, Tranche B | | | | 7.610% | | 10/31/07 | | | 940 | | | 893 | |
UPC Broadband Holding, Term Loan, Tranche N | | | | 7.130% | | 1/2/08 | | | 1,000 | | | 956 | |
| | | | | | | | | | | | | |
| | | | | | | | | | | | 11,311 | |
| | | | | | | | | | | | | |
Multiline Retail | | N.M. | | | | | | | | | | | |
Dollar General Corp., Term Loan, Tranche B | | | | 8.108% | | 10/31/07 | | | 1,000 | | | 949 | |
| | | | | | | | | | | | | |
| | | | | |
Paper and Forest Products | | N.M. | | | | | | | | | | | |
Georgia-Pacific Corp., First Lien Term Loan | | | | 6.948% to 7.474% | | 12/31/07 | | | 990 | | | 968 | |
| | | | | | | | | | | | | |
| | | | | |
Road and Rail | | N.M. | | | | | | | | | | | |
Swift Transportation, Term Loan | | | | 8.375% | | 11/1/07 | | | 884 | | | 800 | |
| | | | | | | | | | | | | |
| | | | | |
Semiconductors and Semiconductor Equipment | | N.M. | | | | | | | | | | | |
Sensata Technologies, Term Loan, Tranche B | | | | 7.090% to 7.110% | | 10/29/07 | | | 1,485 | | | 1,422 | |
| | | | | | | | | | | | | |
Total Loan Participations and Assignments (Cost—$70,617) | | | | | | | | | | | | 69,624 | |
U.S. Government and Agency Obligations | | 14.7% | | | | | | | | | | | |
| | | | | |
Fixed Rate Securities | | 9.6% | | | | | | | | | | | |
Fannie Mae | | | | 2.880% | | 10/22/07 | | | 81,000 | | | 80,900 | |
Fannie Mae | | | | 3.125% | | 12/15/07 | | | 35,000 | | | 34,869 | B |
85
Semi-Annual Report to Shareholders
Portfolio of Investments—Continued
Western Asset Core Plus Bond Portfolio—Continued
| | | | | | | | | | | | | |
| | | % OF
NET ASSETS | | RATE | | MATURITY
DATE | | PAR/
SHARES† | | VALUE | |
| | | | | | | | | | | | | |
U.S. Government and Agency Obligations—Continued | | | | | | | | | | | | | |
| | | | | |
Fixed Rate Securities—Continued | | | | | | | | | | | | | |
Fannie Mae | | | | 5.200% | | 11/8/10 | | $ | 17,470 | | $ | 17,483 | |
Fannie Mae | | | | 5.625% | | 5/19/11 | | | 31,580 | | | 32,182 | B |
Fannie Mae | | | | 4.610% | | 10/10/13 | | | 40,690 | | | 39,857 | |
Fannie Mae | | | | 6.000% | | 4/18/36 | | | 18,560 | | | 19,000 | |
Farmer Mac | | | | 5.125% | | 8/25/16 | | | 410 | | | 416 | |
Federal Home Loan Bank | | | | 3.875% | | 8/22/08 | | | 8,640 | | | 8,582 | B |
Federal Home Loan Bank | | | | 5.100% | | 9/19/08 | | | 800 | | | 804 | |
Federal Home Loan Bank | | | | 5.400% | | 1/2/09 | | | 22,690 | | | 22,690 | |
Federal Home Loan Bank | | | | 5.400% | | 1/16/09 | | | 38,000 | | | 38,015 | |
Federal Home Loan Bank | | | | 5.500% | | 5/21/09 | | | 300 | | | 300 | |
Federal Home Loan Bank | | | | 5.000% | | 12/21/15 | | | 240 | | | 241 | |
Federal Home Loan Bank | | | | 5.500% | | 7/15/36 | | | 3,040 | | | 3,134 | B |
Freddie Mac | | | | 3.500% | | 11/15/07 | | | 100 | | | 100 | |
Freddie Mac | | | | 5.875% | | 11/15/07 | | | 750 | | | 751 | |
Freddie Mac | | | | 4.750% | | 1/18/11 | | | 280 | | | 283 | |
Freddie Mac | | | | 5.250% | | 2/24/11 | | | 16,000 | | | 16,166 | B |
Freddie Mac | | | | 5.625% | | 3/15/11 | | | 25,450 | | | 26,391 | B |
Freddie Mac | | | | 5.125% | | 4/18/11 | | | 14,440 | | | 14,746 | B |
Freddie Mac | | | | 4.650% | | 10/10/13 | | | 47,200 | | | 46,284 | |
Freddie Mac | | | | 5.450% | | 11/21/13 | | | 18,230 | | | 18,350 | |
Freddie Mac | | | | 5.300% | | 5/12/20 | | | 75,000 | | | 73,361 | B |
Freddie Mac | | | | 5.625% | | 11/23/35 | | | 19,270 | | | 18,918 | B |
Tennessee Valley Authority | | | | 6.250% | | 12/15/17 | | | 40 | | | 44 | |
Tennessee Valley Authority | | | | 7.125% | | 5/1/30 | | | 840 | | | 1,039 | |
Tennessee Valley Authority | | | | 5.980% | | 4/1/36 | | | 120 | | | 132 | |
United States Treasury Bonds | | | | 8.875% | | 8/15/17 | | | 10 | | | 13 | B |
United States Treasury Bonds | | | | 4.750% | | 2/15/37 | | | 7,198 | | | 7,098 | B |
United States Treasury Bonds | | | | 5.000% | | 5/15/37 | | | 44,190 | | | 45,329 | B |
United States Treasury Notes | | | | 3.750% | | 5/15/08 | | | 25,460 | | | 25,394 | B |
United States Treasury Notes | | | | 5.000% | | 7/31/08 | | | 5,835 | | | 5,876 | B |
United States Treasury Notes | | | | 4.500% | | 3/31/09 | | | 29,490 | | | 29,718 | B |
United States Treasury Notes | | | | 4.750% | | 5/31/09 | | | 48,800 | | | 49,517 | B |
United States Treasury Notes | | | | 3.625% | | 7/15/09 | | | 62,120 | | | 61,766 | B |
United States Treasury Notes | | | | 6.000% | | 8/15/09 | | | 34,850 | | | 36,121 | B |
United States Treasury Notes | | | | 4.625% | | 11/15/09 | | | 180,120 | | | 182,456 | B |
United States Treasury Notes | | | | 4.000% | | 4/15/10 | | | 10 | | | 10 | B |
United States Treasury Notes | | | | 3.875% | | 9/15/10 | | | 24,700 | | | 24,603 | B |
United States Treasury Notes | | | | 4.875% | | 5/31/11 | | | 11,900 | | | 12,212 | B |
86
Semi-Annual Report to Shareholders
| | | | | | | | | | | | | |
| | | % OF
NET ASSETS | | RATE | | MATURITY
DATE | | PAR/
SHARES† | | VALUE | |
| | | | | | | | | | | | | |
U.S. Government and Agency Obligations—Continued | | | | | | | | | | | | | |
| | | | | |
Fixed Rate Securities—Continued | | | | | | | | | | | | | |
United States Treasury Notes | | | | 4.500% | | 9/30/11 | | $ | 29,420 | | $ | 29,813 | B |
United States Treasury Notes | | | | 4.625% | | 10/31/11 | | | 10,600 | | | 10,789 | B |
United States Treasury Notes | | | | 4.625% | | 12/31/11 | | | 234,920 | | | 239,031 | B |
United States Treasury Notes | | | | 4.500% | | 3/31/12 | | | 9,720 | | | 9,838 | B |
United States Treasury Notes | | | | 4.750% | | 5/31/12 | | | 1,820 | | | 1,861 | B |
United States Treasury Notes | | | | 4.875% | | 6/30/12 | | | 180 | | | 185 | B |
United States Treasury Notes | | | | 4.625% | | 7/31/12 | | | 3,330 | | | 3,388 | B |
United States Treasury Notes | | | | 5.125% | | 5/15/16 | | | 10 | | | 10 | B |
United States Treasury Notes | | | | 4.625% | | 2/15/17 | | | 20,310 | | | 20,404 | B |
United States Treasury Notes | | | | 4.750% | | 8/15/17 | | | 54,800 | | | 55,536 | B |
| | | | | | | | | | | | | |
| | | | | | | | | | | | 1,366,006 | |
| | | | | | | | | | | | | |
Indexed SecuritiesA | | 0.2% | | | | | | | | | | | |
Farmer Mac | | | | 5.011% | | 2/23/09 | | | 27,000 | | | 26,994 | |
| | | | | | | | | | | | | |
| | | | | |
Stripped Securities | | 0.3% | | | | | | | | | | | |
United States Treasury Bonds | | | | 0.000% | | 11/15/21 | | | 37,190 | | | 18,414 | J2 |
United States Treasury Bonds | | | | 0.000% | | 11/15/24 | | | 32,510 | | | 13,864 | B,J2 |
United States Treasury Bonds | | | | 0.000% | | 5/15/30 | | | 17,830 | | | 5,924 | B,J2 |
| | | | | | | | | | | | | |
| | | | | | | | | | | | 38,202 | |
| | | | | | | | | | | | | |
Treasury Inflation-Protected SecuritiesK | | 4.6% | | | | | | | | | | | |
United States Treasury Inflation-
Protected Security | | | | 3.875% | | 1/15/09 | | | 4,522 | | | 4,614 | B |
United States Treasury Inflation-
Protected Security | | | | 0.875% | | 4/15/10 | | | 33 | | | 32 | B |
United States Treasury Inflation-
Protected Security | | | | 2.375% | | 4/15/11 | | | 52 | | | 53 | B |
United States Treasury Inflation-
Protected Security | | | | 1.875% | | 7/15/13 | | | 8,495 | | | 8,359 | B |
United States Treasury Inflation-
Protected Security | | | | 2.000% | | 1/15/14 | | | 1,285 | | | 1,267 | B |
United States Treasury Inflation-
Protected Security | | | | 1.875% | | 7/15/15 | | | 58,557 | | | 57,006 | B |
United States Treasury Inflation-
Protected Security | | | | 2.000% | | 1/15/16 | | | 51,866 | | | 50,699 | B |
United States Treasury Inflation-
Protected Security | | | | 2.500% | | 7/15/16 | | | 7,942 | | | 8,090 | B |
United States Treasury Inflation-
Protected Security | | | | 2.375% | | 1/15/17 | | | 41,161 | | | 41,457 | B |
87
Semi-Annual Report to Shareholders
Portfolio of Investments—Continued
Western Asset Core Plus Bond Portfolio—Continued
| | | | | | | | | | | | | |
| | | % OF
NET ASSETS | | RATE | | MATURITY
DATE | | PAR/
SHARES† | | VALUE | |
| | | | | | | | | | | | | |
U.S. Government and Agency Obligations—Continued | | | | | | | | | | | | | |
| | | | | |
Treasury Inflation-Protected Securities—Continued | | | | | | | | | | | | | |
United States Treasury Inflation-Protected Security | | | | 2.375% | | 1/15/25 | | $ | 77,741 | | $ | 78,427 | B |
United States Treasury Inflation-Protected Security | | | | 2.000% | | 1/15/26 | | | 139,834 | | | 133,541 | B |
United States Treasury Inflation-Protected Security | | | | 2.375% | | 1/15/27 | | | 183,403 | | | 185,639 | B |
United States Treasury Inflation-Protected Security | | | | 3.625% | | 4/15/28 | | | 24,173 | | | 29,446 | B |
United States Treasury Inflation-Protected Security | | | | 3.875% | | 4/15/29 | | | 39,901 | | | 50,668 | B |
United States Treasury Inflation-Protected Security | | | | 3.375% | | 4/15/32 | | | 10,304 | | | 12,585 | B |
| | | | | | | | | | | | | |
| | | | | | | | | | | | 661,883 | |
| | | | | | | | | | | | | |
Total U.S. Government and Agency Obligations (Cost—$2,057,164) | | | | | | | | | | | | 2,093,085 | |
U.S. Government Agency Mortgage-Backed Securities | | 55.4% | | | | | | | | | | | |
| | | | | |
Fixed Rate Securities | | 52.5% | | | | | | | | | | | |
Fannie Mae | | | | 6.500% | | 5/1/14 to 7/1/35 | | | 11,625 | | | 11,877 | |
Fannie Mae | | | | 5.500% | | 1/1/17 to 5/1/37 | | | 727,963 | | | 713,366 | |
Fannie Mae | | | | 9.500% | | 11/1/21 | | | 1 | | | 2 | |
Fannie Mae | | | | 5.000% | | 12/1/22 to 12/1/37 | | | 3,253,500 | | | 3,106,047 | L |
Fannie Mae | | | | 5.500% | | 12/1/22 | | | 163,600 | | | 163,191 | L |
Fannie Mae | | | | 6.000% | | 12/1/22 to 12/1/37 | | | 672,760 | | | 673,277 | L |
Fannie Mae | | | | 6.000% | | 4/1/24 to 8/1/37 | | | 1,380,942 | | | 1,383,176 | |
Fannie Mae | | | | 7.000% | | 8/1/29 to 6/1/32 | | | 4,364 | | | 4,540 | |
Fannie Mae | | | | 7.500% | | 11/1/29 | | | 22 | | | 23 | |
Fannie Mae | | | | 4.500% | | 12/1/34 to 3/1/35 | | | 15,293 | | | 14,196 | |
Fannie Mae | | | | 5.000% | | 6/1/35 to 2/1/37 | | | 310,732 | | | 296,887 | |
Fannie Mae | | | | 4.500% | | 12/1/37 | | | 10,800 | | | 10,017 | L |
Fannie Mae | | | | 6.500% | | 12/1/37 | | | 304,560 | | | 310,074 | L |
Freddie Mac | | | | 6.000% | | 6/1/08 to 7/1/37 | | | 11,345 | | | 11,461 | |
Freddie Mac | | | | 5.500% | | 12/1/13 to 5/1/35 | | | 12,189 | | | 11,975 | |
Freddie Mac | | | | 7.000% | | 10/1/16 to 4/1/32 | | | 1,429 | | | 1,486 | |
Freddie Mac | | | | 6.500% | | 7/1/29 | | | 369 | | | 379 | |
Freddie Mac | | | | 5.000% | | 10/1/35 to 11/1/36 | | | 432,611 | | | 413,345 | |
88
Semi-Annual Report to Shareholders
| | | | | | | | | | | | | |
| | | % OF
NET ASSETS | | RATE | | MATURITY
DATE | | PAR/
SHARES† | | VALUE | |
| | | | | | | | | | | | | |
U.S. Government Agency Mortgage-Backed Securities—Continued | | | | | | | | | | | | | |
| | | | | |
Fixed Rate Securities—Continued | | | | | | | | | | | | | |
Freddie Mac | | | | 5.000% | | 12/1/37 | | $ | 35,000 | | $ | 33,381 | L |
Government National Mortgage Association | | | | 7.500% | | 3/15/23 to 9/15/31 | | | 234 | | | 246 | |
Government National Mortgage Association | | | | 7.000% | | 7/15/23 | | | 0.4 | | | — | M |
Government National Mortgage Association | | | | 7.000% | | 8/15/23 to 7/15/31 | | | 760 | | | 796 | |
Government National Mortgage Association | | | | 6.500% | | 4/15/28 to 4/15/33 | | | 16,175 | | | 16,568 | |
Government National Mortgage Association | | | | 6.000% | | 1/15/29 to 11/15/35 | | | 80,851 | | | 81,479 | |
Government National Mortgage Association | | | | 8.000% | | 12/15/30 to 1/15/31 | | | 24 | | | 26 | |
Government National Mortgage Association | | | | 5.000% | | 7/15/33 to 11/15/35 | | | 75,666 | | | 73,127 | |
Government National Mortgage Association | | | | 5.500% | | 7/15/33 to 6/15/35 | | | 21,921 | | | 21,642 | |
Government National Mortgage Association | | | | 6.000% | | 12/1/37 | | | 15,100 | | | 15,194 | L |
Government National Mortgage Association | | | | 6.500% | | 12/1/37 | | | 107,800 | | | 110,128 | L |
| | | | | | | | | | | | | |
| | | | | | | | | | | | 7,477,906 | |
| | | | | | | | | | | | | |
Indexed SecuritiesA | | 2.9% | | | | | | | | | | | |
Fannie Mae | | | | 4.795% | | 6/1/35 | | | 16,404 | | | 16,453 | |
Fannie Mae | | | | 4.333% | | 8/1/35 | | | 1,766 | | | 1,757 | |
Fannie Mae | | | | 4.615% | | 9/1/35 | | | 10,085 | | | 10,060 | |
Fannie Mae | | | | 4.698% | | 9/1/35 | | | 3,974 | | | 3,964 | |
Fannie Mae | | | | 4.578% | | 10/1/35 | | | 3,401 | | | 3,389 | |
Fannie Mae | | | | 4.704% | | 10/1/35 | | | 5,069 | | | 5,052 | |
Fannie Mae | | | | 4.718% | | 10/1/35 | | | 3,231 | | | 3,229 | |
Fannie Mae | | | | 4.826% | | 10/1/35 | | | 3,133 | | | 3,163 | |
Fannie Mae | | | | 7.007% | | 10/1/35 | | | 22,367 | | | 23,134 | |
Fannie Mae | | | | 7.012% | | 10/1/35 | | | 5,302 | | | 5,452 | |
Fannie Mae | | | | 7.029% | | 10/1/35 | | | 36,701 | | | 37,737 | |
Fannie Mae | | | | 6.998% | | 11/1/35 | | | 15,381 | | | 15,908 | |
Fannie Mae | | | | 5.286% | | 12/1/35 | | | 537 | | | 536 | |
Fannie Mae | | | | 6.454% | | 1/1/37 | | | 25,604 | | | 26,047 | |
Fannie Mae | | | | 5.515% | | 2/1/37 | | | 38,812 | | | 38,902 | |
89
Semi-Annual Report to Shareholders
Portfolio of Investments—Continued
Western Asset Core Plus Bond Portfolio—Continued
| | | | | | | | | | | | | |
| | | % OF
NET ASSETS | | RATE | | MATURITY
DATE | | PAR/
SHARES† | | VALUE | |
| | | | | | | | | | | | | |
U.S. Government Agency Mortgage-Backed Securities—Continued | | | | | | | | | | | | | |
| | | | | |
Indexed Securities—Continued | | | | | | | | | | | | | |
Fannie Mae | | | | 5.726% | | 4/1/37 | | $ | 28,137 | | $ | 28,392 | |
Fannie Mae | | | | 5.896% | | 4/1/37 | | | 18,103 | | | 18,236 | |
Fannie Mae | | | | 6.178% | | 8/1/37 | | | 31,760 | | | 32,145 | |
Freddie Mac | | | | 4.829% | | 10/1/35 | | | 5,815 | | | 5,840 | |
Freddie Mac | | | | 5.141% | | 12/1/35 | | | 734 | | | 731 | |
Freddie Mac | | | | 5.198% | | 12/1/35 | | | 520 | | | 517 | |
Freddie Mac | | | | 5.821% | | 2/1/37 | | | 67 | | | 67 | |
Freddie Mac | | | | 6.092% | | 3/1/37 | | | 39,077 | | | 39,701 | |
Freddie Mac | | | | 5.818% | | 5/1/37 | | | 5,755 | | | 5,803 | |
Freddie Mac | | | | 5.895% | | 5/1/37 | | | 17,207 | | | 17,379 | |
Freddie Mac | | | | 5.958% | | 5/1/37 | | | 190 | | | 192 | |
Freddie Mac | | | | 6.033% | | 5/1/37 | | | 140 | | | 142 | |
Freddie Mac | | | | 5.796% | | 6/1/37 | | | 2,870 | | | 2,893 | |
Freddie Mac | | | | 5.922% | | 7/1/37 | | | 45,139 | | | 45,481 | |
Freddie Mac | | | | 5.900% | | 8/1/37 | | | 13,985 | | | 14,134 | |
Government National Mortgage Association | | | | 5.896% | | 8/20/31 | | | 3 | | | 3 | |
| | | | | | | | | | | | | |
| | | | | | | | | | | | 406,439 | |
| | | | | | | | | | | | | |
Stripped Securities | | N.M. | | | | | | | | | | | |
Financing Corp. | | | | 0.000% | | 11/30/17 to 4/5/19 | | | 1,570 | | | 932 | J2 |
| | | | | | | | | | | | | |
Total U.S. Government Agency Mortgage-Backed Securities
(Cost—$7,899,514) | | | | | | | | | | | | 7,885,277 | |
Yankee BondsN | | 6.8% | | | | | | | | | | | |
| | | | | |
Aerospace and Defense | | N.M. | | | | | | | | | | | |
Systems 2001 Asset Trust | | | | 6.664% | | 9/15/13 | | | 2,429 | | | 2,561 | E |
| | | | | | | | | | | | | |
| | | | | |
Automobiles | | N.M. | | | | | | | | | | | |
General Motors Nova Scotia Finance Co. | | | | 6.850% | | 10/15/08 | | | 1,550 | | | 1,534 | |
| | | | | | | | | | | | | |
| | | | | |
Commercial Banks | | 2.5% | | | | | | | | | | | |
Barclays Capital | | | | 6.060% | | 3/20/08 | | | 23,100 | | | 22,611 | A,E |
Glitnir Banki Hf | | | | 6.330% | | 7/28/11 | | | 10,670 | | | 10,854 | E |
Glitnir Banki Hf | | | | 6.375% | | 9/25/12 | | | 18,040 | | | 18,082 | E |
Glitnir Banki Hf | | | | 6.693% | | 6/15/16 | | | 19,600 | | | 20,031 | D,E |
Glitnir Banki Hf | | | | 7.451% | | 9/14/49 | | | 3,065 | | | 3,020 | D,E |
90
Semi-Annual Report to Shareholders
| | | | | | | | | | | | | |
| | | % OF
NET ASSETS | | RATE | | MATURITY
DATE | | PAR/
SHARES† | | VALUE | |
| | | | | | | | | | | | | |
Yankee Bonds—Continued | | | | | | | | | | | | | |
| | | | | |
Commercial Banks—Continued | | 2.5% | | | | | | | | | | | |
HSBC Capital Funding LP | | | | 4.610% | | 6/27/49 | | $ | 2,090 | | $ | 1,963 | D,E |
ICICI Bank Ltd. | | | | 6.375% | | 4/30/22 | | | 14,359 | | | 13,427 | D,E |
ICICI Bank Ltd. | | | | 6.375% | | 4/30/22 | | | 15,561 | | | 14,541 | B,D,E |
Kaupthing Bank Hf | | | | 6.050% | | 4/12/11 | | | 27,860 | | | 27,635 | A,E |
Kaupthing Bank Hf | | | | 5.750% | | 10/4/11 | | | 5,550 | | | 5,479 | E |
Kaupthing Bank Hf | | | | 7.125% | | 5/19/16 | | | 6,060 | | | 6,116 | E |
Korea Development Bank | | | | 4.250% | | 11/13/07 | | | 200 | | | 200 | |
Korea Development Bank | | | | 5.500% | | 11/13/12 | | | 60 | | | 60 | |
Landsbanki Islands Hf | | | | 6.100% | | 8/25/11 | | | 28,520 | | | 28,895 | E |
Nordea Bank AB | | | | 5.810% | | 4/8/11 | | | 52,000 | | | 51,968 | A,E |
Resona Preferred Global Securities | | | | 7.191% | | 12/29/49 | | | 11,630 | | | 11,671 | D,E |
Royal Bank of Scotland Group PLC | | | | 7.640% | | 3/31/49 | | | 7,400 | | | 7,400 | D |
Royal Bank of Scotland Group PLC | | | | 6.990% | | 10/29/49 | | | 12,030 | | | 12,255 | D,E |
RSHB Capital SA | | | | 6.299% | | 5/15/17 | | | 30,690 | | | 28,892 | E |
Shinsei Finance Cayman Ltd. | | | | 6.418% | | 1/29/49 | | | 25,685 | | | 23,816 | D,E |
TuranAlem Finance BV | | | | 8.250% | | 1/22/37 | | | 29,590 | | | 25,004 | E |
TuranAlem Finance BV | | | | 8.250% | | 1/22/37 | | | 30,793 | | | 26,867 | E |
| | | | | | | | | | | | | |
| | | | | | | | | | | | 360,787 | |
| | | | | | | | | | | | | |
Diversified Financial Services | | 0.4% | | | | | | | | | | | |
Aiful Corp. | | | | 5.000% | | 8/10/10 | | | 12,430 | | | 12,017 | E |
Cascadia Ltd. | | | | 8.849% | | 6/13/08 | | | 4,100 | | | 4,100 | A,E |
Credit Suisse Guernsey Ltd. | | | | 5.860% | | 5/15/49 | | | 40 | | | 38 | D |
European Investment Bank | | | | 4.000% | | 3/3/10 | | | 100 | | | 99 | |
European Investment Bank | | | | 4.625% | | 3/21/12 | | | 50 | | | 50 | |
MUFG Capital Finance 1 Ltd. | | | | 6.346% | | 7/29/49 | | | 7,400 | | | 7,034 | D |
Pemex Finance Ltd. | | | | 9.030% | | 2/15/11 | | | 7 | | | 7 | |
TNK-BP Finance SA | | | | 7.500% | | 7/18/16 | | | 17,280 | | | 17,161 | E |
TNK-BP Finance SA | | | | 7.500% | | 7/18/16 | | | 1,650 | | | 1,645 | E |
TNK-BP Finance SA | | | | 6.625% | | 3/20/17 | | | 11,350 | | | 10,570 | B,E |
TNK-BP Finance SA | | | | 6.625% | | 3/20/17 | | | 724 | | | 678 | E |
| | | | | | | | | | | | | |
| | | | | | | | | | | | 53,399 | |
| | | | | | | | | | | | | |
Diversified Telecommunication Services | | 0.3% | | | | | | | | | | | |
British Telecommunications PLC | | | | 8.625% | | 12/15/10 | | | 2,315 | | | 2,549 | F |
Deutsche Telekom International Finance BV | | | | 5.750% | | 3/23/16 | | | 20,000 | | | 19,764 | B |
Intelsat Bermuda Ltd. | | | | 9.250% | | 6/15/16 | | | 1,105 | | | 1,146 | |
Koninklijke (Royal) KPN NV | | | | 8.000% | | 10/1/10 | | | 14,470 | | | 15,564 | |
Telecom Italia Capital SpA | | | | 5.250% | | 11/15/13 | | | 1,260 | | | 1,223 | |
Telecom Italia Capital SpA | | | | 4.950% | | 9/30/14 | | | 3,730 | | | 3,526 | |
Telecom Italia Capital SpA | | | | 5.250% | | 10/1/15 | | | 6,090 | | | 5,781 | |
| | | | | | | | | | | | | |
| | | | | | | | | | | | 49,553 | |
| | | | | | | | | | | | | |
91
Semi-Annual Report to Shareholders
Portfolio of Investments—Continued
Western Asset Core Plus Bond Portfolio—Continued
| | | | | | | | | | | | | |
| | | % OF
NET ASSETS | | RATE | | MATURITY
DATE | | PAR/
SHARES† | | VALUE | |
| | | | | | | | | | | | | |
Yankee Bonds—Continued | | | | | | | | | | | | | |
| | | | | |
Electric Utilities | | N.M. | | | | | | | | | | | |
Hydro-Quebec | | | | 6.300% | | 5/11/11 | | $ | 1,720 | | $ | 1,805 | |
| | | | | | | | | | | | | |
| | | | | |
Energy Equipment and Services | | 0.1% | | | | | | | | | | | |
Compagnie Generale de Geophysique-Veritas | | | | 7.500% | | 5/15/15 | | | 1,970 | | | 2,029 | |
Compagnie Generale de Geophysique-Veritas | | | | 7.750% | | 5/15/17 | | | 7,494 | | | 7,719 | |
| | | | | | | | | | | | | |
| | | | | | | | | | | | 9,748 | |
| | | | | | | | | | | | | |
Foreign Governments | | 1.2% | | | | | | | | | | | |
Federative Republic of Brazil | | | | 8.875% | | 4/15/24 | | | 950 | | | 1,223 | |
Federative Republic of Brazil | | | | 10.125% | | 5/15/27 | | | 4,255 | | | 6,070 | |
Federative Republic of Brazil | | | | 7.125% | | 1/20/37 | | | 4,528 | | | 5,058 | B |
Federative Republic of Brazil | | | | 11.000% | | 8/17/40 | | | 9,709 | | | 12,986 | |
Province of British Columbia | | | | 4.300% | | 5/30/13 | | | 180 | | | 173 | B |
Republic of Colombia | | | | 7.375% | | 9/18/37 | | | 2,272 | | | 2,499 | |
Republic of Panama | | | | 7.125% | | 1/29/26 | | | 2,566 | | | 2,771 | B |
Republic of Panama | | | | 9.375% | | 4/1/29 | | | 1,933 | | | 2,590 | |
Republic of Panama | | | | 6.700% | | 1/26/36 | | | 2,860 | | | 2,939 | |
Russian Federation | | | | 7.500% | | 3/31/30 | | | 65,229 | | | 73,572 | E |
United Mexican States | | | | 5.625% | | 1/15/17 | | | 374 | | | 373 | B |
United Mexican States | | | | 6.750% | | 9/27/34 | | | 56,506 | | | 61,450 | B |
| | | | | | | | | | | | | |
| | | | | | | | | | | | 171,704 | |
| | | | | | | | | | | | | |
Gas Utilities | | 0.2% | | | | | | | | | | | |
Intergas Finance BV | | | | 6.375% | | 5/14/17 | | | 25,819 | | | 24,933 | E |
| | | | | | | | | | | | | |
| | | | | |
Industrial Conglomerates | | 0.7% | | | | | | | | | | | |
Tyco International Group SA | | | | 6.125% | | 11/1/08 | | | 1,738 | | | 1,757 | |
Tyco International Group SA | | | | 6.125% | | 1/15/09 | | | 644 | | | 654 | |
Tyco International Group SA | | | | 6.750% | | 2/15/11 | | | 35,798 | | | 37,735 | |
Tyco International Group SA | | | | 6.375% | | 10/15/11 | | | 15,948 | | | 16,319 | |
Tyco International Group SA | | | | 6.000% | | 11/15/13 | | | 4,808 | | | 4,853 | |
Tyco International Group SA | | | | 7.000% | | 6/15/28 | | | 945 | | | 1,028 | |
Tyco International Group SA | | | | 6.875% | | 1/15/29 | | | 31,995 | | | 32,115 | |
| | | | | | | | | | | | | |
| | | | | | | | | | | | 94,461 | |
| | | | | | | | | | | | | |
Insurance | | 0.3% | | | | | | | | | | | |
Foundation Re Ltd. | | | | 9.620% | | 11/24/08 | | | 9,400 | | | 9,143 | A,E |
Merna Reinsurance Ltd. | | | | 7.110% | | 6/30/12 | | | 26,450 | | | 26,413 | A,E |
| | | | | | | | | | | | | |
| | | | | | | | | | | | 35,556 | |
| | | | | | | | | | | | | |
92
Semi-Annual Report to Shareholders
| | | | | | | | | | | | | | |
| | | % OF
NET ASSETS | | RATE | | MATURITY
DATE | | PAR/
SHARES† | | | VALUE | |
| | | | | | | | | | | | | | |
Yankee Bonds—Continued | | | | | | | | | | | | | | |
| | | | | |
Media | | N.M. | | | | | | | | | | | | |
Rogers Cable Inc. | | | | 7.875% | | 5/1/12 | | $ | 687 | | | $ | 740 | |
Rogers Cable Inc. | | | | 6.750% | | 3/15/15 | | | 130 | | | | 134 | |
Shaw Communications Inc. | | | | 7.250% | | 4/6/11 | | | 630 | | | | 646 | |
Sun Media Corp. | | | | 7.625% | | 2/15/13 | | | 1,125 | | | | 1,105 | |
| | | | | | | | | | | | | | |
| | | | | | | | | | | | | 2,625 | |
| | | | | | | | | | | | | | |
Metals and Mining | | 0.3% | | | | | | | | | | | | |
Corporacion Nacional del Cobre—Codelco | | | | 4.750% | | 10/15/14 | | | 2,590 | | | | 2,475 | E |
Vale Overseas Ltd. | | | | 8.250% | | 1/17/34 | | | 770 | | | | 912 | |
Vale Overseas Ltd. | | | | 6.875% | | 11/21/36 | | | 37,075 | | | | 38,197 | |
| | | | | | | | | | | | | | |
| | | | | | | | | | | | | 41,584 | |
| | | | | | | | | | | | | | |
Oil, Gas and Consumable Fuels | | 0.7% | | | | | | | | | | | | |
Anadarko Finance Co. | | | | 7.500% | | 5/1/31 | | | 15,957 | | | | 17,378 | |
Conoco Funding Co. | | | | 6.350% | | 10/15/11 | | | 590 | | | | 615 | |
Conoco Funding Co. | | | | 7.250% | | 10/15/31 | | | 810 | | | | 913 | |
Gazprom | | | | 6.212% | | 11/22/16 | | | 29,470 | | | | 29,211 | E |
Gazprom | | | | 6.510% | | 3/7/22 | | | 23,180 | | | | 22,946 | E |
OPTI Canada Inc. | | | | 8.250% | | 12/15/14 | | | 2,405 | | | | 2,423 | E |
Petrobras International Finance Co. | | | | 6.125% | | 10/6/16 | | | 18,870 | | | | 19,015 | |
Teekay Shipping Corp. | | | | 8.875% | | 7/15/11 | | | 1,729 | | | | 1,815 | |
| | | | | | | | | | | | | | |
| | | | | | | | | | | | | 94,316 | |
| | | | | | | | | | | | | | |
Semiconductors and Semiconductor Equipment | | N.M. | | | | | | | | | | | | |
NXP BV/NXP Funding LLC | | | | 7.875% | | 10/15/14 | | | 595 | | | | 573 | |
NXP BV/NXP Funding LLC | | | | 9.500% | | 10/15/15 | | | 2,660 | | | | 2,480 | B |
| | | | | | | | | | | | | | |
| | | | | | | | | | | | | 3,053 | |
| | | | | | | | | | | | | | |
Thrifts and Mortgage Finance | | N.M. | | | | | | | | | | | | |
Willow Re Ltd. | | | | 10.483% | | 6/16/10 | | | 250 | | | | 253 | A,E |
| | | | | | | | | | | | | | |
| | | | | |
Wireless Telecommunication Services | | 0.1% | | | | | | | | | | | | |
Rogers Wireless Inc. | | | | 6.375% | | 3/1/14 | | | 1,850 | | | | 1,869 | |
Vodafone Group PLC | | | | 5.000% | | 9/15/15 | | | 10,600 | | | | 10,002 | |
| | | | | | | | | | | | | | |
| | | | | | | | | | | | | 11,871 | |
| | | | | | | | | | | | | | |
Total Yankee Bonds (Cost—$966,191) | | | | | | | | | | | | | 959,743 | |
Foreign Government Obligations | | 1.3% | | | | | | | | | | | | |
Canadian Government Bond | | | | 5.250% | | 6/1/12 | | | 45,000 | CAD | | | 47,265 | |
Canadian Real Return Bond | | | | 4.000% | | 12/1/31 | | | 6,974 | CAD | | | 9,566 | O |
93
Semi-Annual Report to Shareholders
Portfolio of Investments—Continued
Western Asset Core Plus Bond Portfolio—Continued
| | | | | | | | | | | | | |
| | | % OF
NET ASSETS | | RATE | | MATURITY
DATE | | PAR/
SHARES† | | | VALUE | |
| | | | | | | | | | | | | |
Foreign Government Obligations—Continued | | | | | | | | | | | | | |
Federal Republic of Germany | | | | 3.750% | | 1/4/15 | | 18,440 | EUR | | $ | 25,477 | |
Federative Republic of Brazil | | | | 10.000% | | 1/1/10 | | — | P BRL | | | 1 | |
Federative Republic of Brazil | | | | 10.000% | | 7/1/10 | | 135 | BRL | | | 71,627 | |
Federative Republic of Brazil | | | | 6.000% | | 5/15/15 | | 19 | BRL | | | 16,283 | |
Federative Republic of Brazil | | | | 6.000% | | 5/15/45 | | 22 | BRL | | | 18,511 | |
| | | | | | | | | | | | | |
Total Foreign Government Obligations
(Cost—$162,787) | | | | | | | | | | | | 188,730 | |
Preferred Stocks | | 0.8% | | | | | | | | | | | |
AES Trust III | | | | 6.750% | | | | 71 | shs | | | 3,470 | B,C |
Fannie Mae | | | | 5.375% | | | | — | P | | | 2,836 | C |
Fannie Mae | | | | 7.000% | | | | 53 | | | | 2,768 | |
Ford Motor Co. | | | | 7.500% | | | | 16 | | | | 302 | |
General Motors Corp. | | | | 1.500% | | | | 399 | | | | 11,287 | B,C |
General Motors Corp. | | | | 5.250% | | | | 207 | | | | 4,408 | C |
General Motors Corp. | | | | 6.250% | | | | 2,701 | | | | 66,142 | C |
General Motors Corp. | | | | 7.250% | | | | 128 | | | | 2,385 | B |
General Motors Corp. | | | | 7.250% | | | | 56 | | | | 1,029 | |
General Motors Corp. | | | | 7.250% | | | | 45 | | | | 830 | B |
General Motors Corp. | | | | 7.375% | | | | 328 | | | | 6,114 | |
General Motors Corp. | | | | 7.500% | | | | 260 | | | | 5,025 | B |
Home Ownership Funding Corp. | | | | 1.000% | | | | 2 | | | | 224 | E |
Home Ownership Funding Corp. II | | | | 1.000% | | | | 1 | | | | 195 | E |
| | | | | | | | | | | | | |
Total Preferred Stocks (Cost—$101,411) | | | | | | | | | | | | 107,015 | |
Warrants | | N.M. | | | | | | | | | | | |
Bear Stearns Trust Certficates 2001-2,
Strike Price $97.72 | | | | | | | | 5 | wts | | | 50 | Q |
Bear Stearns Trust Certficates 2001-3,
Strike Price $99.897 | | | | | | | | 5 | | | | 32 | Q |
| | | | | | | | | | | | | |
Total Warrants (Cost—$18) | | | | | | | | | | | | 82 | |
| | | | | | | | | | | | | |
Total Long-Term Securities
(Cost—$16,180,343) | | | | | | | | | | | | 16,155,181 | |
Investment of Collateral From Securities Lending | | 11.1% | | | | | | | | | | | |
State Street Navigator Securities Lending Prime Portfolio | | | | | | | | 1,593,825 | shs | | | 1,593,825 | |
| | | | | | | | | | | | | |
Total Investment of Collateral From Securities Lending (Cost—$1,593,825) | | | | | | | | | | | | 1,593,825 | |
94
Semi-Annual Report to Shareholders
| | | | | | | | | | | | | | |
| | | % OF
NET ASSETS | | RATE | | MATURITY
DATE | | PAR/
SHARES† | | | VALUE | |
| | | | | | | | | | | | | | |
Short-Term Securities | | 17.1% | | | | | | | | | | | | |
| | | | | |
Corporate Bonds and Notes | | 0.4% | | | | | | | | | | | | |
State Street Bank and Trust | | | | 5.100% | | 12/14/07 | | $ | 52,000 | | | $ | 52,000 | |
| | | | | | | | | | | | | | |
| | | | | |
U.S. Government and Agency Obligations | | 2.2% | | | | | | | | | | | | |
Fannie Mae | | | | 0.000% | | 3/31/08 | | | 15,180 | | | | 14,797 | I,R |
Fannie Mae | | | | 0.000% | | 11/28/07 | | | 100,000 | | | | 99,275 | B,I |
Fannie Mae | | | | 0.000% | | 3/17/08 | | | 113,400 | | | | 111,082 | I,R |
Fannie Mae | | | | 0.000% | | 3/17/08 | | | 80 | | | | 78 | I,R |
Fannie Mae | | | | 0.000% | | 4/7/08 | | | 1,720 | | | | 1,677 | I,R |
Federal Home Loan Bank | | | | 0.000% | | 10/1/07 | | | 87,521 | | | | 87,521 | I |
| | | | | | | | | | | | | | |
| | | | | | | | | | | | | 314,430 | |
| | | | | | | | | | | | | | |
Foreign Government Obligations | | 0.2% | | | | | | | | | | | | |
Bank Negara Islamic Notes | | | | 0.000% | | 12/6/07 | | | 77,038 | MYR | | | 22,462 | I |
Bank Negara Islamic Notes | | | | 0.000% | | 12/6/07 | | | 2,785 | MYR | | | 807 | I |
Bank Negara Islamic Notes | | | | 0.000% | | 12/6/07 | | | 3,527 | MYR | | | 1,029 | I |
Bank Negara Islamic Notes | | | | 0.000% | | 12/13/07 | | | 12,139 | MYR | | | 3,514 | I |
Bank Negara Islamic Notes | | | | 0.000% | | 12/21/07 | | | 5,712 | MYR | | | 1,652 | I |
Bank Negara Islamic Notes | | | | 0.000% | | 12/27/07 | | | 8,325 | MYR | | | 2,443 | I |
Bank Negara Malaysia Monetary Notes | | | | 0.000% | | 11/1/07 | | | 6,412 | MYR | | | 1,876 | I |
| | | | | | | | | | | | | | |
| | | | | | | | | | | | | 33,783 | |
| | | | | | | | | | | | | | |
Options PurchasedS | | 0.1% | | | | | | | | | | | | |
Euro Currency Futures Put, December 2007, Strike Price $1.38 | | | | | | | | | 28 | T | | | 11 | |
Euro Currency Futures Put, December 2007, Strike Price $1.40 | | | | | | | | | 1,922 | T | | | 1,490 | |
Eurodollar Futures Call, December 2007, Strike Price $94.00 | | | | | | | | | 678 | T | | | 1,958 | |
Eurodollar Futures Put, December 2007, Strike Price $93.625 | | | | | | | | | 2,384 | T | | | 15 | |
Eurodollar Futures Put, December 2007, Strike Price $93.75 | | | | | | | | | 9,650 | T | | | 1,025 | |
Eurodollar Futures Put, March 2008, Strike Price $93.25 | | | | | | | | | 2,000 | T | | | 12 | |
Eurodollar Futures Put, March 2008, Strike Price $93.75 | | | | | | | | | 886 | T | | | 6 | |
Libor Call, December 2007, Strike Price $93.00 | | | | | | | | | 2,000 | T | | | 4,931 | |
Libor Call, December 2007, Strike Price $93.50 | | | | | | | | | 2,000 | T | | | 2,606 | |
Libor Put, March 2008, Strike Price $93.00 | | | | | | | | | 5,026 | T | | | — | M |
JP Morgan Swaption Call, January 2008, Strike Price $5.1577 | | | | | | | | | 57,570,000 | T | | | 1,024 | |
95
Semi-Annual Report to Shareholders
Portfolio of Investments—Continued
Western Asset Core Plus Bond Portfolio—Continued
| | | | | | | | | | |
| | | % OF
NET ASSETS | | PAR/
SHARES† | | | VALUE | |
| | | | | | | | | | |
Short-Term Securities—Continued | | | | | | | | | | |
| | | |
Options Purchased—Continued | | | | | | | | | | |
Swaption Call, November 2007, Strike Price $5.2725 | | | | | 137,100,000 | T | | $ | 2,730 | |
Merrill Swaption Call, September 2009, Strike Price $4.50 | | | | | 2,300,000 | T | | | 9 | |
Goldman Swaption Call, September 2009, Strike Price $4.50 | | | | | 397,000,000 | T | | | 1,584 | |
Greenwich U.S. Treasury Bond Futures Call, November 2007, Strike Price $113.00 | | | | | 708 | T | | | 509 | |
U.S. Treasury Note Futures Put, November 2007, Strike Price $108.00 | | | | | 68 | T | | | 30 | |
| | | | | | | | | | |
| | | | | | | | | 17,940 | |
| | | | | | | | | | |
Repurchase Agreements | | 14.2% | | | | | | | | |
Goldman Sachs Group, Inc.
4.85% dated 9/28/07, to be repurchased at $869,800 on 10/1/07 (Collateral: $140,535 Freddie Mac notes, 5.25% due 7/18/11, value $145,454; $385,000 Tennessee Valley Authority bonds, 5.375% to 5.88% due 4/1/36 to 4/1/56, value $420,131; $315,000 Fannie Mae notes, 5.78% due 6/7/22, value $321,300) | | | | $ | 869,449 | | | | 869,449 | |
Lehman Brothers Inc.
4.75% dated 9/28/07, to be repurchased at $1,155,203 on 10/1/07 (Collateral: $500,000 Federal Home Loan Bank zero-coupon notes due 9/18/28, value $124,340; $731,860 Fannie Mae notes, 5.15% to 6.27% due 3/8/12 to 6/5/17, value $737,432; $247,900 Tennessee Valley Authority interest-only securities, 7.125% due 5/1/30, value $316,073) | | | | | 1,154,746 | | | | 1,154,746 | |
| | | | | | | | | | |
| | | | | | | | | 2,024,195 | |
| | | | | | | | | | |
Total Short-Term Securities (Cost—$2,439,248) | | | | | | | | | 2,442,348 | |
Total Investments (Cost—$20,213,416)U | | 141.7% | | | | | | | 20,191,354 | |
Obligation to Return Collateral for Securities Loaned | | (11.1)% | | | | | | | (1,593,825 | ) |
Other Assets Less Liabilities | | (30.6)% | | | | | | | (4,352,408 | ) |
| | | | | | | | | | |
| | | |
Net Assets | | 100.0% | | | | | | $ | 14,245,121 | |
| | | | | | | | | | |
| | | | | | | | |
| | | EXPIRATION | | ACTUAL
CONTRACTS | | APPRECIATION/
(DEPRECIATION) | |
Futures Contracts PurchasedS | | | | | | | | |
Australia Bond Futures | | December 2007 | | 97 | | $ | (157 | ) |
Bundesobligations Futures | | December 2007 | | 2,675 | | | (1,055 | ) |
Canada Government Bond Futures | | December 2007 | | 461 | | | (114 | ) |
Canadian Dollar Futures | | December 2007 | | 218 | | | 866 | |
Eurodollar Futures | | December 2007 | | 10,697 | | | 4,268 | |
Eurodollar Futures | | March 2008 | | 4,709 | | | 3,740 | |
Eurodollar Futures | | September 2008 | | 20 | | | 17 | |
LIBOR Futures | | March 2008 | | 6,935 | | | 9,515 | |
U.S. Treasury Note Futures | | December 2007 | | 55 | | | 20 | |
United Kingdom Treasury Bond Futures | | December 2007 | | 418 | | | (32 | ) |
| | | | | | | | |
| | | | | | $ | 17,068 | |
| | | | | | | | |
96
Semi-Annual Report to Shareholders
| | | | | | | | |
| | | EXPIRATION | | ACTUAL
CONTRACTS | | APPRECIATION/
(DEPRECIATION) | |
Futures Contracts WrittenS | | | | | | | | |
Australian Dollar Futures | | December 2007 | | 809 | | $ | (4,425 | ) |
British Pound Futures | | December 2007 | | 1,890 | | | (1,805 | ) |
Euro Currency Futures | | December 2007 | | 268 | | | (1,510 | ) |
Japanese Yen Futures | | December 2007 | | 807 | | | (899 | ) |
Swiss Franc Futures | | December 2007 | | 50 | | | (99 | ) |
U.S. Treasury Bond Futures | | December 2007 | | 4,907 | | | 1,023 | |
U.S. Treasury Note Futures | | December 2007 | | 24,186 | | | (3,043 | ) |
| | | | | | | | |
| | | | | | $ | (10,758 | ) |
| | | | | | | | |
Options WrittenS | | | | | | | | |
Eurodollar Futures Call, Strike Price $95.00 | | March 2008 | | 1,926 | | $ | (2,218 | ) |
Eurodollar Futures Call, Strike Price $95.125 | | December 2007 | | 2,740 | | | (168 | ) |
Eurodollar Futures Call, Strike Price $95.25 | | December 2007 | | 342 | | | 9 | |
Eurodollar Futures Call, Strike Price $95.50 | | December 2007 | | 1,972 | | | 484 | |
Eurodollar Futures Call, Strike Price $95.50 | | March 2008 | | 1,394 | | | 45 | |
Eurodollar Futures Put, Strike Price $95.00 | | December 2007 | | 5,663 | | | 513 | |
Japanese Yen Futures Call, Strike Price $85.00 | | December 2007 | | 805 | | | (2,326 | ) |
Goldman Swaption Call, Strike Price $4.95 | | September 2009 | | 511,000 | | | 1 | |
Greenwich Swaption Call, Strike Price $4.95 | | September 2009 | | 88,225,000 | | | 184 | |
U.S. Treasury Bond Futures Call, Strike Price $112.00 | | October 2007 | | 611 | | | (175 | ) |
U.S. Treasury Bond Futures Put, Strike Price $106.00 | | November 2007 | | 404 | | | 219 | |
U.S. Treasury Bond Futures Put, Strike Price $108.00 | | November 2007 | | 1,566 | | | (111 | ) |
U.S. Treasury Bond Futures Put, Strike Price $109.00 | | November 2007 | | 8,203 | | | (1,386 | ) |
U.S. Treasury Bond Futures Put, Strike Price $109.00 | | February 2008 | | 773 | | | (68 | ) |
U.S. Treasury Bond Futures Put, Strike Price $111.00 | | November 2007 | | 1,827 | | | (694 | ) |
U.S. Treasury Note Futures Call, Strike Price $107.00 | | November 2007 | | 4,118 | | | (8,766 | ) |
U.S. Treasury Note Futures Call, Strike Price $108.00 | | November 2007 | | 4,150 | | | (5,780 | ) |
U.S. Treasury Note Futures Call, Strike Price $109.00 | | November 2007 | | 204 | | | (119 | ) |
U.S. Treasury Note Futures Call, Strike Price $110.00 | | October 2007 | | 1,028 | | | 72 | |
U.S. Treasury Note Futures Call, Strike Price $110.00 | | November 2007 | | 3,938 | | | 299 | |
U.S. Treasury Note Futures Call, Strike Price $111.00 | | November 2007 | | 2,327 | | | 26 | |
U.S. Treasury Note Futures Put, Strike Price $102.00 | | November 2007 | | 871 | | | 472 | |
U.S. Treasury Note Futures Put, Strike Price $103.00 | | November 2007 | | 1,927 | | | 883 | |
U.S. Treasury Note Futures Put, Strike Price $104.00 | | November 2007 | | 1,061 | | | 352 | |
U.S. Treasury Note Futures Put, Strike Price $105.00 | | November 2007 | | 572 | | | 283 | |
U.S. Treasury Note Futures Put, Strike Price $106.00 | | November 2007 | | 371 | | | 24 | |
U.S. Treasury Note Futures Put, Strike Price $106.00 | | November 2007 | | 1,353 | | | 144 | |
U.S. Treasury Note Futures Put, Strike Price $107.00 | | November 2007 | | 1,699 | | | 173 | |
U.S. Treasury Note Futures Put, Strike Price $107.00 | | November 2007 | | 392 | | | (42 | ) |
U.S. Treasury Note Futures Put, Strike Price $107.00 | | February 2008 | | 1,058 | | | 121 | |
97
Semi-Annual Report to Shareholders
Portfolio of Investments—Continued
Western Asset Core Plus Bond Portfolio—Continued
| | | | | | | | |
| | | EXPIRATION | | ACTUAL
CONTRACTS | | APPRECIATION/
(DEPRECIATION) | |
Options Written—Continued | | | | | | | | |
U.S. Treasury Note Futures Put, Strike Price $108.00 | | February 2008 | | 2,147 | | $ | 59 | |
U.S. Treasury Note Futures Put, Strike Price $109.00 | | November 2007 | | 5,426 | | | 570 | |
| | | | | | | | |
| | | | | | $ | (16,920 | ) |
| | | | | | | | |
| | | | | | | | | |
N.M. Not Meaningful.
A | | Indexed Security – The rates of interest earned on these securities are tied to the London Interbank Offered Rate (“LIBOR”), the Euro Interbank Offered Rate (“EURIBOR”) Index, the Consumer Price Index (“CPI”), the one-year Treasury Bill Rate or the ten-year Japanese Government Bond Rate. The coupon rates are the rates as of September 30, 2007. |
B | | All or a portion of this security is on loan. |
C | | Convertible Security – Security may be converted into the issuer’s common stock. |
D | | Stepped Coupon Security – A security with a predetermined schedule of interest or dividend rate changes at which time it begins to accrue interest or pay dividends according to the predetermined schedule. |
E | | Rule 144a Security – A security purchased pursuant to Rule 144a under the Securities Act of 1933 which may not be resold subject to that rule except to qualified institutional buyers. These securities, which the Fund’s investment adviser has determined to be liquid, represent 10.12% of net assets. |
F | | Credit Linked Security – The rates of interest earned on these securities are tied to the credit rating assigned by Standard & Poor’s Rating Service and/or Moody’s Investors Services. |
G | | The coupon rates shown on variable rate securities are the rates at September 30, 2007. These rates vary with the weighted average coupon of the underlying loans. |
H | | Pay-in-Kind (“PIK”) security – A security in which interest or dividends during the initial few years is paid in additional PIK securities rather than in cash. |
I | | Zero coupon bond – A bond with no periodic interest payments which is sold at such a discount as to produce a current yield to maturity. |
J | | Stripped Security – Security with interest-only or principal-only payment streams, denoted by a 1 or 2, respectively. For interest-only securities, the amount shown as principal is the notional balance used to calculate the amount of interest due. |
K | | Treasury Inflation-Protected Security –Treasury security whose principal value is adjusted daily in accordance with changes to the Consumer Price Index for All Urban Consumers. Interest is calculated on the basis of the current adjusted principal value. |
L | | When-issued Security – Security purchased on a delayed delivery basis. Final settlement amount and maturity date have not yet been announced. |
N | | Yankee Bond – A dollar-denominated bond issued in the U.S. by foreign entities. |
O | | Inflation-Protected Security – Security whose principal value is adjusted daily or monthly in accordance with changes to the relevant country’s Consumer Price Index or its equivalent used as an inflation proxy. Interest is calculated on the basis of the current adjusted principal value. |
P | | Amount represents less than $0.50. |
R | | All or a portion of this security is collateral to cover futures and options contracts written. |
S | | Options and futures are described in more detail in the notes to financial statements. |
T | | Par represents actual number of contracts. |
U | | Aggregate cost for federal income tax purposes is substantially the same as book cost. At September 30, 2007, the aggregate gross unrealized appreciation and depreciation of investments for federal income tax purposes were substantially as follows: |
| | | | |
| Gross unrealized appreciation | | $ | 130,210 | |
| Gross unrealized depreciation | | $ | (152,272 | ) |
| | | | |
| Net unrealized appreciation/(depreciation) | | $ | (22,062 | ) |
| | | | |
| † | | Securities are denominated in U.S. Dollars, unless otherwise noted. |
98
Semi-Annual Report to Shareholders
BRL—Brazilian Real
CAD—Canadian Dollar
EUR—Euro
MYR—Malaysian Ringgit
RUB—Russian Ruble
See notes to financial statements.
99
Semi-Annual Report to Shareholders
Statement of Assets and Liabilities
Western Asset Core Plus Bond Portfolio
September 30, 2007 (Unaudited)
(Amounts in Thousands)
| | | | | | | |
Assets: | | | | | | | |
Investment securities at market value (Cost—$17,774,168) | | | | | $ | 17,749,006 | A |
Short-term securities at value (Cost—$2,439,248) | | | | | | 2,442,348 | |
Cash | | | | | | 57,281 | |
Foreign currency at value (Cost—$37,132) | | | | | | 38,798 | |
Receivable for securities sold | | | | | | 3,505,426 | |
Receivable for fund shares sold | | | | | | 66,056 | |
Interest receivable | | | | | | 167,703 | |
Unrealized appreciation of forward foreign currency contracts | | | | | | 12,115 | |
Other assets | | | | | | 2,810 | |
| | | | | | | |
Total assets | | | | | | 24,041,543 | |
| | | | | | | |
| | |
Liabilities: | | | | | | | |
Obligation to return collateral for securities loaned | | $ | 1,593,825 | | | | |
Payable for securities purchased | | | 8,021,309 | | | | |
Payable for fund shares repurchased | | | 21,738 | | | | |
Accrued management fee | | | 4,612 | | | | |
Accrued distribution | | | 207 | | | | |
Income distribution payable | | | 9,292 | | | | |
Amounts payable on swaps | | | 42,693 | | | | |
Futures variation margin payable | | | 11,143 | | | | |
Swap contracts at value | | | 36,067 | | | | |
Options written (Proceeds—$32,569) | | | 49,489 | | | | |
Accrued expenses | | | 539 | | | | |
Unrealized depreciation of forward foreign currency contracts | | | 5,508 | | | | |
| | | | | | | |
Total liabilities | | | | | | 9,796,422 | |
| | | | | | | |
| | |
Net Assets | | | | | $ | 14,245,121 | |
| | | | | | | |
| | |
Net assets consist of: | | | | | | | |
Accumulated paid-in-capital | | | | | $ | 14,442,190 | |
Undistributed net investment income | | | | | | 3,706 | |
Accumulated net realized loss on investments, options, futures, swaps and foreign
currency transactions | | | | | | (195,942 | ) |
Net unrealized depreciation on investments, options, futures, swaps and foreign
currency translations | | | | | | (4,833 | ) |
| | | | | | | |
| | |
Net Assets | | | | | $ | 14,245,121 | |
| | | | | | | |
| | |
Net Asset Value Per Share: | | | | | | | |
Institutional Class (1,284,129 shares outstanding) | | | | | | $10.26 | |
Financial Intermediary Class (104,097 shares outstanding) | | | | | | $10.26 | |
| | | | | | | | |
A | | The market value of securities on loan is $1,770,577. |
See notes to financial statements.
100
Semi-Annual Report to Shareholders
Statement of Operations
Western Asset Core Plus Bond Portfolio
For the Six Months Ended September 30, 2007 (Unaudited)
(Amounts in Thousands)
| | | | | | | | |
Investment Income: | | | | | | | | |
Interest | | $ | 390,405 | | | | | |
Dividends | | | 3,391 | | | | | |
Income from securities lending | | | 1,672 | | | | | |
| | | | | | | | |
Total income | | | | | | $ | 395,468 | |
Expenses: | | | | | | | | |
Management fees | | | 26,515 | | | | | |
Distribution fee | | | | | | | | |
Financial Intermediary Class | | | 1,115 | | | | | |
Audit and legal fees | | | 160 | | | | | |
Custodian fees | | | 781 | | | | | |
Directors’ fees and expenses | | | 209 | | | | | |
Registration fees | | | 145 | | | | | |
Reports to shareholders | | | 284 | | | | | |
Transfer agent and shareholder servicing expense: | | | | | | | | |
Institutional Class | | | 217 | | | | | |
Financial Intermediary Class | | | 18 | | | | | |
Other expenses | | | 83 | | | | | |
| | | | | | | | |
Net expenses | | | | | | | 29,527 | |
| | | | | | | | |
Net Investment Income | | | | | | | 365,941 | |
Net Realized and Unrealized Gain/(Loss) on Investments: | | | | | | | | |
Net realized gain/(loss) on: | | | | | | | | |
Investments | | | (37,584 | ) | | | | |
Options | | | (14,182 | ) | | | | |
Futures | | | (162,385 | ) | | | | |
Swaps | | | 25,421 | | | | | |
Foreign currency transactions | | | (633 | ) | | | | |
| | | | | | | | |
| | | | | | | (189,363 | ) |
Change in unrealized appreciation/depreciation of: | | | | | | | | |
Investments, options, futures, swaps and foreign currency translations | | | (74,880 | ) | | | | |
Assets and liabilities denominated in foreign currency | | | (525 | ) | | | | |
| | | | | | | | |
| | | | | | | (75,405 | ) |
| | | | | | | | |
Net Realized and Unrealized Loss on Investments | | | | | | | (264,768 | ) |
| | | | | | | | | |
Change in Net Assets Resulting From Operations | | | | | | $ | 101,173 | |
| | | | | | | | | |
See notes to financial statements.
101
Semi-Annual Report to Shareholders
Statement of Changes in Net Assets
Western Asset Core Plus Bond Portfolio
(Amounts in Thousands)
| | | | | | | | |
| | | FOR THE
SIX MONTHS ENDED
SEPTEMBER 30, 2007 | | | FOR THE
YEAR ENDED
MARCH 31, 2007 | |
| Change in Net Assets: | | (Unaudited) | | | | |
Net investment income | | $ | 365,941 | | | $ | 456,733 | |
| | |
Net realized gain/(loss) | | | (189,363 | ) | | | 130,745 | |
| | |
Change in unrealized appreciation/depreciation | | | (75,405 | ) | | | 163,631 | |
| | | | | | | | |
Change in net assets resulting from operations | | | 101,173 | | | | 751,109 | |
| | |
Distributions to shareholders from: | | | | | | | | |
Net investment income: | | | | | | | | |
Institutional Class | | | (325,538 | ) | | | (451,788 | ) |
Financial Intermediary Class | | | (22,543 | ) | | | (28,392 | ) |
| | |
Net realized gain on investments: | | | | | | | | |
Institutional Class | | | (92,868 | ) | | | (3,625 | ) |
Financial Intermediary Class | | | (6,596 | ) | | | (231 | ) |
| | |
Change in net assets from fund share transactions: | | | | | | | | |
Institutional Class | | | 2,004,986 | | | | 4,348,340 | |
Financial Intermediary Class | | | 322,762 | | | | 248,300 | |
| | | | | | | | |
Change in net assets | | | 1,981,376 | | | | 4,863,713 | |
| | |
Net Assets: | | | | | | | | |
Beginning of period | | | 12,263,745 | | | | 7,400,032 | |
| | | | | | | | |
| | |
End of period | | $ | 14,245,121 | | | $ | 12,263,745 | |
| | | | | | | | |
| | |
Under/(over) distributions of net investment income | | $ | 3,706 | | | $ | (14,154 | ) |
| | | | | | | | |
| | | | | | | | | |
See notes to financial statements.
102
Semi-Annual Report to Shareholders
Financial Highlights
Western Asset Core Plus Bond Portfolio
For a share of each class of capital stock outstanding:
Institutional Class:
| | | | | | | | | | | | | | | | | | | | | | | | |
| | | SIX MONTHS
ENDED
SEPTEMBER 30, 2007 | | | YEARS ENDED MARCH 31, | |
| | | | 2007 | | | 2006 | | | 2005 | | | 2004 | | | 2003 | |
| | | (Unaudited) | | | | | | | | | | | | | | | | |
Net asset value, beginning of period | | $ | 10.55 | | | $ | 10.24 | | | $ | 10.52 | | | $ | 10.71 | | | $ | 10.40 | | | $ | 9.88 | |
| | | | | | | | | | | | | | | | | | | | | | | | |
Investment operations: | | | | | | | | | | | | | | | | | | | | | | | | |
Net investment income | | | .29 | A | | | .51 | A | | | .45 | B | | | .37 | | | | .37 | | | | .51 | |
Net realized and unrealized gain/(loss) | | | (.23 | ) | | | .33 | | | | (.18 | )B | | | .04 | | | | .55 | | | | .62 | |
| | | | | | | | | | | | | | | | | | | | | | | | |
Total from investment operations | | | .06 | | | | .84 | | | | .27 | | | | .41 | | | | .92 | | | | 1.13 | |
| | | | | | | | | | | | | | | | | | | | | | | | |
Distributions from: | | | | | | | | | | | | | | | | | | | | | | | | |
Net investment income | | | (.27 | ) | | | (.53 | ) | | | (.52 | ) | | | (.35 | ) | | | (.41 | ) | | | (.51 | ) |
Net realized gain on investments | | | (.08 | ) | | | — | C | | | (.03 | ) | | | (.25 | ) | | | (.20 | ) | | | (.10 | ) |
| | | | | | | | | | | | | | | | | | | | | | | | |
Total distributions | | | (.35 | ) | | | (.53 | ) | | | (.55 | ) | | | (.60 | ) | | | (.61 | ) | | | (.61 | ) |
| | | | | | | | | | | | | | | | | | | | | | | | |
Net asset value, end of period | | $ | 10.26 | | | $ | 10.55 | | | $ | 10.24 | | | $ | 10.52 | | | $ | 10.71 | | | $ | 10.40 | |
| | | | | | | | | | | | | | | | | | | | | | | | |
Total return | | | .55 | %D | | | 8.48 | % | | | 2.57 | % | | | 4.01 | % | | | 9.12 | % | | | 11.78 | % |
| | | | | | |
Ratios to Average Net Assets:E | | | | | | | | | | | | | | | | | | | | | | | | |
Total expenses | | | .43 | %F | | | .44 | % | | | .45 | % | | | .45 | % | | | .48 | % | | | .50 | % |
Expenses net of waivers, if any | | | .43 | %F | | | .44 | % | | | .45 | % | | | .45 | % | | | .45 | % | | | .45 | % |
Expenses net of all reductions | | | .43 | %F | | | .44 | % | | | .45 | % | | | .45 | % | | | .45 | % | | | .45 | % |
Net investment income | | | 5.6 | %F | | | 4.9 | % | | | 4.3 | % | | | 3.3 | % | | | 3.6 | % | | | 5.0 | % |
| | | | | | |
Supplemental Data: | | | | | | | | | | | | | | | | | | | | | | | | |
Portfolio turnover rate | | | 240.2 | %D | | | 448.6 | % | | | 549.4 | % | | | 586.1 | % | | | 463.8 | % | | | 422.6 | % |
Net assets, end of period
(in thousands) | | $ | 13,176,623 | | | $ | 11,495,842 | | | $ | 6,896,815 | | | $ | 4,565,054 | | | $ | 3,286,650 | | | $ | 1,866,619 | |
| | | | | | | | | | | | | | | | | | | | | | | | | |
A | | Computed using average daily shares outstanding. |
B | | The amount presented is calculated pursuant to a methodology prescribed by the Securities and Exchange Commission for a share outstanding throughout the period. This amount is inconsistent with the Fund’s aggregate gains and losses because of the timing of sales and redemptions of Fund shares in relation to fluctuating market values for the investment portfolio. |
C | | Amount less than $.01 per share. |
E | | Total expenses reflects operating expenses prior to any voluntary expense waivers and/or compensating balance credits. Expenses net of waivers reflects total expenses before compensating balance credits but net of any voluntary expense waivers. Expenses net of all reductions reflects expenses less any compensating balance credits and/or voluntary expense waivers. |
See notes to financial statements.
103
Semi-Annual Report to Shareholders
Financial Highlights
Western Asset Core Plus Bond Portfolio
For a share of each class of capital stock outstanding:
Financial Intermediary Class:
| | | | | | | | | | | | | | | | | | | | | | | | |
| | | SIX MONTHS
ENDED
SEPTEMBER 30,
2007 | | | YEARS ENDED MARCH 31, | |
| | | | 2007 | | | 2006 | | | 2005 | | | 2004 | | | 2003 | |
| | | (Unaudited) | | | | | | | | | | | | | | | | |
Net asset value, beginning of period | | $ | 10.56 | | | $ | 10.24 | | | $ | 10.52 | | | $ | 10.71 | | | $ | 10.40 | | | $ | 9.87 | |
| | | | | | | | | | | | | | | | | | | | | | | | |
Investment operations: | | | | | | | | | | | | | | | | | | | | | | | | |
Net investment income | | | .27 | A | | | .48 | A | | | .42 | B | | | .35 | | | | .36 | | | | .48 | |
Net realized and unrealized gain/(loss) | | | (.23 | ) | | | .35 | | | | (.18 | )B | | | .04 | | | | .54 | | | | .63 | |
| | | | | | | | | | | | | | | | | | | | | | | | |
Total from investment operations | | | .04 | | | | .83 | | | | .24 | | | | .39 | | | | .90 | | | | 1.11 | |
| | | | | | | | | | | | | | | | | | | | | | | | |
Distributions from: | | | | | | | | | | | | | | | | | | | | | | | | |
Net investment income | | | (.26 | ) | | | (.51 | ) | | | (.49 | ) | | | (.33 | ) | | | (.39 | ) | | | (.48 | ) |
Net realized gain on investments | | | (.08 | ) | | | — | C | | | (.03 | ) | | | (.25 | ) | | | (.20 | ) | | | (.10 | ) |
| | | | | | | | | | | | | | | | | | | | | | | | |
Total distributions | | | (.34 | ) | | | (.51 | ) | | | (.52 | ) | | | (.58 | ) | | | (.59 | ) | | | (.58 | ) |
| | | | | | | | | | | | | | | | | | | | | | | | |
Net asset value, end of period | | $ | 10.26 | | | $ | 10.56 | | | $ | 10.24 | | | $ | 10.52 | | | $ | 10.71 | | | $ | 10.40 | |
| | | | | | | | | | | | | | | | | | | | | | | | |
Total return | | | .52 | %D | | | 8.30 | % | | | 2.32 | % | | | 3.77 | % | | | 8.82 | % | | | 11.57 | % |
| | | | | | |
Ratios to Average Net Assets:E | | | | | | | | | | | | | | | | | | | | | | | | |
Total expenses | | | .68 | %F | | | .69 | % | | | .70 | % | | | .70 | % | | | .73 | % | | | .75 | % |
Expenses net of waivers, if any | | | .68 | %F | | | .69 | % | | | .70 | % | | | .70 | % | | | .70 | % | | | .70 | % |
Expenses net of all reductions | | | .68 | %F | | | .69 | % | | | .70 | % | | | .70 | % | | | .70 | % | | | .70 | % |
Net investment income | | | 5.3 | %F | | | 4.7 | % | | | 4.0 | % | | | 2.9 | % | | | 3.2 | % | | | 4.8 | % |
| | | | | | |
Supplemental Data: | | | | | | | | | | | | | | | | | | | | | | | | |
Portfolio turnover rate | | | 240.2 | %D | | | 448.6 | % | | | 549.4 | % | | | 586.1 | % | | | 463.8 | % | | | 422.6 | % |
Net assets, end of period
(in thousands) | | $ | 1,068,498 | | | $ | 767,903 | | | $ | 503,217 | | | $ | 191,085 | | | $ | 7,040 | | | $ | 369 | |
| | | | | | | | | | | | | | | | | | | | | | | | | |
See notes to financial statements.
104
Semi-Annual Report to Shareholders
Expense Example
Western Asset High Yield Portfolio
As a shareholder of the Fund, you incur ongoing costs, including management fees and other Fund expenses. These examples are intended to help you understand your ongoing costs (in dollars) of investing in the Fund and to compare these costs with the ongoing costs of investing in other mutual funds. The example is based on an investment of $1,000 invested on April 1, 2007, and held through September 30, 2007.
Actual Expenses
The first line in the table below provides information about actual account values and actual expenses for the Fund. You may use the information in this line, together with the amount you invested, to estimate the expenses that you paid over the period. Simply divide your account value by $1,000 (for example, an $8,600 account value divided by $1,000 = 8.6), then multiply the result by the number in the first line under the heading entitled “Expenses Paid During the Period” to estimate the expenses you paid on your account during this period.
Hypothetical Example for Comparison Purposes
The second line in the table below provides information about hypothetical account values and hypothetical expenses based on the Fund’s actual expense ratio and an assumed rate of return of 5% per year before expenses, which is not the Fund’s actual return. The hypothetical account values and expenses may not be used to estimate the actual ending account balance or expenses you paid for the period. You may use this information to compare the ongoing costs of investing in the Fund and other funds. To do so, compare this 5% hypothetical example with the 5% hypothetical examples that appear in the shareholder reports of other funds.
| | | | | | | | | |
| | | Beginning
Account Value
4/1/07 | | Ending
Account Value
9/30/07 | | Expenses PaidA
During the Period
4/1/07 to 9/30/07 |
Institutional Class | | | | | | | | | |
Actual | | $ | 1,000.00 | | $ | 996.50 | | $ | 2.90 |
Hypothetical (5% return before expenses) | | | 1,000.00 | | | 1,022.16 | | | 2.94 |
A | | These calculations are based on expenses incurred in the most recent fiscal half-year. The dollar amounts shown as “Expenses Paid During the Period” are equal to the annualized expense ratio of 0.58% multiplied by the average value over the period, multiplied by the number of days in the most recent fiscal half-year (183), and divided by 365. |
105
Semi-Annual Report to Shareholders
Performance Information
Western Asset High Yield Portfolio
The graph compares the Fund’s total returns to that of an appropriate broad-based securities market index. The lines illustrate the cumulative total return of an initial $1,000,000 investment for the periods indicated. The line for the Fund represents the total return after deducting all Fund investment management and other administrative expenses and the transaction costs of buying and selling securities. The lines representing the securities market index does not include any transaction costs associated with buying and selling securities in the index or other investment management or administrative expenses.
Total return measures investment performance in terms of appreciation or depreciation in the Fund’s net asset value per share, plus dividends and any capital gain distributions. It assumes that dividends and distributions were reinvested at the time they were paid. Returns (and the graph and table found below) do not reflect the deduction of taxes that a shareholder would pay on Fund distributions or the redemption of Fund shares. Average annual returns tend to smooth out variations in a fund’s return, so that they differ from actual year-to-year results.
Growth of a $1,000,000 Investment—Institutional Class
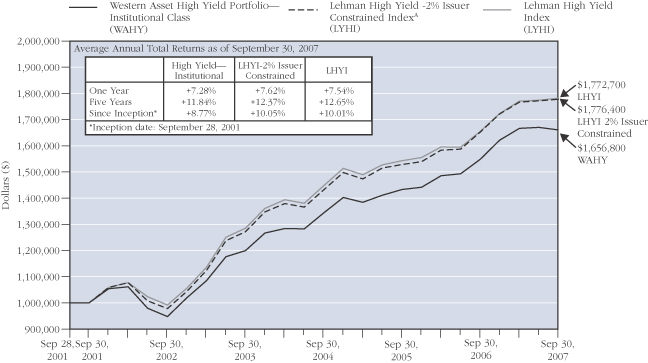
The performance data quoted represents past performance and does not guarantee future results. The performance stated may have been due to extraordinary market conditions, which may not be duplicated in the future. Current performance may be lower or higher than the performance data quoted. To obtain the most recent month-end performance information, please visit www.westernassetfunds.com. The investment return and principal value of the Fund will fluctuate so that an investor’s shares, when redeemed, may be worth more or less than the original cost. Calculations assume reinvestment of dividends and capital gain distributions. Performance would have been lower if fees had not been waived in various periods.
A | | Index returns are for periods beginning September 30, 2001. |
106
Semi-Annual Report to Shareholders
Portfolio Composition (as of September 30, 2007)
Standard & Poor’s Debt RatingsB (as a percentage of the portfolio)
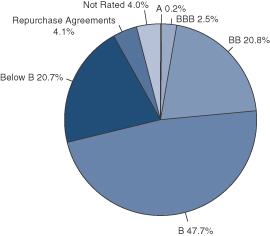
Maturity Schedule (as a percentage of the portfolio)
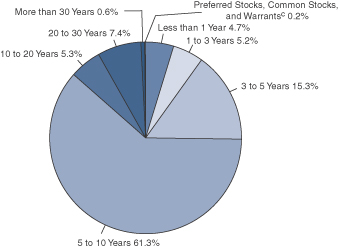
B | | Source: Standard & Poor's. |
C | | Preferred and Common stocks do not have defined maturity dates. |
The Fund is actively managed. As a result, the composition of the portfolio holdings and sectors are subject to change at any time.
107
Semi-Annual Report to Shareholders
Portfolio of Investments
Western Asset High Yield Portfolio
September 30, 2007 (Unaudited)
(Amounts in Thousands)
| | | | | | | | | | | | | |
| | | % OF
NET ASSETS | | RATE | | MATURITY
DATE | | PAR/
SHARES | | VALUE | |
| | | | | | | | | | | | | |
Long-Term Securities | | 95.3% | | | | | | | | | | | |
| | | | | |
Corporate Bonds and Notes | | 82.2% | | | | | | | | | | | |
| | | | | |
Aerospace and Defense | | 1.1% | | | | | | | | | | | |
Alliant Techsystems Inc. | | | | 6.750% | | 4/1/16 | | $ | 1,815 | | $ | 1,797 | |
DRS Technologies Inc. | | | | 6.875% | | 11/1/13 | | | 280 | | | 280 | |
DRS Technologies Inc. | | | | 6.625% | | 2/1/16 | | | 1,705 | | | 1,684 | |
DRS Technologies Inc. | | | | 7.625% | | 2/1/18 | | | 1,500 | | | 1,530 | |
L-3 Communications Corp. | | | | 7.625% | | 6/15/12 | | | 760 | | | 777 | |
L-3 Communications Corp. | | | | 6.375% | | 10/15/15 | | | 4,455 | | | 4,377 | |
| | | | | | | | | | | | | |
| | | | | | | | | | | | 10,445 | |
| | | | | | | | | | | | | |
Airlines | | 1.6% | | | | | | | | | | | |
Continental Airlines Inc. | | | | 8.750% | | 12/1/11 | | | 2,510 | | | 2,409 | |
Continental Airlines Inc. | | | | 7.339% | | 4/19/14 | | | 1,455 | | | 1,364 | |
DAE Aviation Holdings Inc. | | | | 11.250% | | 8/1/15 | | | 7,150 | | | 7,472 | A |
United Air Lines Inc. | | | | 7.032% | | 10/1/10 | | | 990 | | | 995 | |
United Air Lines Inc. | | | | 7.186% | | 10/1/12 | | | 2,837 | | | 2,862 | |
| | | | | | | | | | | | | |
| | | | | | | | | | | | 15,102 | |
| | | | | | | | | | | | | |
Auto Components | | 0.9% | | | | | | | | | | | |
Visteon Corp. | | | | 8.250% | | 8/1/10 | | | 10,147 | | | 8,929 | |
| | | | | | | | | | | | | |
| | | | | |
Automobiles | | 2.2% | | | | | | | | | | | |
Ford Motor Co. | | | | 7.450% | | 7/16/31 | | | 4,000 | | | 3,140 | |
Ford Motor Co. | | | | 8.900% | | 1/15/32 | | | 1,680 | | | 1,386 | |
Ford Motor Co. | | | | 4.250% | | 12/15/36 | | | 410 | | | 479 | B |
General Motors Corp. | | | | 7.200% | | 1/15/11 | | | 1,780 | | | 1,700 | |
General Motors Corp. | | | | 8.250% | | 7/15/23 | | | 3,415 | | | 2,988 | |
General Motors Corp. | | | | 8.375% | | 7/15/33 | | | 12,970 | | | 11,365 | |
| | | | | | | | | | | | | |
| | | | | | | | | | | | 21,058 | |
| | | | | | | | | | | | | |
Beverages | | 0.1% | | | | | | | | | | | |
Constellation Brands Inc. | | | | 7.250% | | 9/1/16 | | | 1,100 | | | 1,100 | |
| | | | | | | | | | | | | |
| | | | | |
Building Products | | 1.6% | | | | | | | | | | | |
Associated Materials Inc. | | | | 9.750% | | 4/15/12 | | | 2,400 | | | 2,436 | |
Associated Materials Inc. | | | | 0.000% | | 3/1/14 | | | 9,565 | | | 6,026 | C |
Nortek Inc. | | | | 8.500% | | 9/1/14 | | | 2,170 | | | 1,882 | |
NTK Holdings Inc. | | | | 0.000% | | 3/1/14 | | | 7,525 | | | 4,628 | C |
| | | | | | | | | | | | | |
| | | | | | | | | | | | 14,972 | |
| | | | | | | | | | | | | |
108
Semi-Annual Report to Shareholders
| | | | | | | | | | | | | |
| | | % OF
NET ASSETS | | RATE | | MATURITY
DATE | | PAR/
SHARES | | VALUE | |
| | | | | | | | | | | | | |
Corporate Bonds and Notes—Continued | | | | | | | | | | | | | |
| | | | | |
Capital Markets | | 0.4% | | | | | | | | | | | |
E*Trade Financial Corp. | | | | 7.375% | | 9/15/13 | | $ | 2,080 | | $ | 1,945 | |
E*Trade Financial Corp. | | | | 7.875% | | 12/1/15 | | | 997 | | | 922 | |
LaBranche and Co. Inc. | | | | 11.000% | | 5/15/12 | | | 1,490 | | | 1,494 | |
| | | | | | | | | | | | | |
| | | | | | | | | | | | 4,361 | |
| | | | | | | | | | | | | |
Chemicals | | 1.4% | | | | | | | | | | | |
ARCO Chemical Co. | | | | 9.800% | | 2/1/20 | | | 80 | | | 79 | |
Equistar Chemicals LP | | | | 10.625% | | 5/1/11 | | | 126 | | | 132 | |
Georgia Gulf Corp. | | | | 9.500% | | 10/15/14 | | | 4,930 | | | 4,511 | |
Huntsman International LLC | | | | 7.875% | | 11/15/14 | | | 2,120 | | | 2,258 | |
Lyondell Chemical Co. | | | | 10.500% | | 6/1/13 | | | 1,450 | | | 1,559 | |
Lyondell Chemical Co. | | | | 8.000% | | 9/15/14 | | | 975 | | | 1,072 | |
Lyondell Chemical Co. | | | | 8.250% | | 9/15/16 | | | 800 | | | 902 | |
Lyondell Chemical Co. | | | | 6.875% | | 6/15/17 | | | 1,850 | | | 2,007 | |
Westlake Chemical Corp. | | | | 6.625% | | 1/15/16 | | | 547 | | | 520 | |
| | | | | | | | | | | | | |
| | | | | | | | | | | | 13,040 | |
| | | | | | | | | | | | | |
Commercial Services and Supplies | | 1.9% | | | | | | | | | | | |
Allied Security Escrow Corp. | | | | 11.375% | | 7/15/11 | | | 6,820 | | | 6,820 | |
Allied Waste North America Inc. | | | | 7.250% | | 3/15/15 | | | 150 | | | 153 | |
Allied Waste North America Inc. | | | | 6.875% | | 6/1/17 | | | 1,251 | | | 1,257 | |
Interface Inc. | | | | 10.375% | | 2/1/10 | | | 5,454 | | | 5,754 | |
Interface Inc. | | | | 9.500% | | 2/1/14 | | | 200 | | | 209 | |
Rental Service Corp. | | | | 9.500% | | 12/1/14 | | | 4,170 | | | 3,983 | |
| | | | | | | | | | | | | |
| | | | | | | | | | | | 18,176 | |
| | | | | | | | | | | | | |
Consumer Finance | | 3.6% | | | | | | | | | | | |
AmeriCredit Corp. | | | | 8.500% | | 7/1/15 | | | 4,305 | | | 3,810 | A |
Ford Motor Credit Co. | | | | 8.625% | | 11/1/10 | | | 1,310 | | | 1,299 | |
Ford Motor Credit Co. | | | | 9.875% | | 8/10/11 | | | 2,875 | | | 2,912 | |
Ford Motor Credit Co. | | | | 8.110% | | 1/13/12 | | | 5,835 | | | 5,514 | D |
Ford Motor Credit Co. | | | | 7.000% | | 10/1/13 | | | 3,270 | | | 2,955 | |
Ford Motor Credit Co. | | | | 8.000% | | 12/15/16 | | | 1,865 | | | 1,745 | |
GMAC LLC | | | | 6.875% | | 8/28/12 | | | 2,120 | | | 1,988 | |
GMAC LLC | | | | 8.000% | | 11/1/31 | | | 14,795 | | | 14,515 | |
| | | | | | | | | | | | | |
| | | | | | | | | | | | 34,738 | |
| | | | | | | | | | | | | |
Containers and Packaging | | 2.5% | | | | | | | | | | | |
Graham Packaging Co. Inc. | | | | 8.500% | | 10/15/12 | | | 260 | | | 258 | |
Graham Packaging Co. Inc. | | | | 9.875% | | 10/15/14 | | | 4,946 | | | 4,897 | |
Graphic Packaging International Corp. | | | | 9.500% | | 8/15/13 | | | 5,685 | | | 5,841 | |
109
Semi-Annual Report to Shareholders
Portfolio of Investments—Continued
Western Asset High Yield Portfolio—Continued
| | | | | | | | | | | | | |
| | | % OF
NET ASSETS | | RATE | | MATURITY
DATE | | PAR/
SHARES | | VALUE | |
| | | | | | | | | | | | | |
Corporate Bonds and Notes—Continued | | | | | | | | | | | | | |
| | | | | |
Containers and Packaging—Continued | | | | | | | | | | | | | |
Greif Inc. | | | | 6.750% | | 2/1/17 | | $ | 3,850 | | $ | 3,840 | |
Owens-Brockway Glass Container Inc. | | | | 8.875% | | 2/15/09 | | | 85 | | | 86 | |
Owens-Brockway Glass Container Inc. | | | | 8.750% | | 11/15/12 | | | 1,910 | | | 1,998 | |
Plastipak Holdings Inc. | | | | 8.500% | | 12/15/15 | | | 2,940 | | | 3,043 | A |
Smurfit-Stone Container Enterprises Inc. | | | | 8.000% | | 3/15/17 | | | 4,190 | | | 4,117 | |
| | | | | | | | | | | | | |
| | | | | | | | | | | | 24,080 | |
| | | | | | | | | | | | | |
Distributors | | 0.3% | | | | | | | | | | | |
Keystone Automotive Operations Inc. | | | | 9.750% | | 11/1/13 | | | 3,970 | | | 3,236 | |
| | | | | | | | | | | | | |
| | | | | |
Diversified Consumer Services | | 1.1% | | | | | | | | | | | |
Education Management LLC | | | | 8.750% | | 6/1/14 | | | 5,475 | | | 5,612 | |
Education Management LLC | | | | 10.250% | | 6/1/16 | | | 1,940 | | | 2,008 | |
Service Corp. International | | | | 7.875% | | 2/1/13 | | | 315 | | | 325 | |
Service Corp. International | | | | 6.750% | | 4/1/16 | | | 515 | | | 499 | |
Service Corp. International | | | | 7.625% | | 10/1/18 | | | 575 | | | 596 | |
Service Corp. International | | | | 7.500% | | 4/1/27 | | | 1,560 | | | 1,459 | |
| | | | | | | | | | | | | |
| | | | | | | | | | | | 10,499 | |
| | | | | | | | | | | | | |
Diversified Financial Services | | 3.2% | | | | | | | | | | | |
AAC Group Holding Corp. | | | | 0.000% | | 10/1/12 | | | 5,510 | | | 4,904 | C |
CCM Merger Inc. | | | | 8.000% | | 8/1/13 | | | 3,400 | | | 3,315 | A |
Chukchansi Economic Development Authority | | | | 8.000% | | 11/15/13 | | | 185 | | | 187 | A |
DI Finance LLC | | | | 9.500% | | 2/15/13 | | | 7,180 | | | 7,431 | |
El Paso Performance-Linked | | | | 7.750% | | 7/15/11 | | | 155 | | | 159 | A |
Hexion US Finance Corp/Hexion Nova Scotia Finance ULC | | | | 10.058% | | 11/15/14 | | | 1,110 | | | 1,143 | D |
Leucadia National Corp. | | | | 8.125% | | 9/15/15 | | | 3,350 | | | 3,371 | |
Milacron Escrow Corp. | | | | 11.500% | | 5/15/11 | | | 3,170 | | | 2,980 | |
The Williams Cos. Inc. Credit Linked Certificate Trust | | | | 8.606% | | 5/1/09 | | | 470 | | | 476 | A,D |
Vanguard Health Holding Co. I LLC | | | | 0.000% | | 10/1/15 | | | 616 | | | 460 | C |
Vanguard Health Holding Co. II LLC | | | | 9.000% | | 10/1/14 | | | 6,749 | | | 6,547 | |
| | | | | | | | | | | | | |
| | | | | | | | | | | | 30,973 | |
| | | | | | | | | | | | | |
Diversified Telecommunication Services | | 4.0% | | | | | | | | | | | |
Cincinnati Bell Inc. | | | | 7.000% | | 2/15/15 | | | 422 | | | 407 | |
Cincinnati Bell Inc. | | | | 6.300% | | 12/1/28 | | | 3,160 | | | 2,765 | |
Citizens Communications Co. | | | | 7.875% | | 1/15/27 | | | 3,585 | | | 3,495 | |
Citizens Communications Co. | | | | 7.050% | | 10/1/46 | | | 380 | | | 311 | |
Hawaiian Telcom Communications Inc. | | | | 10.860% | | 5/1/13 | | | 1,370 | | | 1,387 | D |
110
Semi-Annual Report to Shareholders
| | | | | | | | | | | | | |
| | | % OF
NET ASSETS | | RATE | | MATURITY
DATE | | PAR/
SHARES | | VALUE | |
| | | | | | | | | | | | | |
Corporate Bonds and Notes—Continued | | | | | | | | | | | | | |
| | | | | |
Diversified Telecommunication Services—Continued | | | | | | | | | | | | | |
Intelsat Corp. | | | | 9.000% | | 8/15/14 | | $ | 80 | | $ | 82 | |
Intelsat Corp. | | | | 9.000% | | 6/15/16 | | | 725 | | | 747 | |
Level 3 Financing Inc. | | | | 9.250% | | 11/1/14 | | | 3,625 | | | 3,571 | |
Level 3 Financing Inc. | | | | 9.150% | | 2/15/15 | | | 3,475 | | | 3,310 | D |
MetroPCS Wireless Inc. | | | | 9.250% | | 11/1/14 | | | 120 | | | 122 | A |
MetroPCS Wireless Inc. | | | | 9.250% | | 11/1/14 | | | 1,195 | | | 1,219 | A |
NTL Cable PLC | | | | 8.750% | | 4/15/14 | | | 970 | | | 994 | |
PAETEC Holding Corp. | | | | 9.500% | | 7/15/15 | | | 2,330 | | | 2,330 | A |
Qwest Communications International Inc. | | | | 9.058% | | 2/15/09 | | | 480 | | | 485 | D |
Qwest Communications International Inc. | | | | 7.250% | | 2/15/11 | | | 2,652 | | | 2,682 | |
Qwest Communications International Inc. | | | | 7.500% | | 2/15/14 | | | 5,707 | | | 5,778 | |
Qwest Corp. | | | | 7.875% | | 9/1/11 | | | 255 | | | 268 | |
Qwest Corp. | | | | 7.500% | | 10/1/14 | | | 2,035 | | | 2,117 | |
Qwest Corp. | | | | 6.875% | | 9/15/33 | | | 315 | | | 295 | |
Windstream Corp. | | | | 8.625% | | 8/1/16 | | | 5,500 | | | 5,864 | |
| | | | | | | | | | | | | |
| | | | | | | | | | | | 38,229 | |
| | | | | | | | | | | | | |
Electric Utilities | | 1.5% | | | | | | | | | | | |
Edison Mission Energy | | | | 7.750% | | 6/15/16 | | | 2,190 | | | 2,267 | |
Edison Mission Energy | | | | 7.200% | | 5/15/19 | | | 1,410 | | | 1,389 | A |
Edison Mission Energy | | | | 7.625% | | 5/15/27 | | | 1,515 | | | 1,462 | A |
Elwood Energy LLC | | | | 8.159% | | 7/5/26 | | | 2,611 | | | 2,641 | |
IPALCO Enterprises Inc. | | | | 8.625% | | 11/14/11 | | | 240 | | | 254 | E |
Midwest Generation LLC | | | | 8.560% | | 1/2/16 | | | 2,083 | | | 2,229 | |
Orion Power Holdings Inc. | | | | 12.000% | | 5/1/10 | | | 4,090 | | | 4,478 | |
| | | | | | | | | | | | | |
| | | | | | | | | | | | 14,720 | |
| | | | | | | | | | | | | |
Energy Equipment and Services | | 0.8% | | | | | | | | | | | |
Complete Production Services Inc. | | | | 8.000% | | 12/15/16 | | | 3,350 | | | 3,312 | |
Gulfmark Offshore Inc. | | | | 7.750% | | 7/15/14 | | | 2,300 | | | 2,312 | |
Pride International Inc. | | | | 7.375% | | 7/15/14 | | | 1,975 | | | 2,024 | |
| | | | | | | | | | | | | |
| | | | | | | | | | | | 7,648 | |
| | | | | | | | | | | | | |
Food and Staples Retailing | | 0.3% | | | | | | | | | | | |
Delhaize America Inc. | | | | 9.000% | | 4/15/31 | | | 2,588 | | | 3,083 | |
| | | | | | | | | | | | | |
| | | | | |
Food Products | | 0.5% | | | | | | | | | | | |
Dole Food Co. Inc. | | | | 7.250% | | 6/15/10 | | | 4,275 | | | 4,040 | |
Dole Food Co. Inc. | | | | 8.875% | | 3/15/11 | | | 165 | | | 161 | |
Dole Food Co. Inc. | | | | 8.750% | | 7/15/13 | | | 290 | | | 283 | |
| | | | | | | | | | | | | |
| | | | | | | | | | | | 4,484 | |
| | | | | | | | | | | | | |
111
Semi-Annual Report to Shareholders
Portfolio of Investments—Continued
Western Asset High Yield Portfolio—Continued
| | | | | | | | | | | | | |
| | | % OF
NET ASSETS | | RATE | | MATURITY
DATE | | PAR/
SHARES | | VALUE | |
| | | | | | | | | | | | | |
Corporate Bonds and Notes—Continued | | | | | | | | | | | | | |
| | | | | |
Gas Utilities | | 0.9% | | | | | | | | | | | |
Southern Natural Gas Co. | | | | 8.000% | | 3/1/32 | | $ | 2,280 | | $ | 2,577 | |
Suburban Propane Partners LP | | | | 6.875% | | 12/15/13 | | | 6,660 | | | 6,494 | |
| | | | | | | | | | | | | |
| | | | | | | | | | | | 9,071 | |
| | | | | | | | | | | | | |
Health Care Equipment and Supplies | | 0.4% | | | | | | | | | | | |
Advanced Medical Optics Inc. | | | | 7.500% | | 5/1/17 | | | 2,030 | | | 1,868 | |
Fresenius Medical Care Capital Trust II | | | | 7.875% | | 2/1/08 | | | 1,767 | | | 1,771 | |
Fresenius Medical Care Capital Trust IV | | | | 7.875% | | 6/15/11 | | | 150 | | | 156 | |
| | | | | | | | | | | | | |
| | | | | | | | | | | | 3,795 | |
| | | | | | | | | | | | | |
Health Care Providers and Services | | 5.0% | | | | | | | | | | | |
Community Health Systems Inc. | | | | 8.875% | | 7/15/15 | | | 5,095 | | | 5,235 | A |
DaVita Inc. | | | | 6.625% | | 3/15/13 | | | 165 | | | 164 | |
DaVita Inc. | | | | 7.250% | | 3/15/15 | | | 5,425 | | | 5,439 | |
HCA Inc. | | | | 9.000% | | 12/15/14 | | | 56 | | | 55 | |
HCA Inc. | | | | 6.375% | | 1/15/15 | | | 2,775 | | | 2,366 | |
HCA Inc. | | | | 9.250% | | 11/15/16 | | | 4,230 | | | 4,494 | A |
HCA Inc. | | | | 9.625% | | 11/15/16 | | | 9,325 | | | 9,954 | A,F |
HCA Inc. | | | | 7.500% | | 12/15/23 | | | 170 | | | 139 | |
HCA Inc. | | | | 7.690% | | 6/15/25 | | | 1,870 | | | 1,536 | |
IASIS Healthcare LLC | | | | 8.750% | | 6/15/14 | | | 450 | | | 456 | |
Tenet Healthcare Corp. | | | | 6.375% | | 12/1/11 | | | 5,355 | | | 4,686 | |
Tenet Healthcare Corp. | | | | 7.375% | | 2/1/13 | | | 305 | | | 258 | |
Tenet Healthcare Corp. | | | | 9.875% | | 7/1/14 | | | 5,785 | | | 5,293 | |
Tenet Healthcare Corp. | | | | 9.250% | | 2/1/15 | | | 1,870 | | | 1,650 | |
U.S. Oncology Holdings Inc. | | | | 10.194% | | 3/15/12 | | | 4,515 | | | 4,018 | A,D,F |
Universal Hospital Services Inc. | | | | 8.500% | | 6/1/15 | | | 1,135 | | | 1,124 | A,F |
Universal Hospital Services Inc. | | | | 8.759% | | 6/1/15 | | | 940 | | | 935 | A,D |
| | | | | | | | | | | | | |
| | | | | | | | | | | | 47,802 | |
| | | | | | | | | | | | | |
Hotels, Restaurants and Leisure | | 4.7% | | | | | | | | | | | |
Boyd Gaming Corp. | | | | 7.750% | | 12/15/12 | | | 80 | | | 82 | |
Boyd Gaming Corp. | | | | 6.750% | | 4/15/14 | | | 690 | | | 676 | |
Buffets Inc. | | | | 12.500% | | 11/1/14 | | | 4,245 | | | 2,972 | |
Caesars Entertainment Inc. | | | | 8.125% | | 5/15/11 | | | 165 | | | 168 | |
Denny’s Holdings Inc. | | | | 10.000% | | 10/1/12 | | | 1,710 | | | 1,766 | |
El Pollo Loco Inc. | | | | 11.750% | | 11/15/13 | | | 2,521 | | | 2,597 | |
Fontainebleau Las Vegas Holdings LLC/Fontainebleau Las Vegas Capital Corp. | | | | 10.250% | | 6/15/15 | | | 1,945 | | | 1,823 | A |
Herbst Gaming Inc. | | | | 7.000% | | 11/15/14 | | | 270 | | | 221 | |
112
Semi-Annual Report to Shareholders
| | | | | | | | | | | | | |
| | | % OF
NET ASSETS | | RATE | | MATURITY
DATE | | PAR/
SHARES | | VALUE | |
| | | | | | | | | | | | | |
Corporate Bonds and Notes—Continued | | | | | | | | | | | | | |
| | | | | |
Hotels, Restaurants and Leisure—Continued | | | | | | | | | | | | | |
Inn of the Mountain Gods Resort and Casino | | | | 12.000% | | 11/15/10 | | $ | 5,690 | | $ | 6,003 | |
Las Vegas Sands Corp. | | | | 6.375% | | 2/15/15 | | | 415 | | | 402 | |
Mandalay Resort Group | | | | 9.375% | | 2/15/10 | | | 58 | | | 61 | |
MGM MIRAGE | | | | 8.500% | | 9/15/10 | | | 85 | | | 89 | |
MGM MIRAGE | | | | 8.375% | | 2/1/11 | | | 1,750 | | | 1,824 | |
MGM MIRAGE | | | | 6.750% | | 9/1/12 | | | 125 | | | 123 | |
MGM MIRAGE | | | | 7.500% | | 6/1/16 | | | 1,850 | | | 1,838 | |
MGM MIRAGE | | | | 7.625% | | 1/15/17 | | | 3,500 | | | 3,465 | |
OSI Restaurant Partners Inc. | | | | 10.000% | | 6/15/15 | | | 1,890 | | | 1,673 | A |
Pinnacle Entertainment Inc. | | | | 8.250% | | 3/15/12 | | | 2,985 | | | 3,022 | |
Pinnacle Entertainment Inc. | | | | 8.750% | | 10/1/13 | | | 135 | | | 139 | |
Quapaw Downstream Development | | | | 12.000% | | 10/15/15 | | | 1,490 | | | 1,453 | A |
River Rock Entertainment Authority | | | | 9.750% | | 11/1/11 | | | 4,013 | | | 4,143 | |
Sbarro Inc. | | | | 10.375% | | 2/1/15 | | | 2,265 | | | 2,061 | |
Snoqualmie Entertainment Authority | | | | 9.063% | | 2/1/14 | | | 3,075 | | | 2,990 | A,D |
Station Casinos Inc. | | | | 6.000% | | 4/1/12 | | | 530 | | | 504 | |
Station Casinos Inc. | | | | 7.750% | | 8/15/16 | | | 2,910 | | | 2,881 | |
Station Casinos Inc. | | | | 6.625% | | 3/15/18 | | | 1,155 | | | 967 | |
The Choctaw Resort Development Enterprise | | | | 7.250% | | 11/15/19 | | | 342 | | | 337 | A |
Turning Stone Casino Resort Enterprise | | | | 9.125% | | 9/15/14 | | | 995 | | | 1,030 | A |
| | | | | | | | | | | | | |
| | | | | | | | | | | | 45,310 | |
| | | | | | | | | | | | | |
Household Durables | | 1.7% | | | | | | | | | | | |
American Greetings Corp. | | | | 7.375% | | 6/1/16 | | | 260 | | | 252 | |
Jarden Corp. | | | | 7.500% | | 5/1/17 | | | 3,335 | | | 3,227 | |
K Hovnanian Enterprises Inc. | | | | 6.250% | | 1/15/16 | | | 2,245 | | | 1,729 | |
K Hovnanian Enterprises Inc. | | | | 7.500% | | 5/15/16 | | | 1,570 | | | 1,248 | |
K Hovnanian Enterprises Inc. | | | | 8.625% | | 1/15/17 | | | 505 | | | 417 | |
KB HOME | | | | 7.750% | | 2/1/10 | | | 2,560 | | | 2,425 | |
Norcraft Cos. | | | | 9.000% | | 11/1/11 | | | 4,780 | | | 4,804 | |
Norcraft Holdings LP | | | | 0.000% | | 9/1/12 | | | 2,090 | | | 1,870 | C |
| | | | | | | | | | | | | |
| | | | | | | | | | | | 15,972 | |
| | | | | | | | | | | | | |
Household Products | | 0.2% | | | | | | | | | | | |
American Achievement Corp. | | | | 8.250% | | 4/1/12 | | | 975 | | | 970 | |
Visant Holding Corp. | | | | 8.750% | | 12/1/13 | | | 1,395 | | | 1,427 | |
| | | | | | | | | | | | | |
| | | | | | | | | | | | 2,397 | |
| | | | | | | | | | | | | |
Independent Power Producers and Energy Traders | | 3.8% | | | | | | | | | | | |
Dynegy Holdings Inc. | | | | 7.750% | | 6/1/19 | | | 9,870 | | | 9,438 | A |
Mirant Mid Atlantic LLC | | | | 9.125% | | 6/30/17 | | | 2,232 | | | 2,472 | |
113
Semi-Annual Report to Shareholders
Portfolio of Investments—Continued
Western Asset High Yield Portfolio—Continued
| | | | | | | | | | | | | |
| | | % OF
NET ASSETS | | RATE | | MATURITY
DATE | | PAR/
SHARES | | VALUE | |
| | | | | | | | | | | | | |
Corporate Bonds and Notes—Continued | | | | | | | | | | | | | |
| | | | | |
Independent Power Producers and Energy Traders—Continued | | | | | | | | | | | | | |
Mirant Mid Atlantic LLC | | | | 10.060% | | 12/30/28 | | $ | 604 | | $ | 719 | |
Mirant North America LLC | | | | 7.375% | | 12/31/13 | | | 3,825 | | | 3,883 | |
NRG Energy Inc. | | | | 7.250% | | 2/1/14 | | | 860 | | | 862 | |
NRG Energy Inc. | | | | 7.375% | | 2/1/16 | | | 8,930 | | | 8,952 | |
NRG Energy Inc. | | | | 7.375% | | 1/15/17 | | | 3,045 | | | 3,045 | |
The AES Corp. | | | | 9.375% | | 9/15/10 | | | 200 | | | 211 | |
The AES Corp. | | | | 8.750% | | 5/15/13 | | | 1,849 | | | 1,935 | A |
The AES Corp. | | | | 7.750% | | 3/1/14 | | | 395 | | | 401 | |
The AES Corp. | | | | 9.000% | | 5/15/15 | | | 3,805 | | | 3,995 | A |
TXU Corp. | | | | 6.500% | | 11/15/24 | | | 870 | | | 697 | |
| | | | | | | | | | | | | |
| | | | | | | | | | | | 36,610 | |
| | | | | | | | | | | | | |
Internet and Catalog Retail | | 0.1% | | | | | | | | | | | |
FTD Inc. | | | | 7.750% | | 2/15/14 | | | 1,180 | | | 1,121 | |
| | | | | | | | | | | | | |
| | | | | |
IT Services | | 0.8% | | | | | | | | | | | |
SunGard Data Systems Inc. | | | | 9.125% | | 8/15/13 | | | 430 | | | 447 | |
SunGard Data Systems Inc. | | | | 10.250% | | 8/15/15 | | | 7,155 | | | 7,477 | |
| | | | | | | | | | | | | |
| | | | | | | | | | | | 7,924 | |
| | | | | | | | | | | | | |
Machinery | | 0.1% | | | | | | | | | | | |
American Railcar Industries Inc. | | | | 7.500% | | 3/1/14 | | | 1,250 | | | 1,244 | |
| | | | | | | | | | | | | |
| | | | | |
Media | | 8.9% | | | | | | | | | | | |
Affinion Group Inc. | | | | 10.125% | | 10/15/13 | | | 2,825 | | | 2,980 | |
Affinion Group Inc. | | | | 11.500% | | 10/15/15 | | | 3,455 | | | 3,628 | |
AMC Entertainment Inc. | | | | 11.000% | | 2/1/16 | | | 760 | | | 809 | |
Cablevision Systems Corp. | | | | 8.000% | | 4/15/12 | | | 1,100 | | | 1,067 | |
CCH I Holdings LLC | | | | 11.750% | | 5/15/14 | | | 8,935 | | | 8,265 | |
CCH I Holdings LLC | | | | 12.125% | | 1/15/15 | | | 1,020 | | | 954 | |
CCH I Holdings LLC | | | | 11.000% | | 10/1/15 | | | 7,784 | | | 7,881 | |
CCH II Holdings LLC | | | | 10.250% | | 9/15/10 | | | 3,780 | | | 3,865 | |
CCH II Holdings LLC | | | | 10.250% | | 10/1/13 | | | 125 | | | 130 | |
Charter Communications Holdings LLC | | | | 11.750% | | 5/15/11 | | | 980 | | | 940 | |
Charter Communications Holdings LLC | | | | 12.125% | | 1/15/12 | | | 1,185 | | | 1,136 | |
Charter Communications Operating LLC | | | | 8.000% | | 4/30/12 | | | 700 | | | 697 | A |
CMP Susquehanna Corp. | | | | 9.875% | | 5/15/14 | | | 4,025 | | | 3,743 | |
CSC Holdings Inc. | | | | 8.125% | | 7/15/09 | | | 325 | | | 331 | |
CSC Holdings Inc. | | | | 8.125% | | 8/15/09 | | | 475 | | | 483 | |
114
Semi-Annual Report to Shareholders
| | | | | | | | | | | | | |
| | | % OF
NET ASSETS | | RATE | | MATURITY
DATE | | PAR/
SHARES | | VALUE | |
| | | | | | | | | | | | | |
Corporate Bonds and Notes—Continued | | | | | | | | | | | | | |
| | | | | |
Media—Continued | | | | | | | | | | | | | |
CSC Holdings Inc. | | | | 7.625% | | 4/1/11 | | $ | 915 | | $ | 917 | |
CSC Holdings Inc. | | | | 6.750% | | 4/15/12 | | | 4,030 | | | 3,879 | |
Dex Media Inc. | | | | 0.000% | | 11/15/13 | | | 275 | | | 259 | C |
Dex Media Inc. | | | | 0.000% | | 11/15/13 | | | 145 | | | 136 | C |
Dex Media West LLC | | | | 9.875% | | 8/15/13 | | | 105 | | | 112 | |
EchoStar DBS Corp. | | | | 7.000% | | 10/1/13 | | | 3,440 | | | 3,518 | |
EchoStar DBS Corp. | | | | 6.625% | | 10/1/14 | | | 270 | | | 271 | |
EchoStar DBS Corp. | | | | 7.125% | | 2/1/16 | | | 1,700 | | | 1,747 | |
Idearc Inc. | | | | 8.000% | | 11/15/16 | | | 3,080 | | | 3,072 | |
ION Media Networks Inc. | | | | 8.610% | | 1/15/12 | | | 1,760 | | | 1,751 | A,D |
ION Media Networks Inc. | | | | 11.000% | | 7/31/13 | | | 1,163 | | | 989 | |
Lamar Media Corp. | | | | 6.625% | | 8/15/15 | | | 1,475 | | | 1,423 | |
PGS Solutions Inc. | | | | 9.625% | | 2/15/15 | | | 915 | | | 853 | A |
R.H. Donnelley Corp. | | | | 6.875% | | 1/15/13 | | | 5,305 | | | 5,013 | |
R.H. Donnelley Corp. | | | | 6.875% | | 1/15/13 | | | 3,120 | | | 2,948 | |
R.H. Donnelley Corp. | | | | 8.875% | | 1/15/16 | | | 650 | | | 662 | |
R.H. Donnelley Corp. | | | | 8.875% | | 10/15/17 | | | 4,190 | | | 4,253 | A |
TL Acquisitions Inc. | | | | 10.500% | | 1/15/15 | | | 4,160 | | | 4,108 | A |
TL Acquisitions Inc. | | | | 0.000% | | 7/15/15 | | | 3,145 | | | 2,548 | A,C |
Tube City IMS Corp. | | | | 9.750% | | 2/1/15 | | | 4,575 | | | 4,472 | |
Univision Communications Inc. | | | | 9.750% | | 3/15/15 | | | 1,075 | | | 1,048 | A,F |
WMG Acquisition Corp. | | | | 7.375% | | 4/15/14 | | | 2,410 | | | 2,097 | |
XM Satellite Radio Inc. | | | | 9.856% | | 5/1/13 | | | 1,865 | | | 1,842 | D |
XM Satellite Radio Inc. | | | | 9.750% | | 5/1/14 | | | 690 | | | 692 | |
| | | | | | | | | | | | | |
| | | | | | | | | | | | 85,519 | |
| | | | | | | | | | | | | |
Metals and Mining | | 2.6% | | | | | | | | | | | |
Freeport-McMoRan Copper & Gold Inc. | | | | 8.375% | | 4/1/17 | | | 13,170 | | | 14,388 | |
Metals USA Holdings Corp. | | | | 11.360% | | 7/1/12 | | | 2,615 | | | 2,445 | A,D,F |
Metals USA Inc. | | | | 11.125% | | 12/1/15 | | | 4,520 | | | 4,814 | |
Noranda Aluminium Holding Corp. | | | | 11.146% | | 11/15/14 | | | 3,500 | | | 3,255 | A,D,F |
| | | | | | | | | | | | | |
| | | | | | | | | | | | 24,902 | |
| | | | | | | | | | | | | |
Multiline Retail | | 1.5% | | | | | | | | | | | |
Dollar General Corp. | | | | 10.625% | | 7/15/15 | | | 3,065 | | | 2,881 | A |
Dollar General Corp. | | | | 11.875% | | 7/15/17 | | | 4,330 | | | 3,767 | A,F |
The Neiman-Marcus Group Inc. | | | | 9.000% | | 10/15/15 | | | 3,675 | | | 3,914 | F |
The Neiman-Marcus Group Inc. | | | | 10.375% | | 10/15/15 | | | 3,225 | | | 3,515 | |
| | | | | | | | | | | | | |
| | | | | | | | | | | | 14,077 | |
| | | | | | | | | | | | | |
115
Semi-Annual Report to Shareholders
Portfolio of Investments—Continued
Western Asset High Yield Portfolio—Continued
| | | | | | | | | | | | | |
| | | % OF
NET ASSETS | | RATE | | MATURITY
DATE | | PAR/
SHARES | | VALUE | |
| | | | | | | | | | | | | |
Corporate Bonds and Notes—Continued | | | | | | | | | | | | | |
| | | | | |
Oil, Gas and Consumable Fuels | | 9.7% | | | | | | | | | | | |
ANR Pipeline Inc. | | | | 9.625% | | 11/1/21 | | $ | 1,364 | | $ | 1,817 | |
Belden and Blake Corp. | | | | 8.750% | | 7/15/12 | | | 8,195 | | | 8,339 | |
Chesapeake Energy Corp. | | | | 7.500% | | 6/15/14 | | | 370 | | | 379 | |
Chesapeake Energy Corp. | | | | 6.375% | | 6/15/15 | | | 2,065 | | | 2,026 | |
Chesapeake Energy Corp. | | | | 6.625% | | 1/15/16 | | | 250 | | | 249 | |
Chesapeake Energy Corp. | | | | 6.500% | | 8/15/17 | | | 2,525 | | | 2,456 | |
Chesapeake Energy Corp. | | | | 6.250% | | 1/15/18 | | | 2,515 | | | 2,427 | |
Colorado Interstate Gas Co. | | | | 6.800% | | 11/15/15 | | | 1,175 | | | 1,216 | |
El Paso Corp. | | | | 7.750% | | 6/15/10 | | | 1,568 | | | 1,625 | |
El Paso Corp. | | | | 7.875% | | 6/15/12 | | | 350 | | | 366 | |
El Paso Corp. | | | | 8.050% | | 10/15/30 | | | 4,040 | | | 4,152 | |
El Paso Corp. | | | | 7.800% | | 8/1/31 | | | 4,190 | | | 4,254 | |
El Paso Corp. | | | | 7.750% | | 1/15/32 | | | 205 | | | 208 | |
El Paso Natural Gas Co. | | | | 8.375% | | 6/15/32 | | | 1,600 | | | 1,880 | |
Encore Acquisition Co. | | | | 6.250% | | 4/15/14 | | | 310 | | | 290 | |
Enterprise Products Operating LP | | | | 8.375% | | 8/1/66 | | | 3,640 | | | 3,741 | C |
Exco Resources Inc. | | | | 7.250% | | 1/15/11 | | | 5,038 | | | 5,013 | |
International Coal Group Inc. | | | | 10.250% | | 7/15/14 | | | 3,120 | | | 2,995 | |
Mariner Energy Inc. | | | | 7.500% | | 4/15/13 | | | 1,210 | | | 1,174 | |
Mariner Energy Inc. | | | | 8.000% | | 5/15/17 | | | 1,405 | | | 1,374 | |
Northwest Pipelines Corp. | | | | 7.000% | | 6/15/16 | | | 155 | | | 161 | |
Overseas Shipholding Group | | | | 8.250% | | 3/15/13 | | | 2,020 | | | 2,083 | |
Parker Drilling Co. | | | | 9.625% | | 10/1/13 | | | 3,673 | | | 3,930 | |
Petrohawk Energy Corp. | | | | 9.125% | | 7/15/13 | | | 1,930 | | | 2,036 | |
Pogo Producing Co. | | | | 7.875% | | 5/1/13 | | | 235 | | | 243 | |
Pogo Producing Co. | | | | 6.875% | | 10/1/17 | | | 3,155 | | | 3,171 | |
SemGroup LP | | | | 8.750% | | 11/15/15 | | | 4,020 | | | 3,930 | A |
SESI LLC | | | | 6.875% | | 6/1/14 | | | 135 | | | 131 | |
Sonat Inc. | | | | 7.625% | | 7/15/11 | | | 95 | | | 98 | |
Stone Energy Corp. | | | | 8.250% | | 12/15/11 | | | 9,880 | | | 9,855 | |
Stone Energy Corp. | | | | 6.750% | | 12/15/14 | | | 1,635 | | | 1,512 | |
Swift Energy Co. | | | | 7.625% | | 7/15/11 | | | 85 | | | 85 | |
The Williams Cos. Inc. | | | | 7.875% | | 9/1/21 | | | 335 | | | 364 | |
The Williams Cos. Inc. | | | | 7.500% | | 1/15/31 | | | 1,350 | | | 1,401 | |
The Williams Cos. Inc. | | | | 8.750% | | 3/15/32 | | | 7,559 | | | 8,702 | |
Transcontinental Gas Pipe Line Corp. | | | | 8.875% | | 7/15/12 | | | 1,060 | | | 1,179 | |
VeraSun Energy Corp. | | | | 9.375% | | 6/1/17 | | | 4,205 | | | 3,616 | A |
W&T Offshore Inc. | | | | 8.250% | | 6/15/14 | | | 2,380 | | | 2,291 | A |
116
Semi-Annual Report to Shareholders
| | | | | | | | | | | | | |
| | | % OF
NET ASSETS | | RATE | | MATURITY
DATE | | PAR/
SHARES | | VALUE | |
| | | | | | | | | | | | | |
Corporate Bonds and Notes—Continued | | | | | | | | | | | | | |
| | | | | |
Oil, Gas and Consumable Fuels—Continued | | | | | | | | | | | | | |
Whiting Petroleum Corp. | | | | 7.250% | | 5/1/12 | | $ | 195 | | $ | 192 | |
Whiting Petroleum Corp. | | | | 7.000% | | 2/1/14 | | | 2,350 | | | 2,256 | |
| | | | | | | | | | | | | |
| | | | | | | | | | | | 93,217 | |
| | | | | | | | | | | | | |
Paper and Forest Products | | 1.5% | | | | | | | | | | | |
Appleton Papers Inc. | | | | 8.125% | | 6/15/11 | | | 650 | | | 642 | |
Appleton Papers Inc. | | | | 9.750% | | 6/15/14 | | | 4,225 | | | 4,215 | |
NewPage Corp. | | | | 11.606% | | 5/1/12 | | | 4,915 | | | 5,284 | D |
NewPage Corp. | | | | 12.000% | | 5/1/13 | | | 1,275 | | | 1,367 | |
Verso Paper Holdings LLC | | | | 9.125% | | 8/1/14 | | | 1,575 | | | 1,622 | |
Verso Paper Holdings LLC | | | | 11.375% | | 8/1/16 | | | 1,455 | | | 1,531 | |
| | | | | | | | | | | | | |
| | | | | | | | | | | | 14,661 | |
| | | | | | | | | | | | | |
Personal Products | | 0.1% | | | | | | | | | | | |
Playtex Products Inc. | | | | 9.375% | | 6/1/11 | | | 1,030 | | | 1,065 | |
| | | | | | | | | | | | | |
| | | | | |
Pharmaceuticals | | 0.8% | | | | | | | | | | | |
Leiner Health Products Inc. | | | | 11.000% | | 6/1/12 | | | 9,050 | | | 7,602 | |
| | | | | | | | | | | | | |
| | | | | |
Real Estate Investment Trusts | | 0.4% | | | | | | | | | | | |
Ventas Inc. | | | | 8.750% | | 5/1/09 | | | 1,616 | | | 1,668 | |
Ventas Inc. | | | | 9.000% | | 5/1/12 | | | 762 | | | 829 | |
Ventas Inc. | | | | 6.750% | | 4/1/17 | | | 910 | | | 908 | |
| | | | | | | | | | | | | |
| | | | | | | | | | | | 3,405 | |
| | | | | | | | | | | | | |
Real Estate Management and Development | | 1.2% | | | | | | | | | | | |
Ashton Woods USA LLC | | | | 9.500% | | 10/1/15 | | | 2,160 | | | 1,707 | |
Forest City Enterprises Inc. | | | | 7.625% | | 6/1/15 | | | 465 | | | 438 | |
Forest City Enterprises Inc. | | | | 6.500% | | 2/1/17 | | | 2,010 | | | 1,794 | |
Kimball Hill Inc. | | | | 10.500% | | 12/15/12 | | | 960 | | | 662 | |
Realogy Corp. | | | | 12.375% | | 4/15/15 | | | 9,860 | | | 7,444 | A |
| | | | | | | | | | | | | |
| | | | | | | | | | | | 12,045 | |
| | | | | | | | | | | | | |
Road and Rail | | 2.1% | | | | | | | | | | | |
Hertz Corp. | | | | 8.875% | | 1/1/14 | | | 4,235 | | | 4,362 | |
Hertz Corp. | | | | 10.500% | | 1/1/16 | | | 7,015 | | | 7,576 | |
Kansas City Southern Railway | | | | 7.500% | | 6/15/09 | | | 2,675 | | | 2,705 | |
Saint Acquisition Corp. | | | | 13.308% | | 5/15/15 | | | 1,705 | | | 1,159 | A,D |
Saint Acquisition Corp. | | | | 12.500% | | 5/15/17 | | | 7,010 | | | 4,697 | A |
| | | | | | | | | | | | | |
| | | | | | | | | | | | 20,499 | |
| | | | | | | | | | | | | |
117
Semi-Annual Report to Shareholders
Portfolio of Investments—Continued
Western Asset High Yield Portfolio—Continued
| | | | | | | | | | | | | |
| | | % OF
NET ASSETS | | RATE | | MATURITY
DATE | | PAR/
SHARES | | VALUE | |
| | | | | | | | | | | | | |
Corporate Bonds and Notes—Continued | | | | | | | | | | | | | |
| | | | | |
Semiconductors and Semiconductor Equipment | | 0.3% | | | | | | | | | | | |
Freescale Semiconductor Inc. | | | | 8.875% | | 12/15/14 | | $ | 3,345 | | $ | 3,228 | |
| | | | | | | | | | | | | |
| | | | | |
Software | | 0.2% | | | | | | | | | | | |
Activant Solutions Inc. | | | | 9.500% | | 5/1/16 | | | 2,530 | | | 2,226 | |
| | | | | | | | | | | | | |
| | | | | |
Specialty Retail | | 0.8% | | | | | | | | | | | |
AutoNation Inc. | | | | 7.360% | | 4/15/13 | | | 2,010 | | | 1,920 | D |
Blockbuster Inc. | | | | 9.000% | | 9/1/12 | | | 3,405 | | | 3,064 | |
Eye Care Centers of America Inc. | | | | 10.750% | | 2/15/15 | | | 560 | | | 596 | |
Michaels Stores Inc. | | | | 10.000% | | 11/1/14 | | | 1,950 | | | 1,999 | A |
| | | | | | | | | | | | | |
| | | | | | | | | | | | 7,579 | |
| | | | | | | | | | | | | |
Textiles, Apparel and Luxury Goods | | 0.9% | | | | | | | | | | | |
Levi Strauss and Co. | | | | 9.750% | | 1/15/15 | | | 3,620 | | | 3,801 | |
Levi Strauss and Co. | | | | 8.875% | | 4/1/16 | | | 2,335 | | | 2,405 | |
Oxford Industries Inc. | | | | 8.875% | | 6/1/11 | | | 1,644 | | | 1,660 | |
Simmons Co. | | | | 0.000% | | 12/15/14 | | | 855 | | | 682 | C |
| | | | | | | | | | | | | |
| | | | | | | | | | | | 8,548 | |
| | | | | | | | | | | | | |
Thrifts and Mortgage Finance | | 0.5% | | | | | | | | | | | |
Residential Capital LLC | | | | 9.190% | | 4/17/09 | | | 1,155 | | | 809 | A,D |
Residential Capital LLC | | | | 6.375% | | 6/30/10 | | | 1,980 | | | 1,643 | G |
Residential Capital LLC | | | | 7.500% | | 6/1/12 | | | 2,610 | | | 2,114 | E |
| | | | | | | | | | | | | |
| | | | | | | | | | | | 4,566 | |
| | | | | | | | | | | | | |
Tobacco | | 0.7% | | | | | | | | | | | |
Alliance One International Inc. | | | | 8.500% | | 5/15/12 | | | 1,990 | | | 1,950 | A |
Alliance One International Inc. | | | | 11.000% | | 5/15/12 | | | 2,950 | | | 3,134 | |
Reynolds American Inc. | | | | 6.500% | | 7/15/10 | | | 1,330 | | | 1,365 | |
| | | | | | | | | | | | | |
| | | | | | | | | | | | 6,449 | |
| | | | | | | | | | | | | |
Trading Companies and Distributors | | 1.6% | | | | | | | | | | | |
Ashtead Capital Inc. | | | | 9.000% | | 8/15/16 | | | 3,092 | | | 3,049 | A |
H&E Equipment Services Inc. | | | | 8.375% | | 7/15/16 | | | 5,940 | | | 5,792 | |
Penhall International Corp. | | | | 12.000% | | 8/1/14 | | | 6,245 | | | 6,307 | A |
| | | | | | | | | | | | | |
| | | | | | | | | | | | 15,148 | |
| | | | | | | | | | | | | |
Transportation Infrastructure | | 0.9% | | | | | | | | | | | |
Hawker Beechcraft Acquisition Co. | | | | 8.875% | | 4/1/15 | | | 5,175 | | | 5,214 | A,F |
Hawker Beechcraft Acquisition Co. | | | | 9.750% | | 4/1/17 | | | 3,355 | | | 3,430 | A |
| | | | | | | | | | | | | |
| | | | | | | | | | | | 8,644 | |
| | | | | | | | | | | | | |
118
Semi-Annual Report to Shareholders
| | | | | | | | | | | | | |
| | | % OF
NET ASSETS | | RATE | | MATURITY
DATE | | PAR/
SHARES | | VALUE | |
| | | | | | | | | | | | | |
Corporate Bonds and Notes—Continued | | | | | | | | | | | | | |
| | | | | |
Wireless Telecommunication Services | | 0.8% | | | | | | | | | | | |
Rural Cellular Corp. | | | | 9.875% | | 2/1/10 | | $ | 1,575 | | $ | 1,646 | |
Rural Cellular Corp. | | | | 8.250% | | 3/15/12 | | | 2,775 | | | 2,879 | |
Rural Cellular Corp. | | | | 8.621% | | 6/1/13 | | | 2,685 | | | 2,752 | A,D |
| | | | | | | | | | | | | |
| | | | | | | | | | | | 7,277 | |
| | | | | | | | | | | | | |
Total Corporate Bonds and Notes
(Cost—$808,034) | | | | | | | | | | | | 790,776 | |
Mortgage-Backed Securities | | 0.1% | | | | | | | | | | | |
| | | | | |
Fixed Rate Securities | | N.M. | | | | | | | | | | | |
Ocwen Residential Mortgage Corp. 1998-R1 | | | | 7.000% | | 10/25/40 | | | 306 | | | 18 | H |
| | | | | | | | | | | | | |
| | | | | |
Variable Rate SecuritiesG | | 0.1% | | | | | | | | | | | |
BlackRock Capital Finance LP 1996-R1 | | | | 9.533% | | 9/25/26 | | | 803 | | | 498 | |
| | | | | | | | | | | | | |
Total Mortgage-Backed Securities
(Cost—$794) | | | | | | | | | | | | 516 | |
Yankee BondsI | | 11.2% | | | | | | | | | | | |
| | | | | |
Biotechnology | | N.M. | | | | | | | | | | | |
FMC Finance III SA | | | | 6.875% | | 7/15/17 | | | 10 | | | 10 | A |
| | | | | | | | | | | | | |
| | | | | |
Chemicals | | 0.7% | | | | | | | | | | | |
Methanex Corp. | | | | 8.750% | | 8/15/12 | | | 2,507 | | | 2,657 | |
Montell Finance Co. BV | | | | 8.100% | | 3/15/27 | | | 4,995 | | | 4,346 | A |
| | | | | | | | | | | | | |
| | | | | | | | | | | | 7,003 | |
| | | | | | | | | | | | | |
Commercial Banks | | 0.4% | | | | | | | | | | | |
ATF Capital BV | | | | 9.250% | | 2/21/14 | | | 1,105 | | | 1,126 | A |
TuranAlem Finance BV | | | | 8.250% | | 1/22/37 | | | 1,720 | | | 1,453 | A |
TuranAlem Finance BV | | | | 8.250% | | 1/22/37 | | | 1,585 | | | 1,383 | A |
| | | | | | | | | | | | | |
| | | | | | | | | | | | 3,962 | |
| | | | | | | | | | | | | |
Containers and Packaging | | 0.4% | | | | | | | | | | | |
Smurfit Capital Funding PLC | | | | 7.500% | | 11/20/25 | | | 2,225 | | | 2,136 | |
Smurfit Kappa Funding PLC | | | | 7.750% | | 4/1/15 | | | 2,070 | | | 2,018 | |
| | | | | | | | | | | | | |
| | | | | | | | | | | | 4,154 | |
| | | | | | | | | | | | | |
Diversified Financial Services | | 1.0% | | | | | | | | | | | |
Basell AF SCA | | | | 8.375% | | 8/15/15 | | | 2,595 | | | 2,368 | A |
JPMorgan Chase | | | | 0.000% | | 11/8/07 | | | 3,985 | | | 3,996 | A,J |
Petroplus Finance Ltd. | | | | 6.750% | | 5/1/14 | | | 1,110 | | | 1,065 | A |
Petroplus Finance Ltd. | | | | 7.000% | | 5/1/17 | | | 2,065 | | | 1,962 | A |
| | | | | | | | | | | | | |
| | | | | | | | | | | | 9,391 | |
| | | | | | | | | | | | | |
119
Semi-Annual Report to Shareholders
Portfolio of Investments—Continued
Western Asset High Yield Portfolio—Continued
| | | | | | | | | | | | | |
| | | % OF
NET ASSETS | | RATE | | MATURITY
DATE | | PAR/
SHARES | | VALUE | |
| | | | | | | | | | | | | |
Yankee Bonds—Continued | | | | | | | | | | | | | |
| | | | | |
Diversified Telecommunication Services | | 2.7% | | | | | | | | | | | |
Intelsat Bermuda Ltd. | | | | 9.250% | | 6/15/16 | | $ | 2,625 | | $ | 2,723 | |
Intelsat Bermuda Ltd. | | | | 11.250% | | 6/15/16 | | | 7,265 | | | 7,783 | |
Nordic Telephone Co. Holdings ApS | | | | 8.875% | | 5/1/16 | | | 5,305 | | | 5,597 | A |
NTL Cable PLC | | | | 9.125% | | 8/15/16 | | | 6,250 | | | 6,484 | |
Wind Acquisition Finance SA | | | | 10.750% | | 12/1/15 | | | 2,605 | | | 2,885 | A |
| | | | | | | | | | | | | |
| | | | | | | | | | | | 25,472 | |
| | | | | | | | | | | | | |
Energy Equipment and Services | | 0.2% | | | | | | | | | | | |
Compagnie Generale de Geophysique-Veritas | | | | 7.500% | | 5/15/15 | | | 1,950 | | | 2,008 | |
| | | | | | | | | | | | | |
| | | | | |
Foreign Governments | | 0.9% | | | | | | | | | | | |
Federative Republic of Brazil | | | | 8.000% | | 1/15/18 | | | 240 | | | 268 | |
Federative Republic of Brazil | | | | 11.000% | | 8/17/40 | | | 1,527 | | | 2,042 | |
Russian Federation | | | | 7.500% | | 3/31/30 | | | 5,920 | | | 6,677 | A |
| | | | | | | | | | | | | |
| | | | | | | | | | | | 8,987 | |
| | | | | | | | | | | | | |
Independent Power Producers and Energy Traders | | 0.2% | | | | | | | | | | | |
AES China Generating Co. Ltd. | | | | 8.250% | | 6/26/10 | | | 1,705 | | | 1,675 | |
| | | | | | | | | | | | | |
| | | | | |
Media | | 0.6% | | | | | | | | | | | |
Rogers Cable Inc. | | | | 6.750% | | 3/15/15 | | | 2,150 | | | 2,210 | |
Sun Media Corp. | | | | 7.625% | | 2/15/13 | | | 3,880 | | | 3,812 | |
| | | | | | | | | | | | | |
| | | | | | | | | | | | 6,022 | |
| | | | | | | | | | | | | |
Metals and Mining | | 0.5% | | | | | | | | | | | |
Novelis Inc. | | | | 7.250% | | 2/15/15 | | | 5,125 | | | 4,946 | |
| | | | | | | | | | | | | |
| | | | | |
Oil, Gas and Consumable Fuels | | 1.1% | | | | | | | | | | | |
Corral Finans AB | | | | 10.360% | | 4/15/10 | | | 2,674 | | | 2,540 | A,D,F |
OPTI Canada Inc. | | | | 7.875% | | 12/15/14 | | | 30 | | | 30 | A |
OPTI Canada Inc. | | | | 8.250% | | 12/15/14 | | | 2,645 | | | 2,665 | A |
Teekay Shipping Corp. | | | | 8.875% | | 7/15/11 | | | 1,362 | | | 1,430 | |
Western Oil Sands Inc. | | | | 8.375% | | 5/1/12 | | | 3,285 | | | 3,626 | |
| | | | | | | | | | | | | |
| | | | | | | | | | | | 10,291 | |
| | | | | | | | | | | | | |
Paper and Forest Products | | 0.8% | | | | | | | | | | | |
Abitibi-Consolidated Co. of Canada | | | | 6.000% | | 6/20/13 | | | 2,335 | | | 1,634 | |
Abitibi-Consolidated Co. of Canada | | | | 8.375% | | 4/1/15 | | | 400 | | | 291 | |
Abitibi-Consolidated Inc. | | | | 8.550% | | 8/1/10 | | | 895 | | | 738 | |
Abitibi-Consolidated Inc. | | | | 7.750% | | 6/15/11 | | | 340 | | | 262 | |
120
Semi-Annual Report to Shareholders
| | | | | | | | | | | | | | |
| | | % OF
NET ASSETS | | RATE | | MATURITY
DATE | | PAR/
SHARES | | | VALUE | |
| | | | | | | | | | | | | | |
Yankee Bonds—Continued | | | | | | | | | | | | | | |
| | | | | |
Paper and Forest Products—Continued | | | | | | | | | | | | | | |
Abitibi-Consolidated Inc. | | | | 7.400% | | 4/1/18 | | $ | 4,360 | | | $ | 2,965 | |
Abitibi-Consolidated Inc. | | | | 8.850% | | 8/1/30 | | | 630 | | | | 435 | |
Ainsworth Lumber Co., Ltd. | | | | 7.250% | | 10/1/12 | | | 1,220 | | | | 836 | |
Ainsworth Lumber Co., Ltd. | | | | 6.750% | | 3/15/14 | | | 555 | | | | 358 | |
| | | | | | | | | | | | | | |
| | | | | | | | | | | | | 7,519 | |
| | | | | | | | | | | | | | |
Road and Rail | | 0.5% | | | | | | | | | | | | |
Grupo Transportacion Ferroviaria Mexicana SA de CV | | | | 9.375% | | 5/1/12 | | | 2,510 | | | | 2,629 | |
Grupo Transportacion Ferroviaria Mexicana SA de CV | | | | 7.625% | | 12/1/13 | | | 540 | | | | 529 | A |
Grupo Transportacion Ferroviaria Mexicana SA de CV | | | | 7.375% | | 6/1/14 | | | 1,380 | | | | 1,349 | A |
| | | | | | | | | | | | | | |
| | | | | | | | | | | | | 4,507 | |
| | | | | | | | | | | | | | |
Semiconductors and Semiconductor Equipment | | 0.4% | | | | | | | | | | | | |
NXP BV/NXP Funding LLC | | | | 7.875% | | 10/15/14 | | | 2,895 | | | | 2,787 | |
NXP BV/NXP Funding LLC | | | | 9.500% | | 10/15/15 | | | 1,330 | | | | 1,240 | |
| | | | | | | | | | | | | | |
| | | | | | | | | | | | | 4,027 | |
| | | | | | | | | | | | | | |
Wireless Telecommunication Services | | 0.8% | | | | | | | | | | | | |
Rogers Wireless Inc. | | | | 7.250% | | 12/15/12 | | | 1,060 | | | | 1,122 | |
True Move Co. Ltd. | | | | 10.750% | | 12/16/13 | | | 5,505 | | | | 5,558 | A |
True Move Co. Ltd. | | | | 10.750% | | 12/16/13 | | | 865 | | | | 873 | |
| | | | | | | | | | | | | | |
| | | | | | | | | | | | | 7,553 | |
| | | | | | | | | | | | | | |
Total Yankee Bonds (Cost—$109,926) | | | | | | | | | | | | | 107,527 | |
Common Stocks and Equity Interests | | N.M. | | | | | | | | | | | | |
Washington Group International Inc. | | | | | | | | | 1 | shs | | | 62 | K |
| | | | | | | | | | | | | | |
Total Common Stocks and Equity Interests
(Cost—$—)L | | | | | | | | | | | | | 62 | |
Preferred Stocks | | 0.1% | | | | | | | | | | | | |
Chesapeake Energy Corp. | | | | 6.250% | | | | | 4 | | | | 1,273 | B |
ION Media Networks Inc. | | | | 12.000% | | | | | — | M | | | 60 | |
| | | | | | | | | | | | | | |
Total Preferred Stocks (Cost—$1,226) | | | | | | | | | | | | | 1,333 | |
Warrants | | N.M. | | | | | | | | | | | | |
Next Generation Network Inc. | | | | | | | | | 3 | wts | | | — | H,K,L |
| | | | | | | | | | | | | | |
Total Warrants (Cost—$—)L | | | | | | | | | | | | | — | L |
Loan Participations and AssignmentsD | | 1.7% | | | | | | | | | | | | |
| | | | | |
Auto Components | | 0.4% | | | | | | | | | | | | |
Allison Transmission Inc., Term Loan, Tranche B | | | | 8.480% to
8.570% | | 12/10/07 | | $ | 4,250 | | | | 4,112 | |
| | | | | | | | | | | | | | |
121
Semi-Annual Report to Shareholders
Portfolio of Investments—Continued
Western Asset High Yield Portfolio—Continued
| | | | | | | | | | | | |
| | | % OF
NET ASSETS | | RATE | | MATURITY
DATE | | PAR/
SHARES | | VALUE |
| | | | | | | | | | | | |
Loan Participations and Assignments—Continued | | | | | | | | | | | | |
| | | | | |
Containers and Packaging | | 0.3% | | | | | | | | | | |
Berry Plastics Holding Corp., Term Loan | | | | 12.244% | | 1/7/08 | | $ | 3,000 | | $ | 2,700 |
| | | | | | | | | | | | |
| | | | | |
Independent Power Producers and Energy Traders | | 0.2% | | | | | | | | | | |
Dynegy Holdings Inc., Term Loan | | | | 4.819% | | 4/2/13 | | | 2,000 | | | 1,910 |
| | | | | | | | | | | | |
| | | | | | | | | | | | 1,910 |
| | | | | | | | | | | | |
IT Services | | 0.8% | | | | | | | | | | |
First Data Corp., Term Loan, Tranche B1 | | | | 7.960% | | 12/24/07 | | | 7,500 | | | 7,192 |
| | | | | | | | | | | | |
Total Loan Participations and Assignments
(Cost—$15,885) | | | | | | | | | | | | 15,914 |
| | | | | | | | | | | | |
Total Long-Term Securities (Cost—$935,865) | | | | | | | | | | | | 916,128 |
Short-Term Securities | | 4.1% | | | | | | | | | | |
| | | | | |
Repurchase Agreement | | 4.1% | | | | | | | | | | |
Goldman Sachs & Company
4.85%, dated 9/28/07, to be repurchased at $39,715 on 10/1/07 (Collateral: $38,520 Federal Home Loan Bank notes, 5.375%, due 5/18/16, value $40,494) | | | | | | | | | 39,699 | | | 39,699 |
| | | | | | | | | | | | |
Total Short-Term Securities (Cost—$39,699) | | | | | | | | | | | | 39,699 |
Total Investments (Cost—$975,564)N | | 99.4% | | | | | | | | | | 955,827 |
Other Assets Less Liabilities | | 0.6% | | | | | | | | | | 5,759 |
| | | | | | | | | | | | |
| | | | | |
Net Assets | | 100.0% | | | | | | | | | $ | 961,586 |
| | | | | | | | | | | | |
| | | | | | | | | | | | | |
N.M.—Not Meaningful.
A | | Rule 144a Security – A security purchased pursuant to Rule 144a under the Securities Act of 1933 which may not be resold subject to that rule except to qualified institutional buyers. These securities, which the Fund’s investment adviser has determined to be liquid, represent 20.51% of net assets. |
B | | Convertible Security – Security may be converted into the issuer’s common stock. |
C | | Stepped Coupon Security – A security with a predetermined schedule of interest or dividend rate changes at which time it begins to accrue interest or pay dividends according to the predetermined schedule. |
D | | Indexed Security – The rates of interest earned on these securities are tied to the London Interbank Offered Rate (“LIBOR”), the Consumer Price Index (“CPI”) or the one-year Treasury Bill Rate. The coupon rates are the rates as of September 30, 2007. |
E | | Credit Linked Security – The rates of interest earned on these securities are tied to the credit rating assigned by Standard & Poor’s Rating Service and/or Moody’s Investors Services. |
F | | Pay-in-Kind (“PIK”) security – A security in which interest or dividends during the initial few years is paid in additional PIK securities rather than in cash. |
122
Semi-Annual Report to Shareholders
G | | The coupon rates shown on variable rate securities are the rates at September 30, 2007. These rates vary with the weighted average coupon of the underlying loans. |
H | | Illiquid security valued at fair value under the procedures approved by the Board of Directors. |
I | | Yankee Bond – A dollar-denominated bond issued in the U.S. by foreign entities. |
J | | Zero coupon bond – A bond with no periodic interest payments which is sold at such a discount as to produce a current yield to maturity. |
M | | Amount less than $0.05. |
N | | Aggregate cost for federal income tax purposes is substantially the same as book cost. At September 30, 2007, the aggregate gross unrealized appreciation and depreciation of investments for federal income tax purposes were substantially as follows: |
| | | | |
| Gross unrealized appreciation | | $ | 9,253 | |
| Gross unrealized depreciation | | | (28,980 | ) |
| | | | |
| Net unrealized depreciation | | $ | (19,737 | ) |
| | | | |
See notes to financial statements.
123
Semi-Annual Report to Shareholders
Statement of Assets and Liabilities
Western Asset High Yield Portfolio
September 30, 2007 (Unaudited)
(Amounts in Thousands)
| | | | | | | |
Assets: | | | | | | | |
Investment securities at market value (Cost—$935,865) | | | | | $ | 916,128 | |
Short-term securities at value (Cost—$39,699) | | | | | | 39,699 | |
Cash | | | | | | 1 | |
Interest receivable | | | | | | 22,670 | |
Receivable for securities sold | | | | | | 3,651 | |
Receivable for fund shares sold | | | | | | 101 | |
| | | | | | | |
Total assets | | | | | | 982,250 | |
| | | | | | | |
| | |
Liabilities: | | | | | | | |
Payable for securities purchased | | $ | 19,680 | | | | |
Accrued management fee | | | 428 | | | | |
Swap contracts at value | | | 250 | | | | |
Payable for fund shares repurchased | | | 234 | | | | |
Accrued expenses | | | 72 | | | | |
| | | | | | | |
Total liabilities | | | | | | 20,664 | |
| | | | | | | |
| | |
Net Assets | | | | | $ | 961,586 | |
| | | | | | | |
| | |
Net assets consist of: | | | | | | | |
Accumulated paid-in-capital | | | | | $ | 960,826 | |
Undistributed net investment income | | | | | | 18,784 | |
Accumulated net realized gain on investments and swaps | | | | | | 1,963 | |
Net unrealized depreciation on investments and swaps | | | | | | (19,987 | ) |
| | | | | | | |
| | |
Net Assets | | | | | $ | 961,586 | |
| | | | | | | |
| | |
Net Asset Value Per Share: | | | | | | | |
Institutional Class (93,629 shares outstanding) | | | | | | $10.27 | |
| | | | | | | | |
See notes to financial statements.
124
Semi-Annual Report to Shareholders
Statement of Operations
Western Asset High Yield Portfolio
For the Six Months Ended September 30, 2007 (Unaudited)
(Amounts in Thousands)
| | | | | | | | |
Investment Income: | | | | | | | | |
Interest | | $ | 38,286 | | | | | |
Dividends | | | 33 | | | | | |
| | | | | | | | |
Total income | | | | | | $ | 38,319 | |
Expenses: | | | | | | | | |
Management fees | | | 2,472 | | | | | |
Audit and legal fees | | | 47 | | | | | |
Custodian fees | | | 42 | | | | | |
Directors’ fees and expenses | | | 12 | | | | | |
Registration fees | | | 16 | | | | | |
Reports to shareholders | | | 2 | | | | | |
Transfer agent and shareholder servicing expense: | | | | | | | | |
Institutional Class | | | 10 | | | | | |
Other expenses | | | 22 | | | | | |
| | | | | | | | |
| | | 2,623 | | | | | |
Less: Compensating balance credits | | | (12 | ) | | | | |
| | | | | | | | |
Net expenses | | | | | | | 2,611 | |
| | | | | | | | |
Net Investment Income | | | | | | | 35,708 | |
Net Realized and Unrealized Gain/(Loss) on Investments: | | | | | | | | |
Net realized gain on: | | | | | | | | |
Investments | | | 2,809 | | | | | |
Swaps | | | 129 | | | | | |
| | | | | | | | |
| | | | | | | 2,938 | |
Change in unrealized appreciation/depreciation of investments and swaps | | | | | | | (39,697 | ) |
| | | | | | | | |
Net Realized and Unrealized Loss on Investments | | | | | | | (36,759 | ) |
| | | | | | | | | |
Change in Net Assets Resulting From Operations | | | | | | $ | (1,051 | ) |
| | | | | | | | | |
See notes to financial statements.
125
Semi-Annual Report to Shareholders
Statement of Changes in Net Assets
Western Asset High Yield Portfolio
(Amounts in Thousands)
| | | | | | | | |
| | | FOR THE
SIX MONTHS ENDED
SEPTEMBER 30, 2007 | | | FOR THE
YEAR ENDED
MARCH 31, 2007 | |
| Change in Net Assets: | | (Unaudited) | | | | |
Net investment income | | $ | 35,708 | | | $ | 53,018 | |
| | |
Net realized gain | | | 2,938 | | | | 4,212 | |
| | |
Change in unrealized appreciation/depreciation | | | (39,697 | ) | | | 21,006 | |
| | | | | | | | |
Change in net assets resulting from operations | | | (1,051 | ) | | | 78,236 | |
| | |
Distributions to shareholders from: | | | | | | | | |
Net investment income: | | | | | | | | |
Institutional Class | | | (33,514 | ) | | | (48,140 | ) |
| | |
Net realized gain on investments: | | | | | | | | |
Institutional Class | | | (4,804 | ) | | | (131 | ) |
| | |
Change in net assets from fund share transactions: | | | | | | | | |
Institutional Class | | | 121,632 | | | | 252,440 | |
| | | | | | | | |
Change in net assets | | | 82,263 | | | | 282,405 | |
| | |
Net Assets: | | | | | | | | |
Beginning of period | | | 879,323 | | | | 596,918 | |
| | | | | | | | |
| | |
End of period | | $ | 961,586 | | | $ | 879,323 | |
| | | | | | | | |
| | |
Under distributions of net investment income | | $ | 18,784 | | | $ | 16,590 | |
| | | | | | | | |
| | | | | | | | | |
See notes to financial statements.
126
Semi-Annual Report to Shareholders
Financial Highlights
Western Asset High Yield Portfolio
For a share of each class of capital stock outstanding:
Institutional Class:
| | | | | | | | | | | | | | | | | | | | | | | | |
| | | SIX MONTHS
ENDED SEPTEMBER 30,
2007 | | | YEARS ENDED MARCH 31, | |
| | | | 2007 | | | 2006 | | | 2005 | | | 2004 | | | 2003 | |
| | | (Unaudited) | | | | | | | | | | | | | | | | |
Net asset value, beginning of period | | $ | 10.75 | | | $ | 10.34 | | | $ | 10.49 | | | $ | 10.28 | | | $ | 9.56 | | | $ | 10.36 | |
| | | | | | | | | | | | | | | | | | | | | | | | |
Investment operations: | | | | | | | | | | | | | | | | | | | | | | | | |
Net investment income | | | .41 | A | | | .80 | A | | | .76 | | | | .61 | | | | .78 | | | | .96 | |
Net realized and unrealized gain/(loss) | | | (.44 | ) | | | .39 | | | | (.05 | ) | | | .17 | | | | .89 | | | | (.82 | ) |
| | | | | | | | | | | | | | | | | | | | | | | | |
Total from investment operations | | | (.03 | ) | | | 1.19 | | | | .71 | | | | .78 | | | | 1.67 | | | | .14 | |
| | | | | | | | | | | | | | | | | | | | | | | | |
Distributions from: | | | | | | | | | | | | | | | | | | | | | | | | |
Net investment income | | | (.39 | ) | | | (.78 | ) | | | (.73 | ) | | | (.57 | ) | | | (.95 | ) | | | (.94 | ) |
Net realized gain on investments | | | (.06 | ) | | | — | B | | | (.13 | ) | | | — | | | | — | | | | — | |
| | | | | | | | | | | | | | | | | | | | | | | | |
Total distributions | | | (.45 | ) | | | (.78 | ) | | | (.86 | ) | | | (.57 | ) | | | (.95 | ) | | | (.94 | ) |
| | | | | | | | | | | | | | | | | | | | | | | | |
Net asset value, end of period | | $ | 10.27 | | | $ | 10.75 | | | $ | 10.34 | | | $ | 10.49 | | | $ | 10.28 | | | $ | 9.56 | |
| | | | | | | | | | | | | | | | | | | | | | | | |
Total return | | | (.35 | )%C | | | 12.14 | % | | | 7.30 | % | | | 7.81 | % | | | 18.27 | % | | | 2.22 | % |
| | | | | | |
Ratios to Average Net Assets:D | | | | | | | | | | | | | | | | | | | | | | | | |
Total expenses | | | .58 | %E | | | .61 | % | | | .62 | % | | | .62 | % | | | .67 | % | | | .67 | % |
Expenses net of waivers, if any | | | .58 | %E | | | .61 | % | | | .62 | % | | | .62 | % | | | .58 | % | | | .55 | % |
Expenses net of all reductions | | | .58 | %E | | | .61 | % | | | .62 | % | | | .62 | % | | | .58 | % | | | .55 | % |
Net investment income | | | 7.9 | %E | | | 7.8 | % | | | 7.8 | % | | | 7.0 | % | | | 7.9 | % | | | 10.2 | % |
| | | | | | |
Supplemental Data: | | | | | | | | | | | | | | | | | | | | | | | | |
Portfolio turnover rate | | | 26.3 | %C | | | 63.6 | % | | | 147.2 | % | | | 121.0 | % | | | 116.0 | % | | | 110.1 | % |
Net assets, end of period (in thousands) | | $ | 961,586 | | | $ | 879,323 | | | $ | 596,918 | | | $ | 414,417 | | | $ | 189,458 | | | $ | 149,937 | |
| | | | | | | | | | | | | | | | | | | | | | | | | |
A | | Computed using average daily shares outstanding. |
B | | Amount less than $.01 per share. |
D | | Total expenses reflects operating expenses prior to any voluntary expense waivers and/or compensating balance credits. Expenses net of waivers reflects total expenses before compensating balance credits but net of any voluntary expense waivers. Expenses net of all reductions reflects expenses less any compensating balance credits and/or voluntary expense waivers. |
See notes to financial statements.
127
Semi-Annual Report to Shareholders
Expense Example
Western Asset Inflation Indexed Plus Bond Portfolio
As a shareholder of the Fund, you incur ongoing costs, including management fees, distribution fees on Financial Intermediary Class shares, and other Fund expenses. These examples are intended to help you understand your ongoing costs (in dollars) of investing in the Fund and to compare these costs with the ongoing costs of investing in other mutual funds. The example is based on an investment of $1,000 invested on April 1, 2007, and held through September 30, 2007. The Financial Intermediary Class began operations on June 28, 2007, therefore an expense example is not presented.
Actual Expenses
The first line in the table below provides information about actual account values and actual expenses for the Fund. You may use the information in this line, together with the amount you invested, to estimate the expenses that you paid over the period. Simply divide your account value by $1,000 (for example, an $8,600 account value divided by $1,000 = 8.6), then multiply the result by the number in the first line under the heading entitled “Expenses Paid During the Period” to estimate the expenses you paid on your account during this period.
Hypothetical Example for Comparison Purposes
The second line in the table below provides information about hypothetical account values and hypothetical expenses based on the Fund’s actual expense ratio and an assumed rate of return of 5% per year before expenses, which is not the Fund’s actual return. The hypothetical account values and expenses may not be used to estimate the actual ending account balance or expenses you paid for the period. You may use this information to compare the ongoing costs of investing in the Fund and other funds. To do so, compare this 5% hypothetical example with the 5% hypothetical examples that appear in the shareholder reports of other funds.
| | | | | | | | | |
| | | Beginning
Account Value
4/1/07 | | Ending
Account Value
9/30/07 | | Expenses PaidA
During the Period
4/1/07 to 9/30/07 |
Institutional Class: | | | | | | | | | |
Actual | | $ | 1,000.00 | | $ | 1,032.40 | | $ | 1.27 |
Hypothetical (5% return before expenses) | | | 1,000.00 | | | 1,023.82 | | | 1.27 |
A | | These calculations are based on expenses incurred in the most recent fiscal half-year. The dollar amounts shown as “Expenses Paid During the Period” are equal to the annualized expense ratio of 0.25% multiplied by the average value over the period, multiplied by the number of days in the most recent fiscal half-year (183), and divided by 365 . |
128
Semi-Annual Report to Shareholders
Performance Information
Western Asset Inflation Indexed Plus Bond Portfolio
The graph compares the Fund’s total returns to that of an appropriate broad-based securities market index. The line illustrates the cumulative total return of an initial $1,000,000 investment for the periods indicated. The line for the Fund represents the total return after deducting all Fund investment management and other administrative expenses and the transaction costs of buying and selling securities. The line representing the securities market index does not include any transaction costs associated with buying and selling securities in the index or other investment management or administrative expenses.
Due to the limited operating history of the Financial Intermediary Class, a performance graph is not presented. The Financial Intermediary Class shares, which began operations on June 28, 2007 had a total return of 4.81% for the period from its inception to September 30, 2007.
Total return measures investment performance in terms of appreciation or depreciation in the Fund’s net asset value per share, plus dividends and any capital gain distributions. It assumes that dividends and distributions were reinvested at the time they were paid. Returns (and the graph and table found below) do not reflect the deduction of taxes that a shareholder would pay on Fund distributions or the redemption of Fund shares. Average annual returns tend to smooth out variations in a fund’s return, so that they differ from actual year-to-year results.
Bonds are subject to a variety of risks, including interest rate, credit and inflation risk.
Growth of a $1,000,000 Investment—Institutional Class
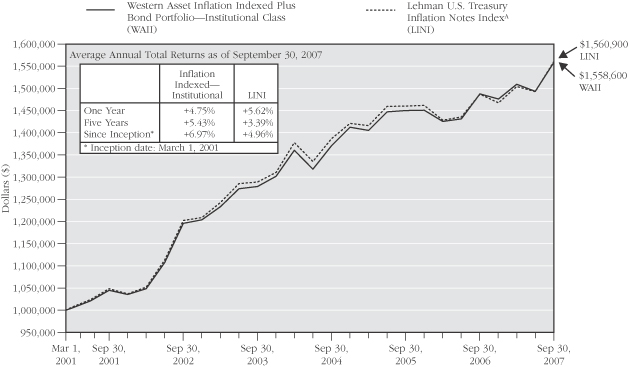
The performance data quoted represents past performance and does not guarantee future results. The performance stated may have been due to extraordinary market conditions, which may not be duplicated in the future. Current performance may be lower or higher than the performance data quoted. To obtain the most recent month-end performance information, please visit www.westernassetfunds.com. The investment return and principal value of the Fund will fluctuate so that an investor’s shares, when redeemed, may be worth more or less than the original cost. Calculations assume reinvestment of dividends and capital gain distributions. Performance would have been lower if fees had not been waived in various periods.
A | | Index returns are for periods beginning February 28, 2001. |
129
Semi-Annual Report to Shareholders
Performance Information—Continued
Portfolio Composition (as of September 30, 2007)
Standard & Poor’s Debt RatingsB
(as a percentage of the portfolio)
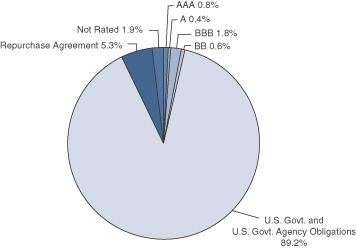
Maturity Schedule (as a percentage of the portfolio)
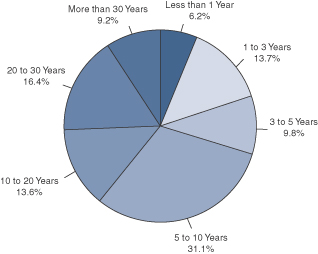
B | | Source: Standard & Poor's. |
The Fund is actively managed. As a result, the composition of the portfolio holdings and sectors are subject to change at any time.
130
Semi-Annual Report to Shareholders
Portfolio of Investments
Western Asset Inflation Indexed Plus Bond Portfolio
September 30, 2007 (Unaudited)
(Amounts in Thousands)
| | | | | | | | | | | | | |
| | | % OF
NET ASSETS | | RATE | | MATURITY
DATE | | PAR† | | VALUE | |
| | | | | | | | | | | | | |
Long-Term Securities | | 101.6% | | | | | | | | | | | |
| | | | | |
Corporate Bonds and Notes | | 1.6% | | | | | | | | | | | |
| | | | | |
Consumer Finance | | 0.5% | | | | | | | | | | | |
SLM Corp. | | | | 5.375% | | 1/15/13 | | $ | 2,775 | | $ | 2,512 | |
SLM Corp. | | | | 5.375% | | 5/15/14 | | | 1,580 | | | 1,379 | |
| | | | | | | | | | | | | |
| | | | | | | | | | | | 3,891 | |
| | | | | | | | | | | | | |
Diversified Financial Services | | 0.4% | | | | | | | | | | | |
J.P. Morgan and Co. Inc. | | | | 7.214% | | 2/15/12 | | | 2,690 | | | 2,777 | A |
| | | | | | | | | | | | | |
| | | | | |
Oil, Gas and Consumable Fuels | | 0.3% | | | | | | | | | | | |
The Williams Cos. Inc. | | | | 8.750% | | 3/15/32 | | | 1,900 | | | 2,187 | |
| | | | | | | | | | | | | |
Thrifts and Mortgage Finance | | 0.4% | | | | | | | | | | | |
Residential Capital LLC | | | | 7.000% | | 2/22/11 | | | 3,500 | | | 2,853 | B |
| | | | | | | | | | | | | |
Total Corporate Bonds and Notes
(Cost—$11,931) | | | | | | | | | | | | 11,708 | |
Asset-Backed Securities | | 0.2% | | | | | | | | | | | |
| | | | | |
Indexed SecuritiesA | | 0.2% | | | | | | | | | | | |
Bear Stearns Asset Backed Securities Inc. 2003-ABF1 | | | | 5.501% | | 2/25/34 | | | 181 | | | 173 | |
Chase Funding Mortgage Loan Asset-Backed Certificates 2002-4 | | | | 5.871% | | 10/25/32 | | | 184 | | | 182 | |
Countrywide Asset-Backed Certificates 2002-1 | | | | 5.691% | | 8/25/32 | | | 46 | | | 45 | |
EMC Mortgage Loan Trust 2003-B | | | | 5.681% | | 11/25/41 | | | 498 | | | 479 | C |
GSRPM Mortgage Loan Trust 2003-2 | | | | 5.831% | | 6/25/33 | | | 350 | | | 352 | |
Residential Asset Mortgage Products Inc. 2003-RS2 | | | | 5.471% | | 3/25/33 | | | 52 | | | 51 | |
| | | | | | | | | | | | | |
Total Asset-Backed Securities (Cost—$1,312) | | | | | | | | | | | | 1,282 | |
Mortgage-Backed Securities | | 0.2% | | | | | | | | | | | |
| | | | | |
Indexed SecuritiesA | | 0.2% | | | | | | | | | | | |
Credit Suisse First Boston Mortgage Securities Corp. 2001-28 | | | | 5.781% | | 11/25/31 | | | 533 | | | 533 | |
Crusade Global Trust 2003-2 | | | | 5.836% | | 9/18/34 | | | 787 | | | 788 | D |
| | | | | | | | | | | | | |
Total Mortgage-Backed Securities (Cost—$1,322) | | | | | | | | | | | | 1,321 | |
U.S. Government and Agency Obligations | | 87.3% | | | | | | | | | | | |
| | | | | |
Treasury Inflation-Protected SecuritiesE | | 87.3% | | | | | | | | | | | |
United States Treasury Inflation-Protected Security | | | | 3.875% | | 1/15/09 | | | 56,584 | | | 57,742 | F |
United States Treasury Inflation-Protected Security | | | | 4.250% | | 1/15/10 | | | 13,904 | | | 14,561 | |
United States Treasury Inflation-Protected Security | | | | 0.875% | | 4/15/10 | | | 35,735 | | | 34,548 | F,G |
United States Treasury Inflation-Protected Security | | | | 3.500% | | 1/15/11 | | | 29,400 | | | 30,682 | F |
131
Semi-Annual Report to Shareholders
Portfolio of Investments—Continued
Western Asset Inflation Indexed Plus Bond Portfolio—Continued
| | | | | | | | | | | | | |
| | | % OF
NET ASSETS | | RATE | | MATURITY
DATE | | PAR† | | VALUE | |
| | | | | | | | | | | | | |
U.S. Government and Agency Obligations—Continued | | | | | | | | | | | | | |
| | | | | |
Treasury Inflation-Protected Securities—Continued | | | | | | | | | | | | | |
United States Treasury Inflation-Protected Security | | | | 2.375% | | 4/15/11 | | $ | 12,635 | | $ | 12,717 | F |
United States Treasury Inflation-Protected Security | | | | 3.000% | | 7/15/12 | | | 26,808 | | | 27,901 | F |
United States Treasury Inflation-Protected Security | | | | 1.875% | | 7/15/13 | | | 35,759 | | | 35,189 | F |
United States Treasury Inflation-Protected Security | | | | 2.000% | | 1/15/14 | | | 31,813 | | | 31,356 | F |
United States Treasury Inflation-Protected Security | | | | 2.000% | | 7/15/14 | | | 21,969 | | | 21,672 | F |
United States Treasury Inflation-Protected Security | | | | 1.625% | | 1/15/15 | | | 26,258 | | | 25,121 | |
United States Treasury Inflation-Protected Security | | | | 1.875% | | 7/15/15 | | | 34,556 | | | 33,641 | F |
United States Treasury Inflation-Protected Security | | | | 2.000% | | 1/15/16 | | | 22,543 | | | 22,036 | F |
United States Treasury Inflation-Protected Security | | | | 2.500% | | 7/15/16 | | | 25,353 | | | 25,824 | F |
United States Treasury Inflation-Protected Security | | | | 2.375% | | 1/15/17 | | | 32,062 | | | 32,292 | F |
United States Treasury Inflation-Protected Security | | | | 2.625% | | 7/15/17 | | | 5,025 | | | 5,180 | F |
United States Treasury Inflation-Protected Security | | | | 2.375% | | 1/15/25 | | | 50,297 | | | 50,741 | F |
United States Treasury Inflation-Protected Security | | | | 2.000% | | 1/15/26 | | | 39,923 | | | 38,126 | F |
United States Treasury Inflation-Protected Security | | | | 2.375% | | 1/15/27 | | | 16,248 | | | 16,446 | F |
United States Treasury Inflation-Protected Security | | | | 3.625% | | 4/15/28 | | | 38,623 | | | 47,048 | F |
United States Treasury Inflation-Protected Security | | | | 3.875% | | 4/15/29 | | | 52,204 | | | 66,291 | F |
| | | | | | | | | | | | | |
Total U.S. Government and Agency Obligations
(Cost—$626,264) | | | | | | | | | | | | 629,114 | |
U.S. Government Agency Mortgage-Backed Securities | | 9.4% | | | | | | | | | | | |
| | | | | |
Fixed Rate Securities | | 9.4% | | | | | | | | | | | |
Fannie Mae | | | | 5.000% | | 12/1/37 | | | 25,600 | | | 24,411 | H |
Fannie Mae | | | | 6.000% | | 12/1/37 | | | 43,100 | | | 43,121 | H |
| | | | | | | | | | | | | |
Total U.S. Government Agency Mortgage-Backed Securities (Cost—$67,481) | | | | | | | | | | | | 67,532 | |
Yankee BondsD | | 1.9% | | | | | | | | | | | |
| | | | | |
Commercial Banks | | 0.8% | | | | | | | | | | | |
Glitnir Banki Hf | | | | 6.693% | | 6/15/16 | | | 1,760 | | | 1,799 | C,I |
Kaupthing Bank Hf | | | | 7.125% | | 5/19/16 | | | 2,940 | | | 2,967 | C |
RSHB Capital SA | | | | 6.299% | | 5/15/17 | | | 1,500 | | | 1,412 | C |
| | | | | | | | | | | | | |
| | | | | | | | | | | | 6,178 | |
| | | | | | | | | | | | | |
Foreign Governments | | 0.9% | | | | | | | | | | | |
Federative Republic of Brazil | | | | 8.875% | | 4/15/24 | | | 180 | | | 232 | |
Federative Republic of Brazil | | | | 10.125% | | 5/15/27 | | | 310 | | | 442 | |
Federative Republic of Brazil | | | | 11.000% | | 8/17/40 | | | 510 | | | 682 | |
Republic of Colombia | | | | 7.375% | | 9/18/37 | | | 410 | | | 451 | |
132
Semi-Annual Report to Shareholders
| | | | | | | | | | | | | | |
| | | % OF
NET ASSETS | | RATE | | MATURITY
DATE | | PAR† | | | VALUE | |
| | | | | | | | | | | | | | |
Yankee Bonds—Continued | | | | | | | | | | | | | | |
| | | | | |
Foreign Governments—Continued | | | | | | | | | | | | | | |
Republic of Panama | | | | 7.125% | | 1/29/26 | | $ | 408 | | | $ | 441 | |
Republic of Panama | | | | 6.700% | | 1/26/36 | | | 305 | | | | 313 | |
Russian Federation | | | | 7.500% | | 3/31/30 | | | 3,354 | | | | 3,783 | C |
| | | | | | | | | | | | | | |
| | | | | | | | | | | | | 6,344 | |
| | | | | | | | | | | | | | |
Metals and Mining | | 0.2% | | | | | | | | | | | | |
Vale Overseas Ltd. | | | | 6.875% | | 11/21/36 | | | 1,463 | | | | 1,507 | |
| | | | | | | | | | | | | | |
Total Yankee Bonds (Cost—$13,585) | | | | | | | | | | | | | 14,029 | |
Foreign Government Obligations | | 1.0% | | | | | | | | | | | | |
Canadian Real Return Bond | | | | 3.000% | | 12/1/36 | | | 962 | CAD | | | 1,166 | J |
Federative Republic of Brazil | | | | 6.000% | | 5/15/45 | | | 4 | BRL | | | 3,048 | J |
Kingdom of Sweden Inflation-Protected Notes | | | | 3.500% | | 12/1/28 | | | 14,480 | SEK | | | 3,219 | J |
| | | | | | | | | | | | | | |
Total Foreign Government Obligations
(Cost—$6,264) | | | | | | | | | | | | | 7,433 | |
| | | | | | | | | | | | | | |
Total Long-Term Securities (Cost—$728,159) | | | | | | | | | | | | | 732,419 | |
Investment of Collateral From Securities Lending | | 17.5% | | | | | | | | | | | | |
State Street Navigator Securities Lending Prime Portfolio | | | | | | | | | 126,271 | shs | | | 126,271 | |
| | | | | | | | | | | | | | |
Total Investment of Collateral From Securities Lending (Cost—$126,271) | | | | | | | | | | | | | 126,271 | |
Short-Term Securities | | 6.7% | | | | | | | | | | | | |
| | | | | |
Repurchase Agreement | | 6.7% | | | | | | | | | | | | |
Goldman Sachs & Company
4.85%, dated 9/28/07, to be repurchased at $48,229 on 10/1/07 (Collateral: $46,780 Federal Home
Loan Bank notes, 5.375%, due 5/18/16, value $49,177) | | | | | | | | | $ 48,210 | | | | 48,210 | |
| | | | | | | | | | | | | | |
Total Short-Term Securities (Cost—$48,210) | | | | | | | | | | | | | 48,210 | |
Total Investments (Cost—$902,640)L | | 125.8% | | | | | | | | | | | 906,900 | |
Obligation to Return Collateral For
Securities Loaned | | (17.5)% | | | | | | | | | | | (126,271 | ) |
Other Assets Less Liabilities | | (8.3)% | | | | | | | | | | | (59,684 | ) |
| | | | | | | | | | | | | | |
| | | | | |
Net Assets | | 100.0% | | | | | | | | | | $ | 720,945 | |
| | | | | | | | | | | | | | |
133
Semi-Annual Report to Shareholders
Portfolio of Investments—Continued
Western Asset Inflation Indexed Plus Bond Portfolio—Continued
| | | | | | | | |
| | | EXPIRATION | | ACTUAL
CONTRACTS | | APPRECIATION/
(DEPRECIATION) | |
Futures Contracts PurchasedK | | | | | | | | |
Eurodollar Futures | | March 2008 | | 105 | | $ | 89 | |
| | | | | | | | |
Futures Contracts WrittenK | | | | | | | | |
U.S. Treasury Note Futures | | January 2008 | | 107 | | $ | 16 | |
| | | | | | | | |
Options WrittenK | | | | | | | | |
U.S. Treasury Note Futures Call, Strike Price $107.50 | | November 2007 | | 184 | | $ | (38 | ) |
U.S. Treasury Note Futures Put, Strike Price $106.00 | | November 2007 | | 475 | | | 67 | |
| | | | | | | | |
| | | | | | $ | 29 | |
| | | | | | | | |
| | | | | | | | | |
A | | Indexed Security – The rates of interest earned on these securities are tied to the London Interbank Offered Rate (“LIBOR”), the Euro Interbank Offered Rate (“EURIBOR”) Index, the Consumer Price Index (“CPI”), the one-year Treasury Bill Rate or the ten-year Japanese Government Bond Rate. The coupon rates are the rates as of September 30, 2007. |
B | | Credit Linked Security – The rates of interest earned on these securities are tied to the credit rating assigned by Standard & Poor’s Rating Service and/or Moody’s Investors Services. |
C | | Rule 144a Security – A security purchased pursuant to Rule 144a under the Securities Act of 1933 which may not be resold subject to that rule except to qualified institutional buyers. These securities, which the Fund’s investment adviser has determined to be liquid, represent 1.45% of net assets. |
D | | Yankee Bond – A dollar-denominated bond issued in the U.S. by foreign entities. |
E | | Treasury Inflation-Protected Security –Treasury security whose principal value is adjusted daily in accordance with changes to the Consumer Price Index for All Urban Consumers. Interest is calculated on the basis of the current adjusted principal value. |
F | | All or a portion of this security is on loan. |
G | | All or a portion of this security is collateral to cover futures and options contracts written. |
H | | When-issued Security – Security purchased on a delayed delivery basis. Final settlement amount and maturity date have not yet been announced. |
I | | Stepped Coupon Security – A security with a predetermined schedule of interest or dividend rate changes at which time it begins to accrue interest or pay dividends according to the predetermined schedule. |
J | | Inflation-Protected Security – Security whose principal value is adjusted daily or monthly in accordance with changes to the relevant country’s Consumer Price Index or its equivalent used as an inflation proxy. Interest is calculated on the basis of the current adjusted principal value. |
K | | Options and futures are described in more detail in the notes to financial statements. |
L | | Aggregate cost for federal income tax purposes is substantially the same as book cost. At September 30, 2007, the aggregate gross unrealized appreciation and depreciation of investments for federal income tax purposes were substantially as follows: |
| | | | |
| Gross unrealized appreciation | | $ | 8,668 | |
| Gross unrealized depreciation | | | (4,408 | ) |
| | | | |
| Net unrealized appreciation/(depreciation) | | $ | 4,260 | |
| | | | |
† | | Securities are denominated in U.S. Dollars, unless otherwise noted. |
BRL—Brazilian Real
CAD—Canadian Dollar
SEK—Swedish Krona
See notes to financial statements.
134
Semi-Annual Report to Shareholders
Statement of Assets and Liabilities
Western Asset Inflation Indexed Plus Bond Portfolio
September 30, 2007 (Unaudited)
(Amounts in Thousands)
| | | | | | | |
Assets: | | | | | | | |
Investment securities at market value (Cost—$854,430) | | | | | $ | 858,690 | A |
Cash | | | | | | 2,073 | |
Short-term securities at value (Cost—$48,210) | | | | | | 48,210 | |
Swap contracts at value | | | | | | 70 | |
Foreign currency at value (Cost—$1,495) | | | | | | 1,544 | |
Receivable for securities sold | | | | | | 33,423 | |
Receivable for fund shares sold | | | | | | 1,099 | |
Interest receivable | | | | | | 5,022 | |
Unrealized appreciation of forward foreign currency contracts | | | | | | 729 | |
| | | | | | | |
Total assets | | | | | | 950,860 | |
| | | | | | | |
| | |
Liabilities: | | | | | | | |
Obligation to return collateral for securities loaned | | $ | 126,271 | | | | |
Payable for securities purchased | | | 102,284 | | | | |
Payable for fund shares repurchased | | | 32 | | | | |
Accrued management fee | | | 107 | | | | |
Income distribution payable | | | 96 | | | | |
Futures variation margin payable | | | 1 | | | | |
Options written (Proceeds—$183) | | | 154 | | | | |
Unrealized depreciation of forward foreign currency contracts | | | 906 | | | | |
Accrued expenses | | | 64 | | | | |
| | | | | | | |
Total liabilities | | | | | | 229,915 | |
| | | | | | | |
| | |
Net Assets | | | | | $ | 720,945 | |
| | | | | | | |
| | |
Net assets consist of: | | | | | | | |
Accumulated paid-in-capital | | | | | $ | 720,875 | |
Undistributed net investment income | | | | | | 1,054 | |
Accumulated net realized loss on investments, options, futures, swaps and foreign currency transactions | | | | | | (6,380 | ) |
Unrealized appreciation of investments, options, futures, swaps and foreign currency translations | | | | | | 5,396 | |
| | | | | | | |
| | |
Net Assets | | | | | $ | 720,945 | |
| | | | | | | |
| | |
Net Asset Value Per Share: | | | | | | | |
Institutional Class (69,546 shares outstanding) | | | | | | $10.37 | |
Financial Intermediary Class (1 shares outstanding) | | | | | | $10.36 | |
| | | | | | | | |
A | | The market value of securities on loan is $178,711. |
See notes to financial statements.
135
Semi-Annual Report to Shareholders
Statement of Operations
Western Asset Inflation Indexed Plus Bond Portfolio
For the Six Months Ended September 30, 2007 (Unaudited)
(Amounts in Thousands)
| | | | | | | | |
Investment Income: | | | | | | | | |
Interest | | $ | 25,685 | | | | | |
Income from securities lending | | | 54 | | | | | |
| | �� | | | | | | |
Total income | | | | | | $ | 25,739 | |
Expenses: | | | | | | | | |
Management fees | | | 667 | | | | | |
Audit and legal fees | | | 32 | | | | | |
Custodian fees | | | 46 | | | | | |
Directors’ fees and expenses | | | 9 | | | | | |
Registration fees | | | 6 | | | | | |
Reports to shareholders | | | 29 | | | | | |
Transfer agent and shareholder servicing expense: | | | | | | | | |
Institutional Class | | | 77 | | | | | |
Other expenses | | | 22 | | | | | |
| | | | | | | | |
| | | 888 | | | | | |
Less: Fees waived | | | (53 | ) | | | | |
Compensating balance credits | | | (1 | ) | | | | |
| | | | | | | | |
Net expenses | | | | | | | 834 | |
| | | | | | | | |
Net Investment Income | | | | | | | 24,905 | |
Net Realized and Unrealized Gain/(Loss) on Investments: | | | | | | | | |
Net realized gain/(loss) on: | | | | | | | | |
Investments | | | (212 | ) | | | | |
Options | | | 3 | | | | | |
Futures | | | (2,302 | ) | | | | |
Swaps | | | 505 | | | | | |
Foreign currency transactions | | | (907 | ) | | | | |
| | | | | | | | |
| | | | | | | (2,913 | ) |
Change in unrealized appreciation/depreciation of: | | | | | | | | |
Investments, options, futures, swaps and foreign currency translations | | | 231 | | | | | |
Assets and liabilities denominated in foreign currency | | | 9 | | | | | |
| | | | | | | | |
| | | | | | | 240 | |
| | | | | | | | |
Net Realized and Unrealized Loss on Investments | | | | | | | (2,673 | ) |
| | | | | | | | | |
Change in Net Assets Resulting From Operations | | | | | | $ | 22,232 | |
| | | | | | | | | |
See notes to financial statements.
136
Semi-Annual Report to Shareholders
Statement of Changes in Net Assets
Western Asset Inflation Indexed Plus Bond Portfolio
(Amounts in Thousands)
| | | | | | | | |
| | | FOR THE
SIX MONTHS ENDED
SEPTEMBER 30, 2007 | | | FOR THE
YEAR ENDED
MARCH 31, 2007 | |
| Change in Net Assets: | | (Unaudited) | | | | |
Net investment income | | $ | 24,905 | | | $ | 22,204 | |
| | |
Net realized loss | | | (2,913 | ) | | | (1,654 | ) |
| | |
Change in unrealized appreciation | | | 240 | | | | 13,104 | |
| | | | | | | | |
Change in net assets resulting from operations | | | 22,232 | | | | 33,654 | |
| | |
Distributions to shareholders from: | | | | | | | | |
Net investment income: | | | | | | | | |
Institutional Class | | | (24,907 | ) | | | (22,375 | ) |
Financial Intermediary Class | | | — | A | | | — | |
| | |
Change in net assets from fund share transactions: | | | | | | | | |
Institutional Class | | | 79,372 | | | | 90,425 | |
Financial Intermediary Class | | | 12 | | | | — | |
| | | | | | | | |
Change in net assets | | | 76,709 | | | | 101,704 | |
| | |
Net Assets: | | | | | | | | |
Beginning of period | | | 644,236 | | | | 542,532 | |
| | | | | | | | |
| | |
End of period | | $ | 720,945 | | | $ | 644,236 | |
| | | | | | | | |
| | |
Under distributions of net investment income | | $ | 1,054 | | | $ | 1,056 | |
| | | | | | | | |
| | | | | | | | | |
A | | Amount represents less than $1. |
See notes to financial statements.
137
Semi-Annual Report to Shareholders
Financial Highlights
Western Asset Inflation Indexed Plus Bond Portfolio
For a share of each class of capital stock outstanding:
Institutional Class:
| | | | | | | | | | | | | | | | | | | | | | | | |
| | | SIX MONTHS
ENDED
SEPTEMBER 30, 2007 | | | YEARS ENDED MARCH 31, | |
| | | | 2007 | | | 2006 | | | 2005 | | | 2004 | | | 2003 | |
| | | (Unaudited) | | | | | | | | | | | | | | | | |
Net asset value, beginning of period | | $ | 10.43 | | | $ | 10.25 | | | $ | 10.74 | | | $ | 11.24 | | | $ | 10.96 | | | $ | 9.92 | |
| | | | | | | | | | | | | | | | | | | | | | | | |
Investment operations: | | | | | | | | | | | | | | | | | | | | | | | | |
Net investment income | | | .38 | A | | | .39 | A | | | .54 | | | | .42 | | | | .37 | | | | .51 | |
Net realized and unrealized gain/(loss) | | | (.05 | ) | | | .20 | | | | (.38 | ) | | | (.10 | ) | | | .71 | | | | 1.19 | |
| | | | | | | | | | | | | | | | | | | | | | | | |
Total from investment operations | | | .33 | | | | .59 | | | | .16 | | | | .32 | | | | 1.08 | | | | 1.70 | |
| | | | | | | | | | | | | | | | | | | | | | | | |
Distributions from: | | | | | | | | | | | | | | | | | | | | | | | | |
Net investment income | | | (.39 | ) | | | (.41 | ) | | | (.56 | ) | | | (.42 | ) | | | (.37 | ) | | | (.51 | ) |
Net realized gain on investments | | | — | | | | — | | | | (.09 | ) | | | (.40 | ) | | | (.43 | ) | | | (.15 | ) |
| | | | | | | | | | | | | | | | | | | | | | | | |
Total distributions | | | (.39 | ) | | | (.41 | ) | | | (.65 | ) | | | (.82 | ) | | | (.80 | ) | | | (.66 | ) |
| | | | | | | | | | | | | | | | | | | | | | | | |
Net asset value, end of period | | $ | 10.37 | | | $ | 10.43 | | | $ | 10.25 | | | $ | 10.74 | | | $ | 11.24 | | | $ | 10.96 | |
| | | | | | | | | | | | | | | | | | | | | | | | |
Total return | | | 3.24 | %B | | | 5.89 | % | | | 1.44 | % | | | 3.27 | % | | | 10.33 | % | | | 17.62 | % |
| | | | | | |
Ratios to Average Net Assets:C | | | | | | | | | | | | | | | | | | | | | | | | |
Total expenses | | | .27 | %D | | | .29 | % | | | .27 | % | | | .27 | % | | | .27 | % | | | .27 | % |
Expenses net of waivers, if any | | | .25 | %D | | | .25 | % | | | .25 | % | | | .25 | % | | | .25 | % | | | .25 | % |
Expenses net of all reductions | | | .25 | %D | | | .25 | % | | | .25 | % | | | .25 | % | | | .25 | % | | | .25 | % |
Net investment income | | | 7.5 | %D | | | 3.8 | % | | | 5.0 | % | | | 3.8 | % | | | 3.4 | % | | | 4.8 | % |
| | | | | | |
Supplemental Data: | | | | | | | | | | | | | | | | | | | | | | | | |
Portfolio turnover rate | | | 39.7 | %B | | | 96.4 | % | | | 177.1 | % | | | 255.5 | % | | | 281.8 | % | | | 75.4 | % |
Net assets, end of period (in thousands) | | $ | 720,933 | | | $ | 644,236 | | | $ | 542,532 | | | $ | 461,746 | | | $ | 346,379 | | | $ | 290,306 | |
| | | | | | | | | | | | | | | | | | | | | | | | | |
A | | Computed using average daily shares outstanding. |
C | | Total expenses reflects operating expenses prior to any voluntary expense waivers and/or compensating balance credits. Expenses net of waivers reflects total expenses before compensating balance credits but net of any voluntary expense waivers. Expenses net of all reductions reflects expenses less any compensating balance credits and/or voluntary expense waivers. |
See notes to financial statements.
138
Semi-Annual Report to Shareholders
Financial Highlights
Western Asset Inflation Indexed Plus Bond Portfolio
For a share of each class of capital stock outstanding:
Financial Intermediary Class:
| | | | |
| | | FOR THE
PERIOD ENDED
SEPTEMBER 30, 2007E | |
| | | (Unaudited) | |
Net asset value, beginning of period | | $ | 10.02 | |
| | | | |
Investment operations: | | | | |
Net investment income | | | .07 | A |
Net realized and unrealized gain | | | .41 | |
| | | | |
Total from investment operations | | | .48 | |
| | | | |
Distributions from: | | | | |
Net investment income | | | (.14 | ) |
| | | | |
Total distributions | | | (.14 | ) |
| | | | |
Net asset value, end of period | | $ | 10.36 | |
| | | | |
Total return | | | 4.81 | %B |
| |
Ratios to Average Net Assets:C | | | | |
Total expenses | | | .52 | %D |
Expenses net of waivers, if any | | | .50 | %D |
Expenses net of all reductions | | | .50 | %D |
Net investment income | | | 2.6 | %D |
| |
Supplemental Data: | | | | |
Portfolio turnover rate | | | 39.7 | %B |
Net assets, end of period (in thousands) | | $ | 12 | |
| | | | | |
E | | For the period June 28, 2007 (commencement of operations) to September 30, 2007. |
See notes to financial statements.
139
Semi-Annual Report to Shareholders
Expense Example
Western Asset Intermediate Bond Portfolio
As a shareholder of the Fund, you incur ongoing costs, including management fees, and other Fund expenses. These examples are intended to help you understand your ongoing costs (in dollars) of investing in the Fund and to compare these costs with the ongoing costs of investing in other mutual funds. The example is based on an investment of $1,000 invested on April 1, 2007, and held through September 30, 2007.
Actual Expenses
The first line in the table below provides information about actual account values and actual expenses for the Fund. You may use the information in this line, together with the amount you invested, to estimate the expenses that you paid over the period. Simply divide your account value by $1,000 (for example, an $8,600 account value divided by $1,000 = 8.6), then multiply the result by the number in the first line under the heading entitled “Expenses Paid During the Period” to estimate the expenses you paid on your account during this period.
Hypothetical Example for Comparison Purposes
The second line in the table below provides information about hypothetical account values and hypothetical expenses based on the Fund’s actual expense ratio and an assumed rate of return of 5% per year before expenses, which is not the Fund’s actual return. The hypothetical account values and expenses may not be used to estimate the actual ending account balance or expenses you paid for the period. You may use this information to compare the ongoing costs of investing in the Fund and other funds. To do so, compare this 5% hypothetical example with the 5% hypothetical examples that appear in the shareholder reports of other funds.
| | | | | | | | | |
| | | Beginning
Account Value
4/1/07 | | Ending
Account Value
9/30/07 | | Expenses PaidA
During the Period
4/1/07 to 9/30/07 |
Institutional Class: | | | | | | | | | |
Actual | | $ | 1,000.00 | | $ | 1,018.10 | | $ | 2.28 |
Hypothetical (5% return before expenses) | | | 1,000.00 | | | 1,022.81 | | | 2.28 |
A | | These calculations are based on expenses incurred in the most recent fiscal half-year. The dollar amounts shown as “Expenses Paid During the Period” are equal to the annualized expense ratio of 0.45% multiplied by the average value over the period, multiplied by the number of days in the most recent fiscal half-year (183), and divided by 365. |
140
Semi-Annual Report to Shareholders
Performance Information
Western Asset Intermediate Bond Portfolio
The graph compares the Fund’s total returns to that of an appropriate broad-based securities market index. The line illustrates the cumulative total return of an initial $1,000,000 investment for the periods indicated. The line for the Fund represents the total return after deducting all Fund investment management and other administrative expenses and the transaction costs of buying and selling securities. The line representing the securities market index does not include any transaction costs associated with buying and selling securities in the index or other investment management or administrative expenses.
Total return measures investment performance in terms of appreciation or depreciation in the Fund’s net asset value per share, plus dividends and any capital gain distributions. It assumes that dividends and distributions were reinvested at the time they were paid. Returns (and the graph and table found below) do not reflect the deduction of taxes that a shareholder would pay on Fund distributions or the redemption of Fund shares. Average annual returns tend to smooth out variations in a fund’s return, so that they differ from actual year-to-year results.
Bonds are subject to a variety of risks, including interest rate, credit, and inflation risk.
Growth of a $1,000,000 Investment—Institutional Class

The performance data quoted represents past performance and does not guarantee future results. The performance stated may have been due to extraordinary market conditions, which may not be duplicated in the future. Current performance may be lower or higher than the performance data quoted. To obtain the most recent month-end performance information, please visit www.westernassetfunds.com. The investment return and principal value of the Fund will fluctuate so that an investor’s shares, when redeemed, may be worth more or less than the original cost. Calculations assume reinvestment of dividends and capital gain distributions. Performance would have been lower if fees had not been waived in various periods.
141
Semi-Annual Report to Shareholders
Performance Information—Continued
Portfolio Composition (as of September 30, 2007)
Standard & Poor’s Debt RatingsA (as a percentage of the portfolio)
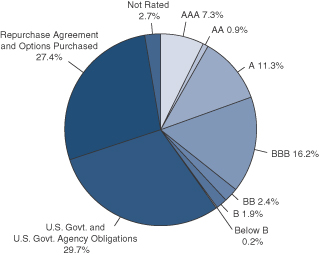
Maturity Schedule (as a percentage of the portfolio)
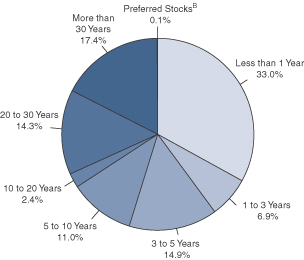
A | | Source: Standard & Poor’s. |
B | | Preferred Stocks do not have a defined maturity date. |
The Fund is actively managed. As a result, the composition of the portfolio holdings and sectors are subject to change at any time.
142
Semi-Annual Report to Shareholders
Portfolio of Investments
Western Asset Intermediate Bond Portfolio
September 30, 2007 (Unaudited)
(Amounts in Thousands)
| | | | | | | | | | | | | |
| | | % OF
NET ASSETS | | RATE | | MATURITY
DATE | | PAR/
SHARES | | VALUE | |
| | | | | | | | | | | | | |
Long-Term Securities | | 79.0% | | | | | | | | | | | |
| | | | | |
Corporate Bonds and Notes | | 27.5% | | | | | | | | | | | |
| | | | | |
Aerospace and Defense | | 0.1% | | | | | | | | | | | |
United Technologies Corp. | | | | 6.350% | | 3/1/11 | | $ | 1,037 | | $ | 1,086 | |
| | | | | | | | | | | | | |
| | | | | |
Airlines | | 0.5% | | | | | | | | | | | |
Continental Airlines Inc. | | | | 6.545% | | 2/2/19 | | | 1,000 | | | 1,006 | |
Delta Air Lines Inc. | | | | 6.619% | | 9/18/12 | | | 1,289 | | | 1,287 | |
US Airways Pass-Through Trust | | | | 6.850% | | 1/30/18 | | | 1,426 | | | 1,405 | |
| | | | | | | | | | | | | |
| | | | | | | | | | | | 3,698 | |
| | | | | | | | | | | | | |
Automobiles | | 0.6% | | | | | | | | | | | |
DaimlerChrysler NA Holding Corp. | | | | 6.500% | | 11/15/13 | | | 2,050 | | | 2,125 | |
Ford Motor Co. | | | | 7.450% | | 7/16/31 | | | 1,159 | | | 910 | A |
General Motors Corp. | | | | 8.375% | | 7/15/33 | | | 1,198 | | | 1,050 | A |
| | | | | | | | | | | | | |
| | | | | | | | | | | | 4,085 | |
| | | | | | | | | | | | | |
Capital Markets | | 3.7% | | | | | | | | | | | |
Goldman Sachs Capital II | | | | 5.793% | | 12/29/49 | | | 11,260 | | | 10,655 | B |
Goldman Sachs Capital III | | | | 6.350% | | 9/29/49 | | | 720 | | | 654 | C |
Lehman Brothers Holdings Capital Trust VII | | | | 5.857% | | 12/31/49 | | | 6,410 | | | 6,107 | B |
Lehman Brothers Holdings Capital Trust VIII | | | | 6.371% | | 5/29/49 | | | 670 | | | 629 | C |
Lehman Brothers Holdings Inc. | | | | 6.500% | | 7/19/17 | | | 480 | | | 486 | A |
Merrill Lynch and Co. Inc. | | | | 5.700% | | 5/2/17 | | | 2,500 | | | 2,431 | |
Morgan Stanley | | | | 5.550% | | 4/27/17 | | | 2,340 | | | 2,270 | |
The Bear Stearns Cos. Inc. | | | | 6.400% | | 10/2/17 | | | 3,590 | | | 3,579 | |
| | | | | | | | | | | | | |
| | | | | | | | | | | | 26,811 | |
| | | | | | | | | | | | | |
Chemicals | | 0.7% | | | | | | | | | | | |
The Dow Chemical Co. | | | | 6.000% | | 10/1/12 | | | 4,850 | | | 4,972 | |
| | | | | | | | | | | | | |
| | | | | |
Commercial Banks | | 2.1% | | | | | | | | | | | |
Comerica Capital Trust II | | | | 6.576% | | 2/20/37 | | | 960 | | | 868 | A,B |
SunTrust Capital VIII | | | | 6.100% | | 12/15/36 | | | 550 | | | 499 | A,B |
Wachovia Capital Trust III | | | | 5.800% | | 3/15/42 | | | 10,868 | | | 10,795 | B |
Wells Fargo Capital X | | | | 5.950% | | 12/15/36 | | | 3,020 | | | 2,771 | A |
| | | | | | | | | | | | | |
| | | | | | | | | | | | 14,933 | |
| | | | | | | | | | | | | |
Commercial Services and Supplies | | 0.4% | | | | | | | | | | | |
Waste Management Inc. | | | | 7.375% | | 8/1/10 | | | 3,055 | | | 3,233 | |
| | | | | | | | | | | | | |
143
Semi-Annual Report to Shareholders
Portfolio of Investments—Continued
Western Asset Intermediate Bond Portfolio—Continued
| | | | | | | | | | | | | |
| | | % OF
NET ASSETS | | RATE | | MATURITY
DATE | | PAR/
SHARES | | VALUE | |
| | | | | | | | | | | | | |
Corporate Bonds and Notes—Continued | | | | | | | | | | | | | |
| | | | | |
Consumer Finance | | 2.8% | | | | | | | | | | | |
American Express Co. | | | | 6.800% | | 9/1/66 | | $ | 6,530 | | $ | 6,692 | A,B |
Ford Motor Credit Co. | | | | 8.359% | | 11/2/07 | | | 251 | | | 251 | A,C |
Ford Motor Credit Co. | | | | 6.625% | | 6/16/08 | | | 9,148 | | | 9,079 | A |
GMAC LLC | | | | 6.360% | | 9/23/08 | | | 995 | | | 980 | A,C |
GMAC LLC | | | | 6.750% | | 12/1/14 | | | 1,556 | | | 1,410 | A |
Nelnet Inc. | | | | 7.400% | | 9/29/36 | | | 1,850 | | | 1,815 | B |
| | | | | | | | | | | | | |
| | | | | | | | | | | | 20,227 | |
| | | | | | | | | | | | | |
Diversified Financial Services | | 2.5% | | | | | | | | | | | |
AGFC Capital Trust I | | | | 6.000% | | 1/15/67 | | | 10,610 | | | 9,942 | B,D |
Capmark Financial Group Inc. | | | | 5.875% | | 5/10/12 | | | 2,500 | | | 2,277 | D,E |
Dryden Investor Trust | | | | 7.157% | | 7/23/08 | | | 652 | | | 657 | |
Glen Meadow Pass-Through Certificates | | | | 6.505% | | 2/12/67 | | | 2,500 | | | 2,403 | B,D |
National Rural Utilities Cooperative Finance Corp. | | | | 5.750% | | 12/1/08 | | | 559 | | | 562 | |
TNK-BP Finance SA | | | | 6.125% | | 3/20/12 | | | 210 | | | 201 | D |
ZFS Finance USA Trust II | | | | 6.450% | | 12/15/65 | | | 2,060 | | | 1,990 | B,D |
| | | | | | | | | | | | | |
| | | | | | | | | | | | 18,032 | |
| | | | | | | | | | | | | |
Diversified Telecommunication Services | | 1.1% | | | | | | | | | | | |
Embarq Corp. | | | | 7.082% | | 6/1/16 | | | 1,880 | | | 1,949 | |
Qwest Corp. | | | | 8.875% | | 3/15/12 | | | 1,510 | | | 1,648 | |
Verizon Global Funding Corp. | | | | 7.250% | | 12/1/10 | | | 4,051 | | | 4,303 | |
| | | | | | | | | | | | | |
| | | | | | | | | | | | 7,900 | |
| | | | | | | | | | | | | |
Electric Utilities | | 0.7% | | | | | | | | | | | |
Duke Energy Corp. | | | | 6.250% | | 1/15/12 | | | 1,078 | | | 1,116 | A |
Duke Energy Corp. | | | | 5.625% | | 11/30/12 | | | 729 | | | 739 | |
Exelon Corp. | | | | 6.750% | | 5/1/11 | | | 2,269 | | | 2,359 | |
TXU Energy Co. | | | | 7.000% | | 3/15/13 | | | 430 | | | 472 | |
| | | | | | | | | | | | | |
| | | | | | | | | | | | 4,686 | |
| | | | | | | | | | | | | |
Food and Staples Retailing | | 0.2% | | | | | | | | | | | |
Safeway Inc. | | | | 6.500% | | 3/1/11 | | | 760 | | | 795 | |
The Kroger Co. | | | | 6.200% | | 6/15/12 | | | 883 | | | 910 | |
| | | | | | | | | | | | | |
| | | | | | | | | | | | 1,705 | |
| | | | | | | | | | | | | |
Health Care Equipment and Supplies | | 0.2% | | | | | | | | | | | |
Hospira Inc. | | | | 5.550% | | 3/30/12 | | | 1,700 | | | 1,698 | |
| | | | | | | | | | | | | |
| | | | | |
Health Care Providers and Services | | 0.7% | | | | | | | | | | | |
HCA Inc. | | | | 8.750% | | 9/1/10 | | | 822 | | | 832 | |
144
Semi-Annual Report to Shareholders
| | | | | | | | | | | | | |
| | | % OF
NET ASSETS | | RATE | | MATURITY
DATE | | PAR/
SHARES | | VALUE | |
| | | | | | | | | | | | | |
Corporate Bonds and Notes—Continued | | | | | | | | | | | | | |
| | | | | |
Health Care Providers and Services—Continued | | | | | | | | | | | | | |
Quest Diagnostics Inc. | | | | 7.500% | | 7/12/11 | | $ | 2,220 | | $ | 2,374 | |
Universal Health Services Inc. | | | | 6.750% | | 11/15/11 | | | 1,720 | | | 1,778 | |
| | | | | | | | | | | | | |
| | | | | | | | | | | | 4,984 | |
| | | | | | | | | | | | | |
Hotels, Restaurants and Leisure | | 0.1% | | | | | | | | | | | |
Caesars Entertainment Inc. | | | | 7.500% | | 9/1/09 | | | 802 | | | 822 | A |
| | | | | | | | | | | | | |
| | | | | |
Independent Power Producers and Energy Traders | | 0.4% | | | | | | | | | | | |
TXU Corp. | | | | 4.800% | | 11/15/09 | | | 610 | | | 615 | A |
TXU Corp. | | | | 5.550% | | 11/15/14 | | | 2,480 | | | 2,000 | |
| | | | | | | | | | | | | |
| | | | | | | | | | | | 2,615 | |
| | | | | | | | | | | | | |
IT Services | | 0.4% | | | | | | | | | | | |
Electronic Data Systems Corp. | | | | 7.125% | | 10/15/09 | | | 2,625 | | | 2,673 | |
| | | | | | | | | | | | | |
| | | | | |
Media | | 1.8% | | | | | | | | | | | |
Clear Channel Communications Inc. | | | | 4.250% | | 5/15/09 | | | 3,347 | | | 3,190 | |
Comcast Corp. | | | | 6.500% | | 1/15/17 | | | 3,300 | | | 3,404 | |
Liberty Media LLC | | | | 7.875% | | 7/15/09 | | | 2,820 | | | 2,902 | |
Time Warner Inc. | | | | 6.875% | | 5/1/12 | | | 1,288 | | | 1,352 | |
Turner Broadcasting System Inc. | | | | 8.375% | | 7/1/13 | | | 1,483 | | | 1,659 | |
Viacom Inc. | | | | 5.750% | | 4/30/11 | | | 410 | | | 414 | |
| | | | | | | | | | | | | |
| | | | | | | | | | | | 12,921 | |
| | | | | | | | | | | | | |
Multi-Utilities | | 0.5% | | | | | | | | | | | |
CenterPoint Energy Inc. | | | | 5.875% | | 6/1/08 | | | 1,325 | | | 1,324 | |
Dominion Resources Inc. | | | | 5.700% | | 9/17/12 | | | 1,596 | | | 1,601 | A |
MidAmerican Energy Holdings Co. | | | | 5.875% | | 10/1/12 | | | 827 | | | 840 | |
| | | | | | | | | | | | | |
| | | | | | | | | | | | 3,765 | |
| | | | | | | | | | | | | |
Multiline Retail | | 0.4% | | | | | | | | | | | |
Federated Retail Holdings Inc. | | | | 5.350% | | 3/15/12 | | | 1,050 | | | 1,030 | |
JC Penney Corp. Inc. | | | | 5.750% | | 2/15/18 | | | 610 | | | 585 | |
May Department Stores Co. | | | | 5.750% | | 7/15/14 | | | 1,470 | | | 1,422 | |
| | | | | | | | | | | | | |
| | | | | | | | | | | | 3,037 | |
| | | | | | | | | | | | | |
Office Electronics | | 0.3% | | | | | | | | | | | |
Xerox Corp. | | | | 5.500% | | 5/15/12 | | | 2,240 | | | 2,219 | |
| | | | | | | | | | | | | |
| | | | | |
Oil, Gas and Consumable Fuels | | 4.0% | | | | | | | | | | | |
Anadarko Petroleum Corp. | | | | 5.950% | | 9/15/16 | | | 3,200 | | | 3,169 | |
145
Semi-Annual Report to Shareholders
Portfolio of Investments—Continued
Western Asset Intermediate Bond Portfolio—Continued
| | | | | | | | | | | | | |
| | | % OF
NET ASSETS | | RATE | | MATURITY
DATE | | PAR/
SHARES | | VALUE | |
| | | | | | | | | | | | | |
Corporate Bonds and Notes—Continued | | | | | | | | | | | | | |
| | | | | |
Oil, Gas and Consumable Fuels—Continued | | | | | | | | | | | | | |
Hess Corp. | | | | 6.650% | | 8/15/11 | | $ | 4,528 | | $ | 4,734 | |
Kinder Morgan Energy Partners LP | | | | 6.000% | | 2/1/17 | | | 3,700 | | | 3,658 | |
Occidental Petroleum Corp. | | | | 6.750% | | 1/15/12 | | | 1,310 | | | 1,387 | |
Pemex Project Funding Master Trust | | | | 6.994% | | 6/15/10 | | | 117 | | | 119 | C,D |
Pemex Project Funding Master Trust | | | | 6.994% | | 6/15/10 | | | 4,683 | | | 4,765 | C,D |
Pemex Project Funding Master Trust | | | | 6.180% | | 12/3/12 | | | 752 | | | 751 | C,D |
Pemex Project Funding Master Trust | | | | 7.375% | | 12/15/14 | | | 178 | | | 196 | |
Sonat Inc. | | | | 7.625% | | 7/15/11 | | | 3,954 | | | 4,092 | |
The Williams Cos. Inc. | | | | 8.125% | | 3/15/12 | | | 1,540 | | | 1,659 | A |
XTO Energy Inc. | | | | 7.500% | | 4/15/12 | | | 859 | | | 928 | A |
XTO Energy Inc. | | | | 6.250% | | 4/15/13 | | | 1,645 | | | 1,691 | |
XTO Energy Inc. | | | | 5.650% | | 4/1/16 | | | 1,612 | | | 1,576 | |
| | | | | | | | | | | | | |
| | | | | | | | | | | | 28,725 | |
| | | | | | | | | | | | | |
Paper and Forest Products | | 0.3% | | | | | | | | | | | |
Willamette Industries Inc. | | | | 7.125% | | 7/22/13 | | | 1,839 | | | 1,935 | |
| | | | | | | | | | | | | |
| | | | | |
Real Estate Investment Trusts | | 0.2% | | | | | | | | | | | |
iStar Financial Inc. | | | | 5.950% | | 10/15/13 | | | 1,400 | | | 1,314 | |
| | | | | | | | | | | | | |
| | | | | |
Thrifts and Mortgage Finance | | 1.9% | | | | | | | | | | | |
Countrywide Financial Corp. | | | | 5.800% | | 6/7/12 | | | 4,400 | | | 4,124 | A |
Residential Capital LLC | | | | 7.800% | | 11/21/08 | | | 5,130 | | | 4,604 | C |
Residential Capital LLC | | | | 7.460% | | 4/17/09 | | | 1,300 | | | 1,105 | C |
Residential Capital LLC | | | | 7.000% | | 2/22/11 | | | 1,286 | | | 1,048 | E |
Washington Mutual Inc. | | | | 4.625% | | 4/1/14 | | | 2,700 | | | 2,459 | A |
| | | | | | | | | | | | | |
| | | | | | | | | | | | 13,340 | |
| | | | | | | | | | | | | |
Wireless Telecommunication Services | | 0.9% | | | | | | | | | | | |
New Cingular Wireless Services Inc. | | | | 8.125% | | 5/1/12 | | | 3,000 | | | 3,326 | |
Sprint Capital Corp. | | | | 8.375% | | 3/15/12 | | | 2,669 | | | 2,939 | |
| | | | | | | | | | | | | |
| | | | | | | | | | | | 6,265 | |
| | | | | | | | | | | | | |
Total Corporate Bonds and Notes
(Cost—$200,786) | | | | | | | | | | | | 197,681 | |
Asset-Backed Securities | | 1.6% | | | | | | | | | | | |
| | | | | |
Fixed Rate Securities | | 0.4% | | | | | | | | | | | |
ABFS Mortgage Loan Trust 2002-3 | | | | 4.263% | | 9/15/33 | | | 129 | | | 125 | B |
Conseco Finance Securitizations Corp. 2000-4 | | | | 8.310% | | 5/1/32 | | | 642 | | | 544 | |
Green Tree Financial Corp. 1994-6 | | | | 8.900% | | 1/15/20 | | | 1,019 | | | 1,020 | |
146
Semi-Annual Report to Shareholders
| | | | | | | | | | | | | |
| | | % OF
NET ASSETS | | RATE | | MATURITY
DATE | | PAR/
SHARES | | VALUE | |
| | | | | | | | | | | | | |
Asset-Backed Securities—Continued | | | | | | | | | | | | | |
| | | | | |
Fixed Rate Securities—Continued | | | | | | | | | | | | | |
Mego Mortgage Home Loan Trust 1996-2 | | | | 7.275% | | 8/25/17 | | $ | 5 | | $ | 5 | |
UCFC Home Equity Loan 1998-D | | | | 6.905% | | 4/15/30 | | | 963 | | | 959 | |
| | | | | | | | | | | | | |
| | | | | | | | | | | | 2,653 | |
| | | | | | | | | | | | | |
Indexed SecuritiesC | | 1.2% | | | | | | | | | | | |
AFC Home Equity Loan Trust 2003-3 | | | | 5.481% | | 10/25/30 | | | 812 | | | 813 | D |
AMRESCO Residential Securities Mortgage Loan Trust 1998-2 | | | | 5.956% | | 6/25/28 | | | 46 | | | 45 | |
Countrywide Asset-Backed Certificates 2002-BC1 | | | | 5.791% | | 4/25/32 | | | 417 | | | 403 | |
Indymac Home Equity Loan Asset-Backed Trust 2001-A | | | | 5.391% | | 3/25/31 | | | 294 | | | 281 | |
Long Beach Mortgage Loan Trust 2005-WL3 2A2A | | | | 5.271% | | 11/25/35 | | | 1,657 | | | 1,646 | |
MSDWCC Heloc Trust 2003-1 | | | | 5.401% | | 11/25/15 | | | 642 | | | 633 | |
Washington Mutual Master Note Trust 2006-A3A A3 | | | | 5.783% | | 9/16/13 | | | 5,180 | | | 5,102 | D |
| | | | | | | | | | | | | |
| | | | | | | | | | | | 8,923 | |
| | | | | | | | | | | | | |
Stripped Securities | | N.M. | | | | | | | | | | | |
Oakwood Mortgage Investors Inc. 2001-C | | | | 6.000% | | 5/15/08 | | | 2,771 | | | 98 | F1 |
| | | | | | | | | | | | | |
Total Asset-Backed Securities
(Cost—$11,853) | | | | | | | | | | | | 11,674 | |
Mortgage-Backed Securities | | 7.4% | | | | | | | | | | | |
| | | | | |
Fixed Rate Securities | | 1.7% | | | | | | | | | | | |
Fannie Mae Grantor Trust 2002-T3 | | | | 5.763% | | 12/25/11 | | | 3,103 | | | 3,159 | |
GMAC Commercial Mortgage Securities Inc. 1998-C1 A2 | | | | 6.700% | | 5/15/30 | | | 296 | | | 296 | |
Prime Mortgage Trust 2006-DR1 2A2 | | | | 6.000% | | 11/25/36 | | | 1,012 | | | 1,000 | D |
Residential Asset Securitization Trust 2003-A14 | | | | 4.750% | | 2/25/19 | | | 3,058 | | | 2,950 | |
Virginia Housing Development Mortgage Bonds Pass-Through Certificates 2006 | | | | 6.000% | | 6/25/34 | | | 4,614 | | | 4,614 | |
| | | | | | | | | | | | | |
| | | | | | | | | | | | 12,019 | |
| | | | | | | | | | | | | |
Indexed SecuritiesC | | 3.8% | | | | | | | | | | | |
Bear Stearns Structured Products Inc. 2007-R10 A1 | | | | 5.853% | | 9/26/37 | | | 7,120 | | | 7,086 | D |
Citigroup Mortgage Loan Trust Inc. 2005-11 A3 | | | | 4.900% | | 12/25/35 | | | 2,848 | | | 2,771 | |
Countrywide Home Loans 2003-49 | | | | 3.697% | | 10/25/33 | | | 692 | | | 683 | |
First Horizon Mortgage Pass-Through Trust 2003-AR2 2A1 | | | | 4.735% | | 7/25/33 | | | 1,796 | | | 1,783 | |
GMAC Mortgage Corp. Loan Trust 2005-AR5 3A1 | | | | 5.046% | | 9/19/35 | | | 1,438 | | | 1,432 | |
IndyMac Inda Mortgage Loan Trust 2007-AR7 1A1 | | | | 6.287% | | 11/25/37 | | | 3,650 | | | 3,648 | |
147
Semi-Annual Report to Shareholders
Portfolio of Investments—Continued
Western Asset Intermediate Bond Portfolio—Continued
| | | | | | | | | | | | | |
| | | % OF
NET ASSETS | | RATE | | MATURITY
DATE | | PAR/
SHARES | | VALUE | |
| | | | | | | | | | | | | |
Mortgage-Backed Securities—Continued | | | | | | | | | | | | | |
| | | | | |
Indexed Securities—Continued | | | | | | | | | | | | | |
MASTR Adjustable Rate Mortgages Trust 2004-13 | | | | 3.786% | | 11/21/34 | | $ | 6,815 | | $ | 6,663 | |
Wells Fargo Mortgage-Backed Securities Trust 2004-S | | | | 3.539% | | 9/25/34 | | | 3,525 | | | 3,448 | |
| | | | | | | | | | | | | |
| | | | | | | | | | | | 27,514 | |
| | | | | | | | | | | | | |
Variable Rate SecuritiesG | | 1.9% | | | | | | | | | | | |
Banc of America Funding Corp. 2005-B | | | | 5.100% | | 4/20/35 | | | 1,989 | | | 1,983 | |
Bear Stearns Alt-A Trust 2005-2 | | | | 4.702% | | 4/25/35 | | | 1,562 | | | 1,549 | |
Citigroup Mortgage Loan Trust Inc. 2005-8 1A1A | | | | 5.292% | | 10/25/35 | | | 1,748 | | | 1,745 | |
Countrywide Home Loans 2004-20 | | | | 7.465% | | 9/25/34 | | | 691 | | | 709 | |
Merrill Lynch Mortgage Investors Inc. 2005-A2 | | | | 4.487% | | 2/25/35 | | | 1,577 | | | 1,558 | |
Merrill Lynch Mortgage Investors Trust 2004-A1 2A1 | | | | 4.557% | | 2/25/34 | | | 2,707 | | | 2,674 | |
MLCC Mortgage Investors Inc. 2005-1 2A1 | | | | 4.965% | | 4/25/35 | | | 785 | | | 781 | |
MLCC Mortgage Investors Inc. 2005-1 2A2 | | | | 4.965% | | 4/25/35 | | | 2,442 | | | 2,430 | |
WaMu Mortgage Pass-Through Certificates 2004-AR11 | | | | 4.554% | | 10/25/34 | | | 351 | | | 346 | |
| | | | | | | | | | | | | |
| | | | | | | | | | | | 13,775 | |
| | | | | | | | | | | | | |
Total Mortgage-Backed Securities
(Cost—$53,400) | | | | | | | | | | | | 53,308 | |
U.S. Government and Agency Obligations | | 13.9% | | | | | | | | | | | |
| | | | | |
Fixed Rate Securities | | 11.4% | | | | | | | | | | | |
Fannie Mae | | | | 7.250% | | 1/15/10 | | | 162 | | | 172 | A |
Fannie Mae | | | | 6.250% | | 2/1/11 | | | 5,890 | | | 6,186 | A |
Fannie Mae | | | | 4.625% | | 5/1/13 | | | 235 | | | 233 | |
Fannie Mae | | | | 5.125% | | 1/2/14 | | | 1,053 | | | 1,063 | A |
Farmer Mac | | | | 4.250% | | 7/29/08 | | | 1,005 | | | 1,001 | |
Farmer Mac | | | | 4.875% | | 4/4/12 | | | 2,561 | | | 2,590 | |
Farmer Mac | | | | 4.500% | | 10/17/12 | | | 1,710 | | | 1,701 | |
Farmer Mac | | | | 5.125% | | 4/19/17 | | | 2,800 | | | 2,789 | |
Federal Home Loan Bank | | | | 5.800% | | 3/30/09 | | | 485 | | | 494 | |
Federal Home Loan Bank | | | | 5.375% | | 10/30/09 | | | 2,000 | | | 2,001 | |
Federal Home Loan Bank | | | | 5.500% | | 7/15/36 | | | 180 | | | 186 | |
Freddie Mac | | | | 4.750% | | 1/18/11 | | | 1,769 | | | 1,785 | A |
Tennessee Valley Authority | | | | 5.625% | | 1/18/11 | | | 373 | | | 385 | |
Tennessee Valley Authority | | | | 6.790% | | 5/23/12 | | | 2,747 | | | 2,984 | |
Tennessee Valley Authority | | | | 5.980% | | 4/1/36 | | | 70 | | | 77 | |
148
Semi-Annual Report to Shareholders
| | | | | | | | | | | | | |
| | | % OF
NET ASSETS | | RATE | | MATURITY
DATE | | PAR/
SHARES | | VALUE | |
| | | | | | | | | | | | | |
U.S. Government and Agency Obligations—Continued | | | | | | | | | | | | | |
| | | | | |
Fixed Rate Securities—Continued | | | | | | | | | | | | | |
United States Treasury Notes | | | | 4.375% | | 1/31/08 | | $ | 81 | | $ | 81 | A |
United States Treasury Notes | | | | 3.375% | | 2/15/08 | | | 105 | | | 105 | A |
United States Treasury Notes | | | | 3.750% | | 5/15/08 | | | 19,642 | | | 19,591 | A |
United States Treasury Notes | | | | 3.875% | | 5/15/09 | | | 8,366 | | | 8,355 | A |
United States Treasury Notes | | | | 3.500% | | 2/15/10 | | | 5,570 | | | 5,506 | A |
United States Treasury Notes | | | | 3.875% | | 9/15/10 | | | 5,956 | | | 5,933 | A |
United States Treasury Notes | | | | 4.875% | | 5/31/11 | | | 3,790 | | | 3,890 | A |
United States Treasury Notes | | | | 4.500% | | 9/30/11 | | | 1,890 | | | 1,915 | A |
United States Treasury Notes | | | | 4.625% | | 10/31/11 | | | 4,280 | | | 4,356 | A |
United States Treasury Notes | | | | 4.875% | | 6/30/12 | | | 4,400 | | | 4,523 | A |
United States Treasury Notes | | | | 4.625% | | 7/31/12 | | | 4,200 | | | 4,273 | A |
United States Treasury Notes | | | | 4.250% | | 8/15/14 | | | 60 | | | 60 | |
United States Treasury Notes | | | | 5.125% | | 5/15/16 | | | 18 | | | 19 | A |
| | | | | | | | | | | | | |
| | | | | | | | | | | | 82,254 | |
| | | | | | | | | | | | | |
Treasury Inflation-Protected SecuritiesH | | 2.5% | | | | | | | | | | | |
United States Treasury Inflation-Protected Security | | | | 0.875% | | 4/15/10 | | | 517 | | | 500 | A |
United States Treasury Inflation-Protected Security | | | | 2.375% | | 4/15/11 | | | 409 | | | 412 | A |
United States Treasury Inflation-Protected Security | | | | 1.875% | | 7/15/13 | | | 349 | | | 344 | A |
United States Treasury Inflation-Protected Security | | | | 2.000% | | 1/15/14 | | | 3,172 | | | 3,127 | A |
United States Treasury Inflation-Protected Security | | | | 2.000% | | 7/15/14 | | | 161 | | | 159 | A |
United States Treasury Inflation-Protected Security | | | | 1.875% | | 7/15/15 | | | 1,320 | | | 1,285 | |
United States Treasury Inflation-Protected Security | | | | 2.000% | | 1/15/16 | | | 1,476 | | | 1,442 | A |
United States Treasury Inflation-Protected Security | | | | 2.500% | | 7/15/16 | | | 1,269 | | | 1,292 | A |
United States Treasury Inflation-Protected Security | | | | 2.375% | | 1/15/17 | | | 1,632 | | | 1,644 | A |
United States Treasury Inflation-Protected Security | | | | 2.375% | | 1/15/25 | | | 1,518 | | | 1,532 | A |
United States Treasury Inflation-Protected Security | | | | 2.000% | | 1/15/26 | | | 967 | | | 923 | A |
United States Treasury Inflation-Protected Security | | | | 2.375% | | 1/15/27 | | | 5,113 | | | 5,175 | A |
| | | | | | | | | | | | | |
| | | | | | | | | | | | 17,835 | |
| | | | | | | | | | | | | |
Total U.S. Government and Agency Obligations (Cost—$99,352) | | | | | | | | | | | | 100,089 | |
149
Semi-Annual Report to Shareholders
Portfolio of Investments—Continued
Western Asset Intermediate Bond Portfolio—Continued
| | | | | | | | | | | | | |
| | | % OF
NET ASSETS | | RATE | | MATURITY
DATE | | PAR/
SHARES | | VALUE | |
| | | | | | | | | | | | | |
U.S. Government Agency Mortgage-Backed Securities | | 18.2% | | | | | | | | | | | |
| | | | | |
Fixed Rate Securities | | 15.5% | | | | | | | | | | | |
Fannie Mae | | | | 6.500% | | 6/1/14 to 4/1/37 | | $ | 1,686 | | $ | 1,717 | |
Fannie Mae | | | | 8.000% | | 9/1/15 | | | 41 | | | 42 | |
Fannie Mae | | | | 9.500% | | 4/15/21 | | | 34 | | | 37 | |
Fannie Mae | | | | 5.000% | | 2/1/36 | | | 8,365 | | | 7,993 | |
Fannie Mae | | | | 6.000% | | 10/1/36 | | | 15,124 | | | 15,149 | |
Fannie Mae | | | | 5.000% | | 12/1/37 | | | 35,700 | | | 34,042 | I |
Fannie Mae | | | | 6.000% | | 12/1/37 | | | 33,100 | | | 33,128 | I |
Fannie Mae | | | | 6.500% | | 12/1/37 | | | 50 | | | 51 | I |
Freddie Mac | | | | 4.375% | | 11/16/07 | | | 4,100 | | | 4,097 | |
Freddie Mac | | | | 4.500% | | 1/15/13 | | | 1,985 | | | 1,968 | |
Freddie Mac | | | | 6.500% | | 6/1/13 to 11/1/15 | | | 51 | | | 52 | |
Freddie Mac | | | | 7.500% | | 4/1/17 | | | 2 | | | 3 | |
Freddie Mac | | | | 9.300% | | 4/15/19 | | | 53 | | | 56 | |
Freddie Mac | | | | 5.000% | | 11/1/35 | | | 464 | | | 443 | |
Freddie Mac | | | | 6.000% | | 9/1/37 | | | 12,036 | | | 12,051 | |
Freddie Mac | | | | 5.000% | | 12/1/37 | | | 491 | | | 468 | I |
Government National Mortgage Association | | | | 6.000% | | 12/1/37 | | | 300 | | | 302 | I |
| | | | | | | | | | | | | |
| | | | | | | | | | | | 111,599 | |
| | | | | | | | | | | | | |
Indexed SecuritiesC | | 2.7% | | | | | | | | | | | |
Fannie Mae | | | | 5.711% | | 3/1/18 | | | 22 | | | 22 | |
Fannie Mae | | | | 4.328% | | 11/1/34 | | | 546 | | | 537 | |
Fannie Mae | | | | 4.220% | | 12/1/34 | | | 790 | | | 776 | |
Fannie Mae | | | | 4.856% | | 1/1/35 | | | 3,490 | | | 3,484 | |
Fannie Mae | | | | 3.821% | | 3/1/35 | | | 898 | | | 878 | |
Fannie Mae | | | | 4.762% | | 4/1/35 | | | 872 | | | 864 | |
Fannie Mae | | | | 5.779% | | 9/1/37 | | | 6,036 | | | 6,090 | |
Freddie Mac | | | | 6.090% | | 1/1/19 | | | 8 | | | 8 | |
Freddie Mac | | | | 4.367% | | 12/1/34 | | | 288 | | | 284 | |
Freddie Mac | | | | 4.473% | | 12/1/34 | | | 1,502 | | | 1,489 | |
Freddie Mac | | | | 4.092% | | 1/1/35 | | | 296 | | | 291 | |
Freddie Mac | | | | 4.132% | | 1/1/35 | | | 486 | | | 477 | |
Freddie Mac | | | | 4.604% | | 7/1/35 | | | 3,898 | | | 3,895 | |
| | | | | | | | | | | | | |
| | | | | | | | | | | | 19,095 | |
| | | | | | | | | | | | | |
Stripped Securities | | N.M. | | | | | | | | | | | |
Fannie Mae | | | | 0.000% | | 5/25/22 | | | 7 | | | 6 | F2 |
150
Semi-Annual Report to Shareholders
| | | | | | | | | | | | | |
| | | % OF
NET ASSETS | | RATE | | MATURITY
DATE | | PAR/
SHARES | | VALUE | |
| | | | | | | | | | | | | |
U.S. Government Agency Mortgage-Backed Securities—Continued | | | | | | | | | | | | | |
| | | | | |
Stripped Securities—Continued | | | | | | | | | | | | | |
Freddie Mac | | | | 10.000% | | 3/1/21 | | $ | 6 | | $ | 2 | F1 |
| | | | | | | | | | | | | |
| | | | | | | | | | | | 8 | |
| | | | | | | | | | | | | |
Total U.S. Government Agency Mortgage-Backed Securities (Cost—$130,951) | | | | | | | | | | | | 130,702 | |
Yankee BondsJ | | 10.3% | | | | | | | | | | | |
| | | | | |
Aerospace and Defense | | 0.2% | | | | | | | | | | | |
Systems 2001 Asset Trust | | | | 6.664% | | 9/15/13 | | | 1,122 | | | 1,183 | D |
| | | | | | | | | | | | | |
| | | | | |
Commercial Banks | | 4.3% | | | | | | | | | | | |
Glitnir Banki Hf | | | | 5.800% | | 1/21/11 | | | 4,310 | | | 4,208 | C,D |
Glitnir Banki Hf | | | | 6.190% | | 7/28/11 | | | 120 | | | 122 | C,D |
Glitnir Banki Hf | | | | 6.693% | | 6/15/16 | | | 810 | | | 828 | B,D |
HBOS Treasury Services PLC | | | | 4.000% | | 9/15/09 | | | 1,240 | | | 1,218 | D |
Kaupthing Bank Hf | | | | 5.750% | | 10/4/11 | | | 4,090 | | | 4,038 | D |
Landsbanki Islands Hf | | | | 6.100% | | 8/25/11 | | | 2,210 | | | 2,239 | D |
Resona Preferred Global Securities | | | | 7.191% | | 12/29/49 | | | 4,590 | | | 4,606 | B,D |
Royal Bank of Scotland Group PLC | | | | 9.118% | | 3/31/49 | | | 2,431 | | | 2,603 | |
RSHB Capital SA | | | | 6.299% | | 5/15/17 | | | 270 | | | 254 | D |
Santander Issuances | | | | 5.805% | | 6/20/16 | | | 1,030 | | | 1,043 | B,D |
Shinsei Finance Cayman Ltd. | | | | 6.418% | | 1/29/49 | | | 5,325 | | | 4,938 | B,D |
TuranAlem Finance BV | | | | 6.735% | | 1/22/09 | | | 970 | | | 953 | C,D |
VTB Capital SA for Vneshtorgbank | | | | 5.956% | | 8/1/08 | | | 3,880 | | | 3,841 | C,D |
VTB Capital SA for Vneshtorgbank | | | | 5.956% | | 8/1/08 | | | 367 | | | 364 | C,D |
| | | | | | | | | | | | | |
| | | | | | | | | | | | 31,255 | |
| | | | | | | | | | | | | |
Diversified Financial Services | | 1.4% | | | | | | | | | | | |
Aiful Corp. | | | | 5.000% | | 8/10/10 | | | 3,371 | | | 3,259 | D |
European Investment Bank | | | | 4.625% | | 3/21/12 | | | 730 | | | 727 | |
MUFG Capital Finance 1 Ltd. | | | | 6.346% | | 7/29/49 | | | 3,402 | | | 3,234 | B |
TNK-BP Finance SA | | | | 6.875% | | 7/18/11 | | | 2,783 | | | 2,762 | D |
| | | | | | | | | | | | | |
| | | | | | | | | | | | 9,982 | |
| | | | | | | | | | | | | |
Diversified Telecommunication Services | | 2.7% | | | | | | | | | | | |
British Telecommunications PLC | | | | 8.625% | | 12/15/10 | | | 3,817 | | | 4,202 | E |
Deutsche Telekom International Finance BV | | | | 5.750% | | 3/23/16 | | | 1,800 | | | 1,779 | A |
France Telecom SA | | | | 7.750% | | 3/1/11 | | | 2,358 | | | 2,535 | |
Koninklijke (Royal) KPN NV | | | | 8.000% | | 10/1/10 | | | 4,007 | | | 4,310 | |
Telecom Italia Capital SpA | | | | 5.250% | | 10/1/15 | | | 1,400 | | | 1,329 | A |
151
Semi-Annual Report to Shareholders
Portfolio of Investments—Continued
Western Asset Intermediate Bond Portfolio—Continued
| | | | | | | | | | | | | | |
| | | % OF
NET ASSETS | | RATE | | MATURITY
DATE | | PAR/
SHARES | | | VALUE | |
| | | | | | | | | | | | | | |
Yankee Bonds—Continued | | | | | | | | | | | | | | |
Diversified Telecommunication Services—Continued | | | | | | | | | | | | | | |
Telefonica Emisiones S.A.U. | | | | 5.690% | | 2/4/13 | | $ | 5,230 | | | $ | 5,133 | A,C |
| | | | | | | | | | | | | | |
| | | | | | | | | | | | | 19,288 | |
| | | | | | | | | | | | | | |
Foreign Government | | N.M. | | | | | | | | | | | | |
Russian Federation | | | | 7.500% | | 3/31/30 | | | 18 | | | | 20 | D |
| | | | | | | | | | | | | | |
| | | | | |
Health Care Equipment and Supplies | | 0.2% | | | | | | | | | | | | |
Baxter Finco BV | | | | 4.750% | | 10/15/10 | | | 1,370 | | | | 1,369 | |
| | | | | | | | | | | | | | |
| | | | | |
Industrial Conglomerates | | 0.3% | | | | | | | | | | | | |
Tyco International Group SA | | | | 6.000% | | 11/15/13 | | | 2,358 | | | | 2,380 | |
| | | | | | | | | | | | | | |
| | | | | |
Insurance | | 0.2% | | | | | | | | | | | | |
Merna Reinsurance Ltd. | | | | 7.110% | | 6/30/12 | | | 1,300 | | | | 1,298 | C,D |
| | | | | | | | | | | | | | |
| | | | | |
Metals and Mining | | 0.5% | | | | | | | | | | | | |
Vale Overseas Ltd. | | | | 6.250% | | 1/23/17 | | | 3,560 | | | | 3,600 | |
| | | | | | | | | | | | | | |
| | | | | |
Oil, Gas and Consumable Fuels | | 0.5% | | | | | | | | | | | | |
Gazprom | | | | 6.212% | | 11/22/16 | | | 1,710 | | | | 1,695 | D |
Gazprom | | | | 6.510% | | 3/7/22 | | | 940 | | | | 930 | D |
Petrozuata Finance Inc. | | | | 8.220% | | 4/1/17 | | | 883 | | | | 881 | D |
| | | | | | | | | | | | | | |
| | | | | | | | | | | | | 3,506 | |
| | | | | | | �� | | | | | | | |
Total Yankee Bonds (Cost—$74,567) | | | | | | | | | | | | | 73,881 | |
Preferred Stocks | | 0.1% | | | | | | | | | | | | |
Home Ownership Funding Corp. | | | | 1.000% | | | | | 1 | shs | | | 90 | D |
Home Ownership Funding Corp. II | | | | 1.000% | | | | | 2 | | | | 269 | D |
| | | | | | | | | | | | | | |
Total Preferred Stocks (Cost—$1,942) | | | | | | | | | | | | | 359 | |
| | | | | | | | | | | | | | |
Total Long-Term Securities (Cost—$572,851) | | | | | | | | | | | | | 567,694 | |
Investment of Collateral From Securities Lending | | 15.0% | | | | | | | | | | | | |
State Street Navigator Securities Lending Prime Portfolio | | | | | | | | | 92,821 | | | | 92,821 | |
| | | | | | | | | | | | | | |
Total Investment of Collateral From Securities Lending (Cost—$92,821) | | | | | | | | | | | | | 92,821 | |
152
Semi-Annual Report to Shareholders
| | | | | | | | | | | | | | |
| | | % OF
NET ASSETS | | RATE | | MATURITY
DATE | | PAR/
SHARES | | | VALUE | |
| | | | | | | | | | | | | | |
Short-Term Securities | | 30.3% | | | | | | | | | | | | |
| | | | | |
U.S. Government and Agency Obligations | | 0.3% | | | | | | | | | | | | |
Fannie Mae | | | | 0.000% | | 3/17/08 | | $ | 2,389 | | | $ | 2,340 | K,L |
| | | | | | | | | | | | | | |
| | | | | |
Options PurchasedM | | 0.1% | | | | | | | | | | | | |
Deutsche Bank Swaption Call, November 2007,
Strike Price $5.27 | | | | | | | | | 14,900,000 | N | | | 294 | |
Greenwich Swaption Call, September 2009,
Strike Price $4.50 | | | | | | | | | 19,700,000 | N | | | 79 | |
| | | | | | | | | | | | | | |
| | | | | | | | | | | | | 373 | |
| | | | | | | | | | | | | | |
Repurchase Agreement | | 29.9% | | | | | | | | | | | | |
Lehman Brothers Inc. 4.75%, dated 9/28/07, to be repurchased at $215,166 on 10/1/07 (Collateral: $667,335 Resolution Fuding Corp principal-only securities, due 1/15/30, value $219,380) | | | | | | | | | 215,081 | | | | 215,081 | |
| | | | | | | | | | | | | | |
Total Short-Term Securities (Cost—$217,617) | | | | | | | | | | | | | 217,794 | |
Total Investments (Cost—$883,289)O | | 122.2% | | | | | | | | | | | 878,309 | |
Obligation to return collateral from securities lending | | (12.9)% | | | | | | | | | | | (92,821 | ) |
Other Assets Less Liabilities | | (9.3)% | | | | | | | | | | | (66,844 | ) |
| | | | | | | | | | | | | | |
| | | | | |
Net Assets | | 100.0% | | | | | | | | | | $ | 718,644 | |
| | | | | | | | | | | | | | |
| | | | | | | |
| | | EXPIRATION | | ACTUAL
CONTRACTS | | APPRECIATION/
(DEPRECIATION) |
Futures Contracts PurchasedM | | | | | | | |
Eurodollar Futures | | December 2007 | | 29 | | $ | 14 |
Eurodollar Futures | | June 2008 | | 83 | | | 188 |
U.S. Treasury Note Futures | | December 2007 | | 116 | | | 53 |
U.S. Treasury Note Futures | | December 2007 | | 120 | | | 92 |
U.S. Treasury Note Futures | | December 2007 | | 868 | | | 624 |
| | | | | | | |
| | | | | | $ | 971 |
| | | | | | | |
Options WrittenM | | | | | | | |
Eurodollar Futures Call, Strike Price $95.50 | | March 2008 | | 207 | | $ | 13 |
JP Morgan Swaption Call, Strike Price $1.40 | | November 2007 | | 28,730,000 | | | 30 |
Greenwich Swaption Call, Strike Price $4.95 | | September 2009 | | 4,378,000 | | | 9 |
153
Semi-Annual Report to Shareholders
Portfolio of Investments—Continued
Western Asset Intermediate Bond Portfolio—Continued
| | | | | | | | |
| | | EXPIRATION | | ACTUAL
CONTRACTS | | APPRECIATION/
(DEPRECIATION) | |
Options Written—Continued | | | | | | | | |
JP Morgan Swaption Put, Strike Price $1.70 | | November 2007 | | 28,730,000 | | $ | (116 | ) |
U.S. Treasury Note Futures Put, Strike Price $108.00 | | December 2007 | | 268 | | | (19 | ) |
| | | | | | | | |
| | | | | | $ | (83 | ) |
| | | | | | | | |
| | | | | | | | | |
N.M. Not Meaningful.
A | | All or a portion of this security is on loan. |
B | | Stepped Coupon Security – A security with a predetermined schedule of interest or dividend rate changes at which time it begins to accrue interest or pay dividends according to the predetermined schedule. |
C | | Indexed Security – The rates of interest earned on these securities are tied to the London Interbank Offered Rate (“LIBOR”), the Euro Interbank Offered Rate (“EURIBOR”) Index, the Consumer Price Index (“CPI”), the one-year Treasury Bill Rate or the ten-year Japanese Government Bond Rate. The coupon rates are the rates as of September 30, 2007. |
D | | Rule 144a Security – A security purchased pursuant to Rule 144a under the Securities Act of 1933 which may not be resold subject to that rule except to qualified institutional buyers. These securities, which the Fund’s investment adviser has determined to be liquid, represent 10.78% of net assets. |
E | | Credit Linked Security – The rates of interest earned on these securities are tied to the credit rating assigned by Standard & Poor’s Rating Service and/or Moody’s Investors Services. |
F | | Stripped Security – Security with interest-only or principal-only payment streams, denoted by a 1 or 2, respectively. For interest-only securities, the amount shown as principal is the notional balance used to calculate the amount of interest due. |
G | | The coupon rates shown on variable rate securities are the rates at September 30, 2007. These rates vary with the weighted average coupon of the underlying loans. |
H | | Treasury Inflation-Protected Security – Treasury security whose principal value is adjusted daily in accordance with changes to the Consumer Price Index for All Urban Consumers. Interest is calculated on the basis of the current adjusted principal value. |
I | | When-issued Security – Security purchased on a delayed delivery basis. Final settlement amount and maturity date have not yet been announced. |
J | | Yankee Bond – A dollar-denominated bond issued in the U.S. by foreign entities. |
K | | Zero coupon bond – A bond with no periodic interest payments which is sold at such a discount as to produce a current yield to maturity. |
L | | All or a portion of this security is collateral to cover futures and options contracts written. |
M | | Options and futures are described in more detail in the notes to financial statements. |
N | | Par represents actual number of contracts. |
O | | Aggregate cost for federal income tax purposes is substantially the same as book cost. At September 30, 2007, the aggregate gross unrealized appreciation and depreciation of investments for federal income tax purposes were substantially as follows: |
| | | | |
Gross unrealized appreciation | | $ | 3,117 | |
Gross unrealized depreciation | | | (8,097 | ) |
| | | | |
Net unrealized depreciation | | $ | (4,980 | ) |
| | | | |
† | | Securities are denominated in U.S. Dollars, unless otherwise noted. |
See notes to financial statements.
154
Semi-Annual Report to Shareholders
Statement of Assets and Liabilities
Western Asset Intermediate Bond Portfolio
September 30, 2007 (Unaudited)
(Amounts in Thousands)
| | | | | | | |
Assets: | | | | | | | |
Investment securities at market value (Cost—$665,672) | | | | | $ | 660,515 | A |
Short-term securities at value (Cost—$217,617) | | | | | | 217,794 | |
Cash | | | | | | 1,106 | |
Receivable for securities sold | | | | | | 60,951 | |
Receivable for fund shares sold | | | | | | 982 | |
Interest receivable | | | | | | 6,238 | |
| | | | | | | |
Total assets | | | | | | 947,586 | |
| | | | | | | |
| | |
Liabilities: | | | | | | | |
Obligation to return collateral for securities loaned | | $ | 92,821 | | | | |
Swap contracts at value | | | 862 | | | | |
Payable for securities purchased | | | 133,495 | | | | |
Payable for fund shares repurchased | | | 148 | | | | |
Accrued management fee | | | 228 | | | | |
Income distribution payable | | | 547 | | | | |
Futures variation margin payable | | | 32 | | | | |
Options written (Proceeds—$622) | | | 705 | | | | |
Accrued expenses | | | 104 | | | | |
| | | | | | | |
Total liabilities | | | | | | 228,942 | |
| | | | | | | |
| | |
Net Assets | | | | | $ | 718,644 | |
| | | | | | | |
| | |
Net assets consist of: | | | | | | | |
Accumulated paid-in-capital | | | | | $ | 730,894 | |
Undistributed net investment income | | | | | | 405 | |
Accumulated net realized loss on investments, options, futures and swaps | | | | | | (8,138 | ) |
Net unrealized depreciation on investments, options, futures and swaps | | | | | | (4,517 | ) |
| | | | | | | |
| | |
Net Assets | | | | | $ | 718,644 | |
| | | | | | | |
| | |
Net Asset Value Per Share: | | | | | | | |
Institutional Class (69,388 shares outstanding) | | | | | | $10.36 | |
| | | | | | | | |
A | | The market value of securities on loan is $105,434. |
See notes to financial statements.
155
Semi-Annual Report to Shareholders
Statement of Operations
Western Asset Intermediate Bond Portfolio
For the Six Months Ended September 30, 2007 (Unaudited)
(Amounts in Thousands)
| | | | | | | | |
Investment Income: | | | | | | | | |
Interest | | $ | 18,826 | | | | | |
Dividends | | | 6 | | | | | |
Income from securities lending | | | 82 | | | | | |
| | | | | | | | |
Total income | | | | | | $ | 18,914 | |
Expenses: | | | | | | | | |
Management fees | | | 1,357 | | | | | |
Audit and legal fees | | | 44 | | | | | |
Custodian fees | | | 48 | | | | | |
Directors’ fees and expenses | | | 9 | | | | | |
Registration fees | | | 27 | | | | | |
Reports to shareholders | | | 8 | | | | | |
Transfer agent and shareholder servicing expense: | | | | | | | | |
Institutional Class | | | 16 | | | | | |
Other expenses | | | 36 | | | | | |
| | | | | | | | |
| | | 1,545 | | | | | |
Less: Fees waived | | | (17 | ) | | | | |
Compensating balance credits | | | (2 | ) | | | | |
| | | | | | | | |
Net expenses | | | | | | | 1,526 | |
| | | | | | | | |
Net Investment Income | | | | | | | 17,388 | |
Net Realized and Unrealized Gain/(Loss) on Investments: | | | | | | | | |
Net realized gain/(loss) on: | | | | | | | | |
Investments | | | (2,960 | ) | | | | |
Options | | | 246 | | | | | |
Futures | | | 324 | | | | | |
Swaps | | | 194 | | | | | |
| | | | | | | | |
| | | | | | | (2,196 | ) |
Change in unrealized appreciation/depreciation of investments, options, futures and swaps | | | | | | | (4,520 | ) |
| | | | | | | | |
Net Realized and Unrealized Loss on Investments | | | | | | | (6,716 | ) |
| | | | | | | | | |
Change in Net Assets Resulting From Operations | | | | | | $ | 10,672 | |
| | | | | | | | | |
See notes to financial statements.
156
Semi-Annual Report to Shareholders
Statement of Changes in Net Assets
Western Asset Intermediate Bond Portfolio
(Amounts in Thousands)
| | | | | | | | |
| | | FOR THE
SIX MONTHS ENDED
SEPTEMBER 30, 2007 | | | FOR THE
YEAR ENDED
MARCH 31, 2007 | |
| Change in Net Assets: | | (Unaudited) | | | | |
Net investment income | | $ | 17,388 | | | $ | 30,716 | |
| | |
Net realized loss | | | (2,196 | ) | | | (1,665 | ) |
| | |
Change in unrealized appreciation/depreciation | | | (4,520 | ) | | | 15,153 | |
| | | | | | | | |
Change in net assets resulting from operations | | | 10,672 | | | | 44,204 | |
| | |
Distributions to shareholders from: | | | | | | | | |
Net investment income: | | | | | | | | |
Institutional Class | | | (17,392 | ) | | | (30,869 | ) |
| | |
Change in net assets from fund share transactions: | | | | | | | | |
Institutional Class | | | 85,629 | | | | (113,092 | ) |
| | | | | | | | |
Change in net assets | | | 78,909 | | | | (99,757 | ) |
| | |
Net Assets: | | | | | | | | |
Beginning of period | | | 639,735 | | | | 739,492 | |
| | | | | | | | |
| | |
End of period | | $ | 718,644 | | | $ | 639,735 | |
| | | | | | | | |
| | |
Under distributions of net investment income | | $ | 405 | | | $ | 409 | |
| | | | | | | | |
| | | | | | | | | |
See notes to financial statements.
157
Semi-Annual Report to Shareholders
Financial Highlights
Western Asset Intermediate Bond Portfolio
For a share of each class of capital stock outstanding:
Institutional Class:
| | | | | | | | | | | | | | | | | | | | | | | | |
| | | SIX MONTHS
ENDED
SEPTEMBER 30,
2007 | | | YEARS ENDED MARCH 31, | |
| | | | 2007 | | | 2006 | | | 2005 | | | 2004 | | | 2003 | |
| | | (Unaudited) | | | | | | | | | | | | | | | | |
Net asset value, beginning of period | | $ | 10.43 | | | $ | 10.21 | | | $ | 10.51 | | | $ | 11.01 | | | $ | 10.92 | | | $ | 10.39 | |
| | | | | | | | | | | | | | | | | | | | | | | | |
Investment operations: | | | | | | | | | | | | | | | | | | | | | | | | |
Net investment income | | | .26 | A | | | .49 | A | | | .44 | | | | .38 | | | | .44 | | | | .53 | |
Net realized and unrealized gain/(loss) | | | (.06 | ) | | | .22 | | | | (.20 | ) | | | (.22 | ) | | | .36 | | | | .62 | |
| | | | | | | | | | | | | | | | | | | | | | | | |
Total from investment operations | | | .20 | | | | .71 | | | | .24 | | | | .16 | | | | .80 | | | | 1.15 | |
| | | | | | | | | | | | | | | | | | | | | | | | |
Distributions from: | | | | | | | | | | | | | | | | | | | | | | | | |
Net investment income | | | (.27 | ) | | | (.49 | ) | | | (.44 | ) | | | (.38 | ) | | | (.44 | ) | | | (.53 | ) |
Net realized gain on investments | | | — | | | | — | | | | (.10 | ) | | | (.28 | ) | | | (.27 | ) | | | (.09 | ) |
| | | | | | | | | | | | | | | | | | | | | | | | |
Total distributions | | | (.27 | ) | | | (.49 | ) | | | (.54 | ) | | | (.66 | ) | | | (.71 | ) | | | (.62 | ) |
| | | | | | | | | | | | | | | | | | | | | | | | |
Net asset value, end of period | | $ | 10.36 | | | $ | 10.43 | | | $ | 10.21 | | | $ | 10.51 | | | $ | 11.01 | | | $ | 10.92 | |
| | | | | | | | | | | | | | | | | | | | | | | | |
Total return | | | 1.81 | %B | | | 7.17 | % | | | 2.37 | % | | | 1.66 | % | | | 7.58 | % | | | 11.37 | % |
| | | | | | |
Ratios to Average Net Assets:C | | | | | | | | | | | | | | | | | | | | | | | | |
Total expenses | | | .46 | %D | | | .46 | % | | | .47 | % | | | .46 | % | | | .47 | % | | | .45 | % |
Expenses net of waivers, if any | | | .45 | %D | | | .45 | % | | | .45 | % | | | .45 | % | | | .45 | % | | | .45 | % |
Expenses net of all reductions | | | .45 | %D | | | .45 | % | | | .45 | % | | | .45 | % | | | .45 | % | | | .45 | % |
Net investment income | | | 5.1 | %D | | | 4.8 | % | | | 4.3 | % | | | 3.6 | % | | | 4.0 | % | | | 5.0 | % |
| | | | | | |
Supplemental Data: | | | | | | | | | | | | | | | | | | | | | | | | |
Portfolio turnover rate | | | 117.6 | %B | | | 244.1 | % | | | 266.1 | % | | | 215.7 | % | | | 255.1 | % | | | 238.5 | % |
Net assets, end of period (in thousands) | | $ | 718,644 | | | $ | 639,735 | | | $ | 739,492 | | | $ | 660,480 | | | $ | 587,229 | | | $ | 539,874 | |
| | | | | | | | | | | | | | | | | | | | | | | | | |
A | | Computed using average daily shares outstanding. |
C | | Total expenses reflects operating expenses prior to any voluntary expense waivers and/or compensating balance credits. Expenses net of waivers reflects total expenses before compensating balance credits but net of any voluntary expense waivers. Expenses net of all reductions reflects expenses less any compensating balance credits and/or voluntary expense waivers. |
See notes to financial statements.
158
Semi-Annual Report to Shareholders
Expense Example
Western Asset Intermediate Plus Bond Portfolio
As a shareholder of the Fund, you incur ongoing costs, including management fees, and other Fund expenses. These examples are intended to help you understand your ongoing costs (in dollars) of investing in the Fund and to compare these costs with the ongoing costs of investing in other mutual funds. The example is based on an investment of $1,000 invested on April 1, 2007, and held through September 30, 2007.
Actual Expenses
The first line in the table below provides information about actual account values and actual expenses for the Fund. You may use the information in this line, together with the amount you invested, to estimate the expenses that you paid over the period. Simply divide your account value by $1,000 (for example, an $8,600 account value divided by $1,000 = 8.6), then multiply the result by the number in the first line under the heading entitled “Expenses Paid During the Period” to estimate the expenses you paid on your account during this period.
Hypothetical Example for Comparison Purposes
The second line in the table below provides information about hypothetical account values and hypothetical expenses based on the Fund’s actual expense ratio and an assumed rate of return of 5% per year before expenses, which is not the Fund’s actual return. The hypothetical account values and expenses may not be used to estimate the actual ending account balance or expenses you paid for the period. You may use this information to compare the ongoing costs of investing in the Fund and other funds. To do so, compare this 5% hypothetical example with the 5% hypothetical examples that appear in the shareholder reports of other funds.
| | | | | | | | | |
| | | Beginning
Account Value
4/1/07 | | Ending
Account Value
9/30/07 | | Expenses PaidA
During the Period
4/1/07 to 9/30/07 |
Institutional Class: | | | | | | | | | |
Actual | | $ | 1,000.00 | | $ | 1,016.10 | | $ | 2.27 |
Hypothetical (5% return before expenses) | | | 1,000.00 | | | 1,022.81 | | | 2.28 |
A | | These calculations are based on expenses incurred in the most recent fiscal half-year. The dollar amounts shown as “Expenses Paid During the Period” are equal to the annualized expense ratio of 0.45% multiplied by the average value over the period, multiplied by the number of days in the most recent fiscal half-year (183), and divided by 365. |
159
Semi-Annual Report to Shareholders
Performance Information
Western Asset Intermediate Plus Bond Portfolio
The graph compares the Fund’s total returns to that of an appropriate broad-based securities market index. The line illustrates the cumulative total return of an initial $1,000,000 investment for the periods indicated. The line for the Fund represents the total return after deducting all Fund investment management and other administrative expenses and the transaction costs of buying and selling securities. The line representing the securities market index does not include any transaction costs associated with buying and selling securities in the index or other investment management or administrative expenses.
Total return measures investment performance in terms of appreciation or depreciation in the Fund’s net asset value per share, plus dividends and any capital gain distributions. It assumes that dividends and distributions were reinvested at the time they were paid. Returns (and the graph and table found below) do not reflect the deduction of taxes that a shareholder would pay on Fund distributions or the redemption of Fund shares. Average annual returns tend to smooth out variations in a fund’s return, so that they differ from actual year-to-year results.
Bonds are subject to a variety of risks, including interest rate, credit, and inflation risk. Non-U.S. investments are subject to currency fluctuations, social, economic and political risk.
Growth of a $1,000,000 Investment—Institutional Class
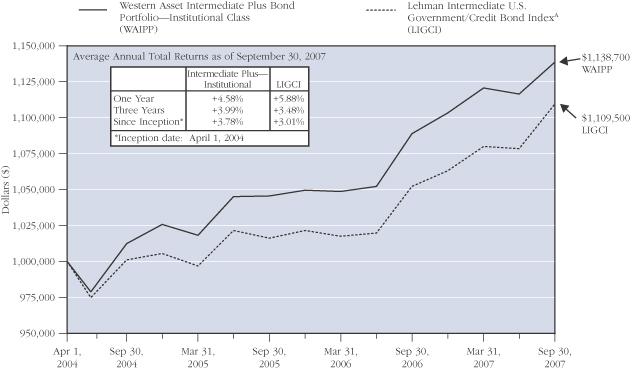
The performance data quoted represents past performance and does not guarantee future results. The performance stated may have been due to extraordinary market conditions, which may not be duplicated in the future. Current performance may be lower or higher than the performance data quoted. To obtain the most recent month-end performance information, please visit www.westernassetfunds.com. The investment return and principal value of the Fund will fluctuate so that an investor’s shares, when redeemed, may be worth more or less than the original cost. Calculations assume reinvestment of dividends and capital gain distributions. Performance would have been lower if fees had not been waived in various periods.
A | | Index returns are for periods beginning March 31, 2004. |
160
Semi-Annual Report to Shareholders
Portfolio Composition (as of September 30, 2007)
Standard & Poor’s Debt RatingsB (as a percentage of the portfolio)
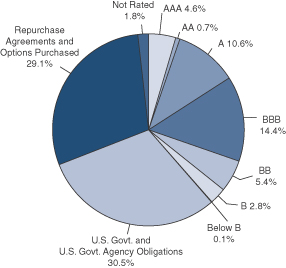
Maturity Schedule (as a percentage of the portfolio)
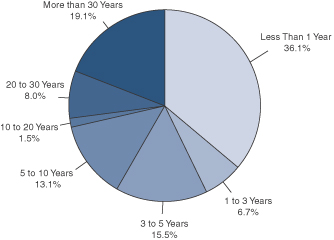
B | | Source: Standard & Poor’s |
The Fund is actively managed. As a result, the composition of the portfolio holdings and sectors are subject to change at any time.
161
Semi-Annual Report to Shareholders
Portfolio of Investments
Western Asset Intermediate Plus Bond Portfolio
September 30, 2007 (Unaudited)
(Amounts in Thousands)
| | | | | | | | | | | | | | |
| | | % OF
NET ASSETS | | RATE | | MATURITY
DATE | | PAR† | | | VALUE | |
| | | | | | | | | | | | | | |
Long-Term Securities | | 77.9% | | | | | | | | | | | | |
| | | | | |
Corporate Bonds and Notes | | 29.1% | | | | | | | | | | | | |
| | | | | |
Airlines | | 0.2% | | | | | | | | | | | | |
Delta Air Lines Inc. | | | | 7.570% | | 11/18/10 | | $ | 200 | | | $ | 205 | |
| | | | | | | | | | | | | | |
| | | | | |
Automobiles | | 0.5% | | | | | | | | | | | | |
DaimlerChrysler NA Holding Corp. | | | | 6.500% | | 11/15/13 | | | 260 | | | | 270 | |
Ford Motor Co. | | | | 7.450% | | 7/16/31 | | | 110 | | | | 86 | |
General Motors Corp. | | | | 8.375% | | 7/5/33 | | | 50 | EUR | | | 62 | |
General Motors Corp. | | | | 8.375% | | 7/15/33 | | | 120 | | | | 105 | |
| | | | | | | | | | | | | | |
| | | | | | | | | | | | | 523 | |
| | | | | | | | | | | | | | |
Capital Markets | | 3.5% | | | | | | | | | | | | |
Goldman Sachs Capital II | | | | 5.793% | | 12/29/49 | | | 1,520 | | | | 1,438 | A |
Goldman Sachs Capital III | | | | 6.350% | | 9/29/49 | | | 100 | | | | 91 | B |
Lehman Brothers Holdings Capital Trust VII | | | | 5.857% | | 5/31/49 | | | 830 | | | | 791 | A |
Lehman Brothers Holdings Capital Trust VIII | | | | 6.371% | | 5/29/49 | | | 70 | | | | 66 | B |
Lehman Brothers Holdings Inc. | | | | 4.500% | | 7/26/10 | | | 140 | | | | 136 | |
Merrill Lynch and Co. Inc. | | | | 5.700% | | 5/2/17 | | | 200 | | | | 194 | |
Morgan Stanley | | | | 5.550% | | 4/27/17 | | | 310 | | | | 301 | |
The Bear Stearns Cos. Inc. | | | | 6.400% | | 10/2/17 | | | 510 | | | | 508 | |
| | | | | | | | | | | | | | |
| | | | | | | | | | | | | 3,525 | |
| | | | | | | | | | | | | | |
Chemicals | | 0.7% | | | | | | | | | | | | |
The Dow Chemical Co. | | | | 6.000% | | 10/1/12 | | | 660 | | | | 677 | |
| | | | | | | | | | | | | | |
| | | | | |
Commercial Banks | | 2.1% | | | | | | | | | | | | |
Comerica Capital Trust II | | | | 6.576% | | 2/20/37 | | | 130 | | | | 117 | A |
SunTrust Capital VIII | | | | 6.100% | | 12/15/36 | | | 80 | | | | 73 | A |
Wachovia Capital Trust III | | | | 5.800% | | 8/29/49 | | | 1,550 | | | | 1,540 | A |
Wells Fargo Capital X | | | | 5.950% | | 12/15/36 | | | 410 | | | | 376 | |
| | | | | | | | | | | | | | |
| | | | | | | | | | | | | 2,106 | |
| | | | | | | | | | | | | | |
Commercial Services and Supplies | | 0.5% | | | | | | | | | | | | |
Waste Management Inc. | | | | 7.375% | | 8/1/10 | | | 460 | | | | 487 | |
| | | | | | | | | | | | | | |
| | | | | |
Consumer Finance | | 4.8% | | | | | | | | | | | | |
American Express Co. | | | | 6.800% | | 9/1/66 | | | 550 | | | | 564 | A |
Ford Motor Credit Co. | | | | 8.110% | | 1/13/12 | | | 940 | | | | 888 | B |
Ford Motor Credit Co. | | | | 9.810% | | 4/15/12 | | | 1,000 | | | | 1,035 | B |
GMAC LLC | | | | 6.875% | | 9/15/11 | | | 700 | | | | 666 | |
GMAC LLC | | | | 6.000% | | 12/15/11 | | | 850 | | | | 785 | |
162
Semi-Annual Report to Shareholders
| | | | | | | | | | | | | |
| | | % OF
NET ASSETS | | RATE | | MATURITY
DATE | | PAR† | | VALUE | |
| | | | | | | | | | | | | |
Corporate Bonds and Notes—Continued | | | | | | | | | | | | | |
| | | | | |
Consumer Finance—Continued | | | | | | | | | | | | | |
GMAC LLC | | | | 6.750% | | 12/1/14 | | $ | 40 | | $ | 36 | |
John Deere Capital Corp. | | | | 5.100% | | 1/15/13 | | | 100 | | | 98 | |
Nelnet Inc. | | | | 7.400% | | 9/29/36 | | | 250 | | | 245 | A |
SLM Corp. | | | | 5.660% | | 1/27/14 | | | 700 | | | 611 | B |
| | | | | | | | | | | | | |
| | | | | | | | | | | | 4,928 | |
| | | | | | | | | | | | | |
Diversified Financial Services | | 2.7% | | | | | | | | | | | |
AGFC Capital Trust I | | | | 6.000% | | 1/15/67 | | | 1,520 | | | 1,424 | A,C |
Capmark Financial Group Inc. | | | | 5.875% | | 5/10/12 | | | 350 | | | 319 | C,D |
Glen Meadow Pass-Through Certificates | | | | 6.505% | | 2/12/67 | | | 340 | | | 327 | A,C |
The Williams Cos. Inc. Credit Linked Certificate Trust | | | | 6.750% | | 4/15/09 | | | 170 | | | 171 | C |
The Williams Cos. Inc. Credit Linked Certificate Trust | | | | 8.606% | | 5/1/09 | | | 255 | | | 258 | B,C |
ZFS Finance USA Trust II | | | | 6.450% | | 12/15/65 | | | 240 | | | 232 | A,C |
| | | | | | | | | | | | | |
| | | | | | | | | | | | 2,731 | |
| | | | | | | | | | | | | |
Diversified Telecommunication Services | | 0.9% | | | | | | | | | | | |
Embarq Corp. | | | | 7.082% | | 6/1/16 | | | 250 | | | 259 | |
Qwest Communications International Inc. | | | | 9.058% | | 2/15/09 | | | 133 | | | 134 | B |
Qwest Corp. | | | | 8.875% | | 3/15/12 | | | 90 | | | 98 | |
Verizon Global Funding Corp. | | | | 7.250% | | 12/1/10 | | | 350 | | | 372 | |
| | | | | | | | | | | | | |
| | | | | | | | | | | | 863 | |
| | | | | | | | | | | | | |
Electric Utilities | | 0.7% | | | | | | | | | | | |
Duke Energy Corp. | | | | 6.250% | | 1/15/12 | | | 200 | | | 207 | |
Duke Energy Corp. | | | | 5.625% | | 11/30/12 | | | 160 | | | 162 | |
Exelon Corp. | | | | 6.750% | | 5/1/11 | | | 300 | | | 312 | |
TXU Energy Co. | | | | 7.000% | | 3/15/13 | | | 50 | | | 55 | |
| | | | | | | | | | | | | |
| | | | | | | | | | | | 736 | |
| | | | | | | | | | | | | |
Food and Staples Retailing | | 0.1% | | | | | | | | | | | |
Safeway Inc. | | | | 6.500% | | 3/1/11 | | | 110 | | | 115 | |
| | | | | | | | | | | | | |
| | | | | |
Health Care Equipment and Supplies | | 0.2% | | | | | | | | | | | |
Hospira Inc. | | | | 5.550% | | 3/30/12 | | | 200 | | | 200 | |
| | | | | | | | | | | | | |
| | | | | |
Health Care Providers and Services | | 1.0% | | | | | | | | | | | |
HCA Inc. | | | | 8.750% | | 9/1/10 | | | 50 | | | 51 | |
HCA Inc. | | | | 6.250% | | 2/15/13 | | | 130 | | | 115 | |
HCA Inc. | | | | 6.750% | | 7/15/13 | | | 70 | | | 63 | |
HCA Inc. | | | | 9.125% | | 11/15/14 | | | 10 | | | 10 | C |
HCA Inc. | | | | 9.250% | | 11/15/16 | | | 90 | | | 96 | C |
163
Semi-Annual Report to Shareholders
Portfolio of Investments—Continued
Western Asset Intermediate Plus Bond Portfolio—Continued
| | | | | | | | | | | | | |
| | | % OF
NET ASSETS | | RATE | | MATURITY
DATE | | PAR† | | VALUE | |
| | | | | | | | | | | | | |
Corporate Bonds and Notes—Continued | | | | | | | | | | | | | |
| | | | | |
Health Care Providers and Services—Continued | | | | | | | | | | | | | |
HCA Inc. | | | | 9.625% | | 11/15/16 | | $ | 60 | | $ | 64 | C,E |
Quest Diagnostics Inc. | | | | 7.500% | | 7/12/11 | | | 320 | | | 342 | |
Universal Health Services Inc. | | | | 6.750% | | 11/15/11 | | | 240 | | | 248 | |
| | | | | | | | | | | | | |
| | | | | | | | | | | | 989 | |
| | | | | | | | | | | | | |
Hotels, Restaurants and Leisure | | 0.1% | | | | | | | | | | | |
Caesars Entertainment Inc. | | | | 7.500% | | 9/1/09 | | | 90 | | | 92 | |
| | | | | | | | | | | | | |
| | | | | |
Independent Power Producers and Energy Traders | | 0.5% | | | | | | | | | | | |
The AES Corp. | | | | 9.500% | | 6/1/09 | | | 150 | | | 156 | |
TXU Corp. | | | | 5.550% | | 11/15/14 | | | 480 | | | 387 | |
| | | | | | | | | | | | | |
| | | | | | | | | | | | 543 | |
| | | | | | | | | | | | | |
IT Services | | 0.3% | | | | | | | | | | | |
Electronic Data Systems Corp. | | | | 7.125% | | 10/15/09 | | | 330 | | | 336 | |
| | | | | | | | | | | | | |
| | | | | |
Leisure Equipment and Products | | N.M. | | | | | | | | | | | |
Eastman Kodak Co. | | | | 3.625% | | 5/15/08 | | | 10 | | | 10 | |
| | | | | | | | | | | | | |
| | | | | |
Media | | 1.8% | | | | | | | | | | | |
Clear Channel Communications Inc. | | | | 4.250% | | 5/15/09 | | | 480 | | | 457 | |
Comcast Corp. | | | | 6.500% | | 1/15/17 | | | 500 | | | 516 | |
Liberty Media LLC | | | | 7.875% | | 7/15/09 | | | 440 | | | 453 | |
Time Warner Inc. | | | | 6.875% | | 5/1/12 | | | 200 | | | 210 | |
Turner Broadcasting System Inc. | | | | 8.375% | | 7/1/13 | | | 130 | | | 145 | |
Viacom Inc. | | | | 5.750% | | 4/30/11 | | | 60 | | | 61 | |
| | | | | | | | | | | | | |
| | | | | | | | | | | | 1,842 | |
| | | | | | | | | | | | | |
Metals and Mining | | 0.4% | | | | | | | | | | | |
Freeport-McMoRan Copper & Gold Inc. | | | | 8.375% | | 4/1/17 | | | 400 | | | 437 | |
| | | | | | | | | | | | | |
| | | | | |
Multi-Utilities | | 0.4% | | | | | | | | | | | |
CenterPoint Energy Inc. | | | | 5.875% | | 6/1/08 | | | 120 | | | 120 | |
Dominion Resources Inc. | | | | 5.700% | | 9/17/12 | | | 280 | | | 281 | |
| | | | | | | | | | | | | |
| | | | | | | | | | | | 401 | |
| | | | | | | | | | | | | |
Multiline Retail | | 0.4% | | | | | | | | | | | |
Federated Retail Holdings Inc. | | | | 5.350% | | 3/15/12 | | | 140 | | | 137 | |
JC Penney Corp. Inc. | | | | 5.750% | | 2/15/18 | | | 80 | | | 77 | |
May Department Stores Co. | | | | 5.750% | | 7/15/14 | | | 210 | | | 203 | |
| | | | | | | | | | | | | |
| | | | | | | | | | | | 417 | |
| | | | | | | | | | | | | |
164
Semi-Annual Report to Shareholders
| | | | | | | | | | | | | |
| | | % OF
NET ASSETS | | RATE | | MATURITY
DATE | | PAR† | | VALUE | |
| | | | | | | | | | | | | |
Corporate Bonds and Notes—Continued | | | | | | | | | | | | | |
| | | | | |
Office Electronics | | 0.3% | | | | | | | | | | | |
Xerox Corp. | | | | 5.500% | | 5/15/12 | | $ | 300 | | $ | 297 | |
| | | | | | | | | | | | | |
| | | | | |
Oil, Gas and Consumable Fuels | | 4.3% | | | | | | | | | | | |
El Paso Corp. | | | | 7.000% | | 5/15/11 | | | 730 | | | 742 | |
El Paso Corp. | | | | 6.875% | | 6/15/14 | | | 540 | | | 545 | |
El Paso Corp. | | | | 7.000% | | 6/15/17 | | | 200 | | | 203 | |
Kerr-McGee Corp. | | | | 6.875% | | 9/15/11 | | | 650 | | | 683 | |
Kinder Morgan Energy Partners LP | | | | 6.000% | | 2/1/17 | | | 470 | | | 465 | |
Occidental Petroleum Corp. | | | | 6.750% | | 1/15/12 | | | 200 | | | 212 | |
Pemex Project Funding Master Trust | | | | 6.994% | | 6/15/10 | | | 24 | | | 24 | B,C |
Pemex Project Funding Master Trust | | | | 6.180% | | 12/3/12 | | | 196 | | | 196 | B,C |
Pemex Project Funding Master Trust | | | | 7.375% | | 12/15/14 | | | 230 | | | 253 | |
The Williams Cos. Inc. | | | | 6.375% | | 10/1/10 | | | 60 | | | 60 | C |
The Williams Cos. Inc. | | | | 7.360% | | 10/1/10 | | | 280 | | | 282 | B,C |
XTO Energy Inc. | | | | 7.500% | | 4/15/12 | | | 100 | | | 108 | |
XTO Energy Inc. | | | | 6.250% | | 4/15/13 | | | 190 | | | 195 | |
XTO Energy Inc. | | | | 5.650% | | 4/1/16 | | | 460 | | | 450 | |
| | | | | | | | | | | | | |
| | | | | | | | | | | | 4,418 | |
| | | | | | | | | | | | | |
Real Estate Investment Trusts | | 0.2% | | | | | | | | | | | |
iStar Financial Inc. | | | | 5.950% | | 10/15/13 | | | 200 | | | 188 | |
| | | | | | | | | | | | | |
| | | | | |
Real Estate Management and Development | | 0.1% | | | | | | | | | | | |
Realogy Corp. | | | | 12.375% | | 4/15/15 | | | 150 | | | 113 | C |
| | | | | | | | | | | | | |
| | | | | |
Thrifts and Mortgage Finance | | 1.6% | | | | | | | | | | | |
Countrywide Financial Corp. | | | | 5.800% | | 6/7/12 | | | 600 | | | 562 | |
Residential Capital LLC | | | | 7.800% | | 11/21/08 | | | 80 | | | 72 | B |
Residential Capital LLC | | | | 7.460% | | 4/17/09 | | | 130 | | | 111 | B |
Residential Capital LLC | | | | 7.595% | | 5/22/09 | | | 90 | | | 77 | B |
Residential Capital LLC | | | | 7.375% | | 6/30/10 | | | 330 | | | 274 | F |
Residential Capital LLC | | | | 7.000% | | 2/22/11 | | | 300 | | | 244 | D |
Washington Mutual Inc. | | | | 4.625% | | 4/1/14 | | | 300 | | | 273 | |
| | | | | | | | | | | | | |
| | | | | | | | | | | | 1,613 | |
| | | | | | | | | | | | | |
Wireless Telecommunication Services | | 0.8% | | | | | | | | | | | |
New Cingular Wireless Services Inc. | | | | 8.125% | | 5/1/12 | | | 400 | | | 444 | |
Sprint Capital Corp. | | | | 8.375% | | 3/15/12 | | | 370 | | | 407 | |
| | | | | | | | | | | | | |
| | | | | | | | | | | | 851 | |
| | | | | | | | | | | | | |
Total Corporate Bonds and Notes (Cost—$30,197) | | | | | | | | | | | | 29,643 | |
165
Semi-Annual Report to Shareholders
Portfolio of Investments—Continued
Western Asset Intermediate Plus Bond Portfolio—Continued
| | | | | | | | | | | | | |
| | | % OF
NET ASSETS | | RATE | | MATURITY
DATE | | PAR† | | VALUE | |
| | | | | | | | | | | | | |
Asset-Backed Securities | | 0.9% | | | | | | | | | | | |
| | | | | |
Indexed SecuritiesB | | 0.9% | | | | | | | | | | | |
Long Beach Mortgage Loan Trust 2005-WL3 2A2A | | | | 5.271% | | 11/25/35 | | $ | 236 | | $ | 234 | |
Washington Mutual Master Note Trust 2006-A3A A3 | | | | 5.783% | | 9/16/13 | | | 700 | | | 690 | C |
| | | | | | | | | | | | | |
Total Asset-Backed Securities (Cost—$922) | | | | | | | | | | | | 924 | |
Mortgage-Backed Securities | | 4.4% | | | | | | | | | | | |
| | | | | |
Fixed Rate Securities | | N.M. | | | | | | | | | | | |
Washington Mutual MSC Mortgage Pass-Through Certificates Series 2004-RA1 | | | | 7.000% | | 3/25/34 | | | 20 | | | 20 | |
| | | | | | | | | | | | | |
| | | | | |
Indexed SecuritiesB | | 2.1% | | | | | | | | | | | |
Bear Stearns Structured Products Inc. 2007-R10 A1 | | | | 5.853% | | 9/26/37 | | | 924 | | | 919 | C |
GMAC Mortgage Corp. Loan Trust 2005-AR5 3A1 | | | | 5.046% | | 9/19/35 | | | 145 | | | 144 | |
IndyMac Inda Mortgage Loan Trust 2007-AR7 1A1 | | | | 6.867% | | 11/25/37 | | | 500 | | | 500 | |
MASTR Adjustable Rate Mortgages Trust 2004-13 | | | | 3.786% | | 11/21/34 | | | 550 | | | 538 | |
MLCC Mortgage Investors Inc. 2004-B | | | | 6.981% | | 5/25/29 | | | 17 | | | 17 | |
| | | | | | | | | | | | | |
| | | | | | | | | | | | 2,118 | |
| | | | | | | | | | | | | |
Variable Rate SecuritiesF | | 2.3% | | | | | | | | | | | |
Banc of America Funding Corp. 2005-B | | | | 5.100% | | 4/20/35 | | | 162 | | | 162 | |
Bear Stearns Alt-A Trust 2005-2 | | | | 4.702% | | 4/25/35 | | | 118 | | | 117 | |
Countrywide Home Loans 2004-20 | | | | 7.465% | | 9/25/34 | | | 17 | | | 17 | |
JP Morgan Mortgage Trust 2004-A3 | | | | 4.304% | | 7/25/34 | | | 518 | | | 515 | |
Merrill Lynch Mortgage Investors Trust 2004-A1 2A1 | | | | 4.557% | | 2/25/34 | | | 374 | | | 370 | |
MLCC Mortgage Investors Inc. 2005-1 2A1 | | | | 4.965% | | 4/25/35 | | | 58 | | | 57 | |
MLCC Mortgage Investors Inc. 2005-1 2A2 | | | | 4.965% | | 4/25/35 | | | 188 | | | 187 | |
Structured Adjustable Rate Mortgage Loan Trust 2004-6 3A2 | | | | 4.715% | | 6/25/34 | | | 170 | | | 168 | |
Washington Mutual Inc. 2005-AR12 | | | | 4.834% | | 10/25/35 | | | 439 | | | 435 | |
Washington Mutual Inc. 2005-AR4 | | | | 4.673% | | 4/25/35 | | | 300 | | | 294 | |
| | | | | | | | | | | | | |
| | | | | | | | | | | | 2,322 | |
| | | | | | | | | | | | | |
Total Mortgage-Backed Securities (Cost—$4,465) | | | | | | | | | | | | 4,460 | |
U.S. Government and Agency Obligations | | 18.0% | | | | | | | | | | | |
| | | | | |
Fixed Rate Securities | | 15.7% | | | | | | | | | | | |
Farmer Mac | | | | 4.250% | | 7/29/08 | | | 80 | | | 80 | |
Farmer Mac | | | | 4.500% | | 10/17/12 | | | 230 | | | 229 | |
Farmer Mac | | | | 5.125% | | 4/19/17 | | | 400 | | | 398 | |
Federal Home Loan Bank | | | | 5.125% | | 6/13/08 | | | 140 | | | 140 | |
Federal Home Loan Bank | | | | 5.000% | | 12/21/15 | | | 540 | | | 543 | |
Federal Home Loan Bank | | | | 5.500% | | 7/15/36 | | | 20 | | | 21 | |
166
Semi-Annual Report to Shareholders
| | | | | | | | | | | | |
| | | % OF
NET ASSETS | | RATE | | MATURITY
DATE | | PAR† | | VALUE |
| | | | | | | | | | | | |
U.S. Government and Agency
Obligations—Continued | | | | | | | | | | | | |
| | | | | |
Fixed Rate Securities—Continued | | | | | | | | | | | | |
Tennessee Valley Authority | | | | 5.625% | | 1/18/11 | | $ | 10 | | $ | 10 |
Tennessee Valley Authority | | | | 6.790% | | 5/23/12 | | | 210 | | | 228 |
Tennessee Valley Authority | | | | 5.980% | | 4/1/36 | | | 10 | | | 11 |
United States Treasury Bonds | | | | 8.875% | | 8/15/17 | | | 10 | | | 13 |
United States Treasury Notes | | | | 4.375% | | 1/31/08 | | | 120 | | | 120 |
United States Treasury Notes | | | | 3.000% | | 2/15/08 | | | 2,250 | | | 2,241 |
United States Treasury Notes | | | | 3.750% | | 5/15/08 | | | 3,940 | | | 3,930 |
United States Treasury Notes | | | | 3.625% | | 7/15/09 | | | 850 | | | 845 |
United States Treasury Notes | | | | 6.500% | | 2/15/10 | | | 40 | | | 42 |
United States Treasury Notes | | | | 3.875% | | 9/15/10 | | | 2,650 | | | 2,640 |
United States Treasury Notes | | | | 4.875% | | 5/31/11 | | | 400 | | | 411 |
United States Treasury Notes | | | | 4.500% | | 9/30/11 | | | 870 | | | 882 |
United States Treasury Notes | | | | 4.625% | | 10/31/11 | | | 470 | | | 478 |
United States Treasury Notes | | | | 4.875% | | 6/30/12 | | | 470 | | | 483 |
United States Treasury Notes | | | | 4.625% | | 7/31/12 | | | 890 | | | 906 |
United States Treasury Notes | | | | 4.250% | | 8/15/14 | | | 1,300 | | | 1,291 |
United States Treasury Notes | | | | 5.125% | | 5/15/16 | | | 31 | | | 32 |
| | | | | | | | | | | | |
| | | | | | | | | | | | 15,974 |
| | | | | | | | | | | | |
Treasury Inflation-Protected SecuritiesG | | 2.3% | | | | | | | | | | |
United States Treasury Inflation-Protected Security | | | | 0.875% | | 4/15/10 | | | 66 | | | 64 |
United States Treasury Inflation-Protected Security | | | | 2.375% | | 4/15/11 | | | 52 | | | 53 |
United States Treasury Inflation-Protected Security | | | | 2.000% | | 1/15/14 | | | 643 | | | 633 |
United States Treasury Inflation-Protected Security | | | | 2.000% | | 7/15/14 | | | 11 | | | 11 |
United States Treasury Inflation-Protected Security | | | | 1.875% | | 7/15/15 | | | 139 | | | 135 |
United States Treasury Inflation-Protected Security | | | | 2.000% | | 1/15/16 | | | 189 | | | 185 |
United States Treasury Inflation-Protected Security | | | | 2.500% | | 7/15/16 | | | 175 | | | 179 |
United States Treasury Inflation-Protected Security | | | | 2.375% | | 1/15/17 | | | 213 | | | 214 |
United States Treasury Inflation-Protected Security | | | | 2.375% | | 1/15/25 | | | 77 | | | 78 |
United States Treasury Inflation-Protected Security | | | | 2.000% | | 1/15/26 | | | 105 | | | 100 |
United States Treasury Inflation-Protected Security | | | | 2.375% | | 1/15/27 | | | 733 | | | 742 |
| | | | | | | | | | | | |
| | | | | | | | | | | | 2,394 |
| | | | | | | | | | | | |
Total U.S. Government and Agency Obligations (Cost—$18,173) | | | | | | | | | | | | 18,368 |
U.S. Government Agency
Mortgage-Backed Securities | | 15.8% | | | | | | | | | | |
| | | | | |
Fixed Rate Securities | | 13.7% | | | | | | | | | | |
Fannie Mae | | | | 5.000% | | 2/1/36 | | | 700 | | | 668 |
167
Semi-Annual Report to Shareholders
Portfolio of Investments—Continued
Western Asset Intermediate Plus Bond Portfolio—Continued
| | | | | | | | | | | | | |
| | | % OF
NET ASSETS | | RATE | | MATURITY
DATE | | PAR† | | VALUE | |
| | | | | | | | | | | | | |
U.S. Government Agency Mortgage-Backed
Securities—Continued | | | | | | | | | | | | | |
| | | | | |
Fixed Rate Securities—Continued | | | | | | | | | | | | | |
Fannie Mae | | | | 5.000% | | 12/1/37 | | $ | 5,400 | | $ | 5,150 | H |
Fannie Mae | | | | 6.000% | | 12/1/37 | | | 6,400 | | | 6,406 | H |
Freddie Mac | | | | 6.000% | | 9/1/37 | | | 1,650 | | | 1,652 | |
Freddie Mac | | | | 5.000% | | 12/1/37 | | | 100 | | | 95 | H |
| | | | | | | | | | | | | |
| | | | | | | | | | | | 13,971 | |
| | | | | | | | | | | | | |
Indexed SecuritiesB | | 2.1% | | | | | | | | | | | |
Fannie Mae | | | | 4.276% | | 12/1/34 | | | 554 | | | 545 | |
Fannie Mae | | | | 4.603% | | 9/1/35 | | | 311 | | | 311 | |
Fannie Mae | | | | 5.879% | | 8/1/37 | | | 400 | | | 406 | |
Freddie Mac | | | | 4.092% | | 1/1/35 | | | 21 | | | 21 | |
Freddie Mac | | | | 4.132% | | 1/1/35 | | | 36 | | | 35 | |
Freddie Mac | | | | 6.126% | | 9/1/37 | | | 800 | | | 808 | |
| | | | | | | | | | | | | |
| | | | | | | | | | | | 2,126 | |
| | | | | | | | | | | | | |
Total U.S. Government Agency Mortgage-Backed Securities (Cost—$16,097) | | | | | | | | | | | | 16,097 | |
Yankee BondsI | | 9.7% | | | | | | | | | | | |
| | | | | |
Commercial Banks | | 4.1% | | | | | | | | | | | |
Banco Santiago SA | | | | 6.074% | | 12/9/09 | | | 200 | | | 200 | B,C |
Glitnir Banki Hf | | | | 5.800% | | 1/21/11 | | | 640 | | | 625 | B,C |
Kaupthing Bank Hf | | | | 5.750% | | 10/4/11 | | | 580 | | | 573 | C |
Landsbanki Islands Hf | | | | 6.100% | | 8/25/11 | | | 330 | | | 334 | C |
Resona Preferred Global Securities | | | | 7.191% | | 12/29/49 | | | 670 | | | 672 | A,C |
Royal Bank of Scotland Group PLC | | | | 9.118% | | 3/31/49 | | | 180 | | | 193 | |
Santander Issuances | | | | 5.805% | | 6/20/16 | | | 140 | | | 142 | A,C |
Shinsei Finance Cayman Ltd. | | | | 6.418% | | 1/29/49 | | | 750 | | | 695 | A,C |
TuranAlem Finance BV | | | | 6.735% | | 1/22/09 | | | 130 | | | 128 | B,C |
VTB Capital SA for Vneshtorgbank | | | | 5.956% | | 8/1/08 | | | 578 | | | 572 | B,C |
| | | | | | | | | | | | | |
| | | | | | | | | | | | 4,134 | |
| | | | | | | | | | | | | |
Diversified Financial Services | | 1.3% | | | | | | | | | | | |
Aiful Corp. | | | | 5.000% | | 8/10/10 | | | 390 | | | 377 | C |
European Investment Bank | | | | 4.625% | | 3/21/12 | | | 100 | | | 100 | |
MUFG Captial Finance 1 Ltd. | | | | 6.346% | | 7/29/49 | | | 450 | | | 428 | A |
TNK-BP Finance SA | | | | 6.875% | | 7/18/11 | | | 380 | | | 377 | C |
| | | | | | | | | | | | | |
| | | | | | | | | | | | 1,282 | |
| | | | | | | | | | | | | |
Diversified Telecommunication Services | | 2.6% | | | | | | | | | | | |
British Telecommunications PLC | | | | 8.625% | | 12/15/10 | | | 350 | | | 385 | D |
168
Semi-Annual Report to Shareholders
| | | | | | | | | | | | | |
| | | % OF
NET ASSETS | | RATE | | MATURITY
DATE | | PAR† | | VALUE | |
| | | | | | | | | | | | | |
Yankee Bonds—Continued | | | | | | | | | | | | | |
| | | | | |
Diversified Telecommunication Services—Continued | | | | | | | | | | | | | |
Deutsche Telekom International Finance BV | | | | 5.750% | | 3/23/16 | | $ | 500 | | $ | 494 | |
France Telecom SA | | | | 7.750% | | 3/1/11 | | | 400 | | | 430 | |
Koninklijke (Royal) KPN NV | | | | 8.000% | | 10/1/10 | | | 490 | | | 527 | |
Telecom Italia Capital SpA | | | | 5.250% | | 10/1/15 | | | 200 | | | 190 | |
Telefonica Emisiones S.A.U. | | | | 5.690% | | 2/4/13 | | | 680 | | | 668 | B |
| | | | | | | | | | | | | |
| | | | | | | | | | | | 2,694 | |
| | | | | | | | | | | | | |
Foreign Governments | | 0.4% | | | | | | | | | | | |
Federative Republic of Brazil | | | | 8.875% | | 4/15/24 | | | 20 | | | 26 | |
Federative Republic of Brazil | | | | 10.125% | | 5/15/27 | | | 22 | | | 31 | |
Federative Republic of Brazil | | | | 11.000% | | 8/17/40 | | | 67 | | | 90 | |
Republic of Colombia | | | | 7.375% | | 9/18/37 | | | 100 | | | 110 | |
Republic of Panama | | | | 7.125% | | 1/29/26 | | | 32 | | | 34 | |
Republic of Panama | | | | 6.700% | | 1/26/36 | | | 24 | | | 25 | |
Russian Federation | | | | 7.500% | | 3/31/30 | | | 40 | | | 45 | C |
United Mexican States | | | | 6.750% | | 9/27/34 | | | 9 | | | 10 | |
| | | | | | | | | | | | | |
| | | | | | | | | | | | 371 | |
| | | | | | | | | | | | | |
Health Care Equipment and Supplies | | 0.2% | | | | | | | | | | | |
Baxter Finco BV | | | | 4.750% | | 10/15/10 | | | 220 | | | 220 | |
| | | | | | | | | | | | | |
| | | | | |
Industrial Conglomerates | | 0.4% | | | | | | | | | | | |
Tyco International Group SA | | | | 6.000% | | 11/15/13 | | | 460 | | | 464 | |
| | | | | | | | | | | | | |
| | | | | |
Metals and Mining | | 0.4% | | | | | | | | | | | |
Vale Overseas Ltd. | | | | 6.250% | | 1/23/17 | | | 460 | | | 465 | |
| | | | | | | | | | | | | |
| | | | | |
Oil, Gas and Consumable Fuels | | 0.3% | | | | | | | | | | | |
Gazprom | | | | 6.212% | | 11/22/16 | | | 190 | | | 188 | C |
Gazprom | | | | 6.510% | | 3/7/22 | | | 110 | | | 109 | C |
| | | | | | | | | | | | | |
| | | | | | | | | | | | 297 | |
| | | | | | | | | | | | | |
Total Yankee Bonds (Cost—$10,014) | | | | | | | | | | | | 9,927 | |
| | | | | | | | | | | | | |
Total Long-Term Securities (Cost—$79,868) | | | | | | | | | | | | 79,419 | |
Short-Term Securities | | 32.9% | | | | | | | | | | | |
| | | | | |
U.S. Government and Agency Obligations | | 0.6% | | | | | | | | | | | |
Fannie Mae | | | | 0.000% | | 3/17/08 | | | 650 | | | 637 | J,K |
| | | | | | | | | | | | | |
169
Semi-Annual Report to Shareholders
Portfolio of Investments—Continued
Western Asset Intermediate Plus Bond Portfolio—Continued
| | | | | | | | | | | | | | |
| | | % OF
NET ASSETS | | | | | | PAR† | | | VALUE | |
| | | | | | | | | | | | | | |
Short-Term Securities—Continued | | | | | | | | | | | | | | |
| | | | | |
Options PurchasedL | | 0.1% | | | | | | | | | | | | |
Deutsche Swaption Call, November 2007, Strike Price $5.27 | | | | | | | | | 1,900,000 | M | | $ | 37 | |
Greenwich Swaption Call, September 2009, Strike Price $4.50 | | | | | | | | | 2,700,000 | M | | | 11 | |
| | | | | | | | | | | | | | |
| | | | | | | | | | | | | 48 | |
| | | | | | | | | | | | | | |
Repurchase Agreement | | 32.2% | | | | | | | | | | | | |
Goldman Sachs Group Inc.
4.85% dated 9/28/07, to be repurchased at $32,845 on 10/1/07 (Collateral: 33,450 Fannie Mae note, 3.875%, due 7/15/08,
value $33,492) | | | | | | | | $ | 32,832 | | | | 32,832 | |
| | | | | | | | | | | | | | |
Total Short-Term Securities (Cost—$33,502) | | | | | | | | | | | | | 33,517 | |
Total Investments (Cost—$113,370)O | | 110.8% | | | | | | | | | | | 112,936 | |
Other Assets Less Liabilities | | (10.8)% | | | | | | | | | | | (11,035 | ) |
| | | | | | | | | | | | | | |
| | | | | |
Net Assets | | 100.0% | | | | | | | | | | $ | 101,901 | |
| | | | | | | | | | | | | | |
| | | | | | | | |
| | | EXPIRATION | | ACTUAL
CONTRACTS | | APPRECIATION/
(DEPRECIATION) | |
Futures Contracts PurchasedL | | | | | | | | |
Bundesobligations Futures | | December 2007 | | 23 | | $ | (4 | ) |
Eurodollar Futures | | December 2007 | | 4 | | | 2 | |
Eurodollar Futures | | June 2008 | | 11 | | | 25 | |
U.S. Treasury Note Futures | | December 2007 | | 20 | | | 16 | |
U.S. Treasury Note Futures | | December 2007 | | 115 | | | 82 | |
| | | | | | | | |
| | | | | | $ | 121 | |
| | | | | | | | |
Futures Contracts WrittenL | | | | | | | | |
U.S. Treasury Bond Futures | | December 2007 | | 2 | | $ | (1 | ) |
U.S. Treasury Note Futures | | December 2007 | | 39 | | | (2 | ) |
| | | | | | | | |
| | | | | | $ | (3 | ) |
| | | | | | | | |
Options WrittenL | | | | | | | | |
Eurodollar Futures Call, Strike Price $95.50 | | March 2008 | | 28 | | $ | 2 | |
JP Morgan Swaption Call, Strike Price $1.40 | | November 2007 | | 4,100,000 | | | 4 | |
Greenwich Swaption Call, Strike Price $4.95 | | September 2009 | | 600,000 | | | 1 | |
JP Morgan Swaption Put, Strike Price $1.70 | | November 2007 | | 4,100,000 | | | (16 | ) |
U.S. Treasury Note Futures Put, Strike Price $108.00 | | December 2007 | | 36 | | | (3 | ) |
| | | | | | | | |
| | | | | | $ | (12 | ) |
| | | | | | | | |
| | | | | | | | | |
170
Semi-Annual Report to Shareholders
N.M. Not Meaningful.
A | | Stepped Coupon Security – A security with a predetermined schedule of interest or dividend rate changes at which time it begins to accrue interest or pay dividends according to the predetermined schedule. |
B | | Indexed Security – The rates of interest earned on these securities are tied to the London Interbank Offered Rate (“LIBOR”), the Euro Interbank Offered Rate (“EURIBOR”) Index, the Consumer Price Index (“CPI”), the one-year Treasury Bill Rate or the ten-year Japanese Government Bond Rate. The coupon rates are the rates as of September 30, 2007. |
C | | Rule 144a Security – A security purchased pursuant to Rule 144a under the Securities Act of 1933 which may not be resold subject to that rule except to qualified institutional buyers. These securities, which the Fund’s investment adviser has determined to be liquid, represent 10.03% of net assets. |
D | | Credit Linked Security – The rates of interest earned on these securities are tied to the credit rating assigned by Standard & Poor’s Rating Service and/or Moody’s Investors Services. |
E | | Pay-in-Kind (“PIK”) security – A security in which interest or dividends during the initial few years is paid in additional PIK securities rather than in cash. |
F | | The coupon rates shown on variable rate securities are the rates at September 30, 2007. These rates vary with the weighted average coupon of the underlying loans. |
G | | Treasury Inflation-Protected Security–Treasury security whose principal value is adjusted daily in accordance with changes to the Consumer Price Index for All Urban Consumers. Interest is calculated on the basis of the current adjusted principal value. |
H | | When-issued Security – Security purchased on a delayed delivery basis. Final settlement amount and maturity date have not yet been announced. |
I | | Yankee Bond – A dollar-denominated bond issued in the U.S. by foreign entities. |
J | | Zero coupon bond – A bond with no periodic interest payments which is sold at such a discount as to produce a current yield to maturity. |
K | | All or a portion of this security is collateral to cover futures and options contracts written. |
L | | Options and futures are described in more detail in the notes to financial statements. |
M | | Par represents actual number of contracts. |
N | | Amount represents less than $1. |
O | | Aggregate cost for federal income tax purposes is substantially the same as book cost. At September 30, 2007, the aggregate gross unrealized appreciation and depreciation of investments for federal income tax purposes were substantially as follows: |
| | | | |
Gross unrealized appreciation | | $ | 526 | |
Gross unrealized depreciation | | | (952 | ) |
| | | | |
Net unrealized appreciation/(depreciation) | | $ | (426 | ) |
| | | | |
† | | Securities are denominated in U.S. Dollars, unless otherwise noted. |
EUR—Euro
See notes to financial statements.
171
Semi-Annual Report to Shareholders
Statement of Assets and Liabilities
Western Asset Intermediate Plus Bond Portfolio
September 30, 2007 (Unaudited)
(Amounts in Thousands)
| | | | | | | |
Assets: | | | | | | | |
Investment securities at market value (Cost—$79,868) | | | | | $ | 79,419 | |
Short-term securities at value (Cost—$33,502) | | | | | | 33,517 | |
Cash | | | | | | 125 | |
Foreign currency at value (Cost—$21) | | | | | | 21 | |
Receivable for securities sold | | | | | | 9,571 | |
Interest receivable | | | | | | 898 | |
Unrealized appreciation of forward foreign currency contracts | | | | | | 132 | |
| | | | | | | |
Total assets | | | | | | 123,683 | |
| | | | | | | |
| | |
Liabilities: | | | | | | | |
Payable for securities purchased | | $ | 21,306 | | | | |
Accrued management fee | | | 20 | | | | |
Income distribution payable | | | 32 | | | | |
Futures variation margin payable | | | 43 | | | | |
Options written (Proceeds—$86) | | | 98 | | | | |
Swap contracts at value | | | 87 | | | | |
Unrealized depreciation of forward foreign currency contracts | | | 137 | | | | |
Accrued expenses | | | 59 | | | | |
| | | | | | | |
Total liabilities | | | | | | 21,782 | |
| | | | | | | |
| | |
Net Assets | | | | | $ | 101,901 | |
| | | | | | | |
| | |
Net assets consist of: | | | | | | | |
Accumulated paid-in-capital | | | | | $ | 102,643 | |
Overdistributed net investment income | | | | | | (32 | ) |
Accumulated net realized loss on investments, options, futures, swaps and foreign currency transactions | | | | | | (334 | ) |
Net unrealized depreciation on investments, options, futures and swaps | | | | | | (376 | ) |
| | | | | | | |
| | |
Net Assets | | | | | $ | 101,901 | |
| | | | | | | |
| | |
Net Asset Value Per Share: | | | | | | | |
Institutional Class (10,368 shares outstanding) | | | | | | $9.83 | |
| | | | | | | | |
See notes to financial statements.
172
Semi-Annual Report to Shareholders
Statement of Operations
Western Asset Intermediate Plus Bond Portfolio
For the Six Months Ended September 30, 2007 (Unaudited)
(Amounts in Thousands)
| | | | | | | | |
Investment Income: | | | | | | | | |
Interest | | | | | | $ | 2,524 | |
Expenses: | | | | | | | | |
Management fees | | $ | 184 | | | | | |
Audit and legal fees | | | 41 | | | | | |
Custodian fees | | | 21 | | | | | |
Directors’ fees and expenses | | | 2 | | | | | |
Registration fees | | | 4 | | | | | |
Reports to shareholders | | | 6 | | | | | |
Transfer agent and shareholder servicing expense: | | | | | | | | |
Institutional Class | | | 7 | | | | | |
Other expenses | | | 11 | | | | | |
| | | | | | | | |
| | | 276 | | | | | |
Less: Fees waived | | | (69 | ) | | | | |
Compensating balance credits | | | — | A | | | | |
| | | | | | | | |
Net expenses | | | | | | | 207 | |
| | | | | | | | |
Net Investment Income | | | | | | | 2,317 | |
Net Realized and Unrealized Gain/(Loss) on Investments: | | | | | | | | |
Net realized gain/(loss) on: | | | | | | | | |
Investments | | | (81 | ) | | | | |
Options | | | 28 | | | | | |
Futures | | | (88 | ) | | | | |
Swaps | | | (88 | ) | | | | |
Foreign currency transactions | | | 51 | | | | | |
| | | | | | | | |
| | | | | | | (178 | ) |
Change in unrealized appreciation/depreciation of: | | | | | | | | |
Investments, options, futures and swaps | | | (627 | ) | | | | |
Assets and liabilities denominated in foreign currency | | | (1 | ) | | | | |
| | | | | | | | |
| | | | | | | (628 | ) |
| | | | | | | | |
Net Realized and Unrealized Loss on Investments | | | | | | | (806 | ) |
| | | | | | | | | |
Change in Net Assets Resulting From Operations | | | | | | $ | 1,511 | |
| | | | | | | | | |
See notes to financial statements.
173
Semi-Annual Report to Shareholders
Statement of Changes in Net Assets
Western Asset Intermediate Plus Bond Portfolio
(Amounts in Thousands)
| | | | | | | | |
| | | FOR THE
SIX MONTHS ENDED
SEPTEMBER 30, 2007 | | | FOR THE
YEAR ENDED
MARCH 31, 2007 | |
| Change in Net Assets: | | (Unaudited) | | | | |
Net investment income | | $ | 2,317 | | | $ | 3,919 | |
| | |
Net realized gain/(loss) | | | (178 | ) | | | 225 | |
| | |
Change in unrealized appreciation/depreciation | | | (628 | ) | | | 1,511 | |
| | | | | | | | |
Change in net assets resulting from operations | | | 1,511 | | | | 5,655 | |
| | |
Distributions to shareholders from: | | | | | | | | |
Net investment income: | | | | | | | | |
Institutional Class | | | (2,317 | ) | | | (3,921 | ) |
Net realized gain on investments: | | | | | | | | |
Institutional Class | | | (161 | ) | | | — | |
| | |
Change in net assets from fund share transactions: | | | | | | | | |
Institutional Class | | | 16,046 | | | | 15,180 | |
| | | | | | | | |
Change in net assets | | | 15,079 | | | | 16,914 | |
| | |
Net Assets: | | | | | | | | |
Beginning of period | | | 86,822 | | | | 69,908 | |
| | | | | | | | |
| | |
End of period | | $ | 101,901 | | | $ | 86,822 | |
| | | | | | | | |
| | |
Overdistributed net investment income | | $ | (32 | ) | | $ | (32 | ) |
| | | | | | | | |
| | | | | | | | | |
See notes to financial statements.
174
Semi-Annual Report to Shareholders
Financial Highlights
Western Asset Intermediate Plus Bond Portfolio
For a share of each class of capital stock outstanding:
Institutional Class:
| | | | | | | | | | | | | | | | |
| | | SIX MONTHS
ENDED
SEPTEMBER 30,
2007
| | | YEARS ENDED MARCH 31, | |
| | | | 2007 | | | 2006 | | | 2005 | |
| | | (Unaudited) | | | | | | | | | | |
Net asset value, beginning of period | | $ | 9.95 | | | $ | 9.74 | | | $ | 9.86 | | | $ | 10.00 | |
| | | | | | | | | | | | | | | | |
Investment operations: | | | | | | | | | | | | | | | | |
Net investment income | | | .25 | A | | | .45 | A | | | .40 | | | | .32 | |
Net realized and unrealized gain/(loss) | | | (.10 | ) | | | .21 | | | | (.11 | ) | | | (.14 | ) |
| | | | | | | | | | | | | | | | |
Total from investment operations | | | .15 | | | | .66 | | | | .29 | | | | .18 | |
| | | | | | | | | | | | | | | | |
Distributions from: | | | | | | | | | | | | | | | | |
Net investment income | | | (.25 | ) | | | (.45 | ) | | | (.41 | ) | | | (.32 | ) |
Net realized gain on investments | | | (.02 | ) | | | — | | | | — | | | | — | |
| | | | | | | | | | | | | | | | |
Total distributions | | | (.27 | ) | | | (.45 | ) | | | (.41 | ) | | | (.32 | ) |
| | | | | | | | | | | | | | | | |
Net asset value, end of period | | $ | 9.83 | | | $ | 9.95 | | | $ | 9.74 | | | $ | 9.86 | |
| | | | | | | | | | | | | | | | |
Total return | | | 1.61 | %B | | | 6.98 | % | | | 2.99 | % | | | 1.81 | % |
| | | | |
Ratios to Average Net Assets:C | | | | | | | | | | | | | | | | |
Total expenses | | | .60 | %D | | | .63 | % | | | .76 | % | | | 1.22 | % |
Expenses net of waivers, if any | | | .45 | %D | | | .45 | % | | | .45 | % | | | .45 | % |
Expenses net of all reductions | | | .45 | %D | | | .45 | % | | | .45 | % | | | .45 | % |
Net investment income | | | 5.1 | %D | | | 4.6 | % | | | 4.1 | % | | | 3.1 | % |
| | | | |
Supplemental Data: | | | | | | | | | | | | | | | | |
Portfolio turnover rate | | | 153.4 | %B | | | 312.2 | % | | | 368.6 | % | | | 463.5 | % |
Net assets, end of period (in thousands) | | $ | 101,901 | | | $ | 86,822 | | | $ | 69,908 | | | $ | 40,637 | |
| | | | | | | | | | | | | | | | | |
A | | Computed using average daily shares outstanding. |
C | | Total expenses reflects operating expenses prior to any voluntary expense waivers and/or compensating balance credits. Expenses net of waivers reflects total expenses before compensating balance credits but net of any voluntary expense waivers. Expenses net of all reductions reflects expenses less any compensating balance credits and/or voluntary expense waivers. |
See notes to financial statements.
175
Semi-Annual Report to Shareholders
Expense Example
Western Asset Limited Duration Bond Portfolio
As a shareholder of the Fund, you incur ongoing costs, including management fees and other Fund expenses. These examples are intended to help you understand your ongoing costs (in dollars) of investing in the Fund and to compare these costs with the ongoing costs of investing in other mutual funds. The example is based on an investment of $1,000 invested on April 1, 2007 and held through September 30, 2007.
Actual Expenses
The first line in the table below provides information about actual account values and actual expenses for the Fund. You may use the information in this line, together with the amount you invested, to estimate the expenses that you paid over the period. Simply divide your account value by $1,000 (for example, an $8,600 account value divided by $1,000 = 8.6), then multiply the result by the number in the first line under the heading entitled “Expenses Paid During the Period” to estimate the expenses you paid on your account during this period.
Hypothetical Example for Comparison Purposes
The second line in the table below provides information about hypothetical account values and hypothetical expenses based on the Fund’s actual expense ratio and an assumed rate of return of 5% per year before expenses, which is not the Fund’s actual return. The hypothetical account values and expenses may not be used to estimate the actual ending account balance or expenses you paid for the period. You may use this information to compare the ongoing costs of investing in the Fund and other funds. To do so, compare this 5% hypothetical example with the 5% hypothetical examples that appear in the shareholder reports of other funds.
| | | | | | | | | |
| | | Beginning
Account Value
4/1/07 | | Ending
Account Value
9/30/07 | | Expenses PaidA
During the Period
4/1/07 to 9/30/07 |
Institutional Class: | | | | | | | | | |
Actual | | $ | 1,000.00 | | $ | 1,006.70 | | $ | 2.01 |
Hypothetical (5% return before expenses) | | $ | 1,000.00 | | $ | 1,023.06 | | $ | 2.03 |
A | | These calculations are based on expenses incurred in the most recent fiscal half-year. The dollar amounts shown as “Expenses Paid During the Period” are equal to the annualized expense ratio of 0.40% multiplied by the average value over the period, multiplied by the number of days in the most recent fiscal half-year (183), and divided by 365. |
176
Semi-Annual Report to Shareholders
Performance Information
Western Asset Limited Duration Bond Portfolio
The graph compares the Fund’s total returns to that of an appropriate broad-based securities market index. The line illustrates the cumulative total return of an initial $1,000,000 investment for the periods indicated. The line for the Fund represents the total return after deducting all Fund investment management and other administrative expenses and the transaction costs of buying and selling securities. The line representing the securities market index does not include any transaction costs associated with buying and selling securities in the index or other investment management or administrative expenses.
Total return measures investment performance in terms of appreciation or depreciation in the Fund’s net asset value per share, plus dividends and any capital gain distributions. It assumes that dividends and distributions were reinvested at the time they were paid. Returns (and the graph and table found below) do not reflect the deduction of taxes that a shareholder would pay on Fund distributions or the redemption of Fund shares. Average annual returns tend to smooth out variations in a fund’s return, so that they differ from actual year-to-year results.
Bonds are subject to a variety of risks, including interest rate, credit and inflation risk. Non-U.S. investments are subject to currency fluctuations, social, economical and political risk.
Growth of a $1,000,000 Investment—Institutional Class
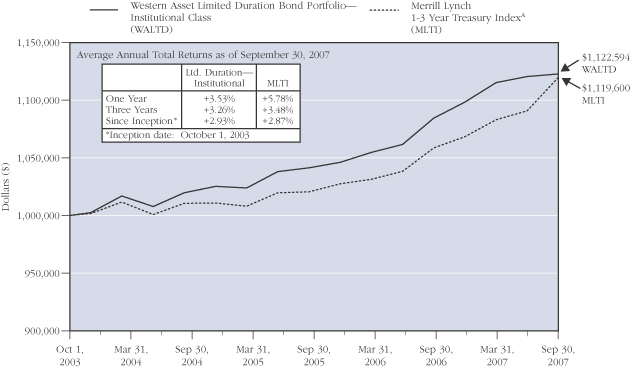
The performance data quoted represents past performance and does not guarantee future results. The performance stated may have been due to extraordinary market conditions, which may not be duplicated in the future. Current performance may be lower or higher than the performance data quoted. To obtain the most recent month-end performance information, please visit www.westernassetfunds.com. The investment return and principal value of the Fund will fluctuate so that an investor’s shares, when redeemed, may be worth more or less than the original cost. Calculations assume reinvestment of dividends and capital gain distributions. Performance would have been lower if fees had not been waived in various periods.
A | | Index returns are for periods beginning September 30, 2003. |
177
Semi-Annual Report to Shareholders
Performance Information—Continued
Portfolio Composition (as of September 30, 2007)
Standard & Poor’s Debt RatingsB (as a percentage of the portfolio)
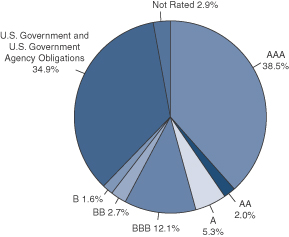
Maturity Schedule (as a percentage of the portfolio)
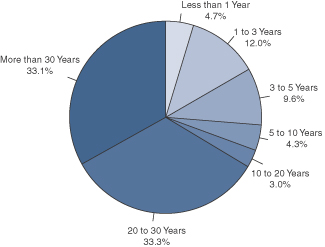
B | | Source: Standard & Poor's. |
The Fund is actively managed. As a result, the composition of the portfolio holdings and sectors are subject to change at any time.
178
Semi-Annual Report to Shareholders
Portfolio of Investments
Western Asset Limited Duration Bond Portfolio
September 30, 2007 (Unaudited)
(Amounts in Thousands)
| | | | | | | | | | | | | |
| | | % OF
NET ASSETS | | RATE | | MATURITY
DATE | | PAR | | VALUE | |
| | | | | | | | | | | | | |
Long-Term Securities | | 120.1% | | | | | | | | | | | |
| | | | | |
Corporate Bonds and Notes | | 20.6% | | | | | | | | | | | |
| | | | | |
Airlines | | 0.4% | | | | | | | | | | | |
Northwest Airlines Inc. | | | | 6.260% | | 5/20/14 | | $ | 468 | | $ | 468 | A |
| | | | | | | | | | | | | |
| | | | | |
Capital Markets | | 2.1% | | | | | | | | | | | |
Goldman Sachs Capital II | | | | 5.793% | | 12/29/49 | | | 260 | | | 246 | B |
Goldman Sachs Capital III | | | | 6.350% | | 9/29/49 | | | 340 | | | 309 | A |
Lehman Brothers Holdings Capital Trust VII | | | | 5.857% | | 11/29/49 | | | 480 | | | 457 | B |
Lehman Brothers Holdings Inc. | | | | 6.500% | | 7/19/17 | | | 200 | | | 203 | |
Merrill Lynch and Co. Inc. | | | | 6.050% | | 8/15/12 | | | 400 | | | 410 | |
Morgan Stanley | | | | 6.600% | | 4/1/12 | | | 200 | | | 208 | |
The Bear Stearns Cos. Inc. | | | | 6.400% | | 10/2/17 | | | 230 | | | 229 | |
The Goldman Sachs Group Inc. | | | | 6.600% | | 1/15/12 | | | 210 | | | 220 | |
| | | | | | | | | | | | | |
| | | | | | | | | | | | 2,282 | |
| | | | | | | | | | | | | |
Commercial Banks | | 1.5% | | | | | | | | | | | |
HSBC Bank PLC | | | | 8.190% | | 7/20/12 | | | 500 | | | 447 | A |
HSBC Bank PLC | | | | 10.749% | | 8/20/12 | | | 40 | | | 40 | A |
SunTrust Capital VIII | | | | 6.100% | | 12/15/36 | | | 60 | | | 55 | B |
Wachovia Capital Trust III | | | | 5.800% | | 8/29/42 | | | 980 | | | 973 | B |
Wells Fargo Capital X | | | | 5.950% | | 12/15/36 | | | 150 | | | 138 | B |
| | | | | | | | | | | | | |
| | | | | | | | | | | | 1,653 | |
| | | | | | | | | | | | | |
Commercial Services and Supplies | | 0.4% | | | | | | | | | | | |
Waste Management Inc. | | | | 7.375% | | 8/1/10 | | | 450 | | | 476 | |
| | | | | | | | | | | | | |
| | | | | |
Consumer Finance | | 3.1% | | | | | | | | | | | |
American Express Co. | | | | 6.800% | | 9/1/66 | | | 300 | | | 307 | B |
Ford Motor Credit Co. | | | | 6.625% | | 6/16/08 | | | 1,510 | | | 1,499 | |
GMAC LLC | | | | 6.360% | | 9/23/08 | | | 1,340 | | | 1,320 | A |
Nelnet Inc. | | | | 7.400% | | 9/29/36 | | | 280 | | | 275 | B |
| | | | | | | | | | | | | |
| | | | | | | | | | | | 3,401 | |
| | | | | | | | | | | | | |
Diversified Financial Services | | 1.5% | | | | | | | | | | | |
AGFC Capital Trust I | | | | 6.000% | | 1/15/67 | | | 630 | | | 590 | B,C |
Capmark Financial Group Inc. | | | | 5.875% | | 5/10/12 | | | 300 | | | 273 | C,D |
General Electric Capital Corp. | | | | 5.000% | | 12/1/10 | | | 270 | | | 271 | |
ZFS Finance USA Trust III | | | | 6.844% | | 12/15/65 | | | 540 | | | 513 | B,C |
| | | | | | | | | | | | | |
| | | | | | | | | | | | 1,647 | |
| | | | | | | | | | | | | |
Diversified Telecommunication Services | | 0.1% | | | | | | | | | | | |
Qwest Corp. | | | | 8.875% | | 3/15/12 | | | 130 | | | 142 | |
| | | | | | | | | | | | | |
179
Semi-Annual Report to Shareholders
Portfolio of Investments—Continued
Western Asset Limited Duration Bond Portfolio—Continued
| | | | | | | | | | | | | |
| | | % OF
NET ASSETS | | RATE | | MATURITY
DATE | | PAR | | VALUE | |
| | | | | | | | | | | | | |
Corporate Bonds and Notes—Continued | | | | | | | | | | | | | |
| | | | | |
Electric Utilities | | 0.4% | | | | | | | | | | | |
Pacific Gas and Electric Co. | | | | 4.800% | | 3/1/14 | | $ | 400 | | $ | 381 | |
| | | | | | | | | | | | | |
| | | | | |
Food and Staples Retailing | | 0.5% | | | | | | | | | | | |
Wal-Mart Stores Inc. | | | | 5.800% | | 2/15/18 | | | 580 | | | 584 | |
| | | | | | | | | | | | | |
| | | | | |
Health Care Equipment and Supplies | | 0.2% | | | | | | | | | | | |
Hospira Inc. | | | | 5.550% | | 3/30/12 | | | 200 | | | 200 | |
| | | | | | | | | | | | | |
| | | | | |
Health Care Providers and Services | | 0.2% | | | | | | | | | | | |
Quest Diagnostics Inc. | | | | 5.125% | | 11/1/10 | | | 180 | | | 180 | |
| | | | | | | | | | | | | |
| | | | | |
Hotels, Restaurants and Leisure | | 0.2% | | | | | | | | | | | |
Caesars Entertainment Inc. | | | | 7.500% | | 9/1/09 | | | 130 | | | 133 | |
Harrah’s Operating Co. Inc. | | | | 5.956% | | 2/8/08 | | | 120 | | | 120 | A,C |
| | | | | | | | | | | | | |
| | | | | | | | | | | | 253 | |
| | | | | | | | | | | | | |
Independent Power Producers and Energy Traders | | 0.7% | | | | | | | | | | | |
TXU Corp. | | | | 4.800% | | 11/15/09 | | | 750 | | | 757 | |
| | | | | | | | | | | | | |
| | | | | |
IT Services | | 0.3% | | | | | | | | | | | |
Electronic Data Systems Corp. | | | | 7.125% | | 10/15/09 | | | 290 | | | 295 | |
| | | | | | | | | | | | | |
| | | | | |
Leisure Equipment and Products | | N.M. | | | | | | | | | | | |
Eastman Kodak Co. | | | | 7.250% | | 11/15/13 | | | 10 | | | 10 | |
| | | | | | | | | | | | | |
| | | | | |
Media | | 1.7% | | | | | | | | | | | |
Clear Channel Communications Inc. | | | | 6.625% | | 6/15/08 | | | 60 | | | 60 | |
Clear Channel Communications Inc. | | | | 4.250% | | 5/15/09 | | | 550 | | | 524 | |
Comcast Cable Communications Inc. | | | | 6.875% | | 6/15/09 | | | 300 | | | 308 | |
Comcast Cable Communications Inc. | | | | 6.750% | | 1/30/11 | | | 200 | | | 208 | |
Liberty Media LLC | | | | 7.875% | | 7/15/09 | | | 300 | | | 309 | |
Time Warner Inc. | | | | 5.500% | | 11/15/11 | | | 400 | | | 399 | |
| | | | | | | | | | | | | |
| | | | | | | | | | | | 1,808 | |
| | | | | | | | | | | | | |
Multi-Utilities | | 0.5% | | | | | | | | | | | |
CenterPoint Energy Inc. | | | | 5.875% | | 6/1/08 | | | 150 | | | 150 | |
Dominion Resources Inc. | | | | 4.750% | | 12/15/10 | | | 400 | | | 394 | |
| | | | | | | | | | | | | |
| | | | | | | | | | | | 544 | |
| | | | | | | | | | | | | |
180
Semi-Annual Report to Shareholders
| | | | | | | | | | | | | |
| | | % OF
NET ASSETS | | RATE | | MATURITY
DATE | | PAR | | VALUE | |
| | | | | | | | | | | | | |
Corporate Bonds and Notes—Continued | | | | | | | | | | | | | |
| | | | | |
Multiline Retail | | 0.2% | | | | | | | | | | | |
Federated Retail Holdings Inc. | | | | 5.350% | | 3/15/12 | | $ | 150 | | $ | 147 | |
May Department Stores Co. | | | | 5.750% | | 7/15/14 | | | 50 | | | 49 | |
| | | | | | | | | | | | | |
| | | | | | | | | | | | 196 | |
| | | | | | | | | | | | | |
Office Electronics | | 0.2% | | | | | | | | | | | |
Xerox Corp. | | | | 5.500% | | 5/15/12 | | | 170 | | | 168 | |
| | | | | | | | | | | | | |
| | | | | |
Oil, Gas and Consumable Fuels | | 2.3% | | | | | | | | | | | |
Devon Financing Corp. ULC | | | | 6.875% | | 9/30/11 | | | 260 | | | 275 | |
El Paso Natural Gas Co. | | | | 5.950% | | 4/15/17 | | | 370 | | | 361 | C |
Hess Corp. | | | | 6.650% | | 8/15/11 | | | 320 | | | 335 | |
Kinder Morgan Energy Partners LP | | | | 6.750% | | 3/15/11 | | | 310 | | | 323 | |
Pemex Project Funding Master Trust | | | | 6.125% | | 8/15/08 | | | 172 | | | 173 | |
Pemex Project Funding Master Trust | | | | 6.994% | | 6/15/10 | | | 59 | | | 60 | A,C |
Pemex Project Funding Master Trust | | | | 6.994% | | 6/15/10 | | | 242 | | | 246 | A,C |
Pemex Project Funding Master Trust | | | | 6.180% | | 12/3/12 | | | 380 | | | 379 | A,C |
XTO Energy Inc. | | | | 5.650% | | 4/1/16 | | | 290 | | | 283 | |
| | | | | | | | | | | | | |
| | | | | | | | | | | | 2,435 | |
| | | | | | | | | | | | | |
Paper and Forest Products | | N.M. | | | | | | | | | | | |
Weyerhaeuser Co. | | | | 5.950% | | 11/1/08 | | | 40 | | | 40 | |
| | | | | | | | | | | | | |
| | | | | |
Real Estate Investment Trusts | | 0.7% | | | | | | | | | | | |
iStar Financial Inc. | | | | 6.034% | | 9/15/09 | | | 300 | | | 280 | A |
iStar Financial Inc. | | | | 5.650% | | 9/15/11 | | | 500 | | | 475 | |
| | | | | | | | | | | | | |
| | | | | | | | | | | | 755 | |
| | | | | | | | | | | | | |
Thrifts and Mortgage Finance | | 2.5% | | | | | | | | | | | |
Countrywide Financial Corp. | | | | 5.430% | | 3/24/09 | | | 570 | | | 536 | A |
Countrywide Financial Corp. | | | | 5.800% | | 6/7/12 | | | 60 | | | 56 | |
Countrywide Home Loans Inc. | | | | 5.665% | | 2/27/08 | | | 10 | | | 10 | A |
Residential Capital LLC | | | | 7.800% | | 11/21/08 | | | 700 | | | 628 | A |
Residential Capital LLC | | | | 7.460% | | 4/17/09 | | | 510 | | | 433 | A |
Residential Capital LLC | | | | 7.000% | | 2/22/11 | | | 1,000 | | | 815 | D |
Washington Mutual Bank | | | | 5.844% | | 6/16/10 | | | 250 | | | 247 | A |
| | | | | | | | | | | | | |
| | | | | | | | | | | | 2,725 | |
| | | | | | | | | | | | | |
Tobacco | | 0.3% | | | | | | | | | | | |
Altria Group Inc. | | | | 5.625% | | 11/4/08 | | | 310 | | | 311 | |
| | | | | | | | | | | | | |
181
Semi-Annual Report to Shareholders
Portfolio of Investments—Continued
Western Asset Limited Duration Bond Portfolio—Continued
| | | | | | | | | | | | | |
| | | % OF
NET ASSETS | | RATE | | MATURITY
DATE | | PAR | | VALUE | |
| | | | | | | | | | | | | |
Corporate Bonds and Notes—Continued | | | | | | | | | | | | | |
| | | | | |
Wireless Telecommunication Services | | 0.6% | | | | | | | | | | | |
Sprint Capital Corp. | | | | 6.125% | | 11/15/08 | | $ | 200 | | $ | 201 | |
Vodafone Group PLC | | | | 5.350% | | 2/27/12 | | | 400 | | | 399 | |
| | | | | | | | | | | | | |
| | | | | | | | | | | | 600 | |
| | | | | | | | | | | | | |
Total Corporate Bonds and Notes
(Cost — $22,840) | | | | | | | | | | | | 22,311 | |
Asset-Backed Securities | | 17.0% | | | | | | | | | | | |
| | | | | |
Fixed Rate Securities | | 1.6% | | | | | | | | | | | |
Countryplace Manufactured Housing Contract Trust 2007-1 A1 | | | | 5.484% | | 7/15/37 | | | 482 | | | 478 | C |
Countryplace Manufactured Housing Contract Trust 2007-1 A2 | | | | 5.232% | | 7/15/37 | | | 500 | | | 493 | C |
GMAC Mortgage Corp. Loan Trust 2005-HE2 A3 | | | | 4.622% | | 11/25/35 | | | 458 | | | 453 | |
MBNA Practice Solutions Owner Trust 2005-2 | | | | 4.100% | | 5/15/09 | | | 41 | | | 42 | C |
Prestige Auto Receivables Trust 2005-1A | | | | 4.370% | | 6/16/12 | | | 147 | | | 146 | C |
Prestige Auto Receivables Trust 2006-1A | | | | 5.120% | | 2/15/10 | | | 57 | | | 57 | C |
UCFC Home Equity Loan 1998-D | | | | 6.905% | | 4/15/30 | | | 52 | | | 52 | |
| | | | | | | | | | | | | |
| | | | | | | | | | | | 1,721 | |
| | | | | | | | | | | | | |
Indexed SecuritiesA | | 15.4% | | | | | | | | | | | |
AESOP Funding II LLC 2004-2A | | | | 5.716% | | 4/20/10 | | | 500 | | | 497 | C |
Ameriquest Mortgage Securities Inc. 2005-R11 A2D | | | | 5.461% | | 1/25/36 | | | 240 | | | 228 | |
Asset Backed Securities Corp. Home Equity Loan Trust 2005-HE5 A1 | | | | 5.291% | | 6/25/35 | | | 439 | | | 436 | |
Bayview Financial Acquisition Trust 2004-C | | | | 5.925% | | 5/28/44 | | | 108 | | | 107 | |
Bayview Financial Acquisition Trust 2006-D 2A4 | | | | 5.785% | | 12/28/36 | | | 743 | | | 728 | |
Bear Stearns Asset Backed Securities Trust 2007-HE6 1A1 | | | | 6.381% | | 8/25/37 | | | 490 | | | 493 | |
Bear Stearns Asset-Backed Securities Inc. 2005-AQ2 | | | | 5.401% | | 9/25/35 | | | 500 | | | 496 | |
Bear Stearns Asset-Backed Securities Inc. 2007-SD2 2A1 | | | | 5.531% | | 9/25/46 | | | 449 | | | 441 | |
Bear Stearns Asset-Backed Securities Trust 2006-SD2 | | | | 5.331% | | 6/25/36 | | | 441 | | | 435 | |
Chase Funding Mortgage Loan Asset-Backed Certificates 2002-4 | | | | 5.871% | | 10/25/32 | | | 21 | | | 20 | |
Citibank Credit Card Issuance Trust 2002-C3 | | | | 6.834% | | 12/15/09 | | | 160 | | | 160 | |
Citigroup Mortgage Loan Trust Inc. 2007-SHL1 A | | | | 5.531% | | 11/25/46 | | | 914 | | | 871 | C |
Countrywide Asset-Backed Certificates 2002-3 | | | | 5.871% | | 5/25/32 | | | 7 | | | 7 | |
Countrywide Asset-Backed Certificates 2007-SE1 1A1 | | | | 5.681% | | 5/25/47 | | | 978 | | | 902 | C |
182
Semi-Annual Report to Shareholders
| | | | | | | | | | | | | |
| | | % OF
NET ASSETS | | RATE | | MATURITY
DATE | | PAR | | VALUE | |
| | | | | | | | | | | | | |
Asset-Backed Securities—Continued | | | | | | | | | | | | | |
| | | | | |
Indexed Securities—Continued | | | | | | | | | | | | | |
Countrywide Home Equity Loan Trust 2004-J | | | | 6.043% | | 12/15/33 | | $ | 40 | | $ | 40 | |
Countrywide Home Equity Loan Trust 2004-O | | | | 6.033% | | 2/15/34 | | | 71 | | | 70 | |
Countrywide Home Equity Loan Trust 2007-GW A | | | | 6.303% | | 8/15/37 | | | 777 | | | 762 | |
Ellington Loan Acquisition Trust 2007-1 A2A1 | | | | 6.131% | | 5/26/37 | | | 306 | | | 306 | C |
First Franklin Mortgage Loan Asset-Backed Certificates 2004-FF10 | | | | 5.531% | | 12/25/32 | | | 22 | | | 22 | |
FLAC Holdings LLC 2006-1 A1 | | | | 5.914% | | 12/15/18 | | | 500 | | | 493 | C |
GSAA Home Equity Trust 2005-8 A2 | | | | 5.725% | | 6/25/35 | | | 1,000 | | | 996 | |
HSI Asset Securitization Corp. Trust 2005-I1 2A1 | | | | 5.251% | | 11/25/35 | | | 346 | | | 345 | |
Ixis Real Estate Capital Trust 2006-HE2 A3 | | | | 5.291% | | 8/25/36 | | | 900 | | | 883 | |
Long Beach Mortgage Loan Trust 2006-A A1 | | | | 5.221% | | 5/25/36 | | | 530 | | | 437 | |
MASTR Specialized Loan Trust 2006-3 A | | | | 5.391% | | 6/25/46 | | | 659 | | | 645 | C |
Morgan Stanley Mortgage Loan Trust 2006-12XS | | | | 5.251% | | 10/25/36 | | | 479 | | | 479 | |
Origen Manufactured Housing 2006-A | | | | 5.903% | | 11/15/18 | | | 383 | | | 382 | |
Ownit Mortgage Loan Asset-Backed Certificates 2005-2 A2C | | | | 5.431% | | 3/25/36 | | | 189 | | | 187 | |
RAAC Series 2007-RP2 A | | | | 5.481% | | 2/25/46 | | | 752 | | | 724 | C |
RAAC Series 2007-RP2 M1 | | | | 5.781% | | 2/25/46 | | | 600 | | | 528 | C |
Rental Car Finance Corp. 2004-1A | | | | 5.331% | | 6/25/09 | | | 750 | | | 750 | C |
Residential Asset Mortgage Products Inc. 2002-RS6 | | | | 6.031% | | 11/25/32 | | | 12 | | | 12 | |
Residential Asset Securities Corp. 2006-KS1 A4 | | | | 5.431% | | 2/25/36 | | | 310 | | | 290 | |
SACO I Trust 2006-3 A3 | | | | 5.361% | | 4/25/36 | | | 927 | | | 795 | |
Securitized Asset Backed Receivables LLC 2006-FR3 A2 | | | | 5.271% | | 5/25/36 | | | 800 | | | 788 | |
Superior Wholesale Inventory Financing Trust 2004-A10 | | | | 5.853% | | 9/15/11 | | | 500 | | | 492 | |
WaMu Asset-Backed Certificates 2007-HE1 2A3 | | | | 5.281% | | 1/25/37 | | | 500 | | | 471 | |
| | | | | | | | | | | | | |
| | | | | | | | | | | | 16,718 | |
| | | | | | | | | | | | | |
Total Asset-Backed Securities
(Cost—$19,001) | | | | | | | | | | | | 18,439 | |
Mortgage-Backed Securities | | 31.1% | | | | | | | | | | | |
| | | | | |
Fixed Rate Securities | | 0.8% | | | | | | | | | | | |
Countrywide Alternative Loan Trust 2004-J1 | | | | 6.000% | | 2/25/34 | | | 48 | | | 47 | |
Residential Asset Mortgage Products Inc. 2004-SL1 | | | | 7.000% | | 11/25/31 | | | 232 | | | 237 | |
Residential Asset Mortgage Products Inc. 2004-SL2 | | | | 8.500% | | 10/25/31 | | | 30 | | | 31 | |
Residential Asset Mortgage Products Inc. 2005-SL1 | | | | 8.000% | | 5/25/32 | | | 569 | | | 602 | |
| | | | | | | | | | | | | |
| | | | | | | | | | | | 917 | |
| | | | | | | | | | | | | |
183
Semi-Annual Report to Shareholders
Portfolio of Investments—Continued
Western Asset Limited Duration Bond Portfolio—Continued
| | | | | | | | | | | | | |
| | | % OF
NET ASSETS | | RATE | | MATURITY
DATE | | PAR | | VALUE | |
| | | | | | | | | | | | | |
Mortgage-Backed Securities—Continued | | | | | | | | | | | | | |
| | | | | |
Indexed SecuritiesA | | 23.2% | | | | | | | | | | | |
American Home Mortgage Investment Trust 2005-4 5A | | | | 5.350% | | 11/25/45 | | $ | 983 | | $ | 972 | |
American Home Mortgage Investment Trust 2005-SD1 | | | | 5.581% | | 9/25/35 | | | 494 | | | 477 | C |
Banc of America Mortgage Securities 2003-D | | | | 4.569% | | 5/25/33 | | | 162 | | | 161 | |
Banc of America Mortgage Securities 2005-F | | | | 5.013% | | 7/25/35 | | | 768 | | | 764 | |
Bayview Commercial Asset Trust 2005-2A A2 | | | | 5.481% | | 8/25/35 | | | 435 | | | 404 | C |
Bear Stearns Alt-A Trust 2007-1 1A1 | | | | 5.291% | | 1/25/47 | | | 1,104 | | | 1,093 | |
Bear Stearns ARM Trust 2004-10 | | | | 4.595% | | 1/25/35 | | | 456 | | | 454 | |
Bear Stearns Second Lien Trust 2007-SV1A A1 | | | | 5.351% | | 12/25/36 | | | 579 | | | 521 | C |
Bear Stearns Structured Products Inc. 2007-R10 A1 | | | | 5.853% | | 9/26/37 | | | 1,070 | | | 1,065 | C |
CBA Commercial Small Balance Commercial Trust 2005-1A | | | | 5.451% | | 7/25/35 | | | 444 | | | 438 | C |
Citigroup Mortgage Loan Trust Inc. 2005-5 | | | | 5.433% | | 7/25/35 | | | 257 | | | 260 | |
Countrywide Alternative Loan Trust 2005-38 A3 | | | | 5.481% | | 9/25/35 | | | 317 | | | 312 | |
Countrywide Alternative Loan Trust 2005-51 2A1 | | | | 5.796% | | 11/20/35 | | | 329 | | | 320 | |
Countrywide Alternative Loan Trust 2006-0A22 A1 | | | | 5.291% | | 2/25/47 | | | 1,088 | | | 1,063 | |
Countrywide Alternative Loan Trust 2006-OA1 2A1 | | | | 5.706% | | 3/20/46 | | | 511 | | | 500 | |
Countrywide Asset-Backed Certificates 2005-IM1 | | | | 5.785% | | 11/25/35 | | | 449 | | | 445 | |
Countrywide Home Loans 2005-R3 | | | | 5.531% | | 9/25/35 | | | 562 | | | 549 | C |
Credit Suisse/Morgan Stanley Commercial Mortgage Trust 2006-HC1A | | | | 5.943% | | 5/15/23 | | | 600 | | | 598 | C |
Crusade Global Trust 2003-2 | | | | 5.836% | | 9/18/34 | | | 57 | | | 57 | E |
CS First Boston Mortgage Securities Corp. 2004-AR5 7A2 | | | | 4.602% | | 6/25/34 | | | 353 | | | 347 | |
CS First Boston Mortgage Securities Corp. 2004-AR6 1A1 | | | | 5.530% | | 10/25/34 | | | 310 | | | 312 | |
Granite Mortgages PLC 2003-1 | | | | 5.550% | | 1/20/20 | | | 50 | | | 49 | C,E |
Greenpoint Mortgage Funding Trust 2006-AR7 1A1B | | | | 5.251% | | 12/25/46 | | | 440 | | | 437 | |
GSMPS Mortgage Loan Trust 2005-RP3 | | | | 5.481% | | 9/25/35 | | | 439 | | | 440 | C |
Harborview Mortgage Loan Trust 2006-13 A | | | | 5.683% | | 11/19/46 | | | 492 | | | 487 | |
Harborview Mortgage Loan Trust 2006-7 | | | | 5.703% | | 10/19/37 | | | 638 | | | 628 | |
JPMorgan Mortgage Trust 2004-A1 1A1 | | | | 4.341% | | 10/25/33 | | | 256 | | | 249 | |
JPMorgan Mortgage Trust 2004-A1 1A1 | | | | 4.811% | | 2/25/34 | | | 326 | | | 314 | |
Luminent Mortgage Trust 2006-2 | | | | 5.331% | | 2/25/46 | | | 561 | | | 551 | |
Luminent Mortgage Trust 2006-7 2A2 | | | | 5.351% | | 12/25/36 | | | 1,153 | | | 1,121 | |
MASTR Adjustable Rate Mortgages Trust 2004-13 | | | | 3.786% | | 11/21/34 | | | 350 | | | 342 | |
MASTR Adjustable Rate Mortgages Trust 2006-OA2 1A1 | | | | 6.105% | | 12/25/46 | | | 589 | | | 579 | |
184
Semi-Annual Report to Shareholders
| | | | | | | | | | | | | | |
| | | % OF
NET ASSETS | | RATE | | MATURITY
DATE | | PAR | | | VALUE | |
| | | | | | | | | | | | | | |
Mortgage-Backed Securities—Continued | | | | | | | | | | | | | | |
| | | | | |
Indexed Securities—Continued | | | | | | | | | | | | | | |
MASTR Specialized Loan Trust 2006-2 | | | | 5.391% | | 2/25/36 | | $ | 405 | | | $ | 397 | C |
Medallion Trust 2000-2G | | | | 5.846% | | 12/18/31 | | | 64 | | | | 63 | E |
Medallion Trust 2003-1G | | | | 5.428% | | 12/21/33 | | | 59 | | | | 59 | E |
MLCC Mortgage Investors Inc. 2003-H | | | | 6.988% | | 1/25/29 | | | 24 | | | | 24 | |
Provident Funding Mortgage Loan Trust 2005-1 1A1 | | | | 4.130% | | 5/25/35 | | | — | F | | | — | G |
Sequoia Mortgage Trust 2003-2 A2 | | | | 5.701% | | 6/20/33 | | | 31 | | | | 31 | |
Structured Adjustable Rate Mortgage Loan Trust 2005-16XS | | | | 5.471% | | 8/25/35 | | | 187 | | | | 184 | |
Structured Adjustable Rate Mortgage Loan Trust 2005-19XS | | | | 5.431% | | 10/25/35 | | | 239 | | | | 231 | |
Structured Asset Mortgage Investments Inc. 2006-AR5 2A1 | | | | 5.341% | | 5/25/36 | | | 351 | | | | 347 | |
Structured Asset Mortgage Investments Inc. 2006-AR5 4A1 | | | | 5.351% | | 5/25/46 | | | 533 | | | | 517 | |
Structured Asset Mortgage Investments Inc. 2006-AR6 | | | | 5.321% | | 7/25/36 | | | 634 | | | | 616 | |
Structured Asset Mortgage Investments Inc. 2006-AR7 A1A | | | | 5.341% | | 8/25/36 | | | 747 | | | | 736 | |
Thornburg Mortgage Securities Trust 2005-2 A4 | | | | 5.381% | | 7/25/45 | | | 911 | | | | 910 | |
Thornburg Mortgage Securities Trust 2005-3 | | | | 5.371% | | 10/25/35 | | | 630 | | | | 628 | |
Wachovia Mortgage Loan Trust LLC 2005-A | | | | 4.732% | | 8/20/35 | | | 269 | | | | 268 | |
WaMu Mortgage Pass-Through Certificates 2003-AR8 A | | | | 4.030% | | 8/25/33 | | | 358 | | | | 354 | |
WaMu Mortgage Pass-Through Certificates 2003-AR10 | | | | 4.057% | | 10/25/33 | | | 600 | | | | 593 | |
WaMu Mortgage Pass-Through Certificates 2005-AR19 | | | | 5.541% | | 12/25/45 | | | 500 | | | | 482 | |
WaMu Mortgage Pass-Through Certificates 2006-AR11 | | | | 6.483% | | 9/25/46 | | | 589 | | | | 573 | |
WaMu Mortgage Pass-Through Certificates 2007-HY7 1A1 | | | | 5.662% | | 7/25/37 | | | 478 | | | | 478 | |
WaMu Mortgage Pass-Through Certificates, 2005-AR15 A1A2 | | | | 5.411% | | 11/25/45 | | | 503 | | | | 491 | |
WaMu Mortgage Pass-Through Certificates 2006-AR4 DA | | | | 5.953% | | 6/25/46 | | | 498 | | | | 485 | |
Zuni Mortgage Loan Trust 2006-OA1 | | | | 5.261% | | 8/25/36 | | | 395 | | | | 392 | |
| | | | | | | | | | | | | | |
| | | | | | | | | | | | | 25,168 | |
| | | | | | | | | | | | | | |
185
Semi-Annual Report to Shareholders
Portfolio of Investments—Continued
Western Asset Limited Duration Bond Portfolio—Continued
| | | | | | | | | | | | | |
| | | % OF
NET ASSETS | | RATE | | MATURITY
DATE | | PAR | | VALUE | |
| | | | | | | | | | | | | |
Mortgage-Backed Securities—Continued | | | | | | | | | | | | | |
| | | | | |
Variable Rate SecuritiesH | | 7.1% | | | | | | | | | | | |
Banc of America Funding Corp. 2004-B | | | | 4.183% | | 12/20/34 | | $ | 177 | | $ | 177 | |
Banc of America Funding Corp. 2005-F 2A1 | | | | 5.207% | | 9/20/35 | | | 1,097 | | | 1,095 | |
Chase Mortgage Finance Corp. 2007-A1 2A3 | | | | 4.139% | | 2/25/37 | | | 472 | | | 465 | |
Citigroup Mortgage Loan Trust Inc. 2007-AR8 1A1A | | | | 5.757% | | 8/25/47 | | | 593 | | | 590 | |
Countrywide Alternative Loan Trust 2004-33 1A1 | | | | 4.989% | | 12/25/34 | | | 55 | | | 55 | |
Countrywide Alternative Loan Trust 2004-33 2A1 | | | | 4.955% | | 12/25/34 | | | 31 | | | 31 | |
Countrywide Alternative Loan Trust 2005-14 | | | | 3.300% | | 5/25/35 | | | 87 | | | 87 | |
Countrywide Home Loans 1A1-11 | | | | 4.983% | | 7/25/34 | | | 247 | | | 248 | |
IndyMac INDX Mortgage Loan Trust 2004-AR15 | | | | 5.035% | | 2/25/35 | | | 344 | | | 342 | |
JPMorgan Mortgage Trust 2006-A2 5A1 | | | | 3.756% | | 11/25/33 | | | 250 | | | 247 | |
Merrill Lynch Mortgage Investors Trust 2004-A1 2A1 | | | | 4.557% | | 2/25/34 | | | 410 | | | 405 | |
Nomura Asset Acceptance Corp. 2004-AR4 1A1 | | | | 4.907% | | 12/25/34 | | | 567 | | | 561 | |
Prime Mortgage Trust 2005-2 | | | | 7.408% | | 10/25/32 | | | 149 | | | 153 | |
Residential Funding Mortgage Securities I 2005-SA3 | | | | 4.905% | | 8/25/35 | | | 440 | | | 437 | |
Small Business Administration Series 2004-2 | | | | 8.080% | | 9/25/18 | | | 432 | | | 454 | |
Structured Adjustable Rate Mortgage Loan Trust 2004-2 4A1 | | | | 4.260% | | 3/25/34 | | | 275 | | | 271 | |
Structured Adjustable Rate Mortgage Loan Trust 2005-12 3A1 | | | | 5.661% | | 6/25/35 | | | 387 | | | 386 | |
Structured Asset Securities Corp. 2003-22A 3A | | | | 4.420% | | 6/25/33 | | | 722 | | | 718 | |
Structured Asset Securities Corp. 2004-SC1 | | | | 9.962% | | 12/25/29 | | | 89 | | | 93 | C |
WaMu Mortgage Pass-Through Certificates 2007-HY3 4A1 | | | | 5.349% | | 3/25/37 | | | 832 | | | 826 | |
| | | | | | | | | | | | | |
| | | | | | | | | | | | 7,641 | |
| | | | | | | | | | | | | |
Total Mortgage-Backed Securities
(Cost—$34,002) | | | | | | | | | | | | 33,726 | |
U.S. Government and Agency Obligations | | 11.2% | | | | | | | | | | | |
| | | | | |
Fixed Rate Securities | | 8.3% | | | | | | | | | | | |
Fannie Mae | | | | 5.000% | | 9/15/08 | | | 150 | | | 151 | |
Federal Home Loan Bank | | | | 5.000% | | 2/20/09 | | | 320 | | | 322 | |
Freddie Mac | | | | 5.000% | | 6/11/09 | | | 4,200 | | | 4,239 | |
Freddie Mac | | | | 5.125% | | 8/23/10 | | | 260 | | | 265 | |
United States Treasury Notes | | | | 5.000% | | 7/31/08 | | | 1,500 | | | 1,510 | |
United States Treasury Notes | | | | 4.750% | | 12/31/08 | | | 300 | | | 303 | |
United States Treasury Notes | | | | 4.500% | | 5/15/10 | | | 1,500 | | | 1,519 | |
United States Treasury Notes | | | | 4.500% | | 9/30/11 | | | 550 | | | 557 | |
United States Treasury Notes | | | | 4.625% | | 10/31/11 | | | 145 | | | 148 | |
| | | | | | | | | | | | | |
| | | | | | | | | | | | 9,014 | |
| | | | | | | | | | | | | |
186
Semi-Annual Report to Shareholders
| | | | | | | | | | | | | |
| | | % OF
NET ASSETS | | RATE | | MATURITY
DATE | | PAR | | VALUE | |
| | | | | | | | | | | | | |
U.S. Government and Agency
Obligations—Continued | | | | | | | | | | | | | |
| | | | | |
Treasury Inflation-Protected SecuritiesI | | 2.9% | | | | | | | | | | | |
United States Treasury Inflation-Protected Security | | | | 1.875% | | 7/15/15 | | $ | 107 | | $ | 104 | |
United States Treasury Inflation-Protected Security | | | | 2.500% | | 7/15/16 | | | 722 | | | 735 | |
United States Treasury Inflation-Protected Security | | | | 2.375% | | 1/15/17 | | | 1,116 | | | 1,124 | |
United States Treasury Inflation-Protected Security | | | | 2.375% | | 1/15/25 | | | 1,105 | | | 1,115 | |
| | | | | | | | | | | | | |
| | | | | | | | | | | | 3,078 | |
| | | | | | | | | | | | | |
Total U.S. Government and Agency Obligations (Cost—$11,918) | | | | | | | | | | | | 12,092 | |
U.S. Government Agency Mortgage-Backed Securities | | 30.6% | | | | | | | | | | | |
| | | | | |
Fixed Rate Securities | | 21.9% | | | | | | | | | | | |
Fannie Mae | | | | 5.000% | | 12/1/22 to 12/1/37 | | | 5,500 | | | 5,253 | J |
Fannie Mae | | | | 5.500% | | 12/1/22 to 12/1/37 | | | 6,550 | | | 6,423 | J |
Fannie Mae | | | | 6.000% | | 12/1/37 | | | 8,800 | | | 8,806 | J |
Fannie Mae | | | | 6.500% | | 12/1/37 | | | 1,500 | | | 1,526 | J |
Freddie Mac | | | | 5.000% | | 12/1/37 | | | 100 | | | 95 | J |
Government National Mortgage Association | | | | 5.000% | | 8/15/33 | | | 73 | | | 71 | |
Government National Mortgage Association | | | | 6.000% | | 12/1/37 | | | 1,500 | | | 1,509 | J |
| | | | | | | | | | | | | |
| | | | | | | | | | | | 23,683 | |
| | | | | | | | | | | | | |
Indexed SecuritiesA | | 8.7% | | | | | | | | | | | |
Fannie Mae | | | | 4.205% | | 12/1/34 | | | 131 | | | 129 | |
Fannie Mae | | | | 4.246% | | 12/1/34 | | | 125 | | | 123 | |
Fannie Mae | | | | 4.331% | | 1/1/35 | | | 145 | | | 144 | |
Fannie Mae | | | | 4.856% | | 1/1/35 | | | 249 | | | 248 | |
Fannie Mae | | | | 4.785% | | 2/1/35 | | | 562 | | | 562 | |
Fannie Mae | | | | 4.536% | | 3/1/35 | | | 259 | | | 256 | |
Fannie Mae | | | | 5.051% | | 3/1/35 | | | 436 | | | 437 | |
Fannie Mae | | | | 4.717% | | 7/1/35 | | | 4,218 | | | 4,189 | |
Freddie Mac | | | | 4.367% | | 12/1/34 | | | 59 | | | 58 | |
Freddie Mac | | | | 4.092% | | 1/1/35 | | | 43 | | | 42 | |
Freddie Mac | | | | 4.132% | | 1/1/35 | | | 71 | | | 69 | |
Freddie Mac | | | | 4.482% | | 1/1/35 | | | 199 | | | 196 | |
187
Semi-Annual Report to Shareholders
Portfolio of Investments—Continued
Western Asset Limited Duration Bond Portfolio—Continued
| | | | | | | | | | | | | |
| | | % OF
NET ASSETS | | RATE | | MATURITY
DATE | | PAR | | VALUE | |
| | | | | | | | | | | | | |
U.S. Government Agency Mortgage-Backed Securities—Continued | | | | | | | | | | | | | |
| | | | | |
Indexed SecuritiesA—Continued | | | | | | | | | | | | | |
Freddie Mac | | | | 6.224% | | 12/1/36 | | $ | 2,902 | | $ | 2,953 | |
| | | | | | | | | | | | | |
| | | | | | | | | | | | 9,406 | |
| | | | | | | | | | | | | |
Total U.S. Government Agency Mortgage-Backed Securities (Cost—$33,128) | | | | | | | | | | | | 33,089 | |
Yankee BondsE | | 9.6% | | | | | | | | | | | |
| | | | | |
Capital Markets | | 0.5% | | | | | | | | | | | |
Deutsche Bank AG | | | | 6.000% | | 9/1/17 | | | 500 | | | 507 | |
| | | | | | | | | | | | | |
| | | | | |
Commercial Banks | | 3.6% | | | | | | | | | | | |
Glitnir Banki Hf | | | | 5.800% | | 1/21/11 | | | 720 | | | 703 | A,C |
HSBC Bank PLC | | | | 10.999% | | 8/20/12 | | | 40 | | | 39 | D |
Kaupthing Bank Hf | | | | 6.050% | | 4/12/11 | | | 300 | | | 298 | A,C |
Kaupthing Bank Hf | | | | 5.750% | | 10/4/11 | | | 290 | | | 286 | C |
Landsbanki Islands Hf | | | | 6.100% | | 8/25/11 | | | 410 | | | 415 | C |
Resona Preferred Global Securities | | | | 7.191% | | 12/29/49 | | | 360 | | | 361 | B,C |
Shinsei Finance Cayman Ltd. | | | | 6.418% | | 1/29/49 | | | 1,070 | | | 992 | B,C |
TuranAlem Finance BV | | | | 6.735% | | 1/22/09 | | | 130 | | | 128 | A,C |
VTB Capital SA for Vneshtorgbank | | | | 5.956% | | 8/1/08 | | | 639 | | | 633 | A,C |
| | | | | | | | | | | | | |
| | | | | | | | | | | | 3,855 | |
| | | | | | | | | | | | | |
Diversified Financial Services | | 1.0% | | | | | | | | | | | |
Aiful Corp. | | | | 5.000% | | 8/10/10 | | | 500 | | | 484 | C |
MUFG Captial Finance 1 Ltd. | | | | 6.346% | | 7/29/49 | | | 240 | | | 228 | B |
TNK-BP Finance SA | | | | 6.875% | | 7/18/11 | | | 370 | | | 367 | C |
| | | | | | | | | | | | | |
| | | | | | | | | | | | 1,079 | |
| | | | | | | | | | | | | |
Diversified Telecommunication Services | | 2.3% | | | | | | | | | | | |
British Telecommunications PLC | | | | 8.625% | | 12/15/10 | | | 400 | | | 440 | D |
Deutsche Telekom International Finance BV | | | | 8.000% | | 6/15/10 | | | 400 | | | 428 | |
France Telecom SA | | | | 7.750% | | 3/1/11 | | | 400 | | | 430 | D |
Koninklijke (Royal) KPN NV | | | | 8.000% | | 10/1/10 | | | 400 | | | 430 | |
Telefonica Emisiones S.A.U. | | | | 5.888% | | 6/19/09 | | | 410 | | | 410 | A |
Telefonica Emisiones S.A.U. | | | | 5.690% | | 2/4/13 | | | 400 | | | 393 | A |
| | | | | | | | | | | | | |
| | | | | | | | | | | | 2,531 | |
| | | | | | | | | | | | | |
188
Semi-Annual Report to Shareholders
| | | | | | | | | | | | | | |
| | | % OF
NET ASSETS | | RATE | | MATURITY
DATE | | PAR | | | VALUE | |
| | | | | | | | | | | | | | |
Yankee Bonds—Continued | | | | | | | | | | | | | | |
| | | | | |
Foreign Governments | | 0.4% | | | | | | | | | | | | |
Russian Federation | | | | 3.000% | | 5/14/08 | | $ | 180 | | | $ | 177 | |
Russian Federation | | | | 8.250% | | 3/31/10 | | | 27 | | | | 28 | C |
Russian Federation | | | | 8.250% | | 3/31/10 | | | 247 | | | | 256 | C |
| | | | | | | | | | | | | | |
| | | | | | | | | | | | | 461 | |
| | | | | | | | | | | | | | |
Health Care Equipment and Supplies | | 0.2% | | | | | | | | | | | | |
Baxter Finco BV | | | | 4.750% | | 10/15/10 | | | 260 | | | | 260 | |
| | | | | | | | | | | | | | |
| | | | | |
Industrial Conglomerates | | 0.3% | | | | | | | | | | | | |
Tyco International Group SA | | | | 6.375% | | 10/15/11 | | | 300 | | | | 307 | |
| | | | | | | | | | | | | | |
| | | | | |
Metals and Mining | | 0.6% | | | | | | | | | | | | |
Vale Overseas Ltd. | | | | 6.250% | | 1/23/17 | | | 620 | | | | 627 | |
| | | | | | | | | | | | | | |
| | | | | |
Oil, Gas and Consumable Fuels | | 0.7% | | | | | | | | | | | | |
Anadarko Finance Co. | | | | 6.750% | | 5/1/11 | | | 700 | | | | 731 | |
| | | | | | | | | | | | | | |
Total Yankee Bonds (Cost—$10,391) | | | | | | | | | | | | | 10,358 | |
| | | | | | | | | | | | | | |
Total Long-Term Securities (Cost—$131,280) | | | | | | | | | | | | | 130,015 | |
Short-Term Securities | | 0.2% | | | | | | | | | | | | |
| | | | | |
U.S. Government and Agency Obligations | | 0.2% | | | | | | | | | | | | |
Fannie Mae | | | | 0.000% | | 3/17/08 | | | 200 | | | | 196 | K,L |
Fannie Mae | | | | 0.000% | | 3/27/08 | | | 32 | | | | 31 | K |
| | | | | | | | | | | | | | |
| | | | | | | | | | | | | 227 | |
| | | | | | | | | | | | | | |
Options PurchasedM | | N.M. | | | | | | | | | | | | |
Deutsche Bank Swaption Call, November 2007, Strike Price $5.27 | | | | | | | | | 2,200,000 | N | | | 44 | |
| | | | | | | | | | | | | | |
Total Short-Term Securities (Cost—$244) | | | | | | | | | | | | | 271 | |
Total Investments (Cost—$131,524)O | | 120.3% | | | | | | | | | | | 130,286 | |
Other Assets Less Liabilities | | (20.3)% | | | | | | | | | | | (21,962 | ) |
| | | | | | | | | | | | | | |
| | | | | |
Net Assets | | 100.0% | | | | | | | | | | $ | 108,324 | |
| | | | | | | | | | | | | | |
189
Semi-Annual Report to Shareholders
Portfolio of Investments—Continued
Western Asset Limited Duration Bond Portfolio—Continued
| | | | | | | | |
| | | EXPIRATION | | ACTUAL
CONTRACTS | | APPRECIATION/
(DEPRECIATION) | |
Futures Contracts PurchasedM | | | | | | | | |
Eurodollar Futures | | December 2007 | | 25 | | $ | 17 | |
U.S. Treasury Note Futures | | December 2007 | | 231 | | | 238 | |
| | | | | | | | |
| | | | | | $ | 255 | |
| | | | | | | | |
Futures Contracts WrittenM | | | | | | | | |
U.S. Treasury Note Futures | | December 2007 | | 203 | | $ | (104 | ) |
U.S. Treasury Note Futures | | December 2007 | | 128 | | | (70 | ) |
| | | | | | | | |
| | | | | | $ | (174 | ) |
| | | | | | | | |
| | | | | | | | | |
N.M.—Not Meaningful.
A | | Indexed Security – The rates of interest earned on these securities are tied to the London Interbank Offered Rate (“LIBOR”), the Euro Interbank Offered Rate (“EURIBOR”) Index, the Consumer Price Index (“CPI”), the one-year Treasury Bill Rate or the ten-year Japanese Government Bond Rate. The coupon rates are the rates as of September 30, 2007. |
B | | Stepped Coupon Security – A security with a predetermined schedule of interest or dividend rate changes at which time it begins to accrue interest or pay dividends according to the predetermined schedule. |
C | | Rule 144a Security – A security purchased pursuant to Rule 144a under the Securities Act of 1933 which may not be resold subject to that rule except to qualified institutional buyers. These securities, which the Fund’s investment adviser has determined to be liquid, represent 17.96% of net assets. |
D | | Credit Linked Security – The rates of interest earned on these securities are tied to the credit rating assigned by Standard & Poor’s Rating Service and/or Moody’s Investors Services. |
E | | Yankee Bond – A dollar-denominated bond issued in the U.S. by foreign entities. |
F | | Amount less than $0.05. |
H | | The coupon rates shown on variable rate securities are the rates at September 30, 2007. These rates vary with the weighted average coupon of the underlying loans. |
I | | Treasury Inflation-Protected Security –Treasury security whose principal value is adjusted daily in accordance with changes to the Consumer Price Index for All Urban Consumers. Interest is calculated on the basis of the current adjusted principal value. |
J | | When-issued Security – Security purchased on a delayed delivery basis. Final settlement amount and maturity date have not yet been announced. |
K | | Zero coupon bond – A bond with no periodic interest payments which is sold at such a discount as to produce a current yield to maturity. |
L | | All or a portion of this security is collateral to cover futures and options contracts written. |
M | | Options and futures are described in more detail in the notes to financial statements. |
N | | Par represents actual number of contracts. |
O | | Aggregate cost for federal income tax purposes is substantially the same as book cost. At September 30, 2007, the aggregate gross unrealized appreciation and depreciation of investments for federal income tax purposes were substantially as follows: |
| | | | |
| Gross unrealized appreciation | | $ | 464 | |
| Gross unrealized depreciation | | | (1,702 | ) |
| | | | |
| Net unrealized appreciation/(depreciation) | | $ | (1,238 | ) |
| | | | |
See notes to financial statements.
190
Semi-Annual Report to Shareholders
Statement of Assets and Liabilities
Western Asset Limited Duration Bond Portfolio
September 30, 2007 (Unaudited)
(Amounts in Thousands)
| | | | | | | |
Assets: | |
Investment securities at market value (Cost—$131,280) | | | | | $ | 130,015 | |
Short-term securities at value (Cost—$244) | | | | | | 271 | |
Cash | | | | | | 160 | |
Receivable for securities sold | | | | | | 13,865 | |
Receivable for fund shares sold | | | | | | 1,395 | |
Interest receivable | | | | | | 810 | |
Futures variation margin receivable | | | | | | 6 | |
Other assets | | | | | | 50 | |
| | | | | | | |
Total assets | | | | | | 146,572 | |
| | | | | | | |
| | |
Liabilities: | | | | | | | |
Payable for securities purchased | | $ | 38,038 | | | | |
Payable for fund shares repurchased | | | 1 | | | | |
Accrued management fee | | | 21 | | | | |
Income distribution payable | | | 1 | | | | |
Swap contracts at value | | | 123 | | | | |
Amounts payable on swaps | | | 26 | | | | |
Accrued expenses | | | 38 | | | | |
| | | | | | | |
Total liabilities | | | | | | 38,248 | |
| | | | | | | |
| | |
Net Assets | | | | | $ | 108,324 | |
| | | | | | | |
| | |
Net assets consist of: | | | | | | | |
Accumulated paid-in-capital | | | | | $ | 110,981 | |
Undistributed net investment income | | | | | | 40 | |
Accumulated net realized loss on investments, options, futures and swaps | | | | | | (1,490 | ) |
Net unrealized depreciation on investments, futures and swaps | | | | | | (1,207 | ) |
| | | | | | | |
| | |
Net Assets | | | | | $ | 108,324 | |
| | | | | | | |
| | |
Net Asset Value Per Share: | | | | | | | |
Institutional Class (11,181 shares outstanding) | | | | | | $9.69 | |
| | | | | | | | |
See notes to financial statements.
191
Semi-Annual Report to Shareholders
Statement of Operations
Western Asset Limited Duration Bond Portfolio
For the Six Months Ended September 30, 2007 (Unaudited)
(Amounts in Thousands)
| | | | | | | | |
Investment Income: | | | | | | | | |
Interest | | | | | | $ | 2,918 | |
Expenses: | | | | | | | | |
Management fees | | $ | 181 | | | | | |
Audit and legal fees | | | 28 | | | | | |
Custodian fees | | | 20 | | | | | |
Directors’ fees and expenses | | | 1 | | | | | |
Registration fees | | | 12 | | | | | |
Reports to shareholders | | | 7 | | | | | |
Transfer agent and shareholder servicing expense: | | | | | | | | |
Institutional Class | | | 7 | | | | | |
Other expenses | | | 13 | | | | | |
| | | | | | | | |
| | | 269 | | | | | |
Less: Fees waived | | | (61 | ) | | | | |
Compensating balance credits | | | (1 | ) | | | | |
| | | | | | | | |
Net expenses | | | | | | | 207 | |
| | | | | | | | |
Net Investment Income | | | | | | | 2,711 | |
Net Realized and Unrealized Gain/(Loss) on Investments: | | | | | | | | |
Net realized gain/(loss) on: | | | | | | | | |
Investments | | | 6 | | | | | |
Options | | | 24 | | | | | |
Futures | | | (535 | ) | | | | |
Swaps | | | (279 | ) | | | | |
| | | | | | | | |
| | | | | | | (784 | ) |
Change in unrealized appreciation/depreciation of investments, futures and swaps | | | | | | | (1,288 | ) |
| | | | | | | | |
Net Realized and Unrealized Loss on Investments | | | | | | | (2,072 | ) |
| | | | | | | | | |
Change in Net Assets Resulting From Operations | | | | | | $ | 639 | |
| | | | | | | | | |
See notes to financial statements.
192
Semi-Annual Report to Shareholders
Statement of Changes in Net Assets
Western Asset Limited Duration Bond Portfolio
(Amounts in Thousands)
| | | | | | | | |
| | | FOR THE
SIX MONTHS ENDED
SEPTEMBER 30, 2007 | | | FOR THE
YEAR ENDED
MARCH 31, 2007 | |
| Change in Net Assets: | | (Unaudited) | | | | |
Net investment income | | $ | 2,711 | | | $ | 3,946 | |
| | |
Net realized loss | | | (784 | ) | | | (158 | ) |
| | |
Change in unrealized appreciation/depreciation | | | (1,288 | ) | | | 841 | |
| | | | | | | | |
Change in net assets resulting from operations | | | 639 | | | | 4,629 | |
| | |
Distributions to shareholders from: | | | | | | | | |
Net investment income: | | | | | | | | |
Institutional Class | | | (2,705 | ) | | | (3,944 | ) |
| | |
Change in net assets from fund share transactions: | | | | | | | | |
Institutional Class | | | 17,990 | | | | 17,572 | |
| | | | | | | | |
Change in net assets | | | 15,924 | | | | 18,257 | |
| | |
Net Assets: | | | | | | | | |
Beginning of period | | | 92,400 | | | | 74,143 | |
| | | | | | | | |
| | |
End of period | | $ | 108,324 | | | $ | 92,400 | |
| | | | | | | | |
| | |
Under distributions of net investment income | | $ | 40 | | | $ | 34 | |
| | | | | | | | |
| | | | | | | | | |
See notes to financial statements.
193
Semi-Annual Report to Shareholders
Financial Highlights
Western Asset Limited Duration Bond Portfolio
For a share of each class of capital stock outstanding:
Institutional Class:
| | | | | | | | | | | | | | | | | | | | |
| | | SIX MONTHS
ENDED
SEPTEMBER 30, 2007 | | | YEARS ENDED MARCH 31, | |
| | | | 2007 | | | 2006 | | | 2005 | | | 2004A | |
| | | (Unaudited) | | | | | | | | | | | | | |
Net asset value, beginning of period | | $ | 9.88 | | | $ | 9.80 | | | $ | 9.89 | | | $ | 10.09 | | | $ | 10.00 | |
| | | | | | | | | | | | | | | | | | | | |
Investment operations: | | | | | | | | | | | | | | | | | | | | |
Net investment income | | | .26 | B | | | .47 | B | | | .38 | | | | .24 | | | | .08 | |
Net realized and unrealized gain/(loss) | | | (.19 | ) | | | .08 | | | | (.09 | ) | | | (.17 | ) | | | .09 | |
| | | | | | | | | | | | | | | | | | | | |
Total from investment operations | | | .07 | | | | .55 | | | | .29 | | | | .07 | | | | .17 | |
| | | | | | | | | | | | | | | | | | | | |
Distributions from: | | | | | | | | | | | | | | | | | | | | |
Net investment income | | | (.26 | ) | | | (.47 | ) | | | (.38 | ) | | | (.25 | ) | | | (.08 | ) |
Net realized gain on investments | | | — | | | | — | | | | — | | | | (.02 | ) | | | — | |
| | | | | | | | | | | | | | | | | | | | |
Total distributions | | | (.26 | ) | | | (.47 | ) | | | (.38 | ) | | | (.27 | ) | | | (.08 | ) |
| | | | | | | | | | | | | | | | | | | | |
Net asset value, end of period | | $ | 9.69 | | | $ | 9.88 | | | $ | 9.80 | | | $ | 9.89 | | | $ | 10.09 | |
| | | | | | | | | | | | | | | | | | | | |
Total return | | | .67 | %C | | | 5.73 | % | | | 3.01 | % | | | .69 | % | | | 1.69 | %C |
| | | | | |
Ratios to Average Net Assets:D | | | | | | | | | | | | | | | | | | | | |
Total expenses | | | .52 | %E | | | .58 | % | | | .68 | % | | | .73 | % | | | .68 | %E |
Expenses net of waivers, if any | | | .40 | %E | | | .40 | % | | | .40 | % | | | .40 | % | | | .40 | %E |
Expenses net of all reductions | | | .40 | %E | | | .40 | % | | | .40 | % | | | .40 | % | | | .40 | %E |
Net investment income | | | 5.2 | %E | | | 4.8 | % | | | 3.9 | % | | | 2.4 | % | | | 1.6 | %E |
| | | | | |
Supplemental Data: | | | | | | | | | | | | | | | | | | | | |
Portfolio turnover rate | | | 162.0 | %C | | | 270.5 | % | | | 244.7 | % | | | 231.5 | % | | | 125.5 | % |
Net assets, end of period (in thousands) | | $ | 108,324 | | | $ | 92,400 | | | $ | 74,143 | | | $ | 37,426 | | | $ | 26,182 | |
| | | | | | | | | | | | | | | | | | | | | |
A | | For the period October 1, 2003 (commencement of operations) to March 31, 2004. |
B | | Computed using average daily shares outstanding. |
D | | Total expenses reflects operating expenses prior to any voluntary expense waivers and/or compensating balance credits. Expenses net of waivers reflects total expenses before compensating balance credits but net of any voluntary expense waivers. Expenses net of all reductions reflects expenses less any compensating balance credits and/or voluntary expense waivers. |
See notes to financial statements.
194
Semi-Annual Report to Shareholders
Expense Example
Western Asset Non-U.S. Opportunity Bond Portfolio
As a shareholder of the Fund, you incur ongoing costs, including management fees and other Fund expenses. These examples are intended to help you understand your ongoing costs (in dollars) of investing in the Fund and to compare these costs with the ongoing costs of investing in other mutual funds. The example is based on an investment of $1,000 invested on April 1, 2007, and held through September 30, 2007.
Actual Expenses
The first line in the table below provides information about actual account values and actual expenses for the Fund. You may use the information in this line, together with the amount you invested, to estimate the expenses that you paid over the period. Simply divide your account value by $1,000 (for example, an $8,600 account value divided by $1,000 = 8.6), then multiply the result by the number in the first line under the heading entitled “Expenses Paid During the Period” to estimate the expenses you paid on your account during this period.
Hypothetical Example for Comparison Purposes
The second line in the table below provides information about hypothetical account values and hypothetical expenses based on the Fund’s actual expense ratio and an assumed rate of return of 5% per year before expenses, which is not the Fund’s actual return. The hypothetical account values and expenses may not be used to estimate the actual ending account balance or expenses you paid for the period. You may use this information to compare the ongoing costs of investing in the Fund and other funds. To do so, compare this 5% hypothetical example with the 5% hypothetical examples that appear in the shareholder reports of other funds.
| | | | | | | | | |
| | | Beginning
Account Value
4/1/07 | | Ending
Account Value
9/30/07 | | Expenses PaidA
During the Period
4/1/07 to 9/30/07 |
Institutional Class: | | | | | | | | | |
Actual | | $ | 1,000.00 | | $ | 1,009.70 | | $ | 2.77 |
Hypothetical (5% return before expenses) | | $ | 1,000.00 | | $ | 1,022.31 | | $ | 2.79 |
A | | These calculations are based on expenses incurred in the most recent fiscal half-year. The dollar amounts shown as “Expenses Paid During the Period” are equal to the annualized expense ratio of 0.55% multiplied by the average value over the period, multiplied by the number of days in the most recent fiscal half-year (183), and divided by 365. |
195
Semi-Annual Report to Shareholders
Performance Information
Western Asset Non-U.S. Opportunity Bond Portfolio
The graph compares the Fund’s total returns against that of an appropriate broad-based securities market index. The line illustrates the cumulative total return of an initial $1,000,000 investment for the periods indicated. The line for the Fund represents the total return after deducting all Fund investment management and other administrative expenses and the transaction costs of buying and selling securities. The line representing the securities market index does not include any transaction costs associated with buying and selling securities in the index or other investment management or administrative expenses.
Total return measures investment performance in terms of appreciation or depreciation in the Fund’s net asset value per share, plus dividends and any capital gain distributions. It assumes that dividends and distributions were reinvested at the time they were paid. Returns (and the graph and table found below) do not reflect the deduction of taxes that a shareholder would pay on Fund distributions or the redemption of Fund shares. Average annual returns tend to smooth out variations in a fund’s return, so that they differ from actual year-to-year results.
Bonds are subject to a variety of risks, including interest rate, credit and inflation risk. Non U.S. investments are subject to currency fluctuations, social, economic, and political risk.
Growth of a $1,000,000 Investment—Institutional Class
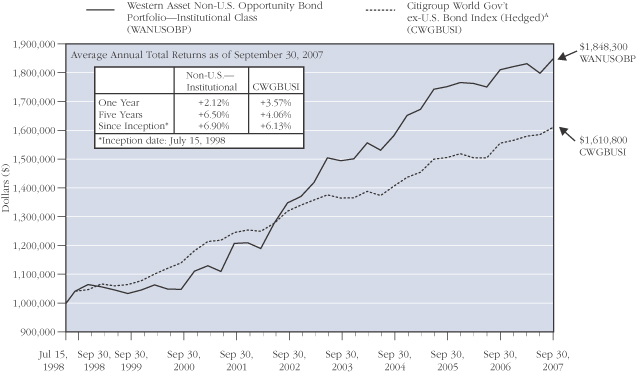
The performance data quoted represents past performance and does not guarantee future results. The performance stated may have been due to extraordinary market conditions, which may not be duplicated in the future. Current performance may be lower or higher than the performance data quoted. To obtain the most recent month-end performance information, please visit www.westernassetfunds.com. The investment return and principal value of the Fund will fluctuate so that an investor’s shares, when redeemed, may be worth more or less than the original cost. Calculations assume reinvestment of dividends and capital gain distributions. Performance would have been lower if fees had not been waived in various periods.
A | | Index returns are for periods beginning July 31, 1998. |
196
Semi-Annual Report to Shareholders
Portfolio Composition (as of September 30, 2007)
Standard & Poor’s Debt RatingsB (as a percentage of the portfolio)
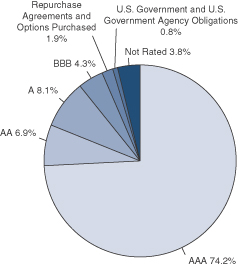
Maturity Schedule (as a percentage of the portfolio)
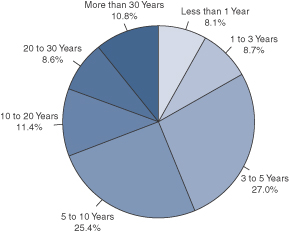
B | | Source: Standard & Poor's. |
The Fund is actively managed. As a result, the composition of the portfolio holdings and sectors are subject to change at any time.
197
Semi-Annual Report to Shareholders
Portfolio of Investments
Western Asset Non-U.S. Opportunity Bond Portfolio
September 30, 2007 (Unaudited)
(Amounts in Thousands)
| | | | | | | | | | | | | |
| | | % OF
NET ASSETS | | RATE | | MATURITY
DATE | | PAR† | | | VALUE | |
| | | | | | | | | | | | | |
Long-Term Securities | | 90.2% | | | | | | | | | | | |
| | | | | |
Corporate Bonds and Notes | | 26.7% | | | | | | | | | | | |
| | | | | |
Capital Markets | | 1.0% | | | | | | | | | | | |
Lehman Brothers Holdings Inc. | | | | 4.625% | | 3/14/19 | | 1,300 | EUR | | $ | 1,682 | A |
| | | | | | | | | | | | | |
| | | | | |
Commercial Banks | | 8.5% | | | | | | | | | | | |
Alliance and Leicester PLC | | | | 5.000% | | 10/4/10 | | 1,200 | EUR | | | 1,692 | |
Banco Popolare di Verona e Novara Scrl | | | | 6.156% | | 6/29/49 | | 1,000 | EUR | | | 1,353 | A |
Commerzbank Capital Funding Trust | | | | 5.012% | | 3/29/49 | | 550 | EUR | | | 717 | A |
Deutsche Postbank IV | | | | 5.983% | | 6/29/49 | | 1,150 | EUR | | | 1,549 | A |
Dexia Municipal Agency | | | | 1.550% | | 10/31/13 | | 282,000 | JPY | | | 2,469 | |
European Investment Bank | | | | 4.250% | | 12/7/10 | | 2,280 | GBP | | | 4,504 | |
Fortis Bank SA/NV | | | | 5.757% | | 10/4/17 | | 706 | EUR | | | 1,013 | |
HSH Nordbank Luxembourg | | | | 7.408% | | 6/29/49 | | 1,100 | EUR | | | 1,605 | A |
| | | | | | | | | | | | | |
| | | | | | | | | | | | 14,902 | |
| | | | | | | | | | | | | |
Diversified Financial Services | | 14.6% | | | | | | | | | | | |
Banca Italease SpA | | | | 4.499% | | 2/11/08 | | 100 | EUR | | | 141 | B |
Banca Italease SpA | | | | 4.911% | | 5/27/08 | | 200 | EUR | | | 283 | B |
Banca Italease SpA | | | | 4.904% | | 3/2/09 | | 50 | EUR | | | 69 | B |
Banca Italease SpA | | | | 4.459% | | 10/15/09 | | 50 | EUR | | | 68 | B |
Banca Italease SpA | | | | 4.460% | | 2/2/10 | | 250 | EUR | | | 336 | B |
Banca Italease SpA | | | | 4.914% | | 11/23/10 | | 200 | EUR | | | 264 | B |
Banca Italease SpA | | | | 4.609% | | 2/8/12 | | 50 | EUR | | | 66 | B |
Banca Italease SpA | | | | 5.000% | | 3/14/12 | | 50 | EUR | | | 67 | B |
Caisse Refinancement de l’Habitat | | | | 4.200% | | 4/25/11 | | 2,000 | EUR | | | 2,833 | |
Eksportfinans ASA | | | | 1.600% | | 3/20/14 | | 365,000 | JPY | | | 3,206 | |
Eurohypo Capital Funding Trust 1 | | | | 6.445% | | 5/29/49 | | 61 | EUR | | | 89 | A |
Irish Nationwide Building Society | | | | 5.875% | | 12/15/08 | | 200 | GBP | | | 407 | |
Japan Finance Corp. for Municipal Enterprises | | | | 1.350% | | 11/26/13 | | 181,000 | JPY | | | 1,575 | |
Kreditanstalt fuer Wiederaufbau | | | | 5.250% | | 1/4/10 | | 1,800 | EUR | | | 2,617 | |
Kreditanstalt fuer Wiederaufbau | | | | 2.050% | | 2/16/26 | | 570,000 | JPY | | | 4,851 | |
Kreditanstalt fuer Wiederaufbau | | | | 2.600% | | 6/20/37 | | 106,000 | JPY | | | 944 | |
Landesbank Hessen-Thueringen Girozentrale | | | | 5.375% | | 3/7/12 | | 200 | GBP | | | 405 | |
Network Rail MTN Finance PLC | | | | 4.875% | | 3/6/09 | | 3,000 | GBP | | | 6,084 | |
Resona Bank Ltd. | | | | 4.125% | | 9/29/49 | | 200 | EUR | | | 261 | A,C |
SNS Reaal | | | | 6.258% | | 7/17/17 | | 650 | EUR | | | 905 | A |
| | | | | | | | | | | | | |
| | | | | | | | | | | | 25,471 | |
| | | | | | | | | | | | | |
198
Semi-Annual Report to Shareholders
| | | | | | | | | | | | | |
| | | % OF
NET ASSETS | | RATE | | MATURITY
DATE | | PAR† | | | VALUE | |
| | | | | | | | | | | | | |
Corporate Bonds and Notes—Continued | | | | | | | | | | | | | |
| | | | | |
Diversified Telecommunication Services | | 0.4% | | | | | | | | | | | |
British Telecommunications PLC | | | | 5.250% | | 6/23/14 | | 274 | EUR | | $ | 391 | |
Telecom Italia SpA | | | | 5.250% | | 3/17/55 | | 200 | EUR | | | 228 | |
| | | | | | | | | | | | | |
| | | | | | | | | | | | 619 | |
| | | | | | | | | | | | | |
Insurance | | 1.0% | | | | | | | | | | | |
AXA SA | | | | 5.777% | | 7/29/49 | | 200 | EUR | | | 285 | A |
Mapfre SA | | | | 5.921% | | 7/24/37 | | 400 | EUR | | | 570 | A |
Muenchener Rueckversicherungs-Gesellschaft AG (MunichRe) | | | | 5.767% | | 6/29/49 | | 700 | EUR | | | 980 | A |
| | | | | | | | | | | | | |
| | | | | | | | | | | | 1,835 | |
| | | | | | | | | | | | | |
Pharmaceuticals | | 0.5% | | | | | | | | | | | |
AstraZeneca PLC | | | | 5.125% | | 1/15/15 | | 639 | EUR | | | 917 | |
| | | | | | | | | | | | | |
| | | | | |
Thrifts and Mortgage Finance | | 0.3% | | | | | | | | | | | |
Hypo Real Estate International Trust I | | | | 5.864% | | 6/14/49 | | 350 | EUR | | | 442 | A |
| | | | | | | | | | | | | |
| | | | | |
Tobacco | | 0.4% | | | | | | | | | | | |
BAT International Finance PLC | | | | 5.375% | | 6/29/17 | | 500 | EUR | | | 708 | |
| | | | | | | | | | | | | |
Total Corporate Bonds and Notes
(Cost—$42,218) | | | | | | | | | | | | 46,576 | |
U.S. Government and Agency Obligations | | 0.8% | | | | | | | | | | | |
| | | | | |
Fixed Rate Securities | | 0.8% | | | | | | | | | | | |
Freddie Mac | | | | 5.750% | | 9/15/10 | | 900 | EUR | | | 1,329 | |
| | | | | | | | | | | | | |
Total U.S. Government and Agency Obligations
(Cost—$867) | | | | | | | | | | | | 1,329 | |
Foreign Government Obligations | | 62.7% | | | | | | | | | | | |
Canadian Real Return Bond | | | | 4.500% | | 6/1/15 | | 4,348 | CAD | | | 4,429 | D |
Canadian Real Return Bond | | | | 4.000% | | 12/1/31 | | 196 | CAD | | | 269 | D |
Federal Republic of Germany | | | | 4.125% | | 7/4/08 | | 6,720 | EUR | | | 9,586 | |
Federal Republic of Germany | | | | 3.500% | | 10/10/08 | | 2,130 | EUR | | | 3,021 | |
Federal Republic of Germany | | | | 3.500% | | 4/8/11 | | 2 | EUR | | | 3 | |
Federal Republic of Germany | | | | 4.750% | | 7/4/34 | | 2,390 | EUR | | | 3,482 | |
France Government Bond OAT | | | | 4.000% | | 4/25/55 | | 7,760 | EUR | | | 9,787 | |
Government of Canada | | | | 4.000% | | 6/1/16 | | 4,130 | CAD | | | 4,065 | |
Government of Poland | | | | 5.000% | | 10/24/13 | | 2,550 | PLN | | | 934 | |
Government of Poland | | | | 6.250% | | 10/24/15 | | 7,204 | PLN | | | 2,818 | |
Government of Poland | | | | 5.750% | | 9/23/22 | | 8,680 | PLN | | | 3,303 | |
199
Semi-Annual Report to Shareholders
Portfolio of Investments—Continued
Western Asset Non-U.S. Opportunity Bond Portfolio—Continued
| | | | | | | | | | | | | | |
| | | % OF
NET ASSETS | | RATE | | MATURITY
DATE | | PAR† | | | VALUE | |
| | | | | | | | | | | | | | |
Foreign Government Obligations—Continued | | | | | | | | | | | | | | |
Japan Development Bank | | | | 2.300% | | 3/19/26 | | | 560,000 | JPY | | $ | 4,952 | |
Kingdom of Denmark | | | | 5.000% | | 11/15/13 | | | 17,460 | DKK | | | 3,457 | |
Kingdom of Norway | | | | 6.500% | | 5/15/13 | | | 10,000 | NOK | | | 2,007 | |
Kingdom of Norway | | | | 5.000% | | 5/15/15 | | | 29,280 | NOK | | | 5,465 | |
Kingdom of Norway | | | | 4.250% | | 5/19/17 | | | 9,370 | NOK | | | 1,643 | |
Kingdom of Spain | | | | 5.750% | | 7/30/32 | | | 1,970 | EUR | | | 3,245 | |
Kingdom of the Netherlands | | | | 4.500% | | 7/15/17 | | | 2,500 | EUR | | | 3,588 | |
Kingdom of the Netherlands | | | | 5.500% | | 1/15/28 | | | 1,270 | EUR | | | 2,014 | |
Queensland Treasury Corp. | | | | 6.000% | | 6/14/11 | | | 16,640 | AUD | | | 14,413 | D |
Republic of France | | | | 5.000% | | 10/25/16 | | | 1,419 | EUR | | | 2,114 | D |
Republic of France | | | | 4.750% | | 4/25/35 | | | 2,220 | EUR | | | 3,211 | D |
United Kingdom of Great Britain and Northern Ireland | | | | 8.000% | | 6/7/21 | | | 960 | GBP | | | 2,550 | |
United Kingdom Treasury Stock | | | | 5.000% | | 3/7/12 | | | 9,350 | GBP | | | 19,114 | |
| | | | | | | | | | | | | | |
| | | | | |
Total Foreign Government Obligations
(Cost—$99,946) | | | | | | | | | | | | | 109,470 | |
| | | | | | | | | | | | | | |
Total Long-Term Securities (Cost—$143,031) | | | | | | | | | | | | | 157,375 | |
Short-Term Securities | | 1.7% | | | | | | | | | | | | |
| | | | | |
Options PurchasedE | | 0.3% | | | | | | | | | | | | |
U.S. Treasury Note Futures Call, December 2007, Strike Price $107.00 | | | | | | | | | 714 | F | | | 547 | |
| | | | | | | | | | | | | | |
| | | | | | | | | | | | | 547 | |
| | | | | | | | | | | | | | |
Repurchase Agreement | | 1.4% | | | | | | | | | | | | |
Goldman Sachs & Company
4.85%, dated 9/28/07, to be repurchased at $2,459 on 10/1/07 (Collateral: $2,385 Federal Home Loan Bank notes, 5.375%, due 5/18/16, value $2,507) | | | | | | | | $ | 2,458 | | | | 2,458 | |
| | | | | | | | | | | | | | |
Total Short-Term Securities (Cost—$3,252) | | | | | | | | | | | | | 3,005 | |
Total Investments (Cost—$146,283)H | | 91.9% | | | | | | | | | | | 160,380 | |
Other Assets Less Liabilities | | 8.1% | | | | | | | | | | | 14,113 | |
| | | | | | | | | | | | | | |
| | | | | |
Net Assets | | 100.0% | | | | | | | | | | $ | 174,493 | |
| | | | | | | | | | | | | | |
200
Semi-Annual Report to Shareholders
| | | | | | | | |
| | | EXPIRATION | | ACTUAL
CONTRACTS | | APPRECIATION/
(DEPRECIATION) | |
Futures Contracts PurchasedE | | | | | | | | |
Bundesobligations Futures | | December 2007 | | 99 | | $ | — | G |
Euro Currency Futures | | December 2007 | | 1 | | | — | G |
LIBOR Futures | | March 2008 | | 109 | | | 61 | |
| | | | | | | | |
| | | | | | $ | 61 | |
| | | | | | | | |
Futures Contracts WrittenE | | | | | | | | |
Bundesobligations Futures | | December 2007 | | 49 | | $ | 42 | |
U.S. Treasury Note Futures | | December 2007 | | 40 | | | (8 | ) |
United Kingdom Treasury Bond Futures | | December 2007 | | 6 | | | (1 | ) |
| | | | | | | | |
| | | | | | $ | 33 | |
| | | | | | | | |
| | | | | | | | | |
A | | Stepped Coupon Security – A security with a predetermined schedule of interest or dividend rate changes at which time it begins to accrue interest or pay dividends according to the predetermined schedule. |
B | | Indexed Security – The rates of interest earned on these securities are tied to the London Interbank Offered Rate (“LIBOR”), the Euro Interbank Offered Rate (“EURIBOR”) Index, the Consumer Price Index (“CPI”), the one-year Treasury Bill Rate or the ten-year Japanese Government Bond Rate. The coupon rates are the rates as of September 30, 2007. |
C | | Rule 144a Security – A security purchased pursuant to Rule 144a under the Securities Act of 1933 which may not be resold subject to that rule except to qualified institutional buyers. These securities, which the Fund’s investment adviser has determined to be liquid, represent 0.15% of net assets. |
D | | Inflation-Protected Security – Security whose principal value is adjusted daily or monthly in accordance with changes to the relevant country’s Consumer Price Index or its equivalent used as an inflation proxy. Interest is calculated on the basis of the current adjusted principal value. |
E | | Options and futures are described in more detail in the notes to financial statements. |
F | | Par represents actual number of contracts. |
H | | Aggregate cost for federal income tax purposes is substantially the same as book cost. At September 30, 2007, the aggregate gross unrealized appreciation and depreciation of investments for federal income tax purposes were substantially as follows: |
| | | | |
| Gross unrealized appreciation | | $ | 14,480 | |
| Gross unrealized depreciation | | | (383 | ) |
| | | | |
| Net unrealized appreciation/(depreciation) | | $ | 14,097 | |
| | | | |
† | | Securities are denominated in U.S. Dollars, unless otherwise noted. |
AUD—Australian Dollar
CAD—Canadian Dollar
DKK—Danish Krone
EUR—Euro
GBP—British Pound
JPY—Japanese Yen
NOK—Norwegian Krone
PLN—Polish Zloty
See notes to financial statements.
201
Semi-Annual Report to Shareholders
Statement of Assets and Liabilities
Western Asset Non-U.S. Opportunity Bond Portfolio
September 30, 2007 (Unaudited)
(Amounts in Thousands)
| | | | | | | |
Assets: | | | | | | | |
Investment securities at market value (Cost—$143,031) | | | | | $ | 157,375 | |
Short-term securities at value (Cost—$3,252) | | | | | | 3,005 | |
Cash | | | | | | 1,950 | |
Foreign currency at value (Cost—$11,861) | | | | | | 11,934 | |
Receivable for securities sold | | | | | | 7,896 | |
Receivable for fund shares sold | | | | | | 2,223 | |
Interest receivable | | | | | | 2,577 | |
Futures variation margin receivable | | | | | | 70 | |
| | | | | | | |
Total assets | | | | | | 187,030 | |
| | | | | | | |
| | |
Liabilities: | | | | | | | |
Payable for securities purchased | | $ | 7,969 | | | | |
Payable for fund shares repurchased | | | 398 | | | | |
Accrued management fee | | | 55 | | | | |
Unrealized depreciation of forward foreign currency contracts | | | 4,063 | | | | |
Accrued expenses | | | 52 | | | | |
| | | | | | | |
Total liabilities | | | | | | 12,537 | |
| | | | | | | |
| | |
Net Assets | | | | | $ | 174,493 | |
| | | | | | | |
| | |
Net assets consist of: | | | | | | | |
Accumulated paid-in-capital | | | | | $ | 167,058 | |
Undistributed net investment income | | | | | | 4,356 | |
Accumulated net realized loss on investments, futures and foreign currency transactions | | | | | | (7,368 | ) |
Unrealized appreciation of investments, futures and foreign currency translations | | | | | | 10,447 | |
| | | | | | | |
| | |
Net Assets | | | | | $ | 174,493 | |
| | | | | | | |
| | |
Net Asset Value Per Share: | | | | | | | |
Institutional Class (17,735 shares outstanding) | | | | | | $9.84 | |
| | | | | | | | |
See notes to financial statements.
202
Semi-Annual Report to Shareholders
Statement of Operations
Western Asset Non-U.S. Opportunity Bond Portfolio
For the Six Months Ended September 30, 2007 (Unaudited)
(Amounts in Thousands)
| | | | | | | | |
Investment Income: | | | | | | | | |
Interest | | | | | | $ | 3,631 | |
Expenses: | | | | | | | | |
Management fees | | $ | 384 | | | | | |
Audit and legal fees | | | 30 | | | | | |
Custodian fees | | | 43 | | | | | |
Directors’ fees and expenses | | | 3 | | | | | |
Registration fees | | | 14 | | | | | |
Reports to shareholders | | | 6 | | | | | |
Transfer agent and shareholder servicing expense: | | | | | | | | |
Institutional Class | | | 10 | | | | | |
Other expenses | | | 22 | | | | | |
| | | | | | | | |
| | | 512 | | | | | |
Less: Fees waived | | | (42 | ) | | | | |
Compensating balance credits | | | — | A | | | | |
| | | | | | | | |
Net expenses | | | | | | | 470 | |
| | | | | | | | |
Net Investment Income | | | | | | | 3,161 | |
Net Realized and Unrealized Gain/(Loss) on Investments: | | | | | | | | |
Net realized gain/(loss) on: | | | | | | | | |
Investments | | | (1,154 | ) | | | | |
Futures | | | (129 | ) | | | | |
Foreign currency transactions | | | (5,962 | ) | | | | |
Options | | | (123 | ) | | | | |
| | | | | | | | |
| | | | | | | (7,368 | ) |
Change in unrealized appreciation/depreciation of: | | | | | | | | |
Investments, futures and foreign currency translations | | | 6,161 | | | | | |
Assets and liabilities denominated in foreign currency | | | (372 | ) | | | | |
| | | | | | | | |
| | | | | | | 5,789 | |
| | | | | | | | |
Net Realized and Unrealized Loss on Investments | | | | | | | (1,579 | ) |
| | | | | | | | | |
Change in Net Assets Resulting From Operations | | | | | | $ | 1,582 | |
| | | | | | | | | |
See notes to financial statements.
203
Semi-Annual Report to Shareholders
Statement of Changes in Net Assets
Western Asset Non-U.S. Opportunity Bond Portfolio
(Amounts in Thousands)
| | | | | | | | |
| | | FOR THE
SIX MONTHS ENDED
SEPTEMBER 30, 2007 | | | FOR THE
YEAR ENDED
MARCH 31, 2007 | |
| Change in Net Assets: | | (Unaudited) | | | | |
Net investment income | | $ | 3,161 | | | $ | 4,930 | |
| | |
Net realized loss | | | (7,368 | ) | | | (979 | ) |
| | |
Change in unrealized appreciation/depreciation | | | 5,789 | | | | 1,220 | |
| | | | | | | | |
Change in net assets resulting from operations | | | 1,582 | | | | 5,171 | |
| | |
Distributions to shareholders from: | | | | | | | | |
Net investment income: | | | | | | | | |
Institutional Class | | | — | | | | (2,138 | ) |
| | |
Net realized gain on investments: | | | | | | | | |
Institutional Class | | | (73 | ) | | | — | |
| | |
Change in net assets from fund share transactions: | | | | | | | | |
Institutional Class | | | (4,324 | ) | | | 83,854 | |
| | | | | | | | |
Change in net assets | | | (2,815 | ) | | | 86,887 | |
| | |
Net Assets: | | | | | | | | |
Beginning of period | | | 177,308 | | | | 90,421 | |
| | | | | | | | |
| | |
End of period | | $ | 174,493 | | | $ | 177,308 | |
| | | | | | | | |
| | |
Under distributions of net investment income | | $ | 4,356 | | | $ | 1,195 | |
| | | | | | | | |
| | | | | | | | | |
See notes to financial statements.
204
Semi-Annual Report to Shareholders
Financial Highlights
Western Asset Non-U.S. Opportunity Bond Portfolio
For a share of each class of capital stock outstanding:
Institutional Class:
| | | | | | | | | | | | | | | | | | | | | | | | |
| | | SIX MONTHS
ENDED
SEPTEMBER 30, 2007 | | | YEARS ENDED MARCH 31, | |
| | | | 2007 | | | 2006 | | | 2005 | | | 2004 | | | 2003 | |
| | | (Unaudited) | | | | | | | | | | | | | | | | |
Net asset value, beginning of period | | $ | 9.75 | | | $ | 9.59 | | | $ | 10.98 | | | $ | 10.52 | | | $ | 10.91 | | | $ | 9.25 | |
| | | | | | | | | | | | | | | | | | | | | | | | |
Investment operations: | | | | | | | | | | | | | | | | | | | | | | | | |
Net investment income | | | .18 | A | | | .36 | A | | | .64 | | | | .19 | | | | .97 | | | | .25 | |
Net realized and unrealized gain/(loss) | | | (.09 | ) | | | — | B | | | (.07 | ) | | | .57 | | | | (.01 | ) | | | 1.52 | |
| | | | | | | | | | | | | | | | | | | | | | | | |
Total from investment operations | | | .09 | | | | .36 | | | | .57 | | | | .76 | | | | .96 | | | | 1.77 | |
| | | | | | | | | | | | | | | | | | | | | | | | |
Distributions from: | | | | | | | | | | | | | | | | | | | | | | | | |
Net investment income | | | — | | | | (.20 | ) | | | (1.16 | ) | | | (.29 | ) | | | (1.01 | ) | | | (.11 | ) |
Net realized gain on investments | | | — | | | | — | | | | (.80 | ) | | | (.01 | ) | | | (.34 | ) | | | — | |
| | | | | | | | | | | | | | | | | | | | | | | | |
Total distributions | | | — | | | | (.20 | ) | | | (1.96 | ) | | | (.30 | ) | | | (1.35 | ) | | | (.11 | ) |
| | | | | | | | | | | | | | | | | | | | | | | | |
Net asset value, end of period | | $ | 9.84 | | | $ | 9.75 | | | $ | 9.59 | | | $ | 10.98 | | | $ | 10.52 | | | $ | 10.91 | |
| | | | | | | | | | | | | | | | | | | | | | | | |
Total return | | | .97 | %C | | | 3.89 | % | | | 5.33 | % | | | 7.60 | % | | | 9.06 | % | | | 19.26 | % |
| | | | | | |
Ratios to Average Net Assets:D | | | | | | | | | | | | | | | | | | | | | | | | |
Total expenses | | | .60 | %E | | | .64 | % | | | .74 | % | | | .68 | % | | | .80 | % | | | .82 | % |
Expenses net of waivers, if any | | | .55 | %E | | | .55 | % | | | .55 | % | | | .55 | % | | | .55 | % | | | .55 | % |
Expenses net of all reductions | | | .55 | %E | | | .55 | % | | | .55 | % | | | .55 | % | | | .55 | % | | | .55 | % |
Net investment income | | | 3.7 | %E | | | 3.7 | % | | | 3.3 | % | | | 3.2 | % | | | 4.0 | % | | | 4.4 | % |
| | | | | | |
Supplemental Data: | | | | | | | | | | | | | | | | | | | | | | | | |
Portfolio turnover rate | | | 40.4 | %C | | | 117.9 | % | | | 140.1 | % | | | 40.8 | % | | | 42.8 | % | | | 187.5 | % |
Net assets, end of period (in thousands) | | $ | 174,493 | | | $ | 177,308 | | | $ | 90,421 | | | $ | 89,170 | | | $ | 97,027 | | | $ | 59,026 | |
| | | | | | | | | | | | | | | | | | | | | | | | | |
A | | Computed using average daily shares outstanding. |
B | | Amount less than $.01 per share. |
D | | Total expenses reflects operating expenses prior to any voluntary expense waivers and/or compensating balance credits. Expenses net of waivers reflects total expenses before compensating balance credits but net of any voluntary expense waivers. Expenses net of all reductions reflects expenses less any compensating balance credits and/or voluntary expense waivers. |
See notes to financial statements.
205
Semi-Annual Report to Shareholders
Notes to Financial Statements
(Amounts in Thousands) (Unaudited)
1. Significant Accounting Policies:
Western Asset Funds, Inc. (“Corporation”), consisting of Western Asset Absolute Return Portfolio (“Absolute Return”), Western Asset Core Bond Portfolio (“Core”), Western Asset Core Plus Bond Portfolio (“Core Plus”), Western Asset High Yield Portfolio (“High Yield”), Western Asset Inflation Indexed Plus Bond Portfolio (“Inflation Indexed”), Western Asset Intermediate Bond Portfolio (“Intermediate”), Western Asset Intermediate Plus Bond Portfolio (“Intermediate Plus”), Western Asset Limited Duration Bond Portfolio (“Limited Duration”) and Western Asset Non-U.S. Opportunity Bond Portfolio (“Non-U.S.”) (individually a “Fund,” collectively the “Funds”), is registered under the Investment Company Act of 1940, as amended (“1940 Act”), as a diversified, open-end management investment company with the exception of Non-U.S., which is non-diversified.
Each Fund offers two classes of shares: Institutional Class and Financial Intermediary Class. Shares in the Financial Intermediary Class bear a distribution fee. The Financial Intermediary Class shares of Limited Duration, Intermediate, Intermediate Plus, High Yield, and Non-U.S. have not commenced operations. The income and expenses of each of the Funds are allocated proportionately to the two classes of shares based on daily net assets, except for Rule 12b-1 distribution fees, which are charged only on the Financial Intermediary Class shares, and transfer agent shareholder servicing expenses, and certain other expenses, which are determined separately for each class.
Preparation of the financial statements in accordance with accounting principles generally accepted in the United States of America requires management to make estimates and assumptions that affect the reported amounts and disclosures in the financial statements. Actual results could differ from those estimates. The following is a summary of significant accounting policies followed by each Fund in the preparation of its financial statements:
Security Valuation
Securities owned by the Funds for which market quotations are readily available are valued at current market value. Securities for which market quotations are not readily available are fair valued pursuant to procedures approved by and under the general oversight of the Board of Directors. In determining fair value, all relevant qualitative and quantitative factors available are considered. These factors are subject to change over time and are reviewed periodically. The values assigned to fair value investments are based on available information and do not necessarily represent amounts that might ultimately be realized, since such amounts depend on future developments inherent in long-term investments. Further, because of the inherent uncertainty of valuation, those estimated values may differ significantly from the values that would have been used had a ready market of the investments existed, and the differences could be material.
With respect to Absolute Return, Core Plus, High Yield, Inflation Indexed, Intermediate Plus and Non-U.S., where a security is traded on more than one market, which may include foreign markets, the securities are generally valued on the market considered by the Funds’ adviser to be the primary market. The Funds will value their foreign securities in U.S. dollars on the basis of the then-prevailing exchange rates.
Security Transactions
Security transactions are accounted for as of the trade date. Realized gains and losses from security transactions are reported on an identified cost basis for both financial reporting and federal income tax purposes.
For the six months ended September 30, 2007, security transactions (excluding short-term investments) were:
| | | | | | | | | | | | |
| | | Purchases | | Proceeds From Sales |
| | | U.S. Gov’t
Securities | | Other | | U.S. Gov’t
Securities | | Other |
Absolute Return | | $ | 881,825 | | $ | 117,956 | | $ | 728,372 | | $ | 18,493 |
Core | | | 20,107,817 | | | 1,047,994 | | | 19,099,050 | | | 360,269 |
Core Plus | | | 34,759,663 | | | 2,679,843 | | | 32,295,654 | | | 1,253,592 |
High Yield | | | 8,428 | | | 339,643 | | | 8,433 | | | 218,598 |
Inflation Indexed | | | 333,449 | | | 16,230 | | | 262,692 | | | 2,297 |
Intermediate | | | 560,496 | | | 177,261 | | | 538,388 | | | 101,214 |
Intermediate Plus | | | 100,839 | | | 16,482 | | | 101,619 | | | 16,977 |
Limited Duration | | | 182,888 | | | 31,799 | | | 170,585 | | | 15,265 |
Non-U.S. | | | — | | | 70,790 | | | — | | | 61,077 |
206
Semi-Annual Report to Shareholders
Forward Commitments
The Funds may enter into commitments to purchase securities on a “forward commitment” basis, including purchases on a “when-issued” basis or a “to be announced” basis. When such transactions are negotiated, certain terms may be fixed at the time the commitment is made, but delivery and payment for the securities takes place at a later date. During the period between a commitment and settlement, no payment is made by the purchaser for the securities purchased and, thus, no interest accrues to the purchaser from the transaction. In a “to be announced” transaction, a Fund commits to purchase securities for which all specific information is not yet known at the time of the trade, particularly the exact face amount in forward commitment mortgage backed securities transactions. Depending on market conditions, a Fund’s forward commitment purchases could cause its net asset value to be more volatile.
A Fund may sell the securities subject to a forward commitment purchase, which may result in a gain or loss. When a Fund purchases securities on a forward commitment basis, it assumes the risks of ownership, including the risk of price fluctuation, at the time of purchase, not at the time of receipt. Purchases of forward commitment securities also involve a risk of loss if the seller fails to deliver after the value of the securities has risen.
Each Fund may also enter into a forward commitment to sell securities it owns and will generally do so only with the intention of actually delivering the securities. In a forward sale, a Fund does not participate in gains or losses on the security occurring after the commitment date. Forward commitments to sell securities also involve a risk of loss if the seller fails to take delivery after the value of the securities has declined.
Foreign Currency Translation
Assets and liabilities initially expressed in non-U.S. currencies are translated into U.S. dollars using currency exchange rates determined prior to the close of trading on the New York Stock Exchange, usually at 2:00 p.m. Eastern time. Purchases and sales of securities and income and expenses are translated into U.S. dollars at the prevailing market rates on the dates of such transactions. The effects of changes in non-U.S. currency exchange rates on investment securities and other assets and liabilities are included with the net realized and unrealized gain or loss on investment securities.
Repurchase Agreements
The Funds may engage in repurchase agreement transactions. Under the terms of a typical repurchase agreement, a fund takes possession of an underlying debt obligation subject to an obligation of the seller to repurchase, and a fund to resell, the obligation at an agreed-upon price and time, thereby determining the yield during a fund’s holding period. This arrangement results in a fixed rate of return that is not subject to market fluctuations during the fund’s holding period. The value of the collateral is at all times at least equal to the total amount of the repurchase obligation, including interest. In the event of counterparty default, a fund has the right to use the collateral to satisfy the terms of the repurchase agreement. However, there could be potential loss to the fund in the event the fund is delayed or prevented from exercising its right to dispose of the collateral securities, including the risk of a possible decline in the value of the collateral securities during the period in which the fund seeks to assert its rights. Each Fund’s investment adviser reviews the value of the collateral and the creditworthiness of those banks and dealers with which the Funds enter into repurchase agreements to evaluate potential risks.
Options, Futures and Swap Agreements
The current market value of an exchange traded option is the last sale price or, in the absence of a sale, the price obtained by reference to broker-dealer quotations. Futures contracts are valued daily at the settlement price established by the board of trade or exchange on which they are traded. Futures contracts are marked-to-market on a daily basis. As the contract’s value fluctuates, payments known as variation margin are made or received by the Fund each day, depending on the daily fluctuation in the value of the contract. The daily changes in contract value are recorded as unrealized gains or losses, and the Fund recognizes a gain or loss when the contract is closed. Swap agreements are generally priced daily based upon quotations from brokers and the change, if any, is recorded as unrealized appreciation or depreciation.
Investment Income and Distributions to Shareholders
Investment income and distributions to shareholders are allocated at the class level and are recorded on the ex-dividend date. Dividends from net investment income are declared daily and paid monthly for each Fund except High Yield and Non-U.S., which declare and pay dividends quarterly. Net capital gain distributions, which are calculated at the Fund level, are declared and paid annually in May. An additional distribution may be made in December to the extent necessary in order to comply with federal excise tax requirements. Distributions are determined in accordance with federal income tax regulations, which may differ from
207
Semi-Annual Report to Shareholders
Notes to Financial Statements—Continued
those determined in accordance with accounting principles generally accepted in the United States of America; accordingly, periodic reclassifications are made within the Funds’ capital accounts to reflect income and gains available for distribution under federal income tax regulations. Interest income and expenses are recorded on the accrual basis. Bond discounts and premiums are amortized and included in interest income for financial reporting and federal income tax purposes.
Compensating Balance Credits
The Funds have an arrangement with their custodian bank, whereby a portion of the custodian’s fee is paid indirectly by credits earned on each Fund’s cash on deposit with the bank. This deposit arrangement is an alternative to purchasing overnight investments.
Credit and Market Risk
Investments in structured securities collateralized by residential real estate mortgages are subject to certain credit and liquidity risks. When market conditions result in an increase in default rates of the underlying mortgages and the foreclosure values of underlying real estate properties are materially below the outstanding amount of these underlying mortgages, collection of accrued interest and principal on these investments may be doubtful. Such market conditions may significantly impair the value of these investments resulting in a lack of correlation between their credit ratings and values.
Other
In the normal course of business, each Fund enters into contracts that provide general indemnifications. Each Fund’s maximum exposure under these arrangements is dependent upon claims that may be made against the Fund in the future and, therefore, cannot be estimated; however, based on experience, the risk of material loss from such claims is considered remote.
2. Federal Income Taxes:
It is the Funds’ policy to continue to comply with the federal income and excise tax requirements of the Internal Revenue Code of 1986, as amended, applicable to regulated investment companies. Accordingly, the Funds intend to distribute substantially all of their income and net realized gains on investments, if any, to shareholders each year. Therefore, no federal income tax provision is required in the Funds’ financial statements. Under the applicable foreign tax laws, a withholding tax may be imposed on interest, dividends and capital gains at various rates. The amount and character of tax-basis distributions and composition of net assets are finalized at fiscal-year end; accordingly, tax-basis balances have not been determined as of September 30, 2007.
3. Financial Instruments:
Forward Currency Exchange Contracts
As part of its investment programs, the Funds may utilize forward currency exchange contracts. The nature and risks of these financial instruments and the reasons for using them are set forth more fully in the Corporation’s prospectus and statement of additional information.
Forward foreign currency contracts are marked-to-market daily using forward foreign currency exchange rates supplied by an independent pricing service. The change in a contract’s market value is recorded by a Fund as an unrealized gain or loss. When the contract is closed or delivery is taken, the Fund records a realized gain or loss equal to the difference between the value of the contract at the time it was opened and the value at the time it was closed.
The use of forward foreign currency exchange contracts does not eliminate fluctuations in the underlying prices of the Funds’ securities, but it does establish a rate of exchange that can be achieved in the future. These forward foreign currency exchange contracts involve market risk in excess of amounts reflected in the financial statements. Although forward foreign currency exchange contracts used for hedging purposes limit the risk of loss due to a decline in the value of the hedged currency, they also limit any potential gain that might result should the value of the currency increase. In addition, the Fund could be exposed to risks if the counterparties to the contracts are unable to meet the terms of their contracts.
208
Semi-Annual Report to Shareholders
At September 30, 2007, open forward currency exchange contracts (expressed in the contractual currency) were:
Absolute Return
| | | | | | | | | | | | | | |
Broker | | Settlement
Date | | Contract to | | Unrealized
Gain/(Loss) | |
| | | Receive | | Deliver | |
Citibank NA | | 11/7/07 | | EUR | | 23 | | USD | | 32 | | | 1 | |
Credit Suisse First Boston | | 11/7/07 | | JPY | | 380,220 | | USD | | 3,192 | | | 137 | |
Citibank NA | | 11/7/07 | | JPY | | 1,008,284 | | USD | | 8,461 | | | 367 | |
Citibank NA | | 11/7/07 | | USD | | 1,103 | | CAD | | 1,150 | | | (56 | ) |
Credit Suisse First Boston | | 11/7/07 | | USD | | 1,581 | | GBP | | 768 | | | 13 | |
Citibank NA | | 11/7/07 | | USD | | 4,857 | | GBP | | 2,377 | | | 3 | |
Citibank NA | | 11/7/07 | | USD | | 2,042 | | JPY | | 233,910 | | | (6 | ) |
| | | | | | | | | | | | | | |
| | | | | | | | | | | | $ | 459 | |
| | | | | | | | | | | | | | |
Core Plus
| | | | | | | | | | | | | | |
Broker | | Settlement
Date | | Contract to | | Unrealized
Gain/(Loss) | |
| | | Receive | | Deliver | |
Credit Suisse First Boston | | 11/7/07 | | AUD | | 1,610 | | USD | | 1,417 | | $ | 8 | |
Goldman Sachs International | | 11/7/07 | | EUR | | 28,857 | | USD | | 39,976 | | | 1,218 | |
Deutsche Bank AG London | | 11/7/07 | | JPY | | 6,594,775 | | USD | | 55,407 | | | 2,336 | |
Credit Suisse First Boston | | 11/7/07 | | JPY | | 6,924,498 | | USD | | 58,125 | | | 2,505 | |
UBS AG London | | 11/7/07 | | JPY | | 3,680,000 | | USD | | 30,864 | | | 1,358 | |
Morgan Stanley London FX | | 11/7/07 | | JPY | | 13,222,000 | | USD | | 111,079 | | | 4,690 | |
UBS AG London | | 11/7/07 | | USD | | 20,079 | | CAD | | 20,929 | | | (1,005 | ) |
JPMorgan Chase Bank | | 11/7/07 | | USD | | 49,343 | | CAD | | 51,481 | | | (2,521 | ) |
UBS AG London | | 11/7/07 | | USD | | 5,463 | | EUR | | 3,945 | | | (169 | ) |
Credit Suisse First Boston | | 11/7/07 | | USD | | 37,668 | | EUR | | 27,191 | | | (1,147 | ) |
Citibank NA | | 11/7/07 | | USD | | 16,024 | | EUR | | 16,024 | | | (666 | ) |
| | | | | | | | | | | | | | |
| | | | | | | | | | | | $ | 6,607 | |
| | | | | | | | | | | | | | |
Inflation Indexed
| | | | | | | | | | | | | | |
| Broker | | Settlement
Date | | Contract to | | Unrealized
Gain/(Loss) | |
| | | Receive | | Deliver | |
| UBS AG London | | 11/7/07 | | CAD | | 6,462 | | USD | | 6,200 | | $ | 310 | |
| Morgan Stanley London FX | | 11/7/07 | | EUR | | 2,834 | | USD | | 3,927 | | | 119 | |
| Deutsche Bank AG London | | 11/7/07 | | JPY | | 564,264 | | USD | | 4,741 | | | 200 | |
| Credit Suisse First Boston | | 11/7/07 | | JPY | | 278,245 | | USD | | 2,336 | | | 101 | |
| Deutsche Bank AG London | | 11/7/07 | | USD | | 7,832 | | CAD | | 8,166 | | | (394 | ) |
| Credit Suisse First Boston | | 11/7/07 | | USD | | 5,846 | | CAD | | 6,100 | | | (299 | ) |
| Citibank NA | | 11/7/07 | | USD | | 1,830 | | EUR | | 1,320 | | | (55 | ) |
| Credit Suisse First Boston | | 11/7/07 | | USD | | 2,482 | | EUR | | 1,792 | | | (76 | ) |
| Deutsche Bank AG London | | 11/7/07 | | USD | | 1,939 | | SEK | | 12,850 | | | (59 | ) |
| UBS AG London | | 11/7/07 | | USD | | 883 | | SEK | | 5,837 | | | (24 | ) |
| | | | | | | | | | | | | | |
| | | | | | | | | | | | $ | (177 | ) |
| | | | | | | | | | | | | | |
209
Semi-Annual Report to Shareholders
Notes to Financial Statements—Continued
Intermediate Plus
| | | | | | | | | | | | | | |
Broker | | Settlement
Date | | Contract to | | Unrealized
Gain/(Loss) | |
| | | Receive | | Deliver | |
Credit Suisse First Boston | | 11/7/07 | | AUD | | 289 | | USD | | 255 | | $ | 1 | |
UBS AG London | | 11/7/07 | | EUR | | 664 | | USD | | 918 | | | 28 | |
Credit Suisse First Boston | | 11/7/07 | | EUR | | 660 | | USD | | 912 | | | 30 | |
Citibank NA | | 11/7/07 | | EUR | | 660 | | USD | | 915 | | | 27 | |
Credit Suisse First Boston | | 11/7/07 | | JPY | | 157,122 | | USD | | 1,335 | | | 41 | |
UBS AG London | | 11/7/07 | | USD | | 239 | | AUD | | 272 | | | (1 | ) |
Citibank NA | | 11/7/07 | | USD | | 633 | | EUR | | 456 | | | (19 | ) |
Credit Suisse First Boston | | 11/7/07 | | USD | | 306 | | EUR | | 221 | | | (9 | ) |
UBS AG London | | 11/7/07 | | USD | | 913 | | EUR | | 660 | | | (29 | ) |
Citibank NA | | 11/7/07 | | USD | | 1,900 | | EUR | | 1,380 | | | (70 | ) |
Credit Suisse First Boston | | 11/7/07 | | USD | | 676 | | GBP | | 328 | | | 5 | |
Credit Suisse First Boston | | 11/7/07 | | USD | | 1,383 | | JPY | | 159,000 | | | (9 | ) |
| | | | | | | | | | | | | | |
| | | | | | | | | | | | $ | (5 | ) |
| | | | | | | | | | | | | | |
Non-US
| | | | | | | | | | | | | | |
Broker | | Settlement
Date | | Contract to | | Unrealized
Gain/(Loss) | |
| | | Receive | | Deliver | |
UBS AG London | | 11/7/07 | | AUD | | 2,000 | | USD | | 1,761 | | $ | 9 | |
UBS AG London | | 11/7/07 | | DKK | | 12,386 | | USD | | 2,306 | | | 66 | |
Morgan Stanley London FX | | 11/7/07 | | EUR | | 594 | | USD | | 824 | | | 25 | |
Citibank NA | | 11/7/07 | | GBP | | 1,212 | | USD | | 2,495 | | | (20 | ) |
Morgan Stanley London FX | | 11/7/07 | | JPY | | 41,140 | | USD | | 346 | | | 14 | |
Deutsche Bank AG London | | 11/7/07 | | JPY | | 650,000 | | USD | | 5,652 | | | 39 | |
UBS AG London | | 11/7/07 | | NOK | | 2,238 | | USD | | 391 | | | 24 | |
Credit Suisse First Boston | | 11/7/07 | | SEK | | 12,242 | | USD | | 1,853 | | | 50 | |
Goldman Sachs International | | 11/7/07 | | USD | | 16,964 | | AUD | | 19,236 | | | (70 | ) |
Goldman Sachs International | | 11/7/07 | | USD | | 1,337 | | CAD | | 1,391 | | | (64 | ) |
Credit Suisse First Boston | | 11/7/07 | | USD | | 7,185 | | CAD | | 7,497 | | | (367 | ) |
JPMorgan Chase Bank | | 11/7/07 | | USD | | 1,797 | | CAD | | 1,875 | | | (92 | ) |
JPMorgan Chase Bank | | 11/7/07 | | USD | | 3,851 | | DKK | | 20,691 | | | (111 | ) |
Citibank NA | | 11/7/07 | | USD | | 2,076 | | DKK | | 11,155 | | | (60 | ) |
Citibank NA | | 11/7/07 | | USD | | 26,557 | | EUR | | 19,161 | | | (796 | ) |
Deutsche Bank AG London | | 11/7/07 | | USD | | 288 | | EUR | | 208 | | | (9 | ) |
JPMorgan Chase Bank | | 11/7/07 | | USD | | 25,063 | | EUR | | 18,086 | | | (755 | ) |
UBS AG London | | 11/7/07 | | USD | | 19,030 | | EUR | | 13,743 | | | (588 | ) |
Goldman Sachs International | | 11/7/07 | | USD | | 513 | | GBP | | 250 | | | 3 | |
Deutsche Bank AG London | | 11/7/07 | | USD | | 25,593 | | GBP | | 12,433 | | | 199 | |
Credit Suisse First Boston | | 11/7/07 | | USD | | 9,150 | | GBP | | 4,442 | | | 77 | |
UBS AG London | | 11/7/07 | | USD | | 2,270 | | GBP | | 1,104 | | | 14 | |
JPMorgan Chase Bank | | 11/7/07 | | USD | | 2,987 | | GBP | | 1,450 | | | 25 | |
Goldman Sachs International | | 11/7/07 | | USD | | 8,344 | | JPY | | 1,000,000 | | | (411 | ) |
Citibank NA | | 11/7/07 | | USD | | 10,001 | | JPY | | 1,191,731 | | | (434 | ) |
Deutsche Bank AG London | | 11/7/07 | | USD | | 2,041 | | JPY | | 237,440 | | | (37 | ) |
Goldman Sachs International | | 11/7/07 | | USD | | 1,800 | | JPY | | 204,190 | | | 12 | |
Deutsche Bank AG London | | 11/7/07 | | USD | | 7,018 | | NOK | | 40,060 | | | (408 | ) |
Citibank NA | | 11/7/07 | | USD | | 2,312 | | NOK | | 13,219 | | | (139 | ) |
Citibank NA | | 11/7/07 | | USD | | 7,255 | | PLN | | 19,741 | | | (223 | ) |
| | | | | | | | | | | | | | |
| | | | | | | | | | | | $ | (4,027 | ) |
| | | | | | | | | | | | | | |
AUD—Australian dollar
CAD—Canadian dollar
DKK—Danish krona
EUR—Euro
GBP—British pound
JPY—Japanese yen
NOK—Norwegian krone
PLN—Polish zloty
SEK—Swedish krona
USD—United States dollar
210
Semi-Annual Report to Shareholders
Loan Participations and Assignments
The Funds may invest in loans arranged through private negotiation between one or more financial institutions. The Funds’ investment in any such loan may be in the form of a participation in or an assignment of the loan. In connection with purchasing participations, the Funds generally will have no right to enforce compliance by the borrower with the terms of the loan agreement relating to the loan, nor any rights of set-off against the borrower and the Funds may not benefit directly from any collateral supporting the loan in which it has purchased the participation.
The Funds will assume the credit risk of both the borrower and the lender that is selling the participation. In the event of the insolvency of the lender selling the participation, the Funds may be treated as a general creditor of the lender and may not benefit from any set-off between the lender and the borrower.
Options and Futures
As part of their investment programs, the Funds may utilize options and futures. Options may be written (sold) or purchased by the Funds. When a Fund purchases a put or call option, the premium paid is recorded as an investment and its value is marked-to-market daily. When a Fund writes a put or call option, an amount equal to the premium received by the Fund is recorded as a liability and its value is marked-to-market daily.
When options, whether written or purchased, expire, are exercised or are closed (by entering into a closing purchase or sale transaction), the Fund realizes a gain or loss as described in the chart below:
| | |
| Purchased option: | | Impact on the Fund: |
| The option expires | | Realize a loss in the amount of the cost of the option. |
| The option is closed through a closing sale transaction | | Realize a gain or loss depending on whether the proceeds from the closing sale transaction are greater or less than the cost of the option. |
| The Fund exercises a call option | | The cost of the security purchased through the exercise of the option will be increased by the premium originally paid to purchase the option. |
| The Fund exercises a put option | | Realize a gain or loss from the sale of the underlying security. The proceeds of that sale will be reduced by the premium originally paid to purchase the put option. |
| |
| Written option: | | Impact on the Fund: |
| The option expires | | Realize a gain equal to the amount of the premium received. |
| The option is closed through a closing purchase transaction | | Realize a gain or loss without regard to any unrealized gain or loss on the underlying security and eliminate the option liability. The Fund will realize a loss in this transaction if the cost of the closing purchase exceeds the premium received when the option was written. |
| A written call option is exercised by the option purchaser | | Realize a gain or loss from the sale of the underlying security. The proceeds of that sale will be increased by the premium originally received when the option was written. |
| A written put option is exercised by the option purchaser | | The amount of the premium originally received will reduce the cost of the security that the Fund purchased when the option was exercised. |
211
Semi-Annual Report to Shareholders
Notes to Financial Statements—Continued
The risk associated with purchasing options is limited to the premium originally paid. Options written by a Fund involve, to varying degrees, risk of loss in excess of the option value reflected in the statement of net assets. The risk in writing a covered call option is that a Fund may forgo the opportunity of profit if the market price of the underlying security increases and the option is exercised. The risk in writing a put option is that a Fund may incur a loss if the market price of the underlying security decreases and the option is exercised. In addition, there is the risk a Fund may not be able to enter into a closing transaction because of an illiquid secondary market or, for over-the-counter options, because of the counterparty’s inability or unwillingness to perform.
Activity in written call and put options during the six months ended September 30, 2007, was as follows:
| | | | | | | |
| Absolute Return | | Actual
Contracts | | | Premiums | |
Options outstanding at March 31, 2007 | | 208 | | | $ | 74 | |
Options written | | 15,702,119 | | | | 744 | |
Options closed | | (680 | ) | | | (204 | ) |
Options expired | | (14,900,654 | ) | | | (107 | ) |
Options exercised | | (800,316 | ) | | | (69 | ) |
| | | | | | | |
Options outstanding at September 30, 2007 | | 677 | | | $ | 438 | |
| | | | | | | |
| | |
| Core | | Actual
Contracts | | | Premiums | |
Options outstanding at March 31, 2007 | | 28,799 | | | $ | 12,147 | |
Options written | | 276,176,389 | | | | 36,016 | |
Options closed | | (29,730 | ) | | | (13,279 | ) |
Options expired | | (150,390,298 | ) | | | (14,465 | ) |
Options exercised | | (81,911,958 | ) | | | (4,567 | ) |
| | | | | | | |
Options outstanding at September 30, 2007 | | 43,873,202 | | | $ | 15,852 | |
| | | | | | | |
| | |
| Core Plus | | Actual
Contracts | | | Premiums | |
Options outstanding at March 31, 2007 | | 48,443 | | | $ | 20,217 | |
Options written | | 800,067,239 | | | | 71,223 | |
Options closed | | (48,781 | ) | | | (22,745 | ) |
Options expired | | (577,542,949 | ) | | | (27,082 | ) |
Options exercised | | (133,727,034 | ) | | | (9,044 | ) |
| | | | | | | |
Options outstanding at September 30, 2007 | | 88,796,918 | | | $ | 32,569 | |
| | | | | | | |
| | |
| Inflation Indexed | | Actual
Contracts | | | Premiums | |
Options outstanding at March 31, 2007 | | 177 | | | $ | 79 | |
Options written | | 659 | | | | 183 | |
Options closed | | (88 | ) | | | (39 | ) |
Options expired | | — | | | | — | |
Options exercised | | (89 | ) | | | (40 | ) |
| | | | | | | |
Options outstanding at September 30, 2007 | | 659 | | | $ | 183 | |
| | | | | | | |
| | |
| Intermediate | | Actual
Contracts | | | Premiums | |
Options outstanding at March 31, 2007 | | 47,700,450 | | | $ | 169 | |
Options written | | 109,919,247 | | | | 974 | |
Options closed | | (5,100,836 | ) | | | (230 | ) |
Options expired | | (46,280,000 | ) | | | (80 | ) |
Options exercised | | (44,400,386 | ) | | | (211 | ) |
| | | | | | | |
Options outstanding at September 30, 2007 | | 61,838,475 | | | $ | 622 | |
| | | | | | | |
212
Semi-Annual Report to Shareholders
| | | | | | | |
| Intermediate Plus | | Actual
Contracts | | | Premiums | |
Options outstanding at March 31, 2007 | | 10,000,060 | | | $ | 28 | |
Options written | | 14,880,168 | | | | 133 | |
Options closed | | (6,600,112 | ) | | | (40 | ) |
Options expired | | (6,680,000 | ) | | | (12 | ) |
Options exercised | | (2,800,052 | ) | | | (23 | ) |
| | | | | | | |
Options outstanding at September 30, 2007 | | 8,800,064 | | | $ | 86 | |
| | | | | | | |
| | |
| Limited Duration | | Actual
Contracts | | | Premiums | |
Options outstanding at March 31, 2007 | | 10,700,106 | | | $ | 43 | |
Options written | | 6,610,039 | | | | 32 | |
Options closed | | (2,100,145 | ) | | | (48 | ) |
Options expired | | (8,010,000 | ) | | | (14 | ) |
Options exercised | | (7,200,000 | ) | | | (13 | ) |
| | | | | | | |
Options outstanding at September 30, 2007 | | — | | | $ | — | |
| | | | | | | |
Upon entering into a futures contract, the Funds are required to deposit with the broker cash or cash equivalents in an amount equal to a certain percentage of the contract amount. This is known as the “initial margin.” Subsequent payments (“variation margin”) are made or received by the Fund each day, depending on the daily fluctuation in the value of the contract. For non-U.S. and foreign denominated futures held in Absolute Return, Core Plus, Inflation Indexed, Intermediate Plus, and Non-U.S. Opportunity, payment is not sent daily, but is recorded as a net payable or receivable by the Fund to or from the futures broker, which holds cash collateral from the Fund. The daily changes in contract value are recorded as unrealized gains or losses and each Fund recognizes a realized gain or loss when the contract is closed. Futures contracts are valued daily at the settlement price established by the board of trade or exchange on which they are traded.
The Funds enter into futures contracts for various reasons, including in connection with their interest rate management strategy. Futures contracts involve, to varying degrees, risk of loss in excess of the amounts reflected in the financial statements. The change in the value of futures contracts primarily corresponds with the value of the underlying instruments, which may not correlate with changes in interest rates, if applicable. In addition, there is a risk that a Fund may not be able to enter into a closing transaction because of an illiquid secondary market. The nature and risks of these financial instruments and other reasons for using them are set forth more fully in the Corporation’s prospectus and statement of additional information.
The open futures positions and related appreciation or depreciation at September 30, 2007 are listed at the end of each Fund’s portfolio of investments.
Swap Agreements
The Funds may invest in swaps for the purpose of managing their exposure to interest rate, credit or market risk, or for other purposes. The use of swaps involves risks that are different from those associated with ordinary portfolio transactions.
Credit default swaps (denoted in the table on the following pages by a superscript 1) involve the exchange of a fixed rate premium for protection against the loss in value of an underlying debt instrument in the event of a defined credit event (such as payment default or bankruptcy). Under the terms of the swap, one party acts as a “guarantor,” receiving a periodic payment that is a fixed percentage applied to a notional principal amount. In return, the party agrees to purchase the notional amount of the underlying instrument, at par, if a credit event occurs during the term of the swap. The Fund may enter into credit default swaps in which the Fund or its counterparty act as guarantors. By acting as the guarantor of a swap, the Fund assumes the market and credit risk of the underlying instrument, including liquidity and loss of value. Interest rate swap contracts (denoted in the table on the following pages by a superscript 2) involve the exchange of commitments to pay and receive interest based on a notional principal amount.
213
Semi-Annual Report to Shareholders
Notes to Financial Statements—Continued
Commodity swaps, (denoted in the table on the following pages by a superscript 3), are agreements to exchange cash flows at specified intervals to gain investment exposure to the relevant spread of commodity reference prices. Total return swaps, (denoted in the table on the following pages by a superscript 4), are agreements to exchange the return generated by one instrument for the return generated by another instrument, for example, the agreement to pay interest in exchange for a market-linked return based on a notional amount. To the extent the total return of the index exceeds the offsetting interest obligation, the Fund will receive a payment from the counterparty. To the extent it is less, the Fund will make a payment to the counterparty. Periodic payments received or made by the Fund are recorded in the accompanying statements of operations as realized gains or losses, respectively.
Swaps are marked-to-market daily and changes in value are recorded as unrealized appreciation/(depreciation). Gains or losses are realized upon termination of the swap agreement. Periodic payments and premiums received or made by a Fund are recorded in the accompanying statements of operations as realized gains or losses, respectively. Collateral, in the form of restricted cash or securities, may be required to be held in segregated accounts with the Fund’s custodian in compliance with the terms of the swap contracts. Risks may exceed amounts recognized on the statements of assets and liabilities. These risks include changes in the returns of the underlying instruments, failure of the counterparties to perform under the contracts’ terms, and the possible lack of liquidity with respect to the swap agreements.
If the fund is a seller of protection and a credit event occurs, as defined under the terms of the particular swap agreement, the portfolio will pay to the buyer of the protection an amount up to the notional value of the swap and in certain instances, take delivery of the security.
As of September 30, 2007, the one-and three-month London Interbank Offered Rates were 5.12% and 5.23%, respectively.
The Lehman Brothers US ABS AAA Floating Home Equities Index was 5.33%. The 28 day Mexican Interbank Deposit Rate was 7.68%.
The following is a summary of open swap contracts outstanding as of September 30, 2007.
| | | | | | | | | | | | | |
| Western Asset Absolute Return Bond Portfolio | |
Agreement With: | | Termination Date | | The Fund
Agrees to Pay | | The Fund
Will Receive | | Contract
Notional Amount | | Unrealized
Appreciation/
(Depreciation) | |
| | | | | | | | | | | | | |
Banc of America Securities LLC2 | | December 1, 2008 | | 5.03%
Semi-Annually | | 3-month
LIBOR | | $ | 100 | | $ | — | |
| | | | | |
Banc of America Securities LLC2 | | March 1, 2013 | | 5.104%
Semi-Annually | | 3-month
LIBOR | | | 100 | | | (1 | ) |
| | | | | |
Banc of America Securities LLC (Heinz Corp.,
6.428%, due 12/01/08)1 | | December 20, 2008 | | 0.165%
Quarterly | | Specified amount upon credit event notice | | | 100 | | | — | |
| | | | | |
Banc of America Securities LLC (PHH Corporate Note, 7.125%, due 3/1/13)1 | | March 20, 2013 | | 1.05%
Monthly | | Specified amount upon credit event notice | | | 110 | | | 1 | |
| | | | | |
Barclays Capital Inc.
(Cardinal Health Inc.
5.85%, due 12/15/17)1 | | September 20, 2016 | | 0.49%
Quarterly | | Specified amount upon credit event notice | | | 60 | | | — | |
| | | | | |
Barclays Capital Inc.
(General Motors Corp.
7.125%, due 7/15/13)1 | | March 20, 2012 | | Specified amount upon credit event notice | | 3.45%
Quarterly | | | 1,600 | | | (68 | ) |
| | | | | |
Barclays Capital Inc.2 | | June 25, 2012 | | 5.06%
Semi-Annually | | 3-month
LIBOR | | | 60 | | | (1 | ) |
| | | | | |
Barclays Capital Inc.2 | | October 20, 2016 | | 5.326%
Semi-Annually | | 3-month
LIBOR | | | 60 | | | (1 | ) |
214
Semi-Annual Report to Shareholders
| | | | | | | | | | | | | |
| Western Asset Absolute Return Bond Portfolio—Continued | |
Agreement With: | | Termination Date | | The Fund
Agrees to Pay | | The Fund
Will Receive | | Contract
Notional Amount | | Unrealized
Appreciation/
(Depreciation) | |
| | | | | | | | | | | | | |
Barclays Capital Inc.
(CDX IG HVOL 8)1 | | June 20, 2012 | | Specified amount upon credit event notice | | 0.75%
Quarterly | | $ | 800 | | $ | (16 | ) |
| | | | | |
Barclays Capital Inc.
(CDX IG HVOL 8)1 | | June 20, 2012 | | Specified amount upon credit event notice | | 0.75%
Quarterly | | | 10,000 | | | (120 | ) |
| | | | | |
Barclays Capital Inc.
(Countrywide Home Loans, Inc., 4%, due 3/22/11)1 | | September 20, 2008 | | Specified amount upon credit event notice | | 4.8%
Quarterly | | | 3,500 | | | 12 | |
| | | | | |
Barclays Capital Inc.
(Health Care Property Investments Inc.,
6.45%, due 06/25/12)1 | | June 20, 2012 | | 0.63%
Quarterly | | Specified amount upon credit
event notice | | | 60 | | | 1 | |
| | | | | |
Barclays Capital Inc.
(SLM Corp.,
5.125%, due 8/27/12)1 | | September 20, 2012 | | Specified amount upon credit event notice | | 2.35%
Quarterly | | | 2,350 | | | — | |
| | | | | |
Barclays Capital Inc.
(The AES Corp.,
7.75%, due 3/1/14)1 | | September 20, 2012 | | Specified amount upon credit event notice | | 3.15%
Quarterly | | | 3,000 | | | 28 | |
| | | | | |
Barclays Capital Inc.
(The AES Corp.,
7.75%, due 3/1/14)1 | | September 20, 2012 | | Specified amount upon credit event notice | | 3.65%
Quarterly | | | 3,000 | | | 90 | |
| | | | | |
Barclays Capital Inc.
(TXU Corp.,
5.55%, due 11/15/14)1 | | September 20, 2012 | | Specified amount upon credit event notice | | 2.97%
Quarterly | | | 2,000 | | | (128 | ) |
| | | | | |
Barclays Capital Inc.
(CDX HY 8)1 | | June 20, 2012 | | 2.75%
Quarterly | | Specified amount upon credit
event notice | | | 3,200 | | | 109 | |
| | | | | |
Bear Stearns, Inc.2 | | April 30, 2011 | | 5.05%
Semi-Annually | | 3-month
LIBOR | | | 100 | | | (1 | ) |
| | | | | |
Bear Stearns, Inc.
(Viacom Inc.,
6.25%, due 4/30/16)1 | | March 20, 2011 | | 0.59%
Quarterly | | Specified amount upon credit
event notice | | | 100 | | | (1 | ) |
| | | | | |
Credit Suisse First Boston USA2 | | May 1, 2012 | | 5.085%
Semi-Annually | | 3-month
LIBOR | | | 50 | | | — | |
| | | | | |
Credit Suisse First Boston USA2 | | August 15, 2013 | | 5.023%
Semi-Annually | | 3-month
LIBOR | | | 50 | | | — | |
| | | | | |
Credit Suisse First Boston USA2 | | September 15, 2015 | | 5.16%
Semi-Annually | | 3-month
LIBOR | | | 50 | | | — | |
| | | | | |
Credit Suisse First Boston USA2 | | September 15, 2015 | | 5.1285%
Semi-Annually | | 3-month
LIBOR | | | 90 | | | — | |
215
Semi-Annual Report to Shareholders
Notes to Financial Statements—Continued
| | | | | | | | | | | | | |
| Western Asset Absolute Return Bond Portfolio—Continued | |
Agreement With: | | Termination Date | | The Fund
Agrees to Pay | | The Fund
Will Receive | | Contract
Notional Amount | | Unrealized
Appreciation/
(Depreciation) | |
| | | | | | | | | | | | | |
Credit Suisse First Boston USA
(Amerisource Bergen Corp.,
8.125%, due 9/1/08)1 | | September 20, 2015 | | 0.9%
Monthly | | Specified amount upon credit
event notice | | $ | 50 | | $ | (1 | ) |
| | | | | |
Credit Suisse First Boston USA
(Masco Corp.,
5.875%, due 7/15/12)1 | | September 20, 2013 | | 0.75%
Quarterly | | Specified amount upon credit
event notice | | | 50 | | | — | |
| | | | | |
Credit Suisse First Boston USA
(Starwood Hotels Resorts,
7.875%, due 8/25/34)1 | | December 20, 2011 | | 1.37%
Quarterly | | Specified amount
upon credit
event notice | | | 50 | | | (1 | ) |
| | | | | |
Credit Suisse First Boston USA
(Vodafone Group,
7.75%, due 02/15/10)1 | | September 20, 2015 | | 0.54%
Monthly | | Specified amount
upon credit
event notice | | | 100 | | | — | |
| | | | | |
Deutsche Bank AG
(ABX. HE-AAA 06-2)1 | | May 25, 2046 | | Specified amount upon credit event notice | | 0.11%
Monthly | | | 700 | | | 5 | |
| | | | | |
Lehman Brothers Holdings Inc.2 | | September 15, 2011 | | 5.193%
Semi-Annually | | 3-month
LIBOR | | | 150 | | | (2 | ) |
| | | | | |
Lehman Brothers Holdings Inc.
(Sara Lee Corp.,
6.125%, due 11/01/32)1 | | September 20, 2011 | | 1.37%
Quarterly | | Specified amount
upon credit
event notice | | | 150 | | | (1 | ) |
| | | | | |
Morgan Stanley & Co., Inc.
(Gannett Co.,
6.375%, due 4/01/12)1 | | March 20, 2012 | | 1.37%
Quarterly | | Specified amount
upon credit
event notice | | | 40 | | | — | |
| | | | | |
RBS Greenwich2 | | April 1, 2012 | | 5.011%
Semi-Annually | | 3-month
LIBOR | | | 40 | | | — | |
| | | | | | | | | | | | | |
| | | | | | | | $ | 31,870 | | $ | (96 | ) |
| | | | | | | | | | | | | |
| | | | | | | | | | | | | |
|
| Western Asset Core Bond Portfolio | |
Agreement With: | | Termination Date | | The Fund
Agrees to Pay | | The Fund
Will Receive | | Contract
Notional Amount | | Unrealized
Appreciation/
(Depreciation) | |
| | | | | | | | | | | | | |
Banc of America Securities LLC2 | | December 1, 2008 | | 5.03%
Semi-Annually | | 3-month
LIBOR | | $ | 6,650 | | $ | (15 | ) |
| | | | | |
Banc of America Securities LLC2 | | March 1, 2013 | | 5.104%
Semi-Annually | | 3-month
LIBOR | | | 4,700 | | | (40 | ) |
| | | | | |
Banc of America Securities LLC2 | | December 16, 2013 | | 5.381%
Semi-Annually | | 3-month
LIBOR | | | 2,740 | | | (57 | ) |
| | | | | |
Banc of America Securities LLC2 | | November 10, 2015 | | 4.864%
Semi-Annually | | 3-month
LIBOR | | | 4,400 | | | 70 | |
| | | | | |
Banc of America Securities LLC2 | | January 15, 2016 | | 5.45084%
Semi-Annually | | 3-month
LIBOR | | | 2,750 | | | (62 | ) |
| | | | | |
Banc of America Securities LLC2 | | October 3, 2016 | | 5.425%
Semi-Annually | | 3-month
LIBOR | | | 4,120 | | | (81 | ) |
216
Semi-Annual Report to Shareholders
| | | | | | | | | | | | | |
| Western Asset Core Bond Portfolio—Continued | |
Agreement With: | | Termination Date | | The Fund
Agrees to Pay | | The Fund
Will Receive | | Contract
Notional Amount | | Unrealized
Appreciation/
(Depreciation) | |
| | | | | | | | | | | | | |
Banc of America Securities LLC
(Heinz Co.,
6.428%, due 12/01/08)1 | | December 20, 2008 | | 0.165%
Monthly | | Specified amount upon credit event notice | | $ | 6,650 | | $ | (8 | ) |
| | | | | |
Banc of America Securities LLC
(Home Depot Inc.,
3.75%, due 9/15/09)1 | | December 20, 2013 | | 0.635%
Quarterly | | Specified amount upon credit event notice | | | 2,740 | | | 12 | |
| | | | | |
Banc of America Securities LLC
(Marriot International Inc.,
4.625%, due 6/15/12)1 | | December 20, 2015 | | 0.73%
Monthly | | Specified amount upon credit event notice | | | 4,400 | | | (45 | ) |
| | | | | |
Banc of America Securities LLC
(Masco Corp.,
5.875%, due 7/15/12)1 | | December 20, 2016 | | 1.04%
Quarterly | | Specified amount upon credit event notice | | | 4,120 | | | (9 | ) |
| | | | | |
Banc of America Securities LLC
(MBIA Global Funding LLC,
5.37563%, due 10/6/10)1 | | September 20, 2008 | | Specified amount upon credit event notice | | 1.4%
Quarterly | | | 9,810 | | | 32 | |
| | | | | |
Banc of America Securities LLC
(MBIA Global Funding LLC,
5.37563%, due 10/6/10)1 | | September 20, 2008 | | Specified amount upon credit event notice | | 1.5%
Quarterly | | | 6,440 | | | 27 | |
| | | | | |
Banc of America Securities LLC
(PHH Corporate Note,
7.125%, due 3/1/13)1 | | March 20, 2013 | | 1.05%
Monthly | | Specified amount upon credit event notice | | | 5,010 | | | 47 | |
| | | | | |
Banc of America Securities LLC
(Viacom Inc.,
4.625%, due 5/15/18)1 | | December 20, 2015 | | 1.13%
Quarterly | | Specified amount upon credit event notice | | | 2,750 | | | (62 | ) |
| | | | | |
Barclays Capital Inc.2 | | November 1, 2011 | | 5.439%
Semi-Annually | | 3-month
LIBOR | | | 5,600 | | | (131 | ) |
| | | | | |
Barclays Capital Inc.2 | | June 25, 2012 | | 5.06%
Semi-Annually | | 3-month
LIBOR | | | 3,550 | | | (31 | ) |
| | | | | |
Barclays Capital Inc.2 | | September 15, 2012 | | 5.189%
Semi-Annually | | 3-month
LIBOR | | | 3,520 | | | (45 | ) |
| | | | | |
Barclays Capital Inc.2 | | October 20, 2016 | | 5.326%
Semi-Annually | | 3-month
LIBOR | | | 3,530 | | | (41 | ) |
| | | | | |
Barclays Capital Inc.
(Amerisourcebergen Corp.,
5.625%, due 9/15/12)1 | | September 20, 2012 | | 0.5%
Quarterly | | Specified amount upon credit event notice | | | 3,520 | | | — | |
| | | | | |
Barclays Capital Inc.
(Cardinal Health Inc.,
5.85%, due 12/15/17)1 | | September 20, 2016 | | 0.49%
Quarterly | | Specified amount upon credit event notice | | | 3,530 | | | 3 | |
| | | | | |
Barclays Capital Inc.
(CDX IG HVOL 8)1 | | June 20, 2012 | | Specified amount upon credit event notice | | 0.75%
Quarterly | | | 13,900 | | | (276 | ) |
217
Semi-Annual Report to Shareholders
Notes to Financial Statements—Continued
| | | | | | | | | | | | | |
| Western Asset Core Bond Portfolio—Continued | |
Agreement With: | | Termination Date | | The Fund
Agrees to Pay | | The Fund
Will Receive | | Contract
Notional Amount | | Unrealized
Appreciation/
(Depreciation) | |
| | | | | | | | | | | | | |
Barclays Capital Inc.
(Health Care Property Investments Inc.,
6.45%, due 06/25/12)1 | | June 20, 2012 | | 0.63%
Quarterly | | Specified amount upon credit event notice | | $ | 3,550 | | $ | 37 | |
| | | | | |
Barclays Capital Inc.
(Motorola Inc.,
6.5%, due 9/1/25)1 | | December 20, 2011 | | 0.32%
Quarterly | | Specified amount upon credit event notice | | | 5,600 | | | (9 | ) |
| | | | | |
Bear Stearns, Inc.2 | | April 30, 2011 | | 5.05%
Semi-Annually | | 3-month
LIBOR | | | 2,500 | | | (24 | ) |
| | | | | |
Bear Stearns, Inc.2 | | September 15, 2014 | | 5%
Semi-Annually | | 3-month
LIBOR | | | 4,270 | | | 11 | |
| | | | | |
Bear Stearns, Inc.
(CDX IG HVOL 8)1 | | June 20, 2012 | | Specified amount upon credit event notice | | 0.75%
Quarterly | | | 28,500 | | | (687 | ) |
| | | | | |
Bear Stearns, Inc.
(ABX. HE-AAA 07-2)1 | | January 25, 2038 | | Specified amount upon credit event notice | | 0.76%
Monthly | | | 5,000 | | | (75 | ) |
| | | | | |
Bear Stearns, Inc.
(ABX. HE-A 06-2)1 | | May 25, 2046 | | Specified amount upon credit event notice | | 0.44%
Quarterly | | | 25,000 | | | (7,332 | ) |
| | | | | |
Bear Stearns, Inc.
(Bell South Corp.,
6%, due 10/15/11)1 | | September 20, 2014 | | 0.28%
Quarterly | | Specified amount upon credit event notice | | | 4,270 | | | 2 | |
| | | | | |
Bear Stearns, Inc.
(CDX IG 8)1 | | June 20, 2012 | | Specified amount upon credit event notice | | 0.35%
Quarterly | | | 42,200 | | | (93 | ) |
| | | | | |
Bear Stearns, Inc.
(CDX IG HVOL 8)1 | | June 20, 2012 | | Specified amount upon credit event notice | | 0.75%
Quarterly | | | 14,300 | | | (264 | ) |
| | | | | |
Bear Stearns, Inc.
(CDX IG HVOL 8)1 | | June 20, 2012 | | Specified amount upon credit event notice | | 0.75%
Quarterly | | | 14,200 | | | (267 | ) |
| | | | | |
Bear Stearns, Inc.
(Ford Motor Credit Company,
7%, due 10/1/13)1 | | June 20, 2010 | | Specified amount upon credit event notice | | 4.83%
Quarterly | | | 12,500 | | | 316 | |
| | | | | |
Bear Stearns, Inc.
(Viacom Inc.,
6.25%, due 4/30/16)1 | | March 20, 2011 | | 0.59%
Quarterly | | Specified amount upon credit event notice | | | 2,500 | | | (24 | ) |
| | | | | |
Bear Stearns, Inc.
(Washington Mutual Inc.,
5.25%, due 9/15/17)1 | | March 20, 2017 | | Specified amount upon credit event notice | | 0.81%
Quarterly | | | 9,600 | | | 32 | |
218
Semi-Annual Report to Shareholders
| | | | | | | | | | | | | |
| Western Asset Core Bond Portfolio—Continued | |
Agreement With: | | Termination Date | | The Fund
Agrees to Pay | | The Fund
Will Receive | | Contract
Notional Amount | | Unrealized
Appreciation/
(Depreciation) | |
| | | | | | | | | | | | | |
Credit Suisse First Boston USA2 | | August 15, 2010 | | 5.446%
Semi-Annually | | 3-month
LIBOR | | $ | 1,380 | | $ | (27 | ) |
| | | | | |
Credit Suisse First Boston USA2 | | September 15, 2010 | | 5.0025%
Semi-Annually | | 3-month
LIBOR | | | 3,070 | | | (22 | ) |
| | | | | |
Credit Suisse First Boston USA2 | | March 1, 2011 | | 5.229%
Semi-Annually | | 3-month
LIBOR | | | 2,110 | | | (31 | ) |
| | | | | |
Credit Suisse First Boston USA2 | | May 1, 2012 | | 5.085%
Semi-Annually | | 3-month
LIBOR | | | 2,750 | | | (27 | ) |
| | | | | |
Credit Suisse First Boston USA2 | | December 1, 2012 | | 4.9025%
Semi-Annually | | 3-month
LIBOR | | | 5,870 | | | 1 | |
| | | | | |
Credit Suisse First Boston USA2 | | August 15, 2013 | | 5.0225%
Semi-Annually | | 3-month
LIBOR | | | 3,020 | | | (10 | ) |
| | | | | |
Credit Suisse First Boston USA2 | | March 15, 2014 | | 5.131%
Semi-Annually | | 3-month
LIBOR | | | 3,290 | | | (22 | ) |
| | | | | |
Credit Suisse First Boston USA2 | | September 15, 2015 | | 5.1285% Semi-Annually | | 3-month
LIBOR | | | 5,740 | | | (8 | ) |
| | | | | |
Credit Suisse First Boston USA2 | | September 15, 2015 | | 5.16%
Semi-Annually | | 3-month
LIBOR | | | 3,050 | | | (11 | ) |
| | | | | |
Credit Suisse First Boston USA2 | | March 1, 2017 | | 5.335%
Semi-Annually | | 3-month
LIBOR | | | 2,420 | | | (30 | ) |
| | | | | |
Credit Suisse First Boston USA
(AAMES Mortgage Investment
Trust 2005-1 M8 1-Month
LIBOR + 160 bp,
due 6/25/35)1 | | June 25, 2035 | | 1.28%
Monthly | | Specified amount upon credit event notice | | | 784 | | | 245 | |
| | | | | |
Credit Suisse First Boston USA
(AAMES Mortgage Investment
Trust 2005-1 M9 1-Month
LIBOR + 250 bp,
due 6/25/35)1 | | June 25, 2035 | | 2.05%
Monthly | | Specified amount upon credit event notice | | | 784 | | | 236 | |
| | | | | |
Credit Suisse First Boston USA
(ABX.HE-AAA 07-2)1 | | January 25, 2038 | | Specified amount upon credit event notice | | 0.76%
Monthly | | | 11,800 | | | (262 | ) |
| | | | | |
Credit Suisse First Boston USA
(ABX.HE-AAA 07-2)1 | | January 25, 2038 | | Specified amount upon credit event notice | | 0.76%
Monthly | | | 6,400 | | | (6 | ) |
| | | | | |
Credit Suisse First Boston USA
(ABX.HE-AAA 07-2)1 | | January 25, 2038 | | Specified amount upon credit event notice | | 0.76%
Monthly | | | 1,300 | | | (6 | ) |
219
Semi-Annual Report to Shareholders
Notes to Financial Statements—Continued
| | | | | | | | | | | | | |
| Western Asset Core Bond Portfolio—Continued | |
Agreement With: | | Termination Date | | The Fund
Agrees to Pay | | The Fund
Will Receive | | Contract
Notional Amount | | Unrealized
Appreciation/
(Depreciation) | |
| | | | | | | | | | | | | |
Credit Suisse First Boston USA
(ACE Securities Corp.,
2005-HE1 M8 1-Month
LIBOR + 138 bp,
due 2/25/35)1 | | February 25, 2035 | | 1.31%
Monthly | | Specified amount upon credit event notice | | $ | 784 | | $ | 167 | |
| | | | | |
Credit Suisse First Boston USA
(ACE Securities Corp.,
2005-HE1 M9 1-Month
LIBOR + 220 bp,
due 2/25/35)1 | | February 25, 2035 | | 2.06%
Monthly | | Specified amount upon credit event notice | | | 784 | | | 204 | |
| | | | | |
Credit Suisse First Boston USA
(Aegis Asset Backed
Securities Trust 2004-4 B2 1-Month LIBOR + 190 bp,
due 10/25/34)1 | | October 25, 2034 | | 1.37%
Monthly | | Specified amount upon credit event notice | | | 1,046 | | | 213 | |
| | | | | |
Credit Suisse First Boston USA (Aegis Asset Backed Securities Trust 2005 B2 1Month
LIBOR + 130 bp,
due 3/25/35)1 | | March 25, 2035 | | 1.31%
Quarterly | | Specified amount upon credit event notice | | | 784 | | | 275 | |
| | | | | |
Credit Suisse First Boston USA (Aegis Asset Backed Securities Trust 2005 B3 1-Month
LIBOR + 200 bp,
due 3/25/35)1 | | March 25, 2035 | | 2.18%
Quarterly | | Specified amount upon credit event notice | | | 784 | | | 318 | |
| | | | | |
Credit Suisse First Boston USA (Amerisource Bergen Corp., 8.125%, due 9/1/08)1 | | September 20, 2015 | | 0.9%
Monthly | | Specified amount upon credit event notice | | | 3,050 | | | (27 | ) |
| | | | | |
Credit Suisse First Boston USA
(Argent Securities Inc,
2004-W11 M10 1-Month
LIBOR + 350 bp,
due 11/25/34)1 | | November 25, 2034 | | 2.15%
Monthly | | Specified amount upon credit event notice | | | 784 | | | 127 | |
| | | | | |
Credit Suisse First Boston USA
(Argent Securities Inc,
2004-W11 M9 1-Month
LIBOR + 225 bp,
due 11/25/34)1 | | November 25, 2034 | | 1.33%
Monthly | | Specified amount upon credit event notice | | | 784 | | | 107 | |
| | | | | |
Credit Suisse First Boston USA
(Argent Securities Inc.,
2004-W4 M3 1-Month
LIBOR + 300 bp,
due 3/25/34)1 | | March 25, 2034 | | 2.2%
Monthly | | Specified amount upon credit event notice | | | 401 | | | 59 | |
220
Semi-Annual Report to Shareholders
| | | | | | | | | | | | | |
| Western Asset Core Bond Portfolio—Continued | |
Agreement With: | | Termination Date | | The Fund
Agrees to Pay | | The Fund
Will Receive | | Contract
Notional Amount | | Unrealized
Appreciation/
(Depreciation) | |
| | | | | | | | | | | | | |
Credit Suisse First Boston USA
(ConocoPhillips,
4.75%, due 10/15/12)1 | | September 20, 2012 | | Specified amount upon credit event notice | | 0.27%
Quarterly | | $ | 1,000 | | $ | 2 | |
| | | | | |
Credit Suisse First Boston USA
(Eastman Kodak Company,
7.25%, due 11/15/13)1 | | March 20, 2010 | | Specified amount upon credit event notice | | 1.4%
Quarterly | | | 6,500 | | | 83 | |
| | | | | |
Credit Suisse First Boston USA
(Finance America Mortgage Loan Trust 2004-3 M8 1-Month LIBOR + 180 bp,
due 11/25/34)1 | | November 25, 2034 | | 1.31%
Monthly | | Specified amount upon credit event notice | | | 285 | | | 95 | |
| | | | | |
Credit Suisse First Boston USA
(Finance America Mortgage Loan Trust 2004-3 M9 1-Month LIBOR + 315 bp,
due 11/25/34)1 | | November 25, 2034 | | 2.18%
Monthly | | Specified amount upon credit event notice | | | 285 | | | 119 | |
| | | | | |
Credit Suisse First Boston USA
(Fremont Home Loan
Trust 2005-A, 1-Month
LIBOR + 135 bp,
due 1/25/35)1 | | January 25, 2035 | | 1.31%
Monthly | | Specified amount upon credit event notice | | | 784 | | | 116 | |
| | | | | |
Credit Suisse First Boston USA
(Fremont Home Loan
Trust 2005-A,1-Month
LIBOR + 100 bp,
due 1/25/35)1 | | January 25, 2035 | | 2.08%
Monthly | | Specified amount upon credit event notice | | | 493 | | | 127 | |
| | | | | |
Credit Suisse First Boston USA
(Home Depot Inc.,
3.75%, due 9/15/09)1 | | September 20, 2010 | | 0.17%
Quarterly | | Specified amount upon credit event notice | | | 1,380 | | | 9 | |
| | | | | |
Credit Suisse First Boston USA
(iBoxx IG Hi-Vol2)1 | | September 20, 2009 | | 1.15%
Quarterly | | Specified amount upon credit event notice | | | 24,167 | | | (41 | ) |
| | | | | |
Credit Suisse First Boston USA
(IndyMac Home Equity Loan Asset-Backed, Trust 2004-C M8, 1-Month LIBOR + 190 bp,
due 3/25/35)1 | | March 25, 2035 | | 1.28%
Monthly | | Specified amount upon credit event notice | | | 784 | | | 193 | |
| | | | | |
Credit Suisse First Boston USA
(IndyMac Home Equity Loan Asset-Backed, Trust 2004-C M9, 1-Month LIBOR + 325 bp,
due 3/25/35)1 | | March 25, 2035 | | 2.05%
Monthly | | Specified amount upon credit event notice | | | 784 | | | 213 | |
221
Semi-Annual Report to Shareholders
Notes to Financial Statements—Continued
| | | | | | | | | | | | | |
| Western Asset Core Bond Portfolio—Continued | |
Agreement With: | | Termination Date | | The Fund
Agrees to Pay | | The Fund
Will Receive | | Contract
Notional Amount | | Unrealized
Appreciation/
(Depreciation) | |
| | | | | | | | | | | | | |
Credit Suisse First Boston USA
(Limited Brands Inc.,
6.125%, due 12/01/12)1 | | December 20, 2012 | | 0.6%
Monthly | | Specified amount upon credit event notice | | $ | 5,870 | | $ | 80 | |
| | | | | |
Credit Suisse First Boston USA
(Long Beach Mortgage Loan
Trust 2004-1 M9 1-Month
LIBOR + 350 bp, due 2/25/34)1 | | February 25, 2034 | | 2.15%
Monthly | | Specified amount upon credit event notice | | | 315 | | | 61 | |
| | | | | |
Credit Suisse First Boston USA
(Long Beach Mortgage Loan
Trust 2005-1 M8 1-Month
LIBOR + 170 bp, due 2/25/35)1 | | February 25, 2035 | | 1.31%
Monthly | | Specified amount upon credit event notice | | | 784 | | | 230 | |
| | | | | |
Credit Suisse First Boston USA
(Long Beach Mortgage Loan
Trust 2005-1 M9 1-Month
LIBOR + 275 bp, due 2/25/35)1 | | February 25, 2035 | | 2.08%
Monthly | | Specified amount upon credit event notice | | | 784 | | | 255 | |
| | | | | |
Credit Suisse First Boston USA
(Marsh & Mclennan Company, Inc.,
5.375%, due 7/15/14)1 | | September 20, 2010 | | 0.46%
Quarterly | | Specified amount upon credit event notice | | | 3,070 | | | (20 | ) |
| | | | | |
Credit Suisse First Boston USA
(Masco Corp.,
5.875%, due 7/15/12)1 | | September 20, 2013 | | 0.75%
Monthly | | Specified amount upon credit event notice | | | 3,320 | | | 15 | |
| | | | | |
Credit Suisse First Boston USA
(MASTR Asset Backed Securities Trust 2005-NC1 M8 1-Month LIBOR + 153 bp, due 12/25/34)1 | | December 25, 2034 | | 1.31%
Monthly | | Specified amount upon credit event notice | | | 784 | | | 102 | |
| | | | | |
Credit Suisse First Boston USA
(MASTR Asset Backed Securities Trust 2005-NC1 M9 1-Month LIBOR + 240 bp, due 12/25/34)1 | | December 25, 2034 | | 2.08%
Monthly | | Specified amount upon credit event notice | | | 784 | | | 222 | |
| | | | | |
Credit Suisse First Boston USA
(Merrill Lynch Mortgage Investors, Inc 2005-WMC1 B2 1-Month LIBOR + 135 bp, due 9/25/35)1 | | September 25, 2035 | | 1.28%
Monthly | | Specified amount upon credit event notice | | | 784 | | | 165 | |
222
Semi-Annual Report to Shareholders
| | | | | | | | | | | | |
| Western Asset Core Bond Portfolio—Continued |
Agreement With: | | Termination Date | | The Fund
Agrees to Pay | | The Fund
Will Receive | | Contract
Notional Amount | | Unrealized
Appreciation/
(Depreciation) |
| | | | | | | | | | | | |
Credit Suisse First Boston USA
(Merrill Lynch Mortgage Investors, Inc. 2004-WMC4 B3 1-Month LIBOR + 375 bp, due 4/25/35)1 | | April 25, 2035 | | 2.15%
Monthly | | Specified amount upon credit event notice | | $ | 1,046 | | $ | 126 |
| | | | | |
Credit Suisse First Boston USA
(Merrill Lynch Mortgage Investors, Inc. 2005-NC1 B2 1-Month LIBOR + 130 bp, due 10/25/35)1 | | October 25, 2035 | | 1.28%
Monthly | | Specified amount upon credit event notice | | | 784 | | | 108 |
| | | | | |
Credit Suisse First Boston USA
(Merrill Lynch Mortgage Investors, Inc. 2005-NC1 B3 1-Month LIBOR + 205 bp, due 10/25/35)1 | | October 25, 2035 | | 2.05%
Monthly | | Specified amount upon credit event notice | | | 784 | | | 133 |
| | | | | |
Credit Suisse First Boston USA
(Merrill Lynch Mortgage Investors, Inc. 2005-WMC1 B3 1-Month LIBOR + 225 bp, due 9/25/35)1 | | September 25, 2035 | | 2.05%
Monthly | | Specified amount upon credit event notice | | | 784 | | | 114 |
| | | | | |
Credit Suisse First Boston USA
(Morgan Stanley ABS Capital I 2005-WMC1 B2 1-Month LIBOR + 130 bp, due 1/25/35)1 | | January 25, 2035 | | 1.31%
Monthly | | Specified amount upon credit event notice | | | 784 | | | 146 |
| | | | | |
Credit Suisse First Boston USA
(Morgan Stanley ABS Capital I 2005-WMC1 B3 1-Month LIBOR + 215 bp, due 1/25/35)1 | | January 25, 2035 | | 2.18%
Monthly | | Specified amount upon credit event notice | | | 727 | | | 87 |
| | | | | |
Credit Suisse First Boston USA
(New Century Home Equity Loan Trust 2004-2 M9 1-Month LIBOR + 325 bp, due 8/25/34)1 | | August 25, 2034 | | 2.15%
Monthly | | Specified amount upon credit event notice | | | 1,046 | | | 169 |
| | | | | |
Credit Suisse First Boston USA
(New Century Home Equity Loan Trust 2005-1 M8 1-Month LIBOR + 140 bp, due 3/25/35)1 | | March 25, 2035 | | 1.31%
Monthly | | Specified amount upon credit event notice | | | 784 | | | 105 |
223
Semi-Annual Report to Shareholders
Notes to Financial Statements—Continued
| | | | | | | | | | | | |
| Western Asset Core Bond Portfolio—Continued |
Agreement With: | | Termination Date | | The Fund
Agrees to Pay | | The Fund
Will Receive | | Contract
Notional Amount | | Unrealized
Appreciation/
(Depreciation) |
| | | | | | | | | | | | |
Credit Suisse First Boston USA
(New Century Home Equity Loan Trust 2005-1 M9 1-Month LIBOR + 205 bp, due 3/25/35)1 | | March 25, 2035 | | 2.18%
Monthly | | Specified amount upon credit event notice | | $ | 784 | | $ | 232 |
| | | | | |
Credit Suisse First Boston USA
(Novastar Home Equity Loan
2005-1 B2 1-Month
LIBOR + 135 bp, due 6/25/35)1 | | June 25, 2035 | | 1.28%
Monthly | | Specified amount upon credit event notice | | | 784 | | | 135 |
| | | | | |
Credit Suisse First Boston USA
(Novastar Home Equity Loan
2005-4 B3 1-Month
LIBOR + 195 bp, due 6/25/35)1 | | June 25, 2035 | | 2.05%
Monthly | | Specified amount upon credit event notice | | | 784 | | | 167 |
| | | | | |
Credit Suisse First Boston USA
(Park Place Securities Inc.
2005-WCH1 M8 1-Month
LIBOR + 155 bp, due 1/25/36)1 | | January 25, 2036 | | 1.36%
Monthly | | Specified amount upon credit event notice | | | 784 | | | 256 |
| | | | | |
Credit Suisse First Boston USA
(Park Place Securities Inc.
2005-WCH1 M9 1-Month
LIBOR + 250 bp, due 1/25/36)1 | | January 25, 2036 | | 2.18%
Monthly | | Specified amount upon credit event notice | | | 784 | | | 296 |
| | | | | |
Credit Suisse First Boston USA
(People’s Choice Home Loan Securities Trust 2004-1 M6 1-Month LIBOR + 230 bp, due 6/25/34)1 | | June 25, 2034 | | 1.37%
Quarterly | | Specified amount upon credit event notice | | | 1,046 | | | 181 |
| | | | | |
Credit Suisse First Boston USA
(People’s Choice Home Loan Securities Trust 2005-1 B3 1-Month LIBOR + 260 bp, due 1/25/35)1 | | January 25, 2035 | | 2.05%
Monthly | | Specified amount upon credit event notice | | | 784 | | | 299 |
| | | | | |
Credit Suisse First Boston USA
(People’s Choice Home Loan Securities Trust 2005-1, 1-Month LIBOR + 165 bp, due 1/25/35)1 | | January 25, 2035 | | 1.28%
Monthly | | Specified amount upon credit event notice | | | 784 | | | 197 |
| | | | | |
Credit Suisse First Boston USA
(Pulte Homes Inc.,
7.875%, due 8/1/11)1 | | March 20, 2011 | | 0.79%
Quarterly | | Specified amount upon credit event notice | | | 2,100 | | | 189 |
224
Semi-Annual Report to Shareholders
| | | | | | | | | | | | | |
| Western Asset Core Bond Portfolio—Continued | |
Agreement With: | | Termination Date | | The Fund
Agrees to Pay | | The Fund
Will Receive | | Contract
Notional Amount | | Unrealized
Appreciation/
(Depreciation) | |
| | | | | | | | | | | | | |
Credit Suisse First Boston USA
(Southwest Airlines Co.,
5.25%, due 10/1/14)1 | | March 20, 2017 | | 0.69%
Quarterly | | Specified amount upon credit event notice | | $ | 2,420 | | $ | 3 | |
| | | | | |
Credit Suisse First Boston USA
(Starwood Hotels,
7.875%, due 5/1/12)1 | | December 20, 2011 | | 1.37%
Monthly | | Specified amount upon credit event notice | | | 3,050 | | | (66 | ) |
| | | | | |
Credit Suisse First Boston USA
(Vodafone Group,
7.75%, due 02/15/10)1 | | September 20, 2015 | | 0.54%
Monthly | | Specified amount upon credit event notice | | | 6,040 | | | (11 | ) |
| | | | | |
Credit Suisse First Boston USA
(Waste Management Inc.,
7.375%, due 8/1/10)1 | | March 20, 2014 | | 0.49%
Quarterly | | Specified amount upon credit event notice | | | 3,290 | | | (11 | ) |
| | | | | |
Deutsche Bank AG2 | | October 5, 2008 | | 3-month
LIBOR | | 4.6545%
Semi-Annually | | | 115,540 | | | (199 | ) |
| | | | | |
Deutsche Bank AG2 | | June 17, 2010 | | 3-month
LIBOR | | 4.3132%
Semi-Annually | | | 31,430 | | | (326 | ) |
| | | | | |
Deutsche Bank AG2 | | October 11, 2010 | | 3-month
LIBOR | | 4.7077%
Semi-Annually | | | 206,790 | | | (17 | ) |
| | | | | |
Deutsche Bank AG2 | | July 13, 2011 | | 3-month
LIBOR | | 5.6281%
Semi-Annually | | | 83,870 | | | 2,461 | |
| | | | | |
Deutsche Bank AG2 | | June 15, 2016 | | 5.1825%
Semi-Annually | | 3-month
LIBOR | | | 5,620 | | | (13 | ) |
| | | | | |
Deutsche Bank AG2 | | July 21, 2016 | | 3-month
LIBOR | | 5.6931%
Semi-Annually | | | 77,910 | | | 3,037 | |
| | | | | |
Deutsche Bank AG2 | | April 1, 2017 | | 5.435%
Semi-Annually | | 3-month
LIBOR | | | 4,120 | | | (79 | ) |
| | | | | |
Deutsche Bank AG
(ABX AAA)1 | | May 25, 2046 | | Specified amount upon credit event notice | | 0.11%
Monthly | | | 7,600 | | | 59 | |
| | | | | |
Deutsche Bank AG
(ABX. HE-AAA 06-2)1 | | May 25, 2046 | | Specified amount upon credit event notice | | 0.11%
Monthly | | | 7,700 | | | 98 | |
| | | | | |
Deutsche Bank AG
(Autozone Inc.,
6.95%, due 6/15/16)1 | | June 20, 2016 | | 0.58%
Quarterly | | Specified amount upon credit event notice | | | 5,620 | | | (9 | ) |
| | | | | |
Deutsche Bank AG
(Centurytel Inc.,
7.875%, due 8/15/12)1 | | March 20, 2017 | | 0.89%
Quarterly | | Specified amount upon credit event notice | | | 4,120 | | | (32 | ) |
225
Semi-Annual Report to Shareholders
Notes to Financial Statements—Continued
| | | | | | | | | | | | | |
| Western Asset Core Bond Portfolio—Continued | |
Agreement With: | | Termination Date | | The Fund
Agrees to Pay | | The Fund
Will Receive | | Contract
Notional Amount | | Unrealized
Appreciation/
(Depreciation) | |
| | | | | | | | | | | | | |
Deutsche Bank AG
(Countrywide Home Loan Inc., 4%, due 3/22/11)1 | | March 20, 2017 | | Specified amount upon credit event notice | | 0.94%
Quarterly | | $ | 9,600 | | $ | (581 | ) |
| | | | | |
Deutsche Bank AG
(Eastman Kodak Company,
7.25%, due 11/15/13)1 | | March 20, 2010 | | Specified amount upon credit event notice | | 1.25%
Quarterly | | | 1,100 | | | 10 | |
| | | | | |
Deutsche Bank AG
(Eastman Kodak Company,
7.25%, due 11/15/13)1 | | March 20, 2015 | | Specified amount upon credit event notice | | 1.67%
Quarterly | | | 1,300 | | | (45 | ) |
| | | | | |
Deutsche Bank AG
(Fannie Mae,
6%, due 5/15/11)1 | | December 20, 2009 | | Specified amount upon credit event notice | | 0.215%
Quarterly | | | 11,700 | | | 29 | |
| | | | | |
Deutsche Bank AG
(Ford Motor Credit Company,
7%, due 10/1/13)1 | | December 20, 2010 | | Specified amount upon credit event notice | | 5.05%
Quarterly | | | 17,100 | | | 563 | |
| | | | | |
Deutsche Bank AG
(Ford Motor Credit Company,
7.45%, due 7/16/31)1 | | March 20, 2015 | | Specified amount upon credit event notice | | 2.93%
Quarterly | | | 1,700 | | | (242 | ) |
| | | | | |
Deutsche Bank AG
(Freddie Mac,
5%, due 7/15/14)1 | | March 20, 2015 | | Specified amount upon credit event notice | | 0.29%
Quarterly | | | 15,600 | | | 85 | |
| | | | | |
Deutsche Bank AG
(iBoxx 30 Hi-Vol)1 | | March 20, 2009 | | 1.25%
Quarterly | | Specified amount upon credit event notice | | | 7,153 | | | 41 | |
| | | | | |
Deutsche Bank AG
(iBoxx IG Hi-Vol)1 | | March 20, 2009 | | Specified amount upon credit event notice | | 1.25%
Quarterly | | | 9,415 | | | 10 | |
| | | | | |
Deutsche Bank AG
(iBoxx IG Hi-Vol2)1 | | September 20, 2014 | | Specified amount upon credit event notice | | 1.3%
Quarterly | | | 8,043 | | | (44 | ) |
| | | | | |
Deutsche Bank AG
(iBoxx IG TMT)1 | | March 20, 2009 | | 0.6%
Quarterly | | Specified amount upon credit event notice | | | 7,400 | | | (48 | ) |
| | | | | |
JP Morgan Chase & Co.2 | | June 8, 2009 | | 3-month LIBOR | | 5.393%
Semi-Annually | | | 157,400 | | | 1,686 | |
| | | | | |
JP Morgan Chase & Co.2 | | December 1, 2012 | | 5.275%
Semi-Annually | | 3-month
LIBOR | | | 3,550 | | | (59 | ) |
| | | | | |
JP Morgan Chase & Co.2 | | September 7, 2016 | | 5.3215%
Semi-Annually | | 3-month
LIBOR | | | 35,900 | | | (389 | ) |
226
Semi-Annual Report to Shareholders
| | | | | | | | | | | | | |
| Western Asset Core Bond Portfolio—Continued | |
Agreement With: | | Termination Date | | The Fund
Agrees to Pay | | The Fund
Will Receive | | Contract
Notional Amount | | Unrealized
Appreciation/
(Depreciation) | |
| | | | | | | | | | | | | |
JP Morgan Chase & Co.
(CDX IG HVOL 8)1 | | June 20, 2012 | | Specified amount upon credit event notice | | 0.75%
Quarterly | | $ | 29,100 | | $ | (571 | ) |
| | | | | |
JP Morgan Chase & Co.
(CDX IG HVOL 8)1 | | June 20, 2012 | | Specified amount upon credit event notice | | 0.75%
Quarterly | | | 38,900 | | | (703 | ) |
| | | | | |
JP Morgan Chase & Co.
(CDX IG HVOL 8)1 | | June 20, 2012 | | Specified amount upon credit event notice | | 0.75%
Quarterly | �� | | 45,250 | | | (1,091 | ) |
| | | | | |
JP Morgan Chase & Co.
(General Motors Acceptance Corporation,
7.125%, due 7/15/13)1 | | September 20, 2010 | | Specified amount upon credit event notice | | 6%
Quarterly | | | 10,500 | | | 512 | |
| | | | | |
JP Morgan Chase & Co.
(Limited Brands Inc.,
6.125%, due 12/1/12)1 | | December 20, 2012 | | 0.67%
Quarterly | | Specified amount upon credit event notice | | | 3,550 | | | 37 | |
| | | | | |
Lehman Brothers Holdings Inc.2 | | October 7, 2007 | | 3-month
LIBOR | | 4.6012%
Semi-Annually | | | 630 | | | — | |
| | | | | |
Lehman Brothers Holdings Inc.4 | | January 1, 2008 | | 1-month
LIBOR | | LEHM U.S. ABS AAA
Floating Home Equities Index | | | 26,400 | | | 258 | |
| | | | | |
Lehman Brothers Holdings Inc.4 | | March 1, 2008 | | 1-month
LIBOR | | MBS Fixed | | | 248,600 | | | 1,312 | |
| | | | | |
Lehman Brothers Holdings Inc.4 | | March 1, 2008 | | 1-month
LIBOR | | LEHM U.S. ABS AAA
Floating Home Equities Index | | | 197,900 | | | 1,749 | |
| | | | | |
Lehman Brothers Holdings Inc.2 | | April 30, 2011 | | 5.0704%
Semi-Annually | | 3-month
LIBOR | | | 3,580 | | | (37 | ) |
| | | | | |
Lehman Brothers Holdings Inc.2 | | September 15, 2011 | | 5.193%
Semi-Annually | | 3-month
LIBOR | | | 5,500 | | | (74 | ) |
| | | | | |
Lehman Brothers Holdings Inc.
(CDX IG HVOL 8)1 | | June 20, 2012 | | Specified amount upon credit event notice | | 0.75%
Quarterly | | | 7,400 | | | (35 | ) |
| | | | | |
Lehman Brothers Holdings Inc.
(CDX IG HVOL 8)1 | | June 20, 2012 | | Specified amount upon credit event notice | | 0.75%
Quarterly | | | 97,000 | | | (590 | ) |
| | | | | |
Lehman Brothers Holdings Inc.
(CDX IG HVOL 8)1 | | June 20, 2012 | | Specified amount upon credit event notice | | 0.75%
Quarterly | | | 14,900 | | | 59 | |
227
Semi-Annual Report to Shareholders
Notes to Financial Statements—Continued
| | | | | | | | | | | | | |
| Western Asset Core Bond Portfolio—Continued | |
Agreement With: | | Termination Date | | The Fund
Agrees to Pay | | The Fund
Will Receive | | Contract
Notional Amount | | Unrealized
Appreciation/
(Depreciation) | |
| | | | | | | | | | | | | |
Lehman Brothers Holdings Inc.
(CDX IG HVOL 8)1 | | June 20, 2012 | | Specified amount upon credit event notice | | 0.75%
Quarterly | | $ | 15,000 | | $ | (82 | ) |
| | | | | |
Lehman Brothers Holdings Inc.
(General Motors Acceptance Corporation,
6.875%, due 8/28/12)1 | | March 20, 2010 | | Specified amount upon credit event notice | | 5.25% Quarterly | | | 10,000 | | | 102 | |
| | | | | |
Lehman Brothers Holdings Inc.
(iBoxx IG Hi-Vol2)1 | | September 20, 2009 | | 1.15%
Quarterly | | Specified amount upon credit event notice | | | 8,507 | | | 28 | |
| | | | | |
Lehman Brothers Holdings Inc.
(iBoxx IG Hi-Vol3)1 | | September 20, 2009 | | 1.05%
Quarterly | | Specified amount upon credit event notice | | | 773 | | | 2 | |
| | | | | |
Lehman Brothers Holdings Inc.
(Sara Lee Corporation,
6.125%, due 11/1/32)1 | | September 20, 2011 | | 0.44%
Quarterly | | Specified amount upon credit event notice | | | 5,500 | | | (43 | ) |
| | | | | |
Lehman Brothers Holdings Inc.
(Sprint Capital Corporation,
8.375%, due 3/15/12)1 | | December 20, 2007 | | Specified amount upon credit event notice | | 0.05% Quarterly | | | 1,230 | | | (1 | ) |
| | | | | |
Lehman Brothers Holdings Inc.
(Viacom Inc.,
6.25%, due 4/30/16)1 | | March 20, 2011 | | 0.57%
Quarterly | | Specified amount upon credit event notice | | | 3,580 | | | (33 | ) |
| | | | | |
Lehman Brothers Holdings Inc.
(Washington Mutual Inc.,
5.25%, due 9/15/17)1 | | June 20, 2017 | | Specified amount upon credit event notice | | 0.65%
Quarterly | | | 9,600 | | | (77 | ) |
| | | | | |
Merrill Lynch & Co., Inc.
(CDX HY 8)1 | | June 20, 2012 | | Specified amount upon credit event notice | | 0.82%
Quarterly | | | 47,600 | | | (1,882 | ) |
| | | | | |
Merrill Lynch & Co., Inc.
(CDX HY 8)1 | | June 20, 2012 | | Specified amount upon credit event notice | | 0.90%
Quarterly | | | 16,400 | | | (593 | ) |
| | | | | |
Merrill Lynch & Co., Inc.
(Pacific Gas & Electric Co.,
4.8%, due 3/1/14)1 | | June 20, 2009 | | Specified amount upon credit event notice | | 0.42%
Quarterly | | | 2,100 | | | 9 | |
| | | | | |
Morgan Stanley & Co., Inc.
(Weyerhaeuser Co. Note,
7.125%, due 7/15/23)1 | | March 20, 2012 | | 0.74%
Quarterly | | Specified amount upon credit event notice | | | 2,750 | | | 20 | |
| | | | | |
Morgan Stanley & Co., Inc.2 | | March 15, 2012 | | 4.7625% Semi-Annually | | 3-month
LIBOR | | | 2,750 | | | 10 | |
| | | | | |
Morgan Stanley & Co., Inc.2 | | April 30, 2016 | | 5.189% Semi-Annually | | 3-month
LIBOR | | | 3,400 | | | (15 | ) |
228
Semi-Annual Report to Shareholders
| | | | | | | | | | | | | |
| Western Asset Core Bond Portfolio—Continued | |
Agreement With: | | Termination Date | | The Fund
Agrees to Pay | | The Fund
Will Receive | | Contract
Notional Amount | | Unrealized
Appreciation/
(Depreciation) | |
| | | | | | | | | | | | | |
Morgan Stanley & Co., Inc. (Viacom Inc.,
6.25%, due 4/30/16)1 | | March 20, 2012 | | 0.36%
Monthly | | Specified amount upon credit event notice | | $ | 5,460 | | $ | 9 | |
| | | | | |
RBS Greenwich2 | | March 1, 2016 | | 5.12% Semi-Annually | | 3-month
LIBOR | | | 4,250 | | | 2 | |
| | | | | |
RBS Greenwich2 | | February 15, 2017 | | 5.115% Semi-Annually | | 3-month
LIBOR | | | 3,580 | | | 15 | |
| | | | | |
RBS Greenwich
(CDX IG 8)1 | | June 20, 2012 | | Specified amount upon credit event notice | | 0.35%
Quarterly | | | 45,900 | | | (199 | ) |
| | | | | |
RBS Greenwich
(CDX IG 8)1 | | June 20, 2012 | | Specified amount upon credit event notice | | 0.35%
Quarterly | | | 7,400 | | | 77 | |
| | | | | |
RBS Greenwich
(CDX IG 8)1 | | June 20, 2012 | | Specified amount upon credit event notice | | 0.35%
Quarterly | | | 7,200 | | | 63 | |
| | | | | |
RBS Greenwich
(CDX IG HVOL 8)1 | | June 20, 2012 | | Specified amount upon credit event notice | | 0.75%
Quarterly | | | 14,200 | | | (359 | ) |
| | | | | |
RBS Greenwich
(CDX IG HVOL 8)1 | | June 20, 2012 | | Specified amount upon credit event notice | | 0.75%
Quarterly | | | 17,300 | | | (393 | ) |
| | | | | |
RBS Greenwich
(CDX IG HVOL 8)1 | | June 20, 2012 | | Specified amount upon credit event notice | | 0.75%
Quarterly | | | 14,600 | | | (320 | ) |
| | | | | |
RBS Greenwich
(CDX IG HVOL 8)1 | | June 20, 2012 | | Specified amount upon credit event notice | | 0.75%
Quarterly | | | 50,000 | | | (1,063 | ) |
| | | | | |
RBS Greenwich
(CDX IG HVOL 8)1 | | June 20, 2012 | | Specified amount upon credit event notice | | 0.75%
Quarterly | | | 14,200 | | | (276 | ) |
| | | | | |
RBS Greenwich
(CDX IG HVOL 8)1 | | June 20, 2012 | | Specified amount upon credit event notice | | 0.75%
Quarterly | | | 14,400 | | | (266 | ) |
| | | | | |
RBS Greenwich
(CDX IG HVOL 8)1 | | June 20, 2012 | | Specified amount upon credit event notice | | 0.75%
Quarterly | | | 14,400 | | | (269 | ) |
| | | | | |
RBS Greenwich
(CDX IG HVOL 8)1 | | June 20, 2012 | | Specified amount upon credit event notice | | 0.75%
Quarterly | | | 18,100 | | | (209 | ) |
229
Semi-Annual Report to Shareholders
Notes to Financial Statements—Continued
| | | | | | | | | | | | | |
| Western Asset Core Bond Portfolio—Continued | |
Agreement With: | | Termination Date | | The Fund
Agrees to Pay | | The Fund
Will Receive | | Contract
Notional Amount | | Unrealized
Appreciation/
(Depreciation) | |
| | | | | | | | | | | | | |
RBS Greenwich
(CDX IG HVOL 8)1 | | June 20, 2012 | | Specified amount upon credit event notice | | 0.75%
Quarterly | | $ | 7,300 | | $ | (80 | ) |
| | | | | |
RBS Greenwich
(CDX IG HVOL 8)1 | | June 20, 2012 | | Specified amount upon credit event notice | | 0.75%
Quarterly | | | 14,400 | | | 125 | |
| | | | | |
RBS Greenwich
(CDX IG HVOL 8)1 | | June 20, 2012 | | Specified amount upon credit event notice | | 0.75%
Quarterly | | | 100,000 | | | (517 | ) |
| | | | | |
RBS Greenwich
(CDX IG HVOL 8)1 | | June 20, 2012 | | Specified amount upon credit event notice | | 0.75%
Quarterly | | | 91,800 | | | (556 | ) |
| | | | | |
RBS Greenwich
(CDX IG HVOL 8)1 | | June 20, 2012 | | Specified amount upon credit event notice | | 0.75%
Quarterly | | | 91,800 | | | 532 | |
| | | | | |
RBS Greenwich
(CDX IG HVOL 8)1 | | June 20, 2012 | | Specified amount upon credit event notice | | 0.75%
Quarterly | | | 7,500 | | | (38 | ) |
| | | | | |
RBS Greenwich
(Countrywide Home Loan Inc.,
4%, due 3/22/11)1 | | March 20, 2012 | | Specified amount upon credit event notice | | 0.66%
Quarterly | | | 39,300 | | | (2,966 | ) |
| | | | | |
RBS Greenwich
(Countrywide Home Loan Inc.,
4%, due 3/22/11)1 | | June 20, 2012 | | Specified amount upon credit event notice | | 0.72%
Quarterly | | | 25,000 | | | (1,818 | ) |
| | | | | |
RBS Greenwich
(Countrywide Home Loans, Inc.,
4%, due 3/22/11)1 | | September 20, 2012 | | Specified amount upon credit event notice | | 6%
Quarterly | | | 9,100 | | | 1,256 | |
| | | | | |
RBS Greenwich
(Countrywide Home Loans, Inc.,
4%, due 3/22/11)1 | | September 20, 2012 | | Specified amount upon credit event notice | | 6.1%
Quarterly | | | 9,100 | | | 1,292 | |
| | | | | |
RBS Greenwich
(Countrywide Home Loans, Inc.,
4.0%, due 3/22/11)1 | | September 20, 2012 | | Specified amount upon credit event notice | | 0.86%
Quarterly | | | 9,100 | | | (606 | ) |
| | | | | |
RBS Greenwich
(Countrywide Home Loans, Inc.,
4.0%, due 3/22/11)1 | | September 20, 2012 | | Specified amount upon credit event notice | | 2.75%
Quarterly | | | 10,000 | | | 86 | |
| | | | | |
RBS Greenwich
(DSLA Mortgage Loan
Trust 2005-AR5, 1-Month
LIBOR + 175 bp, due 8/19/45)1 | | August 19, 2045 | | 4.5%
Monthly | | Specified amount upon credit event notice | | | 1,298 | | | (44 | ) |
230
Semi-Annual Report to Shareholders
| | | | | | | | | | | | | |
| Western Asset Core Bond Portfolio—Continued | |
Agreement With: | | Termination Date | | The Fund
Agrees to Pay | | The Fund
Will Receive | | Contract
Notional Amount | | Unrealized
Appreciation/
(Depreciation) | |
| | | | | | | | | | | | | |
RBS Greenwich
(Ford Motor Credit Company,
7%, due 10/1/13)1 | | December 20, 2010 | | Specified amount upon credit event notice | | 4.26%
Quarterly | | $ | 25,000 | | $ | 309 | |
| | | | | |
RBS Greenwich
(General Mills Inc.,
5.7%, due 2/15/17)1 | | March 20, 2017 | | 0.33 %
Quarterly | | Specified amount upon credit event notice | | | 3,580 | | | 43 | |
| | | | | |
RBS Greenwich
(General Motors Acceptance Corporation,
6.875%, due 8/12/12)1 | | June 20, 2010 | | Specified amount upon credit event notice | | 4.53%
Quarterly | | | 15,000 | | | 460 | |
| | | | | |
RBS Greenwich
(General Motors Acceptance Corporation,
6.875%, due 8/28/12)1 | | June 20, 2010 | | Specified amount upon credit event notice | | 4.68%
Quarterly | | | 25,000 | | | 853 | |
| | | | | |
RBS Greenwich
(General Motors Acceptance Corporation,
6.875%, due 8/28/12)1 | | September 20, 2010 | | Specified amount upon credit event notice | | 5.75%
Quarterly | | | 7,500 | | | 467 | |
| | | | | |
RBS Greenwich
(General Motors Acceptance Corporation,
7.125%, due 7/15/13)1 | | June 20, 2010 | | Specified amount upon credit event notice | | 6.8%
Quarterly | | | 5,900 | | | 392 | |
| | | | | |
RBS Greenwich
(General Motors Acceptance Corporation,
7.125%, due 7/15/13)1 | | June 20, 2010 | | Specified amount upon credit event notice | | 7.1%
Quarterly | | | 5,800 | | | 426 | |
| | | | | |
RBS Greenwich
(General Motors Acceptance Corporation,
7.125%, due 7/15/13)1 | | June 20, 2010 | | Specified amount upon credit event notice | | 8.4%
Quarterly | | | 12,500 | | | 1,302 | |
| | | | | |
RBS Greenwich
(General Motors Acceptance Corporation,
7.125%, due 7/15/13)1 | | September 20, 2010 | | Specified amount upon credit event notice | | 7.7%
Quarterly | | | 12,500 | | | 1,148 | |
| | | | | |
RBS Greenwich
(Harborview Mortgage Loan
Trust 2005-12, 1-Month
LIBOR + 175 bp,
due 10/19/35)1 | | October 19, 2035 | | 2.5%
Monthly | | Specified amount upon credit event notice | | | 1,295 | | | (8 | ) |
| | | | | |
RBS Greenwich
(Home Depot Inc.,
5.4%, due 3/1/16)1 | | March 20, 2016 | | 0.48%
Monthly | | Specified amount upon credit event notice | | | 4,250 | | | 106 | |
231
Semi-Annual Report to Shareholders
Notes to Financial Statements—Continued
| | | | | | | | | | | | | |
| Western Asset Core Bond Portfolio—Continued | |
Agreement With: | | Termination Date | | The Fund
Agrees to Pay | | The Fund
Will Receive | | Contract
Notional Amount | | Unrealized
Appreciation/
(Depreciation) | |
| | | | | | | | | | | | | |
RBS Greenwich
(iBoxx IG Hi-Vol3)1 | | March 20, 2010 | | 1.05%
Quarterly | | Specified amount upon credit event notice | | $ | 17,303 | | $ | 151 | |
| | | | | |
RBS Greenwich
(IndyMac Index Mortgage Loan Trust 2005—AR18, 1-Month LIBOR + 125 bp, due 10/25/36)1 | | October 25, 2036 | | 2.7%
Monthly | | Specified amount upon credit event notice | | | 1,390 | | | (73 | ) |
| | | | | |
RBS Greenwich
(Residential Capital Corp.,
6.5%, due 4/17/13)1 | | September 20, 2012 | | Specified amount upon credit event notice | | 2.32%
Quarterly | | | 25,000 | | | (4,442 | ) |
| | | | | |
RBS Greenwich
(Residential Capital, LLC,
7.5%, due 4/17/13)1 | | September 20, 2012 | | Specified amount upon credit event notice | | 4.9%
Quarterly | | | 9,100 | | | (935 | ) |
| | | | | |
RBS Greenwich
(SLM Corp.,
5.125%, due 8/27/12)1 | | June 20, 2012 | | Specified amount upon credit event notice | | 1.38%
Quarterly | | | 20,000 | | | (788 | ) |
| | | | | |
RBS Greenwich
(SLM Corp.,
5.125%, due 8/27/12)1 | | June 20, 2012 | | Specified amount upon credit event notice | | 1.78%
Quarterly | | | 25,000 | | | (509 | ) |
| | | | | |
RBS Greenwich
(SLM Corp.,
5.125%, due 8/27/12)1 | | September 20, 2012 | | Specified amount upon credit event notice | | 2.35%
Quarterly | | | 1,500 | | | — | |
| | | | | |
RBS Greenwich
(SLM Corp.,
5.125%, due 8/27/12)1 | | September 20, 2012 | | Specified amount upon credit event notice | | 2.4%
Quarterly | | | 1,500 | | | 3 | |
| | | | | |
RBS Greenwich
(SLM Corp.,
5.125%, due 8/27/12)1 | | September 20, 2012 | | Specified amount upon credit event notice | | 2.44%
Quarterly | | | 25,000 | | | 98 | |
| | | | | |
RBS Greenwich
(SLM Corp.,
5.125%, due 8/27/12)1 | | September 20, 2012 | | Specified amount upon credit event notice | | 2.67 %
Quarterly | | | 10,000 | | | 135 | |
| | | | | |
RBS Greenwich
(SLM Corp.,
5.125%, due 8/27/12)1 | | September 20, 2012 | | Specified amount upon credit event notice | | 2.67%
Quarterly | | | 10,000 | | | 135 | |
| | | | | |
RBS Greenwich
(Time Warner Inc.
6.875%, due 5/1/12)1 | | September 20, 2010 | | Specified amount upon credit event notice | | 0.47%
Quarterly | | | 5,000 | | | 28 | |
| | | | | |
RBS Greenwich
(Time Warner Inc.,
6.875%, due 5/1/12)1 | | December 20, 2010 | | Specified amount upon credit event notice | | 0.5%
Quarterly | | | 12,500 | | | 83 | |
232
Semi-Annual Report to Shareholders
| | | | | | | | | | | | | |
| Western Asset Core Bond Portfolio—Continued | |
Agreement With: | | Termination Date | | The Fund
Agrees to Pay | | The Fund
Will Receive | | Contract
Notional Amount | | Unrealized
Appreciation/
(Depreciation) | |
| | | | | | | | | | | | | |
RBS Greenwich
(Washington Mutual
2005-AR11, 1-Month
LIBOR + 120 bp, due 8/25/45)1 | | August 25, 2045 | | 2.55%
Monthly | | Specified amount upon credit event notice | | $ | 521 | | $ | (25 | ) |
| | | | | |
RBS Greenwich
(Washington Mutual Inc.,
5.25%, due 9/15/17)1 | | March 20, 2017 | | Specified amount upon credit event notice | | 0.64%
Quarterly | | | 10,000 | | | (90 | ) |
| | | | | |
The Goldman Sachs Group, Inc.2 | | October 18, 2008 | | 3-month
LIBOR | | 5.55%
Semi-Annually | | | 229,100 | | | 926 | |
| | | | | |
The Goldman Sachs Group, Inc.2 | | October 19, 2008 | | 3-month
LIBOR | | 5.55%
Semi-Annually | | | 223,508 | | | 952 | |
| | | | | |
The Goldman Sachs Group, Inc.2 | | March 10, 2009 | | 3-month
LIBOR | | 4.36%
Semi-Annually | | | 54,100 | | | 88 | |
| | | | | |
The Goldman Sachs Group, Inc.2 | | July 7, 2011 | | 3-month
LIBOR | | 5.7125%
Semi-Annually | | | 71,600 | | | 2,303 | |
| | | | | |
The Goldman Sachs Group, Inc.2 | | November 3, 2011 | | 3-month
LIBOR | | 5.0435%
Semi-Annually | | | 81,800 | | | 722 | |
| | | | | |
The Goldman Sachs Group, Inc.2 | | January 10, 2012 | | 3-month
LIBOR | | 5.658%
Semi-Annually | | | 71,900 | | | 1,655 | |
| | | | | |
The Goldman Sachs Group, Inc.2 | | January 12, 2012 | | 3-month
LIBOR | | 5.0863%
Semi-Annually | | | 71,000 | | | 725 | |
| | | | | |
The Goldman Sachs Group, Inc.2 | | January 31, 2012 | | 3-month
LIBOR | | 5.279%
Semi-Annually | | | 71,100 | | | 1,254 | |
| | | | | |
The Goldman Sachs Group, Inc.2 | | February 1, 2012 | | 3-month
LIBOR | | 5.315%
Semi-Annually | | | 81,200 | | | 1,536 | |
| | | | | |
The Goldman Sachs Group, Inc.2 | | October 18, 2016 | | 5.67%
Semi-Annually | | 3-month
LIBOR | | | 55,877 | | | (1,457 | ) |
| | | | | |
The Goldman Sachs Group, Inc.2 | | October 19, 2016 | | 5.69%
Semi-Annually | | 3-month
LIBOR | | | 55,877 | | | (1,508 | ) |
| | | | | |
The Goldman Sachs Group, Inc.2 | | February 2, 2017 | | 3-month
LIBOR | | 5.376%
Semi-Annually | | | 35,200 | | | 527 | |
| | | | | |
The Goldman Sachs Group, Inc.2 | | July 30, 2017 | | 3-month
LIBOR | | 5.56545%
Semi-Annually | | | 150,000 | | | 4,264 | |
| | | | | |
The Goldman Sachs Group, Inc.2 | | August 20, 2017 | | 3-month
LIBOR | | 5.45136%
Semi-Annually | | | 64,570 | | | 1,244 | |
| | | | | |
The Goldman Sachs Group, Inc.2 | | September 14, 2017 | | 5.0575%
Semi-Annually | | 3-month
LIBOR | | | 30,100 | | | 362 | |
233
Semi-Annual Report to Shareholders
Notes to Financial Statements—Continued
| | | | | | | | | | | | | |
| Western Asset Core Bond Portfolio—Continued | |
Agreement With: | | Termination Date | | The Fund
Agrees to Pay | | The Fund
Will Receive | | Contract
Notional Amount | | Unrealized
Appreciation/
(Depreciation) | |
| | | | | | | | | | | | | |
The Goldman Sachs Group, Inc.2 | | March 19, 2018 | | 3-month
LIBOR | | 5%
Semi-Annually | | $ | 45,100 | | $ | 284 | |
| | | | | |
The Goldman Sachs Group, Inc.2 | | March 19, 2038 | | 3-month
LIBOR | | 5.25%
Semi-Annually | | | 335,084 | | | (2,696 | ) |
| | | | | |
The Goldman Sachs Group, Inc.
(CDX HY 8)1 | | June 20, 2012 | | Specified amount upon credit event notice | | 0.82%
Quarterly | | | 47,700 | | | (1,886 | ) |
| | | | | |
The Goldman Sachs Group, Inc.
(CDX IG 8)1 | | June 20, 2012 | | Specified amount upon credit event notice | | 0.35%
Quarterly | | | 42,300 | | | (260 | ) |
| | | | | |
The Goldman Sachs Group, Inc.
(CDX IG 8)1 | | June 20, 2012 | | Specified amount upon credit event notice | | 0.35%
Quarterly | | | 42,800 | | | (199 | ) |
| | | | | |
The Goldman Sachs Group, Inc.
(CDX IG 8)1 | | June 20, 2012 | | Specified amount upon credit event notice | | 0.35%
Quarterly | | | 14,700 | | | 140 | |
| | | | | |
The Goldman Sachs Group, Inc.
(CDX IG HVOL 3)1 | | March 20, 2010 | | Specified amount upon credit event notice | | 1.05%
Quarterly | | | 16,433 | | | 182 | |
| | | | | |
The Goldman Sachs Group, Inc.
(CDX IG HVOL 3)1 | | March 20, 2010 | | Specified amount upon credit event notice | | 1.05%
Quarterly | | | 32,093 | | | 777 | |
| | | | | |
The Goldman Sachs Group, Inc.
(CDX IG HVOL 3)1 | | March 20, 2010 | | Specified amount upon credit event notice | | 1.05%
Quarterly | | | 48,333 | | | 322 | |
| | | | | |
The Goldman Sachs Group, Inc.
(CDX IG HVOL 4)1 | | June 20, 2010 | | 0.9%
Quarterly | | Specified amount upon credit event notice | | | 14,200 | | | 135 | |
| | | | | |
The Goldman Sachs Group, Inc.
(CDX IG HVOL 4)1 | | December 20, 2010 | | 0.85%
Quarterly | | Specified amount upon credit event notice | | | 14,200 | | | 114 | |
| | | | | |
The Goldman Sachs Group, Inc.
(CDX IG HVOL 5)1 | | December 20, 2010 | | 0.85%
Quarterly | | Specified amount upon credit event notice | | | 30,100 | | | 232 | |
| | | | | |
The Goldman Sachs Group, Inc.
(CDX IG HVOL 8)1 | | June 20, 2012 | | Specified amount upon credit event notice | | 0.75%
Quarterly | | | 80,900 | | | (2,492 | ) |
| | | | | |
The Goldman Sachs Group, Inc.
(CDX IG HVOL 8)1 | | June 20, 2012 | | Specified amount upon credit event notice | | 0.75%
Quarterly | | | 34,000 | | | (884 | ) |
234
Semi-Annual Report to Shareholders
| | | | | | | | | | | | | |
| Western Asset Core Bond Portfolio—Continued | |
Agreement With: | | Termination Date | | The Fund
Agrees to Pay | | The Fund
Will Receive | | Contract
Notional Amount | | Unrealized
Appreciation/
(Depreciation) | |
| | | | | | | | | | | | | |
The Goldman Sachs Group, Inc.
(CDX IG HVOL 8)1 | | June 20, 2012 | | Specified amount upon credit event notice | | 0.75%
Quarterly | | $ | 29,200 | | $ | (826 | ) |
| | | | | |
The Goldman Sachs Group, Inc.
(CDX IG HVOL 8)1 | | June 20, 2012 | | Specified amount upon credit event notice | | 0.75%
Quarterly | | | 14,100 | | | (374 | ) |
| | | | | |
The Goldman Sachs Group, Inc.
(CDX IG HVOL 8)1 | | June 20, 2012 | | Specified amount upon credit event notice | | 0.75%
Quarterly | | | 14,700 | | | (356 | ) |
| | | | | |
The Goldman Sachs Group, Inc.
(CDX IG HVOL 8)1 | | June 20, 2012 | | Specified amount upon credit event notice | | 0.75%
Quarterly | | | 28,200 | | | (659 | ) |
| | | | | |
The Goldman Sachs Group, Inc.
(CDX IG HVOL 8)1 | | June 20, 2012 | | Specified amount upon credit event notice | | 0.75%
Quarterly | | | 100,000 | | | (2,357 | ) |
| | | | | |
The Goldman Sachs Group, Inc.
(CDX IG HVOL 8)1 | | June 20, 2012 | | Specified amount upon credit event notice | | 0.75%
Quarterly | | | 100,000 | | | (2,127 | ) |
| | | | | |
The Goldman Sachs Group, Inc.
(CDX IG HVOL 8)1 | | June 20, 2012 | | Specified amount upon credit event notice | | 0.75%
Quarterly | | | 14,100 | | | (269 | ) |
| | | | | |
The Goldman Sachs Group, Inc.
(CDX IG HVOL 8)1 | | June 20, 2012 | | Specified amount upon credit event notice | | 0.75%
Quarterly | | | 14,300 | | | (270 | ) |
| | | | | |
The Goldman Sachs Group, Inc.
(CDX IG HVOL 8)1 | | June 20, 2012 | | Specified amount upon credit event notice | | 0.75%
Quarterly | | | 14,600 | | | (130 | ) |
| | | | | |
The Goldman Sachs Group, Inc.
(CDX IG HVOL 8)1 | | June 20, 2012 | | Specified amount upon credit event notice | | 0.75%
Quarterly | | | 14,600 | | | (151 | ) |
| | | | | |
The Goldman Sachs Group, Inc.
(CDX IG HVOL 8)1 | | June 20, 2012 | | Specified amount upon credit event notice | | 0.75%
Quarterly | | | 14,200 | | | 148 | |
| | | | | |
The Goldman Sachs Group, Inc.
(CDX IG HVOL 8)1 | | June 20, 2012 | | Specified amount upon credit event notice | | 0.75%
Quarterly | | | 14,700 | | | 252 | |
| | | | | |
The Goldman Sachs Group, Inc.
(Countrywide Home Loans, Inc., 4%, due 3/22/11)1 | | September 20, 2012 | | Specified amount upon credit event notice | | 6%
Quarterly | | | 4,700 | | | 648 | |
235
Semi-Annual Report to Shareholders
Notes to Financial Statements—Continued
| | | | | | | | | | | | | |
| `Western Asset Core Bond Portfolio—Continued | |
Agreement With: | | Termination Date | | The Fund
Agrees to Pay | | The Fund
Will Receive | | Contract
Notional Amount | | Unrealized
Appreciation/
(Depreciation) | |
| | | | | | | | | | | | | |
The Goldman Sachs Group, Inc.
(Eastman Kodak Company,
7.25%, due 11/15/13)1 | | March 20, 2015 | | Specified amount upon credit event notice | | 1.67%
Quarterly | | $ | 1,400 | | $ | (49 | ) |
| | | | | |
The Goldman Sachs Group, Inc.
(Ford Motor Credit Company,
7%, due 10/1/13)1 | | June 20, 2010 | | Specified amount upon credit event notice | | 4.75%
Quarterly | | | 1,900 | | | 45 | |
| | | | | |
The Goldman Sachs Group, Inc.
(General Motors Acceptance Corporation,
6.875%, due 8/28/12)1 | | June 20, 2010 | | Specified amount upon credit event notice | | 6%
Quarterly | | | 5,000 | | | 320 | |
| | | | | |
The Goldman Sachs Group, Inc.
(General Motors Acceptance Corporation,
7.125%, due 7/15/13)1 | | June 20, 2010 | | Specified amount upon credit event notice | | 8.95%
Quarterly | | | 5,000 | | | 585 | |
| | | | | |
The Goldman Sachs Group, Inc.
(Washington Mutual Inc.,
5.25%, due 9/15/17)1 | | June 20, 2017 | | Specified amount upon credit event notice | | 0.75%
Quarterly | | | 9,600 | | | (3 | ) |
| | | | | | | | | | | | | |
| | | | | | | | $ | 5,604,202 | | $ | (3,942 | ) |
| | | | | | | | | | | | | |
|
| Western Asset Core Plus Bond Portfolio | |
Agreement With: | | Termination Date | | The Fund
Agrees to Pay | | The Fund
Will Receive | | Contract
Notional Amount | | Unrealized
Appreciation/ (Depreciation) | |
| | | | | | | | | | | | | |
Banc of America Securities LLC2 | | December 1, 2008 | | 5.03%
Semi-Annually | | 3-month
LIBOR | | $ | 11,660 | | $ | (26 | ) |
| | | | | |
Banc of America Securities LLC2 | | March 1, 2013 | | 5.104%
Semi-Annually | | 3-month
LIBOR | | | 8,100 | | | (69 | ) |
| | | | | |
Banc of America Securities LLC2 | | December 16, 2013 | | 5.381%
Semi-Annually | | 3-month
LIBOR | | | 5,510 | | | (114 | ) |
| | | | | |
Banc of America Securities LLC2 | | November 10, 2015 | | 4.864%
Semi-Annually | | 3-month
LIBOR | | | 7,950 | | | 127 | |
| | | | | |
Banc of America Securities LLC2 | | January 15, 2016 | | 5.45084%
Semi-Annually | | 3-month
LIBOR | | | 5,500 | | | (125 | ) |
| | | | | |
Banc of America Securities LLC2 | | October 3, 2016 | | 5.425%
Semi-Annually | | 3-month
LIBOR | | | 8,270 | | | (162 | ) |
| | | | | |
Banc of America Securities LLC
(Heinz Co.,
6.428%, due 12/01/08)1 | | December 20, 2008 | | 0.165%
Monthly | | Specified amount upon credit event notice | | | 11,660 | | | (15 | ) |
236
Semi-Annual Report to Shareholders
| | | | | | | | | | | | | |
| Western Asset Core Plus Bond Portfolio—Continued | |
Agreement With: | | Termination Date | | The Fund
Agrees to Pay | | The Fund
Will Receive | | Contract
Notional Amount | | Unrealized
Appreciation/ (Depreciation) | |
| | | | | | | | | | | | | |
Banc of America Securities LLC
(Home Depot Inc.,
3.75%, due 9/15/09)1 | | December 20, 2013 | | 0.635%
Quarterly | | Specified amount upon credit event notice | | $ | 5,510 | | $ | 24 | |
| | | | | |
Banc of America Securities LLC
(Marriot International Inc.,
4.625%, due 6/15/12)1 | | December 20, 2015 | | 0.73%
Monthly | | Specified amount upon credit event notice | | | 7,950 | | | (81 | ) |
| | | | | |
Banc of America Securities LLC
(Masco Corp.,
5.875%, due 7/15/12)1 | | December 20, 2016 | | 1.04%
Quarterly | | Specified amount upon credit event notice | | | 8,270 | | | (18 | ) |
| | | | | |
Banc of America Securities LLC
(PHH Corporate Note,
7.125%, due 3/1/13)1 | | March 20, 2013 | | 1.05%
Monthly | | Specified amount upon credit event notice | | | 8,640 | | | 80 | |
| | | | | |
Banc of America Securities LLC
(Viacom Inc.,
4.625%, due 5/15/18)1 | | December 20, 2015 | | 1.13%
Quarterly | | Specified amount upon credit event notice | | | 5,500 | | | (124 | ) |
| | | | | |
Barclays Capital Inc.2 | | November 1, 2011 | | 5.439%
Semi-Annually | | 3-month
LIBOR | | | 10,850 | | | (254 | ) |
| | | | | |
Barclays Capital Inc.2 | | June 25, 2012 | | 5.06%
Semi-Annually | | 3-month
LIBOR | | | 6,240 | | | (54 | ) |
| | | | | |
Barclays Capital Inc.2 | | September 15, 2012 | | 5.189%
Semi-Annually | | 3-month
LIBOR | | | 6,330 | | | (81 | ) |
| | | | | |
Barclays Capital Inc.2 | | October 20, 2016 | | 5.326%
Semi-Annually | | 3-month
LIBOR | | | 6,260 | | | (73 | ) |
| | | | | |
Barclays Capital Inc.
(Amerisourcebergen Corp.,
5.625%, due 9/15/12)1 | | September 20, 2012 | | 0.5%
Quarterly | | Specified amount upon credit event notice | | | 6,330 | | | — | |
| | | | | |
Barclays Capital Inc.
(Cardinal Health Inc.,
5.85%, due 12/15/17)1 | | September 20, 2016 | | 0.49%
Quarterly | | Specified amount upon credit event notice | | | 6,260 | | | 5 | |
| | | | | |
Barclays Capital Inc.
(CDX IG HVOL 8)1 | | June 20, 2012 | | Specified amount upon credit event notice | | 0.75%
Quarterly | | | 27,100 | | | (599 | ) |
| | | | | |
Barclays Capital Inc.
(General Motors Corp.,
7.125%, due 07/15/13)1 | | December 20, 2011 | | Specified amount upon credit event notice | | 4.16%
Quarterly | | | 7,000 | | | (101 | ) |
| | | | | |
Barclays Capital Inc.
(Health Care Property Investments Inc.,
6.45%, due 06/25/12)1 | | June 20, 2012 | | 0.63%
Quarterly | | Specified amount upon credit event notice | | | 6,240 | | | 65 | |
237
Semi-Annual Report to Shareholders
Notes to Financial Statements—Continued
| | | | | | | | | | | | | |
| Western Asset Core Plus Bond Portfolio—Continued | |
Agreement With: | | Termination Date | | The Fund
Agrees to Pay | | The Fund
Will Receive | | Contract
Notional Amount | | Unrealized
Appreciation/ (Depreciation) | |
| | | | | | | | | | | | | |
Barclays Capital Inc.
(Motorola Inc.,
6.5%, due 9/1/25)1 | | December 20, 2011 | | 0.32%
Quarterly | | Specified amount upon credit event notice | | $ | 10,850 | | $ | (17 | ) |
| | | | | |
Barclays Capital Inc.
(Residential Capital Corp.,
6.5%, due 4/17/13)1 | | September 20, 2008 | | Specified amount upon credit event notice | | 12%
Quarterly | | | 500 | | | (10 | ) |
| | | | | |
Bear Stearns, Inc.2 | | April 30, 2011 | | 5.05%
Semi-Annually | | 3-month
LIBOR | | | 4,300 | | | (41 | ) |
| | | | | |
Bear Stearns, Inc.2 | | December 22, 2011 | | 3-month
LIBOR | | 4.9925%
Semi-Annually | | | 54,900 | | | 378 | |
| | | | | |
Bear Stearns, Inc.2 | | September 15, 2014 | | 5%
Semi-Annually | | 3-month
LIBOR | | | 8,250 | | | 22 | |
| | | | | |
Bear Stearns, Inc.
(ABX.
HE-AAA 07-2)1 | | January 25, 2038 | | Specified amount upon credit event notice | | 0.76%
Monthly | | | 10,000 | | | (150 | ) |
| | | | | |
Bear Stearns, Inc.
(Bell South Corp.,
6%, due 10/15/11)1 | | September 20, 2014 | | 0.28%
Quarterly | | Specified amount upon credit event notice | | | 8,250 | | | 4 | |
| | | | | |
Bear Stearns, Inc.
(CDX HY 6B)1 | | June 20, 2011 | | 3%
Quarterly | | Specified amount upon credit event notice | | | 11,600 | | | 38 | |
| | | | | |
Bear Stearns, Inc.
(CDX HY 6B)1 | | June 20, 2011 | | Specified amount upon credit event notice | | 3%
Quarterly | | | 25,000 | | | (89 | ) |
| | | | | |
Bear Stearns, Inc.
(CDX HY 8)1 | | June 20, 2012 | | Specified amount upon credit
even notice | | 0.91%
Quarterly | | | 31,750 | | | (1,135 | ) |
| | | | | |
Bear Stearns, Inc.
(CDX HY 8)1 | | June 20, 2012 | | Specified amount upon credit event notice | | 1.01%
Quarterly | | | 31,800 | | | (1,004 | ) |
| | | | | |
Bear Stearns, Inc.
(CDX HY 8)1 | | June 20, 2012 | | Specified amount upon credit event notice | | 1.05%
Quarterly | | | 12,700 | | | (379 | ) |
| | | | | |
Bear Stearns, Inc.
(CDX IG 8)1 | | June 20, 2012 | | Specified amount upon credit event notice | | 0.35%
Quarterly | | | 85,500 | | | (189 | ) |
| | | | | |
Bear Stearns, Inc.
(CDX IG HVOL 8)1 | | June 20, 2012 | | Specified amount upon credit event notice | | 0.75%
Quarterly | | | 28,200 | | | (521 | ) |
238
Semi-Annual Report to Shareholders
| | | | | | | | | | | | | |
| Western Asset Core Plus Bond Portfolio—Continued | |
Agreement With: | | Termination Date | | The Fund
Agrees to Pay | | The Fund
Will Receive | | Contract
Notional Amount | | Unrealized
Appreciation/ (Depreciation) | |
| | | | | | | | | | | | | |
Bear Stearns, Inc.
(CDX IG HVOL 8)1 | | June 20, 2012 | | Specified amount upon credit event notice | | 0.75%
Quarterly | | $ | 28,500 | | $ | (536 | ) |
| | | | | |
Bear Stearns, Inc.
(CDX IG HVOL 8)1 | | June 20, 2012 | | Specified amount upon credit event notice | | 0.75%
Quarterly | | | 207,400 | | | (1,213 | ) |
| | | | | |
Bear Stearns, Inc.
(CDX IG HVOL 8)1 | | June 20, 2012 | | Specified amount upon credit event notice | | 0.75%
Quarterly | | | 56,100 | | | (1,352 | ) |
| | | | | |
Bear Stearns, Inc. (Ford Motor Credit Company,
7%, due 10/1/13)1 | | June 20, 2010 | | Specified amount upon credit event notice | | 4.83% Quarterly | | | 12,500 | | | 316 | |
| | | | | |
Bear Stearns, Inc.
(General Motors Acceptance Corporation,
7.125%, due 7/15/13)1 | | March 20, 2012 | | Specified amount upon credit event notice | | 3.2% Quarterly | | | 9,900 | | | (504 | ) |
| | | | | |
Bear Stearns, Inc.
(General Motors Acceptance Corporation,
7.125%, due 7/15/13)1 | | March 20, 2012 | | Specified amount upon credit event notice | | 3.25%
Quarterly | | | 18,500 | | | (911 | ) |
| | | | | |
Bear Stearns, Inc.
(GIE PSA Tresorerie,
5.875%, due 9/27/11)1 | | March 20, 2011 | | 0.32%
Quarterly | | Specified amount upon credit event notice | | | 2,620 | | | (7 | ) |
| | | | | |
Bear Stearns, Inc.
(GIE PSA Tresorerie,
5.875%, due 9/27/11)1 | | March 20, 2011 | | 0.32%
Quarterly | | Specified amount upon credit event notice | | | 3,470 | | | (6 | ) |
| | | | | |
Bear Stearns, Inc.
(Renault S.A.,
4.625%, due 5/28/10)1 | | March 20, 2011 | | 0.36%
Quarterly | | Specified amount upon credit event notice | | | 2,620 | | | (6 | ) |
| | | | | |
Bear Stearns, Inc.
(Renault S.A.,
4.625%, due 5/28/10)1 | | March 20, 2011 | | 0.36%
Quarterly | | Specified amount upon credit event notice | | | 2,620 | | | (6 | ) |
| | | | | |
Bear Stearns, Inc.
(Renault S.A.,
4.625%, due 5/28/10)1 | | March 20, 2011 | | 0.35%
Quarterly | | Specified amount upon credit event notice | | | 790 | | | (2 | ) |
| | | | | |
Bear Stearns, Inc.
(Viacom Inc.,
6.25%, due 4/30/16)1 | | March 20, 2011 | | 0.59%
Quarterly | | Specified amount upon credit event notice | | | 4,300 | | | (42 | ) |
239
Semi-Annual Report to Shareholders
Notes to Financial Statements—Continued
| | | | | | | | | | | | | |
| Western Asset Core Plus Bond Portfolio—Continued | |
Agreement With: | | Termination Date | | The Fund
Agrees to Pay | | The Fund
Will Receive | | Contract
Notional Amount | | Unrealized
Appreciation/ (Depreciation) | |
| | | | | | | | | | | | | |
Bear Stearns, Inc.
(Volkswagen International Finance NV,
4.875%, due 5/22/13)1 | | March 20, 2011 | | 0.335%
Quarterly | | Specified amount upon credit event notice | | $ | 2,620 | | $ | (12 | ) |
| | | | | |
Bear Stearns, Inc.
(Volkswagen International Finance NV,
4.875%, due 5/22/13)1 | | March 20, 2011 | | 0.34%
Quarterly | | Specified amount upon credit event notice | | | 2,620 | | | (12 | ) |
| | | | | |
Bear Stearns, Inc.
(Volkswagen International Finance NV,
4.875%, due 5/22/13)1 | | March 20, 2011 | | 0.33%
Quarterly | | Specified amount upon credit event notice | | | 790 | | | (3 | ) |
| | | | | |
Credit Suisse First Boston USA2 | | January 19, 2009 | | Mexican Interbank
Deposit Rate | | 7.69%
Monthly | | | 144,500 | | | (59 | ) |
| | | | | |
Credit Suisse First Boston USA2 | | August 15, 2010 | | 5.446%
Semi-Annually | | 3-month
LIBOR | | | 2,720 | | | (53 | ) |
| | | | | |
Credit Suisse First Boston USA2 | | September 15, 2010 | | 5.0025% Semi-Annually | | 3-month
LIBOR | | | 5,990 | | | (43 | ) |
| | | | | |
Credit Suisse First Boston USA2 | | March 1, 2011 | | 5.229%
Semi-Annually | | 3-month LIBOR | | | 4,110 | | | (61 | ) |
| | | | | |
Credit Suisse First Boston USA2 | | May 1, 2012 | | 5.085%
Semi-Annually | | 3-month
LIBOR | | | 4,800 | | | (47 | ) |
| | | | | |
Credit Suisse First Boston USA2 | | December 1, 2012 | | 4.9025% Semi-Annually | | 3-month
LIBOR | | | 10,600 | | | 2 | |
| | | | | |
Credit Suisse First Boston USA2 | | August 15, 2013 | | 5.0225% Semi-Annually | | 3-month
LIBOR | | | 5,300 | | | (18 | ) |
| | | | | |
Credit Suisse First Boston USA2 | | March 15, 2014 | | 5.131% Semi-Annually | | 3-month
LIBOR | | | 6,630 | | | (45 | ) |
| | | | | |
Credit Suisse First Boston USA2 | | September 15, 2015 | | 5.1285% Semi-Annually | | 3-month
LIBOR | | | 10,070 | | | (14 | ) |
| | | | | |
Credit Suisse First Boston USA2 | | September 15, 2015 | | 5.16% Semi-Annually | | 3-month
LIBOR | | | 5,350 | | | (18 | ) |
| | | | | |
Credit Suisse First Boston USA2 | | March 1, 2017 | | 5.335% Semi-Annually | | 3-month
LIBOR | | | 4,880 | | | (60 | ) |
| | | | | |
Credit Suisse First Boston USA
(AAMES Mortgage Investment Trust 2005-1 M8 1-Month LIBOR + 160 bp,
due 6/25/35)1 | | June 25, 2035 | | 1.28%
Monthly | | Specified amount upon credit event notice | | | 1,122 | | | 350 | |
240
Semi-Annual Report to Shareholders
| | | | | | | | | | | | | |
| Western Asset Core Plus Bond Portfolio—Continued | |
Agreement With: | | Termination Date | | The Fund
Agrees to Pay | | The Fund
Will Receive | | Contract
Notional Amount | | Unrealized
Appreciation/ (Depreciation) | |
| | | | | | | | | | | | | |
Credit Suisse First Boston USA
(AAMES Mortgage Investment Trust 2005-1 M9 1-Month LIBOR + 250 bp,
due 6/25/35)1 | | June 25, 2035 | | 2.05%
Monthly | | Specified amount upon credit event notice | | $ | 1,122 | | $ | 338 | |
| | | | | |
Credit Suisse First Boston USA
(ABX.
HE-AAA 07-2)1 | | January 25, 2038 | | Specified amount upon credit event notice | | 0.76%
Monthly | | | 23,300 | | | (517 | ) |
| | | | | |
Credit Suisse First Boston USA
(ABX.
HE-AAA 07-2)1 | | January 25, 2038 | | Specified amount upon credit event notice | | 0.76%
Monthly | | | 12,800 | | | (12 | ) |
| | | | | |
Credit Suisse First Boston USA
(ABX.
HE-AAA 07-2)1 | | January 25, 2038 | | Specified amount upon credit event notice | | 0.76%
Monthly | | | 2,600 | | | (12 | ) |
| | | | | |
Credit Suisse First Boston USA
(ACE Securities Corp.,
2005-HE1 M8 1-Month
LIBOR + 138 bp,
due 2/25/35)1 | | February 25, 2035 | | 1.31%
Monthly | | Specified amount upon credit event notice | | | 1,122 | | | 238 | |
| | | | | |
Credit Suisse First Boston USA
(ACE Securities Corp.,
2005-HE1 M9 1-Month
LIBOR + 220 bp,
due 2/25/35)1 | | February 25, 2035 | | 2.06%
Monthly | | Specified amount upon credit event notice | | | 1,122 | | | 292 | |
| | | | | |
Credit Suisse First Boston USA
(Aegis Asset Backed Securities Trust 2004-4 B2 1-Month LIBOR + 190 bp,
due 10/25/34)1 | | October 25, 2034 | | 1.37%
Monthly | | Specified amount upon credit event notice | | | 1,494 | | | 304 | |
| | | | | |
Credit Suisse First Boston USA
(Aegis Asset Backed Securities Trust 2005 B2 1Month LIBOR + 130 bp,
due 3/25/35)1 | | March 25, 2035 | | 1.31%
Quarterly | | Specified amount upon credit event notice | | | 1,122 | | | 394 | |
| | | | | |
Credit Suisse First Boston USA
(Aegis Asset Backed Securities Trust 2005 B3 1-Month LIBOR + 200 bp,
due 3/25/35)1 | | March 25, 2035 | | 2.18%
Quarterly | | Specified amount upon credit event notice | | | 1,122 | | | 455 | |
| | | | | |
Credit Suisse First Boston USA
(Amerisource Bergen Corp.,
8.125%, due 9/1/08)1 | | September 20, 2015 | | 0.9%
Monthly | | Specified amount upon credit event notice | | | 5,350 | | | (47 | ) |
241
Semi-Annual Report to Shareholders
Notes to Financial Statements—Continued
| | | | | | | | | | | | |
| Western Asset Core Plus Bond Portfolio—Continued |
Agreement With: | | Termination Date | | The Fund
Agrees to Pay | | The Fund
Will Receive | | Contract
Notional Amount | | Unrealized
Appreciation/ (Depreciation) |
| | | | | | | | | | | | |
Credit Suisse First Boston USA
(Argent Securities Inc,
2004-W11 M10 1-Month
LIBOR + 350 bp,
due 11/25/34)1 | | November 25, 2034 | | 2.15%
Monthly | | Specified amount upon credit event notice | | $ | 1,122 | | $ | 182 |
| | | | | |
Credit Suisse First Boston USA
(Argent Securities Inc,
2004-W11 M9 1-Month
LIBOR + 225 bp,
due 11/25/34)1 | | November 25, 2034 | | 1.33%
Monthly | | Specified amount upon credit event notice | | | 1,122 | | | 153 |
| | | | | |
Credit Suisse First Boston USA
(Argent Securities Inc.,
2004-W4 M3 1-Month
LIBOR + 300 bp,
due 3/25/34)1 | | March 25, 2034 | | 2.2%
Monthly | | Specified amount upon credit event notice | | | 572 | | | 85 |
| | | | | |
Credit Suisse First Boston USA
(ConocoPhillips,
4.75%, due 10/15/12)1 | | September 20, 2012 | | Specified amount upon credit event notice | | 0.27%
Quarterly | | | 1,460 | | | 2 |
| | | | | |
Credit Suisse First Boston USA
(Eastman Kodak Company,
7.25%, due 11/15/13)1 | | September 20, 2010 | | Specified amount upon credit event notice | | 2.32%
Quarterly | | | 2,400 | | | 86 |
| | | | | |
Credit Suisse First Boston USA
(Eastman Kodak Company,
7.25%, due 11/15/13)1 | | March 20, 2010 | | Specified amount upon credit event notice | | 1.4%
Quarterly | | | 9,000 | | | 114 |
| | | | | |
Credit Suisse First Boston USA
(Finance America Mortgage Loan Trust 2004-3 M8 1-Month LIBOR + 180 bp,
due 11/25/34)1 | | November 25, 2034 | | 1.31%
Monthly | | Specified amount upon credit event notice | | | 408 | | | 136 |
| | | | | |
Credit Suisse First Boston USA
(Finance America Mortgage Loan Trust 2004-3 M9 1-Month LIBOR + 315 bp,
due 11/25/34)1 | | November 25, 2034 | | 2.18%
Monthly | | Specified amount upon credit event notice | | | 408 | | | 170 |
| | | | | |
Credit Suisse First Boston USA
(Fremont Home Loan Trust 2005-A, 1-Month LIBOR + 135 bp, due 1/25/35)1 | | January 25, 2035 | | 1.31%
Monthly | | Specified amount upon credit event notice | | | 1,122 | | | 166 |
Credit Suisse First Boston USA
(Fremont Home Loan Trust 2005-A,1-Month LIBOR + 100 bp, due 1/25/35)1 | | January 25, 2035 | | 2.08%
Monthly | | Specified amount upon credit event notice | | | 705 | | | 182 |
242
Semi-Annual Report to Shareholders
| | | | | | | | | | | | | |
| Western Asset Core Plus Bond Portfolio—Continued | |
Agreement With: | | Termination Date | | The Fund
Agrees to Pay | | The Fund
Will Receive | | Contract
Notional Amount | | Unrealized
Appreciation/ (Depreciation) | |
| | | | | | | | | | | | | |
Credit Suisse First Boston USA
(Home Depot Inc.,
3.75%, due 9/15/09)1 | | September 20, 2010 | | 0.17%
Quarterly | | Specified amount upon credit event notice | | $ | 2,720 | | $ | 18 | |
| | | | | |
Credit Suisse First Boston USA
(iBoxx HY 3)1 | | December 20, 2009 | | Specified amount upon credit event notice | | 4%
Quarterly | | | 3,007 | | | 252 | |
| | | | | |
Credit Suisse First Boston USA
(iBoxx HY 3)1 | | December 20, 2009 | | Specified amount upon credit event notice | | 4%
Quarterly | | | 3,007 | | | 252 | |
| | | | | |
Credit Suisse First Boston USA
(iBoxx HY 3)1 | | December 20, 2009 | | Specified amount upon credit event notice | | 4%
Quarterly | | | 15,177 | | | 739 | |
| | | | | |
Credit Suisse First Boston USA
(iBoxx HY 3)1 | | December 20, 2009 | | Specified amount upon credit event notice | | 4%
Quarterly | | | 11,264 | | | 464 | |
| | | | | |
Credit Suisse First Boston USA
(iBoxx IG Hi-Vol)1 | | March 20, 2009 | | Specified amount upon credit event notice | | 1.25%
Quarterly | | | 48,333 | | | 88 | |
| | | | | |
Credit Suisse First Boston USA
(iBoxx IG Hi-Vol2)1 | | September 20, 2009 | | 1.15%
Quarterly | | Specified amount upon credit event notice | | | 24,167 | | | (41 | ) |
| | | | | |
Credit Suisse First Boston USA
(IndyMac Home Equity Loan Asset-Backed, Trust 2004-C M8, 1-Month
LIBOR + 190 bp,
due 3/25/35)1 | | March 25, 2035 | | 1.28%
Monthly | | Specified amount upon credit event notice | | | 1,122 | | | 276 | |
| | | | | |
Credit Suisse First Boston USA
(IndyMac Home Equity Loan Asset-Backed, Trust 2004-C M9, 1-Month
LIBOR + 325 bp, due 3/25/35)1 | | March 25, 2035 | | 2.05%
Monthly | | Specified amount upon credit event notice | | | 1,122 | | | 304 | |
| | | | | |
Credit Suisse First Boston USA
(Limited Brands Inc.,
6.125%, due 12/01/12)1 | | December 20, 2012 | | 0.6%
Monthly | | Specified amount upon credit event notice | | | 10,600 | | | 145 | |
| | | | | |
Credit Suisse First Boston USA
(Long Beach Mortgage Loan Trust 2004-1 M9 1-Month LIBOR + 350 bp, due 2/25/34)1 | | February 25, 2034 | | 2.15%
Monthly | | Specified amount upon credit event notice | | | 450 | | | 87 | |
243
Semi-Annual Report to Shareholders
Notes to Financial Statements—Continued
| | | | | | | | | | | | | |
| Western Asset Core Plus Bond Portfolio—Continued | |
Agreement With: | | Termination Date | | The Fund
Agrees to Pay | | The Fund
Will Receive | | Contract
Notional Amount | | Unrealized
Appreciation/ (Depreciation) | |
| | | | | | | | | | | | | |
Credit Suisse First Boston USA
(Long Beach Mortgage Loan Trust 2005-1 M8 1-Month LIBOR + 170 bp, due 2/25/35)1 | | February 25, 2035 | | 1.31%
Monthly | | Specified amount upon credit event notice | | $ | 1,122 | | $ | 329 | |
| | | | | |
Credit Suisse First Boston USA
(Long Beach Mortgage Loan Trust 2005-1 M9 1-Month LIBOR + 275 bp, due 2/25/35)1 | | February 25, 2035 | | 2.08%
Monthly | | Specified amount upon credit event notice | | | 1,122 | | | 365 | |
| | | | | |
Credit Suisse First Boston USA
(Marsh & Mclennan Company, Inc.,
5.375%, due 7/15/14)1 | | September 20, 2010 | | 0.46%
Quarterly | | Specified amount upon credit event notice | | | 5,990 | | | (38 | ) |
| | | | | |
Credit Suisse First Boston USA
(Masco Corp.,
5.875%, due 7/15/12)1 | | September 20, 2013 | | 0.75%
Monthly | | Specified amount upon credit event notice | | | 5,830 | | | 26 | |
| | | | | |
Credit Suisse First Boston USA
(MASTR Asset Backed Securities Trust 2005-NC1 M8 1-Month LIBOR + 153 bp, due 12/25/34)1 | | December 25, 2034 | | 1.31%
Monthly | | Specified amount upon credit event notice | | | 1,122 | | | 146 | |
| | | | | |
Credit Suisse First Boston USA
(MASTR Asset Backed Securities Trust 2005-NC1 M9 1-Month LIBOR + 240 bp, due 12/25/34)1 | | December 25, 2034 | | 2.08%
Monthly | | Specified amount upon credit event notice | | | 1,122 | | | 318 | |
| | | | | |
Credit Suisse First Boston USA
(Merrill Lynch Mortgage Investors, Inc 2005-WMC1 B2 1-Month LIBOR + 135 bp, due 9/25/35)1 | | September 25, 2035 | | 1.28%
Monthly | | Specified amount upon credit event notice | | | 1,122 | | | 235 | |
| | | | | |
Credit Suisse First Boston USA
(Merrill Lynch Mortgage Investors, Inc. 2004-WMC4 B3 1-Month LIBOR + 375 bp, due 4/25/35)1 | | April 25, 2035 | | 2.15%
Monthly | | Specified amount upon credit event notice | | | 1,494 | | | 180 | |
| | | | | |
Credit Suisse First Boston USA
(Merrill Lynch Mortgage Investors, Inc. 2005-NC1 B2 1-Month LIBOR + 130 bp, due 10/25/35)1 | | October 25, 2035 | | 1.28%
Monthly | | Specified amount upon credit event notice | | | 1,122 | | | 154 | |
244
Semi-Annual Report to Shareholders
| | | | | | | | | | | | |
| Western Asset Core Plus Bond Portfolio—Continued |
Agreement With: | | Termination Date | | The Fund
Agrees to Pay | | The Fund
Will Receive | | Contract
Notional Amount | | Unrealized
Appreciation/ (Depreciation) |
| | | | | | | | | | | | |
Credit Suisse First Boston USA
(Merrill Lynch Mortgage Investors, Inc. 2005-NC1 B3 1-Month LIBOR + 205 bp, due 10/25/35)1 | | October 25, 2035 | | 2.05%
Monthly | | Specified amount upon credit event notice | | $ | 1,122 | | $ | 190 |
| | | | | |
Credit Suisse First Boston USA
(Merrill Lynch Mortgage Investors, Inc. 2005-WMC1 B3 1-Month LIBOR + 225 bp, due 9/25/35)1 | | September 25, 2035 | | 2.05%
Monthly | | Specified amount upon credit event notice | | | 1,122 | | | 164 |
| | | | | |
Credit Suisse First Boston USA
(Morgan Stanley ABS Capital I 2005-WMC1 B2 1-Month LIBOR + 130 bp, due 1/25/35)1 | | January 25, 2035 | | 1.31%
Monthly | | Specified amount upon credit event notice | | | 1,122 | | | 209 |
| | | | | |
Credit Suisse First Boston USA
(Morgan Stanley ABS Capital I 2005-WMC1 B3 1-Month LIBOR + 215 bp, due 1/25/35)1 | | January 25, 2035 | | 2.18%
Monthly | | Specified amount upon credit event notice | | | 1,041 | | | 125 |
| | | | | |
Credit Suisse First Boston USA
(New Century Home Equity Loan Trust 2004-2 M9 1-Month LIBOR + 325 bp, due 8/25/34)1 | | August 25, 2034 | | 2.15%
Monthly | | Specified amount upon credit event notice | | | 1,494 | | | 242 |
| | | | | |
Credit Suisse First Boston USA
(New Century Home Equity Loan Trust 2005-1 M8 1-Month LIBOR + 140 bp, due 3/25/35)1 | | March 25, 2035 | | 1.31%
Monthly | | Specified amount upon credit event notice | | | 1,122 | | | 151 |
| | | | | |
Credit Suisse First Boston USA
(New Century Home Equity Loan Trust 2005-1 M9 1-Month LIBOR + 205 bp, due 3/25/35)1 | | March 25, 2035 | | 2.18%
Monthly | | Specified amount upon credit event notice | | | 1,122 | | | 332 |
| | | | | |
Credit Suisse First Boston USA
(Novastar Home Equity Loan 2005-1 B2 1-Month LIBOR + 135 bp, due 6/25/35)1 | | June 25, 2035 | | 1.28%
Monthly | | Specified amount upon credit event notice | | | 1,122 | | | 193 |
| | | | | |
Credit Suisse First Boston USA
(Novastar Home Equity Loan 2005-4 B3 1-Month LIBOR + 195 bp, due 6/25/35)1 | | June 25, 2035 | | 2.05%
Monthly | | Specified amount upon credit event notice | | | 1,122 | | | 239 |
245
Semi-Annual Report to Shareholders
Notes to Financial Statements—Continued
| | | | | | | | | | | | | |
| Western Asset Core Plus Bond Portfolio—Continued | |
Agreement With: | | Termination Date | | The Fund
Agrees to Pay | | The Fund
Will Receive | | Contract
Notional Amount | | Unrealized
Appreciation/ (Depreciation) | |
| | | | | | | | | | | | | |
Credit Suisse First Boston USA
(Park Place Securities Inc. 2005-WCH1 M8 1-Month LIBOR + 155 bp, due 1/25/36)1 | | January 25, 2036 | | 1.36%
Monthly | | Specified amount upon credit event notice | | $ | 1,122 | | $ | 366 | |
| | | | | |
Credit Suisse First Boston USA
(Park Place Securities Inc. 2005-WCH1 M9 1-Month LIBOR + 250 bp, due 1/25/36)1 | | January 25, 2036 | | 2.18%
Monthly | | Specified amount upon credit event notice | | | 1,122 | | | 423 | |
| | | | | |
Credit Suisse First Boston USA
(People’s Choice Home Loan Securities Trust 2004-1 M6 1-Month LIBOR + 230 bp, due 6/25/34)1 | | June 25, 2034 | | 1.37%
Quarterly | | Specified amount upon credit event notice | | | 1,494 | | | 258 | |
| | | | | |
Credit Suisse First Boston USA
(People’s Choice Home Loan Securities Trust 2005-1 B3 1-Month LIBOR + 260 bp, due 1/25/35)1 | | January 25, 2035 | | 2.05%
Monthly | | Specified amount upon credit event notice | | | 1,122 | | | 427 | |
| | | | | |
Credit Suisse First Boston USA
(People’s Choice Home Loan Securities Trust 2005-1, 1-Month LIBOR + 165 bp, due 1/25/35)1 | | January 25, 2035 | | 1.28%
Monthly | | Specified amount upon credit event notice | | | 1,122 | | | 282 | |
| | | | | |
Credit Suisse First Boston USA
(Pulte Homes Inc.,
7.875%, due 8/1/11)1 | | March 20, 2011 | | 0.79%
Quarterly | | Specified amount upon credit event notice | | | 4,080 | | | 367 | |
| | | | | |
Credit Suisse First Boston USA
(Southwest Airlines Co.,
5.25%, due 10/1/14)1 | | March 20, 2017 | | 0.69%
Quarterly | | Specified amount upon credit event notice | | | 4,880 | | | 7 | |
| | | | | |
Credit Suisse First Boston USA
(Starwood Hotels,
7.875%, due 5/1/12)1 | | December 20, 2011 | | 1.37%
Monthly | | Specified amount upon credit event notice | | | 5,350 | | | (116 | ) |
| | | | | |
Credit Suisse First Boston USA
(Vodafone Group,
7.75%, due 02/15/10)1 | | September 20, 2015 | | 0.54%
Monthly | | Specified amount upon credit event notice | | | 10,600 | | | (19 | ) |
| | | | | |
Credit Suisse First Boston USA
(Waste Management Inc.,
7.375%, due 8/1/10)1 | | March 20, 2014 | | 0.49%
Quarterly | | Specified amount upon credit event notice | | | 6,630 | | | (23 | ) |
246
Semi-Annual Report to Shareholders
| | | | | | | | | | | | | |
| Western Asset Core Plus Bond Portfolio—Continued | |
Agreement With: | | Termination Date | | The Fund
Agrees to Pay | | The Fund
Will Receive | | Contract
Notional Amount | | Unrealized
Appreciation/ (Depreciation) | |
| | | | | | | | | | | | | |
Deutsche Bank AG2 | | October 5, 2008 | | 3-month
LIBOR | | 4.6545%
Semi-Annually | | $ | 194,330 | | $ | (335 | ) |
| | | | | |
Deutsche Bank AG2 | | June 17, 2010 | | 3-month
LIBOR | | 4.3132%
Semi-Annually | | | 41,570 | | | (431 | ) |
| | | | | |
Deutsche Bank AG2 | | October 11, 2010 | | 3-month
LIBOR | | 4.7077%
Semi-Annually | | | 299,650 | | | (25 | ) |
| | | | | |
Deutsche Bank AG2 | | July 13, 2011 | | 3-month
LIBOR | | 5.6281%
Semi-Annually | | | 133,350 | | | 3,913 | |
| | | | | |
Deutsche Bank AG2 | | June 15, 2016 | | 5.1825%
Semi-Annually | | 3-month
LIBOR | | | 10,890 | | | (25 | ) |
| | | | | |
Deutsche Bank AG2 | | July 21, 2016 | | 3-month
LIBOR | | 5.6931%
Semi-Annually | | | 124,720 | | | 4,861 | |
| | | | | |
Deutsche Bank AG2 | | April 1, 2017 | | 5.435%
Semi-Annually | | 3-month
LIBOR | | | 8,270 | | | (159 | ) |
| | | | | |
Deutsche Bank AG
(ABX. HE-AAA 06-2)1 | | May 25, 2046 | | Specified amount upon credit event notice | | 0.11%
Monthly | | | 15,700 | | | 121 | |
| | | | | |
Deutsche Bank AG
(AES Corp.,
7.75%, due 3/1/14)1 | | December 20, 2016 | | Specified amount upon credit event notice | | 2.2%
Quarterly | | | 3,700 | | | (330 | ) |
| | | | | |
Deutsche Bank AG
(AES Corp.,
7.75%, due 3/1/14)1 | | December 20, 2016 | | Specified amount upon credit event notice | | 2.21%
Quarterly | | | 4,200 | | | (372 | ) |
| | | | | |
Deutsche Bank AG
(Autozone Inc.,
6.95%, due 6/15/16)1 | | June 20, 2016 | | 0.58%
Quarterly | | Specified amount upon credit event notice | | | 10,890 | | | (17 | ) |
| | | | | |
Deutsche Bank AG
(Centurytel Inc.,
7.875%, due 8/15/12)1 | | March 20, 2017 | | 0.89%
Quarterly | | Specified amount upon credit event notice | | | 8,270 | | | (63 | ) |
| | | | | |
Deutsche Bank AG
(Eastman Kodak Company,
7.25%, due 11/15/13)1 | | March 20, 2010 | | Specified amount upon credit event notice | | 1.25%
Quarterly | | | 1,600 | | | 15 | |
| | | | | |
Deutsche Bank AG
(Eastman Kodak Company,
7.25%, due 11/15/13)1 | | September 20, 2010 | | Specified amount upon credit event notice | | 2.3%
Quarterly | | | 3,020 | | | 107 | |
| | | | | |
Deutsche Bank AG
(Eastman Kodak Company,
7.25%, due 11/15/13)1 | | September 20, 2010 | | Specified amount upon credit event notice | | 2.32%
Quarterly | | | 3,200 | | | 115 | |
247
Semi-Annual Report to Shareholders
Notes to Financial Statements—Continued
| | | | | | | | | | | | | |
| Western Asset Core Plus Bond Portfolio—Continued | |
Agreement With: | | Termination Date | | The Fund
Agrees to Pay | | The Fund
Will Receive | | Contract
Notional Amount | | Unrealized
Appreciation/ (Depreciation) | |
| | | | | | | | | | | | | |
Deutsche Bank AG
(Eastman Kodak Company,
7.25%, due 11/15/13)1 | | September 20, 2010 | | Specified amount upon credit event notice | | 2.3%
Quarterly | | $ | 5,430 | | $ | 193 | |
| | | | | |
Deutsche Bank AG
(Eastman Kodak Company,
7.25%, due 11/15/13)1 | | March 20, 2015 | | Specified amount upon credit event notice | | 1.67%
Quarterly | | | 1,900 | | | (66 | ) |
| | | | | |
Deutsche Bank AG
(Fannie Mae,
6%, due 5/15/11)1 | | December 20, 2009 | | Specified amount upon credit event notice | | 0.215%
Quarterly | | | 17,000 | | | 42 | |
| | | | | |
Deutsche Bank AG
(Ford Motor Credit Co.,
7.25%, due 10/25/11)1 | | September 20, 2007 | | Specified amount upon credit event notice | | 3.65%
Quarterly | | | 3,500 | | | — | |
| | | | | |
Deutsche Bank AG
(Ford Motor Credit Co.,
7.25%, due 10/25/11)1 | | September 20, 2017 | | Specified amount upon credit event notice | | 3.65%
Quarterly | | | 4,450 | | | (65 | ) |
| | | | | |
Deutsche Bank AG
(Ford Motor Credit Company,
7%, due 10/1/13)1 | | December 20, 2010 | | Specified amount upon credit event notice | | 5.05%
Quarterly | | | 25,400 | | | 837 | |
| | | | | |
Deutsche Bank AG
(Ford Motor Credit Company,
7.45%, due 7/16/31)1 | | March 20, 2015 | | Specified amount upon credit event notice | | 2.93%
Quarterly | | | 2,600 | | | (370 | ) |
| | | | | |
Deutsche Bank AG
(Freddie Mac,
5%, due 7/15/14)1 | | March 20, 2015 | | Specified amount upon credit event notice | | 0.29%
Quarterly | | | 25,100 | | | 137 | |
| | | | | |
Deutsche Bank AG
(GIE PSA Tresorerie,
5.875%, due 9/27/11)1 | | March 20, 2011 | | 0.34%
Quarterly | | Specified amount upon credit event notice | | | 2,540 | | | (6 | ) |
| | | | | |
Deutsche Bank AG
(GIE PSA Tresorerie,
5.875%, due 9/27/11)1 | | March 20, 2011 | | 0.325%
Quarterly | | Specified amount upon credit event notice | | | 2,540 | | | (8 | ) |
| | | | | |
Deutsche Bank AG
(GIE PSA Tresorerie,
5.875%, due 9/27/11)1 | | March 20, 2011 | | 0.325%
Quarterly | | Specified amount upon credit event notice | | | 2,540 | | | (5 | ) |
| | | | | |
Deutsche Bank AG
(iBoxx 100 HY)1 | | March 20, 2009 | | Specified amount upon credit event notice | | 4.25%
Quarterly | | | 9,400 | | | 343 | |
| | | | | |
Deutsche Bank AG
(iBoxx 30 Hi-Vol)1 | | March 20, 2009 | | 1.25%
Quarterly | | Specified amount upon credit event notice | | | 9,183 | | | 53 | |
248
Semi-Annual Report to Shareholders
| | | | | | | | | | | | | |
| Western Asset Core Plus Bond Portfolio—Continued | |
Agreement With: | | Termination Date | | The Fund
Agrees to Pay | | The Fund
Will Receive | | Contract
Notional Amount | | Unrealized
Appreciation/ (Depreciation) | |
| | | | | | | | | | | | | |
Deutsche Bank AG
(iBoxx HY 2)1 | | September 20, 2009 | | Specified amount upon credit event notice | | 4.8%
Quarterly | | $ | 2,498 | | $ | 194 | |
| | | | | |
Deutsche Bank AG
(iBoxx HY B)1 | | March 20, 2009 | | Specified amount upon credit event notice | | 5%
Quarterly | | | 4,651 | | | 117 | |
| | | | | |
Deutsche Bank AG
(iBoxx HY B)1 | | March 20, 2009 | | Specified amount upon credit event notice | | 5%
Quarterly | | | 9,302 | | | 200 | |
| | | | | |
Deutsche Bank AG
(iBoxx IG Hi-Vol)1 | | March 20, 2009 | | Specified amount upon credit event notice | | 1.25%
Quarterly | | | 13,301 | | | 14 | |
| | | | | |
Deutsche Bank AG
(iBoxx IG Hi-Vol2)1 | | September 20, 2014 | | Specified amount upon credit event notice | | 1.3%
Quarterly | | | 11,175 | | | (61 | ) |
| | | | | |
Deutsche Bank AG
(iBoxx IG TMT)1 | | March 20, 2009 | | 0.6%
Quarterly | | Specified amount upon credit event notice | | | 6,450 | | | (41 | ) |
| | | | | |
Deutsche Bank AG
(iBoxx IG TMT)1 | | March 20, 2009 | | 0.6%
Quarterly | | Specified amount upon credit event notice | | | 9,500 | | | (61 | ) |
| | | | | |
Deutsche Bank AG
(Renault S.A.,
4.625%, due 5/28/10)1 | | March 20, 2011 | | 0.38%
Quarterly | | Specified amount upon credit event notice | | | 2,540 | | | (8 | ) |
| | | | | |
Deutsche Bank AG
(Renault S.A.,
4.625%, due 5/28/10)1 | | March 20, 2011 | | 0.36%
Quarterly | | Specified amount upon credit event notice | | | 2,540 | | | (6 | ) |
| | | | | |
Deutsche Bank AG
(Volkswagen International Finance NV,
4.875%, due 5/22/13)1 | | March 20, 2011 | | 0.37%
Quarterly | | Specified amount upon credit event notice | | | 2,540 | | | (12 | ) |
| | | | | |
Deutsche Bank AG
(Volkswagen International Finance NV,
4.875%, due 5/22/13)1 | | March 20, 2011 | | 0.34%
Quarterly | | Specified amount upon credit event notice | | | 2,540 | | | (12 | ) |
| | | | | |
JP Morgan Chase & Co.2 | | January 19, 2009 | | Mexican Interbank Deposit Rate | | 7.69%
Monthly | | | 144,500 | | | (59 | ) |
| | | | | |
JP Morgan Chase & Co.2 | | June 8, 2009 | | 3-month
LIBOR | | 5.393%
Semi-Annually | | | 304,600 | | | 3,262 | |
249
Semi-Annual Report to Shareholders
Notes to Financial Statements—Continued
| | | | | | | | | | | | | |
| Western Asset Core Plus Bond Portfolio—Continued | |
Agreement With: | | Termination Date | | The Fund
Agrees to Pay | | The Fund
Will Receive | | Contract
Notional Amount | | Unrealized
Appreciation/ (Depreciation) | |
| | | | | | | | | | | | | |
JP Morgan Chase & Co.2 | | November 6, 2011 | | 3-month
LIBOR | | 5.02%
Semi-Annually | | $ | 93,600 | | $ | 744 | |
| | | | | |
JP Morgan Chase & Co.2 | | December 1, 2012 | | 5.275%
Semi-Annually | | 3-month
LIBOR | | | 6,300 | | | (105 | ) |
| | | | | |
JP Morgan Chase & Co.2 | | September 7, 2016 | | 5.3215%
Semi-Annually | | 3-month
LIBOR | | | 59,000 | | | (639 | ) |
| | | | | |
JP Morgan Chase & Co.
(ABX. HE-AAA 06-1)1 | | July 25, 2045 | | Specified amount upon credit event notice | | 0.18%
Monthly | | | 24,000 | | | 142 | |
| | | | | |
JP Morgan Chase & Co.
(CDX IG HVOL 8)1 | | June 20, 2012 | | Specified amount upon credit event notice | | 0.75%
Quarterly | | | 56,800 | | | (1,115 | ) |
| | | | | |
JP Morgan Chase & Co.
(CDX IG HVOL 8)1 | | June 20, 2012 | | Specified amount upon credit event notice | | 0.75%
Quarterly | | | 76,900 | | | (2,028 | ) |
| | | | | |
JP Morgan Chase & Co.
(CDX IG HVOL 8)1 | | June 20, 2012 | | Specified amount upon credit event notice | | 0.75%
Quarterly | | | 87,875 | | | (2,117 | ) |
| | | | | |
JP Morgan Chase & Co.
(General Motors Acceptance Corporation,
7.125%, due 7/15/13)1 | | September 20, 2010 | | Specified amount upon credit event notice | | 6%
Quarterly | | | 14,300 | | | 698 | |
| | | | | |
JP Morgan Chase & Co.
(Limited Brands Inc.,
6.125%, due 12/1/12)1 | | December 20, 2012 | | 0.67%
Quarterly | | Specified amount upon credit event notice | | | 6,300 | | | 66 | |
| | | | | |
Lehman Brothers Holdings Inc.2 | | October 7, 2007 | | 3-month
LIBOR | | 4.6012%
Semi-Annually | | | 80,020 | | | (20 | ) |
| | | | | |
Lehman Brothers Holdings Inc.4 | | January 1, 2008 | | 1-month
LIBOR | | LEHM U.S. ABS AAA Floating Home Equities Index | | | 51,700 | | | 505 | |
| | | | | |
Lehman Brothers Holdings Inc.4 | | March 1, 2008 | | 1-month
LIBOR | | LEHM U.S. ABS AAA Floating Home Equities Index | | | 387,800 | | | 3,425 | |
| | | | | |
Lehman Brothers Holdings Inc.2 | | April 30, 2011 | | 5.0704%
Semi-Annually | | 3-month
LIBOR | | | 6,270 | | | (65 | ) |
| | | | | |
Lehman Brothers Holdings Inc.2 | | September 15, 2011 | | 5.193%
Semi-Annually | | 3-month
LIBOR | | | 9,750 | | | (132 | ) |
250
Semi-Annual Report to Shareholders
| | | | | | | | | | | | | |
| Western Asset Core Plus Bond Portfolio—Continued | |
Agreement With: | | Termination Date | | The Fund
Agrees to Pay | | The Fund
Will Receive | | Contract
Notional Amount | | Unrealized
Appreciation/ (Depreciation) | |
| | | | | | | | | | | | | |
Lehman Brothers Holdings Inc.
(CDX IG HVOL 8)1 | | June 20, 2012 | | Specified amount upon credit event notice | | 0.75%
Quarterly | | $ | 14,800 | | $ | (71 | ) |
| | | | | |
Lehman Brothers Holdings Inc.
(CDX IG HVOL 8)1 | | June 20, 2012 | | Specified amount upon credit event notice | | 0.75%
Quarterly | | | 29,600 | | | 118 | |
| | | | | |
Lehman Brothers Holdings Inc.
(CDX IG HVOL 8)1 | | June 20, 2012 | | Specified amount upon credit event notice | | 0.75%
Quarterly | | | 29,900 | | | (163 | ) |
| | | | | |
Lehman Brothers Holdings Inc.
(General Motors Acceptance Corporation,
6.875%, due 8/28/12)1 | | March 20, 2010 | | Specified amount upon credit event notice | | 5.25%
Quarterly | | | 4,400 | | | 45 | |
| | | | | |
Lehman Brothers Holdings Inc.
(iBoxx HY 3)1 | | December 20, 2009 | | Specified amount upon credit even notice | | 4%
Quarterly | | | 3,150 | | | 177 | |
| | | | | |
Lehman Brothers Holdings Inc.
(iBoxx HY 3)1 | | December 20, 2009 | | Specified amount
upon credit
even notice | | 4%
Quarterly | | | 3,245 | | | 105 | |
| | | | | |
Lehman Brothers Holdings Inc.
(iBoxx HY 3)1 | | December 20, 2009 | | Specified amount
upon credit
even notice | | 4%
Quarterly | | | 3,245 | | | 105 | |
| | | | | |
Lehman Brothers Holdings Inc.
(iBoxx IG Hi-Vol2)1 | | September 20, 2009 | | 1.15%
Quarterly | | Specified amount
upon credit
event notice | | | 12,180 | | | 40 | |
| | | | | |
Lehman Brothers Holdings Inc.
(iBoxx IG Hi-Vol3)1 | | September 20, 2009 | | 1.05%
Quarterly | | Specified amount
upon credit
event notice | | | 1,450 | | | 4 | |
| | | | | |
Lehman Brothers Holdings Inc.
(iBoxx IG TMT)1 | | March 20, 2009 | | 0.6%
Quarterly | | Specified amount
upon credit
even notice | | | 9,000 | | | (91 | ) |
| | | | | |
Lehman Brothers Holdings Inc.
(Sara Lee Corporation,
6.125%, due 11/1/32)1 | | September 20, 2011 | | 0.44%
Quarterly | | Specified amount
upon credit
event notice | | | 9,750 | | | (77 | ) |
| | | | | |
Lehman Brothers Holdings Inc.
(Sprint Capital Corporation,
8.375%, due 3/15/12)1 | | December 20, 2007 | | Specified amount
upon credit
event notice | | 0.05%
Quarterly | | | 2,220 | | | (1 | ) |
| | | | | |
Lehman Brothers Holdings Inc.
(Viacom Inc.,
6.25%, due 4/30/16)1 | | March 20, 2011 | | 0.57%
Quarterly | | Specified amount
upon credit
event notice | | | 6,270 | | | (57 | ) |
251
Semi-Annual Report to Shareholders
Notes to Financial Statements—Continued
| | | | | | | | | | | | | |
| Western Asset Core Plus Bond Portfolio—Continued | |
Agreement With: | | Termination Date | | The Fund
Agrees to Pay | | The Fund
Will Receive | | Contract
Notional Amount | | Unrealized
Appreciation/ (Depreciation) | |
| | | | | | | | | | | | | |
Merrill Lynch & Co., Inc.
(AES Corp.,
7.75%, due 3/1/14)1 | | March 20, 2017 | | Specified amount
upon credit
even notice | | 2.8%
Quarterly | | $ | 5,600 | | $ | (367 | ) |
| | | | | |
Merrill Lynch & Co., Inc.
(AES Corp.,
7.75%, due 3/1/14)1 | | March 20, 2017 | | Specified amount
upon credit
even notice | | 2.6%
Quarterly | | | 3,600 | | | (241 | ) |
| | | | | |
Merrill Lynch & Co., Inc.
(CDX HY 8)1 | | June 20, 2012 | | Specified amount
upon credit
even notice | | 0.82%
Quarterly | | | 42,600 | | | (1,684 | ) |
| | | | | |
Merrill Lynch & Co., Inc.
(CDX HY 8)1 | | June 20, 2012 | | Specified amount
upon credit
even notice | | 0.92%
Quarterly | | | 31,750 | | | (1,122 | ) |
| | | | | |
Merrill Lynch & Co., Inc.
(CDX HY 8)1 | | June 20, 2012 | | Specified amount
upon credit
even notice | | 1.125%
Quarterly | | | 18,800 | | | (503 | ) |
| | | | | |
Merrill Lynch & Co., Inc.
(Pacific Gas & Electric Co.,
4.8%, due 3/1/14)1 | | June 20, 2009 | | Specified amount
upon credit
event notice | | 0.42%
Quarterly | | | 2,980 | | | 13 | |
| | | | | |
Merrill Lynch & Co., Inc.
(The AES Corp.,
7.75%, due 3/1/14)1 | | September 20, 2017 | | Specified amount
upon credit
event notice | | 3.9%
Quarterly | | | 10,100 | | | 129 | |
| | | | | |
Merrill Lynch & Co., Inc.
(Eastman Kodak Company,
7.25%, due 11/15/13)1 | | September 20, 2010 | | Specified amount
upon credit
even notice | | 2.3%
Quarterly | | | 1,610 | | | 57 | |
| | | | | |
Morgan Stanley & Co. Inc.
(ABX. HE-AAA 06-2)1 | | May 25, 2046 | | Specified amount
upon credit
event notice | | 0.11%
Monthly | | | 17,200 | | | 218 | |
| | | | | |
Morgan Stanley & Co. Inc.
(Residential Capital Corp.,
6.5%, due 4/17/13)1 | | September 20, 2008 | | Specified amount
upon credit
event notice | | 11.5%
Quarterly | | | 3,800 | | | (94 | ) |
| | | | | |
Morgan Stanley & Co. Inc.
(Residential Capital Corp.,
6.5%, due 4/17/13)1 | | September 20, 2008 | | Specified amount
upon credit
event notice | | 12.75%
Quarterly | | | 3,800 | | | (55 | ) |
| | | | | |
Morgan Stanley & Co. Inc.
(Residential Capital Corp.,
6.5%, due 4/17/13)1 | | September 20, 2008 | | Specified amount
upon credit
event notice | | 13.5%
Quarterly | | | 3,800 | | | (31 | ) |
| | | | | |
Morgan Stanley & Co., Inc.2 | | March 15, 2012 | | 4.7625%
Semi-annually | | 3-month
LIBOR | | | 5,540 | | | 20 | |
| | | | | |
Morgan Stanley & Co., Inc.2 | | April 30, 2016 | | 5.189%
Semi-Annually | | 3-month
LIBOR | | | 6,600 | | | (28 | ) |
252
Semi-Annual Report to Shareholders
| | | | | | | | | | | | | |
| Western Asset Core Plus Bond Portfolio—Continued | |
Agreement With: | | Termination Date | | The Fund
Agrees to Pay | | The Fund
Will Receive | | Contract
Notional Amount | | Unrealized
Appreciation/ (Depreciation) | |
| | | | | | | | | | | | | |
Morgan Stanley & Co., Inc.
(Eastman Kodak Co.,
7.25%, due 11/15/13)1 | | March 20, 2011 | | Specified amount
upon credit
even notice | | 2.7%
Quarterly | | $ | 5,000 | | $ | 237 | |
| | | | | |
Morgan Stanley & Co., Inc.
(Gannett Company Inc.,
6.375%, due 4/1/12)1 | | March 20, 2012 | | 0.46%
Quarterly | | Specified amount
upon credit
even notice | | | 4,560 | | | 13 | |
| | | | | |
Morgan Stanley & Co., Inc.
(Residential Capital Corp.,
6.5%, due 4/17/13)1 | | August 20, 2008 | | Specified amount
upon credit
event notice | | 10.25%
Quarterly | | | 18,800 | | | (663 | ) |
| | | | | |
Morgan Stanley & Co., Inc.
(Viacom Inc.,
6.25%, due 4/30/16)1 | | March 20, 2012 | | 0.36%
Monthly | | Specified amount
upon credit
event notice | | | 10,540 | | | 18 | |
| | | | | |
Morgan Stanley & Co., Inc.
(Weyerhaeuser Co. Note,
7.125%, due 7/15/23)1 | | March 20, 2012 | | 0.74%
Quarterly | | Specified amount upon credit event notice | | | 5,540 | | | 39 | |
| | | | | |
RBS Greenwich2 | | April 1, 2012 | | 5.011%
Semi-Annually | | 3-month
LIBOR | | | 4,560 | | | (32 | ) |
| | | | | |
RBS Greenwich2 | | March 1, 2016 | | 5.12%
Semi-Annually | | 3-month
LIBOR | | | 8,230 | | | 5 | |
| | | | | |
RBS Greenwich2 | | February 15, 2017 | | 5.115%
Semi-annually | | 3-month
LIBOR | | | 7,210 | | | 31 | |
| | | | | |
RBS Greenwich
(AES Corp.,
7.75%, due 3/1/14)1 | | March 20, 2012 | | Specified amount upon credit event notice | | 2.07%
Quarterly | | | 3,900 | | | (85 | ) |
| | | | | |
RBS Greenwich
(AES Corp.,
7.75%, due 3/1/14)1 | | March 20, 2013 | | Specified amount upon credit event notice | | 1.64%
Quarterly | | | 4,000 | | | (154 | ) |
| | | | | |
RBS Greenwich
(AES Corp.,
7.75%, due 3/1/14)1 | | June 20, 2012 | | Specified amount upon credit event notice | | 2.14%
Quarterly | | | 10,500 | | | (274 | ) |
| | | | | |
RBS Greenwich
(CDX IG 8)1 | | June 20, 2012 | | Specified amount upon credit event notice | | 0.35%
Quarterly | | | 16,900 | | | 177 | |
| | | | | |
RBS Greenwich
(CDX IG 8)1 | | June 20, 2012 | | Specified amount upon credit event notice | | 0.35%
Quarterly | | | 14,500 | | | 126 | |
| | | | | |
RBS Greenwich
(CDX IG HVOL 8)1 | | June 20, 2012 | | Specified amount upon credit event notice | | 0.75 %
Quarterly | | | 250,000 | | | (7,181 | ) |
253
Semi-Annual Report to Shareholders
Notes to Financial Statements—Continued
| | | | | | | | | | | | | |
| Western Asset Core Plus Bond Portfolio—Continued | |
Agreement With: | | Termination Date | | The Fund
Agrees to Pay | | The Fund
Will Receive | | Contract
Notional Amount | | Unrealized
Appreciation/ (Depreciation) | |
| | | | | | | | | | | | | |
RBS Greenwich
(CDX IG HVOL 8)1 | | June 20, 2012 | | Specified amount upon credit event notice | | 0.75%
Quarterly | | $ | 28,500 | | $ | (720 | ) |
| | | | | |
RBS Greenwich
(CDX IG HVOL 8)1 | | June 20, 2012 | | Specified amount upon credit event notice | | 0.75%
Quarterly | | | 33,300 | | | (757 | ) |
| | | | | |
RBS Greenwich
(CDX IG HVOL 8)1 | | June 20, 2012 | | Specified amount upon credit event notice | | 0.75%
Quarterly | | | 29,100 | | | (638 | ) |
| | | | | |
RBS Greenwich
(CDX IG HVOL 8)1 | | June 20, 2012 | | Specified amount upon credit event notice | | 0.75%
Quarterly | | | 28,300 | | | (549 | ) |
| | | | | |
RBS Greenwich
(CDX IG HVOL 8)1 | | June 20, 2012 | | Specified amount upon credit event notice | | 0.75%
Quarterly | | | 28,400 | | | (524 | ) |
| | | | | |
RBS Greenwich
(CDX IG HVOL 8)1 | | June 20, 2012 | | Specified amount upon credit event notice | | 0.75%
Quarterly | | | 28,700 | | | (537 | ) |
| | | | | |
RBS Greenwich
(CDX IG HVOL 8)1 | | June 20, 2012 | | Specified amount upon credit event notice | | 0.75%
Quarterly | | | 36,400 | | | (421 | ) |
| | | | | |
RBS Greenwich
(CDX IG HVOL 8)1 | | June 20, 2012 | | Specified amount upon credit event notice | | 0.75%
Quarterly | | | 16,200 | | | (178 | ) |
| | | | | |
RBS Greenwich
(CDX IG HVOL 8)1 | | June 20, 2012 | | Specified amount upon credit event notice | | 0.75%
Quarterly | | | 28,800 | | | 250 | |
| | | | | |
RBS Greenwich
(CDX IG HVOL 8)1 | | June 20, 2012 | | Specified amount upon credit event notice | | 0.75%
Quarterly | | | 15,400 | | | (78 | ) |
| | | | | |
RBS Greenwich
(Countrywide Home Loan Inc.,
4%, due 3/22/11)1 | | March 20, 2012 | | Specified amount upon credit event notice | | 0.6%
Quarterly | | | 7,400 | | | (575 | ) |
| | | | | |
RBS Greenwich
(Countrywide Home Loans, Inc.,
4.0%, due 3/22/11)1 | | June 20, 2012 | | Specified amount upon credit event notice | | 0.66%
Quarterly | | | 9,900 | | | (743 | ) |
| | | | | |
RBS Greenwich
(DSLA Mortgage Loan
Trust 2005-AR5, 1-Month
LIBOR + 175 bp,
due 8/19/45)1 | | August 19, 2045 | | 4.5%
Monthly | | Specified amount upon credit event notice | | | 2,097 | | | (71 | ) |
254
Semi-Annual Report to Shareholders
| | | | | | | | | | | | | |
| Western Asset Core Plus Bond Portfolio—Continued | |
Agreement With: | | Termination Date | | The Fund
Agrees to Pay | | The Fund
Will Receive | | Contract
Notional Amount | | Unrealized
Appreciation/ (Depreciation) | |
| | | | | | | | | | | | | |
RBS Greenwich
(Dynergy Holdings Inc.,
6.875%, due 4/1/11)1 | | June 20, 2011 | | Specified amount upon credit event notice | | 2.25%
Quarterly | | $ | 4,200 | | $ | (73 | ) |
| | | | | |
RBS Greenwich
(Eastman Kodak Co.,
7.25%, due 11/15/13)1 | | September 20, 2017 | | Specified amount upon credit event notice | | 3.32%
Quarterly | | | 7,100 | | | 373 | |
| | | | | |
RBS Greenwich
(Eastman Kodak Co.,
7.25%, due 11/15/13)1 | | September 20, 2017 | | Specified amount upon credit event notice | | 3.22%
Quarterly | | | 7,130 | | | 325 | |
| | | | | |
RBS Greenwich
(Eastman Kodak,
7.25%, due 11/15/13)1 | | December 20, 2010 | | Specified amount upon credit event notice | | 3.2%
Quarterly | | | 19,300 | | | 1,217 | |
| | | | | |
RBS Greenwich
(Eastman Kodak,
7.25%, due 11/15/13)1 | | December 20, 2011 | | Specified amount upon credit event notice | | 1.83%
Quarterly | | | 4,200 | | | 51 | |
| | | | | |
RBS Greenwich
(Eastman Kodak,
7.25%, due 11/15/13)1 | | December 20, 2011 | | Specified amount upon credit event notice | | 2.1%
Quarterly | | | 4,200 | | | 93 | |
| | | | | |
RBS Greenwich
(Eastman Kodak,
7.25%, due 11/15/13)1 | | December 20, 2011 | | Specified amount upon credit event notice | | 2.15%
Quarterly | | | 4,100 | | | 99 | |
| | | | | |
RBS Greenwich
(Eastman Kodak,
7.25%, due 11/15/13)1 | | December 20, 2011 | | Specified amount upon credit event notice | | 2.15%
Quarterly | | | 4,100 | | | 99 | |
| | | | | |
RBS Greenwich
(Eastman Kodak,
7.25%, due 11/15/13)1 | | December 20, 2016 | | Specified amount upon credit event notice | | 2.8%
Quarterly | | | 7,200 | | | 147 | |
| | | | | |
RBS Greenwich
(El Paso Corp.,
7.875%, due 6/15/12)1 | | December 20, 2011 | | Specified amount upon credit event notice | | 1.42%
Quarterly | | | 3,500 | | | 17 | |
| | | | | |
RBS Greenwich
(Ford Motor Credit Company,
7%, due 10/1/13)1 | | September 20, 2011 | | Specified amount upon credit event notice | | 3.75%
Quarterly | | | 8,900 | | | 74 | |
| | | | | |
RBS Greenwich
(Ford Motor Credit Company,
7%, due 10/1/13)1 | | March 20, 2012 | | Specified amount upon credit event notice | | 5.38%
Quarterly | | | 8,200 | | | (90 | ) |
| | | | | |
RBS Greenwich
(Ford Motor Credit Company,
7.45%, due 7/16/31)1 | | September 20, 2011 | | Specified amount upon credit event notice | | 6.75%
Quarterly | | | 18,400 | | | 746 | |
255
Semi-Annual Report to Shareholders
Notes to Financial Statements—Continued
| | | | | | | | | | | | | |
| Western Asset Core Plus Bond Portfolio—Continued | |
Agreement With: | | Termination Date | | The Fund
Agrees to Pay | | The Fund
Will Receive | | Contract
Notional Amount | | Unrealized
Appreciation/ (Depreciation) | |
| | | | | | | | | | | | | |
RBS Greenwich
(Ford Motor Credit Company,
7.45%, due 7/16/31)1 | | June 20, 2012 | | Specified amount upon credit event notice | | 5.85%
Quarterly | | $ | 7,400 | | $ | 15 | |
| | | | | |
RBS Greenwich
(Ford Motor Credit Company,
7.45%, due 7/16/31)1 | | June 20, 2012 | | Specified amount upon credit event notice | | 5.1%
Quarterly | | | 12,450 | | | (306 | ) |
| | | | | |
RBS Greenwich
(Ford Motor Credit Company,
7.45%, due 7/16/31)1 | | June 20, 2012 | | Specified amount upon credit event notice | | 5.15%
Quarterly | | | 6,900 | | | (157 | ) |
| | | | | |
RBS Greenwich
(General Mills Inc.,
5.7%, due 2/15/17)1 | | March 20, 2017 | | 0.33 %
Quarterly | | Specified amount upon credit event notice | | | 7,210 | | | 86 | |
| | | | | |
RBS Greenwich
(General Motors Acceptance Corp.,
6.875%, due 8/28/12)1 | | September 20, 2012 | | Specified amount upon credit event notice | | 5.95%
Quarterly | | | 3,800 | | | 350 | |
| | | | | |
RBS Greenwich
(General Motors Acceptance Corp.,
7.125%, due 7/15/13)1 | | September 20, 2010 | | Specified amount upon credit event notice | | 6.63%
Quarterly | | | 19,600 | | | 1,269 | |
| | | | | |
RBS Greenwich
(General Motors Acceptance Corp., Inc.,
6.875%, due 8/28/12)1 | | September 20, 2012 | | Specified amount upon credit event notice | | 7.2%
Quarterly | | | 10,700 | | | 1,456 | |
| | | | | |
RBS Greenwich
(General Motors Acceptance Corporation,
6%, due 4/1/11)1 | | December 20, 2011 | | Specified amount upon credit event notice | | 1.34%
Quarterly | | | 780 | | | (48 | ) |
| | | | | |
RBS Greenwich
(General Motors Acceptance Corporation,
6.875%, due 8/28/12)1 | | September 20, 2010 | | Specified amount upon credit event notice | | 5.75%
Quarterly | | | 1,250 | | | 78 | |
| | | | | |
RBS Greenwich
(General Motors Acceptance Corporation,
6.875%, due 8/28/12)1 | | December 20, 2011 | | Specified amount upon credit event notice | | 1.2%
Quarterly | | | 680 | | | (45 | ) |
| | | | | |
RBS Greenwich
(General Motors Acceptance Corporation,
6.875%, due 8/28/12)1 | | March 20, 2012 | | Specified amount upon credit event notice | | 1.17%
Quarterly | | | 8,500 | | | (598 | ) |
256
Semi-Annual Report to Shareholders
| | | | | | | | | | | | | |
| Western Asset Core Plus Bond Portfolio—Continued | |
Agreement With: | | Termination Date | | The Fund
Agrees to Pay | | The Fund
Will Receive | | Contract
Notional Amount | | Unrealized
Appreciation/ (Depreciation) | |
| | | | | | | | | | | | | |
RBS Greenwich
(General Motors Acceptance Corporation,
6.875%, due 8/28/12)1 | | March 20, 2012 | | Specified amount upon credit event notice | | 1.4%
Quarterly | | $ | 9,400 | | $ | (590 | ) |
| | | | | |
RBS Greenwich
(General Motors Acceptance Corporation,
6.875%, due 8/28/12)1 | | March 20, 2012 | | Specified amount upon credit event notice | | 1.85%
Quarterly | | | 9,700 | | | (466 | ) |
| | | | | |
RBS Greenwich
(General Motors Acceptance Corporation,
6.875%, due 8/28/12)1 | | March 20, 2012 | | Specified amount upon credit event notice | | 2%
Quarterly | | | 9,300 | | | (401 | ) |
| | | | | |
RBS Greenwich
(General Motors Acceptance Corporation,
6.875%, due 8/28/12)1 | | December 20, 2016 | | Specified amount upon credit event notice | | 1.55%
Quarterly | | | 4,200 | | | (381 | ) |
| | | | | |
RBS Greenwich
(General Motors Acceptance Corporation,
7.125%, due 7/15/13)1 | | September 20, 2010 | | Specified amount upon credit event notice | | 6.1%
Quarterly | | | 8,000 | | | 411 | |
| | | | | |
RBS Greenwich
(General Motors Acceptance Corporation,
7.125%, due 7/15/13)1 | | September 20, 2010 | | Specified amount upon credit event notice | | 6.9%
Quarterly | | | 10,000 | | | 716 | |
| | | | | |
RBS Greenwich
(General Motors Acceptance Corporation,
7.125%, due 7/15/13)1 | | September 20, 2010 | | Specified amount upon credit event notice | | 7.2%
Quarterly | | | 7,820 | | | 619 | |
| | | | | |
RBS Greenwich
(General Motors Acceptance Corporation,
7.125%, due 7/15/13)1 | | December 20, 2010 | | Specified amount upon credit event notice | | 8.95%
Quarterly | | | 19,300 | | | 2,502 | |
| | | | | |
RBS Greenwich
(General Motors Acceptance Corporation,
7.125%, due 7/15/13)1 | | March 20, 2012 | | Specified amount upon credit event notice | | 3.7% Quarterly | | | 8,400 | | | (284 | ) |
| | | | | |
RBS Greenwich
(General Motors Acceptance Corporation,
7.125%, due 7/15/13)1 | | June 20, 2010 | | Specified amount upon credit event notice | | 7.1%
Quarterly | | | 8,000 | | | 588 | |
257
Semi-Annual Report to Shareholders
Notes to Financial Statements—Continued
| | | | | | | | | | | | | |
| Western Asset Core Plus Bond Portfolio—Continued | |
Agreement With: | | Termination Date | | The Fund
Agrees to Pay | | The Fund
Will Receive | | Contract
Notional Amount | | Unrealized
Appreciation/ (Depreciation) | |
| | | | | | | | | | | | | |
RBS Greenwich
(General Motors Acceptance Corporation,
7.125%, due 7/15/13)1 | | June 20, 2010 | | Specified amount upon credit event notice | | 6.8% Quarterly | | $ | 7,500 | | $ | 498 | |
| | | | | |
RBS Greenwich
(General Motors Acceptance Corporation,
7.125%, due 7/15/13)1 | | June 20, 2010 | | Specified amount upon credit event notice | | 8.4%
Quarterly | | | 12,500 | | | 1,302 | |
| | | | | |
RBS Greenwich
(General Motors Acceptance Corporation,
7.125%, due 7/15/13)1 | | September 20, 2010 | | Specified amount upon credit event notice | | 7.7% Quarterly | | | 12,500 | | | 1,148 | |
| | | | | |
RBS Greenwich
(Harborview Mortgage Loan
Trust 2005-12, 1-Month
LIBOR + 175 bp,
due 10/19/35)1 | | October 19, 2035 | | 2.5%
Monthly | | Specified amount upon credit event notice | | | 1,992 | | | (12 | ) |
| | | | | |
RBS Greenwich
(Home Depot Inc.,
5.4%, due 3/1/16)1 | | March 20, 2016 | | 0.48%
Monthly | | Specified amount upon credit event notice | | | 8,230 | | | 206 | |
| | | | | |
RBS Greenwich
(IndyMac Index Mortgage Loan Trust 2005-AR18, 1-Month LIBOR + 125 bp,
due 10/25/36)1 | | October 25, 2036 | | 2.7%
Monthly | | Specified amount upon credit event notice | | | 1,886 | | | (99 | ) |
| | | | | |
RBS Greenwich
(LCDX 8)1 | | June 20, 2012 | | Specified amount upon credit event notice | | 1.2 %
Quarterly | | | 40,000 | | | (204 | ) |
| | | | | |
RBS Greenwich
(LCDX 8)1 | | June 20, 2012 | | Specified amount upon credit event notice | | 1.2 %
Quarterly | | | 23,800 | | | 449 | |
| | | | | |
RBS Greenwich
(LCDX 8)1 | | June 20, 2012 | | Specified amount upon credit event notice | | 1.2 %
Quarterly | | | 47,700 | | | (434 | ) |
| | | | | |
RBS Greenwich
(LCDX 8)1 | | June 20, 2012 | | Specified amount upon credit event notice | | 1.2 %
Quarterly | | | 20,000 | | | (82 | ) |
| | | | | |
RBS Greenwich
(SLM Corp.,
5.125%, due 8/27/12)1 | | June 20, 2012 | | Specified amount upon credit event notice | | 1.76%
Quarterly | | | 24,300 | | | (514 | ) |
258
Semi-Annual Report to Shareholders
| | | | | | | | | | | | | |
| Western Asset Core Plus Bond Portfolio—Continued | |
Agreement With: | | Termination Date | | The Fund
Agrees to Pay | | The Fund
Will Receive | | Contract
Notional Amount | | Unrealized
Appreciation/ (Depreciation) | |
| | | | | | | | | | | | | |
RBS Greenwich
(SLM Corp.,
5.125%, due 8/27/12)1 | | September 20, 2012 | | Specified amount upon credit event notice | | 2.35%
Quarterly | | $ | 3,600 | | $ | 1 | |
| | | | | |
RBS Greenwich
(SLM Corp.,
5.125%, due 8/27/12)1 | | September 20, 2012 | | Specified amount upon credit event notice | | 2.4%
Quarterly | | | 3,600 | | | 8 | |
| | | | | |
RBS Greenwich
(Tenet Healthcare Corporation,
6.375%, due 12/1/11)1 | | September 20, 2010 | | Specified amount upon credit event notice | | 3.5%
Quarterly | | | 3,920 | | | (197 | ) |
| | | | | |
RBS Greenwich
(Tenet Healthcare Corporation,
6.375%, due 12/1/11)1 | | September 20, 2010 | | Specified amount upon credit event notice | | 3.55%
Quarterly | | | 1,600 | | | (78 | ) |
| | | | | |
RBS Greenwich
(Tenet Healthcare Corporation,
6.375%, due 12/1/11)1 | | September 20, 2010 | | Specified amount upon credit event notice | | 3.55%
Quarterly | | | 3,900 | | | (191 | ) |
| | | | | |
RBS Greenwich
(Tenet Healthcare Corporation,
6.375%, due 12/1/11)1 | | September 20, 2010 | | Specified amount upon credit event notice | | 3.67%
Quarterly | | | 5,000 | | | (230 | ) |
| | | | | |
RBS Greenwich
(Tenet Healthcare Corporation,
6.375%, due 12/1/11)1 | | December 20, 2010 | | Specified amount upon credit event notice | | 3.87%
Quarterly | | | 7,700 | | | (354 | ) |
| | | | | |
RBS Greenwich
(The AES Corp.,
7.75%, due 3/1/14)1 | | June 20, 2012 | | Specified amount upon credit even notice | | 2.23%
Quarterly | | | 7,400 | | | (167 | ) |
| | | | | |
RBS Greenwich
(The AES Corp.,
7.75%, due 3/1/14)1 | | June 20, 2012 | | Specified amount upon credit even notice | | 2.23%
Quarterly | | | 6,300 | | | (142 | ) |
| | | | | |
RBS Greenwich
(The AES Corp.,
7.75%, due 3/1/14)1 | | June 20, 2012 | | Specified amount upon credit even notice | | 1.9 %
Quarterly | | | 12,000 | | | (429 | ) |
| | | | | |
RBS Greenwich
(Time Warner Inc.
6.875%, due 5/1/12)1 | | September 20, 2010 | | Specified amount upon credit event notice | | 0.47%
Quarterly | | | 5,000 | | | 28 | |
| | | | | |
RBS Greenwich
(Time Warner Inc.,
6.875%, due 5/1/12)1 | | December 20, 2010 | | Specified amount upon credit event notice | | 0.5%
Quarterly | | | 12,500 | | | 83 | |
259
Semi-Annual Report to Shareholders
Notes to Financial Statements—Continued
| | | | | | | | | | | | | |
| Western Asset Core Plus Bond Portfolio—Continued | |
Agreement With: | | Termination Date | | The Fund
Agrees to Pay | | The Fund
Will Receive | | Contract
Notional Amount | | Unrealized
Appreciation/ (Depreciation) | |
| | | | | | | | | | | | | |
RBS Greenwich
(TXU Corp.,
5.55%, due 11/15/14)1 | | September 20, 2012 | | Specified amount
upon credit
even notice | | 3%
Quarterly | | $ | 5,500 | | $ | (346 | ) |
| | | | | |
RBS Greenwich
(TXU Corp.,
5.55%, due 11/15/14)1 | | September 20, 2012 | | Specified amount upon credit
even notice | | 3.05%
Quarterly | | | 2,700 | | | (165 | ) |
| | | | | |
RBS Greenwich
(TXU Corp.,
5.55%, due 11/15/14)1 | | September 20, 2012 | | Specified amount upon credit
even notice | | 3.4%
Quarterly | | | 3,100 | | | (147 | ) |
| | | | | |
RBS Greenwich
(Washington Mutual
2005-AR11, 1-Month
LIBOR + 120 bp,
due 8/25/45)1 | | August 25, 2045 | | 2.55%
Monthly | | Specified amount
upon credit
event notice | | | 759 | | | (36 | ) |
| | | | | |
The Goldman Sachs Group, Inc.2 | | October 18, 2008 | | 3-month
LIBOR | | 5.55%
Semi-Annually | | | 364,010 | | | 1,471 | |
| | | | | |
The Goldman Sachs Group, Inc.2 | | October 19, 2008 | | 3-month
LIBOR | | 5.55%
Semi-Annually | | | 355,124 | | | 1,512 | |
| | | | | |
The Goldman Sachs Group, Inc.2 | | March 10, 2009 | | 3-month
LIBOR | | 4.36%
Semi-Annually | | | 74,400 | | | 121 | |
| | | | | |
The Goldman Sachs Group, Inc.2 | | September 24, 2009 | | 3.7135%
Semi-Annually | | 3-month
LIBOR | | | 100,000 | | | 1,763 | |
| | | | | |
The Goldman Sachs Group, Inc.2 | | July 7, 2011 | | 3-month
LIBOR | | 5.7125%
Semi-Annually | | | 113,400 | | | 3,647 | |
| | | | | |
The Goldman Sachs Group, Inc.2 | | November 3, 2011 | | 3-month
LIBOR | | 5.0435%
Semi-Annually | | | 147,000 | | | 1,298 | |
| | | | | |
The Goldman Sachs Group, Inc.2 | | January 10, 2012 | | 3-month
LIBOR | | 5.658%
Semi-Annually | | | 113,900 | | | 2,622 | |
| | | | | |
The Goldman Sachs Group, Inc.2 | | January 12, 2012 | | 3-month
LIBOR | | 5.0863
Semi-Annually | | | 128,700 | | | 1,315 | |
| | | | | |
The Goldman Sachs Group, Inc.2 | | January 31, 2012 | | 3-month
LIBOR | | 5.279%
Semi-Annually | | | 132,400 | | | 2,336 | |
| | | | | |
The Goldman Sachs Group, Inc.2 | | February 1, 2012 | | 3-month
LIBOR | | 5.315%
Semi-Annually | | | 151,100 | | | 2,857 | |
| | | | | |
The Goldman Sachs Group, Inc.2 | | October 18, 2016 | | 5.67%
Semi-Annually | | 3-month
LIBOR | | | 88,781 | | | (2,315 | ) |
| | | | | |
The Goldman Sachs Group, Inc.2 | | October 19, 2016 | | 5.69%
Semi-Annually | | 3-month
LIBOR | | | 88,781 | | | (2,395 | ) |
260
Semi-Annual Report to Shareholders
| | | | | | | | | | | | | |
| Western Asset Core Plus Bond Portfolio—Continued | |
Agreement With: | | Termination Date | | The Fund
Agrees to Pay | | The Fund
Will Receive | | Contract
Notional Amount | | Unrealized
Appreciation/ (Depreciation) | |
| | | | | | | | | | | | | |
The Goldman Sachs Group, Inc.2 | | February 2, 2017 | | 3-month
LIBOR | | 5.376%
Semi-Annually | | $ | 65,200 | | $ | 976 | |
| | | | | |
The Goldman Sachs Group, Inc.2 | | July 24, 2017 | | 3-month
LIBOR | | 5.63965%
Semi-Annually | | | 150,000 | | | 5,137 | |
| | | | | |
The Goldman Sachs Group, Inc.2 | | July 30, 2017 | | 3-month
LIBOR | | 5.56545%
Semi-Annually | | | 150,000 | | | 4,264 | |
| | | | | |
The Goldman Sachs Group, Inc.2 | | August 20, 2017 | | 3-month
LIBOR | | 5.45136%
Semi-Annually | | | 130,200 | | | 2,508 | |
| | | | | |
The Goldman Sachs Group, Inc.2 | | August 21, 2017 | | 3-month
LIBOR | | 5.37551%
Semi-Annually | | | 85,000 | | | 1,140 | |
| | | | | |
The Goldman Sachs Group, Inc.2 | | September 14, 2017 | | 5.0575%
Semi-Annually | | 3-month
LIBOR | | | 60,400 | | | 727 | |
| | | | | |
The Goldman Sachs Group, Inc.2 | | March 19, 2018 | | 3-month
LIBOR | | 5%
Semi-Annually | | | 129,800 | | | 816 | |
| | | | | |
The Goldman Sachs Group, Inc.2 | | March 19, 2038 | | 3-month
LIBOR | | 5.25%
Semi-Annually | | | 567,555 | | | (4,565 | ) |
| | | | | |
The Goldman Sachs Group, Inc.
(CDX HY 8)1 | | June 20, 2012 | | 0.9%
Quarterly | | Specified amount
upon credit
even notice | | | 32,000 | | | (1,158 | ) |
| | | | | |
The Goldman Sachs Group, Inc.
(CDX IG 8)1 | | June 20, 2012 | | Specified amount
upon credit
event notice | | 0.35%
Quarterly | | | 85,500 | | | (525 | ) |
| | | | | |
The Goldman Sachs Group, Inc.
(CDX IG 8)1 | | June 20, 2012 | | Specified amount
upon credit
event notice | | 0.35%
Quarterly | | | 86,400 | | | (401 | ) |
| | | | | |
The Goldman Sachs Group, Inc.
(CDX IG 8)1 | | June 20, 2012 | | Specified amount
upon credit
event notice | | 0.35%
Quarterly | | | 29,100 | | | 277 | |
| | | | | |
The Goldman Sachs Group, Inc.
(CDX IG HVOL 3)1 | | March 20, 2010 | | Specified amount
upon credit
event notice | | 1.05%
Quarterly | | | 21,847 | | | 242 | |
| | | | | |
The Goldman Sachs Group, Inc.
(CDX IG HVOL 3)1 | | March 20, 2010 | | Specified amount
upon credit
event notice | | 1.05%
Quarterly | | | 42,823 | | | 1,037 | |
| | | | | |
The Goldman Sachs Group, Inc.
(CDX IG HVOL 4)1 | | June 20, 2010 | | 0.9%
Quarterly | | Specified amount
upon credit
event notice | | | 25,300 | | | 240 | |
| | | | | |
The Goldman Sachs Group, Inc.
(CDX IG HVOL 4)1 | | December 20, 2010 | | 0.85%
Quarterly | | Specified amount
upon credit
event notice | | | 25,300 | | | 203 | |
261
Semi-Annual Report to Shareholders
Notes to Financial Statements—Continued
| | | | | | | | | | | | | |
| Western Asset Core Plus Bond Portfolio—Continued | |
Agreement With: | | Termination Date | | The Fund
Agrees to Pay | | The Fund
Will Receive | | Contract
Notional Amount | | Unrealized
Appreciation/ (Depreciation) | |
| | | | | | | | | | | | | |
The Goldman Sachs Group, Inc.
(CDX IG HVOL 5)1 | | December 20, 2010 | | 0.85%
Quarterly | | Specified amount
upon credit
event notice | | $ | 48,200 | | $ | 372 | |
| | | | | |
The Goldman Sachs Group, Inc.
(CDX IG HVOL 8)1 | | June 20, 2012 | | Specified amount
upon credit
event notice | | 0.75%
Quarterly | | | 156,700 | | | (4,828 | ) |
| | | | | |
The Goldman Sachs Group, Inc.
(CDX IG HVOL 8)1 | | June 20, 2012 | | Specified amount
upon credit
event notice | | 0.75%
Quarterly | | | 65,500 | | | (1,703 | ) |
| | | | | |
The Goldman Sachs Group, Inc.
(CDX IG HVOL 8)1 | | June 20, 2012 | | Specified amount upon credit event notice | | 0.75%
Quarterly | | | 58,400 | | | (1,651 | ) |
| | | | | |
The Goldman Sachs Group, Inc.
(CDX IG HVOL 8)1 | | June 20, 2012 | | Specified amount
upon credit
event notice | | 0.75%
Quarterly | | | 27,200 | | | (721 | ) |
| | | | | |
The Goldman Sachs Group, Inc.
(CDX IG HVOL 8)1 | | June 20, 2012 | | Specified amount
upon credit
event notice | | 0.75%
Quarterly | | | 76,200 | | | (1,844 | ) |
| | | | | |
The Goldman Sachs Group, Inc.
(CDX IG HVOL 8)1 | | June 20, 2012 | | Specified amount upon credit
event notice | | 0.75%
Quarterly | | | 55,600 | | | (1,299 | ) |
| | | | | |
The Goldman Sachs Group, Inc.
(CDX IG HVOL 8)1 | | June 20, 2012 | | Specified amount
upon credit
event notice | | 0.75%
Quarterly | | | 150,000 | | | (3,535 | ) |
| | | | | |
The Goldman Sachs Group, Inc.
(CDX IG HVOL 8)1 | | June 20, 2012 | | Specified amount
upon credit
event notice | | 0.75%
Quarterly | | | 28,200 | | | (538 | ) |
| | | | | |
The Goldman Sachs Group, Inc.
(CDX IG HVOL 8)1 | | June 20, 2012 | | Specified amount
upon credit
event notice | | 0.75%
Quarterly | | | 6,700 | | | (99 | ) |
| | | | | |
The Goldman Sachs Group, Inc.
(CDX IG HVOL 8)1 | | June 20, 2012 | | Specified amount
upon credit
event notice | | 0.75%
Quarterly | | | 28,500 | | | (539 | ) |
| | | | | |
The Goldman Sachs Group, Inc.
(CDX IG HVOL 8)1 | | June 20, 2012 | | Specified amount
upon credit
event notice | | 0.75%
Quarterly | | | 29,100 | | | (260 | ) |
| | | | | |
The Goldman Sachs Group, Inc.
(CDX IG HVOL 8)1 | | June 20, 2012 | | Specified amount
upon credit
event notice | | 0.75%
Quarterly | | | 29,100 | | | (302 | ) |
| | | | | |
The Goldman Sachs Group, Inc.
(CDX IG HVOL 8)1 | | June 20, 2012 | | Specified amount
upon credit event notice | | 0.75%
Quarterly | | | 27,100 | | | 282 | |
262
Semi-Annual Report to Shareholders
| | | | | | | | | | | | | |
| Western Asset Core Plus Bond Portfolio—Continued | |
Agreement With: | | Termination Date | | The Fund
Agrees to Pay | | The Fund
Will Receive | | Contract
Notional Amount | | Unrealized
Appreciation/ (Depreciation) | |
| | | | | | | | | | | | | |
The Goldman Sachs Group, Inc.
(CDX IG HVOL 8)1 | | June 20, 2012 | | Specified amount
upon credit
event notice | | 0.75%
Quarterly | | $ | 29,100 | | $ | 499 | |
| | | | | |
The Goldman Sachs Group, Inc.
(CMBX A3)1 | | December 13, 2049 | | 0.62%
Monthly | | Specified amount
upon credit even notice | | | 5,000 | | | (507 | ) |
| | | | | |
The Goldman Sachs Group, Inc.
(Eastman Kodak Co.,
7.25%, due 11/15/13)1 | | September 20, 2017 | | Specified amount
upon credit
event notice | | 3.4%
Quarterly | | | 4,400 | | | 255 | |
| | | | | |
The Goldman Sachs Group, Inc.
(Eastman Kodak Company,
7.25%, due 11/15/13)1 | | March 20, 2015 | | Specified amount
upon credit
event notice | | 1.67%
Quarterly | | | 1,900 | | | (66 | ) |
| | | | | |
The Goldman Sachs Group, Inc.
(Ford Motor Credit Co.,
7%, due 10/1/2013)1 | | September 20, 2017 | | Specified amount
upon credit
event notice | | 3.77%
Quarterly | | | 6,400 | | | (54 | ) |
| | | | | |
The Goldman Sachs Group, Inc.
(Ford Motor Credit Co.,
7.45%, due 7/16/31)1 | | September 20, 2011 | | Specified amount
upon credit event notice | | 6.8%
Quarterly | | | 10,000 | | | 421 | |
| | | | | |
The Goldman Sachs Group, Inc.
(Ford Motor Credit Company,
7%, due 10/1/13)1 | | June 20, 2010 | | Specified amount
upon credit
event notice | | 4.75%
Quarterly | | | 2,500 | | | 59 | |
| | | | | |
The Goldman Sachs Group, Inc.
(Ford Motor Credit Company,
7%, due 10/1/13)1 | | September 20, 2011 | | Specified amount
upon credit
event notice | | 3.8%
Quarterly | | | 9,200 | | | (7 | ) |
| | | | | |
The Goldman Sachs Group, Inc.
(Ford Motor Credit Company,
7.45%, due 7/16/31)1 | | September 20, 2011 | | Specified amount
upon credit
event notice | | 6.8%
Quarterly | | | 8,400 | | | 354 | |
| | | | | |
The Goldman Sachs Group, Inc.
(Ford Motor Credit Company,
7.45%, due 7/16/31)1 | | March 20, 2012 | | Specified amount
upon credit
event notice | | 6.05%
Quarterly | | | 11,500 | | | 138 | |
| | | | | |
The Goldman Sachs Group, Inc.
(General Motors Acceptance Corporation,
6.875%, due 8/28/12)1 | | June 20, 2010 | | Specified amount
upon credit
event notice | | 5.95%
Quarterly | | | 80 | | | 5 | |
| | | | | |
The Goldman Sachs Group, Inc.
(General Motors Acceptance Corporation,
6.875%, due 8/28/12)1 | | June 20, 2010 | | Specified amount
upon credit
event notice | | 5.75%
Quarterly | | | 2,000 | | | 117 | |
| | | | | |
The Goldman Sachs Group, Inc.
(General Motors Acceptance Corporation,
6.875%, due 8/28/12)1 | | June 20, 2010 | | Specified amount
upon credit
event notice | | 6%
Quarterly | | | 1,000 | | | 64 | |
263
Semi-Annual Report to Shareholders
Notes to Financial Statements—Continued
| | | | | | | | | | | | | |
| Western Asset Core Plus Bond Portfolio—Continued | |
Agreement With: | | Termination Date | | The Fund
Agrees to Pay | | The Fund
Will Receive | | Contract
Notional Amount | | Unrealized
Appreciation/ (Depreciation) | |
| | | | | | | | | | | | | |
The Goldman Sachs Group, Inc.
(General Motors Acceptance Corporation,
7.125%, due 7/15/13)1 | | June 20, 2010 | | Specified amount
upon credit
event notice | | 8.95%
Quarterly | | $ | 5,000 | | $ | 585 | |
| | | | | |
The Goldman Sachs Group, Inc.
(General Motors Acceptance Corporation,
7.125%, due 7/15/13)1 | | March 20, 2012 | | Specified amount upon credit event notice | | 3.15%
Quarterly | | | 19,400 | | | (1,022 | ) |
| | | | | |
The Goldman Sachs Group, Inc.
(General Motors Acceptance Corporation,
7.125%, due 7/15/13)1 | | March 20, 2012 | | Specified amount upon credit event notice | | 4.4%
Quarterly | | | 11,500 | | | (113 | ) |
| | | | | |
The Goldman Sachs Group, Inc.
(General Motors Acceptance Corporation,
8.375%, due 7/15/33)1 | | December 20, 2010 | | Specified amount upon credit event notice | | 7%
Quarterly | | | 42,500 | | | 3,272 | |
| | | | | |
The Goldman Sachs Group, Inc.
(iBoxx HY 3)1 | | December 20, 2009 | | Specified amount upon credit event notice | | 4%
Quarterly | | | 2,845 | | | 194 | |
| | | | | |
The Goldman Sachs Group, Inc.
(iBoxx HY 3)1 | | December 20, 2009 | | Specified amount upon credit event notice | | 4%
Quarterly | | | 955 | | | 55 | |
| | | | | |
The Goldman Sachs Group, Inc.
(iBoxx HY 3)1 | | December 20, 2009 | | 4%
Quarterly | | Specified amount upon credit event notice | | | 5,785 | | | 246 | |
| | | | | |
The Goldman Sachs Group, Inc.
(iBoxx HY 4)1 | | June 20, 2010 | | Specified amount upon credit event notice | | 3.4%
Quarterly | | | 2,200 | | | 140 | |
| | | | | |
The Goldman Sachs Group, Inc.
(iBoxx HY 6B)1 | | June 20, 2011 | | Specified amount upon credit event notice | | 3%
Quarterly | | | 11,400 | | | (19 | ) |
| | | | | |
The Goldman Sachs Group, Inc.
(iBoxx HY 6B)1 | | June 20, 2011 | | Specified amount upon credit event notice | | 3%
Quarterly | | | 15,000 | | | (54 | ) |
| | | | | |
The Goldman Sachs Group, Inc.
(JPM Chase Commercial Mortgage,
5.7966%, due 5/15/47)1 | | May 15, 2047 | | 0.75%
Monthly | | Specified amount upon credit event notice | | | 5,000 | | | 1,506 | |
| | | | | |
The Goldman Sachs Group, Inc.
(LCDX 8)1 | | June 20, 2012 | | Specified amount upon credit event notice | | 1.2%
Quarterly | | | 17,000 | | | 670 | |
264
Semi-Annual Report to Shareholders
| | | | | | | | | | | | | |
| Western Asset Core Plus Bond Portfolio—Continued | |
Agreement With: | | Termination Date | | The Fund
Agrees to Pay | | The Fund
Will Receive | | Contract
Notional Amount | | Unrealized
Appreciation/ (Depreciation) | |
| | | | | | | | | | | | | |
The Goldman Sachs Group, Inc.
(The AES Corp.,
7.75%, due 3/1/14)1 | | September 20, 2017 | | Specified amount upon credit event notice | | 3.8% Quarterly | | $ | 4,320 | | $ | 23 | |
| | | | | |
The Goldman Sachs Group, Inc.
(TXU Corp.,
5.55%, due 11/15/2014)1 | | September 20, 2012 | | Specified amount upon credit even notice | | 3.24%
Quarterly | | | 2,700 | | | (145 | ) |
| | | | | | | | | | | | | |
| | | | | | | | $ | 9,842,486 | | $ | 19,172 | |
| | | | | | | | | | | | | |
|
| Western Asset High Yield Portfolio | |
Agreement With: | | Termination Date | | The Fund
Agrees to Pay | | The Fund
Will Receive | | Contract
Notional Amount | | Unrealized
Appreciation/
(Depreciation) | |
| | | | | | | | | | | | | |
Deutsche Bank AG
(Residential Capital Corp., 6.5%, due 4/17/13)1 | | September 20, 2008 | | Specified amount upon credit event notice | | 8.5%
Quarterly | | $ | 5,000 | | $ | (250 | ) |
| | | | | | | | | | | | | |
| | | | | | | | $ | 5,000 | | $ | (250 | ) |
| | | | | | | | | | | | | |
| | |
| Western Asset Inflation Indexed Plus Bond Portfolio | | | | | |
Agreement With: | | Termination Date | | The Fund
Agrees to Pay | | The Fund
Will Receive | | Contract
Notional Amount | | Unrealized
Appreciation/
(Depreciation) | |
| | | | | | | | | | | | | |
Barclays Capital Inc.
(CDX HY 8)1 | | June 20, 2012 | | Specified amount upon credit event notice | | 2.75%
Quarterly | | $ | 7,200 | | $ | 321 | |
| | | | | |
Bear Stearns, Inc.
(CDX HY 8)1 | | June 20, 2012 | | Specified amount upon credit event notice | | 2.75%
Quarterly | | | 13,400 | | | (38 | ) |
| | | | | |
Deutsche Bank AG
(CDX HY 4)1 | | June 20, 2010 | | Specified amount upon credit even notice | | 3.6%
Quarterly | | | 9,500 | | | 578 | |
| | | | | |
Deutsche Bank AG
(CDX IG HVOL 8)1 | | June 20, 2012 | | Specified amount upon credit even notice | | .75%
Quarterly | | | 14,700 | | | (390 | ) |
| | | | | |
J.P. Morgan Chase & Co.
(Ford Motor Credit Company,
7%, due 8/15/12)1 | | June 20, 2010 | | Specified amount upon credit even notice | | 2.9%
Quarterly | | | 5,000 | | | (95 | ) |
| | | | | |
Merrill Lynch & Co., Inc.
(El Paso Corporation,
7%, due 5/15/11)1 | | June 20, 2010 | | Specified amount upon credit even notice | | 3.625%
Quarterly | | | 2,500 | | | 169 | |
| | | | | |
Merrill Lynch & Co., Inc.
(Ford Motor Credit Company,
7.375%, due 10/28/09)1 | | June 20, 2010 | | Specified amount upon credit even notice | | 5.5%
Quarterly | | | 2,500 | | | 102 | |
265
Semi-Annual Report to Shareholders
Notes to Financial Statements—Continued
| | | | | | | | | | | | | |
| Western Asset Inflation Indexed Plus Bond Portfolio—Continued | | | | | |
Agreement With: | | Termination Date | | The Fund
Agrees to Pay | | The Fund
Will Receive | | Contract
Notional Amount | | Unrealized
Appreciation/
(Depreciation) | |
| | | | | | | | | | | | | |
Merrill Lynch & Co., Inc.
(General Motors Acceptance Corporation,
7.75%, due 1/19/10)1 | | March 20, 2010 | | Specified amount upon credit even notice | | 3.55%
Quarterly | | $ | 5,000 | | $ | 41 | |
| | | | | |
The Goldman Sachs Group, Inc.
(Eastman Kodak Corporation,
7.25%, due 11/15/13)1 | | March 20, 2011 | | Specified amount upon credit even notice | | 2.57%
Quarterly | | | 4,800 | | | 207 | |
| | | | | |
The Goldman Sachs Group, Inc. (General Motors Acceptance Corporation,
6.875%, due 8/28/12)1 | | June 20, 2010 | | Specified amount upon credit even notice | | 4.5%
Quarterly | | | 7,500 | | | 225 | |
| | | | | | | | | | | | | |
| | | | | | | | $ | 72,100 | | $ | 1,120 | |
| | | | | | | | | | | | | |
|
| Western Asset Intermediate Bond Portfolio | |
Agreement With: | | Termination Date | | The Fund
Agrees to Pay | | The Fund
Will Receive | | Contract
Notional Amount | | Unrealized
Appreciation/
(Depreciation) | |
Banc of America Securities LLC
(MBIA Global Funding LLC,
5.37563%, due 10/6/10)1 | | September 20, 2008 | | Specified amount upon credit event notice | | 1.4%
Quarterly | | $ | 980 | | $ | 3 | |
| | | | | |
Banc of America Securities LLC
(MBIA Global Funding LLC,
5.37563%, due 10/6/10)1 | | September 20, 2008 | | Specified amount upon credit event notice | | 1.5%
Quarterly | | | 640 | | | 3 | |
| | | | | |
Banc of America Securities LLC
(Nadarko Petroleum Corp.,
5.95%, due 9/15/16)1 | | December 20, 2007 | | Specified Amount upon credit event notice | | 0.1%
Quarterly | | | 1,900 | | | — | |
| | | | | |
Barclays Capital Inc.
(CDX IG HVOL 8)1 | | June 20, 2012 | | 0.75%
Quarterly | | Specified amount upon credit event notice | | | 5,200 | | | (104 | ) |
| | | | | |
Barclays Capital Inc.
(CDX IG HVOL 8)1 | | June 20, 2012 | | Specified amount upon credit event notice | | 0.75%
Quarterly | | | 3,600 | | | (60 | ) |
| | | | | |
Barclays Capital Inc.
(CDX IG HVOL 8)1 | | June 20, 2012 | | Specified amount upon credit event notice | | 0.75%
Quarterly | | | 1,400 | | | (28 | ) |
| | | | | |
Deutsche Bank AG
(Freddie Mac,
5%, due 7/15/14)1 | | March 20, 2015 | | Specified Amount upon credit event notice | | .29%
Quarterly | | | 1,945 | | | 11 | |
| | | | | |
JP Morgan Chase & Co.
(CDX IG HVOL 8)1 | | June 20, 2012 | | Specified amount upon credit event notice | | 0.75%
Quarterly | | | 2,900 | | | (57 | ) |
266
Semi-Annual Report to Shareholders
| | | | | | | | | | | | | |
| Western Asset Intermediate Bond Portfolio—Continued | | | | | |
Agreement With: | | Termination Date | | The Fund
Agrees to Pay | | The Fund
Will Receive | | Contract
Notional Amount | | Unrealized
Appreciation/
(Depreciation) | |
| | | | | | | | | | | | | |
Morgan Stanley & Co., Inc.
(CDX IG HVOL 8)1 | | June 20, 2012 | | Specified amount upon credit event notice | | 0.75%
Quarterly | | $ | 1,500 | | $ | (43 | ) |
| | | | | |
Morgan Stanley & Co., Inc.
(SLM Corp.,
5.125%, due 8/27/12)1 | | June 26, 2012 | | Specified amount upon credit event notice | | 2.6%
Quarterly | | | 800 | | | 10 | |
| | | | | |
The Goldman Sachs Group, Inc.
(CDX HVOL 8)1 | | June 20, 2012 | | Specified amount upon credit event notice | | 0.75%
Quarterly | | | 5,500 | | | (146 | ) |
| | | | | |
The Goldman Sachs Group, Inc.
(CDX IG HVOL 8)1 | | June 20, 2012 | | Specified amount upon credit event notice | | 0.75%
Quarterly | | | 2,800 | | | (72 | ) |
| | | | | |
The Goldman Sachs Group, Inc.
(CDX IG HVOL 8)1 | | June 20, 2012 | | Specified amount upon credit event notice | | 0.75%
Quarterly | | | 2,800 | | | (35 | ) |
| | | | | |
The Goldman Sachs Group, Inc.
(iBoxx IG HiVol4)1 | | June 20, 2012 | | Specified Amount upon credit event notice | | 1%
Quarterly | | | 7,811 | | | 93 | |
| | | | | | | | | | | | | |
| | | | | | | | $ | 39,776 | | $ | (425 | ) |
| | | | | | | | | | | | | |
|
| Western Asset Intermediate Plus Bond Portfolio | |
Agreement With: | | Termination Date | | The Fund
Agrees to Pay | | The Fund
Will Receive | | Contract
Notional Amount | | Unrealized
Appreciation/
(Depreciation) | |
Banc of America Securities LLC
(Nadarko Petroleum Corp.,
5.95%, due 9/15/16)1 | | December 20, 2007 | | Specified amount upon credit event notice | | 0.10%
Quarterly | | $ | 200 | | $ | — | |
| | | | | |
Barclays Capital Inc.
(CDX IG HVOL 8)1 | | June 20, 2012 | | 0.75%
Quarterly | | Specified amount upon credit event notice | | | 700 | | | (14 | ) |
| | | | | |
Barclays Capital Inc.
(CDX IG HVOL 8)1 | | June 20, 2012 | | Specified amount upon credit event notice | | 0.75%
Quarterly | | | 500 | | | (8 | ) |
| | | | | |
Barclays Capital Inc.
(CDX IG HVOL 8)1 | | June 20, 2012 | | Specified amount upon credit event notice | | 0.75%
Quarterly | | | 200 | | | (4 | ) |
| | | | | |
JP Morgan Chase & Co.
(CDX IG HVOL 8)1 | | June 20, 2012 | | Specified amount upon credit event notice | | 0.75%
Quarterly | | | 400 | | | (8 | ) |
| | | | | |
Merrill Lynch & Co., Inc.
(iBoxx HY3)1 | | December 20, 2009 | | Specified amount upon credit event notice | | 3.75%
Quarterly | | | 384 | | | 13 | |
267
Semi-Annual Report to Shareholders
Notes to Financial Statements—Continued
| | | | | | | | | | | | | |
| Western Asset Intermediate Plus Bond Portfolio—Continued | | | | | |
Agreement With: | | Termination Date | | The Fund
Agrees to Pay | | The Fund
Will Receive | | Contract
Notional Amount | | Unrealized
Appreciation/
(Depreciation) | |
| | | | | | | | | | | | | |
Morgan Stanley & Co., Inc.
(SLM Corp.,
5.125%, due 8/27/12)1 | | June 20, 2012 | | Specified amount upon credit event notice | | 2.60%
Quarterly | | $ | 100 | | $ | 1 | |
| | | | | |
Morgan Stanley & Co., Inc.
(CDX IG HVOL 8)1 | | June 20, 2012 | | Specified amount upon credit event notice | | 0.75%
Quarterly | | | 200 | | | (6 | ) |
| | | | | |
The Goldman Sachs Group, Inc.
(CDX IG HVOL 8)1 | | June 20, 2012 | | Specified amount upon credit event notice | | 0.75%
Quarterly | | | 700 | | | (18 | ) |
| | | | | |
The Goldman Sachs Group, Inc.
(CDX IG HVOL 8)1 | | June 20, 2012 | | Specified amount upon credit event notice | | 0.75%
Quarterly | | | 400 | | | (10 | ) |
| | | | | |
The Goldman Sachs Group, Inc.
(CDX IG HVOL 8)1 | | June 20, 2012 | | Specified amount upon credit event notice | | 0.75%
Quarterly | | | 400 | | | (5 | ) |
| | | | | |
The Goldman Sachs Group, Inc.
(iBoxx HY2)1 | | September 20, 2009 | | Specified amount upon credit event notice | | 4.3%
Quarterly | | | 238 | | | 8 | |
| | | | | | | | | | | | | |
| | | | | | | | $ | 4,422 | | $ | (51 | ) |
| | | | | | | | | | | | | |
|
| Western Asset Limited Duration Bond Portfolio | |
Agreement With: | | Termination Date | | The Fund
Agrees to Pay | | The Fund
Will Receive | | Contract
Notional Amount | | Unrealized
Appreciation/
(Depreciation) | |
Barclays Capital Inc.
(CDX HVOL 8)1 | | June 20, 2012 | | 0.75%
Quarterly | | Specified amount upon credit event notice | | $ | 700 | | $ | (14 | ) |
| | | | | |
Barclays Capital Inc.
(CDX HVOL 8)1 | | June 20, 2012 | | Specified amount upon credit event notice | | 0.75%
Quarterly | | | 1600 | | | (35 | ) |
| | | | | |
Barclays Capital Inc.
(CDX HVOL 8)1 | | June 20, 2012 | | Specified amount upon credit event notice | | 0.75%
Quarterly | | | 200 | | | (4 | ) |
| | | | | |
Deutsche Bank AG
(CDX HVOL 8)1 | | June 20, 2012 | | Specified amount upon credit event notice | | 0.75%
Quarterly | | | 240 | | | 2 | |
| | | | | |
Deutsche Bank AG
(CDX HVOL 8)1 | | June 20, 2012 | | Specified amount upon credit event notice | | 0.75%
Quarterly | | | 240 | | | 3 | |
| | | | | |
JP Morgan Chase & Co.
(CDX HVOL 8)1 | | June 20, 2012 | | Specified amount upon credit event notice | | 0.75%
Quarterly | | | 400 | | | (8 | ) |
268
Semi-Annual Report to Shareholders
| | | | | | | | | | | | | |
| Western Asset Limited Duration Bond Portfolio—Continued | |
Agreement With: | | Termination Date | | The Fund
Agrees to Pay | | The Fund
Will Receive | | Contract
Notional Amount | | Unrealized
Appreciation/
(Depreciation) | |
| | | | | | | | | | | | | |
Lehman Brothers Holdings Inc.4 | | January 1, 2008 | | 1-month
LIBOR | | LEHM U.S. ABS AAA
Floating Home Equities Index | | $ | 700 | | $ | 7 | |
| | | | | |
Lehman Brothers Holdings Inc.4 | | March 1, 2008 | | 1-month
LIBOR | | LEHM U.S. ABS AAA
Floating Home Equities Index | | | 5,500 | | | 49 | |
| | | | | |
Morgan Stanley & Co., Inc.
(CDX HVOL 8)1 | | June 20, 2012 | | Specified amount upon credit event notice | | 0.75%
Quarterly | | | 100 | | | (2 | ) |
| | | | | |
Morgan Stanley & Co., Inc.
(CDX HVOL 8)1 | | June 20, 2012 | | Specified amount upon credit event notice | | 0.75%
Quarterly | | | 200 | | | (5 | ) |
| | | | | |
Morgan Stanley & Co., Inc.
(CDX HVOL 8)1 | | June 20, 2012 | | Specified amount upon credit event notice | | 0.75%
Quarterly | | | 200 | | | (5 | ) |
| | | | | |
Morgan Stanley & Co., Inc.
(CDX HVOL 8)1 | | June 20, 2012 | | Specified amount upon credit event notice | | 0.75%
Quarterly | | | 200 | | | (5 | ) |
| | | | | |
The Goldman Sachs Group, Inc.
(CDX IG HVOL 8)1 | | June 20, 2012 | | Specified amount upon credit event notice | | 0.75%
Quarterly | | | 1,100 | | | (29 | ) |
| | | | | |
The Goldman Sachs Group, Inc.
(CDX IG HVOL 8)1 | | June 20, 2012 | | Specified amount upon credit event notice | | 0.75%
Quarterly | | | 300 | | | (4 | ) |
| | | | | | | | | | | | | |
| | | | | | | | $ | 11,680 | | $ | (50 | ) |
| | | | | | | | | | | | | |
4. Securities Lending
Each Fund may lend its securities to approved brokers to earn additional income, and will receive cash and U.S. government securities as collateral against the loans. Cash collateral received is invested in a money market pooled account by the Fund’s lending agent. Collateral is maintained over the life of the loan in an amount not less than 100% of the value of the loaned securities. At September 30, 2007, collateral for securities on loan consisted of:
| | | | | | |
| | | Money Market
Pooled Accounts | | U.S. Government
Securities |
Core | | $ | 511,124 | | $ | 71,998 |
Core Plus | | | 1,593,825 | | | 212,870 |
Inflation Indexed | | | 126,270 | | | 56,102 |
Intermediate | | | 92,821 | | | 14,774 |
269
Semi-Annual Report to Shareholders
Notes to Financial Statements—Continued
5. Transactions With Affiliates:
Each Fund has an investment management agreement with Legg Mason Fund Adviser, Inc. (“LMFA”). Western Asset Management Company (“Western Asset”) is the investment adviser to Absolute Return, Core, Core Plus, High Yield, Inflation Indexed, Intermediate, Intermediate Plus, and Limited Duration. Western Asset Management Company Limited (“WAML”) is the investment adviser to Non-U.S. and shares advisory responsibilities with Western Asset for Absolute Return, Core Plus, Inflation Indexed, and Intermediate Plus. Pursuant to their respective agreements, LMFA provides the Funds with management and administrative services for which each Fund pays a fee, computed daily and payable monthly, at annual rates of each Fund’s average daily net assets. LMFA, Western Asset and WAML have voluntarily agreed to waive their fees and reimburse the Funds to the extent each Fund’s expenses (exclusive of taxes, interest, brokerage and extraordinary expenses) exceed during any month certain annual rates of each Fund’s average daily net assets. Western Asset and WAML have also agreed to waive their advisory fees (which are paid by LMFA, and not the Funds) in corresponding amounts. Any amounts waived or reimbursed in a particular fiscal year will be subject to repayment by a Fund to LMFA, Western Asset and WAML, to the extent that from time to time during the next three fiscal years the repayment will not cause a Fund’s expenses to exceed the limit set forth by LMFA, Western Asset and WAML. The following chart shows annual rates of management fees, expense limits, management fees waived and potential fees which may be recaptured for each Fund.
| | | | | | | | | | | | | | | | | | |
Fund | | Asset
Breakpoint
for Management
Fee | | Management
Fee | | | Asset
Breakpoint
for Expense
Limitation | | Expense
Limitation | | | Six Months
Ended
September 30,
2007 | | | Maximum
Amount
Subject to
Recapture | |
| | | | | | Management
Fees (Waived)/
Recaptured | | |
Absolute Return | | | | | | | | | | | | | | | | | | |
| | | | | | |
Institutional Class | | All asset levels | | 0.750 | % | | Up to $300,000 | | 1.10 | % | | $ | 190 | | | $ | — | |
| | | | | | |
| | | | | | | In excess of $300,000 | | 1.35 | % | | | | | | | | |
| | | | | | |
Financial Intermediary Class | | All asset levels | | 0.750 | % | | Up to $300,000 In excess of $300,000 | | 1.05
1.35 | %
% | |
| —
| A
| | | | |
| | | | | | |
Core | | | | | | | | | | | | | | | | | | |
| | | | | | |
Institutional Class | | Up to $500 million Next $500 million In excess of $1 billion | | 0.450
0.425
0.400 | %
%
% | | All asset levels All asset levels All asset levels | | 0.50 | % | | | — | | | | — | |
| | | | | | |
Financial Intermediary Class | | Up to $500 million Next $500 million In excess of $1 billion | | 0.450
0.425
0.400 | %
%
% | | All asset levels All asset levels All asset levels | | 0.75 | % | | | — | | | | — | |
| | | | | | |
Core Plus | | | | | | | | | | | | | | | | | | |
| | | | | | |
Institutional Class | | Up to $500 million Next $500 million In excess of $1 billion | | 0.450
0.425
0.400 | %
%
% | | All asset levels All asset levels All asset levels | | 0.45 | % | | | — | | | | — | |
| | | | | | |
Financial Intermediary Class | | Up to $500 million Next $500 million In excess of $1 billion | | 0.450
0.425
0.400 | %
%
% | | All asset levels All asset levels All asset levels | | 0.70
| %
| | | — | | | | — | |
| | | | | | |
High Yield | | All asset levels | | 0.550 | % | | All asset levels | | 0.65 | % | | | — | | | | — | |
| | | | | | |
Inflation Indexed | | All asset levels | | 0.200 | % | | All asset levels | | 0.25 | % | | | (53 | ) | | | (408 | ) |
| | | | | | |
Intermediate | | All asset levels | | 0.400 | % | | All asset levels | | 0.45 | % | | | (17 | ) | | | (255 | ) |
| | | | | | |
Intermediate Plus | | All asset levels | | 0.400 | % | | All asset levels | | 0.45 | % | | | (69 | ) | | | (290 | ) |
| | | | | | |
Limited Duration | | All asset levels | | 0.350 | % | | All asset levels | | 0.40 | % | | | (61 | ) | | | (450 | ) |
| | | | | | |
Non-U.S. | | All asset levels | | 0.450 | % | | All asset levels | | 0.55 | % | | | (42 | ) | | | (388 | ) |
A As of September 30, 2007 the Absolute Return Portfolio waived less than $1 of 12 b-1 fees in the Financial Intermediary Class.
Legg Mason Investor Services, LLC (“LMIS”) serves as distributor of the Funds’ shares. LMIS receives from each Fund an annual distribution fee of 0.25% of the average daily net assets of the Financial Intermediary Class of each Fund, computed daily and payable monthly.
LMFA, Western Asset, WAML and LMIS are wholly owned subsidiaries of Legg Mason, Inc.
270
Semi-Annual Report to Shareholders
6. Fund Share Transactions:
At September 30, 2007, there were 13.1 billion shares of common stock of the Corporation authorized at $.001 par value. Transactions in the Funds’ shares were as follows:
| | | | | | | | | | | | | | |
| | | Six Months Ended September 30, 2007 | | | Year Ended March 31, 2007 | |
| | | Shares | | | Amount | | | Shares | | | Amount | |
Absolute Return | | | | | | | | | | | | | | |
Institutional Class | | | | | | | | | | | | | | |
Shares sold | | 15,946 | | | $ | 159,744 | | | 36,584 | | | $ | 371,514 | |
Shares issued on reinvestment | | 1,196 | | | | 12,023 | | | 631 | | | | 6,442 | |
Shares repurchased | | (1,440 | ) | | | (14,442 | ) | | (909 | ) | | | (9,306 | ) |
| | | | | | | | | | | | | | |
Net Increase | | 15,702 | | | $ | 157,325 | | | 36,306 | | | $ | 368,650 | |
| | | | | | | | | | | | | | |
Financial Intermediary Class | | | | | | | | | | | | | | |
Shares sold | | — | | | $ | — | | | 2 | | | $ | 17 | |
Shares issued on reinvestment | | — | | | | — | | | — | | | | — | |
Shares repurchased | | — | | | | — | | | — | | | | — | |
| | | | | | | | | | | | | | |
Net Increase | | — | | | $ | — | | | 2 | | | $ | 17 | |
| | | | | | | | | | | | | | |
| | | | |
Core | | | | | | | | | | | | | | |
Institutional Class | | | | | | | | | | | | | | |
Shares sold | | 89,723 | | | $ | 997,087 | | | 109,208 | | | $ | 1,227,540 | |
Shares issued on reinvestment | | 13,010 | | | | 144,600 | | | 18,453 | | | | 206,866 | |
Shares repurchased | | (45,843 | ) | | | (507,753 | ) | | (73,985 | ) | | | (822,763 | ) |
| | | | | | | | | | | | | | |
Net Increase | | 56,890 | | | $ | 633,934 | | | 53,676 | | | $ | 611,643 | |
| | | | | | | | | | | | | | |
Financial Intermediary Class | | | | | | | | | | | | | | |
Shares sold | | 31,718 | | | $ | 352,667 | | | 104,516 | | | $ | 1,162,120 | |
Shares issued on reinvestment | | 3,906 | | | | 43,403 | | | 4,042 | | | | 45,486 | |
Shares repurchased | | (16,149 | ) | | | (179,077 | ) | | (17,801 | ) | | | (199,444 | ) |
| | | | | | | | | | | | | | |
Net Increase | | 19,475 | | | $ | 216,993 | | | 90,757 | | | $ | 1,008,162 | |
| | | | | | | | | | | | | | |
| | | | |
Core Plus | | | | | | | | | | | | | | |
Institutional Class | | | | | | | | | | | | | | |
Shares sold | | 267,309 | | | $ | 2,748,926 | | | 517,391 | | | $ | 5,399,184 | |
Shares issued on reinvestment | | 32,771 | | | | 337,065 | | | 35,685 | | | | 372,524 | |
Shares repurchased | | (105,419 | ) | | | (1,081,005 | ) | | (137,125 | ) | | | (1,423,368 | ) |
| | | | | | | | | | | | | | |
Net Increase | | 194,661 | | | $ | 2,004,986 | | | 415,951 | | | $ | 4,348,340 | |
| | | | | | | | | | | | | | |
Financial Intermediary Class | | | | | | | | | | | | | | |
Shares sold | | 42,521 | | | $ | 437,158 | | | 35,662 | | | $ | 372,492 | |
Shares issued on reinvestment | | 2,817 | | | | 28,991 | | | 2,729 | | | | 28,501 | |
Shares repurchased | | (13,991 | ) | | | (143,387 | ) | | (14,763 | ) | | | (152,693 | ) |
| | | | | | | | | | | | | | |
Net Increase | | 31,347 | | | $ | 322,762 | | | 23,628 | | | $ | 248,300 | |
| | | | | | | | | | | | | | |
271
Semi-Annual Report to Shareholders
Notes to Financial Statements—Continued
| | | | | | | | | | | | | | |
| | | Six Months Ended September 30, 2007 | | | Year Ended March 31, 2007 | |
| | | Shares | | | Amount | | | Shares | | | Amount | |
High Yield | | | | | | | | | | | | | | |
Institutional Class | | | | | | | | | | | | | | |
Shares sold | | 16,729 | | | $ | 172,882 | | | 21,424 | | | $ | 225,258 | |
Shares issued on reinvestment | | 3,639 | | | | 38,315 | | | 4,733 | | | | 48,268 | |
Shares repurchased | | (8,573 | ) | | | (89,565 | ) | | (2,034 | ) | | | (21,086 | ) |
| | | | | | | | | | | | | | |
Net Increase | | 11,795 | | | $ | 121,632 | | | 24,123 | | | $ | 252,440 | |
| | | | | | | | | | | | | | |
| | | | |
Inflation Indexed | | | | | | | | | | | | | | |
Institutional Class | | | | | | | | | | | | | | |
Shares sold | | 7,809 | | | $ | 79,353 | | | 9,069 | | | $ | 93,117 | |
Shares issued on reinvestment | | 2,275 | | | | 23,236 | | | 2,049 | | | | 20,971 | |
Shares repurchased | | (2,289 | ) | | | (23,217 | ) | | (2,315 | ) | | | (23,663 | ) |
| | | | | | | | | | | | | | |
Net Increase | | 7,795 | | | $ | 79,372 | | | 8,803 | | | $ | 90,425 | |
| | | | | | | | | | | | | | |
Financial Intermediary ClassA | | | | | | | | | | | | | | |
Shares sold | | 1 | | | $ | 12 | | | N/A | | | | N/A | |
Shares issued on reinvestment | | — | | | | — | | | N/A | | | | N/A | |
Shares repurchased | | — | | | | — | | | N/A | | | | N/A | |
| | | | | | | | | | | | | | |
Net Increase | | 1 | | | $ | 12 | | | N/A | | | | N/A | |
| | | | | | | | | | | | | | |
| | | | |
Intermediate | | | | | | | | | | | | | | |
Institutional Class | | | | | | | | | | | | | | |
Shares sold | | 17,436 | | | $ | 179,803 | | | 20,543 | | | $ | 211,660 | |
Shares issued on reinvestment | | 1,366 | | | | 15,953 | | | 2,589 | | | | 26,659 | |
Shares repurchased | | (10,721 | ) | | | (110,127 | ) | | (34,281 | ) | | | (351,411 | ) |
| | | | | | | | | | | | | | |
Net Increase (Decrease) | | 8,081 | | | $ | 85,629 | | | (11,149 | ) | | $ | (113,092 | ) |
| | | | | | | | | | | | | | |
Intermediate Plus | | | | | | | | | | | | | | |
Institutional Class | | | | | | | | | | | | | | |
Shares sold | | 1,527 | | | $ | 14,960 | | | 2,077 | | | $ | 20,298 | |
Shares issued on reinvestment | | 232 | | | | 2,279 | | | 350 | | | | 3,440 | |
Shares repurchased | | (121 | ) | | | (1,193 | ) | | (874 | ) | | | (8,558 | ) |
| | | | | | | | | | | | | | |
Net Increase | | 1,638 | | | $ | 16,046 | | | 1,553 | | | $ | 15,180 | |
| | | | | | | | | | | | | | |
| | | | |
Limited Duration | | | | | | | | | | | | | | |
Institutional Class | | | | | | | | | | | | | | |
Shares sold | | 3,564 | | | $ | 34,892 | | | 6,140 | | | $ | 60,429 | |
Shares issued on reinvestment | | 275 | | | | 2,687 | | | 391 | | | | 3,844 | |
Shares repurchased | | (2,008 | ) | | | (19,589 | ) | | (4,747 | ) | | | (46,701 | ) |
| | | | | | | | | | | | | | |
Net Increase | | 1,831 | | | $ | 17,990 | | | 1,784 | | | $ | 17,572 | |
| | | | | | | | | | | | | | |
272
Semi-Annual Report to Shareholders
| | | | | | | | | | | | | | |
| | | Six Months Ended September 30, 2007 | | | Year Ended March 31, 2007 | |
| | | Shares | | | Amount | | | Shares | | | Amount | |
Non-U.S. | | | | | | | | | | | | | | |
Institutional Class | | | | | | | | | | | | | | |
Shares sold | | 3,584 | | | $ | 34,805 | | | 10,431 | | | $ | 100,110 | |
Shares issued on reinvestment | | 6 | | | | 63 | | | 193 | | | | 1,792 | |
Shares repurchased | | (4,034 | ) | | | (39,192 | ) | | (1,872 | ) | | | (18,048 | ) |
| | | | | | | | | | | | | | |
Net Increase (Decrease) | | (444 | ) | | $ | (4,324 | ) | | 8,752 | | | $ | 83,854 | |
| | | | | | | | | | | | | | |
AFinancial Intermediary Class commenced operations June 28, 2007. | | | | | | | | | | | | | | |
| | | | | | | | | | | | | | | |
7. Recent Accounting Pronouncements
In June 2006, the Financial Accounting Standards Board (“FASB”) issued FASB Interpretation 48 (“FIN 48” or the “Interpretation”), Accounting for Uncertainty in Income Taxes—an interpretation of FASB Statement 109. FIN 48 supplements FASB Statement 109, Accounting for Income Taxes and establishes financial reporting rules regarding recognition, measurement, presentation, and disclosure in its financial statements of tax positions that a fund has taken or expects to take on a tax return. FIN 48 became effective for fiscal periods beginning after December 15, 2006.
On September 20, 2006, the FASB released Statement of Financial Accounting Standards No. 157 “Fair Value Measurements” (“FAS 157”). FAS 157 establishes an authoritative definition of fair value, sets out a framework for measuring fair value, and requires additional disclosures about fair-value measurements. The application of FAS 157 is required for fiscal years beginning after November 15, 2007 and interim periods within those fiscal years. At this time, management is evaluating the implications of FAS 157 and its impact on the financial statements has not yet been determined.
273
Western Asset Funds, Inc.
The Board of Directors
William E. B. Siart, Chairman
Ronald J. Arnault
Anita L. DeFrantz
R. Jay Gerken
Ronald L. Olson
Avedick B. Poladian
Jaynie Miller Studenmund
Officers
R. Jay Gerken, President
D. Daniel Fleet, Vice President
Gavin L. James, Vice President
S. Kenneth Leech, Vice President
Stephen A. Walsh, Vice President
Susanne D. Wilson, Vice President
Marie K. Karpinski, Principal Financial and Accounting Officer
Erin K. Morris, Treasurer
Susan C. Curry, Assistant Treasurer
Todd F. Kuehl, Chief Compliance Officer
Lisa G. Mrozek, Secretary
Investment Manager
Legg Mason Fund Adviser, Inc.
P.O. Box 17635
Baltimore, Maryland 21297-1635
Investment Advisers
Western Asset Management Company
385 East Colorado Boulevard
Pasadena, California 91101
Western Asset Management Company Limited
10 Exchange Square
London, England EC2A2EN
Transfer and Shareholder Servicing Agent
Boston Financial Data Services
66 Brooks Drive
Braintree, Massachusetts 02184
Custodian
State Street Bank & Trust Company
P.O Box 1031
Boston, Massachusetts 02103
Counsel
Ropes & Gray LLP
1211 Avenue of the Americas
New York, New York 10036
Independent Registered Public Accounting Firm
PricewaterhouseCoopers LLP
250 West Pratt Street
Baltimore, Maryland 21201
Information about the policies and procedures that each Fund uses to determine how to vote proxies relating to each Fund’s portfolio securities is contained in the Statement of Additional Information, available upon request without charge by calling 1-888-425-6432 or on the Securities and Exchange Commission’s (“SEC”) website (http://www.sec.gov). Information regarding how the Funds voted proxies relating to portfolio securities during the most recent twelve-month period ended June 30 is also available on the SEC’s website or without charge through www.westernassetfunds.com.
Each Fund files a complete schedule of portfolio holdings with the SEC for the first and third quarters of each fiscal year on Form N-Q. Each Fund’s Form N-Q is available on the Securities and Exchange Commission’s (“SEC”) website (http://www.sec.gov) and may be viewed and copied at the SEC’s Public Reference Room in Washington, D.C. Information about the operation of the Public Reference Room may be obtained by calling 1-800-SEC-0330. Quarterly portfolio holdings are also available upon request by calling 1-888-425-6432 or at www.lminstitutionalfunds.com/fund_information/fund_literature/gbl_literature/proxy_report.asp.
This report must be preceded or accompanied by a free prospectus. Investors should consider the Fund’s investment objectives, risks, charges and expenses carefully before investing. The prospectus contains this and other important information about the Fund. Please read the prospectus carefully before investing.
Western Asset Management Company
Legg Mason Investor Services, LLC, Distributor
Legg Mason, Inc. Subsidiaries
Item 2. Code of Ethics.
Not applicable for semi-annual reports.
Item 3. Audit Committee Financial Expert.
Not applicable for semi-annual reports.
Item 4. Principal Accountant Fees and Services.
Not applicable for semi-annual reports.
Item 5. Audit Committee of Listed Registrants.
Not applicable.
Item 6. Schedule of Investments
The schedule of investments in securities of unaffiliated issuers as of the close of the reporting period is included as part of the semi-annual report to shareholders filed under Item 1 hereto.
Item 7. Disclosure of Proxy Voting Policies and Procedures for Closed-End Management Investment Companies.
Not applicable.
Item 8. Portfolio Managers of Closed-End Management Investment Companies.
Not applicable.
Item 9. Purchases of Equity Securities by Closed-End Management Investment Companies and Affiliated Purchasers.
Not applicable.
Item 10. Submission of Matters to a Vote of Security Holders.
There have been no material changes to the procedures by which shareholders may recommend nominees to the Registrant’s Board of Directors that have been implemented since the Registrant last provided disclosure in response to the requirements of this Item 10.
Item 11. Controls and Procedures.
(a) The Registrant’s principal executive and principal financial officers have concluded, based on their evaluation of the Registrant’s disclosure controls and procedures as of a date within 90 days of the filing date of this report, that the Registrant’s disclosure controls and procedures are reasonably designed to ensure that information required to be disclosed by the Registrant on Form N-CSR is recorded, processed, summarized and reported within the required time periods in the Securities and Exchange Commission’s rules and forms and that information required to be disclosed by the Registrant in the reports that it files or submits on Form N-CSR is accumulated and communicated to the Registrant’s management, including its principal executive and principal financial officers, as appropriate to allow timely decisions regarding required disclosure.
(b) There were no changes in the Registrant’s internal control over financial reporting during the Registrant’s second fiscal quarter of the period covered by this report that have materially affected, or are reasonably likely to materially affect, the Registrant’s internal control over financial reporting.
Item 12. Exhibits.
(a) (1) Not applicable for semi-annual reports.
(a) (2) Certifications pursuant to Rule 30a-2(a) under the Investment Company Act of 1940 – filed as an exhibit hereto.
(a) (3) Not applicable.
(b) Certifications pursuant to Rule 30a-2(b) under the Investment Company Act of 1940 – filed as an exhibit hereto.
SIGNATURES
Pursuant to the requirements of the Securities Exchange Act of 1934 and the Investment Company Act of 1940, the Registrant has duly caused this report to be signed on its behalf by the undersigned, thereunto duly authorized.
Western Asset Funds, Inc.
By: /s/ R. Jay Gerken
R. Jay Gerken
President
Western Asset Funds, Inc.
Date: November 27, 2007
Pursuant to the requirements of the Securities Exchange Act of 1934 and the Investment Company Act of 1940, this report has been signed below by the following persons on behalf of the Registrant and in the capacities and on the dates indicated.
By: /s/ R. Jay Gerken
R. Jay Gerken
President
Western Asset Funds, Inc.
Date: November 27, 2007
By: /s/ Marie K. Karpinski
Marie K. Karpinski
Principal Financial and Accounting Officer
Western Asset Funds, Inc.
Date: November 20, 2007