UNITED STATES
SECURITIES AND EXCHANGE COMMISSION
Washington, D.C. 20549
FORM N-CSR
CERTIFIED SHAREHOLDER REPORT OF REGISTERED
MANAGEMENT INVESTMENT COMPANIES
| | |
Investment Company Act file number: | | 811-06110 |
Western Asset Funds, Inc.
| | |
| 385 East Colorado Boulevard, Pasadena, CA 91101 |
| Address of Principal Executive Offices: |
Robert I. Frenkel, Esq.
Legg Mason & Co., LLC
100 Light Street
Baltimore, MD 21202
|
| Name and address of agent for service: |
Registrant’s telephone number, including area code: 1-888-425-6432
Date of fiscal year end: December 31,
Date of reporting period: June 30, 2009
| Item 1. | Report to Shareholders |

Investment Commentary
and Semi-Annual Report to
Shareholders
June 30, 2009
Western Asset Funds, Inc.
Western Asset Core Bond Portfolio
Western Asset Core Plus Bond Portfolio
Contents
For more information, visit us on the web
at www.westernassetfunds.com.
Investment Commentary
Western Asset Funds, Inc.
For the Six Months Ended June 30, 2009
Financial Market Overview
To a great extent, the financial markets in 2008 were characterized by periods of extreme volatility, illiquidity, frozen credit conditions and heightened risk aversion. Collectively, this caused investors to flock to the safety of short-term Treasuries, driving their yields lower and their prices higher. In contrast, non-Treasuries generally performed poorly, with their spreads moving, in some cases, to historically wide levels.
The market then largely stabilized during the six-month reporting period ended June 30, 2009. A return to more normal market conditions was due, in part, to the aggressive actions taken by the Federal Reserve Board (“Fed”)A, the U.S. Department of the Treasury and other government agencies. Looking back, in 2008 the Fed took several actions to improve liquidity in the credit markets. In March 2008, it established a new lending program allowing certain brokerage firms, known as primary dealers, to also borrow from its discount window. In mid-September 2008, it announced an $85 billion rescue plan for ailing AIG and pumped $70 billion into the financial system as the Lehman Brothers bankruptcy and mounting troubles at other financial firms roiled the markets. Toward the end of the year, the Fed took additional measures to thaw the frozen credit markets, including the purchase of debt issued by Fannie Mae and Freddie Mac, as well as introducing the Term Asset-Backed Securities Loan Facility (“TALF”).
In March 2009, the Fed continued to pursue aggressive measures as it announced its intentions to:
| | • | | Purchase up to an additional $750 billion of agency mortgage-backed securities, bringing its total purchases of these securities to up to $1.25 trillion in 2009. |
| | • | | Increase its purchases of agency debt this year by up to $100 billion to a total of up to $200 billion. |
| | • | | Buy up to $300 billion of longer-term Treasury securities over the next six months. |
After reducing the federal funds rateB from 5.25% in August 2007 to a range of 0 to 1/4 percent in December 2008—a historic low—the Fed has maintained this stance thus far in 2009. In conjunction with its June meeting, the Fed stated that it “will maintain the target range for the federal funds rate at 0 to 1/4 percent and continues to anticipate that economic conditions are likely to warrant exceptionally low levels of the federal funds rate for an extended period.”
The U.S. Department of the Treasury has also taken an active role in attempting to stabilize the financial system, as it orchestrated the government’s takeover of mortgage giants Fannie Mae and Freddie Mac in September 2008. In October, the Treasury’s $700 billion Troubled Asset Relief Program (“TARP”) was approved by Congress and signed into law by former President Bush. Then, in March 2009, Treasury Secretary Geithner introduced the Public-Private Partnership Investment Program (“PPIP”), which is intended to facilitate the purchase of troubled mortgage assets from bank balance sheets. The Treasury also announced its intentions to conduct “stress tests” for major banks to determine if they needed to bolster their capital levels. The results of the stress tests were released in May, and were not as dire as initially feared.
Economic Review
Even though conditions in the financial markets improved during the first half of 2009, the U.S. economy continued to face numerous headwinds. Looking back, the U.S. Department of Commerce reported that third and fourth quarter 2008 U.S. gross domestic product (“GDP”)C contracted 2.7% and 5.4%, respectively. Economic contraction has continued in 2009 as GDP fell 6.4% during the first quarter and the advance estimate for the second quarter is a 1.0% decline. The economy’s more modest contraction in the second quarter was due, in part, to smaller declines in exports and business spending.
While economic news was largely bleak during the first quarter of 2009, there were some indications that things were becoming “less negative” during the second quarter. While the unemployment rate continued to move higher, the number of jobs lost on a monthly basis subsided from the pace earlier in the year. Another strain on the economy, the long-ailing housing market, may also be getting closer to reaching a bottom. After plunging late last year, new single-family home starts have been fairly stable in recent months. In addition, while home prices continued to fall, the pace of the decline has moderated. Other recent economic news also seemed to be “less negative.” Inflation remained low, manufacturing contracted at a slower pace than during the first quarter of the year and inventory levels were drawn down.
The Investment Commentary is not a part of the Semi-Annual Report to Shareholders.
ii
Investment Commentary
Market Review
Both short- and long-term Treasury yields fluctuated during the reporting period. This was often prompted by changing perceptions regarding the economy, future Fed policy decisions and the government’s initiatives to stabilize the financial system. When the reporting period began, Treasury yields were extremely low, given numerous “flights to quality” in 2008 that were triggered by the financial crisis. After starting the period at 0.76% and 2.25%, respectively, two- and ten-year Treasury yields drifted even lower (and their prices higher) in mid-January 2009. Yields generally moved higher (and their prices lower) until early June. Two- and ten-year yields peaked at 1.42% and 3.98%, respectively, before falling and ending the period at 1.11% and 3.53%.
Over the six months ended June 30, 2009, longer-term yields moved higher than their shorter-term counterparts due to fears of future inflation given the government’s massive stimulus program. In a reversal from 2008, investor risk aversion faded as the six-month reporting period progressed, driving spread sector (non-Treasury) prices higher. For the six-month period ended June 30, 2009, the Barclays Capital U.S. Aggregate IndexD returned 1.90%.
Looking Ahead
Despite the market turmoil in 2009, we maintained our investment discipline and remained committed to our investments in the spread sectors. This patience was rewarded, as these securities significantly outperformed U.S. Treasuries during the reporting period.
Looking ahead, there continues to be uncertainties surrounding the economy. As such, we could experience periods of increased market volatility as investors seek to interpret incoming economic data. In such an environment, we believe it is extremely important to have a long-term perspective for your investment portfolio and remain focused on your ultimate financial goals.
Western Asset Management Company
July 31, 2009
The views expressed in this and subsequent commentaries reflect those solely of Western Asset Management Company (“Western Asset”) as of the date of the commentary and may differ from those of Legg Mason, Inc. or its affiliates. Any such views are subject to change at any time based on market or other conditions, and Western Asset and Legg Mason Investor Services, LLC disclaim any responsibility to update such views. These views are not intended to be a forecast of future events, a guarantee of future results or investment advice. Forecasts are inherently limited and should not be relied upon as an indication of actual or future performance. Because investment decisions for the Western Asset Funds are based on numerous factors, these views may not be relied upon as an indication of trading intent on behalf of any Western Asset or Legg Mason Fund. The information contained herein has been prepared from sources believed to be reliable, but is not guaranteed by Western Asset or Legg Mason Investor Services, LLC as to its accuracy or completeness.
Please note that an investor cannot invest directly in an index.
| A | | The Federal Reserve Board (“Fed”) is responsible for the formulation of policies designed to promote economic growth, full employment, stable prices and a sustainable pattern of international trade and payments. |
| B | | The federal funds rate is the rate charged by one depository institution on an overnight sale of immediately available funds (balances at the Federal Reserve) to another depository institution; the rate may vary from depository institution to depository institution and from day to day. |
| C | | Gross domestic product (“GDP”) is the market value of all final goods and services produced within a country in a given period of time. |
| D | | The Barclays Capital (formerly Lehman Brothers) U.S. Aggregate Index is a broad-based bond index comprised of government, corporate, mortgage- and asset-backed issues, rated investment grade or higher, and having at least one year to maturity. |
The Investment Commentary is not a part of the Semi-Annual Report to Shareholders.
iii
Investment Commentary
Performance Information
Western Asset Core Bond Portfolio
Total returns for the Fund for various periods ended June 30, 2009 are presented below, along with those of comparative indices:
| | | | | | | | | | |
| | | | | Average Annual Total Returns |
| | | Six
Months | | One
Year | | Five
Years | | Ten
Years | | Since
Inception |
Western Asset Core Bond Portfolio: | | | | | | | | | | |
Institutional Class | | +8.53% | | -0.78% | | +2.27% | | +5.06% | | +6.91% |
Financial Intermediary Class | | +8.39% | | -1.05% | | +2.01% | | N/A | | +4.71% |
Institutional Select Class | | +8.52% | | N/A | | N/A | | N/A | | +0.84% |
Barclays Capital U.S. Aggregate IndexA | | +1.90% | | +6.05% | | +5.01% | | +5.98% | | +7.09% |
Lipper Intermediate Investment Grade Debt Funds Category AverageB | | +5.38% | | +2.12% | | +3.26% | | +4.84% | | +6.46% |
The performance data quoted represent past performance and do not guarantee future results. Current performance may be lower or higher than the performance data quoted. To obtain performance data current to the most recent month-end, please visit our website at www.westernassetfunds.com. The investment return and principal value of the Fund will fluctuate so that an investor’s shares, when redeemed, may be worth more or less than the original cost. Calculations assume the reinvestment of all distributions, including returns of capital, if any, at net asset value and the deduction of all fund expenses. Performance would have been lower if fees and expenses had not been waived and/or reimbursed in various periods. Performance figures for periods shorter than one year represent cumulative figures and are not annualized. Please note that the Institutional Select Class has been in existence for less than one year. Results for longer periods may differ, in some cases, substantially.
The inception dates of the Institutional, Financial Intermediary and Institutional Select Classes are September 4, 1990, July 22, 1999 and August 29, 2008, respectively. The Index inception return is for the period beginning September 4, 1990. The Lipper inception return is for the period beginning August 31, 1990. All Index performance reflects no deduction for fees, expenses or taxes. Please note that an investor cannot invest directly in an index.
The gross expense ratios for the Institutional, Financial Intermediary and Institutional Select Classes were 0.49%, 0.83% and 0.48%, respectively, as indicated in the Fund’s most current prospectus dated July 1, 2009. These expenses include management fees, 12b-1 distribution fees and other expenses. As a result of contractual expense limitations, the ratio of expenses, other than interest, brokerage, taxes, deferred organizational expenses and extraordinary expenses, to average net assets will not exceed 0.75% for Financial Intermediary Class shares and 0.50% for Institutional Select Class shares until April 30, 2010.
Actual expenses may be higher. For example, expenses may be higher than those shown if average net assets decrease. Net assets are more likely to decrease and Fund expense ratios are more likely to increase when markets are volatile.
For the six months ended June 30, 2009, Institutional Class shares of Western Asset Core Bond Portfolio returned 8.53%. The Fund’s unmanaged benchmark, the Barclays Capital U.S. Aggregate Index, returned 1.90% over the same time frame. The Lipper Intermediate Investment Grade Debt Funds Category Average returned 5.38% for the same period.
A return to more normal market conditions, including improved liquidity and signs that the economy may be bottoming, caused investor risk aversion to decrease, triggering a strong rally in the spread sectors (non-Treasuries). Against this backdrop, the Fund significantly outperformed its benchmark during the reporting period.
The largest contributor to the Fund’s performance was its exposure to investment grade corporate bonds. In particular, the Fund’s holdings in the Financials sector were rewarded as their spreads substantially narrowed versus their historically wide levels that occurred during the financial crisis in 2008. In fact, returns for the April to May 2009 period were among the highest total
The Investment Commentary is not a part of the Semi-Annual Report to Shareholders.
iv
Investment Commentary
returns ever in the U.S. corporate bond market, according to Barclays Capital. An allocation to U.S. Treasury Inflation-Protected Securities (“TIPS”)C was beneficial as fears of deflation were replaced with concerns about future inflation given the government’s massive stimulus program. Exposure to agency mortgage-backed securities was also rewarded. Marginally offsetting these strong results was the Fund’s underweight exposure to commercial mortgage-backed securities which advanced during the period.
The Fund employed U.S. Treasury and Eurodollar futures and options, as well as interest rate swaps/swaptions and credit default swaps during the reporting period, which had an overall negative impact on performance. With the exception of credit default swaps, these strategies were used to manage the portfolio’s durationD and yield curveE exposure. Treasury futures and options along with interest rate swaps were used to hedge duration in the front and intermediate part of the yield curve, while Eurodollar futures and options helped to manage interest rate risk at the front end of the yield curve. The strategies we used for interest rate management enhanced the Fund’s results. Credit default swaps were used to increase our exposure to the corporate and non-agency mortgage-backed sectors. Our credit default swaps used to adjust our corporate exposure were a slight contributor to performance. In contrast, credit default swaps used to adjust our non-agency exposure detracted from performance over the period.
There were several adjustments made to the Fund’s portfolio over the six-month period. We decreased our allocation to agency mortgage-backed securities and redeployed those assets into corporate securities, agency debentures and U.S. Treasuries. Overall, these changes positively contributed to the Fund’s performance.
Western Asset Management Company
July 21, 2009
Investment Risks: All investments are subject to risk including the loss of principal. Past performance is no guarantee of future results. Bonds are subject to a variety of risks, including interest rate, credit and inflation risk. As interest rates rise, bond prices fall, reducing the value of the Fund’s share price. Mortgage-backed securities involve more risk, including prepayment and extension risks, than other investments in fixed-income securities. The Fund may use derivatives, such as options, futures and swaps, which can be illiquid, may disproportionately increase losses, and have a potentially large impact on Fund performance. Please see the Fund’s prospectus for more information on these and other risks.
Please note that an investor cannot invest directly in an index.
| A | | The Barclays Capital (formerly Lehman Brothers) U.S. Aggregate Index is a broad-based bond index comprised of government, corporate, mortgage- and asset-backed issues, rated investment grade or higher, and having at least one year to maturity. |
| B | | Lipper, Inc., a wholly-owned subsidiary of Reuters, provides independent insight on global collective investments. The Lipper Intermediate Investment Grade Debt Funds Category Average is comprised of the Fund’s peer group of mutual funds. |
| C | | U.S. Treasury Inflation-Protected Securities (“TIPS”) are inflation-indexed securities issued by the U.S. Treasury in five-year, ten-year and twenty-year maturities. The principal is adjusted to the Consumer Price Index, the commonly used measure of inflation. The coupon rate is constant, but generates a different amount of interest when multiplied by the inflation-adjusted principal. |
| D | | Duration is the measure of the price sensitivity of a fixed-income security to an interest rate change of 100 basis points. Calculation is based on the weighted average of the present values for all cash flows. |
| E | | The yield curve is the graphical depiction of the relationship between the yield on bonds of the same credit quality but different maturities. |
The Investment Commentary is not a part of the Semi-Annual Report to Shareholders.
v
Investment Commentary
Performance Information—Continued
Western Asset Core Plus Bond Portfolio
Total returns for the Fund for various periods ended June 30, 2009 are presented below, along with those of comparative indices:
| | | | | | | | | | |
| | | | | Average Annual Total Returns |
| | | Six
Months | | One
Year | | Five
Years | | Ten
Years | | Since
Inception |
Western Asset Core Plus Bond Portfolio: | | | | | | | | | | |
Institutional Class | | +10.20% | | +3.32% | | +3.45% | | +5.88% | | +5.48% |
Financial Intermediary Class | | +10.08% | | +3.08% | | +3.17% | | N/A | | +4.49% |
Institutional Select Class | | +10.22% | | N/A | | N/A | | N/A | | +5.22% |
Barclays Capital U.S. Aggregate IndexA | | +1.90% | | +6.05% | | +5.01% | | +5.98% | | +5.70% |
Lipper Intermediate Investment Grade Debt Funds Category AverageB | | +5.38% | | +2.12% | | +3.26% | | +4.84% | | +4.56% |
The performance data quoted represent past performance and do not guarantee future results. Current performance may be lower or higher than the performance data quoted. To obtain performance data current to the most recent month-end, please visit our website at www.westernassetfunds.com. The investment return and principal value of the Fund will fluctuate so that an investor’s shares, when redeemed, may be worth more or less than the original cost. Calculations assume the reinvestment of all distributions, including returns of capital, if any, at net asset value and the deduction of all fund expenses. Performance would have been lower if fees and expenses had not been waived and/or reimbursed in various periods. Performance figures for periods shorter than one year represent cumulative figures and are not annualized. Please note that the Institutional Select Class has been in existence for less than one year. Results for longer periods may differ, in some cases, substantially.
The inception dates of the Institutional, Financial Intermediary and Institutional Select Classes are July 8, 1998, January 8, 2002 and August 4, 2008, respectively. The Index inception return is for the period beginning July 8, 1998. The Lipper inception return is for the period beginning June 30, 1998. All Index performance reflects no deduction for fees, expenses or taxes. Please note that an investor cannot invest directly in an index.
The gross expense ratios for the Institutional, Financial Intermediary and Institutional Select Classes were 0.47%, 0.85% and 0.44%, respectively, as indicated in the Fund’s most current prospectus dated July 1, 2009. These expenses include management fees, 12b-1 distribution fees and other expenses. As a result of contractual expense limitations, the ratio of expenses, other than interest, brokerage, taxes, deferred organizational expenses and extraordinary expenses, to average net assets will not exceed 0.70% for Financial Intermediary Class shares and 0.45% for Institutional Select Class shares until April 30, 2010.
Actual expenses may be higher. For example, expenses may be higher than those shown if average net assets decrease. Net assets are more likely to decrease and Fund expense ratios are more likely to increase when markets are volatile.
For the six months ended June 30, 2009, Institutional Class shares of Western Asset Core Plus Bond Portfolio returned 10.20%. The Fund’s unmanaged benchmark, the Barclays Capital U.S. Aggregate Index, returned 1.90% over the same time frame. The Lipper Intermediate Investment Grade Debt Funds Category Average returned 5.38% for the same period.
While 2008 was largely characterized as being highly volatile, with several investor “flights to quality” due to the escalating financial crisis, conditions in the fixed-income markets largely stabilized over the first half of 2009. During this time, investor risk aversion declined, helping the spread sectors (non-Treasuries) to generate strong results. Given this environment, the Fund significantly outperformed its benchmark.
The largest contributor to the Fund’s performance was its exposure to investment grade corporate bonds. In particular, the Fund’s holdings in the Financials sector were rewarded as their spreads substantially narrowed versus their historically wide levels
The Investment Commentary is not a part of the Semi-Annual Report to Shareholders.
vi
Investment Commentary
that occurred during the financial crisis in 2008. The Fund’s high-yield bond holdings—led by its securities in the Industrials and Financials sectors—also boosted the Fund’s performance. It’s interesting to note that returns for the April to May 2009 period were among the highest total returns ever in the U.S. corporate bond market, according to Barclays Capital. An allocation to U.S. Treasury Inflation-Protected Securities (“TIPS”)C was beneficial as fears of deflation were replaced with concerns about future inflation given the government’s massive stimulus program. The Fund also benefited from its exposure to agency mortgage-backed securities and from its holdings of non-U.S. bonds and emerging market debt.
Marginally offsetting these strong results were the Fund’s exposure to non-agency residential mortgage securities and an underweight to commercial mortgage-backed securities. A long durationD position also slightly detracted from performance, as did our agency debentures and asset-backed securities exposure.
The Fund employed U.S. Treasury and Eurodollar futures and options, as well as interest rate swaps/swaptions and credit default swaps during the reporting period, which had an overall positive impact on performance. With the exception of credit default swaps, these strategies were used to manage the portfolio’s duration and yield curveE exposure. Treasury futures and options along with interest rate swaps were used to hedge duration in the front and intermediate part of the yield curve, while Eurodollar futures and options helped to manage interest rate risk at the front end of the yield curve. The strategies we used for interest rate management enhanced the Fund’s results. Credit default swaps were used to increase our exposure to the corporate and non-agency mortgage-backed sectors. Our credit default swaps used to adjust our corporate exposure were a large contributor to performance. In contrast, credit default swaps used to adjust our non-agency exposure detracted from performance over the period.
There were several adjustments made to the Fund’s portfolio over the six-month period. We decreased the allocation to agency mortgage-backed securities and redeployed those assets into corporate securities, agency debentures and U.S. Treasuries. Overall, these changes positively contributed to the Fund’s performance.
Western Asset Management Company
July 21, 2009
Investment Risks: All investments are subject to risk including the loss of principal. Past performance is no guarantee of future results. Bonds are subject to a variety of risks, including interest rate, credit and inflation risk. As interest rates rise, bond prices fall, reducing the value of the Fund’s share price. The Fund may invest in high-yield bonds, which are rated below investment grade and carry more risk than higher-rated securities. Mortgage-backed securities involve more risk, including prepayment and extension risks, than other investments in fixed-income securities. Non-U.S. investments are subject to currency fluctuations, social, economic and political risk. These risks are magnified in emerging markets. The Fund may use derivatives, such as options, futures and swaps, which can be illiquid, may disproportionately increase losses, and have a potentially large impact on Fund performance. Please see the Fund’s prospectus for more information on these and other risks.
Please note that an investor cannot invest directly in an index.
| A | | The Barclays Capital (formerly Lehman Brothers) U.S. Aggregate Index is a broad-based bond index comprised of government, corporate, mortgage- and asset-backed issues, rated investment grade or higher, and having at least one year to maturity. |
| B | | Lipper, Inc., a wholly-owned subsidiary of Reuters, provides independent insight on global collective investments. The Lipper Intermediate Investment Grade Debt Funds Category Average is comprised of the Fund’s peer group of mutual funds. |
| C | | U.S. Treasury Inflation-Protected Securities (“TIPS”) are inflation-indexed securities issued by the U.S. Treasury in five-year, ten-year and twenty-year maturities. The principal is adjusted to the Consumer Price Index, the commonly used measure of inflation. The coupon rate is constant, but generates a different amount of interest when multiplied by the inflation-adjusted principal. |
| D | | Duration is the measure of the price sensitivity of a fixed-income security to an interest rate change of 100 basis points. Calculation is based on the weighted average of the present values for all cash flows. |
| E | | The yield curve is the graphical depiction of the relationship between the yield on bonds of the same credit quality but different maturities. |
The Investment Commentary is not a part of the Semi-Annual Report to Shareholders.
vii
Western Asset Funds, Inc.
Western Asset Core Bond Portfolio
Western Asset Core Plus Bond Portfolio
Semi-Annual Report to Shareholders
June 30, 2009
Semi-Annual Report to Shareholders
Expense Example (Unaudited)
Western Asset Core Bond Portfolio
As a shareholder of the Fund, you incur ongoing costs, including management fees, distribution (12b-1) fees on Financial Intermediary Class shares, and other Fund expenses. These examples are intended to help you understand your ongoing costs (in dollars) of investing in the Fund and to compare these costs with the ongoing costs of investing in other mutual funds.
Actual Expenses
The first line for each class in the table below provides information about actual account values and actual expenses for each Class. You may use the information in this line, together with the amount you invested, to estimate the expenses that you paid over the period. Simply divide your account value by $1,000 (for example, an $8,600 account value divided by $1,000 = 8.6), then multiply the result by the number in the first line under the heading entitled “Expenses Paid During the Period” to estimate the expenses you paid on your account if your shares were held for the entire period. The example are based on an investment of $1,000 invested on January 1, 2009 and held through June 30, 2009. The ending values assume dividends were reinvested at the time they were paid.
Hypothetical Examples for Comparison Purposes
The second line for each class in the table below provides information about hypothetical account values and hypothetical expenses based on the relevant class’s actual expense ratio and an assumed rate of return of 5% per year before expenses, which is not the class’s actual return. The hypothetical account values and expenses may not be used to estimate the actual ending account balance or expenses you paid for the period. You may use this information to compare the ongoing costs of investing in the Fund and other funds. To do so, compare this 5% hypothetical example with the 5% hypothetical examples for the relevant classes that appear in the shareholder reports of other funds. Because the example is intended to be comparable to the examples provided by other funds, it is based on a hypothetical investment of $1,000 invested on January 1, 2009 and held through June 30, 2009 for each class. The ending values assume dividends were reinvested at the time they were paid.
| | | | | | | | | |
| | | Beginning
Account Value
1/1/09 | | Ending
Account Value
6/30/09 | | Expenses PaidA
During the Period
1/1/09 to 6/30/09 |
Institutional Class: | | | | | | | | | |
Actual | | $ | 1,000.00 | | $ | 1,085.30 | | $ | 2.53 |
Hypothetical (5% return before expenses) | | | 1,000.00 | | | 1,022.36 | | | 2.46 |
Institutional Select Class: | | | | | | | | | |
Actual | | $ | 1,000.00 | | $ | 1,085.20 | | $ | 2.27 |
Hypothetical (5% return before expenses) | | | 1,000.00 | | | 1,022.61 | | | 2.21 |
Financial Intermediary Class: | | | | | | | | | |
Actual | | $ | 1,000.00 | | $ | 1,083.90 | | $ | 3.88 |
Hypothetical (5% return before expenses) | | | 1,000.00 | | | 1,021.08 | | | 3.76 |
| A | | These calculations are based on expenses incurred from January 1, 2009 to June 30, 2009. The dollar amounts shown as “Expenses Paid” are equal to the annualized expense ratios of 0.49%, 0.44% and 0.75% for the Institutional Class, Institutional Select Class and Financial Intermediary Class, respectively, multiplied by the average values over the period, multiplied by the number of days in the most recent fiscal period then divided by 365. |
1
Semi-Annual Report to Shareholders
Performance Information (Unaudited)
Western Asset Core Bond Portfolio
The graphs compare the Fund’s total returns to that of an appropriate broad-based securities market index. The graphs illustrate the cumulative total return of an initial $1,000,000 investment in the Institutional Class, Institutional Select Class and Financial Intermediary Class of the Fund, for the periods indicated. The line for the Fund represents the total return after deducting all Fund investment management and other administrative expenses and the transaction costs of buying and selling securities. The line representing the securities market index does not include any transaction costs associated with buying and selling securities in the index or other investment management or administrative expenses.
Total return measures investment performance in terms of appreciation or depreciation in the Fund’s net asset value per share, plus dividends and any capital gain distributions. It assumes that dividends and distributions were reinvested at the time they were paid. Returns (and the graphs and tables found below) do not reflect the deduction of taxes that a shareholder would pay on Fund distributions or the redemption of Fund shares. Average annual returns tend to smooth out variations in a fund’s return, so that they differ from actual year-to-year results.
Bonds are subject to a variety of risks, including interest rate, credit and inflation risk. Non-U.S. investments are subject to currency fluctuations, social, economical and political risk.
Growth of a $1,000,000 Investment—Institutional Class
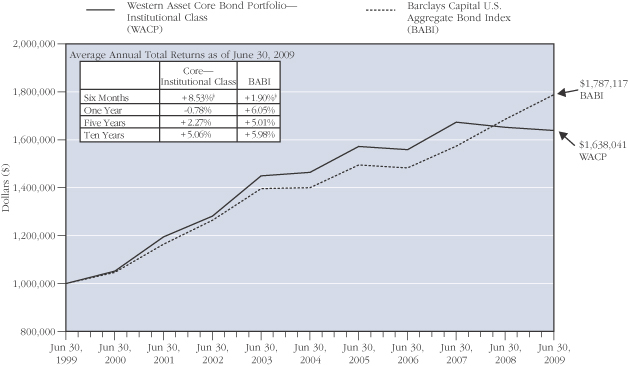
The performance data quoted represent past performance and do not guarantee future results. Current performance may be lower or higher than the performance data quoted. To obtain the most recent month-end performance information, please visit www.westernassetfunds.com. The investment return and principal value of the Fund will fluctuate so that an investor’s shares, when redeemed, may be worth more or less than the original cost. Calculations assume reinvestment of all distributions, including returns of capital, if any, at net asset value and the deduction of all fund expenses. Performance would have been lower if fees had not been waived in various periods.
2
Semi-Annual Report to Shareholders
Growth of a $1,000,000 Investment—Institutional Select Class
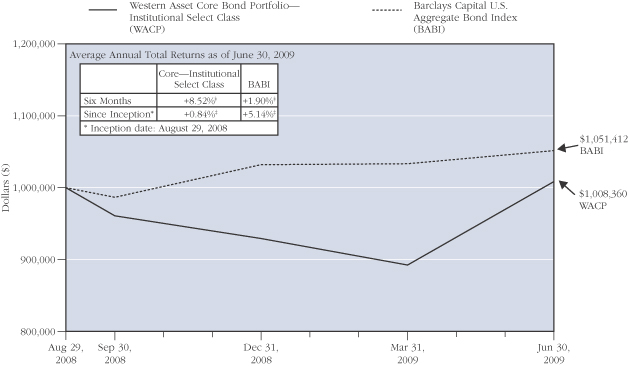
The performance data quoted represent past performance and do not guarantee future results. Current performance may be lower or higher than the performance data quoted. To obtain the most recent month-end performance information, please visit www.westernassetfunds.com. The investment return and principal value of the Fund will fluctuate so that an investor’s shares, when redeemed, may be worth more or less than the original cost. Calculations assume reinvestment of all distributions, including returns of capital, if any, at net asset value and the deduction of all fund expenses. Performance would have been lower if fees had not been waived in various periods.
3
Semi-Annual Report to Shareholders
Performance Information (Unaudited)—Continued
Growth of a $1,000,000 Investment—Financial Intermediary Class
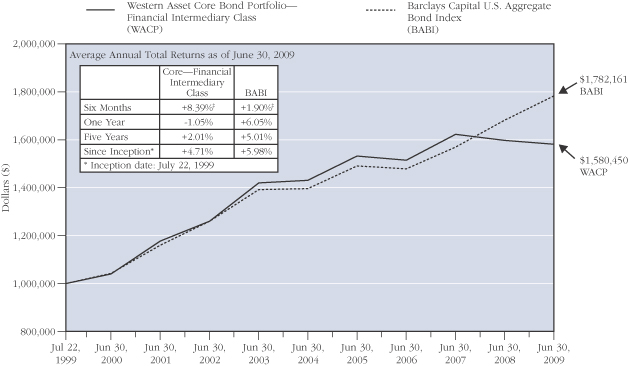
The performance data quoted represent past performance and do not guarantee future results. Current performance may be lower or higher than the performance data quoted. To obtain the most recent month-end performance information, please visit www.westernassetfunds.com. The investment return and principal value of the Fund will fluctuate so that an investor’s shares, when redeemed, may be worth more or less than the original cost. Calculations assume reinvestment of all distributions, including returns of capital, if any, at net asset value and the deduction of all fund expenses. Performance would have been lower if fees had not been waived in various periods.
4
Semi-Annual Report to Shareholders
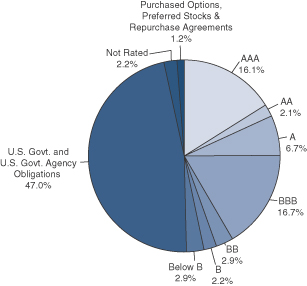
Portfolio Composition (Unaudited) (as of June 30, 2009)A
Standard & Poor’s Debt RatingsB
(as a percentage of the portfolio)
Maturity Schedule
(as a percentage of the portfolio)
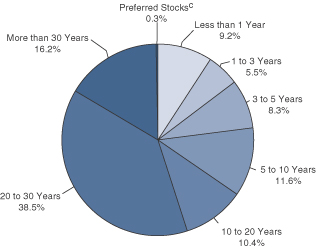
| A | | The pie charts above represent the composition of the Fund’s portfolio as of June 30, 2009 and do not include derivatives such as Futures Contracts, Options Written, and Swaps. The Fund is actively managed. As a result, the composition of the portfolio holdings and sectors are subject to change at any time. |
| B | | Source: Standard & Poor’s. These ratings are the opinions of S&P and not absolute measures of quality or guarantees of performance. |
| C | | Preferred stocks do not have defined maturity dates. |
5
Semi-Annual Report to Shareholders
Spread Duration
Western Asset Core Bond Portfolio
June 30, 2009 (Unaudited)
Economic Exposure
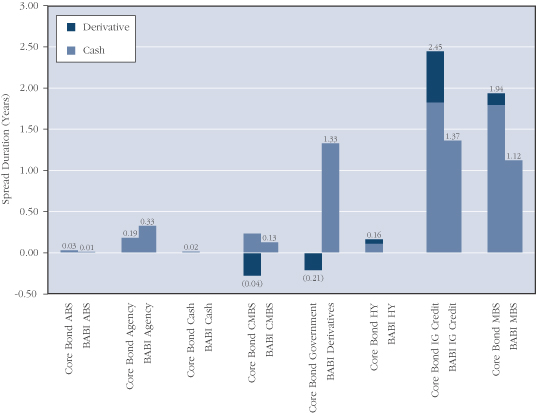
Spread duration is defined as the change in value for a 100 basis point change in the spread relative to Treasuries. The spread over Treasuries is the annual risk-premium demanded by investors to hold non-Treasury securities. This chart highlights the market sector exposure of the Fund’s portfolio and the exposure relative to the selected benchmark as of the end of the reporting period.
ABS — Asset Backed Securities
BABI — Barclays Capital U.S. Aggregate Index
CMBS — Commercial Mortgage Backed Securities
HY — High Yield
IG Credit — Investment Grade Credit
MBS — Mortgage Backed Securities
6
Semi-Annual Report to Shareholders
Effective Duration
Western Asset Core Bond Portfolio
June 30, 2009 (Unaudited)
Interest Rate Exposure
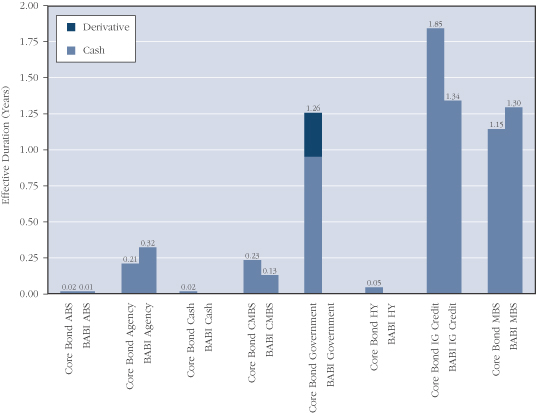
Effective duration is defined as the change in value for a 100 basis point change in Treasury yields. This chart highlights the interest rate exposure of the Fund’s portfolio relative to the selected benchmark as of the end of the reporting period.
ABS — Asset Backed Securities
BABI — Barclays Capital U.S. Aggregate Index
CMBS — Commercial Mortgage Backed Securities
HY — High Yield
IG Credit — Investment Grade Credit
MBS — Mortgage Backed Securities
7
Semi-Annual Report to Shareholders
Portfolio of Investments
Western Asset Core Bond Portfolio
June 30, 2009 (Unaudited)
| | | | | | | | | | | | | |
| | | % OF
NET ASSETS | | RATE | | MATURITY
DATE | | PAR/
SHARES | | VALUE | |
| | | | | | | | | | | | | |
Long-Term Securities | | 104.7% | | | | | | | | | | | |
| | | | | |
Corporate Bonds and Notes | | 29.2% | | | | | | | | | | | |
| | | | | |
Aerospace and Defense | | N.M. | | | | | | | | | | | |
United Technologies Corp. | | | | 5.400% | | 5/1/35 | | $ | 1,460,000 | | $ | 1,426,426 | |
| | | | | | | | | | | | | |
| | | | | |
Airlines | | 1.7% | | | | | | | | | | | |
Continental Airlines Inc. | | | | 6.900% | | 1/2/18 | | | 2,392,508 | | | 2,081,482 | |
Continental Airlines Inc. | | | | 6.820% | | 5/1/18 | | | 548,237 | | | 433,107 | |
Continental Airlines Inc. | | | | 6.545% | | 2/2/19 | | | 4,183,620 | | | 3,869,849 | |
Continental Airlines Inc. | | | | 5.983% | | 4/19/22 | | | 4,000,000 | | | 3,300,000 | |
Continental Airlines Inc. | | | | 6.703% | | 12/15/22 | | | 3,305,517 | | | 2,776,634 | |
Delta Air Lines Inc. | | | | 7.379% | | 5/18/10 | | | 607,713 | | | 592,520 | |
Delta Air Lines Inc. | | | | 7.570% | | 11/18/10 | | | 7,136,000 | | | 6,814,880 | |
Delta Air Lines Inc. | | | | 7.111% | | 9/18/11 | | | 15,600,000 | | | 14,508,000 | |
Delta Air Lines Inc. | | | | 6.821% | | 8/10/22 | | | 10,525,888 | | | 8,736,487 | |
Northwest Airlines Corp. | | | | 7.575% | | 3/1/19 | | | 5,147,144 | | | 3,860,358 | |
Northwest Airlines Inc. | | | | 1.535% | | 5/20/14 | | | 2,374,363 | | | 1,780,772 | A |
Southwest Airlines Co. | | | | 5.125% | | 3/1/17 | | | 2,640,000 | | | 2,268,895 | |
US Airways Pass-Through Trust | | | | 6.850% | | 1/30/18 | | | 10,063,668 | | | 7,346,478 | |
| | | | | | | | | | | | | |
| | | | | | | | | | | | 58,369,462 | |
| | | | | | | | | | | | | |
Automobiles | | N.M. | | | | | | | | | | | |
DaimlerChrysler NA Holding Corp. | | | | 5.875% | | 3/15/11 | | | 700,000 | | | 711,637 | |
General Motors Corp. | | | | 9.450% | | 11/1/11 | | | 160,000 | | | 26,400 | B |
General Motors Corp. | | | | 9.400% | | 7/15/21 | | | 43,000 | | | 5,160 | B |
General Motors Corp. | | | | 8.100% | | 6/15/24 | | | 23,000 | | | 2,702 | B |
General Motors Corp. | | | | 0.000% | | 3/15/36 | | | 567,000 | | | 31,185 | B,C |
| | | | | | | | | | | | | |
| | | | | | | | | | | | 777,084 | |
| | | | | | | | | | | | | |
Building Products | | 0.2% | | | | | | | | | | | |
Masco Corp. | | | | 7.125% | | 8/15/13 | | | 3,320,000 | | | 2,947,772 | |
Masco Corp. | | | | 6.125% | | 10/3/16 | | | 4,120,000 | | | 3,459,135 | |
| | | | | | | | | | | | | |
| | | | | | | | | | | | 6,406,907 | |
| | | | | | | | | | | | | |
Capital Markets | | 1.1% | | | | | | | | | | | |
Goldman Sachs Capital II | | | | 5.793% | | 12/29/49 | | | 770,000 | | | 469,277 | C |
Lehman Brothers Holdings Capital Trust VII | | | | 5.857% | | 11/29/49 | | | 1,300,000 | | | 130 | B,C |
Lehman Brothers Holdings Inc. | | | | 6.200% | | 9/26/14 | | | 4,370,000 | | | 644,575 | B |
Lehman Brothers Holdings Inc. | | | | 6.500% | | 7/19/17 | | | 11,920,000 | | | 1,192 | B |
Lehman Brothers Holdings Inc. | | | | 6.750% | | 12/28/17 | | | 29,990,000 | | | 2,999 | B |
Merrill Lynch and Co. Inc. | | | | 6.110% | | 1/29/37 | | | 3,510,000 | | | 2,710,966 | |
Morgan Stanley | | | | 4.750% | | 4/1/14 | | | 3,070,000 | | | 2,899,891 | |
8
Semi-Annual Report to Shareholders
| | | | | | | | | | | | | |
| | | % OF
NET ASSETS | | RATE | | MATURITY
DATE | | PAR/
SHARES | | VALUE | |
| | | | | | | | | | | | | |
Corporate Bonds and Notes—Continued | | | | | | | | | | | | | |
| | | | | |
Capital Markets—Continued | | | | | | | | | | | | | |
Morgan Stanley | | | | 1.557% | | 10/18/16 | | $ | 4,040,000 | | $ | 3,267,613 | A |
The Bear Stearns Cos. Inc. | | | | 6.400% | | 10/2/17 | | | 17,120,000 | | | 17,150,388 | |
The Goldman Sachs Group Inc. | | | | 5.625% | | 1/15/17 | | | 9,935,000 | | | 9,442,353 | |
| | | | | | | | | | | | | |
| | | | | | | | | | | | 36,589,384 | |
| | | | | | | | | | | | | |
Commercial Banks | | 1.2% | | | | | | | | | | | |
Bank One Corp. | | | | 7.875% | | 8/1/10 | | | 4,500,000 | | | 4,718,056 | |
Bank One Corp. | | | | 5.900% | | 11/15/11 | | | 2,000,000 | | | 2,094,570 | |
HBOS Treasury Services PLC | | | | 5.250% | | 2/21/17 | | | 2,500,000 | | | 2,068,737 | D |
SunTrust Capital VIII | | | | 6.100% | | 12/15/36 | | | 14,970,000 | | | 9,724,213 | C |
Wachovia Capital Trust III | | | | 5.800% | | 3/15/49 | | | 6,130,000 | | | 3,678,000 | C |
Wachovia Corp. | | | | 5.750% | | 6/15/17 | | | 16,100,000 | | | 15,883,600 | |
Wells Fargo Capital X | | | | 5.950% | | 12/15/36 | | | 1,890,000 | | | 1,398,600 | |
| | | | | | | | | | | | | |
| | | | | | | | | | | | 39,565,776 | |
| | | | | | | | | | | | | |
Commercial Services and Supplies | | 0.4% | | | | | | | | | | | |
Waste Management Inc. | | | | 6.375% | | 11/15/12 | | | 2,530,000 | | | 2,686,569 | |
Waste Management Inc. | | | | 5.000% | | 3/15/14 | | | 3,440,000 | | | 3,361,121 | |
Waste Management Inc. | | | | 7.125% | | 12/15/17 | | | 6,000,000 | | | 5,982,732 | |
| | | | | | | | | | | | | |
| | | | | | | | | | | | 12,030,422 | |
| | | | | | | | | | | | | |
Communications Equipment | | 0.2% | | | | | | | | | | | |
Motorola Inc. | | | | 8.000% | | 11/1/11 | | | 5,600,000 | | | 5,637,509 | |
| | | | | | | | | | | | | |
| | | | | |
Consumer Finance | | 3.3% | | | | | | | | | | | |
American Express Co. | | | | 6.800% | | 9/1/66 | | | 4,460,000 | | | 3,211,200 | C |
American General Finance Corp. | | | | 6.900% | | 12/15/17 | | | 4,070,000 | | | 2,203,832 | |
Capital One Financial Corp. | | | | 6.150% | | 9/1/16 | | | 3,170,000 | | | 2,805,545 | |
Ford Motor Credit Co. | | | | 7.375% | | 10/28/09 | | | 50,175,000 | | | 49,744,900 | |
Ford Motor Credit Co. | | | | 7.875% | | 6/15/10 | | | 6,310,000 | | | 5,993,648 | |
Ford Motor Credit Co. | | | | 7.375% | | 2/1/11 | | | 6,435,000 | | | 5,825,445 | |
Ford Motor Credit Co. | | | | 7.250% | | 10/25/11 | | | 5,910,000 | | | 5,111,783 | |
GMAC LLC | | | | 7.750% | | 1/19/10 | | | 3,493,000 | | | 3,405,675 | D |
GMAC LLC | | | | 7.250% | | 3/2/11 | | | 519,000 | | | 474,885 | D |
GMAC LLC | | | | 7.500% | | 12/31/13 | | | 1,449,000 | | | 1,122,975 | D |
GMAC LLC | | | | 0.000% | | 6/15/15 | | | 220,000 | | | 94,600 | E |
GMAC LLC | | | | 8.000% | | 12/31/18 | | | 1,207,000 | | | 766,445 | D |
SLM Corp. | | | | 5.375% | | 5/15/14 | | | 3,000,000 | | | 2,411,130 | |
SLM Corp. | | | | 5.625% | | 8/1/33 | | | 42,895,000 | | | 26,409,508 | |
| | | | | | | | | | | | | |
| | | | | | | | | | | | 109,581,571 | |
| | | | | | | | | | | | | |
9
Semi-Annual Report to Shareholders
Portfolio of Investments—Continued
Western Asset Core Bond Portfolio—Continued
| | | | | | | | | | | | | |
| | | % OF
NET ASSETS | | RATE | | MATURITY
DATE | | PAR/
SHARES | | VALUE | |
| | | | | | | | | | | | | |
Corporate Bonds and Notes—Continued | | | | | | | | | | | | | |
| | | | | |
Diversified Financial Services | | 4.0% | | | | | | | | | | | |
Air 2 US | | | | 8.027% | | 10/1/19 | | $ | 8,610,007 | | $ | 6,113,105 | D |
BAC Capital Trust XIV | | | | 5.630% | | 12/31/49 | | | 500,000 | | | 250,000 | C |
Citigroup Inc. | | | | 8.500% | | 5/22/19 | | | 2,420,000 | | | 2,461,719 | |
Citigroup Inc. | | | | 6.125% | | 8/25/36 | | | 2,000,000 | | | 1,489,332 | |
Citigroup Inc. | | | | 5.875% | | 5/29/37 | | | 17,000,000 | | | 13,283,426 | |
Citigroup Inc. | | | | 6.875% | | 3/5/38 | | | 17,330,000 | | | 15,305,267 | |
General Electric Capital Corp. | | | | 2.125% | | 12/21/12 | | | 21,370,000 | | | 21,222,953 | |
General Electric Capital Corp. | | | | 6.875% | | 1/10/39 | | | 23,700,000 | | | 21,332,678 | |
General Electric Capital Corp. | | | | 6.375% | | 11/15/67 | | | 22,960,000 | | | 15,319,394 | C |
HSBC Finance Corp. | | | | 8.000% | | 7/15/10 | | | 690,000 | | | 716,344 | |
HSBC Finance Corp. | | | | 7.000% | | 5/15/12 | | | 700,000 | | | 721,678 | |
HSBC Finance Corp. | | | | 6.375% | | 11/27/12 | | | 440,000 | | | 447,544 | |
ILFC E-Capital Trust I | | | | 5.900% | | 12/21/65 | | | 10,600,000 | | | 3,922,000 | C,D |
ILFC E-Capital Trust II | | | | 6.250% | | 12/21/65 | | | 4,160,000 | | | 1,539,200 | C,D |
J.P. Morgan and Co. Inc. | | | | 0.000% | | 2/15/12 | | | 2,000,000 | | | 1,732,640 | A |
JPMorgan Chase and Co. | | | | 2.125% | | 12/26/12 | | | 8,450,000 | | | 8,407,260 | |
JPMorgan Chase and Co. | | | | 5.750% | | 1/2/13 | | | 3,770,000 | | | 3,887,914 | |
JPMorgan Chase and Co. | | | | 6.125% | | 6/27/17 | | | 7,855,000 | | | 7,761,046 | |
Liberty Media LLC | | | | 3.750% | | 2/15/30 | | | 290,000 | | | 104,400 | F |
PHH Corp. | | | | 7.125% | | 3/1/13 | | | 5,010,000 | | | 4,003,291 | |
TNK-BP Finance SA | | | | 7.875% | | 3/13/18 | | | 1,435,000 | | | 1,183,875 | D |
Unilever Capital Corp. | | | | 7.125% | | 11/1/10 | | | 1,730,000 | | | 1,847,145 | |
| | | | | | | | | | | | | |
| | | | | | | | | | | | 133,052,211 | |
| | | | | | | | | | | | | |
Diversified Telecommunication Services | | 0.9% | | | | | | | | | | | |
AT&T Inc. | | | | 5.100% | | 9/15/14 | | | 4,960,000 | | | 5,152,389 | |
AT&T Inc. | | | | 6.550% | | 2/15/39 | | | 14,610,000 | | | 14,584,023 | |
BellSouth Corp. | | | | 4.750% | | 11/15/12 | | | 440,000 | | | 455,543 | |
BellSouth Corp. | | | | 5.200% | | 9/15/14 | | | 4,270,000 | | | 4,445,228 | |
CenturyTel Inc. | | | | 6.000% | | 4/1/17 | | | 4,120,000 | | | 3,718,300 | |
Verizon Global Funding Corp. | | | | 7.250% | | 12/1/10 | | | 2,220,000 | | | 2,363,727 | |
Verizon Global Funding Corp. | | | | 7.375% | | 9/1/12 | | | 5,000 | | | 5,594 | |
| | | | | | | | | | | | | |
| | | | | | | | | | | | 30,724,804 | |
| | | | | | | | | | | | | |
Electric Utilities | | 0.7% | | | | | | | | | | | |
Exelon Corp. | | | | 5.625% | | 6/15/35 | | | 345,000 | | | 277,705 | |
FirstEnergy Corp. | | | | 6.450% | | 11/15/11 | | | 290,000 | | | 302,690 | |
FirstEnergy Corp. | | | | 7.375% | | 11/15/31 | | | 10,610,000 | | | 10,014,333 | |
Pacific Gas and Electric Co. | | | | 6.050% | | 3/1/34 | | | 940,000 | | | 975,191 | |
Pacific Gas and Electric Co. | | | | 5.800% | | 3/1/37 | | | 7,330,000 | | | 7,366,635 | |
10
Semi-Annual Report to Shareholders
| | | | | | | | | | | | | |
| | | % OF
NET ASSETS | | RATE | | MATURITY
DATE | | PAR/
SHARES | | VALUE | |
| | | | | | | | | | | | | |
Corporate Bonds and Notes—Continued | | | | | | | | | | | | | |
| | | | | |
Electric Utilities—Continued | | | | | | | | | | | | | |
Progress Energy Inc. | | | | 7.100% | | 3/1/11 | | $ | 1,488,000 | | $ | 1,582,571 | |
The Cleveland Electric Illuminating Co. | | | | 5.700% | | 4/1/17 | | | 630,000 | | | 613,781 | |
The Detroit Edison Co. | | | | 6.125% | | 10/1/10 | | | 920,000 | | | 953,204 | |
| | | | | | | | | | | | | |
| | | | | | | | | | | | 22,086,110 | |
| | | | | | | | | | | | | |
Food and Staples Retailing | | 1.5% | | | | | | | | | | | |
CVS Lease Pass-Through Trust | | | | 6.117% | | 1/10/13 | | | 3,181,297 | | | 3,080,135 | D |
CVS Lease Pass-Through Trust | | | | 6.036% | | 12/10/28 | | | 34,463,106 | | | 29,445,967 | D,G |
The Kroger Co. | | | | 6.400% | | 8/15/17 | | | 580,000 | | | 614,904 | |
The Kroger Co. | | | | 6.150% | | 1/15/20 | | | 850,000 | | | 868,473 | |
Wal-Mart Stores Inc. | | | | 5.800% | | 2/15/18 | | | 9,150,000 | | | 9,967,498 | |
Wal-Mart Stores Inc. | | | | 6.200% | | 4/15/38 | | | 5,410,000 | | | 5,813,916 | |
| | | | | | | | | | | | | |
| | | | | | | | | | | | 49,790,893 | |
| | | | | | | | | | | | | |
Food Products | | 0.3% | | | | | | | | | | | |
General Mills Inc. | | | | 5.700% | | 2/15/17 | | | 3,580,000 | | | 3,768,505 | |
Sara Lee Corp. | | | | 6.250% | | 9/15/11 | | | 5,500,000 | | | 5,813,054 | |
| | | | | | | | | | | | | |
| | | | | | | | | | | | 9,581,559 | |
| | | | | | | | | | | | | |
Gas Utilities | | 0.2% | | | | | | | | | | | |
Southern Natural Gas Co. | | | | 8.000% | | 3/1/32 | | | 7,390,000 | | | 7,819,470 | |
| | | | | | | | | | | | | |
| | | | | |
Health Care Providers and Services | | 1.9% | | | | | | | | | | | |
AmerisourceBergen Corp. | | | | 5.625% | | 9/15/12 | | | 3,520,000 | | | 3,470,470 | |
AmerisourceBergen Corp. | | | | 5.875% | | 9/15/15 | | | 3,050,000 | | | 2,907,092 | |
Cardinal Health Inc. | | | | 5.800% | | 10/15/16 | | | 3,530,000 | | | 3,416,853 | |
Cardinal Health Inc. | | | | 5.850% | | 12/15/17 | | | 12,985,000 | | | 12,146,494 | |
HCA Inc. | | | | 5.750% | | 3/15/14 | | | 35,430,000 | | | 28,344,000 | |
Tenet Healthcare Corp. | | | | 7.375% | | 2/1/13 | | | 6,584,000 | | | 5,925,600 | |
Tenet Healthcare Corp. | | | | 9.000% | | 5/1/15 | | | 1,250,000 | | | 1,259,375 | D |
Tenet Healthcare Corp. | | | | 10.000% | | 5/1/18 | | | 1,250,000 | | | 1,312,500 | D |
WellPoint Inc. | | | | 5.875% | | 6/15/17 | | | 900,000 | | | 880,835 | |
WellPoint Inc. | | | | 7.000% | | 2/15/19 | | | 2,780,000 | | | 2,873,872 | |
| | | | | | | | | | | | | |
| | | | | | | | | | | | 62,537,091 | |
| | | | | | | | | | | | | |
Hotels, Restaurants and Leisure | | 0.2% | | | | | | | | | | | |
Marriott International Inc. | | | | 5.810% | | 11/10/15 | | | 4,400,000 | | | 3,853,260 | |
Starwood Hotels and Resorts Worldwide Inc. | | | | 7.875% | | 5/1/12 | | | 3,050,000 | | | 2,806,000 | |
| | | | | | | | | | | | | |
| | | | | | | | | | | | 6,659,260 | |
| | | | | | | | | | | | | |
11
Semi-Annual Report to Shareholders
Portfolio of Investments—Continued
Western Asset Core Bond Portfolio—Continued
| | | | | | | | | | | | | |
| | | % OF
NET ASSETS | | RATE | | MATURITY
DATE | | PAR/
SHARES | | VALUE | |
| | | | | | | | | | | | | |
Corporate Bonds and Notes—Continued | | | | | | | | | | | | | |
| | | | | |
Household Durables | | 0.1% | | | | | | | | | | | |
Pulte Homes Inc. | | | | 8.125% | | 3/1/11 | | $ | 3,480,000 | | $ | 3,497,400 | |
| | | | | | | | | | | | | |
| | | | | |
Independent Power Producers and Energy Traders | | 0.2% | | | | | | | | | | | |
TXU Corp. | | | | 6.500% | | 11/15/24 | | | 1,090,000 | | | 546,178 | |
TXU Corp. | | | | 6.550% | | 11/15/34 | | | 9,930,000 | | | 4,773,937 | |
| | | | | | | | | | | | | |
| | | | | | | | | | | | 5,320,115 | |
| | | | | | | | | | | | | |
Industrial Conglomerates | | 0.7% | | | | | | | | | | | |
Tyco International Ltd./Tyco International Finance SA | | | | 7.000% | | 12/15/19 | | | 3,380,000 | | | 3,325,660 | |
Tyco International Ltd./Tyco International Finance SA | | | | 6.875% | | 1/15/21 | | | 22,895,000 | | | 21,649,832 | |
| | | | | | | | | | | | | |
| | | | | | | | | | | | 24,975,492 | |
| | | | | | | | | | | | | |
Insurance | | 2.2% | | | | | | | | | | | |
American International Group Inc. | | | | 5.850% | | 1/16/18 | | | 2,370,000 | | | 1,253,846 | |
American International Group Inc. | | | | 6.250% | | 3/15/37 | | | 12,690,000 | | | 3,140,775 | |
ASIF Global Financing XIX | | | | 4.900% | | 1/17/13 | | | 1,210,000 | | | 1,029,385 | D |
Marsh and McLennan Cos. Inc. | | | | 5.150% | | 9/15/10 | | | 3,070,000 | | | 3,076,582 | |
MetLife Inc. | | | | 6.400% | | 12/15/36 | | | 46,870,000 | | | 33,512,050 | |
The Travelers Cos. Inc. | | | | 6.250% | | 3/15/37 | | | 37,460,000 | | | 30,191,411 | C |
| | | | | | | | | | | | | |
| | | | | | | | | | | | 72,204,049 | |
| | | | | | | | | | | | | |
Leisure Equipment and Products | | 0.3% | | | | | | | | | | | |
Eastman Kodak Co. | | | | 7.250% | | 11/15/13 | | | 15,200,000 | | | 9,272,000 | |
| | | | | | | | | | | | | |
| | | | | |
Media | | 1.7% | | | | | | | | | | | |
CBS Corp. | | | | 7.625% | | 1/15/16 | | | 2,750,000 | | | 2,592,381 | |
Comcast Corp. | | | | 6.500% | | 1/15/15 | | | 1,200,000 | | | 1,272,822 | |
Comcast Corp. | | | | 6.500% | | 1/15/17 | | | 1,500,000 | | | 1,591,295 | |
Comcast Corp. | | | | 6.950% | | 8/15/37 | | | 3,130,000 | | | 3,263,585 | |
Cox Communications Inc. | | | | 7.875% | | 8/15/09 | | | 9,640,000 | | | 9,697,753 | |
News America Inc. | | | | 6.200% | | 12/15/34 | | | 105,000 | | | 89,638 | |
News America Inc. | | | | 6.650% | | 11/15/37 | | | 700,000 | | | 629,661 | |
Reed Elsevier Capital Inc. | | | | 8.625% | | 1/15/19 | | | 4,740,000 | | | 5,385,474 | |
Time Warner Cable Inc. | | | | 6.200% | | 7/1/13 | | | 6,470,000 | | | 6,817,077 | |
Time Warner Cable Inc. | | | | 8.750% | | 2/14/19 | | | 1,180,000 | | | 1,374,632 | |
Time Warner Cable Inc. | | | | 8.250% | | 4/1/19 | | | 8,630,000 | | | 9,791,745 | |
Time Warner Cable Inc. | | | | 6.750% | | 6/15/39 | | | 2,950,000 | | | 2,871,208 | |
12
Semi-Annual Report to Shareholders
| | | | | | | | | | | | | |
| | | % OF
NET ASSETS | | RATE | | MATURITY
DATE | | PAR/
SHARES | | VALUE | |
| | | | | | | | | | | | | |
Corporate Bonds and Notes—Continued | | | | | | | | | | | | | |
| | | | | |
Media—Continued | | | | | | | | | | | | | |
Viacom Inc. | | | | 5.750% | | 4/30/11 | | $ | 8,580,000 | | $ | 8,783,878 | |
Viacom Inc. | | | | 6.250% | | 4/30/16 | | | 3,400,000 | | | 3,349,544 | |
| | | | | | | | | | | | | |
| | | | | | | | | | | | 57,510,693 | |
| | | | | | | | | | | | | |
Multi-Utilities | | 0.1% | | | | | | | | | | | |
Dominion Resources Inc. | | | | 5.125% | | 12/15/09 | | | 50,000 | | | 50,633 | |
Dominion Resources Inc. | | | | 4.750% | | 12/15/10 | | | 570,000 | | | 585,825 | |
Dominion Resources Inc. | | | | 5.700% | | 9/17/12 | | | 2,050,000 | | | 2,180,583 | |
| | | | | | | | | | | | | |
| | | | | | | | | | | | 2,817,041 | |
| | | | | | | | | | | | | |
Multiline Retail | | 0.1% | | | | | | | | | | | |
Target Corp. | | | | 4.000% | | 6/15/13 | | | 4,445,000 | | | 4,408,680 | |
| | | | | | | | | | | | | |
| | | | | |
Oil, Gas and Consumable Fuels | | 3.9% | | | | | | | | | | | |
Anadarko Petroleum Corp. | | | | 5.950% | | 9/15/16 | | | 14,503,000 | | | 14,309,008 | |
Anadarko Petroleum Corp. | | | | 6.450% | | 9/15/36 | | | 1,325,000 | | | 1,191,064 | |
Conoco Inc. | | | | 6.950% | | 4/15/29 | | | 2,780,000 | | | 2,995,492 | |
ConocoPhillips | | | | 6.500% | | 2/1/39 | | | 10,660,000 | | | 11,346,856 | |
El Paso Natural Gas Co. | | | | 8.375% | | 6/15/32 | | | 3,610,000 | | | 3,926,712 | |
Hess Corp. | | | | 8.125% | | 2/15/19 | | | 5,610,000 | | | 6,386,727 | |
Hess Corp. | | | | 7.875% | | 10/1/29 | | | 3,840,000 | | | 4,165,041 | |
Hess Corp. | | | | 7.300% | | 8/15/31 | | | 8,695,000 | | | 8,975,353 | |
KazMunaiGaz Exploration Production-GDR | | | | 8.375% | | 7/2/13 | | | 5,830,000 | | | 5,378,175 | D |
Kerr-McGee Corp. | | | | 6.875% | | 9/15/11 | | | 17,000,000 | | | 17,929,322 | |
Kerr-McGee Corp. | | | | 6.950% | | 7/1/24 | | | 650,000 | | | 603,119 | |
Kinder Morgan Energy Partners LP | | | | 7.125% | | 3/15/12 | | | 4,650,000 | | | 4,972,240 | |
Kinder Morgan Energy Partners LP | | | | 5.000% | | 12/15/13 | | | 3,180,000 | | | 3,129,018 | |
Kinder Morgan Energy Partners LP | | | | 6.000% | | 2/1/17 | | | 990,000 | | | 982,144 | |
Kinder Morgan Energy Partners LP | | | | 6.950% | | 1/15/38 | | | 410,000 | | | 397,163 | |
Pemex Project Funding Master Trust | | | | 6.625% | | 6/15/35 | | | 14,213,000 | | | 12,854,692 | |
Sonat Inc. | | | | 7.625% | | 7/15/11 | | | 5,000,000 | | | 4,899,160 | |
Tennessee Gas Pipeline Co. | | | | 8.375% | | 6/15/32 | | | 1,110,000 | | | 1,207,383 | |
The Williams Cos. Inc. | | | | 8.125% | | 3/15/12 | | | 3,240,000 | | | 3,357,774 | |
The Williams Cos. Inc. | | | | 7.500% | | 1/15/31 | | | 7,262,000 | | | 6,390,560 | |
The Williams Cos. Inc. | | | | 8.750% | | 3/15/32 | | | 3,240,000 | | | 3,256,200 | |
XTO Energy Inc. | | | | 7.500% | | 4/15/12 | | | 10,379,000 | | | 11,497,316 | |
XTO Energy Inc. | | | | 6.750% | | 8/1/37 | | | 320,000 | | | 334,065 | |
| | | | | | | | | | | | | |
| | | | | | | | | | | | 130,484,584 | |
| | | | | | | | | | | | | |
13
Semi-Annual Report to Shareholders
Portfolio of Investments—Continued
Western Asset Core Bond Portfolio—Continued
| | | | | | | | | | | | | |
| | | % OF
NET ASSETS | | RATE | | MATURITY
DATE | | PAR/
SHARES | | VALUE | |
| | | | | | | | | | | | | |
Corporate Bonds and Notes—Continued | | | | | | | | | | | | | |
| | | | | |
Paper and Forest Products | | 0.1% | | | | | | | | | | | |
Weyerhaeuser Co. | | | | 6.750% | | 3/15/12 | | $ | 2,775,000 | | $ | 2,775,999 | |
| | | | | | | | | | | | | |
| | | | | |
Pharmaceuticals | | 0.4% | | | | | | | | | | | |
Roche Holdings Inc. | | | | 6.000% | | 3/1/19 | | | 4,330,000 | | | 4,616,997 | D |
Wyeth | | | | 5.950% | | 4/1/37 | | | 9,750,000 | | | 10,086,648 | |
| | | | | | | | | | | | | |
| | | | | | | | | | | | 14,703,645 | |
| | | | | | | | | | | | | |
Real Estate Investment Trusts (REITs) | | 0.1% | | | | | | | | | | | |
Health Care Property Investors Inc. | | | | 6.450% | | 6/25/12 | | | 3,550,000 | | | 3,454,913 | |
| | | | | | | | | | | | | |
| | | | | |
Specialty Retail | | 0.7% | | | | | | | | | | | |
Autozone Inc. | | | | 6.950% | | 6/15/16 | | | 5,620,000 | | | 5,763,001 | |
Home Depot Inc. | | | | 4.625% | | 8/15/10 | | | 1,380,000 | | | 1,405,938 | |
Home Depot Inc. | | | | 5.250% | | 12/16/13 | | | 2,740,000 | | | 2,815,208 | |
Home Depot Inc. | | | | 5.400% | | 3/1/16 | | | 4,250,000 | | | 4,242,439 | |
Limited Brands Inc. | | | | 6.125% | | 12/1/12 | | | 9,420,000 | | | 9,044,877 | |
| | | | | | | | | | | | | |
| | | | | | | | | | | | 23,271,463 | |
| | | | | | | | | | | | | |
Thrifts and Mortgage Finance | | 0.5% | | | | | | | | | | | |
Countrywide Financial Corp. | | | | 6.250% | | 5/15/16 | | | 18,400,000 | | | 16,324,020 | |
| | | | | | | | | | | | | |
| | | | | |
Wireless Telecommunication Services | | 0.3% | | | | | | | | | | | |
Sprint Capital Corp. | | | | 8.375% | | 3/15/12 | | | 7,935,000 | | | 7,815,975 | |
Sprint Capital Corp. | | | | 6.900% | | 5/1/19 | | | 230,000 | | | 190,325 | |
Sprint Capital Corp. | | | | 8.750% | | 3/15/32 | | | 1,050,000 | | | 845,250 | |
| | | | | | | | | | | | | |
| | | | | | | | | | | | 8,851,550 | |
| | | | | | | | | | | | | |
Total Corporate Bonds and Notes
(Cost—$1,129,756,972) | | | | | | | | | | | | 972,507,583 | |
Asset-Backed Securities | | 3.8% | | | | | | | | | | | |
| | | | | |
Fixed Rate Securities | | 0.8% | | | | | | | | | | | |
Conseco Finance Securitizations Corp. 2000-5 | | | | 7.960% | | 2/1/32 | | | 3,550,683 | | | 2,099,297 | |
Drive Auto Receivables Trust 2006-2 A3 | | | | 5.330% | | 4/15/14 | | | 20,143,133 | | | 18,983,398 | D |
E-Trade RV and Marine Trust A3-1 | | | | 3.620% | | 10/8/18 | | | 133,986 | | | 130,508 | |
Equity One ABS Inc. 2003-3 | | | | 4.995% | | 12/25/33 | | | 4,068,582 | | | 2,728,029 | |
Green Tree Financial Corp. 1996-5 | | | | 8.100% | | 7/15/26 | | | 407,940 | | | 46,988 | |
Patrons’ Legacy 2003-IV | | | | 5.775% | | 12/23/63 | | | 5,800,000 | | | 4,654,119 | D,H |
| | | | | | | | | | | | | |
| | | | | | | | | | | | 28,642,339 | |
| | | | | | | | | | | | | |
14
Semi-Annual Report to Shareholders
| | | | | | | | | | | | | |
| | | % OF
NET ASSETS | | RATE | | MATURITY
DATE | | PAR/
SHARES | | VALUE | |
| | | | | | | | | | | | | |
Asset-Backed Securities—Continued | | | | | | | | | | | | | |
| | | | | |
Indexed SecuritiesA | | 3.0% | | | | | | | | | | | |
Amortizing Residential Collateral Trust 2005-BC5 M1 | | | | 1.349% | | 7/25/32 | | $ | 2,354,520 | | $ | 1,452,318 | |
Asset-Backed Funding Certificates 2002-SB1 | | | | 0.744% | | 12/25/30 | | | 1,185,315 | | | 746,027 | |
Bear Stearns Asset Backed Securities Trust 2007-HE6 1A1 | | | | 1.564% | | 8/25/37 | | | 9,546,498 | | | 5,044,550 | |
Brazos Higher Education Authority Inc. 2005-1 | | | | 1.252% | | 9/26/16 | | | 2,597,029 | | | 2,397,603 | |
CDC Mortgage Capital Trust 2002-HE1 | | | | 0.934% | | 1/25/33 | | | 457,551 | | | 328,016 | |
CIT Group Home Equity Loan Trust 2002-1 | | | | 0.604% | | 3/25/33 | | | 278,463 | | | 246,369 | |
Citigroup Mortgage Loan Trust Inc. 2007-SHL1 A | | | | 0.714% | | 11/25/46 | | | 4,418,853 | | | 1,653,093 | D |
Countrywide Asset-Backed Certificates 2003-BC3 | | | | 0.934% | | 9/25/33 | | | 467,213 | | | 256,584 | |
Fleet Home Equity Loan Trust 2003-1 | | | | 0.565% | | 1/20/33 | | | 1,586,276 | | | 958,550 | |
GMAC Mortgage Corp. Loan Trust 2004-VF1 A1 | | | | 1.064% | | 2/25/31 | | | 44,652,684 | | | 17,575,801 | D |
GMAC Mortgage Corp. Loan Trust 2005-HE3 A1VN | | | | 0.569% | | 2/25/36 | | | 19,770,568 | | | 5,155,153 | H |
GSAMP Trust 2006-S4 | | | | 0.404% | | 5/25/36 | | | 1,649,779 | | | 206,430 | |
Lehman XS Trust 2005-5N | | | | 0.614% | | 11/25/35 | | | 7,394,189 | | | 3,093,003 | |
Lehman XS Trust 2006-2N 1A1 | | | | 0.574% | | 2/25/46 | | | 13,950,646 | | | 5,842,765 | |
Lehman XS Trust 2006-GP4 | | | | 0.384% | | 8/25/46 | | | 1,594,848 | | | 1,292,332 | |
Long Beach Mortgage Loan Trust 2000-1 | | | | 0.835% | | 1/21/31 | | | 186,033 | | | 122,057 | |
Long Beach Mortgage Loan Trust 2006-9 2A3 | | | | 0.474% | | 10/25/36 | | | 3,200,000 | | | 763,562 | |
Merrill Lynch Mortgage Investors Trust 2007-SD1 A1 | | | | 0.764% | | 2/25/47 | | | 41,436,928 | | | 21,893,769 | |
MSDWCC Heloc Trust 2005-1 | | | | 0.504% | | 7/25/17 | | | 1,450,276 | | | 607,525 | |
Provident Bank Home Equity Loan Trust 1999-3 | | | | 1.094% | | 1/25/31 | | | 602,389 | | | 216,951 | |
RAAC 2007-SP3 A1 | | | | 1.514% | | 9/25/37 | | | 817,744 | | | 506,961 | |
Residential Asset Mortgage Products Inc. 2003-RS2 | | | | 0.994% | | 3/25/33 | | | 149,081 | | | 66,189 | |
Residential Asset Securities Corp. 2001-KS2 | | | | 0.774% | | 6/25/31 | | | 243,758 | | | 148,941 | |
Residential Asset Securities Corp.
2001-KS3 AII | | | | 0.774% | | 9/25/31 | | | 93,452 | | | 56,604 | |
SACO I Trust 2005-10 1A | | | | 0.574% | | 6/25/36 | | | 3,714,999 | | | 1,019,111 | |
SACO I Trust 2005-8 A1 | | | | 0.594% | | 11/25/20 | | | 1,054,764 | | | 426,935 | |
15
Semi-Annual Report to Shareholders
Portfolio of Investments—Continued
Western Asset Core Bond Portfolio—Continued
| | | | | | | | | | | | | |
| | | % OF
NET ASSETS | | RATE | | MATURITY
DATE | | PAR/
SHARES | | VALUE | |
| | | | | | | | | | | | | |
Asset-Backed Securities—Continued | | | | | | | | | | | | | |
| | | | | |
Indexed Securities—Continued | | | | | | | | | | | | | |
Securitized Asset Backed Receivables LLC Trust 2007-BR2 A2 | | | | 0.544% | | 2/25/37 | | $ | 43,130,928 | | $ | 17,069,535 | |
SLM Student Loan Trust 2006-5 | | | | 1.082% | | 7/25/17 | | | 10,506,775 | | | 10,499,898 | |
| | | | | | | | | | | | | |
| | | | | | | | | | | | 99,646,632 | |
| | | | | | | | | | | | | |
Total Asset-Backed Securities
(Cost—$246,983,365) | | | | | | | | | | | | 128,288,971 | |
Mortgage-Backed Securities | | 19.3% | | | | | | | | | | | |
| | | | | |
Fixed Rate Securities | | 7.4% | | | | | | | | | | | |
Banc of America Commercial Mortgage Inc. 2006-3 A4 | | | | 5.889% | | 7/10/44 | | | 20,000,000 | | | 15,880,860 | |
Banc of America Commercial Mortgage Inc. 2007-5 A3 | | | | 5.620% | | 2/10/51 | | | 3,710,000 | | | 2,782,823 | |
Citicorp Mortgage Securities Inc. 2003-7 A1 | | | | 4.750% | | 8/25/18 | | | 5,909,414 | | | 5,645,248 | |
Commercial Mortgage Asset Trust
1999-C1 A3 | | | | 6.640% | | 1/17/32 | | | 692,049 | | | 695,884 | |
Countrywide Alternative Loan Trust 2003-20CB 1A1 | | | | 5.500% | | 10/25/33 | | | 9,050,881 | | | 7,532,030 | |
Credit Suisse Mortgage Capital Certificates 2006-C5 A3 | | | | 5.311% | | 12/15/39 | | | 14,800,000 | | | 10,143,560 | |
GE Capital Commercial Mortgage Corp. 2007-C1 A4 | | | | 5.543% | | 12/10/49 | | | 1,330,000 | | | 918,769 | |
GMAC Commercial Mortgage Securities Inc 2006-C1 A4 | | | | 5.238% | | 11/10/45 | | | 3,800,000 | | | 3,147,247 | |
GS Mortgage Securities Corp. II 2005-GG4 | | | | 4.680% | | 7/10/39 | | | 12,900,000 | | | 12,418,551 | |
GSR Mortgage Loan Trust 2005-4F 1A1 | | | | 4.500% | | 4/25/20 | | | 5,857,573 | | | 5,505,204 | |
JP Morgan Chase Commercial Mortgage Securities Corp. 2007-LDPX A3 | | | | 5.420% | | 5/15/49 | | | 31,000,000 | | | 22,818,774 | |
LB-UBS Commercial Mortgage Trust 2005-C3 AAB | | | | 4.664% | | 7/15/30 | | | 15,000,000 | | | 14,419,006 | |
LB-UBS Commercial Mortgage Trust 2005-C5 | | | | 4.954% | | 9/15/30 | | | 9,730,000 | | | 8,336,805 | |
MASTR Reperforming Loan Trust 2005-1 | | | | 6.500% | | 8/25/34 | | | 915,128 | | | 947,014 | D |
MASTR Reperforming Loan Trust 2005-1 1A3 | | | | 7.000% | | 8/25/34 | | | 7,448,527 | | | 8,193,380 | D |
Morgan Stanley Capital I 2005-HQ6 | | | | 4.989% | | 8/13/42 | | | 8,370,000 | | | 7,150,768 | |
Prime Mortgage Trust 2006-DR1 1A1 | | | | 5.500% | | 5/25/35 | | | 21,630,064 | | | 20,474,208 | D |
Prime Mortgage Trust 2006-DR1 1A2 | | | | 6.000% | | 5/25/35 | | | 9,704,310 | | | 9,300,974 | D |
Prime Mortgage Trust 2006-DR1 2A2 | | | | 6.000% | | 5/25/35 | | | 40,806,213 | | | 28,353,944 | D |
Residential Accredit Loans Inc.
2007-QS4 3A9 | | | | 6.000% | | 3/25/37 | | | 8,300,000 | | | 3,606,743 | |
16
Semi-Annual Report to Shareholders
| | | | | | | | | | | | | |
| | | % OF
NET ASSETS | | RATE | | MATURITY
DATE | | PAR/
SHARES | | VALUE | |
| | | | | | | | | | | | | |
Mortgage-Backed Securities—Continued | | | | | | | | | | | | | |
| | | | | |
Fixed Rate Securities—Continued | | | | | | | | | | | | | |
Residential Asset Mortgage Products Inc. 2005-SL2 | | | | 7.500% | | 2/25/32 | | $ | 2,983,825 | | $ | 1,611,265 | H |
Residential Asset Securitization Trust 2003-A14 | | | | 4.750% | | 2/25/19 | | | 33,913,996 | | | 33,394,688 | |
Structured Asset Securities Corp. 2003-29 1A1 | | | | 4.750% | | 9/25/18 | | | 19,839,243 | | | 19,733,847 | |
WaMu Mortgage Pass-Through Certificates 2003-S7 A1 | | | | 4.500% | | 8/25/18 | | | 3,532,247 | | | 3,461,051 | |
| | | | | | | | | | | | | |
| | | | | | | | | | | | 246,472,643 | |
| | | | | | | | | | | | | |
Indexed SecuritiesA | | 8.1% | | | | | | | | | | | |
American Home Mortgage Assets 2006-4 | | | | 0.524% | | 10/25/46 | | | 886,862 | | | 287,859 | |
American Home Mortgage Investment Trust 2006-2 1A1 | | | | 0.394% | | 6/25/46 | | | 1,367,251 | | | 1,136,230 | |
Amortizing Residential Collateral Trust 2002-BC1M | | | | 0.594% | | 1/1/32 | | | 1,684,161 | | | 757,872 | |
Banc of America Funding Corp. 2005-E | | | | 3.433% | | 6/20/35 | | | 11,091,636 | | | 4,575,029 | |
Bear Stearns Adjustable Rate Mortgage Trust 2004-9 24A1 | | | | 5.448% | | 11/25/34 | | | 14,789,009 | | | 13,163,370 | |
Bear Stearns Mortgage Funding Trust 2007-AR5 1A1A | | | | 0.484% | | 6/25/47 | | | 7,161,000 | | | 2,894,491 | |
Citigroup Mortgage Loan Trust Inc. 2005-HE2 | | | | 0.714% | | 5/25/35 | | | 2,139,033 | | | 1,280,532 | D |
Countrywide Alternative Loan Trust 2005-14 | | | | 0.524% | | 5/25/35 | | | 6,393,093 | | | 2,878,509 | |
Countrywide Alternative Loan Trust
2005-17 1A1 | | | | 0.574% | | 7/25/35 | | | 8,115,686 | | | 3,778,426 | |
Countrywide Alternative Loan Trust
2005-17 2A1 | | | | 0.554% | | 7/25/35 | | | 17,299,411 | | | 7,227,668 | |
Countrywide Alternative Loan Trust
2005-38 A3 | | | | 0.664% | | 9/25/35 | | | 5,347,117 | | | 2,432,520 | |
Countrywide Alternative Loan Trust
2005-56 3A1 | | | | 0.604% | | 11/25/35 | | | 743,322 | | | 324,843 | |
Countrywide Alternative Loan Trust
2005-59 1A1 | | | | 0.644% | | 11/20/35 | | | 2,294,808 | | | 1,036,439 | |
Countrywide Alternative Loan Trust
2005-85CB 2A5 | | | | 1.414% | | 2/25/36 | | | 7,996,365 | | | 2,306,580 | |
Countrywide Alternative Loan Trust 2006-0A7 | | | | 0.524% | | 6/25/46 | | | 10,396,009 | | | 3,971,147 | |
Countrywide Alternative Loan Trust 2006-OA2 A1 | | | | 0.525% | | 5/20/46 | | | 4,909,622 | | | 1,957,905 | |
17
Semi-Annual Report to Shareholders
Portfolio of Investments—Continued
Western Asset Core Bond Portfolio—Continued
| | | | | | | | | | | | | |
| | | % OF
NET ASSETS | | RATE | | MATURITY
DATE | | PAR/
SHARES | | VALUE | |
| | | | | | | | | | | | | |
Mortgage-Backed Securities—Continued | | | | | | | | | | | | | |
| | | | | |
Indexed Securities—Continued | | | | | | | | | | | | | |
Countrywide Home Loans 2005-03 1A2 | | | | 0.604% | | 4/25/35 | | $ | 9,002,154 | | $ | 4,038,219 | |
Countrywide Home Loans 2005-09 1A1 | | | | 0.614% | | 5/25/35 | | | 8,918,983 | | | 3,995,046 | |
Countrywide Home Loans 2005-09 2A1 | | | | 0.534% | | 5/25/35 | | | 4,887,484 | | | 2,097,436 | |
Deutsche Mortgage Securities Inc.
2004-4 7AR2 | | | | 0.764% | | 6/25/34 | | | 1,958,803 | | | 1,411,909 | |
Downey Savings and Loan Association Mortgage Loan Trust 2005-AR6 | | | | 0.603% | | 10/19/45 | | | 3,349,164 | | | 1,483,877 | |
First Horizon Alternative Mortgage Securities 2006-FA8 1A8 | | | | 0.684% | | 2/25/37 | | | 4,038,893 | | | 1,787,893 | |
GMAC Mortgage Corp. Loan Trust
2004-AR2 3A | | | | 4.490% | | 8/19/34 | | | 27,244,061 | | | 23,720,071 | |
Greenpoint Mortgage Funding Trust 2005-AR1 | | | | 0.534% | | 6/25/45 | | | 6,540,755 | | | 2,781,403 | |
Greenpoint Mortgage Funding Trust 2005-AR4 | | | | 0.574% | | 10/25/45 | | | 1,260,383 | | | 625,951 | |
Greenpoint Mortgage Funding Trust 2006-AR4 | | | | 0.414% | | 9/25/46 | | | 19,183,425 | | | 15,409,120 | |
Greenpoint Mortgage Funding Trust 2006-AR5 | | | | 0.394% | | 10/25/46 | | | 23,901,917 | | | 18,617,710 | |
GSMPS Mortgage Loan Trust 2005-RP2 | | | | 0.664% | | 3/25/35 | | | 14,014,884 | | | 12,733,434 | D |
Harborview Mortgage Loan Trust 2005-7 | | | | 3.477% | | 6/19/45 | | | 13,235,900 | | | 5,295,407 | H |
Harborview Mortgage Loan Trust
2006-14 2A1A | | | | 0.463% | | 3/19/38 | | | 703,753 | | | 270,763 | |
Harborview Mortgage Loan Trust
2006-9 2A1A | | | | 0.523% | | 11/19/36 | | | 852,194 | | | 330,430 | |
Harborview Mortgage Loan Trust
2007-7 2A1A | | | | 1.314% | | 11/25/47 | | | 53,486,315 | | | 20,299,116 | |
Impac Secured Assets Corp. 2005-2 | | | | 0.634% | | 3/25/36 | | | 1,153,781 | | | 474,169 | |
Impac Secured Assets Corp. 2006-2 2A1 | | | | 0.664% | | 8/25/36 | | | 2,537,725 | | | 1,406,758 | |
IndyMac Inda Mortgage Loan Trust 2007-AR7 1A1 | | | | 6.142% | | 11/25/37 | | | 6,773,151 | | | 4,418,445 | |
Luminent Mortgage Trust 2007-2 2A1 | | | | 0.544% | | 5/25/37 | | | 357,584 | | | 146,609 | |
MASTR Adjustable Rate Mortgages Trust 2007-3 22A2 | | | | 0.524% | | 5/25/47 | | | 34,908,000 | | | 14,490,464 | |
Medallion Trust 2003-1G | | | | 0.799% | | 12/21/33 | | | 1,326,617 | | | 1,057,892 | H |
Merrill Lynch Mortgage Investors Inc. 2005-A3 A1 | | | | 0.584% | | 4/25/35 | | | 630,293 | | | 365,087 | |
MLCC Mortgage Investors Inc. 2003-B | | | | 0.654% | | 4/25/28 | | | 1,720,071 | | | 1,367,922 | |
MLCC Mortgage Investors Inc. 2006-1 1A | | | | 4.677% | | 2/25/36 | | | 599,570 | | | 520,271 | H |
18
Semi-Annual Report to Shareholders
| | | | | | | | | | | | | |
| | | % OF
NET ASSETS | | RATE | | MATURITY
DATE | | PAR/
SHARES | | VALUE | |
| | | | | | | | | | | | | |
Mortgage-Backed Securities—Continued | | | | | | | | | | | | | |
| | | | | |
Indexed Securities—Continued | | | | | | | | | | | | | |
Residential Accredit Loans Inc.
2006-QO10 A1 | | | | 0.474% | | 1/25/37 | | $ | 15,694,034 | | $ | 6,314,732 | |
Structured Adjustable Rate Mortgage Loan Trust 2005-19XS | | | | 0.634% | | 10/25/35 | | | 1,374,415 | | | 619,031 | |
Structured Asset Mortgage Investments Inc. 2006-AR6 | | | | 0.504% | | 7/25/46 | | | 15,295,845 | | | 5,356,411 | |
Structured Asset Mortgage Investments Inc. 2006-AR7 A1A | | | | 0.524% | | 8/25/36 | | | 33,603,616 | | | 13,841,555 | |
WaMu Alternative Mortgage Pass-Through Certificates 2007-OA4 A1A | | | | 2.100% | | 4/25/47 | | | 22,781,891 | | | 9,108,168 | |
WaMu Mortgage Pass-Through Certificates 2005-AR06 2A1A | | | | 0.544% | | 4/25/45 | | | 8,177,820 | | | 4,188,700 | |
WaMu Mortgage Pass-Through Certificates 2005-AR08 1A1A | | | | 0.584% | | 7/25/45 | | | 8,810,768 | | | 4,169,861 | |
WaMu Mortgage Pass-Through Certificates 2005-AR11 | | | | 0.634% | | 8/25/45 | | | 22,585,231 | | | 12,249,247 | |
WaMu Mortgage Pass-Through Certificates 2005-AR13 A1A1 | | | | 0.604% | | 10/25/45 | | | 13,597,783 | | | 7,113,826 | |
WaMu Mortgage Pass-Through Certificates 2005-AR13 B10 | | | | 1.514% | | 10/25/45 | | | 3,720,359 | | | 48,974 | D |
WaMu Mortgage Pass-Through Certificates 2005-AR17 A1A2 | | | | 0.604% | | 12/25/45 | | | 8,320,411 | | | 3,689,645 | |
WaMu Mortgage Pass-Through Certificates 2005-AR19 A1A1 | | | | 0.584% | | 12/25/45 | | | 16,301,494 | | | 7,636,298 | |
WaMu Mortgage Pass-Through Certificates 2005-AR19 A1A2 | | | | 0.604% | | 12/25/45 | | | 16,458,844 | | | 7,691,728 | |
| | | | | | | | | | | | | |
| | | | | | | | | | | | 271,182,998 | |
| | | | | | | | | | | | | |
Stripped Securities | | N.M. | | | | | | | | | | | |
FFCA Secured Lending Corp. 1999-1A | | | | 1.283% | | 9/18/25 | | | 2,685,957 | | | 61,807 | D,G,I1 |
LB-UBS Commercial Mortgage Trust 2001-C3 X | | | | 1.144% | | 6/15/36 | | | 15,282,068 | | | 231,016 | D,G,I1 |
Structured Mortgage Asset Residential Trust 1991-8 | | | | 0.014% | | 1/25/23 | | | 557,396 | | | 62 | G,I1 |
| | | | | | | | | | | | | |
| | | | | | | | | | | | 292,885 | |
| | | | | | | | | | | | | |
Variable Rate SecuritiesJ | | 3.8% | | | | | | | | | | | |
Banc of America Commercial Mortgage Inc. 2005-5 A4 | | | | 5.115% | | 10/10/45 | | | 10,000 | | | 8,538 | |
19
Semi-Annual Report to Shareholders
Portfolio of Investments—Continued
Western Asset Core Bond Portfolio—Continued
| | | | | | | | | | | | | |
| | | % OF
NET ASSETS | | RATE | | MATURITY
DATE | | PAR/
SHARES | | VALUE | |
| | | | | | | | | | | | | |
Mortgage-Backed Securities—Continued | | | | | | | | | | | | | |
| | | | | |
Variable Rate Securities—Continued | | | | | | | | | | | | | |
Citigroup Mortgage Loan Trust Inc. 2005-5 3A2A | | | | 5.625% | | 10/25/35 | | $ | 4,199,897 | | $ | 2,842,931 | |
Credit Suisse Mortgage Capital Certificates 2006-C1 A4 | | | | 5.609% | | 2/15/39 | | | 4,180,000 | | | 3,381,719 | |
Credit Suisse Mortgage Capital Certificates A3-C2 | | | | 5.846% | | 3/15/39 | | | 32,000,000 | | | 22,866,806 | |
Deutsche Mortgage Securities Inc. 2005-WF1 1A3 | | | | 5.119% | | 6/26/35 | | | 11,730,000 | | | 7,587,980 | D |
GE Capital Commercial Mortgage Corp. 2005-C4 | | | | 5.513% | | 11/10/45 | | | 10,000 | | | 8,416 | |
Greenwich Capital Commercial Funding Corp. 2006-GG7 | | | | 6.115% | | 7/10/38 | | | 8,370,000 | | | 6,865,767 | |
IndyMac INDX Mortgage Loan Trust
2005-AR15 | | | | 5.099% | | 9/25/35 | | | 6,285,104 | | | 3,885,756 | |
JP Morgan Chase Commercial Mortgage Securities Corp. 2005-CB13 | | | | 5.457% | | 1/12/43 | | | 3,420,000 | | | 2,940,540 | |
JP Morgan Chase Commercial Mortgage Securities Corp. 2007-CB20 A4 | | | | 5.794% | | 2/12/51 | | | 30,000,000 | | | 22,410,456 | |
JP Morgan Mortgage Trust 2004-A3 3A3 | | | | 4.959% | | 7/25/34 | | | 3,600,000 | | | 2,008,567 | |
JP Morgan Mortgage Trust 2007-A2 4A2 | | | | 6.036% | | 4/25/37 | | | 11,550,000 | | | 6,435,601 | |
MASTR Adjustable Rate Mortgages Trust 2004-15 | | | | 5.372% | | 12/25/34 | | | 150,652 | | | 98,978 | |
Merrill Lynch Mortgage Investors Inc. 1998-C1 A3 | | | | 6.720% | | 11/15/26 | | | 2,465,126 | | | 2,450,194 | |
Merrill Lynch Mortgage Investors Inc. 2006-A1 1A1 | | | | 5.802% | | 3/25/36 | | | 1,682,925 | | | 914,389 | |
Morgan Stanley Mortgage Loan Trust 2005-3AR | | | | 4.149% | | 7/25/35 | | | 2,924,402 | | | 1,687,125 | |
Thornburg Mortgage Securities Trust 2007-4 2A1 | | | | 6.207% | | 9/25/37 | | | 21,296,854 | | | 15,391,944 | |
Thornburg Mortgage Securities Trust 2007-4 3A1 | | | | 6.220% | | 9/25/37 | | | 20,997,153 | | | 13,495,072 | |
Wachovia Bank Commercial Mortgage Trust 2005-C20 | | | | 5.118% | | 7/15/42 | | | 4,000,000 | | | 3,370,428 | |
WaMu Mortgage Pass Through Certificates 2005-AR4 | | | | 4.668% | | 4/25/35 | | | 2,500,000 | | | 1,386,303 | |
WaMu Mortgage Pass-Through Certificates 2007-HY7 2A3 | | | | 5.805% | | 7/25/37 | | | 13,000,000 | | | 6,519,677 | |
| | | | | | | | | | | | | |
| | | | | | | | | | | | 126,557,187 | |
| | | | | | | | | | | | | |
Total Mortgage-Backed Securities
(Cost—$961,474,991) | | | | | | | | | | | | 644,505,713 | |
20
Semi-Annual Report to Shareholders
| | | | | | | | | | | | | |
| | | % OF
NET ASSETS | | RATE | | MATURITY
DATE | | PAR/
SHARES | | VALUE | |
| | | | | | | | | | | | | |
U.S. Government and Agency Obligations | | 12.5% | | | | | | | | | | | |
| | | | | |
Fixed Rate Securities | | 7.1% | | | | | | | | | | | |
Fannie Mae | | | | 6.250% | | 2/1/11 | | $ | 3,260,000 | | $ | 3,428,835 | K |
Fannie Mae | | | | 5.250% | | 8/1/12 | | | 2,610,000 | | | 2,712,051 | K |
Freddie Mac | | | | 5.300% | | 5/12/20 | | | 53,095,000 | | | 54,016,623 | K,S |
Freddie Mac | | | | 5.625% | | 11/23/35 | | | 12,290,000 | | | 12,612,613 | K,S |
Tennessee Valley Authority | | | | 7.125% | | 5/1/30 | | | 2,450,000 | | | 2,963,486 | |
United States Treasury Bonds | | | | 4.500% | | 5/15/38 | | | 4,297,000 | | | 4,435,982 | |
United States Treasury Bonds | | | | 3.500% | | 2/15/39 | | | 12,188,000 | | | 10,538,842 | |
United States Treasury Notes | | | | 2.250% | | 5/31/14 | | | 4,780,000 | | | 4,715,757 | |
United States Treasury Notes | | | | 2.625% | | 6/30/14 | | | 132,980,000 | | | 133,396,227 | |
United States Treasury Notes | | | | 2.750% | | 2/15/19 | | | 8,590,000 | | | 8,045,050 | |
United States Treasury Notes | | | | 3.125% | | 5/15/19 | | | 7,000 | | | 6,770 | |
| | | | | | | | | | | | | |
| | | | | | | | | | | | 236,872,236 | |
| | | | | | | | | | | | | |
Stripped Securities | | 0.2% | | | | | | | | | | | |
United States Treasury Notes | | | | 0.000% | | 5/15/18 | | | 7,530,000 | | | 5,447,684 | I2 |
| | | | | | | | | | | | | |
| | | | | |
Treasury Inflation-Protected SecuritiesL | | 5.2% | | | | | | | | | | | |
United States Treasury Inflation-Protected Security | | | | 2.375% | | 1/15/17 | | | 6,396,726 | | | 6,674,587 | S |
United States Treasury Inflation-Protected Security | | | | 2.625% | | 7/15/17 | | | 2,355,929 | | | 2,510,537 | S |
United States Treasury Inflation-Protected Security | | | | 2.375% | | 1/15/25 | | | 40,903,107 | | | 42,040,704 | S |
United States Treasury Inflation-Protected Security | | | | 2.000% | | 1/15/26 | | | 18,832,304 | | | 18,437,993 | |
United States Treasury Inflation-Protected Security | | | | 2.375% | | 1/15/27 | | | 53,637,336 | | | 55,531,378 | M,S |
United States Treasury Inflation-Protected Security | | | | 1.750% | | 1/15/28 | | | 12,566,530 | | | 11,859,662 | M,S |
United States Treasury Inflation-Protected Security | | | | 3.625% | | 4/15/28 | | | 13,262,098 | | | 16,138,316 | |
United States Treasury Inflation-Protected Security | | | | 3.875% | | 4/15/29 | | | 16,627,925 | | | 21,096,679 | M |
| | | | | | | | | | | | | |
| | | | | | | | | | | | 174,289,856 | |
| | | | | | | | | | | | | |
Total U.S. Government and Agency Obligations (Cost—$405,532,176) | | | | | | | | | | | | 416,609,776 | |
21
Semi-Annual Report to Shareholders
Portfolio of Investments—Continued
Western Asset Core Bond Portfolio—Continued
| | | | | | | | | | | | | |
| | | % OF
NET ASSETS | | RATE | | MATURITY
DATE | | PAR/
SHARES | | VALUE | |
| | | | | | | | | | | | | |
U.S. Government Agency Mortgage-Backed Securities | | 33.3% | | | | | | | | | | | |
| | | | | |
Fixed Rate Securities | | 28.3% | | | | | | | | | | | |
Fannie Mae | | | | 7.000% | | 12/1/09 to 2/1/33 | | $ | 6,942,875 | | $ | 7,600,815 | K |
Fannie Mae | | | | 8.000% | | 5/1/15 | | | 6,192 | | | 6,600 | K |
Fannie Mae | | | | 5.500% | | 4/1/18 to 11/1/35 | | | 62,925,201 | | | 65,287,017 | K |
Fannie Mae | | | | 4.500% | | 7/1/18 to 3/1/38 | | | 9,745,266 | | | 9,859,586 | K |
Fannie Mae | | | | 4.000% | | 8/1/20 to 9/1/20 | | | 4,256,343 | | | 4,268,757 | K |
Fannie Mae | | | | 5.000% | | 8/1/20 to 7/1/35 | | | 369,706,819 | | | 379,296,334 | K |
Fannie Mae | | | | 6.000% | | 12/1/24 | | | 8,370,000 | | | 8,859,126 | K,N |
Fannie Mae | | | | 7.500% | | 6/1/25 to 5/1/28 | | | 442,258 | | | 482,409 | K |
Fannie Mae | | | | 6.000% | | 1/1/26 to 8/1/37 | | | 33,125,079 | | | 34,794,588 | K |
Fannie Mae | | | | 6.500% | | 7/1/28 to 8/1/33 | | | 3,502,739 | | | 3,769,288 | K |
Fannie Mae | | | | 4.500% | | 12/1/39 | | | 92,000,000 | | | 91,798,704 | K,N |
Fannie Mae | | | | 5.500% | | 12/1/39 | | | 76,400,000 | | | 78,859,163 | K,N |
Freddie Mac | | | | 6.000% | | 9/1/13 to 5/1/29 | | | 677,940 | | | 719,072 | K |
Freddie Mac | | | | 5.500% | | 12/1/13 to 8/1/35 | | | 26,587,198 | | | 27,552,397 | K |
Freddie Mac | | | | 9.300% | | 4/15/19 | | | 77,324 | | | 84,358 | K |
Freddie Mac | | | | 5.000% | | 9/1/20 to 11/1/36 | | | 48,863,578 | | | 50,118,399 | K |
Freddie Mac | | | | 7.000% | | 4/1/24 to 5/1/32 | | | 2,164,859 | | | 2,352,715 | K |
Freddie Mac | | | | 6.500% | | 6/1/32 | | | 34,589 | | | 37,076 | K |
Freddie Mac | | | | 5.000% | | 12/1/39 | | | 35,500,000 | | | 36,099,063 | K,N |
Government National Mortgage Association | | | | 10.000% | | 11/15/09 | | | 33 | | | 34 | |
Government National Mortgage Association | | | | 8.000% | | 10/15/16 to 7/15/17 | | | 100,409 | | | 110,004 | |
Government National Mortgage Association | | | | 7.500% | | 10/15/22 to 8/15/32 | | | 160,426 | | | 175,784 | |
Government National Mortgage Association | | | | 7.000% | | 6/15/23 to 5/15/32 | | | 245,726 | | | 267,523 | |
Government National Mortgage Association | | | | 6.500% | | 10/15/23 to 3/15/33 | | | 11,816,976 | | | 12,708,444 | |
Government National Mortgage Association | | | | 6.000% | | 3/15/26 to 8/15/35 | | | 21,767,920 | | | 22,813,509 | |
Government National Mortgage Association | | | | 5.500% | | 1/15/33 | | | 212,163 | | | 220,468 | |
Government National Mortgage Association | | | | 5.000% | | 6/15/35 to 9/15/35 | | | 50,324,405 | | | 51,543,204 | |
Government National Mortgage Association | | | | 4.000% | | 12/1/39 | | | 15,000,000 | | | 14,479,688 | N |
22
Semi-Annual Report to Shareholders
| | | | | | | | | | | | | |
| | | % OF
NET ASSETS | | RATE | | MATURITY
DATE | | PAR/
SHARES | | VALUE | |
| | | | | | | | | | | | | |
U.S. Government Agency Mortgage-Backed Securities—Continued | | | | | | | | | | | | | |
| | | | | |
Fixed Rate Securities—Continued | | | | | | | | | | | | | |
Government National Mortgage Association | | | | 4.500% | | 12/1/39 | | $ | 25,600,000 | | $ | 25,489,618 | N |
Government National Mortgage Association | | | | 5.000% | | 12/1/39 | | | 13,300,000 | | | 13,557,688 | N |
| | | | | | | | | | | | | |
| | | | | | | | | | | | 943,211,431 | |
| | | | | | | | | | | | | |
Indexed SecuritiesA | | 4.3% | | | | | | | | | | | |
Fannie Mae | | | | 4.471% | | 6/1/35 | | | 7,327,549 | | | 7,574,161 | K |
Fannie Mae | | | | 4.537% | | 7/1/35 | | | 3,394,245 | | | 3,482,983 | K |
Fannie Mae | | | | 5.117% | | 8/1/35 | | | 776,551 | | | 794,640 | K |
Fannie Mae | | | | 5.018% | | 9/1/35 | | | 1,806,517 | | | 1,853,619 | K |
Fannie Mae | | | | 5.135% | | 9/1/35 | | | 4,327,975 | | | 4,431,770 | K |
Fannie Mae | | | | 3.435% | | 10/1/35 | | | 14,602,034 | | | 14,829,790 | K |
Fannie Mae | | | | 4.873% | | 10/1/35 | | | 1,552,211 | | | 1,602,841 | K |
Fannie Mae | | | | 4.905% | | 10/1/35 | | | 1,644,929 | | | 1,685,053 | K |
Fannie Mae | | | | 4.999% | | 10/1/35 | | | 1,719,482 | | | 1,763,091 | K |
Fannie Mae | | | | 5.672% | | 10/1/35 | | | 1,461,855 | | | 1,511,073 | K |
Fannie Mae | | | | 3.408% | | 11/1/35 | | | 5,872,309 | | | 5,963,465 | K |
Fannie Mae | | | | 3.417% | | 11/1/35 | | | 5,685,435 | | | 5,773,831 | K |
Fannie Mae | | | | 3.433% | | 11/1/35 | | | 6,366,348 | | | 6,465,647 | K |
Fannie Mae | | | | 3.434% | | 11/1/35 | | | 6,427,295 | | | 6,527,545 | K |
Fannie Mae | | | | 3.436% | | 11/1/35 | | | 6,074,861 | | | 6,169,613 | K |
Fannie Mae | | | | 5.486% | | 2/1/37 | | | 48,924,065 | | | 51,265,849 | K,S |
Freddie Mac | | | | 5.001% | | 10/1/35 | | | 2,001,800 | | | 2,066,170 | K |
Freddie Mac | | | | 5.835% | | 8/1/37 | | | 19,134,454 | | | 20,091,041 | K |
| | | | | | | | | | | | | |
| | | | | | | | | | | | 143,852,182 | |
| | | | | | | | | | | | | |
Stripped Securities | | 0.7% | | | | | | | | | | | |
Fannie Mae | | | | 9.500% | | 2/1/17 | | | 8,927 | | | 1,519 | G,I1,K |
Fannie Mae | | | | 1,009.500% | | 2/25/20 | | | 5 | | | 92 | G,I1,K |
Fannie Mae | | | | 1,009.250% | | 8/25/21 | | | 282 | | | 5,516 | G,I1,K |
Fannie Mae | | | | 0.000% | | 5/25/22 | | | 53,656 | | | 49,421 | G,I2,K |
Financing Corp. | | | | 0.000% | | 2/8/18 to 9/26/19 | | | 36,830,000 | | | 24,109,370 | I2 |
Financing Corp. | | | | 0.000% | | 4/5/19 | | | 1,150,000 | | | 718,299 | G,I2 |
Freddie Mac | | | | 10.000% | | 3/1/21 | | | 47,900 | | | 9,138 | G,I1,K |
Freddie Mac | | | | 0.000% | | 7/15/22 | | | 9,239 | | | 8,537 | G,I2,K |
| | | | | | | | | | | | | |
| | | | | | | | | | | | 24,901,892 | |
| | | | | | | | | | | | | |
Total U.S. Government Agency Mortgage-Backed Securities
(Cost—$1,084,306,848) | | | | | | | | | | | | 1,111,965,505 | |
23
Semi-Annual Report to Shareholders
Portfolio of Investments—Continued
Western Asset Core Bond Portfolio—Continued
| | | | | | | | | | | | | |
| | | % OF
NET ASSETS | | RATE | | MATURITY
DATE | | PAR/
SHARES | | VALUE | |
| | | | | | | | | | | | | |
Yankee BondsO | | 6.3% | | | | | | | | | | | |
| | | | | |
Aerospace and Defense | | 0.3% | | | | | | | | | | | |
Systems 2001 Asset Trust | | | | 6.664% | | 9/15/13 | | $ | 8,672,727 | | $ | 8,672,727 | D |
| | | | | | | | | | | | | |
Commercial Banks | | 1.6% | | | | | | | | | | | |
Eksportfinans ASA | | | | 5.500% | | 5/25/16 | | | 10,700,000 | | | 11,172,448 | |
Glitnir Banki Hf | | | | 6.330% | | 7/28/11 | | | 6,080,000 | | | 988,000 | B,D,G |
Glitnir Banki Hf | | | | 6.375% | | 9/25/12 | | | 8,920,000 | | | 1,449,500 | B,D,G |
Glitnir Banki Hf | | | | 6.693% | | 6/15/16 | | | 11,830,000 | | | 1,183 | B,C,D,G |
Glitnir Banki Hf | | | | 7.451% | | 9/14/49 | | | 1,600,000 | | | 160 | B,C,D,G |
HBOS Capital Funding LP | | | | 6.071% | | 6/30/49 | | | 3,105,000 | | | 1,131,772 | C,D |
HSBC Capital Funding LP | | | | 4.610% | | 6/27/49 | | | 1,630,000 | | | 1,146,200 | C,D |
Kaupthing Bank Hf | | | | 5.750% | | 10/4/11 | | | 2,960,000 | | | 384,800 | B,D,G |
Kaupthing Bank Hf | | | | 7.625% | | 2/28/15 | | | 20,280,000 | | | 1,622,400 | B,D,G |
Kaupthing Bank Hf | | | | 7.125% | | 5/19/16 | | | 30,520,000 | | | 3,052 | B,D,G |
Landsbanki Islands Hf | | | | 6.100% | | 8/25/11 | | | 17,170,000 | | | 515,100 | B,D,G |
Rabobank Nederland NV | | | | 11.000% | | 6/30/19 | | | 6,178,000 | | | 6,873,025 | C,D |
Resona Preferred Global Securities | | | | 7.191% | | 12/29/49 | | | 13,670,000 | | | 9,979,100 | C,D |
Royal Bank of Scotland Group PLC | | | | 7.640% | | 3/31/49 | | | 3,700,000 | | | 1,498,500 | C |
RSHB Capital SA | | | | 6.299% | | 5/15/17 | | | 15,740,000 | | | 13,536,400 | D |
Shinsei Finance Cayman Ltd. | | | | 6.418% | | 1/29/49 | | | 11,080,000 | | | 4,432,000 | C,D |
| | | | | | | | | | | | | |
| | | | | | | | | | | | 54,733,640 | |
| | | | | | | | | | | | | |
Diversified Financial Services | | 0.9% | | | | | | | | | | | |
Aiful Corp. | | | | 5.000% | | 8/10/10 | | | 4,030,000 | | | 2,458,300 | D |
MUFG Capital Finance 1 Ltd. | | | | 6.346% | | 7/29/49 | | | 4,660,000 | | | 4,079,411 | C |
SMFG Preferred Capital | | | | 6.078% | | 1/29/49 | | | 13,800,000 | | | 11,029,926 | C,D |
TNK-BP Finance SA | | | | 7.500% | | 7/18/16 | | | 9,940,000 | | | 8,473,850 | D |
TNK-BP Finance SA | | | | 6.625% | | 3/20/17 | | | 4,830,000 | | | 3,815,700 | D |
TNK-BP Finance SA | | | | 6.625% | | 3/20/17 | | | 318,000 | | | 251,220 | D |
| | | | | | | | | | | | | |
| | | | | | | | | | | | 30,108,407 | |
| | | | | | | | | | | | | |
Diversified Telecommunication Services | | 0.7% | | | | | | | | | | | |
British Telecommunications PLC | | | | 9.125% | | 12/15/10 | | | 1,755,000 | | | 1,863,936 | P |
Deutsche Telekom International Finance BV | | | | 5.750% | | 3/23/16 | | | 5,370,000 | | | 5,498,144 | |
Koninklijke (Royal) KPN NV | | | | 8.000% | | 10/1/10 | | | 8,240,000 | | | 8,646,043 | |
Telecom Italia Capital SpA | | | | 5.250% | | 11/15/13 | | | 965,000 | | | 946,268 | |
Telecom Italia Capital SpA | | | | 4.950% | | 9/30/14 | | | 2,570,000 | | | 2,460,310 | |
Telecom Italia Capital SpA | | | | 5.250% | | 10/1/15 | | | 2,060,000 | | | 1,988,594 | |
| | | | | | | | | | | | | |
| | | | | | | | | | | | 21,403,295 | |
| | | | | | | | | | | | | |
24
Semi-Annual Report to Shareholders
| | | | | | | | | | | | | |
| | | % OF
NET ASSETS | | RATE | | MATURITY
DATE | | PAR/
SHARES | | VALUE | |
| | | | | | | | | | | | | |
Yankee Bonds—Continued | | | | | | | | | | | | | |
| | | | | |
Electric Utilities | | N.M. | | | | | | | | | | | |
Hydro-Quebec | | | | 6.300% | | 5/11/11 | | $ | 570,000 | | $ | 617,783 | |
| | | | | | | | | | | | | |
Foreign Governments | | 0.4% | | | | | | | | | | | |
Russian Federation | | | | 7.500% | | 3/31/30 | | | 13,698,240 | | | 13,485,917 | D |
United Mexican States | | | | 5.625% | | 1/15/17 | | | 160,000 | | | 161,760 | |
United Mexican States | | | | 7.500% | | 4/8/33 | | | 302,000 | | | 331,445 | |
| | | | | | | | | | | | | |
| | | | | | | | | | | | 13,979,122 | |
| | | | | | | | | | | | | |
Gas Utilities | | 0.2% | | | | | | | | | | | |
Intergas Finance BV | | | | 6.375% | | 5/14/17 | | | 5,089,000 | | | 3,867,640 | D |
Intergas Finance BV | | | | 6.375% | | 5/14/17 | | | 1,120,000 | | | 834,400 | D |
| | | | | | | | | | | | | |
| | | | | | | | | | | | 4,702,040 | |
| | | | | | | | | | | | | |
Industrial Conglomerates | | 1.1% | | | | | | | | | | | |
Tyco International Group SA | | | | 6.750% | | 2/15/11 | | | 26,549,000 | | | 27,580,933 | |
Tyco International Group SA | | | | 6.375% | | 10/15/11 | | | 6,560,000 | | | 6,912,482 | |
Tyco International Group SA | | | | 6.000% | | 11/15/13 | | | 2,950,000 | | | 2,999,613 | |
| | | | | | | | | | | | | |
| | | | | | | | | | | | 37,493,028 | |
| | | | | | | | | | | | | |
Insurance | | 0.4% | | | | | | | | | | | |
Merna Reinsurance Ltd. | | | | 2.348% | | 7/7/10 | | | 13,500,000 | | | 12,573,900 | A,D |
| | | | | | | | | | | | | |
Metals and Mining | | 0.2% | | | | | | | | | | | |
Corporacion Nacional del Cobre-Codelco | | | | 4.750% | | 10/15/14 | | | 1,750,000 | | | 1,802,694 | D |
Vale Overseas Ltd. | | | | 8.250% | | 1/17/34 | | | 10,000 | | | 11,247 | |
Vale Overseas Ltd. | | | | 6.875% | | 11/21/36 | | | 6,059,000 | | | 5,753,051 | |
| | | | | | | | | | | | | |
| | | | | | | | | | | | 7,566,992 | |
| | | | | | | | | | | | | |
Oil, Gas and Consumable Fuels | | 0.4% | | | | | | | | | | | |
Anadarko Finance Co. | | | | 7.500% | | 5/1/31 | | | 710,000 | | | 692,796 | |
Conoco Funding Co. | | | | 6.350% | | 10/15/11 | | | 400,000 | | | 436,552 | |
Conoco Funding Co. | | | | 7.250% | | 10/15/31 | | | 350,000 | | | 383,685 | |
Gazprom | | | | 6.212% | | 11/22/16 | | | 8,940,000 | | | 7,464,900 | D |
Gazprom | | | | 6.510% | | 3/7/22 | | | 390,000 | | | 292,500 | D |
Petrobras International Finance Co. | | | | 6.125% | | 10/6/16 | | | 5,020,000 | | | 5,145,500 | |
| | | | | | | | | | | | | |
| | | | | | | | | | | | 14,415,933 | |
| | | | | | | | | | | | | |
Wireless Telecommunication Services | | 0.1% | | | | | | | | | | | |
America Movil SA de CV | | | | 5.625% | | 11/15/17 | | | 2,710,000 | | | 2,648,770 | |
| | | | | | | | | | | | | |
Total Yankee Bonds
(Cost—$328,198,640) | | | | | | | | | | | | 208,915,637 | |
25
Semi-Annual Report to Shareholders
Portfolio of Investments—Continued
Western Asset Core Bond Portfolio—Continued
| | | | | | | | | | | | | | |
| | | % OF
NET ASSETS | | RATE | | MATURITY
DATE | | PAR/
SHARES | | | VALUE | |
| | | | | | | | | | | | | | |
Preferred Stocks | | 0.3% | | | | | | | | | | | | |
Fannie Mae | | | | 5.375% | | | | | 44 | shs | | $ | 132,000 | F,K,Q |
Fannie Mae | | | | 7.000% | | | | | 26,600 | | | | 41,230 | A,K,Q |
Fannie Mae | | | | 8.250% | | | | | 578,475 | | | | 775,157 | C,K,Q |
Freddie Mac | | | | 8.375% | | | | | 844,875 | | | | 1,030,748 | C,K,Q |
General Motors Corp. | | | | 5.250% | | | | | 814,445 | | | | 2,137,918 | F |
General Motors Corp. | | | | 1.500% | | | | | 27,922 | | | | 73,295 | F |
General Motors Corp. | | | | 6.250% | | | | | 1,514,912 | | | | 3,976,644 | F |
General Motors Corp. | | | | 4.500% | | | | | 1,606 | | | | 4,216 | F |
Home Ownership Funding Corp. | | | | 1.000% | | | | | 5,575 | | | | 535,318 | D,G,Q |
Home Ownership Funding Corp. II | | | | 1.000% | | | | | 5,000 | | | | 480,106 | D,G,Q |
Preferred Blocker Inc. | | | | 7.000% | | | | | 726 | | | | 312,226 | D |
| | | | | | | | | | | | | | |
Total Preferred Stocks (Cost—$62,158,287) | | | | | | | | | | | | | 9,498,858 | |
| | | | | | | | | | | | | | |
Total Long-Term Securities
(Cost—$4,218,411,279) | | | | | | | | | | | | | 3,492,292,043 | |
Short-Term Securities | | 8.4% | | | | | | | | | | | | |
| | | | | |
U.S. Government and Agency Obligations | | 7.4% | | | | | | | | | | | | |
Fannie Mae | | | | 0.000% | | 10/5/09 | | $ | 90,000,000 | | | | 89,959,230 | E,K |
Fannie Mae | | | | 0.000% | | 8/3/09 | | | 100,000,000 | | | | 99,987,167 | E,K |
Federal Home Loan Bank | | | | 0.000% | | 11/18/09 | | | 51,000,000 | | | | 50,954,406 | E,S |
United States Treasury Bill | | | | 0.000% | | 7/16/09 | | | 4,750,000 | | | | 4,749,881 | E |
| | | | | | | | | | | | | | |
| | | | | | | | | | | | | 245,650,684 | |
| | | | | | | | | | | | | | |
| | | | | |
Options Purchased | | 0.1% | | | | | | | | | | | | |
Barclays Swaption Call, September 2009, Strike Price $2.02 | | | | | | | | | 16,900,000 | R | | | 495,858 | H |
Barclays Swaption Put, August 2009, Strike Price $1.60 | | | | | | | | | 56,400,000 | R | | | 178,425 | H |
Barclays Swaption Put, July 2009, Strike Price $1.60 | | | | | | | | | 37,600,000 | R | | | 31,321 | H |
Credit Suisse First Boston Swaption Call, September 2009, Strike Price $2.02 | | | | | | | | | 18,800,000 | R | | | 551,605 | H |
Credit Suisse First Boston Swaption Put, April 2011, Strike Price $5.18 | | | | | | | | | 33,700,000 | R | | | 1,381,511 | |
Credit Suisse First Boston Swaption Put, April 2012, Strike Price $5.20 | | | | | | | | | 16,800,000 | R | | | 1,344,067 | |
Credit Suisse First Boston Swaption Put, August 2009, Strike Price $1.60 | | | | | | | | | 18,800,000 | R | | | 59,475 | H |
26
Semi-Annual Report to Shareholders
| | | | | | | | | | |
| | | % OF
NET ASSETS | | PAR/
SHARES | | | VALUE | |
| | | | | | | | | | |
Short-Term Securities—Continued | | | | | | | | | | |
| | | |
Options Purchased—Continued | | | | | | | | | | |
Credit Suisse First Boston Swaption Put, May 2011, Strike Price $5.12 | | | | | 16,800,000 | R | | $ | 726,899 | |
Credit Suisse First Boston Swaption Put, September 2009, Strike Price $1.60 | | | | | 37,600,000 | R | | | 206,667 | H |
| | | | | | | | | | |
| | | | | | | | | 4,975,828 | |
| | | | | | | | | | |
Repurchase Agreements | | 0.9% | | | | | | | | |
Deutsche Bank
0.07%, dated 6/30/09, to be repurchased at $10,687,021 on 7/1/09 (Collateral: $10,820,000 Freddie Mac notes, 1.722% due 4/27/11, value $10,900,739) | | | | $ | 10,687,000 | | | | 10,687,000 | |
Goldman Sachs & Co.
0.03%, dated 6/30/09, to be repurchased at $19,150,016 on 7/1/09 (Collateral: $19,445,000 Fannie Mae notes, 2.750% due 3/13/14, value $19,542,225) | | | | | 19,150,000 | | | | 19,150,000 | |
| | | | | | | | | | |
| | | | | | | | | 29,837,000 | |
| | | | | | | | | | |
Total Short-Term Securities (Cost—$279,368,695) | | | | | | | | | 280,463,512 | |
Total Investments (Cost—$4,497,779,974)T | | 113.1% | | | | | | | 3,772,755,555 | |
Other Assets Less Liabilities | | (13.1)% | | | | | | | (437,145,209 | ) |
| | | | | | | | | | |
| | | |
Net Assets | | 100.0% | | | | | | $ | 3,335,610,346 | |
| | | | | | | | | | |
| | | | | | | | |
| | | EXPIRATION | | ACTUAL
CONTRACTS | | APPRECIATION/
(DEPRECIATION) | |
Futures Contracts PurchasedU | | | | | | | | |
Eurodollar Futures | | September 2009 | | 989 | | $ | 4,051,855 | |
Eurodollar Futures | | December 2009 | | 1,615 | | | 1,949,738 | |
Eurodollar Futures | | March 2010 | | 1,115 | | | 667,250 | |
Eurodollar Futures | | June 2010 | | 406 | | | (167,755 | ) |
Eurodollar Futures | | September 2010 | | 644 | | | (286,333 | ) |
U.S. Treasury Bond Futures | | September 2009 | | 1,762 | | | 2,900,838 | |
U.S. Treasury Note Futures | | September 2009 | | 5,254 | | | (4,881,872 | ) |
U.S. Treasury Note Futures | | September 2009 | | 1,382 | | | (801,395 | ) |
| | | | | | | | |
| | | | | | $ | 3,432,326 | |
| | | | | | | | |
Futures Contracts WrittenU | | | | | | | | |
U.S. Treasury Note Futures | | September 2009 | | 3,357 | | $ | (3,398,066 | ) |
| | | | | | | | |
27
Semi-Annual Report to Shareholders
Portfolio of Investments—Continued
Western Asset Core Bond Portfolio—Continued
| | | | | | | | |
| | | EXPIRATION | | ACTUAL
CONTRACTS | | APPRECIATION/
(DEPRECIATION) | |
Options WrittenU | | | | | | | | |
Barclays Swaption Call, Strike Price $1.60 | | September 2009 | | 33,800,000 | | $ | (28,737 | )H |
Barclays Swaption Call, Strike Price $4.86 | | October 2013 | | 31,920,000 | | | (549,994 | ) |
Barclays Swaption Put, Strike Price $4.86 | | October 2013 | | 31,920,000 | | | (276,682 | ) |
Credit Suisse First Boston Swaption Call, Strike Price $1.60 | | September 2009 | | 37,600,000 | | | (31,967 | )H |
Credit Suisse First Boston Swaption Put, Strike Price $4.11 | | July 2009 | | 67,400,000 | | | (403,753 | ) |
Credit Suisse First Boston Swaption Put, Strike Price $4.20 | | August 2009 | | 33,600,000 | | | (294,252 | ) |
Credit Suisse First Boston Swaption Put, Strike Price $4.43 | | October 2009 | | 67,400,000 | | | (963,126 | ) |
Credit Suisse First Boston Swaption Put, Strike Price $4.48 | | November 2009 | | 33,600,000 | | | (473,138 | ) |
Credit Suisse First Boston Swaption Put, Strike Price $4.74 | | October 2009 | | 33,600,000 | | | (774,231 | ) |
Credit Suisse First Boston Swaption Put, Strike Price $5.03 | | April 2010 | | 16,800,000 | | | (522,964 | ) |
Eurodollar Futures Call, Strike Price $99.25 | | September 2009 | | 243 | | | (28,552 | ) |
Eurodollar Futures Put, Strike Price $99.00 | | September 2009 | | 292 | | | 25,915 | |
Greenwich Swaption Call, Strike Price $4.97 | | October 2013 | | 57,220,000 | | | (1,306,441 | ) |
Greenwich Swaption Put, Strike Price $4.97 | | October 2013 | | 57,220,000 | | | (393,508 | ) |
JP Morgan Swaption Call, Strike Price $4.86 | | October 2013 | | 25,300,000 | | | (443,519 | ) |
JP Morgan Swaption Put, Strike Price $4.86 | | October 2013 | | 25,300,000 | | | (211,710 | ) |
U.S. Treasury Bond Futures Call, Strike Price $117.00 | | July 2009 | | 200 | | | (182,250 | ) |
U.S. Treasury Note Futures Call, Strike Price $115.00 | | July 2009 | | 200 | | | (202,563 | ) |
U.S. Treasury Note Futures Call, Strike Price $115.50 | | August 2009 | | 336 | | | (253,680 | ) |
U.S. Treasury Note Futures Call, Strike Price $116.00 | | July 2009 | | 158 | | | (62,509 | ) |
U.S. Treasury Note Futures Call, Strike Price $118.00 | | August 2009 | | 896 | | | 583,176 | |
U.S. Treasury Note Futures Call, Strike Price $124.00 | | August 2009 | | 170 | | | 118,681 | |
U.S. Treasury Note Futures Put, Strike Price $112.00 | | August 2009 | | 134 | | | 105,064 | |
U.S. Treasury Note Futures Put, Strike Price $116.00 | | August 2009 | | 170 | | | (144,289 | ) |
| | | | | | | | |
| | | | | | $ | (6,715,029 | ) |
| | | | | | | | |
| | | | | | | | | |
N.M.—Not Meaningful.
| A | | Indexed Security – The rates of interest earned on these securities are tied to the London Interbank Offered Rate (“LIBOR”), the Euro Interbank Offered Rate (“EURIBOR”) Index, the Consumer Price Index (“CPI”), the one-year Treasury Bill Rate or the ten-year Japanese Government Bond Rate. The coupon rates are the rates as of June 30, 2009. |
| B | | Bond is currently in default. |
| C | | Stepped Coupon Security – A security with a predetermined schedule of interest or dividend rate changes at which time it begins to accrue interest or pay dividends according to the predetermined schedule. |
| D | | Rule 144a Security – A security purchased pursuant to Rule 144a under the Securities Act of 1933 which may not be resold subject to that rule except to qualified institutional buyers. These securities, which the Fund’s investment adviser has determined to be liquid, unless otherwise noted, represent 9.51% of net assets. |
| E | | Zero coupon bond – A bond with no periodic interest payments which is sold at such a discount as to produce a current yield to maturity. |
| F | | Convertible Security – Security may be converted into the issuer’s common stock. |
| G | | Illiquid security valued at fair value under the procedures approved by the Board of Directors. |
| H | | Security is valued in good faith at fair value by or under the direction of the Board of Directors. |
28
Semi-Annual Report to Shareholders
| I | | Stripped Security – Security with interest-only or principal-only payment streams, denoted by a 1 or 2, respectively. For interest-only securities, the amount shown as principal is the notional balance used to calculate the amount of interest due. |
| J | | The coupon rates shown on variable rate securities are the rates at June 30, 2009. These rates vary with the weighted average coupon of the underlying loans. |
| K | | On September 7, 2008, the Federal Housing Finance Agency placed Fannie Mae and Freddie Mac into conservatorship. |
| L | | Treasury Inflation-Protected Security – Treasury security whose principal value is adjusted daily in accordance with changes to the Consumer Price Index for All Urban Consumers. Interest is calculated on the basis of the current adjusted principal value. |
| M | | All or a portion of this security is collateral to cover futures and options contracts written. |
| N | | When-issued Security – Security purchased on a delayed delivery basis. Final settlement amount and maturity date have not yet been announced. |
| O | | Yankee Bond – A dollar-denominated bond issued in the U.S. by foreign entities. |
| P | | Credit Linked Security – The rates of interest earned on these securities are tied to the credit rating assigned by Standard & Poor’s Rating Service and/or Moody’s Investors Services. |
| R | | Par represents actual number of contracts. |
| S | | All or a portion of this security is collateral to cover swaps. |
| T | | Aggregate cost for federal income tax purposes is substantially the same as book cost. At June 30, 2009, the aggregate gross unrealized appreciation and depreciation of investments for federal income tax purposes were substantially as follows: |
| | | | |
Gross unrealized appreciation | | $ | 64,237,489 | |
Gross unrealized depreciation | | | (789,261,908 | ) |
| | | | |
Net unrealized depreciation | | $ | (725,024,419 | ) |
| | | | |
| U | | Options written and futures are described in more detail in the notes to financial statements. |
See notes to financial statements.
29
Semi-Annual Report to Shareholders
Statement of Assets and Liabilities
Western Asset Core Bond Portfolio
June 30, 2009 (Unaudited)
| | | | | | | |
Assets: | | | | | | | |
Investment securities at market value (Cost—$4,218,411,279) | | | | | $ | 3,492,292,043 | |
Short-term securities at value (Cost—$279,368,695) | | | | | | 280,463,512 | |
Cash | | | | | | 213,492 | |
Receivable for securities sold | | | | | | 74,145,845 | |
Premiums paid on open swaps | | | | | | 63,810,911 | |
Unrealized appreciation of swaps | | | | | | 51,729,922 | |
Interest and dividends receivable | | | | | | 31,940,245 | |
Receivable for fund shares sold | | | | | | 3,790,370 | |
Amount receivable for open swaps | | | | | | 1,334,738 | |
Other assets | | | | | | 1,487 | |
| | | | | | | |
Total assets | | | | | | 3,999,722,565 | |
| | | | | | | |
| | |
Liabilities: | | | | | | | |
Payable for securities purchased | | $ | 348,400,953 | | | | |
Unrealized depreciation of swaps | | | 212,103,786 | | | | |
Premiums received on open swaps | | | 53,430,705 | | | | |
Options written (Proceeds—$19,591,260) | | | 26,306,289 | | | | |
Payable for fund shares repurchased | | | 14,979,985 | | | | |
Amount payable for open swaps | | | 4,370,293 | | | | |
Accrued management fee | | | 1,101,165 | | | | |
Futures variation margin payable | | | 857,106 | | | | |
Income distribution payable | | | 499,113 | | | | |
Accrued distribution fees | | | 223,800 | | | | |
Accrued expenses | | | 1,839,024 | | | | |
| | | | | | | |
Total liabilities | | | | | | 664,112,219 | |
| | | | | | | |
| | |
Net Assets | | | | | $ | 3,335,610,346 | |
| | | | | | | |
| | |
Net assets consist of: | | | | | | | |
Accumulated paid-in-capital | | | | | $ | 4,541,573,509 | |
Undistributed net investment income | | | | | | 25,926,497 | |
Accumulated net realized loss on investments, options, futures and swaps | | | | | | (339,810,611 | ) |
Net unrealized depreciation of investments, options, futures and swaps | | | | | | (892,079,049 | ) |
| | | | | | | |
| | |
Net Assets | | | | | $ | 3,335,610,346 | |
| | | | | | | |
| | |
Net Asset Value Per Share: | | | | | | | |
Institutional Class (209,956,708 shares outstanding) | | | | | | $9.60 | |
Institutional Select Class (23,078,631 shares outstanding) | | | | | | $9.61 | |
Financial Intermediary Class (114,392,109 shares outstanding) | | | | | | $9.60 | |
| | | | | | | | |
See notes to financial statements.
30
Semi-Annual Report to Shareholders
Statement of Operations
Western Asset Core Bond Portfolio
| | | | | | | | | | | | | | | | |
| | | FOR THE
SIX MONTHS ENDED
JUNE 30, 2009 (Unaudited) | | | FOR THE
PERIOD ENDED
DECEMBER 31, 2008A | |
| Investment Income: | | | | | | | | | |
Interest | | $ | 102,321,961 | | | | | | | $ | 260,034,011 | | | | | |
Dividends | | | 1,395,329 | | | | | | | | 1,422,129 | | | | | |
Income from securities loaned | | | — | | | | | | | | 1,790,431 | | | | | |
| | | | | | | | | | | | | | | | |
Total income | | | | | | $ | 103,717,290 | | | | | | | $ | 263,246,571 | |
Expenses: | | | | | | | | | | | | | | | | |
Management fees | | | 7,111,326 | | | | | | | | 17,693,084 | | | | | |
Distribution fees: | | | | | | | | | | | | | | | | |
Financial Intermediary Class | | | 1,323,165 | | | | | | | | 2,730,037 | | | | | |
Audit and legal fees | | | 99,755 | | | | | | | | 211,986 | | | | | |
Custodian fees | | | 151,471 | | | | | | | | 413,434 | | | | | |
Directors’ fees and expenses | | | 90,022 | | | | | | | | 160,878 | | | | | |
Registration fees | | | 10,594 | | | | | | | | 61,870 | | | | | |
Reports to shareholders: | | | | | | | | | | | | | | | | |
Institutional Class | | | 283,589 | | | | | | | | 858,187 | | | | | |
Institutional Select Class | | | 488 | | | | | | | | 45 | | | | | |
Financial Intermediary Class | | | 129,265 | | | | | | | | 367,816 | | | | | |
Transfer agent and shareholder servicing expense: | | | | | | | | | | | | | | | | |
Institutional Class | | | 308,724 | | | | | | | | 723,668 | | | | | |
Institutional Select Class | | | 3,807 | | | | | | | | 67,844 | | | | | |
Financial Intermediary Class | | | 553,529 | | | | | | | | 339,219 | | | | | |
Other expenses | | | 67,365 | | | | | | | | 87,120 | | | | | |
| | | | | | | | | | | | | | | | |
| | | 10,133,100 | | | | | | | | 23,715,188 | | | | | |
Less: Fees waived | | | (338,510 | ) | | | | | | | (479,256 | ) | | | | |
Compensating balance credits | | | — | | | | | | | | (166 | ) | | | | |
| | | | | | | | | | | | | | | | |
Net expenses | | | | | | | 9,794,590 | | | | | | | | 23,235,766 | |
| | | | | | | | | | | | | | | | |
Net Investment Income | | | | | | | 93,922,700 | | | | | | | | 240,010,805 | |
Net Realized and Unrealized Gain/(Loss) on Investments: | | | | | | | | | | | | | | | | |
Net realized gain/(loss) on: | | | | | | | | | | | | | | | | |
Investments | | | (38,804,997 | ) | | | | | | | (32,357,233 | ) | | | | |
Options written | | | 28,719,410 | | | | | | | | 50,165,935 | | | | | |
Futures | | | (15,665,182 | ) | | | | | | | 6,474,871 | | | | | |
Swaps | | | (139,539,711 | ) | | | | | | | (49,764,534 | ) | | | | |
| | | | | | | | | | | | | | | | |
Change in unrealized appreciation/(depreciation) of: | | | | | | | (165,290,480 | ) | | | | | | | (25,480,961 | ) |
Investments | | | 201,132,988 | | | | | | | | (691,551,078 | ) | | | | |
Options written | | | 2,531,059 | | | | | | | | (9,829,996 | ) | | | | |
Futures | | | (56,941,178 | ) | | | | | | | 61,285,214 | | | | | |
Swaps | | | 171,257,197 | | | | | | | | (163,323,956 | ) | | | | |
| | | | | | | | | | | | | | | | |
| | | | | | | 317,980,066 | | | | | | | | (803,419,816 | ) |
| | | | | | | | | | | | | | | | |
Net Realized and Unrealized Gain/(Loss) on Investments | | | | | | | 152,689,586 | | | | | | | | (828,900,777 | ) |
| | | | | | | | | | | | | | | | | |
Change in Net Assets Resulting From Operations | | | | | | $ | 246,612,286 | | | | | | | $ | (588,889,972 | ) |
| | | | | | | | | | | | | | | | | |
| A | | For the period April 1, 2008 to December 31, 2008. |
See notes to financial statements.
31
Semi-Annual Report to Shareholders
Statement of Changes in Net Assets
Western Asset Core Bond Portfolio
| | | | | | | | | | | | |
| | | FOR THE
SIX MONTHS ENDED
JUNE 30, 2009 (Unaudited) | | | FOR THE
PERIOD ENDED
DECEMBER 31, 2008A | | | FOR THE
YEAR ENDED
MARCH 31, 2008 | |
| Change in Net Assets: | | | | | | | | | |
Net investment income | | $ | 93,922,700 | | | $ | 240,010,805 | | | $ | 361,354,213 | |
| | | |
Net realized loss | | | (165,290,480 | ) | | | (25,480,961 | ) | | | (77,680,995 | ) |
| | | |
Change in unrealized appreciation/(depreciation) | | | 317,980,066 | | | | (803,419,816 | ) | | | (418,890,141 | ) |
| | | | | | | | | | | | |
Change in net assets resulting from operations | | | 246,612,286 | | | | (588,889,972 | ) | | | (135,216,923 | ) |
| | | |
Distributions to shareholders from: | | | | | | | | | | | | |
Net investment income: | | | | | | | | | | | | |
Institutional Class | | | (57,293,207 | ) | | | (212,870,311 | ) | | | (279,146,241 | ) |
Institutional Select Class | | | (6,212,025 | ) | | | (4,754,933 | ) | | | N/A | |
Financial Intermediary Class | | | (26,593,893 | ) | | | (73,545,140 | ) | | | (77,801,855 | ) |
| | | |
Net realized gain on investments: | | | | | | | | | | | | |
Institutional Class | | | — | | | | — | | | | (22,347,640 | ) |
Financial Intermediary Class | | | — | | | | — | | | | (6,284,549 | ) |
| | | |
Change in net assets from fund share transactions: | | | | | | | | | | | | |
Institutional Class | | | (632,241,624 | ) | | | (1,908,390,929 | ) | | | 567,219,859 | |
Institutional Select Class | | | (32,412,934 | ) | | | 230,873,479 | | | | N/A | |
Financial Intermediary Class | | | (124,699,890 | ) | | | (241,647,090 | ) | | | 343,480,947 | |
| | | | | | | | | | | | |
Change in net assets | | | (632,841,287 | ) | | | (2,799,224,896 | ) | | | 389,903,598 | |
| | | |
Net Assets: | | | | | | | | | | | | |
Beginning of period | | | 3,968,451,633 | | | | 6,767,676,529 | | | | 6,377,772,931 | |
| | | | | | | | | | | | |
| | | |
End of period | | $ | 3,335,610,346 | | | $ | 3,968,451,633 | | | $ | 6,767,676,529 | |
| | | | | | | | | | | | |
| | | |
Undistributed net investment income | | $ | 25,926,497 | | | $ | 22,102,922 | | | $ | 16,291,168 | |
| | | | | | | | | | | | |
| | | | | | | | | | | | | |
| A | | For the period April 1, 2008 to December 31, 2008. |
N/A—Not applicable
See notes to financial statements.
32
Semi-Annual Report to Shareholders
Financial Highlights
Western Asset Core Bond Portfolio
For a share of each class of capital stock outstanding:
Institutional Class:
| | | | | | | | | | | | | | | | | | | | | | | | | | | | |
| | | SIX MONTHS
ENDED
JUNE 30,
2009
(Unaudited) | | | PERIOD
ENDED
DECEMBER 31,
2008A | | | YEARS ENDED MARCH 31, | |
| | | | | 2008 | | | 2007 | | | 2006 | | | 2005 | | | 2004 | |
Net asset value, beginning of period | | | $9.08 | | | | $10.54 | | | | $11.37 | | | | $11.05 | | | | $11.29 | | | | $11.81 | | | | $11.57 | |
| | | | | | | | | | | | | | | | | | | | | | | | | | | | |
Investment operations: | | | | | | | | | | | | | | | | | | | | | | | | | | | | |
Net investment income | | | .24 | B | | | .42 | B | | | .58 | B | | | .55 | B | | | .49 | C | | | .39 | C | | | .41 | C |
Net realized and unrealized gain/(loss) | | | .52 | | | | (1.34 | ) | | | (.78 | ) | | | .34 | | | | (.22 | ) | | | (.21 | ) | | | .45 | |
| | | | | | | | | | | | | | | | | | | | | | | | | | | | |
Total from investment operations | | | .76 | | | | (.92 | ) | | | (.20 | ) | | | .89 | | | | .27 | | | | .18 | | | | .86 | |
| | | | | | | | | | | | | | | | | | | | | | | | | | | | |
Distributions from: | | | | | | | | | | | | | | | | | | | | | | | | | | | | |
Net investment income | | | (.24 | ) | | | (.54 | ) | | | (.58 | ) | | | (.57 | ) | | | (.51 | ) | | | (.39 | ) | | | (.44 | ) |
Net realized gain on investments | | | — | | | | — | | | | (.05 | ) | | | — | | | | — | D | | | (.31 | ) | | | (.18 | ) |
| | | | | | | | | | | | | | | | | | | | | | | | | | | | |
Total distributions | | | (.24 | ) | | | (.54 | ) | | | (.63 | ) | | | (.57 | ) | | | (.51 | ) | | | (.70 | ) | | | (.62 | ) |
| | | | | | | | | | | | | | | | | | | | | | | | | | | | |
Net asset value, end of period | | | $9.60 | | | | $9.08 | | | | $10.54 | | | | $11.37 | | | | $11.05 | | | | $11.29 | | | | $11.81 | |
| | | | | | | | | | | | | | | | | | | | | | | | | | | | |
Total return† | | | 8.53 | % | | | (8.88 | )% | | | (1.88 | )% | | | 8.23 | % | | | 2.46 | % | | | 1.68 | % | | | 7.64 | % |
| | | | | | | |
Ratios to Average Net Assets:E | | | | | | | | | | | | | | | | | | | | | | | | | | | | |
Total expenses | | | .49%F | | | | .47%F | | | | .44% | | | | .47% | | | | .45% | | | | .46% | | | | .49% | |
Expenses net of waivers, if any | | | .49%F | | | | .47%F | | | | .44% | | | | .47% | | | | .45% | | | | .46% | | | | .49% | |
Expenses net of all reductions | | | .49%F | | | | .47%F | | | | .44% | | | | .47% | | | | .45% | | | | .46% | | | | .49% | |
Net investment income | | | 5.5%F | | | | 5.6%F | | | | 5.3% | | | | 4.9% | | | | 4.3% | | | | 3.4% | | | | 3.5% | |
| | | | | | | |
Supplemental Data: | | | | | | | | | | | | | | | | | | | | | | | | | | | | |
Portfolio turnover rate | | | 119.2% | | | | 140.8% | | | | 455.0% | | | | 431.7% | | | | 540.4% | | | | 407.2% | | | | 464.6% | |
Net assets, end of period
(in thousands) | | $ | 2,015,568 | | | $ | 2,558,597 | | | $ | 5,140,277 | | | $ | 4,975,052 | | | $ | 4,243,248 | | | $ | 3,277,782 | | | $ | 2,187,219 | |
| | | | | | | | | | | | | | | | | | | | | | | | | | | | | |
| A | | For the period April 1, 2008 to December 31, 2008. |
| B | | Computed using average daily shares outstanding. |
| C | | Computed using SEC method. |
| D | | Amount less than $.01 per share. |
| E | | Total expenses reflects operating expenses prior to any voluntary expense waivers and/or compensating balance credits. Expenses net of waivers reflects total expenses before compensating balance credits but net of any voluntary expense waivers. Expenses net of all reductions reflects expenses less any compensating balance credits and/or voluntary expense waivers. As of the most current prospectus, the Institutional Class has no limit on expenses. |
| † | | Performance figures may reflect compensating balance credits, fee waivers and/or expense reimbursements. In the absence of compensation balance credits, fee waivers and/or expense reimbursements, the total return would have been lower. Past performance is no guarantee of future results. Total returns for periods of less than one year are not annualized. |
See notes to financial statements.
33
Semi-Annual Report to Shareholders
Financial Highlights—Continued
Western Asset Core Bond Portfolio
For a share of each class of capital stock outstanding:
Institutional Select Class:
| | | | | | |
| | | SIX MONTHS ENDED
JUNE 30, 2009 (Unaudited) | | | PERIOD ENDED
DECEMBER 31,
2008A | |
Net asset value, beginning of period | | $9.09 | | | $10.11 | |
| | | | | | |
Investment operations: | | | | | | |
Net investment income | | .25 | B | | .15 | B |
Net realized and unrealized gain/(loss) | | .51 | | | (.87 | ) |
| | | | | | |
Total from investment operations | | .76 | | | (.72 | ) |
| | | | | | |
Distributions from: | | | | | | |
Net investment income | | (.24 | ) | | (.30 | ) |
| | | | | | |
Total distributions | | (.24 | ) | | (.30 | ) |
| | | | | | |
Net asset value, end of period | | $9.61 | | | $9.09 | |
| | | | | | |
Total return† | | 8.52 | % | | (7.08 | )% |
| | |
Ratios to Average Net Assets:C | | | | | | |
Total expenses | | .44 | %D | | .45 | %D |
Expenses net of waivers, if any | | .44 | %D | | .45 | %D |
Expenses net of all reductions | | .44 | %D | | .45 | %D |
Net investment income | | 5.6 | %D | | 5.2 | %D |
| | |
Supplemental Data: | | | | | | |
Portfolio turnover rate | | 119.2 | % | | 140.8 | % |
Net assets, end of period (in thousands) | | $221,749 | | | $240,681 | |
| | | | | | | |
| A | | For the period August 29, 2008 (commencement of operations) to December 31, 2008. |
| B | | Computed using average daily shares outstanding. |
| C | | Total expenses reflects operating expenses prior to any voluntary expense waivers and/or compensating balance credits. Expenses net of waivers reflects total expenses before compensating balance credits but net of any voluntary expense waivers. Expenses net of all reductions reflects expenses less any compensating balance credits and/or voluntary expense waivers. |
| † | | Performance figures may reflect compensating balance credits, fee waivers and/or expense reimbursements. In the absence of compensation balance credits, fee waivers and/or expense reimbursements, the total return would have been lower. Past performance is no guarantee of future results. Total returns for periods of less than one year are not annualized. |
See notes to financial statements.
34
Semi-Annual Report to Shareholders
Financial Intermediary Class:
| | | | | | | | | | | | | | | | | | | | | | | | | | | | |
| | | SIX MONTHS
ENDED
JUNE 30,
2009
(Unaudited) | | | PERIOD ENDED
DECEMBER 31,
2008A | | | YEARS ENDED MARCH 31, | |
| | | | | 2008 | | | 2007 | | | 2006 | | | 2005 | | | 2004 | |
Net asset value, beginning of period | | | $9.08 | | | | $10.54 | | | | $11.37 | | | | $11.05 | | | | $11.29 | | | | $11.81 | | | | $11.57 | |
| | | | | | | | | | | | | | | | | | | | | | | | | | | | |
Investment operations: | | | | | | | | | | | | | | | | | | | | | | | | | | | | |
Net investment income | | | .23 | B | | | .40 | B | | | .56 | B | | | .51 | B | | | .47 | C | | | .38 | C | | | .40 | C |
Net realized and unrealized gain/(loss) | | | .51 | | | | (1.34 | ) | | | (.79 | ) | | | .35 | | | | (.22 | ) | | | (.23 | ) | | | .43 | |
| | | | | | | | | | | | | | | | | | | | | | | | | | | | |
Total from investment operations | | | .74 | | | | (.94 | ) | | | (.23 | ) | | | .86 | | | | .25 | | | | .15 | | | | .83 | |
| | | | | | | | | | | | | | | | | | | | | | | | | | | | |
Distributions from: | | | | | | | | | | | | | | | | | | | | | | | | | | | | |
Net investment income | | | (.22 | ) | | | (.52 | ) | | | (.55 | ) | | | (.54 | ) | | | (.49 | ) | | | (.36 | ) | | | (.41 | ) |
Net realized gain on investments | | | — | | | | — | | | | (.05 | ) | | | — | | | | — | D | | | (.31 | ) | | | (.18 | ) |
| | | | | | | | | | | | | | | | | | | | | | | | | | | | |
Total distributions | | | (.22 | ) | | | (.52 | ) | | | (.60 | ) | | | (.54 | ) | | | (.49 | ) | | | (.67 | ) | | | (.59 | ) |
| | | | | | | | | | | | | | | | | | | | | | | | | | | | |
Net asset value, end of period | | | $9.60 | | | | $9.08 | | | | $10.54 | | | | $11.37 | | | | $11.05 | | | | $11.29 | | | | $11.81 | |
| | | | | | | | | | | | | | | | | | | | | | | | | | | | |
Total return† | | | 8.39 | % | | | (9.06 | )% | | | (2.12 | )% | | | 7.95 | % | | | 2.19 | % | | | 1.42 | % | | | 7.36 | % |
| | | | | | | |
Ratios to Average Net Assets:E | | | | | | | | | | | | | | | | | | | | | | | | | | | | |
Total expenses | | | .81 | %F | | | .77 | %F | | | .69 | % | | | .72 | % | | | .70 | % | | | .72 | % | | | .76 | % |
Expenses net of waivers, if any | | | .75 | %F | | | .72 | %F | | | .69 | % | | | .72 | % | | | .70 | % | | | .72 | % | | | .75 | % |
Expenses net of all reductions | | | .75 | %F | | | .72 | %F | | | .69 | % | | | .72 | % | | | .70 | % | | | .72 | % | | | .75 | % |
Net investment income | | | 5.3 | %F | | | 5.3 | %F | | | 5.1 | % | | | 4.6 | % | | | 4.1 | % | | | 4.2 | % | | | 3.3 | % |
| | | | | | | |
Supplemental Data: | | | | | | | | | | | | | | | | | | | | | | | | | | | | |
Portfolio turnover rate | | | 119.2 | % | | | 140.8 | % | | | 455.0 | % | | | 431.7 | % | | | 540.4 | % | | | 407.2 | % | | | 464.6 | % |
Net assets, end of period (in thousands) | | $ | 1,098,293 | | | $ | 1,169,174 | | | $ | 1,627,400 | | | $ | 1,402,721 | | | $ | 360,819 | | | $ | 265,518 | | | $ | 121,607 | |
| | | | | | | | | | | | | | | | | | | | | | | | | | | | | |
| A | | For the period April 1, 2008 to December 31, 2008. |
| B | | Computed using average daily shares outstanding. |
| C | | Computed using SEC method. |
| D | | Amount less than $.01 per share. |
| E | | Total expenses reflects operating expenses prior to any voluntary expense waivers and/or compensating balance credits. Expenses net of waivers reflects total expenses before compensating balance credits but net of any voluntary expense waivers. Expenses net of all reductions reflects expenses less any compensating balance credits and/or voluntary expense waivers. |
| † | | Performance figures may reflect compensating balance credits, fee waivers and/or expense reimbursements. In the absence of compensation balance credits, fee waivers and/or expense reimbursements, the total return would have been lower. Past performance is no guarantee of future results. Total returns for periods of less than one year are not annualized. |
See notes to financial statements.
35
Semi-Annual Report to Shareholders
Expense Example (Unaudited)
Western Asset Core Plus Bond Portfolio
As a shareholder of the Fund, you incur ongoing costs, including management fees, distribution (12b-1) fees on Financial Intermediary Class shares, and other Fund expenses. These examples are intended to help you understand your ongoing costs (in dollars) of investing in the Fund and to compare these costs with the ongoing costs of investing in other mutual funds.
Actual Expenses
The first line for each class in the table below provides information about actual account values and actual expenses for each class. You may use the information in this line, together with the amount you invested, to estimate the expenses that you paid over the period. Simply divide your account value by $1,000 (for example, an $8,600 account value divided by $1,000 = 8.6), then multiply the result by the number in the first line under the heading entitled “Expenses Paid During the Period” to estimate the expenses you paid on your account if your shares were held for the period. The example are based on an investment of $1,000 invested on January 1, 2009 and held through June 30, 2009. The ending values assume dividends were reinvested at the time they were paid.
Hypothetical Example for Comparison Purposes
The second line for each class in the table below provides information about hypothetical account values and hypothetical expenses based on the relevant class’s actual expense ratio and an assumed rate of return of 5% per year before expenses, which is not the class’s actual return. The hypothetical account values and expenses may not be used to estimate the actual ending account balance or expenses you paid for the period. You may use this information to compare the ongoing costs of investing in the Fund and other funds. To do so, compare this 5% hypothetical example with the 5% hypothetical examples that appear in the shareholder reports of other funds. Because the example is intended to be comparable to the examples provided by other funds, it is based on a hypothetical investment of $1,000 invested on January 1, 2009 and held through June 30, 2009 for each class. The ending values assume dividends were reinvested at the time they were paid.
| | | | | | | | | |
| | | Beginning
Account Value
1/1/09 | | Ending
Account Value
6/30/09 | | Expenses PaidA
During the Period
1/1/09 to 6/30/09 |
Institutional Class: | | | | | | | | | |
Actual | | $ | 1,000.00 | | $ | 1,102.00 | | $ | 2.40 |
Hypothetical (5% return before expenses) | | | 1,000.00 | | | 1,022.51 | | | 2.31 |
Institutional Select Class: | | | | | | | | | |
Actual | | $ | 1,000.00 | | $ | 1,102.20 | | $ | 2.24 |
Hypothetical (5% return before expenses) | | | 1,000.00 | | | 1,022.66 | | | 2.16 |
Financial Intermediary Class: | | | | | | | | | |
Actual | | $ | 1,000.00 | | $ | 1,100.80 | | $ | 3.65 |
Hypothetical (5% return before expenses) | | | 1,000.00 | | | 1,021.32 | | | 3.51 |
| A | | These calculations are based on expenses incurred from January 1, 2009 to June 30, 2009. The dollar amounts shown as “Expenses Paid” are equal to the annualized expense ratios of 0.46%, 0.43% and 0.70% for the Institutional Class, Institutional Select Class and Financial Intermediary Class, respectively, multiplied by the average values over the period, multiplied by the number of days in the most recent fiscal period then divided by 365. |
36
Semi-Annual Report to Shareholders
Performance Information (Unaudited)
Western Asset Core Plus Bond Portfolio
The graphs compare the Fund’s total returns to that of an appropriate broad-based securities market index. The graphs illustrate the cumulative total return of an initial $1,000,000 investment in the Institutional Class, Institutional Select Class and Financial Intermediary Class of the Fund, for the periods indicated. The lines for the Fund represent the total return after deducting all Fund investment management and other administrative expenses and the transaction costs of buying and selling securities. The line representing the securities market index does not include any transaction costs associated with buying and selling securities in the index or other investment management or administrative expenses.
Total return measures investment performance in terms of appreciation or depreciation in the Fund’s net asset value per share, plus dividends and any capital gain distributions. It assumes that dividends and distributions were reinvested at the time they were paid. Returns (and the graphs and tables found below) do not reflect the deduction of taxes that a shareholder would pay on Fund distributions or the redemption of Fund shares. Average annual returns tend to smooth out variations in a fund’s return, so that they differ from actual year-to-year results.
Bonds are subject to a variety of risks, including interest rate, credit and inflation risk. Non-U.S. investment are subject to currency fluctuations, social, economical and political risk.
Growth of a $1,000,000 Investment—Institutional Class
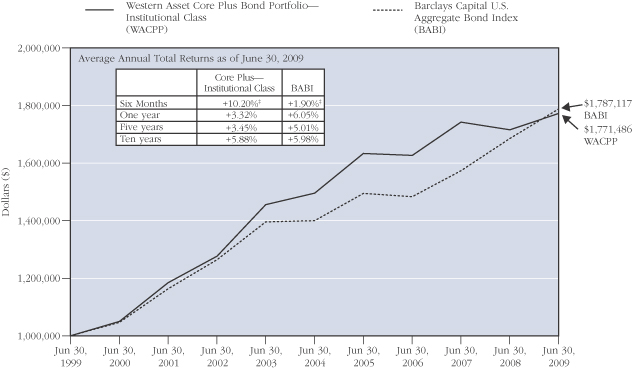
The performance data quoted represent past performance and do not guarantee future results. Current performance may be lower or higher than the performance data quoted. To obtain the most recent month-end performance information, please visit www.westernassetfunds.com. The investment return and principal value of the Fund will fluctuate so that an investor’s shares, when redeemed, may be worth more or less than the original cost. Calculations assume reinvestment of all distributions, including returns of capital, if any, at net asset value and the deduction of all fund expenses. Performance would have been lower if fees had not been waived in various periods.
37
Semi-Annual Report to Shareholders
Performance Information (Unaudited)—Continued
Growth of a $1,000,000 Investment—Institutional Select Class
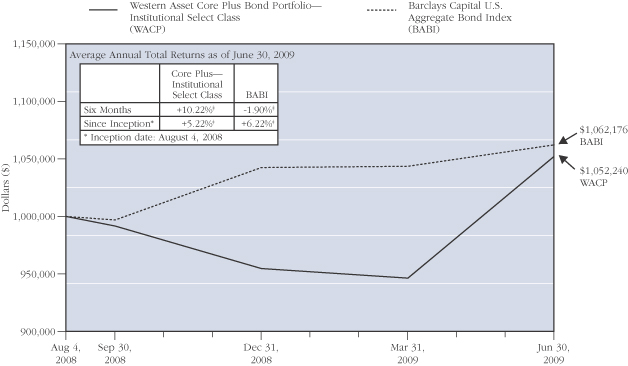
The performance data quoted represent past performance and do not guarantee future results. Current performance may be lower or higher than the performance data quoted. To obtain the most recent month-end performance information, please visit www.westernassetfunds.com. The investment return and principal value of the Fund will fluctuate so that an investor’s shares, when redeemed, may be worth more or less than the original cost. Calculations assume reinvestment of all distributions, including returns of capital, if any, at net asset value and the deduction of all fund expenses. Performance would have been lower if fees had not been waived in various periods.
38
Semi-Annual Report to Shareholders
Growth of a $1,000,000 Investment—Financial Intermediary Class
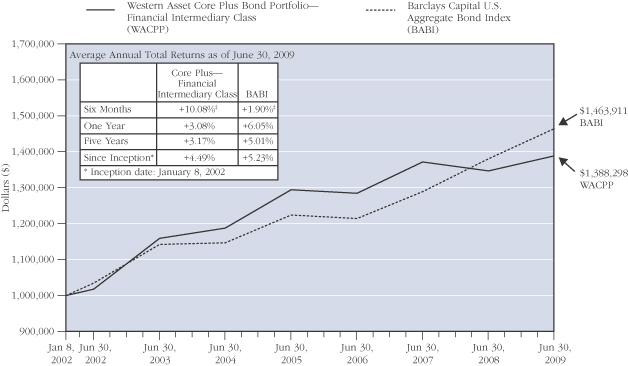
The performance data quoted represent past performance and do not guarantee future results. Current performance may be lower or higher than the performance data quoted. To obtain the most recent month-end performance information, please visit www.westernassetfunds.com. The investment return and principal value of the Fund will fluctuate so that an investor’s shares, when redeemed, may be worth more or less than the original cost. Calculations assume reinvestment of all distributions, including returns of capital, if any, at net asset value and the deduction of all fund expenses. Performance would have been lower if fees had not been waived in various periods.
39
Semi-Annual Report to Shareholders
Spread Duration
Western Asset Core Plus Bond Portfolio
June 30, 2009 (Unaudited)
Economic Exposure
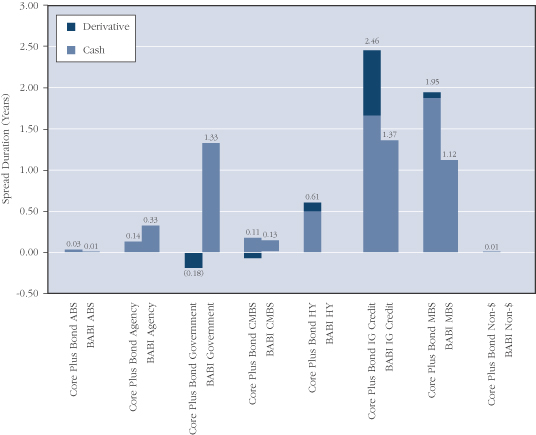
Spread duration is defined as the change in value for a 100 basis point change in the spread relative to Treasuries. The spread over Treasuries is the annual risk-premium demanded by investors to hold non-Treasury securities. This chart highlights the market sector exposure of the Fund’s portfolio and the exposure relative to the selected benchmark as of the end of the reporting period.
ABS — Asset Backed Securities
BABI — Barclays Capital U.S. Aggregate Index
CMBS — Commercial Mortgage Backed Securities
HY — High Yield
IG Credit — Investment Grade Credit
MBS — Mortgage Backed Securities
40
Semi-Annual Report to Shareholders
Effective Duration
Western Asset Core Plus Bond Portfolio
June 30, 2009 (Unaudited)
Interest Rate Exposure
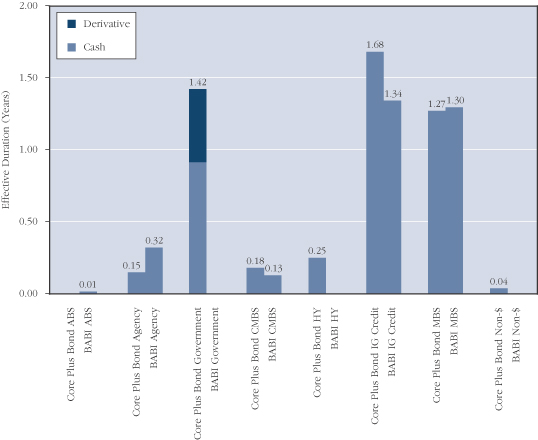
Effective duration is defined as the change in value for a 100 basis point change in Treasury yields. This chart highlights the interest rate exposure of the Fund’s portfolio relative to the selected benchmark as of the end of the reporting period.
ABS — Asset Backed Securities
BABI — Barclays Capital U.S. Aggregate Index
CMBS — Commercial Mortgage Backed Securities
HY — High Yield
IG Credit — Investment Grade Credit
MBS — Mortgage Backed Securities
41
Semi-Annual Report to Shareholders
Performance Information—Continued
Portfolio Composition (Unaudited) (as of June 30, 2009)A
Standard & Poor’s Debt RatingsB
(as a percentage of the portfolio)
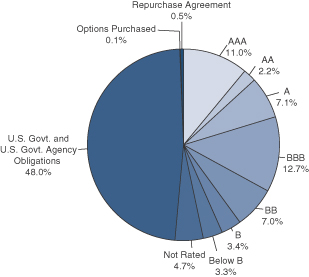
Maturity Schedule
(as a percentage of the portfolio)
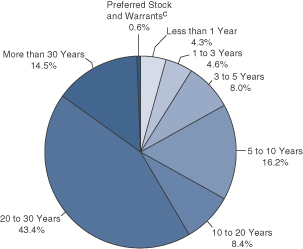
| A | | The pie charts above represent the composition of the Fund’s Portfolio as of June 30, 2009 and do not include derivatives such as Futures Contracts, Options Written, and Swaps. The Fund is actively managed. As a result, the composition of the portfolio holdings and sectors are subject to change at any time. |
| B | | Source: Standard & Poor’s. These ratings are the opinions of S&P and not absolute measures of quality or guarantees of performance. |
| C | | Preferred stocks and warrants do not have a defined maturity date. |
42
Semi-Annual Report to Shareholders
Portfolio of Investments
Western Asset Core Plus Bond Portfolio
June 30, 2009 (Unaudited)
| | | | | | | | | | | | | | |
| | | % OF
NET ASSETS | | RATE | | MATURITY
DATE | | PAR/
SHARES† | | | VALUE | |
| | | | | | | | | | | | | | |
Long-Term Securities | | 105.6% | | | | | | | | | | | | |
| | | | | |
Corporate Bonds and Notes | | 30.3% | | | | | | | | | | | | |
| | | | | |
Aerospace and Defense | | 0.1% | | | | | | | | | | | | |
Boeing Co. | | | | 6.000% | | 3/15/19 | | $ | 8,200,000 | | | $ | 8,941,493 | |
L-3 Communications Corp. | | | | 7.625% | | 6/15/12 | | | 852,000 | | | | 854,130 | |
| | | | | | | | | | | | | | |
| | | | | | | | | | | | | 9,795,623 | |
| | | | | | | | | | | | | | |
Air Freight and Logistics | | N.M. | | | | | | | | | | | | |
United Parcel Service Inc. | | | | 4.500% | | 1/15/13 | | | 270,000 | | | | 283,155 | |
| | | | | | | | | | | | | | |
| | | | | |
Airlines | | 1.0% | | | | | | | | | | | | |
Continental Airlines Inc. | | | | 7.056% | | 3/15/11 | | | 10,000 | | | | 9,900 | |
Continental Airlines Inc. | | | | 6.503% | | 12/15/12 | | | 1,015,000 | | | | 943,950 | |
Continental Airlines Inc. | | | | 6.900% | | 7/2/19 | | | 54,238 | | | | 47,187 | |
Continental Airlines Inc. | | | | 6.545% | | 8/2/20 | | | 11,198,784 | | | | 10,358,876 | |
Continental Airlines Inc. | | | | 5.983% | | 4/19/22 | | | 9,410,000 | | | | 7,763,250 | |
Continental Airlines Inc. | | | | 6.703% | | 12/15/22 | | | 222,554 | | | | 186,945 | |
DAE Aviation Holdings Inc. | | | | 11.250% | | 8/1/15 | | | 1,950,000 | | | | 1,131,000 | A |
Delta Air Lines Inc. | | | | 6.619% | | 3/18/11 | | | 2,738,959 | | | | 2,602,011 | |
Delta Air Lines Inc. | | | | 7.570% | | 5/18/12 | | | 10,975,000 | | | | 10,481,125 | |
Delta Air Lines Inc. | | | | 7.111% | | 3/18/13 | | | 1,300,000 | | | | 1,209,000 | |
Delta Air Lines Inc. | | | | 6.821% | | 8/10/22 | | | 16,206,310 | | | | 13,451,237 | |
Northwest Airlines Corp. | | | | 7.575% | | 3/1/19 | | | 10,330,282 | | | | 7,747,712 | |
Northwest Airlines Inc. | | | | 1.487% | | 8/6/13 | | | 1,104,760 | | | | 762,408 | B,C |
Northwest Airlines Inc. | | | | 2.001% | | 5/20/14 | | | 4,074,317 | | | | 3,055,738 | B |
Southwest Airlines Co. | | | | 5.125% | | 3/1/17 | | | 5,320,000 | | | | 4,572,167 | |
United Air Lines Inc. | | | | 7.032% | | 4/1/12 | | | 1,552,002 | | | | 1,520,962 | |
United Air Lines Inc. | | | | 7.186% | | 10/1/12 | | | 7,507,386 | | | | 7,394,775 | |
United Air Lines Inc. | | | | 6.602% | | 3/1/15 | | | 277,374 | | | | 274,600 | |
| | | | | | | | | | | | | | |
| | | | | | | | | | | | | 73,512,843 | |
| | | | | | | | | | | | | | |
Automobiles | | 0.2% | | | | | | | | | | | | |
DaimlerChrysler NA Holding Corp. | | | | 5.875% | | 3/15/11 | | | 500,000 | | | | 508,312 | |
DaimlerChrysler NA Holding Corp. | | | | 7.300% | | 1/15/12 | | | 3,315,000 | | | | 3,432,831 | |
DaimlerChrysler NA Holding Corp. | | | | 6.500% | | 11/15/13 | | | 1,390,000 | | | | 1,412,985 | |
General Motors Corp. | | | | 9.450% | | 11/1/11 | | | 2,514,000 | | | | 414,810 | D |
General Motors Corp. | | | | 9.400% | | 7/15/21 | | | 674,000 | | | | 80,880 | D |
General Motors Corp. | | | | 8.250% | | 7/15/23 | | | 33,240,000 | | | | 4,071,900 | D |
General Motors Corp. | | | | 8.100% | | 6/15/24 | | | 368,000 | | | | 43,240 | D |
General Motors Corp. | | | | 8.375% | | 7/5/33 | | | 9,520,000 | EUR | | | 1,535,622 | D |
General Motors Corp. | | | | 8.375% | | 7/15/33 | | | 16,990,000 | | | | 2,166,225 | D |
43
Semi-Annual Report to Shareholders
Portfolio of Investments—Continued
Western Asset Core Plus Bond Portfolio—Continued
| | | | | | | | | | | | | |
| | | % OF
NET ASSETS | | RATE | | MATURITY
DATE | | PAR/
SHARES† | | VALUE | |
| | | | | | | | | | | | | |
Corporate Bonds and Notes—Continued | | | | | | | | | | | | | |
| | | | | |
Automobiles—Continued | | | | | | | | | | | | | |
General Motors Corp. | | | | 0.000% | | 3/15/36 | | $ | 8,887,000 | | $ | 488,785 | D,E |
| | | | | | | | | | | | | |
| | | | | | | | | | | | 14,155,590 | |
| | | | | | | | | | | | | |
Beverages | | 0.1% | | | | | | | | | | | |
Dr Pepper Snapple Group Inc. | | | | 6.820% | | 5/1/18 | | | 6,000,000 | | | 6,345,096 | F |
PepsiCo Inc. | | | | 7.900% | | 11/1/18 | | | 210,000 | | | 255,487 | |
| | | | | | | | | | | | | |
| | | | | | | | | | | | 6,600,583 | |
| | | | | | | | | | | | | |
Building Products | | 0.2% | | | | | | | | | | | |
Masco Corp. | | | | 7.125% | | 8/15/13 | | | 5,830,000 | | | 5,176,358 | |
Masco Corp. | | | | 6.125% | | 10/3/16 | | | 8,270,000 | | | 6,943,459 | |
| | | | | | | | | | | | | |
| | | | | | | | | | | | 12,119,817 | |
| | | | | | | | | | | | | |
Capital Markets | | 1.0% | | | | | | | | | | | |
Goldman Sachs Capital II | | | | 5.793% | | 12/29/49 | | | 1,810,000 | | | 1,103,105 | E |
Goldman Sachs Group LP | | | | 4.500% | | 6/15/10 | | | 1,760,000 | | | 1,803,491 | |
Lehman Brothers Holdings Capital
Trust VII | | | | 5.857% | | 11/29/49 | | | 5,530,000 | | | 553 | D,E |
Lehman Brothers Holdings Inc. | | | | 5.250% | | 2/6/12 | | | 1,690,000 | | | 249,275 | D |
Lehman Brothers Holdings Inc. | | | | 6.200% | | 9/26/14 | | | 8,690,000 | | | 1,281,775 | D |
Lehman Brothers Holdings Inc. | | | | 6.500% | | 7/19/17 | | | 5,280,000 | | | 528 | D |
Merrill Lynch and Co. Inc. | | | | 6.050% | | 5/16/16 | | | 390,000 | | | 349,205 | |
Morgan Stanley | | | | 5.625% | | 1/9/12 | | | 470,000 | | | 481,001 | |
Morgan Stanley | | | | 1.950% | | 6/20/12 | | | 210,000 | | | 209,572 | |
Morgan Stanley | | | | 4.750% | | 4/1/14 | | | 8,460,000 | | | 7,991,231 | |
Morgan Stanley | | | | 1.557% | | 10/18/16 | | | 7,380,000 | | | 5,969,055 | B |
The Bear Stearns Cos. Inc. | | | | 6.400% | | 10/2/17 | | | 12,620,000 | | | 12,642,401 | |
The Bear Stearns Cos. Inc. | | | | 7.250% | | 2/1/18 | | | 39,620,000 | | | 41,759,044 | |
The Goldman Sachs Group Inc. | | | | 6.600% | | 1/15/12 | | | 2,810,000 | | | 2,991,877 | |
The Goldman Sachs Group Inc. | | | | 5.625% | | 1/15/17 | | | 1,420,000 | | | 1,349,586 | |
| | | | | | | | | | | | | |
| | | | | | | | | | | | 78,181,699 | |
| | | | | | | | | | | | | |
Chemicals | | N.M. | | | | | | | | | | | |
Westlake Chemical Corp. | | | | 6.625% | | 1/15/16 | | | 1,265,000 | | | 1,106,875 | |
| | | | | | | | | | | | | |
| | | | | |
Commercial Banks | | 0.6% | | | | | | | | | | | |
Bank One Corp. | | | | 7.875% | | 8/1/10 | | | 150,000 | | | 157,268 | |
Bank One Corp. | | | | 5.900% | | 11/15/11 | | | 2,000,000 | | | 2,094,570 | |
HBOS Treasury Services PLC | | | | 5.250% | | 2/21/17 | | | 4,570,000 | | | 3,781,652 | A |
SunTrust Capital VIII | | | | 6.100% | | 12/15/36 | | | 3,140,000 | | | 2,039,681 | E |
Wachovia Capital Trust III | | | | 5.800% | | 3/15/42 | | | 9,480,000 | | | 5,688,000 | E |
44
Semi-Annual Report to Shareholders
| | | | | | | | | | | | | |
| | | % OF
NET ASSETS | | RATE | | MATURITY
DATE | | PAR/
SHARES† | | VALUE | |
| | | | | | | | | | | | | |
Corporate Bonds and Notes—Continued | | | | | | | | | | | | | |
| | | | | |
Commercial Banks—Continued | | | | | | | | | | | | | |
Wachovia Corp. | | | | 5.250% | | 8/1/14 | | $ | 720,000 | | $ | 704,572 | |
Wachovia Corp. | | | | 5.750% | | 2/1/18 | | | 23,000,000 | | | 22,588,438 | |
Wells Fargo and Co. | | | | 5.300% | | 8/26/11 | | | 75,000 | | | 79,306 | |
Wells Fargo and Co. | | | | 5.000% | | 11/15/14 | | | 130,000 | | | 129,773 | |
Wells Fargo Capital X | | | | 5.950% | | 12/15/36 | | | 6,995,000 | | | 5,176,300 | E |
| | | | | | | | | | | | | |
| | | | | | | | | | | | 42,439,560 | |
| | | | | | | | | | | | | |
Commercial Services and Supplies | | 0.2% | | | | | | | | | | | |
RSC Equipment Rental Inc. | | | | 9.500% | | 12/1/14 | | | 1,900,000 | | | 1,524,750 | |
Waste Management Inc. | | | | 7.375% | | 8/1/10 | | | 6,055,000 | | | 6,309,679 | |
Waste Management Inc. | | | | 6.375% | | 11/15/12 | | | 2,110,000 | | | 2,240,577 | |
Waste Management Inc. | | | | 5.000% | | 3/15/14 | | | 6,938,000 | | | 6,778,912 | |
Waste Management Inc. | | | | 7.125% | | 12/15/17 | | | 500,000 | | | 498,561 | |
Waste Management Inc. | | | | 7.750% | | 5/15/32 | | | 90,000 | | | 95,393 | |
| | | | | | | | | | | | | |
| | | | | | | | | | | | 17,447,872 | |
| | | | | | | | | | | | | |
Communications Equipment | | 0.3% | | | | | | | | | | | |
EchoStar DBS Corp. | | | | 7.000% | | 10/1/13 | | | 6,340,000 | | | 6,023,000 | |
EchoStar DBS Corp. | | | | 6.625% | | 10/1/14 | | | 1,185,000 | | | 1,093,163 | |
EchoStar DBS Corp. | | | | 7.750% | | 5/31/15 | | | 2,745,000 | | | 2,614,612 | |
Motorola Inc. | | | | 8.000% | | 11/1/11 | | | 10,850,000 | | | 10,922,673 | |
| | | | | | | | | | | | | |
| | | | | | | | | | | | 20,653,448 | |
| | | | | | | | | | | | | |
Computers and Peripherals | | N.M. | | | | | | | | | | | |
International Business Machines Corp. | | | | 4.750% | | 11/29/12 | | | 40,000 | | | 42,890 | |
| | | | | | | | | | | | | |
| | | | | |
Consumer Finance | | 2.3% | | | | | | | | | | | |
American Express Co. | | | | 6.800% | | 9/1/66 | | | 10,485,000 | | | 7,549,200 | E |
American General Finance Corp. | | | | 6.900% | | 12/15/17 | | | 8,600,000 | | | 4,656,745 | |
Caterpillar Financial Services Corp. | | | | 6.200% | | 9/30/13 | | | 290,000 | | | 307,040 | |
Ford Motor Credit Co. | | | | 7.875% | | 6/15/10 | | | 3,560,000 | | | 3,381,519 | |
Ford Motor Credit Co. | | | | 5.879% | | 6/15/11 | | | 5,724,000 | | | 4,965,570 | B |
Ford Motor Credit Co. | | | | 7.250% | | 10/25/11 | | | 2,525,000 | | | 2,183,968 | |
Ford Motor Credit Co. | | | | 7.800% | | 6/1/12 | | | 19,090,000 | | | 16,425,437 | |
Ford Motor Credit Co. | | | | 7.000% | | 10/1/13 | | | 22,000,000 | | | 17,688,704 | |
GMAC LLC | | | | 6.625% | | 5/15/12 | | | 177,000 | | | 147,795 | A |
GMAC LLC | | | | 7.500% | | 12/31/13 | | | 2,946,000 | | | 2,283,150 | A |
GMAC LLC | | | | 8.000% | | 12/31/18 | | | 2,454,000 | | | 1,558,290 | A |
GMAC LLC | | | | 8.000% | | 11/1/31 | | | 101,534,000 | | | 71,073,800 | A |
SLM Corp. | | | | 5.000% | | 10/1/13 | | | 17,665,000 | | | 14,288,459 | |
SLM Corp. | | | | 5.375% | | 5/15/14 | | | 25,005,000 | | | 20,096,769 | |
45
Semi-Annual Report to Shareholders
Portfolio of Investments—Continued
Western Asset Core Plus Bond Portfolio—Continued
| | | | | | | | | | | | | | |
| | | % OF
NET ASSETS | | RATE | | MATURITY
DATE | | PAR/
SHARES† | | | VALUE | |
| | | | | | | | | | | | | | |
Corporate Bonds and Notes—Continued | | | | | | | | | | | | | | |
| | | | | |
Consumer Finance—Continued | | | | | | | | | | | | | | |
SLM Corp. | | | | 5.050% | | 11/14/14 | | $ | 4,690,000 | | | $ | 3,628,653 | |
SLM Corp. | | | | 5.000% | | 4/15/15 | | | 740,000 | | | | 563,691 | |
SLM Corp. | | | | 5.625% | | 8/1/33 | | | 4,160,000 | | | | 2,561,220 | |
| | | | | | | | | | | | | | |
| | | | | | | | | | | | | 173,360,010 | |
| | | | | | | | | | | | | | |
Diversified Consumer Services | | 0.1% | | | | | | | | | | | | |
Service Corp. International | | | | 6.750% | | 4/1/16 | | | 1,530,000 | | | | 1,380,825 | |
Service Corp. International | | | | 7.625% | | 10/1/18 | | | 400,000 | | | | 371,000 | |
Service Corp. International | | | | 7.500% | | 4/1/27 | | | 5,385,000 | | | | 4,227,225 | |
| | | | | | | | | | | | | | |
| | | | | | | | | | | | | 5,979,050 | |
| | | | | | | | | | | | | | |
Diversified Financial Services | | 4.6% | | | | | | | | | | | | |
AAC Group Holding Corp. | | | | 10.250% | | 10/1/12 | | | 770,000 | | | | 558,250 | A |
Air 2 US | | | | 8.027% | | 10/1/19 | | | 11,969,173 | | | | 8,498,113 | A |
BAC Capital Trust XIV | | | | 5.630% | | 12/31/49 | | | 2,240,000 | | | | 1,120,000 | E |
Banca Italease SpA | | | | 1.572% | | 2/2/10 | | | 57,800,000 | EUR | | | 77,568,888 | B |
Bank of America Corp. | | | | 5.420% | | 3/15/17 | | | 2,030,000 | | | | 1,685,797 | |
Bank of America Corp. | | | | 5.750% | | 12/1/17 | | | 480,000 | | | | 427,406 | |
Citigroup Inc. | | | | 4.125% | | 2/22/10 | | | 860,000 | | | | 860,211 | |
Citigroup Inc. | | | | 6.500% | | 8/19/13 | | | 110,000 | | | | 106,852 | |
Citigroup Inc. | | | | 5.000% | | 9/15/14 | | | 270,000 | | | | 226,346 | |
Citigroup Inc. | | | | 8.500% | | 5/22/19 | | | 35,190,000 | | | | 35,796,640 | |
Citigroup Inc. | | | | 6.125% | | 8/25/36 | | | 1,560,000 | | | | 1,161,679 | |
Citigroup Inc. | | | | 5.875% | | 5/29/37 | | | 6,040,000 | | | | 4,719,523 | |
Citigroup Inc. | | | | 6.875% | | 3/5/38 | | | 36,010,000 | | | | 31,802,808 | |
DI Finance LLC | | | | 9.500% | | 2/15/13 | | | 1,004,000 | | | | 968,860 | |
General Electric Capital Corp. | | | | 2.125% | | 12/21/12 | | | 53,010,000 | | | | 52,645,238 | |
General Electric Capital Corp. | | | | 5.450% | | 1/15/13 | | | 1,155,000 | | | | 1,185,390 | |
General Electric Capital Corp. | | | | 5.625% | | 5/1/18 | | | 530,000 | | | | 501,265 | |
General Electric Capital Corp. | | | | 6.875% | | 1/10/39 | | | 48,530,000 | | | | 43,682,484 | |
General Electric Capital Corp. | | | | 6.375% | | 11/15/67 | | | 47,395,000 | | | | 31,622,939 | E |
HSBC Finance Corp. | | | | 8.000% | | 7/15/10 | | | 70,000 | | | | 72,673 | |
HSBC Finance Corp. | | | | 6.375% | | 8/1/10 | | | 1,000,000 | | | | 1,018,771 | |
HSBC Finance Corp. | | | | 7.000% | | 5/15/12 | | | 160,000 | | | | 164,955 | |
HSBC Finance Corp. | | | | 6.375% | | 11/27/12 | | | 520,000 | | | | 528,916 | |
ILFC E-Capital Trust I | | | | 5.900% | | 12/21/65 | | | 24,400,000 | | | | 9,028,000 | A,E |
ILFC E-Capital Trust II | | | | 6.250% | | 12/21/65 | | | 7,220,000 | | | | 2,671,400 | A,E |
JPMorgan Chase and Co. | | | | 2.125% | | 12/26/12 | | | 19,900,000 | | | | 19,799,346 | |
JPMorgan Chase and Co. | | | | 5.750% | | 1/2/13 | | | 4,430,000 | | | | 4,568,557 | |
JPMorgan Chase and Co. | | | | 5.125% | | 9/15/14 | | | 920,000 | | | | 915,546 | |
46
Semi-Annual Report to Shareholders
| | | | | | | | | | | | | |
| | | % OF
NET ASSETS | | RATE | | MATURITY
DATE | | PAR/
SHARES† | | VALUE | |
| | | | | | | | | | | | | |
Corporate Bonds and Notes—Continued | | | | | | | | | | | | | |
| | | | | |
Diversified Financial Services—Continued | | | | | | | | | | | | | |
JPMorgan Chase and Co. | | | | 5.150% | | 10/1/15 | | $ | 490,000 | | $ | 483,003 | |
JPMorgan Chase and Co. | | | | 6.125% | | 6/27/17 | | | 60,000 | | | 59,282 | |
Liberty Media LLC | | | | 5.700% | | 5/15/13 | | | 535,000 | | | 462,775 | |
Liberty Media LLC | | | | 3.750% | | 2/15/30 | | | 170,000 | | | 61,200 | G |
PHH Corp. | | | | 7.125% | | 3/1/13 | | | 8,640,000 | | | 6,903,878 | |
TNK-BP Finance SA | | | | 7.875% | | 3/13/18 | | | 8,050,000 | | | 6,641,250 | A |
Unilever Capital Corp. | | | | 7.125% | | 11/1/10 | | | 1,450,000 | | | 1,548,185 | |
| | | | | | | | | | | | | |
| | | | | | | | | | | | 350,066,426 | |
| | | | | | | | | | | | | |
Diversified Telecommunication Services | | 2.0% | | | | | | | | | | | |
AT&T Inc. | | | | 5.100% | | 9/15/14 | | | 8,640,000 | | | 8,975,128 | |
AT&T Inc. | | | | 5.600% | | 5/15/18 | | | 25,000,000 | | | 25,134,975 | |
AT&T Inc. | | | | 6.300% | | 1/15/38 | | | 130,000 | | | 125,613 | |
AT&T Inc. | | | | 6.400% | | 5/15/38 | | | 10,377,000 | | | 10,158,170 | |
AT&T Inc. | | | | 6.550% | | 2/15/39 | | | 8,800,000 | | | 8,784,354 | |
BellSouth Corp. | | | | 4.750% | | 11/15/12 | | | 640,000 | | | 662,608 | |
BellSouth Corp. | | | | 5.200% | | 9/15/14 | | | 8,250,000 | | | 8,588,555 | |
CenturyTel Inc. | | | | 6.000% | | 4/1/17 | | | 8,270,000 | | | 7,463,675 | |
Citizens Communications Co. | | | | 9.250% | | 5/15/11 | | | 530,000 | | | 552,525 | |
Citizens Communications Co. | | | | 7.875% | | 1/15/27 | | | 243,000 | | | 194,400 | |
Level 3 Financing Inc. | | | | 9.250% | | 11/1/14 | | | 4,695,000 | | | 3,849,900 | |
Qwest Communications International Inc. | | | | 7.500% | | 2/15/14 | | | 6,774,000 | | | 6,181,275 | |
Qwest Corp. | | | | 7.500% | | 10/1/14 | | | 2,680,000 | | | 2,556,050 | |
Qwest Corp. | | | | 6.875% | | 9/15/33 | | | 5,600,000 | | | 4,088,000 | |
Verizon Communications Inc. | | | | 8.750% | | 11/1/18 | | | 14,000,000 | | | 16,582,706 | |
Verizon Communications Inc. | | | | 6.400% | | 2/15/38 | | | 7,700,000 | | | 7,538,231 | |
Verizon Communications Inc. | | | | 8.950% | | 3/1/39 | | | 20,000,000 | | | 25,256,360 | |
Verizon Global Funding Corp. | | | | 7.375% | | 9/1/12 | | | 155,000 | | | 173,401 | |
Verizon New York Inc. | | | | 6.875% | | 4/1/12 | | | 3,942,000 | | | 4,177,838 | |
Windstream Corp. | | | | 8.625% | | 8/1/16 | | | 10,100,000 | | | 9,670,750 | |
| | | | | | | | | | | | | |
| | | | | | | | | | | | 150,714,514 | |
| | | | | | | | | | | | | |
Electric Utilities | | 1.8% | | | | | | | | | | | |
Duke Energy Corp. | | | | 5.625% | | 11/30/12 | | | 1,010,000 | | | 1,082,485 | |
Energy Future Holdings Corp. | | | | 10.875% | | 11/1/17 | | | 1,051,000 | | | 767,230 | |
Energy Future Holdings Corp. | | | | 11.250% | | 11/1/17 | | | 154,949,740 | | | 94,519,341 | H |
Exelon Corp. | | | | 5.625% | | 6/15/35 | | | 455,000 | | | 366,249 | |
FirstEnergy Corp. | | | | 6.450% | | 11/15/11 | | | 3,190,000 | | | 3,329,594 | |
FirstEnergy Corp. | | | | 7.375% | | 11/15/31 | | | 20,615,000 | | | 19,457,633 | |
47
Semi-Annual Report to Shareholders
Portfolio of Investments—Continued
Western Asset Core Plus Bond Portfolio—Continued
| | | | | | | | | | | | | |
| | | % OF
NET ASSETS | | RATE | | MATURITY
DATE | | PAR/
SHARES† | | VALUE | |
| | | | | | | | | | | | | |
Corporate Bonds and Notes—Continued | | | | | | | | | | | | | |
| | | | | |
Electric Utilities—Continued | | | | | | | | | | | | | |
Pacific Gas and Electric Co. | | | | 8.250% | | 10/15/18 | | $ | 40,000 | | $ | 48,813 | |
Pacific Gas and Electric Co. | | | | 6.050% | | 3/1/34 | | | 5,180,000 | | | 5,373,924 | |
Pacific Gas and Electric Co. | | | | 5.800% | | 3/1/37 | | | 11,790,000 | | | 11,848,927 | |
Progress Energy Inc. | | | | 7.100% | | 3/1/11 | | | 52,000 | | | 55,305 | |
The Cleveland Electric Illuminating Co. | | | | 5.700% | | 4/1/17 | | | 1,080,000 | | | 1,052,195 | |
The Detroit Edison Co. | | | | 5.200% | | 10/15/12 | | | 10,000 | | | 10,404 | |
| | | | | | | | | | | | | |
| | | | | | | | | | | | 137,912,100 | |
| | | | | | | | | | | | | |
Energy Equipment and Services | | 0.1% | | | | | | | | | | | |
Baker Hughes Inc. | | | | 7.500% | | 11/15/18 | | | 280,000 | | | 327,897 | |
Complete Production Services Inc. | | | | 8.000% | | 12/15/16 | | | 5,355,000 | | | 4,578,525 | |
Pacific Energy Partners | | | | 7.125% | | 6/15/14 | | | 630,000 | | | 645,080 | |
Pride International Inc. | | | | 7.375% | | 7/15/14 | | | 1,440,000 | | | 1,429,200 | |
| | | | | | | | | | | | | |
| | | | | | | | | | | | 6,980,702 | |
| | | | | | | | | | | | | |
Food and Staples Retailing | | 0.7% | | | | | | | | | | | |
CVS Caremark Corp. | | | | 6.600% | | 3/15/19 | | | 16,900,000 | | | 18,057,717 | |
CVS Caremark Corp. | | | | 6.943% | | 1/10/30 | | | 3,177,229 | | | 2,874,852 | A |
CVS Corp. | | | | 5.789% | | 1/10/26 | | | 110,854 | | | 95,335 | A |
CVS Corp. | | | | 5.298% | | 1/11/27 | | | 549,228 | | | 438,339 | A |
CVS Lease Pass-Through Trust | | | | 5.880% | | 1/10/28 | | | 5,592,190 | | | 4,699,285 | A |
CVS Lease Pass-Through Trust | | | | 6.036% | | 12/10/28 | | | 19,800,217 | | | 16,917,701 | A,I |
Safeway Inc. | | | | 6.350% | | 8/15/17 | | | 310,000 | | | 327,600 | |
The Kroger Co. | | | | 6.400% | | 8/15/17 | | | 1,270,000 | | | 1,346,429 | |
The Kroger Co. | | | | 6.150% | | 1/15/20 | | | 1,830,000 | | | 1,869,771 | |
Wal-Mart Stores Inc. | | | | 5.800% | | 2/15/18 | | | 180,000 | | | 196,082 | |
Wal-Mart Stores Inc. | | | | 6.200% | | 4/15/38 | | | 2,260,000 | | | 2,428,734 | |
| | | | | | | | | | | | | |
| | | | | | | | | | | | 49,251,845 | |
| | | | | | | | | | | | | |
Food Products | | 0.2% | | | | | | | | | | | |
General Mills Inc. | | | | 5.700% | | 2/15/17 | | | 7,210,000 | | | 7,589,643 | |
Sara Lee Corp. | | | | 6.250% | | 9/15/11 | | | 9,750,000 | | | 10,304,960 | |
| | | | | | | | | | | | | |
| | | | | | | | | | | | 17,894,603 | |
| | | | | | | | | | | | | |
Gas Utilities | | 0.2% | | | | | | | | | | | |
Southern Natural Gas Co. | | | | 5.900% | | 4/1/17 | | | 50,000 | | | 48,425 | A |
Southern Natural Gas Co. | | | | 8.000% | | 3/1/32 | | | 9,410,000 | | | 9,956,862 | |
Suburban Propane Partners LP | | | | 6.875% | | 12/15/13 | | | 2,000,000 | | | 1,840,000 | |
| | | | | | | | | | | | | |
| | | | | | | | | | | | 11,845,287 | |
| | | | | | | | | | | | | |
48
Semi-Annual Report to Shareholders
| | | | | | | | | | | | | |
| | | % OF
NET ASSETS | | RATE | | MATURITY
DATE | | PAR/
SHARES† | | VALUE | |
| | | | | | | | | | | | | |
Corporate Bonds and Notes—Continued | | | | | | | | | | | | | |
| | | | | |
Health Care Equipment and Supplies | | N.M. | | | | | | | | | | | |
Biomet Inc. | | | | 10.375% | | 10/15/17 | | $ | 1,800,000 | | $ | 1,741,500 | H |
Fresenius Medical Care Capital Trust IV | | | | 7.875% | | 6/15/11 | | | 681,000 | | | 692,918 | |
| | | | | | | | | | | | | |
| | | | | | | | | | | | 2,434,418 | |
| | | | | | | | | | | | | |
Health Care Providers and Services | | 1.5% | | | | | | | | | | | |
AmerisourceBergen Corp. | | | | 5.625% | | 9/15/12 | | | 6,330,000 | | | 6,240,931 | |
AmerisourceBergen Corp. | | | | 5.875% | | 9/15/15 | | | 7,070,000 | | | 6,738,735 | |
Cardinal Health Inc. | | | | 5.800% | | 10/15/16 | | | 6,260,000 | | | 6,059,348 | |
Cardinal Health Inc. | | | | 5.850% | | 12/15/17 | | | 270,000 | | | 252,565 | |
Community Health Systems Inc. | | | | 8.875% | | 7/15/15 | | | 6,910,000 | | | 6,771,800 | |
DaVita Inc. | | | | 6.625% | | 3/15/13 | | | 4,435,000 | | | 4,179,988 | |
HCA Inc. | | | | 8.750% | | 9/1/10 | | | 256,000 | | | 256,640 | |
HCA Inc. | | | | 7.875% | | 2/1/11 | | | 1,000,000 | | | 983,750 | |
HCA Inc. | | | | 6.300% | | 10/1/12 | | | 299,000 | | | 274,333 | |
HCA Inc. | | | | 6.250% | | 2/15/13 | | | 1,243,000 | | | 1,087,625 | |
HCA Inc. | | | | 5.750% | | 3/15/14 | | | 221,000 | | | 176,800 | |
HCA Inc. | | | | 9.125% | | 11/15/14 | | | 1,280,000 | | | 1,267,200 | |
HCA Inc. | | | | 9.250% | | 11/15/16 | | | 10,500,000 | | | 10,342,500 | |
HCA Inc. | | | | 9.625% | | 11/15/16 | | | 10,317,000 | | | 10,213,830 | H |
HCA Inc. | | | | 7.690% | | 6/15/25 | | | 723,000 | | | 443,999 | |
HCA Inc. | | | | 7.500% | | 11/6/33 | | | 1,925,000 | | | 1,097,250 | |
HCA Inc. | | | | 7.500% | | 11/15/95 | | | 15,410,000 | | | 8,076,489 | |
Tenet Healthcare Corp. | | | | 7.375% | | 2/1/13 | | | 6,222,000 | | | 5,599,800 | |
Tenet Healthcare Corp. | | | | 9.250% | | 2/1/15 | | | 12,430,000 | | | 11,373,450 | |
Tenet Healthcare Corp. | | | | 9.000% | | 5/1/15 | | | 1,250,000 | | | 1,259,375 | A |
Tenet Healthcare Corp. | | | | 10.000% | | 5/1/18 | | | 1,250,000 | | | 1,312,500 | A |
Tenet Healthcare Corp. | | | | 8.875% | | 7/1/19 | | | 2,681,000 | | | 2,694,405 | A |
UnitedHealth Group Inc. | | | | 4.875% | | 2/15/13 | | | 180,000 | | | 181,942 | |
UnitedHealth Group Inc. | | | | 4.875% | | 4/1/13 | | | 18,130,000 | | | 18,211,204 | |
WellPoint Inc. | | | | 5.875% | | 6/15/17 | | | 3,040,000 | | | 2,975,263 | |
WellPoint Inc. | | | | 7.000% | | 2/15/19 | | | 5,500,000 | | | 5,685,718 | |
| | | | | | | | | | | | | |
| | | | | | | | | | | | 113,757,440 | |
| | | | | | | | | | | | | |
Hotels, Restaurants and Leisure | | 0.3% | | | | | | | | | | | |
Boyd Gaming Corp. | | | | 6.750% | | 4/15/14 | | | 10,000 | | | 8,100 | |
Boyd Gaming Corp. | | | | 7.125% | | 2/1/16 | | | 20,000 | | | 14,825 | |
Inn of the Mountain Gods Resort and Casino | | | | 12.000% | | 11/15/10 | | | 1,070,000 | | | 428,000 | D |
Marriott International Inc. | | | | 5.810% | | 11/10/15 | | | 7,950,000 | | | 6,962,141 | |
McDonald’s Corp. | | | | 5.350% | | 3/1/18 | | | 310,000 | | | 327,102 | |
49
Semi-Annual Report to Shareholders
Portfolio of Investments—Continued
Western Asset Core Plus Bond Portfolio—Continued
| | | | | | | | | | | | | |
| | | % OF
NET ASSETS | | RATE | | MATURITY
DATE | | PAR/
SHARES† | | VALUE | |
| | | | | | | | | | | | | |
| | | | | | | | | | | | | |
Corporate Bonds and Notes—Continued | | | | | | | | | | | | | |
| | | | |
Hotels, Restaurants and Leisure—Continued | | | | | | | | | | | |
MGM MIRAGE | | | | 6.750% | | 9/1/12 | | $ | 435,000 | | $ | 308,850 | |
MGM MIRAGE | | | | 10.375% | | 5/15/14 | | | 685,000 | | | 710,688 | A |
MGM MIRAGE | | | | 6.625% | | 7/15/15 | | | 380,000 | | | 247,950 | |
MGM MIRAGE | | | | 7.625% | | 1/15/17 | | | 3,690,000 | | | 2,389,275 | |
MGM MIRAGE | | | | 11.125% | | 11/15/17 | | | 1,645,000 | | | 1,743,700 | A |
Mohegan Tribal Gaming Authority | | | | 8.000% | | 4/1/12 | | | 245,000 | | | 186,200 | |
River Rock Entertainment Authority | | | | 9.750% | | 11/1/11 | | | 220,000 | | | 165,000 | |
Starwood Hotels and Resorts Worldwide Inc. | | | | 7.875% | | 5/1/12 | | | 5,350,000 | | | 4,922,000 | |
Station Casinos Inc. | | | | 7.750% | | 8/15/16 | | | 9,760,000 | | | 3,367,200 | I |
| | | | | | | | | | | | | |
| | | | | | | | | | | | 21,781,031 | |
| | | | | | | | | | | | | |
Household Durables | | 0.1% | | | | | | | | | | | |
Pulte Homes Inc. | | | | 8.125% | | 3/1/11 | | | 6,890,000 | | | 6,924,450 | |
| | | | | | | | | | | | | |
| | | | | |
Household Products | | N.M. | | | | | | | | | | | |
American Achievement Corp. | | | | 8.250% | | 4/1/12 | | | 250,000 | | | 233,750 | A |
Procter and Gamble Co. | | | | 8.500% | | 8/10/09 | | | 90,000 | | | 90,655 | |
| | | | | | | | | | | | | |
| | | | | | | | | | | | 324,405 | |
| | | | | | | | | | | | | |
Independent Power Producers and Energy Traders | | 2.0% | | | | | | | | | | | |
Calpine Corp. | | | | 8.000% | | 6/1/16 | | | 7,205,000 | | | 6,898,787 | A |
Dynegy Holdings Inc. | | | | 7.750% | | 6/1/19 | | | 9,730,000 | | | 7,577,237 | |
NRG Energy Inc. | | | | 7.250% | | 2/1/14 | | | 3,130,000 | | | 3,036,100 | |
NRG Energy Inc. | | | | 7.375% | | 2/1/16 | | | 6,791,000 | | | 6,425,984 | |
NRG Energy Inc. | | | | 7.375% | | 1/15/17 | | | 595,000 | | | 560,788 | |
The AES Corp. | | | | 8.750% | | 5/15/13 | | | 11,741,000 | | | 11,917,115 | A |
The AES Corp. | | | | 7.750% | | 3/1/14 | | | 32,158,000 | | | 30,469,705 | |
The AES Corp. | | | | 7.750% | | 10/15/15 | | | 8,070,000 | | | 7,505,100 | |
The AES Corp. | | | | 8.000% | | 10/15/17 | | | 52,640,000 | | | 48,955,200 | |
The AES Corp. | | | | 8.000% | | 6/1/20 | | | 14,470,000 | | | 12,986,825 | |
TXU Corp. | | | | 5.550% | | 11/15/14 | | | 1,560,000 | | | 985,015 | |
TXU Corp. | | | | 6.500% | | 11/15/24 | | | 2,850,000 | | | 1,428,081 | |
TXU Corp. | | | | 6.550% | | 11/15/34 | | | 28,635,000 | | | 13,766,534 | |
| | | | | | | | | | | | | |
| | | | | | | | | | | | 152,512,471 | |
| | | | | | | | | | | | | |
Industrial Conglomerates | | 0.5% | | | | | | | | | | | |
General Electric Co. | | | | 5.000% | | 2/1/13 | | | 7,055,000 | | | 7,340,841 | |
Tyco International Ltd./Tyco International Finance SA | | | | 7.000% | | 12/15/19 | | | 945,000 | | | 929,807 | |
50
Semi-Annual Report to Shareholders
| | | | | | | | | | | | | |
| | | % OF
NET ASSETS | | RATE | | MATURITY
DATE | | PAR/
SHARES† | | VALUE | |
| | | | | | | | | | | | | |
| | | | | | | | | | | | | |
Corporate Bonds and Notes—Continued | | | | | | | | | | | | | |
| | | | | |
Industrial Conglomerates—Continued | | | | | | | | | | | | | |
Tyco International Ltd./Tyco International Finance SA | | | | 6.875% | | 1/15/21 | | $ | 31,995,000 | | $ | 30,254,920 | |
| | | | | | | | | | | | | |
| | | | | | | | | | | | 38,525,568 | |
| | | | | | | | | | | | | |
Insurance | | 0.3% | | | | | | | | | | | |
American International Group Inc. | | | | 5.850% | | 1/16/18 | | | 5,390,000 | | | 2,851,574 | |
American International Group Inc. | | | | 6.250% | | 3/15/37 | | | 360,000 | | | 89,100 | E |
ASIF Global Financing XIX | | | | 4.900% | | 1/17/13 | | | 2,180,000 | | | 1,854,594 | A |
Marsh and McLennan Cos. Inc. | | | | 5.150% | | 9/15/10 | | | 5,990,000 | | | 6,002,842 | |
MetLife Capital Trust IV | | | | 7.875% | | 12/15/37 | | | 13,000,000 | | | 10,530,000 | A,E |
MetLife Inc. | | | | 6.400% | | 12/15/66 | | | 2,835,000 | | | 2,027,025 | E |
The Travelers Cos. Inc. | | | | 6.250% | | 3/15/67 | | | 2,760,000 | | | 2,224,461 | E |
| | | | | | | | | | | | | |
| | | | | | | | | | | | 25,579,596 | |
| | | | | | | | | | | | | |
IT Services | | N.M. | | | | | | | | | | | |
Electronic Data Systems Corp. | | | | 6.000% | | 8/1/13 | | | 775,000 | | | 846,028 | F |
| | | | | | | | | | | | | |
| | | | | |
Leisure Equipment and Products | | N.M. | | | | | | | | | | | |
Eastman Kodak Co. | | | | 3.375% | | 10/15/33 | | | 3,160,000 | | | 2,543,800 | G |
| | | | | | | | | | | | | |
| | | | | |
Machinery | | N.M. | | | | | | | | | | | |
Terex Corp. | | | | 7.375% | | 1/15/14 | | | 2,680,000 | | | 2,452,200 | |
| | | | | | | | | | | | | |
| | | | | |
Media | | 1.9% | | | | | | | | | | | |
AMC Entertainment Inc. | | | | 8.750% | | 6/1/19 | | | 300,000 | | | 282,000 | A |
CBS Corp. | | | | 7.625% | | 1/15/16 | | | 5,500,000 | | | 5,184,762 | |
Charter Communications Operating LLC | | | | 10.875% | | 9/15/14 | | | 3,640,000 | | | 3,767,400 | A,D,I |
Comcast Cable Communications Inc. | | | | 6.750% | | 1/30/11 | | | 210,000 | | | 221,889 | |
Comcast Cable Communications Inc. | | | | 8.875% | | 5/1/17 | | | 40,000 | | | 47,031 | |
Comcast Corp. | | | | 6.500% | | 1/15/15 | | | 3,760,000 | | | 3,988,176 | |
Comcast Corp. | | | | 6.500% | | 1/15/17 | | | 3,660,000 | | | 3,882,759 | |
Comcast Corp. | | | | 5.875% | | 2/15/18 | | | 10,000 | | | 10,137 | |
Comcast Corp. | | | | 6.450% | | 3/15/37 | | | 14,000,000 | | | 13,797,546 | |
Comcast Corp. | | | | 6.950% | | 8/15/37 | | | 7,470,000 | | | 7,788,812 | |
Cox Communications Inc. | | | | 7.875% | | 8/15/09 | | | 7,680,000 | | | 7,726,011 | |
CSC Holdings Inc. | | | | 6.750% | | 4/15/12 | | | 500,000 | | | 482,500 | |
CSC Holdings Inc. | | | | 8.625% | | 2/15/19 | | | 3,265,000 | | | 3,175,212 | A |
DirecTV Holdings LLC | | | | 8.375% | | 3/15/13 | | | 3,251,000 | | | 3,259,127 | |
Gannett Co. Inc. | | | | 6.375% | | 4/1/12 | | | 4,560,000 | | | 3,309,963 | |
Lamar Media Corp. | | | | 6.625% | | 8/15/15 | | | 460,000 | | | 388,700 | |
51
Semi-Annual Report to Shareholders
Portfolio of Investments—Continued
Western Asset Core Plus Bond Portfolio—Continued
| | | | | | | | | | | | | |
| | | % OF
NET ASSETS | | RATE | | MATURITY
DATE | | PAR/
SHARES† | | VALUE | |
| | | | | | | | | | | | | |
| | | | | | | | | | | | | |
Corporate Bonds and Notes—Continued | | | | | | | | | | | | | |
| | | | | |
Media—Continued | | | | | | | | | | | | | |
News America Inc. | | | | 6.200% | | 12/15/34 | | $ | 260,000 | | $ | 221,961 | |
News America Inc. | | | | 6.650% | | 11/15/37 | | | 1,330,000 | | | 1,196,356 | |
News America Inc. | | | | 6.750% | | 1/9/38 | | | 200,000 | | | 203,535 | |
Reed Elsevier Capital Inc. | | | | 8.625% | | 1/15/19 | | | 12,580,000 | | | 14,293,094 | |
Time Warner Cable Inc. | | | | 8.750% | | 2/14/19 | | | 15,520,000 | | | 18,079,900 | |
Time Warner Cable Inc. | | | | 8.250% | | 4/1/19 | | | 20,250,000 | | | 22,975,994 | |
Time Warner Cable Inc. | | | | 6.750% | | 6/15/39 | | | 6,785,000 | | | 6,603,779 | |
Time Warner Entertainment Co. LP | | | | 8.375% | | 7/15/33 | | | 20,000 | | | 22,387 | |
Time Warner Inc. | | | | 6.875% | | 5/1/12 | | | 4,460,000 | | | 4,771,063 | |
Viacom Inc. | | | | 5.750% | | 4/30/11 | | | 14,870,000 | | | 15,223,341 | |
Viacom Inc. | | | | 6.250% | | 4/30/16 | | | 6,600,000 | | | 6,502,056 | |
| | | | | | | | | | | | | |
| | | | | | | | | | | | 147,405,491 | |
| | | | | | | | | | | | | |
Metals and Mining | | 0.3% | | | | | | | | | | | |
Freeport-McMoRan Copper & Gold Inc. | | | | 8.375% | | 4/1/17 | | | 14,090,000 | | | 14,195,675 | |
Steel Dynamics Inc. | | | | 6.750% | | 4/1/15 | | | 5,890,000 | | | 5,242,100 | |
Steel Dynamics Inc. | | | | 8.250% | | 4/15/16 | | | 1,980,000 | | | 1,866,150 | A |
| | | | | | | | | | | | | |
| | | | | | | | | | | | 21,303,925 | |
| | | | | | | | | | | | | |
Multi-Utilities | | 0.1% | | | | | | | | | | | |
Dominion Resources Inc. | | | | 5.125% | | 12/15/09 | | | 1,260,000 | | | 1,275,967 | |
Dominion Resources Inc. | | | | 4.750% | | 12/15/10 | | | 1,010,000 | | | 1,038,040 | |
Dominion Resources Inc. | | | | 5.700% | | 9/17/12 | | | 5,495,000 | | | 5,845,026 | |
Dominion Resources Inc. | | | | 8.875% | | 1/15/19 | | | 90,000 | | | 107,329 | |
| | | | | | | | | | | | | |
| | | | | | | | | | | | 8,266,362 | |
| | | | | | | | | | | | | |
Multiline Retail | | 0.1% | | | | | | | | | | | |
J.C. Penney Co. Inc. | | | | 7.400% | | 4/1/37 | | | 690,000 | | | 544,551 | |
Target Corp. | | | | 4.000% | | 6/15/13 | | | 5,340,000 | | | 5,296,367 | |
The Neiman-Marcus Group Inc. | | | | 9.000% | | 10/15/15 | | | 6,986,237 | | | 4,121,880 | H |
| | | | | | | | | | | | | |
| | | | | | | | | | | | 9,962,798 | |
| | | | | | | | | | | | | |
Office Electronics | | N.M. | | | | | | | | | | | |
Xerox Corp. | | | | 6.750% | | 2/1/17 | | | 1,180,000 | | | 1,073,800 | |
| | | | | | | | | | | | | |
| | | | | |
Oil, Gas and Consumable Fuels | | 4.6% | | | | | | | | | | | |
Anadarko Petroleum Corp. | | | | 8.700% | | 3/15/19 | | | 3,275,000 | | | 3,668,740 | |
Anadarko Petroleum Corp. | | | | 6.450% | | 9/15/36 | | | 30,075,000 | | | 27,034,899 | |
Apache Corp. | | | | 6.000% | | 1/15/37 | | | 240,000 | | | 254,089 | |
Chesapeake Energy Corp. | | | | 6.375% | | 6/15/15 | | | 1,205,000 | | | 1,072,450 | |
Chesapeake Energy Corp. | | | | 6.250% | | 1/15/18 | | | 1,970,000 | | | 1,635,100 | |
52
Semi-Annual Report to Shareholders
| | | | | | | | | | | | | |
| | | % OF
NET ASSETS | | RATE | | MATURITY
DATE | | PAR/
SHARES† | | VALUE | |
| | | | | | | | | | | | | |
| | | | | | | | | | | | | |
Corporate Bonds and Notes—Continued | | | | | | | | | | | | | |
| | | | |
Oil, Gas and Consumable Fuels—Continued | | | | | | | | | | | |
Chesapeake Energy Corp. | | | | 7.250% | | 12/15/18 | | $ | 7,765,000 | | $ | 6,755,550 | |
Conoco Inc. | | | | 6.950% | | 4/15/29 | | | 638,000 | | | 687,455 | |
ConocoPhillips | | | | 8.750% | | 5/25/10 | | | 3,100,000 | | | 3,308,925 | |
ConocoPhillips | | | | 5.900% | | 10/15/32 | | | 10,000 | | | 9,924 | |
ConocoPhillips | | | | 6.500% | | 2/1/39 | | | 29,680,000 | | | 31,592,371 | |
Devon Energy Corp. | | | | 6.300% | | 1/15/19 | | | 14,500,000 | | | 15,494,976 | |
Devon Energy Corp. | | | | 7.950% | | 4/15/32 | | | 210,000 | | | 250,425 | |
El Paso Corp. | | | | 7.000% | | 6/15/17 | | | 59,015,000 | | | 53,748,147 | |
El Paso Corp. | | | | 7.800% | | 8/1/31 | | | 4,277,000 | | | 3,488,787 | |
El Paso Corp. | | | | 7.750% | | 1/15/32 | | | 8,074,000 | | | 6,572,406 | |
El Paso Natural Gas Co. | | | | 8.375% | | 6/15/32 | | | 2,520,000 | | | 2,741,085 | |
Energy Transfer Partners LP | | | | 6.125% | | 2/15/17 | | | 5,305,000 | | | 5,270,337 | |
Energy Transfer Partners LP | | | | 6.700% | | 7/1/18 | | | 320,000 | | | 327,137 | |
Energy Transfer Partners LP | | | | 9.700% | | 3/15/19 | | | 15,000,000 | | | 17,220,675 | |
Enterprise Products Operating LLP | | | | 6.300% | | 9/15/17 | | | 4,300,000 | | | 4,321,328 | |
Hess Corp. | | | | 8.125% | | 2/15/19 | | | 22,800,000 | | | 25,956,751 | |
Hess Corp. | | | | 7.875% | | 10/1/29 | | | 5,290,000 | | | 5,737,777 | |
Hess Corp. | | | | 7.300% | | 8/15/31 | | | 13,235,000 | | | 13,661,736 | |
KazMunaiGaz Exploration Production-GDR | | | | 8.375% | | 7/2/13 | | | 13,430,000 | | | 12,389,175 | A |
Kerr-McGee Corp. | | | | 6.875% | | 9/15/11 | | | 800,000 | | | 843,733 | |
Kerr-McGee Corp. | | | | 6.950% | | 7/1/24 | | | 2,780,000 | | | 2,579,493 | |
Kerr-McGee Corp. | | | | 7.875% | | 9/15/31 | | | 10,555,000 | | | 10,299,590 | |
Kinder Morgan Energy Partners LP | | | | 6.750% | | 3/15/11 | | | 40,000 | | | 41,923 | |
Kinder Morgan Energy Partners LP | | | | 7.125% | | 3/15/12 | | | 7,670,000 | | | 8,201,523 | |
Kinder Morgan Energy Partners LP | | | | 5.850% | | 9/15/12 | | | 20,000 | | | 20,851 | |
Kinder Morgan Energy Partners LP | | | | 5.000% | | 12/15/13 | | | 1,879,000 | | | 1,848,876 | |
Kinder Morgan Energy Partners LP | | | | 6.000% | | 2/1/17 | | | 5,190,000 | | | 5,148,817 | |
Kinder Morgan Energy Partners LP | | | | 6.950% | | 1/15/38 | | | 1,697,000 | | | 1,643,869 | |
Noble Energy Inc. | | | | 8.250% | | 3/1/19 | | | 14,600,000 | | | 16,611,033 | |
Occidental Petroleum Corp. | | | | 7.000% | | 11/1/13 | | | 360,000 | | | 412,155 | |
Peabody Energy Corp. | | | | 6.875% | | 3/15/13 | | | 1,085,000 | | | 1,074,150 | |
Peabody Energy Corp. | | | | 5.875% | | 4/15/16 | | | 880,000 | | | 774,400 | |
Pemex Project Funding Master Trust | | | | 1.250% | | 12/3/12 | | | 104,000 | | | 97,240 | A,B |
Pemex Project Funding Master Trust | | | | 6.625% | | 6/15/35 | | | 21,623,000 | | | 19,556,533 | |
SandRidge Energy Inc. | | | | 9.875% | | 5/15/16 | | | 6,450,000 | | | 6,224,250 | A |
Seariver Maritime Inc. | | | | 0.000% | | 9/1/12 | | | 70,000 | | | 65,100 | J |
The Williams Cos. Inc. | | | | 8.750% | | 1/15/20 | | | 7,640,000 | | | 7,964,700 | A |
The Williams Cos. Inc. | | | | 7.500% | | 1/15/31 | | | 990,000 | | | 871,200 | |
53
Semi-Annual Report to Shareholders
Portfolio of Investments—Continued
Western Asset Core Plus Bond Portfolio—Continued
| | | | | | | | | | | | | |
| | | % OF
NET ASSETS | | RATE | | MATURITY
DATE | | PAR/
SHARES† | | VALUE | |
| | | | | | | | | | | | | |
| | | | | | | | | | | | | |
Corporate Bonds and Notes—Continued | | | | | | | | | | | | | |
| | | | |
Oil, Gas and Consumable Fuels—Continued | | | | | | | | | | | |
The Williams Cos. Inc. | | | | 7.750% | | 6/15/31 | | $ | 530,000 | | $ | 477,000 | |
XTO Energy Inc. | | | | 7.500% | | 4/15/12 | | | 971,000 | | | 1,075,623 | |
XTO Energy Inc. | | | | 5.500% | | 6/15/18 | | | 7,710,000 | | | 7,725,890 | |
XTO Energy Inc. | | | | 6.500% | | 12/15/18 | | | 14,476,000 | | | 15,530,446 | |
XTO Energy Inc. | | | | 6.750% | | 8/1/37 | | | 2,570,000 | | | 2,682,959 | |
| | | | | | | | | | | | | |
| | | | | | | | | | | | 354,971,599 | |
| | | | | | | | | | | | | |
Paper and Forest Products | | 0.1% | | | | | | | | | | | |
Georgia-Pacific Corp. | | | | 8.125% | | 5/15/11 | | | 9,000 | | | 9,000 | |
Weyerhaeuser Co. | | | | 6.750% | | 3/15/12 | | | 7,340,000 | | | 7,342,642 | |
| | | | | | | | | | | | | |
| | | | | | | | | | | | 7,351,642 | |
| | | | | | | | | | | | | |
Pharmaceuticals | | 1.1% | | | | | | | | | | | |
Abbott Laboratories | | | | 5.125% | | 4/1/19 | | | 29,920,000 | | | 30,806,530 | |
Pfizer Inc. | | | | 6.200% | | 3/15/19 | | | 17,670,000 | | | 19,324,336 | |
Roche Holdings Inc. | | | | 6.000% | | 3/1/19 | | | 9,890,000 | | | 10,545,519 | A |
Schering-Plough Corp. | | | | 6.000% | | 9/15/17 | | | 340,000 | | | 362,101 | |
Wyeth | | | | 5.950% | | 4/1/37 | | | 19,955,000 | | | 20,644,006 | |
| | | | | | | | | | | | | |
| | | | | | | | | | | | 81,682,492 | |
| | | | | | | | | | | | | |
Real Estate Investment Trusts (REITs) | | 0.1% | | | | | | | | | | | |
Health Care Property Investors Inc. | | | | 6.450% | | 6/25/12 | | | 6,240,000 | | | 6,072,862 | |
Host Marriott LP | | | | 6.750% | | 6/1/16 | | | 2,065,000 | | | 1,791,387 | |
Ventas Inc. | | | | 9.000% | | 5/1/12 | | | 1,240,000 | | | 1,277,200 | |
Ventas Inc. | | | | 6.750% | | 4/1/17 | | | 850,000 | | | 762,875 | |
| | | | | | | | | | | | | |
| | | | | | | | | | | | 9,904,324 | |
| | | | | | | | | | | | | |
Real Estate Management and Development | | N.M. | | | | | | | | | | | |
Forest City Enterprises Inc. | | | | 7.625% | | 6/1/15 | | | 360,000 | | | 226,800 | |
Forest City Enterprises Inc. | | | | 6.500% | | 2/1/17 | | | 597,000 | | | 328,350 | |
| | | | | | | | | | | | | |
| | | | | | | | | | | | 555,150 | |
| | | | | | | | | | | | | |
Road and Rail | | N.M. | | | | | | | | | | | |
Hertz Corp. | | | | 8.875% | | 1/1/14 | | | 1,320,000 | | | 1,214,400 | |
Hertz Corp. | | | | 10.500% | | 1/1/16 | | | 780,000 | | | 694,200 | |
| | | | | | | | | | | | | |
| | | | | | | | | | | | 1,908,600 | |
| | | | | | | | | | | | | |
Semiconductors and Semiconductor Equipment | | N.M. | | | | | | | | | | | |
Freescale Semiconductor Inc. | | | | 8.875% | | 12/15/14 | | | 10,000 | | | 5,050 | |
| | | | | | | | | | | | | |
54
Semi-Annual Report to Shareholders
| | | | | | | | | | | | | |
| | | % OF
NET ASSETS | | RATE | | MATURITY
DATE | | PAR/
SHARES† | | VALUE | |
| | | | | | | | | | | | | |
Corporate Bonds and Notes—Continued | | | | | | | | | | | | | |
| | | | | |
Specialty Retail | | 0.6% | | | | | | | | | | | |
Autozone Inc. | | | | 6.950% | | 6/15/16 | | $ | 10,890,000 | | $ | 11,167,096 | |
Home Depot Inc. | | | | 4.625% | | 8/15/10 | | | 2,720,000 | | | 2,771,125 | |
Home Depot Inc. | | | | 5.250% | | 12/16/13 | | | 5,510,000 | | | 5,661,239 | |
Home Depot Inc. | | | | 5.400% | | 3/1/16 | | | 8,230,000 | | | 8,215,359 | |
Limited Brands Inc. | | | | 6.125% | | 12/1/12 | | | 16,900,000 | | | 16,227,008 | |
| | | | | | | | | | | | | |
| | | | | | | | | | | | 44,041,827 | |
| | | | | | | | | | | | | |
Thrifts and Mortgage Finance | | N.M. | | | | | | | | | | | |
Countrywide Financial Corp. | | | | 5.800% | | 6/7/12 | | | 350,000 | | | 352,181 | |
Countrywide Financial Corp. | | | | 6.250% | | 5/15/16 | | | 290,000 | | | 257,281 | |
Countrywide Home Loans Inc. | | | | 4.125% | | 9/15/09 | | | 160,000 | | | 160,521 | |
| | | | | | | | | | | | | |
| | | | | | | | | | | | 769,983 | |
| | | | | | | | | | | | | |
Tobacco | | 0.1% | | | | | | | | | | | |
Altria Group Inc. | | | | 9.700% | | 11/10/18 | | | 1,130,000 | | | 1,295,484 | F |
Philip Morris Capital Corp. | | | | 7.500% | | 7/16/09 | | | 190,000 | | | 190,010 | |
Reynolds American Inc. | | | | 7.625% | | 6/1/16 | | | 100,000 | | | 100,300 | |
Reynolds American Inc. | | | | 6.750% | | 6/15/17 | | | 8,430,000 | | | 7,871,116 | |
| | | | | | | | | | | | | |
| | | | | | | | | | | | 9,456,910 | |
| | | | | | | | | | | | | |
Wireless Telecommunication Services | | 0.9% | | | | | | | | | | | |
Cellco Partnership | | | | 8.500% | | 11/15/18 | | | 36,200,000 | | | 43,262,367 | A |
Cricket Communications Inc. | | | | 7.750% | | 5/15/16 | | | 6,215,000 | | | 5,981,937 | A |
Nextel Communications Inc. | | | | 6.875% | | 10/31/13 | | | 60,000 | | | 49,650 | |
Nextel Communications Inc. | | | | 5.950% | | 3/15/14 | | | 493,000 | | | 388,238 | |
Nextel Communications Inc. | | | | 7.375% | | 8/1/15 | | | 1,980,000 | | | 1,579,050 | |
Sprint Capital Corp. | | | | 8.375% | | 3/15/12 | | | 17,545,000 | | | 17,281,825 | |
Sprint Capital Corp. | | | | 6.900% | | 5/1/19 | | | 720,000 | | | 595,800 | |
Sprint Capital Corp. | | | | 8.750% | | 3/15/32 | | | 3,395,000 | | | 2,732,975 | |
| | | | | | | | | | | | | |
| | | | | | | | | | | | 71,871,842 | |
| | | | | | | | | | | | | |
Total Corporate Bonds and Notes
(Cost—$2,536,424,510) | | | | | | | | | | | | 2,318,557,694 | |
Asset-Backed Securities | | 3.6% | | | | | | | | | | | |
| | | | | |
Fixed Rate Securities | | 0.3% | | | | | | | | | | | |
Conseco Finance Securitizations Corp. 2000-4 | | | | 8.310% | | 5/1/32 | | | 1,856,081 | | | 1,156,110 | |
Contimortgage Home Equity Trust
1997-4 B1F | | | | 7.330% | | 10/15/28 | | | 991,178 | | | 716,622 | |
Credit-Based Asset Servicing and Securitization LLC 2006-MH1 AF2 | | | | 5.650% | | 10/25/36 | | | 719,129 | | | 674,753 | A,E |
55
Semi-Annual Report to Shareholders
Portfolio of Investments—Continued
Western Asset Core Plus Bond Portfolio—Continued
| | | | | | | | | | | | | |
| | | % OF
NET ASSETS | | RATE | | MATURITY
DATE | | PAR/
SHARES† | | VALUE | |
| | | | | | | | | | | | | |
Asset-Backed Securities—Continued | | | | | | | | | | | | | |
| | | | | |
Fixed Rate Securities—Continued | | | | | | | | | | | | | |
Green Tree Financial Corp. 1992-2 B | | | | 9.150% | | 1/15/18 | | $ | 120,016 | | $ | 78,528 | |
Green Tree Financial Corp. 1993-2 | | | | 8.000% | | 7/15/18 | | | 356,610 | | | 367,721 | |
Green Tree Financial Corp. 1996-5 | | | | 8.100% | | 7/15/27 | | | 2,335,726 | | | 269,036 | |
Green Tree Home Improvement Loan Trust 1996-A | | | | 7.400% | | 2/15/26 | | | 197,463 | | | 129,656 | |
Lehman ABS Manufactured Housing Contract 2001-B A3 | | | | 4.350% | | 5/15/14 | | | 2,900,827 | | | 1,866,730 | |
Lehman ABS Manufactured Housing Contract 2001-B A6 | | | | 6.467% | | 8/15/28 | | | 1,973,352 | | | 1,385,669 | |
Merrill Lynch Mortgage Investors Inc. 2005-SD1 A2 | | | | 5.666% | | 5/25/46 | | | 790,060 | | | 679,488 | |
Origen Manufactured Housing Contract Trust 2005-B | | | | 5.910% | | 1/15/37 | | | 4,797,000 | | | 3,408,094 | |
Origen Manufactured Housing Contract Trust 2005-B | | | | 5.990% | | 1/15/37 | | | 1,500,000 | | | 916,681 | |
Origen Manufactured Housing Contract Trust 2005-B | | | | 6.480% | | 1/15/37 | | | 2,100,000 | | | 1,309,167 | |
Patrons’ Legacy 2003-IV | | | | 5.775% | | 12/23/63 | | | 8,900,000 | | | 7,141,666 | A,C |
Pegasus Aviation Lease Securitization 2000-1 A2 | | | | 8.370% | | 3/25/30 | | | 4,475,000 | | | 1,118,750 | A |
UCFC Home Equity Loan 1998-C | | | | 5.935% | | 1/15/30 | | | 4,469 | | | 3,870 | |
Vanderbilt Mortgage Finance 1997-B 1B2 | | | | 8.155% | | 10/7/26 | | | 166,357 | | | 109,669 | |
WEF Issuer LLC 2006-A | | | | 5.190% | | 12/15/14 | | | 193,149 | | | 190,651 | A |
| | | | | | | | | | | | | |
| | | | | | | | | | | | 21,522,861 | |
| | | | | | | | | | | | | |
Indexed SecuritiesB | | 3.2% | | | | | | | | | | | |
ACE Securities Corp. 2006-GP1 A | | | | 0.444% | | 2/25/31 | | | 447,566 | | | 269,177 | |
Ace Securities Corp. Home Equity Loan Trust 2006-SL3 | | | | 0.414% | | 6/25/36 | | | 964,952 | | | 132,332 | |
AFC Home Equity Loan Trust 2002-2 | | | | 0.614% | | 6/25/30 | | | 383,633 | | | 137,409 | |
Asset Backed Securities Corp. Home Equity Loan Trust 2001-HE3 | | | | 0.859% | | 11/15/31 | | | 230,494 | | | 119,624 | |
Bear Stearns Asset Backed Securities Inc. 2005-CL1 | | | | 0.814% | | 9/25/34 | | | 8,242,495 | | | 3,990,192 | C |
Bear Stearns Asset Backed Securities Inc. 2006-1 A | | | | 0.594% | | 2/25/36 | | | 1,564,866 | | | 1,171,285 | |
Bear Stearns Second Lien Trust
2007-SV1A A3 | | | | 0.564% | | 12/25/36 | | | 2,143,065 | | | 468,889 | A,C |
CDC Mortgage Capital Trust 2002-HE1 | | | | 0.934% | | 1/25/33 | | | 436,289 | | | 312,773 | |
56
Semi-Annual Report to Shareholders
| | | | | | | | | | | | | |
| | | % OF
NET ASSETS | | RATE | | MATURITY
DATE | | PAR/
SHARES† | | VALUE | |
| | | | | | | | | | | | | |
Asset-Backed Securities—Continued | | | | | | | | | | | | | |
| | | | | |
Indexed Securities—Continued | | | | | | | | | | | | | |
Countrywide Asset-Backed Certificates 2002-BC1 | | | | 0.974% | | 4/25/32 | | $ | 133,417 | | $ | 57,754 | |
Countrywide Asset-Backed Certificates 2003-1 | | | | 0.994% | | 6/25/33 | | | 263,264 | | | 223,585 | |
Countrywide Asset-Backed Certificates 2003-BC3 | | | | 0.934% | | 9/25/33 | | | 637,078 | | | 349,870 | |
Countrywide Asset-Backed Certificates 2004-2 M1 | | | | 0.814% | | 5/25/34 | | | 390,000 | | | 201,768 | |
Countrywide Asset-Backed Certificates 2006-SD4 A1 | | | | 0.654% | | 12/25/36 | | | 213,738 | | | 87,184 | A |
Countrywide Home Equity Loan Trust 2002-F | | | | 0.669% | | 11/15/28 | | | 341,085 | | | 207,908 | |
Countrywide Home Equity Loan Trust 2004-I A | | | | 0.609% | | 2/15/34 | | | 380,344 | | | 130,789 | |
Countrywide Home Equity Loan Trust 2006-E 2A | | | | 0.459% | | 7/15/36 | | | 405,636 | | | 122,002 | |
Countrywide Home Equity Loan Trust 2006-RES | | | | 0.579% | | 6/15/29 | | | 490,482 | | | 98,096 | A |
Credit-Based Asset Servicing and Securitization 2007-RP1 A | | | | 0.624% | | 5/25/46 | | | 32,706,840 | | | 16,982,209 | A,C |
EMC Mortgage Loan Trust 2002-B A1 | | | | 0.964% | | 2/25/41 | | | 494,005 | | | 264,766 | A,C |
Fairbanks Capital Mortgage Loan Trust 1999-1 A | | | | 1.514% | | 5/25/28 | | | 774,810 | | | 735,856 | A |
Fleet Home Equity Loan Trust 2003-1 | | | | 0.565% | | 1/20/33 | | | 2,745,738 | | | 1,659,185 | |
GMAC Mortgage Corp. Loan Trust 2004-HE3 A2VN | | | | 0.549% | | 10/25/34 | | | 46,723,083 | | | 19,748,452 | C |
GMAC Mortgage Corp. Loan Trust 2004-VF1 A1 | | | | 1.064% | | 2/25/31 | | | 4,776,202 | | | 1,879,967 | A |
GMAC Mortgage Corp. Loan Trust 2005-HE3 A1VN | | | | 0.569% | | 2/25/36 | | | 38,035,096 | | | 9,917,608 | C |
GMAC Mortgage Corp. Loan Trust 2006-HE1 A | | | | 0.524% | | 11/25/36 | | | 1,895,183 | | | 578,199 | |
Greenpoint Mortgage Funding Trust 2005-HE1 | | | | 0.714% | | 9/25/34 | | | 3,787,000 | | | 1,930,435 | |
GSAA Home Equity Trust 2005-6 A3 | | | | 0.684% | | 6/25/35 | | | 5,000,000 | | | 2,323,355 | |
GSAA Home Equity Trust 2007-6 A4 | | | | 0.614% | | 5/25/47 | | | 10,000,000 | | | 3,470,109 | |
GSAMP Trust 2006-S4 | | | | 0.404% | | 5/25/36 | | | 159,189 | | | 19,919 | |
GSRPM Mortgage Loan Trust 2004-1 A1 | | | | 0.794% | | 9/25/42 | | | 931,099 | | | 899,844 | A |
57
Semi-Annual Report to Shareholders
Portfolio of Investments—Continued
Western Asset Core Plus Bond Portfolio—Continued
| | | | | | | | | | | | | |
| | | % OF
NET ASSETS | | RATE | | MATURITY
DATE | | PAR/
SHARES† | | VALUE | |
| | | | | | | | | | | | | |
Asset-Backed Securities—Continued | | | | | | | | | | | | | |
| | | | | |
Indexed Securities—Continued | | | | | | | | | | | | | |
Indymac Home Equity Loan Asset-Backed Trust 2001-A | | | | 0.574% | | 3/25/31 | | $ | 80,902 | | $ | 49,887 | |
Indymac Seconds Asset Backed Trust A-A | | | | 0.444% | | 6/25/36 | | | 541,541 | | | 38,477 | |
Lehman XS Trust 2005-5N | | | | 0.614% | | 11/25/35 | | | 18,177,380 | | | 7,603,633 | |
Lehman XS Trust 2005-5N 3A1A | | | | 0.614% | | 11/25/35 | | | 4,882,407 | | | 2,083,198 | |
Lehman XS Trust 2006-2N 1A1 | | | | 0.574% | | 2/25/46 | | | 3,828,431 | | | 1,603,411 | |
Lehman XS Trust 2006-4N A2A | | | | 0.534% | | 4/25/46 | | | 6,261,760 | | | 2,637,019 | |
Lehman XS Trust 2007-8H A1 | | | | 0.444% | | 6/25/37 | | | 72,282,424 | | | 49,002,265 | |
Lehman XS Trust 2007-9 1A1 | | | | 0.434% | | 6/25/37 | | | 686,252 | | | 477,972 | |
Long Beach Mortgage Loan Trust
2006-8 2A4 | | | | 0.554% | | 9/25/36 | | | 7,500,000 | | | 1,902,240 | |
Long Beach Mortgage Loan Trust
2006-9 2A3 | | | | 0.474% | | 10/25/36 | | | 6,200,000 | | | 1,479,402 | |
Merrill Lynch Mortgage Investors Trust 2007-SD1 A1 | | | | 0.764% | | 2/25/37 | | | 79,900,803 | | | 42,216,684 | |
Morgan Stanley ABS Capital I
2003-HE3 M1 | | | | 0.994% | | 10/25/33 | | | 1,400,000 | | | 707,333 | |
Morgan Stanley Mortgage Loan Trust 2006-4SL A1 | | | | 0.464% | | 3/25/36 | | | 304,577 | | | 55,233 | |
MSDWCC Heloc Trust 2005-1 | | | | 0.504% | | 7/25/17 | | | 1,687,905 | | | 707,068 | |
Nelnet Student Loan Trust 2008-4 A4 | | | | 2.572% | | 4/25/24 | | | 430,000 | | | 423,670 | |
Option One Mortgage Loan Trust 2003-1 | | | | 1.154% | | 2/25/33 | | | 14,177 | | | 7,553 | |
Provident Bank Home Equity Loan Trust 2000-2 | | | | 0.854% | | 8/25/31 | | | 235,705 | | | 78,851 | |
RAAC 2006-RP2 A | | | | 0.564% | | 2/25/37 | | | 367,053 | | | 171,407 | A |
RAAC 2006-RP3 A | | | | 0.584% | | 5/25/36 | | | 37,932 | | | 12,821 | A |
RAAC 2006-RP4 A | | | | 0.604% | | 1/25/46 | | | 25,715,084 | | | 15,624,251 | A |
RAAC 2007-RP2 M1 | | | | 0.964% | | 2/25/46 | | | 600,000 | | | 10,965 | A |
RAAC 2007-SP3 A1 | | | | 1.514% | | 9/25/37 | | | 817,744 | | | 506,962 | |
Renaissance Home Equity Loan Trust 2003-4 A3 | | | | 0.934% | | 3/25/34 | | | 16,281,501 | | | 8,037,858 | |
Renaissance Home Equity Loan Trust 2005-1 | | | | 0.644% | | 5/25/35 | | | 2,468,986 | | | 1,466,039 | |
Residential Asset Mortgage Products Inc. 2003-RS4 | | | | 0.974% | | 5/25/33 | | | 733,977 | | | 377,562 | |
Residential Funding Mortgage Securities II 2003-HS3 | | | | 0.604% | | 8/25/33 | | | 192,301 | | | 109,873 | |
Residential Funding Securities Corp. 2002-RP2 A1 | | | | 1.064% | | 10/25/32 | | | 5,556,263 | | | 2,923,309 | A,C |
SACO I Trust 2006-3 A3 | | | | 0.544% | | 4/25/36 | | | 3,549,710 | | | 532,724 | |
58
Semi-Annual Report to Shareholders
| | | | | | | | | | | | | |
| | | % OF
NET ASSETS | | RATE | | MATURITY
DATE | | PAR/
SHARES† | | VALUE | |
| | | | | | | | | | | | | |
Asset-Backed Securities—Continued | | | | | | | | | | | | | |
| | | | | |
Indexed Securities—Continued | | | | | | | | | | | | | |
SACO I Trust 2006-5 1A | | | | 0.464% | | 4/25/36 | | $ | 332,543 | | $ | 39,389 | |
SACO I Trust 2006-6 A | | | | 0.444% | | 6/25/36 | | | 836,942 | | | 57,973 | |
Salomon Brothers Mortgage Securities VII 2002-CIT1 | | | | 0.614% | | 3/25/32 | | | 233,940 | | | 208,546 | |
Securitized Asset Backed Receivables LLC 2007-BR3 A2B | | | | 0.534% | | 4/25/37 | | | 51,787,000 | | | 12,526,152 | |
Securitized Asset Backed Receivables LLC Trust 2007-BR2 A2 | | | | 0.544% | | 2/25/37 | | | 32,526,719 | | | 12,872,804 | |
SLM Student Loan Trust 2006-10 A2 | | | | 1.102% | | 10/25/17 | | | 91,140 | | | 91,147 | |
SLM Student Loan Trust 2006-5 | | | | 1.082% | | 7/25/17 | | | 215,624 | | | 215,483 | |
Southern Pacific Secured Asset Corp. 1998-2 | | | | 0.654% | | 7/25/29 | | | 18,345 | | | 7,343 | |
Structured Asset Securities Corp.
2006-ARS1 A1 | | | | 0.424% | | 2/25/36 | | | 681,419 | | | 75,564 | A |
Truman Capital Mortgage Loan Trust 2006-1 | | | | 0.574% | | 3/25/36 | | | 19,989,543 | | | 10,494,510 | A,C |
Vanderbilt Mortgage Finance 1999-D | | | | 3.568% | | 1/7/30 | | | 4,100,000 | | | 2,681,949 | |
Wachovia Asset Securitization Inc. 2002-HE1 | | | | 0.684% | | 9/27/32 | | | 576,412 | | | 276,005 | |
Wachovia Asset Securitization Inc. 2002-HE2 | | | | 0.744% | | 12/25/32 | | | 62,082 | | | 25,460 | |
Wachovia Asset Securitization Inc. 2003-HE1 | | | | 0.604% | | 3/25/33 | | | 13,433 | | | 7,762 | |
| | | | | | | | | | | | | |
| | | | | | | | | | | | 248,918,295 | |
| | | | | | | | | | | | | |
Stripped Securities | | N.M. | | | | | | | | | | | |
Oakwood Mortgage Investors Inc. 2001-E | | | | 6.000% | | 11/15/09 | | | 3,621,951 | | | 70,907 | I,K1 |
| | | | | | | | | | | | | |
| | | | | |
Variable Rate SecuritiesL | | 0.1% | | | | | | | | | | | |
Countrywide Asset-Backed Certificates 2004-15 | | | | 4.614% | | 12/25/32 | | | 9,465,485 | | | 6,334,044 | |
Structured Asset Securities Corp.
2005-SC1 1A2 | | | | 9.002% | | 5/25/31 | | | 627,350 | | | 422,566 | A |
Terwin Mortgage Trust 2006-10SL A1 | | | | 4.392% | | 10/25/37 | | | 25,618,309 | | | 1,977,375 | |
Vanderbilt Mortgage Finance 1997-C | | | | 7.830% | | 8/8/27 | | | 399,671 | | | 290,849 | |
| | | | | | | | | | | | | |
| | | | | | | | | | | | 9,024,834 | |
| | | | | | | | | | | | | |
Total Asset-Backed Securities
(Cost—$573,972,858) | | | | | | | | | | | | 279,536,897 | |
59
Semi-Annual Report to Shareholders
Portfolio of Investments—Continued
Western Asset Core Plus Bond Portfolio—Continued
| | | | | | | | | | | | | |
| | | % OF
NET ASSETS | | RATE | | MATURITY
DATE | | PAR/
SHARES† | | VALUE | |
| | | | | | | | | | | | | |
Mortgage-Backed Securities | | 12.1% | | | | | | | | | | | |
| | | | | |
Fixed Rate Securities | | 3.5% | | | | | | | | | | | |
Banc of America Commercial Mortgage Inc. 2006-1 A4 | | | | 5.372% | | 9/10/45 | | $ | 310,000 | | $ | 255,297 | |
Banc of America Commercial Mortgage Inc. 2007-5 A3 | | | | 5.620% | | 2/10/51 | | | 2,430,000 | | | 1,822,711 | |
Banc of America Funding Corp. 2003-1 | | | | 6.000% | | 5/20/33 | | | 386,672 | | | 365,345 | |
Banc of America Funding Corp.
2006-8T2 A2 | | | | 5.791% | | 10/25/36 | | | 73,813 | | | 63,034 | |
Bear Stearns Commercial Mortgage Securities 2007-PW17 A3 | | | | 5.736% | | 6/11/50 | | | 6,250,000 | | | 5,338,047 | |
Commercial Capital Access One Inc. 2I | | | | 12.000% | | 11/15/27 | | | 1,932,371 | | | 376,426 | A |
Commercial Mortgage Pass-Through Certificates 2001-J1A A2 | | | | 6.457% | | 2/14/34 | | | 337,933 | | | 343,661 | A |
Countrywide Alternative Loan Trust
2003-20CB 1A1 | | | | 5.500% | | 10/25/33 | | | 20,033,570 | | | 16,671,687 | |
Credit Suisse Mortgage Capital Certificates 2006-C4 A3 | | | | 5.467% | | 9/15/39 | | | 1,800,000 | | | 1,259,524 | |
GE Capital Commercial Mortgage Corp. 2007-C1 A4 | | | | 5.543% | | 12/10/49 | | | 24,050,000 | | | 16,613,822 | |
GS Mortgage Securities Corp. II 2005-GG4 | | | | 4.680% | | 7/10/39 | | | 18,650,000 | | | 17,953,952 | |
JP Morgan Chase Commercial Mortgage Pass-Through Certificates 2005-CIBC12 | | | | 4.895% | | 9/12/37 | | | 3,000,000 | | | 2,556,595 | |
JP Morgan Chase Commercial Mortgage Securities Corp. 2006-CB15 | | | | 5.814% | | 6/12/43 | | | 2,370,000 | | | 1,864,060 | |
JP Morgan Chase Commercial Mortgage Securities Corp. 2006-CB17 A4 | | | | 5.429% | | 12/12/43 | | | 1,240,000 | | | 1,002,452 | |
JP Morgan Chase Commercial Mortgage Securities Corp. 2006-LDP9 A3 | | | | 5.336% | | 5/15/47 | | | 50,000,000 | | | 38,329,735 | |
JP Morgan Chase Commercial Mortgage Securities Corp. 2007-LDPX A3 | | | | 5.420% | | 5/15/49 | | | 34,910,000 | | | 25,696,884 | |
LB-UBS Commercial Mortgage Trust 2000-C3 A2 | | | | 7.950% | | 5/15/25 | | | 85,156 | | | 86,541 | |
LB-UBS Commercial Mortgage Trust 2005-C3 A5 | | | | 4.739% | | 7/15/30 | | | 4,120,000 | | | 3,525,341 | |
LB-UBS Commercial Mortgage Trust 2005-C3 AAB | | | | 4.664% | | 7/15/30 | | | 4,100,000 | | | 3,941,195 | |
LB-UBS Commercial Mortgage Trust 2005-C5 | | | | 4.954% | | 9/15/30 | | | 1,570,000 | | | 1,345,199 | |
MASTR Reperforming Loan Trust
2005-1 1A1 | | | | 6.000% | | 8/25/34 | | | 4,550,931 | | | 4,675,370 | A |
60
Semi-Annual Report to Shareholders
| | | | | | | | | | | | | |
| | | % OF
NET ASSETS | | RATE | | MATURITY
DATE | | PAR/
SHARES† | | VALUE | |
| | | | | | | | | | | | | |
Mortgage-Backed Securities—Continued | | | | | | | | | | | | | |
| | | | | |
Fixed Rate Securities—Continued | | | | | | | | | | | | | |
MASTR Reperforming Loan Trust
2005-1 1A3 | | | | 7.000% | | 8/25/34 | | $ | 6,564,221 | | $ | 7,220,644 | A |
Merrill Lynch/Countrywide Commercial Mortgage 2007-6 A4 | | | | 5.485% | | 3/12/51 | | | 22,470,000 | | | 15,071,072 | |
Morgan Stanley Capital I 2005-HQ6 | | | | 4.989% | | 8/13/42 | | | 21,070,000 | | | 18,000,798 | |
Morgan Stanley Capital I 2006-IQ12 A4 | | | | 5.332% | | 12/15/43 | | | 300,000 | | | 224,346 | |
Morgan Stanley Capital I 2007-HQ11 A31 | | | | 5.439% | | 2/12/44 | | | 3,995,000 | | | 3,357,239 | |
Morgan Stanley Capital I 2007-IQ14 A4 | | | | 5.692% | | 4/15/49 | | | 20,290,000 | | | 14,789,838 | |
Morgan Stanley Mortgage Loan Trust 2006-2 5A2 | | | | 5.500% | | 2/25/36 | | | 205,504 | | | 198,640 | |
Prime Mortgage Trust 2006-DR1 2A2 | | | | 6.000% | | 11/25/36 | | | 69,459,802 | | | 48,263,713 | A |
Residential Accredit Loans Inc.
2007-QS4 3A9 | | | | 6.000% | | 3/25/37 | | | 9,200,000 | | | 3,997,835 | |
Residential Asset Mortgage Products Inc. 2004-SL2 | | | | 8.500% | | 10/25/31 | | | 200,788 | | | 177,885 | |
Residential Asset Mortgage Products Inc. 2004-SL4 | | | | 7.500% | | 7/25/32 | | | 1,986,732 | | | 1,858,836 | |
Residential Asset Mortgage Products Inc. 2005-SL2 | | | | 7.500% | | 3/25/32 | | | 9,324,452 | | | 5,035,204 | C |
Residential Asset Securitization Trust 2003-A14 | | | | 4.750% | | 2/25/19 | | | 1,961,722 | | | 1,931,683 | |
| | | | | | | | | | | | | |
| | | | | | | | | | | | 264,214,611 | |
| | | | | | | | | | | | | |
Indexed SecuritiesB | | 4.9% | | | | | | | | | | | |
American Home Mortgage Assets Trust 2006-3 | | | | 0.504% | | 7/25/46 | | | 17,466,006 | | | 7,096,698 | |
American Home Mortgage Investment Trust 2005-4 | | | | 0.604% | | 11/25/45 | | | 14,826,876 | | | 6,534,744 | |
Bayview Commercial Asset Trust
2006-2A A1 | | | | 0.544% | | 7/25/36 | | | 1,644,267 | | | 938,712 | A |
Bayview Commercial Asset Trust
2006-SP1 A1 | | | | 0.584% | | 4/25/36 | | | 1,601,782 | | | 1,130,938 | A |
Bear Stearns Second Lien Trust
2007-SV1A A1 | | | | 0.534% | | 12/25/36 | | | 5,572,751 | | | 2,104,672 | A,C |
Chevy Chase Mortgage Funding Corp. 2005-4A A1 | | | | 0.514% | | 10/25/36 | | | 1,297,208 | | | 573,320 | A |
Citigroup Mortgage Loan Trust Inc. 2005-5 | | | | 5.346% | | 8/25/35 | | | 215,265 | | | 116,426 | |
Citigroup Mortgage Loan Trust Inc. 2005-HE2 | | | | 0.714% | | 7/25/35 | | | 7,703,979 | | | 4,611,987 | A |
61
Semi-Annual Report to Shareholders
Portfolio of Investments—Continued
Western Asset Core Plus Bond Portfolio—Continued
| | | | | | | | | | | | | |
| | | % OF
NET ASSETS | | RATE | | MATURITY
DATE | | PAR/
SHARES† | | VALUE | |
| | | | | | | | | | | | | |
Mortgage-Backed Securities—Continued | | | | | | | | | | | | | |
| | | | | |
Indexed Securities—Continued | | | | | | | | | | | | | |
Citigroup Mortgage Loan Trust Inc. 2006-AR9 1A3 | | | | 0.554% | | 11/25/36 | | $ | 37,346,000 | | $ | 7,158,985 | |
Countrywide Alternative Loan Trust 2004-J9 3A4 | | | | 0.704% | | 10/25/34 | | | 103,121 | | | 49,209 | |
Countrywide Alternative Loan Trust 2005-38 A3 | | | | 0.664% | | 9/25/35 | | | 16,195,245 | | | 7,367,570 | |
Countrywide Alternative Loan Trust 2005-44 1A1 | | | | 0.644% | | 10/25/35 | | | 19,773,116 | | | 8,501,218 | |
Countrywide Alternative Loan Trust 2005-44 2A1 | | | | 0.624% | | 10/25/35 | | | 10,122,940 | | | 4,590,158 | |
Countrywide Alternative Loan Trust 2005-56 3A1 | | | | 0.604% | | 11/25/35 | | | 12,458,073 | | | 5,444,365 | |
Countrywide Alternative Loan Trust 2005-56 4A1 | | | | 0.624% | | 11/25/35 | | | 6,403,984 | | | 2,860,488 | |
Countrywide Alternative Loan Trust 2005-59 1A1 | | | | 0.644% | | 11/20/35 | | | 6,102,102 | | | 2,755,986 | |
Countrywide Alternative Loan Trust 2005-72 A1 | | | | 0.584% | | 1/25/36 | | | 4,404,289 | | | 1,923,847 | |
Countrywide Alternative Loan Trust 2005-J12 | | | | 0.584% | | 8/25/35 | | | 767,460 | | | 347,693 | |
Countrywide Alternative Loan Trust
2006-0A10 4A1 | | | | 0.504% | | 8/25/46 | | | 663,034 | | | 260,498 | |
Countrywide Alternative Loan Trust
2006-0A11 A4 | | | | 0.504% | | 9/25/46 | | | 711,576 | | | 269,409 | |
Countrywide Alternative Loan Trust 2006-0A2 A5 | | | | 0.545% | | 5/20/46 | | | 7,278,006 | | | 2,777,489 | |
Countrywide Alternative Loan Trust 2006-0A9 2A1B | | | | 0.515% | | 7/20/46 | | | 729,637 | | | 280,734 | |
Countrywide Alternative Loan Trust 2006-OA1 2A1 | | | | 0.525% | | 3/20/46 | | | 154,280 | | | 63,233 | |
Countrywide Alternative Loan Trust
2006-OA18 A2 | | | | 0.554% | | 12/25/36 | | | 303,881 | | | 56,657 | |
Countrywide Alternative Loan Trust 2006-OA2 A1 | | | | 0.525% | | 5/20/46 | | | 14,255,794 | | | 5,685,058 | |
Countrywide Alternative Loan Trust 2006-OC2 2A3 | | | | 0.604% | | 2/25/36 | | | 10,000,000 | | | 1,409,937 | |
Countrywide Home Loans 2005-09 1A1 | | | | 0.614% | | 5/25/35 | | | 7,512,228 | | | 3,364,924 | |
Countrywide Home Loans 2005-R3 | | | | 0.714% | | 9/25/35 | | | 5,667,669 | | | 3,827,944 | A |
Countrywide Home Loans 2006-OA5 1A1 | | | | 0.514% | | 4/25/46 | | | 4,752,140 | | | 1,803,824 | |
62
Semi-Annual Report to Shareholders
| | | | | | | | | | | | | |
| | | % OF
NET ASSETS | | RATE | | MATURITY
DATE | | PAR/
SHARES† | | VALUE | |
| | | | | | | | | | | | | |
Mortgage-Backed Securities—Continued | | | | | | | | | | | | | |
| | | | | |
Indexed Securities—Continued | | | | | | | | | | | | | |
DSLA Mortgage Loan Trust
2006-AR1 1A1A | | | | 2.260% | | 3/19/46 | | $ | 1,869,450 | | $ | 523,446 | |
DSLA Mortgage Loan Trust
2006-AR1 1A1B | | | | 2.260% | | 3/19/47 | | | 1,448,824 | | | 344,477 | |
First Horizon Alternative Mortgage Securities 2006-FA8 1A8 | | | | 0.684% | | 2/25/37 | | | 673,149 | | | 297,982 | |
GMAC Mortgage Corp. Loan Trust 2005-AR6 2A1 | | | | 5.222% | | 11/19/35 | | | 258,767 | | | 183,767 | |
Greenpoint Mortgage Funding Trust 2005-AR5 2A2 | | | | 0.584% | | 11/25/46 | | | 5,153,138 | | | 1,680,925 | |
Greenpoint Mortgage Funding Trust 2006-AR3 3A1 | | | | 0.544% | | 4/25/36 | | | 5,385,311 | | | 1,937,300 | |
Greenpoint Mortgage Funding Trust 2007-AR2 1A1 | | | | 0.444% | | 4/25/47 | | | 59,883,120 | | | 37,471,198 | |
GSMPS Mortgage Loan Trust 2005-RP2 | | | | 0.664% | | 3/25/35 | | | 18,670,177 | | | 16,963,072 | A |
GSMPS Mortgage Loan Trust 2005-RP3 | | | | 0.664% | | 9/25/35 | | | 28,808,732 | | | 19,836,063 | A |
Harborview Mortgage Loan Trust 2005-3 | | | | 0.553% | | 6/19/35 | | | 15,197,935 | | | 7,116,616 | |
Harborview Mortgage Loan Trust 2005-7 | | | | 3.477% | | 6/19/45 | | | 6,415,360 | | | 2,566,652 | C |
Harborview Mortgage Loan Trust
2006-13 A | | | | 0.493% | | 11/19/46 | | | 714,370 | | | 293,087 | |
Harborview Mortgage Loan Trust 2006-7 | | | | 0.513% | | 10/19/37 | | | 3,560,548 | | | 1,523,865 | |
Harborview Mortgage Loan Trust
2007-4 2A1 | | | | 0.533% | | 7/19/47 | | | 32,265,049 | | | 12,684,652 | |
Impac CMB Trust 2003-4 1A1 | | | | 0.954% | | 10/25/33 | | | 128,222 | | | 76,821 | |
Impac Secured Assets Corp. 2005-2 | | | | 0.634% | | 3/25/36 | | | 423,053 | | | 173,862 | |
Impac Secured Assets Corp. 2006-1 1A2B | | | | 0.514% | | 5/25/36 | | | 173,300 | | | 63,542 | |
Impac Secured Assets Corp. 2006-2 2A1 | | | | 0.664% | | 8/25/36 | | | 4,229,541 | | | 2,344,596 | |
IndyMac Inda Mortgage Loan Trust 2007-AR7 1A1 | | | | 6.142% | | 11/25/37 | | | 13,285,795 | | | 8,666,950 | |
IndyMac Index Mortgage Loan Trust 2004-AR2 2A1 | | | | 0.934% | | 6/25/34 | | | 39,301 | | | 24,267 | |
IndyMac Index Mortgage Loan Trust 2006-AR15 A1 | | | | 0.434% | | 7/25/36 | | | 268,767 | | | 94,493 | |
IndyMac Index Mortgage Loan Trust 2006-AR6 2A1A | | | | 0.514% | | 6/25/47 | | | 650,739 | | | 269,744 | |
La Hipotecaria SA 2007-1GA A | | | | 5.250% | | 12/23/36 | | | 341,013 | | | 265,990 | A |
Lehman XS Trust 2006-GP2 1A1A | | | | 0.384% | | 6/25/46 | | | 291,867 | | | 204,307 | |
Luminent Mortgage Trust 2006-4 A1A | | | | 0.504% | | 5/25/46 | | | 531,826 | | | 198,712 | |
Luminent Mortgage Trust 2006-7 2A1 | | | | 0.484% | | 12/25/36 | | | 4,922,286 | | | 1,927,440 | |
63
Semi-Annual Report to Shareholders
Portfolio of Investments—Continued
Western Asset Core Plus Bond Portfolio—Continued
| | | | | | | | | | | | | |
| | | % OF
NET ASSETS | | RATE | | MATURITY
DATE | | PAR/
SHARES† | | VALUE | |
| | | | | | | | | | | | | |
Mortgage-Backed Securities—Continued | | | | | | | | | | | | | |
| | | | | |
Indexed Securities—Continued | | | | | | | | | | | | | |
MASTR Adjustable Rate Mortgages Trust 2004-13 | | | | 3.469% | | 11/21/34 | | $ | 1,830,000 | | $ | 1,153,160 | |
MASTR Adjustable Rate Mortgages Trust 2006-0A1 1A1 | | | | 0.524% | | 4/25/46 | | | 527,875 | | | 215,763 | |
MASTR Adjustable Rate Mortgages Trust 2007-3 12A1 | | | | 0.514% | | 5/25/47 | | | 949,026 | | | 383,216 | |
MASTR Reperforming Loan Trust
2005-2 1A1F | | | | 0.664% | | 5/25/35 | | | 5,396,464 | | | 3,719,624 | A |
MLCC Mortgage Investors Inc. 2003-B | | | | 0.654% | | 4/25/28 | | | 2,385,905 | | | 1,897,441 | |
MLCC Mortgage Investors Inc. 2006-1 1A | | | | 4.677% | | 2/25/36 | | | 799,427 | | | 693,695 | C |
Novastar Mortgage-Backed Notes
2006-MTA1 2A1A | | | | 0.504% | | 9/25/46 | | | 532,772 | | | 221,962 | |
RBSGC Mortgage Pass-Through Certificates 2007-B 1A4 | | | | 0.764% | | 1/25/37 | | | 40,022,097 | | | 15,606,781 | |
Residential Accredit Loans Inc.
2005-QO3 A1 | | | | 0.714% | | 10/24/45 | | | 2,353,336 | | | 1,068,229 | |
Residential Accredit Loans Inc.
2006-QO10 A1 | | | | 0.474% | | 1/25/37 | | | 13,126,293 | | | 5,281,562 | |
Residential Accredit Loans Inc.
2006-QO8 1A1A | | | | 0.404% | | 10/25/46 | | | 1,747,985 | | | 1,431,705 | |
Residential Accredit Loans Inc.
2007-QO4 A1A | | | | 0.504% | | 5/25/47 | | | 13,292,886 | | | 5,046,619 | |
Sequoia Mortgage Trust A4 | | | | 0.675% | | 11/25/24 | | | 9,995 | | | 7,771 | |
Structured Adjustable Rate Mortgage Loan Trust 2004-20 2A1 | | | | 5.149% | | 1/25/35 | | | 334,256 | | | 226,214 | |
Structured Adjustable Rate Mortgage Loan Trust 2005-19XS | | | | 0.614% | | 10/25/35 | | | 409,083 | | | 193,854 | |
Structured Asset Mortgage Investments Inc. 2006-AR3 11A1 | | | | 0.524% | | 4/25/36 | | | 5,351,424 | | | 2,246,161 | |
Structured Asset Mortgage Investments Inc. 2006-AR6 1A1 | | | | 0.494% | | 7/25/46 | | | 456,592 | | | 187,638 | |
Structured Asset Mortgage Investments Inc. 2006-AR7 A1A | | | | 0.524% | | 8/25/36 | | | 39,186,417 | | | 16,141,148 | |
Structured Asset Mortgage Investments Inc. 2007-AR4 GA4B | | | | 0.494% | | 9/25/47 | | | 1,045,282 | | | 356,471 | |
Terwin Mortgage Trust 2006-9HGA A1 | | | | 0.394% | | 10/25/37 | | | 304,830 | | | 273,054 | A |
WaMu Mortgage Pass-Through Certificates 2005-AR06 2A1A | | | | 0.544% | | 4/25/45 | | | 10,422,846 | | | 5,338,608 | |
WaMu Mortgage Pass-Through Certificates 2005-AR08 1A1A | | | | 0.584% | | 7/25/45 | | | 10,095,938 | | | 4,778,091 | |
64
Semi-Annual Report to Shareholders
| | | | | | | | | | | | | |
| | | % OF
NET ASSETS | | RATE | | MATURITY
DATE | | PAR/
SHARES† | | VALUE | |
| | | | | | | | | | | | | |
Mortgage-Backed Securities—Continued | | | | | | | | | | | | | |
| | | | | |
Indexed Securities—Continued | | | | | | | | | | | | | |
WaMu Mortgage Pass-Through Certificates 2005-AR1 A1A | | | | 0.634% | | 1/25/45 | | $ | 2,412,645 | | $ | 1,213,342 | |
WaMu Mortgage Pass-Through Certificates 2005-AR11 | | | | 0.634% | | 8/25/45 | | | 32,638,704 | | | 17,701,813 | |
WaMu Mortgage Pass-Through Certificates 2005-AR13 A1A1 | | | | 0.604% | | 10/25/45 | | | 18,713,636 | | | 9,790,239 | |
WaMu Mortgage Pass-Through Certificates 2005-AR13 B10 | | | | 1.514% | | 10/25/45 | | | 5,829,154 | | | 76,734 | A |
WaMu Mortgage Pass-Through Certificates 2005-AR15 A1A1 | | | | 0.574% | | 11/25/45 | | | 17,162,947 | | | 8,303,767 | |
WaMu Mortgage Pass-Through Certificates 2005-AR15 A1A2 | | | | 0.594% | | 11/25/45 | | | 26,993,752 | | | 12,271,616 | |
WaMu Mortgage Pass-Through Certificates 2005-AR17 A1A1 | | | | 0.584% | | 12/25/45 | | | 402,087 | | | 189,946 | |
WaMu Mortgage Pass-Through Certificates 2005-AR17 A1A2 | | | | 0.604% | | 12/25/45 | | | 16,672,670 | | | 7,393,412 | |
WaMu Mortgage Pass-Through Certificates 2005-AR19 A1A1 | | | | 0.584% | | 12/25/45 | | | 24,518,328 | | | 11,485,405 | |
WaMu Mortgage Pass-Through Certificates 2005-AR19 A1A2 | | | | 0.604% | | 12/25/45 | | | 26,749,555 | | | 12,500,896 | |
WaMu Mortgage Pass-Through Certificates 2007-0A5 1A | | | | 2.090% | | 6/25/47 | | | 12,556,535 | | | 4,853,435 | C |
Wells Fargo Alternative Loan Trust 2007-PA2 2A1 | | | | 0.744% | | 6/25/37 | | | 48,330,810 | | | 20,360,799 | |
Wells Fargo Mortgage Backed Securities Trust 2006-AR8 3A2 | | | | 5.237% | | 4/25/36 | | | 5,713,000 | | | 3,084,418 | |
| | | | | | | | | | | | | |
| | | | | | | | | | | | 377,335,138 | |
| | | | | | | | | | | | | |
Stripped Securities | | N.M. | | | | | | | | | | | |
Diversified REIT Trust 2001-1A | | | | 1.338% | | 3/8/10 | | | 3,705,380 | | | 84,890 | A,I,K1 |
FFCA Secured Lending Corp. 1999-1A | | | | 1.283% | | 9/18/25 | | | 159,944 | | | 3,681 | A,I,K1 |
GMAC Commercial Mortgage Securities Inc. 1999-CTL1 | | | | 0.326% | | 12/15/16 | | | 3,654 | | | — | A,I,K1 |
LB-UBS Commercial Mortgage Trust 2001-C3 X | | | | 1.144% | | 6/15/36 | | | 8,089,561 | | | 122,288 | A,I,K1 |
| | | | | | | | | | | | | |
| | | | | | | | | | | | 210,859 | |
| | | | | | | | | | | | | |
Variable Rate SecuritiesL | | 3.7% | | | | | | | | | | | |
Banc of America Commercial Mortgage Inc. 2005-5 A4 | | | | 5.115% | | 10/10/45 | | | 8,600,000 | | | 7,342,996 | |
65
Semi-Annual Report to Shareholders
Portfolio of Investments—Continued
Western Asset Core Plus Bond Portfolio—Continued
| | | | | | | | | | | | | |
| | | % OF
NET ASSETS | | RATE | | MATURITY
DATE | | PAR/
SHARES† | | VALUE | |
| | | | | | | | | | | | | |
Mortgage-Backed Securities—Continued | | | | | | | | | | | | | |
| | | | | |
Variable Rate Securities—Continued | | | | | | | | | | | | | |
Banc of America Commercial Mortgage Inc. 2006-2 A4 | | | | 5.929% | | 5/10/45 | | $ | 28,805,000 | | $ | 24,022,385 | |
Banc of America Funding Corp. 2005-F 2A1 | | | | 4.839% | | 9/20/35 | | | 18,502,083 | | | 8,590,965 | |
Bear Stearns Adjustable Rate Mortgage Trust 2005-12 11A1 | | | | 5.030% | | 2/25/36 | | | 558,514 | | | 304,611 | |
Bear Stearns Commercial Mortgage Securities 2005-PW10 A4 | | | | 5.405% | | 12/11/40 | | | 400,000 | | | 355,838 | |
Citigroup Mortgage Loan Trust Inc.
2005-10 1A1A | | | | 5.115% | | 12/25/35 | | | 343,385 | | | 177,146 | |
Commercial Mortgage Asset Trust 1999-C2 | | | | 7.546% | | 11/17/32 | | | 160,554 | | | 162,431 | |
Countrywide Alternative Loan Trust
2004-33 2A1 | | | | 5.184% | | 12/25/34 | | | 41,639 | | | 21,972 | C |
Countrywide Home Loan Mortgage Pass Through Trust 2006-HYB1 2A1 | | | | 5.292% | | 3/20/36 | | | 215,664 | | | 100,981 | |
Countrywide Home Loan Mortgage Pass Through Trust 2006-HYB3 2A1A | | | | 5.683% | | 5/20/36 | | | 884,729 | | | 512,096 | |
Credit Suisse Mortgage Capital Certificates 2006-C1 A4 | | | | 5.609% | | 2/15/39 | | | 2,130,000 | | | 1,723,221 | |
Credit Suisse Mortgage Capital Certificates 2007-C4 A3 | | | | 6.004% | | 9/15/39 | | | 7,700,000 | | | 5,728,924 | |
Credit Suisse Mortgage Capital Certificates 2007-C4 A4 | | | | 6.004% | | 9/15/39 | | | 2,040,000 | | | 1,391,100 | |
Credit Suisse Mortgage Capital Certificates 2007-C5 A3 | | | | 5.694% | | 9/15/40 | | | 2,740,000 | | | 2,147,780 | |
Credit Suisse Mortgage Capital Certificates A3-C2 | | | | 5.846% | | 3/15/39 | | | 8,200,000 | | | 5,859,619 | |
Deutsche Mortgage Securities Inc. 2005-WF1 1A3 | | | | 5.119% | | 6/26/35 | | | 28,770,000 | | | 18,610,927 | A |
GE Capital Commercial Mortgage Corp. 2005-C4 | | | | 5.513% | | 11/10/45 | | | 15,020,000 | | | 12,640,261 | |
GSR Mortgage Loan Trust 2005-AR7 1A1 | | | | 5.388% | | 11/25/35 | | | 2,572,571 | | | 1,674,285 | |
Harborview Mortgage Loan Trust 2006-2 | | | | 4.874% | | 2/25/36 | | | 5,300,558 | | | 2,597,273 | |
IndyMac INDX Mortgage Loan Trust
2004-AR15 | | | | 4.721% | | 2/25/35 | | | 426,148 | | | 208,812 | |
IndyMac INDX Mortgage Loan Trust 2005-AR1 1A1 | | | | 4.714% | | 3/25/35 | | | 312,995 | | | 160,880 | |
IndyMac INDX Mortgage Loan Trust
2005-AR13 | | | | 3.881% | | 8/25/35 | | | 656,585 | | | 355,815 | |
66
Semi-Annual Report to Shareholders
| | | | | | | | | | | | | |
| | | % OF
NET ASSETS | | RATE | | MATURITY
DATE | | PAR/
SHARES† | | VALUE | |
| | | | | | | | | | | | | |
Mortgage-Backed Securities—Continued | | | | | | | | | | | | | |
| | | | | |
Variable Rate Securities—Continued | | | | | | | | | | | | | |
IndyMac INDX Mortgage Loan Trust
2005-AR15 | | | | 5.099% | | 9/25/35 | | $ | 9,280,802 | | $ | 5,737,842 | |
IndyMac INDX Mortgage Loan Trust 2005-AR9 1A1 | | | | 3.675% | | 7/25/35 | | | 136,216 | | | 73,697 | |
JP Morgan Chase Commercial Mortgage Securities Corp. 2005-CB13 | | | | 5.457% | | 1/12/43 | | | 11,800,000 | | | 10,145,723 | |
JP Morgan Chase Commercial Mortgage Securities Corp. 2006-LDP9 HS | | | | 5.939% | | 5/15/47 | | | 5,000,000 | | | 409,922 | A |
JP Morgan Mortgage Trust 2004-A3 SF3 | | | | 4.594% | | 6/25/34 | | | 308,548 | | | 270,063 | |
JP Morgan Mortgage Trust 2007-A2 4A2 | | | | 6.036% | | 4/25/37 | | | 10,700,000 | | | 5,961,985 | |
MASTR Adjustable Rate Mortgages Trust 2004-15 | | | | 5.372% | | 12/25/34 | | | 30,130 | | | 19,796 | |
MASTR Adjustable Rate Mortgages Trust 2004-4 3A1 | | | | 3.507% | | 5/25/34 | | | 1,906,752 | | | 1,663,644 | |
MASTR Adjustable Rate Mortgages Trust 2005-1 7A1 | | | | 4.781% | | 2/25/35 | | | 623,650 | | | 323,401 | |
MASTR Adjustable Rate Mortgages Trust 2006-2 3A1 | | | | 4.853% | | 1/25/36 | | | 2,816,935 | | | 1,960,660 | |
MASTR Adjustable Rate Mortgages Trust 2007-R5 A1 | | | | 5.644% | | 11/25/35 | | | 7,349,454 | | | 3,221,208 | A |
Merrill Lynch Mortgage Investors Inc. 2006-A1 1A1 | | | | 5.802% | | 3/25/36 | | | 33,096,531 | | | 17,982,444 | |
Merrill Lynch Mortgage Investors Trust 2005-A2 A4 | | | | 4.482% | | 2/25/35 | | | 206,113 | | | 167,374 | |
Merrill Lynch Mortgage Trust 2005-CKI1 | | | | 5.415% | | 11/12/37 | | | 18,940,000 | | | 16,065,838 | |
Merrill Lynch Mortgage Trust 2005-MCP1 | | | | 4.747% | | 6/12/43 | | | 12,230,000 | | | 10,497,166 | |
Merrill Lynch Mortgage Trust 2006-C1 A4 | | | | 5.840% | | 5/12/39 | | | 510,000 | | | 415,221 | |
Merrill Lynch/Countrywide Commercial Mortgage Trust 2007-7 A4 | | | | 5.810% | | 6/12/50 | | | 5,150,000 | | | 3,682,738 | |
Merrill Lynch/Countrywide Commercial Mortgage Trust 2007-8 A3 | | | | 6.156% | | 8/12/49 | | | 2,800,000 | | | 1,933,667 | |
Morgan Stanley Mortgage Loan Trust
2004-10AR 4A | | | | 5.452% | | 11/25/34 | | | 4,739,909 | | | 3,804,876 | |
Morgan Stanley Mortgage Loan Trust 2004-8AR 4A1 | | | | 5.274% | | 10/25/34 | | | 9,664 | | | 6,651 | |
Morgan Stanley Mortgage Loan Trust 2005-3AR | | | | 4.149% | | 7/25/35 | | | 6,391,476 | | | 3,687,325 | |
Morgan Stanley Mortgage Loan Trust 2006-6AR 3A1 | | | | 6.073% | | 5/25/36 | | | 9,175,866 | | | 4,385,833 | |
67
Semi-Annual Report to Shareholders
Portfolio of Investments—Continued
Western Asset Core Plus Bond Portfolio—Continued
| | | | | | | | | | | | |
| | | % OF
NET ASSETS | | RATE | | MATURITY
DATE | | PAR/
SHARES† | | VALUE |
| | | | | | | | | | | | |
Mortgage-Backed Securities—Continued | | | | | | | | | | | | |
| | | | | |
Variable Rate Securities—Continued | | | | | | | | | | | | |
Prime Mortgage Trust 2005-2 | | | | 7.429% | | 10/25/32 | | $ | 984,999 | | $ | 852,640 |
Structured Adjustable Rate Mortgage Loan Trust 2004-16 5A2 | | | | 5.070% | | 11/25/34 | | | 34,443,455 | | | 27,423,142 |
Thornburg Mortgage Securities Trust 2004-1 | | | | 4.110% | | 3/25/44 | | | 86,431 | | | 76,812 |
Thornburg Mortgage Securities Trust 2007-4 2A1 | | | | 6.207% | | 9/25/37 | | | 42,353,692 | | | 30,610,419 |
Thornburg Mortgage Securities Trust 2007-4 3A1 | | | | 6.190% | | 9/25/37 | | | 40,036,579 | | | 25,731,894 |
WaMu Mortgage Pass-Through Certificates 2005-AR14 1A1 | | | | 5.040% | | 12/25/35 | | | 553,800 | | | 484,162 |
WaMu Mortgage Pass-Through Certificates 2006-AR10 1A1 | | | | 5.929% | | 9/25/36 | | | 423,566 | | | 272,536 |
WaMu Mortgage Pass-Through Certificates 2007-HY4 4A1 | | | | 5.501% | | 9/25/36 | | | 125,422 | | | 75,813 |
WaMu Mortgage Pass-Through Certificates 2007-HY7 2A3 | | | | 5.805% | | 7/25/37 | | | 23,300,000 | | | 11,685,267 |
Wells Fargo Mortgage Backed Securities Trust 2006-AR8 2A3 | | | | 5.241% | | 4/25/36 | | | 239,151 | | | 175,372 |
| | | | | | | | | | | | |
| | | | | | | | | | | | 284,495,449 |
| | | | | | | | | | | | |
Total Mortgage-Backed Securities
(Cost—$1,435,238,560) | | | | | | | | | | | | 926,256,057 |
Loan Participations and AssignmentsB | | 0.6% | | | | | | | | | | |
| | | | | |
Auto Components | | N.M. | | | | | | | | | | |
Allison Transmission Inc., Term Loan, Tranche B | | | | 3.070% to 3.080% | | 7/13/09 | | | 964,466 | | | 762,272 |
| | | | | | | | | | | | |
| | | | | |
Communications Equipment | | N.M. | | | | | | | | | | |
Panamsat Corp., Term Loan, Tranche A | | | | 2.819% | | 7/6/09 | | | 1,350,000 | | | 1,260,000 |
| | | | | | | | | | | | |
68
Semi-Annual Report to Shareholders
| | | | | | | | | | | | |
| | | % OF
NET ASSETS | | RATE | | MATURITY
DATE | | PAR/
SHARES† | | VALUE |
| | | | | | | | | | | | |
Loan Participations and Assignments—Continued | | | | | | | | | | | | |
| | | | | |
Computers and Peripherals | | N.M. | | | | | | | | | | |
SunGard Data Systems Inc., Term Loan, Tranche B | | | | 2.071% to 2.724% | | 8/11/09 | | $ | 1,945,126 | | $ | 1,799,242 |
| | | | | | | | | | | | |
| | | | | |
Containers and Packaging | | N.M. | | | | | | | | | | |
Amscan Holdings Inc., Term Loan, Tranche B | | | | 2.759% to 3.381% | | 9/28/09 | | | 980,000 | | | 855,050 |
| | | | | | | | | | | | |
| | | | | |
Diversified Consumer Services | | N.M. | | | | | | | | | | |
Thomson Medical Education, First Lien Term Loan | | | | 2.810% | | 7/31/09 | | | 985,000 | | | 824,664 |
| | | | | | | | | | | | |
| | | | | |
Diversified Financial Services | | N.M. | | | | | | | | | | |
CCM Merger Inc., Term Loan, Tranche B | | | | 8.500% | | 9/30/09 | | | 883,686 | | | 737,877 |
| | | | | | | | | | | | |
| | | | | |
Electric Utilities | | N.M. | | | | | | | | | | |
TXU, Term Loan, Tranche B2 | | | | 3.810% to 3.821% | | 7/31/09 | | | 1,231,250 | | | 877,727 |
| | | | | | | | | | | | |
| | | | | |
Health Care Providers and Services | | 0.1% | | | | | | | | | | |
Vanguard Health Holding Co. II, Replacement Term Loan | | | | 2.560% | | 7/31/09 | | | 1,945,682 | | | 1,853,263 |
| | | | | | | | | | | | |
| | | | | |
Hotels, Restaurants and Leisure | | N.M. | | | | | | | | | | |
Metro-Goldwyn-Mayer Studios Inc., Term Loan, Tranche B | | | | 3.560% | | 7/31/09 | | | 1,454,887 | | | 798,976 |
| | | | | | | | | | | | |
| | | | | |
IT Services | | 0.4% | | | | | | | | | | |
First Data Corp., Term Loan, Tranche B1 | | | | 3.060% to 3.065% | | 7/31/09 | | | 36,212,850 | | | 27,094,962 |
| | | | | | | | | | | | |
| | | | | |
Media | | 0.1% | | | | | | | | | | |
Carmike Cinemas Inc., Delayed Draw Term Loan | | | | 5.190% | | 7/13/09 | | | 605,489 | | | 550,616 |
Charter Communications Operating LLC, Term Loan | | | | 6.250% | | 9/30/09 | | | 1,970,000 | | | 1,774,231 |
Citadel Communication Group, Term Loan, Tranche B | | | | 2.350% to 2.930% | | 9/30/09 | | | 1,000,000 | | | 518,333 |
69
Semi-Annual Report to Shareholders
Portfolio of Investments—Continued
Western Asset Core Plus Bond Portfolio—Continued
| | | | | | | | | | | | |
| | | % OF
NET ASSETS | | RATE | | MATURITY
DATE | | PAR/
SHARES† | | VALUE |
| | | | | | | | | | | | |
Loan Participations and Assignments—Continued | | | | | | | | | | | | |
| | | | | |
Media—Continued | | | | | | | | | | | | |
CSC Holdings Inc., Incremental Term Loan, B | | | | 2.069% | | 7/15/09 | | $ | 449,448 | | $ | 421,920 |
CSC Holdings Inc., Incremental Term Loan, B2 | | | | 2.069% | | 7/15/09 | | | 236,942 | | | 222,429 |
Idearc Inc., Term Loan, Tranche B | | | | 6.250% | | 9/30/09 | | | 951,360 | | | 404,328 |
Nielsen Finance LLC, Term Loan, Tranche B | | | | 2.321% | | 7/10/09 | | | 1,710,598 | | | 1,536,213 |
Tribune Co., Tranche B | | | | 5.250% | | 5/17/14 | | | 987,500 | | | 332,869 |
Univision Communications, Term Loan, Tranche B | | | | 2.560% | | 7/31/09 | | | 1,000,000 | | | 743,214 |
UPC Broadband Holding, Term Loan, Tranche N1 | | | | 2.065% | | 7/1/09 | | | 648,288 | | | 598,208 |
UPC, Term Loan | | | | 2.065% | | 10/17/13 | | | 351,712 | | | 333,907 |
| | | | | | | | | | | | |
| | | | | | | | | | | | 7,436,268 |
| | | | | | | | | | | | |
Multiline Retail | | N.M. | | | | | | | | | | |
Dollar General Corp., Term Loan, Tranche B | | | | 3.060% to 3.789% | | 7/31/09 | | | 1,000,000 | | | 948,745 |
| | | | | | | | | | | | |
| | | | | |
Paper and Forest Products | | N.M. | | | | | | | | | | |
Georgia-Pacific Corp., First Lien Term Loan | | | | 2.310% to 2.650% | | 9/10/09 | | | 867,884 | | | 816,304 |
| | | | | | | | | | | | |
| | | | | |
Road and Rail | | N.M. | | | | | | | | | | |
Swift Transportation, Term Loan | | | | 3.625% | | 7/6/09 | | | 881,775 | | | 651,962 |
| | | | | | | | | | | | |
| | | | | |
Semiconductors and Semiconductor Equipment | | N.M. | | | | | | | | | | |
Sensata Technologies, Term Loan, Tranche B | | | | 2.804% | | 7/29/09 | | | 1,458,750 | | | 1,103,788 |
| | | | | | | | | | | | |
Total Loan Participations and Assignments
(Cost—$60,889,743) | | | | | | | | | | | | 47,821,100 |
70
Semi-Annual Report to Shareholders
| | | | | | | | | | | | | |
| | | % OF
NET ASSETS | | RATE | | MATURITY
DATE | | PAR/
SHARES† | | VALUE | |
| | | | | | | | | | | | | |
U.S. Government and Agency Obligations | | 10.6% | | | | | | | | | | | |
| | | | | |
Fixed Rate Securities | | 5.3% | | | | | | | | | | | |
Fannie Mae | | | | 6.250% | | 2/1/11 | | $ | 6,960,000 | | $ | 7,320,459 | M |
Fannie Mae | | | | 5.250% | | 8/1/12 | | | 6,050,000 | | | 6,286,555 | M |
Fannie Mae | | | | 5.000% | | 5/20/24 | | | 75,000,000 | | | 73,840,050 | M |
Federal Home Loan Bank | | | | 5.500% | | 7/15/36 | | | 3,040,000 | | | 3,100,143 | |
Freddie Mac | | | | 4.875% | | 2/9/10 | | | 20,000,000 | | | 20,538,560 | M |
Tennessee Valley Authority | | | | 7.125% | | 5/1/30 | | | 840,000 | | | 1,016,052 | |
Tennessee Valley Authority | | | | 5.980% | | 4/1/36 | | | 120,000 | | | 127,638 | |
United States Treasury Bonds | | | | 8.750% | | 5/15/17 | | | 10,000 | | | 13,694 | |
United States Treasury Bonds | | | | 8.875% | | 8/15/17 | | | 10,000 | | | 13,823 | |
United States Treasury Bonds | | | | 4.500% | | 5/15/38 | | | 9,552,000 | | | 9,860,950 | |
United States Treasury Bonds | | | | 3.500% | | 2/15/39 | | | 16,190,000 | | | 13,999,331 | |
United States Treasury Bonds | | | | 4.250% | | 5/15/39 | | | 11,330,000 | | | 11,214,887 | |
United States Treasury Notes | | | | 2.625% | | 6/30/14 | | | 228,210,000 | | | 228,924,297 | |
United States Treasury Notes | | | | 3.250% | | 6/30/16 | | | 1,600,000 | | | 1,605,000 | |
United States Treasury Notes | | | | 2.750% | | 2/15/19 | | | 32,000,000 | | | 29,969,920 | |
United States Treasury Notes | | | | 3.125% | | 5/15/19 | | | 3,178,000 | | | 3,073,730 | |
| | | | | | | | | | | | | |
| | | | | | | | | | | | 410,905,089 | |
| | | | | | | | | | | | | |
Stripped Securities | | 0.2% | | | | | | | | | | | |
United States Treasury Bonds | | | | 0.000% | | 11/15/24 | | | 510,000 | | | 257,942 | K2 |
United States Treasury Notes | | | | 0.000% | | 5/15/18 | | | 17,210,000 | | | 12,450,815 | K2 |
| | | | | | | | | | | | | |
| | | | | | | | | | | | 12,708,757 | |
| | | | | | | | | | | | | |
Treasury Inflation-Protected SecuritiesN | | 5.1% | | | | | | | | | | | |
United States Treasury Inflation- Protected Security | | | | 0.875% | | 4/15/10 | | | 1,519,438 | | | 1,519,438 | |
United States Treasury Inflation- Protected Security | | | | 2.375% | | 1/15/25 | | | 73,254,569 | | | 75,291,925 | |
United States Treasury Inflation- Protected Security | | | | 2.000% | | 1/15/26 | | | 54,015,301 | | | 52,884,329 | O |
United States Treasury Inflation- Protected Security | | | | 2.375% | | 1/15/27 | | | 157,729,506 | | | 163,299,250 | O |
United States Treasury Inflation- Protected Security | | | | 1.750% | | 1/15/28 | | | 14,330,342 | | | 13,524,261 | O |
United States Treasury Inflation- Protected Security | | | | 3.625% | | 4/15/28 | | | 24,744,491 | | | 30,110,952 | O |
71
Semi-Annual Report to Shareholders
Portfolio of Investments—Continued
Western Asset Core Plus Bond Portfolio—Continued
| | | | | | | | | | | | | |
| | | % OF
NET ASSETS | | RATE | | MATURITY
DATE | | PAR/
SHARES† | | VALUE | |
| | | | | | | | | | | | | |
U.S. Government and Agency Obligations—Continued | | | | | | | | | | | | | |
| | | | | |
Treasury Inflation-Protected Securities—Continued | | | | | | | | | | | | | |
United States Treasury Inflation- Protected Security | | | | 3.875% | | 4/15/29 | | $ | 40,843,475 | | $ | 51,820,159 | O |
| | | | | | | | | | | | | |
| | | | | | | | | | | | 388,450,314 | |
| | | | | | | | | | | | | |
Total U.S. Government and Agency Obligations
(Cost—$790,042,201) | | | | | | | | | | | | 812,064,160 | |
U.S. Government Agency Mortgage-Backed Securities | | 39.5% | | | | | | | | | | | |
| | | | | |
Fixed Rate Securities | | 36.4% | | | | | | | | | | | |
Fannie Mae | | | | 6.500% | | 5/1/14 to 4/1/36 | | | 11,083,127 | | | 11,846,781 | M |
Fannie Mae | | | | 5.500% | | 1/1/17 to 3/1/37 | | | 301,106,054 | | | 311,702,474 | M |
Fannie Mae | | | | 9.500% | | 11/1/21 | | | 1,084 | | | 1,188 | M |
Fannie Mae | | | | 6.000% | | 4/1/24 to 8/1/37 | | | 8,363,740 | | | 8,789,333 | M |
Fannie Mae | | | | 5.000% | | 12/1/24 | | | 50,000,000 | | | 51,734,400 | M,P |
Fannie Mae | | | | 6.000% | | 12/1/24 to 12/1/39 | | | 74,430,000 | | | 77,893,976 | M,P |
Fannie Mae | | | | 7.000% | | 8/1/29 to 6/1/32 | | | 3,274,245 | | | 3,587,140 | M |
Fannie Mae | | | | 7.500% | | 11/1/29 | | | 16,096 | | | 17,535 | M |
Fannie Mae | | | | 5.000% | | 10/1/35 | | | 1,524,052,093 | | | 1,561,950,986 | M |
Fannie Mae | | | | 6.500% | | 12/1/39 | | | 119,200,000 | | | 126,948,000 | M,P |
Freddie Mac | | | | 6.000% | | 4/1/11 to 11/1/36 | | | 4,794,424 | | | 5,074,830 | M |
Freddie Mac | | | | 5.500% | | 12/1/13 to 7/1/20 | | | 907,350 | | | 954,675 | M |
Freddie Mac | | | | 7.000% | | 10/1/16 to 4/1/32 | | | 1,056,426 | | | 1,146,680 | M |
Freddie Mac | | | | 6.500% | | 7/1/29 | | | 256,267 | | | 275,332 | M |
Freddie Mac | | | | 5.000% | | 11/1/36 | | | 39,530,373 | | | 40,362,672 | M |
Freddie Mac | | | | 5.000% | | 12/1/39 | | | 145,800,000 | | | 148,260,375 | M,P |
Freddie Mac | | | | 5.500% | | 12/1/39 | | | 65,400,000 | | | 67,505,095 | M,P |
Government National Mortgage Association | | | | 7.500% | | 3/15/23 to 9/15/31 | | | 195,379 | | | 214,159 | |
Government National Mortgage Association | | | | 7.000% | | 7/15/23 to 7/15/31 | | | 544,374 | | | 593,405 | |
Government National Mortgage Association | | | | 6.500% | | 4/15/28 to 4/15/33 | | | 12,233,114 | | | 13,152,251 | |
Government National Mortgage Association | | | | 6.000% | | 1/15/29 to 11/15/35 | | | 57,877,166 | | | 60,668,245 | |
Government National Mortgage Association | | | | 8.000% | | 12/15/30 to 1/15/31 | | | 23,612 | | | 26,681 | |
72
Semi-Annual Report to Shareholders
| | | | | | | | | | | | | |
| | | % OF
NET ASSETS | | RATE | | MATURITY
DATE | | PAR/
SHARES† | | VALUE | |
| | | | | | | | | | | | | |
U.S. Government Agency Mortgage-Backed Securities—Continued | | | | | | | | | | | | | |
| | | | | |
Indexed Securities—Continued | | | | | | | | | | | | | |
Government National Mortgage Association | | | | 5.000% | | 7/15/33 to 11/15/35 | | $ | 60,241,649 | | $ | 61,623,715 | |
Government National Mortgage Association | | | | 5.500% | | 7/15/33 to 6/15/35 | | | 16,731,970 | | | 17,379,088 | |
Government National Mortgage Association | | | | 4.000% | | 12/1/39 | | | 85,000,000 | | | 82,051,250 | P |
Government National Mortgage Association | | | | 5.000% | | 12/1/39 | | | 129,800,000 | | | 132,314,875 | P |
| | | | | | | | | | | | | |
| | | | | | | | | | | | 2,786,075,141 | |
| | | | | | | | | | | | | |
Indexed SecuritiesB | | 2.4% | | | | | | | | | | | |
Fannie Mae | | | | 4.601% | | 5/1/35 | | | 4,002,955 | | | 4,139,443 | M |
Fannie Mae | | | | 4.471% | | 6/1/35 | | | 10,751,277 | | | 11,113,117 | M |
Fannie Mae | | | | 5.341% | | 6/1/35 | | | 2,580,399 | | | 2,687,341 | M |
Fannie Mae | | | | 5.117% | | 8/1/35 | | | 1,170,955 | | | 1,198,231 | M |
Fannie Mae | | | | 5.018% | | 9/1/35 | | | 2,722,345 | | | 2,793,326 | M |
Fannie Mae | | | | 5.135% | | 9/1/35 | | | 6,589,966 | | | 6,748,010 | M |
Fannie Mae | | | | 4.873% | | 10/1/35 | | | 2,311,443 | | | 2,386,837 | M |
Fannie Mae | | | | 4.905% | | 10/1/35 | | | 2,464,612 | | | 2,524,731 | M |
Fannie Mae | | | | 4.999% | | 10/1/35 | | | 2,580,769 | | | 2,646,222 | M |
Fannie Mae | | | | 5.672% | | 10/1/35 | | | 2,197,033 | | | 2,271,004 | M |
Fannie Mae | | | | 3.408% | | 11/1/35 | | | 329,288 | | | 334,400 | M |
Fannie Mae | | | | 3.417% | | 11/1/35 | | | 275,820 | | | 280,108 | M |
Fannie Mae | | | | 3.433% | | 11/1/35 | | | 281,697 | | | 286,091 | M |
Fannie Mae | | | | 3.434% | | 11/1/35 | | | 284,394 | | | 288,829 | M |
Fannie Mae | | | | 3.436% | | 11/1/35 | | | 271,199 | | | 275,429 | M |
Fannie Mae | | | | 5.306% | | 12/1/35 | | | 4,038,937 | | | 4,205,435 | M |
Fannie Mae | | | | 5.500% | | 2/1/36 | | | 665,121 | | | 694,615 | M |
Fannie Mae | | | | 5.486% | | 2/1/37 | | | 30,352,643 | | | 31,805,493 | M |
Fannie Mae | | | | 5.738% | | 8/1/37 | | | 1,059,794 | | | 1,107,392 | M |
Fannie Mae | | | | 5.531% | | 11/1/37 | | | 401,313 | | | 419,986 | M |
Freddie Mac | | | | 4.679% | | 8/1/35 | | | 12,972,482 | | | 13,218,712 | M |
Freddie Mac | | | | 4.772% | | 9/1/35 | | | 4,975,235 | | | 5,092,810 | M |
Freddie Mac | | | | 5.156% | | 9/1/35 | | | 1,750,344 | | | 1,818,916 | M |
Freddie Mac | | | | 5.001% | | 10/1/35 | | | 2,964,598 | | | 3,059,928 | M |
Freddie Mac | | | | 5.106% | | 12/1/35 | | | 5,701,047 | | | 5,917,803 | M |
Freddie Mac | | | | 5.184% | | 12/1/35 | | | 396,327 | | | 411,781 | M |
Freddie Mac | | | | 5.753% | | 2/1/37 | | | 51,732 | | | 54,403 | M |
73
Semi-Annual Report to Shareholders
Portfolio of Investments—Continued
Western Asset Core Plus Bond Portfolio—Continued
| | | | | | | | | | | | | |
| | | % OF
NET ASSETS | | RATE | | MATURITY
DATE | | PAR/
SHARES† | | VALUE | |
| | | | | | | | | | | | | |
U.S. Government Agency Mortgage-Backed Securities—Continued | | | | | | | | | | | | | |
| | | | | |
Indexed Securities—Continued | | | | | | | | | | | | | |
Freddie Mac | | | | 5.784% | | 5/1/37 | | $ | 5,043,680 | | $ | 5,298,958 | M |
Freddie Mac | | | | 5.849% | | 5/1/37 | | | 13,421,755 | | | 14,106,603 | M |
Freddie Mac | | | | 5.867% | | 5/1/37 | | | 97,182 | | | 102,090 | M |
Freddie Mac | | | | 5.923% | | 5/1/37 | | | 552,278 | | | 581,831 | M |
Freddie Mac | | | | 5.381% | | 6/1/37 | | | 980,817 | | | 1,024,868 | M |
Freddie Mac | | | | 5.826% | | 6/1/37 | | | 2,531,899 | | | 2,660,583 | M |
Freddie Mac | | | | 5.900% | | 7/1/37 | | | 35,572,473 | | | 37,241,788 | M |
Freddie Mac | | | | 5.890% | | 8/1/37 | | | 12,237,845 | | | 12,863,389 | M |
Freddie Mac | | | | 6.087% | | 9/1/37 | | | 239,511 | | | 251,158 | M |
Government National Mortgage Association | | | | 0.715% | | 8/20/31 | | | 2,155 | | | 2,121 | |
| | | | | | | | | | | | | |
| | | | | | | | | | | | 181,913,782 | |
| | | | | | | | | | | | | |
| | | | | | | | | | | | | |
Stripped Securities | | 0.7% | | | | | | | | | | | |
Financing Corp. | | | | 0.000% | | 11/30/17 to 4/5/19 | | | 1,570,000 | | | 1,047,821 | I,K2 |
Financing Corp. | | | | 0.000% | | 2/8/18 to 9/26/19 | | | 83,954,000 | | | 54,957,823 | K2 |
| | | | | | | | | | | | | |
| | | | | | | | | | | | 56,005,644 | |
| | | | | | | | | | | | | |
Total U.S. Government Agency Mortgage-Backed Securities
(Cost—$2,948,238,617) | | | | | | | | | | | | 3,023,994,567 | |
Yankee BondsQ | | 7.2% | | | | | | | | | | | |
| | | | | |
Aerospace and Defense | | 0.1% | | | | | | | | | | | |
Systems 2001 Asset Trust | | | | 6.664% | | 9/15/13 | | | 7,398,695 | | | 7,398,695 | A |
| | | | | | | | | | | | | |
| | | | | |
Commercial Banks | | 1.3% | | | | | | | | | | | |
Eksportfinans ASA | | | | 5.500% | | 5/25/16 | | | 260,000 | | | 271,480 | |
Glitnir Banki Hf | | | | 6.330% | | 7/28/11 | | | 10,670,000 | | | 1,733,875 | A,D,I |
Glitnir Banki Hf | | | | 6.375% | | 9/25/12 | | | 18,040,000 | | | 2,931,500 | A,D,I |
HBOS Capital Funding LP | | | | 6.071% | | 6/30/49 | | | 60,000 | | | 21,870 | A,E |
HSBC Capital Funding LP | | | | 4.610% | | 6/27/49 | | | 2,090,000 | | | 1,469,667 | A,E |
Hypothekenbank in Essen AG | | | | 5.000% | | 1/20/12 | | | 1,380,000 | | | 1,421,789 | A |
ICICI Bank Ltd. | | | | 6.375% | | 4/30/22 | | | 14,709,000 | | | 11,470,902 | A,E |
ICICI Bank Ltd. | | | | 6.375% | | 4/30/22 | | | 15,561,000 | | | 12,154,324 | A,E |
Kaupthing Bank Hf | | | | 5.750% | | 10/4/11 | | | 5,550,000 | | | 721,500 | A,D,I |
Kaupthing Bank Hf | | | | 7.625% | | 2/28/15 | | | 80,340,000 | | | 6,427,200 | A,D,I |
Korea Development Bank | | | | 5.500% | | 11/13/12 | | | 60,000 | | | 60,965 | |
74
Semi-Annual Report to Shareholders
| | | | | | | | | | | | | |
| | | % OF
NET ASSETS | | RATE | | MATURITY
DATE | | PAR/
SHARES† | | VALUE | |
| | | | | | | | | | | | | |
Yankee Bonds—Continued | | | | | | | | | | | | | |
| | | | | |
Commercial Banks—Continued | | | | | | | | | | | | | |
Landsbanki Islands Hf | | | | 6.100% | | 8/25/11 | | $ | 28,520,000 | | $ | 855,600 | A,D,I |
Rabobank Nederland NV | | | | 11.000% | | 6/30/19 | | | 11,897,000 | | | 13,235,412 | A,E |
Resona Preferred Global Securities | | | | 7.191% | | 12/29/49 | | | 11,950,000 | | | 8,723,500 | A,E |
Royal Bank of Scotland Group PLC | | | | 7.640% | | 3/31/49 | | | 7,500,000 | | | 3,037,500 | E |
RSHB Capital SA | | | | 6.299% | | 5/15/17 | | | 30,690,000 | | | 26,393,400 | A |
Shinsei Finance Cayman Ltd. | | | | 6.418% | | 1/29/49 | | | 26,025,000 | | | 10,410,000 | A,E |
| | | | | | | | | | | | | |
| | | | | | | | | | | | 101,340,484 | |
| | | | | | | | | | | | | |
Diversified Financial Services | | 0.5% | | | | | | | | | | | |
Aiful Corp. | | | | 5.000% | | 8/10/10 | | | 12,610,000 | | | 7,692,100 | A |
Credit Suisse Guernsey Ltd. | | | | 5.860% | | 5/29/49 | | | 150,000 | | | 97,500 | E |
European Investment Bank | | | | 4.000% | | 3/3/10 | | | 100,000 | | | 102,423 | |
European Investment Bank | | | | 4.625% | | 3/21/12 | | | 50,000 | | | 53,412 | |
MUFG Capital Finance 1 Ltd. | | | | 6.346% | | 7/29/49 | | | 7,400,000 | | | 6,478,034 | E |
Pemex Finance Ltd. | | | | 9.030% | | 2/15/11 | | | 3,500 | | | 3,745 | |
SMFG Preferred Capital | | | | 6.078% | | 1/29/49 | | | 350,000 | | | 279,745 | A,E |
TNK-BP Finance SA | | | | 7.500% | | 7/18/16 | | | 1,650,000 | | | 1,435,500 | A |
TNK-BP Finance SA | | | | 7.500% | | 7/18/16 | | | 17,520,000 | | | 14,935,800 | A |
TNK-BP Finance SA | | | | 6.625% | | 3/20/17 | | | 724,000 | | | 571,960 | A |
TNK-BP Finance SA | | | | 6.625% | | 3/20/17 | | | 11,350,000 | | | 8,966,500 | A |
| | | | | | | | | | | | | |
| | | | | | | | | | | | 40,616,719 | |
| | | | | | | | | | | | | |
Diversified Telecommunication Services | | 0.9% | | | | | | | | | | | |
British Telecommunications PLC | | | | 9.125% | | 12/15/10 | | | 2,315,000 | | | 2,458,697 | F |
British Telecommunications PLC | | | | 9.625% | | 12/15/30 | | | 11,160,000 | | | 12,372,623 | F |
Deutsche Telekom International Finance BV | | | | 5.750% | | 3/23/16 | | | 20,180,000 | | | 20,661,555 | |
Intelsat Bermuda Ltd. | | | | 9.500% | | 6/15/16 | | | 1,367,000 | | | 1,373,835 | A |
Koninklijke (Royal) KPN NV | | | | 8.000% | | 10/1/10 | | | 14,800,000 | | | 15,529,300 | |
Telecom Italia Capital SpA | | | | 5.250% | | 11/15/13 | | | 1,260,000 | | | 1,235,541 | |
Telecom Italia Capital SpA | | | | 4.950% | | 9/30/14 | | | 3,730,000 | | | 3,570,800 | |
Telecom Italia Capital SpA | | | | 5.250% | | 10/1/15 | | | 6,280,000 | | | 6,062,316 | |
Wind Acquisition Finance SA | | | | 10.750% | | 12/1/15 | | | 4,800,000 | | | 4,800,000 | A |
| | | | | | | | | | | | | |
| | | | | | | | | | | | 68,064,667 | |
| | | | | | | | | | | | | |
Electric Utilities | | N.M. | | | | | | | | | | | |
Hydro-Quebec | | | | 6.300% | | 5/11/11 | | | 1,720,000 | | | 1,864,186 | |
| | | | | | | | | | | | | |
| | | | | |
Energy Equipment and Services | | 0.2% | | | | | | | | | | | |
Compagnie Generale de Geophysique-Veritas | | | | 7.500% | | 5/15/15 | | | 1,970,000 | | | 1,807,475 | |
75
Semi-Annual Report to Shareholders
Portfolio of Investments—Continued
Western Asset Core Plus Bond Portfolio—Continued
| | | | | | | | | | | | | |
| | | % OF
NET ASSETS | | RATE | | MATURITY
DATE | | PAR/
SHARES† | | VALUE | |
| | | | | | | | | | | | | |
Yankee Bonds—Continued | | | | | | | | | | | | | |
| | | | | |
Energy Equipment and Services—Continued | | | | | | | | | | | | | |
Compagnie Generale de Geophysique-Veritas | | | | 7.750% | | 5/15/17 | | $ | 8,594,000 | | $ | 7,820,540 | |
Transocean Inc. | | | | 5.250% | | 3/15/13 | | | 290,000 | | | 300,716 | |
Transocean Ltd. | | | | 6.000% | | 3/15/18 | | | 6,000,000 | | | 6,237,696 | |
| | | | | | | | | | | | | |
| | | | | | | | | | | | 16,166,427 | |
| | | | | | | | | | | | | |
| | | | | |
Food and Staples Retailing | | N.M. | | | | | | | | | | | |
Delhaize Group | | | | 6.500% | | 6/15/17 | | | 120,000 | | | 122,541 | |
| | | | | | | | | | | | | |
| | | | | |
Foreign Governments | | 0.4% | | | | | | | | | | | |
Province of British Columbia | | | | 4.300% | | 5/30/13 | | | 180,000 | | | 181,874 | |
Russian Federation | | | | 7.500% | | 3/31/30 | | | 20,050,560 | | | 19,739,776 | A |
United Mexican States | | | | 5.625% | | 1/15/17 | | | 374,000 | | | 378,114 | |
United Mexican States | | | | 6.750% | | 9/27/34 | | | 7,443,000 | | | 7,506,266 | |
| | | | | | | | | | | | | |
| | | | | | | | | | | | 27,806,030 | |
| | | | | | | | | | | | | |
Gas Utilities | | 0.2% | | | | | | | | | | | |
Intergas Finance BV | | | | 6.375% | | 5/14/17 | | | 12,570,000 | | | 9,553,200 | A |
Intergas Finance BV | | | | 6.375% | | 5/14/17 | | | 2,055,000 | | | 1,530,975 | A |
| | | | | | | | | | | | | |
| | | | | | | | | | | | 11,084,175 | |
| | | | | | | | | | | | | |
Industrial Conglomerates | | 0.8% | | | | | | | | | | | |
Tyco International Group SA | | | | 6.750% | | 2/15/11 | | | 35,798,000 | | | 37,189,432 | |
Tyco International Group SA | | | | 6.375% | | 10/15/11 | | | 15,948,000 | | | 16,804,918 | |
Tyco International Group SA | | | | 6.000% | | 11/15/13 | | | 5,398,000 | | | 5,488,784 | |
| | | | | | | | | | | | | |
| | | | | | | | | | | | 59,483,134 | |
| | | | | | | | | | | | | |
Insurance | | 0.3% | | | | | | | | | | | |
Merna Reinsurance Ltd. | | | | 2.348% | | 6/30/12 | | | 26,450,000 | | | 24,635,530 | A,B |
| | | | | | | | | | | | | |
| | | | | |
Media | | N.M. | | | | | | | | | | | |
Rogers Cable Inc. | | | | 7.875% | | 5/1/12 | | | 687,000 | | | 740,478 | |
Rogers Cable Inc. | | | | 6.750% | | 3/15/15 | | | 130,000 | | | 137,699 | |
Shaw Communications Inc. | | | | 7.250% | | 4/6/11 | | | 630,000 | | | 648,900 | |
Sun Media Corp. | | | | 7.625% | | 2/15/13 | | | 1,125,000 | | | 739,688 | |
| | | | | | | | | | | | | |
| | | | | | | | | | | | 2,266,765 | |
| | | | | | | | | | | | | |
Metals and Mining | | 1.1% | | | | | | | | | | | |
Barrick Gold Corp. | | | | 6.950% | | 4/1/19 | | | 7,165,000 | | | 8,024,843 | |
BHP Billiton Finance USA Ltd. | | | | 6.500% | | 4/1/19 | | | 23,410,000 | | | 25,997,390 | |
76
Semi-Annual Report to Shareholders
| | | | | | | | | | | | | |
| | | % OF
NET ASSETS | | RATE | | MATURITY
DATE | | PAR/
SHARES† | | VALUE | |
| | | | | | | | | | | | | |
Yankee Bonds—Continued | | | | | | | | | | | | | |
| | | | | |
Metals and Mining—Continued | | | | | | | | | | | | | |
Corporacion Nacional del Cobre-Codelco | | | | 4.750% | | 10/15/14 | | $ | 2,590,000 | | $ | 2,667,988 | A |
Evraz Group SA | | | | 8.875% | | 4/24/13 | | | 27,310,000 | | | 22,394,200 | A |
Evraz Group SA Series 2008 | | | | 8.875% | | 4/24/13 | | | 2,150,000 | | | 1,811,377 | A |
Rio Tinto Finance (USA) Ltd. | | | | 6.500% | | 7/15/18 | | | 6,528,000 | | | 6,531,806 | |
Rio Tinto Finance USA Ltd. | | | | 5.875% | | 7/15/13 | | | 3,467,000 | | | 3,488,728 | |
Teck Resources Ltd. | | | | 9.750% | | 5/15/14 | | | 800,000 | | | 828,000 | A |
Teck Resources Ltd. | | | | 10.250% | | 5/15/16 | | | 640,000 | | | 670,400 | A |
Teck Resources Ltd. | | | | 10.750% | | 5/15/19 | | | 1,330,000 | | | 1,429,750 | A |
Vale Overseas Ltd. | | | | 8.250% | | 1/17/34 | | | 20,000 | | | 22,494 | |
Vale Overseas Ltd. | | | | 6.875% | | 11/21/36 | | | 14,286,000 | | | 13,564,628 | |
| | | | | | | | | | | | | |
| | | | | | | | | | | | 87,431,604 | |
| | | | | | | | | | | | | |
Oil, Gas and Consumable Fuels | | 1.2% | | | | | | | | | | | |
Anadarko Finance Co. | | | | 7.500% | | 5/1/31 | | | 16,297,000 | | | 15,902,107 | |
BP Capital Markets PLC | | | | 5.250% | | 11/7/13 | | | 25,550,000 | | | 27,423,096 | |
Conoco Funding Co. | | | | 6.350% | | 10/15/11 | | | 590,000 | | | 643,915 | |
Conoco Funding Co. | | | | 7.250% | | 10/15/31 | | | 810,000 | | | 887,956 | |
Gazprom | | | | 6.212% | | 11/22/16 | | | 15,320,000 | | | 12,792,200 | A |
Gazprom | | | | 6.510% | | 3/7/22 | | | 6,778,000 | | | 5,083,500 | A |
OPTI Canada Inc. | | | | 8.250% | | 12/15/14 | | | 2,405,000 | | | 1,587,300 | |
Petrobras International Finance Co. | | | | 6.125% | | 10/6/16 | | | 11,400,000 | | | 11,685,000 | |
Shell International Finance BV | | | | 6.375% | | 12/15/38 | | | 11,845,000 | | | 12,901,846 | |
Teekay Shipping Corp. | | | | 8.875% | | 7/15/11 | | | 1,729,000 | | | 1,716,033 | |
| | | | | | | | | | | | | |
| | | | | | | | | | | | 90,622,953 | |
| | | | | | | | | | | | | |
Road and Rail | | 0.1% | | | | | | | | | | | |
Kansas City Southern de Mexico | | | | 12.500% | | 4/1/16 | | | 6,195,000 | | | 6,287,925 | |
| | | | | | | | | | | | | |
| | | | | |
Thrifts and Mortgage Finance | | N.M. | | | | | | | | | | | |
Willow Re Ltd. | | | | 6.295% | | 6/16/10 | | | 250,000 | | | 120,000 | A,B,D |
| | | | | | | | | | | | | |
| | | | | |
Wireless Telecommunication Services | | 0.1% | | | | | | | | | | | |
America Movil SA de CV | | | | 5.625% | | 11/15/17 | | | 6,290,000 | | | 6,147,884 | |
Rogers Wireless Inc. | | | | 6.375% | | 3/1/14 | | | 1,850,000 | | | 1,982,961 | |
| | | | | | | | | | | | | |
| | | | | | | | | | | | 8,130,845 | |
| | | | | | | | | | | | | |
Total Yankee Bonds (Cost—$725,933,386) | | | | | | | | | | | | 553,442,680 | |
77
Semi-Annual Report to Shareholders
Portfolio of Investments—Continued
Western Asset Core Plus Bond Portfolio—Continued
| | | | | | | | | | | | | | |
| | | % OF
NET ASSETS | | RATE | | MATURITY
DATE | | PAR/
SHARES† | | | VALUE | |
| | | | | | | | | | | | | | |
Foreign Government Obligations | | 1.0% | | | | | | | | | | | | |
Brazil Notas do Tesouro Nacional Series F | | | | 10.000% | | 1/1/12 | | | 147,147,000 | BRL | | $ | 69,426,007 | |
Canadian Real Return Bond | | | | 4.000% | | 12/1/31 | | | 7,092,301 | CAD | | | 8,435,058 | R |
| | | | | | | | | | | | | | |
Total Foreign Government Obligations
(Cost—$66,068,399) | | | | | | | | | | | | | 77,861,065 | |
Preferred Stocks | | 0.7% | | | | | | | | | | | | |
AES Trust III | | | | 6.750% | | | | | 71,200 | shs | | | 3,042,376 | G |
Fannie Mae | | | | 5.375% | | | | | 29 | | | | 87,000 | G,M,S |
Fannie Mae | | | | 7.000% | | | | | 53,100 | | | | 82,305 | B,M,S |
Fannie Mae | | | | 8.250% | | | | | 1,193,775 | | | | 1,599,658 | E,M,S |
Freddie Mac | | | | 8.375% | | | | | 1,737,615 | | | | 2,119,890 | E,M,S |
General Motors Corp. | | | | 1.500% | | | | | 437,087 | | | | 1,147,353 | |
General Motors Corp. | | | | 4.500% | | | | | 25,191 | | | | 66,126 | G |
General Motors Corp. | | | | 5.250% | | | | | 3,790,025 | | | | 9,948,816 | G |
General Motors Corp. | | | | 6.250% | | | | | 8,565,662 | | | | 22,484,863 | G |
General Motors Corp. | | | | 7.250% | | | | | 127,900 | | | | 335,738 | |
General Motors Corp. | | | | 7.250% | | | | | 56,300 | | | | 147,788 | |
General Motors Corp. | | | | 7.250% | | | | | 45,400 | | | | 119,175 | |
General Motors Corp. | | | | 7.375% | | | | | 327,800 | | | | 860,475 | |
General Motors Corp. | | | | 7.500% | | | | | 259,700 | | | | 681,712 | |
Home Ownership Funding Corp. | | | | 1.000% | | | | | 1,500 | | | | 144,032 | A,I,S |
Home Ownership Funding Corp. II | | | | 1.000% | | | | | 1,300 | | | | 124,828 | A,I,S |
Preferred Blocker Inc. | | | | 7.000% | | | | | 25,421 | | | | 10,932,619 | A |
| | | | | | | | | | | | | | |
Total Preferred Stocks
(Cost—$204,122,477) | | | | | | | | | | | | | 53,924,754 | |
Warrants | | N.M. | | | | | | | | | | | | |
Bear Stearns Trust Certficates 2001-2, Strike Price $97.72 | | | | | | | | | 10,000 | wts | | | 140,179 | C,S |
| | | | | | | | | | | | | | |
Total Warrants (Cost—$55,800) | | | | | | | | | | | | | 140,179 | |
| | | | | | | | | | | | | | |
Total Long-Term Securities
(Cost—$9,340,986,551) | | | | | | | | | | | | | 8,093,599,153 | |
Short-Term Securities | | 2.6% | | | | | | | | | | | | |
| | | | | |
U.S. Government and Agency Obligations | | 1.9% | | | | | | | | | | | | |
Fannie Mae | | | | 0.000% | | 8/3/09 | | $ | 90,000,000 | | | | 89,988,450 | J,M |
United States Treasury Bill | | | | 0.000% | | 10/29/09 | | | 55,000,000 | | | | 54,965,185 | J |
| | | | | | | | | | | | | | |
| | | | | | | | | | | | | 144,953,635 | |
| | | | | | | | | | | | | | |
78
Semi-Annual Report to Shareholders
| | | | | | | | | | |
| | | % OF
NET ASSETS | | PAR/
SHARES† | | | VALUE | |
| | | | | | | | | | |
Short-Term Securities—Continued | | | | | | | | | | |
| | | |
Options Purchased | | 0.2% | | | | | | | | |
Barclays Swaption Call, September 2009, Strike Price $2.02 | | | | | 40,000,000 | T | | $ | 1,173,628 | C |
Barclays Swaption Put, August 2009, Strike Price $1.60 | | | | | 133,400,000 | T | | | 422,019 | C |
Barclays Swaption Put, July 2009, Strike Price $1.60 | | | | | 89,000,000 | T | | | 74,136 | C |
Credit Suisse First Boston Swaption Call, September 2009, Strike Price $2.02 | | | | | 44,500,000 | T | | | 1,305,661 | C |
Credit Suisse First Boston Swaption Put, April 2011, Strike Price $5.18 | | | | | 79,800,000 | T | | | 3,271,353 | |
Credit Suisse First Boston Swaption Put, April 2012, Strike Price $5.20 | | | | | 40,000,000 | T | | | 3,200,160 | |
Credit Suisse First Boston Swaption Put, August 2009, Strike Price $1.60 | | | | | 44,400,000 | T | | | 140,462 | C |
Credit Suisse First Boston Swaption Put, May 2011, Strike Price $5.12 | | | | | 40,000,000 | T | | | 1,730,712 | |
Credit Suisse First Boston Swaption Put, September 2009, Strike Price $1.60 | | | | | 89,000,000 | T | | | 489,186 | C |
| | | | | | | | | | |
| | | | | | | | | 11,807,317 | |
| | | | | | | | | | |
Repurchase Agreement | | 0.5% | | | | | | | | |
Goldman Sachs & Co.
0.030%, dated 6/30/09, to be repurchased at $42,235,035 on 7/1/09 (Collateral: $42,880,000 Fannie Mae note, 2.750%, due 3/13/14, value $43,094,400) | | | | $ | 42,235,000 | | | | 42,235,000 | |
| | | | | | | | | | |
Total Short-Term Securities (Cost—$196,691,705) | | | | | | | | | 198,995,952 | |
Total Investments (Cost—$9,537,678,256)U | | 108.2% | | | | | | | 8,292,595,105 | |
Other Assets Less Liabilities | | (8.2)% | | | | | | | (631,695,380 | ) |
| | | | | | | | | | |
| | | |
Net Assets | | 100.0% | | | | | | $ | 7,660,899,725 | |
| | | | | | | | | | |
| | | | | | | | |
| | | EXPIRATION | | ACTUAL
CONTRACTS | | APPRECIATION/
(DEPRECIATION) | |
Futures Contracts PurchasedV | | | | | | | | |
Eurodollar Futures | | September 2009 | | 2,678 | | $ | 9,591,604 | |
Eurodollar Futures | | December 2009 | | 291 | | | 342,945 | |
Eurodollar Futures | | March 2010 | | 2,492 | | | 1,465,452 | |
Eurodollar Futures | | June 2010 | | 900 | | | (351,550 | ) |
Eurodollar Futures | | September 2010 | | 844 | | | (339,470 | ) |
U.S. Treasury Bond Futures | | September 2009 | | 2,988 | | | 6,181,161 | |
U.S. Treasury Note Futures | | September 2009 | | 11,926 | | | (9,555,499 | ) |
U.S. Treasury Note Futures | | September 2009 | | 2,728 | | | (1,564,063 | ) |
| | | | | | | | |
| | | | | | $ | 5,770,580 | |
| | | | | | | | |
79
Semi-Annual Report to Shareholders
Portfolio of Investments—Continued
Western Asset Core Plus Bond Portfolio—Continued
| | | | | | | | |
| | | EXPIRATION | | ACTUAL
CONTRACTS | | APPRECIATION/
(DEPRECIATION) | |
| | | |
Futures Contracts WrittenV | | | | | | | | |
U.S. Treasury Note Futures | | September 2009 | | 4,112 | | $ | (6,938,638 | ) |
| | | | | | | | |
| | | | | | $ | (6,938,638 | ) |
| | | | | | | | |
Options WrittenV | | | | | | | | |
Barclays Swaption Call, Strike Price $1.60 | | September 2009 | | 80,000,000 | | $ | (68,016 | )C |
Barclays Swaption Call, Strike Price $4.95 | | October 2013 | | 124,690,000 | | | (2,767,869 | ) |
Barclays Swaption Put, Strike Price $4.95 | | October 2013 | | 124,690,000 | | | (909,988 | ) |
Credit Suisse First Boston Swaption Call, Strike Price $1.60 | | September 2009 | | 89,000,000 | | | (75,668 | )C |
Credit Suisse First Boston Swaption Put, Strike Price $4.11 | | July 2009 | | 159,600,000 | | | (956,068 | ) |
Credit Suisse First Boston Swaption Put, Strike Price $4.20 | | August 2009 | | 80,000,000 | | | (700,600 | ) |
Credit Suisse First Boston Swaption Put, Strike Price $4.43 | | October 2009 | | 159,600,000 | | | (2,280,636 | ) |
Credit Suisse First Boston Swaption Put, Strike Price $4.48 | | November 2009 | | 80,000,000 | | | (1,126,520 | ) |
Credit Suisse First Boston Swaption Put, Strike Price $4.74 | | October 2009 | | 80,000,000 | | | (1,843,408 | ) |
Credit Suisse First Boston Swaption Put, Strike Price $5.03 | | April 2010 | �� | 40,000,000 | | | (1,245,152 | ) |
Eurodollar Futures Call, Strike Price $99.25 | | September 2009 | | 520 | | | (61,100 | ) |
Eurodollar Futures Put, Strike Price $99.00 | | September 2009 | | 673 | | | 59,729 | |
JP Morgan Swaption Call, Strike Price $4.86 | | October 2013 | | 124,700,000 | | | (2,186,041 | ) |
JP Morgan Swaption Put, Strike Price $4.86 | | October 2013 | | 124,700,000 | | | (1,043,489 | ) |
U.S. Treasury Bond Futures Call, Strike Price $117.00 | | July 2009 | | 457 | | | (416,441 | ) |
U.S. Treasury Note Futures Call, Strike Price $115.00 | | July 2009 | | 460 | | | (465,894 | ) |
U.S. Treasury Note Futures Call, Strike Price $115.50 | | August 2009 | | 776 | | | (585,880 | ) |
U.S. Treasury Note Futures Call, Strike Price $118.00 | | August 2009 | | 2,088 | | | 1,368,966 | |
U.S. Treasury Note Futures Call, Strike Price $124.00 | | August 2009 | | 403 | | | 281,344 | |
U.S. Treasury Note Futures Put, Strike Price $112.00 | | August 2009 | | 298 | | | 233,651 | |
U.S. Treasury Note Futures Put, Strike Price $116.00 | | August 2009 | | 403 | | | (342,046 | ) |
| | | | | | | | |
| | | | | | $ | (15,131,126 | ) |
| | | | | | | | |
| | | | | | | | | |
N.M. —Not Meaningful.
| A | | Rule 144a Security – A security purchased pursuant to Rule 144a under the Securities Act of 1933 which may not be resold subject to that rule except to qualified institutional buyers. These securities, which the Fund’s investment adviser has determined to be liquid, unless otherwise noted, represent 9.55% of net assets. |
| B | | Indexed Security – The rates of interest earned on these securities are tied to the London Interbank Offered Rate (“LIBOR”), the Euro Interbank Offered Rate (“EURIBOR”) Index, the Consumer Price Index (“CPI”), the one-year Treasury Bill Rate or the ten-year Japanese Government Bond Rate. The coupon rates are the rates as of June 30, 2009. |
| C | | Security is valued in good faith at fair value by or under the direction of the Board of Directors. |
| D | | Bond is currently in default. |
80
Semi-Annual Report to Shareholders
| E | | Stepped Coupon Security – A security with a predetermined schedule of interest or dividend rate changes at which time it begins to accrue interest or pay dividends according to the predetermined schedule. |
| F | | Credit Linked Security – The rates of interest earned on these securities are tied to the credit rating assigned by Standard & Poor’s Rating Service and/or Moody’s Investors Services. |
| G | | Convertible Security – Security may be converted into the issuer’s common stock. |
| H | | Pay-in-Kind (“PIK”) security – A security in which interest or dividends during the initial few years is paid in additional PIK securities rather than in cash. |
| I | | Illiquid security valued at fair value under the procedures approved by the Board of Directors. |
| J | | Zero coupon bond – A bond with no periodic interest payments which is sold at such a discount as to produce a current yield to maturity. |
| K | | Stripped Security – Security with interest-only or principal-only payment streams, denoted by a 1 or 2, respectively. For interest-only securities, the amount shown as principal is the notional balance used to calculate the amount of interest due. |
| L | | The coupon rates shown on variable rate securities are the rates at June 30, 2009. These rates vary with the weighted average coupon of the underlying loans. |
| M | | On September 7, 2008, the Federal Housing Finance Agency placed Fannie Mae and Freddie Mac into conservatorship. |
| N | | Treasury Inflation-Protected Security –Treasury security whose principal value is adjusted daily in accordance with changes to the Consumer Price Index for All Urban Consumers. Interest is calculated on the basis of the current adjusted principal value. |
| O | | All or a portion of this security is collateral to cover futures and options contracts written. |
| P | | When-issued Security – Security purchased on a delayed delivery basis. Final settlement amount and maturity date have not yet been announced. |
| Q | | Yankee Bond – A dollar-denominated bond issued in the U.S. by foreign entities. |
| R | | Inflation-Protected Security – Security whose principal value is adjusted daily or monthly in accordance with changes to the relevant country’s Consumer Price Index or its equivalent used as an inflation proxy. Interest is calculated on the basis of the current adjusted principal value. |
| T | | Par represents actual number of contracts. |
| U | | Aggregate cost for federal income tax purposes is substantially the same as book cost. At June 30, 2009, the aggregate gross unrealized appreciation and depreciation of investments for federal income tax purposes were substantially as follows: |
| | | | |
Gross unrealized appreciation | | $ | 207,947,335 | |
Gross unrealized depreciation | | | (1,453,030,486 | ) |
| | | | |
Net unrealized depreciation | | $ | (1,245,083,151 | ) |
| | | | |
| V | | Options written and futures are described in more detail in the notes to financial statements. |
| † | | Securities are denominated in U.S. Dollars, unless otherwise noted. |
BRL—Brazilian Real
CAD—Canadian Dollar
EUR—Euro
See notes to financial statements.
81
Semi-Annual Report to Shareholders
Statement of Assets and Liabilities
Western Asset Core Plus Bond Portfolio
June 30, 2009 (Unaudited)
| | | | | | | |
Assets: | | | | | | | |
Investment securities at market value (Cost—$9,340,986,551) | | | | | $ | 8,093,599,153 | |
Short-term securities at value (Cost—$196,691,705) | | | | | | 198,995,952 | |
Foreign currency at value (Cost—$2,002,622) | | | | | | 1,947,447 | |
Restricted cash pledged as collateral for swaps | | | | | | 474,530,000 | |
Receivable for securities sold | | | | | | 278,403,791 | |
Interest and dividends receivable | | | | | | 85,529,371 | |
Unrealized appreciation of swaps | | | | | | 50,843,278 | |
Premiums paid on open swaps | | | | | | 43,893,212 | |
Unrealized appreciation of forward foreign currency contracts | | | | | | 19,546,581 | |
Receivable for fund shares sold | | | | | | 4,419,463 | |
Amount receivable for open swaps | | | | | | 2,736,812 | |
Deposits with brokers for open futures contracts | | | | | | 573,112 | |
| | | | | | | |
Total assets | | | | | | 9,255,018,172 | |
| | | | | | | |
| | |
Liabilities: | | | | | | | |
Payable for securities purchased | | $ | 979,333,156 | | | | |
Unrealized depreciation of swaps | | | 374,243,247 | | | | |
Premiums received on open swaps | | | 85,745,302 | | | | |
Options written (Proceeds—$43,287,806) | | | 58,418,932 | | | | |
Payable for fund shares repurchased | | | 38,008,849 | | | | |
Payable for Lehman settlement | | | 23,750,000 | | | | |
Unrealized depreciation of forward foreign currency contracts | | | 9,391,215 | | | | |
Amount payable for open swaps | | | 8,966,392 | | | | |
Due to custodian | | | 5,763,520 | | | | |
Income distribution payable | | | 3,279,043 | | | | |
Accrued management fee | | | 2,398,047 | | | | |
Futures variation margin payable | | | 2,276,450 | | | | |
Accrued distribution fees | | | 126,657 | | | | |
Accrued expenses and other liabilities | | | 2,417,637 | | | | |
| | | | | | | |
Total liabilities | | | | | | 1,594,118,447 | |
| | | | | | | |
| | |
Net Assets | | | | | $ | 7,660,899,725 | |
| | | | | | | |
| | |
Net assets consist of: | | | | | | | |
Accumulated paid-in-capital | | | | | $ | 9,718,871,700 | |
Undistributed net investment income | | | | | | 56,488,771 | |
Accumulated net realized loss on investments, options, futures, swaps
and foreign currency transactions | | | | | | (540,251,964 | ) |
Net unrealized depreciation of investments, options, futures, swaps
and foreign currency translations | | | | | | (1,574,208,782 | ) |
| | | | | | | |
| | |
Net Assets | | | | | $ | 7,660,899,725 | |
| | | | | | | |
| | |
Net Asset Value Per Share: | | | | | | | |
Institutional Class (605,092,463 shares outstanding) | | | | | | $9.16 | |
Institutional Select Class (164,610,860 shares outstanding) | | | | | | $9.16 | |
Financial Intermediary Class (66,599,980 shares outstanding) | | | | | | $9.16 | |
| | | | | | | | |
See notes to financial statements.
82
Semi-Annual Report to Shareholders
Statement of Operations
Western Asset Core Plus Bond Portfolio
| | | | | | | | | | | | | | | | |
| | | FOR THE
SIX MONTHS ENDED
JUNE 30, 2009
(Unaudited) | | | FOR THE
PERIOD ENDED
DECEMBER 31, 2008A | |
Investment Income: | | | | | | | | | | | | |
| | | | |
Interest | | $ | 236,422,946 | | | | | | | $ | 541,517,843 | | | | | |
Dividends | | | 8,355,546 | | | | | | | | 8,165,221 | | | | | |
Income from securities loaned | | | — | | | | | | | | 4,681,641 | | | | | |
Less: Foreign taxes withheld | | | — | | | | | | | | (8 | ) | | | | |
| | | | | | | | | | | | | | | | |
Total income | | | | | | $ | 244,778,492 | | | | | | | $ | 554,364,697 | |
Expenses: | | | | | | | | | | | | | | | | |
Management fees | | | 16,338,107 | | | | | | | | 37,570,426 | | | | | |
Distribution fees: | | | | | | | | | | | | | | | | |
Financial Intermediary Class | | | 845,417 | | | | | | | | 2,052,242 | | | | | |
Audit and legal fees | | | 145,986 | | | | | | | | 330,701 | | | | | |
Custodian fees | | | 446,710 | | | | | | | | 1,213,485 | | | | | |
Directors’ fees and expenses | | | 184,006 | | | | | | | | 305,871 | | | | | |
Registration fees | | | 52,227 | | | | | | | | 90,664 | | | | | |
Reports to shareholders: | | | | | | | | | | | | | | | | |
Institutional Class | | | 513,054 | | | | | | | | 1,263,633 | | | | | |
Institutional Select Class | | | 7,507 | | | | | | | | 445 | | | | | |
Financial Intermediary Class | | | 292,976 | | | | | | | | 369,298 | | | | | |
Transfer agent and shareholder servicing expense: | | | | | | | | | | | | | | | | |
Institutional Class | | | 489,359 | | | | | | | | 767,454 | | | | | |
Institutional Select Class | | | 10,410 | | | | | | | | 1,788 | | | | | |
Financial Intermediary Class | | | 594,306 | | | | | | | | 580,100 | | | | | |
Other expenses | | | 182,439 | | | | | | | | 156,951 | | | | | |
| | | | | | | | | | | | | | | | |
| | | 20,102,504 | | | | | | | | 44,703,058 | | | | | |
Less: Fees waived | | | (818,469 | ) | | | | | | | (312,394 | ) | | | | |
Compensating balance credits | | | 0 | * | | | | | | | (239 | ) | | | | |
| | | | | | | | | | | | | | | | |
Net expenses | | | | | | | 19,284,035 | | | | | | | | 44,390,425 | |
| | | | | | | | | | | | | | | | |
Net Investment Income | | | | | | | 225,494,457 | | | | | | | | 509,974,272 | |
Net Realized and Unrealized Gain/(Loss) on Investments: | | | | | | | | | | | | | | | | |
Net realized gain/(loss) on: | | | | | | | | | | | | | | | | |
Investments | | | (75,913,239 | ) | | | | | | | (98,546,155 | ) | | | | |
Options written | | | 62,471,396 | | | | | | | | 113,732,898 | | | | | |
Futures | | | (10,786,771 | ) | | | | | | | 98,112,457 | | | | | |
Swaps | | | (333,273,593 | ) | | | | | | | 17,432,632 | | | | | |
Foreign currency transactions | | | 5,702,082 | | | | | | | | 17,728,216 | | | | | |
| | | | | | | | | | | | | | | | |
Change in unrealized appreciation/(depreciation) of: | | | | | | | (351,800,125 | ) | | | | | | | 148,460,048 | |
Investments | | | 428,327,754 | | | | | | | | (1,306,238,848 | ) | | | | |
Options written | | | 2,829,205 | | | | | | | | (7,590,707 | ) | | | | |
Futures | | | (173,209,738 | ) | | | | | | | 250,307,147 | | | | | |
Swaps | | | 584,602,828 | | | | | | | | (718,842,163 | ) | | | | |
Foreign currency translations | | | 4,228,987 | | | | | | | | (15,301,926 | ) | | | | |
| | | | | | | | | | | | | | | | |
| | | | | | | 846,779,036 | | | | | | | | (1,797,666,497 | ) |
| | | | | | | | | | | | | | | | |
Net Realized and Unrealized Gain/(Loss) on Investments | | | | | | | 494,978,911 | | | | | | | | (1,649,206,449 | ) |
| | | | | | | | | | | | | | | | | |
Change in Net Assets Resulting From Operations | | | | | | $ | 720,473,368 | | | | | | | $ | (1,139,232,177 | ) |
| | | | | | | | | | | | | | | | | |
| A | | For the period April 1, 2008 to December 31, 2008. |
| * | | Amount represents less than $100. |
See notes to financial statements.
83
Semi-Annual Report to Shareholders
Statement of Changes in Net Assets
Western Asset Core Plus Bond Portfolio
| | | | | | | | | | | | |
| | | FOR THE
SIX MONTHS ENDED
JUNE 30, 2009 (Unaudited) | | | FOR THE
PERIOD ENDED
DECEMBER 31, 2008A | | | FOR THE
YEAR ENDED
MARCH 31, 2008 | |
| Change in Net Assets: | | | | | | | | | |
Net investment income | | $ | 225,494,457 | | | $ | 509,974,272 | | | $ | 738,844,157 | |
| | | |
Net realized gain/(loss) | | | (351,800,125 | ) | | | 148,460,048 | | | | (139,242,624 | ) |
| | | |
Change in unrealized appreciation/(depreciation) | | | 846,779,036 | | | | (1,797,666,497 | ) | | | (693,893,653 | ) |
| | | | | | | | | | | | |
Change in net assets resulting from operations | | | 720,473,368 | | | | (1,139,232,177 | ) | | | (94,292,120 | ) |
| | | |
Distributions to shareholders from: | | | | | | | | | | | | |
Net investment income: | | | | | | | | | | | | |
Institutional Class | | | (156,279,946 | ) | | | (476,291,179 | ) | | | (661,064,696 | ) |
Institutional Select Class | | | (39,655,314 | ) | | | (32,587,186 | ) | | | N/A | |
Financial Intermediary Class | | | (16,840,952 | ) | | | (47,328,816 | ) | | | (51,232,414 | ) |
| | | |
Net realized gain on investments: | | | | | | | | | | | | |
Institutional Class | | | (82,194,816 | ) | | | — | | | | (92,868,453 | ) |
Institutional Select Class | | | (22,083,719 | ) | | | — | | | | N/A | |
Financial Intermediary Class | | | (9,199,687 | ) | | | — | | | | (6,596,142 | ) |
| | | |
Change in net assets from fund share transactions: | | | | | | | | | | | | |
Institutional Class | | | (1,354,997,264 | ) | | | (4,840,376,183 | ) | | | 2,284,647,990 | |
Institutional Select Class | | | (134,325,597 | ) | | | 1,625,591,241 | | | | N/A | |
Financial Intermediary Class | | | (251,471,234 | ) | | | (242,167,517 | ) | | | 517,528,015 | |
| | | | | | | | | | | | |
Change in net assets | | | (1,346,575,161 | ) | | | (5,152,391,817 | ) | | | 1,896,122,180 | |
| | | |
Net Assets: | | | | | | | | | | | | |
Beginning of period | | | 9,007,474,886 | | | | 14,159,866,703 | | | | 12,263,744,523 | |
| | | | | | | | | | | | |
| | | |
End of period | | $ | 7,660,899,725 | | | $ | 9,007,474,886 | | | $ | 14,159,866,703 | |
| | | | | | | | | | | | |
| | | |
Undistributed net investment income | | $ | 56,488,771 | | | $ | 43,770,526 | | | $ | 21,015,663 | |
| | | | | | | | | | | | |
| | | | | | | | | | | | | |
| A | | For the period April 1, 2008 to December 31, 2008. |
N/A—Not applicable
See notes to financial statements.
84
Semi-Annual Report to Shareholders
Financial Highlights
Western Asset Core Plus Bond Portfolio
For a share of each class of capital stock outstanding:
Institutional Class:
| | | | | | | | | | | | | | | | | | | | | | | |
| | | SIX MONTHS
ENDED
JUNE 30,
2009
(Unaudited) | | | PERIOD
ENDED
DECEMBER 31,
2008A | | | YEARS ENDED MARCH 31, |
| | | | 2008 | | 2007 | | 2006 | | 2005 | | 2004 |
Net asset value, beginning of period | | | $8.66 | | | | $9.87 | | | | $10.55 | | | $10.24 | | | $10.52 | | | $10.71 | | | $10.40 |
| | | | | | | | | | | | | | | | | | | | | | | |
Investment operations: | | | | | | | | | | | | | | | | | | | | | | | |
Net investment income | | | .24B | | | | .39B | | | | .55B | | | .51B | | | .45C | | | .37C | | | .37C |
Net realized and unrealized
gain/(loss) | | | .63 | | | | (1.17) | | | | (.62) | | | .33 | | | (.18) | | | .04 | | | .55 |
| | | | | | | | | | | | | | | | | | | | | | | |
Total from investment operations | | | .87 | | | | (.78) | | | | (.07) | | | .84 | | | .27 | | | .41 | | | .92 |
| | | | | | | | | | | | | | | | | | | | | | | |
Distributions from: | | | | | | | | | | | | | | | | | | | | | | | |
Net investment income | | | (.23) | | | | (.43) | | | | (.53) | | | (.53) | | | (.52) | | | (.35) | | | (.41) |
Net realized gain on investments | | | (.14) | | | | — | | | | (.08) | | | —D | | | (.03) | | | (.25) | | | (.20) |
| | | | | | | | | | | | | | | | | | | | | | | |
Total distributions | | | (.37) | | | | (.43) | | | | (.61) | | | (.53) | | | (.55) | | | (.60) | | | (.61) |
| | | | | | | | | | | | | | | | | | | | | | | |
Net asset value, end of period | | | $9.16 | | | | $8.66 | | | | $9.87 | | | $10.55 | | | $10.24 | | | $10.52 | | | $10.71 |
| | | | | | | | | | | | | | | | | | | | | | | |
Total return† | | | 10.20% | | | | (8.01)% | | | | (.72)% | | | 8.48% | | | 2.57% | | | 4.01% | | | 9.12% |
| | | | | | | |
Ratios to Average Net Assets:E | | | | | | | | | | | | | | | | | | | | | | | |
Total expenses | | | .46% | F | | | .46%F | | | | .43% | | | .44% | | | .45% | | | .45% | | | .48% |
Expenses net of waivers, if any | | | .46% | F | | | .46%F | | | | .43% | | | .44% | | | .45% | | | .45% | | | .45% |
Expenses net of all reductions | | | .46% | F | | | .46%F | | | | .43% | | | .44% | | | .45% | | | .45% | | | .45% |
Net investment income | | | 5.6%F | | | | 5.5%F | | | | 5.4% | | | 4.9% | | | 4.3% | | | 3.3% | | | 3.6% |
| | | | | | | |
Supplemental Data: | | | | | | | | | | | | | | | | | | | | | | | |
Portfolio turnover rate | | | 120.9% | | | | 124.4% | | | | 488.2% | | | 448.6% | | | 549.4% | | | 586.1% | | | 463.8% |
Net assets, end of period (in thousands) | | $ | 5,543,672 | | | $ | 6,607,180 | | | $ | 12,943,882 | | $ | 11,495,842 | | $ | 6,896,815 | | $ | 4,565,054 | | $ | 3,286,650 |
| | | | | | | | | | | | | | | | | | | | | | | | |
| A | | For the period April 1, 2008 to December 31, 2008. |
| B | | Computed using average daily shares outstanding. |
| C | | Computed using SEC method. |
| D | | Amount less than $.01 per share. |
| E | | Total expenses reflects operating expenses prior to any voluntary expense waivers and/or compensating balance credits. Expenses net of waivers reflects total expenses before compensating balance credits but net of any voluntary expense waivers. Expenses net of all reductions reflects expenses less any compensating balance credits and/or voluntary expense waivers. |
| † | | Performance figures may reflect compensating balance credits, fee waivers and/or expense reimbursements. In the absence of compensation balance credits, fee waivers and/or expense reimbursements, the total return would have been lower. Past performance is no guarantee of future results. Total returns for periods of less than one year are not annualized. |
See notes to financial statements.
85
Semi-Annual Report to Shareholders
Financial Highlights
Western Asset Core Plus Bond Portfolio
For a share of each class of capital stock outstanding:
Institutional Select Class:
| | | | | | |
| | | SIX MONTHS
ENDED
JUNE 30,
2009 (Unaudited) | | PERIOD ENDED
DECEMBER 31,
2008A |
Net asset value, beginning of period | | | $8.66 | | | $9.34 |
| | | | | | |
Investment operations: | | | | | | |
Net investment income | | | .25B | | | .20B |
Net realized and unrealized gain/(loss) | | | .62 | | | (.62) |
| | | | | | |
Total from investment operations | | | .87 | | | (.42) |
| | | | | | |
Distributions from: | | | | | | |
Net investment income | | | (.23) | | | (.26) |
Net realized gain on investments | | | (.14) | | | — |
| | | | | | |
Total distributions | | | (.37) | | | (.26) |
| | | | | | |
Net asset value, end of period | | | $9.16 | | | $8.66 |
| | | | | | |
Total return† | | | 10.22% | | | (4.54)% |
| | |
Ratios to Average Net Assets:C | | | | | | |
Total expenses | | | .43%D | | | .44%D |
Expenses net of waivers, if any | | | .43%D | | | .44%D |
Expenses net of all reductions | | | .43%D | | | .44%D |
Net investment income | | | 5.7%D | | | 5.7%D |
| | |
Supplemental Data: | | | | | | |
Portfolio turnover rate | | | 120.9% | | | 124.4% |
Net assets, end of period (in thousands) | | $ | 1,507,235 | | $ | 1,559,843 |
| | | | | | | |
| A | | For the period August 4, 2008 (commencement of operations) to December 31, 2008. |
| B | | Computed using average daily shares outstanding. |
| C | | Total expenses reflects operating expenses prior to any voluntary expense waivers and/or compensating balance credits. Expenses net of waivers reflects total expenses before compensating balance credits but net of any voluntary expense waivers. Expenses net of all reductions reflects expenses less any compensating balance credits and/or voluntary expense waivers. |
| † | | Performance figures may reflect compensating balance credits, fee waivers and/or expense reimbursements. In the absence of compensation balance credits, fee waivers and/or expense reimbursements, the total return would have been lower. Past performance is no guarantee of future results. Total returns for periods of less than one year are not annualized. |
See notes to financial statements.
86
Semi-Annual Report to Shareholders
Financial Intermediary Class:
| | | | | | | | | | | | | | |
| | | SIX MONTHS
ENDED
JUNE 30,
2009
(Unaudited) | | PERIOD
ENDED
DECEMBER 31,
2008A | | YEARS ENDED MARCH 31, |
| | | | 2008 | | 2007 | | 2006 | | 2005 | | 2004 |
Net asset value, beginning of period | | $8.66 | | $9.88 | | $10.56 | | $10.24 | | $10.52 | | $10.71 | | $10.40 |
| | | | | | | | | | | | | | |
Investment operations: | | | | | | | | | | | | | | |
Net investment income | | .24B | | .37B | | .52B | | .48B | | .42C | | .35C | | .36C |
Net realized and unrealized gain/(loss) | | .62 | | (1.17) | | (.62) | | .35 | | (.18) | | .04 | | .54 |
| | | | | | | | | | | | | | |
Total from investment operations | | .86 | | (.80) | | (.10) | | .83 | | .24 | | .39 | | .90 |
| | | | | | | | | | | | | | |
Distributions from: | | | | | | | | | | | | | | |
Net investment income | | (.22) | | (.42) | | (.50) | | (.51) | | (.49) | | (.33) | | (.39) |
Net realized gain on investments | | (.14) | | — | | (.08) | | —D | | (.03) | | (.25) | | (.20) |
| | | | | | | | | | | | | | |
Total distributions | | (.36) | | (.42) | | (.58) | | (.51) | | (.52) | | (.58) | | (.59) |
| | | | | | | | | | | | | | |
Net asset value, end of period | | $9.16 | | $8.66 | | $9.88 | | $10.56 | | $10.24 | | $10.52 | | $10.71 |
| | | | | | | | | | | | | | |
Total return† | | 10.08% | | (8.28)% | | (.97)% | | 8.30% | | 2.32% | | 3.77% | | 8.82% |
| | | | | | | |
Ratios to Average Net Assets:E | | | | | | | | | | | | | | |
Total expenses | | .94%F | | .77%F | | .68% | | .69% | | .70% | | .70% | | .73% |
Expenses net of waivers, if any | | .70%F | | .70%F | | .68% | | .69% | | .70% | | .70% | | .70% |
Expenses net of all reductions | | .70%F | | .70%F | | .68% | | .69% | | .70% | | .70% | | .70% |
Net investment income | | 5.3%F | | 5.2%F | | 5.1% | | 4.7% | | 4.0% | | 2.9% | | 3.2% |
| | | | | | | |
Supplemental Data: | | | | | | | | | | | | | | |
Portfolio turnover rate | | 120.9% | | 124.4% | | 488.2% | | 448.6% | | 549.4% | | 586.1% | | 463.8% |
Net assets, end of period (in thousands) | | $609,993 | | $840,452 | | $1,215,985 | | $767,903 | | $503,217 | | $191,085 | | $7,040 |
| | | | | | | | | | | | | | | |
| A | | For the period April 1, 2008 to December 31, 2008. |
| B | | Computed using average daily shares outstanding. |
| C | | Computed using SEC method. |
| D | | Amount less than $.01 per share. |
| E | | Total expenses reflects operating expenses prior to any voluntary expense waivers and/or compensating balance credits. Expenses net of waivers reflects total expenses before compensating balance credits but net of any voluntary expense waivers. Expenses net of all reductions reflects expenses less any compensating balance credits and/or voluntary expense waivers. |
| † | | Performance figures may reflect compensating balance credits, fee waivers and/or expense reimbursements. In the absence of compensation balance credits, fee waivers and/or expense reimbursements, the total return would have been lower. Past performance is no guarantee of future results. Total returns for periods of less than one year are not annualized. |
See notes to financial statements.
87
Semi-Annual Report to Shareholders
Notes to Financial Statements
(Unaudited)
1. Significant Accounting Policies:
Western Asset Funds, Inc. (“Corporation”), consisting of Western Asset Absolute Return Portfolio (“Absolute Return”), Western Asset Core Bond Portfolio (“Core”), Western Asset Core Plus Bond Portfolio (“Core Plus”), Western Asset High Yield Portfolio (“High Yield”), Western Asset Inflation Indexed Plus Bond Portfolio (“Inflation Indexed”), Western Asset Intermediate Bond Portfolio (“Intermediate”), Western Asset Intermediate Plus Bond Portfolio (“Intermediate Plus”), Western Asset Limited Duration Bond Portfolio (“Limited Duration”) and Western Asset Non-U.S. Opportunity Bond Portfolio (“Non-U.S.”) (individually a “Fund,” collectively the “Funds”), is registered under the Investment Company Act of 1940, as amended (“the 1940 Act”), as a diversified, open-end management investment company with the exception of Non-U.S., which is non-diversified. Financial Statements for Absolute Return, High Yield, Inflation Indexed, Intermediate, Intermediate Plus, Limited Duration and Non-U.S. are contained in a separate Report to Shareholders. As of December 31, 2008, the funds’ fiscal year end has changed from March 31 to December 31.
Each Fund offers three classes of shares: Institutional Class, Institutional Select Class and Financial Intermediary Class. Shares in the Financial Intermediary Class bear a distribution fee. The income and expenses of each of the Funds are allocated proportionately to the three classes of shares based on daily net assets, except for Rule 12b-1 distribution fees, which are charged only on the Financial Intermediary Class shares, and transfer agent and shareholder servicing expenses, and certain other expenses, which are determined separately for each class.
The following are significant accounting policies consistently followed by the Funds and are in conformity with U.S. generally accepted accounting principles (“GAAP”). Estimates and assumptions are required to be made regarding assets, liabilities and changes in net assets resulting from operations when financial statements are prepared. Changes in the economic environment, financial markets and any other parameters used in determining these estimates could cause actual results to differ. Subsequent events have been evaluated through August 24, 2009, the issuance date of the financial statements.
Investment Valuation
The Funds’ securities are valued under policies approved by and under the general oversight of the Board of Directors. The Fund adopted Statement of Financial Accounting Standards No. 157 (“FAS 157”). FAS 157 establishes a single definition of fair value, creates a three-tier hierarchy as a framework for measuring fair value based on inputs used to value the Fund’s investments, and requires additional disclosure about fair value. The hierarchy of inputs is summarized below.
| | • | | Level 1—quoted prices in active markets for identical investments |
| | • | | Level 2—other significant observable inputs (including quoted prices for similar investments, interest rates, prepayment speeds, credit risk, etc.) |
| | • | | Level 3—significant unobservable inputs (including the Fund’s own assumptions in determining the fair value of investments) |
Debt securities are valued at the last quoted bid prices provided by an independent pricing service that are based on transactions in debt obligations, quotations from bond dealers, market transactions in comparable securities and various other relationships between securities. Publicly traded foreign government debt securities are typically traded internationally in the over-the-counter market and are valued at the bid price as of the close of business of that market. Futures contracts are valued daily at the settlement price established by the board of trade or exchange on which they are traded. Equity securities for which market quotations are available are valued at the last sale price or official closing price on the primary market or exchange on which they trade. When prices are not readily available, or are determined not to reflect fair value, such as when the value of a security has been significantly affected by events after the close of the exchange or market on which the security is principally traded, but before the Fund calculates its net asset value, the Fund may value these securities at fair value as determined in accordance with the procedures approved by the Fund’s Board of Directors.
The inputs or methodology used for valuing securities are not necessarily an indication of the risk associated with investing in these securities.
88
Semi-Annual Report to Shareholders
The following is a summary of the inputs used in valuing the Fund’s assets carried at fair value:
Core
| | | | | | | | | | | | | | | |
Description | | Quoted Prices
(Level 1) | | | Other
Significant
Observable
Inputs
(Level 2) | | | Significant
Unobservable
Inputs
(Level 3) | | Total | |
Long-Term Securities: | | | | | | | | | | | | | | | |
Corporate Bonds and Notes | | | — | | | $ | 972,507,583 | | | | — | | $ | 972,507,583 | |
Asset-Backed Securities | | | — | | | | 128,288,971 | | | | — | | | 128,288,971 | |
Mortgage-Backed Securities | | | — | | | | 642,374,177 | | | $ | 2,131,536 | | | 644,505,713 | |
U.S. Government and Agency Obligations | | | — | | | | 416,609,776 | | | | — | | | 416,609,776 | |
U.S. Government Agency Mortgage-Backed Securities | | | — | | | | 1,111,965,505 | | | | — | | | 1,111,965,505 | |
Yankee Bonds | | | — | | | | 208,915,637 | | | | — | | | 208,915,637 | |
Preferred Stocks | | $ | 8,039,208 | | | | 444,226 | | | | 1,015,424 | | | 9,498,858 | |
Total Long-Term Securities | | | 8,039,208 | | | | 3,481,105,875 | | | | 3,146,960 | | | 3,492,292,043 | |
Short-Term Securities: | | | | | | | | | | | | | | | |
U.S. Government and Agency Obligations | | | — | | | | 245,650,684 | | | | — | | | 245,650,684 | |
Options Purchased | | | — | | | | 4,975,828 | | | | — | | | 4,975,828 | |
Repurchase Agreements | | | — | | | | 29,837,000 | | | | — | | | 29,837,000 | |
Total Short-Term Securities | | | — | | | | 280,463,512 | | | | — | | | 280,463,512 | |
Total Investments | | | 8,039,208 | | | | 3,761,569,387 | | | | 3,146,960 | | | 3,772,755,555 | |
Other Financial Instruments | | | | | | | | | | | | | | | |
Futures Contracts Purchased | | | 3,432,326 | | | | — | | | | — | | | 3,432,326 | |
Futures Contracts Written | | | (3,398,066 | ) | | | — | | | | — | | | (3,398,066 | ) |
Options Written | | | (3,232,814 | ) | | | (23,073,475 | ) | | | — | | | (26,306,289 | ) |
Swaps: | | | | | | | | | | | | | | | |
Interest Rate Swaps | | | — | | | | (12,344,454 | ) | | | — | | | (12,344,454 | ) |
Credit Default Swaps on Corporate Issues—Buy | | | — | | | | 21,236,379 | | | | — | | | 21,236,379 | |
Credit Default Swaps on Corporate Issues—Sell | | | — | | | | (32,153,527 | ) | | | — | | | (32,153,527 | ) |
Credit Default Swaps on Credit Indices—Sell | | | — | | | | (141,745,385 | ) | | | — | | | (141,745,385 | ) |
Credit Default Swaps on Credit Indices—Buy | | | — | | | | 4,633,123 | | | | — | | | 4,633,123 | |
Total Other Financial Instruments | | | (3,198,554 | ) | | | (183,447,339 | ) | | | — | | | (186,645,893 | ) |
Total | | $ | 4,840,654 | | | $ | 3,578,122,048 | | | $ | 3,146,960 | | $ | 3,586,109,662 | |
| | | | | | | | | | | | | | | | |
Following is a reconciliation of investments in which significant unobservable inputs (Level 3) were used in determining fair value:
| | | | | | | | | | | | | | | | | | | | |
Long-Term Securities | | Corporate
Bonds and
Notes | | | Mortgage-
Backed
Securities | | | Yankee
Bonds | | | Preferred
Stocks | | | Total | |
Investments in Securities | | | | | | | | | | | | | | | | | | | | |
Balance as of December 31, 2008 | | $ | 4,043,831 | | | $ | 2,503,942 | | | $ | 1,216,800 | | | $ | 1,042,166 | | | $ | 8,806,739 | |
Accrued Premiums Discounts | | | 37,112 | | | | 144 | | | | 175,697 | | | | — | | | | 212,953 | |
Realized Gain (Loss) | | | — | | | | 2,441 | | | | — | | | | — | | | | 2,441 | |
Change in Unrealized Appreciation (Depreciation) | | | 2,012,876 | | | | 23,221 | | | | 229,903 | | | | (26,742 | ) | | | 2,239,258 | |
Net Purchases (Sales) | | | 3,042,346 | | | | 398,212 | | | | — | | | | — | | | | 3,440,558 | |
Transfers in and/or out of Level 3 | | | 8,736,487 | | | | — | | | | 1,622,400 | | | | — | | | | 10,358,887 | |
Balance as of June 30, 2009 | | | — | | | | 2,131,536 | | | | — | | | | 1,015,424 | | | | 3,146,960 | |
Net Unrealized Appreciation (Depreciation) for Investments in securities still held at June 30, 2009 | | $ | (768,324 | ) | | $ | (1,465,409 | ) | | $ | (15,815,730 | ) | | $ | (8,029,369 | ) | | $ | (26,078,832 | ) |
| | | | | | | | | | | | | | | | | | | | | |
89
Semi-Annual Report to Shareholders
Notes to Financial Statements—Continued
Core Plus
| | | | | | | | | | | | | | | |
Description | | Quoted Prices
(Level 1) | | | Other
Significant
Observable
Inputs
(Level 2) | | | Significant
Unobservable
Inputs
(Level 3) | | Total | |
Long-Term Securities: | | | | | | | | | | | | | | | |
Corporate Bonds and Notes | | | — | | | $ | 2,318,557,694 | | | | — | | $ | 2,318,557,694 | |
Asset-Backed Securities | | | — | | | | 248,069,986 | | | $ | 31,466,911 | | | 279,536,897 | |
Mortgage-Backed Securities | | | — | | | | 920,505,186 | | | | 5,750,871 | | | 926,256,057 | |
Loan Participations and Assignments | | | — | | | | 47,821,100 | | | | — | | | 47,821,100 | |
U.S. Government and Agency Obligations | | | — | | | | 812,064,160 | | | | — | | | 812,064,160 | |
U.S. Government Agency Mortgage-Backed Securities | | | — | | | | 3,023,994,567 | | | | — | | | 3,023,994,567 | |
Yankee Bonds | | | — | | | | 553,442,680 | | | | — | | | 553,442,680 | |
Foreign Government Obligations | | | — | | | | 77,861,065 | | | | — | | | 77,861,065 | |
Preferred Stocks | | $ | 42,636,275 | | | | 11,019,619 | | | | 268,860 | | | 53,924,754 | |
Warrants | | | — | | | | 140,179 | | | | — | | | 140,179 | |
Total Long-Term Securities | | | 42,636,275 | | | | 8,013,476,236 | | | | 37,486,642 | | | 8,093,599,153 | |
Short-Term Securities: | | | | | | | | | | | | | | | |
U.S. Government and Agency Obligations | | | — | | | | 144,953,635 | | | | — | | | 144,953,635 | |
Options Purchased | | | — | | | | 11,807,317 | | | | — | | | 11,807,317 | |
Repurchase Agreement | | | — | | | | 42,235,000 | | | | — | | | 42,235,000 | |
Total Short-Term Securities | | | — | | | | 198,995,952 | | | | — | | | 198,995,952 | |
Total Investments | | | 42,636,275 | | | | 8,212,472,188 | | | | 37,486,642 | | | 8,292,595,105 | |
Other Financial Instruments | | | | | | | | | | | | | | | |
Futures Contracts Purchased | | | 5,770,580 | | | | — | | | | — | | | 5,770,580 | |
Futures Contracts Written | | | (6,938,638 | ) | | | — | | | | — | | | (6,938,638 | ) |
Options Written | | | (6,955,584 | ) | | | (51,463,348 | ) | | | — | | | (58,418,932 | ) |
Forward foreign currency contracts | | | — | | | | 10,156,830 | | | | — | | | 10,156,830 | |
Swaps: | | | | | | | | | | | | | | | |
Interest Rate Swaps | | | — | | | | (28,899,910 | ) | | | — | | | (28,899,910 | ) |
Credit Default Swaps on Corporate Issues—Buy | | | — | | | | 38,538,850 | | | | — | | | 38,538,850 | |
Credit Default Swaps on Corporate Issues—Sell | | | — | | | | (65,550,410 | ) | | | — | | | (65,550,410 | ) |
Credit Default Swaps on Credit Indices—Sell | | | — | | | | (268,483,427 | ) | | | — | | | (268,483,427 | ) |
Credit Default Swaps on Credit Indices—Buy | | | — | | | | 994,928 | | | | — | | | 994,928 | |
Total Other Financial Instruments | | | (8,123,642 | ) | | | (364,706,487 | ) | | | — | | | (372,830,129 | ) |
Total | | $ | 34,512,633 | | | $ | 7,847,765,701 | | | $ | 37,486,642 | | $ | 7,919,764,976 | |
| | | | | | | | | | | | | | | | |
90
Semi-Annual Report to Shareholders
Following is a reconciliation of investments in which significant unobservable inputs (Level 3) were used in determining fair value:
| | | | | | | | | | | | | | | | | | | | | | | | |
Long-Term Securities | | Corporate
Bonds and
Notes | | | Asset-
Backed
Securities | | | Mortgage-
Backed
Securities | | | Yankee
Bonds | | | Preferred
Stocks | | | Total | |
Investments in Securities | | | | | | | | | | | | | | | | | | | | | | | | |
Balance as of December 31, 2008 | | $ | 8,401,752 | | | $ | 12,803,818 | | | $ | 8,295,524 | | | $ | 4,820,400 | | | $ | 275,940 | | | $ | 34,597,434 | |
Accrued Premiums/Discounts | | | 25,589 | | | | 15 | | | | (4,059 | ) | | | 696,029 | | | | — | | | | 717,574 | |
Realized Gain (Loss) | | | — | | | | 86 | | | | (15,389 | ) | | | — | | | | — | | | | (15,303 | ) |
Change in Unrealized Appreciation (Depreciation) | | | 3,667,977 | | | | (800,340 | ) | | | (196,251 | ) | | | 910,771 | | | | (7,080 | ) | | | 3,575,077 | |
Net Purchases (Sales) | | | 2,191,796 | | | | 1,040,180 | | | | 1,219,988 | | | | — | | | | — | | | | 4,451,964 | |
Transfers in and/or out of Level 3 | | | 13,451,238 | | | | 21,441,290 | | | | 1,152,910 | | | | 6,427,200 | | | | — | | | | 42,472,638 | |
Balance as of June 30, 2009 | | | — | | | | 31,466,911 | | | | 5,750,871 | | | | — | | | | 268,860 | | | | 37,486,642 | |
Net Unrealized Appreciation (Depreciation) for Investments in securities still held at June 30, 2009 | | $ | (2,042,042 | ) | | | (31,038,117 | ) | | | (5,061,136 | ) | | | (62,654,616 | ) | | | (1,525,236 | ) | | $ | (102,321,147 | ) |
| | | | | | | | | | | | | | | | | | | | | | | | | |
Security Transactions
Security transactions are accounted for as of the trade date. Realized gains and losses from security transactions are reported on an identified cost basis for both financial reporting and federal income tax purposes.
For the six months ended June 30, 2009, security transactions (excluding short-term investments) were as follows:
| | | | | | | | | | | | |
| | | Purchases | | Proceeds From Sales |
| | | U.S. Gov’t.
Securities | | Other | | U.S. Gov’t.
Securities | | Other |
Core | | $ | 4,520,677,588 | | $ | 227,218,662 | | $ | 5,751,587,234 | | $ | 427,650,264 |
Core Plus | | | 9,833,510,716 | | | 922,430,680 | | | 12,293,481,317 | | | 769,571,244 |
Forward Commitments
The Funds may enter into commitments to purchase securities on a “forward commitment” basis, including purchases on a “when-issued” basis or a “to be announced” basis. When such transactions are negotiated, certain terms may be fixed at the time the commitment is made, but delivery and payment for the securities takes place at a later date. During the period between a commitment and settlement, no payment is made by the purchaser for the securities purchased and, thus, no interest accrues to the purchaser from the transaction. In a “to be announced” transaction, a Fund commits to purchase securities for which all specific information is not yet known at the time of the trade, particularly the exact face amount in forward commitment mortgage backed securities transactions. Depending on market conditions, a Fund’s forward commitment purchases could cause its net asset value to be more volatile.
A Fund may sell the securities subject to a forward commitment purchase, which may result in a gain or loss. When a Fund purchases securities on a forward commitment basis, it assumes the risks of ownership, including the risk of price fluctuation, at the time of purchase, not at the time of receipt. Purchases of forward commitment securities also involve a risk of loss if the seller fails to deliver after the value of the securities has risen.
Each Fund may also enter into a forward commitment to sell securities it owns and will generally do so only with the intention of actually delivering the securities. In a forward sale, a Fund does not participate in gains or losses on the security occurring after the commitment date. Forward commitments to sell securities also involve a risk of loss if the seller fails to take delivery after the value of the securities has declined.
91
Semi-Annual Report to Shareholders
Notes to Financial Statements—Continued
Foreign Currency Translation
Assets and liabilities initially expressed in non-U.S. currencies are translated into U.S. dollars using currency exchange rates determined prior to the close of trading on the New York Stock Exchange, usually at 2:00 p.m. Eastern time. Purchases and sales of securities and income and expenses are translated into U.S. dollars at the prevailing market rates on the dates of such transactions. The effects of changes in non-U.S. currency exchange rates on investment securities and other assets and liabilities are included with the net realized and unrealized gain or loss on investment securities.
Repurchase Agreements
Each Fund may enter into repurchase agreements with institutions that its investment adviser has determined are creditworthy. Each repurchase agreement is recorded at cost. Under the terms of a typical repurchase agreement, a fund takes possession of an underlying debt obligation subject to an obligation of the seller to repurchase, and of the fund to resell, the obligation at an agreed-upon price and time, thereby determining the yield during a fund’s holding period. When entering into repurchase agreements, it is each Fund’s policy that its custodian acting on the Fund’s behalf, or a third party custodian take possession of the underlying collateral securities, the market value of which, at all times, at least equals the principal amount of the repurchase transaction, including accrued interest. To the extent that any repurchase transaction exceeds one business day, the value of the collateral is marked to market daily to ensure the adequacy of the collateral. If the counterparty defaults, the affected Fund generally has the right to use the collateral to satisfy the terms of the repurchase transaction. However, if the market value of the collateral declines during the period in which a Fund seeks to assert its rights or if bankruptcy proceedings are commenced with respect to the seller of the security, realization of the collateral by the Fund may be delayed or limited.
Investment Income and Distributions to Shareholders
Investment income and distributions to shareholders are allocated at the class level and are recorded on the ex-dividend date. Dividends from net investment income are declared daily and paid monthly for each Fund. Net capital gain distributions, which are calculated at the Fund level, are declared and paid after the end of the tax year in which the gain is realized. An additional distribution may be made in December to the extent necessary in order to comply with federal excise tax requirements. Distributions are determined in accordance with federal income tax regulations, which may differ from those determined in accordance with accounting principles generally accepted in the United States of America; accordingly, periodic reclassifications are made within the Funds’ capital accounts to reflect income and gains available for distribution under federal income tax regulations. Interest income and expenses are recorded on the accrual basis. Bond discounts and premiums are amortized and included in interest income for financial reporting and federal income tax purposes.
Short Sales
The Fund may sell a security it does not own in anticipation of a decline in the market price of that security. The Fund must then borrow the security sold short and deliver it to the dealer that brokered the short sale. A gain, limited to the price at which the security was sold short, or a loss, potentially unlimited in size, will be recognized upon the termination of the short sale. With respect to each short sale, the Fund must maintain collateral in a segregated account consisting of liquid assets with a value at least equal to the current market value of the shorted securities, marked-to-market daily, or take other actions permitted by law to cover its obligations. Dividend expenses and fees paid to brokers to borrow securities in connection with short sales are considered part of the cost of short sale transactions. Dividends declared on securities sold short are recorded as an expense on the ex-dividend date. The Funds had no open short sales as of June 30, 2009.
Compensating Balance Credits
The Funds have an arrangement with their custodian bank, whereby a portion of the custodian’s fee is paid indirectly by credits earned on each Fund’s cash on deposit with the bank. This deposit arrangement is an alternative to purchasing overnight investments.
Subscription In-Kind
The Fund under certain conditions may accept portfolio securities rather than cash as payment for the purchase of fund shares. The cost basis of contributed securities is equal to the market value of securities on the date of contribution. There are no gains or losses recognized by the Fund and there are no tax consequences on subscription in-kind transactions. For the six months ended June 30, 2009, there were no subscription in-kind transactions.
92
Semi-Annual Report to Shareholders
Credit and Market Risk
Investments in structured securities collateralized by residential real estate mortgages are subject to certain credit and liquidity risks. When market conditions result in an increase in default rates of the underlying mortgages and the foreclosure values of underlying real estate properties are materially below the outstanding amount of these underlying mortgages, collection of accrued interest and principal on these investments may be doubtful. Such market conditions may significantly impair the value of these investments resulting in a lack of correlation between their credit ratings and values.
Other
In the normal course of business, each Fund enters into contracts that provide general indemnifications. Each Fund’s maximum exposure under these arrangements is dependent upon claims that may be made against the Fund in the future and, therefore, cannot be estimated; however, based on experience, the risk of material loss from such claims is considered remote.
2. Federal Income Taxes:
It is each Fund’s policy to comply with the federal income and excise tax requirements of the Internal Revenue Code of 1986, as amended, applicable to regulated investment companies. Accordingly, the Funds intend to distribute substantially all of their taxable income and net realized gains on investments, if any, to shareholders each year. Therefore, no federal income tax provision is required in the Funds’ financial statements. Under the applicable foreign tax laws, a withholding tax may be imposed on interest, dividends and capital gains at various rates.
Management has analyzed the Funds’ tax positions taken on federal income tax returns for all open tax years and has concluded that as of June 30, 2009, no provision for income tax would be required in the Funds’ financial statements. The Funds’ federal and state income and federal excise tax returns for tax years for which the applicable statutes of limitations have not expired are subject to examination by the Internal Revenue Service and state departments of revenue.
Under the applicable foreign tax laws, a withholding tax may be imposed on interest, dividends and capital gains at various rates
3. Financial Instruments:
Forward Currency Exchange Contracts
As part of their investment program, the Funds may utilize forward currency exchange contracts. The nature and risks of these financial instruments and the reasons for using them are set forth more fully in the Corporation’s prospectus and statement of additional information.
Forward foreign currency contracts are marked-to-market daily using forward foreign currency exchange rates supplied by an independent pricing service. The change in a contract’s market value is recorded by a Fund as an unrealized gain or loss. When the contract is closed or delivery is taken, the Fund records a realized gain or loss equal to the difference between the value of the contract at the time it was opened and the value at the time it was closed.
The use of forward foreign currency contracts does not eliminate fluctuations in the underlying prices of the Funds’ securities, but it does establish a rate of exchange that can be achieved in the future. These forward foreign currency contracts involve market risk in excess of amounts reflected in the financial statements. Although forward foreign currency contracts used for hedging purposes limit the risk of loss due to a decline in the value of the hedged currency, they also limit any potential gain that might result should the value of the currency increase. In addition, the Fund could be exposed to risks if the counterparties to the contracts are unable to meet the terms of their contracts.
93
Semi-Annual Report to Shareholders
Notes to Financial Statements—Continued
At June 30, 2009, open forward currency exchange contracts (expressed in the contractual currency) were:
Core Plus
| | | | | | | | | | | | | | |
Broker | | Settlement
Date | | Contract to | | Unrealized
Gain/(Loss) | |
| | | Receive | | Deliver | |
JPMorgan Chase Bank | | 8/19/09 | | CAD | | 18,877,545 | | USD | | 15,468,294 | | $ | 772,960 | |
Citibank NA | | 8/19/09 | | EUR | | 19,761,277 | | USD | | 25,717,523 | | | 1,999,659 | |
Credit Suisse First Boston (London) | | 8/19/09 | | EUR | | 21,793,419 | | USD | | 28,717,189 | | | 1,850,278 | |
Deutsche Bank AG London | | 8/19/09 | | EUR | | 33,000,000 | | USD | | 42,901,650 | | | 3,384,176 | |
Goldman Sachs International | | 8/19/09 | | EUR | | 2,469,906 | | USD | | 3,244,715 | | | 219,577 | |
JPMorgan Chase Bank | | 8/19/09 | | EUR | | 30,795,000 | | USD | | 40,047,358 | | | 3,145,733 | |
Citibank NA | | 8/19/09 | | GBP | | 6,828,801 | | USD | | 9,929,145 | | | 1,300,474 | |
JPMorgan Chase Bank | | 8/19/09 | | GBP | | 29,600,000 | | USD | | 43,046,688 | | | 5,629,018 | |
Citibank NA | | 8/19/09 | | USD | | 76,000,000 | | EUR | | 54,040,602 | | | 202,610 | |
Citibank NA | | 8/19/09 | | USD | | 29,154,600 | | GBP | | 20,000,000 | | | (3,734,391 | ) |
Deutsche Bank AG London | | 8/19/09 | | USD | | 38,520,498 | | EUR | | 28,650,000 | | | (1,664,014 | ) |
Deutsche Bank AG London | | 8/19/09 | | USD | | 16,995,406 | | GBP | | 11,646,033 | | | (2,155,908 | ) |
JPMorgan Chase Bank | | 8/19/09 | | USD | | 160,798,325 | | EUR | | 113,900,000 | | | 1,042,096 | |
JPMorgan Chase Bank | | 8/19/09 | | USD | | 15,409,256 | | EUR | | 11,610,000 | | | (874,939 | ) |
UBS AG London | | 8/19/09 | | USD | | 12,223,948 | | EUR | | 9,400,000 | | | (960,499 | ) |
| | | | | | | | | | | | | | |
| | | | | | | | | | | | $ | 10,156,830 | |
| | | | | | | | | | | | | | |
CAD—Canadian dollar
EUR—Euro
GBP—British pound
USD—United States dollar
Loan Participations and Assignments
The Funds may invest in loans arranged through private negotiation between one or more financial institutions. The Funds’ investment in any such loan may be in the form of a participation in or an assignment of the loan. In connection with purchasing participations, the Funds generally will have no right to enforce compliance by the borrower with the terms of the loan agreement relating to the loan, nor any rights of set-off against the borrower and the Funds may not benefit directly from any collateral supporting the loan in which it has purchased the participation.
The Funds will assume the credit risk of both the borrower and the lender that is selling the participation. In the event of the insolvency of the lender selling the participation, the Funds may be treated as a general creditor of the lender and may not benefit from any set-off between the lender and the borrower.
Written Options
When the Funds write an option, an amount equal to the premium received by the Funds are recorded as a liability, the value of which is marked-to-market daily to reflect the current market value of the option written. If the option expires, the Funds realize a gain from investments equal to the amount of the premium received. When a written call option is exercised, the difference between the premium received plus the option exercise price and the Funds’ basis in the underlying security (in the case of a covered written call option), or the cost to purchase the underlying security (in the case of an uncovered written call option), including brokerage commission, is treated as a realized gain or loss. When a written put option is exercised, the amount of the premium received is subtracted from the cost of the security purchased by the Funds from the exercise of the written put option to form the Funds’ basis in the underlying security purchased. The writer or buyer of an option traded on an exchange can liquidate the position before the exercise of the option by entering into a closing transaction. The cost of a closing transaction is deducted from the original premium received resulting in a realized gain or loss to the Funds.
94
Semi-Annual Report to Shareholders
The risk in writing a covered call option is that the Funds may forego the opportunity of profit if the market price of the underlying security increases and the option is exercised. The risk in writing a put option is that the Funds may incur a loss if the market price of the underlying security decreases and the option is exercised. The risk in writing a call option is that the Funds are exposed to the risk of loss if the market price of the underlying security increases. In addition, there is the risk that the Funds may not be able to enter into a closing transaction because of an illiquid secondary market.
Activity in written call and put options during the six months ended June 30, 2009, was as follows:
| | | | | | | |
| Core | | Actual
Contracts | | | Premiums | |
Options outstanding at December 31, 2008 | | 647,290,423 | | | $ | 32,385,640 | |
Options written | | 1,095,014,848 | | | | 20,928,848 | |
Options closed | | (151,807,567 | ) | | | (7,375,665 | ) |
Options expired | | (900,809,849 | ) | | | (18,717,362 | ) |
Options exercised | | (137,005,056 | ) | | | (7,630,201 | ) |
| | | | | | | |
Options outstanding at June 30, 2009 | | 552,682,799 | | | $ | 19,591,260 | |
| | | | | | | |
| | | | | | | |
| Core Plus | | Actual
Contracts | | | Premiums | |
Options outstanding at December 31, 2008 | | 1,404,999,259 | | | $ | 65,919,361 | |
Options written | | 2,471,139,062 | | | | 52,512,486 | |
Options closed | | (354,019,037 | ) | | | (18,310,362 | ) |
Options expired | | (2,214,383,206 | ) | | | (55,778,254 | ) |
Options exercised | | (40,750,000 | ) | | | (1,055,425 | ) |
| | | | | | | |
Options outstanding at June 30, 2009 | | 1,266,986,078 | | | $ | 43,287,806 | |
| | | | | | | |
Futures Contracts
Each Fund may use futures contracts to gain exposure to, or hedge against, changes in the value of equities, interest rates or foreign currencies. A futures contract represents a commitment for the future purchase or sale of an asset at a specified price on a specified date.
Upon entering into a futures contract, the Funds are required to deposit with a broker cash or cash equivalents in an amount equal to a certain percentage of the contract amount. This is known as the ‘‘initial margin.’’ Subsequent payments (‘‘variation margin’’) are made or received by the Fund each day, depending on the daily fluctuation in the value of the contract. For certain futures including foreign denominated futures held in Core Plus, variation margin is not-settled daily, but is recorded as a net variation margin payable or receivable Futures contracts are valued daily at the settlement price established by the board of trade or exchange on which they are traded. The daily changes in contract value are recorded as unrealized gains or losses in the Statement of Operations and the Funds recognize a realized gain or loss when the contract is closed.
Futures contracts involve, to varying degrees, risk of loss in excess of the amounts reflected in the financial statements. In addition, there is the risk that the Funds may not be able to enter into a closing transaction because of an illiquid secondary market.
The open futures positions and related appreciation or depreciation at June 30, 2009 are listed at the end of each Fund’s portfolio of investments.
Swap Agreements
The Fund may invest in swaps for the purpose of managing its exposure to interest rate, credit or market risk, or for other purposes. The use of swaps involves risks that are different from those associated with ordinary portfolio transactions.
95
Semi-Annual Report to Shareholders
Notes to Financial Statements—Continued
Swap contracts are marked-to-market daily and changes in value are recorded as unrealized appreciation/ (depreciation). Gains or losses are realized upon termination of the swap agreement. Periodic payments and premiums received or made by a Fund are recorded in the Statement of Operations as realized gains or losses, respectively. Collateral, in the form of restricted cash or securities, may be required to be held in segregated accounts with the Fund’s custodian in compliance with the terms of the swap contracts.
Securities held as collateral for swap contracts are identified in the Portfolio of Investments and restricted cash, if any, is identified in the Statement of Assets and Liabilities. Risks may exceed amounts recognized in the Statement of Assets and Liabilities. These risks include changes in the returns of the underlying instruments, failure of the counterparties to perform under the contracts’ terms, and the possible lack of liquidity with respect to the swap agreements.
As disclosed in the Fair Values of Derivatives—Balance Sheet table that follows each Fund’s summary of open swap contracts, the aggregate fair value of credit default swaps in a net liability position as of June 30, 2009 were $196,639,148 and $343,437,770 for Core and Core Plus, respectively. The aggregate fair value of assets posted as collateral, for all swaps were $207,329,230 and $474,530,000 for Core and Core Plus, respectively. If a defined credit event had occurred as of June 30, 2009, the swaps’ credit-risk-related contingent features would have been triggered and the Fund would have been required to pay up to $1,618,645,500 and $3,535,101,959 for Core and Core Plus, respectively, less the value of the contracts’ related reference obligations.
Credit Default Swaps
The Fund may enter into credit default swap (“CDS”) contracts for investment purposes, to manage its credit risk or to add leverage. CDS agreements involve one party making a stream of payments to another party in exchange for the right to receive a specified return in the event of a default by a third party, typically corporate or sovereign issuers, on a specified obligation, or in the event of a write-down, principal shortfall, interest shortfall or default of all or part of the referenced entities comprising a credit index. The Fund may use a CDS to provide protection against defaults of the issuers (i.e., to reduce risk where a Fund has exposure to a sovereign issuer) or to take an active long or short position with respect to the likelihood of a particular issuer’s default. As a seller of protection, the Fund generally receives an upfront payment or a stream of payments throughout the term of the swap provided that there is no credit event. If the Fund is a seller of protection and a credit event occurs, as defined under the terms of that particular swap agreement, the maximum potential amount of future payments (undiscounted) that the Fund could be required to make under a credit default swap agreement would be an amount equal to the notional amount of the agreement. These amounts of potential payments will be partially offset by any recovery of values from the respective referenced obligations. As a seller of protection, the Fund effectively adds leverage to its portfolio because, in addition to its total net assets, the Fund would be subject to investment exposure on the notional amount of the swap. As a buyer of protection, the Fund generally receives an amount up to the notional value of the swap if a credit event occurs.
Implied spreads are the theoretical prices a lender receives for credit default protection. When spreads rise, market perceived credit risk rises and when spreads fall, market perceived credit risk falls. The implied credit spread of a particular referenced entity reflects the cost of buying/selling protection and may include upfront payments required to enter into the agreement. Wider credit spreads and decreasing market values, when compared to the notional amount of the swap, represent a deterioration of the referenced entity’s credit soundness and a greater likelihood or risk of default or other credit event occurring as defined under the terms of the agreement. Credit spreads utilized in determining the period end market value of credit default swap agreements on corporate or sovereign issues are disclosed in the Notes to Financial Statements and serve as an indicator of the current status of the payment/performance risk and represent the likelihood or risk of default for credit derivatives. For credit default swap agreements on asset-backed securities and credit indices, the quoted market prices and resulting values, particularly in relation to the notional amount of the contract as well as the annual payment rate, serve as an indication of the current status of the payment/performance risk.
Payments received or made at the beginning of the measurement period are reflected as a premium or deposit, respectively, on the Statement of Assets and Liabilities. These upfront payments are amortized over the life of the swap and are recognized as realized gain or loss in the Statement of Operations. A liquidation payment received or made at the termination of the swap is recognized as realized gain or loss in the Statement of Operations. Net periodic payments received or paid by the Fund are recognized as realized gain or loss at the time of receipt of payment on the Statement of Operations.
96
Semi-Annual Report to Shareholders
The Fund’s maximum risk of loss from counterparty risk, either as the protection seller or as the protection buyer, is the fair value of the contract (this risk is mitigated by the posting of collateral by the counterparty to the Fund to cover the Fund’s exposure to the counterparty). Credit default swaps are considered to have credit risk-related contingent features since they require payment by the protection seller to the protection buyer upon the occurrence of a defined credit event.
Entering into a CDS agreement involves, to varying degrees, elements of credit, market and documentation risk in excess of the related amounts recognized in the Statement of Assets and Liabilities. Such risks involve the possibility that there will be no liquid market for these agreements, that the counterparty to the agreement may default on its obligation to perform or disagree as to the meaning of the contractual terms in the agreement, and that there will be unfavorable changes in net interest rates.
Interest Rate Swaps
The Fund may enter into interest rate swap contracts. Interest rate swaps are agreements between two parties to exchange cash flows based on a notional principal amount. The Fund may elect to pay a fixed rate and receive a floating rate, or, receive a fixed rate and pay a floating rate on a notional principal amount. The net periodic payments received or paid on interest rate swap agreements are recognized as realized gains or losses in the Statement of Operations. Interest rate swaps are marked to market daily based upon quotations from the market makers and the change, if any, is recorded as an unrealized gain or loss in the Statement of Operations. A liquidation payment received or made at the termination of the swap is recognized as a realized gain or loss in the Statement of Operations. The risks of interest rate swaps include changes in market conditions that will affect the value of the contract or changes in the present value of the future cash flow streams and the possible inability of the counterparty to fulfill its obligations under the agreement. The Fund’s maximum risk of loss from counterparty credit risk is the discounted net value of the cash flows to be received from the counterparty over the contract’s remaining life, to the extent that that amount is positive. This risk is mitigated by the posting of collateral by the counterparty to the Fund to cover the Fund’s exposure to the counterparty.
Total Return Swaps
Total return swaps are agreements to exchange the return generated by one instrument for the return generated by another instrument. For example, the agreement to pay a predetermined or fixed interest rate in exchange for a market-linked return based on a notional amount. To the extent the total return of the referenced index or instrument exceeds the offsetting interest obligation, the Fund will receive a payment from the counterparty. To the extent it is less, the Fund will make a payment to the counterparty. Periodic payments received or made by the Fund are recorded in the Statement of Operations as realized gains or losses, respectively.
As of June 30, 2009, the one-and three-month London Interbank Offered Rates (“LIBOR”) were 0.309% and 0.595%, respectively. The following is a summary of open swap contracts outstanding as of June 30, 2009.
| | | | | | | | | | | | | | | |
Core Interest Rate Swaps: | |
Swap Counterparty
(Reference Entity) | | Termination Date | | Periodic Payments Made
by the Fund‡ | | Periodic Payments
Received by
the Fund‡ | | Contract
Notional
Amount | | Upfront
Premiums
Paid/(Received) | | Unrealized
Appreciation/
(Depreciation) | |
| | | | | | | | | | | | | | | |
Banc of America Securities LLC | | March 1, 2013 | | 5.104%
Semi-Annually | | 3-month LIBOR | | $ | 4,700,000 | | — | | $ | (434,539 | ) |
| | | | | | |
Banc of America Securities LLC | | December 16, 2013 | | 5.381%
Semi-Annually | | 3-month LIBOR | | | 2,740,000 | | — | | | (299,741 | ) |
| | | | | | |
Banc of America Securities LLC | | November 10, 2015 | | 4.864%
Semi-Annually | | 3-month LIBOR | | | 4,400,000 | | — | | | (398,756 | ) |
97
Semi-Annual Report to Shareholders
Notes to Financial Statements—Continued
| | | | | | | | | | | | | | | | |
Core—Continued | |
Interest Rate Swaps—Continued | | | | | | | | | | | | |
Swap Counterparty
(Reference Entity) | | Termination Date | | Periodic
Payments Made
by the Fund‡ | | Periodic Payments
Received by
the Fund‡ | | Contract
Notional
Amount | | Upfront
Premiums
Paid/(Received) | | Unrealized
Appreciation/
(Depreciation) | |
| | | | | | | | | | | | | | | | |
Banc of America Securities LLC | | January 15, 2016 | | 5.45084%
Semi-Annually | | 3-month LIBOR | | $ | 2,750,000 | | | — | | $ | (346,808 | ) |
| | | | | | |
Banc of America Securities LLC | | October 3, 2016 | | 5.425%
Semi-Annually | | 3-month LIBOR | | | 4,120,000 | | | — | | | (530,470 | ) |
| | | | | | |
Banc of America Securities LLC | | February 15, 2025 | | 4.29456%
Semi-Annually | | 3-month LIBOR | | | 146,800,000 | | | — | | | (4,337,382 | ) |
| | | | | | |
Barclays Capital Inc. | | November 1, 2011 | | 5.439%
Semi-Annually | | 3-month LIBOR | | | 5,600,000 | | | — | | | (470,929 | ) |
| | | | | | |
Barclays Capital Inc. | | June 25, 2012 | | 5.06%
Semi-Annually | | 3-month LIBOR | | | 3,550,000 | | | — | | | (300,722 | ) |
| | | | | | |
Barclays Capital Inc. | | September 15, 2012 | | 5.189%
Semi-Annually | | 3-month LIBOR | | | 3,520,000 | | | — | | | (320,087 | ) |
| | | | | | |
Barclays Capital Inc. | | October 20, 2016 | | 5.326%
Semi-Annually | | 3-month LIBOR | | | 3,530,000 | | | — | | | (431,675 | ) |
| | | | | | |
Barclays Capital Inc. | | February 15, 2025 | | 4.3%
Semi-Annually | | 3-month LIBOR | | | 39,100,000 | | $ | 199,349 | | | (1,379,559 | ) |
| | | | | | |
Barclays Capital Inc. | | February 15, 2025 | | 3-month
LIBOR | | 4.3%
Semi-Annually | | | 26,400,000 | | | 552,349 | | | 252,470 | |
| | | | | | |
Bear Stearns, Inc. | | September 15, 2014 | | 5% Semi-Annually | | 3-month LIBOR | | | 4,270,000 | | | — | | | (409,799 | ) |
| | | | | | |
Citigroup Global Markets | | April 30, 2011 | | 3.22% Semi-Annually | | 3-month LIBOR | | | 3,580,000 | | | — | | | (115,529 | ) |
| | | | | | |
Citigroup Global Markets | | September 15, 2011 | | 3.34% Semi-Annually | | 3-month LIBOR | | | 5,500,000 | | | — | | | (199,039 | ) |
| | | | | | |
Credit Suisse First Boston USA | | August 15, 2010 | | 5.446% Semi-Annually | | 3-month LIBOR | | | 1,380,000 | | | — | | | (68,847 | ) |
| | | | | | |
Credit Suisse First Boston USA | | September 15, 2010 | | 5.0025% Semi-Annually | | 3-month LIBOR | | | 3,070,000 | | | — | | | (146,875 | ) |
| | | | | | |
Credit Suisse First Boston USA | | March 1, 2011 | | 5.229% Semi-Annually | | 3-month LIBOR | | | 2,110,000 | | | — | | | (136,371 | ) |
| | | | | | |
Credit Suisse First Boston USA | | May 1, 2012 | | 5.085% Semi-Annually | | 3-month LIBOR | | | 2,750,000 | | | — | | | (229,079 | ) |
| | | | | | |
Credit Suisse First Boston USA | | December 1, 2012 | | 4.9025% Semi-Annually | | 3-month LIBOR | | | 5,870,000 | | | — | | | (490,842 | ) |
| | | | | | |
Credit Suisse First Boston USA | | August 15, 2013 | | 5.023% Semi-Annually | | 3-month LIBOR | | | 3,020,000 | | | — | | | (278,474 | ) |
98
Semi-Annual Report to Shareholders
| | | | | | | | | | | | | | | | | |
| Core—Continued | |
| | | | |
Interest Rate Swaps—Continued | | | | | | | | | | | | | |
Swap Counterparty
(Reference Entity) | | Termination Date | | Periodic
Payments Made
by the Fund‡ | | Periodic Payments
Received by
the Fund‡ | | Contract
Notional
Amount | | Upfront
Premiums
Paid/(Received) | | | Unrealized
Appreciation/
(Depreciation) | |
| | | | | | | | | | | | | | | | | |
Credit Suisse First Boston USA | | March 15, 2014 | | 5.131% Semi-Annually | | 3-month LIBOR | | $ | 3,290,000 | | | — | | | $ | (329,993 | ) |
| | | | | | |
Credit Suisse First Boston USA | | September 15, 2015 | | 5.16% Semi-Annually | | 3-month LIBOR | | | 3,050,000 | | | — | | | | (328,200 | ) |
| | | | | | |
Credit Suisse First Boston USA | | March 1, 2017 | | 5.335% Semi-Annually | | 3-month LIBOR | | | 2,420,000 | | | — | | | | (301,460 | ) |
| | | | | | |
Deutsche Bank AG | | June 17, 2010 | | 3-month LIBOR | | 4.3132% Semi-Annually | | | 31,430,000 | | | — | | | | 1,038,605 | |
| | | | | | |
Deutsche Bank AG | | June 15, 2016 | | 5.1825% Semi-Annually | | 3-month LIBOR | | | 5,620,000 | | | — | | | | (629,007 | ) |
| | | | | | |
Deutsche Bank AG | | April 1, 2017 | | 5.435% Semi-annually | | 3-month LIBOR | | | 4,120,000 | | | — | | | | (543,297 | ) |
| | | | | | |
JP Morgan Chase & Co. | | April 30, 2011 | | 5.05% Semi-Annually | | 3-month LIBOR | | | 2,500,000 | | | — | | | | (163,320 | ) |
| | | | | | |
JP Morgan Chase & Co. | | December 1, 2012 | | 5.275% Semi-Annually | | 3-month LIBOR | | | 3,550,000 | | | — | | | | (340,578 | ) |
| | | | | | |
Morgan Stanley & Co., Inc. | | March 15, 2012 | | 4.7625% Semi-Annually | | 3-month LIBOR | | | 2,750,000 | | | — | | | | (202,016 | ) |
| | | | | | |
Morgan Stanley & Co., Inc. | | April 30, 2016 | | 5.189% Semi-Annually | | 3-month LIBOR | | | 3,400,000 | | | — | | | | (379,876 | ) |
| | | | | | |
Morgan Stanley & Co., Inc. | | September 16, 2019 | | 3.25%
Semi-Annually | | 3-month LIBOR | | | 28,710,000 | | $ | (396,993 | ) | | | 1,829,109 | |
| | | | | | |
RBS Greenwich | | March 1, 2011 | | 4.7%
Semi-Annually | | 3-month LIBOR | | | 1,370,000 | | | — | | | | (76,585 | ) |
| | | | | | |
RBS Greenwich | | March 1, 2016 | | 5.12%
Semi-Annually | | 3-month LIBOR | | | 4,250,000 | | | — | | | | (454,755 | ) |
| | | | | | |
RBS Greenwich | | February 15, 2017 | | 5.115%
Semi-Annually | | 3-month LIBOR | | | 3,580,000 | | | — | | | | (390,028 | ) |
| | | | | | | | | | | | | | | | | |
| |
Net unrealized depreciation on interest rate swaps | | | $ | (12,344,454 | ) |
| | | | | | | | | | | | | | | | | |
99
Semi-Annual Report to Shareholders
Notes to Financial Statements—Continued
| | | | | | | | | | | | | | | | | |
| Core—Continued | |
|
| Credit Default Swap on Corporate Issues—Sell Protection1 | |
Swap Counterparty (Reference Entity) | | Termination Date | | Implied Credit
Spread At
June 30,
20092 | | Periodic
Payments
Received by
the Fund‡ | | Contract
Notional
Amount3 | | Market Value | | | Upfront
Premiums
Paid/(Received) | | Unrealized
Appreciation/
(Depreciation) | |
| | | | | | | | | | | | | | | | | |
Bear Stearns, Inc. (Ford Motor Credit Company,
7%, due 10/1/13) | | June 20, 2010 | | 10.81% | | 4.83% Quarterly | | $ | 12,500,000 | | $ (687,900) | | | — | | $ (687,900) | |
| | | | | | | |
Credit Suisse First Boston USA (Eastman Kodak Company,
7.25%, due 11/15/13) | | March 20, 2010 | | 14.39% | | 1.4% Quarterly | | | 6,500,000 | | (570,569 | ) | | — | | (570,569 | ) |
| | | | | | | |
Deutsche Bank AG (Eastman Kodak Company,
7.25%, due 11/15/13) | | March 20, 2010 | | 14.39% | | 1.25% Quarterly | | | 1,100,000 | | (97,678 | ) | | — | | (97,678 | ) |
| | | | | | | |
Deutsche Bank AG (Eastman Kodak Company,
7.25%, due 11/15/13) | | March 20, 2015 | | 17.26% | | 1.67% Quarterly | | | 1,300,000 | | (545,189 | ) | | — | | (545,189 | ) |
| | | | | | | |
Deutsche Bank AG (Ford Motor Credit Company,
7%, due 10/1/13) | | December 20, 2010 | | 10.10% | | 5.05% Quarterly | | | 17,100,000 | | (1,160,420 | ) | | — | | (1,160,420 | ) |
| | | | | | | |
Deutsche Bank AG (Ford Motor Credit Company,
7.45%, due 7/16/31) | | March 20, 2015 | | 16.93% | | 2.93% Quarterly | | | 1,700,000 | | (802,559 | ) | | — | | (802,559 | ) |
| | | | | | | |
RBS Greenwich (Countrywide Home Loan Inc.,
4%, due 3/22/11) | | June 20, 2012 | | 2.21% | | 0.72%
Quarterly | | | 25,000,000 | | (1,039,000 | ) | | — | | (1,039,000 | ) |
| | | | | | | |
RBS Greenwich (Countrywide Home Loans, Inc.,
4%, due 3/22/11) | | September 20, 2012 | | 2.20% | | 6%
Quarterly | | | 9,100,000 | | 1,037,666 | | | — | | 1,037,666 | |
| | | | | | | |
RBS Greenwich (Countrywide Home Loans, Inc.,
4%, due 3/22/11) | | September 20, 2012 | | 2.20% | | 6.1%
Quarterly | | | 9,100,000 | | 1,064,935 | | | — | | 1,064,935 | |
| | | | | | | |
RBS Greenwich (Countrywide Home Loans, Inc.,
4%, due 3/22/11) | | September 20, 2012 | | 2.20% | | 2.75%
Quarterly | | | 10,000,000 | | 166,386 | | | — | | 166,386 | |
100
Semi-Annual Report to Shareholders
| | | | | | | | | | | | | | | | | | | | | |
| Core—Continued | | | | | | | |
|
| Credit Default Swap on Corporate Issues—Sell Protection1 —Continued | |
Swap Counterparty (Reference Entity) | | Termination Date | | Implied Credit
Spread At
June 30,
20092 | | Periodic
Payments
Received by
the Fund‡ | | Contract
Notional
Amount3 | | Market
Value | | | Upfront
Premiums
Paid/(Received) | | | Unrealized
Appreciation/
(Depreciation) | |
| | | | | | | | | | | | | | | | | | | | | |
RBS Greenwich (Countrywide Home Loans, Inc.,
4%, due 3/22/11) | | December 20, 2012 | | 2.18% | | 5%
Quarterly | | $ | 10,000,000 | | $ | 903,139 | | | $ | (861,624 | ) | | $ | 1,764,763 | |
| | | | | | | |
RBS Greenwich
(Ford Motor Credit Company,
7%, due 10/1/13) | | December 20, 2010 | | 10.10% | | 4.26%
Quarterly | | | 25,000,000 | | | (1,962,943 | ) | | | — | | | | (1,962,943 | ) |
| | | | | | | |
RBS Greenwich
(General Motors Acceptance Corporation,
6.875%, due 8/12/12) | | June 20, 2010 | | 11.92% | | 4.53% Quarterly | | | 15,000,000 | | | (1,013,022 | ) | | | — | | | | (1,013,022 | ) |
| | | | | | | |
RBS Greenwich
(General Motors Acceptance Corporation,
6.875%, due 8/28/12) | | June 20, 2010 | | 11.92% | | 4.68%
Quarterly | | | 25,000,000 | | | (1,653,925 | ) | | | — | | | | (1,653,925 | ) |
| | | | | | | |
RBS Greenwich
(General Motors Acceptance Corporation,
6.875%, due 8/28/12) | | September 20, 2010 | | 11.26% | | 5.75%
Quarterly | | | 7,500,000 | | | (464,786 | ) | | | — | | | | (464,786 | ) |
| | | | | | | |
RBS Greenwich (Residential Capital Corp.,
6.5%, due 4/17/13) | | September 20, 2012 | | 18.72% | | 2.32%
Quarterly | | | 25,000,000 | | | (9,082,647 | ) | | | — | | | | (9,082,647 | ) |
| | | | | | | |
RBS Greenwich (Residential Capital, LLC,
7.5%, due 4/17/13) | | September 20, 2012 | | 18.72% | | 4.9%
Quarterly | | | 9,100,000 | | | (2,785,088 | ) | | | — | | | | (2,785,088 | ) |
| | | | | | | |
RBS Greenwich
(Ryland Group Inc.,
5.375%, due 1/15/15) | | December 20, 2012 | | 2.45% | | 2.4%
Quarterly | | | 9,800,000 | | | (14,518 | ) | | | — | | | | (14,518 | ) |
| | | | | | | |
RBS Greenwich
(SLM Corp.,
5.125%, due 8/27/12) | | June 20, 2012 | | 7.93% | | 1.38%
Quarterly | | | 20,000,000 | | | (3,356,434 | ) | | | — | | | | (3,356,434 | ) |
| | | | | | | |
RBS Greenwich
(SLM Corp.,
5.125%, due 8/27/12) | | June 20, 2012 | | 7.95% | | 1.78%
Quarterly | | | 25,000,000 | | | (3,767,885 | ) | | | — | | | | (3,767,885 | ) |
| | | | | | | |
RBS Greenwich
(SLM Corp.,
5.125%, due 8/27/12) | | September 20, 2012 | | 7.92% | | 2.35%
Quarterly | | | 1,500,000 | | | (217,464 | ) | | | — | | | | (217,464 | ) |
101
Semi-Annual Report to Shareholders
Notes to Financial Statements—Continued
| | | | | | | | | | | | | | | | | | | |
| Core—Continued | | | | | | |
|
| Credit Default Swap on Corporate Issues—Sell Protection1 —Continued | |
Swap Counterparty (Reference Entity) | | Termination Date | | Implied Credit
Spread At
June 30,
20092 | | Periodic
Payments
Received by
the Fund‡ | | Contract
Notional
Amount3 | | Market
Value | | | Upfront
Premiums
Paid/(Received) | | Unrealized
Appreciation/
(Depreciation) | |
| | | | | | | | | | | | | | | | | | | |
RBS Greenwich
(SLM Corp.,
5.125%, due 8/27/12) | | September 20, 2012 | | 7.92% | | 2.4%
Quarterly | | $ | 1,500,000 | | $ | (215,509 | ) | | — | | $ | (215,509 | ) |
| | | | | | | |
RBS Greenwich
(SLM Corp., 5.125%, due 8/27/12) | | September 20, 2012 | | 7.92% | | 2.44%
Quarterly | | | 25,000,000 | | | (3,565,738 | ) | | — | | | (3,565,738 | ) |
| | | | | | | |
RBS Greenwich
(SLM Corp.,
5.125%, due 8/27/12) | | September 20, 2012 | | 7.92% | | 2.67%
Quarterly | | | 10,000,000 | | | (1,366,321 | ) | | — | | | (1,366,321 | ) |
| | | | | | | |
RBS Greenwich
(SLM Corp.,
5.125%, due 8/27/12) | | September 20, 2012 | | 7.92% | | 2.67% Quarterly | | | 10,000,000 | | | (1,366,321 | ) | | — | | | (1,366,321 | ) |
| | | | | | | |
RBS Greenwich
(Time Warner Inc.
6.875%, due 5/1/12) | | September 20, 2010 | | 0.56% | | 0.47% Quarterly | | | 5,000,000 | | | (5,607 | ) | | — | | | (5,607 | ) |
| | | | | | | |
RBS Greenwich
(Time Warner Inc.,
6.875%, due 5/1/12) | | December 20, 2010 | | 0.60% | | 0.5% Quarterly | | | 12,500,000 | | | (18,438 | ) | | — | | | (18,438 | ) |
| | | | | | | |
The Goldman Sachs Group, Inc.
(Countrywide Financial,
0.0%, due 2/8/31) | | September 20, 2012 | | 2.20% | | 6% Quarterly | | | 4,700,000 | | | 535,937 | | | — | | | 535,937 | |
| | | | | | | | | | | | | | | | | | | |
| | | | | | | |
The Goldman Sachs Group, Inc.
(Eastman Kodak Company,
7.25%, due 11/15/13) | | March 20, 2015 | | 17.26% | | 1.67% Quarterly | | | 1,400,000 | | | (587,127 | ) | | — | | | (587,127 | ) |
| | | | | | | |
The Goldman Sachs Group, Inc.
(Ford Motor Credit Company,
7%, due 10/1/13) | | June 20, 2010 | | 10.81% | | 4.75% Quarterly | | | 1,900,000 | | | (105,966 | ) | | — | | | (105,966 | ) |
| | | | | | | |
The Goldman Sachs Group, Inc.
(General Motors Acceptance Corporation,
6.875%, due 8/28/12) | | June 20, 2010 | | 11.92% | | 6% Quarterly | | | 5,000,000 | | | (270,160 | ) | | — | | | (270,160 | ) |
| | | | | | | | | | | | | | | | | | | |
| | |
Net unrealized depreciation on sales of credit default swaps on corporate issues | | | | | $ | (32,153,527 | ) |
| | | | | | | | | | | | | | | | | | | |
102
Semi-Annual Report to Shareholders
| | | | | | | | | | | | | | | | |
| Core—Continued | |
|
| Credit Default Swaps on Corporate Issues—Buy Protection4 | |
Swap Counterparty
(Reference Entity) | | Termination Date | | Periodic
Payments Made
by the Fund‡ | | Contract
Notional
Amount3 | | Market Value | | | Upfront
Premiums
Paid/(Received) | | Unrealized
Appreciation/
Depreciation | |
| | | | | | | | | | | | | | | | |
Banc of America Securities LLC
(Home Depot Inc.,
3.75%, due 9/15/09) | | December 20, 2013 | | 0.635%
Quarterly | | $2,740,000 | | $ | 34,733 | | | — | | $ | 34,733 | |
| | | | | | |
Banc of America Securities LLC
(Marriot International Inc.,
4.625%, due 6/15/12 ) | | December 20, 2015 | | 0.73%
Monthly | | 4,400,000 | | | 308,389 | | | — | | | 308,389 | |
| | | | | | |
Banc of America Securities LLC
(Masco Corp.,
5.875%, due 7/15/12) | | December 20, 2016 | | 1.04%
Quarterly | | 4,120,000 | | | 466,608 | | | — | | | 466,608 | |
| | | | | | |
Banc of America Securities LLC
(PHH Corporate Note,
7.125%, due 3/1/13 ) | | March 20, 2013 | | 1.05%
Monthly | | 5,010,000 | | | 1,140,321 | | | — | | | 1,140,321 | |
| | | | | | |
Banc of America Securities LLC
(Viacom Inc.,
4.625%, due 5/15/18) | | December 20, 2015 | | 1.13%
Quarterly | | 2,750,000 | | | 230,506 | | | — | | | 230,506 | |
| | | | | | |
Barclays Capital Inc.
(Amerisourcebergen Corp.,
5.625%, due 9/15/12) | | September 20, 2012 | | 0.5%
Quarterly | | 3,520,000 | | | (8,474 | ) | | — | | | (8,474 | ) |
| | | | | | |
Barclays Capital Inc.
(Cardinal Health Inc.
5.85%, due 12/15/17) | | September 20, 2016 | | 0.49% Quarterly | | 3,530,000 | | | 3,272 | | | — | | | 3,272 | |
| | | | | | |
Barclays Capital Inc.
(Health Care Property Investments Inc.,
6.45%, due 06/25/12) | | June 20, 2012 | | 0.63% Quarterly | | 3,550,000 | | | 288,464 | | | — | | | 288,464 | |
| | | | | | |
Barclays Capital Inc.
(Motorola Inc.,
6.5%, due 9/1/25) | | December 20, 2011 | | 0.32% Quarterly | | 5,600,000 | | | 264,524 | | | — | | | 264,524 | |
| | | | | | |
Bear Stearns, Inc.
(Bell South Corp.,
6%, due 10/15/11) | | September 20, 2014 | | 0.28% Quarterly | | 4,270,000 | | | 17,528 | | | — | | | 17,528 | |
| | | | | | |
Bear Stearns, Inc.
(Viacom Inc.,
6.25%, due 4/30/16) | | March 20, 2011 | | 0.59% Quarterly | | 2,500,000 | | | 34,473 | | | — | | | 34,473 | |
| | | | | | |
Credit Suisse First Boston USA (AAMES Mortgage Investment Trust 2005-1 M8, 1-Month LIBOR + 160 bp, due 6/25/35) | | June 25, 2035 | | 1.28%
Monthly | | 784,000 | | | 739,284 | | | — | | | 739,284 | |
103
Semi-Annual Report to Shareholders
Notes to Financial Statements—Continued
| | | | | | | | | | | | | | | | |
| Core—Continued | |
|
| Credit Default Swaps on Corporate Issues—Buy Protection4—Continued | |
Swap Counterparty
(Reference Entity) | | Termination Date | | Periodic
Payments Made
by the Fund‡ | | Contract
Notional
Amount3 | | Market Value | | | Upfront
Premiums
Paid/(Received) | | Unrealized
Appreciation/
Depreciation | |
| | | | | | | | | | | | | | | | |
Credit Suisse First Boston USA (AAMES Mortgage Investment Trust 2005-1 M9, 1-Month
LIBOR + 250 bp, due 6/25/35) | | June 25, 2035 | | 2.05%
Monthly | | $784,000 | | $ | 751,485 | | | — | | $ | 751,485 | |
| | | | | | |
Credit Suisse First Boston USA
(ACE Securities Corp. 2005-HE1 M8, 1-Month LIBOR + 138 bp, due 2/25/35) | | February 25, 2035 | | 1.31%
Monthly | | 606,825 | | | 592,471 | | | — | | | 592,471 | |
| | | | | | |
Credit Suisse First Boston USA (Aegis Asset Backed Securities Trust 2004-4 B2, 1-Month LIBOR + 190bp, due 10/25/34) | | October 25, 2034 | | 1.37%
Monthly | | 581,482 | | | 513,730 | | | — | | | 513,730 | �� |
| | | | | | |
Credit Suisse First Boston USA (Aegis Asset Backed Securities Trust 2005 B2, 1-Month LIBOR + 130 bp, due 3/25/35) | | March 25, 2035 | | 1.31%
Monthly | | 784,000 | | | 778,183 | | | — | | | 778,183 | |
| | | | | | |
Credit Suisse First Boston USA (Aegis Asset Backed Securities Trust 2005 B3, 1-Month LIBOR + 200 bp, due 3/25/35) | | March 25, 2035 | | 2.18%
Monthly | | 784,000 | | | 783,349 | | | — | | | 783,349 | |
| | | | | | |
Credit Suisse First Boston USA (Amerisource Bergen Corp., 8.125%, due 9/1/08) | | September 20, 2015 | | 0.9%
Quarterly | | 3,050,000 | | | (68,692 | ) | | — | | | (68,692 | ) |
| | | | | | |
Credit Suisse First Boston USA (Argent Securities Inc. 2004-W11 M10, 1-Month LIBOR + 350bp, due 11/25/34) | | November 25, 2034 | | 2.15%
Monthly | | 298,717 | | | 289,991 | | | — | | | 289,991 | |
| | | | | | |
Credit Suisse First Boston USA (Argent Securities Inc. 2004-W11 M9, 1-Month LIBOR + 225bp, due 11/25/34) | | November 25, 2034 | | 1.33%
Monthly | | 298,717 | | | 287,576 | | | — | | | 287,576 | |
| | | | | | |
Credit Suisse First Boston USA
(Argent Securities Inc. 2004-W4 M3, 1-Month LIBOR + 300 bp, due 3/25/34) | | March 25, 2034 | | 2.2%
Monthly | | 371,871 | | | 292,801 | | | — | | | 292,801 | |
| | | | | | |
Credit Suisse First Boston USA (Finance America Mortgage Loan Trust 2004-3 M8, 1-Month LIBOR + 180bp, due 11/25/34) | | November 25, 2034 | | 1.31%
Monthly | | 285,027 | | | 274,241 | | | — | | | 274,241 | |
104
Semi-Annual Report to Shareholders
| | | | | | | | | | | | | | |
| Core—Continued |
|
| Credit Default Swaps on Corporate Issues—Buy Protection4—Continued |
Swap Counterparty
(Reference Entity) | | Termination Date | | Periodic
Payments Made
by the Fund‡ | | Contract
Notional
Amount3 | | Market Value | | Upfront
Premiums
Paid/(Received) | | Unrealized
Appreciation/
Depreciation |
| | | | | | | | | | | | | | |
Credit Suisse First Boston USA (Finance America Mortgage
Loan Trust 2004-3 M9, 1-Month LIBOR + 315bp, due 11/25/34) | | November 25, 2034 | | 2.18%
Monthly | | $156,443 | | $ | 153,330 | | — | | $ | 153,330 |
| | | | | | |
Credit Suisse First Boston USA (Fremont Home Loan Trust 2005-A M8, 1-Month LIBOR
+ 135 bp, due 1/25/35) | | January 25, 2035 | | 1.31%
Monthly | | 310,788 | | | 302,966 | | — | | | 302,966 |
| | | | | | |
Credit Suisse First Boston USA (Fremont Home Loan Trust 2005-A, 1-Month LIBOR
+ 100bp, due 1/25/35) | | January 25, 2035 | | 2.08%
Monthly | | 76,223 | | | 75,828 | | — | | | 75,828 |
| | | | | | |
Credit Suisse First Boston USA
(Home Depot Inc.,
3.75%, due 9/15/09) | | September 20, 2010 | | 0.17%
Quarterly | | 1,380,000 | | | 11,693 | | — | | | 11,693 |
| | | | | | |
Credit Suisse First Boston USA
(IndyMac Home Equity Loan Asset-Backed, Trust 2004-C M8, 1-Month LIBOR + 190bp, due 3/25/35) | | March 25, 2035 | | 1.28%
Monthly | | 409,241 | | | 375,332 | | — | | | 375,332 |
| | | | | | |
Credit Suisse First Boston USA (IndyMac Home Equity Loan Asset-Backed, Trust 2004-C M9, 1-Month LIBOR + 325bp, due 3/25/35) | | March 25, 2035 | | 2.05%
Monthly | | 326,584 | | | 303,594 | | — | | | 303,594 |
| | | | | | |
Credit Suisse First Boston USA (Limited Brands Inc.,
6.125%, due 12/01/12) | | December 20, 2012 | | 0.6%
Quarterly | | 5,870,000 | | | 377,629 | | — | | | 377,629 |
| | | | | | |
Credit Suisse First Boston USA
(Long Beach Mortgage Loan Trust 2004-1 M9, 1-Month
LIBOR + 350bp, due 2/25/34) | | February 25, 2034 | | 2.15%
Monthly | | 217,356 | | | 126,624 | | — | | | 126,624 |
| | | | | | |
Credit Suisse First Boston USA
(Long Beach Mortgage Loan Trust 2005-1 M8, 1-Month
LIBOR + 170 bp, due 2/25/35) | | February 25, 2035 | | 1.31%
Monthly | | 380,679 | | | 371,767 | | — | | | 371,767 |
| | | | | | |
Credit Suisse First Boston USA
(Long Beach Mortgage Loan Trust 2005-1 M9, 1-Month
LIBOR + 275bp, due 2/25/35) | | February 25, 2035 | | 2.08%
Monthly | | 238,705 | | | 238,171 | | — | | | 238,171 |
105
Semi-Annual Report to Shareholders
Notes to Financial Statements—Continued
| | | | | | | | | | | | | | | | |
| Core—Continued | |
|
| Credit Default Swaps on Corporate Issues—Buy Protection4—Continued | |
Swap Counterparty
(Reference Entity) | | Termination Date | | Periodic
Payments Made
by the Fund‡ | | Contract
Notional
Amount3 | | Market Value | | | Upfront
Premiums
Paid/(Received) | | Unrealized
Appreciation/
Depreciation | |
| | | | | | | | | | | | | | | | |
Credit Suisse First Boston USA
(Marsh & Mclennan Company, Inc.,
5.375%, due 7/15/14) | | September 20, 2010 | | 0.46%
Quarterly | | $3,070,000 | | $ | (4,120 | ) | | — | | $ | (4,120 | ) |
| | | | | | |
Credit Suisse First Boston USA
(Masco Corp.,
5.875%, due 7/15/12) | | September 20, 2013 | | 0.75%
Quarterly | | 3,320,000 | | | 326,433 | | | — | | | 326,433 | |
| | | | | | |
Credit Suisse First Boston USA
(MASTR Asset Backed Securities Trust 2005-NC1 M8, 1-Month LIBOR + 153bp, due 12/25/34) | | December 25, 2034 | | 1.31%
Monthly | | 461,351 | | | 435,316 | | | — | | | 435,316 | |
| | | | | | |
Credit Suisse First Boston USA
(MASTR Asset Backed Securities Trust 2005-NC1 M9, 1-Month LIBOR + 240bp, due 12/25/34) | | December 25, 2034 | | 2.08%
Monthly | | 414,556 | | | 397,589 | | | — | | | 397,589 | |
| | | | | | |
Credit Suisse First Boston USA
(Merrill Lynch Mortgage Investors, Inc. 2004-WMC1 B3, 1-Month LIBOR + 225bp, due 9/25/35) | | September 25, 2035 | | 2.05%
Monthly | | 206,563 | | | 189,413 | | | — | | | 189,413 | |
| | | | | | |
Credit Suisse First Boston USA
(Merrill Lynch Mortgage Investors, Inc. 2004-WMC4 B3, 1-Month LIBOR + 375bp, due 4/25/35) | | April 25, 2035 | | 2.15%
Monthly | | 228,419 | | | 221,096 | | | — | | | 221,096 | |
| | | | | | |
Credit Suisse First Boston USA
(Merrill Lynch Mortgage Investors, Inc. 2005-NC1 B2, 1-Month LIBOR + 130bp, due 10/25/35) | | October 25, 2035 | | 1.28%
Monthly | | 280,552 | | | 256,458 | | | — | | | 256,458 | |
| | | | | | |
Credit Suisse First Boston USA
(Merrill Lynch Mortgage Investors, Inc. 2005-NC1 B3, 1-Month LIBOR + 205bp, due 10/25/35) | | October 25, 2035 | | 2.05%
Monthly | | 281,898 | | | 263,339 | | | — | | | 263,339 | |
| | | | | | |
Credit Suisse First Boston USA
(Merrill Lynch Mortgage Investors, Inc. 2005-WMC1 B2, 1-Month LIBOR + 135bp, due 9/25/35) | | September 25, 2035 | | 1.28%
Monthly | | 266,082 | | | 246,215 | | | — | | | 246,215 | |
106
Semi-Annual Report to Shareholders
| | | | | | | | | | | | | | |
| Core—Continued |
|
| Credit Default Swaps on Corporate Issues—Buy Protection4—Continued |
Swap Counterparty
(Reference Entity) | | Termination Date | | Periodic
Payments Made
by the Fund‡ | | Contract
Notional
Amount3 | | Market Value | | Upfront
Premiums
Paid/(Received) | | Unrealized
Appreciation/
Depreciation |
| | | | | | | | | | | | | | |
Credit Suisse First Boston USA
(Morgan Stanley ABS Capital I 2005-WMC1 B2, 1-Month LIBOR + 130 bp, due 1/25/35) | | January 25, 2035 | | 1.31%
Monthly | | $248,671 | | $ | 241,360 | | — | | $ | 241,360 |
| | | | | | |
Credit Suisse First Boston USA
(Morgan Stanley ABS Capital I 2005-WMC1 B3, 1-Month LIBOR + 215bp, due 1/25/35) | | January 25, 2035 | | 2.18%
Monthly | | 109,388 | | | 108,905 | | — | | | 108,905 |
| | | | | | |
Credit Suisse First Boston USA
(New Century Home Equity Loan Trust 2004-2 M9, 1-Month LIBOR + 325bp, due 8/25/34) | | August 25, 2034 | | 2.15%
Monthly | | 310,850 | | | 186,919 | | — | | | 186,919 |
| | | | | | |
Credit Suisse First Boston USA
(New Century Home Equity Loan Trust 2005-1 M8, 1-Month LIBOR + 140 bp, due 3/25/35) | | March 25, 2035 | | 1.31%
Monthly | | 384,430 | |
| 331,189
| | —
| | | 331,189 |
| | | | | | |
Credit Suisse First Boston USA
(New Century Home Equity Loan Trust 2005-1 M9, 1-Month LIBOR + 205 bp, due 3/25/35) | | March 25, 2035 | | 2.18%
Monthly | | 335,297 | | | 293,558 | | — | | | 293,558 |
| | | | | | |
Credit Suisse First Boston USA (Novastar Home Equity Loan 2005-1 B2, 1-Month LIBOR + 135 bp, due 6/25/35) | | June 25, 2035 | | 1.28%
Monthly | | 784,000 | | | 705,028 | | — | | | 705,028 |
| | | | | | |
Credit Suisse First Boston USA (Novastar Home Equity Loan 2005-4 B3, 1-Month LIBOR + 195 bp, due 6/25/35) | | June 25, 2035 | | 2.05%
Monthly | | 784,000 | | | 727,215 | | — | | | 727,215 |
| | | | | | |
Credit Suisse First Boston USA (Park Place Securities Inc. 2005-WCH1 M8, 1-Month LIBOR + 155bp, due 1/25/36) | | January 25, 2036 | | 1.36%
Monthly | | 784,000 | | | 749,942 | | — | | | 749,942 |
| | | | | | |
Credit Suisse First Boston USA (Park Place Securities, Inc. 2005-WCH1 M9, 1-Month LIBOR + 250 bp, due 1/25/36) | | January 25, 2036 | | 2.18%
Monthly | | 755,964 | | | 737,016 | | — | | | 737,016 |
| | | | | | |
Credit Suisse First Boston USA (People’s Choice Home Loan Securities Trust 2004-1 M6, 1-Month LIBOR + 230bp, due 6/25/34) | | June 25, 2034 | | 1.37% Quarterly | | 482,247 | | | 473,296 | | — | | | 473,296 |
| | | | | | |
Credit Suisse First Boston USA (People’s Choice Home Loan Securities Trust 2005-1 B3, 1-Month LIBOR + 260bp, due 1/25/35) | | January 25, 2035 | | 2.05%
Monthly | | 614,700 | | | 614,178 | | — | | | 614,178 |
107
Semi-Annual Report to Shareholders
Notes to Financial Statements—Continued
| | | | | | | | | | | | | | | | |
| Core—Continued | |
|
| Credit Default Swaps on Corporate Issues—Buy Protection4—Continued | |
Swap Counterparty
(Reference Entity) | | Termination Date | | Periodic
Payments Made
by the Fund‡ | | Contract
Notional
Amount3 | | Market Value | | | Upfront
Premiums
Paid/(Received) | | Unrealized
Appreciation/
Depreciation | |
| | | | | | | | | | | | | | | | |
Credit Suisse First Boston USA (People’s Choice Home Loan Securities Trust 2005-1, 1-Month LIBOR + 165bp, due 1/25/35) | | January 25, 2035 | | 1.28%
Monthly | | $784,000 | | $ | 766,984 | | | — | | $ | 766,984 | |
| | | | | | |
Credit Suisse First Boston USA (Pulte Homes Inc.,
7.875%, due 8/1/11) | | March 20, 2011 | | 0.79% Quarterly | | 2,100,000 | | | 58,765 | | | — | | | 58,765 | |
| | | | | | |
Credit Suisse First Boston USA
(Southwest Airlines Co.,
5.25%, due 10/1/14) | | March 20, 2017 | | 0.69% Quarterly | | 2,420,000 | | | 170,219 | | | — | | | 170,219 | |
| | | | | | |
Credit Suisse First Boston USA
(Starwood Hotels Resorts,
7.875%, due 8/25/34) | | December 20, 2011 | | 1.37%
Quarterly | | 3,050,000 | | | 155,500 | | | — | | | 155,500 | |
| | | | | | |
Credit Suisse First Boston USA
(Waste Management Inc.,
7.375%, due 8/1/10) | | March 20, 2014 | | 0.49%
Quarterly | | 3,290,000 | | | 43,942 | | | — | | | 43,942 | |
| | | | | | |
Deutsche Bank AG
(Autozone Inc.,
6.95%, due 6/15/16) | | June 20, 2016 | | 0.58%
Quarterly | | 5,620,000 | | | (1,362 | ) | | — | | | (1,362 | ) |
| | | | | | |
Deutsche Bank AG
(Centurytel Inc.,
7.875%, due 8/15/12) | | March 20, 2017 | | 0.89%
Quarterly | | 4,120,000 | | | (17,592 | ) | | — | | | (17,592 | ) |
| | | | | | |
JP Morgan Chase & Co.
(Limited Brands Inc.,
6.125%, due 12/1/12) | | December 20, 2012 | | 0.67%
Quarterly | | 3,550,000 | | | 220,493 | | | — | | | 220,493 | |
| | | | | | |
Morgan Stanley & Co., Inc.
(Pulte Homes Inc.,
5.25%, due 1/15/14) | | March 20, 2011 | | 4%
Quarterly | | 1,370,000 | | | (35,195 | ) | | — | | | (35,195 | ) |
| | | | | | |
Morgan Stanley & Co., Inc.
(Sara Lee Corp.
6.125% due 11/01/32) | | September 20, 2011 | | 0.62%
Quarterly | | 5,500,000 | | | (34,885 | ) | | — | | | (34,885 | ) |
| | | | | | |
Morgan Stanley & Co., Inc.
(Viacom Inc.,
6.25%, due 4/30/16) | | March 20, 2012 | | 0.36%
Quarterly | | 5,460,000 | | | 162,608 | | | — | | | 162,608 | |
| | | | | | |
Morgan Stanley & Co., Inc.
(Weyerhaeuser Co. Note,
7.125%, due 7/15/23) | | March 20, 2012 | | 0.74%
Quarterly | | 2,750,000 | | | 68,599 | | | — | | | 68,599 | |
| | | | | | |
RBS Greenwich
(General Mills Inc.,
5.7%, due 2/15/17) | | March 20, 2017 | | 0.33%
Quarterly | | 3,580,000 | | | 31,604 | | | — | | | 31,604 | |
108
Semi-Annual Report to Shareholders
| | | | | | | | | | | | | | | | | | |
| Core—Continued | |
|
| Credit Default Swaps on Corporate Issues—Buy Protection4—Continued | |
Swap Counterparty
(Reference Entity) | | Termination Date | | Periodic Payments Made by the Fund‡ | | Contract
Notional
Amount3 | | | Market Value | | |
| Upfront
Premiums
Paid/(Received) |
| |
| Unrealized
Appreciation/
Depreciation |
|
| | | | | | | | | | | | | | | | | | |
RBS Greenwich
(Harborview Mortgage Loan Trust 2005-12, 1-Month LIBOR + 175 bp, due 10/19/35) | | October 19, 2035 | | 2.5%
Monthly | | $1,292,206 | | $ | 1,226,223 | | | | — | | | $ | 1,226,223 | * |
| | | | | | |
RBS Greenwich
(Home Depot Inc.,
5.4%, due 3/1/16) | | March 20, 2016 | | 0.48%
Monthly | | 4,250,000 | | | 107,468 | | | | — | | | | 107,468 | |
| | | | | | |
RBS Greenwich (Washington Mutual 2005-AR11, 1-Month LIBOR + 120 bp, due 8/25/45) | | August 25, 2045 | | 2.55%
Monthly | | 466,243 | | | 460,941 | | | | — | | | | 460,941 | * |
| | | | | | |
The Goldman Sachs Group, Inc. (Viacom Inc. 6.25% due 4/30/2016) | | March 20, 2011 | | 1.4%
Quarterly | | 3,580,000 | | | 25 | | | | — | | | | 25 | |
| | | | | | | | | | | | | | | | | | |
| |
Net unrealized appreciation on buys of credit default swaps on corporate issues | | | $ | 21,236,379 | |
| | | | | | | | | | | | | | | | | | |
|
| Credit Default Swap on Credit Indices—Sell Protection1 | |
Swap Counterparty (Reference Entity) | | Termination Date | | Periodic
Payments
Received by
the Fund‡ | | Contract Notional Amount3 | | Market Value5 | | | Upfront
Premiums
Paid/(Received) | | | Unrealized
Appreciation/
(Depreciation) | |
| | | | | | | | | | | | | | | | | | |
Barclays Capital Inc.
(CDX IG 10) | | June 20, 2013 | | 1.55%
Quarterly | | $20,984,000 | | $ | (229,424 | ) | | $ | (53,420 | ) | | $ | (176,004 | ) |
| | | | | | |
Barclays Capital Inc.
(CDX IG 10) | | June 20, 2013 | | 1.55%
Quarterly | | 70,760,000 | | | (773,640 | ) | | | (55,049 | ) | | | (718,591 | ) |
| | | | | | |
Barclays Capital Inc.
(CDX IG 10) | | June 20, 2013 | | 1.55%
Quarterly | | 21,667,200 | | | (236,894 | ) | | | (51,262 | ) | | | (185,632 | ) |
| | | | | | |
Barclays Capital Inc.
(CDX IG 10) | | June 20, 2013 | | 1.55%
Quarterly | | 18,592,800 | | | (203,281 | ) | | | (57,464 | ) | | | (145,817 | ) |
| | | | | | |
Barclays Capital Inc.
(CDX IG 9) | | December 20, 2017 | | 0.8%
Quarterly | | 47,892,320 | | | (2,542,843 | ) | | | (1,723,959 | ) | | | (818,884 | ) |
| | | | | | |
Barclays Capital Inc.
(CDX IG 9) | | December 20, 2017 | | 0.8%
Quarterly | | 42,621,920 | | | (2,263,011 | ) | | | (1,750,380 | ) | | | (512,631 | ) |
| | | | | | |
Barclays Capital Inc.
(CDX IG HVOL 9) | | December 20, 2012 | | 1.4%
Quarterly | | 14,403,383 | | | (1,500,169 | ) | | | (670,194 | ) | | | (829,975 | ) |
| | | | | | |
Barclays Capital Inc.
(CDX IG HVOL 9) | | December 20, 2012 | | 1.4%
Quarterly | | 33,833,450 | | | (3,523,886 | ) | | | (952,749 | ) | | | (2,571,137 | ) |
| | | | | | |
Barclays Capital Inc.
(CDX IG HVOL 9) | | December 20, 2012 | | 1.4%
Quarterly | | 33,833,450 | | | (3,523,886 | ) | | | (942,599 | ) | | | (2,581,287 | ) |
109
Semi-Annual Report to Shareholders
Notes to Financial Statements—Continued
| | | | | | | | | | | | | | | | | | |
| Core—Continued | |
|
| Credit Default Swap on Credit Indices—Sell Protection1—Continued | |
Swap Counterparty (Reference Entity) | | Termination Date | | Periodic
Payments
Received by
the Fund‡ | | Contract Notional Amount3 | | Market Value5 | | | Upfront
Premiums
Paid/(Received) | | | Unrealized
Appreciation/
(Depreciation) | |
| | | | | | | | | | | | | | | | | | |
Barclays Capital Inc.
(CDX IG HVOL 9) | | December 20, 2012 | | 3%
Quarterly | | $70,663,577 | | $ | (7,359,888 | ) | | $ | (2,498,663 | ) | | $ | (4,861,225 | ) |
| | | | | | |
Bear Stearns, Inc.
(ABX-HE-A 06-2) | | May 25, 2046 | | 0.44% Quarterly | | 20,641,958 | | | (19,919,489 | ) | | | (111,383 | ) | | | (19,808,106 | ) |
| | | | | | |
Credit Suisse First Boston USA
(ABX.HE-AAA 06-1) | | July 25, 2045 | | 0.18%
Monthly | | 97,536,258 | | | (29,504,718 | ) | | | (8,234,400 | ) | | | (21,270,318 | ) |
| | | | | | |
Credit Suisse First Boston USA
(ABX.HE-AAA 06-1) | | July 25, 2045 | | 0.18%
Monthly | | 14,783,856 | | | (4,472,116 | ) | | | (1,319,239 | ) | | | (3,152,877 | ) |
| | | | | | |
Credit Suisse First Boston USA
(ABX.HE-AAA 06-1) | | July 25, 2045 | | 0.18%
Monthly | | 116,225,284 | | | (35,158,149 | ) | | | (11,558,044 | ) | | | (23,600,105 | ) |
| | | | | | |
Credit Suisse First Boston USA
(CDX IG HVOL 10) | | June 20, 2013 | | 3.5%
Quarterly | | 18,850,065 | | | (739,886 | ) | | | 215,722 | | | | (955,608 | ) |
| | | | | | |
Credit Suisse First Boston USA
(CDX IG HVOL 10) | | June 20, 2013 | | 3.5%
Quarterly | | 18,753,398 | | | (736,092 | ) | | | (289,742 | ) | | | (446,350 | ) |
| | | | | | |
Deutsche Bank AG
(ABX.HE-AAA 06-1) | | July 25, 2045 | | 0.18%
Monthly | | 20,083,729 | | | (6,075,328 | ) | | | (1,707,659 | ) | | | (4,367,669 | ) |
| | | | | | |
Deutsche Bank AG
(ABX.HE-AAA 06-1) | | July 25, 2045 | | 0.18%
Monthly | | 10,227,825 | | | (3,093,917 | ) | | | (912,681 | ) | | | (2,181,236 | ) |
| | | | | | |
Deutsche Bank AG
(ABX.HE-AAA 06-1) | | July 25, 2045 | | 0.18% Monthly | | 4,834,972 | | | (1,462,579 | ) | | | (532,575 | ) | | | (930,004 | ) |
| | | | | | |
Deutsche Bank AG
(iBoxx IG Hi-Vol2) | | September 20, 2014 | | 1.3% Quarterly | | 8,042,667 | | | (275,337 | ) | | | 23,760 | | | | (299,097 | ) |
| | | | | | |
JP Morgan Chase & Co.
(CDX HY 9) | | December 20, 2012 | | 6.356% Quarterly | | 25,000,000 | | | (4,381,605 | ) | | | — | | | | (4,381,605 | ) |
| | | | | | |
JP Morgan Chase & Co.
(CDX IG 8) | | June 20, 2012 | | 0.35% Quarterly | | 35,545,920 | | | (1,414,475 | ) | | | (191,108 | ) | | | (1,223,367 | ) |
| | | | | | |
JP Morgan Chase & Co.
(CMBX 3 2007-1 AAA) | | August 17, 2050 | | 0.08% Quarterly | | 38,430,000 | | | (9,557,541 | ) | | | (12,655,568 | ) | | | 3,098,027 | * |
| | | | | | |
Merrill Lynch & Co., Inc.
(CDX HY 9) | | December 20, 2012 | | 2% Quarterly | | 4,650,000 | | | (1,425,585 | ) | | | — | | | | (1,425,585 | ) |
| | | | | | |
Merrill Lynch & Co., Inc.
(CDX HY 9) | | December 20, 2012 | | 2.3% Quarterly | | 4,580,000 | | | (1,362,705 | ) | | | — | | | | (1,362,705 | ) |
| | | | | | |
Merrill Lynch & Co., Inc.
(CDX HY 9) | | December 20, 2012 | | 3.995% Quarterly | | 25,000,000 | | | (6,160,935 | ) | | | — | | | | (6,160,935 | ) |
| | | | | | |
Merrill Lynch & Co., Inc.
(CDX HY 9) | | December 20, 2012 | | 5.4% Quarterly | | 50,000,000 | | | (10,204,160 | ) | | | — | | | | (10,204,160 | ) |
110
Semi-Annual Report to Shareholders
| | | | | | | | | | | | | | | | | | |
| Core—Continued | |
|
| Credit Default Swap on Credit Indices—Sell Protection1—Continued | |
Swap Counterparty (Reference Entity) | | Termination Date | | Periodic
Payments
Received by
the Fund‡ | | Contract Notional Amount3 | | Market Value5 | | | Upfront
Premiums
Paid/(Received) | | | Unrealized
Appreciation/
(Depreciation) | |
| | | | | | | | | | | | | | | | | | |
Merrill Lynch & Co., Inc.
(CDX HY 9) | | December 20, 2012 | | 6.2% Quarterly | | $30,000,000 | | $ | (5,399,004 | ) | | | — | | | $ | (5,399,004 | ) |
| | | | | | |
Morgan Stanley & Co., Inc.
(CDX IG HVOL 10) | | June 20, 2013 | | 3.5% Quarterly | | 9,666,700 | | | (379,429 | ) | | $ | 46,542 | | | | (425,971 | ) |
| | | | | | |
Morgan Stanley & Co., Inc.
(CDX IG HVOL 9) | | December 20, 2012 | | 1.4% Quarterly | | 9,666,700 | | | (1,006,824 | ) | | | (265,426 | ) | | | (741,398 | ) |
| | | | | | |
Morgan Stanley & Co., Inc.
(Dow Jones CDX IG HVOL 12) | | June 20, 2014 | | 5% Quarterly | | 11,200,000 | | | 856,472 | | | | 351,682 | | | | 504,790 | |
| | | | | | |
RBS Greenwich
(CDX IG 8) | | June 20, 2012 | | 0.35% Quarterly | | 44,798,400 | | | (1,782,658 | ) | | | (182,804 | ) | | | (1,599,854 | ) |
| | | | | | |
RBS Greenwich
(CDX IG 8) | | June 20, 2012 | | 0.35% Quarterly | | 7,222,400 | | | (287,400 | ) | | | (94,556 | ) | | | (192,844 | ) |
| | | | | | |
RBS Greenwich
(CDX IG 8) | | June 20, 2012 | | 0.35% Quarterly | | 7,027,200 | | | (279,632 | ) | | | (85,397 | ) | | | (194,235 | ) |
| | | | | | |
RBS Greenwich
(CDX IG HVOL 10) | | June 20, 2013 | | 3.5% Quarterly | | 30,643,439 | | | (1,202,789 | ) | | | 645,489 | | | | (1,848,278 | ) |
| | | | | | |
The Goldman Sachs Group, Inc. (CDX HY 9) | | October 12, 2012 | | 1.8% Quarterly | | 17,580,000 | | | (5,495,624 | ) | | | — | | | | (5,495,624 | ) |
| | | | | | |
The Goldman Sachs Group, Inc. (CDX HY 9) | | December 20, 2012 | | 2% Quarterly | | 4,360,000 | | | (1,336,678 | ) | | | — | | | | (1,336,678 | ) |
| | | | | | |
The Goldman Sachs Group, Inc.
(CDX HY 9) | | December 20, 2012 | | 5.44% Quarterly | | 50,000,000 | | | (10,143,865 | ) | | | — | | | | (10,143,865 | ) |
| | | | | | |
The Goldman Sachs Group, Inc. (CDX IG 8) | | June 20, 2012 | | 0.35% Quarterly | | 8,813,280 | | | (350,706 | ) | | | (55,117 | ) | | | (295,589 | ) |
| | | | | | |
The Goldman Sachs Group, Inc. (CDX IG 9) | | December 20, 2017 | | 0.8% Quarterly | | 31,329,600 | | | (1,663,445 | ) | | | (1,020,866 | ) | | | (642,579 | ) |
| | | | | | |
The Goldman Sachs Group, Inc. (CDX IG HVOL 3) | | March 20, 2010 | | 1.05% Quarterly | | 48,333,000 | | | (579,701 | ) | | | 1,601 | | | | (581,302 | ) |
| | | | | | |
The Goldman Sachs Group, Inc. (CDX IG HVOL 3) | | March 20, 2010 | | 1.05% Quarterly | | 16,432,200 | | | (197,086 | ) | | | (22,236 | ) | | | (174,850 | ) |
| | | | | | |
The Goldman Sachs Group, Inc. (CDX IG HVOL 3) | | March 20, 2010 | | 1.05% Quarterly | | 32,091,120 | | | (384,898 | ) | | | (176,284 | ) | | | (208,614 | ) |
| | | | | | |
The Goldman Sachs Group, Inc. (CDX IG HVOL 9) | | December 20, 2012 | | 1.4% Quarterly | | 11,600,040 | | | (1,208,189 | ) | | | (448,291 | ) | | | (759,898 | ) |
| | | | | | |
The Goldman Sachs Group, Inc. (CDX IG HVOL 9) | | December 20, 2012 | | 1.4% Quarterly | | 16,143,389 | | | (1,681,397 | ) | | | (1,544,688 | ) | | | (136,709 | ) |
| | | | | | | | | | | | | | | | | | |
| |
Net unrealized depreciation on sales of credit default swaps on credit indices | | | $ | (141,745,385 | ) |
| | | | | | | | | | | | | | | | | | |
111
Semi-Annual Report to Shareholders
Notes to Financial Statements—Continued
| | | | | | | | | | | | | | | | | | |
| Core—Continued | | | | |
| |
| Credit Default Swap on Credit Indices—Buy Protection4 | | | | |
Swap Counterparty
(Reference Entity) | | Termination Date | | Periodic
Payments Made
by the Fund‡ | | Contract
Notional
Amount3 | | Market Value5 | | Upfront
Premiums
Paid/(Received) | | | Unrealized
Appreciation/
(Depreciation) | |
| | | | | | | | | | | | | | | | | | |
Barclays Capital Inc.
(CDX IG 10 6/13) | | June 20, 2013 | | 1.55%
Quarterly | | $ | 9,272,000 | | $ | 101,374 | | $ | 150,671 | | | $ | (49,297 | ) |
| | | | | | |
Barclays Capital Inc.
(CDX IG 10) | | June 20, 2013 | | 1.55%
Quarterly | | | 10,492,000 | | | 114,712 | | | 28,148 | | | | 86,564 | |
| | | | | | |
Barclays Capital Inc.
(CDX IG 10) | | June 20, 2013 | | 1.55%
Quarterly | | | 37,185,600 | | | 406,561 | | | 195,210 | | | | 211,351 | |
| | | | | | |
Barclays Capital Inc.
(CDX IG 11) | | December 20, 2013 | | 1.5%
Quarterly | | | 2,860,000 | | | 21,387 | | | 77,968 | | | | (56,581 | ) |
| | | | | | |
Barclays Capital Inc.
(CDX IG 11) | | December 20, 2013 | | 1.5%
Quarterly | | | 21,200,000 | | | 158,531 | | | 677,909 | | | | (519,378 | ) |
| | | | | | |
Barclays Capital Inc.
(CDX IG HVOL 10) | | June 20, 2013 | | 3.5%
Quarterly | | | 9,666,700 | | | 379,428 | | | (329,174 | ) | | | 708,602 | |
| | | | | | |
Credit Suisse First Boston USA
(CDX IG 11) | | March 20, 2013 | | 1.5%
Quarterly | | | 37,800,000 | | | 282,665 | | | 1,203,619 | | | | (920,954 | ) |
| | | | | | |
Credit Suisse First Boston USA
(CMBX 1 2006-1 AAA) | | March 22, 2045 | | 0.1%
Monthly | | | 7,300,000 | | | 941,700 | | | 1,703,276 | | | | (761,576 | )* |
| | | | | | |
Credit Suisse First Boston USA
(CMBX 2 2006-2 AAA) | | September 22, 2045 | | 0.07%
Monthly | | | 4,200,000 | | | 777,840 | | | 922,606 | | | | (144,766 | )* |
| | | | | | |
Credit Suisse First Boston USA
(CMBX 3 2007-1 AAA) | | August 17, 2050 | | 0.08%
Monthly | | | 18,625,000 | | | 4,632,037 | | | 6,165,295 | | | | (1,533,258 | )* |
| | | | | | |
Credit Suisse First Boston USA
(CMBX 4 2007-2 AAA) | | August 17, 2050 | | 0.35%
Monthly | | | 29,200,000 | | | 7,816,840 | | | 9,794,418 | | | | (1,977,578 | )* |
| | | | | | |
Credit Suisse First Boston USA
(CMBX 4 2007-2 AJ) | | February 17, 2051 | | 0.96%
Monthly | | | 9,900,000 | | | 6,804,270 | | | 2,109,925 | | | | 4,694,345 | * |
| | | | | | |
JP Morgan Chase & Co.
(CDX IG 10 6/13) | | June 20, 2013 | | 1.55%
Quarterly | | | 18,836,800 | | | 205,948 | | | 439,364 | | | | (233,416 | ) |
| | | | | | |
JP Morgan Chase & Co.
(CDX IG 10 6/13) | | June 20, 2013 | | 1.55%
Quarterly | | | 4,684,800 | | | 51,220 | | | 56,949 | | | | (5,729 | ) |
| | | | | | |
JP Morgan Chase & Co.
(CDX IG HVOL 10) | | June 20, 2013 | | 3.5%
Quarterly | | | 20,783,405 | | | 815,771 | | | (747,985 | ) | | | 1,563,756 | |
| | | | | | |
JP Morgan Chase & Co.
(CDX IG HVOL 10) | | June 20, 2013 | | 3.5%
Quarterly | | | 21,653,408 | | | 849,920 | | | (920,544 | ) | | | 1,770,464 | |
112
Semi-Annual Report to Shareholders
| | | | | | | | | | | | | | | | | | |
| Core—Continued | | | | |
| |
| Credit Default Swap on Credit Indices—Buy Protection4—Continued | | | | |
Swap Counterparty
(Reference Entity) | | Termination Date | | Periodic
Payments Made
by the Fund‡ | | Contract
Notional
Amount3 | | Market Value5 | | | Upfront
Premiums
Paid/(Received) | | | Unrealized
Appreciation/
(Depreciation) | |
| | | | | | | | | | | | | | | | | | |
JP Morgan Chase & Co.
(CMBX 3 2007-1 AAA) | | August 17, 2050 | | 0.08%
Monthly | | $19,805,000 | | $ | 4,925,503 | | | $ | 6,555,901 | | | $ | (1,630,398 | )* |
| | | | | | |
JP Morgan Chase & Co.
(CMBX 4 2007-2 AAA) | | March 22, 2047 | | 0.35%
Monthly | | 38,430,000 | | | 10,287,711 | | | | 12,879,354 | | | | (2,591,643 | )* |
| | | | | | |
JP Morgan Chase & Co.
(CMBX 4 2007-2 AAA) | | April 17, 2050 | | 0.35%
Quarterly | | 38,630,000 | | | 10,341,251 | | | | 13,720,911 | | | | (3,379,660 | )* |
| | | | | | |
Merrill Lynch & Co., Inc.
(CMBX 4 2007-2 AJ) | | February 17, 2051 | | 0.96%
Monthly | | 9,900,000 | | | 6,804,270 | | | | 2,109,925 | | | | 4,694,345 | * |
| | | | | | |
RBS Greenwich
(iBoxx IG Hi-Vol3) | | March 20, 2010 | | 1.05%
Quarterly | | 17,303,214 | | | (207,533 | ) | | | (10,582 | ) | | | (196,951 | ) |
| | | | | | |
The Goldman Sachs Group, Inc.
(CDX IG 10 6/13) | | June 20, 2013 | | 1.55%
Quarterly | | 18,446,400 | | | 201,680 | | | | 437,177 | | | | (235,497 | ) |
| | | | | | |
The Goldman Sachs Group, Inc.
(CDX IG 11) | | December 20, 2013 | | 1.5%
Quarterly | | 9,800,000 | | | 73,283 | | | | 234,013 | | | | (160,730 | ) |
| | | | | | |
The Goldman Sachs
Group, Inc.
(CDX IG HVOL 10) | | June 20, 2013 | | 3.5%
Quarterly | | 18,850,065 | | | 739,886 | | | | 180,541 | | | | 559,345 | |
| | | | | | |
The Goldman Sachs
Group, Inc.
(CMBX 4 2007-2 AJ) | | February 17, 2051 | | 0.96%
Monthly | | 10,000,000 | | | 6,873,000 | | | | 2,131,237 | | | | 4,741,763 | * |
| | | | | | | | | | | | | | | | | | |
| |
Net unrealized appreciation on buys of credit default swaps on credit indices | | | $ | 4,633,123 | |
| | | | | | | | | | | | | | | | | | |
| | | | | | | | | | | | | | | |
| Core Plus | | | |
| |
| Interest Rate Swaps: | | | |
Swap Counterparty
(Reference Entity) | | Termination Date | | Periodic
Payments Made
by the Fund‡ | | Periodic
Payments
Received by
the Fund‡ | | Contract
Notional
Amount | | Upfront
Premiums
Paid/(Received) | | Unrealized
Appreciation/
(Depreciation) | |
| | | | | | | | | | | | | | | |
Banc of America Securities LLC | | March 1, 2013 | | 5.104%
Semi-Annually | | 3-month LIBOR | | $ | 8,100,000 | | — | | $ | (748,886 | ) |
| | | | | | |
Banc of America Securities LLC | | December 16, 2013 | | 5.381%
Semi-Annually | | 3-month LIBOR | | | 5,510,000 | | — | | | (602,765 | ) |
| | | | | | |
Banc of America Securities LLC | | November 10, 2015 | | 4.864%
Semi-Annually | | 3-month LIBOR | | | 7,950,000 | | — | | | (720,479 | ) |
| | | | | | |
Banc of America Securities LLC | | January 15, 2016 | | 5.45084%
Semi-Annually | | 3-month LIBOR | | | 5,500,000 | | — | | | (693,615 | ) |
| | | | | | |
Banc of America Securities LLC | | October 3, 2016 | | 5.425%
Semi-Annually | | 3-month LIBOR | | | 8,270,000 | | — | | | (1,064,802 | ) |
113
Semi-Annual Report to Shareholders
Notes to Financial Statements—Continued
| | | | | | | | | | | | | | | | |
| Core Plus—Continued | | | |
| |
| Interest Rate Swaps—Continued | | | |
Swap Counterparty
(Reference Entity) | | Termination Date | | Periodic
Payments Made
by the Fund‡ | | Periodic
Payments
Received by
the Fund‡ | | Contract
Notional
Amount | | Upfront
Premiums
Paid/(Received) | | Unrealized
Appreciation/
(Depreciation) | |
| | | | | | | | | | | | | | | | |
Banc of America Securities LLC | | February 15, 2025 | | 4.29456%
Semi-Annually | | 3-month LIBOR | | $ | 308,300,000 | | $ | 387 | | $ | (9,109,481 | ) |
| | | | | | |
Barclays Capital Inc. | | November 1, 2011 | | 5.439%
Semi-Annually | | 3-month LIBOR | | | 10,850,000 | | | — | | | (912,426 | ) |
| | | | | | |
Barclays Capital Inc. | | June 25, 2012 | | 5.06%
Semi-Annually | | 3-month LIBOR | | | 6,240,000 | | | — | | | (528,593 | ) |
| | | | | | |
Barclays Capital Inc. | | September 15, 2012 | | 5.189%
Semi-Annually | | 3-month LIBOR | | | 6,330,000 | | | — | | | (575,612 | ) |
| | | | | | |
Barclays Capital Inc. | | October 20, 2016 | | 5.326%
Semi-Annually | | 3-month LIBOR | | | 6,260,000 | | | — | | | (765,519 | ) |
| | | | | | |
Barclays Capital Inc. | | February 15, 2025 | | 4.3%
Semi-Annually | | 3-month LIBOR | | | 82,100,000 | | | 418,546 | | | (2,896,684 | ) |
| | | | | | |
Barclays Capital Inc. | | February 15, 2025 | | 3-month LIBOR | | 4.3%
Semi-Annually | | | 55,600,000 | | | 1,163,113 | | | 531,886 | |
| | | | | | |
Bear Stearns, Inc. | | September 15, 2014 | | 5%
Semi-Annually | | 3-month LIBOR | | | 8,250,000 | | | — | | | (791,767 | ) |
| | | | | | |
Citigroup Global Markets | | April 30, 2011 | | 3.22%
Semi-Annually | | 3-month LIBOR | | | 6,270,000 | | | — | | | (202,337 | ) |
| | | | | | |
Citigroup Global Markets | | September 15, 2011 | | 3.34%
Semi-Annually | | 3-month LIBOR | | | 9,750,000 | | | — | | | (352,842 | ) |
| | | | | | |
Credit Suisse First Boston USA | | August 15, 2010 | | 5.446%
Semi-Annually | | 3-month LIBOR | | | 2,720,000 | | | — | | | (135,699 | ) |
| | | | | | |
Credit Suisse First Boston USA | | September 15, 2010 | | 5.0025%
Semi-Annually | | 3-month LIBOR | | | 5,990,000 | | | — | | | (286,573 | ) |
| | | | | | |
Credit Suisse First Boston USA | | March 1, 2011 | | 5.229%
Semi-Annually | | 3-month LIBOR | | | 4,110,000 | | | — | | | (265,633 | ) |
| | | | | | |
Credit Suisse First Boston USA | | May 1, 2012 | | 5.085%
Semi-Annually | | 3-month LIBOR | | | 4,800,000 | | | — | | | (399,847 | ) |
| | | | | | |
Credit Suisse First Boston USA | | December 1, 2012 | | 4.9025%
Semi-Annually | | 3-month LIBOR | | | 10,600,000 | | | — | | | (886,358 | ) |
| | | | | | |
Credit Suisse First Boston USA | | August 15, 2013 | | 5.023%
Semi-Annually | | 3-month LIBOR | | | 5,300,000 | | | — | | | (488,713 | ) |
| | | | | | |
Credit Suisse First Boston USA | | March 15, 2014 | | 5.131%
Semi-Annually | | 3-month LIBOR | | | 6,630,000 | | | — | | | (665,001 | ) |
| | | | | | |
Credit Suisse First Boston USA | | September 15, 2015 | | 5.16%
Semi-Annually | | 3-month LIBOR | | | 5,350,000 | | | — | | | (575,695 | ) |
114
Semi-Annual Report to Shareholders
| | | | | | | | | | | | | | | |
| Core Plus—Continued | | | |
| | | | |
| Interest Rate Swaps—Continued | | | | | | | | | | | |
Swap Counterparty
(Reference Entity) | | Termination Date | | Periodic
Payments Made
by the Fund‡ | | Periodic
Payments
Received by
the Fund‡ | | Contract
Notional
Amount | | Upfront
Premiums
Paid/(Received) | | Unrealized
Appreciation/
(Depreciation) | |
| | | | | | | | | | | | | | | |
Credit Suisse First Boston USA | | March 1, 2017 | | 5.335%
Semi-Annually | | 3-month LIBOR | | $ | 4,880,000 | | — | | $ | (607,902 | ) |
| | | | | | |
Deutsche Bank AG | | June 17, 2010 | | 3-month LIBOR | | 4.3132%
Semi-Annually | | | 41,570,000 | | — | | | 1,373,681 | |
| | | | | | |
Deutsche Bank AG | | June 15, 2016 | | 5.1825%
Semi-Annually | | 3-month LIBOR | | | 10,890,000 | | — | | | (1,218,841 | ) |
| | | | | | |
Deutsche Bank AG | | April 1, 2017 | | 5.435%
Semi-annually | | 3-month LIBOR | | | 8,270,000 | | — | | | (1,090,550 | ) |
| | | | | | |
JP Morgan Chase & Co. | | April 30, 2011 | | 5.05%
Semi-Annually | | 3-month LIBOR | | | 4,300,000 | | — | | | (280,911 | ) |
| | | | | | |
JP Morgan Chase & Co. | | December 1, 2012 | | 5.275%
Semi-Annually | | 3-month LIBOR | | | 6,300,000 | | — | | | (604,405 | ) |
| | | | | | |
Morgan Stanley & Co., Inc. | | March 15, 2012 | | 4.7625%
Semi-annually | | 3-month LIBOR | | | 5,540,000 | | — | | | (406,971 | ) |
| | | | | | |
Morgan Stanley & Co., Inc. | | April 30, 2016 | | 5.189%
Semi-Annually | | 3-month LIBOR | | | 6,600,000 | | — | | | (737,407 | ) |
| | | | | | |
RBS Greenwich | | March 1, 2011 | | 4.7%
Semi-Annually | | 3-month LIBOR | | | 2,780,000 | | — | | | (155,408 | ) |
| | | | | | |
RBS Greenwich | | April 1, 2012 | | 5.011%
Semi-Annually | | 3-month LIBOR | | | 4,560,000 | | — | | | (367,630 | ) |
| | | | | | |
RBS Greenwich | | March 1, 2016 | | 5.12%
Semi-Annually | | 3-month LIBOR | | | 8,230,000 | | — | | | (880,621 | ) |
| | | | | | |
RBS Greenwich | | February 15, 2017 | | 5.115%
Semi-Annually | | 3-month LIBOR | | | 7,210,000 | | — | | | (785,504 | ) |
| | | | | | | | | | | | | | | |
| | | | |
Net unrealized depreciation on interest rate swaps | | | | | | | | | $ | (28,899,910 | ) |
| | | | | | | | | | | | | | | |
| | | | | | | | | | | | | | | | | | | | |
|
| Credit Default Swap on Corporate Issues—Sell Protection1 |
Swap Counterparty (Reference Entity) | | Termination
Date | | Implied Credit
Spread At
June 30,
20092 | | Periodic
Payments
Received by
the Fund‡ | | Contract
Notional
Amount3 | | Market Value | | | Upfront
Premiums
Paid/(Received) | | | Unrealized
Appreciation/
(Depreciation) |
| | | | | | | | | | | | | | | | | | | | |
Citigroup Global Markets (General Motors Acceptance Corporation,
7.75%, due 1/19/2010) | | March 20, 2010 | | 11.92% | | 3.65%
Quarterly | | $ | 4,400,000 | | $ | (252,424 | ) | | $ | (442,252 | ) | | $ | 189,828 |
115
Semi-Annual Report to Shareholders
Notes to Financial Statements—Continued
| | | | | | | | | | | | | | | | | | | |
| Core Plus—Continued | |
|
| Credit Default Swap on Corporate Issues—Sell Protection1—Continued | |
Swap Counterparty (Reference Entity) | | Termination Date | | Implied Credit
Spread At
June 30,
20092 | | Periodic
Payments
Received by
the Fund‡ | | Contract
Notional
Amount3 | | Market Value | | | Upfront
Premiums
Paid/(Received) | | Unrealized
Appreciation/
(Depreciation) | |
Credit Suisse First Boston USA
(Eastman Kodak Company,
7.25%, due 11/15/13) | | March 20, 2010 | | $14.39% | | 1.4%
Quarterly | | $ | 9,000,000 | | $ | (790,019 | ) | | — | | $ | (790,019 | ) |
| | | | | | | |
Credit Suisse First Boston USA
(Eastman Kodak Company,
7.25%, due 11/15/13) | | September 20, 2010 | | 16.48% | | 2.32%
Quarterly | | | 2,400,000 | | | (364,002 | ) | | — | | | (364,002 | ) |
| | | | | | | |
Deutsche Bank AG
(AES Corp.,
7.75%, due 3/1/14) | | December 20, 2016 | | 6.46% | | 2.21%
Quarterly | | | 1,700,000 | | | (342,472 | ) | | — | | | (342,472 | ) |
| | | | | | | |
Deutsche Bank AG (AES Corp.,
7.75%, due 3/1/14) | | December 20, 2016 | | 6.46% | | 2.2%
Quarterly | | | 2,500,000 | | | (504,822 | ) | | — | | | (504,822 | ) |
| | | | | | | |
Deutsche Bank AG (Eastman Kodak Company,
7.25%, due 11/15/13) | | March 20, 2010 | | 14.39% | | 1.25%
Quarterly | | | 1,600,000 | | | (142,076 | ) | | — | | | (142,076 | ) |
| | | | | | | |
Deutsche Bank AG (Eastman Kodak Company,
7.25%, due 11/15/13) | | September 20, 2010 | | 16.48% | | 2.3%
Quarterly | | | 3,020,000 | | | (458,685 | ) | | — | | | (458,685 | ) |
| | | | | | | |
Deutsche Bank AG (Eastman Kodak Company,
7.25%, due 11/15/13) | | September 20, 2010 | | 16.48% | | 2.3%
Quarterly | | | 5,430,000 | | | (824,721 | ) | | — | | | (824,721 | ) |
| | | | | | | |
Deutsche Bank AG (Eastman Kodak Company,
7.25%, due 11/15/13) | | September 20, 2010 | | 16.48% | | 2.32%
Quarterly | | | 3,200,000 | | | (485,336 | ) | | — | | | (485,336 | ) |
116
Semi-Annual Report to Shareholders
| | | | | | | | | | | | | | | | | | | |
| Core Plus—Continued | | | | | | |
|
| Credit Default Swap on Corporate Issues—Sell Protection1—Continued | |
Swap Counterparty (Reference Entity) | | Termination Date | | Implied Credit
Spread At
June 30,
20092 | | Periodic Payments
Received by the Fund‡ | | Contract
Notional
Amount3 | | Market Value | | | Upfront
Premiums
Paid/(Received) | | Unrealized
Appreciation/
(Depreciation) | |
| | | | | | | | | | | | | | | | | | | |
Deutsche Bank AG
(Eastman Kodak Company,
7.25%, due 11/15/13) | | March 20, 2015 | | 17.26% | | 1.67%
Quarterly | | $ | 1,900,000 | | $ | (796,815 | ) | | — | | $ | (796,815 | ) |
| | | | | | | |
Deutsche Bank AG
(Ford Motor Credit Co.,
7.25%, due 10/25/11) | | September 20, 2017 | | 8.90% | | 3.65%
Quarterly | | | 4,450,000 | | | (1,143,309 | ) | | — | | | (1,143,309 | ) |
| | | | | | | |
Deutsche Bank AG
(Ford Motor Credit Co.,
7.25%, due 10/25/11) | | September 20, 2017 | | 8.90% | | 3.65%
Quarterly | | | 3,500,000 | | | (899,232 | ) | | — | | | (899,232 | ) |
| | | | | | | |
Deutsche Bank AG
(Ford Motor Credit Company,
7%, due 10/1/13) | | December 20, 2010 | | 10.10% | | 5.05%
Quarterly | | | 25,400,000 | | | (1,723,664 | ) | | — | | | (1,723,664 | ) |
| | | | | | | |
Deutsche Bank AG
(Ford Motor Credit Company,
7.45%, due 7/16/31) | | March 20, 2015 | | 16.93% | | 2.93%
Quarterly | | | 2,600,000 | | | (1,227,444 | ) | | — | | | (1,227,444 | ) |
| | | | | | | |
Merrill Lynch & Co., Inc.
(AES Corp.,
7.75%, due 3/1/14) | | March 20, 2017 | | 6.43% | | 2.8%
Quarterly | | | 5,600,000 | | | (982,041 | ) | | — | | | (982,041 | ) |
| | | | | | | |
Merrill Lynch & Co., Inc.
(AES Corp.,
7.75%, due 3/1/14) | | March 20, 2017 | | 6.43% | | 2.6%
Quarterly | | | 3,600,000 | | | (666,085 | ) | | — | | | (666,085 | ) |
| | | | | | | |
Merrill Lynch & Co., Inc.
(Eastman Kodak Company,
7.25%, due 11/15/13) | | September 20, 2010 | | 16.48% | | 2.3%
Quarterly | | | 1,610,000 | | | (244,531 | ) | | — | | | (244,531 | ) |
| | | | | | | |
RBS Greenwich
(Countrywide Home Loan Inc.,
4%, due 3/22/11) | | March 20, 2012 | | 2.24% | | 0.6%
Quarterly | | | 7,400,000 | | | (310,456 | ) | | — | | | (310,456 | ) |
117
Semi-Annual Report to Shareholders
Notes to Financial Statements—Continued
| | | | | | | | | | | | | | | | | | | | | |
| Core Plus—Continued | | | | | | | |
|
| Credit Default Swap on Corporate Issues—Sell Protection1—Continued | |
Swap Counterparty (Reference Entity) | | Termination Date | | Implied Credit
Spread At
June 30,
20092 | | Periodic Payments
Received by the Fund‡ | | Contract
Notional
Amount3 | | Market Value | | | Upfront
Premiums
Paid/(Received) | | | Unrealized
Appreciation/
(Depreciation) | |
| | | | | | | | | | | | | | | | | | | | | |
RBS Greenwich
(Countrywide Home Loans, Inc.,
4%, due 3/22/11) | | June 20, 2012 | | 2.21% | | 0.66%
Quarterly | | $ | 9,900,000 | | $ | (427,985 | ) | | | — | | | $ | (427,985 | ) |
| | | | | | | |
RBS Greenwich
(Eastman Kodak Company,
7.25%, due 11/15/13) | | December 20, 2010 | | 18.00% | | 3.2%
Quarterly | | | 19,300,000 | | | (3,542,972 | ) | | | — | | | | (3,542,972 | ) |
| | | | | | | |
RBS Greenwich
(Eastman Kodak Company,
7.25%, due 11/15/13) | | December 20, 2016 | | 16.07% | | 2.8%
Quarterly | | | 3,600,000 | | | (1,432,615 | ) | | | — | | | | (1,432,615 | ) |
| | | | | | | |
RBS Greenwich
(Eastman Kodak Company,
7.25%, due 11/15/13) | | September 20, 2012 | | 19.03% | | 2.25%
Quarterly | | | 13,030,000 | | | (4,477,363 | ) | | | — | | | | (4,477,363 | ) |
| | | | | | | |
RBS Greenwich
(Ford Motor Credit Company,
7%, due 10/1/13) | | September 20, 2011 | | 9.59% | | 3.75%
Quarterly | | | 8,900,000 | | | (996,480 | ) | | $ | (38,291 | ) | | | (958,189 | ) |
| | | | | | | |
RBS Greenwich
(Ford Motor Credit Company,
7%, due 10/1/13) | | March 20, 2012 | | 17.91% | | 5.38%
Quarterly | | | 8,200,000 | | | (2,138,001 | ) | | | — | | | | (2,138,001 | ) |
| | | | | | | |
RBS Greenwich
(Ford Motor Credit Company,
7.45%, due 7/16/31) | | September 20, 2011 | | 18.35% | | 6.75%
Quarterly | | | 18,400,000 | | | (3,795,635 | ) | | | — | | | | (3,795,635 | ) |
| | | | | | | |
RBS Greenwich
(Ford Motor Credit Company,
7.45%, due 7/16/31) | | June 20, 2012 | | 17.75% | | 5.85%
Quarterly | | | 7,400,000 | | | (1,956,255 | ) | | | — | | | | (1,956,255 | ) |
| | | | | | | |
RBS Greenwich
(Ford Motor Credit Company,
7.45%, due 7/16/31) | | June 20, 2012 | | 17.75% | | 5.1%
Quarterly | | | 12,450,000 | | | (3,499,114 | ) | | | — | | | | (3,499,114 | ) |
118
Semi-Annual Report to Shareholders
| | | | | | | | | | | | | | | | | | | |
| Core Plus—Continued | | | | | | |
|
| Credit Default Swap on Corporate Issues—Sell Protection1—Continued | |
Swap Counterparty (Reference Entity) | | Termination Date | | Implied Credit
Spread At
June 30,
20092 | | Periodic Payments
Received by the Fund‡ | | Contract
Notional
Amount3 | | Market Value | | | Upfront
Premiums
Paid/(Received) | | Unrealized
Appreciation/
(Depreciation) | |
| | | | | | | | | | | | | | | | | | | |
RBS Greenwich (Ford Motor Credit Company,
7.45%, due 7/16/31) | | June 20, 2012 | | 17.75% | | 5.15% Quarterly | | $ | 6,900,000 | | $ | (1,931,589 | ) | | — | | $ | (1,931,589 | ) |
| | | | | | | |
RBS Greenwich (General Motors Acceptance Corporation,
6%, due 4/1/11) | | December 20, 2011 | | 9.74% | | 1.34% Quarterly | | | 780,000 | | | (137,496 | ) | | — | | | (137,496 | ) |
| | | | | | | |
RBS Greenwich (General Motors Acceptance Corporation,
6.875%, due 8/28/12) | | September 20, 2010 | | 11.26% | | 5.75% Quarterly | | | 1,250,000 | | | (77,464 | ) | | — | | | (77,464 | ) |
| | | | | | | |
RBS Greenwich (General Motors Acceptance Corporation,
6.875%, due 8/28/12) | | September 20, 2012 | | 9.39% | | 7.2% Quarterly | | | 10,700,000 | | | (610,774 | ) | | — | | | (610,774 | ) |
| | | | | | | |
RBS Greenwich (General Motors Acceptance Corporation,
6.875%, due 8/28/12) | | December 20, 2011 | | 9.74% | | 1.2% Quarterly | | | 680,000 | | | (121,870 | ) | | — | | | (121,870 | ) |
| | | | | | | |
RBS Greenwich (General Motors Acceptance Corporation,
6.875%, due 8/28/12) | | December 20, 2016 | | 8.78% | | 1.55% Quarterly | | | 4,200,000 | | | (1,413,882 | ) | | — | | | (1,413,882 | ) |
| | | | | | | |
RBS Greenwich (General Motors Acceptance Corporation,
6.875%, due 8/28/12) | | March 20, 2012 | | 9.60% | | 1.17% Quarterly | | | 8,500,000 | | | (1,630,274 | ) | | — | | | (1,630,274 | ) |
119
Semi-Annual Report to Shareholders
Notes to Financial Statements—Continued
| | | | | | | | | | | | | | | | | | | | | |
| Core Plus—Continued | | | | | | | |
|
| Credit Default Swap on Corporate Issues—Sell Protection1—Continued | |
Swap Counterparty (Reference Entity) | | Termination Date | | Implied Credit
Spread At
June 30,
20092 | | Periodic Payments
Received by the Fund‡ | | Contract
Notional
Amount3 | | Market Value | | | Upfront
Premiums
Paid/(Received) | | | Unrealized
Appreciation/
(Depreciation) | |
| | | | | | | | | | | | | | | | | | | | | |
RBS Greenwich
(General Motors Acceptance Corporation,
6.875%, due 8/28/12) | | March 2, 2012 | | 9.60% | | 1.4%
Quarterly | | $ | 9,400,000 | | $ | (1,753,643 | ) | | | — | | | $ | (1,753,643 | ) |
| | | | | | | |
RBS Greenwich
(General Motors Acceptance Corporation,
6.875%, due 8/28/12) | | March 20, 2012 | | 9.60% | | 1.85%
Quarterly | | | 9,700,000 | | | (1,710,182 | ) | | | — | | | | (1,710,182 | ) |
| | | | | | | |
RBS Greenwich
(General Motors Acceptance Corporation,
6.875%, due 8/28/12) | | March 20, 2012 | | 9.60% | | 2%
Quarterly | | | 9,300,000 | | | (1,607,883 | ) | | | — | | | | (1,607,883 | ) |
| | | | | | | |
RBS Greenwich
(General Motors Acceptance Corporation,
6.875%, due 8/28/12) | | September 20, 2012 | | 9.39% | | 5.95%
Quarterly | | | 3,800,000 | | | (341,102 | ) | | | — | | | | (341,102 | ) |
| | | | | | | |
RBS Greenwich
(Residential Capital, LLC,
7.5%, due 4/17/13) | | December 20, 2012 | | 18.20% | | 5%
Quarterly | | | 10,800,000 | | | (3,341,957 | ) | | $ | (934,100 | ) | | | (2,407,857 | ) |
| | | | | | | |
RBS Greenwich
(Residential Capital, LLC,
7.5%, due 4/17/13) | | December 20, 2012 | | 18.20% | | 5%
Quarterly | | | 10,800,000 | | | (3,341,958 | ) | | | (1,197,611 | ) | | | (2,144,347 | ) |
| | | | | | | |
RBS Greenwich
(SLM Corp.,
5.125%, due 8/27/12) | | June 20, 2012 | | 7.95% | | 1.76%
Quarterly | | | 24,300,000 | | | (3,674,264 | ) | | | — | | | | (3,674,264 | ) |
| | | | | | | |
RBS Greenwich
(SLM Corp.,
5.125%, due 8/27/12) | | September 20, 2012 | | 7.92% | | 2.35%
Quarterly | | | 3,600,000 | | | (521,915 | ) | | | — | | | | (521,915 | ) |
120
Semi-Annual Report to Shareholders
| | | | | | | | | | | | | | | | | | | |
| Core Plus—Continued | | | | | | |
|
| Credit Default Swap on Corporate Issues—Sell Protection1—Continued | |
Swap Counterparty (Reference Entity) | | Termination Date | | Implied Credit
Spread At
June 30,
20092 | | Periodic Payments
Received by the Fund‡ | | Contract
Notional
Amount3 | | Market Value | | | Upfront
Premiums
Paid/(Received) | | Unrealized
Appreciation/
(Depreciation) | |
| | | | | | | | | | | | | | | | | | | |
RBS Greenwich
(SLM Corp., 5.125%, due 8/27/12) | | September 20, 2012 | | 7.92% | | 2.4%
Quarterly | | $ | 3,600,000 | | $ | (517,221 | ) | | — | | $ | (517,221 | ) |
| | | | | | | |
RBS Greenwich
(Time Warner Inc. 6.875%, due 5/1/12) | | September 20, 2010 | | 0.56% | | 0.47%
Quarterly | | | 5,000,000 | | | (5,607 | ) | | — | | | (5,607 | ) |
| | | | | | | |
RBS Greenwich
(Time Warner Inc., 6.875%, due 5/1/12) | | December 20, 2010 | | 0.60% | | 0.5%
Quarterly | | | 12,500,000 | | | (18,438 | ) | | — | | | (18,438 | ) |
| | | | | | | |
The Goldman Sachs Group, Inc.
(Eastman Kodak Company, 7.25%, due 11/15/13) | | March 20, 2015 | | 17.26% | | 1.67%
Quarterly | | | 1,900,000 | | | (796,815 | ) | | — | | | (796,815 | ) |
| | | | | | | |
The Goldman Sachs Group, Inc.
(Ford Motor Credit Co., 7%, due 10/1/2013) | | September 20, 2017 | | 8.90% | | 3.77%
Quarterly | | | 6,400,000 | | | (1,606,662 | ) | | — | | | (1,606,662 | ) |
| | | | | | | |
The Goldman Sachs Group, Inc.
(Ford Motor Credit Co., 7.45%, due 7/16/31) | | September 20, 2011 | | 18.35% | | 6.8%
Quarterly | | | 10,000,000 | | | (2,053,932 | ) | | — | | | (2,053,932 | ) |
| | | | | | | |
The Goldman Sachs Group, Inc.
(Ford Motor Credit Company, 7%, due 10/1/13) | | June 20, 2010 | | 10.81% | | 4.75%
Quarterly | | | 2,500,000 | | | (139,429 | ) | | — | | | (139,429 | ) |
| | | | | | | |
The Goldman Sachs Group, Inc.
(Ford Motor Credit Company, 7%, due 10/1/13) | | September 20, 2011 | | 9.59% | | 3.8%
Quarterly | | | 9,200,000 | | | (1,030,069 | ) | | — | | | (1,030,069 | ) |
| | | | | | | |
The Goldman Sachs Group, Inc.
(Ford Motor Credit Company, 7.45%, due 7/16/31) | | September 20, 2011 | | 18.35% | | 6.8%
Quarterly | | | 8,400,000 | | | (1,725,303 | ) | | — | | | (1,725,303 | ) |
121
Semi-Annual Report to Shareholders
Notes to Financial Statements—Continued
| | | | | | | | | | | | | | | | | | | |
| Core Plus—Continued | | | | | | |
|
| Credit Default Swap on Corporate Issues—Sell Protection1—Continued | |
Swap Counterparty (Reference Entity) | | Termination Date | | Implied Credit
Spread At
June 30,
20092 | | Periodic Payments
Received by the Fund‡ | | Contract
Notional
Amount3 | | Market Value | | | Upfront
Premiums
Paid/(Received) | | Unrealized
Appreciation/
(Depreciation) | |
| | | | | | | | | | | | | | | | | | | |
The Goldman Sachs Group, Inc.
(Ford Motor Credit Company, 7.45%, due 7/16/31) | | March 20, 2012 | | 17.91% | | 6.05%
Quarterly | | $ | 11,500,000 | | $ | (2,837,810 | ) | | — | | $ | (2,837,810 | ) |
| | | | | | | |
The Goldman Sachs Group, Inc.
(General Motors Acceptance Corporation, 6.875%, due 8/28/12) | | June 20, 2010 | | 11.92% | | 5.75%
Quarterly | | | 2,000,000 | | | (112,657 | ) | | — | | | (112,657 | ) |
| | | | | | | |
The Goldman Sachs Group, Inc.
(General Motors Acceptance Corporation, 6.875%, due 8/28/12) | | June 20, 2010 | | 11.92% | | 5.95%
Quarterly | | | 80,000 | | | (4,359 | ) | | — | | | (4,359 | ) |
| | | | | | | |
The Goldman Sachs Group, Inc.
(General Motors Acceptance Corporation, 6.875%, due 8/28/12) | | June 20, 2010 | | 11.92% | | 6%
Quarterly | | | 1,000,000 | | | (54,032 | ) | | — | | | (54,032 | ) |
| | | | | | | |
The Goldman Sachs Group, Inc.
(TXU Corp., 5.55%, due 11/15/2014) | | September 20, 2012 | | 12.37% | | 3.24%
Quarterly | | | 2,700,000 | | | (619,523 | ) | | — | | | (619,523 | ) |
| | | | | | | | | | | | | | | | | | | |
| |
Net unrealized depreciation on sales of credit default swaps on corporate issues | | $ | (65,550,410 | ) |
| | | | | | | | | | | | | | | | | | | |
| | | | | | | | | | | | | | |
| | | | |
| Credit Default Swaps on Corporate Issues—Buy Protection4 | | | | | | | | |
Swap Counterparty
(Reference Entity) | | Termination Date | | Periodic
Payments Made
by the Fund‡ | | Contract
Notional
Amount3 | | Market Value | | Upfront
Premiums
Paid/(Received) | | Unrealized
Appreciation/
Depreciation |
| | | | | | | | | | | | | | |
Banc of America Securities LLC
(Home Depot Inc.,
3.75%, due 9/15/09) | | December 20, 2013 | | 0.635%
Quarterly | | $ 5,510,000 | | $ | 69,845 | | — | | $ | 69,845 |
| | | | | | |
Banc of America Securities LLC
(Marriot International Inc.,
4.625%, due 6/15/12) | | December 20, 2015 | | 0.73%
Monthly | | 7,950,000 | | | 557,204 | | — | | | 557,204 |
| | | | | | |
Banc of America Securities LLC
(Masco Corp.,
5.875%, due 7/15/12) | | December 20, 2016 | | 1.04%
Quarterly | | 8,270,000 | | | 936,614 | | — | | | 936,614 |
122
Semi-Annual Report to Shareholders
| | | | | | | | | | | | | | | | |
| Core Plus—Continued | |
| | | | |
| Credit Default Swaps on Corporate Issues—Buy Protection4 | | | | | | | | | | |
Swap Counterparty
(Reference Entity) | | Termination Date | | Periodic
Payments Made
by the Fund‡ | | Contract
Notional
Amount3 | | Market Value | | | Upfront
Premiums
Paid/(Received) | | Unrealized
Appreciation/
Depreciation | |
| | | | | | | | | | | | | | | | |
Banc of America Securities LLC
(PHH Corporate Note,
7.125%, due 3/1/13) | | March 20, 2013 | | 1.05%
Monthly | | $ 8,640,000 | | $ | 1,966,541 | | | — | | $ | 1,966,541 | |
| | | | | | |
Banc of America Securities LLC
(Viacom Inc.,
4.625%, due 5/15/18) | | December 20, 2015 | | 1.13%
Quarterly | | 5,500,000 | | | 461,013 | | | — | | | 461,013 | |
| | | | | | |
Barclays Capital Inc.
(Amerisourcebergen Corp.,
5.625%, due 9/15/12) | | September 20, 2012 | | 0.5%
Quarterly | | 6,330,000 | | | (15,238 | ) | | — | | | (15,238 | ) |
| | | | | | |
Barclays Capital Inc.
(Cardinal Health Inc.
5.85%, due 12/15/17) | | September 20, 2016 | | 0.49%
Quarterly | | 6,260,000 | | | 5,803 | | | — | | | 5,803 | |
| | | | | | |
Barclays Capital Inc.
(Health Care Property Investments Inc.,
6.45%, due 06/25/12) | | June 20, 2012 | | 0.63%
Quarterly | | 6,240,000 | | | 507,046 | | | — | | | 507,046 | |
| | | | | | |
Barclays Capital Inc.
(Motorola Inc.,
6.5%, due 9/1/25) | | December 20, 2011 | | 0.32%
Quarterly | | 10,850,000 | | | 512,515 | | | — | | | 512,515 | |
| | | | | | |
Bear Stearns, Inc.
(Bell South Corp.,
6%, due 10/15/11) | | September 20, 2014 | | 0.28%
Quarterly | | 8,250,000 | | | 33,866 | | | — | | | 33,866 | |
| | | | | | |
Bear Stearns, Inc.
(Ford Motor Credit Company,
7%, due 10/1/13) | | June 20, 2010 | | 5.75%
Quarterly | | 12,500,000 | | | 437,092 | | | — | | | 437,092 | |
| | | | | | |
Bear Stearns, Inc.
(Viacom Inc.,
6.25%, due 4/30/16) | | March 20, 2011 | | 0.59%
Quarterly | | 4,300,000 | | | 59,294 | | | — | | | 59,294 | |
| | | | | | |
Credit Suisse First Boston USA
(AAMES Mortgage Investment Trust
2005-1 M8, 1-Month
LIBOR + 160 bp, due 6/25/35) | | June 25, 2035 | | 1.28%
Monthly | | 1,122,000 | | | 1,058,006 | | | — | | | 1,058,006 | |
123
Semi-Annual Report to Shareholders
Notes to Financial Statements—Continued
| | | | | | | | | | | | | | | | |
| Core Plus—Continued | |
| |
| Credit Default Swaps on Corporate Issues—Buy Protection4—Continued | | | |
Swap Counterparty
(Reference Entity) | | Termination Date | | Periodic
Payments Made
by the Fund‡ | | Contract
Notional
Amount3 | | Market Value | | | Upfront
Premiums
Paid/(Received) | | Unrealized
Appreciation/
Depreciation | |
| | | | | | | | | | | | | | | | |
Credit Suisse First Boston USA
(AAMES Mortgage Investment Trust 2005-1 M9, 1-Month LIBOR + 250 bp, due 6/25/35) | | June 25, 2035 | | 2.05%
Monthly | | $1,122,000 | | $ | 1,075,467 | | | — | | $ | 1,075,467 | |
| | | | | | |
Credit Suisse First Boston USA
(ACE Securities Corp. 2005-HE1 M8,
1-Month LIBOR + 138 bp, due 2/25/35) | | February 25, 2035 | | 1.31%
Monthly | | 868,441 | | | 847,898 | | | — | | | 847,898 | |
| | | | | | |
Credit Suisse First Boston USA
(Aegis Asset Backed Securities Trust 2004-4 B2,
1-Month LIBOR + 190bp, due 10/25/34) | | October 25, 2034 | | 1.37%
Monthly | | 830,530 | | | 733,759 | | | — | | | 733,759 | |
| | | | | | |
Credit Suisse First Boston USA
(Aegis Asset Backed Securities Trust 2005 B2,
1-Month LIBOR + 130 bp, due 3/25/35) | | March 25, 2035 | | 1.31%
Monthly | | 1,122,000 | | | 1,113,675 | | | — | | | 1,113,675 | |
| | | | | | |
Credit Suisse First Boston USA
(Aegis Asset Backed Securities Trust 2005 B3,
1-Month LIBOR + 200 bp, due 3/25/35) | | March 25, 2035 | | 2.18%
Monthly | | 1,122,000 | | | 1,121,069 | | | — | | | 1,121,069 | |
| | | | | | |
Credit Suisse First Boston USA
(Amerisource Bergen Corp.,
8.125%, due 9/1/08) | | September 20, 2015 | | 0.9%
Quarterly | | 5,350,000 | | | (120,492 | ) | | — | | | (120,492 | ) |
| | | | | | |
Credit Suisse First Boston USA
(Argent Securities Inc. 2004-W11 M10,
1-Month LIBOR + 350bp, due 11/25/34) | | November 25, 2034 | | 2.15%
Monthly | | 427,500 | | | 415,013 | | | — | | | 415,013 | |
| | | | | | |
Credit Suisse First Boston USA
(Argent Securities Inc. 2004-W11 M9,
1-Month LIBOR + 225bp, due 11/25/34) | | November 25, 2034 | | 1.33%
Monthly | | 427,500 | | | 411,557 | | | — | | | 411,557 | |
124
Semi-Annual Report to Shareholders
| | | | | | | | | | | | | | |
| Core Plus—Continued |
| |
| Credit Default Swaps on Corporate Issues—Buy Protection4—Continued | | |
Swap Counterparty
(Reference Entity) | | Termination Date | | Periodic
Payments Made
by the Fund‡ | | Contract
Notional
Amount3 | | Market Value | | Upfront
Premiums
Paid/(Received) | | Unrealized
Appreciation/
Depreciation |
| | | | | | | | | | | | | | |
Credit Suisse First Boston USA
(Argent Securities Inc. 2004-W4 M3,
1-Month LIBOR + 300 bp, due 3/25/34) | | March 25, 2034 | | 2.2%
Monthly | | $531,142 | | $ | 418,207 | | — | | $ | 418,207 |
| | | | | | |
Credit Suisse First Boston USA
(Finance America Mortgage Loan Trust 2004-3 M8, 1-Month LIBOR + 180bp, due 11/25/34) | | November 25, 2034 | | 1.31% Monthly | | 407,909 | | | 392,472 | | — | | | 392,472 |
| | | | | | |
Credit Suisse First Boston USA
(Finance America Mortgage Loan Trust 2004-3 M9, 1-Month LIBOR + 315bp, due 11/25/34) | | November 25, 2034 | | 2.18% Monthly | | 223,889 | | | 219,434 | | — | | | 219,434 |
| | | | | | |
Credit Suisse First Boston USA
(Fremont Home Loan Trust 2005-A M8, 1-Month LIBOR + 135 bp, due 1/25/35) | | January 25, 2035 | | 1.31% Monthly | | 444,776 | | | 433,581 | | — | | | 433,581 |
| | | | | | |
Credit Suisse First Boston USA
(Fremont Home Loan Trust 2005-A, 1-Month LIBOR + 100bp, due 1/25/35) | | January 25, 2035 | | 2.08% Monthly | | 109,084 | | | 108,519 | | — | | | 108,519 |
| | | | | | |
Credit Suisse First Boston USA
(Home Depot Inc., 3.75%, due 9/15/09) | | September 20, 2010 | | 0.17% Quarterly | | 2,720,000 | | | 23,047 | | — | | | 23,047 |
| | | | | | |
Credit Suisse First Boston USA
(IndyMac Home Equity Loan Asset-Backed, Trust 2004-C M8, 1-Month LIBOR + 190bp, due 3/25/35) | | March 25, 2035 | | 1.28% Monthly | | 585,674 | | | 537,146 | | — | | | 537,146 |
| | | | | | |
Credit Suisse First Boston USA
(IndyMac Home Equity Loan Asset-Backed, Trust 2004-C M9, 1-Month LIBOR + 325bp, due 3/25/35) | | March 25, 2035 | | 2.05% Monthly | | 467,382 | | | 434,480 | | — | | | 434,480 |
| | | | | | |
Credit Suisse First Boston USA
(Limited Brands Inc., 6.125%, due 12/01/12) | | December 20, 2012 | | 0.6% Quarterly | | 10,600,000 | | | 681,920 | | — | | | 681,920 |
125
Semi-Annual Report to Shareholders
Notes to Financial Statements—Continued
| | | | | | | | | | | | | | | | |
| Core Plus—Continued | |
| |
| Credit Default Swaps on Corporate Issues—Buy Protection4—Continued | | | |
Swap Counterparty
(Reference Entity) | | Termination Date | | Periodic
Payments Made
by the Fund‡ | | Contract
Notional
Amount3 | | Market Value | | | Upfront
Premiums
Paid/(Received) | | Unrealized
Appreciation/
Depreciation | |
| | | | | | | | | | | | | | | | |
Credit Suisse First Boston USA
(Long Beach Mortgage Loan Trust 2004-1 M9,
1-Month LIBOR + 350bp, due 2/25/34) | | February 25, 2034 | | 2.15% Monthly | | $ 310,450 | | $ | 180,857 | | | — | | $ | 180,857 | |
| | | | | | |
Credit Suisse First Boston USA
(Long Beach Mortgage Loan Trust 2005-1 M8,
1-Month LIBOR + 170 bp, due 2/25/35) | | February 25, 2035 | | 1.31% Monthly | | 544,798 | | | 532,044 | | | — | | | 532,044 | |
| | | | | | |
Credit Suisse First Boston USA
(Long Beach Mortgage Loan Trust 2005-1 M9,
1-Month LIBOR + 275bp, due 2/25/35) | | February 25, 2035 | | 2.08% Monthly | | 341,616 | | | 340,851 | | | — | | | 340,851 | |
| | | | | | |
Credit Suisse First Boston USA
(Marsh & Mclennan Company, Inc., 5.375%, due 7/15/14) | | September 20, 2010 | | 0.46% Quarterly | | 5,990,000 | | | (8,039 | ) | | — | | | (8,039 | ) |
| | | | | | |
Credit Suisse First Boston USA
(Masco Corp., 5.875%, due 7/15/12) | | September 20, 2013 | | 0.75% Quarterly | | 5,830,000 | | | 573,224 | | | — | | | 573,224 | |
| | | | | | |
Credit Suisse First Boston USA
(MASTR Asset Backed Securities Trust 2005-NC1 M8, 1-Month LIBOR + 153bp, due 12/25/34) | | December 25, 2034 | | 1.31% Monthly | | 660,250 | | | 622,991 | | | — | | | 622,991 | |
| | | | | | |
Credit Suisse First Boston USA
(MASTR Asset Backed Securities Trust 2005-NC1 M9, 1-Month LIBOR + 240bp, due 12/25/34) | | December 25, 2034 | | 2.08% Monthly | | 593,281 | | | 568,999 | | | — | | | 568,999 | |
| | | | | | |
Credit Suisse First Boston USA
(Merrill Lynch Mortgage Investors, Inc. 2004-WMC1 B3, 1-Month LIBOR + 225bp, due 9/25/35) | | September 25, 2035 | | 2.05% Monthly | | 295,616 | | | 271,073 | | | — | | | 271,073 | |
| | | | | | |
Credit Suisse First Boston USA
(Merrill Lynch Mortgage Investors, Inc. 2004-WMC4 B3, 1-Month LIBOR + 375bp, due 4/25/35) | | April 25, 2035 | | 2.15% Monthly | | 326,250 | | | 315,791 | | | — | | | 315,791 | |
126
Semi-Annual Report to Shareholders
| | | | | | | | | | | | | | |
| Core Plus—Continued |
| |
| Credit Default Swaps on Corporate Issues—Buy Protection4—Continued | | |
Swap Counterparty
(Reference Entity) | | Termination Date | | Periodic
Payments Made
by the Fund‡ | | Contract
Notional
Amount3 | | Market Value | | Upfront
Premiums
Paid/(Received) | | Unrealized
Appreciation/
Depreciation |
| | | | | | | | | | | | | | |
Credit Suisse First Boston USA
(Merrill Lynch Mortgage Investors, Inc. 2005-NC1 B2, 1-Month LIBOR + 130bp, due 10/25/35) | | October 25, 2035 | | 1.28% Monthly | | $ 401,504 | | $ | 367,023 | | — | | $ | 367,023 |
| | | | | | |
Credit Suisse First Boston USA
(Merrill Lynch Mortgage Investors, Inc. 2005-NC1 B3, 1-Month LIBOR + 205bp, due 10/25/35) | | October 25, 2035 | | 2.05%
Monthly | | 403,431 | | | 376,871 | | — | | | 376,871 |
| | | | | | |
Credit Suisse First Boston USA
(Merrill Lynch Mortgage Investors, Inc. 2005-WMC1 B2, 1-Month LIBOR + 135bp, due 9/25/35) | | September 25, 2035 | | 1.28%
Monthly | | 380,796 | | | 352,363 | | — | | | 352,363 |
| | | | | | |
Credit Suisse First Boston USA
(Morgan Stanley ABS Capital I 2005-WMC1 B2, 1-Month LIBOR + 130 bp, due 1/25/35) | | January 25, 2035 | | 1.31%
Monthly | | 355,878 | | | 345,416 | | — | | | 345,416 |
| | | | | | |
Credit Suisse First Boston USA
(Morgan Stanley ABS Capital I 2005-WMC1 B3, 1-Month LIBOR + 215bp, due 1/25/35) | | January 25, 2035 | | 2.18%
Monthly | | 156,548 | | | 155,857 | | — | | | 155,857 |
| | | | | | |
Credit Suisse First Boston USA
(New Century Home Equity Loan Trust 2004-2 M9, 1-Month LIBOR + 325bp, due 8/25/34) | | August 25, 2034 | | 2.15%
Monthly | | 443,987 | | | 266,976 | | — | | | 266,976 |
| | | | | | |
Credit Suisse First Boston USA
(New Century Home Equity Loan Trust 2005-1 M8, 1-Month LIBOR +
140 bp, due 3/25/35) | | March 25, 2035 | | 1.31%
Monthly | | 550,167 | | | 473,971 | | — | | | 473,971 |
| | | | | | |
Credit Suisse First Boston USA
(New Century Home Equity Loan Trust 2005-1 M9, 1-Month LIBOR +
205 bp, due 3/25/35) | | March 25, 2035 | | 2.18%
Monthly | | 479,851 | | | 420,119 | | — | | | 420,119 |
127
Semi-Annual Report to Shareholders
Notes to Financial Statements—Continued
| | | | | | | | | | | | | | |
| Core Plus—Continued |
| |
| Credit Default Swaps on Corporate Issues—Buy Protection4—Continued | | |
Swap Counterparty
(Reference Entity) | | Termination Date | | Periodic
Payments Made
by the Fund‡ | | Contract
Notional
Amount3 | | Market Value | | Upfront
Premiums
Paid/(Received) | | Unrealized
Appreciation/
Depreciation |
| | | | | | | | | | | | | | |
Credit Suisse First Boston USA
(Novastar Home Equity Loan 2005-1 B2, 1-Month LIBOR + 135 bp, due 6/25/35) | | June 25, 2035 | | 1.28%
Monthly | | $ 1,122,000 | | $ | 1,008,982 | | — | | $ | 1,008,982 |
| | | | | | |
Credit Suisse First Boston USA
(Novastar Home Equity Loan 2005-4 B3, 1-Month LIBOR + 195 bp, due 6/25/35) | | June 25, 2035 | | 2.05%
Monthly | | 1,122,000 | | | 1,040,734 | | — | | | 1,040,734 |
| | | | | | |
Credit Suisse First Boston USA
(Park Place Securities Inc. 2005-WCH1 M8,
1-Month LIBOR + 155bp, due 1/25/36) | | January 25, 2036 | | 1.36%
Monthly | | 1,122,000 | | | 1,073,259 | | — | | | 1,073,259 |
| | | | | | |
Credit Suisse First Boston USA
(Park Place Securities, Inc. 2005-WCH1 M9,
1-Month LIBOR + 250 bp, due 1/25/36) | | January 25, 2036 | | 2.18%
Monthly | | 1,081,878 | | | 1,054,761 | | — | | | 1,054,761 |
| | | | | | |
Credit Suisse First Boston USA
(People’s Choice Home Loan Securities Trust 2004-1 M6, 1-Month LIBOR + 230bp, due 6/25/34) | | June 25, 2034 | | 1.37%
Quarterly | | 688,793 | | | 676,008 | | — | | | 676,008 |
| | | | | | |
Credit Suisse First Boston USA
(People’s Choice Home Loan Securities Trust 2005-1 B3, 1-Month LIBOR + 260bp, due 1/25/35) | | January 25, 2035 | | 2.05%
Monthly | | 879,711 | | | 878,963 | | — | | | 878,963 |
| | | | | | |
Credit Suisse First Boston USA
(People’s Choice Home Loan Securities Trust 2005-1,
1-Month LIBOR + 165bp, due 1/25/35) | | January 25, 2035 | | 1.28%
Monthly | | 1,122,000 | | | 1,097,648 | | — | | | 1,097,648 |
| | | | | | |
Credit Suisse First Boston USA
(Pulte Homes Inc.,
7.875%, due 8/1/11) | | March 20, 2011 | | 0.79%
Quarterly | | 4,080,000 | | | 114,171 | | — | | | 114,171 |
| | | | | | |
Credit Suisse First Boston USA
(Southwest Airlines Co.,
5.25%, due 10/1/14) | | March 20, 2017 | | 0.69%
Quarterly | | 4,880,000 | | | 343,251 | | — | | | 343,251 |
128
Semi-Annual Report to Shareholders
| | | | | | | | | | | | | | | | |
| Core Plus—Continued | |
| |
| Credit Default Swaps on Corporate Issues—Buy Protection4—Continued | | | |
Swap Counterparty
(Reference Entity) | | Termination Date | | Periodic
Payments Made
by the Fund‡ | | Contract
Notional
Amount3 | | Market Value | | | Upfront
Premiums
Paid/(Received) | | Unrealized
Appreciation/
Depreciation | |
| | | | | | | | | | | | | | | | |
Credit Suisse First Boston USA
(Starwood Hotels Resorts,
7.875%, due 8/25/34) | | December 20, 2011 | | 1.37%
Quarterly | | $ 5,350,000 | | $ | 272,763 | | | — | | $ | 272,763 | |
| | | | | | |
Credit Suisse First Boston USA
(Waste Management Inc.,
7.375%, due 8/1/10) | | March 20, 2014 | | 0.49%
Quarterly | | 6,630,000 | | | 88,551 | | | — | | | 88,551 | |
| | | | | | |
Deutsche Bank AG
(Autozone Inc.,
6.95%, due 6/15/16) | | June 20, 2016 | | 0.58%
Quarterly | | 10,890,000 | | | (2,639 | ) | | — | | | (2,639 | ) |
| | | | | | |
Deutsche Bank AG
(Centurytel Inc.,
7.875%, due 8/15/12) | | March 20, 2017 | | 0.89%
Quarterly | | 8,270,000 | | | (35,313 | ) | | — | | | (35,313 | ) |
| | | | | | | | | | | | | | | | |
| | | | | | |
JP Morgan Chase & Co.
(Limited Brands Inc.,
6.125%, due 12/1/12) | | December 20, 2012 | | 0.67%
Quarterly | | 6,300,000 | | | 391,297 | | | — | | | 391,297 | |
| | | | | | |
Morgan Stanley & Co., Inc.
(Gannett Co.,
6.375%, due 4/01/12) | | March 20, 2012 | | 0.46%
Quarterly | | 4,560,000 | | | 1,145,258 | | | — | | | 1,145,258 | |
| | | | | | |
Morgan Stanley & Co., Inc.
(Pulte Homes Inc.,
5.25%, due 1/15/14) | | March 20, 2011 | | 4%
Quarterly | | 2,780,000 | | | (71,417 | ) | | — | | | (71,417 | ) |
| | | | | | |
Morgan Stanley & Co., Inc.
(Sara Lee Corp.
6.125% due 11/01/32) | | September 20, 2011 | | 0.62%
Quarterly | | 9,750,000 | | | (61,842 | ) | | — | | | (61,842 | ) |
| | | | | | |
Morgan Stanley & Co., Inc.
(Viacom Inc.,
6.25%, due 4/30/16) | | March 20, 2012 | | 0.36%
Quarterly | | 10,540,000 | | | 313,898 | | | — | | | 313,898 | |
| | | | | | |
Morgan Stanley & Co., Inc.
(Weyerhaeuser Co. Note,
7.125%, due 7/15/23) | | March 20, 2012 | | 0.74%
Quarterly | | 5,540,000 | | | 138,196 | | | — | | | 138,196 | |
| | | | | | |
RBS Greenwich
(General Mills Inc.,
5.7%, due 2/15/17) | | March 20, 2017 | | 0.33%
Quarterly | | 7,210,000 | | | 63,648 | | | — | | | 63,648 | |
| | | | | | |
RBS Greenwich
(Harborview Mortgage Loan Trust 2005-12, 1-Month LIBOR + 175 bp,
due 10/19/35) | | October 19, 2035 | | 2.5%
Monthly | | 1,988,009 | | | 1,886,498 | | | — | | | 1,886,498 | * |
| | | | | | |
RBS Greenwich
(Home Depot Inc.,
5.4%, due 3/1/16) | | March 20, 2016 | | 0.48%
Monthly | | 8,230,000 | | | 208,109 | | | — | | | 208,109 | |
129
Semi-Annual Report to Shareholders
Notes to Financial Statements—Continued
| | | | | | | | | | | | | | | |
| Core Plus—Continued | |
| |
| Credit Default Swaps on Corporate Issues—Buy Protection4—Continued | | | |
Swap Counterparty
(Reference Entity) | | Termination Date | | Periodic
Payments Made
by the Fund‡ | | Contract
Notional
Amount3 | | Market Value | | Upfront
Premiums
Paid/(Received) | | Unrealized
Appreciation/
Depreciation | |
| | | | | | | | | | | | | | | |
RBS Greenwich
(Washington Mutual 2005-AR11, 1-Month LIBOR +
120 bp, due 8/25/45) | | August 25, 2045 | | 2.55%
Monthly | | $ 678,915 | | $ | 671,195 | | — | | $ | 671,195 | * |
| | | | | | |
The Goldman Sachs Group, Inc.
(JPM Chase Commercial Mortgage,
5.7966%, due 5/15/47) | | May 15, 2047 | | 0.75%
Monthly | | 5,000,000 | | | 4,650,086 | | — | | | 4,650,086 | * |
| | | | | | | | | | | | | | | |
| | | | | | |
The Goldman Sachs Group, Inc.
(Viacom Inc.
6.25% due 4/30/2016) | | March 20, 2011 | | 1.4%
Quarterly | | 6,270,000 | | | 45 | | — | | | 45 | |
| | | | | | | | | | | | | | | |
| | | |
Net unrealized appreciation on buys of credit default swaps on corporate issues | | | | | | | $ | 38,538,850 | |
| | | | | | | | | | | | | | | |
| | | | | | | | | | | | | | | | | | |
| | | |
| Credit Default Swap on Credit Indices—Sell Protection1 | | | | | | | | | |
Swap Counterparty
(Reference Entity) | | Termination Date | | Periodic
Payments
Received
by the Fund‡ | | Contract
Notional
Amount3 | | Market Value5 | | | Upfront
Premiums
Paid/(Received) | | | Unrealized
Appreciation/
(Depreciation) | |
| | | | | | | | | | | | | | | | | | |
Barclays Capital Inc.
(CDX IG 10) | | June 20, 2013 | | 1.55%
Quarterly | | $ 45,676,800 | | $ | (499,398 | ) | | $ | (117,412 | ) | | $ | (381,986 | ) |
| | | | | | |
Barclays Capital Inc.
(CDX IG 10) | | June 20, 2013 | | 1.55%
Quarterly | | 40,552,800 | | | (443,376 | ) | | | (390,297 | ) | | | (53,079 | ) |
| | | | | | |
Barclays Capital Inc.
(CDX IG 9) | | December 20, 2017 | | 0.8%
Quarterly | | 98,946,880 | | | (5,253,585 | ) | | | (3,576,229 | ) | | | (1,677,356 | ) |
| | | | | | |
Barclays Capital Inc.
(CDX IG 9) | | December 20, 2017 | | 0.8%
Quarterly | | 85,595,200 | | | (4,544,677 | ) | | | (3,530,593 | ) | | | (1,014,084 | ) |
| | | | | | |
Barclays Capital Inc.
(CDX IG HVOL 8) | | June 20, 2012 | | 0.75%
Quarterly | | 7,700,000 | | | (484,396 | ) | | | (56,893 | ) | | | (427,503 | ) |
| | | | | | |
Barclays Capital Inc.
(CDX IG HVOL 9) | | December 20, 2012 | | 1.4%
Quarterly | | 12,760,044 | | | (1,329,009 | ) | | | (271,619 | ) | | | (1,057,390 | ) |
| | | | | | |
Barclays Capital Inc.
(CDX IG HVOL 9) | | December 20, 2012 | | 1.4%
Quarterly | | 25,036,753 | | | (2,607,676 | ) | | | (580,267 | ) | | | (2,027,409 | ) |
| | | | | | |
Barclays Capital Inc.
(CDX IG HVOL 9) | | December 20, 2012 | | 1.4%
Quarterly | | 29,290,101 | | | (3,050,679 | ) | | | (767,885 | ) | | | (2,282,794 | ) |
| | | | | | |
Barclays Capital Inc.
(CDX IG HVOL 9) | | December 20, 2012 | | 1.4%
Quarterly | | 178,930,617 | | | (18,636,322 | ) | | | (5,669,299 | ) | | | (12,967,023 | ) |
| | | | | | |
Barclays Capital Inc.
(CDX IG HVOL 9) | | December 20, 2012 | | 1.4%
Quarterly | | 62,833,550 | | | (6,544,359 | ) | | | (2,040,279 | ) | | | (4,504,080 | ) |
130
Semi-Annual Report to Shareholders
| | | | | | | | | | | | | | | | | | |
| Core Plus—Continued | |
| | | |
| Credit Default Swap on Credit Indices—Sell Protection1—Continued | | | | | | | | | |
Swap Counterparty
(Reference Entity) | | Termination Date | | Periodic
Payments
Received
by the Fund‡ | | Contract
Notional
Amount3 | | Market Value5 | | | Upfront
Premiums
Paid/(Received) | | | Unrealized
Appreciation/
(Depreciation) | |
| | | | | | | | | | | | | | | | | | |
Barclays Capital Inc.
(CDX IG HVOL 9) | | December 20, 2012 | | 1.4%
Quarterly | | $ 62,833,550 | | $ | (6,544,359 | ) | | $ | (2,022,821 | ) | | $ | (4,521,538 | ) |
| | | | | | |
Barclays Capital Inc.
(CDX IG HVOL 9) | | December 20, 2012 | | 1.4%
Quarterly | | 4,833,350 | | | (503,412 | ) | | | (209,499 | ) | | | (293,913 | ) |
| | | | | | |
Barclays Capital Inc.
(CDX IG HVOL 9) | | December 20, 2012 | | 1.4%
Quarterly | | 125,425,433 | | | (13,063,548 | ) | | | (5,623,648 | ) | | | (7,439,900 | ) |
| | | | | | |
Barclays Capital Inc.
(CDX IG HVOL 9) | | December 20, 2012 | | 1.4%
Quarterly | | 11,841,708 | | | (1,233,361 | ) | | | (537,440 | ) | | | (695,921 | ) |
| | | | | | |
Barclays Capital Inc.
(CDX IG HVOL 9) | | December 20, 2012 | | 1.4%
Every 3 Days | | 23,103,413 | | | (2,406,311 | ) | | | (1,043,859 | ) | | | (1,362,452 | ) |
| | | | | | |
Barclays Capital Inc.
(CDX IG HVOL 9) | | December 20, 2012 | | 1.4%
Quarterly | | 31,706,776 | | | (3,302,384 | ) | | | (1,827,253 | ) | | | (1,475,131 | ) |
| | | | | | |
Bear Stearns, Inc.
(CDX HY 6B) | | June 20, 2011 | | 3%
Quarterly | | 21,354,000 | | | (1,530,191 | ) | | | 101,434 | | | | (1,631,625 | ) |
| | | | | | |
Bear Stearns, Inc.
(CDX HY 8) | | June 20, 2012 | | 0.91%
Quarterly | | 31,750,000 | | | (8,358,295 | ) | | | — | | | | (8,358,295 | ) |
| | | | | | |
Bear Stearns, Inc.
(CDX HY 8) | | June 20, 2012 | | 1.01%
Quarterly | | 11,800,000 | | | (3,074,903 | ) | | | — | | | | (3,074,903 | ) |
| | | | | | |
Bear Stearns, Inc.
(CDX HY 8) | | June 20, 2012 | | 1.05%
Quarterly | | 12,700,000 | | | (3,295,875 | ) | | | — | | | | (3,295,875 | ) |
| | | | | | |
Bear Stearns, Inc.
(CDX IG HVOL 8) | | June 20, 2012 | | 0.75%
Quarterly | | 1,875,000 | | | (117,954 | ) | | | (18,592 | ) | | | (99,362 | ) |
| | | | | | |
Bear Stearns, Inc.
(CDX IG HVOL 9) | | December 20, 2012 | | 1.4%
Quarterly | | 11,696,707 | | | (1,218,258 | ) | | | (27,647 | ) | | | (1,190,611 | ) |
| | | | | | |
Credit Suisse First Boston USA
(ABX.HE-AAA 06-1) | | July 25, 2045 | | 0.18%
Monthly | | 160,576,853 | | | (48,574,498 | ) | | | (13,554,911 | ) | | | (35,019,587 | ) |
| | | | | | |
Credit Suisse First Boston USA
(ABX.HE-AAA 06-1) | | July 25, 2045 | | 0.18%
Monthly | | 23,059,096 | | | (6,975,376 | ) | | | (2,053,824 | ) | | | (4,921,552 | ) |
| | | | | | |
Credit Suisse First Boston USA
(CDX IG HVOL 10) | | June 20, 2013 | | 3.5%
Quarterly | | 40,310,139 | | | (1,582,217 | ) | | | 467,994 | | | | (2,050,211 | ) |
| | | | | | |
Credit Suisse First Boston USA
(CDX IG HVOL 10) | | June 20, 2013 | | 3.5%
Quarterly | | 40,890,141 | | | (1,604,983 | ) | | | (533,856 | ) | | | (1,071,127 | ) |
131
Semi-Annual Report to Shareholders
Notes to Financial Statements—Continued
| | | | | | | | | | | | | | | | | | |
| Core Plus—Continued | |
| | | |
| Credit Default Swap on Credit Indices—Sell Protection1—Continued | | | | | | | | | |
Swap Counterparty
(Reference Entity) | | Termination Date | | Periodic
Payments
Received
by the Fund‡ | | Contract
Notional
Amount3 | | Market Value5 | | | Upfront
Premiums
Paid/(Received) | | | Unrealized
Appreciation/
(Depreciation) | |
| | | | | | | | | | | | | | | | | | |
Credit Suisse First Boston USA
(iBoxx HY 3) | | December 20, 2009 | | 4%
Quarterly | | $ 2,720,437 | | $ | (262 | ) | | $ | (9,998 | ) | | $ | 9,736 | |
| | | | | | |
Credit Suisse First Boston USA
(iBoxx HY 3) | | December 20, 2009 | | 4%
Quarterly | | 2,720,437 | | | (262 | ) | | | (9,998 | ) | | | 9,736 | |
| | | | | | |
Deutsche Bank AG
(ABX.HE-AAA 06-1) | | July 25, 2045 | | 0.18%
Monthly | | 31,520,297 | | | (9,534,890 | ) | | | (2,685,515 | ) | | | (6,849,375 | ) |
| | | | | | |
Deutsche Bank AG
(ABX.HE-AAA 06-1) | | July 25, 2045 | | 0.18%
Monthly | | 15,899,619 | | | (4,809,635 | ) | | | (1,395,283 | ) | | | (3,414,352 | ) |
| | | | | | |
Deutsche Bank AG
(ABX.HE-AAA 06-1) | | July 25, 2045 | | 0.18%
Monthly | | 7,624,379 | | | (2,306,375 | ) | | | (840,078 | ) | | | (1,466,297 | ) |
| | | | | | |
Deutsche Bank AG
(iBoxx HY 2) | | September 20, 2009 | | 4.8%
Quarterly | | 2,193,466 | | | (4,382 | ) | | | (2,297 | ) | | | (2,085 | ) |
| | | | | | |
Deutsche Bank AG
(iBoxx IG Hi-Vol2) | | September 20, 2014 | | 1.3%
Quarterly | | 11,174,667 | | | (382,560 | ) | | | 21,847 | | | | (404,407 | ) |
| | | | | | |
JP Morgan Chase & Co.
(ABX. HE-AAA 06-1) | | July 25, 2045 | | 0.18%
Monthly | | 22,315,255 | | | (6,750,365 | ) | | | (529,394 | ) | | | (6,220,971 | ) |
| | | | | | |
JP Morgan Chase & Co.
(CDX HY 9) | | December 20, 2012 | | 2.25%
Quarterly | | 8,900,000 | | | (2,661,466 | ) | | | — | | | | (2,661,466 | ) |
| | | | | | |
JP Morgan Chase & Co.
(CDX HY 9) | | December 20, 2012 | | 3.75%
Quarterly | | 174,000 | | | (24,282 | ) | | | (13,869 | ) | | | (10,413 | ) |
| | | | | | |
JP Morgan Chase & Co.
(CDX HY 9) | | December 20, 2012 | | 6.356%
Quarterly | | 75,000,000 | | | (13,144,815 | ) | | | — | | | | (13,144,815 | ) |
| | | | | | |
JP Morgan Chase & Co.
(CDX IG 10) | | June 20, 2013 | | 1.55%
Quarterly | | 154,208,000 | | | (1,686,003 | ) | | | (616,069 | ) | | | (1,069,934 | ) |
| | | | | | |
JP Morgan Chase & Co.
(CDX IG 10) | | June 20, 2013 | | 1.55%
Quarterly | | 141,910,400 | | | (1,551,549 | ) | | | (1,209,067 | ) | | | (342,482 | ) |
| | | | | | |
JP Morgan Chase & Co.
(CDX IG 8) | | June 20, 2012 | | 0.35%
Quarterly | | 83,448,000 | | | (3,320,638 | ) | | | (467,692 | ) | | | (2,852,946 | ) |
| | | | | | |
JP Morgan Chase & Co.
(CDX IG HVOL 9) | | December 20, 2012 | | 1.4%
Quarterly | | 2,900,010 | | | (302,047 | ) | | | (79,257 | ) | | | (222,790 | ) |
| | | | | | |
Merrill Lynch & Co., Inc.
(ABX.HE-AAA 06-1) | | July 25, 2045 | | 0.18%
Monthly | | 23,245,057 | | | (7,031,630 | ) | | | (1,283,061 | ) | | | (5,748,569 | ) |
| | | | | | |
Merrill Lynch & Co., Inc.
(CDX HY 8) | | June 20, 2012 | | 0.82%
Quarterly | | 30,600,000 | | | (8,129,040 | ) | | | — | | | | (8,129,040 | ) |
132
Semi-Annual Report to Shareholders
| | | | | | | | | | | | | | | | | | |
| Core Plus—Continued | |
| | | |
| Credit Default Swap on Credit Indices—Sell Protection 1—Continued | | | | | | | | | |
Swap Counterparty
(Reference Entity) | | Termination Date | | Periodic
Payments
Received
by the Fund‡ | | Contract
Notional
Amount3 | | Market Value5 | | | Upfront
Premiums
Paid/(Received) | | | Unrealized
Appreciation/
(Depreciation) | |
| | | | | | | | | | | | | | | | | | |
Merrill Lynch & Co., Inc.
(CDX HY 8) | | June 20, 2012 | | 0.92%
Quarterly | | $ 31,750,000 | | $ | (8,349,821 | ) | | | — | | | $ | (8,349,821 | ) |
| | | | | | |
Merrill Lynch & Co., Inc.
(CDX HY 8) | | June 20, 2012 | | 1.125%
Quarterly | | 18,800,000 | | | (4,841,308 | ) | | | — | | | | (4,841,308 | ) |
| | | | | | |
Merrill Lynch & Co., Inc.
(CDX HY 9) | | December 20, 2012 | | 2%
Quarterly | | 9,340,000 | | | (2,863,434 | ) | | | — | | | | (2,863,434 | ) |
| | | | | | |
Merrill Lynch & Co., Inc.
(CDX HY 9) | | December 20, 2012 | | 2.3%
Quarterly | | 9,220,000 | | | (2,743,263 | ) | | | — | | | | (2,743,263 | ) |
| | | | | | |
Merrill Lynch & Co., Inc.
(CDX HY 9) | | December 20, 2012 | | 3.75%
Quarterly | | 1,848,000 | | | (257,896 | ) | | $ | (59,045 | ) | | | (198,851 | ) |
| | | | | | |
Merrill Lynch & Co., Inc.
(CDX HY 9) | | December 20, 2012 | | 6.35%
Quarterly | | 15,000,000 | | | (2,631,675 | ) | | | — | | | | (2,631,675 | ) |
| | | | | | |
Merrill Lynch & Co., Inc.
(CDX HY 9) | | December 20, 2012 | | 6.43%
Quarterly | | 2,000,000 | | | (346,067 | ) | | | — | | | | (346,067 | ) |
| | | | | | |
Merrill Lynch & Co., Inc.
(CDX HY 9) | | December 20, 2012 | | 6.2%
Quarterly | | 13,000,000 | | | (2,339,568 | ) | | | — | | | | (2,339,568 | ) |
| | | | | | |
Merrill Lynch & Co., Inc.
(CDX IG HVOL 8) | | June 20, 2012 | | 0.75%
Quarterly | | 4,650,000 | | | (292,525 | ) | | | (10,380 | ) | | | (282,145 | ) |
| | | | | | |
Merrill Lynch & Co., Inc.
(CDX IG HVOL 8) | | June 20, 2012 | | 0.75%
Quarterly | | 95,680,000 | | | (6,019,095 | ) | | | (345,525 | ) | | | (5,673,570 | ) |
| | | | | | |
Merrill Lynch & Co., Inc.
(CDX IG HVOL 8) | | June 20, 2012 | | 0.75%
Quarterly | | 14,200,000 | | | (893,302 | ) | | | (168,693 | ) | | | (724,609 | ) |
| | | | | | |
Merrill Lynch & Co., Inc.
(CDX IG HVOL 9) | | December 20, 2012 | | 1.4%
Quarterly | | 7,926,694 | | | (825,596 | ) | | | (80,243 | ) | | | (745,353 | ) |
| | | | | | |
Merrill Lynch & Co., Inc.
(CDX IG HVOL 9) | | December 20, 2012 | | 1.4%
Quarterly | | 4,543,349 | | | (473,208 | ) | | | (120,356 | ) | | | (352,852 | ) |
| | | | | | |
Merrill Lynch & Co., Inc.
(Dow Jones CDX IG HVOL 12) | | June 20, 2014 | | 5%
Quarterly | | 25,400,000 | | | 1,942,356 | | | | 860,681 | | | | 1,081,675 | |
| | | | | | |
Morgan Stanley & Co., Inc.
(CDX HY 9) | | December 20, 2012 | | 6.2%
Quarterly | | 43,000,000 | | | (7,738,572 | ) | | | — | | | | (7,738,572 | ) |
| | | | | | |
Morgan Stanley & Co., Inc.
(CDX IG HVOL 9) | | December 20, 2012 | | 1.4%
Quarterly | | 2,320,008 | | | (241,638 | ) | | | (46,029 | ) | | | (195,609 | ) |
| | | | | | |
Morgan Stanley & Co., Inc.
(CDX IG HVOL 9) | | December 20, 2012 | | 1.4%
Quarterly | | 62,833,550 | | | (6,544,359 | ) | | | (2,004,745 | ) | | | (4,539,614 | ) |
133
Semi-Annual Report to Shareholders
Notes to Financial Statements—Continued
| | | | | | | | | | | | | | | | | | |
| Core Plus—Continued | |
| | | |
| Credit Default Swap on Credit Indices—Sell Protection 1—Continued | | | | | | | | | |
Swap Counterparty
(Reference Entity) | | Termination Date | | Periodic
Payments
Received
by the Fund‡ | | Contract
Notional
Amount3 | | Market Value5 | | | Upfront
Premiums
Paid/(Received) | | | Unrealized
Appreciation/
(Depreciation) | |
| | | | | | | | | | | | | | | | | | |
RBS Greenwich
(CDX HY 10) | | June 20, 2013 | | 5%
Quarterly | | $ 10,736,000 | | $ | (1,223,434 | ) | | $ | (1,163,595 | ) | | $ | (59,839 | ) |
| | | | | | |
RBS Greenwich
(CDX HY 9) | | December 20, 2012 | | 3.75%
Quarterly | | 1,408,000 | | | (196,492 | ) | | | (115,181 | ) | | | (81,311 | ) |
| | | | | | |
RBS Greenwich
(CDX IG 8) | | June 20, 2012 | | 0.35%
Quarterly | | 16,494,400 | | | (656,360 | ) | | | (224,142 | ) | | | (432,218 | ) |
| | | | | | |
RBS Greenwich
(CDX IG 8) | | June 20, 2012 | | 0.35%
Quarterly | | 14,152,000 | | | (563,149 | ) | | | (172,329 | ) | | | (390,820 | ) |
| | | | | | |
RBS Greenwich
(LCDX HY 9) | | December 20, 2012 | | 2.25%
Quarterly | | 13,760,000 | | | (2,181,126 | ) | | | (827,811 | ) | | | (1,353,315 | ) |
| | | | | | |
The Goldman Sachs Group, Inc.
(ABX.HE-AAA 06-1) | | July 25, 2045 | | 0.18%
Monthly | | 23,012,606 | | | (6,961,313 | ) | | | (1,548,122 | ) | | | (5,413,191 | ) |
| | | | | | |
The Goldman Sachs Group, Inc.
(CDX HY 8) | | June 20, 2012 | | 0.9%
Quarterly | | 32,000,000 | | | (8,432,646 | ) | | | — | | | | (8,432,646 | ) |
| | | | | | |
The Goldman Sachs Group, Inc.
(CDX HY 9) | | October 12, 2012 | | 1.8%
Quarterly | | 35,500,000 | | | (11,097,534 | ) | | | — | | | | (11,097,534 | ) |
| | | | | | |
The Goldman Sachs Group, Inc.
(CDX HY 9) | | December 20, 2012 | | 2%
Quarterly | | 8,780,000 | | | (2,691,750 | ) | | | — | | | | (2,691,750 | ) |
| | | | | | |
The Goldman Sachs Group, Inc.
(CDX HY 9) | | December 20, 2012 | | 3.75%
Quarterly | | 10,208,000 | | | (1,424,568 | ) | | | (632,148 | ) | | | (792,420 | ) |
| | | | | | |
The Goldman Sachs Group, Inc.
(CDX HY 9) | | December 20, 2012 | | 3.75%
Quarterly | | 19,360,000 | | | (2,701,767 | ) | | | (1,338,554 | ) | | | (1,363,213 | ) |
| | | | | | |
The Goldman Sachs Group, Inc.
(CDX IG 8) | | June 20, 2012 | | 0.35%
Quarterly | | 19,149,120 | | | (761,999 | ) | | | (123,350 | ) | | | (638,649 | ) |
| | | | | | |
The Goldman Sachs Group, Inc.
(CDX IG 9) | | December 20, 2017 | | 0.8%
Quarterly | | 63,440,000 | | | (3,368,347 | ) | | | (2,073,610 | ) | | | (1,294,737 | ) |
| | | | | | |
The Goldman Sachs Group, Inc.
(CDX IG HVOL 10) | | June 20, 2013 | | 3.5%
Quarterly | | 242,730,837 | | | (9,527,452 | ) | | | 3,469,838 | | | | (12,997,290 | ) |
| | | | | | |
The Goldman Sachs Group, Inc.
(CDX IG HVOL 10) | | June 20, 2013 | | 3.5%
Quarterly | | 32,673,446 | | | (1,282,468 | ) | | | 1,015,979 | | | | (2,298,447 | ) |
134
Semi-Annual Report to Shareholders
| | | | | | | | | | | | | | | | | | |
| Core Plus—Continued | |
| | | |
| Credit Default Swap on Credit Indices—Sell Protection 1—Continued | | | | | | | | | |
Swap Counterparty
(Reference Entity) | | Termination Date | | Periodic
Payments
Received
by the Fund‡ | | Contract
Notional
Amount3 | | Market Value5 | | | Upfront
Premiums
Paid/(Received) | | | Unrealized
Appreciation/
(Depreciation) | |
| | | | | | | | | | | | | | | | | | |
The Goldman Sachs Group, Inc.
(CDX IG HVOL 10) | | June 20, 2013 | | 3.5%
Quarterly | | $ 32,770,113 | | $ | (1,286,263 | ) | | $ | 507,008 | | | $ | (1,793,271 | ) |
| | | | | | |
The Goldman Sachs Group, Inc.
(CDX IG HVOL 3) | | March 20, 2010 | | 1.05%
Quarterly | | 21,845,160 | | | (262,008 | ) | | | (17,699 | ) | | | (244,309 | ) |
| | | | | | |
The Goldman Sachs Group, Inc.
(CDX IG HVOL 3) | | March 20, 2010 | | 1.05%
Quarterly | | 42,820,380 | | | (513,583 | ) | | | (142,019 | ) | | | (371,564 | ) |
| | | | | | |
The Goldman Sachs Group, Inc.
(CDX IG HVOL 8) | | June 20, 2012 | | 0.75%
Quarterly | | 4,400,000 | | | (276,797 | ) | | | (54,707 | ) | | | (222,090 | ) |
| | | | | | |
The Goldman Sachs Group, Inc.
(CDX IG HVOL 8) | | June 20, 2012 | | 0.75%
Quarterly | | 700,000 | | | (44,036 | ) | | | (19,480 | ) | | | (24,556 | ) |
| | | | | | |
The Goldman Sachs Group, Inc.
(CDX IG HVOL 9) | | December 20, 2012 | | 1.4%
Quarterly | | 5,413,352 | | | (563,822 | ) | | | 16,734 | | | | (580,556 | ) |
| | | | | | |
The Goldman Sachs Group, Inc.
(CDX IG HVOL 9) | | December 20, 2012 | | 1.4%
Quarterly | | 48,333,500 | | | (5,034,123 | ) | | | (831,124 | ) | | | (4,202,999 | ) |
| | | | | | |
The Goldman Sachs Group, Inc.
(CDX IG HVOL 9) | | December 20, 2012 | | 1.4%
Quarterly | | 12,180,042 | | | (1,268,599 | ) | | | (326,116 | ) | | | (942,483 | ) |
| | | | | | |
The Goldman Sachs Group, Inc.
(CDX IG HVOL 9) | | December 20, 2012 | | 1.4%
Quarterly | | 12,180,042 | | | (1,268,599 | ) | | | (325,443 | ) | | | (943,156 | ) |
| | | | | | |
The Goldman Sachs Group, Inc.
(CDX IG HVOL 9) | | December 20, 2012 | | 1.4%
Quarterly | | 29,290,101 | | | (3,050,678 | ) | | | (784,044 | ) | | | (2,266,634 | ) |
| | | | | | |
The Goldman Sachs Group, Inc.
(CDX IG HVOL 9) | | December 20, 2012 | | 1.4%
Quarterly | | 28,420,098 | | | (2,960,064 | ) | | | (1,157,519 | ) | | | (1,802,545 | ) |
| | | | | | |
The Goldman Sachs Group, Inc.
(CDX IG HVOL 9) | | December 20, 2012 | | 1.4%
Quarterly | | 28,420,098 | | | (2,960,064 | ) | | | (1,011,115 | ) | | | (1,948,949 | ) |
| | | | | | |
The Goldman Sachs Group, Inc.
(CDX IG HVOL 9) | | December 20, 2012 | | 1.4%
Quarterly | | 110,490,381 | | | (11,508,004 | ) | | | (10,745,273 | ) | | | (762,731 | ) |
| | | | | | |
The Goldman Sachs Group, Inc.
(Dow Jones CDX HY B.3) | | December 20, 2009 | | 4%
Quarterly | | 8,722,672 | | | (842 | ) | | | 89,841 | | | | (90,683 | ) |
135
Semi-Annual Report to Shareholders
Notes to Financial Statements—Continued
| | | | | | | | | | | | | | | | | | |
| Core Plus—Continued | |
| | | |
| Credit Default Swap on Credit Indices—Sell Protection 1—Continued | | | | | | | | | |
Swap Counterparty
(Reference Entity) | | Termination Date | | Periodic
Payments
Received
by the Fund‡ | | Contract
Notional
Amount3 | | Market Value5 | | | Upfront
Premiums
Paid/(Received) | | | Unrealized
Appreciation/
(Depreciation) | |
| | | | | | | | | | | | | | | | | | |
The Goldman Sachs Group,
Inc.
(iBoxx HY 3) | | December 20, 2009 | | 4%
Quarterly | | $2,573,620 | | $ | (248 | ) | | $ | (4,132 | ) | | $ | 3,884 | |
| | | | | | |
The Goldman Sachs Group,
Inc.
(iBoxx HY 3) | | December 20, 2009 | | 4% Quarterly | | $863,631 | | | (83 | ) | | | (150 | ) | | | 67 | |
| | | | | | |
The Goldman Sachs Group,
Inc.
(iBoxx HY 4) | | June 20, 2010 | | 3.4% Quarterly | | 1,980,000 | | | 19,165 | | | | (10,212 | ) | | | 29,377 | |
| | | | | | |
The Goldman Sachs Group,
Inc.
(iBoxx HY 6B) | | June 20, 2011 | | 3% Quarterly | | 9,737,424 | | | (697,768 | ) | | | 38,085 | | | | (735,853 | ) |
| | | | | | |
The Goldman Sachs Group, Inc.
(iBoxx HY 6B) | | June 20, 2011 | | 3% Quarterly | | 12,812,400 | | | (918,115 | ) | | | 60,505 | | | | (978,620 | ) |
| | | | | | |
The Goldman Sachs Group, Inc.
(LCDX 9) | | December 20, 2012 | | 2.25% Quarterly | | 14,620,000 | | | (2,317,447 | ) | | | 51,116 | | | | (2,368,563 | ) |
| | | | | | | | | | | | | | | | | | |
| |
Net unrealized depreciation on sales of credit default swaps on credit indices | | | $ | (268,483,427 | ) |
| | | | | | | | | | | | | | | | | | |
|
| Credit Default Swap on Credit Indices—Buy Protection4 | |
Swap Counterparty
(Reference Entity) | | Termination Date | | Periodic
Payments
Made by the Fund‡ | | Contract
Notional
Amount3 | | Market Value5 | | | Upfront
Premiums
Paid/(Received) | | | Unrealized
Appreciation/
(Depreciation) | |
| | | | | | | | | | | | | | | | | | |
Barclays Capital Inc.
(CDX IG 10 6/13) | | June 20, 2013 | | 1.55% Quarterly | | $19,617,600 | | $ | 214,485 | | | $ | 317,146 | | | $ | (102,661 | ) |
| | | | | | |
Barclays Capital Inc.
(CDX IG 10) | | June 20, 2013 | | 1.55% Quarterly | | 22,838,400 | | | 249,699 | | | | 28,596 | | | | 221,103 | |
| | | | | | |
Barclays Capital Inc.
(CDX IG 10) | | June 20, 2013 | | 1.55% Quarterly | | 81,105,600 | | | 886,752 | | | | 334,591 | | | | 552,161 | |
| | | | | | |
Barclays Capital Inc.
(CDX IG 11) | | December 20, 2013 | | 1.5% Quarterly | | 6,240,000 | | | 46,662 | | | | 166,322 | | | | (119,660 | ) |
| | | | | | |
Barclays Capital Inc.
(CDX IG 11) | | December 20, 2013 | | 1.5% Quarterly | | 44,400,000 | | | 332,019 | | | | 1,450,185 | | | | (1,118,166 | ) |
| | | | | | |
Bear Stearns, Inc.
(CDX HY 6B) | | June 20, 2011 | | 3% Quarterly | | 9,908,256 | | | (710,009 | ) | | | 16,845 | | | | (726,854 | ) |
| | | | | | |
Citigroup Global Markets
(CMBX 1 2006-1 AAA) | | March 22, 2045 | | 0.1% Monthly | | 9,530,000 | | | 1,229,370 | | | | 953,000 | | | | 276,370 | * |
136
Semi-Annual Report to Shareholders
| | | | | | | | | | | | | | | | | |
| Core Plus—Continued | |
|
| Credit Default Swap on Credit Indices—Buy Protection4—Continued | |
Swap Counterparty
(Reference Entity) | | Termination Date | | Periodic
Payments
Made by the Fund‡ | | Contract
Notional
Amount3 | | Market Value5 | | Upfront
Premiums
Paid/(Received) | | | Unrealized
Appreciation/
(Depreciation) | |
| | | | | | | | | | | | | | | | | |
Credit Suisse First Boston USA
(CDX IG 11) | | March 20, 2013 | | 1.5% Quarterly | | $90,100,000 | | $ | 673,759 | | $ | 2,942,829 | | | $ | (2,269,070 | ) |
| | | | | | |
Credit Suisse First Boston USA
(CMBX 1 2006-1 AAA) | | March 22, 2045 | | 0.1% Monthly | | 9,520,000 | | | 1,228,080 | | | 2,219,056 | | | | (990,976 | )* |
| | | | | | |
Credit Suisse First Boston USA
(CMBX 2 2006-2 AAA) | | September 22, 2045 | | 0.07% Monthly | | 16,420,000 | | | 3,040,984 | | | 3,605,591 | | | | (564,607 | )* |
| | | | | | |
Credit Suisse First Boston USA
(CMBX 4 2007-2 AAA) | | March 22, 2047 | | 0.35% Quarterly | | 34,700,000 | | | 9,289,190 | | | 8,988,775 | | | | 300,415 | * |
| | | | | | |
JP Morgan Chase & Co.
(CDX IG 10 6/13) | | June 20, 2013 | | 1.55% Quarterly | | 39,820,800 | | | 435,373 | | | 938,450 | | | | (503,077 | ) |
| | | | | | |
JP Morgan Chase & Co.
(CDX IG 10 6/13) | | June 20, 2013 | | 1.55% Quarterly | | 9,857,600 | | | 107,776 | | | 120,119 | | | | (12,343 | ) |
| | | | | | |
JP Morgan Chase & Co.
(CDX IG HVOL 10) | | June 20, 2013 | | 3.5% Quarterly | | 28,710,099 | | | 1,126,903 | | | (1,142,170 | ) | | | 2,269,073 | |
| | | | | | |
JP Morgan Chase & Co.
(CDX IG HVOL 10) | | June 20, 2013 | | 3.5% Quarterly | | 26,100,090 | | | 1,024,457 | | | (1,325,712 | ) | | | 2,350,169 | |
| | | | | | |
JP Morgan Chase & Co.
(CMBX 1 2006-1 AAA) | | March 22, 2045 | | 0.1% Monthly | | 9,530,000 | | | 1,229,370 | | | 958,956 | | | | 270,414 | * |
| | | | | | |
JP Morgan Chase & Co.
(CMBX 4 2007-2 AAA) | | March 22, 2047 | | 0.35% Quarterly | | 34,700,000 | | | 9,289,190 | | | 8,989,509 | | | | 299,681 | * |
| | | | | | |
RBS Greenwich
(CDX HY 10) | | June 20, 2013 | | 5% Quarterly | | 10,858,000 | | | 1,237,336 | | | 1,717,931 | | | | (480,595 | ) |
| | | | | | |
RBS Greenwich
(CDX IG HVOL 10) | | June 20, 2013 | | 3.5% Quarterly | | 11,213,372 | | | 440,137 | | | (586,575 | ) | | | 1,026,712 | |
| | | | | | |
The Goldman Sachs Group, Inc.
(CDX IG 10 6/13) | | June 20, 2013 | | 1.55% Quarterly | | 39,040,000 | | | 426,836 | | | 931,511 | | | | (504,675 | ) |
| | | | | | |
The Goldman Sachs Group, Inc.
(CDX IG 11) | | December 20, 2013 | | 1.5% Quarterly | | 22,800,000 | | | 170,496 | | | 539,377 | | | | (368,881 | ) |
| | | | | | |
The Goldman Sachs Group, Inc.
(CDX IG HVOL 10) | | June 20, 2013 | | 3.5% Quarterly | | 40,310,139 | | | 1,582,217 | | | 388,737 | | | | 1,193,480 | |
137
Semi-Annual Report to Shareholders
Notes to Financial Statements—Continued
| | | | | | | | | | | | | | | | | |
| Core Plus—Continued | |
|
| Credit Default Swap on Credit Indices—Buy Protection—Continued | |
Swap Counterparty
(Reference Entity) | | Termination Date | | Periodic
Payments
Made by the Fund‡ | | Contract
Notional
Amount(3) | | Market Value(5) | | | Upfront
Premiums
Paid/(Received) | | Unrealized
Appreciation/
(Depreciation) | |
| | | | | | | | | | | | | | | | | |
The Goldman Sachs Group, Inc.
(iBoxx HY 3) | | December 20, 2009 | | 4% Quarterly | | $5,233,603 | | $ | (505 | ) | | $ | 2,580 | | $ | (3,085 | ) |
| | | | | | | | | | | | | | | | | |
| |
Net unrealized appreciation on buys of credit default swaps on credit indices | | $ | 994,928 | |
| | | | | | | | | | | | | | | | | |
| 1 | | If the Fund is a seller of protection and a credit event occurs, as defined under the terms of that particular swap agreement, the Fund will either (i) pay to the buyer of protection an amount equal to the notional amount of the swap and take delivery of the referenced obligation or underlying securities comprising the referenced index or (ii) pay a net settlement amount in the form of cash or securities equal to the notional amount of the swap less the recovery value of the referenced obligation or underlying securities comprising the referenced index. |
| 2 | | Implied credit spreads, utilized in determining the market value of credit default swap agreements on corporate issues or sovereign issues of an emerging country as of period end serve as an indicator of the current status of the payment/performance risk and represent the likelihood or risk of default for the credit derivative. The implied credit spread of a particular referenced entity reflects the cost of buying/selling protection and may include upfront payments required to be made to enter into the agreement. Wider credit spreads represent a deterioration of the referenced entity’s credit soundness and a greater likelihood or risk of default or other credit event occurring as defined under the terms of the agreement. A credit spread identified as “Defaulted” indicates a credit event has occurred for the referenced entity or obligation. |
| 3 | | The maximum potential amount the Fund could be required to make as a seller of credit protection or receive as a buyer of credit protection if a credit event occurs as defined under the terms of that particular swap agreement. |
| 4 | | If the Fund is a buyer of protection and a credit event occurs, as defined under the terms of that particular swap agreement, the Fund will either (i) receive from the seller of protection an amount equal to the notional amount of the swap and deliver the underlying securities comprising the referenced index or (ii) receive a net settlement amount in the form of cash or securities equal to the notional amount of the swap less the recovery value of the underlying securities comprising the referenced index. |
| 5 | | The quoted market prices and resulting values for credit default swap agreements on asset-backed securities and credit indices serve as an indicator of the current status of the payment/performance risk and represent the likelihood of an expected liability (or profit) for the credit derivative should the notional amount of the swap agreement been closed/sold as of the period end. Decreasing market values when compared to the notional amount of the swap, represent a deterioration of the referenced entity’s credit soundness and a greater likelihood or risk of default or other credit event occurring as defined under the terms of the agreement. |
| ‡ | | Percentage shown is an annual percentage rate. |
| * | | Security is valued in good faith at fair value by or under the direction of the Board of Directors. |
4. Derivative Instruments and Hedging Activities
Financial Accounting Standards Board (“FASB”) Statement of Financial Accounting Standards No. 161, “Disclosures about Derivative Instruments and Hedging Activities,” requires enhanced disclosure about an entity’s derivative and hedging activities.
Below are tables, grouped by derivative type that provides information about the fair value and the location of derivatives within the Statement of Assets and Liabilities’ at June 30, 2009.
Core
| | | | | | | | | | | |
| | | Asset Derivatives |
| | | Interest Rate
Contracts Risk1 | | Credit
Contracts Risk2 | | Other
Contracts Risk2 | | Total |
Futures Contracts3 | | $ | 9,569,681 | | | — | | — | | $ | 9,569,681 |
Swap Contracts | | | 3,120,184 | | $ | 48,609,738 | | — | | | 51,729,922 |
| | | | | | | | | | | |
Total | | $ | 12,689,865 | | $ | 48,609,738 | | — | | $ | 61,299,603 |
| | | | | | | | | | | |
| 1 | | Balance sheet location: Receivables, Net Assets—Unrealized appreciation (depreciation) |
| 2 | | Balance sheet location: Receivables |
| 3 | | Includes cumulative appreciation/depreciation of futures contracts as reported in the footnotes. Only current day’s variation margin is reported within the Statement of Assets and Liabilities. |
138
Semi-Annual Report to Shareholders
| | | | | | | | | | | |
| | | Liability Derivatives |
| | | Interest Rate
Contracts Risk1 | | Credit
Contracts Risk2 | | Other
Contracts Risk2 | | Total |
Written Options | | $ | 26,309,289 | | | — | | — | | $ | 26,309,289 |
Futures Contracts(3) | | | 9,535,421 | | | — | | — | | | 9,535,421 |
Swap Contracts | | | 15,464,638 | | $ | 196,639,148 | | — | | | 212,103,786 |
| | | | | | | | | | | |
Total | | $ | 51,309,348 | | $ | 196,639,148 | | — | | $ | 247,948,496 |
| | | | | | | | | | | |
| 1 | | Balance sheet location: Payables, Net Assets—Unrealized appreciation (depreciation) |
| 2 | | Balance sheet location: Payables |
| 3 | | Includes cumulative appreciation/depreciation of futures contracts as reported in the footnotes. Only current day’s variation margin is reported within the Statement of Assets and Liabilities. |
Core Plus
| | | | | | | | | | | | | | |
| | | Asset Derivatives |
| | | Interest Rate
Contracts Risk1 | | Foreign Exchange
Contracts Risk2 | | Credit
Contracts Risk2 | | Other
Contracts Risk2 | | Total |
Futures Contracts(3) | | $ | 17,581,162 | | | — | | | — | | — | | $ | 17,581,162 |
Swap Contracts | | | 1,950,567 | | | — | | $ | 48,892,711 | | — | | | 50,843,278 |
Forward Foreign Currency Contracts | | | — | | $ | 19,546,581 | | | — | | — | | | 19,546,581 |
| | | | | | | | | | | | | | |
Total | | $ | 19,531,729 | | $ | 19,546,581 | | $ | 48,892,711 | | — | | $ | 87,971,021 |
| | | | | | | | | | | | | | |
| 1 | | Balance sheet location: Receivables, Net Assets—Unrealized appreciation (depreciation) |
| 2 | | Balance sheet location: Receivables |
| 3 | | Includes cumulative appreciation/depreciation of futures contracts as reported in the footnotes. Only current day’s variation margin is reported within the Statement of Assets and Liabilities. |
| | | | | | | | | | | | | | |
| | | Liability Derivatives |
| | | Interest Rate
Contracts Risk1 | | Foreign Exchange
Contracts Risk2 | | Credit
Contracts Risk2 | | Other
Contracts Risk2 | | Total |
Written Options | | $ | 58,418,932 | | | — | | | — | | — | | $ | 58,418,932 |
Futures Contracts(3) | | | 18,749,220 | | | — | | | — | | — | | | 18,749,220 |
Swap Contracts | | | 30,805,477 | | | — | | $ | 343,437,770 | | — | | | 374,243,247 |
Forward Foreign Currency Contracts | | | — | | $ | 9,391,215 | | | — | | — | | | 9,391,215 |
| | | | | | | | | | | | | | |
Total | | $ | 107,973,629 | | $ | 9,391,215 | | $ | 343,437,770 | | — | | $ | 460,802,614 |
| | | | | | | | | | | | | | |
| 1 | | Balance sheet location: Payables, Net Assets—Unrealized appreciation (depreciation) |
| 2 | | Balance sheet location: Payables |
| 3 | | Includes cumulative appreciation/depreciation of futures contracts as reported in the footnotes. Only current day’s variation margin is reported within the Statement of Assets and Liabilities. |
139
Semi-Annual Report to Shareholders
Notes to Financial Statements—Continued
The following tables provide information about the effect of derivatives and hedging activities on the Funds’ Statement of Operations for the six months ended June 30, 2009. The first table provides additional detail about the amounts and sources of gains/(losses) realized on derivatives during the period. The second table provides additional information about the changes in unrealized appreciation/(depreciation) resulting from the Funds’ derivatives and hedging activities during the period.
Core
| | | | | | | | | | | | | | |
| | | Amount of Realized Gain or (Loss) on Derivatives Recognized | |
| | | Interest Rate
Contracts Risk | | | Credit
Contracts Risk | | | Other
Contracts Risk | | Total | |
Written Options | | $ | 28,719,410 | | | | — | | | — | | $ | 28,719,410 | |
Futures Contracts | | | (15,665,182 | ) | | | — | | | — | | | (15,665,182 | ) |
Swap Contracts | | | 27,683,681 | | | $ | (167,223,392 | ) | | — | | | (139,539,711 | ) |
| | | | | | | | | | | | | | |
Total | | $ | 40,737,909 | | | $ | (167,223,392 | ) | | — | | $ | (126,485,483 | ) |
| | | | | | | | | | | | | | |
| | | | | | | | | | | | | |
| | | Change in Unrealized Appreciation/Depreciation
on Derivatives Recognized | |
| | | Interest Rate
Contracts Risk | | | Credit
Contracts Risk | | Other
Contracts Risk | | Total | |
Written Options | | $ | 2,531,059 | | | | — | | — | | $ | 2,531,059 | |
Futures Contracts | | | (56,941,178 | ) | | | — | | — | | | (56,941,178 | ) |
Swap Contracts | | | 47,314,170 | | | $ | 123,943,027 | | — | | | 171,257,197 | |
| | | | | | | | | | | | | |
Total | | $ | (7,095,949 | ) | | $ | 123,943,027 | | — | | $ | 116,847,078 | |
| | | | | | | | | | | | | |
Core Plus
| | | | | | | | | | | | | | | | | |
| | | Amount of Realized Gain or (Loss) on Derivatives Recognized | |
| | | Interest Rate
Contracts Risk | | | Foreign Exchange
Contracts Risk | | Credit
Contracts Risk | | | Other
Contracts Risk | | Total | |
Written Options | | $ | 62,471,396 | | | | — | | | — | | | — | | $ | 62,471,396 | |
Futures Contracts | | | (10,786,771 | ) | | | — | | | — | | | — | | | (10,786,771 | ) |
Swap Contracts | | | 22,838,865 | | | | — | | $ | (356,112,458 | ) | | — | | | (333,273,593 | ) |
Forward Foreign Currency Contracts | | | — | | | $ | 4,764,787 | | | — | | | — | | | 4,764,787 | |
| | | | | | | | | | | | | | | | | |
Total | | $ | 74,523,490 | | | $ | 4,764,787 | | $ | (356,112,458 | ) | | — | | $ | (276,824,181 | ) |
| | | | | | | | | | | | | | | | | |
| | | | | | | | | | | | | | | | |
| | | Change in Unrealized Appreciation/Depreciation on Derivatives Recognized | |
| | | Interest Rate
Contracts Risk | | | Foreign Exchange
Contracts Risk | | Credit
Contracts Risk | | Other
Contracts Risk | | Total | |
Written Options | | $ | 2,829,205 | | | | — | | | — | | — | | $ | 2,829,205 | |
Futures Contracts | | | (173,209,738 | ) | | | — | | | — | | — | | | (173,209,738 | ) |
Swap Contracts | | | 153,289,414 | | | | — | | $ | 431,313,414 | | — | | | 584,602,828 | |
Forward Foreign Currency Contracts | | | — | | | $ | 5,969,523 | | | — | | — | | | 5,969,523 | |
| | | | | | | | | | | | | | | | |
Total | | $ | (17,091,119 | ) | | $ | 5,969,523 | | $ | 431,313,414 | | — | | $ | 420,191,818 | |
| | | | | | | | | | | | | | | | |
5. Transactions With Affiliates:
Each Fund has an investment management agreement with Legg Mason Fund Adviser, Inc. (“LMFA”). Western Asset Management Company (“Western Asset”) is the investment adviser to Core and Core Plus. Western Asset Management Company Limited (“WAML”), Western Asset Management Company Pte. Ltd. (“Western Singapore”) and Western Asset Management Company Ltd (“Western Japan”) shares investment advisory responsibilities with Western Asset for Core Plus.
Pursuant to their respective agreements, LMFA provides the Funds with management and administrative services for which each Fund pays a fee, computed daily and payable monthly, at annual rates of each Fund’s average daily net assets. From
140
Semi-Annual Report to Shareholders
August 1, 2008 through April 30, 2010, the Manager is contractually obligated to follow the Fee Cap for the Institutional Select and Financial Intermediary Classes of each Fund. The Fee Cap ceased to apply to the Institutional Class of each Fund beginning August 1, 2008. From August 1, 2008 through April 30, 2010, the Manager is contractually obligated to waive its compensation (and, to the extent necessary, bear other expenses of the Portfolio) with respect to the Institutional Class of certain Funds in amounts equal to specified annual rates of each such Fund’s average daily net assets attributable to such share class (“Flat Waiver”). Western Asset and WAML also agreed to waive their advisory fees (which are paid by LMFA, and not the Funds) in corresponding amounts under both the Fee Cap and the Flat Waiver.
Any amounts waived or reimbursed in a particular fiscal year under the Fee Cap will be subject to repayment by a Fund on behalf of the applicable class to LMFA to the extent that from time to time during the next three fiscal years the repayment will not cause a Fund’s expenses for such class to exceed a limit agreed between the Fund and LMFA. The following chart shows annual rates of management fees, expense limits or waivers (as applicable), management fees waived and potential fees which may be recaptured for the Funds’ share classes.
| | | | | | | | | | | | | | | |
Fund | | Asset Breakpoint for
Management Fee | | Management
Fee | | | Expense
Limitation
8/1/08-4/30/10 | | | Waiver | | Management
Fees (Waived/
Recaptured) | | Maximum
Amount
Subject to
Recapture |
Core | | | | | | | | | | | | | | | |
Institutional Class | | Up to $500 million Next $500 million In excess of $1 billion | | 0.450
0.425 0.400 | %
% % | | —
|
| | —
| | —
| |
| —
|
Institutional Select Class | | Up to $500 million Next $500 million In excess of $1 billion | | 0.450
0.425 0.400 | %
% % | | 0.50 | % | | — | | — | | | — |
Financial Intermediary Class | | Up to $500 million Next $500 million In excess of $1 billion | | 0.450
0.425 0.400 | %
% % | | 0.75 | % | | — | | — | | $ | 388,510 |
| | | | | | |
Core Plus | | | | | | | | | | | | | | | |
Institutional Class | | Up to $500 million Next $500 million In excess of $1 billion | | 0.450
0.425 0.400 | %
% % | | —
|
| | —
| | —
| |
| —
|
Institutional Select Class | | Up to $500 million Next $500 million In excess of $1 billion | | 0.450
0.425 0.400 | %
% % | | 0.45 | % | | — | | — | | | — |
Financial Intermediary Class | | Up to $500 million Next $500 million In excess of $1 billion | | 0.450
0.425 0.400 | %
% % | | 0.70 | % | | — | | — | | $ | 818,469 |
Legg Mason Investor Services, LLC (“LMIS”) serves as distributor of the Funds’ shares. LMIS receives from each Fund an annual distribution fee of 0.25% of the average daily net assets of the Financial Intermediary Class of each Fund, computed daily and payable monthly.
The Board has approved the substitution of Legg Mason Partners Funds Advisor, LLC (“LMPFA”) for LMFA. Effective upon the substitution, LMPFA will assume the rights and responsibilities of LMFA under its investment management agreement with the Fund, including all of the responsibilities to the Fund described in the Fund’s prospectus. This substitution is expected to occur in the third quarter of 2009.
LMFA, LMPFA, Western Asset, WAML, Western Singapore, Western Japan and LMIS are wholly owned subsidiaries of Legg Mason, Inc.
141
Semi-Annual Report to Shareholders
Notes to Financial Statements—Continued
7. Fund Share Transactions:
At June 30, 2009, there were 21.05 billion shares of common stock of the Corporation authorized at $.001 par value. Transactions in the Funds’ shares were as follows:
| | | | | | | | | | | | | | | | | | | | | |
| | | Six Months Ended
June 30, 2009 | | | Year Ended
December 31, 2008A | | | Year Ended
March 31, 2008 | |
| | | Shares | | | Amount | | | Shares | | | Amount | | | Shares | | | Amount | |
Core | | | | | | | | | | | | | | | | | | | | | |
Institutional Class | | | | | | | | | | | | | | | | | | | | | |
Shares sold | | 28,003,015 | | | $ | 245,232,854 | | | 45,809,011 | | | $ | 462,764,704 | | | 145,194,635 | | | $ | 1,603,386,410 | |
Shares issued on reinvestment | | 6,026,843 | | | | 53,905,311 | | | 19,465,391 | | | | 189,411,274 | | | 24,570,553 | | | | 270,401,252 | |
Shares repurchased | | (105,815,963 | ) | | | (931,379,789 | ) | | (271,357,244 | ) | | | (2,560,566,907 | ) | | (119,670,207 | ) | | | (1,306,567,803 | ) |
| | | | | | | | | | | | | | | | | | | | | |
Net Increase (Decrease) | | (71,786,105 | ) | | $ | (632,241,624 | ) | | (206,082,842 | ) | | $ | (1,908,390,929 | ) | | 50,094,981 | | | $ | 567,219,859 | |
| | | | | | | | | | | | | | | | | | | | | |
Institutional Select ClassB | | | | | | | | | | | | | | | | | | | | | |
Shares sold | | 1,906,144 | | | $ | 17,009,649 | | | 26,523,024 | | | $ | 231,066,783 | | | — | | | | — | |
Shares issued on reinvestment | | 644,232 | | | | 5,799,168 | | | 506,958 | | | | 4,593,497 | | | — | | | | — | |
Shares repurchased | | (5,955,501 | ) | | | (55,221,751 | ) | | (546,226 | ) | | | (4,786,801 | ) | | — | | | | — | |
| | | | | | | | | | | | | | | | | | | | | |
Net Increase (Decrease) | | (3,405,125 | ) | | $ | (32,412,934 | ) | | 26,483,756 | | | $ | 230,873,479 | | | — | | | | — | |
| | | | | | | | | | | | | | | | | | | | | |
Financial Intermediary Class | | | | | | | | | | | | | | | | | | | | | |
Shares sold | | 13,538,146 | | | $ | 120,501,399 | | | 32,207,905 | | | $ | 319,217,126 | | | 61,374,893 | | | $ | 675,386,074 | |
Shares issued on reinvestment | | 2,901,090 | | | | 26,015,102 | | | 7,514,997 | | | | 72,497,732 | | | 7,607,185 | | | | 83,678,848 | |
Shares repurchased | | (30,774,054 | ) | | | (271,216,391 | ) | | (65,446,508 | ) | | | (633,361,948 | ) | | (37,942,574 | ) | | | (415,583,975 | ) |
| | | | | | | | | | | | | | | | | | | | | |
Net Increase (Decrease) | | (14,334,818 | ) | | $ | (124,699,890 | ) | | (25,723,606 | ) | | $ | (241,647,090 | ) | | 31,039,504 | | | $ | 343,480,947 | |
| | | | | | | | | | | | | | | | | | | | | |
| | | | | | |
Core Plus | | | | | | | | | | | | | | | | | | | | | |
Institutional Class | | | | | | | | | | | | | | | | | | | | | |
Shares sold | | 34,056,951 | | | $ | 297,226,889 | | | 147,333,326 | | | $ | 1,395,839,016 | | | 431,074,565 | | | $ | 4,418,392,877 | |
Shares issued on reinvestment | | 24,716,124 | | | | 218,812,800 | | | 46,231,902 | | | | 426,186,161 | | | 60,102,475 | | | | 614,857,736 | |
Shares repurchased | | (216,922,646 | ) | | | (1,871,036,953 | ) | | (741,151,845 | ) | | | (6,662,401,360 | ) | | (269,816,777 | ) | | | (2,748,602,623 | ) |
| | | | | | | | | | | | | | | | | | | | | |
Net Increase (Decrease) | | (158,149,571 | ) | | $ | (1,354,997,264 | ) | | (547,586,617 | ) | | $ | (4,840,376,183 | ) | | 221,360,263 | | | $ | 2,284,647,990 | |
| | | | | | | | | | | | | | | | | | | | | |
Institutional Select ClassC | | | | | | | | | | | | | | | | | | | | | |
Shares sold | | 23,762,747 | | | $ | 207,338,256 | | | 206,086,935 | | | $ | 1,850,661,361 | | | — | | | | — | |
Shares issued on reinvestment | | 6,400,056 | | | | 56,737,633 | | | 3,637,450 | | | | 31,448,482 | | | — | | | | — | |
Shares repurchased | | (45,749,190 | ) | | | (398,401,486 | ) | | (29,527,138 | ) | | | (256,518,602 | ) | | — | | | | — | |
| | | | | | | | | | | | | | | | | | | | | |
Net Increase (Decrease) | | (15,586,387 | ) | | $ | (134,325,597 | ) | | 180,197,247 | | | $ | 1,625,591,241 | | | — | | | | — | |
| | | | | | | | | | | | | | | | | | | | | |
Financial Intermediary Class | | | | | | | | | | | | | | | | | | | | | |
Shares sold | | 11,868,230 | | | $ | 103,521,935 | | | 57,558,798 | | | $ | 523,353,929 | | | 92,870,337 | | | $ | 950,307,000 | |
Shares issued on reinvestment | | 2,819,959 | | | | 24,936,147 | | | 5,007,719 | | | | 46,006,164 | | | 5,521,041 | | | | 56,470,452 | |
Shares repurchased | | (45,158,851 | ) | | | (379,929,316 | ) | | (88,631,269 | ) | | | (811,527,610 | ) | | (48,005,422 | ) | | | (489,249,437 | ) |
| | | | | | | | | | | | | | | | | | | | | |
Net Increase (Decrease) | | (30,470,662 | ) | | $ | (251,471,234 | ) | | (26,064,752 | ) | | $ | (242,167,517 | ) | | 50,385,956 | | | $ | 517,528,015 | |
| | | | | | | | | | | | | | | | | | | | | |
| A | | For the period April 1, 2008 to December 31, 2008. |
| B | | Institutional Select Class commenced operations August 29, 2008. |
| C | | Institutional Select Class commenced operations August 4, 2008. |
142
Semi-Annual Report to Shareholders
Privacy Policy
The Funds are committed to keeping nonpublic personal information secure and confidential. This notice is intended to help a shareholder understand how the Funds fulfill this commitment.
From time to time, the Funds, through their service providers, may collect a variety of personal information, including:
| | • | | Information received on applications and forms, via the telephone, and through websites; |
| | • | | Information about transactions with the Funds, affiliates, or others (such as purchases, sales, or account balances); and |
| | • | | Information about shareholders received from consumer reporting agencies. |
The Funds do not disclose shareholder nonpublic personal information, except as permitted by applicable law or regulation. For example, the Funds may share this information with others in order to process transactions. Any information provided to companies that perform services on behalf of the Funds, such as printing and mailing or to other financial institutions with which the Funds have joint marketing agreements are required to protect the confidentiality of shareholders, information and to use it only to perform the services for which the companies are hired.
The Funds, through their service providers, maintain physical, electronic, and procedural safeguards to protect shareholder nonpublic personal information. Access to this information is restricted.
If a shareholder decides at some point either to close his/her account(s) or become an inactive customer, the Funds will continue to adhere to these privacy policies and practices with respect to shareholder nonpublic personal information.
This notice is being provided on behalf of:
Western Asset Funds, Inc.
Western Asset Funds, Inc.
The Board of Directors
William E. B. Siart, Chairman
Ronald J. Arnault
Anita L. DeFrantz
R. Jay Gerken
Ronald L. Olson
Avedick B. Poladian
Jaynie Miller Studenmund
Officers
R. Jay Gerken, President
Gavin L. James, Vice President
S. Kenneth Leech, Vice President
Stephen A. Walsh, Vice President
Frances M. Guggino, Principal Financial and Accounting Officer
Erin K. Morris, Treasurer
Todd F. Kuehl, Chief Compliance Officer
Robert I. Frenkel, Secretary and Chief Legal Officer
Investment Manager
Legg Mason Fund Adviser, Inc.
P.O. Box 17635
Baltimore, Maryland 21297-1635
Investment Advisers
Western Asset Management Company
385 East Colorado Boulevard
Pasadena, California 91101
Investment Advisers
Western Asset Management Company Limited
10 Exchange Square
London, England EC2A2EN
Western Asset Management Company Ltd
36F Shin-Marunouchi Building
5-1 Marunouchi 1-Chronu Chiyoda
Tokyo 100-6536
Western Asset Management Company Pte. Ltd.
1 George Street #23-01
Singapore 049145
Transfer and Shareholder Servicing Agent
Boston Financial Data Services
66 Brooks Drive
Braintree, Massachusetts 02184
Custodian
State Street Bank and Trust Company
1 Lincoln Street
Boston, Massachusetts 02111
Counsel
Ropes & Gray LLP
1211 Avenue of the Americas
New York, New York 10036
Independent Registered Public Accounting Firm
PricewaterhouseCoopers LLP
100 East Pratt Street
Baltimore, Maryland 21201
Information about the policies and procedures that each Fund uses to determine how to vote proxies relating to each Fund’s portfolio securities is contained in the Statement of Additional Information, available upon request without charge by calling 1-888-425-6432 or on the Securities and Exchange Commission’s (“SEC”) website (http://www.sec.gov). Information regarding how the Funds voted proxies relating to portfolio securities during the most recent twelve-month period ended June 30 is also available on the SEC’s website or without charge through www.westernassetfunds.com.
Each Fund files a complete schedule of portfolio holdings with the SEC for the first and third quarters of each fiscal year on Form N-Q. Each Fund’s Form N-Q is available on the Securities and Exchange Commission’s (“SEC”) website (http://www.sec.gov) and may be viewed and copied at the SEC’s Public Reference Room in Washington, D.C. Information about the operation of the Public Reference Room may be obtained by calling 1-800-SEC-0330. Quarterly portfolio holdings are also available upon request by calling 1-888-425-6432 or at www.lminstitutionalfunds.com/fund_information/fund_literature/gbl_literature/proxy_report.asp.
This report must be preceded or accompanied by a free prospectus. Investors should consider the Fund’s investment objectives, risks, charges and expenses carefully before investing. The prospectus contains this and other important information about the Fund. Please read the prospectus carefully before investing.
Western Asset Management Company
Legg Mason Investor Services, LLC, Distributor
Legg Mason, Inc. Subsidiaries
| | |
| WAF-A-(8/09) SR09-893 | | WASX011414 |
Not applicable for semiannual reports.
| Item 3. | Audit Committee Financial Expert. |
Not applicable for semiannual reports.
| Item 4. | Principal Accountant Fees and Services. |
Not applicable for semiannual reports.
| Item 5. | Audit Committee of Listed Registrants. |
Not applicable for semiannual reports.
| Item 6. | Schedule of Investments |
The schedule of investments in securities of unaffiliated issuers as of the close of the reporting period is included as part of the report to shareholders filed under Item 1 of this Form.
| Item 7. | Disclosure of Proxy Voting Policies and Procedures for Closed-End Management Investment Companies. |
Not applicable for reports.
| Item 8. | Portfolio Managers of Closed-End Management Investment Companies. |
Not applicable for reports.
| Item 9. | Purchases of Equity Securities by Closed-End Management Investment Companies and Affiliated Purchasers. |
Not applicable.
| Item 10. | Submission of Matters to a Vote of Security Holders. |
There have been no material changes to the procedures by which shareholders may recommend nominees to the Registrant’s Board of Directors that have been implemented since the Registrant last provided disclosure in response to the requirements of this Item 10.
| Item 11. | Controls and Procedures. |
(a) The Registrant’s principal executive and principal financial officers have concluded, based on their evaluation of the Registrant’s disclosure controls and procedures as of a date within 90 days of the filing date of this report, that the Registrant’s disclosure controls and procedures are reasonably designed to ensure that information required to be disclosed by the Registrant on Form N-CSR is recorded, processed, summarized and reported within the required time periods in the SEC’s rules and forms and that
information required to be disclosed by the Registrant in the reports that it files or submits on Form N-CSR is accumulated and communicated to the Registrant’s management, including its principal executive and principal financial officers, as appropriate to allow timely decisions regarding required disclosure.
(b) There were no changes in the Registrant’s internal control over financial reporting during the Registrant’s second fiscal quarter of the period covered by this report that have materially affected, or are reasonably likely to materially affect, the Registrant’s internal control over financial reporting.
(a) (1) Not applicable for semi-annual reports.
(a) (2) Certifications pursuant to Rule 30a-2(a) under the Investment Company Act of 1940 – filed as an exhibit hereto.
(a) (3) Not applicable.
(b) Certifications pursuant to Rule 30a-2(b) under the Investment Company Act of 1940 – filed as an exhibit hereto.
SIGNATURES
Pursuant to the requirements of the Securities Exchange Act of 1934 and the Investment Company Act of 1940, the Registrant has duly caused this report to be signed on its behalf by the undersigned, thereunto duly authorized.
| | |
| Western Asset Funds, Inc. |
| |
| By: | | /s/ R. Jay Gerken |
| | R. Jay Gerken |
| | President |
| | Western Asset Funds, Inc. |
|
| Date: September 2, 2009 |
Pursuant to the requirements of the Securities Exchange Act of 1934 and the Investment Company Act of 1940, this report has been signed below by the following persons on behalf of the Registrant and in the capacities and on the dates indicated.
| | |
| By: | | /s/ R. Jay Gerken |
| | R. Jay Gerken |
| | President |
| | Western Asset Funds, Inc. |
|
| Date: September 2, 2009 |
| |
| By: | | /s/ Frances M. Guggino |
| | Frances M. Guggino |
| | Principal Financial and Accounting Officer |
| | Western Asset Funds, Inc. |
|
| Date: September 2, 2009 |