UNITED STATES
SECURITIES AND EXCHANGE COMMISSION
Washington, D.C. 20549
FORM N-CSR
CERTIFIED SHAREHOLDER REPORT OF REGISTERED
MANAGEMENT INVESTMENT COMPANIES
Investment Company Act file number: 811-06110
Name of Fund: Western Asset Funds, Inc.
Address of Principal Executive Offices:
385 East Colorado Boulevard
Pasadena, CA 91101
Name and address of agent for service:
Richard M. Wachterman, Esq.
Legg Mason Wood Walker, Incorporated
100 Light Street
Baltimore, MD 21202
Registrant’s telephone number, including area code: (410) 539-0000
Date of fiscal year end: March 31, 2006
Date of reporting period: September 30, 2005
Item 1– Report to Shareholders

Investment Commentary
and Semi-Annual Report to
Shareholders
September 30, 2005
Western Asset Funds, Inc.
Institutional and Financial Intermediary Classes
Western Asset Limited Duration Bond Portfolio
Western Asset Intermediate Bond Portfolio
Western Asset Intermediate Plus Bond Portfolio
Western Asset Core Bond Portfolio
Western Asset Core Plus Bond Portfolio
Western Asset Inflation Indexed Plus Bond Portfolio
Western Asset High Yield Portfolio
Western Asset Non-U.S. Opportunity Bond Portfolio
Contents
For more information, visit us on the web
at www.westernassetfunds.com.
Investment Commentary
Market Commentary, April 2005-September 2005
Led by four 25 basis pointA hikes in the Fed funds rate, short-term interest rates rose substantially higher during the period, while longer-maturity bond yields fell, resulting in a significant, and quite unusual, flattening of the yield curve. The economy remained healthy, as suggested by a 14% surge in federal tax receipts, 2.5% growth in real personal incomes, ongoing double-digit growth in capital spending, and a record-setting level of corporate profits relative to GDP. The dollar rose against most currencies, as higher short-term interest rates bolstered the market’s confidence in the Fed’s ability to keep inflation contained, while the faltering European and Japanese economies weakened demand for their currencies and allowed interest rates to fall. Commodity prices were mixed, but crude oil surged from $55 to as high as $70 per barrel and prices in the energy sector in general moved significantly higher. Credit markets were surprised by news that GM and Ford debt was downgraded to junk, and the ripple effects were felt throughout the investment grade, high yield and emerging markets sectors as spreads generally widened, particularly on lower-quality and longer-maturity issues. Wider spreads finally lured buyers from out of the woodwork, however, with the result that spreads tightened toward the end of the period. Mortgage-backed spreads widened marginally, as the pace of refinancings increased and rising short-term interest rates raised the specter of extension risk. Treasury Inflation-Protected Securities (“TIPS”) outperformed Treasuries, as actual inflation proved higher than what the market had assumed at the beginning of the period.
Performance Information
The performance data quoted represents past performance and does not guarantee future results. Current performance may be lower or higher than the performance data quoted. To obtain the most recent month-end performance information, please visit www.westernassetfunds.com. The investment return and principal value of the fund will fluctuate so that an investor’s shares, when redeemed, may be worth more or less than the original cost. Calculations assume reinvestment of dividends and capital gains distributions. Performance would have been lower if fees had not been waived in various periods.
Western Asset Limited Duration Bond Portfolio
| | | | | | |
| | | | | Average Annual
Total Return
|
| | | Third
Quarter 2005 | | One
Year | | Since
InceptionB |
Western Asset Limited Duration Bond Portfolio | | | | | | |
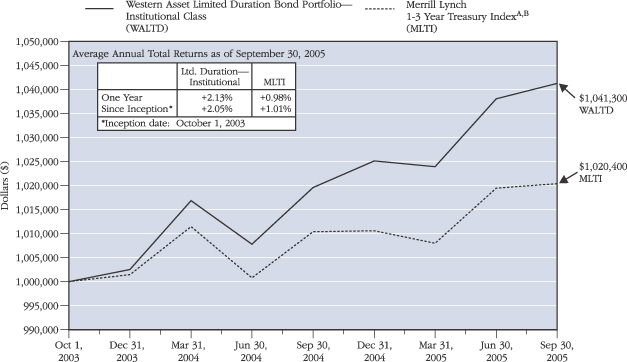
Institutional Class | | 0.32% | | 2.13% | | 2.05% |
Merril Lynch 1-3 Year Treasury IndexC | | 0.09% | | 0.98% | | 1.01% |
The impact of market conditions on the Fund’s performance was mixed for the 6-month period ended September 30, 2005, since short-term interest rates and lower quality credit spreads rose. With strategies producing mixed but generally positive results, however, the Portfolio’s total return of 1.70% (net of expenses) exceeded that of its benchmark, the Merrill Lynch 1-3 year Treasury Index, which recorded a total return of 1.23%. Mortgage-backed sector exposure was underweight for the first part of the period, and this benefited from a gradual widening of spreads. Overweight exposure to TIPS made a positive contribution to returns since inflation came in somewhat higher than expectations. A modest barbelled exposure to maturities contributed to performance since the curve continued to flatten, and our tactical duration shifts within a neutral to underweight range benefited as rates moved irregularly higher. An overweighting to intermediate BBB corporate securities detracted somewhat from performance, since spreads rose.
| B | The Fund’s Institutional Class inception date is October 1, 2003. Index returns are for periods beginning September 30, 2003. |
| C | A subset of the Merrill Lynch Treasury Master Index, consisting of bonds with an outstanding par that is greater than or equal to $25 million and fixed rate coupons greater than 4.25%. The maturity range on these securities is from 1 to 3 years. The index does not incur fees and expenses and cannot be purchased directly by investors. |
The Investment Commentary is not a part of the Semi-Annual Report to Shareholders.
ii
Investment Commentary
Western Asset Intermediate Bond Portfolio
| | | | | | | | |
| | | | | Average Annual Total
Returns
|
| | | Third
Quarter 2005 | | One
Year | | Five
Years | | Ten
Years |
Western Asset Intermediate Bond Portfolio | | | | | | | | |
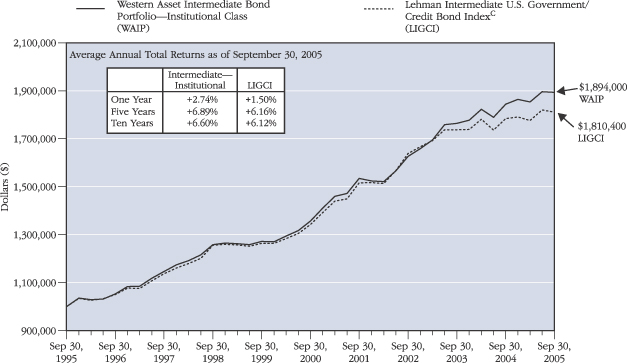
Institutional Class | | -0.12% | | 2.74% | | 6.89% | | 6.60% |
Lehman Intermediate U.S. Government/Credit Bond IndexD | | -0.52% | | 1.50% | | 6.16% | | 6.12% |
The impact of market conditions on the Fund’s performance was mixed for the 6-month period ended September 30, 2005, since short-term interest rates and lower quality credit spreads rose. With strategies producing mixed but generally positive results, however, the Portfolio’s total return of 2.19% (net of expenses) exceeded that of its benchmark, the Lehman Intermediate U.S. Government/Credit Bond Index, which recorded a total return of 1.95%. Mortgage-backed sector exposure was underweight for the first part of the period, and this benefited from a gradual widening of spreads. Overweight exposure to TIPS made a positive contribution to returns since inflation came in somewhat higher than expectations. A modest barbelled exposure to maturities contributed to performance since the curve continued to flatten, and our tactical duration shifts within a neutral to underweight range benefited as rates moved irregularly higher. An overweighting to intermediate BBB corporate securities detracted somewhat from performance, since spreads rose.
Western Asset Intermediate Plus Bond Portfolio
| | | | | | |
| | | | | Average Annual
Total Return
|
| | | Third
Quarter 2005 | | One
Year | | Since
InceptionE |
Western Asset Intermediate Plus Bond Portfolio | | | | | | |
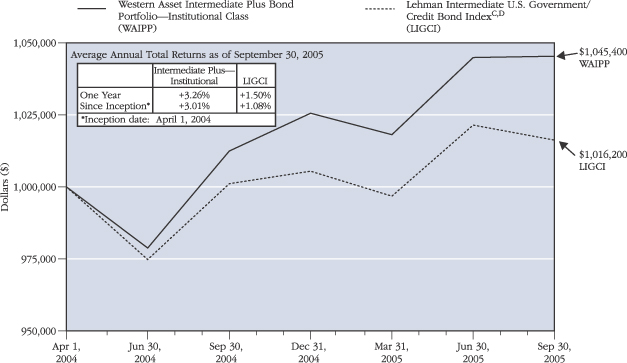
Institutional Class | | 0.05% | | 3.26% | | 3.01% |
Lehman Intermediate U.S. Government/Credit Bond IndexD | | -0.52% | | 1.50% | | 1.08% |
The impact of market conditions on the Fund’s performance was mixed for the 6-month period ended September 30, 2005, since short-term interest rates and lower quality credit spreads rose. With strategies producing mixed but generally positive results, however, the Portfolio’s total return of 2.69% (net of expenses) exceeded that of its benchmark, the Lehman Intermediate U.S. Government/Credit Bond Index, which recorded a total return of 1.95%. Mortgage-backed sector exposure was underweight for the first part of the period, and this benefited from a gradual widening of spreads. Overweight exposure to TIPS made a positive contribution to returns since inflation came in somewhat higher than expectations. A modest barbelled exposure to maturities contributed to performance since the curve continued to flatten, and our tactical duration shifts within a neutral to underweight range benefited as rates moved irregularly higher. An overweighting to intermediate BBB corporate securities detracted somewhat from performance, since spreads rose. Modest nondollar bond exposure added to returns since foreign yields fell. Modest exposure to high-yield and emerging-market debt also added to returns as spreads tightened.
| D | A market value-weighted index that tracks the daily price, coupon and total return performance of fixed-rate, publicly placed, dollar-denominated obligations. Issuers include the U.S. Treasury, U.S. Government agencies, quasi-federal corporations and corporations whose debt is guaranteed by the U.S. Government and has at least $100 million par amount outstanding and at least one year to maturity. The index does not incur fees and expenses and cannot be purchased directly by investors. |
| E | The Fund’s Institutional Class inception date is April 1, 2004. Index returns are for periods beginning March 31, 2004. |
The Investment Commentary is not a part of the Semi-Annual Report to Shareholders.
iii
Investment Commentary
Western Asset Core Bond Portfolio
| | | | | | | | | | |
| | | | | Average Annual Total Returns
|
| | | Third Quarter 2005 | | One
Year | | Five
Years | | Ten
Years | | SinceF
Inception |
Western Asset Core Bond Portfolio | | | | | | | | | | |
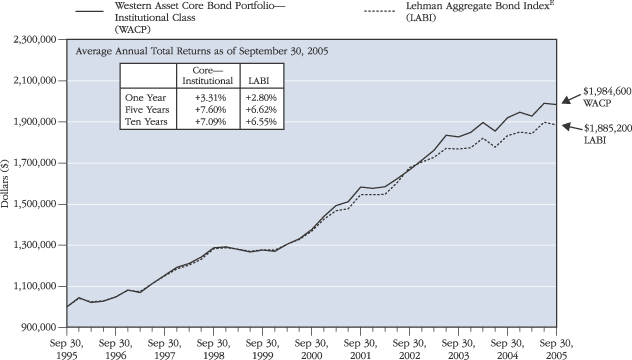
Institutional Class | | -0.34% | | 3.31% | | 7.60% | | 7.09% | | 8.39% |
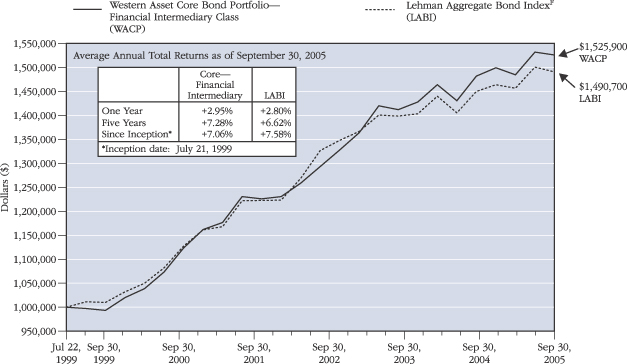
Financial Intermediary Class | | -0.40% | | 2.95% | | 7.28% | | N/A | | 7.06% |
Lehman Aggregate Bond IndexG | | -0.67% | | 2.80% | | 6.62% | | 6.55% | | 7.58% |
The impact of market conditions on the Fund’s performance was mixed for the 6-month period ended September 30, 2005, since short-term interest rates and lower quality credit spreads rose. With strategies producing mixed but generally positive results, the Portfolio’s Institutional Class total return of 2.90% (net of expenses) exceeded that of its benchmark, the Lehman Aggregate Bond Index, which recorded a total return of 2.31%. Mortgage-backed sector exposure was underweight for the first part of the period, and this benefited from a gradual widening of spreads. Overweight exposure to TIPS made a positive contribution to returns since inflation came in somewhat higher than expectations. A modest barbelled exposure to maturities contributed to performance since the curve continued to flatten, and our tactical duration shifts within a neutral to underweight range benefited as rates moved irregularly higher. An overweighting to intermediate BBB corporate securities detracted somewhat from performance, since spreads rose.
Western Asset Core Plus Bond Portfolio
| | | | | | | | | | |
| | | | | Average Annual Total Returns
|
| | | Third
Quarter 2005 | | One
Year | | Three
Years | | Five
Years | | SinceH
Inception |
Western Asset Core Plus Bond Portfolio | | | | | | | | | | |
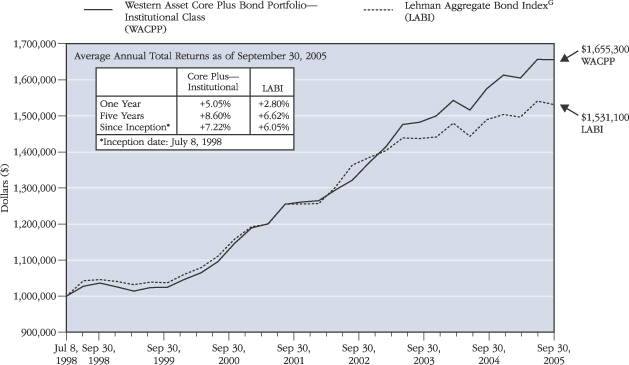
Institutional Class | | -0.08% | | 5.05% | | 7.81% | | 8.60% | | 7.22% |
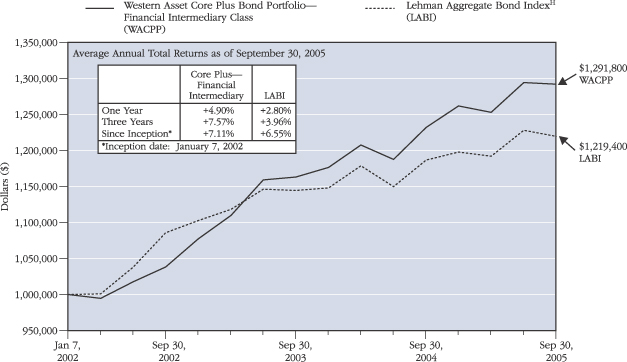
Financial Intermediary Class | | -0.14% | | 4.90% | | 7.57% | | N/A | | 7.11% |
Lehman Aggregate Bond IndexG | | -0.67% | | 2.80% | | 3.96% | | 6.62% | | 6.05% |
The impact of market conditions on the Fund’s performance was mixed for the 6-month period ended September 30, 2005, since short-term interest rates and lower quality credit spreads rose. With strategies producing generally positive results, the Portfolio’s Institutional Class total return of 3.16% (net of expenses) exceeded that of its benchmark, the Lehman Aggregate Bond Index, which recorded a total return of 2.31%. Mortgage-backed sector exposure was underweight for the first part of the period, and this benefited from a gradual widening of spreads. Overweight exposure to TIPS made a positive contribution to returns since inflation came in somewhat higher than expectations. A modest barbelled exposure to maturities contributed to performance since the curve continued to flatten, and our tactical duration shifts within a neutral to underweight range benefited as rates moved irregularly higher. Moderate nondollar exposure benefited as foreign bonds outperformed their domestic counterparts. Moderate exposure to high-yield and emerging market debt benefited from tighter spreads. An overweighting to intermediate BBB corporate securities detracted somewhat from performance, since spreads rose.
| F | The Fund’s Institutional Class inception date is September 4, 1990. The Financial Intermediary Class inception date is July 22, 1999. Index returns are for periods beginning August 31, 1990, for the Institutional Class. |
| G | A market value-weighted index that tracks the daily price, coupon, pay-downs, and total return performance of fixed-rate, publicly placed, dollar-denominated, and nonconvertible investment grade debt issues with at least $100 million par amount outstanding and with at least one year to final maturity. The index does not incur fees and expenses and cannot be purchased directly by investors. |
| H | The Fund’s Institutional Class inception date is July 8, 1998. The Financial Intermediary Class inception date is January 8, 2002. Index returns are for periods beginning June 30, 1998, for the Institutional Class. |
The Investment Commentary is not a part of the Semi-Annual Report to Shareholders.
iv
Portfolio Manager Commentary
Western Asset Inflation Indexed Bond Portfolio
| | | | | | | | |
| | | | | Average Annual Total Returns
|
| | | Third
Quarter 2005 | | One
Year | | Three
Years | | SinceI
Inception |
Western Asset Inflation Indexed Plus Bond Portfolio | | | | | | | | |
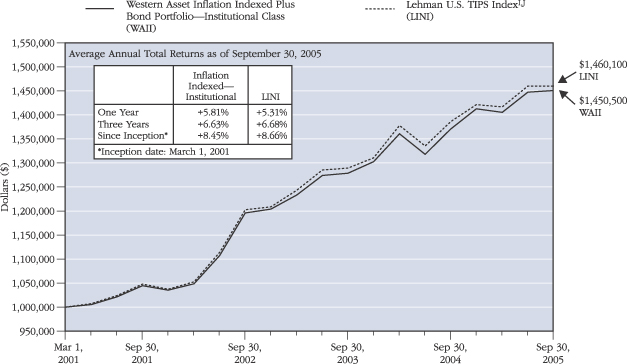
Institutional Class | | 0.23% | | 5.81% | | 6.63% | | 8.45% |
Lehman U.S. Treasury Inflation Notes IndexJ | | 0.08% | | 5.31% | | 6.68% | | 8.66% |
Rising real yields were negative for the Fund’s performance (nominal performance). In a sense it was an unfriendly environment. But on a relative basis our strategies added value and we beat the benchmark. With strategies producing mixed but generally positive results, the Fund’s total return of 3.20% (net of expenses) exceeded that of its benchmark, the Lehman U.S. Treasury Inflation Notes Index, which recorded a total return of 3.07%. Underweight duration exposure contributed to performance as yields rose, and our expectation that the yield curve would flatten was rewarded as short- and intermediate-term yields rose more than longer-term yields. Modest exposure to nondollar inflation-linked bonds added to returns since foreign real yields rose by less than their domestic counterparts. Modest exposure to lower-quality corporate bonds and emerging-market debt also added to returns thanks to their higher yields and a tightening of spreads.
Western Asset High Yield Bond Portfolio
| | | | | | | | |
| | | | | Average Annual Total Returns
|
| | | Third
Quarter 2005 | | One
Year | | Three
Years | | SinceK
Inception |
Western Asset High Yield Bond Portfolio | | | | | | | | |
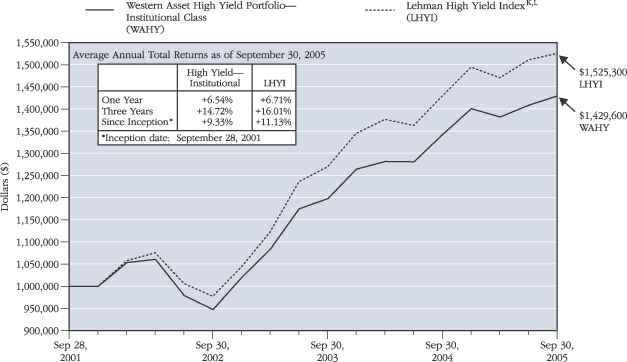
Institutional Class | | 1.51% | | 6.54% | | 14.72% | | 9.33% |
Lehman High Yield IndexL | | 0.93% | | 6.71% | | 16.01% | | 11.13% |
For the six-month period ending September 30, 2005, the Fund returned 3.46%, (net of expenses) versus 3.61% for the 2% Issuer Constrained Lehman High Yield Index. The primary reason for the underperformance was due to the Fund’s overweighted position to lower rated issues. BB rated issues returned 4.28% for the period versus CCC’s which returned 2.77%. Additionally, our somewhat shorter duration position detracted from performance as longer duration securities experienced markedly better performance. During the period, short-term interest rates rose while long-term interest rates dropped. Industry positioning had little impact on relative performance. The Fund’s underweight to Basic Industry and overweight to Energy credits aided performance. Overweights to Capital Goods and underweight to Media Non-Cable hurt relative performance. Issue selection added to performance. The Fund was overweight a number of top performers, including GM (+4.87%), El Paso (+6.62%), and Charter (+6.94%) and underweight poor performers including Calpine (-7.38%). Fundamentals and technicals remain, on balance, favorable. However, historically tight valuations as well as increasing LBO risks and other shareholder friendly activities necessitate a more cautious approach to the market going forward.
| I | The Fund’s Institutional Class inception date is March 1, 2001. Index returns are for periods beginning February 28, 2001. |
| J | An unmanaged index that measures the performance of intermediate (1 to 10 year) U.S. Treasury inflation-protected securities. The index does not incur fees and expenses and cannot be purchased directly by investors. |
| K | The Fund’s Institutional Class inception date is September 28, 2001. Index returns are for periods beginning September 30, 2001. |
| L | A market value-weighted index that tracks the daily price-only, coupon, and total return performance of non-investment grade, fixed-rate, publicly placed, dollar-denominated, and non-convertible debt registered with the U.S. Securities and Exchange Commission. The index does not incur fees and expenses and cannot be purchased directly by investors. |
The Portfolio Manager Commentary is not a part of the Xxxxx Report to Shareholders.
v
Western Asset Non-U.S. Opportunity Bond Portfolio
| | | | | | | | | | |
| | | | | Average Annual Total Returns
|
| | | Third
Quarter 2005 | | One
Year | | Three
Years | | Five
Years | | SinceM
Inception |
Western Asset Non-U.S. Opportunity Bond Portfolio | | | | | | | | | | |
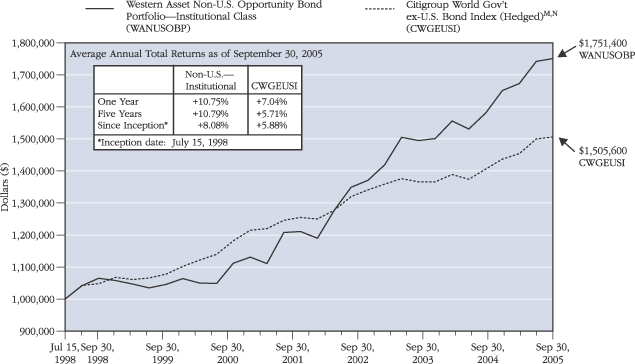
Institutional Class | | 0.53% | | 10.75% | | 9.09% | | 10.79% | | 8.08% |
Citigroup World Government | | | | | | | | | | |
ex-U.S. Bond Index (Hedged)N | | 0.33% | | 7.04% | | 4.47% | | 5.71% | | 5.88% |
For the six-month period ending September 30, 2005, the Fund returned 4.70%, (net of expenses), which exceeded that of its reference index, Citigroup World Government ex-U.S. Bond Index (Hedged), which recorded a total return of 3.51% for the six-months period ending September 30, 2005. The Fund was initially short duration compared to its index, which detracted from performance. We then added to duration in late April, which contributed positively to performance. Throughout the period, the Fund was underweight to Japan, which contributed to performance. Throughout the period, the Fund held a changing allocation to inflation-linked bonds (TIPS, French Linkers), which had a mixed contribution to performance as real yields initially rose but fell later in the period. In general, positions in peripheral markets were rewarded. Also, the Fund’s currency positions had a positive impact following the “no” votes in France and the Netherlands, which led to a decline of the euro.
INVESTMENT COMMENTS
The Katrina disaster has seriously disrupted a portion of the U.S. economy and the lives of millions of people, but it’s not likely a major hit to the economy as a whole. There are good things and bad things going on in the world, and while caution is in order, we don’t have reason to expect any dramatic changes in current conditions in the near term.
Energy prices have subsided in the wake of the tragedy, but are still elevated. However, in real terms, today’s oil prices are less than they were in the early 1980s, and the U.S. economy (and most industrialized economies) now requires about half as much oil per unit of output as it did back then, thanks to conservation, substitution, and the expansion of the service sector. Higher prices have already resulted in a significant increase in oil exploration, and together with a marginal decline in demand for oil, this likely precludes a “we’re running out of oil” scenario from developing.
U.S. fiscal policy remains stimulative, thanks to relatively low tax burdens and low levels of taxation on capital. Given that federal revenues have increased $100 billion more than expected just a year ago, Katrina-related spending—which is unlikely to exceed $50-100 billion in the next year—should not significantly impact the deficit, the bond market, or the economy. Meanwhile, corporate profits continue to be robust, giving corporations the wherewithal to boost capital spending at double-digit rates for the foreseeable future.
While many fret that rising interest rates and prices of real estate and energy pose a serious threat to the economy in the future, they are better thought of as the result of strong demand. Rising oil prices are an expense to many but a boon to producers, who recycle their profits in part into new exploration and in part back into the financial markets. Easy money boosts demand for oil inventories, and also makes it easier for higher energy costs to be passed through to other prices. As for the broader issue of the U.S. current account deficit, should foreigners tire of spending their trade surplus on our bonds, their demand for our exports will surge, and this shift could well make headlines in coming years. Housing prices seem extravagant, but according to the Federal Reserve, U.S. households are spending roughly the same fraction of their disposable income on housing as they have for the past few decades. Rising prices thus reflect not only strong demand and strong growth in incomes, but also relatively low interest rates. Higher interest rates could actually benefit the household sector, since consumers have more floating rate assets than floating rate debts.
| M | The Fund’s Institutional Class inception date is July 15, 1998. Index returns are for periods beginning July 31, 1998. |
| N | An index encompassing an all-inclusive universe of institutionally traded bonds, including all fixed-rate bonds with remaining maturities of one year or longer and with amounts outstanding of at least the equivalent of $25 million USD. This index excludes the U.S. and is currency-hedged as a means of achieving low-risk interest rate diversification. The index does not incur fees and expenses and cannot be purchased directly by investors. |
vi
The bigger picture is one in which prices of most tangible assets are rising, led by gold. Gold is the “canary in the coal mine” that signals whether monetary policy is too easy or too tight, and $475 gold suggests that monetary policy has not yet restored an equilibrium between the supply and demand for money. Relatively slow growth in U.S. monetary aggregates is also a part of this picture, since it reflects declining dollar demand and rising velocity, another inflation symptom.
The inflation signal from sensitive asset prices cannot be dismissed just because interest rates are low and breakeven spreads on inflation-linked bonds are also relatively low. The bond market has rarely been a good predictor of inflation pressures, as evidenced by low real interest rates in the rising inflation period of the 1970s and the high real rates that prevailed during the disinflationary 1980s and 90s. The bond market will probably continue to underestimate inflation risks for some time, as it has for the past several years, and the Fed is unlikely to do more than raise rates by 25 basis points at each of its next several meetings. So this leaves us with the conundrum of expecting inflation and interest rates to drift irregularly higher over the long haul, but to not go vertical anytime soon. With a dearth of obvious investment opportunities, we will need to be cautious overall and somewhat more tactical and opportunistic in our approach to adding value.
As yields have risen over the past month we increased our duration exposure, but we remain reluctant to take on extra interest rate risk that is not tied to Fed policy or connected to inflation-linked bonds. Credit spreads are fairly tight, but we don’t see a reason to be overly concerned for now. Looking out over the next few years, we need to be prepared for the time when the profits picture deteriorates. We think this calls for a modestly overweight exposure to intermediate BBB and high-yield bonds, while remaining broadly neutral to the corporate sector. Emerging market debt is losing its appeal as spreads reach ever-lower levels, so reduced exposure is prudent even while recognizing that fundamentals—global growth, low interest rates, strong commodity markets—remain supportive of those with larger debt burdens. Mortgage spreads are now at levels that warrant a broadly neutral exposure. Bond yields in most industrialized countries are now substantially lower than in the U.S., dictating reduced exposure to the nondollar sector.
Western Asset Management Company
October 28, 2005
The views expressed in this commentary reflect those of the portfolio manager as of the date of this commentary. Any such views are subject to change at any time based on market or other conditions and Western Asset Funds, Inc. and Western Asset Management Company disclaim any responsibility to update such views. These views may not be relied upon as investment advice and, because investment decisions for the Western Asset Funds are based on numerous factors, may not be relied upon as an indication of trading intent on behalf of any Western Asset Fund.
vii
Western Asset Funds, Inc.
Western Asset Limited Duration Bond Portfolio
Western Asset Intermediate Bond Portfolio
Western Asset Intermediate Plus Bond Portfolio
Western Asset Core Bond Portfolio
Western Asset Core Plus Bond Portfolio
Western Asset Inflation Indexed Plus Bond Portfolio
Western Asset High Yield Portfolio
Western Asset Non-U.S. Opportunity Bond Portfolio
Semi-Annual Report to Shareholders
September 30, 2005
Semi-Annual Report to Shareholders
EXPENSE EXAMPLES
As a shareholder of any of the Funds, you incur ongoing costs, including management fees, service (12b-1) fees on Financial Intermediary Class shares, and other Fund expenses. These examples are intended to help you understand your ongoing costs (in dollars) of investing in a Fund and to compare these costs with the ongoing costs of investing in other mutual funds. The examples are based on an investment of $1,000 invested on April 1, 2005, and held through September 30, 2005.
Actual Expenses
The first line for each Fund in the accompanying table provides information about actual account values and actual expenses. You may use the information in this line, together with the amount you invested, to estimate the expenses that you paid over the period. Simply divide your account value by $1,000 (for example, an $8,600 account divided by $1,000 = 8.6), then multiply the result by the number in the first line under the heading entitled “Expenses Paid During Period” to estimate the expenses you paid on your account during this period.
Hypothetical Example for Comparison Purposes
The second line for each Fund in the accompanying table provides information about hypothetical account values and hypothetical expenses based on each Fund’s actual expense ratio and an assumed rate of return of 5% per year before expenses, which is not the actual return of any of the Funds. The hypothetical account values and expenses may not be used to estimate the actual ending account balance or expenses you paid for the period. You may use this information to compare the ongoing costs of investing in a Fund and other funds. To do so, compare this 5% hypothetical example with the 5% hypothetical examples that appear in the shareholder reports of other funds.
| | | | | | | | | | | |
| | | Beginning
Account Value
4/1/05 | | Ending
Account Value
9/30/05 | | Expenses PaidA
During the Period
4/1/05 to 9/30/05 | | Annualized
Expense Ratio |
Limited Duration Bond Portfolio
Institutional Class: | | | | | | | | | | | |
Actual | | $ | 1,000.00 | | $ | 1,017.00 | | $ | 2.02 | | 0.40% |
Hypothetical (5% return before expenses) | | | 1,000.00 | | | 1,023.06 | | | 2.03 | | |
| | | | |
Intermediate Bond Portfolio
Institutional Class: | | | | | | | | | | | |
Actual | | $ | 1,000.00 | | $ | 1,021.90 | | $ | 2.28 | | 0.45% |
Hypothetical (5% return before expenses) | | | 1,000.00 | | | 1,022.81 | | | 2.28 | | |
| | | | |
Intermediate Plus Bond Portfolio
Institutional Class: | | | | | | | | | | | |
Actual | | $ | 1,000.00 | | $ | 1,026.90 | | $ | 2.29 | | 0.45% |
Hypothetical (5% return before expenses) | | | 1,000.00 | | | 1,022.81 | | | 2.28 | | |
| | | | |
Core Bond Portfolio
Institutional Class: | | | | | | | | | | | |
Actual | | $ | 1,000.00 | | $ | 1,029.00 | | $ | 2.29 | | 0.45% |
Hypothetical (5% return before expenses) | | | 1,000.00 | | | 1,022.81 | | | 2.28 | | |
Financial Intermediary Class: | | | | | | | | | | | |
Actual | | $ | 1,000.00 | | $ | 1,027.60 | | $ | 3.61 | | 0.71% |
Hypothetical (5% return before expenses) | | | 1,000.00 | | | 1,021.51 | | | 3.60 | | |
| A | These calculations are based on expenses incurred in the most recent fiscal half-year. The dollar amounts shown as “Expenses Paid” are equal to the annualized expense ratio multiplied by the average value over the period, multiplied by the number of days in the most recent fiscal half-year (183), and divided by 365 (to reflect the one-half year period). |
1
Semi-Annual Report to Shareholders
| | | | | | | | | | | |
| | | Beginning
Account Value
4/1/05 | | Ending
Account Value
9/30/05 | | Expenses PaidA
During the Period
4/1/05 to 9/30/05 | | Annualized
Expense Ratio |
Core Plus Bond Portfolio
Institutional Class: | | | | | | | | | | | |
Actual | | $ | 1,000.00 | | $ | 1,031.60 | | $ | 2.29 | | 0.45% |
Hypothetical (5% return before expenses) | | | 1,000.00 | | | 1,022.81 | | | 2.28 | | |
Financial Intermediary Class: | | | | | | | | | | | |
Actual | | $ | 1,000.00 | | $ | 1,031.40 | | $ | 3.56 | | 0.70% |
Hypothetical (5% return before expenses) | | | 1,000.00 | | | 1,021.56 | | | 3.55 | | |
| | | | |
Inflation Indexed Plus Bond Portfolio Institutional Class: | | | | | | | | | | | |
Actual | | $ | 1,000.00 | | $ | 1,032.00 | | $ | 1.27 | | 0.25% |
Hypothetical (5% return before expenses) | | | 1,000.00 | | | 1,023.82 | | | 1.27 | | |
| | | | |
High Yield Bond Portfolio
Institutional Class: | | | | | | | | | | | |
Actual | | $ | 1,000.00 | | $ | 1,034.60 | | $ | 3.21 | | 0.62% |
Hypothetical (5% return before expenses) | | | 1,000.00 | | | 1,021.91 | | | 3.19 | | |
| | | | |
Non-U.S. Opportunity Bond Portfolio Institutional Class: | | | | | | | | | | | |
Actual | | $ | 1,000.00 | | $ | 1,047.00 | | $ | 2.82 | | 0.55% |
Hypothetical (5% return before expenses) | | | 1,000.00 | | | 1,022.31 | | | 2.79 | | |
2
Semi-Annual Report to Shareholders
PORTFOLIO COMPOSITION
The Funds file a complete schedule of portfolio holdings with the SEC for the first and third quarters of each fiscal year on Form N-Q. The Funds’ Form N-Q is available on the Securities and Exchange Commission (“SEC”) website (http://www.sec.gov) and may be viewed and copied at the SEC’s Public Reference Room in Washington, DC. Information about the operation of the Public Reference Room may be obtained by calling 1-800-SEC-0330.
The following tables show the portfolio composition (as a percentage of the portfolio) for each of the Funds:
| | | | | | | | | | | | | | | | | | | | | | | | |
| Debt RatingsA | | Limited
Duration | | | Intermediate | | | Intermediate
Plus | | | Core | | | Core
Plus | | | Inflation
Indexed Plus | | | High
Yield | | | Non-U.S. | |
AAA | | 68.44 | % | | 56.30 | % | | 49.45 | % | | 80.26 | % | | 79.65 | % | | 91.38 | % | | 4.52 | % | | 86.87 | % |
AA | | 2.83 | % | | 3.00 | % | | 2.66 | % | | 0.55 | % | | 1.24 | % | | 0.94 | % | | — | | | 0.53 | % |
A | | 7.91 | % | | 13.16 | % | | 12.27 | % | | 3.53 | % | | 2.68 | % | | 1.51 | % | | 0.65 | % | | 1.64 | % |
BBB | | 13.88 | % | | 17.73 | % | | 22.65 | % | | 8.33 | % | | 6.75 | % | | 2.44 | % | | 0.72 | % | | — | |
BB | | 5.48 | % | | 6.22 | % | | 8.77 | % | | 4.49 | % | | 5.75 | % | | 2.03 | % | | 21.79 | % | | — | |
B | | 0.01 | % | | 1.44 | % | | 3.09 | % | | 1.74 | % | | 3.34 | % | | 0.46 | % | | 54.96 | % | | — | |
Below B | | — | | | 0.09 | % | | — | | | 0.29 | % | | 0.21 | % | | — | | | 16.47 | % | | — | |
Not Rated | | 1.45 | % | | 2.06 | % | | 1.11 | % | | 0.81 | % | | 0.38 | % | | 1.24 | % | | 0.89 | % | | 10.96 | % |
| | |
|
| |
|
| |
|
| |
|
| |
|
| |
|
| |
|
| |
|
|
| | | 100.00 | % | | 100.00 | % | | 100.00 | % | | 100.00 | % | | 100.00 | % | | 100.00 | % | | 100.00 | % | | 100.00 | % |
| | |
|
| |
|
| |
|
| |
|
| |
|
| |
|
| |
|
| |
|
|
| | | | | | | | |
Maturity
Schedule | | Limited
Duration | | | Intermediate | | | Intermediate
Plus | | | Core | | | Core
Plus | | | Inflation
Indexed Plus | | | High
Yield | | | Non-U.S. | |
Less Than 1 Year | | 2.71 | % | | 13.05 | % | | 7.89 | % | | 12.51 | % | | 16.25 | % | | 1.05 | % | | 5.16 | % | | 3.24 | % |
1 to 3 Years | | 48.78 | % | | 27.42 | % | | 32.57 | % | | 6.24 | % | | 6.85 | % | | 11.35 | % | | 3.51 | % | | 0.52 | % |
3 to 5 Years | | 10.32 | % | | 18.02 | % | | 17.69 | % | | 13.91 | % | | 13.75 | % | | 12.62 | % | | 12.61 | % | | 37.63 | % |
5 to 10 Years | | 4.16 | % | | 21.61 | % | | 20.08 | % | | 7.06 | % | | 9.00 | % | | 42.17 | % | | 67.89 | % | | 43.65 | % |
10 to 20 Years | | 2.35 | % | | 4.08 | % | | 3.49 | % | | 3.88 | % | | 1.96 | % | | 5.06 | % | | 5.36 | % | | 5.18 | % |
20 to 30 Years | | 24.77 | % | | 15.06 | % | | 11.72 | % | | 23.30 | % | | 17.23 | % | | 26.46 | % | | 4.87 | % | | 8.28 | % |
More Than 30 Years | | 6.91 | % | | 0.76 | % | | 6.56 | % | | 33.10 | % | | 34.96 | % | | 1.29 | % | | 0.60 | % | | 1.50 | % |
| | |
|
| |
|
| |
|
| |
|
| |
|
| |
|
| |
|
| |
|
|
| | | 100.00 | % | | 100.00 | % | | 100.00 | % | | 100.00 | % | | 100.00 | % | | 100.00 | % | | 100.00 | % | | 100.00 | % |
| | |
|
| |
|
| |
|
| |
|
| |
|
| |
|
| |
|
| |
|
|
| A | Source: Standard & Poor's. |
The Funds are actively managed. As a result, the composition of their portfolio holdings and sectors are subject to change at any time.
3
Semi-Annual Report to Shareholders
PERFORMANCE INFORMATION
The graphs and tables on the following pages compare each Fund’s total returns against that of an appropriate broad-based securities market index. The lines illustrate the cumulative total return of an initial $1,000,000 investment for the periods indicated. The line for each Fund represents the total return after deducting all Fund investment management and other administrative expenses and the transaction costs of buying and selling securities. The lines representing the securities market indices do not include any transaction costs associated with buying and selling securities in the index or other investment management or administrative expenses.
Total return measures investment performance in terms of appreciation or depreciation in net asset value per share, plus dividends and any capital gain distributions. It assumes that dividends and distributions were reinvested at the time they were paid. Returns do not reflect the deduction of taxes that a shareholder would pay on Fund distributions or the redemption of Fund shares. Average annual returns tend to smooth out variations in a fund’s return, so that they differ from actual year-to-year results.
Bonds are subject to a variety of risks, including interest rate, credit and inflation risk.
The performance data quoted represents past performance and does not guarantee future results. The performance stated may have been due to extraordinary market conditions, which may not be duplicated in the future. Current performance may be lower or higher than the performance data quoted. To obtain the most recent month-end performance information, please visit www.westernassetfunds.com. The investment return and principal value of the Funds will fluctuate so that an investor’s shares, when redeemed, may be worth more or less than the original cost. Calculations assume reinvestment of dividends and capital gain distributions. Performance would have been lower if fees had not been waived in various periods.
4
Semi-Annual Report to Shareholders
PERFORMANCE INFORMATION—Continued
Western Asset Limited Duration Bond Portfolio
The graph and table do not reflect the deduction of taxes that a shareholder
would pay on Fund distributions or the redemption of Fund shares.
Past performance does not predict future performance.
| A | Index returns are for periods beginning September 30, 2003. |
| B | A subset of the Merrill Lynch Treasury Master Index, consisting of bonds with an outstanding par that is greater than or equal to $25 million and fixed-rate coupons greater than 4.25%. The maturity range on these securities is from 1 to 3 years. The index does not incur fees and expenses and cannot be purchased directly by investors. |
5
Semi-Annual Report to Shareholders
Western Asset Intermediate Bond Portfolio
The graph and table do not reflect the deduction of taxes that a shareholder
would pay on Fund distributions or the redemption of Fund shares.
Past performance does not predict future performance.
| C | A market value-weighted index that tracks the daily price, coupon and total return performance of fixed-rate, publicly placed, dollar-denominated obligations. Issuers include the U.S. Treasury, U.S. Government agencies, quasi-federal corporations and corporations whose debt is guaranteed by the U.S. Government and has at least $100 million par amount outstanding and at least one year to maturity. The index does not incur fees and expenses and cannot be purchased directly by investors. |
6
Semi-Annual Report to Shareholders
PERFORMANCE INFORMATION—Continued
Western Asset Intermediate Plus Bond Portfolio
The graph and table do not reflect the deduction of taxes that a shareholder
would pay on Fund distributions or the redemption of Fund shares.
Past performance does not predict future performance.
| D | Index returns are for periods beginning March 31, 2004. |
7
Semi-Annual Report to Shareholders
Western Asset Core Bond Portfolio
The graph and table do not reflect the deduction of taxes that a shareholder
would pay on Fund distributions or the redemption of Fund shares.
Past performance does not predict future performance.
| E | A market value-weighted index that tracks the daily price, coupon, pay-downs, and total return performance of fixed-rate, publicly placed, dollar-denominated, and nonconvertible investment grade debt issues with at least $100 million par amount outstanding and with at least one year to final maturity. The index does not incur fees and expenses and cannot be purchased directly by investors. |
8
Semi-Annual Report to Shareholders
PERFORMANCE INFORMATION—Continued
Western Asset Core Bond Portfolio—Continued
The graph and table do not reflect the deduction of taxes that a shareholder
would pay on Fund distributions or the redemption of Fund shares.
Past performance does not predict future performance.
| F | Index returns are for periods beginning July 31, 1999. |
9
Semi-Annual Report to Shareholders
Western Asset Core Plus Bond Portfolio
The graph and table do not reflect the deduction of taxes that a shareholder
would pay on Fund distributions or the redemption of Fund shares.
Past performance does not predict future performance.
| G | Index returns are for periods beginning June 30, 1998. |
10
Semi-Annual Report to Shareholders
PERFORMANCE INFORMATION—Continued
Western Asset Core Plus Bond Portfolio—Continued
The graph and table do not reflect the deduction of taxes that a shareholder
would pay on Fund distributions or the redemption of Fund shares.
Past performance does not predict future performance.
| H | Index returns are for periods beginning December 31, 2001. |
11
Semi-Annual Report to Shareholders
Western Asset Inflation Indexed Plus Bond Portfolio
The graph and table do not reflect the deduction of taxes that a shareholder
would pay on Fund distributions or the redemption of Fund shares.
Past performance does not predict future performance.
| I | Index returns are for periods beginning February 28, 2001. |
| J | An unmanaged index that measures the performance of intermediate (1 to 10 year) U.S. Treasury inflation-protected securities. The index does not incur fees and expenses and cannot be purchased directly by investors. |
12
Semi-Annual Report to Shareholders
PERFORMANCE INFORMATION—Continued
Western Asset High Yield Portfolio
The graph and table do not reflect the deduction of taxes that a shareholder
would pay on Fund distributions or the redemption of Fund shares.
Past performance does not predict future performance.
| K | Index returns are for periods beginning September 30, 2001. |
| L | A market value-weighted index that tracks the daily price-only, coupon, and total return performance of non-investment grade, fixed-rate, publicly placed, dollar-denominated, and non-convertible debt registered with the U.S. Securities and Exchange Commission. The index does not incur fees and expenses and cannot be purchased directly by investors. |
13
Semi-Annual Report to Shareholders
Western Asset Non-U.S. Opportunity Bond Portfolio
The graph and table do not reflect the deduction of taxes that a shareholder
would pay on Fund distributions or the redemption of Fund shares.
Past performance does not predict future performance.
| M | Index returns are for periods beginning July 31, 1998. |
| N | An index encompassing an all-inclusive universe of institutionally traded bonds, including all fixed-rate bonds with remaining maturities of one year or longer and with amounts outstanding of at least the equivalent of $25 million USD. This index excludes the U.S. and is currency-hedged as a means of achieving low-risk interest rate diversification. The index does not incur fees and expenses and cannot be purchased directly by investors. |
14
Semi-Annual Report to Shareholders
PORTFOLIO OF INVESTMENTS
September 30, 2005 (Unaudited)
(Amounts in Thousands)
Western Asset Limited Duration Bond Portfolio
| | | | | | | | | | | | |
| | | % OF
NET ASSETS | | RATE | | MATURITY
DATE | | PAR/
SHARES | | VALUE |
Long-Term Securities | | 100.6% | | | | | | | | | | |
| | | | | |
Corporate Bonds and Notes | | 25.3% | | | | | | | | | | |
| | | | | |
Aerospace/Defense | | 0.1% | | | | | | | | | | |
Northrop Grumman Corporation | | | | 4.079% | | 11/16/06 | | $ | 110 | | $ | 109 |
| | | | | | | | | | | |
|
|
| | | | | |
Banking and Finance | | 7.3% | | | | | | | | | | |
American General Finance Corporation (AGFC) | | | | 3.729% | | 1/18/08 | | | 30 | | | 30A |
Aspetuck Trust 2004-1 | | | | 3.899% | | 10/17/05 | | | 290 | | | 290A |
Boeing Capital Corporation | | | | 5.750% | | 2/15/07 | | | 320 | | | 325 |
Caterpillar Financial Services | | | | 3.450% | | 1/15/09 | | | 160 | | | 154 |
Countrywide Financial Corporation | | | | 3.983% | | 5/5/08 | | | 260 | | | 261A |
Ford Motor Credit Company | | | | 4.830% | | 9/28/07 | | | 420 | | | 409A |
Ford Motor Credit Company | | | | 6.625% | | 6/16/08 | | | 1,510 | | | 1,476 |
General Motors Acceptance Corporation | | | | 5.100% | | 7/16/07 | | | 120 | | | 117A |
General Motors Acceptance Corporation | | | | 5.110% | | 9/23/08 | | | 1,790 | | | 1,659A |
HSBC Finance Corporation | | | | 4.010% | | 5/10/10 | | | 210 | | | 210A |
John Deere Capital Corporation | | | | 3.900% | | 1/15/08 | | | 360 | | | 354 |
Nissan Motor Acceptance Corporation | | | | 4.625% | | 3/8/10 | | | 90 | | | 88B |
Residential Capital Corporation | | | | 5.385% | | 6/29/07 | | | 200 | | | 202A,B |
SLM Corporation | | | | 4.340% | | 7/27/09 | | | 350 | | | 350A |
| | | | | | | | | | | |
|
|
| | | | | | | | | | | | | 5,924 |
| | | | | | | | | | | |
|
|
Banks | | 0.1% | | | | | | | | | | |
U.S. Bank | | | | 4.400% | | 8/15/08 | | | 70 | | | 70 |
| | | | | | | | | | | |
|
|
| | | | | |
Cable | | 0.9% | | | | | | | | | | |
Comcast Cable Communications, Inc. | | | | 8.375% | | 5/1/07 | | | 330 | | | 348 |
Cox Communications, Inc. | | | | 4.407% | | 12/14/07 | | | 370 | | | 373A |
| | | | | | | | | | | |
|
|
| | | | | | | | | | | | | 721 |
| | | | | | | | | | | |
|
|
Chemicals | | 0.3% | | | | | | | | | | |
The Dow Chemical Company | | | | 5.000% | | 11/15/07 | | | 160 | | | 161 |
The Dow Chemical Company | | | | 5.970% | | 1/15/09 | | | 100 | | | 104 |
| | | | | | | | | | | |
|
|
| | | | | | | | | | | | | 265 |
| | | | | | | | | | | |
|
|
Computer Services and Systems | | 0.4% | | | | | | | | | | |
Electronic Data Systems Corporation | | | | 7.125% | | 10/15/09 | | | 290 | | | 311 |
| | | | | | | | | | | |
|
|
| | | | | |
Diversified Consumer Services | | 0.3% | | | | | | | | | | |
Honeywell International Incorporated | | | | 5.125% | | 11/1/06 | | | 240 | | | 241 |
| | | | | | | | | | | |
|
|
15
Semi-Annual Report to Shareholders
PORTFOLIO OF INVESTMENTS—Continued
Western Asset Limited Duration Bond Portfolio—Continued
| | | | | | | | | | | | |
| | | % OF
NET ASSETS | | RATE | | MATURITY
DATE | | PAR/
SHARES | | VALUE |
Corporate Bonds and Notes—Continued | | | | | | | | | | | | |
| | | | | |
Diversified Financial Services | | 1.2% | | | | | | | | | | |
Capital One Financial Corporation | | | | 4.738% | | 5/17/07 | | $ | 90 | | $ | 90 |
CIT Group Inc. | | | | 4.033% | | 5/23/08 | | | 80 | | | 80A |
Citigroup Inc. | | | | 3.625% | | 2/9/09 | | | 320 | | | 310 |
General Electric Capital Corporation | | | | 3.970% | | 6/15/09 | | | 160 | | | 160A |
iStar Financial Inc. | | | | 4.245% | | 3/3/08 | | | 360 | | | 360 |
| | | | | | | | | | | |
|
|
| | | | | | | | | | | | | 1,001 |
| | | | | | | | | | | |
|
|
Electric | | 1.3% | | | | | | | | | | |
Appalachian Power Company | | | | 3.600% | | 5/15/08 | | | 390 | | | 379 |
Dominion Resources, Inc. | | | | 4.125% | | 2/15/08 | | | 160 | | | 158 |
FirstEnergy Corp. | | | | 5.500% | | 11/15/06 | | | 430 | | | 434 |
Southern California Edison Co. | | | | 4.430% | | 1/13/06 | | | 60 | | | 60A |
| | | | | | | | | | | |
|
|
| | | | | | | | | | | | | 1,031 |
| | | | | | | | | | | |
|
|
Energy | | 0.9% | | | | | | | | | | |
Alabama Power Company | | | | 4.026% | | 8/25/09 | | | 50 | | | 50A |
CenterPoint Energy, Inc. | | | | 5.875% | | 6/1/08 | | | 150 | | | 153 |
Duke Energy Corporation | | | | 3.750% | | 3/5/08 | | | 60 | | | 59 |
Pacific Gas and Electric Co. | | | | 3.600% | | 3/1/09 | | | 90 | | | 87 |
Sempra Energy | | | | 4.621% | | 5/17/07 | | | 270 | | | 269 |
Sempra Energy | | | | 4.290% | | 5/21/08 | | | 90 | | | 90A |
TXU Energy Co. | | | | 4.920% | | 1/17/06 | | | 50 | | | 50A |
| | | | | | | | | | | |
|
|
| | | | | | | | | | | | | 759 |
| | | | | | | | | | | |
|
|
Environmental Services | | 0.7% | | | | | | | | | | |
Waste Management, Inc. | | | | 7.000% | | 10/15/06 | | | 135 | | | 138 |
Waste Management, Inc. | | | | 6.500% | | 11/15/08 | | | 200 | | | 209 |
Waste Management, Inc. | | | | 7.375% | | 8/1/10 | | | 170 | | | 187 |
| | | | | | | | | | | |
|
|
| | | | | | | | | | | | | 534 |
| | | | | | | | | | | |
|
|
Food, Beverage and Tobacco | | 1.3% | | | | | | | | | | |
Altria Group, Inc. | | | | 7.650% | | 7/1/08 | | | 30 | | | 32 |
Altria Group, Inc. | | | | 7.200% | | 2/1/07 | | | 110 | | | 113 |
Altria Group, Inc. | | | | 5.625% | | 11/4/08 | | | 380 | | | 390 |
General Mills, Inc. | | | | 6.449% | | 10/15/06 | | | 200 | | | 203 |
Kraft Foods Inc. | | | | 5.250% | | 6/1/07 | | | 240 | | | 242 |
Sara Lee Corporation | | | | 1.950% | | 6/15/06 | | | 120 | | | 118 |
| | | | | | | | | | | |
|
|
| | | | | | | | | | | | | 1,098 |
| | | | | | | | | | | |
|
|
16
Semi-Annual Report to Shareholders
| | | | | | | | | | | | |
| | | % OF
NET ASSETS | | RATE | | MATURITY
DATE | | PAR/
SHARES | | VALUE |
Corporate Bonds and Notes—Continued | | | | | | | | | | | | |
| | | | | |
Investment Banking/Brokerage | | 0.5% | | | | | | | | | | |
Lehman Brothers Holdings Inc. | | | | 4.010% | | 11/10/09 | | $ | 130 | | $ | 131A |
Morgan Stanley | | | | 4.430% | | 1/15/10 | | | 100 | | | 100A |
The Bear Stearns Companies Inc. | | | | 4.068% | | 9/9/09 | | | 150 | | | 151A |
| | | | | | | | | | | |
|
|
| | | | | | | | | | | | | 381 |
| | | | | | | | | | | |
|
|
Media | | 2.2% | | | | | | | | | | |
Clear Channel Communications, Inc. | | | | 3.125% | | 2/1/07 | | | 80 | | | 78 |
Clear Channel Communications, Inc. | | | | 6.625% | | 6/15/08 | | | 60 | | | 62 |
Clear Channel Communications, Inc. | | | | 4.250% | | 5/15/09 | | | 290 | | | 280 |
Clear Channel Communications, Inc. | | | | 7.650% | | 9/15/10 | | | 20 | | | 22 |
Liberty Media Corporation | | | | 7.875% | | 7/15/09 | | | 460 | | | 484 |
News America Incorporated | | | | 6.625% | | 1/9/08 | | | 400 | | | 416 |
Time Warner Inc. | | | | 6.150% | | 5/1/07 | | | 320 | | | 327 |
Viacom Inc. | | | | 5.625% | | 5/1/07 | | | 160 | | | 162 |
| | | | | | | | | | | |
|
|
| | | | | | | | | | | | | 1,830 |
| | | | | | | | | | | |
|
|
Oil and Gas | | 1.2% | | | | �� | | | | | | |
Amerada Hess Corporation | | | | 7.375% | | 10/1/09 | | | 280 | | | 304 |
Anadarko Petroleum Corporation | | | | 3.250% | | 5/1/08 | | | 330 | | | 319 |
Occidental Petroleum Corporation | | | | 7.375% | | 11/15/08 | | | 90 | | | 97 |
Texas Eastern Transmission Corporation | | | | 5.250% | | 7/15/07 | | | 160 | | | 161 |
Tosco Corporation | | | | 7.625% | | 5/15/06 | | | 115 | | | 117 |
| | | | | | | | | | | |
|
|
| | | | | | | | | | | | | 998 |
| | | | | | | | | | | |
|
|
Paper and Forest Products | | 1.0% | | | | | | | | | | |
International Paper Company | | | | 3.800% | | 4/1/08 | | | 290 | | | 283 |
Union Camp Corporation | | | | 6.500% | | 11/15/07 | | | 200 | | | 206 |
Weyerhaeuser Company | | | | 6.125% | | 3/15/07 | | | 320 | | | 326 |
| | | | | | | | | | | |
|
|
| | | | | | | | | | | | | 815 |
| | | | | | | | | | | |
|
|
Pharmaceuticals | | 0.3% | | | | | | | | | | |
Bristol-Myers Squibb Company | | | | 4.000% | | 8/15/08 | | | 240 | | | 237 |
| | | | | | | | | | | |
|
|
| | | | | |
Photo Equipment and Supplies | | N.M. | | | | | | | | | | |
Eastman Kodak Company | | | | 7.250% | | 11/15/13 | | | 10 | | | 9 |
| | | | | | | | | | | |
|
|
| | | | | |
Special Purpose | | 4.2% | | | | | | | | | | |
American Honda Finance Corporation | | | | 3.860% | | 5/12/08 | | | 70 | | | 70A,B |
American Honda Finance Corporation | | | | 3.850% | | 11/6/08 | | | 34 | | | 33B |
BAE Systems Holdings Inc. | | | | 4.050% | | 8/15/08 | | | 200 | | | 200A,B |
17
Semi-Annual Report to Shareholders
PORTFOLIO OF INVESTMENTS—Continued
Western Asset Limited Duration Bond Portfolio—Continued
| | | | | | | | | | | | |
| | | % OF
NET ASSETS | | RATE | | MATURITY
DATE | | PAR/
SHARES | | VALUE |
Corporate Bonds and Notes—Continued | | | | | | | | | | | | |
| | | | | |
Special Purpose—Continued | | | | | | | | | | | | |
DaimlerChrysler NA Holding Corporation | | | | 4.026% | | 3/7/07 | | $ | 210 | | $ | 210A |
DaimlerChrysler NA Holding Corporation | | | | 4.314% | | 9/10/07 | | | 940 | | | 942A |
International Lease Finance Corporation | | | | 4.625% | | 6/2/08 | | | 240 | | | 239 |
International Lease Finance Corporation | | | | 5.000% | | 4/15/10 | | | 60 | | | 60 |
National Rural Utilities Cooperative Finance Corporation | | | | 3.875% | | 2/15/08 | | | 160 | | | 157 |
Sprint Capital Corporation | | | | 4.780% | | 8/17/06 | | | 410 | | | 411C |
Sprint Capital Corporation | | | | 6.125% | | 11/15/08 | | | 610 | | | 633 |
Tyco International Group SA | | | | 4.436% | | 6/15/07 | | | 200 | | | 199B |
Verizon Global Funding Corp. | | | | 6.125% | | 6/15/07 | | | 240 | | | 246 |
| | | | | | | | | | | |
|
|
| | | | | | | | | | | | | 3,401 |
| | | | | | | | | | | |
|
|
Telecommunications (Cellular/Wireless) | | 1.0% | | | | | | | | | | |
ALLTEL Corporation | | | | 4.656% | | 5/17/07 | | | 310 | | | 310 |
Motorola, Inc. | | | | 4.608% | | 11/16/07 | | | 170 | | | 170 |
New Cingular Wireless Services Inc. | | | | 7.500% | | 5/1/07 | | | 300 | | | 313 |
| | | | | | | | | | | |
|
|
| | | | | | | | | | | | | 793 |
| | | | | | | | | | | |
|
|
Telecommunciations Equipment | | 0.1% | | | | | | | | | | |
New York Telephone Co. | | | | 6.000% | | 4/15/08 | | | 120 | | | 123 |
| | | | | | | | | | | |
|
|
Total Corporate Bonds and Notes
(Identified Cost—$20,821) | | | | | | | | | | | | 20,651 |
Asset-Backed Securities | | 8.2% | | | | | | | | | | |
| | | | | |
Fixed Rate Securities | | 2.7% | | | | | | | | | | |
ACE Securities Corp. 2003-MH1 | | | | 2.200% | | 8/15/30 | | | 52 | | | 52B |
AmeriCredit Automobile Receivables Trust 2001-C | | | | 5.010% | | 7/14/08 | | | 257 | | | 257 |
AmeriCredit Automobile Receivables Trust 2003-BX A4A | | | | 2.720% | | 1/6/10 | | | 400 | | | 394 |
Capital One Auto Finance Trust 2001-B A4 | | | | 4.880% | | 9/15/08 | | | 186 | | | 187 |
Hyundai Auto Receivables Trust 2002-A | | | | 2.800% | | 2/15/07 | | | 34 | | | 33B |
MBNA Practice Solutions Owners Trust 2005-2 | | | | 4.100% | | 5/15/09 | | | 400 | | | 395B |
Onyx Acceptance Owner Trust 2002-D | | | | 3.100% | | 7/15/09 | | | 92 | | | 92 |
Prestige Auto Receivables Trust 2005-1A | | | | 4.370% | | 6/15/12 | | | 200 | | | 198B |
UCFC Home Equity Loan 1998-D | | | | 6.905% | | 4/15/30 | | | 124 | | | 125 |
UPFC Auto Receivables Trust 2004-A | | | | 3.270% | | 9/15/10 | | | 500 | | | 491 |
| | | | | | | | | | | |
|
|
| | | | | | | | | | | | | 2,224 |
| | | | | | | | | | | |
|
|
Indexed SecuritiesA | | 5.5% | | | | | | | | | | |
AmeriCredit Automobile Receivables Trust 2003-BX A4B | | | | 4.270% | | 1/6/10 | | | 30 | | | 30 |
18
Semi-Annual Report to Shareholders
| | | | | | | | | | | | |
| | | % OF
NET ASSETS | | RATE | | MATURITY
DATE | | PAR/
SHARES | | VALUE |
Asset-Backed Securities—Continued | | | | | | | | | | | | |
| | | | | |
Indexed Securities—Continued | | | | | | | | | | | | |
AQ Finance Nim Trust 2003-N13 | | | | 4.268% | | 12/25/08 | | $ | 29 | | $ | 29B |
Bayview Financial Acquisition Trust 2004-C | | | | 4.490% | | 5/28/44 | | | 255 | | | 256 |
Chase Funding Mortgage Loan Asset-Backed Certificates 2002-4 | | | | 4.408% | | 10/25/32 | | | 39 | | | 39 |
Chesapeake Funding LLC 2003-1 | | | | 4.140% | | 8/7/08 | | | 120 | | | 120 |
Citibank Credit Card Issuance Trust 2000-C2 | | | | 4.249% | | 10/15/07 | | | 90 | | | 90 |
Citibank Credit Card Issuance Trust 2002-C3 | | | | 5.010% | | 12/15/09 | | | 160 | | | 163 |
Countrywide Asset-Backed Certificates 2002-3 | | | | 4.408% | | 5/25/32 | | | 7 | | | 7 |
Countrywide Home Equity Loan Trust 2002-C | | | | 4.210% | | 5/15/28 | | | 55 | | | 55 |
Countrywide Home Equity Loan Trust 2004-J | | | | 4.260% | | 12/15/33 | | | 223 | | | 223 |
Countrywide Home Equity Loan Trust 2004-O | | | | 4.250% | | 2/15/34 | | | 252 | | | 253 |
CS First Boston Mortgage Securities Corporation
2004-HC1A | | | | 4.370% | | 12/15/21 | | | 579 | | | 579B |
EQCC Trust 2002-1 | | | | 4.338% | | 11/25/31 | | | 54 | | | 54 |
First North American National Bank 2003-A | | | | 4.450% | | 5/16/11 | | | 220 | | | 221 |
Fremont Home Loan Trust 2004-C | | | | 4.308% | | 1/25/32 | | | 190 | | | 190 |
GSAA Home Equity Trust 2004-9 | | | | 4.418% | | 9/25/34 | | | 276 | | | 276 |
Navistar Financial 2003-B Owner Trust | | | | 4.170% | | 4/15/08 | | | 184 | | | 184 |
New Century Home Equity Loan Trust 2001-NC1 | | | | 4.290% | | 6/20/31 | | | 4 | | | 4 |
Providian Gateway Master Trust 2002-B | | | | 4.670% | | 6/15/09 | | | 500 | | | 501B |
Rental Car Finance Corp. 2004-1A | | | | 4.238% | | 6/25/09 | | | 500 | | | 500B |
Residential Asset Mortgage Products, Inc. 2002-RS6 | | | | 4.488% | | 11/25/32 | | | 79 | | | 79 |
Residential Asset Securities Corporation 1999-KS1 | | | | 4.588% | | 3/25/29 | | | 100 | | | 100 |
Superior Wholesale Inventory Financing Trust 2004-A10 | | | | 4.070% | | 9/15/11 | | | 500 | | | 500 |
| | | | | | | | | | | |
|
|
| | | | | | | | | | | | | 4,453 |
| | | | | | | | | | | |
|
|
Total Asset-Backed Securities
(Identified Cost—$6,712) | | | | | | | | | | | | 6,677 |
Mortgage-Backed Securities | | 13.3% | | | | | | | | | | |
| | | | | |
Fixed Rate Securities | | 2.2% | | | | | | | | | | |
Asset Securitization Corporation 1996-D2 | | | | 6.920% | | 2/14/29 | | | 116 | | | 117 |
Countrywide Alternative Loan Trust 2004-J1 1A1 | | | | 6.000% | | 2/25/34 | | | 67 | | | 68 |
Countrywide Home Loans 2005-R3 | | | | 4.438% | | 9/25/35 | | | 900 | | | 900B |
Prime Mortgage Trust 2005-2 | | | | 7.596% | | 10/25/32 | | | 290 | | | 302 |
Residential Asset Mortgage Products, Inc. 2004-SL2 A4 | | | | 8.500% | | 10/25/31 | | | 53 | | | 54 |
Residential Asset Mortgage Products, Inc. 2005-SL1 A7 | | | | 8.000% | | 5/25/32 | | | 325 | | | 340 |
| | | | | | | | | | | |
|
|
| | | | | | | | | | | | | 1,781 |
| | | | | | | | | | | |
|
|
19
Semi-Annual Report to Shareholders
PORTFOLIO OF INVESTMENTS—Continued
Western Asset Limited Duration Bond Portfolio—Continued
| | | | | | | | | | | | |
| | | % OF
NET ASSETS | | RATE | | MATURITY
DATE | | PAR/
SHARES | | VALUE |
Mortgage-Backed Securities—Continued | | | | | | | | | | | | |
| | | | | |
Indexed SecuritiesA | | 8.6% | | | | | | | | | | |
Banc of America Mortgage Securities 2003-D | | | | 4.569% | | 5/25/33 | | $ | 225 | | $ | 223 |
Bear Stearns Arm Trust 2004-10 | | | | 4.618% | | 1/25/35 | | | 137 | | | 136 |
CBA Commercial Small Balance Commercial Mortgage 2005-1A | | | | 4.358% | | 8/25/35 | | | 667 | | | 667B |
Countrywide Alternative Loan Trust 2005-38 | | | | 4.388% | | 9/25/35 | | | 780 | | | 779 |
Countrywide Asset-backed Certificates 2005-Im1 | | | | 4.318% | | 7/25/35 | | | 1,000 | | | 999 |
Crusade Global Trust 2003-2 | | | | 4.076% | | 9/18/34 | | | 109 | | | 110D |
Granite Mortgages PLC 2003-1 | | | | 4.364% | | 1/20/20 | | | 228 | | | 228D |
Impac CMB Trust 2002-8 | | | | 4.498% | | 3/25/33 | | | 56 | | | 56 |
J.P. Morgan Chase Commercial Mortgage Securities Corp. 2003-FL2A | | | | 4.220% | | 11/15/16 | | | 93 | | | 93B |
J.P. Morgan Mortgage Trust 2003-A1 | | | | 4.377% | | 10/25/33 | | | 314 | | | 307 |
MASTR Adjustable Rate Mortgages Trust 2004-13 | | | | 3.787% | | 11/21/34 | | | 350 | | | 336 |
Medallion Trust 2000-2G | | | | 4.086% | | 12/18/31 | | | 118 | | | 118D |
Medallion Trust 2003-1G | | | | 4.110% | | 12/21/33 | | | 106 | | | 106D |
Merrill Lynch Mortgage Investor, Inc. 2004-SL1 | | | | 4.298% | | 4/25/35 | | | 35 | | | 35 |
MLCC Mortgage Investors, Inc. 2003-H | | | | 4.949% | | 1/25/29 | | | 96 | | | 97 |
Provident Funding Mortgage Loan Trust
2005-1 1A1 | | | | 4.189% | | 5/25/35 | | | 355 | | | 353 |
Sequoia Mortgage Trust 2003-2 A2 | | | | 4.700% | | 6/20/33 | | | 119 | | | 119 |
Structured Adjustable Rate Mortgage Loan Trust 2005-16xs | | | | 4.377% | | 8/25/35 | | | 748 | | | 744 |
Structured Adjustable Rate Mortgage Loan Trust 2005-19Xs | | | | 4.338% | | 9/25/35 | | | 775 | | | 772 |
Torrens Trust 2000-1GA | | | | 4.230% | | 7/15/31 | | | 52 | | | 52B,D |
Wachovia Mortgage Loan Trust, LLC | | | | 4.838% | | 8/20/35 | | | 485 | | | 485 |
WaMu Mortgage Pass-Through Certificates, Series 2003-AR10 | | | | 4.072% | | 10/25/33 | | | 200 | | | 198 |
| | | | | | | | | | | |
|
|
| | | | | | | | | | | | | 7,013 |
| | | | | | | | | | | |
|
|
Variable Rate SecuritiesE | | 2.5% | | | | | | | | | | |
Banc of America Funding Corporation 2004-B | | | | 4.224% | | 12/20/34 | | | 269 | | | 269 |
Banc of America Funding Corporation 2005-F | | | | 5.500% | | 9/20/35 | | | 382 | | | 384 |
Countrywide Alternative Loan Trust 2004-33 | | | | 4.953% | | 12/25/34 | | | 71 | | | 71 |
Countrywide Alternative Loan Trust 2004-33 | | | | 5.057% | | 12/25/34 | | | 149 | | | 149 |
Countrywide Alternative Loan Trust 2005-14 | | | | 3.300% | | 5/25/35 | | | 232 | | | 228 |
Residential Funding Mortgage Securities I, Inc., Series 2005-Sa3 | | | | 4.968% | | 8/25/35 | | | 756 | | | 755 |
Structured Asset Securities Corporation 2004-SC1 A | | | | 9.144% | | 12/25/29 | | | 176 | | | 186 |
| | | | | | | | | | | |
|
|
| | | | | | | | | | | | | 2,042 |
| | | | | | | | | | | |
|
|
Total Mortgage-Backed Securities
(Identified Cost—$10,896) | | | | | | | | | | | | 10,836 |
20
Semi-Annual Report to Shareholders
| | | | | | | | | | | | |
| | | % OF
NET ASSETS | | RATE | | MATURITY
DATE | | PAR/
SHARES | | VALUE |
Municipal Bonds | | 0.1% | | | | | | | | | | |
Liberty New York Development Corporation Revenue | | | | 5.250% | | 10/1/35 | | $ | 70 | | $ | 78 |
| | | | | | | | | | | |
|
|
Total Municipal Bonds
(Identified Cost—$77) | | | | | | | | | | | | 78 |
U.S. Government and Agency Obligations | | 33.6% | | | | | | | | | | |
| | | | | |
Fixed Rate Securities | | 30.4% | | | | | | | | | | |
Fannie Mae | | | | 2.800% | | 3/1/19 | | | 260 | | | 258 |
Freddie Mac | | | | 3.125% | | 9/15/06 | | | 950 | | | 939 |
Freddie Mac | | | | 3.800% | | 12/27/06 | | | 1,820 | | | 1,808 |
Freddie Mac | | | | 3.625% | | 11/14/08 | | | 375 | | | 366 |
United States Treasury Notes | | | | 3.500% | | 5/31/07 | | | 2,160 | | | 2,137 |
United States Treasury Notes | | | | 3.625% | | 6/30/07 | | | 18,630 | | | 18,452 |
United States Treasury Notes | | | | 3.000% | | 11/15/07 | | | 110 | | | 107 |
United States Treasury Notes | | | | 3.750% | | 5/15/08 | | | 790 | | | 782 |
United States Treasury Notes | | | | 4.000% | | 3/15/10 | | | 2 | | | 2 |
United States Treasury Notes | | | | 4.250% | | 11/15/14 | | | 10 | | | 10 |
| | | | | | | | | | | |
|
|
| | | | | | | | | | | | | 24,861 |
| | | | | | | | | | | |
|
|
Indexed SecuritiesF | | 3.2% | | | | | | | | | | |
United States Treasury Inflation-Protected Security | | | | 3.000% | | 7/15/12 | | | 1,684 | | | 1,833 |
United States Treasury Inflation-Protected Security | | | | 2.375% | | 1/15/25 | | | 726 | | | 776 |
| | | | | | | | | | | |
|
|
| | | | | | | | | | | | | 2,609 |
| | | | | | | | | | | |
|
|
Total U.S. Government and Agency Obligations (Identified Cost—$27,613) | | | | | | | | | | | | 27,470 |
U.S. Government Agency Mortgage-Backed Securities | | 15.1% | | | | | | | | | | |
| | | | | |
Fixed Rate Securities | | 4.8% | | | | | | | | | | |
Fannie Mae | | | | 5.000% | | 12/1/35 | | | 2,500 | | | 2,447G |
Fannie Mae | | | | 6.000% | | 12/1/35 | | | 1,150 | | | 1,169G |
Freddie Mac | | | | 5.000% | | 12/1/35 | | | 100 | | | 98G |
Government National Mortgage Association | | | | 5.000% | | 12/1/35 | | | 230 | | | 228G |
| | | | | | | | | | | |
|
|
| | | | | | | | | | | | | 3,942 |
| | | | | | | | | | | |
|
|
Indexed SecuritiesA | | 10.3% | | | | | | | | | | |
Fannie Mae | | | | 4.218% | | 12/1/34 | | | 184 | | | 181 |
Fannie Mae | | | | 4.262% | | 12/1/34 | | | 178 | | | 176 |
Fannie Mae | | | | 4.330% | | 1/1/35 | | | 187 | | | 184 |
21
Semi-Annual Report to Shareholders
PORTFOLIO OF INVESTMENTS—Continued
Western Asset Limited Duration Bond Portfolio—Continued
| | | | | | | | | | | | |
| | | % OF
NET ASSETS | | RATE | | MATURITY
DATE | | PAR/
SHARES | | VALUE |
U.S. Government Agency Mortgage-Backed Securities—Continued | | | | | | | | | | | | |
| | | | | |
Indexed Securities—Continued | | | | | | | | | | | | |
Fannie Mae | | | | 4.877% | | 1/1/35 | | $ | 369 | | $ | 369 |
Fannie Mae | | | | 4.818% | | 2/1/35 | | | 900 | | | 900 |
Fannie Mae | | | | 4.551% | | 3/1/35 | | | 392 | | | 389 |
Fannie Mae | | | | 5.116% | | 3/1/35 | | | 685 | | | 687 |
Fannie Mae | | | | 4.738% | | 7/1/35 | | | 4,893 | | | 4,905 |
Freddie Mac | | | | 4.354% | | 12/1/34 | | | 91 | | | 90 |
Freddie Mac | | | | 4.089% | | 1/1/35 | | | 61 | | | 60 |
Freddie Mac | | | | 4.096% | | 1/1/35 | | | 110 | | | 108 |
Freddie Mac | | | | 4.516% | | 1/1/35 | | | 336 | | | 333 |
| | | | | | | | | | | |
|
|
| | | | | | | | | | | | | 8,382 |
| | | | | | | | | | | |
|
|
Total U.S. Government Agency Mortgage-Backed Securities (Identified Cost—$12,388) | | | | | | | | | | | | 12,324 |
Yankee BondsD | | 3.3% | | | | | | | | | | |
| | | | | |
Banks | | 0.1% | | | | | | | | | | |
The Korea Development Bank | | | | 4.750% | | 7/20/09 | | | 70 | | | 70 |
| | | | | | | | | | | |
|
|
| | | | | |
Foreign Governments | | 0.2% | | | | | | | | | | |
Russian Federation | | | | 3.000% | | 5/14/08 | | | 70 | | | 67 |
Russian Federation | | | | 8.250% | | 3/31/10 | | | 130 | | | 140B |
| | | | | | | | | | | |
|
|
| | | | | | | | | | | | | 207 |
| | | | | | | | | | | |
|
|
Oil and Gas | | 1.1% | | | | | | | | | | |
Ocean Energy Inc. | | | | 4.375% | | 10/1/07 | | | 160 | | | 159 |
Pemex Project Funding Master Trust | | | | 8.500% | | 2/15/08 | | | 50 | | | 54 |
Pemex Project Funding Master Trust | | | | 6.125% | | 8/15/08 | | | 490 | | | 504 |
Pemex Project Funding Master Trust | | | | 5.170% | | 6/15/10 | | | 140 | | | 146A,B |
| | | | | | | | | | | |
|
|
| | | | | | | | | | | | | 863 |
| | | | | | | | | | | |
|
|
Special Purpose | | 0.5% | | | | | | | | | | |
BP Capital Markets Plc | | | | 2.750% | | 12/29/06 | | | 100 | | | 98 |
ChevronTexaco Capital Company | | | | 3.500% | | 9/17/07 | | | 20 | | | 20 |
Deutsche Telekom International Finance BV | | | | 3.875% | | 7/22/08 | | | 160 | | | 156 |
Diageo Capital Plc | | | | 3.375% | | 3/20/08 | | | 100 | | | 97 |
| | | | | | | | | | | |
|
|
| | | | | | | | | | | | | 371 |
| | | | | | | | | | | |
|
|
Telecommunications | | 1.3% | | | | | | | | | | |
British Telecommunications PLC | | | | 8.375% | | 12/15/10 | | | 450 | | | 521 |
Koninklijke (Royal) KPN NV | | | | 8.000% | | 10/1/10 | | | 40 | | | 45 |
22
Semi-Annual Report to Shareholders
| | | | | | | | | | | | | | |
| | | % OF
NET ASSETS | | RATE | | MATURITY
DATE | | PAR/
SHARES | | | VALUE | |
Yankee Bonds—Continued | | | | | | | | | | | | | | |
| | | | | |
Telecommunications—Continued | | | | | | | | | | | | | | |
Telecom Italia Capital | | | | 4.000% | | 11/15/08 | | $ | 260 | | | $ | 254 | |
Telecom Italia Capital | | | | 4.480% | | 2/1/11 | | | 80 | | | | 80A | |
Telefonos de Mexico SA de CV (Telmex) | | | | 8.250% | | 1/26/06 | | | 190 | | | | 192 | |
| | | | | | | | | | | | |
|
|
|
| | | | | | | | | | | | | | 1,092 | |
| | | | | | | | | | | | |
|
|
|
Telecommunications (Cellular/Wireless) | | 0.1% | | | | | | | | | | | | |
Vodafone Group Plc | | | | 3.950% | | 1/30/08 | | | 80 | | | | 80 | |
| | | | | | | | | | | | |
|
|
|
Total Yankee Bonds (Identified Cost—$2,694) | | | | | | | | | | | | | 2,683 | |
Preferred Stocks | | 1.7% | | | | | | | | | | | | |
Fannie Mae | | | | 7.000% | | | | | 26 | shs | | | 1,403A | |
| | | | | | | | | | | | |
|
|
|
Total Preferred Stocks (Identified Cost—$1,423) | | | | | | | | | | | | | 1,403 | |
| | | | | | | | | | | | |
|
|
|
Total Long-Term Securities (Identified Cost—$82,624) | | | | | | | | | | | 82,122 | |
Short-Term Securities | | N.M. | | | | | | | | | | | | |
| | | | | |
U.S. Government and Agency Obligations | | N.M. | | | | | | | | | | | | |
Fannie Mae | | | | 0.000% | | 12/5/05 | | $ | 50 | | | | 50H,I | |
| | | | | | | | | | | | |
|
|
|
Total Short-Term Securities (Identified Cost—$50) | | | | | | | | | | | 50 | |
Total Investments (Identified Cost—$82,674) | | 100.6% | | | | | | | | | | $ | 82,172 | |
Other Assets Less Liabilities | | (0.6)% | | | | | | | | | | | (513 | ) |
| | | | | | | | | | | | |
|
|
|
| | | | | |
Net Assets | | 100.0% | | | | | | | | | | $ | 81,659 | |
| | | | | | | | | | | | |
|
|
|
23
Semi-Annual Report to Shareholders
PORTFOLIO OF INVESTMENTS—Continued
Western Asset Limited Duration Bond Portfolio—Continued
| | | | | | | | |
| | | EXPIRATION | | ACTUAL
CONTRACTS | | APPRECIATION/
(DEPRECIATION) | |
Futures Contracts PurchasedJ | | | | | | | | |
U.S. Treasury Note Futures | | December 2005 | | 10 | | $ | (9 | ) |
| | | | | | |
|
|
|
Futures Contracts WrittenJ | | | | | | | | |
Eurodollar Futures | | March 2006 | | 26 | | $ | 27 | |
U.S. Treasury Note Futures | | December 2005 | | 17 | | | 15 | |
U.S. Treasury Note Futures | | December 2005 | | 9 | | | 14 | |
| | | | | | |
|
|
|
| | | | | | | $ | 56 | |
| | | | | | |
|
|
|
| | | | | | | | | |
| A | Indexed security – The rate of interest earned on this security is tied to the London Interbank Offered Rate (“LIBOR”). The coupon rate is the rate as of September 30, 2005. |
| B | Rule 144a Security – A security purchased pursuant to Rule 144a under the Securities Act of 1933 which may not be resold subject to that rule except to qualified institutional buyers. These securities represent 6.2% of net assets. |
| C | Stepped coupon security – A security with predetermined schedule of interest or dividend rate changes, at which time it begins to accrue interest or pay dividends. |
| D | Yankee Bond – A dollar denominated bond issued in the U.S. by foreign entities. |
| E | The coupon rates shown on variable rate securities are the rates at September 30, 2005. These rates vary with the weighted average coupon of the underlying loans. |
| F | Inflation-Protected Security – A security whose principal value is adjusted daily in accordance with changes to the Consumer Price Index for All Urban Consumers. Interest is calculated on the basis of the current adjusted principal value. |
| G | When-issued security – Security purchased on a delayed delivery basis. Final settlement amount and maturity date have not yet been announced. |
| H | Zero coupon bond – A bond with no periodic interest payments which is sold at such a discount as to produce a current yield to maturity. |
| I | All or a portion of this security is collateral to cover futures contracts. |
| J | Options and futures are described in more detail in the notes to financial statements. |
See notes to financial statements.
24
Semi-Annual Report to Shareholders
PORTFOLIO OF INVESTMENTS
September 30, 2005 (Unaudited)
(Amounts in Thousands)
Western Asset Intermediate Bond Portfolio
| | | | | | | | | | | | |
| | | % OF
NET ASSETS | | RATE | | MATURITY
DATE | | PAR/
SHARES | | VALUE |
Long-Term Securities | | 91.5% | | | | | | | | | | |
| | | | | |
Corporate Bonds and Notes | | 35.5% | | | | | | | | | | |
| | | | | |
Aerospace/Defense | | 0.4% | | | | | | | | | | |
Systems 2001 Asset Trust | | | | 6.664% | | 9/15/13 | | $ | 1,526 | | $ | 1,635 |
United Technologies Corporation | | | | 6.350% | | 3/1/11 | | | 1,280 | | | 1,376 |
| | | | | | | | | | | |
|
|
| | | | | | | | | | | | | 3,011 |
| | | | | | | | | | | |
|
|
| | | | | |
Automotive | | 0.6% | | | | | | | | | | |
Ford Motor Company | | | | 7.450% | | 7/16/31 | | | 1,430 | | | 1,115A |
General Motors Corporation | | | | 8.375% | | 7/15/33 | | | 4,440 | | | 3,463A |
| | | | | | | | | | | |
|
|
| | | | | | | | | | | | | 4,578 |
| | | | | | | | | | | |
|
|
Banking and Finance | | 7.3% | | | | | | | | | | |
Aspetuck Trust 2004-1 | | | | 3.899% | | 10/17/05 | | | 4,000 | | | 3,999B |
Caterpillar Financial Services
Corporation | | | | 3.450% | | 1/15/09 | | | 1,700 | | | 1,638 |
Countrywide Financial Corporation | | | | 3.983% | | 5/5/08 | | | 5,150 | | | 5,161B |
Ford Motor Credit Company | | | | 4.830% | | 9/28/07 | | | 8,600 | | | 8,381B |
Ford Motor Credit Company | | | | 6.625% | | 6/16/08 | | | 11,160 | | | 10,908A |
General Motors Acceptance Corporation | | | | 6.125% | | 8/28/07 | | | 4,680 | | | 4,607 |
General Motors Acceptance Corporation | | | | 5.110% | | 9/23/08 | | | 5,768 | | | 5,344 |
General Motors Acceptance Corporation | | | | 6.750% | | 12/1/14 | | | 2,420 | | | 2,105A |
HSBC Finance Corporation | | | | 4.010% | | 5/10/10 | | | 1,570 | | | 1,570 |
Nissan Motor Acceptance Corporation | | | | 4.625% | | 3/8/10 | | | 1,540 | | | 1,512C |
Residential Capital Corporation | | | | 5.385% | | 6/29/07 | | | 4,100 | | | 4,134A,C |
U.S. Bank National Association | | | | 4.400% | | 8/15/08 | | | 2,600 | | | 2,586 |
| | | | | | | | | | | |
|
|
| | | | | | | | | | | | | 51,945 |
| | | | | | | | | | | |
|
|
Cable | | 0.4% | | | | | | | | | | |
Cox Communications, Inc. | | | | 4.407% | | 12/14/07 | | | 2,860 | | | 2,880B |
| | | | | | | | | | | |
|
|
| | | | | |
Casino Resorts | | 0.2% | | | | | | | | | | |
Harrah’s Operating Company, Inc. | | | | 5.625% | | 6/1/15 | | | 1,700 | | | 1,681C |
| | | | | | | | | | | |
|
|
| | | | | |
Chemicals | | 0.4% | | | | | | | | | | |
Rohm and Haas Company | | | | 7.400% | | 7/15/09 | | | 342 | | | 373 |
The Dow Chemical Company | | | | 5.750% | | 12/15/08 | | | 760 | | | 786 |
The Dow Chemical Company | | | | 5.970% | | 1/15/09 | | | 880 | | | 916 |
The Dow Chemical Company | | | | 6.000% | | 10/1/12 | | | 1,000 | | | 1,059 |
| | | | | | | | | | | |
|
|
| | | | | | | | | | | | | 3,134 |
| | | | | | | | | | | |
|
|
25
Semi-Annual Report to Shareholders
PORTFOLIO OF INVESTMENTS—Continued
Western Asset Intermediate Bond Portfolio—Continued
| | | | | | | | | | | | |
| | | % OF
NET ASSETS | | RATE | | MATURITY
DATE | | PAR/
SHARES | | VALUE |
Corporate Bonds and Notes—Continued | | | | | | | | | | | | |
| | | | | |
Computer Services and Systems | | 0.4% | | | | | | | | | | |
Electronic Data Systems Corporation | | | | 7.125% | | 10/15/09 | | $ | 2,740 | | $ | 2,935A |
| | | | | | | | | | | |
|
|
| | | | | |
Diversified Financial Services | | 1.3% | | | | | | | | | | |
Capital One Bank | | | | 4.250% | | 12/1/08 | | | 2,030 | | | 1,994 |
CIT Group Inc. | | | | 4.033% | | 5/23/08 | | | 3,600 | | | 3,609B |
iStar Financial Inc. | | | | 4.245% | | 3/3/08 | | | 1,280 | | | 1,281B |
iStar Financial Inc. | | | | 4.875% | | 1/15/09 | | | 620 | | | 614A |
iStar Financial Inc. | | | | 5.375% | | 4/15/10 | | | 1,510 | | | 1,512 |
| | | | | | | | | | | |
|
|
| | | | | | | | | | | | | 9,010 |
| | | | | | | | | | | |
|
|
Drug and Grocery Store Chains | | 0.2% | | | | | | | | | | |
The Kroger Co. | | | | 6.200% | | 6/15/12 | | | 1,090 | | | 1,135 |
| | | | | | | | | | | |
|
|
| | | | | |
Electric | | 2.1% | | | | | | | | | | |
Appalachian Power Company | | | | 3.600% | | 5/15/08 | | | 3,350 | | | 3,258A |
Carolina Power & Light Company | | | | 5.950% | | 3/1/09 | | | 1,175 | | | 1,216 |
Commonwealth Edison Company | | | | 6.150% | | 3/15/12 | | | 325 | | | 338 |
Dominion Resources, Inc. | | | | 4.750% | | 12/15/10 | | | 540 | | | 534 |
Dominion Resources, Inc. | | | | 5.700% | | 9/17/12 | | | 1,970 | | | 2,033 |
FirstEnergy Corp. | | | | 6.450% | | 11/15/11 | | | 2,600 | | | 2,768 |
Niagara Mohawk Power Corporation | | | | 7.750% | | 10/1/08 | | | 2,150 | | | 2,326 |
The Cleveland Electric Illuminating Company | | | | 5.650% | | 12/15/13 | | | 2,115 | | | 2,167 |
| | | | | | | | | | | |
|
|
| | | | | | | | | | | | | 14,640 |
| | | | | | | | | | | |
|
|
Energy | | 2.1% | | | | | | | | | | |
Alabama Power Company | | | | 4.026% | | 8/25/09 | | | 1,400 | | | 1,404B |
CenterPoint Energy Inc. | | | | 5.875% | | 6/1/08 | | | 1,635 | | | 1,669 |
Duke Energy Corporation | | | | 6.250% | | 1/15/12 | | | 1,330 | | | 1,415 |
Exelon Corporation | | | | 6.750% | | 5/1/11 | | | 2,200 | | | 2,358 |
MidAmerican Energy Holdings Company | | | | 5.875% | | 10/1/12 | | | 1,020 | | | 1,064 |
Pacific Gas and Electric Company | | | | 3.600% | | 3/1/09 | | | 2,850 | | | 2,753A |
Progress Energy, Inc. | | | | 5.850% | | 10/30/08 | | | 1,250 | | | 1,283 |
Progress Energy, Inc. | | | | 7.100% | | 3/1/11 | | | 1,650 | | | 1,794 |
TXU Energy Co. | | | | 4.920% | | 1/17/06 | | | 890 | | | 890B |
| | | | | | | | | | | |
|
|
| | | | | | | | | | | | | 14,630 |
| | | | | | | | | | | |
|
|
| | | | | |
Environmental Services | | 0.8% | | | | | | | | | | |
Waste Management, Inc. | | | | 6.875% | | 5/15/09 | | | 2,820 | | | 3,000 |
Waste Management, Inc. | | | | 7.375% | | 8/1/10 | | | 2,480 | | | 2,727 |
| | | | | | | | | | | |
|
|
| | | | | | | | | | | | | 5,727 |
| | | | | | | | | | | |
|
|
26
Semi-Annual Report to Shareholders
| | | | | | | | | | | | |
| | | % OF
NET ASSETS | | RATE | | MATURITY
DATE | | PAR/
SHARES | | VALUE |
Corporate Bonds and Notes—Continued | | | | | | | | | | | | |
| | | | | |
Food, Beverage and Tobacco | | 1.6% | | | | | | | | | | |
Altria Group, Inc. | | | | 6.950% | | 6/1/06 | | $ | 1,390 | | $ | 1,411 |
Altria Group, Inc. | | | | 7.200% | | 2/1/07 | | | 4,130 | | | 4,248 |
Altria Group, Inc. | | | | 7.650% | | 7/1/08 | | | 100 | | | 107 |
Kraft Foods Inc. | | | | 5.625% | | 11/1/11 | | | 780 | | | 806 |
Pepsi Bottling Holdings Inc. | | | | 5.625% | | 2/17/09 | | | 2,441 | | | 2,520C |
Sara Lee Corporation | | | | 2.750% | | 6/15/08 | | | 2,050 | | | 1,941 |
Sara Lee Corporation | | | | 6.250% | | 9/15/11 | | | 670 | | | 701 |
| | | | | | | | | | | |
|
|
| | | | | | | | | | | | | 11,734 |
| | | | | | | | | | | |
|
|
Gas and Pipeline Utilities | | 0.5% | | | | | | | | | | |
Kinder Morgan Energy Partners, L.P. | | | | 7.500% | | 11/1/10 | | | 1,630 | | | 1,808 |
The Williams Companies, Inc. | | | | 8.125% | | 3/15/12 | | | 1,900 | | | 2,076 |
| | | | | | | | | | | |
|
|
| | | | | | | | | | | | | 3,884 |
| | | | | | | | | | | |
|
|
Health Care | | 0.2% | | | | | | | | | | |
WellPoint Inc. | | | | 3.750% | | 12/14/07 | | | 1,800 | | | 1,763 |
| | | | | | | | | | | |
|
|
| | | | | |
Insurance | | 0.2% | | | | | | | | | | |
ACE INA Holdings Inc. | | | | 8.300% | | 8/15/06 | | | 1,610 | | | 1,660 |
| | | | | | | | | | | |
|
|
| | | | | |
Investment Banking/Brokerage | | 3.3% | | | | | | | | | | |
Goldman Sachs Group, L.P. | | | | 4.300% | | 6/28/10 | | | 6,780 | | | 6,796B |
J.P. Morgan & Co. Incorporated | | | | 8.094% | | 2/15/12 | | | 2,190 | | | 2,312B |
J.P. Morgan Chase Capital XIII | | | | 4.970% | | 9/30/34 | | | 150 | | | 149A,B |
J.P. Morgan Chase & Co. | | | | 4.094% | | 1/17/11 | | | 4,130 | | | 4,129B |
Merrill Lynch & Co. Inc. | | | | 3.953% | | 2/5/10 | | | 2,880 | | | 2,884B |
Morgan Stanley | | | | 3.879% | | 1/15/10 | | | 5,600 | | | 5,621B |
The Bear Stearns Companies Inc. | | | | 4.550% | | 6/23/10 | | | 1,380 | | | 1,365 |
| | | | | | | | | | | |
|
|
| | | | | | | | | | | | | 23,256 |
| | | | | | | | | | | |
|
|
| | | | | |
Investment Management | | 0.3% | | | | | | | | | | |
Dryden Investor Trust | | | | 7.157% | | 7/23/08 | | | 2,114 | | | 2,183C |
| | | | | | | | | | | |
|
|
| | | | | |
Media | | 2.4% | | | | | | | | | | |
Clear Channel Communications, Inc. | | | | 6.000% | | 11/1/06 | | | 2,730 | | | 2,769 |
Clear Channel Communications, Inc. | | | | 4.625% | | 1/15/08 | | | 2,820 | | | 2,791A |
Clear Channel Communications, Inc. | | | | 4.250% | | 5/15/09 | | | 350 | | | 338 |
Liberty Media Corporation | | | | 7.875% | | 7/15/09 | | | 3,800 | | | 3,999 |
News America Incorporated | | | | 6.625% | | 1/9/08 | | | 3,124 | | | 3,246A |
27
Semi-Annual Report to Shareholders
PORTFOLIO OF INVESTMENTS—Continued
Western Asset Intermediate Bond Portfolio—Continued
| | | | | | | | | | | | |
| | | % OF
NET ASSETS | | RATE | | MATURITY
DATE | | PAR/
SHARES | | VALUE |
Corporate Bonds and Notes—Continued | | | | | | | | | | | | |
| | | | | |
Media—Continued | | | | | | | | | | | | |
Time Warner Inc. | | | | 6.875% | | 5/1/12 | | $ | 1,740 | | $ | 1,902 |
Turner Broadcasting System, Inc. | | | | 8.375% | | 7/1/13 | | | 1,830 | | | 2,157 |
| | | | | | | | | | | |
|
|
| | | | | | | | | | | | | 17,202 |
| | | | | | | | | | | |
|
|
Medical Care Facilities | | 0.3% | | | | | | | | | | |
HCA, Inc. | | | | 8.750% | | 9/1/10 | | | 1,705 | | | 1,883 |
| | | | | | | | | | | |
|
|
| | | | | |
Oil and Gas | | 1.6% | | | | | | | | | | |
Amerada Hess Corporation | | | | 7.375% | | 10/1/09 | | | 2,440 | | | 2,649 |
Occidental Petroleum Corporation | | | | 7.375% | | 11/15/08 | | | 2,370 | | | 2,561 |
Sonat Inc. | | | | 7.625% | | 7/15/11 | | | 4,880 | | | 4,953 |
XTO Energy, Inc. | | | | 7.500% | | 4/15/12 | | | 1,060 | | | 1,194 |
| | | | | | | | | | | |
|
|
| | | | | | | | | | | | | 11,357 |
| | | | | | | | | | | |
|
|
Paper and Forest Products | | 0.9% | | | | | | | | | | |
International Paper Company | | | | 3.800% | | 4/1/08 | | | 2,310 | | | 2,251 |
International Paper Company | | | | 6.750% | | 9/1/11 | | | 1,000 | | | 1,072A |
Weyerhaeuser Company | | | | 5.250% | | 12/15/09 | | | 290 | | | 292A |
Willamette Industries, Inc. | | | | 7.125% | | 7/22/13 | | | 2,270 | | | 2,501 |
| | | | | | | | | | | |
|
|
| | | | | | | | | | | | | 6,116 |
| | | | | | | | | | | |
|
|
Photo Equipment and Supplies | | 0.3% | | | | | | | | | | |
Eastman Kodak Company | | | | 7.250% | | 11/15/13 | | | 2,470 | | | 2,343 |
| | | | | | | | | | | |
|
|
| | | | | |
Special Purpose | | 6.2% | | | | | | | | | | |
BAE Systems Holdings Inc. | | | | 4.050% | | 8/15/08 | | | 1,740 | | | 1,739B,C |
DaimlerChrysler NA Holding Corporation | | | | 4.026% | | 3/7/07 | | | 2,790 | | | 2,786B,C |
DaimlerChrysler NA Holding Corporation | | | | 4.314% | | 9/10/07 | | | 7,670 | | | 7,688A,B |
DaimlerChrysler NA Holding Corporation | | | | 4.875% | | 6/15/10 | | | 1,800 | | | 1,764 |
Devon Financing Corporation ULC | | | | 6.875% | | 9/30/11 | | | 2,500 | | | 2,748 |
International Lease Finance Corporation | | | | 4.625% | | 6/2/08 | | | 950 | | | 944 |
International Lease Finance Corporation | | | | 5.000% | | 4/15/10 | | | 5,160 | | | 5,178A |
National Rural Utilities Cooperative Finance Corporation | | | | 3.875% | | 2/15/08 | | | 1,160 | | | 1,142A |
National Rural Utilities Cooperative Finance Corporation | | | | 5.750% | | 12/1/08 | | | 690 | | | 712 |
Sprint Capital Corporation | | | | 4.780% | | 8/17/06 | | | 1,970 | | | 1,973D |
Sprint Capital Corporation | | | | 6.125% | | 11/15/08 | | | 3,270 | | | 3,396 |
Sprint Capital Corporation | | | | 8.375% | | 3/15/12 | | | 4,280 | | | 5,037 |
Tyco International Group SA | | | | 4.436% | | 6/15/07 | | | 3,350 | | | 3,334C |
Verizon Global Funding Corp. | | | | 7.250% | | 12/1/10 | | | 5,000 | | | 5,526 |
| | | | | | | | | | | |
|
|
| | | | | | | | | | | | | 43,967 |
| | | | | | | | | | | |
|
|
28
Semi-Annual Report to Shareholders
| | | | | | | | | | | | | |
| | | % OF
NET ASSETS | | RATE | | MATURITY
DATE | | PAR/
SHARES | | VALUE | |
Corporate Bonds and Notes—Continued | | | | | | | | | | | | | |
| | | | | |
Telecommunications (Cellular/Wireless) | | 0.6% | | | | | | | | | | | |
ALLTEL Corporation | | | | 4.656% | | 5/17/07 | | $ | 1,530 | | $ | 1,529 | |
New Cingular Wireless Services Inc. | | | | 8.125% | | 5/1/12 | | | 2,304 | | | 2,702 | |
| | | | | | | | | | | |
|
|
|
| | | | | | | | | | | | | 4,231 | |
| | | | | | | | | | | |
|
|
|
Transportation | | 0.9% | | | | | | | | | | | |
Continental Airlines, Inc. | | | | 6.545% | | 2/2/19 | | | 1,317 | | | 1,291 | |
Delta Air Lines, Inc. | | | | 6.619% | | 3/18/11 | | | 503 | | | 470 | |
Delta Air Lines, Inc. | | | | 6.718% | | 7/2/24 | | | 2,393 | | | 2,450 | |
U.S. Airways | | | | 6.850% | | 1/30/18 | | | 1,277 | | | 1,271 | |
Union Pacific Corporation | | | | 6.650% | | 1/15/11 | | | 1,000 | | | 1,078 | |
| | | | | | | | | | | |
|
|
|
| | | | | | | | | | | | | 6,560 | |
| | | | | | | | | | | |
|
|
|
Total Corporate Bonds and Notes
(Identified Cost—$254,827) | | | | | | | | | | | | 253,445 | |
| | | | | |
Asset-Backed Securities | | 3.7% | | | | | | | | | | | |
| | | | | |
Fixed Rate Securities | | 0.9% | | | | | | | | | | | |
ABFS Mortgage Loan Trust 2002-3 | | | | 4.263% | | 9/15/33 | | | 1,368 | | | 1,357 | |
Conseco Finance Securitizations Corp. 2000-4 | | | | 8.310% | | 5/1/32 | | | 800 | | | 653 | |
Green Tree Financial Corporation 1994-6 | | | | 8.900% | | 1/15/20 | | | 3,402 | | | 3,544 | |
Mego Mortgage Home Loan Trust 1996-2 | | | | 7.275% | | 8/25/17 | | | 31 | | | 31 | |
UCFC Home Equity Loan 1998-D | | | | 6.905% | | 4/15/30 | | | 698 | | | 704 | |
| | | | | | | | | | | |
|
|
|
| | | | | | | | | | | | | 6,289 | |
| | | | | | | | | | | |
|
|
|
Indexed SecuritiesB | | 2.7% | | | | | | | | | | | |
AFC Home Equity Loan Trust 2003-3 | | | | 4.180% | | 10/25/30 | | | 1,901 | | | 1,904A | |
AMRESCO Residential Securites Mortgage Loan Trust 1998-2 | | | | 4.863% | | 6/25/28 | | | 371 | | | 371 | |
Capital One Auto Finance Trust 2003-A | | | | 4.130% | | 10/15/07 | | | 1,391 | | | 1,391 | |
CNH Equipment Trust 2003-A | | | | 4.150% | | 7/16/07 | | | 1,564 | | | 1,564 | |
Countrywide Asset-Backed Certificates 2002-BC1 | | | | 4.368% | | 4/25/32 | | | 1,161 | | | 1,161 | |
Household Home Equity Loan Trust 2002-3 | | | | 4.450% | | 7/20/32 | | | 1,646 | | | 1,647 | |
IndyMac Home Equity Loan Asset-Backed Trust 2001-A | | | | 4.298% | | 3/25/31 | | | 944 | | | 944 | |
MMCA Automobile Trust 2002-1 | | | | 4.250% | | 1/15/10 | | | 195 | | | 195 | |
Morgan Stanley ABS Capital I
2003-NC8 A2 | | | | 4.398% | | 9/25/33 | | | 832 | | | 832 | |
MSDWCC HELOC Trust 2003-1 | | | | 4.308% | | 11/25/15 | | | 2,405 | | | 2,410 | |
29
Semi-Annual Report to Shareholders
PORTFOLIO OF INVESTMENTS—Continued
Western Asset Intermediate Bond Portfolio—Continued
| | | | | | | | | | | | |
| | | % OF
NET ASSETS | | RATE | | MATURITY
DATE | | PAR/
SHARES | | VALUE |
Asset-Backed Securities—Continued | | | | | | | | | | | | |
| | | | | |
Indexed Securities—Continued | | | | | | | | | | | | |
Residential Asset Securities Corporation 2003-KS1 | | | | 4.408% | | 1/25/33 | | $ | 1,237 | | $ | 1,241 |
Sovereign Dealer Floor Plan Master LLC
2000-1A | | | | 4.220% | | 10/15/07 | | | 5,500 | | | 5,500A |
| | | | | | | | | | | |
|
|
| | | | | | | | | | | | | 19,160 |
| | | | | | | | | | | |
|
|
Stripped Securities | | 0.1% | | | | | | | | | | |
ACA CDS 2002-1, Ltd. | | | | 2.742% | | 7/15/08 | | | 7,600 | | | 369E1 |
Oakwood Mortgage Investors Inc. 2001-C | | | | 6.000% | | 5/15/08 | | | 4,433 | | | 515E1 |
| | | | | | | | | | | |
|
|
| | | | | | | | | | | | | 884 |
| | | | | | | | | | | |
|
|
Total Asset-Backed Securities
(Identified Cost—$26,795) | | | | | | | | | | | | 26,333 |
| | | | | |
Mortgage-Backed Securities | | 5.7% | | | | | | | | | | |
| | | | | |
Fixed Rate Securities | | 1.7% | | | | | | | | | | |
Asset Securitization Corporation 1996-D2 | | | | 6.920% | | 2/14/29 | | | 728 | | | 732 |
Fannie Mae Grantor Trust 2002-T3 | | | | 5.763% | | 12/25/11 | | | 3,830 | | | 4,041 |
GMAC Commercial Mortgage Securities Inc. 1998-C1 | | | | 6.700% | | 5/15/30 | | | 873 | | | 907 |
Merrill Lynch Mortgage Investors, Inc.
1998-C1 | | | | 6.310% | | 11/15/26 | | | 454 | | | 456 |
MLCC Mortgage Investors, Inc. 2005-1 2A2 | | | | 4.970% | | 4/25/35 | | | 3,990 | | | 3,918 |
Nomura Asset Securities Corporation 1996-MD5 | | | | 7.120% | | 4/13/39 | | | 1,500 | | | 1,518 |
Ocwen Residential MBS Corporation 1998-R1 | | | | 7.000% | | 10/25/40 | | | 155 | | | 155 |
| | | | | | | | | | | |
|
|
| | | | | | | | | | | | | 11,727 |
| | | | | | | | | | | |
|
|
Indexed SecuritiesB | | 2.0% | | | | | | | | | | |
Countrywide Home Loans 2003-49 | | | | 3.697% | | 12/19/33 | | | 1,000 | | | 972 |
Impac CMB Trust 2003-12 | | | | 4.210% | | 12/25/33 | | | 2,540 | | | 2,543 |
MASTR Adjustable Rate Mortgages Trust 2004-13 | | | | 3.787% | | 11/21/34 | | | 7,300 | | | 7,004 |
Wells Fargo Mortgage Backed Securities Trust 2004-S | | | | 3.540% | | 9/25/34 | | | 4,350 | | | 4,191 |
| | | | | | | | | | | |
|
|
| | | | | | | | | | | | | 14,710 |
| | | | | | | | | | | |
|
|
Stripped Securities | | N.M. | | | | | | | | | | |
FFCA Secured Lending Corporation 1997-1 | | | | 0.370% | | 2/18/22 | | | 65 | | | 0.157A,E1 |
| | | | | | | | | | | |
|
|
| | | | | |
Variable Rate SecuritiesG | | 2.0% | | | | | | | | | | |
Banc of America Funding Corporation
2005-B | | | | 5.139% | | 4/25/35 | | | 3,639 | | | 3,624 |
Bear Stearns ALT-A Trust 2005-2 | | | | 4.740% | | 4/25/35 | | | 3,567 | | | 3,541 |
Countrywide Home Loans 2004-20 | | | | 5.261% | | 9/25/34 | | | 2,823 | | | 2,874 |
30
Semi-Annual Report to Shareholders
| | | | | | | | | | | | |
| | | % OF
NET ASSETS | | RATE | | MATURITY
DATE | | PAR/
SHARES | | VALUE |
| | | | | |
Mortgage-Backed Securities—Continued | | | | | | | | | | | | |
| | | | | |
Variable Rate Securities—Continued | | | | | | | | | | | | |
Merrill Lynch Mortgage Investors, Inc.
2005-A2 | | | | 4.500% | | 2/25/35 | | $ | 2,487 | | $ | 2,455 |
MLCC Mortgage Investors, Inc. 2005-1 2A1 | | | | 4.970% | | 4/25/35 | | | 1,282 | | | 1,273 |
WaMu Mortgage Pass-Through Certificates
2004-AR11 | | | | 4.604% | | 10/25/34 | | | 601 | | | 592 |
| | | | | | | | | | | |
|
|
| | | | | | | | | | | | | 14,359 |
| | | | | | | | | | | |
|
|
Total Mortgage-Backed Securities
(Identified Cost—$41,719) | | | | | | | | | | | | 40,796 |
| | | | | |
Municipal Bonds | | 0.1% | | | | | | | | | | |
Liberty New York Development
Corporation Revenue | | | | 5.250% | | 10/1/35 | | | 540 | | | 602 |
| | | | | | | | | | | |
|
|
Total Municipal Bonds
(Identified Cost—$598) | | | | | | | | | | | | 602 |
| | | | | |
U.S. Government and Agency Obligations | | 29.6% | | | | | | | | | | |
| | | | | |
Fixed Rate Securities | | 25.6% | | | | | | | | | | |
Fannie Mae | | | | 7.250% | | 1/15/10 | | | 200 | | | 221 |
Fannie Mae | | | | 4.375% | | 3/15/13 | | | 3,540 | | | 3,494 |
Fannie Mae | | | | 4.625% | | 5/1/13 | | | 290 | | | 285A |
Fannie Mae | | | | 5.125% | | 1/2/14 | | | 1,300 | | | 1,320 |
Farmer Mac | | | | 4.250% | | 7/29/08 | | | 1,240 | | | 1,233 |
Federal Farm Credit Bank | | | | 4.875% | | 4/4/12 | | | 3,160 | | | 3,213 |
Federal Home Loan Bank | | | | 3.125% | | 9/15/06 | | | 6,000 | | | 5,932 |
Federal Home Loan Bank | | | | 4.125% | | 4/18/08 | | | 2,460 | | | 2,445 |
Federal Home Loan Bank | | | | 5.800% | | 3/30/09 | | | 600 | | | 625 |
Tennessee Valley Authority | | | | 5.625% | | 1/18/11 | | | 460 | | | 483 |
Tennessee Valley Authority | | | | 6.790% | | 5/23/12 | | | 3,390 | | | 3,805 |
Tennessee Valley Authority | | | | 5.880% | | 4/1/36 | | | 220 | | | 250 |
United States Treasury Bonds | | | | 8.000% | | 11/15/21 | | | 3,430 | | | 4,748A |
United States Treasury Bonds | | | | 6.250% | | 5/15/30 | | | 170 | | | 211A |
United States Treasury Bonds | | | | 5.375% | | 2/15/31 | | | 2,060 | | | 2,308A |
United States Treasury Notes | | | | 2.375% | | 8/15/06 | | | 30 | | | 30A |
United States Treasury Notes | | | | 2.250% | | 2/15/07 | | | 2,370 | | | 2,310A |
United States Treasury Notes | | | | 3.125% | | 5/15/07 | | | 3,860 | | | 3,797A |
United States Treasury Notes | | | | 4.375% | | 5/15/07 | | | 980 | | | 983A |
United States Treasury Notes | | | | 6.625% | | 5/15/07 | | | 2,290 | | | 2,379A |
United States Treasury Notes | | | | 2.750% | | 8/15/07 | | | 520 | | | 507A |
United States Treasury Notes | | | | 4.000% | | 8/31/07 | | | 44,690 | | | 44,538A |
31
Semi-Annual Report to Shareholders
PORTFOLIO OF INVESTMENTS—Continued
Western Asset Intermediate Bond Portfolio—Continued
| | | | | | | | | | | | |
| | | % OF
NET ASSETS | | RATE | | MATURITY
DATE | | PAR/
SHARES | | VALUE |
| | | | | |
U.S. Government and Agency
Obligations—Continued | | | | | | | | | | | | |
| | | | | |
Fixed Rate Securities—Continued | | | | | | | | | | | | |
United States Treasury Notes | | | | 3.750% | | 5/15/08 | | $ | 24,240 | | $ | 23,981A |
United States Treasury Notes | | | | 3.875% | | 5/15/09 | | | 4,870 | | | 4,817A |
United States Treasury Notes | | | | 4.000% | | 6/15/09 | | | 5,240 | | | 5,204A |
United States Treasury Notes | | | | 3.625% | | 1/15/10 | | | 6,760 | | | 6,604A |
United States Treasury Notes | | | | 3.500% | | 2/15/10 | | | 11,550 | | | 11,219A |
United States Treasury Notes | | | | 4.000% | | 4/15/10 | | | 6,515 | | | 6,456A |
United States Treasury Notes | | | | 4.125% | | 8/15/10 | | | 2,850 | | | 2,837A |
United States Treasury Notes | | | | 4.250% | | 11/15/14 | | | 2,520 | | | 2,502A |
United States Treasury Notes | | | | 4.125% | | 5/15/15 | | | 34,730 | | | 34,132A |
United States Treasury Notes | | | | 4.250% | | 8/15/15 | | | 20 | | | 20A |
| | | | | | | | | | | |
|
|
| | | | | | | | | | | | | 182,889 |
| | | | | | | | | | | |
|
|
| | | | | |
Indexed SecuritiesH | | 3.8% | | | | | | | | | | |
United States Treasury Inflation-Protected Security | | | | 0.875% | | 4/15/10 | | | 2,929 | | | 2,854A |
United States Treasury Inflation-Protected Security | | | | 3.000% | | 7/15/12 | | | 1,532 | | | 1,667A |
United States Treasury Inflation-Protected Security | | | | 1.875% | | 7/15/13 | | | 745 | | | 755A |
United States Treasury Inflation-Protected Security | | | | 2.000% | | 1/15/14 | | | 6,820 | | | 6,962A |
United States Treasury Inflation-Protected Security | | | | 2.000% | | 7/15/14 | | | 2,612 | | | 2,668A |
United States Treasury Inflation-Protected Security | | | | 2.375% | | 1/15/25 | | | 11,283 | | | 12,071A |
| | | | | | | | | | | |
|
|
| | | | | | | | | | | | | 26,977 |
| | | | | | | | | | | |
|
|
Stripped Securities | | 0.2% | | | | | | | | | | |
United States Treasury Notes | | | | 0.000% | | 5/15/30 | | | 3,790 | | | 1,234A,E2 |
| | | | | | | | | | | |
|
|
Total U.S. Government and Agency Obligations
(Identified Cost— $212,649) | | | | | | | | | | | | 211,100 |
32
Semi-Annual Report to Shareholders
| | | | | | | | | | | | |
| | | % OF
NET ASSETS | | RATE | | MATURITY
DATE | | PAR/
SHARES | | VALUE |
U.S. Government Agency Mortgage-Backed Securities | | 8.6% | | | | | | | | | | |
| | | | | |
Fixed Rate Securities | | 5.5% | | | | | | | | | | |
Fannie Mae | | | | 6.500% | | 6/1/14 | | $ | 229 | | $ | 238 |
Fannie Mae | | | | 8.000% | | 9/1/15 | | | 97 | | | 104 |
Fannie Mae | | | | 9.500% | | 4/15/21 | | | 67 | | | 74 |
Fannie Mae | | | | 5.000% | | 12/1/35 | | | 23,900 | | | 23,392I |
Fannie Mae | | | | 5.500% | | 12/1/35 | | | 600 | | | 600I |
Freddie Mac | | | | 4.250% | | 2/28/07 | | | 5,060 | | | 5,052 |
Freddie Mac | | | | 4.500% | | 1/15/13 | | | 2,450 | | | 2,432 |
Freddie Mac | | | | 6.500% | | 6/1/13 | | | 25 | | | 26 |
Freddie Mac | | | | 6.500% | | 6/1/14 | | | 63 | | | 66 |
Freddie Mac | | | | 5.000% | | 7/15/14 | | | 6,270 | | | 6,428 |
Freddie Mac | | | | 6.500% | | 11/1/15 | | | 12 | | | 13 |
Freddie Mac | | | | 7.500% | | 4/1/17 | | | 6 | | | 6 |
Freddie Mac | | | | 9.300% | | 4/15/19 | | | 107 | | | 107 |
Freddie Mac | | | | 5.000% | | 12/1/35 | | | 1,100 | | | 1,076I |
Government National Mortgage Association | | | | 9.000% | | 6/15/06 | | | 12 | | | 12 |
| | | | | | | | | | | |
|
|
| | | | | | | | | | | | | 39,626 |
| | | | | | | | | | | |
|
|
| | | | | |
Indexed SecuritiesB | | 3.1% | | | | | | | | | | |
Fannie Mae | | | | 3.546% | | 3/1/18 | | | 41 | | | 41 |
Fannie Mae | | | | 4.325% | | 11/1/34 | | | 1,183 | | | 1,167 |
Fannie Mae | | | | 4.205% | | 12/1/34 | | | 1,282 | | | 1,262 |
Fannie Mae | | | | 4.878% | | 1/1/35 | | | 4,336 | | | 4,333 |
Fannie Mae | | | | 3.777% | | 3/1/35 | | | 2,170 | | | 2,111 |
Fannie Mae | | | | 4.785% | | 4/1/35 | | | 1,576 | | | 1,576 |
Freddie Mac | | | | 4.022% | | 1/1/19 | | | 18 | | | 18 |
Freddie Mac | | | | 4.366% | | 12/1/34 | | | 549 | | | 541 |
Freddie Mac | | | | 4.485% | | 12/1/34 | | | 2,645 | | | 2,618 |
Freddie Mac | | | | 4.088% | | 1/1/35 | | | 516 | | | 506 |
Freddie Mac | | | | 4.097% | | 1/1/35 | | | 935 | | | 917 |
Freddie Mac | | | | 4.595% | | 7/1/35 | | | 7,100 | | | 7,079 |
| | | | | | | | | | | |
|
|
| | | | | | | | | | | | | 22,169 |
| | | | | | | | | | | |
|
|
33
Semi-Annual Report to Shareholders
PORTFOLIO OF INVESTMENTS—Continued
Western Asset Intermediate Bond Portfolio—Continued
| | | | | | | | | | | | |
| | | % OF
NET ASSETS | | RATE | | MATURITY
DATE | | PAR/
SHARES | | VALUE |
U.S. Government Agency Mortgage-Backed Securities—Continued | | | | | | | | | | | | |
| | | | | |
Stripped Securities | | N.M. | | | | | | | | | | |
Fannie Mae | | | | 0.000% | | 5/25/22 | | $ | 15 | | $ | 13E2 |
Freddie Mac | | | | 10.000% | | 3/1/21 | | | 13 | | | 3E1 |
| | | | | | | | | | | |
|
|
| | | | | | | | | | | | | 16 |
| | | | | | | | | | | |
|
|
Total U.S. Government Agency
Mortgage-Backed Securities
(Identified Cost—$62,425) | | | | | | | | | | | | 61,811 |
Yankee BondsF | | 6.9% | | | | | | | | | | |
| | | | | |
Banking and Finance | | 1.4% | | | | | | | | | | |
AIFUL CORPORATION | | | | 5.000% | | 8/10/10 | | | 2,590 | | | 2,573C |
HBOS Treasury Services plc | | | | 4.000% | | 9/15/09 | | | 1,530 | | | 1,496C |
HSBC Holdings plc | | | | 7.500% | | 7/15/09 | | | 5,700 | | | 6,238 |
| | | | | | | | | | | |
|
|
| | | | | | | | | | | | | 10,307 |
| | | | | | | | | | | |
|
|
Banks | | 0.8% | | | | | | | | | | |
Banco Santiago SA | | | | 4.148% | | 12/9/09 | | | 290 | | | 289B,C |
Royal Bank of Scotland Group plc | | | | 9.118% | | 3/31/49 | | | 3,000 | | | 3,488 |
The Korea Development Bank | | | | 4.750% | | 7/20/09 | | | 60 | | | 60 |
The Korea Development Bank | | | | 4.574% | | 10/20/09 | | | 1,980 | | | 1,981B,C |
| | | | | | | | | | | |
|
|
| | | | | | | | | | | | | 5,818 |
| | | | | | | | | | | |
|
|
| | | | | |
Electric | | 0.3% | | | | | | | | | | |
SP PowerAssets Limited | | | | 5.000% | | 10/22/13 | | | 1,965 | | | 1,981C |
| | | | | | | | | | | |
|
|
| | | | | |
Foreign Governments | | 0.8% | | | | | | | | | | |
Russian Federation | | | | 5.000% | | 3/31/30 | | | 4,640 | | | 5,331D |
| | | | | | | | | | | |
|
|
| | | | | |
Manufacturing (Diversified) | | 0.2% | | | | | | | | | | |
Tyco International Group SA | | | | 6.375% | | 10/15/11 | | | 180 | | | 192 |
Tyco International Group SA | | | | 6.000% | | 11/15/13 | | | 1,020 | | | 1,078 |
| | | | | | | | | | | |
|
|
| | | | | | | | | | | | | 1,270 |
| | | | | | | | | | | |
|
|
| | | | | |
Oil and Gas | | 1.1% | | | | | | | | | | |
Pemex Project Funding Master Trust | | | | 8.500% | | 2/15/08 | | | 1,000 | | | 1,080 |
Pemex Project Funding Master Trust | | | | 6.125% | | 8/15/08 | | | 660 | | | 680 |
Pemex Project Funding Master Trust | | | | 5.170% | | 6/15/10 | | | 5,680 | | | 5,910B,C |
Pemex Project Funding Master Trust | | | | 7.375% | | 12/15/14 | | | 220 | | | 244 |
| | | | | | | | | | | |
|
|
| | | | | | | | | | | | | 7,914 |
| | | | | | | | | | | |
|
|
34
Semi-Annual Report to Shareholders
| | | | | | | | | | | | | |
| | | % OF
NET ASSETS | | RATE | | MATURITY
DATE | | PAR/
SHARES | | | VALUE |
Yankee BondsF—Continued | | | | | | | | | | | | | |
Special Purpose | | 0.4% | | | | | | | | | | | |
Deutsche Telekom International Finance BV | | | | 8.500% | | 6/15/10 | | $ | 1,300 | | | $ | 1,474 |
Petrozuata Finance, Inc. | | | | 8.220% | | 4/1/17 | | | 1,090 | | | | 1,041C |
| | | | | | | | | | | | |
|
|
| | | | | | | | | | | | | | 2,515 |
| | | | | | | | | | | | |
|
|
Telecommunications | | 1.5% | | | | | | | | | | | |
British Telecommunications plc | | | | 8.375% | | 12/15/10 | | | 4,610 | | | | 5,338 |
Koninklijke (Royal) KPN NV | | | | 8.000% | | 10/1/10 | | | 1,600 | | | | 1,815 |
Telecom Italia Capital | | | | 4.000% | | 11/15/08 | | | 990 | | | | 966 |
Telecom Italia Capital | | | | 4.480% | | 2/1/11 | | | 2,690 | | | | 2,690A,B |
| | | | | | | | | | | | |
|
|
| | | | | | | | | | | | | | 10,809 |
| | | | | | | | | | | | |
|
|
Utilities | | 0.4% | | | | | | | | | | | |
United Utilities plc | | | | 6.450% | | 4/1/08 | | | 2,960 | | | | 3,071 |
| | | | | | | | | | | | |
|
|
Total Yankee Bonds
(Identified Cost—$47,666) | | | | | | | | | | | | | 49,016 |
| | | | | |
Preferred Stocks | | 1.4% | | | | | | | | | | | |
Fannie Mae | | | | 7.000% | | | | | 175 | shs | | | 9,576B |
Home Ownership Funding Corporation | | | | 13.331% | | | | | 1 | | | | 180C,D |
Home Ownership Funding Corporation II | | | | 13.338% | | | | | 2 | | | | 541C,D |
| | | | | | | | | | | | |
|
|
Total Preferred Stocks (Identified Cost—$11,705) | | | | | | | | | | | | | 10,297 |
| | | | | | | | | | | | |
|
|
Total Long-Term Securities (Identified Cost—$658,384) | | | | | | | | | | | 653,400 |
| | | | | |
Investment of Collateral From Securities Lending | | 25.2% | | | | | | | | | | | |
State Street Navigator Securities Lending Prime Portfolio | | | | | | | | | 179,860 | | | | 179,860 |
| | | | | | | | | | | | |
|
|
Total Investments of Collateral From Securities Lending (Identified Cost—179,860 ) | | | | | | | | | | | | | 179,860 |
| | | | | |
Short-Term Securities | | 10.8% | | | | | | | | | | | |
| | | | | |
U.S. Government and Agency Obligations | | 0.2% | | | | | | | | | | | |
Fannie Mae | | | | 0.000% | | 12/5/05 | | $ | 1,343 | | | | 1,335J,K |
| | | | | | | | | | | | |
|
|
| | | | | |
Options PurchasedL | | N.M. | | | | | | | | | | | |
Federal Funds Futures Call, November 2005, Strike
Price $96.31 | | | | | | | 35M | | | | 0.365 |
| | | | | | | | | | | | |
|
|
35
Semi-Annual Report to Shareholders
PORTFOLIO OF INVESTMENTS—Continued
Western Asset Intermediate Bond Portfolio—Continued
| | | | | | | | | |
| | | % OF
NET ASSETS | | PAR/
SHARES | | VALUE | |
| | | |
Short-Term Securities—Continued | | | | | | | | | |
| | | |
Repurchase Agreements | | 10.6% | | | | | | | |
Goldman, Sachs & Company
3.8%, dated 9/30/05, to be repurchased at $75,967 on 10/3/05 (Collateral: $79,250 Freddie Mac notes, 2.375%, due 2/15/07, value $77,467) | | | | $ | 75,943 | | $ | 75,943 | |
| | | | | | | |
|
|
|
| | | | | | | | | | |
Total Short Term Securities (Identified Cost—$77,281) | | | | | | | | 77,278 | |
Total Investments (Identified Cost—$915,525) | | 127.5% | | | | | $ | 910,538 | |
Obligation to Return Collateral for Securities Loaned | | (25.2)% | | | | | | (179,860 | ) |
Other Assets Less Liabilities | | (2.3)% | | | | | | (16,214 | ) |
| | | | | | | |
|
|
|
Net Assets | | 100.0% | | | | | $ | 714,464 | |
| | | | | | | |
|
|
|
36
Semi-Annual Report to Shareholders
| | | | | | | | |
| | | EXPIRATION | | ACTUAL
CONTRACTS | | APPRECIATION/
(DEPRECIATION) | |
Futures Contracts PurchasedL | | | | | | | | |
Eurodollar Futures | | March 2006 | | 239 | | $ | (89 | ) |
Eurodollar Futures | | December 2005 | | 127 | | | (136 | ) |
U.S. Treasury Note Futures | | December 2005 | | 431 | | | (448 | ) |
U.S. Treasury Note Futures | | December 2005 | | 31 | | | 2 | |
U.S. Treasury Note Futures | | December 2005 | | 36 | | | (0.180 | ) |
| | | | | | |
|
|
|
| | | | | | | $ | (671 | ) |
| | | | | | |
|
|
|
Futures Contracts WrittenL | | | | | | | | |
U.S. Treasury Note Futures | | December 2005 | | 215 | | $ | 328 | |
U.S. Treasury Note Futures | | December 2005 | | 164 | | | (247 | ) |
| | | | | | |
|
|
|
| | | | | | | $ | 81 | |
| | | | | | |
|
|
|
Options WrittenL | | | | | | | | |
U.S. Treasury Bond Futures Put, Strike Price $113.00 | | November 2005 | �� | 153 | | $ | 14 | |
U.S. Treasury Note Futures Put, Strike Price $109.00 | | November 2005 | | 206 | | | (11 | ) |
| | | | | | |
|
|
|
| | | | | | | $ | 3 | |
| | | | | | |
|
|
|
| | | | | | | | | |
| A | All or a portion of these securities is on loan. |
| B | Indexed security – The rate of interest earned on this security is tied to the London Interbank Offered Rate (“LIBOR”) or the one-year Treasury Bill rate. The coupon rate is the rate as of September 30, 2005. |
| C | Rule 144a Security – A security purchased pursuant to Rule 144a under the Securities Act of 1933 which may not be resold subject to that rule except to qualified institutional buyers. These securities represent 5% of net assets. |
| D | Stepped coupon security – A security with a predetermined schedule of interest or dividend rate changes, at which time it begins to accrue interest or pay dividends. |
| E | Security with interest-only or principal-only payment streams, denoted by a 1 or 2, respectively. For interest-only securities, the amount shown as principal is the notional balance used to calculate the amount of interest due. |
| F | Yankee Bond – A dollar denominated bond issued in the U.S. by foreign entities. |
| G | The coupon rates shown on variable rate securities are the rates at September 30, 2005. These rates vary with the weighted average coupon of the underlying loans. |
| H | Inflation-Protected Security – A security whose principal value is adjusted daily in accordance with changes to the Consumer Price Index for All Urban Consumers. Interest is calculated on the basis of the current adjusted principal value. |
| I | When-issued security – Security purchased on a delayed delivery basis. Final settlement amount and maturity date have not yet been announced. |
| J | Zero coupon bond – A bond with no periodic interest payments which is sold at such a discount as to produce a current yield to maturity. |
| K | All or a portion of this security is collateral to cover futures and option contracts. |
| L | Options and futures are described in more detail in the notes to financial statements. |
| M | Par represents actual number of contracts. |
N.M.—Not meaningful.
37
Semi-Annual Report to Shareholders
PORTFOLIO OF INVESTMENTS
September 30, 2005
(Amounts in Thousands) (Unaudited)
Western Asset Intermediate Plus Bond Portfolio
| | | | | | | | | | | | |
| | | % OF
NET ASSETS | | RATE | | MATURITY
DATE | | PAR/
SHARES | | VALUE |
Long-Term Securities | | 91.9% | | | | | | | | | | |
| | | | | |
Corporate Bonds and Notes | | 37.2% | | | | | | | | | | |
| | | | | |
Automotive | | 0.5% | | | | | | | | | | |
Ford Motor Company | | | | 7.450% | | 7/16/31 | | $ | 110 | | $ | 86 |
General Motors Corporation | | | | 8.375% | | 7/15/33 | | | 210 | | | 164 |
| | | | | | | | | | | |
|
|
| | | | | | | | | | | | | 250 |
| | | | | | | | | | | |
|
|
Banking and Finance | | 7.4% | | | | | | | | | | |
Aspetuck Trust 2004-1 | | | | 3.899% | | 10/17/05 | | | 90 | | | 90A |
Caterpillar Financial Services Corporation | | | | 3.450% | | 1/15/09 | | | 120 | | | 116 |
Countrywide Financial Corporation | | | | 3.983% | | 5/5/08 | | | 130 | | | 130A |
Ford Motor Credit Company | | | | 4.830% | | 9/28/07 | | | 650 | | | 634A |
Ford Motor Credit Company | | | | 6.625% | | 6/16/08 | | | 830 | | | 811 |
General Motors Acceptance Corporation | | | | 6.125% | | 8/28/07 | | | 370 | | | 364 |
General Motors Acceptance Corporation | | | | 6.311% | | 11/30/07 | | | 30 | | | 29 |
General Motors Acceptance Corporation | | | | 5.110% | | 9/23/08 | | | 490 | | | 454A |
General Motors Acceptance Corporation | | | | 6.750% | | 12/1/14 | | | 120 | | | 104 |
HSBC Finance Corporation | | | | 4.010% | | 5/10/10 | | | 454 | | | 454A |
Nissan Motor Acceptance Corporation | | | | 4.625% | | 3/8/10 | | | 100 | | | 98B |
Residential Capital Corporation | | | | 5.385% | | 6/29/07 | | | 300 | | | 303A,B |
U.S. Bank National Association | | | | 4.400% | | 8/15/08 | | | 190 | | | 189 |
| | | | | | | | | | | |
|
|
| | | | | | | | | | | | | 3,776 |
| | | | | | | | | | | |
|
|
Cable | | 0.6% | | | | | | | | | | |
Cox Communications, Inc. | | | | 4.407% | | 12/14/07 | | | 280 | | | 282A |
| | | | | | | | | | | |
|
|
| | | | | |
Casino Resorts | | 0.3% | | | | | | | | | | |
Harrah’s Operating Company, Inc. | | | | 5.625% | | 6/1/15 | | | 130 | | | 128B |
| | | | | | | | | | | |
|
|
| | | | | |
Chemicals | | 0.6% | | | | | | | | | | |
Rohm and Haas Company | | | | 7.400% | | 7/15/09 | | | 20 | | | 22 |
The Dow Chemical Company | | | | 5.750% | | 12/15/08 | | | 100 | | | 103 |
The Dow Chemical Company | | | | 5.970% | | 1/15/09 | | | 70 | | | 73 |
The Dow Chemical Company | | | | 6.000% | | 10/1/12 | | | 100 | | | 106 |
| | | | | | | | | | | |
|
|
| | | | | | | | | | | | | 304 |
| | | | | | | | | | | |
|
|
Computer Services and Systems | | 0.5% | | | | | | | | | | |
Electronic Data Systems Corporation | | | | 7.125% | | 10/15/09 | | | 230 | | | 246 |
| | | | | | | | | | | |
|
|
38
Semi-Annual Report to Shareholders
| | | | | | | | | | | | |
| | | % OF
NET ASSETS | | RATE | | MATURITY
DATE | | PAR/
SHARES | | VALUE |
Corporate Bonds and Notes—Continued | | | | | | | | | | | | |
| | | | | |
Diversified Financial Services | | 1.4% | | | | | | | | | | |
Capital One Bank | | | | 4.250% | | 12/1/08 | | $ | 210 | | $ | 206 |
CIT Group Inc. | | | | 4.033% | | 5/23/08 | | | 240 | | | 241A |
iStar Financial Inc. | | | | 4.250% | | 3/3/08 | | | 100 | | | 100A |
iStar Financial Inc. | | | | 4.875% | | 1/15/09 | | | 70 | | | 69 |
iStar Financial Inc. | | | | 5.375% | | 4/15/10 | | | 90 | | | 90 |
| | | | | | | | | | | |
|
|
| | | | | | | | | | | | | 706 |
| | | | | | | | | | | |
|
|
Electric | | 2.7% | | | | | | | | | | |
Alabama Power Company | | | | 4.026% | | 8/25/09 | | | 120 | | | 120A |
Appalachian Power Company | | | | 3.600% | | 5/15/08 | | | 277 | | | 269 |
Dominion Resources, Inc. | | | | 4.750% | | 12/15/10 | | | 20 | | | 20 |
Dominion Resources, Inc. | | | | 5.700% | | 9/17/12 | | | 80 | | | 83 |
FirstEnergy Corp. | | | | 6.450% | | 11/15/11 | | | 500 | | | 532 |
Niagara Mohawk Power Corporation | | | | 7.750% | | 10/1/08 | | | 50 | | | 54 |
The AES Corporation | | | | 9.500% | | 6/1/09 | | | 150 | | | 164 |
The Cleveland Electric Illuminating Company | | | | 5.650% | | 12/15/13 | | | 110 | | | 113 |
| | | | | | | | | | | |
|
|
| | | | | | | | | | | | | 1,355 |
| | | | | | | | | | | |
|
|
Energy | | 1.7% | | | | | | | | | | |
CenterPoint Energy, Inc. | | | | 5.875% | | 6/1/08 | | | 120 | | | 122 |
Exelon Corporation | | | | 6.750% | | 5/1/11 | | | 150 | | | 161 |
Pacific Gas and Electric Company | | | | 3.600% | | 3/1/09 | | | 120 | | | 116 |
Progress Energy, Inc. | | | | 5.850% | | 10/30/08 | | | 100 | | | 103 |
Progress Energy, Inc. | | | | 7.100% | | 3/1/11 | | | 170 | | | 185 |
TXU Corp. | | | | 6.375% | | 6/15/06 | | | 60 | | | 61 |
TXU Corp. | | | | 6.375% | | 1/1/08 | | | 90 | | | 92 |
TXU Energy Co. | | | | 4.920% | | 1/17/06 | | | 50 | | | 50A |
| | | | | | | | | | | |
|
|
| | | | | | | | | | | | | 890 |
| | | | | | | | | | | |
|
|
Environmental Services | | 0.8% | | | | | | | | | | |
Waste Management, Inc. | | | | 6.875% | | 5/15/09 | | | 250 | | | 266 |
Waste Management, Inc. | | | | 7.375% | | 8/1/10 | | | 150 | | | 165 |
| | | | | | | | | | | |
|
|
| | | | | | | | | | | | | 431 |
| | | | | | | | | | | |
|
|
Food, Beverage and Tobacco | | 1.5% | | | | | | | | | | |
Altria Group, Inc. | | | | 7.650% | | 7/1/08 | | | 10 | | | 11 |
Altria Group, Inc. | | | | 5.625% | | 11/4/08 | | | 350 | | | 359 |
Kraft Foods Inc. | | | | 5.625% | | 11/1/11 | | | 40 | | | 41 |
Pepsi Bottling Holdings Inc. | | | | 5.625% | | 2/17/09 | | | 120 | | | 124B |
Sara Lee Corporation | | | | 2.750% | | 6/15/08 | | | 150 | | | 142 |
Sara Lee Corporation | | | | 6.250% | | 9/15/11 | | | 60 | | | 63 |
| | | | | | | | | | | |
|
|
| | | | | | | | | | | | | 740 |
| | | | | | | | | | | |
|
|
39
Semi-Annual Report to Shareholders
PORTFOLIO OF INVESTMENTS—Continued
Western Asset Intermediate Plus Bond Portfolio—Continued
| | | | | | | | | | | | |
| | | % OF
NET ASSETS | | RATE | | MATURITY
DATE | | PAR/
SHARES | | VALUE |
Corporate Bonds and Notes—Continued | | | | | | | | | | | | |
| | | | | |
Gas and Pipeline Utilities | | 0.8% | | | | | | | | | | |
ANR Pipeline, Inc. | | | | 8.875% | | 3/15/10 | | $ | 65 | | $ | 70 |
Kinder Morgan Energy Partners, L.P. | | | | 7.500% | | 11/1/10 | | | 90 | | | 100 |
Southern Natural Gas Company | | | | 8.875% | | 3/15/10 | | | 85 | | | 92 |
The Williams Companies, Inc. | | | | 5.890% | | 10/1/10 | | | 150 | | | 149A,B |
| | | | | | | | | | | |
|
|
| | | | | | | | | | | | | 411 |
| | | | | | | | | | | |
|
|
Health Care | | 0.2% | | | | | | | | | | |
WellPoint Inc. | | | | 3.750% | | 12/14/07 | | | 130 | | | 127 |
| | | | | | | | | | | |
|
|
| | | | | |
Insurance | | 0.3% | | | | | | | | | | |
ACE INA Holdings Inc. | | | | 8.300% | | 8/15/06 | | | 150 | | | 155 |
| | | | | | | | | | | |
|
|
| | | | | |
Investment Banking/Brokerage | | 3.2% | | | | | | | | | | |
Goldman Sachs Group, L.P. | | | | 4.300% | | 6/28/10 | | | 530 | | | 531A |
J.P. Morgan Chase & Co. | | | | 4.320% | | 1/17/11 | | | 500 | | | 500A |
J.P. Morgan Chase Capital XIII | | | | 4.970% | | 9/30/34 | | | 20 | | | 20A |
Lehman Brothers Holdings Inc. | | | | 4.500% | | 7/26/10 | | | 40 | | | 39 |
Merrill Lynch & Co., Inc. | | | | 3.953% | | 2/5/10 | | | 160 | | | 160A |
Morgan Stanley | | | | 4.430% | | 1/15/10 | | | 330 | | | 331A |
The Bear Stearns Companies Inc. | | | | 4.550% | | 6/23/10 | | | 50 | | | 50 |
| | | | | | | | | | | |
|
|
| | | | | | | | | | | | | 1,631 |
| | | | | | | | | | | |
|
|
| | | | | |
Media | | 2.9% | | | | | | | | | | |
Clear Channel Communications, Inc. | | | | 6.000% | | 11/1/06 | | | 180 | | | 183 |
Clear Channel Communications, Inc. | | | | 4.625% | | 1/15/08 | | | 180 | | | 178 |
Clear Channel Communications, Inc. | | | | 4.250% | | 5/15/09 | | | 20 | | | 19 |
Clear Channel Communications, Inc. | | | | 7.650% | | 9/15/10 | | | 10 | | | 11 |
Clear Channel Communications, Inc. | | | | 5.500% | | 9/15/14 | | | 40 | | | 39 |
Liberty Media Corporation | | | | 7.875% | | 7/15/09 | | | 360 | | | 379 |
News America, Inc. | | | | 6.625% | | 1/9/08 | | | 270 | | | 281 |
Time Warner Inc. | | | | 6.875% | | 5/1/12 | | | 120 | | | 131 |
Turner Broadcasting System, Inc. | | | | 8.375% | | 7/1/13 | | | 130 | | | 153 |
Viacom Inc. | | | | 5.625% | | 5/1/07 | | | 120 | | | 121 |
| | | | | | | | | | | |
|
|
| | | | | | | | | | | | | 1,495 |
| | | | | | | | | | | |
|
|
| | | | | |
Medical Care Facilities | | 0.2% | | | | | | | | | | |
HCA, Inc. | | | | 6.750% | | 7/15/13 | | | 70 | | | 71 |
HCA, Inc. | | | | 8.750% | | 9/1/10 | | | 50 | | | 55 |
| | | | | | | | | | | |
|
|
| | | | | | | | | | | | | 126 |
| | | | | | | | | | | |
|
|
40
Semi-Annual Report to Shareholders
| | | | | | | | | | | | |
| | | % OF
NET ASSETS | | RATE | | MATURITY
DATE | | PAR/
SHARES | | VALUE |
Corporate Bonds and Notes—Continued | | | | | | | | | | | | |
Medical Products | | 0.2% | | | | | | | | | | |
Bristol-Myers Squibb Company | | | | 5.750% | | 10/1/11 | | $ | 110 | | $ | 115 |
| | | | | | | | | | | |
|
|
| | | | | |
Oil and Gas | | 2.2% | | | | | | | | | | |
Amerada Hess Corporation | | | | 7.375% | | 10/1/09 | | | 153 | | | 166 |
El Paso Corporation | | | | 6.950% | | 12/15/07 | | | 300 | | | 304 |
Kerr-McGee Corporation | | | | 5.875% | | 9/15/06 | | | 115 | | | 116 |
Kerr-McGee Corporation | | | | 6.625% | | 10/15/07 | | | 60 | | | 62 |
Occidental Petroleum Corporation | | | | 7.375% | | 11/15/08 | | | 140 | | | 151 |
Occidental Petroleum Corporation | | | | 6.750% | | 1/15/12 | | | 200 | | | 222 |
XTO Energy, Inc. | | | | 7.500% | | 4/15/12 | | | 100 | | | 113 |
| | | | | | | | | | | |
|
|
| | | | | | | | | | | | | 1,134 |
| | | | | | | | | | | |
|
|
Paper and Forest Products | | 0.9% | | | | | | | | | | |
International Paper Company | | | | 3.800% | | 4/1/08 | | | 230 | | | 224 |
International Paper Company | | | | 6.750% | | 9/1/11 | | | 50 | | | 54 |
Weyerhaeuser Company | | | | 5.250% | | 12/15/09 | | | 20 | | | 20 |
Weyerhaeuser Company | | | | 6.750% | | 3/15/12 | | | 130 | | | 140 |
| | | | | | | | | | | |
|
|
| | | | | | | | | | | | | 438 |
| | | | | | | | | | | |
|
|
Photo Equipment and Supplies | | 0.3% | | | | | | | | | | |
Eastman Kodak Company | | | | 7.250% | | 11/15/13 | | | 150 | | | 142 |
| | | | | | | | | | | |
|
|
| | | | | |
Special Purpose | | 6.4% | | | | | | | | | | |
BAE Systems Holdings Inc. | | | | 4.050% | | 8/15/08 | | | 130 | | | 130A,B |
DaimlerChrysler NA Holding Corporation | | | | 4.026% | | 3/7/07 | | | 190 | | | 190A |
DaimlerChrysler NA Holding Corporation | | | | 4.314% | | 9/10/07 | | | 580 | | | 581 |
DaimlerChrysler NA Holding Corporation | | | | 4.875% | | 6/15/10 | | | 160 | | | 157 |
Devon Financing Corporation ULC | | | | 6.875% | | 9/30/11 | | | 250 | | | 275 |
International Lease Finance Corporation | | | | 4.625% | | 6/2/08 | | | 90 | | | 89 |
International Lease Finance Corporation | | | | 5.000% | | 4/15/10 | | | 320 | | | 321 |
Sprint Capital Corporation | | | | 4.780% | | 8/17/06 | | | 360 | | | 361 |
Sprint Capital Corporation | | | | 6.125% | | 11/15/08 | | | 280 | | | 291 |
Sprint Capital Corporation | | | | 8.375% | | 3/15/12 | | | 110 | | | 129 |
The Williams Companies, Inc. Credit-Linked Certificates | | | | 6.750% | | 4/15/09 | | | 170 | | | 173B |
The Williams Companies, Inc. Credit-Linked Certificates | | | | 6.960% | | 5/1/09 | | | 255 | | | 265A,B |
Tyco International Group SA | | | | 4.436% | | 6/15/07 | | | 280 | | | 279B |
| | | | | | | | | | | |
|
|
| | | | | | | | | | | | | 3,241 |
| | | | | | | | | | | |
|
|
41
Semi-Annual Report to Shareholders
PORTFOLIO OF INVESTMENTS—Continued
Western Asset Intermediate Plus Bond Portfolio—Continued
| | | | | | | | | | | | | |
| | | % OF
NET ASSETS | | RATE | | MATURITY
DATE | | PAR/
SHARES | | VALUE | |
Corporate Bonds and Notes—Continued | | | | | | | | | | | | | |
| | | | | |
Telecommunications | | 0.6% | | | | | | | | | | | |
BellSouth Corporation | | | | 3.915% | | 11/15/07 | | $ | 140 | | $ | 140A | |
GTE Hawaiian Telephone Company, Inc. | | | | 7.000% | | 2/1/06 | | | 16 | | | 16 | |
GTE Hawaiian Telephone Company, Inc. | | | | 7.375% | | 9/1/06 | | | 10 | | | 10 | |
Qwest Communications International Incorporated | | | | 7.290% | | 2/15/09 | | | 160 | | | 158A | |
| | | | | | | | | | | |
|
|
|
| | | | | | | | | | | | | 324 | |
| | | | | | | | | | | |
|
|
|
Telecommunications (Cellular/Wireless) | | 0.9% | | | | | | | | | | | |
ALLTEL Corporation | | | | 4.656% | | 5/17/07 | | | 110 | | | 110 | |
AT&T Wireless Services Inc. | | | | 8.125% | | 5/1/12 | | | 200 | | | 235 | |
SBC Communications Inc. | | | | 6.250% | | 3/15/11 | | | 100 | | | 106 | |
| | | | | | | | | | | |
|
|
|
| | | | | | | | | | | | | 451 | |
| | | | | | | | | | | |
|
|
|
Transportation | | 0.1% | | | | | | | | | | | |
Union Pacific Corporation | | | | 6.650% | | 1/15/11 | | | 70 | | | 75 | |
| | | | | | | | | | | |
|
|
|
Total Corporate Bonds and Notes
(Identified Cost—$19,182) | | | | | | | | | | | | 18,973 | |
Asset-Backed Securities | | 0.3% | | | | | | | | | | | |
| | | | | |
Indexed SecuritiesA | | 0.3% | | | | | | | | | | | |
Metris Master Trust 2004-1 | | | | 4.280% | | 4/20/11 | | | 100 | | | 100 | |
Morgan Stanley ABS Capital I 2003-NC8 A2 | | | | 4.400% | | 9/25/33 | | | 29 | | | 29 | |
Residential Asset Securities Corporation 2002-KS7 | | | | 4.410% | | 11/25/32 | | | 42 | | | 42 | |
| | | | | | | | | | | |
|
|
|
Total Asset-Backed Securities
(Identified Cost—$171) | | | | | | | | | | | | 171 | |
Mortgage-Backed Securities | | 4.9% | | | | | | | | | | | |
| | | | | |
Fixed Rate Securities | | 0.1% | | | | | | | | | | | |
Washington Mutual MSC Mortgage Pass-Through Certificates, Series 2004-RA1 | | | | 7.000% | | 3/25/34 | | | 37 | | | 38 | |
| | | | | | | | | | | |
|
|
|
| | | | | |
Indexed SecuritiesA | | 1.0% | | | | | | | | | | | |
MASTR Adjustable Rate Mortgages Trust 2004-13 | | | | 3.787% | | 11/21/34 | | | 450 | | | 432 | |
Merrill Lynch Mortgage Investors, Inc. 2004-B | | | | 4.854% | | 6/25/29 | | | 61 | | | 62 | |
| | | | | | | | | | | |
|
|
|
| | | | | | | | | | | | | 494 | |
| | | | | | | | | | | |
|
|
|
Variable Rate SecuritiesC | | 3.8% | | | | | | | | | | | |
Banc of America Funding Corporation 2005-B | | | | 5.139% | | 4/25/35 | | | 240 | | | 239 | |
Bear Stearns ALT-A Trust 2005-2 | | | | 4.740% | | 4/25/35 | | | 218 | | | 217 | |
Countrywide Home Loans 2004-20 | | | | 5.260% | | 9/25/34 | | | 51 | | | 52 | |
J.P. Morgan Mortgage Trust 2004-A3 | | | | 4.329% | | 7/25/34 | | | 387 | | | 382 | |
42
Semi-Annual Report to Shareholders
| | | | | | | | | | | | |
| | | % OF
NET ASSETS | | RATE | | MATURITY
DATE | | PAR/
SHARES | | VALUE |
Mortgage-Backed Securities—Continued | | | | | | | | | | | | |
| | | | | |
Variable Rate Securities—Continued | | | | | | | | | | | | |
MLCC Mortgage Investors, Inc. 2005-1 2A1 | | | | 4.970% | | 4/25/35 | | $ | 77 | | $ | 76 |
MLCC Mortgage Investors, Inc. 2005-1 2A2 | | | | 4.970% | | 4/25/35 | | | 249 | | | 244 |
Structured Adjustable Rate Mortgage Loan Trust 2004-6 3A2 | | | | 4.739% | | 6/25/34 | | | 271 | | | 267 |
WaMu Mortgage Pass-Through Certificates, Series 2005-AR12 | | | | 4.846% | | 10/25/35 | | | 197 | | | 197 |
WaMu Mortgage Pass-Through Certificates, Series 2005-AR4 | | | | 4.680% | | 4/25/35 | | | 300 | | | 300 |
| | | | | | | | | | | |
|
|
| | | | | | | | | | | | | 1,974 |
| | | | | | | | | | | |
|
|
Total Mortgage-Backed Securities
(Identified Cost—$2,530) | | | | | | | | | | | | 2,506 |
Municipal Bonds | | 0.1% | | | | | | | | | | |
Liberty New York Development Corporation Revenue | | | | 5.250% | | 10/1/35 | | | 40 | | | 45 |
| | | | | | | | | | | |
|
|
Total Municipal Bonds (Identified Cost—$44) | | | | | | | | | | | | |
U.S. Government and Agency Obligations | | 29.1% | | | | | | | | | | |
| | | | | |
Fixed Rate Securities | | 24.2% | | | | | | | | | | |
Farmer Mac | | | | 4.250% | | 7/29/08 | | | 80 | | | 79 |
Federal Home Loan Bank | | | | 3.125% | | 9/15/06 | | | 100 | | | 99 |
Federal Home Loan Bank | | | | 4.125% | | 4/18/08 | | | 140 | | | 139 |
Tennessee Valley Authority | | | | 5.625% | | 1/18/11 | | | 10 | | | 10 |
Tennessee Valley Authority | | | | 6.790% | | 5/23/12 | | | 210 | | | 236 |
Tennessee Valley Authority | | | | 5.880% | | 4/1/36 | | | 20 | | | 23 |
United States Treasury Bonds | | | | 8.000% | | 11/15/21 | | | 410 | | | 567 |
United States Treasury Bonds | | | | 5.375% | | 2/15/31 | | | 130 | | | 146 |
United States Treasury Notes | | | | 4.000% | | 8/31/07 | | | 1,290 | | | 1,286 |
United States Treasury Notes | | | | 3.000% | | 11/15/07 | | | 3,600 | | | 3,516 |
United States Treasury Notes | | | | 3.750% | | 5/15/08 | | | 3,000 | | | 2,968 |
United States Treasury Notes | | | | 3.375% | | 9/15/09 | | | 770 | | | 747 |
United States Treasury Notes | | | | 3.375% | | 10/15/09 | | | 10 | | | 10 |
United States Treasury Notes | | | | 6.500% | | 2/15/10 | | | 40 | | | 44 |
United States Treasury Notes | | | | 4.000% | | 4/15/10 | | | 270 | | | 267 |
United States Treasury Notes | | | | 4.125% | | 8/15/10 | | | 250 | | | 249 |
United States Treasury Notes | | | | 4.250% | | 11/15/14 | | | 275 | | | 273 |
United States Treasury Notes | | | | 4.125% | | 5/15/15 | | | 1,730 | | | 1,700 |
| | | | | | | | | | | |
|
|
| | | | | | | | | | | | | 12,359 |
| | | | | | | | | | | |
|
|
43
Semi-Annual Report to Shareholders
PORTFOLIO OF INVESTMENTS—Continued
Western Asset Intermediate Plus Bond Portfolio—Continued
| | | | | | | | | | | | |
| | | % OF
NET ASSETS | | RATE | | MATURITY
DATE | | PAR/
SHARES | | VALUE |
U.S. Government and Agency Obligations—Continued | | | | | | | | | | | | |
| | | | | |
Indexed SecuritiesD | | 4.7% | | | | | | | | | | |
United States Treasury Inflation-Protected Security | | | | 0.875% | | 4/15/10 | | $ | 217 | | $ | 211 |
United States Treasury Inflation-Protected Security | | | | 2.000% | | 1/15/14 | | | 1,110 | | | 1,133 |
United States Treasury Inflation-Protected Security | | | | 2.000% | | 7/15/14 | | | 166 | | | 169 |
United States Treasury Inflation-Protected Security | | | | 2.375% | | 1/15/25 | | | 818 | | | 876 |
| | | | | | | | | | | |
|
|
| | | | | | | | | | | | | 2,389 |
| | | | | | | | | | | |
|
|
Stripped Securities | | 0.2% | | | | | | | | | | |
United States Treasury Notes | | | | 0.000% | | 5/15/30 | | | 410 | | | 134E2 |
| | | | | | | | | | | |
|
|
Total U.S. Government and Agency Obligations
(Identified Cost—$15,053) | | | | | | | | | | | | 14,882 |
U.S. Government Agency Mortgage-Backed Securities | | 8.1% | | | | | | | | | | |
| | | | | |
Fixed Rate Securities | | 8.1% | | | | | | | | | | |
Fannie Mae | | | | 4.590% | | 9/1/35 | | | 500 | | | 498 |
Fannie Mae | | | | 4.317% | | 12/1/34 | | | 940 | | | 927 |
Fannie Mae | | | | 5.000% | | 12/1/35 | | | 1,800 | | | 1,762F |
Freddie Mac | | | | 4.250% | | 2/28/07 | | | 370 | | | 369 |
Freddie Mac | | | | 5.000% | | 7/15/14 | | | 390 | | | 400 |
Freddie Mac | | | | 4.088% | | 1/1/35 | | | 30 | | | 30A |
Freddie Mac | | | | 4.097% | | 1/1/35 | | | 55 | | | 54A |
Freddie Mac | | | | 5.000% | | 12/1/35 | | | 100 | | | 98F |
| | | | | | | | | | | |
|
|
Total U.S. Government Agency Mortgage-Backed Securities (Identified Cost—$4,174) | | | | | | | | | | | | 4,138 |
Yankee BondsG | | 9.8% | | | | | | | | | | |
| | | | | |
Banking and Finance | | 1.1% | | | | | | | | | | |
AIFUL CORPORATION | | | | 5.000% | | 8/10/10 | | | 190 | | | 189B |
HSBC Holdings plc | | | | 7.500% | | 7/15/09 | | | 120 | | | 131 |
Royal Bank of Scotland Group plc | | | | 9.118% | | 3/31/49 | | | 180 | | | 209 |
| | | | | | | | | | | |
|
|
| | | | | | | | | | | | | 529 |
| | | | | | | | | | | |
|
|
Banks | | 0.5% | | | | | | | | | | |
Banco Santiago SA | | | | 4.148% | | 12/9/09 | | | 200 | | | 199A,B |
The Korea Development Bank | | | | 4.750% | | 7/20/09 | | | 70 | | | 70 |
| | | | | | | | | | | |
|
|
| | | | | | | | | | | | | 269 |
| | | | | | | | | | | |
|
|
44
Semi-Annual Report to Shareholders
| | | | | | | | | | | | |
| | | % OF
NET ASSETS | | RATE | | MATURITY
DATE | | PAR/
SHARES | | VALUE |
Yankee Bonds—Continued | | | | | | | | | | | | |
| | | | | |
Energy | | 1.6% | | | | | | | | | | |
Pemex Project Funding Master Trust | | | | 6.125% | | 8/15/08 | | $ | 540 | | $ | 556 |
Pemex Project Funding Master Trust | | | | 7.375% | | 12/15/14 | | | 230 | | | 256 |
| | | | | | | | | | | |
|
|
| | | | | | | | | | | | | 812 |
| | | | | | | | | | | |
|
|
Foreign Governments | | 3.7% | | | | | | | | | | |
Federative Republic of Brazil | | | | 14.500% | | 10/15/09 | | | 130 | | | 169 |
Federative Republic of Brazil | | | | 5.250% | | 4/15/12 | | | 39 | | | 38A,B |
Federative Republic of Brazil | | | | 8.875% | | 4/15/24 | | | 30 | | | 32 |
Federative Republic of Brazil | | | | 8.875% | | 4/15/24 | | | 20 | | | 21 |
Federative Republic of Brazil | | | | 12.250% | | 3/6/30 | | | 50 | | | 69 |
Federative Republic of Brazil | | | | 11.000% | | 8/17/40 | | | 175 | | | 215 |
Republic of Bulgaria | | | | 8.250% | | 1/15/15 | | | 30 | | | 37 |
Republic of Colombia | | | | 11.750% | | 2/25/20 | | | 78 | | | 108 |
Republic of Panama | | | | 10.750% | | 5/15/20 | | | 68 | | | 95 |
Republic of Peru | | | | 5.000% | | 3/7/17 | | | 41 | | | 40H |
Republic of Peru | | | | 8.750% | | 11/21/33 | | | 50 | | | 60 |
Russian Federation | | | | 5.000% | | 3/31/30 | | | 220 | | | 253B,H |
Russian Federation | | | | 5.000% | | 3/31/30 | | | 210 | | | 241H |
United Mexican States | | | | 8.375% | | 1/14/11 | | | 25 | | | 29 |
United Mexican States | | | | 8.300% | | 8/15/31 | | | 10 | | | 13 |
United Mexican States | | | | 7.500% | | 4/8/33 | | | 420 | | | 487 |
| | | | | | | | | | | |
|
|
| | | | | | | | | | | | | 1,907 |
| | | | | | | | | | | |
|
|
Manufacturing (Diversified) | | 0.9% | | | | | | | | | | |
Tyco International Group SA | | | | 6.375% | | 10/15/11 | | | 180 | | | 192 |
Tyco International Group SA | | | | 6.000% | | 11/15/13 | | | 250 | | | 264 |
| | | | | | | | | | | |
|
|
| | | | | | | | | | | | | 456 |
| | | | | | | | | | | |
|
|
Telecommunications | | 1.6% | | | | | | | | | | |
British Telecommunications plc | | | | 8.375% | | 12/15/10 | | | 350 | | | 405 |
Koninklijke (Royal) KPN NV | | | | 8.000% | | 10/1/10 | | | 50 | | | 57 |
Telecom Italia Capital | | | | 4.000% | | 11/15/08 | | | 40 | | | 39 |
Telecom Italia Capital | | | | 4.480% | | 2/1/11 | | | 230 | | | 230A |
Telefonos de Mexico SA de CV | | | | 4.500% | | 11/19/08 | | | 100 | | | 99 |
| | | | | | | | | | | |
|
|
| | | | | | | | | | | | | 830 |
| | | | | | | | | | | |
|
|
Utilities | | 0.4% | | | | | | | | | | |
United Utilities plc | | | | 6.450% | | 4/1/08 | | | 170 | | | 176 |
| | | | | | | | | | | |
|
|
Total Yankee Bonds (Identified Cost—$4,889) | | | | | | | | | | | | 4,979 |
45
Semi-Annual Report to Shareholders
PORTFOLIO OF INVESTMENTS—Continued
Western Asset Intermediate Plus Bond Portfolio—Continued
| | | | | | | | | | | | |
| | | % OF
NET ASSETS | | RATE | | MATURITY
DATE | | PAR/
SHARES | | VALUE |
Foreign Government Obligations | | 0.9% | | | | | | | | | | |
| | | | | |
Fixed Rate Securities | | 0.9% | | | | | | | | | | |
Canadian Real Return Bond | | | | 4.000% | | 12/1/31 | | $ | 188I | | $ | 244D |
Queensland Treasury Corp | | | | 6.000% | | 6/14/11 | | | 270J | | | 211D |
| | | | | | | | | | | |
|
|
Total Foreign Government Obligations
(Identified Cost—$420) | | | | | | | | | | | | 455 |
Foreign Corporate Bonds | | 0.1% | | | | | | | | | | |
General Motors Corporation | | | | 8.375% | | 7/5/33 | | | 50J | | | 47 |
| | | | | | | | | | | |
|
|
Total Foreign Corporate Bonds
(Identified Cost—$65) | | | | | | | | | | | | |
Preferred Stocks | | 1.4% | | | | | | | | | | |
Fannie Mae | | | | 7.000% | | | | | 13 shs | | | 726A |
| | | | | | | | | | | |
|
|
Total Preferred Stocks (Identified Cost—$740) | | | | | | | | | | | | |
| | | | | |
Total Long-Term Securities (Identified Cost—$47,268) | | | | | | | | | | | | 46,922 |
Short-Term Securities | | 5.8% | | | | | | | | | | |
| | | | | |
U.S. Government and Agency Obligations | | 0.3% | | | | | | | | | | |
Fannie Mae | | | | 0.000% | | 12/5/05 | | $ | 147 | | | 146K,M |
| | | | | | | | | | | |
|
|
| | | | | |
Options PurchasedN | | N.M. | | | | | | | | | | |
Federal Funds Futures Call, November 2005,
Strike Price $96.31 | | | | | | | | | 3L | | | 0.031 |
| | | | | | | | | | | |
|
|
| | | | | |
Repurchase Agreements | | 5.5% | | | | | | | | | | |
Merrill Lynch Government Securities, Inc. 3.85%, dated 9/30/05, to be repurchased at $2,681 on 10/3/05 (Collateral: $2,735 Fannie Mae discount notes, 4.375%, due 9/7/07, value $2,735) | | | | | | | | $ | 2,680 | | | 2,680 |
Goldman, Sachs & Company
3.8%, dated 9/30/05, to be repurchased at $156 on 10/3/05 (Collateral: $165 Fannie Mae discount notes, 3.25%, due 2/15/09, value $160) | | | | | | | | | 156 | | | 156 |
| | | | | | | | | | | |
|
|
| | | | | | | | | | | | | 2,836 |
| | | | | | | | | | | |
|
|
Total Short-Term Securities (Identified Cost—$2,982) | | | | | | | | | | | | 2,982 |
Total Investments (Identified Cost—$50,250) | | 97.7% | | | | | | | | | $ | 49,904 |
Other Assets Less Liabilities | | 2.3% | | | | | | | | | | 1,158 |
| | | | | | | | | | | |
|
|
Net Assets | | 100.0% | | | | | | | | | $ | 51,062 |
| | | | | | | | | | | |
|
|
46
Semi-Annual Report to Shareholders
| | | | | | | | |
| | | EXPIRATION | | ACTUAL
CONTRACTS | | APPRECIATION/
(DEPRECIATION) | |
Futures Contracts PurchasedN | | | | | | | | |
Eurodollar Futures | | March 2006 | | 18 | | $ | (7 | ) |
Eurodollar Futures | | December 2005 | | 9 | | | (9 | ) |
U.S. Treasury Note Futures | | September 2005 | | 5 | | | 0.100 | |
U.S. Treasury Note Futures | | December 2005 | | 53 | | | (62 | ) |
| | | | | | |
|
|
|
| | | | | | | | $(78) | |
| | | | | | |
|
|
|
Futures Contracts WrittenN | | | | | | | | |
U.S. Treasury Note Futures | | December 2005 | | 22 | | $ | 34 | |
| | | | | | |
|
|
|
Options WrittenN | | | | | | | | |
U.S. Treasury Bond Futures Put, Strike $113.00 | | November 2005 | | 11 | | $ | 1 | |
U.S. Treasury Note Futures Put, Strike $109.00 | | November 2005 | | 15 | | | (1 | ) |
| | | | | | |
|
|
|
| | | | | | | $ | — | |
| | | | | | |
|
|
|
| | | | | | | | | |
| A | Indexed security – The rate of interest earned on this security is tied to the London Interbank Offered Rate (“LIBOR”) or the one-year Treasury Bill rate. The coupon rate is the rate as of September 30, 2005. |
| B | Rule 144a Security – A security purchased pursuant to Rule 144a under the Securities Act of 1933 which may not be resold subject to that rule except to qualified institutional buyers. These securities represent 4.6% of net assets. |
| C | The coupon rates shown on variable rate securities are the rates at September 30, 2005. These rates vary with the weighted average coupon of the underlying loans. |
| D | Inflation-Protected Security – A security whose principal value is adjusted daily or monthly in accordance with changes to the relevant country’s Consumer Price Index or its equivalent used as an inflation proxy. Interest is calculated on the basis of the current adjusted principal value. |
| E | Securities with interest-only or principal-only payment streams, denoted by a 1 or 2, respectively. For interest-only securities, the amount shown as principal is the notional balance used to calculate the amount of interest due. |
| F | When-issued security – Security purchased on a delayed delivery basis. Final settlement amount and maturity date have not yet been announced. |
| G | Yankee Bond – A dollar denominated bond issued in the U.S. by foreign entities. |
| H | Stepped coupon security – A security with a predetermined schedule of interest or dividend rate changes, at which time it begins to accrue interest or pay dividends. |
| I | Denominated in canadian dollars. |
| J | Denominated in euro currency. |
| K | All or a portion of this security is collateral to cover futures and options contracts. |
| L | Par represents actual number of contracts. |
| M | Zero coupon bond – A bond with no periodic interest payments which is sold at such a discount as to produce a current yield to maturity. |
| N | Options and futures are described in more detail in the notes to financial statements. |
N.M.—Not meaningful.
47
Semi-Annual Report to Shareholders
PORTFOLIO OF INVESTMENTS
September 30, 2005 (Unaudited)
(Amounts in Thousands)
Western Asset Core Bond Portfolio
| | | | | | | | | | | | | |
| | | % OF
NET ASSETS | | RATE | | MATURITY
DATE | | PAR/
SHARES | | VALUE | |
Long-Term Securities | | 121.9% | | | | | | | | | | | |
| | | | | |
Corporate Bonds and Notes | | 19.2% | | | | | | | | | | | |
| | | | | |
Aerospace/Defense | | 0.2% | | | | | | | | | | | |
Lockheed Martin Corporation | | | | 7.650% | | 5/1/16 | | $ | 135 | | $ | 163 | A |
Northrop Grumman Corporation | | | | 4.079% | | 11/16/06 | | | 2,600 | | | 2,586 | |
Raytheon Company | | | | 6.000% | | 12/15/10 | | | 32 | | | 33 | |
Raytheon Company | | | | 5.500% | | 11/15/12 | | | 65 | | | 67 | |
Raytheon Company | | | | 5.375% | | 4/1/13 | | | 705 | | | 720 | |
Systems 2001 Asset Trust | | | | 6.664% | | 9/15/13 | | | 2,808 | | | 3,010 | B |
United Technologies Corporation | | | | 5.400% | | 5/1/35 | | | 1,460 | | | 1,459 | A |
| | | | | | | | | | | |
|
|
|
| | | | | | | | | | | | | 8,038 | |
| | | | | | | | | | | |
|
|
|
Automotive | | 0.5% | | | | | | | | | | | |
Ford Motor Company | | | | 7.450% | | 7/16/31 | | | 15,410 | | | 12,020 | A |
General Motors Corporation | | | | 8.375% | | 7/15/33 | | | 11,020 | | | 8,596 | A |
| | | | | | | | | | | |
|
|
|
| | | | | | | | | | | | | 20,616 | |
| | | | | | | | | | | |
|
|
|
Banking and Finance | | 3.1% | | | | | | | | | | | |
Boeing Capital Corporation | | | | 7.375% | | 9/27/10 | | | 3,240 | | | 3,615 | |
Ford Motor Credit Company | | | | 6.625% | | 6/16/08 | | | 8,900 | | | 8,699 | A |
Ford Motor Credit Company | | | | 7.375% | | 10/28/09 | | | 49,035 | | | 47,365 | |
Ford Motor Credit Company | | | | 7.875% | | 6/15/10 | | | 7,450 | | | 7,250 | A |
Ford Motor Credit Company | | | | 7.375% | | 2/1/11 | | | 6,435 | | | 6,155 | |
Ford Motor Credit Company | | | | 7.250% | | 10/25/11 | | | 360 | | | 342 | A |
General Motors Acceptance Corporation | | | | 6.125% | | 2/1/07 | | | 5,210 | | | 5,179 | A |
General Motors Acceptance Corporation | | | | 6.150% | | 4/5/07 | | | 4,150 | | | 4,118 | |
General Motors Acceptance Corporation | | | | 6.125% | | 8/28/07 | | | 8,620 | | | 8,486 | A |
General Motors Acceptance Corporation | | | | 5.625% | | 5/15/09 | | | 9,550 | | | 8,755 | |
General Motors Acceptance Corporation | | | | 7.750% | | 1/19/10 | | | 5,355 | | | 5,191 | A |
General Motors Acceptance Corporation | | | | 7.250% | | 3/2/11 | | | 820 | | | 763 | |
General Motors Acceptance Corporation | | | | 0.000% | | 6/15/15 | | | 13,910 | | | 6,093 | C |
HSBC Finance Corporation | | | | 7.875% | | 3/1/07 | | | 2,800 | | | 2,923 | |
HSBC Finance Corporation | | | | 8.000% | | 7/15/10 | | | 690 | | | 779 | |
HSBC Finance Corporation | | | | 7.000% | | 5/15/12 | | | 700 | | | 775 | |
HSBC Finance Corporation | | | | 6.375% | | 11/27/12 | | | 440 | | | 473 | A |
SB Treasury Company LLC | | | | 9.400% | | 12/29/49 | | | 2,930 | | | 3,233 | B |
SLM Corporation | | | | 4.300% | | 4/1/09 | | | 7,620 | | | 7,505 | D |
| | | | | | | | | | | |
|
|
|
| | | | | | | | | | | | | 127,699 | |
| | | | | | | | | | | |
|
|
|
Banks | | 0.2% | | | | | | | | | | | |
Bank of America Corporation | | | | 7.400% | | 1/15/11 | | | 2,000 | | | 2,234 | |
Bank One Corporation | | | | 7.875% | | 8/1/10 | | | 4,500 | | | 5,083 | |
48
Semi-Annual Report to Shareholders
| | | | | | | | | | | | | |
| | | % OF
NET ASSETS | | RATE | | MATURITY
DATE | | PAR/
SHARES | | VALUE | |
| | | | | |
Corporate Bonds and Notes—Continued | | | | | | | | | | | | | |
| | | | | |
Banks—Continued | | | | | | | | | | | | | |
Bank One Corporation | | | | 5.900% | | 11/15/11 | | $ | 2,000 | | $ | 2,096 | |
Firstar Bank NA | | | | 7.125% | | 12/1/09 | | | 450 | | | 492 | |
| | | | | | | | | | | |
|
|
|
| | | | | | | | | | | | | 9,905 | |
| | | | | | | | | | | |
|
|
|
Cable | | 0.9% | | | | | | | | | | | |
Comcast Cable Communications, Inc. | | | | 6.375% | | 1/30/06 | | | 17,490 | | | 17,604 | |
Comcast Corporation | | | | 6.500% | | 1/15/15 | | | 1,800 | | | 1,944 | |
Comcast Corporation | | | | 7.050% | | 3/15/33 | | | 3,130 | | | 3,484 | A |
Comcast MO of Delaware Inc. | | | | 9.000% | | 9/1/08 | | | 2,200 | | | 2,441 | |
Cox Communications, Inc. | | | | 7.875% | | 8/15/09 | | | 9,640 | | | 10,576 | |
| | | | | | | | | | | |
|
|
|
| | | | | | | | | | | | | 36,049 | |
| | | | | | | | | | | |
|
|
|
Computer Services and Systems | | 0.2% | | | | | | | | | | | |
Electronic Data Systems Corporation | | | | 7.125% | | 10/15/09 | | | 7,685 | | | 8,231 | A |
| | | | | | | | | | | |
|
|
|
| | | | | |
Diversified Financial Services | | 1.2% | | | | | | | | | | | |
Marsh & McLennan Companies, Inc. | | | | 5.150% | | 9/15/10 | | | 38,220 | | | 37,972 | |
U.S. Bancorp | | | | 3.125% | | 3/15/08 | | | 10,300 | | | 9,956 | |
Wells Fargo & Company | | | | 5.000% | | 11/15/14 | | | 690 | | | 692 | |
| | | | | | | | | | | |
|
|
|
| | | | | | | | | | | | | 48,620 | |
| | | | | | | | | | | |
|
|
|
Electric | | 1.0% | | | | | | | | | | | |
Dominion Resources, Inc. | | | | 4.125% | | 2/15/08 | | | 10,850 | | | 10,700 | |
Dominion Resources, Inc. | | | | 5.125% | | 12/15/09 | | | 50 | | | 50 | |
Dominion Resources, Inc. | | | | 4.750% | | 12/15/10 | | | 570 | | | 564 | |
Dominion Resources, Inc. | | | | 5.700% | | 9/17/12 | | | 2,050 | | | 2,115 | A |
FirstEnergy Corp. | | | | 5.500% | | 11/15/06 | | | 15,290 | | | 15,419 | |
FirstEnergy Corp. | | | | 6.450% | | 11/15/11 | | | 340 | | | 362 | |
FirstEnergy Corp. | | | | 7.375% | | 11/15/31 | | | 10,850 | | | 12,726 | A |
The Cleveland Electric Illuminating Company | | | | 5.650% | | 12/15/13 | | | 280 | | | 287 | |
The Detroit Edison Company | | | | 6.125% | | 10/1/10 | | | 920 | | | 972 | |
| | | | | | | | | | | |
|
|
|
| | | | | | | | | | | | | 43,195 | |
| | | | | | | | | | | |
|
|
|
Energy | | 1.6% | | | | | | | | | | | |
Duke Energy Corporation | | | | 6.250% | | 1/15/12 | | | 590 | | | 628 | |
Duke Energy Corporation | | | | 5.625% | | 11/30/12 | | | 1,330 | | | 1,373 | |
Pacific Gas and Electric Company | | | | 6.050% | | 3/1/34 | | | 5,500 | | | 5,722 | |
Progress Energy, Inc. | | | | 7.100% | | 3/1/11 | | | 3,170 | | | 3,446 | |
TXU Corp. | | | | 6.375% | | 6/15/06 | | | 8,380 | | | 8,471 | |
TXU Corp. | | | | 4.800% | | 11/15/09 | | | 9,000 | | | 8,672 | |
TXU Corp. | | | | 6.550% | | 11/15/34 | | | 11,020 | | | 10,228 | A |
49
Semi-Annual Report to Shareholders
PORTFOLIO OF INVESTMENTS—Continued
Western Asset Core Bond Portfolio—Continued
| | | | | | | | | | | | | |
| | | % OF
NET ASSETS | | RATE | | MATURITY
DATE | | PAR/
SHARES | | VALUE | |
| | | | | |
Corporate Bonds and Notes—Continued | | | | | | | | | | | | | |
| | | | | |
Energy—Continued | | | | | | | | | | | | | |
TXU Energy Co. | | | | 4.920% | | 1/17/06 | | $ | 510 | | $ | 510 | D |
TXU Energy Co. | | | | 7.000% | | 3/15/13 | | | 25,800 | | | 28,009 | |
| | | | | | | | | | | |
|
|
|
| | | | | | | | | | | | | 67,059 | |
| | | | | | | | | | | |
|
|
|
Environmental Services | | 0.6% | | | | | | | | | | | |
Waste Management, Inc. | | | | 7.125% | | 10/1/07 | | | 10,330 | | | 10,770 | |
Waste Management, Inc. | | | | 6.875% | | 5/15/09 | | | 2,000 | | | 2,128 | A |
Waste Management, Inc. | | | | 6.375% | | 11/15/12 | | | 2,530 | | | 2,712 | |
Waste Management, Inc. | | | | 7.125% | | 12/15/17 | | | 6,000 | | | 6,789 | |
Waste Management, Inc. | | | | 7.375% | | 5/15/29 | | | 1,220 | | | 1,418 | |
| | | | | | | | | | | |
|
|
|
| | | | | | | | | | | | | 23,817 | |
| | | | | | | | | | | |
|
|
|
Food, Beverage and Tobacco | | 0.3% | | | | | | | | | | | |
Altria Group, Inc. | | | | 7.000% | | 11/4/13 | | | 3,815 | | | 4,176 | |
Altria Group, Inc. | | | | 7.750% | | 1/15/27 | | | 2,500 | | | 2,915 | |
R.J. Reynolds Tobacco Holdings, Inc. | | | | 7.875% | | 5/15/09 | | | 3,240 | | | 3,402 | |
| | | | | | | | | | | |
|
|
|
| | | | | | | | | | | | | 10,493 | |
| | | | | | | | | | | |
|
|
|
Gas and Pipeline Utilities | | 0.9% | | | | | | | | | | | |
Dynegy Holdings Inc. | | | | 8.750% | | 2/15/12 | | | 11,260 | | | 12,217 | A |
Southern Natural Gas Company | | | | 8.000% | | 3/1/32 | | | 7,390 | | | 8,160 | |
Tennessee Gas Pipeline Company | | | | 8.375% | | 6/15/32 | | | 1,110 | | | 1,268 | |
The Williams Companies, Inc. | | | | 8.125% | | 3/15/12 | | | 3,730 | | | 4,075 | |
The Williams Companies, Inc. | | | | 7.500% | | 1/15/31 | | | 5,000 | | | 5,313 | A |
The Williams Companies, Inc. | | | | 8.750% | | 3/15/32 | | | 3,240 | | | 3,823 | |
| | | | | | | | | | | |
|
|
|
| | | | | | | | | | | | | 34,856 | |
| | | | | | | | | | | |
|
|
|
Health Care | | 0.3% | | | | | | | | | | | |
Tenet Healthcare Corporation | | | | 6.375% | | 12/1/11 | | | 2,500 | | | 2,331 | A |
Tenet Healthcare Corporation | | | | 7.375% | | 2/1/13 | | | 9,462 | | | 8,965 | A |
| | | | | | | | | | | |
|
|
|
| | | | | | | | | | | | | 11,296 | |
| | | | | | | | | | | |
|
|
|
Investment Banking/Brokerage | | 0.9% | | | | | | | | | | | |
J.P. Morgan & Co. Incorporated | | | | 8.019% | | 2/15/12 | | | 2,000 | | | 2,111 | D |
J.P. Morgan Chase & Co. | | | | 5.750% | | 1/2/13 | | | 3,770 | | | 3,921 | |
Lehman Brothers Holdings Inc. | | | | 4.294% | | 4/20/07 | | | 5,470 | | | 5,477 | D |
Merrill Lynch & Co., Inc. | | | | 3.970% | | 3/12/07 | | | 5,210 | | | 5,195 | D |
Merrill Lynch & Co., Inc. | | | | 3.375% | | 9/14/07 | | | 11,120 | | | 10,926 | |
Morgan Stanley | | | | 5.300% | | 3/1/13 | | | 3,380 | | | 3,414 | |
The Goldman Sachs Group, Inc. | | | | 4.750% | | 7/15/13 | | | 4,370 | | | 4,270 | |
| | | | | | | | | | | |
|
|
|
| | | | | | | | | | | | | 35,314 | |
| | | | | | | | | | | |
|
|
|
50
Semi-Annual Report to Shareholders
| | | | | | | | | | | | | |
| | | % OF
NET ASSETS | | RATE | | MATURITY
DATE | | PAR/
SHARES | | VALUE | |
| | | | | |
Corporate Bonds and Notes—Continued | | | | | | | | | | | | | |
| | | | | |
Investment Management | | 0.2% | | | | | | | | | | | |
Dryden Investor Trust | | | | 7.157% | | 7/23/08 | | $ | 8,828 | | $ | 9,118 | B |
| | | | | | | | | | | |
|
|
|
| | | | | |
Media | | 1.2% | | | | | | | | | | | |
Clear Channel Communications, Inc. | | | | 4.625% | | 1/15/08 | | | 1,430 | | | 1,416 | A |
Clear Channel Communications, Inc. | | | | 4.250% | | 5/15/09 | | | 2,130 | | | 2,054 | A |
Clear Channel Communications, Inc. | | | | 5.500% | | 9/15/14 | | | 2,850 | | | 2,747 | A |
Liberty Media Corporation | | | | 5.370% | | 9/17/06 | | | 10,573 | | | 10,650D | |
Liberty Media Corporation | | | | 7.875% | | 7/15/09 | | | 9,000 | | | 9,471 | A |
Liberty Media Corporation | | | | 3.750% | | 2/15/30 | | | 290 | | | 161 | E |
News America, Inc. | | | | 6.200% | | 12/15/34 | | | 605 | | | 606 | |
Time Warner Inc. | | | | 6.875% | | 5/1/12 | | | 8,270 | | | 9,038 | A |
Time Warner Inc. | | | | 6.950% | | 1/15/28 | | | 2,000 | | | 2,167 | |
Time Warner Inc. | | | | 7.625% | | 4/15/31 | | | 1,350 | | | 1,582 | |
Time Warner Inc. | | | | 7.700% | | 5/1/32 | | | 8,565 | | | 10,140 | |
Viacom Inc. | | | | 5.625% | | 8/15/12 | | | 970 | | | 986 | |
| | | | | | | | | | | |
|
|
|
| | | | | | | | | | | | | 51,018 | |
| | | | | | | | | | | |
|
|
|
Medical Care Facilities | | 0.9% | | | | | | | | | | | |
HCA, Inc. | | | | 5.750% | | 3/15/14 | | | 40,360 | | | 38,470 | A |
| | | | | | | | | | | |
|
|
|
| | | | | |
Oil and Gas | | 1.5% | | | | | | | | | | | |
Amerada Hess Corporation | | | | 7.300% | | 8/15/31 | | | 12,535 | | | 14,624 | |
Conoco Inc. | | | | 6.950% | | 4/15/29 | | | 9,950 | | | 12,112 | |
ConocoPhillips | | | | 4.750% | | 10/15/12 | | | 1,770 | | | 1,777 | A |
Devon Energy Corporation | | | | 7.950% | | 4/15/32 | | | 4,145 | | | 5,284 | |
El Paso Corporation | | | | 0.000% | | 2/28/21 | | | 330 | | | 178 | C,E |
El Paso Corporation | | | | 7.800% | | 8/1/31 | | | 140 | | | 140 | A |
El Paso Natural Gas Company | | | | 8.375% | | 6/15/32 | | | 3,610 | | | 4,100 | |
Kerr-McGee Corporation | | | | 6.875% | | 9/15/11 | | | 17,000 | | | 18,173 | A |
Sonat Inc. | | | | 7.625% | | 7/15/11 | | | 5,000 | | | 5,075 | A |
XTO Energy, Inc. | | | | 7.500% | | 4/15/12 | | | 1,110 | | | 1,250 | |
XTO Energy, Inc. | | | | 6.250% | | 4/15/13 | | | 980 | | | 1,046 | |
| | | | | | | | | | | |
|
|
|
| | | | | | | | | | | | | 63,759 | |
| | | | | | | | | | | |
|
|
|
Paper and Forest Products | | 0.1% | | | | | | | | | | | |
International Paper Company | | | | 5.500% | | 1/15/14 | | | 2,110 | | | 2,101 | |
Weyerhaeuser Company | | | | 6.750% | | 3/15/12 | | | 3,445 | | | 3,723 | |
| | | | | | | | | | | |
|
|
|
| | | | | | | | | | | | | 5,824 | |
| | | | | | | | | | | |
|
|
|
51
Semi-Annual Report to Shareholders
PORTFOLIO OF INVESTMENTS—Continued
Western Asset Core Bond Portfolio—Continued
| | | | | | | | | | | | | |
| | | % OF
NET ASSETS | | RATE | | MATURITY
DATE | | PAR/
SHARES | | VALUE | |
| | | | | |
Corporate Bonds and Notes—Continued | | | | | | | | | | | | | |
| | | | | |
Pharmaceuticals | | N.M. | | | | | | | | | | | |
Bristol-Myers Squibb Company | | | | 5.750% | | 10/1/11 | | $ | 830 | | $ | 871 | |
| | | | | | | | | | | |
|
|
|
| | | | | |
Photo Equipment and Supplies | | 1.2% | | | | | | | | | | | |
Eastman Kodak Company | | | | 3.625% | | 5/15/08 | | | 17,500 | | | 16,377 | A |
Eastman Kodak Company | | | | 7.250% | | 11/15/13 | | | 34,680 | | | 32,893 | A |
| | | | | | | | | | | |
|
|
|
| | | | | | | | | | | | | 49,270 | |
| | | | | | | | | | | |
|
|
|
Real Estate | | N.M. | | | | | | | | | | | |
Socgen Real Estate Co. LLC | | | | 7.640% | | 12/29/49 | | | 260 | | | 274 | B |
| | | | | | | | | | | |
|
|
|
| | | | | |
Retail | | 0.1% | | | | | | | | | | | |
Target Corporation | | | | 4.000% | | 6/15/13 | | | 4,445 | | | 4,203 | A |
Wal-Mart Stores, Inc. | | | | 5.450% | | 8/1/06 | | | 150 | | | 151 | |
| | | | | | | | | | | |
|
|
|
| | | | | | | | | | | | | 4,354 | |
| | | | | | | | | | | |
|
|
|
Special Purpose | | 1.6% | | | | | | | | | | | |
ASIF Global Financing XIX | | | | 4.900% | | 1/17/13 | | | 2,010 | | | 1,973 | B |
DaimlerChrysler NA Holding Corporation | | | | 4.050% | | 6/4/08 | | | 2,250 | | | 2,197 | A |
DaimlerChrysler NA Holding Corporation | | | | 7.200% | | 9/1/09 | | | 1,240 | | | 1,323 | A |
Patrons’ Legacy 2003 IV | | | | 5.775% | | 1/23/17 | | | 5,100 | | | 5,153 | B |
Rabobank Capital Funding Trust II | | | | 5.260% | | 12/31/49 | | | 470 | | | 471 | B |
Rabobank Capital Funding Trust III | | | | 5.254% | | 12/29/49 | | | 3,030 | | | 3,019 | B |
Sprint Capital Corporation | | | | 6.000% | | 1/15/07 | | | 31,760 | | | 32,289 | |
Sprint Capital Corporation | | | | 8.375% | | 3/15/12 | | | 7,935 | | | 9,338 | |
Texaco Capital Inc. | | | | 5.500% | | 1/15/09 | | | 1,000 | | | 1,038 | |
Unilever Capital Corporation | | | | 7.125% | | 11/1/10 | | | 1,730 | | | 1,914 | |
Verizon Global Funding Corp. | | | | 7.250% | | 12/1/10 | | | 2,220 | | | 2,453 | |
Verizon Global Funding Corp. | | | | 6.875% | | 6/15/12 | | | 1,290 | | | 1,423 | |
Verizon Global Funding Corp. | | | | 7.375% | | 9/1/12 | | | 1,275 | | | 1,447 | |
| | | | | | | | | | | |
|
|
|
| | | | | | | | | | | | | 64,038 | |
| | | | | | | | | | | |
|
|
|
Telecommunications | | N.M. | | | | | | | | | | | |
GTE Hawaiian Telephone Company, Inc. | | | | 7.375% | | 9/1/06 | | | 700 | | | 702 | |
| | | | | | | | | | | |
|
|
|
| | | | | |
Transportation | | 0.5% | | | | | | | | | | | |
Continental Airlines, Inc. | | | | 6.900% | | 1/2/18 | | | 321 | | | 314 | |
Continental Airlines, Inc. | | | | 6.545% | | 2/2/19 | | | 2,634 | | | 2,582 | |
Delta Air Lines, Inc. | | | | 7.111% | | 9/18/11 | | | 500 | | | 484 | A |
Delta Air Lines, Inc. | | | | 6.718% | | 1/2/23 | | | 4,237 | | | 4,339 | |
52
Semi-Annual Report to Shareholders
| | | | | | | | | | | | | |
| | | % OF
NET ASSETS | | RATE | | MATURITY
DATE | | PAR/
SHARES | | VALUE | |
| | | | | |
Corporate Bonds and Notes—Continued | | | | | | | | | | | | | |
| | | | | |
Transportation—Continued | | | | | | | | | | | | | |
Southwest Airlines Co. | | | | 5.496% | | 11/1/06 | | $ | 9,000 | | $ | 9,097 | |
United Airlines, Inc. | | | | 7.783% | | 1/1/14 | | | 2,539 | | | 2,420 | |
| | | | | | | | | | | |
|
|
|
| | | | | | | | | | | | | 19,236 | |
| | | | | | | | | | | |
|
|
|
Total Corporate Bonds and Notes
(Identified Cost—$791,372) | | | | | | | | | | | | 792,122 | |
Asset-Backed Securities | | 3.6% | | | | | | | | | | | |
| | | | | |
Fixed Rate Securities | | 0.3% | | | | | | | | | | | |
Advanta Mortgage Loan Trust 1999-3 | | | | 7.590% | | 6/25/14 | | | 287 | | | 292 | |
Conseco Finance Securitizations Corp. 2000-5 | | | | 7.960% | | 2/1/32 | | | 4,700 | | | 3,886 | |
Equity One ABS, Inc. 2003-3 | | | | 4.995% | | 12/25/33 | | | 8,200 | | | 8,191 | |
Green Tree Financial Corporation 1996-5 | | | | 8.100% | | 7/15/26 | | | 336 | | | 151 | |
Green Tree Home Improvement Loan Trust 1997-D | | | | 7.450% | | 9/15/28 | | | 922 | | | 923 | |
| | | | | | | | | | | |
|
|
|
| | | | | | | | | | | | | 13,443 | |
| | | | | | | | | | | |
|
|
|
Indexed SecuritiesD | | 3.3% | | | | | | | | | | | |
AAA Trust 2005-2 | | | | 3.930% | | 11/26/35 | | | 15,853 | | | 15,845 | B |
Aegis Asset Backed Securities Trust 2005-2 | | | | 4.138% | | 6/25/35 | | | 26,921 | | | 26,925 | |
Aesop Funding II LLC 2003-4A | | | | 4.230% | | 8/20/07 | | | 13,900 | | | 13,922 | B |
Amortizing Residential Collateral Trust 2002-BC1M | | | | 4.318% | | 1/1/32 | | | 415 | | | 438 | |
Asset Backed Funding Certificates 2002-SB1 | | | | 4.468% | | 12/25/30 | | | 2,323 | | | 2,331 | |
Bayview Financial Aquisition Trust 2002-CA | | | | 4.368% | | 5/25/32 | | | 2,245 | | | 2,245 | B |
CDC Mortgage Capital Trust 2002-HE1 | | | | 4.348% | | 1/25/33 | | | 1,394 | | | 1,396 | |
CIT Group Home Equity Loan Trust 2002-1 | | | | 4.328% | | 3/25/33 | | | 942 | | | 944 | |
Countrywide Asset-Backed Certificates 2003-BC3 | | | | 4.348% | | 9/25/33 | | | 2,772 | | | 2,776 | |
Countrywide Asset-Backed Certificates 2005-AB1 | | | | 4.138% | | 8/25/35 | | | 20,607 | | | 20,612 | |
Fleet Home Equity Loan Trust 2003-1 | | | | 4.250% | | 1/20/33 | | | 6,182 | | | 6,188 | |
Household Home Equity Loan Trust 2002-4A | | | | 4.550% | | 10/20/32 | | | 1,322 | | | 1,323 | |
Long Beach Mortgage Loan Trust 2000-1 | | | | 4.263% | | 1/21/31 | | | 472 | | | 472 | |
New Century Home Equity Loan Trust 2001-NC1 | | | | 4.290% | | 6/20/31 | | | 137 | | | 137 | |
Provident Bank Home Equity Loan Trust 1999-3 | | | | 4.428% | | 1/25/31 | | | 1,494 | | | 1,495 | |
Providian Gateway Master Trust 2002-B | | | | 4.670% | | 6/15/09 | | | 8,800 | | | 8,813 | B |
53
Semi-Annual Report to Shareholders
PORTFOLIO OF INVESTMENTS—Continued
Western Asset Core Bond Portfolio—Continued
| | | | | | | | | | | | | |
| | | % OF
NET ASSETS | | RATE | | MATURITY
DATE | | PAR/
SHARES | | VALUE | |
Asset-Backed Securities—Continued | | | | | | | | | | | | | |
| | | | | |
Indexed Securities—Continued | | | | | | | | | | | | | |
Residential Asset Mortgage Products, Inc. 2000-RS3 | | | | 4.328% | | 9/25/30 | | $ | 52 | | $ | 52 | |
Residential Asset Mortgage Products, Inc. 2003-RS2 | | | | 4.378% | | 3/25/33 | | | 650 | | | 652 | |
Residential Asset Securities Corporation 2001-KS2 | | | | 4.268% | | 6/25/31 | | | 949 | | | 950 | |
Residential Asset Securities Corporation 2001-KS3 | | | | 4.268% | | 9/25/31 | | | 383 | | | 383 | |
Structured Asset Investment Loan Trust 2005-3 | | | | 4.168% | | 4/25/35 | | | 27,272 | | | 27,271 | |
| | | | | | | | | | | |
|
|
|
| | | | | | | | | | | | | 135,170 | |
| | | | | | | | | | | |
|
|
|
Stripped Securities | | N.M. | | | | | | | | | | | |
Diversified REIT Trust 1999-1A | | | | 0.532% | | 3/18/11 | | | 121,096 | | | 1,816 | F1 |
| | | | | | | | | | | |
|
|
|
Total Asset-Backed Securities
(Identified Cost—$151,478) | | | | | | | | | | | | 150,429 | |
Mortgage-Backed Securities | | 19.6% | | | | | | | | | | | |
| | | | | |
Fixed Rate Securities | | 5.1% | | | | | | | | | | | |
Asset Securitization Corporation 1996-D2 | | | | 6.920% | | 2/14/29 | | | 4,719 | | | 4,750 | |
Banc of America Commercial Mortgage Inc. 2005-5 | | | | 5.115% | | 9/10/15 | | | 9,200 | | | 9,247 | |
Bear Stearns Commercial Mortgage Securities Trust 2005-PWR9 | | | | 4.871% | | 9/11/42 | | | 6,570 | | | 6,524 | |
Criimi Mae Commercial Mortgage Trust 1998-C1 | | | | 7.000% | | 6/2/33 | | | 7,838 | | | 8,112 | B |
Deutsche Mortgage and Asset Receiving Corporation 1998-C1 | | | | 6.538% | | 6/15/31 | | | 10,471 | | | 10,816 | |
GS Mortgage Securities Corporation II 2005-GG4 | | | | 4.680% | | 7/10/39 | | | 12,900 | | | 12,715 | |
J.P. Morgan Chase Commercial Mortgage Pass-Through Certificates, Series 2005-CIBC12 | | | | 4.895% | | 9/12/37 | | | 1,610 | | | 1,593 | |
LB-UBS Commercial Mortgage Trust 2005-C3A5 | | | | 4.739% | | 7/15/30 | | | 8,590 | | | 8,423 | |
LB-UBS Commercial Mortgage Trust 2005-C3AAB | | | | 4.664% | | 7/15/30 | | | 15,000 | | | 14,721 | |
LB-UBS Commercial Mortgage Trust 2005-C5 | | | | 4.954% | | 9/15/40 | | | 10,800 | | | 10,763 | |
MASTR Reperforming Loan Trust 2005-1 | | | | 7.000% | | 8/25/34 | | | 15,140 | | | 15,801 | B |
MASTR Specialized Loan Trust 2005-1 | | | | 6.500% | | 8/25/34 | | | 1,847 | | | 1,860 | B |
54
Semi-Annual Report to Shareholders
| | | | | | | | | | | | | |
| | | % OF
NET ASSETS | | RATE | | MATURITY
DATE | | PAR/
SHARES | | VALUE | |
Mortgage-Backed Securities—Continued | | | | | | | | | | | | | |
| | | | | |
Fixed Rate Securities—Continued | | | | | | | | | | | | | |
Merrill Lynch Mortgage Investors, Inc. 1996-C2 | | | | 6.960% | | 11/21/28 | | $ | 412 | | $ | 418 | |
Morgan Stanley Capital I 2005-HQ6 | | | | 4.989% | | 8/13/42 | | | 25,900 | | | 25,853 | |
Nomura Asset Securities Corporation 1996-MD5 | | | | 7.120% | | 4/13/39 | | | 5,500 | | | 5,566 | |
Nomura Asset Securities Corporation
1996-MD5A | | | | 7.070% | | 4/13/39 | | | 375 | | | 378 | |
Residential Asset Mortgage Products, Inc. 2005-SL2 | | | | 7.500% | | 3/25/32 | | | 7,277 | | | 7,474 | |
Residential Asset Securitization Trust 2003-A14 | | | | 4.750% | | 2/25/19 | | | 66,479 | | | 65,191 | |
| | | | | | | | | | | |
|
|
|
| | | | | | | | | | | | | 210,205 | |
| | | | | | | | | | | |
|
|
|
Indexed SecuritiesD | | 14.5% | | | | | | | | | | | |
Banc of America Funding Corporation 2005-E | | | | 4.300% | | 6/20/35 | | | 36,209 | | | 36,013 | |
Chevy Chase Mortgage Funding Corporation 2003-2A | | | | 4.418% | | 5/25/34 | | | 6,802 | | | 6,824 | B |
Countrywide Alternative Loan Trust 2005-14 | | | | 4.248% | | 5/25/35 | | | 22,931 | | | 22,850 | |
Countrywide Alternative Loan Trust 2005-17 1A1 | | | | 4.298% | | 7/25/35 | | | 28,104 | | | 28,059 | |
Countrywide Alternative Loan Trust 2005-17 2A1 | | | | 4.278% | | 7/25/35 | | | 34,141 | | | 34,071 | |
Countrywide Alternative Loan Trust 2005-38 | | | | 4.388% | | 9/25/35 | | | 878 | | | 878 | |
Countrywide Asset-Backed Certificates 2005-3 | | | | 4.328% | | 4/25/35 | | | 30,032 | | | 30,003 | |
Countrywide Home Loans 2005-9 1A1 | | | | 4.338% | | 5/25/35 | | | 31,366 | | | 31,326 | |
Countrywide Home Loans 2005-9 2A1 | | | | 4.258% | | 5/25/35 | | | 27,589 | | | 27,566 | |
Credit-Based Asset Servicing and Securitization 2001-CB2 | | | | 4.328% | | 8/25/33 | | | 1,439 | | | 1,440 | |
Granite Mortgages PLC 2003-1 | | | | 4.364% | | 1/20/20 | | | 5,073 | | | 5,074 | G |
Greenpoint Mortgage Funding Trust 2005-AR1 | | | | 4.258% | | 6/25/45 | | | 27,398 | | | 27,332 | |
Greenpoint Mortgage Funding Trust 2005-AR4 | | | | 4.298% | | 10/25/45 | | | 10,680 | | | 10,678 | |
GSMPS Mortgage Loan Trust 2005-RP2 | | | | 4.388% | | 3/25/35 | | | 28,205 | | | 28,175 | |
Harborview Mortgage Loan Trust 2005-7 | | | | 4.607% | | 6/19/45 | | | 37,660 | | | 38,037 | |
Impac CMB Trust 2003-7 | | | | 4.358% | | 8/25/33 | | | 2,843 | | | 2,845 | |
Medallion Trust 2000-1G | | | | 4.345% | | 7/12/31 | | | 214 | | | 214 | G |
Medallion Trust 2000-2G | | | | 4.086% | | 12/18/31 | | | 1,537 | | | 1,537 | G |
Medallion Trust 2003-1G | | | | 4.110% | | 12/21/33 | | | 3,714 | | | 3,722 | G |
MLCC Mortgage Investors, Inc. 2003-B | | | | 4.378% | | 4/25/28 | | | 8,129 | | | 8,175 | |
55
Semi-Annual Report to Shareholders
PORTFOLIO OF INVESTMENTS—Continued
Western Asset Core Bond Portfolio—Continued
| | | | | | | | | | | | | |
| | | % OF
NET ASSETS | | RATE | | MATURITY
DATE | | PAR/
SHARES | | VALUE | |
Mortgage-Backed Securities—Continued | | | | | | | | | | | | | |
| | | | | |
Indexed Securities—Continued | | | | | | | | | | | | | |
MSDWCC Heloc Trust 2005-1 | | | | 4.228% | | 7/25/17 | | $ | 4,251 | | $ | 4,251 | |
People’s Choice Home Loan Securities Trust 2005-2 | | | | 4.148% | | 5/25/35 | | | 23,508 | | | 23,512 | |
Thornburg Mortgage Securities Trust 2005-2A1 | | | | 4.258% | | 7/25/45 | | | 18,251 | | | 18,148 | |
Thornburg Mortgage Securities Trust 2005-2A2 | | | | 4.268% | | 7/25/45 | | | 19,151 | | | 19,043 | |
WaMu Mortgage Pass-Through Certificates, Series 2005-AR6 | | | | 4.268% | | 4/25/45 | | | 30,395 | | | 30,290 | |
WaMu Mortgage Pass-Through Certificates, Series 2005-AR8 | | | | 4.308% | | 7/25/45 | | | 40,128 | | | 40,127 | |
WaMu Mortgage Pass-Through Certificates, Series 2005-AR11 | | | | 4.358% | | 8/25/45 | | | 79,764 | | | 79,754 | |
WaMu Mortgage Pass-Through Certificates, Series 2005-AR13 | | | | 4.328% | | 10/25/45 | | | 34,010 | | | 34,003 | |
| | | | | | | | | | | |
|
|
|
| | | | | | | | | | | | | 593,947 | |
| | | | | | | | | | | |
|
|
|
Stripped Securities | | N.M. | | | | | | | | | | | |
FFCA Secured Lending Corporation 1999-1A | | | | 1.558% | | 9/18/25 | | | 9,386 | | | 383 | F1 |
LB-UBS Commercial Mortgage Trust 2001-C3 | | | | 0.978% | | 6/15/36 | | | 19,097 | | | 821 | F1 |
Structured Mortgage Asset Residential Trust 1991-8 | | | | 0.013% | | 1/25/23 | | | 636 | | | 0.079 | F1 |
| | | | | | | | | | | |
|
|
|
| | | | | | | | | | | | | 1,204 | |
| | | | | | | | | | | |
|
|
|
Total Mortgage-Backed Securities
(Identified Cost—$809,720) | | | | | | | | | | | | 805,356 | |
Municipal Bonds | | 1.1% | | | | | | | | | | | |
Brazos Higher Education Authority, Inc. 2005-1 | | | | 3.991% | | 9/26/16 | | | 18,300 | | | 18,300 | D |
Liberty New York Development Corporation Revenue Bonds | | | | 5.250% | | 10/1/35 | | | 24,060 | | | 26,844 | |
| | | | | | | | | | | |
|
|
|
Total Municipal Bonds
(Identified Cost—$45,225) | | | | | | | | | | | | 45,144 | |
U.S. Government and Agency Obligations | | 25.4% | | | | | | | | | | | |
| | | | | |
Fixed Rate Securities | | 17.7% | | | | | | | | | | | |
Federal Home Loan Bank | | | | 7.250% | | 2/15/07 | | | 100 | | | 104 | |
Tennessee Valley Authority | | | | 6.750% | | 11/1/25 | | | 2,560 | | | 3,161 | |
Tennessee Valley Authority | | | | 7.125% | | 5/1/30 | | | 2,450 | | | 3,211 | |
United States Treasury Bonds | | | | 7.500% | | 11/15/16 | | | 1,490 | | | 1,886 | A |
56
Semi-Annual Report to Shareholders
| | | | | | | | | | | | | |
| | | % OF
NET ASSETS | | RATE | | MATURITY
DATE | | PAR/
SHARES | | VALUE | |
U.S. Government and Agency
Obligations—Continued | | | | | | | | | | | | | |
| | | | | |
Fixed Rate Securities—Continued | | | | | | | | | | | | | |
United States Treasury Bonds | | | | 7.250% | | 8/15/22 | | $ | 13,010 | | $ | 16,998 | A |
United States Treasury Bonds | | | | 6.250% | | 8/15/23 | | | 1,980 | | | 2,368 | A |
United States Treasury Bonds | | | | 5.250% | | 11/15/28 | | | 5,630 | | | 6,133 | A |
United States Treasury Bonds | | | | 5.250% | | 2/15/29 | | | 12,700 | | | 13,845 | A |
United States Treasury Bonds | | | | 6.250% | | 5/15/30 | | | 85,755 | | | 106,480 | A |
United States Treasury Bonds | | | | 5.375% | | 2/15/31 | | | 11,930 | | | 13,365 | A |
United States Treasury Notes | | | | 1.875% | | 12/31/05 | | | 3,340 | | | 3,326 | A |
United States Treasury Notes | | | | 1.500% | | 3/31/06 | | | 3,940 | | | 3,894 | A |
United States Treasury Notes | | | | 2.750% | | 6/30/06 | | | 10,360 | | | 10,262 | A |
United States Treasury Notes | | | | 2.500% | | 9/30/06 | | | 44,470 | | | 43,775 | A |
United States Treasury Notes | | | | 3.125% | | 1/31/07 | | | 370 | | | 365 | A |
United States Treasury Notes | | | | 3.125% | | 5/15/07 | | | 480 | | | 472 | A |
United States Treasury Notes | | | | 3.000% | | 2/15/08 | | | 12,760 | | | 12,422 | A |
United States Treasury Notes | | | | 3.375% | | 2/15/08 | | | 31,310 | | | 30,745 | A |
United States Treasury Notes | | | | 3.750% | | 5/15/08 | | | 3,770 | | | 3,730 | A |
United States Treasury Notes | | | | 3.125% | | 10/15/08 | | | 12,680 | | | 12,296 | A |
United States Treasury Notes | | | | 2.625% | | 3/15/09 | | | 10,510 | | | 9,981 | A |
United States Treasury Notes | | | | 4.000% | | 6/15/09 | | | 72,160 | | | 71,664 | A |
United States Treasury Notes | | | | 3.500% | | 8/15/09 | | | 104,700 | | | 102,054 | A |
United States Treasury Notes | | | | 3.375% | | 10/15/09 | | | 750 | | | 727 | A |
United States Treasury Notes | | | | 3.500% | | 12/15/09 | | | 18,492 | | | 17,988 | A |
United States Treasury Notes | | | | 3.625% | | 1/15/10 | | | 2,900 | | | 2,833 | A |
United States Treasury Notes | | | | 3.500% | | 2/15/10 | | | 114,720 | | | 111,435 | A |
United States Treasury Notes | | | | 4.000% | | 4/15/10 | | | 45,360 | | | 44,947 | A |
United States Treasury Notes | | | | 3.875% | | 5/15/10 | | | 25,190 | | | 24,825 | A |
United States Treasury Notes | | | | 3.875% | | 7/15/10 | | | 25,000 | | | 24,620 | A |
United States Treasury Notes | | | | 4.125% | | 8/15/10 | | | 28,390 | | | 28,262 | A |
United States Treasury Notes | | | | 5.000% | | 2/15/11 | | | 2,100 | | | 2,177 | A |
United States Treasury Notes | | | | 4.250% | | 8/15/15 | | | 40 | | | 40 | A |
| | | | | | | | | | | |
|
|
|
| | | | | | | | | | | | | 730,391 | |
| | | | | | | | | | | |
|
|
|
Indexed SecuritiesH | | 7.6% | | | | | | | | | | | |
United States Treasury Inflation-Protected Security | | | | 3.375% | | 1/15/07 | | | 95,949 | | | 99,229 | |
United States Treasury Inflation-Protected Security | | | | 3.625% | | 1/15/08 | | | 3,725 | | | 3,943 | |
United States Treasury Inflation-Protected Security | | | | 3.875% | | 1/15/09 | | | 23,468 | | | 25,459 | |
57
Semi-Annual Report to Shareholders
PORTFOLIO OF INVESTMENTS—Continued
Western Asset Core Bond Portfolio—Continued
| | | | | | | | | | | | | |
| | | % OF
NET ASSETS | | RATE | | MATURITY DATE | | PAR/
SHARES | | VALUE | |
U.S. Government and Agency
Obligations—Continued | | | | | | | | | | | | | |
| | | | | |
Indexed Securities—Continued | | | | | | | | | | | | | |
United States Treasury Inflation-Protected Security | | | | 4.250% | | 1/15/10 | | $ | 75,549 | | $ | 84,506 | |
United States Treasury Inflation-Protected Security | | | | 0.875% | | 4/15/10 | | | 39,632 | | | 38,619 | |
United States Treasury Inflation-Protected Security | | | | 3.375% | | 1/15/12 | | | 7,702 | | | 8,529 | |
United States Treasury Inflation-Protected Security | | | | 1.875% | | 7/15/13 | | | 14,711 | | | 14,909 | |
United States Treasury Inflation-Protected Security | | | | 2.000% | | 1/15/14 | | | 624 | | | 637 | |
United States Treasury Inflation-Protected Security | | | | 1.875% | | 7/15/15 | | | 3,988 | | | 4,023 | |
United States Treasury Inflation-Protected Security | | | | 2.375% | | 1/15/25 | | | 11,919 | | | 12,752 | |
United States Treasury Inflation-Protected Security | | | | 3.625% | | 4/15/28 | | | 12,152 | | | 15,899 | |
United States Treasury Inflation-Protected Security | | | | 3.875% | | 4/15/29 | | | 3,803 | | | 5,206 | |
United States Treasury Inflation-Protected Security | | | | 2.000% | | 7/15/14 | | | 31 | | | 32 | |
| | | | | | | | | | | |
|
|
|
| | | | | | | | | | | | | 313,743 | |
| | | | | | | | | | | |
|
|
|
Stripped Securities | | 0.1% | | | | | | | | | | | |
United States Treasury Bonds | | | | 0.000% | | 8/15/27 | | | 1,630 | | | 592 | A,F2 |
United States Treasury Notes | | | | 0.000% | | 5/15/30 | | | 10,800 | | | 3,517 | A,F2 |
| | | | | | | | | | | |
|
|
|
| | | | | | | | | | | | | 4,109 | |
| | | | | | | | | | | |
|
|
|
Total U.S. Government and
Agency Obligations
(Identified Cost—$1,054,215) | | | | | | | | | | | | 1,048,243 | |
U.S. Government Agency Mortgage- Backed Securities | | 46.7% | | | | | | | | | | | |
| | | | | |
Fixed Rate Securities | | 46.2% | | | | | | | | | | | |
Fannie Mae | | | | 7.000% | | 9/1/07 to 2/1/33 | | | 13,768 | | | 14,410 | |
Fannie Mae | | | | 4.610% | | 10/10/13 | | | 30,420 | | | 29,799 | |
Fannie Mae | | | | 8.000% | | 5/1/15 | | | 49 | | | 52 | |
Fannie Mae | | | | 6.000% | | 11/1/16 to 10/1/35 | | | 28,588 | | | 29,096 | |
Fannie Mae | | | | 5.500% | | 4/1/18 to 10/1/35 | | | 70,118 | | | 70,165 | |
Fannie Mae | | | | 4.500% | | 7/1/18 to 9/1/35 | | | 14,463 | | | 13,929 | |
58
Semi-Annual Report to Shareholders
| | | | | | | | | | | | | |
| | | % OF
NET ASSETS | | RATE | | MATURITY DATE | | PAR/
SHARES | | VALUE | |
U.S. Government Agency Mortgage- Backed Securities—Continued | | | | | | | | | | | | | |
| | | | | |
Fixed Rate Securities—Continued | | | | | | | | | | | | | |
Fannie Mae | | | | 4.000% | | 8/1/20 to 9/1/20 | | $ | 6,499 | | $ | 6,256 | |
Fannie Mae | | | | 5.000% | | 8/1/20 to 9/1/20 | | | 20,700 | | | 20,653 | |
Fannie Mae | | | | 7.500% | | 6/1/25 to 7/1/29 | | | 1,035 | | | 1,095 | |
Fannie Mae | | | | 6.500% | | 7/1/28 to 7/1/35 | | | 40,119 | | | 41,333 | |
Fannie Mae | | | | 5.500% | | 12/1/35 | | | 405,300 | | | 405,046 | I |
Fannie Mae | | | | 6.000% | | 12/1/35 | | | 289,450 | | | 294,243 | I |
Fannie Mae | | | | 6.500% | | 12/1/35 | | | 83,550 | | | 85,977 | I |
Freddie Mac | | | | 9.750% | | 7/1/08 | | | 30 | | | 31 | |
Freddie Mac | | | | 6.000% | | 3/1/09 to 5/1/29 | | | 1,944 | | | 1,996 | |
Freddie Mac | | | | 4.125% | | 10/18/10 | | | 2,490 | | | 2,445 | |
Freddie Mac | | | | 4.650% | | 10/10/13 | | | 34,390 | | | 33,635 | |
Freddie Mac | | | | 5.500% | | 12/1/13 to 8/1/35 | | | 42,056 | | | 42,095 | |
Freddie Mac | | | | 9.300% | | 4/15/19 | | | 205 | | | 205 | |
Freddie Mac | | | | 5.000% | | 9/1/20 to 8/1/33 | | | 70,132 | | | 69,181 | |
Freddie Mac | | | | 7.000% | | 4/1/24 to 5/1/32 | | | 4,703 | | | 4,915 | |
Freddie Mac | | | | 6.500% | | 6/1/32 | | | 92 | | | 94 | |
Government National Mortgage Association | | | | 10.000% | | 11/15/09 | | | 0.286 | | | 0.306 | |
Government National Mortgage Association | | | | 8.000% | | 10/15/16 to 7/15/17 | | | 255 | | | 273 | |
Government National Mortgage Association | | | | 7.500% | | 10/15/22 to 8/15/32 | | | 615 | | | 653 | |
Government National Mortgage Association | | | | 7.000% | | 6/15/23 to 5/15/32 | | | 582 | | | 613 | |
Government National Mortgage Association | | | | 6.500% | | 10/15/23 to 3/15/33 | | | 28,579 | | | 29,747 | |
Government National Mortgage Association | | | | 6.000% | | 3/15/26 to 8/15/35 | | | 50,052 | | | 51,278 | |
Government National Mortgage Association | | | | 5.500% | | 1/15/33 | | | 276 | | | 278 | |
Government National Mortgage Association | | | | 5.000% | | 6/15/35 to 9/15/35 | | | 77,865 | | | 77,099 | |
Government National Mortgage Association | | | | 5.000% | | 12/1/35 | | | 591,450 | | | 578,841 | I |
| | | | | | | | | | | |
|
|
|
| | | | | | | | | | | | | 1,905,433 | |
| | | | | | | | | | | |
|
|
|
Indexed SecuritiesD | | 0.5% | | | | | | | | | | | |
Fannie Mae | | | | 3.035% | | 10/1/35 | | | 20,800 | | | 21,366 | |
| | | | | | | | | | | |
|
|
|
59
Semi-Annual Report to Shareholders
PORTFOLIO OF INVESTMENTS—Continued
Western Asset Core Bond Portfolio—Continued
| | | | | | | | | | | | | |
| | | % OF
NET ASSETS | | RATE | | MATURITY
DATE | | PAR/
SHARES | | VALUE | |
U.S. Government Agency Mortgage- Backed Securities—Continued | | | | | | | | | | | | | |
| | | | | |
Stripped Securities | | N.M. | | | | | | | | | | | |
Fannie Mae | | | | 9.500% | | 2/1/17 | | $ | 20 | | $ | 4 | F1 |
Fannie Mae | | | | 1009.500% | | 2/25/20 | | | 0.001 | | | 0.238 | F1 |
Fannie Mae | | | | 1009.250% | | 8/25/21 | | | 1 | | | 16 | F1 |
Fannie Mae | | | | 0.000% | | 5/25/22 | | | 177 | | | 152 | F2 |
Financing Corporation | | | | 0.000% | | 4/5/19 | | | 1,150 | | | 598 | F2 |
Freddie Mac | | | | 10.000% | | 3/1/21 | | | 141 | | | 32 | F1 |
Freddie Mac | | | | 0.000% | | 7/15/22 | | | 23 | | | 20 | F2 |
| | | | | | | | | | | |
|
|
|
| | | | | | | | | | | | | 822 | |
| | | | | | | | | | | |
|
|
|
Total U.S. Government Agency Mortgage-
Backed Securities (Identified Cost—$1,940,174) | | | | | | | | | | 1,927,621 | |
Yankee BondsG | | 5.7% | | | | | | | | | | | |
| | | | | |
Banking and Finance | | 0.1% | | | | | | | | | | | |
AIFUL CORPORATION | | | | 4.450% | | 2/16/10 | | | 800 | | | 779 | B |
AIFUL CORPORATION | | | | 5.000% | | 8/10/10 | | | 3,230 | | | 3,209 | |
| | | | | | | | | | | |
|
|
|
| | | | | | | | | | | | | 3,988 | |
| | | | | | | | | | | |
|
|
|
| | | | | |
Banks | | 0.1% | | | | | | | | | | | |
The Korea Development Bank | | | | 4.250% | | 11/13/07 | | | 6,045 | | | 5,985 | |
| | | | | | | | | | | |
|
|
|
| | | | | |
Cable | | 0.1% | | | | | | | | | | | |
Rogers Cable Inc. | | | | 5.500% | | 3/15/14 | | | 4,340 | | | 4,004 | |
| | | | | | | | | | | |
|
|
|
Electric | | N.M. | | | | | | | | | | | |
Hydro-Quebec | | | | 6.300% | | 5/11/11 | | | 570 | | | 616 | |
| | | | | | | | | | | |
|
|
|
Foreign Governments | | 2.7% | | | | | | | | | | | |
Quebec Province | | | | 5.500% | | 4/11/06 | | | 200 | | | 201 | |
Russian Federation | | | | 5.000% | | 3/31/30 | | | 51,110 | | | 58,725 | J |
United Mexican States | | | | 8.375% | | 1/14/11 | | | 8,970 | | | 10,316 | |
United Mexican States | | | | 8.300% | | 8/15/31 | | | 6,100 | | | 7,625 | |
United Mexican States | | | | 7.500% | | 4/8/33 | | | 29,407 | | | 34,112 | |
| | | | | | | | | | | |
|
|
|
| | | | | | | | | | | | | 110,979 | |
| | | | | | | | | | | |
|
|
|
Insurance | | 0.1% | | | | | | | | | | | |
Korea Deposit Insurance Corp. | | | | 2.500% | | 12/11/05 | | | 2,400 | | | 2,654 | E |
| | | | | | | | | | | |
|
|
|
60
Semi-Annual Report to Shareholders
| | | | | | | | | | | | | |
| | | % OF
NET ASSETS | | RATE | | MATURITY
DATE | | PAR/
SHARES | | VALUE | |
Yankee Bonds—Continued | | | | | | | | | | | | | |
| | | | | |
Manufacturing (Diversified) | | 1.6% | | | | | | | | | | | |
Tyco International Group SA | | | | 6.375% | | 2/15/06 | | $ | 16,600 | | $ | 16,711 | |
Tyco International Group SA | | | | 5.800% | | 8/1/06 | | | 10,250 | | | 10,346 | |
Tyco International Group SA | | | | 6.750% | | 2/15/11 | | | 430 | | | 464 | |
Tyco International Group SA | | | | 6.375% | | 10/15/11 | | | 1,230 | | | 1,311 | |
Tyco International Group SA | | | | 6.000% | | 11/15/13 | | | 2,300 | | | 2,430 | A |
Tyco International Group SA | | | | 7.000% | | 6/15/28 | | | 3,070 | | | 3,548 | |
Tyco International Group SA | | | | 6.875% | | 1/15/29 | | | 27,780 | | | 31,877 | |
| | | | | | | | | | | |
|
|
|
| | | | | | | | | | | | | 66,687 | |
| | | | | | | | | | | |
|
|
|
Mining | | N.M. | | | | | | | | | | | |
Corporacion Nacional del Cobre—Codelco | | | | 4.750% | | 10/15/14 | | | 1,750 | | | 1,698 | B |
| | | | | | | | | | | |
|
|
|
| | | | | |
Oil And Gas | | 0.1% | | | | | | | | | | | |
YPF Sociedad Anonima | | | | 7.750% | | 8/27/07 | | | 3,250 | | | 3,426 | |
| | | | | | | | | | | |
|
|
|
| | | | | |
Special Purpose | | 0.7% | | | | | | | | | | | |
Anadarko Finance Company | | | | 6.750% | | 5/1/11 | | | 1,590 | | | 1,728 | |
Conoco Funding Company | | | | 6.350% | | 10/15/11 | | | 400 | | | 434 | A |
Conoco Funding Company | | | | 7.250% | | 10/15/31 | | | 350 | | | 442 | |
CVRD Finance Ltd. | | | | 4.800% | | 10/15/07 | | | 3,376 | | | 3,376 | B,D |
HSBC Capital Funding LP | | | | 4.610% | | 12/29/49 | | | 1,630 | | | 1,559 | A,B,K |
Petronas Capital Ltd. | | | | 7.875% | | 5/22/22 | | | 1,340 | | | 1,659 | |
Petrozuata Finance, Inc. | | | | 8.220% | | 4/1/17 | | | 3,950 | | | 3,772 | |
Resona Preferred Global Securities
(Cayman) Ltd. | | | | 7.191% | | 12/29/49 | | | 13,670 | | | 14,152 | B,K |
| | | | | | | | | | | |
|
|
|
| | | | | | | | | | | | | 27,122 | |
| | | | | | | | | | | |
|
|
|
Telecommunications | | 0.2% | | | | | | | | | | | |
British Telecommunications plc | | | | 8.375% | | 12/15/10 | | | 1,755 | | | 2,032 | |
Telecom Italia Capital S.p.A. | | | | 5.250% | | 11/15/13 | | | 965 | | | 958 | |
Telecom Italia Capital S.p.A. | | | | 4.950% | | 9/30/14 | | | 2,570 | | | 2,487 | |
Telecom Italia Capital S.p.A. | | | | 5.250% | | 10/1/15 | | | 2,060 | | | 2,024 | A,B |
| | | | | | | | | | | |
|
|
|
| | | | | | | | | | | | | 7,501 | |
| | | | | | | | | | | |
|
|
|
Total Yankee Bonds
(Identified Cost—$215,977) | | | | | | | | | | | | 234,660 | |
61
Semi-Annual Report to Shareholders
PORTFOLIO OF INVESTMENTS—Continued
Western Asset Core Bond Portfolio—Continued
| | | | | | | | | | | | | | |
| | | % OF
NET ASSETS | | RATE | | MATURITY
DATE | | PAR/
SHARES | | | VALUE | |
Preferred Stocks | | 0.6% | | | | | | | | | | | | |
Fannie Mae | | | | 7.000% | | | | | 141 | shs | | $ | 7,715 | D |
Fannie Mae | | | | 5.375% | | | | | 0.111 | | | | 7,420 | E |
General Motors Corporation | | | | 5.250% | | | | | 368 | | | | 6,363 | E |
Home Ownership Funding Corporation | | | | 13.331% | | | | | 6 | | | | 1,675 | B,J |
Home Ownership Funding Corporation II | | | | 13.338% | | | | | 5 | | | | 1,503 | B,J |
| | | | | | | | | | | | |
|
|
|
Total Preferred Stocks
(Identified Cost—$30,779) | | | | | | | | | | | | | 24,676 | |
| | | | | | | | | | | | |
|
|
|
Total Long-Term Securities
(Identified Cost—$5,038,940) | | | | | | | | | | | | | 5,028,251 | |
Investment of Collateral From Securities Lending | | 24.2% | | | | | | | | | | | | |
State Street Navigator Securities Lending Prime Portfolio | | | | | | | | | 998,356 | | | | 998,356 | |
| | | | | | | | | | | | |
|
|
|
Total Investments of Collateral From Securities Lending
(Identified Cost—$998,356) | | | | | | | | | | | | | 998,356 | |
Short-Term Securities | | 13.8% | | | | | | | | | | | | |
| | | | | |
U.S. Government and Agency Obligations | | 10.4% | | | | | | | | | | | | |
Fannie Mae | | | | 0.000% | | 12/5/05 | | $ | 19,396 | | | | 19,277 | C,L |
Fannie Mae | | | | 0.000% | | 10/3/05 | | | 80,000 | | | | 79,986 | C |
Freddie Mac | | | | 0.000% | | 12/12/05 | | | 10,000 | | | | 9,926 | A,C,L |
Freddie Mac | | | | 0.000% | | 10/3/05 | | | 180,000 | | | | 179,969 | C |
Freddie Mac | | | | 0.000% | | 10/3/05 | | | 140,000 | | | | 139,975 | C |
| | | | | | | | | | | | |
|
|
|
| | | | | | | | | | | | | | 429,133 | |
| | | | | | | | | | | | |
|
|
|
Options PurchasedM | | 0.3% | | | | | | | | | | | | |
Deutsche Bank Swaption Call, July 2006, Strike Price $4.61 | | | | | | | | | 76,000,000N | | | | 1,043 | |
Deutsche Bank Swaption Put, July 2006, Strike Price $4.61 | | | | | | | | | 76,000,000N | | | | 1,206 | |
Eurodollar Futures Call, April 2006, Strike Price $95.00 | | | | | | | | | 5,755N | | | | 7,266 | |
Eurodollar Futures Call, January 2006, Strike Price $95.00 | | | | | | | | | 291N | | | | 447 | |
Eurodollar Futures Call, July 2006, Strike Price $95.00 | | | | | | | | | 485N | | | | 555 | |
62
Semi-Annual Report to Shareholders
| | | | | | | | | |
| | | % OF
NET ASSETS | | PAR/
SHARES | | VALUE | |
Short-Term Securities—Continued | | | | | | | | | |
| | | |
Options Purchased—Continued | | | | | | | | | |
Eurodollar Futures Call, November 2005, Strike Price $96.00 | | | | | 720N | | $ | 5 | |
Eurodollar Futures Put, July 2005, Strike Price $94.00 | | | | | 215N | | | 1 | |
Goldman Sachs Swaption Call, March 2006, Strike Price $4.43 | | | | | 33,300,000N | | | 243 | |
Goldman Sachs Swaption Put, March 2006, Strike Price $4.43 | | | | | 33,300,000N | | | 501 | |
Goldman Sachs Swaption Put, November 2005, Strike
Price $4.12 | | | | | 61,184,000N | | | 468 | |
U.S. Treasury Bond Futures Call, December 2005, Strike Price $115.00 | | | | | 429N | | | 442 | |
U.S. Treasury Bond Futures Call, December 2005, Strike Price $119.00 | | | | | 651N | | | 92 | |
U.S. Treasury Note Futures Call, December 2005, Strike Price $104.50 | | | | | 177N | | | 420 | |
U.S. Treasury Note Futures Call, December 2005, Strike Price $106.50 | | | | | 394N | | | 283 | |
U.S. Treasury Note Futures Call, December 2005, Strike Price $108.50 | | | | | 498N | | | 39 | |
| | | | | | | |
|
|
|
| | | | | | | | | 13,011 | |
| | | | | | | |
|
|
|
| | | |
Repurchase Agreements | | 3.1% | | | | | | | |
Goldman, Sachs & Company
3.8%, dated 9/30/05, to be repurchased at $128,331 on 10/3/05 (Collateral: $98,115 Tennessee Valley Authority bonds, 7.125%, due 5/1/30, value $133,754) | | | | $ | 128,290 | | | 128,290 | |
| | | | | | | |
|
|
|
Total Short-Term Securities
(Identified Cost—$573,557) | | | | | | | | 570,434 | |
Total Investments (Identified Cost—$6,610,853) | | 159.9% | | | | | $ | 6,597,041 | |
Other Assets Less Liabilities | | (35.7)% | | | | | | (1,472,219 | ) |
Obligations to Return Collateral for Securities Loaned | | (24.2)% | | | | | | (998,356 | ) |
| | | | | | | |
|
|
|
| | | |
Net Assets | | 100.0% | | | | | $ | 4,126,466 | |
| | | | | | | |
|
|
|
| | | | | | | | |
| | | EXPIRATION | | ACTUAL
CONTRACTS | | APPRECIATION/
(DEPRECIATION) | |
Futures Contracts PurchasedL | | | | | | | | |
Eurodollar Futures | | June 2006 | | 3,048 | | $ | (2,146 | ) |
Eurodollar Futures | | March 2006 | | 49 | | | (14 | ) |
Eurodollar Futures | | September 2006 | | 220 | | | (133 | ) |
U.S. Treasury Bond Futures | | December 2005 | | 520 | | | (166 | ) |
| | | | | | |
|
|
|
| | | | | | | $ | (2,459 | ) |
| | | | | | |
|
|
|
Futures Contracts WrittenK | | | | | | | | |
U.S. Treasury Bond Futures | | December 2005 | | 5 | | $ | 1,130 | |
U.S. Treasury Note Futures | | December 2005 | | 1,022 | | | 5 | |
| | | | | | |
|
|
|
| | | | | | | $ | 1,135 | |
| | | | | | |
|
|
|
63
Semi-Annual Report to Shareholders
PORTFOLIO OF INVESTMENTS—Continued
Western Asset Core Bond Portfolio—Continued
| | | | | | | | |
| | | EXPIRATION | | ACTUAL
CONTRACTS | | APPRECIATION/
(DEPRECIATION) | |
Options WrittenL | | | | | | | | |
Deutsche Bank Swaption Call, Strike Price $4.745 | | July 2006 | | 45,600,000 | | $ | 229 | |
Deutsche Bank Swaption Put, Strike Price $4.745 | | July 2006 | | 45,600,000 | | | 8 | |
Eurodollar Futures Put, Strike Price $95.625 | | October 2005 | | 720 | | | (332 | ) |
Eurodollar Futures Put, Strike Price $95.75 | | March 2006 | | 482 | | | (266 | ) |
Eurodollar Futures Put, Strike Price $95.75 | | June 2006 | | 643 | | | (407 | ) |
Goldman Sachs Swaption Call, Strike Price $4.36 | | March 2006 | | 54,100,000 | | | (143 | ) |
Goldman Sachs Swaption Put, Strike Price $4.48 | | November 2005 | | 15,675,000 | | | (158 | ) |
Goldman Sachs Swaption Put, Strike Price $4.36 | | March 2006 | | 54,100,000 | | | 167 | |
U.S. Treasury Bond Futures Call, Strike Price $117.00 | | November 2005 | | 903 | | | 555 | |
U.S. Treasury Bond Futures Call, Strike Price $118.00 | | November 2005 | | 432 | | | 331 | |
U.S. Treasury Bond Futures Call, Strike Price $120.00 | | November 2005 | | 160 | | | 130 | |
U.S. Treasury Bond Futures Call, Strike Price $122.00 | | November 2005 | | 122 | | | 77 | |
U.S. Treasury Bond Futures Put, Strike Price $113.00 | | November 2005 | | 2,170 | | | 16 | |
U.S. Treasury Bond Futures Put, Strike Price $115.00 | | November 2005 | | 231 | | | (217 | ) |
U.S. Treasury Note Futures Call, Strike Price $108.00 | | November 2005 | | 307 | | | 63 | |
U.S. Treasury Note Futures Call, Strike Price $111.00 | | November 2005 | | 1,027 | | | 234 | |
U.S. Treasury Note Futures Call, Strike Price $112.00 | | November 2005 | | 1,232 | | | 426 | |
U.S. Treasury Note Futures Call, Strike Price $113.00 | | November 2005 | | 1,946 | | | 924 | |
U.S. Treasury Note Futures Call, Strike Price $113.00 | | October 2005 | | 161 | | | 70 | |
U.S. Treasury Note Futures Call, Strike Price $113.00 | | February 2006 | | 299 | | | 30 | |
U.S. Treasury Note Futures Call, Strike Price $114.00 | | November 2005 | | 658 | | | 387 | |
U.S. Treasury Note Futures Put, Strike Price $106.50 | | November 2005 | | 80 | | | (4 | ) |
U.S. Treasury Note Futures Put, Strike Price $107.00 | | February 2006 | | 216 | | | (5 | ) |
U.S. Treasury Note Futures Put, Strike Price $107.00 | | November 2005 | | 182 | | | (3 | ) |
U.S. Treasury Note Futures Put, Strike Price $107.50 | | November 2005 | | 1,198 | | | (372 | ) |
U.S. Treasury Note Futures Put, Strike Price $109.00 | | November 2005 | | 2,667 | | | 408 | |
U.S. Treasury Note Futures Put, Strike Price $110.00 | | November 2005 | | 327 | | | (141 | ) |
U.S. Treasury Note Futures Put, Strike Price $111.00 | | November 2005 | | 503 | | | (233 | ) |
| | | | | | |
|
|
|
| | | | | | | $ | 1,774 | |
| | | | | | |
|
|
|
| | | | | | | | | |
| A | All or a portion of these securities is on loan. See note 4 to the financial statements. |
| B | Rule 144a Security – A security purchased pursuant to Rule 144a under the Securities Act of 1933 which may not be resold subject to that rule except to qualified institutional buyers. These securities represent 3.1% of net assets. |
| C | Zero coupon bond – A bond with no periodic interest payments which is sold at such a discount as to produce a current yield to maturity. |
| D | Indexed security – The rate of interest earned on this security is tied to the London Interbank Offered Rate ("LIBOR"), the Consumer Price Index (“CPI”), or the one-year Treasury Bill rate. The coupon rate is the rate as of September 30, 2005. |
| E | Convertible Security – Security may be converted into issuer's common stock. |
| F | Securities with interest-only or principal-only payment streams, denoted by a 1 or 2, respectively. For interest-only securities, the amount shown as principal is the notional balance used to calculate the amount of interest due. |
| G | Yankee Bond – A dollar denominated bond issued in the U.S. by foreign entities. |
| H | Inflation-Protected Security – A security whose principal value is adjusted daily in accordance with changes to the Consumer Price Index for All Urban Consumers. Interest is calculated on the basis of the current adjusted principal value. |
| I | When-issued security – Security purchased on a delayed delivery basis. Final settlement amount and maturity date have not yet been announced. |
| J | Stepped coupon security – A security with a predetermined schedule of interest or dividend rate changes, at which time it begins to accrue interest or pay dividends. |
| K | The coupon rates shown on variable rate securities are the rates at September 30, 2005. These rates vary with the weighted average coupon of the underlying loans. |
| L | All or a portion of this security is collateral to cover futures and options contracts. |
| M | Options and futures are described in more detail in the notes to financial statements. |
| N | Par represents actual number of contracts. |
N.M.—Not meaningful.
See notes to financial statements.
64
Semi-Annual Report to Shareholders
PORTFOLIO OF INVESTMENTS
September 30, 2005 (Unaudited)
(Amounts in Thousands)
Western Asset Core Plus Bond Portfolio
| | | | | | | | | | | | |
| | | % OF
NET ASSETS | | RATE | | MATURITY
DATE | | PAR/
SHARES | | VALUE |
Long-Term Securities | | 113.6% | | | | | | | | | | |
| | | | | |
Corporate Bonds and Notes | | 18.3% | | | | | | | | | | |
| | | | | |
Aerospace/Defense | | 0.2% | | | | | | | | | | |
L-3 Communications Corp. | | | | 7.625% | | 6/15/12 | | $ | 852 | | $ | 895 |
Lockheed Martin Corporation | | | | 7.650% | | 5/1/16 | | | 945 | | | 1,144 |
Lockheed Martin Corporation | | | | 8.500% | | 12/1/29 | | | 20 | | | 28 |
Northrop Grumman Corporation | | | | 4.079% | | 11/16/06 | | | 3,580 | | | 3,561 |
Raytheon Company | | | | 6.750% | | 8/15/07 | | | 15 | | | 16A |
Raytheon Company | | | | 6.000% | | 12/15/10 | | | 41 | | | 43 |
Raytheon Company | | | | 5.500% | | 11/15/12 | | | 75 | | | 77 |
Raytheon Company | | | | 5.375% | | 4/1/13 | | | 875 | | | 894A |
Systems 2001 Asset Trust | | | | 6.664% | | 9/15/13 | | | 2,709 | | | 2,903 |
| | | | | | | | | | | |
|
|
| | | | | | | | | | | | | 9,561 |
| | | | | | | | | | | |
|
|
Apparel | | N.M. | | | | | | | | | | |
Oxford Industries, Inc. | | | | 8.875% | | 6/1/11 | | | 800 | | | 832 |
Russell Corporation | | | | 9.250% | | 5/1/10 | | | 130 | | | 131 |
| | | | | | | | | | | |
|
|
| | | | | | | | | | | | | 963 |
| | | | | | | | | | | |
|
|
Auto Trucks and Parts | | N.M. | | | | | | | | | | |
Visteon Corporation | | | | 8.250% | | 8/1/10 | | | 2,050 | | | 1,948A |
| | | | | | | | | | | |
|
|
| | | | | |
Automotive | | 1.5% | | | | | | | | | | |
Ford Motor Company | | | | 7.450% | | 7/16/31 | | | 42,400 | | | 33,072A |
General Motors Corporation | | | | 8.250% | | 7/15/23 | | | 8,000 | | | 6,220A |
General Motors Corporation | | | | 8.375% | | 7/15/33 | | | 64,530 | | | 50,333A |
| | | | | | | | | | | |
|
|
| | | | | | | | | | | | | 89,625 |
| | | | | | | | | | | |
|
|
Banking and Finance | | 1.7% | | | | | | | | | | |
Boeing Capital Corporation | | | | 5.800% | | 1/15/13 | | | 2,030 | | | 2,145 |
Ford Motor Credit Company | | | | 6.625% | | 6/16/08 | | | 7,040 | | | 6,881 |
Ford Motor Credit Company | | | | 7.375% | | 10/28/09 | | | 45,280 | | | 43,738 |
Ford Motor Credit Company | | | | 7.875% | | 6/15/10 | | | 4,200 | | | 4,087 |
Ford Motor Credit Company | | | | 7.375% | | 2/1/11 | | | 14,135 | | | 13,520 |
Ford Motor Credit Company | | | | 7.250% | | 10/25/11 | | | 5,760 | | | 5,467A |
General Motors Acceptance Corporation | | | | 6.311% | | 11/30/07 | | | 4,570 | | | 4,417 |
General Motors Acceptance Corporation | | | | 8.000% | | 11/1/31 | | | 3,800 | | | 3,318 |
HSBC Finance Corporation | | | | 7.200% | | 7/15/06 | | | 3,750 | | | 3,826 |
HSBC Finance Corporation | | | | 6.400% | | 6/17/08 | | | 20 | | | 21 |
HSBC Finance Corporation | | | | 6.500% | | 11/15/08 | | | 40 | | | 42 |
HSBC Finance Corporation | | | | 8.000% | | 7/15/10 | | | 70 | | | 79 |
HSBC Finance Corporation | | | | 6.375% | | 8/1/10 | | | 1,000 | | | 1,062 |
65
Semi-Annual Report to Shareholders
PORTFOLIO OF INVESTMENTS—Continued
Western Asset Core Plus Bond Portfolio—Continued
| | | | | | | | | | | | |
| | | % OF
NET ASSETS | | RATE | | MATURITY
DATE | | PAR/
SHARES | | VALUE |
Corporate Bonds and Notes—Continued | | | | | | | | | | | | |
| | | | | |
Banking and Finance—Continued | | | | | | | | | | | | |
HSBC Finance Corporation | | | | 7.000% | | 5/15/12 | | $ | 160 | | $ | 177A |
HSBC Finance Corporation | | | | 6.375% | | 11/27/12 | | | 520 | | | 559 |
SB Treasury Company LLC | | | | 9.400% | | 12/29/49 | | | 360 | | | 397B |
SLM Corporation | | | | 4.300% | | 4/1/09 | | | 10,680 | | | 10,518C |
| | | | | | | | | | | |
|
|
| | | | | | | | | | | | | 100,254 |
| | | | | | | | | | | |
|
|
Banks | | 0.9% | | | | | | | | | | |
Bank of America Corporation | | | | 3.805% | | 12/9/05 | | | 23,100 | | | 23,102C |
Bank of America Corporation | | | | 7.400% | | 1/15/11 | | | 3,090 | | | 3,451 |
Bank One Corporation | | | | 4.125% | | 9/1/07 | | | 2,780 | | | 2,763 |
Bank One Corporation | | | | 6.000% | | 8/1/08 | | | 150 | | | 155 |
Bank One Corporation | | | | 5.900% | | 11/15/11 | | | 2,000 | | | 2,096 |
Firstar Bank NA | | | | 7.125% | | 12/1/09 | | | 350 | | | 383 |
Royal Bank of Scotland/ New York | | | | 3.800% | | 7/5/06 | | | 21,900 | | | 21,891C |
| | | | | | | | | | | |
|
|
| | | | | | | | | | | | | 53,841 |
| | | | | | | | | | | |
|
|
Cable | | 0.7% | | | | | | | | | | |
Comcast Cable Communications, Inc. | | | | 6.375% | | 1/30/06 | | | 12,650 | | | 12,733 |
Comcast Cable Communications, Inc. | | | | 6.750% | | 1/30/11 | | | 680 | | | 731A |
Comcast Corporation | | | | 6.500% | | 1/15/15 | | | 1,690 | | | 1,826A |
Comcast Corporation | | | | 7.050% | | 3/15/33 | | | 6,530 | | | 7,267A |
Comcast MO of Delaware Inc. | | | | 9.000% | | 9/1/08 | | | 1,060 | | | 1,176 |
Cox Communications, Inc. | | | | 7.875% | | 8/15/09 | | | 7,680 | | | 8,425 |
CSC Holdings Inc. | | | | 7.625% | | 4/1/11 | | | 1,620 | | | 1,592 |
CSC Holdings Inc. | | | | 7.000% | | 4/15/12 | | | 500 | | | 472B |
CSC Holdings Inc. | | | | 7.875% | | 2/15/18 | | | 260 | | | 248 |
CSC Holdings Inc. | | | | 7.625% | | 7/15/18 | | | 650 | | | 608 |
DirectTV Holdings | | | | 6.375% | | 6/15/15 | | | 2,450 | | | 2,432B |
EchoStar DBS Corporation | | | | 6.754% | | 10/1/08 | | | 833 | | | 848C |
EchoStar DBS Corporation | | | | 6.625% | | 10/1/14 | | | 805 | | | 797 |
| | | | | | | | | | | |
|
|
| | | | | | | | | | | | | 39,155 |
| | | | | | | | | | | |
|
|
Casino Resorts | | 0.2% | | | | | | | | | | |
Caesars Entertainment Inc. | | | | 8.125% | | 5/15/11 | | | 733 | | | 816 |
Inn of The Mountain Gods Resort and Casino | | | | 12.000% | | 11/15/10 | | | 1,070 | | | 1,209A |
Mandalay Resort Group | | | | 9.500% | | 8/1/08 | | | 80 | | | 87A |
MGM MIRAGE | | | | 9.750% | | 6/1/07 | | | 795 | | | 847 |
MGM MIRAGE | | | | 8.500% | | 9/15/10 | | | 2,079 | | | 2,261 |
MGM MIRAGE | | | | 6.750% | | 9/1/12 | | | 815 | | | 828 |
MGM MIRAGE | | | | 6.625% | | 7/15/15 | | | 2,240 | | | 2,215B |
66
Semi-Annual Report to Shareholders
| | | | | | | | | | | | |
| | | % OF
NET ASSETS | | RATE | | MATURITY
DATE | | PAR/
SHARES | | VALUE |
Corporate Bonds and Notes—Continued | | | | | | | | | | | | |
| | | | | |
Casino Resorts—Continued | | | | | | | | | | | | |
Premier Entertainment Biloxi LLC | | | | 10.750% | | 2/1/12 | | $ | 810 | | $ | 730 |
Station Casinos, Inc. | | | | 6.000% | | 4/1/12 | | | 1,390 | | | 1,388A |
Station Casinos, Inc. | | | | 6.875% | | 3/1/16 | | | 1,050 | | | 1,065B |
| | | | | | | | | | | |
|
|
| | | | | | | | | | | | | 11,446 |
| | | | | | | | | | | |
|
|
Chemicals | | 0.1% | | | | | | | | | | |
IMC Global Inc. | | | | 10.875% | | 6/1/08 | | | 685 | | | 774A |
IMC Global Inc. | | | | 11.250% | | 6/1/11 | | | 132 | | | 145 |
IMC Global Inc. | | | | 10.875% | | 8/1/13 | | | 460 | | | 543 |
Lyondell Chemical Company | | | | 9.625% | | 5/1/07 | | | 836 | | | 878 |
MacDermid, Incorporated | | | | 9.125% | | 7/15/11 | | | 1,067 | | | 1,142 |
Westlake Chemical Corporation | | | | 8.750% | | 7/15/11 | | | 702 | | | 756 |
| | | | | | | | | | | |
|
|
| | | | | | | | | | | | | 4,238 |
| | | | | | | | | | | |
|
|
Computer Services and Systems | | 0.4% | | | | | | | | | | |
Electronic Data Systems Corporation | | | | 7.125% | | 10/15/09 | | | 19,905 | | | 21,318A |
International Business Machines Corporation | | | | 4.750% | | 11/29/12 | | | 40 | | | 40 |
Sungard Data Systems Incorporated | | | | 9.125% | | 8/15/13 | | | 1,640 | | | 1,700B |
| | | | | | | | | | | |
|
|
| | | | | | | | | | | | | 23,058 |
| | | | | | | | | | | |
|
|
Containers and Packaging | | N.M. | | | | | | | | | | |
Horizon Lines, LLC | | | | 9.000% | | 11/1/12 | | | 1,085 | | | 1,162 |
Solo Cup Company | | | | 8.500% | | 2/15/14 | | | 880 | | | 779A |
| | | | | | | | | | | |
|
|
| | | | | | | | | | | | | 1,941 |
| | | | | | | | | | | |
|
|
Diversified Financial Services | | 0.9% | | | | | | | | | | |
American General Finance Corporation (AGFC) | | | | 4.100% | | 6/27/08 | | | 18,300 | | | 18,317C |
CIT Group Inc. | | | | 6.500% | | 2/7/06 | | | 40 | | | 40 |
CIT Group Inc. | | | | 5.750% | | 9/25/07 | | | 80 | | | 82 |
Citigroup Global Markets Holdings Inc. | | | | 3.884% | | 12/12/05 | | | 12,600 | | | 12,598C |
Citigroup Inc. | | | | 5.000% | | 3/6/07 | | | 500 | | | 504 |
Citigroup Inc. | | | | 4.125% | | 2/22/10 | | | 2,790 | | | 2,724 |
Citigroup Inc. | | | | 5.000% | | 9/15/14 | | | 150 | | | 149 |
General Electric Capital Corporation | | | | 5.450% | | 1/15/13 | | | 2,555 | | | 2,645 |
Mizuho Preferred Capital Corp. LLC | | | | 8.790% | | 12/29/49 | | | 3,380 | | | 3,679B |
U.S. Bancorp | | | | 3.125% | | 3/15/08 | | | 8,290 | | | 8,013 |
Wells Fargo & Company | | | | 3.924% | | 6/12/06 | | | 50 | | | 50C |
Wells Fargo & Company | | | | 5.000% | | 11/15/14 | | | 2,750 | | | 2,756A |
| | | | | | | | | | | |
|
|
| | | | | | | | | | | | | 51,557 |
| | | | | | | | | | | |
|
|
67
Semi-Annual Report to Shareholders
PORTFOLIO OF INVESTMENTS—Continued
Western Asset Core Plus Bond Portfolio—Continued
| | | | | | | | | | | | |
| | | % OF
NET ASSETS | | RATE | | MATURITY
DATE | | PAR/
SHARES | | VALUE |
Corporate Bonds and Notes—Continued | | | | | | | | | | | | |
| | | | | |
Electric | | 2.5% | | | | | | | | | | |
Dominion Resources, Inc. | | | | 4.125% | | 2/15/08 | | $ | 2,000 | | $ | 1,972 |
Dominion Resources, Inc. | | | | 5.125% | | 12/15/09 | | | 1,260 | | | 1,271 |
Dominion Resources, Inc. | | | | 4.750% | | 12/15/10 | | | 1,010 | | | 999A |
Dominion Resources, Inc. | | | | 5.700% | | 9/17/12 | | | 3,335 | | | 3,441 |
FirstEnergy Corp. | | | | 5.500% | | 11/15/06 | | | 15,580 | | | 15,712 |
FirstEnergy Corp. | | | | 6.450% | | 11/15/11 | | | 1,640 | | | 1,746A |
FirstEnergy Corp. | | | | 7.375% | | 11/15/31 | | | 15,140 | | | 17,757A |
General Electric Company | | | | 5.000% | | 2/1/13 | | | 8,980 | | | 9,055 |
Niagara Mohawk Power Corporation | | | | 7.750% | | 10/1/08 | | | 500 | | | 541A |
The AES Corporation | | | | 9.500% | | 6/1/09 | | | 736 | | | 802A |
The AES Corporation | | | | 9.375% | | 9/15/10 | | | 1,494 | | | 1,647A |
The AES Corporation | | | | 8.750% | | 5/15/13 | | | 18,838 | | | 20,628B |
The AES Corporation | | | | 7.750% | | 3/1/14 | | | 60,985 | | | 64,644A |
The AES Corporation | | | | 9.000% | | 5/15/15 | | | 7,700 | | | 8,451B |
The Cleveland Electric Illuminating Company | | | | 5.650% | | 12/15/13 | | | 1,495 | | | 1,531 |
The Detroit Edison Company | | | | 5.200% | | 10/15/12 | | | 10 | | | 10 |
| | | | | | | | | | | |
|
|
| | | | | | | | | | | | | 150,207 |
| | | | | | | | | | | |
|
|
Energy | | 0.8% | | | | | | | | | | |
Duke Energy Corporation | | | | 6.250% | | 1/15/12 | | | 620 | | | 660 |
Duke Energy Corporation | | | | 5.625% | | 11/30/12 | | | 1,420 | | | 1,466A |
MidAmerican Energy Holdings Company | | | | 5.875% | | 10/1/12 | | | 30 | | | 31 |
Pacific Gas and Electric Company | | | | 6.050% | | 3/1/34 | | | 7,730 | | | 8,042 |
Peabody Energy Corporation | | | | 6.875% | | 3/15/13 | | | 860 | | | 899 |
Peabody Energy Corporation | | | | 5.875% | | 4/15/16 | | | 880 | | | 875A |
Progress Energy, Inc. | | | | 7.100% | | 3/1/11 | | | 110 | | | 120 |
Reliant Energy Inc. | | | | 6.750% | | 12/15/14 | | | 1,475 | | | 1,449A |
TXU Corp. | | | | 6.375% | | 6/15/06 | | | 9,795 | | | 9,901 |
TXU Corp. | | | | 4.800% | | 11/15/09 | | | 7,760 | | | 7,477 |
TXU Corp. | | | | 6.550% | | 11/15/34 | | | 13,325 | | | 12,367A |
TXU Electric Delivery Company | | | | 6.375% | | 1/15/15 | | | 685 | | | 740 |
TXU Energy Co. | | | | 4.920% | | 1/17/06 | | | 875 | | | 875C |
TXU Energy Co. | | | | 7.000% | | 3/15/13 | | | 10 | | | 11 |
| | | | | | | | | | | |
|
|
| | | | | | | | | | | | | 44,913 |
| | | | | | | | | | | |
|
|
Environmental Services | | 0.5% | | | | | | | | | | |
Waste Management, Inc. | | | | 7.000% | | 10/15/06 | | | 5,565 | | | 5,686 |
Waste Management, Inc. | | | | 7.125% | | 10/1/07 | | | 1,060 | | | 1,105 |
Waste Management, Inc. | | | | 6.500% | | 11/15/08 | | | 4,340 | | | 4,538A |
68
Semi-Annual Report to Shareholders
| | | | | | | | | | | | |
| | | % OF
NET ASSETS | | RATE | | MATURITY
DATE | | PAR/
SHARES | | VALUE |
Corporate Bonds and Notes—Continued | | | | | | | | | | | | |
Environmental Services—Continued | | | | | | | | | | | | |
Waste Management, Inc. | | | | 6.875% | | 5/15/09 | | $ | 8,000 | | $ | 8,512A |
Waste Management, Inc. | | | | 7.375% | | 8/1/10 | | | 6,055 | | | 6,658A |
Waste Management, Inc. | | | | 7.125% | | 12/15/17 | | | 500 | | | 566 |
Waste Management, Inc. | | | | 7.000% | | 7/15/28 | | | 3,010 | | | 3,389 |
Waste Management, Inc. | | | | 7.375% | | 5/15/29 | | | 80 | | | 93 |
Waste Management, Inc. | | | | 7.750% | | 5/15/32 | | | 750 | | | 922A |
| | | | | | | | | | | |
|
|
| | | | | | | | | | | | | 31,469 |
| | | | | | | | | | | |
|
|
Food, Beverage and Tobacco | | 0.2% | | | | | | | | | | |
Altria Group, Inc. | | | | 7.000% | | 11/4/13 | | | 4,905 | | | 5,369 |
Altria Group, Inc. | | | | 7.750% | | 1/15/27 | | | 5,000 | | | 5,830A |
R.J. Reynolds Tobacco Holdings, Inc. | | | | 7.750% | | 5/15/06 | | | 1,080 | | | 1,099 |
R.J. Reynolds Tobacco Holdings, Inc. | | | | 6.500% | | 6/1/07 | | | 590 | | | 599 |
R.J. Reynolds Tobacco Holdings, Inc. | | | | 7.875% | | 5/15/09 | | | 730 | | | 767 |
Sara Lee Corporation | | | | 6.250% | | 9/15/11 | | | 30 | | | 31 |
Sara Lee Corporation | | | | 3.875% | | 6/15/13 | | | 20 | | | 18A |
| | | | | | | | | | | |
|
|
| | | | | | | | | | | | | 13,713 |
| | | | | | | | | | | |
|
|
Funeral Parlors and Cemeteries | | N.M. | | | | | | | | | | |
Service Corporation International | | | | 7.000% | | 6/15/17 | | | 1,510 | | | 1,525B |
| | | | | | | | | | | |
|
|
| | | | | |
Gaming | | N.M. | | | | | | | | | | |
Mohegan Tribal Gaming Authority | | | | 8.000% | | 4/1/12 | | | 245 | | | 259 |
River Rock Entertainment Authority | | | | 9.750% | | 11/1/11 | | | 220 | | | 244 |
| | | | | | | | | | | |
|
|
| | | | | | | | | | | | | 503 |
| | | | | | | | | | | |
|
|
Gas and Pipeline Utilities | | 0.7% | | | | | | | | | | |
Dynegy Holdings Inc. | | | | 8.750% | | 2/15/12 | | | 5,890 | | | 6,391A |
Southern Natural Gas Company | | | | 8.875% | | 3/15/10 | | | 1,220 | | | 1,319 |
Southern Natural Gas Company | | | | 8.000% | | 3/1/32 | | | 11,940 | | | 13,183 |
The Williams Companies, Inc. | | | | 7.500% | | 1/15/31 | | | 4,113 | | | 4,370 |
The Williams Companies, Inc. | | | | 7.750% | | 6/15/31 | | | 530 | | | 574A |
The Williams Companies, Inc. | | | | 8.750% | | 3/15/32 | | | 15,130 | | | 17,853 |
| | | | | | | | | | | |
|
|
| | | | | | | | | | | | | 43,690 |
| | | | | | | | | | | |
|
|
Health Care | | 0.8% | | | | | | | | | | |
Tenet Healthcare Corporation | | | | 6.375% | | 12/1/11 | | | 2,500 | | | 2,331A |
Tenet Healthcare Corporation | | | | 7.375% | | 2/1/13 | | | 6,222 | | | 5,895A |
Tenet Healthcare Corporation | | | | 9.875% | | 7/1/14 | | | 27,435 | | | 28,670 |
Tenet Healthcare Corporation | | | | 9.250% | | 2/1/15 | | | 12,430 | | | 12,554B |
| | | | | | | | | | | |
|
|
| | | | | | | | | | | | | 49,450 |
| | | | | | | | | | | |
|
|
69
Semi-Annual Report to Shareholders
PORTFOLIO OF INVESTMENTS—Continued
Western Asset Core Plus Bond Portfolio—Continued
| | | | | | | | | | | | |
| | | % OF
NET ASSETS | | RATE | | MATURITY
DATE | | PAR/
SHARES | | VALUE |
Corporate Bonds and Notes—Continued | | | | | | | | | | | | |
| | | | | |
Homebuilding | | N.M. | | | | | | | | | | |
Beazer Homes USA, Inc. | | | | 8.375% | | 4/15/12 | | $ | 210 | | $ | 223 |
| | | | | | | | | | | |
|
|
| | | | | |
Insurance | | N.M. | | | | | | | | | | |
Loews Corporation | | | | 8.875% | | 4/15/11 | | | 90 | | | 105 |
| | | | | | | | | | | |
|
|
| | | | | |
Investment Banking/Brokerage | | 0.5% | | | | | | | | | | |
E*Trade Financial Corporation | | | | 7.375% | | 9/15/13 | | | 590 | | | 596B |
J.P. Morgan Capital Trust II | | | | 7.950% | | 2/1/27 | | | 20 | | | 21 |
J.P. Morgan Chase & Co. | | | | 6.000% | | 2/15/09 | | | 10 | | | 10 |
J.P. Morgan Chase & Co. | | | | 4.500% | | 11/15/10 | | | 140 | | | 138 |
J.P. Morgan Chase & Co. | | | | 5.750% | | 1/2/13 | | | 4,430 | | | 4,607 |
Lehman Brothers Holdings Inc. | | | | 4.000% | | 1/22/08 | | | 6,840 | | | 6,748A |
Lehman Brothers Holdings Inc. | | | | 7.000% | | 2/1/08 | | | 160 | | | 168 |
Merrill Lynch & Co., Inc. | | | | 3.375% | | 9/14/07 | | | 3,130 | | | 3,075 |
Merrill Lynch & Co., Inc. | | | | 3.125% | | 7/15/08 | | | 3,115 | | | 2,992A |
Merrill Lynch & Co., Inc. | | | | 6.375% | | 10/15/08 | | | 2,670 | | | 2,801 |
Morgan Stanley | | | | 3.625% | | 4/1/08 | | | 90 | | | 88A |
Morgan Stanley | | | | 5.300% | | 3/1/13 | | | 4,090 | | | 4,131 |
The Goldman Sachs Group, Inc. | | | | 6.600% | | 1/15/12 | | | 2,810 | | | 3,046 |
The Goldman Sachs Group, Inc. | | | | 4.750% | | 7/15/13 | | | 1,420 | | | 1,388 |
| | | | | | | | | | | |
|
|
| | | | | | | | | | | | | 29,809 |
| | | | | | | | | | | |
|
|
Investment Management | | N.M. | | | | | | | | | | |
Dryden Investor Trust | | | | 7.157% | | 7/23/08 | | | 1,156 | | | 1,194B |
| | | | | | | | | | | |
|
|
| | | | | |
Lodging/Hotels | | N.M. | | | | | | | | | | |
Host Marriott Corporation | | | | 7.875% | | 8/1/08 | | | 83 | | | 84 |
Starwood Hotels & Resorts Worldwide, Inc. | | | | 7.375% | | 5/1/07 | | | 890 | | | 918 |
| | | | | | | | | | | |
|
|
| | | | | | | | | | | | | 1,002 |
| | | | | | | | | | | |
|
|
Machinery | | N.M. | | | | | | | | | | |
Case New Holland Incorporated | | | | 9.250% | | 8/1/11 | | | 782 | | | 827 |
Terex Corporation | | | | 7.375% | | 1/15/14 | | | 114 | | | 115 |
| | | | | | | | | | | |
|
|
| | | | | | | | | | | | | 942 |
| | | | | | | | | | | |
|
|
Manufacturing (Diversified) | | N.M. | | | | | | | | | | |
American Achievement Corp. | | | | 8.250% | | 4/1/12 | | | 250 | | | 253A |
Jacuzzi Brands Incorporated | | | | 9.625% | | 7/1/10 | | | 200 | | | 212A |
Procter & Gamble Company | | | | 8.500% | | 8/10/09 | | | 90 | | | 102 |
The Gillette Company | | | | 2.500% | | 6/1/08 | | | 160 | | | 152 |
| | | | | | | | | | | |
|
|
| | | | | | | | | | | | | 719 |
| | | | | | | | | | | |
|
|
70
Semi-Annual Report to Shareholders
| | | | | | | | | | | | |
| | | % OF
NET ASSETS | | RATE | | MATURITY
DATE | | PAR/
SHARES | | VALUE |
Corporate Bonds and Notes—Continued | | | | | | | | | | | | |
| | | | | |
Media | | 1.1% | | | | | | | | | | |
AMC Entertainment Inc. | | | | 8.000% | | 3/1/14 | | $ | 580 | | $ | 510A |
Clear Channel Communications, Inc. | | | | 4.625% | | 1/15/08 | | | 165 | | | 163 |
Clear Channel Communications, Inc. | | | | 4.250% | | 5/15/09 | | | 2,760 | | | 2,662 |
Clear Channel Communications, Inc. | | | | 5.500% | | 9/15/14 | | | 14,250 | | | 13,735A |
Lamar Media Corporation | | | | 7.250% | | 1/1/13 | | | 1,459 | | | 1,525A |
Liberty Media Corporation | | | | 5.370% | | 9/17/06 | | | 5,387 | | | 5,426C |
Liberty Media Corporation | | | | 7.875% | | 7/15/09 | | | 8,730 | | | 9,186A |
Liberty Media Corporation | | | | 5.700% | | 5/15/13 | | | 4,295 | | | 3,909A |
Liberty Media Corporation | | | | 3.750% | | 2/15/30 | | | 170 | | | 95 |
News America, Inc. | | | | 6.200% | | 12/15/34 | | | 1,300 | | | 1,302 |
News America, Inc. | | | | 6.750% | | 1/9/38 | | | 200 | | | 218 |
Readers Digest Association, Inc. | | | | 6.500% | | 3/1/11 | | | 460 | | | 467 |
Sinclair Broadcast Group, Inc. | | | | 8.000% | | 3/15/12 | | | 360 | | | 369 |
Time Warner Inc. | | | | 6.875% | | 5/1/12 | | | 5,850 | | | 6,393 |
Time Warner Inc. | | | | 7.625% | | 4/15/31 | | | 440 | | | 515 |
Time Warner Inc. | | | | 7.700% | | 5/1/32 | | | 14,180 | | | 16,788A |
Viacom Inc. | | | | 5.625% | | 8/15/12 | | | 1,350 | | | 1,372 |
| | | | | | | | | | | |
|
|
| | | | | | | | | | | | | 64,635 |
| | | | | | | | | | | |
|
|
Medical Care Facilities | | 0.3% | | | | | | | | | | |
DaVita, Inc. | | | | 7.250% | | 3/15/15 | | | 900 | | | 912 |
HCA, Inc. | | | | 7.250% | | 5/20/08 | | | 314 | | | 325 |
HCA, Inc. | | | | 8.750% | | 9/1/10 | | | 256 | | | 283 |
HCA, Inc. | | | | 6.300% | | 10/1/12 | | | 3 | | | 3 |
HCA, Inc. | | | | 6.250% | | 2/15/13 | | | 2,230 | | | 2,204 |
HCA, Inc. | | | | 5.750% | | 3/15/14 | | | 150 | | | 143 |
HCA, Inc. | | | | 7.690% | | 6/15/25 | | | 723 | | | 727 |
HCA, Inc. | | | | 7.500% | | 11/6/33 | | | 13,540 | | | 13,509 |
Health Care REIT, Inc. | | | | 8.000% | | 9/12/12 | | | 128 | | | 145 |
Manor Care, Inc. | | | | 8.000% | | 3/1/08 | | | 58 | | | 62 |
| | | | | | | | | | | |
|
|
| | | | | | | | | | | | | 18,313 |
| | | | | | | | | | | |
|
|
Medical Products | | 0.1% | | | | | | | | | | |
Fresenius Medical Care Capital Trust II | | | | 7.875% | | 2/1/08 | | | 900 | | | 936D |
Fresenius Medical Care Capital Trust IV | | | | 7.875% | | 6/15/11 | | | 681 | | | 732 |
Mylan Laboratories Inc. | | | | 6.375% | | 8/15/15 | | | 1,510 | | | 1,512B |
| | | | | | | | | | | |
|
|
| | | | | | | | | | | | | 3,180 |
| | | | | | | | | | | |
|
|
Oil and Gas | | 1.5% | | | | | | | | | | |
Amerada Hess Corporation | | | | 7.300% | | 8/15/31 | | | 16,795 | | | 19,594A |
AmeriGas Partners, L.P. | | | | 7.250% | | 5/20/15 | | | 990 | | | 1,035B |
71
Semi-Annual Report to Shareholders
PORTFOLIO OF INVESTMENTS—Continued
Western Asset Core Plus Bond Portfolio—Continued
| | | | | | | | | | | | |
| | | % OF
NET ASSETS | | RATE | | MATURITY
DATE | | PAR/
SHARES | | VALUE |
Corporate Bonds and Notes—Continued | | | | | | | | | | | | |
| | | | | |
Oil and Gas—Continued | | | | | | | | | | | | |
Chesapeake Energy Corporation | | | | 7.500% | | 9/15/13 | | $ | 670 | | $ | 714 |
Chesapeake Energy Corporation | | | | 6.250% | | 1/15/18 | | | 1,580 | | | 1,548 |
Conoco Inc. | | | | 6.950% | | 4/15/29 | | | 245 | | | 298 |
ConocoPhillips | | | | 8.750% | | 5/25/10 | | | 3,100 | | | 3,625 |
ConocoPhillips | | | | 4.750% | | 10/15/12 | | | 2,590 | | | 2,600A |
ConocoPhillips | | | | 5.900% | | 10/15/32 | | | 10 | | | 11 |
Devon Energy Corporation | | | | 7.950% | | 4/15/32 | | | 5,035 | | | 6,418 |
El Paso Corporation | | | | 0.000% | | 2/28/21 | | | 210 | | | 113E,F |
El Paso Corporation | | | | 7.800% | | 8/1/31 | | | 10,220 | | | 10,245 |
El Paso Corporation | | | | 7.750% | | 1/15/32 | | | 9,560 | | | 9,632A |
El Paso Natural Gas Company | | | | 8.375% | | 6/15/32 | | | 1,310 | | | 1,488 |
Kerr-McGee Corporation | | | | 6.875% | | 9/15/11 | | | 800 | | | 855 |
Kerr-McGee Corporation | | | | 7.875% | | 9/15/31 | | | 14,920 | | | 17,269A |
Pacific Energy Partners | | | | 7.125% | | 6/15/14 | | | 630 | | | 654 |
Plains Exploration & Production Company | | | | 7.125% | | 6/15/14 | | | 1,010 | | | 1,063A |
Pogo Producing Company | | | | 6.875% | | 10/1/17 | | | 850 | | | 862 |
Pride International, Inc. | | | | 7.375% | | 7/15/14 | | | 1,440 | | | 1,564A |
Seariver Maritime Inc. | | | | 0.000% | | 9/1/12 | | | 70 | | | 50F |
Sonat Inc. | | | | 7.625% | | 7/15/11 | | | 3,000 | | | 3,045A |
Suburban Propane Partners LP | | | | 6.875% | | 12/15/13 | | | 1,120 | | | 1,019B |
Suburban Propane Partners LP | | | | 6.875% | | 12/15/13 | | | 870 | | | 792 |
Vintage Petroleum, Inc. | | | | 7.875% | | 5/15/11 | | | 1,150 | | | 1,202 |
Vintage Petroleum, Inc. | | | | 8.250% | | 5/1/12 | | | 661 | | | 707 |
XTO Energy, Inc. | | | | 7.500% | | 4/15/12 | | | 691 | | | 778 |
XTO Energy, Inc. | | | | 6.250% | | 4/15/13 | | | 2,317 | | | 2,473 |
| | | | | | | | | | | |
|
|
| | | | | | | | | | | | | 89,654 |
| | | | | | | | | | | |
|
|
Paper and Forest Products | | 0.1% | | | | | | | | | | |
Georgia-Pacific Corp. | | | | 7.500% | | 5/15/06 | | | 200 | | | 202 |
Georgia-Pacific Corp. | | | | 8.875% | | 2/1/10 | | | 245 | | | 273 |
Georgia-Pacific Corp. | | | | 8.125% | | 5/15/11 | | | 9 | | | 10 |
Georgia-Pacific Corp. | | | | 9.500% | | 12/1/11 | | | 191 | | | 226 |
Georgia-Pacific Corp. | | | | 9.375% | | 2/1/13 | | | 12 | | | 13 |
Georgia-Pacific Corp. | | | | 7.700% | | 6/15/15 | | | 176 | | | 194A |
International Paper Company | | | | 5.500% | | 1/15/14 | | | 2,870 | | | 2,859 |
Weyerhaeuser Company | | | | 6.750% | | 3/15/12 | | | 4,635 | | | 5,008A |
| | | | | | | | | | | |
|
|
| | | | | | | | | | | | | 8,785 |
| | | | | | | | | | | |
|
|
72
Semi-Annual Report to Shareholders
| | | | | | | | | | | | |
| | | % OF
NET ASSETS | | RATE | | MATURITY
DATE | | PAR/
SHARES | | VALUE |
Corporate Bonds and Notes—Continued | | | | | | | | | | | | |
| | | | | |
Pharmaceuticals | | 0.2% | | | | | | | | | | |
AmerisourceBergen Corporation | | | | 5.875% | | 9/15/15 | | $ | 1,720 | | $ | 1,698B |
Bristol-Myers Squibb Company | | | | 5.750% | | 10/1/11 | | | 8,840 | | | 9,273 |
Omnicare, Inc. | | | | 8.125% | | 3/15/11 | | | 709 | | | 741 |
| | | | | | | | | | | |
|
|
| | | | | | | | | | | | | 11,712 |
| | | | | | | | | | | |
|
|
Photo Equipment and Supplies | | 0.3% | | | | | | | | | | |
Eastman Kodak Company | | | | 6.375% | | 6/15/06 | | | 5,920 | | | 5,940A |
Eastman Kodak Company | | | | 3.625% | | 5/15/08 | | | 1,430 | | | 1,338A |
Eastman Kodak Company | | | | 7.250% | | 11/15/13 | | | 11,704 | | | 11,101A |
| | | | | | | | | | | |
|
|
| | | | | | | | | | | | | 18,379 |
| | | | | | | | | | | |
|
|
Real Estate | | 0.1% | | | | | | | | | | |
Forest City Enterprises, Inc. | | | | 7.625% | | 6/1/15 | | | 360 | | | 382 |
Forest City Enterprises, Inc. | | | | 6.500% | | 2/1/17 | | | 597 | | | 591 |
La Quinta Properties, Inc. | | | | 7.000% | | 8/15/12 | | | 220 | | | 226A |
Ventas Realty, Limited Partnership | | | | 8.750% | | 5/1/09 | | | 770 | | | 824 |
Ventas Realty, Limited Partnership | | | | 6.750% | | 6/1/10 | | | 800 | | | 812B |
Ventas Realty, Limited Partnership | | | | 9.000% | | 5/1/12 | | | 440 | | | 499 |
Ventas Realty, Limited Partnership | | | | 6.625% | | 10/15/14 | | | 50 | | | 50 |
Ventas Realty, Limited Partnership | | | | 7.125% | | 6/1/15 | | | 800 | | | 828 |
| | | | | | | | | | | |
|
|
| | | | | | | | | | | | | 4,212 |
| | | | | | | | | | | |
|
|
Retail | | 0.2% | | | | | | | | | | |
J.C. Penney Company, Inc. | | | | 7.400% | | 4/1/37 | | | 690 | | | 746 |
Target Corporation | | | | 4.000% | | 6/15/13 | | | 5,340 | | | 5,050A |
Toys “R” Us, Inc. | | | | 7.375% | | 10/15/18 | | | 2,082 | | | 1,665A |
Wal-Mart Stores, Inc. | | | | 4.125% | | 2/15/11 | | | 3,160 | | | 3,074A |
| | | | | | | | | | | |
|
|
| | | | | | | | | | | | | 10,535 |
| | | | | | | | | | | |
|
|
Special Purpose | | 1.3% | | | | | | | | | | |
AAC Group Holding Corporation | | | | 0.000% | | 10/1/12 | | | 980 | | | 706B,G |
Air 2 US Series A | | | | 8.027% | | 10/1/19 | | | 168 | | | 157B |
ASIF Global Financing XIX | | | | 4.900% | | 1/17/13 | | | 3,980 | | | 3,907 |
Cascadia Ltd | | | | 6.915% | | 6/13/08 | | | 1,400 | | | 1,403B,C |
DaimlerChrysler NA Holding Corporation | | | | 4.050% | | 6/4/08 | | | 1,130 | | | 1,103 |
DaimlerChrysler NA Holding Corporation | | | | 7.200% | | 9/1/09 | | | 620 | | | 661 |
DaimlerChrysler NA Holding Corporation | | | | 7.300% | | 1/15/12 | | | 3,315 | | | 3,600 |
DaimlerChrysler NA Holding Corporation | | | | 6.500% | | 11/15/13 | | | 1,290 | | | 1,364A |
Di Finance Corporation | | | | 9.500% | | 2/15/13 | | | 1,100 | | | 1,149B |
Entercom Capital Inc. | | | | 7.625% | | 3/1/14 | | | 565 | | | 583 |
John Deere Capital Corporation | | | | 7.000% | | 3/15/12 | | | 80 | | | 89A |
73
Semi-Annual Report to Shareholders
PORTFOLIO OF INVESTMENTS—Continued
Western Asset Core Plus Bond Portfolio—Continued
| | | | | | | | | | | | |
| | | % OF
NET ASSETS | | RATE | | MATURITY
DATE | | PAR/
SHARES | | VALUE |
Corporate Bonds and Notes—Continued | | | | | | | | | | | | |
| | | | | |
Special Purpose—Continued | | | | | | | | | | | | |
Patrons’ Legacy 2003 IV | | | | 5.775% | | 1/23/17 | | $ | 6,600 | | $ | 6,669B |
Philip Morris Capital Corporation | | | | 7.500% | | 7/16/09 | | | 190 | | | 203 |
Rabobank Capital Funding Trust II | | | | 5.260% | | 12/31/49 | | | 590 | | | 592B |
Rabobank Capital Funding Trust III | | | | 5.254% | | 12/29/49 | | | 4,140 | | | 4,125B |
Sprint Capital Corporation | | | | 4.780% | | 8/17/06 | | | 4,725 | | | 4,732G |
Sprint Capital Corporation | | | | 6.000% | | 1/15/07 | | | 16,370 | | | 16,643 |
Sprint Capital Corporation | | | | 6.125% | | 11/15/08 | | | 130 | | | 135 |
Sprint Capital Corporation | | | | 8.375% | | 3/15/12 | | | 13,945 | | | 16,411 |
TCI Communications Financing III | | | | 9.650% | | 3/31/27 | | | 1,480 | | | 1,621 |
Texaco Capital Inc. | | | | 5.500% | | 1/15/09 | | | 1,600 | | | 1,661 |
UGS Corporation | | | | 10.000% | | 6/1/12 | | | 400 | | | 438 |
Unilever Capital Corporation | | | | 7.125% | | 11/1/10 | | | 1,450 | | | 1,604A |
Verizon Global Funding Corp. | | | | 6.875% | | 6/15/12 | | | 2,130 | | | 2,350 |
Verizon Global Funding Corp. | | | | 7.375% | | 9/1/12 | | | 2,645 | | | 3,002A |
| | | | | | | | | | | |
|
|
| | | | | | | | | | | | | 74,908 |
| | | | | | | | | | | |
|
|
Telecommunications | | 0.2% | | | | | | | | | | |
Cincinnati Bell Inc. | | | | 7.000% | | 2/15/15 | | | 3,277 | | | 3,162 |
Citizens Communications Company | | | | 9.250% | | 5/15/11 | | | 530 | | | 582 |
Qwest Communications International Incorporated | | | | 7.290% | | 2/15/09 | | | 1,745 | | | 1,723C |
Qwest Corporation | | | | 5.625% | | 11/15/08 | | | 3,860 | | | 3,802 |
Qwest Corporation | | | | 8.875% | | 3/15/12 | | | 1,260 | | | 1,377 |
TCI Communications Inc. | | | | 6.875% | | 2/15/06 | | | 3,382 | | | 3,408 |
Valor Telecommunications Enterprises LLC | | | | 7.750% | | 2/15/15 | | | 360 | | | 349 |
| | | | | | | | | | | |
|
|
| | | | | | | | | | | | | 14,403 |
| | | | | | | | | | | |
|
|
Telecommunications (Cellular/Wireless) | | 0.1% | | | | | | | | | | |
New Cingular Wireless Services Inc. | | | | 7.350% | | 3/1/06 | | | 3,000 | | | 3,035 |
Nextel Communications, Inc. | | | | 5.950% | | 3/15/14 | | | 493 | | | 504 |
Nextel Communications, Inc. | | | | 7.375% | | 8/1/15 | | | 1,980 | | | 2,120 |
| | | | | | | | | | | |
|
|
| | | | | | | | | | | | | 5,659 |
| | | | | | | | | | | |
|
|
Transportation | | 0.2% | | | | | | | | | | |
Continental Airlines, Inc. | | | | 6.545% | | 2/2/19 | | | 4,362 | | | 4,277 |
Delta Air Lines, Inc. | | | | 6.619% | | 3/18/11 | | | 1,788 | | | 1,672 |
Delta Air Lines, Inc. | | | | 6.417% | | 7/2/12 | | | 40 | | | 40 |
Delta Air Lines, Inc. | | | | 6.718% | | 7/2/24 | | | 2,418 | | | 2,476 |
Kansas City Southern Railway | | | | 9.500% | | 10/1/08 | | | 558 | | | 612 |
Norfolk Southern Corporation | | | | 6.200% | | 4/15/09 | | | 20 | | | 21A |
| | | | | | | | | | | |
|
|
| | | | | | | | | | | | | 9,098 |
| | | | | | | | | | | |
|
|
Total Corporate Bonds and Notes (Identified Cost—$1,077,121) | | | | | | | | | | | | 1,090,524 |
74
Semi-Annual Report to Shareholders
| | | | | | | | | | | | |
| | | % OF
NET ASSETS | | RATE | | MATURITY
DATE | | PAR/
SHARES | | VALUE |
Asset-Backed Securities | | 3.1% | | | | | | | | | | |
| | | | | |
Fixed Rate Securities | | 0.4% | | | | | | | | | | |
Bay View Auto Trust 2003-LJ1 | | | | 3.440% | | 4/25/12 | | $ | 300 | | $ | 294 |
Conseco Finance Securitizations Corp. 2000-4 | | | | 8.310% | | 5/1/32 | | | 2,200 | | | 1,795 |
Conseco Finance Securitizations Corp. 2000-6 | | | | 6.770% | | 9/1/32 | | | 911 | | | 917 |
Contimortgage Home Equity Loan Trust 1997-4 | | | | 7.330% | | 10/15/28 | | | 1,389 | | | 1,133 |
Green Tree Financial Corporation 1992-2 | | | | 9.150% | | 1/15/18 | | | 365 | | | 325 |
Green Tree Financial Corporation 1993-2 | | | | 8.000% | | 7/15/18 | | | 1,002 | | | 989 |
Green Tree Financial Corporation 1996-5 | | | | 8.100% | | 7/15/26 | | | 5,235 | | | 862 |
Green Tree Home Improvement Loan Trust 1996-A | | | | 7.400% | | 2/15/26 | | | 629 | | | 543 |
Green Tree Home Improvement Loan Trust 1997-D | | | | 7.450% | | 9/15/28 | | | 659 | | | 659 |
Lehman ABS Manufactured Housing Contract 2001-B A3 | | | | 4.350% | | 5/15/14 | | | 4,757 | | | 4,609 |
Lehman ABS Manufactured Housing Contract 2001-B A6 | | | | 6.467% | | 8/15/28 | | | 3,576 | | | 3,698 |
Pegasus Aviation Lease Securitization 2000-1 | | | | 8.370% | | 3/25/30 | | | 2,500 | | | 1,588B |
Residential Asset Mortgage Products, Inc. 2004-SL4 | | | | 7.500% | | 7/25/32 | | | 3,215 | | | 3,352 |
UCFC Home Equity Loan Trust 1998-C | | | | 5.935% | | 1/15/30 | | | 44 | | | 44 |
Vanderbilt Mortgage Finance 1996-A | | | | 8.150% | | 5/7/26 | | | 567 | | | 582 |
Vanderbilt Mortgage Finance 1997-B | | | | 8.155% | | 10/7/26 | | | 250 | | | 263 |
Vanderbilt Mortgage Finance 1997-C | | | | 7.830% | | 8/7/27 | | | 500 | | | 520 |
| | | | | | | | | | | |
|
|
| | | | | | | | | | | | | 22,173 |
| | | | | | | | | | | |
|
|
Indexed SecuritiesC | | 2.7% | | | | | | | | | | |
AAA Trust 2005-2 | | | | 4.151% | | 11/26/35 | | | 21,323 | | | 21,313B |
Advanta Revolving Home Equity Loan Trust 2000-A | | | | 4.538% | | 8/25/24 | | | 690 | | | 691 |
AFC Home Equity Loan Trust 2002-2 | | | | 4.130% | | 6/25/30 | | | 1,133 | | | 1,136 |
Asset Backed Securities Corporation Home Equity Loan Trust 2001 HE3 | | | | 4.240% | | 11/15/31 | | | 785 | | | 785 |
CDC Mortgage Capital Trust 2002-HE1 | | | | 4.348% | | 1/25/33 | | | 1,329 | | | 1,331 |
Citibank Credit Card Issuance Trust 2002-C1 | | | | 4.737% | | 2/9/09 | | | 2,040 | | | 2,060 |
Conseco Finance 2000-C | | | | 4.340% | | 12/15/29 | | | 93 | | | 93 |
Countrywide Asset-Backed Certificates 2002-BC1 | | | | 4.367% | | 4/25/32 | | | 403 | | | 403 |
75
Semi-Annual Report to Shareholders
PORTFOLIO OF INVESTMENTS—Continued
Western Asset Core Plus Bond Portfolio—Continued
| | | | | | | | | | | | |
| | | % OF
NET ASSETS | | RATE | | MATURITY
DATE | | PAR/
SHARES | | VALUE |
Asset-Backed Securities—Continued | | | | | | | | | | | | |
| | | | | |
Indexed Securities—Continued | | | | | | | | | | | | |
Countrywide Asset-Backed Certificates 2003-1 | | | | 4.377% | | 6/25/33 | | $ | 1,006 | | $ | 1,007 |
Countrywide Asset-Backed Certificates 2003-BC3 | | | | 4.348% | | 9/25/33 | | | 3,780 | | | 3,785 |
Countrywide Asset-Backed Certificates 2005-BC2 | | | | 3.920% | | 5/25/35 | | | 19,580 | | | 19,582 |
Countrywide Home Equity Loan Trust 2002-F | | | | 4.320% | | 11/15/28 | | | 1,936 | | | 1,947 |
Credit Suisse First Boston Mortgage Securities Corp. 2005-AGE1 | | | | 4.177% | | 2/25/32 | | | 26,694 | | | 26,696 |
Fannie Mae Grantor Trust 2002-T15 | | | | 4.238% | | 11/26/32 | | | 2,521 | | | 2,520 |
Fannie Mae Grantor Trust 2005-T2 | | | | 3.651% | | 11/28/35 | | | 30,807 | | | 30,778 |
Fleet Home Equity Loan Trust 2003-1 | | | | 4.250% | | 1/20/33 | | | 10,344 | | | 10,355 |
Greenpoint Mortgage Funding Trust 2005-HE1 | | | | 4.437% | | 9/25/34 | | | 1,200 | | | 1,199 |
Household Home Equity Loan Trust 2002-3 | | | | 4.450% | | 7/20/32 | | | 285 | | | 285 |
IndyMac Home Equity Loan Asset-Backed Trust 2001-A | | | | 4.297% | | 3/25/31 | | | 227 | | | 227 |
Option One Mortgage Loan Trust 2000-2 | | | | 4.617% | | 6/25/30 | | | 88 | | | 88 |
Option One Mortgage Loan Trust 2003-1 | | | | 4.457% | | 2/25/33 | | | 29 | | | 29 |
Popular ABA Mortgage Pass-Through Trust 2005-A | | | | 4.138% | | 6/25/35 | | | 7,135 | | | 7,135 |
Provident Bank Home Equity Loan Trust 2000-2 | | | | 4.307% | | 8/25/31 | | | 630 | | | 631 |
Providian Gateway Master Trust 2002-B | | | | 4.670% | | 6/15/09 | | | 14,970 | | | 14,991B |
Residential Asset Mortgage Products, Inc. 2003-RS4 | | | | 4.367% | | 5/25/33 | | | 3,418 | | | 3,427 |
Residential Funding Mortgage Secs II 2003-HS3 | | | | 4.328% | | 8/25/33 | | | 93 | | | 93 |
Salomon Brothers Mortgage Securities VII 2002-CIT1 | | | | 4.337% | | 3/25/32 | | | 1,695 | | | 1,699 |
Southern Pacific Secured Assets Corporation 1998-2 | | | | 4.377% | | 7/25/29 | | | 47 | | | 47 |
Vanderbilt Mortgage Finance 1999-D | | | | 7.140% | | 1/7/30 | | | 4,100 | | | 4,265 |
Wachovia Asset Securitization, Inc. 2002-HE1 | | | | 4.200% | | 9/27/32 | | | 2,661 | | | 2,665 |
Wachovia Asset Securitization, Inc. 2002-HE2 | | | | 4.260% | | 12/25/32 | | | 250 | | | 251 |
Wachovia Asset Securitization, Inc. 2003-HE1 | | | | 4.328% | | 3/25/33 | | | 97 | | | 97 |
| | | | | | | | | | | |
|
|
| | | | | | | | | | | | | 161,611 |
| | | | | | | | | | | |
|
|
76
Semi-Annual Report to Shareholders
| | | | | | | | | | | | |
| | | % OF
NET ASSETS | | RATE | | MATURITY
DATE | | PAR/
SHARES | | VALUE |
Asset-Backed Securities—Continued | | | | | | | | | | | | |
| | | | | |
Stripped Securities | | N.M. | | | | | | | | | | |
Diversified REIT Trust 2001-1 | | | | 0.656% | | 3/8/10 | | $ | 15,164 | | $ | 379B,H1 |
Oakwood Mortgage Investors Inc. 2001-E | | | | 6.000% | | 11/15/09 | | | 6,209 | | | 990H1 |
| | | | | | | | | | | |
|
|
| | | | | | | | | | | | | 1,369 |
| | | | | | | | | | | |
|
|
Total Asset-Backed Securities
(Identified Cost—$185,682) | | | | | | | | | | | | 185,153 |
Mortgage-Backed Securities | | 15.3% | | | | | | | | | | |
| | | | | |
Fixed Rate Securities | | 2.7% | | | | | | | | | | |
Asset Securitization Corporation 1996-D2 | | | | 6.920% | | 2/14/29 | | | 7,334 | | | 7,382 |
Banc of America Commercial Mortgage Inc. 2005-5 | | | | 5.115% | | 9/10/15 | | | 10,900 | | | 10,955 |
Banc of America Funding Corporation 2003-1 | | | | 6.000% | | 5/20/33 | | | 803 | | | 803 |
Blackrock Capital Finance L.P. 1997-R3 | | | | 7.220% | | 11/25/28 | | | 90 | | | 91B |
Criimi Mae Commercial Mortgage Trust 1998-C1 | | | | 7.000% | | 6/2/33 | | | 680 | | | 704B |
FFCA Secured Lending Corporation 1999-1A | | | | 6.370% | | 9/18/25 | | | 46 | | | 46B |
GMAC Commercial Mortgage Securities Inc. 1998-C1 | | | | 6.700% | | 5/15/30 | | | 9,427 | | | 9,797 |
GMAC Commercial Mortgage Securities Inc. 1999-C2 | | | | 6.945% | | 9/15/33 | | | 340 | | | 362 |
GS Mortgage Securities Corporation II 1998-C1 | | | | 6.620% | | 10/18/30 | | | 5,500 | | | 5,734 |
GS Mortgage Securities Corporation II 2005-GG4 | | | | 4.680% | | 7/10/39 | | | 18,650 | | | 18,383 |
J.P. Morgan Chase Commercial Mortgage Securities Corp., Series 2005-CIBC12 | | | | 4.895% | | 9/12/37 | | | 3,000 | | | 2,968 |
J.P. Morgan Commercial Mortgage Finance Corporation 1999-C8 | | | | 7.400% | | 7/15/31 | | | 2,000 | | | 2,150 |
LB-UBS Commercial Mortgage Trust 2005-C3 AAB | | | | 4.664% | | 7/15/30 | | | 4,100 | | | 4,024 |
MASTR Reperforming Loan Trust 2005-1 | | | | 6.000% | | 8/25/34 | | | 8,811 | | | 8,952B |
MASTR Reperforming Loan Trust 2005-1 | | | | 7.000% | | 8/25/34 | | | 13,343 | | | 13,925B |
Morgan Stanley Capital I 2005-HQ6 | | | | 4.989% | | 8/13/42 | | | 40,690 | | | 40,616 |
Nomura Asset Securities Corporation 1996-MD5 | | | | 7.120% | | 4/13/39 | | | 2,000 | | | 2,024 |
Residential Asset Mortgage Products, Inc. 2005-SL2 | | | | 7.500% | | 2/25/32 | | | 22,741 | | | 23,356 |
Residential Asset Securitization Trust 2003-A14 | | | | 4.750% | | 2/25/19 | | | 3,845 | | | 3,771 |
Structured Asset Securities Corporation 1996-CFL | | | | 7.750% | | 2/25/28 | | | 1,993 | | | 2,057 |
| | | | | | | | | | | |
|
|
| | | | | | | | | | | | | 158,100 |
| | | | | | | | | | | |
|
|
77
Semi-Annual Report to Shareholders
PORTFOLIO OF INVESTMENTS—Continued
Western Asset Core Plus Bond Portfolio—Continued
| | | | | | | | | | | | |
| | | % OF
NET ASSETS | | RATE | | MATURITY
DATE | | PAR/
SHARES | | VALUE |
Mortgage-Backed Securities—Continued | | | | | | | | | | | | |
Indexed SecuritiesC | | 12.3% | | | | | | | | | | |
American Home Mortgage Investment Trust 2005-4 | | | | 4.328% | | 10/25/35 | | $ | 59,000 | | $ | 58,981 |
Chase Commercial Mortgage Securities Corporation 2000-FL1A | | | | 4.008% | | 12/12/13 | | | 946 | | | 946B |
Citigroup Mortgage Loan Trust 2005-HE2 | | | | 4.437% | | 5/25/35 | | | 34,046 | | | 34,046B |
Countrywide Alternative Loan Trust | | | | 4.387% | | 9/25/35 | | | 44,770 | | | 44,770 |
Countrywide Alternative Loan Trust 2005-44 1A1 | | | | 4.368% | | 10/25/35 | | | 54,527 | | | 54,527 |
Countrywide Alternative Loan Trust 2005-44 2A1 | | | | 4.348% | | 10/25/35 | | | 46,987 | | | 46,987 |
Countrywide Alternative Loan Trust 2005-56 3A1 | | | | 4.128% | | 11/25/35 | | | 55,308 | | | 55,303 |
Countrywide Alternative Loan Trust 2005-56 4A1 | | | | 4.160% | | 11/25/35 | | | 13,269 | | | 13,268 |
Countrywide Alternative Loan Trust 2005-H 2A | | | | 4.070% | | 12/15/35 | | | 7,150 | | | 7,150 |
Countrywide Home Loans 2005-9 1A1 | | | | 4.337% | | 5/25/35 | | | 26,419 | | | 26,385 |
Government National Mortgage Association 2001-36 | | | | 4.400% | | 8/20/31 | | | 5 | | | 5 |
GSMPS Mortgage Loan Trust 2005-RP2 | | | | 4.387% | | 3/25/35 | | | 37,574 | | | 37,533B |
GSMPS Mortgage Loan Trust 2005-RP3 | | | | 4.387% | | 9/25/35 | | | 54,744 | | | 54,684 |
Harborview Mortgage Loan Trust 2005-3 | | | | 4.236% | | 6/19/35 | | | 47,492 | | | 47,395 |
Impac CMB Trust 2003-4 1A1 | | | | 4.357% | | 10/25/33 | | | 1,095 | | | 1,096 |
Impac CMB Trust 2003-5 A1 | | | | 4.590% | | 8/25/33 | | | 1,217 | | | 1,217 |
Impac CMB Trust 2003-7 | | | | 4.357% | | 8/25/33 | | | 2,909 | | | 2,911 |
Medallion Trust 2000-2G | | | | 4.086% | | 12/18/31 | | | 532 | | | 532I |
MLCC Mortgage Investors, Inc. 2003-B | | | | 4.377% | | 4/25/28 | | | 11,276 | | | 11,340 |
MSDWCC Heloc Trust 2005-1 | | | | 4.227% | | 7/25/17 | | | 5,965 | | | 5,965 |
Sequoia Mortgage Trust 4 | | | | 4.390% | | 11/22/24 | | | 32 | | | 32 |
WaMu Mortgage Pass-Through Certificates, Series 2005-AR6 | | | | 4.267% | | 4/25/45 | | | 43,341 | | | 43,192 |
WaMu Mortgage Pass-Through Certificates, Series 2005-AR8 | | | | 4.307% | | 6/25/45 | | | 25,227 | | | 25,226 |
WaMu Mortgage Pass-Through Certificates, Series 2005-AR11 | | | | 4.150% | | 8/25/45 | | | 108,639 | | | 108,625 |
WaMu Mortgage Pass-Through Certificates, Series 2005-AR13 | | | | 4.550% | | 11/25/45 | | | 51,460 | | | 51,450 |
Westpac Securitization Trust 1999-1G | | | | 4.010% | | 5/19/30 | | | 105 | | | 106J |
| | | | | | | | | | | |
|
|
| | | | | | | | | | | | | 733,672 |
| | | | | | | | | | | |
|
|
78
Semi-Annual Report to Shareholders
| | | | | | | | | | | | |
| | | % OF
NET ASSETS | | RATE | | MATURITY
DATE | | PAR/
SHARES | | VALUE |
Mortgage-Backed Securities—Continued | | | | | | | | | | | | |
Stripped Securities | | N.M. | | | | | | | | | | |
Commercial Capital Access One, Inc. 2 | | | | 1200.00% | | 11/15/27 | | $ | 2,594 | | $ | 971H1 |
FFCA Secured Lending Corporation 1999-1A | | | | 1.593% | | 9/18/25 | | | 572 | | | 23B |
GMAC Commercial Mortgage Securities Inc. 1999-CTL1 | | | | 0.840% | | 12/15/16 | | | 1,438 | | | 15B |
LB-UBS Commercial Mortgage Trust 2001-C3 | | | | 0.978% | | 6/15/36 | | | 5,347 | | | 230B |
| | | | | | | | | | | |
|
|
| | | | | | | | | | | | | 1,239 |
| | | | | | | | | | | |
|
|
| | | | | |
Variable Rate SecuritiesC | | 0.3% | | | | | | | | | | |
Commercial Mortgage Asset Trust 1999-C2 | | | | 7.546% | | 11/17/32 | | | 330 | | | 359 |
Countrywide Alternative Loan Trust Series 2005-J12 | | | | 4.340% | | 11/25/35 | | | 2,010 | | | 2,010 |
Merrill Lynch Mortgage Trust 2005-MCP1 | | | | 4.747% | | 6/12/43 | | | 15,240 | | | 14,907 |
| | | | | | | | | | | |
|
|
| | | | | | | | | | | | | 17,276 |
| | | | | | | | | | | |
|
|
Total Mortgage-Backed Securities (Identified Cost—$913,953) | | | | | | | | | | | | 910,287 |
Municipal Bonds | | 0.6% | | | | | | | | | | |
Liberty New York Development Corporation Revenue | | | | 5.250% | | 10/1/35 | | | 34,480 | | | 38,469 |
| | | | | | | | | | | |
|
|
Total Municipal Bonds
(Identified Cost—$38,585) | | | | | | | | | | | | 38,469 |
U.S. Government and Agency Obligations | | 26.1% | | | | | | | | | | |
| | | | | |
Fixed Rate Securities | | 18.6% | | | | | | | | | | |
Fannie Mae | | | | 3.125% | | 12/15/07 | | | 35,000 | | | 34,055A |
Fannie Mae | | | | 4.610% | | 10/10/13 | | | 40,690 | | | 39,860 |
Federal Home Loan Bank | | | | 4.875% | | 11/15/06 | | | 100 | | | 101 |
Federal Home Loan Bank | | | | 3.500% | | 11/15/07 | | | 100 | | | 98 |
Federal Home Loan Bank | | | | 5.875% | | 11/15/07 | | | 750 | | | 772 |
Tennessee Valley Authority | | | | 6.250% | | 12/15/17 | | | 40 | | | 45 |
Tennessee Valley Authority | | | | 6.750% | | 11/1/25 | | | 1,670 | | | 2,062 |
Tennessee Valley Authority | | | | 7.125% | | 5/1/30 | | | 840 | | | 1,101 |
United States Treasury Bonds | | | | 6.250% | | 8/15/23 | | | 510 | | | 610A |
United States Treasury Bonds | | | | 5.250% | | 2/15/29 | | | 35,550 | | | 38,754A |
United States Treasury Bonds | | | | 6.250% | | 5/15/30 | | | 55,455 | | | 68,857A |
United States Treasury Bonds | | | | 5.375% | | 2/15/31 | | | 10,425 | | | 11,679A |
United States Treasury Notes | | | | 1.875% | | 12/31/05 | | | 4,840 | | | 4,819A |
United States Treasury Notes | | | | 3.000% | | 12/31/06 | | | 11,784 | | | 11,617A |
79
Semi-Annual Report to Shareholders
PORTFOLIO OF INVESTMENTS—Continued
Western Asset Core Plus Bond Portfolio—Continued
| | | | | | | | | | | | |
| | | % OF
NET ASSETS | | RATE | | MATURITY
DATE | | PAR/
SHARES | | VALUE |
U.S. Government and Agency Obligations—Continued | | | | | | | | | | | | |
| | | | | |
Fixed Rate Securities—Continued | | | | | | | | | | | | |
United States Treasury Notes | | | | 3.125% | | 1/31/07 | | $ | 26,140 | | $ | 25,791A |
United States Treasury Notes | | | | 2.250% | | 2/15/07 | | | 66,440 | | | 64,756A |
United States Treasury Notes | | | | 3.625% | | 4/30/07 | | | 10,070 | | | 9,985A |
United States Treasury Notes | | | | 3.125% | | 5/15/07 | | | 12,070 | | | 11,872A |
United States Treasury Notes | | | | 3.000% | | 2/15/08 | | | 26,210 | | | 25,517A |
United States Treasury Notes | | | | 3.375% | | 2/15/08 | | | 82,220 | | | 80,736A |
United States Treasury Notes | | | | 3.750% | | 5/15/08 | | | 4,350 | | | 4,303A |
United States Treasury Notes | | | | 2.625% | | 3/15/09 | | | 6,940 | | | 6,591A |
United States Treasury Notes | | | | 4.000% | | 6/15/09 | | | 103,495 | | | 102,783A |
United States Treasury Notes | | | | 3.500% | | 8/15/09 | | | 36,100 | | | 35,188A |
United States Treasury Notes | | | | 3.375% | | 10/15/09 | | | 5,910 | | | 5,727 |
United States Treasury Notes | | | | 3.500% | | 12/15/09 | | | 177,775 | | | 172,928A |
United States Treasury Notes | | | | 3.625% | | 1/15/10 | | | 20,320 | | | 19,851A |
United States Treasury Notes | | | | 3.500% | | 2/15/10 | | | 81,960 | | | 79,613A |
United States Treasury Notes | | | | 4.000% | | 4/15/10 | | | 89,270 | | | 88,457A |
United States Treasury Notes | | | | 3.875% | | 5/15/10 | | | 32,950 | | | 32,472A |
United States Treasury Notes | | | | 3.875% | | 7/15/10 | | | 35,000 | | | 34,468A |
United States Treasury Notes | | | | 4.125% | | 8/15/10 | | | 64,620 | | | 64,330A |
United States Treasury Notes | | | | 4.250% | | 8/15/13 | | | 140 | | | 140A |
United States Treasury Notes | | | | 4.250% | | 8/15/15 | | | 29,163 | | | 28,981A |
| | | | | | | | | | | |
|
|
| | | | | | | | | | | | | 1,108,919 |
| | | | | | | | | | | |
|
|
Indexed SecuritiesJ | | 7.1% | | | | | | | | | | |
United States Treasury Inflation-Protected Security | | | | 3.375% | | 1/15/07 | | | 151,550 | | | 156,730A |
United States Treasury Inflation-Protected Security | | | | 3.625% | | 1/15/08 | | | 5,514 | | | 5,837A |
United States Treasury Inflation-Protected Security | | | | 3.875% | | 1/15/09 | | | 34,225 | | | 37,129A |
United States Treasury Inflation-Protected Security | | | | 4.250% | | 1/15/10 | | | 21,471 | | | 24,017A |
United States Treasury Inflation-Protected Security | | | | 0.875% | | 4/15/10 | | | 72,014 | | | 70,174 |
United States Treasury Inflation-Protected Security | | | | 3.375% | | 1/15/12 | | | 11,905 | | | 13,184A |
United States Treasury Inflation-Protected Security | | | | 1.875% | | 7/15/13 | | | 20,594 | | | 20,871A |
United States Treasury Inflation-Protected Security | | | | 2.000% | | 1/15/14 | | | 1,205 | | | 1,231A |
80
Semi-Annual Report to Shareholders
| | | | | | | | | | | | |
| | | % OF
NET ASSETS | | RATE | | MATURITY
DATE | | PAR/
SHARES | | VALUE |
U.S. Government and Agency Obligations—Continued | | | | | | | | | | | | |
| | | | | |
Indexed Securities—Continued | | | | | | | | | | | | |
United States Treasury Inflation-Protected Security | | | | 2.000% | | 7/15/14 | | $ | 41 | | $ | 42A |
United States Treasury Inflation-Protected Security | | | | 1.875% | | 7/15/15 | | | 5,615 | | | 5,664A |
United States Treasury Inflation-Protected Security | | | | 2.375% | | 1/15/25 | | | 26,513 | | | 28,364A |
United States Treasury Inflation-Protected Security | | | | 3.625% | | 4/15/28 | | | 22,673 | | | 29,665A |
United States Treasury Inflation-Protected Security | | | | 3.875% | | 4/15/29 | | | 22,010 | | | 30,129A |
| | | | | | | | | | | |
|
|
| | | | | | | | | | | | | 423,037 |
| | | | | | | | | | | |
|
|
Stripped Securities | | 0.4% | | | | | | | | | | |
United States Treasury Bonds | | | | 0.000% | | 11/15/21 | | | 37,190 | | | 17,562A,H2 |
United States Treasury Bonds | | | | 0.000% | | 8/15/27 | | | 1,520 | | | 552A,H2 |
United States Treasury Notes | | | | 0.000% | | 5/15/30 | | | 11,650 | | | 3,794A,H2 |
| | | | | | | | | | | |
|
|
| | | | | | | | | | | | | 21,908 |
| | | | | | | | | | | |
|
|
Total U.S. Government and Agency Obligations (Identified Cost—$1,557,638) | | | | | | | | | | | | 1,553,864 |
U.S. Government Agency Mortgage-Backed Securities | | 39.4% | | | | | | | | | | |
| | | | | |
Fixed Rate Securities | | 38.2% | | | | | | | | | | |
Fannie Mae | | | | 6.500% | | 5/1/14 to 7/1/35 | | | 33,070 | | | 34,075 |
Fannie Mae | | | | 6.000% | | 5/1/16 to 10/1/35 | | | 8,702 | | | 8,867 |
Fannie Mae | | | | 5.500% | | 1/1/17 to 10/1/35 | | | 55,904 | | | 56,044 |
Fannie Mae | | | | 9.500% | | 11/1/21 | | | 2 | | | 2 |
Fannie Mae | | | | 7.000% | | 8/1/29 to 7/1/32 | | | 7,337 | | | 7,681 |
Fannie Mae | | | | 7.500% | | 11/1/29 | | | 37 | | | 39 |
Fannie Mae | | | | 1.000% | | 12/1/35 | | | 49,300 | | | 50,641K |
Fannie Mae | | | | 4.500% | | 12/1/35 | | | 26,400 | | | 25,163K |
Fannie Mae | | | | 5.000% | | 12/1/35 | | | 952,300 | | | 932,064K |
Fannie Mae | | | | 5.500% | | 12/1/35 | | | 345,000 | | | 344,784K |
Fannie Mae | | | | 6.000% | | 12/1/35 | | | 200,475 | | | 203,795K |
Fannie Mae | | | | 6.500% | | 12/1/35 | | | 60,800 | | | 62,567K |
Freddie Mac | | | | 4.125% | | 10/18/10 | | | 3,720 | | | 3,652 |
Freddie Mac | | | | 4.650% | | 10/10/13 | | | 47,200 | | | 46,163 |
Freddie Mac | | | | 5.500% | | 12/1/13 to 5/1/35 | | | 16,254 | | | 16,291 |
81
Semi-Annual Report to Shareholders
PORTFOLIO OF INVESTMENTS—Continued
Western Asset Core Plus Bond Portfolio—Continued
| | | | | | | | | | | | |
| | | % OF
NET ASSETS | | RATE | | MATURITY
DATE | | PAR/
SHARES | | VALUE |
U.S. Government Agency Mortgage-Backed Securities—Continued | | | | | | | | | | | | |
| | | | | |
Fixed Rate Securities—Continued | | | | | | | | | | | | |
Freddie Mac | | | | 7.000% | | 10/1/16 to 4/1/32 | | $ | 2,513 | | $ | 2,626 |
Freddie Mac | | | | 6.500% | | 7/1/29 | | | 579 | | | 597 |
Freddie Mac | | | | 6.000% | | 12/1/15 | | | 12,200 | | | 12,528K |
Freddie Mac | | | | 5.000% | | 12/1/35 | | | 35,000 | | | 34,245K |
Government National Mortgage Association | | | | 9.500% | | 1/15/06 | | | 5 | | | 5 |
Government National Mortgage Association | | | | 7.500% | | 3/15/23 to 9/15/31 | | | 357 | | | 378 |
Government National Mortgage Association | | | | 7.000% | | 7/15/23 to 7/15/31 | | | 1,284 | | | 1,353 |
Government National Mortgage Association | | | | 6.500% | | 4/15/28 to 4/15/33 | | | 27,541 | | | 28,662 |
Government National Mortgage Association | | | | 6.000% | | 1/15/29 to 7/15/33 | | | 35,655 | | | 36,528 |
Government National Mortgage Association | | | | 8.000% | | 12/15/30 to 1/15/31 | | | 44 | | | 47 |
Government National Mortgage Association | | | | 5.500% | | 7/15/33 to 6/15/35 | | | 32,451 | | | 32,778 |
Government National Mortgage Association | | | | 5.000% | | 12/1/35 | | | 239,000 | | | 236,461K |
Government National Mortgage Association | | | | 6.000% | | 12/1/35 | | | 92,690 | | | 94,920K |
| | | | | | | | | | | |
|
|
| | | | | | | | | | | | | 2,272,956 |
| | | | | | | | | | | |
|
|
Indexed SecuritiesD | | 1.2% | | | | | | | | | | |
Fannie Mae | | | | 1.246% | | 10/1/35 | | | 8,200 | | | 8,422 |
Fannie Mae | | | | 3.035% | | 10/1/35 | | | 57,503 | | | 59,067 |
| | | | | | | | | | | |
|
|
| | | | | | | | | | | | | 67,489 |
| | | | | | | | | | | |
|
|
Stripped Securities | | N.M. | | | | | | | | | | |
Financing Corporation | | | | 0.000% | | 11/30/17 | | | 1,250 | | | 700H2 |
Financing Corporation | | | | 0.000% | | 4/5/19 | | | 320 | | | 166H2 |
| | | | | | | | | | | |
|
|
| | | | | | | | | | | | | 866 |
Total U.S. Government Agency Mortgage-Backed Securities (Identified Cost—$2,358,004) | | | | | | | | | | | | 2,341,311 |
82
Semi-Annual Report to Shareholders
| | | | | | | | | | | | |
| | | % OF
NET ASSETS | | RATE | | MATURITY
DATE | | PAR/
SHARES | | VALUE |
Yankee BondsI | | 7.2% | | | | | | | | | | |
| | | | | |
Banking and Finance | | 0.1% | | | | | | | | | | |
AIFUL CORPORATION | | | | 4.450% | | 2/16/10 | | $ | 1,000 | | $ | 974A |
AIFUL CORPORATION | | | | 5.000% | | 8/10/10 | | | 4,680 | | | 4,649A |
| | | | | | | | | | | |
|
|
| | | | | | | | | | | | | 5,623 |
| | | | | | | | | | | |
|
|
| | | | | |
Banks | | N.M. | | | | | | | | | | |
KFW Kreditanstalt fuer Wiederaufbau | | | | 2.375% | | 9/25/06 | | | 240 | | | 235A |
The Korea Development Bank | | | | 4.250% | | 11/13/07 | | | 200 | | | 198 |
The Korea Development Bank | | | | 5.500% | | 11/13/12 | | | 60 | | | 62 |
| | | | | | | | | | | |
|
|
| | | | | | | | | | | | | 495 |
| | | | | | | | | | | |
|
|
Cable | | N.M. | | | | | | | | | | |
Kabel Deutschland GmbH | | | | 10.625% | | 7/1/14 | | | 680 | | | 752B |
Rogers Cable Inc. | | | | 7.875% | | 5/1/12 | | | 687 | | | 730 |
Rogers Cable Inc. | | | | 5.500% | | 3/15/14 | | | 860 | | | 793 |
Rogers Cable Inc. | | | | 6.750% | | 3/15/15 | | | 130 | | | 130 |
| | | | | | | | | | | |
|
|
| | | | | | | | | | | | | 2,405 |
| | | | | | | | | | | |
|
|
Chemicals | | N.M. | | | | | | | | | | |
Rhodia SA | | | | 10.250% | | 6/1/10 | | | 780 | | | 825A |
| | | | | | | | | | | |
|
|
Diversified Financial Services | | N.M. | | | | | | | | | | |
Pemex Finance LTD. | | | | 9.030% | | 2/15/11 | | | 10 | | | 11 |
| | | | | | | | | | | |
|
|
Electric | | 0.1% | | | | | | | | | | |
Empresa Nacional de Electricidad S.A. | | | | 8.350% | | 8/1/13 | | | 1,700 | | | 1,935 |
Hydro-Quebec | | | | 6.300% | | 5/11/11 | | | 1,720 | | | 1,858 |
| | | | | | | | | | | |
|
|
| | | | | | | | | | | | | 3,793 |
| | | | | | | | | | | |
|
|
Electronics | | N.M. | | | | | | | | | | |
Flextronics International Limited | | | | 6.250% | | 11/15/14 | | | 270 | | | 269A |
| | | | | | | | | | | |
|
|
Foreign Governments | | 4.8% | | | | | | | | | | |
Federative Republic of Brazil | | | | 14.500% | | 10/15/09 | | | 14,720 | | | 19,143A |
Federative Republic of Brazil | | | | 12.000% | | 4/15/10 | | | 3,240 | | | 3,967A |
Federative Republic of Brazil | | | | 5.250% | | 4/15/12 | | | 5,089 | | | 5,007C |
Federative Republic of Brazil | | | | 8.875% | | 4/15/24 | | | 3,830 | | | 4,087 |
Federative Republic of Brazil | | | | 8.875% | | 4/15/24 | | | 888 | | | 948 |
Federative Republic of Brazil | | | | 12.250% | | 3/6/30 | | | 6,570 | | | 9,040 |
Federative Republic of Brazil | | | | 11.000% | | 8/17/40 | | | 17,926 | | | 21,977A |
Province of British Columbia | | | | 4.300% | | 5/30/13 | | | 180 | | | 176 |
Province of Ontario | | | | 3.500% | | 9/17/07 | | | 110 | | | 108 |
Republic of Bulgaria | | | | 8.250% | | 1/15/15 | | | 6,090 | | | 7,514 |
Republic of Colombia | | | | 11.750% | | 2/25/20 | | | 3,515 | | | 4,889A |
83
Semi-Annual Report to Shareholders
PORTFOLIO OF INVESTMENTS—Continued
Western Asset Core Plus Bond Portfolio—Continued
| | | | | | | | | | | | |
| | | % OF
NET ASSETS | | RATE | | MATURITY
DATE | | PAR/
SHARES | | VALUE |
Yankee Bonds—Continued | | | | | | | | | | | | |
| | | | | |
Foreign Governments—Continued | | | | | | | | | | | | |
Republic of Colombia | | | | 8.125% | | 5/21/24 | | $ | 8,560 | | $ | 9,181 |
Republic of Panama | | | | 9.625% | | 2/8/11 | | | 1,203 | | | 1,438 |
Republic of Panama | | | | 10.750% | | 5/15/20 | | | 2,587 | | | 3,602 |
Republic of Panama | | | | 9.375% | | 1/16/23 | | | 1,210 | | | 1,528A |
Republic of Panama | | | | 8.875% | | 9/30/27 | | | 690 | | | 840 |
Republic of Peru | | | | 5.000% | | 3/7/17 | | | 3,819 | | | 3,771G |
Republic of Peru | | | | 5.000% | | 3/7/17 | | | 41 | | | 40B,G |
Republic of Peru | | | | 8.750% | | 11/21/33 | | | 5,480 | | | 6,617A |
Russian Federation | | | | 5.000% | | 3/31/30 | | | 81,700 | | | 93,873G |
United Mexican States | | | | 8.375% | | 1/14/11 | | | 14,550 | | | 16,733 |
United Mexican States | | | | 11.500% | | 5/15/26 | | | 9,330 | | | 14,975 |
United Mexican States | | | | 8.300% | | 8/15/31 | | | 8,250 | | | 10,313 |
United Mexican States | | | | 7.500% | | 4/8/33 | | | 39,755 | | | 46,116A |
| | | | | | | | | | | |
|
|
| | | | | | | | | | | | | 285,883 |
| | | | | | | | | | | |
|
|
Insurance | | 0.1% | | | | | | | | | | |
Foundation Re Ltd | | | | 7.897% | | 11/24/08 | | | 2,150 | | | 2,107B,C |
Korea Deposit Insurance Corp. | | | | 2.500% | | 12/11/05 | | | 2,500 | | | 2,764E |
Oil Insurance Ltd | | | | 5.150% | | 8/15/33 | | | 35 | | | 35B,L |
| | | | | | | | | | | |
|
|
| | | | | | | | | | | | | 4,906 |
| | | | | | | | | | | |
|
|
Manufacturing (Diversified) | | 1.2% | | | | | | | | | | |
Tyco International Group SA | | | | 6.375% | | 2/15/06 | | | 10,250 | | | 10,318 |
Tyco International Group SA | | | | 5.800% | | 8/1/06 | | | 10,250 | | | 10,346 |
Tyco International Group SA | | | | 6.125% | | 11/1/08 | | | 100 | | | 104 |
Tyco International Group SA | | | | 6.750% | | 2/15/11 | | | 460 | | | 497A |
Tyco International Group SA | | | | 6.375% | | 10/15/11 | | | 5,580 | | | 5,948 |
Tyco International Group SA | | | | 7.000% | | 6/15/28 | | | 145 | | | 168 |
Tyco International Group SA | | | | 6.875% | | 1/15/29 | | | 37,200 | | | 42,686A |
| | | | | | | | | | | |
|
|
| | | | | | | | | | | | | 70,067 |
| | | | | | | | | | | |
|
|
Media | | N.M. | | | | | | | | | | |
Shaw Communications Inc. | | | | 8.250% | | 4/11/10 | | | 27 | | | 29 |
Shaw Communications Inc. | | | | 7.250% | | 4/6/11 | | | 630 | | | 665A |
Shaw Communications Inc. | | | | 7.200% | | 12/15/11 | | | 395 | | | 417A |
| | | | | | | | | | | |
|
|
| | | | | | | | | | | | | 1,111 |
| | | | | | | | | | | |
|
|
Mining | | N.M. | | | | | | | | | | |
Corporacion Nacional del Cobre—Codelco | | | | 4.750% | | 10/15/14 | | | 2,590 | | | 2,513B |
| | | | | | | | | | | |
|
|
84
Semi-Annual Report to Shareholders
| | | | | | | | | | | | |
| | | % OF
NET ASSETS | | RATE | | MATURITY
DATE | | PAR/
SHARES | | VALUE |
Yankee Bonds—Continued | | | | | | | | | | | | |
| | | | | |
Oil and Gas | | 0.1% | | | | | | | | | | |
Gazprom | | | | 9.625% | | 3/1/13 | | $ | 990 | | $ | 1,229B |
Gazprom | | | | 9.625% | | 3/1/13 | | | 330 | | | 408 |
Pemex Project Funding Master Trust | | | | 8.500% | | 2/15/08 | | | 110 | | | 119 |
Western Oil Sands Inc. | | | | 8.375% | | 5/1/12 | | | 2,738 | | | 3,145 |
YPF Sociedad Anonima | | | | 7.750% | | 8/27/07 | | | 1,000 | | | 1,054 |
| | | | | | | | | | | |
|
|
| | | | | | | | | | | | | 5,955 |
| | | | | | | | | | | |
|
|
Paper and Forest Products | | N.M. | | | | | | | | | | |
Abitibi-Consolidated Inc. | | | | 7.750% | | 6/15/11 | | | 2,350 | | | 2,315A |
| | | | | | | | | | | |
|
|
| | | | | |
Publishing | | N.M. | | | | | | | | | | |
Sun Media Corporation | | | | 7.625% | | 2/15/13 | | | 565 | | | 591 |
| | | | | | | | | | | |
|
|
| | | | | |
Special Purpose | | 0.5% | | | | | | | | | | |
Anadarko Finance Company | | | | 6.750% | | 5/1/11 | | | 240 | | | 261 |
Arcel Finance | | | | 5.984% | | 2/1/09 | | | 6,907 | | | 7,017B |
ChevronTexaco Capital Company | | | | 3.500% | | 9/17/07 | | | 20 | | | 20 |
Conoco Funding Company | | | | 6.350% | | 10/15/11 | | | 590 | | | 640 |
Conoco Funding Company | | | | 7.250% | | 10/15/31 | | | 810 | | | 1,022 |
Eircom Funding | | | | 8.250% | | 8/15/13 | | | 900 | | | 976A |
European Investment Bank | | | | 4.000% | | 3/3/10 | | | 100 | | | 99 |
General Motors Nova Scotia Finance Company | | | | 6.850% | | 10/15/08 | | | 1,550 | | | 1,452 |
HSBC Capital Funding LP | | | | 4.610% | | 12/29/49 | | | 2,090 | | | 1,999B |
Petrozuata Finance, Inc. | | | | 8.220% | | 4/1/17 | | | 5,220 | | | 4,985B |
Resona Preferred Global Securities Limited | | | | 7.191% | | 12/29/49 | | | 8,970 | | | 9,286 |
| | | | | | | | | | | |
|
|
| | | | | | | | | | | | | 27,757 |
| | | | | | | | | | | |
|
|
Telecommunications | | 0.2% | | | | | | | | | | |
British Telecommunications plc | | | | 8.375% | | 12/15/10 | | | 1,145 | | | 1,326 |
Intelsat(Bermuda), Ltd. | | | | 8.625% | | 1/15/15 | | | 540 | | | 551B |
Telecom Italia Capital S.p.A | | | | 5.250% | | 10/1/15 | | | 2,950 | | | 2,899 |
Telecom Italia Capital S.p.A. | | | | 5.250% | | 11/15/13 | | | 1,260 | | | 1,251 |
Telecom Italia Capital S.p.A. | | | | 4.950% | | 9/30/14 | | | 3,730 | | | 3,609B |
| | | | | | | | | | | |
|
|
| | | | | | | | | | | | | 9,636 |
| | | | | | | | | | | |
|
|
Telecommunications (Cellular/Wireless) | | N.M. | | | | | | | | | | |
Rogers Wireless Communications Inc. | | | | 6.375% | | 3/1/14 | | | 1,850 | | | 1,859A |
Rogers Wireless Communications Inc. | | | | 7.500% | | 3/15/15 | | | 420 | | | 453 |
| | | | | | | | | | | |
|
|
| | | | | | | | | | | | | 2,312 |
| | | | | | | | | | | |
|
|
85
Semi-Annual Report to Shareholders
PORTFOLIO OF INVESTMENTS—Continued
Western Asset Core Plus Bond Portfolio—Continued
| | | | | | | | | | | | | |
| | | % OF
NET ASSETS | | RATE | | MATURITY
DATE | | PAR/
SHARES | | | VALUE |
Yankee Bonds—Continued | | | | | | | | | | | | | |
| | | | | |
Transportation | | 0.1% | | | | | | | | | | | |
OMI Corporation | | | | 7.625% | | 12/1/13 | | $ | 1,450 | | | $ | 1,501 |
Teekay Shipping Corporation | | | | 8.875% | | 7/15/11 | | | 1,729 | | | | 1,971 |
| | | | | | | | | | | | |
|
|
| | | | | | | | | | | | | | 3,472 |
| | | | | | | | | | | | |
|
|
Total Yankee Bonds (Identified Cost—$386,612) | | | | | | | | | | | 429,939 |
Foreign Government Obligations | | 2.9% | | | | | | | | | | | |
| | | | | |
Fixed Rate Securities | | 2.9% | | | | | | | | | | | |
Canadian Real Return Bond | | | | 4.000% | | 12/1/31 | | | 11,360M | | | | 14,748J |
Government of Canada | | | | 5.250% | | 6/1/12 | | | 45,000M | | | | 42,082 |
Queensland Treasury Corp. | | | | 6.000% | | 6/14/11 | | | 31,020N | | | | 24,277J |
Republic of France | | | | 3.000% | | 7/25/09 | | | 67,924O | | | | 89,513J |
| | | | | | | | | | | | |
|
|
Total Foreign Government Obligations (Identified Cost—$168,503) | | | | | | | | | | | | | 170,620 |
Foreign Corporate Bonds | | 0.2% | | | | | | | | | | | |
General Motors Corporation | | | | 8.375% | | 7/5/33 | | | 9,520O | | | | 8,984A |
| | | | | | | | | | | | |
|
|
Total Foreign Corporate Bonds (Identified Cost—$12,355) | | | | | | | | | | | | | 8,984 |
Preferred Stocks | | 0.5% | | | | | | | | | | | |
Fannie Mae | | | | 7.000% | | | | | 211 | | | | 11,590C |
Fannie Mae | | | | 5.375% | | | | | 0.053 | shs | | | 4,855E |
General Motors Corporation | | | | 5.250% | | | | | 813 | | | | 14,046E |
Home Ownership Funding Corporation | | | | 13.331% | | | | | 2 | | | | 450B,E |
Home Ownership Funding Corporation II | | | | 13.338% | | | | | 1 | | | | 391B,E |
| | | | | | | | | | | | |
|
|
Total Preferred Stocks (Identified Cost—$32,466) | | | | | | | | | | | | | 31,332 |
Options PurchasedQ | | N.M. | | | | | | | | | | | |
BellSouth Telecommunications Inc. Call, July 2006, Strike Price $97.72 | | | | | | | | | 500R | | | | 64 |
International Business Machines Corporation Call, July 2006, Strike Price $99.90 | | | | | | | | | 500R | | | | 87 |
| | | | | | | | | | | | |
|
|
Total Options Purchased (Identified Cost—$18) | | | | | | | | | | | 151 |
| | | | | | | | | | | | |
|
|
Total Long-Term Securities
(Identified Cost—$6,730,937) | | | | | | | | | | | | | 6,760,634 |
86
Semi-Annual Report to Shareholders
| | | | | | | | | | | | | |
| | | % OF
NET ASSETS | | RATE | | MATURITY
DATE | | PAR/
SHARES | | | VALUE |
Investment of Collateral From Securities Lending | | 25.2% | | | | | | | | | | | |
State Street Navigator Securities Leading Prime Portfolio | | | | | | | | | 1,500,496 | shs | | $ | 1,500,496 |
| | | | | | | | | | | | |
|
|
Total Investments of Collateral From Securities Lending
(Identified Cost—$1,500,496) | | | | | | | | | | | | | 1,500,496 |
Short-Term Securities | | 19.3% | | | | | | | | | | | |
| | | | | |
U.S. Government and Agency Obligations | | 13.0% | | | | | | | | | | | |
Fannie Mae | | | | 0.000% | | 10/3/05 | | $ | 240,000 | | | | 239,958F,P |
Fannie Mae | | | | 0.000% | | 12/5/05 | | | 25,412 | | | | 25,256F |
Freddie Mac | | | | 0.000% | | 10/3/05 | | | 240,000 | | | | 239,958F,P |
Freddie Mac | | | | 0.000% | | 10/3/05 | | | 270,000 | | | | 269,953F,P |
| | | | | | | | | | | | |
|
|
| | | | | | | | | | | | | | 775,125 |
| | | | | | | | | | | | |
|
|
Options PurchasedQ | | 0.3% | | | | | | | | | | | |
Eurodollar Futures Call, November 2005, Strike Price $96.00 | | | | | | | | | 996R | | | | 6 |
Eurodollar Futures Call, January 2006, Strike Price $95.00 | | | | | | | | | 411R | | | | 632 |
Eurodollar Futures Call, April 2006, Strike Price $95.00 | | | | | | | | | 8,159R | | | | 10,301 |
Eurodollar Futures Call, April 2006, Strike Price $95.50 | | | | | | | | | 19R | | | | 7 |
Eurodollar Future Call, July 2006, Strike Price $95.00 | | | | | | | | | 685R | | | | 783 |
Eurodollar Futures Put, July 2006, Strike Price $93.75 | | | | | | | | | 1,000R | | | | 0 |
Eurodollar Futures Put, July 2006, Strike Price $94.00 | | | | | | | | | 284R | | | | 2 |
Japanese Yen Future Call, January 2006, Strike Price $90.00 | | | | | | | | | 25R | | | | 24 |
Deutsche Bank Swaption Futures Call, July 2006, Strike Price $4.61 | | | | | | | | | 103,200,000R | | | | 1,416 |
Deutsche Bank Swaption Futures Call, March 2006, Strike Price $4.43 | | | | | | | | | 45,800,000R | | | | 334 |
Deutsche Bank Swaption Futures Put, July 2006, Strike Price $4.61 | | | | | | | | | 103,200,000R | | | | 1,638 |
Goldman Sachs Swaption Futures Put, March 2006, Strike Price $4.43 | | | | | | | | | 45,800,000R | | | | 689 |
87
Semi-Annual Report to Shareholders
PORTFOLIO OF INVESTMENTS—Continued
Western Asset Core Plus Bond Portfolio—Continued
| | | | | | | | | |
| | | % OF
NET ASSETS | | PAR/
SHARES | | VALUE | |
Short-Term Securities—Continued | | | | | | | | | |
| | | |
Options PurchasedQ—Continued | | 6.0% | | | | | | | |
Goldman Sachs Swaption Futures Put, November 2005, Strike Price $4.12 | | | | | 83,046,988R | | $ | 635 | |
U.S. Treasury Bond Futures Call, December 2005, Strike Price $115.00 | | | | | 626R | | | 646 | |
U.S. Treasury Bond Futures Call, December 2005, Strike Price $119.00 | | | | | 916R | | | 129 | |
U.S. Treasury Note Futures Call, December 2005, Strike Price $104.50 | | | | | 963R | | | 2,287 | |
U.S. Treasury Note Futures Call, December 2005, Strike Price $106.50 | | | | | 550R | | | 395 | |
U.S. Treasury Note Futures Call, December 2005, Strike Price $108.50 | | | | | 691R | | | 54 | |
| | | | | | | |
|
|
|
| | | | | | | | | 19,978 | |
| | | | | | | |
|
|
|
Repurchase Agreements | | 6.0% | | | | | | | |
Deutsche Bank AG
3.7%, dated 9/30/05, to be repurchased at $112,900 on 10/3/05 (Collateral: $114,701 Freddie Mac notes, 3.8%, due 12/27/06,
value $116,271) | | $ | 112,865 | | | 112,865 | |
Goldman, Sachs & Company
3.8%, dated 9/30/05, to be repurchased at $240,742 on 10/3/05
(Collateral: $246,735 Freddie Mac notes, 4.25%, due 9/22/10,
value $245,762) | | | 240,666 | | | 240,666 | |
| | | | | | | |
|
|
|
| | | | | | | | | 353,531 | |
| | | | | | | |
|
|
|
Total Short-Term Securities (Identified Cost—$1,153,841) | | | | | | | | 1,148,634 | |
Total Investments (Identified Cost—$9,385,274) | | 158.1% | | | | | $ | 9,409,764 | |
Obligation to Return Collateral for Securities Loaned | | (25.2)% | | | | | | (1,500,496 | ) |
Other Assets Less Liabilities | | (32.9)% | | | | | | (1,958,647 | ) |
| | | | | | | |
|
|
|
Net Assets | | 100.0% | | | | | $ | 5,950,621 | |
| | | | | | | |
|
|
|
| | | | | | | | |
| | | EXPIRATION
DATE | | ACTUAL
CONTRACTS | | APPRECIATION/
(DEPRECIATION) | |
Futures Contracts PurchasedQ | | | | | | | | |
Australian Dollar Futures | | December 2005 | | 61 | | $ | (32 | ) |
Australian Treasury Bond Futures | | December 2005 | | 50 | | | (118 | ) |
British Pound Futures | | December 2005 | | 25 | | | (45 | ) |
Canadian Dollar Futures | | December 2005 | | 172 | | | 224 | |
Euro Currency Futures | | December 2005 | | 250 | | | (657 | ) |
88
Semi-Annual Report to Shareholders
| | | | | | | | |
| | | EXPIRATION
DATE | | ACTUAL
CONTRACTS | | APPRECIATION/
(DEPRECIATION) | |
Futures Contracts PurchasedQ—Continued | | | | | | | | |
Eurodollar Futures | | March 2006 | | 57 | | $ | (16 | ) |
Eurodollar Futures | | June 2006 | | 3,208 | | | (2,012 | ) |
Eurodollar Futures | | September 2006 | | 221 | | | (134 | ) |
Japanese Yen Futures | | December 2005 | | 1,140 | | | (3,625 | ) |
LIBOR Futures | | June 2006 | | 300 | | | 27 | |
U.S. Treasury Note Futures | | December 2005 | | 3,661 | | | (2,485 | ) |
| | | | | | |
|
|
|
| | | | | | | $ | (8,873 | ) |
| | | | | | |
|
|
|
Futures Contracts WrittenQ | | | | | | | | |
Bundesobligation Futures | | December 2005 | | 200 | | $ | 307 | |
U.S. Treasury Bond Futures | | December 2005 | | 697 | | | 523 | |
U.S. Treasury Note Futures | | December 2005 | | 599 | | | 662 | |
| | | | | | |
|
|
|
| | | | | | | $ | 1,492 | |
| | | | | | |
|
|
|
Options WrittenQ | | | | | | | | |
Euro Currency Futures Call, Strike Price $1.24 | | January 2006 | | 50 | | $ | 56 | |
Euro Currency Futures Call, Strike Price $1.26 | | January 2006 | | 75 | | | 57 | |
Euro Currency Futures Call, Strike Price $1.28 | | January 2006 | | 100 | | | 104 | |
Euro Currency Futures Put, Strike Price $1.22 | | December 2005 | | 40 | | | (86 | ) |
Eurodollar Futures Put, Strike Price $95.625 | | November 2005 | | 996 | | | (460 | ) |
Eurodollar Futures Put, Strike Price $95.75 | | April 2006 | | 672 | | | (370 | ) |
Eurodollar Futures Put, Strike Price $95.75 | | July 2006 | | 904 | | | (576 | ) |
Japanese Yen Futures Call, Strike Price $92.00 | | January 2006 | | 20 | | | 30 | |
Japanese Yen Futures Call, Strike Price $92.50 | | January 2006 | | 225 | | | 274 | |
Japanese Yen Futures Call, Strike Price $93.00 | | January 2006 | | 300 | | | 407 | |
Deutsche Bank Swaption Futures Call, Strike Price $4.745 | | July 2006 | | 62,100,000 | | | 312 | |
Goldman Sachs Swaption Futures Call, Strike Price $4.30 | | October 2005 | | 50,000,000 | | | 330 | |
Goldman Sachs Swaption Futures Call, Strike Price $4.36 | | March 2006 | | 74,400,000 | | | (197 | ) |
Deutsche Bank Swaption Futures Put, Strike Price $4.745 | | July 2006 | | 62,100,000 | | | 11 | |
Goldman Sachs Swaption Futures Put, Strike Price $4.80 | | September 2006 | | 50,000,000 | | | 258 | |
Goldman Sachs Swaption Futures Put, Strike Price $7.00 | | December 2005 | | 42,500,000 | | | (852 | ) |
Goldman Sachs Swaption Futures Put, Strike Price $4.36 | | March 2006 | | 74,400,000 | | | 229 | |
Goldman Sachs Swaption Futures Put, Strike Price $4.48 | | November 2005 | | 21,230,000 | | | (214 | ) |
U.S. Treasury Bond Futures Call, Strike Price $117.00 | | December 2005 | | 1,278 | | | 785 | |
U.S. Treasury Bond Futures Call, Strike Price $118.00 | | December 2005 | | 592 | | | 453 | |
U.S. Treasury Bond Futures Call, Strike Price $120.00 | | November 2005 | | 216 | | | 176 | |
U.S. Treasury Bond Futures Call, Strike Price $122.00 | | December 2005 | | 160 | | | 102 | |
U.S. Treasury Bond Futures Put, Strike Price $113.00 | | December 2005 | | 3,397 | | | 51 | |
U.S. Treasury Bond Futures Put, Strike Price $115.00 | | December 2005 | | 290 | | | (272 | ) |
U.S. Treasury Note Futures Call, Strike Price $108.00 | | December 2005 | | 440 | | | 91 | |
U.S. Treasury Note Futures Call, Strike Price $111.00 | | December 2005 | | 1,468 | | | 335 | |
89
Semi-Annual Report to Shareholders
PORTFOLIO OF INVESTMENTS—Continued
Western Asset Core Plus Bond Portfolio—Continued
| | | | | | | | |
| | | EXPIRATION
DATE | | ACTUAL
CONTRACTS | | APPRECIATION/
(DEPRECIATION) | |
Options WrittenQ—Continued | | | | | | | | |
U.S. Treasury Note Futures Call, Strike Price $112.00 | | December 2005 | | 2,008 | | $ | 701 | |
U.S. Treasury Note Futures Call, Strike Price $113.00 | | December 2005 | | 2,674 | | | 1,269 | |
U.S. Treasury Note Futures Call, Strike Price $113.00 | | November 2005 | | 227 | | | 98 | |
U.S. Treasury Note Futures Call, Strike Price $113.00 | | March 2006 | | 432 | | | 44 | |
U.S. Treasury Note Futures Call, Strike Price $114.00 | | December 2005 | | 896 | | | 526 | |
U.S. Treasury Note Futures Put, Strike Price $106.50 | | December 2005 | | 108 | | | (6 | ) |
U.S. Treasury Note Futures Put, Strike Price $107.00 | | December 2005 | | 264 | | | (4 | ) |
U.S. Treasury Note Futures Put, Strike Price $107.00 | | March 2006 | | 309 | | | (6 | ) |
U.S. Treasury Note Futures Put, Strike Price $107.50 | | December 2005 | | 1,628 | | | (510 | ) |
U.S. Treasury Note Futures Put, Strike Price $109.00 | | December 2005 | | 3,487 | | | 470 | |
U.S. Treasury Note Futures Put, Strike Price $110.00 | | December 2005 | | 449 | | | (193 | ) |
U.S. Treasury Note Futures Put, Strike Price $111.00 | | December 2005 | | 691 | | | (321 | ) |
| | | | | | |
|
|
|
| | | | | | | $ | 3,102 | |
| | | | | | |
|
|
|
| | | | | | | | | |
| A | All or a portion of these securities is on loan. See note 4 to the financial statements. |
| B | Rule 144a Security – A security purchased pursuant to Rule 144a under the Securities Act of 1933 which may not be resold subject to that rule except to qualified institutional buyers. These securities represent 4% of net assets. |
| C | Indexed security – The rate of interest earned on this security is tied to the London Interbank Offered Rate (“LIBOR”) or the one-year Treasury Bill rate. The coupon rate is the rate as of September 30, 2005. |
| D | Unit – A security which consists of a bond and warrants to purchase the stock of the issuer. |
| E | Convertible Security – Security may be converted into issuer’s common stock. |
| F | Zero coupon bond – A bond with no periodic interest payments which is sold at such a discount as to produce a current yield to maturity. |
| G | Stepped coupon security – A security with a predetermined schedule of interest or dividend rate changes, at which time it begins to accrue interest or pay dividends. |
| H | Securities with interest-only or principal-only payment streams, denoted by a 1 or 2, respectively. For interest-only securities, the amount shown as principal is the notional balance used to calculate the amount of interest due. |
| I | Yankee Bond – A dollar denominated bond issued in the U.S. by foreign entities. |
| J | Inflation-Protected Security – A security whose principal value is adjusted daily or monthly in accordance with changes to the relevant country’s Consumer Price Index or its equivalent used as an inflation proxy. Interest is calculated on the basis of the current adjusted principal value. |
| K | When-issued security – Security purchased on a delayed delivery basis. Final settlement amount and maturity date have not yet been announced. |
| L | The coupon rates shown on variable rate securities are the rates at September 30, 2005. These rates vary with the weighted average coupon of the underlying loans. |
| M | Denominated in Canadian dollars. |
| N | Denominated in Australian dollars. |
| O | Denominated in Euro currency. |
| P | All or a portion of this security is collateral to cover futures and options contracts. |
| Q | Options and futures are described in more detail in the notes to financial statements. |
| R | Par represents actual number of contracts. |
N.M.—Not meaningful.
See notes to financial statements.
90
Semi-Annual Report to Shareholders
PORTFOLIO OF INVESTMENTS
September 30, 2005 (Unaudited)
(Amounts in Thousands)
Western Asset Inflation Indexed Plus Bond Portfolio
| | | | | | | | | | | | | |
| | | % OF
NET ASSETS | | RATE | | MATURITY
DATE | | PAR/
SHARES | | VALUE | |
Long-Term Securities | | 103.6% | | | | | | | | | | | |
| | | | | |
Corporate Bonds and Notes | | 3.0% | | | | | | | | | | | |
| | | | | |
Gas and Pipeline Utilities | | | | | | | | | | | | | |
The Williams Companies, Inc. | | | | 8.750% | | 3/15/32 | | $ | 1,900 | | $ | 2,242 | |
| | | | | | | | | | | |
|
|
|
| | | | | |
Investment Banking/Brokerage | | | | | | | | | | | | | |
J.P. Morgan & Co. Incorporated | | | | 8.094% | | 2/15/12 | | | 2,690 | | | 2,840A | |
Merrill Lynch & Co., Inc. | | | | 3.970% | | 3/12/07 | | | 4,600 | | | 4,587A | |
| | | | | | | | | | | |
|
|
|
| | | | | | | | | | | | | 7,427 | |
| | | | | | | | | | | |
|
|
|
Special Purpose | | | | | | | | | | | | | |
Allstate Life Global Funding Trust | | | | 4.500% | | 4/2/07 | | | 4,600 | | | 4,588A | |
| | | | | | | | | | | |
|
|
|
Total Corporate Bonds and Notes
(Identified Cost—$14,110) | | | | | | | | | | | | 14,257 | |
Asset-Backed Securities | | 0.8% | | | | | | | | | | | |
| | | | | |
Indexed SecuritiesA | | 0.8% | | | | | | | | | | | |
ACE Securities Corp. Home Equity Loan Trust 2003-HS1 | | | | 4.408% | | 6/25/33 | | | 393 | | | 394 | |
Ameriquest Mortgage Securities, Inc. 2002-5 | | | | 4.508% | | 2/25/33 | | | 54 | | | 54 | |
Ameriquest Mortgage Securities, Inc. 2003-AR3 | | | | 4.408% | | 10/25/33 | | | 118 | | | 118 | |
Bear Stearns Asset Backed Securities, Inc. 2003-ABF1 | | | | 4.408% | | 1/25/34 | | | 666 | | | 668 | |
Chase Funding Mortgage Loan Asset-Backed Certificates 2002-4 | | | | 4.408% | | 10/25/32 | | | 348 | | | 350 | |
Countrywide Asset-Backed Certificates 2002-1 | | | | 4.318% | | 8/25/32 | | | 88 | | | 88 | |
EMC Mortgage Loan Trust ABS Security 2002-B | | | | 4.588% | | 11/25/41 | | | 1,504 | | | 1,508B | |
EQCC Trust 2002-1 | | | | 4.338% | | 11/25/31 | | | 330 | | | 331 | |
Residential Asset Mortgage Products, Inc. 2003-RS2 | | | | 4.378% | | 3/25/33 | | | 231 | | | 231 | |
| | | | | | | | | | | |
|
|
|
Total Asset-Backed Securities
(Identified Cost—$3,733) | | | | | | | | | | | | 3,742 | |
Mortgage-Backed Securities | | 0.8% | | | | | | | | | | | |
| | | | | |
Indexed SecuritiesA | | 0.8% | | | | | | | | | | | |
Crusade Global Trust 2003-2 | | | | 4.100% | | 9/18/34 | | | 1,503 | | | 1,506C | |
CS First Boston Mortgage Securities Corp. 2001-28 | | | | 4.688% | | 11/25/31 | | | 1,077 | | | 1,081 | |
GSRPM Mortgage Loan Trust Series 2003-2 | | | | 4.530% | | 6/25/33 | | | 946 | | | 949 | |
| | | | | | | | | | | |
|
|
|
Total Mortgage-Backed Securities
(Identified Cost—$3,529) | | | | | | | | | | | | 3,536 | |
91
Semi-Annual Report to Shareholders
PORTFOLIO OF INVESTMENTS—Continued
Western Asset Inflation Indexed Plus Bond Portfolio—Continued
| | | | | | | | | | | | | |
| | | % OF
NET ASSETS | | RATE | | MATURITY
DATE | | PAR/
SHARES | | VALUE | |
U.S. Government and Agency Obligations | | 92.2% | | | | | | | | | | | |
| | | | | |
Indexed SecuritiesD | | 92.2% | | | | | | | | | | | |
Tennessee Valley Authority | | | | 3.375% | | 1/15/07 | | $ | 7,892 | | $ | 8,157 | |
United States Treasury Inflation-Protected Security | | | | 3.375% | | 1/15/07 | | | 11,302 | | | 11,688E | |
United States Treasury Inflation-Protected Security | | | | 3.625% | | 1/15/08 | | | 25,196 | | | 26,670E | |
United States Treasury Inflation-Protected Security | | | | 3.875% | | 1/15/09 | | | 17,679 | | | 19,178 | |
United States Treasury Inflation-Protected Security | | | | 4.250% | | 1/15/10 | | | 14,817 | | | 16,574E | |
United States Treasury Inflation-Protected Security | | | | 0.875% | | 4/15/10 | | | 20,477 | | | 19,953 | |
United States Treasury Inflation-Protected Security | | | | 3.500% | | 1/15/11 | | | 21,176 | | | 23,323E | |
United States Treasury Inflation-Protected Security | | | | 3.375% | | 1/15/12 | | | 17,252 | | | 19,106E | |
United States Treasury Inflation-Protected Security | | | | 3.000% | | 7/15/12 | | | 40,682 | | | 44,271E | |
United States Treasury Inflation-Protected Security | | | | 1.875% | | 7/15/13 | | | 31,348 | | | 31,769E | |
United States Treasury Inflation-Protected Security | | | | 2.000% | | 1/15/14 | | | 31,498 | | | 32,154E | |
United States Treasury Inflation-Protected Security | | | | 2.000% | | 7/15/14 | | | 17,392 | | | 17,766E | |
United States Treasury Inflation-Protected Security | | | | 1.625% | | 1/15/15 | | | 21,456 | | | 21,201E | |
United States Treasury Inflation-Protected Security | | | | 1.875% | | 7/15/15 | | | 13,841 | | | 13,963E | |
United States Treasury Inflation-Protected Security | | | | 2.375% | | 1/15/25 | | | 20,008 | | | 21,406E | |
United States Treasury Inflation-Protected Security | | | | 3.625% | | 4/15/28 | | | 36,951 | | | 48,346E | |
United States Treasury Inflation-Protected Security | | | | 3.875% | | 4/15/29 | | | 41,857 | | | 57,298E | |
| | | | | | | | | | | |
|
|
|
Total U.S. Government and Agency Obligations
(Identified Cost—$422,724) | | | | | | | | | | | | 432,823 | |
92
Semi-Annual Report to Shareholders
| | | | | | | | | | | | | |
| | | % OF
NET ASSETS | | RATE | | MATURITY
DATE | | PAR/
SHARES | | | VALUE |
Yankee Bonds | | 4.7% | | | | | | | | | | | |
| | | | | |
Foreign Governments | | 4.7% | | | | | | | | | | | |
Federative Republic of Brazil | | | | 8.875% | | 4/15/24 | | $ | 86 | | | $ | 92 |
Federative Republic of Brazil | | | | 14.500% | | 10/15/09 | | | 1,600 | | | | 2,081 |
Federative Republic of Brazil | | | | 5.250% | | 4/15/12 | | | 494 | | | | 486A |
Federative Republic of Brazil | | | | 8.875% | | 4/15/24 | | | 350 | | | | 373 |
Federative Republic of Brazil | | | | 12.250% | | 3/6/30 | | | 560 | | | | 771 |
Federative Republic of Brazil | | | | 11.000% | | 8/17/40 | | | 2,040 | | | | 2,501 |
Republic of Colombia | | | | 11.750% | | 2/25/20 | | | 900 | | | | 1,252 |
Republic of Panama | | | | 10.750% | | 5/15/20 | | | 850 | | | | 1,184 |
Republic of Peru | | | | 5.000% | | 3/7/17 | | | 492 | | | | 486F |
Republic of Peru | | | | 8.750% | | 11/21/33 | | | 600 | | | | 724 |
Russian Federation | | | | 5.000% | | 3/31/30 | | | 5,200 | | | | 5,975F |
United Mexican States | | | | 8.300% | | 8/15/31 | | | 880 | | | | 1,100 |
United Mexican States | | | | 7.500% | | 4/8/33 | | | 4,240 | | | | 4,918 |
| | | | | | | | | | | | |
|
|
Total Yankee Bonds (Identified Cost—$20,791) | | | | | | | | | | | | | 21,943 |
Foreign Government Obligations | | 2.1% | | | | | | | | | | | |
| | | | | |
Indexed SecuritiesD | | 2.1% | | | | | | | | | | | |
Canadian Real Return Bond | | | | 3.000% | | 12/1/36 | | | 2,049G | | | | 2,324 |
Kingdom of Sweden Inflation-Protected Notes | | | | 3.500% | | 12/1/28 | | | 10,600H | | | | 2,097 |
Republic of France | | | | 3.000% | | 7/25/09 | | | 3,738I | | | | 4,926 |
Republic of France | | | | 0.000% | | 10/25/32 | | | 1,305I | | | | 577J2 |
| | | | | | | | | | | | |
|
|
Total Foreign Government Obligations
(Identified Cost—$9,235) | | | | | | | | | | | | | 9,924 |
| | | | | | | | | | | | |
|
|
Total Long-Term Securities
(Identified Cost—$474,122) | | | | | | | | | | | | | 486,225 |
Investment of Collateral From Securities Lending | | 25.3% | | | | | | | | | | | |
State Street Navigator Securities Lending Prime Portfolio | | | | | | | | | 118,493 | shs | | | 118,493 |
| | | | | | | | | | | | |
|
|
Total Investments of Collateral From Securities Lending (Identified Cost—$118,493) | | | | | | | | | | | | | 118,493 |
93
Semi-Annual Report to Shareholders
PORTFOLIO OF INVESTMENTS—Continued
Western Asset Inflation Indexed Plus Bond Portfolio—Continued
| | | | | | | | | | | | | |
| | | % OF
NET ASSETS | | RATE | | MATURITY
DATE | | PAR/
SHARES | | VALUE | |
Short-Term Securities | | 1.1% | | | | | | | | | | | |
| | | | | |
U.S. Government and Agency Obligations | | 0.4% | | | | | | | | | | | |
Freddie Mac | | | | 0.000% | | 12/12/05 | | $ | 2,000 | | $ | 1,985K,L | |
| | | | | |
Options PurchasedN | | N.M. | | | | | | | | | | | |
Eurodollar Futures Call, April 2005, Strike Price $96.25 | | | | | | | | | 72M | | | 3 | |
Eurodollar Futures Call, November 2005, Strike
Price $96.00 | | | | | | | 537M | | | 3 | |
Eurodollar Futures Put, April 2005, Strike Price $96.00 | | | | | | | | | 72M | | | 99 | |
| | | | | | | | | | | |
|
|
|
| | | | | | | | | | | | | 105 | |
| | | | | | | | | | | |
|
|
|
Repurchase Agreements | | 0.7% | | | | | | | | | | | |
Goldman, Sachs & Company
3.8%, dated 9/30/05, to be repurchased at
$3,073 on 10/3/05 (Collateral: $3,195 Freddie Mac
zero coupon bonds, due 3/14/06, value $3,135) | | $ | 3,072 | | | 3,072 | |
| | | | | | | | | | | |
|
|
|
| Total Short-Term Securities (Identified Cost—$5,171) | | | | | | | | | | 5,162 | |
| Total Investments (Identified Cost—$597,786) | | 130.0% | | | | | | | | | $ | 609,880 | |
Obligation to Return Collateral for Securities Loaned | | (25.3)% | | | | | | | | | | (118,493 | ) |
| Other Assets Less Liabilities | | (4.7)% | | | | | | | | | | (22,123 | ) |
| | | | | | | | | | | |
|
|
|
| Net Assets | | 100.0% | | | | | | | | | $ | 469,264 | |
| | | | | | | | | | | |
|
|
|
94
Semi-Annual Report to Shareholders
| | | | | | | | | |
| | | EXPIRATION | | ACTUAL
CONTRACTS | | | APPRECIATION/
(DEPRECIATION) | |
Futures Contracts PurchasedN | | | | | | | | | |
Eurodollar Futures | | September 2006 | | 76 | | | $ | (86 | ) |
U.S. Treasury Bond Futures | | December 2005 | | 28 | | | | (11 | ) |
U.S. Treasury Note Futures | | December 2005 | | 235 | | | | (41 | ) |
U.S. Treasury Note Futures | | December 2005 | | 130 | | | | (259 | ) |
| | | | | | | |
|
|
|
| | | | | | | | $ | (397 | ) |
| | | | | | | |
|
|
|
Options WrittenN | | | | | | | | | |
Eurodollar Futures Put, Strike Price $95.50 | | October 2005 | | 1,077 | | | $ | (295 | ) |
U.S. Treasury Bond Futures Put, Strike Price $114.00 | | November 2005 | | 81 | | | | (13 | ) |
| | | | | | | |
|
|
|
| | | | | | | | $ | (308 | ) |
| | | | | | | |
|
|
|
| | | | | | | | | | |
| A | Indexed security – The rate of interest earned on this security is tied to the London Interbank Offered Rate (“LIBOR”) or the Consumer Price Index (“CPI”). The coupon rate is the rate as of September 30, 2005. |
| B | Rule 144a Security – A security purchased pursuant to Rule 144a under the Securities Act of 1933 which may not be resold subject to that rule except to qualified institutional buyers. This security represents 0.3% of net assets. |
| C | Yankee Bond – A dollar denominated bond issued in the U.S. by foreign entities. |
| D | Inflation-Protected Security – A security whose principal value is adjusted daily or monthly in accordance with changes to the relevant country’s Consumer Price Index or its equivalent used as an inflation proxy. Interest is calculated on the basis of the current adjusted principal value. |
| E | All or a portion of these securities is on loan. |
| F | Stepped coupon security – A security with a predetermined schedule of interest or divident rate changes, at which time it begins to accrue interest or pay dividends. |
| G | Denominated in Canadian dollars. |
| H | Denominated in Swedish krona. |
| I | Denominated in Euro currency. |
| J | Stripped Security – Security with interest-only or principal-only payment streams, denoted by a 1 or 2, respectively. For interest-only securities, the amount shown as principal is the notional balance used to calculate the amount of interest due. |
| K | Zero coupon bond – A bond with no periodic interest payments which is sold at such a discount as to produce a current yield to maturity. |
| L | All or a portion of this security is collateral to cover futures and options contracts. |
| M | Par represents actual number of contracts. |
| N | Options and futures are described in more detail in the notes to financial statements. |
See notes to financial statements.
95
Semi-Annual Report to Shareholders
PORTFOLIO OF INVESTMENTS
September 30, 2005 (Unaudited)
(Amounts in Thousands)
Western Asset High Yield Portfolio
| | | | | | | | | | | | | |
| | | % OF
NET ASSETS | | RATE | | MATURITY
DATE | | PAR/
SHARES | | VALUE | |
Long-Term Securities | | 94.1% | | | | | | | | | | | |
| | | | | |
Corporate Bonds and Notes | | 84.0% | | | | | | | | | | | |
| | | | | |
Advertising | | 0.6% | | | | | | | | | | | |
WDAC Subsidiary Corp. | | | | 8.375% | | 12/1/14 | | $ | 3,020 | | $ | 2,922 | A |
| | | | | | | | | | | |
|
|
|
| | | | | |
Apparel | | 1.4% | | | | | | | | | | | |
Levi Strauss & Co. | | | | 9.750% | | 1/15/15 | | | 3,210 | | | 3,274 | |
Oxford Industries, Inc. | | | | 8.875% | | 6/1/11 | | | 1,484 | | | 1,543 | |
Russell Corporation | | | | 9.250% | | 5/1/10 | | | 1,666 | | | 1,683 | |
| | | | | | | | | | | |
|
|
|
| | | | | | | | | | | | | 6,500 | |
| | | | | | | | | | | |
|
|
|
Auto and Automotive Parts | | 2.1% | | | | | | | | | | | |
Commercial Vehicle Group, Inc. | | | | 8.000% | | 7/1/13 | | | 2,120 | | | 2,131 | A |
Delphi Corporation | | | | 6.550% | | 6/15/06 | | | 4,950 | | | 3,638 | B |
Delphi Corporation | | | | 6.500% | | 8/15/13 | | | 110 | | | 74 | B |
Keystone Automotive Operations Inc. | | | | 9.750% | | 11/1/13 | | | 3,900 | | | 3,880 | |
| | | | | | | | | | | |
|
|
|
| | | | | | | | | | | | | 9,723 | |
| | | | | | | | | | | |
|
|
|
| | | | | |
Auto Parts and Equipment | | 1.5% | | | | | | | | | | | |
Visteon Corporation | | | | 8.250% | | 8/1/10 | | | 7,382 | | | 7,013 | |
| | | | | | | | | | | |
|
|
|
| | | | | |
Automotive Retailer | | 0.7% | | | | | | | | | | | |
Asbury Automotive Group Inc. | | | | 9.000% | | 6/15/12 | | | 3,132 | | | 3,148 | |
| | | | | | | | | | | |
|
|
|
| | | | | |
Banking and Finance | | 2.9% | | | | | | | | | | | |
Ford Motor Credit Company | | | | 7.375% | | 2/1/11 | | | 1,470 | | | 1,406 | |
General Motors Acceptance Corporation | | | | 6.875% | | 8/28/12 | | | 6,190 | | | 5,540 | |
General Motors Acceptance Corporation | | | | 8.000% | | 11/1/31 | | | 4,580 | | | 3,999 | |
Refco Finance Holdings | | | | 9.000% | | 8/1/12 | | | 2,431 | | | 2,644 | |
| | | | | | | | | | | |
|
|
|
| | | | | | | | | | | | | 13,589 | |
| | | | | | | | | | | |
|
|
|
| | | | | |
Building Materials | | 2.2% | | | | | | | | | | | |
American Standard, Inc. | | | | 7.375% | | 2/1/08 | | | 31 | | | 33 | |
Associated Materials Incorporated | | | | 0.000% | | 3/1/14 | | | 5,260 | | | 2,630 | C |
Interface, Inc. | | | | 7.300% | | 4/1/08 | | | 411 | | | 411 | |
Interface, Inc. | | | | 10.375% | | 2/1/10 | | | 3,182 | | | 3,437 | |
K Hovnanian Enterprises Inc. | | | | 6.250% | | 1/15/16 | | | 270 | | | 251 | A |
Nortek, Inc. | | | | 8.500% | | 9/1/14 | | | 2,120 | | | 1,950 | |
NTK Holdings, Inc. | | | | 0.000% | | 3/1/14 | | | 3,090 | | | 1,730 | C |
| | | | | | | | | | | |
|
|
|
| | | | | | | | | | | | | 10,442 | |
| | | | | | | | | | | |
|
|
|
96
Semi-Annual Report to Shareholders
| | | | | | | | | | | | | |
| | | % OF
NET ASSETS | | RATE | | MATURITY
DATE | | PAR/
SHARES | | VALUE | |
Corporate Bonds and Notes—Continued | | | | | | | | | | | | | |
| | | | | |
Cable | | 3.8% | | | | | | | | | | | |
Charter Communications Holdings, LLC | | | | 10.250% | | 9/15/10 | | $ | 5,799 | | $ | 5,944 | |
Charter Communications Holdings, LLC | | | | 0.000% | | 5/15/11 | | | 2,550 | | | 1,823 | C |
CSC Holdings Inc. | | | | 8.125% | | 8/15/09 | | | 970 | | | 977 | |
CSC Holdings Inc. | | | | 7.625% | | 4/1/11 | | | 2,450 | | | 2,407 | |
CSC Holdings Inc. | | | | 7.000% | | 4/15/12 | | | 360 | | | 340 | A |
CSC Holdings Inc. | | | | 7.625% | | 7/15/18 | | | 888 | | | 830 | |
EchoStar DBS Corporation | | | | 6.754% | | 10/1/08 | | | 610 | | | 621 | D |
EchoStar DBS Corporation | | | | 6.625% | | 10/1/14 | | | 2,830 | | | 2,802 | |
LodgeNet Entertainment Corporation | | | | 9.500% | | 6/15/13 | | | 2,052 | | | 2,247 | |
| | | | | | | | | | | |
|
|
|
| | | | | | | | | | | | | 17,991 | |
| | | | | | | | | | | |
|
|
|
Casino Resorts | | 2.0% | | | | | | | | | | | |
Inn of The Mountain Gods Resort and Casino | | | | 12.000% | | 11/15/10 | | | 4,420 | | | 4,994 | |
Mandalay Resort Group | | | | 9.375% | | 2/15/10 | | | 58 | | | 64 | |
Mirage Resorts, Incorporated | | | | 7.250% | | 10/15/06 | | | 328 | | | 334 | |
Premier Entertainment Biloxi LLC | | | | 10.750% | | 2/1/12 | | | 4,434 | | | 3,996 | |
| | | | | | | | | | | |
|
|
|
| | | | | | | | | | | | | 9,388 | |
| | | | | | | | | | | |
|
|
|
Chemicals | | 1.1% | | | | | | | | | | | |
Georgia Gulf Corporation | | | | 7.625% | | 11/15/05 | | | 17 | | | 17 | |
Huntsman International LLC | | | | 10.125% | | 7/1/09 | | | 791 | | | 814 | |
Lyondell Chemical Company | | | | 10.500% | | 6/1/13 | | | 2,140 | | | 2,418 | |
Westlake Chemical Corporation | | | | 8.750% | | 7/15/11 | | | 1,943 | | | 2,094 | |
| | | | | | | | | | | |
|
|
|
| | | | | | | | | | | | | 5,343 | |
| | | | | | | | | | | |
|
|
|
Coal | | 2.0% | | | | | | | | | | | |
Alpha Natural Resources LLC | | | | 10.000% | | 6/1/12 | | | 3,265 | | | 3,624 | |
Sungard Data Systems Inc. | | | | 10.250% | | 8/15/15 | | | 5,640 | | | 5,711 | A |
| | | | | | | | | | | |
|
|
|
| | | | | | | | | | | | | 9,335 | |
| | | | | | | | | | | |
|
|
|
Computer Services and Systems | | 0.6% | | | | | | | | | | | |
Activant Solutions, Inc. | | | | 9.504% | | 4/1/10 | | | 2,700 | | | 2,754 | A,D |
| | | | | | | | | | | |
|
|
|
| | | | | |
Containers and Packaging | | 1.5% | | | | | | | | | | | |
Graham Packaging Company Inc. | | | | 9.875% | | 10/15/14 | | | 1,650 | | | 1,584 | |
Graphic Packaging International Corp. | | | | 9.500% | | 8/15/13 | | | 1,740 | | | 1,636 | |
Owens Brockway Glass Containers | | | | 8.750% | | 11/15/12 | | | 1,790 | | | 1,933 | |
Solo Cup Company | | | | 8.500% | | 2/15/14 | | | 1,940 | | | 1,717 | |
| | | | | | | | | | | |
|
|
|
| | | | | | | | | | | | | 6,870 | |
| | | | | | | | | | | |
|
|
|
97
Semi-Annual Report to Shareholders
PORTFOLIO OF INVESTMENTS—Continued
Western Asset High Yield Portfolio—Continued
| | | | | | | | | | | | | |
| | | % OF
NET ASSETS | | RATE | | MATURITY
DATE | | PAR/
SHARES | | VALUE | |
| | | | | |
Corporate Bonds and Notes—Continued | | | | | | | | | | | | | |
| | | | | |
Drug and Grocery Store Chains | | 0.6% | | | | | | | | | | | |
Delhaize America, Inc. | | | | 8.125% | | 4/15/11 | | $ | 2,468 | | $ | 2,675 | |
| | | | | | | | | | | |
|
|
|
| | | | | |
Electric | | 1.4% | | | | | | | | | | | |
Mission Energy Holding Company | | | | 13.500% | | 7/15/08 | | | 1,200 | | | 1,413 | |
The AES Corporation | | | | 8.750% | | 5/15/13 | | | 1,400 | | | 1,533 | A |
The AES Corporation | | | | 7.750% | | 3/1/14 | | | 1,650 | | | 1,749 | |
The AES Corporation | | | | 9.000% | | 5/15/15 | | | 1,665 | | | 1,827 | A |
| | | | | | | | | | | |
|
|
|
| | | | | | | | | | | | | 6,522 | |
| | | | | | | | | | | |
|
|
|
Electronics | | 1.6% | | | | | | | | | | | |
L 3 Communications Corporation | | | | 6.375% | | 10/15/15 | | | 4,750 | | | 4,786 | A |
Rayovac Corporation | | | | 8.500% | | 10/1/13 | | | 1,740 | | | 1,679 | |
Spectrum Brands Inc. | | | | 7.375% | | 2/1/15 | | | 990 | | | 891 | |
| | | | | | | | �� | | | |
|
|
|
| | | | | | | | | | | | | 7,356 | |
| | | | | | | | | | | |
|
|
|
Energy | | 2.4% | | | | | | | | | | | |
Elwood Energy LLC | | | | 8.159% | | 7/5/26 | | | 3,572 | | | 3,965 | |
Midwest Generation LLC | | | | 8.560% | | 1/2/16 | | | 1,277 | | | 1,405 | |
Reliant Energy Inc. | | | | 6.750% | | 12/15/14 | | | 3,540 | | | 3,478 | |
Sierra Pacific Resources | | | | 6.750% | | 8/15/17 | | | 2,360 | | | 2,366 | A |
| | | | | | | | | | | |
|
|
|
| | | | | | | | | | | | | 11,214 | |
| | | | | | | | | | | |
|
|
|
Entertainment | | 0.5% | | | | | | | | | | | |
Cinemark USA, Inc. | | | | 9.000% | | 2/1/13 | | | 1,505 | | | 1,554 | |
Warner Music Group | | | | 7.375% | | 4/15/14 | | | 1,000 | | | 1,002 | |
| | | | | | | | | | | |
|
|
|
| | | | | | | | | | | | | 2,556 | |
| | | | | | | | | | | |
|
|
|
Environmental Services | | 1.1% | | | | | | | | | | | |
Allied Waste North America Incorporated | | | | 8.875% | | 4/1/08 | | | 1,522 | | | 1,586 | |
Allied Waste North America Incorporated | | | | 8.500% | | 12/1/08 | | | 1,125 | | | 1,173 | |
Waste Services Inc. | | | | 9.500% | | 4/15/14 | | | 2,250 | | | 2,239 | A |
| | | | | | | | | | | |
|
|
|
| | | | | | | | | | | | | 4,998 | |
| | | | | | | | | | | |
|
|
|
Food, Beverage and Tobacco | | 1.0% | | | | | | | | | | | |
Dole Food Company, Inc. | | | | 8.875% | | 3/15/11 | | | 21 | | | 22 | |
Domino’s, Inc. | | | | 8.250% | | 7/1/11 | | | 1,924 | | | 2,020 | |
R.J. Reynolds Tobacco Holdings Incorporated | | | | 6.500% | | 7/15/10 | | | 1,330 | | | 1,326 | A |
Stater Bros. Holdings Inc. | | | | 7.370% | | 6/15/10 | | | 1,280 | | | 1,261 | D |
| | | | | | | | | | | |
|
|
|
| | | | | | | | | | | | | 4,629 | |
| | | | | | | | | | | |
|
|
|
98
Semi-Annual Report to Shareholders
| | | | | | | | | | | | | |
| | | % OF
NET ASSETS | | RATE | | MATURITY
DATE | | PAR/
SHARES | | VALUE | |
Corporate Bonds and Notes—Continued | | | | | | | | | | | | | |
| | | | | |
Gaming | | 0.7% | | | | | | | | | | | |
River Rock Entertainment Authority | | | | 9.750% | | 11/1/11 | | $ | 3,060 | | $ | 3,397 | |
| | | | | | | | | | | |
|
|
|
| | | | | |
Gas and Pipeline Utilities | | 3.8% | | | | | | | | | | | |
ANR Pipeline, Inc. | | | | 9.625% | | 11/1/21 | | | 1,604 | | | 1,976 | |
Dynegy Holdings Inc. | | | | 9.875% | | 7/15/10 | | | 1,820 | | | 1,984 | A |
Dynegy Holdings Inc. | | | | 8.750% | | 2/15/12 | | | 2,480 | | | 2,691 | |
Dynegy Holdings Inc. | | | | 10.125% | | 7/15/13 | | | 2,235 | | | 2,492 | A |
Southern Natural Gas Company | | | | 8.875% | | 3/15/10 | | | 2,015 | | | 2,178 | |
The Williams Companies, Inc. | | | | 7.500% | | 1/15/31 | | | 800 | | | 850 | |
The Williams Companies, Inc. | | | | 8.750% | | 3/15/32 | | | 4,674 | | | 5,515 | |
| | | | | | | | | | | |
|
|
|
| | | | | | | | | | | | | 17,686 | |
| | | | | | | | | | | |
|
|
|
Health Care | | 1.8% | | | | | | | | | | | |
Tenet Healthcare Corporation | | | | 9.875% | | 7/1/14 | | | 5,959 | | | 6,227 | |
Tenet Healthcare Corporation | | | | 9.250% | | 2/1/15 | | | 2,250 | | | 2,273 | |
| | | | | | | | | | | |
|
|
|
| | | | | | | | | | | | | 8,500 | |
| | | | | | | | | | | |
|
|
|
Homebuilding | | N.M. | | | | | | | | | | | |
Schuler Homes, Inc. | | | | 10.500% | | 7/15/11 | | | 69 | | | 75 | |
| | | | | | | | | | | |
|
|
|
| | | | | |
Investment Banking/Brokerage | | 0.3% | | | | | | | | | | | |
E*Trade Financial Corporation | | | | 7.375% | | 9/15/13 | | | 1,610 | | | 1,626 | A |
| | | | | | | | | | | |
|
|
|
| | | | | |
Lodging/Hotels | | N.M. | | | | | | | | | | | |
Host Marriott LP | | | | 9.250% | | 10/1/07 | | | 135 | | | 142 | |
| | | | | | | | | | | |
|
|
|
| | | | | |
Machinery | | 0.9% | | | | | | | | | | | |
Case New Holland Incorporated | | | | 9.250% | | 8/1/11 | | | 2,520 | | | 2,665 | |
Terex Corporation | | | | 7.375% | | 1/15/14 | | | 1,755 | | | 1,772 | |
| | | | | | | | | | | |
|
|
|
| | | | | | | | | | | | | 4,437 | |
| | | | | | | | | | | |
|
|
|
Manufacturing (Diversified) | | 2.4% | | | | | | | | | | | |
American Achievement Corp. | | | | 8.250% | | 4/1/12 | | | 530 | | | 535 | |
Jacuzzi Brands Incorporated | | | | 9.625% | | 7/1/10 | | | 5,086 | | | 5,391 | |
Ki Holdings Inc. | | | | 0.000% | | 11/15/14 | | | 4,986 | | | 3,403 | C |
Koppers Inc. | | | | 9.875% | | 10/15/13 | | | 909 | | | 1,005 | |
Samsonite Corporation | | | | 8.875% | | 6/1/11 | | | 1,035 | | | 1,100 | |
| | | | | | | | | | | |
|
|
|
| | | | | | | | | | | | | 11,434 | |
| | | | | | | | | | | |
|
|
|
99
Semi-Annual Report to Shareholders
PORTFOLIO OF INVESTMENTS—Continued
Western Asset High Yield Portfolio—Continued
| | | | | | | | | | | | | |
| | | % OF
NET ASSETS | | RATE | | MATURITY
DATE | | PAR/
SHARES | | VALUE | |
Corporate Bonds and Notes—Continued | | | | | | | | | | | | | |
| | | | | |
Media | | 2.8% | | | | | | | | | | | |
AMC Entertainment Incorporated | | | | 8.000% | | 3/1/14 | | $ | 1,220 | | $ | 1,074 | |
Emmis Operating Company | | | | 6.875% | | 5/15/12 | | | 990 | | | 986 | |
Lamar Media Corporation | | | | 7.250% | | 1/1/13 | | | 1,560 | | | 1,630 | |
Lamar Media Corporation | | | | 6.625% | | 8/15/15 | | | 450 | | | 458 | A |
LIN Television Corporation | | | | 6.500% | | 5/15/13 | | | 1,370 | | | 1,298 | A |
Paxson Communications Corporation | | | | 10.750% | | 7/15/08 | | | 26 | | | 25 | |
Paxson Communications Corporation | | | | 0.000% | | 1/15/09 | | | 701 | | | 680 | C |
PRIMEDIA Inc. | | | | 9.165% | | 5/15/10 | | | 1,630 | | | 1,720 | D |
PRIMEDIA Inc. | | | | 8.875% | | 5/15/11 | | | 1,000 | | | 1,047 | |
Readers Digest Association, Inc. | | | | 6.500% | | 3/1/11 | | | 945 | | | 959 | |
Sinclair Broadcast Group, Inc. | | | | 8.750% | | 12/15/11 | | | 1,480 | | | 1,554 | |
Sinclair Broadcast Group, Inc. | | | | 8.000% | | 3/15/12 | | | 1,540 | | | 1,577 | |
| | | | | | | | | | | |
|
|
|
| | | | | | | | | | | | | 13,008 | |
| | | | | | | | | | | |
|
|
|
Medical Care Facilities | | 2.3% | | | | | | | | | | | |
Community Health Systems Inc. | | | | 6.500% | | 12/15/12 | | | 1,060 | | | 1,063 | |
DaVita, Inc. | | | | 7.250% | | 3/15/15 | | | 1,950 | | | 1,977 | |
Extendicare Health Services, Inc. | | | | 9.500% | | 7/1/10 | | | 981 | | | 1,045 | |
HCA, Inc. | | | | 9.000% | | 12/15/14 | | | 56 | | | 65 | |
HCA, Inc. | | | | 7.690% | | 6/15/25 | | | 2,130 | | | 2,141 | |
HCA, Inc. | | | | 7.500% | | 11/6/33 | | | 190 | | | 189 | |
HEALTHSOUTH Corporation | | | | 8.500% | | 2/1/08 | | | 423 | | | 412 | |
HEALTHSOUTH Corporation | | | | 10.750% | | 10/1/08 | | | 2,350 | | | 2,297 | |
Select Medical Corporation | | | | 7.625% | | 2/1/15 | | | 1,730 | | | 1,656 | |
| | | | | | | | | | | |
|
|
|
| | | | | | | | | | | | | 10,845 | |
| | | | | | | | | | | |
|
|
|
Medical Products | | 0.4% | | | | | | | | | | | |
Fresenius Medical Care Capital Trust II | | | | 7.875% | | 2/1/08 | | | 1,667 | | | 1,734 | E |
Fresenius Medical Care Capital Trust IV | | | | 7.875% | | 6/15/11 | | | 150 | | | 161 | |
| | | | | | | | | | | |
|
|
|
| | | | | | | | | | | | | 1,895 | |
| | | | | | | | | | | |
|
|
|
Office Equipment and Supplies | | 0.4% | | | | | | | | | | | |
Acco Brands Corporation | | | | 7.625% | | 8/15/15 | | | 1,910 | | | 1,891 | A |
| | | | | | | | | | | |
|
|
|
| | | | | |
Oil and Gas | | 9.3% | | | | | | | | | | | |
AmeriGas Partners, L.P. | | | | 7.625% | | 8/15/15 | | | 2,090 | | | 2,184 | A |
Belden & Blake Corporation | | | | 8.750% | | 7/15/12 | | | 6,715 | | | 7,017 | |
Chesapeake Energy Corporation | | | | 7.250% | | 5/20/15 | | | 100 | | | 107 | |
Chesapeake Energy Corporation | | | | 8.750% | | 7/15/12 | | | 500 | | | 503 | |
Chesapeake Energy Corporation | | | | 7.500% | | 9/15/13 | | | 1,760 | | | 1,725 | |
El Paso CGP Co. | | | | 6.375% | | 6/15/15 | | | 1,818 | | | 1,854 | |
100
Semi-Annual Report to Shareholders
| | | | | | | | | | | | | |
| | | % OF
NET ASSETS | | RATE | | MATURITY
DATE | | PAR/
SHARES | | VALUE | |
Corporate Bonds and Notes—Continued | | | | | | | | | | | | | |
| | | | | |
Oil and Gas—Continued | | | | | | | | | | | | | |
El Paso Corporation | | | | 7.625% | | 8/16/07 | | $ | 2,790 | | $ | 2,839 | A |
El Paso Corporation | | | | 7.800% | | 8/1/31 | | | 570 | | | 571 | |
El Paso Corporation | | | | 7.750% | | 1/15/32 | | | 2,410 | | | 2,428 | |
El Paso Production Holding Company | | | | 7.750% | | 6/1/13 | | | 2,130 | | | 2,226 | |
Encore Acquisition Company | | | | 6.250% | | 4/15/14 | | | 310 | | | 309 | |
Encore Acquisition Company | | | | 6.000% | | 7/15/15 | | | 1,030 | | | 1,004 | A |
KCS Energy, Inc. | | | | 7.125% | | 4/1/12 | | | 730 | | | 748 | |
KCS Energy, Inc. | | | | 7.125% | | 4/1/12 | | | 860 | | | 882 | A |
Kerr-McGee Corporation | | | | 7.875% | | 9/15/31 | | | 1,970 | | | 2,280 | |
Pacific Energy Partners | | | | 7.125% | | 6/15/14 | | | 510 | | | 529 | |
Pacific Energy Partners | | | | 6.250% | | 9/15/15 | | | 1,530 | | | 1,534 | A |
Parker Drilling Company | | | | 9.625% | | 10/1/13 | | | 3,520 | | | 4,004 | |
Plains Exploration & Production Company | | | | 7.125% | | 6/15/14 | | | 1,340 | | | 1,410 | |
Pogo Producing Company | | | | 6.875% | | 10/1/17 | | | 2,280 | | | 2,311 | A |
Pride International, Inc. | | | | 7.375% | | 7/15/14 | | | 1,890 | | | 2,053 | |
SESI, LLC | | | | 8.875% | | 5/15/11 | | | 710 | | | 749 | |
Suburban Propane Partners LP | | | | 6.875% | | 12/15/13 | | | 220 | | | 200 | A |
Suburban Propane Partners LP | | | | 6.875% | | 12/15/13 | | | 3,140 | | | 2,857 | |
Whiting Petroleum Corporation | | | | 7.000% | | 2/1/14 | | | 1,520 | | | 1,541 | A |
| | | | | | | | | | | |
|
|
|
| | | | | | | | | | | | | 43,865 | |
| | | | | | | | | | | |
|
|
|
Paper and Forest Products | | 1.5% | | | | | | | | | | | |
Georgia-Pacific Corp. | | | | 9.500% | | 12/1/11 | | | 1,593 | | | 1,880 | |
Georgia-Pacific Corp. | | | | 7.700% | | 6/15/15 | | | 46 | | | 51 | |
NewPage Corporation | | | | 12.000% | | 5/1/13 | | | 6,065 | | | 5,276 | |
| | | | | | | | | | | |
|
|
|
| | | | | | | | | | | | | 7,207 | |
| | | | | | | | | | | |
|
|
|
Pharmaceuticals | | 0.4% | | | | | | | | | | | |
Leiner Health Products Inc. | | | | 11.000% | | 6/1/12 | | | 2,300 | | | 1,967 | |
| | | | | | | | | | | |
|
|
|
| | | | | |
Real Estate | | 0.9% | | | | | | | | | | | |
Forest City Enterprises, Inc. | | | | 7.625% | | 6/1/15 | | | 255 | | | 270 | |
Forest City Enterprises, Inc. | | | | 6.500% | | 2/1/17 | | | 1,700 | | | 1,683 | |
Ventas Realty, Limited Partnership | | | | 8.750% | | 5/1/09 | | | 1,256 | | | 1,344 | |
Ventas Realty, Limited Partnership | | | | 9.000% | | 5/1/12 | | | 412 | | | 468 | |
Ventas Realty, Limited Partnership | | | | 6.625% | | 10/15/14 | | | 290 | | | 291 | |
| | | | | | | | | | | |
|
|
|
| | | | | | | | | | | | | 4,056 | |
| | | | | | | | | | | |
|
|
|
101
Semi-Annual Report to Shareholders
PORTFOLIO OF INVESTMENTS—Continued
Western Asset High Yield Portfolio—Continued
| | | | | | | | | | | | | |
| | | % OF
NET ASSETS | | RATE | | MATURITY
DATE | | PAR/
SHARES | | VALUE | |
Corporate Bonds and Notes—Continued | | | | | | | | | | | | | |
| | | | | |
Rental and Lease Services (Commercial) | | 1.0% | | | | | | | | | | | |
NationsRent Inc. | | | | 9.500% | | 10/15/10 | | $ | 2,430 | | $ | 2,649 | |
NationsRent Inc. | | | | 9.500% | | 5/1/15 | | | 1,840 | | | 1,913 | |
| | | | | | | | | | | |
|
|
|
| | | | | | | | | | | | | 4,562 | |
| | | | | | | | | | | |
|
|
|
| | | | | |
Retail | | 3.8% | | | | | | | | | | | |
Ames True Temper | | | | 7.599% | | 1/15/12 | | | 2,010 | | | 1,869 | D |
Brookstone Company Inc. | | | | 12.000% | | 10/15/12 | | | 2,030 | | | 2,010 | A |
J.C. Penney Company, Inc. | | | | 6.875% | | 10/15/15 | | | 1,760 | | | 1,890 | |
J.C. Penney Company, Inc. | | | | 7.400% | | 4/1/37 | | | 2,480 | | | 2,681 | |
Neiman Marcus Group, Inc. | | | | 10.375% | | 10/15/15 | | | 3,150 | | | 3,134 | A |
Norcraft Companies | | | | 9.000% | | 11/1/11 | | | 2,400 | | | 2,484 | |
Pantry Inc. | | | | 7.750% | | 2/15/14 | | | 875 | | | 875 | |
Toys “R” Us, Inc. | | | | 7.875% | | 4/15/13 | | | 3,110 | | | 2,776 | |
Toys “R” Us, Inc. | | | | 7.375% | | 10/15/18 | | | 130 | | | 104 | |
| | | | | | | | | | | |
|
|
|
| | | | | | | | | | | | | 17,823 | |
| | | | | | | | | | | |
|
|
|
Special Purpose | | 7.9% | | | | | | | | | | | |
AAC Group Holding Corporation | | | | 0.000% | | 10/1/12 | | | 5,450 | | | 3,924 | A,C |
Alamosa Incorporated | | | | 11.000% | | 7/31/10 | | | 923 | | | 1,041 | |
Alamosa Incorporated | | | | 8.500% | | 1/31/12 | | | 1,020 | | | 1,089 | |
Di Finance Corporation | | | | 9.500% | | 2/15/13 | | | 4,920 | | | 5,141 | A |
Goodman Global Holding Company, Inc. | | | | 6.410% | | 6/15/12 | | | 700 | | | 684 | A |
H & E Equipment Services LLC | | | | 11.125% | | 6/15/12 | | | 3,460 | | | 3,875 | |
H Lines Finance Holding Corporation | | | | 0.000% | | 4/1/13 | | | 2,570 | | | 2,133A,C | |
Milacron Escrow Corporation | | | | 11.500% | | 5/15/11 | | | 5,464 | | | 5,355 | |
Norcraft Holdings LP | | | | 0.000% | | 9/1/12 | | | 1,150 | | | 805 | C |
Qwest Capital Funding, Inc. | | | | 7.900% | | 8/15/10 | | | 1,332 | | | 1,322 | |
Rainbow National Services LLC | | | | 8.750% | | 9/1/12 | | | 930 | | | 992 | A |
Rainbow National Services LLC | | | | 10.375% | | 9/1/14 | | | 1,120 | | | 1,265 | A |
Texas Genco LLC | | | | 6.875% | | 12/15/14 | | | 1,313 | | | 1,336 | A |
The Williams Companies, Inc. Credit Certificate Trust | | | | 6.750% | | 4/15/09 | | | 1,590 | | | 1,618 | A |
UCAR Finance Inc. | | | | 10.250% | | 2/15/12 | | | 3,176 | | | 3,406 | |
UGS Corporation | | | | 10.000% | | 6/1/12 | | | 1,640 | | | 1,796 | |
Vanguard Health Holding Company II | | | | 9.000% | | 10/1/14 | | | 1,310 | | | 1,395 | |
| | | | | | | | | | | |
|
|
|
| | | | | | | | | | | | | 37,177 | |
| | | | | | | | | | | |
|
|
|
102
Semi-Annual Report to Shareholders
| | | | | | | | | | | | | |
| | | % OF
NET ASSETS | | RATE | | MATURITY
DATE | | PAR/
SHARES | | VALUE | |
Corporate Bonds and Notes—Continued | | | | | | | | | | | | | |
Steel Products | | 1.7% | | | | | | | | | | | |
Allegheny Technologies, Inc. | | | | 8.375% | | 12/15/11 | | $ | 2,570 | | $ | 2,763 | |
Chaparrel Steel Company | | | | 10.000% | | 7/15/13 | | | 2,240 | | | 2,363 | A |
Citisteel USA, Inc. | | | | 11.553% | | 9/1/10 | | | 3,070 | | | 3,024 | A,D |
| | | | | | | | | | | |
|
|
|
| | | | | | | | | | | | | 8,150 | |
| | | | | | | | | | | |
|
|
|
Storage Facilities | | 0.2% | | | | | | | | | | | |
Mobile Mini, Inc. | | | | 9.500% | | 7/1/13 | | | 987 | | | 1,091 | |
| | | | | | | | | | | |
|
|
|
Telecommunications | | 4.9% | | | | | | | | | | | |
AT&T Corp. | | | | 9.050% | | 11/15/11 | | | 668 | | | 752 | |
Cincinnati Bell Inc. | | | | 7.000% | | 2/15/15 | | | 4,332 | | | 4,180 | |
Hawaiian Telcom Communications, Inc. | | | | 12.500% | | 5/1/15 | | | 4,280 | | | 4,323 | A |
Qwest Communications International Inc. | | | | 7.250% | | 2/15/11 | | | 1,320 | | | 1,285 | |
Qwest Communications International Inc. | | | | 7.500% | | 2/15/14 | | | 932 | | | 886 | A |
Qwest Corporation | | | | 7.875% | | 9/1/11 | | | 2,180 | | | 2,273 | |
Qwest Corporation | | | | 7.120% | | 6/15/13 | | | 840 | | | 874 | A,D |
Qwest Services Corporation | | | | 13.500% | | 12/15/10 | | | 5,270 | | | 6,034 | |
Telcordia Technologies Inc. | | | | 10.000% | | 3/15/13 | | | 400 | | | 378 | A |
Valor Telecommunications Enterprises | | | | 7.750% | | 2/15/15 | | | 2,170 | | | 2,105 | |
| | | | | | | | | | | |
|
|
|
| | | | | | | | | | | | | 23,090 | |
| | | | | | | | | | | |
|
|
|
Telecommunications (Cellular/Wireless) | | 1.3% | | | | | | | | | | | |
Citizens Communications Company | | | | 9.250% | | 5/15/11 | | | 778 | | | 854 | |
Nextel Communications, Inc. | | | | 5.950% | | 3/15/14 | | | 1,562 | | | 1,599 | |
Nextel Communications, Inc. | | | | 7.375% | | 8/1/15 | | | 1,295 | | | 1,386 | |
Ubiquitel Operating Company | | | | 9.875% | | 3/1/11 | | | 1,250 | | | 1,388 | |
US Unwired Inc. | | | | 10.000% | | 6/15/12 | | | 780 | | | 897 | |
| | | | | | | | | | | |
|
|
|
| | | | | | | | | | | | | 6,124 | |
| | | | | | | | | | | |
|
|
|
Transportation | | 4.3% | | | | | | | | | | | |
American Airlines, Inc. | | | | 7.800% | | 10/1/06 | | | 2,590 | | | 2,480 | |
American Commercial Lines LLC | | | | 9.500% | | 2/15/15 | | | 1,790 | | | 1,933 | |
Continental Airlines, Inc. | | | | 7.568% | | 12/1/06 | | | 5,084 | | | 4,719 | |
Continental Airlines, Inc. | | | | 7.033% | | 6/15/11 | | | 2,486 | | | 2,227 | |
Gulfmark Offshore, Inc. | | | | 7.750% | | 7/15/14 | | | 2,250 | | | 2,391 | |
Horizon Lines, LLC | | | | 9.000% | | 11/1/12 | | | 3,370 | | | 3,610 | |
Kansas City Southern Railway | | | | 9.500% | | 10/1/08 | | | 779 | | | 854 | |
Progress Rail Corp. | | | | 7.750% | | 4/1/12 | | | 1,830 | | | 1,864 | A |
| | | | | | | | | | | |
|
|
|
| | | | | | | | | | | | | 20,078 | |
| | | | | | | | | | | |
|
|
|
Total Corporate Bonds and Notes
(Identified Cost—$397,344) | | | | | | | | | | | | 395,094 | |
103
Semi-Annual Report to Shareholders
PORTFOLIO OF INVESTMENTS—Continued
Western Asset High Yield Portfolio—Continued
| | | | | | | | | | | | | |
| | | % OF
NET ASSETS | | RATE | | MATURITY
DATE | | PAR/
SHARES | | VALUE | |
Mortgage-Backed Securities | | 0.2% | | | | | | | | | | | |
| | | | | |
Fixed Rate Securities | | | | | | | | | | | | | |
Blackrock Capital Finance L.P. 1996-R1 | | | | 9.489% | | 9/25/26 | | $ | 1,286 | | $ | 823 | |
Ocwen Residential Mortgage Corporation 1998-R1 | | | | 7.000 | | 10/25/40 | | | 410 | | | 65 | |
| | | | | | | | | | | |
|
|
|
Total Mortgage-Backed Securities
(Identified Cost—$997) | | | | | | | | | | | | 888 | |
Yankee BondsH | | 9.2% | | | | | | | | | | | |
| | | | | |
Cable | | 0.3% | | | | | | | | | | | |
Rogers Cable Inc. | | | | 5.500% | | 3/15/14 | | | 1,650 | | | 1,522 | |
| | | | | | | | | | | |
|
|
|
| | | | | |
Chemicals | | 1.5% | | | | | | | | | | | |
Montell Finance Co. BV | | | | 8.100% | | 3/15/27 | | | 1,790 | | | 1,727 | A |
Nell AF SARL | | | | 8.375% | | 8/15/15 | | | 1,360 | | | 1,330 | A |
Rhodia SA | | | | 10.250% | | 6/1/10 | | | 3,790 | | | 4,008 | |
| | | | | | | | | | | |
|
|
|
| | | | | | | | | | | | | 7,065 | |
| | | | | | | | | | | |
|
|
|
| | | | | |
Electronics | | 0.4% | | | | | | | | | | | |
Flextronics International Ltd. | | | | 6.500% | | 5/15/13 | | | 1,600 | | | 1,632 | |
| | | | | | | | | | | |
|
|
|
| | | | | |
Media | | 0.6% | | | | | | | | | | | |
Kabel Deutschland GmbH | | | | 10.625% | | 7/1/14 | | | 2,565 | | | 2,834 | A |
| | | | | | | | | | | |
|
|
|
| | | | | |
Oil and Gas | | 1.7% | | | | | | | | | | | |
Ocean Rig Norway AS | | | | 8.375% | | 7/1/13 | | | 3,140 | | | 3,399 | A |
UtiliCorp Canada Finance Corporation | | | | 7.750% | | 6/15/11 | | | 940 | | | 989 | |
Western Oil Sands Inc. | | | | 8.375% | | 5/1/12 | | | 3,285 | | | 3,774 | |
| | | | | | | | | | | |
|
|
|
| | | | | | | | | | | | | 8,162 | |
| | | | | | | | | | | |
|
|
|
| | | | | |
Paper and Forest Products | | 1.0% | | | | | | | | | | | |
Abitibi-Consolidated Inc. | | | | 7.370% | | 6/15/11 | | | 987 | | | 987 | D |
Abitibi-Consolidated Inc. | | | | 8.375% | | 4/1/15 | | | 950 | | | 933 | |
Abitibi-Consolidated Inc. | | | | 7.750% | | 6/15/11 | | | 430 | | | 423 | |
Ainsworth Lumber Co. Ltd. | | | | 7.250% | | 10/1/12 | | | 1,220 | | | 1,147 | |
Domtar Inc. | | | | 7.875% | | 10/15/11 | | | 1,030 | | | 1,020 | |
| | | | | | | | | | | |
|
|
|
| | | | | | | | | | | | | 4,510 | |
| | | | | | | | | | | |
|
|
|
104
Semi-Annual Report to Shareholders
| | | | | | | | | | | | | | |
| | | % OF
NET ASSETS | | RATE | | MATURITY
DATE | | PAR/
SHARES | | | VALUE | |
Yankee Bonds—Continued | | | | | | | | | | | | | | |
| | | | | |
Services | | 0.4% | | | | | | | | | | | | |
Compagnie Generale de Geophysique SA | | | | 7.500% | | 5/15/15 | | $ | 1,870 | | | $ | 1,945 | A |
| | | | | | | | | | | | |
|
|
|
| | | | | |
Special Purpose | | 0.3% | | | | | | | | | | | | |
JSG Funding PLC | | | | 9.625% | | 10/1/12 | | | 1,350 | | | | 1,357 | |
| | | | | | | | | | | | |
|
|
|
| | | | | |
Steel (Producers) | | 0.5% | | | | | | | | | | | | |
Ispat Inland ULC | | | | 9.750% | | 4/1/14 | | | 2,070 | | | | 2,401 | |
| | | | | | | | | | | | |
|
|
|
| | | | | |
Telecommunications | | 1.1% | | | | | | | | | | | | |
Intelsat, Ltd. | | | | 8.625% | | 1/15/15 | | | 360 | | | | 367 | A |
Intelsat, Ltd. | | | | 5.250% | | 11/1/08 | | | 500 | | | | 460 | |
Intelsat, Ltd. | | | | 7.625% | | 4/15/12 | | | 4,910 | | | | 4,112 | |
| | | | | | | | | | | | |
|
|
|
| | | | | | | | | | | | | | 4,939 | |
| | | | | | | | | | | | |
|
|
|
| | | | | |
Telecommunications (Cellular/Wireless) | | 0.6% | | | | | | | | | | | | |
Rogers Wireless Communications Inc. | | | | 9.625% | | 5/1/11 | | | 1,876 | | | | 2,167 | |
Rogers Wireless Communications Inc. | | | | 8.000% | | 12/15/12 | | | 670 | | | | 708 | |
Rogers Wireless Communications Inc. | | | | 7.500% | | 3/15/15 | | | 130 | | | | 140 | |
| | | | | | | | | | | | |
|
|
|
| | | | | | | | | | | | | | 3,015 | |
| | | | | | | | | | | | |
|
|
|
| | | | | |
Transportation | | 0.8% | | | | | | | | | | | | |
OMI Corporation | | | | 7.625% | | 12/1/13 | | | 2,279 | | | | 2,359 | |
Teekay Shipping Corporation | | | | 8.875% | | 7/15/11 | | | 1,195 | | | | 1,362 | |
| | | | | | | | | | | | |
|
|
|
| | | | | | | | | | | | | | 3,721 | |
| | | | | | | | | | | | |
|
|
|
Total Yankee Bonds (Identified Cost—$42,528) | | | | | | | | | | | | | 43,103 | |
Common Stocks | | 0.1% | | | | | | | | | | | | |
| | | | | |
Construction and Engineering | | 0.1% | | | | | | | | | | | | |
Washington Group International, Inc. | | | | | | | | | 8 | shs | | | 488 | G,I |
| | | | | | | | | | | | |
|
|
|
Total Common Stocks (Identified Cost—$51) | | | | | | | | | | | | | | |
105
Semi-Annual Report to Shareholders
PORTFOLIO OF INVESTMENTS—Continued
Western Asset High Yield Portfolio—Continued
| | | | | | | | | |
| | | % OF
NET ASSETS | | PAR/
SHARES | | | VALUE | |
Preferred Stocks | | 0.5% | | | | | | | |
| | | |
Banking and Finance | | 0.3% | | | | | | | |
General Motors Corporation | | | | 68 | shs | | $ | 1,180 | |
| | | | | | | |
|
|
|
| | | |
Media | | 0.2% | | | | | | | |
Paxson Communications Corporation | | | | 0.155 | | | | 1,054 | G |
| | | | | | | |
|
|
|
Total Preferred Stocks (Identified Cost—$2,463) | | | | | | | | 2,234 | |
Warrants | | 0.1% | | | | | | | |
American Tower Corporation | | | | 1 | wts | | | 259 | A,H |
Next Generation Network, Inc. | | | | 3 | | | | 0.028 | A,H |
Washington Group International, Series A | | | | 6 | | | | 143 | H |
Washington Group International, Series B | | | | 6 | | | | 143 | H |
Washington Group International, Series C | | | | 3 | | | | 71 | H |
| | | | | | | |
|
|
|
Total Warrants (Identified Cost—$48) | | | | | | | | 616 | |
| | | | | | | |
|
|
|
Total Long-Term Securities (Identified Cost—$443,431) | | | | | | | | 442,423 | |
Short-Term Securities | | 4.3% | | | | | | | |
| | | |
Repurchase Agreements | | 4.3% | | | | | | | |
Deutsche Bank
3.7%, dated 9/30/05, to be repurchased $20,043 on 10/3/05
(Collateral: $20,363 Freddie Mac notes, 2.8%, due 12/27/06, value $20,442) | | $20,037 | | | | 20,037 | |
| | | | | | | |
|
|
|
Total Short-Term Securities (Identified Cost—$20,037) | | | | | | | | 20,037 | |
Total Investments (Identified Cost—$463,468) | | 98.4% | | | | | $ | 462,460 | |
Other Assets Less Liabilities | | 1.6% | | | | | | 7,733 | |
| | | | | | | |
|
|
|
| | | |
Net Assets | | 100.0% | | | | | $ | 470,193 | |
| | | | | | | |
|
|
|
| | | | | | | | | | |
| ARule | 144a Security – A security purchased pursuant to Rule 144a under the Securities Act of 1933 which may not be resold subject to that rule except to qualified institutional buyers. These securities represent 20.8% of net assets. |
| B | Bond is in default at September 30, 2005. |
| CStepped | coupon security – A security with a predetermined schedule of interest or dividend rate changes, at which time it begins to accrue interest or pay dividends. |
| DIndexed | security – The rate of interest earned on this security is tied to the London Interbank Offered Rate (“LIBOR”). The coupon rate is the rate as of September 30, 2005. |
| EUnit | – A security which consists of a bond and warrants to purchase the common stock of the issuer. |
| FYankee | Bond – A dollar denominated bond issued in the U.S. by foreign entities. |
| GPay-in-kind | (“PIK”) security – A bond in which interest or dividends during the initial few years is paid in additional PIK securities rather than in cash. |
N.M.—Not meaningful.
See notes to financial statements.
106
Semi-Annual Report to Shareholders
PORTFOLIO OF INVESTMENTS
September 30, 2005 (Unaudited)
(Amounts in Thousands)
Western Asset Non-U.S. Opportunity Bond Portfolio
| | | | | | | | | | | | |
| | | % OF
NET ASSETS | | RATE | | MATURITY
DATE | | PARA | | VALUE | |
Long-Term Securities | | 97.2% | | | | | | | | | | |
| | | | | |
Australian Dollar | | 14.3% | | | | | | | | | | |
| | | | | |
Government Obligations | | 14.3% | | | | | | | | | | |
Commonwealth of Australia | | | | 5.250% | | 8/15/10 | | 4,030 | | $ | 3,064 | |
Queensland Treasury Corp | | | | 6.000% | | 6/14/11 | | 9,100 | | | 7,122B | |
| | | | | | | | | | |
|
|
|
Total Australian Dollar | | | | | | | | | | | 10,186 | |
British Sterling | | 31.3% | | | | | | | | | | |
| | | | | |
Corporate Bonds and Notes | | 8.5% | | | | | | | | | | |
| | | | | |
Banking and Finance | | 0.5% | | | | | | | | | | |
Landesbank Hessen-Thueringen Girozentrale | | | | 5.375% | | 3/7/12 | | 200 | | | 368 | |
| | | | | | | | | | |
|
|
|
| | | | | |
Diversified Financial Services | | 8.0% | | | | | | | | | | |
Irish Nationwide Building Society | | | | 5.875% | | 12/15/08 | | 200 | | | 364 | |
Network Rail MTN Finance PLC | | | | 4.875% | | 3/6/09 | | 3,000 | | | 5,369 | |
| | | | | | | | | | |
|
|
|
| | | | | | | | | | | | 5,733 | |
| | | | | | | | | | |
|
|
|
Government Obligations | | 22.8% | | | | | | | | | | |
United Kingdom Treasury Bond | | | | 4.750% | | 9/7/15 | | 230 | | | 421 | |
United Kingdom of Great Britain and Northern Ireland | | | | 8.000% | | 6/7/21 | | 960 | | | 2,396 | |
United Kingdom Treasury Stock | | | | 4.750% | | 6/7/10 | | 4,440 | | | 8,004 | |
United Kingdom Treasury Stock | | | | 5.000% | | 3/7/12 | | 2,980 | | | 5,478 | |
| | | | | | | | | | |
|
|
|
| | | | | | | | | | | | 16,299 | |
| | | | | | | | | | |
|
|
|
Total British Sterling | | | | | | | | | | | 22,400 | |
Canadian Dollar | | 0.7% | | | | | | | | | | |
| | | | | |
Government Obligations | | 0.7% | | | | | | | | | | |
Canadian Real Return Bond | | | | 4.000% | | 12/1/31 | | 422 | | | 548 | B |
Danish Krone | | 6.0% | | | | | | | | | | |
| | | | | |
Corporate Bonds and Notes | | 1.5% | | | | | | | | | | |
Nordea Kredit Realkreditaktieselskab | | | | 4.000% | | 10/1/35 | | 6,560 | | | 1,042 | |
| | | | | | | | | | |
|
|
|
| | | | | |
Government Obligations | | 4.5% | | | | | | | | | | |
Kingdom of Denmark | | | | 5.000% | | 11/15/13 | | 17,460 | | | 3,230 | |
| | | | | | | | | | |
|
|
|
Total Danish Krone | | | | | | | | | | | 4,272 | |
107
Semi-Annual Report to Shareholders
PORTFOLIO OF INVESTMENTS—Continued
Western Asset Non-U.S. Opportunity Bond Portfolio—Continued
| | | | | | | | | | | | |
| | | % OF
NET ASSETS | | RATE | | MATURITY
DATE | | PARA | | VALUE | |
Euro | | 31.3% | | | | | | | | | | |
| | | | | |
Corporate Bonds and Notes | | 11.5% | | | | | | | | | | |
| | | | | |
Banks | | 3.5% | | | | | | | | | | |
Bank Nederlandse Gemeenten NV | | | | 5.625% | | 10/25/10 | | 1,850 | | $ | 2,529 | |
| | | | | | | | | | |
|
|
|
| | | | | |
Diversified Financial Services | | 3.4% | | | | | | | | | | |
Kreditanstalt fuer Wiederaufbau | | | | 5.250% | | 1/4/10 | | 1,800 | | | 2,391 | |
| | | | | | | | | | |
|
|
|
| | | | | |
Investment Banking/Brokerage | | 4.6% | | | | | | | | | | |
Caisse de Refinancement L’ Habitat | | | | 4.200% | | 4/25/11 | | 2,000 | | | 2,577 | |
Morgan Stanley | | | | 2.423% | | 7/20/12 | | 600 | | | 720 | C |
| | | | | | | | | | |
|
|
|
| | | | | | | | | | | | 3,297 | |
| | | | | | | | | | |
|
|
|
U.S. Government and Agency Obligations | | 1.7% | | | | | | | | | | |
Freddie Mac | | | | 5.750% | | 9/15/10 | | 900 | | | 1,228 | |
| | | | | | | | | | |
|
|
|
Government Obligations | | 18.1% | | | | | | | | | | |
Federal Republic of Germany | | | | 2.500% | | 9/22/06 | | 1,740 | | | 2,097 | |
Kingdom of Spain | | | | 5.750% | | 7/30/32 | | 1,970 | | | 3,235 | |
Kingdom of the Netherlands | | | | 5.500% | | 1/15/28 | | 1,270 | | | 1,978 | |
Republic of France | | | | 3.000% | | 7/25/09 | | 2,174 | | | 2,865 | B |
Republic of France | | | | 3.000% | | 7/25/12 | | 1,968 | | | 2,721 | B |
| | | | | | | | | | |
|
|
|
| | | | | | | | | | | | 12,896 | |
| | | | | | | | | | |
|
|
|
Total Euro | | | | | | | | | | | 22,341 | |
Norwegian Krone | | 2.8% | | | | | | | | | | |
| | | | | |
Government Obligations | | 2.8% | | | | | | | | | | |
Kingdom of Norway | | | | 6.500% | | 5/15/13 | | 8,370 | | | 1,540 | |
Kingdom of Norway | | | | 5.000% | | 5/15/15 | | 2,820 | | | 481 | |
| | | | | | | | | | |
|
|
|
Total Norwegian Krone | | | | | | | | | | | 2,021 | |
Polish Zloty | | 2.3% | | | | | | | | | | |
| | | | | |
Government Obligations | | 2.3% | | | | | | | | | | |
Republic of Poland | | | | 6.000% | | 5/24/09 | | 1,310 | | | 420 | |
Republic of Poland | | | | 6.250% | | 10/24/15 | | 3,510 | | | 1,207 | |
| | | | | | | | | | |
|
|
|
Total Polish Zloty | | | | | | | | | | | 1,627 | |
108
Semi-Annual Report to Shareholders
| | | | | | | | | | | | |
| | | % OF
NET ASSETS | | RATE | | MATURITY
DATE | | PARA | | VALUE |
Swedish Krona | | 8.5% | | | | | | | | | | |
| | | | | |
Corporate Bonds and Notes | | 4.0% | | | | | | | | | | |
| | | | | |
Banking and Finance | | 4.0% | | | | | | | | | | |
Stadshypotek AB | | | | 6.000% | | 3/18/09 | | | 20,000 | | $ | 2,859 |
| | | | | | | | | | | |
|
|
Government Obligations | | 4.5% | | | | | | | | | | |
Kingdom of Sweden | | | | 5.500% | | 10/8/12 | | | 21,370 | | | 3,203 |
| | | | | | | | | | | |
|
|
Total Swedish Krona | | | | | | | | | | | | 6,062 |
| | | | | | | | | | | |
|
|
Total Long-Term Securities
(Identified Cost—$64,934) | | | | | | | | | | | | 69,457 |
Short-Term Securities | | 0.2% | | | | | | | | | | |
Repurchase Agreements | | | | | | | | | | | | |
Goldman, Sachs & Company
3.8%, dated 9/30/05, to be repurchased at $161 on 10/3/05 (Collateral: $125 Tennessee Valley Authority bonds, 7.125%, due 5/1/30, value $167) | | | | | | $ | 161 | | | 161 |
| | | | | | | | | | | |
|
|
Total Short-Term Securities (Identified Cost—$161) | | | | | | | | | | | | |
Total Investments (Identified Cost—$65,095) | | 97.4% | | | | | | | | | $ | 69,618 |
Other Assets Less Liabilities | | 2.6% | | | | | | | | | | 1,828 |
| | | | | | | | | | | |
|
|
| | | | | |
Net Assets | | 100.0% | | | | | | | | | $ | 71,446 |
| | | | | | | | | | | |
|
|
| | | | | | | | | | | | | |
| | | | | | | |
| | | EXPIRATION | | ACTUAL
CONTRACT | | APPRECIATION/
(DEPRECIATION) |
Futures Contracts PurchasedD | | | | | | | |
Bundesobligation Futures | | December 2005 | | 31 | | $ | 24 |
Bundesobligation Futures | | December 2005 | | 55 | | | 42 |
| | | | | | |
|
|
| | | | | | | $ | 66 |
| | | | | | |
|
|
| | | | | | | | |
| A | Securities are grouped by the currencies in which they were issued, and the par amounts are also in the issuance currency of the security. |
| B | Inflation-Protected Security – A security whose principal value is adjusted daily or monthly in accordance with changes to the relevant country’s Consumer Price Index or its equivalent used as an inflation proxy. Interest is calculated on the basis of the current adjusted principal value. |
| C | Indexed security – The rate of interest earned on this security is tied to the London Interbank Offered Rate (“LIBOR”). The coupon rate is the rate as of September 30, 2005. |
| D | Options and futures are described in more detail in the notes to financial statements. |
109
Semi-Annual Report to Shareholders
STATEMENTS OF ASSETS AND LIABILITIES
September 30, 2005 (Unaudited)
(Amounts in Thousands)
Western Asset Limited Duration Bond Portfolio
| | | | | | | |
Assets: | | | | | | | |
Investment securities at market value (Identified Cost—$82,624) | | | | | $ | 82,122 | |
Short-term securities at value (Identified Cost—$50) | | | | | | 50 | |
Cash | | | | | | 2,434 | |
Receivable for fund shares sold | | | | | | 500 | |
Receivable for futures variation margin | | | | | | 10 | |
Interest and dividends receivable | | | | | | 626 | |
| | | | | |
|
|
|
Total assets | | | | | | 85,742 | |
| | |
Liabilities: | | | | | | | |
Payable for securities purchased | | $ | 4,048 | | | | |
Accrued management fee | | | 3 | | | | |
Accrued expenses | | | 32 | | | | |
| | |
|
| | | | |
Total liabilities | | | | | | 4,083 | |
| | | | | |
|
|
|
Net Assets | | | | | $ | 81,659 | |
| | | | | |
|
|
|
| | |
Net assets consist of: | | | | | | | |
Accumulated paid-in-capital applicable to: | | | | | | | |
8,269 Institutional Class shares outstanding | | | | | $ | 82,299 | |
Undistributed net investment income | | | | | | 7 | |
Accumulated net realized loss on investments and futures | | | | | | (192 | ) |
Unrealized depreciation of investments and futures | | | | | | (455 | ) |
| | | | | |
|
|
|
Net Assets | | | | | $ | 81,659 | |
| | | | | |
|
|
|
| | |
Net Asset Value Per Share: | | | | | | | |
Institutional Class | | | | |
| $9.88
|
|
| | | | | | | | |
See notes to financial statements.
110
Semi-Annual Report to Shareholders
Western Asset Intermediate Bond Portfolio
| | | | | | | |
Assets: | | | | | | | |
Investment securities at market value (Identified Cost—$838,244)A | | | | | $ | 833,260 | |
Short-term securities at value (Identified Cost—$77,281) | | | | | | 77,278 | |
Receivable for securities sold | | | | | | 59,394 | |
Receivable for fund shares sold | | | | | | 2,350 | |
Interest and dividends receivable | | | | | | 6,680 | |
| | | | | |
|
|
|
Total assets | | | | | | 978,962 | |
| | |
Liabilities: | | | | | | | |
Obligation to return collateral for securities loaned | | $ | 179,860 | | | | |
Payable for securities purchased | | | 83,840 | | | | |
Payable for fund shares repurchased | | | 3 | | | | |
Income distribution payable | | | 134 | | | | |
Accrued management fee | | | 208 | | | | |
Accrued expenses | | | 86 | | | | |
Interest payable | | | 16 | | | | |
Options written (Proceeds—$221) | | | 218 | | | | |
Swap contracts at value | | | 16 | | | | |
Futures variation margin | | | 117 | | | | |
| | |
|
| | | | |
Total liabilities | | | | | | 264,498 | |
| | | | | |
|
|
|
Net Assets | | | | | $ | 714,464 | |
| | | | | |
|
|
|
| | |
Net assets consist of: | | | | | | | |
Accumulated paid-in-capital applicable to: | | | | | | | |
68,590 Institutional Class shares outstanding | | | | | $ | 719,809 | |
Undistributed net investment income | | | | | | 253 | |
Accumulated net realized loss on investments, options, futures and swaps | | | | | | (90 | ) |
Unrealized depreciation of investments, options, futures and swaps | | | | | | (5,508 | ) |
| | | | | |
|
|
|
Net Assets | | | | | $ | 714,464 | |
| | | | | |
|
|
|
| | |
Net Asset Value Per Share: | | | | | | | |
Institutional Class | | | | |
| $10.42
|
|
| | | | | | | | |
| A | Market value of securities on loan is $176,243. |
See notes to financial statements.
111
Semi-Annual Report to Shareholders
STATEMENTS OF ASSETS AND LIABILITIES—Continued
Western Asset Intermediate Plus Bond Portfolio
| | | | | | | |
Assets: | | | | | | | |
Investment securities at market value (Identified Cost—$47,268) | | | | | $ | 46,922 | |
Short-term securities at value (Identified Cost—$2,982) | | | | | | 2,982 | |
Cash and foreign currencies | | | | | | 1,994 | |
Swap contracts at value | | | | | | 20 | |
Receivable for fund shares repurchased | | | | | | 821 | |
Receivable for securities sold | | | | | | 4,927 | |
Interest and dividends receivable | | | | | | 509 | |
| | | | | |
|
|
|
Total assets | | | | | | 58,175 | |
| | |
Liabilities: | | | | | | | |
Payable for securities purchased | | $ | 6,977 | | | | |
Options written (Proceeds—$16) | | | 16 | | | | |
Income distribution payable | | | 46 | | | | |
Futures variation margin | | | 11 | | | | |
Unrealized depreciation of forward foreign currency contracts | | | 16 | | | | |
Accrued expenses | | | 47 | | | | |
| | |
|
| | | | |
Total liabilities | | | | | | 7,113 | |
| | | | | |
|
|
|
Net Assets | | | | | $ | 51,062 | |
| | | | | |
|
|
|
| | |
Net assets consist of: | | | | | | | |
Accumulated paid-in-capital applicable to: | | | | | | | |
5,144 Institutional Class shares outstanding | | | | | $ | 51,407 | |
Undistributed net investment income | | | | | | 8 | |
Undistributed net realized gain on investments, options, futures, swaps and foreign currency transactions | | | | | | 38 | |
Unrealized depreciation of investments, options, futures, swaps and foreign currency translations | | | | | | (391 | ) |
| | | | | |
|
|
|
Net Assets | | | | | $ | 51,062 | |
| | | | | |
|
|
|
| | |
Net Asset Value Per Share: | | | | | | | |
Institutional Class | | | | |
| $9.93
|
|
| | | | | | | | |
See notes to financial statements.
112
Semi-Annual Report to Shareholders
Western Asset Core Bond Portfolio
| | | | | | | |
Assets: | | | | | | | |
Investment securities at market value (Identified Cost—$6,037,296)A | | | | | $ | 6,026,607 | |
Short-term securities at value (Identified Cost—$573,557) | | | | | | 570,434 | |
Cash | | | | | | 1,260 | |
Receivable for securities sold | | | | | | 8,541 | |
Receivable for fund shares sold | | | | | | 92,336 | |
Interest and dividends receivable | | | | | | 33,031 | |
Other assets | | | | | | 1 | |
| | | | | |
|
|
|
Total assets | | | | | | 6,732,210 | |
| | |
Liabilities: | | | | | | | |
Obligation to return collateral for securities loaned | | $ | 998,356 | | | | |
Payable for securities purchased | | | 1,570,502 | | | | |
Payable for fund shares repurchased | | | 11,442 | | | | |
Accrued management fee | | | 1,401 | | | | |
Accrued distribution fee | | | 66 | | | | |
Income distribution payable | | | 1,060 | | | | |
Interest expense payable | | | 3,749 | | | | |
Options written (Proceeds—$13,721) | | | 11,947 | | | | |
Futures variation margin | | | 456 | | | | |
Swap contracts at value | | | 6,385 | | | | |
Accrued expenses | | | 380 | | | | |
| | |
|
| | | | |
Total liabilities | | | | | | 2,605,744 | |
| | | | | |
|
|
|
Net Assets | | | | | $ | 4,126,466 | |
| | | | | |
|
|
|
| | |
Net assets consist of: | | | | | | | |
Accumulated paid-in-capital applicable to: | | | | | | | |
335,221 Institutional Class shares outstanding | | | | | $ | 3,799,973 | |
28,121 Financial Intermediary Class shares outstanding | | | | | | 321,340 | |
Overdistributed net investment income | | | | | | (5,768 | ) |
Undistributed net realized gain on investments, options, futures and swaps | | | | | | 23,411 | |
Unrealized depreciation of investments, options, futures and swaps | | | | | | (12,490 | ) |
| | | | | |
|
|
|
Net Assets | | | | | $ | 4,126,466 | |
| | | | | |
|
|
|
| | |
Net Asset Value Per Share: | | | | | | | |
Institutional Class | | | | |
| $11.36
|
|
Financial Intermediary Class | | | | |
| $11.36
|
|
| | | | | | | | |
| A | Market value of securities on loan is $978,251. |
See notes to financial statements.
113
Semi-Annual Report to Shareholders
STATEMENTS OF ASSETS AND LIABILITIES—Continued
Western Asset Core Plus Bond Portfolio
| | | | | | |
Assets: | | | | | | |
Investment securities at market value (Identified Cost—$8,231,433)A | | | | | $ | 8,261,130 |
Short-term securities at value (Identified Cost—$1,153,841) | | | | | | 1,148,634 |
Cash and foreign currencies | | | | | | 194,103 |
Receivable for securities sold | | | | | | 92,085 |
Receivable for fund shares sold | | | | | | 17,871 |
Interest and dividends receivable | | | | | | 52,933 |
| | | | | |
|
|
Total Assets | | | | | | 9,766,756 |
Liabilities: | | | | | | |
Obligation to return collateral for securities loaned | | $ | 1,500,496 | | | |
Payable for securities purchased | | | 2,274,740 | | | |
Payable for fund shares repurchased | | | 838 | | | |
Accrued management fee | | | 1,948 | | | |
Accrued distribution fee | | | 60 | | | |
Income distribution payable | | | 1,900 | | | |
Interest expense payable | | | 8,231 | | | |
Options written (Proceeds—$22,669) | | | 19,567 | | | |
Swap contracts at value | | | 3,027 | | | |
Futures variation margin | | | 1,632 | | | |
Unrealized depreciation of forward foreign currency contracts | | | 3,131 | | | |
Accrued expenses | | | 565 | | | |
| | |
|
| | | |
Total liabilities | | | | | | 3,816,135 |
| | | | | |
|
|
Net Assets | | | | | $ | 5,950,621 |
| | | | | |
|
|
| | |
Net assets consist of: | | | | | | |
Accumulated paid-in-capital applicable to: | | | | | | |
532,397 Institutional Class shares outstanding | | | | | $ | 5,531,228 |
29,892 Financial Intermediary Class shares outstanding | | | | | | 317,934 |
Undistributed net investment income | | | | | | 8,713 |
Undistributed net realized gain on investments, options, futures, swaps and foreign currency transactions | | | | | | 69,939 |
Unrealized appreciation of investments, options, futures, swaps and foreign currency translations | | | | | | 22,807 |
| | | | | |
|
|
Net Assets | | | | | $ | 5,950,621 |
| | | | | |
|
|
| | |
Net Asset Value Per Share: | | | | | | |
Institutional Class | | | | |
| $10.58
|
Financial Intermediary Class | | | | |
| $10.59
|
| | | | | | | |
| A | Market value of securities on loan is $1,470,363. |
See notes to financial statements.
114
Semi-Annual Report to Shareholders
Western Asset Inflation Indexed Plus Bond Portfolio
| | | | | | | |
Assets: | | | | | | | |
Investment securities at market value (Identified Cost—$592,615)A | | | | | $ | 604,718 | |
Short-term securities at value (Identified Cost—$5,171) | | | | | | 5,162 | |
Cash and foreign currencies | | | | | | 842 | |
Receivable for fund shares sold | | | | | | 22 | |
Receivable for securities sold | | | | | | 642 | |
Interest and dividends receivable | | | | | | 3,753 | |
Unrealized appreciation of forward foreign currency contracts | | | | | | 435 | |
| | | | | |
|
|
|
Total assets | | | | | | 615,574 | |
| | |
Liabilities: | | | | | | | |
Obligation to return collateral for securities loaned | | $ | 118,493 | | | | |
Payable for securities purchased | | | 26,138 | | | | |
Income distribution payable | | | 187 | | | | |
Accrued management fee | | | 61 | | | | |
Options written (Proceeds—$146) | | | 454 | | | | |
Swap contracts at value | | | 791 | | | | |
Futures variation margin | | | 127 | | | | |
Accrued expenses | | | 59 | | | | |
| | |
|
| | | | |
Total liabilities | | | | | | 146,310 | |
| | | | | |
|
|
|
Net Assets | | | | | $ | 469,264 | |
| | | | | |
|
|
|
| | |
Net assets consist of: | | | | | | | |
Accumulated paid-in-capital applicable to: | | | | | | | |
43,701 Institutional Class shares outstanding | | | | | $ | 454,840 | |
Overdistributions net investment income | | | | | | (15 | ) |
Undistributed net realized gain on investments, options, futures, swaps and foreign currency transactions | | | | | | 2,986 | |
Unrealized appreciation of investments, options, futures, swaps and foreign currency translations | | | | | | 11,453 | |
| | | | | |
|
|
|
Net Assets | | | | | $ | 469,264 | |
| | | | | |
|
|
|
| | |
Net Asset Value Per Share: | | | | | | | |
Institutional Class | | | | | | $10.74 | |
| | | | | |
|
|
|
| | | | | | | | |
| A | Market value of securities on loan is $116,150. |
See notes to financial statements.
115
Semi-Annual Report to Shareholders
STATEMENTS OF ASSETS AND LIABILITIES—Continued
Western Asset High Yield Portfolio
| | | | | | | |
Assets: | | | | | | | |
Investment securities at market value (Identified Cost—$443,431) | | | | | $ | 442,423 | |
Short-term securities at value (Identified Cost—$20,037) | | | | | | 20,037 | |
Cash | | | | | | 1,855 | |
Receivable for securities sold | | | | | | 4,370 | |
Interest and dividends receivable | | | | | | 9,715 | |
| | | | | |
|
|
|
Total assets | | | | | | 478,400 | |
| | |
Liabilities: | | | | | | | |
Payable for securities purchased | | $ | 7,928 | | | | |
Accrued management fee | | | 214 | | | | |
Accrued expenses | | | 65 | | | | |
| | |
|
| | | | |
Total liabilities | | | | | | 8,207 | |
| | | | | |
|
|
|
Net Assets | | | | | $ | 470,193 | |
| | | | | |
|
|
|
| | |
Net assets consist of: | | | | | | | |
Accumulated paid-in-capital applicable to: | | | | | | | |
45,536 Institutional Class shares outstanding | | | | | $ | 462,715 | |
Undistributed net investment income | | | | | | 8,010 | |
Undistributed net realized gain on investments | | | | | | 476 | |
Unrealized depreciation of investments | | | | | | (1,008 | ) |
| | | | | |
|
|
|
Net Assets | | | | | $ | 470,193 | |
| | | | | |
|
|
|
| | |
Net Asset Value Per Share: | | | | | | | |
Institutional Class | | | | |
| $10.33
|
|
| | | | | | | | |
See notes to financial statements.
116
Semi-Annual Report to Shareholders
Western Asset Non U.S. Opportunity Bond Portfolio
| | | | | | | |
Assets: | | | | | | | |
Investment securities at market value (Identified Cost—$64,934) | | | | | $ | 69,457 | |
Short-term securities at value (Identified Cost—$161) | | | | | | 161 | |
Cash and foreign currencies | | | | | | 401 | |
Futures variation margin | | | | | | 66 | |
Receivable for fund shares sold | | | | | | 240 | |
Interest and dividends receivable | | | | | | 1,348 | |
| | | | | |
|
|
|
Total assets | | | | | | 71,673 | |
| | |
Liabilities: | | | | | | | |
Unrealized depreciation of forward foreign currency contracts | | $ | 189 | | | | |
Accrued management fee | | | 3 | | | | |
Accrued expenses | | | 35 | | | | |
| | |
|
| | | | |
Total liabilities | | | | | | 227 | |
| | | | | |
|
|
|
Net Assets | | | | | $ | 71,446 | |
| | | | | |
|
|
|
| | |
Net assets consist of: | | | | | | | |
Accumulated paid-in-capital applicable to: | | | | | | | |
6,268 Institutional Class shares outstanding | | | | | $ | 56,617 | |
Overdistributions of net investment income | | | | | | (686 | ) |
Undistributed net realized gain on investments, options, futures and foreign currency transactions | | | | | | 11,167 | |
Unrealized appreciation of investments, options, futures and foreign currency translations | | | | | | 4,348 | |
| | | | | |
|
|
|
Net Assets | | | | | $ | 71,446 | |
| | | | | |
|
|
|
| | |
Net Asset Value Per Share: | | | | | | | |
Institutional Class | | | | |
| $11.40
|
|
| | | | | | | | |
See notes to financial statements.
117
Semi-Annual Report to Shareholders
STATEMENTS OF OPERATIONS
(Amounts in Thousands) (Unaudited)
| | | | | | | | | | | | |
| | | SIX MONTHS ENDED SEPTEMBER 30, 2005
| |
| | | WESTERN
ASSET
LIMITED
DURATION
BOND
PORTFOLIO | | | WESTERN
ASSET
INTERMEDIATE
BOND
PORTFOLIO | | | WESTERN
ASSET
INTERMEDIATE
PLUS BOND
PORTFOLIO | |
Investment Income: | | | | | | | | | | | | |
Interest | | $ | 1,138 | | | $ | 15,375 | | | $ | 1,008 | |
Dividends | | | 35 | | | | 458 | | | | 22 | |
| | |
|
|
| |
|
|
| |
|
|
|
Total income | | | 1,173 | | | | 15,833 | | | | 1,030 | |
| | |
|
|
| |
|
|
| |
|
|
|
Expenses: | | | | | | | | | | | | |
Advisory fee | | | 102 | | | | 1,377 | | | | 96 | |
Distribution fee: | | | | | | | | | | | | |
Financial Intermediary Class | | | N/A | | | | N/A | | | | N/A | |
Audit and legal fees | | | 45 | | | | 61 | | | | 53 | |
Custodian fees | | | 23 | | | | 94 | | | | 34 | |
Directors’ fees and expenses | | | 1 | | | | 25 | | | | 1 | |
Registration fees | | | 25 | | | | 23 | | | | 2 | |
Reports to shareholders | | | 3 | | | | 15 | | | | 8 | |
Transfer agent and shareholder servicing expense: | | | | | | | | | | | | |
Institutional Class | | | 7 | | | | 19 | | | | 7 | |
Financial Intermediary Class | | | N/A | | | | N/A | | | | N/A | |
Other expenses | | | 5 | | | | 24 | | | | 4 | |
| | |
|
|
| |
|
|
| |
|
|
|
| | | | 211 | | | | 1,638 | | | | 205 | |
Less: Fees waived | | | (94 | ) | | | (80 | ) | | | (96 | ) |
Compensating balance creditsA | | | (1 | ) | | | (8 | ) | | | (1 | ) |
| | |
|
|
| |
|
|
| |
|
|
|
Total expenses, net of waivers and compensating balance credits | | | 116 | | | | 1,550 | | | | 108 | |
| | |
|
|
| |
|
|
| |
|
|
|
Net Investment Income | | | 1,057 | | | | 14,283 | | | | 922 | |
| | |
|
|
| |
|
|
| |
|
|
|
Net Realized and Unrealized Gain/(Loss) on Investments: | | | | | | | | | | | | |
Realized gain/(loss) on: | | | | | | | | | | | | |
Investments | | | (126 | ) | | | (573 | ) | | | 34 | |
Options | | | — | | | | 647 | | | | 58 | |
Futures | | | (37 | ) | | | (331 | ) | | | 78 | |
Foreign currency transactions | | | N/A | | | | N/A | | | | 2 | |
Swaps | | | — | | | | 31 | | | | 4 | |
| | |
|
|
| |
|
|
| |
|
|
|
| | | | (163 | ) | | | (226 | ) | | | 176 | |
| | |
|
|
| |
|
|
| |
|
|
|
Change in unrealized gain/(loss) on: | | | | | | | | | | | | |
Investments | | | (153 | ) | | | 358 | | | | 54 | |
Assets and liabilities denominated in foreign currencies | | | N/A | | | | N/A | | | | 1 | |
| | |
|
|
| |
|
|
| |
|
|
|
| | | | (153 | ) | | | 358 | | | | 55 | |
| | |
|
|
| |
|
|
| |
|
|
|
Net Realized and Unrealized Gain/(Loss) on Investments | | | (316 | ) | | | 133 | | | | 231 | |
| | |
|
|
| |
|
|
| |
|
|
|
Change in Net Assets Resulting From Operations | | $ | 741 | | | $ | 14,415 | | | $ | 1,153 | |
| | |
|
|
| |
|
|
| |
|
|
|
| | | | | | | | | | | | | |
| A | See note 1, compensating balance credits, in the notes to financial statements. |
N/A—Not applicable.
See notes to financial statements.
118
Semi-Annual Report to Shareholders
| | | | | | | | | | | | | | | | | | |
SIX MONTHS ENDED SEPTEMBER 30, 2005
| |
WESTERN
ASSET
CORE
BOND
PORTFOLIO | | | WESTERN
ASSET
CORE
PLUS BOND
PORTFOLIO | | | WESTERN
ASSET
INFLATION
INDEXED
PLUS BOND
PORTFOLIO | | | WESTERN
ASSET
HIGH YIELD
PORTFOLIO | | | WESTERN
ASSET
NON-U.S.
OPPORTUNITY
BOND
PORTFOLIO | |
| | | | | | | | | | | | | | | | | | | |
| $ | 88,309 | | | $ | 118,147 | | | $ | 13,765 | | | $ | 18,458 | | | $ | 1,621 | |
| | 1,437 | | | | 1,165 | | | | — | | | | 99 | | | | — | |
|
|
| |
|
|
| |
|
|
| |
|
|
| |
|
|
|
| | 89,746 | | | | 119,312 | | | | 13,765 | | | | 18,557 | | | | 1,621 | |
|
|
| |
|
|
| |
|
|
| |
|
|
| |
|
|
|
| | | | | | | | | | | | | | | | | | | |
| | 8,016 | | | | 10,777 | | | | 465 | | | | 1,226 | | | | 191 | |
| | | | | | | | | | | | | | | | | | | |
| | 370 | | | | 288 | | | | N/A | | | | N/A | | | | N/A | |
| | 120 | | | | 171 | | | | 46 | | | | 45 | | | | 44 | |
| | 359 | | | | 501 | | | | 68 | | | | 64 | | | | 40 | |
| | 105 | | | | 141 | | | | 16 | | | | 13 | | | | 3 | |
| | 103 | | | | 173 | | | | 4 | | | | 11 | | | | 11 | |
| | 30 | | | | 55 | | | | 9 | | | | 9 | | | | 3 | |
| | | | | | | | | | | | | | | | | | | |
| | 62 | | | | 48 | | | | 11 | | | | 9 | | | | 8 | |
| | 15 | | | | 6 | | | | N/A | | | | N/A | | | | N/A | |
| | 38 | | | | 38 | | | | 15 | | | | 17 | | | | 10 | |
|
|
| |
|
|
| |
|
|
| |
|
|
| |
|
|
|
| | 9,218 | | | | 12,198 | | | | 634 | | | | 1,394 | | | | 310 | |
| | — | | | | (5 | ) | | | (47 | ) | | | — | | | | (77 | ) |
| | (11 | ) | | | (11 | ) | | | (6 | ) | | | (5 | ) | | | —B | |
|
|
| |
|
|
| |
|
|
| |
|
|
| |
|
|
|
| | 9,207 | | | | 12,182 | | | | 581 | | | | 1,389 | | | | 233 | |
|
|
| |
|
|
| |
|
|
| |
|
|
| |
|
|
|
| | 80,539 | | | | 107,130 | | | | 13,184 | | | | 17,168 | | | | 1,388 | |
|
|
| |
|
|
| |
|
|
| |
|
|
| |
|
|
|
| | | | | | | | | | | | | | | | | | | |
| | | | | | | | | | | | | | | | | | | |
| | 1,972 | | | | 24,009 | | | | 4,116 | | | | 791 | | | | 2,431 | |
| | 4,779 | | | | (5,581 | ) | | | 20 | | | | — | | | | — | |
| | 665 | | | | 24,619 | | | | (819 | ) | | | — | | | | 2 | |
| | N/A | | | | (975 | ) | | | (63 | ) | | | — | | | | 8,739 | |
| | 12,366 | | | | 19,995 | | | | 607 | | | | — | | | | — | |
|
|
| |
|
|
| |
|
|
| |
|
|
| |
|
|
|
| | 19,782 | | | | 62,067 | | | | 3,861 | | | | 791 | | | | 11,172 | |
|
|
| |
|
|
| |
|
|
| |
|
|
| |
|
|
|
| | | | | | | | | | | | | | | | | | | |
| | 4,155 | | | | (14,078 | ) | | | (2,625 | ) | | | (2,471 | ) | | | (8,617 | ) |
| | — | | | | 210 | | | | (1 | ) | | | — | | | | (33 | ) |
|
|
| |
|
|
| |
|
|
| |
|
|
| |
|
|
|
| | 4,155 | | | | (13,868 | ) | | | (2,626 | ) | | | (2,471 | ) | | | (8,650 | ) |
|
|
| |
|
|
| |
|
|
| |
|
|
| |
|
|
|
| | 23,937 | | | | 48,199 | | | | 1,235 | | | | (1,679 | ) | | | 2,522 | |
|
|
| |
|
|
| |
|
|
| |
|
|
| |
|
|
|
| $ | 104,476 | | | $ | 155,329 | | | $ | 14,419 | | | $ | 15,488 | | | $ | 3,910 | |
|
|
| |
|
|
| |
|
|
| |
|
|
| |
|
|
|
| | | | | | | | | | | | | | | | | | | |
119
Semi-Annual Report to Shareholders
STATEMENTS OF CHANGES IN NET ASSETS
(Amounts in Thousands)
| | | | | | | | | | | | | | | | | | | | | | | | |
| | | WESTERN ASSET
LIMITED DURATION
BOND PORTFOLIO
| | | WESTERN ASSET
INTERMEDIATE
BOND PORTFOLIO
| | | WESTERN ASSET
INTERMEDIATE PLUS
BOND PORTFOLIO
| |
| | | SIX
MONTHS
ENDED
9/30/05 | | | YEARS
ENDED
3/31/05 | | | SIX
MONTHS
ENDED
9/30/05 | | | YEARS
ENDED
3/31/05 | | | SIX
MONTHS
ENDED
9/30/05 | | | YEAR
ENDED
3/31/05 | |
| Change in Net Assets: | | (UNAUDITED) | | | | | | (UNAUDITED) | | | | | | (UNAUDITED) | | | | |
Net investment income | | $ | 1,057 | | | $ | 855 | | | $ | 14,283 | | | $ | 21,360 | | | $ | 922 | | | $ | 530 | |
| | | | | | |
Net realized gain/(loss) on investments, options, futures, swaps and foreign currency transactions | | | (163 | ) | | | 66 | | | | (226 | ) | | | 7,190 | | | | 176 | | | | (107 | ) |
| | | | | | |
Change in unrealized appreciation/(depreciation) of investments, options, futures, swaps and assets and liabilities denominated in foreign currencies | | | (153 | ) | | | (552 | ) | | | 358 | | | | (19,466 | ) | | | 55 | | | | (446 | ) |
| | |
|
|
| |
|
|
| |
|
|
| |
|
|
| |
|
|
| |
|
|
|
Change in net assets resulting from operations | | | 741 | | | | 369 | | | | 14,415 | | | | 9,084 | | | | 1,153 | | | | (23 | ) |
| | | | | | |
Distributions to Shareholders: | | | | | | | | | | | | | | | | | | | | | | | | |
From net investment income: | | | | | | | | | | | | | | | | | | | | | | | | |
Institutional Class | | | (1,050 | ) | | | (882 | ) | | | (14,109 | ) | | | (21,565 | ) | | | (932 | ) | | | (543 | ) |
Financial Intermediary Class | | | N/A | | | | N/A | | | | N/A | | | | N/A | | | | N/A | | | | N/A | |
| | | | | | |
From net realized gain on investments: | | | | | | | | | | | | | | | | | | | | | | | | |
Institutional Class | | | — | | | | (62 | ) | | | (6,581 | ) | | | (15,309 | ) | | | — | | | | — | |
Financial Intermediary Class | | | N/A | | | | N/A | | | | N/A | | | | N/A | | | | N/A | | | | N/A | |
| | | | | | |
Change in net assets from | | | | | | | | | | | | | | | | | | | | | | | | |
Fund share transactions: | | | | | | | | | | | | | | | | | | | | | | | | |
Institutional Class | | | 44,542 | | | | 11,819 | | | | 60,259 | | | | 101,041 | | | | 10,204 | | | | 41,203 | |
Financial Intermediary Class | | | N/A | | | | N/A | | | | N/A | | | | N/A | | | | N/A | | | | N/A | |
| | |
|
|
| |
|
|
| |
|
|
| |
|
|
| |
|
|
| |
|
|
|
Change in net assets | | | 44,233 | | | | 11,244 | | | | 53,984 | | | | 73,251 | | | | 10,425 | | | | 40,637 | |
| | | | | | |
Net Assets: | | | | | | | | | | | | | | | | | | | | | | | | |
Beginning of period | | | 37,426 | | | | 26,182 | | | | 660,480 | | | | 587,229 | | | | 40,637 | | | | — | |
| | |
|
|
| |
|
|
| |
|
|
| |
|
|
| |
|
|
| |
|
|
|
| | | | | | |
End of period | | $ | 81,659 | | | $ | 37,426 | | | $ | 714,464 | | | $ | 660,480 | | | $ | 51,062 | | | $ | 40,637 | |
| | |
|
|
| |
|
|
| |
|
|
| |
|
|
| |
|
|
| |
|
|
|
| | | | | | |
Under/(Over) distributed net investment income | | $ | 7 | | | $ | — | | | $ | 253 | | | $ | 79 | | | $ | 8 | | | $ | 18 | |
| | |
|
|
| |
|
|
| |
|
|
| |
|
|
| |
|
|
| |
|
|
|
| | | | | | | | | | | | | | | | | | | | | | | | | |
N/A—Not applicable.
See notes to financial statements.
120
Semi-Annual Report to Shareholders
| | | | | | | | | | | | | | | | | | | | | | | | | | | | | | | | | | | | | | |
WESTERN ASSET
CORE BOND
PORTFOLIO
| | | WESTERN ASSET
CORE PLUS BOND
PORTFOLIO
| | | WESTERN ASSET
INFLATION INDEXED
PLUS BOND PORTFOLIO
| | | WESTERN ASSET
HIGH YIELD
PORTFOLIO
| | | WESTERN ASSET
NON-U.S. OPPORTUNITY
BOND PORTFOLIO
| |
SIX
MONTHS
ENDED
9/30/05 | | | YEAR
ENDED
3/31/05 | | | SIX
MONTHS
ENDED
9/30/05 | | | YEAR
ENDED
3/31/05 | | | SIX
MONTHS
ENDED
9/30/05 | | | YEARS
ENDED
3/31/05 | | | SIX
MONTHS
ENDED
9/30/05 | | | YEARS
ENDED
3/31/05 | | | SIX
MONTHS
ENDED
9/30/05 | | | YEARS
ENDED
3/31/05 | |
| (UNAUDITED) | | | | | | (UNAUDITED) | | | | | | (UNAUDITED) | | | | | | (UNAUDITED) | | | | | | (UNAUDITED) | | | | |
| $ | 80,539 | | | $ | 94,566 | | | $ | 107,130 | | | $ | 130,635 | | | $ | 13,184 | | | $ | 14,553 | | | $ | 17,168 | | | $ | 25,540 | | | $ | 1,388 | | | $ | 3,166 | |
| | | | | | | | | |
| | 19,782 | | | | 21,564 | | | | 62,067 | | | | 109,589 | | | | 3,861 | | | | 1,791 | | | | 791 | | | | 9,217 | | | | 11,172 | | | | 5,065 | |
| | | | | | | | | |
| | 4,155 | | | | (68,316 | ) | | | (13,868 | ) | | | (83,280 | ) | | | (2,626 | ) | | | (2,789 | ) | | | (2,471 | ) | | | (5,788 | ) | | | (8,650 | ) | | | (506 | ) |
|
|
| |
|
|
| |
|
|
| |
|
|
| |
|
|
| |
|
|
| |
|
|
| |
|
|
| |
|
|
| |
|
|
|
| | 104,476 | | | | 47,814 | | | | 155,329 | | | | 156,944 | | | | 14,419 | | | | 13,555 | | | | 15,488 | | | | 28,969 | | | | 3,910 | | | | 7,725 | |
| | | | | | | | | |
| | | | | | | | | | | | | | | | | | | | | | | | | | | | | | | | | | | | | | | |
| | | | | | | | | | | | | | | | | | | | | | | | | | | | | | | | | | | | | | | |
| | (79,688 | ) | | | (88,562 | ) | | | (113,387 | ) | | | (129,075 | ) | | | (13,797 | ) | | | (14,661 | ) | | | (16,111 | ) | | | (21,159 | ) | | | (167 | ) | | | (2,732 | ) |
| | (6,137 | ) | | | (5,081 | ) | | | (4,863 | ) | | | (2,045 | ) | | | N/A | | | | N/A | | | | N/A | | | | N/A | | | | N/A | | | | N/A | |
| | | | | | | | | |
| | | | | | | | | | | | | | | | | | | | | | | | | | | | | | | | | | | | | | | |
| | (1,163 | ) | | | (62,444 | ) | | | (14,478 | ) | | | (86,844 | ) | | | (942 | ) | | | (12,719 | ) | | | (5,384 | ) | | | — | | | | (611 | ) | | | (137 | ) |
| | (94 | ) | | | (3,343 | ) | | | (622 | ) | | | (995 | ) | | | N/A | | | | N/A | | | | N/A | | | | N/A | | | | N/A | | | | N/A | |
| | | | | | | | | |
| | | | | | | | | | | | | | | | | | | | | | | | | | | | | | | | | | | | | | | |
| | | | | | | | | | | | | | | | | | | | | | | | | | | | | | | | | | | | | | | |
| | 513,084 | | | | 1,195,269 | | | | 1,047,306 | | | | 1,338,685 | | | | 7,838 | | | | 129,192 | | | | 61,783 | | | | 217,149 | | | | (20,856 | ) | | | (12,713 | ) |
| | 52,688 | | | | 150,821 | | | | 125,197 | | | | 185,779 | | | | N/A | | | | N/A | | | | N/A | | | | N/A | | | | N/A | | | | N/A | |
|
|
| |
|
|
| |
|
|
| |
|
|
| |
|
|
| |
|
|
| |
|
|
| |
|
|
| |
|
|
| |
|
|
|
| | 583,166 | | | | 1,234,474 | | | | 1,194,482 | | | | 1,462,449 | | | | 7,518 | | | | 115,367 | | | | 55,776 | | | | 224,959 | | | | (17,724 | ) | | | (7,857 | ) |
| | | | | | | | | |
| | | | | | | | | | | | | | | | | | | | | | | | | | | | | | | | | | | | | | | |
| | 3,543,300 | | | | 2,308,826 | | | | 4,756,139 | | | | 3,293,690 | | | | 461,746 | | | | 346,379 | | | | 414,417 | | | | 189,458 | | | | 89,170 | | | | 97,027 | |
|
|
| |
|
|
| |
|
|
| |
|
|
| |
|
|
| |
|
|
| |
|
|
| |
|
|
| |
|
|
| |
|
|
|
| | | | | | | | | |
| $ | 4,126,466 | | | $ | 3,543,300 | | | $ | 5,950,621 | | | $ | 4,756,139 | | | $ | 469,264 | | | $ | 461,746 | | | $ | 470,193 | | | $ | 414,417 | | | $ | 71,446 | | | $ | 89,170 | |
|
|
| |
|
|
| |
|
|
| |
|
|
| |
|
|
| |
|
|
| |
|
|
| |
|
|
| |
|
|
| |
|
|
|
| | | | | | | | | |
| $ | (5,768 | ) | | $ | (482 | ) | | $ | 8,713 | | | $ | 19,833 | | | $ | (15 | ) | | $ | 598 | | | $ | 8,010 | | | $ | 6,953 | | | $ | (686 | ) | | $ | (1,907 | ) |
|
|
| |
|
|
| |
|
|
| |
|
|
| |
|
|
| |
|
|
| |
|
|
| |
|
|
| |
|
|
| |
|
|
|
| | | | | | | | | | | | | | | | | | | | | | | | | | | | | | | | | | | | | | | |
121
Semi-Annual Report to Shareholders
FINANCIAL HIGHLIGHTS
Contained below is per share operating performance data for a share of common stock outstanding throughout each period shown, total investment return, ratios to average net assets and other supplemental data. This information has been derived from information in the financial statements.
| | | | | | | | | | | | | | |
| | | | | INVESTMENT OPERATIONS
|
| | | NET ASSET
VALUE,
BEGINNING
OF PERIOD | | NET
INVESTMENT
INCOME | | | NET REALIZED
AND UNREALIZED
GAIN/(LOSS) ON
INVESTMENTS,
OPTIONS, FUTURES,
SWAPS, AND
FOREIGN CURRENCY
TRANSACTIONS | | | TOTAL
FROM
INVESTMENT
OPERATIONS |
| Western Asset Limited Duration Bond Portfolio | | | | | | | | | | |
—Institutional Class | | | | | | | | | | | | | | |
Six Months Ended, September 30, 2005C | | $ | 9.89 | | $ | .18D | | | $ | (.01 | ) | | $ | .17 |
Years Ended March 31, | | | | | | | | | | | | | | |
2005 | | | 10.09 | | | .24 | D | | | (.17 | ) | | | .07 |
2004E | | | 10.00 | | | .08 | D | | | .09 | | | | .17 |
| | | | |
Western Asset Intermediate Bond Portfolio | | | | | | | | | | | | | | |
—Institutional Class | | | | | | | | | | | | | | |
Six Months Ended, September 30, 2005C | | $ | 10.51 | | $ | .22 | H | | $ | .01 | | | $ | .23 |
Years Ended March 31, | | | | | | | | | | | | | | |
2005 | | | 11.01 | | | .38 | H | | | (.22 | ) | | | .16 |
2004 | | | 10.92 | | | .44 | H | | | .36 | | | | .80 |
2003 | | | 10.39 | | | .53 | | | | .62 | | | | 1.15 |
2002 | | | 10.65 | | | .57 | H | | | (.13 | ) | | | .44 |
2001 | | | 10.09 | | | .68 | H | | | .56 | | | | 1.24 |
| | | | |
Western Asset Intermediate Plus Bond Portfolio | | | | | | | | | | | | | | |
—Institutional Class | | | | | | | | | | | | | | |
Six Months Ended, September 30, 2005C | | $ | 9.86 | | $ | .19 | I | | $ | .07 | | | $ | .26 |
Year Ended March 31, 2005 | | | 10.00 | | | .32 | I | | | (.14 | ) | | | .18 |
| | | | |
Western Asset Core Bond Portfolio | | | | | | | | | | | | | | |
—Institutional Class | | | | | | | | | | | | | | |
Six Months Ended, September 30, 2005C | | $ | 11.29 | | $ | .24 | | | $ | .08 | | | $ | .32 |
Years Ended March 31, | | | | | | | | | | | | | | |
2005 | | | 11.81 | | | .39 | | | | (.21 | ) | | | .18 |
2004 | | | 11.57 | | | .41 | | | | .45 | | | | .86 |
2003 | | | 11.01 | | | .55 | | | | .65 | | | | 1.20 |
2002 | | | 11.09 | | | .62 | J | | | .05 | | | | .67 |
2001 | | | 10.39 | | | .73 | J | | | .70 | | | | 1.43 |
—Financial Intermediary Class | | | | | | | | | | | | | | |
Six Months Ended, September 30, 2005C | | $ | 11.29 | | $ | .22 | | | $ | .09 | | | $ | .31 |
Years Ended March 31, | | | | | | | | | | | | | | |
2005 | | | 11.81 | | | .38 | | | | (.23 | ) | | | .15 |
2004 | | | 11.57 | | | .40 | K | | | .43 | | | | .83 |
2003 | | | 11.02 | | | .53 | | | | .63 | | | | 1.16 |
2002 | | | 11.10 | | | .59 | K | | | .06 | | | | .65 |
2001 | | | 10.40 | | | .70 | K | | | .70 | | | | 1.40 |
| | | | | | | | | | | | | | | |
122
Semi-Annual Report to Shareholders
| | | | | | | | | | | | | | | | | | | | | | | | | | | | | | | |
DISTRIBUTIONS
| | | | | RATIOS/SUPPLEMENTAL DATA
|
FROM
NET
INVESTMENT
INCOME | | | FROM
NET
REALIZED
GAIN ON
INVESTMENTS | | | TOTAL
DISTRIBUTIONS | | | NET ASSET
VALUE,
END OF
PERIOD | | TOTAL
RETURN | | | EXPENSES
TO
AVERAGE
NET
ASSETSA | | | NET EXPENSES TO AVERAGE NET ASSETSB | | |
NET
INVESTMENT
INCOME
TO
AVERAGE
NET ASSETS | | | PORTFOLIO
TURNOVER
RATE | | | NET
ASSETS,
END OF
PERIOD
(IN
THOUSANDS) |
| | | | | | | | | | | | | | | | | | | | | | | | | | | |
| | | | | | | | | | | | | | | | | | | | | | | | | | | | | | | | |
| $ | (.18 | ) | | $ | — | | | $ | (.18 | ) | | $ | 9.88 | | 1.70 | %F | | .40 | %D,G | | 0.40 | %D,G | | 3.7 | %D,G | | 83.5 | %F | | $ | 81,659 |
| | | | | | | | | | | | | | | | | | | | | | | | | | | | | | | | |
| | (.25 | ) | | | (.02 | ) | | | (.27 | ) | | | 9.89 | | .69 | % | | .40 | %D | | 0.40 | %D | | 2.4 | %D | | 231.5 | % | | | 37,426 |
| | (.08 | ) | | | — | | | | (.08 | ) | | | 10.09 | | 1.69 | %F | | .40 | %D,G | | 0.40 | %D,G | | 1.6 | %D,G | | 125.5 | %F | | | 26,182 |
| | | | | | | | | |
| | | | | | | | | | | | | | | | | | | | | | | | | | | | | | | | |
| | | | | | | | | | | | | | | | | | | | | | | | | | | | | | | | |
| $ | (.22 | ) | | $ | (.10 | ) | | $ | (.32 | ) | | $ | 10.42 | | 2.19 | %F | | .45 | %G,H | | 0.45 | %G,H | | 4.10 | %G,H | | 116.37 | %F | | $ | 714,464 |
| | | | | | | | | | | | | | | | | | | | | | | | | | | | | | | | |
| | (.38 | ) | | | (.28 | ) | | | (.66 | ) | | | 10.51 | | 1.66 | % | | .45 | %H | | 0.45 | %H | | 3.6 | %H | | 215.7 | % | | | 660,480 |
| | (.44 | ) | | | (.27 | ) | | | (.71 | ) | | | 11.01 | | 7.58 | % | | .45 | %H | | 0.45 | %H | | 4.0 | %H | | 255.1 | % | | | 587,229 |
| | (.53 | ) | | | (.09 | ) | | | (.62 | ) | | | 10.92 | | 11.37 | % | | .45 | % | | 0.45 | % | | 5.0 | % | | 238.5 | % | | | 539,874 |
| | (.57 | ) | | | (.13 | ) | | | (.70 | ) | | | 10.39 | | 4.20 | % | | .45 | %H | | 0.45 | %H | | 5.3 | %H | | 274.8 | % | | | 628,196 |
| | (.68 | ) | | | — | | | | (.68 | ) | | | 10.65 | | 12.79 | % | | .45 | %H | | 0.45 | %H | | 6.6 | %H | | 328.4 | % | | | 457,822 |
| | | | | | | | | |
| | | | | | | | | | | | | | | | | | | | | | | | | | | | | | | | |
| | | | | | | | | | | | | | | | | | | | | | | | | | | | | | | | |
| $ | (.19 | ) | | $ | — | | | $ | (.19 | ) | | $ | 9.93 | | 2.69 | %F | | .45 | %G,I | | 0.45 | %G,I | | 3.8 | %G,I | | 184.2 | %F | | $ | 51,062 |
| | (.32 | ) | | | — | | | | (.32 | ) | | | 9.86 | | 1.81 | %F | | .45 | %G,I | | 0.45 | %G,I | | 3.1 | %G,I | | 463.5 | %F | | | 40,637 |
| | | | | | | | | |
| | | | | | | | | | | | | | | | | | | | | | | | | | | | | | | | |
| | | | | | | | | | | | | | | | | | | | | | | | | | | | | | | | |
| $ | (.25 | ) | | $ | N.M. | | | $ | (.25 | ) | | $ | 11.36 | | 2.90 | %F | | .45 | %G | | 0.45 | %G | | 4.1 | %G | | 299.23 | %F | | $ | 3,807,056 |
| | | | | | | | | | | | | | | | | | | | | | | | | | | | | | | | |
| | (.39 | ) | | | (.31 | ) | | | (.70 | ) | | | 11.29 | | 1.68 | % | | .46 | % | | 0.46 | % | | 3.4 | % | | 407.2 | % | | | 3,277,782 |
| | (.44 | ) | | | (.18 | ) | | | (.62 | ) | | | 11.81 | | 7.64 | % | | .49 | % | | 0.49 | % | | 3.5 | % | | 464.6 | % | | | 2,187,219 |
| | (.55 | ) | | | (.09 | ) | | | (.64 | ) | | | 11.57 | | 11.19 | % | | .49 | % | | 0.49 | % | | 4.9 | % | | 438.6 | % | | | 1,400,431 |
| | (.62 | ) | | | (.13 | ) | | | (.75 | ) | | | 11.01 | | 6.14 | % | | .50 | %J | | 0.50 | %J | | 5.6 | %J | | 595.2 | % | | | 971,544 |
| | (.73 | ) | | | — | | | | (.73 | ) | | | 11.09 | | 14.37 | % | | .50 | %J | | 0.50 | %J | | 6.8 | %J | | 387.2 | % | | | 826,459 |
| | | | | | | | | | | | | | | | | | | | | | | | | | | | | | | | |
| $ | (.24 | ) | | $ | N.M. | | | $ | (.24 | ) | | $ | 11.36 | | 2.76 | %F | | .71 | %G | | 0.71 | %G | | 3.9 | %G | | 299.23 | %F | | $ | 319,410 |
| | | | | | | | | | | | | | | | | | | | | | | | | | | | | | | | |
| | (.36 | ) | | | (.31 | ) | | | (.67 | ) | | | 11.29 | | 1.42 | % | | .72 | % | | 0.72 | % | | 4.2 | % | | 407.2 | % | | | 265,518 |
| | (.41 | ) | | | (.18 | ) | | | (.59 | ) | | | 11.81 | | 7.36 | % | | .75 | %K | | 0.75 | %K | | 3.3 | %K | | 464.6 | % | | | 121,607 |
| | (.52 | ) | | | (.09 | ) | | | (.61 | ) | | | 11.57 | | 10.80 | % | | .75 | % | | 0.75 | % | | 4.1 | % | | 438.6 | % | | | 79,120 |
| | (.60 | ) | | | (.13 | ) | | | (.73 | ) | | | 11.02 | | 5.88 | % | | .75 | %K | | 0.75 | %K | | 5.3 | %K | | 595.2 | % | | | 1,885 |
| | (.70 | ) | | | — | | | | (.70 | ) | | | 11.10 | | 13.96 | % | | .75 | %K | | 0.75 | %K | | 6.6 | %K | | 387.2 | % | | | 1,883 |
| | | | | | | | | | | | | | | | | | | | | | | | | | | | | | | | |
123
Semi-Annual Report to Shareholders
FINANCIAL HIGHLIGHTS—Continued
| | | | | | | | | | | | | | | |
| | | | | INVESTMENT OPERATIONS
| |
| | | NET ASSET
VALUE,
BEGINNING
OF PERIOD | | NET
INVESTMENT
INCOME | | | NET REALIZED
AND UNREALIZED
GAIN/(LOSS) ON
INVESTMENTS,
OPTIONS, FUTURES,
SWAPS, AND
FOREIGN CURRENCY
TRANSACTIONS | | | TOTAL
FROM
INVESTMENT
OPERATIONS | |
| Western Asset Core Plus Bond Portfolio | | | | | | | | | | | |
—Institutional Class | | | | | | | | | | | | | | | |
Six Months Ended, September 30, 2005C | | $ | 10.52 | | $ | .21 | | | $ | .12 | | | $ | .33 | |
Years Ended March 31, | | | | | | | | | | | | | | | |
2005 | | | 10.71 | | | .37 | L | | | .04 | | | | .41 | |
2004 | | | 10.40 | | | .37 | L | | | .55 | | | | .92 | |
2003 | | | 9.88 | | | .51 | L | | | .62 | | | | 1.13 | |
2002 | | | 10.07 | | | .56 | L,M | | | .06 | M | | | .62 | |
2001 | | | 9.48 | | | .66 | L | | | .59 | | | | 1.25 | |
—Financial Intermediary Class | | | | | | | | | | | | | | | |
Six Months Ended, September 30, 2005C | | $ | 10.52 | | $ | .17 | N | | $ | .16 | | | $ | .33 | |
Years Ended March 31, | | | | | | | | | | | | | | | |
2005 | | | 10.71 | | | .35 | N | | | .04 | | | | .39 | |
2004 | | | 10.40 | | | .36 | N | | | .54 | | | | .90 | |
2003 | | | 9.87 | | | .48 | N | | | .63 | | | | 1.11 | |
2002O | | | 10.04 | | | .11 | M,N | | | (.17 | )M | | | (.06 | ) |
| | | | |
Western Asset Inflation Indexed Plus Bond Portfolio | | | | | | | | | | | | | | | |
—Institutional Class | | | | | | | | | | | | | | | |
Six Months Ended, September 30, 2005C | | $ | 10.74 | | $ | .31P | | | $ | .03 | | | $ | .34 | |
Years Ended March 31, | | | | | | | | | | | | | | | |
2005 | | | 11.24 | | | .42 | P | | | (.10 | ) | | | .32 | |
2004 | | | 10.96 | | | .37 | P | | | .71 | | | | 1.08 | |
2003 | | | 9.92 | | | .51 | P | | | 1.19 | | | | 1.70 | |
2002 | | | 9.98 | | | .41 | P | | | .01 | | | | .42 | |
2001Q | | | 10.00 | | | .08 | P | | | (.02 | ) | | | .06 | |
| | | | |
Western Asset High Yield Portfolio | | | | | | | | | | | | | | | |
—Institutional Class | | | | | | | | | | | | | | | |
Six Months Ended September, 2005C | | $ | 10.49 | | $ | .38 | | | $ | (.03 | ) | | $ | .35 | |
Years Ended March 31, | | | | | | | | | | | | | | | |
2005 | | | 10.28 | | | .61 | | | | .17 | | | | .78 | |
2004 | | | 9.56 | | | .78 | R | | | .89 | | | | 1.67 | |
2003 | | | 10.36 | | | .96 | R | | | (.82 | ) | | | .14 | |
2002S | | | 10.00 | | | .53 | R | | | .07 | | | | .60 | |
| | | | | | | | | | | | | | | | |
124
Semi-Annual Report to Shareholders
| | | | | | | | | | | | | | | | | | | | | | | | | | | | | | | |
DISTRIBUTIONS
| | | | | RATIOS/SUPPLEMENTAL DATA
|
FROM
NET
INVESTMENT
INCOME | | | FROM
NET
REALIZED
GAIN ON
INVESTMENTS | | | TOTAL
DISTRIBUTIONS | | | NET ASSET
VALUE,
END OF
PERIOD | | TOTAL
RETURN | | | EXPENSES
TO
AVERAGE
NET
ASSETS | | | NET
EXPENSES
TO
AVERAGE
NET
ASSETSB | | |
NET
INVESTMENT
INCOME
TO
AVERAGE
NET ASSETS | | | PORTFOLIO
TURNOVER
RATE | | | NET
ASSETS,
END OF
PERIOD
(IN
THOUSANDS) |
| | | | | | | | | | | | | | | | | | | | | | | | | | | |
| | | | | | | | | | | | | | | | | | | | | | | | | | | | | | | | |
| $ | (.24 | ) | | $ | (.03 | ) | | $ | (.27 | ) | | $ | 10.58 | | 3.16 | %F | | .45 | %G | | .45 | %G | | 4.1 | %G | | 239.02 | %F | | $ | 5,634,151 |
| | | | | | | | | | | | | | | | | | | | | | | | | | | | | | | | |
| | (.35 | ) | | | (.25 | ) | | | (.60 | ) | | | 10.52 | | 4.01 | % | | .45 | %L | | .45 | %L | | 3.3 | %L | | 586.1 | % | | | 4,565,054 |
| | (.41 | ) | | | (.20 | ) | | | (.61 | ) | | | 10.71 | | 9.12 | % | | .45 | %L | | .45 | %L | | 3.6 | %L | | 463.8 | % | | | 3,286,650 |
| | (.51 | ) | | | (.10 | ) | | | (.61 | ) | | | 10.40 | | 11.78 | % | | .45 | %L | | .45 | %L | | 5.0 | %L | | 422.6 | % | | | 1,866,619 |
| | (.54 | ) | | | (.27 | ) | | | (.81 | ) | | | 9.88 | | 6.34 | % | | .45 | %L | | .45 | %L | | 5.3 | %L | | 590.7 | % | | | 991,673 |
| | (.66 | ) | | | — | | | | (.66 | ) | | | 10.07 | | 13.73 | % | | .46 | %L | | .46 | %L | | 6.8 | %L | | 432.8 | % | | | 444,451 |
| | | | | | | | | | | | | | | | | | | | | | | | | | | | | | | | |
| $ | (.23 | ) | | $ | (.03 | ) | | $ | (.26 | ) | | $ | 10.59 | | 3.14 | %F | | .70 | %G,N | | .70 | %G,N | | 3.7 | %G,N | | 239.02 | %F | | $ | 316,470 |
| | | | | | | | | | | | | | | | | | | | | | | | | | | | | | | | |
| | (.33 | ) | | | (.25 | ) | | | (.58 | ) | | | 10.52 | | 3.77 | % | | .70 | %N | | .70 | %N | | 2.9 | %N | | 586.1 | % | | | 191,085 |
| | (.39 | ) | | | (.20 | ) | | | (.59 | ) | | | 10.71 | | 8.82 | % | | .70 | %N | | .70 | %N | | 3.2 | %N | | 463.8 | % | | | 7,040 |
| | (.48 | ) | | | (.10 | ) | | | (.58 | ) | | | 10.40 | | 11.57 | % | | .70 | %M | | .70 | %N | | 4.8 | %N | | 422.6 | % | | | 369 |
| | (.11 | ) | | | — | | | | (.11 | ) | | | 9.87 | | (.57 | )%F | | .70 | %G,N | | .70 | %G,N | | 5.3 | %G,N | | 590.7 | %G | | | 235 |
| | | | | | | | | |
| | | | | | | | | | | | | | | | | | | | | | | | | | | | | | | | |
| | | | | | | | | | | | | | | | | | | | | | | | | | | | | | | | |
| $ | (.32 | ) | | $ | (.02 | ) | | $ | (.34 | ) | | $ | 10.74 | | 3.20 | %F | | .25 | %G,P | | .25 | %G,P | | 5.7 | %G,P | | 103.2 | %F | | $ | 469,264 |
| | | | | | | | | | | | | | | | | | | | | | | | | | | | | | | | |
| | (.42 | ) | | | (.40 | ) | | | (.82 | ) | | | 10.74 | | 3.27 | % | | .25 | %P | | .25 | %P | | 3.8 | %P | | 255.5 | % | | | 461,746 |
| | (.37 | ) | | | (.43 | ) | | | (.80 | ) | | | 11.24 | | 10.33 | % | | .25 | %P | | .25 | %P | | 3.4 | %P | | 281.8 | % | | | 346,379 |
| | (.51 | ) | | | (.15 | ) | | | (.66 | ) | | | 10.96 | | 17.62 | % | | .25 | %P | | .25 | %P | | 4.8 | %P | | 75.4 | % | | | 290,306 |
| | (.41 | ) | | | (.07 | ) | | | (.48 | ) | | | 9.92 | | 4.28 | % | | .25 | %P | | .25 | %P | | 5.0 | %P | | 79.5 | % | | | 210,635 |
| | (.08 | ) | | | — | | | | (.08 | ) | | | 9.98 | | .55 | %F | | .25 | %G,P | | .25 | %G,P | | 8.9 | %G,P | | — | | | | 11,978 |
| | | | | | | | | |
| | | | | | | | | | | | | | | | | | | | | | | | | | | | | | | | |
| | | | | | | | | | | | | | | | | | | | | | | | | | | | | | | | |
| $ | (.38 | ) | | $ | (.13 | ) | | $ | (.51 | ) | | $ | 10.33 | | 3.46 | %F | | .63 | %G | | .63 | %G | | 7.7 | %G | | 72.6 | %F | | $ | 470,193 |
| | | | | | | | | | | | | | | | | | | | | | | | | | | | | | | | |
| | (.57 | ) | | | — | | | | (.57 | ) | | | 10.49 | | 7.81 | % | | .62 | % | | .62 | % | | 7.0 | % | | 121.0 | % | | | 414,417 |
| | (.95 | ) | | | — | | | | (.95 | ) | | | 10.28 | | 18.27 | % | | .58 | %R | | .58 | %R | | 7.9 | %R | | 116.0 | % | | | 189,458 |
| | (.94 | ) | | | — | | | | (.94 | ) | | | 9.56 | | 2.22 | % | | .55 | %R | | .55 | %R | | 10.2 | %R | | 110.1 | % | | | 149,937 |
| | (.24 | ) | | | — | | | | (.24 | ) | | | 10.36 | | 6.02 | %F | | .55 | %G,R | | .55 | %G,R | | 10.4 | %G,R | | 51.8 | %G | | | 152,729 |
| | | | | | | | | | | | | | | | | | | | | | | | | | | | | | | | |
125
Semi-Annual Report to Shareholders
FINANCIAL HIGHLIGHTS—Continued
| | | | | | | | | | | | | | |
| | | | | INVESTMENT OPERATIONS
|
| | | NET ASSET
VALUE,
BEGINNING
OF PERIOD | | NET
INVESTMENT
INCOME | | | NET REALIZED
AND UNREALIZED
GAIN/(LOSS) ON
INVESTMENTS,
OPTIONS, FUTURES,
SWAPS, AND
FOREIGN CURRENCY
TRANSACTIONS | | | TOTAL
FROM
INVESTMENT
OPERATIONS |
Western Asset Non-U.S. Opportunity Bond
Portfolio | | | | | | | | | | |
—Institutional Class | | | | | | | | | | | | | | |
Six Months Ended September, 2005 | | $ | 10.98 | | $ | .15T | | | $ | .36 | | | $ | .51 |
Years Ended March 31, | | | | | | | | | | | | | | |
2005 | | | 10.52 | | | .19T | | | | .57 | | | | .76 |
2004 | | | 10.91 | | | .97T | | | | (.01 | ) | | | .96 |
2003 | | | 9.25 | | | .25 | T | | | 1.52 | | | | 1.77 |
2002 | | | 9.25 | | | — | M,T | | | .46 | M | | | .46 |
2001 | | | 9.59 | | | .59 | T | | | (.05 | ) | | | .54 |
| | | | | | | | | | | | | | | |
| A | This ratio reflects expenses before compensating balance credits, but any of the voluntary expense waiver. |
| B | This ratio reflects expenses net of compensating balance credits and voluntary expense waivers. |
| D | Net of advisory fees waived by the adviser pursuant to a voluntary expense limitation of 0.40%. If no fees had been waived by the adviser, the annualized ratio of expenses to average net assets would have been as follows: for the six months ended September 30, 2005, 0.73%; and for the year ended March 31, 2005, 0.73%; and for the period October 1, 2003 (commencement of operations) to March 31, 2004, 0.68%. |
| E | For the period October 1, 2003 (commencement of operations) to March 31, 2004. |
| H | Net of advisory fees waived by the adviser pursuant to a voluntary expense limitation of 0.45%. If no fees had been waived by the adviser, the ratio of expenses to average net assets would have been: for the six months ended September 30, 2005, 0.47%; and for the years ended March 31, 2005, 0.46%; 2004, 0.47%; 2002, 0.47%; and 2001, 0.47%. |
| I | Net of advisory fees waived by the adviser pursuant to a voluntary expense limitation of 0.45%. If no fees had been waived by the adviser, the ratio of expenses to average net assets would have been as follows: for the six months ended September 30, 2005, 0.85%; and for the period ended March 31, 2005, 1.22%. |
| J | Net of advisory fees waived by the adviser pursuant to a voluntary expense limitation of 0.50%. If no fees had been waived by the adviser, the ratio of expenses to average net assets would have been as follows: for the years ended March 31, 2002, 0.52% and 2001, 0.53%. |
| K | Net of advisory fees waived by the adviser pursuant to a voluntary expense limitation of 0.75%. If no fees had been waived by the adviser, the ratio of expenses to average net assets would have been as follows: for the years ended March 31, 2004, 0.76% ; 2002, 0.77%; and 2001, 0.78%. |
| L | Net of advisory fees waived by the adviser pursuant to a voluntary expense limitation of 0.50% to June 30, 2000, and 0.45% thereafter. If no fees had been waived by the adviser, the ratio of expenses to average net assets would have been as follows: for the years ended March 31, 2005, 0.45%; 2004, 0.48%; 2003, 0.50%; 2002, 0.54%; and 2001, 0.57%. |
126
Semi-Annual Report to Shareholders
| | | | | | | | | | | | | | | | | | | | | | | | | | | | | | | |
DISTRIBUTIONS
| | | | | RATIOS/SUPPLEMENTAL DATA
|
FROM
NET
INVESTMENT
INCOME | | | FROM
NET
REALIZED
GAIN ON
INVESTMENTS | | | TOTAL
DISTRIBUTIONS | | | NET ASSET
VALUE,
END OF
PERIOD | | TOTAL
RETURN | | | EXPENSES
TO
AVERAGE
NET
ASSETS | | | NET
EXPENSES
TO AVERAGE NET ASSETSB | | |
NET
INVESTMENT
INCOME
TO
AVERAGE
NET ASSETS | | | PORTFOLIO
TURNOVER
RATE | | | NET
ASSETS,
END OF
PERIOD
(IN
THOUSANDS) |
| | | | | | | | | | | | | | | | | | | | | | | | | | | |
| | | | | | | | | | | | | | | | | | | | | | | | | | | | | | | | |
| $ | (.02 | ) | | $ | (.07 | ) | | $ | (.09 | ) | | $ | 11.40 | | 4.70 | %F | | .55 | %G,T | | .55 | %G,T | | 3.3 | %G,T | | 106.9 | %F | | $ | 71,446 |
| | | | | | | | | | | | | | | | | | | | | | | | | | | | | | | | |
| | (.29 | ) | | | (.01 | ) | | | (.30 | ) | | | 10.98 | | 7.60 | % | | .55 | %T | | .55 | %T | | 3.2 | %T | | 40.8 | % | | | 89,170 |
| | (1.01 | ) | | | (.34 | ) | | | (1.35 | ) | | | 10.52 | | 9.06 | % | | .55 | %T | | .55 | %T | | 4.0 | %T | | 42.8 | % | | | 97,027 |
| | (.11 | ) | | | — | | | | (.11 | ) | | | 10.91 | | 19.26 | % | | .55 | %T | | .55 | %T | | 4.4 | %T | | 187.5 | % | | | 59,026 |
| | (.46 | ) | | | — | | | | (.46 | ) | | | 9.25 | | 5.21 | % | | .55 | %T | | .55 | %T | | 4.5 | %T | | 307.6 | % | | | 47,487 |
| | (.88 | ) | | | — | | | | (.88 | ) | | | 9.25 | | 6.31 | % | | .55 | %T | | .55 | %T | | 5.6 | %T | | 263.4 | % | | | 93,385 |
| | | | | | | | | | | | | | | | | | | | | | | | | | | | | | | | |
| M | The amount presented is calculated pursuant to a methodology prescribed by the Securities and Exchange Commission for a share outstanding throughout the period. This amount is inconsistent with the Fund’s aggregate gains and losses because of the timing of sales and redemptions of Fund shares in relation to fluctuating market values for the investment portfolio. |
| N | Net of advisory fees waived by the adviser pursuant to a voluntary expense limitation of 0.70%. If no fees had been waived by the adviser, the ratio of expenses to average net assets would have been as follows: for the six months ended September 30, 2005, 0.71%; and for the years ended March 31, 2005, 0.71%; 2004, 0.73%; and 2003, 0.75%. For the period January 8, 2002 (commencement of operations) to March 31, 2002, the annualized ratio of expenses to average net assets would have been 0.75%. |
| O | For the period January 8, 2002 (commencement of operations) to March 31, 2002. |
| P | Net of advisory fees waived by the adviser pursuant to a voluntary expense limitation of 0.25%. If no fees had been waived by the adviser, the ratio of expenses to average net assets would have been as follows: for the six months ended September 30, 2005, 0.27%; and for the years ended March 31, 2005, 0.27%; 2004, 0.27%; 2003, 0.27%; and 2002, 0.67%. For the period March 1, 2001 (commencement of operations) to March 31, 2001, the annualized ratio of expenses to average net assets would have been 2.03%. |
| Q | For the period March 1, 2001 (commencement of operations) to March 31, 2001. |
| R | Net of advisory fees waived by the adviser pursuant to a voluntary expense limitation of 0.55% to December 31, 2003, and 0.65% thereafter. If no fees had been waived by the adviser, the ratio of expenses to average net assets would have been as follows: for the years ended March 31, 2004, 0.67% and 2003, 0.67%. For the period September 28, 2001 (commencement of operations) to March 31, 2002, the annualized ratio of expenses to average net assets would have been 0.75%. |
| S | For the period September 28, 2001 (commencement of operations) to March 31, 2002. |
| T | Net of advisory fees waived by the adviser pursuant to a voluntary expense limitation of 0.55%. If no fees had been waived by the adviser, the ratio of expenses to average net assets would have been as follows: for the six months ended September 30, 2005, 0.73%; and for the years ended March 31, 2005, 0.68%; 2004, 0.80%; 2003, 0.82%; 2002, 0.82%; and 2001, 0.85%. |
See notes to financial statements.
127
Semi-Annual Report to Shareholders
NOTES TO FINANCIAL STATEMENTS
(Amounts in Thousands) (Unaudited)
1. Significant Accounting Policies:
Western Asset Funds, Inc. (“Corporation”), consisting of Western Asset Limited Duration Bond Portfolio (“Limited Duration”), Western Asset Intermediate Bond Portfolio (“Intermediate”), Western Asset Intermediate Plus Bond Portfolio (“Intermediate Plus”), Western Asset Core Bond Portfolio (“Core”), Western Asset Core Plus Bond Portfolio (“Core Plus”), Western Asset Inflation Indexed Plus Bond Portfolio (“Inflation Indexed”), Western Asset High Yield Portfolio (“High Yield”), and Western Asset Non-U.S. Opportunity Bond Portfolio (“Non-U.S.”) (individually a “Fund,” collectively the “Funds”), is registered under the Investment Company Act of 1940, as amended (“1940 Act”), as a diversified, open-end management investment company with the exception of Non-U.S., which is non-diversified.
Each Fund offers two classes of shares: Institutional Class and Financial Intermediary Class. Shares in the Financial Intermediary Class bear a distribution fee. The Financial Intermediary Class shares of Limited Duration, Intermediate, Intermediate Plus, Inflation Indexed, High Yield, and Non-U.S. are not active. The income and expenses of each of the Funds are allocated proportionately to the two classes of shares based on daily net assets, except for Rule 12b-1 distribution fees, which are charged only on the Financial Intermediary Class shares, and transfer agent and shareholder servicing expenses, which are determined separately for each class.
Preparation of the financial statements in accordance with accounting principles generally accepted in the United States of America requires management to make estimates and assumptions that affect the reported amounts and disclosures in the financial statements. Actual results could differ from these estimates. The following is a summary of significant accounting policies followed by the Funds in the preparation of their financial statements:
Security Valuation
Securities owned by the Funds for which market quotations are readily available are valued at current market value. Securities for which market quotations are not readily available are fair valued by the Board of Directors or the Funds’ Valuation Committee pursuant to procedures adopted by the Board of Directors. In determining fair value, the Board of Directors or the Funds’ Valuation Committee considers all relevant qualitative and quantitative factors available. These factors are subject to change over time and are reviewed periodically. The values assigned to fair value investments are based on available information and do not necessarily represent amounts that might ultimately be realized, since such amounts depend on future developments inherent in long-term investments. Further, because of the inherent uncertainty of valuation, those estimated values may differ significantly from the values that would have been used had a ready market of the investments existed, and the differences could be material.
With respect to Intermediate Plus, Core Plus, Inflation Indexed, High Yield and Non-U.S., where a security is traded on more than one market, which may include foreign markets, the securities are generally valued on the market considered by the Funds’ adviser to be the primary market. The Funds will value their foreign securities in U.S. dollars on the basis of the then-prevailing exchange rates.
Security Transactions
Security transactions are recorded on the trade date. Realized gains and losses from security transactions are reported on an identified cost basis for both financial reporting and federal income tax purposes.
For the six months ended September 30, 2005, investment transactions (excluding short-term investments) were:
| | | | | | | | | | | | |
| | | Purchases
| | Proceeds From Sales
|
| | | U.S. Gov’t
Securities
| | Other
| | U.S. Gov’t
Securities
| | Other
|
Limited Duration | | $ | 64,919 | | $ | 27,367 | | $ | 38,922 | | $ | 7,944 |
Intermediate | | | 446,842 | | | 306,587 | | | 423,433 | | | 331,640 |
Intermediate Plus | | | 58,600 | | | 35,043 | | | 53,410 | | | 29,070 |
Core | | | 12,538,650 | | | 2,286,628 | | | 11,968,005 | | | 1,345,721 |
Core Plus | | | 11,026,009 | | | 4,661,712 | | | 9,650,892 | | | 3,487,307 |
Inflation Indexed | | | 432,587 | | | 60,148 | | | 439,279 | | | 54,710 |
High Yield | | | — | | | 352,584 | | | — | | | 309,988 |
Non-U.S. | | | — | | | 78,761 | | | — | | | 85,843 |
128
Semi-Annual Report to Shareholders
Foreign Currency Translation
Assets and liabilities initially expressed in non-U.S. currencies are translated into U.S. dollars using currency exchange rates determined prior to the close of trading on the Exchange, usually at 2:00 p.m. Eastern time. Purchases and sales of securities and income and expenses are translated into U.S. dollars at the prevailing market rates on the dates of such transactions. The effects of changes in non-U.S. currency exchange rates on investment securities and other assets and liabilities are included with the net realized and unrealized gain or loss on investment securities.
Repurchase Agreements
The Funds may engage in repurchase agreement transactions. Under the terms of a typical repurchase agreement, a fund takes possession of an underlying debt obligation subject to an obligation of the seller to repurchase, and a fund to resell, the obligation at an agreed-upon price and time, thereby determining the yield during a fund’s holding period. This arrangement results in a fixed rate of return that is not subject to market fluctuations during the fund’s holding period. The value of the collateral is at all times at least equal to the total amount of the repurchase obligation, including interest. In the event of counterparty default, a fund has the right to use the collateral to satisfy the terms of the repurchase agreement. However, there could be potential loss to the fund in the event the fund is delayed or prevented from exercising its right to dispose of the collateral securities, including the risk of a possible decline in the value of the collateral securities during the period in which the fund seeks to assert its rights. The Funds’ investment advisers review the value of the collateral and the creditworthiness of those banks and dealers with which the Funds enter into repurchase agreements to evaluate potential risks.
Options, Futures and Swap Agreements
The current market value of a traded option is the last sale price or, in the absence of a sale, the mean between the closing bid and asked price. Futures contracts are valued daily at the settlement price established by the board of trade or exchange on which they are traded. Futures contracts are marked-to-market on a daily basis. As a contract’s value fluctuates, payments known as variation margin are made or received by a Fund each day, depending on the daily fluctuation in the value of the contract. The daily changes in contract value are recorded as unrealized gains or losses, and the Fund recognizes a gain or loss when the contract is closed. Swap agreements are priced daily based upon quotations from brokers and the change, if any, is recorded as unrealized appreciation or depreciation.
Investment Income and Distributions to Shareholders
Dividend income and distributions to shareholders are allocated at the class level and are recorded on the ex-dividend date. Dividends from net investment income are declared daily and paid monthly for each Fund except High Yield and Non-U.S., which declare and pay dividends quarterly. Net capital gain distributions, which are calculated at the Fund level, are declared and paid annually in June. An additional distribution may be made in November to the extent necessary in order to comply with federal excise tax requirements. Distributions are determined in accordance with federal income tax regulations, which may differ from those determined in accordance with accounting principles generally accepted in the United States of America; accordingly, periodic reclassifications are made within the Funds’ capital accounts to reflect income and gains available for distribution under federal income tax regulations. Interest income and expenses are recorded on the accrual basis. Bond discounts and premiums are amortized and included in interest income for financial reporting and federal income tax purposes.
Compensating Balance Credits
The Funds have an arrangement with their custodian bank, whereby a portion of the custodian’s fee is paid indirectly by credits earned on the Funds’ cash on deposit with the bank. This deposit arrangement is an alternative to purchasing overnight investments. For the period ended September 30, 2005, the Funds earned compensating balance credits of $1 for Limited Duration, $8 for Intermediate, $1 for Intermediate Plus, $11 for Core, $11 for Core Plus, $6 for Inflation Indexed, and $5 for High Yield. Non-U.S. earned compensating balance credits of less than $1.
Other
In the normal course of business, each Fund enters into contracts that provide general indemnifications. Each Fund’s maximum exposure under these arrangements is dependent upon claims that may be made against the Fund in the future and, therefore, cannot be estimated; however, based on experience, the risk of material loss from such claims in considered remote.
129
Semi-Annual Report to Shareholders
NOTES TO FINANCIAL STATEMENTS—Continued
2. Federal Income Taxes:
No provision for federal income or excise taxes is required since each Fund intends to continue to qualify as a regulated investment company and distribute substantially all of its taxable income and capital gains to its shareholders. Because federal income tax regulations differ from accounting principles generally accepted in the United States of America, income and capital gain distributions determined in accordance with tax regulations may differ from net investment income and realized gains recognized for financial reporting purposes. Accordingly, the character of distributions and composition of net assets for tax purposes may differ from those reflected in the accompanying financial statements. The amount and character of tax-basis distributions and composition of net assets are finalized at fiscal year-end; accordingly, tax-basis balances have not been determined as of September 30, 2005.
The Funds intend to retain realized capital gains that may be offset against available capital loss carryforwards for federal income tax purposes. As of March 31, 2005, Intermediate Plus had capital loss carryforwards of $113, expiring in 2013. There were no capital loss carryforwards for any of the other Funds.
3. Financial Instruments:
Forward Currency Exchange Contracts
As part of their investment programs, the Funds may utilize forward currency exchange contracts. The nature and risks of these financial instruments and the reasons for using them are set forth more fully in the Corporation’s prospectus and statement of additional information.
Forward foreign currency contracts are marked-to-market daily using forward foreign currency exchange rates supplied by an independent pricing service. The change in a contract’s market value is recorded by the Funds as an unrealized gain or loss. When the contract is closed or delivery is taken, the Funds record a realized gain or loss equal to the difference between the value of the contract at the time it was opened and the value at the time it was closed.
The use of forward foreign currency exchange contracts does not eliminate fluctuations in the underlying prices of the Funds’ securities, but it does establish a rate of exchange that can be achieved in the future. These forward foreign currency contracts involve market risk in excess of amounts reflected in the financial statements. Although forward foreign currency contracts used for hedging purposes limit the risk of loss due to a decline in the value of the hedged currency, they also limit any potential gain that might result should the value of the currency increase. In addition, the Funds could be exposed to risks if the counterparties to the contracts are unable to meet the terms of their contracts.
At September 30, 2005, open forward currency exchange contracts were as follows:
Intermediate Plus
| | | | | | | | | | | | |
Settlement
Date
| | Contract to
| | Unrealized
Gain/(Loss)
| |
| | ReceiveA
| | DeliverA
| |
| 11/8/05 | | USD | | 205 | | AUD | | 272 | | $ | (2 | ) |
| 11/8/05 | | USD | | 410 | | CAD | | 498 | | | (20 | ) |
| 11/8/05 | | USD | | 1,394 | | EUR | | 1,153 | | | 6 | |
| | | | | | | | | | |
|
|
|
| | | | | | | | | | | $ | (16 | ) |
| | | | | | | | | | |
|
|
|
Core Plus
| | | | | | | | | | | | |
Settlement
Date
| | Contract to
| | Unrealized
Gain/(Loss)
| |
| | ReceiveA
| | DeliverA
| |
| 11/8/05 | | EUR | | 28,857 | | USD | | 34,912 | | $ | (154 | ) |
| 11/8/05 | | USD | | 200,043 | | EUR | | 165,560 | | | 795 | |
| 11/8/05 | | JPY | | 3,680,000 | | USD | | 33,153 | | | (622 | ) |
| 11/8/05 | | USD | | 23,850 | | AUD | | 31,627 | | | (238 | ) |
| 11/8/05 | | USD | | 59,513 | | CAD | | 72,410 | | | (2,912 | ) |
| | | | | | | | | | |
|
|
|
| | | | | | | | | | | $ | (3,131 | ) |
| | | | | | | | | | |
|
|
|
130
Semi-Annual Report to Shareholders
Inflation Indexed
| | | | | | | | | | | | |
Settlement
Date
| | Contract to
| | Unrealized
Gain/(Loss)
| |
| | ReceiveA
| | DeliverA
| |
| 11/8/05 | | CAD | | 10,340 | | USD | | 8,559 | | $ | 356 | |
| 11/8/05 | | USD | | 1,468 | | CAD | | 1,796 | | | (80 | ) |
| 11/8/05 | | EUR | | 2,834 | | USD | | 3,430 | | | (17 | ) |
| 11/8/05 | | USD | | 10,882 | | EUR | | 8,904 | | | 157 | |
| 11/8/05 | | EUR | | 2,730 | | SEK | | 25,700 | | | (16 | ) |
| 11/8/05 | | JPY | | 1,548,862 | | USD | | 14,045 | | | (352 | ) |
| 11/8/05 | | USD | | 9,857 | | JPY | | 1,052,090 | | | 387 | |
| | | | | | | | | | |
|
|
|
| | | | | | | | | | | $ | 435 | |
| | | | | | | | | | |
|
|
|
Non-U.S.
| | | | | | | | | | | | |
Settlement
Date
| | Contract to
| | Unrealized
Gain/(Loss)
| |
| | ReceiveA
| | DeliverA
| |
| 11/8/05 | | CAD | | 548 | | USD | | 450 | | $ | 22 | |
| 11/8/05 | | USD | | 905 | | CAD | | 1,100 | | | (44 | ) |
| 11/8/05 | | EUR | | 2,864 | | AUD | | 8,023 | | | (37 | ) |
| 11/8/05 | | EUR | | 3,108 | | NOK | | 57,272 | | | (2 | ) |
| 11/8/05 | | NOK | | 40,876 | | EUR | | 6,176 | | | 7 | |
| 11/8/05 | | EUR | | 665 | | PLN | | 5,524 | | | (47 | ) |
| 11/8/05 | | EUR | | 18,966 | | USD | | 23,344 | | | (499 | ) |
| 11/8/05 | | USD | | 54,215 | | EUR | | 44,825 | | | 226 | |
| 11/8/05 | | HUF | | 148,156 | | USD | | 751 | | | (40 | ) |
| 11/8/05 | | USD | | 720 | | HUF | | 148,156 | | | 8 | |
| 11/8/05 | | NOK | | 17,115 | | USD | | 2,614 | | | 1 | |
| 11/8/05 | | USD | | 3,383 | | NOK | | 22,119 | | | 2 | |
| 11/8/05 | | PLN | | 1,220 | | USD | | 1,216 | | | (4 | ) |
| 11/8/05 | | USD | | 1,740 | | PLN | | 5,956 | | | (87 | ) |
| 11/8/05 | | SEK | | 17,178 | | USD | | 2,220 | | | 18 | |
| 11/8/05 | | USD | | 8,431 | | SEK | | 65,546 | | | (40 | ) |
| 11/8/05 | | USD | | 6,767 | | AUD | | 8,800 | | | 4 | |
| 11/8/05 | | USD | | 4,227 | | DKK | | 26,146 | | | 7 | |
| 11/8/05 | | USD | | 22,972 | | GBP | | 12,859 | | | 316 | |
| | | | | | | | | | |
|
|
|
| | | | | | | | | | | $ | (189 | ) |
| | | | | | | | | | |
|
|
|
| A | Definitions of currency abbreviations: |
AUD—Australian dollar
CAD—Canadian dollar
DKK—Danish krona
EUR—Euro
GBP—British pound
HUF—Hungarian forint
JPY—Japanese yen
NOK—Norwegian krone
PLN—Polish zlotych
SEK—Swedish krona
USD—United States dollar
131
Semi-Annual Report to Shareholders
NOTES TO FINANCIAL STATEMENTS—Continued
Options and Futures
As part of their investment programs, the Funds may utilize options and futures. Options may be written (sold) or purchased by the Funds. When a Fund purchases a put or call option, the premium paid is recorded as an investment and its value is marked-to-market daily. When a Fund writes a put or call option, an amount equal to the premium received by the Fund is recorded as a liability and its value is marked-to-market daily.
When options, whether written or purchased, expire, are exercised or are closed (by entering into a closing purchase or sale transaction), the Fund realizes a gain or loss as described in the chart below:
| | |
| Purchased option: | | Impact on the Fund: |
| The option expires | | Realize a loss in the amount of the cost of the option. |
| The option is closed through a closing sale transaction | | Realize a gain or loss depending on whether the proceeds from the closing sale transaction are greater or less than the cost of the option. |
| The Fund exercises a call option | | The cost of the security purchased through the exercise of the option will be increased by the premium originally paid to purchase the call option. |
| The Fund exercises a put option | | Realize a gain or loss from the sale of the underlying security. The proceeds of that sale will be reduced by the premium originally paid to purchase the put option. |
| |
| Written option: | | Impact on the Fund: |
| The option expires | | Realize a gain equal to the amount of the premium received. |
| The option is closed through a closing purchase transaction | | Realize a gain or loss without regard to any unrealized gain or loss on the underlying security and eliminate the option liability. The Fund will realize a loss in this transaction if the cost of the closing purchase exceeds the premium received when the option was written. |
| A written call option is exercised by the option purchaser | | Realize a gain or loss from the sale of the underlying security. The proceeds of that sale will be increased by the premium originally received when the option was written. |
| A written put option is exercised by the option purchaser | | The amount of the premium originally received will reduce the cost of the security that the Fund purchased when the option was exercised. |
The risk associated with purchasing options is limited to the premium originally paid. Options written by a Fund involve, to varying degrees, risk of loss in excess of the option value reflected in the statement of net assets. The risk in writing a covered call option is that a Fund may forgo the opportunity of profit if the market price of the underlying security increases and the option is exercised. The risk in writing a put option is that a Fund may incur a loss if the market price of the underlying security decreases and the option is exercised. In addition, there is the risk a Fund may not be able to enter into a closing transaction because of an illiquid secondary market or, for over-the-counter options, because of the counterparty’s inability or unwillingness to perform. The nature and risks of these financial instruments and the reasons for using them are set forth more fully in the Corporation’s prospectus and statement of additional information.
132
Semi-Annual Report to Shareholders
Activity in written call and put options during the six months ended September 30, 2005, was as follows:
| | | | | | | | | | | | | | |
| | | Calls
| | | Puts
| |
| Intermediate | | Actual
Contracts
| | | Premiums
| | | Actual
Contracts
| | | Premiums
| |
Options outstanding at March 31, 2005 | | 330 | | | $ | 109 | | | 406 | | | $ | 106 | |
Options written | | 15,401,010 | | | | 474 | | | 1,130 | | | | 476 | |
Options closed | | (1,340 | ) | | | (549 | ) | | (1,177 | ) | | | (362 | ) |
Options expired | | (15,400,000 | ) | | | (34 | ) | | — | | | | — | |
Options exercised | | — | | | | — | | | | | | | | |
| | |
|
| |
|
|
| |
|
| |
|
|
|
Options outstanding at September 30, 2005 | | — | | | $ | — | | | 359 | | | $ | 220 | |
| | |
|
| |
|
|
| |
|
| |
|
|
|
| | | | | | | | | | | | | | |
| | | Calls
| | | Puts
| |
| Intermediate Plus | | Actual
Contracts
| | | Premiums
| | | Actual
Contracts
| | | Premiums
| |
Options outstanding at March 31, 2005 | | 18 | | | $ | 4 | | | 26 | | | $ | 7 | |
Options written | | 3,200,064 | | | | 40 | | | 2,200,073 | | | | 45 | |
Options closed | | (82 | ) | | | (31 | ) | | (73 | ) | | | (22 | ) |
Options expired | | (3,200,000 | ) | | | (13 | ) | | (2,200,000 | ) | | | (14 | ) |
Options exercised | | — | | | | — | | | — | | | | — | |
| | |
|
| |
|
|
| |
|
| |
|
|
|
Options outstanding at September 30, 2005 | | — | | | $ | — | | | 26 | | | $ | 16 | |
| | |
|
| |
|
|
| |
|
| |
|
|
|
| | | | | | | | | | | | | | |
| | | Calls
| | | Puts
| |
| Core | | Actual
Contracts
| | | Premiums
| | | Actual
Contracts
| | | Premiums
| |
Options outstanding at March 31, 2005 | | 6,504,873 | | | $ | 3,162 | | | 136,603,194 | | | $ | 2,866 | |
Options written | | 250,019,011 | | | | 16,648 | | | 236,919,682 | | | | 15,501 | |
Options closed | | (62,207,621 | ) | | | (5,730 | ) | | (142,930,925 | ) | | | (5,092 | ) |
Options expired | | (94,606,529 | ) | | | (6,051 | ) | | (115,206,290 | ) | | | (5,097 | ) |
Options exercised | | (2,487 | ) | | | (1,730 | ) | | (1,242 | ) | | | (756 | ) |
| | |
|
| |
|
|
| |
|
| |
|
|
|
Options outstanding at September 30, 2005 | | 99,707,247 | | | $ | 6,299 | | | 115,384,419 | | | $ | 7,422 | |
| | |
|
| |
|
|
| |
|
| |
|
|
|
| | | | | | | | | | | | | | |
| | | Calls
| | | Puts
| |
| Core Plus | | Actual
Contracts
| | | Premiums
| | | Actual
Contracts
| | | Premiums
| |
Options outstanding at March 31, 2005 | | 9,008,669 | | | $ | 6,366 | | | 191,104,704 | | | $ | 4,321 | |
Options written | | 434,028,097 | | | | 25,944 | | | 512,627,431 | | | | 25,428 | |
Options closed | | (26,710,891 | ) | | | (8,170 | ) | | (199,478,458 | ) | | | (7,640 | ) |
Options expired | | (229,807,363 | ) | | | (7,869 | ) | | (254,006,969 | ) | | | (7,228 | ) |
Options exercised | | (7,351 | ) | | | (5,856 | ) | | (3,473 | ) | | | (2,629 | ) |
| | |
|
| |
|
|
| |
|
| |
|
|
|
Options outstanding at September 30, 2005 | | 186,511,161 | | | $ | 10,415 | | | 250,243,235 | | | $ | 12,254 | |
| | |
|
| |
|
|
| |
|
| |
|
|
|
| | | | | | | | | | | | |
| | | Calls
| | | Puts
|
| Inflation Indexed | | Actual
Contracts
| | | Premiums
| | | Actual
Contracts
| | Premiums
|
Options outstanding at March 31, 2005 | | 38 | | | $ | 24 | | | — | | $ | — |
Options written | | 320 | | | | 156 | | | 1,197 | | | 146 |
Options closed | | (282 | ) | | | (130 | ) | | — | | | — |
Options expired | | (76 | ) | | | (50 | ) | | — | | | — |
Options exercised | | — | | | | — | | | — | | | — |
| | |
|
| |
|
|
| |
| |
|
|
Options outstanding at September 30, 2005 | | — | | | $ | — | | | 1,197 | | $ | 146 |
| | |
|
| |
|
|
| |
| |
|
|
133
Semi-Annual Report to Shareholders
NOTES TO FINANCIAL STATEMENTS—Continued
Upon entering into a futures contract, the Funds are required to deposit with the broker cash or cash equivalents in an amount equal to a certain percentage of the contract amount. This is known as the “initial margin.” Subsequent payments (“variation margin”) are made or received by the Fund each day, depending on the daily fluctuation in the value of the contract. For Non-U.S. and foreign denominated futures held in Intermediate Plus, Core Plus and Inflation Indexed, payment is not sent daily, but is recorded as a net payable or receivable by the Fund to or from the futures broker, which holds cash collateral from the Fund. The daily changes in contract value are recorded as unrealized gains or losses, and each Fund recognizes a realized gain or loss when the contract is closed. Futures contracts are valued daily at the settlement price established by the board of trade or exchange on which they are traded.
The Funds enter into futures contracts for various reasons, including in connection with their interest rate management strategy. Futures contracts involve, to varying degrees, risk of loss in excess of the amounts reflected in the financial statements. The change in value of the futures contracts primarily corresponds with the value of the underlying instruments, which may not correlate with changes in interest rates, if applicable. In addition, there is a risk that a Fund may not be able to enter into a closing transaction because of an illiquid secondary market. The nature and risks of these financial instruments and other reasons for using them are set forth more fully in the Corporation’s prospectus and statement of additional information.
The open futures positions and related appreciation or depreciation at September 30, 2005, are listed at the end of each Fund’s portfolio of investments.
Swap Agreements
The Funds may invest in swaps for the purpose of managing their exposure to interest rate, credit or market risk.
Total return swaps are agreements to exchange the return generated by one instrument for the return generated by another instrument, for example, the agreement to pay interest in exchange for a market-linked return based on a notional amount. To the extent the total return of the index exceeds the offsetting interest obligation, the Funds will receive a payment from the counterparty. To the extent it is less, the Funds will make a payment to the counterparty. Periodic payments received or made by the Funds are recorded in the accompanying statements of operations as realized gains or losses, respectively.
Credit default swaps (denoted in the table on the following pages by a superscript 1) involve the exchange of a fixed-rate premium for protection against the loss in value of an underlying debt instrument in the event of a defined credit event (such as payment default or bankruptcy). Under the terms of the swap, one party acts as a “guarantor,” receiving a periodic payment that is a fixed percentage applied to a notional principal amount. In return, the party agrees to purchase the notional amount of the underlying instrument, at par, if a credit event occurs during the term of the swap. The Funds may enter into credit default swaps in which a Fund or its counterparty act as guarantors. By acting as the guarantor of a swap, a Fund assumes the market and credit risk of the underlying instrument, including liquidity and loss of value. Interest rate swap contracts (denoted in the table on the following pages by a superscript 2) involve the exchange of commitments to pay and receive interest based on a notional principal amount.
Swaps are marked-to-market daily and changes in value are recorded as unrealized appreciation/(depreciation). Gains or losses are realized upon termination of the swap agreement. Periodic payments and premiums received or made by a Fund are recorded in the accompanying statements of operations as realized gains or losses, respectively. Collateral, in the form of cash or securities, may be required to be held in segregated accounts with the Funds’ custodian in compliance with swap contracts. Risks may exceed amounts recognized on the statements of assets and liabilities. These risks include changes in the returns of the underlying instruments, failure of the counterparties to perform under the contracts’ terms, and the possible lack of liquidity with respect to the swap agreements.
134
Semi-Annual Report to Shareholders
| | | | | | | | | | | | |
WESTERN ASSET INTERMEDIATE BOND PORTFOLIO |
Agreement With:
| | Termination Date
| | The Fund
Agrees to Pay
| | The Fund
Will Receive
| | Contract
Notional Amount
| | Unrealized
Appreciation/
(Depreciation)
|
Deutsche Bank AG
(Apache Corporation, 6.25%, due 4/15/12)1 | | March 20, 2010 | | Specified amount
upon credit
event noticeB | | 0.36%
Quarterly | | $ | 2,275 | | $ | 5 |
| | | | | |
Deutsche Bank AG
(Freddie Mac,
5.00%, due 7/15/14)1 | | March 20, 2015 | | Specified amount
upon credit
event noticeB | | 0.29%
Quarterly | | | 2,400 | | | 20 |
| | | | | |
Lehman Brothers Holdings Inc. (Dynegy Holdings,
8.75%, due 2/15/12)1 | | April 23, 2007 | | Specified amount
upon credit
event noticeC | | 3-month
LIBORE
Quarterly | | | 2,200 | | | 33 |
| | | | | |
Merrill Lynch & Co., Inc. (iBoxx IG Hi-Vol4)1 | | June 20, 2010 | | Specified amount
upon credit
event noticeB | | 0.90%
Quarterly | | | 6,500 | | | 8 |
| | | | | | | | |
|
| |
|
|
| | | | | | | | | $ | 13,375 | | $ | 66 |
| | | | | | | | |
|
| |
|
|
|
WESTERN ASSET INTERMEDIATE PLUS BOND PORTFOLIO |
Agreement With:
| | Termination Date
| | The Fund
Agrees to Pay
| | The Fund
Will Receive
| | Contract
Notional Amount
| | Unrealized
Appreciation/
(Depreciation)
|
Deutsche Bank AG
(Apache Corporation, 6.25%, due 4/15/12)1 | | March 20, 2015 | | Specified amount
upon credit
event noticeB | | 0.36%
Quarterly | | $ | 100 | | $ | N.M. |
| | | | | |
JP Morgan Chase & Co. (Countrywide Home Loans, 5.625%, due 7/15/09)1 | | June 20, 2010 | | Specified amount
upon credit
event noticeB | | 0.58%
Quarterly | | | 200 | | | 1 |
| | | | | |
Merrill Lynch & Co., Inc. (iBoxx IG Hi-Vol4)1 | | June 20, 2010 | | Specified amount
upon credit
event noticeB | | 0.90%
Quarterly | | | 400 | | | 0.4 |
| | | | | |
Merrill Lynch & Co., Inc. (iBoxx HY3)1 | | December 20, 2009 | | Specified amount
upon credit
event noticeB | | 3.75%
Quarterly | | | 396 | | | 5 |
| | | | | |
The Goldman Sachs Group, Inc. (iBoxx HY2)1 | | September 20, 2009 | | Specified amount
upon credit
event noticeB | | 4.30%
Quarterly | | | 248 | | | 8 |
| | | | | | | | |
|
| |
|
|
| | | | | | | | | $ | 1,344 | | $ | 14 |
| | | | | | | | |
|
| |
|
|
|
WESTERN ASSET CORE BOND PORTFOLIO |
Agreement With:
| | Termination Date
| | The Fund
Agrees to Pay
| | The Fund
Will Receive
| | Contract
Notional Amount
| | Unrealized
Appreciation/
(Depreciation)
|
Bear Stearns, Inc.
(Ford Motor Credit Company,
7.00%, due 10/1/13)1 | | June 20, 2010 | | Specified amount
upon credit
event noticeB | | 4.830%
Quarterly | | $ | 12,500 | | $ | 281 |
135
Semi-Annual Report to Shareholders
NOTES TO FINANCIAL STATEMENTS—Continued
| | | | | | | | | | | | |
WESTERN ASSET CORE BOND PORTFOLIO—Continued |
Agreement With:
| | Termination Date
| | The Fund
Agrees to Pay
| | The Fund
Will Receive
| | Contract
Notional Amount
| | Unrealized
Appreciation/
(Depreciation)
|
Credit Suisse First Boston USA (AAMES Mortgage Investment Trust 2005-1 M8 1-Month LIBORE + 160 bpF, due 6/25/35)1 | | April 25, 2035 | | 1.280%
Monthly | | Specified amount
upon credit
event noticeD | | $ | 784 | | $ | 2 |
| | | | | |
Credit Suisse First Boston USA (AAMES Mortgage Investment Trust 2005-1 M9 1-Month LIBORE + 250 bpF, due 6/25/35)1 | | April 25, 2035 | | 2.050%
Monthly | | Specified amount
upon credit
event noticeD | | | 784 | | | (5) |
| | | | | |
Credit Suisse First Boston USA (ACE Securities Corp. 2005-HE1 M8 1-Month LIBORE + 138 bpF,
due 2/25/35)1 | | February 25, 2035 | | 1.310%
Monthly | | Specified amount
upon credit
event noticeD | | | 784 | | | 1 |
| | | | | |
Credit Suisse First Boston USA (ACE Securities Corp. 2005-HE1 M9 1-Month LIBORE + 220 bpF,
due 2/25/35)1 | | February 25, 2035 | | 2.060%
Monthly | | Specified amount
upon credit
event noticeD | | | 784 | | | (6) |
| | | | | |
Credit Suisse First Boston USA (Aegis Asset Backed Securities Trust 2004-4 B2 1-Month LIBORE +190 bpF, due 10/25/34)1 | | October 25, 2034 | | 1.370%
Monthly | | Specified amount
upon credit
event noticeD | | | 1,046 | | | (0.4) |
| | | | | |
Credit Suisse First Boston USA (Aegis Asset Backed Securities Trust 2005 B2 1Month LIBORE + 130 bpF, due 3/25/35)1 | | March 25, 2035 | | 1.310%
Quarterly | | Specified amount
upon credit
event noticeD | | | 784 | | | 1 |
| | | | | |
Credit Suisse First Boston USA (Aegis Asset Backed Securities Trust 2005 B3 1-Month LIBORE + 200 bpF, due 3/25/35)1 | | March 25, 2035 | | 2.180%
Quarterly | | Specified amount
upon credit
event noticeD | | | 784 | | | (10) |
| | | | | |
Credit Suisse First Boston USA (Argent Securities Inc. 2004-W4 M3 1-Month LIBORE + 300 bpF,
due 3/25/34)1 | | March 25, 2034 | | 2.200%
Monthly | | Specified amount
upon credit
event noticeD | | | 1,046 | | | (10) |
| | | | | |
Credit Suisse First Boston USA (Argent Securities Inc, 2004-W11 M9 1-Month LIBORE + 225 bpF,
due 11/25/34)1 | | November 25, 2034 | | 1.330%
Monthly | | Specified amount
upon credit
event noticeD | | | 784 | | | 1 |
136
Semi-Annual Report to Shareholders
| | | | | | | | | | | | |
WESTERN ASSET CORE BOND PORTFOLIO—Continued |
Agreement With:
| | Termination Date
| | The Fund
Agrees to Pay
| | The Fund
Will Receive
| | Contract
Notional Amount
| | Unrealized
Appreciation/
(Depreciation)
|
Credit Suisse First Boston USA (Argent Securities Inc, 2004-W11 M10 1-Month LIBORE + 350 bpF,
due 11/25/34)1 | | November 25, 2034 | | 2.150%
Monthly | | Specified amount
upon credit
event noticeD | | $ | 784 | | $ | (7) |
| | | | | |
Credit Suisse First Boston USA (Eastman Kodak Company, 7.25%, due 11/15/13)1 | | March 20, 2010 | | Specified amount
upon credit
event noticeB | | 1.400%
Quarterly | | | 6,500 | | | (288) |
| | | | | |
Credit Suisse First Boston USA (Finance America Mortgage Loan Trust 2004-3 M8 1-Month LIBORE + 180 bpF,
due 11/25/34)1 | | November 25, 2034 | | 1.310%
Monthly | | Specified amount
upon credit
event noticeD | | | 784 | | | 1 |
| | | | | |
Credit Suisse First Boston USA (Finance America Mortgage Loan Trust 2004-3 M9 1-Month LIBORE + 315 bpF,
due 11/25/34)1 | | November 25, 2034 | | 2.180%
Monthly | | Specified amount
upon credit
event noticeD | | | 784 | | | (8) |
| | | | | |
Credit Suisse First Boston USA (Fremont Home Loan Trust 2005-A, 1-Month LIBORE + 135 bpF,
due 1/25/35)1 | | January 25, 2035 | | 1.310%
Monthly | | Specified amount
upon credit
event noticeD | | | 784 | | | 1 |
| | | | | |
Credit Suisse First Boston USA (Fremont Home Loan Trust 2005-A, 1-Month
LIBORE + 100 bpF,
due 1/25/35)1 | | January 25, 2035 | | 2.080%
Monthly | | Specified amount
upon credit
event noticeD | | | 784 | | | (7) |
| | | | | |
Credit Suisse First Boston USA (IndyMac Home Equity Loan Asset-Backed, Trust 2004-C M8, 1-Month LIBORE + 190 bpF,
due 3/25/35)1 | | March 25, 2035 | | 1.280%
Monthly | | Specified amount
upon credit
event noticeD | | | 784 | | | 2 |
| | | | | |
Credit Suisse First Boston USA (IndyMac Home Equity Loan Asset-Backed, Trust 2004-C M9, 1-Month LIBORE + 325 bpF,
due 3/25/35)1 | | March 25, 2035 | | 2.050%
Monthly | | Specified amount
upon credit
event noticeD | | | 784 | | | (5) |
137
Semi-Annual Report to Shareholders
NOTES TO FINANCIAL STATEMENTS—Continued
| | | | | | | | | | | | |
WESTERN ASSET CORE BOND PORTFOLIO—Continued |
Agreement With:
| | Termination Date
| | The Fund
Agrees to Pay
| | The Fund
Will Receive
| | Contract
Notional Amount
| | Unrealized
Appreciation/
(Depreciation)
|
Credit Suisse First Boston USA (Long Beach Mortgage Loan Trust 2004-1 M9 1-Month LIBORE + 350 bpF,
due 2/25/34)1 | | February 25, 2034 | | 2.150%
Monthly | | Specified amount
upon credit
event noticeD | | $ | 1,046 | | $ | (5) |
| | | | | |
Credit Suisse First Boston USA (Long Beach Mortgage Loan Trust 2005-1 M8 1-Month LIBORE + 170 bpF,
due 2/25/35)1 | | February 25, 2035 | | 1.310%
Monthly | | Specified amount
upon credit
event noticeD | | | 784 | | | 2 |
| | | | | |
Credit Suisse First Boston USA (Long Beach Mortgage Loan Trust 2005-1 M9 1-Month LIBORE + 275 bpF,
due 2/25/35)1 | | February 25, 2035 | | 2.080%
Monthly | | Specified amount
upon credit
event noticeD | | | 784 | | | (8) |
| | | | | |
Credit Suisse First Boston USA (MASTR Asset Backed Securities Trust 2005-NC1 M8 1-Month LIBORE + 153 bpF,
due 12/25/34)1 | | December 25, 2034 | | 1.310%
Monthly | | Specified amount
upon credit
event noticeD | | | 784 | | | 1 |
| | | | | |
Credit Suisse First Boston USA (MASTR Asset Backed Securities Trust 2005-NC1 M9 1-Month LIBORE + 240 bpF,
due 12/25/34)1 | | December 25, 2034 | | 2.080%
Monthly | | Specified amount
upon credit
event noticeD | | | 784 | | | (6) |
| | | | | |
Credit Suisse First Boston USA (Merrill Lynch Mortgage Investors, Inc 2004-WMC4 B3 1-Month LIBORE + 375 bpF,
due 4/25/35)1 | | April 25, 2035 | | 2.150%
Monthly | | Specified amount
upon credit
event noticeD | | | 1,046 | | | (7) |
| | | | | |
Credit Suisse First Boston USA (Merrill Lynch Mortgage
Investors, Inc 2005-WMC1 B2 1-Month LIBORE + 135 bpF,
due 9/25/35)1 | | September 25, 2035 | | 1.280%
Monthly | | Specified amount
upon credit
event noticeD | | | 784 | | | 2 |
| | | | | |
Credit Suisse First Boston USA (Merrill Lynch Mortgage Investors, Inc 2005-WMC1 B3 1-Month LIBORE + 225 bpF,
due 9/25/35)1 | | September 25, 2035 | | 2.050%
Monthly | | Specified amount
upon credit
event noticeD | | | 784 | | | (5) |
| | | | | |
Credit Suisse First Boston USA (Merrill Lynch Mortgage Investors, Inc 2005-NC1 B2 1-Month LIBORE + 130 bpF,
due 10/25/35)1 | | October 25, 2035 | | 1.280%
Monthly | | Specified amount
upon credit
event noticeD | | | 784 | | | 2 |
138
Semi-Annual Report to Shareholders
| | | | | | | | | | | | |
WESTERN ASSET CORE BOND PORTFOLIO—Continued |
Agreement With:
| | Termination Date
| | The Fund
Agrees to Pay
| | The Fund
Will Receive
| | Contract
Notional Amount
| | Unrealized
Appreciation/
(Depreciation)
|
Credit Suisse First Boston USA (Merrill Lynch Mortgage Investors, Inc 2005-NC1 B3 1-Month LIBORE + 205 bpF,
due 10/25/35)1 | | October 25, 2035 | | 2.050%
Monthly | | Specified amount
upon credit
event noticeD | | $ | 784 | | $ | (5) |
| | | | | |
Credit Suisse First Boston USA (Morgan Stanley ABS Capital I 2005-WMC1 B2 1-Month LIBORE + 130 bpF,
due 1/25/35)1 | | January 25, 2035 | | 1.310%
Monthly | | Specified amount
upon credit
event noticeD | | | 784 | | | 1 |
| | | | | |
Credit Suisse First Boston USA (Morgan Stanley ABS Capital I 2005-WMC1 B3 1-Month LIBORE + 215 bpF,
due 1/25/35)1 | | January 25, 2035 | | 2.180%
Monthly | | Specified amount
upon credit
event noticeD | | | 784 | | | (9) |
| | | | | |
Credit Suisse First Boston USA (New Century Home Equity Loan Trust 2004-2 M9 1-Month LIBORE + 325 bpF,
due 8/25/34)1 | | August 25, 2034 | | 2.150%
Monthly | | Specified amount
upon credit
event noticeD | | | 1,046 | | | (6) |
| | | | | |
Credit Suisse First Boston USA (New Century Home Equity Loan Trust 2005-1 M8 1-Month LIBORE + 140 bpF, due 3/25/35)1 | | March 25, 2035 | | 1.310%
Monthly | | Specified amount
upon credit
event noticeD | | | 784 | | | 1 |
| | | | | |
Credit Suisse First Boston USA (New Century Home Equity Loan Trust 2005-1 M9 1-Month LIBORE + 205 bpF, due 3/25/35)1 | | March 25, 2035 | | 2.180%
Monthly | | Specified amount
upon credit
event noticeD | | | 784 | | | (10) |
| | | | | |
Credit Suisse First Boston USA (Novastar Home Equity Loan 2005-1 B2 1-Month LIBORE + 135 bpF,
due 6/25/35)1 | | June 25, 2035 | | 1.280%
Monthly | | Specified amount
upon credit
event noticeD | | | 784 | | | 2 |
| | | | | |
Credit Suisse First Boston USA (Novastar Home Equity Loan 2005-4 B3 1-Month LIBORE + 195 bpF,
due 6/25/35)1 | | June 25, 2035 | | 2.050%
Monthly | | Specified amount
upon credit
event noticeD | | | 784 | | | (7) |
| | | | | |
Credit Suisse First Boston USA (Park Place Securities Inc. 2005-WCH1 M8 1-Month LIBORE + 155 bpF,
due 1/25/36)1 | | January 25, 2036 | | 1.360%
Monthly | | Specified amount
upon credit
event noticeD | | | 784 | | | 1 |
139
Semi-Annual Report to Shareholders
NOTES TO FINANCIAL STATEMENTS—Continued
| | | | | | | | | | | | |
WESTERN ASSET CORE BOND PORTFOLIO—Continued |
Agreement With:
| | Termination Date
| | The Fund
Agrees to Pay
| | The Fund
Will Receive
| | Contract
Notional Amount
| | Unrealized
Appreciation/
(Depreciation)
|
Credit Suisse First Boston USA (Park Place Securities Inc. 2005-WCH1 M9 1-Month LIBORE + 250 bpF,
due 1/25/36)1 | | January 25, 2036 | | 2.180%
Monthly | | Specified amount
upon credit
event noticeD | | $ | 784 | | $ | (9) |
| | | | | |
Credit Suisse First Boston USA (People’s Choice Home Loan Securities Trust 2004-1 M6 1-Month LIBORE + 230 bpF, due 6/25/34)1 | | June 25, 2034 | | 1.370%
Quarterly | | Specified amount
upon credit
event noticeD | | | 1,046 | | | 0 |
| | | | | |
Credit Suisse First Boston USA (People’s Choice Home Loan Securities Trust 2005-1, 1-Month LIBORE + 165 bpF, due 1/25/35)1 | | January 25, 2035 | | 1.258%
Monthly | | Specified amount
upon credit
event noticeD | | | 784 | | | 2 |
| | | | | |
Credit Suisse First Boston USA (People’s Choice Home Loan Securities Trust 2005-1 B3 1-Month LIBORE + 260 bpF, due 1/25/35)1 | | January 25, 2035 | | 2.050%
Monthly | | Specified amount
upon credit
event noticeD | | | 784 | | | (8) |
| | | | | |
Deutsche Bank AG
(Apache Corporation,
6.25%, due 4/15/12)1 | | March 20, 2015 | | Specified amount
upon credit
event noticeB | | 0.360%
Quarterly | | | 1,170 | | | 2 |
| | | | | |
Deutsche Bank AG
(Dynegy Holdings,
8.75%, due 2/15/12)1 | | May 1, 2007 | | Specified amount
upon credit
event noticeC | | 5.250%
Quarterly | | | 3,340 | | | 154 |
| | | | | |
Deutsche Bank AG
(Eastman Kodak Company,
7.25%, due 11/15/13)1 | | March 20, 2010 | | Specified amount
upon credit
event noticeB | | 1.250%
Quarterly | | | 1,100 | | | (54) |
| | | | | |
Deutsche Bank AG
(Eastman Kodak Company,
7.25%, due 11/15/13)1 | | March 20, 2015 | | Specified amount
upon credit
event noticeB | | 1.670%
Quarterly | | | 1,300 | | | (148) |
| | | | | |
Deutsche Bank AG
(Fannie Mae,
6.00%, due 5/15/11)1 | | December 20, 2009 | | Specified amount
upon credit
event noticeB | | 0.215%
Quarterly | | | 11,700 | | | (56) |
| | | | | |
Deutsche Bank AG
(Ford Motor Company,
7.45%, due 7/16/31)1 | | March 20, 2015 | | Specified amount
upon credit
event noticeB | | 2.930%
Quarterly | | | 1,700 | | | (285) |
| | | | | |
Deutsche Bank AG
(Freddie Mac,
5.00%, due 7/15/14)1 | | March 20, 2015 | | Specified amount
upon credit
event noticeB | | 0.290%
Quarterly | | | 15,600 | | | 133 |
140
Semi-Annual Report to Shareholders
| | | | | | | | | | | | |
WESTERN ASSET CORE BOND PORTFOLIO—Continued |
Agreement With:
| | Termination Date
| | The Fund
Agrees to Pay
| | The Fund
Will Receive
| | Contract
Notional Amount
| | Unrealized
Appreciation/
(Depreciation)
|
Deutsche Bank AG
(General Motors Acceptance Corporation, 6.875%, due 8/28/12)1 | | March 20, 2007 | | Specified amount
upon credit
event noticeB | | 2.280%
Quarterly | | $ | 5,000 | | $ | (33) |
| | | | | |
Deutsche Bank AG (General Motors Acceptance Corporation,
8.375%, due 7/15/33)1 | | March 20, 2015 | | Specified amount
upon credit
event noticeB | | 3.510%
Quarterly | | | 1,700 | | | (369) |
| | | | | |
Deutsche Bank AG
(iBoxx IG TMT)1 | | March 20, 2009 | | 0.60%
Quarterly | | Specified amount
upon credit
event noticeD | | | 7,400 | | | (46) |
| | | | | |
Deutsche Bank AG
(iBoxx 30 Hi-Vol)1 | | March 20, 2009 | | 1.25%
Quarterly | | Specified amount
upon credit
event noticeD | | | 7,400 | | | 103 |
| | | | | |
Deutsche Bank AG
(iBoxx IG Hi-Vol)1 | | March 20, 2009 | | Specified amount
upon credit
event noticeB | | 1.25% Quarterly | | | 9,740 | | | (70) |
| | | | | |
Deutsche Bank AG
(iBoxx IG Hi-Vol2)1 | | September 20, 2009 | | 1.15%
Quarterly | | Specified amount
upon credit
event noticeD | | | 25,000 | | | 322 |
| | | | | |
Deutsche Bank AG
(iBoxx IG Hi-Vol2)1 | | September 20, 2014 | | Specified amount
upon credit
event noticeB | | 1.30%
Quarterly | | | 8,320 | | | (230) |
| | | | | |
Deutsche Bank AG2 | | January 14, 2007 | | 3-month
LIBORE | | 3.571%
Semi-annually | | | 150,920 | | | (1,746) |
| | | | | |
Deutsche Bank AG2 | | June 17, 2010 | | 3-month
LIBORE | | 4.3132%
Semi-annually | | | 31,430 | | | (434) |
| | | | | |
JP Morgan Chase & Co. (General Motors Acceptance Corporation, 7.125%, due 7/15/13)1 | | September 20, 2010 | | Specified amount
upon credit
event noticeB | | 6.000%
Quarterly | | | 10,500 | | | (653) |
| | | | | |
JP Morgan Chase & Co. (DJCDX IG4)1 | | June 20, 2015 | | 0.260%
Quarterly | | Specified amount
upon credit
event noticeD | | | 6,000 | | | (30) |
| | | | | |
Lehman Brothers Holdings Inc. (General Motors Acceptance Corporation, 6.875%, due 8/28/12)1 | | May 1, 2007 | | Specified amount
upon credit
event noticeB | | 5.250%
Quarterly | | | 10,000 | | | (434) |
| | | | | |
Lehman Brothers Holdings Inc. (iBoxx IG Fin 3)1 | | March 20, 2010 | | Specified amount
upon credit
event noticeB | | 0.50%
Quarterly | | | 13,900 | | | 101 |
141
Semi-Annual Report to Shareholders
NOTES TO FINANCIAL STATEMENTS—Continued
| | | | | | | | | | | | |
WESTERN ASSET CORE BOND PORTFOLIO—Continued |
Agreement With:
| | Termination Date
| | The Fund
Agrees to Pay
| | The Fund
Will Receive
| | Contract
Notional Amount
| | Unrealized
Appreciation/
(Depreciation)
|
Lehman Brothers Holdings Inc. (iBoxx IG Hi-Vol2)1 | | September 20,
2009 | | 1.150%
Quarterly | | Specified amount
upon credit
event noticeD | | $ | 8,800 | | $ | 157 |
| | | | | |
Lehman Brothers Holdings Inc. (iBoxx IG Hi-Vol3)1 | | March 20, 2010 | | 1.050%
Quarterly | | Specified amount
upon credit
event noticeD | | | 800 | | | 14 |
| | | | | |
Lehman Brothers Holdings Inc.2 | | October 28, 2014 | | 4.378%
Semi-annually | | 3-month
LIBORE | | | 87,400 | | | 2,461 |
| | | | | |
Merrill Lynch & Co., Inc. (Pacific Gas & Electric Co., 4.80%, due 3/1/14)1 | | June 20, 2009 | | Specified amount
upon credit
event noticeB | | 0.420%
Quarterly | | | 2,100 | | | 9 |
| | | | | |
Merrill Lynch & Co., Inc. (DJCDX IG4)1 | | June 20, 2015 | | 0.264%
Quarterly | | Specified amount
upon credit
event noticeD | | | 15,000 | | | 60 |
| | | | | |
RBS Greenwich
(Ford Motor Credit Company,
7.00%, due 10/1/13)1 | | December 20, 2010 | | Specified amount
upon credit
event noticeB | | 4.260%
Quarterly | | | 25,000 | | | (106) |
| | | | | |
RBS Greenwich
(General Motors Acceptance Corporation,
6.875%, due 8/12/12)1 | | June 20, 2010 | | Specified amount
upon credit
event noticeB | | 4.300%
Quarterly | | | 1,730 | | | (45) |
| | | | | |
RBS Greenwich
(General Motors Acceptance Corporation,
6.875%, due 8/12/12)1 | | June 20, 2010 | | Specified amount
upon credit
event noticeB | | 4.530%
Quarterly | | | 25,000 | | | (442) |
| | | | | |
RBS Greenwich
(General Motors Acceptance Corporation,
6.875%, due 8/28/12)1 | | June 20, 2010 | | Specified amount
upon credit
event noticeB | | 4.900%
Quarterly | | | 2,400 | | | (10) |
| | | | | |
RBS Greenwich
(General Motors Acceptance Corporation,
6.875%, due 8/28/12)1 | | June 20, 2010 | | Specified amount
upon credit
event noticeB | | 5.750%
Quarterly | | | 7,500 | | | 184 |
| | | | | |
RBS Greenwich
(General Motors Acceptance Corporation,
7.125%, due 7/15/13)1 | | June 20, 2010 | | Specified amount
upon credit
event noticeB | | 6.800%
Quarterly | | | 5,900 | | | (157) |
| | | | | |
RBS Greenwich
(General Motors Acceptance Corporation,
7.125%, due 7/15/13)1 | | June 20, 2010 | | Specified amount
upon credit
event noticeB | | 7.100%
Quarterly | | | 5,800 | | | (95) |
142
Semi-Annual Report to Shareholders
| | | | | | | | | | | | |
WESTERN ASSET CORE BOND PORTFOLIO—Continued |
Agreement With:
| | Termination Date
| | The Fund
Agrees to Pay
| | The Fund
Will Receive
| | Contract
Notional Amount
| | Unrealized
Appreciation/
(Depreciation)
|
RBS Greenwich (General Motors Acceptance Corporation,
7.125%, due 7/15/13)1 | | June 20, 2010 | | Specified amount
upon credit
event noticeB | | 7.700%
Quarterly | | $ | 12,500 | | $ | 0.1 |
| | | | | |
RBS Greenwich
(General Motors Acceptance Corporation,
7.125%, due 7/15/13)1 | | June 20, 2010 | | Specified amount
upon credit
event noticeB | | 8.400%
Quarterly | | | 12,500 | | | 350 |
| | | | | |
RBS Greenwich
(Time Warner Inc
6.875%, due 5/1/12)1 | | September 20, 2010 | | Specified amount
upon credit
event noticeB | | 0.470%
Quarterly | | | 5,000 | | | (16) |
| | | | | |
RBS Greenwich
(Time Warner Inc.,
6.875%, due 5/1/12)1 | | December 20, 2010 | | Specified amount
upon credit
event noticeB | | 0.500%
Quarterly | | | 12,500 | | | (36) |
| | | | | |
RBS Greenwich
(iBoxx IG Hi-Vol4)1 | | June 20, 2010 | | Specified amount
upon credit
event noticeB | | 0.900%
Quarterly | | | 36,300 | | | (11) |
| | | | | |
RBS Greenwich
(iBoxx IG Hi-Vol3)1 | | March 20, 2010 | | 1.050%
Quarterly | | Specified amount
upon credit
event noticeD | | | 17,900 | | | (178) |
| | | | | |
The Goldman Sachs Group, Inc. (Ford Motor Credit Company, 7.00%, due 10/1/13)1 | | June 20, 2010 | | Specified amount
upon credit
event noticeB | | 4.750%
Quarterly | | | 1,900 | | | 36 |
| | | | | |
The Goldman Sachs Group, Inc. (Eastman Kodak Company, 7.25%, due 11/15/13)1 | | March 20, 2015 | | Specified amount
upon credit
event noticeB | | 1.670%
Quarterly | | | 1,400 | | | (159) |
| | | | | |
The Goldman Sachs Group, Inc. (General Motors Acceptance Corporation,
6.875%, due 8/28/12)1 | | June 20, 2010 | | Specified amount
upon credit
event noticeB | | 4.680%
Quarterly | | | 25,000 | | | (304) |
| | | | | |
The Goldman Sachs Group, Inc. (General Motors Acceptance Corporation,
6.875%, due 8/28/12)1 | | June 20, 2010 | | Specified amount
upon credit
event noticeB | | 6.000%
Quarterly | | | 5,000 | | | 179 |
| | | | | |
The Goldman Sachs Group, Inc. (General Motors Acceptance Corporation,
7.125%, due 7/15/13)1 | | June 20, 2010 | | Specified amount
upon credit
event noticeB | | 8.950%
Quarterly | | | 5,000 | | | 247 |
| | | | | |
The Goldman Sachs Group, Inc. (General Motors Acceptance Corporation,
8.375%, due 7/15/33)1 | | September 20, 2010 | | Specified amount
upon credit
event noticeB | | 6.000%
Quarterly | | | 18,500 | | | (1,043) |
143
Semi-Annual Report to Shareholders
NOTES TO FINANCIAL STATEMENTS—Continued
| | | | | | | | | | | | |
WESTERN ASSET CORE BOND PORTFOLIO—Continued |
Agreement With:
| | Termination Date
| | The Fund
Agrees to Pay
| | The Fund
Will Receive
| | Contract
Notional Amount
| | Unrealized
Appreciation/
(Depreciation)
|
The Goldman Sachs Group, Inc. (DJCDX IG 4)1 | | June 20, 2010 | | 0.255%
Quarterly | | Specified amount
upon credit
event noticeB | | $ | 4,700 | | $ | 4 |
| | | | | |
The Goldman Sachs Group, Inc. (DJCDX IG 4)1 | | June 20, 2010 | | 0.2625%
Quarterly | | Specified amount
upon credit
event noticeB | | | 4,700 | | | 3 |
| | | | | |
The Goldman Sachs Group, Inc. (DJCDX IG 4)1 | | June 20, 2010 | | Specified amount
upon credit
event noticeB | | 0.40%
Quarterly | | | 17,600 | | | 149 |
| | | | | |
The Goldman Sachs Group, Inc. (DJCDX IG 4)1 | | June 20, 2010 | | Specified amount
upon credit
event noticeB | | 0.40%
Quarterly | | | 45,500 | | | 461 |
| | | | | |
The Goldman Sachs Group, Inc. (iBoxx IG Fin 3)1 | | March 20, 2010 | | Specified amount
upon credit
event noticeB | | 0.50%
Quarterly | | | 5,200 | | | 38 |
| | | | | |
The Goldman Sachs Group, Inc. (iBoxx IG Fin 3)1 | | March 20, 2015 | | Specified amount
upon credit
event noticeB | | 0.70%
Quarterly | | | 5,300 | | | 60 |
| | | | | |
The Goldman Sachs Group, Inc. (iBoxx IG Hi-Vol4)1 | | June 20, 2010 | | Specified amount
upon credit
event noticeB | | 0.900%
Quarterly | | | 50,000 | | | 908 |
| | | | | |
The Goldman Sachs Group, Inc. (iBoxx IG Hi-Vol4)1 | | June 20, 2010 | | Specified amount
upon credit
event noticeB | | 0.900%
Quarterly | | | 100,000 | | | 2,485 |
| | | | | |
The Goldman Sachs Group, Inc. (iBoxx IG Hi-Vol3)1 | | March 20, 2010 | | Specified amount
upon credit
event noticeB | | 1.05%
Quarterly | | | 50,000 | | | (601) |
| | | | | |
The Goldman Sachs Group, Inc. (iBoxx IG Hi-Vol3)1 | | March 20, 2010 | | Specified amount
upon credit
event noticeB | | 1.050%
Quarterly | | | 17,000 | | | (129) |
| | | | | |
The Goldman Sachs Group, Inc. (iBoxx IG Hi-Vol3)1 | | March 20, 2010 | | Specified amount
upon credit
event noticeB | | 1.050%
Quarterly | | | 33,200 | | | 184 |
| | | | | |
The Goldman Sachs Group, Inc.2 | | September 14, 2007 | | 3-month
LIBORE | | 3.215%
Semi-annually | | | 26,500 | | | (657) |
| | | | | |
The Goldman Sachs Group, Inc.2 | | October 18, 2014 | | 4.492%
Semi-annually | | 3-month
LIBORE | | | 39,000 | | | 773 |
| | | | | | | | |
|
| |
|
|
| | | | | |
| | | | | | | | | $ | 1,113,214 | | $ | 872 |
| | | | | | | | |
|
| |
|
|
144
Semi-Annual Report to Shareholders
| | | | | | | | | | | | |
WESTERN ASSET CORE PLUS BOND PORTFOLIO |
Agreement With:
| | Termination Date
| | The Fund
Agrees to Pay
| | The Fund
Will Receive
| | Contract
Notional Amount
| | Unrealized
Appreciation/
(Depreciation)
|
Bear Stearns, Inc. (Ford Motor Credit Company 7.00%, due 10/1/13)1 | | June 20, 2010 | | Specified amount
upon credit
event noticeB | | 4.830%
Quarterly | | $ | 12,500 | | $ | 281 |
| | | | | |
Credit Suisse First Boston USA (AAMES Mortgage Investment Trust 2005-1 M8 1-Month LIBORE + 160 bpF,
due 6/25/35)1 | | April 25, 2035 | | 1.280%
Monthly | | Specified amount
upon credit
event noticeD | | | 1,122 | | | 3 |
| | | | | |
Credit Suisse First Boston USA (AAMES Mortgage Investment Trust 2005-1 M9 1-Month LIBORE + 250 bpF, due 6/25/35)1 | | April 25, 2035 | | 2.050%
Monthly | | Specified amount
upon credit
event noticeD | | | 1,122 | | | (7) |
| | | | | |
Credit Suisse First Boston USA (ACE Securities Corp. 2005-HE1 M8, 1-Month LIBORE + 138 bpF,
due 2/25/35)1 | | February 25, 2035 | | 1.310%
Monthly | | Specified amount
upon credit
event noticeD | | | 1,122 | | | 2 |
| | | | | |
Credit Suisse First Boston USA (ACE Securities Corp. 2005-HE1 M9, 1-Month LIBORE + 220 bpF,
due 2/25/35)1 | | February 25, 2035 | | 2.060%
Monthly | | Specified amount
upon credit
event noticeD | | | 1,122 | | | (9) |
| | | | | |
Credit Suisse First Boston USA (Aegis Asset Backed Securities Trust 2004-4 B2 1-Month LIBORE +190 bpF, due 10/25/34)1 | | October 25, 2034 | | 1.370%
Monthly | | Specified amount
upon credit
event noticeD | | | 1,494 | | | (1) |
| | | | | |
Credit Suisse First Boston USA (Aegis Asset Backed Securities Trust 2005 B2, 1Month LIBORE + 130 bpF, due 3/25/35)1 | | March 25, 2035 | | 1.310%
Quarterly | | Specified amount
upon credit
event noticeD | | | 1,122 | | | 2 |
| | | | | |
Credit Suisse First Boston USA (Aegis Asset Backed Securities Trust 2005 B3, 1-Month LIBORE + 200 bpF, due 3/25/35)1 | | March 25, 2035 | | 2.180%
Quarterly | | Specified amount
upon credit
event noticeD | | | 1,122 | | | (14) |
| | | | | |
Credit Suisse First Boston USA (Argent Securities Inc. 2004-W4 M3 1-Month LIBORE + 300 bpF,
due 3/25/34)1 | | March 25, 2034 | | 2.200%
Monthly | | Specified amount
upon credit
event noticeD | | | 1,494 | | | (15) |
145
Semi-Annual Report to Shareholders
NOTES TO FINANCIAL STATEMENTS—Continued
| | | | | | | | | | | | |
WESTERN ASSET CORE PLUS BOND PORTFOLIO—Continued |
Agreement With:
| | Termination Date
| | The Fund
Agrees to Pay
| | The Fund
Will Receive
| | Contract
Notional Amount
| | Unrealized
Appreciation/
(Depreciation)
|
Credit Suisse First Boston USA (Argent Securities Inc, 2004-W11 M9, 1-Month LIBORE + 225 bpF,
due 11/25/34)1 | | November 25, 2034 | | 1.330%
Monthly | | Specified amount
upon credit
event noticeD | | $ | 1,122 | | $ | 1 |
| | | | | |
Credit Suisse First Boston USA (Argent Securities Inc, 2004-W11 M10, 1-Month LIBORE + 350 bpF,
due 11/25/34)1 | | November 25, 2034 | | 2.150%
Monthly | | Specified amount
upon credit
event noticeD | | | 1,122 | | | (11) |
| | | | | |
Credit Suisse First Boston USA (Eastman Kodak Company, 7.25%, due 11/15/13)1 | | March 20, 2010 | | Specified amount
upon credit
event noticeB | | 1.400%
Quarterly | | | 9,000 | | | (399) |
| | | | | |
Credit Suisse First Boston USA (Eastman Kodak Company, 7.25%, due 11/15/13)1 | | September 20, 2010 | | Specified amount
upon credit
event noticeB | | 2.320%
Quarterly | | | 2,400 | | | (39) |
| | | | | |
Credit Suisse First Boston USA (Finance America Mortgage Loan Trust 2004-3 M8, 1-Month LIBORE + 180 bpF, due 11/25/34)1 | | November 25, 2034 | | 1.310%
Monthly | | Specified amount
upon credit
event noticeD | | | 1,122 | | | 2 |
| | | | | |
Credit Suisse First Boston USA (Finance America Mortgage Loan Trust 2004-3 M9, 1-Month LIBORE + 315 bpF, due 11/25/34)1 | | November 25, 2034 | | 2.180%
Monthly | | Specified amount
upon credit
event noticeD | | | 1,122 | | | (11) |
| | | | | |
Credit Suisse First Boston USA (Fremont Home Loan Trust 2005-A M8, 1-Month LIBORE + 135 bpF,
due 1/25/35)1 | | January 25, 2035 | | 1.310%
Monthly | | Specified amount
upon credit
event noticeD | | | 1,122 | | | 2 |
| | | | | |
Credit Suisse First Boston USA (Fremont Home Loan Trust 2005-A, 1-Month LIBORE + 100 bpF, due 1/25/35)1 | | January 25, 2035 | | 2.080%
Monthly | | Specified amount
upon credit
event noticeD | | | 1,122 | | | (10) |
| | | | | |
Credit Suisse First Boston USA (IndyMac Home Equity Loan Asset-Backed, Trust 2004-C M8, 1-Month LIBORE + 190 bpF,
due 3/25/35)1 | | March 25, 2035 | | 1.280%
Monthly | | Specified amount
upon credit
event noticeD | | | 1,122 | | | 3 |
146
Semi-Annual Report to Shareholders
| | | | | | | | | | | | |
WESTERN ASSET CORE PLUS BOND PORTFOLIO—Continued |
Agreement With:
| | Termination Date
| | The Fund
Agrees to Pay
| | The Fund
Will Receive
| | Contract
Notional Amount
| | Unrealized
Appreciation/
(Depreciation)
|
Credit Suisse First Boston USA (IndyMac Home Equity Loan Asset-Backed, Trust 2004-C M9, 1-Month LIBORE + 325 bpF, due 3/25/35)1 | | March 25, 2035 | | 2.050%
Monthly | | Specified amount
upon credit
event noticeD | | $ | 1,122 | | $ | (8) |
| | | | | |
Credit Suisse First Boston USA (Long Beach Mortgage Loan Trust 2004-1 M9, 1-Month LIBORE + 350 bpF,
due 2/25/34)1 | | February 25, 2034 | | 2.150%
Monthly | | Specified amount
upon credit
event noticeD | | | 1,494 | | | (8) |
| | | | | |
Credit Suisse First Boston USA (Long Beach Mortgage Loan Trust 2005-1 M8, 1-Month LIBORE + 170 bpF,
due 2/25/35)1 | | February 25, 2035 | | 1.310%
Monthly | | Specified amount
upon credit
event noticeD | | | 1,122 | | | 2 |
| | | | | |
Credit Suisse First Boston USA (Long Beach Mortgage Loan Trust 2005-1 M9, 1-Month LIBORE + 275 bpF,
due 2/25/35)1 | | February 25, 2035 | | 2.080%
Monthly | | Specified amount
upon credit
event noticeD | | | 1,122 | | | (12) |
| | | | | |
Credit Suisse First Boston USA (MASTR Asset Backed Securities Trust 2005-NC1 M8, 1-Month LIBORE + 153 bpF,
due 12/25/34)1 | | December 25, 2034 | | 1.310%
Monthly | | Specified amount
upon credit
event noticeD | | | 1,122 | | | 2 |
| | | | | |
Credit Suisse First Boston USA (MASTR Asset Backed Securities Trust 2005-NC1 M9, 1-Month LIBORE + 240 bpF,
due 12/25/34)1 | | December 25, 2034 | | 2.080%
Monthly | | Specified amount
upon credit
event noticeD | | | 1,122 | | | (8) |
| | | | | |
Credit Suisse First Boston USA (Merrill Lynch Mortgage Investors, Inc 2004-WMC4 B3, 1-Month LIBORE + 375 bpF, due 4/25/35)1 | | April 25, 2035 | | 2.150%
Monthly | | Specified amount
upon credit
event noticeD | | | 1,494 | | | (10) |
| | | | | |
Credit Suisse First Boston USA (Merrill Lynch Mortgage Investors, Inc 2005-NC1 B2, 1-Month LIBORE + 130 bpF, due 10/25/35)1 | | October 25, 2035 | | 1.280%
Monthly | | Specified amount
upon credit
event noticeD | | | 1,122 | | | 3 |
147
Semi-Annual Report to Shareholders
NOTES TO FINANCIAL STATEMENTS—Continued
| | | | | | | | | | | | |
WESTERN ASSET CORE PLUS BOND PORTFOLIO—Continued |
Agreement With:
| | Termination Date
| | The Fund
Agrees to Pay
| | The Fund
Will Receive
| | Contract
Notional Amount
| | Unrealized
Appreciation/
(Depreciation)
|
Credit Suisse First Boston USA (Merrill Lynch Mortgage Investors, Inc 2005-NC1 B3, 1-Month LIBORE + 205 bpF, due 10/25/35)1 | | October 25, 2035 | | 2.050%
Monthly | | Specified amount
upon credit
event noticeD | | $ | 1,122 | | $ | (7) |
| | | | | |
Credit Suisse First Boston USA (Merrill Lynch Mortgage Investors, Inc 2005-WMC1 B2, 1-Month LIBORE +
135 bpF, due 9/25/35)1 | | September 25, 2035 | | 1.280%
Monthly | | Specified amount
upon credit
event noticeD | | | 1,122 | | | 3 |
| | | | | |
Credit Suisse First Boston USA (Merrill Lynch Mortgage Investors, Inc 2005-WMC1 B3, 1-Month LIBORE +
225 bpF, due 9/25/35)1 | | September 25, 2035 | | 2.050%
Monthly | | Specified amount
upon credit
event noticeD | | | 1,122 | | | (7) |
| | | | | |
Credit Suisse First Boston USA (Morgan Stanley ABS Capital I 2005-WMC1 B2, 1-Month LIBORE + 130 bpF, due 1/25/35)1 | | January 25, 2035 | | 1.310%
Monthly | | Specified amount
upon credit
event noticeD | | | 1,122 | | | 2 |
| | | | | |
Credit Suisse First Boston USA (Morgan Stanley ABS Capital I 2005-WMC1 B3, 1-Month LIBORE + 215 bpF, due 1/25/35)1 | | January 25, 2035 | | 2.180%
Monthly | | Specified amount
upon credit
event noticeD | | | 1,122 | | | (13) |
| | | | | |
Credit Suisse First Boston USA (New Century Home Equity Loan Trust 2004-2 M9, 1-Month LIBORE + 325 bpF, due 8/25/34)1 | | August 25, 2034 | | 2.150%
Monthly | | Specified amount
upon credit
event noticeD | | | 1,494 | | | (9) |
| | | | | |
Credit Suisse First Boston USA (New Century Home Equity Loan Trust 2005-1 M8, 1-Month LIBORE + 140 bpF, due 3/25/35)1 | | March 25, 2035 | | 1.310%
Monthly | | Specified amount
upon credit
event noticeD | | | 1,122 | | | 2 |
| | | | | |
Credit Suisse First Boston USA (New Century Home Equity Loan Trust 2005-1 M9, 1-Month LIBORE + 205 bpF, due 3/25/35)1 | | March 25, 2035 | | 2.180%
Monthly | | Specified amount
upon credit
event noticeD | | | 1,122 | | | (14) |
148
Semi-Annual Report to Shareholders
| | | | | | | | | | | | |
WESTERN ASSET CORE PLUS BOND PORTFOLIO—Continued |
Agreement With:
| | Termination Date
| | The Fund
Agrees to Pay
| | The Fund
Will Receive
| | Contract
Notional Amount
| | Unrealized
Appreciation/
(Depreciation)
|
Credit Suisse First Boston USA (Novastar Home Equity Loan 2005-1 B2, 1-Month LIBORE + 135 bpF,
due 6/25/35)1 | | June 25, 2035 | | 1.280%
Monthly | | Specified amount
upon credit
event noticeD | | $ | 1,122 | | $ | 3 |
| | | | | |
Credit Suisse First Boston USA (Novastar Home Equity Loan 2005-4 B3, 1-Month LIBORE + 195 bpF,
due 6/25/35)1 | | June 25, 2035 | | 2.050%
Monthly | | Specified amount
upon credit
event noticeD | | | 1,122 | | | (10) |
| | | | | |
Credit Suisse First Boston USA (Park Place Securities Inc. 2005-WCH1 M8, 1-Month LIBORE + 155 bpF,
due 1/25/36)1 | | January 25, 2036 | | 1.360%
Monthly | | Specified amount
upon credit
event noticeD | | | 1,122 | | | 2 |
| | | | | |
Credit Suisse First Boston USA (Park Place Securities Inc. 2005-WCH1 M9, 1-Month LIBORE + 250 bpF,
due 1/25/36)1 | | January 25, 2036 | | 2.180%
Monthly | | Specified amount
upon credit
event noticeD | | | 1,122 | | | (12) |
| | | | | |
Credit Suisse First Boston USA (People’s Choice Home Loan Securities Trust 2004-1 M6, 1-Month LIBORE +
230 bpF, due 6/25/34)1 | | June 25, 2034 | | 1.370%
Quarterly | | Specified amount
upon credit
event noticeD | | | 1,494 | | | 0 |
| | | | | |
Credit Suisse First Boston USA (People’s Choice Home Loan Securities Trust 2005-1, 1-Month LIBORE + 165 bpF, due 1/25/35)1 | | January 25, 2035 | | 1.258%
Monthly | | Specified amount
upon credit
event noticeD | | | 1,122 | | | 3 |
| | | | | |
Credit Suisse First Boston USA (People’s Choice Home Loan Securities Trust 2005-1 B3, 1-Month LIBORE +
260 bpF, due 1/25/35)1 | | January 25, 2035 | | 2.050%
Monthly | | Specified amount
upon credit
event noticeD | | | 1,122 | | | (12) |
| | | | | |
Credit Suisse First Boston USA (iBoxx IG Hi-Vol)1 | | March 20, 2009 | | Specified amount
upon credit
event noticeB | | 1.2500%
Quarterly | | | 50,000 | | | (318) |
| | | | | |
Credit Suisse First Boston USA (iBoxx IG Hi-Vol2)1 | | September 20, 2009 | | 1.1500%
Quarterly | | Specified amount
upon credit
event noticeD | | | 25,000 | | | 322 |
149
Semi-Annual Report to Shareholders
NOTES TO FINANCIAL STATEMENTS—Continued
| | | | | | | | | | | | |
WESTERN ASSET CORE PLUS BOND PORTFOLIO—Continued |
Agreement With:
| | Termination Date
| | The Fund
Agrees to Pay
| | The Fund
Will Receive
| | Contract
Notional Amount
| | Unrealized
Appreciation/
(Depreciation)
|
Credit Suisse First Boston USA (iBoxx HY 2B)1 | | September 20, 2009 | | Specified amount
upon credit
event noticeB | | 4.3000%
Quarterly | | $ | 4,950 | | $ | 314 |
| | | | | |
Credit Suisse First Boston USA (iBoxx HY 3)1 | | December 20, 2009 | | Specified amount
upon credit
event noticeB | | 4.0000%
Quarterly | | | 3,078 | | | 195 |
| | | | | |
Credit Suisse First Boston USA (iBoxx HY 3)1 | | December 20, 2009 | | Specified amount
upon credit
event noticeB | | 4.0000%
Quarterly | | | 3,078 | | | 195 |
| | | | | |
Credit Suisse First Boston USA (iBoxx HY 3)1 | | December 20, 2009 | | Specified amount
upon credit
event noticeB | | 4.0000%
Quarterly | | | 15,539 | | | 441 |
| | | | | |
Credit Suisse First Boston USA (iBoxx HY 3)1 | | December 20, 2009 | | Specified amount
upon credit
event noticeB | | 4.0000%
Quarterly | | | 11,532 | | | 240 |
| | | | | |
Deutsche Bank AG
(Apache Corporation, 6.25%, due 4/15/12)1 | | March 20, 2015 | | Specified amount
upon credit
event noticeB | | 0.360%
Quarterly | | | 1,265 | | | 3 |
| | | | | |
Deutsche Bank AG
(Dynegy Holdings,
8.75%, due 2/15/12)1 | | April 23, 2007 | | Specified amount
upon credit
event noticeB | | 2.9500%
Quarterly | | | 2,250 | | | 26 |
| | | | | |
Deutsche Bank AG
(Dynegy Holdings,
8.75%, due 2/15/12)1 | | May 1, 2007 | | Specified amount
upon credit
event noticeB | | 5.2500%
Quarterly | | | 3,460 | | | 160 |
| | | | | |
Deutsche Bank AG
(Eastman Kodak Company,
7.25%, due 11/15/13)1 | | March 20, 2010 | | Specified amount
upon credit
event noticeB | | 1.250%
Quarterly | | | 1,600 | | | (78) |
| | | | | |
Deutsche Bank AG
(Eastman Kodak Company,
7.25%, due 11/15/13)1 | | September 20, 2010 | | Specified amount
upon credit
event noticeB | | 2.300%
Quarterly | | | 3,020 | | | (57) |
| | | | | |
Deutsche Bank AG
(Eastman Kodak Company,
7.25%, due 11/15/13)1 | | September 20, 2010 | | Specified amount
upon credit
event noticeB | | 2.300%
Quarterly | | | 5,430 | | | (103) |
| | | | | |
Deutsche Bank AG (Eastman Kodak Company, 7.25%, due 11/15/13)1 | | September 20, 2010 | | Specified amount
upon credit
event noticeB | | 2.320%
Quarterly | | | 3,200 | | | (58) |
| | | | | |
Deutsche Bank AG (Fannie Mae, 6%,
due 5/15/11)1 | | December 20, 2009 | | Specified amount
upon credit
event noticeB | | 0.2150%
Quarterly | | | 17,000 | | | (82) |
150
Semi-Annual Report to Shareholders
| | | | | | | | | | | | |
WESTERN ASSET CORE PLUS BOND PORTFOLIO—Continued |
Agreement With:
| | Termination Date
| | The Fund
Agrees to Pay
| | The Fund
Will Receive
| | Contract
Notional Amount
| | Unrealized
Appreciation/
(Depreciation)
|
Deutsche Bank AG
(Ford Motor Company 7.45%, due 7/16/31)1 | | March 20, 2015 | | Specified amount
upon credit
event noticeB | | 2.930%
Quarterly | | $ | 2,600 | | $ | (437) |
| | | | | |
Deutsche Bank AG (Freddie Mac 5.00%,
due 7/15/14)1 | | March 20, 2015 | | Specified amount
upon credit
event noticeB | | 0.290%
Quarterly | | | 25,100 | | | 214 |
| | | | | |
Deutsche Bank AG (General Motors Acceptance Corporation, 6.75%, due 12/1/14)1 | | December 20, 2005 | | Specified amount
upon credit
event noticeB | | 1.750%
Quarterly | | | 8,400 | | | (4) |
| | | | | |
Deutsche Bank AG (General Motors Acceptance Corporation, 6.875%, due 8/12/12)1 | | March 20, 2010 | | Specified amount
upon credit
event noticeB | | 2.280%
Quarterly | | | 5,500 | | | (36) |
| | | | | |
Deutsche Bank AG (General Motors Acceptance Corporation, 8.375%, due 7/15/33)1 | | March 20, 2015 | | Specified amount
upon credit
event noticeB | | 3.510%
Quarterly | | | 2,600 | | | (564) |
| | | | | |
Deutsche Bank AG
(iBoxx 100 HY)1 | | March 20, 2009 | | Specified amount
upon credit
event noticeB | | 4.2500%
Quarterly | | | 9,800 | | | 527 |
| | | | | |
Deutsche Bank AG
(iBoxx 100 IG)1 | | March 20, 2009 | | 4.2500%
Quarterly | | Specified amount
upon credit
event noticeD | | | 3,636 | | | 4 |
| | | | | |
Deutsche Bank AG
(iBoxx IG Hi-Vol)1 | | March 20, 2009 | | Specified amount
upon credit
event noticeB | | 1.2500%
Quarterly | | | 13,760 | | | (98) |
| | | | | |
Deutsche Bank AG
(iBoxx IG Hi-Vol2)1 | | September 20, 2014 | | Specified amount
upon credit
event noticeB | | 1.3000%
Quarterly | | | 11,560 | | | (319) |
| | | | | |
Deutsche Bank AG
(iBoxx IG Hi-Vol4)1 | | June 20, 2010 | | Specified amount
upon credit
event noticeB | | 3.6000%
Quarterly | | | 5,356 | | | 147 |
| | | | | |
Deutsche Bank AG
(iBoxx IG TMT)1 | | March 20, 2009 | | 0.6000%
Quarterly | | Specified amount
upon credit
event noticeD | | | 6,450 | | | (40) |
| | | | | |
Deutsche Bank AG
(iBoxx IG TMT)1 | | March 20, 2009 | | 0.6000%
Quarterly | | Specified amount
upon credit
event noticeD | | | 9,500 | | | (59) |
151
Semi-Annual Report to Shareholders
NOTES TO FINANCIAL STATEMENTS—Continued
| | | | | | | | | | | | |
WESTERN ASSET CORE PLUS BOND PORTFOLIO—Continued |
Agreement With:
| | Termination Date
| | The Fund
Agrees to Pay
| | The Fund
Will Receive
| | Contract
Notional Amount
| | Unrealized
Appreciation/
(Depreciation)
|
Deutsche Bank AG
(iBoxx IG TMT)1 | | March 20, 2009 | | 1.2500%
Quarterly | | Specified amount
upon credit
event noticeD | | $ | 9,500 | | $ | 132 |
| | | | | |
Deutsche Bank AG
(iBoxx 100 HY)1 | | March 20, 2009 | | 4.2500%
Quarterly | | Specified amount
upon credit
event noticeD | | | 1,862 | | | (102) |
| | | | | |
Deutsche Bank AG
(iBoxx HY 2)1 | | September 20, 2009 | | Specified amount
upon credit
event noticeB | | 4.8000%
Quarterly | | | 2,559 | | | 213 |
| | | | | |
Deutsche Bank AG
(iBoxx HY B)1 | | March 20, 2009 | | Specified amount
upon credit
event noticeB | | 5.0000%
Quarterly | | | 4,884 | | | 188 |
| | | | | |
Deutsche Bank AG
(iBoxx HY B)1 | | March 20, 2009 | | Specified amount
upon credit
event noticeB | | 5.0000%
Quarterly | | | 9,767 | | | 339 |
| | | | | |
Deutsche Bank AG2 | | January 14, 2007 | | 3-month
LIBORE | | 3.571%
Quarterly | | | 199,990 | | | (2,313) |
| | | | | |
Deutsche Bank AG2 | | January 10, 2008 | | 3-month
LIBORE | | 3.7538%
Semi-annually | | | 143,500 | | | (2,565) |
| | | | | |
Deutsche Bank AG2 | | June 17, 2010 | | 3-month
LIBORE | | 4.3132%
Semi-annually | | | 41,570 | | | (574) |
| | | | | |
JP Morgan Chase & Co. (DJCDX IG4)1 | | June 20, 2015 | | 0.260%
Quarterly | | Specified amount
upon credit
event noticeD | | | 7,100 | | | (36) |
| | | | | |
JP Morgan Chase & Co. (General Motors Acceptance Corporation,
7.125%, due 7/15/13)1 | | September 20, 2010 | | Specified amount
upon credit
event noticeB | | 6.000%
Quarterly | | | 14,300 | | | (889) |
| | | | | |
JP Morgan Chase & Co.2 | | October 18, 2014 | | 4.4926%
Semi-annually | | 3-month
LIBORE | | | 51,300 | | | 1,012 |
| | | | | |
Lehman Brothers Holdings Inc. (General Motors Acceptance Corporation,
6.875%, due 8/12/12)1 | | March 20, 2010 | | Specified amount
upon credit
event noticeB | | 3.650%
Quarterly | | | 25,000 | | | (1,086) |
| | | | | |
Lehman Brothers Holdings Inc. (iBoxx IG Hi-Vol2)1 | | September 20, 2009 | | 1.1500%
Quarterly | | Specified amount
upon credit
event noticeD | | | 1,500 | | | 26 |
| | | | | |
Lehman Brothers Holdings Inc. (iBoxx IG Hi-Vol2)1 | | September 20, 2009 | | 1.1500%
Quarterly | | Specified amount
upon credit
event noticeD | | | 12,600 | | | 225 |
152
Semi-Annual Report to Shareholders
| | | | | | | | | | | | |
WESTERN ASSET CORE PLUS BOND PORTFOLIO—Continued |
Agreement With:
| | Termination Date
| | The Fund
Agrees to Pay
| | The Fund
Will Receive
| | Contract
Notional Amount
| | Unrealized
Appreciation/
(Depreciation)
|
Lehman Brothers Holdings Inc. (iBoxx HY 3)1 | | December 20,
2009 | | Specified amount
upon credit
event noticeB | | 4.0000%
Quarterly | | $ | 3,225 | | $ | 116 |
| | | | | |
Lehman Brothers Holdings Inc. (iBoxx HY 3)1 | | December 20,
2009 | | Specified amount
upon credit
event noticeB | | 4.0000%
Quarterly | | | 3,323 | | | 40 |
| | | | | |
Lehman Brothers Holdings Inc. (iBoxx HY 3)1 | | December 20,
2009 | | Specified amount
upon credit
event noticeB | | 4.0000%
Quarterly | | | 3,323 | | | 40 |
| | | | | |
Lehman Brothers Holdings Inc. (iBoxx IG FIN 3)1 | | March 20, 2010 | | Specified amount
upon credit
event noticeB | | 0.5000%
Quarterly | | | 19,700 | | | 143 |
| | | | | |
Lehman Brothers Holdings Inc. (iBoxx IG TMT)1 | | March 20, 2009 | | 0.6000%
Quarterly | | Specified amount
upon credit
event noticeD | | | 9,000 | | | (89) |
| | | | | |
Lehman Brothers Holdings Inc.2 | | October 28, 2014 | | 4.3780%
Semi-annually | | 3-month
LIBORE | | | 124,400 | | | 3,503 |
| | | | | |
Merrill Lynch & Co., Inc. (DJCDX IG4)1 | | June 20, 2015 | | 0.264%
Quarterly | | Specified amount
upon credit
event noticeD | | | 22,000 | | | 88 |
| | | | | |
Merrill Lynch & Co., Inc. (Eastman Kodak Company, 7.25%, due 11/15/13)1 | | September 20,
2010 | | Specified amount
upon credit
event noticeB | | 2.300%
Quarterly | | | 1,610 | | | (33) |
| | | | | |
Merrill Lynch & Co., Inc. (Pacific Gas & Electric Co., 4.80%, due 3/1/14)1 | | June 20, 2009 | | Specified amount
upon credit
event noticeC | | 0.4200%
Quarterly | | | 2,980 | | | 12 |
| | | | | |
RBS Greenwich
(General Motors Acceptance Corporation, 6.875%, due 8/28/12)1 | | March 20, 2010 | | Specified amount
upon credit
event noticeB | | 4.300%
Quarterly | | | 5,000 | | | (131) |
| | | | | |
RBS Greenwich
(General Motors Acceptance Corporation, 6.875%, due 8/28/12)1 | | June 20, 2010 | | Specified amount
upon credit
event noticeB | | 4.900%
Quarterly | | | 5,440 | | | (22) |
| | | | | |
RBS Greenwich
(General Motors Acceptance Corporation, 6.875%, due 8/28/12)1 | | June 20, 2010 | | Specified amount
upon credit
event noticeB | | 5.750%
Quarterly | | | 7,500 | | | 184 |
| | | | | |
RBS Greenwich
(General Motors Acceptance Corporation, 7.125%, due 7/15/13)1 | | June 20, 2010 | | Specified amount
upon credit
event noticeB | | 6.800%
Quarterly | | | 7,500 | | | (200) |
153
Semi-Annual Report to Shareholders
NOTES TO FINANCIAL STATEMENTS—Continued
| | | | | | | | | | | | |
WESTERN ASSET CORE PLUS BOND PORTFOLIO—Continued |
Agreement With:
| | Termination Date
| | The Fund
Agrees to Pay
| | The Fund
Will Receive
| | Contract
Notional Amount
| | Unrealized
Appreciation/
(Depreciation)
|
RBS Greenwich (General Motors Acceptance Corporation, 7.125%, due 7/15/13)1 | | June 20, 2010 | | Specified amount
upon credit
event noticeB | | 7.100%
Quarterly | | $ | 8,000 | | $ | (131) |
| | | | | |
RBS Greenwich
(General Motors Acceptance Corporation, 7.125%, due 7/15/13)1 | | June 20, 2010 | | Specified amount
upon credit
event noticeB | | 7.700%
Quarterly | | | 12,500 | | | 0 |
| | | | | |
RBS Greenwich
(General Motors Acceptance Corporation, 7.125%, due 7/15/13)1 | | June 20, 2010 | | Specified amount
upon credit
event noticeB | | 8.400%
Quarterly | | | 12,500 | | | 350 |
| | | | | |
RBS Greenwich
(General Motors Acceptance Corporation, 7.125%, due 7/15/13)1 | | September 20, 2010 | | Specified amount
upon credit
event noticeB | | 6.100%
Quarterly | | | 8,000 | | | (417) |
| | | | | |
RBS Greenwich
(General Motors Acceptance Corporation, 7.125%, due 7/15/13)1 | | September 20, 2010 | | Specified amount
upon credit
event noticeB | | 6.630%
Quarterly | | | 19,600 | | | (658) |
| | | | | |
RBS Greenwich (General Motors Acceptance Corporation, 7.125%, due 7/15/13)1 | | September 20, 2010 | | Specified amount
upon credit
event noticeB | | 6.900%
Quarterly | | | 10,000 | | | (252) |
| | | | | |
RBS Greenwich (General Motors Acceptance Corporation, 7.125%, due 7/15/13)1 | | September 20, 2005 | | Specified amount
upon credit
event noticeB | | 7.200%
Quarterly | | | 7,820 | | | (154) |
| | | | | |
RBS Greenwich
(iBoxx CDX5)1 | | December 20, 2010 | | Specified amount
upon credit
event noticeB | | 2.0000%
Quarterly | | | 30,900 | | | 53 |
| | | | | |
RBS Greenwich
(iBoxx Hi-Vol4)1 | | June 20, 2010 | | Specified amount
upon credit
event noticeB | | 0.9000%
Quarterly | | | 50,000 | | | (16) |
| | | | | |
RBS Greenwich
(Tenet Healthcare Corporation, 6.375%, due 12/1/11)1 | | September 20, 2010 | | Specified amount
upon credit
event noticeB | | 3.550%
Quarterly | | | 1,600 | | | 3 |
| | | | | |
RBS Greenwich
(Tenet Healthcare Corporation, 6.375%, due 12/1/11)1 | | September 20, 2010 | | Specified amount
upon credit
event noticeB | | 3.550%
Quarterly | | | 3,900 | | | 1 |
154
Semi-Annual Report to Shareholders
| | | | | | | | | | | | |
WESTERN ASSET CORE PLUS BOND PORTFOLIO—Continued |
Agreement With:
| | Termination Date
| | The Fund
Agrees to Pay
| | The Fund
Will Receive
| | Contract
Notional Amount
| | Unrealized
Appreciation/
(Depreciation)
|
RBS Greenwich
(Tenet Healthcare Corporation, 6.375%, due 12/1/11)1 | | September 20,
2010 | | Specified amount
upon credit
event noticeB | | 3.500%
Quarterly | | $ | 3,920 | | $ | 0 |
| | | | | |
RBS Greenwich
(Tenet Healthcare Corporation, 6.375%, due 12/1/11)1 | | September 20,
2010 | | Specified amount
upon credit
event noticeB | | 3.670%
Quarterly | | | 5,000 | | | 26 |
| | | | | |
RBS Greenwich
(Time Warner Inc.,
6.875%, due 5/1/12)1 | | September 20,
2010 | | Specified amount
upon credit
event noticeB | | 0.470%
Quarterly | | | 5,000 | | | (16) |
| | | | | |
RBS Greenwich
(Time Warner Inc.,
6.875%, due 5/1/12)1 | | December 20,
2010 | | Specified amount
upon credit
event noticeB | | 0.500%
Quarterly | | | 12,500 | | | (36) |
| | | | | |
The Goldman Sachs Group, Inc.
(Eastman Kodak Company,
7.25%, due 11/15/13)1 | | March 20,
2015 | | Specified amount
upon credit
event noticeB | | 1.670%
Quarterly | | | 1,900 | | | (216) |
| | | | | |
The Goldman Sachs Group, Inc.
(Eastman Kodak Company,
7.25%, due 11/15/13)1 | | March 20,
2015 | | Specified amount
upon credit
event noticeB | | 1.670%
Quarterly | | | 1,900 | | | (216) |
| | | | | |
The Goldman Sachs Group, Inc. (Ford Motor Credit Company, 7.00%, due 10/1/13)1 | | June 20, 2010 | | Specified amount
upon credit
event noticeB | | 4.750%
Quarterly | | | 2,500 | | | 48 |
| | | | | |
The Goldman Sachs Group, Inc. (General Motors Acceptance Corporation,
6.875%, due 8/28/12)1 | | June 20, 2010 | | Specified amount
upon credit
event noticeB | | 4.900%
Quarterly | | | 10,000 | | | 332 |
| | | | | |
The Goldman Sachs Group, Inc. (General Motors Acceptance Corporation,
6.875%, due 8/28/12)1 | | June 20, 2010 | | Specified amount
upon credit
event noticeB | | 5.750%
Quarterly | | | 10,000 | | | 270 |
| | | | | |
The Goldman Sachs Group, Inc. (General Motors Acceptance Corporation,
6.875%, due 8/28/12)1 | | June 20, 2010 | | Specified amount
upon credit
event noticeB | | 5.950%
Quarterly | | | 500 | | | 17 |
| | | | | |
The Goldman Sachs Group, Inc. (General Motors Acceptance Corporation,
6.875%, due 8/28/12)1 | | June 20, 2010 | | Specified amount
upon credit
event noticeB | | 6.000%
Quarterly | | | 5,000 | | | 179 |
| | | | | |
The Goldman Sachs Group, Inc. (General Motors Acceptance Corporation,
7.125%, due 7/15/13)1 | | June 20, 2010 | | Specified amount
upon credit
event noticeB | | 8.950%
Quarterly | | | 5,000 | | | 247 |
155
Semi-Annual Report to Shareholders
NOTES TO FINANCIAL STATEMENTS—Continued
| | | | | | | | | | | | |
WESTERN ASSET CORE PLUS BOND PORTFOLIO—Continued |
Agreement With:
| | Termination Date
| | The Fund
Agrees to Pay
| | The Fund
Will Receive
| | Contract
Notional Amount
| | Unrealized
Appreciation/
(Depreciation)
|
The Goldman Sachs Group, Inc. (General Motors Acceptance Corporation,
8.375%, due 7/15/33)1 | | September 20, 2010 | | Specified amount
upon credit
event noticeB | | 6.000%
Quarterly | | $ | 25,100 | | $ | (1,415) |
| | | | | |
The Goldman Sachs Group, Inc. (iBoxx CDX5)1 | | December 20, 2010 | | Specified amount
upon credit
event noticeB | | 2.000%
Quarterly | | | 16,400 | | | 18 |
| | | | | |
The Goldman Sachs Group, Inc. (DJCDX IG 4)1 | | June 20, 2010 | | 0.255%
Quarterly | | Specified amount
upon credit
event noticeB | | | 6,500 | | | 6 |
| | | | | |
The Goldman Sachs Group, Inc. (DJCDX IG 4)1 | | June 20, 2010 | | 0.2625%
Quarterly | | Specified amount
upon credit
event noticeB | | | 6,500 | | | 3 |
| | | | | |
The Goldman Sachs Group, Inc. (DJCDX IG 4)1 | | June 20, 2010 | | Specified amount
upon credit
event noticeB | | 0.40%
Quarterly | | | 23,300 | | | 197 |
| | | | | |
The Goldman Sachs Group, Inc. (DJCDX IG 4)1 | | June 20, 2010 | | Specified amount
upon credit
event noticeB | | 0.40%
Quarterly | | | 61,600 | | | 625 |
| | | | | |
The Goldman Sachs Group, Inc. (iBoxx HY 3)1 | | December 20, 2009 | | Specified amount
upon credit
event noticeB | | 4.0000%
Quarterly | | | 13,095 | | | 388 |
| | | | | |
The Goldman Sachs Group, Inc. (iBoxx HY 3)1 | | December 20, 2009 | | Specified amount
upon credit
event noticeB | | 4.0000%
Quarterly | | | 2,912 | | | 139 |
| | | | | |
The Goldman Sachs Group, Inc. (iBoxx HY 3)1 | | December 20, 2009 | | Specified amount
upon credit
event noticeB | | 4.0000%
Quarterly | | | 3,714 | | | 138 |
| | | | | |
The Goldman Sachs Group, Inc. (iBoxx HY 3)1 | | December 20, 2009 | | 4.0000%
Quarterly | | Specified amount
upon credit
event noticeD | | | 5,922 | | | 131 |
| | | | | |
The Goldman Sachs Group, Inc. (iBoxx HY 4)1 | | June 20, 2010 | | Specified amount
upon credit
event noticeB | | 3.600%
Quarterly | | | 3,168 | | | 135 |
| | | | | |
The Goldman Sachs Group, Inc. (iBoxx HY 4)1 | | June 20, 2010 | | Specified amount
upon credit
event noticeB | | 3.400%
Quarterly | | | 2,200 | | | 65 |
| | | | | |
The Goldman Sachs Group, Inc. (iBoxx IG FIN 3)1 | | March 20, 2010 | | Specified amount
upon credit
event noticeB | | 0.5000%
Quarterly | | | 7,500 | | | 54 |
| | | | | |
The Goldman Sachs Group, Inc. (iBoxx IG FIN 3)1 | | March 20, 2015 | | Specified amount
upon credit
event noticeB | | 0.7000%
Quarterly | | | 7,600 | | | 86 |
156
Semi-Annual Report to Shareholders
| | | | | | | | | | | | |
WESTERN ASSET CORE PLUS BOND PORTFOLIO—Continued |
Agreement With:
| | Termination Date
| | The Fund
Agrees to Pay
| | The Fund
Will Receive
| | Contract
Notional Amount
| | Unrealized
Appreciation/
(Depreciation)
|
The Goldman Sachs Group, Inc. (iBoxx IG Hi-Vol3)1 | | March 20, 2010 | | Specified amount
upon credit
event noticeB | | 1.050%
Quarterly | | $ | 22,600 | | $ | (172) |
| | | | | |
The Goldman Sachs Group, Inc. (iBoxx IG Hi-Vol3)1 | | March 20, 2010 | | Specified amount
upon credit
event noticeB | | 1.050%
Quarterly | | | 44,300 | | | 245 |
| | | | | |
The Goldman Sachs Group, Inc. (iBoxx IG Hi-Vol4)1 | | June 20, 2010 | | Specified amount
upon credit
event noticeB | | 0.900%
Quarterly | | | 31,200 | | | 579 |
| | | | | |
The Goldman Sachs Group, Inc. (iBoxx IG Hi-Vol4)1 | | June 20, 2010 | | Specified amount
upon credit
event noticeB | | 0.900%
Quarterly | | | 100,000 | | | 2,237 |
| | | | | |
The Goldman Sachs Group, Inc. (iBoxx IG Hi-Vol4)1 | | June 20, 2010 | | Specified amount
upon credit
event noticeB | | 0.900%
Quarterly | | | 50,000 | | | 673 |
| | | | | |
The Goldman Sachs Group, Inc.2 | | July 14, 2007 | | 3-month
LIBORE | | 4.1650%
Semi-annually | | | 45,000 | | | (299) |
| | | | | |
The Goldman Sachs Group, Inc.2 | | September 14, 2007 | | 3-month
LIBORE | | 3.2150%
Semi-annually | | | 37,270 | | | (924) |
| | | | | |
The Goldman Sachs Group, Inc.2 | | September 24, 2009 | | 3.7135%
Semi-annually | | 3-month
LIBORE | | | 100,000 | | | 3,271 |
| | | | | |
The Goldman Sachs Group, Inc.2 | | July 14, 2010 | | 4.3250%
Semi-annually | | 3-month
LIBORE | | | 35,000 | | | 442 |
| | | | | |
The Goldman Sachs Group, Inc.2 | | October 18, 2014 | | 4.4915%
Semi-annually | | 3-month
LIBORE | | | 54,000 | | | 1,070 |
| | | | | |
The Goldman Sachs Group, Inc2 | | July 14, 2015 | | 3-month
LIBORE | | 4.5500%
Semi-annually | | | 10,000 | | | (182) |
| | | | | | | | |
|
| |
|
|
| | | | | | | | | $ | 2,006,786 | | $ | 5,352 |
| | | | | | | | |
|
| |
|
|
|
WESTERN ASSET INFLATION INDEXED BOND PLUS PORTFOLIO |
Agreement With:
| | Termination Date
| | The Fund
Agrees to Pay
| | The Fund
Will Receive
| | Contract
Notional Amount
| | Unrealized
Appreciation/
(Depreciation)
|
Deutsche Bank AG (iBoxx HY4)1 | | June 20, 2010 | | Specified amount
upon credit
event noticeB | | 3.60%
Quarterly | | $ | 9,900 | | $ | 81 |
| | | | | |
J.P. Morgan Chase & Co.
(Ford Motor Company,
7.00%, due 8/15/12)1 | | June 20, 2010 | | Specified amount
upon credit
event noticeB | | 2.90%
Quarterly | | | 5,000 | | | (250) |
157
Semi-Annual Report to Shareholders
NOTES TO FINANCIAL STATEMENTS—Continued
| | | | | | | | | | | | |
WESTERN ASSET INFLATION INDEXED BOND PLUS PORTFOLIO—Continued |
Agreement With:
| | Termination Date
| | The Fund
Agrees to Pay
| | The Fund
Will Receive
| | Contract
Notional Amount
| | Unrealized
Appreciation/
(Depreciation)
|
J.P. Morgan Chase & Co.
(iBoxx IG Hi-Vol4)1 | | June 20, 2010 | | Specified amount
upon credit
event noticeB | | 0.90%
Quarterly | | $ | 11,700 | | $ | 85 |
| | | | | |
Merrill Lynch & Co., Inc.
(El Paso Corporation,
7%, due 5/15/11)1 | | June 20, 2010 | | Specified amount
upon credit
event noticeB | | 3.625%
Quarterly | | | 2,500 | | | 66 |
| | | | | |
Merrill Lynch & Co., Inc.
(Ford Motor Company, 7.375%, due 10/28/09)1 | | June 20, 2010 | | Specified amount
upon credit
event noticeB | | 5.50%
Quarterly | | | 2,500 | | | 112 |
| | | | | |
Merrill Lynch & Co., Inc. (General Motors Acceptance Corporation, 7.75%, due 1/19/10)1 | | March 20, 2007 | | Specified amount
upon credit
event noticeB | | 3.55%
Quarterly | | | 5,000 | | | (264) |
| | | | | |
Merrill Lynch & Co., Inc.
(iBoxx IG Hi-Vol4)1 | | June 20, 2010 | | Specified amount
upon credit
event noticeB | | 0.90%
Quarterly | | | 5,000 | | | (43) |
| | | | | |
The Goldman Sachs Group, Inc. (General Motors Acceptance Corporation,
6.875%, due 8/28/12)1 | | June 20, 2010 | | Specified amount
upon credit
event noticeB | | 4.50%
Quarterly | | | 7,500 | | | (131) |
| | | | | |
The Goldman Sachs Group, Inc. (iBoxx IG Hi-Vol4)1 | | June 20, 2010 | | Specified amount
upon credit
event noticeB | | 0.90%
Quarterly | | | 9,500 | | | (22) |
| | | | | | | | |
|
| |
|
|
| | | | | | | | | $ | 58,600 | | $ | (366) |
| | | | | | | | |
|
| |
|
|
| B | Upon bankruptcy or failure to make a scheduled interest payment, the Fund will pay $1,000. |
| C | Upon bankruptcy or failure to make a scheduled interest payment, the Fund will pay $1,000; upon default, the Fund will pay $10,000. |
| D | Upon bankruptcy or failure to make a scheduled interest payment, the Fund will receive $1,000. |
| E | As of September 30, 2005, the one- and three-month London Interbank Offered Rates were 3.86% and 4.06%, respectively. |
4. Securities Loaned:
Each Fund may lend its securities to approved brokers to earn additional income and will receive cash and U.S. government securities as collateral against the loans. Cash collateral received is invested in a money market pooled account by each Fund’s lending agent. Collateral is maintained over the life of the loan in an amount not less than 100% of the value of the loaned securities.
At September 30, 2005, the market value of securities on loan to broker-dealers was $176,243 for Intermediate, $978,251 for Core, and $1,470,363 for Core Plus and $116,150 for Inflation Indexed Plus. Cash collateral received was $179,860 for Intermediate, $998,356 for Core, $1,500,496 for Core Plus and $118,493 for Inflation Indexed Plus.
5. Transactions With Affiliates:
Each Fund has an investment management agreement with Legg Mason Fund Adviser, Inc. (“LMFA”). Western Asset Management Company (“Western Asset”) is the investment adviser to Limited Duration, Intermediate, Intermediate Plus, Core, Core Plus, Inflation
158
Semi-Annual Report to Shareholders
Indexed, and High Yield. Western Asset Management Company Limited (“WAML”) is the investment adviser to Non-U.S. and shares advisory responsibilities with Western Asset for Intermediate Plus, Core Plus and Inflation Indexed. Pursuant to their respective agreements, LMFA provides the Funds with management and administrative services for which each Fund pays a fee, computed daily and payable monthly, at annual rates of each Fund’s average daily net assets. LMFA, Western Asset and WAML have voluntarily agreed to waive their fees and reimburse the Funds to the extent each Fund’s expenses (exclusive of taxes, interest, brokerage and extraordinary expenses) exceed during any month certain annual rates of each Fund’s average daily net assets. Western Asset and WAML have also agreed to waive their advisory fees (which are paid by LMFA, and not the Funds) in corresponding amounts. The following chart shows annual rates of management fees, expense limits, and management fees waived for each Fund:
| | | | | | | | |
Fund
| | Asset
Breakpoint
| | Management Fee
| | | Expense Limitation
| |
Limited Duration | | All asset levels | | 0.350 | % | | 0.40 | % |
| | | |
Intermediate | | All asset levels | | 0.400 | % | | 0.45 | % |
| | | |
Intermediate Plus | | All asset levels | | 0.400 | % | | 0.45 | % |
| | | |
Core | | | | | | | | |
Institutional Class | | Up to $500 million | | 0.450 | % | | 0.50 | % |
| | | Next $500 million | | 0.425 | % | | | |
| | | In excess of $1 billion | | 0.400 | % | | | |
| | | |
Financial Intermediary Class | | Up to $500 million | | 0.450 | % | | 0.75 | % |
| | | Next $500 million | | 0.425 | % | | | |
| | | In excess of $1 billion | | 0.400 | % | | | |
| | | |
Core Plus | | | | | | | | |
Institutional Class | | Up to $500 million | | 0.450 | % | | 0.45 | % |
| | | Next $500 million | | 0.425 | % | | | |
| | | In excess of $1 billion | | 0.400 | % | | | |
| | | |
Financial Intermediary Class | | Up to $500 million | | 0.450 | % | | 0.70 | % |
| | | Next $500 million | | 0.425 | % | | | |
| | | In excess of $1 billion | | 0.400 | % | | | |
| | | |
Inflation Indexed | | All asset levels | | 0.200 | % | | 0.25 | % |
| | | |
High Yield | | All asset levels | | 0.550 | % | | 0.65 | % |
| | | |
Non-U.S. | | All asset levels | | 0.450 | % | | 0.55 | % |
Legg Mason Wood Walker, Incorporated (“LMWW”), a member of the New York Stock Exchange, serves as distributor of the Funds’ shares. LMWW receives from each Fund an annual distribution fee of 0.25% of the average daily net assets of the Financial Intermediary Class of each Fund, computed daily and payable monthly.
LMFA, Western Asset, WAML and LMWW are wholly owned subsidiaries of Legg Mason, Inc.
159
Semi-Annual Report to Shareholders
NOTES TO FINANCIAL STATEMENTS—Continued
6. Fund Share Transactions:
At September 30, 2005, there were 13.1 billion shares of common stock of the Corporation authorized at $.001 par value. Transactions in Fund shares were as follows:
| | | | | | | | | | | | | | | | | | | | | | | | |
| | | Sold
| | Reinvestment of Dividends
| | Repurchased
| | | Net Change
| |
| | | Shares
| | Amount
| | Shares
| | Amount
| | Shares
| | | Amount
| | | Shares
| | | Amount
| |
Limited Duration | | | | | | | | | | | | | | | | | | | | | | | | |
—Institutional Class | | | | | | | | | | | | | | | | | | | | | | | | |
Six Months Ended September 30, 2005 | | 5,695 | | $ | 56,507 | | 106 | | $ | 1,050 | | (1,316 | ) | | $ | (13,015 | ) | | 4,485 | | | $ | 44,542 | |
Year Ended Mar. 31, 2005 | | 2,314 | | | 23,070 | | 95 | | | 942 | | (1,220 | ) | | | (12,193 | ) | | 1,189 | | | | 11,819 | |
| | | | | | | | |
Intermediate | | | | | | | | | | | | | | | | | | | | | | | | |
—Institutional Class | | | | | | | | | | | | | | | | | | | | | | | | |
Six Months Ended September 30, 2005 | | 10,163 | | $ | 106,872 | | 1,883 | | $ | 19,779 | | (6,321 | ) | | $ | (66,392 | ) | | 5,726 | | | $ | 60,259 | |
Year Ended Mar. 31, 2005 | | 15,428 | | | 163,649 | | 3,396 | | | 35,624 | | (9,292 | ) | | | (98,232 | ) | | 9,532 | | | | 101,041 | |
| | | | | | | | |
Intermediate Plus | | | | | | | | | | | | | | | | | | | | | | | | |
—Institutional Class | | | | | | | | | | | | | | | | | | | | | | | | |
Six Months Ended September 30, 2005 | | 1,199 | | $ | 11,974 | | 74 | | $ | 738 | | (252 | ) | | $ | (2,508 | ) | | 1,021 | | | $ | 10,204 | |
Period Ended Mar. 31, 2005F | | 4,511 | | | 45,012 | | 54 | | | 531 | | (442 | ) | | | (4,340 | ) | | 4,123 | | | | 41,203 | |
| | | | | | | | |
Core | | | | | | | | | | | | | | | | | | | | | | | | |
—Institutional Class | | | | | | | | | | | | | | | | | | | | | | | | |
Six Months Ended September 30, 2005 | | 64,316 | | $ | 734,749 | | 6,521 | | $ | 74,647 | | (25,947 | ) | | $ | (296,312 | ) | | 44,890 | | | $ | 513,084 | |
Year Ended Mar. 31, 2005 | | 130,619 | | | 1,488,655 | | 12,384 | | | 139,680 | | (37,948 | ) | | | (433,066 | ) | | 105,055 | | | | 1,195,269 | |
| | | | | | | | |
—Financial Intermediary Class | | | | | | | | | | | | | | | | | | | | | | | | |
Six Months Ended September 30, 2005 | | 6,359 | | $ | 72,724 | | 541 | | $ | 6,198 | | (2,295 | ) | | $ | (26,234 | ) | | 4,605 | | | $ | 52,688 | |
Year Ended Mar. 31, 2005 | | 16,894 | | | 192,947 | | 746 | | | 8,418 | | (4,423 | ) | | | (50,544 | ) | | 13,217 | | | | 150,821 | |
| | | | | | | | |
Core Plus | | | | | | | | | | | | | | | | | | | | | | | | |
—Institutional Class | | | | | | | | | | | | | | | | | | | | | | | | |
Six Months Ended September 30, 2005 | | 112,809 | | $ | 1,201,615 | | 10,869 | | $ | 115,722 | | (25,382 | ) | | $ | (270,031 | ) | | 98,296 | | | $ | 1,047,306 | |
Year Ended Mar. 31, 2005 | | 178,983 | | | 1,885,071 | | 18,064 | | | 188,984 | | (69,914 | ) | | | (735,370 | ) | | 127,133 | | | | 1,338,685 | |
| | | | | | | | |
—Financial Intermediary Class | | | | | | | | | | | | | | | | | | | | | | | | |
Six Months Ended September 30, 2005 | | 12,929 | | $ | 137,986 | | 514 | | $ | 5,479 | | (1,715 | ) | | $ | (18,268 | ) | | 11,728 | | | $ | 125,197 | |
Year Ended Mar. 31, 2005 | | 19,384 | | | 205,763 | | 286 | | | 3,027 | | (2,163 | ) | | | (23,011 | ) | | 17,507 | | | | 185,779 | |
| | | | | | | | |
Inflation Indexed | | | | | | | | | | | | | | | | | | | | | | | | |
—Institutional Class | | | | | | | | | | | | | | | | | | | | | | | | |
Six Months Ended September 30, 2005 | | 723 | | $ | 7,814 | | 1,266 | | $ | 13,689 | | (1,263 | ) | | $ | (13,665 | ) | | 726 | | | $ | 7,838 | |
Year Ended Mar. 31, 2005 | | 11,379 | | | 121,576 | | 2,469 | | | 25,781 | | (1,683 | ) | | | (18,165 | ) | | 12,165 | | | | 129,192 | |
| | | | | | | | |
High Yield | | | | | | | | | | | | | | | | | | | | | | | | |
—Institutional Class | | | | | | | | | | | | | | | | | | | | | | | | |
Six Months Ended September 30, 2005 | | 5,393 | | $ | 55,594 | | 2,112 | | $ | 21,398 | | (1,457 | ) | | $ | (15,209 | ) | | 6,048 | | | $ | 61,783 | |
Year Ended Mar. 31, 2005 | | 29,305 | | | 305,054 | | 2,049 | | | 21,159 | | (10,290 | ) | | | (109,064 | ) | | 21,064 | | | | 217,149 | |
| | | | | | | | |
Non-U.S. | | | | | | | | | | | | | | | | | | | | | | | | |
—Institutional Class | | | | | | | | | | | | | | | | | | | | | | | | |
Six Months Ended September 30, 2005 | | 375 | | $ | 4,237 | | 69 | | $ | 777 | | (2,295 | ) | | $ | (25,870 | ) | | (1,851 | ) | | $ | (20,856 | ) |
Year Ended Mar. 31, 2005 | | 760 | | | 8,175 | | 285 | | | 2,869 | | (2,151 | ) | | | (23,757 | ) | | (1,106 | ) | | | (12,713 | ) |
| | | | | | | | | | | | | | | | | | | | | | | | | |
| F | For the period from October 1, 2004 (commencement of operations) to March 31, 2005. |
160
Semi-Annual Report to Shareholders
SHAREHOLDER MEETING RESULTS
At a Special Meeting of Stockholders of Western Asset Intermediate Bond Portfolio (the “Portfolio”) held on May 10, 2005, the following action was taken:
A change to the Portfolio’s investment objective, such that the target average modified duration of the Portfolio would be expected to range within 20% of the duration of its benchmark, the Lehman Brothers Intermediate Government/Credit Bond Index was approved as follows:
| | |
Shares Voted For
| | Shares Abstained
|
| 35,371,202.597 | | 26,170,497.266 |
161
PRIVACY POLICY
We are committed to keeping nonpublic personal information about you secure and confidential. This notice is intended to help you understand how we fulfill this commitment.
From time to time, we may collect a variety of personal information about you, including:
| | • | | Information we receive from you on applications and forms, via the telephone, and through our websites; |
| | • | | Information about your transactions with us, our affiliates, or others (such as your purchases, sales, or account balances); and |
| | • | | Information we receive from consumer reporting agencies. |
We do not disclose your nonpublic personal information, except as permitted by applicable law or regulation. For example, we may share this information with others in order to process your transactions. We may also provide this information to companies that perform services on our behalf, such as printing and mailing, or to other financial institutions with whom we have joint marketing agreements. We will require these companies to protect the confidentiality of this information and to use it only to perform the services for which we hired them.
With respect to our internal security procedures, we maintain physical, electronic, and procedural safeguards to protect your nonpublic personal information, and we restrict access to this information.
If you decide at some point either to close your account(s) or become an inactive customer, we will continue to adhere to our privacy policies and practices with respect to your nonpublic personal information.
This notice is being provided on behalf of:
Western Asset Funds, Inc.
Western Asset Funds, Inc.
The Board of Directors
William E. B. Siart, Chairman
Ronald J. Arnault
John E. Bryson
Anita L. DeFrantz
Ronald L. Olson
Louis A. Simpson
Jaynie Miller Studenmund
Officers
James W. Hirschmann, President
Scott F. Grannis, Vice President
Ilene S. Harker, Vice President
S. Kenneth Leech, Vice President
Stephen A. Walsh, Vice President
Marie K. Karpinski, Vice President and Treasurer and Principal Financial and Accounting Officer
Amy M. Olmert, Chief Compliance Officer
Lisa G. Mrozek, Secretary
Erin K. Morris, Assistant Treasurer
Investment Manager
Legg Mason Fund Adviser, Inc.
P.O. Box 17635
Baltimore, Maryland 21297-1635
Investment Advisers
Western Asset Management Company
385 East Colorado Boulevard
Pasadena, California 91101
Western Asset Management Company Limited
155 Bishopgate
London, England EC2M3XG
Transfer and Shareholder Servicing Agent
Boston Financial Data Services
66 Brooks Drive
Braintree, Massachusetts 02184
Custodian
State Street Bank & Trust Company
P.O Box 1031
Boston, Massachusetts 02103
Counsel
Ropes & Gray LLP
45 Rockefeller Plaza
New York, New York 10111
Independent Registered Public Accounting Firm
PricewaterhouseCoopers LLP
250 West Pratt Street
Baltimore, Maryland 21201
Information about the policies and procedures that the Funds use to determine how to vote proxies relating to each Fund’s portfolio securities is contained in the Statement of Additional Information, available upon request without charge by calling 1-888-425-6432 or on the Securities and Exchange Commission (“SEC”) website (http://www.sec.gov). Information regarding how the Funds voted proxies relating to portfolio securities during the most recent twelve-month period ended June 30 is also available on the SEC’s website or without charge through www.westernassetfunds.com.
Quarterly portfolio holdings are available upon request
by calling 1-888-425-6432.
This report is not to be distributed unless preceded or accompanied by a prospectus.
Legg Mason Wood Walker, Inc., Distributor
(9/05)
Item 2 – Code of Ethics
Not applicable for semi-annual reports.
Item 3 – Audit Committee Financial Expert
Not applicable for semi-annual reports.
Item 4 – Principal Accountant Fees and Services
Not applicable for semi-annual reports.
Item 5 – Audit Committee of Listed Registrants
Not applicable.
Item 6 – Schedule of Investments
The schedule of investments in securities of unaffiliated issuers as of the close of the reporting period is included as part of the semi-annual report to shareholders filed under Item 1 hereto.
Item 7 – Disclosure of Proxy Voting Policies and Procedures for Closed-End Management Investment Companies
Not applicable.
Item 8 – Portfolio Managers of Closed-End Management Investment Companies
Not applicable.
Item 9 – Purchases of Equity Securities by Closed-End Management Investment
Companies and Affiliated Purchasers
Not applicable.
Item 10 – Submission of Matters to a Vote of Security Holders
There have been no material changes to the procedures by which shareholders may recommend nominees to the Registrant’s Board of Directors that have been implemented since the Registrant last provided disclosure in response to the requirements of this Item 9.
Item 11 – Controls and Procedures
| | (a) | The registrant’s principal executive and principal financial officers have concluded, based on their evaluation of the Registrant’s disclosure controls and procedures as of a date within 90 days of the filing date of this report, that the Registrant’s disclosure controls and procedures are reasonably designed to ensure that information required to be disclosed by the Registrant on Form N-CSR is recorded, processed, summarized and reported within the required time periods in the Securities and Exchange Commission’s rule and forms and that information required to be disclosed by the Registrant in the reports that it files or submits on Form N-CSR is accumulated and communicated to the Registrant’s management, including its principal executive and principal financial officers, as appropriate to allow timely decisions regarding required disclosure. |
| | (b) | There were no changes in the Registrant’s internal control over financial reporting during the registrant’s second fiscal quarter of the period covered by this report that have materially affected, or are reasonably likely to materially affect, the Registrant’s internal control over financial reporting. |
Item 12 – Exhibits
| | (a)(1) | Not applicable for semi-annual reports. |
| | (a)(2) | Certifications pursuant to Rule 30a-2(a) under the Investment Company Act of 1940 are attached hereto. |
| | (b) | Certifications pursuant to Rule 30a-2(b) under the Investment Company Act of 1940 are attached hereto. |
SIGNATURES
Pursuant to the requirements of the Securities Exchange Act of 1934 and the Investment Company Act of 1940, the registrant has duly caused this report to be signed on its behalf by the undersigned, thereunto duly authorized.
| | |
Western Asset Funds, Inc. |
| |
| By: | | /s/ JAMES W. HIRSCHMANN |
| | | James W. Hirschmann |
| | | President |
| | | Western Asset Funds, Inc. |
| |
Date: | | November 29, 2005 |
Pursuant to the requirements of the Securities Exchange Act of 1934 and the Investment Company Act of 1940, this report has been signed below by the following persons on behalf of the registrant and in the capacities and on the dates indicated.
| | |
| |
| By: | | /s/ JAMES W. HIRSCHMANN |
| | | James W. Hirschmann |
| | | President |
| | | Western Asset Funds, Inc. |
| |
Date: | | November 29, 2005 |
| |
| By: | | /s/ MARIE K. KARPINSKI |
| | | Marie K. Karpinski |
| | | Treasurer and Principal Financial and Accounting Officer |
| | | Western Asset Funds, Inc. |
| |
Date: | | November 25, 2005 |