UNITED STATES
SECURITIES AND EXCHANGE COMMISSION
Washington, D.C. 20549
FORM N-CSR
CERTIFIED SHAREHOLDER REPORT OF REGISTERED MANAGEMENT
INVESTMENT COMPANIES
Investment Company Act file number: 811-06113
The Caldwell & Orkin Funds, Inc.
(Exact name of registrant as specified in charter)
5185 Peachtree Parkway, Suite 370, Norcross, GA 30092-6541
(Address of principal executive offices) (Zip code)
Michael B. Orkin, 5185 Peachtree Parkway, Suite 370, Norcross, Georgia 30092-6541
(Name and address of agent for service)
Registrant's telephone number, including area code: 678-533-7850
Date of fiscal year end: 4/30
Date of reporting period: 10/31/2009
Form N-CSR is to be used by management investment companies to file reports with the Commission not later than 10 days after the transmission to stockholders of any report that is required to be transmitted to stockholders under Rule 30e-1 under the Investment Company Act of 1940 (17 CFR 270.30e-1). The Commission may use the information provided on Form N-CSR in its regulatory, disclosure review, inspection, and policymaking roles.
A registrant is required to disclose the information specified by Form N-CSR, and the Commission will make this information public. A registrant is not required to respond to the collection of information contained in Form N-CSR unless the Form displays a currently valid Office of Management and Budget ("OMB") control number. Please direct comments concerning the accuracy of the information collection burden estimate and any suggestions for reducing the burden to Secretary, Securities and Exchange Commission, 450 Fifth Street, NW, Washington, DC 20549-0609. The OMB has reviewed this collection of information under the clearance requirements of 44 U.S.C. § 3507.
Item 1. Reports to Stockholders.
Investment Adviser C&O Funds Advisor, Inc. 5185 Peachtree Parkway Suite 370 Norcross, Georgia 30092-6541 (800) 237-7073 | MARKET OPPORTUNITY FUND Semi-Annual Report to Shareholders | Shareholder Accounts c/o JPMorgan P.O. Box 5354 Cincinnati, Ohio 45201-5354 (800) 467-7903 |
Dear Fellow Shareholder: | December 29, 2009 |
The Caldwell & Orkin Market Opportunity Fund (the “Fund”) dipped -5.32% in the 6-month period ended October 31, 2009. The S&P 500 Total Return index (“S&P 500”) rose 20.04% during the same period. For the 12 months ended October 31, 2009, the Fund was down -3.33%, while the S&P 500 gained 9.80%. And, since commencement of active management on August 24, 1992 through October 31, 2009, the Fund has generated a 9.65% average annual return, outpacing the S&P 500’s 7.61% average annual return during the same period. Of course, past performance is no guarantee of future results.
Importantly, the Fund has achieved these results while maintaining a low market risk profile and with little reliance on the movement of the stock market (see pages 5, 6, 7 and 8). Since we began actively managing the Fund on August 24, 1992, the Fund’s price movements have correlated very little (0.06%) with the price movements of the S&P 500. An S&P 500 index fund has a 100% correlation to the market. The Fund’s lack of correlation to the market indicates that its performance is not attributable to that of the index. Additionally, given the Fund’s low correlation to its benchmark (the S&P 500), deviations in Fund performance relative to the S&P 500’s performance are to be expected. (Statistical computations by Ned Davis Research, Inc.)
Given the Fund’s long / short investment process we’re often asked how best to judge its performance. The S&P 500 is long-only, and there is no generally accepted long / short mutual fund index that we know of. While the fund rating services have long / short categories, the funds included in those categories practice a myriad of alternative investment styles, not purely long / short. Furthermore, most have a strong net long bias. Our response to the inquiry is that we seek to outperform the S&P 500 over the course of a full market cycle, which includes both bull market and bear market cycles.
Ned Davis Research, Inc. (“NDR”) has computed what they consider to be bull and bear market cycles for the S&P 500. Most of their definition focuses on a 20% market move in either direction. A bull market phase and bear market phase together make up a full market cycle. The NDR report (below) shows that during the four full market cycles going back to 1992, the Fund has lagged the market during the bull phase, and outperformed during the bear phase. Importantly, the Fund has outperformed the S&P 500 during each of the four full market cycles. Of note, as referenced in the second paragraph above, the Fund’s performance has had virtually no correlation to the performance of the S&P 500, meaning that we haven’t been riding the market’s wave. While we tend to think of bull and bear market cycles as longer-term events, we note that the NDR report contains a bull phase that’s just six months in duration. We see that as an anomaly and not typical of a market cycle. Nonetheless, these are NDR’s computations, not ours, and we present them for your review.
Bull Market Phase | Bear Market Phase | Full Market Cycle | ||||||||
Start Date | MOF | S&P | Start Date ** | MOF | S&P | End Date *** | MOF | S&P | ||
8/24/1992 * | 210.84% | 230.03% | 7/17/1998 | 4.02% | -19.19% | 8/31/1998 | 223.35% | 166.69% | ||
8/31/1998 | 6.14% | 62.88% | 9/1/2000 | 15.10% | -35.71% | 9/21/2001 | 22.17% | 4.72% | ||
9/21/2001 | -5.72% | 22.00% | 3/19/2002 | 10.02% | -33.01% | 10/9/2002 | 3.73% | -18.27% | ||
10/9/2002 | 16.86% | 119.38% | 10/9/2007 | -0.61% | -55.26% | 3/9/2009 | 16.14% | -1.85% |
* | The first bull market phase began 10/11/1990, but the table begins with 8/24/1992, which coincides with commencement of active management of the Caldwell & Orkin Market Opportunity Fund. |
** | The bear market start date is the bull market’s end date. |
*** | A full market cycle runs from the bull market start date to the full market cycle end date. |
Management Discussion and Analysis
The Fund opened the semi-annual period on May 1, 2009 positioned 43.55% long, -27.65% short (15.90% net long), 0.19% in put options, 0.06% in call options, 7.05% in corporate bonds and 21.50% in cash & equivalents. Our largest long sector exposure was to emerging country exchange-traded funds, and our largest short focus was to the commercial services – schools sector.
Washington’s recession-busting checkbook appears to be working for the time being, though probably not without long-term negative repercussions. Because of substantial total credit market debt equal to about 369% of GDP (as of 9/30/2009), we’ve maintained a view that we are in a secular (longer-term) bear market that began in 2000, and that the bear market will be punctuated by periodic, sharp cyclical (shorter-term) rallies - rallies that could last months or even years. We believe we are in the midst of such a rally now, a rally whose roots are nourished by massive amounts of government stimulus.
You’ll notice in reading our client communications that the word “liquidity” is used frequently. Monetary / Economic Liquidity - the relationship between money supply growth and economic growth - is an important factor in causing financial assets to change in value, and an important factor in our investment process. When money supply growth outpaces the growth in the economy, the excess economic liquidity has to find a home, and typically (at least initially) it flows into liquid financial assets (stocks and bonds) before being absorbed into the broader economy, driving the markets higher. Conversely, when the economy becomes overheated, inflation increases and as the Fed takes action, money supply contracts relative to economic growth, and stocks and bonds are sold driving prices down. For now, the monetary stimulus flowing from the Fed has increased the money supply, and helped drive the markets higher.
To say that the past six months have been frustrating would be an understatement. To set the stage for this review period we look back to late last year. At that time we had positioned the Fund for such a cyclical rally by increasing net long exposure. Several times we pulled the net long position back down when the anticipated rally didn’t materialize. The markets finally did begin to rally in March of this year (the S&P 500 hit its low on March 9, 2009) and continued into June. Of note, March 9, 2009 also represented the endpoint of the worst drawdown the S&P 500 has seen since we’ve been actively managing the Fund (August 24, 1992). The drawdown began on October 9, 2007, and during that period the S&P 500 fell a gut-wrenching -55.26%. The Fund, meanwhile, slipped -0.61% during the same timeframe.
Fiscal and monetary stimuli have been aggressively used to help jump-start economies around the world. In some emerging market economies, with extraordinary monetary and fiscal stimulus as catalysts, prospects looked stronger than they did in the U.S. We initiated long positions to those economies in mid and late April. That exposure proved beneficial. During the month of May our longs performed well, rising 9.91% and outpacing the S&P 500’s 5.59% gain. The shorts (a smaller part of the portfolio compared to the longs) also did well relative to market, dipping just - -3.92%. The Fund returned 3.30% in May, and we exited the month 15.03% net long and 97.21% invested.
On June 12 the S&P 500 peaked after having run up 40.79% from its March 9 low (the Fund rose 8.20% during that period). Year-to-date through June 12 the S&P 500 was up 6.11%, slightly behind the Fund’s 6.26% gain. As the market ran up during that time period we ratcheted down our net long exposure, locking in profits along the way. Although we had anticipated a small market correction, it began to appear that a sharper correction was in the making. On June 16 we aggressively pared back the long exposure. We opened the day 13.44% net long and closed the day -10.82% net short. While the Fund fell -2.55% in June, the long side of the portfolio was down - -4.43%. The S&P 500 inched up 0.20%. We closed the month 82.35% invested and basically market neutral … -0.82% net short.
The market setback reversed course on July 11. Between June 12 and July 10 the S&P 500 fell -6.95% while the Fund slipped -2.56%. In early July we pulled in the shorts and increased our net long exposure, while decreasing our total invested position. By mid-July we transitioned back to a net long exposure as the markets resumed their advance. That said, there was clearly a persistent and strong short squeeze beginning in July. The prices of some of our shorts moved up significantly more than the market, negatively impacting the Fund’s performance. We covered many short positions, but maintained others due to our conviction that there was a misperception regarding their prospects. The shorts lost -14.28% during the month, and the longs were up 6.92%, slightly underperforming the S&P 500’s 7.56% return. The Fund was down - -2.39% in July. We closed the month 71.20% invested and 29.59% net long.
The disappointing performance continued into August. We entered the month net long and maintained a net long position throughout the month. Our long portfolio outperformed the market for the month (3.93% vs. 3.61% for the S&P 500), but the short allocation and put options again adversely affected performance. The shorts were down -6.90%, and the Fund dipped -0.62% in August.
2
While we had conviction in the securities we were short, we recognized that they weren’t working. During September we added to the long side and pulled in the shorts, increasing the net long exposure. September’s performance looked like August on instant replay: our longs outperformed the S&P 500 (5.01% vs. 3.73%) and the shorts and options were down more than the market. However during September we turned in a modest gain of 0.58% thanks to the change in asset allocation. The Fund exited the third quarter 75.30% invested and 47.74% net long – the greatest net long positioning since May 23, 2007.
That bullish repositioning proved detrimental during October. The S&P 500 declined -1.86%, and the Fund was down -3.60%. The long portfolio was hit hard, falling - -7.57%, but the shorts did well, returning 4.45%.
This has been a frustrating few months. At the close on June 11 the Fund was up 6.69% year-to-date. And even though we had transitioned to a net long position in early to mid-July, and our long selections performed well relative to the market, our short and put positions held back overall portfolio performance. Certain exposure in three of our long sectors – technology, natural gas and gaming - also contributed to underperformance during the market’s setback in October. Overall, technology and natural gas have been beneficial to performance.
One of our technology standouts has been Apple Inc. (AAPL). For most of this review period AAPL was our largest long holding. Apple continues to innovate and invigorate the personal computing and digital media businesses, and their multi-pronged product strategy – Mac, iPod, iPhone and eventually the “Tablet” – should continue to drive profits higher. Still, when the markets took a hit, so did AAPL.
Natural gas may be one of the cheapest, most readily available and proven answers to the climate change issue, an issue which the current administration seems to embrace. In addition to powering vehicles (particularly fleet transportation), natural gas can be used to generate electricity with significantly less carbon dioxide emissions. New extraction technology has greatly increased the amount of proven reserves in the U.S., however the hydraulic fracking technique used to extract the shale gas has been blamed for water contamination, a risk to the investment. However increased use of natural gas could lessen our dependence on energy imports, and unlike oil, natural gas is found in abundance in the U.S. One of the headwinds facing the natural gas industry has been the fact that it’s comprised of smaller companies with limited lobbying force in Washington D.C., especially when compared to the lobby muscle of the oil and coal conglomerates. At least one giant in the oil patch concurs. On December 14, 2009 Exxon Mobil Corp. (XOM) announced plans to buy XTO Energy Inc. (XTO) for about $30 billion in stock. XTO is one of the leading developers of unconventional methods to drill for shale oil and gas and gas trapped in sand.
We closed the fiscal half-year year positioned 46.95% long, -23.99% short (22.96% net long), 0.77% in put options, 1.04% in call options, 6.89% in corporate bonds, and 20.36% in cash & equivalents. The Fund’s October 31, 2009 sector allocation can be found on page 10.
Outlook
According to the Bureau of Labor Statistics, the U.S. unemployment rate stood at 10.0% in November 2009 (after peaking at 10.2% in October). That rate jumps to 17.2% if you include underemployed/discouraged workers. While there has been some price stabilization in the housing market, Washington’s attempt at mortgage modification has thus far not worked, and a significant flood of adjustable rate mortgage resets and foreclosures loom on the horizon. There’s also great concern about the risks posed by the commercial real estate market, and the exposure to commercial real estate lending by financial institutions.
We maintain our investment thesis that we are in an economic liquidity-driven cyclical rally within a secular bear market, mindful that such rallies could last from months to years as they did during the Great Depression. While there’s currently some evidence of a recovery, there’s still a good chance that we may well be in the eye of the hurricane. Ned Davis Research, Inc. has a telling chart of total credit market debt (private, corporate and government) as a percent of gross domestic product (GDP). In the quarter ending December 31, 1932 it peaked at 259.4%. At September 30, 2009 (the most recent data available) it stood at 368.8%. We are levered to the hilt. To the extent that the consumer and corporations have paid down debt, the government’s share is skyrocketing. NDR has another table that shows for every decade going back to 1950 to present, it takes an increasing amount of debt to generate the same increment of GDP growth. During the 1950’s, it took $1.36 of debt to generate $1.00 of GDP. During the 2000’s (through June 30, 2009), it’s taken $6.03 of debt to spark $1.00 of GDP growth. As Ned states, “We are at a point of greatly diminishing returns regarding debt.”
The Great Unwind of both stimulus and leverage is fraught with risk and may lead to further market setbacks, and we still face potentially other longer-term risks, including inflation or deflation (depending on government intervention), a falling dollar and crowding out of private investment. We are keenly aware of the risks associated with deleveraging, and are on guard for what could happen.
3
We are sailing in uncharted waters, and as such risks remain high.
On behalf of all of us at Caldwell & Orkin, I thank you for your continued support.
Sincerely,
Michael B. Orkin, CFA
Portfolio Manager and Chief Investment Officer
The Fund’s investment objective is to provide long-term capital growth with a short-term focus on capital preservation. We use active asset allocation - the opportunistic shifting of assets between long stock positions, short stock positions (selling borrowed stock and attempting to replace the borrowed securities in the future at a lower price), options, bonds and cash equivalents - to manage exposure to market risk (the risk that the broad market declines, taking good companies down with it). Short positions and put options are employed with the intent of making money when those stocks we judge to be overvalued fall. In summary, our goal is to make money over a full market cycle, but with less stomach churn. The Fund’s disciplined investment philosophy and active management style typically leads to higher-than-average portfolio turnover. High turnover may have an unfavorable impact on the amount of taxable distributions paid to shareholders. Higher turnover may also result in higher brokerage costs for the Fund. The Fund’s turnover rate will typically exceed 100% per year, and will not be a limiting factor when we deem change appropriate. Fund holdings, industry and asset allocations are subject to change without notice. The Fund may or may not have a position in any of the companies mentioned in this commentary as of the date of this report.
The performance data quoted represents past performance. Past performance is no guarantee of future results. The investment return and principal value of an investment in the Fund will fluctuate so that an investor's shares, when redeemed, may be worth more or less than their original cost. Current performance may be higher or lower than the performance data quoted. Please call 800-237-7073 or visit www.CaldwellOrkin.com for current month-end performance. The Fund's performance assumes the reinvestment of dividends and capital gains, if any. Fund holdings, industry and asset allocations are subject to change without notice.
Total annualized Fund operating expenses for the Fund’s fiscal year ended April 30, 2009 were 2.00%. Additional information about the Fund’s fees and expenses is available in the Fund’s prospectus.
An investment in the Fund involves risk, including the loss of principal. Additionally, there are certain risks inherent in investing in the Fund, including market risk, short sale risk, interest rate risk, business risk, small company risk, market valuation risk, political risk, and portfolio turnover risk. For a complete discussion of these risks, you may request a copy of the Fund’s prospectus by calling 800-237-7073. The Fund uses aggressive investment strategies (including short positions and options) that have the potential for yielding high returns; however, these strategies may also result in losses. Stocks sold short have unlimited risk. Investment return and principal value will fluctuate so that shares, when redeemed, may be worth more or less than their original cost. Options are not suitable for all investors.
Investors should expect that the Fund’s performance may fluctuate independently of stock market indices, such as the S&P 500 Total Return index. The S&P 500 Total Return index is a widely recognized unmanaged index of 500 common stock prices, adjusted to reflect the reinvestment of dividends and distributions. You may not invest directly in an index.
An investor should consider the investment objectives, risks, charges and expenses of the Fund carefully before investing. The prospectus contains this and other information. For more complete information, including charges and expenses, you may obtain a prospectus by calling 800-237-7073. The prospectus should be read carefully before investing or sending money.
Portfolio Statistic Definitions:
Correlation Coefficient: A measurement of investment risk that quantifies the degree to which a fund’s performancecorrelates with the performance of a benchmark.
Beta: A measure of a fund’s sensitivity to market movements. Usually the higher betas represent riskier investments. Whencorrelation is low, beta has minimal, if any, significance.
Standard deviation: A statistical measure of dispersion about an average, indicating the volatility of a fund’s total returns.
Sharpe Ratio: A measure of return per unit of risk. The higher the Sharpe Ratio, the better the risk-adjusted performance.
Semi-Variance: A measure of a fund’s downside (negative return) volatility relative to a benchmark. Lower numbers areassociated with less risk.
Distributed by ALPS Distributors, Inc., Member FINRA/SIPC
1290 Broadway, Suite 1100, Denver, CO 80203
4
Caldwell & Orkin Market Opportunity Fund
Performance Summary
Fiscal Year Ended April 30, | C&O Market Opportunity Fund 1 | S&P 500 Total Return Index 2 | Fiscal Year Ended April 30, | C&O Market Opportunity Fund 1 | S&P 500 Total Return Index 2 | |||||
1991 | 1.25% | 0.42% | 2000 | -0.02% | 10.13% | |||||
1992 | 11.96% | 14.03% | 2001 | 11.43% | -12.97% | |||||
1993 * | 15.09% | 9.24% | 2002 | 1.88% | -12.63% | |||||
1993 ** | 21.09% | 9.18% | 2003 | 1.12% | -13.31% | |||||
1994 | 16.48% | 5.32% | 2004 | -3.55% | 22.88% | |||||
1995 | -2.28% | 17.47% | 2005 | -0.17% | 6.34% | |||||
1996 | 31.80% | 30.21% | 2006 | -2.74% | 15.42% | |||||
1997 | 23.24% | 25.13% | 2007 | 15.31% | 15.24% | |||||
1998 | 25.77% | 41.07% | 2008 | 17.92% | -4.68% | |||||
1999 | 19.43% | 21.82% | 2009 | 4.73% | -35.31% |
Total Return Through October 31, 2009 | Average Annual Returns Through October 31, 2009 | |||||||||
Six months ended | -5.32% | 20.04% | One Year | -3.33% | 9.80% | |||||
Twelve months ended | -3.33% | 9.80% | Three Years | 8.93% | -7.02% | |||||
Since 8/24/92 3 | 387.31% | 253.21% | Five Years | 5.50% | 0.33% | |||||
Ten Years | 4.43% | -0.95% | ||||||||
Since 8/24/92 3 | 9.65% | 7.61% |
Net Asset Allocation
Common Stock Sold Short represents the market value, excluding margin requirements.
1 | The performance data quoted represents past performance. Past performance is no guarantee of future results. The investment return and principal value of an investment in the Fund will fluctuate so that an investor's shares, when redeemed, may be worth more or less than their original cost. Current performance may be higher or lower than the performance data quoted. Please call 800-377-7073 or visit www.CaldwellOrkin.com for current month-end performance. The Fund's performance assumes the reinvestment of dividends and capital gains, if any. Fund holdings, industry and asset allocations are subject to change without notice. See additional important disclosures on page 4. |
Fund holdings, industry and asset allocations are subject to change without notice. The Fund may or may not have a position in any of the companies mentioned in this report as of the date of this report.
2 | Investors should expect that the Fund’s performance may fluctuate independently of stock market indices, such as the S&P 500 Total Return index. The S&P 500 Total Return index is a widely recognized unmanaged index of 500 common stock prices adjusted to reflect the reinvestment of dividends and distributions. You may not invest directly in an index. |
3 | Effective August 24, 1992, the Fund changed its investment objective to provide long-term capital growth with a short-term focus on capital preservation through investment selection and asset allocation. Prior to that time, the Fund was passively managed and indexed to the largest 100 over-the-counter (OTC) stocks. |
* | For the full fiscal year ending April 30, 1993. |
** | From August 24, 1992 through April 30, 1993 - the portion of the year using the active investment management style of C&O Funds Advisor, Inc., the manager of the Fund. |
5
CALDWELL & ORKIN MARKET OPPORTUNITY FUND
STATISTICAL RISK PROFILE 8/31/1992 – 10/31/2009
Ten Worst S&P 500 Total Return Days
Date | C&O MOF | S&P 500 | Variance | |||||
10/15/2008 | -1.47% | -9.02% | 7.55% | The Caldwell & Orkin Market Opportunity Fund outperformed the S&P 500 Total Return index on all ten of the ten worst days, and was positive on three of the ten days. | ||||
12/01/2008 | -1.58% | -8.92% | 7.34% | |||||
09/29/2008 | -0.37% | -8.78% | 8.41% | |||||
10/09/2008 | -2.12% | -7.61% | 5.49% | |||||
10/27/1997 | -1.60% | -6.89% | 5.29% | |||||
08/31/1998 | 0.42% | -6.79% | 7.21% | |||||
11/20/2008 | 0.23% | -6.70% | 6.93% | |||||
11/19/2008 | -0.28% | -6.10% | 5.82% | |||||
10/22/2008 | -1.11% | -6.09% | 4.98% | |||||
04/14/2000 | 1.81% | -5.82% | 7.63% |
Ten Worst S&P 500 Total Return Weeks
Week Ending | C&O MOF | S&P 500 | Variance | |||||
10/10/2008 | -2.71% | -18.14% | 15.43% | The Caldwell & Orkin Market Opportunity Fund outperformed the S&P 500 Total Return index in all ten of the ten worst weeks, and was positive in seven of those weeks. | ||||
09/21/2001 | 1.63% | -11.57% | 13.20% | |||||
04/14/2000 | 4.51% | -10.52% | 15.03% | |||||
10/03/2008 | 1.83% | -9.33% | 11.16% | |||||
11/21/2008 | 0.56% | -8.33% | 8.89% | |||||
07/19/2002 | 0.65% | -7.96% | 8.61% | |||||
03/06/2009 | -0.88% | -6.96% | 6.08% | |||||
07/12/2002 | 1.01% | -6.81% | 7.82% | |||||
02/20/2009 | 0.20% | -6.80% | 7.00% | |||||
10/24/2008 | -0.28% | -6.72% | 6.44% |
Ten Worst S&P 500 Total Return Months
Month | C&O MOF | S&P 500 | Variance | |||||
10/31/2008 | 3.42% | -16.74% | 20.16% | The Caldwell & Orkin Market Opportunity Fund outperformed the S&P 500 Total Return index in all ten of the ten worst months, and was positive in eight of those months. | ||||
08/31/1998 | 3.12% | -14.46% | 17.58% | |||||
09/30/2002 | 2.10% | -10.86% | 12.96% | |||||
02/28/2009 | 0.30% | -10.71% | 11.01% | |||||
02/28/2001 | 4.78% | -9.13% | 13.91% | |||||
09/30/2008 | -0.42% | -8.89% | 8.47% | |||||
06/30/2008 | 4.84% | -8.43% | 13.27% | |||||
01/31/2009 | -0.73% | -8.30% | 7.57% | |||||
09/30/2001 | 3.29% | -8.06% | 11.35% | |||||
11/30/2000 | 6.92% | -7.91% | 14.83% | |||||
Short selling began May 2, 1994. Past performance is no guarantee of future results. See additional important disclosures on page 4. Computations by Ned Davis Research, Inc.
6
CALDWELL & ORKIN MARKET OPPORTUNITY FUND
STATISTICAL RISK PROFILE 8/31/1992 – 10/31/2009 (continued)
Ten Worst Drawdowns
Caldwell & Orkin Market Opportunity Fund
Date Range | C&O MOF | S&P 500 |
4/12/1999 - 11/23/1999 | -13.24% | 4.23% |
10/9/2002 - 5/25/2006 | -13.12% | 74.17% |
1/17/2008 - 9/19/2008 | -11.17% | -4.50% |
6/11/2009 - 10/30/2009 | -8.61% | 10.77% |
5/26/2000 - 6/7/2000 | -8.15% | 6.81% |
12/29/2000 - 1/19/2001 | -8.06% | 1.75% |
4/4/2001 - 3/11/2002 | -7.98% | 7.22% |
3/15/1993 - 4/26/1993 | -7.83% | -3.65% |
3/18/1994 - 2/3/1995 | -7.68% | 4.21% |
4/10/2007 - 5/24/2007 | -7.14% | 4.31% |
S&P 500 Total Return Index
Date Range | C&O MOF | S&P 500 |
10/9/2007 - 3/9/2009 | -0.61% | -55.26% |
3/24/2000 - 10/9/2002 | 28.57% | -47.41% |
7/17/1998 - 8/31/1998 | 4.02% | -19.19% |
11/27/2002 - 3/11/2003 | 2.19% | -14.28% |
7/16/1999 - 10/15/1999 | -0.45% | -11.78% |
10/7/1997 - 10/27/1997 | 0.18% | -10.74% |
9/23/1998 - 10/8/1998 | 2.02% | -9.94% |
2/18/1997 - 4/11/1997 | 2.72% | -9.39% |
7/19/2007 - 8/15/2007 | 7.66% | -9.30% |
12/31/1999 - 2/25/2000 | 0.58% | -9.14% |
Statistical Risk Measurements
C&O MOF | S&P 500 | |
Correlation Coefficient (R-Squared) | 0.06% | 100.00% |
Beta | -0.01 | 1.00 |
Standard Deviation | 0.52 | 1.21 |
Sharpe Ratio | 0.71 | 0.29 |
Semi-Variance (downside volatility) | 0.13 | 0.72 |
Performance During the Last Three Market Downturns of 20% or More
C&O MOF | S&P 500 | |
January 6, 2009 through March 9, 2009 | -3.42% | -27.19% |
October 9, 2007 through November 20, 2008 | 1.80% | -50.73% |
January 4, 2002 through October 9, 2002 | 7.25% | -32.95% |
Short selling began May 2, 1994. Past performance is no guarantee of future results. See additional important disclosures on page 4. Computations by Ned Davis Research, Inc.
7
Caldwell & Orkin Market Opportunity Fund Versus S&P 500 Total Return Index
Since Commencement of Active Style of Investment Management
Results of a Hypothetical $10,000 Investment
August 24, 1992 through October 31, 2009
Past performance does not predict future performance. The returns do not reflect the deduction of taxes that a
shareholder would pay on Fund distributions or the redemption of Fund shares. See additional disclosure on page 4.
Chart courtesy of Ned Davis Research, Inc.
8
CALDWELL & ORKIN MARKET OPPORTUNITY FUND
DISCLOSURE OF FUND EXPENSES (UNAUDITED)
We believe it is important for you to understand the impact of fees and expenses on your investment in the Fund. As a shareholder of the Fund, you incur two types of costs: (1) transaction costs related to the purchase and redemption of Fund shares, including redemption fees and brokerage commissions (if applicable); and (2) ongoing costs, including management fees, administrative expenses, portfolio transaction costs and other Fund expenses. A mutual fund’s ongoing costs are expressed as a percentage of its average net assets. This figure is known as the expense ratio. The following example is intended to help you understand your ongoing costs (in dollars and cents) of investing in the Fund and to compare these costs with the ongoing costs of investing in other mutual funds.
The below example is based on an investment of $1,000.00 invested at the beginning of the period and held for the entire period indicated, May 1, 2009 through October 31, 2009. The table below illustrates the Fund’s expenses in two ways:
Based on Actual Fund Returns
The first line of the table below provides information about actual account values and actual expenses. You may use the information in this line, together with the amount you invested, to estimate the expenses that you paid over the period. Simply divide your account value by $1,000 (for example, an $8,600 account value divided by $1,000 = 8.6), then multiply the result by the number in the first line under the heading entitled "Expenses Paid During Period" to estimate the expenses you paid on your account during this period.
Based on a Hypothetical 5% Return for Comparison Purposes
The second line of the table below provides information about hypothetical account values and hypothetical expenses based on the Fund's actual expense ratio and an assumed rate of return of 5% per year before expenses, which is not the Fund's actual return. The hypothetical account values and expenses may not be used to estimate the actual ending account balance or expenses you paid for the period. You may use this information to compare the ongoing costs of investing in the Fund and other funds. To do so, compare this 5% hypothetical example with the 5% hypothetical examples that appear in the shareholder reports of the other funds.
Please note that the expenses shown in the table are meant to highlight your ongoing costs only and do not reflect any transactional costs, such as redemption fees or brokerage commissions. Therefore, the second line of the table is useful in comparing ongoing costs only, and will not help you determine the relative total costs of owning different funds. In addition, if these transactional costs were included, your costs would have been higher.
Beginning Account Value 5/1/2009 | Ending Account Value 10/31/2009 | Annualized Expense Ratio | Expenses Paid During Period (1) 5/1/2009-10/31/2009 | |
Actual Fund Return (2) | $1,000.00 | $946.80 | 1.41% | $6.92 |
Hypothetical 5% Annual Return before expenses (3) | $1,000.00 | $1,015.33 | 1.41% | $7.17 |
1. | Expenses are equal to the Fund's annualized expense ratio of 1.41%, multiplied by the average account value over the period, multiplied by 184, and divided by 365 (to reflect the one-half year period). |
2. | Excluding interest expense and dividend expense from short positions, your actual cost of investment in the Fund would be $5.40. |
3. | Excluding interest expense and dividend expense from short positions, your hypothetical cost of investment in the Fund would be $5.60. |
9
CALDWELL & ORKIN MARKET OPPORTUNITY FUND
SECTOR DIVERSIFICATION (unaudited)
The following table presents the Fund's 10/31/2009 portfolio holdings by sector based on total net assets, sorted by net exposure (net long to net short).
Long | Short | Total (a) | Net (b) | |
Oil & Gas - US Exploration & Production | 6.96% | 6.96% | 6.96% | |
Food - Misc Preparation | 3.32% | 3.32% | 3.32% | |
Computer - Manufacturers | 3.04% | 3.04% | 3.04% | |
Retail - Clothing / Shoe | 3.04% | 3.04% | 3.04% | |
Telecom - Wireless Services | 2.19% | 2.19% | 2.19% | |
Telecom - Services | 2.09% | 2.09% | 2.09% | |
Elec - Semiconductor Manufacturing | 2.44% | -0.46% | 2.90% | 1.98% |
Finance - Savings & Loan | 1.82% | 1.82% | 1.82% | |
Leisure - Services | 1.74% | 1.74% | 1.74% | |
Computer - Networking | 1.58% | 1.58% | 1.58% | |
Cosmetics / Personal Care | 1.50% | 1.50% | 1.50% | |
Retail - Major Discount Chains | 1.29% | 1.29% | 1.29% | |
Diversified Operations | 1.19% | 1.19% | 1.19% | |
Retail - Home Furnishings | 1.19% | 1.19% | 1.19% | |
Medical - Hospitals | 1.18% | 1.18% | 1.18% | |
Computer Software - Desktop | 1.17% | 1.17% | 1.17% | |
Media - Diversified | 1.17% | 1.17% | 1.17% | |
Internet - Content | 1.16% | 1.16% | 1.16% | |
Finance - Investment Bankers | 1.13% | 1.13% | 1.13% | |
Leisure - Movies & Related | 1.05% | 1.05% | 1.05% | |
Apparel - Clothing Manufacturing | 1.01% | 1.01% | 1.01% | |
Beverages - Soft Drinks | 0.98% | 0.98% | 0.98% | |
Banks - Midwest | 0.95% | 0.95% | 0.95% | |
Elec - Semiconductor Equipment | 0.61% | 0.61% | 0.61% | |
Internet - E-Commerce | 0.40% | 0.40% | 0.40% | |
Computer Software - Enterprise | 0.39% | 0.39% | 0.39% | |
Retail - Drug Stores | 0.39% | 0.39% | 0.39% | |
Leisure - Hotels & Motels | 0.29% | 0.29% | 0.29% | |
Leisure - Gaming / Equipment | -0.02% | 0.02% | -0.02% | |
Retail / Wholesale - Autos / Parts | 0.20% | -0.58% | 0.78% | -0.38% |
Telecom - Wireless Equipment | -0.43% | 0.43% | -0.43% | |
Building - Construction Products / Misc | 0.92% | -1.37% | 2.29% | -0.45% |
Medical - Systems / Equipment | -0.50% | 0.50% | -0.50% | |
Medical - Products | -0.52% | 0.52% | -0.52% | |
Banks - Money Center | 0.37% | -1.01% | 1.38% | -0.64% |
Commercial Services - Market Research | -1.35% | 1.35% | -1.35% | |
Leisure - Products | 0.19% | -1.72% | 1.91% | -1.53% |
Financial Services - Misc | -1.60% | 1.60% | -1.60% | |
US Treasury Bond Fund | -1.62% | 1.62% | -1.62% | |
Medical - Outpatient / Home Care | -1.91% | 1.91% | -1.91% | |
Medical - Health Maintenance Organization | -2.16% | 2.16% | -2.16% | |
Banks - Super Regional | -2.61% | 2.61% | -2.61% | |
Banks - West / Southwest | -2.96% | 2.96% | -2.96% | |
Emerging Country Exchange-Traded Funds | -3.17% | 3.17% | -3.17% | |
Subtotal Equities (long & short positions) | 46.95% | -23.99% | 70.94% | 22.96% |
Call Options | 1.04% | 1.04% | ||
Put Options | 0.77% | 0.77% | ||
Corporate Bonds | 6.89% | 6.89% | ||
Other Assets Less Liabilities | 20.36% | 20.36% | ||
Total Portfolio Holdings | 76.01% | -23.99% | 100.00% |
(a) Total exposure is Long exposure plus the absolute value of the Short exposure.
(b) Net exposure is Long exposure less Short exposure.
10
SCHEDULE OF INVESTMENTS |
Market | ||||||||||||
October 31, 2009 (Unaudited) | Shares | Value | ||||||||||
COMMON STOCKS (LONG POSITIONS) | 46.95 | % | ||||||||||
Apparel - Clothing Manufacturing | 1.01 | % | ||||||||||
Coach Inc | 76,500 | $ | 2,522,205 | |||||||||
Polo Ralph Lauren Corp | 23,100 | 1,719,102 | ||||||||||
4,241,307 | ||||||||||||
Banks - Midwest | 0.95 | % | ||||||||||
FirstMerit Corporation | 117,800 | 2,232,310 | ||||||||||
Old National Bancorp Ind | 169,000 | 1,752,530 | ||||||||||
3,984,840 | ||||||||||||
Banks - Money Center | 0.37 | % | ||||||||||
Goldman Sachs Group Inc | 9,100 | 1,548,547 | ||||||||||
Beverages - Soft Drinks | 0.98 | % | ||||||||||
Coca Cola Co | 77,800 | 4,147,518 | ||||||||||
Building - Construction Products / Misc | 0.92 | % | ||||||||||
Owens Corning * | 174,300 | 3,853,773 | ||||||||||
Computer - Manufacturers | 3.04 | % | ||||||||||
Apple Inc * | 40,300 | 7,596,550 | ||||||||||
Hewlett-Packard Co | 109,300 | 5,187,378 | ||||||||||
12,783,928 | ||||||||||||
Computer - Networking | 1.58 | % | ||||||||||
Brocade Communication Systems Inc * | 380,600 | 3,273,160 | ||||||||||
Cisco Systems Inc * | 148,300 | 3,382,723 | ||||||||||
6,655,883 | ||||||||||||
Computer Software - Desktop | 1.17 | % | ||||||||||
Microsoft Corp | 176,900 | 4,905,437 | ||||||||||
Computer Software - Enterprise | 0.39 | % | ||||||||||
Sybase Inc * | 41,700 | 1,649,652 |
The accompanying notes are an integral part of the financial statements.
11
CALDWELL & ORKIN MARKET OPPORTUNITY FUND | ||||||||
SCHEDULE OF INVESTMENTS - (Continued) |
Market | ||||||||||||
October 31, 2009 (Unaudited) | Shares | Value | ||||||||||
Cosmetics / Personal Care | 1.50 | % | ||||||||||
Colgate Palmolive Co | 26,600 | $ | 2,091,558 | |||||||||
Kimberly-Clark Corp | 69,000 | 4,220,040 | ||||||||||
6,311,598 | ||||||||||||
Diversified Operations | 1.19 | % | ||||||||||
Berkshire Hathaway Cl B * | 1,520 | 4,990,160 | ||||||||||
Elec - Semiconductor Equipment | 0.61 | % | ||||||||||
ASML Holding Nv Ny | 700 | 18,858 | ||||||||||
Lam Research Corp * | 35,500 | 1,197,060 | ||||||||||
Teradyne Inc * | 160,200 | 1,340,874 | ||||||||||
2,556,792 | ||||||||||||
Elec - Semiconductor Manufacturing | 2.44 | % | ||||||||||
Intel Corp | 259,000 | 4,949,490 | ||||||||||
ON Semiconductor Corp * | 303,500 | 2,030,415 | ||||||||||
SanDisk Corp * | 159,800 | 3,272,704 | ||||||||||
10,252,609 | ||||||||||||
Finance - Investment Bankers | 1.13 | % | ||||||||||
Lazard Ltd Cl A | 126,000 | 4,756,500 | ||||||||||
Finance - Savings & Loan | 1.82 | % | ||||||||||
TFS Financial Corp | 146,200 | 1,704,692 | ||||||||||
Washington Federal Inc | 348,000 | 5,968,200 | ||||||||||
7,672,892 | ||||||||||||
Food - Misc Preparation | 3.32 | % | ||||||||||
General Mills Inc | 79,100 | 5,214,272 | ||||||||||
Kellogg Company | 87,200 | 4,494,288 | ||||||||||
PepsiCo Inc | 70,400 | 4,262,720 | ||||||||||
13,971,280 | ||||||||||||
Internet - Content | 1.16 | % | ||||||||||
Yahoo! Inc * | 308,500 | 4,905,150 |
The accompanying notes are an integral part of the financial statements.
12
CALDWELL & ORKIN MARKET OPPORTUNITY FUND | ||||||||
SCHEDULE OF INVESTMENTS - (Continued) |
Market | ||||||||||||
October 31, 2009 (Unaudited) | Shares | Value | ||||||||||
Internet - E-Commerce | 0.40 | % | ||||||||||
Ebay Inc * | 75,600 | $ | 1,683,612 | |||||||||
Leisure - Hotels & Motels | 0.29 | % | ||||||||||
Choice Hotels Intl Inc | 40,800 | 1,216,656 | ||||||||||
Leisure - Movies & Related | 1.05 | % | ||||||||||
Discovery Communications Cl A * | 88,700 | 2,439,250 | ||||||||||
IMAX Corp * | 191,700 | 1,974,510 | ||||||||||
4,413,760 | ||||||||||||
Leisure - Products | 0.19 | % | ||||||||||
Brunswick Corp | 85,000 | 805,800 | ||||||||||
Leisure - Services | 1.74 | % | ||||||||||
Expedia Inc * | 204,900 | 4,645,083 | ||||||||||
Hertz Global Holdings * | 249,000 | 2,318,190 | ||||||||||
Wyndham Worldwide Corp | 21,600 | 368,280 | ||||||||||
7,331,553 | ||||||||||||
Media - Diversified | 1.17 | % | ||||||||||
News Corporation Cl B | 361,500 | 4,916,400 | ||||||||||
Medical - Hospitals | 1.18 | % | ||||||||||
Select Medical Holdings * | 302,800 | 2,937,160 | ||||||||||
Tenet Healthcare Corp * | 400,000 | 2,048,000 | ||||||||||
4,985,160 | ||||||||||||
Oil & Gas - US Exploration & Production | 6.96 | % | ||||||||||
Brigham Exploration Co * | 542,000 | 5,149,000 | ||||||||||
Chesapeake Energy | 179,300 | 4,392,850 | ||||||||||
Comstock Resources * | 75,600 | 3,106,404 | ||||||||||
Forest Oil Corp * | 340,000 | 6,664,000 | ||||||||||
SandRidge Energy Inc * | 532,500 | 5,447,475 | ||||||||||
St Mary Land & Exploration | 72,100 | 2,458,610 | ||||||||||
Swift Energy Co * | 98,500 | 2,086,230 | ||||||||||
29,304,569 |
The accompanying notes are an integral part of the financial statements.
13
CALDWELL & ORKIN MARKET OPPORTUNITY FUND | ||||||||
SCHEDULE OF INVESTMENTS - (Continued) |
Market | ||||||||||||
October 31, 2009 (Unaudited) | Shares | Value | ||||||||||
Retail - Clothing / Shoe | 3.04 | % | ||||||||||
Chicos Fas Inc * | 405,300 | $ | 4,843,335 | |||||||||
Dress Barn Inc * | 151,600 | 2,736,380 | ||||||||||
TJX Cos Inc | 139,900 | 5,225,265 | ||||||||||
12,804,980 | ||||||||||||
Retail - Drug Stores | 0.39 | % | ||||||||||
Walgreen Company | 43,200 | 1,634,256 | ||||||||||
Retail - Home Furnishings | 1.19 | % | ||||||||||
Williams Sonoma Inc | 266,200 | 4,999,236 | ||||||||||
Retail - Major Discount Chains | 1.29 | % | ||||||||||
Wal-Mart Stores | 109,700 | 5,449,896 | ||||||||||
Retail / Wholesale - Autos / Parts | 0.20 | % | ||||||||||
CarMax Inc * | 43,000 | 845,810 | ||||||||||
Telecom - Services | 2.09 | % | ||||||||||
Verizon Communications | 297,000 | 8,788,230 | ||||||||||
Telecom - Wireless Services | 2.19 | % | ||||||||||
American Tower Corp Cl A * | 222,300 | 8,185,086 | ||||||||||
China Unicom Hk ADR | 80,700 | 1,020,855 | ||||||||||
9,205,941 | ||||||||||||
Total Common Stocks (Held Long) | 46.95 | % | 197,573,725 | |||||||||
(Cost $194,852,769) | ||||||||||||
CALL OPTIONS * | 1.04 | % | ||||||||||
Banks - Money Center | 0.25 | % | ||||||||||
Goldman Sachs Group Inc, Call 1/16/2010 - $185.00 | 1,765 | 1,041,350 |
The accompanying notes are an integral part of the financial statements.
14
CALDWELL & ORKIN MARKET OPPORTUNITY FUND | ||||||||
SCHEDULE OF INVESTMENTS - (Continued) |
Market | ||||||||||||
October 31, 2009 (Unaudited) | Shares | Value | ||||||||||
Computer – Manufacturers | 0.23 | % | ||||||||||
Apple Inc, Call 1/16/2010 - $175.00 | 478 | $ | 987,070 | |||||||||
Elec - Semiconductor Manufacturing | 0.12 | % | ||||||||||
Intel Corp, Call 1/16/2010 - $20.00 | 6,700 | 495,800 | ||||||||||
Finance - Investment Bankers | 0.16 | % | ||||||||||
Lazard Ltd Cl A, Call 3/20/2010 - $40.00 | 2,025 | 688,500 | ||||||||||
Oil & Gas - US Exploration & Production | 0.17 | % | ||||||||||
Forest Oil Corp, Call 2/20/2010 - $20.00 | 2,447 | 575,045 | ||||||||||
Sandridge Energy Inc, Call 12/19/2009 - $12.50 | 6,113 | 152,825 | ||||||||||
727,870 | ||||||||||||
Retail / Wholesale - Autos / Parts | 0.11 | % | ||||||||||
Carmax Inc, Call 1/16/2010 - $17.50 | 1,570 | 447,450 | ||||||||||
Total Call Options | 1.04 | % | 4,388,040 | |||||||||
(Cost $7,057,613) | ||||||||||||
PUT OPTIONS * | 0.77 | % | ||||||||||
Exchange - Traded Funds | 0.22 | % | ||||||||||
NASDAQ-100 Shares, Put 11/21/2009 - $42.00 | 3,569 | 571,040 | ||||||||||
S&P 500 Depositary Receipt, Put 11/21/2009 - $107.00 | 815 | 358,600 | ||||||||||
929,640 | ||||||||||||
Financial Services - Misc | 0.11 | % | ||||||||||
Alliance Data Sys Corp, Put 1/16/2010 - $50.00 | 2,134 | 458,810 | ||||||||||
Leisure - Products | 0.02 | % | ||||||||||
Harley Davidson Inc, Put 11/21/2009 - $15.00 | 2,860 | 2,860 | ||||||||||
Harley Davidson Inc, Put 2/10/2010 - $15.00 | 2,170 | 65,100 | ||||||||||
67,960 |
The accompanying notes are an integral part of the financial statements.
15
CALDWELL & ORKIN MARKET OPPORTUNITY FUND | ||||||||
SCHEDULE OF INVESTMENTS - (Continued) |
Market | ||||||||||||
October 31, 2009 (Unaudited) | Shares | Value | ||||||||||
Medical - Outpatient / Home Care | 0.22 | % | ||||||||||
Amedisys Inc, Put 1/16/2010 - $30.00 | 26 | $ | 2,990 | |||||||||
Amedisys Inc, Put 1/16/2010 - $35.00 | 651 | 152,985 | ||||||||||
Amedisys Inc, Put 3/20/2010 - $35.00 | 2,065 | 764,050 | ||||||||||
920,025 | ||||||||||||
Medical - Systems / Equipment | 0.09 | % | ||||||||||
Volcano Corp, Put 1/16/2010 - $15.00 | 3,000 | 405,000 | ||||||||||
US Treasury Bond Fund | 0.11 | % | ||||||||||
iShares Barclays 7-10 Year Treasury Bond Fund, Put 3/20/2010 - $90.00 | 2,200 | 451,000 | ||||||||||
Total Put Options | 0.77 | % | 3,232,435 | |||||||||
(Cost $6,267,935) | ||||||||||||
Principal | Market | |||||||||||
Amount | Value | |||||||||||
CORPORATE BONDS | 6.89 | % | ||||||||||
Bank One Corp / JP Morgan 5.900% due 11/15/2011 | 4,400,000 | 4,730,524 | ||||||||||
CBS Corp 6.625% due 5/15/2011 | 8,170,000 | 8,557,185 | ||||||||||
Conagra Foods Inc 6.750% due 9/15/2011 | 1,475,000 | 1,608,260 | ||||||||||
Estee Lauder Co 7.750% due 11/1/2013 | 2,000,000 | 2,314,900 | ||||||||||
Goldman Sachs Group Inc 6.875% due 1/15/2011 | 4,360,000 | 4,636,973 | ||||||||||
Hewlett - Packard Co 6.125% due 3/1/2014 | 4,400,000 | 4,949,811 | ||||||||||
Safeway Inc 5.625% due 8/15/2014 | 2,000,000 | 2,176,868 | ||||||||||
Total Corporate Bonds | 6.89 | % | 28,974,521 | |||||||||
(Cost $27,465,254) |
The accompanying notes are an integral part of the financial statements.
16
CALDWELL & ORKIN MARKET OPPORTUNITY FUND | ||||||||
SCHEDULE OF INVESTMENTS - (Continued) |
Market | ||||||||||||
October 31, 2009 (Unaudited) | Shares | Value | ||||||||||
Money Market Fund | 35.00 | % | ||||||||||
JP Morgan U.S. Treasury Plus | ||||||||||||
Money Market Fund ** | $ | 147,271,641 | ||||||||||
Total Money Market Fund | 35.00 | % | 147,271,641 | |||||||||
(Cost $147,271,641) | ||||||||||||
Total Investment in Securities | 90.65 | % | 381,440,362 | |||||||||
(Cost $382,915,212) | ||||||||||||
Other Assets Less Liabilities | 9.35 | % | 39,352,704 | |||||||||
Total Net Assets | 100.00 | % | $ | 420,793,066 | ||||||||
*Non-income producing security | ||||||||||||
**A portion of the Money Market Fund assets are held as collateral for short sales activity. | ||||||||||||
COMMON STOCKS (SHORT POSITIONS) | (23.99 | )% | ||||||||||
Banks - Money Center | (1.01 | )% | ||||||||||
Wells Fargo & Company | (154,000 | ) | $ | (4,238,080 | ) | |||||||
Banks - Super Regional | (2.61 | )% | ||||||||||
Fifth Third Bancorp | (561,200 | ) | (5,017,128 | ) | ||||||||
Regions Financial Corp | (417,000 | ) | (2,018,280 | ) | ||||||||
SunTrust Banks Inc | (206,100 | ) | (3,938,571 | ) | ||||||||
(10,973,979 | ) |
The accompanying notes are an integral part of the financial statements.
17
CALDWELL & ORKIN MARKET OPPORTUNITY FUND | ||||||||
SCHEDULE OF INVESTMENTS - (Continued) |
Market | ||||||||||||
October 31, 2009 (Unaudited) | Shares | Value | ||||||||||
Banks - West / Southwest | (2.96 | )% | ||||||||||
City National Corp | (108,600 | ) | $ | (4,090,962 | ) | |||||||
Zions Bancorp | (592,200 | ) | (8,385,552 | ) | ||||||||
(12,476,514 | ) | |||||||||||
Building - Construction Products / Misc | (1.37 | )% | ||||||||||
Mohawk Industries Inc * | (58,500 | ) | (2,505,555 | ) | ||||||||
USG Corp * | (248,000 | ) | (3,258,720 | ) | ||||||||
(5,764,275 | ) | |||||||||||
Commercial Services - Market Research | (1.35 | )% | ||||||||||
Arbitron Inc | (77,300 | ) | (1,675,864 | ) | ||||||||
Moodys Corporation | (169,400 | ) | (4,011,392 | ) | ||||||||
(5,687,256 | ) | |||||||||||
Elec - Semiconductor Manufacturing | (0.46 | )% | ||||||||||
Intersil Corp | (154,000 | ) | (1,932,700 | ) | ||||||||
Emerging Country Exchange-Traded Funds | (3.17 | )% | ||||||||||
iShares FTSE/Xinhua China 25 Index | (118,800 | ) | (4,953,960 | ) | ||||||||
iShares MSCI - South Korea Index | (97,300 | ) | (4,172,224 | ) | ||||||||
iShares MSCI - Taiwan Index | (362,300 | ) | (4,206,303 | ) | ||||||||
(13,332,487 | ) | |||||||||||
Financial Services - Misc | (1.60 | )% | ||||||||||
Alliance Data Systems Corp * | (122,500 | ) | (6,735,050 | ) | ||||||||
Leisure - Gaming / Equipment | (0.02 | )% | ||||||||||
Boyd Gaming Corp * | (12,700 | ) | (93,472 | ) | ||||||||
Leisure - Products | (1.72 | )% | ||||||||||
Harley Davidson Inc | (290,400 | ) | (7,236,768 | ) | ||||||||
Medical - Health Maintenance Organization | (2.16 | )% | ||||||||||
Humana Inc | (118,000 | ) | (4,434,440 | ) | ||||||||
UnitedHealth Group Inc | (180,000 | ) | (4,671,000 | ) | ||||||||
(9,105,440 | ) |
The accompanying notes are an integral part of the financial statements.
18
CALDWELL & ORKIN MARKET OPPORTUNITY FUND | ||||||||
SCHEDULE OF INVESTMENTS - (Continued) |
Market | ||||||||||||
October 31, 2009 (Unaudited) | Shares | Value | ||||||||||
Medical - Outpatient / Home Care | (1.91 | )% | ||||||||||
Amedisys Inc * | (202,000 | ) | $ | (8,037,580 | ) | |||||||
Medical - Products | (0.52 | )% | ||||||||||
Stryker Corp | (47,800 | ) | (2,198,800 | ) | ||||||||
Medical - Systems / Equipment | (0.50 | )% | ||||||||||
Volcano Corp * | (146,000 | ) | (2,095,100 | ) | ||||||||
Retail / Wholesale - Autos / Parts | (0.58 | )% | ||||||||||
AutoZone Inc * | (17,900 | ) | (2,422,049 | ) | ||||||||
Telecom - Wireless Equipment | (0.43 | )% | ||||||||||
Garmin Ltd | (59,700 | ) | (1,806,522 | ) | ||||||||
US Treasury Bond Fund | (1.62 | )% | ||||||||||
iShares Barclays 7-10 Year Treasury Bond Fund | (49,900 | ) | (4,590,301 | ) | ||||||||
iShares Lehman 1-3 Year Treasury Bond Fund | (26,300 | ) | (2,209,726 | ) | ||||||||
(6,800,027 | ) | |||||||||||
Total Securities Sold Short | (23.99 | )% | $ | (100,936,099 | ) | |||||||
(Proceeds $104,340,794) |
The accompanying notes are an integral part of the financial statements.
19
CALDWELL & ORKIN MARKET OPPORTUNITY FUND
STATEMENT OF ASSETS AND LIABILITIES
October 31, 2009 (Unaudited)
ASSETS | ||||
Investments, at value (cost $382,915,212) | $ | 381,440,362 | ||
Deposits with brokers for securities sold short | 87,176,877 | |||
Receivables: | ||||
Investment securities sold | 96,992,957 | |||
Interest and dividends | 668,750 | |||
Capital shares sold | 974,853 | |||
Other assets | 7,331 | |||
Total Assets | 567,261,130 | |||
LIABILITIES | ||||
Securities sold short, not yet purchased (proceeds $104,340,794) | 100,936,099 | |||
Payables | ||||
Investment securities purchased | 43,553,832 | |||
Capital shares redeemed | 1,681,424 | |||
Investment advisory fee | 270,911 | |||
Accrued expenses and other | 25,798 | |||
Total Liabilities | 146,468,064 | |||
Total Net Assets | $ | 420,793,066 | ||
NET ASSETS | ||||
Undistributed net investment loss | $ | (1,441,626 | ) | |
Accumulated net realized loss on investments | (17,161,752 | ) | ||
Net unrealized appreciation of investments | 1,929,845 | |||
Paid-in capital applicable to 20,923,631 shares outstanding; | ||||
par value $0.10 per share; 30,000,000 shares authorized | 437,466,599 | |||
$ | 420,793,066 | |||
NET ASSET VALUE AND OFFERING / REDEMPTION PRICE PER SHARE | $ | 20.11 | ||
NET ASSET VALUE PER SHARE NET OF 2% REDEMPTION FEE * | $ | 19.71 |
* A redemption fee of 2% is assessed on the sale of shares held less than six months.
The accompanying notes are an integral part of the financial statements.
20
CALDWELL & ORKIN MARKET OPPORTUNITY FUND
STATEMENT OF OPERATIONS
For the six months ended October 31, 2009 (Unaudited)
INVESTMENT INCOME | ||||
Interest | $ | 615,567 | ||
Dividends | 717,215 | |||
Total investment income | 1,332,782 | |||
EXPENSES | ||||
Investment advisory fees (Note 2) | 1,488,949 | |||
Dividend expense on securities sold short | 437,284 | |||
Interest expense | 470,961 | |||
Accounting fees | 39,800 | |||
Professional fees | 73,947 | |||
Directors' fees and expenses | 41,264 | |||
Insurance expense | 6,265 | |||
Transfer agent fees | 97,237 | |||
Custodian fees | 16,179 | |||
Blue sky servicing fees | 52,014 | |||
Shareholder report printing | 21,656 | |||
Chief compliance officer expense | 22,685 | |||
Other | 6,167 | |||
Total expenses | 2,774,408 | |||
Net investment loss | (1,441,626 | ) | ||
REALIZED AND UNREALIZED GAIN (LOSS) ON INVESTMENTS | ||||
Net realized gain on investments | 30,025,232 | |||
Net realized loss on securities sold short | (45,583,475 | ) | ||
Change in unrealized appreciation / (depreciation) on investments | (16,972,002 | ) | ||
Change in unrealized appreciation / (depreciation) on securities sold short | 9,591,932 | |||
NET REALIZED AND UNREALIZED GAIN (LOSS) ON INVESTMENTS | (22,938,313 | ) | ||
NET INCREASE IN NET ASSETS RESULTING FROM OPERATIONS | $ | (24,379,939 | ) |
The accompanying notes are an integral part of the financial statements.
21
CALDWELL & ORKIN MARKET OPPORTUNITY FUND
STATEMENT OF CHANGES IN NET ASSETS
Six Months Ended | ||||||||
October 31, 2009 | Year Ended | |||||||
(Unaudited) | April 30, 2009 | |||||||
INCREASE (DECREASE) IN NET ASSETS | ||||||||
Operations | ||||||||
Net investment loss | $ | (1,441,626 | ) | $ | (247,410 | ) | ||
Net realized gain/(loss) from investments | (15,558,243 | ) | 1,594,739 | |||||
Net change unrealized appreciation | ||||||||
(depreciation) on investments | (7,380,070 | ) | 8,999,772 | |||||
Net increase/(decrease) in net assets | ||||||||
resulting from operations | (24,379,939 | ) | 10,347,101 | |||||
Distributions to shareholders | ||||||||
Net investment income | - | (1,175,996 | ) | |||||
Net realized gains on investments | - | (10,378,647 | ) | |||||
Net distributions to shareholders | - | (11,554,643 | ) | |||||
Capital share transactions | ||||||||
Net proceeds from sale of shares | 201,924,563 | 178,951,609 | ||||||
Reinvested distributions | - | 10,655,648 | ||||||
Cost of shares redeemed | (59,857,722 | ) | (114,310,895 | ) | ||||
Redemption fee proceeds | 176,437 | 386,570 | ||||||
Net increase in net assets resulting | ||||||||
from capital share transactions | 142,243,278 | 75,682,932 | ||||||
INCREASE IN NET ASSETS | 117,863,339 | 74,475,390 | ||||||
Net Assets | ||||||||
Beginning of period | 302,929,727 | 228,454,337 | ||||||
End of period (including undistributed | ||||||||
net investment income/(loss) of | ||||||||
$(1,441,626) and $0 respectively) | $ | 420,793,066 | $ | 302,929,727 |
The accompanying notes are an integral part of the financial statements.
22
CALDWELL & ORKIN MARKET OPPORTUNITY FUND
STATEMENT OF CASH FLOWS
For the six months ended October 31, 2009 (Unaudited)
Increase (decrease) in cash - | ||||
Cash flows from operating activities: | ||||
Net decrease in net assets from operations | $ | (24,379,939 | ) | |
Adjustments to reconcile net decrease in net assets from | ||||
operations to net cash used in operating activities: | ||||
Purchase of investment securities | (789,930,381 | ) | ||
Proceeds from disposition of investment securities | 722,744,101 | |||
Sale of short term securities - net | 9,067,876 | |||
Decrease in deposits with brokers for securities sold short | 1,358,249 | |||
Increase in interest and dividends receivable | (122,096 | ) | ||
Increase in receivable for securities sold | (81,073,935 | ) | ||
Increase in other assets | (7,331 | ) | ||
Decrease in securities sold short | (18,819,950 | ) | ||
Increase in payable for securities purchased | 14,122,061 | |||
Decrease in payable for dividend expense | (167,635 | ) | ||
Increase in accrued expenses | 68,784 | |||
Amortization of discount | 95,688 | |||
Unrealized appreciation on long investment | 16,972,002 | |||
Unrealized depreciation on short investment | (9,591,932 | ) | ||
Net realized gain from long investments | (30,024,508 | ) | ||
Net realized loss from short sales | 45,583,475 | |||
Net cash used in operating activities | (144,105,471 | ) | ||
Cash flows from financing activities: | ||||
Proceeds from shares sold | 202,366,688 | |||
Payment on shares redeemed | (58,261,217 | ) | ||
Cash distributions paid | - | |||
Net cash provided in financing activities | 144,105,471 | |||
Net change in cash | - | |||
Cash: | ||||
Beginning balance | - | |||
Ending balance | $ | - |
The accompanying notes are an integral part of the financial statements.
23
CALDWELL & ORKIN MARKET OPPORTUNITY FUND
FINANCIAL HIGHLIGHTS
For a capital share outstanding throughout each period
Six Months Ended October 31, 2009 | Years Ended April 30, | ||||||||||||||||||||||||
(Unaudited) | 2009 | 2008 | 2007 | 2006 | 2005 | ||||||||||||||||||||
Net asset value, beginning of period | $ | 21.24 | $ | 21.40 | $ | 18.68 | $ | 16.69 | $ | 17.35 | $ | 17.38 | |||||||||||||
Income (loss) from investment operations | |||||||||||||||||||||||||
Net investment income | (0.07 | ) | 0.01 | 0.20 | 0.53 | 0.28 | 0.01 | ||||||||||||||||||
Net realized and unrealized gain | |||||||||||||||||||||||||
(loss) on investments | (1.07 | ) | 0.94 | 3.15 | 1.99 | (0.76 | ) | (0.04 | ) | ||||||||||||||||
Total from investment operations | (1.14 | ) | 0.95 | 3.35 | 2.52 | (0.48 | ) | (0.03 | ) | ||||||||||||||||
Less distributions | |||||||||||||||||||||||||
From net investment income | 0.00 | (0.12 | ) | (0.37 | ) | (0.53 | ) | (0.19 | ) | 0.00 | |||||||||||||||
From net realized gain on investments | 0.00 | (1.02 | ) | (0.30 | ) | 0.00 | 0.00 | 0.00 | |||||||||||||||||
Total distributions | 0.00 | (1.14 | ) | (0.67 | ) | (0.53 | ) | (0.19 | ) | 0.00 | |||||||||||||||
Redemption fee proceeds | 0.01 | 0.03 | 0.04 | 0.00 | * | 0.01 | 0.00 | * | |||||||||||||||||
Net asset value, end of period | $ | 20.11 | $ | 21.24 | $ | 21.40 | $ | 18.68 | $ | 16.69 | $ | 17.35 | |||||||||||||
Total Return | -5.32 | % | + | 4.73 | % | 17.92 | % | 15.31 | % | -2.74 | % | -0.17 | % | ||||||||||||
Ratios and Supplemental Data: | |||||||||||||||||||||||||
Net assets, end of period (in 000's) | $ | 420,793 | $ | 302,930 | $ | 228,454 | $ | 135,337 | $ | 153,127 | $ | 207,256 | |||||||||||||
Ratios to average net assets: | |||||||||||||||||||||||||
Management fees | 0.76 | % | ^ | 0.83 | % | 0.84 | % | 0.87 | % | 0.86 | % | 0.83 | % | ||||||||||||
Administrative expenses | 0.19 | % | ^ | 0.27 | % | 0.24 | % | 0.35 | % | 0.22 | % | 0.21 | % | ||||||||||||
Expenses before dividends on | |||||||||||||||||||||||||
securities sold short | 0.95 | % | ^ | 1.10 | % | 1.08 | % | 1.22 | % | 1.08 | % | 1.04 | % | ||||||||||||
Interest expense | 0.24 | % | ^ | 0.24 | % | 0.18 | % | 0.09 | % | 0.00 | % | 0.00 | % | ||||||||||||
Expenses from dividends sold short | 0.22 | % | ^ | 0.55 | % | 1.02 | % | 0.37 | % | 0.97 | % | 0.75 | % | ||||||||||||
Total expenses** | 1.41 | % | ^ | 1.89 | % | 2.28 | % | 1.68 | % | 2.05 | % | 1.79 | % | ||||||||||||
Net investment income (loss) | (0.74 | )% | ^ | (0.11 | )% | 1.23 | % | 2.64 | % | 1.52 | % | 0.08 | % | ||||||||||||
Portfolio turnover | 339 | % | + | 879 | % | 712 | % | 529 | % | 459 | % | 414 | % |
* | Amount is less than $0.01. |
** | The ratio of expense to average net assets and net investment income to average net assets do notreflect the expenses of other investment companies. |
^ | Annualized |
+ | Not annualized |
The accompanying notes are an integral part of the financial statements.
24
CALDWELL & ORKIN MARKET OPPORTUNITY FUND
NOTES TO FINANCIAL STATEMENTS
October 31, 2009 (Unaudited)
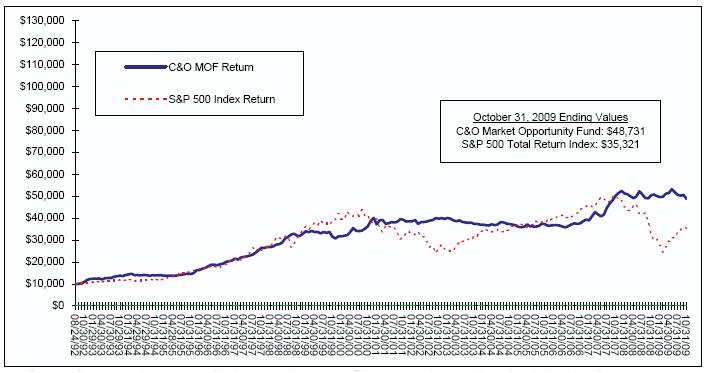
The Caldwell & Orkin Market Opportunity Fund (the “Fund”) is the only active investment portfolio of The Caldwell & Orkin Funds, Inc. (“Caldwell & Orkin”), an open-end, diversified management investment company registered under the Investment Company Act of 1940, as amended (the “1940 Act”), and incorporated under the laws of the State of Maryland on August 15, 1989. Prior to June, 1992, Caldwell & Orkin's name was The OTC Select-100 Fund, Inc. and consisted of only one portfolio, The OTC Select-100 Fund. The shareholders of The OTC Select-100 Fund subsequently approved changing the corporate name from The OTC Select-100 Fund, Inc. to The Caldwell & Orkin Funds, Inc. and to amend the investment objective and policies of The OTC Select-100 Fund. As a result of such amendment, The OTC Select-100 Fund was renamed and its assets and objectives were those of the Caldwell & Orkin Aggressive Growth Fund. In August, 1996, the Board of Directors of Caldwell & Orkin approved changing the name of the Caldwell & Orkin Aggressive Growth Fund to the Caldwell & Orkin Market Opportunity Fund. The Fund’s objectives are to provide long-term capital growth with a short-term focus on capital preservation through investment selection and asset allocation. The Fund seeks to outperform the stock market over the long-term, as measured by indices such as the S&P 500 Total Return index.
1. | SUMMARY OF SIGNIFICANT ACCOUNTING POLICIES |
Securities Valuation |
Securities are stated at the closing price on the date at which the net asset value (“NAV”) is being determined. If the date of determination is not a trading date, the last bid price is used for a value instead. Short-term investments having a maturity of 60 days or less at the time of the purchase are stated at amortized cost, which approximates market value. Any assets or securities for which market quotations are not readily available are valued at fair value as determined in good faith by or under the direction of the Fund’s Board of Directors in accordance with the Fund’s Fair Value Pricing Policy.
Fair Value Measurements |
The Fund has adopted the Financial Accounting Standards Board (“FASB”) Accounting Standards Codification™ (“ASC”), issued in June 2009. The Fund follows the provisions of ASC 820, “Fair Value Measurements and Disclosures” (“ASC 820”). In accordance with ASC 820, fair value is defined as the price that the Fund would receive upon selling an investment in a timely transaction to an independent buyer in the principal or most advantageous market of the investment. ASC 820 established a three-tier hierarchy to maximize the use of observable market data and minimize the use of unobservable inputs and to establish classification of fair value measurements for disclosure purposes. Inputs refer broadly to the assumptions that market participants would use in pricing the asset or liability, including assumptions about risk, for example, the risk inherent in a particular valuation technique used to measure fair value including such a pricing model and/or the risk inherent in the inputs to the valuation technique. Inputs may be observable or unobservable. Observable inputs are inputs that reflect the assumptions market participants would use in pricing the asset or liability developed based on market data obtained from sources independent of the reporting entity. Unobservable inputs are inputs that reflect the reporting entity’s own assumptions about the assumptions market participants would use in pricing the asset or liability developed based on the best information available in the circumstances.
25
CALDWELL & ORKIN MARKET OPPORTUNITY FUND
NOTES TO FINANCIAL STATEMENTS – (Continued)
October 31, 2009 (Unaudited)
The three-tier hierarchy of inputs is summarized in the three broad Levels listed below.
§ | Level 1 - quoted prices in active markets for identical investments |
§ | Level 2 - significant observable inputs (including quoted prices for similar investments, interest rates, prepayment speeds, credit risk, etc.) |
§ | Level 3 - significant unobservable inputs (including the Fund’s own assumption in determining the fair value of investments) |
The valuation techniques used by the Fund to measure fair value during the six months ended October 31, 2009 maximized the use of observable inputs and minimized the use of unobservable inputs.
The following is a summary of the inputs used as of October 31, 2009 in valuing the Fund’s investments carried at value:
Investments in Securities at Value * | Level 1 Quoted Prices | Level 2 Significant Observable Inputs | Level 3 Significant Unobservable Inputs | Total | ||||||||||||
Common Stocks | $ | 197,573,725 | $ | - | $ | - | $ | 197,573,725 | ||||||||
Call Options | 4,388,040 | - | - | 4,388,040 | ||||||||||||
Put Options | 3,232,435 | - | - | 3,232,435 | ||||||||||||
Corporate Bonds | - | 28,974,521 | - | 28,974,521 | ||||||||||||
Money Market Fund | 147,271,641 | - | - | 147,271,641 | ||||||||||||
Total | $ | 352,465,841 | $ | 28,974,521 | $ | - | $ | 381,440,362 | ||||||||
Other Financial Instruments | Level 1 Quoted Prices | Level 2 Significant Observable Inputs | Level 3 Significant Unobservable Inputs | Total | ||||||||||||
Common Stocks Sold Short | $ | 100,936,099 | $ | - | $ | - | $ | 100,936,099 | ||||||||
Total | $ | 100,936,099 | $ | - | $ | - | $ | 100,936,099 |
* For detailed industry descriptions, see the accompanying Schedule of Investments.
For the six months ended October 31, 2009, the Fund did not have significant unobservable inputs (Level 3) used in determining fair value. Therefore, a reconciliation of assets in which significant observable inputs (Level 3) were used for determining fair value is not applicable.
Derivatives
The Fund has adopted the provisions of FASB ASC 815, “Disclosures about Derivative Instruments and Hedging Activities,” (formerly FASB Statement 161). ASC 815 has established improved financial reporting about derivative instruments and hedging activities as it relates to disclosure associated with these types of investments. The following discloses the amounts related to the Fund’s use of derivative instruments and hedging activities.
26
CALDWELL & ORKIN MARKET OPPORTUNITY FUND
NOTES TO FINANCIAL STATEMENTS – (Continued)
October 31, 2009 (Unaudited)
The effect of derivative instruments on the Balance Sheet as of October 31, 2009:
Asset Derivatives 2009 | ||||
Balance Sheet | Market | |||
Location | Value | |||
Equity Contracts | Investments, at value | $ 7,620,475 | ||
Total | $ 7,620,475 |
The Effect of Derivatives Instruments on the Statement of Operations for the six months ended October 31, 2009:
Amount of Realized Gain or (Loss) on Deriatives Recognized in Income | |||
Purchased | Written | ||
Options | Options | Total | |
Equity Contracts | $(7,737,460) | - | $(7,737,460) |
Total | $(7,737,460) | - | $(7,737,460) |
Change in Unrealized Appreciation or (Depreciation) | |||
on Derivatives Recognized in Income | |||
Purchased | Written | ||
Options | Options | Total | |
Equity Contracts | $(5,608,783) | - | $(5,608,783) |
Total | $(5,608,783) | - | $(5,608,783) |
Share Valuation
The NAV per share of the Fund is calculated by dividing the sum of the value of the securities held by the Fund, plus cash or other assets, minus all liabilities (including estimated accrued expenses) by the total number of shares outstanding for the Fund, rounded to the nearest cent. The Fund’s shares will not be priced on the days on which the New York Stock Exchange is closed for trading. The offering and redemption price per share for the Fund is equal to the Fund’s NAV per share. The Fund charges a 2.00% redemption fee on shares held less than six months. These fees are deducted from the redemption proceeds otherwise payable to the shareholder. The Fund will retain the fee charged as paid-in capital and such fees become part of the Fund’s daily NAV calculation.
Securities Transactions And Related Investment Income
Securities transactions are accounted for on trade date. Dividend income is recorded on the ex-dividend date and interest income is recorded as earned. Realized gains and losses from investment transactions are determined using the specific identification method.
Cash
The Fund maintains cash available for the settlement of securities transactions and capital shares reacquired. Available cash is invested daily in money market instruments.
27
CALDWELL & ORKIN MARKET OPPORTUNITY FUND
NOTES TO FINANCIAL STATEMENTS – (Continued)
October 31, 2009 (Unaudited)
Income Taxes
The Fund intends to continue to comply with the requirements of the Internal Revenue Code applicable to regulated investment companies and to distribute all taxable income to their shareholders. Therefore, no federal income tax provision is required.
In order to avoid imposition of the excise tax applicable to regulated investment companies, the Fund intends to declare each year as dividends, in each calendar year, at least 98% of its net investment income (earned during the calendar year) and at least 98% of its net realized capital gains (earned during the twelve months ended October 31) plus undistributed amounts, if any, from prior years.
Net capital losses incurred after October 31 and within the taxable year are deemed to arise on the first business day of the Fund’s next taxable year.
For the year ended April 30, 2009, the Fund made a distribution of $0.12 per share from ordinary income, a distribution of $0.82 per share from short-term capital gains and a distribution of $0.20 per share from long-term capital gains.
The Fund follows ASC 740 “Income Taxes” (“ASC 740”), which requires that the financial statement effects of a tax position taken or expected to be taken in a tax return be recognized in the financial statements when it is more likely than not, based on the technical merits, that the position will be sustained upon examination. Management has concluded that the Fund has taken no uncertain tax positions that require adjustment to the financial statements to comply with the provisions of ASC 740. The Fund files income tax returns in the U.S. federal jurisdiction and Georgia. The statue of limitations on the Fund’s federal and state tax filings remains open for the fiscal years ended April 30, 2006 through April 30, 2009.
Use of Estimates |
The preparation of financial statements in conformity with accounting principles generally accepted in the United States of America requires management to make estimates and assumptions that affect the reported amounts of assets and liabilities and disclosure of contingent assets and liabilities at the date of the financial statements and the reported amounts of revenues and expenses during the reporting period. Actual results could differ from those estimates.
Reclassification of Capital Accounts |
Accounting principles generally accepted in the United States of America require that certain components of net assets relating to permanent differences be reclassified between financial and tax reporting. These reclassifications have no effect on net assets or net asset value per share. For the year ended April 30, 2009, the Fund increased accumulated net realized loss on investments by $110,911, decreased undistributed net investment income loss by $885,538, and decreased paid-in capital by $774,627 due to certain permanent book and tax differences.
28
CALDWELL & ORKIN MARKET OPPORTUNITY FUND
NOTES TO FINANCIAL STATEMENTS – (Continued)
October 31, 2009 (Unaudited)
2. | COMMITMENTS AND OTHER RELATED PARTY TRANSACTIONS |
The Fund has entered into a management agreement (the “Management Agreement”) with C&O Funds Advisor, Inc. (the “Adviser”) pursuant to which the Adviser provides space, facilities, equipment and personnel necessary to perform administrative and investment management services for the Fund. The Management Agreement provides that the Adviser is responsible for the actual management of the Fund’s portfolio. For such services and expenses assumed by the Adviser, the Fund pays a monthly advisory fee at incremental annual rates as follows:
Advisory Fee | Average Daily Net Assets | |
.90% | Up to $100 million | |
.80% | In excess of $100 million but not greater than $200 million | |
.70% | In excess of $200 million but not greater than $300 million | |
.60% | In excess of $300 million but not greater than $500 million | |
.50% | In excess of $500 million |
For the six months ended October 31, 2009, the Fund incurred $1,488,949 in Advisory fees.
As described more fully under “Subsequent Events,” on December 18, 2009, shareholders of the Fund approved an amendment to the Management Agreement. Effective that date, the following fee table goes into effect:
Advisory Fee | Average Daily Net Assets | |
1.00% | Up to $250 million | |
.90% | In excess of $250 million but not greater than $500 million | |
.80% | In excess of $500 million |
The Adviser has agreed to reimburse the Fund to the extent necessary to prevent the Fund’s annual ordinary operating expenses (excluding taxes, expenses related to the execution of portfolio transactions and the investment activities of the Fund (such as, for example, interest, dividend expenses on securities sold short, brokerage commissions and fees and expenses charged to the Fund by any investment company in which the Fund invests) and extraordinary charges such as litigation costs) from exceeding 2.0% of the Fund’s average net assets (the “Expense Cap”). No reimbursement was required for the six months ended October 31, 2009.
At October 31, 2009, IFS Fund Distributors, Inc. (“IFS”) served as the principal underwriter of the Fund under a distribution agreement, pursuant to which IFS provided services to the Fund in connection with the offering of shares of the Fund. As described more fully under “Subsequent Events,” on November 16, 2009, ALPS Distributor, Inc. (“ADI”) succeeded IFS as the Fund’s distributor under a new distribution agreement. The distributor is responsible for the sales and redemptions of the Fund’s shares. The distributor does not charge the Fund for these services.
C&O Funds Advisor, Inc. is a wholly-owned subsidiary of Caldwell & Orkin, Inc.
3. | INVESTMENT PORTFOLIO TRANSACTIONS |
Investment Purchases and Sales |
For the six months ended October 31, 2009, purchases of investments and proceeds from sales of investments (excluding securities sold short and short-term investments) totaled $739,672,805, and $693,801,991, respectively.
29
CALDWELL & ORKIN MARKET OPPORTUNITY FUND
NOTES TO FINANCIAL STATEMENTS – (Continued)
October 31, 2009 (Unaudited)
Short Sales and Segregated Cash |
Short sales are transactions in which the Fund sells a security it does not own, in anticipation of a decline in the market value of that security. To initiate such a transaction, the Fund must borrow the security to deliver to the buyer upon the short sale; the Fund is then obligated to replace the security borrowed by purchasing it in the open market at some later date, completing the transaction.
The Fund will incur a loss if the market price of the security increases between the date of the short sale and the date on which the Fund replaces the borrowed security. The Fund will realize a gain if the security declines in value between those dates.
All short sales must be fully collateralized. The Fund maintains the collateral in segregated accounts consisting of cash and/or U.S. Government securities sufficient to collateralize the market value of its short positions. Typically, the segregated cash with brokers and other financial institutions exceeds the minimum required. Deposits with brokers for securities sold short are invested in money market instruments. Segregated cash is held at the custodian in the name of the broker per a tri-party agreement between the Fund, the custodian, and the broker.
The Fund may also sell short “against the box”, i.e., the Fund enters into a short sale as described above, while holding an offsetting long position in the same security which it sold short. If the Fund enters into a short sale against the box, it will segregate an equivalent amount of securities owned by the Fund as collateral while the short sale is outstanding.
The Fund limits the value of its short positions (excluding short sales “against the box”) to 60% of the Fund’s total net assets. At October 31, 2009, the Fund had 24% of its total net assets in short positions.
For the six months ended October 31, 2009, the cost of investments purchased to cover short sales and the proceeds from investments sold short were $416,585,443 and $397,765,493, respectively.
4. | CAPITAL SHARE TRANSACTIONS |
Capital share transactions were as follows:
Six months ended October 31, 2009 | Year ended April 30, 2009 | |||||||
Shares sold | 9,525,855 | 8,400,395 | ||||||
Shares reinvested | - | 517,013 | ||||||
Shares reacquired | (2,864,226 | ) | (5,329,601 | ) | ||||
Net increase in shares outstanding | 6,661,629 | 3,587,807 |
5. | DISTRIBUTIONS TO SHAREHOLDERS |
On December 10, 2008, a distribution of $1.14 per share was declared. The dividend was paid on December 16, 2008, to shareholders of record on December 15, 2008.
30
CALDWELL & ORKIN MARKET OPPORTUNITY FUND
NOTES TO FINANCIAL STATEMENTS – (Continued)
October 31, 2009 (Unaudited)
The tax character of distributions paid for the year ended April 30, 2009 was as follows:
2009 | |
Distributions paid from: | |
Ordinary income | $ 9,482,472 |
Capital gains | $ 2,072,171* |
* The Fund designates $2,072,171 as a long term capital gain dividend pursuant toSection 852(6)(3) of the Internal Revenue Code for the fiscal year ended April 30, 2009. |
Distribution classifications may differ from the Statement of Changes in Net Assets as aresult of the treatment of short term capital gains as ordinary income for tax purposes.
As of April 30, 2009, the components of distributable earnings on a tax basis were as follows:
Cost of investments (long positions) | $ | 299,732,995 | ||
Cost of investments (short positions) | (77,577,329 | ) | ||
Total cost of investments | $ | 222,155,666 | ||
Gross tax unrealized appreciation | 15,269,927 | |||
Gross tax unrealized depreciation | (10,824,958 | ) | ||
Net tax unrealized appreciation | 4,444,969 | |||
Undistributed ordinary income | 3,261,436 | |||
Accumulated net realized gain | - | |||
Total distributable earnings | 3,261,436 | |||
Total accumulated earnings | $ | 7,706,405 |
Net investment income / (loss), net realized gains / (losses) and unrealized appreciation / depreciation differ for financial statement and tax purposes due to differing treatments of short term capital gains, nondeductible dividend expense and wash sale loss deferrals.
6. | RELATED PARTY TRANSACTIONS |
As of October 31, 2009, Caldwell & Orkin, Inc. and Michael B. Orkin had ownership of the Fund of 0.19% and 1.56%, respectively.
7. | NEW ACCOUNTING PRONOUCEMENTS |
In June 2009, the FASB issued ASC 105 (formerly FASB Statement 168), Generally Accepted Accounting Principles, establishing the FASB Accounting Standards Codification™ (ASC) as the source of authoritative generally accepted accounting principles (GAAP) to be applied by nongovernmental entities. FASB ASC 105 is effective for annual and interim periods ending after September 15, 2009, and the Fund has updated its references to GAAP in this report in accordance with the provisions of this pronouncement. The implementation of FASB ASC 105 did not have a material effect on the Fund’s financial position or results of operation.
31
CALDWELL & ORKIN MARKET OPPORTUNITY FUND
NOTES TO FINANCIAL STATEMENTS – (Continued)
October 31, 2009 (Unaudited)
In April 2009, the FASB issued FASB ASC 820-10-65 (formerly FASB Staff Position No. FAS 157-4), Determining Fair Value When the Volume and Level of Activity for the Asset or Liability Have Significantly Decreased and Identifying Transactions That Are Not Orderly. This standard applies to all assets and liabilities within the scope of accounting pronouncements that require or permit fair value measurements, with certain defined exceptions, and provides additional guidance for estimating fair value when the volume and level of activity for the asset or liability have significantly decreased. ASC 820-10-65 is effective for interim reporting periods ending after June 15, 2009. The implementation of ASC 820-10-65 did not have a material effect on the Fund’s financial position or results of operation.
8. | SUBSEQUENT EVENTS |
On December 18, 2009, a Special Meeting of Shareholders (the “Meeting”) of the Fund was held at the offices of Caldwell & Orkin, Inc. to approve a proposed amendment to the Management Agreement between the Adviser and the Fund (the “Proposal”). Shares represented at the Meeting in person or by proxy constituted 51.49% of the Fund’s outstanding shares entitled to be voted at the Meeting and a quorum necessary for the transaction of business. The Proposal was approved by the affirmative vote of a “majority of the outstanding voting securities” (as defined in the 1940 Act) of the Fund, meaning the lesser of (i) 67% or more of the shares represented at the Meeting, if the holders of more than 50% of the outstanding shares were represented at the Meeting, or (ii) more than 50% of the outstanding shares of the Fund. Shares voted in favor, shares voted against and shares abstaining with respect to the Proposal were as follows:
FOR | AGAINST | ABSTAIN | ||||||
Percent of | Percent of | Percent of | ||||||
Shares | Total Voted | Shares | Total Voted | Shares | Total Voted | |||
9,698,046 | 90.78% | 760,050 | 7.11% | 225,279 | 2.11% |
The Proposal amended and restated Section (a) of Article III of the Management Agreement as follows:
a) Management Fee. For the services rendered under Article I above, the facilities furnished and expenses assumed by the Manager, the Fund shall pay to the Manager monthly compensation at an annual rate, which will vary according to the assets of the Fund. Such annual rate will be determined as follows: (i) 1.00% of the average daily net assets up to $250 million; (ii) 0.90% of the average daily net assets in excess of $250 million but not more than $500 million; and (iii) 0.80% of the average daily net assets in excess of $500 million. Said annual rate will be calculated as hereinafter set forth, commencing on the day following effectiveness hereof. Except as hereinafter set forth, compensation under this Agreement shall be calculated and accrued daily and paid monthly in accordance with this article and by applying the applicable percentage component of the annual rate as set forth above to the average daily net assets of the Fund determined as of each business day and adding to that amount any applicable fixed sum amount as set forth above. If the Agreement becomes effective subsequent to the first day of the month or shall terminate before the last day of a month, compensation for that part of the month this Agreement is in effect shall be prorated in an amount consistent with the calculation of fees as set forth above. Subject to the provisions of subsection (b) and (c) hereof, payment of the Manager's compensation for the proceeding month shall be made as promptly as possible after completion of the computations contemplated by subsection (b) and (c) hereof.
32
CALDWELL & ORKIN MARKET OPPORTUNITY FUND
NOTES TO FINANCIAL STATEMENTS – (Continued)
October 31, 2009 (Unaudited)
On November 16, 2009, ADI succeeded IFS as the Fund’s distributor under a new distribution agreement. The principal offices of ADI are located at 1290 Broadway, Suite 1100, Denver, Colorado 80203.
On November 16, 2009, ALPS Fund Services, Inc. (“ALPS”) began providing fund accounting and fund administration services to the Fund. In addition, on or about February 16, 2010, ALPS will serve as transfer agent to the Fund. The principal offices of ALPS are located at 1290 Broadway, Suite 1100, Denver, Colorado 80203.
In preparing these financial statements, the Fund has evaluated events and transactions for potential recognition or disclosure resulting from subsequent events through December 29, 2009.
33
CALDWELL & ORKIN MARKET OPPORTUNITY FUND
DIRECTOR APPROVAL OF THE INVESTMENT ADVISORY AGREEMENT (unaudited)
The Board of Directors of The Caldwell & Orkin Funds, Inc. (the “Board”) is responsible for overseeing management of the Caldwell & Orkin Market Opportunity Fund (the “Fund”). As required by law, on an annual basis the Board determines whether to continue the Fund’s management agreement (the “Management Agreement”) with C&O Funds Advisor, Inc. (the “Adviser”), the manager of the Fund.
The Board considered the renewal of the current Management Agreement at an in-person meeting at the office of Caldwell & Orkin, Inc., Norcross, Georgia on June 17, 2009. At that meeting, the Board also considered the Adviser's proposal for an increase to the investment management fee under the Management Agreement (the “Proposed Amendment”). In evaluating the Proposed Amendment, the principal areas of review included (1) the change in 1994 in the Fund’s investment style from long-only to long/short, and the consequent increase in the Adviser’s workload and responsibility since the implementation of the Fund’s current management fee; (2) the current and proposed management fees as compared to those of other long/short funds; (3) the favorable performance of the Fund; and (4) the long tenure of the Fund’s portfolio manager.
Prior to the meeting, the Independent Directors and their independent legal counsel requested and received (i) a memorandum from Paul, Hastings, Janofsky & Walker LLP (legal counsel to the Adviser and the Fund) regarding the issues and legal standards the Board should consider in evaluating whether to renew the Management Agreement; and (ii) a memorandum from the Adviser to the Board which included, among other things, the Adviser’s Form ADV; information about the Fund’s personnel, policies and financial circumstances; data regarding the Fund’s performance record and the performance records of other funds in the long/short category; and information about the Fund’s expense ratio and management fees, and the expense ratios and management fees of other funds in the long/short category. The Independent Directors also received a memorandum from the Adviser proposing an increase in the investment management fee paid to the Adviser under the Management Agreement.
The Independent Directors and their independent legal counsel met without members of management present to review the materials presented, and to discuss the investment management and administrative services provided by the Adviser to the Fund, the income, expenses and profitability of the Adviser related to the Fund and related information about the Fund. The Independent Directors and their independent legal counsel also met with management of the Adviser in their consideration of renewal of the current Management Agreement and proposed management fee increase. Throughout the deliberation process, the Independent Directors were advised by their independent counsel.
The factors considered by the Independent Directors in the consideration of the current Management Agreement and Proposed Amendment and the main reasons for the Independent Directors' approval of both are summarized below.
Current Management Agreement Renewal
As a part of their evaluation process of the current Management Agreement, the Independent Directors considered various factors they determined to be relevant, including the material factors detailed below. None of the factors was a sole determining factor; rather, consideration of all the factors formed the basis for the Independent Directors’ decision. The material factors considered by the Independent Directors included, without limitation, the following:
(i) The nature, extent, and quality of the services provided by the Adviser. In this regard, the Independent Directors reviewed the services being provided by the Adviser to the Fund including, without limitation, its investment advisory and administrative services since the Fund’s inception, its coordination of services and distribution efforts for the Fund over the years, and its provision of officers to the Fund (other than the Fund’s chief compliance officer) without additional compensation. After reviewing the foregoing information, the Independent Directors concluded that the quality, extent and nature of the services provided by the Adviser met or exceeded expectations.
34
CALDWELL & ORKIN MARKET OPPORTUNITY FUND
DIRECTOR APPROVAL OF THE INVESTMENT ADVISORY AGREEMENT (continued)
(ii) The costs of the services to be provided and profits to be realized by the Adviser and its affiliates from the relationship with the Fund. In this regard, the Independent Directors considered the Adviser’s staffing, personnel and methods of operating; the financial condition of the Adviser and the level of commitment to the Fund and the Adviser by the principals of the Adviser; the asset levels of the Fund; and the overall expenses of the Fund. The Independent Directors noted and discussed the Fund’s Expense Cap as well as the considerations discussed below regarding the Proposed Amendment. The Independent Directors also considered potential benefits for the Adviser in managing the Fund, including the ability for the Adviser to pay for research with Fund trades that may benefit Adviser clients other than the Fund. The Independent Directors then compared the fees and expenses of the Fund (including the current and proposed management fee) to other funds in the long/short category. The Independent Directors noted that the Adviser’s current fees were generally lower than other funds employing long/short strategies, and that the Fund’s expense ratio was among the lowest for those funds. Specifically, the Independent Directors noted that the Adviser’s current fees were lower than the average and median fees of 48 funds in the universe of long/short funds selected by an independent third-party provider of mutual fund data and analysis, and in fact were lower than the management fees of all but six of the 48 funds in that universe. The Independent Directors also observed that the total expenses of the Fund were lower than all but a few of the 48 funds in that universe. The Independent Directors noted that in light of the Fund’s active and disciplined investment strategy, its performance and other considerations discussed below, a higher fee to the Adviser would be more in line with fees charged by other funds with similar strategies and the time and personnel resources spent by the Adviser in the management of the Fund’s portfolio. Following this comparison and upon further consideration and discussion of the foregoing, the Independent Directors concluded that the fees paid to the Adviser were low relative to the services rendered and other factors, and agreed than an increase was reasonable and in order.
(iii) The investment performance of the Fund and Adviser. In this regard, the Independent Directors compared the performance of the Fund with the performance of a benchmark index and comparable funds managed by other advisers. In particular, the Independent Directors considered the Fund’s absolute and relative performance for the one-, five- and ten-year periods ending April 30, 2009, as compared to the performance of the comparable share class of 63 long/short funds as categorized by and available through Charles Schwab & Co., Inc., (the “Selected Performance Universe”), noting that the Fund ranked first, second and third in the Selected Performance Universe for those respective time periods. The Independent Directors also noted that the Fund had outperformed the S&P 500 for the year-to-date, one-year, three-year and five-year periods ended May 31, 2009, that the Fund’s three-year and five-year performance for the periods ending April 30, 2009 were rated five stars by Morningstar, Inc., and that the Fund has an overall rating of four stars. The Independent Directors also considered the consistency of the Adviser’s management of the Fund with the Fund’s investment objective and policies, and long-term performance of the Fund and the Adviser’s separate accounts. Following further discussion, the Independent Directors concluded that the investment performance of the Fund and Adviser met or exceeded expectations and was consistent with the Fund’s objectives and policies.
(iv) The extent to which economies of scale would be realized as the Fund grows, and whether advisory fee levels reflect these economies of scale for the benefits of the Fund’s investors. In this regard, the Independent Directors considered the Fund’s fee arrangements with the Adviser, the Fund’s fee arrangements with other service providers, and the Expense Cap. The Independent Directors considered the Fund’s current and proposed fee level breakpoints, and noted that the Fund’s shareholders benefit from economies of scale, as the Adviser’s management fees are reduced as asset levels increase. Following further discussion of the Fund’s current asset levels and fee breakpoints, the Independent Directors determined that the Fund’s fee arrangements with the Adviser reflect economies of scale for the benefit of Fund shareholders.
35
CALDWELL & ORKIN MARKET OPPORTUNITY FUND
DIRECTOR APPROVAL OF THE INVESTMENT ADVISORY AGREEMENT (continued)
Based upon its evaluation of the information, materials and factors detailed above, the Board, including all of the Independent Directors, concluded: (i) that the terms of the current Management Agreement were fair and reasonable to the Fund in light of the nature and quality of services performed by the Adviser for the Fund; (ii) that they were satisfied with the Adviser’s services, personnel and investment strategy and performance; and (iii) that it was in the best interest of the Fund and its shareholders to renew the Management Agreement. However, the Independent Directors also determined that a management fee increase should be considered and ultimately resolved to submit the Proposed Amendment to the shareholders for approval and adoption for the reasons stated above and below.
Proposed Amendment
In approving the Proposed Amendment for submission to the shareholders, the Independent Directors considered, among other things, that the Management Agreement was originally entered into by the Adviser and the Fund as of November 16, 1993. At that time, the Fund invested only in long security positions and did not engage in short sales. The Independent Directors considered that in a long-only environment, the greatest loss that can be sustained with respect to any given security is the amount of the original investment in such security, while the greatest potential loss is unlimited when shorting securities. Consequently, a long/short investment style requires a different set of enhanced risk controls, including intense and constant monitoring of portfolio securities, that a long-only investment style does not. Additionally, compared to long-only securities analysis, analysis of potential short sale candidates involves different skill sets, including the ability to detect fraud and other factors that may adversely affect a stock price. Therefore, a greater level of expertise is required to effectively employ a long/short investment style.
The Independent Directors noted that on May 2, 1994 the Adviser changed its investment approach from long-only to a long/short strategy and short positions were limited to 25% of the Fund’s net assets. On August 29, 1997, that limitation was raised to 40%, and on November 16, 1998, it was further increased to 60%. The increases in short position limits were intended to benefit the Fund’s shareholders, and that extra investment latitude resulted in a greater degree of work for the Adviser. While the Adviser’s workload and responsibility increased, its fee schedule did not. The Independent Directors agreed that the management fee should appropriately reflect and be commensurate with the level of work involved to manage the Fund.
When the Fund began to employ short selling in 1994, to the knowledge of management of the Fund there were only three other publicly available mutual funds that employed long/short investment styles. Long/short investing is now generally accepted and in demand, and there are many long/short mutual funds publicly available. The Independent Directors considered that for the six months ended October 31, 2008, the Fund’s blended management fee rate was 0.83% of average daily net assets. Based on the assets as of the close on May 20, 2009 the blended rate on an annualized basis was 0.78%. The Independent Directors considered that as of May 15, 2009, the average management fee rate for a representative sample of 48 long/short mutual funds from different fund families selected by an independent provider of mutual fund data and analysis was 1.25%, and the median management fee rate was 1.18%, as compared to the Fund’s annual management fee rate of 0.83% for the Fund (as of April 30, 2009), and that in that universe of 48 funds, the Fund’s rate was the seventh lowest.
The Independent Directors also considered that the Fund’s portfolio manager, Mr. Orkin, has a 17-year tenure in managing the Fund (the longest tenure reflected in the group of 48 funds referred to above). The average manager tenure in the representative group of 48 long/short mutual funds is 3.53 years, and the median is 2.15 years. This long-term, seasoned tenure, encompassing both “bull” and “bear” market environments, is an important asset for the Fund. In addition, the Fund’s Assistant Portfolio Managers, Mr. David Bockel and Mr. Patrick Fleming, who have full discretion to manage the Fund in Mr. Orkin’s absence, are both very experienced. Mr. Bockel joined Caldwell & Orkin in 2000 as an Operations Specialist, and joined its investment team in 2002. Mr. Fleming joined the firm in an investment management capacity in 2002. The Independent Directors recognized that in order to develop and retain exceptionally qualified staff, the Adviser needs to have the ability to offer competitive wages and benefits, and that the Fund’s current fee structure effectively puts the Adviser at a competitive disadvantage relative to other advisers.
36
CALDWELL & ORKIN MARKET OPPORTUNITY FUND
DIRECTOR APPROVAL OF THE INVESTMENT ADVISORY AGREEMENT (continued)
The Independent Directors also considered that although the Management Agreement provides for the Fund to pay a portion of its compliance costs, the Adviser pays a significantly greater amount of these costs than the Fund. The Independent Directors noted that such costs did not exist and were not contemplated when the original Management Agreement was signed in 1993, and consequently were not taken into account when assessing a fair and competitive fee structure for the Adviser. The Independent Directors also considered that the proposed fee will still maintain a breakpoint structure, thus affording Fund shareholders the benefits of economies of scale achieved by higher asset levels.
The Independent Directors also noted that the Fund’s performance (both short-term and long-term) and risk characteristics are superior when compared to other funds in the Selected Performance Universe, as well as to the S&P 500 Total Return index (sometimes also referred to as the S&P 500 with Income index), the Fund’s benchmark.
As part of its proposal to the Independent Directors, the Adviser proposed a higher fee increase than the one approved by the Independent Directors and included in the Proposed Amendment. Specifically, the Adviser had requested a fee of 1.20% for assets up to $500 million, 1.10% for assets from $500 million to $800 million and 1.0% for assets over $800 million. After considering all factors and following its discussions with the Adviser, however, the Independent Directors concluded the fee increase reflected in the Proposed Amendment represented a more appropriate and reasonable balance between the legitimate reasons for the Adviser to have requested a fee increase and the interest of the Fund to keep fees and expenses as low as is reasonable under the circumstances.
If the Proposed Amendment is approved, at the Fund’s April 30, 2009 asset level, the Fund’s advisory fee rate on an annualized basis would have been 0.98% (0.96% at the September 30, 2009 asset level), which is both below the 1.25% average and 1.18% median rate of funds in the universe of 48 funds referred to above, notwithstanding that the Fund's performance places it at the top of the Selected Performance Universe.
After considering the foregoing factors, the Independent Directors concluded that increasing the management fee payable to the Adviser by the Fund as set forth in the Proposed Amendment is justified and in the best interests of the Fund and its shareholders. Accordingly, the Independent Directors resolved to submit the Proposed Amendment to the shareholders for approval and adoption.
37
CALDWELL & ORKIN MARKET OPPORTUNITY FUND
ADDITIONAL INFORMATION (unaudited)
Information about the Board of Directors and officers* of the Caldwell & Orkin Market Opportunity Fund as of October 31, 2009 is set forth below. The Statement of Additional Information (SAI) includes additional information about the Fund’s Directors and officers and is available free of charge, upon request, by calling (800) 237-7073. The address for each of the persons named below is 5185 Peachtree Parkway, Suite 370, Norcross, GA 30092-6541.
Name, (Age) and Position(s) Held with Fund | Term of Office and Length of Time Served (1) | Principal Occupation(s) During Past Five Years | Number of Funds in Fund Complex Overseen by Director | Other Directorships Held by Director |
DISINTERESTED DIRECTORS | ||||
Frederick T. Blumer (50) Chairman | Since 1990 | Mr. Blumer is Vice President of HUGHES Telematics, Inc., and was formerly the CEO of X-spand International, Inc. | One | None |
David L. Eager (67) Director | Since 1992 | Mr. Eager is a Partner at Eager, Davis & Holmes LLC, and was formerly Director for Product Development for Driehaus Capital Management and a Global Partner with William M. Mercer, Inc. | One | Veracity Mutual Fund |
James L. Underwood (59) | Since 2006 | Mr. Underwood is the President of Tarpley & Underwood, P.C. and Tarpley & Underwood Financial Advisors LLC. | One | None |
INTERESTED DIRECTOR | ||||
Michael B. Orkin (50) (2) Director, President, Portfolio Manager | Since 1990 | Mr. Orkin is the CEO and sole shareholder of Caldwell & Orkin, Inc., of which the Adviser is a wholly-owned subsidiary. Mr. Orkin has been a portfolio manager at Caldwell & Orkin, Inc. since 1985, and is a Chartered Financial Analyst. | One | None |
OFFICERS WHO ARE NOT DIRECTORS | ||||
David R. Bockel (32) Secretary & Ass’t Treasurer | Since 2006 | Mr. Bockel is an Assistant Portfolio Manager for Caldwell & Orkin, Inc., and is a Registered Representative of ALPS Distributors, Inc. | N/A | None |
William C. Horne (51) Chief Compliance Officer & Treasurer | Since 2004 Since 2006 | Mr. Horne is the Director of Client Services and Chief Compliance Officer of Caldwell & Orkin, Inc., and is a Registered Representative of ALPS Distributors, Inc. | N/A | None |
* | The term “officer” means the president, vice president, secretary, treasurer, controller or any other officer who performs policy-making decisions. |
1 | Each Director serves until his / her successor is duly elected and qualified, or until his / her death, resignation or removal. |
2 | Mr. Orkin is an interested person of the Fund by reason of his position with the Adviser. |
38
THIS PAGE INTENTIONALLY LEFT BLANK
39
CALDWELL & ORKIN MARKET OPPORTUNITY FUND
Semi-Annual Report to Shareholders (unaudited)
BOARD OF DIRECTORS Frederick T. Blumer, Independent Chairman Michael B. Orkin, President David L. Eager James L. Underwood INVESTMENT ADVISER C&O Funds Advisor, Inc. 5185 Peachtree Parkway Suite 370 Norcross, GA 30092-6541 DISTRIBUTOR ALPS Distributors, Inc. 1290 Broadway, Suite 1100 Denver, CO 80203 TRANSFER, REDEMPTION & DIVIDEND DISBURSING AGENT JPMorgan 303 Broadway, Suite 900 Cincinnati, OH 45202 | CUSTODIAN JPMorgan Chase Bank, N.A. 1111 Polaris Parkway, Suite 3J Columbus, OH 43240 INDEPENDENT REGISTERED PUBLIC ACCOUNTING FIRM Tait, Weller & Baker LLP 1818 Market Street, Suite 2400 Philadelphia, PA 19103-3638 LEGAL COUNSEL Paul, Hastings, Janofsky & Walker LLP 600 Peachtree Street, N.E. Suite 2400 Atlanta, GA 30308 INDEPENDENT DIRECTORS’ COUNSEL Arnall Golden Gregory LLP 171 17th Street, NW Suite 2100 Atlanta, GA 30363 |
The Caldwell & Orkin Market Opportunity Fund’s (the “Fund”) portfolio may or may not have positions in any of the companies referenced in this Report to Shareholders as of any date after October 31, 2009. The commentary reflects the views of the portfolio manager (or Adviser) through the end of the period or through the date of this report, as the case may be. Of course, these views are subject to change as market and other conditions warrant. These financial statements are submitted for the general information of the Fund’s shareholders. They are not authorized for distribution to prospective investors unless preceded or accompanied by an effective Fund Prospectus.
Availability of Proxy Voting Policy & Procedures, Proxy Voting Record and Code of Ethics - A description of a) the policies and procedures the Fund uses to determine how to vote proxies relating to portfolio securities, b) how the Fund voted proxies relating to portfolio securities during the most recent 12-month period ended June 30, and c) the Code of Ethics applicable to the principal officers of the Fund are available without charge, upon request, by calling toll-free (800) 237-7073, or on the Securities and Exchange Commission’s (the “Commission’s”) website at http://www.sec.gov.
Availability of Quarterly Portfolio Schedule - The Fund files its complete schedule of portfolio holdings with the Commission for the first and third quarters of each fiscal year on Form N-Q. The Fund's Forms N-Q are available on the Commission's website at http://www.sec.gov. The Fund's Forms N-Q may be reviewed and copied at the Commission's Public Reference Room in Washington, D.C. Information on the operation of the Public Reference Room may be obtained by calling 1-800-SEC-0330.
Fund Information - For information about the Fund please call (800) 237-7073 or visit the Fund’s website at www.CaldwellOrkin.com. For information about a specific Fund account, please call Shareholder Services at (800) 467-7903.
Fund Listings - The Fund is listed in many newspapers as C&OMktOpp or CaldOrkMO. The Fund’s Quotation symbol is COAGX. The Fund’s CUSIP number is 128819307.
Caldwell & Orkin Market Opportunity Fund
5185 Peachtree Parkway, Suite 370
Norcross, GA 30092-6541
E-mail: Info@CaldwellOrkin.com
Item 2. Code of Ethics.
Not applicable to this report.
Item 3. Audit Committee Financial Expert.
Not applicable to this report.
Item 4. Principal Accountant Fees and Services.
Not applicable to this report.
Item 5. Audit Committee of Listed Registrants.
Not applicable.
Item 6. Schedule of Investments
Not applicable – included as part of the report to shareholders filed under Item 1 of this Form.
Item 7. Disclosure of Proxy Voting Policies and Procedures for Closed-End Management Investment Companies.
Not applicable.
Item 8. Portfolio Managers of Closed-End Management Investment Companies.
Not applicable.
Item 9. Purchases of Equity Securities by Closed-End Management Investment Company and Affiliated Purchasers.
Not applicable.
Item 10. Submission of Matters to a Vote of Security Holders.
There have been no material changes to the procedures by which shareholders may recommend nominees to the registrant’s board of directors..
Item 11. Controls And Procedures.
(a) The registrant’s principal executive officer and principal financial officer have concluded that the registrant’s disclosure controls and procedures are effective based on their evaluation of these disclosure controls and procedures as of a date within 90 days of the filing of this report.
(b) There were no changes in the registrant's internal control over financial reporting that occurred during the second fiscal quarter of the period covered by this report that have materially affected, or are reasonably likely to materially affect, the registrant's internal control over financial reporting.
Item 12. Exhibits.
(a)(1) Not applicable.
(a)(2) Certifications pursuant to Section 302 of the Sarbanes-Oxley Act of 2002 are attached hereto as 99.302CERT.
(a)(3) Not applicable.
(b)(1) Certifications pursuant to Section 906 of the Sarbanes-Oxley Act of 2002 are attached hereto as 99.906CERT.
SIGNATURES
Pursuant to the requirements of the Securities Exchange Act of 1934 and the Investment Company Act of 1940, the registrant has duly caused this report to be signed on its behalf by the undersigned, thereunto duly authorized.
THE CALDWELL & ORKIN FUNDS, INC.
By: /s/ Michael B. Orkin
Michael B. Orkin, President
Date: January 7, 2010
Pursuant to the requirements of the Securities Exchange Act of 1934 and the Investment Company Act of 1940, this report has been signed below by the following persons on behalf of the registrant and in the capacities and on the dates indicated.
By: /s/ Michael B. Orkin
Michael B. Orkin, President
Date: January 7, 2010
By: /s/ William C. Horne
William C. Horne, Treasurer
Date: January 7, 2010